Embed Size (px)
Citation preview
sustainability
Article
Why Don’t People Ride Bicycles in High-IncomeDeveloping Countries, and Can Bike-Sharing Be theSolution? The Case of Qatar
Khaled Shaaban
Department of Civil Engineering/Qatar Transportation and Traffic Safety Center, Qatar University,Doha P.O. Box 2713, Qatar; [email protected]; Tel.: +974-4403-4185
Received: 30 December 2019; Accepted: 14 February 2020; Published: 24 February 2020�����������������
Abstract: Although cycling is increasing in developed regions, such as Europe and North America,high-income developing countries in the Arabian Gulf region still have low cycling activities. Limitedresearch has investigated the barriers to cycling in these countries. In this study, the barriers andmotivators in Qatar, a high-income developing country, were investigated. Respondents were askedto report their bicycle usage during the last 12 months. The results indicated that approximately 15%used a bicycle during this period, but only 1.7% bicycled for transportation purposes. The analysisrevealed the different barriers to cycling and their relative strengths. The study also compared theperceived challenges of cycling between males and females. The questionnaire results indicated thatboth groups considered the issues related to the weather conditions, bicycle ownership, lack of pathsor connections, and driver behavior as important barriers to cycling. However, the female participantsidentified clothing, parental consent, and cultural and societal pressure as far more important.When asked about motivators for cycling, the results revealed that improving intersections, addingadditional infrastructure facilities, planting trees for shading, affordable bicycles, and campaignstargeting potential cyclists and drivers are needed in order to increase cycling. To better understandhow bike-sharing will be perceived if implemented in the future, the feedback was obtained fromthe participants, and their opinions indicated that there is a great deal of acceptance for this type ofservice. The outcome of this study can be of benefit to public agencies in developing countries thathave the goal of increasing cycling use among their populations.
Keywords: biking; cycling; barriers; motivators; developing countries; active transportation
1. Introduction
Cycling is a physical activity suitable for all age groups. Several advantages are linked to it interms of better health, less pollution, and less traffic congestion. Many countries have implementedpolicies aimed at cycling and raising awareness about its importance. Moreover, many studies havefocused on identifying factors affecting the adoption of cycling as a mode of transportation. The maingoal is to find ways to change non-users’ behavior. Non-users have beliefs, assumptions, perceptions,and expectations that affect their decisions regarding cycling. These beliefs differ from one regionto another.
High-income developing countries are known for their limited adoption of cycling compared tobike-friendly countries in different areas of the world. These countries deal with various challenges topromoting cycling, including but not limited to a negligible cycling culture and a car-oriented culturecharacterized by aggressive driving [1,2]. Given that some of these countries lack a cycling culture, it isnecessary to identify the infrastructure and programs needed to increase the cycling modal share. Tothat end, it is important to find the key factors affecting the adoption of cycling in order to develop
Sustainability 2020, 12, 1693; doi:10.3390/su12041693 www.mdpi.com/journal/sustainability
Sustainability 2020, 12, 1693 2 of 18
effective policies. To date, few studies have been conducted in high-income developing countries.Most relevant studies have focused on barriers and motivators of cycling in developed countries, suchas those in Europe and North America.
Qatar, a high-income developing country in the Arabian Gulf region, was used as a case study inthis research. The country is aiming for a paradigm shift after enormous investment in walking andcycling infrastructure [3,4]. In recent years, there has been a clearly positive change, with an emphasison establishing a comprehensive bicycle network. However, although bike lanes are available, usageremains low, and innovative strategies will be required in order to increase it. The purpose of thisstudy was to determine the cycling modal share in Qatar for the first time, understand the barriers andmotivators of cycling in the country, compare the perceived barriers and motivators between the maleand the female population, and investigate attitudes about the introduction of bike-sharing in this typeof environment.
2. Literature Review
2.1. Barriers to Cycling
The benefits of active transportation, especially cycling, are well known. Increasing the numberof cyclists in any country could help to reduce obesity and improve physical and mental health [5,6].However, behavior change is a complicated process. The first step is to identify barriers to cycling.In this context, barriers are defined as factors that discourage people who are capable of cycling fromdoing so. Many studies have investigated these barriers using different methods, such as questionnaires,observations, and field measurements [7–9].
Barriers can be grouped under four general categories: demographic, environmental,infrastructure-related, and traffic-related factors. In regard to demographic barriers, different studieshave reported mixed results concerning age and income levels [10–12]. In terms of gender, femaleshave been found to be less likely to use a bicycle than males [13]. Studies have also shown that nothaving access to a car and owning a bicycle have a positive impact on bicycle use [14,15].
Regarding environmental barriers, weather, built environment, and topographies have been foundto affect cycling decisions [10,16]. Unusual weather conditions have been found to negatively impactbicycle use [10,17]. Similarly, steep gradients have a negative impact [18]. Furthermore, the urbandesign of a neighborhood affects bicycle use. Dense urban areas are considered to provide favorableconditions [19].
Many studies have focused on infrastructure barriers. A lack of bike lanes has been reported asone of the main barriers. Conversely, the existence of a bicycle network promotes bicycle use [9,20].Moreover, its quality and proper design, including connectivity, have a positive impact [21]. Safeand proper parking areas for bicycles and end-of-trip facilities, such as showers and dressing rooms,also have a positive effect [20]. Regarding traffic-related barriers, many people perceive using abicycle and interacting with vehicles as often dangerous. This barrier can either be assessed byactual measurements, such as speed measurements and crash rate estimations, or by evaluating thepopulation’s risk perception [22,23].
2.2. Motivators for Cycling
Research has identified several motivators for cycling. A study conducted in South Africasuggested various motivators, such as advertising the benefits of cycling, educating the public aboutroad safety, training people in cycling, providing affordable bicycles, and improving the safetyof the cycling environment [24]. A study conducted in Melbourne, Australia, also made variousrecommendations, including campaigns emphasizing the benefits of cycling, training programs toimprove cycling skills and increase safety, and events aimed at offering individuals incentives to cyclemore [25].
Sustainability 2020, 12, 1693 3 of 18
A similar study in New South Wales, Australia, emphasized the need to improve safety byproviding designated bike lanes and facilities at workplaces and recommended promoting the benefitsof cycling and providing financial rewards through marketing activities [26]. In London, UK, a studyunderlined the need to complete the bicycle network by identifying priority routes for its completion.To overcome the enforcement, parking, and facility barriers, it recommended increasing the number ofparking spots for bicycles, including at subway stations and major transportation hubs, and developinga database of bicycle stand locations. To overcome the safety barrier, it suggested launching campaignsto increase safety awareness among cyclists and drivers. To overcome the information and educationbarriers, it recommended providing cyclists with information about cycling routes and parking at allsubway stations [27].
2.3. Bike-Sharing as a Solution
One of the potential solutions to low cycling rates is bike-sharing programs. These programsprovide bicycles in key locations of a city, which the public can rent for short periods and thenreturn to the same or any other docking station in the network. Recently, systems without dockingstations, which offer users more freedom, have encouraged more people to use these programs [28].Programs can vary depending on many factors, such as rental time allowed, operating hours, andcost of the service. Bike-sharing is typically presented as an ideal solution for congested metropolitanenvironments [29,30] and is less often tested in medium-sized or smaller cities [31,32].
Some cities, such as Hangzhou in China, Tokyo in Japan, and Bogota in Colombia, have successfullyintroduced bike-sharing programs in their transportation networks. Others, such as Seattle in theUSA, Melbourne in Australia, and Madrid in Spain, have been less successful [12–14]. Therefore,it is important to understand the population’s perception of using this type of service prior toits implementation.
Despite their increasing popularity in cities across Europe, North America, and elsewhere,bike-sharing programs are uncommon and of limited scope in developing countries. Moreover, thereis limited research in countries with low cycling rates, especially high-income developing countries.These countries typically have sizeable numbers of potential cyclists. This study is among the first toinvestigate the likelihood of using bike-sharing services in the Persian Gulf countries.
3. Methods
3.1. Case Study
Qatar, a country in the Arabian Gulf region with about three million inhabitants, is used as a casestudy for this investigation. The country is considered one of the six high-income Gulf countries thatform the Gulf Cooperative Council. These countries include Qatar, Bahrain, Kuwait, Oman, SaudiArabia, and the United Arab Emirates. They are classified as developing countries, according to theUnited Nations. However, the gross domestic product per capita in this region is one of the highest inthe world. These countries have unique socio-cultural, economic, weather, religion, and geographicalcharacteristics. The six countries have a desert climate, characterized by mild and pleasant wintersfollowed by extremely hot and humid summers.
The six countries host a significant proportion of expatriates who come from various partsof the world. They have different backgrounds, cultures, and training. This combination createsheterogeneous traffic composition and adverse traffic conditions, which affects traffic safety in thisregion. Furthermore, this region suffers from the excessive use of personal vehicles as the main modeof transportation.
The Arabian Gulf countries invest heavily in bicycle facilities, but the effect of these infrastructureson the cycling rates for the population in general and according to gender is still not measured. Thisstudy is one of the first attempts to measure the perception of cycling in this region, where perceptionsdiffer widely from developing countries.
Sustainability 2020, 12, 1693 4 of 18
3.2. Bicycle Network in the City of Doha
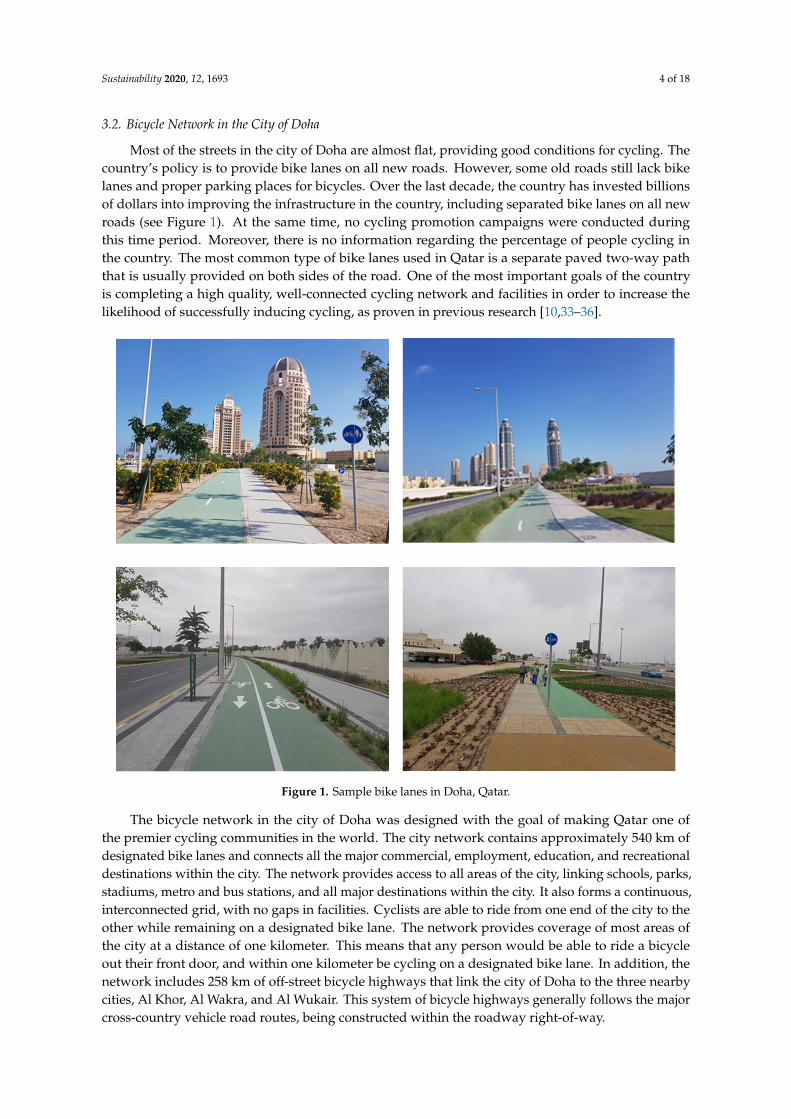
Most of the streets in the city of Doha are almost flat, providing good conditions for cycling. Thecountry’s policy is to provide bike lanes on all new roads. However, some old roads still lack bikelanes and proper parking places for bicycles. Over the last decade, the country has invested billionsof dollars into improving the infrastructure in the country, including separated bike lanes on all newroads (see Figure 1). At the same time, no cycling promotion campaigns were conducted duringthis time period. Moreover, there is no information regarding the percentage of people cycling inthe country. The most common type of bike lanes used in Qatar is a separate paved two-way paththat is usually provided on both sides of the road. One of the most important goals of the countryis completing a high quality, well-connected cycling network and facilities in order to increase thelikelihood of successfully inducing cycling, as proven in previous research [10,33–36].
Sustainability 2020, 12, 1693 4 of 18
3.2. Bicycle Network in the City of Doha
Most of the streets in the city of Doha are almost flat, providing good conditions for cycling. The
country’s policy is to provide bike lanes on all new roads. However, some old roads still lack bike
lanes and proper parking places for bicycles. Over the last decade, the country has invested billions
of dollars into improving the infrastructure in the country, including separated bike lanes on all new
roads (see Figure 1). At the same time, no cycling promotion campaigns were conducted during this
time period. Moreover, there is no information regarding the percentage of people cycling in the
country. The most common type of bike lanes used in Qatar is a separate paved two‐way path that is
usually provided on both sides of the road. One of the most important goals of the country is
completing a high quality, well‐connected cycling network and facilities in order to increase the
likelihood of successfully inducing cycling, as proven in previous research [10,33–36].
Figure 1. Sample bike lanes in Doha, Qatar.
The bicycle network in the city of Doha was designed with the goal of making Qatar one of the
premier cycling communities in the world. The city network contains approximately 540 km of
designated bike lanes and connects all the major commercial, employment, education, and
recreational destinations within the city. The network provides access to all areas of the city, linking
schools, parks, stadiums, metro and bus stations, and all major destinations within the city. It also
forms a continuous, interconnected grid, with no gaps in facilities. Cyclists are able to ride from one
end of the city to the other while remaining on a designated bike lane. The network provides coverage
of most areas of the city at a distance of one kilometer. This means that any person would be able to
ride a bicycle out their front door, and within one kilometer be cycling on a designated bike lane. In
addition, the network includes 258 km of off‐street bicycle highways that link the city of Doha to the
three nearby cities, Al Khor, Al Wakra, and Al Wukair. This system of bicycle highways generally
Figure 1. Sample bike lanes in Doha, Qatar.
The bicycle network in the city of Doha was designed with the goal of making Qatar one ofthe premier cycling communities in the world. The city network contains approximately 540 km ofdesignated bike lanes and connects all the major commercial, employment, education, and recreationaldestinations within the city. The network provides access to all areas of the city, linking schools, parks,stadiums, metro and bus stations, and all major destinations within the city. It also forms a continuous,interconnected grid, with no gaps in facilities. Cyclists are able to ride from one end of the city to theother while remaining on a designated bike lane. The network provides coverage of most areas ofthe city at a distance of one kilometer. This means that any person would be able to ride a bicycleout their front door, and within one kilometer be cycling on a designated bike lane. In addition, thenetwork includes 258 km of off-street bicycle highways that link the city of Doha to the three nearbycities, Al Khor, Al Wakra, and Al Wukair. This system of bicycle highways generally follows the majorcross-country vehicle road routes, being constructed within the roadway right-of-way.
Sustainability 2020, 12, 1693 5 of 18
3.3. Gender and Attitudes Toward Cycling
In general, male cyclists are substantially more likely than females to cycle in countries withlow cycling rates [13]. In Australia and North America, this pattern of gender difference in cyclingrates has been associated with the risks linked to relatively poor cycling infrastructure, policies,and regulations [37,38]. Gender differences in cycling are not known in the Arabian Gulf region.Investigating the existence of gender differences in the region and the causes for these variations isnecessary for the increase of cycling use in this region. Therefore, it was important to investigategender similarities, differences, and perceptions as part of this study.
3.4. Questionnaire Design
A questionnaire survey was designed to include respondents’ socio-demographic information,current mobility patterns, cycling usage, barriers towards cycling, ways to promote cycling, andwillingness to use a bike-sharing program in the future. The participants were categorized into threegroups. The first group was identified as “cannot use a bicycle” based on answering “yes” to any ofthe following statements: “I do not know how to ride a bicycle” or “I have health issues that preventme from using a bicycle”.
The second group was identified as “can use a bicycle” and consisted of people that can use abicycle. This group was divided into two groups: non-users (did not use a bicycle in the last 12 months)and users (used a bicycle at least once in the last 12 months). The third group was composed of peoplewho did not complete the survey.
The non-users were asked to rate different questions regarding the reasons why people do notride a bicycle, what could encourage them to bicycle, and what their perception would be towardsbike-sharing if offered at a reasonable price.
3.5. Sample Description
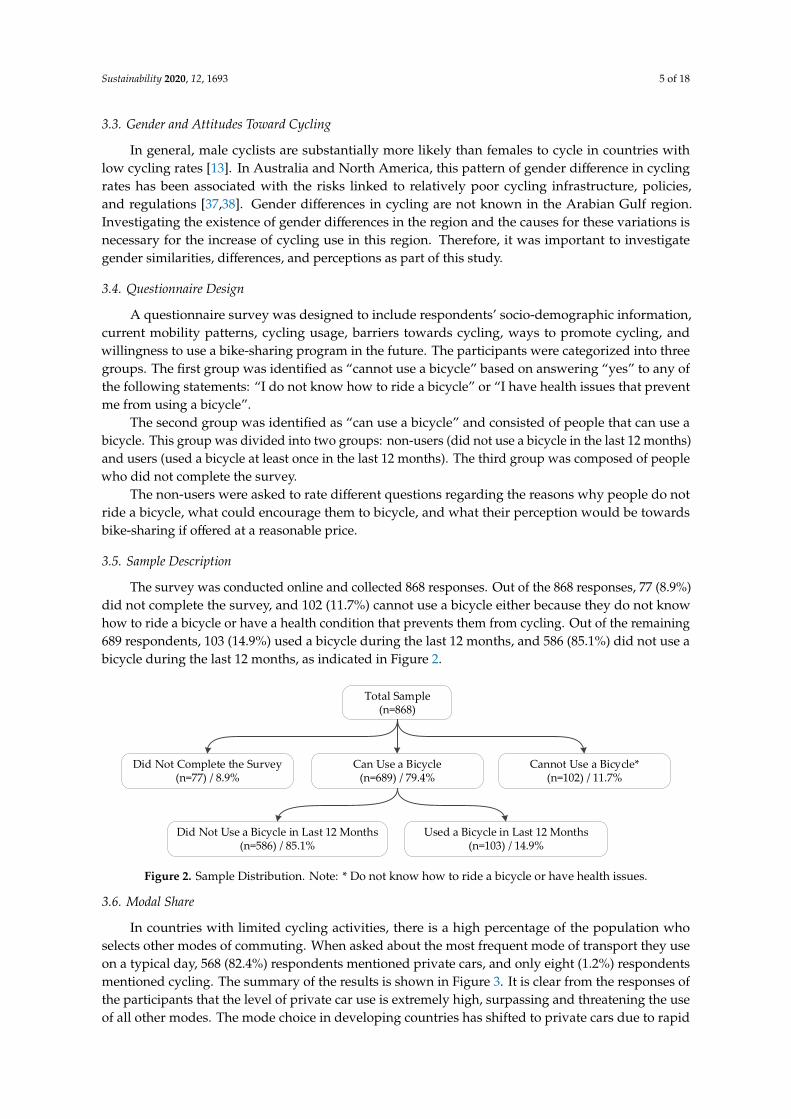
The survey was conducted online and collected 868 responses. Out of the 868 responses, 77 (8.9%)did not complete the survey, and 102 (11.7%) cannot use a bicycle either because they do not knowhow to ride a bicycle or have a health condition that prevents them from cycling. Out of the remaining689 respondents, 103 (14.9%) used a bicycle during the last 12 months, and 586 (85.1%) did not use abicycle during the last 12 months, as indicated in Figure 2.
Sustainability 2020, 12, 1693 5 of 18
follows the major cross‐country vehicle road routes, being constructed within the roadway right‐of‐
way.
3.3. Gender and Attitudes Toward Cycling
In general, male cyclists are substantially more likely than females to cycle in countries with low
cycling rates [13]. In Australia and North America, this pattern of gender difference in cycling rates
has been associated with the risks linked to relatively poor cycling infrastructure, policies, and
regulations [37,38]. Gender differences in cycling are not known in the Arabian Gulf region.
Investigating the existence of gender differences in the region and the causes for these variations is
necessary for the increase of cycling use in this region. Therefore, it was important to investigate
gender similarities, differences, and perceptions as part of this study.
3.4. Questionnaire Design
A questionnaire survey was designed to include respondents’ socio‐demographic information,
current mobility patterns, cycling usage, barriers towards cycling, ways to promote cycling, and
willingness to use a bike‐sharing program in the future. The participants were categorized into three
groups. The first group was identified as “cannot use a bicycle” based on answering “yes” to any of
the following statements: “I do not know how to ride a bicycle” or “I have health issues that prevent
me from using a bicycle”.
The second group was identified as “can use a bicycle” and consisted of people that can use a
bicycle. This group was divided into two groups: non‐users (did not use a bicycle in the last 12
months) and users (used a bicycle at least once in the last 12 months). The third group was composed
of people who did not complete the survey.
The non‐users were asked to rate different questions regarding the reasons why people do not
ride a bicycle, what could encourage them to bicycle, and what their perception would be towards
bike‐sharing if offered at a reasonable price.
3.5. Sample Description
The survey was conducted online and collected 868 responses. Out of the 868 responses, 77
(8.9%) did not complete the survey, and 102 (11.7%) cannot use a bicycle either because they do not
know how to ride a bicycle or have a health condition that prevents them from cycling. Out of the
remaining 689 respondents, 103 (14.9%) used a bicycle during the last 12 months, and 586 (85.1%) did
not use a bicycle during the last 12 months, as indicated in Figure 2.
Cannot Use a Bicycle*(n=102) / 11.7%
Used a Bicycle in Last 12 Months(n=103) / 14.9%
Can Use a Bicycle(n=689) / 79.4%
Total Sample(n=868)
Did Not Complete the Survey(n=77) / 8.9%
Did Not Use a Bicycle in Last 12 Months(n=586) / 85.1%
Figure 2. Sample Distribution. Note: * Do not know how to ride a bicycle or have health issues.
3.6. Modal Share
In countries with limited cycling activities, there is a high percentage of the population who
selects other modes of commuting. When asked about the most frequent mode of transport they use
on a typical day, 568 (82.4%) respondents mentioned private cars, and only eight (1.2%) respondents
mentioned cycling. The summary of the results is shown in Figure 3. It is clear from the responses of
Figure 2. Sample Distribution. Note: * Do not know how to ride a bicycle or have health issues.
3.6. Modal Share
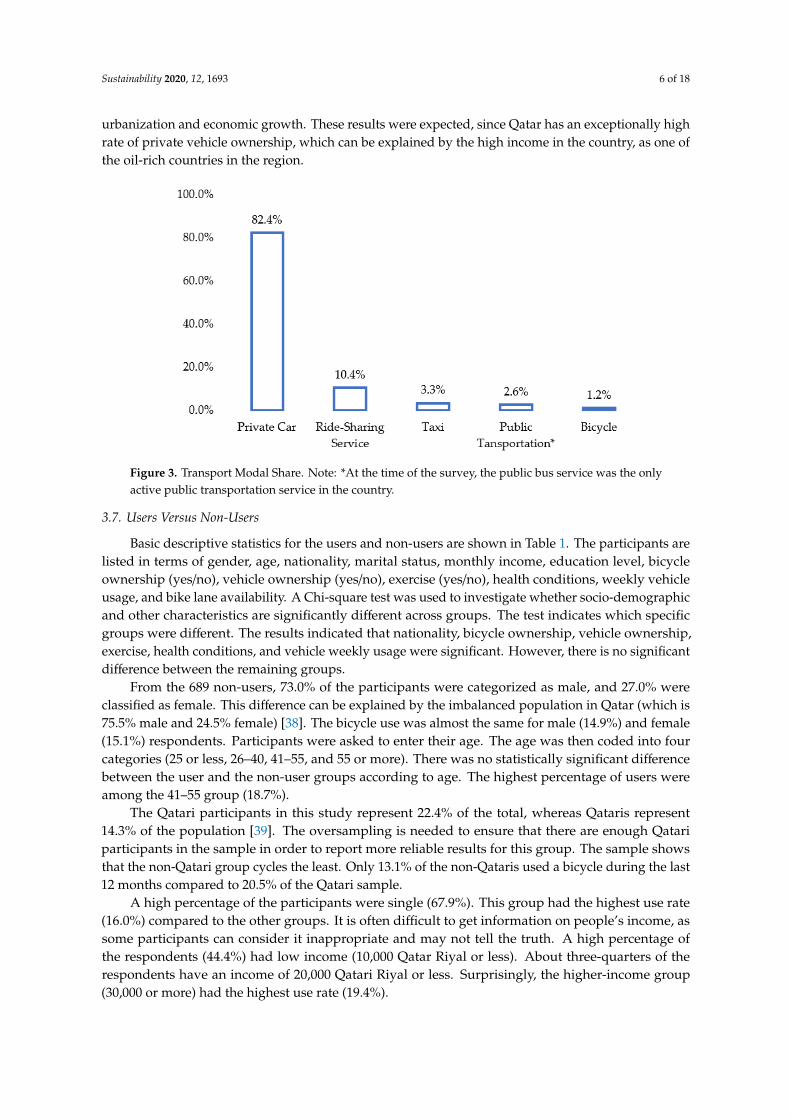
In countries with limited cycling activities, there is a high percentage of the population whoselects other modes of commuting. When asked about the most frequent mode of transport they useon a typical day, 568 (82.4%) respondents mentioned private cars, and only eight (1.2%) respondentsmentioned cycling. The summary of the results is shown in Figure 3. It is clear from the responses ofthe participants that the level of private car use is extremely high, surpassing and threatening the useof all other modes. The mode choice in developing countries has shifted to private cars due to rapid
Sustainability 2020, 12, 1693 6 of 18
urbanization and economic growth. These results were expected, since Qatar has an exceptionally highrate of private vehicle ownership, which can be explained by the high income in the country, as one ofthe oil-rich countries in the region.
Sustainability 2020, 12, 1693 6 of 18
the participants that the level of private car use is extremely high, surpassing and threatening the use
of all other modes. The mode choice in developing countries has shifted to private cars due to rapid
urbanization and economic growth. These results were expected, since Qatar has an exceptionally
high rate of private vehicle ownership, which can be explained by the high income in the country, as
one of the oil‐rich countries in the region.
Figure 3. Transport Modal Share. Note: *At the time of the survey, the public bus service was the only
active public transportation service in the country.
3.7. Users Versus Non‐Users
Basic descriptive statistics for the users and non‐users are shown in Table 1. The participants are
listed in terms of gender, age, nationality, marital status, monthly income, education level, bicycle
ownership (yes/no), vehicle ownership (yes/no), exercise (yes/no), health conditions, weekly vehicle
usage, and bike lane availability. A Chi‐square test was used to investigate whether socio‐
demographic and other characteristics are significantly different across groups. The test indicates
which specific groups were different. The results indicated that nationality, bicycle ownership,
vehicle ownership, exercise, health conditions, and vehicle weekly usage were significant. However,
there is no significant difference between the remaining groups.
From the 689 non‐users, 73.0% of the participants were categorized as male, and 27.0% were
classified as female. This difference can be explained by the imbalanced population in Qatar (which
is 75.5% male and 24.5% female) [38]. The bicycle use was almost the same for male (14.9%) and
female (15.1%) respondents. Participants were asked to enter their age. The age was then coded into
four categories (25 or less, 26–40, 41–55, and 55 or more). There was no statistically significant
difference between the user and the non‐user groups according to age. The highest percentage of
users were among the 41–55 group (18.7%).
The Qatari participants in this study represent 22.4% of the total, whereas Qataris represent
14.3% of the population [39]. The oversampling is needed to ensure that there are enough Qatari
participants in the sample in order to report more reliable results for this group. The sample shows
that the non‐Qatari group cycles the least. Only 13.1% of the non‐Qataris used a bicycle during the
last 12 months compared to 20.5% of the Qatari sample.
A high percentage of the participants were single (67.9%). This group had the highest use rate
(16.0%) compared to the other groups. It is often difficult to get information on people’s income, as
some participants can consider it inappropriate and may not tell the truth. A high percentage of the
respondents (44.4%) had low income (10,000 Qatar Riyal or less). About three‐quarters of the
respondents have an income of 20,000 Qatari Riyal or less. Surprisingly, the higher‐income group
(30,000 or more) had the highest use rate (19.4%).
Figure 3. Transport Modal Share. Note: *At the time of the survey, the public bus service was the onlyactive public transportation service in the country.
3.7. Users Versus Non-Users
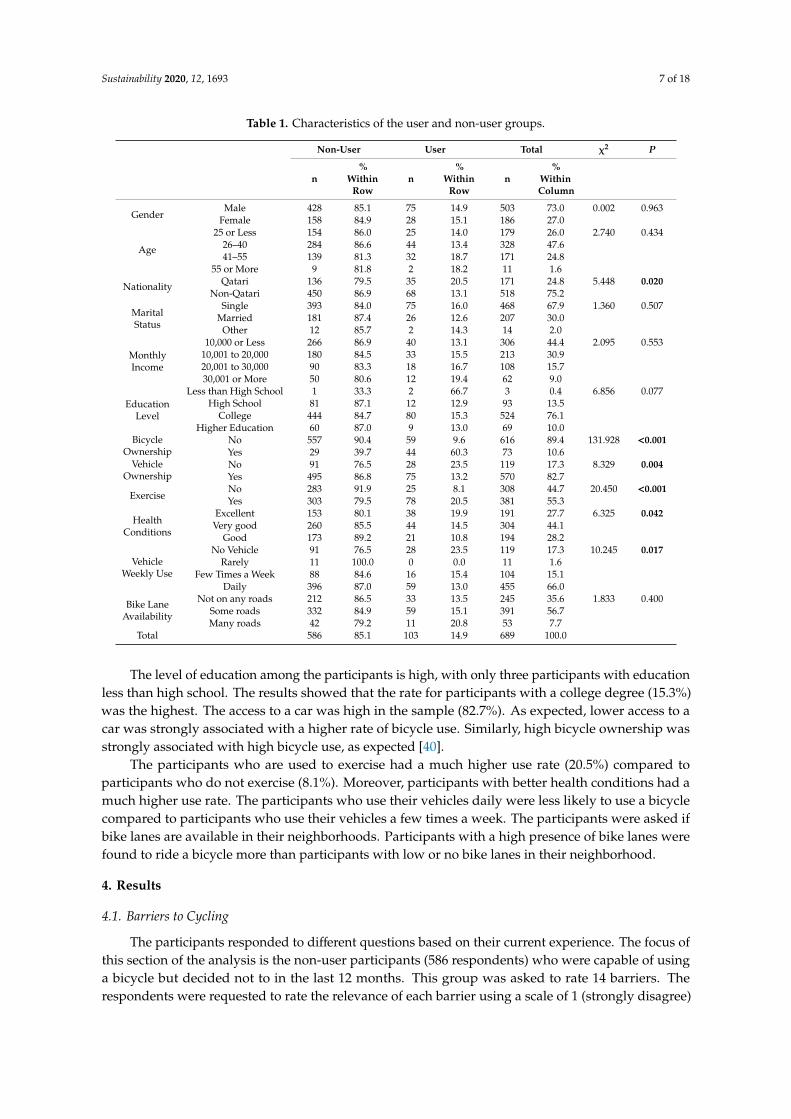
Basic descriptive statistics for the users and non-users are shown in Table 1. The participants arelisted in terms of gender, age, nationality, marital status, monthly income, education level, bicycleownership (yes/no), vehicle ownership (yes/no), exercise (yes/no), health conditions, weekly vehicleusage, and bike lane availability. A Chi-square test was used to investigate whether socio-demographicand other characteristics are significantly different across groups. The test indicates which specificgroups were different. The results indicated that nationality, bicycle ownership, vehicle ownership,exercise, health conditions, and vehicle weekly usage were significant. However, there is no significantdifference between the remaining groups.
From the 689 non-users, 73.0% of the participants were categorized as male, and 27.0% wereclassified as female. This difference can be explained by the imbalanced population in Qatar (which is75.5% male and 24.5% female) [38]. The bicycle use was almost the same for male (14.9%) and female(15.1%) respondents. Participants were asked to enter their age. The age was then coded into fourcategories (25 or less, 26–40, 41–55, and 55 or more). There was no statistically significant differencebetween the user and the non-user groups according to age. The highest percentage of users wereamong the 41–55 group (18.7%).
The Qatari participants in this study represent 22.4% of the total, whereas Qataris represent14.3% of the population [39]. The oversampling is needed to ensure that there are enough Qatariparticipants in the sample in order to report more reliable results for this group. The sample showsthat the non-Qatari group cycles the least. Only 13.1% of the non-Qataris used a bicycle during the last12 months compared to 20.5% of the Qatari sample.
A high percentage of the participants were single (67.9%). This group had the highest use rate(16.0%) compared to the other groups. It is often difficult to get information on people’s income, assome participants can consider it inappropriate and may not tell the truth. A high percentage ofthe respondents (44.4%) had low income (10,000 Qatar Riyal or less). About three-quarters of therespondents have an income of 20,000 Qatari Riyal or less. Surprisingly, the higher-income group(30,000 or more) had the highest use rate (19.4%).
Sustainability 2020, 12, 1693 7 of 18
Table 1. Characteristics of the user and non-user groups.
Non-User User Total χ2 P
n%
WithinRow
n%
WithinRow
n%
WithinColumn
GenderMale 428 85.1 75 14.9 503 73.0 0.002 0.963
Female 158 84.9 28 15.1 186 27.0
Age
25 or Less 154 86.0 25 14.0 179 26.0 2.740 0.43426–40 284 86.6 44 13.4 328 47.641–55 139 81.3 32 18.7 171 24.8
55 or More 9 81.8 2 18.2 11 1.6
Nationality Qatari 136 79.5 35 20.5 171 24.8 5.448 0.020Non-Qatari 450 86.9 68 13.1 518 75.2
MaritalStatus
Single 393 84.0 75 16.0 468 67.9 1.360 0.507Married 181 87.4 26 12.6 207 30.0
Other 12 85.7 2 14.3 14 2.0
MonthlyIncome
10,000 or Less 266 86.9 40 13.1 306 44.4 2.095 0.55310,001 to 20,000 180 84.5 33 15.5 213 30.920,001 to 30,000 90 83.3 18 16.7 108 15.730,001 or More 50 80.6 12 19.4 62 9.0
EducationLevel
Less than High School 1 33.3 2 66.7 3 0.4 6.856 0.077High School 81 87.1 12 12.9 93 13.5
College 444 84.7 80 15.3 524 76.1Higher Education 60 87.0 9 13.0 69 10.0
BicycleOwnership
No 557 90.4 59 9.6 616 89.4 131.928 <0.001Yes 29 39.7 44 60.3 73 10.6
VehicleOwnership
No 91 76.5 28 23.5 119 17.3 8.329 0.004Yes 495 86.8 75 13.2 570 82.7
ExerciseNo 283 91.9 25 8.1 308 44.7 20.450 <0.001Yes 303 79.5 78 20.5 381 55.3
HealthConditions
Excellent 153 80.1 38 19.9 191 27.7 6.325 0.042Very good 260 85.5 44 14.5 304 44.1
Good 173 89.2 21 10.8 194 28.2
VehicleWeekly Use
No Vehicle 91 76.5 28 23.5 119 17.3 10.245 0.017Rarely 11 100.0 0 0.0 11 1.6
Few Times a Week 88 84.6 16 15.4 104 15.1Daily 396 87.0 59 13.0 455 66.0
Bike LaneAvailability
Not on any roads 212 86.5 33 13.5 245 35.6 1.833 0.400Some roads 332 84.9 59 15.1 391 56.7Many roads 42 79.2 11 20.8 53 7.7
Total 586 85.1 103 14.9 689 100.0
The level of education among the participants is high, with only three participants with educationless than high school. The results showed that the rate for participants with a college degree (15.3%)was the highest. The access to a car was high in the sample (82.7%). As expected, lower access to acar was strongly associated with a higher rate of bicycle use. Similarly, high bicycle ownership wasstrongly associated with high bicycle use, as expected [40].
The participants who are used to exercise had a much higher use rate (20.5%) compared toparticipants who do not exercise (8.1%). Moreover, participants with better health conditions had amuch higher use rate. The participants who use their vehicles daily were less likely to use a bicyclecompared to participants who use their vehicles a few times a week. The participants were asked ifbike lanes are available in their neighborhoods. Participants with a high presence of bike lanes werefound to ride a bicycle more than participants with low or no bike lanes in their neighborhood.
4. Results
4.1. Barriers to Cycling
The participants responded to different questions based on their current experience. The focus ofthis section of the analysis is the non-user participants (586 respondents) who were capable of usinga bicycle but decided not to in the last 12 months. This group was asked to rate 14 barriers. Therespondents were requested to rate the relevance of each barrier using a scale of 1 (strongly disagree)
Sustainability 2020, 12, 1693 8 of 18
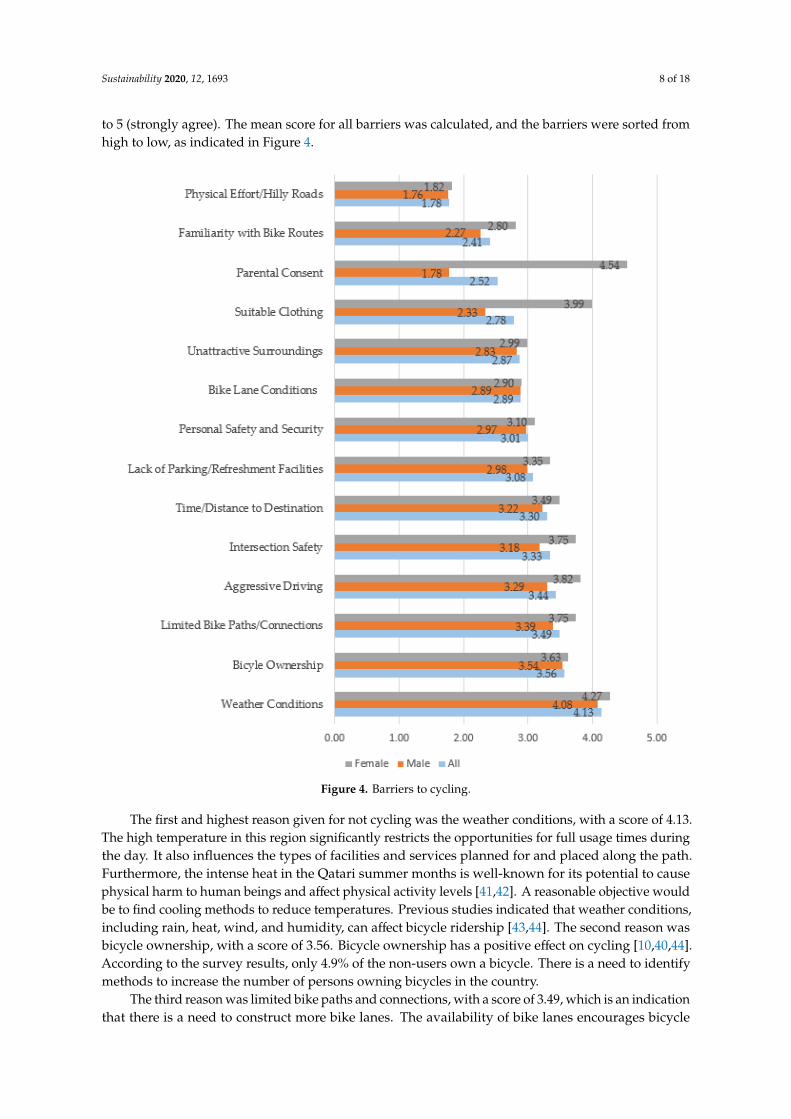
to 5 (strongly agree). The mean score for all barriers was calculated, and the barriers were sorted fromhigh to low, as indicated in Figure 4.Sustainability 2020, 12, 1693 9 of 18
Figure 4. Barriers to cycling.
The eleventh barrier was suitable clothing, with a score of 2.78. It is difficult to ride a bicycle if
not properly dressed for the ride. Not having the right combination of clothing can be a barrier to
having good riding experiences. There were also interesting differences in the responses of the male
and female participants. The male participants did not consider this barrier important (2.33).
However, the female participants (3.99) seem to be more concerned about this barrier. This difference
could be due to the traditional clothing used in the region, as the Qatari female nationals mostly wear
a long black cloak called an “abbayah” that is worn over their clothing, which is probably difficult to
wear while riding a bicycle.
The twelfth barrier was parental consent, with a score of 2.52. It is necessary for some non‐users
to obtain the consent of their parents in order to participate in any cycling activity. Some parents
consider cycling a hazardous activity, which may result in serious or fatal injury and refusal for
parents to give consent to their child. The female participants consider this barrier far more important
(4.57) compared to the male participants (1.78). This may be due to barriers related to social, cultural,
behavioral, or lifestyle issues. Studies show that obesity is much higher for females in all Arab
countries compared to males, which is a great concern from a health perspective [47,48]. In general,
the factors contributing to the physical inactivity among Arab women were identified as fatigue and
Figure 4. Barriers to cycling.
The first and highest reason given for not cycling was the weather conditions, with a score of 4.13.The high temperature in this region significantly restricts the opportunities for full usage times duringthe day. It also influences the types of facilities and services planned for and placed along the path.Furthermore, the intense heat in the Qatari summer months is well-known for its potential to causephysical harm to human beings and affect physical activity levels [41,42]. A reasonable objective wouldbe to find cooling methods to reduce temperatures. Previous studies indicated that weather conditions,including rain, heat, wind, and humidity, can affect bicycle ridership [43,44]. The second reason wasbicycle ownership, with a score of 3.56. Bicycle ownership has a positive effect on cycling [10,40,44].According to the survey results, only 4.9% of the non-users own a bicycle. There is a need to identifymethods to increase the number of persons owning bicycles in the country.
The third reason was limited bike paths and connections, with a score of 3.49, which is an indicationthat there is a need to construct more bike lanes. The availability of bike lanes encourages bicycle
Sustainability 2020, 12, 1693 9 of 18
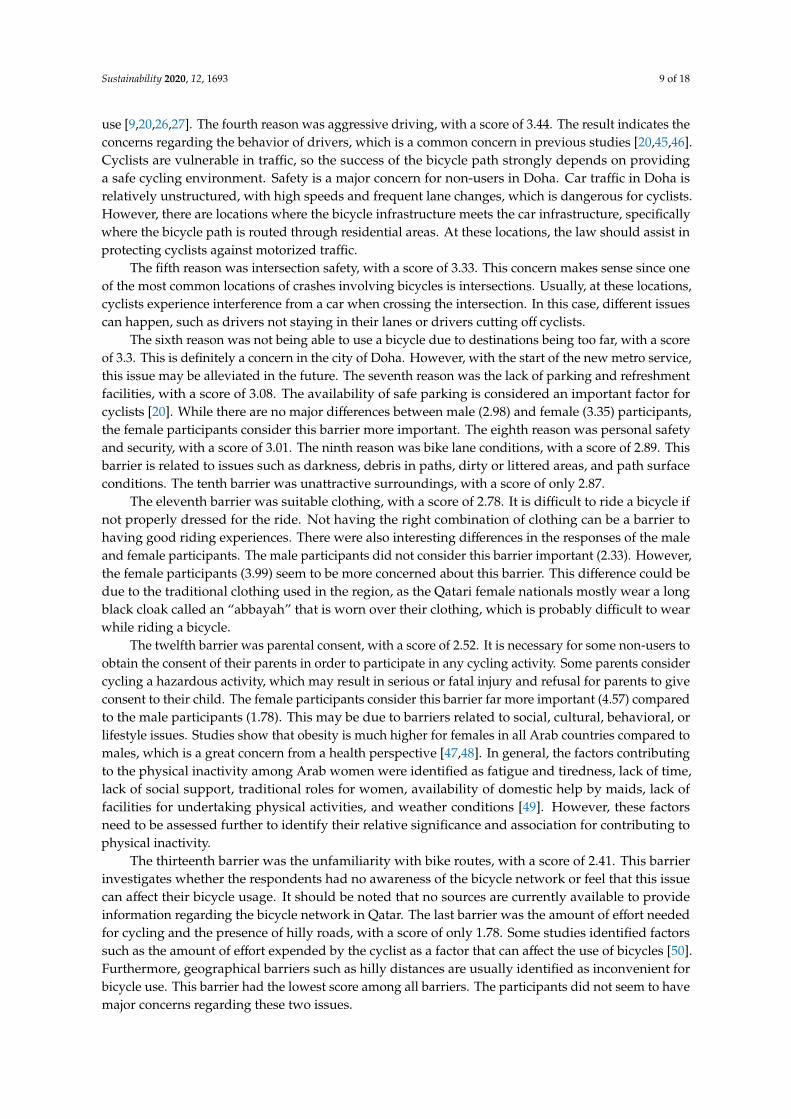
use [9,20,26,27]. The fourth reason was aggressive driving, with a score of 3.44. The result indicates theconcerns regarding the behavior of drivers, which is a common concern in previous studies [20,45,46].Cyclists are vulnerable in traffic, so the success of the bicycle path strongly depends on providinga safe cycling environment. Safety is a major concern for non-users in Doha. Car traffic in Doha isrelatively unstructured, with high speeds and frequent lane changes, which is dangerous for cyclists.However, there are locations where the bicycle infrastructure meets the car infrastructure, specificallywhere the bicycle path is routed through residential areas. At these locations, the law should assist inprotecting cyclists against motorized traffic.
The fifth reason was intersection safety, with a score of 3.33. This concern makes sense since oneof the most common locations of crashes involving bicycles is intersections. Usually, at these locations,cyclists experience interference from a car when crossing the intersection. In this case, different issuescan happen, such as drivers not staying in their lanes or drivers cutting off cyclists.
The sixth reason was not being able to use a bicycle due to destinations being too far, with a scoreof 3.3. This is definitely a concern in the city of Doha. However, with the start of the new metro service,this issue may be alleviated in the future. The seventh reason was the lack of parking and refreshmentfacilities, with a score of 3.08. The availability of safe parking is considered an important factor forcyclists [20]. While there are no major differences between male (2.98) and female (3.35) participants,the female participants consider this barrier more important. The eighth reason was personal safetyand security, with a score of 3.01. The ninth reason was bike lane conditions, with a score of 2.89. Thisbarrier is related to issues such as darkness, debris in paths, dirty or littered areas, and path surfaceconditions. The tenth barrier was unattractive surroundings, with a score of only 2.87.
The eleventh barrier was suitable clothing, with a score of 2.78. It is difficult to ride a bicycle ifnot properly dressed for the ride. Not having the right combination of clothing can be a barrier tohaving good riding experiences. There were also interesting differences in the responses of the maleand female participants. The male participants did not consider this barrier important (2.33). However,the female participants (3.99) seem to be more concerned about this barrier. This difference could bedue to the traditional clothing used in the region, as the Qatari female nationals mostly wear a longblack cloak called an “abbayah” that is worn over their clothing, which is probably difficult to wearwhile riding a bicycle.
The twelfth barrier was parental consent, with a score of 2.52. It is necessary for some non-users toobtain the consent of their parents in order to participate in any cycling activity. Some parents considercycling a hazardous activity, which may result in serious or fatal injury and refusal for parents to giveconsent to their child. The female participants consider this barrier far more important (4.57) comparedto the male participants (1.78). This may be due to barriers related to social, cultural, behavioral, orlifestyle issues. Studies show that obesity is much higher for females in all Arab countries compared tomales, which is a great concern from a health perspective [47,48]. In general, the factors contributingto the physical inactivity among Arab women were identified as fatigue and tiredness, lack of time,lack of social support, traditional roles for women, availability of domestic help by maids, lack offacilities for undertaking physical activities, and weather conditions [49]. However, these factorsneed to be assessed further to identify their relative significance and association for contributing tophysical inactivity.
The thirteenth barrier was the unfamiliarity with bike routes, with a score of 2.41. This barrierinvestigates whether the respondents had no awareness of the bicycle network or feel that this issuecan affect their bicycle usage. It should be noted that no sources are currently available to provideinformation regarding the bicycle network in Qatar. The last barrier was the amount of effort neededfor cycling and the presence of hilly roads, with a score of only 1.78. Some studies identified factorssuch as the amount of effort expended by the cyclist as a factor that can affect the use of bicycles [50].Furthermore, geographical barriers such as hilly distances are usually identified as inconvenient forbicycle use. This barrier had the lowest score among all barriers. The participants did not seem to havemajor concerns regarding these two issues.
Sustainability 2020, 12, 1693 10 of 18
In order to allow the participants to provide their opinion regarding the barriers beyond the itemsprovided in the questionnaire, their feedback was obtained through an open-ended question. Severalmentioned barriers were similar to the structured survey questions. Some of the common barriersto cycling were related to aggressive driving. Answers such as “having to deal with aggressive cardrivers”, “people drive at a high speed and do not respect pedestrians or people riding a bicycle”, and“people feel unsafe riding, especially if they have their kids with them” were mentioned. Weatherconditions were mentioned frequently. Answers such as “harsh weather” and “very hot weather”were mentioned. Some participants mentioned the inadequacy of the cycle road network, the lack ofcoolers to drink from, the lack of repair facilities, and the lack of ability to carry heavy things.
However, somewhat surprisingly, the most common barrier listed was the influence of societalperceptions on the non-users in general, and especially for females. This barrier was not listed inthe structured questions. For example, answers for barriers included: “society’s perspective of afemale riding a bicycle will not be positive”; “it is not in my culture to use a bicycle”; “unfortunately,our society considers anyone not using a private vehicle to be from a lower class”; “I do not ride abicycle because I do not see any females riding a bicycle on the street”; “it is not accepted by thesociety, and therefore I do not do it”; “the lack of suitable places for a girl with a veil to ride a bicycle,because I cannot drive it in public and open places”; “the society is not used to seeing a female ridinga bicycle and I will look weird”; “society is not accustomed to the idea of a male or female studentdriving a bicycle, which would seem strange”; “society rejects the idea of a veiled girl riding a bicycle”;“in general, adults do not use bicycles in our society”; “this is not a thing that is acceptable in oursociety”; “the cultural perspective of seeing a woman riding a bicycle”; “it is very odd to see a girlriding a bicycle and that is why I would never do it”; “it is not socially accepted in Qatar, but I do itonly if I am visiting another country”; and “in the local culture, bicycles are used by children or menonly”. One answer was as simple as “because I am a girl”.
4.2. Potential Motivators
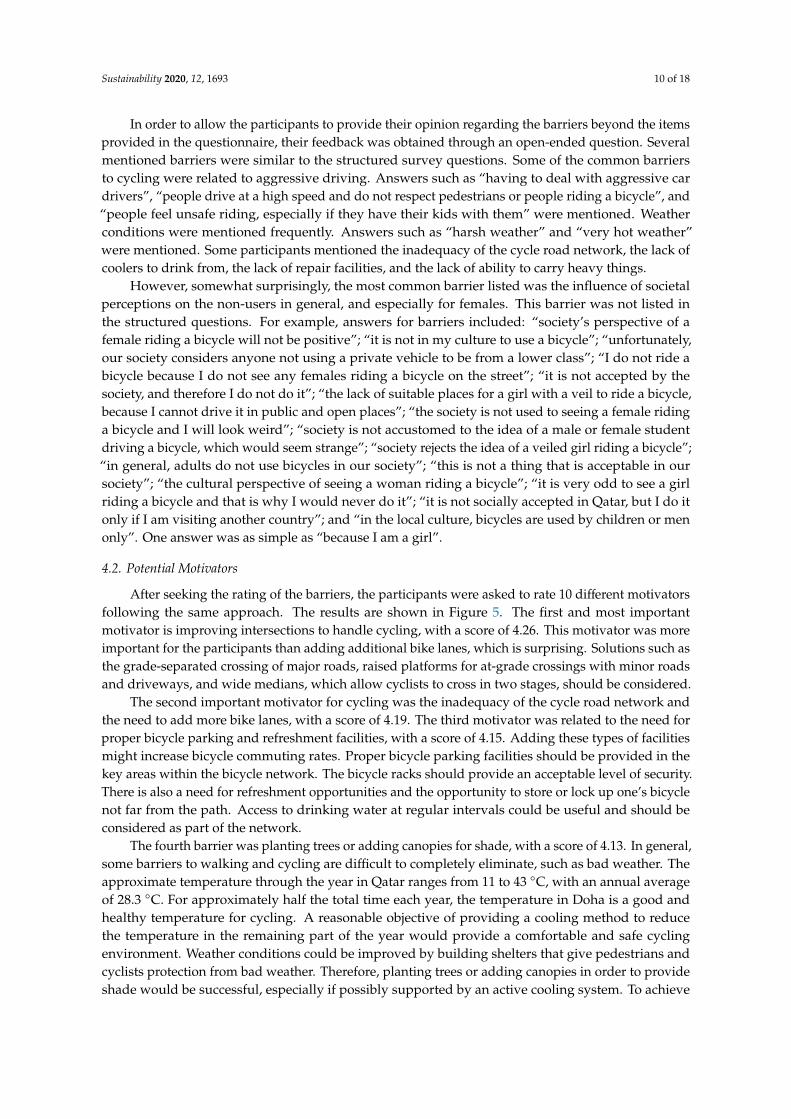
After seeking the rating of the barriers, the participants were asked to rate 10 different motivatorsfollowing the same approach. The results are shown in Figure 5. The first and most importantmotivator is improving intersections to handle cycling, with a score of 4.26. This motivator was moreimportant for the participants than adding additional bike lanes, which is surprising. Solutions such asthe grade-separated crossing of major roads, raised platforms for at-grade crossings with minor roadsand driveways, and wide medians, which allow cyclists to cross in two stages, should be considered.
The second important motivator for cycling was the inadequacy of the cycle road network andthe need to add more bike lanes, with a score of 4.19. The third motivator was related to the need forproper bicycle parking and refreshment facilities, with a score of 4.15. Adding these types of facilitiesmight increase bicycle commuting rates. Proper bicycle parking facilities should be provided in thekey areas within the bicycle network. The bicycle racks should provide an acceptable level of security.There is also a need for refreshment opportunities and the opportunity to store or lock up one’s bicyclenot far from the path. Access to drinking water at regular intervals could be useful and should beconsidered as part of the network.
The fourth barrier was planting trees or adding canopies for shade, with a score of 4.13. In general,some barriers to walking and cycling are difficult to completely eliminate, such as bad weather. Theapproximate temperature through the year in Qatar ranges from 11 to 43 ◦C, with an annual averageof 28.3 ◦C. For approximately half the total time each year, the temperature in Doha is a good andhealthy temperature for cycling. A reasonable objective of providing a cooling method to reducethe temperature in the remaining part of the year would provide a comfortable and safe cyclingenvironment. Weather conditions could be improved by building shelters that give pedestrians andcyclists protection from bad weather. Therefore, planting trees or adding canopies in order to provideshade would be successful, especially if possibly supported by an active cooling system. To achieve
Sustainability 2020, 12, 1693 11 of 18
temperature reduction, there are a number of ways of cooling the bike lanes, such as evaporative andradiant cooling.Sustainability 2020, 12, 1693 11 of 18
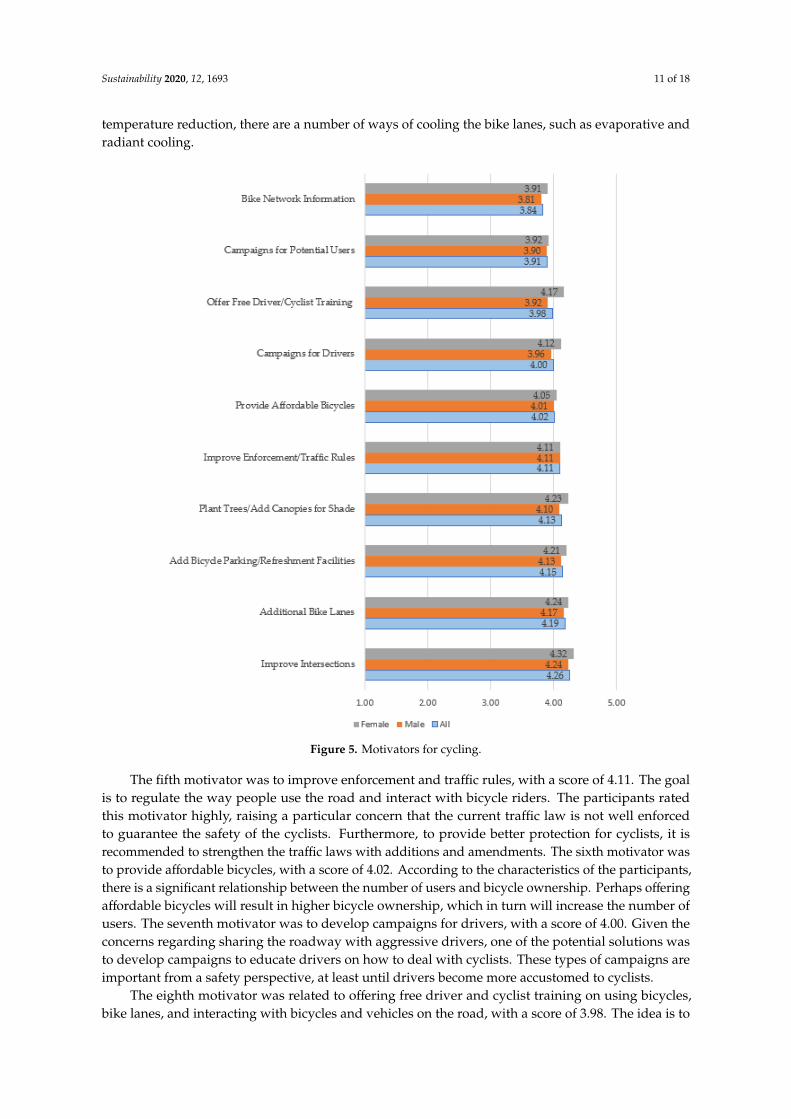
Figure 5. Motivators for cycling.
The second important motivator for cycling was the inadequacy of the cycle road network and
the need to add more bike lanes, with a score of 4.19. The third motivator was related to the need for
proper bicycle parking and refreshment facilities, with a score of 4.15. Adding these types of facilities
might increase bicycle commuting rates. Proper bicycle parking facilities should be provided in the
key areas within the bicycle network. The bicycle racks should provide an acceptable level of security.
There is also a need for refreshment opportunities and the opportunity to store or lock up one’s
bicycle not far from the path. Access to drinking water at regular intervals could be useful and should
be considered as part of the network.
The fourth barrier was planting trees or adding canopies for shade, with a score of 4.13. In
general, some barriers to walking and cycling are difficult to completely eliminate, such as bad
weather. The approximate temperature through the year in Qatar ranges from 11 to 43 °C, with an
annual average of 28.3 °C. For approximately half the total time each year, the temperature in Doha
is a good and healthy temperature for cycling. A reasonable objective of providing a cooling method
to reduce the temperature in the remaining part of the year would provide a comfortable and safe
cycling environment. Weather conditions could be improved by building shelters that give
Figure 5. Motivators for cycling.
The fifth motivator was to improve enforcement and traffic rules, with a score of 4.11. The goalis to regulate the way people use the road and interact with bicycle riders. The participants ratedthis motivator highly, raising a particular concern that the current traffic law is not well enforcedto guarantee the safety of the cyclists. Furthermore, to provide better protection for cyclists, it isrecommended to strengthen the traffic laws with additions and amendments. The sixth motivator wasto provide affordable bicycles, with a score of 4.02. According to the characteristics of the participants,there is a significant relationship between the number of users and bicycle ownership. Perhaps offeringaffordable bicycles will result in higher bicycle ownership, which in turn will increase the number ofusers. The seventh motivator was to develop campaigns for drivers, with a score of 4.00. Given theconcerns regarding sharing the roadway with aggressive drivers, one of the potential solutions wasto develop campaigns to educate drivers on how to deal with cyclists. These types of campaigns areimportant from a safety perspective, at least until drivers become more accustomed to cyclists.
The eighth motivator was related to offering free driver and cyclist training on using bicycles,bike lanes, and interacting with bicycles and vehicles on the road, with a score of 3.98. The idea is to
Sustainability 2020, 12, 1693 12 of 18
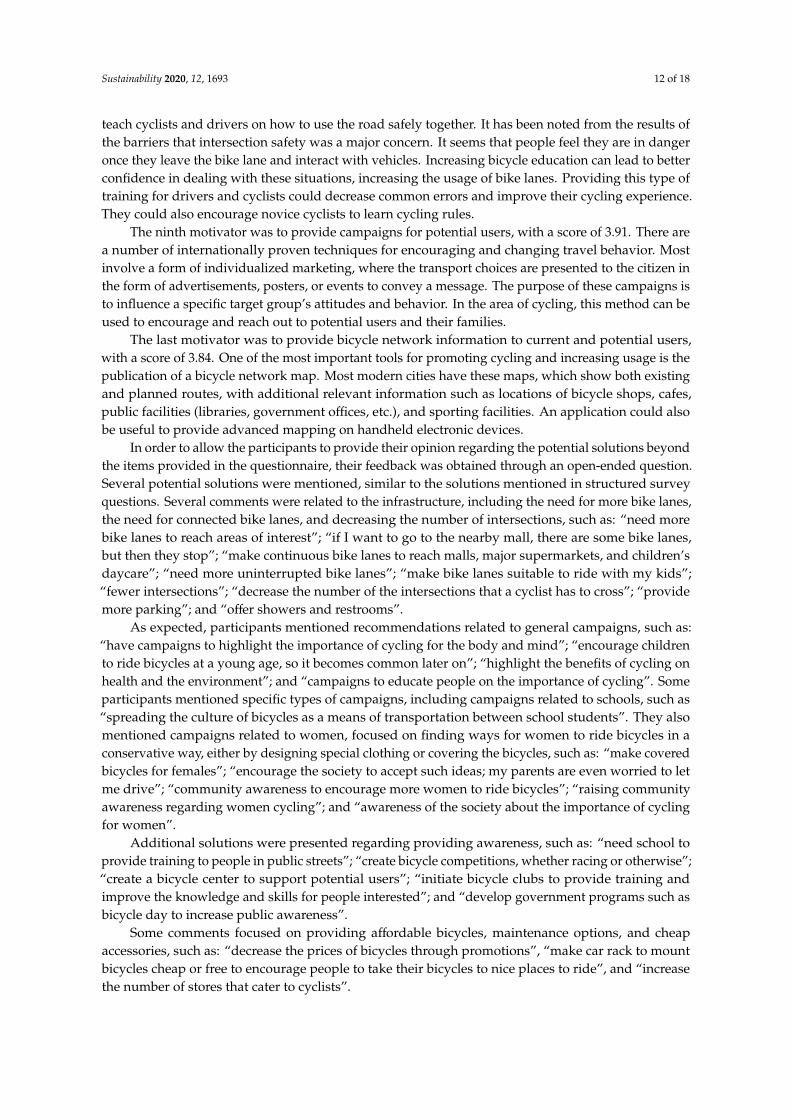
teach cyclists and drivers on how to use the road safely together. It has been noted from the results ofthe barriers that intersection safety was a major concern. It seems that people feel they are in dangeronce they leave the bike lane and interact with vehicles. Increasing bicycle education can lead to betterconfidence in dealing with these situations, increasing the usage of bike lanes. Providing this type oftraining for drivers and cyclists could decrease common errors and improve their cycling experience.They could also encourage novice cyclists to learn cycling rules.
The ninth motivator was to provide campaigns for potential users, with a score of 3.91. There area number of internationally proven techniques for encouraging and changing travel behavior. Mostinvolve a form of individualized marketing, where the transport choices are presented to the citizen inthe form of advertisements, posters, or events to convey a message. The purpose of these campaigns isto influence a specific target group’s attitudes and behavior. In the area of cycling, this method can beused to encourage and reach out to potential users and their families.
The last motivator was to provide bicycle network information to current and potential users,with a score of 3.84. One of the most important tools for promoting cycling and increasing usage is thepublication of a bicycle network map. Most modern cities have these maps, which show both existingand planned routes, with additional relevant information such as locations of bicycle shops, cafes,public facilities (libraries, government offices, etc.), and sporting facilities. An application could alsobe useful to provide advanced mapping on handheld electronic devices.
In order to allow the participants to provide their opinion regarding the potential solutions beyondthe items provided in the questionnaire, their feedback was obtained through an open-ended question.Several potential solutions were mentioned, similar to the solutions mentioned in structured surveyquestions. Several comments were related to the infrastructure, including the need for more bike lanes,the need for connected bike lanes, and decreasing the number of intersections, such as: “need morebike lanes to reach areas of interest”; “if I want to go to the nearby mall, there are some bike lanes,but then they stop”; “make continuous bike lanes to reach malls, major supermarkets, and children’sdaycare”; “need more uninterrupted bike lanes”; “make bike lanes suitable to ride with my kids”;“fewer intersections”; “decrease the number of the intersections that a cyclist has to cross”; “providemore parking”; and “offer showers and restrooms”.
As expected, participants mentioned recommendations related to general campaigns, such as:“have campaigns to highlight the importance of cycling for the body and mind”; “encourage childrento ride bicycles at a young age, so it becomes common later on”; “highlight the benefits of cycling onhealth and the environment”; and “campaigns to educate people on the importance of cycling”. Someparticipants mentioned specific types of campaigns, including campaigns related to schools, such as“spreading the culture of bicycles as a means of transportation between school students”. They alsomentioned campaigns related to women, focused on finding ways for women to ride bicycles in aconservative way, either by designing special clothing or covering the bicycles, such as: “make coveredbicycles for females”; “encourage the society to accept such ideas; my parents are even worried to letme drive”; “community awareness to encourage more women to ride bicycles”; “raising communityawareness regarding women cycling”; and “awareness of the society about the importance of cyclingfor women”.
Additional solutions were presented regarding providing awareness, such as: “need school toprovide training to people in public streets”; “create bicycle competitions, whether racing or otherwise”;“create a bicycle center to support potential users”; “initiate bicycle clubs to provide training andimprove the knowledge and skills for people interested”; and “develop government programs such asbicycle day to increase public awareness”.
Some comments focused on providing affordable bicycles, maintenance options, and cheapaccessories, such as: “decrease the prices of bicycles through promotions”, “make car rack to mountbicycles cheap or free to encourage people to take their bicycles to nice places to ride”, and “increasethe number of stores that cater to cyclists”.
Sustainability 2020, 12, 1693 13 of 18
Bike rental was also mentioned in several comments, such as: “I hope that bicycles are rented invarious places for the purpose of enjoyment and exercise”, “maybe offering a bicycle for free in publicplaces for few months will encourage people using them”, and “have bike lanes and free bicycles inparks for the people to practice and get used to cycling”.
4.3. Perception of Bike-Sharing
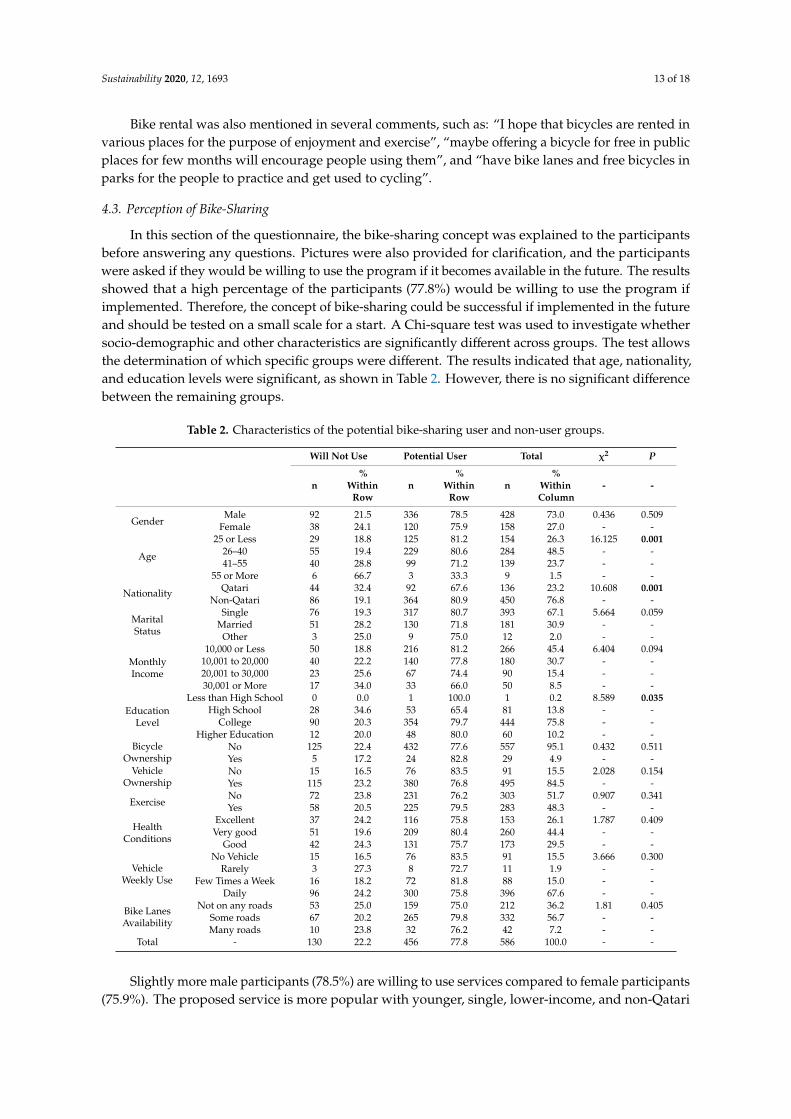
In this section of the questionnaire, the bike-sharing concept was explained to the participantsbefore answering any questions. Pictures were also provided for clarification, and the participantswere asked if they would be willing to use the program if it becomes available in the future. The resultsshowed that a high percentage of the participants (77.8%) would be willing to use the program ifimplemented. Therefore, the concept of bike-sharing could be successful if implemented in the futureand should be tested on a small scale for a start. A Chi-square test was used to investigate whethersocio-demographic and other characteristics are significantly different across groups. The test allowsthe determination of which specific groups were different. The results indicated that age, nationality,and education levels were significant, as shown in Table 2. However, there is no significant differencebetween the remaining groups.
Table 2. Characteristics of the potential bike-sharing user and non-user groups.
Will Not Use Potential User Total χ2 P
n%
WithinRow
n%
WithinRow
n%
WithinColumn
- -
GenderMale 92 21.5 336 78.5 428 73.0 0.436 0.509
Female 38 24.1 120 75.9 158 27.0 - -
Age
25 or Less 29 18.8 125 81.2 154 26.3 16.125 0.00126–40 55 19.4 229 80.6 284 48.5 - -41–55 40 28.8 99 71.2 139 23.7 - -
55 or More 6 66.7 3 33.3 9 1.5 - -
Nationality Qatari 44 32.4 92 67.6 136 23.2 10.608 0.001Non-Qatari 86 19.1 364 80.9 450 76.8 - -
MaritalStatus
Single 76 19.3 317 80.7 393 67.1 5.664 0.059Married 51 28.2 130 71.8 181 30.9 - -
Other 3 25.0 9 75.0 12 2.0 - -
MonthlyIncome
10,000 or Less 50 18.8 216 81.2 266 45.4 6.404 0.09410,001 to 20,000 40 22.2 140 77.8 180 30.7 - -20,001 to 30,000 23 25.6 67 74.4 90 15.4 - -30,001 or More 17 34.0 33 66.0 50 8.5 - -
EducationLevel
Less than High School 0 0.0 1 100.0 1 0.2 8.589 0.035High School 28 34.6 53 65.4 81 13.8 - -
College 90 20.3 354 79.7 444 75.8 - -Higher Education 12 20.0 48 80.0 60 10.2 - -
BicycleOwnership
No 125 22.4 432 77.6 557 95.1 0.432 0.511Yes 5 17.2 24 82.8 29 4.9 - -
VehicleOwnership
No 15 16.5 76 83.5 91 15.5 2.028 0.154Yes 115 23.2 380 76.8 495 84.5 - -
ExerciseNo 72 23.8 231 76.2 303 51.7 0.907 0.341Yes 58 20.5 225 79.5 283 48.3 - -
HealthConditions
Excellent 37 24.2 116 75.8 153 26.1 1.787 0.409Very good 51 19.6 209 80.4 260 44.4 - -
Good 42 24.3 131 75.7 173 29.5 - -
VehicleWeekly Use
No Vehicle 15 16.5 76 83.5 91 15.5 3.666 0.300Rarely 3 27.3 8 72.7 11 1.9 - -
Few Times a Week 16 18.2 72 81.8 88 15.0 - -Daily 96 24.2 300 75.8 396 67.6 - -
Bike LanesAvailability
Not on any roads 53 25.0 159 75.0 212 36.2 1.81 0.405Some roads 67 20.2 265 79.8 332 56.7 - -Many roads 10 23.8 32 76.2 42 7.2 - -
Total - 130 22.2 456 77.8 586 100.0 - -
Slightly more male participants (78.5%) are willing to use services compared to female participants(75.9%). The proposed service is more popular with younger, single, lower-income, and non-Qatari
Sustainability 2020, 12, 1693 14 of 18
participants. It is also more popular with higher-education participants. Furthermore, the percentageof potential users with no access to a private car was higher than participants with access to a car.
To allow the participants to provide their opinion regarding the bike-sharing system beyond theyes/no question, their feedback was obtained through an open-ended question. Many participantsmentioned that this is a great idea. Some participants made some recommendations for the services,such as: “provide a variety of bicycle sizes”, “have bicycles that are suitable for tall and over-sizedpeople”, “provide seats for children so that parents can ride with their children”, “have bicycle basketsto be able to carry groceries”, “include bicycles that can be folded to be carried in private cars”, “makeit possible to also rent car mounts”, “a good location for this service would be around malls”, “thisservice should be offered in universities and colleges for students to move around campus”, and“provide bicycle repair services to fix the bicycle if something goes wrong while using it”.
5. Conclusions
Despite the increasing public interest in cycling worldwide, the high-income developing countriesin the Gulf region, namely Qatar, Bahrain, Kuwait, Oman, Saudi Arabia, and the United Arab Emirates,still have low cycling rates and, in many cases, limited cycling infrastructure. Few studies haveinvestigated the factors related to this problem in these countries. This study investigated the barriersand challenges to cycling in Qatar and identified solutions to help decision-makers and planners launchprograms aimed at increasing cycling rates. The number of people that used a bicycle over a period of12 months prior to the study was less than 15%, and the cycling modal share was much lower (1.7%).The study also revealed a heavy use of private cars (82.4%), which has a detrimental effect on all othermodes, including walking and cycling. Contrary to findings of research in countries with low cyclingrates [13], this study found no significant difference in the cycling rate between males and females.
5.1. Barriers
The top five barriers identified by the participants were, in the order listed, weather conditions,bicycle ownership, limited bike paths, aggressive driving, and intersection safety. Most of these resultsare similar to previous findings in countries both with much higher [51–53] and with low cyclingmaturity levels [8,54,55].
The most cited reasons for male participants matched the overall reasons, except for the fifthreason, which was distance and time to get to a destination instead of intersection safety. The barriersidentified by female participants, however, were not similar. The top barriers were parental consent,weather conditions, suitable clothing, aggressive driving, and intersection safety. Self-image and socialnorms seem to be an important issue. Previous studies investigated the role of the public image ofcycling as a barrier. However, most of these studies were conducted in countries with much highercycling rates. The studies have recognized that self-image and social norms also play a role [7,50].Finally, the analysis of open-ended responses verified the importance of bicycle lanes. It also revealedadditional factors, such as the importance of improved interactions between cyclists and drivers.
5.2. Motivators
The top motivators for cycling were mostly related to infrastructure and facilities. The listincluded improving safety at intersections, adding more bike lanes, providing more bicycle parkingand refreshment facilities, planting trees for shade, and improving traffic rules and their enforcement.These motivators correspond to the barriers cited by non-users.
Participants also recommended general campaigns for cyclists and drivers, especially for childrenand women. The latter was a common recommendation among many female participants. Othersolutions included offering awareness seminars, establishing providing cycling lessons, organizingcycling competitions, forming bicycle clubs, and launching government programs. Some commentswere related to providing affordable bicycles, maintenance options, and cheap accessories, and
Sustainability 2020, 12, 1693 15 of 18
increasing the number of stores that cater to cyclists. These results are consistent with previousresearch [54]. Bike-sharing was also recommended as a solution.
5.3. Bike-Sharing
This study was among the first to investigate the possible success of bike-sharing services inhigh-income developing countries in the Gulf region. The findings can help policy makers andtransportation providers to introduce and manage these schemes more effectively. Participantsindicated a great deal of acceptance for this type of service. Moreover, the study found no differencein acceptance rates between male and female participants. These results suggest that bike-sharingservices can be successful. Therefore, authorities should explore available options, testing them on asmall scale at first.
5.4. Limitations
Identifying the factors influencing people’s decision to cycle is a complex process. As in anyquestionnaire-based study, participants rank barriers and solutions; however, life circumstances andpersonal behavior play a major role in their actual reasons for not using a bicycle and their willingnessto change their behavior. Moreover, there is a possibility that non-users may not accurately perceivethe barriers for cycling, and consequently, may misidentify the proper motivators for cycling [52].Identifying barriers and solutions is a good start; however, what happens in reality once some of thesesolutions are implemented does not necessarily guarantee that people will start to cycle more.
5.5. Future Work
The barriers and motivators of cycling can change over time. They can also change due to majorevents, such as the introduction of a new public transportation service or a major increase in gas prices.For example, the completion of the metro network currently in progress in the city of Doha may also bethe catalyst for a first generation of cyclists. This type of service can encourage people to ride bicyclesto metro stations, thus making cycling part of their commute. Furthermore, it is expected that thecycling rate will increase with the completion of the bicycle network. With all these changes and theimplementation of policies to promote cycling, the barriers and motivators may change. Therefore,additional studies should be conducted in the future to reevaluate these factors.
It is also important to monitor and identify the problems that might be encountered once areasonable number of people have taken up cycling. It would also be particularly interesting toinvestigate issues after the completion of the infrastructure network and the implementation of abike-sharing system to assess their impact.
Future studies can also include research into raising public awareness to increase the adoption ofcycling. This could include assessing tailored programs and policies, which can be applied to differentsegments of the population in order to educate people and raise awareness about the benefits of cyclingat the individual and family levels. Monitoring characteristics before and after implementation isanother area for future research.
Finally, the findings of this research will be helpful in identifying the barriers and challenges tocycling in Qatar. The study can aid in developing strategies for promoting cycling in Qatar and similardeveloping countries, thus contributing to promoting a healthier lifestyle.
Author Contributions: The author confirms sole responsibility for the following: study conception and design,data collection, analysis and interpretation of results, and manuscript preparation. All authors have read andagreed to the published version of the manuscript.
Funding: This research received no external funding.
Conflicts of Interest: The author declares no conflict of interest.
Sustainability 2020, 12, 1693 16 of 18
References
1. Shaaban, K.; Wood, J.S.; Gayah, V.V. Investigating driver behavior at minor-street stop-controlled intersectionsin Qatar. Transp. Res. Rec. J. Transp. Res. Board 2017, 2663, 109–116. [CrossRef]
2. Shaaban, K. Assessment of Drivers’ Perceptions of Various Police Enforcement Strategies and AssociatedPenalties and Rewards. J. Adv. Transp. 2017, 14. [CrossRef]
3. Shaaban, K.; Radwan, E. Rebuilding the Transportation System in the City of Doha. J. Traffic Log. Eng. 2014,2. [CrossRef]
4. Shaaban, K. Assessing Sidewalk and Corridor Walkability in Developing Countries. Sustainability 2019, 11,3865. [CrossRef]
5. Pérez, K.; Olabarria, M.; Rojas-Rueda, D.; Santamariña-Rubio, E.; Borrell, C.; Nieuwenhuijsen, M. The healthand economic benefits of active transport policies in Barcelona. J. Transp. Health 2017, 4, 316–324. [CrossRef]
6. Sallis, J.F.; Frank, L.D.; Saelens, B.E.; KatherineKraft, M. Active transportation and physical activity:opportunities for collaboration on transportation and public health research. Transp. Res. Part A Policy Prac.2004, 38, 249–268. [CrossRef]
7. Daley, M.; Rissel, C. Perspectives and images of cycling as a barrier or facilitator of cycling. Transp. Policy2011, 18, 211–216. [CrossRef]
8. Gatersleben, B.; Appleton, K.M. Contemplating cycling to work: Attitudes and perceptions in differentstages of change. Transp. Res. Part A Policy Prac. 2007, 41, 302–312. [CrossRef]
9. Titze, S.; Stronegger, W.J.; Janschitz, S.; Oja, P. Association of built-environment, social-environment andpersonal factors with bicycling as a mode of transportation among Austrian city dwellers. Prev. Med. 2008,47, 252–259. [CrossRef]
10. Dill, J.; Voros, K. Factors affecting bicycling demand: initial survey findings from the Portland, Oregon,region. Transp. Res. Rec. 2007, 2031, 9–17. [CrossRef]
11. Moudon, A.V.; Lee, C.; Cheadle, A.D.; Collier, C.W.; Johnson, D.; Schmid, T.L.; Weather, R.D. Cycling and thebuilt environment, a US perspective. Transp. Res. Part D Transp. Environ. 2005, 10, 245–261. [CrossRef]
12. Pucher, J.; Buehler, R. Making cycling irresistible: lessons from the Netherlands, Denmark and Germany.Transp. Rev. 2008, 28, 495–528. [CrossRef]
13. Garrard, J.; Rose, G.; Lo, S.K. Promoting transportation cycling for women: the role of bicycle infrastructure.Prev. Med. 2008, 46, 55–59. [CrossRef] [PubMed]
14. de Dios Ortuzar, J.; Iacobelli, A.; Valeze, C. Estimating demand for a cycle-way network. Transp. Res. Part DTransp. Environ. 2000, 34, 353–373.
15. Pinjari, A.R.; Eluru, N.; Bhat, C.R.; Pendyala, R.M.; Spissu, E. Joint model of choice of residential neighborhoodand bicycle ownership: accounting for self-selection and unobserved heterogeneity. Transp. Res. Rec. 2008,2082, 17–26. [CrossRef]
16. Winters, M.; Brauer, M.; Setton, E.M.; Teschke, K. Built environment influences on healthy transportationchoices: bicycling versus driving. J. Urban Health 2010, 87, 969–993. [CrossRef]
17. Nagendra, S.S.; Khare, M. Principal component analysis of urban traffic characteristics and meteorologicaldata. Transp. Res. Part D Transp. Environ. 2003, 8, 285–297. [CrossRef]
18. Menghini, G.; Carrasco, N.; Schüssler, N.; Axhausen, K.W. Route choice of cyclists in Zurich. Transp. Res.Part A Policy Prac. 2010, 44, 754–765. [CrossRef]
19. Zahran, S.; Brody, S.D.; Maghelal, P.; Prelog, A.; Lacy, M. Cycling and walking: Explaining the spatialdistribution of healthy modes of transportation in the United States. Transp. Res. Part D Transp. Environ.2008, 13, 462–470. [CrossRef]
20. Hunt, J.D.; Abraham, J.E. Influences on bicycle use. Transportation 2007, 34, 453–470. [CrossRef]21. Ehrgott, M.; Wang, J.Y.T.; Raith, A.; Houtte, C. A bi-objective cyclist route choice model. Transp. Res. Part A
Policy Prac. 2012, 46, 652–663. [CrossRef]22. Noland, R.B.; Quddus, M.A. Analysis of pedestrian and bicycle casualties with regional panel data. Transp.
Res. Rec. 2004, 1897, 28–33. [CrossRef]23. Rietveld, P.; Daniel, V. Determinants of bicycle use: do municipal policies matter. Transp. Res. Part A Policy
Prac. 2004, 38, 531–550. [CrossRef]24. Irlam, J.H. Barriers to Cycling Mobility in Masiphumelele, Cape Town: A Best-Worst Scaling Approach; University
of Cape Town: Cape Town, South Africa, 2016.
Sustainability 2020, 12, 1693 17 of 18
25. Bauman, A.; Rissel, C.; Garrard, J.; Ker, I.; Speidel, R.; Fishman, E. Cycling: getting Australia moving.In Melbourne: Cycling Promotion Fund for the Department of Health and Ageing, 31st Australasian TransportResearch Forum; Department of Health and Ageing: Melbourne, Australia, 2008.
26. Interactive, A. Research into Barriers to Cycling in NSW: Final Report. New South Wales: NSW Roads and TrafficAuthority; NSW Roads and Traffic Authorit: Sydney, Australia, 2009.
27. Councils, L. LCC Breaking down Barriers to Cycling in London; A Joint Papers by London Councils and LondonCycling Campaign; London Councils: London, UK, 2008.
28. Xu, Y.; Chen, D.; Zhang, X.; Tu, W.; Chen, Y.; Shen, Y.; Ratti, C. Unravel the landscape and pulses of cyclingactivities from a dockless bike-sharing system. Comp. Environ. Urban Syst. 2019, 75, 184–203. [CrossRef]
29. DeMaio, P. Bike-sharing: History, impacts, models of provision, and future. J. Pub. Transp. 2009, 12, 3.[CrossRef]
30. Shaheen, S.; Chan, N. Mobility and the sharing economy: Potential to facilitate the first-and last-mile publictransit connections. Built Environ. 2016, 42, 573–588. [CrossRef]
31. Caulfield, B.; O’Mahony, M.; Brazil, W.; Weldon, P. Examining usage patterns of a bike-sharing scheme in amedium sized city. Transp. Res. Part A Policy Prac. 2017, 100, 152–161. [CrossRef]
32. Gu, T.; Kim, I.; Currie, G. To be or not to be dockless: Empirical analysis of dockless bikeshare developmentin China. Transp. Res. Part A Policy Prac. 2019, 119, 122–147. [CrossRef]
33. Pucher, J.; Buehler, R. Sustainable transport in Canadian cities. Cycl. Trends Policies Berkeley Plan. J. 2006, 19.[CrossRef]
34. Santos, G.; Maoh, H.; Potoglou, D.; Brunn, T. Factors influencing modal split of commuting journeys inmedium-size European cities. J. Transp. Geog. 2013, 30, 127–137. [CrossRef]
35. Braun, L.M.; Rodriguez, D.A.; Cole-Hunter, T.; Ambros, A.; Donaire-Gonzalez, D.; Jerrett, M.; Mendez, M.A.;Nieuwenhuijsen, M.J.; Nazelle, A. Short-term planning and policy interventions to promote cycling in urbancenters: Findings from a commute mode choice analysis in Barcelona, Spain. Transp. Res. Part A Policy Prac.2016, 89, 164–183. [CrossRef]
36. Marqués, R.; Hernández-Herrador, V.; Calvo-Salazar, M.; García-Cebrián, J.A. How infrastructure canpromote cycling in cities: Lessons from Seville. Res. Transp. Econ. 2015, 53, 31–44. [CrossRef]
37. Garrard, J.; Crawford, S.; Hakman, N. Revolutions for Women: Increasing Women’s Participation in CyclingDepartment for Victorian Communities Sport and Recreation; School of Health and Social Development, DeakinUniversity: Melbourne, Australia, 2006; p. 78.
38. Pucher, J.; Dijkstra, L. Promoting safe walking and cycling to improve public health: lessons from theNetherlands and Germany. Am. J. Pub. Health 2003, 93, 1509–1516. [CrossRef] [PubMed]
39. De Bel-Air, F. Demography, Migration, and Labour Market in Qatar; Gulf Research Center: Dubai, UAE, 2014.40. Heinen, E.; Van Wee, B.; Maat, K. Commuting by bicycle: an overview of the literature. Transp. Rev. 2010, 30,
59–96. [CrossRef]41. Shaaban, K.; Muley, D.; Elnashar, D. Evaluating the effect of seasonal variations on walking behaviour in a
hot weather country using logistic regression. Int. J. Urban Sci. 2017, 1–10. [CrossRef]42. Shaaban, K.; Muley, D.; Elnashar, D. Temporal variation in walking behavior: An empirical study. Case Stud.
Transp. Policy 2017, 5, 671–680. [CrossRef]43. Schmiedeskamp, P.; Zhao, W. Estimating daily bicycle counts in Seattle, Washington, from seasonal and
weather factors. Transp. Res. Rec. 2016, 2593, 94–102. [CrossRef]44. Pucher, J.; Dill, J.; Handy, S. Infrastructure, programs, and policies to increase bicycling: an international
review. Prev. Med. 2010, 50, 106–125. [CrossRef]45. Taylor, D.; Mahmassani, H. Analysis of stated preferences for intermodal bicycle-transit interfaces. Transp.
Res. Rec. 1996, 1556, 86–95. [CrossRef]46. Rondinella, G.; Fernandez-Heredia, A.; Monzón, A. Analysis of perceptions of utilitarian cycling by level of
user experience. In Proceedings of the Transportation Research Board Conference Proceedings, Washington,DC, USA, 22−26 January 2012.
47. Badran, M.; Laher, I. Obesity in Arabic-speaking countries. J. Obesity 2011. [CrossRef]48. Kahan, D. Adult physical inactivity prevalence in the Muslim world: analysis of 38 countries. Prev. Med.
Rep. 2015, 2, 71–75. [CrossRef] [PubMed]49. Benjamin, K.; Donnelly, T.T. Barriers and facilitators influencing the physical activity of Arabic adults:
A literature review. Avicenna 2013, 1, 8. [CrossRef]
Sustainability 2020, 12, 1693 18 of 18
50. Parkin, J.; Ryley, T.; Jones, T. Barriers to cycling: an exploration of quantitative analyses. In Cycling and society;Routledge: London, UK, 2016; pp. 83–98.
51. Engbers, L.H.; Hendriksen, I.J. Characteristics of a population of commuter cyclists in the Netherlands:perceived barriers and facilitators in the personal, social and physical environment. Int. J. Behav. Nutr. Phys.Act. 2010, 7, 89. [CrossRef] [PubMed]
52. de Geus, B.; Wuytens, N.; Deliens, T.; Keserü, I.; Macharis, C.; Meeusen, R. Psychosocial and environmentalcorrelates of cycling for transportation in Brussels. Transp. Res. Part A Policy Pract. 2019, 123, 80–90.[CrossRef]
53. Damant-Sirois, G.; El-Geneidy, A.M. Who cycles more? Determining cycling frequency through asegmentation approach in Montreal, Canada. Transp. Res. Part A Policy Pract. 2015, 77, 113–125. [CrossRef]
54. Muñoz, B.; Monzon, A.; Lois, D. Cycling habits and other psychological variables affecting commuting bybicycle in Madrid, Spain. Transp. Res. Rec. 2013, 2382, 1–9. [CrossRef]
55. Iwinska, K.; Blicharska, M.; Pierotti, L.; Tainio, M.; Nazelle, A. Cycling in Warsaw, Poland–Perceived enablersand barriers according to cyclists and non-cyclists. Transp. Res. Part A Policy Pract. 2018, 113, 291–301.[CrossRef]
© 2020 by the author. Licensee MDPI, Basel, Switzerland. This article is an open accessarticle distributed under the terms and conditions of the Creative Commons Attribution(CC BY) license (http://creativecommons.org/licenses/by/4.0/).