Embed Size (px)
Citation preview
Whole-Genome Analysis of Histone H3 Lysine 27Trimethylation in ArabidopsisXiaoyu Zhang
1[, Oliver Clarenz
2,3[, Shawn Cokus
1, Yana V. Bernatavichute
1,4, Matteo Pellegrini
1, Justin Goodrich
2,3,
Steven E. Jacobsen1,5*
1 Department of Molecular, Cell and Developmental Biology, University of California Los Angeles, Los Angeles, California, United States of America, 2 Institute of Molecular
Plant Science, University of Edinburgh, Edinburgh, United Kingdom, 3 School of Biology, University of Edinburgh, Edinburgh, United Kingdom, 4 Molecular Biology Institute,
University of California Los Angeles, Los Angeles, California, United States of America, 5 Howard Hughes Medical Institute, University of California Los Angeles, Los Angeles,
California, United States of America
Trimethylation of histone H3 lysine 27 (H3K27me3) plays critical roles in regulating animal development, and in severalcases, H3K27me3 is also required for the proper expression of developmentally important genes in plants. However,the extent to which H3K27me3 regulates plant genes on a genome-wide scale remains unknown. In addition, it is notclear whether the establishment and spreading of H3K27me3 occur through the same mechanisms in plants andanimals. We identified regions containing H3K27me3 in the genome of the flowering plant Arabidopsis thaliana using ahigh-density whole-genome tiling microarray. The results suggest that H3K27me3 is a major silencing mechanism inplants that regulates an unexpectedly large number of genes in Arabidopsis (;4,400), and that the maintenance ofH3K27me3 is largely independent of other epigenetic pathways, such as DNA methylation or RNA interference. Unlikein animals, where H3K27m3 occupies large genomic regions, in Arabidopsis, we found that H3K27m3 domains werelargely restricted to the transcribed regions of single genes. Furthermore, unlike in animals systems, H3K27m3domains were not preferentially associated with low–nucleosome density regions. The results suggest that differentmechanisms may underlie the establishment and spreading of H3K27me3 in plants and animals.
Citation: Zhang X, Clarenz O, Cokus S, Bernatavichute YV, Pellegrini M, et al. (2007) Whole-genome analysis of histone H3 lysine 27 trimethylation in Arabidopsis. PLoS Biol5(5): e129. doi:10.1371/journal.pbio.0050129
Introduction
Trimethylation of histone H3 lysine 27 (H3K27me3) iscritically important for the normal development of animals.The Polycomb-group (PcG) protein complexes PhoRC, PRC1,and PRC2 collectively establish and maintain H3K27me3 at;400 and ;2,000 genes in Drosophila and mammals, respec-tively [1–4]. In Drosophila, PRC1 and PRC2 are recruited tonucleosome-depleted regions of the genome called Polycombresponse elements (PREs) primarily through the sequence-specific binding activity of Pho [1,5–10]. The PRC2 complexthen catalyzes the trimethylation of H3K27, whereas thePRC1 complex is required for the bidirectional spreading ofH3K27me3 from PREs to the adjacent regions, presumablyuntil an insulator is encountered. As a result, H3K27me3forms broad domains in Drosophila and mammals that canspan up to hundreds of kilobases and cover multiple genes,maintaining them in a transcriptionally suppressed state atappropriate developmental stages [1,3,11,12]. The observa-tion that H3K27me3 target genes are enriched for tran-scription factors underscores the importance of this histonemodification in regulating animal development [1–3,11,12].
Plants also contain ample amounts of H3K27me3, account-ing for ;5% of the canonical histone H3.1, but trimethyla-tion is undetectable on the histone variant H3.2 (referred toas H3.3 in Drosophila) that is predicted to be associated withactively transcribed genes [13,14]. Furthermore, Arabidopsismutants defective in H3K27me3 exhibit severe developmen-tal abnormalities [15–18], and the repression of severalimportant developmental patterning genes in Arabidopsis,such as FLOWERING LOCUS C (FLC), AGAMOUS, andMEDEA,requires H3K27me3 [19–24]. It is therefore likely that the
silencing function of H3K27me3 is conserved between plantsand animals and that H3K27me3 also plays essential roles inregulating normal plant development.However, several important questions regarding the
patterning and function of H3K27me3 in plants remainunanswered. For example, the extent to which H3K27me3regulates plant gene expression on a genome-wide scale isunknown. Thus far, only seven plant genes have been shownto be associated with H3K27me3, including FLC, AGAMOUS,MEDEA, SHOOT MERISTEMLESS (STM), PHERES1, FUSCA3,and AGAMOUS-LIKE 19 (AGL19) [19–27]. In addition, whereasplants have homologs of each of the PRC2 components, theydo not encode components of PRC1 or PhoRC, and it istherefore not clear whether H3K27me3 is established andmaintained by similar mechanisms in plants and animals[28,29]. Furthermore, the relationship between H3K27me3and other important epigenetic pathways in plants such as
Academic Editor: James C. Carrington, Oregon State University, United States ofAmerica
Received December 29, 2006; Accepted March 7, 2007; Published April 17, 2007
Copyright: � 2007 Zhang et al. This is an open-access article distributed under theterms of the Creative Commons Attribution License, which permits unrestricteduse, distribution, and reproduction in any medium, provided the original authorand source are credited.
Abbreviations: bp, base pair; ChIP, chromatin immunoprecipitation; GO, geneontology; H3K27me3, histone H3 lysine 27 trimethylation; LND, low nucleosomedensity; MNase, micrococcal nuclease; PREs, Polycomb response elements; RNAi,RNA interference; siRNA, small interfering RNA
* To whom correspondence should be addressed. E-mail: [email protected]
[ These authors contributed equally to this work.
PLoS Biology | www.plosbiology.org May 2007 | Volume 5 | Issue 5 | e1291026
PLoS BIOLOGY
DNA methylation and RNA interference (RNAi) has not beendetermined.
To begin to address these questions, we identified regionscontaining H3K27me3 in the Arabidopsis genome using high-resolution whole-genome tiling microarrays. We found thatH3K27me3 regulates an unexpectedly large number of genes(;4,400) in Arabidopsis, including numerous transcriptionfactors. In addition, we present evidence that H3K27me3functions independently of DNA methylation or RNAi.Furthermore, several important differences were observedbetween the patterning of H3K27me3 in Arabidopsis andDrosophila, suggesting that distinct mechanisms may underliethe establishment and maintenance of H3K27me3 in plantsand animals.
Results/Discussion
Genome-Wide Identification of H3K27me3 Regions inArabidopsis
We performed a genome-wide identification of regionscontaining H3K27me3 in Arabidopsis using chromatin immu-noprecipitation (ChIP) and high-density Affymetrix whole-genome tiling microarrays (ChIP-on-chip). Genomic DNAassociated with H3K27me3 was isolated by ChIP, amplified,and hybridized to a microarray, which covered ;97% of theArabidopsis genome at 35–base pair (bp) resolution [30]. As acontrol, nucleosomal DNA was isolated by ChIP using anantibody against the C terminus of H3 (regardless of itsmodifications) [31]. Genomic regions associated withH3K27me3 (‘‘H3K27me3 regions’’) were identified as thoseyielding significantly higher hybridization signals whenprobed with H3K27me3 ChIP samples than with nucleosomalDNA, using a two-state hidden Markov model based onprobe-level t statistics (see Materials and Methods) [32].
The H3K27me3 regions identified in this way were highlyconsistent with results from previous studies. All seven known
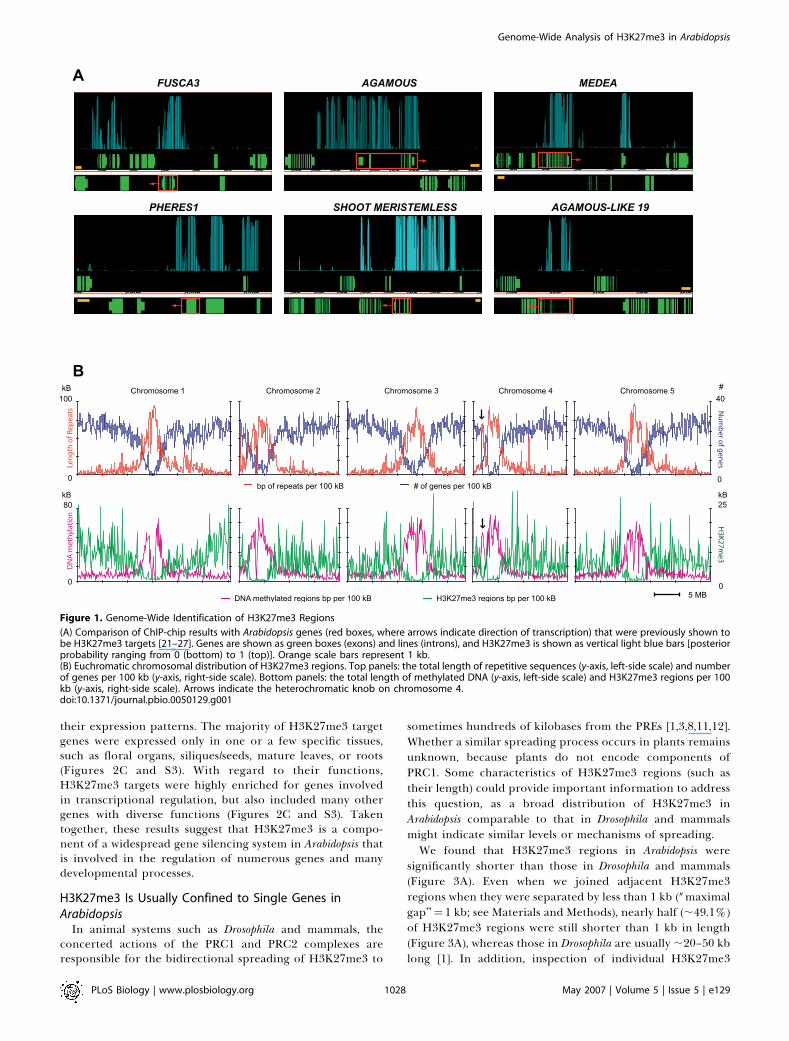
H3K27me3 target genes were found to be enriched forH3K27me3 in our dataset (listed in Figures 1A and S1). Inaddition, we found that many other genes previouslyimplicated by genetic evidence to contain H3K27me3 (e.g.,misregulated in Polycomb-group protein mutant back-grounds) were indeed direct H3K27me3 targets (Figure S1).For example, of the 106 genes overexpressed in an msi1mutant (component of PRC2) and therefore likely to beenriched for direct H3K27me3 targets [33], 48 (;45.3%) wereassociated with H3K27me3 in our dataset, whereas theremaining 58 could represent indirect targets. In contrast,only one region (253 bp) in the 154,478-bp chloroplastgenome (;0.16%) was falsely identified as containingH3K27me3. Additional verifications were obtained by real-time PCR validation of H3K27me3-positive and -negativeregions identified here, using independently prepared ChIPsamples (Figure S2). Taken together, these results indicatethat our procedure was sensitive and yielded a low falsediscovery rate.A total of 8,979 H3K27me3 regions were identified,
covering ;6.9 Mb and representing ;5.7% of the sequencednuclear genome. Consistent with previous results fromcytological studies using immunofluorescence [16], we foundthat H3K27me3 regions were highly enriched in theeuchromatic arms, resembling the distribution of genes(Figure 1B). This is in stark contrast to the heterochromaticdistribution of several other silencing marks such as DNAmethylation, small interfering RNAs (siRNAs), or H3K9me2[16,30,34], and suggests that H3K27me3 is primarily targetedto genic regions. Indeed, 6,357 (;70.8%) of the H3K27me3regions were found in the promoters (200-bp regionsupstream of transcription start sites) or the transcribedregions of genes.
H3K27me3 Targets a Large Number of Arabidopsis GenesH3K27m3 was found to be associated with a large number
of genes in Arabidopsis. We found that 2,778 of the 14,948expressed genes with known functions (‘‘known genes’’;;18.6%) and 1,628 of the 10,475 expressed genes withunknown functions (‘‘unknown genes’’; ;15.6%) wereH3K27me3 targets, as well as many computationally pre-dicted but not expressed genes (‘‘nonexpressed genes’’; 249 of1,116; ;22.3%) and pseudogenes (276 of 3,811; ;7.2%). A listof the H3K27me3 target genes is provided in Dataset S1. Thislikely represents a conservative estimate of all of theH3K27m3 target genes, because only one developmentalstage was assayed here (10-d-old seedlings), and the establish-ment of H3K27me3 at specific genes may take place atdifferent stages of development in response to developmentalor environmental cues [19,20].H3K27me3 target genes were analyzed with respect to their
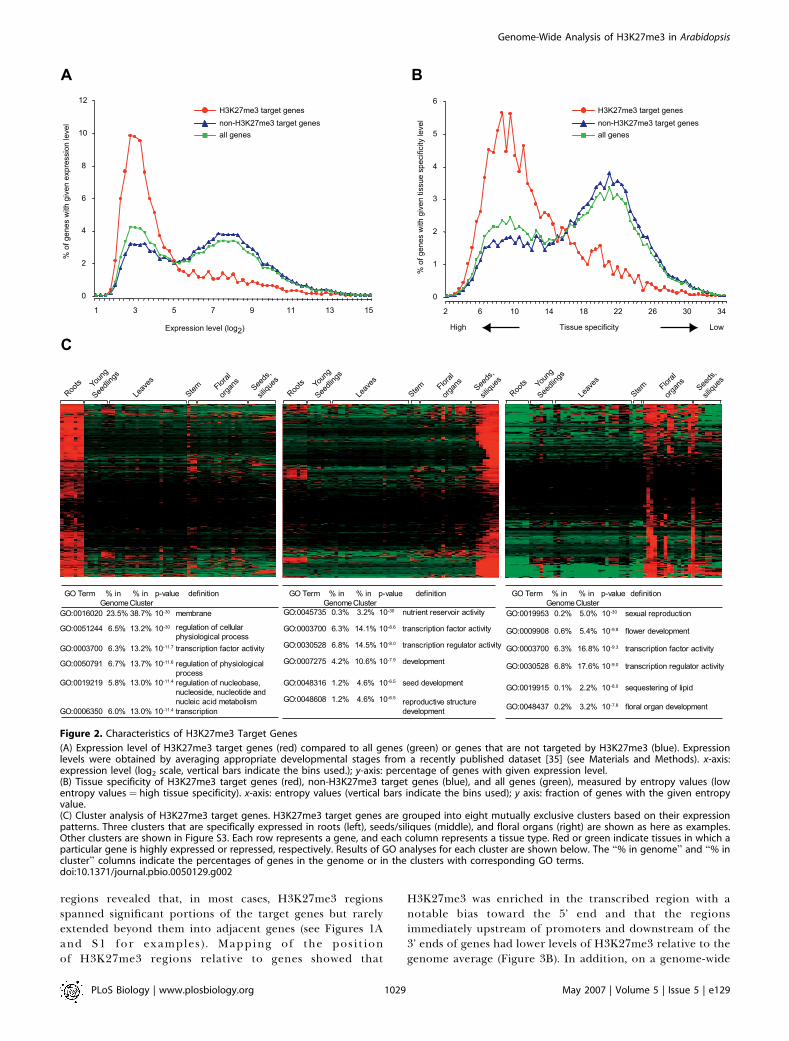
expression level and tissue specificity using a previouslypublished expression dataset [35], as well as their functionalclassifications. Consistent with the function of H3K27me3 intranscriptional silencing, H3K27me3 target genes were ex-pressed at significantly lower levels in young seedlings thanthose that did not contain H3K27me3 (Figure 2A). Impor-tantly, most H3K27me3 target genes are expressed in a verytissue-specific manner (Figure 2B), as measured by Shannonentropy [36], suggesting that H3K27me3 may facilitate therepression of these genes in appropriate tissues. This findingis further supported by cluster analysis of genes based on
PLoS Biology | www.plosbiology.org May 2007 | Volume 5 | Issue 5 | e1291027
Genome-Wide Analysis of H3K27me3 in Arabidopsis
Author summary
During plant and animal development, genes must be activated orrepressed according to a strict temporal and spatial schedule.Histones, which are DNA-packaging proteins, play a key role in thisprocess. For development to proceed normally, an amino acidresidue (lysine 27) in histone H3 must undergo a chemicalmodification (called trimethylation). The modified histone(H3K27me3) maintains the repression of its target genes inappropriate tissues or developmental stages. H3K27me3 has beenshown to regulate hundreds of genes and many developmentalprocesses in animals, where it also appears to interact with otherepigenetic pathways. However, the extent to which this histonemodification regulates plant gene expression remained unknown.Does H3K27me3 interact with other epigenetic pathways in plants?Do plants and animals have similar H3K27me3 patterning andunderlying mechanisms? To address these questions, we combinedchromatin immunoprecipitation with whole-genome tiling micro-arrays (ChIP-chip) to identify H3K27me3-associated regions acrossthe entire genome of the flowering plant Arabidopsis at highresolution (35 base pairs). The results suggest that H3K27me3 is amajor and systematic gene silencing mechanism in plants that actsindependently of small RNAs or DNA methylation. Furthermore,distinct features of Arabidopsis H3K27me3 patterning suggest thatdifferent mechanisms may be responsible for the establishment andspread of this histone modification in plants and animals.
their expression patterns. The majority of H3K27me3 targetgenes were expressed only in one or a few specific tissues,such as floral organs, siliques/seeds, mature leaves, or roots(Figures 2C and S3). With regard to their functions,H3K27me3 targets were highly enriched for genes involvedin transcriptional regulation, but also included many othergenes with diverse functions (Figures 2C and S3). Takentogether, these results suggest that H3K27me3 is a compo-nent of a widespread gene silencing system in Arabidopsis thatis involved in the regulation of numerous genes and manydevelopmental processes.
H3K27me3 Is Usually Confined to Single Genes inArabidopsis
In animal systems such as Drosophila and mammals, theconcerted actions of the PRC1 and PRC2 complexes areresponsible for the bidirectional spreading of H3K27me3 to
sometimes hundreds of kilobases from the PREs [1,3,8,11,12].Whether a similar spreading process occurs in plants remainsunknown, because plants do not encode components ofPRC1. Some characteristics of H3K27me3 regions (such astheir length) could provide important information to addressthis question, as a broad distribution of H3K27me3 inArabidopsis comparable to that in Drosophila and mammalsmight indicate similar levels or mechanisms of spreading.We found that H3K27me3 regions in Arabidopsis were
significantly shorter than those in Drosophila and mammals(Figure 3A). Even when we joined adjacent H3K27me3regions when they were separated by less than 1 kb ("maximalgap’’¼1 kb; see Materials and Methods), nearly half (;49.1%)of H3K27me3 regions were still shorter than 1 kb in length(Figure 3A), whereas those in Drosophila are usually ;20–50 kblong [1]. In addition, inspection of individual H3K27me3
Figure 1. Genome-Wide Identification of H3K27me3 Regions
(A) Comparison of ChIP-chip results with Arabidopsis genes (red boxes, where arrows indicate direction of transcription) that were previously shown tobe H3K27me3 targets [21–27]. Genes are shown as green boxes (exons) and lines (introns), and H3K27me3 is shown as vertical light blue bars [posteriorprobability ranging from 0 (bottom) to 1 (top)]. Orange scale bars represent 1 kb.(B) Euchromatic chromosomal distribution of H3K27me3 regions. Top panels: the total length of repetitive sequences (y-axis, left-side scale) and numberof genes per 100 kb (y-axis, right-side scale). Bottom panels: the total length of methylated DNA (y-axis, left-side scale) and H3K27me3 regions per 100kb (y-axis, right-side scale). Arrows indicate the heterochromatic knob on chromosome 4.doi:10.1371/journal.pbio.0050129.g001
PLoS Biology | www.plosbiology.org May 2007 | Volume 5 | Issue 5 | e1291028
Genome-Wide Analysis of H3K27me3 in Arabidopsis
regions revealed that, in most cases, H3K27me3 regionsspanned significant portions of the target genes but rarelyextended beyond them into adjacent genes (see Figures 1Aand S1 for examples). Mapping of the positionof H3K27me3 regions relative to genes showed that
H3K27me3 was enriched in the transcribed region with anotable bias toward the 5’ end and that the regionsimmediately upstream of promoters and downstream of the3’ ends of genes had lower levels of H3K27me3 relative to thegenome average (Figure 3B). In addition, on a genome-wide
Figure 2. Characteristics of H3K27me3 Target Genes
(A) Expression level of H3K27me3 target genes (red) compared to all genes (green) or genes that are not targeted by H3K27me3 (blue). Expressionlevels were obtained by averaging appropriate developmental stages from a recently published dataset [35] (see Materials and Methods). x-axis:expression level (log2 scale, vertical bars indicate the bins used.); y-axis: percentage of genes with given expression level.(B) Tissue specificity of H3K27me3 target genes (red), non-H3K27me3 target genes (blue), and all genes (green), measured by entropy values (lowentropy values ¼ high tissue specificity). x-axis: entropy values (vertical bars indicate the bins used); y axis: fraction of genes with the given entropyvalue.(C) Cluster analysis of H3K27me3 target genes. H3K27me3 target genes are grouped into eight mutually exclusive clusters based on their expressionpatterns. Three clusters that are specifically expressed in roots (left), seeds/siliques (middle), and floral organs (right) are shown as here as examples.Other clusters are shown in Figure S3. Each row represents a gene, and each column represents a tissue type. Red or green indicate tissues in which aparticular gene is highly expressed or repressed, respectively. Results of GO analyses for each cluster are shown below. The ‘‘% in genome’’ and ‘‘% incluster’’ columns indicate the percentages of genes in the genome or in the clusters with corresponding GO terms.doi:10.1371/journal.pbio.0050129.g002
PLoS Biology | www.plosbiology.org May 2007 | Volume 5 | Issue 5 | e1291029
Genome-Wide Analysis of H3K27me3 in Arabidopsis
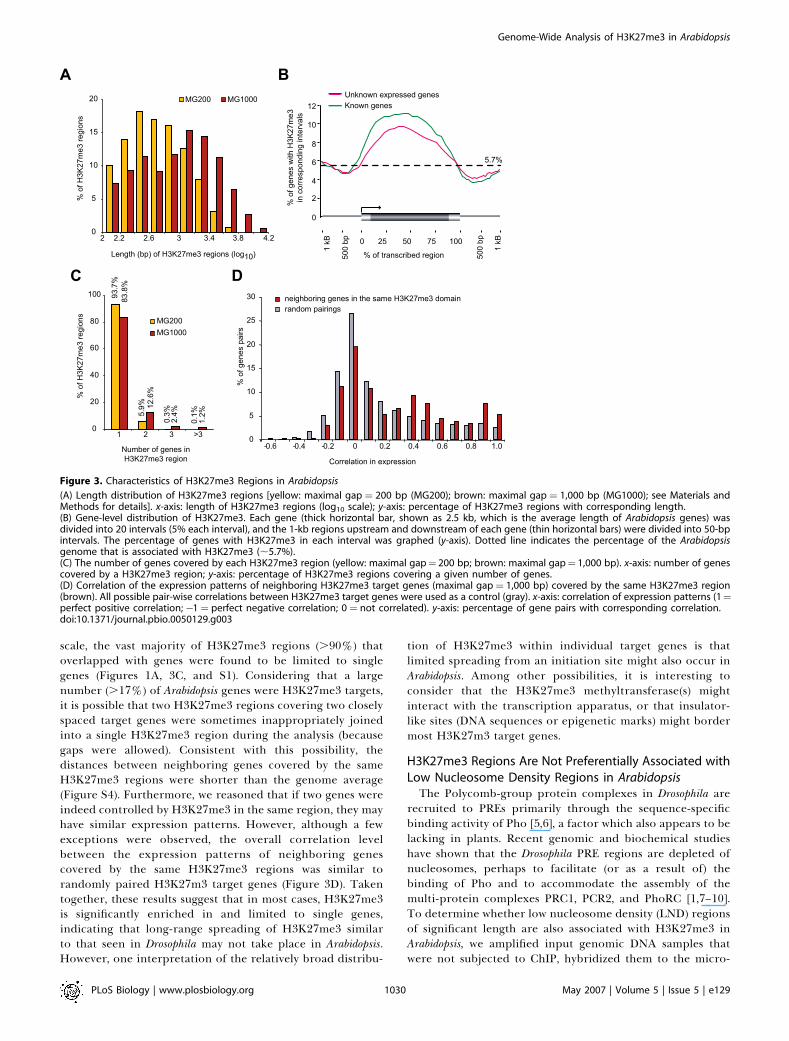
scale, the vast majority of H3K27me3 regions (.90%) thatoverlapped with genes were found to be limited to singlegenes (Figures 1A, 3C, and S1). Considering that a largenumber (.17%) of Arabidopsis genes were H3K27me3 targets,it is possible that two H3K27me3 regions covering two closelyspaced target genes were sometimes inappropriately joinedinto a single H3K27me3 region during the analysis (becausegaps were allowed). Consistent with this possibility, thedistances between neighboring genes covered by the sameH3K27me3 regions were shorter than the genome average(Figure S4). Furthermore, we reasoned that if two genes wereindeed controlled by H3K27me3 in the same region, they mayhave similar expression patterns. However, although a fewexceptions were observed, the overall correlation levelbetween the expression patterns of neighboring genescovered by the same H3K27me3 regions was similar torandomly paired H3K27m3 target genes (Figure 3D). Takentogether, these results suggest that in most cases, H3K27me3is significantly enriched in and limited to single genes,indicating that long-range spreading of H3K27me3 similarto that seen in Drosophila may not take place in Arabidopsis.However, one interpretation of the relatively broad distribu-
tion of H3K27me3 within individual target genes is thatlimited spreading from an initiation site might also occur inArabidopsis. Among other possibilities, it is interesting toconsider that the H3K27me3 methyltransferase(s) mightinteract with the transcription apparatus, or that insulator-like sites (DNA sequences or epigenetic marks) might bordermost H3K27m3 target genes.
H3K27me3 Regions Are Not Preferentially Associated withLow Nucleosome Density Regions in ArabidopsisThe Polycomb-group protein complexes in Drosophila are
recruited to PREs primarily through the sequence-specificbinding activity of Pho [5,6], a factor which also appears to belacking in plants. Recent genomic and biochemical studieshave shown that the Drosophila PRE regions are depleted ofnucleosomes, perhaps to facilitate (or as a result of) thebinding of Pho and to accommodate the assembly of themulti-protein complexes PRC1, PCR2, and PhoRC [1,7–10].To determine whether low nucleosome density (LND) regionsof significant length are also associated with H3K27me3 inArabidopsis, we amplified input genomic DNA samples thatwere not subjected to ChIP, hybridized them to the micro-
Figure 3. Characteristics of H3K27me3 Regions in Arabidopsis
(A) Length distribution of H3K27me3 regions [yellow: maximal gap ¼ 200 bp (MG200); brown: maximal gap ¼ 1,000 bp (MG1000); see Materials andMethods for details]. x-axis: length of H3K27me3 regions (log10 scale); y-axis: percentage of H3K27me3 regions with corresponding length.(B) Gene-level distribution of H3K27me3. Each gene (thick horizontal bar, shown as 2.5 kb, which is the average length of Arabidopsis genes) wasdivided into 20 intervals (5% each interval), and the 1-kb regions upstream and downstream of each gene (thin horizontal bars) were divided into 50-bpintervals. The percentage of genes with H3K27me3 in each interval was graphed (y-axis). Dotted line indicates the percentage of the Arabidopsisgenome that is associated with H3K27me3 (;5.7%).(C) The number of genes covered by each H3K27me3 region (yellow: maximal gap¼ 200 bp; brown: maximal gap¼ 1,000 bp). x-axis: number of genescovered by a H3K27me3 region; y-axis: percentage of H3K27me3 regions covering a given number of genes.(D) Correlation of the expression patterns of neighboring H3K27me3 target genes (maximal gap¼ 1,000 bp) covered by the same H3K27me3 region(brown). All possible pair-wise correlations between H3K27me3 target genes were used as a control (gray). x-axis: correlation of expression patterns (1¼perfect positive correlation;�1¼ perfect negative correlation; 0 ¼ not correlated). y-axis: percentage of gene pairs with corresponding correlation.doi:10.1371/journal.pbio.0050129.g003
PLoS Biology | www.plosbiology.org May 2007 | Volume 5 | Issue 5 | e1291030
Genome-Wide Analysis of H3K27me3 in Arabidopsis
arrays, and compared the results to those from hybridizationusing nucleosomal DNA. LND regions were identified asthose yielding significantly higher hybridization signals whenprobed with input genomic DNA than nucleosomal DNA.
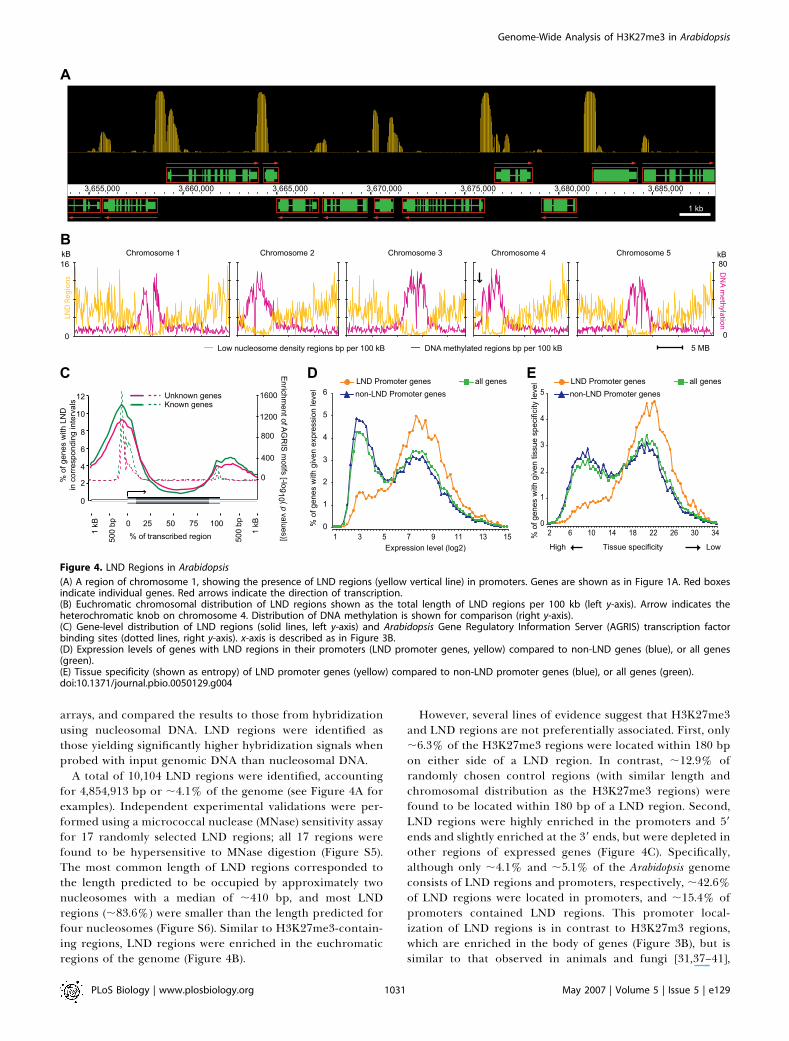
A total of 10,104 LND regions were identified, accountingfor 4,854,913 bp or ;4.1% of the genome (see Figure 4A forexamples). Independent experimental validations were per-formed using a micrococcal nuclease (MNase) sensitivity assayfor 17 randomly selected LND regions; all 17 regions werefound to be hypersensitive to MNase digestion (Figure S5).The most common length of LND regions corresponded tothe length predicted to be occupied by approximately twonucleosomes with a median of ;410 bp, and most LNDregions (;83.6%) were smaller than the length predicted forfour nucleosomes (Figure S6). Similar to H3K27me3-contain-ing regions, LND regions were enriched in the euchromaticregions of the genome (Figure 4B).
However, several lines of evidence suggest that H3K27me3and LND regions are not preferentially associated. First, only;6.3% of the H3K27me3 regions were located within 180 bpon either side of a LND region. In contrast, ;12.9% ofrandomly chosen control regions (with similar length andchromosomal distribution as the H3K27me3 regions) werefound to be located within 180 bp of a LND region. Second,LND regions were highly enriched in the promoters and 59
ends and slightly enriched at the 39 ends, but were depleted inother regions of expressed genes (Figure 4C). Specifically,although only ;4.1% and ;5.1% of the Arabidopsis genomeconsists of LND regions and promoters, respectively, ;42.6%of LND regions were located in promoters, and ;15.4% ofpromoters contained LND regions. This promoter local-ization of LND regions is in contrast to H3K27m3 regions,which are enriched in the body of genes (Figure 3B), but issimilar to that observed in animals and fungi [31,37–41],
Figure 4. LND Regions in Arabidopsis
(A) A region of chromosome 1, showing the presence of LND regions (yellow vertical line) in promoters. Genes are shown as in Figure 1A. Red boxesindicate individual genes. Red arrows indicate the direction of transcription.(B) Euchromatic chromosomal distribution of LND regions shown as the total length of LND regions per 100 kb (left y-axis). Arrow indicates theheterochromatic knob on chromosome 4. Distribution of DNA methylation is shown for comparison (right y-axis).(C) Gene-level distribution of LND regions (solid lines, left y-axis) and Arabidopsis Gene Regulatory Information Server (AGRIS) transcription factorbinding sites (dotted lines, right y-axis). x-axis is described as in Figure 3B.(D) Expression levels of genes with LND regions in their promoters (LND promoter genes, yellow) compared to non-LND genes (blue), or all genes(green).(E) Tissue specificity (shown as entropy) of LND promoter genes (yellow) compared to non-LND promoter genes (blue), or all genes (green).doi:10.1371/journal.pbio.0050129.g004
PLoS Biology | www.plosbiology.org May 2007 | Volume 5 | Issue 5 | e1291031
Genome-Wide Analysis of H3K27me3 in Arabidopsis
indicating that this feature of chromatin organization isconserved in all three eukaryotic kingdoms. Interestingly, thedistribution of LND regions is highly similar to thedistribution of transcription factor binding sites (Figure4C). This suggests that many LND regions identified here maybe functionally significant, perhaps to facilitate (or are causedby) the binding of transcription factors. We hereafter refer topromoters with LND regions as ‘‘low nucleosome densitypromoters (LND promoters),’’ and LND promoter–contain-ing genes are listed in Dataset S2. Importantly, the fraction ofLND promoter genes that were H3K27me3 targets (350 of4,785) was significantly lower than genome average. That is, inthe majority of cases, genes do not simultaneously containLND regions in their promoters and H3K27me3. In fact, LNDpromoter genes were among the most highly expressed genesin Arabidopsis, had very low levels of tissue specificity, andwere enriched in catalytic enzymes involved in a variety ofphysiological processes, whereas nonexpressed genes orpseudogenes usually do not have LND promoters (Figures4D, 4E, S7, and S8). Taken together, these results suggest thatLND regions in the Arabidopsis genome mark the promotersand 59 ends of highly transcribed genes and that H3K27m3regions in Arabidopsis do not colocalize with LND regions ofsignificant length.
H3K27me3 Acts Independently of DNA Methylation andRNAi
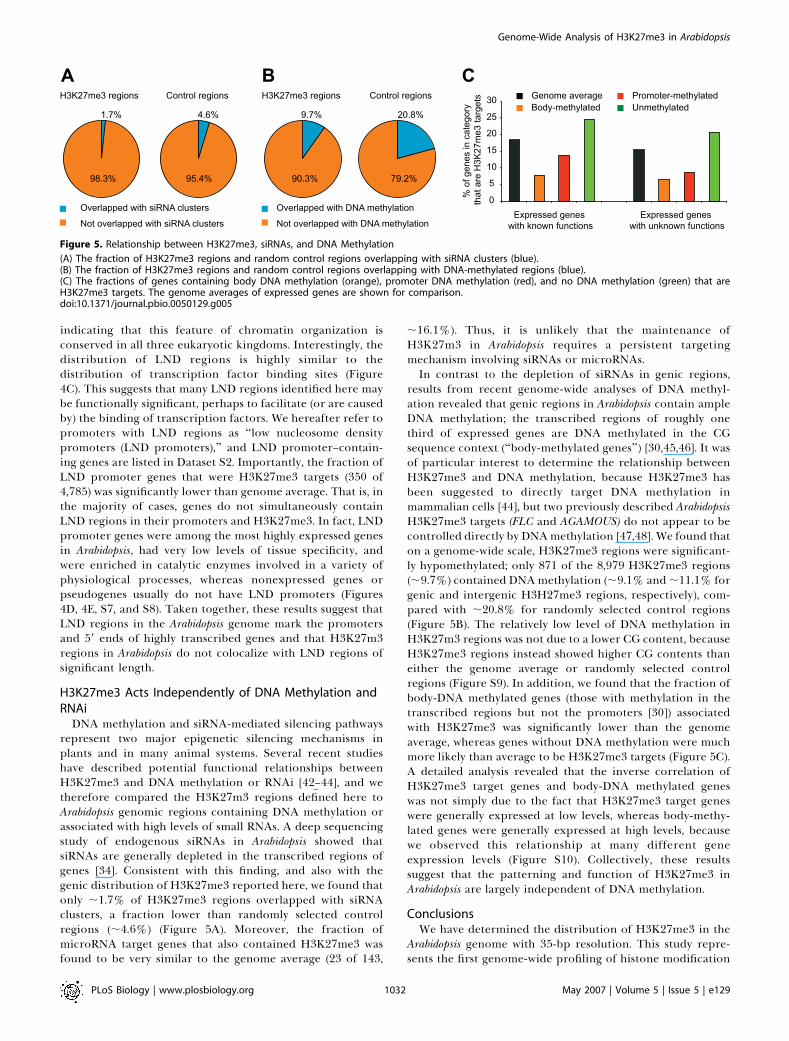
DNA methylation and siRNA-mediated silencing pathwaysrepresent two major epigenetic silencing mechanisms inplants and in many animal systems. Several recent studieshave described potential functional relationships betweenH3K27me3 and DNA methylation or RNAi [42–44], and wetherefore compared the H3K27m3 regions defined here toArabidopsis genomic regions containing DNA methylation orassociated with high levels of small RNAs. A deep sequencingstudy of endogenous siRNAs in Arabidopsis showed thatsiRNAs are generally depleted in the transcribed regions ofgenes [34]. Consistent with this finding, and also with thegenic distribution of H3K27me3 reported here, we found thatonly ;1.7% of H3K27me3 regions overlapped with siRNAclusters, a fraction lower than randomly selected controlregions (;4.6%) (Figure 5A). Moreover, the fraction ofmicroRNA target genes that also contained H3K27me3 wasfound to be very similar to the genome average (23 of 143,
;16.1%). Thus, it is unlikely that the maintenance ofH3K27m3 in Arabidopsis requires a persistent targetingmechanism involving siRNAs or microRNAs.In contrast to the depletion of siRNAs in genic regions,
results from recent genome-wide analyses of DNA methyl-ation revealed that genic regions in Arabidopsis contain ampleDNA methylation; the transcribed regions of roughly onethird of expressed genes are DNA methylated in the CGsequence context (‘‘body-methylated genes’’) [30,45,46]. It wasof particular interest to determine the relationship betweenH3K27me3 and DNA methylation, because H3K27me3 hasbeen suggested to directly target DNA methylation inmammalian cells [44], but two previously described ArabidopsisH3K27me3 targets (FLC and AGAMOUS) do not appear to becontrolled directly by DNAmethylation [47,48]. We found thaton a genome-wide scale, H3K27me3 regions were significant-ly hypomethylated; only 871 of the 8,979 H3K27me3 regions(;9.7%) contained DNAmethylation (;9.1% and ;11.1% forgenic and intergenic H3H27me3 regions, respectively), com-pared with ;20.8% for randomly selected control regions(Figure 5B). The relatively low level of DNA methylation inH3K27m3 regions was not due to a lower CG content, becauseH3K27me3 regions instead showed higher CG contents thaneither the genome average or randomly selected controlregions (Figure S9). In addition, we found that the fraction ofbody-DNA methylated genes (those with methylation in thetranscribed regions but not the promoters [30]) associatedwith H3K27me3 was significantly lower than the genomeaverage, whereas genes without DNA methylation were muchmore likely than average to be H3K27me3 targets (Figure 5C).A detailed analysis revealed that the inverse correlation ofH3K27me3 target genes and body-DNA methylated geneswas not simply due to the fact that H3K27me3 target geneswere generally expressed at low levels, whereas body-methy-lated genes were generally expressed at high levels, becausewe observed this relationship at many different geneexpression levels (Figure S10). Collectively, these resultssuggest that the patterning and function of H3K27me3 inArabidopsis are largely independent of DNA methylation.
ConclusionsWe have determined the distribution of H3K27me3 in the
Arabidopsis genome with 35-bp resolution. This study repre-sents the first genome-wide profiling of histone modification
Figure 5. Relationship between H3K27me3, siRNAs, and DNA Methylation
(A) The fraction of H3K27me3 regions and random control regions overlapping with siRNA clusters (blue).(B) The fraction of H3K27me3 regions and random control regions overlapping with DNA-methylated regions (blue).(C) The fractions of genes containing body DNA methylation (orange), promoter DNA methylation (red), and no DNA methylation (green) that areH3K27me3 targets. The genome averages of expressed genes are shown for comparison.doi:10.1371/journal.pbio.0050129.g005
PLoS Biology | www.plosbiology.org May 2007 | Volume 5 | Issue 5 | e1291032
Genome-Wide Analysis of H3K27me3 in Arabidopsis
in plants, and the data presented here should be useful forfuture studies addressing how H3K27m3 regulates individualgenes. The entire dataset is available at http://rd.plos.org/pbio.0050129 along with annotations of DNA methylation, geneexpression, siRNAs, motif analysis, and related information.The results presented here are consistent with and expandprevious findings at individual loci, and suggest thatH3K27me3 is a major silencing system that likely actsindependently of siRNA-mediated silencing pathways orDNA methylation. At the single developmental stage thatwe analyzed, 10-d-old seedlings, H3K27me3 targets included;4,400 or ;17% of expressed genes in Arabidopsis. Like inanimals, H3K27me3 target genes are enriched for tran-scription factors, indicating that this histone modificationlikely plays a widespread role in regulating plant develop-ment. Unlike in animals, however, H3K27me3 regions inArabidopsis are shorter, enriched in transcribed regions, andappear to be confined to their target genes. In addition,H3K27me3 regions in Arabidopsis do not colocalize withnucleosome-depleted regions of significant length. Collec-tively, these results suggest that although the silencingfunction of H3K27me3 is conserved, fundamental differencesbetween plants and animals may exist in the mechanisms bywhich H3K27me3 is established or maintained.
Materials and Methods
ChIP, sample preparation, and microarray hybridization. ChIP wasperformed as described [23,49]. Plants were grown under 16 h of lighton 1/2 X Murashige and Skoog media, and 1.0–1.5g of whole seedlingtissue was harvested and fixed after 10–14 d. Rabbit polyclonalantibodies a-H3K27me3 (rabbit 6523 bleed 5, generous gift of T.Jenuwein) and a-H3 (Abcam number ab1791; http://www.abcam.com)antibodies (2 lg in 100 ll) were incubated for 3–5 h at 4 8C with 25 llof magnetic protein A beads (Invitrogen number 100.01; http://www.invitrogen.com). The IP was performed as described [23], and DNAwas resuspended in 50–75 ll H2O. Input DNA and ChIP samples wereamplified, labeled, and hybridized to microarrays as described [30].Four biological replicates were performed for each set of experi-ments. LND regions were defined as those giving higher signal whenprobed with the input DNA samples than with nucleosome DNAsamples. Whereas LND regions are most likely relatively devoid ofnucleosomes (Figure S5), it is also possible that some regions of thechromatin were detected as LND regions because they were lessaccessible to the H3 antibody utilized. All raw microarray data (CELfiles) have been deposited in Gene Expression Omnibus (GEO) (http://www.ncbi.nlm.nih.gov/geo/).
Microarray data analyses. Raw microarray data from oligo probesthat mapped to unique locations in the genome (representing ;90%of all probes) were quantile normalized and analyzed using Tilemapwith the Hidden Markov model option, similar to previouslydescribed [30,32]. DNA methylation results shown in Figure 1B werere-analyzed using previously published data, following the sameprocedure as for H3K27me3 or LND regions [30]. Neighboringprobes yielding posterior probabilities of 0.5 or higher were joinedinto regions by requiring a minimal run of 100 bp and allowing amaximal gap of 200 bp. In addition, for results presented in Figure 3Aand C, a maximal gap of 1,000 bp was allowed in a separate analysis.
Gene expression. Data used in the analyses of gene expressionlevels and patterns were from a previous publication reporting thetranscriptional profiling of Arabidopsis genes across various devel-opmental stages [35]. Gene expression values were quantile normal-ized and results from the three replicates of each stage wereaveraged. Results presented in Figures 2A and 4D were derived from7–14-d-old seedlings, a stage comparable to the plant materials usedhere. Entropy and gene ontology analyses were performed asdescribed [30]. For cluster analysis, the logarithm of the expressionratio for each gene divided by its mean value across all conditionswas computed. This data was then clustered into 8–10 mutuallyexclusive groups using K-means clustering [50]. The genes withineach cluster were then hierarchically clustered and displayed in thefigures.
Distribution of putative transcription factor binding sites relativeto genes. The transcription factor binding motifs were downloadedfrom the Arabidopsis Gene Regulatory Information Server (AGRIS) athttp://arabidopsis.med.ohio-state.edu/AtcisDB/bindingSiteContent.jspand mapped to both strands of the genome. Of the 99 motifs, 27 hadtoo few matches in the genome (,18) and were not analyzed further;the remaining 72 motifs had 93 to 413,956 matches, and theirlocations were used to determine the distribution relative to genes.For each gene, the 1-kb regions upstream and downstream of thetranscribed regions were divided into 20 bins (50 bp per bin), and thegene itself is also divided into 20 bins (5% of the length of the geneper bin). For each bin and each motif, a p-value was determined as theprobability of having at least the observed number of matches to thebin. The p-values of all motifs in a bin were then summarized asp[motif1]*p[motif2]*...*p[motif72] and plotted in Figure 4C.
Validation of ChIP-chip results. For ChIP-chip results onH3K27me3, selected regions that were either H3K27me3-positive or-negative were validated using independently prepared ChIP samples.Real-time PCR reactions were performed using the iQ SYBR GreenSupermix (BIO-RAD, http://www.bio-rad.com) and the primers usedare listed in Table S1. The PCR parameters were as follows: 1 cycle of2 min at 95 8C; 40 cycles of 15 s at 95 8C, 30 s at 60 8C, and 30 s at 728C; and 1 cycle of 1 min at 95 8C. The enrichment of H3K27me3 wasdetermined as the fold change of H3K27me3 over input ornucleosomal DNA (normalized by the first negative locus in eachregion).
MNase sensitivity assays were performed as an independentexperimental validation of LND regions identified by ChIP-on-chipresults. Nuclei were prepared as described with the followingmodifications [51]. Ten-d-old Arabidopsis seedlings were ground to afine powder in liquid nitrogen and resuspended in modified Hondabuffer (HBM, 25 mM Tris, 0.44 M sucrose, 10 mM MgCl2,10 mM b-mercaptoethanol, 2 mM spermine, and 0.1% Triton). After homog-enization and filtration, plant extract was applied to a 40%/60%Percoll (GE Healthcare; http://www.gehealthcare.com) gradient andcentrifuged for 30 min at 2000 revolutions per minute. Nuclei pelletwas collected and washed with HBB (HBM without spermine) andHBC (HBB with 20% glycerol). Nuclei were digested with MNase(TaKaRa; http://www.takara-bio.com) for 10 min to mostly mono-nucleosomes, and DNA was isolated as described [52]. Equal amountsof untreated genomic DNA or MNase-treated DNA were used in real-time PCR using the iQ SYBR Green Supermix (BIO-RAD), and theprimers used are listed in Table S2. The PCR parameters were: 1 cycleof 1 min at 95 8C; 40 cycles of 10 s at 95 8C, 15 s at 55 8C, and 20 s at 728C, and 1 cycle of 1 min at 728C. The relative amounts of PCRtemplates in MNase-treated DNA were determined as the percentageof untreated DNA and shown in Figure S5.
Supporting Information
Dataset S1. List of H3K27me3 Target Genes in ArabidopsisFound at doi:10.1371/journal.pbio.0050129.sd001 (65 KB PDF).
Dataset S2. List of Arabidopsis Genes with LND Regions in TheirPromoters (LND Promoter Genes)
Found at doi:10.1371/journal.pbio.0050129.sd002 (28 KB PDF).
Figure S1. Comparison of ChIP-chip Results with Arabidopsis GenesThat Were Previously Known or Implicated to Be H3K27me3 Targets
Red boxes indicated individual genes and arrows indicate direction oftranscription [17,19,20,23,33,53,54]. Note that previous studies haveshown the accumulation of H3K27me3 at FLC, but only aftervernalization (a prolonged exposure to cold which leads to therepression of FLC and promotes flowering) [19,20]. Interestingly, FLCis constitutively repressed in the ecotype used in this study (WS) evenwithout vernalization, and the observed accumulation of H3K27me3at this locus is consistent with other experimental evidence (OC andJG, unpublished data). Genes are shown as green boxes andH3K27me3 is shown as vertical light blue bars [posterior probability,ranging from 0 (bottom) to 1 (top)]. Orange bars represent 1 kb.Additional genes are shown in Figure 1A.
Found at doi:10.1371/journal.pbio.0050129.sg001 (477 KB PDF).
Figure S2. Validation of ChIP-chip Results by Real-Time PCR fromIndependently Prepared Biological ChIP Replicates
ChIP-chip results of three genomic regions are shown in the toppanels and labeled as in Figure 1A. Red horizontal bars representregions assayed by real-time PCR (see Table S1 for coordinates and
PLoS Biology | www.plosbiology.org May 2007 | Volume 5 | Issue 5 | e1291033
Genome-Wide Analysis of H3K27me3 in Arabidopsis
primer sequences). Real-time PCR results are shown as the fold ofenrichment of H3K27me3 over input DNA (middle panels) orH3K27me3 over nucleosomal DNA (H3 ChIP samples; bottompanels).
Found at doi:10.1371/journal.pbio.0050129.sg002 (85 KB PDF).
Figure S3. Cluster Analysis of H3K27me3 Target Genes
H3K27me3 target genes are grouped into eight mutually exclusiveclusters based on their expression patterns. Results for threeadditional clusters are shown in Figure 2. Each row represents agene, and each column represents a tissue type. Red or green indicatetissues in which a particular gene is highly expressed or repressed,respectively. Results of gene ontology (GO) analyses for each clusterare shown below. The ‘‘% in genome’’ and ‘‘% in cluster’’ columnsindicate the percentages of genes in the genome or in the clusterswith corresponding GO terms.
Found at doi:10.1371/journal.pbio.0050129.sg003 (1.6 MB PDF).
Figure S4. Neighboring H3K27me3 Target Genes Covered by theSame H3K27me3 Regions Are More Closely Spaced than AverageNeighboring Gene Pairs
The length of intergenic regions between neighboring H3K27me3target genes (brown) are compared to that between all neighboringgenes (grey). x-axis: intergenic length (negative values indicateoverlapping of genes); y-axis: percentage of gene pairs withcorresponding distance.
Found at doi:10.1371/journal.pbio.0050129.sg004 (50 KB PDF).
Figure S5. Independent Experimental Validations of LND ChIP-chipResults Using an MNase sensitivity assay
LND regions are more sensitive to MNase digestion, and thereforeless DNA from LND regions should remain after MNase digestionthan from non-LND regions. Equal amounts of DNA extracted fromundigested or MNase-digested nuclei were assayed by real-time PCRto measure the relative abundance of 17 randomly selected regions(orange bars) that were found to be LND regions by ChIP-chip (seeTable S2 for primer sequences). Two regions that were not found tohave LND (regions 7 and 8 in Figure S2) were included as controls(gray bars). For each region, the relative abundance of the amplifiedregion in MNase-digested sample was shown as the percentage of itsabundance in undigested samples (y-axis).Found at doi:10.1371/journal.pbio.0050129.sg005 (275 KB PDF).
Figure S6. The Distribution of the Lengths of LND regions inArabidopsisThe x-axis shows the length of LND regions; the y-axis is thepercentage of LND regions with corresponding length.
Found at doi:10.1371/journal.pbio.0050129.sg006 (52 KB PDF).
Figure S7. Cluster Analysis of Genes with LND Regions in TheirPromoters (‘‘LND Promoter Genes’’)
LND promoter genes are grouped into ten mutually exclusive clustersbased on their expression patterns. Each row represents a gene, andeach column represents a tissue type. Red or green indicate tissues inwhich a particular gene is highly expressed or repressed, respectively.The most enriched GO terms in each cluster are shown below. The‘‘% in genome’’ and ‘‘% in cluster’’ columns indicate the percentagesof genes in the genome or in the clusters with corresponding GOterms.
Found at doi:10.1371/journal.pbio.0050129.sg007 (1.0 MB PDF).
Figure S8. The Fractions of Expressed Genes with Known Functions,
Expressed Genes with Unknown Functions, Computationally Pre-dicted but Not Expressed Genes, and Pseudogenes That Have LNDRegions in Their Promoters (Green)
Found at doi:10.1371/journal.pbio.0050129.sg008 (52 KB PDF).
Figure S9. DNA Hypomethylation of H3K27me3 Regions Is Not dueto Their Low CG Contents
(A) The average CG content of H3K27me3 regions (brown) is higherthan that of randomly selected control regions (gray) or the genomeaverage (black). y-axis: the number of CG dinucleotides per 100 bp.(B) The distribution of CG content of H3K27me3 regions (brown)compared to randomly selected control regions (gray). x-axis: numberof base pairs per 1 CG dinucleotides; y-axis: the number of regionswith corresponding CG content.
Found at doi:10.1371/journal.pbio.0050129.sg009 (76 KB PDF).
Figure S10. Genes Containing DNA Methylation Are Less Likely to BeH3K27me3 Targets
To exclude the potential bias introduced by gene expression level inthis analysis, all expressed genes with known (top) or unknown(bottom) functions were divided into ten bins according to theirexpression level (bin 1 has the lowest expression level and bin 10, thehighest); each bin has an equal number of genes. The percentage ofgenes that are H3K27me3 targets was then determined for genes thatare DNA methylated in their promoters (‘‘promoter-methylated;’’red) or transcribed regions (‘‘body-methylated;’’ orange) and genesthat do not contain DNA methylation (‘‘unmethylated;’’ blue). For allthree classes, higher expression levels are correlated with lowerlikelihoods of being H3K27me3 targets. However, within each bin,unmethylated genes are always more likely to be H3K27me3 targetsthan promoter-methylated or body-methylated genes.
Found at doi:10.1371/journal.pbio.0050129.sg010 (61 KB PDF).
Table S1. PCR Primers Used for Validation of H3K27me3 Results
Found at doi:10.1371/journal.pbio.0050129.st001 (8 KB PDF).
Table S2. PCR Primers Used for Validation of LND Regions
Found at doi:10.1371/journal.pbio.0050129.st002 (7 KB PDF).
Accession Numbers
Gene Expression Omnibus (GEO) (http://www.ncbi.nlm.nih.gov/geo/)series accession numbers for construct used are as follows: GSE7064(H3K27me3 ChIP-chip), GSE7062 (H3 ChIP-chip), and GSE7063(input DNA).
Acknowledgments
XZ is supported by a post-doctoral fellowship from the JonssonCancer Center Foundation. OC is supported by BBSRC and DeutscheForschungsgesellschaft (DFG). YVB was supported by USPHS Na-tional Research Service Award GM07104. SEJ is an investigator of theHoward Hughes Medical Institute.
Author contributions. JG and SEJ conceived and designed theexperiments and edited the paper. XZ, OC, and YVB performed theexperiments. XZ, SC, and MP analyzed the data. XZ wrote the paper.
Funding. Research in the Jacobsen lab is supported by NIH grantGM60398 and a grant from the NIH ENCODE Program HG003523.Research in the Goodrich laboratory is supported by a BBSRC grant.
Competing interests. The authors have declared that no competinginterests exist.
References1. Schwartz YB, Kahn TG, Nix DA, Li XY, Bourgon R, et al. (2006) Genome-
wide analysis of Polycomb targets in Drosophila melanogaster. Nat Genet 38:700–705.
2. Lee TI, Jenner RG, Boyer LA, Guenther MG, Levine SS, et al. (2006) Controlof developmental regulators by Polycomb in human embryonic stem cells.Cell 125: 301–313.
3. Bernstein BE, Mikkelsen TS, Xie X, Kamal M, Huebert DJ, et al. (2006) Abivalent chromatin structure marks key developmental genes in embryonicstem cells. Cell 125: 315–326.
4. Boyer LA, Plath K, Zeitlinger J, Brambrink T, Medeiros LA, et al. (2006)Polycomb complexes repress developmental regulators in murine embry-onic stem cells. Nature 441: 349–353.
5. Brown JL, Mucci D, Whiteley M, Dirksen ML, Kassis JA (1998) The Drosophila
Polycomb group gene pleiohomeotic encodes a DNA binding protein withhomology to the transcription factor YY1. Mol Cell 1: 1057–1064.
6. Muller J, Kassis JA (2006) Polycomb response elements and targeting ofPolycomb group proteins in Drosophila. Curr Opin Genet Dev 16: 476–484.
7. Mohd-Sarip A, Cleard F, Mishra RK, Karch F, Verrijzer CP (2005)Synergistic recognition of an epigenetic DNA element by Pleiohomeoticand a Polycomb core complex. Genes Dev 19: 1755–1760.
8. Kahn TG, Schwartz YB, Dellino GI, Pirrotta V (2006) Polycomb complexesand the propagation of the methylation mark at the Drosophila Ubx gene. JBiol Chem 281: 29064–29075.
9. Mohd-Sarip A, van der Knaap JA, Wyman C, Kanaar R, Schedl P, et al.(2006) Architecture of a polycomb nucleoprotein complex. Mol Cell 24: 91–100.
10. Papp B, Muller J (2006) Histone trimethylation and the maintenance of
PLoS Biology | www.plosbiology.org May 2007 | Volume 5 | Issue 5 | e1291034
Genome-Wide Analysis of H3K27me3 in Arabidopsis
transcriptional ON and OFF states by trxG and PcG proteins. Genes Dev20: 2041–2054.
11. Tolhuis B, de Wit E, Muijrers I, Teunissen H, Talhout W, et al. (2006)Genome-wide profiling of PRC1 and PRC2 Polycomb chromatin binding inDrosophila melanogaster. Nat Genet 38: 694–699.
12. Negre N, Hennetin J, Sun LV, Lavrov S, Bellis M, et al. (2006) Chromosomaldistribution of PcG proteins during Drosophila development. PLoS Biol 4:e170.
13. Johnson L, Mollah S, Garcia BA, Muratore TL, Shabanowitz J, et al. (2004)Mass spectrometry analysis of Arabidopsis histone H3 reveals distinctcombinations of post-translational modifications. Nucleic Acids Res 32:6511–6518.
14. Ahmad K, Henikoff S (2002) The histone variant H3.3 marks activechromatin by replication-independent nucleosome assembly. MolecularCell 9: 1191–1200.
15. Schubert D, Clarenz O, Goodrich J (2005) Epigenetic control of plantdevelopment by Polycomb-group proteins. Curr Opin Plant Biol 8: 553–561.
16. Lindroth AM, Shultis D, Jasencakova Z, Fuchs J, Johnson L, et al. (2004)Dual histone H3 methylation marks at lysines 9 and 27 required forinteraction with CHROMOMETHYLASE3. Embo J 23: 4286–4296.
17. Kinoshita T, Harada JJ, Goldberg RB, Fischer RL (2001) Polycombrepression of flowering during early plant development. Proc Natl AcadSci U S A 98: 14156–14161.
18. Chanvivattana Y, Bishopp A, Schubert D, Stock C, Moon YH, et al. (2004)Interaction of Polycomb-group proteins controlling flowering in Arabidop-sis. Development 131: 5263–5276.
19. Bastow R, Mylne JS, Lister C, Lippman Z, Martienssen RA, et al. (2004)Vernalization requires epigenetic silencing of FLC by histone methylation.Nature 427: 164–167.
20. Sung S, Amasino RM (2004) Vernalization in Arabidopsis thaliana is mediatedby the PHD finger protein VIN3. Nature 427: 159–164.
21. Gehring M, Huh JH, Hsieh TF, Penterman J, Choi Y, et al. (2006) DEMETERDNA glycosylase establishes MEDEA polycomb gene self-imprinting byallele-specific demethylation. Cell 124: 495–506.
22. Jullien PE, Katz A, Oliva M, Ohad N, Berger F (2006) Polycomb groupcomplexes self-regulate imprinting of the Polycomb group gene MEDEA inArabidopsis. Curr Biol 16: 486–492.
23. Schubert D, Primavesi L, Bishopp A, Roberts G, Doonan J, et al. (2006)Silencing by plant Polycomb-group genes requires dispersed trimethyla-tion of histone H3 at lysine 27. Embo J 25: 4638–4649.
24. Baroux C, Gagliardini V, Page DR, Grossniklaus U (2006) Dynamicregulatory interactions of Polycomb group genes: MEDEA autoregulationis required for imprinted gene expression in Arabidopsis. Genes Dev 20:1081–1086.
25. Kohler C, Hennig L, Spillane C, Pien S, Gruissem W, et al. (2003) ThePolycomb-group protein MEDEA regulates seed development by control-ling expression of the MADS-box gene PHERES1. Genes Dev 17: 1540–1553.
26. Makarevich G, Leroy O, Akinci U, Schubert D, Clarenz O, et al. (2006)Different Polycomb group complexes regulate common target genes inArabidopsis. EMBO Rep 7: 947–952.
27. Schonrock N, Bouveret R, Leroy O, Borghi L, Kohler C, et al. (2006)Polycomb-group proteins repress the floral activator AGL19 in the FLC-independent vernalization pathway. Genes Dev 20: 1667–1678.
28. Hsieh TF, Hakim O, Ohad N, Fischer RL (2003) From flour to flower: HowPolycomb group proteins influence multiple aspects of plant development.Trends Plant Sci 8: 439–445.
29. Steimer A, Schob H, Grossniklaus U (2004) Epigenetic control of plantdevelopment: New layers of complexity. Curr Opin Plant Biol 7: 11–19.
30. Zhang X, Yazaki J, Sundaresan A, Cokus S, Chan SW, et al. (2006) Genome-wide high-resolution mapping and functional analysis of DNA methylationin Arabidopsis. Cell 126: 1189–1201.
31. Pokholok DK, Harbison CT, Levine S, Cole M, Hannett NM, et al. (2005)
Genome-wide map of nucleosome acetylation and methylation in yeast.Cell 122: 517–527.
32. Ji H, Wong WH (2005) TileMap: Create chromosomal map of tiling arrayhybridizations. Bioinformatics 21: 3629–3636.
33. Bouveret R, Schonrock N, Gruissem W, Hennig L (2006) Regulation offlowering time by Arabidopsis MSI1. Development 133: 1693–1702.
34. Lu C, Tej SS, Luo S, Haudenschild CD, Meyers BC, et al. (2005) Elucidationof the small RNA component of the transcriptome. Science 309: 1567–1569.
35. Schmid M, Davison TS, Henz SR, Pape UJ, Demar M, et al. (2005) A geneexpression map of Arabidopsis thaliana development. Nat Genet 37: 501–506.
36. Schug J, Schuller WP, Kappen C, Salbaum JM, Bucan M, et al. (2005)Promoter features related to tissue specificity as measured by Shannonentropy. Genome Biol 6: R33.
37. Bernstein BE, Liu CL, Humphrey EL, Perlstein EO, Schreiber SL (2004)Global nucleosome occupancy in yeast. Genome Biol 5: R62.
38. Barrera LO, Ren B (2006) The transcriptional regulatory code of eukaryoticcells–Insights from genome-wide analysis of chromatin organization andtranscription factor binding. Curr Opin Cell Biol 18: 291–298.
39. Yuan GC, Liu YJ, Dion MF, Slack MD, Wu LF, et al. (2005) Genome-scaleidentification of nucleosome positions in S. cerevisiae. Science 309: 626–630.
40. Heintzman ND, Stuart RK, Hon G, Fu Y, Ching CW, et al. (2007) Distinctand predictive chromatin signatures of transcriptional promoters andenhancers in the human genome. Nat Genet 39: 311–318.
41. Lee CK, Shibata Y, Rao B, Strahl BD, Lieb JD (2004) Evidence fornucleosome depletion at active regulatory regions genome-wide. Nat Genet36: 900–905.
42. Weinberg MS, Villeneuve LM, Ehsani A, Amarzguioui M, Aagaard L, et al.(2006) The antisense strand of small interfering RNAs directs histonemethylation and transcriptional gene silencing in human cells. RNA 12:256–262.
43. Grimaud C, Bantignies F, Pal-Bhadra M, Ghana P, Bhadra U, et al. (2006)RNAi components are required for nuclear clustering of Polycomb groupresponse elements. Cell 124: 957–971.
44. Vire E, Brenner C, Deplus R, Blanchon L, Fraga M, et al. (2006) ThePolycomb group protein EZH2 directly controls DNA methylation. Nature439: 871–874.
45. Tran RK, Henikoff JG, Zilberman D, Ditt RF, Jacobsen SE, et al. (2005) DNAmethylation profiling identifies CG methylation clusters in Arabidopsisgenes. Curr Biol 15: 154–159.
46. Zilberman D, Gehring M, Tran RK, Ballinger T, Henikoff S (2007) Genome-wide analysis of Arabidopsis thaliana DNA methylation uncovers aninterdependence between methylation and transcription. Nat Genet 39:61–69.
47. Finnegan EJ, Sheldon CC, Jardinaud F, Peacock WJ, Dennis ES (2004) Acluster of Arabidopsis genes with a coordinate response to an environmentalstimulus. Curr Biol 14: 911–916.
48. Jacobsen SE, Sakai H, Finnegan EJ, Cao X, Meyerowitz EM (2000) Ectopichypermethylation of flower-specific genes in Arabidopsis. Curr Biol 10: 179–186.
49. Gendrel AV, Lippman Z, Yordan C, Colot V, Martienssen RA (2002)Dependence of heterochromatic histone H3 methylation patterns on theArabidopsis gene DDM1. Science 297: 1871–1873.
50. Seber GAF (1984) Multivariate observations. New York: Wiley. 686 p.51. Luthe DS, Quatrano RS (1980) Transcription in isolated wheat nuclei: I.
Isolation of nuclei and elimination of endogenous ribonuclease activity.Plant Physiol 65: 305–308.
52. Moon YH, Chen L, Pan RL, Chang HS, Zhu T, et al. (2003) EMF genesmaintain vegetative development by repressing the flower program inArabidopsis. Plant Cell 15: 681–693.
53. Katz A, Oliva M, Mosquna A, Hakim O, Ohad N (2004) FIE and CURLYLEAF polycomb proteins interact in the regulation of homeobox geneexpression during sporophyte development. Plant J 37: 707–719.
PLoS Biology | www.plosbiology.org May 2007 | Volume 5 | Issue 5 | e1291035
Genome-Wide Analysis of H3K27me3 in Arabidopsis


