Embed Size (px)
Citation preview
Who Trades with Whom? Exploring the Linksbetween Firms’ International Activities, Skills,and Wagesroie_919 951..971
Francesco Serti, Chiara Tomasi, and Antonello Zanfei*
AbstractUsing firm-level data on the Italian manufacturing industry, we examine how trade activities are related toworkforce composition and wages.We contribute to empirical research on these issues in three ways. First, weprovide new evidence that is consistent with multi-attribute models on firm heterogeneity and trade.We showthat even after controlling for various company characteristics, including size and capital intensity, exportersstill pay higher wages and employ more skilled workers than nonexporters. Second, we consider engagementin international transactions, either by means of exports, imports, or a combination of the two. We show thatfailing to control for importing activities may bias upward export premia.Third, we look at how the wage andthe employment structures of trading firms change with the country of destination and origin of trade flows.We find that wage and skill premia are influenced by the characteristics of partner countries.
1. Introduction
A growing empirical literature has shown that exporters are not only larger and moreproductive relative to nonexporting firms, but they are also more skill-intensive and payhigher wages (Bernard and Jensen, 1995; Schank et al., 2007; Verhoogen, 2008). Severalof the stylized facts emerging from these contributions have prompted theoreticalapproaches linking firm-level heterogeneity and trade. These include models in whichexport status is explained by a single exogenous company attribute, normally identifiedby either their productivity or their ability to produce quality (Melitz, 2003; Bernardet al., 2003; Kugler and Verhoogen, 2008; Baldwin and Harrigan, 2007). Other recentworks have considered more than one source of company diversity. Hallak and Siva-dasan (2009) introduce two dimensions of intraindustry heterogeneity—productivityand caliber (i.e. the ability to produce quality using few fixed inputs). They examinehow these two factors affect company attitudes to meeting quality requirements forexporting. This literature predicts that, conditional on firm size, exporters will producehigher quality and sell at higher prices than nonexporters.1 Moreover, to the extent thatthe production of quality goods requires more intensive use of skilled labor and capital,exporters will pay higher wages and be more capital-intensive.
* Serti: Departamento de Fundamentos del Análisis Económico, University of Alicante, Campus de SanVicente, 03080 Alicante, Spain. Tel: (+34) 965 90 36 14; Fax: (+34) 965 90 38 98; E-mail: [email protected]. Tomasi: Laboratory of Economics and Management, Scuola Superiore S.Anna, Piazza Martiridella Libertà, 33, 56127, Pisa, Italy. Tel: (+39) 3409164852; E-mail: [email protected]. Zanfei: Department ofEconomics and Quantitative Methods, University of Urbino, Via Saffi, 42, 61029 Urbino, Italy. Tel: (+39)0722305562; E-mail: [email protected]. This work was funded by EU-DG Research and by theItalian Ministry of Research. We are grateful to ISTAT for providing access to company data under aconfidentiality agreement.We thank R. Monducci from ISTAT, G. Dosi,A. Secchi, and M. Grazzi from LEM,Scuola Superiore S.Anna. Support from ISE-University of Urbino is gratefully acknowledged. We also wantto thank D. Castellani for his suggestions. The usual disclaimers apply.
Review of International Economics, 18(5), 951–971, 2010DOI:10.1111/j.1467-9396.2010.00919.x
© 2010 Blackwell Publishing Ltd

Although contributions on export premia have been influential in shaping our under-standing of company behavior in international markets, substantial work is still neededto better capture the links between intraindustry heterogeneity and trade. In thisrespect, we wish to highlight two important gaps in the existing empirical literature;relatively little is known about “who” trades “with whom.”
On the “who” side, there is limited knowledge regarding the identities of tradingfirms, especially in terms of their involvement in international activities other thanexports. While works on exports are quite numerous, much less attention has beendevoted to imports.2 Even less attention has been given to firms engaged in a com-bination of both imports and exports. This is quite surprising given the increasinginternational fragmentation of production, implying that more and more firms areactive in both importation and exportation of intermediate and final goods (Feenstraand Hanson, 2004). The fact that firms are likely to be “two-way traders” implies thatsome of their characteristics, including skill composition and wages, will reflect boththeir export and their import decisions.
On the “with whom” side, most of the empirical literature on intraindustry hetero-geneity and trade does not discriminate between firms based on where they exportto and import from. The number, variety, and characteristics of foreign markets areincreasingly acknowledged as key factors affecting quality and efficiency requirementsin trade models (Baldwin and Harrigan, 2007; Johnson, 2007; Melitz and Ottaviano,2008). Empirical analyses are constrained by the fact that available firm-level datasetsdo not generally obviate the export destination and/or the origin of imports.
Thanks to the richness of the dataset used in this study, we will fill some of theseimportant gaps in the empirical literature. For a large sample of Italian manufacturingfirms we will be able to consider whether or not they are involved in exports, imports,or combinations of both trading activities. As well, we will be able to understand betterthe geographic distribution of their exports and imports and how these trade patternsare related to company employment composition and wages.
The rest of this paper has the following structure. Section 2 describes the data we useand provides some descriptive statistics. Section 3 examines how exporting activity isassociated with company workforce structure and earnings. Consistent with multi-attribute models, we shall confirm that exporters still pay higher wages and employmore skilled workers than nonexporters, depending on various firm characteristics,including size. Section 4 investigates how company employment structures and com-pensations differ when other trade activities are considered—namely imports andcombinations of both importing and exporting (two-way trade).We shall show that skilland wage premia are significantly higher in the case of two-way traders. Section 5illustrates how the whole picture is affected by differences across firms according to themarket of origin or destination of their import and export activities. We shall show thatwage and skill premia increase as firms trade with more distant countries—i.e. withmarket characteristics expected to increase the efficiency and quality requirementsfor both import and export activities. We shall also suggest that richer countries areassociated with higher premia but only in the case of importers. Section 6 will sum-marize the results and conclude.
2. Data Description and Summary Statistics
This paper relies upon a firm-level data panel which combines two different datasetsdeveloped by Italy’s Bureau of Statistics (ISTAT), namely Micro.1 and COE.3
952 Francesco Serti, Chiara Tomasi, and Antonello Zanfei
© 2010 Blackwell Publishing Ltd
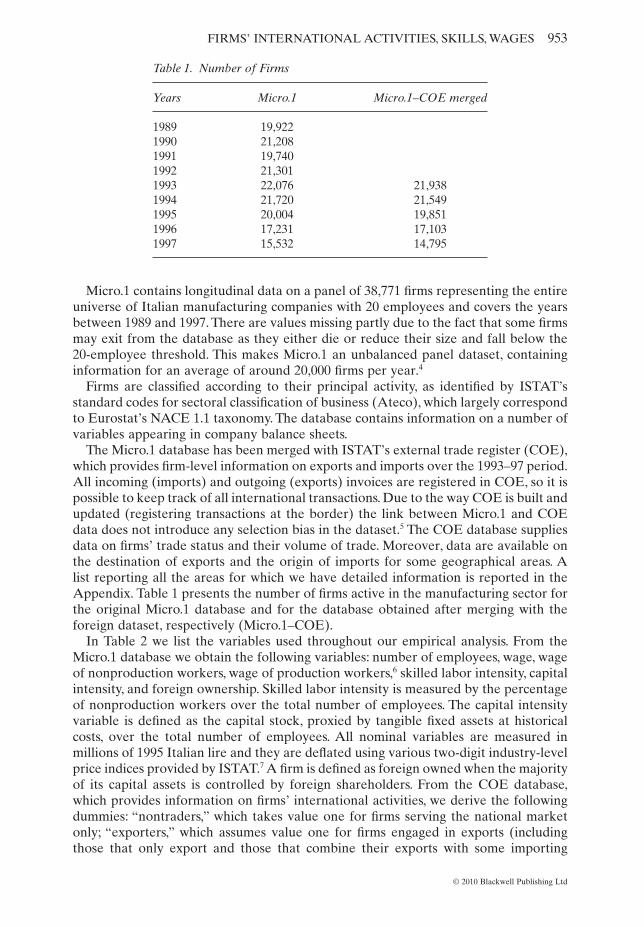
Micro.1 contains longitudinal data on a panel of 38,771 firms representing the entireuniverse of Italian manufacturing companies with 20 employees and covers the yearsbetween 1989 and 1997. There are values missing partly due to the fact that some firmsmay exit from the database as they either die or reduce their size and fall below the20-employee threshold. This makes Micro.1 an unbalanced panel dataset, containinginformation for an average of around 20,000 firms per year.4
Firms are classified according to their principal activity, as identified by ISTAT’sstandard codes for sectoral classification of business (Ateco), which largely correspondto Eurostat’s NACE 1.1 taxonomy. The database contains information on a number ofvariables appearing in company balance sheets.
The Micro.1 database has been merged with ISTAT’s external trade register (COE),which provides firm-level information on exports and imports over the 1993–97 period.All incoming (imports) and outgoing (exports) invoices are registered in COE, so it ispossible to keep track of all international transactions. Due to the way COE is built andupdated (registering transactions at the border) the link between Micro.1 and COEdata does not introduce any selection bias in the dataset.5 The COE database suppliesdata on firms’ trade status and their volume of trade. Moreover, data are available onthe destination of exports and the origin of imports for some geographical areas. Alist reporting all the areas for which we have detailed information is reported in theAppendix. Table 1 presents the number of firms active in the manufacturing sector forthe original Micro.1 database and for the database obtained after merging with theforeign dataset, respectively (Micro.1–COE).
In Table 2 we list the variables used throughout our empirical analysis. From theMicro.1 database we obtain the following variables: number of employees, wage, wageof nonproduction workers, wage of production workers,6 skilled labor intensity, capitalintensity, and foreign ownership. Skilled labor intensity is measured by the percentageof nonproduction workers over the total number of employees. The capital intensityvariable is defined as the capital stock, proxied by tangible fixed assets at historicalcosts, over the total number of employees. All nominal variables are measured inmillions of 1995 Italian lire and they are deflated using various two-digit industry-levelprice indices provided by ISTAT.7 A firm is defined as foreign owned when the majorityof its capital assets is controlled by foreign shareholders. From the COE database,which provides information on firms’ international activities, we derive the followingdummies: “nontraders,” which takes value one for firms serving the national marketonly; “exporters,” which assumes value one for firms engaged in exports (includingthose that only export and those that combine their exports with some importing
Table 1. Number of Firms
Years Micro.1 Micro.1–COE merged
1989 19,9221990 21,2081991 19,7401992 21,3011993 22,076 21,9381994 21,720 21,5491995 20,004 19,8511996 17,231 17,1031997 15,532 14,795
FIRMS’ INTERNATIONAL ACTIVITIES, SKILLS, WAGES 953
© 2010 Blackwell Publishing Ltd

activities); “importers,” which takes value one for firms engaged in imports (includingthose that only import and those that combine their imports with some exportingactivities); and “two-way traders,” which is equal to one for firms that do not export orimport separately but are simultaneously involved in export and import activities.
Table 3 presents summary statistics on our panel, differentiating firms according totheir participation in international markets. The first column illustrates the propensityto trade in the Italian manufacturing industry. Approximately two-thirds of manufac-turing firms are internationalized. Over the 1993–97 period, on average 67% exportedgoods, and 62% imported. While the distinction between exporters and importersis relevant, it is also interesting to observe that the two trade activities are stronglyinterconnected. In fact, a remarkable fraction of importers are also exporters (and viceversa). Consequently, two-way traders (which represent 56% of the overall sample) areby far the largest share of internationalized firms, while firms that only export or onlyimport are a minority (about 11% the only exporters and 6% the only importers).
Consistent with other studies, we find that substantial differences exist betweenexporters and nontraders in terms of size, wages, and workforce composition. Onaverage, exporting firms are bigger, pay higher salaries for both production andnonproduction workers, and are more skill-intensive than their domestic counterparts.The discrimination between exporters and importers provides further evidence on the
Table 2. Variables
Variable name Abbreviation Type of variable Source Years covered
Number of employees N.Empl Continuous Micro.1 1989–97Wage Wage Continuous Micro.1 1989–97Wage nonproduction workers Wage NPW Continuous Micro.1 1989–97Wage production workers Wage PW Continuous Micro.1 1989–97Foreign ownership FO Dummy Micro.1 1989–97Skilled labor intensity SLI Continuous Micro.1 1989–97Capital intensity CI Continuous Micro.1 1989–97Nontraders NT Dummy COE 1993–97Importers—Dimp I Dummy COE 1993–97Exporters—Dexp E Dummy COE 1993–97Two-way traders—Dexp*imp T Dummy COE 1993–97
Note: Monetary values (Wage, Wage NPW, Wage PW) are expressed in millions of 1995 Italian lire.
Table 3. Differences between Nontraders and Other Trading Categories (average values 1993–97)
% of firms Employ Wage Wage NPW Wage PW SLI
Nontraders 27.0 Mean 61 30.7 38.3 29.8 16.2SD (204) (11.5) (50.2) (14.3) (16.8)
Exporters 67.3 Mean 120 35.4 47.4 32.6 25.4SD (809) (11.0) (32.5) (14.7) (17.8)
Importers 62.1 Mean 122 35.7 47.9 32.8 25.8SD (823) (11.2) (32.4) (14.9) (18.2)
Two-way traders 56.4 Mean 127 35.8 48.1 32.8 26.2SD (861) (11.0) (31.5) (15.0) (18.0)
954 Francesco Serti, Chiara Tomasi, and Antonello Zanfei
© 2010 Blackwell Publishing Ltd
remarkable heterogeneity across subsamples of firms. In particular, it is worth notingthat importing firms perform better than nontraders in all dimensions. The averagevalues for importers are quite similar to those reported for exporters. In light ofthe participation rate, this result is mainly driven by the fact that a large majority ofimporters are also exporters, and vice versa. Finally, descriptive statistics in Table 3show that a higher global engagement of firms is associated with better performance.Two-way traders perform better in all dimensions. They are the largest, the mostskill-intensive, and they pay the highest wages.
These summary statistics reveal a high degree of heterogeneity in terms of wages andworkforce composition not only between exporters and nontraders, as a large part ofthe literature has shown, but also among firms with a different degree of internationalinvolvement. We explore this issue in greater detail by studying how company employ-ment and wage structures are associated with their trading activities.
3. Export Premia in Terms of Wages and Skills
As stated earlier, the literature has long analyzed the links between trade, employment,and wages almost exclusively by focusing on the role of exports. In these studies,exporters are found to be systematically different from nonexporters, and exportpremia are traditionally expressed as the coefficient associated with an exporter statusdummy. In the single-attribute models the export dummy coefficient should be zeroonce size is controlled for, while in multi-attribute models, such as the one suggested byHallak and Sivadasan (2009), this is no longer true. In fact exporters are predicted to besystematically different from nonexporters conditional on firm size. In order to test forthe existence of differences between traders and nontraders we first estimate a simpleregression model with wages and employment structure information as dependentvariables and an exporter status dummy as an independent variable. Following theintuition behind the multi-attribute models we then investigate if the export premiapersist after controlling for size and other firms’ characteristics.
Our basic regression takes the following form:
y D Controlsit A A itexp
A it it= + + +α β θ υ . (1)
Coefficient bA captures how exporters differ with respect to the baseline categoryof noninternationalized firms. As a dependent variable we consider alternatively: theaverage wage of all workers, the percentage of nonproduction workers, the averagewage of nonproduction workers, and the average wage of production workers.8 Our setof firm-level controls includes the log of capital intensity, a dummy indicating whetherthe firm is foreign-owned, and three-digit industries, regional and year dummies. As afurther control we include firm size.
Columns (a) of Table 4 report the export premia after controlling for some companycharacteristics apart from size.As shown in the first column of Table 4, we estimate verysignificant premia in terms of wages for exporting firms. These are on average 7%higher than those of nonexporters in the same industry and location and with the sameownership structure and capital intensity.As shown in Table 3, however, exporting firmsare larger than nonexporters, which could bias upward the exporter premia observed.In order to control for this possible confounder we estimate in columns (b) equation (1)including firms’ size as an additional control. In line with previous empirical results andconsistently with the predictions of multi-attribute models, our result suggests thatthere is a residual and positive effect of exports on average wage (around 5%) even ifsize is controlled for.
FIRMS’ INTERNATIONAL ACTIVITIES, SKILLS, WAGES 955
© 2010 Blackwell Publishing Ltd

Tabl
e4.
Em
ploy
men
t,W
age
Stru
ctur
e,an
dE
xpor
tSt
atus
.Poo
led
OL
SR
egre
ssio
ns(1
993–
97)
Wag
eSL
IW
age
NP
WW
age
PW
(a)
(b)
(a)
(b)
(a)
(b)
(a)
(b)
Dex
p0.
071*
**0.
045*
**5.
878*
**5.
12**
*0.
057*
**0.
029*
**0.
033*
**0.
022*
**(0
.003
)(0
.003
)(0
.161
)(0
.162
)(0
.004
)(0
.004
)(0
.003
)(0
.003
)Si
ze0.
066*
**7.
180*
**0.
042*
**0.
031*
**(0
.007
)(0
.588
)(0
.009
)(0
.007
)F
O0.
180*
**0.
053*
**10
.482
***
1.49
1***
0.17
7***
0.04
5***
0.07
6***
0.04
5***
(0.0
07)
(0.0
01)
(0.5
74)
(0.0
83)
(0.0
08)
(0.0
02)
(0.0
07)
(0.0
01)
CI
0.06
6***
0.09
1***
1.84
9***
2.62
0***
0.06
0***
0.10
8***
0.05
0***
0.03
6***
(0.0
02)
(0.0
02)
(0.0
83)
(0.1
19)
(0.0
02)
(0.0
02)
(0.0
01)
(0.0
02)
Sect
oral
dum
mie
sY
esY
esY
esY
esY
esY
esY
esY
esR
egio
nald
umm
ies
Yes
Yes
Yes
Yes
Yes
Yes
Yes
Yes
Yea
rdu
mm
ies
Yes
Yes
Yes
Yes
Yes
Yes
Yes
Yes
Obs
erva
tion
s94
,772
94,7
7294
,776
94,7
7689
,019
89,0
1993
,746
93,7
46R
-squ
ared
0.42
0.46
0.41
0.42
0.18
0.22
0.29
0.3
Not
es:
Dep
ende
ntva
riab
les
are
inlo
gva
lues
exce
ptth
esh
are
ofno
npro
duct
ion
wor
kers
.Rob
ust
stan
dard
erro
rsin
pare
nthe
ses
belo
wth
eco
effic
ient
s.A
ster
isks
deno
tesi
gnifi
canc
ele
vels
:***
p<
1%;*
*p
<5%
;*p
<10
%.
956 Francesco Serti, Chiara Tomasi, and Antonello Zanfei
© 2010 Blackwell Publishing Ltd

The results on average wages could be determined, inter alia, by the fact thatinternationalized firms have a higher share of nonproduction workers with respect to“domestic” firms. This suggests explicitly taking into consideration differences in work-force composition at the firm level between exporters and nonexporters. As shown inTable 4, we first test if the proportion of the two categories of workers varies with theexport status.We estimate very significant premia in terms of skill intensity, around 5%,even controlling for the usual sources of heterogeneity, confirming that being involvedin exporting activities is associated with a different composition of employment interms of white- and blue-collar labor (Verhoogen, 2008). We then consider separatelythe average wage of nonproduction workers and the average wage of productionworkers as additional dependent variables. Consistent with the empirical findingsreported by Bernard and Jensen (1995), coefficients in Table 4 show that the exportstatus has a positive and statistically significant association with the earnings of bothcategories of workers. When controlling for firm size (columns (b)), we obtain a wagepremium of 3% and 2% for nonproduction and production workers, respectively.9
Indeed, our finding that wage premia persist regardless of size, combined with theevidence of a higher ratio of white vs blue collars for exporters could reflect the factthat quality, rather than (or at least in addition to) productivity, plays a key role inexplaining exporting behavior. To the extent that the production of quality goodsrequires more intense use of skilled labor and given that firms serving foreign marketshave to satisfy more binding quality constraints, exporters will employ more nonpro-duction workers and pay higher wages than nonexporters whatever their size (Hallakand Sivadasan, 2009).
4. Exports, Imports, and Two-Way Trade Premia
The model specification presented in the previous section does not allow us to separatethe role of exports from that of imports in explaining firms’ employment and wagestructures.This is a major drawback since a large majority of exporters are also import-ers. Hence one can expect that firms’ characteristics and performances will beinfluenced by both import and export decisions.
In this section, we address this problem by simultaneously controlling for the importand export status. We argue that, on the one hand, imports may have additionalimplications in terms of skill requirements and knowledge accumulation compared toexports. On the other hand, firms involved in both export and import activities (two-way traders) are more exposed to international competition than firms that eitherexport or import, which makes this category of firms particularly interesting whenconsidering employment composition and distributional patterns.
As a first step, we estimate the relationship between internationalization status andfirm heterogeneity in performance by running the following regression:
y D D Controlsit B B itexp
B itimp
B it it= + + + +α β γ θ υ , (2)
where we add a dummy indicating whether or not a firm is an importer (Dimp). Asbefore, we include a set of controls: the log of the number of employees, the log ofcapital intensity, a dummy indicating whether the firm is foreign owned, and three-digitindustries, regional and year dummies.
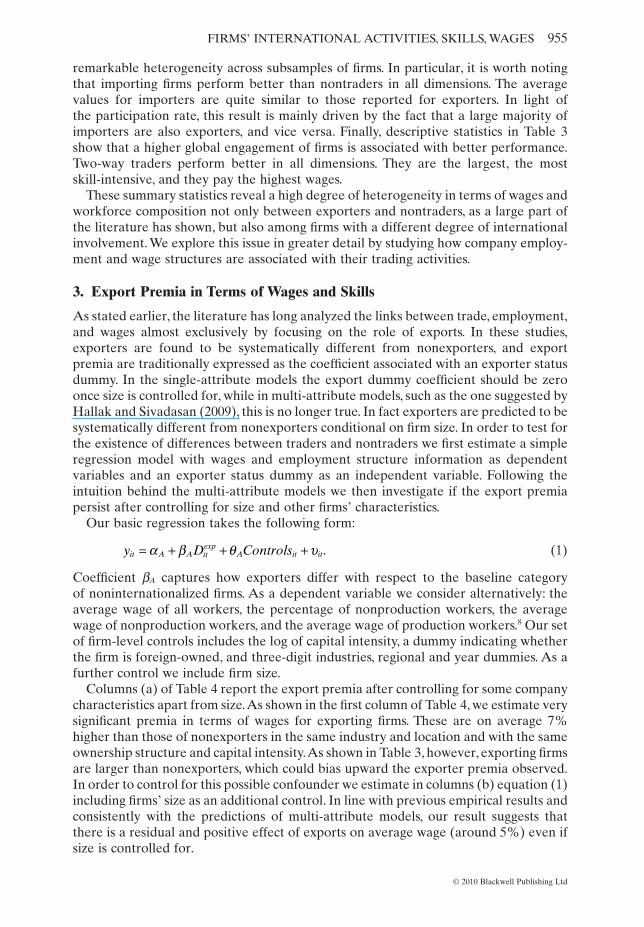
The results are presented in Table 5. In columns (a) we report our baseline resultswith only the exporter dummy, while in columns (b) we include the import statusdummy. Looking at columns (b) we observe that importing activity is also positively
FIRMS’ INTERNATIONAL ACTIVITIES, SKILLS, WAGES 957
© 2010 Blackwell Publishing Ltd
Tabl
e5.
Em
ploy
men
t,W
age
Stru
ctur
e,an
dIn
tern
atio
naliz
atio
nSt
atus
.Poo
led
OL
Sre
gres
sion
s(1
993–
97)
Wag
eSL
IW
age
NP
WW
age
PW
(a)
(b)
(c)
(a)
(b)
(c)
(a)
(b)
(c)
(a)
(b)
(c)
Dex
p0.
045*
**0.
022*
**0.
026*
**5.
121*
**3.
478*
**3.
484*
**0.
029*
**0.
012*
*0.
012*
*0.
022*
**0.
008*
*0.
015*
**(0
.003
)(0
.003
)(0
.004
)(0
.162
)(0
.172
)(0
.197
)(0
.004
)(0
.005
)(0
.006
)(0
.003
)(0
.003
)(0
.004
)D
imp
0.03
9***
0.04
5***
2.67
3***
2.68
3***
0.02
8***
0.02
9***
0.02
4***
0.03
5***
(0.0
03)
(0.0
05)
(0.1
72)
(0.2
69)
(0.0
04)
(0.0
07)
(0.0
03)
(0.0
05)
Dex
p *imp
-0.0
10*
-0.0
15-0
.002
-0.0
17**
*(0
.006
)(0
.323
)(0
.009
)(0
.006
)Si
ze0.
066*
**0.
089*
**0.
089*
**7.
180*
**2.
504*
**2.
504*
**0.
042*
**0.
107*
**0.
107*
**0.
031*
**0.
035*
**0.
035*
**(0
.007
)(0
.002
)(0
.002
)(0
.588
)(0
.119
)(0
.120
)(0
.009
)(0
.002
)(0
.002
)(0
.007
)(0
.002
)(0
.002
)F
O0.
053*
**0.
069*
**0.
069*
**1.
491*
**7.
368*
**7.
368*
**0.
045*
**0.
044*
**0.
044*
**0.
045*
**0.
032*
**0.
033*
**(0
.001
)(0
.007
)(0
.007
)(0
.083
)(0
.589
)(0
.589
)(0
.002
)(0
.009
)(0
.009
)(0
.001
)(0
.007
)(0
.007
)C
I0.
091*
**0.
052*
**0.
052*
**2.
620*
**1.
401*
**1.
401*
**0.
108*
**0.
044*
**0.
044*
**0.
036*
**0.
044*
**0.
044*
**(0
.002
)(0
.001
)(0
.001
)(0
.119
)(0
.083
)(0
.083
)(0
.002
)(0
.002
)(0
.002
)(0
.002
)(0
.001
)(0
.001
)
Sect
oral
dum
mie
sY
esY
esY
esY
esY
esY
esY
esY
esY
esY
esY
esY
esR
egio
nald
umm
ies
Yes
Yes
Yes
Yes
Yes
Yes
Yes
Yes
Yes
Yes
Yes
Yes
Yea
rdu
mm
ies
Yes
Yes
Yes
Yes
Yes
Yes
Yes
Yes
Yes
Yes
Yes
Yes
Obs
erva
tion
s94
,772
94,7
7294
,772
94,7
7694
,776
94,7
7689
,019
89,0
1989
,019
93,7
4693
,746
93,7
46R
-squ
ared
0.46
0.47
0.47
0.42
0.42
0.42
0.22
0.22
0.22
0.30
0.30
0.30
Not
es:
Dep
ende
ntva
riab
les
are
inlo
gva
lues
exce
ptth
esh
are
ofno
npro
duct
ion
wor
kers
.Rob
ust
stan
dard
erro
rsin
pare
nthe
ses
belo
wth
eco
effic
ient
s.A
ster
isks
deno
tesi
gnifi
canc
ele
vels
:***
p<
1%;*
*p
<5%
;*p
<10
%.
958 Francesco Serti, Chiara Tomasi, and Antonello Zanfei
© 2010 Blackwell Publishing Ltd
and significantly correlated with wages and with the share of white-collar workers. Onaverage, importers pay higher wages to both nonproduction and production workersand employ more skilled workers than nontraders.Although the bulk of the theoreticalmodels do not explicitly take into account import behavior, one might suppose thatthere are specific reasons why importers outperform nontraders. It has been suggestedthat importers need to invest in complementary assets (or absorptive capacity) in orderto effectively use imported inputs in their production process and that this mechanismespecially applies when importers purchase abroad higher quality and/or morecomplex inputs compared to those domestically available (Castellani et al., 2010).Similarly, Kugler and Verhoogen (2008) assume that input quality and productivity arecomplementary to obtaining higher-quality output, and that importing allows choicefrom among a wider variety of inputs. Thus, more productive firms can be expected tolook for higher-quality inputs from abroad and are more likely to self-select intoimporting.10
By including the import dummy, the coefficients for exporters drop substantially tobecome lower than those observed for importers. This result suggests that much of theexport premia found in the empirical literature may be driven by imports. In otherwords, part of export premia observed in the data may indeed reflect the skill intensityof imported inputs used to produce goods for foreign markets. Export premia can thusbe expected to be biased upward if firms’ import status is not controlled for. This effectis likely to be particularly relevant in the examined case, as a large majority of exportersare also importers in our dataset (see Table 3).
As a final step, to check for a possible interdependence between importing andexporting status we include in the regression an interaction dummy as follows:
y D D D Controlsit C C itexp
C itimp
C itexp imp
C it it= + + + + +∗α β γ φ θ υ , (3)
where Dexp*imp takes value one if a firm simultaneously exports and imports and zerootherwise. Hence, the trade premium for firms involved in both export and import(two-way traders) is given by bC + gC + fC while coefficients bC and gC respectivelycapture how firms that only export and only import differ with respect to the baselinecategory of noninternationalized firms. Results are shown in columns (c) of Table 5.Weobserve that the magnitude of premia for two-way traders is much higher than thatdetected for only exporters or only importers. Being involved both in importing andexporting is associated with the highest premium in term of firms’ average wages, forboth nonproduction and production workers, followed by only importers and onlyexporters.11 The estimated coefficients for the skill intensity variable confirm thattwo-way traders exhibit a 6% premium; that is, about twice as much as the premiaobserved for the one-way trader categories.
5. Trade Premia across Markets
The results of the previous sections show that a fraction of the observed intraindustryheterogeneity in employment and wage structure is related to the composition ofinternational activities of Italian firms. We have emphasized that excluding the importbehavior may yield misleading results.
In this section we move forward by assessing whether trade premia are influenced bythe characteristics of partner countries. Heterogeneous trade models of quality predictthat more competitive firms produce higher-quality goods implying higher costs andtherefore higher prices.12 In these models, only firms with sufficiently high price/high
FIRMS’ INTERNATIONAL ACTIVITIES, SKILLS, WAGES 959
© 2010 Blackwell Publishing Ltd

quality find it profitable to sell to distant and small markets (Baldwin and Harrigan,2007; Johnson, 2007).13 In their multi-attribute model, Hallak and Sivadasan (2009)suggest that the export quality requirements are likely to increase with distance andincome per capita. Therefore, firms exporting to remote and rich countries shouldexhibit high prices and quality premia.
To investigate how firms’ characteristics depend on the heterogeneity of targetforeign countries, we first group traders according to the type of market served. Asshown in Table 6, we distinguish between three macro geographical areas: Europeancountries (EU); High–Medium-Income countries (HMI) including EFTA, the US, andCanada, Other developed countries, NICs and OPECs; and Low-Income countries(LIC), consisting of ACP, CEECs, PECs, and Other nondeveloped countries. While themajority of companies trade with more than one macro area, there are a small numberof firms exporting to (or importing from) just one group of countries. In order toidentify whether or not a firm trades within a certain macro area, we look at how muchof its total export (or import) is directed towards (or originates from) that area. InPanel A (upper part of Table 6), for instance, we define as EU exporters those firms thatsell more than 90% of their total exports to Europe. Similarly, HMI exporters and LIexporters are those directing more than 90% of their foreign sales to high–medium-income and low-income countries, respectively. The category MC exporters is made upof firms that trade with more than one group of countries, i.e. those firms that exportless than 90% of their total volume to one specific macro area. Following this procedurewe are able to identify four mutually exclusive dummies, one for each macro areaserved by the firm. We constructed importers’ categories in the same way.
To check the consistency of our results we take into account different definitions ofmacro areas using threshold shares of 70% and 50% of total export (import), as shownin Panels B and C, respectively. Obviously, the number of firms that fall in the EU, HMI,and LI category increase as the trade share decreases, while the opposite is true for theMC macro area.
We estimate the following expression:
y E E E E
I Iit it
EUitHMI
itLI
itMC
itEU
itHMI
= + + + ++ + +α β β β β
γ γ γ1 2 3 4
1 2 3II I ControlsitLI
itMC
it+ + +γ θ υ4 , (4)
where yit denotes the logarithm of average wage and the percentage of skilled workers.E’s and I’s denote the dummies for exporters and importers, trading with European
Table 6. Number of Exporters and Importers from Different Groups of Countries: Average1993–97
Exporters to Importers from
Panel A 90% EU HMI LI MC EU HMI LI MCNo. firms 2842 1485 398 8100 4612 1338 390 5498
Panel B 70% EU HMI LI MC EU HMI LI MCNo. firms 5341 2288 590 4605 6208 1984 665 2866
Panel C 50% EU HMI LI MC EU HMI LI MCNo. firms 7390 3461 853 1121 7352 2973 975 537
Notes: EU = Trading with European countries; HMI = Trading with High–Medium-Income countries;LI = Trading with low-income countries; MC = Trading with more than one group of countries.
960 Francesco Serti, Chiara Tomasi, and Antonello Zanfei
© 2010 Blackwell Publishing Ltd

countries (EU), high–medium-income countries (HMI), low-income countries (LI),and more than one group of countries (MC).As usual, controls is a vector including thesize variable, the foreign ownership dummy, the capital intensity indicator and sectoral,region, and year dummies. Hence the bi and g i coefficients represent the percentagepremia for firms exporting to, and importing from, the various markets, with respect tothe baseline category of noninternationalized firms.
In Table 7 we estimate equation (4) using a pooled OLS model. Econometric exer-cises were carried out using all three panels (A, B, and C). While there are differencesin estimated coefficients, the hierarchy of results by country categories is substantiallythe same. For all the regressions, we run the F -tests for the statistical differencebetween firms exporting to (importing from) the three macro areas.The p-values of thetest are shown in the lower part of Table 7.
Table 7. Trade Premia by Country. Pooled OLS Regressions (1993–97)
Wage SLI
90% 70% 50% 90% 70% 50%
EEU 0.019*** 0.023*** 0.026*** 1.754*** 2.565*** 2.974***(0.004) (0.004) (0.003) (0.214) (0.200) (0.195)
EHMI 0.038*** 0.037*** 0.038*** 3.615*** 3.736*** 4.005***(0.004) (0.004) (0.004) (0.248) (0.226) (0.209)
ELI 0.033*** 0.040*** 0.045*** 3.727*** 4.558*** 4.851***(0.007) (0.006) (0.005) (0.419) (0.375) (0.335)
EMC 0.033*** 0.039*** 0.047*** 4.555*** 5.019*** 6.525***(0.004) (0.004) (0.005) (0.209) (0.228) (0.356)
IEU 0.044*** 0.050*** 0.052*** 1.888*** 2.405*** 2.742***(0.003) (0.003) (0.003) (0.192) (0.186) (0.184)
IHMI 0.034*** 0.044*** 0.049*** 1.801*** 2.597*** 3.182***(0.004) (0.004) (0.004) (0.255) (0.237) (0.223)
ILI 0.030*** 0.043*** 0.056*** 2.589*** 3.661*** 4.777***(0.008) (0.007) (0.006) (0.446) (0.412) (0.397)
IMC 0.070*** 0.067*** 0.066*** 4.333*** 4.694*** 4.881***(0.004) (0.004) (0.007) (0.224) (0.252) (0.470)
Observations 95,231 95,231 93,692 95,236 95,236 93,697R-squared 0.44 0.44 0.44 0.42 0.42 0.42
F-tests for equality between coefficients
bEU = bHMI 0.000 0.000 0.000 0.000 0.000 0.000bEU = bLI 0.046 0.005 0.000 0.000 0.000 0.000bHMI = bLI 0.452 0.561 0.186 0.805 0.039 0.013g EU = g HMI 0.010 0.099 0.346 0.739 0.406 0.031g EU = g LI 0.067 0.270 0.476 0.119 0.002 0.000g HMI = g LI 0.645 0.855 0.241 0.099 0.013 0.000
Notes: Robust standard errors in parentheses below the coefficients. Asterisks denote significance levels:*** p < 1%; ** p < 5%; * p < 10%. All regressions include the log of employment, the log of capital intensity,as well as the foreign-ownership dummy, region and year dummies as controls. EU = Trading with Europeancountries; HMI = Trading with high medium-income countries; LI = Trading with low-income countries;MC = Trading with more than one group of countries.
FIRMS’ INTERNATIONAL ACTIVITIES, SKILLS, WAGES 961
© 2010 Blackwell Publishing Ltd

Overall, Table 7 suggests that traders’ characteristics crucially hinge on heterogen-eity of target foreign markets. For both exports and imports we observe that firmstrading with more than one group of countries (MC category) appear to pay higherwages and to be more skill-intensive.14 The result is consistent with the idea thatcompanies’ performance levels increase with the number of countries with which firmstrade (Bernard et al., 2007; Castellani et al., 2010).
Looking closer at the export side, we observe that firms selling goods to Europeancountries pay lower average wages and employ less-skilled workers than exporters tohigh–medium- and low-income countries. The estimated coefficients for the HMI andLI countries are instead very similar and, often, also statistically equivalent. Theseresults seem to suggest that distance is one of the main country characteristics influ-encing trade premia differences across exporters.
A more blurred picture emerges from the import side. As far as wage premia areconcerned, there does not seem to be much variation across firms according to thecountries from which they import. The analysis for the skill intensity variable showsinstead that firms importing from low-income countries exhibit the highest percentageof nonproduction workers.
While the previous exercise suggests that some heterogeneity exists between firmstrading with different markets, it does not help to understand the underlying sourcesthat make trade premia market-specific. To tackle this issue more directly, we explicitlytake into account some country characteristics likely to influence firms’ decision tooperate in one market rather than another. In particular we consider distance (DIST),per capita gross domestic product (GDP), and population (POP).15 For each of thesethree variables (X) we build a firm-level index, for exporters and importers. Themethodology employed in computing these indices follows two steps.
First, we calculate, for each variable X, an indicator that aggregates country-levelinformation into geographical areas. This is necessary because, in our dataset, wehave access to information on firms’ exports and imports by geographical areas (ofdestination or origin) rather than by single countries (see the Appendix).16 For eachgeographical area g, we assign a weight to the characteristics of each country belongingto area g according to Italy’s sectoral share of exports to country c.17 On the export sidethe indicator EXg,s is given by
EX XEXPEXP
X GDP DIST POPg s cc s
sc g,
, , , ,= ∈{ }∈∑
where Xc is the characteristics X of country c, EXPc,s is the total Italian export tocountry c in sector s, while EXPs is the total Italian export in sector s.18 We follow thesame procedure to compute the indicator on the import side (IXg,s).
The second step consists in computing the final firm-level index for each countrycharacteristic by weighting the EXg,s according to the firm’s export share towards eachgeographical area g:
Xe EXEXPEXP
X DIST GDP POPi g si g
ig
= ∗ ∈{ }∑ ,, , , .
Hence, we obtain a firm-level index for each country characteristic (DISTe, GDPe,POPe for export, and DISTi, GDPi, POPi for import). Each index equals zero if the firmdoes not export or import, respectively, in a given year. In order to give flexibility to ourspecification and to account for a possible nonlinear relationship between our depen-
962 Francesco Serti, Chiara Tomasi, and Antonello Zanfei
© 2010 Blackwell Publishing Ltd
dent variable and the indices described above we divide the distribution of each indexinto quartiles at the sectoral (two-digit) level. In this way we also account for thesectoral heterogeneity in the geographical distribution of trade flows. Therefore, weobtain for each index four quartile dummy variables:
Xeq j X DIST GDP POPitj, , , , , , ,with and= ∈{ }1 2 3 4
where Xeqitj equals one if exporter i belongs to the jth quartile of the two-digit sec-toral distribution of the index Xe in year t, zero otherwise. The same holds forimports (Xiqitj).
Then, we regress the (log) value of firms’ characteristics on the above-describeddummies that summarize the distinctive features of the geographical areas a firm tradeswith at time t. Among the four dummies per index, we use the dummy representing thefirst quartile of the index distribution as a reference category. We can thus test whetherthe average trade premia increase or decrease as firms trade with more distant, richer,or larger countries. We also include in our regression exporter, importer, and two-waytrader dummies and we control for size, capital intensity, foreign ownership, industry,geographical location, and aggregate time effects.
y D D D
DISTeq GDPeq
it itexp
itimp
itexp imp
j itjj
j
= + + +
+ +
∗
=∑
α β γ φ
ω σ2
4
iitjj
j itjj
j itjj
j itjj
POPeq
DISTiq GDPiq
= =
= =
∑ ∑
∑ ∑
+
+ +
2
4
2
4
2
4
2
4
λ
τ χ ++
+ +=∑ψ
θ υ
j itjj
it it
POPiq
Controls2
4
. (5)
Tables 8 and 9 show the results for seven different specifications. In the first threecolumns we consider only the export side while in the subsequent three columns weinclude only the import side. From columns (1) to (3) and from (4) to (6) we introduceprogressively the three dummies for each index considered (distance, GDP per capita,and population). In the last column we present the results of the most comprehensivespecification in which we include all country characteristics and we simultaneouslycontrol for the export and the import side.
The results for the market characteristics are qualitatively similar across the twodependent variables—wage and skill intensity.19 We start by investigating on theexport side the relationship between our two dependent variables and distance(column (1) of Tables 8 and 9). We observe that the estimated coefficients for thethree dummies are all positive and statistically significant, both for wage and skillintensity. Moreover, since the estimated coefficients are higher for the dummies indi-cating the third and fourth quartiles, we can infer that exporting to more distantmarkets is associated to relatively higher average wage and skill intensity. FollowingHallak and Sivadasan’s (2009) reasoning, since export quality requirements tend toincrease with distance, one would expect firms exporting to distant countries toproduce higher-quality goods, and hence set higher prices as well. To the extent thatproduction of quality goods requires workers with higher ability, the skill intensitypremia for firms exporting to more distant countries may indicate that they producehigher-quality goods than nonexporters.
FIRMS’ INTERNATIONAL ACTIVITIES, SKILLS, WAGES 963
© 2010 Blackwell Publishing Ltd
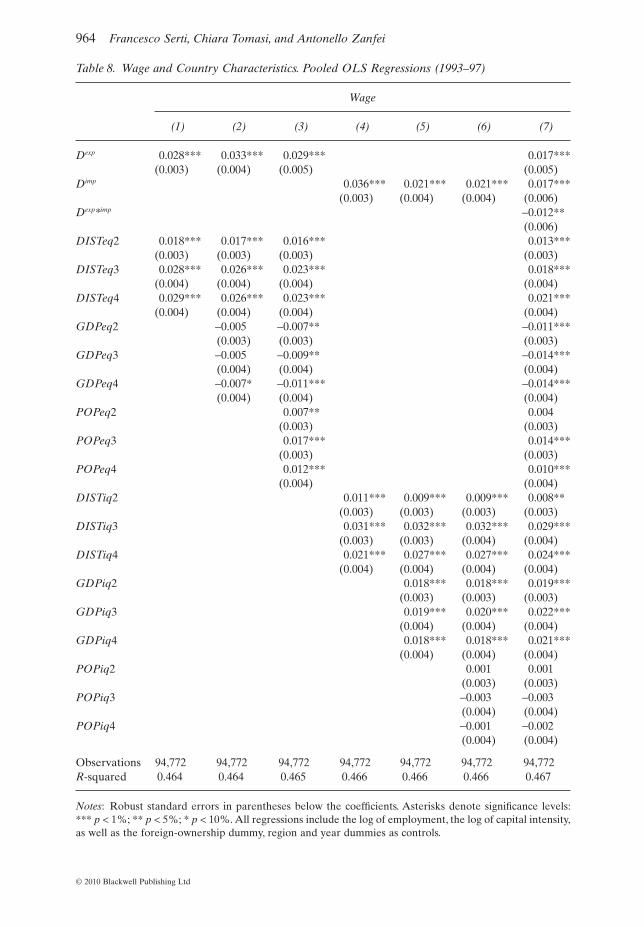
Table 8. Wage and Country Characteristics. Pooled OLS Regressions (1993–97)
Wage
(1) (2) (3) (4) (5) (6) (7)
Dexp 0.028*** 0.033*** 0.029*** 0.017***(0.003) (0.004) (0.005) (0.005)
Dimp 0.036*** 0.021*** 0.021*** 0.017***(0.003) (0.004) (0.004) (0.006)
Dexp*imp -0.012**(0.006)
DISTeq2 0.018*** 0.017*** 0.016*** 0.013***(0.003) (0.003) (0.003) (0.003)
DISTeq3 0.028*** 0.026*** 0.023*** 0.018***(0.004) (0.004) (0.004) (0.004)
DISTeq4 0.029*** 0.026*** 0.023*** 0.021***(0.004) (0.004) (0.004) (0.004)
GDPeq2 -0.005 -0.007** -0.011***(0.003) (0.003) (0.003)
GDPeq3 -0.005 -0.009** -0.014***(0.004) (0.004) (0.004)
GDPeq4 -0.007* -0.011*** -0.014***(0.004) (0.004) (0.004)
POPeq2 0.007** 0.004(0.003) (0.003)
POPeq3 0.017*** 0.014***(0.003) (0.003)
POPeq4 0.012*** 0.010***(0.004) (0.004)
DISTiq2 0.011*** 0.009*** 0.009*** 0.008**(0.003) (0.003) (0.003) (0.003)
DISTiq3 0.031*** 0.032*** 0.032*** 0.029***(0.003) (0.003) (0.004) (0.004)
DISTiq4 0.021*** 0.027*** 0.027*** 0.024***(0.004) (0.004) (0.004) (0.004)
GDPiq2 0.018*** 0.018*** 0.019***(0.003) (0.003) (0.003)
GDPiq3 0.019*** 0.020*** 0.022***(0.004) (0.004) (0.004)
GDPiq4 0.018*** 0.018*** 0.021***(0.004) (0.004) (0.004)
POPiq2 0.001 0.001(0.003) (0.003)
POPiq3 -0.003 -0.003(0.004) (0.004)
POPiq4 -0.001 -0.002(0.004) (0.004)
Observations 94,772 94,772 94,772 94,772 94,772 94,772 94,772R-squared 0.464 0.464 0.465 0.466 0.466 0.466 0.467
Notes: Robust standard errors in parentheses below the coefficients. Asterisks denote significance levels:*** p < 1%; ** p < 5%; * p < 10%. All regressions include the log of employment, the log of capital intensity,as well as the foreign-ownership dummy, region and year dummies as controls.
964 Francesco Serti, Chiara Tomasi, and Antonello Zanfei
© 2010 Blackwell Publishing Ltd
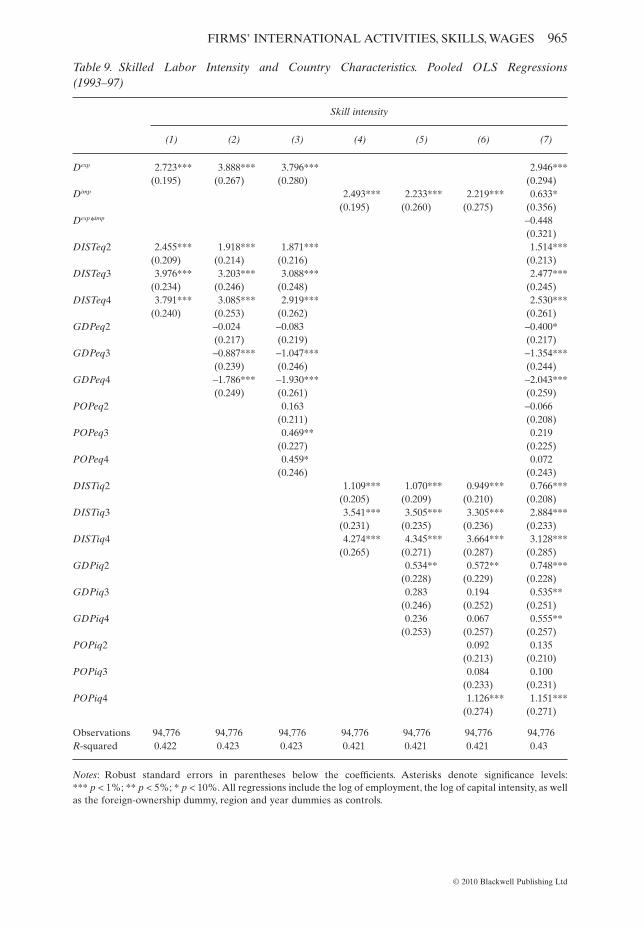
Table 9. Skilled Labor Intensity and Country Characteristics. Pooled OLS Regressions(1993–97)
Skill intensity
(1) (2) (3) (4) (5) (6) (7)
Dexp 2.723*** 3.888*** 3.796*** 2.946***(0.195) (0.267) (0.280) (0.294)
Dimp 2.493*** 2.233*** 2.219*** 0.633*(0.195) (0.260) (0.275) (0.356)
Dexp*imp -0.448(0.321)
DISTeq2 2.455*** 1.918*** 1.871*** 1.514***(0.209) (0.214) (0.216) (0.213)
DISTeq3 3.976*** 3.203*** 3.088*** 2.477***(0.234) (0.246) (0.248) (0.245)
DISTeq4 3.791*** 3.085*** 2.919*** 2.530***(0.240) (0.253) (0.262) (0.261)
GDPeq2 -0.024 -0.083 -0.400*(0.217) (0.219) (0.217)
GDPeq3 -0.887*** -1.047*** -1.354***(0.239) (0.246) (0.244)
GDPeq4 -1.786*** -1.930*** -2.043***(0.249) (0.261) (0.259)
POPeq2 0.163 -0.066(0.211) (0.208)
POPeq3 0.469** 0.219(0.227) (0.225)
POPeq4 0.459* 0.072(0.246) (0.243)
DISTiq2 1.109*** 1.070*** 0.949*** 0.766***(0.205) (0.209) (0.210) (0.208)
DISTiq3 3.541*** 3.505*** 3.305*** 2.884***(0.231) (0.235) (0.236) (0.233)
DISTiq4 4.274*** 4.345*** 3.664*** 3.128***(0.265) (0.271) (0.287) (0.285)
GDPiq2 0.534** 0.572** 0.748***(0.228) (0.229) (0.228)
GDPiq3 0.283 0.194 0.535**(0.246) (0.252) (0.251)
GDPiq4 0.236 0.067 0.555**(0.253) (0.257) (0.257)
POPiq2 0.092 0.135(0.213) (0.210)
POPiq3 0.084 0.100(0.233) (0.231)
POPiq4 1.126*** 1.151***(0.274) (0.271)
Observations 94,776 94,776 94,776 94,776 94,776 94,776 94,776R-squared 0.422 0.423 0.423 0.421 0.421 0.421 0.43
Notes: Robust standard errors in parentheses below the coefficients. Asterisks denote significance levels:*** p < 1%; ** p < 5%; * p < 10%. All regressions include the log of employment, the log of capital intensity, as wellas the foreign-ownership dummy, region and year dummies as controls.
FIRMS’ INTERNATIONAL ACTIVITIES, SKILLS, WAGES 965
© 2010 Blackwell Publishing Ltd

If we include the three dummies for GPD per capita (column (2)), we observe thatdistance still plays a relevant role in determining both wage and skill premia. Incontrast with the aggregate evidence of Hallak and Sivadasan (2009), however, we finda negative correlation between wages/skill intensity and the level of development ofdestination markets. This result could be partially explained by Italian specializationpatterns. Italian firms are more likely to export relatively low skill-intensive goods todeveloped countries (e.g. traditional sectors such as textile, clothing and footwear)(Onida, 1999; DeBenedictis, 2005; Di Maio and Tamagni, 2008).
A positive relationship is instead detected between wage/skill intensity and countrysize (column (3)). Trade premia increase with size of destination markets (Melitz andOttaviano, 2008).
Although there are not enough data to test the product quality theory completely,our results seem to suggest that both quality and efficiency play a relevant role indetermining export behavior. Our results indicate that, in terms of efficiency and/orquality, export requirements are greater in more distant, less rich, and larger markets.
Let us now turn to importers. Some important regularities emerge from the data hereas well. As in the case of exporters, we observe that in all the three different specifica-tions (from columns (4) to (6)), average wages and percentage of nonproductionworkers are positively correlated with distance. Unlike exporters, the estimated GDPper capita coefficients are positive in the case of importers and, almost in all specifica-tions, statistically significant. The size of the countries of origin of imports insteadturned out not to be statistically significant.
The higher trade premia for firms importing from more distant and richer countriesmay be generated by various mechanisms, ranging from differences in quality ofimported products to higher firm’s efficiency. Kasahara and Lapham (2008) develop amodel where heterogeneous final good producers simultaneously decide whether toexport and whether to import. Both importing and exporting activities require payinga fixed cost in any period and in any market they choose to be active. Much like the caseof exporting, importing from more distant countries also requires relatively moreskilled workers in order to deal with legal and informational frictions. Following Cas-tellani et al. (2010), there could be other sources of fixed trade costs that are specific toimporting. Firms buying from rich countries are more likely to import technologies(capital goods) or high-quality intermediate inputs. Hence, importing from these coun-tries may require firms to invest in some complementary assets (or absorptive capacity)in order to be able to use the imported goods in their production process. From asimilar perspective, if we assume that GDP per capita of the countries of origin is asatisfactory proxy for the quality of the imported inputs, our results are consistent witha broad interpretation of the Kugler and Verhoogen (2008) model in which high-qualityimported inputs and a skilled workforce are complementary in increasing companycompetitiveness.
Overall, our results seem to confirm that differences among firms in terms of employ-ment and wage structure can be partially explained by the variety of destinations andof countries of origin with which firms trade. The exact mechanisms underlying theseresults are not testable given the data at hand. For instance, we do not have firm-specificinformation on prices which would be useful to separate out the quality and theefficiency effects and to evaluate their relative importance across countries of originand destination of trade flows. Our results, however, are consistent with a multi-attribute model where both quality and efficiency levels play a key role and in whichcountry characteristics affect the relevant thresholds of these variables, beyond whichtrade can take place.
966 Francesco Serti, Chiara Tomasi, and Antonello Zanfei
© 2010 Blackwell Publishing Ltd

6. Conclusion
This paper has contributed to the existing literature on firms’ heterogeneity in inter-national trade, highlighting several issues only marginally tackled by previous empiricalstudies. Our analysis yields some results which deserve further consideration in futureresearch.
First, we find that, conditional on various firm characteristics such as firm sizeand capital intensity, exporters pay higher wages and employ more skilled workersthan nonexporters. The finding of a wage premium regardless of size together withevidence of a higher white- vs blue-collar ratio for exporters is consistent with amodel in which both dimensions of heterogeneity—productivity and ability toproduce quality—help explain differences in company performances. Although wecannot separate out trade premia into a cost and a quality effect, our results confirmthat trade models based only on one source of firm heterogeneity fail to explainsome trade patterns.
Second, our empirical investigation moves forward by considering the engagementof firms in international transactions, either by means of exports, imports, or a combi-nation of the two.We also find that import is positively and significantly correlated withwages and with the share of white-collar employees. More importantly, we observe that,by including imports, the coefficients for exporters drop substantially and becomelower than those observed for importers. This result suggests that much of the exportpremia found in the data may be driven by the import side. The result we obtain in thisrespect might have to do with the input composition of exported goods. To the extentthat a large fraction of imported inputs used to produce export goods are skill-intensive, this translates into upward-biased export premia if imports are not controlledfor. Moreover, we observe that the magnitude of the premia for two-way traders ismuch higher than that detected for only exporters or only importers. This result couldreveal that being involved in both importing and exporting activities implies a highereffort and commitment to foreign markets, and is thus associated with a higher “liabilityof foreignness” which can be faced only by firms with a more skilled and well-paid laborforce.
Third, by exploiting the richness of our dataset, which identifies destinationmarkets and origin of trade flows for each firm, we show that further heterogeneityexists across internationalized firms. Differences among traders in terms of employ-ment and wage structure are also related to the number and type of markets servedby (sourced from) these firms. Both importers and exporters trading with moredistant countries appear to be the most skill-intensive and to pay the highest wages.This result is consistent with the idea put forward by recent quality trade models(single or multi-attribute) in which only firms with sufficiently high efficiency andquality of production find it profitable to serve distant markets. A new finding madepossible by our dataset is that importers and exporters have different sensitivities tovarious country characteristics (of origin for imports and destination for exports),such as their size and richness. This might have to do with Italy’s specializationmodel, but also with some differential characteristics of exporting vis-à-vis importingactivities in general. This merits further research.
FIRMS’ INTERNATIONAL ACTIVITIES, SKILLS, WAGES 967
© 2010 Blackwell Publishing Ltd

Appendix: Destination of Export and Origin of Import
List of Countries (or Group of Countries)
Developed countries (total)European countriesEuropean Free Trade Association (EFTA)US and CanadaOther developed countries
Non-developed countries (total)Associated ECAfrican, Caribbean, and Pacific (ACP)Organization of Petroleum Exporting Countries (OPEC)Newly industrialized countries (NICs)Other nondeveloped countries
Other countriesCentral and Eastern European Countries (CEECs)Planned economy countries (PECs)Other countries
Disaggregated information on European countriesFranceBelgium and LuxembourgNetherlandsGermanyUKIrelandDenmarkGreecePortugalSpain
References
Altomonte, Carlo and Gabor Bekes,“Trade Complexity and Productivity,” KITes working paper16 (2009).
Amiti, Mary and Josef Konings, “Trade Liberalization, Intermediate Inputs, and Productivity:Evidence from Indonesia,” American Economic Review 97 (2007):1611–38.
Baldwin, Richard and James Harrigan, “Zeros, Quality and Space: Trade Theory and TradeEvidence,” NBER working paper 13214 (2007).
Bartelsman, Eric, John Haltiwanger, and Stefano Scarpetta, “Microeconomic Evidence ofCreative Destruction in Industrial and Developing Countries,” Tinbergen Institute workingpaper 04-114/3 (2004).
Bernard, Andrew and J. Bradford Jensen, “Exporters, Jobs and Wages in U.S. Manufacturing:1976–87,” Brookings Papers on Economic Activity. Microeconomics 1 (1995):67–119.
Bernard, Andrew, Jonathan Eaton, J. Bradford Jensen, and Samuel Kortum, “Plants and Pro-ductivity in International Trade,” American Economic Review 93 (2003):1268–90.
Bernard, Andrew, Bradford Jensen, Stephen Redding, and Peter Schott, “Firms in InternationalTrade,” Journal of Economic Perspectives 21 (2007):105–30.
Bottazzi, Giulio and Marco Grazzi, “Wage–Size Relation and the Structure of Work-ForceComposition in Italian Manufacturing Firms,” Cambridge Journal of Economics 34(2010):649–69.
968 Francesco Serti, Chiara Tomasi, and Antonello Zanfei
© 2010 Blackwell Publishing Ltd
Castellani, Davide, Francesco Serti, and Chiara Tomasi, “Firms in International Trade: Importersand Exporters Heterogeneity in the Italian Manufacturing Industry,” The World Economy 33(2010):424–57.
DeBenedictis, Roberto, “Three Decades of Italian Comparative Advantage,” The WorldEconomy 28 (2005):1679–709.
Di Maio, Michele and Federico Tamagni,“The Evolution of World Export Sophistication and theItalian Trade Anomaly,” Rivista di Politica Economica 98 (2008):135–74.
Feenstra, Robert and Gordon Hanson, “Global Production and Inequality: A Survey of Tradeand Wages,” in C. E. Kwan and J. Harrigan (eds), Handbook of International Economics,Oxford: Basil Blackwell (2004).
Hallak, Carlos J. and Jagadeesh Sivadasan, “Firm’s Exporting Behaviour under Quality Con-straints,” NBER working paper 14928 (2009).
Halpern, Laszlo, Miklos Koren, and Adam Szeidl, “Imports and Productivity,” CEPR workingpaper 5139 (2005).
Johnson, Robert, “Trade and Prices with Heterogeneous Firms’,” manuscript, UC Berkeley(2007).
Kasahara, Hiroyuki and Beverly Lapham, “Productivity and the Decision to Import and Export:Theory and Evidence,” CESifo working paper 2240 (2008).
Kugler, Maurice and Eric Verhoogen, “The Quality–Complementarity Hypothesis: Theory andEvidence from Colombia,” NBER working paper 14418 (2008).
Melitz, Marc, “The Impact of Trade on Intra-Industry Reallocations and Aggregate IndustryProductivity,” Econometrica 71 (2003):1695–725.
Melitz, Marc and Gianmarco Ottaviano, “Market Size, Trade, and Productivity,” Review ofEconomic Studies 75 (2008):295–316.
Muuls, Mirabelle and Mauro Pisu,“Imports and Exports at the Level of the Firm: Evidence fromBelgium,” National Bank of Belgium working paper 114 (2007).
Onida, Fabrizio,“Quali Prospettive per il Modello di Specializzazione Internazionale dell Italia,”Economia Italiana 3 (1999):573–626.
Schank, Thorsten, Claus Schnabel, and Joachim Wagner, “Do Exporters Really Pay HigherWages? First Evidence from German Linked Employer–Employee Data,” Journal of Interna-tional Economics 72 (2007):52–74.
Simon, Herbert, “The Compensation of Executives,” Sociometry 20 (1957):32–35.Verhoogen, Eric,“Trade, Quality Upgrading and Wage Inequality in the Mexican Manufacturing
Sector,” Quarterly Journal of Economics 123 (2008):489–530.
Notes
1. In single attribute models, it is either productivity or quality levels that explain a company’srevenues and export status. This implies a threshold firm size above which all firms export (andbelow which none do). Hence no export premia should be observed once size is controlledfor. In contrast, in multi-attribute model, a given level of sales can be the result of differentcombinations of productivity and caliber. While productivity is positively related to size, caliberis not necessarily so. Since the latter most directly affects quality and hence determines firms’success in foreign markets, exporters can be expected to produce higher-quality goods condi-tional to their size.2. Only recently the relationships between imports and firm characteristics have attracted someconsideration in empirical literature (Halpern et al., 2005; Amiti and Konings, 2007; Bernardet al., 2007; Muuls and Pisu, 2007; Kasahara and Lapham, 2008; Castellani et al., 2010).3. The databases have been made available under the mandatory condition of censorship of anyindividual information.4. As documented by Bottazzi and Grazzi (2010), who employ the same database, despite theunbalanced nature, the validity of the database is largely supported by its census nature, whichavoids possible biases in the data collection process. It is also supported by the fact that there are
FIRMS’ INTERNATIONAL ACTIVITIES, SKILLS, WAGES 969
© 2010 Blackwell Publishing Ltd

no particular trends or changes in the structure and performance of firms that do not appear forsome years (i.e. firms that exit and reappear again in the database). In addition, as reported inBartelsman et al. (2004), although manufacturing firms with fewer than 20 employees account forabout 88% of the total Italian company population, firms with more than 20 employees accountfor almost 70% of total employment.5. Although the 20-employee threshold does not allow us to see the total number offirms involved in international trade and prevents us from analyzing the behavior and theperformances of smaller units, the representativeness of Micro.1 is ensured by the fact that alarge amount of aggregate Italian trade is generated by large firms. As reported by the ItalianStatistical Office (www.coeweb.istat.it), in 2005 firms with less than 20 employees accounted for10% of total manufacturing exports, while nearly 90% of the aggregate value-added was gener-ated by firms with more than 20 employees.6. Production workers include blue-collar, assistants, trainees, and home-based workers corre-sponding respectively to the terms operai, commessi, apprendisti, and lavoratori a domicilio.Nonproduction workers are managers and clerks, corresponding respectively to the terms diri-genti and impiegati. Unfortunately, no detailed data for these subcategories are included in thetwo main classes of production and nonproduction workers.7. Wages are deflated by the consumer price index. Labor costs are deflated using the value-added index.8. We use log values for all these variables, except for the share of nonproduction workers.When the percentage of nonproduction workers is the dependent variable, we use absolutevalues. Hence, the coefficients for the regression with the share of nonproduction workers asa dependent variable are in percentage values, while the ones for wage are scaled to unitvalues.9. The heterogeneity we observe in terms of wages, for both production and nonproductionworkers, is not in contrast with the centralized system of wage bargaining characterizing the labormarket in Italy and in other European countries. It is true that this system pushes wage equal-ization across firms and industries for any given level of qualification. In spite of this collectivebargaining system, which is the main determinant of wages, variation in wages across firms in thesame industry can also happen through different positioning of workers in the rank-ladder asemphasized in the hierarchical theories of the firm (Simon, 1957). In other words, within eachworker category—production and nonproduction—there is room for a large variety of tasks andoccupational levels and, therefore, for different wage levels.10. Another explanation of the premia observed for the importers relates to the fact that firmspurchasing goods from abroad will need to have higher skills to face information asymmetries inmonitoring the quality level of imported goods (Altomonte and Bekes, 2009).11. This ordering conforms to the findings by Bernard et al. (2007) for the US. While in theirwork they look at firms’ skill intensity and wages, we further distinguish between wages of non-production workers and wages of production workers.12. This is true as long as the elasticity of marginal costs with respect to quality is sufficiently high,so that unit prices, which depend on cost, are negatively correlated with quality-adjusted price.13. Note that according to the single attribute models based on diversities in productivity andCES preferences, productivity threshold rises with distance and decreases with destinationmarket size. Since more productive firms charge lower prices, we should observe a negativecorrelation between average export prices and distance and a positive correlation with destina-tion market size. According to the single attribute models based on efficiency sorting and lineardemand (Melitz and Ottaviano, 2008), large markets exhibit tougher competition resulting inlower average markups and higher productivity.14. Similar results are obtained when using the average wage of production and nonproductionworkers as a dependent variable. Results are not shown but are available from the authors.15. Data on GDP and population are from the Penn World Table 6.2 while data on distance arefrom the CEPII database.16. This first step is not necessary in the case of European countries for which we have infor-mation on firms’ exports and imports at the level of single countries (see the Appendix).
970 Francesco Serti, Chiara Tomasi, and Antonello Zanfei
© 2010 Blackwell Publishing Ltd

17. Sectoral-level information at the three-digit level on Italy’s exports and imports by countryare obtained from the Italian Statistical Office.18. For instance, considering GDP as a country characteristic, we obtain an indicator for thesector “Textile” and the geographical area “USA–Canada” which is given by Italy’s share ofexports to the USA in the textile industry multiplied by the USA’s GDP plus Italy’s share ofexports to Canada in the textile industry multiplied by Canada’s GDP.19. Similar results are obtained when using the average wage of production and nonproductionworkers as a dependent variable. Results are not shown but are available from the authors.
FIRMS’ INTERNATIONAL ACTIVITIES, SKILLS, WAGES 971
© 2010 Blackwell Publishing Ltd


