Embed Size (px)
Citation preview

Master Thesis:
Which Companies Pay for Performance?
A Job Content Approach
Master ‘Economics of
Management and Organisations’
Academic Year 2016/2017
Supervisor: Prof. Delfgaauw
Second assessor: Prof. Bijkerk
Jan Biermann
Email: [email protected]
Student number: 452916jb
Version: 10/08/17

Abstract
Why do some companies employ performance pay while others do not? For performance pay
to lead to the desired results, it needs to be based on a suitable performance measure.
Therefore, only firms which can accurately measure performance will introduce such a
payment scheme. The availability of a performance measure, in turn, largely depends on the
type of work conducted in the firm. Understanding work as a bundle of tasks allows one to
analyze the content of this work. I argue that the intensity in routine and non-routine tasks can
serve as a predictor for performance pay. Regression analysis using survey data delivers mixed
evidence for this relationship. The intensity in non-routine tasks which are manual-physical
appears to be negatively associated with the probability to employ performance pay, as
hypothesized. The intensity in other types of routine or non-routine tasks does not show a
significant effect.

Table of Contents
1. Introduction .......................................................................................................................... 1
2. Related literature and hypotheses development ................................................................. 5
2.1. Related theoretical literature ........................................................................................... 5
2.2. Related empirical literature on performance pay ............................................................ 6
2.3. Related empirical literature on task approach and ONET ................................................ 9
2.4. Hypothesis development ................................................................................................ 10
3. The data .............................................................................................................................. 14
3.1. The WERS data set .......................................................................................................... 14
3.2. The ONET data set ........................................................................................................... 15
3.3. Constructing a proxy for intensity in routine tasks ......................................................... 17
3.4. Constructing a data set ................................................................................................... 19
4. Econometric analysis .......................................................................................................... 22
4.1. Identification strategy ..................................................................................................... 22
4.2. Choice of control variables .............................................................................................. 23
4.3. Regression results and interpretation ............................................................................ 27
4.4. Regression diagnostics and robustness checks .............................................................. 33
5. Conclusion ........................................................................................................................... 39
References ..................................................................................................................................... i
Appendix 1: Description and illustration of the data .................................................................. ix
Appendix 2: Regression diagnostics and robustness checks .................................................... xvii

1
1. Introduction
Many organizations constantly aim to become more efficient. One potential channel for
improvement is the management of human resources. An increasingly popular human resource
policy is performance pay: It intends to provide the employees with the right incentives to
become more productive. At the beginning of the century, 40% to 50% of US workers were
receiving performance pay and its importance has been increasing during the last three
decades (Bloom and Van Reenen 20111). These findings illustrate the relevance of performance
pay, but also reveal an interesting heterogeneity in the data: While one half of the workers are
covered by performance pay, the other half are not. What are the reasons for this
heterogeneity?
The existing empirical research on performance pay mainly focuses on how employees react to
performance pay once it is introduced (literature following Lazear 20002). At the same time,
we have little empirical evidence on why firms decide for or against performance pay. To
explain the abovementioned heterogeneity, the thesis assesses performance pay from a
different perspective than previous empirical research and focuses on the behavior of the firm
rather than the employee. By empirically analyzing which firms employ performance pay, the
thesis sheds light on the factors determining a company’s decision to introduce performance pay.
This decision is a delicate one to take, since introducing performance pay doesn’t always entail
the anticipated results: Some studies have demonstrated huge productivity gains and a positive
effect on attracting more productive employees (Lazear 2000). Others have shown that
employing performance pay under the wrong circumstances will backfire and cause significant
damage (Larkin 2014). These mixed findings illustrate that an optimal contract design is highly
relevant not only for academic research but also for decision makers in organizations.
Introducing performance pay can result in important competitive advantages, but it can also
cause serious harm.
1 The authors summarize evidence from several studies including Lawler and Mohrman (2003), Lemieux et al. (2009) and Kruse et al. (2009). 2 Subsequent studies include Paarsch and Shearer (2000), Shearer (2004), Courty and Marschke (2004), Bandiera et al. (2007), Larkin (2014), Griffith and Neely (2009).

2
One decisive factor for the success or failure of performance pay is the performance measure.
In order to pay for performance, the firm needs to determine a way to evaluate it. If the
payment scheme is based on a poor performance measure, it will not lead to the desired
productivity gains. It will more likely result in unintended negative consequences, e.g. the agent
neglecting important dimensions of the principal’s objective (Holmström and Milgrom 1991;
Baker 1992). This process of evaluating performance varies largely depending on the profession
which characterizes the firm. But why is the contribution of some professions easier to measure
than that of others? One way to answer this question is to analyze the typical activities of a job.
In other words: Which tasks determine the everyday work of the employee? Some tasks are
easy to quantify, while others are difficult to assess. As a result, a suitable performance
measure is available for some occupations, but not for others.
As an example, consider the everyday work of a production worker at a car manufacturing
company versus the job of a chef in a good restaurant. The performance of the former can be
measured quite easily while the contribution of the latter is difficult to assess. One of the
underlying reasons appears to be that the work of the production worker is mostly routine: The
job requires lots of repetition and could be captured by programmed instructions. In contrast,
the chef’s work is mostly non-routine: She must react to the orders and special requests of the
customers, the seasonal availability of ingredients and create different meals. The thesis will
argue that the intensity in routine or non-routine tasks of an occupation can serve as a
predictor for performance pay. To present a nuanced view, the analysis will consider different
types of routine and non-routine tasks3.
The remainder of the thesis is structured as follows: Chapter two discusses related literature
and develops the hypothesis. Chapter three presents the data, highlights how this data is
processed and introduces the empirical proxies for the theoretical constructs. Chapter four
contains the empirical analysis: It discusses the identification strategy, introduces relevant
control variables, analyzes the regression results, and presents regression diagnostics. The last
chapter is a conclusion.
3 To do so, the thesis will take into account if tasks are cognitive or physical. Note that in the given example the work of both, the production worker and the chef, is rather physical than cognitive.

3
This master thesis contributes to the existing literature in three different ways. First and most
importantly, the thesis explicitly tests if firms’ decisions to employ performance pay are in-line
with the mechanisms described by economic theory. By doing so, this work provides empirical
evidence on the determinants of the firm’s decision to employ performance pay. While existing
evidence focuses on the reaction of individual workers on performance pay, the thesis builds
on this literature and examines the topic from a different angle by asking if firms recognize the
different consequences of performance pay and make their decision in accordance to this.
Most closely related in this respect is the work of Pendleton et al. (2009). Similarly to the master
thesis, it empirically examines the determinants of performance pay and analyzes the same
data set. The major novelty of this thesis is introducing job content measures which capture if
routine tasks characterize the work in a company. By doing so, the thesis incorporates
characteristics of the job content, while Pendleton et al. (2009) can only relate performance
pay to information from a management survey. To the best of my knowledge, this work is the
first contribution to follow this approach.
Second, to answer the research question, the thesis develops a unique data set by combining
two data sources. The first data source is the ‘Workplace Employment Relations Study’ (‘WERS’).
This UK-wide study collects a representative sample of British companies and includes data
from interviews with employers, employees, and workers’ representatives. It contains
information on performance pay and many other management practices. The second data
source is the ‘Occupational Information Network’ (‘ONET’) which is the main source of
occupational information in the US. Its data allows relating quantitative job descriptors to
occupations from the WERS. From this data, I create job content measures which capture if a
job is routine or non-routine. As has been pointed out, the ONET has great potential to enrich
research in different fields (Handel 2016). At the same time, the academic literature which
makes use of this opportunity is relatively small (ibidem). In this sense, the thesis contributes
to the literature by exploring new ways to analyze the ONET within the scope of empirical
research.
Third, to analyze the content of an occupation, the thesis adopts the logic of the so-called ‘task
approach’ which has been developed by Autor et al. (2003). It defines work as a series of tasks
which need to be performed to accomplish a certain job. This view makes it possible to analyze
occupations by focusing on the content of work rather than on other aspects such as required

4
education or wages. The literature following Autor et al. (2003) applies the task approach to
different aspects of labor economics and mainly focuses the role of technological advancement
and wage structure. The thesis builds on this literature in two ways. First, it relates to this
literature by applying the basic theoretical idea. Second, the methodology of the thesis follows
an article from this field of research (Acemoglu and Autor 2011) to operationalize the concept
of ‘routine’ and ‘non-routine.’ The thesis contributes to this literature by applying the
framework to a novel research question.

5
2. Related literature and hypotheses development
2.1. Related theoretical literature
The theoretical discussion of performance pay 4 in this thesis is grounded on the classical
principal-agent theory. A contribution by Holmström (1979) has popularized the concept, and
subsequent work builds on this foundational model. The paper views an organization as the
relationship between a principal and the agent. The principal (i.e. the firm) owns resources and
hires an agent (i.e. the worker). The agent’s work is seen as exerting effort which transforms
the principal’s resource into output. The principal aims to maximize profits, i.e. the difference
between the value of the output and the agent’s salary. The worker’s objective is to maximize
her own utility which is a function of the difference between her income and the costs of
exerting effort. As a result, the two interests are misaligned, leading to the so-called agency-
dilemma. A key aspect is the issue of observability: Since the agent’s actions are not observable
(or at least not verifiable and thus not contractible), the payment cannot be based on effort.
The salary must be tied to the outcome, which is influenced by the agent’s effort as well as a
random component. Furthermore, the principal is assumed to be risk neutral (or at least less
risk averse than the agent). An optimal compensation scheme can be derived from this
framework5.
Because the agent will not exert any effort if the salary is not linked to the output, a flat-wage
contract is never optimal in the simplest model. Subsequent work has further developed the
framework, introducing aspects which can make paying a flat-wage optimal (Holmström and
Milgrom 1991 being the most prominent contribution). To come to this conclusion, two aspects
are particularly important: First, the performance measure must be imperfect (Holmström
1979 implicitly assumes that the measure is complete). The costs of performance pay only
occur if the performance measure is imperfect. None of the following issues would arise in a
world where the agent’s performance could be measured perfectly. Second, the worker must
be to some degree internally motivated, resulting in some effort under a flat-wage regime. In
this framework, the firm must evaluate costs and benefits of including aspects of performance
4 This chapter understands ‘performance pay’ as any type of pay scheme which links some part of the compensation to results of individual or group work. Synonymous expressions include incentive pay, bonus pay, variable pay, piece-rate, and contingent pay. 5 Most important subsequent work following Holmström (1979) includes Eisenhardt (1989), Holmström and Milgrom (1991), Baker (1992), Holmström and Milgrom (1994).

6
pay based on a performance measure in the contract compared to a flat wage scheme.
Introducing performance pay is associated with certain costs which might outweigh the
benefits making the introduction of performance pay unreasonable.
Several theoretical contributions have outlined the role of the performance measure and the
different ways in which employing performance pay based on a poor performance measure
can hurt the organization. If the measure is imperfectly correlated with the result, the agent
will ‘game the system’ (Baker 1992), i.e. direct her effort to increase the measure without
contributing to the actual objective of the principal. Furthermore, a poor performance measure
could induce effort on satisfying one dimension of the objective while causing the agent to
neglect other aspects. This is the case when the performance measure stresses one dimension
of the principal’s goals at the expense of other facets. One common example is performance
pay based on quantity, which leads to decreased quality (Kerr 1975; Holmström and Milgrom
19916). Lazear’s theoretical article (1986) discusses hourly wages and piece rates and concludes
that a flat hourly wage is preferable in cases where it is very costly to monitor both quality and
quantity (p. 421)7. All this research illustrates that if the performance pay cannot be based on
an appropriate performance measure, the principal might be better off not introducing any
performance pay.
2.2. Related empirical literature on performance pay
Research which specifically addresses the firm’s decision to introduce performance pay is rare
and lacks seminal studies. A study which analyzes this topic is Pendleton et al. (2009), the
contribution which is most closely related to this thesis. It examines data from the same data
source (WERS) and considers the pay systems of different workplaces similarly to this thesis.
However, there are important differences: First, the thesis introduces job content measures
which capture if routine tasks characterize an occupation. By doing so, the thesis incorporates
characteristics of the job content, while Pendleton et al. (2009) can only relate performance
pay to information from the management survey. Second, Pendleton et al. (2009) choose a
broader definition of their dependent variable (‘contingent pay’), including for example share
ownership schemes. The dependent variable of this thesis (‘payment by results’) can be seen
6 Kerr (1975) delivers anecdotal evidence, while Holmström and Milgrom (1991) develop a formalized model. 7 Another potential drawback of performance pay follows directly from the framework: Performance pay typically imposes risk on the risk-averse agent which is costly for the principal.

7
as a subcategory of contingent pay. Third, my work focuses on cross-sectional analysis of the
most recent data (2011), whereas Pendleton et al. (2009) analyze data from 1984 to 2004, at
times specifically focusing on the time dimension.
The following paragraphs present an overview of empirical studies which address the reaction
of the workers to performance pay. Despite the thesis examining performance pay from a
different perspective, this literature is relevant for the analysis of the thesis. If, for example,
workers didn’t respond to monetary incentives, there would be no reasons for the firm to
consider the effects of performance pay. Since the consequences of performance pay are highly
context specific, it is crucial to obtain empirical evidence from a naturally occurring
environment rather than from a laboratory setting. Therefore, the papers in this section
provide evidence from natural field experiments.
Lazear’s seminal paper (2000) considers a manufacturer that switches from paying windshield
glass installers an hourly wage to a piece wage. He concludes that productivity per worker
increases by 44%. The set-up of the study allows analyzing individual data in a before-and-after
design. As a result, the productivity gain can be separated into two parts: Half of it is attributed
to the incentive effect, the other half is due to sorting toward more productive workers8.
Furthermore, since the cooperation introduced the new regime at different times at different
branches, the paper can distinguish the effects of the new wage scheme from external shocks,
affecting the whole company. Lazear’s work illustrates that the positive side of performance
pay includes not only the rise of the existing workforce’s productivity but also positive effects
on the composition of the workforce (also compare Lazear 1986 for a theoretical framework).
Subsequent contributions following Lazear (2000) include a series of studies examining the
effect of a piece-rate wage on tree planters: Paarsch and Shearer (1999), Paarsch and Shearer
(2000), and Shearer (2004). The field experiment of the latter, most prominent study notably
includes randomizing the workers in a treatment and a control group, which improves the
validity of a causal interpretation. Shearer concludes that the incentive effect of performance
pay is 20%, which is very similar to the results presented in Lazear (2000).
Another paper which analyzes work in the agricultural sector is Bandiera et al. (2007). In
contrast to other contributions introduced in this section, it is the wage scheme of managers,
8 The workers’ ability in this study is captured by workers’ fixed effects.

8
not the workers, which varies in this study. It switches from an hourly wage to a piece rate,
while the fruit pickers on the farm are paid a piece rate during the whole study. In this setting,
managers influence the final output by organizing the daily work as well as by selecting the
workers. The authors identify a productivity increase by 21% due to the change in
compensation scheme.
Griffith and Neely (2009) examine performance pay which is based on the so-called ‘Balanced
Scorecard’9 rather than on a piece-rate. The study analyzes its effect on branch performance
of a heating product distributor. It presents an ambiguous conclusion: The introduction of
performance pay caused an increase in sales, but also an increase in costs. The paper also points
out that the new payment regime had a positive effect on branches with more experienced
managers.
Among the papers which illustrate negative consequences of incentivized contracts is Larkin
(2014). The author analyzes the introduction of a nonlinear incentive scheme for sales
personnel in a software company. He illustrates that the employees react by maximizing their
own income. Such behavior results in mispricing and costs the company 6%-8% of revenue. A
study by Courty and Marschke (2004) considers the introduction of explicit nonlinear monetary
incentives for teachers in a job training program. They show that the program causes increased
effort in the measurement period, but also lowers the quality of the training.
Another negative aspect of performance pay is pointed out by Ariely et al. (2009). The study
shows how stronger incentives can lead to worse performance and, therefore, challenges the
assumption that a higher motivation always improves performance. However, it is important
to note that the authors explicitly consider extraordinarily high monetary rewards10. Further,
the authors base their research on a series of laboratory experiments, a methodology which
needs to be viewed with caution in the considered field of research for reasons outlined earlier
in this section.
9 The Balanced Scorecard is a popular way to measure business performance and has been developed by Kaplan and Norton (1992). It includes a range of financial and operational indicators. 10 While the study makes a relevant point, extraordinary high incentives are not the standard case and not the focus of the thesis.

9
2.3. Related empirical literature on task approach and ONET
The type of work conducted in the company determines which measure is available to assess
performance. The measure, in other words, depends on the content of the work. A promising
approach to analyzing this content is the so-called ‘task approach.’ This concept originates from
a line of literature in the field of labor economics. It defines work as a series of tasks which
need to be performed to accomplish the job (Autor 2013). Tasks are activities such as
performing a calculation or driving a vehicle. The concept aims to improve the traditional view
of labor economics which models labor and capital as input factors being either substitutes or
complements. It allows for a more flexible analysis since one particular task can be supplied by
either labor or capital and this might change over time (Autor 2013). An article by Autor et al.
(2003) has laid the foundation for this development in the literature. The article focuses on
evolving technology and its effects on the labor market, such as changes in tasks which are
required in an occupation, a change in demand for different workers and wage effects for
different occupation levels. Most prominent is the ‘routinization hypothesis’ which claims that
machines can replace human workers to perform tasks which can be classified as ‘routine.’
Their empirical analysis of this work is based on data from the ‘Dictionary of Occupational Titles’
(‘DOT’), the predecessor of the ONET (U.S. Department of Labor 1991)11. A later contribution
by Acemoglu and Autor (2011) updates the empirical methods and bases the analysis on data
from the ONET12.
Subsequent work applies the task approach to different aspects of labor economics13. Most of
the papers examine the impact of technological advancement on the labor market from varying
perspectives. Antonczyk et al. (2010) and Dustmann et al. (2009) focus on the ‘polarization’ of
labor, i.e. the decline of middle-class jobs in relation to high-wage and low-wage occupations.
Spitz-Oener (2006) examines increasing skill requirements. Gathmann and Schönberg (2010)
propose the concept of ‘task-specific human capital’ and measure the transferability of labor
market skills to explain the mobility between different jobs. Black and Spitz-Oener (2010)
analyze the effect of polarization on demand for female labor. Peri and Sparber (2009) study
11 The DOT is a publication by the U.S. Department of Labor which defines a large number of occupations in several quantitative dimensions based on information from job analysts. It was first published in 1938 and has been periodically updated until 1999. 12 However, not every contribution employing the task approach analyzes DOT or ONET data. The task approach is a theoretical framework which can be applied to different data. 13 Also compare Autor and Handel (2013) for an overview of this literature.

10
job task assignment for native and immigrant workers. Grossman and Rossi-Hansberg (2008)
explore if jobs intensive in routine tasks are more suitable for international offshoring.
One way in which the thesis builds on this literature is focusing on the content of occupations.
To emphasize this, it appears helpful to understand an occupation as a bundle of tasks14. At the
same time, the approach of this thesis requires analyzing the characteristics of a given
occupation, not the characteristics of the distinct tasks within the occupation, as will be further
discussed in section 3.2. A second way in which the thesis builds on this literature, especially
on Acemoglu and Autor (2011), is the way of developing proxies for ‘routine’ and ‘non-routine’
from the ONET data. This process will be discussed in section 3.3.
The thesis is also related to other literature which makes use of DOT and ONET data. As Handel
(2016) points out, there is only a limited number of studies analyzing such data. Three
prominent examples are Hutchens (1987), Feser (2003), and Hirsch (2006). Hutchens (1987) is
an early contribution which analyzes data from the DOT in order to classify if a job involves a
lot of repetition of tasks and is therefore easy to monitor. He then examines the influence of
repetitiveness on the type of contract. Feser (2003) illustrates how the ONET can be used to
group jobs based on similarities in their broad knowledge and uses these groups to analyze the
type of work done in a certain region. Hirsch (2006) analyzes occupational skill requirements
from ONET data to explain the gap in hourly wages of part-time and full-time workers.
2.4. Hypothesis development
This section will develop a hypothesis of the influence of routine tasks on the employment of
performance pay15. As argued before, a company will only employ performance pay if a suitable
performance measure can be developed. If the worker’s contribution can be measured, in turn,
depends on the intensity in routine tasks. To begin with, it needs to be clarified what defines a
14 Another field of literature which views a job as a bundle of tasks examines the way in which tasks are combined into jobs. However, literature on so-called ‘job design’ (compare Gibbs et al. 2010 for a general overview) is predominantly of theoretical nature. 15 In understanding the term ‘routine,’ the thesis follows the definition adopted by Acemoglu and Autor (2011). They characterize a task as being ‘routine’ if it requires methodological repetition and can be specified by programmed instructions. It does not demand flexibility, judgment, or adaptation to new circumstances. Even if this thesis does not address the technological aspect of replaceability of human workers by machines as the authors do, such a definition results in precisely the attributes which are relevant for the purposes of this thesis and is, therefore, well-suited for the approach of the thesis.

11
suitable performance measure16. Two criteria are particularly important for the hypothesis
development. First, the measure must capture the worker’s contribution to the principal’s
goals. Second, the measure must exclude factors which are outside the control of the worker.
The following paragraphs will relate these two criteria to the intensity in routine tasks.
Concerning the first of the abovementioned criteria, the presented principal-agent literature
has illustrated how performance measures which don’t accurately picture the principal’s
objective will hurt the company: It provides the worker with the possibility to ‘game the system’
(Baker 1992) and leads to the rise of the so-called ‘multi-tasking problem’ (Holmström and
Milgrom 1991). Measuring how well a worker has contributed to this objective can be very
complex depending on the occupation. One particular challenge is the existence of several
performance criteria which can be relevant, such as efficiency and quality (Harris 1994). It is
increasingly difficult to develop an accurate performance measure as more dimensions become
relevant17. In routine-task-intensive occupations, the efficiency dimension tends to dominate
all other aspects. Take for example production workers (windshield glass installers as analyzed
in Lazear 2000): The performance can be defined by the number of correctly installed
windshields per hour. Notably, the occupation does not offer much room for varying quality:
A windshield is either installed correctly, or it is not. The contribution in jobs that are intensive
in non-routine tasks, on the other hand, is often more difficult to evaluate. The work might
even result in different types of output. Consider again the example of a chef: The quality of
the food is essential to evaluate the performance, but at the same time it is highly subjective.
The output of the cook’s work is heterogeneous, as the dishes might be very different18.
Turning to the second of the abovementioned criteria, it is recognized in both the economics
and the accounting literature that if a measure is used to evaluate performance, it should be
determined by factors that are controlled by the recipient of the evaluation (Prendergast 2011
16 A company can employ very different types of performance measures. A call center employee, for example, can be rewarded depending on the number of calls per hour. The performance pay of a courier might depend on the on-time delivery rate. 17 This is widely recognized by academics and business practitioners. The development of the ‘Balanced Scorecard’ (Kaplan and Norton 1992) can be seen as an attempt to address this issue: It broadens the focus from financial accounting measures to a wide range of financial and operational indicators which are believed to drive future performance. Notably, this instrument focuses on the performance of the whole business, rather than on measuring the contribution of the individual worker. 18 The reasoning of the paragraph is in-line with an observation made by Landy et al. (2017). They point out that, in general, a performance measure for routine work is easily quantifiable.

12
for economics literature; Globerson 1985; Lynch and Cross 1991; Neely et al. 1997 for
accounting literature). A performance measure that fulfills these criteria is called ‘relevant’
(Fortuin 1998)19. If the employer cannot develop a performance measure that is relevant or if
the relevance of the performance measure cannot be determined, employing performance pay
will not be meaningful. To determine the relevance of the measure, the principal needs to
separate the impact of the worker’s actions on the performance measure from the impact of
external factors. In jobs intensive in routine tasks, a limited number of working steps is
performed repeatedly. In occupations that are intensive in non-routine tasks, on the other
hand, the agent performs a variety of very different actions in her everyday work. Hence, it is
more feasible to determine the relevance of performance measure for the first type of
occupations.
These two arguments result in the following hypothesis:
H1: Occupations which are intensive in routine tasks (non-routine tasks) are associated
with a higher (lower) likelihood of employing performance pay.
Certain assumptions underlie this hypothesis development. One assumption is that the
measure is given exogenously and that the firm cannot invest in improving the performance
measure. In other words: A company cannot change the composition of the performance
measure and ‘design away’ potential weaknesses of the measure. Therefore, the firm has to
decide if it wants to employ performance pay based on the best available measure.
Furthermore, the organization needs to behave optimally: For the two above arguments to
result in the hypothesis, the principal must recognize the two described theoretical
mechanisms and adjust the compensation schemes in accordance with them.
The reasoning necessary to derive the hypothesis can be found in the classical principal-agent
literature (section 2.1). Yet, this section has additionally introduced some literature from the
field of management accounting to illustrate the relevance of the question for both fields.
19 Banker and Datar (1989) present an alternative phrasing: In their words, a performance measure needs to be ‘precise’ and ‘sensitive.’ The former demands that change in the measure must be primarily caused by a change in worker’s effort rather than noise. The latter requires that changes in worker’s effort must result in a sufficiently large movement of the measure.

13
Including this literature also broadens the discussion of the topic as the contributions from
management accounting are often based on a different, more applied, view on the topic.

14
3. The data
3.1. The WERS data set20
The main data source is the ‘Workplace Employment Relations Study’ (‘WERS’). This UK-wide
study collects a representative sample and includes data from interviews with employers,
employees, and workers’ representatives. The data can generally be characterized as repeated
cross-sections. WERS has been undertaken six times in the period from 1980 to 2011. The
master thesis uses the most recent data from 2011. The main advantage of the WERS data is
that it contains rich and detailed information about the management practices captured by the
management survey. Such data is essential to perform empirical analysis in many fields of
organizational economics. At the same time, it is highly sensitive and therefore often difficult
to access.
The management questionnaire contains the question ‘Do any of the employees in this
workplace get paid by results?’ A dummy is constructed based on this question. It is equal to
one if the manager answers the question in the affirmative and serves as a proxy for ‘company
employs performance pay.’ This is the best proxy available but it has its limitations since it is a
very general way to ask about performance pay. Most importantly, it does not include
information on the fraction of workers receiving performance pay and on the intensity of the
performance pay. It also does not distinguish between individual and group performance pay.
Further, it is important to note that this is a rather narrow definition of ‘performance pay’
compared to related studies: This question excludes raises based on subjective and relative
performance evaluation as well as profit-related pay schemes.
Further, the WERS management questionnaire data set contains a variable which holds a
standard occupation classification (SOC)21 for the largest non-managerial occupation at the
workplace. A verbatim description of the activities of this occupation is recorded during the
management interview and coded to the SOC classification afterwards. Relevant control
variables – which will be introduced in section 4.2 – are also based on this management
questionnaire.
20 This section partly relies on Biermann 2017 (p. 5). 21 Statistical agencies and other institutions in different countries use such a formal system to classify workers into occupational categories (Bureau of Labor Statistics 2017).

15
A general drawback of analyzing survey data is self-reporting bias which results in a
measurement error (Bound et al. 2001; Donaldson and Grant-Vallone 2002): The answers
provided by the manager might be biased and not necessarily equal to the true values.
3.2. The ONET data set A central feature of the thesis is to develop measures of the job content. For this purpose, the
thesis will make use of the ‘Occupational Information Network’ (‘ONET’) relating quantitative
job descriptors to occupations from the WERS. This procedure has been popular among some
papers employing the task approach to labor markets as described in chapter 2.
The ONET is the main source of occupational information in the US. The database has been
developed to replace the Dictionary of Occupational Titles (DOT) by the US Department of
Labor (U.S. Department of Labor 1991). The most current version of the ONET database –
version 21.2 – was released in February 2017. The theoretical framework of the ONET is called
the ‘ONET content model’ (Peterson et al. 1995; O*NET Resource Center 2017a). It covers
different domains of job characteristics, classifying occupations either by the demands placed
on the workers or the type of work being done. This information is encapsulated in a
quantitative dimension through variables called ‘descriptors.’
The data is collected through the ONET data collection program, which uses standardized
questionnaires to measure job characteristics specified by the content model. The program
operates continually updating the database and replacing old ratings on a rolling basis. Most of
the information is collected through a two-stage sample design: First, a random sample of firms
which are expected to employ the target occupation is identified. Second, a random sample of
employees (‘incumbent workers’) within the target occupation and target firms is selected.
Figure 1 (appendix) contains an example to illustrate a questionnaire instrument.
Since the two domains ‘abilities’ and ‘skills’ are of quite abstract nature, the data creation
follows a different procedure for these cases. The data is first collected through a survey of
incumbents and subsequently provided to occupational analysts who create the final ratings
for the descriptors. These analysts are specialists that have at least two years of working
experience, have obtained a graduate degree in a relevant field such as organizational
psychology and have received specific training to be able to design consistent and valid ratings
(Donsbach et al. 2003).

16
The 277 descriptors are structured in six categories and several subcategories. Descriptors are
associated with different scales such as importance or frequency and each scale is defined with
a different range, e.g. 1 for ‘not important’ to 5 for ‘extremely important.’ Figure 2 (appendix)
contains an example to illustrate the hierarchy in which the descriptors are organized. These
descriptors are available for around 1000 occupations22. Occupations are incorporated in the
system based on the SOC.
The ONET data has its weaknesses and three of the most important ones should be pointed
out. First, some survey questions are complex and abstract and are likely to confuse a
respondent (Hubbard et al. 2000; Autor 2013). Second, the documentation is partly unclear. To
name one example, the only publicly available information about the sample size per descriptor
and occupation states that the descriptors are based on at least 15 respondents, often many
more. More precise information on the sample size per descriptor and occupation is not
available. Third, while the project provides a great level of detail, the distinction between some
categories is unclear, resulting in seemingly overlapping survey questions as well as descriptors
(Handel 2016).
At the same time, as Handel (2016) concludes in his general evaluation of the ONET, the
database presents many opportunities for academic researchers. Overall, the sampling method
is a large improvement compared to the DOT or general household surveys. The author
presents an analysis indicating that the limitations of the methods don’t generally threaten the
validity of the ONET measures. Most importantly and as pointed out by Autor (2013), making
use of ONET data adds objectivity to the process of assigning attributes to occupations, since
the descriptors are carefully validated by a statistical agency rather than subjectively evaluated
by the researcher.
Today, the data from the project is widely used in career counseling. Although the data source
is not as popular in academia, some empirical research incorporates information from the
ONET, as pointed out in section 2.1. The big scale, depth of information, and long tradition
22 Notably, the descriptors are available for occupations, not for single tasks. This structure of the data is the reason for why the thesis delivers an analysis at the level of occupations and not at the level of the individual tasks. Importantly, the instruments in the questionnaires of the ONET ask questions about the ‘current job’ and not about separate tasks performed in this job.

17
make the ONET the recognized primary source of occupational information in the US. Even on
a global scale, such an exhaustive source of occupational information is unique.
3.3. Constructing a proxy for intensity in routine tasks As pointed out in the last section, one of the main drawbacks of the DOT and the ONET are the
partly unprecise and overlapping definitions of the descriptors (Handel 2016). As a result, it is
unclear which of the descriptors best represents a certain task construct (Acemoglu and Autor
2011, p. 1078). In other words, one can include many different descriptors to characterize if
routine tasks play an important role in a certain job. In this setting, selecting the right
descriptors would necessarily be based on a subjective judgment. Such judgment calls are
undesirable in empirical work because they give the researcher the chance to select the data
according to his or her prejudices (Autor 2013). Based on this reasoning, this thesis employs
the same five job content measures and descriptors as Acemoglu and Autor (2011), as this
approach is the most prominent in literature and has several advantages as will be pointed out
later in this section.
The analysis includes the following five job content measures: Non-routine tasks are subdivided
into cognitive-analytical, cognitive-interpersonal, and manual-physical tasks, while routine
tasks are separated in cognitive and manual. Cognitive-analytical tasks require ‘problem-
solving, intuition, persuasion, and creativity’ (Acemoglu and Autor 2011, p. 1077). These tasks
are common in occupations related to ‘law, medicine, science, engineering, design, and
management’ (ibidem). Cognitive-interpersonal tasks are characterized by interactions with
other people and require social skills. Occupations which score highly on this measure include
nurses and teachers. Non-routine manual tasks require situational adaptability, visual
recognition, and coordination skills among others. Activities which are non-routine manual-
physical include for example ‘driving a truck through city traffic’ or ‘preparing a meal’ (ibidem).
The job content measures are obtained by summing the standardized task descriptors and
subsequently standardizing the resulting measures (following Hardy 2015, p. 11). The job
content measure ‘non-routine cognitive-analytical’ for example consists of three descriptors:
‘analyzing data/information,’ ‘thinking creatively,’ and ‘interpreting information for others.’
Each of the five job content measures will be assigned to every occupation to classify the
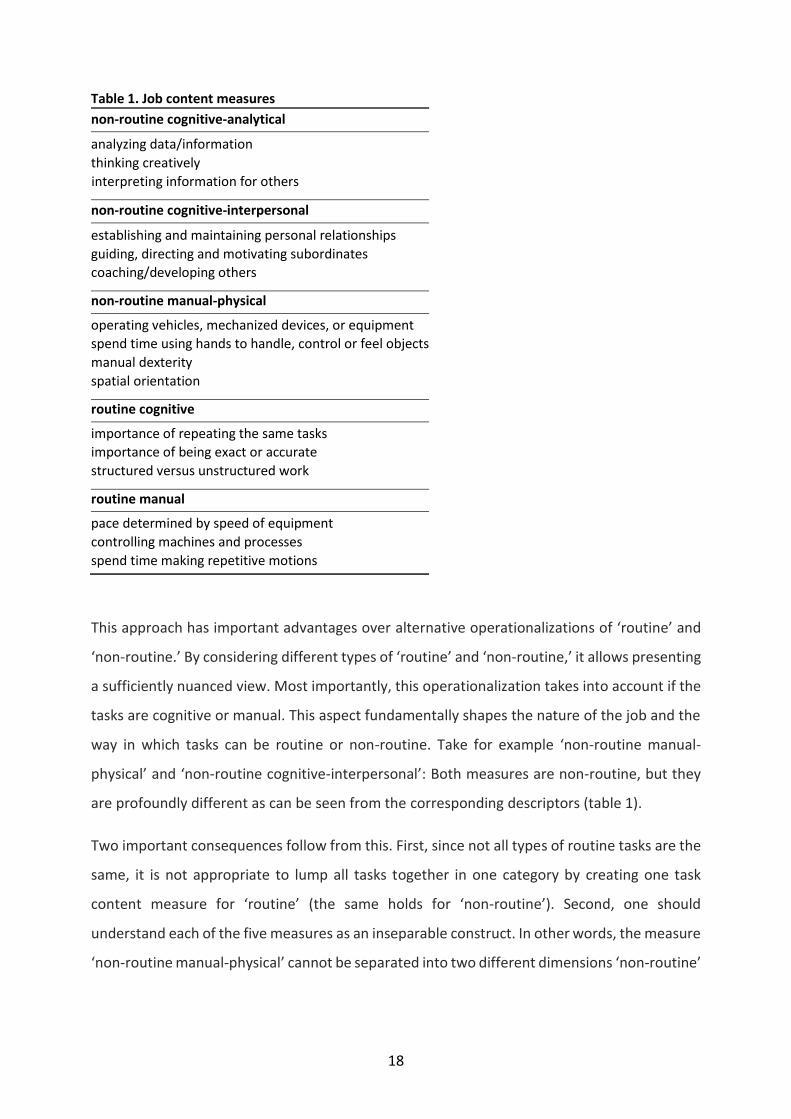
intensity in routine and non-routine tasks in this job. Table 1 illustrates the job content
measures and the corresponding descriptors.
18
Table 1. Job content measures
non-routine cognitive-analytical
analyzing data/information
thinking creatively
interpreting information for others
non-routine cognitive-interpersonal
establishing and maintaining personal relationships
guiding, directing and motivating subordinates
coaching/developing others
non-routine manual-physical
operating vehicles, mechanized devices, or equipment
spend time using hands to handle, control or feel objects
manual dexterity
spatial orientation
routine cognitive
importance of repeating the same tasks
importance of being exact or accurate
structured versus unstructured work
routine manual
pace determined by speed of equipment
controlling machines and processes
spend time making repetitive motions
This approach has important advantages over alternative operationalizations of ‘routine’ and
‘non-routine.’ By considering different types of ‘routine’ and ‘non-routine,’ it allows presenting
a sufficiently nuanced view. Most importantly, this operationalization takes into account if the
tasks are cognitive or manual. This aspect fundamentally shapes the nature of the job and the
way in which tasks can be routine or non-routine. Take for example ‘non-routine manual-
physical’ and ‘non-routine cognitive-interpersonal’: Both measures are non-routine, but they
are profoundly different as can be seen from the corresponding descriptors (table 1).
Two important consequences follow from this. First, since not all types of routine tasks are the
same, it is not appropriate to lump all tasks together in one category by creating one task
content measure for ‘routine’ (the same holds for ‘non-routine’). Second, one should
understand each of the five measures as an inseparable construct. In other words, the measure
‘non-routine manual-physical’ cannot be separated into two different dimensions ‘non-routine’

19
and ‘manual-physical.’ The measure rather captures the intensity of a job in non-routine tasks
which can be classified as manual-physical.
An alternative operationalization would be to avoid having proxies for ‘routine’ as well as ’non-
routine.’ Such an approach would combine all the available information into one variable
‘routine versus non-routine work’ which takes a value between the two extrema ‘routine’ and
‘non-routine.23’ The drawbacks of this approach become clear after, again, examining the
definition of the task content measures as presented in table 1. The table illustrates that the
non-routine measures are not simply a reversal of the routine measures as they capture
information on a different type of tasks. In this sense, this design of task content measure
results from the descriptors contained in the ONET24.
3.4. Constructing a data set To incorporate information on task content from the ONET data into the analysis of the WERS
data, the two databases need to be combined, i.e. appropriate occupational attributes must be
assigned to the WERS data. Both data sets include the variable ‘SOC’; this is hence the natural
key variable. However, different types of occupational classification systems exist, and the two
databases don’t use the same SOC. While the WERS data is based on the British UK SOC (Office
for National Statistics United Kingdom 2017), the ONET follows the so-called ONET SOC (O*NET
Resource Center 2017b), which is based on the American US SOC in the version of 2010. It is,
therefore, necessary to develop a link between the two classification systems. This is achieved
by performing the four following steps:
1.) Mapping the ONET data based on ONET SOC 2010 to US SOC 2010
2.) Transforming the resulting US SOC 2010 to a data set which follows US SOC 2000
3.) Transforming the resulting US SOC 2000 data to a data set which follows UK SOC 2000
4.) Merging the resulting ONET data which follows UK SOC 2000 with the WERS data
To perform steps one and two, a STATA code provided by the University of Warsaw (Institute
for Structural Research Warsaw 2017) is applied. This code allows using different crosswalks
from the original ONET data to other classification systems. In this case, it first trims the ONET
23 This variable could also be subdivided in two measures: One referring to cognitive and one to manual tasks. 24 In addition, this issue will be addressed by an alternative regression specification as presented in section 4.3.

20
SOC 2010 to obtain US SOC 201025. It then transforms the results to US SOC 2000 using a
crosswalk provided by the Bureau of Labor Statistics (Bureau of Labor Statistics 2017a).
In step three, the resulting US SOC 2000 data is mapped to UK SOC 2000. The necessary
crosswalk is provided by Anna Salomons, an associate professor at Utrecht University, who has
developed a mapping system using the online coding tool CASCOT26 and manually testing the
CASCOT results (this crosswalk is used e.g. in Goos et al. 2009).
This allows merging the ONET and the WERS data in a fourth step, using UK SOC 2000 as a key
for matching. The result is a data set which assigns occupational attributes to the WERS data.
A table with the summary statistics of the resulting data will be presented after the discussion
of the control variables (table 2, section 4.2).
The mapping between the different classification systems is not always unambiguous, i.e. a
code in one classification system might have multiple counterparts in another system. Three
cases must be distinguished. First, if the original code translates into multiple target codes,
each of the target codes will be assigned the attribute values of the original code. Second, if
multiple original codes translate to one target code, the target code will be assigned the
average attribute values of the original codes. Third, if multiple original codes translate to
multiple target codes, each of the target codes will be assigned the average attribute values of
the original codes.
To illustrate the merging process, the following paragraphs will provide an example of one
occupation and one ONET descriptor. The occupation ‘sociologist’ is classified by the ONET
2010 code 19-3041.00. The occupation has a value of 4.32 for the ONET descriptor that
captures to which extent thinking creatively is required in an occupation (descriptor code
4.A.2.b.2, scale from one to five). The corresponding US SOC 2000 code is equivalent to the
ONET SOC 2010 minus the last two digits: 19-3041 (transformation step one; one-to-one-match;
descriptor value remains 4.32). Since the classification is the same for US SOC 2010 and US SOC
2000, the next transformation step is equally simple: The code 19-3041 remains the same in
25 The ONET SOC contains the 6-digit code of the US SOC and adds a 2-digit extension, which allows for a more detailed differentiation. 26 The ‘Computer Assisted Structured Coding Tool’ (‘CASCOT’) is designed to convert text information – in this case US SOC labels – to UK SOC codes (Warwick Institute for Employment Research 2017).

21
the US SOC 2000 classification (transformation step two; one-to-one-match; descriptor value
remains 4.32).
The next step is transforming this code to UK SOC 2000. According to the applicable crosswalk,
the US code 19-3041 corresponds to the UK code 2322. Since the UK system is less detailed,
the UK code ‘2322: Social Science Researcher’ combines the US code for seven different
occupations: ‘Economists,’ ‘Sociologists,’ ‘Anthropologists and Archeologists,’ ‘Geographers,’
‘Historians,’ ‘Political Scientists,’ and ‘Social scientists and related workers, all other.’ This step
is, therefore, a many-to-one match and the UK code ‘2322 Social Science Researcher’ is
assigned the average descriptor value of ‘thinking creatively’ of the seven US codes which
equals 4.19 (transformation step three).
In the last step, the value of the ONET descriptor is related to the workplaces in the WERS data:
Two companies in the WERS data are classified to employ social science researchers as the
largest non-managerial occupation at the workplace: The workplaces with the unique identifier
1116013 and 2005011 are assigned the value 4.19 for ‘thinking creatively’ (transformation step
four).

22
4. Econometric analysis
4.1. Identification strategy
The master thesis aims to explain why some companies employ performance pay while others
don’t by analyzing the task content of the largest occupation at the workplace. To do so, it
develops an identification strategy using performance pay as a dependent variable. The
variable is limited in the sense that it is binary: A firm either employs performance pay or it
does not. The independent variables include the five job content measures as developed in
section 3.3 as well as relevant controls. The empirical analysis, therefore, estimates the
following equation:
𝑝𝑎𝑦𝑚𝑒𝑛𝑡 𝑏𝑦 𝑟𝑒𝑠𝑢𝑙𝑡𝑠𝑖 = 𝛽0 + ∑ 𝛽𝑗 𝑗𝑜𝑏 𝑐𝑜𝑛𝑡𝑒𝑛𝑡 𝑚𝑒𝑎𝑠𝑢𝑟𝑒𝑖,𝑗
5
𝑗=1
+ ∑ 𝛽𝑗𝑿𝑖,𝑗
𝑛
𝑗=6
+ 𝑢𝑖
where i relates to the company and j stands for one of the independent variables. The vector
of independent variables other than the job content measures is denoted by X and varies
depending on the model specification.
To analyze the influence of the five job content measures on the employment of performance
pay, the thesis will introduce a series of regression models. The models will be estimated by
ordinary least squares. The first model includes only the five job content measures as
independent variables. This ‘naïve’ model is likely to uncover a spurious correlation between
performance pay and the job content measures. Therefore, different blocks of controls are
added gradually. Such a procedure, often referred to as hierarchical regression or nested
regression analysis, allows analyzing if the relationship between performance pay and the job
content measures is stable across specifications or if the inclusion of other predictors mediates
this relationship. Furthermore, it allows evaluating if the increment in explained variability
obtained by adding a new set of controls is significant (Clogg et al. 1995).
In the first step, a set of controls is added which captures the operating environment of the
firm. Second, another set of controls is included which contains relevant characteristics of the
workforce. In steps three and four, dummies are incorporated which indicate the industry and
the region of a company. The last specification is the full model.

23
Due to missing values, gradually adding controls will reduce the number of the observations
available for a given model. As a result, the change of a coefficient is hard to interpret: It could
be caused by the change of the sample rather than the added controls. Hence, for a valid model
comparison, the models must be estimated on the same sample (Clogg et al. 1995). I therefore
only include firms which are available for the full model in all the reduced models.
Again, an important assumption is that firms make optimal decisions. Thus, decision makers
recognize that performance pay will influence firm performance which depends on firm
characteristics as captured by the independent variables and act in accordance to this. The
outcome of the decision can be observed in the data, i.e. a firm employs performance pay or not.
4.2. Choice of control variables This thesis includes four sets of controls which are expected to influence the firm’s decision to
employ performance pay 27 . The first set of controls contains aspects of the operating
environment of the firm. To begin with, the number of competitors is likely to influence
performance pay. If one assumes that performance pay is a good management practice, higher
competition will tend to drive the less efficient firms out of the market. Bloom et al. (2009)
deliver empirical evidence for the correlation between good management practices and a
measure of competition intensity (also compare Brown and Heywood 2002). Furthermore,
Bloom et al. (2009) find that firms tend to be better managed if companies are more
international28. To acknowledge this aspect, the thesis includes two controls: First, a dummy
which indicates if a company is predominantly foreign owned, and second, a variable which
captures how international the market for the main product is29. Introducing performance pay
might further be associated with additional costs either through lower quality or increased
expenditures due to additional monitoring because pay for performance often puts a stronger
emphasis on quantity than quality (Freeman and Kleiner 2005; Courty and Marschke 2004 for
empirics). This aspect is accounted for by including a variable which indicates how important
quality is to the firm.
27 The choice of control variables is partly based on Pendleton et al. (2009), the wording of these paragraphs partly relies on Biermann (2017). 28 Captured by a categorical variable with the categories ‘local firms,’ ‘exporter,’ and ‘multinational subsidiaries.’ 29 Captured by a categorical variable with the categories ‘local,’ ‘regional,’ ‘national’ and ‘international.’

24
The second set of controls contains relevant characteristics of the workforce. First, the number
of employees in the institution is relevant since bigger firms can spread the costs of
implementing performance pay over a larger number of employees (Heywood et al. 1997).
Second, the model includes the proportion of female workers and part-time workers as
previous literature has argued that these characteristics are related to performance pay
(Heywood et al. 1997; Brown 1990). Third, the proportion of union members is added as a
control variable since unions are expected to oppose performance pay. The reason is reduction
of wage inequality being one of the unions’ main objectives (Slichter et al. 1960 as well as
Hayter 2011 for theory; Gosling and Machin 1995 for empirics). At the same time, pay schemes
based on individual performance rather than fixed pay schemes increase within-firm wage
inequality (Barth et al. 2009). Fourth, communication between the managers and the workers
can reduce risks associated with performance pay (Levine 1990). This aspect is captured by a
dummy equal to one if the company organizes meetings between the workers and the
managers. In addition, the data set allows controlling for the region in the UK and the industry
of the company (third and fourth set of controls). I expect the measurability of performance
and, therefore, the likelihood of performance pay to vary not only across occupations but also
across industries.
Another aspect that is expected to influence the employment of performance pay is intrinsic
motivation. Pay for performance is less attractive if the workforce is highly intrinsically
motivated, as performance pay is an external motivator which is a substitute for internal
motivators (Austin and Larkey 2002). Furthermore, if the workforce is intrinsically motivated,
this motivation might be crowded out by performance pay (Frey and Oberholzer-Gee 1997;
Deci and Ryan 1985). Intrinsic motivation is therefore expected to be negatively correlated with
payment by results. At the same time, intrinsic motivation is correlated with the job content
measure as I expect jobs intensive in non-routine tasks to be more fulfilling and workers in
these occupations, therefore, more likely to be highly intrinsically motivated. However, the
data set contains no variable which can serve as an appropriate proxy for internal motivation.
As a result, the estimation might suffer from an omitted variables bias30. The following table
presents the summary statistics.
30 This relationship results in a downwards bias for non-routine job content measures and upwards bias for routine job content measures.

25
Table 2. Summary statistics full sample
Panel A* Mean S.d. Min Max N
payment by results 0.26 0.44 0 1 2680
importance output quality 4.12 0.99 1 5 1793
number competitors 2.53 0.58 1 3 1797
foreign owned 0.16 0.37 0 1 1829
international market 2.28 1.15 1 4 1805
firm size 449.3 1213.5 5 20746 2680
proportion part time 0.27 0.26 0 1 2646
proportion women 0.52 0.28 0 1 2654
proportion union members 0.21 0.30 0 1 2117
meetings 0.84 0.35 0 1 2674
Panel B** Mean S.d. Min Max N
non-routine cognitive-analytical 9.45 1.47 5.77 13.2 2669
non-routine cognitive-interpersonal 9.33 1.24 6.44 12.85 2669
non-routine manual-physical 9.26 2.63 4.54 16.85 2669
routine cognitive 11.41 1.04 7.95 13.52 2669
routine manual 7.28 1.79 3.62 12.2 2669
* Furthermore, the data set contains information about the industry and the location of the firm as well as the main occupation in the firm. This is captured by the ‘Standard Industry Classification’ (‘SIC’), codes for regions in the UK and the SOC for the largest occupational group, respectively. These variables are measured on a nominal scale. Further details can be found in table 6 (appendix). ** This panel presents the non-standardized values of the job content measures. The subsequent empirical analysis uses the standardized values. Naturally, the standardized values have a mean of 0 and a standard deviation of 1.
Panel A contains the variables from the WERS data set, which includes the dependent variable,
payment by results, as well as the control variables. The table illustrates that most firms don’t
pay their employees by results: Only roughly a quarter of the companies employ performance
pay 31 . The average company in the sample has indicated that quality of the products is
important (4.12 on a 1 to 5 scale), it operates in a rather competitive environment (2.53 on a
1 to 3 scale) and serves a regional or national market. Only 16% of the companies are foreign
owned. The average firm employs 449.3 workers; the large standard deviation and the big
range indicate that companies of very different sizes are included in the sample. The workforce
31 The discrepancy between this value and the levels of performance pay mentioned in the introduction has two reasons: First, this data refers to firms employing performance pay, not employees covered by performance pay. Second, the thesis employs a rather narrow definition of performance pay, resulting from the analyzed data.

26
of the average company looks as follows: 27% are part-time workers, 52% women and 21%
union members. Most companies (84%) organize meetings between workers and their
supervisors. In addition, dummies for the region in the UK and the industry are available.
Further information about these dummies and all other WERS variables can be found in table 6
(appendix).
Panel B presents the main explanatory variables: the job content measures constructed from
the ONET. Directly comparing the statistics across the five measures is not meaningful, since
they are constructed based on different descriptors. Figures 3-7 (appendix) present histograms
which illustrate the distribution of the five measures across firms. One should note that non-
routine manual-physical consists of four descriptors, while the other measures include only
three. Further, all job content measures are standardized for the subsequent analysis.
Some of the variables are available for all 2680 firms in the sample. Others have considerably
fewer observations: Only 1793 workplaces have answered the question concerning the
importance of output quality. The subsequent regression analysis will include only 1477 of the
2680 firms: These are the observations without missing values for any of the relevant variables.
The reason for the reduced sample is the hierarchical regression which requires analyzing the
same observations in all models to make the models comparable. Hence, workplaces which are
dropped from the full model due to missing values are excluded from the whole analysis.
Section 4.4 will further address this issue.
The following table presents an extract of the correlation matrix. The full correlation matrix can
be found in table 7 (appendix).
Table 3. Extract of the correlation matrix: Pearson’s r
PBR NRCA
NRCI
NRMP RC
RM
PBR 1
NRCA 0.07** 1
NRCI 0.02 0.64*** 1
NRMP -0.09*** -0.48*** -0.45*** 1
RC 0.07** 0.35*** 0.15*** -0.38*** 1
RM -0.04 -0.58*** -0.52*** 0.79*** -0.25*** 1
quality 0.01 -0.04 0.01 -0.04 -0.06* -0.002
competitors 0.08*** -0.01 0.02 -0.04 -0.03 -0.01

27
foreign 0.11*** 0.04 -0.08** 0.06* 0.04 0.08***
inter. market 0.13*** 0.15*** -0.10*** 0.02 0.11*** 0.13***
firm size 0.05* 0.13*** 0.06** -0.07** 0.09*** -0.04
part-time -0.12*** -0.20*** 0.15*** -0.18*** -0.12*** -0.16***
women -0.08** -0.005 0.22*** -0.45*** 0.05* -0.41***
union -0.04 0.03 -0.02 0.15*** 0.02 0.09***
meeting 0.07** 0.06** 0.02 -0.08** 0.03 -0.06*
Variables are abbreviated due to reasons of space: PBR: payment by result, NRCA: non-routine cognitive-analytical, NRCI: non-routine cognitive-interpersonal, NRMP: non-routine manual-physical, RC: routine cognitive, RM: routine manual. This table presents an extract of the correlation matrix which focuses on the dependent variable and the five main explanatory variables. The full correlation matrix can be found in table 7 (appendix). *, **, and *** denote significance at the 5%, 1%, and 0.1% levels, respectively.
Table 3 is a starting point for examining the relationship between performance pay and the
main explanatory variables. Among these five variables, non-routine manual-physical shows
the strongest correlation with performance pay (-0.09), followed by non-routine cognitive-
analytical and routine cognitive (both 0.07). It is furthermore noticeable that some of the
independent variables are highly correlated. All the strong correlations occur among the main
explanatory variables. This issue will be further discussed in section 4.4.
4.3. Regression results and interpretation
The following table presents the regression results.
Table 4. Regression results OLS: Baseline specification
payment by result
(1) (2) (3) (4) (5)
non-routine cognitive-analytical
0.051** 0.022 -0.008 -0.005 -0.018 (0.019) (0.020) (0.021) (0.021) (0.024)
non-routine cognitive-interpersonal
-0.031 -0.012 0.006 0.007 0.032 (0.019) (0.020) (0.020) (0.020) (0.022)
non-routine manual-physical
-0.072*** -0.060** -0.074*** -0.071** -0.036 (0.021) (0.021) (0.022) (0.022) (0.023)
routine cognitive 0.010 0.010 0.008 0.009 -0.008 (0.016) (0.016) (0.016) (0.016) (0.016)
routine manual 0.054* 0.028 0.018 0.023 -0.009 (0.022) (0.022) (0.023) (0.023) (0.025)
importance output quality -0.001 -0.004 -0.004 0.007 (0.013) (0.013) (0.013) (0.013)
number competitors 0.071** 0.063** 0.059** 0.064** (0.022) (0.022) (0.022) (0.022)

28
foreign owned 0.125*** 0.113** 0.107** 0.055 (0.035) (0.035) (0.035) (0.035)
international market 0.035** 0.015 0.012 0.017 (0.012) (0.013) (0.013) (0.013)
firm size 0.014 (0.014)
0.018 (0.015)
0.025 (0.015)
proportion part time -0.113* -0.107 -0.165** (0.055) (0.055) (0.056)
proportion women -0.142* -0.136* -0.010 (0.058) (0.058) (0.065)
proportion union members -0.144* -0.128* -0.057 (0.057) (0.057) (0.061)
meetings 0.064* 0.065* 0.070* (0.030) (0.030) (0.029)
dummies region Yes Yes
dummies industry Yes
constant 0.340*** 0.066 0.206* 0.099 -0.016 (0.013) (0.074) (0.087) (0.099) (0.107)
observations 1477 1477 1477 1477 1477 R2 0.02 0.04 0.06 0.07 0.14
Standard errors in parentheses. *, **, and *** denote significance at the 5%, 1%, and 0.1% levels, respectively. The firm’s size is measured in thousands of employees.
Model 1 in table 4 presents a starting point estimating performance pay as a function of the
five job content measures. The association between the two job content measures and the
dependent variable is promising since their impact is statistically significant and the direction
of the impact is in-line with the theoretical prediction: ‘routine manual,’ ‘non-routine manual-
physical’ (in the following: ‘NRMP’). ‘Non-routine cognitive analytical’ appears to have a
significant impact, but the sign of the coefficient contradicts the hypothesis from chapter 2.
The remaining two job content measures are not statistically significant.
Column 2 in table 4 introduces controls for the operating environment of the firm. In the first
place, these controls impact the influence of ‘non-routine cognitive analytical’ and ‘routine
manual.’ The coefficient size of these two job content measures decreases, and they become
insignificant. The effects of these predictors remain insignificant in all the following models.
The explanatory power of the job content measure NRMP is mediated only slightly: The size of
the coefficient declines by about 17 percent, suggesting that some of the association between
performance pay and NRMP is due to characteristics of the operating environment of the firm

29
correlated with NRMP. In other words, the previous specification suffered from an omitted
variable bias. One of the controls in this bundle is the number of competitors. As presented in
the correlation matrix in table 7 (appendix), the number of competitors is positively correlated
with performance pay and negatively correlated with NRMP. Omitting this aspect, therefore,
leads to a downwards bias. Hence, the estimated NRMP-coefficient in column 1 is more
negative than the ‘true’ coefficient32. However, the effect remains statistically significant (at a
0.01% level) and negative. In other words, workplaces, where the job of the largest
occupational group is characterized by non-routine manual-physical tasks, are less likely to
employ performance pay (as hypothesized). The effect is also economically relevant: A one-
standard deviation increase in NRMP is associated with a 6 percentage points decrease in the
likelihood of employing performance pay.
Model 3 additionally accounts for characteristics of the workforce. The impact of NRMP is not
altered by the additional controls: The coefficient remains significant, and the change in
coefficient size even suggests a slightly stronger effect than in column 2. This indicates that
NRMP has a robust impact beyond characteristics of the operating environment and the
workforce of the firm. Column 4 includes controls for the region of the workplace. The effect
of NRMP remains almost unchanged: It stands out as a strong predictor of payment by results.
Column 5 adds industry dummies to the regression specification. The NRMP coefficient drops
by roughly 50 percent compared to the previous model and becomes insignificant at any
conventional significance level (p-value of 0.12).
The change in the NRMP coefficient as a reaction to incorporating industry dummies in the
regression requires an economic interpretation. Simply dismissing NRMP as a spurious result
of the industry might ignore an interesting mechanism revealed by this finding. A potential
explanation is that NRMP and industry are closely related, making it difficult to determine
which of the two factors impacts performance pay. A simple linear regression of NRMP on
industry dummies (unreported) helps to analyze this issue. The R2 of this regression indicates
that over 40% of the variation of NRMP can be explained by the industry (R2: 0.420), supporting
the view that these two aspects strongly influence each other. In other words, the amount of
non-routine physical tasks depends partly on the industry. Based on this evidence, the job
32 This reasoning should be understood as a rough guide to thinking about this bias: Strictly speaking, all other explanatory variables which are correlated with NRMP will also influence the bias.

30
content measure can be interpreted as the mechanism underlying the impact of the industry
on performance pay. Following this interpretation, analyzing job content measures might be a
fruitful approach to analyzing the way in which industry influences the employment of
performance pay.
Turning to control variables of the estimation, two variables appear to be strong predictors and
robust across all specifications. First, the likelihood of performance pay is higher for firms in
more competitive markets. Second, regular meetings between workers and supervisors are
positively associated with performance pay (both as hypothesized). Another aspect which is
significant in the full model is the proportion of part-time workers which negatively influences
the likelihood of performance pay33.
Furthermore, it is striking that three control variables are significant in column 4 and turn
insignificant after including industry dummies and therefore show the same pattern as NRMP:
The dummy capturing if a company is predominantly foreign owned as well as the proportion
of women and union members. This finding is in-line with the interpretation of the difference
in the NRMP coefficient between columns 4 and 5. The industry appears to be an outstandingly
strong predictor of performance pay. It is also strongly related to other characteristics of the
firm – including ownership structure and workers’ characteristics (gender and union
membership) – and is, therefore, a dominant aspect of the relationship between performance
pay and these factors.
The fact that the job content measure manual-physical has a robust significant impact while
other job content measures do not is somewhat surprising. One explanation might be a factor
which plays an overall dominating role in the decision to employ performance pay but cannot
be captured by the data. The effect of a job content measure could only unfold if it is not
overshadowed by such a dominant factor. Suppose this dominating factor is highly important
for occupations with extreme scores on some job content measures but less relevant for the
manual-physical dimension. One example is ethical considerations. Many people might oppose
33 While a similar pattern has been found by earlier empirical studies (Heywood et al. 1997 and Pendleton et al. 2009 for British data; Drago and Heywood 1995 for Australian data; Barth et al. 2009 for Norwegian data), the result remains surprising and it is difficult to find an economical explanation. If anything, Brown and Heywood (2002) argue, one would expect the relationship to move in the opposite direction. Since part-time employees are likely to be less committed to the organization and long-term relationships are less likely, the decision makers in the firm might feel the need to motivate them through performance pay (Brown and Heywood 2002, p. 59).

31
payment for performance for certain jobs. This might be particularly important for occupations
which score highly on the interpersonal measure (including teachers and nurses). It might also
be relevant for some occupations on the tail end of the distribution of the analytical job content
measure (such as doctors and lawyers). At the same time, it is arguably not the case for the
NRMP measure (occupations with high scores include restaurant chefs and truck drivers). As a
result, only the effect of the latter measure can unfold and becomes observable in the data.
Another explanation concerns the nature of available information in the WERS, which is
associated with some inaccuracy. First, performance pay is captured by a dummy variable.
Ideally, one would access information on the fraction of workers receiving performance pay
and on the intensity of the performance pay. Second, the data only makes it possible to observe
the relationship between the job content of the biggest occupational group and employment
of performance pay in the whole company. Ideally, the econometric analysis would relate the
job content of every occupation in the organization with information on performance pay for
this occupation. These limitations of the data make it likely that an effect of the job content
measure can only be detected if this effect is statistically large. Therefore, analyzing the
described ideal data set might reveal a significant impact of the other job content measures.
As pointed out in section 3.3, the regression specification contains explanatory variables which
capture the intensity in non-routine tasks and others which capture the intensity in routine
tasks (for the same category of tasks). One might be concerned that this results in a
misspecification as the regression includes multiple explanatory variables which measure the
same underlying construct. To address this issue, table 5 contains an alternative specification.
This specification excludes the two variables containing information on the intensity in routine
tasks. All non-routine measures are included in this estimation.
Table 5. Regression results OLS: Alternative specification – only non-routine measures
payment by result
(1) (2) (3) (4) (5)
non-routine cognitive-analytical
0.042* 0.017 -0.011 -0.010 -0.017 (0.017) (0.018) (0.020) (0.020) (0.022)
non-routine cognitive-interpersonal
-0.039* -0.015 0.004 0.005 0.032 (0.019) (0.019) (0.020) (0.020) (0.022)
non-routine manual-physical
-0.040** -0.045** -0.066*** -0.060*** -0.038* (0.014) (0.014) (0.016) (0.016) (0.017)
controls I: operating environment
Yes Yes Yes Yes

32
controls II: characteristics workforce
Yes Yes Yes
controls III: dummies region
Yes Yes
controls IV: dummies industry
Yes
observations 1477 1477 1477 1477 1477 R2 0.01 0.04 0.06 0.07 0.14
Standard errors in parentheses. *, **, and *** denote significance at the 5%, 1%, and 0.1% levels, respectively. For clarity, the values of the single control variables are not presented. The identification strategy and the sets of control variables are identical with the baseline regression.
Overall, the results are very similar to the baseline specification in table 4: Non-routine
cognitive-analytical and non-routine cognitive-interpersonal don’t have a significant effect
except for in the first model. NRMP, on the other hand, is significant in columns 1 to 4 and even
after the introduction of industry dummies in column 5. Turning to the coefficient size of NRMP,
table 5 presents a coefficient which is less negative (i.e. closer to zero) than in the baseline
specification. This indicates an omitted variable bias, as two variables have been excluded from
the model. For this reason, I retain the baseline specification as presented in table 4 as my main
specification 34 . This alternative specification, however, indicates that the presented
interpretation is valid. Further, column 5 of table 5 indicates that the former interpretation of
the significant effect of NRMP is, if anything, rather conservative: The coefficient size is very
similar to the one presented in the baseline specification (table 4 column 5) and the coefficient
is now significant due to the lower standard error.
Another potential concern is the exogeneity of the main explanatory variables. The presented
discussions have argued that the performance measure, which results from the job content, is
a factor which determines performance pay. The job content and the resulting performance
measure have been assumed to be exogenously given to the company. One might question this
assumption. After all, it is the organization itself which creates the jobs in the company.
To analyze this issue, it is useful to consider the concept of ‘job design.’ This term has been
established in literature to describe the process of bundling tasks in an organization into jobs
34 The second reason is of rather theoretical nature: As argued in section 3.3, it follows from the way the job content measures are constructed that the different measures do not have the same underlying construct, and therefore all five measures should be included.

33
(compare Gibbs et al. 2010 for a general overview). Assuring the measurability of performance
could be one potential aim during the process of designing jobs. In the most extreme case,
employing performance pay might be a major concern for some firms. As a result, these firms
would design jobs in such a way that performance is easily measurable (at least for some jobs
in the firm) and, therefore, performance pay can be employed. If firms behaved in such a way,
using the performance measure as an explanatory aspect for performance pay would not be a
valid approach.
However, one typically thinks of a firm employing performance pay to improve the company’s
performance rather than employing performance pay as a goal in itself. In this sense, other
aspects are expected to be paramount in the process of designing jobs. Two considerations
seem to be particularly crucial. First, firms will bundle tasks which complement each other
(such as research and teaching for professors, Lazear and Oyer 2007). Second, workers’ skills
are heterogeneous. Hence, the firms will aim to make use of the workers’ comparative
advantage in performing the tasks (Rosen 1978) and design jobs accordingly.
In summary, the presented models illustrate that the NRMP job content measure has a
negative influence on performance pay as predicted by theory. The relationship is robust across
the first four specifications and is mediated when industry dummies are included in the
regression. None of the other job content measures appear to have a significant effect on
performance pay which is robust across specifications.
4.4. Regression diagnostics and robustness checks
The purpose of this section is to detect any characteristics of the data which might lead to
biased results and call the trustworthiness of the conclusions into question. The section refers
to the underlying assumptions of the model. In the case of the OLS regression, these
assumptions are often called the Gauss-Markov assumptions. However, the section only
loosely bases the analysis on these assumptions, understanding them as benchmarks for
discussion. One reason is that the assumptions refer to ideal characteristics of the data, which
are rarely met by real data. Furthermore, there might be characteristics of the data different
than the classical assumptions which are worth discussing.
First, a natural concern is that an OLS model might deliver misleading results in the case of a
binary dependent variable. One classical assumption underlying OLS is linearity in parameters.

34
This is clearly violated in the case of a dependent variable which takes the values zero and one,
leading to a case where the OLS model could provide predictions lying outside of the
meaningful range of zero and one. Previous literature (e.g. Horrace and Oaxaca 2006) has
indicated that a logit model delivers more accurate results than a linear probability model.
Therefore, the baseline specification is estimated using a logit estimation. The results of this
model are presented in table 8 (appendix). The table illustrates that the general conclusions
from the OLS estimation concerning the significance levels similarly hold in the logit estimation:
None of the coefficients of interest is significant in one specification but insignificant in the
other. To compare the coefficient size of the two estimation methods, table 9 (appendix)
contains the average marginal effects of the explanatory variables from the full model of the
logit estimation (table 8 column 5). The size of the coefficients from the two estimation
techniques is very similar. Focusing on the main coefficients of interest, both OLS and logit
present coefficients which are identical to the first two decimal places. Therefore, the
conclusions from both estimation techniques are the same and the relationship appears robust
across these two estimation methods.
Second, a standard OLS assumption is that errors are normally distributed. This assumption
influences the standard errors associated with the coefficients which are required to analyze
exact inference based on t-statistics35. The Shapiro-Wilk test (Shapiro and Wilk 1965) suggests
that this assumption is violated (table 10 in the appendix). This test explores the null hypothesis
that the errors are normally distributed and rejects this hypothesis. However, a violation of this
assumption is nowadays widely considered inconsequential for large samples (Menard 2002;
Lumley et al. 2002; Wooldridge 2015, p. 155). Since this analysis examines a sufficiently large
sample, this finding does not threaten the credibility of the results.
Third, OLS requires homoscedasticity, i.e. the standard deviations of the errors do not depend
on the values of the predictors. Similar to the previous assumption, heteroscedasticity only
affects standard errors (and hence t-values and p-values). Table 10 (appendix) presents the
formal test: The Breusch-Pagan test (Breusch and Pagan 1979) has the underlying null
hypothesis that the variance is constant. The test rejects this hypothesis. One way to address
concerns about the lack of normality and heteroscedasticity is to estimate the standard errors
35 Higher standard errors result in a lower absolute magnitude of t-values (negative or positive). The assumption is not required for unbiasedness of OLS, i.e. it does not influence the magnitude of the coefficients.

35
using robust variance estimators (first proposed by Huber 1967). As a robustness check, I have
considered an OLS estimation using robust standard errors. The standard errors from this
estimation are very similar to the ones from the baseline specification: None of the standard
errors of the main explanatory variables deviate by more than 0.02; they are therefore
unreported.
Fourth, outliers in the data might distort the estimation results. Different measures are
available to analyze the influence of outliers. One way is to consider the studentized residuals.
A residual is the deviation of the observed value from the estimated value. Studentizing is the
procedure of dividing these residuals by an estimate of their standard deviation (in analogy
with normalizing). None of the studentized residuals in the data is larger than 2.5. This measure,
therefore, does not suggest the presence of outliers (unreported). A second method is to
examine Cook’s distance, an estimate of the influence of a data point. Influential points are
outliers which additionally affect the slope of the regression line. Cook and Weisberg (1982)
have suggested that values greater than one should be examined as highly influential points.
This is not the case for any of the data points in the current estimation (unreported). An
alternative measure of influence is DFBETA. Its logic is similar to Cook’s distance, but a separate
value is calculated for each regressor. The data does not contain any value with DFBETA larger
than 1 (unreported); while 2 is a common cut-off value (Belsley 1980). Overall, none of these
methods suggest that outliers threaten the validity of this regression analysis.
Fifth, one might be concerned that some of the independent variables are correlated. In such
a case, the empirical model suffers from collinearity. If there is little variation in one
independent variable that cannot mostly be explained by the variation of another independent
variable, it will be difficult to estimate the effect of these variables on performance pay.
Collinearity inflates the standard errors of the coefficients (and does not influence coefficient
size). It is problematic only if it complicates the determination of the effect of the variables of
interest. As long as the collinear variables are only control variables, collinearity is not harmful:
The standard errors of the coefficients of interest are unaffected, and the virtue of the other
variables as control variables is not influenced (Wooldridge 2015, p. 86). In the current model,
a potential problem might be a high correlation between the different job content measures
as they refer to related underlying constructs.

36
A starting point for examining collinearity is the correlation matrix in table 7 (appendix). It
reveals a high correlation among some of the job content measures. The relationships appear
to be driven by the distinction between manual and cognitive tasks. If an occupation is intensive
in manual tasks, it will score higher on all measures capturing manual tasks, irrespectively of
routine or non-routine. Analogously, it will score lower on all measures referring to cognitive
tasks. This relationship is particularly problematic in the case of the connection between NRMP
and routine manual (Pearson’s r = 0.793). To address the potential issue of collinearity, table 11
(appendix) presents an alternative estimation as a robustness check. This specification excludes
routine manual from the model as this variable is causing a big part of the strong correlations
among the task content measures. The results are very similar to the baseline specification36.
Overall, the results appear robust and collinearity does not threaten the credibility of the
results.
Another way of analyzing the issue of collinearity are variance inflation factors (VIF). They
provide information about how much the variance of each regression coefficient is inflated due
to collinearity. According to a widely-used rule of thumb, a variance inflation factor larger than
ten indicates excessive collinearity (O’Brien 2007). Even if this generalization might not always
be appropriate (ibidem), the analysis of the VIF suggests no reasons for concerns about
collinearity since all VIF values are nowhere close to this threshold (table 10 in the appendix).
Sixth, another potential concern addresses the selection of the sample. As outlined earlier, the
baseline specification only uses observations which are included in the full model to allow for
a valid model comparison among the different columns. This procedure leads to excluding
1192 observations from the estimation. One might be concerned that the remaining
1477 observations are not representative, which could lead to biased results. This threat occurs
in particular when the dropped variables are not a random selection from the full sample but
follow some systematic pattern. Consider for example that firms in a non-competitive
environment are likely to refuse to answer the question about the number of competitors.
Additionally, consider that these observations, which are dropped from the sample, are also
36 Results from table 11 (appendix) are even more similar to the alternative specification which excludes the measures routine manual and routine cognitive (table 5, section 4.3). This is not surprising since the only difference between the two specifications is one explanatory variable, routine cognitive, which did not show a significant influence on performance pay in earlier specifications. For this reason, the master thesis does not present a detailed discussion of the results in table 11. For a more detailed interpretation, compare the discussion of table 5 as presented in section 4.3.

37
less likely to reveal a significant relationship between the job content measures and
performance pay than the other observations, which remain in the sample. The combination
of these two aspects will lead to biased results. In this sense, the uncovered relationships would
be dependent on dropping the observations.
As a first step to examine this issue, one can compare the summary statistics for the full sample
(table 2, section 4.2) with the summary statistics for the reduced sample (table 12 in the
appendix). Overall, the descriptive statistics are similar for both samples. At the same time,
three variables show noticeable changes: First, the proportion of firms which employ payment
by results increases from 26% to 33% in the reduced sample. Second, the average firm size
decreased from 449.3 to 244.9. In addition, the maximum value for firm size shows a strong
decrease. The drop in average firm size is, therefore, likely due to excluding some very large
companies from the sample. Third, the average proportion of union members decreases from
21% to 11%. It is important to acknowledge that the two samples show these differences, in
particular, the 7 percentage points higher proportion of firms which employ payment by results.
At the same time, the changes don’t appear to be large enough to fundamentally question the
validity of the conclusions from the regression analysis based on the reduced sample.
To provide some further evidence that excluding the observations does not change the main
findings, table 13 (appendix) presents two different specifications for the ‘naïve regression,’
one being based on the full sample and one including only the observations from the full model
(identical to table 4 column 1 in section 4.3). The comparison shows that the results are very
similar for four of the five coefficients of interest. None of these four variables is significant in
one specification but insignificant in the other. Some of the coefficients show a change in size,
none of which is larger than 0.025. The fifth measure, non-routine cognitive-interpersonal,
appears to be considerably different in the two columns: The impact is insignificant in the
reduced sample, but highly significant in the full sample. This suggests that a significant effect
of this measure might have been uncovered if the full sample was available for all five steps of
the baseline specification37. I have furthermore tested if there are alternative identification
37 However, in a specification in which all the five columns are estimated based on all available observations (instead of the same observations included in the final model) non-routine cognitive-interpersonal does not show a significant effect in any other than the first column (unreported). Furthermore, even if the thesis neglected a present effect only because of the excluded observations, the thesis would miss an opportunity to uncover an interesting relationship. Most importantly, the robustness check does not challenge the credibility of the uncovered relationship between NRMP and performance pay.

38
strategies which make it possible to avoid losing such a big number of observations by excluding
one of the controls from the baseline specification (unreported). There is no such meaningful
specification because none of the control variables alone accounts for a big drop in available
observations.
Seventh, OLS has been developed to estimate the influence of factors which are measured on
a ratio scale. In the presented regression specification, three of the controls are measured on
an ordinal scale: the number of competitors38, the internationality of the product market, and
the importance of output quality. As it is common in literature, I have treated these variables
as continuous, even when the spacing is not equal across categories (Long and Freese 2006).
I have tested an alternative specification which includes these three variables as categorical
variables (in form of dummy variables) and found almost unchanged results with respect to the
main explanatory variables (therefore unreported).
In summary, this section has illustrated that the main results appear to be robust. None of the
discussed characteristics appears to threaten the validity of the results.
38 With the categories ‘none/organization dominates market,’ ‘few competitors,’ ‘many competitors.’

39
5. Conclusion
The thesis has shed light on the factors determining a company’s decision to introduce
performance pay by empirically analyzing which firms employ such a pay scheme. It has
specifically focused on the relationship between the content of the work conducted in a firm
and the employment of performance pay. The first part after the introduction has identified
the classical principal-agent theory as the foundation for the theoretical reasoning of the thesis.
It has furthermore discussed empirical evidence which mainly focuses on how workers react to
performance pay. In addition, the task approach has been presented as a way of quantifying
the content of an occupation.
Building on these streams of literature allowed for the development of a testable hypothesis
which is based on the following reasoning: A company will only employ performance pay if it
can appropriately measure performance. The availability of a performance measure, in turn,
largely depends on the content of the work conducted in the firm. The thesis has illustrated
why the intensity in routine and non-routine tasks is particularly important. The discussion has
led to the following hypothesis: Occupations which are intensive in routine tasks (non-routine
tasks) are associated with a higher (lower) likelihood of employing performance pay.
The third part has introduced the two relevant data sets. The ‘Workplace Employment
Relations Study’ (‘WERS’) contains information on which companies employ performance pay
as well as rich data on the management practices from a management survey. Data from the
‘Occupational Information Network’ (‘ONET’) includes standardized job descriptors allowing to
construct job content measures which capture if an occupation is intensive in routine and non-
routine tasks. The thesis has described the process of developing the five job content measures
as well as the necessary steps to create one data set from the two sources.
The econometric analysis has discussed the identification strategy and the concept of the
nested regression analysis. It has introduced a rich set of relevant control variables which are
included in the WERS data. The empirical evidence for the tested hypothesis is mixed. While
four job content measures don’t show a statistically significant effect on performance pay, one
measure appears to be a relevant predictor. If the main activities of the workforce are intensive
in non-routine tasks which are manual-physical, the firm will be less likely to employ

40
performance pay. The effect of NRMP is statistically significant, economically relevant and the
relationship is robust across different specifications.
The industry plays an important role in the analyzed relationship: The coefficient of NRMP
becomes insignificant, as industry dummies are added to the regression. I have argued that
despite this finding, NRMP should not simply be dismissed as a spurious result of industry. The
job content measure can be interpreted as the underlying mechanism and can contribute to
understanding why the industry is such a strong predictor of performance pay.
In addition, this research has presented regression diagnostics and robustness checks to
examine potential issues which might lead to biased results and call the trustworthiness of the
conclusions into question. The section has discussed the Gauss-Markov assumptions, the
estimation results of a logit model and the effects of a reduced sample size in a nested
regression analysis. None of the discussed aspects threaten the validity of the main conclusions.
While there is some empirical evidence suggesting that workers react to performance pay, we
still know little about how different factors determine a firm’s decision to employ performance
pay. The master thesis contributes to closing this gap in literature. It has provided empirical
evidence on the relationship between firm characteristics, especially the job content of the
main occupation, and the firm’s decision to introduce performance pay.
Future research might focus on establishing a causal link between the explanatory factors and
the employment of performance pay. Analyzing richer data might help to achieve this goal. One
example is examining panel data which would allow to include fixed effects, making it possible
to control for unobservable time invariant factors. Another example is analyzing a natural field
experiment. Doing so can help to uncover a causal relationship by examining an exogenous
variation in an explanatory variable and the resulting effect on performance pay.

i
References
Acemoglu, D., and Autor, D. (2011). Skills, Tasks and Technologies: Implications for Employment
and Earnings. In: Card, D., and Ashenfelter, O. (Eds.). Handbook of Labor Economics, Volume 4,
Part B, 1043-1171. Amsterdam et al.: Elsevier.
Antonczyk, D., DeLeire, T., and Fitzenberger, B. (2010). Polarization and Rising Wage Inequality:
Comparing the U.S. and Germany. IZA Discussion Paper no. 4842, IZA, Bonn. Retrieved from:
http://ftp.iza.org/dp4842.pdf.
Ariely, D., Gneezy, U., Loewenstein, G., and Mazar, N. (2009). Large Stakes and Big Mistakes.
The Review of Economic Studies, 76(2), 451-469.
Austin, R., and Larkey, P. (2002). The Future of Performance Measurement: Measuring
Knowledge Work. In: Neely, A. (Ed.). Business Performance Measurement: Theory and Practice,
321-342. Cambridge: Cambridge University Press.
Autor, D. H. (2013). The “Task Approach” to Labor Markets: An Overview. Journal for Labour
Market Research, 46(3), 185-199.
Autor, D. H., and Handel, M. J. (2013). Putting Tasks to the Test: Human Capital, Job Tasks, and
Wages. Journal of Labor Economics, 31(1), 59-96.
Autor, D. H., Levy, F., and Murnane, R. J. (2003). The Skill Content of Recent Technological
Change: An Empirical Exploration. The Quarterly Journal of Economics, 118(4), 1279-1333.
Baker, G. P. (1992). Incentive Contracts and Performance Measurement. Journal of Political
Economy, 100(3), 598-614.
Bandiera, O., Barankay, I., and Rasul, I. (2007). Incentives for Managers and Inequality Among
Workers: Evidence from a Firm-Level Experiment. The Quarterly Journal of Economics, 122(2),
729-773.
Banker, R. D., and Datar, S. M. (1989). Sensitivity, Precision, and Linear Aggregation of Signals
for Performance Evaluation. Journal of Accounting Research, 27(1), 21-39.

ii
Barth, E., Bratsberg, B., Haegeland, T., and Raaum, O. (2009). Performance Pay and Within-Firm
Wage Inequality. IZA Discussion Paper no. 4137, IZA, Bonn. Retrieved from: http://anon-
ftp.iza.org/dp4137.pdf.
Belsley, D. A., Kuh, E., and Welsch, R. E. (2005). Regression Diagnostics: Identifying Influential
Data and Sources of Collinearity. Hoboken: John Wiley & Sons.
Biermann, J. (2017). Performance Pay and Firm Characteristics – An Empirical Analysis.
Unpublished seminar paper.
Black, S. E., and Spitz-Oener, A. (2010). Explaining Women’s Success: Technological Change and
the Skill Content of Women’s Work. The Review of Economics and Statistics, 92(1), 187-194.
Bloom, N., Genakos, C., Sadun, R., and Van Reenen, J. (2009). Does Management Matter? New
Empirics and Old Theories. Manuscript, London School Economics/Stanford University.
Bloom, N., and Van Reenen, J. (2011). Human Resource Management and Productivity. In: Card,
D., and Ashenfelter, O. (Eds.). Handbook of Labor Economics, Volume 4, Part B, 1697-1767.
Amsterdam et al.: Elsevier.
Bound, J., Brown, C., and Mathiowetz, N. (2001). Measurement Error in Survey Data. In:
Heckman, J. J. and Leamer, E. (Eds.). Handbook of Econometrics, Volume 5, 3705-3843.
Amsterdam et al.: Elsevier.
Breusch, T. S., and Pagan, A. R. (1979). A Simple Test for Heteroscedasticity and Random
Coefficient Variation. Econometrica, 47(5), 1287-1294.
Brown, C. (1990). Firms’ Choice of Method of Pay. Industrial and Labor Relations Review, 43(3),
165-182.
Brown, M., and Heywood, J. S. (2002). Paying for Performance: An International Comparison.
New York: M.E. Sharpe.
Bureau of Labor Statistics (2017a). Crosswalks Between the 2010 SOC and Systems Used by
Other Federal and International Statistical Agencies. Retrieved from: https://www.bls.
gov/soc/soccrosswalks.htm.

iii
Bureau of Labor Statistics (2017b). Standard Occupational Classification. Retrieved from:
https://www.bls.gov/soc/.
Clogg, C. C., Petkova, E., and Haritou, A. (1995). Statistical Methods for Comparing Regression
Coefficients Between Models. American Journal of Sociology, 100(5), 1261-1293.
Cook, R. D., and Weisberg, S. (1982). Residuals and Influence in Regression. New York: Chapman
and Hall.
Courty, P., and Marschke, G. (2004). An Empirical Investigation of Gaming Responses to
Performance Incentives. Journal of Labor Economics, 22(1), 23-56.
Deci, E. L., and Ryan, R. M. (1985). The General Causality Orientations Scale: Self-Determination
in Personality. Journal of Research in Personality, 19(2), 109-134.
Donaldson, S. I., and Grant-Vallone, E. J. (2002). Understanding Self-Report Bias in
Organizational Behavior Research. Journal of Business and Psychology, 17(2), 245-260.
Donsbach, J., Tsacoumis, S., Sager, C., and Updegraff, J. (2003). O*NET Analyst Occupational
Abilities Ratings: Procedures. Raleigh, N.C.: National Center for O*NET Development. Retrieved
from: https://www.onetcenter.org/dl_files/AnalystProc.pdf.
Dustmann, C., Ludsteck, J., and Schönberg, U. (2009). Revisiting the German Wage Structure.
The Quarterly Journal of Economics, 124(2), 843-881.
Feser, E. J. (2003). What Regions Do Rather than Make: A Proposed Set of Knowledge-Based
Occupation Clusters. Urban Studies, 40(10), 1937-1958.
Fortuin, L. (1988). Performance Indicators – Why, Where and How? European Journal of
Operational Research, 34(1), 1-9.
Freeman, R. B., and Kleiner, M. M. (2005). The Last American Shoe Manufacturers: Decreasing
Productivity and Increasing Profits in the Shift from Piece Rates to Continuous Flow Production.
Industrial Relations: A Journal of Economy and Society, 44(2), 307-330.
Frey, B. S., and Oberholzer-Gee, F. (1997). The Cost of Price Incentives: An Empirical Analysis of
Motivation Crowding-Out. The American Economic Review, 87(4), 746-755.

iv
Gathmann, C., and Schönberg, U. (2010). How General Is Human Capital? A Task-Based
Approach. Journal of Labor Economics, 28(1), 1-49.
Gibbs, M., Levenson, A., and Zoghi, C. (2010). Why Are Jobs Designed the Way They Are?
In: Polachek, S. W., and Tatsiramos, K. (Eds.). Jobs, Training, and Worker Well-Being, 107-154.
Bingley: Emerald Group Publishing Limited.
Globerson, S. (1985). Issues in Developing a Performance Criteria System for an Organization.
International Journal of Production Research, 23(4), 639-646.
Goos, M., Manning, A., and Salomons, A. (2009). Job Polarization in Europe. The American
Economic Review, 99(2), 58-63.
Gosling, A., and Machin, S. (1995). Trade Unions and the Dispersion of Earnings in British
Establishments, 1980-90. Oxford Bulletin of Economics and Statistics, 57(2), 167-184.
Griffith, R., and Neely, A. (2009). Performance Pay and Managerial Experience in Multitask
Teams: Evidence from within a Firm. Journal of Labor Economics, 27(1), 49-82.
Grossman, G. M., and Rossi-Hansberg, E. (2008). Trading Tasks: A Simple Theory of Offshoring.
The American Economic Review, 98(5), 1978-1997.
Handel, M. J. (2016). The O*NET Content Model: Strengths and Limitations. Journal for Labour
Market Research, 49(2), 157-176.
Hardy, W., Keister, R., and Lewandowski, P. (2015). Redefining vs. Reallocating. Task-Driven Job
Segmentation in Poland. IBS Working Paper 10/2015, IBS, Warsaw. Retrieved from:
http://conference.iza.org/conference_files/worldb2015/lewandowski_p9882.pdf.
Harris, D. H. (1994). Organizational Linkages: Understanding the Productivity Paradox.
Washington, D.C.: National Academies Press.
Hayter, S. (2011). The Role of Collective Bargaining in the Global Economy: Negotiating for
Social Justice. Cheltenham: Edward Elgar Publishing.
Heywood, J. S., Siebert, W. S., and Wei, X. (1997). Payment by Results Systems: British Evidence.
British Journal of Industrial Relations, 35(1), 1-22.

v
Hirsch, B. T. (2006). Why Do Part-Time Workers Earn Less? The Role of Worker and Job Skills.
Industrial and Labor Relations Review, 58(4), 525-551.
Holmström, B. (1979). Moral Hazard and Observability. The Bell Journal of Economics, 10(1), 74-91.
Holmström, B., and Milgrom, P. (1991). Multitask Principal-Agent Analyses: Incentive Contracts,
Asset Ownership, and Job Design. Journal of Law, Economics, and Organization, 7, 24-52.
Holmström, B., and Milgrom, P. (1994). The Firm as an Incentive System. The American
Economic Review, 84(4), 972-991.
Horrace, W. C., and Oaxaca, R. L. (2006). Results on the Bias and Inconsistency of Ordinary Least
Squares for the Linear Probability Model. Economics Letters, 90(3), 321-327.
Hubbard, M., McCloy, R., Campbell, J., Nottingham, J., Lewis, P., Rivkin, D., and Levine, J. (2000).
Revision of O*NET Data Collection Instruments. Raleigh, N.C.: National Center for O*NET
Development. Retrieved from: https://www.onetcenter.org/dl_files/Data_appnd.pdf.
Huber, P. J. (1967). The Behavior of Maximum Likelihood Estimates under Nonstandard
Conditions. In: Le Cam, L. M., and Neyman, J. (Eds.). Proceedings of the Fifth Berkeley
Symposium on Mathematical Statistics and Probability, Vol. 1, 221-233. Cambridge: Cambridge
University Press.
Hutchens, R. M. (1987). A Test of Lazear’s Theory of Delayed Payment Contracts. Journal of
Labor Economics, 5(4), 153-170.
Institute for Structural Research Warsaw (2017). Resources. Retrieved from: www.ibs.org.
pl/resources.
Kaplan, R. S., and Norton, D. P. (1992). The Balanced Scorecard: Measures that Drive
Performance. Harvard Business Review, 70(1), 71-79.
Kerr, S. (1975). On the Folly of Rewarding A, While Hoping for B. Academy of Management
Journal, 18(4), 769-783.
Landy, F., Zedeck, S., and Cleveland, J. (2017). Performance Measurement and Theory. London,
New York: Taylor and Francis.

vi
Larkin, I. (2014). The Cost of High-Powered Incentives: Employee Gaming in Enterprise Software
Sales. Journal of Labor Economics, 32(2), 199-227.
Lazear, E. P. (1986). Salaries and Piece Rates. Journal of Business, 9(3), 405-431.
Lazear, E. P. (2000). Performance Pay and Productivity. The American Economic Review, 90(5),
1346-1361.
Lazear, E. P., and Oyer, P. (2007). Personnel Economics. NBER Working Paper no. 13480, NBER,
Cambridge. Retrieved from: http://www.nber.org/papers/w13480.
Levine, D. I. (1990). Participation, Productivity, and the Firm’s Environment. California
Management Review, 32(4), 86-100.
Long, J. S., and Freese, J. (2006). Regression Models for Categorical Dependent Variables Using
Stata, 2nd Edition. College Station, Texas: Stata Press.
Lumley, T., Diehr, P., Emerson, S., and Chen, L. (2002). The Importance of the Normality
Assumption in Large Public Health Data Sets. Annual Review of Public Health, 23(1), 151-169.
Lynch, R. L., and Cross, K. F. (1991). Measure up!: The Essential Guide to Measuring Business
Performance. London: Mandarin.
Menard, S. (2002). Applied Logistic Regression Analysis. New York: Sage Publications.
Neely, A., Richards, H., Mills, J., Platts, K., and Bourne, M. (1997). Designing Performance
Measures: A Structured Approach. International Journal of Operations and Production
Management, 17(11), 1131-1152.
O’Brien, R. M. (2007). A Caution Regarding Rules of Thumb for Variance Inflation Factors.
Quality and Quantity, 41(5), 673-690.
Office for National Statistics United Kingdom (2017). Standard Occupational Classification 2010.
Retrieved from: https://www.ons.gov.uk/methodology/classificationsandstandards/standard
occupationalclassificationsoc/soc2010.
O*NET Resource Center (2017a). Content Model Outline – Detailed. Retrieved from: https://
www.onetcenter.org/content.html.

vii
O*NET Resource Center (2017b). The O*NET-SOC Taxonomy. Retrieved from: https://www.
onetcenter.org/taxonomy.html.
Paarsch, H. J., and Shearer, B. J. (1999). The Response of Worker Effort to Piece Rates: Evidence
from the British Columbia Tree-Planting Industry. Journal of Human Resources, 34(4), 643-667.
Paarsch, H. J., and Shearer, B. J. (2000): Piece Rates, Fixed Wages and Incentive Effects:
Statistical Evidence from Payroll Records. International Economic Review, 41(1), 59-92.
Pendleton, A., Whitfield, K., and Bryson, A. (2009). The Changing Use of Contingent Pay in the
Modern British Workplace. In: Brown, W., Bryson, A., Forth, J., and Whitfield., K. (Eds.). The
Evolution of the Modern Workplace. Cambridge: Cambridge University Press.
Peri, G., and Sparber, C. (2009). Task Specialization, Immigration, and Wages. The American
Economic Journal: Applied Economics, 1(3), 135-169.
Peterson, N. G., Mumford, M. D., Borman, W. C., Jeanneret, P. R., and Fleishman, E. A. (1995).
Development of Prototype Occupational Information Network (O*NET) Content Model.
Volume I: Report. Salt Lake City: Utah Department of Workforce Services.
Prendergast, C. (2011). What Have We Learnt about Pay for Performance? Geary Lecture
Winter 2010. The Economic and Social Review, 42(2), 113-134.
Rosen, S. (1978). Substitution and Division of Labour. Economica, 45(179), 235-250.
Shapiro, S. S., and Wilk, M. B. (1965). An Analysis of Variance Test for Normality (Complete
Samples). Biometrika, 52(3/4), 591-611.
Shearer, B. (2004). Piece Rates, Fixed Wages and Incentives: Evidence from a Field Experiment.
The Review of Economic Studies, 71(2), 513-534.
Slichter, S. H., Healy, J. J. and Livernash, E. R. (1960). The Impact of Collective Bargaining on
Management. Washington, D.C.: Brookings Institution Press.
Spitz-Oener, A. (2006). Technical Change, Job Tasks, and Rising Educational Demands: Looking
outside the Wage Structure. Journal of Labor Economics, 24(2), 235-270.
U.S. Department of Labor (1991). Dictionary of Occupational Titles, 4th Edition. Washington,
D.C.: U.S. Government Printing Office.

viii
Warwick Institute for Employment Research (2017). Cascot: Computer Assisted Structured
Coding Tool. Retrieved from: http://www2.warwick.ac.uk/fac/soc/ier/software/cascot/.
Wooldridge J. M. (2015). Introductory Econometrics: A Modern Approach, 6th Edition. Boston:
Cengage Learning.

ix
Appendix 1: Description and illustration of the data
Table 6. Variables WERS data
Name Description Coding
payment by
results
‘Do any of the employees in this workplace
get paid by results?’
Definition payment by results: ‘Payment by
results’ includes any method of payment
where the pay is determined by the
amount done or its value, rather than just
the number of hours worked. It includes
commission, and bonuses that are
determined by individual, workplace or
organisation productivity or performance.
It does not include profit-related pay
schemes.’
1: ‘Payment by results’
0: otherwise
importance
output quality
‘To what extent would you say that the
demand for your [main] product or service
depends upon you offering better quality
than your competitors?’
1: Demand does not depend at all on
quality
5: Demand depends heavily on superior
quality
(Possible answers 1, 2, 3, 4, 5)
number
competitors
‘How many competitors do you have for
your [main] product or service?’
1: None/Organisation dominates market
2: Few competitors
3: Many competitors
foreign
owned
‘Which of the following statements best
describes the ownership of this
workplace?’
1: ‘Predominantly foreign owned’ or
‘Foreign owned/controlled’
0: otherwise
international
market
‘Is the market for your [main] product or
service primarily ...’
1: Local
2: Regional
3: National
4: International
firm size ‘Currently how many employees do you
have on the payroll at this workplace?’
proportion
part time
Number of part-time employees /
Number of employees
proportion
women
Number of women / Number of
employees
proportion union members
Number of union members / Number of employees
meetings ‘Do you have meetings between line managers or supervisors and all the workers for whom they are responsible?’
1: yes 0: no

x
region Region in the UK 1: North (5.56%)
2: Yorkshire and Humberside (7.95%)
3: East Midlands (6.49%)
4: East Anglia (3.77%)
5: South East (32.65%)
6: South West (8.40%)
7: West Midlands (7.72%)
8: North West (11.68%)
9: Wales (5.49%)
10: Scotland (10.30%)
industry SIC 2007 section AB: Agriculture and Mining (0%)
C: Manufacturing (8.73%)
D: Electricity, gas, steam and air
conditioning supply (1.94%)
E: Water supply, sewarage and waste
management (1.87%)
F: Construction (3.84%)
G: Wholesale and retail (10.67%)
H: Transportation and storage (5.37%)
I: Accommodation and food service
(6.19%)
J: Information and communication
(2.46%)
K: Financial and insurance activities
(1.79%)
L: Real estate activities (2.61%)
M: Professional, Scientific and Technical
Activities (5.45%)
N: Administrative and Support Service
Activities (4.25%)
O: Public administration and defence
(8.81%)
P: Education (13.10%)
Q: Human health and social work
activities (15.75%)
R: Arts, entertainment and recreation
(4.03%)
S: Other service activities (3.13%)

xi
Figure 1: ONET questionnaire
The following graph shows an example how the questions are presented to the participant (Handel 2016).

xii
Figure 2: Hierarchy ONET
The following graph illustrates the hierarchy of the ONET descriptors using the example of ‘Thinking
Creatively (4.A.2.b.2).’ Every descriptor has a code; each digit of the code contains information about
one level in the hierarchy. The code gives detailed information about how the descriptor is classified
within the ONET hierarchy (O*NET Resource Center 2017a).
4. Occupational Requirements
...4.A. Generalized Work Activities
...4.A.2. Mental
Processes
...4.A.2.b.
Reasoning and Decision Making
4.A.2.b.2 Thinking
creatively
....
...

xiii
Figures 3-7: Histograms for the job content measures
The histograms present the non-standardized values of the job content measures.

xiv

xv

xvi
Table 7. Correlation matrix: Pearson’s r
PBR NRCA
NRCI
NRMP RC
RM
quality comp. foreign
inter.
market frim size part-
time women union meeting
PBR 1
NRCA 0.07** 1
NRCI 0.02 0.64*** 1
NRMP -0.09*** -0.48*** -0.45*** 1
RC 0.07** 0.35*** 0.15*** -0.38*** 1
RM -0.04 -0.58*** -0.52*** 0.79*** -0.25*** 1
quality 0.01 -0.04 0.01 -0.04 -0.06* -0.002 1
competitors 0.08*** -0.01 0.02 -0.04 -0.03 -0.01 0.14*** 1
foreign 0.11*** 0.04 -0.08** 0.06* 0.04 0.08*** -0.01 -0.04 1
inter. market 0.13*** 0.15*** -0.10*** 0.02 0.11*** 0.13*** 0.03 0.05* 0.28*** 1
firm size 0.05* 0.13*** 0.06** -0.07** 0.09*** -0.04 0.03 0.009 0.1*** 0.23*** 1
part-time -0.12*** -0.20*** 0.15*** -0.18*** -0.12*** -0.16*** 0.006 -0.01 -0.22*** -0.42*** -0.1*** 1
women -0.08** -0.005 0.22*** -0.45*** 0.05* -0.41*** 0.06* 0.01 -0.23*** -0.35*** -0.09*** 0.54*** 1
union -0.04 0.03 -0.02 0.15*** 0.02 0.09*** -0.1*** -0.15*** 0.16*** 0.11*** 0.26*** -0.16*** -0.21*** 1
meeting 0.07** 0.06** 0.02 -0.08** 0.03 -0.06* 0.02 -0.05* 0.09*** 0.17*** 0.12*** -0.073** -0.032 0.14*** 1
Variables are abbreviated due to reasons of space: PBR: payment by results, NRCA: non-routine cognitive-analytical, NRCI: non-routine cognitive-interpersonal, NRMP: non-routine manual-physical, RC: routine cognitive, RM: routine manual. Correlations bigger than 0.5 among the main explanatory variables are highlighted. *, **, and *** denote significance at the 5%, 1%, and 0.1% levels, respectively.

xvii
Appendix 2: Regression diagnostics and robustness checks
Table 8. Regression results logit
payment by result
(1) (2) (3) (4) (5)
non-routine cognitive-analytical
0.229** 0.1 -0.035 -0.022 -0.073 (0.086) (0.093) (0.101) (0.102) (0.126)
non-routine cognitive-interpersonal
-0.135 -0.047 0.037 0.043 0.166 (0.088) (0.091) (0.095) (0.096) (0.113)
non-routine manual-physical
-0.340*** -0.286** -0.353*** -0.341** -0.178 (0.1) (0.101) (0.106) (0.107) (0.119)
routine 0.044 0.047 0.040 0.044 -0.042 cognitive (0.072) (0.073) (0.074) (0.074) (0.083)
routine 0.258* 0.145 0.103 0.130 -0.022 manual (0.103) (0.107) (0.109) (0.110) (0.132)
controls I: operating environment
Yes Yes Yes Yes
controls II: characteristics workforce
Yes Yes Yes
controls III: dummies region
Yes Yes
controls IV: dummies industry
Yes
observations 1477 1477 1477 1477 1477
Standard errors in parentheses. *, **, and *** denote significance at the 5%, 1%, and 0.1% levels, respectively. For clarity, the values of the single control variables are not presented. The identification strategy and the sets of control variables are identical with the baseline regression.
Table 9. Logit coefficients and average marginal effects for the full model
payment by result
(1) logit coefficients
(2) average marginal
effects
non-routine cognitive-analytical
-0.073 -0.14 (0.126) (0.024)
non-routine cognitive-interpersonal
0.166 0.032 (0.113) (0.216)
non-routine manual-physical
-0.178 -0.034 (0.119) (0.23)
routine -0.042 -0.008 cognitive (0.083) (0.157)

xviii
routine -0.022 -0.004 manual (0.132) (0.025)
controls I: operating environment
Yes Yes
controls II: characteristics workforce
Yes Yes
controls III: dummies region
Yes Yes
controls IV: dummies industry
Yes Yes
observations 1477 1477
Standard errors in parentheses. *, **, and *** denote significance at the 5%, 1%, and 0.1% levels, respectively. For clarity, the values of the single control variables are not presented. The identification strategy and the sets of control variables are identical with the baseline regression.
Table 10. Regression results OLS: Variance inflation factors, Shapiro-Wilk test, and Breusch-Pagan Test
(1) payment by results
OLS full model
(2) variance inflation
factors
non-routine cognitive-analytical
-0.018 3.89
(0.024)
non-routine cognitive-interpersonal
0.032 2.71
(0.022)
non-routine manual-physical
-0.036 4.10
(0.023)
routine -0.008 1.48
cognitive (0.016)
routine -0.009 4.72
manual (0.025)
controls I, II, III, IV Yes Yes
observations 1477 1477
Shapiro-Wilk test (p-value)
0.000
Breusch-Pagan Test (p-value)
0.000
Standard errors in parentheses. *, **, and *** denote significance at the 5%, 1%, and 0.1% levels, respectively. For clarity, the values of the single control variables are not presented. The identification strategy and the sets of control variables are identical with the baseline regression. The row labeled ‘Shapiro- Wilk test’ refers to the null hypothesis that the errors are normally distributed. The row labeled ‘Breusch-Pagan Test’ refers to the null hypothesis that the variance is constant.

xix
Table 11. Regression results OLS: Alternative specification addressing collinearity concerns
payment by result
(1) (2) (3) (4) (5)
non-routine cognitive-analytical
0.037* 0.013 -0.014 -0.013 -0.015 (0.018) (0.019) (0.020) (0.020) (0.022)
non-routine cognitive-interpersonal
-0.036 -0.013 0.006 0.007 0.032 (0.019) (0.020) (0.020) (0.020) (0.022)
non-routine manual-physical
-0.036* -0.041** -0.063*** -0.057** -0.041* (0.015) (0.015) (0.017) (0.017) (0.018)
routine 0.016 0.013 0.010 0.012 -0.009 cognitive (0.016) (0.015) (0.015) (0.015) (0.016)
controls I: operating environment
Yes Yes Yes Yes
controls II: characteristics workforce
Yes Yes Yes
controls III: dummies region
Yes Yes
controls IV: dummies industry
Yes
observations 1477 1477 1477 1477 1477 R2 0.01 0.04 0.06 0.07 0.14
Standard errors in parentheses. *, **, and *** denote significance at the 5%, 1%, and 0.1% levels, respectively. For clarity, the values of the single control variables are not presented. The identification strategy and the sets of control variables are identical with the baseline regression.

xx
Table 12. Summary statistics reduced sample
Panel A Mean S.d. Min Max N
payment by results 0.33 0.47 0 1 1477
importance output quality 4.14 0.97 1 5 1477
number competitors 2.56 0.57 1 3 1477
foreign owned 0.16 0.36 0 1 1477
international market 2.26 1.14 1 4 1477
firm size 244.9 881.0 5 11605 1477
proportion part time 0.27 0.29 0 1 1477
proportion women 0.48 0.28 0 1 1477
proportion union members 0.11 0.23 0 1 1477
meetings 0.78 0.41 0 1 1477
Panel B Mean S.d. Min Max N
non-routine cognitive-analytical 9.13 1.40 5.76 13.20 1477
non-routine cognitive-interpersonal 9.09 1.06 6.44 12.85 1477
non-routine manual-physical 9.76 2.64 4.54 15.77 1477
routine cognitive 11.34 0.90 7.95 13.52 1477
routine manual 7.71 1.80 3.62 12.20 1477
Table 13. Regression results OLS: Compression reduced samples and full sample for the naïve model
payment by result
(1) adjusted sample
(2) full sample
non-routine cognitive-analytical
0.051** 0.052*** (0.019) (0.014)
non-routine cognitive-interpersonal
-0.031 -0.049*** (0.019) (0.013)
non-routine manual-physical
-0.072*** -0.069*** (0.021) (0.015)
routine 0.010 -0.002 cognitive (0.016) (0.009)
routine 0.054* 0.079*** manual (0.022) (0.017)
observations 1477 2669
Standard errors in parentheses. *, **, and *** denote significance at the 5%, 1%, and 0.1% levels, respectively.


