Embed Size (px)
Citation preview
Insider Information and Performance Pay
George-Levi Gayle and Robert A. Miller�
January 2009
Abstract
This paper provides evidence that managers have private information they exploit
for �nancial gain at the expense of shareholders. It develops a model of optimal con-
tracting to show that moral hazard, hidden actions taken by agents, can rationalize why
a principal would optimally induce agents to bene�t from their private information.
Estimates from a structural model shows that moral hazard is an important economic
factor. This leads to the conclusion that, in practice, shareholders and managers might
optimally agree upon an arrangement where managers systematically exploit their pri-
vate information about the �rm.

I. Introduction
This paper provides evidence that managers exploit information hidden from sharehold-
ers for personal gain through their compensation contracts. We demonstrate this can arise
as a part of an optimal arrangement between shareholders and managers, in a model where
managers�actions are also hidden from shareholders and their board of directors, creating
a moral hazard problem. We estimate a structural model of moral hazard that quanti�es
its cost, and �nd that moral hazard from hidden actions is an important determinant of
managerial compensation packages. So from a public policy perspective, one should not in-
terpret evidence that managers bene�t from their insider information as indicative of failure
in corporate governance. Optimal compensation plans may induce managers to bene�t from
their private information, even if shareholders do not face public choice or free rider problems
when aggregating their interests, and can easily communicate their wealth maximizing goal
to managers through their board of directors.
The paper is organized around three questions. Are managerial compensation packages
more likely to be tilted towards performance pay, such as dividends and capital gains from
stock and options in the �rm, when their �rms subsequently perform well on the stock
market? Can theory rationalize why shareholders would sanction this practice under some
circumstances? The third question asks whether there are high economic bene�ts from
shareholders creating incentives that align the manager�s interests to theirs.
Based on evidence we provide in Section 2 from a longitudinal data set which tracks
about 1500 U.S. �rms and their managers for nine years, we answer the �rst question in
the a¢ rmative. Changes in the stock components of the manager�s compensation package
are a signi�cant variable in forecasting �nancial returns. One might interpret this empirical
�nding as a trade-o¤ between higher net �nancial returns to shareholders and more risky
�nancial packages for managers, but this implies some �rms do not maximize net �nancial
returns. We are reluctant to drop the neoclassical premise that shareholders maximize the
expected value of their �rm. We would rather interpret the a¢ rmative answer to the �rst
1

question as evidence that managers have insider information, which helps them decide how
much of their compensation package should be �xed and how much should be a¤ected by
the �rm�s performance.
Our preferred interpretation begs the second question. In Section 3 we develop a princi-
pal agent model in which moral hazard (or hidden actions taken by the agent) is a necessary
condition to rationalize why the principal induces the agent to bene�t from their private
information about the state of the �rm.
Unless moral hazard is an important empirical issue, it is hard to rationalize why share-
holders would tolerate executives who bene�t from private information about the �rms they
manage. Thus in Section 4 we answer the third question by estimating a structural model
of moral hazard and �nd that the economic costs of ignoring moral hazard are indeed sub-
stantial.
There are many reasons why �rm executives are probably much better informed than
shareholders about the prospects of the enterprise, and its demands on managerial time,
energy and expertise. As opportunities to make the �rm more pro�table are explored,
management gain foresight into which ventures are likely to be successful, and those which
will probably fail, putting them in a favorable position to trade on their insider knowledge.
If a manager could choose how many �rm speci�c assets to hold without incurring penalties
directed at those who engage in insider trading, he might prefer holding more stock and
options in his own �rm when his private prognosis was more favorable than the market�s,
and less �rm speci�c assets when his insider knowledge projects a worse outcome than what
stockholders and other investors think.
Insider trading is illegal, and the Securities and Exchange Commission is charged with
combatting insider pro�ts from arbitrage.1 But the SEC does not prevent a manager from
1Harris (2003) describes how the SEC prepares to prosecute cases of alleged insider trading. Large volumetransactions accompanied by big price shifts are a signal that information about the �rm�s prospects mayhave been exploited by insiders. When alerted to a possible infringement (perhaps by a trader who believeshe was exploited by an insider), the SEC compiles a list of investors who traded during the period underconsideration, the insiders privy to information that led to the price change, and tries to match parties fromboth lists.
2

bene�ting from insider information by holding more of his company�s stocks when he be-
lieves his �rm�s medium term prospects look more favorable than usual. Shareholders could
prevent a manager from bene�ting from his detailed knowledge of his �rm. Existing reg-
ulations in the United States require the manager to frequently report all trading in the
�rm�s assets. Hence it would be a relatively straightforward for the board of directors to
penalize the manager, and thus prevent him, from ever holding any of the �rm�s assets. In
the absence of moral hazard and/or the opportunity to bene�t from inside trading, it is hard
to imagine why a manager would prefer to hold �nancial assets in his own �rm compared
to the alternative of holding a well diversi�ed portfolio. Managers of nonpro�t enterprises
and high ranking government o¢ cials are routinely required to divest themselves of assets
that may cause a con�ict of interest between their professional role and personal wealth
management. Therefore managers should have no more qualms about agreeing to such a
requirement, than agreeing to rules governing company perks, or theft of company property.
Thus the board could greatly curb if not entirely eliminate the bene�ts managers garner
for themselves from their inside information by issuing an easily enforced directive to their
executive management.
In practice this never occurs. A large portion of executive compensation is tied to
�rm speci�c assets. From an empirical standpoint, trading by corporate insiders appears
to be pro�table. Seyhun (1986) �nds that insiders tend to buy before an abnormal rise in
stock prices and sell before an abnormal decline. Earlier studies by Lorie and Niederho¤er
(1968), Ja¤e (1974), and Finnerty (1976) draw similar conclusions. More recently, Seyhun
(1992a) �nds compelling evidence that insider trading volume, frequency, and pro�tability all
increases signi�cantly during the 1980s. Over the decade, he documents that insiders earned
over 5 percent abnormal returns on average. Seyhun (1992b) determines that insider trades
predict up to 60 percent of the total variation in one-year-ahead returns. To summarize,
hidden information is an economically important phenomenon in executive compensation.
So it is paradoxical that managers are compensated on the basis of their �rm�s perfor-
3

mance, such as dividends and capital gains, when the pro�tability of the �rm partly depends
on how managers assess their own accomplishments and �rm�s prospects. Bebchuk and Fried
(2003) and others have argued that one reason why managers are paid stock options instead
of assets that are easier to value, such as cash, is that shareholders systematically under-
estimate option expenses. Similarly Bertrand and Mullainthan (2000, 2001) argue that the
separation of management from ownership in public corporations allows the CEO to gain
e¤ective control of the pay-setting process. They argue that skimming is less likely to attract
the attention of shareholders when the �rm performs well. Consequently granting options
should be an excellent vehicle for skimming, costing shareholders nothing when the �rm
performs poorly.
Such explanations are most convincing when there are costs of governance at the level of
the board of directors from administering shareholder goals of maximizing �nancial returns.
However, the fact that managers receive restricted stock and options, which tie their personal
wealth to the fortunes of their employers, does not signify governance problems at the board
level. In principal agent models with hidden actions but no private information, shareholders
could use these instruments to enforce the optimal contract. Margiotta and Miller (2000)
develop econometric methods for estimating a structural model of moral hazard and �nd it
is a very important factor for explaining variation in managerial compensation. Moreover
using similar estimation methods, we �nd in Gayle and Miller (2008a), that the structure
of compensation, conditional on �rm characteristics, has been stable over the last 60 years.
That paper shows the secular increase in the mean and variance of managerial compensation
is largely explained by the changing distribution of �rm size occurring throughout this ex-
tended period. Both studies are applied to relatively small data sets taken from only three
industries, namely aerospace, chemicals and electronics. The empirical work on the costs of
moral hazard reported in Section 4 extends these other results to a broad industry spectrum
of publicly traded �rms.
4
II. Insider Wealth, Abnormal Returns and Compensation
This section addresses the �rst question raised in the introduction. After brie�y de-
scribing the longitudinal data set compiled for undertaking the empirical work, we conduct
a regression analysis of the empirical evidence on the bene�ts of insider information. We
focus on changes in stockholding that occur before the period begins to see whether they help
predict future returns. Using a model with a simple linear decision rule for insider trading,
we test whether managers condition on more information than the market does in forming
their expectations about future returns. Regressing the manager�s portfolio choices on next
period�s abnormal returns to the �rm, we �nd the latter are positive and signi�cant, evidence
that future returns are a noisy indicator of inside information available to the manager.
We then conduct simulations in an attempt to quantify the magnitude of the gains to
managers from their insider information. We construct a simple dynamic portfolio strategy
based on changes in asset holdings by managers, and �nd that this strategy signi�cantly
outperforms the market.
In the latter parts of Section 2 we investigate whether, conditional on the information
held by the manager, compensation to managers �uctuates with the idiosyncratic compo-
nents of the return to his �rm. After controlling for the manager�s portfolio choices and other
observed factors that a¤ect abnormal returns, we �nd that unexplained variation in abnor-
mal returns is positive and signi�cant. This result supports the hypothesis that rather than
simply bene�ting from their private information by structuring their compensation package
in an advantageous way, managers are also motivated, through their work choices, to raise
the mean of unanticipated abnormal returns. These new �ndings suggest a second explana-
tion for why shareholders do not prevent managers from personally exploiting their insider
knowledge about the �rm. If their actions are also hidden and a¤ect �rm performance, then
not linking the manager�s wealth to the �rm�s value might create a moral hazard problem,
an issue we take up in the sections which follow.
5
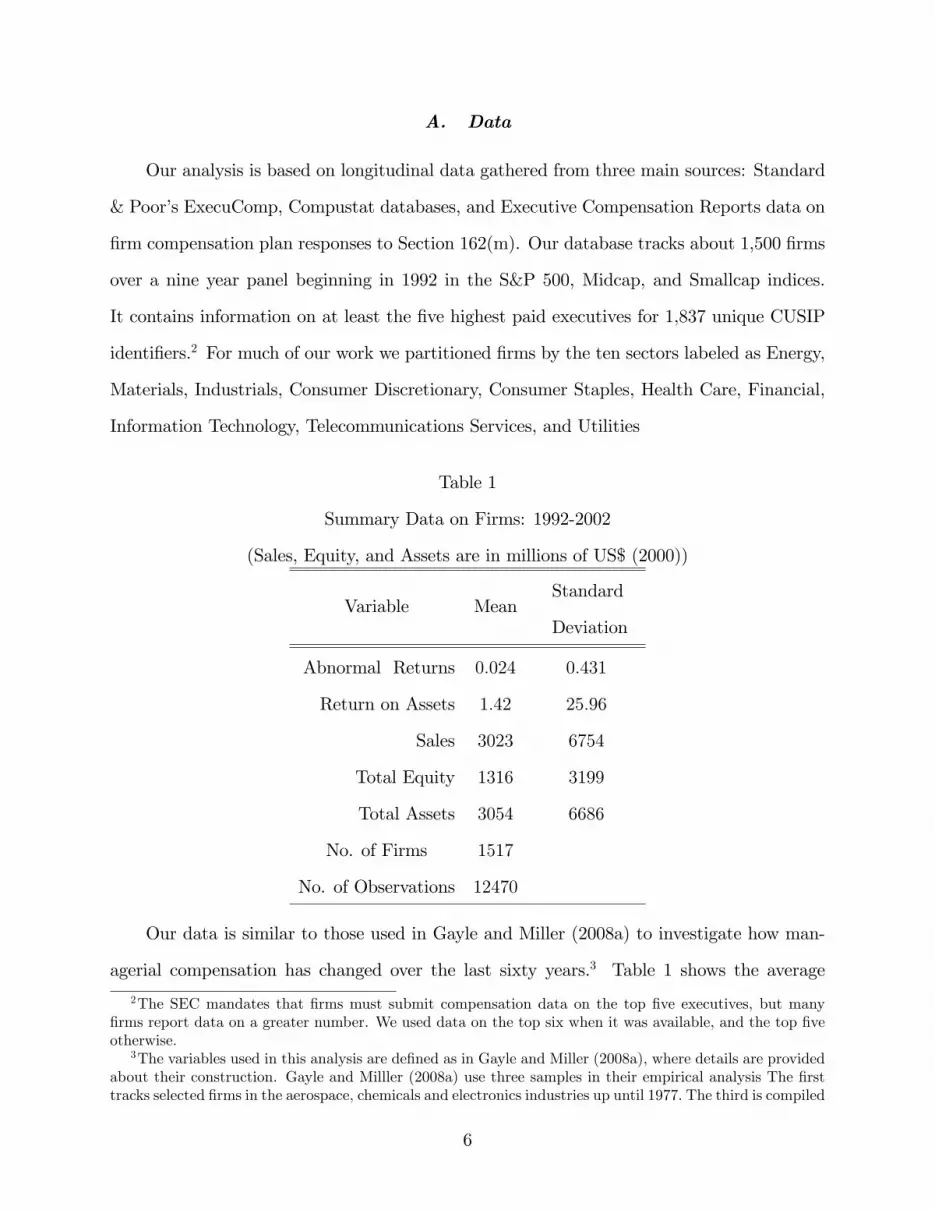
A. Data
Our analysis is based on longitudinal data gathered from three main sources: Standard
& Poor�s ExecuComp, Compustat databases, and Executive Compensation Reports data on
�rm compensation plan responses to Section 162(m). Our database tracks about 1,500 �rms
over a nine year panel beginning in 1992 in the S&P 500, Midcap, and Smallcap indices.
It contains information on at least the �ve highest paid executives for 1,837 unique CUSIP
identi�ers.2 For much of our work we partitioned �rms by the ten sectors labeled as Energy,
Materials, Industrials, Consumer Discretionary, Consumer Staples, Health Care, Financial,
Information Technology, Telecommunications Services, and Utilities
Table 1
Summary Data on Firms: 1992-2002
(Sales, Equity, and Assets are in millions of US$ (2000))
Variable MeanStandard
Deviation
Abnormal Returns 0:024 0:431
Return on Assets 1:42 25:96
Sales 3023 6754
Total Equity 1316 3199
Total Assets 3054 6686
No. of Firms 1517
No. of Observations 12470
Our data is similar to those used in Gayle and Miller (2008a) to investigate how man-
agerial compensation has changed over the last sixty years.3 Table 1 shows the average
2The SEC mandates that �rms must submit compensation data on the top �ve executives, but many�rms report data on a greater number. We used data on the top six when it was available, and the top �veotherwise.
3The variables used in this analysis are de�ned as in Gayle and Miller (2008a), where details are providedabout their construction. Gayle and Milller (2008a) use three samples in their empirical analysis The �rsttracks selected �rms in the aerospace, chemicals and electronics industries up until 1977. The third is compiled
6

�rm size using three measures, sales, equity and assets. The standard deviations are about
twice to three times as large as the sample means. We report two measures of income, the
return on assets and abnormal returns. The latter are de�ned for the nth �rm at time t as
xnt = �nt��t; where �t denotes the return on the market portfolio in period t and �nt is the
�rm�s �nancial return. Thus xnt is a relative measure that uses stock market performance as
a benchmark. We also experimented with other benchmark performance measures such as
industry and sector returns, but they do not signi�cantly a¤ect the results reported below.
Note that measures of income are much more dispersed than the measures of �rm size with
standard deviations about twenty times the respective sample means.
Total compensation and one of its components, pretax salary and bonus, are summarized
in Table 2. The other main components in executive compensation are stock and option
grants, vested retirement bene�ts, as well as gains and losses from abnormal returns on
stocks and other �nancial securities in the manager�s portfolio. The reason for including
the last component is that outsiders eliminate �rm speci�c risk by holding only a negligible
amount of any given �rm�s securities from their wealth portfolios, in this way guaranteeing
the return on the market portfolio, rather a random variable distributed about that return.
Thus the fact each manager is so heavily vested in his own �rm indicates a professional
interest that comes with his job. We report averages for the CEO, as well as the next �ve
highest paid executives in the �rm, along with the respective standard deviations.
in exactly the same way as the data in this paper, but for a longer time period, namely 1992 through 2003(as opposed to 2001), and for fewer executives only (the top 3 as opposed to the top 6). The second is asubset of the third, selecting only those observations from the third sample in the three industries mentionedabove. Since the sample used in this paper is very similar to the third sample, we refer readers to a moredetailed summary of the third sample provided in Tables 1 though 4 of our companion paper.
7
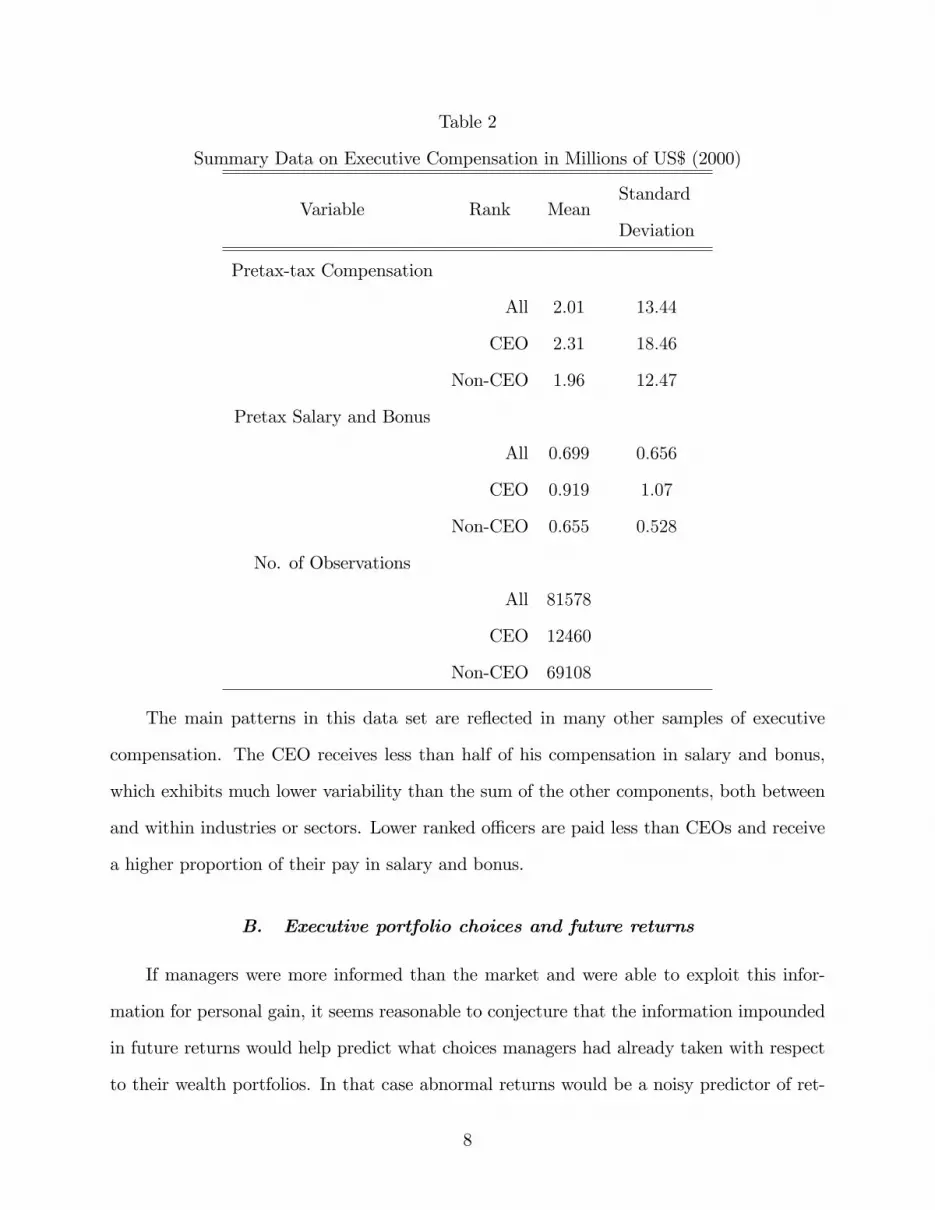
Table 2
Summary Data on Executive Compensation in Millions of US$ (2000)
Variable Rank MeanStandard
Deviation
Pretax-tax Compensation
All 2:01 13:44
CEO 2:31 18:46
Non-CEO 1:96 12:47
Pretax Salary and Bonus
All 0:699 0:656
CEO 0:919 1:07
Non-CEO 0:655 0:528
No. of Observations
All 81578
CEO 12460
Non-CEO 69108
The main patterns in this data set are re�ected in many other samples of executive
compensation. The CEO receives less than half of his compensation in salary and bonus,
which exhibits much lower variability than the sum of the other components, both between
and within industries or sectors. Lower ranked o¢ cers are paid less than CEOs and receive
a higher proportion of their pay in salary and bonus.
B. Executive portfolio choices and future returns
If managers were more informed than the market and were able to exploit this infor-
mation for personal gain, it seems reasonable to conjecture that the information impounded
in future returns would help predict what choices managers had already taken with respect
to their wealth portfolios. In that case abnormal returns would be a noisy predictor of ret-
8

rospective choices. We now denote with a t subscript information available to stockholders
at time t; and denote with a t+� subscript information available to the managers at time
t: We de�ne un;t+�, the conditional expectation of the abnormal return at the beginning of
period t+ 1 based on all the information available to the manager in period t; as:
un;t+� � Et+� [xn;t+1]
and denote by qn;t+� stock purchases by the manager in period t: De�ning:
"n;t+1 � xn;t+1 � un;t+�
as the manager�s forecast error of abnormal returns and (in this section only) assuming that
the manager�s decision rule for trading is linear in un;t+�, it follows that:
qn;t+� = �0 + �1un;t+� � �0 + �1xn;t+1 + �1"n;t+1
where, by the de�nition of un;t+�:
Et+1 ["n;t+1 jun;t+� ] = 0
If we impose the additional restriction that �0 = 0; then this decision rule may be
interpreted as a linear approximation to the optimal rule for a risk averse expected utility
maximizer confronted with a favorable gamble. When �0 = 0 the rule implies that qn;t+� � 0
if and only if un;t+� � 0: From the de�nition of un;t+�, this is true if and only if Et+� [xn;t+1]
and the unconditional expectation, Et [xn;t+1] = 0, are the same. In that case insider trading
is conducted if and only if the manager has insider information about next period�s abnormal
9
return. Regressing qn;t+� on xn;t+1 we obtain a consistent estimator of:
E [qn;t+�xn;t+1]
E [un;t+1xn;t+1]= �1
�1 + E
�"2n;t+1
��The expression is positive if and only if �1 > 0:
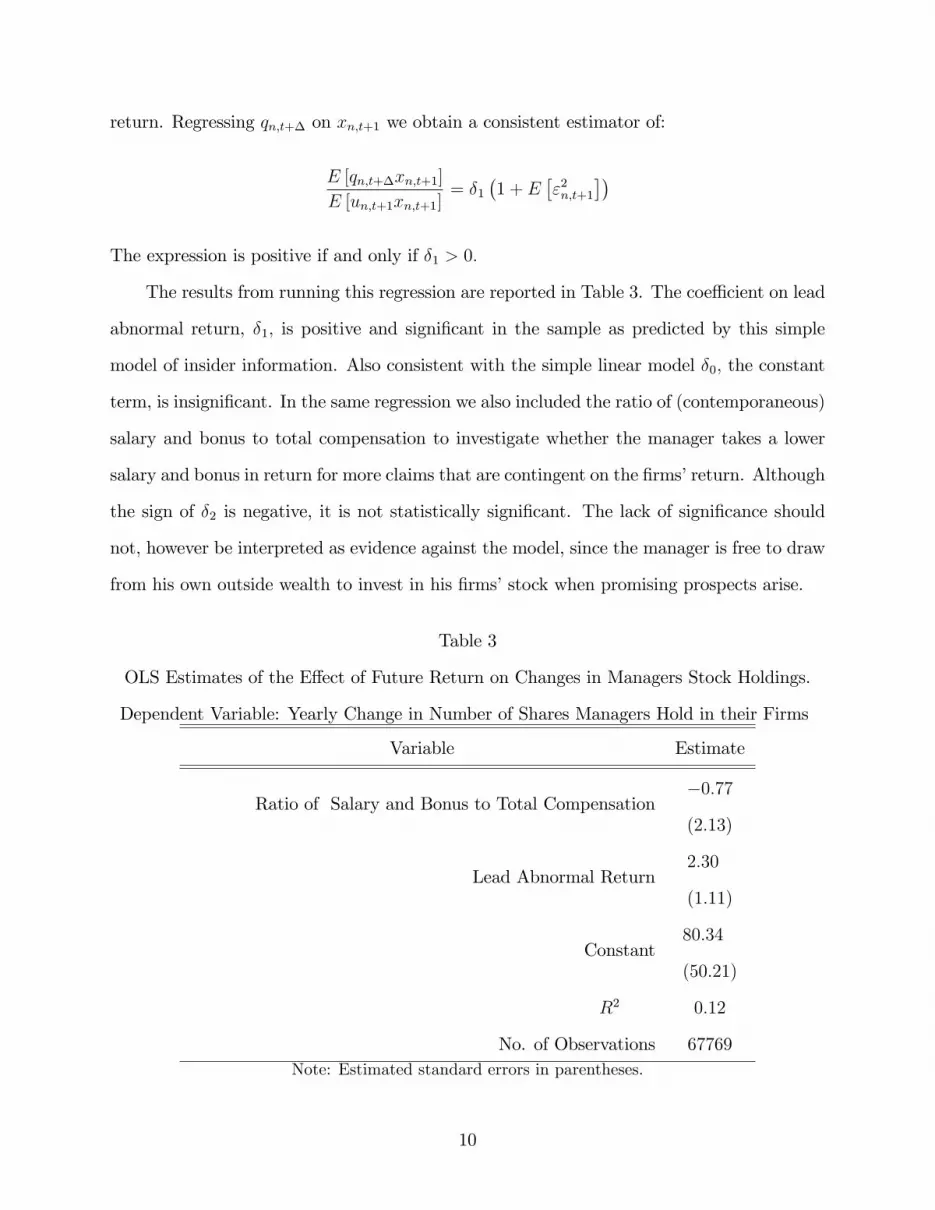
The results from running this regression are reported in Table 3. The coe¢ cient on lead
abnormal return, �1; is positive and signi�cant in the sample as predicted by this simple
model of insider information. Also consistent with the simple linear model �0; the constant
term, is insigni�cant. In the same regression we also included the ratio of (contemporaneous)
salary and bonus to total compensation to investigate whether the manager takes a lower
salary and bonus in return for more claims that are contingent on the �rms�return. Although
the sign of �2 is negative, it is not statistically signi�cant. The lack of signi�cance should
not, however be interpreted as evidence against the model, since the manager is free to draw
from his own outside wealth to invest in his �rms�stock when promising prospects arise.
Table 3
OLS Estimates of the E¤ect of Future Return on Changes in Managers Stock Holdings.
Dependent Variable: Yearly Change in Number of Shares Managers Hold in their Firms
Variable Estimate
Ratio of Salary and Bonus to Total Compensation�0:77
(2:13)
Lead Abnormal Return2:30
(1:11)
Constant80:34
(50:21)
R2 0:12
No. of Observations 67769
Note: Estimated standard errors in parentheses.
10

Managers are required to report all their trading activity to the SEC within a month,
and their reports are available for public scrutiny. Consequently our �nding that managers
appear to exploit inside information when investing in their own �rm raises the possibility
that others might be able to bene�t from their serendipitous choices. Table 4 presents our
�ndings from regressing abnormal returns on the manager�s lagged trading activity, providing
some evidence of how well their trading activity is a useful predictor of abnormal returns.
(Dummy variables for the sectors were also included in the regression, but are not reported
here.) The estimated coe¢ cients in question are positive and signi�cant in both regressions,
consistent with the hypothesis that managers exploit insider information. The estimates
also show there is a negative relationship between abnormal returns of the �rm and the
ratio of salary and bonus to total compensation, but again the relationship is statistically
insigni�cant, reinforcing our earlier point that resources used for insider trading need not
come at the expense of other components in the compensation package, but could simply
re�ect an adjustment in the manager�s asset portfolio.
11

Table 4
OLS Estimates of the E¤ect of Lagged Change in Manager�s Stock Holdings on Firms
Abnormal Returns. Dependent Variable: Yearly Real Abnormal Return
Regressors Estimate
Lagged Change in Manager�s Stock Holdings2:9e� 04
(8:0e� 05)
Ratio of Salary and bonus to Total Compensation�8:2e� 03
(5:2e� 01)
Lagged Return on Book Value of Assets�4:1e� 03
(4:7e� 04)
Lagged Dividends per Share�3:5e� 02
(9:5e� 03)
Lagged Return on Market Value of Equity�4:2e� 04
(5:9e� 05)
Lagged Earnings per Share3:75e� 06
(1:2e� 04)
R2 0:04
No. of Observations 67769
Note: Estimated standard errors in parentheses.
Much of the evidence from Tables 3 and 4 supports the notion that managers exploit
their superior knowledge about their own �rm�s performance on the stock market, but not
all. As above, suppose the manager follows the linear decision rule for insider trading, and
has access to the other regressors listed in Table 4, which we now call znt. In this case the
inverse of the coe¢ cient on lagged changes in the manager�s stock holdings is �1, and the
coe¢ cients values on all the other variables are zero because:
xn;t+1 = ��11 qn;t+� � �0��11 � "n;t+1
12
and the manager�s forecast error satis�es the conditional expectation E ["n;t+1 jznt ] = 0:
Hence, our �nding that several coe¢ cients are signi�cant, constitutes evidence against the
linear model. We also note that an estimate of E�"2n;t+1
�can obtained by subtracting 1 from
the product of the estimated coe¢ cient on xn;t+1 in Table 3 and the estimated coe¢ cient on
qn;t+� in Table 4. The estimated variance is negative, casting further doubt on the linear
speci�cation.
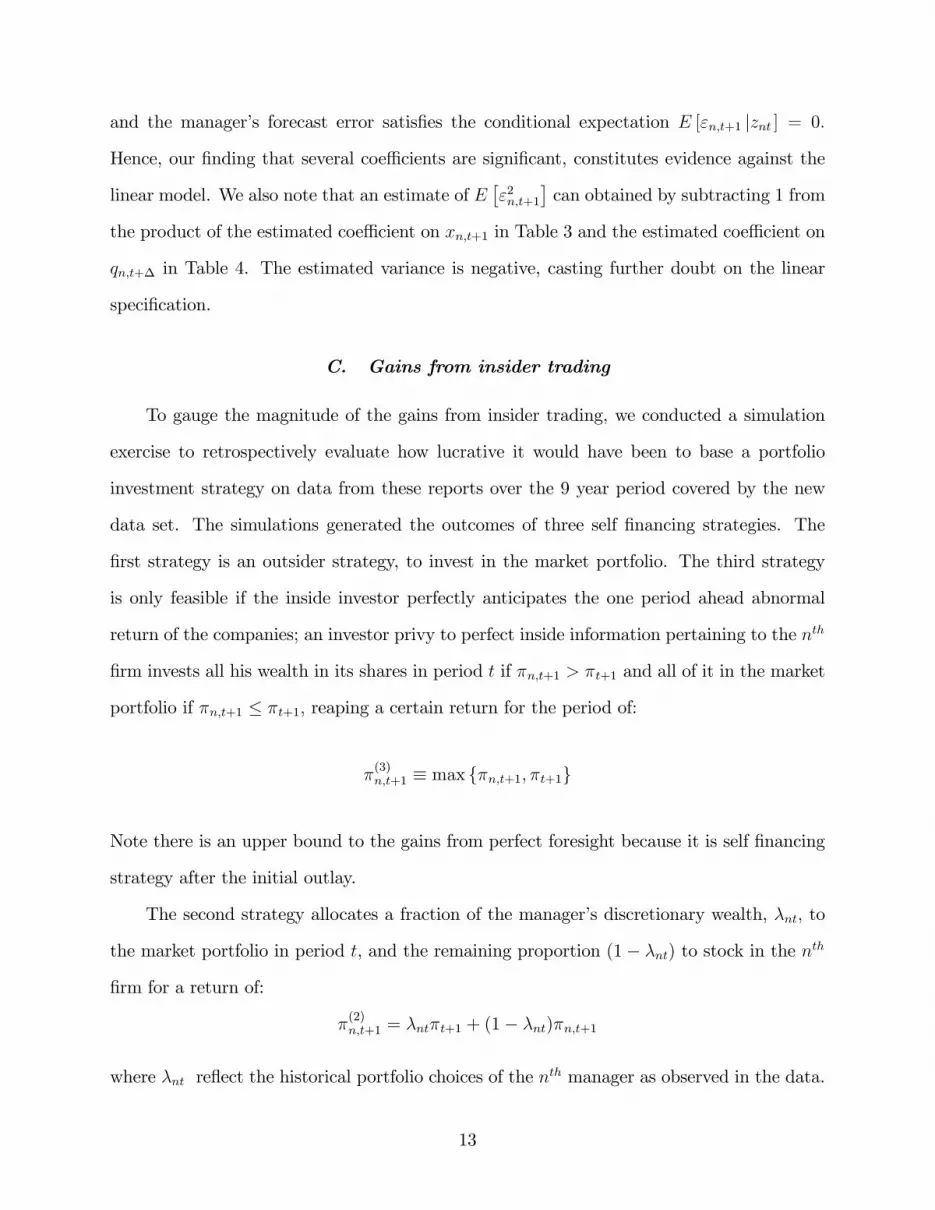
C. Gains from insider trading
To gauge the magnitude of the gains from insider trading, we conducted a simulation
exercise to retrospectively evaluate how lucrative it would have been to base a portfolio
investment strategy on data from these reports over the 9 year period covered by the new
data set. The simulations generated the outcomes of three self �nancing strategies. The
�rst strategy is an outsider strategy, to invest in the market portfolio. The third strategy
is only feasible if the inside investor perfectly anticipates the one period ahead abnormal
return of the companies; an investor privy to perfect inside information pertaining to the nth
�rm invests all his wealth in its shares in period t if �n;t+1 > �t+1 and all of it in the market
portfolio if �n;t+1 � �t+1; reaping a certain return for the period of:
�(3)n;t+1 � max f�n;t+1; �t+1g
Note there is an upper bound to the gains from perfect foresight because it is self �nancing
strategy after the initial outlay.
The second strategy allocates a fraction of the manager�s discretionary wealth, �nt; to
the market portfolio in period t, and the remaining proportion (1� �nt) to stock in the nth
�rm for a return of:
�(2)n;t+1 = �nt�t+1 + (1� �nt)�n;t+1
where �nt re�ect the historical portfolio choices of the nth manager as observed in the data.
13
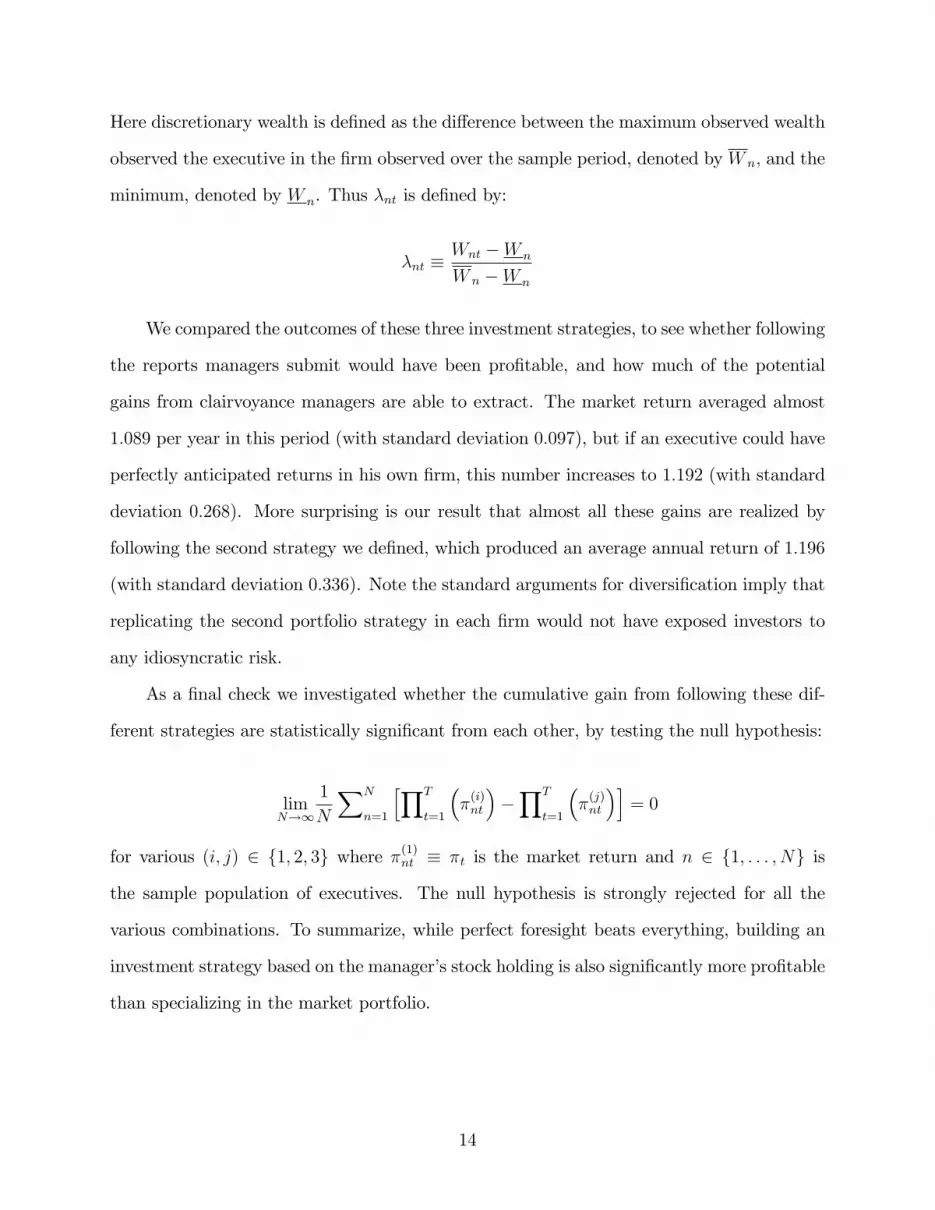
Here discretionary wealth is de�ned as the di¤erence between the maximum observed wealth
observed the executive in the �rm observed over the sample period, denoted byW n; and the
minimum, denoted by W n. Thus �nt is de�ned by:
�nt �Wnt �W n
W n �W n
We compared the outcomes of these three investment strategies, to see whether following
the reports managers submit would have been pro�table, and how much of the potential
gains from clairvoyance managers are able to extract. The market return averaged almost
1:089 per year in this period (with standard deviation 0:097), but if an executive could have
perfectly anticipated returns in his own �rm, this number increases to 1:192 (with standard
deviation 0:268). More surprising is our result that almost all these gains are realized by
following the second strategy we de�ned, which produced an average annual return of 1:196
(with standard deviation 0:336). Note the standard arguments for diversi�cation imply that
replicating the second portfolio strategy in each �rm would not have exposed investors to
any idiosyncratic risk.
As a �nal check we investigated whether the cumulative gain from following these dif-
ferent strategies are statistically signi�cant from each other, by testing the null hypothesis:
limN!1
1
N
XN
n=1
hYT
t=1
��(i)nt
��YT
t=1
��(j)nt
�i= 0
for various (i; j) 2 f1; 2; 3g where �(1)nt � �t is the market return and n 2 f1; : : : ; Ng is
the sample population of executives. The null hypothesis is strongly rejected for all the
various combinations. To summarize, while perfect foresight beats everything, building an
investment strategy based on the manager�s stock holding is also signi�cantly more pro�table
than specializing in the market portfolio.
14
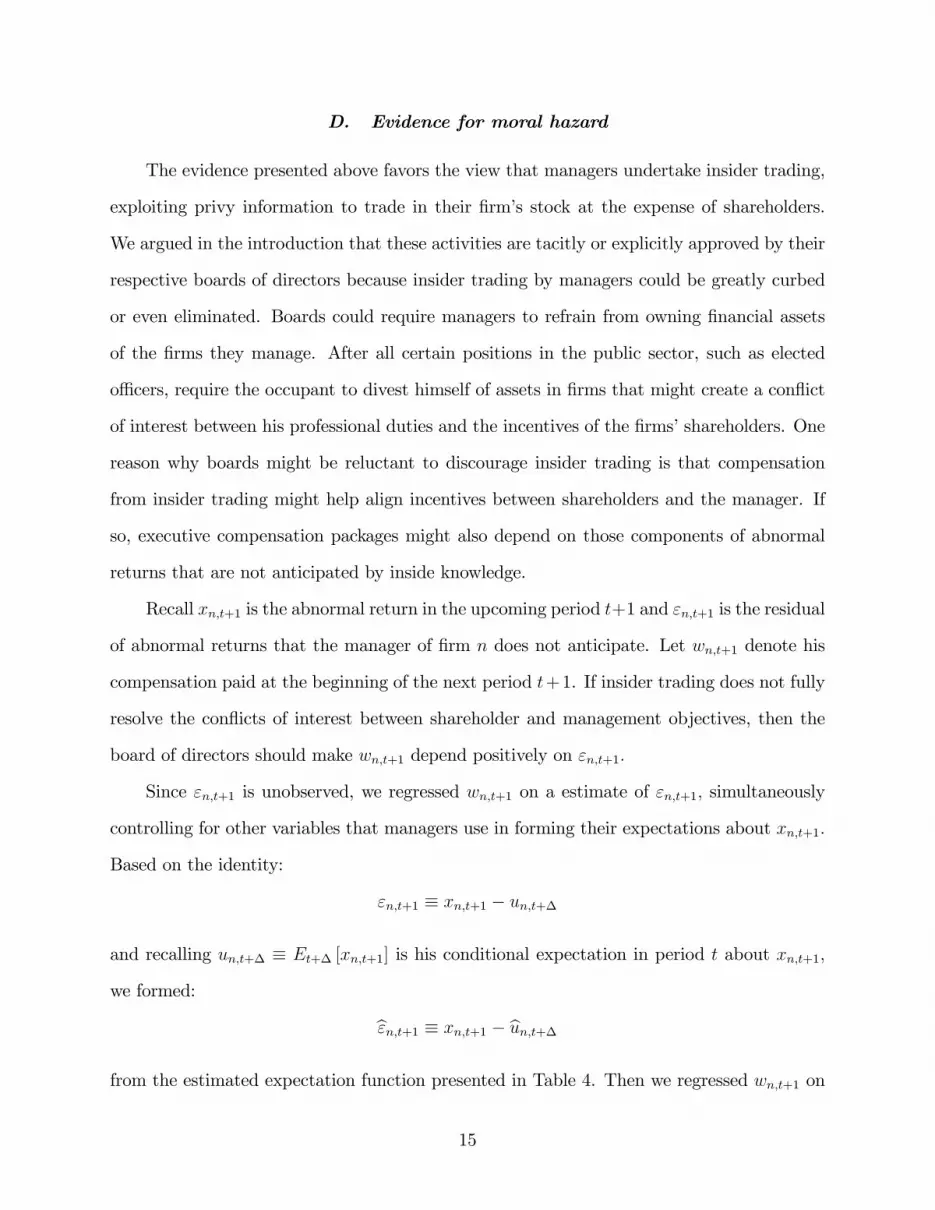
D. Evidence for moral hazard
The evidence presented above favors the view that managers undertake insider trading,
exploiting privy information to trade in their �rm�s stock at the expense of shareholders.
We argued in the introduction that these activities are tacitly or explicitly approved by their
respective boards of directors because insider trading by managers could be greatly curbed
or even eliminated. Boards could require managers to refrain from owning �nancial assets
of the �rms they manage. After all certain positions in the public sector, such as elected
o¢ cers, require the occupant to divest himself of assets in �rms that might create a con�ict
of interest between his professional duties and the incentives of the �rms�shareholders. One
reason why boards might be reluctant to discourage insider trading is that compensation
from insider trading might help align incentives between shareholders and the manager. If
so, executive compensation packages might also depend on those components of abnormal
returns that are not anticipated by inside knowledge.
Recall xn;t+1 is the abnormal return in the upcoming period t+1 and "n;t+1 is the residual
of abnormal returns that the manager of �rm n does not anticipate. Let wn;t+1 denote his
compensation paid at the beginning of the next period t+1. If insider trading does not fully
resolve the con�icts of interest between shareholder and management objectives, then the
board of directors should make wn;t+1 depend positively on "n;t+1:
Since "n;t+1 is unobserved, we regressed wn;t+1 on a estimate of "n;t+1; simultaneously
controlling for other variables that managers use in forming their expectations about xn;t+1:
Based on the identity:
"n;t+1 � xn;t+1 � un;t+�
and recalling un;t+� � Et+� [xn;t+1] is his conditional expectation in period t about xn;t+1;
we formed:
b"n;t+1 � xn;t+1 � bun;t+�from the estimated expectation function presented in Table 4. Then we regressed wn;t+1 on
15

b"n;t+1 as well as the variables used in estimating bun;t+�: Our estimates in Table 5 show thatmanagers are rewarded (punished) when the unanticipated component of abnormal returns is
higher (lower) than they expected. This suggests that shareholders are not only less informed
about the economic prospects of their �rm, but also that shareholders do not fully monitor
the activities of their management.
16

Table 5
OLS Estimates of the E¤ect of Unanticipated Changes in Abnormal Return on Total
Compensation. Dependent Variable: Yearly Total Income Compensation in Thousands of
US$ (2000)
Regressors Estimate
Unanticipated change in abnormal return726
(89)
lagged change in stock holdings11.6
(1.2)
lagged return on assets16.9
(6.7)
lagged dividends per share60.4
(115)
lagged return on equity0.56
(0.85)
lagged earnings per share-0.95
(1.65)
constant2504
(98)
R2 0.28
No. of Observations 67769Note: Estimated standard errors in parentheses.
17

III. Generalized Moral Hazard
This section answers the second question using a principal agent model borrowed from
Gayle and Miller (2008b) that analyzes interactions between insider information, moral haz-
ard and executive compensation. We take up the idea that both insider information and
moral hazard might play a role in contracting with managers. In our model shareholders do
not observe the manager�s activities. After paying the manager for his work in the previous
period, at the beginning of each period the board of directors proposes a compensation plan
to the manager, which depends on the realization of the �rms abnormal returns as well as
accounting information to be later provided by the manager. Based on the board�s proposal
the manager decides whether to remain with the �rm or leave and picks real consumption
expenditure for the period. Having accepted the contract o¤er, the manager observes the
�rms prospects, provides some accounting information, and chooses a work routine that is
not observed by the directors. The return on the �rms assets are realized at the end of
the period. It depends on how well the �rm was managed during the period, the private
information available to the manager, as well as other unanticipated factors.
The objective of the manager is to sequentially maximize his expected lifetime utility,
and the goal of the �rm is expected value maximization. An optimal contract between
shareholders and executives satis�es three conditions, a participation constraint, that assures
the manager he will have higher expected utility from employment with his �rm rather than
another one, an incentive compatibility constraint, that induces him to maximize the value
of the �rm rather than using the resources of the �rm to pursue some other objective, and
truth telling constraint that induces the manager to reveal his inside information. We show
that absent moral hazard, the optimal contract is to pay the manager a �xed compensation
irrespective of his private information. Furthermore, if insider information is not intrinsically
linked to the moral hazard problem in a sense we make explicit, then although the optimal
contract should depend on the �rm�s abnormal returns, permitting the manager to exploit
his nsider information is suboptimal. Finally, if moral hazard and private information are
18
intrinsically linked, then the gains from private information can be incorporated into the
optimal contract. Rather than discourage managers from bene�tting from their insider
knowledge, the board might optimally sanction it.
A. The model
More speci�cally, at the beginning of period t the manager is paid compensation denoted
wt for his work in period t � 1 according to the schedule the shareholders had previously
committed, and his managerial contract is up for renewal. He makes his consumption choice,
a positive real number denoted by ct, and the board proposes a new contract. At that time
the manager chooses whether to be engaged by the �rm or be engaged outside the �rm,
either with another �rm or in retirement. Denote this decision by the indicator lt0 2 f0; 1g,
where lt0 = 1 if the manager chooses to be engaged outside the �rm and lt0 = 0 if he chooses
to be engaged inside the �rm. If lt0 = 0, the prospects of the �rm are then fully revealed to
the manager but partially hidden to the shareholders.
We assume throughout that managers privately observe st 2 f1; 2g in period t; infor-
mation that a¤ects the distribution of the �rm�s abnormal returns. The board announces
how managerial compensation will be determined as a function of s0t 2 f1; 2g ; what he tells
them about the �rm�s prospects, and its subsequent performance, as measured by abnor-
mal returns xt+1 revealed at the beginning period t + 1. The manager truthfully declares
or lies about the �rm�s prospects by announcing s0t 2 f1; 2g ; e¤ectively selecting a sched-
ule w (s0t; xt+1) indexed by his announcement s0t: He then makes his unobserved labor e¤ort
choice, denoted by ltj 2 f0; 1g for j 2 f1; 2g in each period t. There are two possibilities, to
work diligently for the �rm by pursuing the shareholders objectives of value maximization,
and indicated by setting lt2 = 1; or to be employed by the �rm but shirk, following di¤erent
objectives than maximizing the �rm�s value, and here denoted by lt1 = 1.
At the beginning of the period t + 1 abnormal returns xt+1 for the �rm are drawn
from a probability distribution which depends on the true state st and the manager�s action
19

lt. We denote the probability density function for abnormal returns in period t when the
manager works diligently and the state is s by fs (xt+1) ; and let fs (xt+1) gs (xt+1) denote
the probability density function for abnormal returns in period t when the manager shirks,
bounded below by the same real number . Note that gs (x) is the likelihood ratio for
abnormal returns from shirking versus working diligently in state s. We assume that the
�rm�s losses from shirking do not depend on the state, meaning f1 (x) g1 (x) � f2 (x) g2 (x).
Consequently higher pro�ts from being in the better state can only be realized if the manager
is diligent.
Preferences over consumption and work are parameterized by a utility function ex-
hibiting absolute risk aversion that is additively separable over periods and multiplicatively
separable with respect to consumption and work activity within periods. Lifetime utility is
expressed as:
�X1
t=0
X2
j=0�t�jltj exp (��ct)
where � is the constant subjective discount factor, � is the constant absolute level of risk
aversion, and �j is a utility parameters with consumption equivalent ���1 log (�j) that
measures the distaste from working at level j 2 f0; 1; 2g. We assume �2 > �1 meaning
that compared to the activity called shirking, diligence is more aligned to the shareholders�
interest than the manager�s interests, and without loss of generality scale utility so that
�0 = 1. This simply means that �j values the nonpecuniary features of engaging in activity
j 2 f1; 2g within the �rm relative to the total current utility value from leaving the �rm.
The manager�s wealth is endogenously determined by his consumption and compen-
sation. We assume there are a complete set of markets for all publicly disclosed events,
e¤ectively attributing all deviations from the law of one price to the market imperfections
under consideration.
20
B. The optimal contract
Drawing upon the work of Fudenberg, Holmstrom and Milgrom (1990), we can show
that the optimal long term contract solved by shareholders can be implemented by a sequence
of short term contracts. Appealing to Myerson (1982), the revelation principle implies that,
without loss of generality, we can restrict the set of feasible contracts to those that respect
the participation, incentive compatibility and truth telling constraints we now de�ne. The
participation constraint states that the manager prefers working one more period and then
leaving to not working for the �rm at all. The incentive compatibility constraint restricts
short term contracts to those payment schedules in which the manager prefers to work dili-
gently rather than shirk. The truth telling condition requires shareholders to write contracts
that induce the manager to select a compensation schedule that reveals the �rm�s prospects.
We assume throughout that legal considerations induce the manager not to overstate the
�rm�s prospects but that incentives must be provided to persuade the manager from under-
stating them.
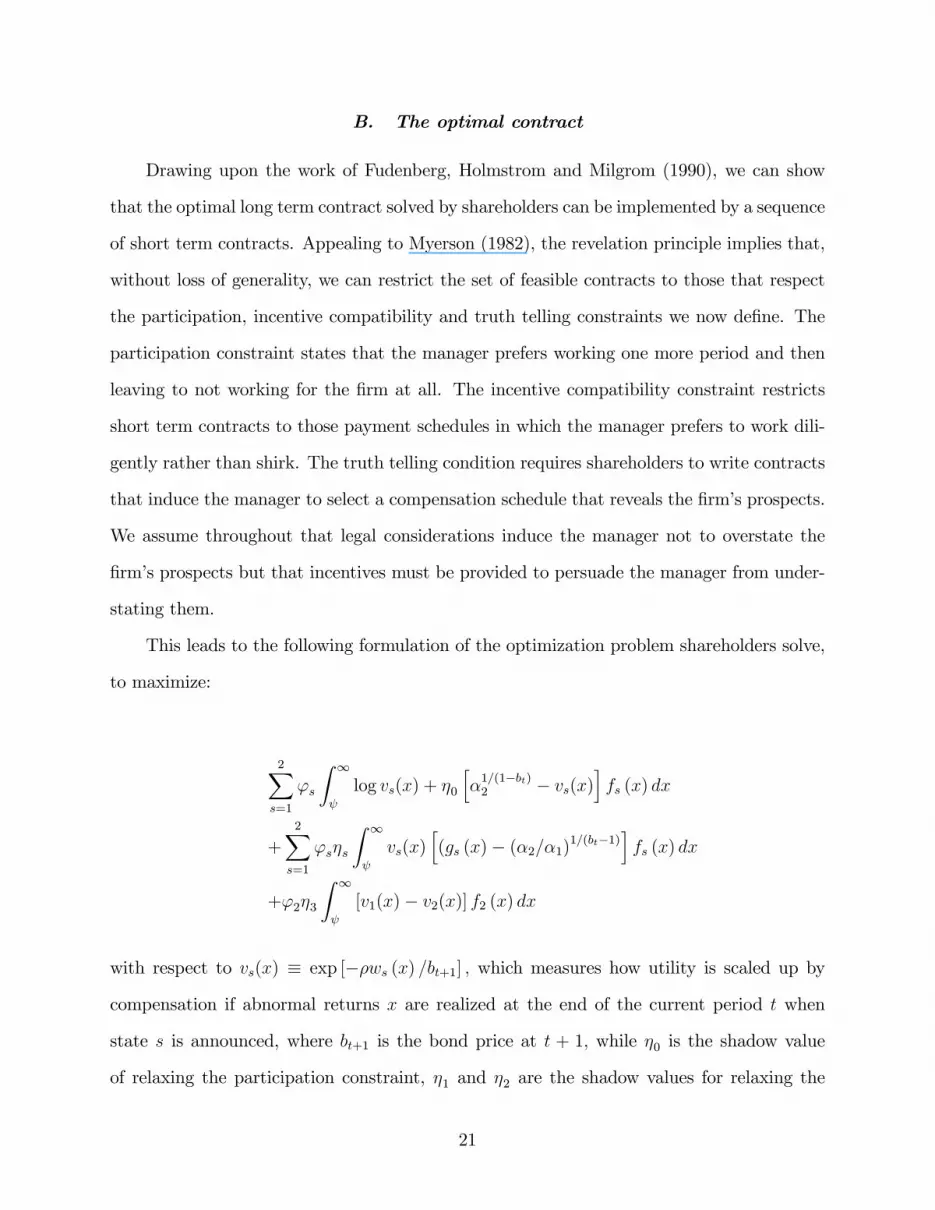
This leads to the following formulation of the optimization problem shareholders solve,
to maximize:
2Xs=1
's
Z 1
log vs(x) + �0
h�1=(1�bt)2 � vs(x)
ifs (x) dx
+2Xs=1
's�s
Z 1
vs(x)h(gs (x)� (�2=�1)1=(bt�1)
ifs (x) dx
+'2�3
Z 1
[v1(x)� v2(x)] f2 (x) dx
with respect to vs(x) � exp [��ws (x) =bt+1] ; which measures how utility is scaled up by
compensation if abnormal returns x are realized at the end of the current period t when
state s is announced, where bt+1 is the bond price at t + 1; while �0 is the shadow value
of relaxing the participation constraint, �1 and �2 are the shadow values for relaxing the
21

incentive compatibility constraints, and �3 is the shadow value of relaxing the truth telling
constraint. The �rst order conditions for this problem are:
v1(x)�1 = �0 + �1
�(�2=�1)
1=(bt�1) � g1 (x)�� �3h(x)
v2(x)�1 = �0 + �2
�(�2=�1)
1=(bt�1) � g2 (x)�+ �3
where h(x) � '2f2 (x) ='1f1 (x) and 's denotes the probability the state is s: It is straight-
forward to show that �0 = �1=(bt�1)2 : If the truth telling constraint is not binding, then �3 = 0
and the optimization problem reduces to the pure moral hazard problem solved in Margiotta
and Miller (2000). Otherwise �3 > 0; and we substitute the �rst order condition into the
incentive compatibility and truth telling constraints, yielding the following system of three
equations to solve for the remaining three unknowns �1; �2; and �3:
Z 1
1
�1=(bt�1)2 � �3h (x) + �1
h(�2=�1)
1=(bt�1) � g1 (x)if2 (x) dx
=
Z 1
1
�1=(bt�1)2 + �3 + �2
h(�2=�1)
1=(bt�1) � g2 (x)if2 (x) dx
0 =
Z 1
g1 (x)� (�2=�1)1=(bt�1)
�1=(bt�1)2 � �3h(x) + �1 (�2=�1)
1=(bt�1) � �1g1 (x)f1 (x) dx
=
Z 1
g2 (x)� (�2=�1)1=(bt�1)
�1=(bt�1)2 � �3 + �2 (�2=�1)
1=(bt�1) � �2g2 (x)f2 (x) dx
The �rms solves similar maximization problems for two of the remaining combinations of
e¤ort level, shirking in the �rst state but working diligently in the second, shirking in the
second but not the �rst, and selects the value maximizing contract.
If there is moral hazard, it is easy to see from the �rst order conditions that compensation
varies with the �rm�s abnormal returns, exposing the manager to uncertainty. Consequently
the �rm must pay a risk premium to meet the participation constraint if his compensation is
22

uncertain and depends on the �rm�s abnormal returns, because the manager is risk averse.
Absent moral hazard, the optimal compensation is a �xed wage award of:
wj;t+1 = ��1(bt � 1)�1bt+1 log (�j)
for working at e¤ort level j; which just o¤sets the alternative use of his time. Setting j = 1
gives the shirking contract. A rule prohibiting any trading in the �rm stock is optimal in
this case, and can easily be implemented if the manager�s trades are publicly disclosed.
More generally, the compensation schedule should not depend on the manager�s private
information if, conditional on the manager�s e¤ort, the distribution of abnormal returns
is independently distributed of the state. To prove this second claim, consider a model
where there is only one state, by setting '2 = h (x) = 0: Let w� (x) denote the optimal
contract for the one state model where ��1 is the associated multiplier for the incentive
compatibility constraint. Now suppose '2 6= 0 but assume f1 (x) = f2 (x) instead. For
example the states might be revealed to the manager after he has committed to his e¤ort
level but before the end of the period when abnormal returns are realized. In this case
he would still personally bene�t from insider trading if he was permitted. By assumption,
the shirking distributions are the same in both states, meaning f1 (x) g1 (x) = f2 (x) g2 (x) ;
so it now follows that g1 (x) = g2 (x) : Hence, upon inspection of the �rst order conditions
and the solution equations for the multipliers, w� (x) is also the optimal contract for the
specialization f1 (x) = f2 (x) ; and is supported by the multipliers ��1 = �1 = �2 with �3 = 0:
This demonstrates the manager should not be compensated for his hidden information in
this case. Unless it is intrinsically tied to the moral hazard problem of motivating them
to work diligently, in this model managers should not be allowed to trade on their inside
information.
Finally if �3 > 0; meaning the truth telling constraint is binding, it follows from argu-
ments in Gayle and Miller (2008b), that the manager is paid more on average in the second
state than he would be in the pure moral hazard case, and less in the �rst state. Intuitively
23

shareholders must bribe the manager to truthfully reveal the second state when they cannot
observe it directly, in order to incentivize his e¤ort. However this gain is o¤set by a penalty
paid in the �rst state, because competition amongst executives for the position before the
state is revealed equalizes their expected utility to the level attained in the pure moral hazard
case. The optimal contract exposes managers to uncertainty from two sources, namely the
state s, and conditional on the state, the draw of the abnormal return x. Thus the additional
uncertainty increases the expected cost of the compensation package to shareholders for the
higher risk premium.
IV. Estimating the Costs of Moral Hazard
Our model in Section 3 demonstrates the manager does not pro�t from an increase in
the value of the �rm if he signs an optimal contract unless there is a moral hazard problem.
As we remarked in the introduction, the disclosure rules of the SEC make it relatively easy
for boards to write contracts with managers that prohibit any trading in the �rm�s securities.
Yet the reduced form empirical evidence reported in Section 2 shows that managers bene�t
signi�cantly from their �rm�s good fortune. Although linking pay to performance can be
rationalized within theoretical models of optimal contracting with moral hazard and hidden
actions, the practical relevance of moral hazard to managerial compensation is ultimately
an empirical phenomenon, the nub of the third question in the second paragraph of the
introduction. Given the risks that insider trading pose for shareholders, is moral hazard a
su¢ ciently important economic factor for �rms to incentivize managers?
In this section we estimate the structural parameters of a pure moral hazard model, and
compute the costs and bene�ts to shareholders from incentivizing managers. Our empirical
analysis applies nonlinear estimation techniques for parametric models of optimal contracting
developed in Margiotta and Miller (2000) and Gayle and Miller (2008a). A companion paper,
Gayle and Miller (2008b), analyzes identi�cation, testing and estimation in nonparametric
optimal contracting models where there is both moral hazard and private information. Here
24

we apply parametric methods to a broad industry spectrum of publicly traded �rms, thus
extending the earlier applications of Margiotta and Miller (2000) and Gayle and Miller
(2008a) on smaller data sets to a few select industries. Our new estimates corroborate
the earlier work, by showing the estimated losses �rms would incur by paying executives a
constant wage are much greater than the relatively small amount we estimate shareholders
currently pay to incentivize them.
A. Parameterizing the model
There are �ve parameters to account for systematic di¤erences in executive compen-
sation. They are the probability distribution of abnormal returns conditional on working,
f (x) ; the probability distribution of abnormal returns conditional on shirking, f (x) g (x) ;
the risk aversion parameter, �; the nonpecuniary bene�t from shirking versus working, cap-
tured by parameter ratio �2=�1; and the nonpecuniary bene�t of working versus retiring or
accepting employment outside the �rm, �2.
Our empirical analysis assumes f(x) and f (x) g (x) are truncated normal with support
bounded below by ; where (�2; �2) and (�1; �
2) respectively denote the mean and variance
of the parent normal distributions. Thus:
f(x) =exp [� (x2 � 2x�2 + �2
2) =2�2]
� [(�2 � ) =�]�p2�
and:
g (x) =� [(�2 � ) =�]
� [(�1 � ) =�]exp
���22 � �1
2 � 2x�2 + 2x�1�=2�2
�where � is the standard normal distribution function. As indicated in the previous section,
we cannot reject the null hypothesis of restricting the mean of abnormal returns to zero
conditional on working in the data, a restriction we impose in the estimation of the parameter
�2: This leaves the truncation point ; the mean of the parent normal distribution under
shirking �1; the common variance of the parent normal �; the risk aversion parameter �; the
25

ratio of nonpecuniary bene�ts from working to shirking �2=�1; and the ratio of nonpecuniary
bene�ts from working to quitting �2=�0; to estimate.
The parameters of the distribution of returns are estimated separately for each sector,
whereas the taste parameters �2=�1 and �2 are speci�ed as mappings of executive rank. To
accommodate other factors that might a¤ect compensation not included in the model we
assumed that total compensation, denoted ewt; is the sum of optimal contract compensation
wt plus an independently distributed disturbance term "t; assumed orthogonal to the other
variables of interest.
B. Parameter Estimates
Table 6 presents the estimates of i for i 2 f1; 2; : : : ; 10g ; the minimal abnormal return
de�ning the lower support point of the truncated normal distribution in the ith sector. The
estimators are the minimum di¤erence of the �rm return and the market return across all
observations in the sector. Because the estimators converge faster than the square root
of sample size, so their standard errors (not reported) have no impact on the asymptotic
properties of the other parameter estimates.
Loosely speaking, the reported values represent the abnormal return that trigger de-
listing from the exchange. Our estimates suggest the points at which creditors instigate
bankruptcy proceedings, are bought by private investors, or are amalgamated, di¤er by
sector, but are dispersed around the value where the equity value of the �rm is close to zero.
Since the di¤erence between the �rm�s �nancial returns and the return on the market is
identically the abnormal return it follows that if the return on a diversi�ed portfolio was r;
then an abnormal return of �r would reduce shareholder value to zero, and we previously
noted the return on the market portfolio over this period was 1:089.
26
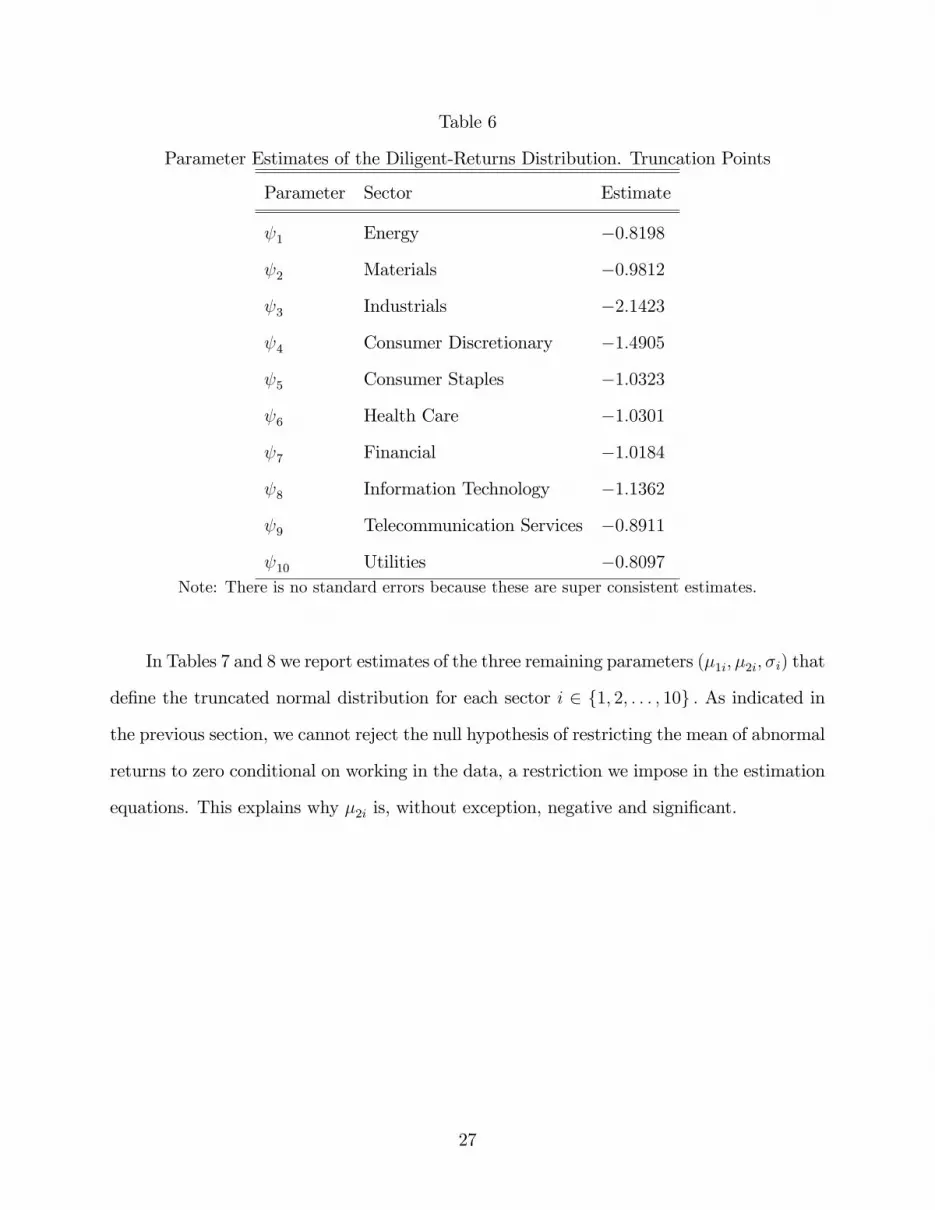
Table 6
Parameter Estimates of the Diligent-Returns Distribution. Truncation Points
Parameter Sector Estimate
1 Energy �0:8198
2 Materials �0:9812
3 Industrials �2:1423
4 Consumer Discretionary �1:4905
5 Consumer Staples �1:0323
6 Health Care �1:0301
7 Financial �1:0184
8 Information Technology �1:1362
9 Telecommunication Services �0:8911
10 Utilities �0:8097Note: There is no standard errors because these are super consistent estimates.
In Tables 7 and 8 we report estimates of the three remaining parameters (�1i; �2i; �i) that
de�ne the truncated normal distribution for each sector i 2 f1; 2; : : : ; 10g : As indicated in
the previous section, we cannot reject the null hypothesis of restricting the mean of abnormal
returns to zero conditional on working in the data, a restriction we impose in the estimation
equations. This explains why �2i is, without exception, negative and signi�cant.
27

Table 7
Parameter Estimates of the Diligent-Return Distribution: Means and Standard Deviations
of Parent Distribution
Parameter Sector EstimatesStandard
Error
�1 Energy 0:898 0:032
�2 Materials 0:333 0:005
�3 Industrials 1:743 0:022
�4 Consumer Discretionary 0:626 0:006
Standard Deviation �5 Consumer Staples 0:420 0:008
�6 Health care 42:815 0:775
�7 Financial 0:373 0:004
�8 Information Technology 1:849 0:069
�9 Telecommunication Services 0:579 0:029
�10 Utilities 0:289 0:004
�21 Energy �0:5591 0:0592
�22 Materials �0:0017 0:0003
�23 Industrials �0:5652 0:02452
�24 Consumer Discretionary �0:0158 0:0011
Mean �25 Consumer Staples �0:0087 0:0012
�26 Health Care �1608:1984 29:0809
�27 Financial �0:0037 0:0004
�28 Information Technology �2:2483 0:2108
�29 Telecommunication Services �0:0989 0:0207
�210 Utilities �0:0024 0:0003
28
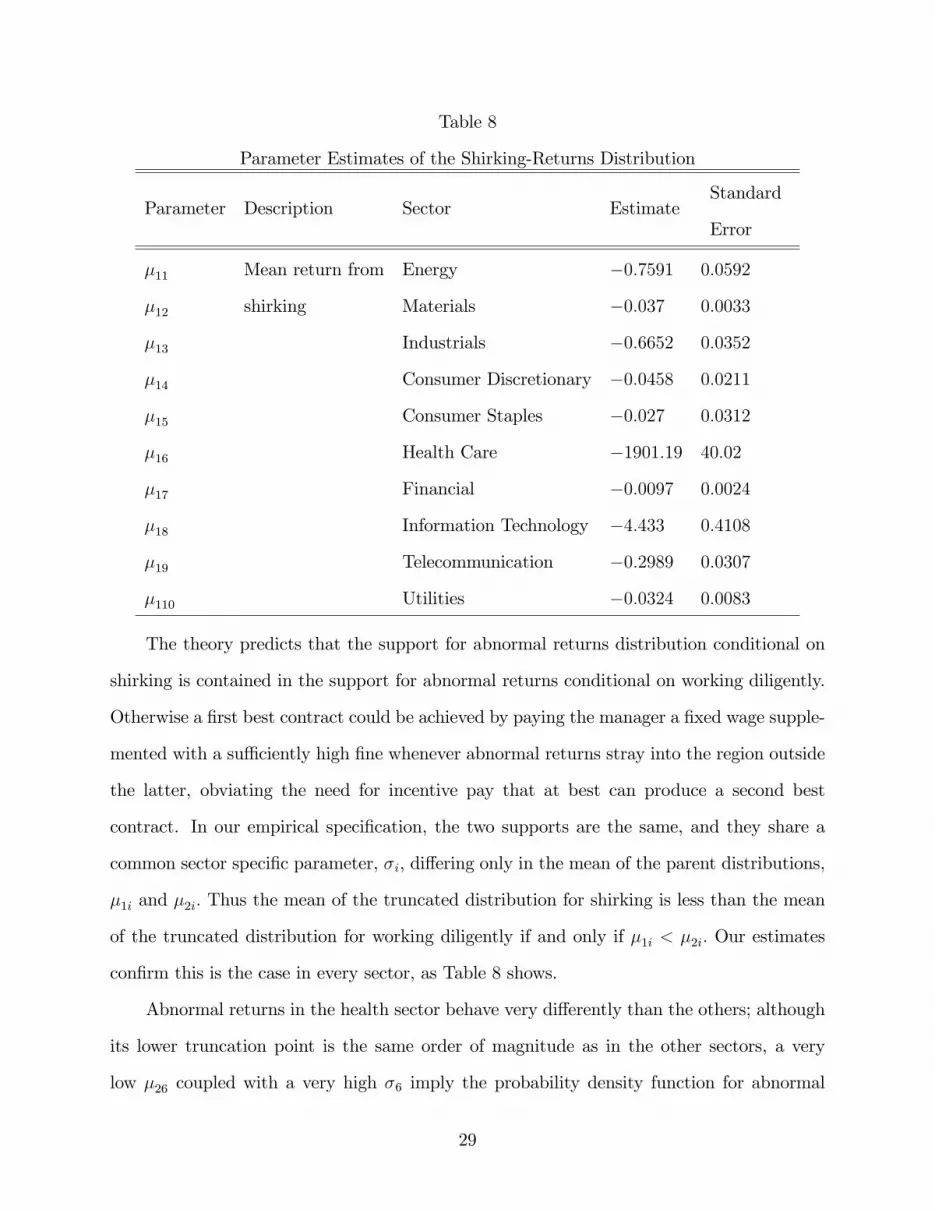
Table 8
Parameter Estimates of the Shirking-Returns Distribution
Parameter Description Sector EstimateStandard
Error
�11 Mean return from Energy �0:7591 0:0592
�12 shirking Materials �0:037 0:0033
�13 Industrials �0:6652 0:0352
�14 Consumer Discretionary �0:0458 0:0211
�15 Consumer Staples �0:027 0:0312
�16 Health Care �1901:19 40:02
�17 Financial �0:0097 0:0024
�18 Information Technology �4:433 0:4108
�19 Telecommunication �0:2989 0:0307
�110 Utilities �0:0324 0:0083
The theory predicts that the support for abnormal returns distribution conditional on
shirking is contained in the support for abnormal returns conditional on working diligently.
Otherwise a �rst best contract could be achieved by paying the manager a �xed wage supple-
mented with a su¢ ciently high �ne whenever abnormal returns stray into the region outside
the latter, obviating the need for incentive pay that at best can produce a second best
contract. In our empirical speci�cation, the two supports are the same, and they share a
common sector speci�c parameter, �i, di¤ering only in the mean of the parent distributions,
�1i and �2i: Thus the mean of the truncated distribution for shirking is less than the mean
of the truncated distribution for working diligently if and only if �1i < �2i: Our estimates
con�rm this is the case in every sector, as Table 8 shows.
Abnormal returns in the health sector behave very di¤erently than the others; although
its lower truncation point is the same order of magnitude as in the other sectors, a very
low �26 coupled with a very high �6 imply the probability density function for abnormal
29

returns in that sector is estimated to be very �at so that it can capture some high returns
that occurred in some �rm/years. Similarly our estimate of �1i is orders of magnitude lower
than the counterparts for the other sectors, signifying an even �atter density for the shirking
distribution.
The preference parameter estimates are presented in Table 9. Our estimate of �; the risk
aversion parameter, implies utility is concave increasing as required by the model, and lies
between results in reported in Margiotta and Miller (2000) and Gayle and Miller(2008a). It
implies that a manager would be indi¤erent between accepting a lottery o¤ering even odds
of winning or losing one million dollars versus losing an amount of $103; 259 for sure. Our
estimate of �; the parameter explaining variation not captured by the model, is similar too.
(More precisely, the variance of the measurement error is 2bt+1��2�:)
We estimated �2; the parameter determining competitive opportunities in the labor
market for executives, and �2=�1; a measure of nonpecuniary bene�ts from shirking versus
working diligently, by executive position for the top six ranked executives. All our estimates
of �2 are greater than one numerically, but only in the upper ranks is the null hypothesis that
�2 = 1 rejected in favor of the one sided alternative �2 > 1. Recalling that the exponential
utility function is negative, these results are weak evidence that the nonpecuniary bene�ts
of the job relative to outside opportunities in the labor market, decline with promotion.
It appears that �nancial remuneration, rather than power, prestige or perks, is necessary
to motivate executives to climb the corporate ladder. Our estimates of �2=�1 show that
chief executive o¢ cers would bene�t signi�cantly from taking actions that are not in the
shareholder�s interests if they are not incentivized, whereas the opportunities a¤orded to
lower ranked executives if their pay is not tied to performance are more limited, presumably
because discretion about work activities and job duties increase with rank while the degree
of supervision declines. These issues are investigated more thoroughly in Gayle, Golan
and Miller (2008), who estimate the dynamic life cycle aspects of executive promotion and
turnover.
30

Table 9
Parameter Estimates of the Manager�s Utility Function
Parameter Description Executive Rank EstimateStandard
Error
� Risk aversion 0:208 0:102
� Measurement error 2:03 0:505
�2 Preference for CEO 1:292 0:0162
diligence relative 2nd ranked 1:523 0:126
to quitting �rm 3rd ranked 1:420 0:118
4th ranked 1.48 0:375
5th ranked 1:373 0:504
6th ranked 1:849 0:969
�2=�1 Preference for CEO 1:356 0:129
diligence relative 2nd ranked 1:034 0:034
to shirking 3rd ranked 1:012 0:045
4th ranked 1:023 0:078
5th ranked 1:01 0:678
6th ranked 0:987 0:567
C. The Costs of Moral Hazard
We characterize the importance of moral hazard three ways, the gross loss shareholders
would incur before accounting for managerial compensation from the manager tending his
own interests, the bene�ts accruing to the manager from tending his own interests instead of
his shareholders, and how much the shareholders are willing to pay to eliminate the problem
of moral hazard altogether.
31

Table 10
Gross Loss to Firms from not Controlling Moral Hazard
in millions of US$ (2000)
Sector Estimate of � 1
Energy 1,290
Materials 1,468
Industrials 1,679
Consumer Discretionary 1,235
Consumer Staples 987
Health Care 2,877
Financial 1,568
Information Technology 1,457
Telecommunication 1,078
Utilities 569
The �rst measure, denoted � 1; is the expected gross output loss to the �rm switching
from the distribution of abnormal returns for diligent work to the distribution for shirking,
which has probability density function f (x) g (x). Stated di¤erently, � 1 is the di¤erence
between the expected output to the plant from the manager pursuing the �rm�s goals versus
his own, before netting out expected managerial compensation:
� 1 = �VZxg (x) f (x) dx � �V E [xg (x)]
where V is the equity value of the �rm, this formula exploiting the identity that the expected
value of abnormal returns is zero when the manager pursues the interests of the �rm. Table
10 displays the estimated average over all �rms in each sector for withdrawing the incentives
for the managers to work diligently. Comparing these numbers with the size of �rms reported
in Table 3, we �nd that the value of equity would decline precipitously if managers were not
32
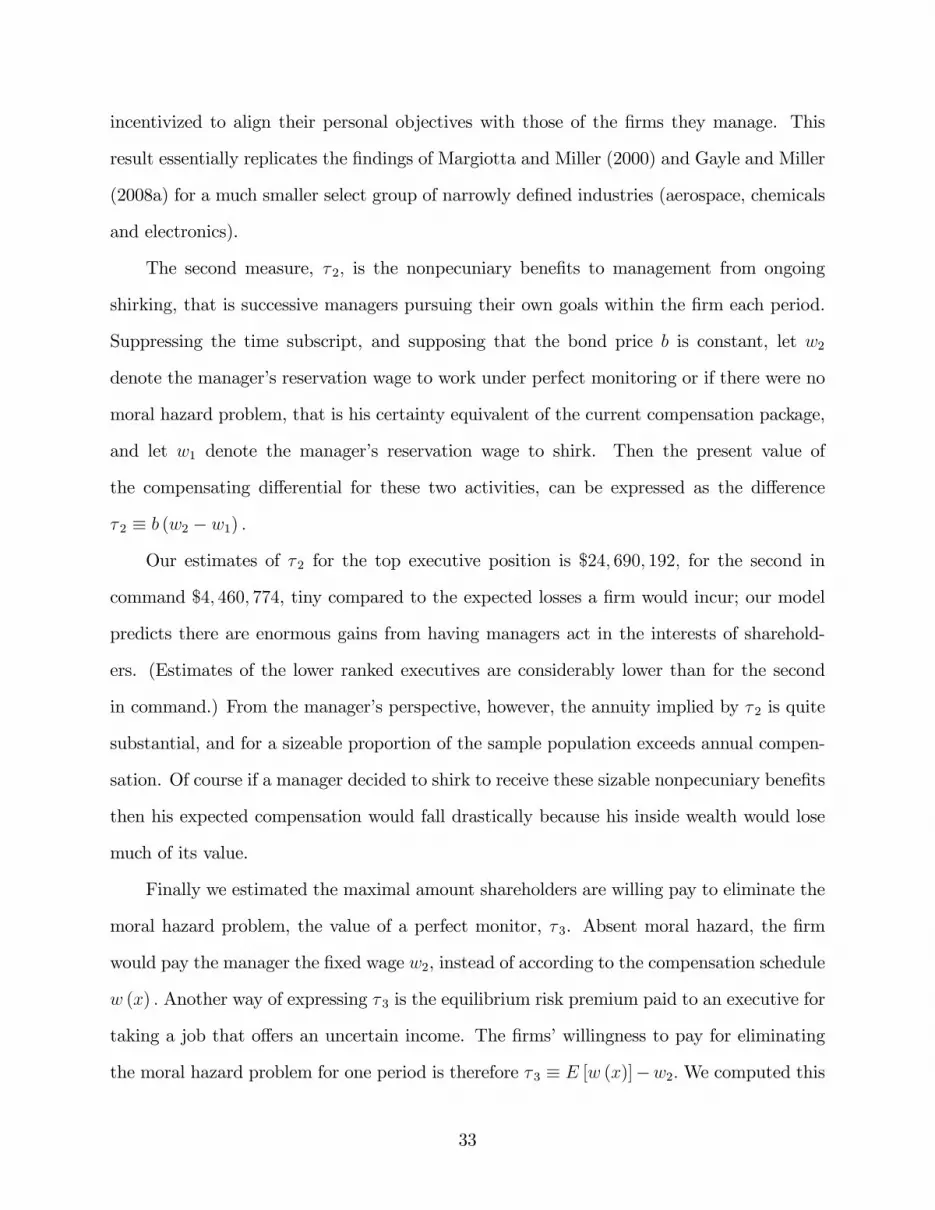
incentivized to align their personal objectives with those of the �rms they manage. This
result essentially replicates the �ndings of Margiotta and Miller (2000) and Gayle and Miller
(2008a) for a much smaller select group of narrowly de�ned industries (aerospace, chemicals
and electronics).
The second measure, � 2; is the nonpecuniary bene�ts to management from ongoing
shirking, that is successive managers pursuing their own goals within the �rm each period.
Suppressing the time subscript, and supposing that the bond price b is constant, let w2
denote the manager�s reservation wage to work under perfect monitoring or if there were no
moral hazard problem, that is his certainty equivalent of the current compensation package,
and let w1 denote the manager�s reservation wage to shirk. Then the present value of
the compensating di¤erential for these two activities, can be expressed as the di¤erence
� 2 � b (w2 � w1) :
Our estimates of � 2 for the top executive position is $24; 690; 192; for the second in
command $4; 460; 774, tiny compared to the expected losses a �rm would incur; our model
predicts there are enormous gains from having managers act in the interests of sharehold-
ers. (Estimates of the lower ranked executives are considerably lower than for the second
in command.) From the manager�s perspective, however, the annuity implied by � 2 is quite
substantial, and for a sizeable proportion of the sample population exceeds annual compen-
sation. Of course if a manager decided to shirk to receive these sizable nonpecuniary bene�ts
then his expected compensation would fall drastically because his inside wealth would lose
much of its value.
Finally we estimated the maximal amount shareholders are willing pay to eliminate the
moral hazard problem, the value of a perfect monitor, � 3. Absent moral hazard, the �rm
would pay the manager the �xed wage w2, instead of according to the compensation schedule
w (x) : Another way of expressing � 3 is the equilibrium risk premium paid to an executive for
taking a job that o¤ers an uncertain income. The �rms�willingness to pay for eliminating
the moral hazard problem for one period is therefore � 3 � E [w (x)]�w2:We computed this
33

measure for the CEO and second highest paid executive for each sector.4
Table 11
Cost of Moral Hazard in US$ (2000)
Sector Executive Estimate of � 3
EnergyCEO
2nd ranked
10,450,320
1,345,098
MaterialsCEO
2nd ranked
11,450,450
1,745,067
IndustrialsCEO
2nd ranked
14,670,350
1,675,067
Consumer DiscretionaryCEO
2nd ranked
8,210,950
3,245,067
Consumer StaplesCEO
2nd ranked
4,210,950
545,068
Health careCEO
2nd ranked
30,410,580
10,450,000
Information TechnologyCEO
2nd ranked
12,410,580
4,550,134
TelecommunicationCEO
2nd ranked
15,670,892
4,550,134
UtilitiesCEO
2nd ranked
6,590,872
450,674
Con�rming our previous work, the estimates in Table 11 demonstrate that the risk
premium paid to executives is a very important part of their pay package. Elsewhere we have
argued, in Gayle and Miller (2008b), that changes in this component are largely responsible
4Note that since the probability distribution of abnormal returns conditional on e¤ort level varies withthe sector, the cost of moral hazard is sector dependent too.
34
for expected compensation and its volatility, increasing faster than real wages over the last
60 years. Here we simply add that there is notable variation between the costs of moral
hazard across the sectors, with the health care sector registering as an outlier worthy of
special attention in a future study.
V. Conclusion
The disclosure rules of the SEC make it relatively easy for boards to write contracts with
managers that prohibit any trading in the �rm�s securities. Yet our empirical evidence shows
that managers signi�cantly bene�t from their �rm�s good fortune. Consistent with previous
work, in this area we �nd that managers exploit insider information about the pro�tability
of their own �rm for direct personal gain. But this is not su¢ cient to prove that executive
compensation contracts are de�cient. Our theoretical framework demonstrates that in an
optimal contract the manager should not pro�t from changes in the value of the �rm unless
there is a moral hazard problem. This feature might explain the paradox of inside information
and performance pay. Optimal contracting in models of generalized moral hazard, with both
private information and hidden actions, reward managers for truthfully revealing the state of
the �rm. Shareholders permit compensation schemes that correlate �rm performance with
executive pay because the pro�tability of the �rm depends on how managers assess their
own accomplishments and �rm�s prospects, as well as what managers do, which is organizing
human resources in creative ways that add value to their �rm. Rewarding managers for
revealing hidden information about the �rm�s pro�tability helps the board set contracts that
incentivize the manager�s work activities. If moral hazard is anywhere near as costly as our
estimated values, then de-coupling managerial compensation from changes in shareholder
wealth, for example by imposing an upper limit on maximal compensation, could be very
costly indeed.
35
Notes
�We would like to thank seminar participants, at SOLE 2006, Econometric Society sum-
mer meetings 2006, Carnegie Mellon University, Cornell University, Duke University, Univer-
sity of Essex, Georgia State University, London School of Economics University of Maryland,
New York University, University of Pennsylvania, Princeton University and the Venice Sum-
mer Institute Workshop on Executive Pay. A previous version of this paper appears under
the title " The Paradox of Insider Information and Moral Hazard".
REFERENCES
Bebchuk, L., and J. Fried (2003), �Executive Compensation as an Agency Problem�, Journal
of Economic Perspectives 17, 71-92.
Bertrand, M., and S. Mullainathan (2000), "Agents with and without Principals", American
Economic Review 90, 203-208.
Bertrand, M., and S. Mullainathan (2001), "Are CEOs Rewarded for Luck? The Ones
without Principals Are", The Quarterly Journal of Economics 116, 901-932.
Fudenberg, D., B. Holmstrom and P. Milgrom (1990) "Short-Term Contracts and Long-Term
Agency Relationships", Journal of Economic Theory 51, 1-31.
Finnerty, J. (1976), "Insiders and Market E¢ ciency", The Journal of Finance 31, 1141-1148.
Gayle G., L. Golan and R. Miller (2008) "Promotion, Turnover and Compensation in the
Executive Market", Working paper, Tepper School of Business, Carnegie Mellon University.
Gayle, G., and R. Miller (2008a), "Has Moral Hazard Become a More Important Factor in
Managerial Compensation?", American Economic Review, forthcoming.
36

Gayle, G., and R. Miller (2008b), "Identifying and Testing Generalized Moral Hazard Models
of Managerial Compensation", Working paper, Tepper School of Business, Carnegie Mellon
University.
Harris, L. (2003), Trading and Exchanges: Market Microstructure for Practitioners, Oxford
University Press, Oxford.
Ja¤e, J. (1974) "Special Information and Insider Trading", Journal of Business 47, 410-428.
Lorie, J., and V. Niederho¤er (1968), "Predictive and Statistical Properties of Insider Trad-
ing", Journal of Law and Economics 11, 35-53.
Margiotta, M., and R. Miller (2000), �Managerial Compensation and the Cost of Moral
Hazard �, International Economic Review 41, 669-719.
Myerson, R. (1982), "Optimal Coordination Mechanisms in Generalized Principal-Agent
Models", Journal of Mathematical Economics 10, 67�81.
Seyhun, H. (1992a), "The E¤ectiveness of Insider Trading Sanctions", Journal of Law and
Economics 35, 149-182.
Seyhun, H. (1992b), "Why Does Aggregate Insider Trading Predict Future Stock Returns?",
The Quarterly Journal of Economics 107, 1303-1331.
37


