Embed Size (px)
Citation preview
Wheat syntenome unveils new evidences of contrastedevolutionary plasticity between paleo- and neoduplicatedsubgenomes
Caroline Pont1,†, Florent Murat1,†, Sebastien Guizard1, Raphael Flores2, Severine Foucrier1, Yannick Bidet3, Umar Masood
Quraishi1, Michael Alaux2, Jaroslav Dolezel4, Tzion Fahima5, Hikmet Budak6, Beat Keller7, Silvio Salvi8, Marco Maccaferri8,
Delphine Steinbach2, Catherine Feuillet1, Hadi Quesneville2 and Jerome Salse1,*1INRA/UBP UMR 1095, Centre de Clermont Ferrand-Theix, 5 Chemin de Beaulieu, 63100 Clermont Ferrand, France,2INRA/URGI, Centre de Versailles, batiment 18, route de Saint Cyr, 78026 Versailles cedex, France,3Clermont Universit�e/Plateforme GINA, Centre Jean Perrin, 58 rue Montalembert, 63011 Clermont Ferrand, France,4Centre of the Region Han�a for Biotechnological and Agricultural Research, Institute of Experimental Botany, Olomouc,
Czech Republic,5Department of Evolutionary and Environmental Biology, Faculty of Natural Sciences University of Haifa Mt. Carmel,
University of Haifa, Haifa, 31905 Israel,6Faculty of Engineering and Natural Sciences, Sabanci University, Orhanli, Tuzla-Istanbul, Turkey,7Institute of Plant Biology, University of Zurich, Zollikerstrasse 107, 8008 Zurich, Switzerland, and8University of Bologna, DiSTA – Agronomy, Viale Fanin, 44, 40127 Bologna, Italy
Received 27 August 2013; revised 1 October 2013; accepted 8 October 2013; published online 26 October 2013.
*For correspondence (e-mail [email protected]).†These authors contributed equally to the work.
SUMMARY
Bread wheat derives from a grass ancestor structured in seven protochromosomes followed by a paleotetra-
ploidization to reach a 12 chromosomes intermediate and a neohexaploidization (involving subgenomes A,
B and D) event that finally shaped the 21 modern chromosomes. Insights into wheat syntenome in sequenc-
ing conserved orthologous set (COS) genes unravelled differences in genomic structure (such as gene
conservation and diversity) and genetical landscape (such as recombination pattern) between ancestral as
well as recent duplicated blocks. Contrasted evolutionary plasticity is observed where the B subgenome
appears more sensitive (i.e. plastic) in contrast to A as dominant (i.e. stable) in response to the neotetra-
ploidization and D subgenome as supra-dominant (i.e. pivotal) in response to the neohexaploidization
event. Finally, the wheat syntenome, delivered through a public web interface PlantSyntenyViewer at
http://urgi. versailles.inra.fr/synteny-wheat, can be considered as a guide for accelerated dissection of major
agronomical traits in wheat.
Keywords: paleogenomics, dominance, partitioning, conserved orthologous set, single nucleotide
polymorphism.
INTRODUCTION
Recent comparative genomics studies based on monocot
genome sequences, including Panicoideae (sorghum, Pat-
erson et al., 2009; maize, Schnable et al., 2009), Ehrhartoi-
deae (rice, IRGSP, 2005), and Pooideae (Brachypodium, IBI,
2010), suggest that grasses derive from n = 7 (alternative
scenario with n = 5) to 12 ancestral karyotypes (named
AGK for Ancestral Grass Karyotypes). Modern grass
genomes were then shaped from this AGK through a
shared whole-genome duplication (WGD) followed by
ancestral chromosome fusion (CF) events (for review
Salse, 2012). Polyploidization has been shown to be fol-
lowed by genome-wide diploidization (also referenced as
partitioning) through differential elimination of duplicated
gene redundancy at the whole-genome level (Wang et al.,
2005; Freeling et al., 2012; Schnable et al., 2012a,b), lead-
ing to dominant (i.e. D, stable genomic compartment asso-
ciated with low duplicated gene loss and reduced gene
diversity) and sensitive (i.e. S, plastic genomic compart-
ment associated with high duplicated gene loss and
increased gene diversity) subgenomes in modern grass
© 2013 The AuthorsThe Plant Journal © 2013 John Wiley & Sons Ltd
1030
The Plant Journal (2013) 76, 1030–1044 doi: 10.1111/tpj.12366

species (Woodhouse et al., 2010; Abrouk et al., 2012; Sch-
nable et al., 2012a,b).
Bread wheat is a good plant model to study the impact
of distinct rounds of WGD on the subgenome dominance
phenomenon, as its genome comprises: (i) seven ancestral
paleoduplicated blocks corresponding to the shared paleo-
tetraploidization event identified in all known cereal
genomes and dating back to 65 million years ago (here-
after, mya); as well as (ii) two recent neopolyploidization
events leading to Triticum aestivum, which originated from
two hybridizations between T. urartu (A genome) and an
Aegilops. Speltoides related species (B genome) 1.5 mya,
forming T. turgidum ssp. dicoccoides; and between
T. turgidum ssp. durum (genomes A–B) and A. tauschii
(D genome) 10 000 years ago (Feldman et al., 1995). Wheat
diploidization (between A, B and D subgenomes) has been
partially investigated at the whole-genome and gene levels
where recent transcriptome analysis in hexaploid wheat
suggested that 39 up to 46% of the wheat homoeologous
genes may have either been lost or neo-/subfunctionalized
within 1.5 my of evolution (Pont et al., 2011). Such struc-
tural or functional diploidization brings unbalanced poly-
ploidy gene systems into diploid-like mode of expression
(Edger and Pires, 2009).
The recent access to a large bread wheat genomic
resources offers the opportunity to study in the same
analysis not only the structural plasticity of paleoduplicat-
ed genes (during the last 50–70 million years of evolution)
but also neoduplicated genes (during 0.1–1.5 million years
of evolution) by comparing the conservation of A, B and D
homoeologous gene copies, i.e. wheat homoeoalleles.
Wheat genomics resources have been recently published
with the release of the wheat genome shotgun sequences
in hexaploid (Brenchley et al., 2012) and diploids (D gen-
ome ancestor sequence in Jia et al., 2013 and Luo et al.,
2013 as well as the A genome progenitor sequence in Ling
et al., 2013). However, these studies reported incomplete
gene repertoire (i.e. whole-genome short reads assembled
into gene models instead of whole-chromosome pseudo-
molecules) either not ordered or partially ordered based
on synteny relationships, mainly with Brachypodium. Inde-
pendently, genome-wide diversity maps have been also
made recently available in hexaploids (Chao et al., 2009;
Allen et al., 2011, 2013; Lai et al., 2012; Winfield et al.,
2012; Cavanagh et al., 2013), tetraploids (Saintenac et al.,
2011; Trebbi et al., 2011; Ren et al., 2013) or diploid pro-
genitors (You et al., 2011; Wang et al., 2013). However,
most of these studies relied on transcriptome (i.e. exome)
sequencing from different genotypes and then are depen-
dent on both the tissues used and the expression of the
three homoeologs on the considered tested tissues and
developmental conditions, then potentially leading to pos-
sible bias in homoeoallele diversity estimation due to gene
silencing in the tested biological conditions.
In contrast, the evolution of the homoeologous gene
space in hexaploid wheat can be investigated through
comparative genomics approaches trying to introduce no
(or reduced) bias in gene loss and sequence polymorphism
assessment (Thomas et al., 2006; Bekaert et al., 2011). Up
to now very few genes are physically and genetically
mapped in hexaploid bread wheat. The integration of both
genomic and genetic resources, described in the previous
section, offers the opportunity to provide the most accu-
rate wheat syntenic (or also referenced as computed, Pont
et al., 2011) gene order (i.e. defined as syntenome) and test
its accuracy as this will probably represent in a long-term
the wheat reference genome, until complete pseudomole-
cules will be publicly released for the 21 chromosomes.
Such validated wheat syntenome will also offer the oppor-
tunity to perform a comprehensive analysis of the wheat
gene space evolutionary plasticity during the last 100 mil-
lion years and to investigate the impact of paleo- and neo-
polyploidization events on genome rearrangement and
gene diversity. Despite insights into wheat subgenome
evolution, the wheat syntenome can also be consider as an
applied tool for the dissection of major traits in wheat.
RESULTS
Wheat syntenome defines paleo/neodominant and
sensitive blocks
Grasses has been proposed to derive from a n = 7 ancestor
that has been duplicated to reach a n = 14 intermediate fol-
lowed by two chromosomal fusions to reach a n = 12
ancestor (Figure 1a centre of the circle and inner circle A1–
A12) founder of all the modern grasses (Salse, 2012). Com-
paring grass genome sequences, we identified a 17 317
conserved orthologous set (COS; also referenced as prot-
ogenes) located on 12 syntenic blocks (i.e. conserved
ancestral regions; CARs) covering the rice, maize, sor-
ghum, Brachypodium genomes (Figure 1a inner cereal cir-
cles and Table 1) and refining the previously reported
conserved gene repertoire in grasses of 9731 protogenes
(Murat et al., 2010). The 17 317 COS has been used as a
matrix to produce a wheat syntenome where on average
2474 COS have been ordered on the seven wheat chromo-
some groups in respect to the position of their orthologous
counterparts following the ordering priority of rice > Brac-
hypodium > sorghum (cf wheat consensus circle on
Figure 1a and Table 1). We made this wheat syntenome
available through a public web interface named PlantSynt-
enyViewer at http://urgi.versailles.inra.fr/synteny-wheat
(illustrated in Figure 1b and with raw data available in
Table S1). The wheat syntenome offered the opportunity
to unravel the evolutionary fate of such COS in wheat in
characterizing retained vs. lost duplicates in response
to both ancestral shared (~65 mya) and recent specific
(<1.5 mya) polyploidization events. To do this, we
© 2013 The AuthorsThe Plant Journal © 2013 John Wiley & Sons Ltd, The Plant Journal, (2013), 76, 1030–1044
Wheat genome evolution 1031
performed two complementary strategies, bypassing the
requirement of a complete reference genome sequence,
consisting aligning the public wheat gene repertoire to the
previous COS-based wheat syntenome (strategy #1 in
Figure 1a referenced as ‘Wheat?COS’) as well as COS
de novo sequencing in wheat (strategy #2 in Figure 1a
referenced as ‘COS?Wheat’), Figure S1.
The first strategy (#1, black arrow Figure 1a) in investi-
gating the retention of ancestral genes in bread wheat con-
sisted in comparing the recently published wheat genome
shotgun sequence (Brenchley et al., 2012) to the previous
wheat syntenome. When comparing the published wheat
genome consisting in ~95K gene models with 18 483 of
them assigned to the three subgenomes (consisting in 48
120 homoeologous-specific genes distributed 15 996 on A,
15 244 on B and 16 880 on D) to the 17 317 ordered prot-
ogenes in wheat (mapped on chromosome groups 1–7),
6423 (35%) ancestral grass genes appear retained in wheat
(Table S1 and Figure 1a). This reduced rate of gene conser-
vation is consistent with the 17 093 genes in A. tauschii
with 26.1% associated with orthologs in grasses (Luo et al.,
2013) as well as 42% (14 578 genes) of the 34 879 gene
models from T. urartu reported as conserved with Brac-
hypodium (Ling et al., 2013). Such limited level of single
gene orthologous relationships between the wheat gene
repertoire and the ancestral retained grass genes in the
other species, is largely due to wheat-specific gene content
amplification though intra- and inter-chromosomal dupli-
cations (Figure S2). The distribution of the retained ances-
tral genes on the wheat subgenomes (4905, 158, 347, 652,
62, 187, 112 respectively located on A–B–D, A–B, B–D, A–D,
B, D and A genomes specifically) showed an increased
gene density at the subtelomeric regions compared to the
centromeres (compare with BIN-based gene density distri-
bution in green on the Figure 1a). Homoeolog gene den-
sity appeared correlated to the recombination rate, as
previously reported in the diploid A. tauschii (Jia et al.,
2013; Luo et al., 2013) and T. urartu (Ling et al., 2013) gen-
ome sequences. The density of non-colinear genes per bin
was correlated with recombination rate, with non-collinear
genes located in distal compartments of the chromo-
somes, then suggesting that non-collinear genes may have
survived in distal high recombination regions compared to
proximal low-recombination regions.
The wheat syntenome illustrates that the seven Triticeae
chromosome groups originated from a n = 12 ancestral spe-
cies by five nested chromosome fusions (NCFs), involving
chromosomes 1 (A5 + A10), 2 (A4 + A7), 4 (A3 + A11), 5
(A12 + A9 + A3), 7 (A6 + A8), Figure 1(a). The previous
chromosome-to-chromosome relationships, established at
the BIN-resolution level between wheat and the sequenced
grass genomes, allowed us to transfer the ancestral domi-
nant (A1–2–3–4–9–11, associated with higher retention of
ancestral genes) and sensitive (A5–6–7–8–10–12, associated
with higher loss of ancestral genes) chromosomal blocks
reported in grasses (Figure S3) into the 21 bread wheat
chromosomes (Figure 1a with D and S blocks). Among the
157 BINs available on the 21 bread wheat chromosomes, 79
and 69 were respectively identified as dominant and sensi-
tive according to the known nature of their orthologous
counterparts in the sequenced grass species (Table S2). The
Triticeae genomes, that derived from the n = 12 ancestor
(centre on the circle on Figure 1a) through five ancestral
chromosome fusions, can then be re-organized into paleo-D
and paleo-S (i.e. paralogous dominant (D) and Sensitive (S)
blocks deriving from the ancestral WGD) chromosomal
compartments where w1(S) = A10(S) + A5(S), w2(D) = A7
(S) + A4(D), w3(D) = A1(D), w4(D) = A11(D) + A3(D), w5
(D) = A9(D) + A12(S), w6(D) = A2(D), w7(S) = A8(S) + A6(S).
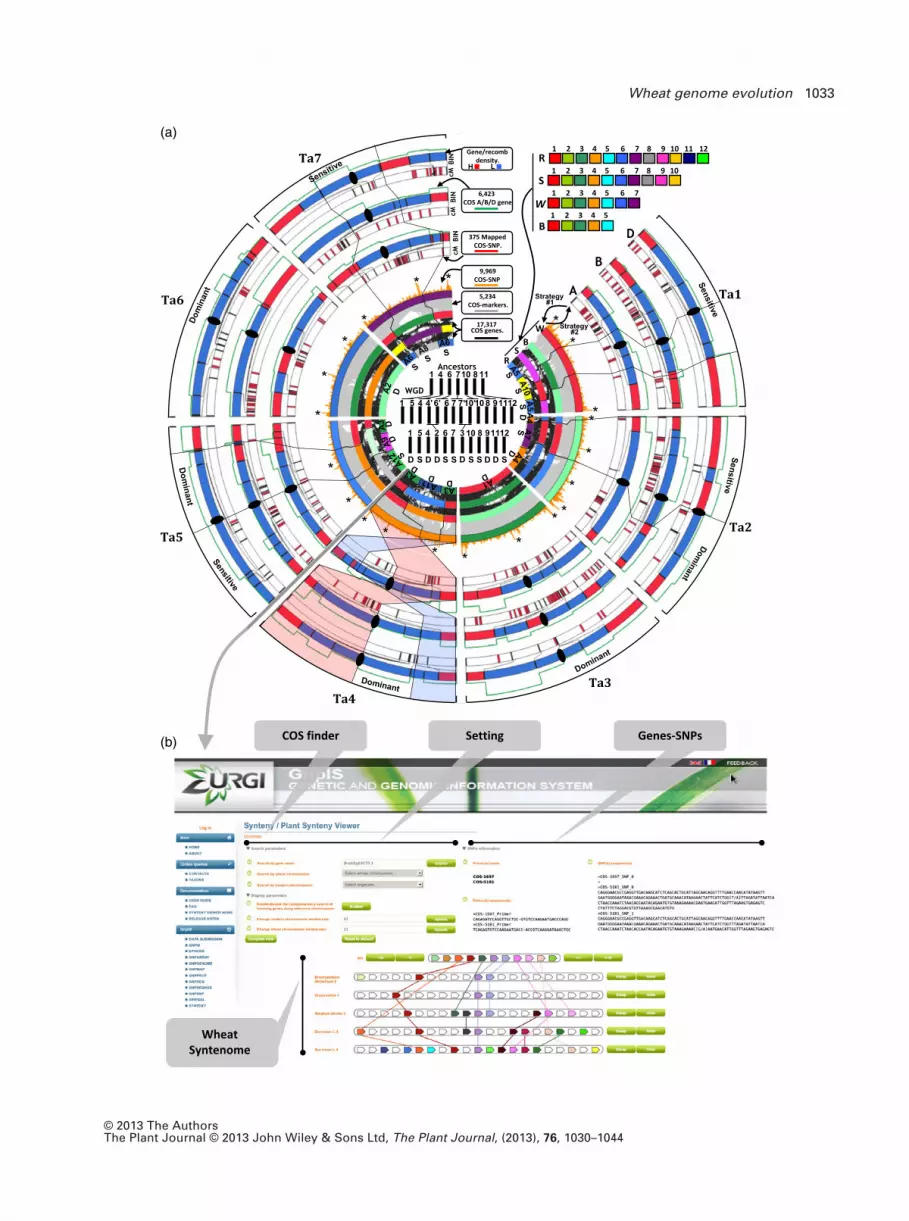
Such high resolution BIN-based wheat syntenome
offered the opportunity to investigate the retention of the
ancestral genes in wheat following the paleotetraploidiza-
tion event (by comparing D and S wheat blocks defined
previously) as well as the neohexaploidization event (by
comparing the A, B and D subgenomes), as illustrated in
Figure 2(a) (top) with D chromosomes in blue and S chro-
mosomes in red. Regarding the number of retained genes
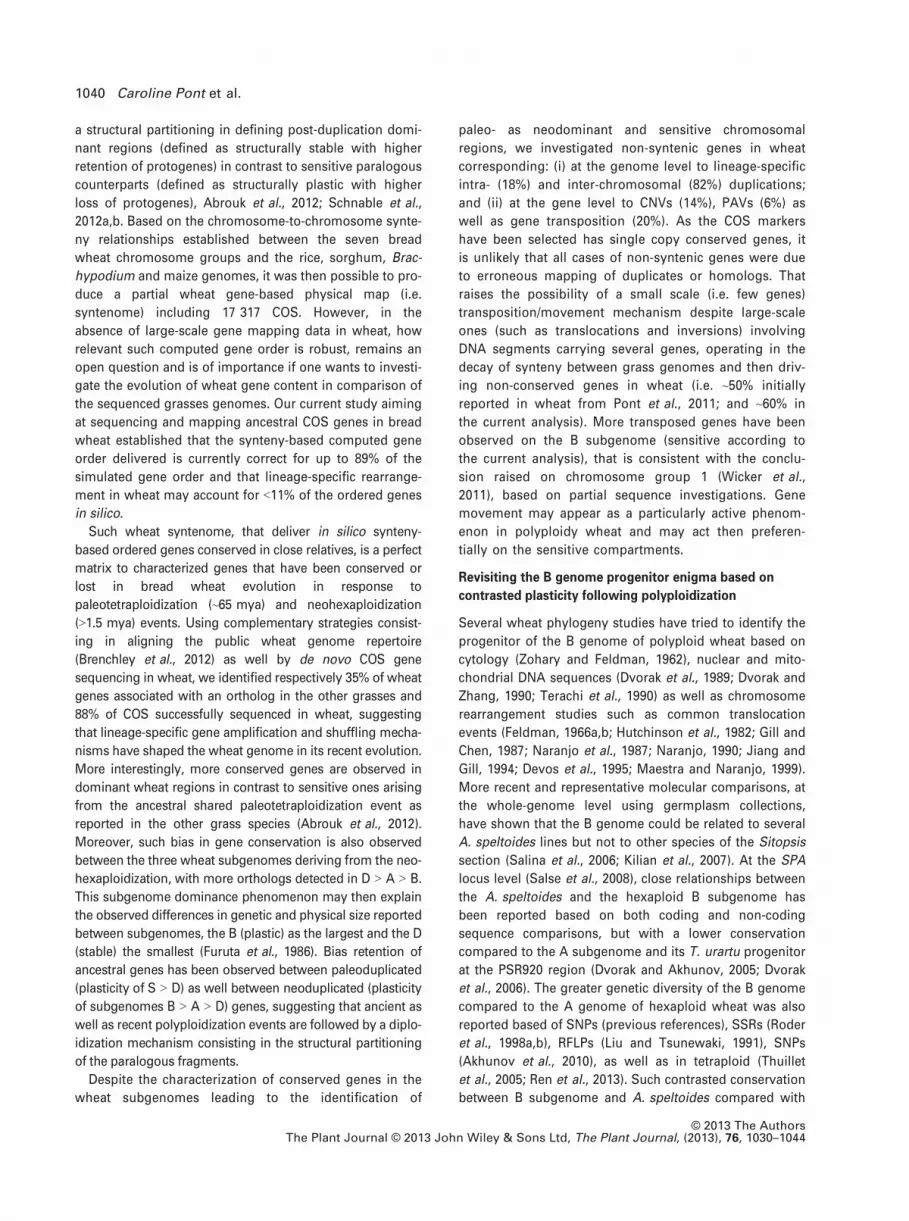
in D vs. S blocks, we observed the expected higher reten-
tion (P < 5%) of protogenes in paleodominant blocks com-
pared to paleosensitive counterparts (Figure 2b, left). This
result confirm the existence of shared D and S blocks in
wheat following the paleoteraploidization (~65 mya) as
reported in rice, sorghum, Brachypodium and maize
(Abrouk et al., 2012). Surprisingly, when comparing the
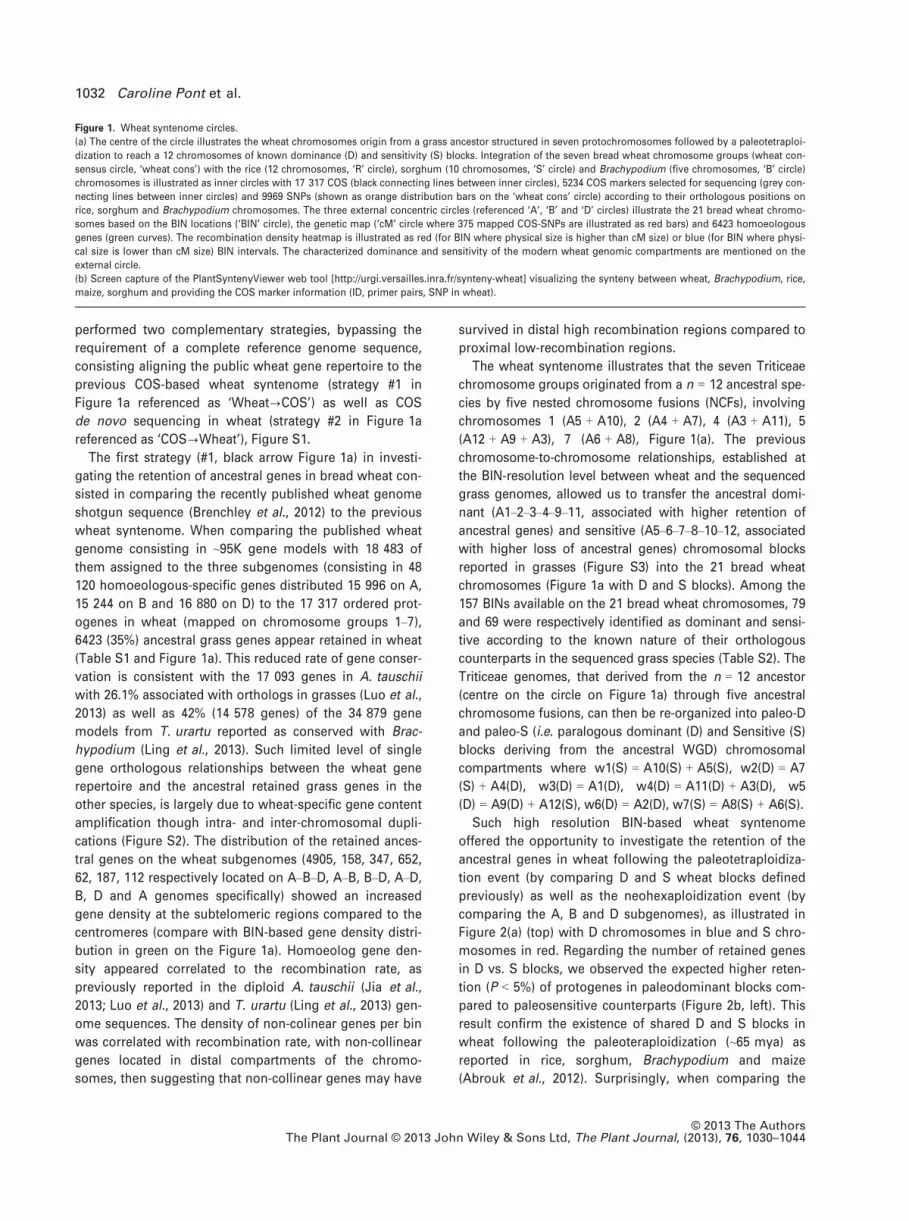
Figure 1. Wheat syntenome circles.
(a) The centre of the circle illustrates the wheat chromosomes origin from a grass ancestor structured in seven protochromosomes followed by a paleotetraploi-
dization to reach a 12 chromosomes of known dominance (D) and sensitivity (S) blocks. Integration of the seven bread wheat chromosome groups (wheat con-
sensus circle, ‘wheat cons’) with the rice (12 chromosomes, ‘R’ circle), sorghum (10 chromosomes, ‘S’ circle) and Brachypodium (five chromosomes, ‘B’ circle)
chromosomes is illustrated as inner circles with 17 317 COS (black connecting lines between inner circles), 5234 COS markers selected for sequencing (grey con-
necting lines between inner circles) and 9969 SNPs (shown as orange distribution bars on the ‘wheat cons’ circle) according to their orthologous positions on
rice, sorghum and Brachypodium chromosomes. The three external concentric circles (referenced ‘A’, ‘B’ and ‘D’ circles) illustrate the 21 bread wheat chromo-
somes based on the BIN locations (‘BIN’ circle), the genetic map (‘cM’ circle where 375 mapped COS-SNPs are illustrated as red bars) and 6423 homoeologous
genes (green curves). The recombination density heatmap is illustrated as red (for BIN where physical size is higher than cM size) or blue (for BIN where physi-
cal size is lower than cM size) BIN intervals. The characterized dominance and sensitivity of the modern wheat genomic compartments are mentioned on the
external circle.
(b) Screen capture of the PlantSyntenyViewer web tool [http://urgi.versailles.inra.fr/synteny-wheat] visualizing the synteny between wheat, Brachypodium, rice,
maize, sorghum and providing the COS marker information (ID, primer pairs, SNP in wheat).
© 2013 The AuthorsThe Plant Journal © 2013 John Wiley & Sons Ltd, The Plant Journal, (2013), 76, 1030–1044
1032 Caroline Pont et al.
17,317 COS genes.
375 Mapped COS-SNP.
6,423 COS A/B/D gene
5,234 COS-markers.
1 2 3 4 5 6 7 8 9 10 11 12R
S
B1 2 3 4 5
1 2 3 4 5 6 7 8 9 10
W1 2 3 4 5 6 7
9,969COS-SNP
Gene/recomb density.
LH
cMBIN
cMBIN
cMBIN
A
B
D
WheatSyntenome
COS finder Setting Genes-SNPs
Ta1
Ta2
Ta3Ta4
Ta5
Ta6
Ta7
1
1 5
4
4 4’
6
6’ 6
710
10’107 7’
8 11
12118 9
121198
Ancestors
WGD
5
S
1
D
4
D
6
S
2
SDS D
7 103
D SSD
*
Strategy#1
Strategy#2
*
**
*
***
***
**
*
*
*
*
**
* *
B
RS
W
(a)
(b)
© 2013 The AuthorsThe Plant Journal © 2013 John Wiley & Sons Ltd, The Plant Journal, (2013), 76, 1030–1044
Wheat genome evolution 1033

retention of protogenes in the A, B and D subgenomes, we
also observed a bias retention (P < 5%, Figure 2b right) of
ancestral genes, with the B subgenome showing the prop-
erty of a so-called sensitive subgenome with higher loss of
protogenes. This observation raised the hypothesis that
the reported genome partitioning phenomenon following
the ancestral shared paleotetraploidization event (bias
retention of protogenes between paleo-D and S blocks
confirmed in wheat as illustrated in Figure 2b left) may
also acts between the A, B and D subgenomes deriving
form the neohexaploidization, with A and D as dominant
(i.e. stable) and B as sensitive (i.e. plastic), Figure 2(b)
right. This confirms and largely complements recent evi-
dences of differential gene loss observed between the sub-
genomes of the wheat chromosome group 7 with
increased gene numbers reported respectively on
D > A > B (Berkman et al., 2013).
However, the previous conclusions regarding the wheat
genome partitioning in response to both paleo- and
neopolyploidization events were obtained in exploiting the
public wheat genome shotgun sequence (Brenchley et al.,
2012) that consists only in a partial gene repertoire. We can-
not exclude that missing (non-sequenced) genes/families/
homoeologs in such resource may have impacted our
conclusion regarding the observed structural plasticity of
paleo- and neoduplicated compartments in modern hexa-
ploid bread wheat. Consequently, in order to validate and
complement the previous conclusions regarding the wheat
subgenome dominance, we performed a second strategy
(#2, black arrow Figure 1a and Figure S1) that consisted in
de novo sequencing and mapping of COS genes in wheat
deriving from the 17 317 protogenes but not included in the
previous 6423 wheat/grass ortholog repertoire (Figure S4).
To do so, we applied a COS-finder tool (see Method, Qurai-
shi et al., 2009) to the 10 894 (17 317 total COS excluding
the 6423 COS identified from Brenchley et al., 2012) ances-
tral grass genes not associated with a public wheat gene
model sequence. We have then been able to develop a tre-
mendous catalog of 6033 primer pair set (primers pairs
selection criteria in Method section) defining 5234 COS rela-
tionships (Table S1). Such COS primers, selected on highly
conserved exonic regions, offer all the guarantee to be use-
ful in sequencing the wheat orthologs (and associated ho-
moeologs), based on the observed transferability of such
COS markers among monocot species (i.e. sorghum, maize,
oat, rice, Triticale, wheat, Brachypodium and rye) at both the
amplification (Figure S5a on agarose gels and Figure S5b on
capillary sequencer) and sequence levels (Figure S5c with
melting curve profiles supported by sequence-based haplo-
typing data). Overall, the characterized COS markers (17 317
COS with 5234 selected COS for sequencing and 6033 asso-
ciated primer pairs) as well as the COS-finder software are
made available at http://urgi.versailles.inra.fr/synteny-wheat
(Figure 1b and Table S1).
In order to validate the orthologous, homoeologous
and paralogous gene contents and retention in wheat
paleohistory, raising the evolutionary model suggesting
subgenome dominance between D>A>B, we performed the
sequencing of the selected 5234 COS (Experimental Proce-
dure and detailed strategy in Figure S6). COS markers have
been sequenced in Chinese Spring using the 454 (Roche)
technology, delivering 23 463 reference transcripts (RTs)
covering 4582 COS (with an average of three RTs per COS,
putatively homoeoalleles, Figure S6). This result estab-
lished that 88% of the COS (i.e. genes conserved in rice,
Brachypodium, maize and sorghum) are conserved in
wheat, in contrast to 35% of the 18 483 gene models (from
Brenchley et al., 2012) that have been associated with a
COS gene in the previous section. This result reinforces
the previous conclusion (Figure S2) that wheat has been
enriched, in the course of evolution, by species and/or line-
age-specific genes. The capture (Agilent SureSelect Target
Enrichment) of the 23 463 RTs in eight bread wheat geno-
types (Chinese Spring, Renan, Courtot, Alcedo, Brigadier,
Genial, Hustler and Nicam) and short read sequencing (Illu-
mina HiSeq 2000) delivered 9969 high quality SNP cover-
ing 2197 COS markers with a density of 1.9 SNP/500 bp
(Table S1 and Figure S7). Such de novo COS sequences in
wheat allowed us to confirm the bias retention of protoge-
nes defining dominant as well as sensitive blocks for both
paleo- and neopolyploidization events (Figure 2c). The
number of sequenced COS in wheat observed in dominant
and sensitive compartments confirmed our previous con-
clusions based on the public gene repertoire, where more
retained ancestral genes (or orthologs) are observed in the
dominant blocks (Figure 2c left). We also confirmed the
bias retention of homoeologs between A, B and D subge-
nomes (Figures 2c right and S8). Overall, we then pro-
posed, based on a pure in silico experiment (alignment-
based synteny analysis) complement by a de novo
sequencing strategy (COS characterization), that the
ancient subgenome dominance process related to the
shared paleotetraploidization in grasses is observed in
wheat and has been eroded (P-values from ~3.10e�2 to
~5.10e�2) by the neohexaploidization event that may have
led to a modern subgenome dominance where B is sensi-
tive and A–D are dominant (P-values from ~1.10e�3 to
~8.10e�7).
Genome partitioning shaped wheat genetic landscape
In order to address not only the bias in gene retention
(detailed in the previous section) but also in gene diversity
between modern and ancient dominant vs. sensitive
blocks, we used the overall depth of read coverage across
COS as well as the depth of read coverage at variable sites
to detect not only sequence variants (i.e. 9969 SNPs, Figure
S7) but also putative structural variants such as presence/
absence variations (PAVs), copy number variations (CNVs)
© 2013 The AuthorsThe Plant Journal © 2013 John Wiley & Sons Ltd, The Plant Journal, (2013), 76, 1030–1044
1034 Caroline Pont et al.

in contrast to non-structural variation (NSV), in which all
genotypes are covered for the considered COS). Figure S9
illustrates three distinct COS markers associated with: (i)
sequences for the eight sequenced genotypes [COS-5368,
observed in 80% (4286 COS) of the cases]; (ii) missing
sequences [COS-542, PAV observed in 6% (304 COS) of the
cases]; or (iii) extra copy sequences [COS-3070, CNV
observed in 14% (644 COS) of the cases]. We then provide
a complete view of the gene diversity distribution in wheat
based on the precise characterization of both non-struc-
tural (SNPs) as well as structural variants (InDels, CNVs
and PAVs). The wheat COS sequences offered the opportu-
nity to test the impact of the reported biased chromosomal
plasticity between dominant and sensitive blocks on gene
diversity through differential SNP/InDel contents observed
in such wheat genomic compartments. Figure S10 illus-
trates the observed distribution of InDel and SNP polymor-
phisms in wheat where the more frequently observed (61%
of the cases) sequence variations of SNPs correspond to
transitions (A/G or T/C) compared with transversions (A/T,
A/C, T/G or G/C). The most frequently observed (52% of the
cases) sequence variations of InDels correspond to a single
nucleotide. The distribution of SNPs on D and S blocks as
well as A, B and D subgenomes shows that the gene diver-
sity increases in the sensitive blocks (either paleo-S blocks
or B genome, Figure 2d, plain box-plots). Wheat chromo-
some groups derived five fusions of the 12 ancestral chro-
mosomes then juxtaposing high-gene-density terminal
paleoregions near low-gene-density paleocentomeric
regions in the post-fusion neo-chromosome (Figure 1a
doted connecting black lines), Murat et al. (2010). Conse-
quently, despite bias distribution of sequence variants
between dominant and sensitive subgenomes, we
observed a higher gene (COS) diversity (i.e. SNP/bp density)
in telomeric regions and synteny breakpoints (SBP) regard-
ing the wheat chromosome groups that derived from the
centromeric nested insertion of ancestral chromosomes
(Figures 1a black stars and S11).
Until the wheat genome is entirely sequenced and avail-
able (in delivering complete pseudomolecules) the discov-
ery and application of genome polymorphism for wheat
crop improvement and evolutionary investigation remains
a real challenge, in which the provided wheat syntenome
constitutes a tremendous matrix for these purposes. Based
on the previous in silico syntenome and SNP-based diver-
sity map, we addressed differences in gene content and
plasticity between dominant and sensitive fragments for
both paleo- and neopolyploidization events. As the previ-
ous conclusions derived from pure in silico syntenome
and COS-SNPs characterization, we validated the delivered
computed wheat gene order (17 317 ordered COS) as well
as associated sequence variants (9969 SNPs) through COS-
SNP mapping (Figure S4). As a validation procedure, we
have randomly selected a subset of 1135 (22%) among theTable
1Whea
tsy
ntenomean
dderived
COS-SNPmak
ers
Chr.
Gen
erepertoire
COSgen
esCOS-SNPmarke
rs
Gen
es/
group
gA
gB
gD
Protogen
esCOS
primers
COS-seq
aCOS-SNPb
COSMap
ped
cCOS
conse
rved
COS
tran
spose
dc
119
4565
560
069
020
0169
863
4(279
2/42
/64)
1492
(299
)76
(36/28
/12)
72(94%
)4(0/4/0)
229
6488
294
210
2829
6310
2088
2(413
9/41
/125
)20
77(386
)64
(27/33
/4)
57(89%
)7(6/1/0)
328
3075
588
099
327
3392
475
5(329
8/40
/105
)15
07(323
)82
(25/47
/10)
77(93%
)5(1/3/1)
425
5377
080
988
930
1977
668
5(303
5/39
/79)
861(243
)18
(7/11/0)
12(66%
)6(4/2/0)
525
1978
880
487
820
2394
187
3(401
2/59
/103
)13
39(352
)28
(5/22/1)
15(53%
)13
(1/12/0)
621
5662
568
176
320
9771
762
5(276
9/42
/69)
1147
(264
)51
(22/22
/7)
49(96%
)2(0/1/1)
724
2378
075
685
024
8195
778
0(341
8/41
/99)
1546
(330
)56
(25/21
/10)
53(94%
)3(2/1/0)
Total
1739
0(4812
0)d
5827
(1599
6)d
5472
(1524
4)d
6091
(1688
0)d
1731
760
3352
34(428
6/30
4/64
4)99
69(219
7)37
5(147
/184
/44)
335(89%
)40
(14/24
/2)
aIn
paren
thes
is:number
ofNSV,PAVan
dCNV.
bIn
paren
thes
is:number
ofCOSco
rres
pondingto
thenumber
ofSNP.
c Inparen
thes
is:number
ofmap
ped
andtran
spose
dCOSresp
ective
lyin
A,Ban
dD
subgen
omes
.dIn
paren
thes
is:totalnumber
ofwhea
thomoeo
logousgen
esfrom
Brench
leyet
al.(201
2).
© 2013 The AuthorsThe Plant Journal © 2013 John Wiley & Sons Ltd, The Plant Journal, (2013), 76, 1030–1044
Wheat genome evolution 1035
A B D
Num
ber
of o
rtho
logs
D S
D S
D S
D S
D S
A B D
A B D
SNP/
500b
pcM
/Mar
ker
cM/M
arke
r
200
400
600
800
1000
1.5
2
0.2
0.4
0.6
600
700
800
900
1.5
0.4
0.6
0.8
1
1.2
1.4
A B D
Num
ber
of C
-ban
d
0.5
0.6
0.7
0.8
2.5
0.4
0.6
0.8
1
0.8
1000
T-test P-value = 0.056 (0.036*) T-test P-value = 7.903E-05 T-test P-value = 8.145E-07
T-test P-value = 0.015 T-test P-value = 0.005T-test P-value = 0.48 (0.488*)
T-test P-value = 0.012 (0.027*) T-test P-value = 0.002 T-test P-value = 0.012
T-test P-value = 0.024 T-test P-value = 0.001T-test P-value = 0.349 (0.208*)
Num
ber
of C
OS
300
400
500
600
700
T-test P-value = 0.121 (0.052*)
220
A B D
AB 4n D 2n
ABD 6n
ABD 6n
~ 5.8 MYA
~ 0.5 MYA
~ 0.01 MYA
0
~70 MYA
~50 MYA
~5.8 MYA A7T1 T2 T3 T4 T5 T6 T7
A1 A5 A7 A3 A10 A11 A12 A8 A9 A6 A2 A4
A1 A5 A7’A7 A10’ A10 A12 A11 A8 A9 A6’ A6 A4 A4’
A5 A7’ A10’ A12 A8 A6’ A4
n = 7
n = 14
n = 12
n = 7
T1 T2 T3 T4 T5 T6 T7
Num
ber
of o
rtho
logs
Num
ber
of C
OS
Num
ber
of C
-ban
d
Paleotetraploidization Neohexaploidization
DominantSensitive
5 NCF
Binom (1/2) P-value = 0.001**Binom (1/2) P-value = 0.00004**
A B D
240
260
280
300
320
1.20.9
2
2.5
1200
340
3
1.6
1.41
1
3
800
1200
0
0.2
0.4
0.6
0.8
In s
ilco
SNP/
500
bpa
map
ped
COS
rate
b
(a)
(b)
(c)
(d)
(e)
(f)
© 2013 The AuthorsThe Plant Journal © 2013 John Wiley & Sons Ltd, The Plant Journal, (2013), 76, 1030–1044
1036 Caroline Pont et al.
5234 COS markers to test the accuracy of the characterized
in silico COS-SNPs as well as computed gene order of such
COS. We have identified 807 in silico SNPs from 986
(out of 1135, 87%) COS markers that have been success-
fully sequenced in genotypes for witch mapping popula-
tions are available (see Experimental Procedure section).
Five hundred and forty high quality scoring (Quality
score A to D) and 267 low quality scoring (Quality score
classes E and F) in silico SNPs (based on SNP calling
criterion described in Figure S7) have been tested. 357
(66%) and 63 (24%) respectively have been validated as
polymorphic between bread wheat cultivars Chinese
Spring, Courtot, Arche, Recital and Renan. 375 (89%) out
of the 420 (357 high quality + 63 low quality scores) vali-
dated SNP have been successfully mapped (Illumina
approach) on the three available mapping populations
(Courtot 9 Chinese Spring, Arche 9 Recital, Renan 9
Recital, see Experimental Procedure), illustrated in Fig-
ure 1(a) (red bars on the wheat chromosome circles) and
available in Table S1. Such observed validation rate (420/
807 = 52%) of in silico SNPs is consistent with the one
(60%) reported by Allen et al. (2011) as well as in Trick
et al. (2012) (56–58% of validation accuracy). Overall,
based on the previous genotyping data, we provided in
the current analysis 9969 high confidence SNPs (deriving
from 5234 sequenced COS markers) for witch 4613
(9969 9 0.52 9 0.89) are expected to be converted effi-
ciently in any functional assays. The remaining non-poly-
morphic in silico SNPs may be related to: (i)
heterogeneity observed in using different genotyping
approach (for example five SNPs failed to be mapped
using Illumina technology but recovered with KASpar);
(ii) in silico intervarietal high quality SNPs that happened
to be homoeoSNPs; and (iii) SNPs associated with the
same quality score that can either be validated or not
through Illumina genotyping approach (Figure S12).
COS-SNPs have been mapped and tested on Illumina,
KASpar, SSCP, HRM, LNA detection (see Experimental Pro-
cedure) to test the accuracy of the provided computed
wheat gene order based on the observed COS genetic
position, Figure 2(b). Overall, taking into account the
mapped COS-SNP information over the 21 bread wheat
chromosomes, 89% (335) of mapped COS were retained at
the conserved (i.e. expected orthologous position) loci
whereas 40 are non-syntenic (Table 1 and Figure S13).
Whereas 147 and 184 COS-SNPs have been mapped on the
A and B genomes, only 44 have been positioned on the
D-genome (Table 1 and illustrated as ‘mapped COS rate’ on
Figure 2d, dashed box-plots) supporting the higher plastic-
ity of the B (sensitive) compared to the A (dominant) related
to long-term paleo-tetraploidization evolutionary event; and
between A/B and D subgenomes due to the low level of
genetic diversity in the D-genome associated with recent
origin of hexaploid wheat. Comparison of the in silico
COS-SNP density (Figure 2d, plain box-plots representing
the observed ‘SNP/500COS ratio’ from 9969 in silico
COS-SNPs) and mapped COS-SNP rate (observed from the
375 mapped COS-SNPs) it appeared that the D genome
diversity may has been overestimated in silico through the
possible mis-association of SNPs either on the A or D
genomes, especially for short sequence reads not harbour-
ing clear and multiple homoeoSNPs (Quality score classes
E and F, Figure S7). Interestingly the 11% (40 genes) of
COS-SNP markers mapped at non-orthologous positions
(that can be considered as transposed genes) are mostly
located (60%) on the B genome, reinforcing the structural
plasticity nature of such genomic compartment (Table 1).
As expected, due to the considered time frame (~65 mya),
bias in gene diversity (expressed as SNPs/bp) cannot be
observed for the ancestral paleotetraploidization event
(Figure 2d left). The same observation is made when inves-
tigating the impact of paleo-dominance and paleo-sensitiv-
ity on the recombination pattern where no difference can
be observed between paleo-D vs. paleo-S blocks (P > 5%)
but a higher cM/marker ratio was observed for the B com-
pared with the A (P = 2.4 9 10�2) and the D (P = 1 9 10�3)
subgenomes (Figure 2e). The observed reduced cM/marker
ratio of D subgenome compared with the A and B counter-
parts has been attributed to the loss of polymorphism dur-
ing the genetic bottleneck that accompanied the
development of modern elite cultivars. Overall, taking into
account the provided COS-SNP markers associated with
reference public wheat genetic maps, we then produced
the most complete composite bread wheat genetic map
(consisting in 7520 molecular markers covering 4318.03 cM
with a marker density of one marker every 0.78 cM) of the
21 chromosomes and including mapped RFLP (Restriction
fragment length polymorphism) (1687), AFLP (712), STS
(262), SSR (2315), DaRTs (1246) and COS-SNP (375) gene
markers, named Wheat Composite Genetic Map
Figure 2. Wheat paleo- and neosubgenomes.
(a) Illustration of the dominant (blue) and sensitive ancestral chromosome derived from a n = 7 AGK that has been duplicated (WGD) to reach a n = 12 interme-
diate. The Triticeae ancestor (T1–T7) derived from five NCF that took place between the 12 ancestral chromosomes (left). The modern hexaploid bread wheat
derived from the polyploidization between three diploid progenitors (A, B and D sub-genomes) structured in seven protochromosomes (right). Distribution and
associated statistical significance are illustrated as box-plots (considering individually the seven wheat chromosomal groups) for the number of orthologs (b),
number of COS (c), SNP (aSNP/500COS ratio from 9969 in silico COS-SNPs and bmapped COS rate from 375 mapped COS-SNPs) data (d), cM/marker ratio (e),
number of C-band (f) between ancestral D and S blocks (left) as well as modern A, B and D subgenomes (right) in wheat. Paired t-test P-values are referenced
between paleo-D and paleo-S blocks (at the left, with A11–A12 pair excluded in parenthesis highlighted with *), and between A–B and B–D subgenomes (at the
right, with binomial (n = 2) P-value highlighted with **).
© 2013 The AuthorsThe Plant Journal © 2013 John Wiley & Sons Ltd, The Plant Journal, (2013), 76, 1030–1044
Wheat genome evolution 1037
‘WCGM2013’ (available as Table S3 and detailed provided
in Figure S14).
Genome partitioning in delivering D and S fragments
(shown as associated to bias in gene content, diversity and
recombination in the current study) following polyploidy
has been suggested to be epigenetically driven (Doyle
et al., 2008). To test this hypothesis, we investigated
C-band (from Hutchinson et al., 1982) differences between
paleo- and neodominant and sensitive blocks (Figure 2f).
Where differences are observed between ancient D and S
compartments P = 2.7 9 10�2, Figure 2f left), the difference
is more visible between the neodominant (A–D subge-
nomes) and neosensitive (B subgenome, P = 1.2 9 10�2
and 2 9 10�3 respectively) compartments, Figure 2(f) right.
The transition nature (A/G or T/C) of the reported 9969
SNPs may also indicate the historic methylation profile of
each subgenomes as the transition abundance bias is com-
monly observed for SNPs reflecting the high frequency of
C to T mutation following methylation (Coulondre et al.,
1978). Such a bias observed in polyploid wheat is greater
than that observed in its diploid Triticea relative barley
(Duran et al., 2009) and may reflect a higher level of meth-
ylation in polyploid wheat genome as part of the diploidi-
zation process leading to D (low methylation) and S (high
methylation) compartments. Both observations (C-band
differences as SNP transition enrichments) lead to the
opening question of epigenetic driving the observed paleo-
and neodominance in wheat as well as in other grasses.
Overall, the clear characterization of ancient and recent D-S
compartments, in relation respectively to the paleotetraplo-
idization and the neohexaploidization events, suggest that
they may have shape the modern bread wheat genomic
and genetic landscapes with bias in gene number (i.e.
higher gene retention in dominant blocks), gene diversity
(i.e. higher variant per genes in sensitive blocks), recombi-
nation (i.e. lower cM/Marker in sensitive blocks) and het-
erochromatin structure (i.e. higher C-band and possibly
methylation in sensitive blocks).
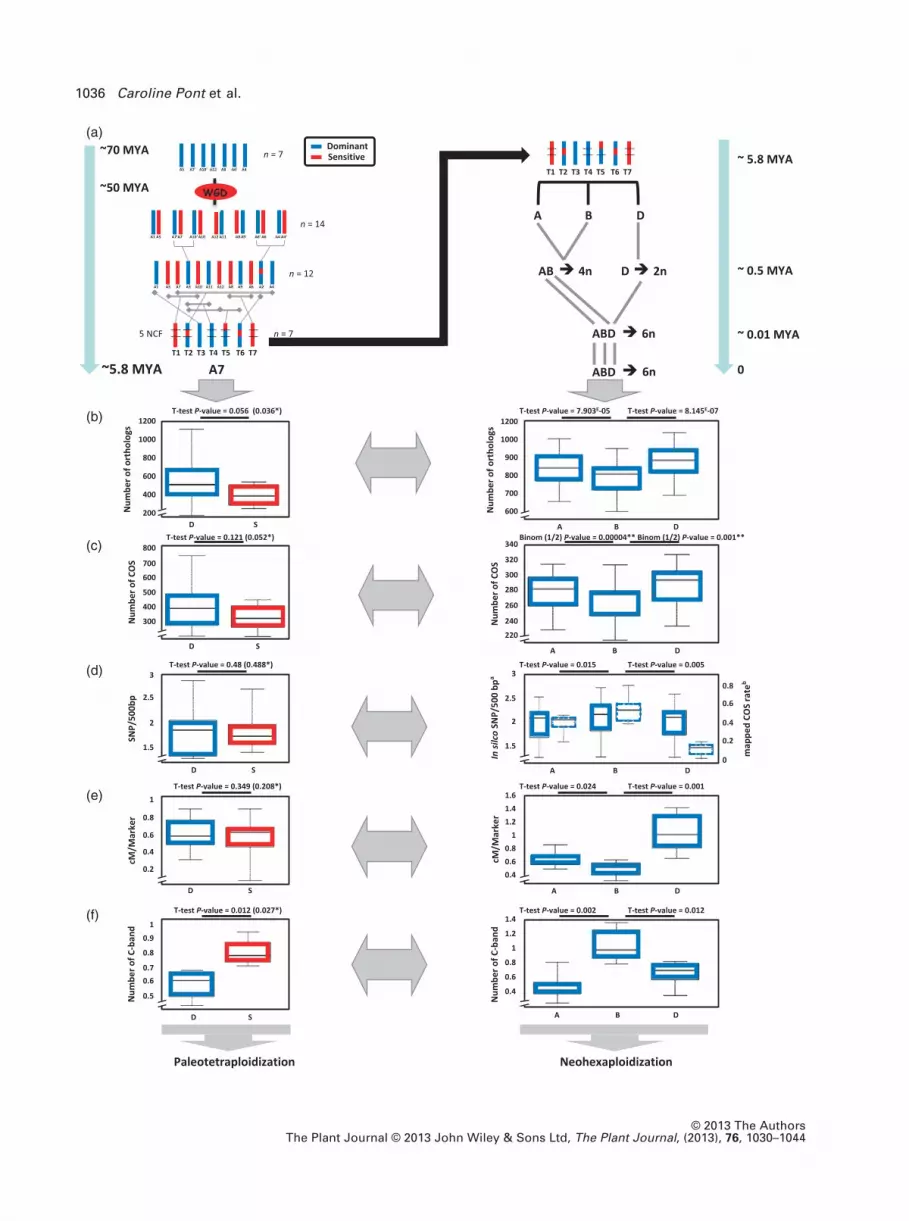
Bread wheat evolutionary model
Based on the previous observations, we propose an evolu-
tionary scenario that has shaped the modern bread wheat
genome during the last 65 my of evolution in response to
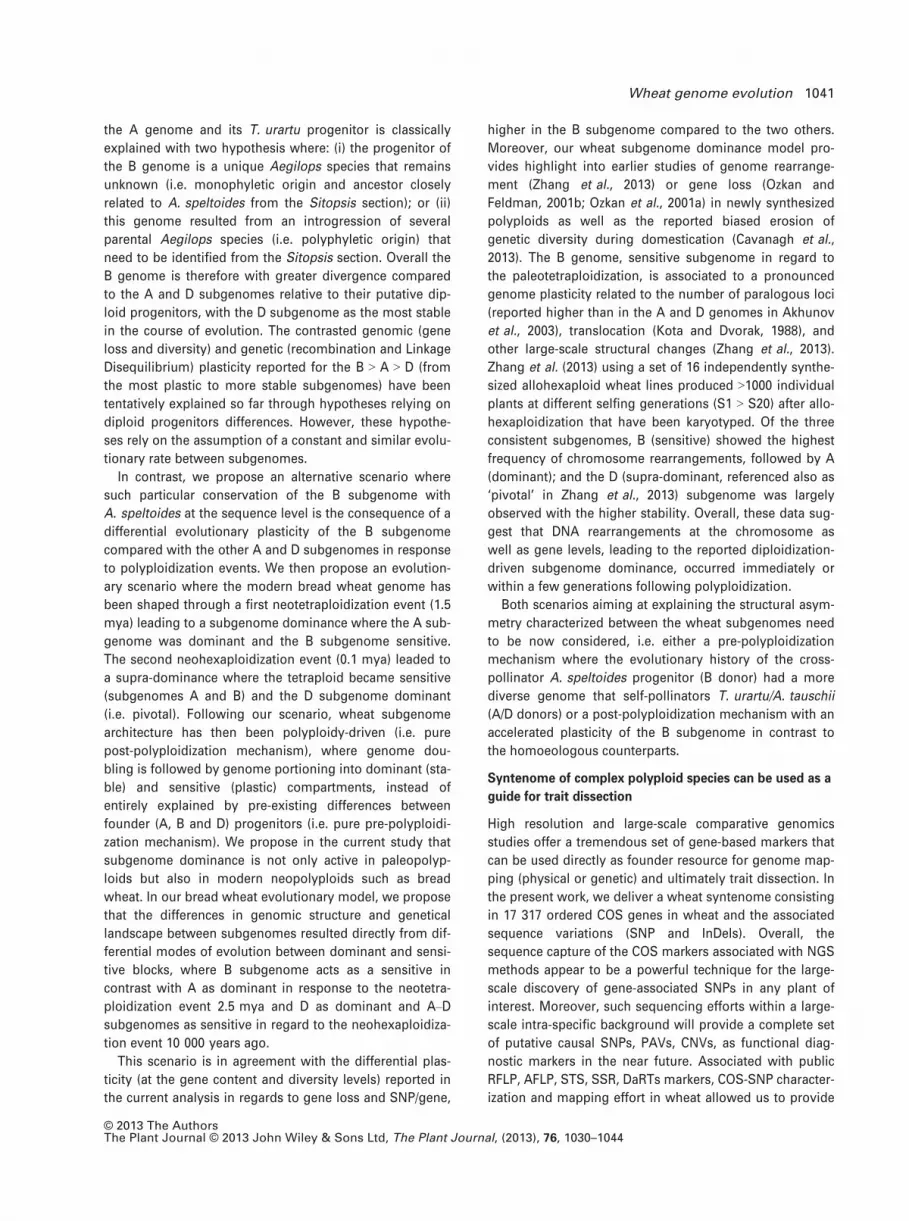
three polyploidization events (Figure 3a). The n = 7 AGK
has been paleotraploidized leading to seven pairs of domi-
nant (red) and sensitive (blue) chromosomes. Five ances-
tral chromosomes fusions took place to build the seven
Triticeae chromosomes and wheat ancestors (i.e. T. urartu,
A. speltoides and A. tauschii), where T3–T4 are entirely
sensitive, T1–T7 are entirely dominant and T2–T5–T6 are
structured as a mosaic of D and S blocks. The first neotet-
raploidization event (1.5 mya) leaded to a subgenome
dominance where the A subgenome became dominant
and the B subgenome sensitive. The second neohexaploi-
dization event (0.1 mya) leaded to a supra-dominance
where the tetraploid became sensitive (subgenomes A and
B) and the D subgenome dominant. Thus, the modern
bread wheat genome can be divided into five supra-domi-
nant chromosomes (also referenced as pivotal) deriving
from surimposed dominances (i.e. chromosomes 3D, 2D-S/
L, 4D, 5D-L, 6D-S/L) in contrast to five supra-sensitive ones
(i.e. chromosomes 1B, 2B-C, 5B-S, 6B-C, 7B), and the
remaining regions are associated with opposite D and S
following the successive duplication events (i.e. with S for
short arm, L for long arm and C for centromeric region), see
Figure 3(a) (with the stability/plasticity scale at the right).
In order to investigate precisely supra-dominant and
supra-sensitive chromosomal architecture, we focussed on
rice chromosomes 1 (dominant) and 5 (sensitive) associ-
ated with differences in gene content, orthologous/ances-
tral gene retention, chromosome length as well as
transposable element (mainly TE class II) repertoire (Fig-
ure 3b left). The orthologous counterparts in wheat (group
1 as sensitive and group 3 as dominant) display the same
bias in number of orthologs (i.e. COS number higher on the
dominant group 3) as well as gene diversity (i.e. SNP/COS
density higher on the sensitive group 1). In our scenario,
among the six investigated chromosomes, 3D is supra-D in
contrast to 1B as supra-S. Consequently the chromosome
1B displays the lowest gene retention, the highest gene
diversity, lowest cM/marker ratio, the highest number of
transposed genes and highest number of the C-band.
DISCUSSION
Wheat genome architecture has been shaped by
subgenome partitioning following paleo- and
neopolyploidization
Common anchors (COS genes) to compare genomes and
reconstruct CARs are necessary to unravel plant genome
paleohistory (Salse, 2012). It has been shown that CARs
duplication in the grass paleohistory has been followed by
Figure 3. Wheat evolutionary model.
(a) Evolutionary model of the modern wheat genome from a n = 7 (AGK), 12 (duplicated AGK), 7 (Triticeae) ancestors illustrated as dominant (blue bars) and
sensitive (red bars) blocks. The subgenome dominance took place in wheat paleohistory when the diploid progenitors hybridized. Genome A (blue outlines)
was dominant and B (red outlines) sensitive after the first polyploidization event 1.5 mya. The tetraploid (A–B genome) was sensitive and D dominant after the
second polyploidization event 0.1 mya. The modern 21 bread wheat chromosomes are then illustrated as dominant, sensitive, supra-dominant and supra-sensi-
tive fragments according to the colored scale at the right defining distinct degree of genomic stability and plasticity.
(b) Distribution of gene number, ortholog number, chromosome length, transposable element observed between paleo-S and paleo-D fragments in rice (left).
Distribution of COS number, SNP/COS ratio, cM/marker ratio, number of transposed genes, C-band number observed between chromosomes 1A (sensitive), 1B
(supra-sensitive), 1D (sensitive), 3A (dominant), 3B (dominant), 3D (supra-dominant), right.
© 2013 The AuthorsThe Plant Journal © 2013 John Wiley & Sons Ltd, The Plant Journal, (2013), 76, 1030–1044
1038 Caroline Pont et al.

COS
Num
ber
0200400600800
10001200
Gen
e nu
mbe
r
0
1000
2000
3000
4000
5000
6000
SNP/
500
bp
00.5
11.5
22.5
3
cM/M
arke
r
00.20.40.60.8
11.2
0
0.04
0.08
0.12
0.16
0.2
3A 3B 3D 1A 1B 1D
Tran
spos
ed g
enes
nu
mbe
r
0
0.4
0.8
1.2
1.6
C-ba
nd n
umbe
r
0
Chro
mos
ome
leng
th (M
b)
10
20
30
40
50
Oot
holo
g nu
mbe
r
0
400
800
1200
1600
Tran
spos
able
el
emen
ts (M
b)
0
2
4
6
ClassI ClassI ClassIIClassII
T1 T2 T3 T4 T5 T6 T7
T1 T2 T3 T4 T5 T6 T7 T1 T2 T3 T4 T5 T6 T7 T1 T2 T3 T4 T5 T6 T7
T1 T2 T3 T4 T5 T6 T7
A1 A5 A7 A3 A10 A11 A12 A8 A9 A6 A2 A4
A1 A5 A7’A7 A10’ A10 A12 A11 A8 A9 A6’ A6 A4 A4’
A5 A7’ A10’ A12 A8 A6’ A4
n = 7
n = 14
n = 12
- Grass ancestor n = 7
- Grass ancestor n = 14
- Grass ancestor n = 12
50-70 MYA
Modern species
A-B A-B A-B A-B A-B A-B A-B
D D D D D D D
n = 7
n = 7
n = 14
n = 21n = 12
T. urartu (A) Ae. speltoïdes (B) Ae. tauschii (D)
T. Turgidum (AB)
Ae. tauschii (D)
T. aestivum (ABD)O. Sativa
T1 T2 T3 T4 T5 T6 T7
A B D A B D A B D A B D A B D A B D A B D
R1 R2 R3 R4 R5 R6 R7 R8 R9 R10 R11 R12
D S
DS
R1 (Dominant) R5 (Sensi�ve) 3A 3B 3D (supra-D) 1A 1B (supra-S) 1D
Dup.T1 T2 T3 T4 T5 T6 T7T1 T2 T3 T4 T5 T6 T7
A-B A-B A-B A-B A-B A-B A-B
D
S
D
S
- Tri�ceae ancestor n = 7
95 MYA
10 MYA
1.5 MYA
0.1 MYA
n = 14
Paleo-dominance Neo-dominance Neo-dominance
Paleo-dominance
Supra-D Stability
PlasticitySupra-S
(a)
(b)
© 2013 The AuthorsThe Plant Journal © 2013 John Wiley & Sons Ltd, The Plant Journal, (2013), 76, 1030–1044
Wheat genome evolution 1039
a structural partitioning in defining post-duplication domi-
nant regions (defined as structurally stable with higher
retention of protogenes) in contrast to sensitive paralogous
counterparts (defined as structurally plastic with higher
loss of protogenes), Abrouk et al., 2012; Schnable et al.,
2012a,b. Based on the chromosome-to-chromosome synte-
ny relationships established between the seven bread
wheat chromosome groups and the rice, sorghum, Brac-
hypodium and maize genomes, it was then possible to pro-
duce a partial wheat gene-based physical map (i.e.
syntenome) including 17 317 COS. However, in the
absence of large-scale gene mapping data in wheat, how
relevant such computed gene order is robust, remains an
open question and is of importance if one wants to investi-
gate the evolution of wheat gene content in comparison of
the sequenced grasses genomes. Our current study aiming
at sequencing and mapping ancestral COS genes in bread
wheat established that the synteny-based computed gene
order delivered is currently correct for up to 89% of the
simulated gene order and that lineage-specific rearrange-
ment in wheat may account for <11% of the ordered genes
in silico.
Such wheat syntenome, that deliver in silico synteny-
based ordered genes conserved in close relatives, is a perfect
matrix to characterized genes that have been conserved or
lost in bread wheat evolution in response to
paleotetraploidization (~65 mya) and neohexaploidization
(>1.5 mya) events. Using complementary strategies consist-
ing in aligning the public wheat genome repertoire
(Brenchley et al., 2012) as well by de novo COS gene
sequencing in wheat, we identified respectively 35% of wheat
genes associated with an ortholog in the other grasses and
88% of COS successfully sequenced in wheat, suggesting
that lineage-specific gene amplification and shuffling mecha-
nisms have shaped the wheat genome in its recent evolution.
More interestingly, more conserved genes are observed in
dominant wheat regions in contrast to sensitive ones arising
from the ancestral shared paleotetraploidization event as
reported in the other grass species (Abrouk et al., 2012).
Moreover, such bias in gene conservation is also observed
between the three wheat subgenomes deriving from the neo-
hexaploidization, with more orthologs detected in D > A > B.
This subgenome dominance phenomenon may then explain
the observed differences in genetic and physical size reported
between subgenomes, the B (plastic) as the largest and the D
(stable) the smallest (Furuta et al., 1986). Bias retention of
ancestral genes has been observed between paleoduplicated
(plasticity of S > D) as well between neoduplicated (plasticity
of subgenomes B > A > D) genes, suggesting that ancient as
well as recent polyploidization events are followed by a diplo-
idization mechanism consisting in the structural partitioning
of the paralogous fragments.
Despite the characterization of conserved genes in the
wheat subgenomes leading to the identification of
paleo- as neodominant and sensitive chromosomal
regions, we investigated non-syntenic genes in wheat
corresponding: (i) at the genome level to lineage-specific
intra- (18%) and inter-chromosomal (82%) duplications;
and (ii) at the gene level to CNVs (14%), PAVs (6%) as
well as gene transposition (20%). As the COS markers
have been selected has single copy conserved genes, it
is unlikely that all cases of non-syntenic genes were due
to erroneous mapping of duplicates or homologs. That
raises the possibility of a small scale (i.e. few genes)
transposition/movement mechanism despite large-scale
ones (such as translocations and inversions) involving
DNA segments carrying several genes, operating in the
decay of synteny between grass genomes and then driv-
ing non-conserved genes in wheat (i.e. ~50% initially
reported in wheat from Pont et al., 2011; and ~60% in
the current analysis). More transposed genes have been
observed on the B subgenome (sensitive according to
the current analysis), that is consistent with the conclu-
sion raised on chromosome group 1 (Wicker et al.,
2011), based on partial sequence investigations. Gene
movement may appear as a particularly active phenom-
enon in polyploidy wheat and may act then preferen-
tially on the sensitive compartments.
Revisiting the B genome progenitor enigma based on
contrasted plasticity following polyploidization
Several wheat phylogeny studies have tried to identify the
progenitor of the B genome of polyploid wheat based on
cytology (Zohary and Feldman, 1962), nuclear and mito-
chondrial DNA sequences (Dvorak et al., 1989; Dvorak and
Zhang, 1990; Terachi et al., 1990) as well as chromosome
rearrangement studies such as common translocation
events (Feldman, 1966a,b; Hutchinson et al., 1982; Gill and
Chen, 1987; Naranjo et al., 1987; Naranjo, 1990; Jiang and
Gill, 1994; Devos et al., 1995; Maestra and Naranjo, 1999).
More recent and representative molecular comparisons, at
the whole-genome level using germplasm collections,
have shown that the B genome could be related to several
A. speltoides lines but not to other species of the Sitopsis
section (Salina et al., 2006; Kilian et al., 2007). At the SPA
locus level (Salse et al., 2008), close relationships between
the A. speltoides and the hexaploid B subgenome has
been reported based on both coding and non-coding
sequence comparisons, but with a lower conservation
compared to the A subgenome and its T. urartu progenitor
at the PSR920 region (Dvorak and Akhunov, 2005; Dvorak
et al., 2006). The greater genetic diversity of the B genome
compared to the A genome of hexaploid wheat was also
reported based of SNPs (previous references), SSRs (Roder
et al., 1998a,b), RFLPs (Liu and Tsunewaki, 1991), SNPs
(Akhunov et al., 2010), as well as in tetraploid (Thuillet
et al., 2005; Ren et al., 2013). Such contrasted conservation
between B subgenome and A. speltoides compared with
© 2013 The AuthorsThe Plant Journal © 2013 John Wiley & Sons Ltd, The Plant Journal, (2013), 76, 1030–1044
1040 Caroline Pont et al.
the A genome and its T. urartu progenitor is classically
explained with two hypothesis where: (i) the progenitor of
the B genome is a unique Aegilops species that remains
unknown (i.e. monophyletic origin and ancestor closely
related to A. speltoides from the Sitopsis section); or (ii)
this genome resulted from an introgression of several
parental Aegilops species (i.e. polyphyletic origin) that
need to be identified from the Sitopsis section. Overall the
B genome is therefore with greater divergence compared
to the A and D subgenomes relative to their putative dip-
loid progenitors, with the D subgenome as the most stable
in the course of evolution. The contrasted genomic (gene
loss and diversity) and genetic (recombination and Linkage
Disequilibrium) plasticity reported for the B > A > D (from
the most plastic to more stable subgenomes) have been
tentatively explained so far through hypotheses relying on
diploid progenitors differences. However, these hypothe-
ses rely on the assumption of a constant and similar evolu-
tionary rate between subgenomes.
In contrast, we propose an alternative scenario where
such particular conservation of the B subgenome with
A. speltoides at the sequence level is the consequence of a
differential evolutionary plasticity of the B subgenome
compared with the other A and D subgenomes in response
to polyploidization events. We then propose an evolution-
ary scenario where the modern bread wheat genome has
been shaped through a first neotetraploidization event (1.5
mya) leading to a subgenome dominance where the A sub-
genome was dominant and the B subgenome sensitive.
The second neohexaploidization event (0.1 mya) leaded to
a supra-dominance where the tetraploid became sensitive
(subgenomes A and B) and the D subgenome dominant
(i.e. pivotal). Following our scenario, wheat subgenome
architecture has then been polyploidy-driven (i.e. pure
post-polyploidization mechanism), where genome dou-
bling is followed by genome portioning into dominant (sta-
ble) and sensitive (plastic) compartments, instead of
entirely explained by pre-existing differences between
founder (A, B and D) progenitors (i.e. pure pre-polyploidi-
zation mechanism). We propose in the current study that
subgenome dominance is not only active in paleopolyp-
loids but also in modern neopolyploids such as bread
wheat. In our bread wheat evolutionary model, we propose
that the differences in genomic structure and genetical
landscape between subgenomes resulted directly from dif-
ferential modes of evolution between dominant and sensi-
tive blocks, where B subgenome acts as a sensitive in
contrast with A as dominant in response to the neotetra-
ploidization event 2.5 mya and D as dominant and A–D
subgenomes as sensitive in regard to the neohexaploidiza-
tion event 10 000 years ago.
This scenario is in agreement with the differential plas-
ticity (at the gene content and diversity levels) reported in
the current analysis in regards to gene loss and SNP/gene,
higher in the B subgenome compared to the two others.
Moreover, our wheat subgenome dominance model pro-
vides highlight into earlier studies of genome rearrange-
ment (Zhang et al., 2013) or gene loss (Ozkan and
Feldman, 2001b; Ozkan et al., 2001a) in newly synthesized
polyploids as well as the reported biased erosion of
genetic diversity during domestication (Cavanagh et al.,
2013). The B genome, sensitive subgenome in regard to
the paleotetraploidization, is associated to a pronounced
genome plasticity related to the number of paralogous loci
(reported higher than in the A and D genomes in Akhunov
et al., 2003), translocation (Kota and Dvorak, 1988), and
other large-scale structural changes (Zhang et al., 2013).
Zhang et al. (2013) using a set of 16 independently synthe-
sized allohexaploid wheat lines produced >1000 individual
plants at different selfing generations (S1 > S20) after allo-
hexaploidization that have been karyotyped. Of the three
consistent subgenomes, B (sensitive) showed the highest
frequency of chromosome rearrangements, followed by A
(dominant); and the D (supra-dominant, referenced also as
‘pivotal’ in Zhang et al., 2013) subgenome was largely
observed with the higher stability. Overall, these data sug-
gest that DNA rearrangements at the chromosome as
well as gene levels, leading to the reported diploidization-
driven subgenome dominance, occurred immediately or
within a few generations following polyploidization.
Both scenarios aiming at explaining the structural asym-
metry characterized between the wheat subgenomes need
to be now considered, i.e. either a pre-polyploidization
mechanism where the evolutionary history of the cross-
pollinator A. speltoides progenitor (B donor) had a more
diverse genome that self-pollinators T. urartu/A. tauschii
(A/D donors) or a post-polyploidization mechanism with an
accelerated plasticity of the B subgenome in contrast to
the homoeologous counterparts.
Syntenome of complex polyploid species can be used as a
guide for trait dissection
High resolution and large-scale comparative genomics
studies offer a tremendous set of gene-based markers that
can be used directly as founder resource for genome map-
ping (physical or genetic) and ultimately trait dissection. In
the present work, we deliver a wheat syntenome consisting
in 17 317 ordered COS genes in wheat and the associated
sequence variations (SNP and InDels). Overall, the
sequence capture of the COS markers associated with NGS
methods appear to be a powerful technique for the large-
scale discovery of gene-associated SNPs in any plant of
interest. Moreover, such sequencing efforts within a large-
scale intra-specific background will provide a complete set
of putative causal SNPs, PAVs, CNVs, as functional diag-
nostic markers in the near future. Associated with public
RFLP, AFLP, STS, SSR, DaRTs markers, COS-SNP character-
ization and mapping effort in wheat allowed us to provide
© 2013 The AuthorsThe Plant Journal © 2013 John Wiley & Sons Ltd, The Plant Journal, (2013), 76, 1030–1044
Wheat genome evolution 1041
here the most complete genetic map consisting in 7520
molecular markers. Such resolution including synteny-
based COS markers allows to refine metaQTL intervals and
immediately benefits from the COS markers to access
robust links with sequence genomes and precise ortholo-
gous candidate genes as we precisely illustrated in Quraishi
et al. (2011a,b) and Dibari et al. (2012). Moreover the wheat
syntenome has been also used as a matrix for physical
map construction (Lucas et al., 2013) prior QTL dissection.
The proposed impact of polyploidization-based subge-
nome partitioning on contrasted gene content and diver-
sity in dominant and sensitive blocks may need to
reconsider in agronomic traits dissection. First of all, the
sensitive chromosomal compartments that appeared most
plastic (in tem of polymorphism as well as recombination
pattern) may be more accessible to QTL cloning. It would
be then interesting to investigate the differential efficiency
in trait or gene cloning observed in both D and S compart-
ments. Moreover, the difference in subgenome stability
(with higher plasticity observed for B > A > D) may also
lead to the hypothesis that homoeologous groups may
support different type of agronomic traits. Feldman et al.
(2012a), Feldman and Levy (2012b) reported that genome
A was found to control morphological traits while genome
B in allotetraploid to control reactions to biotic and abiotic
factors. This difference in trait natures in also consistent
with the subgenome dominance hypothesis where the sen-
sitive compartment (B subgenome in wheat as defined in
the current analysis) has been suggested to control adapta-
tive traits in contrast to more stable processes driven by
the dominant counterpart (A and D in hexaploid wheat),
Abrouk et al., 2012;. Moreover, QTL partitioning following
polyploidy has been also suggested recently with 21%
homoeologous fiber quality QTLs in cotton (Rong et al.,
2007) and 23% homoeologous fruit quality QTLs in straw-
berry (Lerceteau-K€ohler et al., 2012) characterized, then
suggesting that the majority of QTL are no longer main-
tained on the duplicated blocks as putatively a direct con-
sequence of the diploidization mechanism. To what extent
the hexaploid wheat adaptation (in particular regarding
adaptation in responses to biotic and abiotic stresses) is
possibly partitioned in the genome, between the currently
defined dominant and sensitive chromosomal compart-
ments, remains an open question that still needs to be
addressed in the future.
EXPERIMENTAL PROCEDURE
The experimental procedures may be found in the online versionof this article in detailing: (i) Wheat Syntenome Protocol (COSidentification; CAR identification; computational gene order inwheat; D-S blocks identification); (ii) Wheat COS Sequencing Pro-tocol (COS-primer design; COS-SNP sequencing and clustering);(iii) SNP Genotyping Protocol (SSCP, Illumina, size polymorphism,sequencing, KASpar, LNA� Dual-Labeled Fluorogenic Probes); and(vi) Wheat Comprehensive Consensus Genetic Map Protocol
(selection of public reference genetic maps; Construction ofWCGM2013).
FUNDING AND ACKNOWLEDGEMENT
This work has been supported by grants from INRA (‘G�en�etique etAm�elioration des Plantes’ reference: ‘Appel d’Offre AIP Biores-sources’), the Auvergne region (‘Pole de comp�etitivit�e: C�er�ealesVall�ee’ reference: programme ‘Semences de Demain’), the AgenceNationale de la Recherche (Programs ANRjc-PaleoCereal, ref:ANR-09-JCJC-0058–01 and programme ANR Blanc-PAGE, refer-ence: ANR-2011-BSV6–00801), and the European 7th FrameworkProgramme (programme ‘TRITICEAE GENOME’, reference: FP7–212019). The author would like to thank Emmanuelle Lagendijk,Nils Stein, Laura Rossini for the coordination of the COS sequenc-ing and Grain Fiber Content QTL characterization initiatives aswell as S�ebastien Faure for providing the wheat lines in the frameof the TRITICEAE GENOME project.
SUPPORTING INFORMATION
Additional Supporting Information may be found in the onlineversion of this article.Table S1. Wheat syntenome raw data.
Table S2. List of dominant (D) and sensitive (S) chromosomalblocks in wheat.
Table S3. Wheat Composite Genetic Map (WCGM 2013).
Figure S1. Wheat syntenome characterization flow chart.Figure S2. Wheat duplicated genes (homoeologs & paralogs)characterization.Figure S3. Grass dominant and sensitive compartments followingancestral WGD.Figure S4. Strategy for COS-SNP marker development and exploi-tation.Figure S5. COS-SNP transferability in sorghum, maize, oat, rice,Triticale, wheat, wheat, rye, barley, ray grass (illustrated withCOS-5598).Figure S6. De novo COS sequencing in wheat.Figure S7. HomoeoSNP vs. SNP calling through sequence cover-age criterion.Figure S8. Characterization of wheat homoeologs (A, B and Dhomoeoalleles).Figure S9. Identification of PAVs and CNVs.Figure S10. COS-SNP and InDels typology in wheat.Figure S11. Genome-wide distribution of the COS-SNP diversity inwheat.Figure S12. False COS-SNP origins.Figure S13. Validation of COS computed gene order.Figure S14. Detailed characteristics of the WCGM 2013.Figure S15. Wheat Synteny Viewer characterization flow chart.
Data S1. Experimental procedure.
REFERENCES
Abrouk, M., Zhang, R., Murat, F., Li, A., Pont, C., Mao, L. and Salse, J.
(2012) Grass microRNA gene paleohistory unveils new insights into gene
dosage balance in subgenome partitioning after whole genome duplica-
tion. Plant Cell, 24, 1776–1792.Akhunov, E.D., Akhunova, A.R., Linkiewicz, A.M. et al. (2003) Synteny per-
turbations between wheat homoeologous chromosomes caused by
locus duplications and deletions correlate with recombination rates. Proc
Natl Acad Sci USA, 100, 10836–10841.Akhunov, E.D., Akhunova, A.R., Anderson, O.D. et al. (2010) Nucleotide
diversity maps reveal variation in diversity among wheat genomes and
chromosomes. BMC Genomics, 11, 702.
© 2013 The AuthorsThe Plant Journal © 2013 John Wiley & Sons Ltd, The Plant Journal, (2013), 76, 1030–1044
1042 Caroline Pont et al.

Allen, A.M., Barker, G.L., Berry, S.T. et al. (2011) Transcript-specific,
single-nucleotide polymorphism discovery and linkage analysis in
hexaploid bread wheat (Triticum aestivum L.). Plant Biotechnol. J. 9,
1086–1099.Allen, A.M., Barker, G.L., Wilkinson, P. et al. (2013) Discovery and develop-
ment of exome-based, co-dominant single nucleotide polymorphism
markers in hexaploid wheat (Triticum aestivum L.). Plant Biotechnol.
J. 11, 279–295.Bekaert, M., Edger, P.P., Pires, J.C. and Conant, G.C. (2011) Two-phase reso-
lution of polyploidy in the Arabidopsis metabolic network gives rise to
relative and absolute dosage constraints. Plant Cell, 23, 1719–1728.Berkman, P.J., Visendi, P., Lee, H.C. et al. (2013) Dispersion and domesti-
cation shaped the genome of bread wheat. Plant Biotechnol. J. 11,
564–571.Brenchley, R., Spannagl, M., Pfeifer, M. et al. (2012) Analysis of the bread
wheat genome using whole-genome shotgun sequencing. Nature, 491,
705–710.Cavanagh, C.R., Chao, S., Wang, S. et al. (2013) Genome-wide comparative
diversity uncovers multiple targets of selection for improvement in
hexaploid wheat landraces and cultivars. Proc Natl Acad Sci USA, 110,
8057–8062.Chao, S., Zhang, W., Akhunov, E., Sherman, J., Ma, Y., Luo, M. and Dubcov-
sky, J. (2009) Analysis of gene-derived SNP marker polymorphism in
wheat (Triticum aestivum L.). Mol. Breeding, 23, 23–33.Coulondre, C., Miller, J.H., Farabaugh, P.J. and Gilbert, W. (1978) Molecular
basis of base substitution hotspots in Escherichia coli. Nature, 274,
775–780.Devos, K.M., Dubcovsky, J., Dvor�ak, J., Chinoy, C.N. and Gale, M.D. (1995)
Structural evolution of wheat chromosomes 4A, 5A and 7B and its
impact on recombination. Theor. Appl. Genet. 91, 282–288.Dibari, B., Murat, F., Chosson, A. et al. (2012) Deciphering the genomic
structure, function and evolution of carotenogenesis related phytoene
synthases in grasses. BMC Genomics, 13, 221.
Doyle, J.J., Flagel, L.E., Paterson, A.H., Rapp, R.A., Soltis, D.E., Soltis, P.S.
and Wendel, J.F. (2008) Evolutionary genetics of genome merger and
doubling in plants. Annu. Rev. Genet. 42, 443–461.Duran, C., Edwards, D. and Batley, J. (2009) Genetic maps and the use of
synteny. Methods Mol. Biol. 513, 41–55.Dvorak, J. and Akhunov, E.D. (2005) Tempos of gene locus deletions and
duplications and their relationship to recombination rate during diploid
and polyploid evolution in the Aegilops–Triticum alliance. Genetics, 171,
323–332.Dvorak, J. and Zhang, H.B. (1990) Variation in repeated nucleotide
sequences sheds light on the phylogeny of the wheat B and G genomes.
Proc Natl Acad Sci USA, 87, 9640–9644.Dvorak, J., Zhang, H.B., Kota, R.S. and Lassner, M. (1989) Organization and
evolution of the 5S ribosomal RNA gene family in wheat and related spe-
cies. Genome, 32, 1003–1016.Dvorak, J., Akhunov, E.D., Akhunov, A.R., Deal, K.R. and Luo, M.C. (2006)
Molecular characterization of a diagnostic DNA marker for domesticated
tetraploid wheat provides evidence for gene flow from wild tetraploid
wheat to hexaploid wheat. Mol. Biol. Evol. 23, 1386–1396.Edger, P.P. and Pires, J.C. (2009) Gene and genome duplications: the impact
of dosage-sensitivity on the fate of nuclear genes. Chromosome Res. 17,
699–717.Feldman, M. (1966a) Identification of unpaired chromosomes in F1 hybrids
involving Triticum aestivum and T. timopheevii. Can. J. Genet. Cytol. 8,
144–151.Feldman, M. (1966b) The mechanism regulating pairing in Triticum tim-
opheevii. Wheat Inf. Serv. 21, 1–2.Feldman, M. and Levy, A.A. (2012b) Genome evolution due to allopolyploi-
dization in wheat. Genetics, 192, 763–774.Feldman, M., Lupton, F.G.H. and Miller, T.E. (1995) Wheats. In Evolution of
Crop Plants, 2nd edn (Smartt, J. and Simmonds, N.W., eds). Harlow:
Longman Scientific & Technical, pp. 184–192.Feldman, M., Levy, A.A., Fahima, T. and Korol, A. (2012a) Genomic asymme-
try in allopolyploid plants: wheat as a model. J. Exp. Bot. 63, 5045–5059.Freeling, M., Woodhouse, M.R., Subramaniam, S., Turco, G., Lisch, D. and
Schnable, J.C. (2012) Fractionation mutagenesis and similar conse-
quences of mechanisms removing dispensable or less-expressed DNA in
plants. Curr. Opin. Plant Biol. 15, 131–139.
Furuta, Y., Nishikawa, K. and Yamaguchi, S. (1986) Nuclear DNA content in
diploid wheat and its relatives in relation to the phylogeny of tetraploid
wheat. Jpn. J. Genet. 61, 97–105.Gill, B.S. and Chen, P.D. (1987) Role of cytoplasm specific introgression in
the evolution of the polyploid wheats. Proc Natl Acad Sci USA, 84, 6800–6804.
Hutchinson, J., Miller, T.E., Jahier, J. and Shepherd, K.W. (1982) Compari-
son of the chromosomes of Triticum timopheevii with related wheats
using the techniques of C-banding and in situ hybridization. Theor. Appl.
Genet. 64, 31–40.International Brachypodium Initiative. (2010) Genome sequencing and
analysis of the model grass Brachypodium distachyon. Nature, 463,
763–768.International Rice Genome Sequencing Project. (2005) The map-based
sequence of the rice genome. Nature, 436, 793–800.Jia, J., Zhao, S., Kong, X. et al. (2013) Aegilops tauschii draft genome
sequence reveals a gene repertoire for wheat adaptation. Nature, 496,
91–95.Jiang, J. and Gill, B.S. (1994) Different species-specific chromosome translo-
cations in Triticum timopheevii and T. turgidum support the diphyletic
origin of polyploid wheats. Chromosome Res. 2, 59–64.Kilian, B., Ozkan, H., Deusch, O., Effgen, S., Brandolini, A., Kohl, J., Martin,
W. and Salamini, F. (2007) Independent wheat B and G genome origins
in outcrossing Aegilops progenitor haplotypes. Mol. Biol. Evol. 24,
217–227.Kota, R.S. and Dvorak, J. (1988) Genomic instability in wheat induced by
chromosome 6b(s) of Triticum speltoides. Genetics, 120, 1085–1094.Lai, K., Duran, C., Berkman, P.J. et al. (2012) Single nucleotide polymor-
phism discovery from wheat next-generation sequence data. Plant Bio-
technol. J. 10, 743–749.Lerceteau-K€ohler, E., Moing, A., Gu�erin, G., Renaud, C., Petit, A., Rothan, C.
and Denoyes, B. (2012) Genetic dissection of fruit quality traits in the
octoploid cultivated strawberry highlights the role of homoeo-QTL in
their control. Theor. Appl. Genet. 124, 1059–1077.Ling, H.Q., Zhao, S., Liu, D. et al. (2013) Draft genome of the wheat A-gen-
ome progenitor Triticum urartu. Nature, 496, 87–90.Liu, Y.G. and Tsunewaki, K. (1991) Restriction fragment length polymor-
phism (RFLP) analysis in wheat. II. Linkage maps of the RFLP sites in
common wheat. Jpn. J. Genet. 66, 617–633.Lucas, S.J., Akpınar, B.A., Kantar, M. et al. (2013) Physical mapping inte-
grated with syntenic analysis to characterize the gene space of the long
arm of wheat chromosome 1A. PLoS ONE, 8, e59542.
Luo, M.C., Gu, Y.Q., You, F.M. et al. (2013) A 4-gigabase physical map
unlocks the structure and evolution of the complex genome of Aegilops
tauschii, the wheat D-genome progenitor. Proc Natl Acad Sci USA, 110,
7940–7945.Maestra, B. and Naranjo, T. (1999) Structural chromosome differentiation
between Triticum timopheevii and T. turgidum and T. aestivum. Theor.
Appl. Genet. 98, 744–750.Murat, F., Xu, J.H., Tannier, E., Abrouk, M., Guilhot, N., Pont, C., Messing,
J. and Salse, J. (2010) Ancestral grass karyotype reconstruction unravels
new mechanisms of genome shuffling as a source of plant evolution.
Genome Res. 20, 1545–1557.Naranjo, T. (1990) Chromosome structure of durum wheat. Theor. Appl.
Genet. 79, 397–400.Naranjo, T., Roca, A., Goicoechea, P.G. and Gir�aldez, R. (1987) Arm homoe-
ology of wheat and rye chromosomes. Genome, 29, 873–882.Ozkan, H. and Feldman, M. (2001b) Genotypic variation in tetraploid wheat
affecting homoeologous pairing in hybrids with Aegilops peregrina.
Genome, 44, 1000–1006.Ozkan, H., Levy, A.A. and Feldman, M. (2001a) Allopolyploidy-induced rapid
genome evolution in the wheat (Aegilops–Triticum) group. Plant Cell, 13,
1735–1747.Paterson, A.H., Bowers, J.E., Bruggmann, R. et al. (2009) The Sorghum
bicolor genome and the diversification of grasses. Nature, 457, 551–556.Pont, C., Murat, F., Confolent, C., Balzergue, S. and Salse, J. (2011) RNA-seq
in grain unveils fate of neo- and paleopolyploidization events in bread
wheat (Triticum aestivum L.). Genome Biol. 12, R119.
Quraishi U.M., Abrouk, M., Bolot, S. et al. (2009) Genomics in cereals: from
genome-wide conserved orthologous set (COS) sequences to candidate
genes for trait dissection. Funct. Integr. Genomics, 9, 473–484.
© 2013 The AuthorsThe Plant Journal © 2013 John Wiley & Sons Ltd, The Plant Journal, (2013), 76, 1030–1044
Wheat genome evolution 1043
Quraishi, U.M., Murat, F., Abrouk, M. et al. (2011a) Combined meta-genom-
ics analyses unravel candidate genes for the grain dietary fiber content in
bread wheat (Triticum aestivum L.). Funct. Integr. Genomics, 11, 71–83.Quraishi, U.M., Abrouk, M., Murat, F. et al. (2011b) Cross-genome map--
based dissection of a nitrogen use efficiency ortho-metaQTL in bread
wheat unravels concerted cereal genome evolution. Plant J. 65, 745–756.Ren, J., Sun, D., Chen, L. et al. (2013) Genetic diversity revealed by single
nucleotide polymorphism markers in a worldwide germplasm collection
of durum wheat. Int. J. Mol. Sci. 14, 7061–7088.Roder, M.S., Korzun, V., Gill, B.S. and Ganal, M.W. (1998a) The physical
mapping of microsatellite markers in wheat. Genome, 41, 278–283.Roder, M.S., Korzun, V., Wendehake, K., Plaschke, J., Tixier, M.H., Leroy, P.
and Ganal, M.W. (1998b) A microsatellite map of wheat. Genetics, 149,
2007–2023.Rong, J., Feltus, F.A., Waghmare, V.N. et al. (2007) Meta-analysis of poly-
ploid cotton QTL shows unequal contributions of subgenomes to a com-
plex network of genes and gene clusters implicated in lint fiber
development. Genetics, 176, 2577–2588.Saintenac, C., Jiang, D. and Akhunov, E.D. (2011) Targeted analysis of
nucleotide and copy number variation by exon capture in allotetraploid
wheat genome. Genome Biol. 12, R88.
Salina, E.A., Lim, K.Y., Badaeva, E.D., Shcherban, A.B., Adonina, I.G., Amos-
ova, A.V., Samatadze, T.E., Vatolina, T.Y., Zoshchuk, S.A. and Leitch,
A.R. (2006) Phylogenetic reconstruction of Aegilops section Sitopsis and
the evolution of tandem repeats in the diploids and derived wheat polyp-
loids. Genome, 49, 1023–1035.Salse, J. (2012) In silico archeogenomics unveils modern plant genome orga-
nization, regulation and evolution. Curr. Opin. Plant Biol. 15, 122–130.Salse, J., Chagu�e, V., Bolot, S. et al. (2008) New insights into the origin of
the B genome of hexaploid wheat: evolutionary relationships at the SPA
genomic region with the S genome of the diploid relative Aegilops
speltoides. BMC Genomics, 9, 555.
Schnable, P.S., Ware, D., Fulton, R.S. et al. (2009) The B73 maize genome:
complexity, diversity, and dynamics. Science, 326, 1112–1115.Schnable, J.C., Freeling, M. and Lyons, E. (2012a) Genome-wide analysis of
syntenic gene deletion in the grasses. Genome Biol. Evol. 4, 265–277.Schnable, J.C., Wang, X., Pires, J.C. and Freeling, M. (2012b) Escape from
preferential retention following repeated whole genome duplications in
plants. Front Plant Sci. 3, 94.
Terachi, T., Ogihara, Y. and Tsunewaki, K. (1990) The molecular basis of
genetic diversity among cytoplasms of Triticum and Aegilops. 7. Restric-
tion endonuclease analysis of mitochondrial DNA from polyploid wheats
and their ancestral species. Theor. Appl. Genet. 80, 366–373.
Thomas, B.C., Pedersen, B. and Freeling, M. (2006) Following tetraploidy in
an Arabidopsis ancestor, genes were removed preferentially from one
homeolog leaving clusters enriched in dose-sensitive genes. Genome
Res. 16, 934–946.Thuillet, A.C., Bataillon, T., Poirier, S., Santoni, S. and David, J.L. (2005)
Estimation of long-term effective population sizes through the history of
durum wheat using microsatellite data. Genetics, 169, 1589–1599.Trebbi, D., Maccaferri, M., de Heer, P., Sørensen, A., Giuliani, S., Salvi, S.,
Sanguineti, M.C., Massi, A., van der Vossen, E.A. and Tuberosa, R.
(2011) High-throughput SNP discovery and genotyping in durum wheat
(Triticum durum Desf.). Theor. Appl. Genet. 123, 555–569.Trick, M., Adamski, N.M., Mugford, S.G., Jiang, C.C., Febrer, M. and Uauy,
C. (2012) Combining SNP discovery from next-generation sequencing
data with bulked segregant analysis (BSA) to fine-map genes in poly-
ploid wheat. BMC Plant Biol. 12, 14.
Wang, X., Shi, X., Hao, B., Ge, S. and Luo, J. (2005) Duplication and DNA
segmental loss in the rice genome: implications for diploidization. New
Phytol. 165, 937–946.Wang, J., Luo, M.C., Chen, Z., You, F.M., Wei, Y., Zheng, Y. and Dvorak, J.
(2013) Aegilops tauschii single nucleotide polymorphisms shed light on
the origins of wheat D-genome genetic diversity and pinpoint the geo-
graphic origin of hexaploid wheat. New Phytol. 198, 925–937.Wicker, T., Mayer, K.F., Gundlach, H. et al. (2011) Frequent gene movement
and pseudogene evolution is common to the large and complex
genomes of wheat, barley, and their relatives. Plant Cell, 23, 1706–1718.Winfield, M.O., Wilkinson, P.A., Allen, A.M. et al. (2012) Targeted
re-sequencing of the allohexaploid wheat exome. Plant Biotechnol. J. 10,
733–742.Woodhouse, M.R., Schnable, J.C., Pedersen, B.S., Lyons, E., Lisch, D.,
Subramaniam, S. and Freeling, M. (2010) Following tetraploidy in maize,
a short deletion mechanism removed genes preferentially from one of
the two homologs. PLoS Biol. 8, e1000409.
You, F.M., Huo, N., Deal, K.R., Gu, Y.Q., Luo, M.C., McGuire, P.E., Dvorak,
J. and Anderson, O.D. (2011) Annotation-based genome-wide SNP dis-
covery in the large and complex Aegilops tauschii genome using
next-generation sequencing without a reference genome sequence.
BMC Genomics, 12, 59.
Zhang, H., Bian, Y., Gou, X. et al. (2013) Persistent whole-chromosome
aneuploidy is generally associated with nascent allohexaploid wheat.
Proc Natl Acad Sci USA, 110, 3447–3452.Zohary, D. and Feldman, M. (1962) Hybridization between amphidiploids
and the evolution of polyploids in the wheat (Aegilops–Triticum) group.
Evolution, 16, 44–61.
© 2013 The AuthorsThe Plant Journal © 2013 John Wiley & Sons Ltd, The Plant Journal, (2013), 76, 1030–1044
1044 Caroline Pont et al.


