Embed Size (px)
Citation preview
What’s cooking in the Indus Civilisation?
Investigating Indus food through ceramic lipid
residue analysis
Akshyeta Suryanarayan
Sidney Sussex College
University of Cambridge
This dissertation is submitted for the degree of Doctor of Philosophy
August 2019

This dissertation is the result of my own work and includes nothing which is the
outcome of work done in collaboration except as declared in the Preface and specified in
the text.
It is not substantially the same as any that I have submitted, or, is being concurrently
submitted for a degree or diploma or other qualification at the University of Cambridge
or any other University or similar institution except as declared in the Preface and
specified in the text. I further state that no substantial part of my dissertation has already
been submitted, or, is being concurrently submitted for any such degree, diploma or
other qualification at the University of Cambridge or any other University or similar
institution except as declared in the Preface and specified in the text.
The length of the dissertation does not exceed the word limit set by the Degree
Committee for the Department of Archaeology.

“Even the most ordinary dish follows a satisfying arc of transformation, magically
becoming more than the sum of its parts. And in almost every dish, you can find, besides
the culinary ingredients, the ingredients of a story: a beginning, a middle, and an end…
How many of us still do the kind of work that engages us in a dialogue with the material
world that concludes with such a gratifying and delicious sense of closure?”
Michael Pollan, Cooked

i
Abstract
This thesis investigates which products were used in ceramic vessels by populations of the
Indus Civilisation through ceramic lipid residue analysis. It uses concepts of food choice
and foodways to explore the culinary practices of Indus populations.
Specifically, the thesis examines how vessels may have been used in urban and rural Indus
settlements located in northwest India during the urban period (c. 2600/2500-1900 BC),
and identifies whether changes in vessel use occurred in the post-urban period (c. 1900-
1300 BC). It also analyses a small sample of Arabian and Indus-origin vessels from the
Umm an-Nar period (c. 2400-2000 BC) in the Sultanate of Oman.
As the first large-scale investigation into Indus foodstuff and vessel-use using lipid residue
analysis, the thesis first tests the viability of the method in the South Asian context. It
compares lipid yields from pottery recovered from collections, washed pottery from recent
excavations, and unwashed pottery from fresh excavations. It then integrates the molecular
and compound-specific isotopic data with available bioarchaeological evidence from the
study region to reconstruct which products were used in vessels at different sites.
The results indicate that overall, lipid residues are typically poorly preserved in Indus
vessels, but the acidified methanol extraction technique provides a good lipid recovery
rate. No significant differences in lipid yield are observable between washed pottery
samples and those collected directly from the field, which suggests that washed pottery
may serve as a good source for samples for future lipid residue analysis. However, it is
difficult to interpret lipid evidence from samples obtained from collections with limited
contextual information, suggesting that future lipid analyses in South Asia must be
carefully planned to yield optimum results.
The molecular results indicate that animal fats were primarily used in vessels, with minor
indications of plant products. The compound-specific results suggest processing of
different animal fats, primarily non-ruminants, however, equivocally, many vessels may
also have been used to store or process mixtures of products. Inter-site differences in vessel
use are observed, but there are broad similarities in vessel-use between urban and rural
sites. No change over time in vessel use is observed at rural sites, suggesting stability of
food choices. No correlations are observed between vessel-form and products used in
vessels, indicating their multifunctionality. These results provide a new means by which to
investigate Indus foodways, broadening our understanding of what ancient Indus cuisine at
both urban and rural settlements may have looked like.

ii
iii
Acknowledgements
A big, heartfelt thank you to my supervisors, Dr Cameron Petrie and Dr Tamsin
O’Connell, who helped shape a curiosity in organic residues and a fascination for the Indus
Civilisation into a full-fledged PhD project. Thank you both for giving me the support I
needed to see this project through. Tamsin, thank you for Thursday meetings, and making
me think/write more precisely. Cameron, thank you for being one of the most approachable
and available supervisors a PhD student could ask for, and for the emojis and long chats.
Thank you to my advisors who helped throughout the process: Prof. Oliver Craig, Bioarch,
University of York and Prof. Carl Heron, Scientific Research, British Museum. My
training in lipid residues would have never happened if not for your support, Ol; I’m
grateful for the time and resources you gave to me, and glad for that chance conversation at
Must Farm that started this project from a ‘let’s try it’ to what it is now. Thanks also to
you, Carl, for your kind words, support and encouragement, and for hosting me at the
British Museum. At York, I would like to thank Dr Shinya Shoda, Dr Miriam Cubas, Dr
Anita Radini and Dr Alex Lucquin for training me, running my samples and answering all
my questions during my visits. Miriam, a special thanks to you for everything and making
me feel so much at home. Anita, thank you for your support at York even during
tumultuous times. Many thanks also to Matthew von Tersch for his help in the lab and with
software; and a special thanks to Dr Alice Toso and Dessislava Veltcheva at Bioarch. At
the British Museum, Dr Blandine Courel’s guidance and methodical advice significantly
improved my labwork. Thank you to Chris Mussell for solving all my technical problems,
for inviting me to speak at LBMSDG, and to Adrià Breu Barcons, Edward Standall and
Sana Boekenfast for being my ‘lipids4lyf buddies’.
Financial support for my PhD came from Cambridge Trust and Nehru Trust for Cambridge
University. A very special thanks to Dr Anil Seal for his support. Parts of this research
were carried out as part of the TwoRains project
(http://www.arch.cam.ac.uk/research/projects/two-rains), which is funded by a Horizon
2020 European Research Council (ERC) Consolidator Grant (H2020, 648609), and is
based in the McDonald Institute for Archaeological Research at the University of
Cambridge. TwoRains is being carried out in collaboration with Prof. Ravindra Nath Singh
and the Department of AIHC and Archaeology at Banaras Hindu University. Some
iv
samples analysed in this thesis were also acquired from the Land, Water and
Settlement project (http://www.arch.cam.ac.uk/research/projects/land-water-settlement),
whose work has laid the foundations for the TwoRains project. Thanks also to Sidney
Sussex College, Anthony Wilkin Trust, Smuts Memorial Fund and McDonald Institute for
Archaeological Research for research and travel funding.
This thesis would have been impossible without the tireless efforts of the Land, Water and
Settlement and TwoRains team, and support of Prof. R.N. Singh. I am especially grateful
for Prof. Singh’s help with arranging all the necessary permissions for analysis of pottery
in this thesis. I am also grateful to Prof. Vasant Shinde, Deccan College, Pune, for granting
me access to pottery from Farmana and Rakhigarhi and for his support. Very special
thanks to Pandeyji, Dr Dheerendra Pratap Singh, Dr Aftab Alam, Dr Amit Shah, Aarti
Chowdhary, Sudarshan Chakradhari, Banaras Hindu University, and Dr Vikas Pawar,
MDU, Rohtak. Thank you for your hospitality in Varanasi, your friendship, and for
organising many practical details during fieldwork at Lohari Ragho I. Thanks also to
Balwan Deswal for his assistance with the collection of ethnographic pots, and for
Ramjatanji for his excellent cooking. At Deccan College, special thanks to Dr Nilesh
Jadhav, Yogesh Yadav for their assistance with accessing materials from Farmana and
Rakhigarhi.
Very special thanks to Michele Degli Esposti, Prof. Alessandra Avanzini and the Office of
the Adviser to His Majesty the Sultan for Cultural Affairs for granting me permission to
analyse samples from Stone Tower I, Salut, and for hosting my visit to Nizwa in 2015. A
big thanks to Dr Peter Magee, Dr Steve Karacic, Dr Charlotte Cable and Dr Chris
Thornton for introducing me to the archaeology of the Arabian Peninsula.
In Cambridge, there are countless people to thank. The Dorothy Garrod isotope lab group:
Alice Rose, Sam Leggett, Dr Emma Lightfoot, Dr Cemre Ustunkaya, Emily Tilby, Danny
Buss, Catherine Kneale and of course, Tamsin, to thank for all the fun lab meetings, for
introducing me to R, making me work hard to make nice plots, think about variability and
really question statistics! Our lab group has a special place in my heart. Thanks to the
TwoRains group for all the fun and trying times during fieldwork, and for all the cake.
Many thanks also to different members of the Pitt-Rivers lab and Department of
Archaeology for conversations, encouragement and advice throughout the PhD process;
special shout-out to Dr Penny Jones, Dr Jennifer Bates, Dr Janine Ochoa, Dr Eva Meharry,
v
Dr Jess Thompson, Jeremy Bennet, Dr Hermine Xhauflair, Dr Laerke Recht, Dr. Nathan
Wright, Dr Jess Beck, Laure Bonner, Jess Rippengal, Tonko Rakjovaca. A special thanks
to Danika Parikh for being such a support for me in the department, for the pottery
drawings and photos, and for all the sea-salt chocolate-chip cookies.
I would also like to thank Ananya Mishra and Danika Parikh for our collective effort with
the Untold Histories Museum tours at MAA. They have brought a lot of meaning to me in
my final year of the PhD.
Thank you to Ruth Hatfield for driving me to Huntington in a mad rush to get my passport
before I left for Oman in 2015. I promised to thank you in my acknowledgements and here
you are!
Thank you to Rashmi Singh and Dr Asiya Islam for their friendship, love for food, and for
that (failed) trip to the beach. To Dr Wiebke Lamping and Dr Louise Purdue, thanks for
making Thoday Street such a fun place to live; I will miss us commiserating together about
academia and life in general.
Thank you to my friends near and far: Chhavi Kotwani, Megha Thumbunkel, Tanya
Ginwala, Christine Marie Dickerson, Mine Serizawa, Meghna Singh, Neha Aurora, Rudi
Vanzin, Alice Netherton, Sitara Chowfla, Nikita Ramachandran, Sebastian Selven and
Varun Khanna. Many thanks also to my friends in Copenhagen who took me into the
Symfuni, Plenum and DTU family.
To Meghna Nag Chowdhuri, who knows what I would have done without you! And to my
other family in Cambridge: Manuel Piña Dreyer and Vibhu Tewary, thank you for all the
food, fun, travels, movie-watching and gym sessions.
Thank you to my family, my dear parents and sister for their never-ending love and
support. Papa, thank you for your excitement about my research and helping me organise
so many aspects of my data collection in Delhi. Mummy, thank you for your constant
support. Sachita, thank you for your understanding and love; I can’t believe we both did it!
Thank you to Tara and Kalyani didi for their endless care, and to Fuzzy.
And finally, to François: thank you for all your love, and for giving me gentleness,
sustenance, and perspective when I needed it the most.

vi
vii
Contents
List of Figures ................................................................................................................................. xvii
List of Tables ................................................................................................................................ xxiii
List of Abbreviations .................................................................................................................... xxvii
Chapter One
Introduction ....................................................................................................................................... 1
1.1. Food in the Indus Civilisation: research questions and approach ................................................ 1
1.2. Theoretical Relevance .................................................................................................................. 2
1.2.1. Why study ancient food?....................................................................................................... 3
1.2.2. Food practices (and politics) in South Asia .......................................................................... 4
1.2.3. Food in ancient South Asia and the Indus Civilisation ......................................................... 4
1.3. Methodological Rationale: why ceramic lipid analysis? ............................................................. 6
1.4. Definitions: food, vessel-use, food choice, foodways.................................................................. 8
1.5. Chapter Summary and Thesis Structure ..................................................................................... 10
Chapter Two
Indus Civilisation settlements, environment and subsistence: urban and post-urban periods
.......................................................................................................................................................... 11
2.1. Contextual background to the Indus Civilisation: chronology, urbanism and environment ...... 11
2.1.1. Chronology ......................................................................................................................... 11
2.1.2. Indus urban period: settlements and material culture ......................................................... 14
2.1.2.2. Rural Indus settlements ............................................................................................... 17
2.1.2.3. Uniformity and diversity across the Indus Civilisation ............................................... 17
2.1.3. Climatic and environmental context ................................................................................... 18
2.1.3.1 Climate before and after Indus urbanism ...................................................................... 20
2.1.3.2. Fluvial dynamics and vegetation ................................................................................. 22
2.2. Decline or transformation from urbanism .................................................................................. 23
2.3. Indus ceramics, subsistence practices and foodways ................................................................. 25
2.3.1. Indus ceramics .................................................................................................................... 25
viii
2.3.1.1. Diversity in ceramic production and use ..................................................................... 26
2.3.1.2. Pottery types: ‘Classic Harappan’............................................................................... 26
2.3.1.3. Pottery types: northwest India Indus sites ................................................................... 27
2.3.1.4. Vessels and cuisine ..................................................................................................... 29
2.3.2. Indus agriculture through macro- and micro-botanical analyses ........................................ 30
2.3.2.1. Cropping processes and terminology ........................................................................... 31
2.3.2.2. Regional diversity ........................................................................................................ 31
2.3.2.3. Cropping practices, urbanism and deurbanisation ....................................................... 34
2.3.3. Indus zooarchaeology ......................................................................................................... 35
2.3.3.1. State of research ........................................................................................................... 35
2.3.3.2. Approaches to Indus faunal analysis ........................................................................... 38
2.3.3.3. Slaughter and age profiles: meat and secondary-products utilisation .......................... 39
2.3.3.4. Evidence for carcass processing .................................................................................. 42
2.3.3.5. Animal-human relationships and ‘continuum of lifestyles’......................................... 43
2.3.4. Indus isotopic studies .......................................................................................................... 46
2.3.4.1. Human isotopic studies ................................................................................................ 46
2.3.4.2. Faunal enamel carbonate isotopic studies .................................................................... 47
2.3.5. Indus biomolecular archaeology: starch-grains, ceramic vessel-function, and lipid
residues ......................................................................................................................................... 48
2.3.5.1. Starch-grain analyses ................................................................................................... 49
2.3.5.2. Ceramic form and function and residue analysis ......................................................... 49
2.4. Urban and post-urban food production in Indus agropastoral societies .................................... 50
2.5. Chapter Summary ...................................................................................................................... 52
Chapter Three
Background to ceramic organic residue analysis......................................................................... 53
3.1. Organic compounds in archaeological contexts ........................................................................ 53
3.1.1. Lipids .................................................................................................................................. 53
3.1.1.1. Fatty Acids ................................................................................................................... 55
3.1.1.2. Alcohols ....................................................................................................................... 57
ix
3.1.1.3. Alkanes ........................................................................................................................ 57
3.1.1.4. Triacylglycerides .......................................................................................................... 57
3.1.1.5. Waxes ........................................................................................................................... 58
3.2. Preservation and degradation of lipids ....................................................................................... 58
3.2.1. Lipid diagenesis .................................................................................................................. 59
3.2.2. Burial conditions ................................................................................................................. 61
3.2.3. Vessel characteristics and use ............................................................................................. 63
3.2.3.1. Vessel porosity and fabric ............................................................................................ 63
3.2.3.2. Vessel manufacture ...................................................................................................... 64
3.2.3.3. Vessel-use .................................................................................................................... 64
3.3. Contamination ............................................................................................................................ 66
3.3.1. Migration of soil lipids ........................................................................................................ 66
3.3.2. Other sources of contamination .......................................................................................... 67
3.4. Extraction methods .................................................................................................................... 68
3.4.1. Solvent extraction ............................................................................................................... 68
3.4.2. Acidified methanol extraction ............................................................................................. 69
3.5. Instrumental analyses ................................................................................................................. 70
3.5.1. GC and GC-MS ................................................................................................................... 70
3.5.2 GC-c-IRMS .......................................................................................................................... 73
3.6. Interpretation .............................................................................................................................. 77
3.6.1. ‘Biomarkers’ and molecular proxies ................................................................................... 78
3.6.2. Molecular ratios .................................................................................................................. 80
3.6.3. Interpretational challenges .................................................................................................. 81
3.6.3.1. Complex formation processes ...................................................................................... 81
3.6.3.2. Modern reference fats and resolving mixtures ............................................................. 83
3.7. Chapter Summary ...................................................................................................................... 85
x
Chapter Four
Background to study sites .............................................................................................................. 87
4.1. Indus sites in northwest India .................................................................................................... 89
4.1.1 Very small settlements (‘small villages’: 1-3 ha) ................................................................ 89
4.1.1.1 Alamgirpur (ALM) ....................................................................................................... 89
4.1.1.2 Masudpur VII (MSDVII) .............................................................................................. 93
4.1.2. Small settlements (‘villages’: 3-10 ha) ............................................................................... 98
4.1.2.1 Masudpur I (MSDI) ...................................................................................................... 98
4.1.2.2 Lohari Ragho I (LHRI) ............................................................................................... 102
4.1.2.3. Khanak (KNK) .......................................................................................................... 105
4.1.3. Medium-sized settlements (‘towns’: 10-20 ha) ................................................................ 107
4.1.3.1. Farmana (FRN) .......................................................................................................... 107
4.1.4 Large-sized settlements (>20 ha) ....................................................................................... 116
4.1.4.1 Rakhigarhi (RGR) ....................................................................................................... 116
4.2. Samples from collections ......................................................................................................... 120
4.2.1. Mohenjo-daro (MD) ..................................................................................................... 120
4.2.2. Kalibangan (KLB) ........................................................................................................ 122
4.3. Sites outside the Indus Civilisation (Sultanate of Oman) .................................................... 124
4.3.1. Stone Tower I, Salut (STI)............................................................................................ 124
4.3. Chapter Summary .................................................................................................................... 126
Chapter Five
Materials and methods ................................................................................................................. 127
5.1. Pottery Selection ...................................................................................................................... 127
5.1.1. Group I: Pottery from collections ..................................................................................... 128
5.1.2. Group II: recently-excavated samples .............................................................................. 129
5.1.2.1. Alamgirpur (ALM) ................................................................................................... 129
5.1.2.2. Masudpur VII (MSDVII) .......................................................................................... 130
5.1.2.3. Masudpur I (MSDI) .................................................................................................. 138
5.1.2.4. Farmana (FRN) .......................................................................................................... 139
xi
5.1.2.5. Rakhigarhi (RGR) ..................................................................................................... 141
5.1.3. Group III: freshly-excavated samples ............................................................................... 142
5.1.3.1. Lohari Ragho I (LHRI) .............................................................................................. 142
5.1.3.2. Khanak (KNK) ........................................................................................................... 143
5.1.3.3. Stone Tower I, Salut (STI) ......................................................................................... 143
5.1.4. Vessel forms ...................................................................................................................... 144
5.1.5. Documentation .................................................................................................................. 144
5.3. Drilling of pottery and extraction method ................................................................................ 144
5.3.1. Drilling of pottery ............................................................................................................. 145
5.3.2. Lipid Extraction ................................................................................................................ 146
5.3.2.1. Acidified methanol extraction .................................................................................... 146
5.3.2.2. Solvent extraction ...................................................................................................... 147
5.4. Instrumental Analyses .............................................................................................................. 147
5.4.1. Gas Chromatography Flame-Ionisation Detection (GC-FID) ........................................... 147
5.4.2 Gas-Chromatography-Mass Spectrometry (GC-MS) ........................................................ 147
5.4.2.1. Group I and STI samples ........................................................................................... 147
5.4.2.2. Group II and Group III samples ................................................................................. 148
5.4.2.3. Interpretation .............................................................................................................. 149
5.4.3. Gas Chromatography-combustion-Isotopic Ratio Mass Spectrometry (GC-c-IRMS) ..... 150
5.5. Statistical Analysis ................................................................................................................... 150
5.6. Reproducibility ........................................................................................................................ 151
Chapter Six
Lipid yields in archaeological pottery from South Asia and Sultanate of Oman .................... 152
6.1. Results: Lipid Yields ................................................................................................................ 152
6.1.1. Group I: Pottery from collections ..................................................................................... 152
6.1.1.1. Lipid yields ................................................................................................................ 152
6.1.1.2. Lipid yields across sites ............................................................................................. 154
6.1.1.3. Presence of contaminants ........................................................................................... 156
6.1.2. Group II: ‘recently excavated samples’ ............................................................................ 157
xii
6.1.2.1. Lipid yields ................................................................................................................ 157
6.1.2.2. Lipid yields across sites ............................................................................................. 160
6.1.2.3. Presence of contaminants .......................................................................................... 162
6.1.3. Group III: freshly-excavated samples ............................................................................... 164
6.1.3.1. Lipid yields ................................................................................................................ 164
6.1.3.2. Lipid yields across sites ............................................................................................. 174
6.1.3.3. Presence of contaminants .......................................................................................... 177
6.2. Discussion: lipid yields and preservation ................................................................................ 178
6.2.1. Comparison of lipid yield with other regions of the world ............................................... 178
6.2.2. Lipid yields across vessel fragments ................................................................................ 180
6.2.3. Comparison of lipid yields across Groups I, II and III ..................................................... 181
6.2.4. Presence of contaminants across groups ........................................................................... 184
6.2.5. Lipids in sediment versus interior surfaces of sherds ....................................................... 184
6.2.6. Effect of time since excavation on lipid yield .................................................................. 188
6.3. Chapter Summary and Future Directions ................................................................................ 189
Chapter Seven
Lipid and isotopic analyses of pottery from Indus sites in northwest India............................ 192
7.1 Summary of analyses ................................................................................................................ 192
7. 2. Site-based results .................................................................................................................... 193
7.2.1. Very small settlements (small villages) ............................................................................ 193
7.2.1.1. Alamgirpur (ALM) .................................................................................................... 193
7.2.1.2. Masudpur VII (MSDVII) .......................................................................................... 198
7.2.2. Small settlements (‘villages’) ........................................................................................... 205
7.2.2.1. Masudpur I (MSD I) .................................................................................................. 205
7.2.2.2. Lohari Ragho I (LHRI) .............................................................................................. 210
7.2.2.3. Khanak (KNK) .......................................................................................................... 215
7.2.3. Mid-sized settlements (‘towns’) ....................................................................................... 218
7.2.3.1. Farmana (FRN) .......................................................................................................... 219
7.2.4. Large settlements (‘cities’) ............................................................................................... 223
xiii
7.2.4.1. Rakhigarhi (RGR) ...................................................................................................... 224
7.3. Vessel-specific results: vessel function and use....................................................................... 229
7.3.1 Vessel shape, size and use.................................................................................................. 231
7.3.1.1. Ledged jars ................................................................................................................. 231
7.3.1.2 Perforated vessels ........................................................................................................ 234
7.3.2. ‘Classic’ and ‘Haryana Harappan’ vessels ........................................................................ 236
7.4. Discussion: vessel-use comparison across sites and time ........................................................ 238
7.4.1. Summary of results ........................................................................................................... 238
7.4.2. Diversity of resources across settlements, processing similar foodstuffs? ....................... 240
7.4.3. Variability between sites ................................................................................................... 241
7.4.4. Chronological trends ......................................................................................................... 245
7.5. Chapter Summary .................................................................................................................... 246
Chapter Eight
Synthesis: Vessel-use and foodways in the Indus Civilisation .................................................. 248
8.1. Lipid yields and vessel use....................................................................................................... 248
8.2. Food choice: products in Indus vessels in northwest India ...................................................... 250
8.2.1. Dairy products ................................................................................................................... 251
8.2.2. Ruminant carcass fats ....................................................................................................... 256
8.2.3. Non-ruminant fats ............................................................................................................. 257
8.2.3.1 Pigs? ............................................................................................................................ 257
8.1.3.2 Chicken? ..................................................................................................................... 258
8.2.4. Mixtures of products ......................................................................................................... 260
8.3. Food preparation in the Indus Civilisation ............................................................................... 263
8.4. Rural and urban food practice in northwest India .................................................................... 266
8.5. Cautionary tales: preservation and interpretation .................................................................... 269
8.6. Chapter Summary .................................................................................................................... 270
xiv
Chapter Nine
Towards an integrative approach for studying Indus food: implications for Indus
archaeology ................................................................................................................................... 272
9.1. Thesis summary ....................................................................................................................... 272
9.2. Developing new perspectives and approaches in Indus archaeology ...................................... 274
9.2.1. Theorising food in Indus archaeology .............................................................................. 274
9.2.2. Refining models of Indus agriculture and pastoralism ..................................................... 275
9.2.3. Biomolecular archaeology in South Asian archaeology ................................................... 275
9.3. Final conclusions ..................................................................................................................... 277
Bibliography .................................................................................................................................. 280
Appendix A .................................................................................................................................... 330
Supplementary information and analyses from Stone Tower I, Salut ..................................... 330
A.1. Supplementary site background .............................................................................................. 330
A.2. GC-MS and GC-c-IRMS analyses of Arabian vessels and Indus Black-Slipped Jars ............ 331
A.2.1. Lipid composition ............................................................................................................ 331
A.2.2. Compound-specific isotopic results ................................................................................. 331
A.2.3. Discussion ........................................................................................................................ 332
Appendix B
Details of analysed vessels per site .............................................................................................. 334
B.1. Kalibangan (KLB)………………………………………………………………….………..333
B.2. Mohenjo-daro (MD)………………………………………………………………..………...334
B.3. Alamgirpur (ALM) ................................................................................................................. 336
B.4. Masudpur VII (MSDVII) ........................................................................................................ 341
B.5. Masudpur I (MSDI) ................................................................................................................ 351
B.6. Lohari Ragho I (LHRI) ........................................................................................................... 360
B.7. Khanak (KNK) ........................................................................................................................ 367
B.8. Farmana (FRN) ....................................................................................................................... 370
B.9. Rakhigarhi (RGR) ................................................................................................................... 378
B.10. Stone Tower I, Salut (STI) ...………………………………………………...…...………...386
xv
Appendix C
Protocol: Lipid extraction with acidified methanol ................................................................... 390
Appendix D
Protocol: Lipid extraction with solvent method ......................................................................... 394
Appendix E
Protocol: Silylation of organic residues fo GC/GC-MS ............................................................. 398
Appendix F
GC-MS and GC-c-IRMS analyses from Kalibangan and Mohenjo-daro (Group I) .............. 400
F.1. Lipid composition .................................................................................................................... 400
F.2. Compound-specific isotopic data............................................................................................. 400
F.3. Discussion ................................................................................................................................ 403
Appendix G
Vessel-specific GC-c-IRMS results .............................................................................................. 406
G.1. Small jars................................................................................................................................. 406
G.2. Medium-mouthed jars ............................................................................................................. 407
G.3. Large jars (storage jars or vats) ............................................................................................... 409
G.4. Jars .......................................................................................................................................... 410
G.5. Necked jars .............................................................................................................................. 411
G.6. Globular jars ............................................................................................................................ 413
G.7. Serving vessels: bowls and dishes ........................................................................................... 414
Appendix H
Details and lipid yields of vessels excluded from analysis ......................................................... 416

xvi
xvii
List of Figures
Figure 1.1: Diagram illustrating foodways. ...................................................................................... 10
Figure 2.1: Examples of Indus material culture ................................................................................ 16
Figure 2.2: Extent of the Indus Civilisation in the urban period, with modern rainfall isohyets
reflecting winter (A) and summer (B) rain gradients. ..................................................... 19
Figure 2.3: Extent of the Indus Civilisation in the post-urban period with settlements marked in
yellow, with modern rainfall isohyets reflecting winter (A) and summer (B) rain
gradients .......................................................................................................................... 19
Figure 2.4: Examples of Indus pottery. ............................................................................................. 27
Figure 3.1: Structural formulae of different lipids.. .......................................................................... 54
Figure 3.2: Structures of commonly occurring fatty carboxylic acids. ............................................. 56
Figure 3.3: Structures of various fatty acid oxidation products. ....................................................... 60
Figure 3.4: Map marking pH of soils and pre- and protohistoric sites in Europe from where pottery
has been analysed for residue analysis.. .......................................................................... 62
Figure 3.5: Representation of a chromatogram ................................................................................. 72
Figure 3.6: Mass spectrum of methyl palmitate.. .............................................................................. 72
Figure 3.7: Examples of scatterplots of δ13C values of C16:0 and C18:0 fatty acids measured from
sites from prehistoric pottery from the United Kingdom. ............................................... 77
Figure 3.8: Inputs, losses and transformation processes affecting the survival and composition of
organic residues in archaeological ceramics ................................................................... 82
Figure 3.9: Density distributions of Δ13C values obtained by theoretical mixing of a) dairy and b)
ruminant adipose fats with an increasing amount of C3 plant lipids. .............................. 84
Figure 4.1: Map of northwest India and Arabian Peninsula with urban Indus settlements and cities
(in yellow and white, respectively) and sites investigated in this thesis (in red). ........... 88
Figure 4.2: Incremental tooth enamel carbonate data from domestic and wild animals from
Alamgirpur. ..................................................................................................................... 92
Figure 4.3: Radiocarbon dates from Masudpur VII demonstrating occupation during the Early
Harappan, Early Mature and Late Mature Harappan (EMH and LMH) and Late
Harappan periods ............................................................................................................ 94
Figure 4.4: Incremental tooth enamel carbonate data from domestic animals from Masudpur VII...
........................................................................................................................................ 96
Figure 4.5: Examples of Mature Harappan pottery from Masudpur VII .......................................... 96
xviii
Figure 4.6: Radiocarbon dates from Masudpur I indicating occupation during Early Harappan and
Late Mature Harappan (LMH) periods. .......................................................................... 99
Figure 4.7: Incremental tooth enamel carbonate data from domestic and wild animals from
Masudpur VII. .............................................................................................................. 101
Figure 4.8: Radiocarbon dates from Trench EA at Lohari Ragho I................................................ 104
Figure 4.9: Incremental tooth enamel carbonate data from Bos/Bubalus from Lohari Ragho I. .... 104
Figure 4.10: Radiocarbon dates from deposits at Khanak .............................................................. 106
Figure 4.11: Radiocarbon dates obtained from Trench 1D5 in the ‘Central Area’ from Farmana. 109
Figure 4.12: Incremental tooth enamel carbonate data from domestic and wild animals from
Farmana.. .................................................................................................................... 112
Figure 4.13: Top: 1-18: Examples of ‘Classic Harappan’ (“Harappan”) pottery from the Settlement
area at Farmana. Bottom: 1-13: Examples of ‘Haryana Harappan’ (“Non-Harappan”)
pottery from the Settlement area at Farmana. ............................................................ 115
Figure 4.14: Plan of archaeological mounds at Rakhigarhi. ........................................................... 117
Figure 4.15: Trenches excavated on RGR-4 by Deccan College, Pune. ........................................ 117
Figure 4.16: Plan of the tower and location of Indus objects at Stone Tower I, Salut. .................. 125
Figure 4.17: Examples of Indus Black-Slipped Jars found at Stone Tower I, Salut (STI). ............ 126
Figure 5.1: Section drawing of the ALM SC trench. ...................................................................... 130
Figure 5.2: Stratigraphy of trench YA2 (top) and YB1 (bottom) at Masudpur VII ....................... 131
Figure 5.3: Stratigraphy of trench XM2 (top) and XA1 (bottom) at Masudpur I. .......................... 138
Figure 5.4: Locations of selected sherd samples from Farmana. .................................................... 140
Figure 5.5: Photographs from the hearth structure with in situ storage vessel from Trench 1.B (top)
and mud-brick platform (Trench 1.E) (bottom left) and storage bin feature (Trench
1.F) (bottom right) at Rakhigarhi. .............................................................................. 140
Figure 6.1: Partial ion chromatograms of vessel fragments from Kalibangan……………………153
Figure 6.2: Boxplot demonstrating lipid concentrations (summarised in Table 6.2) obtained from
pottery from Kalibangan and Mohenjo-daro .............................................................. 155
Figure 6.3: Boxplot demonstrating phthalate concentrations (summarised in Table 6.2) obtained
from pottery from Kalibangan and Mohenjo-daro.. ................................................... 155
Figure 6.4: Partial ion chromatograms of vessel fragments from Mohenjo-daro. .......................... 157
Figure 6.5: Lipid concentrations of samples from Group II sites. .................................................. 161
Figure 6.6: Partial total ion chromatograms of vessel fragments from Masudpur VII, Masudpur VI,
Farmana and Alamgirpur ........................................................................................... 163
Figure 6.7: Phthalate concentrations of samples from recently excavated sites.. ........................... 164
Figure 6.8: Partial total ion chromatograms of KNK02, fragment of a red-slipped jar, and KNK14,
sediment adhering to the sherd ................................................................................... 166
xix
Figure 6.9: Partial total ion chromatograms of KNK18, base fragment, and KNK15, sediment
adhering to the sherd. ................................................................................................. 166
Figure 6.10: Partial total ion chromatograms of two sediment samples from archaeological loci at
Lohari Ragho I ............................................................................................................ 168
Figure 6.11: Boxplot of lipid concentrations of Indus Black-Slipped Jars versus Arabian vessels
from Stone Tower I, Salut .......................................................................................... 170
Figure 6.12: Partial total ion chromatograms of two vessel fragments from Stone Tower I, Salut.
.................................................................................................................................... 171
Figure 6.15: Boxplot of lipid concentrations of pottery from Khanak, Lohari Ragho I and Stone
Tower I, Salut (Tables 6.5 and 6.6) ............................................................................ 175
Figure 6.16: Left: Site of Lohari Ragho I. Middle: School yard at Khanak where excavations were
conducted with view of inselberg. Right: Remains of Umm an-Nar tower at Stone
Tower I, Salut showing calcretic deposits in the profile, demonstrating fluctuating
water movement. ........................................................................................................ 176
Figure 6.17: Boxplot of phthalate concentrations in lipid extracts from pottery samples from
Khanak, Lohari Ragho I and Stone Tower I, Salut. ................................................... 177
Figure 6.18: Boxplots of lipid concentrations of Group II and Group III (Table 6.11).. ................ 182
Figure 6.19: Phthalate concentrations from sherds from Groups I, II and III. Values are represented
on a log-scale for better visualisation; red diamonds represent mean values. ............ 185
Figure 6.20: Scatterplot of lipid and phthalate concentrations from Groups II and III ................... 185
Figure 7.1: Heatmap showing percentage contribution of different fatty acids to the total lipid
content of individual samples from Alamgirpur, and presence/absence of branched-
chain fatty acids, dicarboxylic acids and n-alkanes. ................................................... 195
Figure 7.2: Partial total ion chromatogram of sample ALM117-276 ............................................. 195
Figure 7.3: Δ13C (δ13C18:0 - δ13C16:0) values plotted against δ13C16:0 values of vessel forms from
Alamgirpur and colour-coded by trench and context number………………………...196
Figure 7.4: Heatmap showing percentage contribution of different fatty acids to the total lipid
content of individual samples from Masudpur VII, and presence/absence of branched-
chain fatty acids, dicarboxylic acids and n-alkanes ...................................................... 200
Figure 7.5: Partial total ion chromatogram of samples MSD3603 and MSD3586 ......................... 200
Figure 7.6: Δ13C (δ13C18:0 - δ13C16:0) values plotted against δ13C16:0 values of vessel forms from
Masudpur VII and colour-coded according to time period………………………...…202
Figure 7.7: Δ13C (δ13C18:0 - δ13C16:0) values plotted against δ13C16:0 values of vessel forms from
Masudpur VII and colour-coded by trench and context number .................................. 202
Figure 7.8: Heatmap showing percentage contribution of different fatty acids to the total lipid
content of individual samples from Masudpur I, and presence/absence of branched-
chain fatty acids, dicarboxylic acids and n-alkanes ...................................................... 206
xx
Figure 7.9: Partial total ion chromatogram of sample MSD329 ..................................................... 206
Figure 7.10: Δ13C (δ13C18:0 - δ13C16:0) values plotted against δ13C16:0 values values of different
vessels from Masudpur I, colour-coded according to context ...................................... 208
Figure 7.11: Heatmap showing percentage contribution of different fatty acids to the total lipid
content of individual samples from Lohari Ragho I, and presence/absence of branched-
chain fatty acids, dicarboxylic acids and n-alkanes ...................................................... 211
Figure 7.12: Partial total ion chromatogram of sample LHR10. .................................................... 211
Figure 7.13: Δ13C (δ13C18:0 - δ13C16:0) values plotted against δ13C16:0 values of different vessel forms
from Lohari Ragho I, colour-coded according to time period……………………..….213
Figure 7.14: Δ13C (δ13C18:0 - δ13C16:0) values plotted against δ13C16:0 values of different vessel forms
from Lohari Ragho I, colour-coded according to context ............................................ 213
Figure 7.15: Heatmap showing percentage contribution of different fatty acids to the total lipid
content of individual samples from Khanak, and presence/absence of branched-chain
fatty acids, dicarboxylic acids and n-alkanes. .............................................................. 216
Figure 7.16: Partial total ion chromatogram of sample KNK11 ..................................................... 217
Figure 7.17: Δ13C (δ13C18:0 - δ13C16:0) values plotted against δ13C16:0 values of vessels from Khanak,
colour-coded according to context................................................................................ 217
Figure 7.18: Heatmap showing percentage contribution of different fatty acids to the total lipid
content of individual samples from Farmana, and presence/absence of branched-chain
fatty acids, dicarboxylic acids and n-alkanes.. ............................................................. 220
Figure 7.19: Partial total ion chromatogram of sample FRN18. .................................................... 220
Figure 7.20: Δ13C (δ13C18:0 - δ13C16:0) values plotted against δ13C16:0 values of vessels from Farmana,
colour-coded according to context................................................................................ 221
Figure 7.21: Heatmap showing percentage contribution of different fatty acids to the total lipid
content of individual samples from Rakhigarhi, and presence/absence of branched-chain
fatty acids, dicarboxylic acids and n-alkanes ............................................................... 225
Figure 7.22: Partial total ion chromatogram of sample RGR24 ..................................................... 225
Figure 7.23: Δ13C (δ13C18:0 - δ13C16:0) values plotted against δ13C16:0 values of vessels from
Rakhigarhi, colour-coded according to trench and context number ............................. 226
Figure 7.24: Lipid concentrations of different vessel forms across Indus sites in northwest India.
...................................................................................................................................... 229
Figure 7.25: Lipid concentrations of vessels across Indus sites in northwest India. ...................... 230
Figure 7.26: Δ13C (δ13C18:0 - δ13C16:0) values plotted against δ13C16:0 values of vessel-types across
Indus sites in northwest India, colour-coded according to range of lipid concentration in
each vessel. ................................................................................................................... 230
Figure 7.27: Lipid concentrations of fragments from different vessel-types at Masdupur VII ...... 232
xxi
Figure 7.28: Δ13C (δ13C18:0 - δ13C16:0) values plotted against δ13C16:0 values of ledged jars across
Indus sites in northwest India, colour-coded according to site.. ................................... 233
Figure 7.29: Δ13C (δ13C18:0 - δ13C16:0) values plotted against δ13C16:0 values of perforated vessels
across Indus sites in northwest India, colour-coded according to site. ......................... 233
Figure 7.30: Example of a modern Indian still from Bihar. ............................................................ 235
Figure 7.31: Δ13C (δ13C18:0 - δ13C16:0) values plotted against δ13C16:0 values of ‘Classic’ versus
‘Haryana Harappan’ vessels across Indus sites in northwest India, colour-coded
according to site.. ........................................................................................................ 237
Figure 7.32: Scatterplot of δ13C18:0 and δ13C16:0 values from vessels across Indus sites in northwest
India, colour-coded according to site.. ....................................................................... 239
Figure 7.33: Δ13C (δ13C18:0 - δ13C16:0) values plotted against δ13C16:0 values of vessels across Indus
sites in northwest India, colour-coded according to site.. .......................................... 239
Figure 7.34: Boxplots of δ13C16:0 and δ13C18:0 values across Indus sites in northwest India discussed
in this chapter. ............................................................................................................ 241
Figure 7.35: Boxplots of δ13C16:0 and δ13C18:0 values of vessels from Indus sites in northwest India
divided by chronological time period ......................................................................... 243
Figure 7.37: Boxplots of δ13C16:0 and δ13C18:0 values of vessels from Indus sites in northwest India
divided into pre-, during and post-4.2 ka BP. ............................................................. 244
Figure 7.38: Δ13C (δ13C18:0 - δ13C16:0) values plotted against δ13C16:0 values of vessels across Indus
sites in northwest India, colour-coded according to site and divided into pre-, during,
and post-4.2 ka BP ...................................................................................................... 244
Figure 8.1: Vessels with fatty acid-specific δ13C values that indicate dairy processing. ................ 252
Figure 8.2: Examples of representations of bulls and related material culture in the Indus
Civilisation ................................................................................................................. 252
Figure 8.3: Density distributions of Δ13C values obtained by theoretical mixtures of plant and
animal products. ......................................................................................................... 262
Figure A.1: Δ13C (δ13C18:0 - δ13C16:0) values plotted against δ13C16:0 values of local Arabian Umm
an-Nar vessels and Indus Black-Slipped Jars (BSJs) from Stone Tower I, Salut. ...... 332
Figure F.1: Δ13C (δ13C18:0 - δ13C16:0) values plotted against δ13C16:0 values of vessels from
Kalibangan.. ................................................................................................................ 401
Figure F.2: Δ13C (δ13C18:0 - δ13C16:0) values plotted against δ13C16:0 values of vessels from Mohenjo-
daro ............................................................................................................................. 402
Figure F.3: Δ13C (δ13C18:0 - δ13C16:0) values plotted against δ13C16:0 values of vessels from Group I..
.................................................................................................................................... 402
Figure G.2: Δ13C (δ13C18:0 - δ13C16:0) values against δ13C16:0 values of medium-mouthed jars across
Indus sites in northwest India ..................................................................................... 408
xxii
Fig G.3: Δ13C (δ13C18:0 - δ13C16:0) values against δ13C16:0 values of large jars across Indus sites in
northwest India ........................................................................................................... 409
Figure G.4: Δ13C (δ13C18:0 - δ13C16:0) values against δ13C16:0 values of jars (unknown rim diameter)
across Indus sites in northwest India .......................................................................... 411
Figure G.6: Δ13C (δ13C18:0 - δ13C16:0) values against δ13C16:0 values of globular jars from Loharo
Ragho I. ...................................................................................................................... 414
Figure G.7: Δ13C (δ13C18:0 - δ13C16:0) value against δ13C16:0 value of a dish from Alamgirpur. ....... 415
xxiii
List of Tables
Table 2.1: Basic chronology of the Indus Civilisation ...................................................................... 13
Table 2.2: Chronology used in this thesis. ........................................................................................ 13
Table 2.3: List of winter and summer crops found in the Indus Civilisation, based on approximate
order of ubiquity ............................................................................................................. 33
Table 3.1: Different types of fatty acids found in natural products. ................................................. 56
Table 3.2: Examples of molecular signatures, proxies and ratios used to identify different natural
products commonly used as foodstuff. ........................................................................... 79
Table 4.1: Names and sizes of sites analysed in this thesis. Group I: samples from collections;
Group II: samples from sites that were excavated between 2008-2014; Group III:
samples from fresh excavations ...................................................................................... 87
Table 4.2: AMS radiocarbon results from SC trench from Alamgirpur ........................................... 91
Table 4.3: Faunal remains from ‘Harappan levels’ at Alamgirpur ................................................... 92
Table 4.4: Faunal remains from Mature and Late Harappan contexts from Masudpur VII. ............. 96
Table 4.5: Faunal remains from Mature Harappan contexts from Trenches XAI, YA3 and XM2 at
Masudpur I .................................................................................................................... 101
Table 4.6: Faunal remains from Farmana from Mature Harappan and ‘General Mature Harappan’
(which includes both periods IIA and IIB) contexts ..................................................... 112
Table 5.1: Number of potsherds analysed from Groups I, II and III with site names and site codes.
...................................................................................................................................... 128
Table 5.2: Details of samples selected from Kalibangan ................................................................ 132
Table 5.3: Details of samples selected from Mohenjo-daro ........................................................... 132
Table 5.4: Details of samples selected for analysis from Alamgirpur ............................................ 133
Table 5.5: Details of samples selected for analysis from Masudpur VII ........................................ 134
Table 5.6: Details of samples selected for analysis from Masudpur I. ........................................... 135
Table 5.7: Details of samples selected for analysis from Lohari Ragho I ...................................... 143
Table 5.8: Details of samples selected for analysis from Khanak .................................................. 144
Table 5.9: Details of samples selected for analysis from Stone Tower I, Salut .............................. 144
Table 5.10: Details of where different analyses were conducted…………………………..……..149
Table 6.1: Sample descriptions and lipid concentrations for individual sherds from Kalibangan .. 153
Table 6.2: Sample descriptions and lipid concentrations for individual sherds from Mohenjo-
daro…………………………………………………………..………………………..153
Table 6.3: Range, mean and median lipid concentrations of vessel-type from recently excavated
sites. .............................................................................................................................. 158
xxiv
Table 6.4: Total vessel fragments analysed, samples with appreciable lipid concentration (above
5.0 μg/g), % of samples with appreciable lipid yield, and mean lipid concentrations for
vessels per site .............................................................................................................. 160
Table 6.5: Range and mean lipid concentrations by vessel form from Group II sites in northwest
India .............................................................................................................................. 165
Table 6.6: Lipid concentrations for samples analysed from Stone Tower I, Salut with details of
vessels ........................................................................................................................... 169
Table 6.7: Lipid concentrations from interior and exterior surfaces of pottery and sediment samples
from Stone Tower I, Salut ............................................................................................ 172
Table 6.8: Total vessel fragments analysed, samples with appreciable lipid concentration (above
5.0 μg/g), % of samples with appreciable lipid yield, and mean lipid concentrations for
vessels per site. ............................................................................................................. 175
Table 6.9: Details of recovery rates, range and mean of lipid concentrations obtained from different
sites in the Near East, Anatolia and North Africa (when available) compared with sites
studied in this thesis. ..................................................................................................... 179
Table 6.10: Details of ceramic fragments analysed, lipid concentrations, % of samples with lipid
concentrations above 5 μg/g, range, mean and median of lipid concentration per sample
type. .............................................................................................................................. 180
Table 6.11: Range, mean and median lipid concentrations from all three groups. Samples with lipid
concentrations below 5 µg/g are excluded.................................................................... 182
Table 6.12: List and details of archaeological sediments and soils analysed via GC-MS. ............. 187
Table 7.1: Details of samples analysed via GC-MS and GC-c-IRMS analyses ............................. 192
Table 7.3: Details of samples analysed for GC-c-IRMS analysis from Masudpur VII .................. 201
Table 7.4: Details of samples analysed for GC-c-IRMS analysis from Masudpur I. ..................... 207
Table 7.6: Details of samples analysed for GC-c-IRMS analysis from Khanak. ........................... 217
Table 7.8: Details of samples analysed for GC-c-IRMS analysis from Rakhigarhi. ...................... 226
Table 8.1: Comparison of the results of organic residue analysis from Indus pottery and frequency
of faunal remains. ......................................................................................................... 251
Table A.1. δ13C values from fatty acids from vessels from Stone Tower I, Salut .......................... 331
Table B.1: Details of all analysed vessels from Kalibangan. ......................................................... 334
Table B.2: Details of all analysed vessels from Mohenjo-daro. ..................................................... 335
Table B.3: Details of all analysed vessels from Alamgirpur .......................................................... 336
Table B.4: List of analysed samples from Alamgirpur with lipid concentrations <5 μg/g ............. 338
Table B.5: Details of all analysed vessels from Masudpur VII ...................................................... 341
Table B.6. List of analysed samples from Masudpur VII with lipid concentrations <5 μg/g......... 347
Table B.7: Details of all analysed vessels from Masudpur VII ...................................................... 351
Table B.8: List of analysed samples from Masudpur I with lipid concentrations <5 μg/g ............ 357
xxv
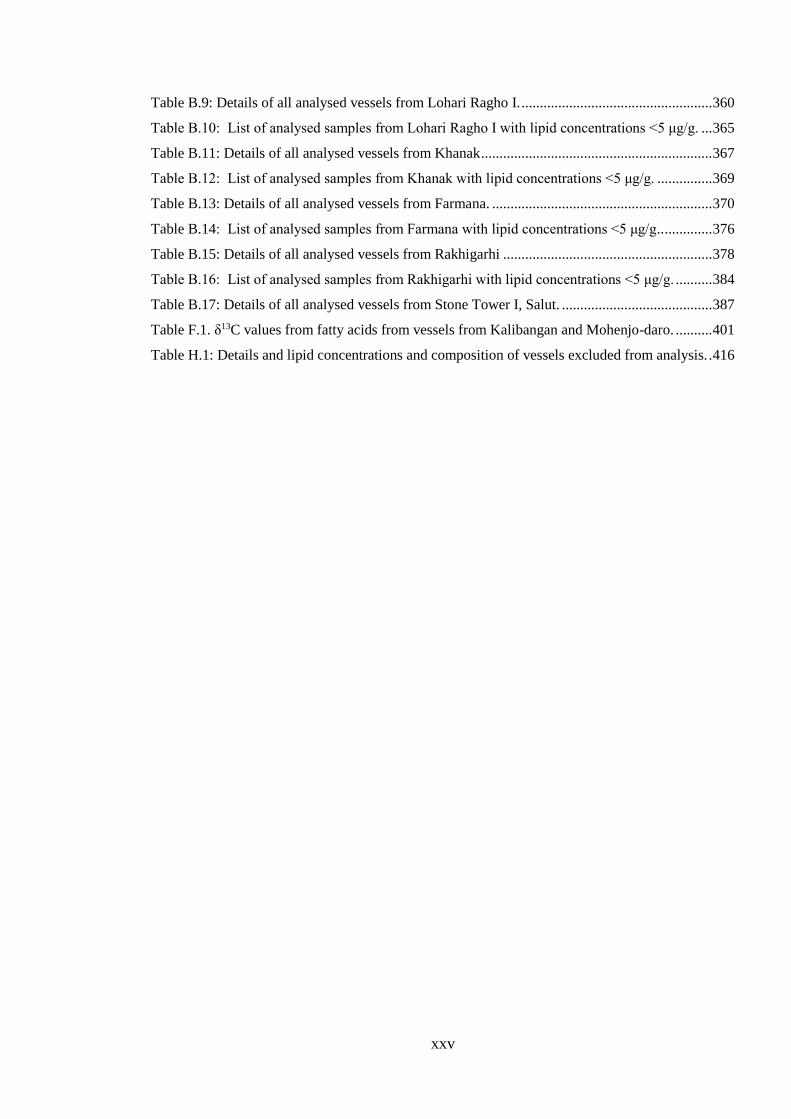
Table B.9: Details of all analysed vessels from Lohari Ragho I. .................................................... 360
Table B.10: List of analysed samples from Lohari Ragho I with lipid concentrations <5 μg/g. ... 365
Table B.11: Details of all analysed vessels from Khanak ............................................................... 367
Table B.12: List of analysed samples from Khanak with lipid concentrations <5 μg/g. ............... 369
Table B.13: Details of all analysed vessels from Farmana. ............................................................ 370
Table B.14: List of analysed samples from Farmana with lipid concentrations <5 μg/g.. ............. 376
Table B.15: Details of all analysed vessels from Rakhigarhi ......................................................... 378
Table B.16: List of analysed samples from Rakhigarhi with lipid concentrations <5 μg/g. .......... 384
Table B.17: Details of all analysed vessels from Stone Tower I, Salut. ......................................... 387
Table F.1. δ13C values from fatty acids from vessels from Kalibangan and Mohenjo-daro. .......... 401
Table H.1: Details and lipid concentrations and composition of vessels excluded from analysis. . 416

xxvi
xxvii
List of Abbreviations
Δ13C…Difference in stable carbon isotope values of C18:0 and C16:0 fatty acids
δ13C…Stable carbon isotope ratio
ALK…n-alkane
ALM…Alamgirpur
BSJ…Black-Slipped Jar
DAGs…Diacylglycerols
EMH…Early Mature Harappan
FA…Fatty acid
FRN…Farmana
GC…Gas-Chromatography
GC-c-IRMS…Gas Chromatography-combustion-Isotopic Ratio Mass Spectrometry
GC-FID…Gas-Chromatography Flame-Ionisation Detection
GC-MS…Gas Chromatography-Mass Spectrometry
ISM…Indian Summer Monsoon
ITCZ…Intertropical Convergence Zone
KLB…Kalibangan
KNK…Khanak
LH…Late Harappan
LHRI…Lohari Ragho I
LMH…Late Mature Harappan
LWS…Land, Water and Settlement Project
MAGs…Monoacylglycerols
MD…Mohenjo-daro
xxviii
MSDI…Masudpur I
MSDVII…Masudpur VII
RGR…Rakhigarhi
STI…Stone Tower I, Salut
TAGs…Triacylglycerols
TLE…Total Lipid Extract
VPDB…Vienna Pee Dee Belemnite
1
Chapter One
Introduction
1.1. Food in the Indus Civilisation: research questions and
approach
This thesis is focused on understanding which types of foodstuff were processed in
ceramic vessels from settlements of the Indus Civilisation, South Asia’s first urban
civilisation, using organic residue analysis. The Indus Civilisation (c.3000-1300 BC) is one
of the great early complex civilisations of the Old World (Marshall 1931; Kenoyer 1998;
Possehl 2002; Wright 2010), but is often neglected in discussions about early urbanism due
to its enigmatic nature and the lack of decipherable texts (Wright 2010; Petrie 2013).
Spread across a vast geographic region, including large parts of modern Pakistan,
northwest and western India and Afghanistan, our present understanding of settlement
distribution suggests that the Indus Civilisation was likely the most geographically
extensive of all the early Old World civilisations (cf. Wheeler 1968:4; Possehl 2002;
Agrawal 2007; Petrie et al. 2017). The Indus Civilisation also occupied an environmentally
diverse and climatically dynamic stretch of South Asia and experienced climatic instability
in 4.2 ka BP (c.2100 BC) (Wright 2010; Petrie et al. 2017). Questions about environmental
and regional diversity but apparent ‘cultural uniformity’ have pervaded archaeological
literature on the Indus Civilisation (Marshall 2004[1931]; Wheeler 1953; Allchin and
Allchin 1968), but for the past few decades, regional ecological and cultural variation
within the Indus Civilisation has been increasingly recognised and characterised. Thus, the
Indus Civilisation provides an excellent setting to investigate how quotidian human
activities such as the creation of food and use of vessels are manifested in early urban
societies, and how they respond to cultural or climatic change.
This study investigates lipid residues from vessels recovered from a range of
settlements located in northwest India dated to the urban period (c. 2600/2500-1900 BC),
and tests whether there was continuity or change in vessel-use practices in the post-urban
period (c. 1900-1300 BC), a period hypothesized to be marked by dramatic societal
2
transformations and potential climatic instability (Staubwasser 2003, Dixit et al. 2014a/b).
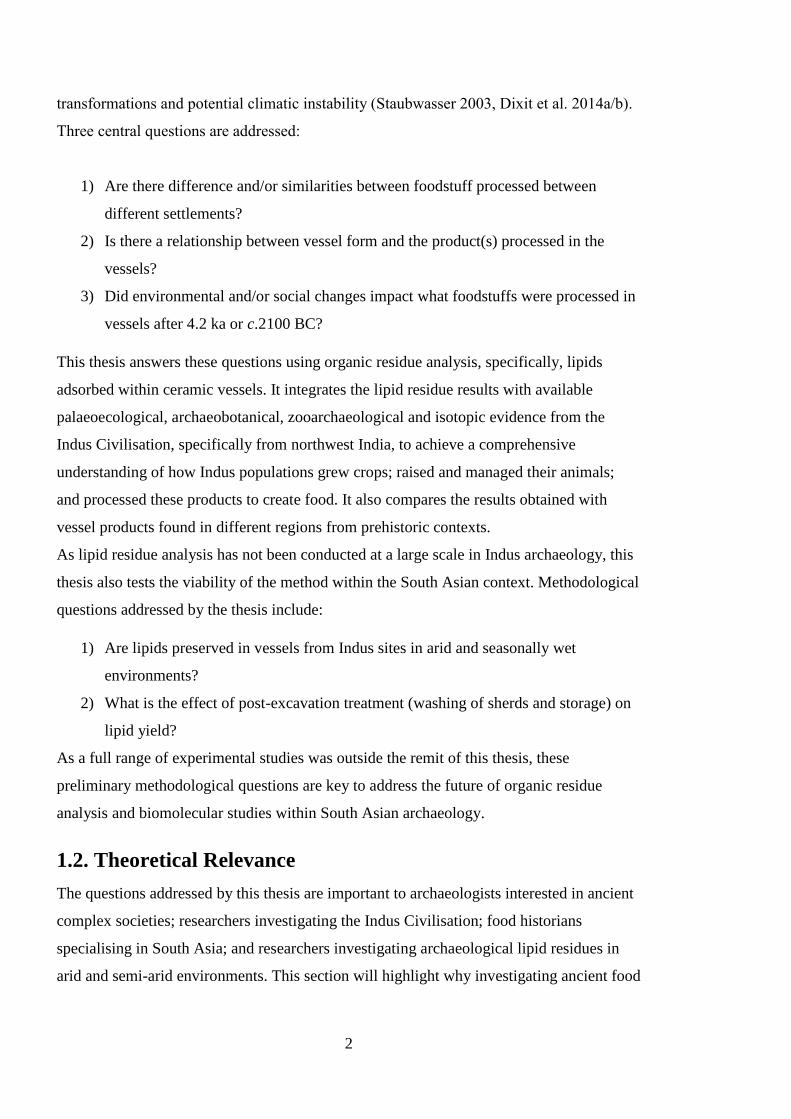
Three central questions are addressed:
1) Are there difference and/or similarities between foodstuff processed between
different settlements?
2) Is there a relationship between vessel form and the product(s) processed in the
vessels?
3) Did environmental and/or social changes impact what foodstuffs were processed in
vessels after 4.2 ka or c.2100 BC?
This thesis answers these questions using organic residue analysis, specifically, lipids
adsorbed within ceramic vessels. It integrates the lipid residue results with available
palaeoecological, archaeobotanical, zooarchaeological and isotopic evidence from the
Indus Civilisation, specifically from northwest India, to achieve a comprehensive
understanding of how Indus populations grew crops; raised and managed their animals;
and processed these products to create food. It also compares the results obtained with
vessel products found in different regions from prehistoric contexts.
As lipid residue analysis has not been conducted at a large scale in Indus archaeology, this
thesis also tests the viability of the method within the South Asian context. Methodological
questions addressed by the thesis include:
1) Are lipids preserved in vessels from Indus sites in arid and seasonally wet
environments?
2) What is the effect of post-excavation treatment (washing of sherds and storage) on
lipid yield?
As a full range of experimental studies was outside the remit of this thesis, these
preliminary methodological questions are key to address the future of organic residue
analysis and biomolecular studies within South Asian archaeology.
1.2. Theoretical Relevance
The questions addressed by this thesis are important to archaeologists interested in ancient
complex societies; researchers investigating the Indus Civilisation; food historians
specialising in South Asia; and researchers investigating archaeological lipid residues in
arid and semi-arid environments. This section will highlight why investigating ancient food
3
is of interest to archaeologists, and its relevance to research on ancient and contemporary
South Asia and the Indus Civilisation.
1.2.1. Why study ancient food?
Humans eat every day to survive; and the regular practice of ingesting food makes it
inherently ‘about the body’ (Ray and Srinivas 2012), as food is biosynthesized to become a
part of the flesh, bone and muscle. It has been argued that in converting some part of their
environment into food, humans create a peculiarly powerful semiotic device (Appadurai
1981: 494). More than any other human activity, food creates the individual as well as the
community through the daily practices of eating, forming the ultimate habitus practice
(Bordieu 1977; Atalay and Hastorf 2006). Thus, acts of acquiring, preparing and
consuming foods, as regular, repeated actions, form the basis of the social (D’Anna and
Jauss 2015). These acts also structure the lives of preparers and consumers, serving as a
mnemonic medium through which habitus is expressed and learned over generations
(Bourdieu 1977; Atalay and Hastorf 2006; McCorriston 2011). As a ‘highly condensed
social fact’, food encodes all kinds of cosmological meanings and ‘collective
representation’ (Levi Strauss 1966; Appadurai 1981: 494). Depending on its contexts and
function, food can become the site where ideology and power relations are expressed or
negotiated, “signalling rank and rivalry, solidarity and community, identity and exclusion,
and intimacy or distance” (Appadurai 1981: 494). Thus, commensal acts create and
reinforce social relations.
Investigating food archaeologically provides a powerful lens to investigate the
relationship between humans and the environment, plants, and animals, as well as gain
insight into socio-political relationships. Archaeological investigations on food have
ranged from traditional considerations of calories, crops, and subsistence to investigating
symbolic dimensions of food used for the negotiation of power (Dietler 2003: 272). A
variety of material culture has been studied to investigate food practices, including
ceramics, faunal and botanical assemblages, human remains, individual domestic spaces,
refuse deposits and ritual structures (Dietler 2003; Kerner et al. 2015). However, given that
archaeology rarely has access to human thoughts or intentions, understanding cultural
constructions of food and its edibility, delving into food avoidance, taboos or preferences
(such as in anthropology, see Leach 1964; Douglas 1966; Tambiah 1969; Harris 1998;
Minz and Du Bois 2002) is challenging.
4
1.2.2. Food practices (and politics) in South Asia
A great diversity of food traditions across South Asia is well-recognised (Appadurai 1981;
Nandy 2004), but investigations into the archaeology of food, specifically from prehistoric
contexts, are in a relatively nascent stage. Although there is an increase in the use of
bioarchaeological techniques to study specific aspects of ancient food (for reviews, see
Thomas and Joglekar 1994; Fuller 2002, 2006; Murphy and Fuller 2016), these are often
characterised as subsistence strategies and their social meaning is rarely investigated. In
historical periods, concepts like the relationship between food and ideas of the body,
personality, health, religiosity, and identity have been primarily explored through
historical, philosophical and religious texts (e.g. Khare 1976a, 1976b; Malmoud 1996;
Zimmerman 1999), with important work also done in archaeology (e.g. Morrison 1994,
2001; Smith 2006). Anthropological studies of contemporary South Asian communities
explore how notions of belonging and exclusion are tied into culinary choices, particularly
through religious and caste identity (Appadurai 1981; Daniel 1987; Achaya 1994; Khare
1976a, 1976b, 1992; Desai 2008; Rege et al. 2009; Staples 2008, 2016), as well as how
South Asian diaspora communities negotiate their identity in globalised, multicultural
urban spaces through their alimentary choices and experiences (Kuper 1967; Bharati 1967;
Ray and Srinivas 2012; Parveen 2016). Although food has never been apolitical in the
subcontinent, present-day gastro-politics of food have transcended the private spaces of the
household and entered the realms of nationalistic politics, especially in India. Meat
consumption (especially cattle and buffalo meat) has become a virtual battleground where
debates about identity, loyalty, morality, and nationality are waged (O’Toole 2003;
Gorringe and Karthikeyan 2014; Deepak 2018; Gowen 2018). Similarly, the study of
history and archaeology, particularly of the Indus Civilisation, has become highly
politicised (Menon and Mishra 2018; Joseph 2018). In this current climate, investigating
the connections between archaeology, food, and identity are highly relevant.
1.2.3. Food in ancient South Asia and the Indus Civilisation
Within the realm of South Asian prehistory, there is a growing focus on understanding
processes of domestication of crops and animals in the Neolithic period across South Asia
(Fuller 2006; Murphy and Fuller 2016), but there has been a strong preoccupation with
research on the Indus Civilisation (Murphy and Fuller 2016). Despite this focus, there are
long-held views about homogeneity of food practices, particularly in terms of crop choice,
across the Indus Civilisation (see Chapter Two). These ideas have been challenged by
5
recent research indicating regional diversity of practices (Madella and Fuller 2006; Petrie
and Bates 2017). Regional variations in environment, geography and crop availability
within the Indus Civilisation suggest that acts of acquiring, preparing, storing, and eating
food may be representative of unique culinary choices within different settlements and
regions of the Indus Civilisation. Studying food choice and their change or stability across
time may reveal a deeper understanding of the expression and maintenance of regional,
rural/urban or relational identities in the Indus Civilisation.
Till now, discussion of food production and variability in the Indus Civilisation has
been focused on crops (e.g. Petrie et al. 2016; Petrie and Bates 2017), and there has not
been much effort to explore the role of plants and animals as food in Indus society (e.g.,
Fuller 2005). This thesis explores the meaningful creation of food by Indus populations,
and studies it with relation to specific categories of pottery. This approach emphasizes the
active use of food within ceramics against the relatively static picture of food use often
presented by faunal and botanical analysis (Jones 1999: 57).
This thesis uses material from, and complements the research questions posed by the
Land, Water and Settlement and TwoRains projects, which are two inter-disciplinary
collaborative endeavours directed by Dr Cameron Petrie, University of Cambridge and
Prof. R. N Singh, Banaras Hindu University. These projects have been investigating
cultural and environmental landscape transformation in the plains of northwest India
between c.3000-1500 BC, and looking into the extent of climatic, environmental,
hydrological and settlement change following the weakening of the Indian Summer
Monsoon (ISM) in northwest India. As key debates in Indus archaeology centre around the
hypothesised relationship between climate and cultural change, food production, and the
development and decline of urbanism, these projects are interested in investigating the
resilience and sustainability of this region of the Indus Civilisation in the face of variable
weather conditions, or climate change. This thesis examines Indus consumption and
culinary choices at two scales, adopting both a synchronic approach (vessel-usage across
sites during the urban period), and a diachronic approach (change in vessel-usage over
time) to understand how an ancient society consciously coped with diverse and varied
ecologies, and if they adapted to change in the face of shifting environmental parameters as
reflected in everyday acts of cooking, consuming and storing. Thus, this research is distinct
yet complementary to the greater aims of both projects.
6
1.3. Methodological Rationale: why ceramic lipid analysis?
One of the most ubiquitous artefacts found in the archaeological record, pottery has been
widely studied and used as both a cultural and chronological marker in archaeology (Rice
1987), and especially in South Asian archaeology (Dales and Kenoyer 1986; Krishnan
2018). However, manufacturing process, shape, style or decoration are not the only
defining criteria of pottery: their cultural use and everyday function would have served as
an integral part of how they were experienced in the past. Additionally, processes of
transmission of learning how to process foodstuff are closely linked to social identity
(Arthur 2002, 2014; Craig et al. 2015). The study of the use of vessels provides a deeper
understanding of what types of natural products were used, and allows questions related to
seasonality, spatial organisation or the structuring of domestic spaces to be raised (Arthur
2002, 2014; Vieugue 2016).
Ceramic vessels are designed within limits of size and form in order to perform
certain functions. For example, storage and transport vessel sizes vary according to the
product form (liquid vs. solid) and the distance these items need to be transported, and
serving vessels usually are smaller than storage and processing vessels to make them
suitable for individual portions (Miller 1985). Researchers have used ethnographic data
and morphological characteristics of archaeological vessels to correlate specific vessels
forms with primary vessel function (Henrickson and McDonald 1983; Rice 1996, Abbink
1999; Skibo 2013). The difference between ‘vessel function’, which refers to the broad
roles or activities or capabilities of ceramics, for example as containers (for storage,
processing, transport), and ‘vessel use’, which refers to the specific way(s) in which a
vessel was brought into service for a particular purpose has also been discussed (Rice
1996).
The study of adsorbed organic residues in ceramic vessels provide a unique means to
study the cultural use of vessels. Depending on the number of vessels studied, it may also
provide a means to study vessel function, however this is often difficult to ascertain, and
vessels often are multifunctional (Heron and Evershed 1993). Details of the method are
provided in Chapter Three. Investigations of lipid residues in pottery have revealed
fascinating insights into the transformation of organic products for cultural uses across
multiple spatial and temporal contexts in the world. There has been a heavy focus on
characterising what products were processed in Neolithic pottery, a period which generally
marks the transition to an agricultural lifestyle which includes the managing of various
7
animals, growing of crops and exploitation of secondary products (Craig et al. 2005;
Evershed 2008a; Debono-Spiteri et al. 2016; Whelton et al. 2018). This focus is reflected
by the attention given to degraded animal fats in the field, especially ruminant dairy and
ruminant adipose products. Another major focus of interest has been in investigating
products processed in early pottery produced by hunter-gatherer groups in Europe and East
Asia (Cramp et al. 2014; Lucquin et al. 2016a; Shoda et al. 2017, 2018), where evidence
suggests the predominance of marine and freshwater products in vessels, especially in the
Mesolithic period in European, Japanese and Korean prehistory. Broadly speaking,
investigating these broad temporal and spatial patterns of vessel usage demonstrates the
relationship between the symbolic meaning of ‘new’ material culture (pottery in East Asia)
or ‘new’ foodstuff (dairy products in Europe) and their perceived ‘value’ over time.
As lipid residues are one of the few methods available in archaeology to investigate
the use of vessels (Reber et al. 2019), this method also provides a unique opportunity to
examine the relationship between material culture (i.e., ceramic vessels), and natural
products processed or transformed for food or other applications. Different methods of
food processing associated with particular shapes of vessels have been studied, such as the
presence of ketones in cooking pots,which indicate repeated heating (Evershed et al. 1995;
Raven et al. 1997) and the accumulation of lipid in certain parts of a vessel which highlight
differences in practices such as boiling or roasting (Charters et al. 1993). Such studies
provide insight into cooking traditions that occupy an important role in how populations
conceptualise their foodstuff, which is inherently linked to taste preferences and cultural
choices. Examples include the preference for sticky foods in East Asia that are generally
processed via boiling and steaming, as opposed to the culture of baking and roasting in
western Asia (Fuller 2011; Fuller and Rowlands 2009, 2011). Being able to access this
level of detail into ancient culinary choices is possible when organic residue analysis is
combined with other palaeodietary information and robust ceramic analyses.
The study of the use of organic materials to seal and repair ceramic vessels, or
transport other substances has been another area of interest in the field of organic residue
analysis. A range of products such as waxes, resins and bituminous materials have been
identified within archaeological ceramics dating from the Neolithic to the 9th centuries AD
across different regions (Urem-Kotsou et al. 2002, Charters et al. 2003, Regert et al. 2003,
Stern et al. 2003; Knappet et al. 2005, Stacey et al. 2006; Salque et al. 2013). Sometimes,
the sources of these resins and bituminous materials suggest evidence of long-distance
exchange of organic products (Regert et al. 2008, Connan and van de Velde 2010; van de
8
Velde 2015; Courel et al. 2017). The field has provided unique insight into technologies of
vessel manufacture and their chaîne opératoire, the production of non-culinary organic
substances, as well as the movement or connectivity between different regions that
underlies their production.
Ceramics are one of the most ubiquitous artefacts recovered during archaeological
excavation, especially in South Asia. Within the context of Indus archaeology, pottery is
often embedded in typology- and form-based discussions alone and is divorced from its
cultural role. The analysis of performance-based physical properties of ceramics, vessel
form, and ethnoarchaeology are widely used by archaeologists to determine the intended
use of vessels (Kenoyer 1997). However, the relationship of form and physical properties
to actual pottery use may be ambiguous (Heron and Evershed 1993), and in some cases,
vessel form variability may have little or nothing to do with performance characteristics
(Miller 1985). Thus, this thesis emphasises the obvious connections between
archaeological ceramics and ancient foods and organic products. The application of residue
analysis on ancient pottery enables the investigation of the use of vessels through the
determination of past vessel contents, a topic often left out of the traditional discourse in
archaeological ceramic analysis in South Asia. As this method has never been applied at a
large scale in Indus archaeology (a previous study analysed a single sample: see Section
2.3.5.2), this study is the first to apply it to investigate Indus foodways and vessel-use at a
larger scale.
Finally, as no single dataset can reflect a people’s entire diet or food technology;
multiple datasets, each with their own limitations and interpretational challenges, must be
combined. This thesis attempts to integrate lipid residue with archaeobotanical,
zooarchaeological and isotopic data (e.g. Evershed 2008a), factoring in quantitative issues
and taphonomic processes influencing the creation of different archaeological datasets.
Although this exercise is challenging, this thesis demonstrates that the results can provide
new, intriguing insights into ancient human-environment-food relations.
1.4. Definitions: food, vessel-use, food choice, foodways
The archaeology of food faces certain definitional issues. As an extremely multifaceted
phenomenon, food has the ability to testify to many different aspects of life, but this also
makes it challenging to study (Twiss 2015). As archaeologists, food is often implicitly
conceptualised as ‘solid consumables’, and categories like beverages, inhalables, and
swallowables such as ‘medicines’ do not usually fall under it (Twiss 2015: 93). Secondly,
9
food is also defined as a subset of theoretically available nutrients (Twiss 2015:92), which
tends to undermine the social role of food, and ignore culturally defined aspects of food
such as edibility, taste, and choice. As there can be multiple appropriate definitions of food
depending on the context, it is important to let research questions guide the boundaries to
conceptions of food, shrinking or expanding to encompass various aspects of the
environment and material culture (Twiss 2015). This thesis specifically attempts to use
organic residues embedded within ceramic vessels as a proxy towards understanding of
how ancient populations processed and transformed natural products to produce what was
conceived as food. It is possible that not everything that was processed in vessels was
consumed. However, as most vessels were recovered from domestic contexts, it is likely
most of them were used for quotidian practices and were primarily involved in food
processing.
Other definitions prominently used in the archaeological food literature include
‘feasting’, ‘food choice’ and ‘foodways’. ‘Feasting’ pervades archaeological studies of
food (Bray 2003; Dietler and Hayden 2010; Twiss 2015), but definitions of feasting vary in
their details (Dietler and Hayden 2010) and are debated (Twiss 2015). As evidence of
large-scale, “special” communal consumption has not been clearly identified in the Indus
Civilisation, this term is not used in this thesis. Food choice implies the selection of
“ingredients” and their consumption, and encompasses what is eaten, why, where, and
how. Food choice has an important role in the social, economic, and symbolic aspects of
life because it conveys information on preferences, identities, and culture (Fuller and Lucas
2017). Taking a broader approach, ‘foodways’, incorporates the whole interrelated system
of food conceptualization, procurement, preservation, preparation, distribution, and
consumption (see Figure 1.1; Camp 1982). In this thesis ‘food choice’ is used to highlight
the active, engaged culinary practices of Indus populations. Additionally, it focuses on
aspects related to procurement and preparation of food in Indus society, and emphasizes
that a foodways approach in Indus archaeology may yield interesting insights into studying
the diversity of Indus commensality.
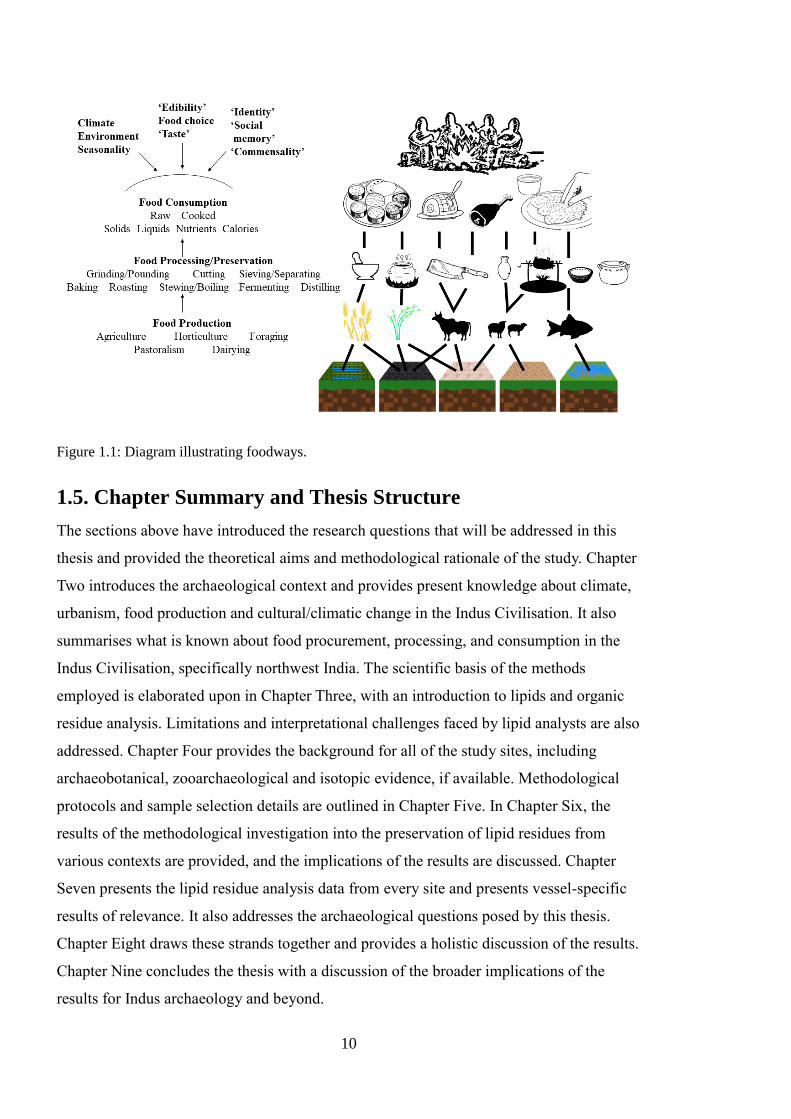
10
Figure 1.1: Diagram illustrating foodways.
1.5. Chapter Summary and Thesis Structure
The sections above have introduced the research questions that will be addressed in this
thesis and provided the theoretical aims and methodological rationale of the study. Chapter
Two introduces the archaeological context and provides present knowledge about climate,
urbanism, food production and cultural/climatic change in the Indus Civilisation. It also
summarises what is known about food procurement, processing, and consumption in the
Indus Civilisation, specifically northwest India. The scientific basis of the methods
employed is elaborated upon in Chapter Three, with an introduction to lipids and organic
residue analysis. Limitations and interpretational challenges faced by lipid analysts are also
addressed. Chapter Four provides the background for all of the study sites, including
archaeobotanical, zooarchaeological and isotopic evidence, if available. Methodological
protocols and sample selection details are outlined in Chapter Five. In Chapter Six, the
results of the methodological investigation into the preservation of lipid residues from
various contexts are provided, and the implications of the results are discussed. Chapter
Seven presents the lipid residue analysis data from every site and presents vessel-specific
results of relevance. It also addresses the archaeological questions posed by this thesis.
Chapter Eight draws these strands together and provides a holistic discussion of the results.
Chapter Nine concludes the thesis with a discussion of the broader implications of the
results for Indus archaeology and beyond.
11
Chapter Two
Indus Civilisation settlements, environment and
subsistence: urban and post-urban periods
This chapter lays out the background for the archaeological context and details of relevant
literature relating to the research questions explored in this thesis. Section 2.1 provides an
introduction and brief background to the Indus Civilisation, specifically focusing on
urbanism and the nature of settlements in the urban phase. The climatic and environmental
contexts of the Indus Civilisation are also introduced, including discussions about the
extent of cultural uniformity and variability. Section 2.2 summarises literature about the
decline or transformation of the Indus Civilisation in the post-urban phase. Section 2.3
delves into a review of literature concerning the reconstruction of the subsistence practices
by Indus populations in the urban and post-urban phases. This includes archaeobotanical
research, zooarchaeological evidence, and biomolecular approaches including stable
isotopic research and starch-grain analyses. Finally, Section 2.4 synthesises how each of
these approaches have framed discourse about Indus society, economy and food-
production in the urban period and in the transition to post-urbanism.
2.1. Contextual background to the Indus Civilisation:
chronology, urbanism and environment
2.1.1. Chronology
The Indus Civilisation is best known for its urban phase which spanned from the mid-third
to early second millennium BC (∼4.6– 4.5 ka BP, or c.2600-1900 BC), but the urban
period was preceded by an extended period of village-based settlement beginning in the
sixth millennium BC (Petrie 2013). Complex processes led to the development of small-
scale farming societies in the pre-urban period (late fourth-early third millennium BC),
which eventually gave rise to urban settlements (Chakrabarti 1995; Possehl 2002, Wright
2010). The transformation from pre-urban to urban settlements was not a linear
developmental process, and there was considerable variation in lifeways throughout the
region that constituted the Indus Civilisation in this formative stage (Petrie 2013: 5).
12
However, as this thesis focuses on the urban and post-urban period, these will not be
discussed in this chapter.
Table 2.1 provides an overview of the chronology of the Indus Civilisation. As the
terminology used to refer to different periods in the literature is varied (Possehl 1977;
Shaffer 1992; Kenoyer 1997; Wright 2010), the table provides the different terms used as
well as regional variations present in the chronology.
Chronological frameworks employed in this thesis are based on a mixture of
stratigraphy, periodisation on the basis of ceramic analysis, and Bayesian radiocarbon
modelling. This framework uses the generally accepted chronological divisions of ‘Mature
Harappan’ and ‘Late Harappan’ based on pottery typologies found at Indus sites, which are
further broken into sub-divisions that have been fine-tuned through ceramic analysis within
Indus sites in northwest India. These include Early Mature Harappan (EMH) and Late
Mature Harappan (LMH) (Table 2.2). This thesis favours these terms as they are used in
the ceramic literature in northwest India but will also use the terms ‘urban’ and ‘post-
urban’ as urbanism is a fundamental aspect to discourse related to social organisation and
subsistence practices in the Indus Civilisation. These cultural periods were assigned during
excavation on the basis of relative stratigraphy and later clarified via the use of radiocarbon
dating and Bayesian radiocarbon modelling. Samples have also been discussed according
to whether they pre-date, post-date, and/or fall during the 4.2 ka climatic ‘event’, discussed
in Section 2.1.3. This was done in order to make comparisons about the products processed
in vessels, or vessel-usage before, during and after the onset of significant climatic
instability in the region. Classifications have been done on the basis of radiocarbon dates
obtained from strata. The approximate time window covered in this thesis are detailed in
Table 2.2.
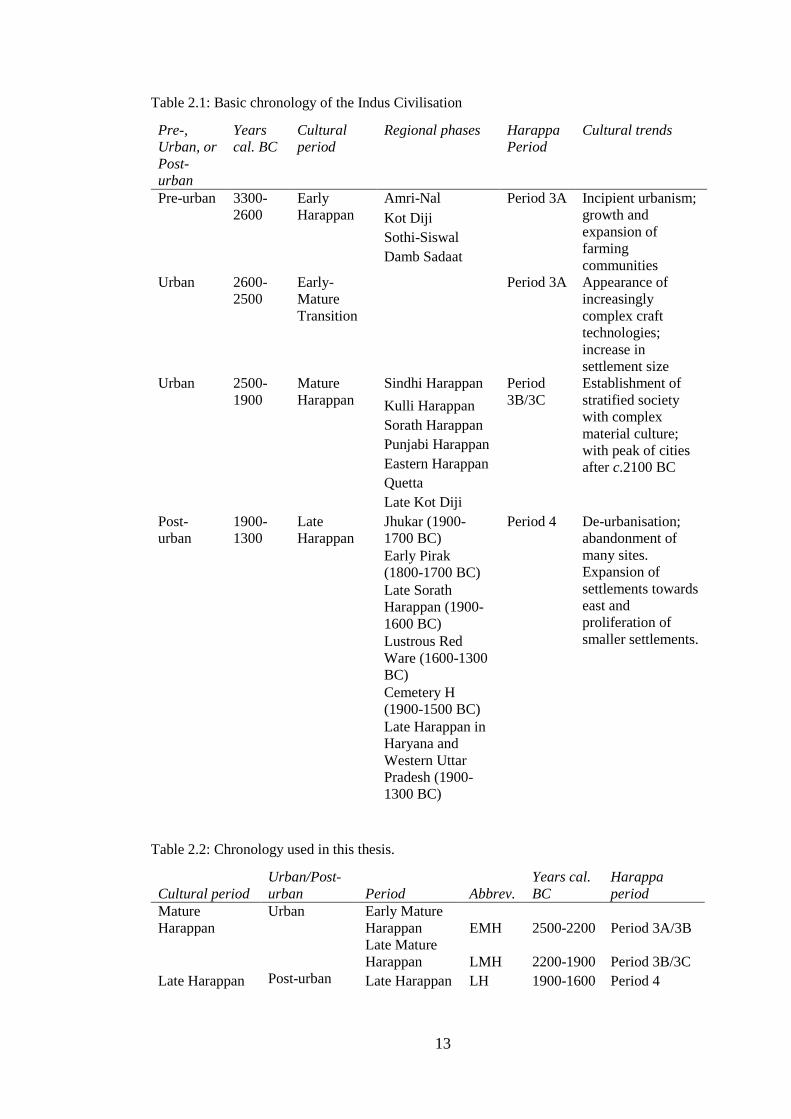
13
Table 2.1: Basic chronology of the Indus Civilisation
Pre-,
Urban, or
Post-
urban
Years
cal. BC
Cultural
period
Regional phases Harappa
Period
Cultural trends
Pre-urban 3300-
2600
Early
Harappan
Amri-Nal Period 3A Incipient urbanism;
growth and
expansion of
farming
communities
Kot Diji
Sothi-Siswal
Damb Sadaat
Urban 2600-
2500
Early-
Mature
Transition
Period 3A Appearance of
increasingly
complex craft
technologies;
increase in
settlement size
Urban 2500-
1900
Mature
Harappan
Sindhi Harappan Period
3B/3C
Establishment of
stratified society
with complex
material culture;
with peak of cities
after c.2100 BC
Kulli Harappan
Sorath Harappan
Punjabi Harappan
Eastern Harappan
Quetta
Late Kot Diji
Post-
urban
1900-
1300
Late
Harappan
Jhukar (1900-
1700 BC)
Period 4 De-urbanisation;
abandonment of
many sites.
Expansion of
settlements towards
east and
proliferation of
smaller settlements.
Early Pirak
(1800-1700 BC)
Late Sorath
Harappan (1900-
1600 BC)
Lustrous Red
Ware (1600-1300
BC)
Cemetery H
(1900-1500 BC)
Late Harappan in
Haryana and
Western Uttar
Pradesh (1900-
1300 BC)
Table 2.2: Chronology used in this thesis.
Cultural period
Urban/Post-
urban Period Abbrev.
Years cal.
BC
Harappa
period
Mature
Harappan
Urban Early Mature
Harappan EMH 2500-2200 Period 3A/3B
Late Mature
Harappan LMH 2200-1900 Period 3B/3C
Late Harappan Post-urban Late Harappan LH 1900-1600 Period 4
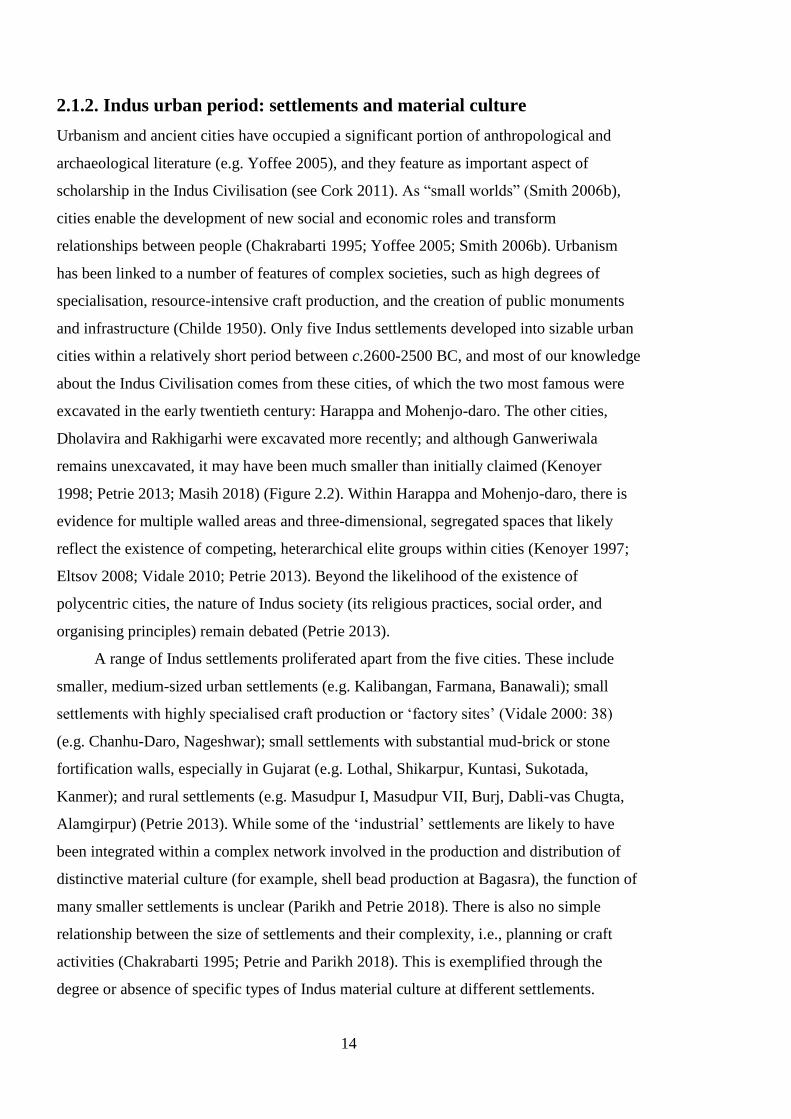
14
2.1.2. Indus urban period: settlements and material culture
Urbanism and ancient cities have occupied a significant portion of anthropological and
archaeological literature (e.g. Yoffee 2005), and they feature as important aspect of
scholarship in the Indus Civilisation (see Cork 2011). As “small worlds” (Smith 2006b),
cities enable the development of new social and economic roles and transform
relationships between people (Chakrabarti 1995; Yoffee 2005; Smith 2006b). Urbanism
has been linked to a number of features of complex societies, such as high degrees of
specialisation, resource-intensive craft production, and the creation of public monuments
and infrastructure (Childe 1950). Only five Indus settlements developed into sizable urban
cities within a relatively short period between c.2600-2500 BC, and most of our knowledge
about the Indus Civilisation comes from these cities, of which the two most famous were
excavated in the early twentieth century: Harappa and Mohenjo-daro. The other cities,
Dholavira and Rakhigarhi were excavated more recently; and although Ganweriwala
remains unexcavated, it may have been much smaller than initially claimed (Kenoyer
1998; Petrie 2013; Masih 2018) (Figure 2.2). Within Harappa and Mohenjo-daro, there is
evidence for multiple walled areas and three-dimensional, segregated spaces that likely
reflect the existence of competing, heterarchical elite groups within cities (Kenoyer 1997;
Eltsov 2008; Vidale 2010; Petrie 2013). Beyond the likelihood of the existence of
polycentric cities, the nature of Indus society (its religious practices, social order, and
organising principles) remain debated (Petrie 2013).
A range of Indus settlements proliferated apart from the five cities. These include
smaller, medium-sized urban settlements (e.g. Kalibangan, Farmana, Banawali); small
settlements with highly specialised craft production or ‘factory sites’ (Vidale 2000: 38)
(e.g. Chanhu-Daro, Nageshwar); small settlements with substantial mud-brick or stone
fortification walls, especially in Gujarat (e.g. Lothal, Shikarpur, Kuntasi, Sukotada,
Kanmer); and rural settlements (e.g. Masudpur I, Masudpur VII, Burj, Dabli-vas Chugta,
Alamgirpur) (Petrie 2013). While some of the ‘industrial’ settlements are likely to have
been integrated within a complex network involved in the production and distribution of
distinctive material culture (for example, shell bead production at Bagasra), the function of
many smaller settlements is unclear (Parikh and Petrie 2018). There is also no simple
relationship between the size of settlements and their complexity, i.e., planning or craft
activities (Chakrabarti 1995; Petrie and Parikh 2018). This is exemplified through the
degree or absence of specific types of Indus material culture at different settlements.
15
Indus material culture includes painted and non-painted pottery, terracotta bangles,
figurines (likely produced locally) (Parikh and Petrie 2018), jewellery such as beads,
bangles and micro-beads made from semi-precious and precious stones like agate,
carnelian, lapis lazuli and gold procured from far-away sources (Law 2011), and
standardised weights and stamp steatite seals (Wright 2010: 148-166) (Figure 2.1). Within
cities, such as at Harappa, there was likely a diversity of production organisation including
independent household, communal or kin group, and centralised production and exchange
(Wright 2010: 180). Although the literature is dominated by discussions about Indus cities
and exchange networks of iconic material culture (e.g. Kenoyer 1997; Wright 2010; Law
2011), many aspects of these networks and the relationship between large settlements,
‘industrial settlements’, and the range of smaller settlements are not well-understood
(Petrie et al. 2017; Parikh and Petrie 2018). While some settlements may have been
involved in the production of specific crafts, there is evidence for highly valued material
culture coming from far-off distances such as lapis lazuli and gold beads present at very
small settlements, for example, Alladino in Sindh (Dales and Kenoyer 1986: 9), and rural
settlements in Haryana (Petrie et al. 2009, 2017). The presence of this highly valued
material in small, likely rural settlements, suggests that long-distance networks of
exchange were accessible by various populations (Petrie et al. 2009, 2017). It is also
possible the food products moved between different settlements (Madella 2014). This
suggests that relationships between settlements was complex; possibly governed by mutual
economic dependence rather than overt control of cities over rural hinterlands (Wright
2010; Parikh and Petrie 2018).
As medium-sized and smaller settlements are yet to be appropriately classified
(Parikh and Petrie 2018), and the dynamics between large and smaller settlements have not
been systematically investigated (Petrie 2013), it is difficult to characterise the (likely
varied) nature of interactions between different settlements in the Indus Civilisation. Petrie
and colleagues argue that given the vast geographical spread of the Indus Civilisation, the
landscape was more likely dominated by rural settlements which have received relatively
little attention by scholars (Petrie 2013; Petrie et al. 2017). This thesis addresses this
problem by studying vessels from range of differently-sized Indus settlements, with a focus
on small rural settlements in northwest India.
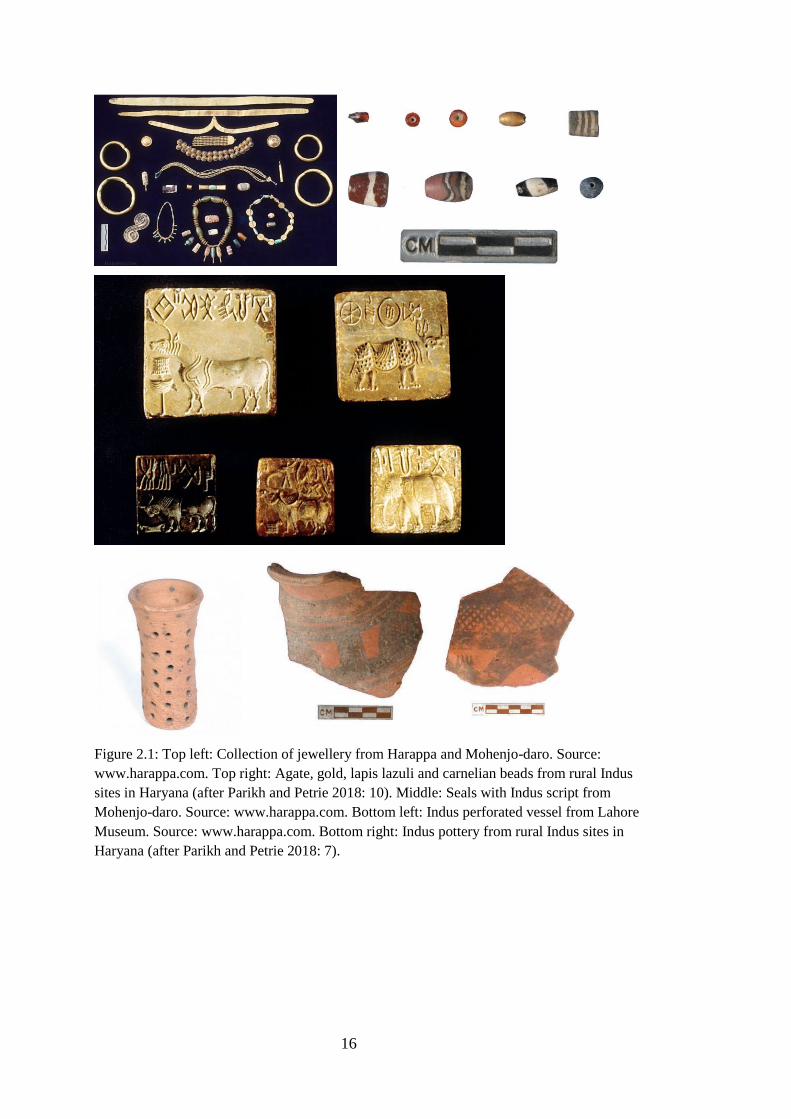
16
Figure 2.1: Top left: Collection of jewellery from Harappa and Mohenjo-daro. Source:
www.harappa.com. Top right: Agate, gold, lapis lazuli and carnelian beads from rural Indus
sites in Haryana (after Parikh and Petrie 2018: 10). Middle: Seals with Indus script from
Mohenjo-daro. Source: www.harappa.com. Bottom left: Indus perforated vessel from Lahore
Museum. Source: www.harappa.com. Bottom right: Indus pottery from rural Indus sites in
Haryana (after Parikh and Petrie 2018: 7).
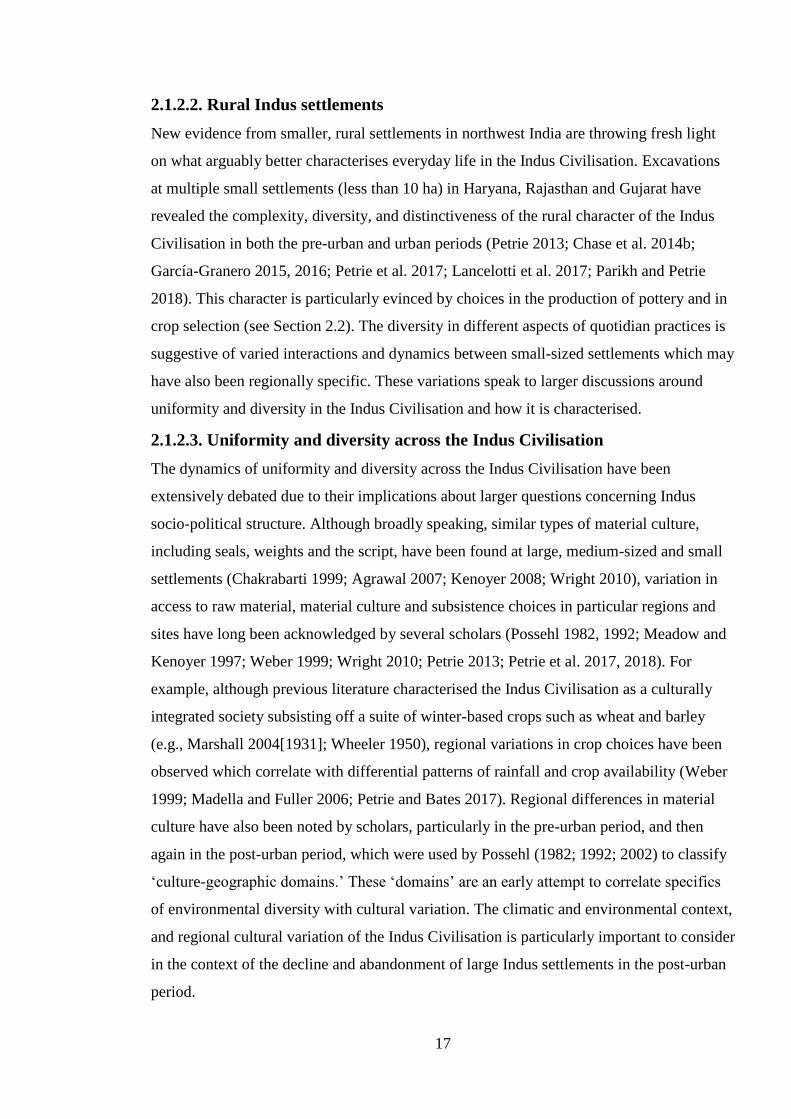
17
2.1.2.2. Rural Indus settlements
New evidence from smaller, rural settlements in northwest India are throwing fresh light
on what arguably better characterises everyday life in the Indus Civilisation. Excavations
at multiple small settlements (less than 10 ha) in Haryana, Rajasthan and Gujarat have
revealed the complexity, diversity, and distinctiveness of the rural character of the Indus
Civilisation in both the pre-urban and urban periods (Petrie 2013; Chase et al. 2014b;
García-Granero 2015, 2016; Petrie et al. 2017; Lancelotti et al. 2017; Parikh and Petrie
2018). This character is particularly evinced by choices in the production of pottery and in
crop selection (see Section 2.2). The diversity in different aspects of quotidian practices is
suggestive of varied interactions and dynamics between small-sized settlements which may
have also been regionally specific. These variations speak to larger discussions around
uniformity and diversity in the Indus Civilisation and how it is characterised.
2.1.2.3. Uniformity and diversity across the Indus Civilisation
The dynamics of uniformity and diversity across the Indus Civilisation have been
extensively debated due to their implications about larger questions concerning Indus
socio-political structure. Although broadly speaking, similar types of material culture,
including seals, weights and the script, have been found at large, medium-sized and small
settlements (Chakrabarti 1999; Agrawal 2007; Kenoyer 2008; Wright 2010), variation in
access to raw material, material culture and subsistence choices in particular regions and
sites have long been acknowledged by several scholars (Possehl 1982, 1992; Meadow and
Kenoyer 1997; Weber 1999; Wright 2010; Petrie 2013; Petrie et al. 2017, 2018). For
example, although previous literature characterised the Indus Civilisation as a culturally
integrated society subsisting off a suite of winter-based crops such as wheat and barley
(e.g., Marshall 2004[1931]; Wheeler 1950), regional variations in crop choices have been
observed which correlate with differential patterns of rainfall and crop availability (Weber
1999; Madella and Fuller 2006; Petrie and Bates 2017). Regional differences in material
culture have also been noted by scholars, particularly in the pre-urban period, and then
again in the post-urban period, which were used by Possehl (1982; 1992; 2002) to classify
‘culture-geographic domains.’ These ‘domains’ are an early attempt to correlate specifics
of environmental diversity with cultural variation. The climatic and environmental context,
and regional cultural variation of the Indus Civilisation is particularly important to consider
in the context of the decline and abandonment of large Indus settlements in the post-urban
period.
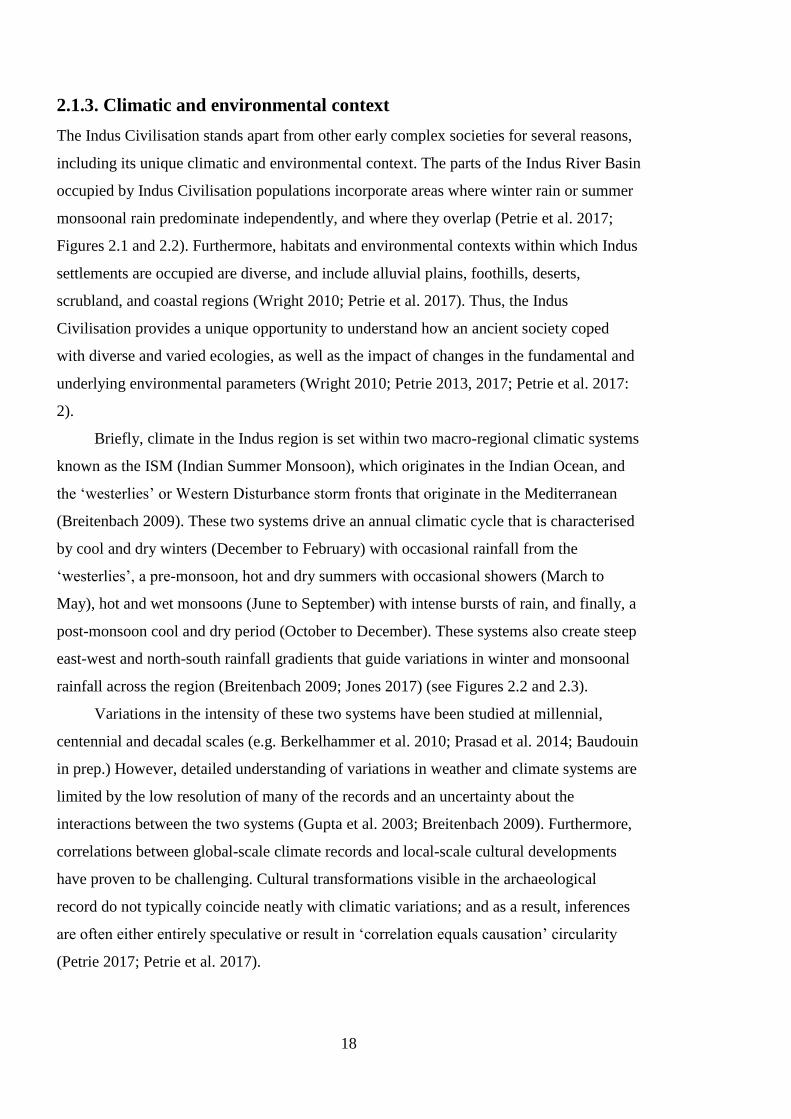
18
2.1.3. Climatic and environmental context
The Indus Civilisation stands apart from other early complex societies for several reasons,
including its unique climatic and environmental context. The parts of the Indus River Basin
occupied by Indus Civilisation populations incorporate areas where winter rain or summer
monsoonal rain predominate independently, and where they overlap (Petrie et al. 2017;
Figures 2.1 and 2.2). Furthermore, habitats and environmental contexts within which Indus
settlements are occupied are diverse, and include alluvial plains, foothills, deserts,
scrubland, and coastal regions (Wright 2010; Petrie et al. 2017). Thus, the Indus
Civilisation provides a unique opportunity to understand how an ancient society coped
with diverse and varied ecologies, as well as the impact of changes in the fundamental and
underlying environmental parameters (Wright 2010; Petrie 2013, 2017; Petrie et al. 2017:
2).
Briefly, climate in the Indus region is set within two macro-regional climatic systems
known as the ISM (Indian Summer Monsoon), which originates in the Indian Ocean, and
the ‘westerlies’ or Western Disturbance storm fronts that originate in the Mediterranean
(Breitenbach 2009). These two systems drive an annual climatic cycle that is characterised
by cool and dry winters (December to February) with occasional rainfall from the
‘westerlies’, a pre-monsoon, hot and dry summers with occasional showers (March to
May), hot and wet monsoons (June to September) with intense bursts of rain, and finally, a
post-monsoon cool and dry period (October to December). These systems also create steep
east-west and north-south rainfall gradients that guide variations in winter and monsoonal
rainfall across the region (Breitenbach 2009; Jones 2017) (see Figures 2.2 and 2.3).
Variations in the intensity of these two systems have been studied at millennial,
centennial and decadal scales (e.g. Berkelhammer et al. 2010; Prasad et al. 2014; Baudouin
in prep.) However, detailed understanding of variations in weather and climate systems are
limited by the low resolution of many of the records and an uncertainty about the
interactions between the two systems (Gupta et al. 2003; Breitenbach 2009). Furthermore,
correlations between global-scale climate records and local-scale cultural developments
have proven to be challenging. Cultural transformations visible in the archaeological
record do not typically coincide neatly with climatic variations; and as a result, inferences
are often either entirely speculative or result in ‘correlation equals causation’ circularity
(Petrie 2017; Petrie et al. 2017).
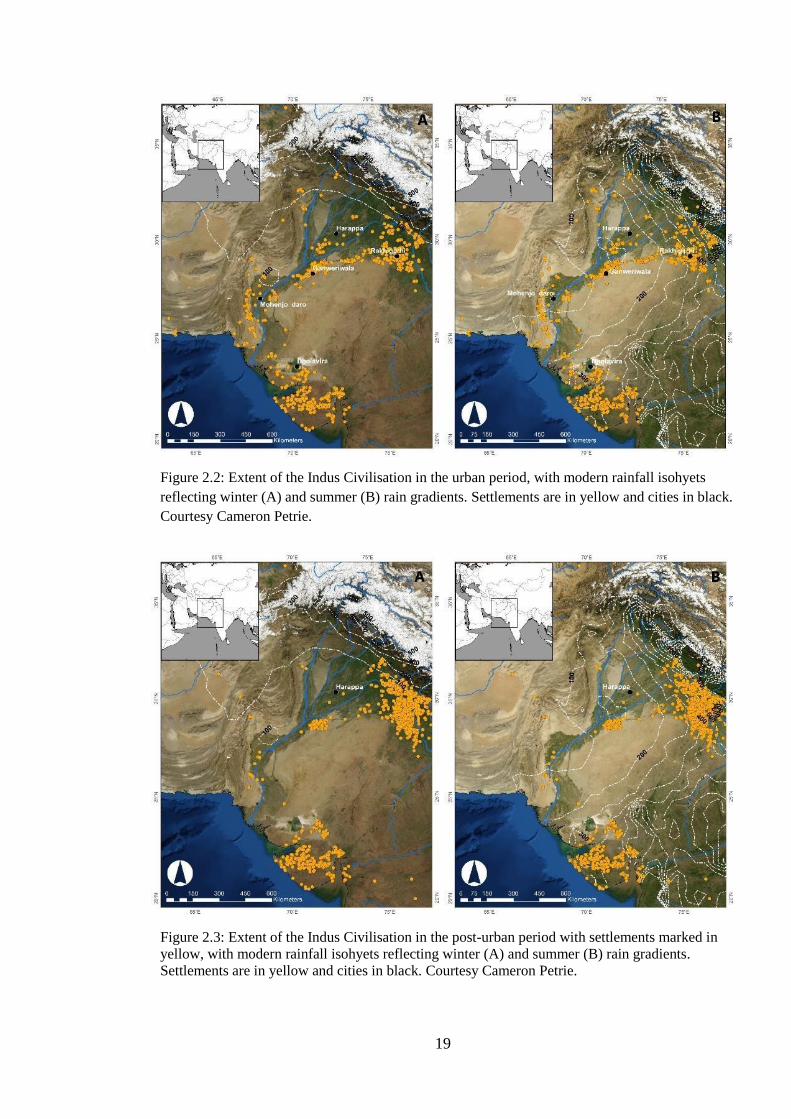
19
Figure 2.2: Extent of the Indus Civilisation in the urban period, with modern rainfall isohyets
reflecting winter (A) and summer (B) rain gradients. Settlements are in yellow and cities in black.
Courtesy Cameron Petrie.
Figure 2.3: Extent of the Indus Civilisation in the post-urban period with settlements marked in
yellow, with modern rainfall isohyets reflecting winter (A) and summer (B) rain gradients.
Settlements are in yellow and cities in black. Courtesy Cameron Petrie.
20
2.1.3.1 Climate before and after Indus urbanism
The climatic context of South Asia before the development and during the floruit of the
Indus Civilisation (before 5.2 ka BP or c.3200 BC until 4.6/4.5 ka BP or c.2600-2500 BC)
is characterised by an early Holocene wet phase followed by a long-term drying trend in
the mid- and late-Holocene (Ponton et al. 2012; Zorzi et al. 2015; Dixit et al. 2018;
Giesche et al. 2019). Although instances of the onset of monsoon weakening appears in
records in the subcontinent around 8.2 ka BP and between 6.5-6.0 ka BP (Dixit et al.
2014a, 2014b; Sarkar et al. 2015) it is likely that the ISM potentially intensified between
5.3-4.2 ka BP, which includes the period that saw the development of Indus cities (Dixit et
al. 2018; Giesche et al. 2019). However, this pattern is not apparent in all climate records
(e.g. Thar Desert, Prasad et al. 1997), which likely reflects local hydrological responses to
monsoon decline (Madella and Fuller 2006). The general trend towards a weaker monsoon
no doubt affected Indus populations, but the limited number of well-dated, high-resolution,
local palaeoclimatic records limits the ability to correlate these changes with
archaeologically-relevant temporal scales. Furthermore, there are only limited indications
of climate obtained directly from archaeological sites (Sarkar et al. 2015; Jones 2017).
Most researchers investigating the Indus Civilisation populations and their
relationship to the climate have focused on a specific abrupt arid phase which began c. 4.2
ka BP or c. 2150 BC and lasted up to several centuries (e.g. Staubwasser 2003, Dixit et al.
2014a/b; Giesche et al. 2019). This ‘4.2 ka event’ has been described in climatic records in
the Americas, Middle East, Africa and China (Jones 2017), but its manifestation in the
Indus region is contested (Staubwasser 2003; Sarkar et al. 2015). While several records
provide evidence of abrupt monsoon weakening around this time (Gupta et al. 2003;
Staubwasser 2003; Breitenbach 2009; Dixit et al. 2014a; Giesche et al. 2019); others
indicate contrary evidence, including an arid period that begins before 4.2 ka, or no
evidence of monsoon weakening at all (Ponton et al. 2012; Tiwari et al. 2015). These
differences are likely reflective of the varying sensitivities of different proxies, as well as
complexities driven by the interactions of winter and monsoon rainfall in some regions
(Madella and Fuller 2006; Breitenback 2009; Jones 2017). Significantly, there is clear
evidence for step-wise monsoon weakening at Kotla Dahar around 4.2-4.1 ka BP (Dixit et
al. 2014a), which is an ephemeral lake that lies relatively close to the Indus sites
investigated in this thesis. It is not clear, however, if the 4.2 ka BP weakening involved
more than just a reduction in monsoon intensity, or also changes in seasonality and annual
21
moisture availability, as well as a reduction in winter rainfall (Staubwasser 2003; Giesche
et al. 2019). Additionally, this shift must also be put within the context of an ongoing
monsoon weakening, likely winter rainfall weakening after 4.3 ka (Giesche et al. 2019),
and variability over decadal and centennial scales. Thus, it is still not possible to determine
exactly what this ‘event’ meant for rainfall patterns, nor how detrimental it may have been
for human populations.
The period between c. 3.9-3.2 ka (during the post-urban Indus phase) is characterised
by moisture recovery in parts of the Indus region, but moisture levels did not recover to
early or mid-Holocene levels (Wright et al. 2008; Prasad et al. 2014; Dixit et al. 2014a;
Giesche et al. 2019). In the eastern part of the Indus Civilisation (i.e. in Haryana and
Rajasthan), it appears that any recovery was either absent, or insufficient to reverse the step
changes from permanent to ephemeral or dry lake systems at Kotla Dahar or in the Thar
Desert (Dixit et al. 2014a). Others have suggested an increase in Indus river discharge and
recovery of moisture levels based off cores from the Indus delta (von Rad et al. 1999;
Staubwasser 2003), and an increase in Beas River discharge based off a model derived
from ITCZ (Inter-Tropical Convergence Zone) dynamics (Wright et al. 2008). At present,
it is not known if there was a return to stable climatic conditions for winter and/or summer
rain in the post-urban period. Further palaeoclimatic work is necessary to resolve these
uncertainties and what they might suggest about climatic conditions in the post-urban
period.
Thus, the spatial and temporal resolution required to make nuanced inferences about
the relationship between Indus populations and the climate is insufficient at present.
However, broadly speaking, the development of Indus urbanism clearly occurred in the
context of a long-term decline in summer monsoon intensity. The abrupt 4.2 ka BP ‘event’
likely brought a further reduction in monsoon rainfall, but its expression across different
zones in the Indus Civilisation is not yet clearly understood. New research also suggests
the weakening summer monsoon was coupled with variations and reduction in winter
rainfall (Giesche et al. 2019), which also likely had a negative impact on Indus
populations. Finally, the post-urban period was characterised by recovering ISM moisture
levels (Wright et al. 2008) but it is uncertain how winter rainfall systems recovered after
4.1 ka BP (Giesche et al. 2019). It is clear that far more detailed, high-resolution records of
both winter and summer rainfall dynamics are necessary to better correlate the relationship
between climate and human response. This thesis will address whether the processing of
food products in vessels experienced change or continuity during and after the 4.2 ka BP
22
‘event’ but will frame its interpretations with the recognition of the known uncertainties
and problems with linking cultural transformations with climatic change.
2.1.3.2. Fluvial dynamics and vegetation
Apart from climate and rainfall systems, access to fluvial systems and vegetation no doubt
shaped the lives of Indus populations. The Indus Civilisation has been described as riverine
(Marshal 1931[2004]), but settlements have been found in a range of environments,
including alluvial fans, intermontane valleys, within arid regions and their margins, even
islands (Possehl 2002, Wright 2010: 33–38; Petrie 2013, 2017; Petrie and Thomas 2012;
Petrie et al. 2017; Petrie et al 2018: 456). Although the reconstruction of vegetation and
land cover across the Indus Civilisation based on paleoenvironmental data has been
limited, available data suggests the dominance of dry-thorn scrubland in the alluvial plains,
as well as arid desert and steppe species (Lancelotti 2018). In Gujarat, studies suggest the
existence of a C3 rich plant environment, with an increase in arid-adapted C4 plant (for
definitions of C3 and C4 plants, see Section 3.5.2) in the late phase of the urban period
attributed to the growing and foddering of animals on millet (Reddy 1997; Chase et al.
2018; Chakraborty et al. 2018).
Variations in water supply combined with differing vegetation, soils and hydrology
would have created unique ecological niches that likely impacted on human behaviour,
particularly in terms of subsistence choices (Petrie et al. 2017). For example, in lower parts
of Punjab and Sindh in modern-day Pakistan, access to direct rainfall is limited, however,
runoff from both winter and summer rainfall through perennial and seasonal rivers and
streams would have been extremely important to Indus populations (e.g. Miller 2006,
2015). Conversely, in Haryana, the analysis of satellite imagery suggests that a profusion
of relatively small-scale watercourses are preserved in the subsurface (Orengo and Petrie
2017, 2018), but the precise nature and the timing of their flow remains unclear (e.g.
Durcan et al. 2017, 2019). If these watercourse(s) were indeed ephemeral, it is likely that
the inhabitants also made use of a combination of wells and ponds to collect monsoon
runoff (Petrie et al. 2017: 457).
Fluvial processes have also formed a key component of discourse about Indus de-
urbanisation. Models ranging from changes in river flow, river avulsion, flooding and
drying have been put forward as major drivers of the decline of the Indus civilisation
which is covered in the next section and relevant for this thesis.
23
2.2. Decline or transformation from urbanism
The period after c.2100 BC marked the peak of the Indus urban phase, and then an
abandonment of settlements in Sindh and west Punjab, but an increase in settlement
density in Rajasthan, Haryana and western Uttar Pradesh (Possehl 2002; Petrie 2013) (see
Figure 2.3). Harappa is the only city-sized settlement for which there is evidence of
continuity in the post-urban period (Kenoyer 2008; Wright 2010). By 1900 BC, many
defining traits of Indus urbanism such as the use of the Indus script, seals, and weights
were no longer evident.
Although there is evidence for a variety of ways of organising craft production in the
urban period that emphasize communal and collective action (Wright 2010: 182-202;
Green 2016, 2017), the disappearance of the circulation and use of these items in the post-
urban period suggests a likely shift away from specialised labour and elite economic
control (Vidale and Miller 2000; Wright 2010; Law 2011). There was a clear shift to
village-based settlements with less complex and less inter-connected economies during this
period, with significant changes to the scale and extent of Indus exchange systems (Wright
2010; Law 2011). There was also a breakdown of civic infrastructure at settlements such as
Harappa, suggesting that authority structures were weakened or being challenged (Kenoyer
2008; Wright 2010). Thus, taken together, these changes reflect a dramatic alteration to the
urban character of the Indus Civilisation, resulting in reduced labour specialisation,
shorter-range cultural and economic links between settlements, and changes to the
prevailing socio-political systems.
‘General’ causes used to explain the demise of the urban phase of the Indus
Civilisation range from shifts in climate to the occurrence of a natural catastrophe, warfare
or cultural crisis (see Raikes 1964, 1968, 1979; Possehl 1977; 1997, 2002; Wright 2010).
As mentioned above, while there is evidence for a sudden weakening of the ISM around
4.2 ka BP/c.2100 BC (Staubwasser et al. 2003; Dixit et al. 2014a), which broadly coincides
with the peak density of occupation at Harappa, and then the onset of the decline of Indus
cities, reliable evidence for a connection between the two processes is lacking. Other
explanations have included the ‘invasion’ or influx of foreign peoples, and disruptions to
maritime trade (Wheeler 1947, 1955; Kenoyer 1998). ‘Local’ causes potentially were
specific to particular settlements or regions and must be assessed individually (Wright
2010: 309). Certain urban settlements were likely abandoned altogether, such as Mohenjo-
daro, Dholavira, and potentially Ganweriwala (Kenoyer 2008). For example, studies
24
suggest that dramatic shifts in the Indus River course placed the city of Mohenjo-daro in a
perilous position (Flam 1993). Occupation at Harappa continued (Dales and Kenoyer 1986;
Kenoyer 2008; Wright 2010), and the number of village-sized settlements in the eastern
regions (i.e. Haryana and Gujarat) increased (Madella and Fuller 2006; Wright 2010:317-
318; Petrie et al. 2017; Green and Petrie 2018). While some have suggested that reduced
seasonal (monsoonal) flooding and divergence of water flows may have caused
unpredictability in water supply of the seasonal Ghaggar-Hakra River in Haryana and
Gujarat (Courty 1995; Staubwasser 2003; Giosan et al. 2012), others have suggested that
more reliable rainfall from a weakened monsoon was available in the region, which may
have spurred increased settlement density (Petrie et al. 2017; Green and Petrie 2018). For
example, there is clear evidence for an increase in sites in the post-urban period around
Rakhigarhi (Singh et al 2010: 42; Green and Petrie 2018), but at present is uncertain to
what extent occupation at Rakhigarhi continued. Thus, although the precise nature of the
‘collapse’, ‘decline’, or ‘transformation’ of urban Indus society is contested, it is
increasingly recognised that Indus de-urbanisation was a gradual and uneven process that
played out differently at different regions and sites (Meadow and Kenoyer 2005; Wright
2010; Petrie 2013; 2017; Petrie et al. 2017).
How did these processes affect the day-to-day lives of Indus populations, and to what
extent can they be characterised and quantified? Changes in systems of pottery production
are identifiable in the post-urban period, but these vary regionally and have limited
chronological resolution as most regions have a small number of radiocarbon dates. For
example, it is traditionally claimed that diagnostic pottery types for the post-urban/Late
Harappan in Cholistan and northwest India were typically related to the Cemetery H
pottery at Harappa (Wright 2010: 310). Ongoing studies suggest that ceramic production
systems in northwest India were far more complex and exhibited variability and degrees of
continuity in the post-urban period (Parikh and Petrie 2017, 2018; Ceccarelli in prep.,
Parikh in prep).
Regarding changes in subsistence strategies in the face of possible food stress in the
post-urban period, there is no clear pattern. For example, Fuller and Madella (2002) have
argued that the presence of low-yielding but arid-adapted millet in the post-urban period at
Harappa indicates the adoption of a strategy to cope with increasing aridification.
However, Weber (2003) has argued that millet was present in Harappa across time in small
amounts and that fluctuations in climate were too gradual to affect agricultural strategy.
There is also evidence for crop diversity in the pre-urban period from rural sites in
25
Haryana, as well as flexibility in crop use (Bates and Petrie 2017). Additionally,
archaeobotanical remains do not reflect substantial changes of cropping patterns in
northwest India (Bates 2016; Petrie et al. 2016; Petrie and Bates 2017), suggesting a broad
continuation of everyday practices but slight shift towards increased summer crops. The
diversity and apparent continuity in the subsistence regime across different sites (Possehl
2002: 16) exemplifies the challenges in reconciling different types of archaeological
evidence and data obtained from climate proxies. Keeping these uncertainties in mind, this
thesis further adds to this question by investigating whether there are measurable
differences in how vessels were used over periods of fluctuations in climate, and if
products processed in vessels in certain settlements varied from the urban to the post-urban
period.
2.3. Indus ceramics, subsistence practices and foodways
2.3.1. Indus ceramics
Pottery from Indus settlements has been the focus of a range of studies, but the production,
use and distribution of the protohistoric ceramic industries of the subcontinent are still far
from completely understood (see Ceccarelli and Petrie 2018; Parikh and Petrie 2017, 2018;
Petrie et al. 2018). Most reports on Indus pottery have categorised it into types and styles
(e.g. Dales and Kenoyer 1986: 62), and this pattern continues today. Although broadly
useful, ceramic classifications are not always clear or reproducible. Additionally, ideas
about the uniformity of ceramics across the Indus region in the urban period, the use of
culture-historical theoretical frameworks, and unsystematic documentation methods further
hinder a wide-scale assessment of the range and variability of Indus ceramic industries (see
Ceccarelli and Petrie 2018; Parikh and Petrie 2017, 2018; Krishnan 2018; Petrie et al.
2018; Ceccarelli in prep; Parikh in prep). Despite this, the possible social meaning ceramic
technologies and distributions have for urban hierarchy, specialisation, organisation and
transmission of knowledge have been examined extensively (e.g. Kenoyer 1989a, 1989b,
1992; Vidale 2000; Vidale and Miller 2000; Miller 1999; 2000; Ratnagar 2015), and a
range of scientific approaches such as geochemical and petrographic analysis have been
used to study Indus pottery and pottery from historical periods in South Asia (Hegde 1962,
1975; Krishnan and Hegde 1988; Krishnan 1992; Méry and Blackman 1996; Gogte 1997;
Krishnan et al. 2005). The following section will focus on ceramics from the urban and
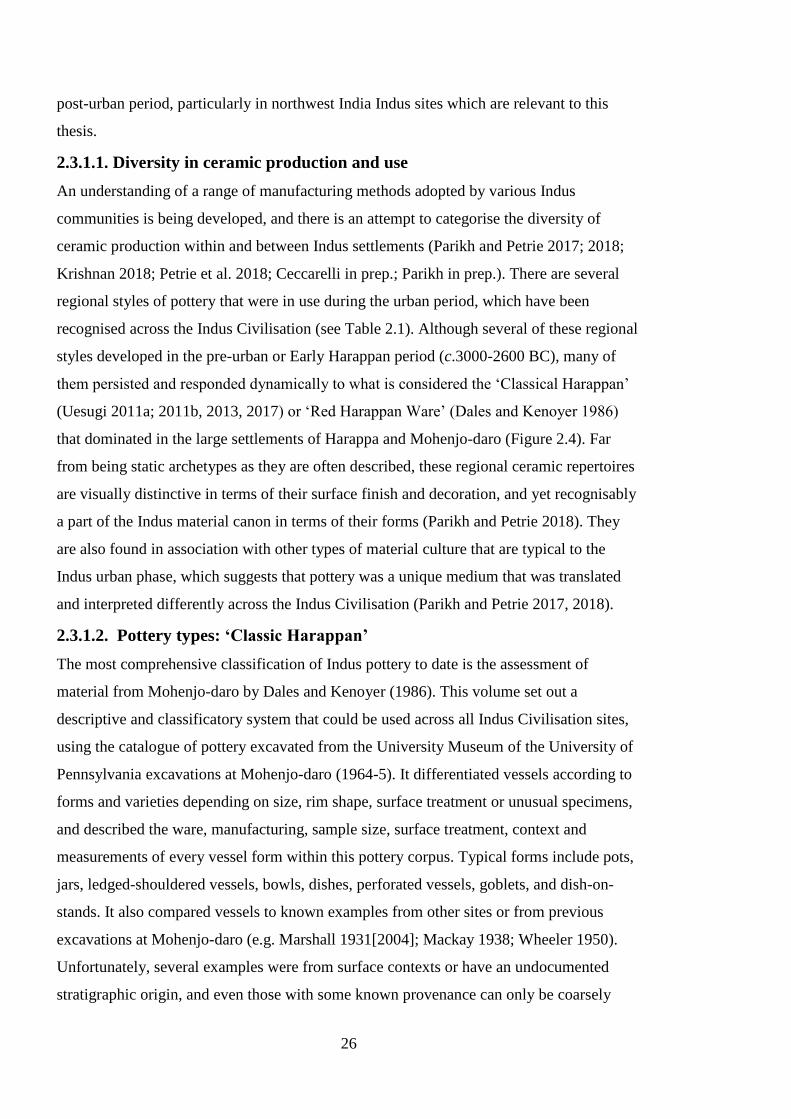
26
post-urban period, particularly in northwest India Indus sites which are relevant to this
thesis.
2.3.1.1. Diversity in ceramic production and use
An understanding of a range of manufacturing methods adopted by various Indus
communities is being developed, and there is an attempt to categorise the diversity of
ceramic production within and between Indus settlements (Parikh and Petrie 2017; 2018;
Krishnan 2018; Petrie et al. 2018; Ceccarelli in prep.; Parikh in prep.). There are several
regional styles of pottery that were in use during the urban period, which have been
recognised across the Indus Civilisation (see Table 2.1). Although several of these regional
styles developed in the pre-urban or Early Harappan period (c.3000-2600 BC), many of
them persisted and responded dynamically to what is considered the ‘Classical Harappan’
(Uesugi 2011a; 2011b, 2013, 2017) or ‘Red Harappan Ware’ (Dales and Kenoyer 1986)
that dominated in the large settlements of Harappa and Mohenjo-daro (Figure 2.4). Far
from being static archetypes as they are often described, these regional ceramic repertoires
are visually distinctive in terms of their surface finish and decoration, and yet recognisably
a part of the Indus material canon in terms of their forms (Parikh and Petrie 2018). They
are also found in association with other types of material culture that are typical to the
Indus urban phase, which suggests that pottery was a unique medium that was translated
and interpreted differently across the Indus Civilisation (Parikh and Petrie 2017, 2018).
2.3.1.2. Pottery types: ‘Classic Harappan’
The most comprehensive classification of Indus pottery to date is the assessment of
material from Mohenjo-daro by Dales and Kenoyer (1986). This volume set out a
descriptive and classificatory system that could be used across all Indus Civilisation sites,
using the catalogue of pottery excavated from the University Museum of the University of
Pennsylvania excavations at Mohenjo-daro (1964-5). It differentiated vessels according to
forms and varieties depending on size, rim shape, surface treatment or unusual specimens,
and described the ware, manufacturing, sample size, surface treatment, context and
measurements of every vessel form within this pottery corpus. Typical forms include pots,
jars, ledged-shouldered vessels, bowls, dishes, perforated vessels, goblets, and dish-on-
stands. It also compared vessels to known examples from other sites or from previous
excavations at Mohenjo-daro (e.g. Marshall 1931[2004]; Mackay 1938; Wheeler 1950).
Unfortunately, several examples were from surface contexts or have an undocumented
stratigraphic origin, and even those with some known provenance can only be coarsely
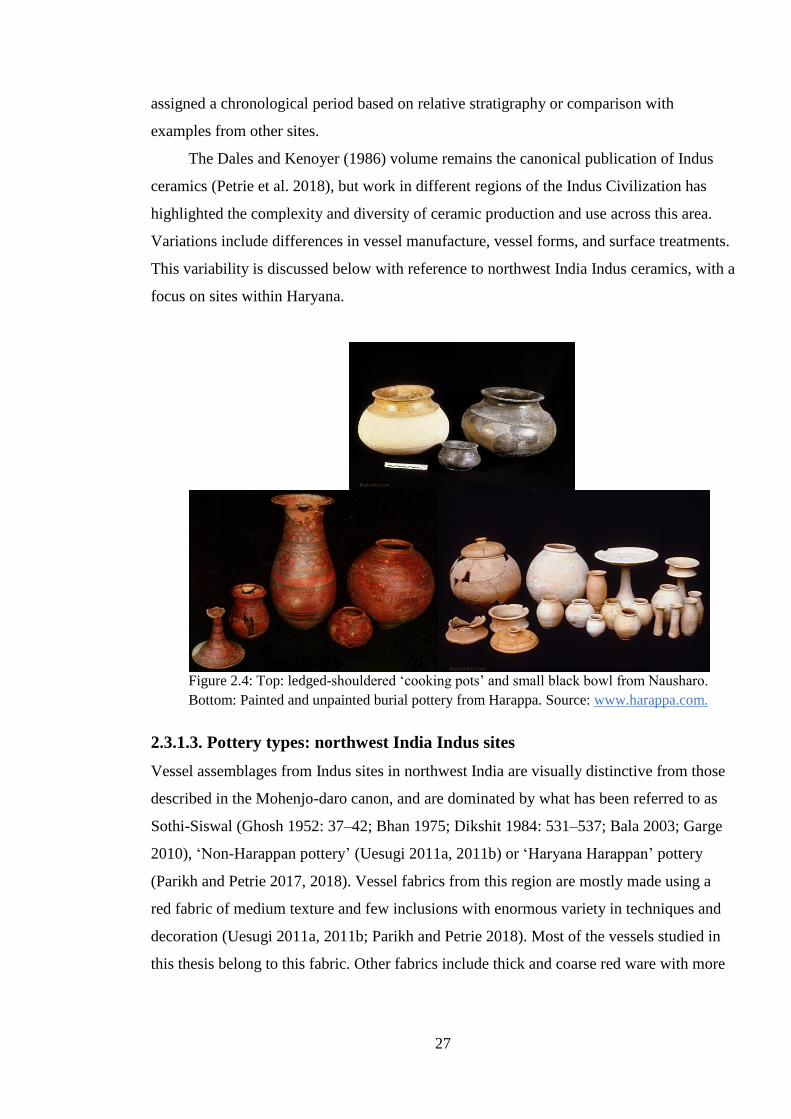
27
assigned a chronological period based on relative stratigraphy or comparison with
examples from other sites.
The Dales and Kenoyer (1986) volume remains the canonical publication of Indus
ceramics (Petrie et al. 2018), but work in different regions of the Indus Civilization has
highlighted the complexity and diversity of ceramic production and use across this area.
Variations include differences in vessel manufacture, vessel forms, and surface treatments.
This variability is discussed below with reference to northwest India Indus ceramics, with a
focus on sites within Haryana.
Figure 2.4: Top: ledged-shouldered ‘cooking pots’ and small black bowl from Nausharo.
Bottom: Painted and unpainted burial pottery from Harappa. Source: www.harappa.com.
2.3.1.3. Pottery types: northwest India Indus sites
Vessel assemblages from Indus sites in northwest India are visually distinctive from those
described in the Mohenjo-daro canon, and are dominated by what has been referred to as
Sothi-Siswal (Ghosh 1952: 37–42; Bhan 1975; Dikshit 1984: 531–537; Bala 2003; Garge
2010), ‘Non-Harappan pottery’ (Uesugi 2011a, 2011b) or ‘Haryana Harappan’ pottery
(Parikh and Petrie 2017, 2018). Vessel fabrics from this region are mostly made using a
red fabric of medium texture and few inclusions with enormous variety in techniques and
decoration (Uesugi 2011a, 2011b; Parikh and Petrie 2018). Most of the vessels studied in
this thesis belong to this fabric. Other fabrics include thick and coarse red ware with more
28
inclusions, and a grey fabric of a fine quality that is unique to the region (Parikh and Petrie
2018).
Techniques used to manufacture vessels in northwest India are distinctive from those
visible in ‘Classic Harappan’ ceramics, which show the predominant use of the fast wheel
to form and/or finish vessels (Parikh and Petrie 2017, 2018). In contrast, ‘Haryana
Harappan’ vessels were formed in different ways: with some evidence of coiling, hand-
building, finishing on a slow wheel, or the absence of the wheel in the manufacturing
process (Parikh and Petrie 2017, 2018; Ceccarelli in prep.; Parikh in prep.). Surface
treatments vary between ‘Classic Harappan’ and ‘Haryana Harappan’ as well, as the
former are often slipped with a dark red glossy slip and decorated with ornate, elaborate
motifs (Dales and Kenoyer 1986; Quivron 2000), while the latter have varying slips
(ranging from light red to dark brown) and are painted with visually distinct geometric or
naturalistic patterns (Parikh and Petrie 2017). This clear variation in approaches to surface
decoration has led to the differentiation of ‘Classic Harappan’ and ‘Haryana Harappan’ or
Sothi-Siswal in excavated assemblages, with the former being familiar at major centres
(e.g. Harappa, Mohenjo-daro, Banawali), and the latter either predominating (e.g.
comprising 80% of the assemblage at Farmana; Uesugi 2011a, 2011b) or completely
dominating the assemblage at rural sites (e.g. Masudpur I, Masudpur VII) (Parikh and
Petrie 2017, 2018; Petrie et al. 2018). This thesis includes both Classic and ‘Haryana
Harappan’ ceramics from settlements where both types are found, for example, at
Rakhigarhi and Farmana.
Despite the unique visual and technical language used to produce ‘Haryana
Harappan’ pottery, there are overlaps with the ‘Classical’ Harappan form canon. Vessel
forms like perforated jars, ‘cooking vessels’, and dish-on-stands are present, even at very
small sites. However, the range of vessel forms is relatively limited, and storage vessels are
typically smaller in size (Parikh, pers. comm.). Additionally, other forms such as basins
with incised decorative motives on the interior, which were first found at Kalibangan
(Thapar 1975; Bala 2003), have also been found at small sites in Haryana (Parikh and
Petrie 2017, 2018; Parikh in prep.), suggesting overlapping ceramic vocabularies across
northwest India (Parikh and Petrie 2018). The pottery in the region suggests a vibrant
ceramic milieu that was driven by potters’ choices and the consumers of pottery within
different settlements (Petrie et al. 2017), hinting at the complexity of village-based craft
industries that were markedly unique from, and yet not unrelated to those in larger
settlements (Parikh and Petrie 2018).
29
2.3.1.4. Vessels and cuisine
Some reports on Indus pottery discuss certain vessels that might have been associated with
specific culinary activities (e.g. Dales and Kenoyer 1986: 110; Wright 1991; Kenoyer
1998; Krishnan 2018). Wright (1991: 83) has suggested that ledge-shouldered jars and
large storage jars at Harappa were likely used to store liquids such as wine and oil. Dish-
on-stand vessels have been linked to the display and offering of food (Dales and Kenoyer
1986). Other examples include cooking vessels or jars, which are classified so either
according to their shape (based on a distinct carination on the shoulder that has also earned
them the descriptor ‘ledged jars’)(Figure 2.4: top), or fabric (Krishnan 2018). Krishnan
(2018: 266) argues that cooking vessels share a similar form across “Gujarat and the core
Indus regions” and have similar non-plastic inclusions within their clay paste, suggesting
there may have been specialised workshops dedicated to their production. Others have
highlighted that the carinated shape of ‘cooking vessels’ in Indus contexts resemble
handis, vessels made from clay and/or steel or copper that are used for cooking in
contemporary contexts in Pakistan and northwest India (Dales and Kenoyer 1986), and
specifically for cooking daal (pulses) in present-day Haryana (Singh, pers. comm.; Pawar,
pers. comm.).
Another vessel form of interest to scholars and relevant to this thesis are perforated
vessels. Perforated vessels come in various shapes and sizes, ranging from tall, straight-
sided jars to miniature globular pots (Dales and Kenoyer 1986: 110), and are documented
at numerous Indus sites. The distinguishing feature of this vessel shape is that almost the
entire body is pierced with holes, and the base often has a large hole through its centre. The
unique form of this vessel has prompted multiple interpretations of its purported uses.
While some have connected them to dairy processing based on their similarities to
ethnoarchaeological dairy-processing vessels in Central Asia and Iran (Gouin 1990;
Bourgeois and Gouin 1995), others have suggested they were braziers for heating (Mackay
1938: 207), colanders for draining or straining liquids, or sieves for preparing cereal pastes
(Dales and Kenoyer 1986: 108-109). This thesis examines different vessel-forms, including
‘cooking jars’ and perforated vessels, to reconstruct their possible function in food
production.
30
2.3.2. Indus agriculture through macro- and micro-botanical analyses
This section summarises present knowledge about Indus agricultural practices and how
they relate to food production. As mentioned above (Section 2.1.3.), Indus populations
occupied an area that straddled an environmental threshold where presently there is an
overlap of summer and winter rainfall systems (Petrie et al. 2017). Until the 1980s it was
assumed that Indus cereal exploitation was dominated by wheat and barley (Fairservis
1967, 1971), but the regional diversity of domesticated plants through the Indus region was
recognised after excavations at sites in Gujarat, particularly at Surkotada, Rojdi and
Rangpur, revealed a sequence of occupation dominated by summer crops and millets;
particularly Eleusine sp., Panicum sumatrense, Setaria cf. pumila and Setaria cf. italica
(Vishnu-Mittre and Savithri 1982; Weber and Vishnu-Mittre 1989; Weber 1991, 1999;
Reddy 2003). Since then, there is increasing recognition of how diverse environmental and
geographical conditions across the Indus Civilisation would have led to variable
agricultural strategies (Possehl 2002; Weber 1999, 2003, Weber et al. 2010). Some
examples of crops grown include winter crops (rabi) such as wheat, barley, oats, pulses
such as peas and chickpeas, plants for fiber and oil like flax and linen, and fruits like
jujube. These thrive best during cooler months, and their growing season would have been
between November/December and April/May (Fuller 2006; Wright 2010). Conversely,
summer cropping (kharif) involved cereal grasses like millets, rice (see Fuller 2006; Bates
2016; Petrie et al. 2016), mustard, grapes, dates, sesame, cotton, hemp, and jute (Wright
2010), and their planting would have taken place in May for an October harvest, with the
monsoon likely providing ample rainfall for their survival (Weber 2003). Many perennial
crops would have likely been grown year-long (Wright 2010; Bates 2019) (see Table 2.3).
Unravelling issues of seasonality and environmental diversity through
archaeobotanical evidence has been challenging due to the unsystematic study of much
archaeobotanical data. This has been regarded as a fundamental challenge for South Asian
archaeology and archaeobotany for some time (e.g. Fairservis 1967; Vishnu-Mittre and
Savithri 1982; Fuller and Madella 2002; Madella and Fuller 2006; Weber et al. 2010;
Petrie and Bates 2017; Petrie et al. 2018). As reviews of the state of Indus archaeobotany
exist elsewhere (Fuller and Madella 2002; Madella and Fuller 2006; Bates 2016; Petrie and
Bates 2017; Petrie et al. 2017; Petrie et al. 2018), only a brief summary and a discussion
about their implications for reconstructing Indus foodways will be provided here. Although
several phytolith studies exist that discuss the use of plant and vegetal material within the
31
Indus context (e.g. Eksambedkar 1999; Fujiwara et al. 1992; Madella 1995, 1997, 2003)
their primary focus is on non-culinary products. This is why they will not be considered in
detail here.
2.3.2.1. Cropping processes and terminology
Indus cropping practices have often been described using terms like ‘mixed-cropping’ or
multi-cropping’ to characterise the growing of multiple crops in one or more seasons (e.g.
Weber 1999, 2003; Wright 2010). However, Petrie and Bates (2017: 83) have critically
addressed how much of what is said about Indus cropping is based on inference and
characterised imprecisely with incorrect usage of terminology. They suggest that use of
data on modern varieties of the most common crops, which have distinctive sowing times,
growing periods, water requirements and harvest times can provide more nuanced
assessment of how multiple crops were being grown at settlements. For example, crops
like barley (Hordeum vulgare) and wheat (Triticum sp.) have different water and
fertilisation requirements and generally are not cropped in close proximity; some crops
have intense labour requirements and are usually mono-crops (e.g. Macrotylma cf.
uniflorum); and a range of millet species (Echinochloa sp., Setaria sp. and Panicum sp.)
share ecological and crop-processing requirements and can be grown as mixed
intercropping crops (Petrie and Bates 2017: 93-94). However, the limited amount of
detailed published archaeobotanical data restricts such an analysis to a handful of sites
(Petrie and Bates 2017: 94); a region-based summary of which is provided below.
2.3.2.2. Regional diversity
Archaeobotanical evidence from Indus sites in Gujarat was previously used to support a
model of winter/rabi cropping in the ‘core’ and summer/kharif cropping in the ‘periphery’,
where the periphery was regarded as unusual and not representative of the situation across
the Indus Civilisation as a whole (Meadow 1989, 1996, Fuller and Madella 2002: 353‐5).
Fuller and Madella (2002: 355) also suggested that ‘core’ areas practised more intensive
agriculture, whereas populations in the summer cropping areas utilised more extensive
systems. However, newer evidence contests this claim (Petrie et al. 2017: 457).
Based on an updated assessment of the data, it has been suggested that single-season
winter mono-cropping was likely practised in Sindh and Baluchistan (Petrie 2017; Petrie
and Bates 2017), although there is very limited archaeobotanical evidence available. In
Gujarat, the lack of winter rainfall and presence of summer crops suggests populations
used a single-season mono-cropping strategy focusing on a variety of summer crops, such
32
as millets and pulses (García-Granero et al. 2016; Petrie and Bates 2017). In Punjab,
however, there is evidence that both winter and summer cropping was practised (Weber
1999; 2003). For example, it was suggested that at Harappa, the predominant cropping
pattern involved the cultivation of winter plants and to a lesser extent, millets, which are
present from the pre-urban period (Weber 1999; 2003). Weber (2003) suggested that the
cultivation of millets and other summer crops intensified during the urban period, though
wheat and barley continued to be dominant crops. Petrie and Bates (2017: 95; also Petrie et
al. 2016) have noted that the evidence for this is ambiguous: although summer crops
increased in ubiquity across samples; their relative abundance does not see much growth
from the pre-urban to post-urban phases. Rather, it appears that there was a marked decline
in the relative abundance of winter crops over time; with an increase in the
‘weeds/unknown/other’ category (Weber 2003; Petrie and Bates 2017: 95). In northwest
India, combinations of winter and summer crops have been attested at several Indus
settlements, including at Banawali, Balu, Kunal and Farmana, in contexts that appear to
date before and/or during the Indus urban phase (Saraswat & Pokharia 2000, 2001, 2002;
Kashyap and Weber 2010; Weber et al. 2011). In the region of central Haryana, evidence
from small rural Indus settlements suggest complex agricultural strategies where wheat and
barley were likely intercropped, and summer crops like rice, millets and tropical pulses
were likely sequentially multi-cropped (Bates 2016; Petrie and Bates 2017). Apart from
suggesting the diversity of agricultural management strategies across regions; these
patterns indicate how food choices in the Indus may have been extremely diverse and
complex (Table 2.3). Different regions likely had different ideas of what were staples
versus ‘special’ cereals, pulses, and vegetables, accompanied with seasonal cycles to plant
foods that were prepared. Similarly, certain plant foods may have had prestige associations
in specific regions (Fuller 2003). Trade and exchange in staple crops between populations
living in different regions may have also occurred (Fuller 2014; Madella 2014). An
understanding of variations in practices will only be possible when the proportional
exploitation of individual plant species in different regions is widely available (Petrie and
Bates 2017).
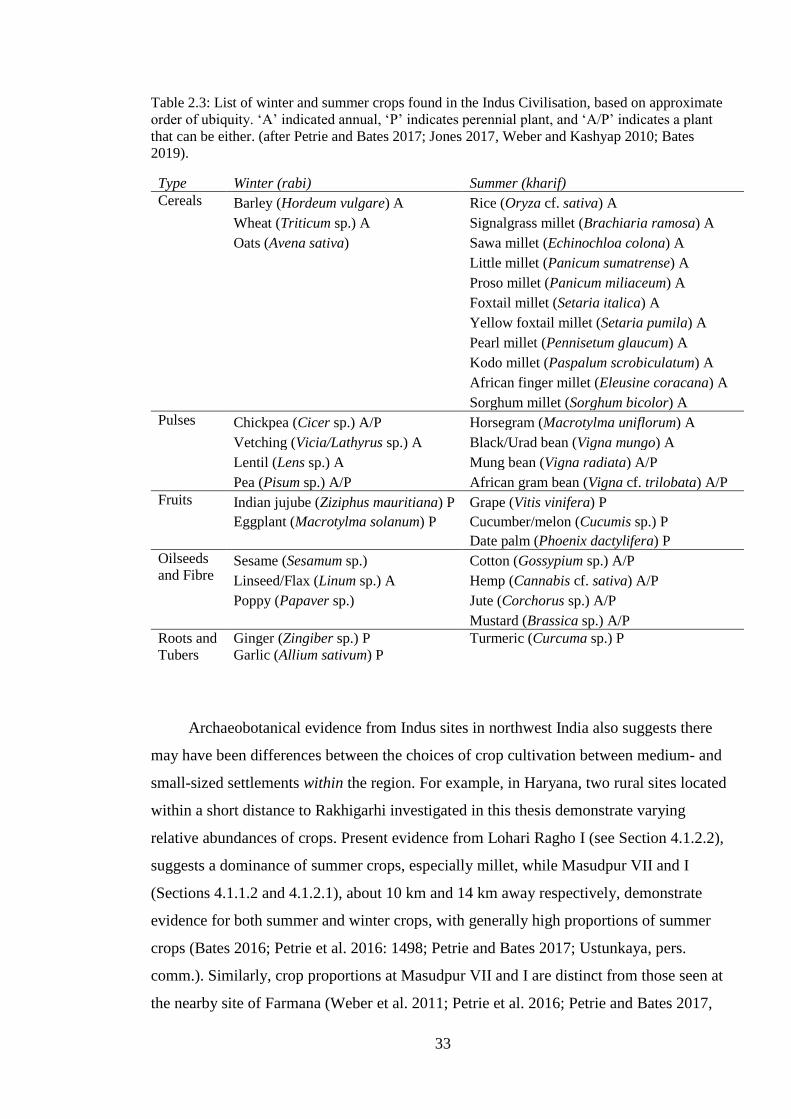
33
Table 2.3: List of winter and summer crops found in the Indus Civilisation, based on approximate
order of ubiquity. ‘A’ indicated annual, ‘P’ indicates perennial plant, and ‘A/P’ indicates a plant
that can be either. (after Petrie and Bates 2017; Jones 2017, Weber and Kashyap 2010; Bates
2019).
Type Winter (rabi) Summer (kharif)
Cereals Barley (Hordeum vulgare) A Rice (Oryza cf. sativa) A
Wheat (Triticum sp.) A Signalgrass millet (Brachiaria ramosa) A
Oats (Avena sativa) Sawa millet (Echinochloa colona) A
Little millet (Panicum sumatrense) A
Proso millet (Panicum miliaceum) A
Foxtail millet (Setaria italica) A
Yellow foxtail millet (Setaria pumila) A
Pearl millet (Pennisetum glaucum) A
Kodo millet (Paspalum scrobiculatum) A
African finger millet (Eleusine coracana) A
Sorghum millet (Sorghum bicolor) A
Pulses Chickpea (Cicer sp.) A/P Horsegram (Macrotylma uniflorum) A
Vetching (Vicia/Lathyrus sp.) A Black/Urad bean (Vigna mungo) A
Lentil (Lens sp.) A Mung bean (Vigna radiata) A/P
Pea (Pisum sp.) A/P African gram bean (Vigna cf. trilobata) A/P
Fruits Indian jujube (Ziziphus mauritiana) P Grape (Vitis vinifera) P
Eggplant (Macrotylma solanum) P Cucumber/melon (Cucumis sp.) P
Date palm (Phoenix dactylifera) P
Oilseeds
and Fibre Sesame (Sesamum sp.) Cotton (Gossypium sp.) A/P
Linseed/Flax (Linum sp.) A Hemp (Cannabis cf. sativa) A/P
Poppy (Papaver sp.) Jute (Corchorus sp.) A/P
Mustard (Brassica sp.) A/P
Roots and
Tubers
Ginger (Zingiber sp.) P
Garlic (Allium sativum) P
Turmeric (Curcuma sp.) P
Archaeobotanical evidence from Indus sites in northwest India also suggests there
may have been differences between the choices of crop cultivation between medium- and
small-sized settlements within the region. For example, in Haryana, two rural sites located
within a short distance to Rakhigarhi investigated in this thesis demonstrate varying
relative abundances of crops. Present evidence from Lohari Ragho I (see Section 4.1.2.2),
suggests a dominance of summer crops, especially millet, while Masudpur VII and I
(Sections 4.1.1.2 and 4.1.2.1), about 10 km and 14 km away respectively, demonstrate
evidence for both summer and winter crops, with generally high proportions of summer
crops (Bates 2016; Petrie et al. 2016: 1498; Petrie and Bates 2017; Ustunkaya, pers.
comm.). Similarly, crop proportions at Masudpur VII and I are distinct from those seen at
the nearby site of Farmana (Weber et al. 2011; Petrie et al. 2016; Petrie and Bates 2017,
34
Section 4.1.3.1). These differences could be attributed to taphonomical factors; however,
they may also hint at unique crop and food choices made by farmers in rural settlements
(Petrie et al. 2016; Petrie and Bates 2017). This thesis will further explore the potential of
variations in food choices and vessel usage between these rural sites.
2.3.2.3. Cropping practices, urbanism and deurbanisation
Discussions about the relationships between agricultural systems, urbanism, and changing
climate are at the heart of Indus archaeology (Possehl 1982; Kenoyer 1998; Weber 1999;
Fuller and Madella 2002; Madella and Fuller 2006; Wright 2010). For example, it has been
argued that the transition to the urban phase of the Indus Civilisation was characterised by
intensification, diversification and specialisation in agricultural, pastoralism, and foraging
systems, especially at Harappa (Wright 2010: 145). Similarly, Weber (2003: 198) has
argued that the continued effort at Harappa to diversify crops was interconnected with
changing needs within its society to issues dealing with storage, trade, and the
centralisation and control of the food supply (Wright 2010: 177). It is assumed these
processes enabled the surplus to provision individuals engaging in non-agrarian, craft-
producing activities (Wright 2010: 145).
Evidence for increasing crop diversity at Harappa, and evidence for the
implementation of plough agriculture and draft animals have been used to suggest that
large tracts of lands were farmed (Weber 2003; Miller 2003, 2004). Weber (2003:181)
suggests there is an increase in the density and proportions of by-products associated with
crop-processing at Harappa over its occupation. This evidence was used to suggest that
crops was processed after harvesting and before storage at a location that was not an
individual household, (Wright 2010: 205), indicating a communal or even centralised
organisation of production (Wright 2010: 205 citing Fuller and Madella 2000; Weber
2003). Other examples of the cropping of perennial fruits, dates and grapes; and fibers such
as jute and cotton harvesting and seed collecting for planting have been used to suggest the
existence of complex productive systems in the urban phase (Wright 2010: 206).
Unfortunately, there is not enough data to support any of these models; which have been
premised on evidence from Harappa.
It is also possible that there were extensive food supply networks across the Indus
Civilisation in the urban period. Kenoyer (2008) suggested that food supply to cities was
derived from hinterlands, and Madella (2014) proposed that Cholistan may have exported
cereal to different regions. Apart from possible luxury items like beads, everyday items
35
used in culinary activities like grinding-stones made from non-local stone have been found
across the Indus Civilisation (Law 2011), suggesting that bulky, quotidian items moved
across large distances.
The transition into the post-urban phase has also been characterised as being marked
by a progressive diversification of agriculture, with the introduction of new crops such as
millet and increased summer cropping, specifically at Harappa (Weber 2003; Madella and
Fuller 2006). But given the evidence of the diversity of winter and summer crops in pre-
urban contexts from northwest India (Bates 2016; Petrie et al. 2016; Petrie and Bates
2017), more nuanced approaches to characterising the shift to the post-urban phase in
different parts of the Indus Civilisation are required. Petrie and colleagues suggest that in
regions where only single-season cropping was possible, it is probable that some form of
organised and potentially centralised storage would have been required to feed large urban
populations throughout the year (Petrie et al. 2016: 1501). However, in regions where
multiple crops were grown in different seasons, there may have been differential storage
requirements due to the regular supply of crops and possibly reduced need of centralisation
(Petrie and Bates 2017). This would have also likely affected how different populations
managed and mitigated food stress in the face of changing environmental conditions in the
post-urban phase (Petrie 2017; Petrie and Bates 2017). Similarly, if long- and short-
distance food supply networks existed; these would have been variably affected by changes
in the environment and/or social systems in place. Keeping this in mind, this thesis
investigates the use of foodstuffs in vessels across settlements in the urban period, as well
as possible changes in vessel-usage patterns in the post-urban period at certain settlements.
Although concepts such as intensification and diversification are difficult to assess via
residues in pottery, results may be indicative of the diversity or uniformity of products
processed in vessels within or across sites. The next section addresses Indus
zooarchaeology, providing important background for the interpretation of results in this
thesis.
2.3.3. Indus zooarchaeology
2.3.3.1. State of research
The diversity of faunal species exploited by Indus populations is well-attested through
numerous zooarchaeological studies conducted in different regions. A number of reviews
have highlighted the exploitation of both domestic and wild mammals, as well as non-
mammalian resources (Thomas and Joglekar 1994, Meadow and Patel 2002, 2003;
36
Joglekar et al. 2013). Despite the increase in the number of zooarchaeological studies since
the 1950’s (Meadow and Patel 2002), there are still many gaps in our knowledge of
human-animal interactions in different sites and regions of the Indus Civilisation. Problems
include lack of systematic sampling, gaps in reporting of sample sizes, the absence of
detailed contextual or stratigraphic recording or association (and as a result, poor
chronological resolution), as well as the absence of standard zooarchaeological protocols
for reporting faunal remains (Joglekar et al. 2013). Problems of identification are acute in
South Asia because of the presence in archaeological sites of skeletal parts that are
morphologically quite similar between taxa. The most common difficulties of
identification relate to distinguishing the bones of different ruminants, for example,
differentiating Ovis (sheep) from Capra (goat) from Gazella (chinkara) from Antilope
(blackbuck) as well as large ruminants such as Bos (cattle) from Bubalus (water buffalo)
from Boselaphus (nilgai).
Additionally, the resolution of data collected is not nuanced enough to make
interpretations about the social meaning of animals. Across the Indus, Gujarat is perhaps
the region with the most detailed site-based zooarchaeological studies, with work on the
reconstruction of mortality profiles and systematic analyses of butchering practices (Chase
2010, 2012, 2014; Chase et al. 2014a, 2018). In Pakistani Punjab, Harappa has had the
most intensive examination of animal bones (Belcher 1991; Meadow 1991; Miller 2003,
2004). Few sites in Sindh and Baluchistan have had limited systematic investigation of
faunal material, except for Mehrgarh and Nausharo (Meadow 1989, 1991; Belcher 1991;
Chase 2005, 2012). In Haryana, excavators have begun to conduct basic zooarchaeological
analyses on faunal assemblages (e.g. Joglekar et al. 2013, 2017), but many of the reports
are unpublished and interpretations that can be made are limited to a general level
(Joglekar et al. 2013).
While discussions about the diversity and variability of agricultural practices across
the Indus region have increased in scholarship in recent years, our understanding of
cultural and regional variations in patterns of animal exploitation have been extremely
limited. Crucially, as it stands, reports suggest a uniformity in the use and cultural
preference for certain animals, for example, the importance of cattle across the Indus
Civilisation (Possehl, 1979; Thomas 1989, 2002; Thomas and Joglekar 1994; Meadow and
Patel 2003). This pattern has been highlighted by several scholars (e.g. Fairservis 1986;
Thomas and Joglekar 1994; Meadow and Patel 2003); but has not been critically assessed
37
in terms of Indus commensality and the social context of the role of animals in Indus
societies.
On average about 80% of the faunal assemblage from various Indus sites belong to
domestic animal species (Thomas and Joglekar 1994; Thomas 2002; Joglekar et al. 2013),
which include cattle/buffalo, sheep/goat, and pig. Out of the domestic animals, cattle (and
possibly buffalo) are the most abundant type of animal discovered in faunal assemblages
across the Indus Civilisation, averaging between 50 to 60% of the animal bones found
across Indus sites (Thomas 2002; Miller 2004; Joglekar et al. 2013; Chase 2014) As it can
be difficult to securely distinguish between cows and buffalo, differences in proportions of
Bos and Bubalus at sites cannot always be determined. Meadow (1991) has claimed that
the ratio of cattle to buffalo at Harappa is 34:1; indicating that buffalo made a very small
contribution to Harappa’s economy and diet and may have not been fully domesticated. In
contrast, water buffalo appear to be present in large proportions at Dholavira (Patel 1997).
Despite the arid environment of Kadir Island, it is possible their survival was assured by
their immersion in the large reservoirs around the site (Bisht 1991, 2005; Patel 1997).
Meanwhile, on average, sheep/goat remains account for about 10% of the total faunal
assemblage across Indus sites located in alluvial plains (Thomas and Joglekar 1994;
Meadow and Patel 2003). Wright (2010: 173) has noted that goats were more likely to be
found in arid and semi-arid environments, such as at Nausharo and regions in Gujarat,
whereas in better-watered areas, such as Pakistani Punjab, sheep probably outnumbered
goats, as seen for example, at Harappa (Meadow 1991). Pigs make up about 2-3% of total
faunal assemblages across Indus sites (Thomas 2002). Thomas (2002), and Chase (2014)
have noted that the domestic status of the pig in Indus stock-raising is yet to be ascertained.
Faunal assemblages from rural village sites that have been studied appear to be broadly
similar to those from urban centres with respect to species ratios (Chase 2014; Joglekar et
al. 2014, Joglekar et al. 2017).
The overwhelming proportions of cattle bones across Indus sites indicates a cultural
preference/predilection for beef-consumption across Indus populations, supplemented by
the consumption of mutton and lamb. It is possible that meat consumption was
complemented with the widespread existence of dairy economies. Wild animal species like
deer, antelope, gazelle, hares, birds, and possibly wild pigs are also found in small
proportions in the faunal assemblages of both rural and urban Indus sites, suggesting a
taste for game. Riverine resources such as reptiles, fish and molluscs also featured at
Harappa, Alladino, Balakot and Nausharo (Belcher 1991, 1994, 2003), as did marine
38
resources on coastal sites such as Balakot and sites in Gujarat (Belcher 1991; Deshpande-
Mukherjee 1996, 1998), suggesting that these diverse resources had a place in the Indus
diet. The presence of a marine catfish species (family Ariidae) at Harappa (Belcher 1991)
indicates that some fish may have reached this inland site in dried form through long
distance exchange networks running between Harappa and sites located near coastal
environments.
2.3.3.2. Approaches to Indus faunal analysis
To gain insight into the relationship between humans and animals beyond species
identifications, zooarchaeologists use species ratios, animal mortality and sex profiles, and
studies of butchery practices (e.g. Payne 1973; Grant 1982; Reitz and Wing 1999;
O’Connor 2000; Sykes 2014). Some or a combination of these methods have been used
successfully at Indus sites, but poor preservation conditions have introduced problems that
limit the extent of detailed analyses. For example, many bones from Indus sites are
mineralised, have salt and phosphate inclusions, or are encrusted with calcite and organic
materials (e.g. Chase et al. 2014a; Joglekar et al. 2017). The taphonomic alternation of
bones makes it difficult to conduct detailed studies of cutmarks or butchery practices,
which would help reconstruct the chaîne opératoire of how cuts of meat were produced
(e.g. Chase 2005, 2012). It may also obscure the pathology of animal bones that may be
informative about the use of animals for traction or dairying in their lifetimes (Miller
2004). Taphonomy aside, the scarcity of ageable and sexable faunal specimens within an
assemblage, or small assemblages make slaughter profiles difficult to construct, which in
turn make inferences about the extent of meat-production or secondary-product
exploitation challenging. These problems persist within the Indus context, (see Joglekar et
al. 2013, 2017; Chase 2010, 2012, 2014).
Some studies have recorded site-specific spatial variations in animal patterning, for
example, at Harappa (Meadow 1991; Miller 2004), Dholavira (Patel 1997), and Farmana
(Channarayapatna 2014, 2018), as well as smaller sites such as Mehrgarh (Meadow 1989),
Balakot (Meadow 1988), Shikarpur (Chase 2014), Bagasara, Jaidak, and Kotada Badli
(Chase 2010, 2012; Chase et al. 2014a, 2014b, 2018; Chakraborty et al. 2018). Changes in
species ratios over time have been noted at large and small sites such as Harappa,
Dholavira and Nausharo, suggesting the increasing and/or decreasing importance of
particular animal species, which are possibly correlated with the demands of increasing
urbanism. For example, research on animal bones from Harappa indicates that cattle
39
became more important in the economy over time. Miller’s (2004) research on the
assessment of the extent of secondary products economy at Harappa suggested more
intensive cattle husbandry strategies and secondary products exploitation in the urban
period with a notable decrease in the post-urban period, and a higher proportion of medium
or small animals being observed in later contexts (Meadow 1991: 103; Miller 2003, 2004).
She suggested this pattern may be consistent with a decline in specialist pastoral producers,
and a return to generalised household pastoral production systems. Alternatively, it could
also be interpreted as the potential decrease in secondary products exploitation over time,
perhaps as a strategy to cope with stress on resources in the post-urban period. Among the
small ruminants, sheep are more numerous than goat at Harappa; suggesting further
emphasis on dairying, and perhaps, on fiber products (Meadow 1991, Meadow and
Kenoyer 1997). At both Nausharo and Dholavira, however, sheep and goat are found in
relatively equal proportions, although there are slightly more sheep present (Meadow 1989;
Patel 1997). The differences in kill-off patterns suggests that sheep may have been bred
principally for wool (Wright 2010).
As faunal analyses at Indus urban sites have mostly dealt with secondary or trash
deposits of bone (e.g. Meadow 1991; Miller 2004), making inferences about within-site
variation in the access or consumption of different animals is challenging as there may be
no correlation between the distribution, consumption and disposal patterns that eventually
led to the creation of the archaeological assemblage (Meadow 1991; Miller 2004). For
example, the presence of elements of cattle on all of Harappa’s mounds suggests that
residents in all mounds (or neighbourhoods) had access to animals that might be used for
traction and as a meat source (Miller 2003). Similar patterns of large bovid bones in street
deposits have been found in Dholavira (Patel 1997). In Haryana, Girawad had wild
mammal remains concentrated in the central part of the site in the Early Harappan period,
but at Farmana, an assessment of the different anatomical parts of different animals,
including wild species, revealed that a system of distribution or sharing of high meat-
bearing parts may have been in place, as not all the complexes had all the parts across all
time periods (Channarayapatna 2014, 2018). These patterns may be indicative of
distributive systems or preferences of particular social groups within the settlement.
2.3.3.3. Slaughter and age profiles: meat and secondary-products utilisation
The construction of age and slaughter profiles is an important feature of zooarchaeological
studies as it reveals patterns that help reconstruct the strategies used for the creation and
40
management of animal products (meat, milk, or traction). These activities also reflect
ontological changes in the relationship between humans and animals (Sykes 2014). The
precise origins and extent of secondary products exploitation in ancient South Asia are not
well understood. Several scholars have commented on the importance of large bovids like
Bos indicus and Bubalus Bubalus for dairy products and draft/traction, insisting on the
overwhelming importance of cattle pastoralism for Indus society (e.g. Fairservis 1986;
Possehl 1979; Meadow and Patel 2002; Miller 2004). Dairy production provides milk,
butter, ghee, cheese, and yoghurt, which are all items that are high in nutritional value, but
also storable and replenishable (Miller 2004: 46; Greenfield 2010). Similarly, the use of
traction animals for agricultural purposes and the transport of agricultural products, craft
items, and building materials (e.g. wood, clay) would have been vital for the provisioning
of urban and rural populations (Miller 2004). The evidence of miniature terracotta bullock
cart frames from Indus sites throughout the region, as well as yokes from Indus phase
levels at Nausharo, and ploughs from Banawali, suggest that bovines were harnessed for
draft (Meadow and Patel 2002).
Despite being limited in number, slaughter profiles for Indus settlements reveal a
general trend of the presence of older adults (for bovine and caprine/ovine species)
(Joglekar et al. 2013; Chase 2010, 2012, 2014). The present state of knowledge regarding
species distinctions among the large stock and breed variation within these preclude the
morphometric analyses required to distinguish cow, bulls, and castrates among cattle and
buffalo (Chase et al. 2014a: 9). Miller (2004) incorporated ethnoarchaeological studies in
present-day Pakistan, and artefactual and zooarchaeological analyses of cattle remains to
specifically address the extent of secondary product exploitation of cattle at Harappa. She
found that out of the bovine animals studied, 90% were kept alive until the age of 3-3.5
years, which indicates that females were used for dairying production, whereas males were
used for traction (Miller 2004). Importantly, there were higher proportions of older adults
in the urban period (42% pre-urban vs. 56% urban), which she suggested indicates the
increasing importance of secondary products in the urban period and the use of animals for
longer productive lifetimes (Miller 2004). Based on this, she suggested that dairying and
traction activities were vital for the agro-pastoral economy at Harappa, with an
intensification of secondary product exploitation and specialisation in pastoral production
systems during the urban phase (Miller 2004).
Age and slaughter profiles at Bagasara, Shikarpur, Jaidak and Kotada Badli in
Gujarat indicate that cattle were probably exploited for secondary products (milk and
41
traction), but sheep/goat were likely primarily raised for meat (Chase 2014; Chase et al.
2014a, 2018; Chakraborty et al. 2018). For example, at Shikarpur during the urban period,
fewer adult sheep/goat were kept in a herd (enough to maintain the long-term viability of
the herd), but more than half the cattle were kept to adulthood age prior to consumption
(Chase et al. 2014a). These patterns are consistent with subsistence-oriented production
and secondary product exploitation (milk and traction), respectively (Chase et al. 2014a).
Both Miller (2004), Chase (2014) and Chase and colleagues (2014a) have noted that most
zooarchaeological studies use the presence of high numbers of young animals (nursing
calves) as evidence of dairying production (e.g. Payne 1973) as most milk is available for
human consumption if male lambs, kids or calves are slaughtered soon after birth.
Additionally, the presence of adult males has also been interpreted as a strategy for the
maximisation of meat products. This interpretative approach has also been widely
criticised (Halstead 1998; Greenfield 2010), however, and may only be relevant in the case
of a focus on a single-product economy. Given the absence of the slaughtered calves at
Harappa and some sites in Gujarat, and a predominance of adult animals, it is likely that
most Indus settlements adopted complex mixed product-economies, possibly ones that
emphasised secondary-product use. Similar evidence exists at Dholavira (Patel 1997),
which has a predominance of adult bovids. However, Patel (1997) has also noted the
presence of higher proportions of young animals slaughtered in the 2.5 to 3.5-year age-
ranges, hinting at a different production economy at Dholavira. She has also observed
differences in cattle size distributions, suggesting the presence of different and smaller
cattle breeds at the site, as well as a high number of water buffalo bones (Patel 1997).
Taken altogether, age, size, and species patterns suggest a regional diversity in subsistence
strategies, particularly between Harappa and Dholavira in the urban period, but less clear
differences between Harappa and smaller settlements in Gujarat such as Shikarpur,
Bagasara, Jaidak and Kotada Badli (Chase 2014; Chase et al. 2014a, 2018, Chakraborty et
al. 2018).
Another example of clear regional variation in cattle slaughter patterns is evident at
the site of Balakot (Meadow 1979). The slaughter profiles of cattle in the urban period
were recorded as 90% juvenile, with high proportion of sub-adults versus adult cattle
(Meadow 1979). The high proportion of young cattle visibly contrast with patterns
observed at the sites mentioned above. This pattern was interpreted as a strategy employed
for optimising meat production (Meadow 1979). When compared to patterns observable
from the pre-urban period, however, an increase in the slaughter of adults was observed,
42
possibly suggesting a gradual increase in the importance of secondary products
exploitation from the pre-urban to urban period (Meadow 1979). Miller (2004) suggested
that this shift may have occurred at a regional or multi-regional level, a shift towards
intensive secondary products exploitation representing larger subsistence and economic
trends for the civilisation as a whole. Such a claim would need much more evidence from
many other Indus settlements.
In northwest India, Joglekar and colleagues (2013) reviewed evidence from fourteen
sites within Haryana, Punjab, and Uttar Pradesh to make preliminary observations about
the faunal diversity during the Indus period in the region. It is challenging to meaningfully
compare this with faunal data obtained from other regions as the published data provides
limited resolution, and slaughter profiles have not been created. Some site-specific
variations, however, have been observed. They noted that Indus communities in northwest
India consumed a wide range of animals, including domestic and wild mammals, birds,
reptiles, riverine fish, and molluscs (Joglekar et al. 2013). Proportions of domestic animals
outnumber wild species; and cattle make up the largest proportion of domestic species
across sites (Joglekar et al. 2013). Out of the medium-sized domestic mammals, goats
outnumber sheep across sites (Joglekar et al. 2013), except at Girawad, where more sheep
appear to have been reared than goats, and at Farmana, where they have equal
representation prior to and during the urban phase (Channarayapatna 2014, 2018). Pigs are
found at ten out of fourteen sites (Joglekar et al. 2013). Cattle size measurements suggest
that small numbers of bulls versus a dominance of castrated bulls or females were present
in the assemblages studied, a herding strategy likely adopted to practice dairying (Joglekar
et al. 2013). This thesis will test whether vessels were used to process dairy products in
northwest India and will critically assess the evidence provided for widespread dairy
production in the Indus.
2.3.3.4. Evidence for carcass processing
Butchery practices have only been systematically studied from a few sites in the Indus
Civilisation. Chase (2005:51) noted that butchery practices reflect cultural preferences and
technological choices, and the specific way in which an animal was prepared for
consumption encapsulates important economic and social information. These practices also
inform us about food preparation, which is the primary focus in this thesis. Cut-marks and
charring have been observed on meat and marrow-rich bones of domestic and wild animals
across the Indus Civilisation (Meadow 1979; Belcher 2003; Joglekar et al. 2013;
43
Channarayapatna 2014, 2018). In Gujarat, faunal assemblages at Bagasra suggested that
relatively more cut-marked pieces of bone were found within the walled precinct of the
settlement, indicating that residents within the enclosure prepared meat-based dishes
differently from those outside the walls, perhaps signifying a social or cultural variance,
while at Shikarpur, bones from all portions of the skeleton of animals are present in all
areas of the site (Chase 2012, 2014). However, at Bagasra, initial stages of the butchery
process were the same for all animals that were eventually consumed as food, and the
butchering process was done solely with the use of metal tools (Chase 2012). Chase (2014)
suggested that this pattern would arise if both communities were raising and butchering
their own animals, or if they were receiving meat from an external, common meat market.
At Indus sites in northwest India that are being investigated for this thesis, cut-marks
appear to have been made with a sharp metal blade, just like at Bagasra (Channaryapatna
2014; cf. Chase 2012). Additionally, completely charred and vitrified bones were dominant
among the bone modifications observed at Farmana and Masudpur I and Masudpur VII
(Channarayapatna 2014; Joglekar et al. 2013, 2016, 2017). At Farmana, it was also noted
that nearly all anatomical elements of cattle/buffalo had charring marks, whereas only the
cranial fragments, ribs, scapula, vertebrae, and phalanges of sheep/goat were charred to
different degrees (Channarayapatna 2014, 2018). These differences hint at different
butchery practices for different animals and may indicate preferences for the roasting of
meat. Using a different approach, Goyal (2017) suggested that at Kanmer, preparation via
roasting was more common in wild animals, particularly deer, than in domestic animals.
2.3.3.5. Animal-human relationships and ‘continuum of lifestyles’
Sykes (2014) has argued that methods and approaches in zooarchaeology often make it
difficult to conduct ‘social zooarchaeology’, which is an understanding of how human-
animal relations transform both parties, with the two becoming mutually socialised through
their exchanges (see also Mullin 1999; Mlekuz 2007; Brittain and Overton 2013). For
example, the determination of kill-off patterns and age profiles focus on the productive and
alimentary rather than the social significance of animals (Sykes 2014). The emphasis on
the death of animals rather than their life-histories also diminishes the relationship that
existed between people and the living animals around them (Sykes 2014). Other issues
result from quantitative methods such as NISP, MNI, or MNE, which have come under
tremendous scrutiny for what they calculate, but they have not been interrogated for what
they might mean or represent socially (Sykes 2014: 9). It is also well-recognised that
44
different parts of an animal carcass will be deemed variously as ‘good’ or ‘poor’ depending
on cultural attitudes (Crabtree 1991). Additionally, these distinctions may not just be in
terms of high or low value foodstuffs; they likely represent ontologies that are
representative of power relations and extend into ritual and/or political lives (Davis 2008;
Choyke 2010).
Direct correlations between the number of bones found in a faunal assemblage and
the importance of animal are also found in Indus archaeology (e.g. Meadow and Patel
2003; Joglekar et al. 2013). The frequency of cattle bones is high in Indus faunal
assemblages, leading to the assumption that cattle/buffalo were the most important
animal(s). However, high levels of archaeological representation need not equate to an
animal’s social importance, and there may also be taphonomic variables contributing to
biases in the archaeological record. The presence of adult cattle in a majority of faunal
assemblages at Indus sites (see above) does suggest that bonds would have developed
between people and their cattle. Ethnographical parallels exist with modern pastoral
communities; the Suri herders of Northeast Africa see cattle as extensions of human
society (Abbink 2003: 342), while the Skaha of northeastern Sibera see cows as central to
society (Crate 2008), even though they do eventually consume them.
Some scholars have discussed how the relationship between people and their animals
framed the lives of various Indus societies. For example, Wright (2010: 173-174) has
discussed how a ‘continuum of lifestyles’ marked by degrees of mobility would have
accommodated the keeping of animals in the Indus context, including nomadic pastoralists,
semisedentary pastoralists, and sedentary pastoralists. A full range of animal specialisation
types was likely present in the Indus Civilisation (Wright 2010). Wright (2010) has
suggested that sedentary pastoralism is reflected by the large numbers of animal bones and
cart tracks found in street deposits at Harappa, and water storage tanks in Dholavira. She
claims that the current evidence indicates that animals were kept by urban inhabitants to
supply dairy products, such a milk or yoghurt (Wright 2010), but more evidence is needed
to support this. Settled pastoralists on the alluvial plains most likely took advantage of its
varied landscape, seeking out well-watered areas for water buffalo. Sheep and goats could
graze on marginal lands on the outskirts of agricultural lands and on stubble from
harvested fields. The evidence from Bagasra shows that all the animals were pastured in
the region with no seasonal migration; however, unlike sheep/goat, which were raised from
birth locally at Bagasra, many of the cattle/buffalo were acquired at a young age from
different locations, but probably from within the same region (Chase et al. 2014a, 2018).
45
Semisedentary pastoralism was possibly practised at settlements such as Nausharo where
pastoralists moved seasonally between upland and lowland settlements to avoid harsh
winters and hot summers when grazing areas were reduced (Wright 2010), and at Oriyo
Timbo in Gujarat, which was seasonally occupied (Rissman 1985; Reddy 1994; Wright
2010). Examples of nomadic pastoralism in the pre-urban (Hakra) period are suggested by
the presence of surface scatters of small camp sites discovered by Mughal (1997) in
Cholistan. It is possible that nomadic pastoralists lived beyond the limit of agricultural
zones returned to the same location on a seasonal basis (Wright 2010). Elsewhere, it has
been suggested that hunting and gathering populations possibly engaged in symbiotic
relationships with village and town dwellers (Possehl 2002; Wright 2010), but there is
limited evidence to support any of these ideas. Overall, evidence from Indus faunal
assemblages has led scholars to focus on questions of the extent of urban pastoralism
and/or mobile pastoralism practised across settlements, and the relationship between urban
dwellers and hunter-gatherer groups across time. As the history of the development of
pastoral systems in South Asia remains sketchy (Meadow and Patel 2003: 84),
archaeologists often rely on ethnographic and historical record to make interpretations
about the past (Guha 1994). It is likely that the mix of environments and specialisation of
husbandry could have provided rich resource viability and exchange of products that was
mutually beneficial. No pastoral system exists, or is likely to have existed for very long,
without agricultural products being available through one means or another (Meadow and
Patel 2003: 75). Nomadic pastoralists may have facilitated the movement of trade goods
and their own products through their mobility. However, it is possible that these
relationships were complex and required negotiation, especially during periods of food
stress or crisis.
The different species of wild plants, animals and forest products in archaeological
assemblages across the Indus Civilisation suggests that these resources were exchanged
between hunters and gatherer groups, nomadic populations, and/or permanently-settled
people (Wright 2010: 175). Although, it is also possible that rural and urban inhabitants
hunted and consumed wild animals. The consistent presence of the bones of wild species
of animals and fish at both large and small Indus sites, attests to the continued utilisation of
wild animal resources by inhabitants. The possible complex systems of animal production
and distribution are not easy to untangle with present evidence as they may have involved
networks of multiple ‘animal specialists’: urban, rural, and nomadic, or may not have
involved ‘specialists’ at all. As these has implications for how food sources were produced,
46
accessed, and valued across different Indus societies, these considerations are vital to how
Indus foodways are imagined.
2.3.4. Indus isotopic studies
The use of isotopes of C, N, O and Sr from human and/or animal bone and teeth give an
indication of diet and mobility (see Richards and Hedges 1999; Balasse et al. 2002;
Schulting and Richards 2002; Evans et al. 2006; Hedges and Raynard 2007; Pollard et al.
2007). Carbon isotope values (δ13C) are used to estimate dietary proportions of C3 versus
C4 terrestrial plants (see Section 3.5.2) eaten and to assess marine versus terrestrial
inputs (DeNiro and Epstein 1978; Heaton 1999; Balasse et al. 2002; Kohn 2010). Nitrogen
isotope values (δ15N) are commonly used to determine trophic level (DeNiro and Epstein
1981; Hedges and Raynard 2007). Oxygen isotope values (δ18O) reflect the isotope values
of the water ingested (as water or from food) at the time of tissue formation, providing a
palaeoclimatic indicator (Bryant et al. 1996; Evans et al. 2006; Lightfoot and O’Connell
2016). Finally, the strontium isotope signature (87Sr/86Sr) of an individual or animal can be
compared to a biologically available signature determined by the surrounding biosphere to
determine mobility of humans and animals (Lee-Thorp and Sponheimer 2003; Price et al.
2008).
In the South Asian context, and especially in the Indus Civilisation, only a small
number of studies using isotopes have been conducted. Poor preservation of bone collagen
has meant that researchers can typically only analyse carbonate from bioapatite available
from human or animal teeth, which limits our understanding of diet.
2.3.4.1. Human isotopic studies
C, O and Sr isotopic values of tooth enamel have been studied from individuals buried at
Harappa, Farmana and Sanauli (Valentine 2013; Valentine et al. 2015). The results
suggested that individuals at Farmana consumed more C4 plants than at Harappa and
Sanauli (Valentine 2013: 193-194), and that millet, or other arid-adapted C4 plants, were an
important proportion of the diet at Farmana. The results pertaining to diet of individuals
suggest that there are inter-individual differences in diet at all three sites, but there was no
relationship between age and sex and the relative contribution of C3 and C4 foods in diet
(Valentine 2013: 124, 147, 169). δ15N values were not available, so it is not possible to
know the contribution of animal protein to the individuals studied. Unfortunately, the
aggressive sample preparation methods used by Valentine (2013) suggest that these results
may be unreliable (Lightfoot et al. in prep). Re-analysis of these results is currently
47
underway (Lightfoot et al. in prep; Nayak in prep.). As this thesis investigates vessels from
Farmana, the results obtained will be able to provide further insight into the foodways and
dietary habits of populations at the site.
2.3.4.2. Faunal enamel carbonate isotopic studies
Carbon isotopic results from domestic and wild ungulate tooth enamel from Indus sites in
northwest India provide further information about animal management and serve as a
proxy for reconstructing the various inputs into human diet. Bioapatite carbonate values
from animal teeth from small, rural Indus settlements demonstrate differential animal
management practices and give insight into the diet of different species of domestic
animals and wild ruminants (Sarkar et al. 2016; Jones 2017; Lightfoot et al. in prep). The
data demonstrates that in northwest India, most domestic and wild bovine species had
primarily C4 diets, with evidence for the mixed consumption of C4 and C3 plants for the
wild ungulates and sheep/goat at most sites. There is little evidence for clear seasonal
variation in diet in any of the species. Crucially, there is clear difference between bovine
and ovine/caprine feeding; both cows and buffaloes ate C4 plants throughout the year,
whereas sheep/goat followed patterns consistent with wild ungulates, indicating mixing of
C3 and C4 plants, and a less controlled diet, except at the site of Alamgirpur in Uttar
Pradesh (see Chapter 4). Although the information available for different time periods is
limited, there appears to be no change in δ13C values for most species across time.
Results from enamel carbonate δ13C values from Gujarat (Chase et al. 2014a, 2018)
reveal patterns very similar to data from Haryana, except at the site of Kotada Badli
(Chakraborty et al. 2018). Evidence from most sites in Gujarat suggests that cattle were
consistently feeding on C4 plants, whereas sheep/goat demonstrate some mixing of C3 and
C4 plants (but data for wild ruminants is not provided) (Chase et al. 2014a, 2018;
Chakraborty et al. 2018). The authors concluded that the high proportion of C4 in cattle
diets is an indication of cattle being fed millet throughout the year (Chase et al. 2014a).
However, at Kotada Badli, individual cattle/buffalo demonstrate considerable variation and
appear to have consumed a mixed diet of C4 and C3 vegetation, whereas sheep possibly
consumed more C4 plants than goats (Chakraborty et al. 2018).
The input of C4 plants into the diet of wild ruminants and sheep/goat suggests the
presence of C4 plants in the surrounding landscape. Although the consistent C4 diets for
cattle/buffalo are suggestive of specific feeding practices for cattle/buffalo in many sites in
Gujarat and Haryana, the possibility that cattle were feeding on wild C4 vegetation cannot
48
be excluded. According to Reddy (1994) and Pokharia and colleagues (2017), the soil
organics from sites in Gujarat indicate a C3-dominated environment during the Mature
Harappan period, with increased input of C4 plants towards the Late Mature Harappan
period due to the increased cultivation of millets (Chakraborty et al. 2018). Thus, in
Gujarat, it is possible that the primary source of C4 for cattle/buffalo was from agricultural
millets through specialized foddering. However, other studies around the world have
demonstrated the fallacy of the assumption that any C4-based dietary input in animals or
plants arises from millet (or maize in the Americas) (e.g. Cadwallader 2013; Warinner
2013). This is especially true if cattle/buffalo were valued for dairy production. Since
millets are generally sown to take advantage of the monsoon and harvested in October and
November, cattle would have to be fed dry millet in spring and summer. Ethnographic
research conducted by Miller (2004) demonstrated that dairy animals are dependent on
fresh green fodder supplies because the lactation process depletes animals of minerals,
proteins, and sugars, components vital for their nutritional health. Although animals that
consume dry fodders (chaff, grass) will continue to produce milk, the quantity and quality
(fat content) of the milk is severely reduced. Miller (2004) noted that in Pakistani Punjab,
when green fodder is scarce during the summer, cattle and buffalo are milked only once a
day, and the volume of milk produced is much lower than in the winter and spring, when
they are milked twice a day. During the driest summer months, many animals cease
producing milk entirely and dry up (Miller 2004) but recover later in the year. Thus, dairy
products would likely be subject to seasonal availability. These seasonal patterns are
important to consider when reconstructing the likely contribution of different sources into
animal and human diet. Considerations of animal management practices and animal diets
thus serve as important proxies for reconstructing direct or indirect inputs into human
foodstuff. As this thesis will demonstrate, evidence from dietary isotope studies can
provide insight into interpreting the potential source(s) of lipid residues into vessels.
2.3.5. Indus biomolecular archaeology: starch-grains, ceramic vessel-
function, and lipid residues
Methods to directly investigate food remains associated with archaeological artefacts, such
as the study of starch, lipids and proteins have been limited in the South Asian context.
Studies of starch-grains in association with artefacts such as grinding stones, pottery and
human/animal teeth have been conducted in Gujarat and Haryana, from time periods
spanning from the Chalcolithic and Mature Harappan periods (García-Granero et al. 2015,
49
2016, 2017), and Mature Harappan period, respectively (Kashyap and Weber 2010; Weber
et al. 2011). There is only one example of a lipid residue study from Indus ceramics
(Bourgeois and Gouin 1995), and another that has assessed Indus vessel-function (Gouin
1990). This thesis aims to fill this gap.
2.3.5.1. Starch-grain analyses
Kashyap and Weber (2010; Weber et al. 2011) reported the preliminary results of the first
starch grain-analysis on several Indus artefacts from Farmana. They examined the surfaces
of stone tools, pottery, and human and cattle teeth for charred residues and dental calculus
respectively, extracting starches from encrustations (Weber et al. 2011). The authors found
starches of barley, mango, and small millet adhering to the surfaces of pounders and
grinding stones; lentils, curcuma, Macrotylma solanum (cf. aubergine), Zingiber (cf.
ginger) in storage jars; and starches of lentils, small- and large-grained cereals, fruits,
vegetables, roots and tubers in human tooth calculus (Kashyap and Weber 2010; Weber et
al. 2011: 820) . They also mention correlations between certain artefact types and starches,
suggesting that certain vessels were used to process specific plant matter (Kashyap and
Weber 2010). These results are extremely exciting, and suggest it is possible to study
specific ingredients that were a part of food production, and the relationship between
foodstuff and material culture like grinding stones and pottery. However, starch-grains
associated with archaeological objects are particularly susceptible to contamination from
the surrounding sediment, or airborne starch in the storage or laboratory environment (e.g.
Haslam 2004; Crowther et al. 2014; Barton and Torrence 2015) Thus, as details of the
sample collection, laboratory or storage environment, reference collection, and full details
of the results are yet to be published, it difficult to assess the robustness of the study.
2.3.5.2. Ceramic form and function and residue analysis
Few researchers have attempted to test the relationship between Indus artefacts and their
purported function in antiquity using organic residue analysis or use-wear analysis.
Bourgeois and Gouin (1995) conducted the chemical analysis of a single fragment of a
perforated vessel from Nausharo. They used the chemical methods available at the time to
extract fatty acids from the potsherd and compared it with proportions of fatty acids
present in modern-day milk collected from sheep, goat, and cattle (Bourgeois and Gouin
1995). They suggested that the results confirmed the ethnoarchaeological hypothesis that
perforated vessels were used as ‘cheese-drainers’ and went as far as to suggest that the
lipids suggest the use of goat milk for cheese or ghee production. This was used to support
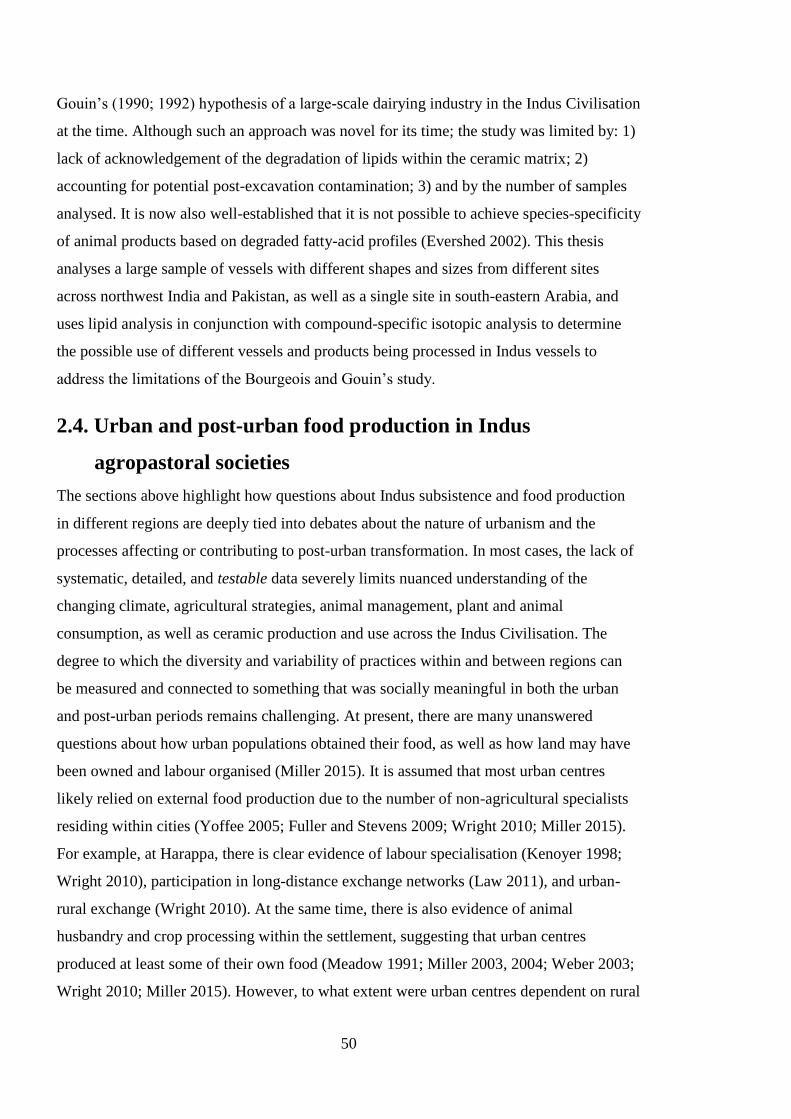
50
Gouin’s (1990; 1992) hypothesis of a large-scale dairying industry in the Indus Civilisation
at the time. Although such an approach was novel for its time; the study was limited by: 1)
lack of acknowledgement of the degradation of lipids within the ceramic matrix; 2)
accounting for potential post-excavation contamination; 3) and by the number of samples
analysed. It is now also well-established that it is not possible to achieve species-specificity
of animal products based on degraded fatty-acid profiles (Evershed 2002). This thesis
analyses a large sample of vessels with different shapes and sizes from different sites
across northwest India and Pakistan, as well as a single site in south-eastern Arabia, and
uses lipid analysis in conjunction with compound-specific isotopic analysis to determine
the possible use of different vessels and products being processed in Indus vessels to
address the limitations of the Bourgeois and Gouin’s study.
2.4. Urban and post-urban food production in Indus
agropastoral societies
The sections above highlight how questions about Indus subsistence and food production
in different regions are deeply tied into debates about the nature of urbanism and the
processes affecting or contributing to post-urban transformation. In most cases, the lack of
systematic, detailed, and testable data severely limits nuanced understanding of the
changing climate, agricultural strategies, animal management, plant and animal
consumption, as well as ceramic production and use across the Indus Civilisation. The
degree to which the diversity and variability of practices within and between regions can
be measured and connected to something that was socially meaningful in both the urban
and post-urban periods remains challenging. At present, there are many unanswered
questions about how urban populations obtained their food, as well as how land may have
been owned and labour organised (Miller 2015). It is assumed that most urban centres
likely relied on external food production due to the number of non-agricultural specialists
residing within cities (Yoffee 2005; Fuller and Stevens 2009; Wright 2010; Miller 2015).
For example, at Harappa, there is clear evidence of labour specialisation (Kenoyer 1998;
Wright 2010), participation in long-distance exchange networks (Law 2011), and urban-
rural exchange (Wright 2010). At the same time, there is also evidence of animal
husbandry and crop processing within the settlement, suggesting that urban centres
produced at least some of their own food (Meadow 1991; Miller 2003, 2004; Weber 2003;
Wright 2010; Miller 2015). However, to what extent were urban centres dependent on rural
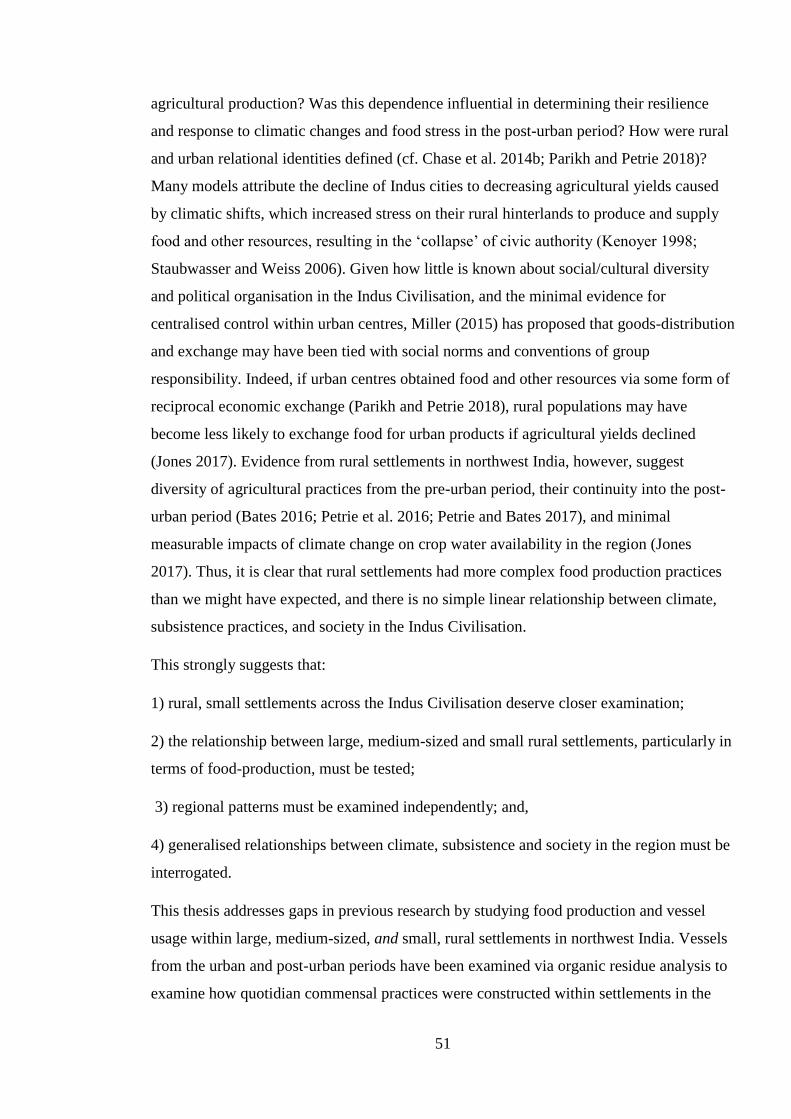
51
agricultural production? Was this dependence influential in determining their resilience
and response to climatic changes and food stress in the post-urban period? How were rural
and urban relational identities defined (cf. Chase et al. 2014b; Parikh and Petrie 2018)?
Many models attribute the decline of Indus cities to decreasing agricultural yields caused
by climatic shifts, which increased stress on their rural hinterlands to produce and supply
food and other resources, resulting in the ‘collapse’ of civic authority (Kenoyer 1998;
Staubwasser and Weiss 2006). Given how little is known about social/cultural diversity
and political organisation in the Indus Civilisation, and the minimal evidence for
centralised control within urban centres, Miller (2015) has proposed that goods-distribution
and exchange may have been tied with social norms and conventions of group
responsibility. Indeed, if urban centres obtained food and other resources via some form of
reciprocal economic exchange (Parikh and Petrie 2018), rural populations may have
become less likely to exchange food for urban products if agricultural yields declined
(Jones 2017). Evidence from rural settlements in northwest India, however, suggest
diversity of agricultural practices from the pre-urban period, their continuity into the post-
urban period (Bates 2016; Petrie et al. 2016; Petrie and Bates 2017), and minimal
measurable impacts of climate change on crop water availability in the region (Jones
2017). Thus, it is clear that rural settlements had more complex food production practices
than we might have expected, and there is no simple linear relationship between climate,
subsistence practices, and society in the Indus Civilisation.
This strongly suggests that:
1) rural, small settlements across the Indus Civilisation deserve closer examination;
2) the relationship between large, medium-sized and small rural settlements, particularly in
terms of food-production, must be tested;
3) regional patterns must be examined independently; and,
4) generalised relationships between climate, subsistence and society in the region must be
interrogated.
This thesis addresses gaps in previous research by studying food production and vessel
usage within large, medium-sized, and small, rural settlements in northwest India. Vessels
from the urban and post-urban periods have been examined via organic residue analysis to
examine how quotidian commensal practices were constructed within settlements in the
52
region, and if they changed over time. Importantly, this thesis also focuses on addressing
the interaction between Indus material culture and foodstuff, on a regional, and local, site-
specific scale.
2.5. Chapter Summary
This chapter has provided an introduction to the Indus Civilisation with an overview of
chronology, urbanism, climate, ceramics, agricultural and pastoral practices and possible
human and animal dietary practices. This chapter sets the necessary groundwork to
contextualise and interpret the results from lipid residue analyses conducted in this thesis.
The next chapter provides a background for the scientific analyses conducted in this thesis.
53
Chapter 3
Background to ceramic organic residue analysis
This chapter defines and characterises the different concepts integral to the study of
organic residues within archaeology, particularly to those related to organic residues
adhering to ceramics, which is the focus of this thesis. Section 3.1 introduces different
organic compounds and key terminology that will be used throughout the thesis. Sections
3.2 and 3.3 describe various aspects that influence our understanding of lipids within
archaeological contexts including preservation, degradation and contamination. Section 3.4
details aspects of methodology by describing extraction processes, Section 3.5 describes
analytical techniques with a focus on the ones used in this thesis, and Section 3.6 discusses
interpretive methods. This chapter aims to summarise key concepts related to organic
residues within archaeological contexts, particularly related to ceramics, as well as
contribute critical insights concerning the assumptions and interpretations made within the
field.
3.1. Organic compounds in archaeological contexts
Different types of organic compounds are found and investigated within archaeological
contexts (Evershed 1993). These encompass a wide range of molecules belonging to
different families of compounds with varying potential for preservation. These include
nucleotides such as RNA and DNA, proteins, carbohydrates, and lipids (Evershed 1993).
Of these, lipids have demonstrated a higher rate of survival, which is generally attributed to
their easy entrapment in organic or mineral matrices and their inherent hydrophobicity
which aids their long-term survival (Evershed 1993). Investigations of organic remains in
ceramics have studied charred, visible residues (‘foodcrusts’) adhering to pottery vessel
surfaces (Heron et al. 2016) as well as amorphous compounds adsorbed within the ceramic
matrix (Evershed 1993; 2008). The sections below will focus on different types of lipids
adsorbed into pottery vessels.
3.1.1. Lipids
Lipids are defined by their solubility in organic solvents such as chloroform, ethers and
alcohols (Christie 1989; Wade 2013). Lipids are composed mainly of carbon, hydrogen
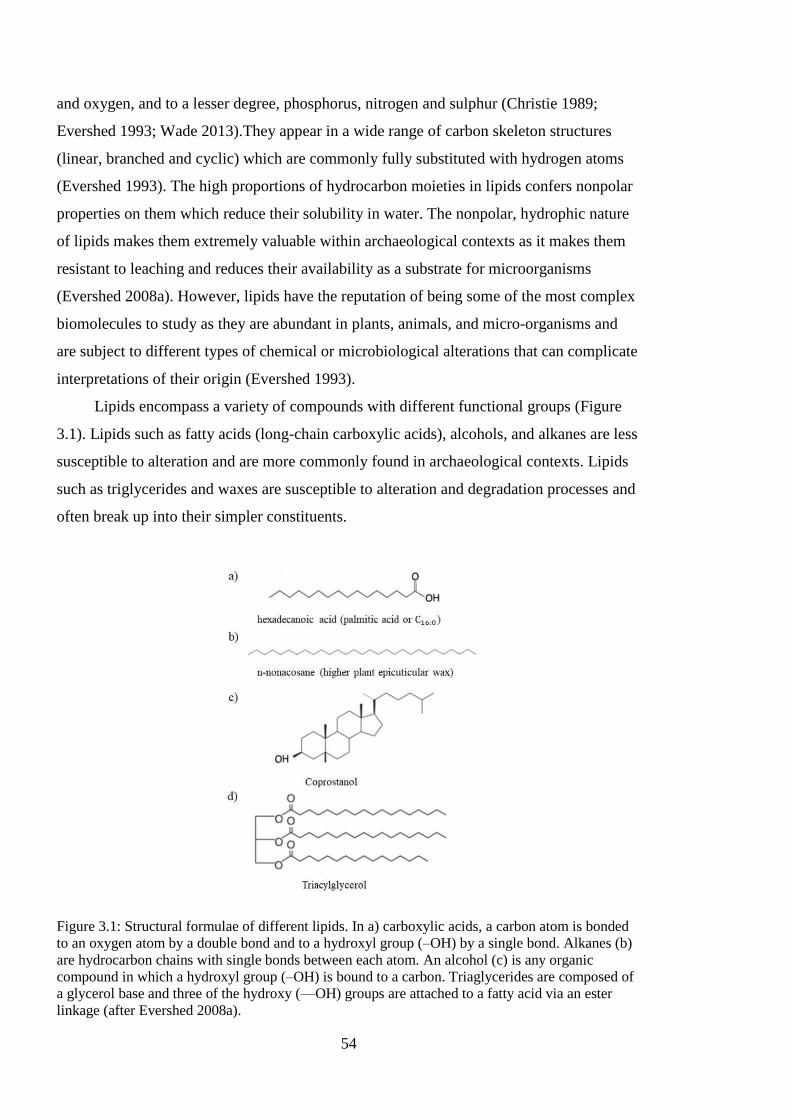
54
and oxygen, and to a lesser degree, phosphorus, nitrogen and sulphur (Christie 1989;
Evershed 1993; Wade 2013).They appear in a wide range of carbon skeleton structures
(linear, branched and cyclic) which are commonly fully substituted with hydrogen atoms
(Evershed 1993). The high proportions of hydrocarbon moieties in lipids confers nonpolar
properties on them which reduce their solubility in water. The nonpolar, hydrophic nature
of lipids makes them extremely valuable within archaeological contexts as it makes them
resistant to leaching and reduces their availability as a substrate for microorganisms
(Evershed 2008a). However, lipids have the reputation of being some of the most complex
biomolecules to study as they are abundant in plants, animals, and micro-organisms and
are subject to different types of chemical or microbiological alterations that can complicate
interpretations of their origin (Evershed 1993).
Lipids encompass a variety of compounds with different functional groups (Figure
3.1). Lipids such as fatty acids (long-chain carboxylic acids), alcohols, and alkanes are less
susceptible to alteration and are more commonly found in archaeological contexts. Lipids
such as triglycerides and waxes are susceptible to alteration and degradation processes and
often break up into their simpler constituents.
Figure 3.1: Structural formulae of different lipids. In a) carboxylic acids, a carbon atom is bonded
to an oxygen atom by a double bond and to a hydroxyl group (–OH) by a single bond. Alkanes (b)
are hydrocarbon chains with single bonds between each atom. An alcohol (c) is any organic
compound in which a hydroxyl group (–OH) is bound to a carbon. Triaglycerides are composed of
a glycerol base and three of the hydroxy (—OH) groups are attached to a fatty acid via an ester
linkage (after Evershed 2008a).
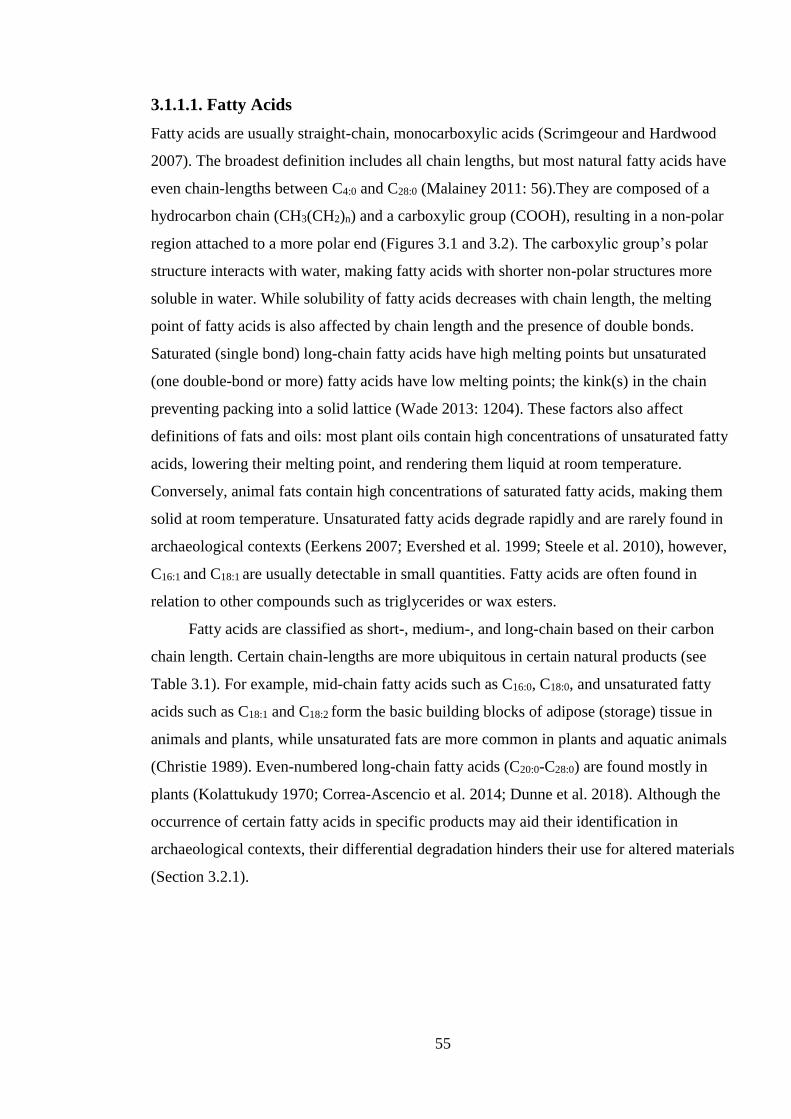
55
3.1.1.1. Fatty Acids
Fatty acids are usually straight-chain, monocarboxylic acids (Scrimgeour and Hardwood
2007). The broadest definition includes all chain lengths, but most natural fatty acids have
even chain-lengths between C4:0 and C28:0 (Malainey 2011: 56).They are composed of a
hydrocarbon chain (CH3(CH2)n) and a carboxylic group (COOH), resulting in a non-polar
region attached to a more polar end (Figures 3.1 and 3.2). The carboxylic group’s polar
structure interacts with water, making fatty acids with shorter non-polar structures more
soluble in water. While solubility of fatty acids decreases with chain length, the melting
point of fatty acids is also affected by chain length and the presence of double bonds.
Saturated (single bond) long-chain fatty acids have high melting points but unsaturated
(one double-bond or more) fatty acids have low melting points; the kink(s) in the chain
preventing packing into a solid lattice (Wade 2013: 1204). These factors also affect
definitions of fats and oils: most plant oils contain high concentrations of unsaturated fatty
acids, lowering their melting point, and rendering them liquid at room temperature.
Conversely, animal fats contain high concentrations of saturated fatty acids, making them
solid at room temperature. Unsaturated fatty acids degrade rapidly and are rarely found in
archaeological contexts (Eerkens 2007; Evershed et al. 1999; Steele et al. 2010), however,
C16:1 and C18:1 are usually detectable in small quantities. Fatty acids are often found in
relation to other compounds such as triglycerides or wax esters.
Fatty acids are classified as short-, medium-, and long-chain based on their carbon
chain length. Certain chain-lengths are more ubiquitous in certain natural products (see
Table 3.1). For example, mid-chain fatty acids such as C16:0, C18:0, and unsaturated fatty
acids such as C18:1 and C18:2 form the basic building blocks of adipose (storage) tissue in
animals and plants, while unsaturated fats are more common in plants and aquatic animals
(Christie 1989). Even-numbered long-chain fatty acids (C20:0-C28:0) are found mostly in
plants (Kolattukudy 1970; Correa-Ascencio et al. 2014; Dunne et al. 2018). Although the
occurrence of certain fatty acids in specific products may aid their identification in
archaeological contexts, their differential degradation hinders their use for altered materials
(Section 3.2.1).
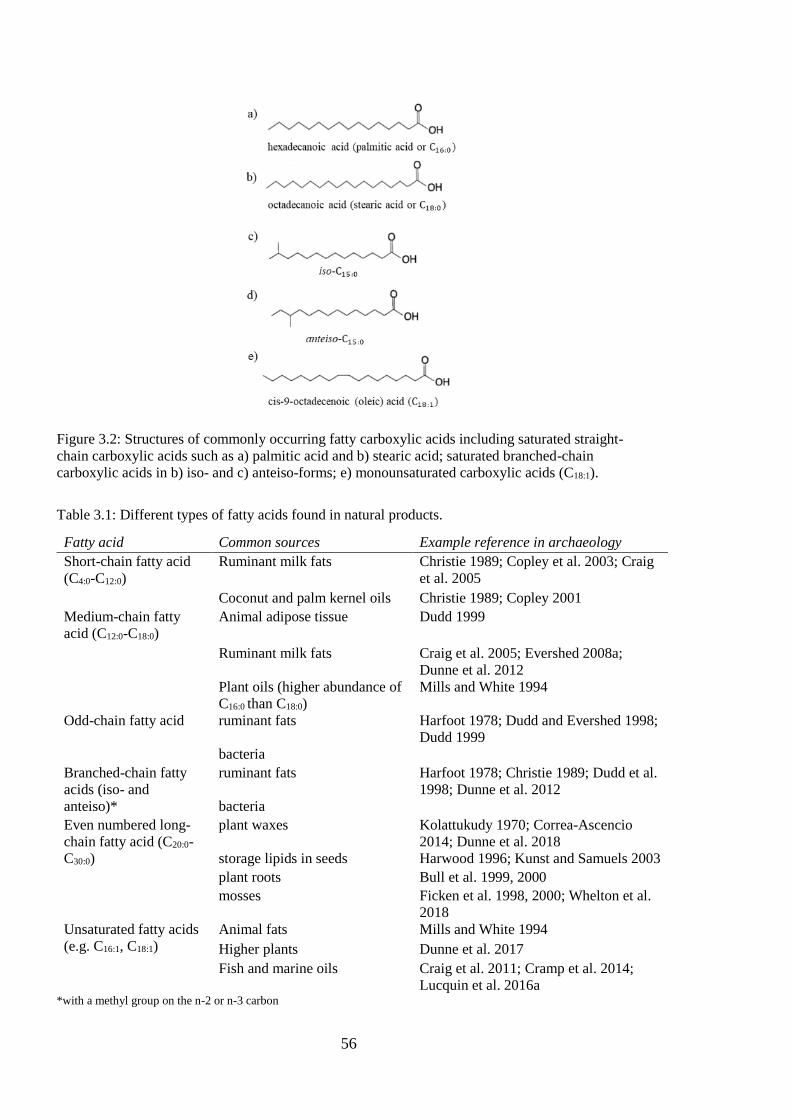
56
Figure 3.2: Structures of commonly occurring fatty carboxylic acids including saturated straight-
chain carboxylic acids such as a) palmitic acid and b) stearic acid; saturated branched-chain
carboxylic acids in b) iso- and c) anteiso-forms; e) monounsaturated carboxylic acids (C18:1).
Table 3.1: Different types of fatty acids found in natural products.
Fatty acid Common sources Example reference in archaeology
Short-chain fatty acid
(C4:0-C12:0)
Ruminant milk fats Christie 1989; Copley et al. 2003; Craig
et al. 2005
Coconut and palm kernel oils Christie 1989; Copley 2001
Medium-chain fatty
acid (C12:0-C18:0)
Animal adipose tissue Dudd 1999
Ruminant milk fats Craig et al. 2005; Evershed 2008a;
Dunne et al. 2012
Plant oils (higher abundance of
C16:0 than C18:0)
Mills and White 1994
Odd-chain fatty acid ruminant fats Harfoot 1978; Dudd and Evershed 1998;
Dudd 1999
bacteria
Branched-chain fatty
acids (iso- and
anteiso)*
ruminant fats Harfoot 1978; Christie 1989; Dudd et al.
1998; Dunne et al. 2012
bacteria
Even numbered long-
chain fatty acid (C20:0-
C30:0)
plant waxes Kolattukudy 1970; Correa-Ascencio
2014; Dunne et al. 2018
storage lipids in seeds Harwood 1996; Kunst and Samuels 2003
plant roots Bull et al. 1999, 2000
mosses Ficken et al. 1998, 2000; Whelton et al.
2018
Unsaturated fatty acids
(e.g. C16:1, C18:1)
Animal fats Mills and White 1994
Higher plants Dunne et al. 2017
Fish and marine oils Craig et al. 2011; Cramp et al. 2014;
Lucquin et al. 2016a *with a methyl group on the n-2 or n-3 carbon
57
3.1.1.2. Alcohols
Linear alcohols, sometimes referred to as fatty alcohols, have a hydroxy group at the end
of their hydrocarbon chain. Like fatty acids, they exist rarely in free form, but rather in
combination with other molecules, for example in the form of wax esters (Christie 1989:
149, Killops and Killops 2009: 44). n-alcohols found in association with n-alkanes in
archaeological contexts are likely indicative of plant products (Harwood 1996, Dunne et al.
2017), but sterols of both animal (cholesterol) and plant (campesterol, sitosterol and
stigmastanol) origin are also reported (Dudd et al.1999). However, sterols are rarely
preserved in archaeological organic residues (Evershed 1993) as they oxidise rapidly and
dissolve into groundwater under oxic burial conditions. Often, the presence of cholesterol
in vessel extracts may indicate post-excavation contamination arising from human skin.
3.1.1.3. Alkanes
Alkanes are characterised by a hydrocarbon chain and the absence of functional group
(Killops and Killops 2009: 30). Linear alkanes with an odd number of carbon atoms are
among the main compounds of waxes, be they of vegetable or apicultural origin (Eglinton
and Hamilton 1967; Kolattukudy 1970; Heron et al. 1994; Charters et al. 1995; Regert et
al. 2001, 2005; Kimpe et al. 2002; Roffet-Salque et al. 2016). As waxes may be absent in
archaeological contexts, the presence of n-alkanes can help distinguish between products
derived from the epicuticular waxes of leaves, beeswax, or aquatic or terrestrial plants
(Evershed et al. 1997, Dunne et al. 2017; Whelton et al. 2018).
3.1.1.4. Triacylglycerides
Triacylglycerides (TAGs) are the major component of fats and oils of natural origin
(Christie 1989). They are composed of a glycerol base and all three of the hydroxy (—OH)
groups are attached to a fatty acid via an ester linkage (Christie 1989:10; Wade 2013:
1202, Figure 3.1). The position of each fatty acid composing the TAG, as well as its chain
length, number and position of unsaturation are highly variable and dependent on the
natural origin of the fat (Christie 1989:10). It is thus necessary to know the composition of
fatty acids and their distribution on the glycerol backbone to determine the origin of TAGs.
TAGs are affected by various degradative processes such as chemical or enzymatic
hydrolysis. Hydrolysis of TAGs results in the breakage of the bonds between the glycerol
backbone and the fatty acids, leading to diacylglycerides (DAGs), monoglycerides
(MAGs) and free fatty acids. While TAGs, DAGs and MAGs may be preserved in some
58
archaeological contexts (e.g. Regert et al. 1998; Dudd 1999), they rarely survive and
usually hydrolyse completely to their fatty acid constituents.
3.1.1.5. Waxes
Waxes are esters of long-chain fatty acids linked to long-chain alcohols via an ester bond
(Christie 1989: 12; Wade 2013: 1202). They occur widely in nature and serve several
purposes in plants, animals and microbes (Wade 2013). A variety of alcohols and
constituent fatty acids are linked to various natural waxes origins: animal, plant or
microbial (Christie 1989). For example, ketones are restricted to higher plants and bacteria,
whilst terpenoids are found widely in plants and animals and aldehydes are mainly found
in higher plants. Wax esters are susceptible to hydrolysis, releasing fatty acids and alcohols
which compose them. In archaeological contexts, waxes are often distinguished on the
basis of the presence of long-chain n-alkanes, which may be indicative of leafy plants or
apicultural origin. For example, beeswax has a characteristic odd- carbon numbered n-
alkanes (C21-C33), even-numbered free fatty acids (C22-C30) and long-chain palmitate esters
in the carbon range (C40-C52) (Frith et al. 2004). The brief overview of different types of
lipids provides necessary context for the organic compounds discussed later in this thesis.
3.2. Preservation and degradation of lipids
Variations in temperature and precipitation affect the survival of all organic matter (Pollard
et al. 2007), and specific conditions of the depositional environment may facilitate or
reduce the preservation potential of organic compounds (Eglington et al. 1991; Evershed
2008a). Rodents, insects, fungi, and bacteria can all affect the survival of all buried organic
matter, but microbial degradation is accelerated in most depositional environments through
fluctuations in temperature, moisture, and redox conditions (Eglington et al. 1991;
Evershed 2008a; Gregg 2009). Thus, both burial conditions coupled with the physical and
structural characteristics of different lipids influence their preservation potential. For
example, the most common compounds to survive in archaeological pottery are the most
non-polar and hydrophobic lipid classes in animal fats and vegetable oils which are C16:0
and C18:0 saturated fatty acids (Evershed 2008a; Gregg 2009). Certain classes of lipids are
more susceptible to degradation than others; thus, survival of TAGs, DAGs and MAGs,
short-chain fatty acids and alcohols is strongly dependent on depositional environment and
have been recovered from archaeological pottery only in certain contexts (Regert et al.
1997; Dudd 1999; Stern 2000; Copley et al. 2001; Copley 2002). This section will provide
59
a short summary of the transformative processes affecting certain classes of lipids during
diagenesis generated by a combination of biological and chemical factors.
3.2.1. Lipid diagenesis
Our understanding of lipid diagenesis in ceramics comes primarily from foundational
laboratory decay experiments and studies on ethnographic pottery samples (Charters et
al.1993, 1997; Evershed et al. 1995; Dudd 1999; Aillaud 2002). For example, experiments
involving a range of fatty acids and other aliphatic lipids dosed into replica ceramics have
allowed degradation in oxic versus anoxic environments to be investigated (Evershed et al.
1995; Charters et al. 1997; Dudd 1999; Aillaud 2002; Evershed 2008b). The results
showed unequivocally that there is little fatty acid diagenesis under anoxic conditions,
while little or no lipid remained after only a few weeks of microbial degradation under
oxic conditions (Evershed et al. 1992; Dudd et al. 1998; Evershed 2008b). While our
knowledge about degradation processes is incomplete, it is well-established that the two
main chemical processes that result in the diagenesis of lipids are oxidation (reactions in
the presence of oxygen) and hydrolysis (breakage of bonds in the presence of water).
Of the pathways of oxidation (α- , β-, and ω-), β-oxidation is the most prevalent
(Pollard and Heron 2008: 394) This is a biological mechanism of fatty acids metabolism by
enzymatic action which occurs in aerobic conditions (Evershed et al. 1992). This
mechanism affects all fatty acids, whether linear or branched, particularly leading to a
decrease in chain length (Aillaud 2002: 11), although saturated fatty acids are less sensitive
than unsaturated fatty acids. Polyunsaturated fatty acids oxidise much faster than their
unsaturated or monosaturated equivalents, and longer-chain molecules oxidise slightly
faster than shorter compounds (Eglington and Logan 1991; Eerkens 2005). The oxidation
of unsaturated fatty acids, either by atmospheric oxygen or enzymatic processes, can lead
to the formation of many products and their isomers, such as α , ω-dicarboxylic acids
(diacids) and dihydroxy fatty acids (Passi et al. 1993; Regert et al. 1998; Aillaud 2001;
Hansel et al. 2004;Frankel 2005; Hansel and Evershed 2009). As distinctive oxidation
products, the chain length of a diacid and the position of the diol on the dihydroxy acid can
reflect the position of the double bond on its original unsaturated fatty acid (Regert et al
1998; Dudd 1999). For example, 9- and 10-hydroxyoctadecanoic acids and C9 diacid are
usually derived from the oxidation of C18:1 (Figure 3.3). These components are thought to
be formed by extensive oxidation of lipids in commodities during processing in vessels.
Only those components which became bound within the matrix of the pottery (e.g. through
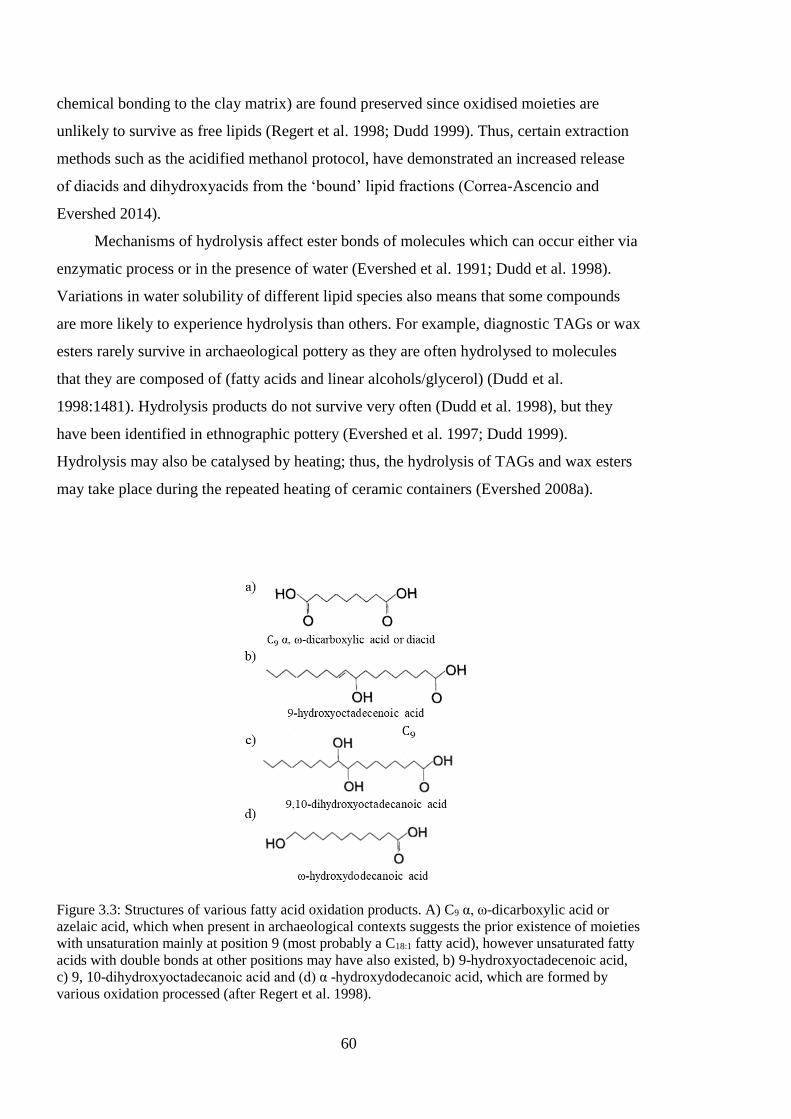
60
chemical bonding to the clay matrix) are found preserved since oxidised moieties are
unlikely to survive as free lipids (Regert et al. 1998; Dudd 1999). Thus, certain extraction
methods such as the acidified methanol protocol, have demonstrated an increased release
of diacids and dihydroxyacids from the ‘bound’ lipid fractions (Correa-Ascencio and
Evershed 2014).
Mechanisms of hydrolysis affect ester bonds of molecules which can occur either via
enzymatic process or in the presence of water (Evershed et al. 1991; Dudd et al. 1998).
Variations in water solubility of different lipid species also means that some compounds
are more likely to experience hydrolysis than others. For example, diagnostic TAGs or wax
esters rarely survive in archaeological pottery as they are often hydrolysed to molecules
that they are composed of (fatty acids and linear alcohols/glycerol) (Dudd et al.
1998:1481). Hydrolysis products do not survive very often (Dudd et al. 1998), but they
have been identified in ethnographic pottery (Evershed et al. 1997; Dudd 1999).
Hydrolysis may also be catalysed by heating; thus, the hydrolysis of TAGs and wax esters
may take place during the repeated heating of ceramic containers (Evershed 2008a).
Figure 3.3: Structures of various fatty acid oxidation products. A) C9 α, ω-dicarboxylic acid or
azelaic acid, which when present in archaeological contexts suggests the prior existence of moieties
with unsaturation mainly at position 9 (most probably a C18:1 fatty acid), however unsaturated fatty
acids with double bonds at other positions may have also existed, b) 9-hydroxyoctadecenoic acid,
c) 9, 10-dihydroxyoctadecanoic acid and (d) α -hydroxydodecanoic acid, which are formed by
various oxidation processed (after Regert et al. 1998).
61
3.2.2. Burial conditions
While hydrolysis and oxidation result in the degradation of lipids, various biological and
chemical conditions including pH levels, level of microbial activity, fluctuating water
conditions and temperature changes strongly influence these processes (Eglington et al.
1991). It has been suggested that 99% of extractable lipid is lost through microbial action;
and most degradation takes place in the first year, or first weeks of burial (Dudd et al.
1998; Aillaud 2002: 61-62); the surviving lipids protected due to their adsorption into the
clay fabric microstructure of vessels (Evershed et al. 1995; Evershed 2008a; Budja 2014).
Soil pH is known to affect lipid preservation. Several authors suggest that acidic soils are
considered the most favourable environments for the survival of lipids after burial
(Evershed 1993; Evershed 2008b; Gregg and Slater 2010; Debono Spiteri 2012; Debono
Spiter et al. 2016). Degradation experiments suggest that pH levels between 8 and 5 are
optimum for the preservation of organic matter (DeLaune et al. 1981; Debono Spiteri
2012). However, microorganisms responsible for hydrolysis are active in neutral soils
(Aillaud 2001: 145), and acidic soils can lead to the rapid hydrolysis of ester linkages in
triacylglycerides (Evershed 1990; Eglinton and Logan 1991). Meanwhile, calcareous soils
with high pH levels can lead to the formation of water-soluble salts of free fatty acids,
which would be susceptible to leaching from potsherds via percolating groundwater
(Copley et al. 2005a; Cramp 2008). These reactions can further be catalysed by the
presence of metal ions such as iron, manganese or magnesium (Aillaud 2001: 145). Thus,
although the relationship between soil pH and lipid preservation in pottery is not
straightforward, acidic soils appear to have better preservation potential than basic soils.
Apart from pH conditions, alternating wetting and drying conditions affect microbial
activity, and may also result in the leaching of more soluble lipids by percolating
groundwater moving through the stratigraphic profile (Dudd et al. 1998; Evershed 2008a).
Thus, it is suggested that areas where seasons of high rainfall are followed by hot, dry
periods might be detrimental to the survival of organic residues (Cramp 2008; Evershed
2008a). As most of the study sites in this thesis are located in regions with alternating wet-
dry conditions, experiencing both heavy monsoon rains and winter rains interspersed with
hot, dry periods, it was important to test the extent of the preservation of lipids in pottery
(see Chapter Six).
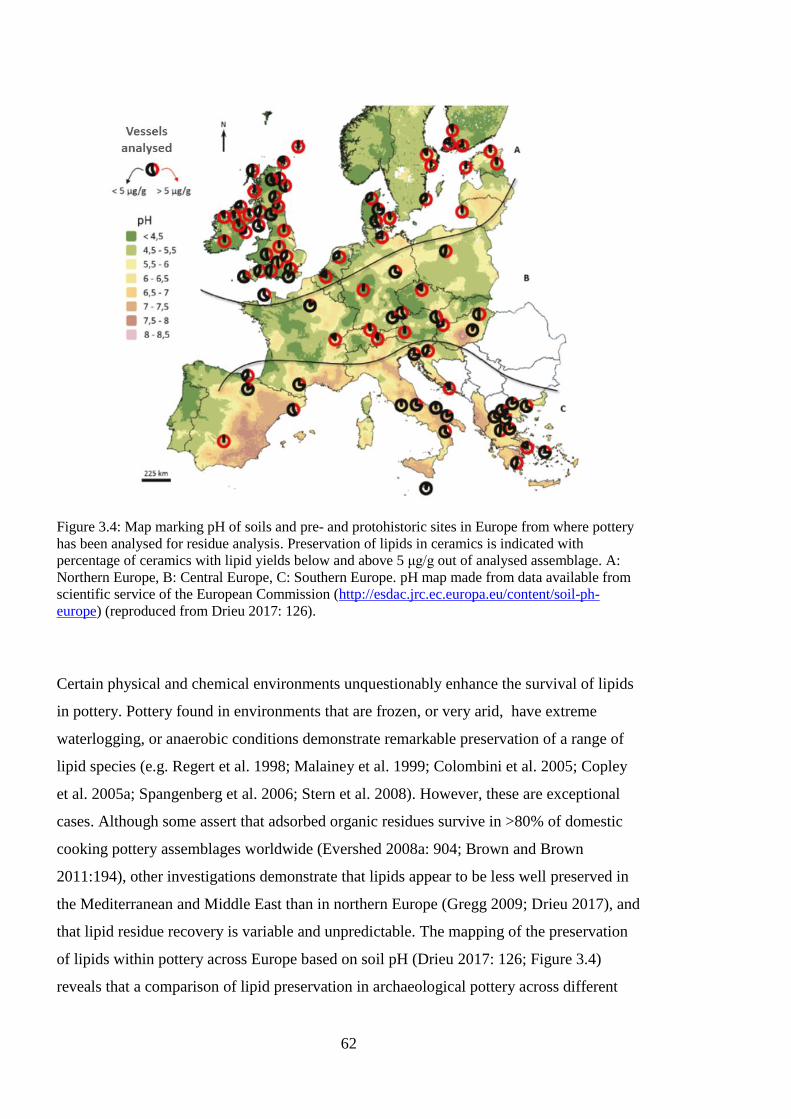
62
Figure 3.4: Map marking pH of soils and pre- and protohistoric sites in Europe from where pottery
has been analysed for residue analysis. Preservation of lipids in ceramics is indicated with
percentage of ceramics with lipid yields below and above 5 μg/g out of analysed assemblage. A:
Northern Europe, B: Central Europe, C: Southern Europe. pH map made from data available from
scientific service of the European Commission (http://esdac.jrc.ec.europa.eu/content/soil-ph-
europe) (reproduced from Drieu 2017: 126).
Certain physical and chemical environments unquestionably enhance the survival of lipids
in pottery. Pottery found in environments that are frozen, or very arid, have extreme
waterlogging, or anaerobic conditions demonstrate remarkable preservation of a range of
lipid species (e.g. Regert et al. 1998; Malainey et al. 1999; Colombini et al. 2005; Copley
et al. 2005a; Spangenberg et al. 2006; Stern et al. 2008). However, these are exceptional
cases. Although some assert that adsorbed organic residues survive in >80% of domestic
cooking pottery assemblages worldwide (Evershed 2008a: 904; Brown and Brown
2011:194), other investigations demonstrate that lipids appear to be less well preserved in
the Mediterranean and Middle East than in northern Europe (Gregg 2009; Drieu 2017), and
that lipid residue recovery is variable and unpredictable. The mapping of the preservation
of lipids within pottery across Europe based on soil pH (Drieu 2017: 126; Figure 3.4)
reveals that a comparison of lipid preservation in archaeological pottery across different
63
geographies is challenging as there are several factors influencing the preservation of
adsorbed residues, and micro-environments of exceptional lipid preservation may exist
within regions with poor lipid preservation.
3.2.3. Vessel characteristics and use
Manufacturing characteristics of the vessel and its usage in antiquity also affect
preservation of organic remains. For example, vessel fabrication such as the size and shape
of ceramic pores, firing conditions and surface treatments will impact vessel porosity and
the degree of absorption of lipids (Evershed et al. 1995, Raven et al. 1997; Debono Spiteri
2012; Correa-Ascencio and Evershed 2014; Drieu 2017). The use of the vessel in antiquity
will also influence the preservation and composition of organic matter.
3.2.3.1. Vessel porosity and fabric
Several researchers have highlighted the complexity of interactions between lipids and the
clayey matrix of ceramics (Evershed 2008a, Debono Spiteri 2012; Drieu 2017; Drieu et al.
2019). Clays are an active matrix due to their structure that comprises of sheets of
aluminosilicates layered between water and cations. Firing the clay creates a collapsed,
ridged porous unit (Raven et al. 1997), with pores of molecular dimensions that trap
organic compounds and possible reaction products. Thus, vessels with high porosity (with
large pore-sizes) are likely to adsorb a large amount of organic matter. However,
experimental research suggests that ceramics with pore sizes between 0.5 to 3 μm diameter
appears to be more favourable compared to larger pores (greater than 4 μm), as the latter
may be easily accessible to microorganisms (Drieu 2017). The porosity of terracotta is
reported to be between 20-25 μm (Rice 1987: 106), which facilitates adsorption of organic
products, but may not be conducive to their preservation against microbial action.
It is also likely that functional groups of lipid molecules influence adsorption
properties (Matlova et al. 2017), as non-functional molecules like alkanes are only weakly
bound to the ceramic matrix (Craig et al. 2004), while stronger interactions are likely to
exist between carboxylic acids and metal cations within the ceramic matrix (Craig et al.
2004; Correa-Ascencio and Evershed 2014; Matlova et al. 2017) Additionally, when metal
oxides and salts such as calcium carbonate, iron oxide or magnesium oxide within the
ceramic matrix are heated, they catalyse fatty acid ketonic decarboxylation, producing long
mid-chain ketones derived from precursor fatty acids (Evershed et al. 1995; Raven et al.
1997). These examples highlight how the relationship between pore size and lipid
64
preservation is complex and the interaction of lipids and the vessel matrix is dependent on
different factors.
3.2.3.2. Vessel manufacture
Organic matter may be incorporated into the original clay as temper before firing (Orton
and Hughes 2013), but it is well-established that lipids do not survive exposure to
temperatures ≥600 °C, and thus, contamination from lipid signatures of organic temper
within pots is unlikely to be a concern during lipid analysis of well-fired pottery (Heron et
al. 1991; Drieu 2017). However, the porosity of the fabric of vessels does influence the
preservation of lipids, and high levels of small pores are considered generally favourable
for lipid preservation (Drieu et al. 2019). Questions of surface treatment and the addition of
organic sealants at the final stage of vessel manufacture have also been raised by many
researchers (Charters et al. 1993; Heron and Evershed 1993; Diallo et al. 1995; Copley et
al. 2005a; Craig et al. 2005). Plant adhesive applied to the surfaces of ceramics, such as
resins of birch pitch and pine have been identified by chemical analysis (Urem-Kotsou et
al. 2002; Regert et al. 2003; Colombini et al. 2005; Reber and Hart 2008; Stern et al.
2008), which were possibly used to seal the vessels. Similarly, there are ethnographic
examples that describe potters dipping vessels in substances like milk or lining with plants
after production and before cooking to reduce the porosity of the vessel and make it usable
for greater retention of liquids (Arnold 1985: 140). As archaeological parallels for this
might exist, it is important to analyse and compare lipids signatures in both the exterior and
interior surfaces of vessels in order to confirm the use of organic sealants.
3.2.3.3. Vessel-use
Lipids, proteins and carbohydrates are liberated from foodstuffs during the boiling,
roasting or cooking of food and adsorbed by the ceramic fabric. Researchers hypothesise
that adsorbed residues contain compounds from the entire life-use of a vessel, representing
an integrated signature as opposed to its first or last use (Evershed 2008a; Budja 2014).
Thus, the use-history of vessel will affect not only the type of lipids obtained, but also lipid
recovery. The frequent use of a vessel for either processing or storing fatty or oily products
will lead to a higher chance of lipids being found. Additionally, vessels in which
commodities are processed, such as cooking pots, often contain higher concentrations of
lipid rather than those used for serving or dry storage (Correa-Ascencio and Evershed
2014) as the processing of foodstuff usually involves the addition of water, prolonged
heating and/or mechanical action, which helps transfer the fats in liquid form into the
65
ceramic walls (Correa-Ascencio and Evershed 2014). Many chemical reactions may be
catalysed by inorganic elements, especially by ions of salts and metals either present in the
ceramic matrix or introduced as components of commodities processed in vessels
(Evershed et al. 1995; Raven et al. 1997; Evershed 2008a). This is also influenced by
cooking temperatures. For example, the creation of ketones (especially K33) by interaction
with metal salts or oxides in the ceramic matrix occurs when animal fats are heated at
temperatures above 300 °C and are used as evidence of repeated heating of a vessel (Raven
et al. 1997). Similarly, the presence of long-chain ω-(o-alkylphenyl) alkanoic acids in
vessels suggests the protracted heating of products with significant amounts of
polyunsaturated fatty acids (i.e. marine or freshwater fats and oils) at temperatures around
270°C (Evershed 2008a; Cramp et al. 2014; Lucquin et al. 2016a, 2016b). Together with
dihydroxy acids and isoprenoid acids, the presence of these compounds provides a
sensitive means of characterising the processing of marine products in ceramic vessels
(Cramp et al. 2014).
The processing of two or more materials in a vessel simultaneously may also affect
levels of lipid recovery by archaeologists. For example, recent cooking experiments
suggest that the cooking of cereals in vessels liberates only small quantities of lipid into the
ceramic matrix, however, the processing of both meat and cereals at the same time enables
the transfer of cereal lipids such as alkylresorcinols into the vessel matrix (Hamman and
Cramp 2018). Similarly, cooking experiments involving the cooking of lamb meat and
brassica leaves led to considerably higher levels of adsorbed lipids leading to high lipid
concentrations in vessels (Evershed 2008a). Thus, the absence of lipid in a vessel may be
indicative of its use for non-fatty products, or less frequent use (Regert 2007; Šoberl et al
2014). For example, Drieu (2017) demonstrates that vessels with very low concentrations
of lipid (0-7 μg/g) probably contained very little fatty products, as analysis of carbonised
surface residues from the same vessels also revealed low quantities of lipid whereas other
surface residues contained high (100+ μg/g) lipid concentrations.
Finally, vessel form may be indicative of vessel use, which would influence the
mechanism of accumulation of organic residues during use (Charters et al. 1993). As the
transfer of lipids is dependent upon the methods of food processing, i.e., boiling, roasting,
or frying, certain locations of the sherd on the vessel (rim, body or base) may contain more
concentrations of lipid than others (Charters et al.1993). Experimental evidence suggests
that the boiling of products in vessels would lead to lipids accumulating at the rims of
vessels (Charter et al. 1993), which has influenced sampling strategies in this thesis.
66
3.3. Contamination
Lipid residues present in archaeological vessels do not only reflect the use-history of
vessels but also their abandonment, recovery, and post-excavation treatment. As these
factors strongly affect archaeological interpretation, it is important to control for all
possible contamination of extraneous lipids into archaeological vessels that are not related
to its use-history. These include the influence of the burial environment, recovery
conditions, processing and handling techniques, and storage environments. Full knowledge
of these conditions enables more careful assignment of organic products to their potential
role in the life-history of the vessel. Most archaeological literature does not highlight this
explicitly enough. In this thesis, a small selection of soil samples adhering to vessel
fragments or directly from contexts were collected for comparative purposes, and possible
sources of contamination have been discussed in lipid extracts (Chapter Six).
3.3.1. Migration of soil lipids
The effects of post-depositional intrusion of soil organic matter on organic residues
retained in the walls of pottery vessels was a key concern in early studies of organic
residue analysis. As lipids are ubiquitous in soils, bacteria, algae, fungi, plants and animals,
this concern was well-founded. A few key studies initially ruled out the effects of intrusion
of soil organic matter within pottery residues. For example, Heron and others (1991)
assessed the possible migration of lipids from the soil on the organic residues preserved in
buried potsherds from West Cotton, Northamptonshire, U.K. It was observed that the
composition of the soil and sherd lipid exhibited marked variation, with soil lipid content
falling within a more closely defined range (30-510 µg/g) and the lipid content of the
sherds exhibiting much greater variation (60-4800 µg/g) (Heron et al. 1991: 648).
Additionally, soil lipids were found to be of relatively consistent composition, made up of
a complex mixture of lipids originating from plant, animal and microbial detritus; whereas
sherd extracts were generally of simpler and more variable composition (Heron et al. 1991;
Evershed 1993). The major compounds present in every soil sample investigated were
long-chain free fatty acids, particularly pentacosanoic acid (C25:0) which is absent in the
vast majority of foodstuffs and only present in the cuticular leaf waxes of some plants as a
minor trace component (Heron et al. 1991). These results suggested that negligible
migration of soil lipids occurs during burial. Several others (Craig et al. 2003, 2005;
Evershed 2008a; Correa-Ascencio and Evershed 2014; Drieu 2017) have supported this
finding.
67
However, it is important to be cautious and account for potential sources of
contamination, and samples must be assessed on a case-by-case basis. In order to account
for potential contamination, the exterior surface of the sherd is removed via drilling (e.g.
Heron et al. 1991), and samples with lipid concentrations below 5 μg/g are usually
excluded from analysis (Heron et al. 1991; Evershed et al. 1999; 2008a). The interaction
between soil organic matter, soil microorganisms and soil structure and properties is
extraordinarily complex, and many aspects of the diagenesis of organic residues in
archaeological contexts are not fully understood (Haslam 2004). Differences in
decomposition factors and rates between artefact surfaces and in sediments have also not
yet been thoroughly investigated (Haslam 2004). This makes it important to test for the
possible effects of migration and microbial activity by comparing the organic matter
content of the buried sherd and its burial context.
3.3.2. Other sources of contamination
Apart from exposure to lipids in sediment, potsherds may adsorb additional compounds, or
lose organic compounds after their recovery. Most potsherds are washed and scrubbed
after excavation. The washing and scrubbing of pottery may result in the loss of less
hydrophobic compounds. Excavators may also introduce lipids from their fingertips onto
the surface of the vessel, write on potsherds, use adhesives to stick potsherds together, and
store them in plastic bags, exposing the potsherds to a range of synthetic compounds and
modern sources of contamination. Phthalates are often found within lipid extracts of
ancient pottery. Phthalates are a group of colourless, odourless liquids which are most
often used as plasticisers (or softeners). A plasticiser is a substance added to plastic that
makes it more flexible, resilient, and easier to handle. They are produced by the simple
reaction of alcohols with an acid (e.g. phthalic anhydride) (Meeks et al. 2009). These
compounds are components of plastics, safety glasses, rubber coating agents, moulding
powders, insect repellents and pesticides. Although phthalates are easily recognisable via
their mass spectra and can be excluded from analysis, a high degree of plastic
contamination may interfere with the recognition and interpretation of other organic
molecules within lipids extracts.
Finally, contaminants may also be introduced into at any time during the sample
preparation process in the laboratory (Stern et al. 2000). Although extraction protocols are
carefully designed to minimise laboratory contamination and cross-contamination (see
Chapter Five), with the use of nitrile gloves during the handling of the sample and
68
extraction of lipids, the repeated cleaning of drill bits, syringes and needles with
dichloromethane or hexane between transfer of samples, etc.), it is always possible to
introduce organic compounds from the laboratory environment into the sample. For this
reason, method blanks are also processed during extraction of samples, making it possible
to identify potential introduced organic compounds during analysis, if any, and exclude
them from analysis.
3.4. Extraction methods
Extraction involves the separation of relatively non-volatile analytes in analysis of the
organic fraction from solid samples (food, animal and plant tissues, ceramics, sediments).
The extraction of lipids from archaeological pottery operates on a basic principle about the
solubility of lipids in non-polar organic solvents. Ad-hoc experimentation and the use of a
variety of extraction methods, especially soxhlet extraction, was common in the early days
of organic residue analysis in archaeology (e.g. Condamin et al. 1976; Shackley 1982;
Bourgeois and Gouin 1990; Oudemans and Boon 1991). Later, researchers suggested using
a microwave-assisted extraction (Gregg et al. 2009; Gregg and Slater 2010) and automatic
shaker extraction (Zagorevski and Loughmiller-Newman 2012). Microwave radiation can
heat the whole sample in a short time and accelerate extraction, cutting solvent
consumption and extraction time (Gregg et al. 2009). However, recently ultrasonication
and other extraction protocols have found more favour among researchers (e.g. Evershed
et al. 1990; Craig et al. 2013; Correa Ascenscio and Evershed 2014) The two commonly
used extraction methods are detailed below. Details of the extraction of lipids from
archaeological pottery and instrumental analyses used in this thesis are provided in Chapter
Five.
3.4.1. Solvent extraction
The solvent extraction method was established in 1990s, using chloroform/methanol and
trimethylsilylation derivatisation (Evershed et al. 1990). Recently, this method has been
adapted to use dichloromethane/methanol instead of chloroform (e.g. Lucquin et al 2016;
Oras et al 2018). This method involves the repeated washing of the powdered sherd sample
with the prepared solvent mixture through ultrasonication. The solvent extract is then
evaporated to obtain a total lipid extract (TLE). Subsequently, TMS ether and ester
derivatives, or methyl ester derivatives are prepared by silylation or methylation to
69
improve the separation, resolution and detection of peaks via analysis with Gas
Chromatography-Mass Spectrometry.
This method enables the detection of a range of lipids including fatty acids, long-
chain ketones, wax ester, n-alkanols, n-alkanes, acylglycerols (MAGs, DAGs and TAGs),
terpenes and sterols, however, it is unable to extract polar lipids that have stronger
interaction with the ceramic matrix, such as diacids and hydroxyacids (Correa Ascencio
and Evershed 2014). Thus, often this method does not extract appreciable lipid yields from
pottery recovered from burial contexts that are not amenable to good preservation of
organic matter. For example, Gregg (2009; Gregg and Slater 2010) was unable to extract
appreciable quantities (above 5 μg /g) of lipid from Near Eastern vessels using this
method. The method is also time-consuming as derivatisation is necessary after extraction.
3.4.2. Acidified methanol extraction
The second method was developed in order to improve the efficiency and effectiveness of
the solvent method. The use of acidified methanol demonstrated enhanced recovery of
organic residues from vessels that did not yield lipid concentrations above 5 μg /g using
the solvent method.
The use of a reagant such as concentrated sulphuric acid (95%) enables the cleavage
of chemical bonds that may exist between lipid species and the clay fabric of the vessels.
Correa-Ascencio and Evershed (2014: 1334) suggest that aluminosilicates within the
ceramic fabric can promote lipid polymerisation reactions (the joining of small molecules
to form long molecules) and strong intermolecular interactions, especially with molecules
with one or more polar functional groups (e.g. hydroxyl and carboxyl). The number and
strength of intermolecular interactions will affect their extraction with organic solvents.
Thus, the use of an acid solution removes both polar and non-polar lipids from the surface
and deeper layers of the ceramic matrix (Correa-Ascencio and Evershed 2014). The
extraction also includes the derivatisation step with the simultaneous production of methyl
esters of fatty acids, thereby making the extraction process more efficient (Correa-
Ascencio and Evershed 2014).
The acidified methanol extraction process enables the recovery of long-chain fatty
acids and usually reveals a wide range of oxidation products, such as series of dicarboxylic
acids, dihydroxy C16:0 and C18:0 fatty acids and ketoacids (Aillaud 2002; Correa-Ascencio
and Evershed 2014). Compounds such as terpenes and sterols are also revealed (Correa-
Ascencio and Evershed 2014). The position of the double bond within the original
70
molecule may still be revealed by oxidation products, although caution must be exercised
in interpretation. Long-chain fatty acids have also been observed in pottery vessels
containing degraded animal fats when extracted with acidified methanol (Correa-Ascencio
and Evershed 2014), suggesting that they may arise through routing from the plant diet into
the carcass and dairy fats (Whelton et al. 2018).
Overall, the acidified methanol extraction process has improved the efficiency and
feasibility of lipid extraction. This is especially when analysing vessels from regions where
lipid preservation may be low, as traditional solvent extraction may fail to yield any lipids,
resulting in the waste of the sample and money. However, this extraction process also
affects the structure of larger and more complex molecules such as triacylglyerols and wax
esters (Correa-Ascencio and Evershed 2014). All these compounds are hydrolysed to their
constituent acids and alcohols, resulting in loss of compositional information (Correa-
Ascencio and Evershed 2014). However, other lipid classes such as n-alkanes, n-alkanols
and ketones remain unaltered (Correa-Ascencio and Evershed 2014). This method has thus
enabled the investigation of lipids in pottery from areas reporting poor lipid preservation;
such as the Mediterranean (Barcons 2015); southern France (Drieu 2017); parts of
Northern Africa (Dunne et al. 2017, 2018), western India (García-Granero et al. in prep.)
and in this thesis, northwest India.
3.5. Instrumental analyses
The analyses of amorphous archaeological organic residues have involved the use of
multiple techniques including Liquid Chromatography-Mass Spectrometry (LC-MS),
High-Performance Liquid Chromatography (HPLC), and Thin-layer Chromatography
(TLC) (e.g. Passi et al.1981; Hurst et al. 1987; Charters et al. 1993; Heron and Evershed
1993). More recently, the use of Gas Chromatography (GC) and Gas Chromatography-
Mass Spectrometry (GC-MS) have become the common instrumental analyses for
characterising organic residues in pottery. Lately these have been coupled with the use of
Gas-Chromatography-combustion-Isotope Ratio Mass Spectrometry (GC-c-IRMS),
allowing for increased scope of distinction between the potential source(s) of the
archaeological residue.
3.5.1. GC and GC-MS
GC enables the separation of compounds within heterogenous complex mixtures based on
their boiling point and polarity. GC is particularly well-suited for volatile compounds and
71
for the analysis of complex, degraded molecular mixtures. Detection is often carried out
via flame ionization detection (FID) where molecules are identified by comparing their
retention times (i.e. time elapsed between the injection of the sample and detection of the
molecule after its separation) with those of standard molecules and according to the elution
order of homologous series (Evershed et al. 1991). The response from the detector is
amplified by a data system and plotted against time, giving rise to a ‘chromatogram’ (see
Fig 3.5). The data system can also be used in association with various softwares to perform
different quantitative and qualitative operations on the chromatogram, which assist with
sample identification and quantification. Compounds (analytes and sample components)
that are retained elute as approximately ‘Gaussian’ (following the shape of a ‘normal’
distribution) shaped peaks in the chromatogram. The retention time of a compound will
always be the same under identical chromatographic conditions. The chromatographic
peak height or peak area is related to the quantity of analyte. For determination of the
actual amount of the compound, the area or height is compared against standards of known
concentration.
Samples analysed by GC must be volatile under conditions in the GC, i.e., they must
have significant vapour pressure below 250oC. Within organic residue analysis,
derivatisation of molecules is conducted during sample preparation to increase volatility,
such as methylation (e.g. Condamin et al. 1976) or trimethylsilylation (Evershed et al.
1990) to derivatise -OH groups with CH3 and SiCH3 respectively, reducing the polarity of
molecules, and improving the resolution of the peaks during chromatographic analysis.
Thus, often the molecules identified via GC-MS are methylated or silylated compounds.
For example, FAMES (Fatty Acid Methyl Esters) are identified and described in the
literature instead of unmethylated fatty acids. Silylation may be used after methylation for
the identification of n-alcohols (Correa-Ascencio and Evershed 2014). The fast, efficient
and highly sensitive nature of GC, along with its ability to couple to MS makes it a good
choice for the analysis of volatile samples. MS is an instrument that measures the masses
of individual molecules that have converted to ions, i.e., molecules that are electrically
charged.
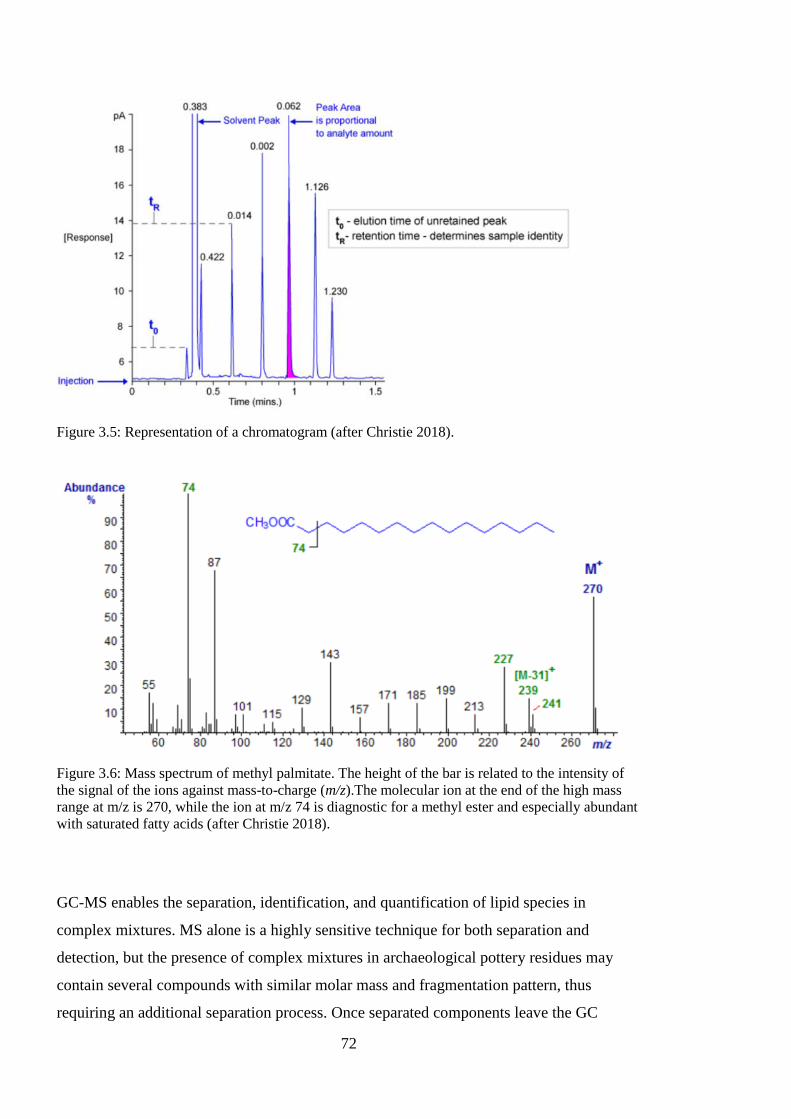
72
Figure 3.5: Representation of a chromatogram (after Christie 2018).
Figure 3.6: Mass spectrum of methyl palmitate. The height of the bar is related to the intensity of
the signal of the ions against mass-to-charge (m/z).The molecular ion at the end of the high mass
range at m/z is 270, while the ion at m/z 74 is diagnostic for a methyl ester and especially abundant
with saturated fatty acids (after Christie 2018).
GC-MS enables the separation, identification, and quantification of lipid species in
complex mixtures. MS alone is a highly sensitive technique for both separation and
detection, but the presence of complex mixtures in archaeological pottery residues may
contain several compounds with similar molar mass and fragmentation pattern, thus
requiring an additional separation process. Once separated components leave the GC
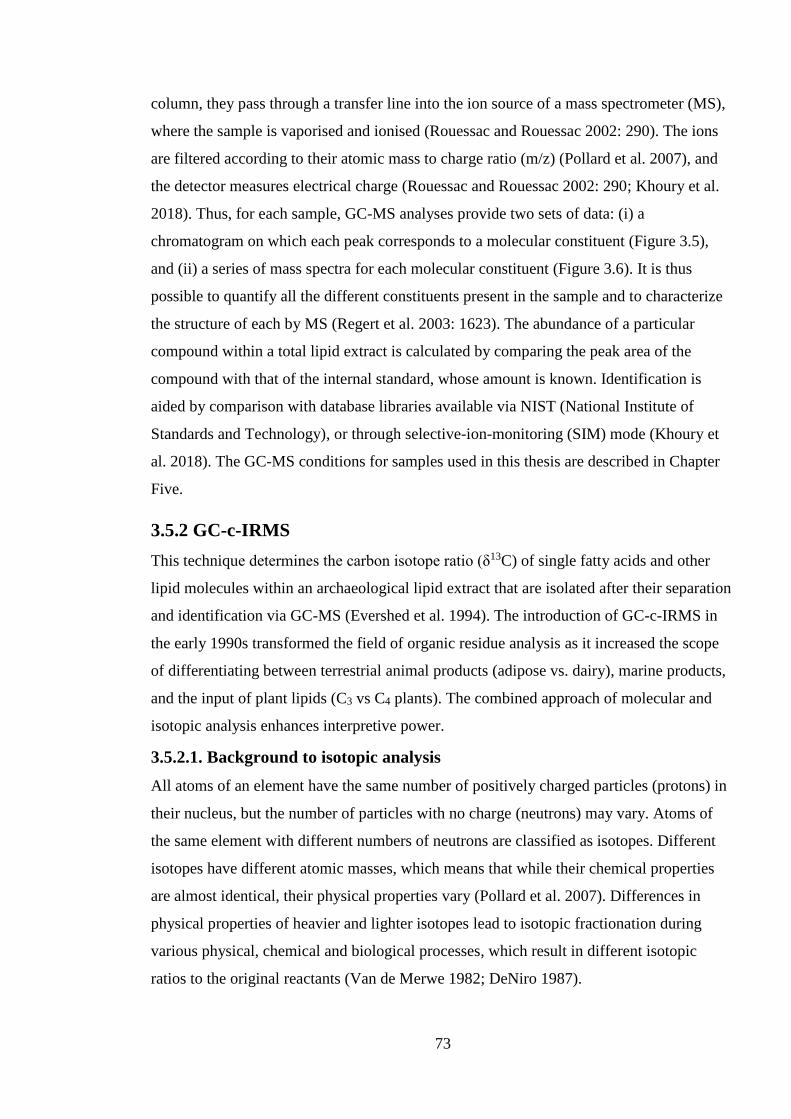
73
column, they pass through a transfer line into the ion source of a mass spectrometer (MS),
where the sample is vaporised and ionised (Rouessac and Rouessac 2002: 290). The ions
are filtered according to their atomic mass to charge ratio (m/z) (Pollard et al. 2007), and
the detector measures electrical charge (Rouessac and Rouessac 2002: 290; Khoury et al.
2018). Thus, for each sample, GC-MS analyses provide two sets of data: (i) a
chromatogram on which each peak corresponds to a molecular constituent (Figure 3.5),
and (ii) a series of mass spectra for each molecular constituent (Figure 3.6). It is thus
possible to quantify all the different constituents present in the sample and to characterize
the structure of each by MS (Regert et al. 2003: 1623). The abundance of a particular
compound within a total lipid extract is calculated by comparing the peak area of the
compound with that of the internal standard, whose amount is known. Identification is
aided by comparison with database libraries available via NIST (National Institute of
Standards and Technology), or through selective-ion-monitoring (SIM) mode (Khoury et
al. 2018). The GC-MS conditions for samples used in this thesis are described in Chapter
Five.
3.5.2 GC-c-IRMS
This technique determines the carbon isotope ratio (δ13C) of single fatty acids and other
lipid molecules within an archaeological lipid extract that are isolated after their separation
and identification via GC-MS (Evershed et al. 1994). The introduction of GC-c-IRMS in
the early 1990s transformed the field of organic residue analysis as it increased the scope
of differentiating between terrestrial animal products (adipose vs. dairy), marine products,
and the input of plant lipids (C3 vs C4 plants). The combined approach of molecular and
isotopic analysis enhances interpretive power.
3.5.2.1. Background to isotopic analysis
All atoms of an element have the same number of positively charged particles (protons) in
their nucleus, but the number of particles with no charge (neutrons) may vary. Atoms of
the same element with different numbers of neutrons are classified as isotopes. Different
isotopes have different atomic masses, which means that while their chemical properties
are almost identical, their physical properties vary (Pollard et al. 2007). Differences in
physical properties of heavier and lighter isotopes lead to isotopic fractionation during
various physical, chemical and biological processes, which result in different isotopic
ratios to the original reactants (Van de Merwe 1982; DeNiro 1987).
74
Isotopic measurements are reported as a ratio of the heavier to the lighter isotope.
This ratio is measured with reference to an element-specific international standard, with
the isotopic deviation from the standard expressed using the δ notation as illustrated in the
equation 3.1. Here, X denotes the heavy isotope and R is the ratio of the heavier to lighter
isotope. The measurements are generally expressed in parts per mil (‰).
𝛿𝑋 = 𝑅𝑠𝑎𝑚𝑝𝑙𝑒−𝑅𝑠𝑡𝑎𝑛𝑑𝑎𝑟𝑑
𝑅𝑠𝑡𝑎𝑛𝑑𝑎𝑟𝑑 𝑋 1000 3.1
This thesis specifically focuses on stable isotopes of carbon of specific compounds within
lipid extracts, particularly C16:0 and C18:0 fatty acids, however the δ13C values of other
compounds are also used (e.g. Copley et al. 2001; Dunne et al. 2017). Carbon stable
isotope ratios are expressed as delta values (e.g. δ13C) on the VPDB (Vienna Pee Dee
Belemnite) international scale (Coplen et al. 2006; Coplen 2011). The precision of δ13C
values is typically ±0.3% (Regert 2011).
3.5.2.2. Compound-specific isotopic analysis
The use of compound-specific isotopic analysis in organic lipid residue analysis uses basic
principles in animal digestive metabolism and plant photosynthesis to distinguish between
potential food sources in vessels. There are also differences in how lipids are
biosynthesised and routed to tissues of different animals (Christie 1981; Dudd et al. 1998;
Dudd 1999)
In plants, the stable isotopic values of carbon in tissues are primarily related to the
mechanisms of photosynthesis that enable metabolism of CO2 (Smith and Epstein
1971). These differ according to the type of plant and the ecosystem to which they are
adapted: C3, C4 and Crassulacean Acid Metabolism (CAM) (O’Leary 1981). About 85% of
plant species in the world are C3 plants, including all trees, and crops like wheat, barley,
and rice (O’Leary 1981). C4 plants are better adapted to arid climates, such as crops like
millets and maize. Each photosynthetic pathway involves very different amounts of
fractionation and responds differently to environmental and physiological controls
(O’Leary 1981; DeNiro 1987; Farquhar et al. 1989), allowing for distinctions to be made
based on their isotopic values. For example, δ13C values for C3 plants are around -27.1‰
±2‰; C4 plants have values of -13.1‰ ±1.2‰; and marine values fall around -20‰ (Regert
2011).
75
Isotopic fractionation also occurs in consumers. As carbon isotopic fractionation
between the tissues of the consumer and its diet is very small, from 1% to 2% (DeNiro and
Epstein 1978), δ13C values of animals are often directly linked to those of the
plants/herbivores consumed (Regert 2011). Fundamental differences between the digestive
physiology of ruminants (cattle, sheep/ goat) and non-ruminant animals such as pigs also
exist, which enable distinction between the δ13C values of their fats. For example, while
the primary source of C16:0 and C18:0 is all animals is through dietary carbohydrates, in
ruminant dairy products, C16:0 is synthesised in the mammary gland de novo from acetate
(derived mainly from dietary carbohydrate) while C18:0 is derived from dietary fatty acids
and other sources in the rumen (Dudd et al. 1998). In ruminant adipose fats, the C16:0 and
C18:0 fatty acids are derived directly from the rumen (Copley et al. 2003). As the mammary
gland cannot biosynthesize C18:0 directly, the routing of dietary fatty acids of milk during
lactation gives rise to more negative δ13C values for the C18:0 fatty acid of milk compared
to the adipose of animals feeding on the same diet (Dudd et al. 1998; Copley et al. 2003).
Meanwhile, non-ruminants such as pigs use carbon from both acetate and glucose to
produce C16:0 and C18:0, creating more positive δ13C values than those obtained by ruminant
adipose fats. These differences in δ13C values of fatty acids and carbohydrate components
of forage and fodder in animals’ diets make it possible to distinguish between ruminant
dairy fats, ruminant adipose fats and non-ruminant adipose fats (Dudd et al. 1998; Copley
et al. 2003).
However, isotopic values of animal tissues are influenced both by biosynthetic
processes, specific to each species (and each organ or tissue) and are also related to
the environment and the type of diet (DeNiro and Epstein 1978; Van Klinken et al. 2000;
Boecklen et al. 2011). The δ13C values obtained from archaeological lipids are compared
with modern reference values of the δ13C values of C16:0 and C18:0 fatty acids of known
animal or plant origin (Figure 3.7), and corrected for the modification of atmospheric CO2
due to the burning of fossil fuels (Friedli et al.1986; DeNiro 1987; Evershed et al. 1994;
Dudd and Evershed 1998; Spangenberg et al. 2006). All these factors must be accounted
for during interpretation.
As stable carbon isotopic values are known to be stable even after degradation and
transformation of the source fatty acids (Dudd and Evershed 1998; Dudd et al. 1999,
Evershed et al. 2002; Steele et al. 2010) they provide means to establish the potential
source/s of the archaeological lipid, albeit with the potential of providing a ‘mixed’
isotopic signal when multiple products have been processed in the same vessel (Copley
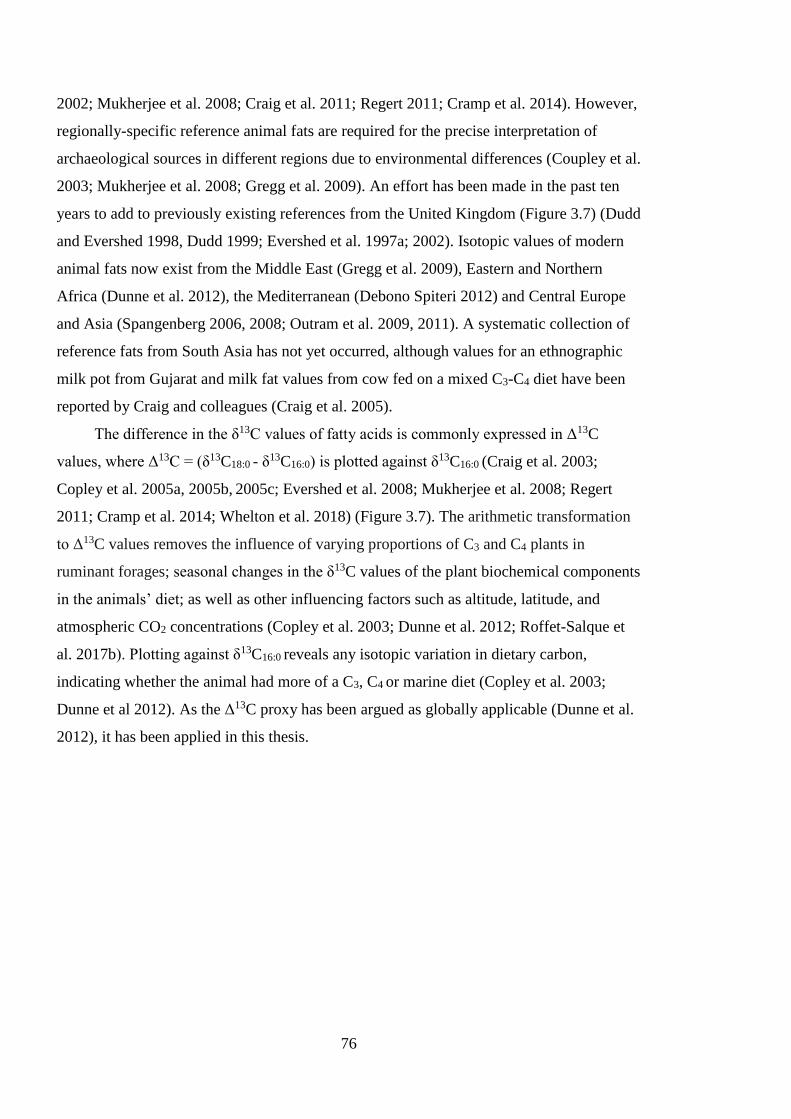
76
2002; Mukherjee et al. 2008; Craig et al. 2011; Regert 2011; Cramp et al. 2014). However,
regionally-specific reference animal fats are required for the precise interpretation of
archaeological sources in different regions due to environmental differences (Coupley et al.
2003; Mukherjee et al. 2008; Gregg et al. 2009). An effort has been made in the past ten
years to add to previously existing references from the United Kingdom (Figure 3.7) (Dudd
and Evershed 1998, Dudd 1999; Evershed et al. 1997a; 2002). Isotopic values of modern
animal fats now exist from the Middle East (Gregg et al. 2009), Eastern and Northern
Africa (Dunne et al. 2012), the Mediterranean (Debono Spiteri 2012) and Central Europe
and Asia (Spangenberg 2006, 2008; Outram et al. 2009, 2011). A systematic collection of
reference fats from South Asia has not yet occurred, although values for an ethnographic
milk pot from Gujarat and milk fat values from cow fed on a mixed C3-C4 diet have been
reported by Craig and colleagues (Craig et al. 2005).
The difference in the δ13C values of fatty acids is commonly expressed in Δ13C
values, where Δ13C = (δ13C18:0 - δ13C16:0) is plotted against δ13C16:0 (Craig et al. 2003;
Copley et al. 2005a, 2005b, 2005c; Evershed et al. 2008; Mukherjee et al. 2008; Regert
2011; Cramp et al. 2014; Whelton et al. 2018) (Figure 3.7). The arithmetic transformation
to Δ13C values removes the influence of varying proportions of C3 and C4 plants in
ruminant forages; seasonal changes in the δ13C values of the plant biochemical components
in the animals’ diet; as well as other influencing factors such as altitude, latitude, and
atmospheric CO2 concentrations (Copley et al. 2003; Dunne et al. 2012; Roffet-Salque et
al. 2017b). Plotting against δ13C16:0 reveals any isotopic variation in dietary carbon,
indicating whether the animal had more of a C3, C4 or marine diet (Copley et al. 2003;
Dunne et al 2012). As the Δ13C proxy has been argued as globally applicable (Dunne et al.
2012), it has been applied in this thesis.
77
Figure 3.7: Examples of scatterplots of δ13C values of C16:0 and C18:0 fatty acids measured from
sites from prehistoric pottery from the United Kingdom (a, b, and c). The ellipses represent 1SD
confidence ellipses, while curves from the porcine adipose ellipse to the ruminant dairy and
adipose ellipses and between the ruminant dairy and adipose ellipses represent theoretical δ13C
values for mixture of these fats. Scatterplots d, e and f are examples of Δ13C values against δ13C
values of C16:0 fatty acid, often used in the absence of modern reference fats (reproduced from
Mukherjee et al. 2008).
3.6. Interpretation
After the completion of analyses, the interpretation of the constituents of the organic
residue is undertaken. The assignment of a specific source or constituent of a residue based
on the presence of a particular biomarker component or mixture of components demands a
high degree of rigour (Evershed 2008a: 898). The direct comparison of ancient and
contemporary organic products is not straightforward, as archaeological residues are
extremely complex mixtures, complicated by effects of decay over archaeological time
(possibly in different burial environments) and effects of human intervention (the mixing
or alteration of natural products during processing or cooking) (Evershed 1993).
Furthermore, certain compounds in natural products may not survive, or may transform
78
over time, giving rise to altered rather than original chemical structures (Evershed 2008a).
A good knowledge of the chemical and biochemical pathways involved in the degradation
and transformation of organic compounds is required to make nuanced interpretations of
the potential source of the archaeological residue. A variety of different methods enable the
identification of specific or general lipids. These are highlighted below.
3.6.1. ‘Biomarkers’, molecular signatures and proxies
Certain chemical compounds, or a combination of compounds might be unique to a
specific product in nature. A compound or mixtures of compounds in an archaeological
organic residue must be compared to those present in contemporary plants and animals
(known as modern references) (Evershed 1993). A unique chemical ‘fingerprint’ or
signature may enable the determination of the presence or use of a specific organic product
in the past. Several types of molecular markers have been defined by bioarchaeologists: (i)
‘biomarkers’ that unambiguously correspond to native molecules whose association can be
linked with natural sources (e.g. theobromine for cacao) (e.g. Zarillo et al. 2018); (ii)
anthropogenic transformation markers that are the result of chemical transformations
induced by different human activities; (iii) natural degradation markers that are formed by
natural decay of the initial biomarkers or transformation markers in the archaeological
deposits by chemical or biochemical processes (Evershed et al. 1992; Regert 2007, 2011;
Evershed 2008a).
Archaeologists have used the molecular signature concept to determine the origin of
a constituent of an organic residue in multiple geographic and archaeological contexts (see
Evershed 2008a for detailed summary). Certain compounds of organic products like
beeswax, plant resins, fish oils, and other plant organisms have been widely studied and
robustly associated as components in ancient archaeological residues. These are
summarised in Table 3.2.
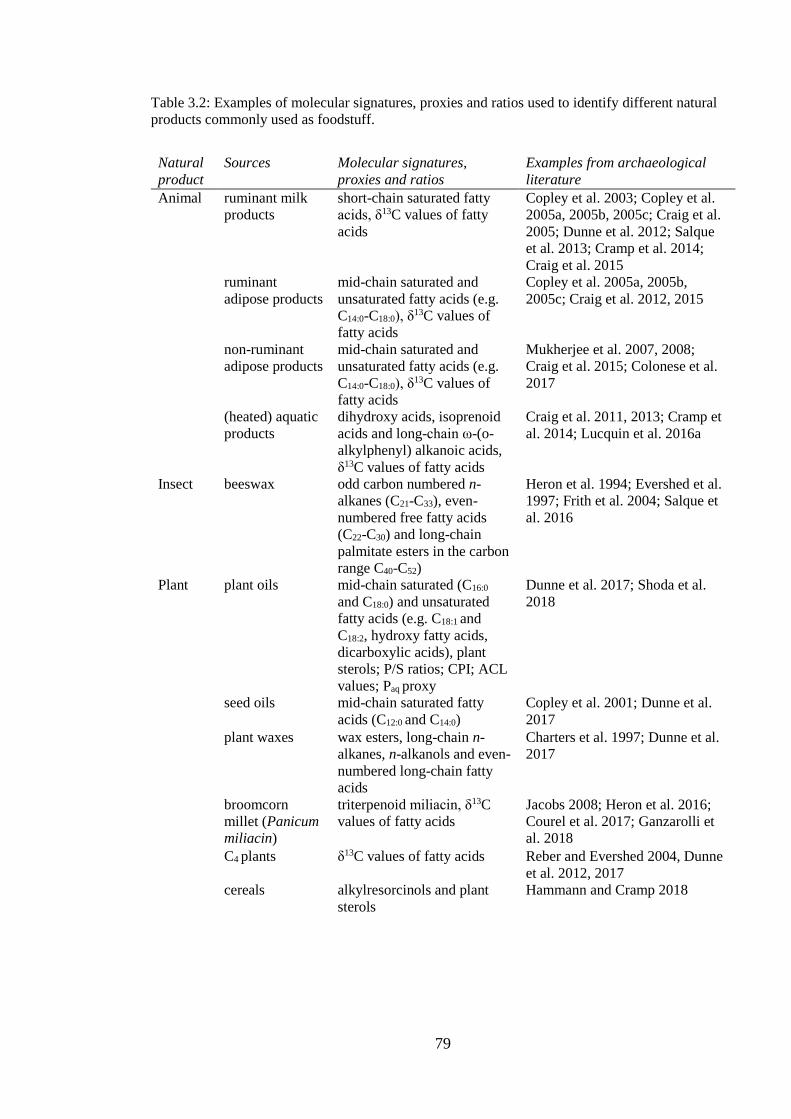
79
Table 3.2: Examples of molecular signatures, proxies and ratios used to identify different natural
products commonly used as foodstuff.
Natural
product
Sources Molecular signatures,
proxies and ratios
Examples from archaeological
literature
Animal ruminant milk
products
short-chain saturated fatty
acids, δ13C values of fatty
acids
Copley et al. 2003; Copley et al.
2005a, 2005b, 2005c; Craig et al.
2005; Dunne et al. 2012; Salque
et al. 2013; Cramp et al. 2014;
Craig et al. 2015
ruminant
adipose products
mid-chain saturated and
unsaturated fatty acids (e.g.
C14:0-C18:0), δ13C values of
fatty acids
Copley et al. 2005a, 2005b,
2005c; Craig et al. 2012, 2015
non-ruminant
adipose products
mid-chain saturated and
unsaturated fatty acids (e.g.
C14:0-C18:0), δ13C values of
fatty acids
Mukherjee et al. 2007, 2008;
Craig et al. 2015; Colonese et al.
2017
(heated) aquatic
products
dihydroxy acids, isoprenoid
acids and long-chain ω-(o-
alkylphenyl) alkanoic acids,
δ13C values of fatty acids
Craig et al. 2011, 2013; Cramp et
al. 2014; Lucquin et al. 2016a
Insect beeswax odd carbon numbered n-
alkanes (C21-C33), even-
numbered free fatty acids
(C22-C30) and long-chain
palmitate esters in the carbon
range C40-C52)
Heron et al. 1994; Evershed et al.
1997; Frith et al. 2004; Salque et
al. 2016
Plant plant oils mid-chain saturated (C16:0
and C18:0) and unsaturated
fatty acids (e.g. C18:1 and
C18:2, hydroxy fatty acids,
dicarboxylic acids), plant
sterols; P/S ratios; CPI; ACL
values; Paq proxy
Dunne et al. 2017; Shoda et al.
2018
seed oils mid-chain saturated fatty
acids (C12:0 and C14:0)
Copley et al. 2001; Dunne et al.
2017
plant waxes wax esters, long-chain n-
alkanes, n-alkanols and even-
numbered long-chain fatty
acids
Charters et al. 1997; Dunne et al.
2017
broomcorn
millet (Panicum
miliacin)
triterpenoid miliacin, δ13C
values of fatty acids
Jacobs 2008; Heron et al. 2016;
Courel et al. 2017; Ganzarolli et
al. 2018
C4 plants δ13C values of fatty acids Reber and Evershed 2004, Dunne
et al. 2012, 2017
cereals alkylresorcinols and plant
sterols
Hammann and Cramp 2018
80
Archaeologists also use the presence of specific compounds to make inferences about
the way the product has been processed in antiquity. Within the environmental and plant
sciences, the term ‘molecular proxy’ has come into use to include individual compounds
characterising specific biogenic sources and individual compounds acting as a proxy for
another compound. For example, the presence of long-chain ketones within pottery lipid
extracts is used as a molecular proxy for the continuous heating of plant waxes to
temperatures above 300°C (Regert et al. 1998; Evershed 2008a). Other examples of
molecular proxies for heat alteration include ω-(o-alkylphenyl) alkanoic acids with 16-22
carbon atoms, which are produced when polyunsaturated fatty acids (PUFAs) are heated to
over 270°C, and dihydroxy fatty acids and dicarboxylic acids that are produced by the
oxidation of unsaturated fatty acids. The production of short-chain α, ω-dicarboxylic acids
(diacids) occurs by oxidative degradation of a carbon-carbon double bond in an
unsaturated fatty acid (Regert et al. 1998). Various diacids are known to be formed, and
assumptions can be made from the distribution pattern of the homologues (compounds
belonging to a series, but differing from each other by a repeating unit), for example, the
prominence of the C9 diacid implies the presence of compounds with unsaturation at
position 9 (most probably C18:1 fatty acid) (Regert et al 1998: 2030). Similarly, with
dihydroxy acids, the position of the hydroxyl groups added to the carbon atoms bearing the
original double-bond record the original position of unsaturation, which in combination of
the carbon number of the fatty acids can be related back to the original compound in the
vessel (Copley et al. 2003; Colombini et al. 2005; Evershed 2008a). Thus, the presence of
diacids in a vessel may be indicative of the presence of plant-based residues or fish, which
contain high proportions of unsaturated fatty acids. Examples of such ‘molecular proxies’
are also included in Table 3.2.
3.6.2. Molecular ratios
Archaeologists and plant scientists also use molecular ratios of sets of compounds to
distinguish between sources of products (Jansen and Wiesenberg 2017). Examples include
the carbon preference index (CPI), palmitic and stearic acids ratio (P/S ratio), average
chain length (ACL) and Paq proxy ratio (Dunne et al 2017). CPI measures the relative
abundance of odd over even carbon chain lengths, P/S ratio measures the ratio of the
relative abundance of palmitic (C16:0) and stearic (C18:0) fatty acids, ACL measures the
weight-averaged number of carbon atoms of the higher plant C25:0 to C33:0 n-alkanes, and
Paq proxy ratio measures the emergent and non-emergent aquatic macrophyte input (Dunne
81
et al. 2017: 4) respectively, in lipid extracts (Table 3.2). In general, these ratios may be
indicative of the presence of plant species (for example, CPI values for plant species have
strong odd-chain preferences, P/S ratios greater than 4 indicate a plant origin, and ACL
values and the Paq proxy ratio are indicative of different plant taxa and aqueous plant
species, respectively (Ficken et al 2000; Diefendorf et al. 2011; Dunne et al. 2017). The
use of molecular ratios in plant sciences and archaeology is common as the direct
comparison of lipid compositions from contemporary biogenic sources is not possible due
to degradation, whereas broadly speaking, ratios of compounds may be more stable
indicators of biological origin of residues (Eerkens 2005). Archaeologists are known to use
not only P/S ratios, but also C18:1/C16:0, C16:1/C18:1 or C16:0/C14:0. (e.g. Malainey et al. 1999),
and ratios of odd-chain vs. even-chain fatty acids ((C15:0 +C17:0)/C18:0)
C16:0+C18:0/(C12:0+C14:0 (e.g. Eerkens 2005). Caution must be exercised, however, as while
ratios are effective in discriminating against fresh animal fats or plant oils, the differential
degradation of fatty acids prevents their use for heavily altered or degraded fats. For
example, the ratio C16:0/C18:0 cannot be regarded as constant over archaeological time as
C16:0 is twice as soluble in water at 20°C than C18:0, and may be preferentially leached from
the residues at all but the driest of burial sites (Steele et al. 2010). Fatty acid ratios are also
affected by the solvents used and method employed to extract and analyse organic residues
(Steele et al. 2010). As a result, they cannot be considered diagnostic for the degraded fats
found in archaeological samples but may be broadly indicative.
3.6.3. Interpretational challenges
The sections above have described a variety of methods by which archaeologists interpret
the likely origins of the compounds present in lipid extracts from archaeological vessels.
But interpretation of the likely source(s) can be challenging due to several factors. These
include complex formation processes, lack of available modern reference fats, and
challenges of resolving mixtures of products in vessels.
3.6.3.1. Complex formation processes
Understanding the various formation processes of organic residues can be very complex.
Potsherds may adsorb a variety of organic compounds during their life-, depositional- or
excavation histories. The porosity and fabric of the vessel may influence lipid adsorption
(Drieu 2017). The use-history of the vessel may be varied, and compounds within the pot
may represent an aggregate of all or most of the vessel’s uses over its lifetime. Upon
deposition of the vessel, a variety of factors conducive to diagenesis could affect the
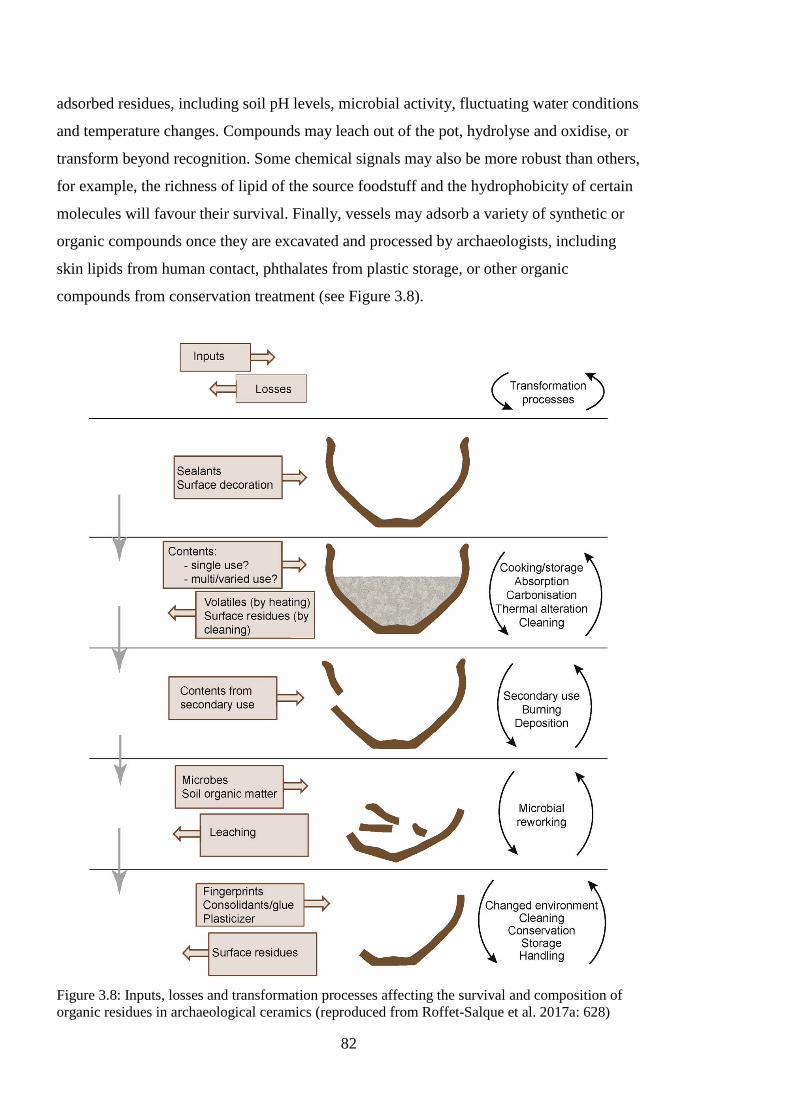
82
adsorbed residues, including soil pH levels, microbial activity, fluctuating water conditions
and temperature changes. Compounds may leach out of the pot, hydrolyse and oxidise, or
transform beyond recognition. Some chemical signals may also be more robust than others,
for example, the richness of lipid of the source foodstuff and the hydrophobicity of certain
molecules will favour their survival. Finally, vessels may adsorb a variety of synthetic or
organic compounds once they are excavated and processed by archaeologists, including
skin lipids from human contact, phthalates from plastic storage, or other organic
compounds from conservation treatment (see Figure 3.8).
Figure 3.8: Inputs, losses and transformation processes affecting the survival and composition of
organic residues in archaeological ceramics (reproduced from Roffet-Salque et al. 2017a: 628)
83
3.6.3.2. Modern reference fats and resolving mixtures
The development of any biomolecular or stable isotope proxy for reconstructing past
environments or processes requires measurements of reference collections of organisms
from contemporary or past environments of known provenance (Roffet-Salque et al.
2017b). Lipid researchers generally use modern references that are specific to the study
region, enabling greater specificity with identifying the potential source(s) of ancient lipids
(e.g. Spangenberg et al. 2006; Gregg et al. 2009). However, recent studies have
demonstrated the potential pitfalls in creating reference fats from meat or dairy products
sourced from animals fed on unknown diets or those exposed to modern practices (Roffet-
Salque et al. 2017a). This is because the diet of animals can alter the δ13C values of fatty
acids by affecting pathways of fatty acid synthesis during metabolism (Roffet-Salque et al.
2017b). For example, cattle fed on high starch diets like modern silage produce milk with
altered δ13C18:0 values, creating an unreliable proxy for archaeological samples (Roffet-
Salque et al. 2017b). Thus, extreme care must be exercised in selecting animals raised on
diets isotopically similar to those that would have existed in prehistory (Roffet-Salque et
al. 2017b). However, access to animals with known diets, and the export and analysis of
modern animal products can be challenging.
Reference fats from different animals and regions have demonstrated that isotopic
values can overlap (Evershed et al. 2002, Steele et al. 2010; Craig et al. 2012).
Additionally, some demonstrate high variability, for example, the subcutaneous fats of deer
(Dudd 1999; Evershed et al. 2002a; Spangenberg et al. 2006; Craig et al. 2012) and
freshwater fish (Craig et al. 2007, 2011, 2013; Outram et al. 2009, 2011; Cramp and
Evershed 2014; Taché and Craig 2015), creating interpretational challenges. Similarly,
although the Δ13C proxy has been used by researchers with limited access to regionally-
specific modern animal fats as it is applicable in regions with both C3 and C4 plants
(Evershed et al. 2002; Copley et al. 2005a; Evershed et al. 2008; Dunne et al. 2012;
Whelton et al. 2018), it is limited in scenarios where animal-based products were mixed
with plant-based products in vessels (Hendy et al. 2018). As this was ostensibly was
common throughout different regions in prehistory, it is important to develop more
strategies to resolve potential mixtures.
Resolving mixtures of products in vessels is one of the major challenges faced by
lipid residue studies (Craig et al. 2011; Regert 2011). Researchers have attempted to
resolve these issues by creating models that consider the concentration of each fatty acid
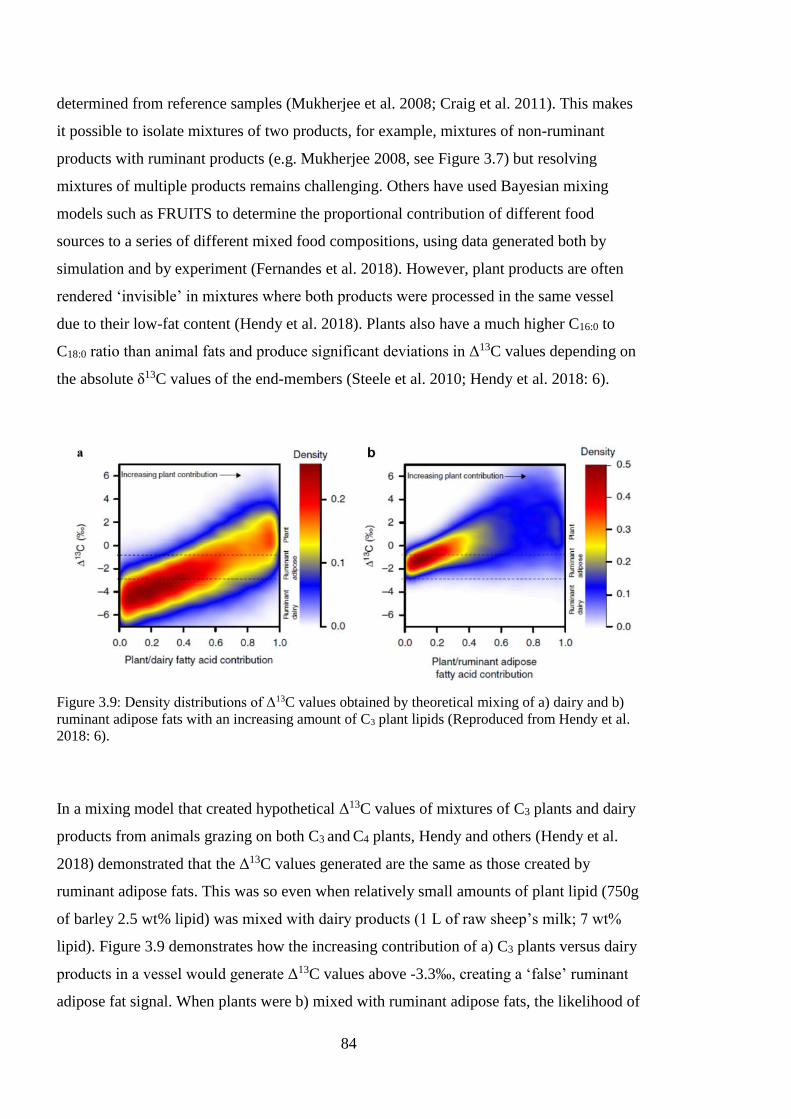
84
determined from reference samples (Mukherjee et al. 2008; Craig et al. 2011). This makes
it possible to isolate mixtures of two products, for example, mixtures of non-ruminant
products with ruminant products (e.g. Mukherjee 2008, see Figure 3.7) but resolving
mixtures of multiple products remains challenging. Others have used Bayesian mixing
models such as FRUITS to determine the proportional contribution of different food
sources to a series of different mixed food compositions, using data generated both by
simulation and by experiment (Fernandes et al. 2018). However, plant products are often
rendered ‘invisible’ in mixtures where both products were processed in the same vessel
due to their low-fat content (Hendy et al. 2018). Plants also have a much higher C16:0 to
C18:0 ratio than animal fats and produce significant deviations in Δ13C values depending on
the absolute δ13C values of the end-members (Steele et al. 2010; Hendy et al. 2018: 6).
Figure 3.9: Density distributions of Δ13C values obtained by theoretical mixing of a) dairy and b)
ruminant adipose fats with an increasing amount of C3 plant lipids (Reproduced from Hendy et al.
2018: 6).
In a mixing model that created hypothetical Δ13C values of mixtures of C3 plants and dairy
products from animals grazing on both C3 and C4 plants, Hendy and others (Hendy et al.
2018) demonstrated that the Δ13C values generated are the same as those created by
ruminant adipose fats. This was so even when relatively small amounts of plant lipid (750g
of barley 2.5 wt% lipid) was mixed with dairy products (1 L of raw sheep’s milk; 7 wt%
lipid). Figure 3.9 demonstrates how the increasing contribution of a) C3 plants versus dairy
products in a vessel would generate Δ13C values above -3.3‰, creating a ‘false’ ruminant
adipose fat signal. When plants were b) mixed with ruminant adipose fats, the likelihood of
85
creating a non-ruminant adipose fat signal was increased. This suggests that resolving
mixtures of products in vessels, particularly those of plants and animals, is notoriously
tricky. Environments with high abundance of C4 plants and/or marine and freshwater
resources add further complexities as they increase the isotopic variability of products
available for both humans and animals to consume. In contexts with both C3 and C4 plants
in the landscape, such as in the Sahara and in Anatolia, and in this thesis, northwest India,
it is possible the applicability of the Δ13C proxy, particularly in contexts where animal fats
and plant oils were processed in vessels together, is limited. These interpretational
complexities are discussed in detail in Section 8.2.4.
In summary, although lipid researchers use a variety of interpretive strategies to
understand the possible source(s) processed within a vessel’s use-history, there are degrees
of uncertainty associated with different interpretive processes. The combination of
molecular and isotopic techniques enable the narrowing of potential ancient source(s) into
vessels, but a consideration of the available palaeoecological and bioarchaeological
evidence; possible formation processes and burial environment affecting preservation or
diagenesis of the lipid residues; pyrolytic chemistry and experimental literature; excavation
conditions and storage environment influencing contamination are vital in order to make
any interpretation of their past use (e.g. Mazow et al. 2014). It is also essential that the full
extent of the possibilities and limitations of lipid residue analysis are understood by
archaeologists. This means that archaeologists and lipid specialists must work closely and
readily share information with one another for an accurate characterisation of organic
residues within ceramics.
3.7. Chapter Summary
This chapter has provided the necessary background to lipid residue analysis, including an
introduction to lipids, issues surrounding preservation, degradation and contamination, a
brief description of common extraction methods and instrumental analyses. This chapter
also outlines techniques or proxies used to interpret lipid residue data and highlights some
of the challenges faced during the interpretive stage. The information provided in this
chapter is necessary to understand the results and discussions presented in Chapters Six
and Seven, and for the synthesis in Chapter Eight. The next chapter provides a detailed
background to the archaeological sites investigated in this thesis, also providing
archaeobotanical and zooarchaeological data that aid in the interpretation of results from
the analyses.

86
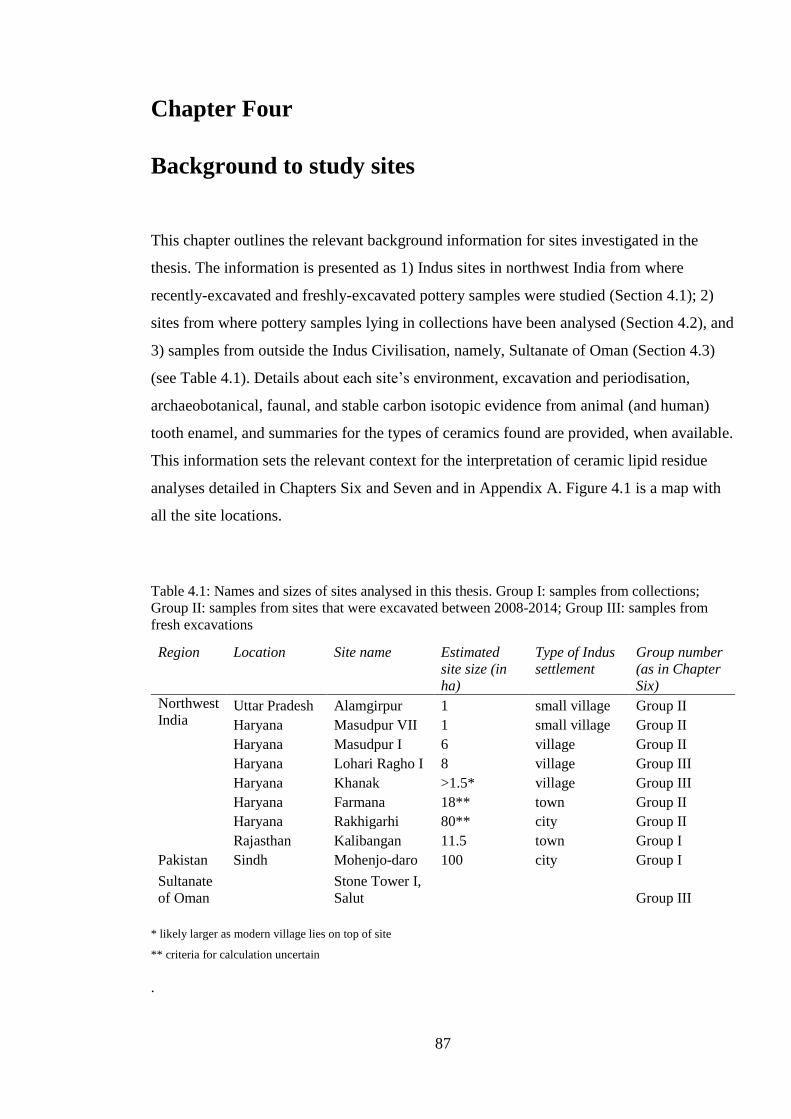
87
Chapter Four
Background to study sites
This chapter outlines the relevant background information for sites investigated in the
thesis. The information is presented as 1) Indus sites in northwest India from where
recently-excavated and freshly-excavated pottery samples were studied (Section 4.1); 2)
sites from where pottery samples lying in collections have been analysed (Section 4.2), and
3) samples from outside the Indus Civilisation, namely, Sultanate of Oman (Section 4.3)
(see Table 4.1). Details about each site’s environment, excavation and periodisation,
archaeobotanical, faunal, and stable carbon isotopic evidence from animal (and human)
tooth enamel, and summaries for the types of ceramics found are provided, when available.
This information sets the relevant context for the interpretation of ceramic lipid residue
analyses detailed in Chapters Six and Seven and in Appendix A. Figure 4.1 is a map with
all the site locations.
Table 4.1: Names and sizes of sites analysed in this thesis. Group I: samples from collections;
Group II: samples from sites that were excavated between 2008-2014; Group III: samples from
fresh excavations
Region
Location
Site name
Estimated
site size (in
ha)
Type of Indus
settlement
Group number
(as in Chapter
Six)
Northwest
India Uttar Pradesh Alamgirpur 1 small village Group II
Haryana Masudpur VII 1 small village Group II
Haryana Masudpur I 6 village Group II
Haryana Lohari Ragho I 8 village Group III
Haryana Khanak >1.5* village Group III
Haryana Farmana 18** town Group II
Haryana Rakhigarhi 80** city Group II
Rajasthan Kalibangan 11.5 town Group I
Pakistan Sindh Mohenjo-daro 100 city Group I
Sultanate
of Oman
Stone Tower I,
Salut Group III
* likely larger as modern village lies on top of site
** criteria for calculation uncertain
.
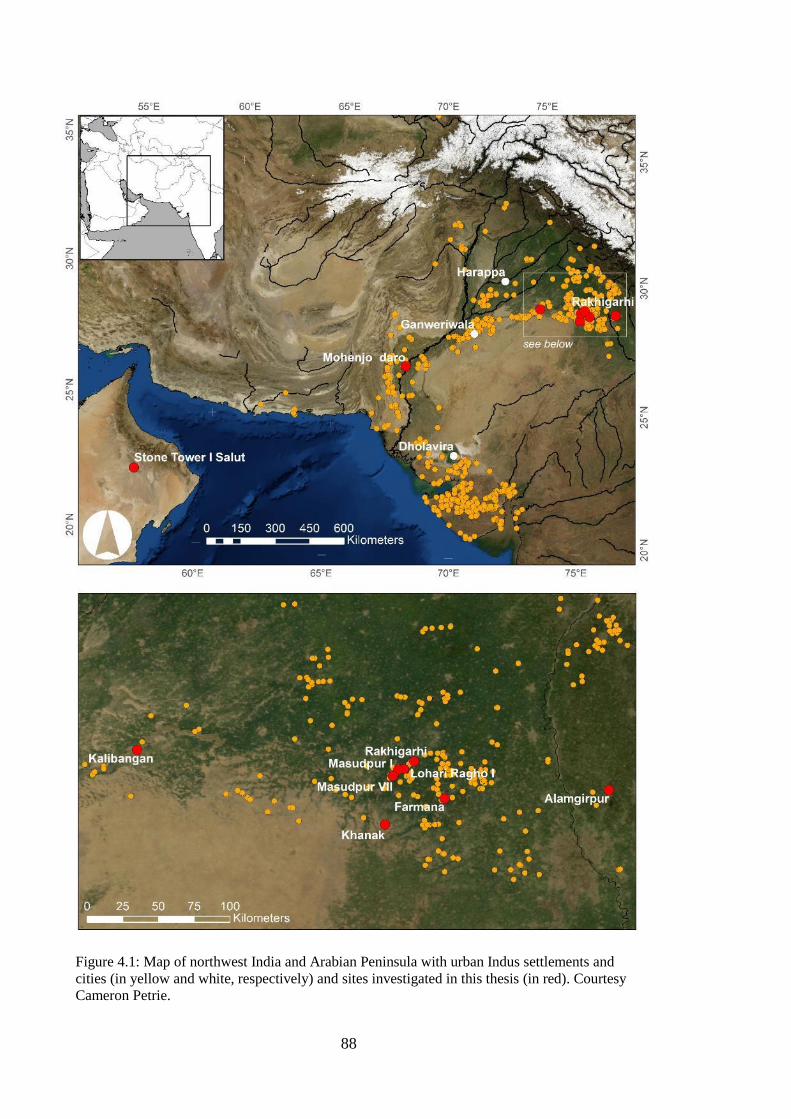
88
Figure 4.1: Map of northwest India and Arabian Peninsula with urban Indus settlements and
cities (in yellow and white, respectively) and sites investigated in this thesis (in red). Courtesy
Cameron Petrie.
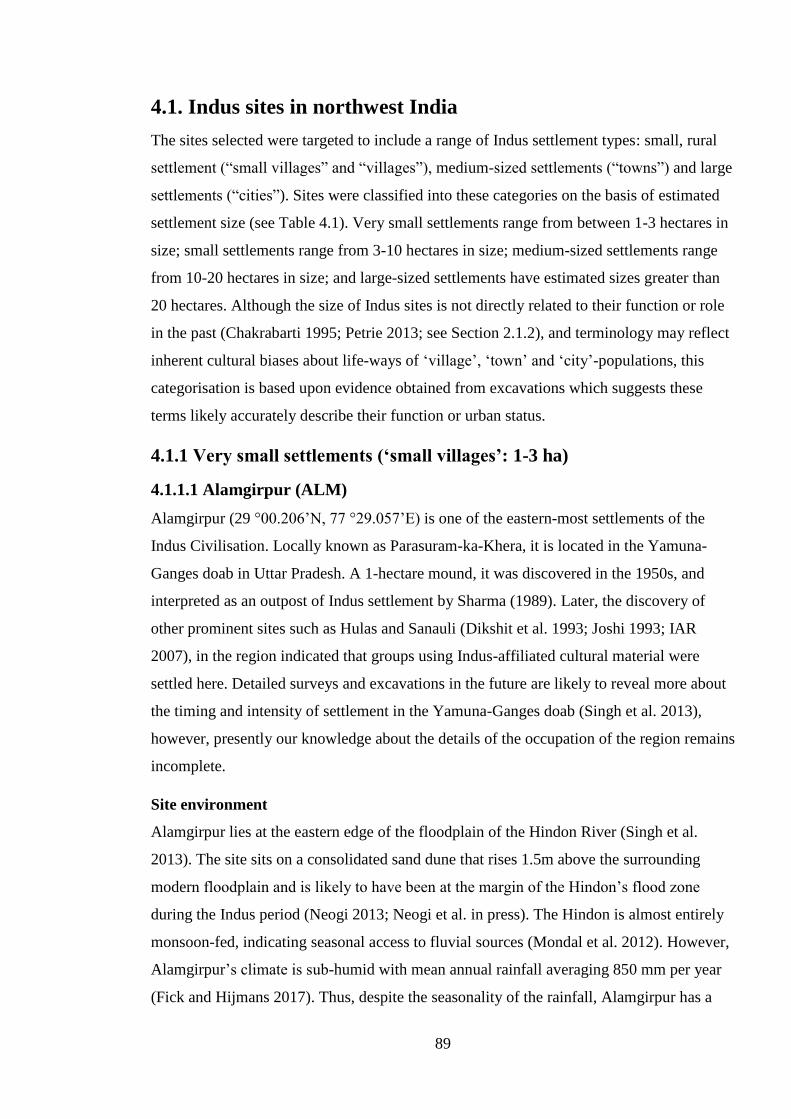
89
4.1. Indus sites in northwest India
The sites selected were targeted to include a range of Indus settlement types: small, rural
settlement (“small villages” and “villages”), medium-sized settlements (“towns”) and large
settlements (“cities”). Sites were classified into these categories on the basis of estimated
settlement size (see Table 4.1). Very small settlements range from between 1-3 hectares in
size; small settlements range from 3-10 hectares in size; medium-sized settlements range
from 10-20 hectares in size; and large-sized settlements have estimated sizes greater than
20 hectares. Although the size of Indus sites is not directly related to their function or role
in the past (Chakrabarti 1995; Petrie 2013; see Section 2.1.2), and terminology may reflect
inherent cultural biases about life-ways of ‘village’, ‘town’ and ‘city’-populations, this
categorisation is based upon evidence obtained from excavations which suggests these
terms likely accurately describe their function or urban status.
4.1.1 Very small settlements (‘small villages’: 1-3 ha)
4.1.1.1 Alamgirpur (ALM)
Alamgirpur (29 °00.206’N, 77 °29.057’E) is one of the eastern-most settlements of the
Indus Civilisation. Locally known as Parasuram-ka-Khera, it is located in the Yamuna-
Ganges doab in Uttar Pradesh. A 1-hectare mound, it was discovered in the 1950s, and
interpreted as an outpost of Indus settlement by Sharma (1989). Later, the discovery of
other prominent sites such as Hulas and Sanauli (Dikshit et al. 1993; Joshi 1993; IAR
2007), in the region indicated that groups using Indus-affiliated cultural material were
settled here. Detailed surveys and excavations in the future are likely to reveal more about
the timing and intensity of settlement in the Yamuna-Ganges doab (Singh et al. 2013),
however, presently our knowledge about the details of the occupation of the region remains
incomplete.
Site environment
Alamgirpur lies at the eastern edge of the floodplain of the Hindon River (Singh et al.
2013). The site sits on a consolidated sand dune that rises 1.5m above the surrounding
modern floodplain and is likely to have been at the margin of the Hindon’s flood zone
during the Indus period (Neogi 2013; Neogi et al. in press). The Hindon is almost entirely
monsoon-fed, indicating seasonal access to fluvial sources (Mondal et al. 2012). However,
Alamgirpur’s climate is sub-humid with mean annual rainfall averaging 850 mm per year
(Fick and Hijmans 2017). Thus, despite the seasonality of the rainfall, Alamgirpur has a
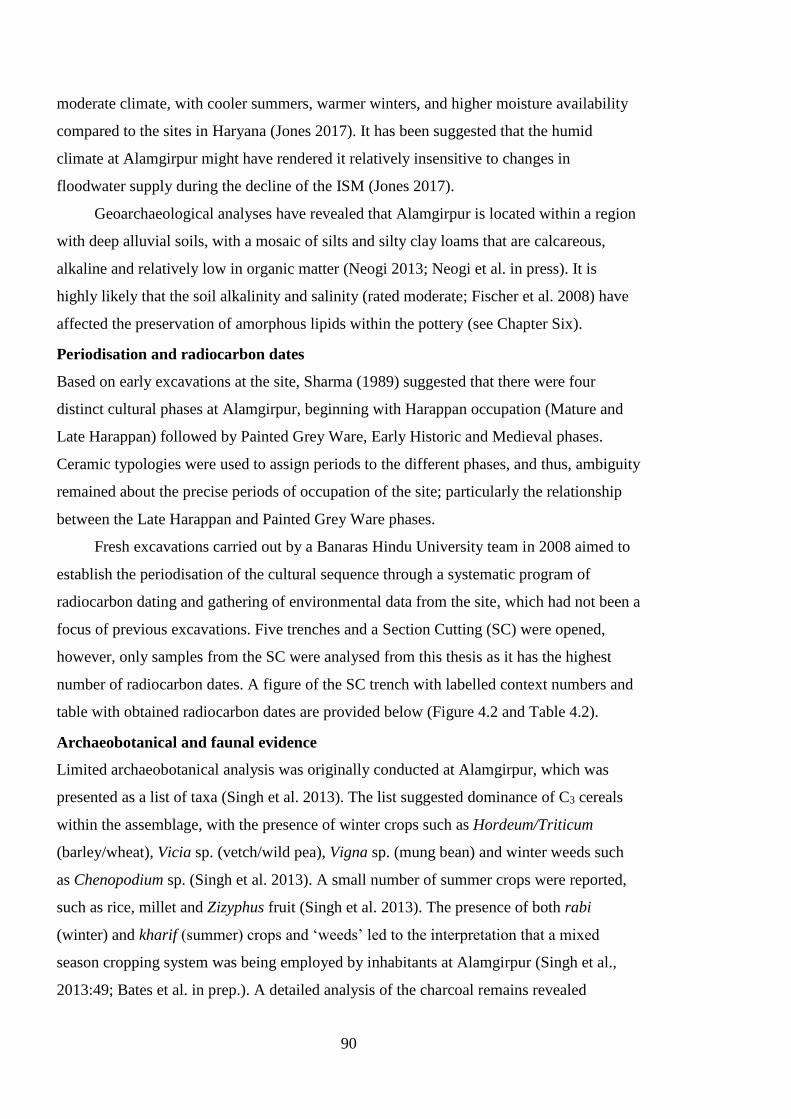
90
moderate climate, with cooler summers, warmer winters, and higher moisture availability
compared to the sites in Haryana (Jones 2017). It has been suggested that the humid
climate at Alamgirpur might have rendered it relatively insensitive to changes in
floodwater supply during the decline of the ISM (Jones 2017).
Geoarchaeological analyses have revealed that Alamgirpur is located within a region
with deep alluvial soils, with a mosaic of silts and silty clay loams that are calcareous,
alkaline and relatively low in organic matter (Neogi 2013; Neogi et al. in press). It is
highly likely that the soil alkalinity and salinity (rated moderate; Fischer et al. 2008) have
affected the preservation of amorphous lipids within the pottery (see Chapter Six).
Periodisation and radiocarbon dates
Based on early excavations at the site, Sharma (1989) suggested that there were four
distinct cultural phases at Alamgirpur, beginning with Harappan occupation (Mature and
Late Harappan) followed by Painted Grey Ware, Early Historic and Medieval phases.
Ceramic typologies were used to assign periods to the different phases, and thus, ambiguity
remained about the precise periods of occupation of the site; particularly the relationship
between the Late Harappan and Painted Grey Ware phases.
Fresh excavations carried out by a Banaras Hindu University team in 2008 aimed to
establish the periodisation of the cultural sequence through a systematic program of
radiocarbon dating and gathering of environmental data from the site, which had not been a
focus of previous excavations. Five trenches and a Section Cutting (SC) were opened,
however, only samples from the SC were analysed from this thesis as it has the highest
number of radiocarbon dates. A figure of the SC trench with labelled context numbers and
table with obtained radiocarbon dates are provided below (Figure 4.2 and Table 4.2).
Archaeobotanical and faunal evidence
Limited archaeobotanical analysis was originally conducted at Alamgirpur, which was
presented as a list of taxa (Singh et al. 2013). The list suggested dominance of C3 cereals
within the assemblage, with the presence of winter crops such as Hordeum/Triticum
(barley/wheat), Vicia sp. (vetch/wild pea), Vigna sp. (mung bean) and winter weeds such
as Chenopodium sp. (Singh et al. 2013). A small number of summer crops were reported,
such as rice, millet and Zizyphus fruit (Singh et al. 2013). The presence of both rabi
(winter) and kharif (summer) crops and ‘weeds’ led to the interpretation that a mixed
season cropping system was being employed by inhabitants at Alamgirpur (Singh et al.,
2013:49; Bates et al. in prep.). A detailed analysis of the charcoal remains revealed
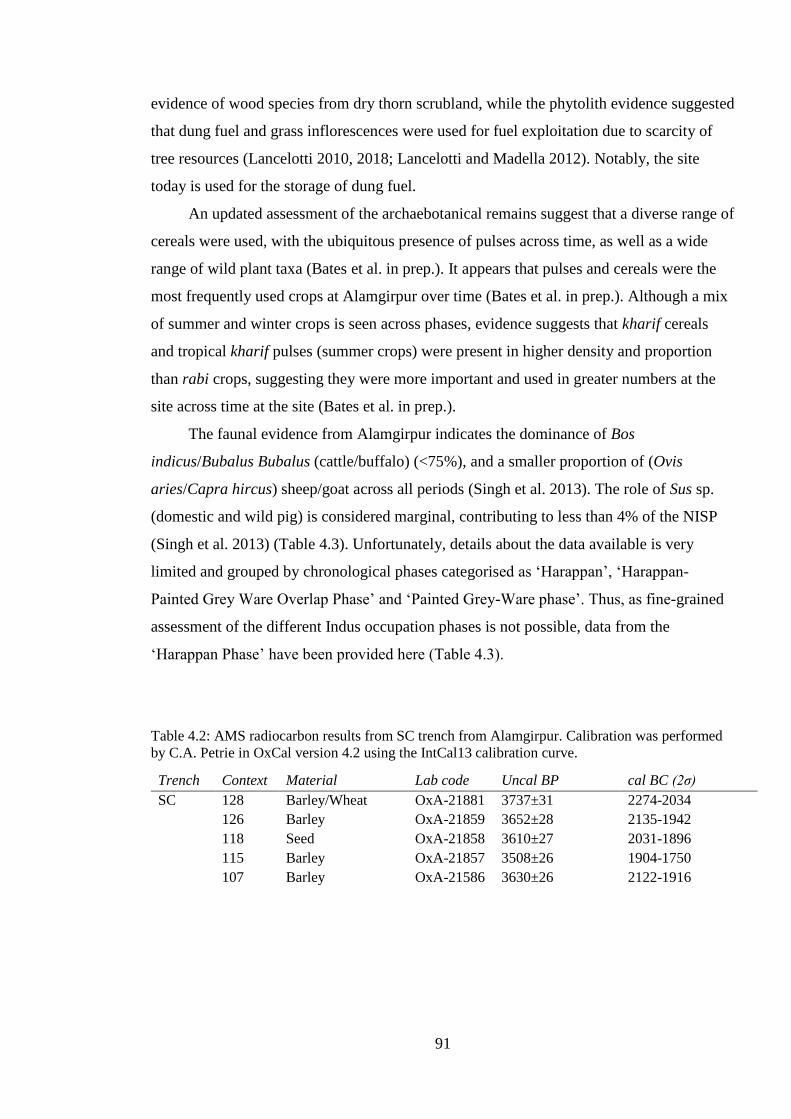
91
evidence of wood species from dry thorn scrubland, while the phytolith evidence suggested
that dung fuel and grass inflorescences were used for fuel exploitation due to scarcity of
tree resources (Lancelotti 2010, 2018; Lancelotti and Madella 2012). Notably, the site
today is used for the storage of dung fuel.
An updated assessment of the archaebotanical remains suggest that a diverse range of
cereals were used, with the ubiquitous presence of pulses across time, as well as a wide
range of wild plant taxa (Bates et al. in prep.). It appears that pulses and cereals were the
most frequently used crops at Alamgirpur over time (Bates et al. in prep.). Although a mix
of summer and winter crops is seen across phases, evidence suggests that kharif cereals
and tropical kharif pulses (summer crops) were present in higher density and proportion
than rabi crops, suggesting they were more important and used in greater numbers at the
site across time at the site (Bates et al. in prep.).
The faunal evidence from Alamgirpur indicates the dominance of Bos
indicus/Bubalus Bubalus (cattle/buffalo) (<75%), and a smaller proportion of (Ovis
aries/Capra hircus) sheep/goat across all periods (Singh et al. 2013). The role of Sus sp.
(domestic and wild pig) is considered marginal, contributing to less than 4% of the NISP
(Singh et al. 2013) (Table 4.3). Unfortunately, details about the data available is very
limited and grouped by chronological phases categorised as ‘Harappan’, ‘Harappan-
Painted Grey Ware Overlap Phase’ and ‘Painted Grey-Ware phase’. Thus, as fine-grained
assessment of the different Indus occupation phases is not possible, data from the
‘Harappan Phase’ have been provided here (Table 4.3).
Table 4.2: AMS radiocarbon results from SC trench from Alamgirpur. Calibration was performed
by C.A. Petrie in OxCal version 4.2 using the IntCal13 calibration curve.
Trench Context Material Lab code Uncal BP cal BC (2σ)
SC 128 Barley/Wheat OxA-21881 3737±31 2274-2034
126 Barley OxA-21859 3652±28 2135-1942
118 Seed OxA-21858 3610±27 2031-1896
115 Barley OxA-21857 3508±26 1904-1750
107 Barley OxA-21586 3630±26 2122-1916
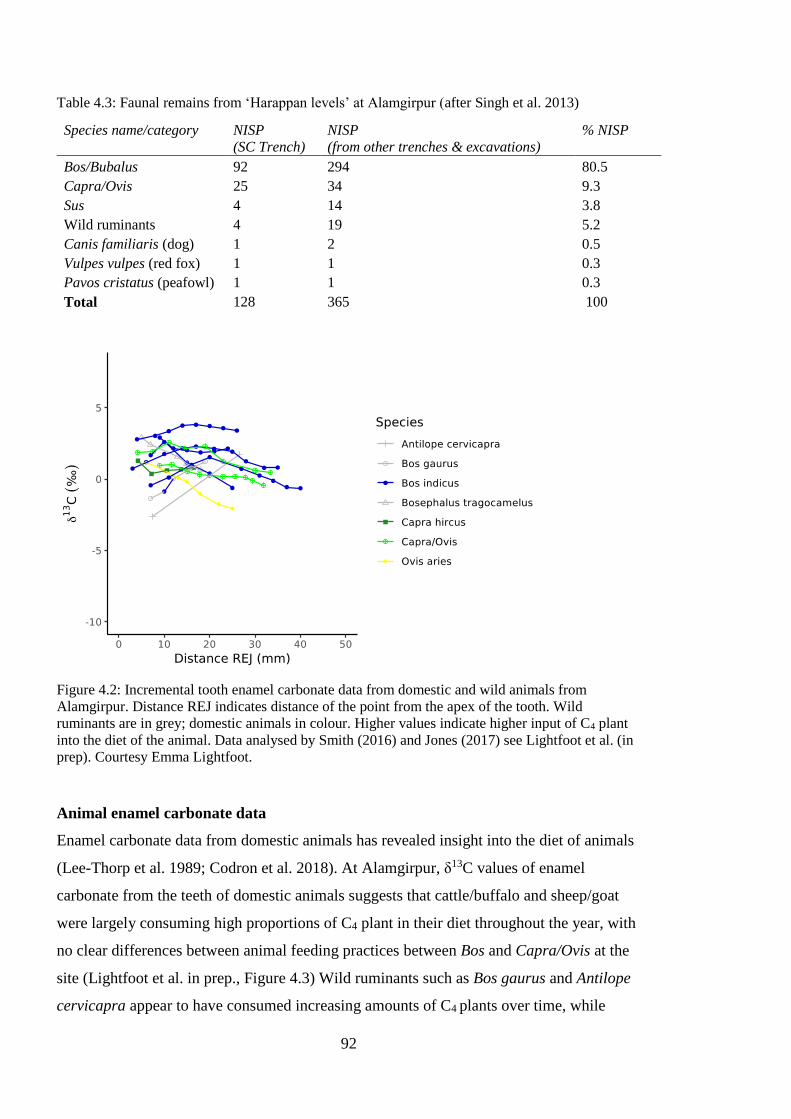
92
Table 4.3: Faunal remains from ‘Harappan levels’ at Alamgirpur (after Singh et al. 2013)
Species name/category NISP
(SC Trench)
NISP
(from other trenches & excavations)
% NISP
Bos/Bubalus 92 294 80.5
Capra/Ovis 25 34 9.3
Sus 4 14 3.8
Wild ruminants 4 19 5.2
Canis familiaris (dog) 1 2 0.5
Vulpes vulpes (red fox) 1 1 0.3
Pavos cristatus (peafowl) 1 1 0.3
Total 128 365 100
Figure 4.2: Incremental tooth enamel carbonate data from domestic and wild animals from
Alamgirpur. Distance REJ indicates distance of the point from the apex of the tooth. Wild
ruminants are in grey; domestic animals in colour. Higher values indicate higher input of C4 plant
into the diet of the animal. Data analysed by Smith (2016) and Jones (2017) see Lightfoot et al. (in
prep). Courtesy Emma Lightfoot.
Animal enamel carbonate data
Enamel carbonate data from domestic animals has revealed insight into the diet of animals
(Lee-Thorp et al. 1989; Codron et al. 2018). At Alamgirpur, δ13C values of enamel
carbonate from the teeth of domestic animals suggests that cattle/buffalo and sheep/goat
were largely consuming high proportions of C4 plant in their diet throughout the year, with
no clear differences between animal feeding practices between Bos and Capra/Ovis at the
site (Lightfoot et al. in prep., Figure 4.3) Wild ruminants such as Bos gaurus and Antilope
cervicapra appear to have consumed increasing amounts of C4 plants over time, while
93
Bosephalus tragocamelus (‘nilgai’), the bovine wild ruminant species, consistently
consumed C4 plants. The high proportion of C4 plants in the diet of wild ruminants is
suggestive of the presence of wild C4 plants in the surrounding environment.
Ceramic evidence
The ceramic assemblage at Alamgirpur is distinct to those from other Indus sites,
demonstrating the presence of both Indus, or Indus-inspired (‘Harappan’) and a regional
variant (‘Bara’) types of pottery (Singh et al. 2013; Ceccarelli in prep.). While the Indus or
Indus-inspired pottery comprise red-slipped and dark-slipped (“chocolate”) wares, the Bara
types are red wares and have shapes such as long-necked jars with flaring mouths, dish-on-
stand vessels with sloping or drooping rims, and lids with out-turned and painted rims
(Singh et al. 2013). At Alamgirpur, a variety of differently shaped vessels were found,
including goblets, bowls, perforated jars, cylindrical vases, shallow dishes and basins,
long-necked jars and miniature vessels.
4.1.1.2 Masudpur VII (MSDVII)
Masudpur VII (29°12.445”E, 75°57.090”N) is a 1 hectare mound site lying 4 km to the
SSW of Masudpur I. Surveys indicated Early, Mature and Late Harappan material on the
surface (Petrie et al. 2009), providing an opportunity to examine a rural settlement’s
cultural developments over time, especially in relation to Rakhigarhi, an Indus city located
16 km away.
Site environment
Locally known as Bhimwada Jodha, Masudpur VII lies within a belt of alluvial plains
about 50km away from the modern Ghaggar river (Saini and Mujtaba 2012). It lies close to
one of the major incursions of aeolian sediments that extends from the Pleistocene palaeo-
extension of the Thar desert (Saini and Mujtaba 2012). Neogi (2013; Neogi et al. in prep.)
mentions the presence of sandy loams interspersed with patches of clay loams which were
seasonally watered by ephemeral channels fed by summer monsoon rain. It is possible that
the weakly alkaline, relatively lower levels of salinity, soil conditions, and the site’s
location near aeolian deposits enabled the relatively better preservation of organic remains
and lipids within the pottery. The location receives an average of 432 mm of rainfall per
year (Fick and Hijmans 2017), mostly during the kharif, or summer monsoon months
(July-September), and an average of 42 mm of rainfall in the rabi season (November-
April).
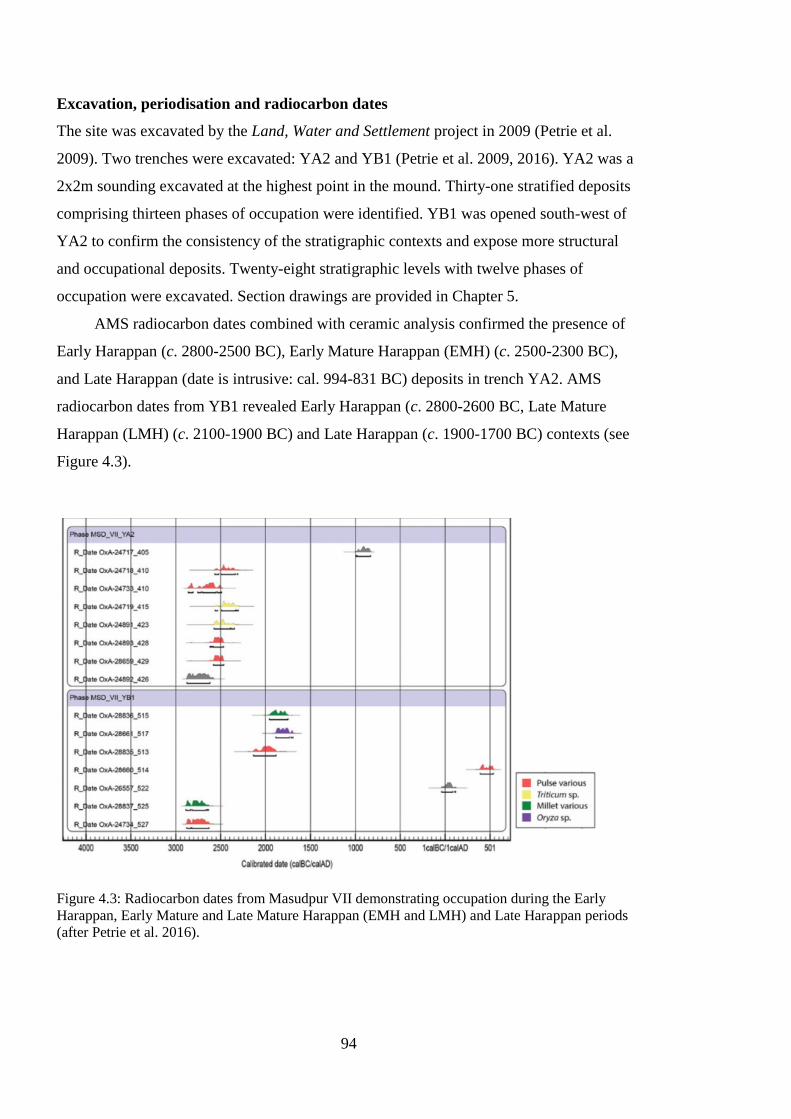
94
Excavation, periodisation and radiocarbon dates
The site was excavated by the Land, Water and Settlement project in 2009 (Petrie et al.
2009). Two trenches were excavated: YA2 and YB1 (Petrie et al. 2009, 2016). YA2 was a
2x2m sounding excavated at the highest point in the mound. Thirty-one stratified deposits
comprising thirteen phases of occupation were identified. YB1 was opened south-west of
YA2 to confirm the consistency of the stratigraphic contexts and expose more structural
and occupational deposits. Twenty-eight stratigraphic levels with twelve phases of
occupation were excavated. Section drawings are provided in Chapter 5.
AMS radiocarbon dates combined with ceramic analysis confirmed the presence of
Early Harappan (c. 2800-2500 BC), Early Mature Harappan (EMH) (c. 2500-2300 BC),
and Late Harappan (date is intrusive: cal. 994-831 BC) deposits in trench YA2. AMS
radiocarbon dates from YB1 revealed Early Harappan (c. 2800-2600 BC, Late Mature
Harappan (LMH) (c. 2100-1900 BC) and Late Harappan (c. 1900-1700 BC) contexts (see
Figure 4.3).
Figure 4.3: Radiocarbon dates from Masudpur VII demonstrating occupation during the Early
Harappan, Early Mature and Late Mature Harappan (EMH and LMH) and Late Harappan periods
(after Petrie et al. 2016).
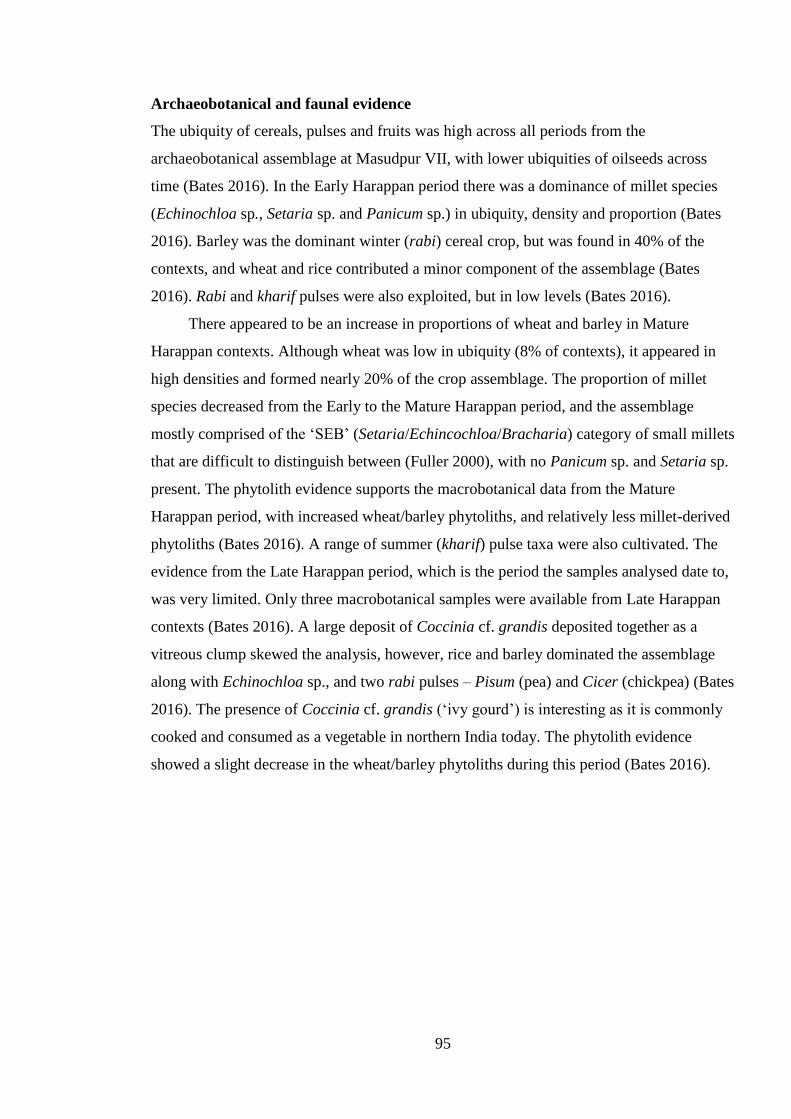
95
Archaeobotanical and faunal evidence
The ubiquity of cereals, pulses and fruits was high across all periods from the
archaeobotanical assemblage at Masudpur VII, with lower ubiquities of oilseeds across
time (Bates 2016). In the Early Harappan period there was a dominance of millet species
(Echinochloa sp., Setaria sp. and Panicum sp.) in ubiquity, density and proportion (Bates
2016). Barley was the dominant winter (rabi) cereal crop, but was found in 40% of the
contexts, and wheat and rice contributed a minor component of the assemblage (Bates
2016). Rabi and kharif pulses were also exploited, but in low levels (Bates 2016).
There appeared to be an increase in proportions of wheat and barley in Mature
Harappan contexts. Although wheat was low in ubiquity (8% of contexts), it appeared in
high densities and formed nearly 20% of the crop assemblage. The proportion of millet
species decreased from the Early to the Mature Harappan period, and the assemblage
mostly comprised of the ‘SEB’ (Setaria/Echincochloa/Bracharia) category of small millets
that are difficult to distinguish between (Fuller 2000), with no Panicum sp. and Setaria sp.
present. The phytolith evidence supports the macrobotanical data from the Mature
Harappan period, with increased wheat/barley phytoliths, and relatively less millet-derived
phytoliths (Bates 2016). A range of summer (kharif) pulse taxa were also cultivated. The
evidence from the Late Harappan period, which is the period the samples analysed date to,
was very limited. Only three macrobotanical samples were available from Late Harappan
contexts (Bates 2016). A large deposit of Coccinia cf. grandis deposited together as a
vitreous clump skewed the analysis, however, rice and barley dominated the assemblage
along with Echinochloa sp., and two rabi pulses – Pisum (pea) and Cicer (chickpea) (Bates
2016). The presence of Coccinia cf. grandis (‘ivy gourd’) is interesting as it is commonly
cooked and consumed as a vegetable in northern India today. The phytolith evidence
showed a slight decrease in the wheat/barley phytoliths during this period (Bates 2016).
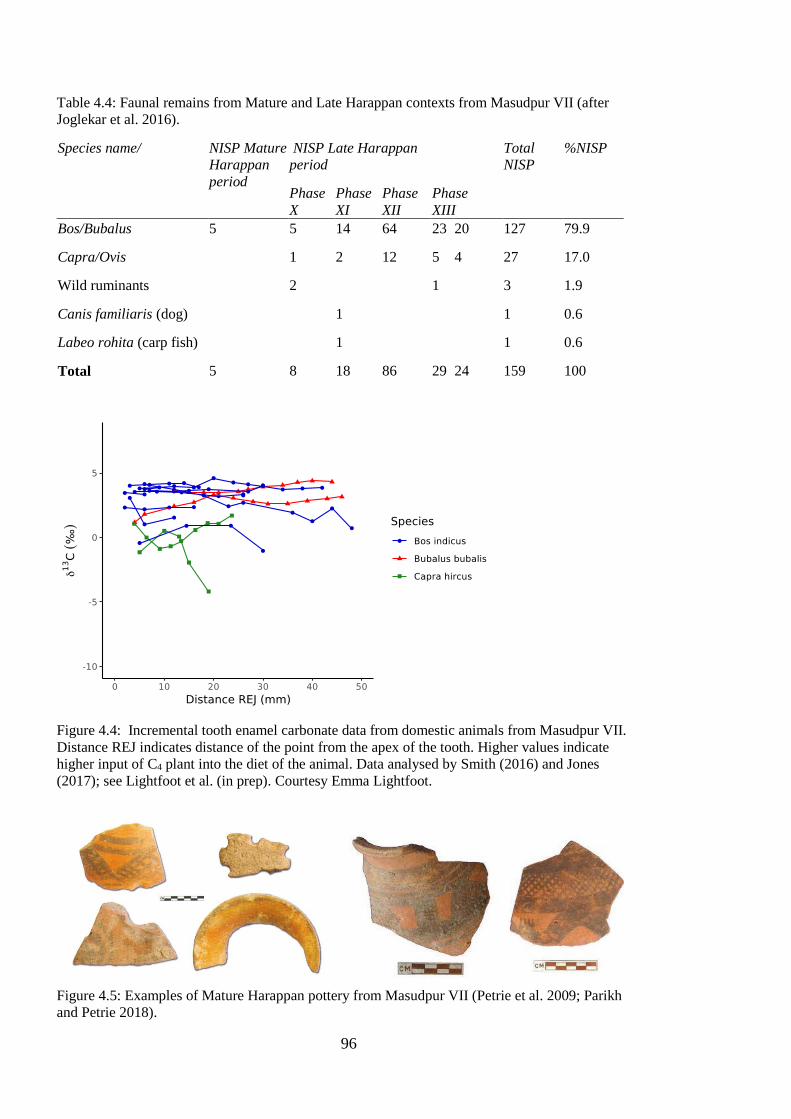
96
Table 4.4: Faunal remains from Mature and Late Harappan contexts from Masudpur VII (after
Joglekar et al. 2016).
Species name/
NISP Mature
Harappan
period
NISP Late Harappan
period
Total
NISP
%NISP
Phase
X
Phase
XI
Phase
XII
Phase
XIII
Bos/Bubalus 5 5 14 64 23 20 127 79.9
Capra/Ovis 1 2 12 5 4 27 17.0
Wild ruminants 2 1 3 1.9
Canis familiaris (dog) 1 1 0.6
Labeo rohita (carp fish) 1 1 0.6
Total 5 8 18 86 29 24 159 100
Figure 4.4: Incremental tooth enamel carbonate data from domestic animals from Masudpur VII.
Distance REJ indicates distance of the point from the apex of the tooth. Higher values indicate
higher input of C4 plant into the diet of the animal. Data analysed by Smith (2016) and Jones
(2017); see Lightfoot et al. (in prep). Courtesy Emma Lightfoot.
Figure 4.5: Examples of Mature Harappan pottery from Masudpur VII (Petrie et al. 2009; Parikh
and Petrie 2018).
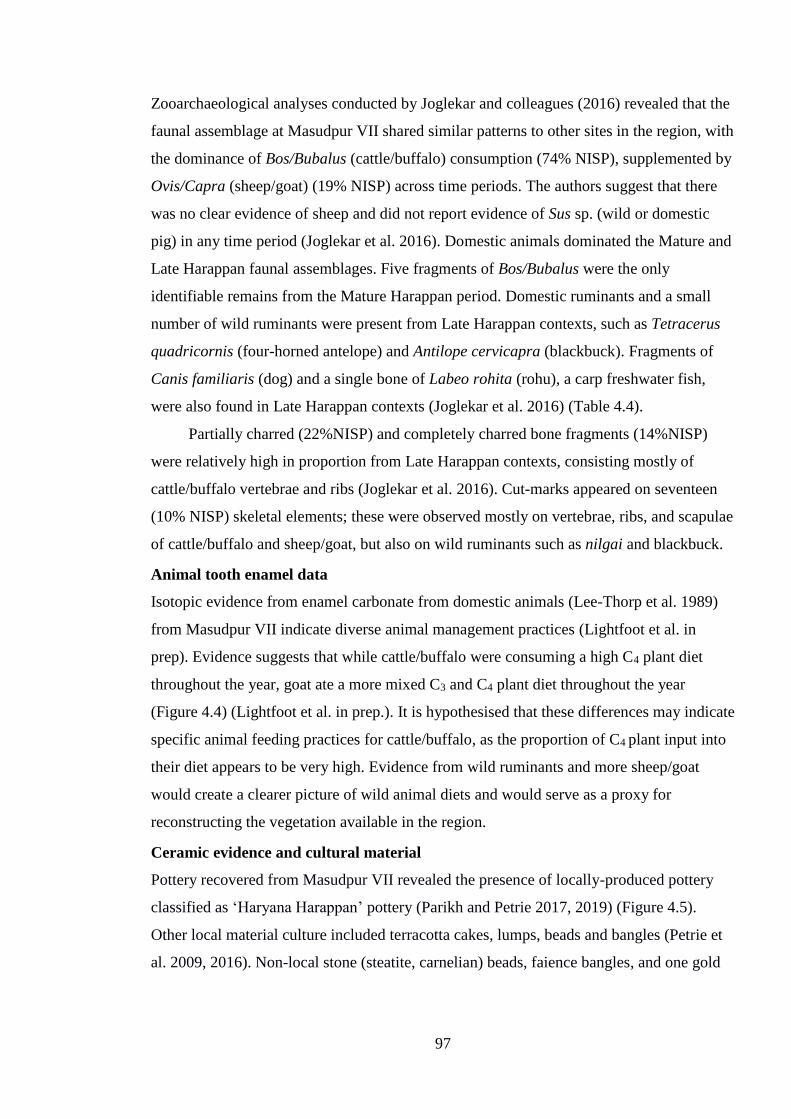
97
Zooarchaeological analyses conducted by Joglekar and colleagues (2016) revealed that the
faunal assemblage at Masudpur VII shared similar patterns to other sites in the region, with
the dominance of Bos/Bubalus (cattle/buffalo) consumption (74% NISP), supplemented by
Ovis/Capra (sheep/goat) (19% NISP) across time periods. The authors suggest that there
was no clear evidence of sheep and did not report evidence of Sus sp. (wild or domestic
pig) in any time period (Joglekar et al. 2016). Domestic animals dominated the Mature and
Late Harappan faunal assemblages. Five fragments of Bos/Bubalus were the only
identifiable remains from the Mature Harappan period. Domestic ruminants and a small
number of wild ruminants were present from Late Harappan contexts, such as Tetracerus
quadricornis (four-horned antelope) and Antilope cervicapra (blackbuck). Fragments of
Canis familiaris (dog) and a single bone of Labeo rohita (rohu), a carp freshwater fish,
were also found in Late Harappan contexts (Joglekar et al. 2016) (Table 4.4).
Partially charred (22%NISP) and completely charred bone fragments (14%NISP)
were relatively high in proportion from Late Harappan contexts, consisting mostly of
cattle/buffalo vertebrae and ribs (Joglekar et al. 2016). Cut-marks appeared on seventeen
(10% NISP) skeletal elements; these were observed mostly on vertebrae, ribs, and scapulae
of cattle/buffalo and sheep/goat, but also on wild ruminants such as nilgai and blackbuck.
Animal tooth enamel data
Isotopic evidence from enamel carbonate from domestic animals (Lee-Thorp et al. 1989)
from Masudpur VII indicate diverse animal management practices (Lightfoot et al. in
prep). Evidence suggests that while cattle/buffalo were consuming a high C4 plant diet
throughout the year, goat ate a more mixed C3 and C4 plant diet throughout the year
(Figure 4.4) (Lightfoot et al. in prep.). It is hypothesised that these differences may indicate
specific animal feeding practices for cattle/buffalo, as the proportion of C4 plant input into
their diet appears to be very high. Evidence from wild ruminants and more sheep/goat
would create a clearer picture of wild animal diets and would serve as a proxy for
reconstructing the vegetation available in the region.
Ceramic evidence and cultural material
Pottery recovered from Masudpur VII revealed the presence of locally-produced pottery
classified as ‘Haryana Harappan’ pottery (Parikh and Petrie 2017, 2019) (Figure 4.5).
Other local material culture included terracotta cakes, lumps, beads and bangles (Petrie et
al. 2009, 2016). Non-local stone (steatite, carnelian) beads, faience bangles, and one gold
98
bead were recovered, indicating that even this small one-hectare settlement had access to
broader exchange networks across the Indus Civilisation (Petrie et al. 2009).
4.1.2. Small settlements (‘villages’: 3-10 ha)
4.1.2.1 Masudpur I (MSDI)
Locally known as Sampolia Khera, Masudpur I (29°14.636” E, 75°59.611” N) is a 6-
hectare mound site located in the Hissar district in present-day Haryana. It lies
approximately 12 km to the west of Rakhigarhi and 4 km to the NNE of Masudpur VII. It
has been suggested that the relative proximity of these sites to Rakhigarhi indicates that
they were within the hinterland of the city during the phases of Indus occupation and may
have had established networks of exchange (Singh et al. 2010).
Site environment and background
Masudpur I lies in an environment very similar to Masudpur VII. Today it is located on an
alluvial plain about 50 km south of the modern-day channel of the Ghaggar river (Saini
and Mujtaba 2012), but sedimentary evidence suggests that ephemeral channels seasonally
aggraded the area during Indus occupation (Neogi 2013; Neogi et al. in press). Like
Masudpur VII, it receives an average of 432 mm of rainfall per year (Fick and Hijmans
2017), mostly during the summer monsoon months (kharif) (July-September), an average
of only 42 mm of rainfall in the winter (rabi) season (November-April). Thus, it is possible
that monsoon-driven run-off would have been the primary water source for the settlement
during the Indus period.
Geoarchaeological evidence suggest that much like today, Indus-period soils around
Masudpur I were weakly alkaline, low salinity sandy-loams with patches of clay-loams
(Singh 2007; Neogi 2013; Neogi et al. in press). High levels of calcium carbonate and
leaching of nutrients down soil profiles were observed by Neogi (2013; Neogi et al. in
press), however, the Indus period soils were characterised as reasonably fertile (Neogi
2013; Neogi et al. in press). As at Masudpur VII, it is possible that the weakly alkaline and
relatively lower levels of salinity enabled relatively better preservation of organic remains
and lipids within the pottery. Today the site has been heavily truncated by agricultural
activity (Petrie et al. 2009).
Excavation, periodisation and radiocarbon dates
Excavations at Masudpur I were conducted in 2008 by the Land, Water and Settlement
team, a joint University of Cambridge and Banaras Hindu University collaboration (Petrie
et al. 2009). Three trenches were excavated, namely XA1, YA3 and XM2. XAI was
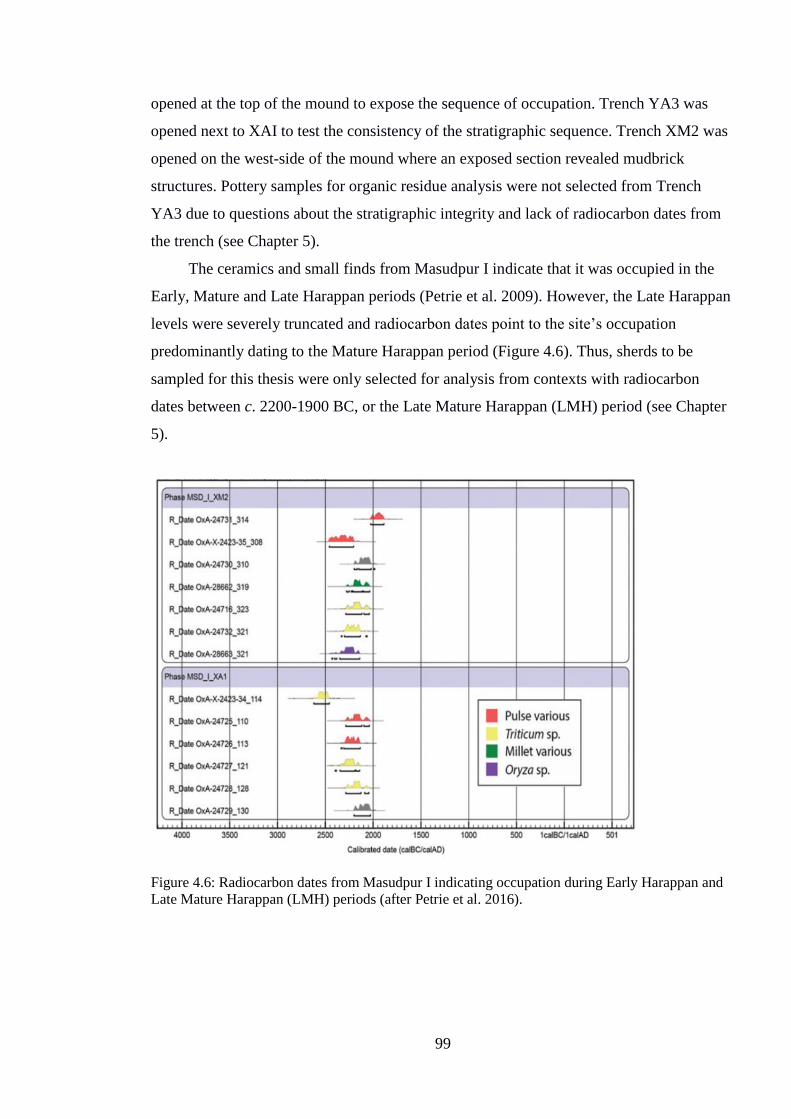
99
opened at the top of the mound to expose the sequence of occupation. Trench YA3 was
opened next to XAI to test the consistency of the stratigraphic sequence. Trench XM2 was
opened on the west-side of the mound where an exposed section revealed mudbrick
structures. Pottery samples for organic residue analysis were not selected from Trench
YA3 due to questions about the stratigraphic integrity and lack of radiocarbon dates from
the trench (see Chapter 5).
The ceramics and small finds from Masudpur I indicate that it was occupied in the
Early, Mature and Late Harappan periods (Petrie et al. 2009). However, the Late Harappan
levels were severely truncated and radiocarbon dates point to the site’s occupation
predominantly dating to the Mature Harappan period (Figure 4.6). Thus, sherds to be
sampled for this thesis were only selected for analysis from contexts with radiocarbon
dates between c. 2200-1900 BC, or the Late Mature Harappan (LMH) period (see Chapter
5).
Figure 4.6: Radiocarbon dates from Masudpur I indicating occupation during Early Harappan and
Late Mature Harappan (LMH) periods (after Petrie et al. 2016).
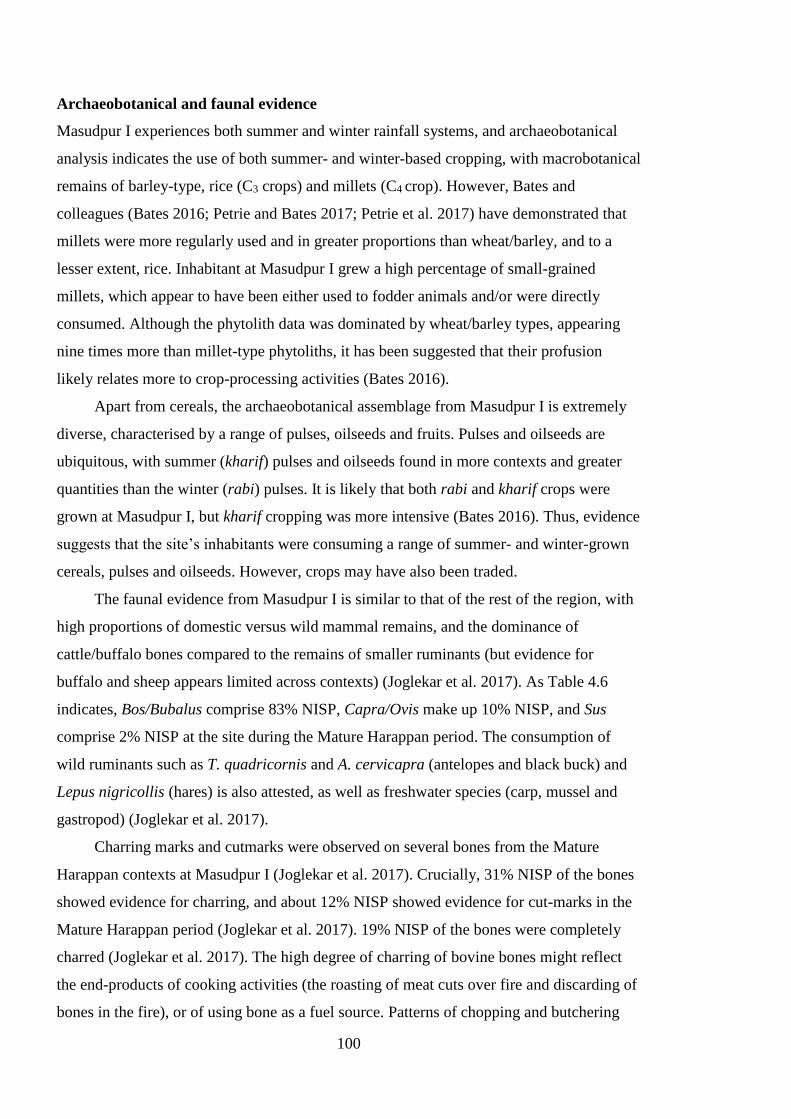
100
Archaeobotanical and faunal evidence
Masudpur I experiences both summer and winter rainfall systems, and archaeobotanical
analysis indicates the use of both summer- and winter-based cropping, with macrobotanical
remains of barley-type, rice (C3 crops) and millets (C4 crop). However, Bates and
colleagues (Bates 2016; Petrie and Bates 2017; Petrie et al. 2017) have demonstrated that
millets were more regularly used and in greater proportions than wheat/barley, and to a
lesser extent, rice. Inhabitant at Masudpur I grew a high percentage of small-grained
millets, which appear to have been either used to fodder animals and/or were directly
consumed. Although the phytolith data was dominated by wheat/barley types, appearing
nine times more than millet-type phytoliths, it has been suggested that their profusion
likely relates more to crop-processing activities (Bates 2016).
Apart from cereals, the archaeobotanical assemblage from Masudpur I is extremely
diverse, characterised by a range of pulses, oilseeds and fruits. Pulses and oilseeds are
ubiquitous, with summer (kharif) pulses and oilseeds found in more contexts and greater
quantities than the winter (rabi) pulses. It is likely that both rabi and kharif crops were
grown at Masudpur I, but kharif cropping was more intensive (Bates 2016). Thus, evidence
suggests that the site’s inhabitants were consuming a range of summer- and winter-grown
cereals, pulses and oilseeds. However, crops may have also been traded.
The faunal evidence from Masudpur I is similar to that of the rest of the region, with
high proportions of domestic versus wild mammal remains, and the dominance of
cattle/buffalo bones compared to the remains of smaller ruminants (but evidence for
buffalo and sheep appears limited across contexts) (Joglekar et al. 2017). As Table 4.6
indicates, Bos/Bubalus comprise 83% NISP, Capra/Ovis make up 10% NISP, and Sus
comprise 2% NISP at the site during the Mature Harappan period. The consumption of
wild ruminants such as T. quadricornis and A. cervicapra (antelopes and black buck) and
Lepus nigricollis (hares) is also attested, as well as freshwater species (carp, mussel and
gastropod) (Joglekar et al. 2017).
Charring marks and cutmarks were observed on several bones from the Mature
Harappan contexts at Masudpur I (Joglekar et al. 2017). Crucially, 31% NISP of the bones
showed evidence for charring, and about 12% NISP showed evidence for cut-marks in the
Mature Harappan period (Joglekar et al. 2017). 19% NISP of the bones were completely
charred (Joglekar et al. 2017). The high degree of charring of bovine bones might reflect
the end-products of cooking activities (the roasting of meat cuts over fire and discarding of
bones in the fire), or of using bone as a fuel source. Patterns of chopping and butchering
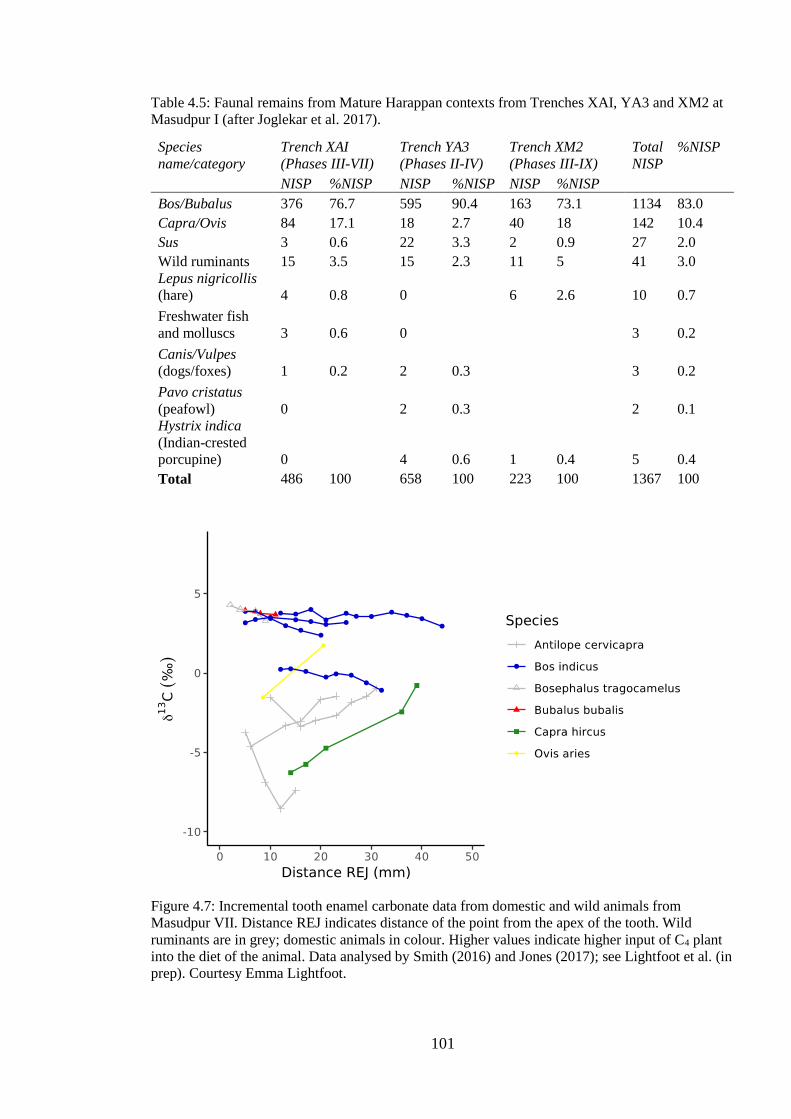
101
Table 4.5: Faunal remains from Mature Harappan contexts from Trenches XAI, YA3 and XM2 at
Masudpur I (after Joglekar et al. 2017).
Species
name/category
Trench XAI
(Phases III-VII)
Trench YA3
(Phases II-IV)
Trench XM2
(Phases III-IX)
Total
NISP
%NISP
NISP %NISP NISP %NISP NISP %NISP
Bos/Bubalus 376 76.7 595 90.4 163 73.1 1134 83.0
Capra/Ovis 84 17.1 18 2.7 40 18 142 10.4
Sus 3 0.6 22 3.3 2 0.9 27 2.0
Wild ruminants 15 3.5 15 2.3 11 5 41 3.0
Lepus nigricollis
(hare) 4 0.8 0 6 2.6 10 0.7
Freshwater fish
and molluscs 3 0.6 0 3 0.2
Canis/Vulpes
(dogs/foxes) 1 0.2 2 0.3 3 0.2
Pavo cristatus
(peafowl) 0 2 0.3 2 0.1
Hystrix indica
(Indian-crested
porcupine) 0 4 0.6 1 0.4 5 0.4
Total 486 100 658 100 223 100 1367 100
Figure 4.7: Incremental tooth enamel carbonate data from domestic and wild animals from
Masudpur VII. Distance REJ indicates distance of the point from the apex of the tooth. Wild
ruminants are in grey; domestic animals in colour. Higher values indicate higher input of C4 plant
into the diet of the animal. Data analysed by Smith (2016) and Jones (2017); see Lightfoot et al. (in
prep). Courtesy Emma Lightfoot.
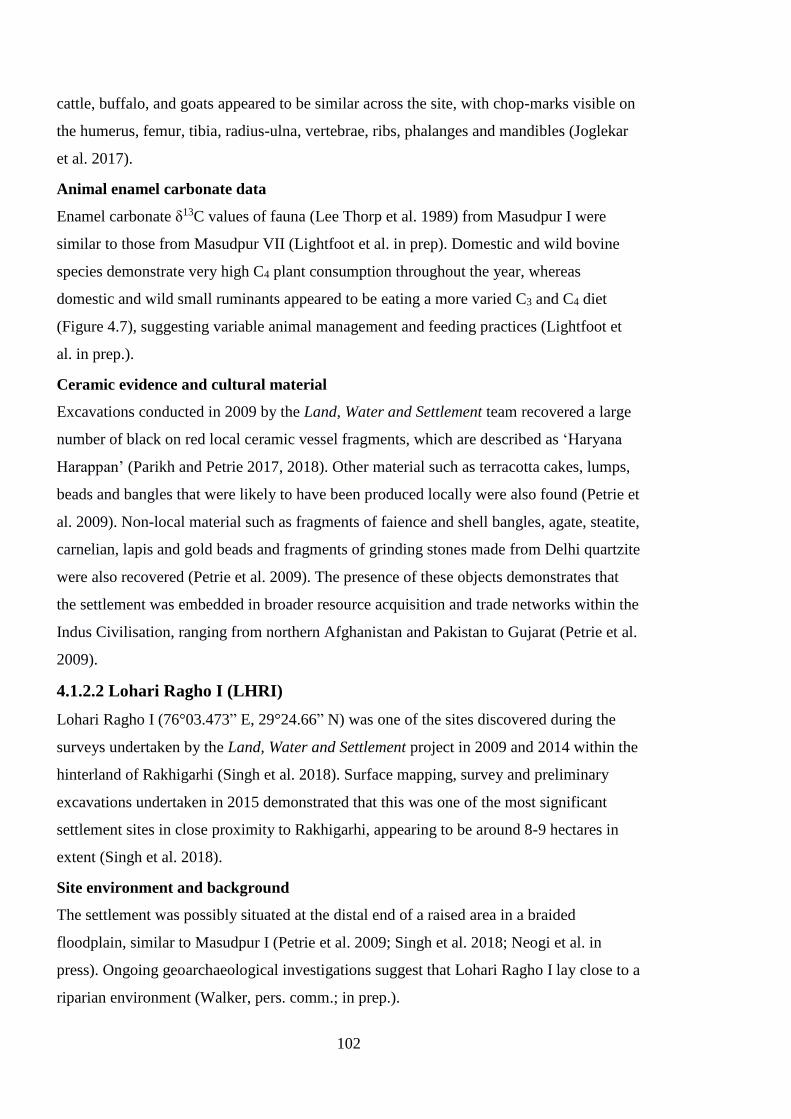
102
cattle, buffalo, and goats appeared to be similar across the site, with chop-marks visible on
the humerus, femur, tibia, radius-ulna, vertebrae, ribs, phalanges and mandibles (Joglekar
et al. 2017).
Animal enamel carbonate data
Enamel carbonate ẟ13C values of fauna (Lee Thorp et al. 1989) from Masudpur I were
similar to those from Masudpur VII (Lightfoot et al. in prep). Domestic and wild bovine
species demonstrate very high C4 plant consumption throughout the year, whereas
domestic and wild small ruminants appeared to be eating a more varied C3 and C4 diet
(Figure 4.7), suggesting variable animal management and feeding practices (Lightfoot et
al. in prep.).
Ceramic evidence and cultural material
Excavations conducted in 2009 by the Land, Water and Settlement team recovered a large
number of black on red local ceramic vessel fragments, which are described as ‘Haryana
Harappan’ (Parikh and Petrie 2017, 2018). Other material such as terracotta cakes, lumps,
beads and bangles that were likely to have been produced locally were also found (Petrie et
al. 2009). Non-local material such as fragments of faience and shell bangles, agate, steatite,
carnelian, lapis and gold beads and fragments of grinding stones made from Delhi quartzite
were also recovered (Petrie et al. 2009). The presence of these objects demonstrates that
the settlement was embedded in broader resource acquisition and trade networks within the
Indus Civilisation, ranging from northern Afghanistan and Pakistan to Gujarat (Petrie et al.
2009).
4.1.2.2 Lohari Ragho I (LHRI)
Lohari Ragho I (76°03.473” E, 29°24.66” N) was one of the sites discovered during the
surveys undertaken by the Land, Water and Settlement project in 2009 and 2014 within the
hinterland of Rakhigarhi (Singh et al. 2018). Surface mapping, survey and preliminary
excavations undertaken in 2015 demonstrated that this was one of the most significant
settlement sites in close proximity to Rakhigarhi, appearing to be around 8-9 hectares in
extent (Singh et al. 2018).
Site environment and background
The settlement was possibly situated at the distal end of a raised area in a braided
floodplain, similar to Masudpur I (Petrie et al. 2009; Singh et al. 2018; Neogi et al. in
press). Ongoing geoarchaeological investigations suggest that Lohari Ragho I lay close to a
riparian environment (Walker, pers. comm.; in prep.).
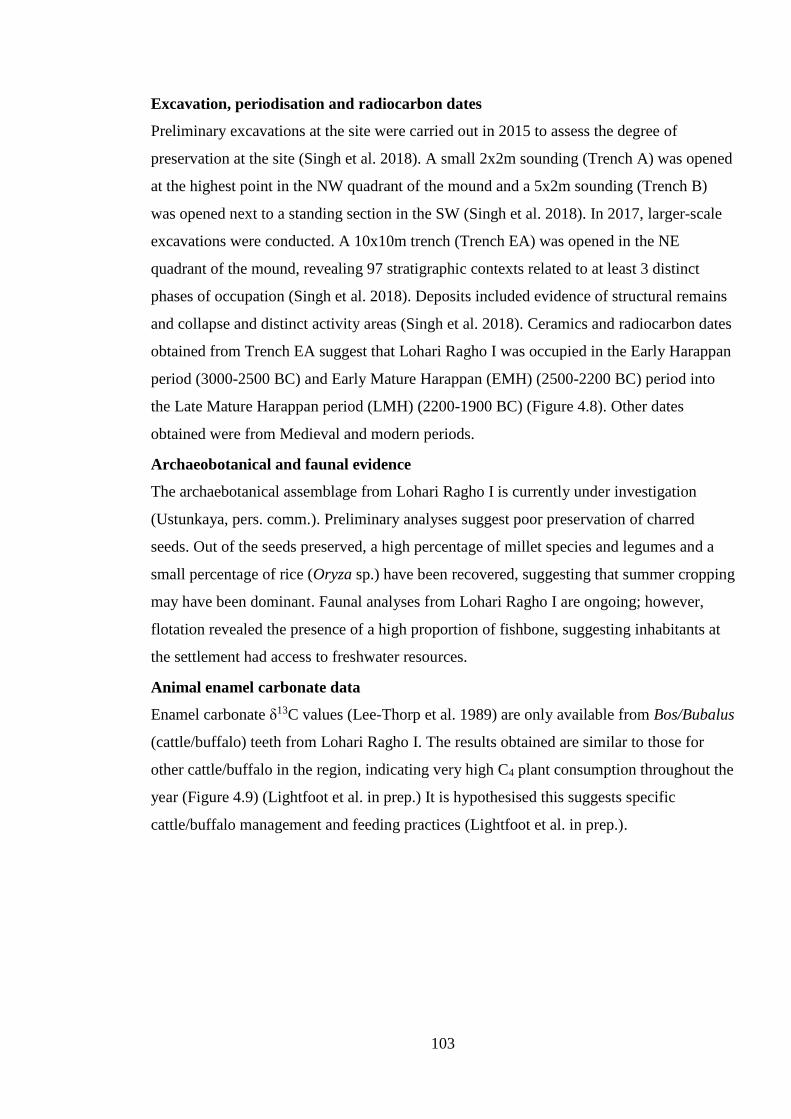
103
Excavation, periodisation and radiocarbon dates
Preliminary excavations at the site were carried out in 2015 to assess the degree of
preservation at the site (Singh et al. 2018). A small 2x2m sounding (Trench A) was opened
at the highest point in the NW quadrant of the mound and a 5x2m sounding (Trench B)
was opened next to a standing section in the SW (Singh et al. 2018). In 2017, larger-scale
excavations were conducted. A 10x10m trench (Trench EA) was opened in the NE
quadrant of the mound, revealing 97 stratigraphic contexts related to at least 3 distinct
phases of occupation (Singh et al. 2018). Deposits included evidence of structural remains
and collapse and distinct activity areas (Singh et al. 2018). Ceramics and radiocarbon dates
obtained from Trench EA suggest that Lohari Ragho I was occupied in the Early Harappan
period (3000-2500 BC) and Early Mature Harappan (EMH) (2500-2200 BC) period into
the Late Mature Harappan period (LMH) (2200-1900 BC) (Figure 4.8). Other dates
obtained were from Medieval and modern periods.
Archaeobotanical and faunal evidence
The archaebotanical assemblage from Lohari Ragho I is currently under investigation
(Ustunkaya, pers. comm.). Preliminary analyses suggest poor preservation of charred
seeds. Out of the seeds preserved, a high percentage of millet species and legumes and a
small percentage of rice (Oryza sp.) have been recovered, suggesting that summer cropping
may have been dominant. Faunal analyses from Lohari Ragho I are ongoing; however,
flotation revealed the presence of a high proportion of fishbone, suggesting inhabitants at
the settlement had access to freshwater resources.
Animal enamel carbonate data
Enamel carbonate ẟ13C values (Lee-Thorp et al. 1989) are only available from Bos/Bubalus
(cattle/buffalo) teeth from Lohari Ragho I. The results obtained are similar to those for
other cattle/buffalo in the region, indicating very high C4 plant consumption throughout the
year (Figure 4.9) (Lightfoot et al. in prep.) It is hypothesised this suggests specific
cattle/buffalo management and feeding practices (Lightfoot et al. in prep.).
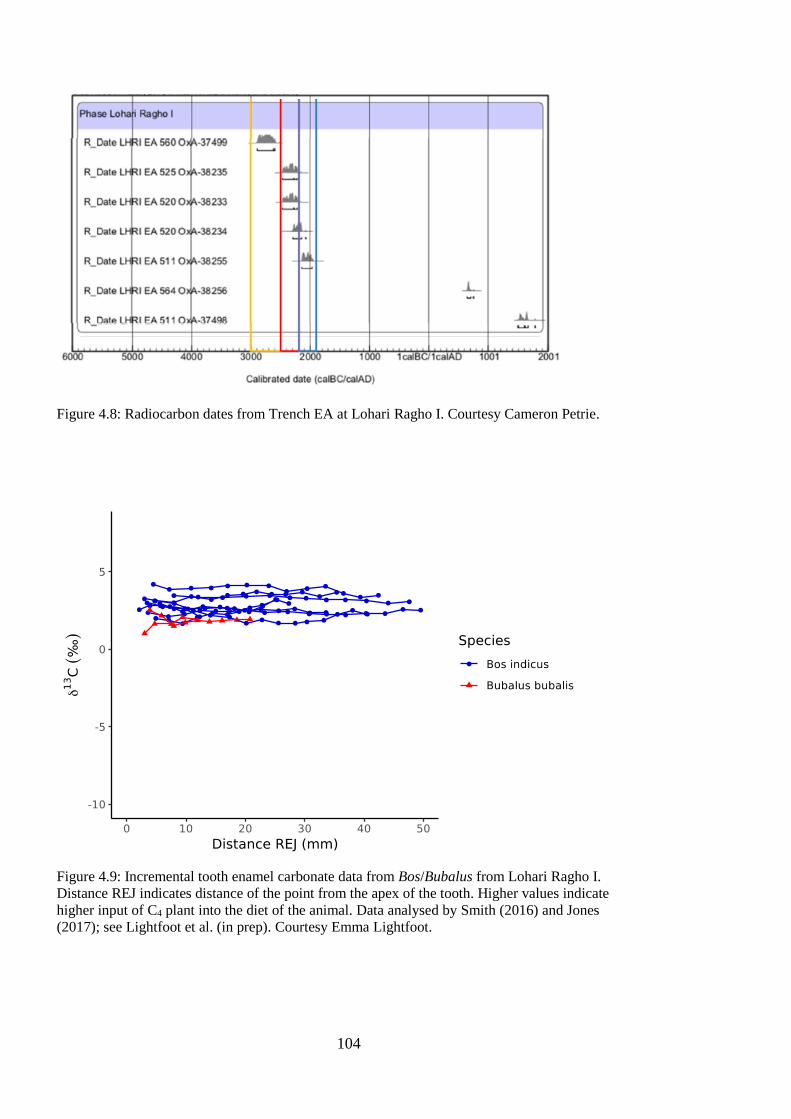
104
Figure 4.8: Radiocarbon dates from Trench EA at Lohari Ragho I. Courtesy Cameron Petrie.
Figure 4.9: Incremental tooth enamel carbonate data from Bos/Bubalus from Lohari Ragho I.
Distance REJ indicates distance of the point from the apex of the tooth. Higher values indicate
higher input of C4 plant into the diet of the animal. Data analysed by Smith (2016) and Jones
(2017); see Lightfoot et al. (in prep). Courtesy Emma Lightfoot.
105
Ceramic evidence and cultural material
The pottery excavated from Lohari Ragho I is currently under study (Ceccarelli in prep.),
but the ceramics recovered closely match black on red ‘Haryana Harappan’ pottery found
at sites in Masudpur VII, Masudpur I, and Farmana (Singh et al. 2018; see Parikh and
Petrie 2017, 2018). In contrast to Masudpur VII and Masudpur I, a small number of
examples of pottery that resembled ‘Classic Harappan’ shapes and decoration were also
found. Further analysis is ongoing (Cecccarelli in prep.) Nearly 240 fragments of grinding
stones were recovered from the surface of the site; matching types similar to those
recovered at Rakhigarhi (Nath 2014; see Singh et al. 2018). Although no formal
identifications have taken place, most of the stones appear to be made from red/pink Delhi
quartzite from the Kaliana Hills, Haryana, with others are visually similar to granite from
Tosham (near Khanak), Pab sandstone from the Sulaiman Range in Pakistan and rounded
cobbles of possible Himalayan origin (Law 2011; Singh et al. 2018). The ceramic and
cultural material suggest that inhabitants of Lohari Ragho I were integrated into the same
raw material acquisition networks that were accessed by those living at Rakhigarhi, and
producing and obtaining local and ‘non-local’ pottery, respectively (Singh et al. 2018;
Ceccarelli in prep.). The movement of quotidian, bulky items involved in food-processing
is particularly significant.
4.1.2.3. Khanak (KNK)
Khanak’s (28°54’26.5” N, 75°52’08.9” E) location within southern Haryana is unique in
contrast to the other sites discussed in this chapter. It lies adjacent to an inselberg, which is
an isolated outcrop of the Aravalli hills. The geology of the region comprises a range of
igneous, granite and quartzite rocks, including a type of the infamous Delhi quartzite. The
stone from these outcrops is red-pink to pinkish-grey in colour and is criss-crossed with
thin haematite and quartz-filled fractures (Law 2011). This specific type of stone has been
found in Harappa in the form of grinding stones (Law 2011) and other sites in Haryana,
including Lohari Ragho I (Singh et al. 2018). Tin has also been reported in the form of
cassiterite from the region (Singh et al. 2015).
The proximity of the site to rocks and minerals that were important within Indus
trade networks suggests it played a role in stone mining and tin or copper smelting
activities (Singh et al. 2015). Although the estimated size of the site was calculated to be
1.5 hectares, there is evidence that the modern village of Khanak is now lying on top of
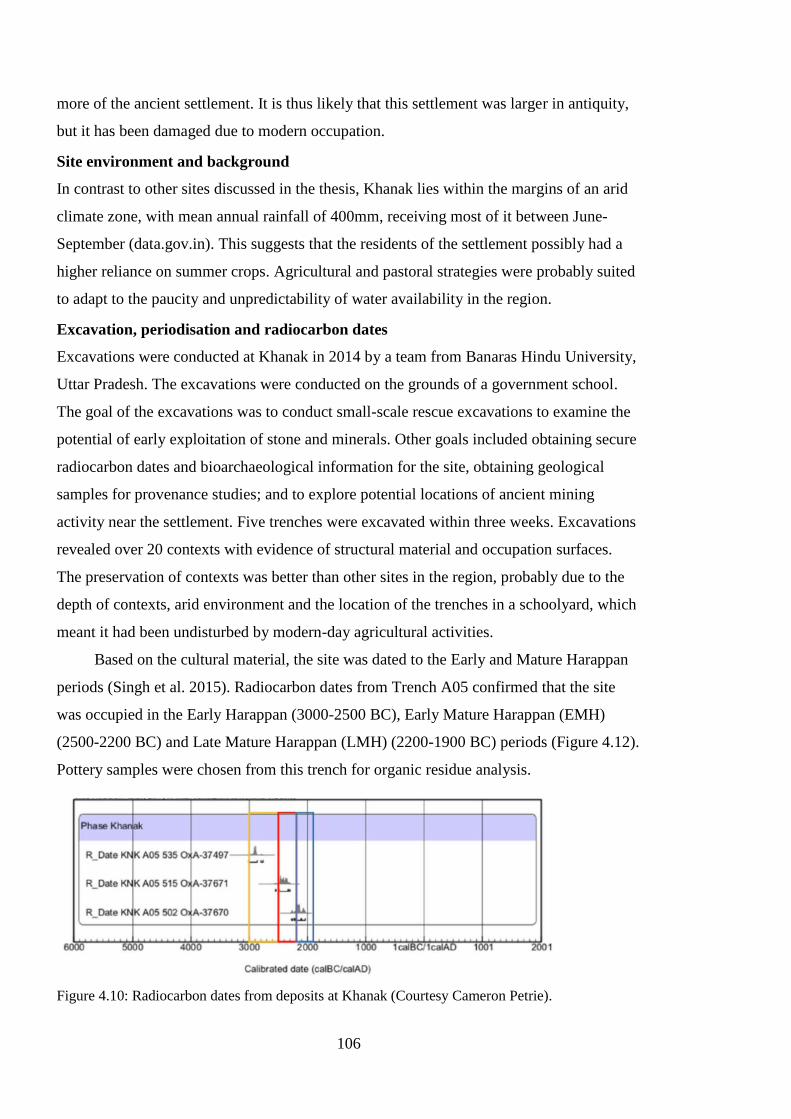
106
more of the ancient settlement. It is thus likely that this settlement was larger in antiquity,
but it has been damaged due to modern occupation.
Site environment and background
In contrast to other sites discussed in the thesis, Khanak lies within the margins of an arid
climate zone, with mean annual rainfall of 400mm, receiving most of it between June-
September (data.gov.in). This suggests that the residents of the settlement possibly had a
higher reliance on summer crops. Agricultural and pastoral strategies were probably suited
to adapt to the paucity and unpredictability of water availability in the region.
Excavation, periodisation and radiocarbon dates
Excavations were conducted at Khanak in 2014 by a team from Banaras Hindu University,
Uttar Pradesh. The excavations were conducted on the grounds of a government school.
The goal of the excavations was to conduct small-scale rescue excavations to examine the
potential of early exploitation of stone and minerals. Other goals included obtaining secure
radiocarbon dates and bioarchaeological information for the site, obtaining geological
samples for provenance studies; and to explore potential locations of ancient mining
activity near the settlement. Five trenches were excavated within three weeks. Excavations
revealed over 20 contexts with evidence of structural material and occupation surfaces.
The preservation of contexts was better than other sites in the region, probably due to the
depth of contexts, arid environment and the location of the trenches in a schoolyard, which
meant it had been undisturbed by modern-day agricultural activities.
Based on the cultural material, the site was dated to the Early and Mature Harappan
periods (Singh et al. 2015). Radiocarbon dates from Trench A05 confirmed that the site
was occupied in the Early Harappan (3000-2500 BC), Early Mature Harappan (EMH)
(2500-2200 BC) and Late Mature Harappan (LMH) (2200-1900 BC) periods (Figure 4.12).
Pottery samples were chosen from this trench for organic residue analysis.
Figure 4.10: Radiocarbon dates from deposits at Khanak (Courtesy Cameron Petrie).
107
Archaeobotanical and faunal evidence
The archaeobotanical and faunal analyses from excavations at Khanak are ongoing.
Preliminary results suggest that the archaeobotanical assemblage at the site is distinctive as
it contains very limited evidence of charred seeds and demonstrates high ubiquity of
charred wood species (Ustunkaya, pers. comm.). Out of the studied assemblage, economic
crops at Khanak involved Hordeum/Triticum (wheat/barley) as dominant species (24%)
followed by millets (12.5%) and a small percentage of legumes (2.5%). Dominant
economic non-crop species included Ziziphus sp. (20%) (fruit), along with Plantago sp.;
plants that are generally found in riparian environments (Ustunkaya, pers. comm.).
Unexpectedly, a seed of Allium sp. (garlic) was preserved in the assemblage (Ustunkaya,
pers. comm.). Thus, it appears that summer and winter crops were grown at Khanak but
details about agricultural practices are presently being collated. The faunal assemblage
from Khanak is also under study, however a significant number of fishbones were
recovered via flotation (Ustunkaya, pers. comm.), which suggests that inhabitants of
Khanak had access to freshwater resources.
Ceramic evidence and cultural material
The ceramic assemblage at Khanak included typical ‘Haryana Harappan’ pottery, with
black on red painted jars, chocolate slipped jars, vases, bowls, basins, perforated jars, and
examples of dish-on-stand vessels. Some vessel shapes typical of ‘Classic Harappan’
pottery were also found, such as goblets and miniature vessels (Singh et al. 2015).
Examples of nearly complete vessels were recovered from several trenches. Other objects
included terracotta cakes, steatite beads, semiprecious stones including lapis lazuli, large
quantities of slag and a copper celt.
4.1.3. Medium-sized settlements (‘towns’: 10-20 ha)
4.1.3.1. Farmana (FRN)
The site of Farmana (29 °02’22” N, 76 °18’21” E) is located in Rohtak district, Haryana
and is locally known as Daksh Kheda (Shinde 2011). It has been suggested that nearly 18
hectares of the site were densely occupied in the past (Shinde et al. 2008), although it is
unclear how this estimation was calculated, as the preserved architecture has been revealed
across a much smaller area.
108
Site environment and background
Farmana lies about 30km away from the modern Chautang River, a tributary of the
Ghaggar River, within a large alluvial plain. The site is located on an elevated sand deposit
that the excavators suggested was formed by fluvial action (Shinde 2011). However,
aeolian deposits are located close to the site and are interspersed with alluvial sediments
(Shinde 2011). Detailed information about the sedimentological conditions and soil quality
at Farmana are not available to make inferences about how they might have influenced the
preservation of organic remains.
Excavation, periodisation and radiocarbon dates
Excavations at Farmana were led by Prof. Vasant Shinde from Deccan College, Pune, Dr.
Manmohan Kumar, Maharishi Dayanand University, Rohtak, and Prof. Toshiki Osada,
Research Institute for Humanity and Nature (RIHN), Kyoto, between 2006-2009.
Excavations revealed that only the central portion of the mound (80x60m) was preserved,
with the upper levels being heavily truncated by modern agricultural activity (Shinde
2011).
Excavations at Farmana revealed evidence of an extensive settlement area, and a
cemetery located less than a kilometre away. Burials in the cemetery date to the Mature
Harappan period, but as pottery from the cemetery has not been investigated in this thesis,
only details of the settlement area are provided here. Large-scale excavations revealed at
least three architectural complexes with multiple rooms, bathing platforms, drains, storage
units and courtyards, with a main street and smaller streets dividing them. Although
multiple phases of occupation (at least five) were exposed in soundings, the precise extent
of occupation at different points has been interpreted in contradictory ways. The
radiocarbon dates suggest that the settlement was occupied in the Early Harappan and
Early Mature Harappan period (EMH) (c.2500-2250 BC) (Figure 4.11) (Shinde et al. 2011:
831). The excavators, however, suggest that the central area of the site is composed of both
Early Harappan (‘Period I’: c. 3500-2600 BC ) deposits and Mature Harappan deposits,
with the latter being represented by three sub-phases: ‘Period IIA’ (early Mature: c.2600-
2400 BC), ‘Period IIB’ (middle Mature: c. 2400-2200 BC) and ‘Period IIC’ (late Mature:
c.2200-2000 BC) (Shinde 2011: 6).These classifications were based on stratigraphy,
pottery, and burials from the cemetery.
Pottery samples selected for analysis from Farmana in this thesis are from three
architectural complexes in the ‘Central Area’ where the excavators and the radiocarbon
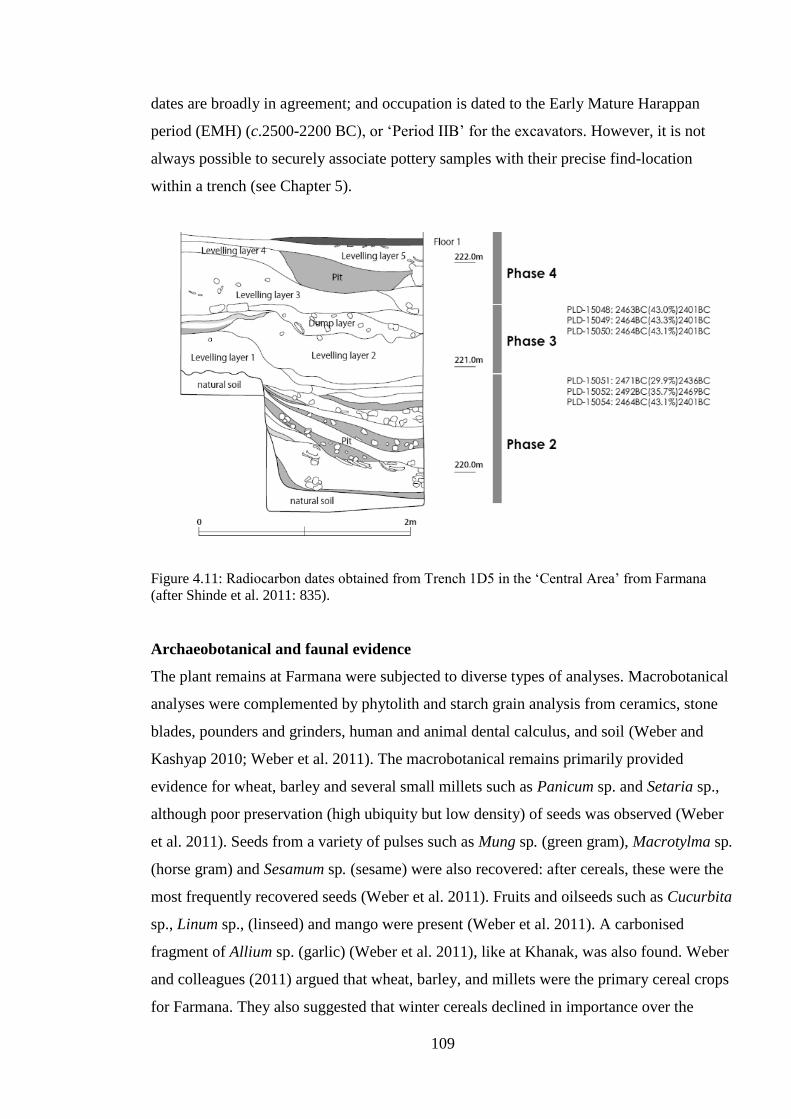
109
dates are broadly in agreement; and occupation is dated to the Early Mature Harappan
period (EMH) (c.2500-2200 BC), or ‘Period IIB’ for the excavators. However, it is not
always possible to securely associate pottery samples with their precise find-location
within a trench (see Chapter 5).
Figure 4.11: Radiocarbon dates obtained from Trench 1D5 in the ‘Central Area’ from Farmana
(after Shinde et al. 2011: 835).
Archaeobotanical and faunal evidence
The plant remains at Farmana were subjected to diverse types of analyses. Macrobotanical
analyses were complemented by phytolith and starch grain analysis from ceramics, stone
blades, pounders and grinders, human and animal dental calculus, and soil (Weber and
Kashyap 2010; Weber et al. 2011). The macrobotanical remains primarily provided
evidence for wheat, barley and several small millets such as Panicum sp. and Setaria sp.,
although poor preservation (high ubiquity but low density) of seeds was observed (Weber
et al. 2011). Seeds from a variety of pulses such as Mung sp. (green gram), Macrotylma sp.
(horse gram) and Sesamum sp. (sesame) were also recovered: after cereals, these were the
most frequently recovered seeds (Weber et al. 2011). Fruits and oilseeds such as Cucurbita
sp., Linum sp., (linseed) and mango were present (Weber et al. 2011). A carbonised
fragment of Allium sp. (garlic) (Weber et al. 2011), like at Khanak, was also found. Weber
and colleagues (2011) argued that wheat, barley, and millets were the primary cereal crops
for Farmana. They also suggested that winter cereals declined in importance over the
110
occupation of the site (from 61% to 20% ubiquity), that millets remained important, but
that rice never played an important role (Weber et al. 2011).
Starch grains and phytoliths were collected from 240 surfaces from both the
cemetery and settlement area, including human and animal teeth, ceramic vessels, stone
tools and sediment (for control; Weber et al. 2011). Out of the 50 specimens that were
subsequently analysed, starch remains of millet, barley and gram were found on human
dental calculus (n=9; 3 individuals). Solanum sp. (aubergine) and mango were found on
long, narrow stone blades (n=2). In contrast, spices such as Curcuma sp. and Zingiber sp.
(turmeric and ginger respectively), were only found on the surface of ceramics. Starches of
barley, millet and mango were found on grinders and pounding stones (n=8). Additionally,
the phytolith remains revealed evidence of Oryza sativa (rice), which was found on three
artefacts, wheat/barley, Panicese-type (possibly derived from millets), and Poacese
(grasses and reeds) phytoliths.
The authors (Weber et al. 2011) used this evidence to suggest that individuals at
Farmana had a broad plant diet and consumed wheat, barley, a variety of small-grained
cereals, pulses, fruits, vegetables and roots and tubers. Although the starch-grain analyses
provide direct evidence for the processing and consumption of plant-remains, there is
inadequate data and information presented about the measures taken to prevent and check
for contamination that may have occurred from starches in the sediment and surrounding
environment (Chapter Two, Section 2.3.5.1). This is particularly important as many of the
starch remains are ingredients used in Indian cooking today. Since these details, as well as
detailed information and analyses remain unpublished, the results must be treated with
caution.
The faunal remains at Farmana were studied by Sharda C.V. The results from her
thesis and other publications (Channarayapatna 2014, 2018; Joglekar and Channarayapatna
2018) suggest that just as at other sites in the region, the proportions of domestic animals
outnumber wild species at Farmana. In the Mature Harappan period, Bos/Bubalus
(cattle/buffalo) made up the largest proportion of domestic species (78% NISP) (Table
4.7). Out of the medium-sized domestic mammals, which make up about 11% NISP, Ovis
and Capra (sheep and goat) appear to have equal representation (Channarayapatna 2014,
2018). Although distinguishing between sheep and goat is very difficult and depends on
the presence of specific anatomical elements, if this interpretation is correct, it suggests
that residents of Farmana may have practised different animal management systems from
other settlements, as not many sites have clear evidence for sheep (Joglekar et al. 2016;
111
2017). Sus (wild and/or domestic pig) remains comprise 0.6% NISP from the Mature
Harappan period. Remains of several wild deer, including Antilope cervicapra, Tetracerus
quadricornus, Gazella benneti, hare, small-, medium-, and large-sized birds and freshwater
fish and molluscs were found in all parts of the settlement. However, except for a single
trench (1D5), which yielded high proportions of freshwater fish (58.2% NISP), the remains
of wild ruminants, hare, birds and freshwater fish and molluscs account for a small
proportion of the fauna. Despite the low ubiquity of wild faunal remains, Farmana exhibits
the highest level of wild mammal utilisation diversity compared to other sites in the region
(61% compared to 20-40%) (see Joglekar et al. 2013). It is also notable that the presence of
ruminants such as Tetracerus quadricornus (four-horned antelope) suggests that residents
possibly had direct or indirect access to humid evergreen open jungles, where these
animals are found (Joglekar et al. 2013). Overall, the presence of over fifteen species of
wild ruminants and freshwater fish indicate the diversity of animals brought to the site
(Channarayapatna 2014, 2018).
The study of butchery practices at Farmana revealed cut marks and charring on meat
and marrow-rich bones of domestic and wild animals (Channarayapatna 2014, 2018).
Completely charred and vitrified bones were dominant among the bone modifications
observed (Channarayapatna 2014, 2018). It was also noted that nearly all anatomical
elements of cattle/buffalo had charring marks, whereas only the cranial fragments, ribs,
scapula, vertebrae, and phalanges of sheep/goat were charred to different degrees
(Channarayapatna 2014, 2018). These differences might hint at different butchery practices
for different animals at the settlement, and preferences for certain cuts of meat amongst
residents. More than half of the fish bones recovered from Trench 1D5 were charred
(Channarayapatna 2014, 2018). The wide range of animal types and high percentage of
fish remains is unique to Farmana. No clear patterns of discard and deposition of animal
bones within the settlement could be discerned, with a variety of anatomical elements of
different animals present across the settlement. This suggests that hunting was an activity
practised by urban residents, or that urban residents procured whole carcasses of wild
mammals from other communities and butchered them on site before consumption.
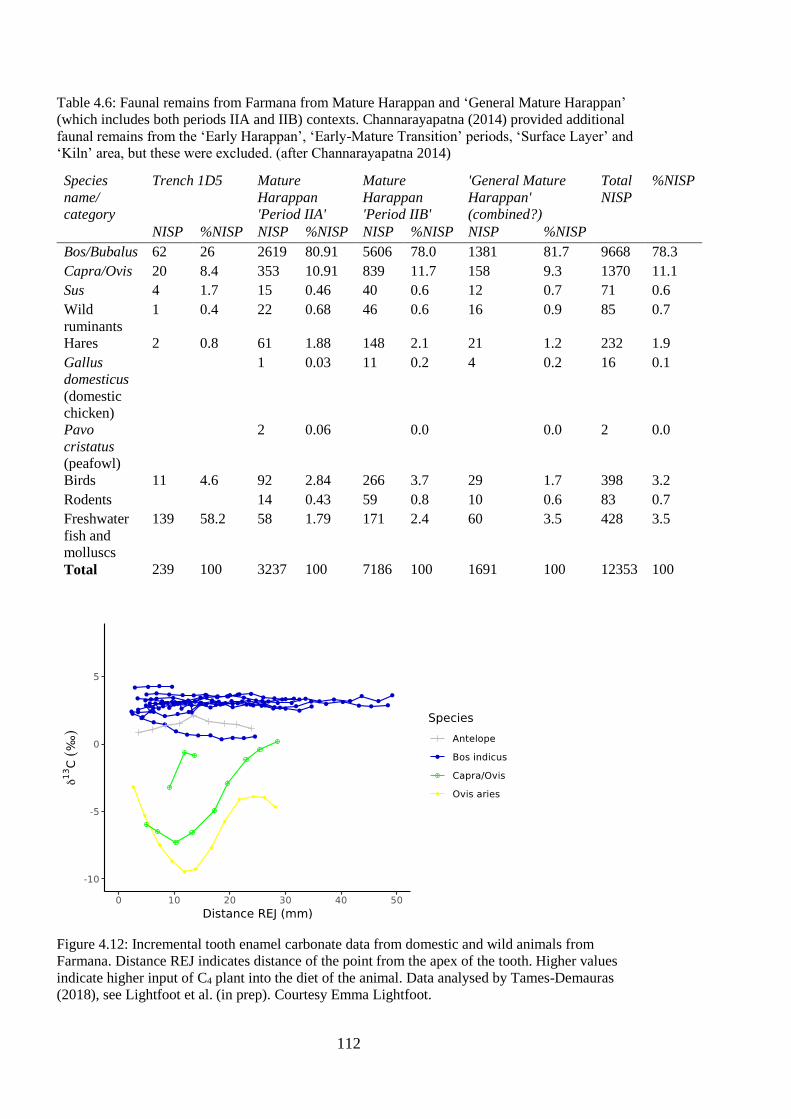
112
Table 4.6: Faunal remains from Farmana from Mature Harappan and ‘General Mature Harappan’
(which includes both periods IIA and IIB) contexts. Channarayapatna (2014) provided additional
faunal remains from the ‘Early Harappan’, ‘Early-Mature Transition’ periods, ‘Surface Layer’ and
‘Kiln’ area, but these were excluded. (after Channarayapatna 2014)
Species
name/
category
Trench 1D5 Mature
Harappan
'Period IIA'
Mature
Harappan
'Period IIB'
'General Mature
Harappan'
(combined?)
Total
NISP
%NISP
NISP %NISP NISP %NISP NISP %NISP NISP %NISP
Bos/Bubalus 62 26 2619 80.91 5606 78.0 1381 81.7 9668 78.3
Capra/Ovis 20 8.4 353 10.91 839 11.7 158 9.3 1370 11.1
Sus 4 1.7 15 0.46 40 0.6 12 0.7 71 0.6
Wild
ruminants
1 0.4 22 0.68 46 0.6 16 0.9 85 0.7
Hares 2 0.8 61 1.88 148 2.1 21 1.2 232 1.9
Gallus
domesticus
(domestic
chicken)
1 0.03 11 0.2 4 0.2 16 0.1
Pavo
cristatus
(peafowl)
2 0.06 0.0 0.0 2 0.0
Birds 11 4.6 92 2.84 266 3.7 29 1.7 398 3.2
Rodents 14 0.43 59 0.8 10 0.6 83 0.7
Freshwater
fish and
molluscs
139 58.2 58 1.79 171 2.4 60 3.5 428 3.5
Total 239 100 3237 100 7186 100 1691 100 12353 100
Figure 4.12: Incremental tooth enamel carbonate data from domestic and wild animals from
Farmana. Distance REJ indicates distance of the point from the apex of the tooth. Higher values
indicate higher input of C4 plant into the diet of the animal. Data analysed by Tames-Demauras
(2018), see Lightfoot et al. (in prep). Courtesy Emma Lightfoot.
113
Animal and human isotopic data
The carbon isotope values of the tooth enamel (Lee-Thorp et al. 1989) from domestic and
wild animals at Farmana revealed similar patterns to other sites in the region (Lightfoot et
al. in prep.) (Figure 4.12). An assemblage of multiple cattle and two sheep/goat teeth, and a
single wild ruminant tooth were investigated as part of a MPhil dissertation (Tames-
Demauras 2018). Cattle, like at other sites, demonstrated very little change in diet
throughout the year, foddering consistently on C4 plants. A single sheep/goat demonstrated
a change in diet from C3 plant consumption to higher inputs of C4 plant consumption
throughout the formation of the tooth. The wild ruminant (Antilope cervicapra) tooth
reflected δ13C values that were extremely similar to cattle, suggesting a C4 plant-based diet,
which is unlike the δ13C values of other wild ruminants from the region that demonstrate a
mixed C3 and C4 plant-based diet across the period of tooth formation (Tames-Demauras
2018). The lack of diet variation exhibited in the δ13C values of this wild ruminant might
be suggestive of its origin from a different habitat, but extrapolating meaning from a single
outlier in the assemblage is difficult (Tames-Demauras 2018).
Oxygen isotope values (Bryant et al. 1996) demonstrated another aspect of the
animal management at Farmana. Sinusoidal curves were observed in the δ18O values of six
cattle teeth, reflecting a change in oxygen isotope values throughout the year based on
seasons (Tames-Demauras 2018). However, no clear pattern was observed, suggesting that
the cattle were born in different seasons. It was hypothesised that the variable time of birth
of the cattle may reflect an active controlling of the breeding season of cattle by residents
at Farmana to maintain a constant source of meat and secondary products (Tames-
Demauras 2018). A correlation between the sinusoidal curves of δ18O and δ13C values for
the single sheep/goat analysed was observed, suggesting C3 plant consumption in winter,
and higher C4 plant consumption in summer, reflecting an environmental shift in access to
plants (Tames-Demauras 2018). When considered together, the isotopic values from cattle
teeth suggest the active monitoring of foddering practices and possible breeding control at
Farmana (Tames-Demauras 2018).
Results from Valentine’s (2013) analysis of enamel carbonate from humans buried in
the cemetery at Farmana suggested that populations at Farmana were eating both C3 and C4
plants. There was a limited variation in the relative contribution of C3 and C4 consumption
at the population level (δ13C range = 4.7‰), but this variation did not correlate with tooth
type, sex or age (Valentine 2013). Unfortunately, as bone collagen was not available for
114
analysis, δ15N values were not obtained, limiting an assessment of protein input into
individuals’ diet.
Ceramic evidence and cultural material
The ceramic assemblage at Farmana was studied in detail by Uesugi (2011). He reported
the presence of ‘Harappan’ and ‘Non-Harappan’ pottery, which has been termed here as
‘Classic Harappan’ and locally-produced ‘Haryana Harappan’ pottery, respectively (Figure
4.13). Uesegi (2011) and Shinde (2011) noted the persistence of ‘Haryana Harappan’
pottery throughout the sequence; suggesting that no particular trend in the relative
frequencies of both types of pottery could be observed across time or in different areas
(Uesugi 2011). Although there are concerns about the degree to which taphonomic
processes were accounted for while conducting the analysis, the overwhelming presence of
‘Haryana Harappan’ pottery at the site suggests that locally-produced pottery predominated
in medium-sized Indus settlements like Farmana.
Other cultural material recovered from the excavations link it to larger urban centres
and long-distance exchange networks (Konasukawa et al. 2011). For example, four steatite
seals, and two seal impressions were found, out of which two seals and one seal impression
were found in Structural Complex No. 3 (Konasukawa et al. 2011), from where pottery
samples for organic residue analysis have been selected. Other finds included a variety of
stone beads made from steatite, carnelian, chert, agate, jasper, chalcedony, lapis lazuli, and
precious metals like gold (Konasukawa et al. 2011). Faience and shell bangles and beads
were also reported from the excavations (Konasukawa et al. 2011).
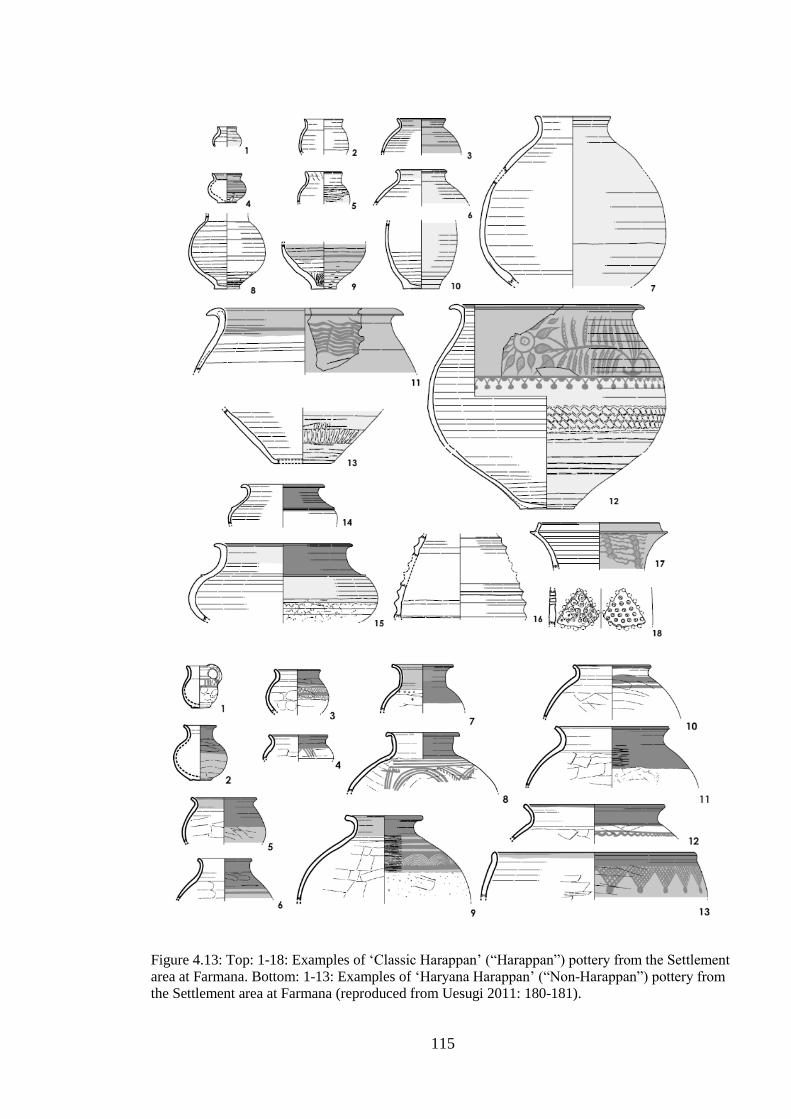
115
Figure 4.13: Top: 1-18: Examples of ‘Classic Harappan’ (“Harappan”) pottery from the Settlement
area at Farmana. Bottom: 1-13: Examples of ‘Haryana Harappan’ (“Non-Harappan”) pottery from
the Settlement area at Farmana (reproduced from Uesugi 2011: 180-181).
116
4.1.4 Large-sized settlements (>20 ha)
4.1.4.1 Rakhigarhi (RGR)
Today, Rakhigarhi (29°17’19” N, 76°06’47” E) is a large village in Hissar district in the
state of Haryana, but in 1963, Suraj Bhan (1975) identified one of the largest Indus sites in
the region located underneath it. At least seven mounds exist in the area; five in close
proximity, and two others a distance away, numbered RGR-1 to RGR-7 (see Figure 4.14).
A cemetery area (RGR-7) with multiple burials lies between 300-750m away from RGR-1
and RGR-2, respectively (Nath et al. 2015; Shinde et al. 2018a, 2018b). It has been argued
that archaeological remains at Rakhigarhi extend to 300 hectares (Nath 2014: 128), but this
estimation includes the area of all seven mounds. Thus, it is unclear if the mounds
effectively made up a single settlement in antiquity, and there has been a tendency to
overestimate its size. Despite this, there is no doubt that the archaeological remains at
Rakhigarhi are substantial, possibly comparable to Harappa. The cemetery area (Shinde et
al. 2018a, 2018b) is not described in this thesis as pottery samples were only taken from
the settlement, specifically, RGR-4.
Site environment and background
Like other sites discussed in this thesis, Rakhigarhi lies on the Satluj-Yamuna alluvial
plain. The landscape comprises of mixed alluvial and aeolian deposits. Aeolian deposits of
varying thicknesses overly the Pleistocene alluvium, which is exposed at various instances
in topographic depressions or beneath a veneer of sands (Nath 2014: 59-62). The region
immediately around Rakhigarhi (1km) has a series of sandy loam to moderately developed
loam soils that are well-drained. In the larger vicinity, soils range from sandy and heavily
eroded to loamy and calcareous, with variable levels of fertility (Nath 2014: 60).
Geomorphological evidence of pluvial and fluvial processes (multiple rivers and braided
drainage and deposition as well as major stream action) are indicated with the presence of
riverine sediments comprising of clay, sand, silt and gravel (Ahuja and Singh 1983; Nath
2014: 60-61). Seasonal flooding continues to take place between July through to
September during the monsoon season.
It has been suggested that Rakhigarhi was located on a now-dried river bed (Bhan
1975: 95), and idealised plans of the site show a channel encompassing most of the
mounds (e.g., Nath 1998: 40; Fig 4.14). It is notable that the channel is not clearly visible
today, or on the British maps from the early decades of the twentieth century (Singh et al.
2010). Nath (2014: 105) also mentions evidence of 60cm of flood deposits at RGR-1. Such
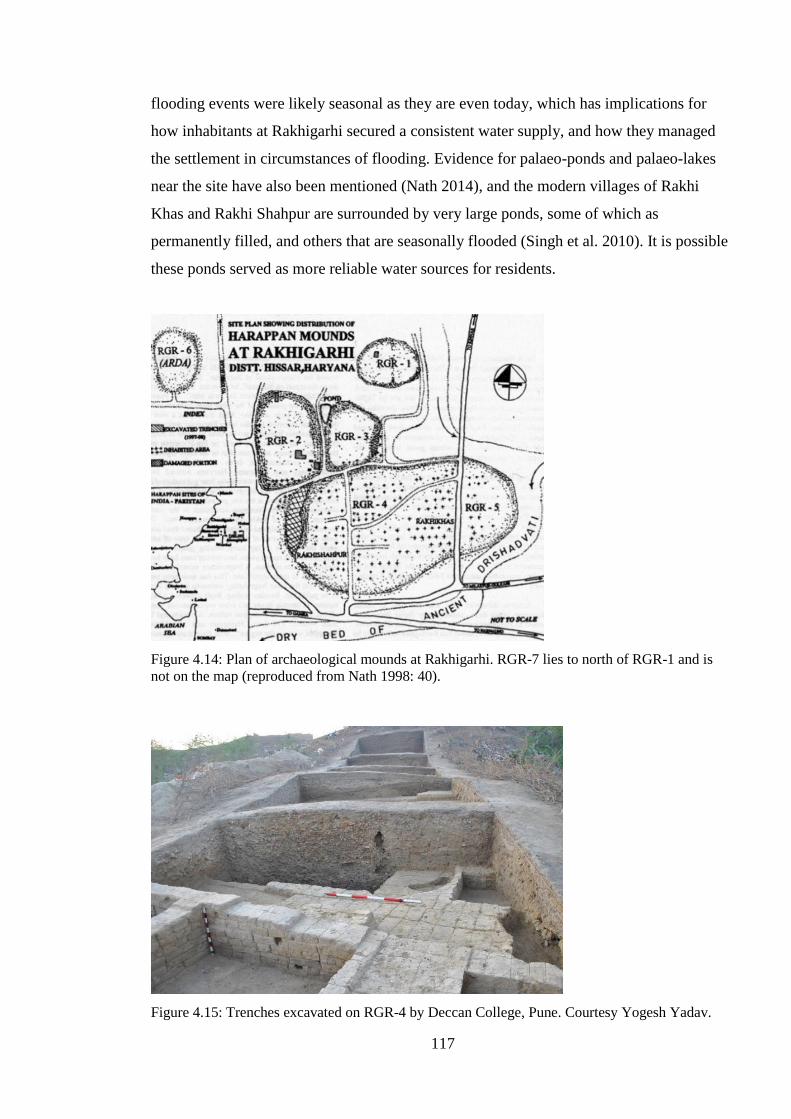
117
flooding events were likely seasonal as they are even today, which has implications for
how inhabitants at Rakhigarhi secured a consistent water supply, and how they managed
the settlement in circumstances of flooding. Evidence for palaeo-ponds and palaeo-lakes
near the site have also been mentioned (Nath 2014), and the modern villages of Rakhi
Khas and Rakhi Shahpur are surrounded by very large ponds, some of which as
permanently filled, and others that are seasonally flooded (Singh et al. 2010). It is possible
these ponds served as more reliable water sources for residents.
Figure 4.14: Plan of archaeological mounds at Rakhigarhi. RGR-7 lies to north of RGR-1 and is
not on the map (reproduced from Nath 1998: 40).
Figure 4.15: Trenches excavated on RGR-4 by Deccan College, Pune. Courtesy Yogesh Yadav.
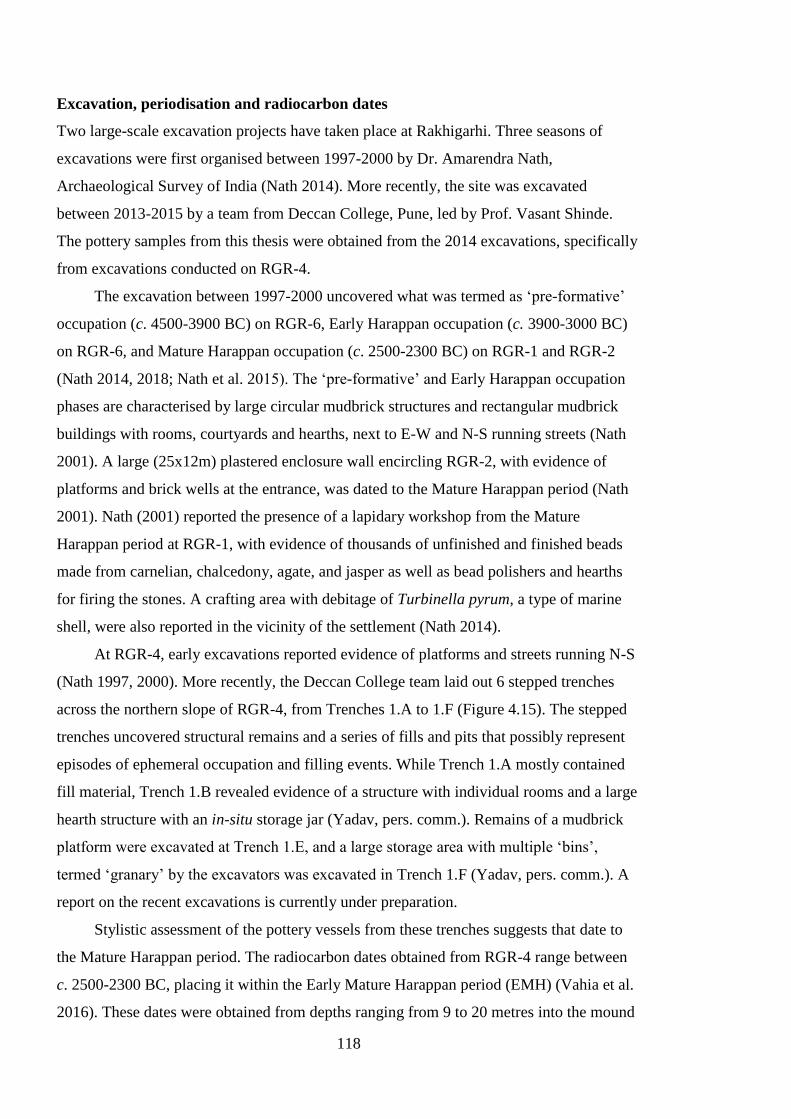
118
Excavation, periodisation and radiocarbon dates
Two large-scale excavation projects have taken place at Rakhigarhi. Three seasons of
excavations were first organised between 1997-2000 by Dr. Amarendra Nath,
Archaeological Survey of India (Nath 2014). More recently, the site was excavated
between 2013-2015 by a team from Deccan College, Pune, led by Prof. Vasant Shinde.
The pottery samples from this thesis were obtained from the 2014 excavations, specifically
from excavations conducted on RGR-4.
The excavation between 1997-2000 uncovered what was termed as ‘pre-formative’
occupation (c. 4500-3900 BC) on RGR-6, Early Harappan occupation (c. 3900-3000 BC)
on RGR-6, and Mature Harappan occupation (c. 2500-2300 BC) on RGR-1 and RGR-2
(Nath 2014, 2018; Nath et al. 2015). The ‘pre-formative’ and Early Harappan occupation
phases are characterised by large circular mudbrick structures and rectangular mudbrick
buildings with rooms, courtyards and hearths, next to E-W and N-S running streets (Nath
2001). A large (25x12m) plastered enclosure wall encircling RGR-2, with evidence of
platforms and brick wells at the entrance, was dated to the Mature Harappan period (Nath
2001). Nath (2001) reported the presence of a lapidary workshop from the Mature
Harappan period at RGR-1, with evidence of thousands of unfinished and finished beads
made from carnelian, chalcedony, agate, and jasper as well as bead polishers and hearths
for firing the stones. A crafting area with debitage of Turbinella pyrum, a type of marine
shell, were also reported in the vicinity of the settlement (Nath 2014).
At RGR-4, early excavations reported evidence of platforms and streets running N-S
(Nath 1997, 2000). More recently, the Deccan College team laid out 6 stepped trenches
across the northern slope of RGR-4, from Trenches 1.A to 1.F (Figure 4.15). The stepped
trenches uncovered structural remains and a series of fills and pits that possibly represent
episodes of ephemeral occupation and filling events. While Trench 1.A mostly contained
fill material, Trench 1.B revealed evidence of a structure with individual rooms and a large
hearth structure with an in-situ storage jar (Yadav, pers. comm.). Remains of a mudbrick
platform were excavated at Trench 1.E, and a large storage area with multiple ‘bins’,
termed ‘granary’ by the excavators was excavated in Trench 1.F (Yadav, pers. comm.). A
report on the recent excavations is currently under preparation.
Stylistic assessment of the pottery vessels from these trenches suggests that date to
the Mature Harappan period. The radiocarbon dates obtained from RGR-4 range between
c. 2500-2300 BC, placing it within the Early Mature Harappan period (EMH) (Vahia et al.
2016). These dates were obtained from depths ranging from 9 to 20 metres into the mound
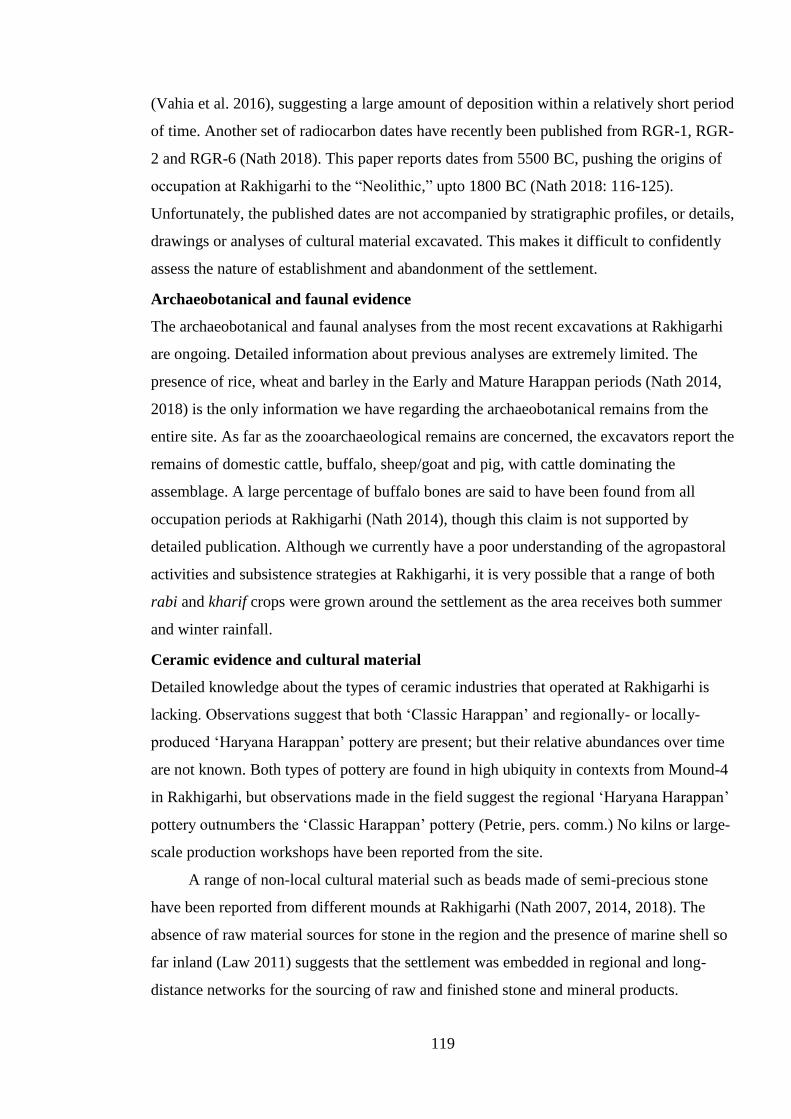
119
(Vahia et al. 2016), suggesting a large amount of deposition within a relatively short period
of time. Another set of radiocarbon dates have recently been published from RGR-1, RGR-
2 and RGR-6 (Nath 2018). This paper reports dates from 5500 BC, pushing the origins of
occupation at Rakhigarhi to the “Neolithic,” upto 1800 BC (Nath 2018: 116-125).
Unfortunately, the published dates are not accompanied by stratigraphic profiles, or details,
drawings or analyses of cultural material excavated. This makes it difficult to confidently
assess the nature of establishment and abandonment of the settlement.
Archaeobotanical and faunal evidence
The archaeobotanical and faunal analyses from the most recent excavations at Rakhigarhi
are ongoing. Detailed information about previous analyses are extremely limited. The
presence of rice, wheat and barley in the Early and Mature Harappan periods (Nath 2014,
2018) is the only information we have regarding the archaeobotanical remains from the
entire site. As far as the zooarchaeological remains are concerned, the excavators report the
remains of domestic cattle, buffalo, sheep/goat and pig, with cattle dominating the
assemblage. A large percentage of buffalo bones are said to have been found from all
occupation periods at Rakhigarhi (Nath 2014), though this claim is not supported by
detailed publication. Although we currently have a poor understanding of the agropastoral
activities and subsistence strategies at Rakhigarhi, it is very possible that a range of both
rabi and kharif crops were grown around the settlement as the area receives both summer
and winter rainfall.
Ceramic evidence and cultural material
Detailed knowledge about the types of ceramic industries that operated at Rakhigarhi is
lacking. Observations suggest that both ‘Classic Harappan’ and regionally- or locally-
produced ‘Haryana Harappan’ pottery are present; but their relative abundances over time
are not known. Both types of pottery are found in high ubiquity in contexts from Mound-4
in Rakhigarhi, but observations made in the field suggest the regional ‘Haryana Harappan’
pottery outnumbers the ‘Classic Harappan’ pottery (Petrie, pers. comm.) No kilns or large-
scale production workshops have been reported from the site.
A range of non-local cultural material such as beads made of semi-precious stone
have been reported from different mounds at Rakhigarhi (Nath 2007, 2014, 2018). The
absence of raw material sources for stone in the region and the presence of marine shell so
far inland (Law 2011) suggests that the settlement was embedded in regional and long-
distance networks for the sourcing of raw and finished stone and mineral products.
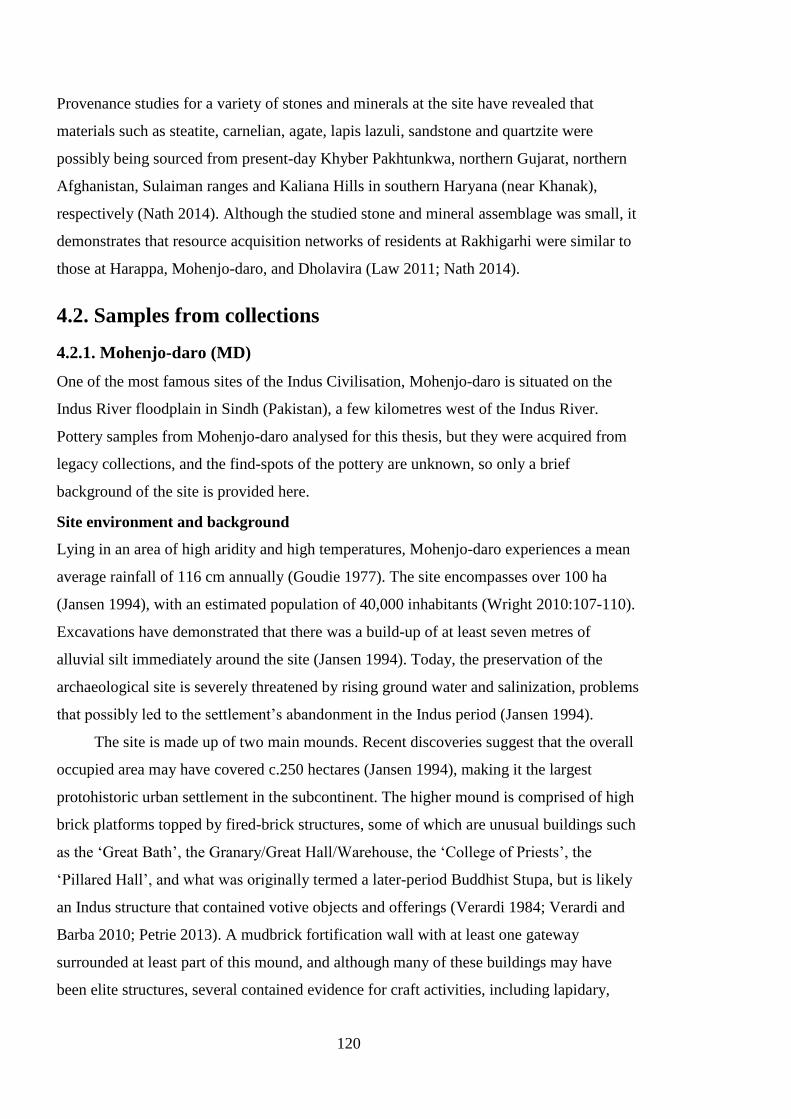
120
Provenance studies for a variety of stones and minerals at the site have revealed that
materials such as steatite, carnelian, agate, lapis lazuli, sandstone and quartzite were
possibly being sourced from present-day Khyber Pakhtunkwa, northern Gujarat, northern
Afghanistan, Sulaiman ranges and Kaliana Hills in southern Haryana (near Khanak),
respectively (Nath 2014). Although the studied stone and mineral assemblage was small, it
demonstrates that resource acquisition networks of residents at Rakhigarhi were similar to
those at Harappa, Mohenjo-daro, and Dholavira (Law 2011; Nath 2014).
4.2. Samples from collections
4.2.1. Mohenjo-daro (MD)
One of the most famous sites of the Indus Civilisation, Mohenjo-daro is situated on the
Indus River floodplain in Sindh (Pakistan), a few kilometres west of the Indus River.
Pottery samples from Mohenjo-daro analysed for this thesis, but they were acquired from
legacy collections, and the find-spots of the pottery are unknown, so only a brief
background of the site is provided here.
Site environment and background
Lying in an area of high aridity and high temperatures, Mohenjo-daro experiences a mean
average rainfall of 116 cm annually (Goudie 1977). The site encompasses over 100 ha
(Jansen 1994), with an estimated population of 40,000 inhabitants (Wright 2010:107-110).
Excavations have demonstrated that there was a build-up of at least seven metres of
alluvial silt immediately around the site (Jansen 1994). Today, the preservation of the
archaeological site is severely threatened by rising ground water and salinization, problems
that possibly led to the settlement’s abandonment in the Indus period (Jansen 1994).
The site is made up of two main mounds. Recent discoveries suggest that the overall
occupied area may have covered c.250 hectares (Jansen 1994), making it the largest
protohistoric urban settlement in the subcontinent. The higher mound is comprised of high
brick platforms topped by fired-brick structures, some of which are unusual buildings such
as the ‘Great Bath’, the Granary/Great Hall/Warehouse, the ‘College of Priests’, the
‘Pillared Hall’, and what was originally termed a later-period Buddhist Stupa, but is likely
an Indus structure that contained votive objects and offerings (Verardi 1984; Verardi and
Barba 2010; Petrie 2013). A mudbrick fortification wall with at least one gateway
surrounded at least part of this mound, and although many of these buildings may have
been elite structures, several contained evidence for craft activities, including lapidary,
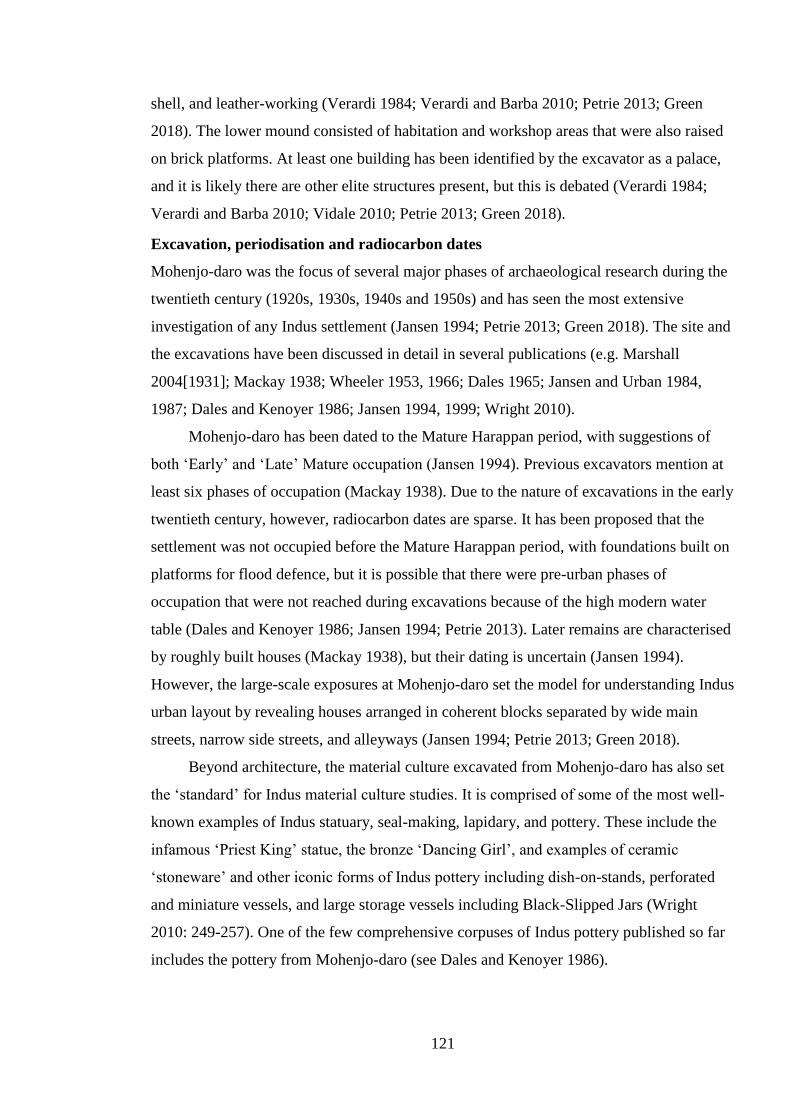
121
shell, and leather-working (Verardi 1984; Verardi and Barba 2010; Petrie 2013; Green
2018). The lower mound consisted of habitation and workshop areas that were also raised
on brick platforms. At least one building has been identified by the excavator as a palace,
and it is likely there are other elite structures present, but this is debated (Verardi 1984;
Verardi and Barba 2010; Vidale 2010; Petrie 2013; Green 2018).
Excavation, periodisation and radiocarbon dates
Mohenjo-daro was the focus of several major phases of archaeological research during the
twentieth century (1920s, 1930s, 1940s and 1950s) and has seen the most extensive
investigation of any Indus settlement (Jansen 1994; Petrie 2013; Green 2018). The site and
the excavations have been discussed in detail in several publications (e.g. Marshall
2004[1931]; Mackay 1938; Wheeler 1953, 1966; Dales 1965; Jansen and Urban 1984,
1987; Dales and Kenoyer 1986; Jansen 1994, 1999; Wright 2010).
Mohenjo-daro has been dated to the Mature Harappan period, with suggestions of
both ‘Early’ and ‘Late’ Mature occupation (Jansen 1994). Previous excavators mention at
least six phases of occupation (Mackay 1938). Due to the nature of excavations in the early
twentieth century, however, radiocarbon dates are sparse. It has been proposed that the
settlement was not occupied before the Mature Harappan period, with foundations built on
platforms for flood defence, but it is possible that there were pre-urban phases of
occupation that were not reached during excavations because of the high modern water
table (Dales and Kenoyer 1986; Jansen 1994; Petrie 2013). Later remains are characterised
by roughly built houses (Mackay 1938), but their dating is uncertain (Jansen 1994).
However, the large-scale exposures at Mohenjo-daro set the model for understanding Indus
urban layout by revealing houses arranged in coherent blocks separated by wide main
streets, narrow side streets, and alleyways (Jansen 1994; Petrie 2013; Green 2018).
Beyond architecture, the material culture excavated from Mohenjo-daro has also set
the ‘standard’ for Indus material culture studies. It is comprised of some of the most well-
known examples of Indus statuary, seal-making, lapidary, and pottery. These include the
infamous ‘Priest King’ statue, the bronze ‘Dancing Girl’, and examples of ceramic
‘stoneware’ and other iconic forms of Indus pottery including dish-on-stands, perforated
and miniature vessels, and large storage vessels including Black-Slipped Jars (Wright
2010: 249-257). One of the few comprehensive corpuses of Indus pottery published so far
includes the pottery from Mohenjo-daro (see Dales and Kenoyer 1986).
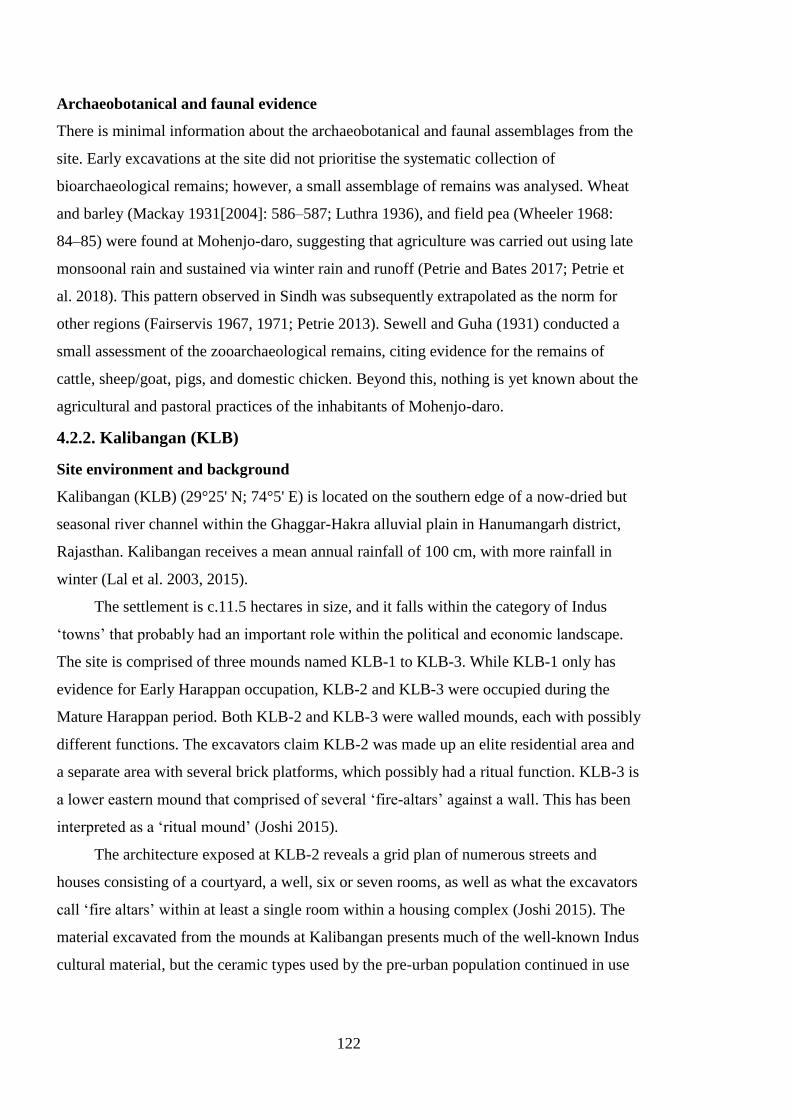
122
Archaeobotanical and faunal evidence
There is minimal information about the archaeobotanical and faunal assemblages from the
site. Early excavations at the site did not prioritise the systematic collection of
bioarchaeological remains; however, a small assemblage of remains was analysed. Wheat
and barley (Mackay 1931[2004]: 586–587; Luthra 1936), and field pea (Wheeler 1968:
84–85) were found at Mohenjo-daro, suggesting that agriculture was carried out using late
monsoonal rain and sustained via winter rain and runoff (Petrie and Bates 2017; Petrie et
al. 2018). This pattern observed in Sindh was subsequently extrapolated as the norm for
other regions (Fairservis 1967, 1971; Petrie 2013). Sewell and Guha (1931) conducted a
small assessment of the zooarchaeological remains, citing evidence for the remains of
cattle, sheep/goat, pigs, and domestic chicken. Beyond this, nothing is yet known about the
agricultural and pastoral practices of the inhabitants of Mohenjo-daro.
4.2.2. Kalibangan (KLB)
Site environment and background
Kalibangan (KLB) (29°25' N; 74°5' E) is located on the southern edge of a now-dried but
seasonal river channel within the Ghaggar-Hakra alluvial plain in Hanumangarh district,
Rajasthan. Kalibangan receives a mean annual rainfall of 100 cm, with more rainfall in
winter (Lal et al. 2003, 2015).
The settlement is c.11.5 hectares in size, and it falls within the category of Indus
‘towns’ that probably had an important role within the political and economic landscape.
The site is comprised of three mounds named KLB-1 to KLB-3. While KLB-1 only has
evidence for Early Harappan occupation, KLB-2 and KLB-3 were occupied during the
Mature Harappan period. Both KLB-2 and KLB-3 were walled mounds, each with possibly
different functions. The excavators claim KLB-2 was made up an elite residential area and
a separate area with several brick platforms, which possibly had a ritual function. KLB-3 is
a lower eastern mound that comprised of several ‘fire-altars’ against a wall. This has been
interpreted as a ‘ritual mound’ (Joshi 2015).
The architecture exposed at KLB-2 reveals a grid plan of numerous streets and
houses consisting of a courtyard, a well, six or seven rooms, as well as what the excavators
call ‘fire altars’ within at least a single room within a housing complex (Joshi 2015). The
material excavated from the mounds at Kalibangan presents much of the well-known Indus
cultural material, but the ceramic types used by the pre-urban population continued in use
123
for at least part of the later period of occupation, suggesting both continuity of the local
population and a progressive emulation of non-local material (Petrie 2013: 9).
Excavation, periodisation and radiocarbon dates
Large-scale excavations at Kalibangan were conducted between 1960 until 1969 by Prof.
B.B. Lal, Jagat Pati Joshi and the Archaeological Survey of India. A report on the Early
Harappan remains was published in 2003 (Lal et al. 2003), and a volume which includes
the stratigraphy, radiocarbon dates and descriptions of the objects from the Mature
Harappan occupation levels at KLB-2 and KLB-3 was published in 2015 (Lal et al. 2015).
Radiocarbon dates from the Mature Harappan occupation levels suggest the site was
occupied between 2600-2100 BC (Lal et al. 2015). The dates demonstrate some mixing in
contexts; however, they largely point at occupation of the settlement in the Early Harappan
and Mature Harappan period, with minimal evidence for occupation in the Late Harappan
period (Lal et al. 2015).
Archaeobotanical and faunal evidence
Knowledge about plant use at Kalibangan is very limited and there is a lack of published
material. Evidence of a ploughed field dating to the Early Harappan period is often cited as
early evidence for plough agriculture in this region (Lal et al. 2003; Joshi 2015: 714). The
plough marks cross each other at right angles, which is argued as evidence for ‘mixed crop
cultivation’ (Joshi 2015: 714). Reports mention the growing of winter crops, such as
barley, wheat, peas, and horse gram (Joshi 2015: 714), but there is not published quantified
evidence. Similarly, the zooarchaeological assemblage at Kalibangan has not been
adequately studied or published. The site report mentions a large proportion of cattle bones
compared to goat, pig and fowl, and the presence of small and large hooks that were used
for fishing (Joshi 2015).
Other evidence for subsistence practices include stone saddle querns, mortars and
pestles that were probably used during food preparation. The excavators noted the presence
of grains in large jars at Kalibangan, as well as an underground lime-plastered pit that was
interpreted as a granary (Joshi 2015). The multiple hearths and ovens found inside the
residential structures are said to be reminiscent of modern-day tandoors that are used for
baking flat bread (Joshi 2015). The excavators also mention evidence for the presence of
ceramics and other tools that are used in modern-day Indian cooking to roll and roast
chapattis made from cereals (Joshi 2015: 824).
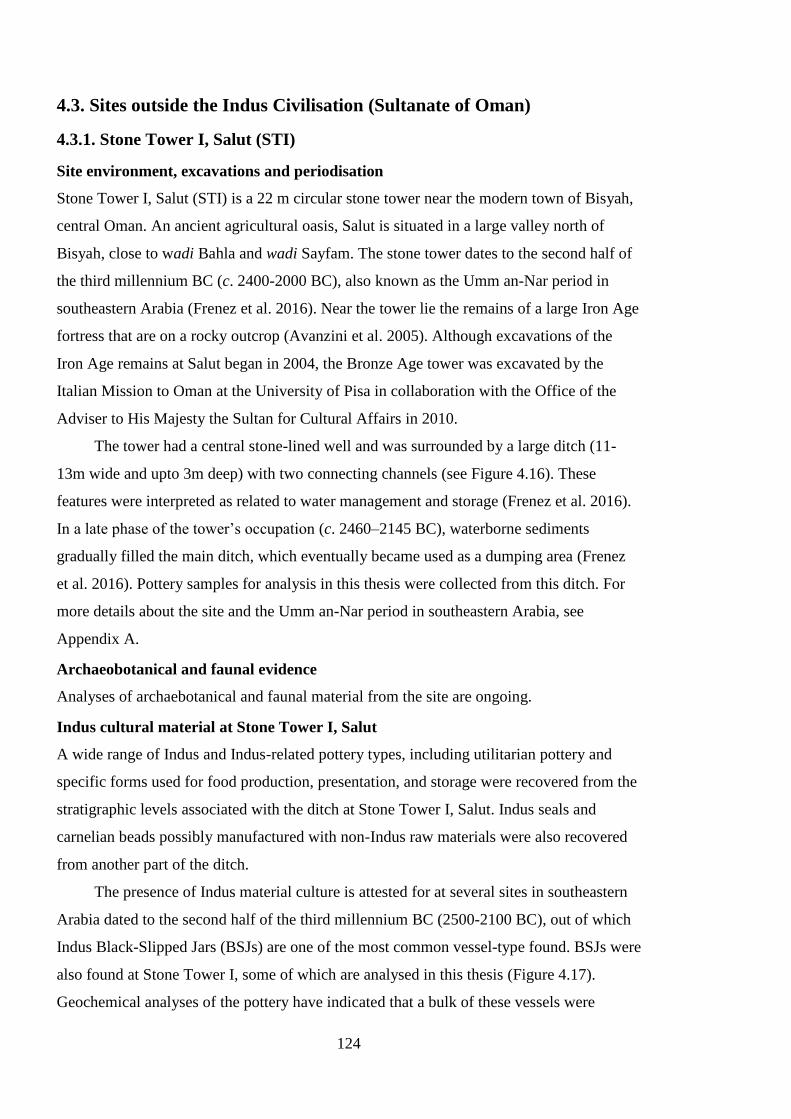
124
4.3. Sites outside the Indus Civilisation (Sultanate of Oman)
4.3.1. Stone Tower I, Salut (STI)
Site environment, excavations and periodisation
Stone Tower I, Salut (STI) is a 22 m circular stone tower near the modern town of Bisyah,
central Oman. An ancient agricultural oasis, Salut is situated in a large valley north of
Bisyah, close to wadi Bahla and wadi Sayfam. The stone tower dates to the second half of
the third millennium BC (c. 2400-2000 BC), also known as the Umm an-Nar period in
southeastern Arabia (Frenez et al. 2016). Near the tower lie the remains of a large Iron Age
fortress that are on a rocky outcrop (Avanzini et al. 2005). Although excavations of the
Iron Age remains at Salut began in 2004, the Bronze Age tower was excavated by the
Italian Mission to Oman at the University of Pisa in collaboration with the Office of the
Adviser to His Majesty the Sultan for Cultural Affairs in 2010.
The tower had a central stone-lined well and was surrounded by a large ditch (11-
13m wide and upto 3m deep) with two connecting channels (see Figure 4.16). These
features were interpreted as related to water management and storage (Frenez et al. 2016).
In a late phase of the tower’s occupation (c. 2460–2145 BC), waterborne sediments
gradually filled the main ditch, which eventually became used as a dumping area (Frenez
et al. 2016). Pottery samples for analysis in this thesis were collected from this ditch. For
more details about the site and the Umm an-Nar period in southeastern Arabia, see
Appendix A.
Archaeobotanical and faunal evidence
Analyses of archaebotanical and faunal material from the site are ongoing.
Indus cultural material at Stone Tower I, Salut
A wide range of Indus and Indus-related pottery types, including utilitarian pottery and
specific forms used for food production, presentation, and storage were recovered from the
stratigraphic levels associated with the ditch at Stone Tower I, Salut. Indus seals and
carnelian beads possibly manufactured with non-Indus raw materials were also recovered
from another part of the ditch.
The presence of Indus material culture is attested for at several sites in southeastern
Arabia dated to the second half of the third millennium BC (2500-2100 BC), out of which
Indus Black-Slipped Jars (BSJs) are one of the most common vessel-type found. BSJs were
also found at Stone Tower I, some of which are analysed in this thesis (Figure 4.17).
Geochemical analyses of the pottery have indicated that a bulk of these vessels were
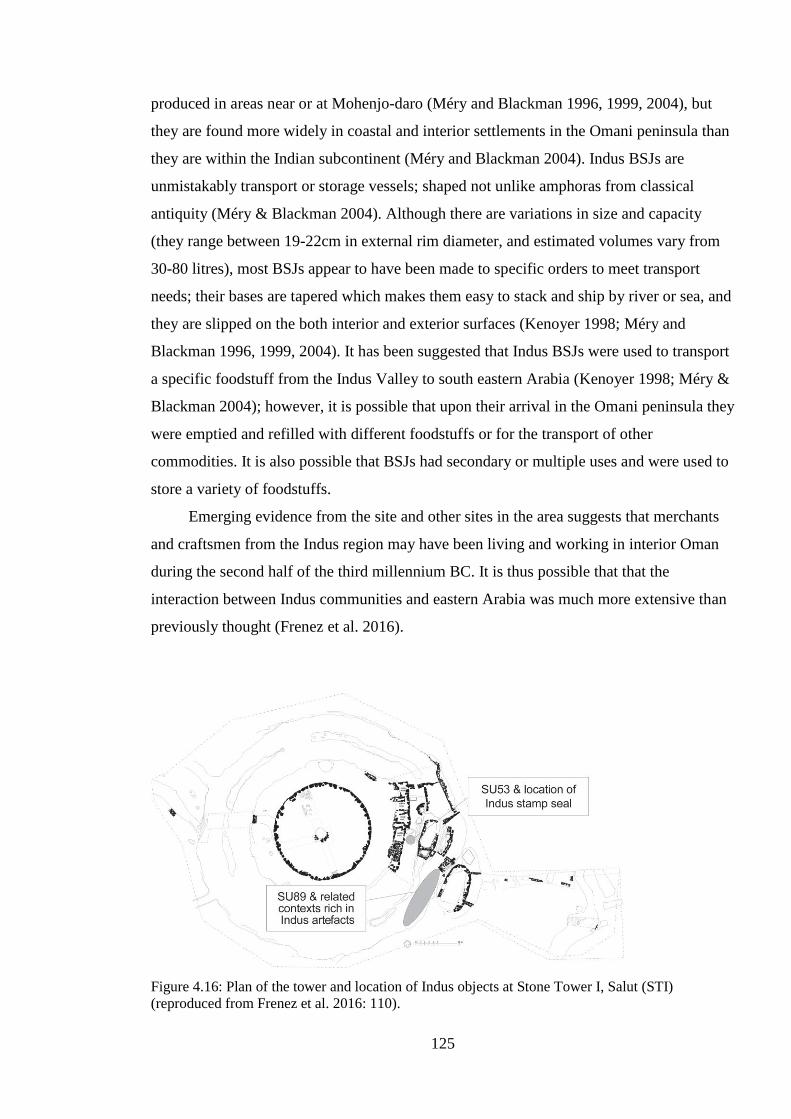
125
produced in areas near or at Mohenjo-daro (Méry and Blackman 1996, 1999, 2004), but
they are found more widely in coastal and interior settlements in the Omani peninsula than
they are within the Indian subcontinent (Méry and Blackman 2004). Indus BSJs are
unmistakably transport or storage vessels; shaped not unlike amphoras from classical
antiquity (Méry & Blackman 2004). Although there are variations in size and capacity
(they range between 19-22cm in external rim diameter, and estimated volumes vary from
30-80 litres), most BSJs appear to have been made to specific orders to meet transport
needs; their bases are tapered which makes them easy to stack and ship by river or sea, and
they are slipped on the both interior and exterior surfaces (Kenoyer 1998; Méry and
Blackman 1996, 1999, 2004). It has been suggested that Indus BSJs were used to transport
a specific foodstuff from the Indus Valley to south eastern Arabia (Kenoyer 1998; Méry &
Blackman 2004); however, it is possible that upon their arrival in the Omani peninsula they
were emptied and refilled with different foodstuffs or for the transport of other
commodities. It is also possible that BSJs had secondary or multiple uses and were used to
store a variety of foodstuffs.
Emerging evidence from the site and other sites in the area suggests that merchants
and craftsmen from the Indus region may have been living and working in interior Oman
during the second half of the third millennium BC. It is thus possible that that the
interaction between Indus communities and eastern Arabia was much more extensive than
previously thought (Frenez et al. 2016).
Figure 4.16: Plan of the tower and location of Indus objects at Stone Tower I, Salut (STI)
(reproduced from Frenez et al. 2016: 110).
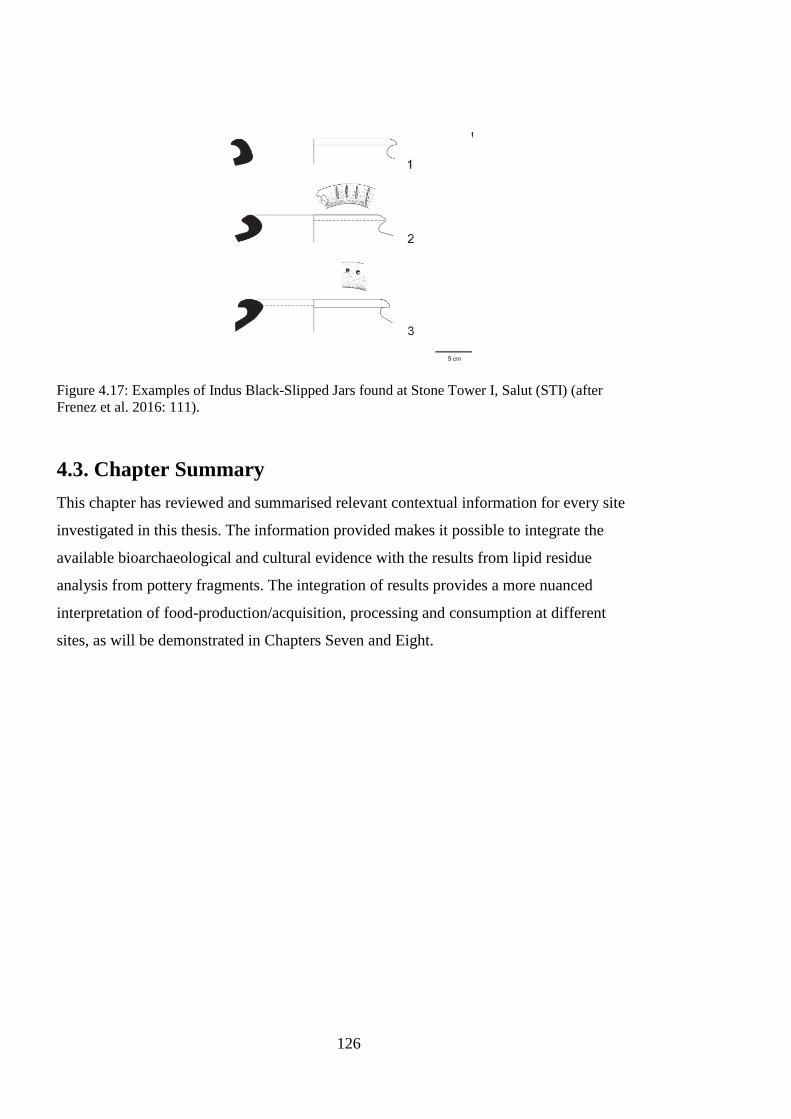
126
Figure 4.17: Examples of Indus Black-Slipped Jars found at Stone Tower I, Salut (STI) (after
Frenez et al. 2016: 111).
4.3. Chapter Summary
This chapter has reviewed and summarised relevant contextual information for every site
investigated in this thesis. The information provided makes it possible to integrate the
available bioarchaeological and cultural evidence with the results from lipid residue
analysis from pottery fragments. The integration of results provides a more nuanced
interpretation of food-production/acquisition, processing and consumption at different
sites, as will be demonstrated in Chapters Seven and Eight.
127
Chapter Five
Materials and methods
This chapter describes the rationale behind the sampling strategies and analytical methods
used in this thesis. Section 5.1 covers the rationale behind selection of pottery samples and
specific details of the collection of pottery from sites. Section 5.3, Section 5.4 and Section
5.5 provide the lipid extraction protocol, study design, and details of the instrumental
analyses conducted, namely Gas Chromatography, Gas Chromatography-Mass
Spectrometry and Gas Chromatography-Combustion-Mass Spectrometry, respectively.
Details of the statistical tests performed are provided in Section 5.6 and details of data
reproducibility in Section 5.7.
5.1. Pottery Selection
Pottery from Indus sites in northwest India and Sindh, and Umm an-Nar and Indus pottery
from the Sultanate of Oman were selected for analysis. Samples of pottery were collected
from selected sites in 2015 and 2017. Three groups of samples were collected, representing
the ‘worst-’ and the ‘best-’ case scenarios for pottery sampling for organic residue analysis.
The first group of sherds (n=10), ‘Group I’, came from legacy collections and had no
contextual information associated with them except for which site they were collected
from. The sherds had been washed, and were likely exposed to a variety of synthetic
contaminants, such as plasticisers from being stored in plastic bags for several years, skin
lipids from individuals handling them, and other products like adhesives, nail varnish,
marker pens, etc. that are used to process pottery after collection. It is also likely they were
susceptible to the vicissitudes of being exposed on the surface of a site for an indeterminate
period.
The second group of sherds (n=135), ‘Group II’, were excavated between 2008-2014
by different excavation projects. Although mostly recovered from well-stratified contexts,
these sherds had been washed and processed, and touched and handled by multiple
individuals. Most sherds were written on with marker pens and stored in plastic bags; and
some had traces of adhesive on them. Care was taken to avoid drilling portions of the sherd
that had writing on them and areas with adhesive were avoided.
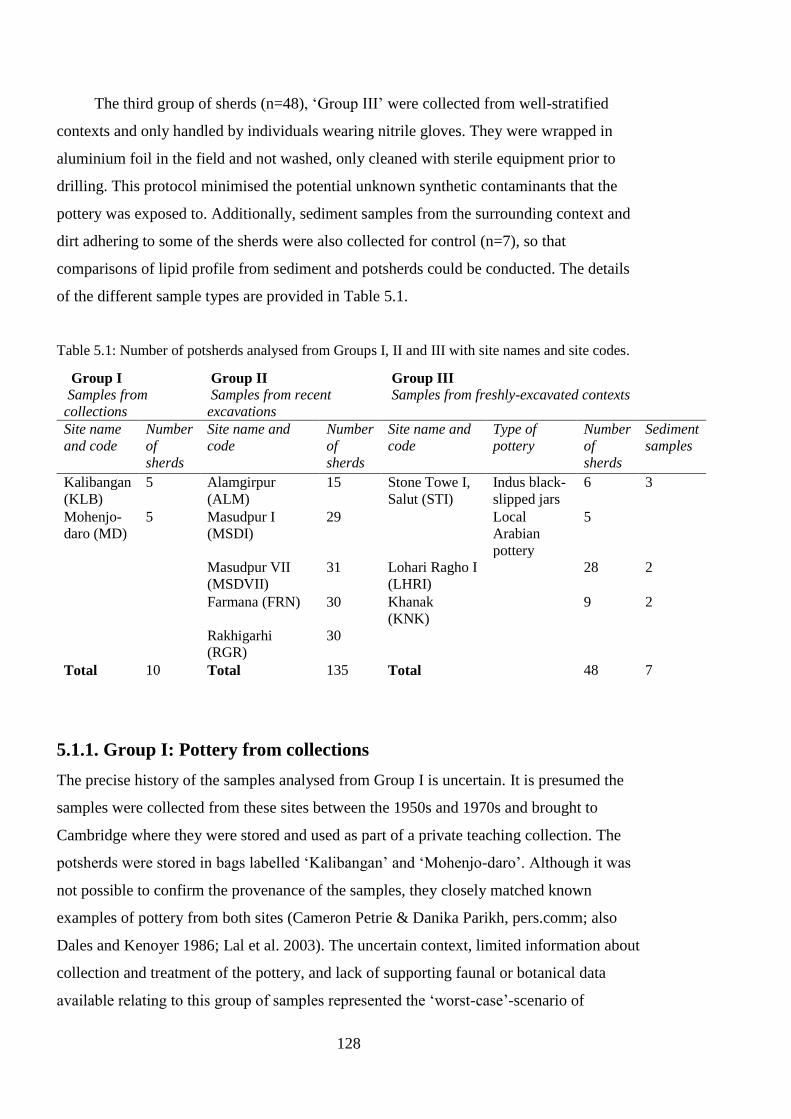
128
The third group of sherds (n=48), ‘Group III’ were collected from well-stratified
contexts and only handled by individuals wearing nitrile gloves. They were wrapped in
aluminium foil in the field and not washed, only cleaned with sterile equipment prior to
drilling. This protocol minimised the potential unknown synthetic contaminants that the
pottery was exposed to. Additionally, sediment samples from the surrounding context and
dirt adhering to some of the sherds were also collected for control (n=7), so that
comparisons of lipid profile from sediment and potsherds could be conducted. The details
of the different sample types are provided in Table 5.1.
Table 5.1: Number of potsherds analysed from Groups I, II and III with site names and site codes.
Group I
Samples from
collections
Group II
Samples from recent
excavations
Group III
Samples from freshly-excavated contexts
Site name
and code
Number
of
sherds
Site name and
code
Number
of
sherds
Site name and
code
Type of
pottery
Number
of
sherds
Sediment
samples
Kalibangan
(KLB)
5 Alamgirpur
(ALM)
15 Stone Towe I,
Salut (STI)
Indus black-
slipped jars
6 3
Mohenjo-
daro (MD)
5 Masudpur I
(MSDI)
29 Local
Arabian
pottery
5
Masudpur VII
(MSDVII)
31 Lohari Ragho I
(LHRI)
28 2
Farmana (FRN) 30 Khanak
(KNK)
9 2
Rakhigarhi
(RGR)
30
Total 10 Total 135 Total 48 7
5.1.1. Group I: Pottery from collections
The precise history of the samples analysed from Group I is uncertain. It is presumed the
samples were collected from these sites between the 1950s and 1970s and brought to
Cambridge where they were stored and used as part of a private teaching collection. The
potsherds were stored in bags labelled ‘Kalibangan’ and ‘Mohenjo-daro’. Although it was
not possible to confirm the provenance of the samples, they closely matched known
examples of pottery from both sites (Cameron Petrie & Danika Parikh, pers.comm; also
Dales and Kenoyer 1986; Lal et al. 2003). The uncertain context, limited information about
collection and treatment of the pottery, and lack of supporting faunal or botanical data
available relating to this group of samples represented the ‘worst-case’-scenario of
129
sampling options for lipid analysis. It was not possible to collect specific data about the
preservational environment immediately surrounding the sherds, but broadly speaking,
both sites are located in areas of high aridity and experience seasonal rainfall. At the same
time, all the potsherds had been stored in poor-quality plastic bags for several years, and 6
out of 10 potsherds samples from Group I had been labelled with varnish and marker pen.
It was thus expected that lipid extracts from these samples would also contain high
concentrations of synthetic compounds. Five samples were selected from a plastic bag
labelled ‘Kalibangan’ (KLB), and 5 samples were selected from a bag labelled ‘Mohenjo-
daro’ (MD) Details are provided in Tables 5.2 and 5.3.
5.1.2. Group II: recently-excavated samples
Group II samples were collected from: Alamgirpur (ALM), Masudpur VII (MSDVII),
Masupdur I (MSDI), Farmana (FRN) and Rakhigarhi (RGR). The potsherds from these
sites were excavated between 2008-2014. All these sites lie within an alluvial plain and
experience seasonal variation in temperature and rainfall (see Chapter Four). Assessing the
potential for these samples to undergo routine lipid residue analysis was essential since
most potsherds available for organic residue analysis in archaeology come from similar
collection and storage conditions.
Pottery fragments were collected from Group II based on four key parameters:
chronological period, shape of vessel, context, and location of sherd on vessel. Following
these parameters, sherds were generally selected from contexts that had radiocarbon dates
associated with them (when available), and/or from contexts that were indicative of
occupational surfaces, such as fills of floor surfaces, deliberate fills or hearth contexts.
Pottery from pits or dumps were avoided, however, vessel fragments of interest were
chosen even if they originated from these contexts (e.g. perforated vessels). Potsherds
likely to have been used in the cooking of foodstuffs, for example, pots/jars versus bowls
or dishes, were selected. Rims or body sherds from upper parts of vessels were selected
where possible, as these have previously been linked to high abundances of absorbed lipid
(Charters et al. 1993). All except a single potsherd showed minimal signs of post-firing
exposure to heat with no extensive exterior soot marks.
5.1.2.1. Alamgirpur (ALM)
Rims of 15 vessels (9 jars of different sizes, 3 necked jars 2 dishes), and 1 body sherd were
selected from floor and fill contexts from Trench SC (Section Cutting) (Figure 5.1).
Detailed descriptions of individual fragments are provided in Appendix B. Radiocarbon
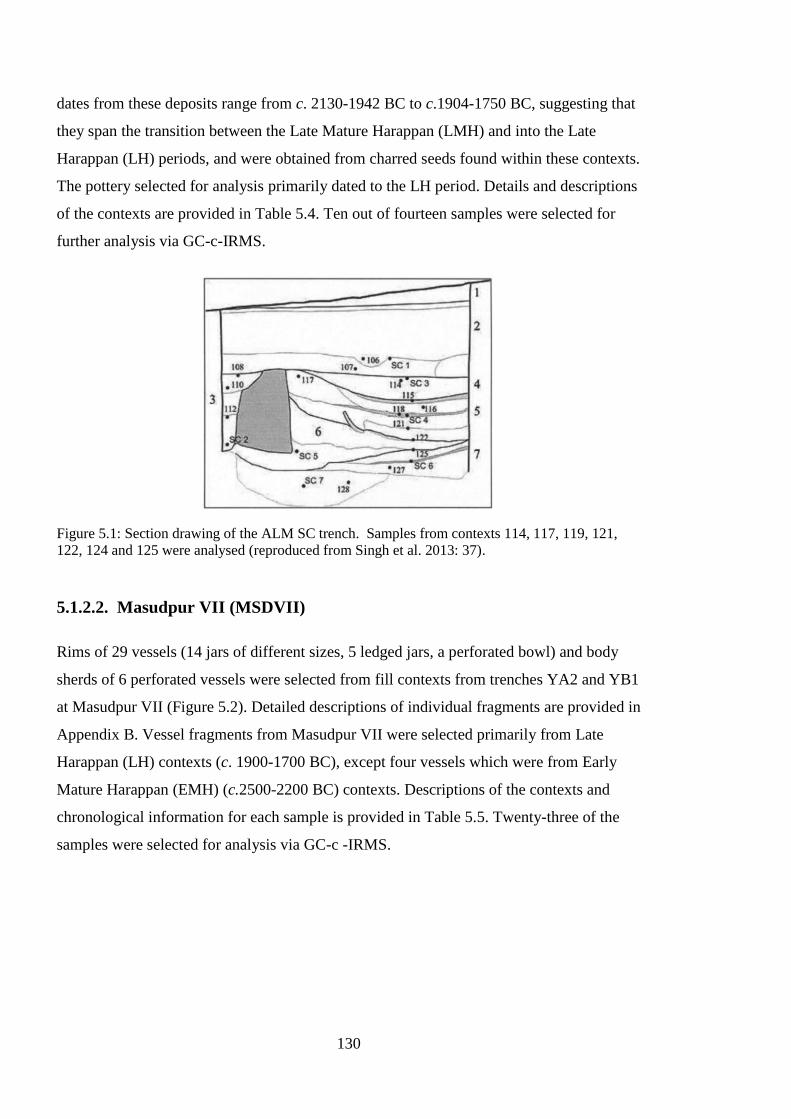
130
dates from these deposits range from c. 2130-1942 BC to c.1904-1750 BC, suggesting that
they span the transition between the Late Mature Harappan (LMH) and into the Late
Harappan (LH) periods, and were obtained from charred seeds found within these contexts.
The pottery selected for analysis primarily dated to the LH period. Details and descriptions
of the contexts are provided in Table 5.4. Ten out of fourteen samples were selected for
further analysis via GC-c-IRMS.
Figure 5.1: Section drawing of the ALM SC trench. Samples from contexts 114, 117, 119, 121,
122, 124 and 125 were analysed (reproduced from Singh et al. 2013: 37).
5.1.2.2. Masudpur VII (MSDVII)
Rims of 29 vessels (14 jars of different sizes, 5 ledged jars, a perforated bowl) and body
sherds of 6 perforated vessels were selected from fill contexts from trenches YA2 and YB1
at Masudpur VII (Figure 5.2). Detailed descriptions of individual fragments are provided in
Appendix B. Vessel fragments from Masudpur VII were selected primarily from Late
Harappan (LH) contexts (c. 1900-1700 BC), except four vessels which were from Early
Mature Harappan (EMH) (c.2500-2200 BC) contexts. Descriptions of the contexts and
chronological information for each sample is provided in Table 5.5. Twenty-three of the
samples were selected for analysis via GC-c -IRMS.
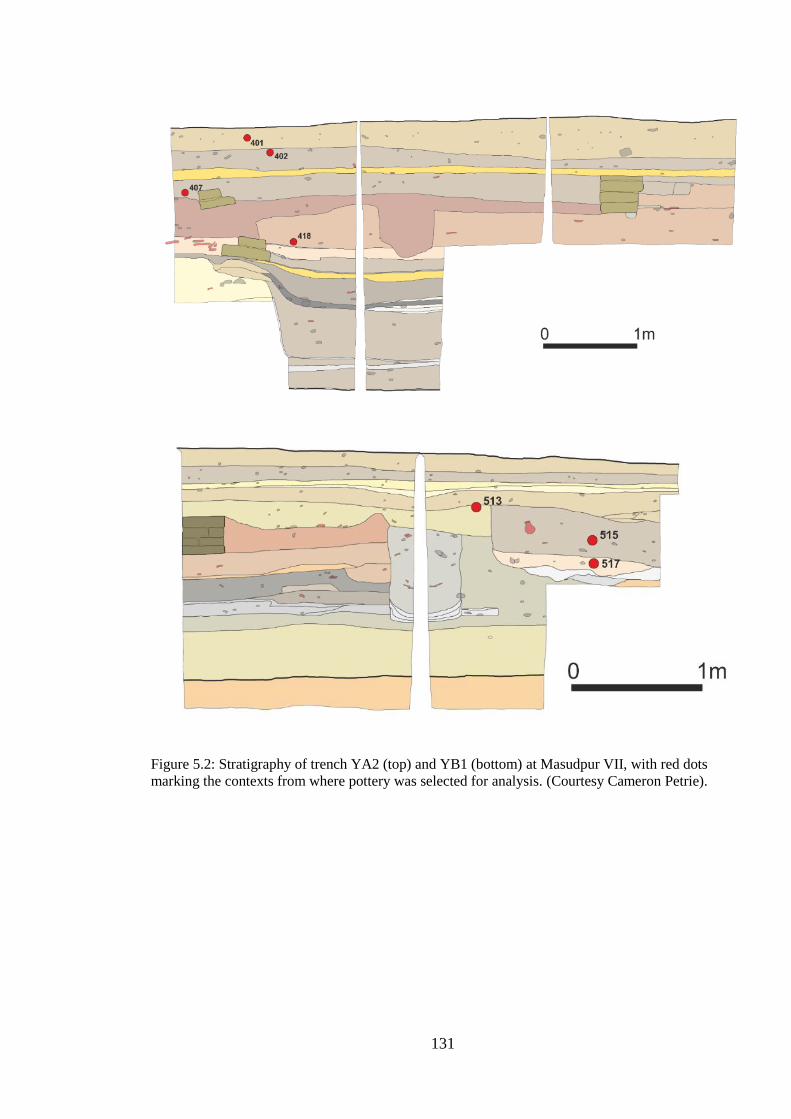
131
Figure 5.2: Stratigraphy of trench YA2 (top) and YB1 (bottom) at Masudpur VII, with red dots
marking the contexts from where pottery was selected for analysis. (Courtesy Cameron Petrie).
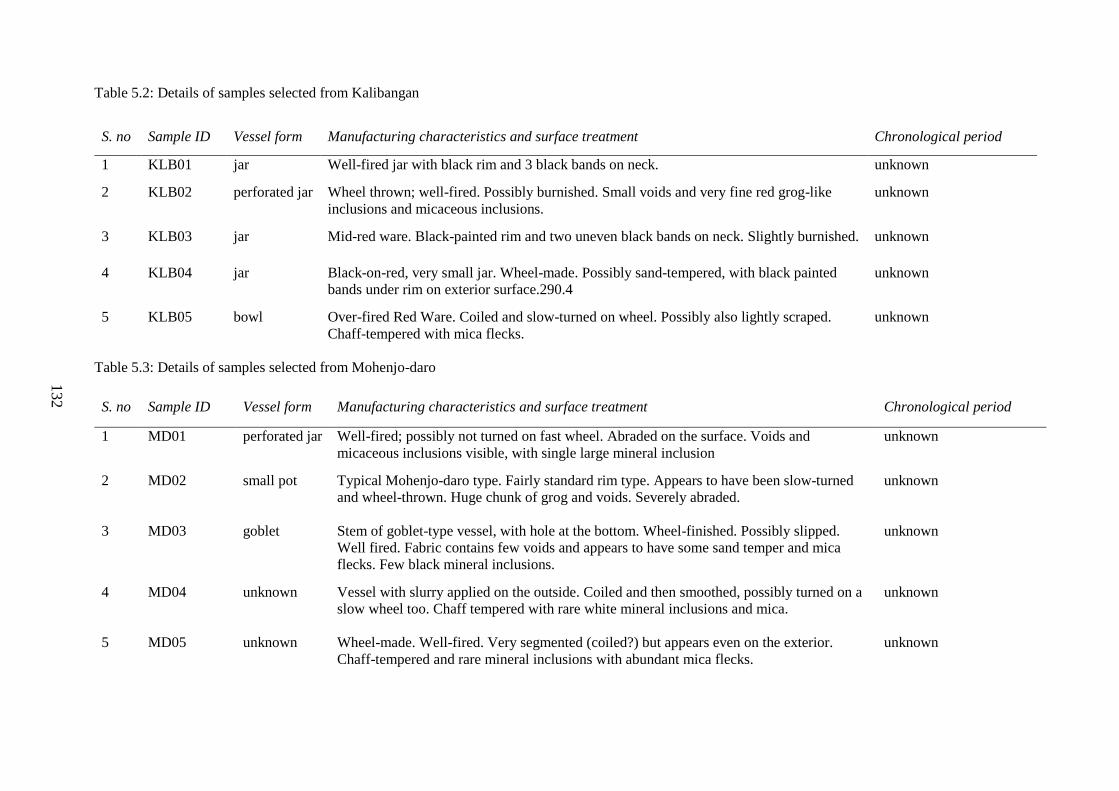
132
132
Table 5.2: Details of samples selected from Kalibangan
Table 5.3: Details of samples selected from Mohenjo-daro
S. no Sample ID Vessel form Manufacturing characteristics and surface treatment Chronological period
1 KLB01 jar Well-fired jar with black rim and 3 black bands on neck. unknown
2 KLB02 perforated jar Wheel thrown; well-fired. Possibly burnished. Small voids and very fine red grog-like
inclusions and micaceous inclusions.
unknown
3 KLB03 jar Mid-red ware. Black-painted rim and two uneven black bands on neck. Slightly burnished. unknown
4 KLB04 jar Black-on-red, very small jar. Wheel-made. Possibly sand-tempered, with black painted
bands under rim on exterior surface.290.4
unknown
5 KLB05 bowl Over-fired Red Ware. Coiled and slow-turned on wheel. Possibly also lightly scraped.
Chaff-tempered with mica flecks.
unknown
S. no Sample ID Vessel form Manufacturing characteristics and surface treatment Chronological period
1 MD01 perforated jar Well-fired; possibly not turned on fast wheel. Abraded on the surface. Voids and
micaceous inclusions visible, with single large mineral inclusion
unknown
2 MD02 small pot Typical Mohenjo-daro type. Fairly standard rim type. Appears to have been slow-turned
and wheel-thrown. Huge chunk of grog and voids. Severely abraded.
unknown
3 MD03 goblet Stem of goblet-type vessel, with hole at the bottom. Wheel-finished. Possibly slipped.
Well fired. Fabric contains few voids and appears to have some sand temper and mica
flecks. Few black mineral inclusions.
unknown
4 MD04 unknown Vessel with slurry applied on the outside. Coiled and then smoothed, possibly turned on a
slow wheel too. Chaff tempered with rare white mineral inclusions and mica.
unknown
5 MD05 unknown Wheel-made. Well-fired. Very segmented (coiled?) but appears even on the exterior.
Chaff-tempered and rare mineral inclusions with abundant mica flecks.
unknown
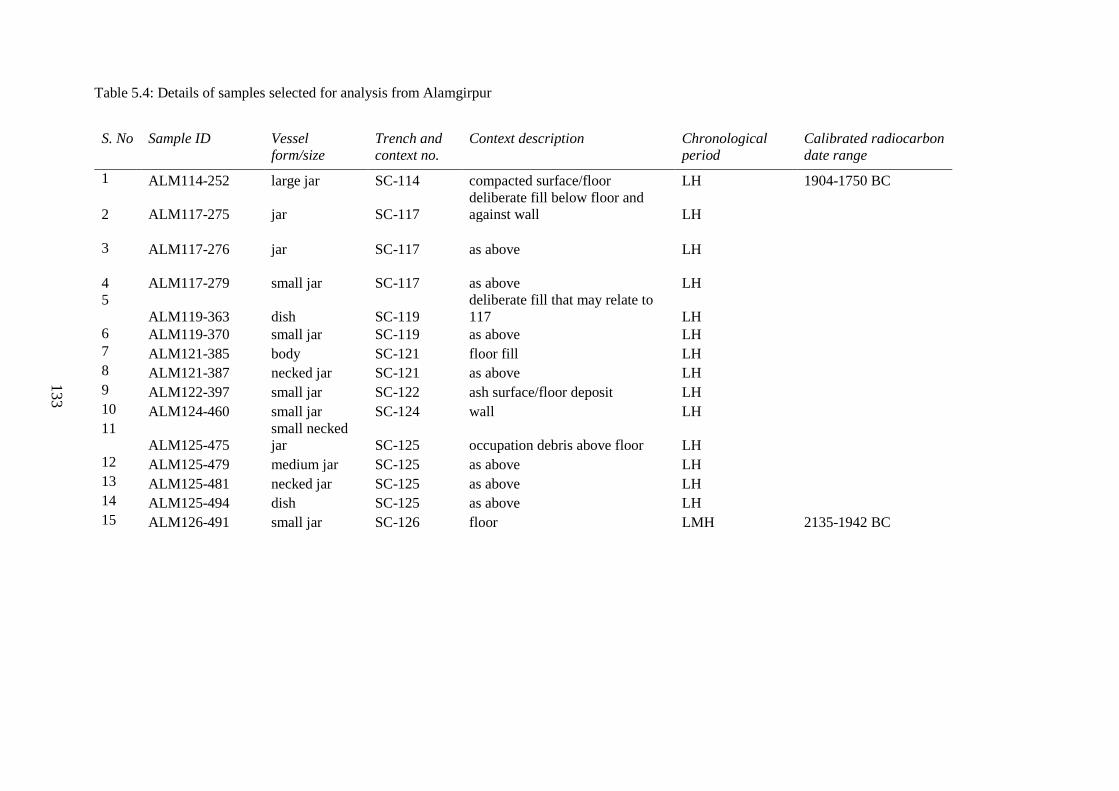
133
133
Table 5.4: Details of samples selected for analysis from Alamgirpur
S. No Sample ID Vessel
form/size
Trench and
context no.
Context description Chronological
period
Calibrated radiocarbon
date range
1 ALM114-252 large jar SC-114 compacted surface/floor LH 1904-1750 BC
2 ALM117-275 jar SC-117
deliberate fill below floor and
against wall LH
3 ALM117-276 jar SC-117 as above LH
4 ALM117-279 small jar SC-117 as above LH
5
ALM119-363 dish SC-119
deliberate fill that may relate to
117 LH
6 ALM119-370 small jar SC-119 as above LH
7 ALM121-385 body SC-121 floor fill LH
8 ALM121-387 necked jar SC-121 as above LH
9 ALM122-397 small jar SC-122 ash surface/floor deposit LH
10 ALM124-460 small jar SC-124 wall LH
11
ALM125-475
small necked
jar SC-125 occupation debris above floor LH
12 ALM125-479 medium jar SC-125 as above LH
13 ALM125-481 necked jar SC-125 as above LH
14 ALM125-494 dish SC-125 as above LH
15 ALM126-491 small jar SC-126 floor LMH 2135-1942 BC
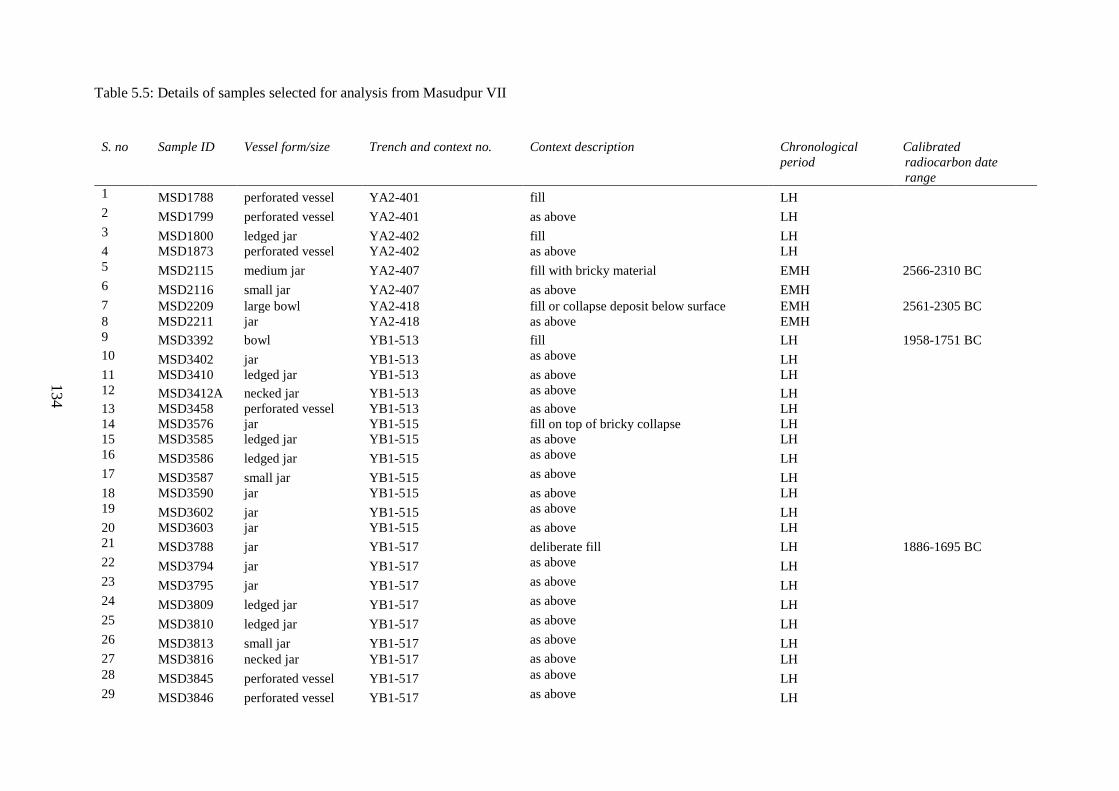
134
134
Table 5.5: Details of samples selected for analysis from Masudpur VII
S. no Sample ID Vessel form/size Trench and context no. Context description Chronological
period
Calibrated
radiocarbon date
range
1 MSD1788 perforated vessel YA2-401 fill LH
2 MSD1799 perforated vessel YA2-401 as above LH
3 MSD1800 ledged jar YA2-402 fill LH
4 MSD1873 perforated vessel YA2-402 as above LH
5 MSD2115 medium jar YA2-407 fill with bricky material EMH 2566-2310 BC
6 MSD2116 small jar YA2-407 as above EMH
7 MSD2209 large bowl YA2-418 fill or collapse deposit below surface EMH 2561-2305 BC
8 MSD2211 jar YA2-418 as above EMH
9 MSD3392 bowl YB1-513 fill LH 1958-1751 BC
10 MSD3402 jar YB1-513 as above LH
11 MSD3410 ledged jar YB1-513 as above LH
12 MSD3412A necked jar YB1-513 as above LH
13 MSD3458 perforated vessel YB1-513 as above LH
14 MSD3576 jar YB1-515 fill on top of bricky collapse LH
15 MSD3585 ledged jar YB1-515 as above LH
16 MSD3586 ledged jar YB1-515 as above LH
17 MSD3587 small jar YB1-515 as above LH
18 MSD3590 jar YB1-515 as above LH
19 MSD3602 jar YB1-515 as above LH
20 MSD3603 jar YB1-515 as above LH
21 MSD3788 jar YB1-517 deliberate fill LH 1886-1695 BC
22 MSD3794 jar YB1-517 as above LH
23 MSD3795 jar YB1-517 as above LH
24 MSD3809 ledged jar YB1-517 as above LH
25 MSD3810 ledged jar YB1-517 as above LH
26 MSD3813 small jar YB1-517 as above LH
27 MSD3816 necked jar YB1-517 as above LH
28 MSD3845 perforated vessel YB1-517 as above LH
29 MSD3846 perforated vessel YB1-517 as above LH
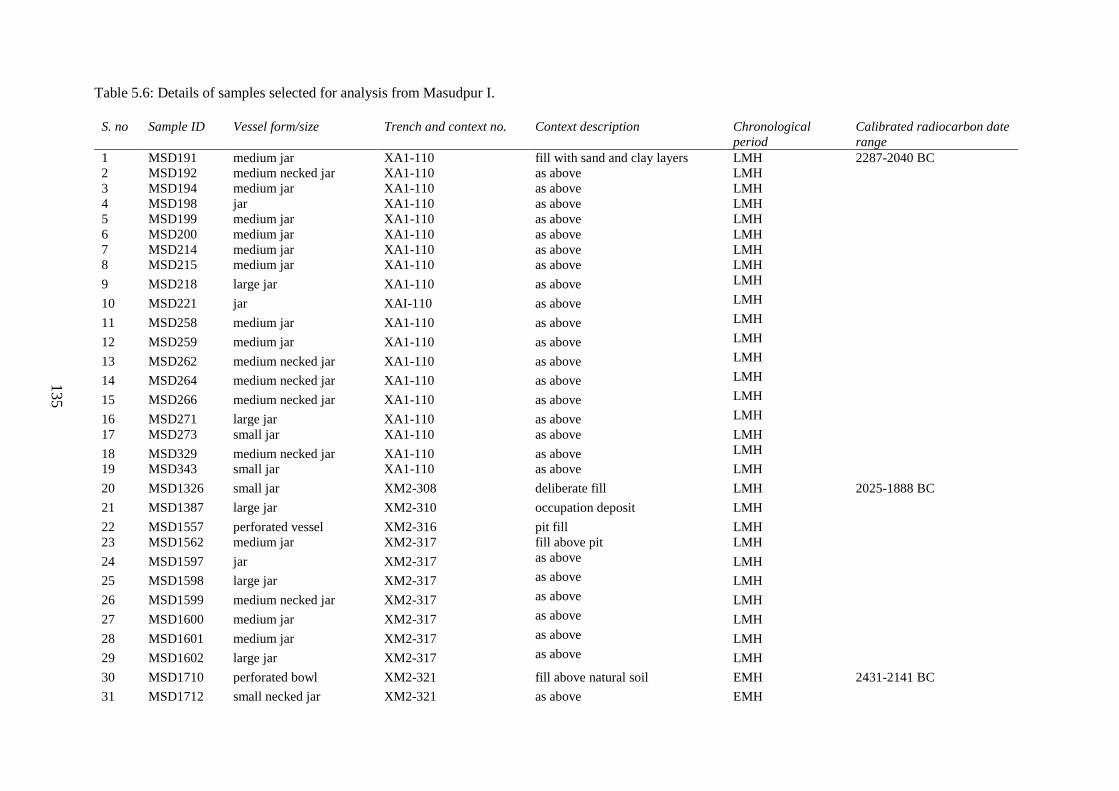
135
135
Table 5.6: Details of samples selected for analysis from Masudpur I.
S. no Sample ID Vessel form/size Trench and context no. Context description Chronological
period
Calibrated radiocarbon date
range
1 MSD191 medium jar XA1-110 fill with sand and clay layers LMH 2287-2040 BC
2 MSD192 medium necked jar XA1-110 as above LMH
3 MSD194 medium jar XA1-110 as above LMH
4 MSD198 jar XA1-110 as above LMH
5 MSD199 medium jar XA1-110 as above LMH
6 MSD200 medium jar XA1-110 as above LMH
7 MSD214 medium jar XA1-110 as above LMH
8 MSD215 medium jar XA1-110 as above LMH
9 MSD218 large jar XA1-110 as above LMH
10 MSD221 jar XAI-110 as above LMH
11 MSD258 medium jar XA1-110 as above LMH
12 MSD259 medium jar XA1-110 as above LMH
13 MSD262 medium necked jar XA1-110 as above LMH
14 MSD264 medium necked jar XA1-110 as above LMH
15 MSD266 medium necked jar XA1-110 as above LMH
16 MSD271 large jar XA1-110 as above LMH
17 MSD273 small jar XA1-110 as above LMH
18 MSD329 medium necked jar XA1-110 as above LMH
19 MSD343 small jar XA1-110 as above LMH
20 MSD1326 small jar XM2-308 deliberate fill LMH 2025-1888 BC
21 MSD1387 large jar XM2-310 occupation deposit LMH
22 MSD1557 perforated vessel XM2-316 pit fill LMH
23 MSD1562 medium jar XM2-317 fill above pit LMH
24 MSD1597 jar XM2-317 as above LMH
25 MSD1598 large jar XM2-317 as above LMH
26 MSD1599 medium necked jar XM2-317 as above LMH
27 MSD1600 medium jar XM2-317 as above LMH
28 MSD1601 medium jar XM2-317 as above LMH
29 MSD1602 large jar XM2-317 as above LMH
30 MSD1710 perforated bowl XM2-321 fill above natural soil EMH 2431-2141 BC
31 MSD1712 small necked jar XM2-321 as above EMH
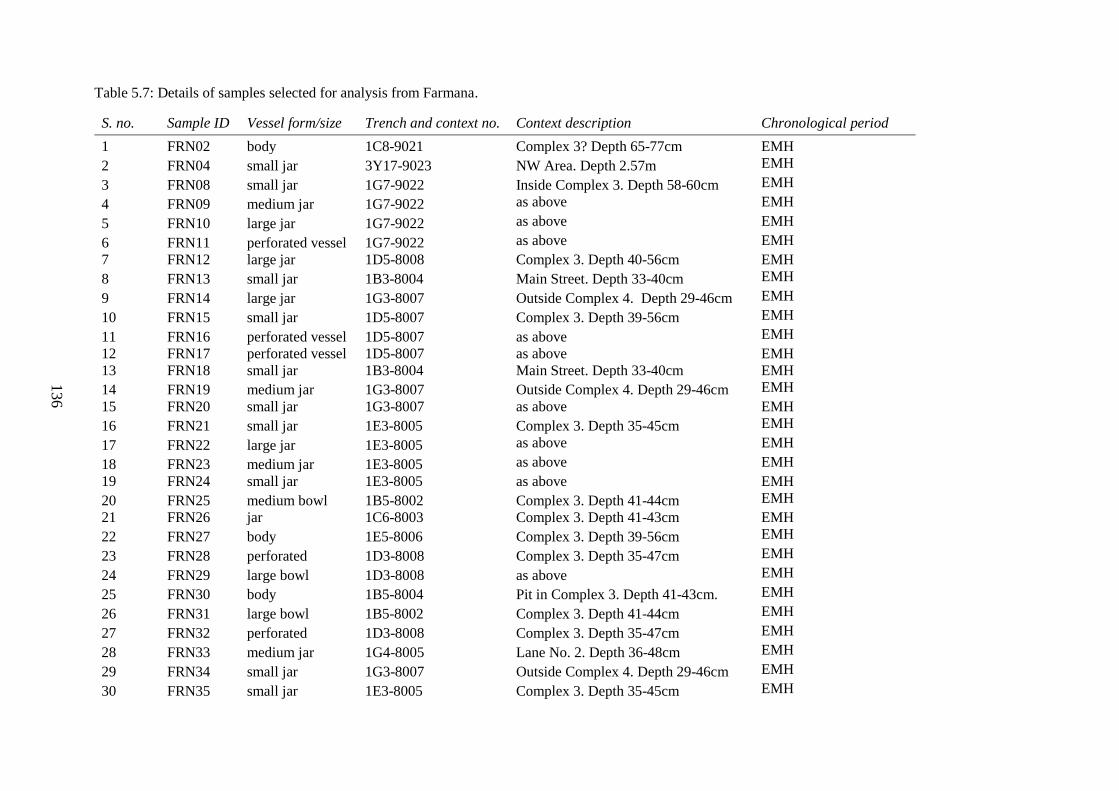
136
136
Table 5.7: Details of samples selected for analysis from Farmana.
S. no. Sample ID Vessel form/size Trench and context no. Context description Chronological period
1 FRN02 body 1C8-9021 Complex 3? Depth 65-77cm EMH
2 FRN04 small jar 3Y17-9023 NW Area. Depth 2.57m EMH
3 FRN08 small jar 1G7-9022 Inside Complex 3. Depth 58-60cm EMH
4 FRN09 medium jar 1G7-9022 as above EMH
5 FRN10 large jar 1G7-9022 as above EMH
6 FRN11 perforated vessel 1G7-9022 as above EMH
7 FRN12 large jar 1D5-8008 Complex 3. Depth 40-56cm EMH
8 FRN13 small jar 1B3-8004 Main Street. Depth 33-40cm EMH
9 FRN14 large jar 1G3-8007 Outside Complex 4. Depth 29-46cm EMH
10 FRN15 small jar 1D5-8007 Complex 3. Depth 39-56cm EMH
11 FRN16 perforated vessel 1D5-8007 as above EMH
12 FRN17 perforated vessel 1D5-8007 as above EMH
13 FRN18 small jar 1B3-8004 Main Street. Depth 33-40cm EMH
14 FRN19 medium jar 1G3-8007 Outside Complex 4. Depth 29-46cm EMH
15 FRN20 small jar 1G3-8007 as above EMH
16 FRN21 small jar 1E3-8005 Complex 3. Depth 35-45cm EMH
17 FRN22 large jar 1E3-8005 as above EMH
18 FRN23 medium jar 1E3-8005 as above EMH
19 FRN24 small jar 1E3-8005 as above EMH
20 FRN25 medium bowl 1B5-8002 Complex 3. Depth 41-44cm EMH
21 FRN26 jar 1C6-8003 Complex 3. Depth 41-43cm EMH
22 FRN27 body 1E5-8006 Complex 3. Depth 39-56cm EMH
23 FRN28 perforated 1D3-8008 Complex 3. Depth 35-47cm EMH
24 FRN29 large bowl 1D3-8008 as above EMH
25 FRN30 body 1B5-8004 Pit in Complex 3. Depth 41-43cm. EMH
26 FRN31 large bowl 1B5-8002 Complex 3. Depth 41-44cm EMH
27 FRN32 perforated 1D3-8008 Complex 3. Depth 35-47cm EMH
28 FRN33 medium jar 1G4-8005 Lane No. 2. Depth 36-48cm EMH
29 FRN34 small jar 1G3-8007 Outside Complex 4. Depth 29-46cm EMH
30 FRN35 small jar 1E3-8005 Complex 3. Depth 35-45cm EMH
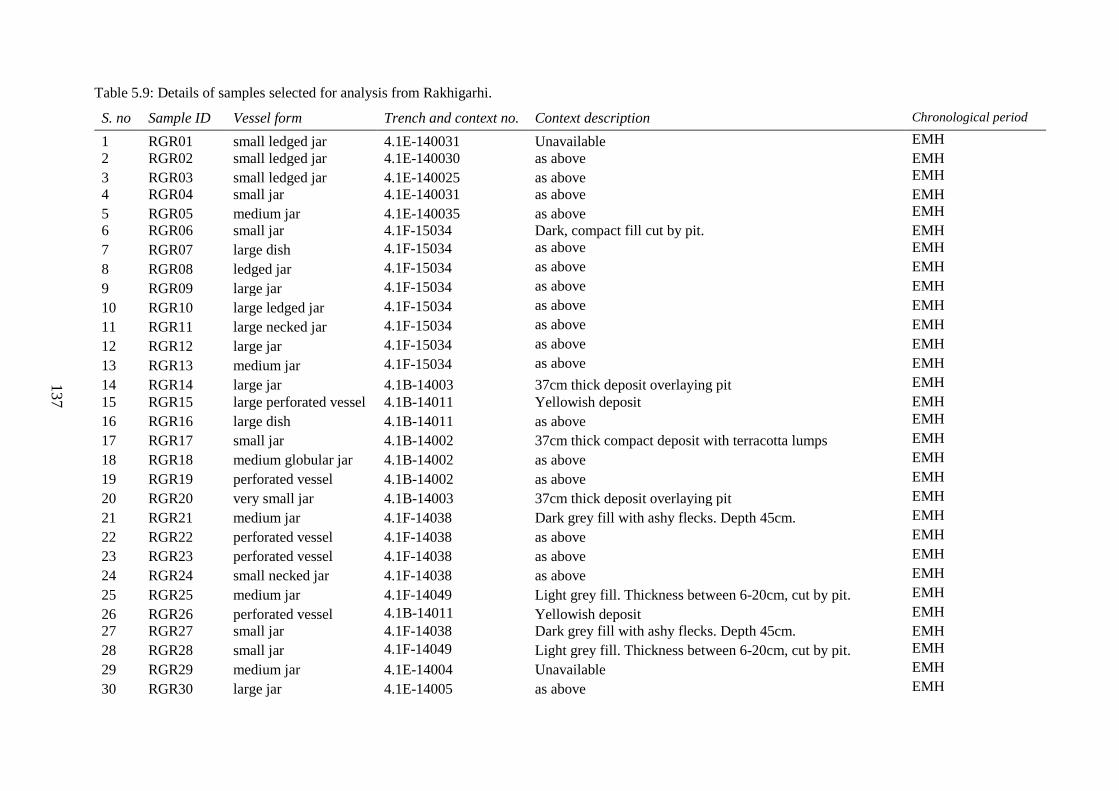
137
137
Table 5.9: Details of samples selected for analysis from Rakhigarhi.
S. no Sample ID Vessel form Trench and context no. Context description Chronological period
1 RGR01 small ledged jar 4.1E-140031 Unavailable EMH
2 RGR02 small ledged jar 4.1E-140030 as above EMH
3 RGR03 small ledged jar 4.1E-140025 as above EMH
4 RGR04 small jar 4.1E-140031 as above EMH
5 RGR05 medium jar 4.1E-140035 as above EMH
6 RGR06 small jar 4.1F-15034 Dark, compact fill cut by pit. EMH
7 RGR07 large dish 4.1F-15034 as above EMH
8 RGR08 ledged jar 4.1F-15034 as above EMH
9 RGR09 large jar 4.1F-15034 as above EMH
10 RGR10 large ledged jar 4.1F-15034 as above EMH
11 RGR11 large necked jar 4.1F-15034 as above EMH
12 RGR12 large jar 4.1F-15034 as above EMH
13 RGR13 medium jar 4.1F-15034 as above EMH
14 RGR14 large jar 4.1B-14003 37cm thick deposit overlaying pit EMH
15 RGR15 large perforated vessel 4.1B-14011 Yellowish deposit EMH
16 RGR16 large dish 4.1B-14011 as above EMH
17 RGR17 small jar 4.1B-14002 37cm thick compact deposit with terracotta lumps EMH
18 RGR18 medium globular jar 4.1B-14002 as above EMH
19 RGR19 perforated vessel 4.1B-14002 as above EMH
20 RGR20 very small jar 4.1B-14003 37cm thick deposit overlaying pit EMH
21 RGR21 medium jar 4.1F-14038 Dark grey fill with ashy flecks. Depth 45cm. EMH
22 RGR22 perforated vessel 4.1F-14038 as above EMH
23 RGR23 perforated vessel 4.1F-14038 as above EMH
24 RGR24 small necked jar 4.1F-14038 as above EMH
25 RGR25 medium jar 4.1F-14049 Light grey fill. Thickness between 6-20cm, cut by pit. EMH
26 RGR26 perforated vessel 4.1B-14011 Yellowish deposit EMH
27 RGR27 small jar 4.1F-14038 Dark grey fill with ashy flecks. Depth 45cm. EMH
28 RGR28 small jar 4.1F-14049 Light grey fill. Thickness between 6-20cm, cut by pit. EMH
29 RGR29 medium jar 4.1E-14004 Unavailable EMH
30 RGR30 large jar 4.1E-14005 as above EMH
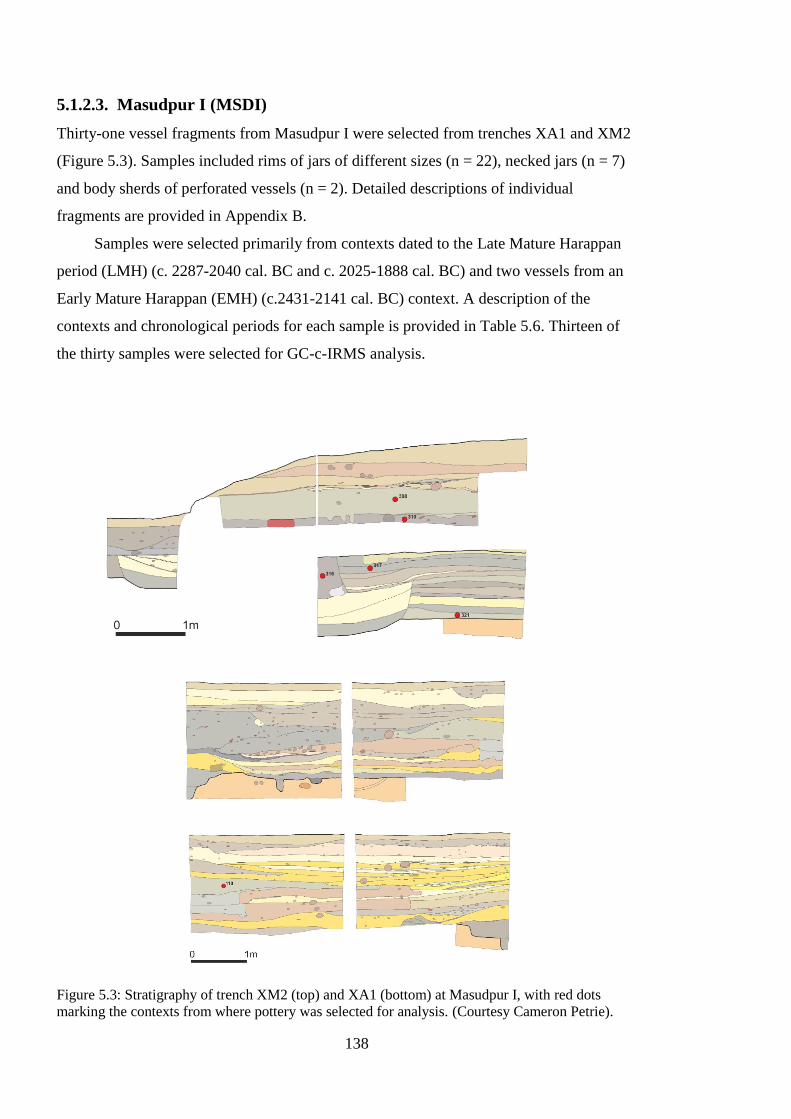
138
5.1.2.3. Masudpur I (MSDI)
Thirty-one vessel fragments from Masudpur I were selected from trenches XA1 and XM2
(Figure 5.3). Samples included rims of jars of different sizes (n = 22), necked jars (n = 7)
and body sherds of perforated vessels (n = 2). Detailed descriptions of individual
fragments are provided in Appendix B.
Samples were selected primarily from contexts dated to the Late Mature Harappan
period (LMH) (c. 2287-2040 cal. BC and c. 2025-1888 cal. BC) and two vessels from an
Early Mature Harappan (EMH) (c.2431-2141 cal. BC) context. A description of the
contexts and chronological periods for each sample is provided in Table 5.6. Thirteen of
the thirty samples were selected for GC-c-IRMS analysis.
Figure 5.3: Stratigraphy of trench XM2 (top) and XA1 (bottom) at Masudpur I, with red dots
marking the contexts from where pottery was selected for analysis. (Courtesy Cameron Petrie).
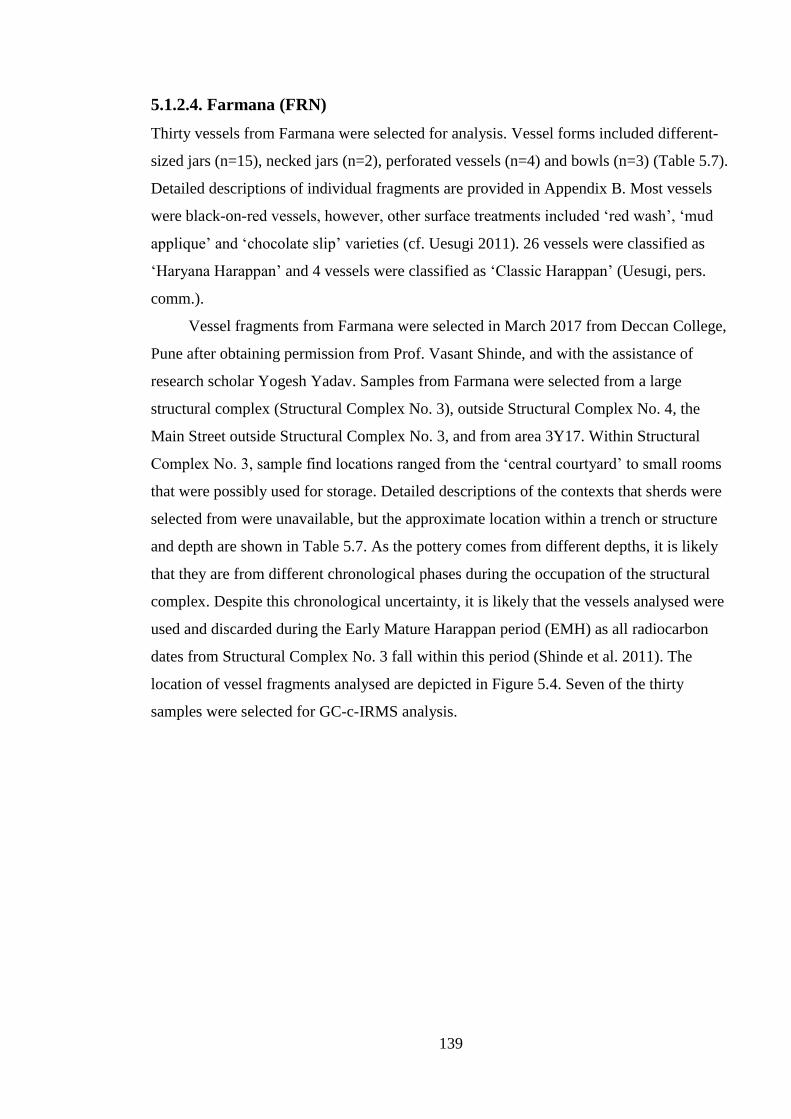
139
5.1.2.4. Farmana (FRN)
Thirty vessels from Farmana were selected for analysis. Vessel forms included different-
sized jars (n=15), necked jars (n=2), perforated vessels (n=4) and bowls (n=3) (Table 5.7).
Detailed descriptions of individual fragments are provided in Appendix B. Most vessels
were black-on-red vessels, however, other surface treatments included ‘red wash’, ‘mud
applique’ and ‘chocolate slip’ varieties (cf. Uesugi 2011). 26 vessels were classified as
‘Haryana Harappan’ and 4 vessels were classified as ‘Classic Harappan’ (Uesugi, pers.
comm.).
Vessel fragments from Farmana were selected in March 2017 from Deccan College,
Pune after obtaining permission from Prof. Vasant Shinde, and with the assistance of
research scholar Yogesh Yadav. Samples from Farmana were selected from a large
structural complex (Structural Complex No. 3), outside Structural Complex No. 4, the
Main Street outside Structural Complex No. 3, and from area 3Y17. Within Structural
Complex No. 3, sample find locations ranged from the ‘central courtyard’ to small rooms
that were possibly used for storage. Detailed descriptions of the contexts that sherds were
selected from were unavailable, but the approximate location within a trench or structure
and depth are shown in Table 5.7. As the pottery comes from different depths, it is likely
that they are from different chronological phases during the occupation of the structural
complex. Despite this chronological uncertainty, it is likely that the vessels analysed were
used and discarded during the Early Mature Harappan period (EMH) as all radiocarbon
dates from Structural Complex No. 3 fall within this period (Shinde et al. 2011). The
location of vessel fragments analysed are depicted in Figure 5.4. Seven of the thirty
samples were selected for GC-c-IRMS analysis.
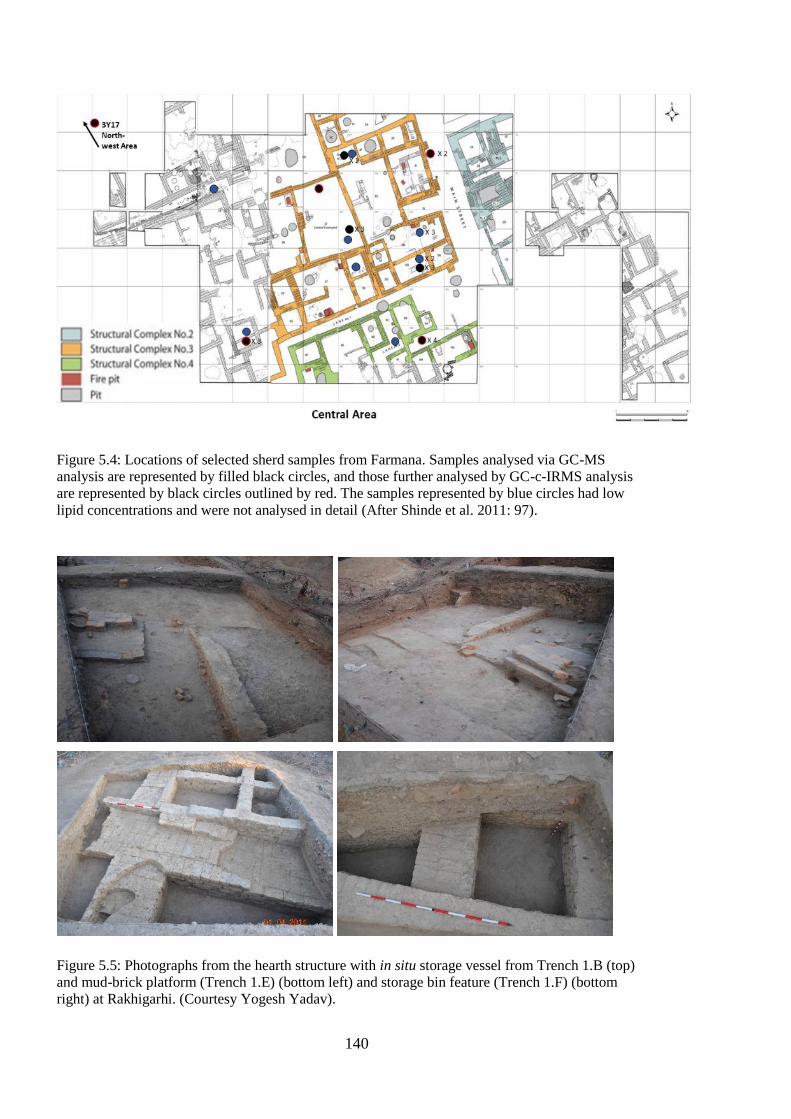
140
Figure 5.4: Locations of selected sherd samples from Farmana. Samples analysed via GC-MS
analysis are represented by filled black circles, and those further analysed by GC-c-IRMS analysis
are represented by black circles outlined by red. The samples represented by blue circles had low
lipid concentrations and were not analysed in detail (After Shinde et al. 2011: 97).
Figure 5.5: Photographs from the hearth structure with in situ storage vessel from Trench 1.B (top)
and mud-brick platform (Trench 1.E) (bottom left) and storage bin feature (Trench 1.F) (bottom
right) at Rakhigarhi. (Courtesy Yogesh Yadav).
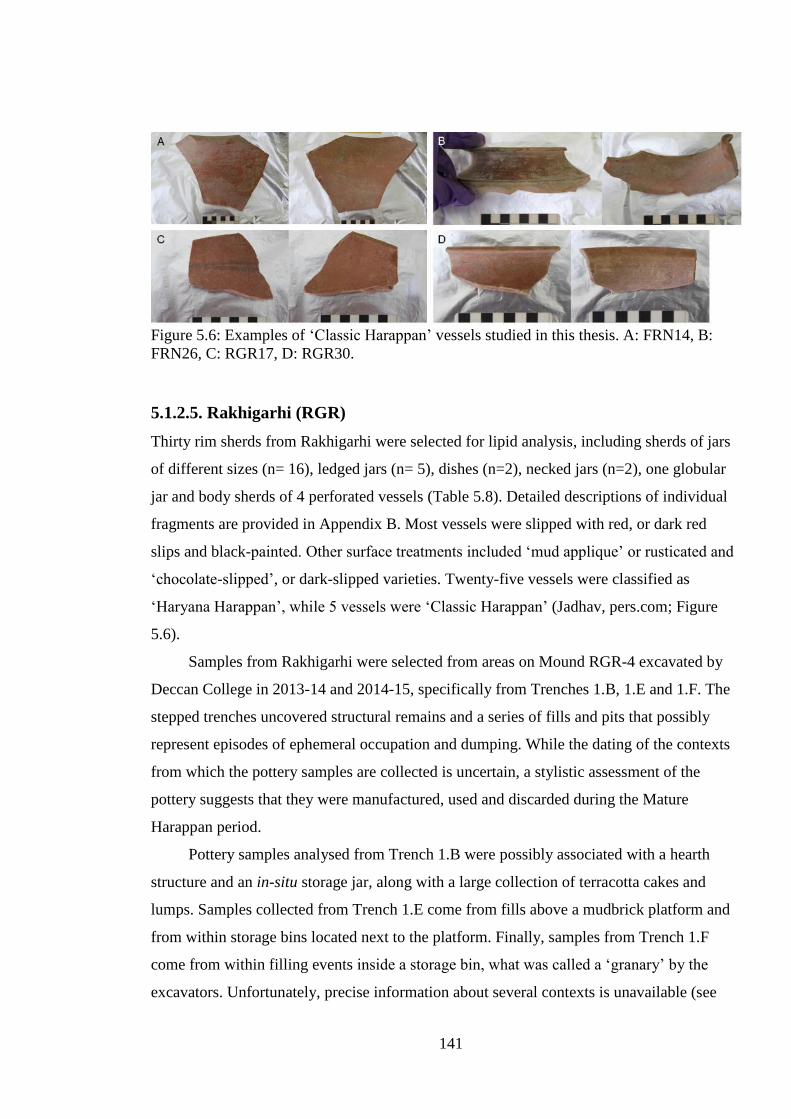
141
Figure 5.6: Examples of ‘Classic Harappan’ vessels studied in this thesis. A: FRN14, B:
FRN26, C: RGR17, D: RGR30.
5.1.2.5. Rakhigarhi (RGR)
Thirty rim sherds from Rakhigarhi were selected for lipid analysis, including sherds of jars
of different sizes (n= 16), ledged jars (n= 5), dishes (n=2), necked jars (n=2), one globular
jar and body sherds of 4 perforated vessels (Table 5.8). Detailed descriptions of individual
fragments are provided in Appendix B. Most vessels were slipped with red, or dark red
slips and black-painted. Other surface treatments included ‘mud applique’ or rusticated and
‘chocolate-slipped’, or dark-slipped varieties. Twenty-five vessels were classified as
‘Haryana Harappan’, while 5 vessels were ‘Classic Harappan’ (Jadhav, pers.com; Figure
5.6).
Samples from Rakhigarhi were selected from areas on Mound RGR-4 excavated by
Deccan College in 2013-14 and 2014-15, specifically from Trenches 1.B, 1.E and 1.F. The
stepped trenches uncovered structural remains and a series of fills and pits that possibly
represent episodes of ephemeral occupation and dumping. While the dating of the contexts
from which the pottery samples are collected is uncertain, a stylistic assessment of the
pottery suggests that they were manufactured, used and discarded during the Mature
Harappan period.
Pottery samples analysed from Trench 1.B were possibly associated with a hearth
structure and an in-situ storage jar, along with a large collection of terracotta cakes and
lumps. Samples collected from Trench 1.E come from fills above a mudbrick platform and
from within storage bins located next to the platform. Finally, samples from Trench 1.F
come from within filling events inside a storage bin, what was called a ‘granary’ by the
excavators. Unfortunately, precise information about several contexts is unavailable (see
142
Table 5.8). Seven vessel fragments were analysed via GC-c-IRMS to provide
differentiation between degraded animal fats.
5.1.3. Group III: freshly-excavated samples
Group III samples were considered the ‘best-case scenario’ for sampling potsherds for
organic residue analysis as all the steps from excavation to extraction were controlled.
Freshly-excavated samples were recovered from three sites: Khanak (KNK) and Lohari
Ragho I (LHRI) in Haryana, northwest India and Stone Tower I, Salut (STI) in the
Sultanate of Oman. The details of each site are provided in Chapter Four.
Potsherds were chosen directly from the site during excavation and selected from
contexts of interest. Sediment samples up to 2-4g from the locations from where sherds
were retrieved, or from soil adhering to the sherd were sampled. Care was taken to
minimise the potsherds’ exposure to contaminants: the pottery was not washed but only
cleaned using nitrile gloves before being photographed and wrapped in aluminium foil.
Samples were handled with nitrile gloves and wrapped in aluminium foil to avoid any
contact with human fingers or plastics.
5.1.3.1. Lohari Ragho I (LHRI)
The samples from Lohari Ragho I were selected from contexts associated with floors and
hearths; the shape of vessel fragments was also a determining factor for selection. The
vessels were selected from contexts that likely date to the Early Mature Harappan (EMH)
and Late Mature Harappan (LMH) on the basis of pottery typologies. Radiocarbon dates
from the site confirmed that most of the vessels selected come from contexts dated to the
Early Mature Harappan (EMH) (2500-2200 BC) period and three vessels come from a
context dated to the Late Mature Harappan (LMH) (2200-1900 BC) period. Description of
the contexts are provided in Table 5.9.
Rims of twenty-five vessels were selected for lipid analysis, as well as sediment
samples adhering to the surface of potsherds (n=2), and terracotta cakes (n=2). Vessel
forms included rims of globular jars (n = 3; 2 were from complete vessels), necked jars
(n=3), jars of different sizes (n=14), perforated jars (n = 2), a ledged jar, a dish and a base
fragment (Table 5.9). Detailed descriptions of individual fragments are provided in
Appendix B. Twelve of the twenty-six ceramic samples were selected for analysis via GC-
c-IRMS.
143
5.1.3.2. Khanak (KNK)
Pottery and sediment samples were selected from Trench A05 from the 2016 excavations
at Khanak. Nine pottery samples and two sediment samples were selected from fill
contexts, a pit with evidence for pyrotechnical waste (burnt clay lumps) which contained a
smashed vessel at the bottom of the pit, and a floor surface. Description of the contexts that
sherds were selected from are provided in Table 5.10.
From the ceramic assemblage, jars of different sizes (n=8) and a bowl were analysed
(Table 5.10). Detailed descriptions of individual fragments are provided in Appendix B.
Samples in this thesis mostly date to the Early Mature Harappan (EMH) period, with one
sample possibly dating to the Early Harappan period and four samples dating to the Late
Mature Harappan (LMH) period.
Four of the potsherds were from semi-complete vessels and appeared to contain
visible residues inside. Upon closer examination, it was apparent that these residues were
encrustations of sediments and intrusive organic material, and likely unrelated to the actual
contents of the vessels. Two sediment samples from soil adhering to two sherds were
analysed via GC-MS in order to compare their lipid profiles with those obtained from the
vessels they were found in. Three ceramic samples with relatively high lipid concentrations
were selected for GC-c-IRMS analysis.
5.1.3.3. Stone Tower I, Salut (STI)
Pottery and sediment samples from the excavations at the Stone Tower I (STI) at Salut,
near Nizwa, Sulatate of Oman were collected in December 2015. The excavation was
headed by the Italian Archaelogical Mission to Oman in collaboration with the Office of
the Adviser to His Majesty the Sultan for Cultural Affairs.
Eleven potsherds were analysed from Stone Tower I, Salut. These included the rims
of 5 Arabian Umm an-Nar vessels and rims, bases and body sherds of 6 Indus Black-
Slipped Jars (BSJs) (see Chapter 4 and Appendix A, Table 5.11). Potsherds were chosen
from a context that contained evidence of ephemeral occupation, demonstrated by hearths
in sandy fills and concentrations of pottery. Several sediment samples were collected, out
of which three were analysed. Seven of the eleven ceramic samples were selected for
analysis via GC-c-IRMS. Descriptions of the pottery and lipid yields are provided in
Section 6.1.3.1 and GC-c-IRMS results are provided in Appendix A.
144
5.1.4. Vessel forms
Of the entire analysed assemblage, vessel profiles could be determined from most
preserved rim or body fragments. Based on these, vessels were characterised as very small
or small jars, medium jars, large jars, jars (of unknown diameter), perforated vessels,
necked jars, ledged jars, globular jars, bowls, dishes or goblets. Some base and body
fragments (n=4) could not be reliably characterised. The size categorisations were done
following Dales and Kenoyer (1986), but these measurements reflect rim sizes and may not
accurately represent the size of the overall vessel, or its volumetric capacity; they merely
provide a sense of the shape of the mouth of the vessel. The rim sizes and vessel
categorisation of every potsherd are provided in Appendix B.
5.1.5. Documentation
The exterior and interior surfaces, and profiles of all potsherds were photographed prior to,
and after drilling. Photographs of selected sherds are provided in Appendix B.
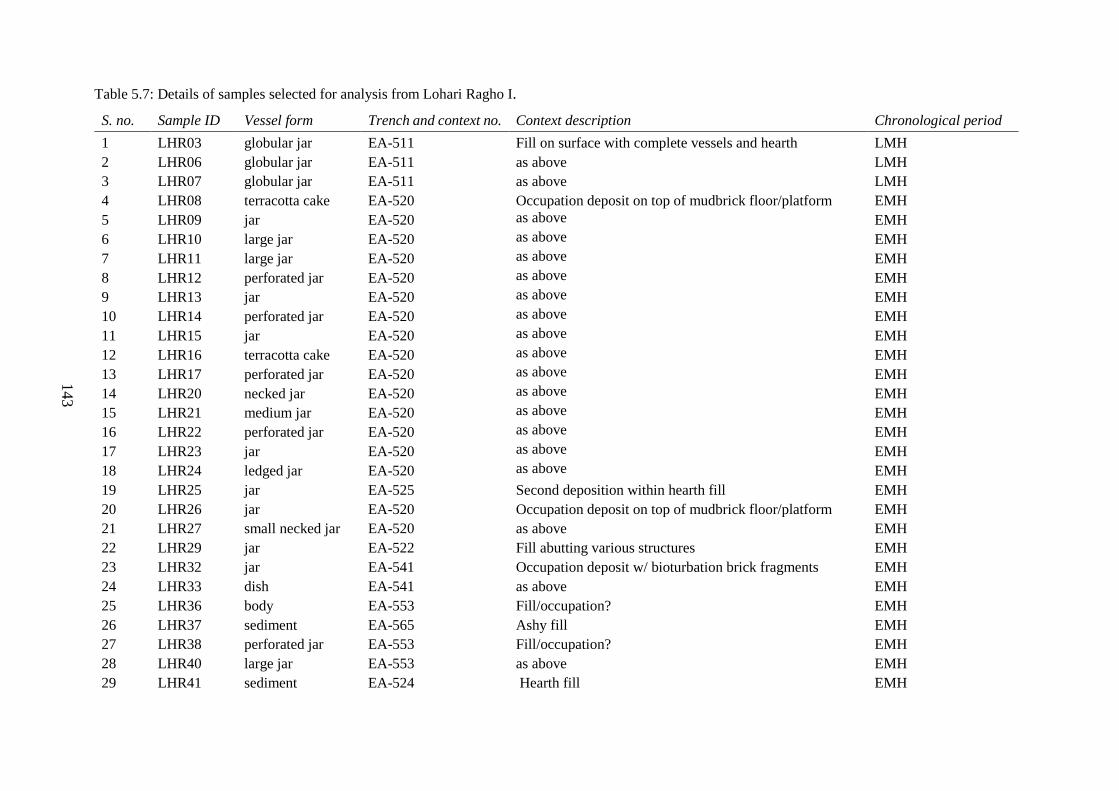
143
143
Table 5.7: Details of samples selected for analysis from Lohari Ragho I.
S. no. Sample ID Vessel form Trench and context no. Context description Chronological period
1 LHR03 globular jar EA-511 Fill on surface with complete vessels and hearth LMH
2 LHR06 globular jar EA-511 as above LMH
3 LHR07 globular jar EA-511 as above LMH
4 LHR08 terracotta cake EA-520 Occupation deposit on top of mudbrick floor/platform EMH
5 LHR09 jar EA-520 as above EMH
6 LHR10 large jar EA-520 as above EMH
7 LHR11 large jar EA-520 as above EMH
8 LHR12 perforated jar EA-520 as above EMH
9 LHR13 jar EA-520 as above EMH
10 LHR14 perforated jar EA-520 as above EMH
11 LHR15 jar EA-520 as above EMH
12 LHR16 terracotta cake EA-520 as above EMH
13 LHR17 perforated jar EA-520 as above EMH
14 LHR20 necked jar EA-520 as above EMH
15 LHR21 medium jar EA-520 as above EMH
16 LHR22 perforated jar EA-520 as above EMH
17 LHR23 jar EA-520 as above EMH
18 LHR24 ledged jar EA-520 as above EMH
19 LHR25 jar EA-525 Second deposition within hearth fill EMH
20 LHR26 jar EA-520 Occupation deposit on top of mudbrick floor/platform EMH
21 LHR27 small necked jar EA-520 as above EMH
22 LHR29 jar EA-522 Fill abutting various structures EMH
23 LHR32 jar EA-541 Occupation deposit w/ bioturbation brick fragments EMH
24 LHR33 dish EA-541 as above EMH
25 LHR36 body EA-553 Fill/occupation? EMH
26 LHR37 sediment EA-565 Ashy fill EMH
27 LHR38 perforated jar EA-553 Fill/occupation? EMH
28 LHR40 large jar EA-553 as above EMH
29 LHR41 sediment EA-524 Hearth fill EMH
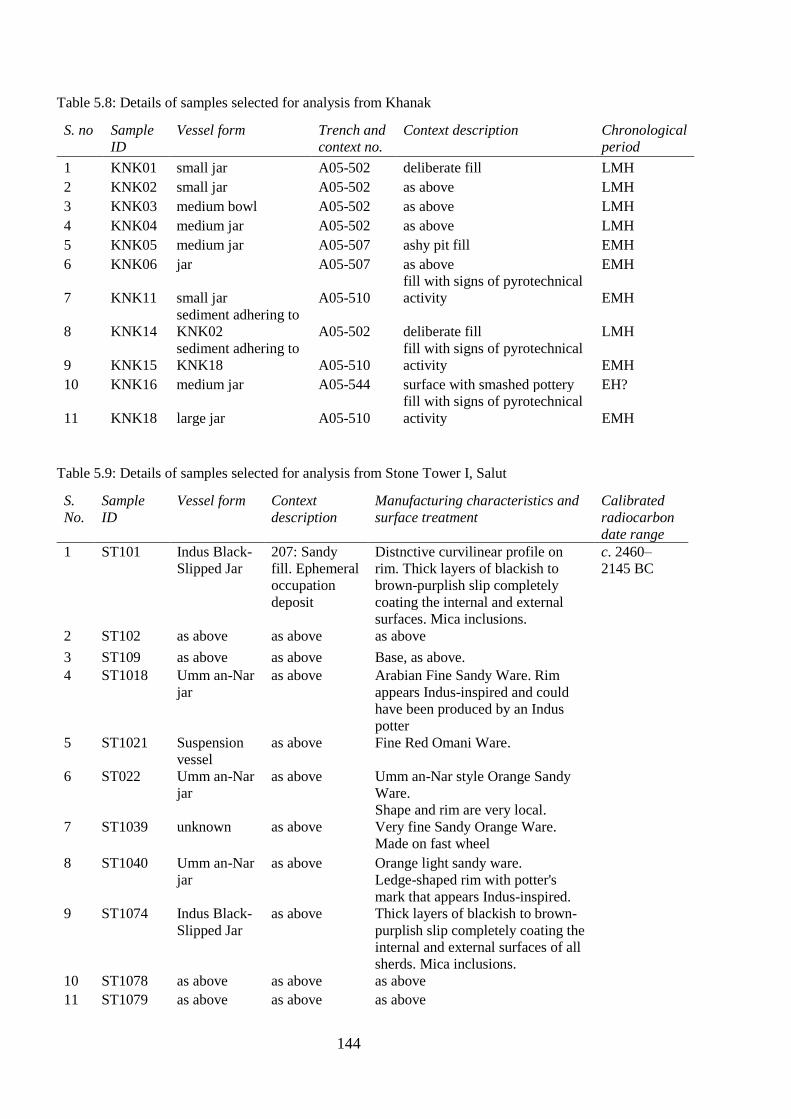
144
Table 5.8: Details of samples selected for analysis from Khanak
Table 5.9: Details of samples selected for analysis from Stone Tower I, Salut
S.
No.
Sample
ID
Vessel form Context
description
Manufacturing characteristics and
surface treatment
Calibrated
radiocarbon
date range
1 ST101 Indus Black-
Slipped Jar
207: Sandy
fill. Ephemeral
occupation
deposit
Distnctive curvilinear profile on
rim. Thick layers of blackish to
brown-purplish slip completely
coating the internal and external
surfaces. Mica inclusions.
c. 2460–
2145 BC
2 ST102 as above as above as above
3 ST109 as above as above Base, as above.
4 ST1018 Umm an-Nar
jar
as above Arabian Fine Sandy Ware. Rim
appears Indus-inspired and could
have been produced by an Indus
potter
5 ST1021 Suspension
vessel
as above Fine Red Omani Ware.
6 ST022 Umm an-Nar
jar
as above Umm an-Nar style Orange Sandy
Ware.
Shape and rim are very local.
7 ST1039 unknown as above Very fine Sandy Orange Ware.
Made on fast wheel
8 ST1040 Umm an-Nar
jar
as above Orange light sandy ware.
Ledge-shaped rim with potter's
mark that appears Indus-inspired.
9 ST1074 Indus Black-
Slipped Jar
as above Thick layers of blackish to brown-
purplish slip completely coating the
internal and external surfaces of all
sherds. Mica inclusions.
10 ST1078 as above as above as above
11 ST1079 as above as above as above
S. no Sample
ID
Vessel form Trench and
context no.
Context description Chronological
period
1 KNK01 small jar A05-502 deliberate fill LMH
2 KNK02 small jar A05-502 as above LMH
3 KNK03 medium bowl A05-502 as above LMH
4 KNK04 medium jar A05-502 as above LMH
5 KNK05 medium jar A05-507 ashy pit fill EMH
6 KNK06 jar A05-507 as above EMH
7 KNK11 small jar A05-510
fill with signs of pyrotechnical
activity EMH
8 KNK14
sediment adhering to
KNK02 A05-502 deliberate fill LMH
9 KNK15
sediment adhering to
KNK18 A05-510
fill with signs of pyrotechnical
activity EMH
10 KNK16 medium jar A05-544 surface with smashed pottery EH?
11 KNK18 large jar A05-510
fill with signs of pyrotechnical
activity EMH
145
5.3. Drilling of pottery and extraction method
5.3.1. Drilling of pottery
Group I and samples from Stone Tower I, Salut were drilled in the McDonald Institute for
Archaeological Research at the University of Cambridge. Out of the samples from Group
II, the samples from Farmana and Rakhigarhi were drilled at Deccan College, Pune, (in
Maharastra, India) and the remaining were drilled at my parents’ residence in Noida (Uttar
Pradesh, India). Out of the samples from Group III, some potsherds from Lohari Ragho I
were drilled during fieldwork at the excavation house, while the rest were drilled in my
parents’ residence in Noida (Uttar Pradesh, India).
In India, care was taken to procure HPLC grade dichloromethane from local vendors
in New Delhi and Pune. All other laboratory and safety equipment was transported from
University of Cambridge. Working surfaces were covered in aluminium foil and cleaned
with dichloromethane. Sterile nitrile gloves were worn at all times and changed regularly
while handling potsherds and drilling. Vessel fragments were never handled with bare
hands. All pottery grinding took place under controlled conditions with PPE (Protective
Personal Equipment) including eye and face masks.
When sampling archaeological ceramics, the relevant area of the outer surface of the
ceramic was cleaned with a modelling drill to remove the influence of exogenous lipids
that may have been absorbed the vessel during deposition and post-excavation (cf. Heron
et al. 1991; Correa-Ascencio and Evershed 2014). The removal of potentially contaminated
external surfaces of ceramic is now an accepted approach that is applied to all samples
(Roffet-Salque et al. 2017a). The sherd fragments are then usually ground to a powder in a
mortar and pestle that has been washed and cleaned with solvents (e.g. Dunne et al. 2012;
Correa-Ascencio and Evershed 2014; Roffet-Salque et al. 2017a). Alternatively, a
modelling drill can also be used to remove the internal surface or sub-surface of the sherd
which powders the ceramic very finely (Craig et al. 2005, 2011; 2015). The latter approach
was used in this thesis as most ceramic fragments were extremely hard and breaking off
the potsherd or drilling the exterior surface would have caused irreversible damage to the
pottery. Crushing or drilling of the ceramic increases the surface area of each individual
particle, increasing the rate of reaction of the ceramic particles with solvents used for lipid
extraction. About 2-3g of pottery powder was collected which provided enough material
for repeat analysis if necessary. Excess powder is stored in the freezers in the Pitt-Rivers
Laboratory.
146
For samples from Group III, 2-3g of soil adhering to the potsherds was collected
using tweezers cleaned with dichloromethane. This is was done in order to compare lipid
yields of the sediments versus the sub-surface powder of the sherds. 2-3g of soil was also
collected from specific contexts of interest (such as hearths).
Extensive precautions were taken to prevent contamination from environment and
cross-contamination during drilling of pottery. Abrasive tungsten drill bits were cleaned
prior to use with dichloromethane via sonication. Drill bits were changed between the
drilling of the interior surface and sub-surface of the potsherd samples and between
samples.
5.3.2. Lipid Extraction
5.3.2.1. Acidified methanol extraction
The direct acidified methanol extraction protocol (Correa-Ascencio and Evershed 2014)
was used to extract lipids from all potsherds in the thesis. This method was chosen as it has
demonstrated the recovery of lipids from contexts that are not conducive to the
preservation of organic remains.
The extraction protocol is provided in Appendix C. For Group I and Stone Tower I
samples, 10 μg of an internal standard, C34 alkane (n-tetratriacontane) was added at the
start of the extraction to compare with obtained peak heights. For Group II and III samples,
two internal standards were used: C34 alkane (n-tetratriacontane) was added at the start of
the extraction to assess lipid recovery, and C36 alkane (n-hexatriacontane) was added at the
end of the extraction process before analysis to quantify lipids.
The acidified methanol protocol enables the direct hydrolysis and methylation of
lipids and facilitates high recovery of lipids (Correa-Ascencio and Evershed 2014). Since
methyl esters are produced simultaneously during the extraction process, this method takes
less time than the conventional solvent extraction method, however, it does result in the
loss of compositional information, as triacylglycerols or wax esters (if preserved) may be
hydrolysed (Correa-Ascencio and Evershed 2014, See Section 3.4.2).
It is not possible to predict lipid preservation within potsherds, but the burial
conditions of the potsherds analysed in this thesis are not optimal for organic preservation.
Thus, it was hypothesised that lipid preservation would be low, and the most aggressive
lipid extraction protocol would be ideal to gauge the degree of lipid preservation within the
pottery. One gram of pottery powder for each sample was lipid-extracted via acidified
147
methanol extraction, and the remaining pottery powder was reserved for re-examination
via solvent extraction if required.
5.3.2.2. Solvent extraction
Six samples yielding high lipid concentrations (FRN11, KNK02, LHR10, MSD1326,
MSD3795, RGR24) via the acidified methanol extraction protocol were lipid-extracted
using the solvent extraction method (see Appendix D for protocol) to check for the
preservation of more complex compounds that may have been hydrolysed via the acidified
methanol extraction method.
Importantly, none of potsherds extracted via solvent extraction yielded appreciable
quantities of lipid; the only visible peaks in chromatograms were some those of
contaminants such as plasticisers. These were thus excluded from further analysis.
Precautions were taken during both types of extraction to avoid any potential
contamination from the laboratory environment. Glassware was washed, combusted, and
rinsed sequentially with methanol, dichloromethane and hexane before use. Sample blanks
were prepared and extracted at the same time as every batch of sample, following the same
protocol(s) as outlined in Appendices D and E. Blanks were also used to isolate any
contaminants that may have been introduced during the extraction or analytical procedures.
5.4. Instrumental Analyses
5.4.1. Gas Chromatography Flame-Ionisation Detection (GC-FID)
The obtained total lipid extracts (TLEs) from Group I samples and samples from Stone
Tower I, Salut, were screened using gas chromatography‐flame ionization detection (GC‐
FID) in order to determine the lipid concentrations. This data was used to identify the
internal standard, and screen for possible contaminants, specifically plasticisers, which
might otherwise have been included in quantitative analyses. GC-FID analysis was done
using an Agilent 7890 A Series chromatograph (Agilent technologies, Cheadle, Cheshire,
UK) at the University of York (Table 5.10).
5.4.2 Gas-Chromatography-Mass Spectrometry (GC-MS)
5.4.2.1. Group I and STI samples
GC-MS analysis was carried out on Group I samples and samples from Stone Tower I,
Salut (n=21) using an Agilent 7890 A Series chromatograph attached to an Agilent 5975 C
Inert XL mass-selective detector with a quadrupole mass analyser (Agilent technologies,
148
Cheadle, Cheshire, UK) at the University of York (Table 5.10). All samples were initially
screened using a splitless injector maintained at 300 °C. The carrier gas used was helium,
and inlet/column head-pressure was constant. The column (DB-5 ms) was coated with 5%
phenyl-methylpolysiloxane (30 m × 0.25 mm x 0.25 μm; J&W Scientific, Folsom, CA,
USA). The oven temperature was set at 50 °C for 2 min, then raised by 10 °C min−1 until
325 °C was reached, where it was held for 15 minutes until the end of the run. The GC
column was inserted directly into the ion source of the mass spectrometer. The ionization
energy of the mass spectrometer was 70 eV and spectra were obtained in scanning mode
between m/z 50 and 800 (Craig et al. 2007, 2012).
Samples from Group I were also tested for the presence of miliacin using selected
ion monitoring in the MS. The oven temperature was set at 50 °C for 1 min, then raised by
20 °C min−1 until 280 °C, then raised at 10 °C min−1until reaching 325 °C, where it was
held for 10 minutes until the end of the run. In SIM mode, a first group of ions
(m/z 189, m/z 204, m/z 231, m/z 425, m/z 440) corresponding to miliacin fragmentation
were monitored. After 16 minutes, a second group of ions
(m/z 57, m/z 71, m/z 85, m/z 478, m/z 506) were monitored to record the internal standard.
An authentic standard of miliacin was injected in each sample run to monitor the retention
time and confirm the presence of this compound. Hexane ‘blanks’ were injected regularly
throughout the sequence to monitor for any carry-over between analytical runs.
After GC-MS analysis, seven samples from Group I and Stone Tower I, Salut with
high lipid concentrations were divided into two. An aliquot was reserved for GC-c-IRMS
analysis; another aliquot was derivatized with N,O-bis(trimethylsilyl)trifluoroacetamide
(BSTFA to derivatize neutral lipids in the extract to trimethylsilyl (TMS) esters (See
Appendix E for protocol) (Craig et al. 2007, 2012).
5.4.2.2. Group II and Group III samples
GC-MS was carried out using an Agilent 7890 B Series Gas Chromatograph attached to an
Agilent 5977 B Mass Spectromer with a quadrupole mass analyser (Agilent technologies,
Cheadle, Cheshire, UK) at Scientific Research, British Museum (Table 5.10). All samples
were initially screened using a split/splitless injector in splitless mode which was
maintained at 300 °C. The GC carrier gas was helium, configured at a constant flow rate of
1ml min-1. The column (HP-5MS) was coated with 5% phenyl-methylpolysiloxane
(30 m × 0.25 mm x 0.25 μm; Agilent technologies, Cheadle, Cheshire, UK). The oven
temperature was set at 50 °C for 2 min, then raised by 10 °C min−1 until 325 °C was
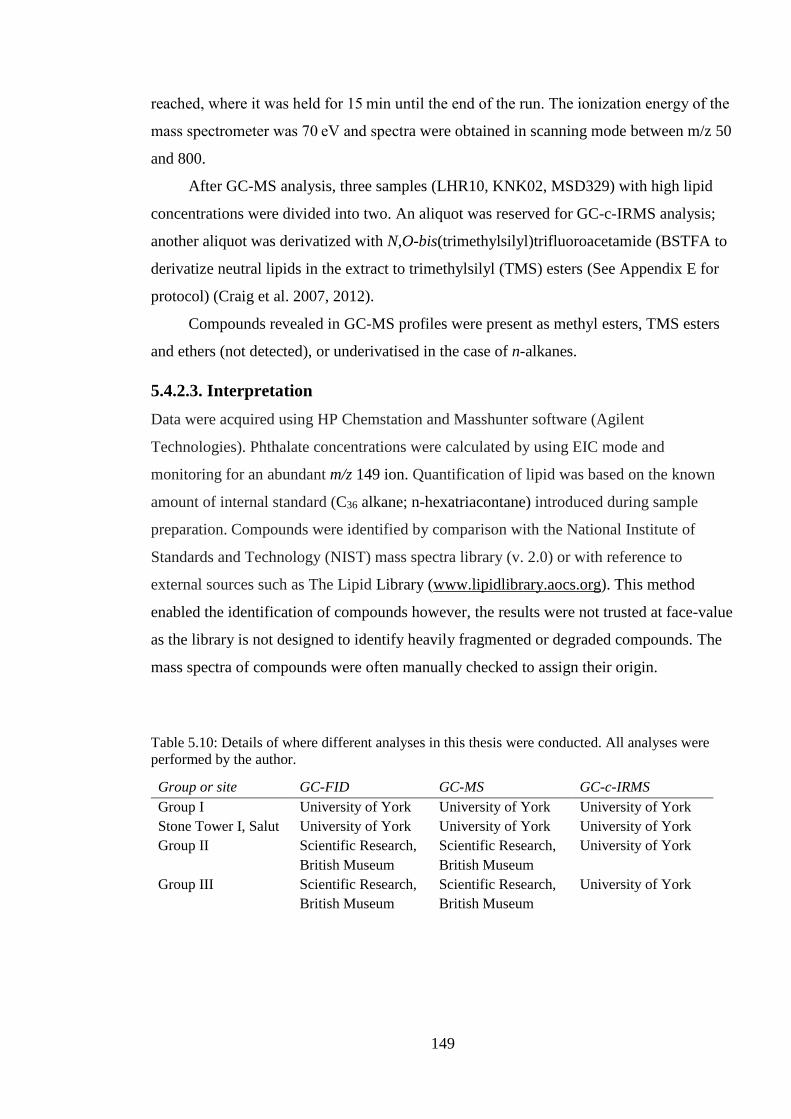
149
reached, where it was held for 15 min until the end of the run. The ionization energy of the
mass spectrometer was 70 eV and spectra were obtained in scanning mode between m/z 50
and 800.
After GC-MS analysis, three samples (LHR10, KNK02, MSD329) with high lipid
concentrations were divided into two. An aliquot was reserved for GC-c-IRMS analysis;
another aliquot was derivatized with N,O-bis(trimethylsilyl)trifluoroacetamide (BSTFA to
derivatize neutral lipids in the extract to trimethylsilyl (TMS) esters (See Appendix E for
protocol) (Craig et al. 2007, 2012).
Compounds revealed in GC-MS profiles were present as methyl esters, TMS esters
and ethers (not detected), or underivatised in the case of n-alkanes.
5.4.2.3. Interpretation
Data were acquired using HP Chemstation and Masshunter software (Agilent
Technologies). Phthalate concentrations were calculated by using EIC mode and
monitoring for an abundant m/z 149 ion. Quantification of lipid was based on the known
amount of internal standard (C36 alkane; n-hexatriacontane) introduced during sample
preparation. Compounds were identified by comparison with the National Institute of
Standards and Technology (NIST) mass spectra library (v. 2.0) or with reference to
external sources such as The Lipid Library (www.lipidlibrary.aocs.org). This method
enabled the identification of compounds however, the results were not trusted at face-value
as the library is not designed to identify heavily fragmented or degraded compounds. The
mass spectra of compounds were often manually checked to assign their origin.
Table 5.10: Details of where different analyses in this thesis were conducted. All analyses were
performed by the author.
Group or site GC-FID GC-MS GC-c-IRMS
Group I University of York University of York University of York
Stone Tower I, Salut University of York University of York University of York
Group II Scientific Research,
British Museum
Scientific Research,
British Museum
University of York
Group III Scientific Research,
British Museum
Scientific Research,
British Museum
University of York
150
5.4.3. Gas Chromatography-combustion-Isotopic Ratio Mass
Spectrometry (GC-c-IRMS)
Ninety-one samples were analysed with a GC-c-IRMS system comprising of an Isoprime
100 (Isoprime, Cheadle, UK) linked to a Hewlett Packard 7890B series Gas
Chromatograph (Agilent Technologies, Santa Clara, CA, USA) with an Isoprime GC5
interface (Isoprime, Cheadle, UK), according to previously described protocols (Lucquin et
al. 2016a) at the University of York (Table 5.10). The results from the analyses are
reported relative to an international scale (VPDB). Replicate measurements of the sample
and a mixture of fatty acid methyl esters (FAMEs) with δ13C values comparable to
international standards were used to determine instrument precision (±0.3‰ SE) and
accuracy (±0.5‰ SE). Values were further corrected to account for the methylation of the
carboxyl group (Lucquin et al. 2016a). Calibration and corrections are provided in the
repository (see Section 5.6).
Reference fats from South Asia were not available except for two dairy references
obtained from previous publications (Craig et al. 2005). Following previous publications
(e.g. Evershed et al. 2008; Dunne et al. 2012), Δ13C (δ13C18:0 - δ13C16:0) values obtained
from fatty acids were compared to modern reference animal fats from Africa (Dunne et al.
2012, United Kingdom (animals raised on a pure C3 diet) (Dudd and Evershed 1998),
Kazakhstan (Outram et al. 2009), Switzerland (Spangenberg et al. 2006) and the Near East
(Gregg et al. 2009).
5.5. Statistical Analysis
All statistical tests were performed in R (version 3.4.1). The comparison of lipid
concentrations from vessels from different sites was performed via various statistical tests.
Comparisons were conducted between vessel forms from sites within Groups I, II and III
and between vessel forms from sites across Groups I, II and III.
Lipid concentrations for most groups were not normally distributed. Thus, non-
parametric tests such as the Kruskal-Wallis and Mann-Whitney-U tests were used for
comparing multiple groups or two groups, respectively. One-way ANOVA tests were used
for comparing lipid yields from multiple groups of vessels when data was normally
distributed.
151
Differences in the distribution of Δ13C values and 1) vessel-types, 2) chronological
periods, and 3) climatic periods between sites were also conducted using non-parametric
(Kruskal-Wallis) tests.
5.6. Reproducibility
To enable re-use of the data and improve reproducibility and transparency (cf. Marwick
2017; Marwick et al. 2018), the GC-MS data, analysis files, GC-c-IRMS calibration and
correction files, and R code for statistical analysis and visualisations in Chapters Six and
Seven are available at the University of Cambridge data repository at
https://doi.org/10.17863/CAM.42339. All the figures and statistical tests presented in this
thesis can be reproduced with the data and code in the repository. The next chapters
provide the results of the lipid and compound-speciific isotopic analysis.
152
Chapter Six
Lipid yields in archaeological pottery from South Asia
and Sultanate of Oman
This thesis presents the first large-scale investigations into lipid residues in South Asian
archaeology. This study has necessitated an examination of the probability of preservation
of lipid residues recovered from different contexts. As mentioned in Chapter Three, several
factors influence the preservation of lipids within ceramics. The following questions have
been explored based on a comparative study of lipid concentrations of archaeological
pottery from private collections (Group I), recently excavated (Group II), and freshly
excavated pottery samples (Group III):
Are sufficient quantities of lipids preserved within potsherds from sites in
northwest India, Sindh (Pakistan) and the Sultanate of Oman?
What is the effect of post-excavation treatment (washing of sherds) on lipid yield?
To what degree does potential contamination from storage environment and/or
adhering sediment affect the interpretation of the lipid profiles from vessels?
These questions address the viability of conducting future studies in lipid residue analysis
in the subcontinent.
6.1. Results: Lipid Yields
This section presents the lipid concentrations obtained from vessels from Groups I, II and
III. Lipid yields obtained from each site within groups are provided, and the extent of
contaminants within samples are also characterised. Lipid concentrations and presence of
contaminants within samples across sites are compared, and their possible links with burial
environment are explored.
6.1.1. Group I: Pottery from collections
6.1.1.1. Lipid yields
Kalibangan
Five vessel fragments (4 rims, 1 base) from Kalibangan were selected for analysis (Chapter
Five). Table 6.1 provides details about the vessel form/type, manufacturing characteristics
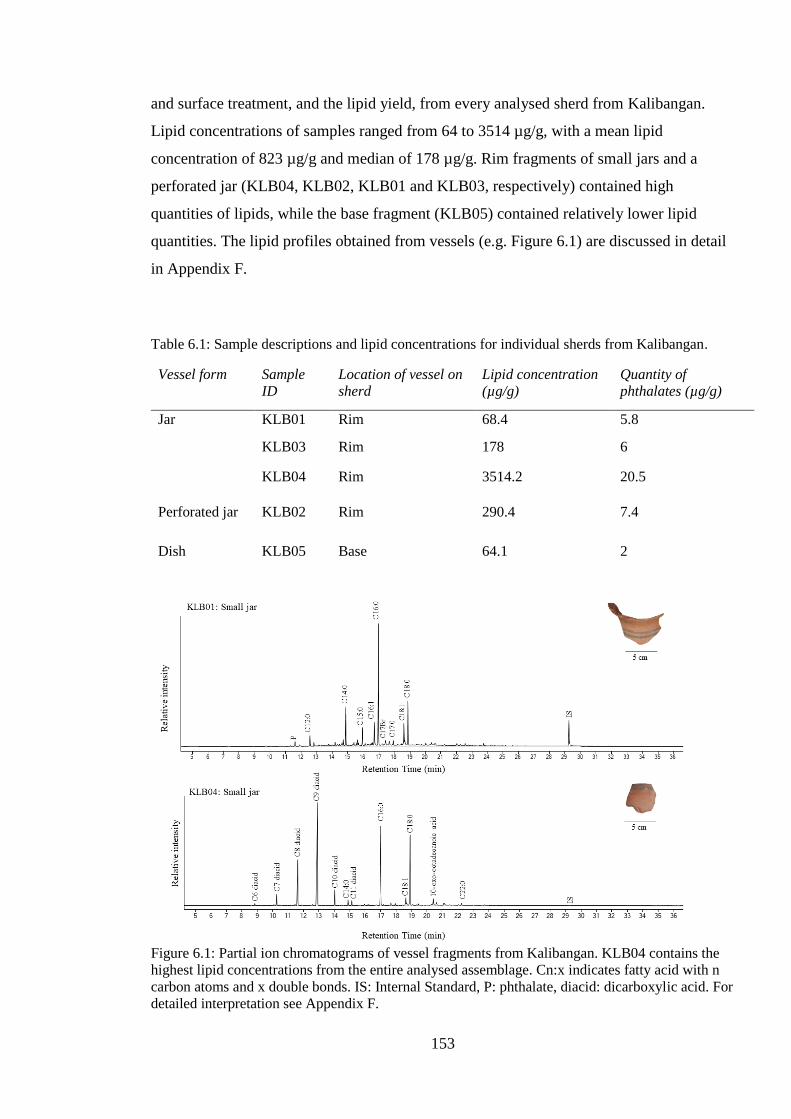
153
and surface treatment, and the lipid yield, from every analysed sherd from Kalibangan.
Lipid concentrations of samples ranged from 64 to 3514 µg/g, with a mean lipid
concentration of 823 µg/g and median of 178 µg/g. Rim fragments of small jars and a
perforated jar (KLB04, KLB02, KLB01 and KLB03, respectively) contained high
quantities of lipids, while the base fragment (KLB05) contained relatively lower lipid
quantities. The lipid profiles obtained from vessels (e.g. Figure 6.1) are discussed in detail
in Appendix F.
Table 6.1: Sample descriptions and lipid concentrations for individual sherds from Kalibangan.
Vessel form Sample
ID
Location of vessel on
sherd
Lipid concentration
(µg/g)
Quantity of
phthalates (µg/g)
Jar KLB01 Rim 68.4 5.8
KLB03 Rim 178 6
KLB04 Rim 3514.2 20.5
Perforated jar KLB02 Rim 290.4 7.4
Dish KLB05 Base 64.1 2
Figure 6.1: Partial ion chromatograms of vessel fragments from Kalibangan. KLB04 contains the
highest lipid concentrations from the entire analysed assemblage. Cn:x indicates fatty acid with n
carbon atoms and x double bonds. IS: Internal Standard, P: phthalate, diacid: dicarboxylic acid. For
detailed interpretation see Appendix F.
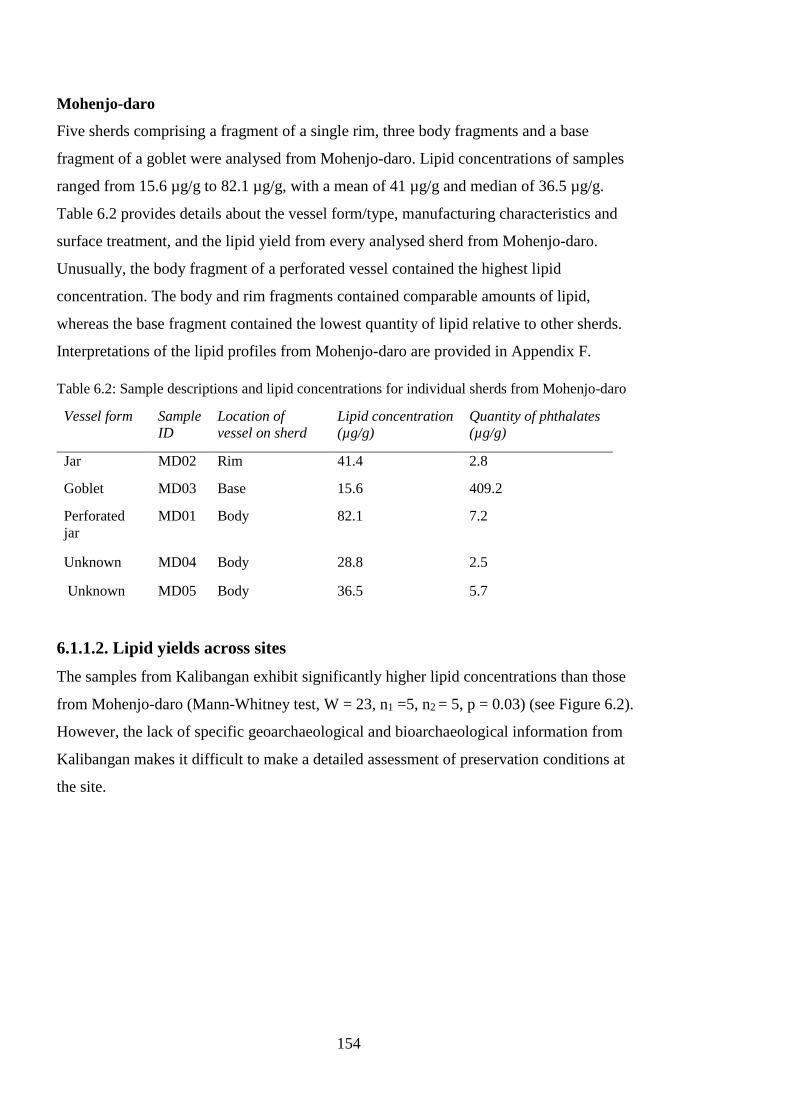
154
Mohenjo-daro
Five sherds comprising a fragment of a single rim, three body fragments and a base
fragment of a goblet were analysed from Mohenjo-daro. Lipid concentrations of samples
ranged from 15.6 µg/g to 82.1 µg/g, with a mean of 41 µg/g and median of 36.5 µg/g.
Table 6.2 provides details about the vessel form/type, manufacturing characteristics and
surface treatment, and the lipid yield from every analysed sherd from Mohenjo-daro.
Unusually, the body fragment of a perforated vessel contained the highest lipid
concentration. The body and rim fragments contained comparable amounts of lipid,
whereas the base fragment contained the lowest quantity of lipid relative to other sherds.
Interpretations of the lipid profiles from Mohenjo-daro are provided in Appendix F.
Table 6.2: Sample descriptions and lipid concentrations for individual sherds from Mohenjo-daro
Vessel form Sample
ID
Location of
vessel on sherd
Lipid concentration
(µg/g)
Quantity of phthalates
(µg/g)
Jar MD02 Rim 41.4 2.8
Goblet MD03 Base 15.6 409.2
Perforated
jar
MD01 Body 82.1 7.2
Unknown MD04 Body 28.8 2.5
Unknown MD05 Body 36.5 5.7
6.1.1.2. Lipid yields across sites
The samples from Kalibangan exhibit significantly higher lipid concentrations than those
from Mohenjo-daro (Mann-Whitney test, W = 23, n1 =5, n2 = 5, p = 0.03) (see Figure 6.2).
However, the lack of specific geoarchaeological and bioarchaeological information from
Kalibangan makes it difficult to make a detailed assessment of preservation conditions at
the site.
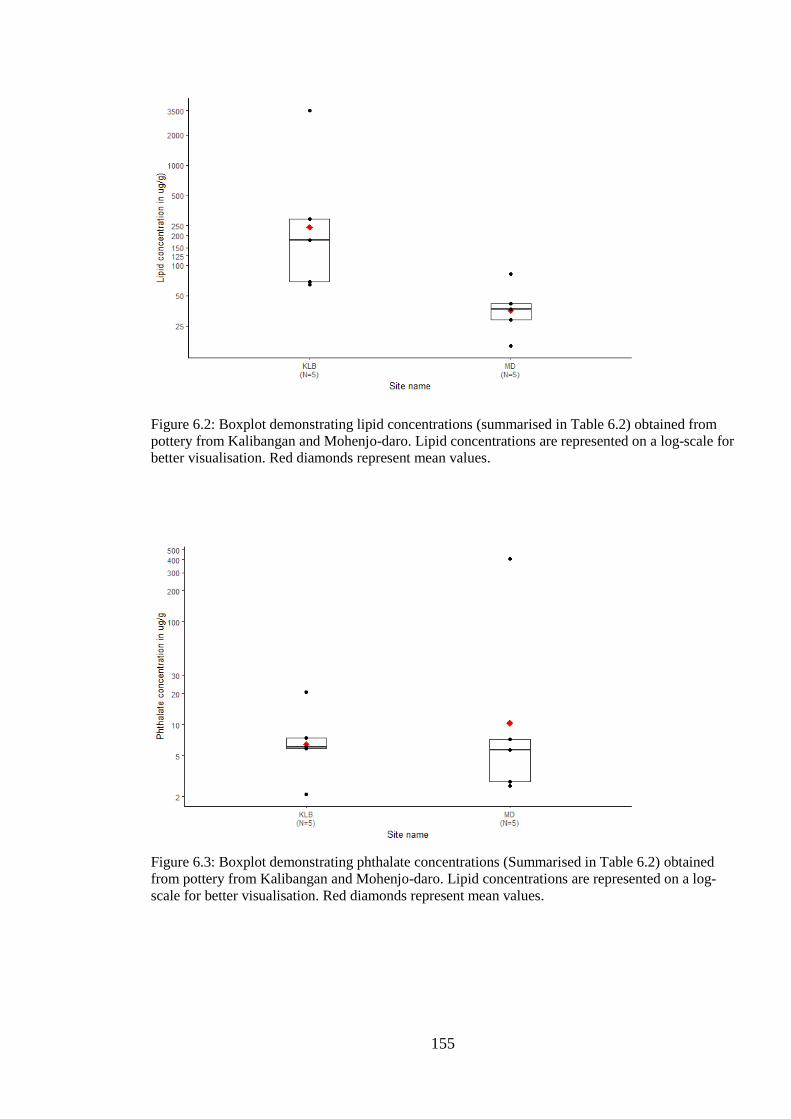
155
Figure 6.2: Boxplot demonstrating lipid concentrations (summarised in Table 6.2) obtained from
pottery from Kalibangan and Mohenjo-daro. Lipid concentrations are represented on a log-scale for
better visualisation. Red diamonds represent mean values.
Figure 6.3: Boxplot demonstrating phthalate concentrations (Summarised in Table 6.2) obtained
from pottery from Kalibangan and Mohenjo-daro. Lipid concentrations are represented on a log-
scale for better visualisation. Red diamonds represent mean values.
156
Lipids were preserved in low quantities in pottery from Mohenjo-daro. The lack of specific
contextual information for the potsherds makes it difficult to connect this with preservation
conditions at the site. It is possible that the type of vessels selected for analysis from
Kalibangan and Mohenjo-daro have influenced the preservation of lipids. As the samples
analysed belong to different vessel forms (or are from unknown forms) across both sites, it
is not possible to compare lipid concentrations across vessel forms. Additionally, as the
specific context from where the pottery comes from is unknown, it is also not possible to
discuss their use in antiquity.
6.1.1.3. Presence of contaminants
Samples from both Kalibangan and Mohenjo-daro contained varying levels of phthalates
(Tables 6.1-6.2 and Figure 6.3). The origins of these compounds may be from the exposure
to contaminants on the surface of a site, the storage of sherds in plastic bags, or their
exposure to varnish, marker fluid, and/or glues. Phthalates like dimethyl phthalate and
phthalic acids were found in Group I samples. Although the presence of phthalates in
archaeological ceramic lipid extracts is widely acknowledged (e.g. Evershed et al. 1990;
Cramp et al. 2011), they are not usually discussed in detail. However, the presence of
phthalates is problematic as they can interfere with the identification of other
archaeologically meaningful compounds. Phthalate concentrations in samples from
Kalibangan and Mohenjo-daro range from 2-410 µg/g. Most samples contain less than 10
µg/g of phthalates, but sample MD03 had high concentrations of di-n-octyl phthalate
(DnOP). The high quantity of plasticiser in this sample makes it unreliable for further
study. The lack of contextual information, absence of palaeoenvironmental data from these
sites, the fact that the samples were subjected to long-term storage and handling, and the
high degree of phthalates in several samples reduce the degree of confidence with one can
attribute the lipid concentrations to archaeological vessel-usage and make interpretations
challenging. For this reason, lipid profiles of vessels from Group I are excluded from
further discussion (results are provided in Appendix F).
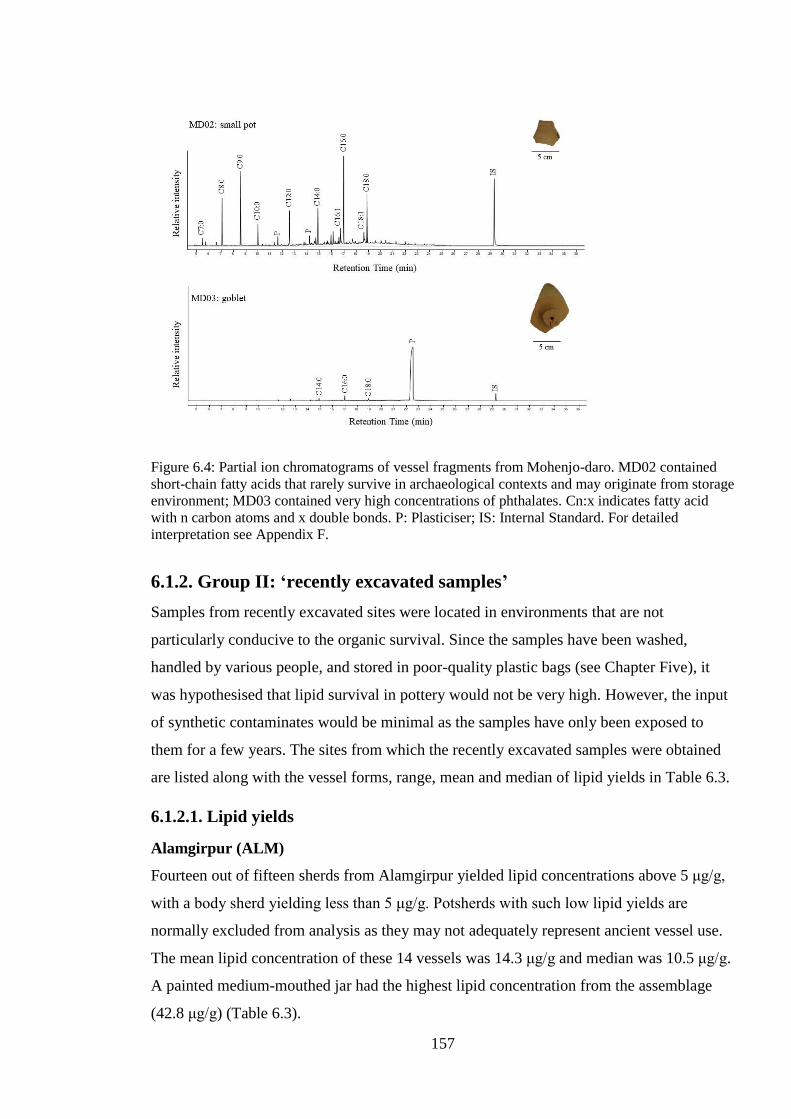
157
Figure 6.4: Partial ion chromatograms of vessel fragments from Mohenjo-daro. MD02 contained
short-chain fatty acids that rarely survive in archaeological contexts and may originate from storage
environment; MD03 contained very high concentrations of phthalates. Cn:x indicates fatty acid
with n carbon atoms and x double bonds. P: Plasticiser; IS: Internal Standard. For detailed
interpretation see Appendix F.
6.1.2. Group II: ‘recently excavated samples’
Samples from recently excavated sites were located in environments that are not
particularly conducive to the organic survival. Since the samples have been washed,
handled by various people, and stored in poor-quality plastic bags (see Chapter Five), it
was hypothesised that lipid survival in pottery would not be very high. However, the input
of synthetic contaminates would be minimal as the samples have only been exposed to
them for a few years. The sites from which the recently excavated samples were obtained
are listed along with the vessel forms, range, mean and median of lipid yields in Table 6.3.
6.1.2.1. Lipid yields
Alamgirpur (ALM)
Fourteen out of fifteen sherds from Alamgirpur yielded lipid concentrations above 5 μg/g,
with a body sherd yielding less than 5 μg/g. Potsherds with such low lipid yields are
normally excluded from analysis as they may not adequately represent ancient vessel use.
The mean lipid concentration of these 14 vessels was 14.3 μg/g and median was 10.5 μg/g.
A painted medium-mouthed jar had the highest lipid concentration from the assemblage
(42.8 μg/g) (Table 6.3).
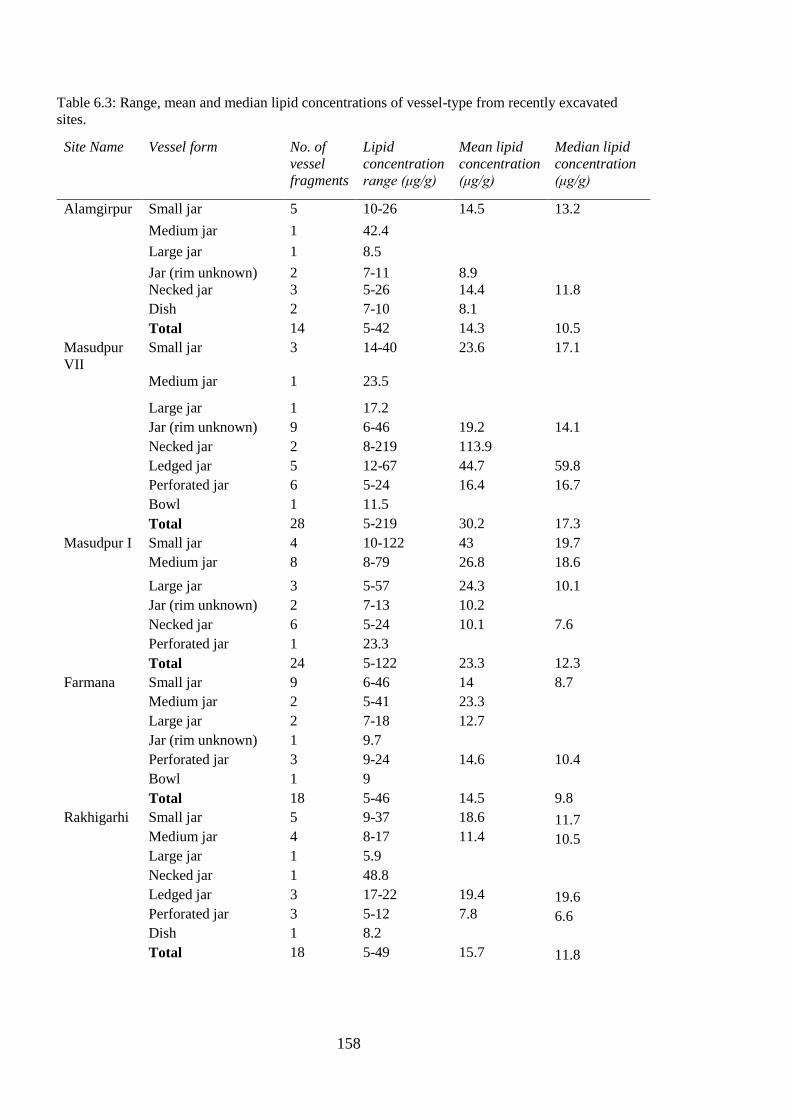
158
Table 6.3: Range, mean and median lipid concentrations of vessel-type from recently excavated
sites.
Site Name Vessel form No. of
vessel
fragments
Lipid
concentration
range (μg/g)
Mean lipid
concentration
(μg/g)
Median lipid
concentration
(μg/g)
Alamgirpur Small jar 5 10-26 14.5 13.2
Medium jar 1 42.4
Large jar 1 8.5
Jar (rim unknown) 2 7-11 8.9
Necked jar 3 5-26 14.4 11.8
Dish 2 7-10 8.1
Total 14 5-42 14.3 10.5
Masudpur
VII
Small jar 3 14-40 23.6 17.1
Medium jar 1 23.5
Large jar 1 17.2
Jar (rim unknown) 9 6-46 19.2 14.1
Necked jar 2 8-219 113.9
Ledged jar 5 12-67 44.7 59.8
Perforated jar 6 5-24 16.4 16.7
Bowl 1 11.5
Total 28 5-219 30.2 17.3
Masudpur I Small jar 4 10-122 43 19.7
Medium jar 8 8-79 26.8 18.6
Large jar 3 5-57 24.3 10.1
Jar (rim unknown) 2 7-13 10.2
Necked jar 6 5-24 10.1 7.6
Perforated jar 1 23.3
Total 24 5-122 23.3 12.3
Farmana Small jar 9 6-46 14 8.7
Medium jar 2 5-41 23.3
Large jar 2 7-18 12.7
Jar (rim unknown) 1 9.7
Perforated jar 3 9-24 14.6 10.4
Bowl 1 9
Total 18 5-46 14.5 9.8
Rakhigarhi Small jar 5 9-37 18.6 11.7
Medium jar 4 8-17 11.4 10.5
Large jar 1 5.9
Necked jar 1 48.8
Ledged jar 3 17-22 19.4 19.6
Perforated jar 3 5-12 7.8 6.6
Dish 1 8.2
Total 18 5-49 15.7 11.8
159
Masudpur VII (MSDVII)
Lipid yields of samples from Masudpur VII were relatively higher compared to other sites
in the region. A total of 28 out of the 31 vessel fragments analysed had appreciable
quantities of lipid (over 5 μg/g). The two samples with very low lipid concentrations
(under 5 μg/g) are not included in the discussion about the lipid composition of the sherds
(see Appendix H). The mean lipid concentration of vessels from Masudpur VII that
contained interpretable quantities of lipids was 30.2 μg/g and median was 17.3 μg/g.
(Table 6.3) A necked jar had the highest lipid concentrations out of the different vessels
(219.3 μg/g). Overall, ledged jars demonstrated relatively higher mean lipid concentrations
than other vessel forms but the difference was not significantly higher (one-way ANOVA
test, F(7, 20) = 0.96, p = 0.48). Perforated body sherds had lipid concentrations similar to
rim sherds of jars, which may be indicative of their use for processing similar products.
Masudpur I (MSDI)
Thirty vessel fragments from Masudpur I were analysed. Twenty-four out of 30 sherds had
appreciable quantities of lipids, while six sherds contained less than 5 μg/g. These latter
sherds were excluded in the discussion about lipid composition (see Appendix H). The
mean lipid concentration of vessels from Masudpur I that contained appreciable quantities
of lipids was 23.3 μg/g and median was 12.3 μg/g (Table 6.3). A small red-slipped jar
(MSD343) had the highest lipid concentration out of the entire assemblage (122 μg/g).
Farmana (FRN)
The lipid yields from vessels analysed at Farmana were typically low. Out of 30 vessels,
only 18 vessels contained interpretable quantities of lipid (above 5 μg/g) (see Appendix H),
and the mean lipid concentration of these vessels was 14.5 μg/g and median was 9.8 μg/g
(Table 6.3) There were no observable differences between the lipid concentrations of
different vessel forms. It is notable that the lipid concentrations of the body sherds of
perforated vessels are comparable to the rims of other vessels, but it is not possible to make
further interpretations about the frequency of use or function of vessels due to low organic
preservation across the analysed assemblage.
Rakhigarhi (RGR)
Samples from Rakhigarhi also had poor lipid yields. Only 18 out of 30 vessels had
interpretable concentrations of lipid (above 5 μg/g) (see Appendix H). The mean lipid
concentration of these vessels was 15.7 μg/g, with a median value of 11.8 μg/g (Table 6.3).
There were no differences between the lipid concentrations of different vessel forms. A
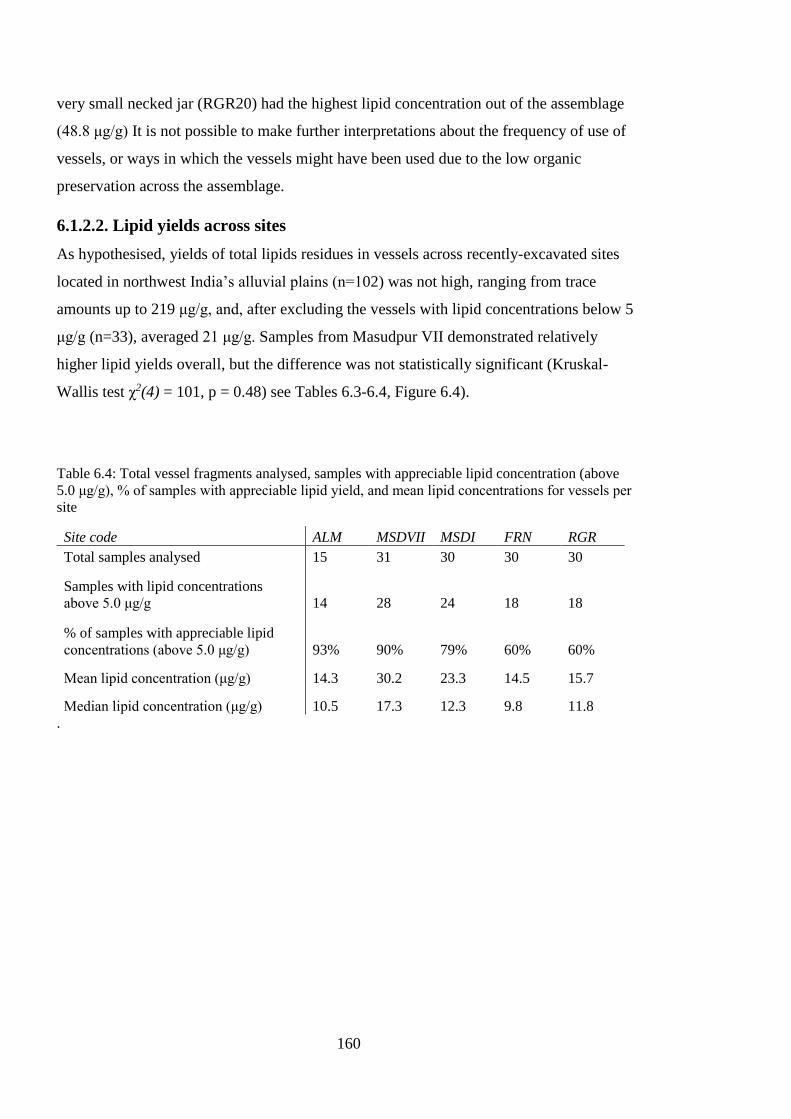
160
very small necked jar (RGR20) had the highest lipid concentration out of the assemblage
(48.8 μg/g) It is not possible to make further interpretations about the frequency of use of
vessels, or ways in which the vessels might have been used due to the low organic
preservation across the assemblage.
6.1.2.2. Lipid yields across sites
As hypothesised, yields of total lipids residues in vessels across recently-excavated sites
located in northwest India’s alluvial plains (n=102) was not high, ranging from trace
amounts up to 219 μg/g, and, after excluding the vessels with lipid concentrations below 5
μg/g (n=33), averaged 21 μg/g. Samples from Masudpur VII demonstrated relatively
higher lipid yields overall, but the difference was not statistically significant (Kruskal-
Wallis test χ2(4) = 101, p = 0.48) see Tables 6.3-6.4, Figure 6.4).
Table 6.4: Total vessel fragments analysed, samples with appreciable lipid concentration (above
5.0 μg/g), % of samples with appreciable lipid yield, and mean lipid concentrations for vessels per
site
Site code ALM MSDVII MSDI FRN RGR
Total samples analysed 15 31 30 30 30
Samples with lipid concentrations
above 5.0 μg/g 14 28 24 18 18
% of samples with appreciable lipid
concentrations (above 5.0 μg/g) 93% 90% 79% 60% 60%
Mean lipid concentration (μg/g) 14.3 30.2 23.3 14.5 15.7
Median lipid concentration (μg/g) 10.5 17.3 12.3 9.8 11.8
.
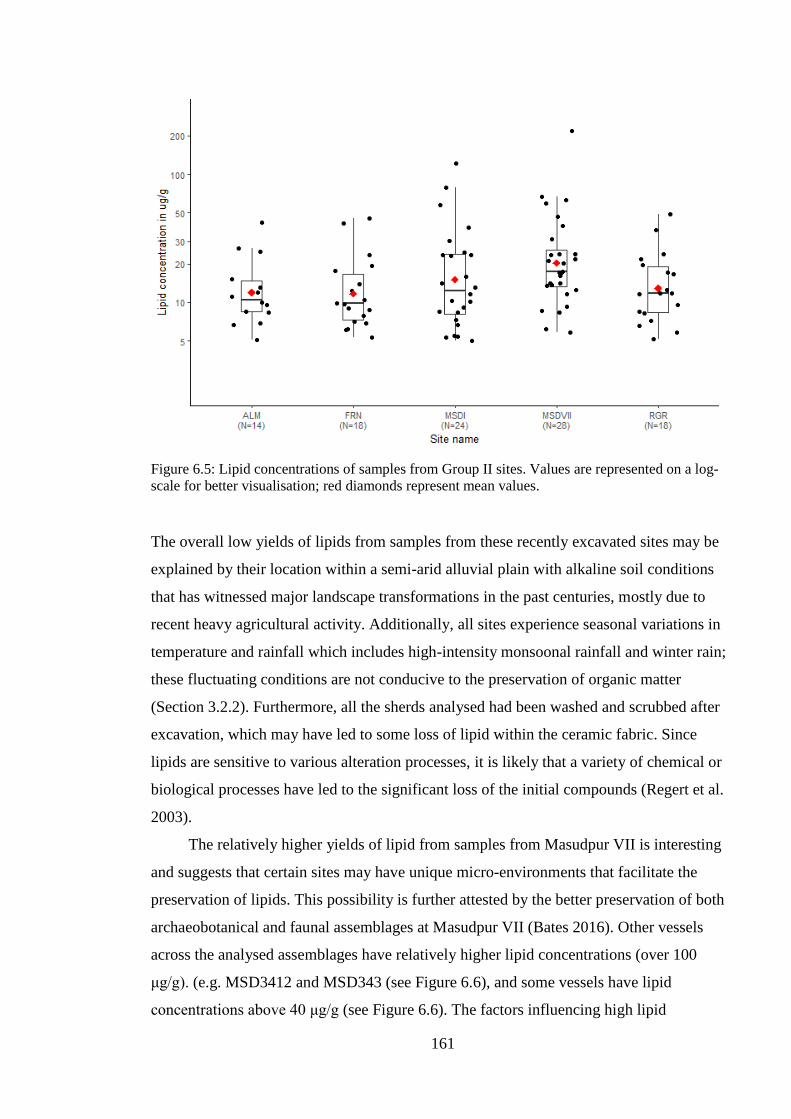
161
Figure 6.5: Lipid concentrations of samples from Group II sites. Values are represented on a log-
scale for better visualisation; red diamonds represent mean values.
The overall low yields of lipids from samples from these recently excavated sites may be
explained by their location within a semi-arid alluvial plain with alkaline soil conditions
that has witnessed major landscape transformations in the past centuries, mostly due to
recent heavy agricultural activity. Additionally, all sites experience seasonal variations in
temperature and rainfall which includes high-intensity monsoonal rainfall and winter rain;
these fluctuating conditions are not conducive to the preservation of organic matter
(Section 3.2.2). Furthermore, all the sherds analysed had been washed and scrubbed after
excavation, which may have led to some loss of lipid within the ceramic fabric. Since
lipids are sensitive to various alteration processes, it is likely that a variety of chemical or
biological processes have led to the significant loss of the initial compounds (Regert et al.
2003).
The relatively higher yields of lipid from samples from Masudpur VII is interesting
and suggests that certain sites may have unique micro-environments that facilitate the
preservation of lipids. This possibility is further attested by the better preservation of both
archaeobotanical and faunal assemblages at Masudpur VII (Bates 2016). Other vessels
across the analysed assemblages have relatively higher lipid concentrations (over 100
μg/g). (e.g. MSD3412 and MSD343 (see Figure 6.6), and some vessels have lipid
concentrations above 40 μg/g (see Figure 6.6). The factors influencing high lipid
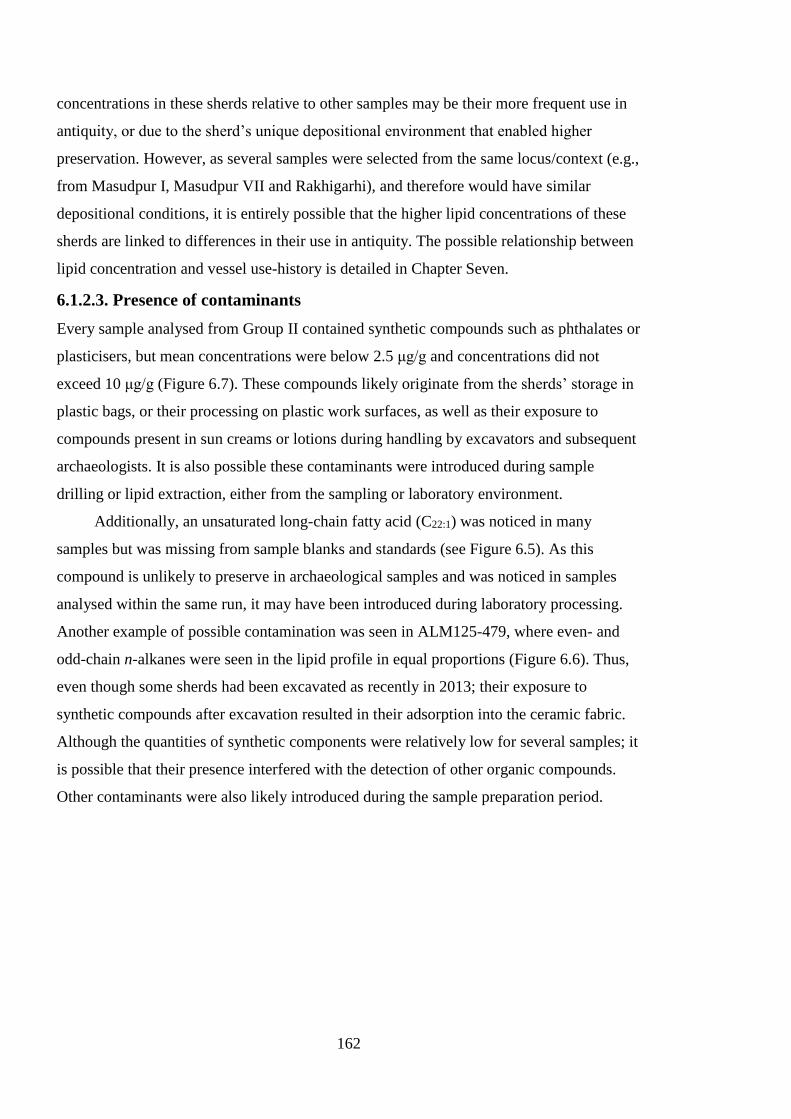
162
concentrations in these sherds relative to other samples may be their more frequent use in
antiquity, or due to the sherd’s unique depositional environment that enabled higher
preservation. However, as several samples were selected from the same locus/context (e.g.,
from Masudpur I, Masudpur VII and Rakhigarhi), and therefore would have similar
depositional conditions, it is entirely possible that the higher lipid concentrations of these
sherds are linked to differences in their use in antiquity. The possible relationship between
lipid concentration and vessel use-history is detailed in Chapter Seven.
6.1.2.3. Presence of contaminants
Every sample analysed from Group II contained synthetic compounds such as phthalates or
plasticisers, but mean concentrations were below 2.5 μg/g and concentrations did not
exceed 10 μg/g (Figure 6.7). These compounds likely originate from the sherds’ storage in
plastic bags, or their processing on plastic work surfaces, as well as their exposure to
compounds present in sun creams or lotions during handling by excavators and subsequent
archaeologists. It is also possible these contaminants were introduced during sample
drilling or lipid extraction, either from the sampling or laboratory environment.
Additionally, an unsaturated long-chain fatty acid (C22:1) was noticed in many
samples but was missing from sample blanks and standards (see Figure 6.5). As this
compound is unlikely to preserve in archaeological samples and was noticed in samples
analysed within the same run, it may have been introduced during laboratory processing.
Another example of possible contamination was seen in ALM125-479, where even- and
odd-chain n-alkanes were seen in the lipid profile in equal proportions (Figure 6.6). Thus,
even though some sherds had been excavated as recently in 2013; their exposure to
synthetic compounds after excavation resulted in their adsorption into the ceramic fabric.
Although the quantities of synthetic components were relatively low for several samples; it
is possible that their presence interfered with the detection of other organic compounds.
Other contaminants were also likely introduced during the sample preparation period.
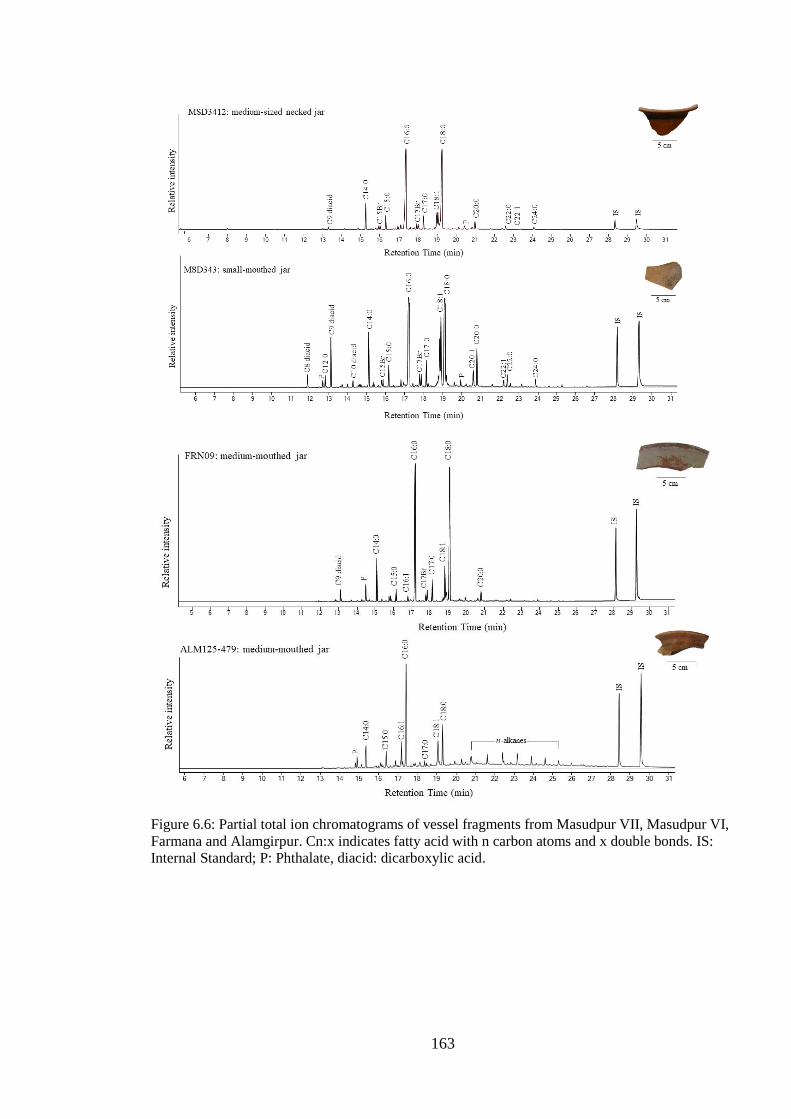
163
Figure 6.6: Partial total ion chromatograms of vessel fragments from Masudpur VII, Masudpur VI,
Farmana and Alamgirpur. Cn:x indicates fatty acid with n carbon atoms and x double bonds. IS:
Internal Standard; P: Phthalate, diacid: dicarboxylic acid.
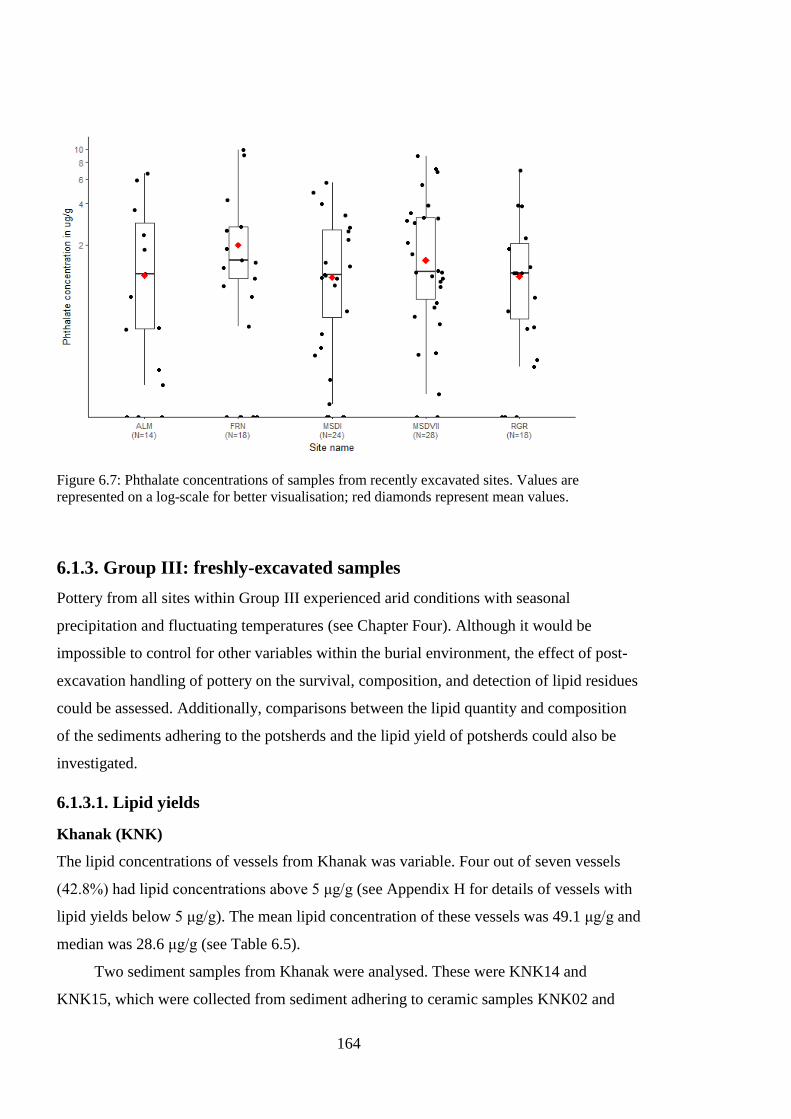
164
Figure 6.7: Phthalate concentrations of samples from recently excavated sites. Values are
represented on a log-scale for better visualisation; red diamonds represent mean values.
6.1.3. Group III: freshly-excavated samples
Pottery from all sites within Group III experienced arid conditions with seasonal
precipitation and fluctuating temperatures (see Chapter Four). Although it would be
impossible to control for other variables within the burial environment, the effect of post-
excavation handling of pottery on the survival, composition, and detection of lipid residues
could be assessed. Additionally, comparisons between the lipid quantity and composition
of the sediments adhering to the potsherds and the lipid yield of potsherds could also be
investigated.
6.1.3.1. Lipid yields
Khanak (KNK)
The lipid concentrations of vessels from Khanak was variable. Four out of seven vessels
(42.8%) had lipid concentrations above 5 μg/g (see Appendix H for details of vessels with
lipid yields below 5 μg/g). The mean lipid concentration of these vessels was 49.1 μg/g and
median was 28.6 μg/g (see Table 6.5).
Two sediment samples from Khanak were analysed. These were KNK14 and
KNK15, which were collected from sediment adhering to ceramic samples KNK02 and
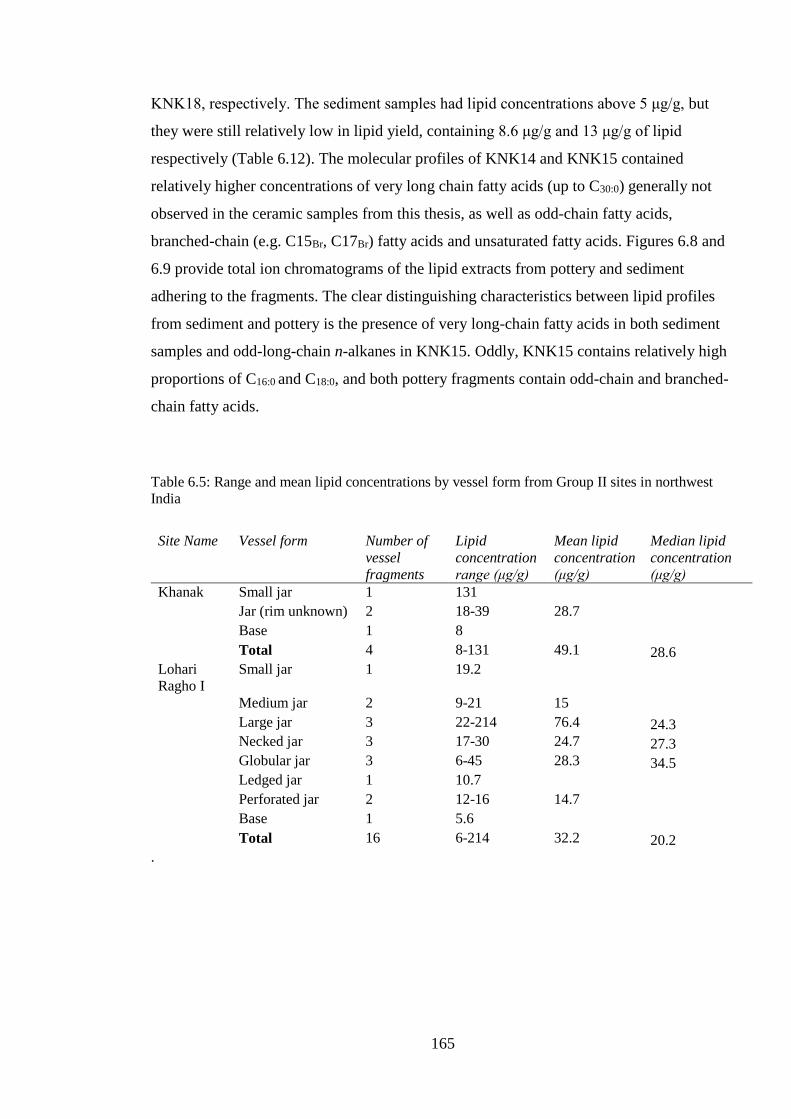
165
KNK18, respectively. The sediment samples had lipid concentrations above 5 μg/g, but
they were still relatively low in lipid yield, containing 8.6 μg/g and 13 μg/g of lipid
respectively (Table 6.12). The molecular profiles of KNK14 and KNK15 contained
relatively higher concentrations of very long chain fatty acids (up to C30:0) generally not
observed in the ceramic samples from this thesis, as well as odd-chain fatty acids,
branched-chain (e.g. C15Br, C17Br) fatty acids and unsaturated fatty acids. Figures 6.8 and
6.9 provide total ion chromatograms of the lipid extracts from pottery and sediment
adhering to the fragments. The clear distinguishing characteristics between lipid profiles
from sediment and pottery is the presence of very long-chain fatty acids in both sediment
samples and odd-long-chain n-alkanes in KNK15. Oddly, KNK15 contains relatively high
proportions of C16:0 and C18:0, and both pottery fragments contain odd-chain and branched-
chain fatty acids.
Table 6.5: Range and mean lipid concentrations by vessel form from Group II sites in northwest
India
.
Site Name Vessel form Number of
vessel
fragments
Lipid
concentration
range (μg/g)
Mean lipid
concentration
(μg/g)
Median lipid
concentration
(μg/g)
Khanak Small jar 1 131
Jar (rim unknown) 2 18-39 28.7
Base 1 8
Total 4 8-131 49.1 28.6
Lohari
Ragho I
Small jar 1 19.2
Medium jar 2 9-21 15
Large jar 3 22-214 76.4 24.3
Necked jar 3 17-30 24.7 27.3
Globular jar 3 6-45 28.3 34.5
Ledged jar 1 10.7
Perforated jar 2 12-16 14.7
Base 1 5.6
Total 16 6-214 32.2 20.2
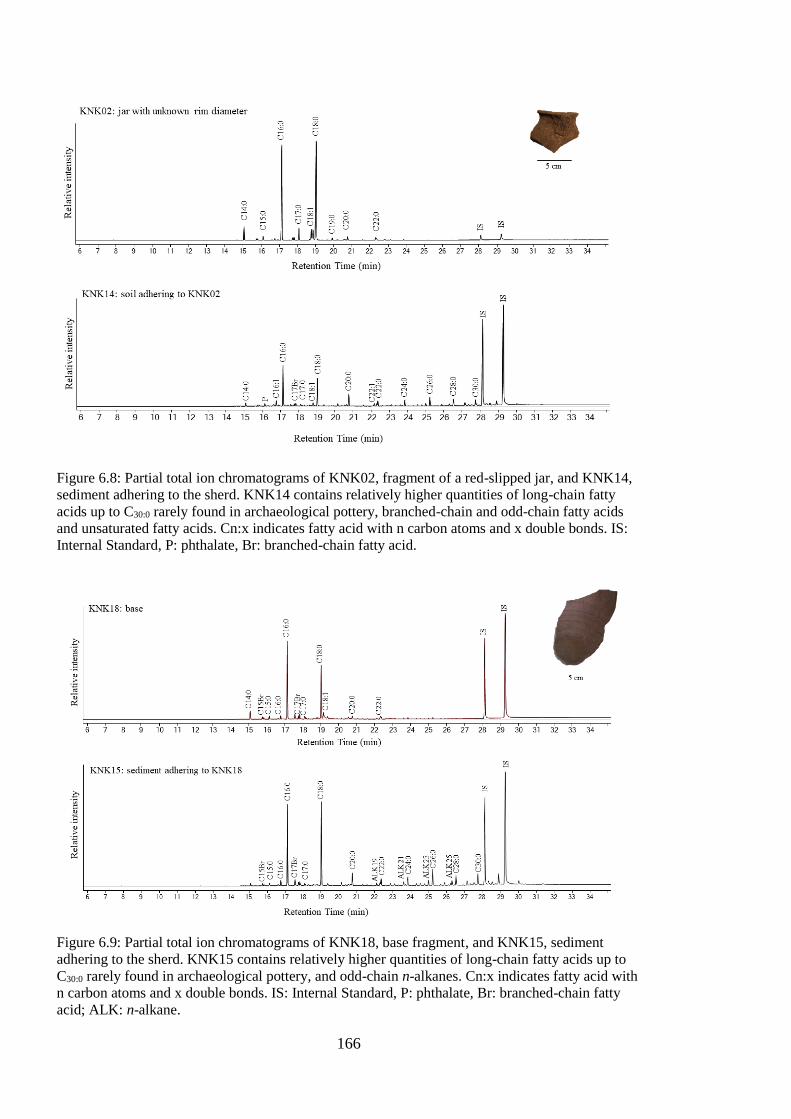
166
Figure 6.8: Partial total ion chromatograms of KNK02, fragment of a red-slipped jar, and KNK14,
sediment adhering to the sherd. KNK14 contains relatively higher quantities of long-chain fatty
acids up to C30:0 rarely found in archaeological pottery, branched-chain and odd-chain fatty acids
and unsaturated fatty acids. Cn:x indicates fatty acid with n carbon atoms and x double bonds. IS:
Internal Standard, P: phthalate, Br: branched-chain fatty acid.
Figure 6.9: Partial total ion chromatograms of KNK18, base fragment, and KNK15, sediment
adhering to the sherd. KNK15 contains relatively higher quantities of long-chain fatty acids up to
C30:0 rarely found in archaeological pottery, and odd-chain n-alkanes. Cn:x indicates fatty acid with
n carbon atoms and x double bonds. IS: Internal Standard, P: phthalate, Br: branched-chain fatty
acid; ALK: n-alkane.
167
Lohari Ragho I
Twenty-six pottery fragments were analysed from Lohari Ragho I, and out of these, sixteen
contained appreciable concentrations of lipid (above 5 μg/g). Two terracotta cakes revealed
trace quantities of lipids and were thus not included in further analyses (see Appendix H
for details of vessels with lipid yields below 5 μg/g).The mean lipid concentration of these
vessels was 32.2 μg/g and median was 20.2 μg/g (Table 6.5).
Two sediment samples from Lohari Ragho I were analysed to compare lipid yield
and lipid composition of sediments versus ceramic sherds. Unusually, a sediment sample
(LHR41) obtained from context number 524, a hearth, contained 38.6 μg/g of lipids
(Figure 6.10), which is comparable to yields obtained from pottery vessels in this thesis.
This concentration may be suggestive of mixtures of lipids from sediment and remains of
food-processing activities associated with the hearth. In contrast, LHR37, a sediment
sample from locus 520, from which several sherds were analysed, contained only 7.9 μg/g
of lipid. The low quantities of lipids in LHR37 suggest it is unlikely to have influenced
lipid composition in the sherds. The lipid composition of both sediment samples included
relatively higher proportions of very long-chain fatty acids, odd-chain fatty acids,
branched-chain fatty acids and unsaturated fatty acids, which were not present (e.g. C20:1),
or present in very low quantities (e.g .C18:1), in the ceramic samples.
Small peaks of plasticisers were detected in the lipid extracts, which may have been
introduced during sample preparation. A compound (C22:1) was noticed in all samples,
especially in sediment sample LHR41, but was missing from sample blanks. As this
compound is unlikely to preserve in archaeological samples and was noticed in virtually all
the samples analysed within the same run, it may have been introduced during laboratory
processing.
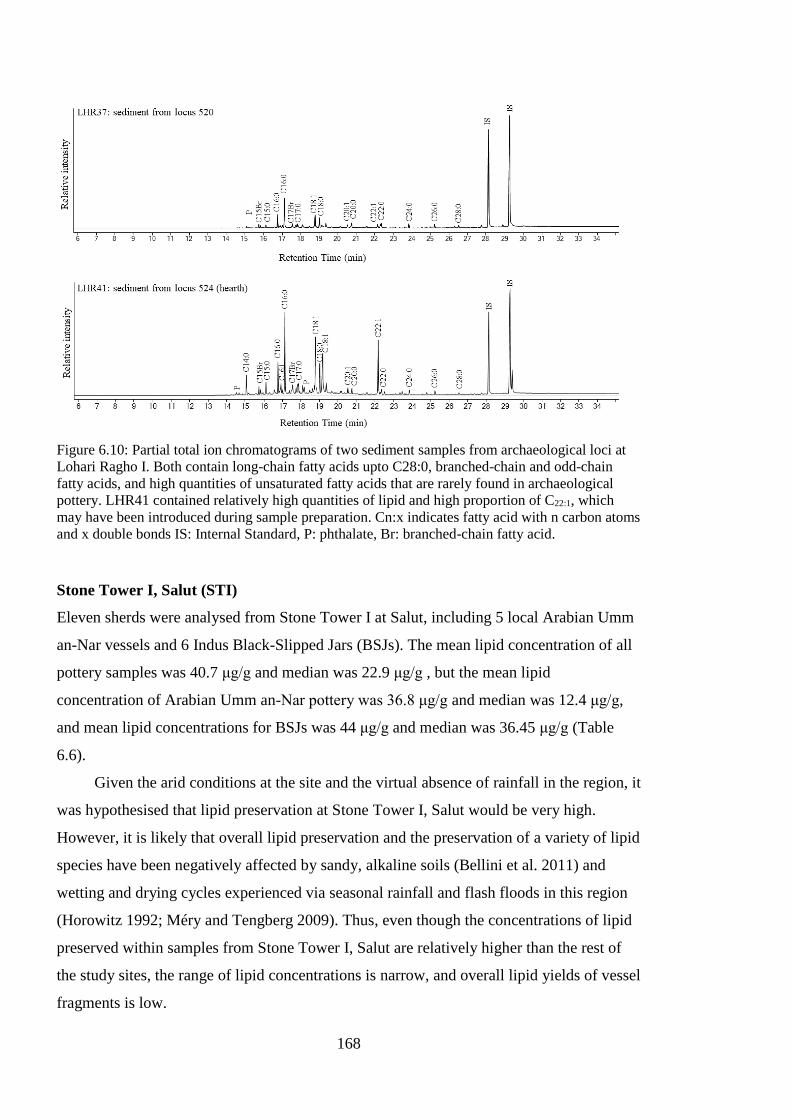
168
Figure 6.10: Partial total ion chromatograms of two sediment samples from archaeological loci at
Lohari Ragho I. Both contain long-chain fatty acids upto C28:0, branched-chain and odd-chain
fatty acids, and high quantities of unsaturated fatty acids that are rarely found in archaeological
pottery. LHR41 contained relatively high quantities of lipid and high proportion of C22:1, which
may have been introduced during sample preparation. Cn:x indicates fatty acid with n carbon atoms
and x double bonds IS: Internal Standard, P: phthalate, Br: branched-chain fatty acid.
Stone Tower I, Salut (STI)
Eleven sherds were analysed from Stone Tower I at Salut, including 5 local Arabian Umm
an-Nar vessels and 6 Indus Black-Slipped Jars (BSJs). The mean lipid concentration of all
pottery samples was 40.7 μg/g and median was 22.9 μg/g , but the mean lipid
concentration of Arabian Umm an-Nar pottery was 36.8 μg/g and median was 12.4 μg/g,
and mean lipid concentrations for BSJs was 44 μg/g and median was 36.45 μg/g (Table
6.6).
Given the arid conditions at the site and the virtual absence of rainfall in the region, it
was hypothesised that lipid preservation at Stone Tower I, Salut would be very high.
However, it is likely that overall lipid preservation and the preservation of a variety of lipid
species have been negatively affected by sandy, alkaline soils (Bellini et al. 2011) and
wetting and drying cycles experienced via seasonal rainfall and flash floods in this region
(Horowitz 1992; Méry and Tengberg 2009). Thus, even though the concentrations of lipid
preserved within samples from Stone Tower I, Salut are relatively higher than the rest of
the study sites, the range of lipid concentrations is narrow, and overall lipid yields of vessel
fragments is low.
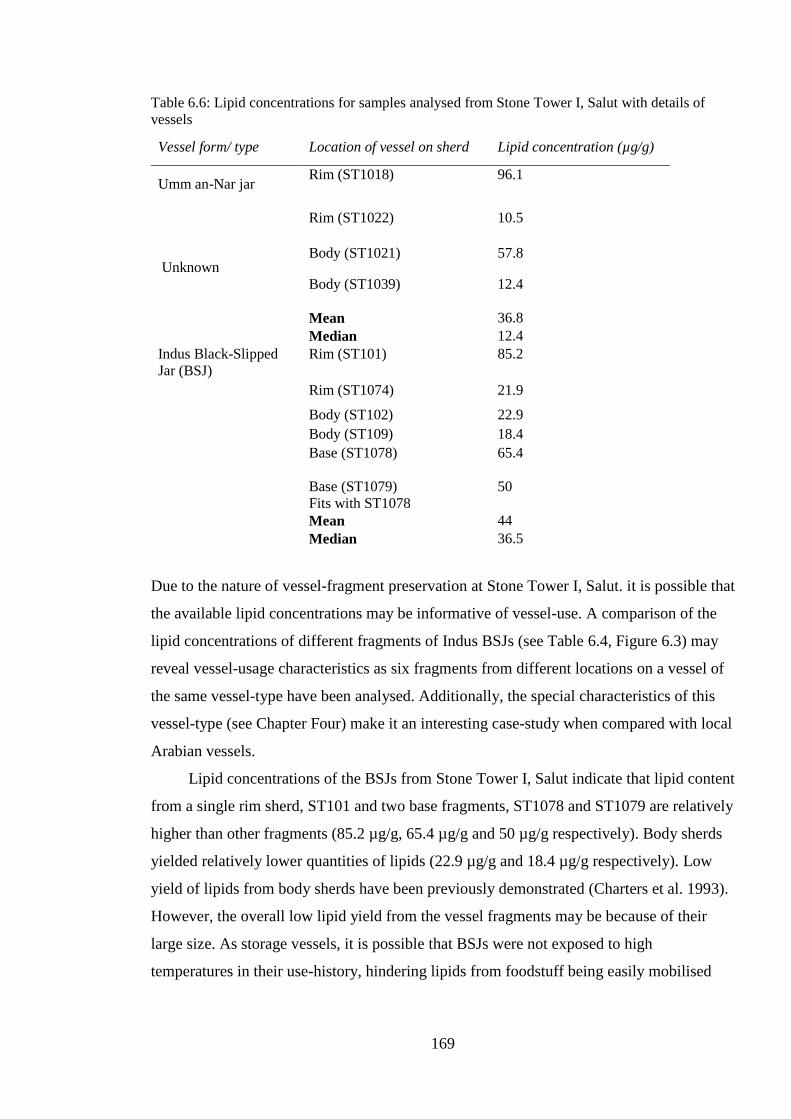
169
Table 6.6: Lipid concentrations for samples analysed from Stone Tower I, Salut with details of
vessels
Vessel form/ type Location of vessel on sherd Lipid concentration (µg/g)
Umm an-Nar jar
Rim (ST1018) 96.1
Rim (ST1022) 10.5
Unknown Body (ST1021) 57.8
Body (ST1039) 12.4
Mean 36.8
Median 12.4
Indus Black-Slipped
Jar (BSJ)
Rim (ST101) 85.2
Rim (ST1074) 21.9
Body (ST102) 22.9
Body (ST109) 18.4
Base (ST1078)
65.4
Base (ST1079)
Fits with ST1078
50
Mean 44
Median 36.5
Due to the nature of vessel-fragment preservation at Stone Tower I, Salut. it is possible that
the available lipid concentrations may be informative of vessel-use. A comparison of the
lipid concentrations of different fragments of Indus BSJs (see Table 6.4, Figure 6.3) may
reveal vessel-usage characteristics as six fragments from different locations on a vessel of
the same vessel-type have been analysed. Additionally, the special characteristics of this
vessel-type (see Chapter Four) make it an interesting case-study when compared with local
Arabian vessels.
Lipid concentrations of the BSJs from Stone Tower I, Salut indicate that lipid content
from a single rim sherd, ST101 and two base fragments, ST1078 and ST1079 are relatively
higher than other fragments (85.2 µg/g, 65.4 µg/g and 50 µg/g respectively). Body sherds
yielded relatively lower quantities of lipids (22.9 µg/g and 18.4 µg/g respectively). Low
yield of lipids from body sherds have been previously demonstrated (Charters et al. 1993).
However, the overall low lipid yield from the vessel fragments may be because of their
large size. As storage vessels, it is possible that BSJs were not exposed to high
temperatures in their use-history, hindering lipids from foodstuff being easily mobilised
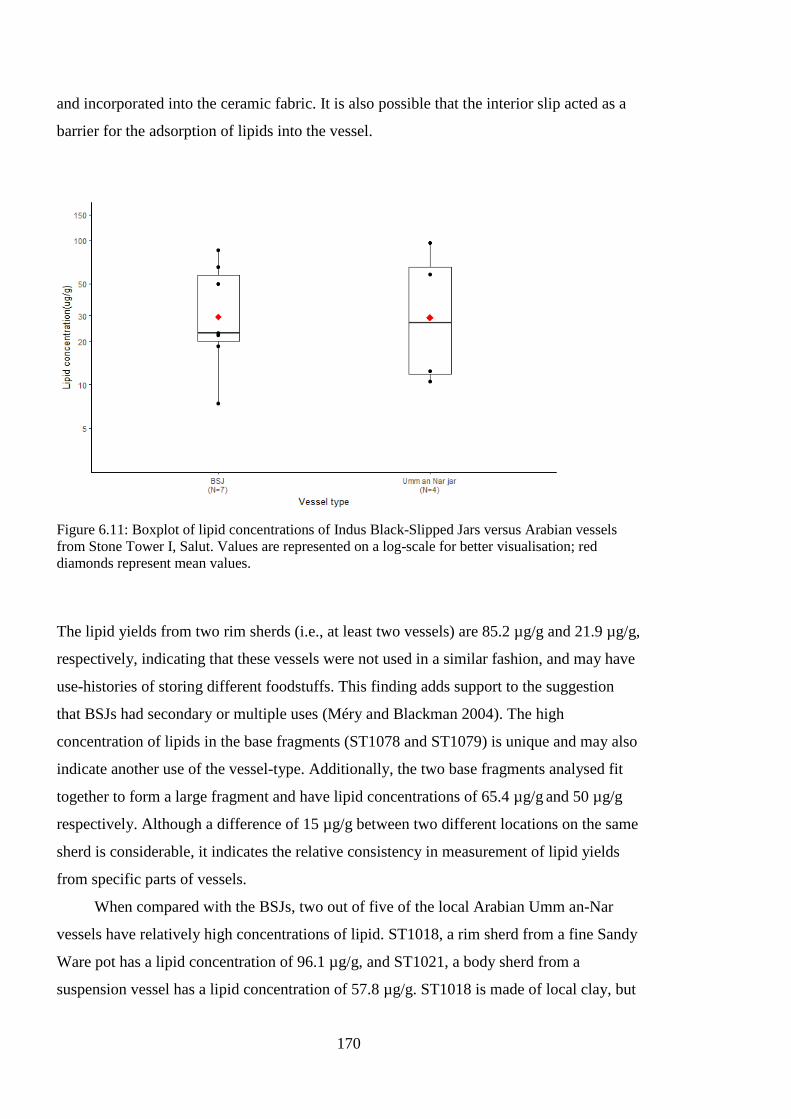
170
and incorporated into the ceramic fabric. It is also possible that the interior slip acted as a
barrier for the adsorption of lipids into the vessel.
Figure 6.11: Boxplot of lipid concentrations of Indus Black-Slipped Jars versus Arabian vessels
from Stone Tower I, Salut. Values are represented on a log-scale for better visualisation; red
diamonds represent mean values.
The lipid yields from two rim sherds (i.e., at least two vessels) are 85.2 µg/g and 21.9 µg/g,
respectively, indicating that these vessels were not used in a similar fashion, and may have
use-histories of storing different foodstuffs. This finding adds support to the suggestion
that BSJs had secondary or multiple uses (Méry and Blackman 2004). The high
concentration of lipids in the base fragments (ST1078 and ST1079) is unique and may also
indicate another use of the vessel-type. Additionally, the two base fragments analysed fit
together to form a large fragment and have lipid concentrations of 65.4 µg/g and 50 µg/g
respectively. Although a difference of 15 µg/g between two different locations on the same
sherd is considerable, it indicates the relative consistency in measurement of lipid yields
from specific parts of vessels.
When compared with the BSJs, two out of five of the local Arabian Umm an-Nar
vessels have relatively high concentrations of lipid. ST1018, a rim sherd from a fine Sandy
Ware pot has a lipid concentration of 96.1 µg/g, and ST1021, a body sherd from a
suspension vessel has a lipid concentration of 57.8 µg/g. ST1018 is made of local clay, but
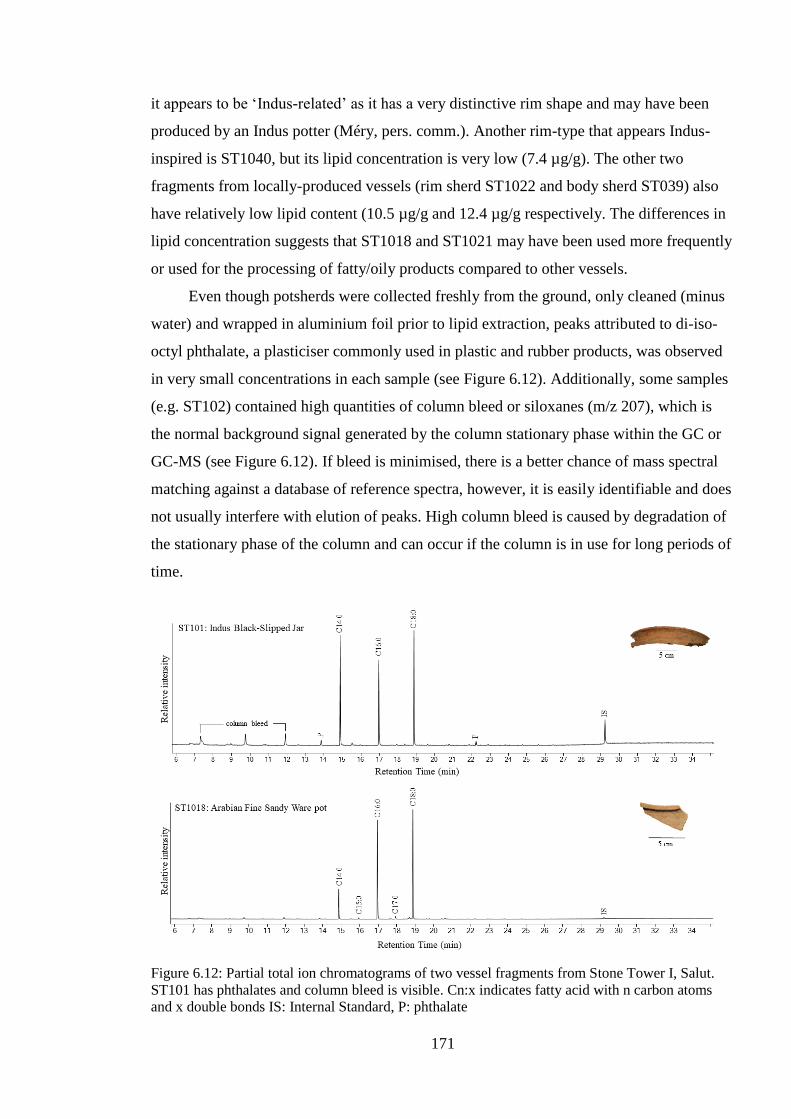
171
it appears to be ‘Indus-related’ as it has a very distinctive rim shape and may have been
produced by an Indus potter (Méry, pers. comm.). Another rim-type that appears Indus-
inspired is ST1040, but its lipid concentration is very low (7.4 µg/g). The other two
fragments from locally-produced vessels (rim sherd ST1022 and body sherd ST039) also
have relatively low lipid content (10.5 µg/g and 12.4 µg/g respectively. The differences in
lipid concentration suggests that ST1018 and ST1021 may have been used more frequently
or used for the processing of fatty/oily products compared to other vessels.
Even though potsherds were collected freshly from the ground, only cleaned (minus
water) and wrapped in aluminium foil prior to lipid extraction, peaks attributed to di-iso-
octyl phthalate, a plasticiser commonly used in plastic and rubber products, was observed
in very small concentrations in each sample (see Figure 6.12). Additionally, some samples
(e.g. ST102) contained high quantities of column bleed or siloxanes (m/z 207), which is
the normal background signal generated by the column stationary phase within the GC or
GC-MS (see Figure 6.12). If bleed is minimised, there is a better chance of mass spectral
matching against a database of reference spectra, however, it is easily identifiable and does
not usually interfere with elution of peaks. High column bleed is caused by degradation of
the stationary phase of the column and can occur if the column is in use for long periods of
time.
Figure 6.12: Partial total ion chromatograms of two vessel fragments from Stone Tower I, Salut.
ST101 has phthalates and column bleed is visible. Cn:x indicates fatty acid with n carbon atoms
and x double bonds IS: Internal Standard, P: phthalate
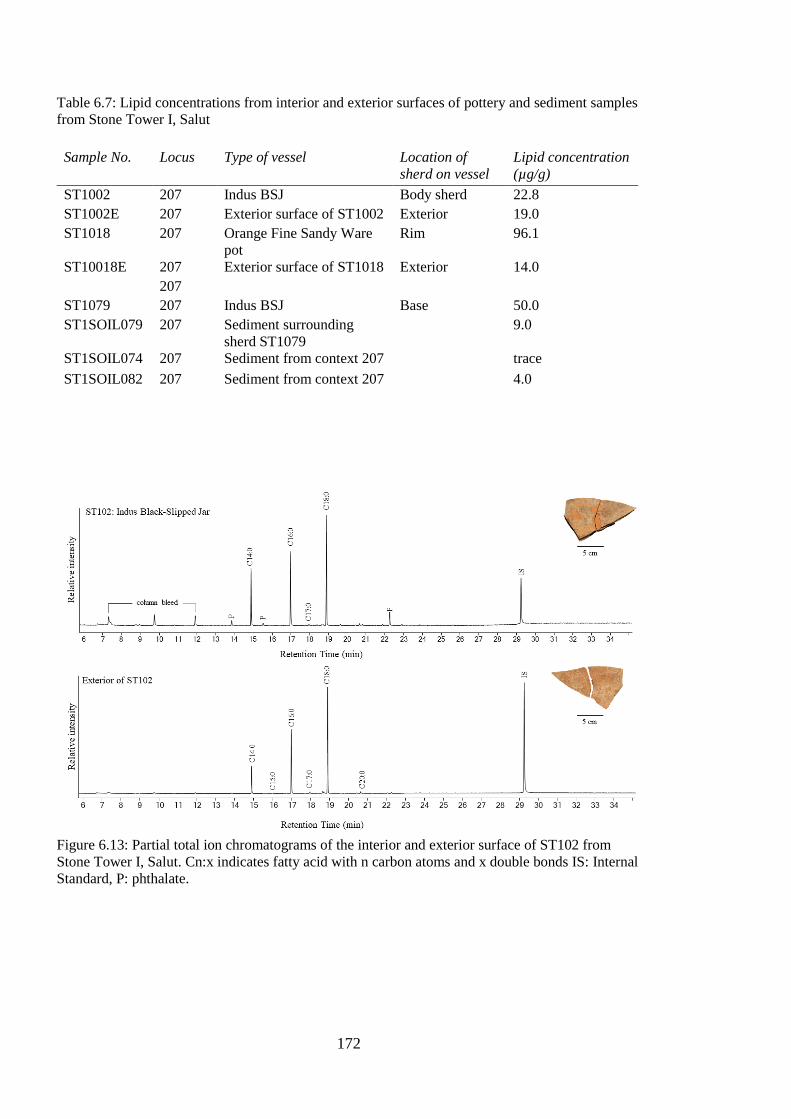
172
Table 6.7: Lipid concentrations from interior and exterior surfaces of pottery and sediment samples
from Stone Tower I, Salut
Figure 6.13: Partial total ion chromatograms of the interior and exterior surface of ST102 from
Stone Tower I, Salut. Cn:x indicates fatty acid with n carbon atoms and x double bonds IS: Internal
Standard, P: phthalate.
Sample No. Locus Type of vessel Location of
sherd on vessel
Lipid concentration
(µg/g)
ST1002 207 Indus BSJ Body sherd 22.8
ST1002E 207 Exterior surface of ST1002 Exterior 19.0
ST1018 207 Orange Fine Sandy Ware
pot
Rim 96.1
ST10018E 207 Exterior surface of ST1018 Exterior 14.0
207
ST1079 207 Indus BSJ Base 50.0
ST1SOIL079 207 Sediment surrounding
sherd ST1079
9.0
ST1SOIL074 207 Sediment from context 207 trace
ST1SOIL082 207 Sediment from context 207 4.0
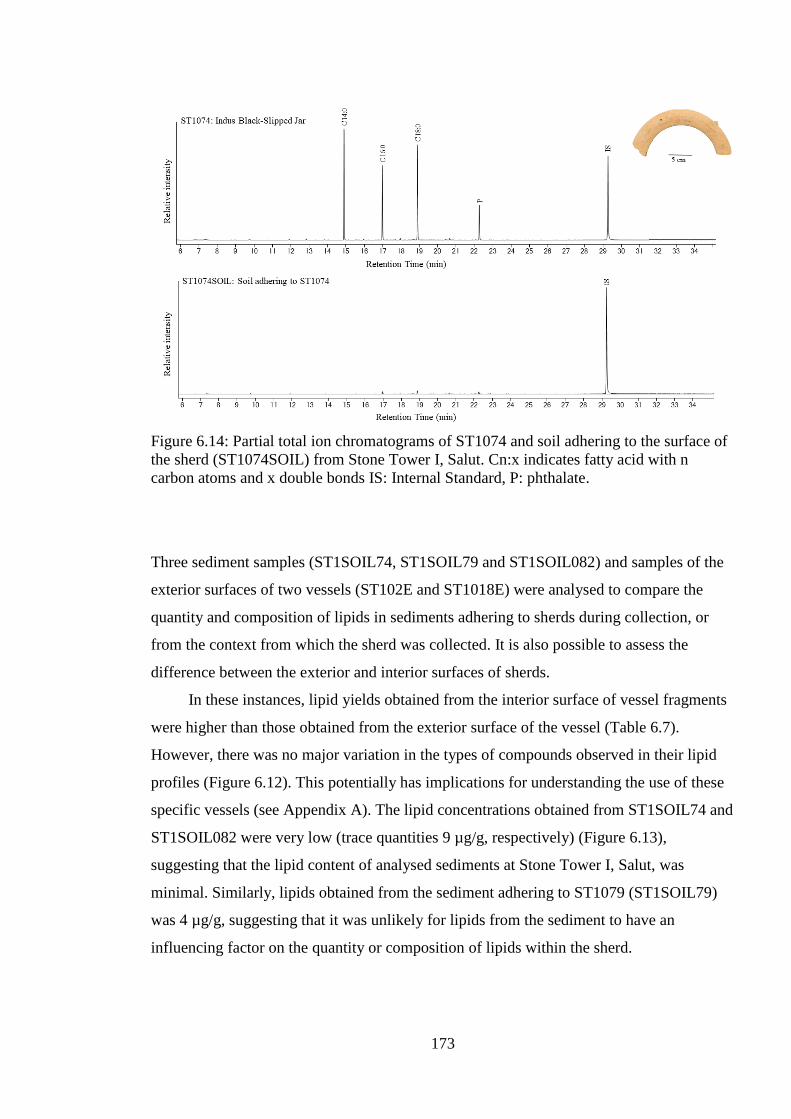
173
Figure 6.14: Partial total ion chromatograms of ST1074 and soil adhering to the surface of
the sherd (ST1074SOIL) from Stone Tower I, Salut. Cn:x indicates fatty acid with n
carbon atoms and x double bonds IS: Internal Standard, P: phthalate.
Three sediment samples (ST1SOIL74, ST1SOIL79 and ST1SOIL082) and samples of the
exterior surfaces of two vessels (ST102E and ST1018E) were analysed to compare the
quantity and composition of lipids in sediments adhering to sherds during collection, or
from the context from which the sherd was collected. It is also possible to assess the
difference between the exterior and interior surfaces of sherds.
In these instances, lipid yields obtained from the interior surface of vessel fragments
were higher than those obtained from the exterior surface of the vessel (Table 6.7).
However, there was no major variation in the types of compounds observed in their lipid
profiles (Figure 6.12). This potentially has implications for understanding the use of these
specific vessels (see Appendix A). The lipid concentrations obtained from ST1SOIL74 and
ST1SOIL082 were very low (trace quantities 9 µg/g, respectively) (Figure 6.13),
suggesting that the lipid content of analysed sediments at Stone Tower I, Salut, was
minimal. Similarly, lipids obtained from the sediment adhering to ST1079 (ST1SOIL79)
was 4 µg/g, suggesting that it was unlikely for lipids from the sediment to have an
influencing factor on the quantity or composition of lipids within the sherd.
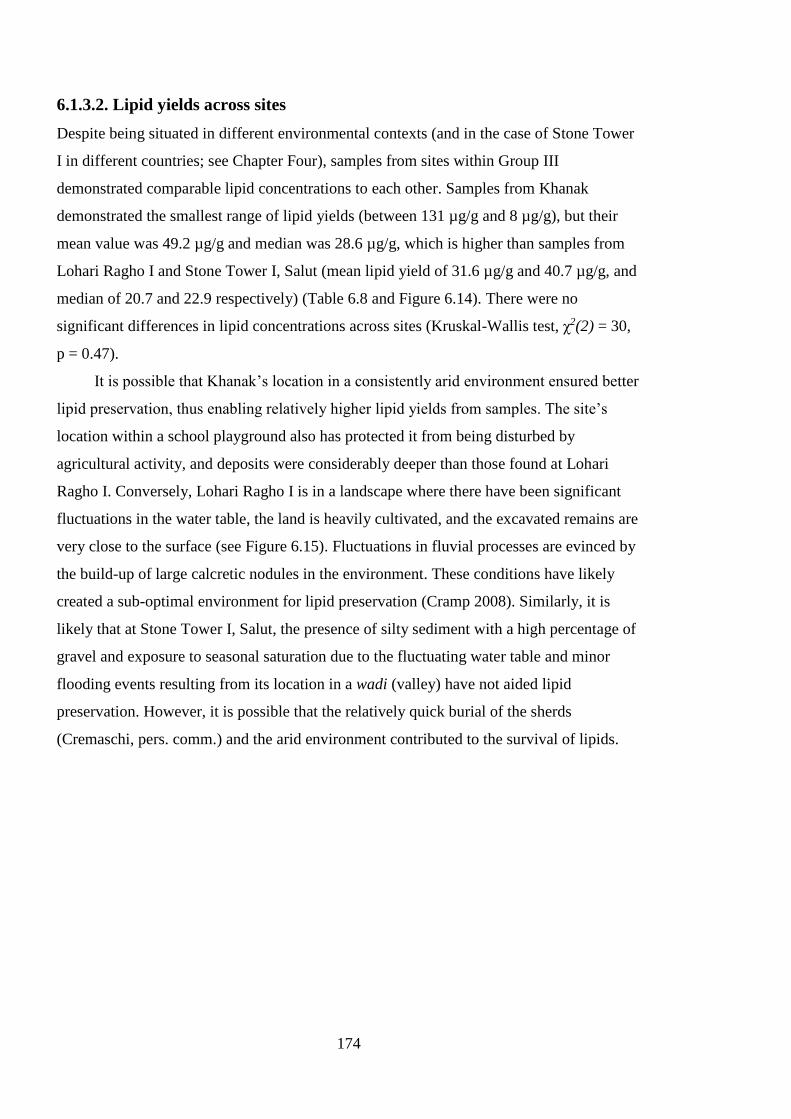
174
6.1.3.2. Lipid yields across sites
Despite being situated in different environmental contexts (and in the case of Stone Tower
I in different countries; see Chapter Four), samples from sites within Group III
demonstrated comparable lipid concentrations to each other. Samples from Khanak
demonstrated the smallest range of lipid yields (between 131 µg/g and 8 µg/g), but their
mean value was 49.2 µg/g and median was 28.6 µg/g, which is higher than samples from
Lohari Ragho I and Stone Tower I, Salut (mean lipid yield of 31.6 µg/g and 40.7 µg/g, and
median of 20.7 and 22.9 respectively) (Table 6.8 and Figure 6.14). There were no
significant differences in lipid concentrations across sites (Kruskal-Wallis test, χ2(2) = 30,
p = 0.47).
It is possible that Khanak’s location in a consistently arid environment ensured better
lipid preservation, thus enabling relatively higher lipid yields from samples. The site’s
location within a school playground also has protected it from being disturbed by
agricultural activity, and deposits were considerably deeper than those found at Lohari
Ragho I. Conversely, Lohari Ragho I is in a landscape where there have been significant
fluctuations in the water table, the land is heavily cultivated, and the excavated remains are
very close to the surface (see Figure 6.15). Fluctuations in fluvial processes are evinced by
the build-up of large calcretic nodules in the environment. These conditions have likely
created a sub-optimal environment for lipid preservation (Cramp 2008). Similarly, it is
likely that at Stone Tower I, Salut, the presence of silty sediment with a high percentage of
gravel and exposure to seasonal saturation due to the fluctuating water table and minor
flooding events resulting from its location in a wadi (valley) have not aided lipid
preservation. However, it is possible that the relatively quick burial of the sherds
(Cremaschi, pers. comm.) and the arid environment contributed to the survival of lipids.
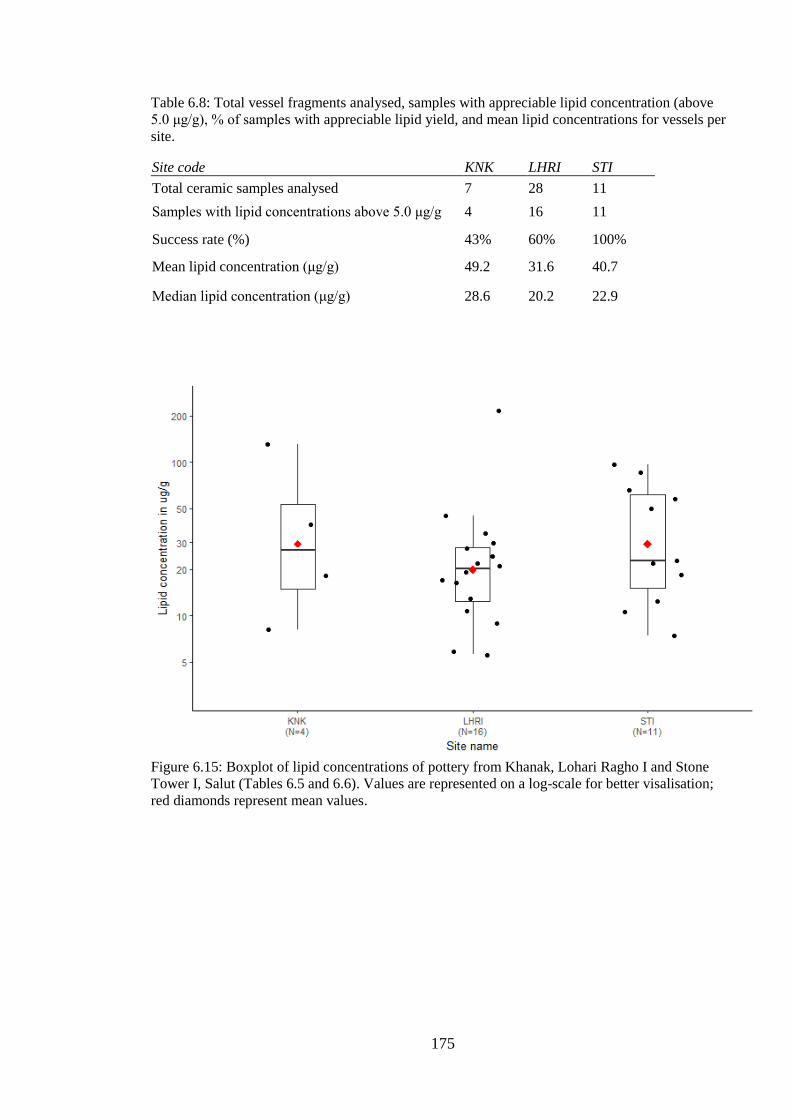
175
Table 6.8: Total vessel fragments analysed, samples with appreciable lipid concentration (above
5.0 μg/g), % of samples with appreciable lipid yield, and mean lipid concentrations for vessels per
site.
Site code KNK LHRI STI
Total ceramic samples analysed 7 28 11
Samples with lipid concentrations above 5.0 μg/g 4 16 11
Success rate (%) 43% 60% 100%
Mean lipid concentration (μg/g) 49.2 31.6 40.7
Median lipid concentration (μg/g) 28.6 20.2 22.9
Figure 6.15: Boxplot of lipid concentrations of pottery from Khanak, Lohari Ragho I and Stone
Tower I, Salut (Tables 6.5 and 6.6). Values are represented on a log-scale for better visalisation;
red diamonds represent mean values.
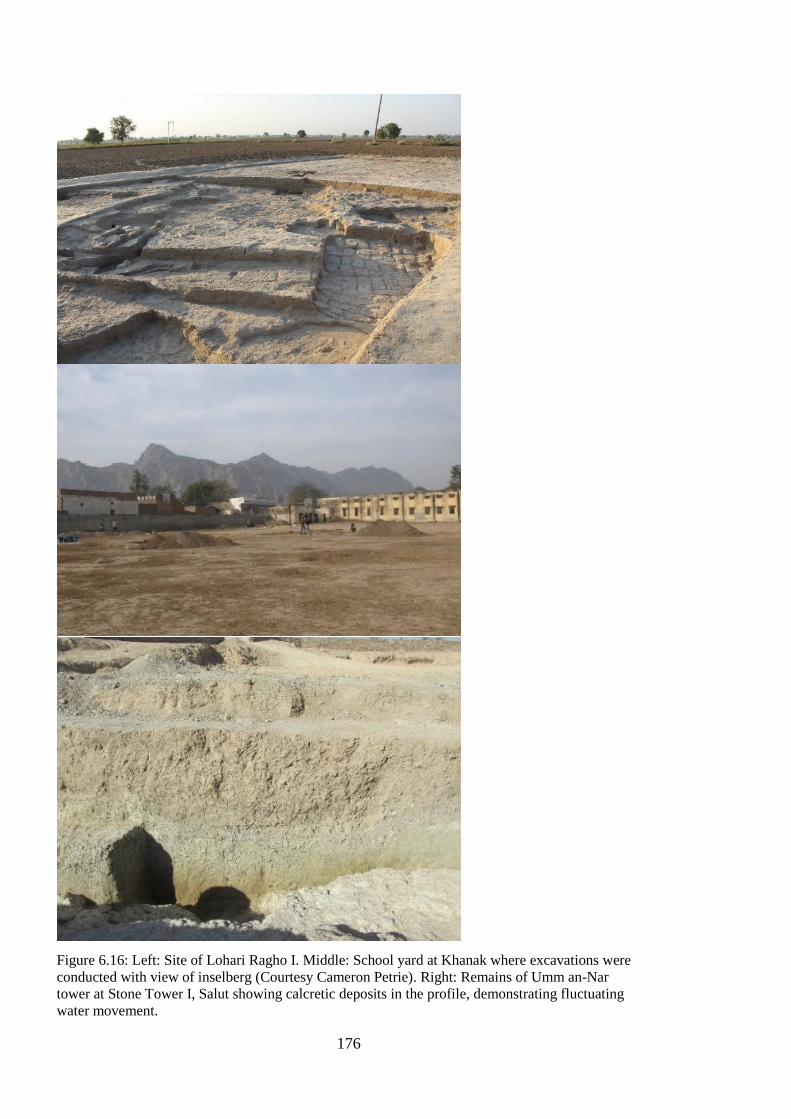
176
Figure 6.16: Left: Site of Lohari Ragho I. Middle: School yard at Khanak where excavations were
conducted with view of inselberg (Courtesy Cameron Petrie). Right: Remains of Umm an-Nar
tower at Stone Tower I, Salut showing calcretic deposits in the profile, demonstrating fluctuating
water movement.
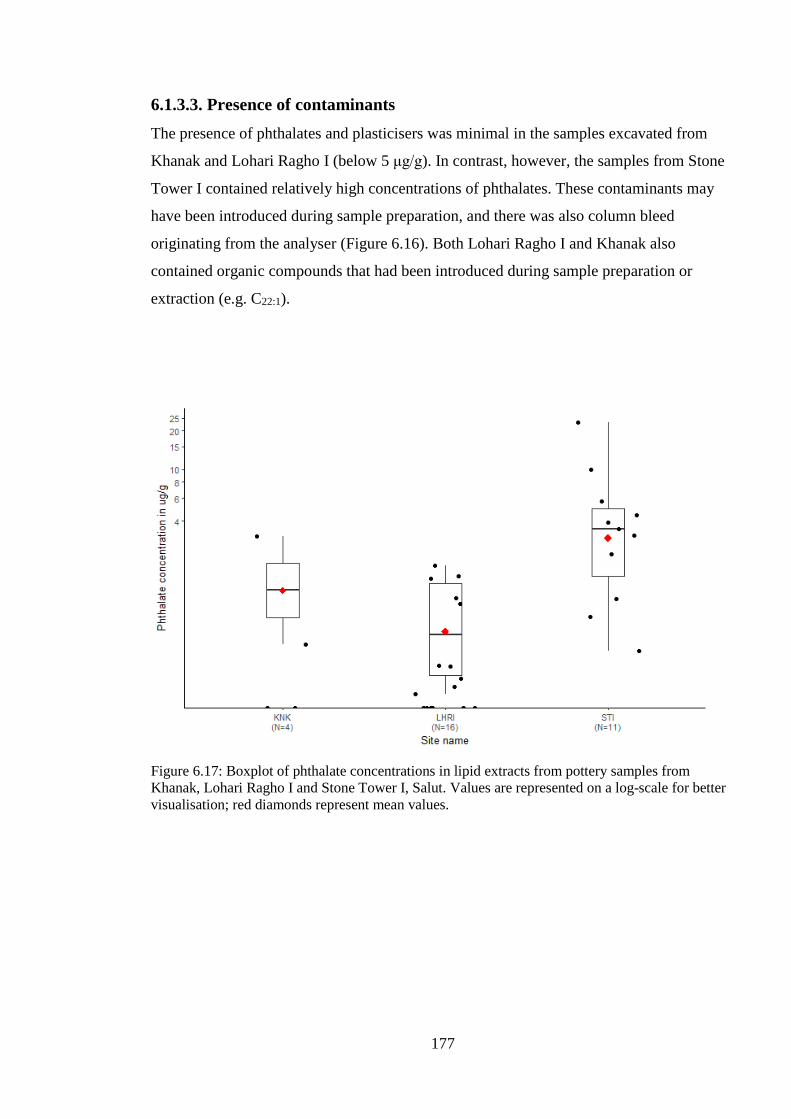
177
6.1.3.3. Presence of contaminants
The presence of phthalates and plasticisers was minimal in the samples excavated from
Khanak and Lohari Ragho I (below 5 μg/g). In contrast, however, the samples from Stone
Tower I contained relatively high concentrations of phthalates. These contaminants may
have been introduced during sample preparation, and there was also column bleed
originating from the analyser (Figure 6.16). Both Lohari Ragho I and Khanak also
contained organic compounds that had been introduced during sample preparation or
extraction (e.g. C22:1).
Figure 6.17: Boxplot of phthalate concentrations in lipid extracts from pottery samples from
Khanak, Lohari Ragho I and Stone Tower I, Salut. Values are represented on a log-scale for better
visualisation; red diamonds represent mean values.
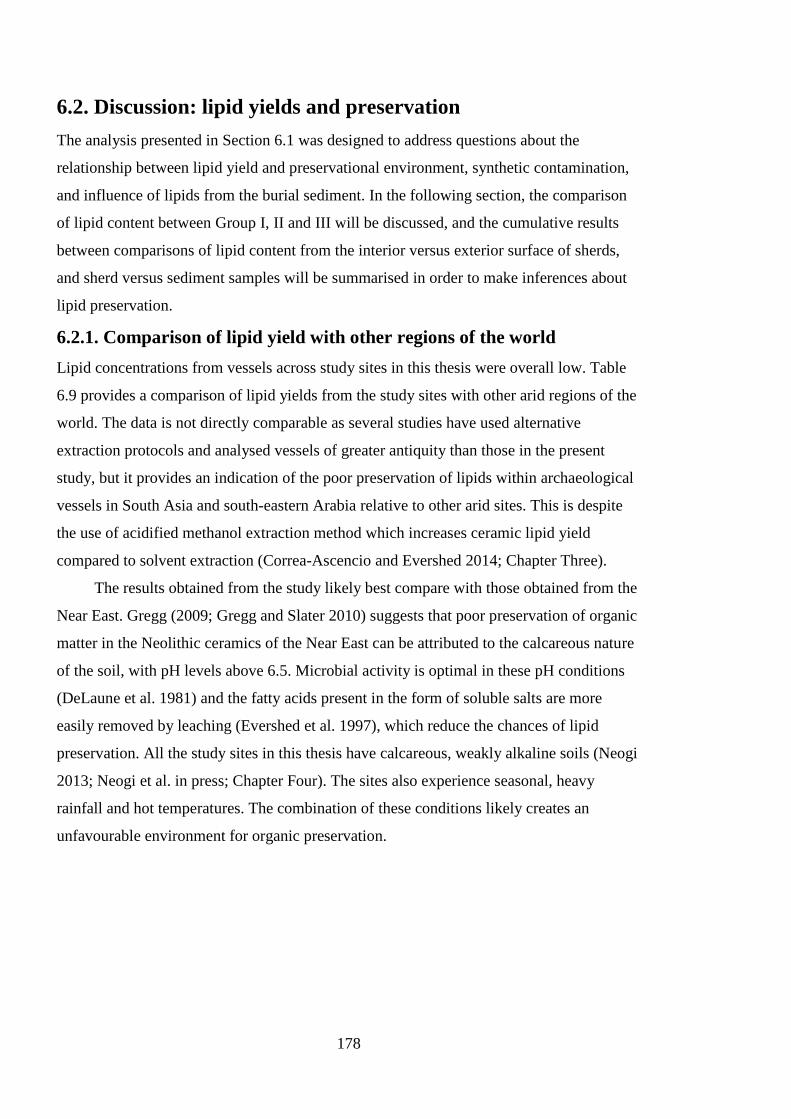
178
6.2. Discussion: lipid yields and preservation
The analysis presented in Section 6.1 was designed to address questions about the
relationship between lipid yield and preservational environment, synthetic contamination,
and influence of lipids from the burial sediment. In the following section, the comparison
of lipid content between Group I, II and III will be discussed, and the cumulative results
between comparisons of lipid content from the interior versus exterior surface of sherds,
and sherd versus sediment samples will be summarised in order to make inferences about
lipid preservation.
6.2.1. Comparison of lipid yield with other regions of the world
Lipid concentrations from vessels across study sites in this thesis were overall low. Table
6.9 provides a comparison of lipid yields from the study sites with other arid regions of the
world. The data is not directly comparable as several studies have used alternative
extraction protocols and analysed vessels of greater antiquity than those in the present
study, but it provides an indication of the poor preservation of lipids within archaeological
vessels in South Asia and south-eastern Arabia relative to other arid sites. This is despite
the use of acidified methanol extraction method which increases ceramic lipid yield
compared to solvent extraction (Correa-Ascencio and Evershed 2014; Chapter Three).
The results obtained from the study likely best compare with those obtained from the
Near East. Gregg (2009; Gregg and Slater 2010) suggests that poor preservation of organic
matter in the Neolithic ceramics of the Near East can be attributed to the calcareous nature
of the soil, with pH levels above 6.5. Microbial activity is optimal in these pH conditions
(DeLaune et al. 1981) and the fatty acids present in the form of soluble salts are more
easily removed by leaching (Evershed et al. 1997), which reduce the chances of lipid
preservation. All the study sites in this thesis have calcareous, weakly alkaline soils (Neogi
2013; Neogi et al. in press; Chapter Four). The sites also experience seasonal, heavy
rainfall and hot temperatures. The combination of these conditions likely creates an
unfavourable environment for organic preservation.
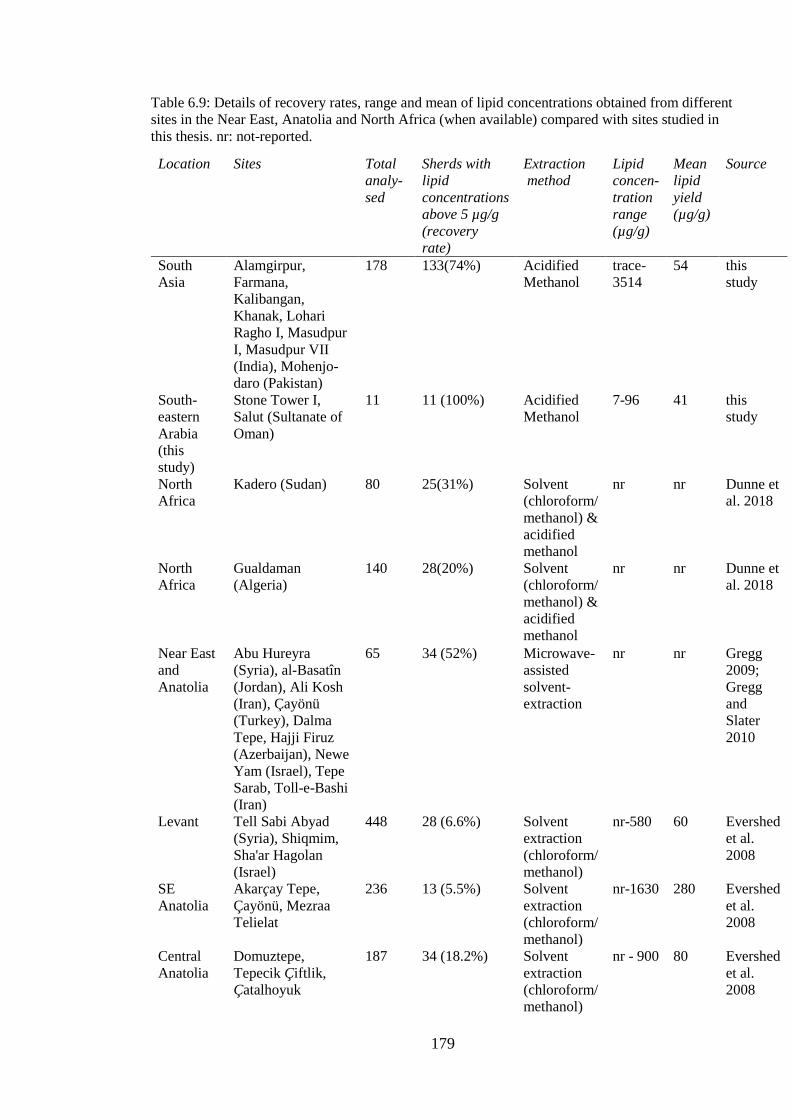
179
Table 6.9: Details of recovery rates, range and mean of lipid concentrations obtained from different
sites in the Near East, Anatolia and North Africa (when available) compared with sites studied in
this thesis. nr: not-reported.
Location Sites Total
analy-
sed
Sherds with
lipid
concentrations
above 5 µg/g
(recovery
rate)
Extraction
method
Lipid
concen-
tration
range
(µg/g)
Mean
lipid
yield
(µg/g)
Source
South
Asia
Alamgirpur,
Farmana,
Kalibangan,
Khanak, Lohari
Ragho I, Masudpur
I, Masudpur VII
(India), Mohenjo-
daro (Pakistan)
178 133(74%) Acidified
Methanol
trace-
3514
54 this
study
South-
eastern
Arabia
(this
study)
Stone Tower I,
Salut (Sultanate of
Oman)
11 11 (100%) Acidified
Methanol
7-96 41 this
study
North
Africa
Kadero (Sudan) 80 25(31%) Solvent
(chloroform/
methanol) &
acidified
methanol
nr nr Dunne et
al. 2018
North
Africa
Gualdaman
(Algeria)
140 28(20%) Solvent
(chloroform/
methanol) &
acidified
methanol
nr nr Dunne et
al. 2018
Near East
and
Anatolia
Abu Hureyra
(Syria), al-Basatîn
(Jordan), Ali Kosh
(Iran), Çayönü
(Turkey), Dalma
Tepe, Hajji Firuz
(Azerbaijan), Newe
Yam (Israel), Tepe
Sarab, Toll-e-Bashi
(Iran)
65 34 (52%) Microwave-
assisted
solvent-
extraction
nr nr Gregg
2009;
Gregg
and
Slater
2010
Levant Tell Sabi Abyad
(Syria), Shiqmim,
Sha'ar Hagolan
(Israel)
448 28 (6.6%) Solvent
extraction
(chloroform/
methanol)
nr-580 60 Evershed
et al.
2008
SE
Anatolia
Akarçay Tepe,
Çayönü, Mezraa
Telielat
236 13 (5.5%) Solvent
extraction
(chloroform/
methanol)
nr-1630 280 Evershed
et al.
2008
Central
Anatolia
Domuztepe,
Tepecik Çiftlik,
Çatalhoyuk
187 34 (18.2%) Solvent
extraction
(chloroform/
methanol)
nr - 900 80 Evershed
et al.
2008
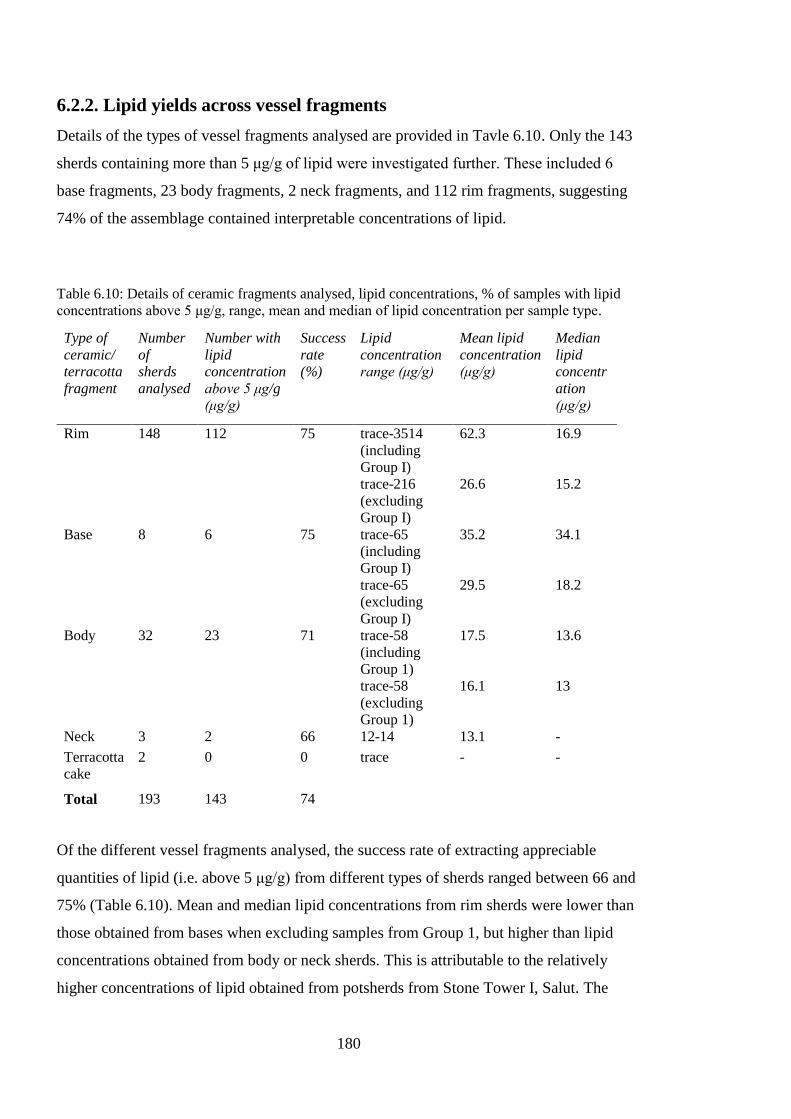
180
6.2.2. Lipid yields across vessel fragments
Details of the types of vessel fragments analysed are provided in Tavle 6.10. Only the 143
sherds containing more than 5 μg/g of lipid were investigated further. These included 6
base fragments, 23 body fragments, 2 neck fragments, and 112 rim fragments, suggesting
74% of the assemblage contained interpretable concentrations of lipid.
Table 6.10: Details of ceramic fragments analysed, lipid concentrations, % of samples with lipid
concentrations above 5 μg/g, range, mean and median of lipid concentration per sample type.
Type of
ceramic/
terracotta
fragment
Number
of
sherds
analysed
Number with
lipid
concentration
above 5 μg/g
(μg/g)
Success
rate
(%)
Lipid
concentration
range (μg/g)
Mean lipid
concentration
(μg/g)
Median
lipid
concentr
ation
(μg/g)
Rim 148 112 75 trace-3514
(including
Group I)
62.3 16.9
trace-216
(excluding
Group I)
26.6 15.2
Base 8 6 75 trace-65
(including
Group I)
35.2 34.1
trace-65
(excluding
Group I)
29.5 18.2
Body 32 23 71 trace-58
(including
Group 1)
17.5 13.6
trace-58
(excluding
Group 1)
16.1 13
Neck 3 2 66 12-14 13.1 -
Terracotta
cake
2 0 0 trace - -
Total 193 143 74
Of the different vessel fragments analysed, the success rate of extracting appreciable
quantities of lipid (i.e. above 5 μg/g) from different types of sherds ranged between 66 and
75% (Table 6.10). Mean and median lipid concentrations from rim sherds were lower than
those obtained from bases when excluding samples from Group 1, but higher than lipid
concentrations obtained from body or neck sherds. This is attributable to the relatively
higher concentrations of lipid obtained from potsherds from Stone Tower I, Salut. The
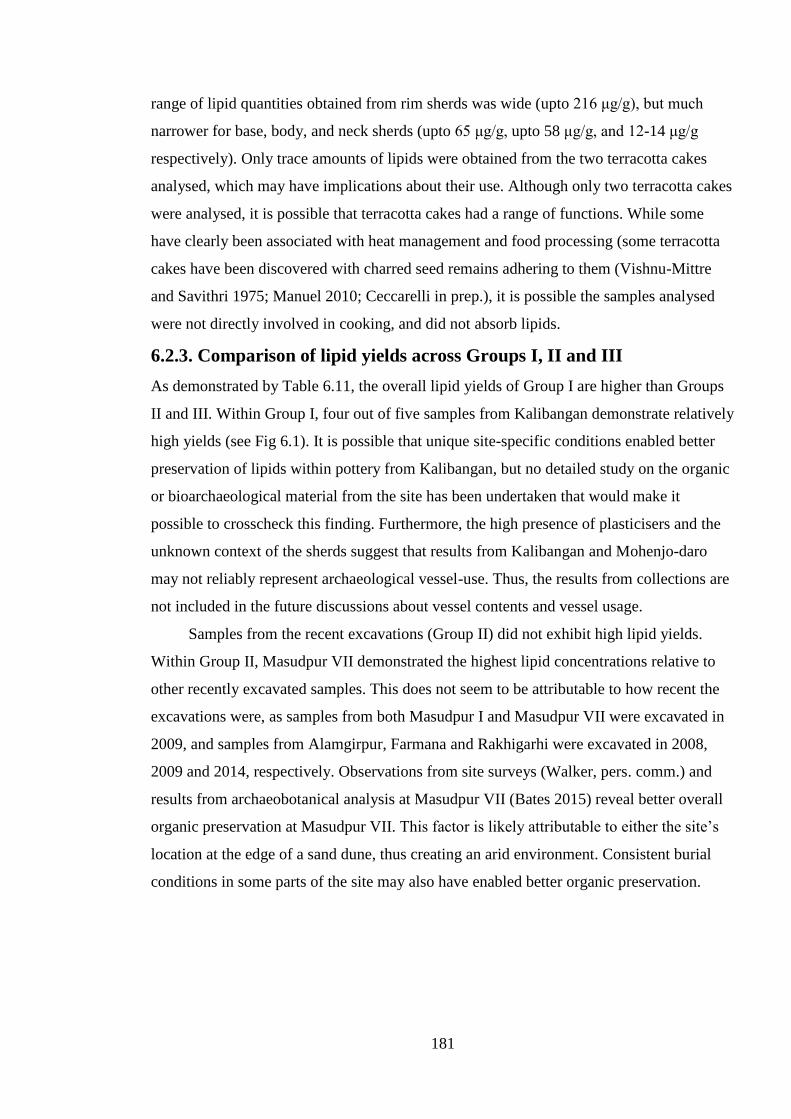
181
range of lipid quantities obtained from rim sherds was wide (upto 216 μg/g), but much
narrower for base, body, and neck sherds (upto 65 μg/g, upto 58 μg/g, and 12-14 μg/g
respectively). Only trace amounts of lipids were obtained from the two terracotta cakes
analysed, which may have implications about their use. Although only two terracotta cakes
were analysed, it is possible that terracotta cakes had a range of functions. While some
have clearly been associated with heat management and food processing (some terracotta
cakes have been discovered with charred seed remains adhering to them (Vishnu-Mittre
and Savithri 1975; Manuel 2010; Ceccarelli in prep.), it is possible the samples analysed
were not directly involved in cooking, and did not absorb lipids.
6.2.3. Comparison of lipid yields across Groups I, II and III
As demonstrated by Table 6.11, the overall lipid yields of Group I are higher than Groups
II and III. Within Group I, four out of five samples from Kalibangan demonstrate relatively
high yields (see Fig 6.1). It is possible that unique site-specific conditions enabled better
preservation of lipids within pottery from Kalibangan, but no detailed study on the organic
or bioarchaeological material from the site has been undertaken that would make it
possible to crosscheck this finding. Furthermore, the high presence of plasticisers and the
unknown context of the sherds suggest that results from Kalibangan and Mohenjo-daro
may not reliably represent archaeological vessel-use. Thus, the results from collections are
not included in the future discussions about vessel contents and vessel usage.
Samples from the recent excavations (Group II) did not exhibit high lipid yields.
Within Group II, Masudpur VII demonstrated the highest lipid concentrations relative to
other recently excavated samples. This does not seem to be attributable to how recent the
excavations were, as samples from both Masudpur I and Masudpur VII were excavated in
2009, and samples from Alamgirpur, Farmana and Rakhigarhi were excavated in 2008,
2009 and 2014, respectively. Observations from site surveys (Walker, pers. comm.) and
results from archaeobotanical analysis at Masudpur VII (Bates 2015) reveal better overall
organic preservation at Masudpur VII. This factor is likely attributable to either the site’s
location at the edge of a sand dune, thus creating an arid environment. Consistent burial
conditions in some parts of the site may also have enabled better organic preservation.
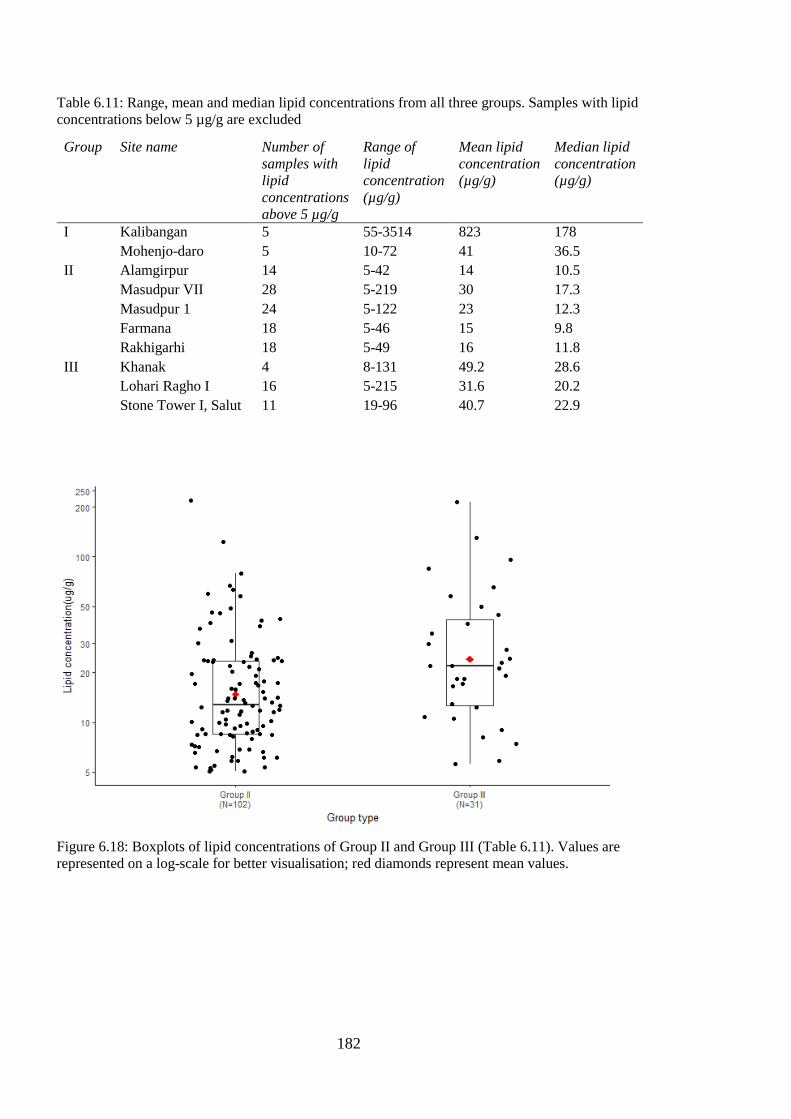
182
Table 6.11: Range, mean and median lipid concentrations from all three groups. Samples with lipid
concentrations below 5 µg/g are excluded
Group Site name Number of
samples with
lipid
concentrations
above 5 µg/g
Range of
lipid
concentration
(µg/g)
Mean lipid
concentration
(µg/g)
Median lipid
concentration
(µg/g)
I Kalibangan 5 55-3514 823 178
Mohenjo-daro 5 10-72 41 36.5
II Alamgirpur 14 5-42 14 10.5
Masudpur VII 28 5-219 30 17.3
Masudpur 1 24 5-122 23 12.3
Farmana 18 5-46 15 9.8
Rakhigarhi 18 5-49 16 11.8
III Khanak 4 8-131 49.2 28.6
Lohari Ragho I 16 5-215 31.6 20.2
Stone Tower I, Salut 11 19-96 40.7 22.9
Figure 6.18: Boxplots of lipid concentrations of Group II and Group III (Table 6.11). Values are
represented on a log-scale for better visualisation; red diamonds represent mean values.
183
The differences between the Group II and III samples suggests there may be exceptional
micro-conditions conducive to the survival of organic remains within environments that
are generally low in organic preservation. The possibility of the presence of micro-
environments supporting better organic preservation is vital to consider when designing
future excavations in regions with poor organic preservation. Small ‘proof-of-concept’
studies testing preservation should be planned before budgeting a dedicated programme of
organic residue analyses. Additionally, as the samples were chosen from well-documented
and specific archaeological contexts of interest (e.g. occupational surfaces and hearth
contexts) and could be complemented with other site-specific faunal, archaeobotanical,
starch-grain, or isotopic data, they are more reliable and provide the necessary
palaeoecological context to deduce the likely source(s) of the lipid residues detected within
vessels. This deductive aspect is essential to interpreting the remains found within lipid
extracts of vessels, as only the presence of a constituent of a residue that is consistent with
the archaeology and palaeoecology of the settlement, region, and/or period from which the
vessels are obtained are considered (Evershed 2008a).
Samples from freshly excavated pottery (Group III) demonstrated higher lipid yields
than those from recent excavations (Group II), though the difference was not statistically
significant (Kruskal-Wallis test, χ2(7) = 132, p = 0.48). This finding is interesting as Group
III includes samples from Stone Tower I, Salut, in the Sultanate of Oman, which
experiences a more arid climate than Lohari Ragho I and Khanak. However, Salut is prone
to flooding events as it is in a flat valley and lies within a region with alkaline soils. This
suggests that overall, environmental conditions in the alluvial plains of northwest India and
wadis (valleys) in Oman may not be conducive to the survival of organic remains,
particularly lipids in pottery (see Section 3.2.2). Nonetheless, the Group III samples
represented the ‘best-case’ scenario for collection of pottery samples for organic residue
analysis as all the steps from excavation to extraction and analysis were controlled. This
opportunity reduced the likelihood of incorporation of extraneous compounds unrelated to
the archaeological use of the vessel into the fabric and increased the degree of confidence
with which one could attribute organic remains within the vessel to its use-history.
Additionally, ceramic samples were not washed or scrubbed, which can lead to the
removal of lipids. Thus, despite the low levels of preservations, these samples are the most
reliable as their removal was controlled and the interpretations could be contextualised
within site-specific bioarchaeological studies when available.
184
6.2.4. Presence of contaminants across groups
Phthalates and synthetic contaminants were present across Groups I, II and III. Samples
from Group I exhibited the highest quantities of phthalates (Figure 6.19), with a single
sample (MD03) containing the highest quantities from all analysed samples (Figure 6.4).
These samples were excluded from discussions in later chapters. Samples from Group II
also contained phthalates, but they occurred in relatively lower proportions than those
observed in samples from Group I. Within Group II, samples from Masudpur VII and
Farmana included examples with relatively high concentrations of phthalates, but none
exceeded 10 µg/g (Figure 6.7). Plasticisers were also present in samples from Group III,
with concentrations comparable to those from Group II (Figure 6.18).The presence of
phthalates in freshly excavated material is unexpected as the samples were wrapped in
aluminium foil after excavation and they did not come in direct contact with plastic bags at
any stage. This finding suggests that phthalates and other compounds can easily be
introduced during the sample preparation and lipid extraction process. Figure 6.20 suggests
that there is no relationship between lipid and phthalate concentrations between Groups II
and III. This result is positive, however, it is not always possible to distinguish between
what may be introduced from the laboratory and/or post-excavation/storage environment,
making interpretations challenging and increasing the need for caution.
6.2.5. Lipids in sediment versus interior surfaces of sherds
Seven sediment samples (1g each) from three sites were analysed via GC-MS. Lipid
profiles of sediment samples varied from those obtained from the interior surfaces of
potsherds. The samples either had negligible quantities of lipid (e.g. ST1074SOIL) (Table
6.12) or very long-chain fatty acids (up to C30:0), odd- and branched-chain fatty acids
and/or long-chained n-alkanes, which were not present, or present in relatively lower
quantities in the ceramic samples. This finding correlates with the distinctive nature of
lipid moieties within soils noted by others, generally attributed to their origins in higher
plants or microbial organisms (Heron et al. 1991; Eckmeier and Wiesenberg 2009). For
example, the presence of long-chain fatty acids and odd-, long-chained n-alkanes is
indicative of higher plants, whereas odd-chain fatty acids and short-chain odd n-alkanes
are derived from microbial organisms (Heron et al. 1991; Eckmeier and Wiesenberg 2009).
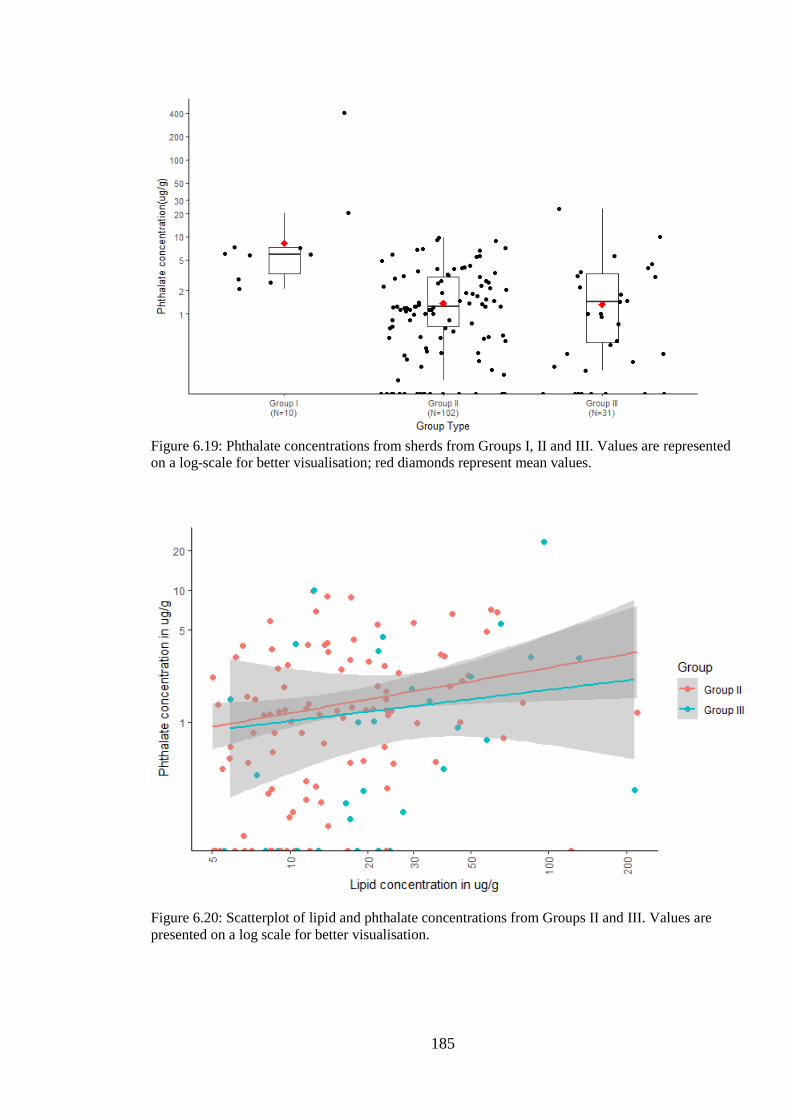
185
Figure 6.19: Phthalate concentrations from sherds from Groups I, II and III. Values are represented
on a log-scale for better visualisation; red diamonds represent mean values.
Figure 6.20: Scatterplot of lipid and phthalate concentrations from Groups II and III. Values are
presented on a log scale for better visualisation.
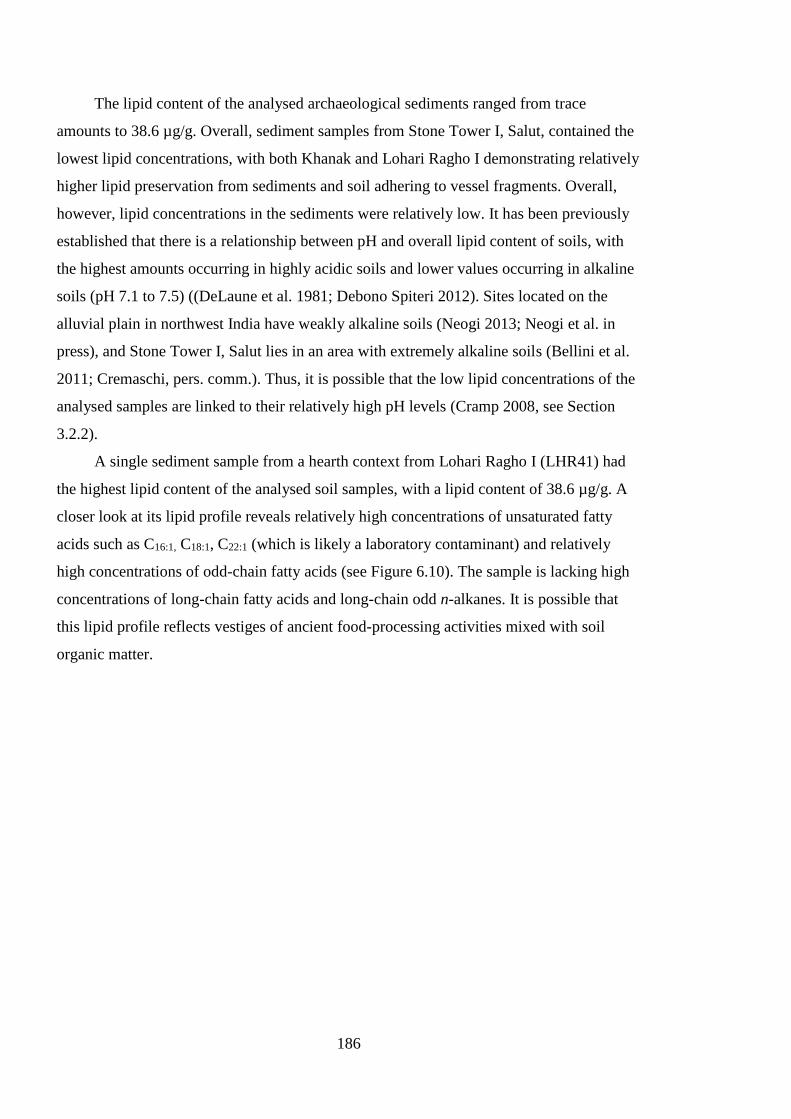
186
The lipid content of the analysed archaeological sediments ranged from trace
amounts to 38.6 µg/g. Overall, sediment samples from Stone Tower I, Salut, contained the
lowest lipid concentrations, with both Khanak and Lohari Ragho I demonstrating relatively
higher lipid preservation from sediments and soil adhering to vessel fragments. Overall,
however, lipid concentrations in the sediments were relatively low. It has been previously
established that there is a relationship between pH and overall lipid content of soils, with
the highest amounts occurring in highly acidic soils and lower values occurring in alkaline
soils (pH 7.1 to 7.5) ((DeLaune et al. 1981; Debono Spiteri 2012). Sites located on the
alluvial plain in northwest India have weakly alkaline soils (Neogi 2013; Neogi et al. in
press), and Stone Tower I, Salut lies in an area with extremely alkaline soils (Bellini et al.
2011; Cremaschi, pers. comm.). Thus, it is possible that the low lipid concentrations of the
analysed samples are linked to their relatively high pH levels (Cramp 2008, see Section
3.2.2).
A single sediment sample from a hearth context from Lohari Ragho I (LHR41) had
the highest lipid content of the analysed soil samples, with a lipid content of 38.6 µg/g. A
closer look at its lipid profile reveals relatively high concentrations of unsaturated fatty
acids such as C16:1, C18:1, C22:1 (which is likely a laboratory contaminant) and relatively
high concentrations of odd-chain fatty acids (see Figure 6.10). The sample is lacking high
concentrations of long-chain fatty acids and long-chain odd n-alkanes. It is possible that
this lipid profile reflects vestiges of ancient food-processing activities mixed with soil
organic matter.
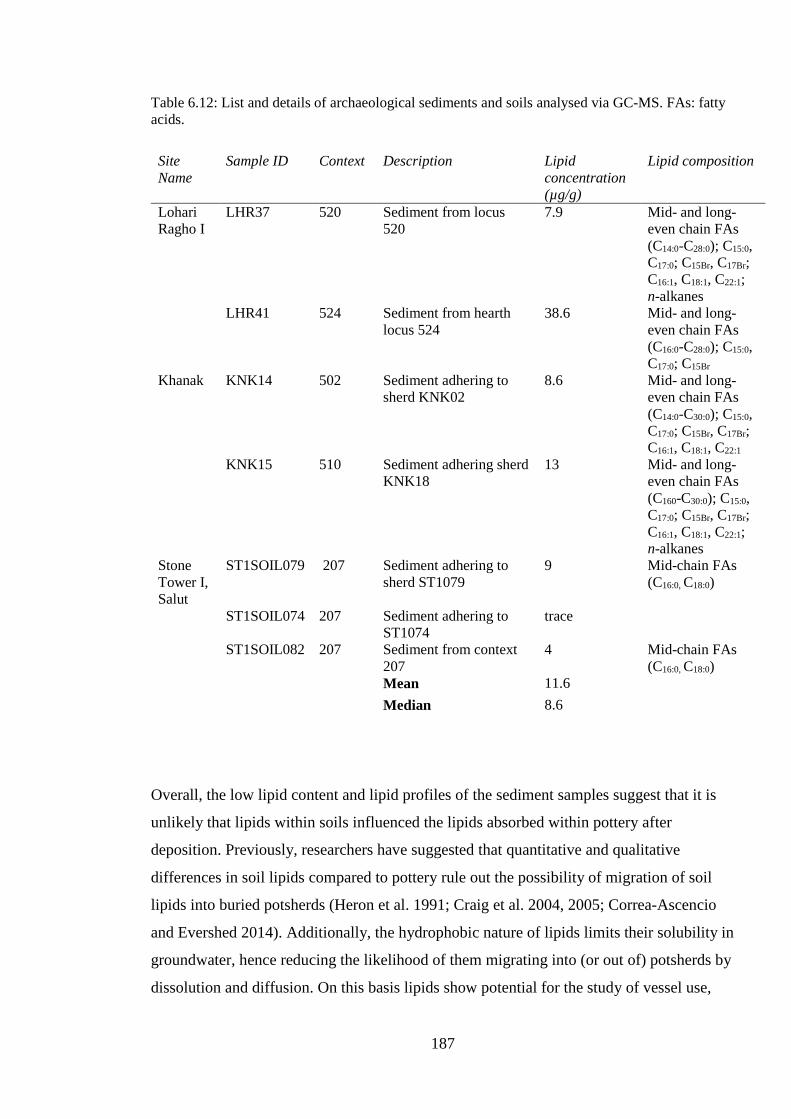
187
Table 6.12: List and details of archaeological sediments and soils analysed via GC-MS. FAs: fatty
acids.
Overall, the low lipid content and lipid profiles of the sediment samples suggest that it is
unlikely that lipids within soils influenced the lipids absorbed within pottery after
deposition. Previously, researchers have suggested that quantitative and qualitative
differences in soil lipids compared to pottery rule out the possibility of migration of soil
lipids into buried potsherds (Heron et al. 1991; Craig et al. 2004, 2005; Correa-Ascencio
and Evershed 2014). Additionally, the hydrophobic nature of lipids limits their solubility in
groundwater, hence reducing the likelihood of them migrating into (or out of) potsherds by
dissolution and diffusion. On this basis lipids show potential for the study of vessel use,
Site
Name
Sample ID Context Description Lipid
concentration
(µg/g)
Lipid composition
Lohari
Ragho I
LHR37 520 Sediment from locus
520
7.9 Mid- and long-
even chain FAs
(C14:0-C28:0); C15:0,
C17:0; C15Br, C17Br;
C16:1, C18:1, C22:1;
n-alkanes
LHR41 524 Sediment from hearth
locus 524
38.6 Mid- and long-
even chain FAs
(C16:0-C28:0); C15:0,
C17:0; C15Br
Khanak KNK14 502 Sediment adhering to
sherd KNK02
8.6 Mid- and long-
even chain FAs
(C14:0-C30:0); C15:0,
C17:0; C15Br, C17Br;
C16:1, C18:1, C22:1
KNK15 510 Sediment adhering sherd
KNK18
13 Mid- and long-
even chain FAs
(C160-C30:0); C15:0,
C17:0; C15Br, C17Br;
C16:1, C18:1, C22:1;
n-alkanes
Stone
Tower I,
Salut
ST1SOIL079 207 Sediment adhering to
sherd ST1079
9 Mid-chain FAs
(C16:0, C18:0)
ST1SOIL074 207 Sediment adhering to
ST1074
trace
ST1SOIL082 207 Sediment from context
207
4 Mid-chain FAs
(C16:0, C18:0)
Mean 11.6
Median 8.6
188
diet and other cultural activities. Despite the affirmative nature of the results, it is
important to be cautious and account for potential sources of contamination, and samples
must be assessed on a case-by-case basis. The interaction between soil organic matter, soil
microorganisms and soil structure and properties is extraordinarily complex, and many
aspects of the diagenesis of organic residues in archaeological contexts are not fully
understood (Haslam 2004). Differences in decomposition factors and rates between
artefact surfaces and in sediments have also not yet been thoroughly investigated (Haslam
2004). Thus, it is important to test for the possible effects of migration and microbial
activity by comparing the organic matter content of the buried sherd and its burial context.
Additionally, different pottery may have different rates of porosity and unique burial
conditions that may influence the leaching of lipids. Further experimental studies with
various types of pottery buried in different sediments with controlled degradation would
help assess and model the scenarios under which the migration of soil lipids into pottery
may occur, but these were not attempted for the research presented in this thesis.
6.2.6. Effect of time since excavation on lipid yield
One of the objectives of the first stage of the study was to assess the effect of time between
excavation and analysis on the survival of lipid residues in pottery. Samples from Group I,
II and III originated from sites that were broadly similar in terms of their environmental
characteristics. The differences lie in the fact that Group I sherds were stored in plastic
bags after collection (for over twenty years), Group II sherds were washed, processed and
stored in plastic bags from between three to nine years prior to organic residue extraction
and analysis, and Group III sherds were unwashed, did not come into direct contact with
plastic, and analysed soon after removal (between one month to one year) from their
original depositional context.
The analytical results suggest that lipid yield of potsherds is not visibly affected by
the time interval between excavation and analysis; instead, lipid preservation in pottery
appears to be most influenced by its original depositional environment. This has also been
suggested by other studies that report that most degradation of lipid takes place shortly
after abandonment or burial of the vessel (Aillaud 2002; Stacey 2009). Although lipid
concentrations from Kalibangan are higher than those obtained from samples from Group
II and Group III, which may be attributed to site-specific characteristics or post-excavation
organic input, samples from Mohenjo-daro have lipid yields comparable to samples from
both other groups. This suggests that time since excavation does not have a measurable
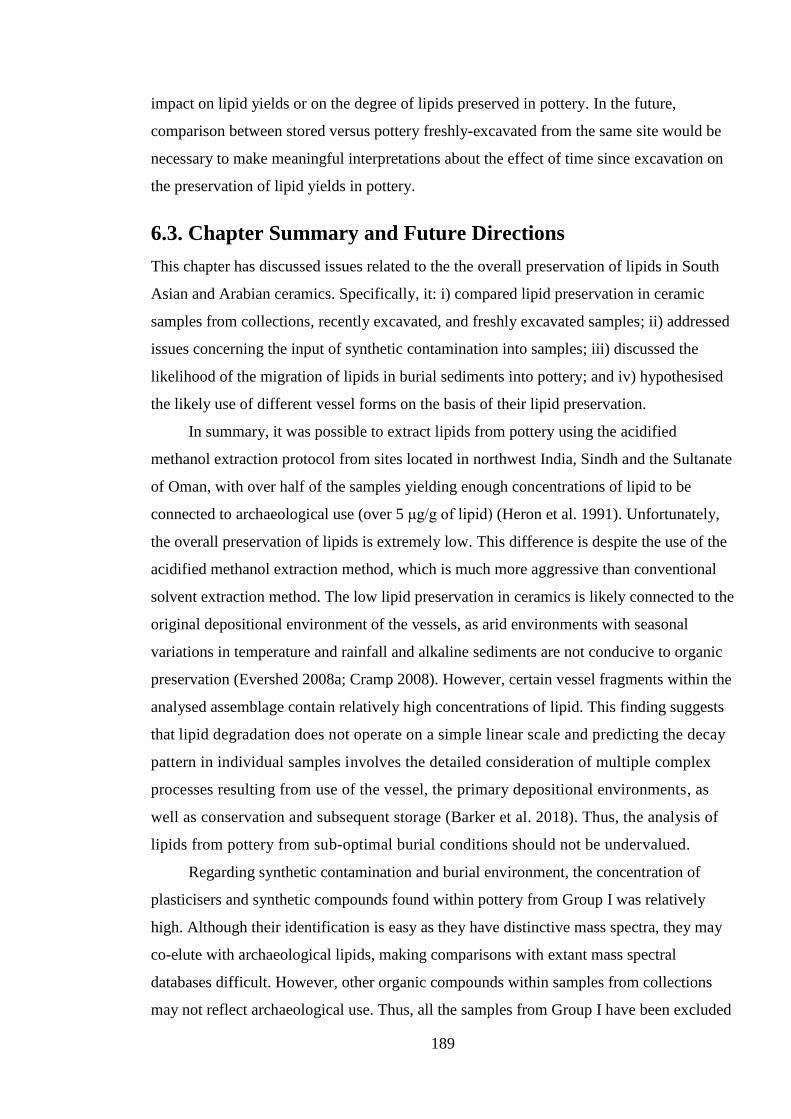
189
impact on lipid yields or on the degree of lipids preserved in pottery. In the future,
comparison between stored versus pottery freshly-excavated from the same site would be
necessary to make meaningful interpretations about the effect of time since excavation on
the preservation of lipid yields in pottery.
6.3. Chapter Summary and Future Directions
This chapter has discussed issues related to the the overall preservation of lipids in South
Asian and Arabian ceramics. Specifically, it: i) compared lipid preservation in ceramic
samples from collections, recently excavated, and freshly excavated samples; ii) addressed
issues concerning the input of synthetic contamination into samples; iii) discussed the
likelihood of the migration of lipids in burial sediments into pottery; and iv) hypothesised
the likely use of different vessel forms on the basis of their lipid preservation.
In summary, it was possible to extract lipids from pottery using the acidified
methanol extraction protocol from sites located in northwest India, Sindh and the Sultanate
of Oman, with over half of the samples yielding enough concentrations of lipid to be
connected to archaeological use (over 5 μg/g of lipid) (Heron et al. 1991). Unfortunately,
the overall preservation of lipids is extremely low. This difference is despite the use of the
acidified methanol extraction method, which is much more aggressive than conventional
solvent extraction method. The low lipid preservation in ceramics is likely connected to the
original depositional environment of the vessels, as arid environments with seasonal
variations in temperature and rainfall and alkaline sediments are not conducive to organic
preservation (Evershed 2008a; Cramp 2008). However, certain vessel fragments within the
analysed assemblage contain relatively high concentrations of lipid. This finding suggests
that lipid degradation does not operate on a simple linear scale and predicting the decay
pattern in individual samples involves the detailed consideration of multiple complex
processes resulting from use of the vessel, the primary depositional environments, as
well as conservation and subsequent storage (Barker et al. 2018). Thus, the analysis of
lipids from pottery from sub-optimal burial conditions should not be undervalued.
Regarding synthetic contamination and burial environment, the concentration of
plasticisers and synthetic compounds found within pottery from Group I was relatively
high. Although their identification is easy as they have distinctive mass spectra, they may
co-elute with archaeological lipids, making comparisons with extant mass spectral
databases difficult. However, other organic compounds within samples from collections
may not reflect archaeological use. Thus, all the samples from Group I have been excluded
190
from further analysis in this thesis. Samples from Group III demonstrated that
contaminants might be also incorporated into freshly excavated samples and may be
introduced at any point during the extraction or analysis period. This discovery suggests it
is advisable to know as much about the post-excavation burial environment of selected
sherds so as to be more confident about the likely origins of the lipid species obtained from
ceramic samples.
Comparisons with lipids from soil (adhering to pottery and collected from the
original depositional contexts) with those found in the interior surfaces of pottery suggest
the likelihood of migration of soil lipids into ceramics is low. However, certain soils may
contain anthropological input and results may vary depending on individual scenarios.
Thus, a systematic analysis of sediments and pottery from exterior and interior surfaces,
and more experimental research is recommended for future studies.
The results of this chapter suggest that researchers should not devalue the possibility
of gaining valuable results from lipid residue analysis studies in regions with sub-optimal
preservational conditions. As Barker and others (2018) suggest, more effort should be
given towards analysing ceramics from poor preservational contexts as negative results
provide a framework against which more positive results can be better understood; and
spur further methodological developments (Barker et al. 2018). The development of the
acidified methanol extraction protocol is one such example. It is essential, however, that
the examination of lipid residues in non-ideal conditions for organic preservation must be
meaningfully supplemented with archaeobotanical and zooarchaeological analyses so as to
develop trustworthy claims regarding past vessel use and subsistence patterns. This can
only occur if a comprehensive bioarchaeological programme has been implemented at the
site(s) of interest and may not always be possible. Thus, going forward it is important to
acknowledge the challenges associated with lipid preservation in ceramics and the
strengths and limitations of existing methodologies.
Now that the nature of preservation of lipids in the samples has been assessed, Chapter
Seven will discuss the site-specific lipid and compound-specific isotopic results and
address key archaeological questions posed by this thesis.

191
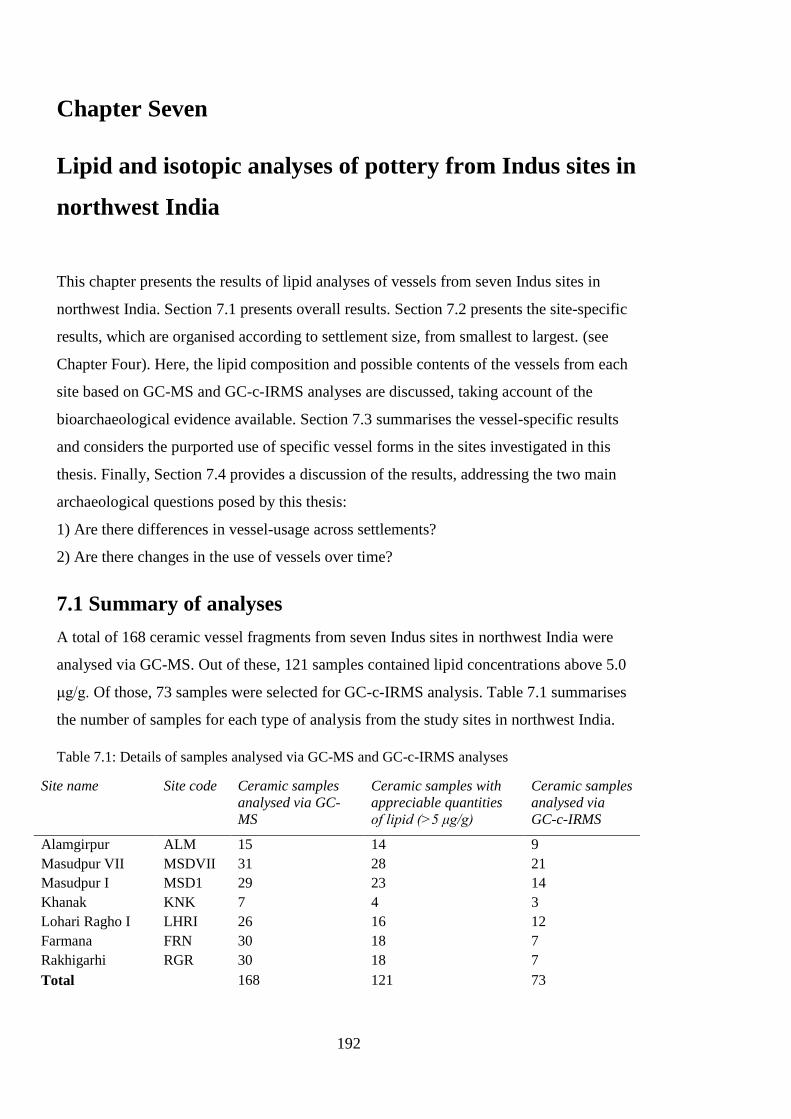
192
Chapter Seven
Lipid and isotopic analyses of pottery from Indus sites in
northwest India
This chapter presents the results of lipid analyses of vessels from seven Indus sites in
northwest India. Section 7.1 presents overall results. Section 7.2 presents the site-specific
results, which are organised according to settlement size, from smallest to largest. (see
Chapter Four). Here, the lipid composition and possible contents of the vessels from each
site based on GC-MS and GC-c-IRMS analyses are discussed, taking account of the
bioarchaeological evidence available. Section 7.3 summarises the vessel-specific results
and considers the purported use of specific vessel forms in the sites investigated in this
thesis. Finally, Section 7.4 provides a discussion of the results, addressing the two main
archaeological questions posed by this thesis:
1) Are there differences in vessel-usage across settlements?
2) Are there changes in the use of vessels over time?
7.1 Summary of analyses
A total of 168 ceramic vessel fragments from seven Indus sites in northwest India were
analysed via GC-MS. Out of these, 121 samples contained lipid concentrations above 5.0
μg/g. Of those, 73 samples were selected for GC-c-IRMS analysis. Table 7.1 summarises
the number of samples for each type of analysis from the study sites in northwest India.
Table 7.1: Details of samples analysed via GC-MS and GC-c-IRMS analyses
Site name Site code Ceramic samples
analysed via GC-
MS
Ceramic samples with
appreciable quantities
of lipid (>5 μg/g)
Ceramic samples
analysed via
GC-c-IRMS
Alamgirpur ALM 15 14 9
Masudpur VII MSDVII 31 28 21
Masudpur I MSD1 29 23 14
Khanak KNK 7 4 3
Lohari Ragho I LHRI 26 16 12
Farmana FRN 30 18 7
Rakhigarhi RGR 30 18 7
Total 168 121 73
193
The lipid profiles of vessel fragments from all sites were almost entirely composed of fatty
acids of varying chain lengths, but dominated by medium-, odd- and branched-chain fatty
acids, which suggest the presence of degraded animal fats such as dairy or carcass fats.
There is minimal evidence for direct plant-processing, however, some vessels have
evidence for dicarboxylic acids, long-chain fatty acids and n-alkanes, which could suggest
plant input. There is no direct evidence for the processing of aquatic products. Compound-
specific isotopic analyses were used to further characterise the differences between the
sources of animal fats processed in the vessels. The evidence demonstrated that a range of
animal products and mixtures of animal (or plant) products were being processed in
different vessels across different sites. Descriptions of sherd samples from each site, lipid
concentrations, brief description of lipid composition, and isotopic values of the two main
fatty acids (C16:0 and C18:0) where available, are provided in Appendix B.
The next section presents the site-by-site results of the GC-MS and GC-c-IRMS
analyses and provides short discussions on vessel usage and food processing.
7. 2. Site-based results
7.2.1. Very small settlements (small villages)
This section presents and discusses the GC-MS and GC-c-IRMS results from samples from
Alamgirpur and Masudpur VII. Given the very small estimated size of these settlements (1-
3 ha), it is likely the vessels are indicative of household food production, possibly
reflecting food choices of a small number of families. However, as Alamgirpur and
Masudpur VII are located in unique environmental contexts; respectively, by the edge of a
summer-fed seasonal river, receiving little winter rainfall, and in an area receiving both
summer and winter rain, it was expected that lipid residues within vessels would reflect
varying food-processing strategies that reflect these differing environments.
7.2.1.1. Alamgirpur (ALM)
Rims of fourteen vessels were analysed from Alamgirpur. The vessel form and periods
from which they originate have been introduced in Chapter Five, Section 5.1.2.1. Some of
these contexts likely dated to a period after the 4.2 ka BP ‘event’ as indicated by Bayesian
modelling (Jones 2017), whereas most contexts were deposited during 4.2 ka BP. The
chronological span of these phases of occupation suggests the vessels investigated
represent at least 300 years of vessel use-history at the site and may reflect changes in food
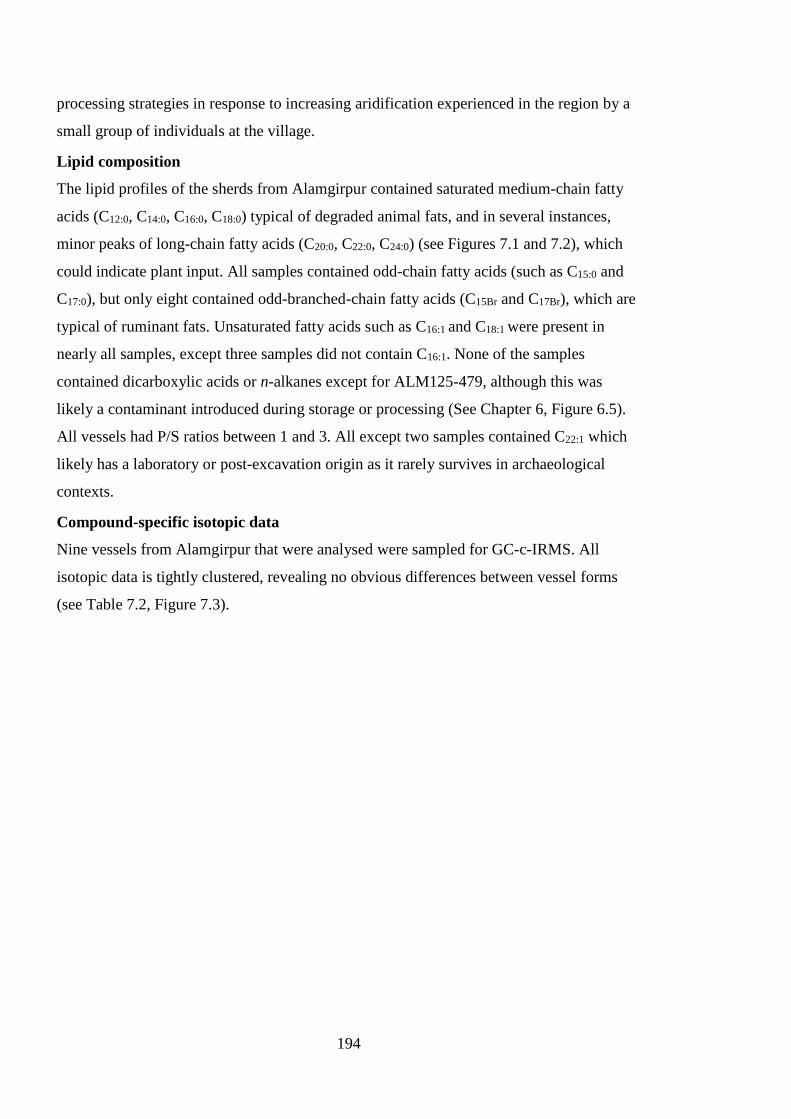
194
processing strategies in response to increasing aridification experienced in the region by a
small group of individuals at the village.
Lipid composition
The lipid profiles of the sherds from Alamgirpur contained saturated medium-chain fatty
acids (C12:0, C14:0, C16:0, C18:0) typical of degraded animal fats, and in several instances,
minor peaks of long-chain fatty acids (C20:0, C22:0, C24:0) (see Figures 7.1 and 7.2), which
could indicate plant input. All samples contained odd-chain fatty acids (such as C15:0 and
C17:0), but only eight contained odd-branched-chain fatty acids (C15Br and C17Br), which are
typical of ruminant fats. Unsaturated fatty acids such as C16:1 and C18:1 were present in
nearly all samples, except three samples did not contain C16:1. None of the samples
contained dicarboxylic acids or n-alkanes except for ALM125-479, although this was
likely a contaminant introduced during storage or processing (See Chapter 6, Figure 6.5).
All vessels had P/S ratios between 1 and 3. All except two samples contained C22:1 which
likely has a laboratory or post-excavation origin as it rarely survives in archaeological
contexts.
Compound-specific isotopic data
Nine vessels from Alamgirpur that were analysed were sampled for GC-c-IRMS. All
isotopic data is tightly clustered, revealing no obvious differences between vessel forms
(see Table 7.2, Figure 7.3).
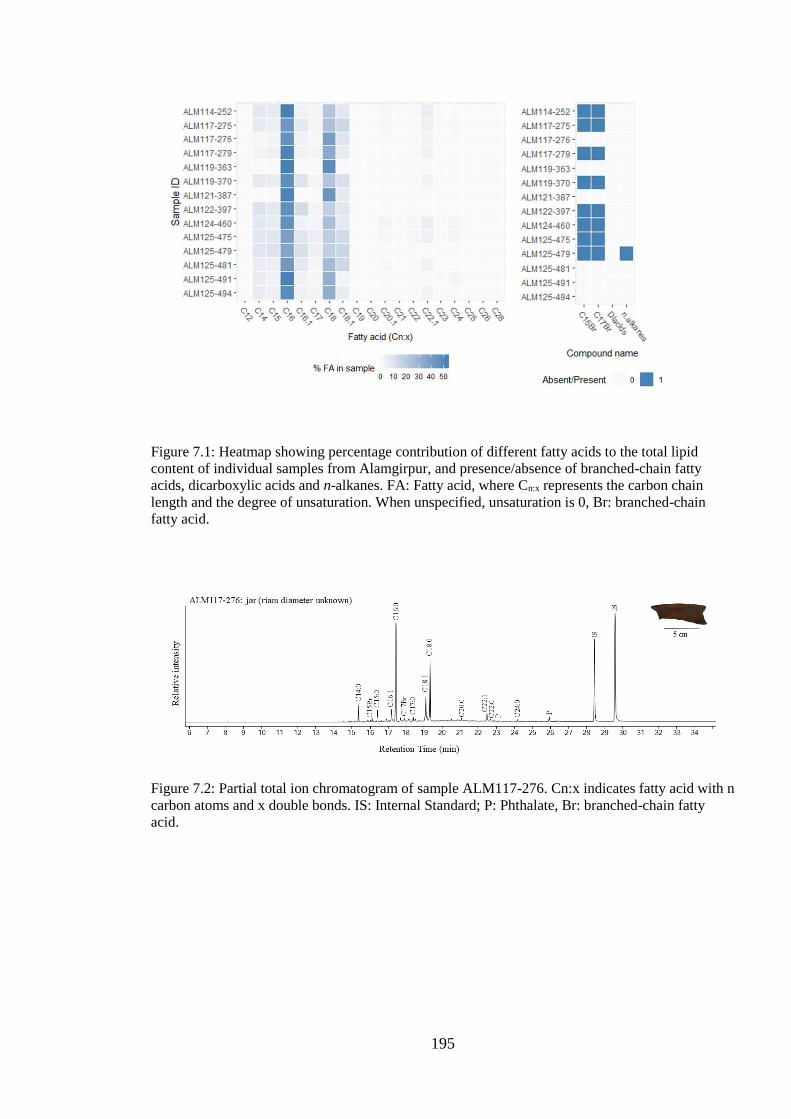
195
Figure 7.1: Heatmap showing percentage contribution of different fatty acids to the total lipid
content of individual samples from Alamgirpur, and presence/absence of branched-chain fatty
acids, dicarboxylic acids and n-alkanes. FA: Fatty acid, where Cn:x represents the carbon chain
length and the degree of unsaturation. When unspecified, unsaturation is 0, Br: branched-chain
fatty acid.
Figure 7.2: Partial total ion chromatogram of sample ALM117-276. Cn:x indicates fatty acid with n
carbon atoms and x double bonds. IS: Internal Standard; P: Phthalate, Br: branched-chain fatty
acid.
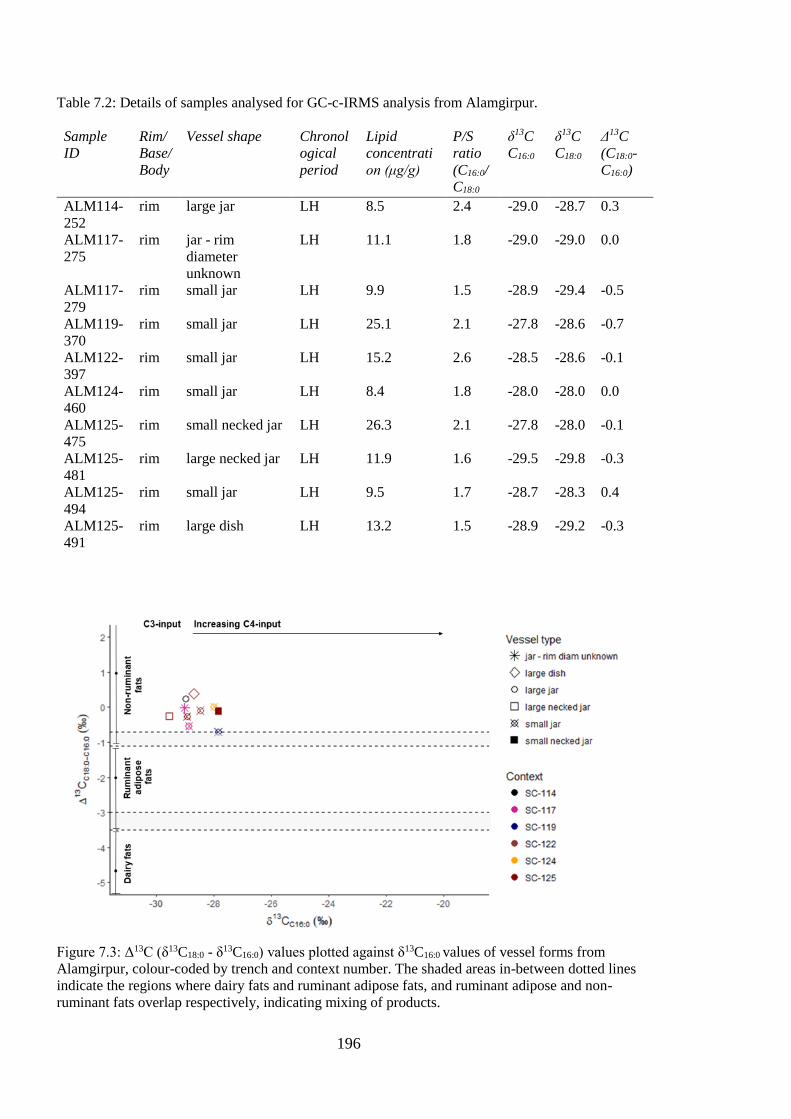
196
Table 7.2: Details of samples analysed for GC-c-IRMS analysis from Alamgirpur.
Sample
ID
Rim/
Base/
Body
Vessel shape Chronol
ogical
period
Lipid
concentrati
on (μg/g)
P/S
ratio
(C16:0/
C18:0
δ13C
C16:0
δ13C
C18:0
Δ13C
(C18:0-
C16:0)
ALM114-
252
rim large jar LH 8.5 2.4 -29.0 -28.7 0.3
ALM117-
275
rim jar - rim
diameter
unknown
LH 11.1 1.8 -29.0 -29.0 0.0
ALM117-
279
rim small jar LH 9.9 1.5 -28.9 -29.4 -0.5
ALM119-
370
rim small jar LH 25.1 2.1 -27.8 -28.6 -0.7
ALM122-
397
rim small jar LH 15.2 2.6 -28.5 -28.6 -0.1
ALM124-
460
rim small jar LH 8.4 1.8 -28.0 -28.0 0.0
ALM125-
475
rim small necked jar LH 26.3 2.1 -27.8 -28.0 -0.1
ALM125-
481
rim large necked jar LH 11.9 1.6 -29.5 -29.8 -0.3
ALM125-
494
rim small jar LH 9.5 1.7 -28.7 -28.3 0.4
ALM125-
491
rim large dish LH 13.2 1.5 -28.9 -29.2 -0.3
Figure 7.3: Δ13C (δ13C18:0 - δ13C16:0) values plotted against δ13C16:0 values of vessel forms from
Alamgirpur, colour-coded by trench and context number. The shaded areas in-between dotted lines
indicate the regions where dairy fats and ruminant adipose fats, and ruminant adipose and non-
ruminant fats overlap respectively, indicating mixing of products.
197
Discussion
The molecular results from Alamgirpur suggest a remarkable degree of consistency in the
products being processed in vessels. The lipid profiles of all the vessels are characteristic
of degraded animal fats. For example, the presence of branched-chain fatty acids (C15Br and
C17Br) in most extracts may be indicative of the presence of ruminant fats (Dudd 1999).
When only considering the molecular results and contextualising these results within
the available bioarchaeological evidence from the site, one could hypothesise that either
cattle/buffalo or sheep/goat adipose fats or milk were processed in vessels, as
zooarchaeological data from Alamgirpur reveal high percentages of cattle/buffalo remains
with a minor presence of goats in the faunal assemblage (no clear evidence for sheep), and
very minor presence of domestic/wild pig (Singh et al. 2013). Additionally, tooth enamel
carbonate ẟ13C values from domestic and wild animals suggest that cattle/buffalo and
sheep/goat were consuming a high proportion of C4 plants throughout the year (Jones
2017; Lightfoot et al. in prep.). Archaeobotanical evidence from the Late Harappan period
at Alamgirpur indicates a dominance of C3 rabi (winter) cereals, especially barley and
pulses, with minor evidence for kharif (summer) cereals such as small millets and tropical
pulses (Singh et al. 2013; Bates in prep.). However, direct evidence of plant-processing is
not visible in the lipid extracts.
But the fatty acid-specific isotopic results within lipid extracts from Alamgirpur
vessels do not suggest the sole processing of ruminant adipose or dairy fats. Instead,
comparisons with global reference fats suggest that these vessels were used to process non-
ruminant fats or, for a single vessel (ALM117-279, a painted jar with unknown rim
diameter), mixtures of ruminant and non-ruminant fats (Figure 7.3). Given that there is no
molecular evidence for direct processing of plant products within the vessels analysed, the
δ13C values from C16:0 fatty acids are likely indicative of plant input via animal diet, which
is primarily C3 with some evidence of mixing with C4 plants. As both cattle/buffalo and
sheep/goat at the site had high proportions of C4 plants in their diet (Lightfoot et al. in
prep.), this data suggests the meat of animals dominantly consuming C3 plants were more
often processed in vessels at Alamgirpur.
Importantly, there appears to be no evidence for dairy processing or use within the
vessels. This absence of evidence does not unequivocally mean that dairy was not a
component of the diet at Alamgirpur, as it is possible that vessels used for storing or
processing dairy products were not sampled. It is also possible that dairy products were
198
mixed with other products during processing, or that the proportion of dairy products being
consumed by populations was minimal.
It is also not possible to rule out the likelihood of other mixtures of products in
vessels. Recent mixing models (Hendy et al. 2018, see Section 3.6.3.2) suggest vessels
with mixtures of C3 plants and dairy products from ruminants grazing on C3 and C4 plants
yield Δ13C values that plot within the ranges of ruminant adipose fats. Thus, vessels from
Alamgirpur may also represent the use of vessels for cooking C3 plants (wheat, barley,
winter legumes, vegetables) and ruminant adipose products. Chapter Eight (Section 8.2.4)
will demonstrate these values are also consistent with mixtures of C3 plants and dairy
products from C4 fed animals. Thus, at present the data is ambiguous and multiple
interpretations are possible.
Both the molecular and isotopic data from the Alamgirpur vessels are remarkably
consistent. There appear to be no differences in how specific vessels forms were being
used; jars of different sizes and dishes seem to have been used to process, store, and/or
serve similar foodstuff. However, lipid concentrations may be indicative of the frequency
of vessel usage. Small- and medium-sized jars have relatively higher lipid concentrations
compared to other vessels, but the difference is not statistically significant. Higher lipid
concentrations in some vessels might suggest the more frequent usage of these vessels.
There are also no observable differences in vessel-use over time or across different
contexts, which suggests that there is no visible shift in vessel usage from during 4.2 ka BP
to the period after 4.2 ka BP. It is possible that the populations of Alamgirpur were already
well-adapted to seasonal fluctuations in rainfall and the relatively humid environment in
the region enabled the maintenance of cropping or pastoral strategies at the settlement over
long time periods. Although the number of samples investigated is small, the consistency
of results reflects a uniformity in vessel usage over hundreds of years.
7.2.1.2. Masudpur VII (MSDVII)
Twenty-eight vessel fragments were selected for analysis from Masudpur VII. Details of
the samples and chronological periods are provided in Section 5.1.2.2. The selected vessel
fragments represent diversity in form and two unique chronological periods in Masudpur
VII’s occupation history. Several vessel fragments were selected from the same
depositional context, enabling comparison of vessel usage within a relatively short time
interval, and what likely represents the subsistence practices of a small number of
individuals at the settlement.
199
Lipid composition
Lipids preserved in the sherds from Masudpur VII contained medium-chain fatty acids
(C14:0, C16:0, C18:0; 11 samples also contained C12:0), and 22 out of 28 samples contained
long-chain fatty acids like C20:0, C 22:0, C:24:0, C26:0. All samples contained C15:0, and most
contained C17:0 fatty acids. MSD3586 also contained long-chain odd-chain fatty acids
(Figure 7.5). Thirteen samples contained small peaks of series of long-chain n-alkanes
from C26-C33 (odd-over-even carbon number predominating), and 21 of 28 (75%) of the
samples contained dicarboxylic acids (diacids) ranging from C6 to C12 carbon-chain-length,
with C9 (azelaic acid) the most abundant homologue. All vessels had P/S ratios between 1
and 3.
Compound-specific isotopic data
The 23 vessels sampled for compound-specific isotopic analyses included vessels from
both the Early Mature Harappan (EMH) and Late Harappan (LH) periods, out of which
three vessels from the EMH period were analysed. Most of the Δ13C values plot between
1‰ and -1‰, except for two vessels (Table 7.3)
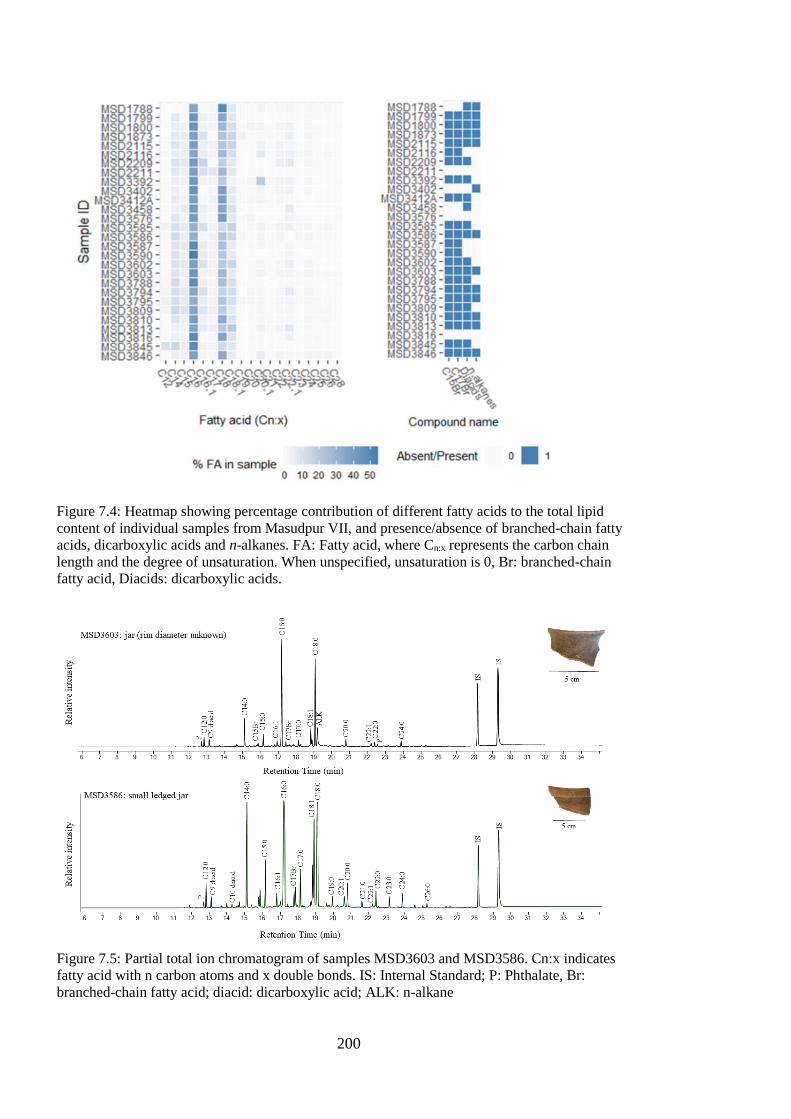
200
Figure 7.4: Heatmap showing percentage contribution of different fatty acids to the total lipid
content of individual samples from Masudpur VII, and presence/absence of branched-chain fatty
acids, dicarboxylic acids and n-alkanes. FA: Fatty acid, where Cn:x represents the carbon chain
length and the degree of unsaturation. When unspecified, unsaturation is 0, Br: branched-chain
fatty acid, Diacids: dicarboxylic acids.
Figure 7.5: Partial total ion chromatogram of samples MSD3603 and MSD3586. Cn:x indicates
fatty acid with n carbon atoms and x double bonds. IS: Internal Standard; P: Phthalate, Br:
branched-chain fatty acid; diacid: dicarboxylic acid; ALK: n-alkane
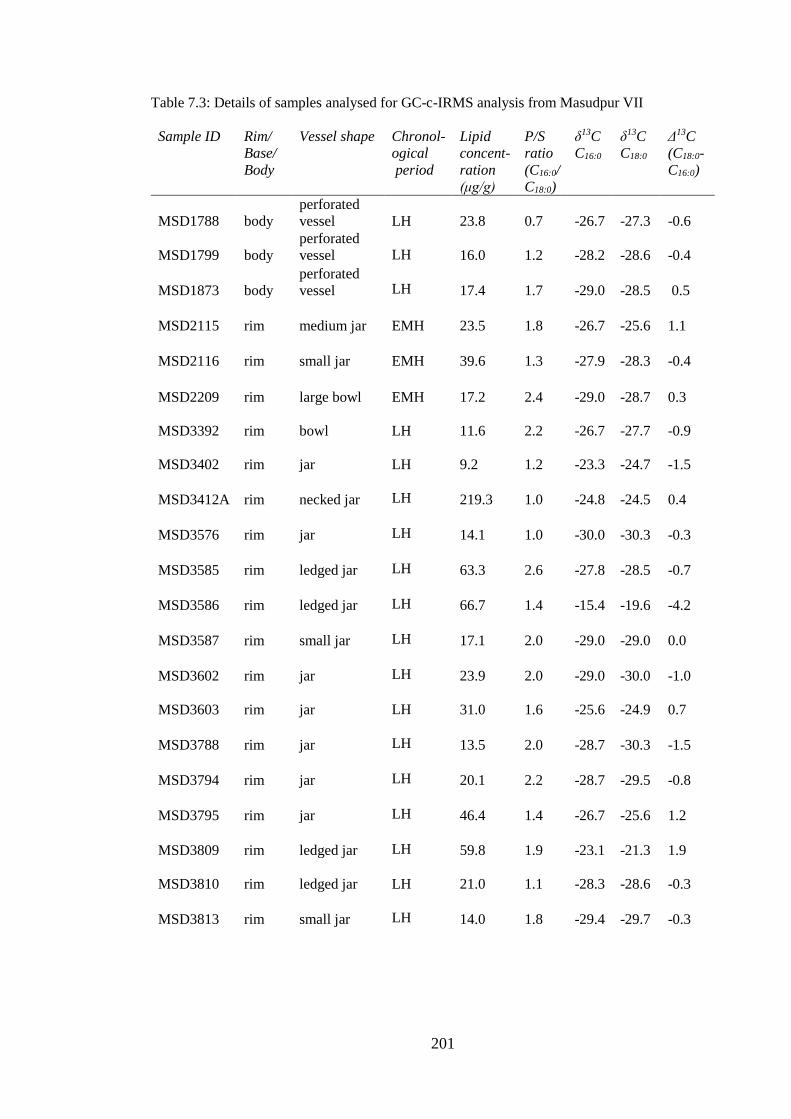
201
Table 7.3: Details of samples analysed for GC-c-IRMS analysis from Masudpur VII
Sample ID Rim/
Base/
Body
Vessel shape Chronol-
ogical
period
Lipid
concent-
ration
(μg/g)
P/S
ratio
(C16:0/
C18:0)
δ13C
C16:0
δ13C
C18:0
Δ13C
(C18:0-
C16:0)
MSD1788 body
perforated
vessel LH 23.8 0.7 -26.7 -27.3 -0.6
MSD1799 body
perforated
vessel
LH 16.0 1.2 -28.2 -28.6 -0.4
MSD1873 body
perforated
vessel
LH 17.4 1.7 -29.0 -28.5 0.5
MSD2115 rim medium jar EMH 23.5 1.8 -26.7 -25.6 1.1
MSD2116 rim small jar EMH 39.6 1.3 -27.9 -28.3 -0.4
MSD2209 rim large bowl EMH 17.2 2.4 -29.0 -28.7 0.3
MSD3392 rim bowl
LH 11.6 2.2 -26.7 -27.7 -0.9
MSD3402 rim jar
LH 9.2 1.2 -23.3 -24.7 -1.5
MSD3412A rim necked jar
LH 219.3 1.0 -24.8 -24.5 0.4
MSD3576 rim jar
LH 14.1 1.0 -30.0 -30.3 -0.3
MSD3585 rim ledged jar
LH 63.3 2.6 -27.8 -28.5 -0.7
MSD3586 rim ledged jar
LH 66.7 1.4 -15.4 -19.6 -4.2
MSD3587 rim small jar
LH 17.1 2.0 -29.0 -29.0 0.0
MSD3602 rim jar
LH 23.9 2.0 -29.0 -30.0 -1.0
MSD3603 rim jar
LH 31.0 1.6 -25.6 -24.9 0.7
MSD3788 rim jar
LH 13.5 2.0 -28.7 -30.3 -1.5
MSD3794 rim jar
LH 20.1 2.2 -28.7 -29.5 -0.8
MSD3795 rim jar
LH 46.4 1.4 -26.7 -25.6 1.2
MSD3809 rim ledged jar
LH 59.8 1.9 -23.1 -21.3 1.9
MSD3810 rim ledged jar
LH 21.0 1.1 -28.3 -28.6 -0.3
MSD3813 rim small jar
LH 14.0 1.8 -29.4 -29.7 -0.3
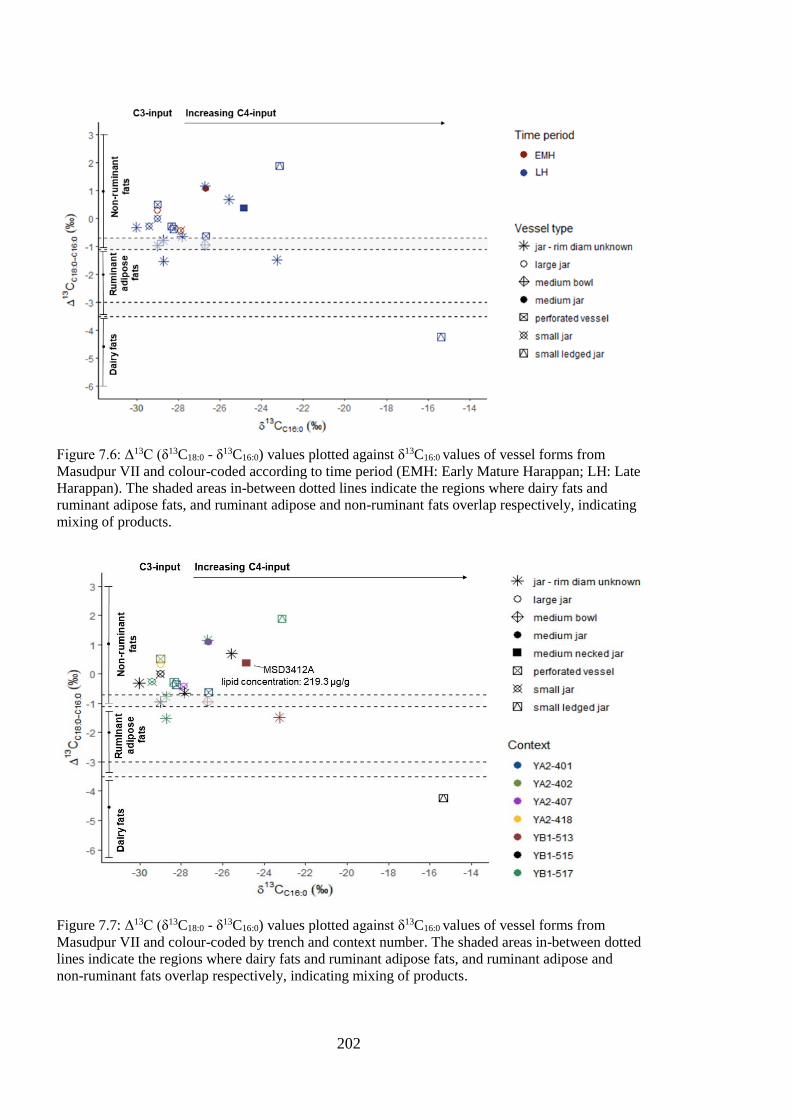
202
Figure 7.6: Δ13C (δ13C18:0 - δ13C16:0) values plotted against δ13C16:0 values of vessel forms from
Masudpur VII and colour-coded according to time period (EMH: Early Mature Harappan; LH: Late
Harappan). The shaded areas in-between dotted lines indicate the regions where dairy fats and
ruminant adipose fats, and ruminant adipose and non-ruminant fats overlap respectively, indicating
mixing of products.
Figure 7.7: Δ13C (δ13C18:0 - δ13C16:0) values plotted against δ13C16:0 values of vessel forms from
Masudpur VII and colour-coded by trench and context number. The shaded areas in-between dotted
lines indicate the regions where dairy fats and ruminant adipose fats, and ruminant adipose and
non-ruminant fats overlap respectively, indicating mixing of products.
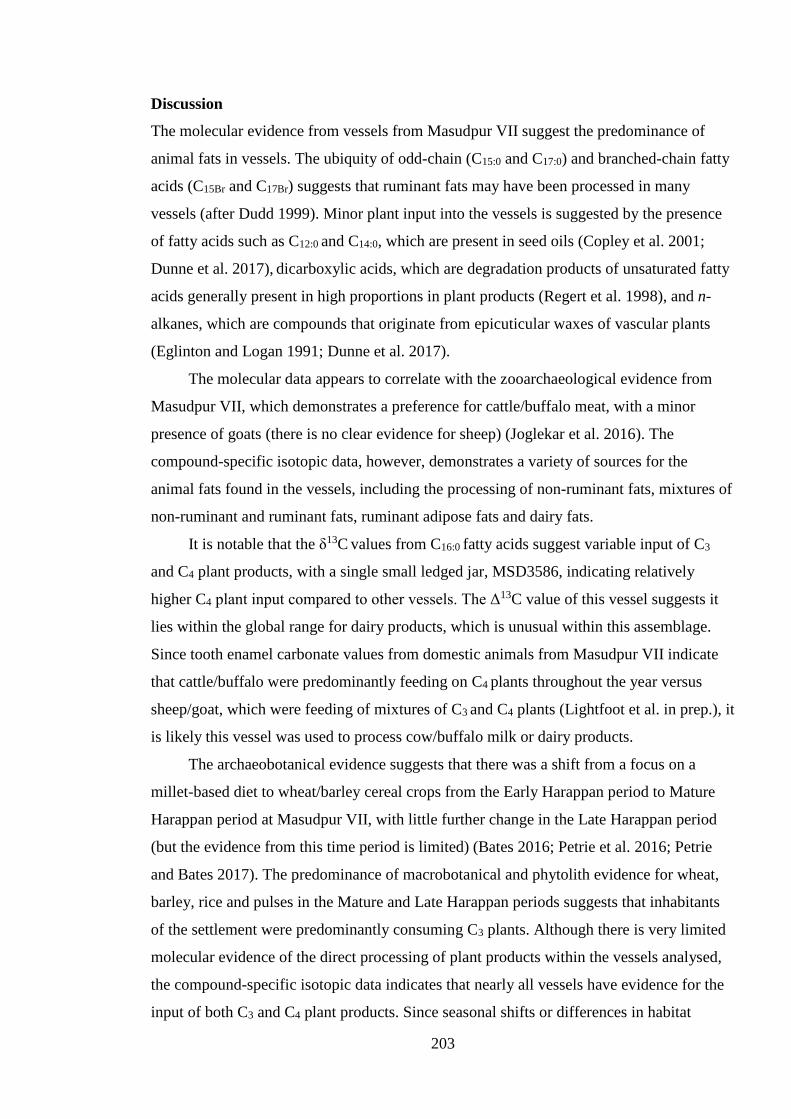
203
Discussion
The molecular evidence from vessels from Masudpur VII suggest the predominance of
animal fats in vessels. The ubiquity of odd-chain (C15:0 and C17:0) and branched-chain fatty
acids (C15Br and C17Br) suggests that ruminant fats may have been processed in many
vessels (after Dudd 1999). Minor plant input into the vessels is suggested by the presence
of fatty acids such as C12:0 and C14:0, which are present in seed oils (Copley et al. 2001;
Dunne et al. 2017), dicarboxylic acids, which are degradation products of unsaturated fatty
acids generally present in high proportions in plant products (Regert et al. 1998), and n-
alkanes, which are compounds that originate from epicuticular waxes of vascular plants
(Eglinton and Logan 1991; Dunne et al. 2017).
The molecular data appears to correlate with the zooarchaeological evidence from
Masudpur VII, which demonstrates a preference for cattle/buffalo meat, with a minor
presence of goats (there is no clear evidence for sheep) (Joglekar et al. 2016). The
compound-specific isotopic data, however, demonstrates a variety of sources for the
animal fats found in the vessels, including the processing of non-ruminant fats, mixtures of
non-ruminant and ruminant fats, ruminant adipose fats and dairy fats.
It is notable that the δ13C values from C16:0 fatty acids suggest variable input of C3
and C4 plant products, with a single small ledged jar, MSD3586, indicating relatively
higher C4 plant input compared to other vessels. The Δ13C value of this vessel suggests it
lies within the global range for dairy products, which is unusual within this assemblage.
Since tooth enamel carbonate values from domestic animals from Masudpur VII indicate
that cattle/buffalo were predominantly feeding on C4 plants throughout the year versus
sheep/goat, which were feeding of mixtures of C3 and C4 plants (Lightfoot et al. in prep.), it
is likely this vessel was used to process cow/buffalo milk or dairy products.
The archaeobotanical evidence suggests that there was a shift from a focus on a
millet-based diet to wheat/barley cereal crops from the Early Harappan period to Mature
Harappan period at Masudpur VII, with little further change in the Late Harappan period
(but the evidence from this time period is limited) (Bates 2016; Petrie et al. 2016; Petrie
and Bates 2017). The predominance of macrobotanical and phytolith evidence for wheat,
barley, rice and pulses in the Mature and Late Harappan periods suggests that inhabitants
of the settlement were predominantly consuming C3 plants. Although there is very limited
molecular evidence of the direct processing of plant products within the vessels analysed,
the compound-specific isotopic data indicates that nearly all vessels have evidence for the
input of both C3 and C4 plant products. Since seasonal shifts or differences in habitat
204
composition affect isotopic variations in plants that have been incorporated into the tissues
of animals consuming them (Roffet-Salque et al. 2017b), the isotopic values of lipid
extracts from vessels possibly demonstrate variable inputs of plants into different animals’
diets.
Combining all the palaeo-ecological and bioarchaeological evidence together, it
appears likely that the isotopic values from the vessels are either representative of the
processing of the carcass of small ruminants that have mixed C3-C4 diets, mixed with non-
ruminant animal fats, or alternatively, of the cooking of C3 plants mixed with dairy
products from ruminants grazing on C3 and C4 plants, as suggested by recent mixing
models (after Hendy et al. 2018). Chapter Eight (Section 8.2.4) will demonstrate these
values are also consistent with mixtures of C3 plants and dairy products from C4 fed
animals. Thus, at present the data is ambiguous and multiple interpretations are possible.
Extracts with positive Δ13C values are better explained by mixing models (Hendy et al.
2018; see Section 8.2.4) than by the assumption that non-ruminant fats were processed in
vessels due to the paucity of these animals in the Masudpur VII faunal record.
Lipid concentrations of vessels from Masudpur VII suggest that ledged jars have
higher mean lipid yields compared to other vessel forms (44.7 μg/g versus 23.6 μg/g [small
jars], 19.2 μg/g [jars] and 16.4 μg/g [perforated jars]), suggesting their more frequent or
prolonged use for processing oily or fatty products over other vessels. However, the
compound-specific isotopic results demonstrate that the two ledged jars analysed were
used to process different products: one for dairy products, and the other for non-ruminant
fats or mixtures of plant and dairy products. Additionally, a single necked jar
(MSD3412A) (Chapter Six, Figure 6.5) with the highest lipid concentration out of the
entire assemblage (219.3 μg/g) falls within the range for non-ruminant fats, which suggests
it was either consistently used for storing lard or cooking pork, or for processing plant and
dairy products intensively over a long period of time. As the data is complex and local
references are unavailable, at present it is not possible to distinguish between these two
diverse interpretations.
Overall, the results from Masudpur VII demonstrate the multifunctionality of vessels,
as foodstuff derived from range of animal products, and possibly, mixtures of plants and
dairy fats, were processed in vessels. Several vessels were obtained from the same context
(Fig. 7.5), indicating they were deposited broadly within the same time period, and may
also have been used contemporaneously. The spread of fatty acid-specific values from
vessels within individual contexts reflects a diversity of animal products being processed in
205
vessels, and importantly, a diversity of animal diets. This pattern may have broader
implications for the conception of the organisation of animal management strategies in
small Indus settlements. Additionally, although evidence from the EMH period is limited
to three vessels from Masudpur VII, these vessels provide a picture of vessel usage across
two distinct time periods from what likely represents quotidian practices of small
households within this 1 ha village.
7.2.2. Small settlements (‘villages’)
This section presents and discusses the GC-MS and GC-c-IRMS results from samples from
Masudpur I, Lohari Ragho I and Khanak. The estimated size of these settlements is
between 3-10 hectares, which suggests that they were larger than Masudpur VII and
Alamgirpur, but still represent the vessel use of populations living in villages. It is likely
the vessels are indicative of household food production, possibly reflecting food choices of
a small number of families. A comparison of the vessel-use practices of Masudpur I and
Lohari Ragho I is useful, as although they are located about 5 km from each other, ongoing
geoarchaeological research indicates that each had unique environmental contexts, with
evidence of a riparian or pond environment surrounding Lohari Ragho I (Walker in prep),
but not at Masudpur I. Khanak is located in a very arid environment and is considerably far
away from both these sites.
7.2.2.1. Masudpur I (MSD I)
Twenty-four vessel fragments were analysed from Masudpur I. The vessel forms and
chronological details of every sample are provided in Section 5.1.2.3. Several samples
were selected from the same depositional context, enabling comparison of vessel usage
within a relatively short time interval, and what likely represents the subsistence practices
of a small number of individuals at the settlement.
Lipid composition
Of the 24 samples analysed, all contained medium-chain fatty acids such as C12:0, C14:0,
C16:0, C18:0 (with all except 2 samples containing C12:0 and/or C14:0). Most samples
contained odd-chain fatty acids such as C15:0 and C17:0 as well as branched-chain fatty acids
like C15Br and C17Br. Several samples contained long-chain fatty acids such as C20:0, C22:0,
C24:0 and fifteen contained dicarboxylic acids (diacids) ranging from C7 to C12 carbon-
chain-length, with C9 (azelaic acid) the most abundant homologue (see Figure 7.8). All
vessels had P/S ratios between 1 and 3. Nearly all samples contained C22:1, which is an
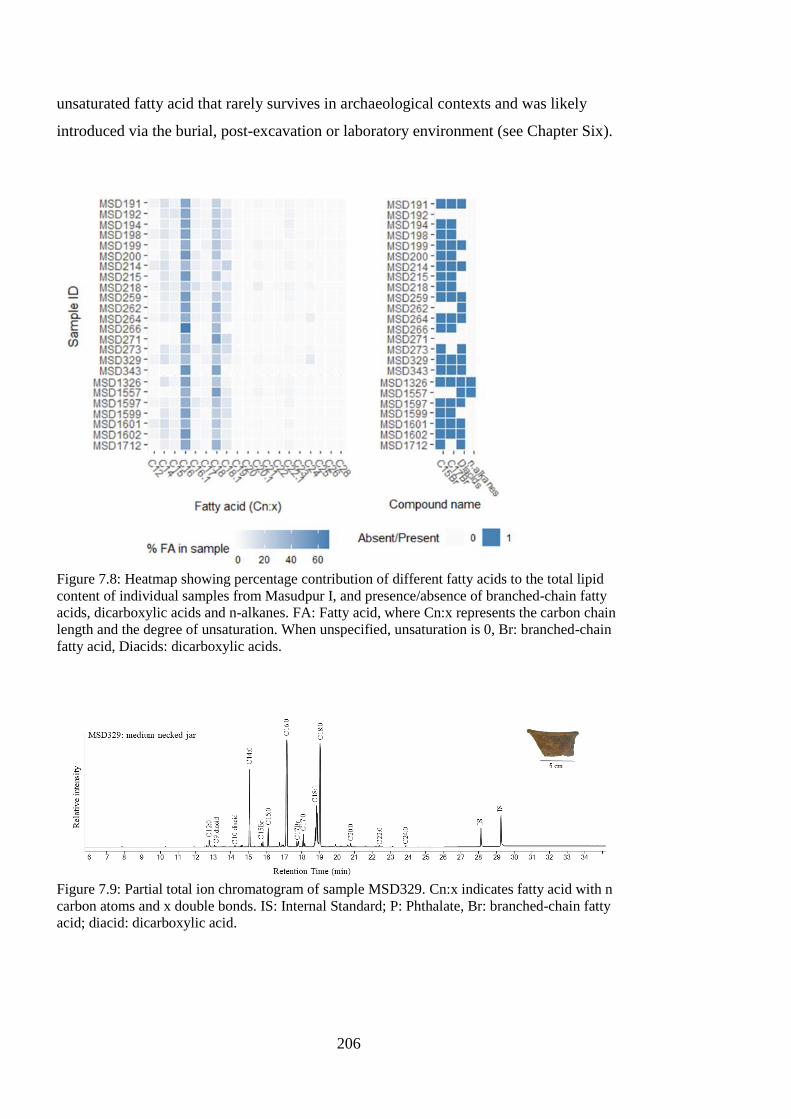
206
unsaturated fatty acid that rarely survives in archaeological contexts and was likely
introduced via the burial, post-excavation or laboratory environment (see Chapter Six).
Figure 7.8: Heatmap showing percentage contribution of different fatty acids to the total lipid
content of individual samples from Masudpur I, and presence/absence of branched-chain fatty
acids, dicarboxylic acids and n-alkanes. FA: Fatty acid, where Cn:x represents the carbon chain
length and the degree of unsaturation. When unspecified, unsaturation is 0, Br: branched-chain
fatty acid, Diacids: dicarboxylic acids.
Figure 7.9: Partial total ion chromatogram of sample MSD329. Cn:x indicates fatty acid with n
carbon atoms and x double bonds. IS: Internal Standard; P: Phthalate, Br: branched-chain fatty
acid; diacid: dicarboxylic acid.
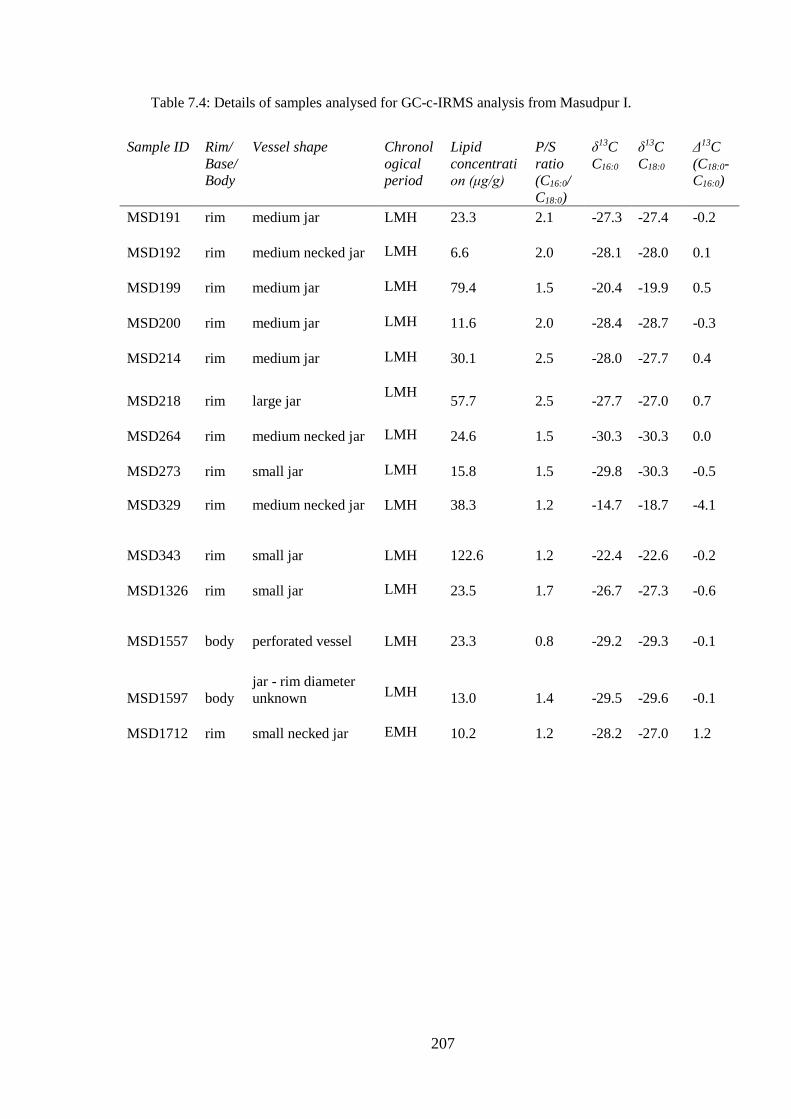
207
Table 7.4: Details of samples analysed for GC-c-IRMS analysis from Masudpur I.
Sample ID Rim/
Base/
Body
Vessel shape Chronol
ogical
period
Lipid
concentrati
on (μg/g)
P/S
ratio
(C16:0/
C18:0)
δ13C
C16:0
δ13C
C18:0
Δ13C
(C18:0-
C16:0)
MSD191 rim medium jar LMH 23.3 2.1 -27.3 -27.4 -0.2
MSD192 rim medium necked jar
LMH 6.6 2.0 -28.1 -28.0 0.1
MSD199 rim medium jar
LMH 79.4 1.5 -20.4 -19.9 0.5
MSD200 rim medium jar
LMH 11.6 2.0 -28.4 -28.7 -0.3
MSD214 rim medium jar
LMH 30.1 2.5 -28.0 -27.7 0.4
MSD218 rim large jar
LMH 57.7 2.5 -27.7 -27.0 0.7
MSD264 rim medium necked jar
LMH 24.6 1.5 -30.3 -30.3 0.0
MSD273 rim small jar
LMH 15.8 1.5 -29.8 -30.3 -0.5
MSD329 rim medium necked jar
LMH 38.3 1.2 -14.7 -18.7 -4.1
MSD343 rim small jar
LMH 122.6 1.2 -22.4 -22.6 -0.2
MSD1326 rim small jar
LMH 23.5 1.7 -26.7 -27.3 -0.6
MSD1557 body perforated vessel
LMH 23.3 0.8 -29.2 -29.3 -0.1
MSD1597 body
jar - rim diameter
unknown
LMH 13.0 1.4 -29.5 -29.6 -0.1
MSD1712 rim small necked jar
EMH 10.2 1.2 -28.2 -27.0 1.2
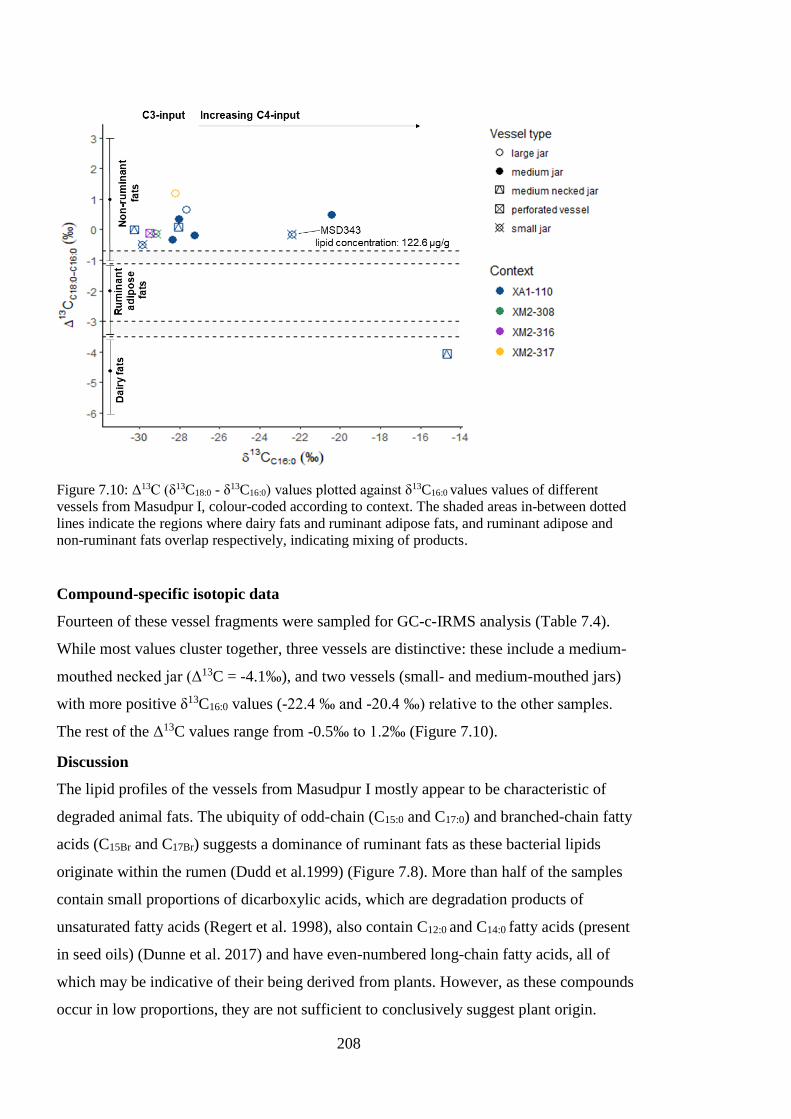
208
Figure 7.10: Δ13C (δ13C18:0 - δ13C16:0) values plotted against δ13C16:0 values values of different
vessels from Masudpur I, colour-coded according to context. The shaded areas in-between dotted
lines indicate the regions where dairy fats and ruminant adipose fats, and ruminant adipose and
non-ruminant fats overlap respectively, indicating mixing of products.
Compound-specific isotopic data
Fourteen of these vessel fragments were sampled for GC-c-IRMS analysis (Table 7.4).
While most values cluster together, three vessels are distinctive: these include a medium-
mouthed necked jar (Δ13C = -4.1‰), and two vessels (small- and medium-mouthed jars)
with more positive ẟ13C16:0 values (-22.4 ‰ and -20.4 ‰) relative to the other samples.
The rest of the Δ13C values range from -0.5‰ to 1.2‰ (Figure 7.10).
Discussion
The lipid profiles of the vessels from Masudpur I mostly appear to be characteristic of
degraded animal fats. The ubiquity of odd-chain (C15:0 and C17:0) and branched-chain fatty
acids (C15Br and C17Br) suggests a dominance of ruminant fats as these bacterial lipids
originate within the rumen (Dudd et al.1999) (Figure 7.8). More than half of the samples
contain small proportions of dicarboxylic acids, which are degradation products of
unsaturated fatty acids (Regert et al. 1998), also contain C12:0 and C14:0 fatty acids (present
in seed oils) (Dunne et al. 2017) and have even-numbered long-chain fatty acids, all of
which may be indicative of their being derived from plants. However, as these compounds
occur in low proportions, they are not sufficient to conclusively suggest plant origin.
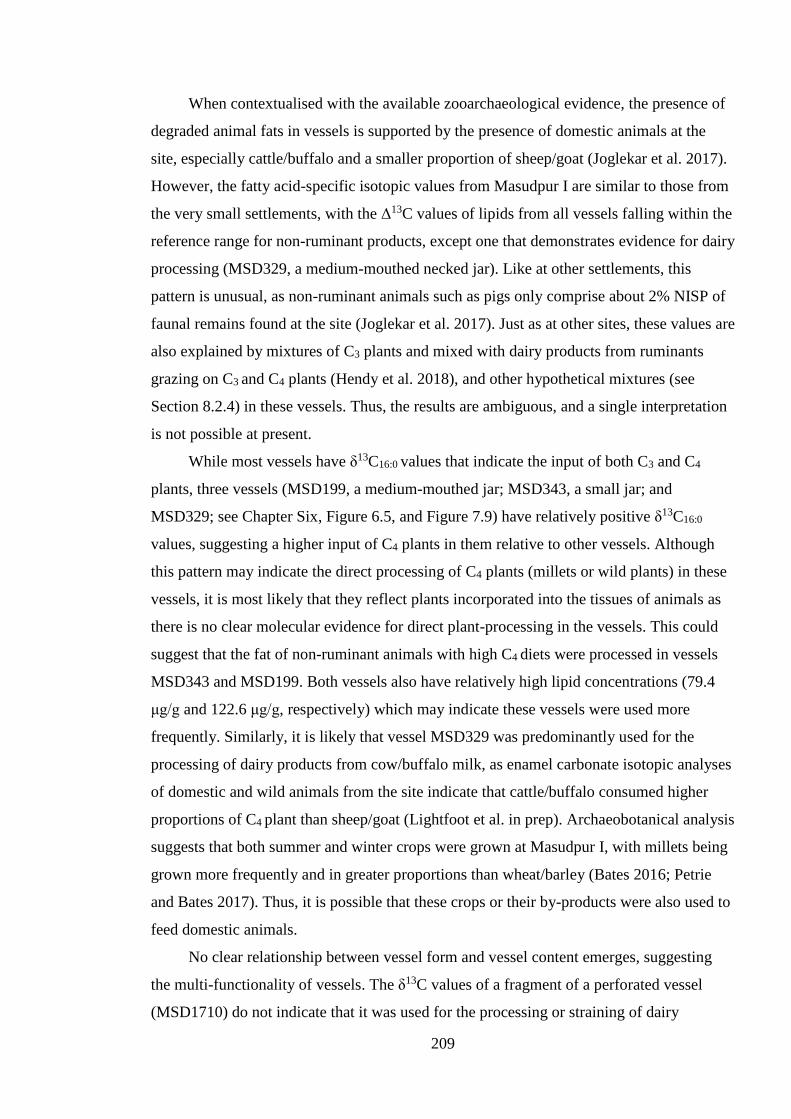
209
When contextualised with the available zooarchaeological evidence, the presence of
degraded animal fats in vessels is supported by the presence of domestic animals at the
site, especially cattle/buffalo and a smaller proportion of sheep/goat (Joglekar et al. 2017).
However, the fatty acid-specific isotopic values from Masudpur I are similar to those from
the very small settlements, with the Δ13C values of lipids from all vessels falling within the
reference range for non-ruminant products, except one that demonstrates evidence for dairy
processing (MSD329, a medium-mouthed necked jar). Like at other settlements, this
pattern is unusual, as non-ruminant animals such as pigs only comprise about 2% NISP of
faunal remains found at the site (Joglekar et al. 2017). Just as at other sites, these values are
also explained by mixtures of C3 plants and mixed with dairy products from ruminants
grazing on C3 and C4 plants (Hendy et al. 2018), and other hypothetical mixtures (see
Section 8.2.4) in these vessels. Thus, the results are ambiguous, and a single interpretation
is not possible at present.
While most vessels have δ13C16:0 values that indicate the input of both C3 and C4
plants, three vessels (MSD199, a medium-mouthed jar; MSD343, a small jar; and
MSD329; see Chapter Six, Figure 6.5, and Figure 7.9) have relatively positive δ13C16:0
values, suggesting a higher input of C4 plants in them relative to other vessels. Although
this pattern may indicate the direct processing of C4 plants (millets or wild plants) in these
vessels, it is most likely that they reflect plants incorporated into the tissues of animals as
there is no clear molecular evidence for direct plant-processing in the vessels. This could
suggest that the fat of non-ruminant animals with high C4 diets were processed in vessels
MSD343 and MSD199. Both vessels also have relatively high lipid concentrations (79.4
μg/g and 122.6 μg/g, respectively) which may indicate these vessels were used more
frequently. Similarly, it is likely that vessel MSD329 was predominantly used for the
processing of dairy products from cow/buffalo milk, as enamel carbonate isotopic analyses
of domestic and wild animals from the site indicate that cattle/buffalo consumed higher
proportions of C4 plant than sheep/goat (Lightfoot et al. in prep). Archaeobotanical analysis
suggests that both summer and winter crops were grown at Masudpur I, with millets being
grown more frequently and in greater proportions than wheat/barley (Bates 2016; Petrie
and Bates 2017). Thus, it is possible that these crops or their by-products were also used to
feed domestic animals.
No clear relationship between vessel form and vessel content emerges, suggesting
the multi-functionality of vessels. The δ13C values of a fragment of a perforated vessel
(MSD1710) do not indicate that it was used for the processing or straining of dairy
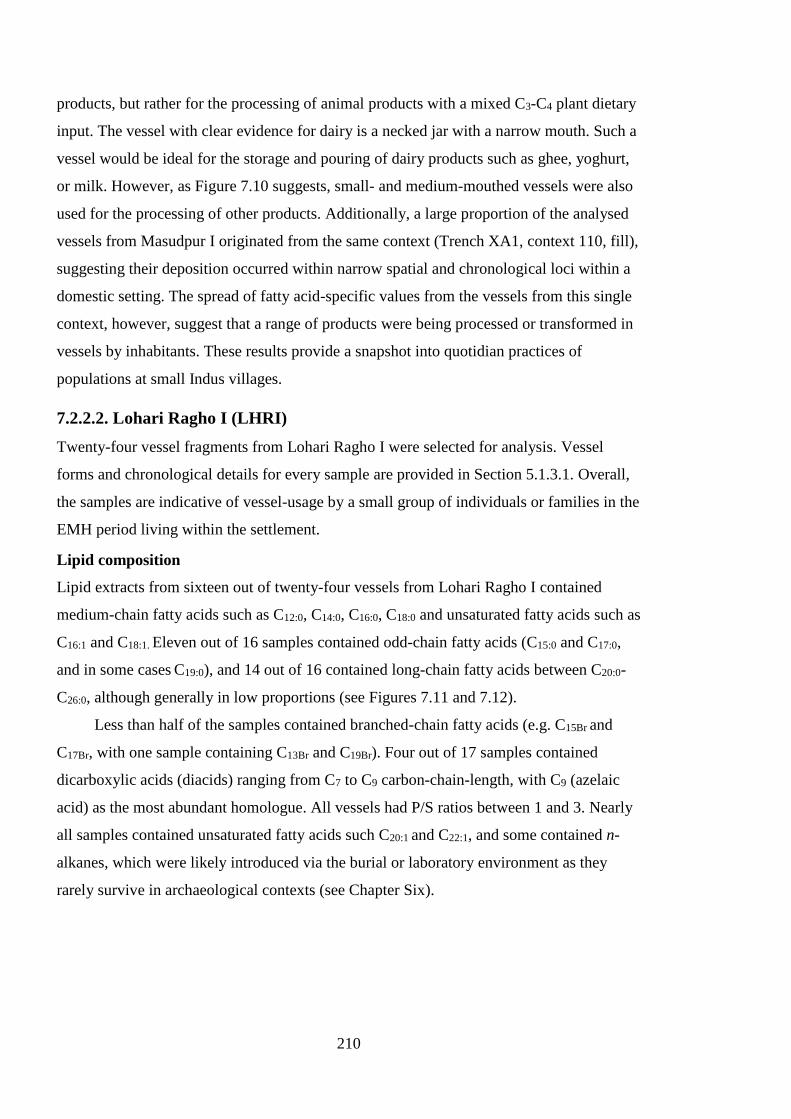
210
products, but rather for the processing of animal products with a mixed C3-C4 plant dietary
input. The vessel with clear evidence for dairy is a necked jar with a narrow mouth. Such a
vessel would be ideal for the storage and pouring of dairy products such as ghee, yoghurt,
or milk. However, as Figure 7.10 suggests, small- and medium-mouthed vessels were also
used for the processing of other products. Additionally, a large proportion of the analysed
vessels from Masudpur I originated from the same context (Trench XA1, context 110, fill),
suggesting their deposition occurred within narrow spatial and chronological loci within a
domestic setting. The spread of fatty acid-specific values from the vessels from this single
context, however, suggest that a range of products were being processed or transformed in
vessels by inhabitants. These results provide a snapshot into quotidian practices of
populations at small Indus villages.
7.2.2.2. Lohari Ragho I (LHRI)
Twenty-four vessel fragments from Lohari Ragho I were selected for analysis. Vessel
forms and chronological details for every sample are provided in Section 5.1.3.1. Overall,
the samples are indicative of vessel-usage by a small group of individuals or families in the
EMH period living within the settlement.
Lipid composition
Lipid extracts from sixteen out of twenty-four vessels from Lohari Ragho I contained
medium-chain fatty acids such as C12:0, C14:0, C16:0, C18:0 and unsaturated fatty acids such as
C16:1 and C18:1. Eleven out of 16 samples contained odd-chain fatty acids (C15:0 and C17:0,
and in some cases C19:0), and 14 out of 16 contained long-chain fatty acids between C20:0-
C26:0, although generally in low proportions (see Figures 7.11 and 7.12).
Less than half of the samples contained branched-chain fatty acids (e.g. C15Br and
C17Br, with one sample containing C13Br and C19Br). Four out of 17 samples contained
dicarboxylic acids (diacids) ranging from C7 to C9 carbon-chain-length, with C9 (azelaic
acid) as the most abundant homologue. All vessels had P/S ratios between 1 and 3. Nearly
all samples contained unsaturated fatty acids such C20:1 and C22:1, and some contained n-
alkanes, which were likely introduced via the burial or laboratory environment as they
rarely survive in archaeological contexts (see Chapter Six).
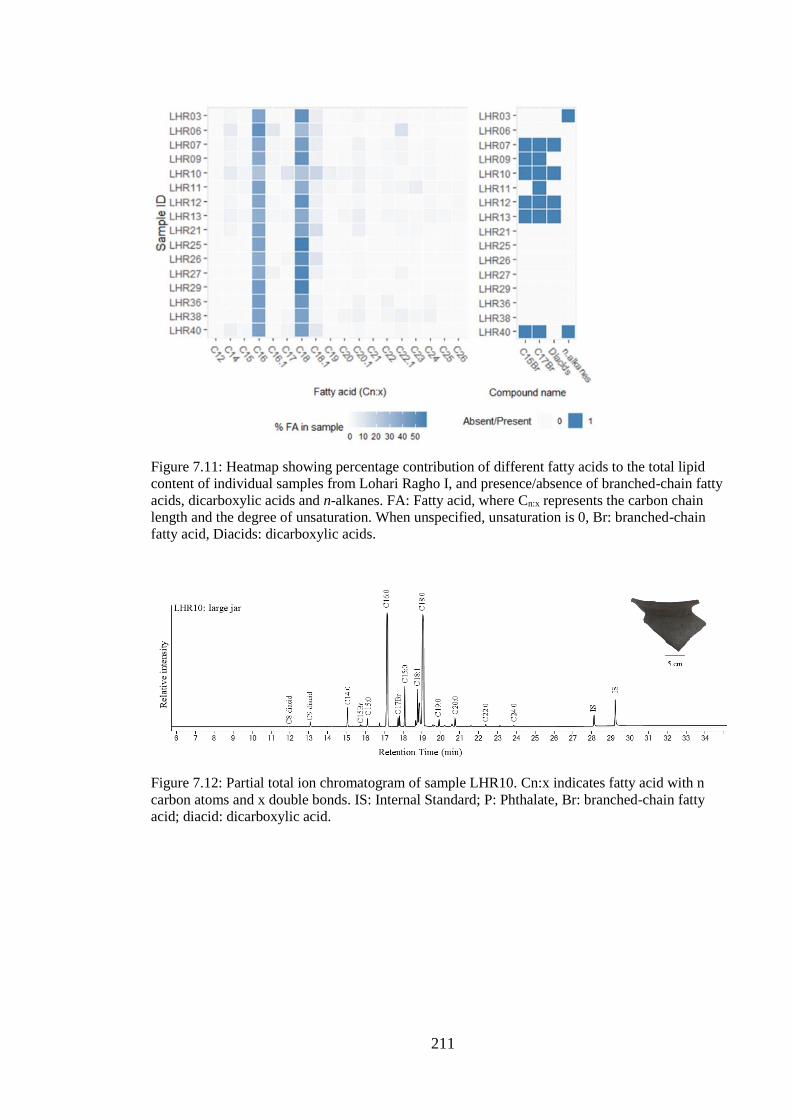
211
Figure 7.11: Heatmap showing percentage contribution of different fatty acids to the total lipid
content of individual samples from Lohari Ragho I, and presence/absence of branched-chain fatty
acids, dicarboxylic acids and n-alkanes. FA: Fatty acid, where Cn:x represents the carbon chain
length and the degree of unsaturation. When unspecified, unsaturation is 0, Br: branched-chain
fatty acid, Diacids: dicarboxylic acids.
Figure 7.12: Partial total ion chromatogram of sample LHR10. Cn:x indicates fatty acid with n
carbon atoms and x double bonds. IS: Internal Standard; P: Phthalate, Br: branched-chain fatty
acid; diacid: dicarboxylic acid.
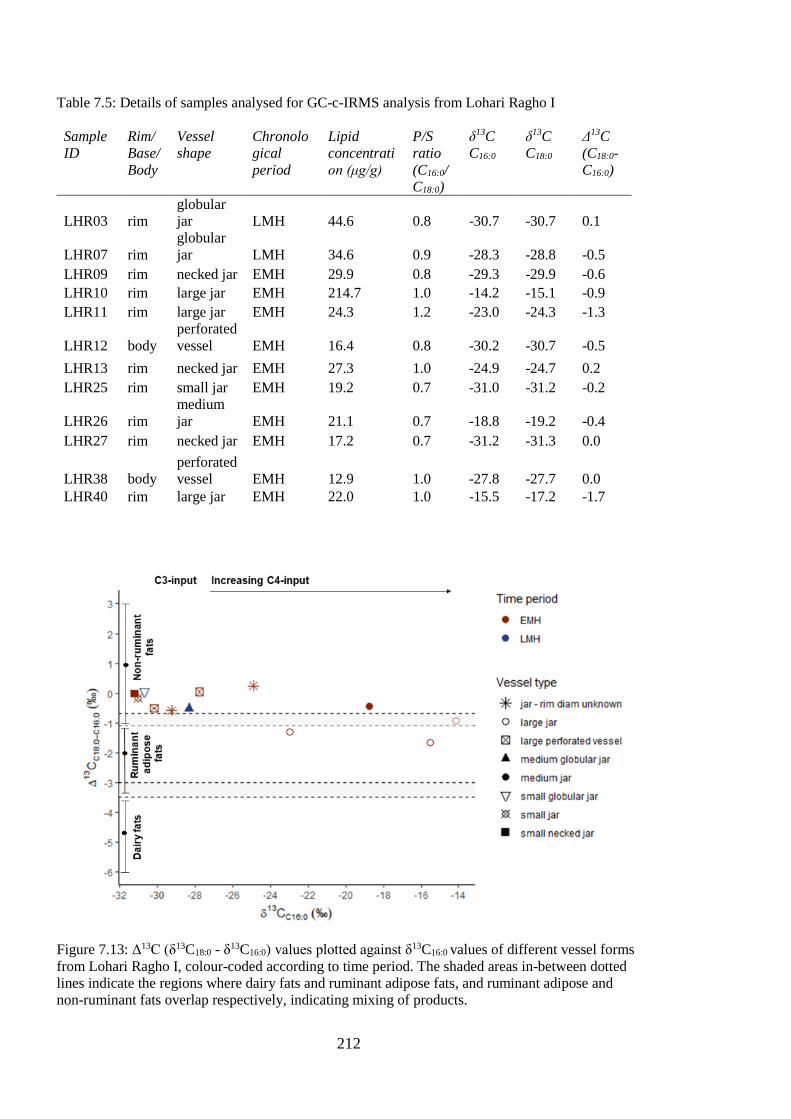
212
Table 7.5: Details of samples analysed for GC-c-IRMS analysis from Lohari Ragho I
Sample
ID
Rim/
Base/
Body
Vessel
shape
Chronolo
gical
period
Lipid
concentrati
on (μg/g)
P/S
ratio
(C16:0/
C18:0)
δ13C
C16:0
δ13C
C18:0
Δ13C
(C18:0-
C16:0)
LHR03 rim
globular
jar LMH 44.6 0.8 -30.7 -30.7 0.1
LHR07 rim
globular
jar LMH 34.6 0.9 -28.3 -28.8 -0.5
LHR09 rim necked jar EMH 29.9 0.8 -29.3 -29.9 -0.6
LHR10 rim large jar EMH 214.7 1.0 -14.2 -15.1 -0.9
LHR11 rim large jar EMH 24.3 1.2 -23.0 -24.3 -1.3
LHR12 body
perforated
vessel EMH 16.4 0.8 -30.2 -30.7 -0.5
LHR13 rim necked jar EMH 27.3 1.0 -24.9 -24.7 0.2
LHR25 rim small jar EMH 19.2 0.7 -31.0 -31.2 -0.2
LHR26 rim
medium
jar EMH 21.1 0.7 -18.8 -19.2 -0.4
LHR27 rim necked jar EMH 17.2 0.7 -31.2 -31.3 0.0
LHR38 body
perforated
vessel EMH 12.9 1.0 -27.8 -27.7 0.0
LHR40 rim large jar EMH 22.0 1.0 -15.5 -17.2 -1.7
Figure 7.13: Δ13C (δ13C18:0 - δ13C16:0) values plotted against δ13C16:0 values of different vessel forms
from Lohari Ragho I, colour-coded according to time period. The shaded areas in-between dotted
lines indicate the regions where dairy fats and ruminant adipose fats, and ruminant adipose and
non-ruminant fats overlap respectively, indicating mixing of products.
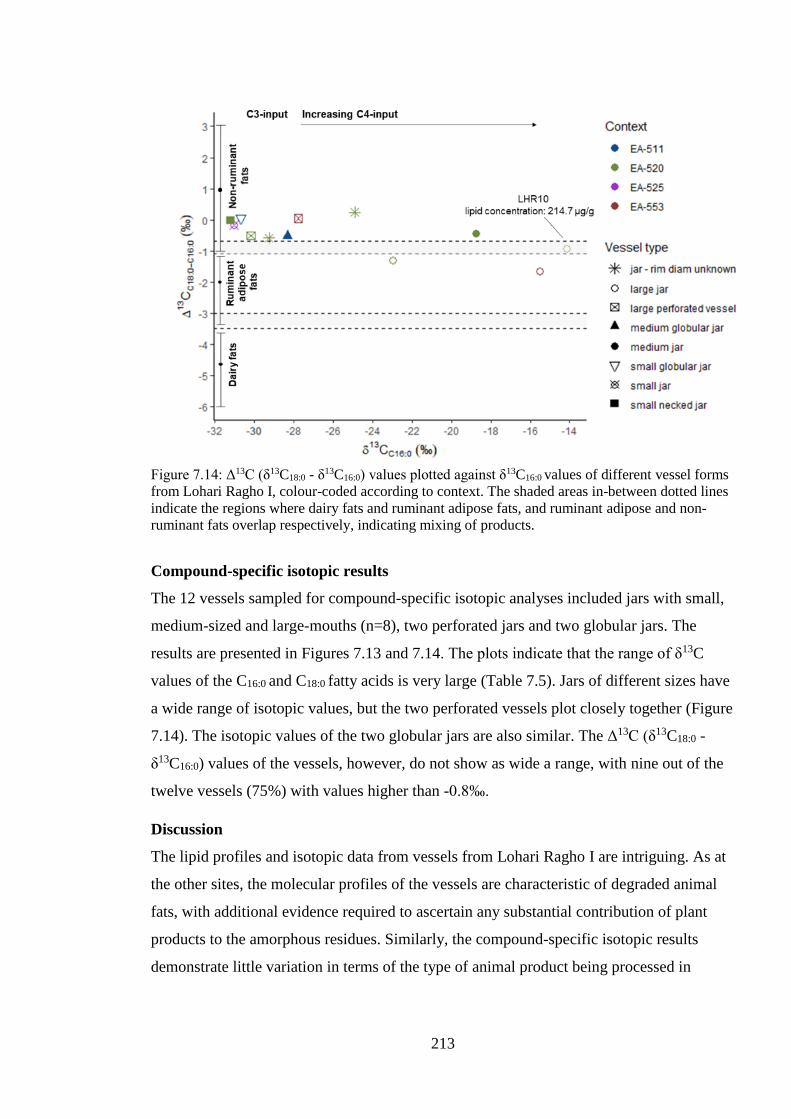
213
Figure 7.14: Δ13C (δ13C18:0 - δ13C16:0) values plotted against δ13C16:0 values of different vessel forms
from Lohari Ragho I, colour-coded according to context. The shaded areas in-between dotted lines
indicate the regions where dairy fats and ruminant adipose fats, and ruminant adipose and non-
ruminant fats overlap respectively, indicating mixing of products.
Compound-specific isotopic results
The 12 vessels sampled for compound-specific isotopic analyses included jars with small,
medium-sized and large-mouths (n=8), two perforated jars and two globular jars. The
results are presented in Figures 7.13 and 7.14. The plots indicate that the range of δ13C
values of the C16:0 and C18:0 fatty acids is very large (Table 7.5). Jars of different sizes have
a wide range of isotopic values, but the two perforated vessels plot closely together (Figure
7.14). The isotopic values of the two globular jars are also similar. The Δ13C (δ13C18:0 -
δ13C16:0) values of the vessels, however, do not show as wide a range, with nine out of the
twelve vessels (75%) with values higher than -0.8‰.
Discussion
The lipid profiles and isotopic data from vessels from Lohari Ragho I are intriguing. As at
the other sites, the molecular profiles of the vessels are characteristic of degraded animal
fats, with additional evidence required to ascertain any substantial contribution of plant
products to the amorphous residues. Similarly, the compound-specific isotopic results
demonstrate little variation in terms of the type of animal product being processed in
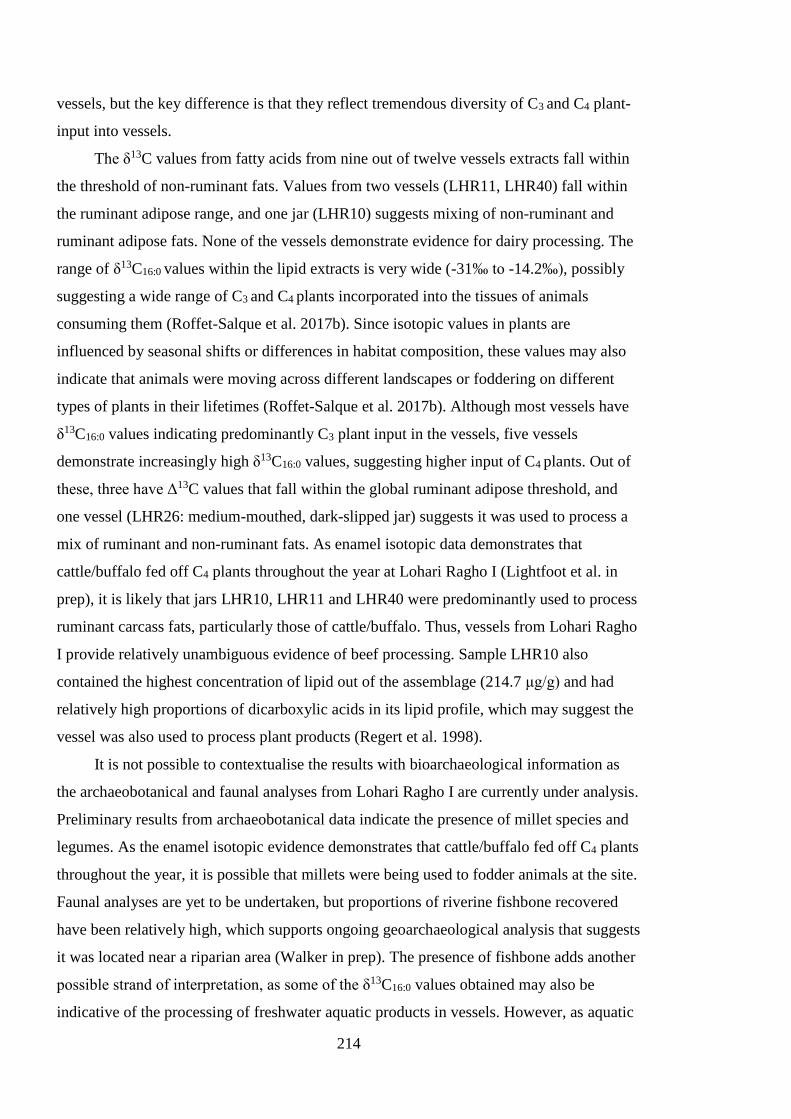
214
vessels, but the key difference is that they reflect tremendous diversity of C3 and C4 plant-
input into vessels.
The δ13C values from fatty acids from nine out of twelve vessels extracts fall within
the threshold of non-ruminant fats. Values from two vessels (LHR11, LHR40) fall within
the ruminant adipose range, and one jar (LHR10) suggests mixing of non-ruminant and
ruminant adipose fats. None of the vessels demonstrate evidence for dairy processing. The
range of δ13C16:0 values within the lipid extracts is very wide (-31‰ to -14.2‰), possibly
suggesting a wide range of C3 and C4 plants incorporated into the tissues of animals
consuming them (Roffet-Salque et al. 2017b). Since isotopic values in plants are
influenced by seasonal shifts or differences in habitat composition, these values may also
indicate that animals were moving across different landscapes or foddering on different
types of plants in their lifetimes (Roffet-Salque et al. 2017b). Although most vessels have
δ13C16:0 values indicating predominantly C3 plant input in the vessels, five vessels
demonstrate increasingly high δ13C16:0 values, suggesting higher input of C4 plants. Out of
these, three have Δ13C values that fall within the global ruminant adipose threshold, and
one vessel (LHR26: medium-mouthed, dark-slipped jar) suggests it was used to process a
mix of ruminant and non-ruminant fats. As enamel isotopic data demonstrates that
cattle/buffalo fed off C4 plants throughout the year at Lohari Ragho I (Lightfoot et al. in
prep), it is likely that jars LHR10, LHR11 and LHR40 were predominantly used to process
ruminant carcass fats, particularly those of cattle/buffalo. Thus, vessels from Lohari Ragho
I provide relatively unambiguous evidence of beef processing. Sample LHR10 also
contained the highest concentration of lipid out of the assemblage (214.7 μg/g) and had
relatively high proportions of dicarboxylic acids in its lipid profile, which may suggest the
vessel was also used to process plant products (Regert et al. 1998).
It is not possible to contextualise the results with bioarchaeological information as
the archaeobotanical and faunal analyses from Lohari Ragho I are currently under analysis.
Preliminary results from archaeobotanical data indicate the presence of millet species and
legumes. As the enamel isotopic evidence demonstrates that cattle/buffalo fed off C4 plants
throughout the year, it is possible that millets were being used to fodder animals at the site.
Faunal analyses are yet to be undertaken, but proportions of riverine fishbone recovered
have been relatively high, which supports ongoing geoarchaeological analysis that suggests
it was located near a riparian area (Walker in prep). The presence of fishbone adds another
possible strand of interpretation, as some of the δ13C16:0 values obtained may also be
indicative of the processing of freshwater aquatic products in vessels. However, as aquatic
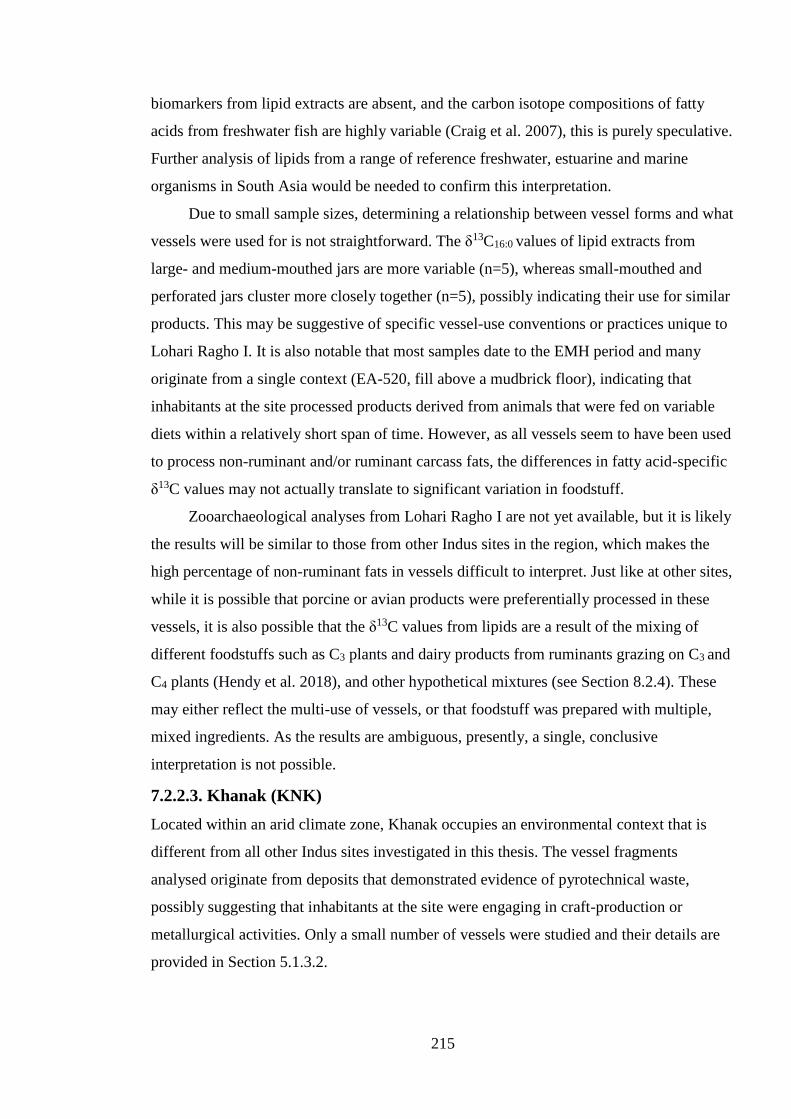
215
biomarkers from lipid extracts are absent, and the carbon isotope compositions of fatty
acids from freshwater fish are highly variable (Craig et al. 2007), this is purely speculative.
Further analysis of lipids from a range of reference freshwater, estuarine and marine
organisms in South Asia would be needed to confirm this interpretation.
Due to small sample sizes, determining a relationship between vessel forms and what
vessels were used for is not straightforward. The δ13C16:0 values of lipid extracts from
large- and medium-mouthed jars are more variable (n=5), whereas small-mouthed and
perforated jars cluster more closely together (n=5), possibly indicating their use for similar
products. This may be suggestive of specific vessel-use conventions or practices unique to
Lohari Ragho I. It is also notable that most samples date to the EMH period and many
originate from a single context (EA-520, fill above a mudbrick floor), indicating that
inhabitants at the site processed products derived from animals that were fed on variable
diets within a relatively short span of time. However, as all vessels seem to have been used
to process non-ruminant and/or ruminant carcass fats, the differences in fatty acid-specific
δ13C values may not actually translate to significant variation in foodstuff.
Zooarchaeological analyses from Lohari Ragho I are not yet available, but it is likely
the results will be similar to those from other Indus sites in the region, which makes the
high percentage of non-ruminant fats in vessels difficult to interpret. Just like at other sites,
while it is possible that porcine or avian products were preferentially processed in these
vessels, it is also possible that the δ13C values from lipids are a result of the mixing of
different foodstuffs such as C3 plants and dairy products from ruminants grazing on C3 and
C4 plants (Hendy et al. 2018), and other hypothetical mixtures (see Section 8.2.4). These
may either reflect the multi-use of vessels, or that foodstuff was prepared with multiple,
mixed ingredients. As the results are ambiguous, presently, a single, conclusive
interpretation is not possible.
7.2.2.3. Khanak (KNK)
Located within an arid climate zone, Khanak occupies an environmental context that is
different from all other Indus sites investigated in this thesis. The vessel fragments
analysed originate from deposits that demonstrated evidence of pyrotechnical waste,
possibly suggesting that inhabitants at the site were engaging in craft-production or
metallurgical activities. Only a small number of vessels were studied and their details are
provided in Section 5.1.3.2.
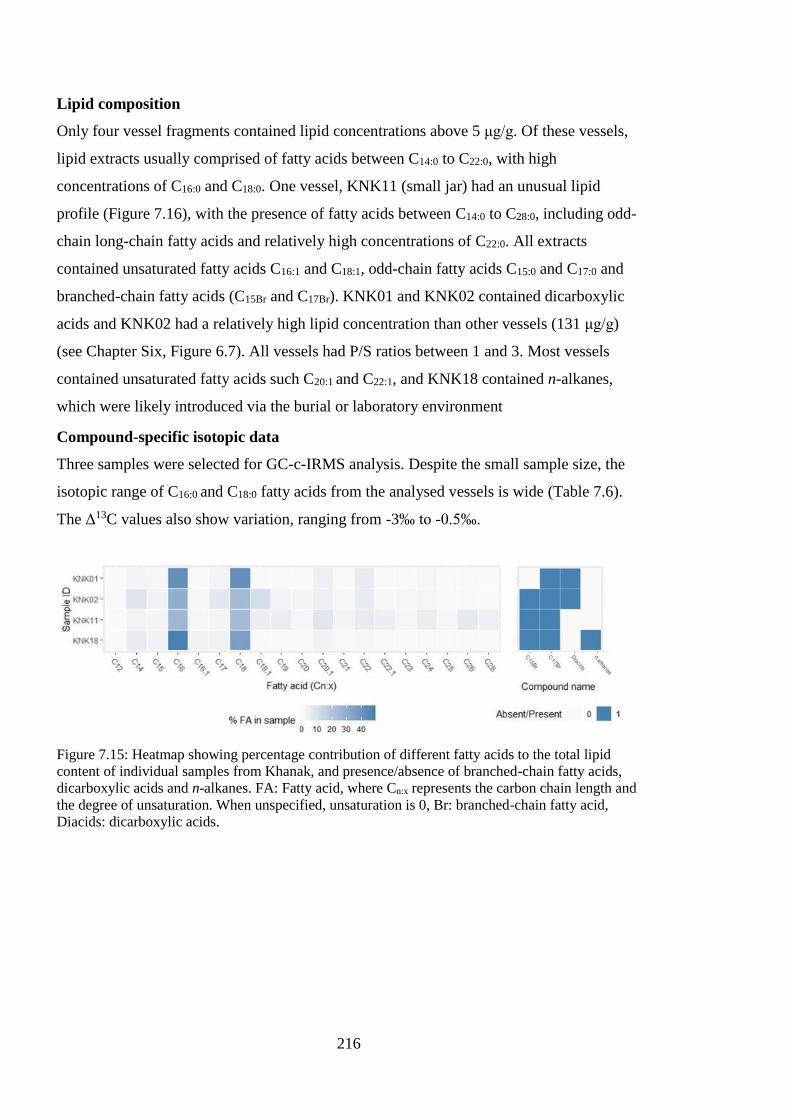
216
Lipid composition
Only four vessel fragments contained lipid concentrations above 5 μg/g. Of these vessels,
lipid extracts usually comprised of fatty acids between C14:0 to C22:0, with high
concentrations of C16:0 and C18:0. One vessel, KNK11 (small jar) had an unusual lipid
profile (Figure 7.16), with the presence of fatty acids between C14:0 to C28:0, including odd-
chain long-chain fatty acids and relatively high concentrations of C22:0. All extracts
contained unsaturated fatty acids C16:1 and C18:1, odd-chain fatty acids C15:0 and C17:0 and
branched-chain fatty acids (C15Br and C17Br). KNK01 and KNK02 contained dicarboxylic
acids and KNK02 had a relatively high lipid concentration than other vessels (131 μg/g)
(see Chapter Six, Figure 6.7). All vessels had P/S ratios between 1 and 3. Most vessels
contained unsaturated fatty acids such C20:1 and C22:1, and KNK18 contained n-alkanes,
which were likely introduced via the burial or laboratory environment
Compound-specific isotopic data
Three samples were selected for GC-c-IRMS analysis. Despite the small sample size, the
isotopic range of C16:0 and C18:0 fatty acids from the analysed vessels is wide (Table 7.6).
The Δ13C values also show variation, ranging from -3‰ to -0.5‰.
Figure 7.15: Heatmap showing percentage contribution of different fatty acids to the total lipid
content of individual samples from Khanak, and presence/absence of branched-chain fatty acids,
dicarboxylic acids and n-alkanes. FA: Fatty acid, where Cn:x represents the carbon chain length and
the degree of unsaturation. When unspecified, unsaturation is 0, Br: branched-chain fatty acid,
Diacids: dicarboxylic acids.
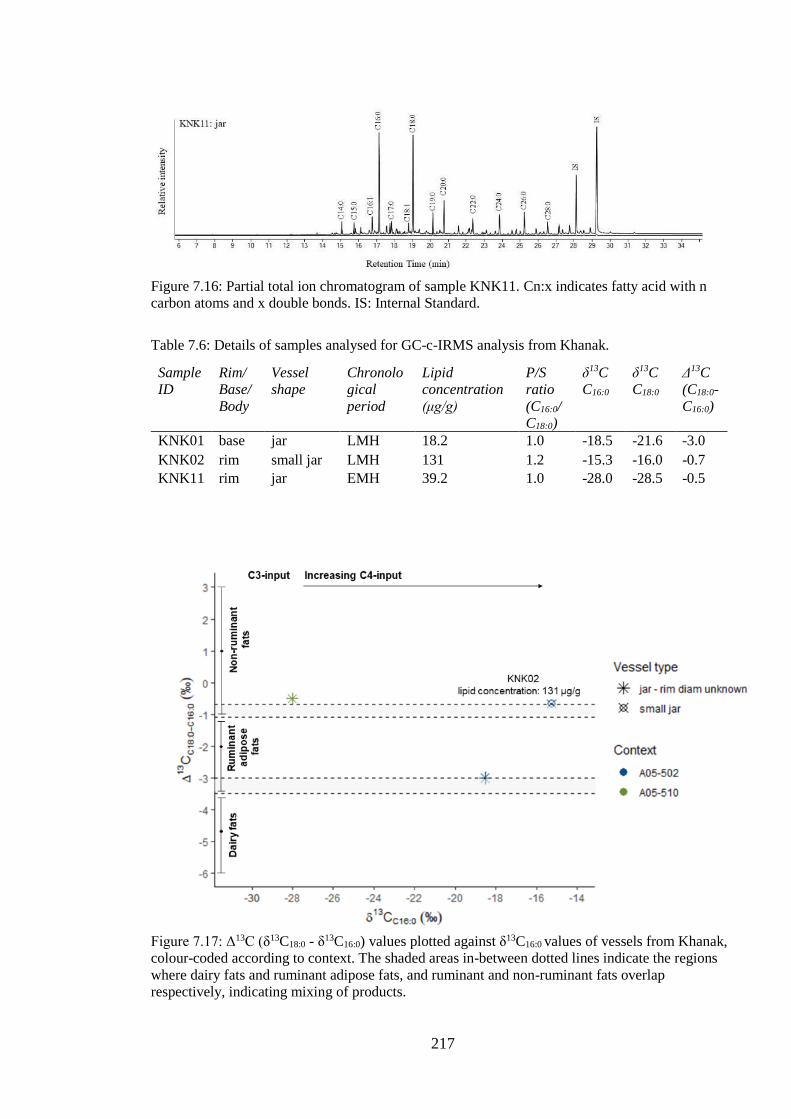
217
Figure 7.16: Partial total ion chromatogram of sample KNK11. Cn:x indicates fatty acid with n
carbon atoms and x double bonds. IS: Internal Standard.
Table 7.6: Details of samples analysed for GC-c-IRMS analysis from Khanak.
Sample
ID
Rim/
Base/
Body
Vessel
shape
Chronolo
gical
period
Lipid
concentration
(μg/g)
P/S
ratio
(C16:0/
C18:0)
δ13C
C16:0
δ13C
C18:0
Δ13C
(C18:0-
C16:0)
KNK01 base jar LMH 18.2 1.0 -18.5 -21.6 -3.0
KNK02 rim small jar LMH 131 1.2 -15.3 -16.0 -0.7
KNK11 rim jar EMH 39.2 1.0 -28.0 -28.5 -0.5
Figure 7.17: Δ13C (δ13C18:0 - δ13C16:0) values plotted against δ13C16:0 values of vessels from Khanak,
colour-coded according to context. The shaded areas in-between dotted lines indicate the regions
where dairy fats and ruminant adipose fats, and ruminant and non-ruminant fats overlap
respectively, indicating mixing of products.
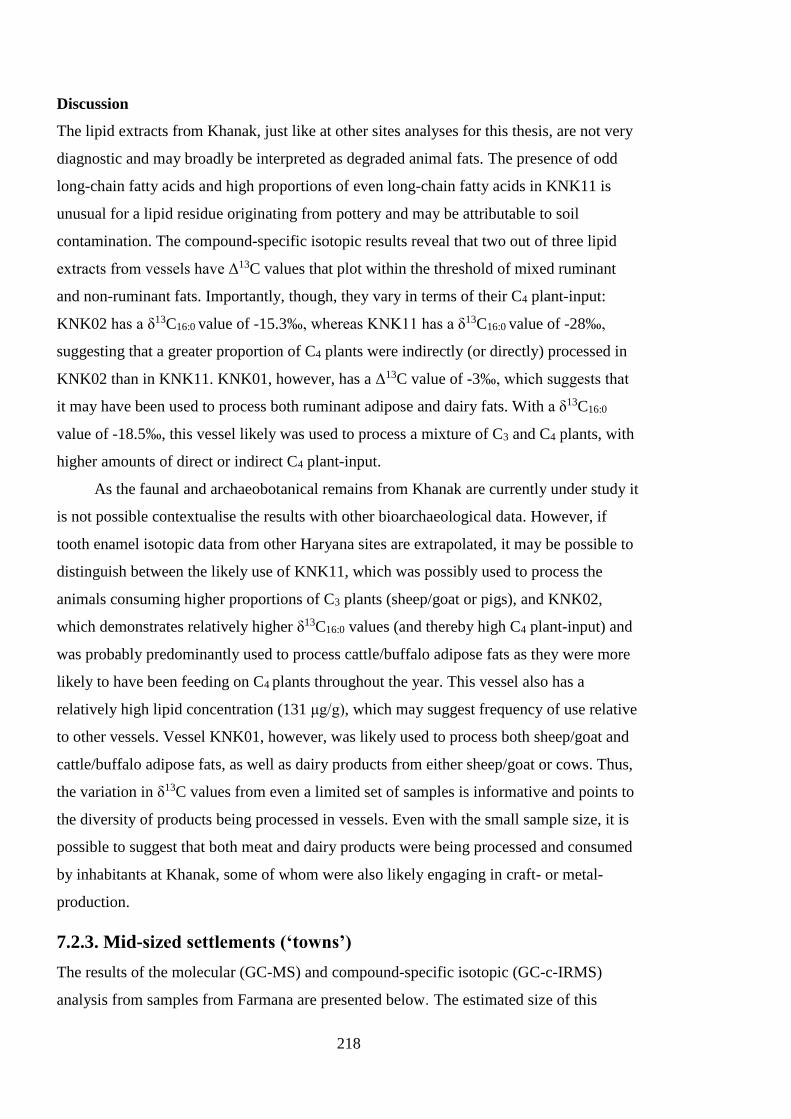
218
Discussion
The lipid extracts from Khanak, just like at other sites analyses for this thesis, are not very
diagnostic and may broadly be interpreted as degraded animal fats. The presence of odd
long-chain fatty acids and high proportions of even long-chain fatty acids in KNK11 is
unusual for a lipid residue originating from pottery and may be attributable to soil
contamination. The compound-specific isotopic results reveal that two out of three lipid
extracts from vessels have Δ13C values that plot within the threshold of mixed ruminant
and non-ruminant fats. Importantly, though, they vary in terms of their C4 plant-input:
KNK02 has a δ13C16:0 value of -15.3‰, whereas KNK11 has a δ13C16:0 value of -28‰,
suggesting that a greater proportion of C4 plants were indirectly (or directly) processed in
KNK02 than in KNK11. KNK01, however, has a Δ13C value of -3‰, which suggests that
it may have been used to process both ruminant adipose and dairy fats. With a δ13C16:0
value of -18.5‰, this vessel likely was used to process a mixture of C3 and C4 plants, with
higher amounts of direct or indirect C4 plant-input.
As the faunal and archaeobotanical remains from Khanak are currently under study it
is not possible contextualise the results with other bioarchaeological data. However, if
tooth enamel isotopic data from other Haryana sites are extrapolated, it may be possible to
distinguish between the likely use of KNK11, which was possibly used to process the
animals consuming higher proportions of C3 plants (sheep/goat or pigs), and KNK02,
which demonstrates relatively higher δ13C16:0 values (and thereby high C4 plant-input) and
was probably predominantly used to process cattle/buffalo adipose fats as they were more
likely to have been feeding on C4 plants throughout the year. This vessel also has a
relatively high lipid concentration (131 μg/g), which may suggest frequency of use relative
to other vessels. Vessel KNK01, however, was likely used to process both sheep/goat and
cattle/buffalo adipose fats, as well as dairy products from either sheep/goat or cows. Thus,
the variation in δ13C values from even a limited set of samples is informative and points to
the diversity of products being processed in vessels. Even with the small sample size, it is
possible to suggest that both meat and dairy products were being processed and consumed
by inhabitants at Khanak, some of whom were also likely engaging in craft- or metal-
production.
7.2.3. Mid-sized settlements (‘towns’)
The results of the molecular (GC-MS) and compound-specific isotopic (GC-c-IRMS)
analysis from samples from Farmana are presented below. The estimated size of this
219
settlement is between 10-20 hectares, which suggests that it can be characterised as a
‘smaller-than-city’ settlement within the constellation of Indus settlements in the region
(Petrie 2013).The contextual information from excavations suggests that vessels analysed
from this site are likely indicative of household food production, possibly reflecting food
choices of a small number of families over a relatively short period of time within the
Early Mature Harappan (EMH) period.
7.2.3.1. Farmana (FRN)
Eighteen vessels had lipid concentrations above 5 μg/g, the details of which are provided
in Chapter Five, Section 5.1.2.4. They originated from different locations within the
structural complexes exposed at the site, allowing for comparisons between vessel use
across different households or buildings. Comparison between ‘Haryana Harappan’ and
‘Classic Harappan’ pottery was also possible (cf. Uesugi 2011).
Lipid composition
Nearly all analysed vessels contained mid-chain fatty acids such as C14:0, C16:0, C18:0, and
seven vessels also contained C12:0. Long-chain fatty acids (C20:0, C22:0, C24:0) were only
present in nine vessels in very low proportions, but all samples contained odd-chain fatty
acids (C15:0, C17:0). Most vessels contained C16:1 and/or C18:1 unsaturated fatty acid,
however, unusually, four vessels contained unmethylated C18:1.
Six out of eighteen vessels contained branched-chain fatty acids (C15Br and C17Br).
Only 4 out of 18 (22%) vessels contained dicarboxylic acids in very low concentrations
(see Figure 7.18). A single vessel (FRN26, body sherd from a jar with mud applique
surface decoration) had a P/S ratio of 3.5, while the rest had P/S ratios between 1 and 3.
Six vessels contained unsaturated fatty acids such as C20:1 and C22:1 which were likely
introduced via the burial or laboratory environment as they rarely survive in archaeological
contexts, and some contained n-alkanes, but these may also be attributed to contamination
(see Chapter Six).
Compound-specific isotopic data
Seven vessels were selected for GC-c-IRMS analysis. These included small jars (n=2), a
medium jar, a large jar, a perforated vessel, a ledged jar, and a jar with an unknown rim
diameter. Despite the small sample size, the range of isotopic values of the lipid extracts
was wide (Table 7.7). The Δ13C values also demonstrated considerable variability, ranging
from -3.8‰ to -0.3‰.
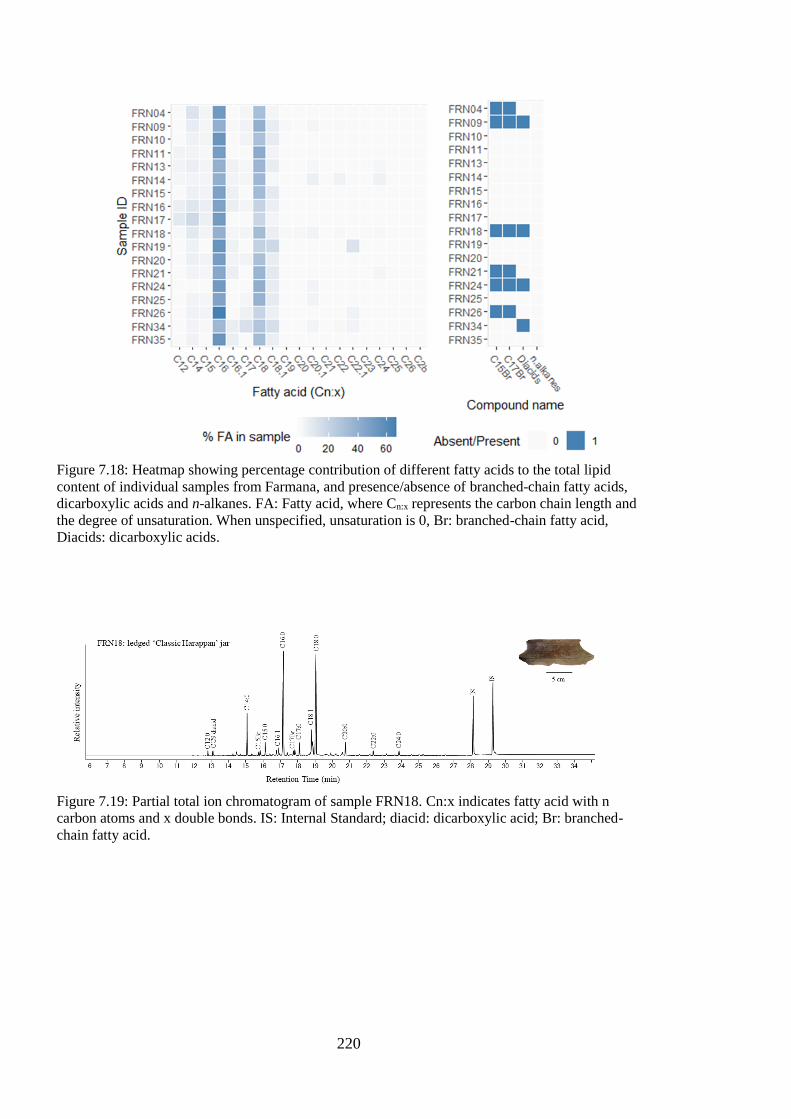
220
Figure 7.18: Heatmap showing percentage contribution of different fatty acids to the total lipid
content of individual samples from Farmana, and presence/absence of branched-chain fatty acids,
dicarboxylic acids and n-alkanes. FA: Fatty acid, where Cn:x represents the carbon chain length and
the degree of unsaturation. When unspecified, unsaturation is 0, Br: branched-chain fatty acid,
Diacids: dicarboxylic acids.
Figure 7.19: Partial total ion chromatogram of sample FRN18. Cn:x indicates fatty acid with n
carbon atoms and x double bonds. IS: Internal Standard; diacid: dicarboxylic acid; Br: branched-
chain fatty acid.
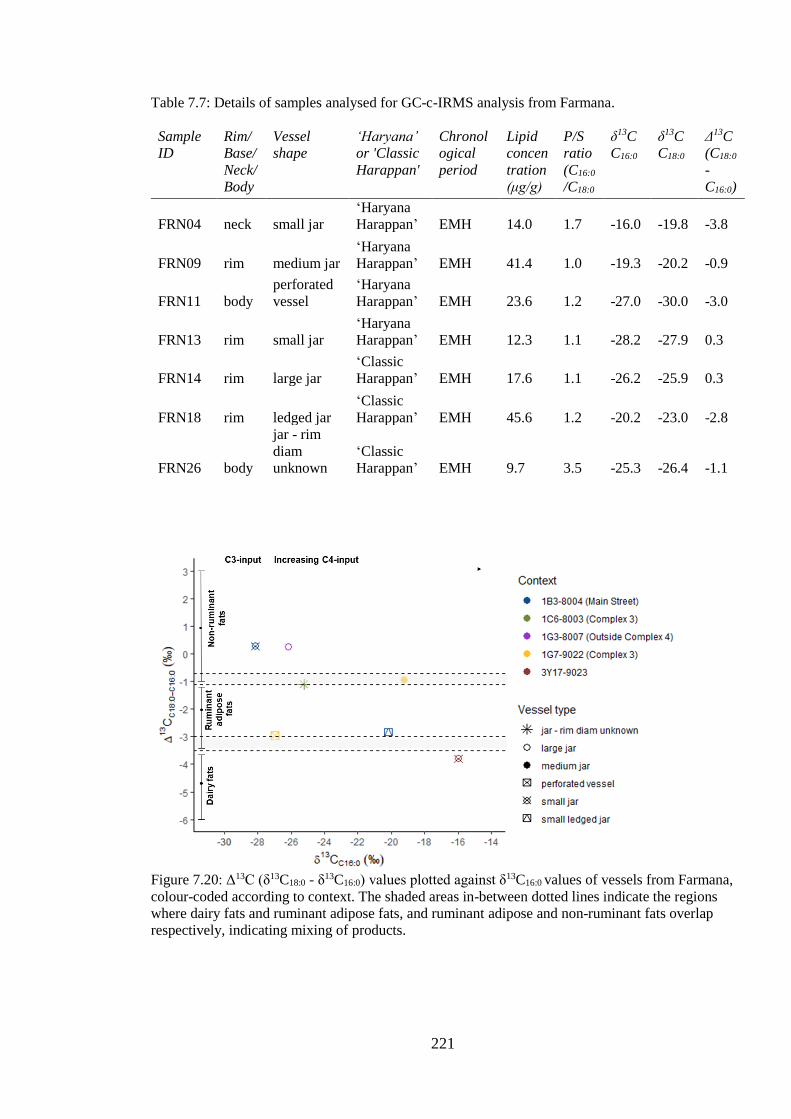
221
Table 7.7: Details of samples analysed for GC-c-IRMS analysis from Farmana.
Sample
ID
Rim/
Base/
Neck/
Body
Vessel
shape
‘Haryana’
or 'Classic
Harappan'
Chronol
ogical
period
Lipid
concen
tration
(μg/g)
P/S
ratio
(C16:0
/C18:0
δ13C
C16:0
δ13C
C18:0
Δ13C
(C18:0
-
C16:0)
FRN04 neck small jar
‘Haryana
Harappan’ EMH 14.0 1.7 -16.0 -19.8 -3.8
FRN09 rim medium jar
‘Haryana
Harappan’ EMH 41.4 1.0 -19.3 -20.2 -0.9
FRN11 body
perforated
vessel
‘Haryana
Harappan’ EMH 23.6 1.2 -27.0 -30.0 -3.0
FRN13 rim small jar
‘Haryana
Harappan’ EMH 12.3 1.1 -28.2 -27.9 0.3
FRN14 rim large jar
‘Classic
Harappan’ EMH 17.6 1.1 -26.2 -25.9 0.3
FRN18 rim ledged jar
‘Classic
Harappan’ EMH 45.6 1.2 -20.2 -23.0 -2.8
FRN26 body
jar - rim
diam
unknown
‘Classic
Harappan’ EMH 9.7 3.5 -25.3 -26.4 -1.1
Figure 7.20: Δ13C (δ13C18:0 - δ13C16:0) values plotted against δ13C16:0 values of vessels from Farmana,
colour-coded according to context. The shaded areas in-between dotted lines indicate the regions
where dairy fats and ruminant adipose fats, and ruminant adipose and non-ruminant fats overlap
respectively, indicating mixing of products.
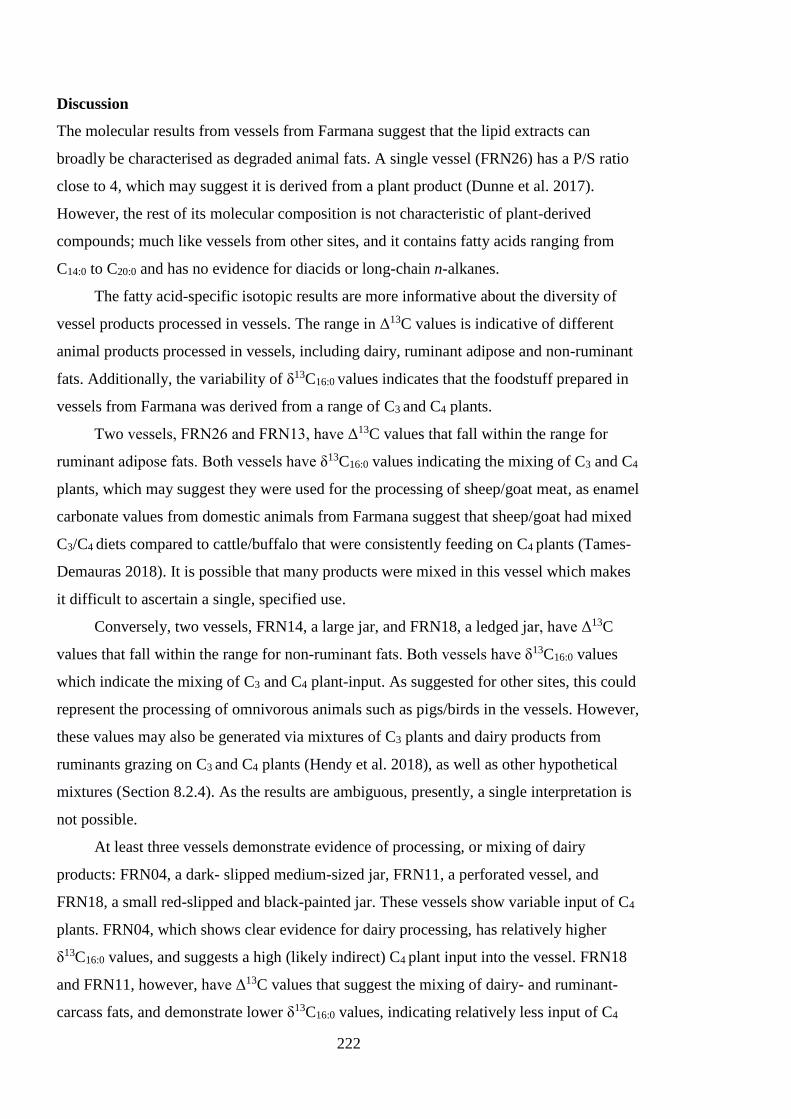
222
Discussion
The molecular results from vessels from Farmana suggest that the lipid extracts can
broadly be characterised as degraded animal fats. A single vessel (FRN26) has a P/S ratio
close to 4, which may suggest it is derived from a plant product (Dunne et al. 2017).
However, the rest of its molecular composition is not characteristic of plant-derived
compounds; much like vessels from other sites, and it contains fatty acids ranging from
C14:0 to C20:0 and has no evidence for diacids or long-chain n-alkanes.
The fatty acid-specific isotopic results are more informative about the diversity of
vessel products processed in vessels. The range in Δ13C values is indicative of different
animal products processed in vessels, including dairy, ruminant adipose and non-ruminant
fats. Additionally, the variability of δ13C16:0 values indicates that the foodstuff prepared in
vessels from Farmana was derived from a range of C3 and C4 plants.
Two vessels, FRN26 and FRN13, have Δ13C values that fall within the range for
ruminant adipose fats. Both vessels have δ13C16:0 values indicating the mixing of C3 and C4
plants, which may suggest they were used for the processing of sheep/goat meat, as enamel
carbonate values from domestic animals from Farmana suggest that sheep/goat had mixed
C3/C4 diets compared to cattle/buffalo that were consistently feeding on C4 plants (Tames-
Demauras 2018). It is possible that many products were mixed in this vessel which makes
it difficult to ascertain a single, specified use.
Conversely, two vessels, FRN14, a large jar, and FRN18, a ledged jar, have Δ13C
values that fall within the range for non-ruminant fats. Both vessels have δ13C16:0 values
which indicate the mixing of C3 and C4 plant-input. As suggested for other sites, this could
represent the processing of omnivorous animals such as pigs/birds in the vessels. However,
these values may also be generated via mixtures of C3 plants and dairy products from
ruminants grazing on C3 and C4 plants (Hendy et al. 2018), as well as other hypothetical
mixtures (Section 8.2.4). As the results are ambiguous, presently, a single interpretation is
not possible.
At least three vessels demonstrate evidence of processing, or mixing of dairy
products: FRN04, a dark- slipped medium-sized jar, FRN11, a perforated vessel, and
FRN18, a small red-slipped and black-painted jar. These vessels show variable input of C4
plants. FRN04, which shows clear evidence for dairy processing, has relatively higher
δ13C16:0 values, and suggests a high (likely indirect) C4 plant input into the vessel. FRN18
and FRN11, however, have Δ13C values that suggest the mixing of dairy- and ruminant-
carcass fats, and demonstrate lower δ13C16:0 values, indicating relatively less input of C4
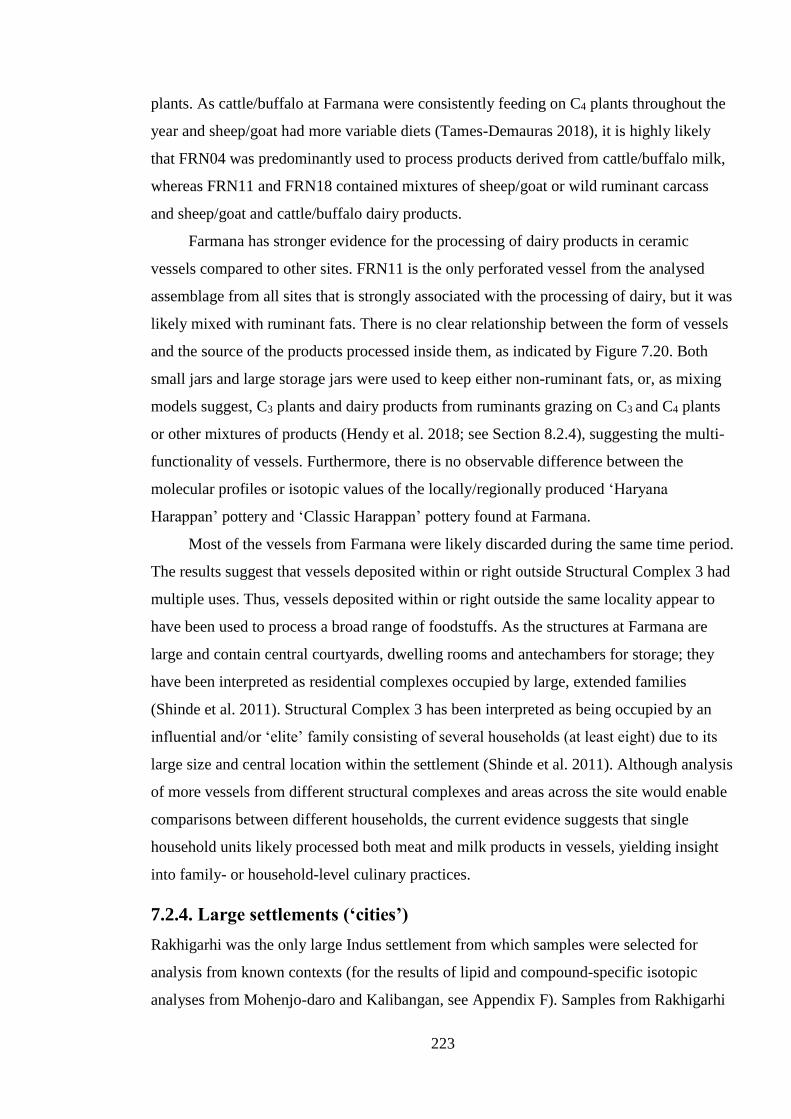
223
plants. As cattle/buffalo at Farmana were consistently feeding on C4 plants throughout the
year and sheep/goat had more variable diets (Tames-Demauras 2018), it is highly likely
that FRN04 was predominantly used to process products derived from cattle/buffalo milk,
whereas FRN11 and FRN18 contained mixtures of sheep/goat or wild ruminant carcass
and sheep/goat and cattle/buffalo dairy products.
Farmana has stronger evidence for the processing of dairy products in ceramic
vessels compared to other sites. FRN11 is the only perforated vessel from the analysed
assemblage from all sites that is strongly associated with the processing of dairy, but it was
likely mixed with ruminant fats. There is no clear relationship between the form of vessels
and the source of the products processed inside them, as indicated by Figure 7.20. Both
small jars and large storage jars were used to keep either non-ruminant fats, or, as mixing
models suggest, C3 plants and dairy products from ruminants grazing on C3 and C4 plants
or other mixtures of products (Hendy et al. 2018; see Section 8.2.4), suggesting the multi-
functionality of vessels. Furthermore, there is no observable difference between the
molecular profiles or isotopic values of the locally/regionally produced ‘Haryana
Harappan’ pottery and ‘Classic Harappan’ pottery found at Farmana.
Most of the vessels from Farmana were likely discarded during the same time period.
The results suggest that vessels deposited within or right outside Structural Complex 3 had
multiple uses. Thus, vessels deposited within or right outside the same locality appear to
have been used to process a broad range of foodstuffs. As the structures at Farmana are
large and contain central courtyards, dwelling rooms and antechambers for storage; they
have been interpreted as residential complexes occupied by large, extended families
(Shinde et al. 2011). Structural Complex 3 has been interpreted as being occupied by an
influential and/or ‘elite’ family consisting of several households (at least eight) due to its
large size and central location within the settlement (Shinde et al. 2011). Although analysis
of more vessels from different structural complexes and areas across the site would enable
comparisons between different households, the current evidence suggests that single
household units likely processed both meat and milk products in vessels, yielding insight
into family- or household-level culinary practices.
7.2.4. Large settlements (‘cities’)
Rakhigarhi was the only large Indus settlement from which samples were selected for
analysis from known contexts (for the results of lipid and compound-specific isotopic
analyses from Mohenjo-daro and Kalibangan, see Appendix F). Samples from Rakhigarhi
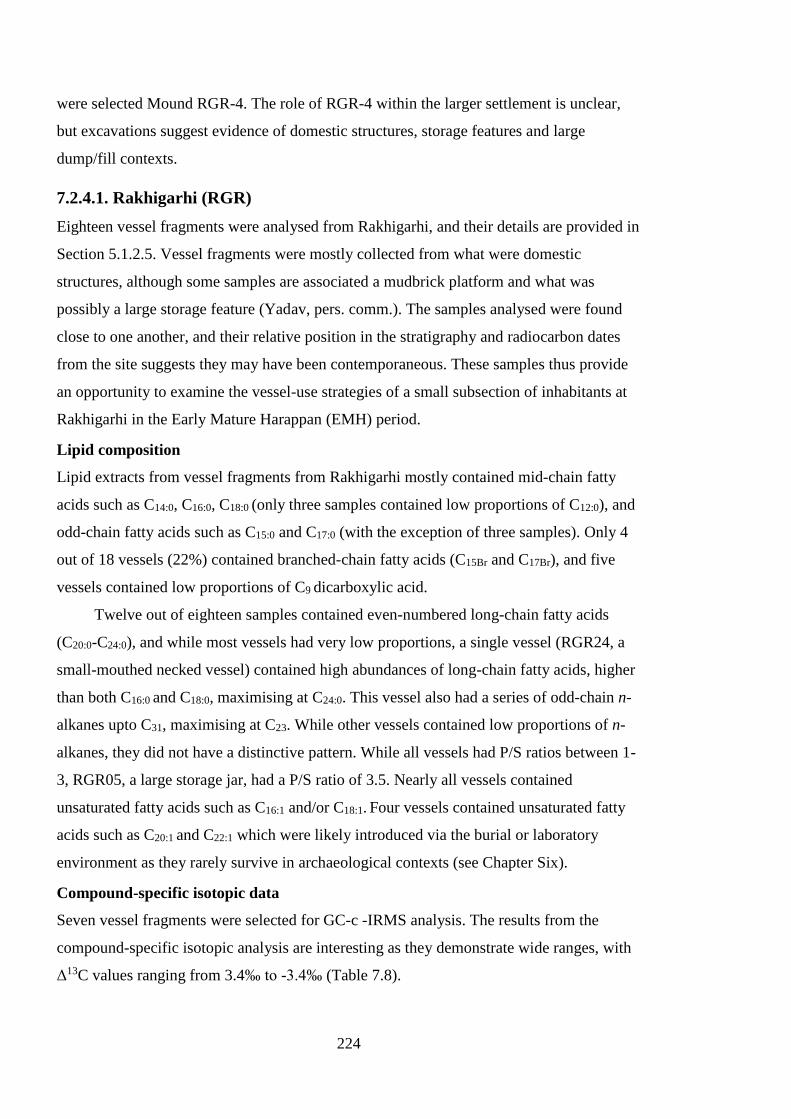
224
were selected Mound RGR-4. The role of RGR-4 within the larger settlement is unclear,
but excavations suggest evidence of domestic structures, storage features and large
dump/fill contexts.
7.2.4.1. Rakhigarhi (RGR)
Eighteen vessel fragments were analysed from Rakhigarhi, and their details are provided in
Section 5.1.2.5. Vessel fragments were mostly collected from what were domestic
structures, although some samples are associated a mudbrick platform and what was
possibly a large storage feature (Yadav, pers. comm.). The samples analysed were found
close to one another, and their relative position in the stratigraphy and radiocarbon dates
from the site suggests they may have been contemporaneous. These samples thus provide
an opportunity to examine the vessel-use strategies of a small subsection of inhabitants at
Rakhigarhi in the Early Mature Harappan (EMH) period.
Lipid composition
Lipid extracts from vessel fragments from Rakhigarhi mostly contained mid-chain fatty
acids such as C14:0, C16:0, C18:0 (only three samples contained low proportions of C12:0), and
odd-chain fatty acids such as C15:0 and C17:0 (with the exception of three samples). Only 4
out of 18 vessels (22%) contained branched-chain fatty acids (C15Br and C17Br), and five
vessels contained low proportions of C9 dicarboxylic acid.
Twelve out of eighteen samples contained even-numbered long-chain fatty acids
(C20:0-C24:0), and while most vessels had very low proportions, a single vessel (RGR24, a
small-mouthed necked vessel) contained high abundances of long-chain fatty acids, higher
than both C16:0 and C18:0, maximising at C24:0. This vessel also had a series of odd-chain n-
alkanes upto C31, maximising at C23. While other vessels contained low proportions of n-
alkanes, they did not have a distinctive pattern. While all vessels had P/S ratios between 1-
3, RGR05, a large storage jar, had a P/S ratio of 3.5. Nearly all vessels contained
unsaturated fatty acids such as C16:1 and/or C18:1. Four vessels contained unsaturated fatty
acids such as C20:1 and C22:1 which were likely introduced via the burial or laboratory
environment as they rarely survive in archaeological contexts (see Chapter Six).
Compound-specific isotopic data
Seven vessel fragments were selected for GC-c -IRMS analysis. The results from the
compound-specific isotopic analysis are interesting as they demonstrate wide ranges, with
Δ13C values ranging from 3.4‰ to -3.4‰ (Table 7.8).
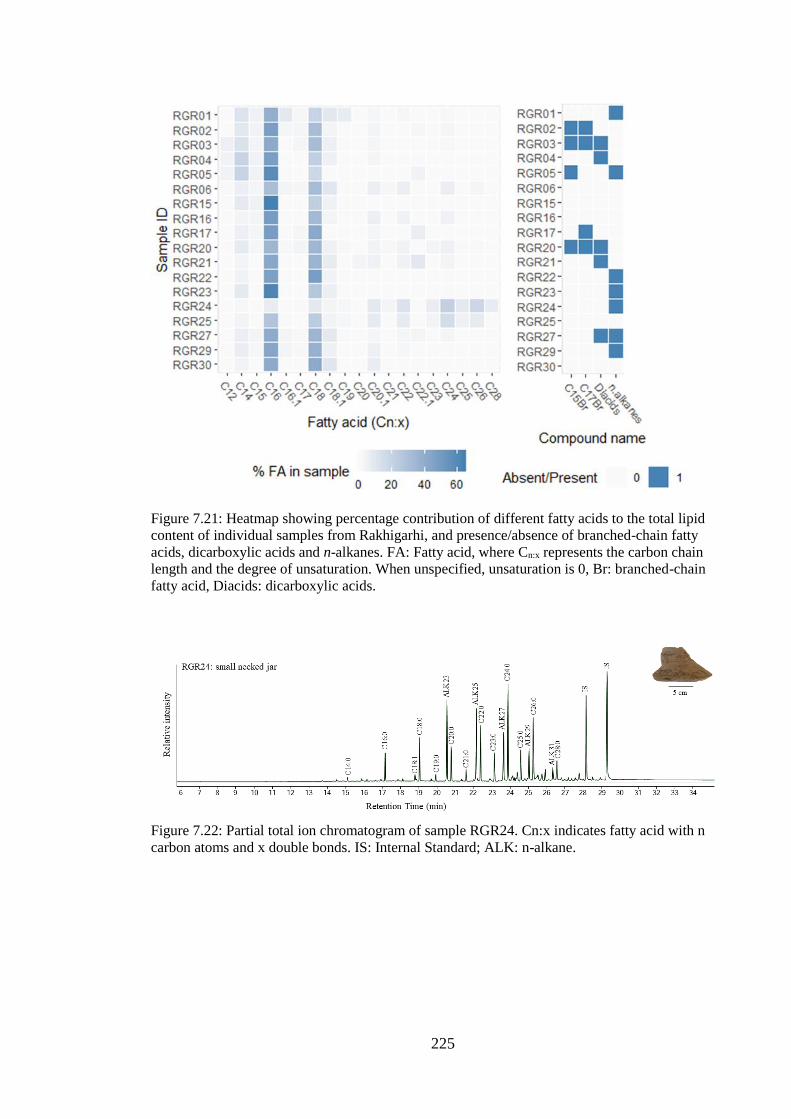
225
Figure 7.21: Heatmap showing percentage contribution of different fatty acids to the total lipid
content of individual samples from Rakhigarhi, and presence/absence of branched-chain fatty
acids, dicarboxylic acids and n-alkanes. FA: Fatty acid, where Cn:x represents the carbon chain
length and the degree of unsaturation. When unspecified, unsaturation is 0, Br: branched-chain
fatty acid, Diacids: dicarboxylic acids.
Figure 7.22: Partial total ion chromatogram of sample RGR24. Cn:x indicates fatty acid with n
carbon atoms and x double bonds. IS: Internal Standard; ALK: n-alkane.
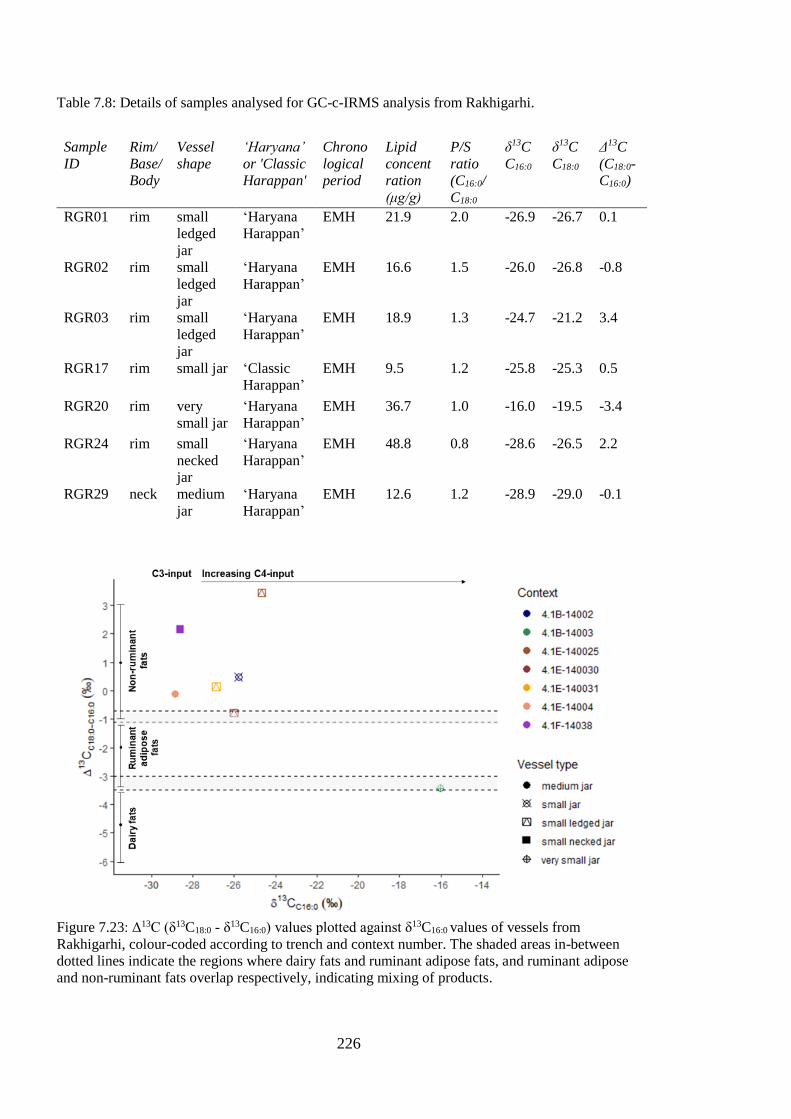
226
Table 7.8: Details of samples analysed for GC-c-IRMS analysis from Rakhigarhi.
Sample
ID
Rim/
Base/
Body
Vessel
shape
‘Haryana’
or 'Classic
Harappan'
Chrono
logical
period
Lipid
concent
ration
(μg/g)
P/S
ratio
(C16:0/
C18:0
δ13C
C16:0
δ13C
C18:0
Δ13C
(C18:0-
C16:0)
RGR01 rim small
ledged
jar
‘Haryana
Harappan’
EMH 21.9 2.0 -26.9 -26.7 0.1
RGR02 rim small
ledged
jar
‘Haryana
Harappan’
EMH 16.6 1.5 -26.0 -26.8 -0.8
RGR03 rim small
ledged
jar
‘Haryana
Harappan’
EMH 18.9 1.3 -24.7 -21.2 3.4
RGR17 rim small jar ‘Classic
Harappan’
EMH 9.5 1.2 -25.8 -25.3 0.5
RGR20 rim very
small jar
‘Haryana
Harappan’
EMH 36.7 1.0 -16.0 -19.5 -3.4
RGR24 rim small
necked
jar
‘Haryana
Harappan’
EMH 48.8 0.8 -28.6 -26.5 2.2
RGR29 neck medium
jar
‘Haryana
Harappan’
EMH 12.6 1.2 -28.9 -29.0 -0.1
Figure 7.23: Δ13C (δ13C18:0 - δ13C16:0) values plotted against δ13C16:0 values of vessels from
Rakhigarhi, colour-coded according to trench and context number. The shaded areas in-between
dotted lines indicate the regions where dairy fats and ruminant adipose fats, and ruminant adipose
and non-ruminant fats overlap respectively, indicating mixing of products.
227
Discussion
The molecular evidence from Rakhigarhi, like that from the other sites, suggest that lipid
residues within vessels are broadly characterised by degraded animal fats. However, a
single vessel (RGR24) has a lipid profile that is characteristic of a plant product as it
contains high proportions of odd-chain n-alkanes, which are found in higher plants (Dunne
et al. 2017) and high proportions of long-chain fatty acids, which are also found in plant
products (Figure 7.22). A predominance of C23 and C25 n-alkanes is known to be
characteristic of submerged and floating aquatic plants (Kolattukudy et al. 1970; Ficken et
al. 2000; Dunne et al. 2017). Another vessel (RGR05) has a high P/S ratio relative to other
vessels (3.5), and P/S ratios of 4 are suggestive of plant input (Dunne et al. 2017). The
lipid profile of this vessel is, however, not characteristic of plant-derived compounds: it
contains fatty acids ranging from C14:0 to C22:0 and contains no odd-long-chain n-alkanes.
Other vessels contained n-alkanes, but their pattern was not distinctive, and they appeared
in very low proportions. It is possible they arise from post-excavation or laboratory
contamination.
Compound-specific isotopic results suggest a variety of animal products were
processed in vessels from Rakhigarhi. There is a 7‰ difference in Δ13C values, indicating
products processed in the vessels originated from both non-ruminant fats and dairy
products. The variation in δ13C16:0 values reflects varying amounts of C4 plant input into
vessels, with a value of -16‰ indicating relatively higher input of C4 plants (see Figure
7.23).
Five vessels from Rakhigarhi have Δ13C values that fall within the non-ruminant fats
range, with one vessel with a value falling in ranges that indicate the mixing of non-
ruminant and ruminant adipose fats (RGR02, small ledged jar) and one with a value which
falls within the dairy products range (RGR20, a very small jar). RGR20 has clear evidence
for the processing of dairy products with a high contribution of C4 plant. Given that there is
evidence for the diet of cattle/buffalo being almost exclusively C4 plant-derived in this
region, it is highly likely that dairy products from cattle/buffalo milk were processed in this
vessel. However, as the zooarchaeological and archaeobotanical remains from Rakhigarhi
are undergoing analysis, it is not possible to integrate the results obtained with other
bioarchaeological evidence.
Although the number of vessels from Rakhigarhi analysed via GC-c-IRMS analysis were
low, all three ledged jars have high Δ13C values: one (RGR03) has the highest Δ13C value
from the entire assemblage of pottery studied in this thesis (3.4‰), the second (RGR01)
228
falls well within the established range of non-ruminant fats, and the third vessel (RGR02)
falls between the non-ruminant and ruminant adipose fats range, indicating the mixing of
products. As ledged jars have been linked with contemporary/modern cooking vessels
(handis), this could suggest their use for the cooking of meat products. However, variable
δ13C16:0 values suggest differential input of C3 and C4 plant, indicating that animals
processed in the vessels had variable diets.
Like at Farmana, the pottery from Rakhigarhi consists of a range of locally produced,
regional ‘Haryana Harappan’ pottery, as well as ‘Classic Harappan’ pottery that may have
been produced outside the Haryana region. Although the ‘Classic Harappan’ vessels that
have been analysed have very low lipid concentrations relative to ‘Haryana Harappan’
vessels (out of 5 vessels analysed, only one has a lipid yield over 5 μg/g and is listed in
Table 7.7), the molecular profiles of these vessels show no observable difference. All
vessels have evidence for the processing of meat products, except for with a single small
necked jar (RGR24) that contains clear evidence for plant products. When combined with
isotopic analyses, the use of the vessels appears primarily associated with the processing of
non-ruminant products, but the vessel with clear molecular evidence for plant products also
falls within this range. It has been noted that the Δ13C values of plants can be variable,
ranging between -2‰ and 1‰ (Steele et al. 2010). All except one of the vessels from
Rakhigarhi (and several other sites) fall within this ambiguous region. Thus, at present it is
not possible to confidently state whether these vessels were predominantly used for the
processing of non-ruminant fats, plant products, or mixtures of C3 plants and dairy products
from ruminants grazing on C3 and C4 plants (Hendy et al. 2018) or other mixtures (see
Section 8.2.4).
Overall, the results from Rakhigarhi demonstrate variable ranges of δ13C values from
fatty acids in lipid extracts, suggesting meat, milk and possibly plant products were
processed in vessels. Since vessel fragments were collected from domestic contexts that
are broadly contemporaneous, they likely are indicative of the vessel-use practices of a few
individuals or families at the settlement, providing a unique glimpse into culinary practices
of a small subsection of the city.
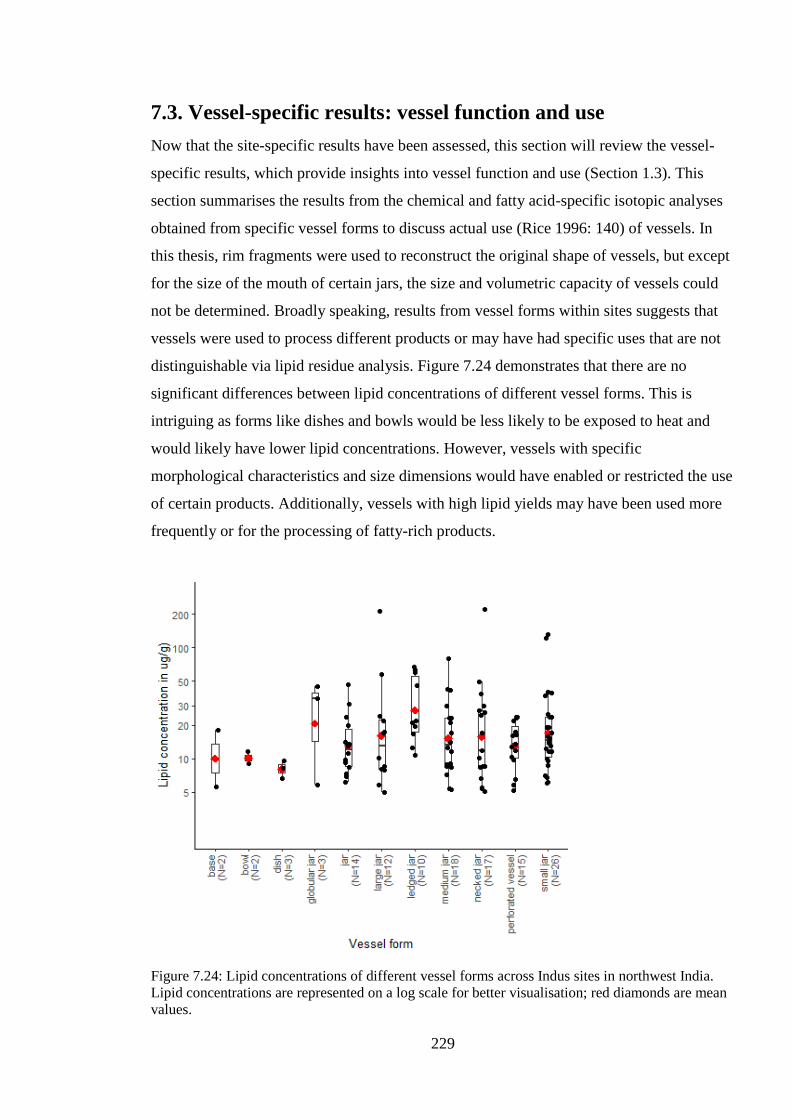
229
7.3. Vessel-specific results: vessel function and use
Now that the site-specific results have been assessed, this section will review the vessel-
specific results, which provide insights into vessel function and use (Section 1.3). This
section summarises the results from the chemical and fatty acid-specific isotopic analyses
obtained from specific vessel forms to discuss actual use (Rice 1996: 140) of vessels. In
this thesis, rim fragments were used to reconstruct the original shape of vessels, but except
for the size of the mouth of certain jars, the size and volumetric capacity of vessels could
not be determined. Broadly speaking, results from vessel forms within sites suggests that
vessels were used to process different products or may have had specific uses that are not
distinguishable via lipid residue analysis. Figure 7.24 demonstrates that there are no
significant differences between lipid concentrations of different vessel forms. This is
intriguing as forms like dishes and bowls would be less likely to be exposed to heat and
would likely have lower lipid concentrations. However, vessels with specific
morphological characteristics and size dimensions would have enabled or restricted the use
of certain products. Additionally, vessels with high lipid yields may have been used more
frequently or for the processing of fatty-rich products.
Figure 7.24: Lipid concentrations of different vessel forms across Indus sites in northwest India.
Lipid concentrations are represented on a log scale for better visualisation; red diamonds are mean
values.
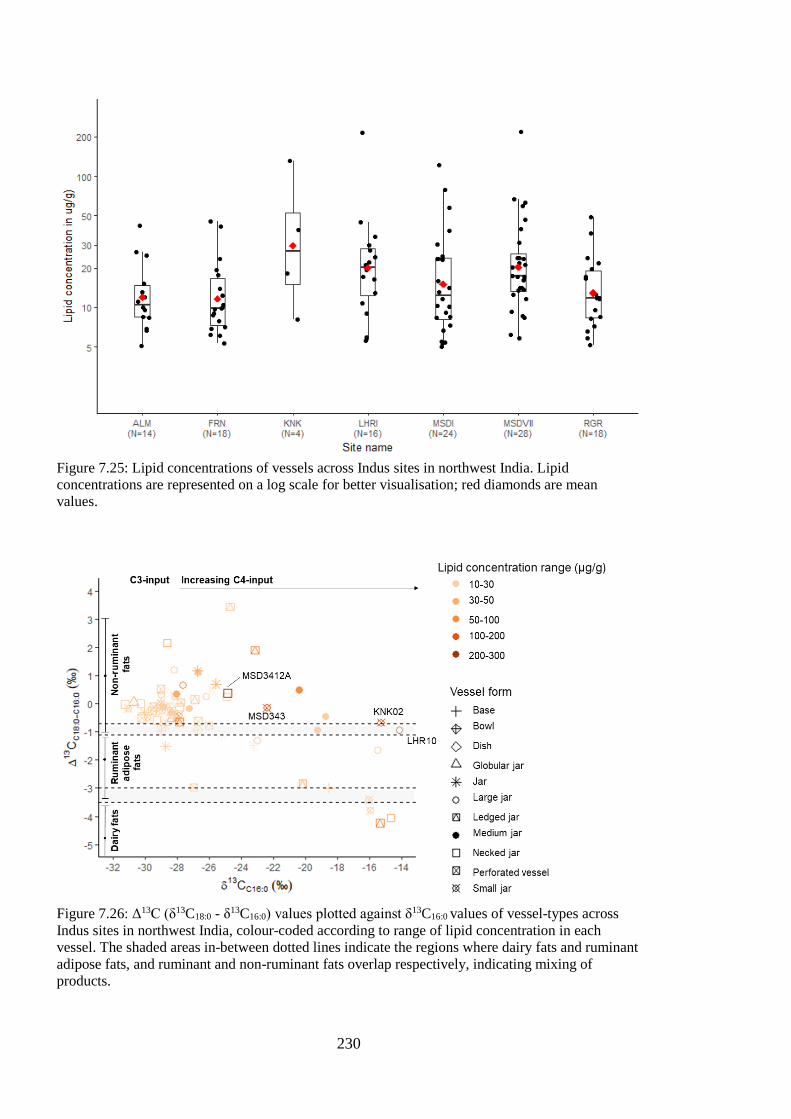
230
Figure 7.25: Lipid concentrations of vessels across Indus sites in northwest India. Lipid
concentrations are represented on a log scale for better visualisation; red diamonds are mean
values.
Figure 7.26: Δ13C (δ13C18:0 - δ13C16:0) values plotted against δ13C16:0 values of vessel-types across
Indus sites in northwest India, colour-coded according to range of lipid concentration in each
vessel. The shaded areas in-between dotted lines indicate the regions where dairy fats and ruminant
adipose fats, and ruminant and non-ruminant fats overlap respectively, indicating mixing of
products.
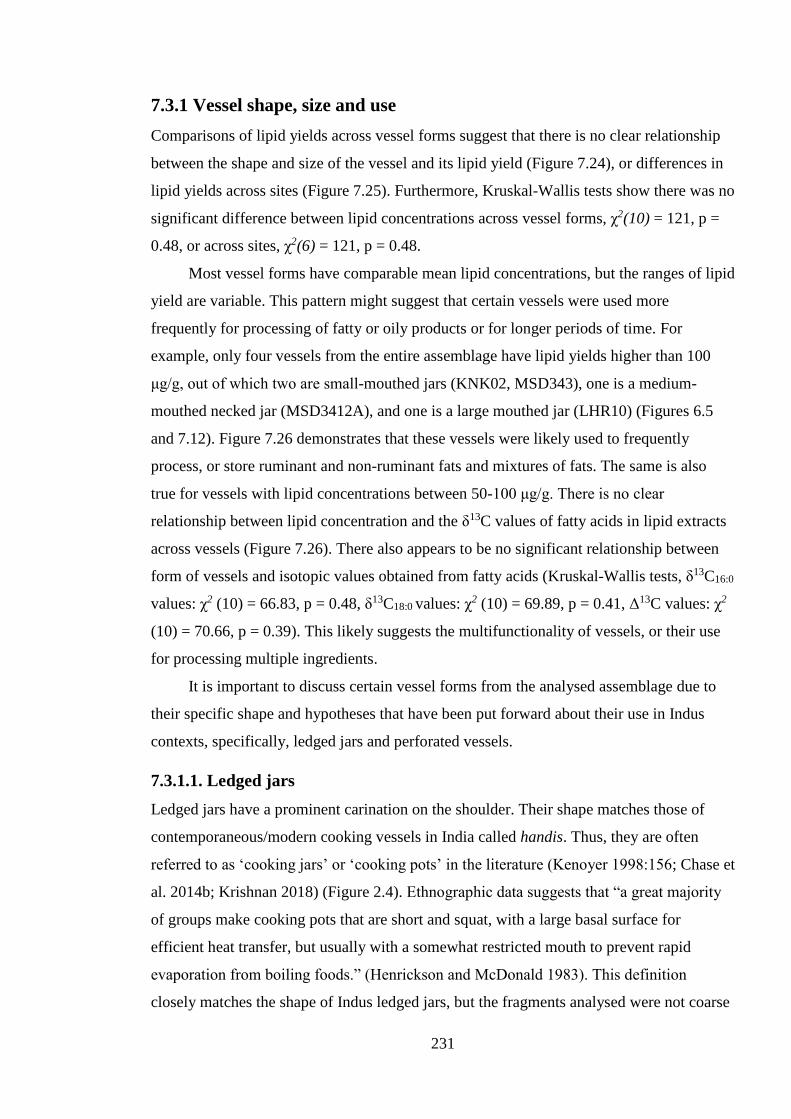
231
7.3.1 Vessel shape, size and use
Comparisons of lipid yields across vessel forms suggest that there is no clear relationship
between the shape and size of the vessel and its lipid yield (Figure 7.24), or differences in
lipid yields across sites (Figure 7.25). Furthermore, Kruskal-Wallis tests show there was no
significant difference between lipid concentrations across vessel forms, χ2(10) = 121, p =
0.48, or across sites, χ2(6) = 121, p = 0.48.
Most vessel forms have comparable mean lipid concentrations, but the ranges of lipid
yield are variable. This pattern might suggest that certain vessels were used more
frequently for processing of fatty or oily products or for longer periods of time. For
example, only four vessels from the entire assemblage have lipid yields higher than 100
μg/g, out of which two are small-mouthed jars (KNK02, MSD343), one is a medium-
mouthed necked jar (MSD3412A), and one is a large mouthed jar (LHR10) (Figures 6.5
and 7.12). Figure 7.26 demonstrates that these vessels were likely used to frequently
process, or store ruminant and non-ruminant fats and mixtures of fats. The same is also
true for vessels with lipid concentrations between 50-100 μg/g. There is no clear
relationship between lipid concentration and the δ13C values of fatty acids in lipid extracts
across vessels (Figure 7.26). There also appears to be no significant relationship between
form of vessels and isotopic values obtained from fatty acids (Kruskal-Wallis tests, δ13C16:0
values: χ2 (10) = 66.83, p = 0.48, δ13C18:0 values: χ2 (10) = 69.89, p = 0.41, Δ13C values: χ2
(10) = 70.66, p = 0.39). This likely suggests the multifunctionality of vessels, or their use
for processing multiple ingredients.
It is important to discuss certain vessel forms from the analysed assemblage due to
their specific shape and hypotheses that have been put forward about their use in Indus
contexts, specifically, ledged jars and perforated vessels.
7.3.1.1. Ledged jars
Ledged jars have a prominent carination on the shoulder. Their shape matches those of
contemporaneous/modern cooking vessels in India called handis. Thus, they are often
referred to as ‘cooking jars’ or ‘cooking pots’ in the literature (Kenoyer 1998:156; Chase et
al. 2014b; Krishnan 2018) (Figure 2.4). Ethnographic data suggests that “a great majority
of groups make cooking pots that are short and squat, with a large basal surface for
efficient heat transfer, but usually with a somewhat restricted mouth to prevent rapid
evaporation from boiling foods.” (Henrickson and McDonald 1983). This definition
closely matches the shape of Indus ledged jars, but the fragments analysed were not coarse
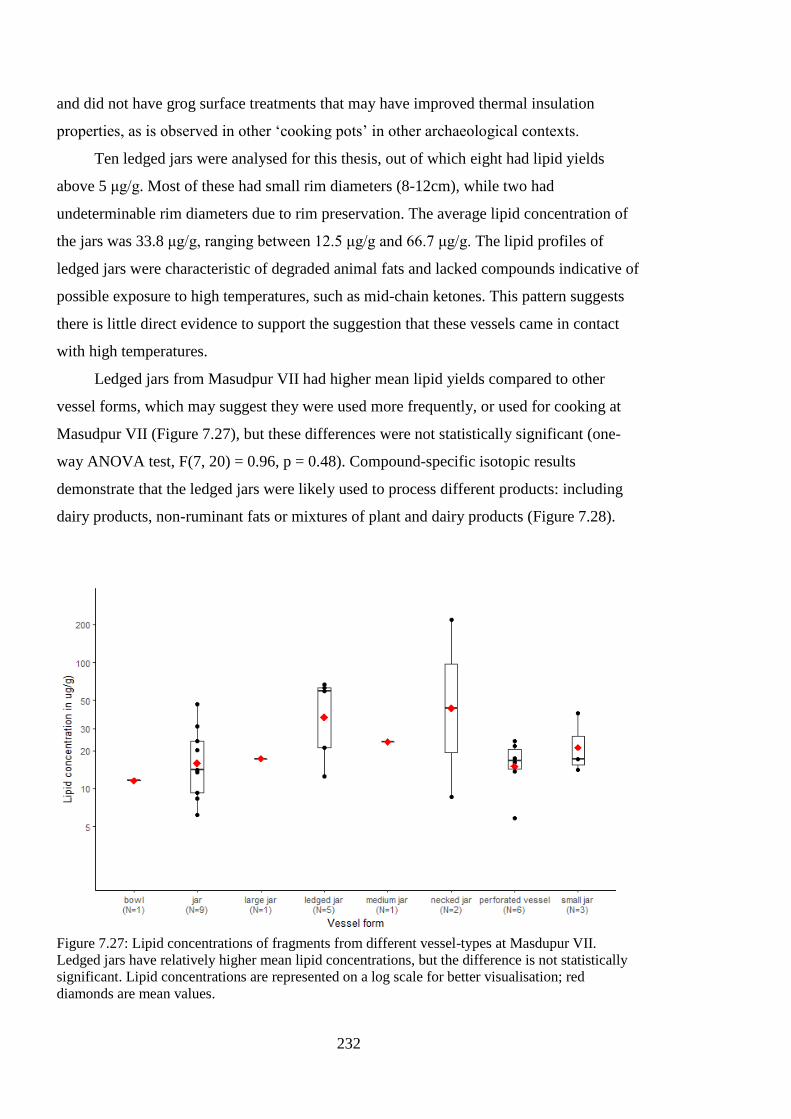
232
and did not have grog surface treatments that may have improved thermal insulation
properties, as is observed in other ‘cooking pots’ in other archaeological contexts.
Ten ledged jars were analysed for this thesis, out of which eight had lipid yields
above 5 μg/g. Most of these had small rim diameters (8-12cm), while two had
undeterminable rim diameters due to rim preservation. The average lipid concentration of
the jars was 33.8 μg/g, ranging between 12.5 μg/g and 66.7 μg/g. The lipid profiles of
ledged jars were characteristic of degraded animal fats and lacked compounds indicative of
possible exposure to high temperatures, such as mid-chain ketones. This pattern suggests
there is little direct evidence to support the suggestion that these vessels came in contact
with high temperatures.
Ledged jars from Masudpur VII had higher mean lipid yields compared to other
vessel forms, which may suggest they were used more frequently, or used for cooking at
Masudpur VII (Figure 7.27), but these differences were not statistically significant (one-
way ANOVA test, F(7, 20) = 0.96, p = 0.48). Compound-specific isotopic results
demonstrate that the ledged jars were likely used to process different products: including
dairy products, non-ruminant fats or mixtures of plant and dairy products (Figure 7.28).
Figure 7.27: Lipid concentrations of fragments from different vessel-types at Masdupur VII.
Ledged jars have relatively higher mean lipid concentrations, but the difference is not statistically
significant. Lipid concentrations are represented on a log scale for better visualisation; red
diamonds are mean values.
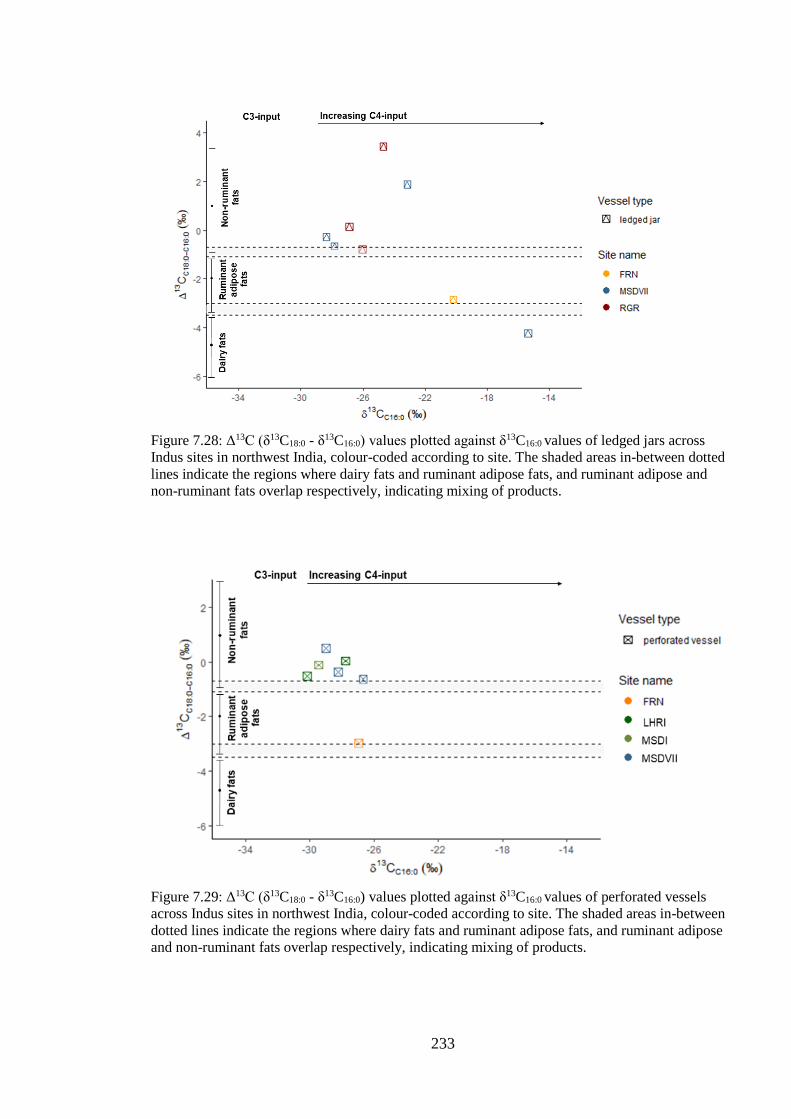
233
Figure 7.28: Δ13C (δ13C18:0 - δ13C16:0) values plotted against δ13C16:0 values of ledged jars across
Indus sites in northwest India, colour-coded according to site. The shaded areas in-between dotted
lines indicate the regions where dairy fats and ruminant adipose fats, and ruminant adipose and
non-ruminant fats overlap respectively, indicating mixing of products.
Figure 7.29: Δ13C (δ13C18:0 - δ13C16:0) values plotted against δ13C16:0 values of perforated vessels
across Indus sites in northwest India, colour-coded according to site. The shaded areas in-between
dotted lines indicate the regions where dairy fats and ruminant adipose fats, and ruminant adipose
and non-ruminant fats overlap respectively, indicating mixing of products.
234
7.3.1.2 Perforated vessels
Perforated vessels are another distinctive vessel form within the Indus Civilisation.
Proposed functions of Indus perforated vessels range from vessels used for brewing or
straining to braziers for storing coal and used for heating (Dales and Kenoyer 1986: 108-
109).
Perforated vessels have been used for identifying dairy activities archaeologically in
European contexts (Roffet-Salque et al. 2013). For example, perforated vessels have been
used for draining and separating curds during the hard cheese making process (Roffet-
Salque et al. 2013). But they have not always been associated with ‘cheese-straining’ in
South Asian contexts, because a hard cheese-making tradition has not existed historically
in South Asia, and still does not today. Dairy curds and yoghurt are prepared daily in
households, but cloth is preferentially used in the straining process. Ethnographic research
of dairy practices in modern Punjab has, however, described the use of perforated lids used
for heat regulation during dairy production (Miller 2004: 216-217). Beyond this, Bourgeois
and Gouin (1995) are the only researchers to have proposed the use of perforated vessels
for dairy processing on the basis of fatty acid profile of a single vessel from Nausharo (see
Section 2.3.5.2.).
Figure 7.27 demonstrates that lipid concentrations of perforated vessels analysed in
this thesis are comparable to those obtained for other types of jars, which is interesting as
most of perforated vessels analysed were fragments of body sherds while other fragments
analysed were rim sherds. Rim sherds are more likely to absorb lipids when foodstuff is
boiled (Charters et al. 1997), but body sherds of perforated vessels would not be able to
retain foodstuff. This morphological parameter suggests it is likely that the perforated
vessels that have been analysed were used to process products that were high in fat or oil
content (as this would increase the likelihood of lipid absorption into the ceramic matrix)
or were very frequently used.
The lipid profiles of perforated vessels were similar to other vessels, and
characteristic of degraded animal fats. Seven out of 15 perforated vessels (47%) were
analysed via GC-c-IRMS analysis. The obtained δ13C values of the fatty acids (Figure
7.29) fall within the established range for non-ruminant fats (n=5), with values of one
vessel from Masudpur VII (MSD1873) falling in between the ranges for non-ruminant and
ruminant adipose fats, and values of a vessel from Farmana (FRN11) falling within the
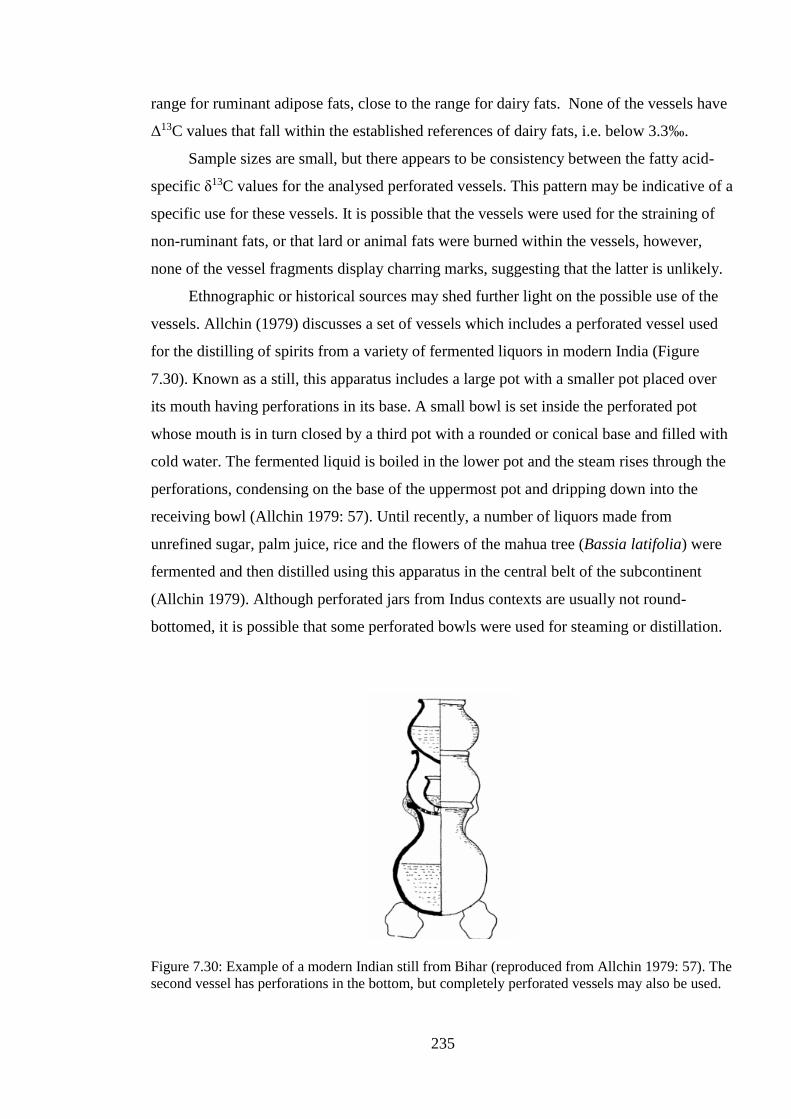
235
range for ruminant adipose fats, close to the range for dairy fats. None of the vessels have
Δ13C values that fall within the established references of dairy fats, i.e. below 3.3‰.
Sample sizes are small, but there appears to be consistency between the fatty acid-
specific δ13C values for the analysed perforated vessels. This pattern may be indicative of a
specific use for these vessels. It is possible that the vessels were used for the straining of
non-ruminant fats, or that lard or animal fats were burned within the vessels, however,
none of the vessel fragments display charring marks, suggesting that the latter is unlikely.
Ethnographic or historical sources may shed further light on the possible use of the
vessels. Allchin (1979) discusses a set of vessels which includes a perforated vessel used
for the distilling of spirits from a variety of fermented liquors in modern India (Figure
7.30). Known as a still, this apparatus includes a large pot with a smaller pot placed over
its mouth having perforations in its base. A small bowl is set inside the perforated pot
whose mouth is in turn closed by a third pot with a rounded or conical base and filled with
cold water. The fermented liquid is boiled in the lower pot and the steam rises through the
perforations, condensing on the base of the uppermost pot and dripping down into the
receiving bowl (Allchin 1979: 57). Until recently, a number of liquors made from
unrefined sugar, palm juice, rice and the flowers of the mahua tree (Bassia latifolia) were
fermented and then distilled using this apparatus in the central belt of the subcontinent
(Allchin 1979). Although perforated jars from Indus contexts are usually not round-
bottomed, it is possible that some perforated bowls were used for steaming or distillation.
Figure 7.30: Example of a modern Indian still from Bihar (reproduced from Allchin 1979: 57). The
second vessel has perforations in the bottom, but completely perforated vessels may also be used.
236
Another interesting historical example worth mentioning is the use of “a pot with a
hundred holes” in the preparation of alcoholic beverages known as sura and soma (Oort
2002). These beverages feature prominently in later ancient Hindu texts such as the
Rigveda and are associated with healing and consumed in ritual and sacrificial contexts.
The use and preparation of sura are described in Satapatha Brahmana and other
Brahmanic texts with elaborate ritualization of the process, with ingredients such as malted
grain, especially rice and barley; powders made of pulses and spices; milk; even the hair of
exotic animals (Oort 2002).
The mention of ‘a pot with a “hundred” holes’ is reminiscent of the perforated vessel,
however, the texts do not specify how this vessel is used in the preparation of sura. While
it would be unwise to draw parallels between the use of a Vedic or possibly later satatrnna
‘pot with holes’ and Indus perforated vessels, given the form of the vessel, its use for the
preparation of a liquid-based product is highly likely. Δ13C values from the lipid extracts of
the analysed perforated vessels are consistent with values obtained by mixtures of C3 plants
and dairy products from ruminants grazing on C3 and C4 plants (Hendy et al. 2018; see
Section 8.2.4), which suggests vessels could have been used to prepare brews with these
ingredients. This finding can be confirmed with the analysis of more perforated vessel
fragments and the collection of reference fats from South Asia.
7.3.2. ‘Classic’ and ‘Haryana Harappan’ vessels
The difference between ‘Classic’ and ‘Haryana Harappan’ vessels were outlined in
Chapter Two (Section 2.3.1.2). Although vessels from the analysed assemblage exhibiting
‘Classic Harappan’ characteristics were limited (n=9), the lipid and isotopic results did not
reveal any visible differences between these two vessel types (see Figure 7.31, only seven
‘Classic Harappan’ vessels were analysed for GC-c-IRMS analysis). This pattern suggests
that even though ‘Classic Harappan’ vessels may have been produced differently and
perhaps acquired from elsewhere, they were used in similar ways as locally-produced,
‘Haryana Harappan’ vessels. Nonetheless, it is also possible that they were used to process
foodstuff or products prepared in unique ways that are not distinguishable via lipid
analysis.
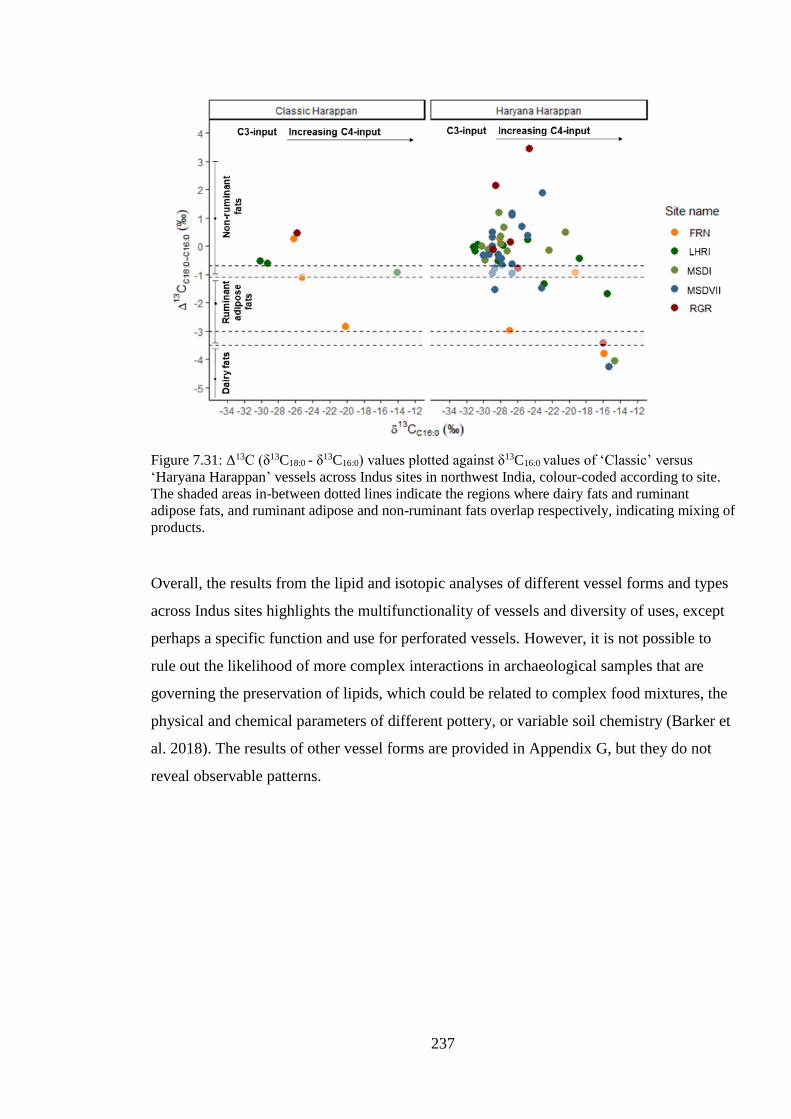
237
Figure 7.31: Δ13C (δ13C18:0 - δ13C16:0) values plotted against δ13C16:0 values of ‘Classic’ versus
‘Haryana Harappan’ vessels across Indus sites in northwest India, colour-coded according to site.
The shaded areas in-between dotted lines indicate the regions where dairy fats and ruminant
adipose fats, and ruminant adipose and non-ruminant fats overlap respectively, indicating mixing of
products.
Overall, the results from the lipid and isotopic analyses of different vessel forms and types
across Indus sites highlights the multifunctionality of vessels and diversity of uses, except
perhaps a specific function and use for perforated vessels. However, it is not possible to
rule out the likelihood of more complex interactions in archaeological samples that are
governing the preservation of lipids, which could be related to complex food mixtures, the
physical and chemical parameters of different pottery, or variable soil chemistry (Barker et
al. 2018). The results of other vessel forms are provided in Appendix G, but they do not
reveal observable patterns.
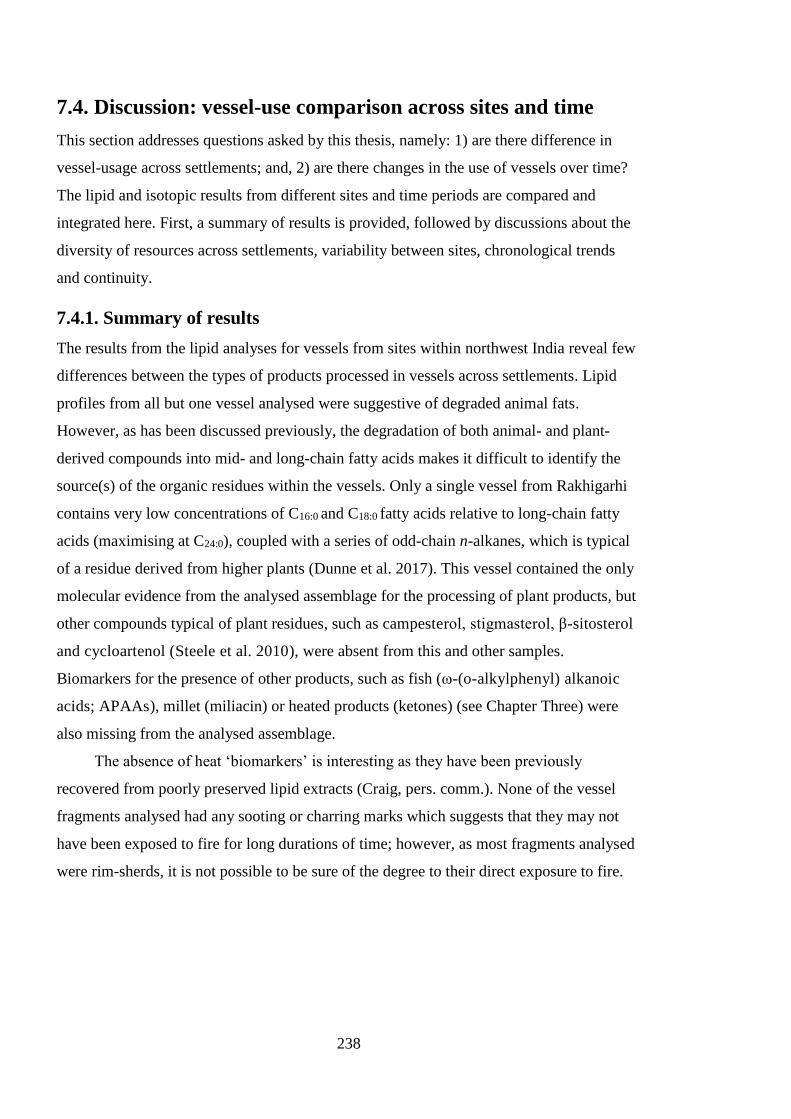
238
7.4. Discussion: vessel-use comparison across sites and time
This section addresses questions asked by this thesis, namely: 1) are there difference in
vessel-usage across settlements; and, 2) are there changes in the use of vessels over time?
The lipid and isotopic results from different sites and time periods are compared and
integrated here. First, a summary of results is provided, followed by discussions about the
diversity of resources across settlements, variability between sites, chronological trends
and continuity.
7.4.1. Summary of results
The results from the lipid analyses for vessels from sites within northwest India reveal few
differences between the types of products processed in vessels across settlements. Lipid
profiles from all but one vessel analysed were suggestive of degraded animal fats.
However, as has been discussed previously, the degradation of both animal- and plant-
derived compounds into mid- and long-chain fatty acids makes it difficult to identify the
source(s) of the organic residues within the vessels. Only a single vessel from Rakhigarhi
contains very low concentrations of C16:0 and C18:0 fatty acids relative to long-chain fatty
acids (maximising at C24:0), coupled with a series of odd-chain n-alkanes, which is typical
of a residue derived from higher plants (Dunne et al. 2017). This vessel contained the only
molecular evidence from the analysed assemblage for the processing of plant products, but
other compounds typical of plant residues, such as campesterol, stigmasterol, β-sitosterol
and cycloartenol (Steele et al. 2010), were absent from this and other samples.
Biomarkers for the presence of other products, such as fish (ω-(o-alkylphenyl) alkanoic
acids; APAAs), millet (miliacin) or heated products (ketones) (see Chapter Three) were
also missing from the analysed assemblage.
The absence of heat ‘biomarkers’ is interesting as they have been previously
recovered from poorly preserved lipid extracts (Craig, pers. comm.). None of the vessel
fragments analysed had any sooting or charring marks which suggests that they may not
have been exposed to fire for long durations of time; however, as most fragments analysed
were rim-sherds, it is not possible to be sure of the degree to their direct exposure to fire.
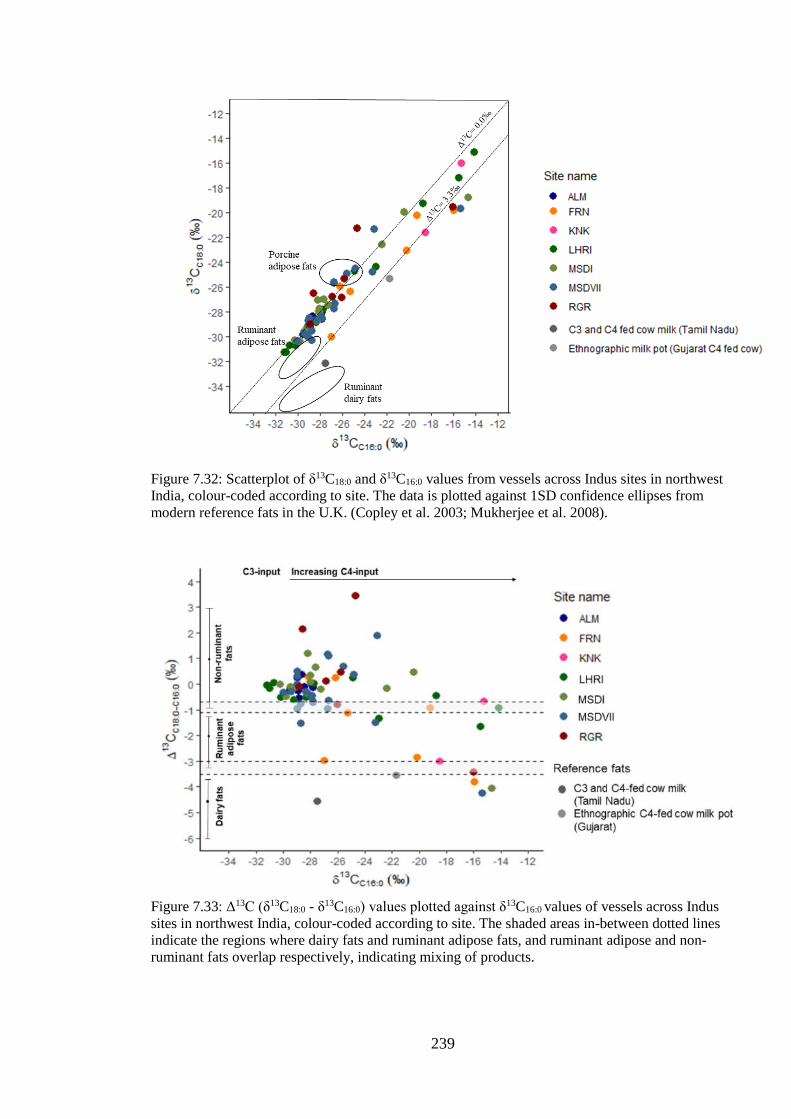
239
Figure 7.32: Scatterplot of δ13C18:0 and δ13C16:0 values from vessels across Indus sites in northwest
India, colour-coded according to site. The data is plotted against 1SD confidence ellipses from
modern reference fats in the U.K. (Copley et al. 2003; Mukherjee et al. 2008).
Figure 7.33: Δ13C (δ13C18:0 - δ13C16:0) values plotted against δ13C16:0 values of vessels across Indus
sites in northwest India, colour-coded according to site. The shaded areas in-between dotted lines
indicate the regions where dairy fats and ruminant adipose fats, and ruminant adipose and non-
ruminant fats overlap respectively, indicating mixing of products.
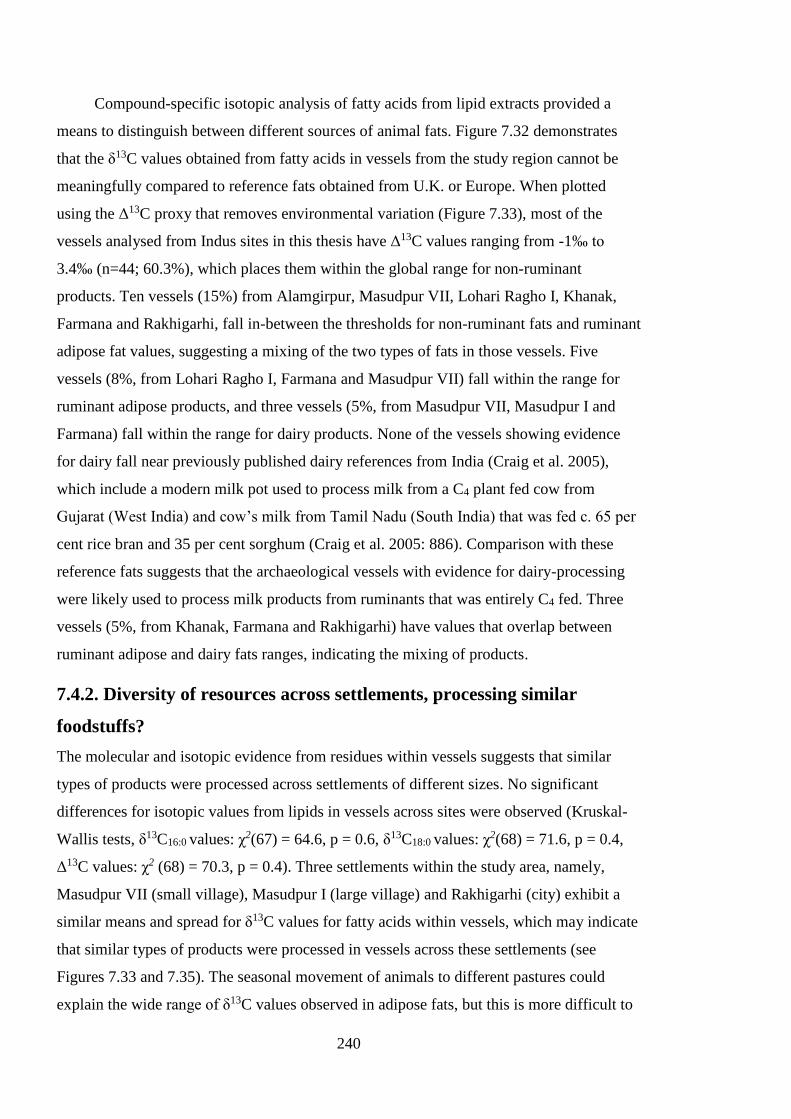
240
Compound-specific isotopic analysis of fatty acids from lipid extracts provided a
means to distinguish between different sources of animal fats. Figure 7.32 demonstrates
that the δ13C values obtained from fatty acids in vessels from the study region cannot be
meaningfully compared to reference fats obtained from U.K. or Europe. When plotted
using the Δ13C proxy that removes environmental variation (Figure 7.33), most of the
vessels analysed from Indus sites in this thesis have Δ13C values ranging from -1‰ to
3.4‰ (n=44; 60.3%), which places them within the global range for non-ruminant
products. Ten vessels (15%) from Alamgirpur, Masudpur VII, Lohari Ragho I, Khanak,
Farmana and Rakhigarhi, fall in-between the thresholds for non-ruminant fats and ruminant
adipose fat values, suggesting a mixing of the two types of fats in those vessels. Five
vessels (8%, from Lohari Ragho I, Farmana and Masudpur VII) fall within the range for
ruminant adipose products, and three vessels (5%, from Masudpur VII, Masudpur I and
Farmana) fall within the range for dairy products. None of the vessels showing evidence
for dairy fall near previously published dairy references from India (Craig et al. 2005),
which include a modern milk pot used to process milk from a C4 plant fed cow from
Gujarat (West India) and cow’s milk from Tamil Nadu (South India) that was fed c. 65 per
cent rice bran and 35 per cent sorghum (Craig et al. 2005: 886). Comparison with these
reference fats suggests that the archaeological vessels with evidence for dairy-processing
were likely used to process milk products from ruminants that was entirely C4 fed. Three
vessels (5%, from Khanak, Farmana and Rakhigarhi) have values that overlap between
ruminant adipose and dairy fats ranges, indicating the mixing of products.
7.4.2. Diversity of resources across settlements, processing similar
foodstuffs?
The molecular and isotopic evidence from residues within vessels suggests that similar
types of products were processed across settlements of different sizes. No significant
differences for isotopic values from lipids in vessels across sites were observed (Kruskal-
Wallis tests, δ13C16:0 values: χ2(67) = 64.6, p = 0.6, δ13C18:0 values: χ2(68) = 71.6, p = 0.4,
Δ13C values: χ2 (68) = 70.3, p = 0.4). Three settlements within the study area, namely,
Masudpur VII (small village), Masudpur I (large village) and Rakhigarhi (city) exhibit a
similar means and spread for δ13C values for fatty acids within vessels, which may indicate
that similar types of products were processed in vessels across these settlements (see
Figures 7.33 and 7.35). The seasonal movement of animals to different pastures could
explain the wide range of δ13C values observed in adipose fats, but this is more difficult to
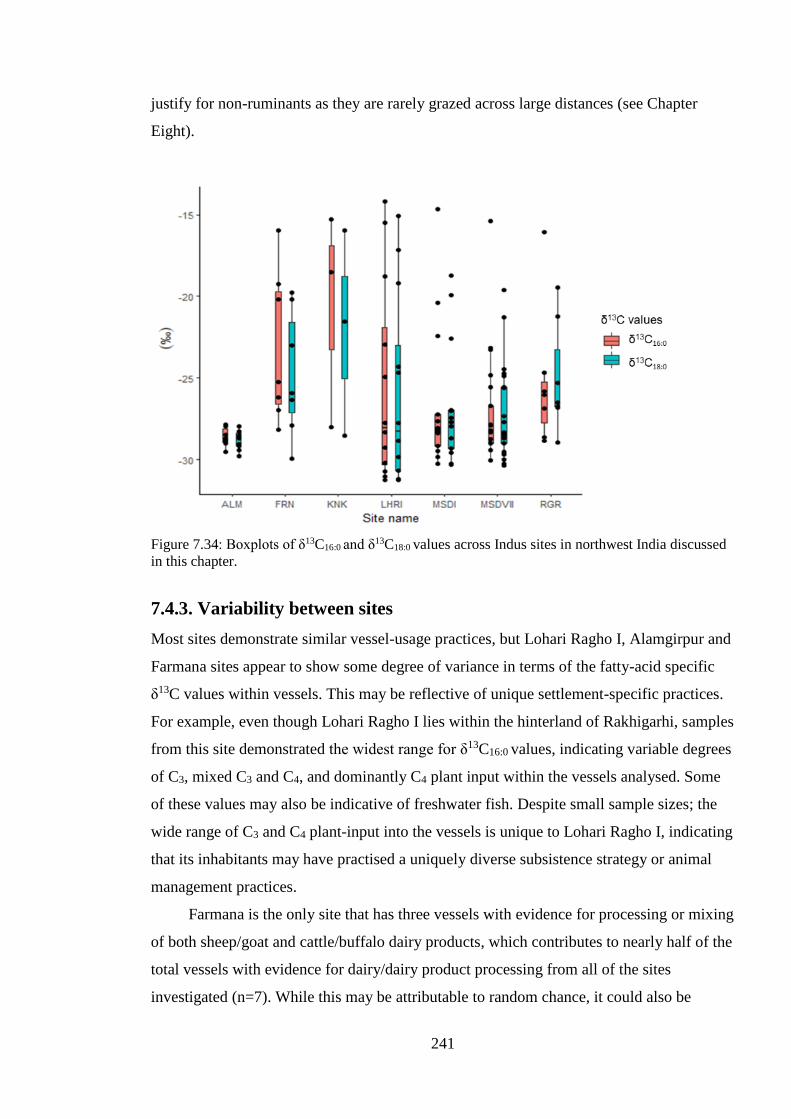
241
justify for non-ruminants as they are rarely grazed across large distances (see Chapter
Eight).
Figure 7.34: Boxplots of δ13C16:0 and δ13C18:0 values across Indus sites in northwest India discussed
in this chapter.
7.4.3. Variability between sites
Most sites demonstrate similar vessel-usage practices, but Lohari Ragho I, Alamgirpur and
Farmana sites appear to show some degree of variance in terms of the fatty-acid specific
δ13C values within vessels. This may be reflective of unique settlement-specific practices.
For example, even though Lohari Ragho I lies within the hinterland of Rakhigarhi, samples
from this site demonstrated the widest range for δ13C16:0 values, indicating variable degrees
of C3, mixed C3 and C4, and dominantly C4 plant input within the vessels analysed. Some
of these values may also be indicative of freshwater fish. Despite small sample sizes; the
wide range of C3 and C4 plant-input into the vessels is unique to Lohari Ragho I, indicating
that its inhabitants may have practised a uniquely diverse subsistence strategy or animal
management practices.
Farmana is the only site that has three vessels with evidence for processing or mixing
of both sheep/goat and cattle/buffalo dairy products, which contributes to nearly half of the
total vessels with evidence for dairy/dairy product processing from all of the sites
investigated (n=7). While this may be attributable to random chance, it could also be
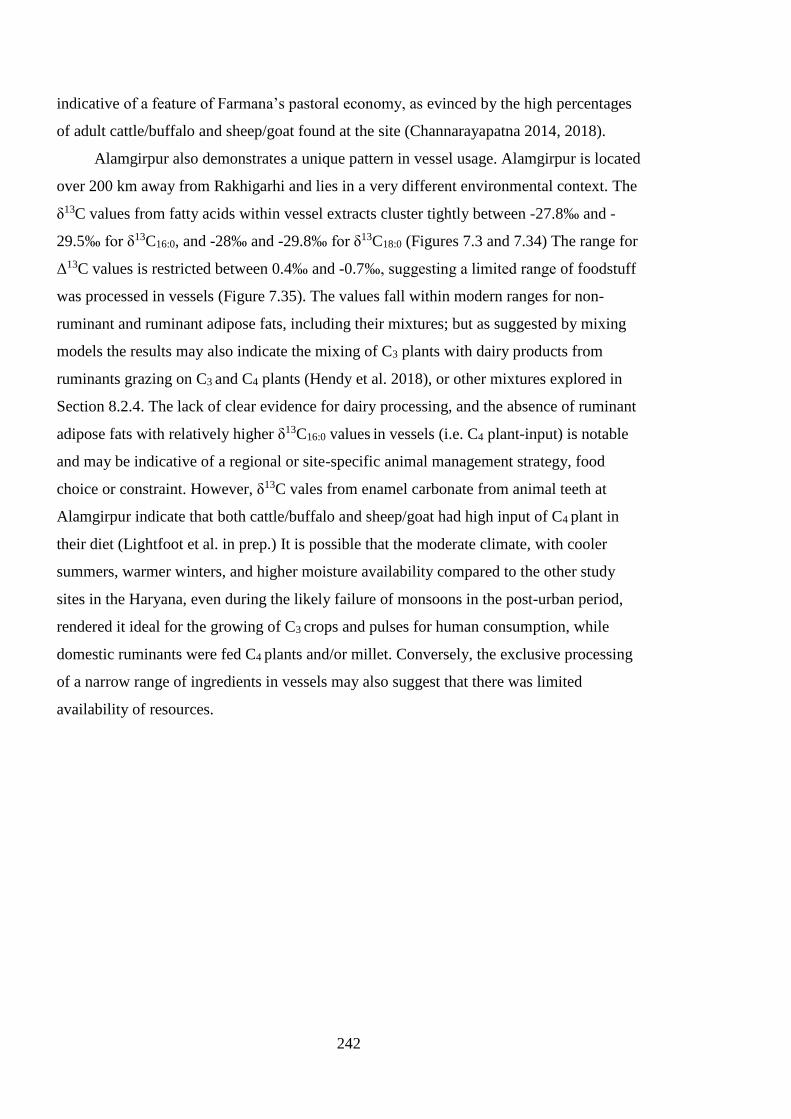
242
indicative of a feature of Farmana’s pastoral economy, as evinced by the high percentages
of adult cattle/buffalo and sheep/goat found at the site (Channarayapatna 2014, 2018).
Alamgirpur also demonstrates a unique pattern in vessel usage. Alamgirpur is located
over 200 km away from Rakhigarhi and lies in a very different environmental context. The
δ13C values from fatty acids within vessel extracts cluster tightly between -27.8‰ and -
29.5‰ for δ13C16:0, and -28‰ and -29.8‰ for δ13C18:0 (Figures 7.3 and 7.34) The range for
Δ13C values is restricted between 0.4‰ and -0.7‰, suggesting a limited range of foodstuff
was processed in vessels (Figure 7.35). The values fall within modern ranges for non-
ruminant and ruminant adipose fats, including their mixtures; but as suggested by mixing
models the results may also indicate the mixing of C3 plants with dairy products from
ruminants grazing on C3 and C4 plants (Hendy et al. 2018), or other mixtures explored in
Section 8.2.4. The lack of clear evidence for dairy processing, and the absence of ruminant
adipose fats with relatively higher δ13C16:0 values in vessels (i.e. C4 plant-input) is notable
and may be indicative of a regional or site-specific animal management strategy, food
choice or constraint. However, δ13C vales from enamel carbonate from animal teeth at
Alamgirpur indicate that both cattle/buffalo and sheep/goat had high input of C4 plant in
their diet (Lightfoot et al. in prep.) It is possible that the moderate climate, with cooler
summers, warmer winters, and higher moisture availability compared to the other study
sites in the Haryana, even during the likely failure of monsoons in the post-urban period,
rendered it ideal for the growing of C3 crops and pulses for human consumption, while
domestic ruminants were fed C4 plants and/or millet. Conversely, the exclusive processing
of a narrow range of ingredients in vessels may also suggest that there was limited
availability of resources.
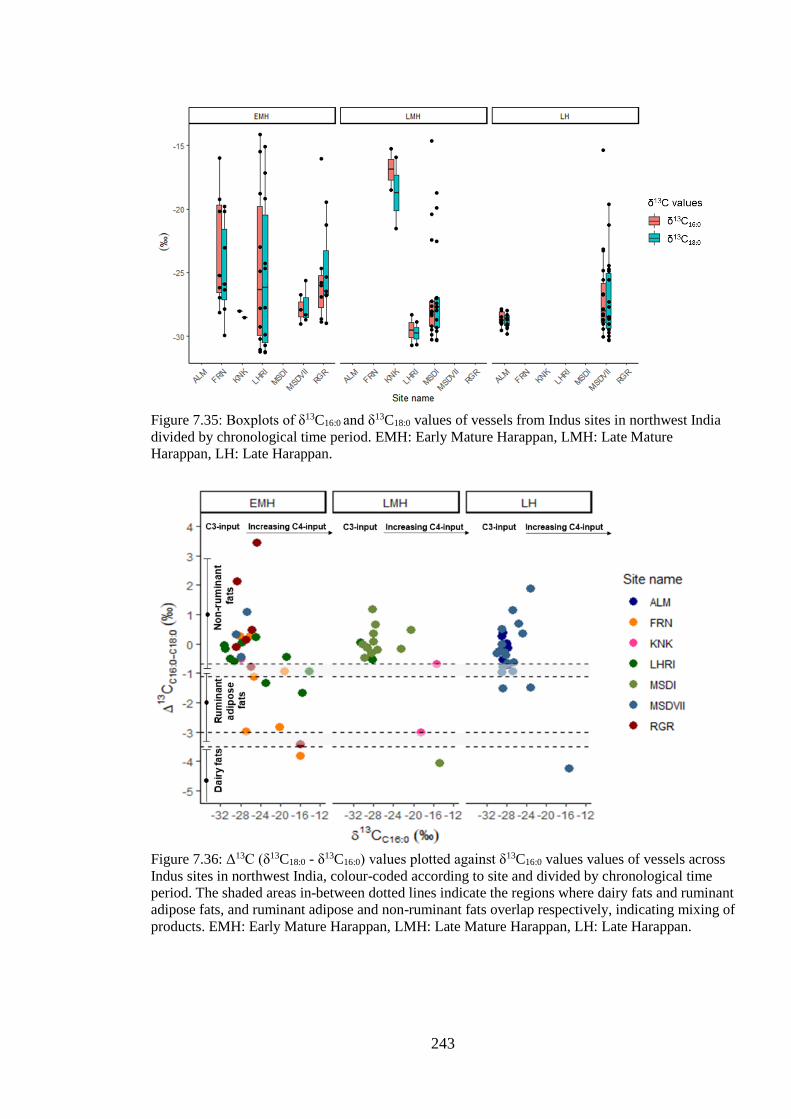
243
Figure 7.35: Boxplots of δ13C16:0 and δ13C18:0 values of vessels from Indus sites in northwest India
divided by chronological time period. EMH: Early Mature Harappan, LMH: Late Mature
Harappan, LH: Late Harappan.
Figure 7.36: Δ13C (δ13C18:0 - δ13C16:0) values plotted against δ13C16:0 values values of vessels across
Indus sites in northwest India, colour-coded according to site and divided by chronological time
period. The shaded areas in-between dotted lines indicate the regions where dairy fats and ruminant
adipose fats, and ruminant adipose and non-ruminant fats overlap respectively, indicating mixing of
products. EMH: Early Mature Harappan, LMH: Late Mature Harappan, LH: Late Harappan.
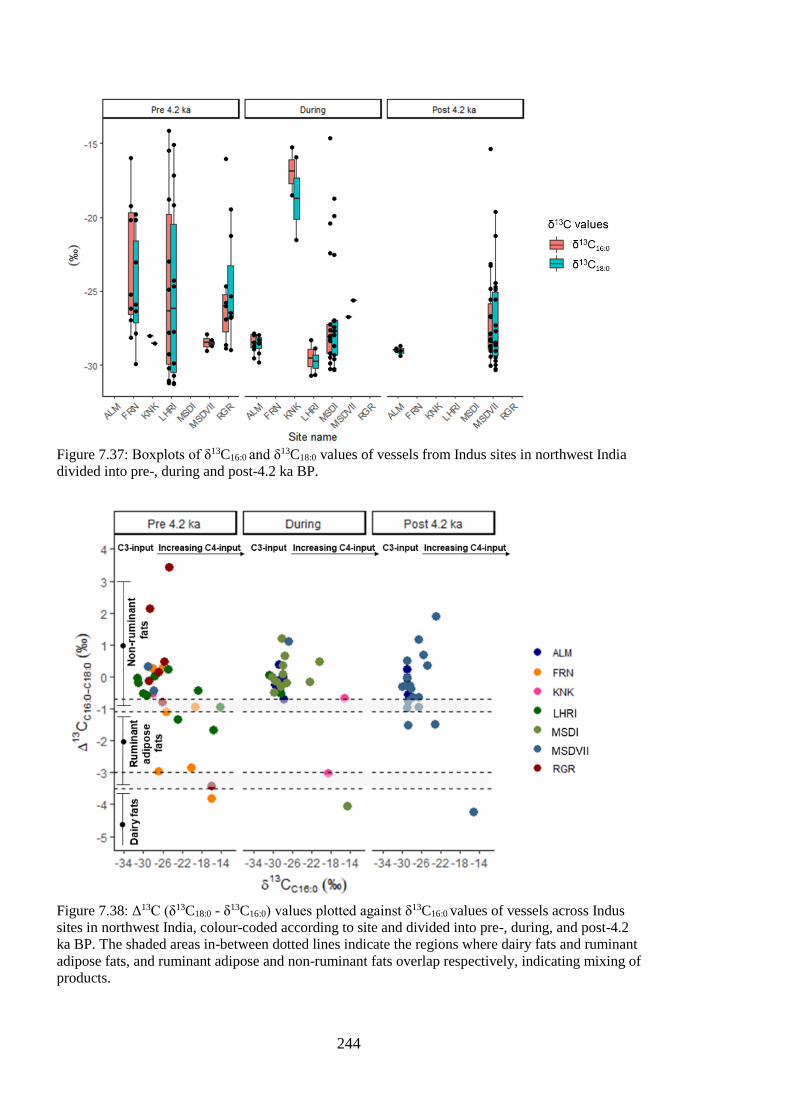
244
Figure 7.37: Boxplots of δ13C16:0 and δ13C18:0 values of vessels from Indus sites in northwest India
divided into pre-, during and post-4.2 ka BP.
Figure 7.38: Δ13C (δ13C18:0 - δ13C16:0) values plotted against δ13C16:0 values of vessels across Indus
sites in northwest India, colour-coded according to site and divided into pre-, during, and post-4.2
ka BP. The shaded areas in-between dotted lines indicate the regions where dairy fats and ruminant
adipose fats, and ruminant adipose and non-ruminant fats overlap respectively, indicating mixing of
products.
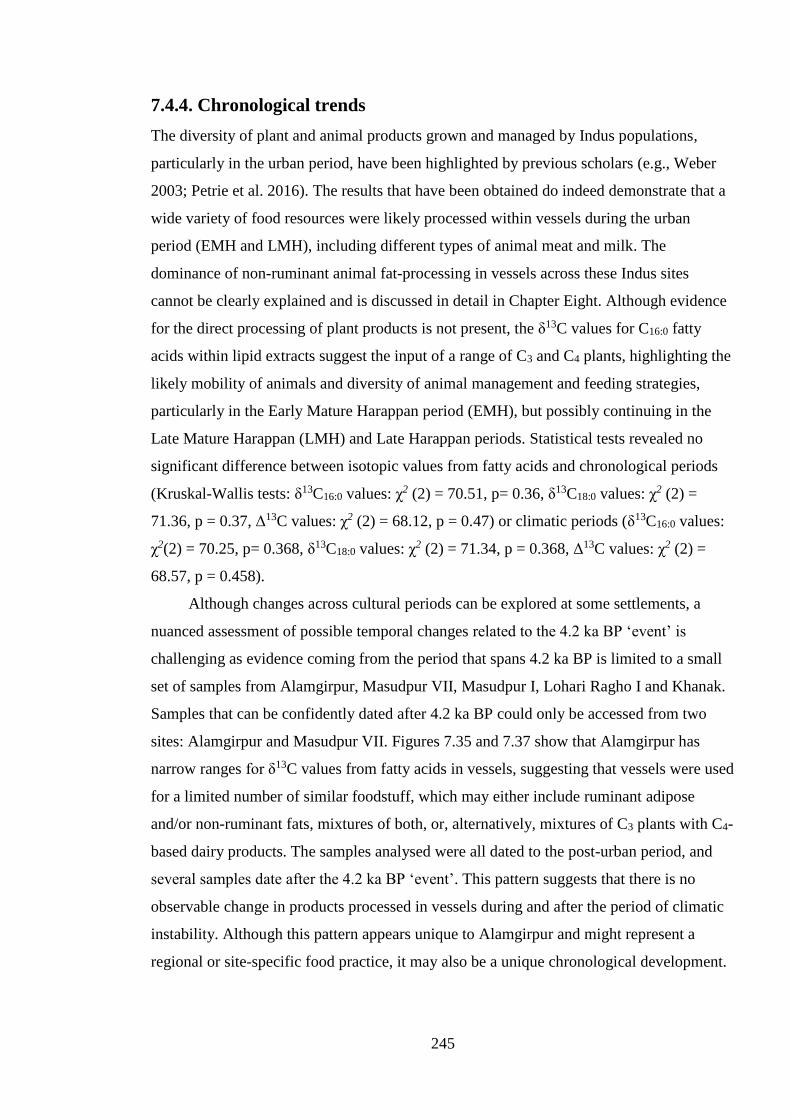
245
7.4.4. Chronological trends
The diversity of plant and animal products grown and managed by Indus populations,
particularly in the urban period, have been highlighted by previous scholars (e.g., Weber
2003; Petrie et al. 2016). The results that have been obtained do indeed demonstrate that a
wide variety of food resources were likely processed within vessels during the urban
period (EMH and LMH), including different types of animal meat and milk. The
dominance of non-ruminant animal fat-processing in vessels across these Indus sites
cannot be clearly explained and is discussed in detail in Chapter Eight. Although evidence
for the direct processing of plant products is not present, the δ13C values for C16:0 fatty
acids within lipid extracts suggest the input of a range of C3 and C4 plants, highlighting the
likely mobility of animals and diversity of animal management and feeding strategies,
particularly in the Early Mature Harappan period (EMH), but possibly continuing in the
Late Mature Harappan (LMH) and Late Harappan periods. Statistical tests revealed no
significant difference between isotopic values from fatty acids and chronological periods
(Kruskal-Wallis tests: δ13C16:0 values: χ2 (2) = 70.51, p= 0.36, δ13C18:0 values: χ2 (2) =
71.36, p = 0.37, Δ13C values: χ2 (2) = 68.12, p = 0.47) or climatic periods (δ13C16:0 values:
χ2(2) = 70.25, p= 0.368, δ13C18:0 values: χ2 (2) = 71.34, p = 0.368, Δ13C values: χ2 (2) =
68.57, p = 0.458).
Although changes across cultural periods can be explored at some settlements, a
nuanced assessment of possible temporal changes related to the 4.2 ka BP ‘event’ is
challenging as evidence coming from the period that spans 4.2 ka BP is limited to a small
set of samples from Alamgirpur, Masudpur VII, Masudpur I, Lohari Ragho I and Khanak.
Samples that can be confidently dated after 4.2 ka BP could only be accessed from two
sites: Alamgirpur and Masudpur VII. Figures 7.35 and 7.37 show that Alamgirpur has
narrow ranges for δ13C values from fatty acids in vessels, suggesting that vessels were used
for a limited number of similar foodstuff, which may either include ruminant adipose
and/or non-ruminant fats, mixtures of both, or, alternatively, mixtures of C3 plants with C4-
based dairy products. The samples analysed were all dated to the post-urban period, and
several samples date after the 4.2 ka BP ‘event’. This pattern suggests that there is no
observable change in products processed in vessels during and after the period of climatic
instability. Although this pattern appears unique to Alamgirpur and might represent a
regional or site-specific food practice, it may also be a unique chronological development.
246
It is not possible to be certain of this interpretation as samples dating to earlier periods at
Alamgirpur were not analysed due to logistic and time restrictions.
Four vessels from Masudpur VII date between c.2500-2300 BC and twenty-one
vessels date between c.1900-1700 BC, representing diachronic vessel-usage pre-, during,
and post 4.2 ka BP (see Figures 7.34 to 7.37). Although the sample sizes are small, vessels
pre- and during 4.2 ka BP fall within the range for non-ruminant fats, suggesting they were
used for processing meat of omnivorous animals, or alternatively, mixtures of C3 plants
and dairy products from ruminants grazing on C3 and C4 plants (Hendy et al. 2018), or
other mixtures (see Section 8.2.4). The range of δ13C values of the fatty acids from vessels
from after 4.2 ka BP is wider, indicating evidence for the processing of a broader range of
products including ruminant adipose fats and dairy products. It is possible that the
differences observed are due to uneven sample sizes, or reflect the fact that inhabitants at
Masudpur VII diversified the products processed in vessels after 4.2 ka BP. Although there
is considerable difficulty in reconciling climate ‘events’ and archaeological evidence as
they operate on unique temporal scales, the evidence appears to suggest that specific
culinary practices seem to have been practised for hundreds of years at Alamgirpur, with
minor evidence for some change at Masudpur VII.
7.5. Chapter Summary
This chapter has provided the results for lipid and isotopic analysis of vessel residues from
very small settlements (small villages), small settlements (villages), a medium-sized
settlement (town) and a large settlements (city) in the Indus civilisation in northwest India.
The results obtained from vessels from each site are provided along with a short discussion
and interpretation. The results are also discussed at a broader, vessel-specific level, with
salient findings highlighted. Finally, a discussion integrating the results across settlements
is provided, which addresses two key questions framed by this thesis. Chapter Eight will
provide a broader discussion, integrating the results presented in both Chapters Six and
Seven with zooarchaeological remains and discussing the implication of results for
understanding Indus foodways.

247
248
Chapter Eight
Synthesis: Vessel-use and foodways in the Indus
Civilisation
The analyses presented in this thesis has made it possible to assess a range of topics,
including preservation of lipid residues in Indus vessels, inter- and intra-site variation in
ceramic lipid residues, vessel-specific results, and spatial and chronological patterns. This
chapter synthesises the results provided in previous chapters, contextualising the findings
with bioarchaeological evidence available from northwest India in the Indus period and
organic residue analyses from other regions in the world. Section 8.1 discusses the extent
to which lipid yields inform us about vessel usage in the Indus Civilisation, and Section 8.2
discusses the different types of products that have been detected in different Indus vessels,
setting out to answer the main question posed by this thesis, ‘what was cooking in Indus
vessels?’ Section 8.3 addresses how this thesis contributes to our understanding of Indus
foodways, and Section 8.4 expands upon our understanding of urban and rural food
practice in Indus sites in northwest India. Finally, potential issues influencing
interpretation of the results are discussed, along with future research avenues.
8.1. Lipid yields and vessel use
The first objective of this thesis was to test, as proof of concept, whether lipid residues are
preserved in a range of Indus pottery from different sites (Chapter Six). As hypothesised,
results demonstrated that lipid concentrations obtained from vessel fragments were low,
ranging between trace amounts to 215 μg/g, with mean lipid concentration of 23.5 μg/g
and median of 13.8 μg/g (n=122). This is likely due to the location of the study sites in arid
environments with alkaline sediments, experiencing seasonal variations in temperature and
rainfall, factors that are detrimental to the survival of organic remains (Cramp 2008;
Evershed 2008a). Lipid yields from sediment were similarly low, ranging between trace
amounts to 38.6 μg/g, (mean of 11.2 μg/g, median of 8.6 μg/g; n=7) suggesting that it is
unlikely lipid yields from vessels were influenced by surrounding sediment organic
content, but this must be assessed on a case-by-case basis. Thus, preservation of lipids is
strongly contingent on burial conditions at sites. However, results from this thesis also
249
indicate that certain sites, or locations within sites may have unique micro-environments
that enable the preservation of organic residues (Barker et al. 2018), for example,
Masudpur VII and Khanak in northwest India. Thus, lipid residue studies in South Asia
should not be neglected due to assumptions about poor organic preservation.
Despite low yields of organic residues, 74% of the analysed vessels contained lipid
concentrations above 5 μg/g, which is the threshold by which lipid yields are considered
archaeologically meaningful (Heron and Evershed 1991; Reber et al. 2019). Vessels
recovered from the same archaeological context had varying ranges of lipid yields. As it is
likely these vessels were buried at similar times and experienced similar post-depositional
conditions, their lipid yields are likely to be indicative of their use in antiquity, with higher
lipid concentrations indicating more frequent use, or their use for the processing of fatty-
rich products. Conversely, although difficult to conclusively suggest, low lipid yields may
indicate brief or ephemeral usage of vessels. Given the vast quantities of vessels recovered
from Indus sites occupied for relatively short periods of time; the sheer volume of ceramic
production may suggest that vessels were transient and not intended for long-term usage.
Previous studies in lipid residue analysis have suggested that there is a relationship
between lipid yields and the life-use of ancient vessels (Evershed 2008a; Budja 2014;
Correa-Ascencio and Evershed 2014; Cramp et al. 2014; Reber et al. 2019). Other studies
have demonstrated how specific types of food processing in vessels, such as boiling or
roasting, would lead to higher concentrations of lipid in specific parts of vessels (e.g.
Charters et al. 1993, 1997). No significant differences between lipid concentrations across
different type of fragments such as rims, bases, neck- and body fragments were observed in
the samples analysed in this thesis. Additionally, the body fragments of perforated vessels
had mean lipid concentrations comparable to rim fragments, which might indicate they
were used for the processing of fat-rich products. However, as different parts of the same
vessel were not analysed, it was not possible to make interpretations about the use of
vessels for specific types of food-processing, except with samples from Stone Tower I,
Salut, Sultanate of Oman (Section 6.1.3.1). Additionally, no significant relationship
between lipid yields within sites and vessel-types were observed, even at Masudpur VII,
where ledged jars, that have previously been associated with cooking (Kenoyer 1998;
Chase et al. 2014b), had higher lipid concentrations relative to other vessel forms (but this
was not significant).
This thesis was also able to address questions related to the use of Indus perforated
vessels, which has been much debated (e.g. Dales and Kenoyer 1986). The results suggest
250
that perforated vessels were not primarily associated only with dairy processing, which
was previously suggested (Bourgeois and Gouin 1995). Instead they have ambiguous, yet
consistent fatty acid-specific δ13C values that links them either to the processing of the
meat of ruminant and/or non-ruminant animals, or mixtures of C3 plants and dairy
products. Although not conclusive, these results are exciting and have implications for how
the Indus perforated vessel is interpreted in future Indus research.
8.2. Food choice: products in Indus vessels in northwest India
This thesis has conducted the first large-scale ceramic lipid residue analysis on vessels in
the Indus Civilisation to address questions about the cultural use of vessels by Indus
populations. While studies have investigated Indus subsistence strategies by examining
crops and agricultural strategies via macrobotanical and phytolith studies (e.g. Vishnu-
Mitre and Savithri 1982; Fuller and Madella 2002; Weber 2003; Madella and Fuller 2006;
Weber et al. 2010; Wright 2010; Fuller 2011; Petrie and Bates 2017), or animal
consumption via zooarchaeology (Meadow 1991; Belcher 1991; Joglekar et al. 2013;
Chase 2014; Chase et al. 2014a, 2018) few studies have considered both (for an exception,
see Fuller 2005; García-Granero et al. in prep). Such combined approaches were advocated
by Weber and Kashyap (2010), but their study only investigated plant-use.
An integration of zooarchaeological, archaeobotanical and other bioarchaeological
evidence with food-related artefacts such as ceramics and grinding stones is necessary to
provide a deeper understanding of how Indus food systems operated in the past. This has
been attempted for the Neolithic in India (Fuller 2005) but has not been discussed in terms
of the Indus Civilisation. Furthermore, it is important to consider how both plants and
animals were grown/raised, prepared and consumed, and how these processes related to
social life and ideas of identity or power. The study of cultural, social and economic
practices concerning food production and consumption, or ‘foodways’ (Staller and
Carrasco 2009; Twiss et al. 2009; Peres 2017) have been largely neglected for the Indus
Civilisation.
This thesis contributes to our understanding of how Indus populations processed
organic products in ceramic vessels and suggests new means by which we can reconstruct
daily habitus practices of inhabitants of Indus settlements. The organic residue analyses
presented here has revealed a range of degraded animal fats in vessels, including dairy fats,
ruminant adipose fats, non-ruminant adipose fats, and their mixtures. Evidence for plant-
processing is limited, as only a single vessel from Rakhigarhi provides direct evidence for
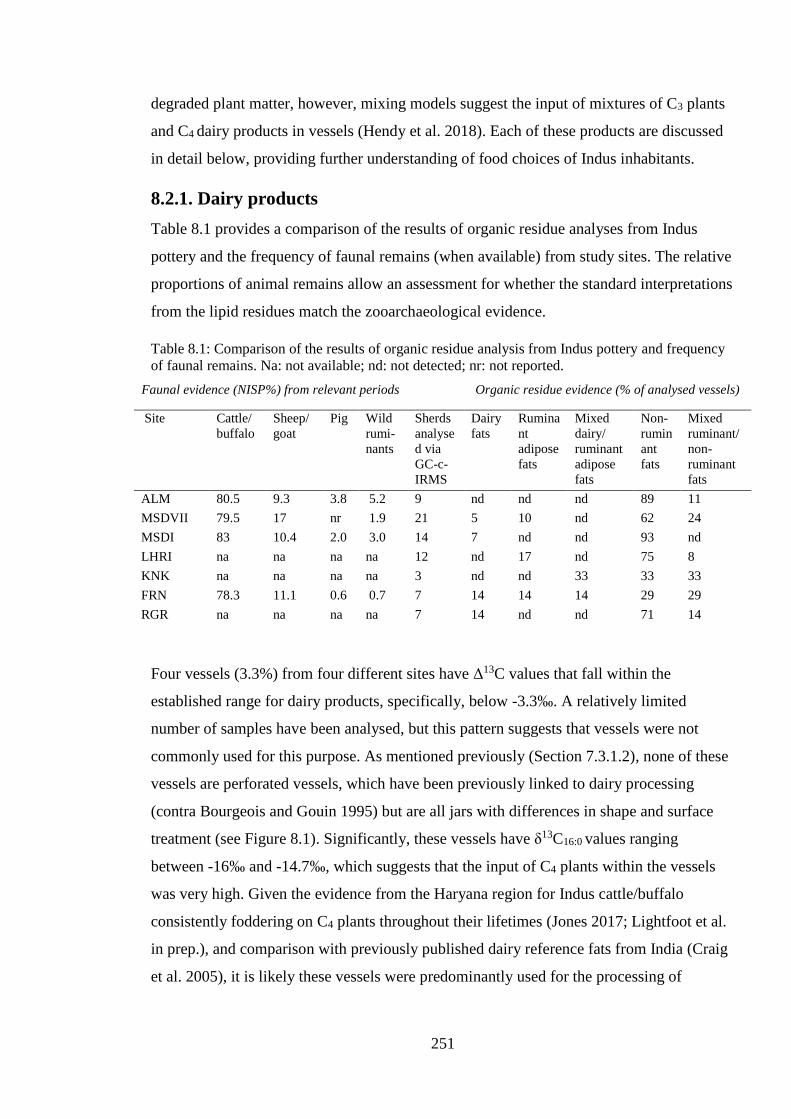
251
degraded plant matter, however, mixing models suggest the input of mixtures of C3 plants
and C4 dairy products in vessels (Hendy et al. 2018). Each of these products are discussed
in detail below, providing further understanding of food choices of Indus inhabitants.
8.2.1. Dairy products
Table 8.1 provides a comparison of the results of organic residue analyses from Indus
pottery and the frequency of faunal remains (when available) from study sites. The relative
proportions of animal remains allow an assessment for whether the standard interpretations
from the lipid residues match the zooarchaeological evidence.
Table 8.1: Comparison of the results of organic residue analysis from Indus pottery and frequency
of faunal remains. Na: not available; nd: not detected; nr: not reported.
Four vessels (3.3%) from four different sites have Δ13C values that fall within the
established range for dairy products, specifically, below -3.3‰. A relatively limited
number of samples have been analysed, but this pattern suggests that vessels were not
commonly used for this purpose. As mentioned previously (Section 7.3.1.2), none of these
vessels are perforated vessels, which have been previously linked to dairy processing
(contra Bourgeois and Gouin 1995) but are all jars with differences in shape and surface
treatment (see Figure 8.1). Significantly, these vessels have δ13C16:0 values ranging
between -16‰ and -14.7‰, which suggests that the input of C4 plants within the vessels
was very high. Given the evidence from the Haryana region for Indus cattle/buffalo
consistently foddering on C4 plants throughout their lifetimes (Jones 2017; Lightfoot et al.
in prep.), and comparison with previously published dairy reference fats from India (Craig
et al. 2005), it is likely these vessels were predominantly used for the processing of
Faunal evidence (NISP%) from relevant periods Organic residue evidence (% of analysed vessels)
Site Cattle/
buffalo
Sheep/
goat
Pig Wild
rumi-
nants
Sherds
analyse
d via
GC-c-
IRMS
Dairy
fats
Rumina
nt
adipose
fats
Mixed
dairy/
ruminant
adipose
fats
Non-
rumin
ant
fats
Mixed
ruminant/
non-
ruminant
fats
ALM 80.5 9.3 3.8 5.2 9 nd nd nd 89 11
MSDVII 79.5 17 nr 1.9 21 5 10 nd 62 24
MSDI 83 10.4 2.0 3.0 14 7 nd nd 93 nd
LHRI na na na na 12 nd 17 nd 75 8
KNK na na na na 3 nd nd 33 33 33
FRN 78.3 11.1 0.6 0.7 7 14 14 14 29 29
RGR na na na na 7 14 nd nd 71 14
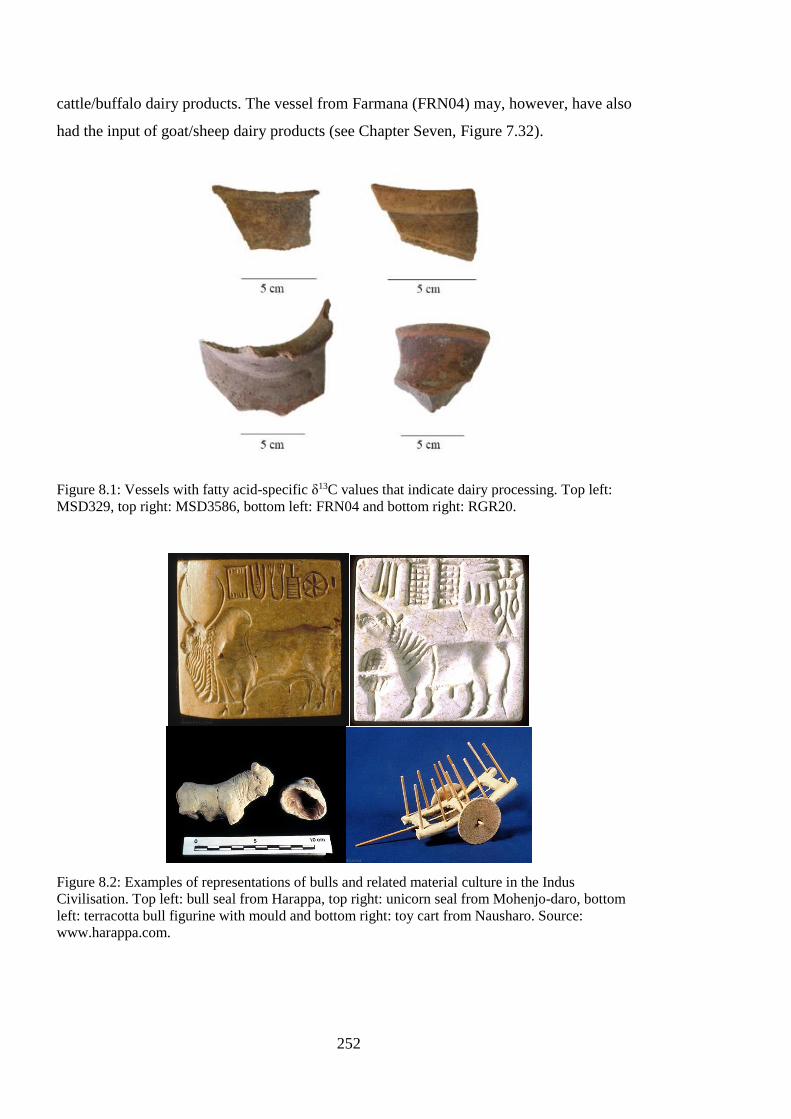
252
cattle/buffalo dairy products. The vessel from Farmana (FRN04) may, however, have also
had the input of goat/sheep dairy products (see Chapter Seven, Figure 7.32).
Figure 8.1: Vessels with fatty acid-specific δ13C values that indicate dairy processing. Top left:
MSD329, top right: MSD3586, bottom left: FRN04 and bottom right: RGR20.
Figure 8.2: Examples of representations of bulls and related material culture in the Indus
Civilisation. Top left: bull seal from Harappa, top right: unicorn seal from Mohenjo-daro, bottom
left: terracotta bull figurine with mould and bottom right: toy cart from Nausharo. Source:
www.harappa.com.
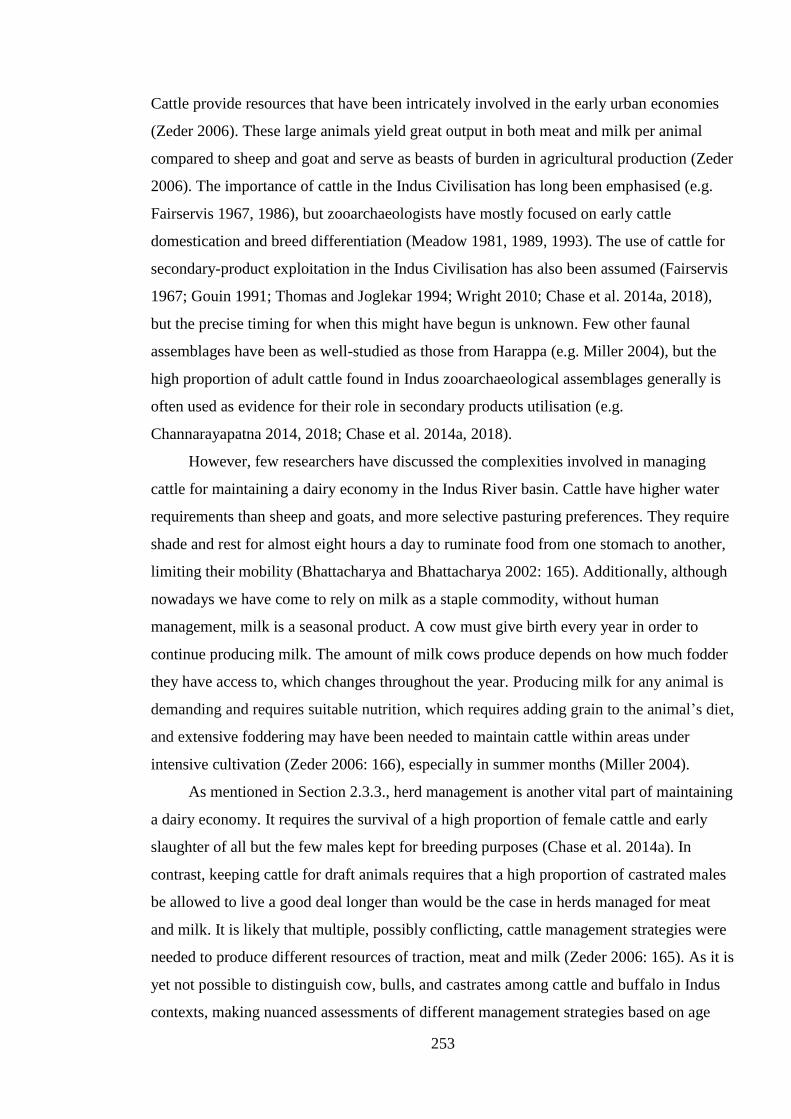
253
Cattle provide resources that have been intricately involved in the early urban economies
(Zeder 2006). These large animals yield great output in both meat and milk per animal
compared to sheep and goat and serve as beasts of burden in agricultural production (Zeder
2006). The importance of cattle in the Indus Civilisation has long been emphasised (e.g.
Fairservis 1967, 1986), but zooarchaeologists have mostly focused on early cattle
domestication and breed differentiation (Meadow 1981, 1989, 1993). The use of cattle for
secondary-product exploitation in the Indus Civilisation has also been assumed (Fairservis
1967; Gouin 1991; Thomas and Joglekar 1994; Wright 2010; Chase et al. 2014a, 2018),
but the precise timing for when this might have begun is unknown. Few other faunal
assemblages have been as well-studied as those from Harappa (e.g. Miller 2004), but the
high proportion of adult cattle found in Indus zooarchaeological assemblages generally is
often used as evidence for their role in secondary products utilisation (e.g.
Channarayapatna 2014, 2018; Chase et al. 2014a, 2018).
However, few researchers have discussed the complexities involved in managing
cattle for maintaining a dairy economy in the Indus River basin. Cattle have higher water
requirements than sheep and goats, and more selective pasturing preferences. They require
shade and rest for almost eight hours a day to ruminate food from one stomach to another,
limiting their mobility (Bhattacharya and Bhattacharya 2002: 165). Additionally, although
nowadays we have come to rely on milk as a staple commodity, without human
management, milk is a seasonal product. A cow must give birth every year in order to
continue producing milk. The amount of milk cows produce depends on how much fodder
they have access to, which changes throughout the year. Producing milk for any animal is
demanding and requires suitable nutrition, which requires adding grain to the animal’s diet,
and extensive foddering may have been needed to maintain cattle within areas under
intensive cultivation (Zeder 2006: 166), especially in summer months (Miller 2004).
As mentioned in Section 2.3.3., herd management is another vital part of maintaining
a dairy economy. It requires the survival of a high proportion of female cattle and early
slaughter of all but the few males kept for breeding purposes (Chase et al. 2014a). In
contrast, keeping cattle for draft animals requires that a high proportion of castrated males
be allowed to live a good deal longer than would be the case in herds managed for meat
and milk. It is likely that multiple, possibly conflicting, cattle management strategies were
needed to produce different resources of traction, meat and milk (Zeder 2006: 165). As it is
yet not possible to distinguish cow, bulls, and castrates among cattle and buffalo in Indus
contexts, making nuanced assessments of different management strategies based on age
254
and sex profiles of faunal remains alone difficult (Chase et al. 2014a: 9). At Harappa,
Miller suggested that since 90% of the bovine animals were kept alive into adulthood, it
was likely that cows were used for dairying and bulls were used for draft/traction, but
evidence for dairying at Harappa is ambiguous (2004: 625).
The storage of milk is an additional practical aspect of managing a dairy economy.
As milk spoils quickly and may be difficult to digest in its various raw forms, it must be
quickly consumed or converted into products like butter, clarified butter or cheese. DNA
studies of modern Indian populations indicate that the lactase persistence -13910*T allele
has highest frequency among observed mutations as well as the widest distribution
throughout the Indian subcontinent, but only one out of eighteen individuals in India can
digest lactose (Gallego Romero et al. 2011; Gerbault et al. 2011). This statistic suggests
that populations may have developed strategies to convert milk into more easily digestible
products (such as yoghurt or ghee) from an early period.
Notably, scholars have noticed an emphasis on male cattle across the Indus
Civilisation. Increase in use of cattle for traction is documented by their increased size
from late pre-urban to urban period in Harappa, a change suggestive of an emphasis on
males and castrates (Miller 2004: 619; Wright 2010; 204). Miller suggests there is
evidence for the development of special cattle breeds for traction, such as for plow
agriculture and harnessing carts (2003: 304; see also Wright 2010: 207). The most
common engraving on Indus stamp seals consists of a male bovid (often called ‘unicorn’)
in profile that faces the left side of the seal (Rissman 1989), and other bovids usually
include male zebu cattle, bison and water buffalo (Ameri 2013: 361). These
representations may suggest a requirement for bulls (Figure 8.2). Cows are noticeably
missing from the visual repertoire of the Indus Civilisation, which may suggest that they
were not as highly valued as bulls.
The results of this thesis confirm that cattle/buffalo milk, and possibly goat/sheep
milk in some contexts, was processed in some Indus vessels, either stored in its raw form,
or used to produce different types of dairy products, including yoghurt, clarified butter
(ghee), or cream. However, the percentage of vessels that can be directly linked to dairy
processing is very small, which raises questions about how widespread the practice of
dairying may have been. A comparison of these results with ceramic residues found in
prehistoric contexts around the world suggests that the minimal presence of dairy
processing in Indus vessels from northwest India is highly unusual. Direct evidence for
extensive dairy processing has been found at sites in northwest Anatolia as early as the
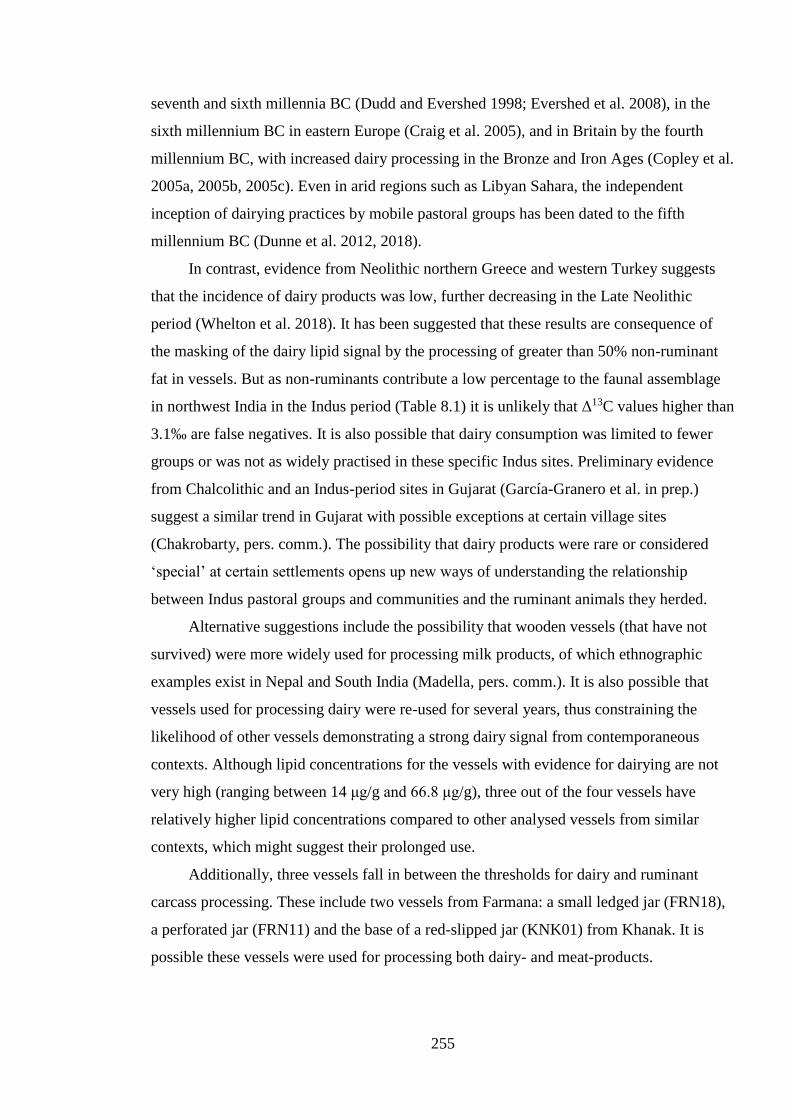
255
seventh and sixth millennia BC (Dudd and Evershed 1998; Evershed et al. 2008), in the
sixth millennium BC in eastern Europe (Craig et al. 2005), and in Britain by the fourth
millennium BC, with increased dairy processing in the Bronze and Iron Ages (Copley et al.
2005a, 2005b, 2005c). Even in arid regions such as Libyan Sahara, the independent
inception of dairying practices by mobile pastoral groups has been dated to the fifth
millennium BC (Dunne et al. 2012, 2018).
In contrast, evidence from Neolithic northern Greece and western Turkey suggests
that the incidence of dairy products was low, further decreasing in the Late Neolithic
period (Whelton et al. 2018). It has been suggested that these results are consequence of
the masking of the dairy lipid signal by the processing of greater than 50% non-ruminant
fat in vessels. But as non-ruminants contribute a low percentage to the faunal assemblage
in northwest India in the Indus period (Table 8.1) it is unlikely that Δ13C values higher than
3.1‰ are false negatives. It is also possible that dairy consumption was limited to fewer
groups or was not as widely practised in these specific Indus sites. Preliminary evidence
from Chalcolithic and an Indus-period sites in Gujarat (García-Granero et al. in prep.)
suggest a similar trend in Gujarat with possible exceptions at certain village sites
(Chakrobarty, pers. comm.). The possibility that dairy products were rare or considered
‘special’ at certain settlements opens up new ways of understanding the relationship
between Indus pastoral groups and communities and the ruminant animals they herded.
Alternative suggestions include the possibility that wooden vessels (that have not
survived) were more widely used for processing milk products, of which ethnographic
examples exist in Nepal and South India (Madella, pers. comm.). It is also possible that
vessels used for processing dairy were re-used for several years, thus constraining the
likelihood of other vessels demonstrating a strong dairy signal from contemporaneous
contexts. Although lipid concentrations for the vessels with evidence for dairying are not
very high (ranging between 14 μg/g and 66.8 μg/g), three out of the four vessels have
relatively higher lipid concentrations compared to other analysed vessels from similar
contexts, which might suggest their prolonged use.
Additionally, three vessels fall in between the thresholds for dairy and ruminant
carcass processing. These include two vessels from Farmana: a small ledged jar (FRN18),
a perforated jar (FRN11) and the base of a red-slipped jar (KNK01) from Khanak. It is
possible these vessels were used for processing both dairy- and meat-products.
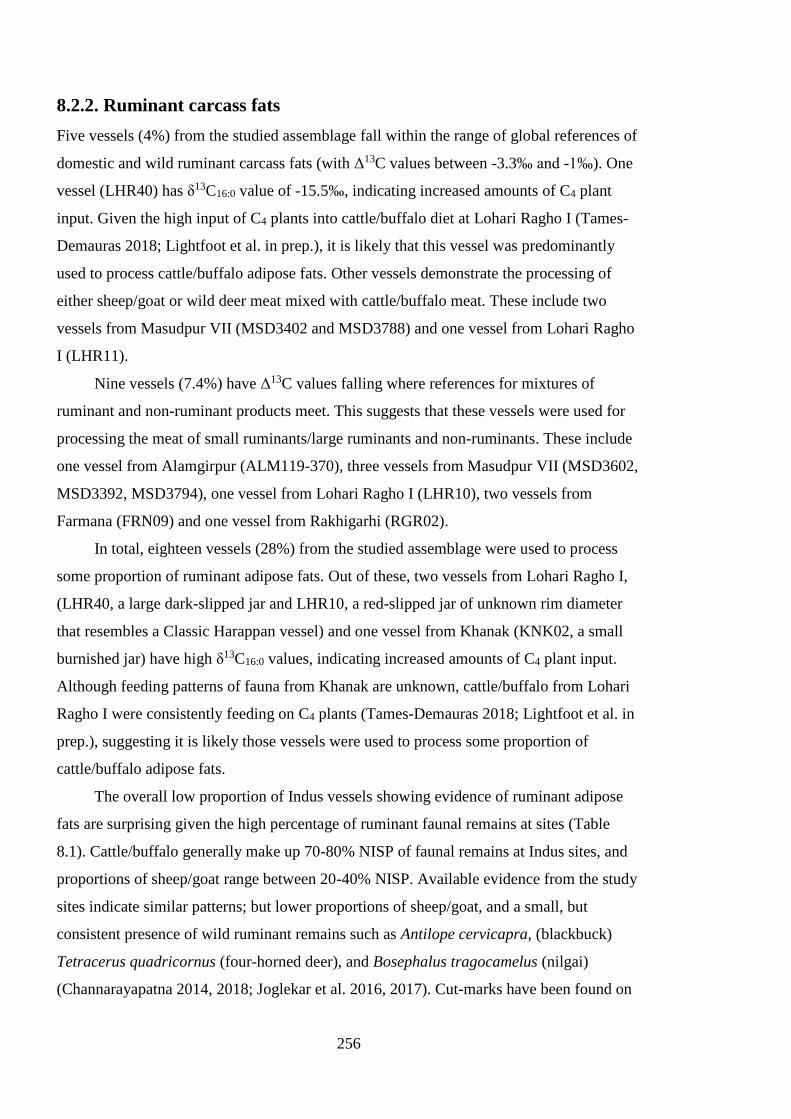
256
8.2.2. Ruminant carcass fats
Five vessels (4%) from the studied assemblage fall within the range of global references of
domestic and wild ruminant carcass fats (with Δ13C values between -3.3‰ and -1‰). One
vessel (LHR40) has δ13C16:0 value of -15.5‰, indicating increased amounts of C4 plant
input. Given the high input of C4 plants into cattle/buffalo diet at Lohari Ragho I (Tames-
Demauras 2018; Lightfoot et al. in prep.), it is likely that this vessel was predominantly
used to process cattle/buffalo adipose fats. Other vessels demonstrate the processing of
either sheep/goat or wild deer meat mixed with cattle/buffalo meat. These include two
vessels from Masudpur VII (MSD3402 and MSD3788) and one vessel from Lohari Ragho
I (LHR11).
Nine vessels (7.4%) have Δ13C values falling where references for mixtures of
ruminant and non-ruminant products meet. This suggests that these vessels were used for
processing the meat of small ruminants/large ruminants and non-ruminants. These include
one vessel from Alamgirpur (ALM119-370), three vessels from Masudpur VII (MSD3602,
MSD3392, MSD3794), one vessel from Lohari Ragho I (LHR10), two vessels from
Farmana (FRN09) and one vessel from Rakhigarhi (RGR02).
In total, eighteen vessels (28%) from the studied assemblage were used to process
some proportion of ruminant adipose fats. Out of these, two vessels from Lohari Ragho I,
(LHR40, a large dark-slipped jar and LHR10, a red-slipped jar of unknown rim diameter
that resembles a Classic Harappan vessel) and one vessel from Khanak (KNK02, a small
burnished jar) have high δ13C16:0 values, indicating increased amounts of C4 plant input.
Although feeding patterns of fauna from Khanak are unknown, cattle/buffalo from Lohari
Ragho I were consistently feeding on C4 plants (Tames-Demauras 2018; Lightfoot et al. in
prep.), suggesting it is likely those vessels were used to process some proportion of
cattle/buffalo adipose fats.
The overall low proportion of Indus vessels showing evidence of ruminant adipose
fats are surprising given the high percentage of ruminant faunal remains at sites (Table
8.1). Cattle/buffalo generally make up 70-80% NISP of faunal remains at Indus sites, and
proportions of sheep/goat range between 20-40% NISP. Available evidence from the study
sites indicate similar patterns; but lower proportions of sheep/goat, and a small, but
consistent presence of wild ruminant remains such as Antilope cervicapra, (blackbuck)
Tetracerus quadricornus (four-horned deer), and Bosephalus tragocamelus (nilgai)
(Channarayapatna 2014, 2018; Joglekar et al. 2016, 2017). Cut-marks have been found on
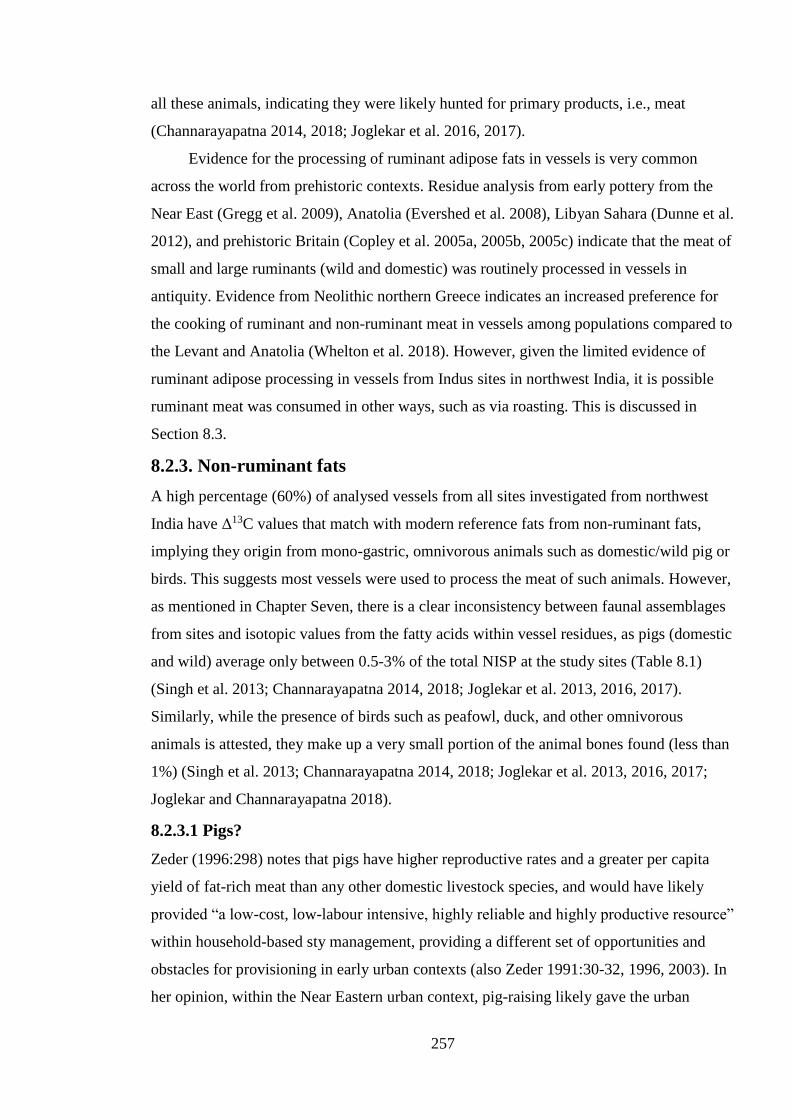
257
all these animals, indicating they were likely hunted for primary products, i.e., meat
(Channarayapatna 2014, 2018; Joglekar et al. 2016, 2017).
Evidence for the processing of ruminant adipose fats in vessels is very common
across the world from prehistoric contexts. Residue analysis from early pottery from the
Near East (Gregg et al. 2009), Anatolia (Evershed et al. 2008), Libyan Sahara (Dunne et al.
2012), and prehistoric Britain (Copley et al. 2005a, 2005b, 2005c) indicate that the meat of
small and large ruminants (wild and domestic) was routinely processed in vessels in
antiquity. Evidence from Neolithic northern Greece indicates an increased preference for
the cooking of ruminant and non-ruminant meat in vessels among populations compared to
the Levant and Anatolia (Whelton et al. 2018). However, given the limited evidence of
ruminant adipose processing in vessels from Indus sites in northwest India, it is possible
ruminant meat was consumed in other ways, such as via roasting. This is discussed in
Section 8.3.
8.2.3. Non-ruminant fats
A high percentage (60%) of analysed vessels from all sites investigated from northwest
India have Δ13C values that match with modern reference fats from non-ruminant fats,
implying they origin from mono-gastric, omnivorous animals such as domestic/wild pig or
birds. This suggests most vessels were used to process the meat of such animals. However,
as mentioned in Chapter Seven, there is a clear inconsistency between faunal assemblages
from sites and isotopic values from the fatty acids within vessel residues, as pigs (domestic
and wild) average only between 0.5-3% of the total NISP at the study sites (Table 8.1)
(Singh et al. 2013; Channarayapatna 2014, 2018; Joglekar et al. 2013, 2016, 2017).
Similarly, while the presence of birds such as peafowl, duck, and other omnivorous
animals is attested, they make up a very small portion of the animal bones found (less than
1%) (Singh et al. 2013; Channarayapatna 2014, 2018; Joglekar et al. 2013, 2016, 2017;
Joglekar and Channarayapatna 2018).
8.2.3.1 Pigs?
Zeder (1996:298) notes that pigs have higher reproductive rates and a greater per capita
yield of fat-rich meat than any other domestic livestock species, and would have likely
provided “a low-cost, low-labour intensive, highly reliable and highly productive resource”
within household-based sty management, providing a different set of opportunities and
obstacles for provisioning in early urban contexts (also Zeder 1991:30-32, 1996, 2003). In
her opinion, within the Near Eastern urban context, pig-raising likely gave the urban
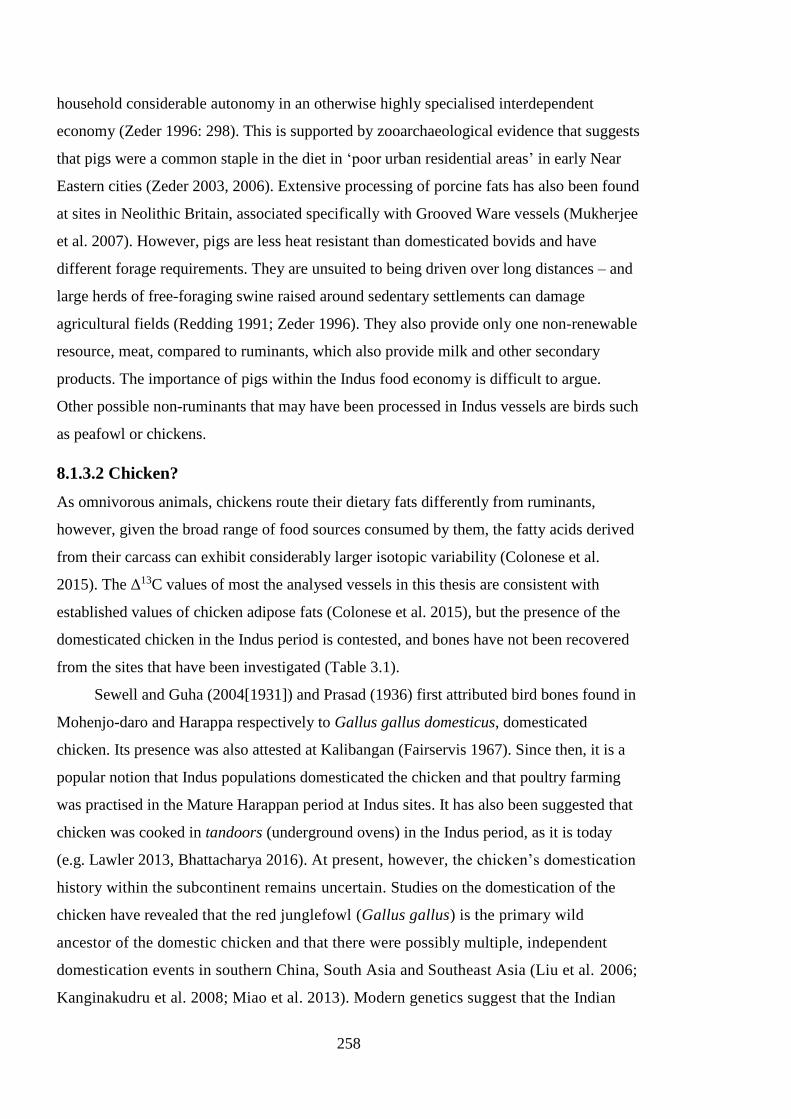
258
household considerable autonomy in an otherwise highly specialised interdependent
economy (Zeder 1996: 298). This is supported by zooarchaeological evidence that suggests
that pigs were a common staple in the diet in ‘poor urban residential areas’ in early Near
Eastern cities (Zeder 2003, 2006). Extensive processing of porcine fats has also been found
at sites in Neolithic Britain, associated specifically with Grooved Ware vessels (Mukherjee
et al. 2007). However, pigs are less heat resistant than domesticated bovids and have
different forage requirements. They are unsuited to being driven over long distances – and
large herds of free-foraging swine raised around sedentary settlements can damage
agricultural fields (Redding 1991; Zeder 1996). They also provide only one non-renewable
resource, meat, compared to ruminants, which also provide milk and other secondary
products. The importance of pigs within the Indus food economy is difficult to argue.
Other possible non-ruminants that may have been processed in Indus vessels are birds such
as peafowl or chickens.
8.1.3.2 Chicken?
As omnivorous animals, chickens route their dietary fats differently from ruminants,
however, given the broad range of food sources consumed by them, the fatty acids derived
from their carcass can exhibit considerably larger isotopic variability (Colonese et al.
2015). The Δ13C values of most the analysed vessels in this thesis are consistent with
established values of chicken adipose fats (Colonese et al. 2015), but the presence of the
domesticated chicken in the Indus period is contested, and bones have not been recovered
from the sites that have been investigated (Table 3.1).
Sewell and Guha (2004[1931]) and Prasad (1936) first attributed bird bones found in
Mohenjo-daro and Harappa respectively to Gallus gallus domesticus, domesticated
chicken. Its presence was also attested at Kalibangan (Fairservis 1967). Since then, it is a
popular notion that Indus populations domesticated the chicken and that poultry farming
was practised in the Mature Harappan period at Indus sites. It has also been suggested that
chicken was cooked in tandoors (underground ovens) in the Indus period, as it is today
(e.g. Lawler 2013, Bhattacharya 2016). At present, however, the chicken’s domestication
history within the subcontinent remains uncertain. Studies on the domestication of the
chicken have revealed that the red junglefowl (Gallus gallus) is the primary wild
ancestor of the domestic chicken and that there were possibly multiple, independent
domestication events in southern China, South Asia and Southeast Asia (Liu et al. 2006;
Kanginakudru et al. 2008; Miao et al. 2013). Modern genetics suggest that the Indian
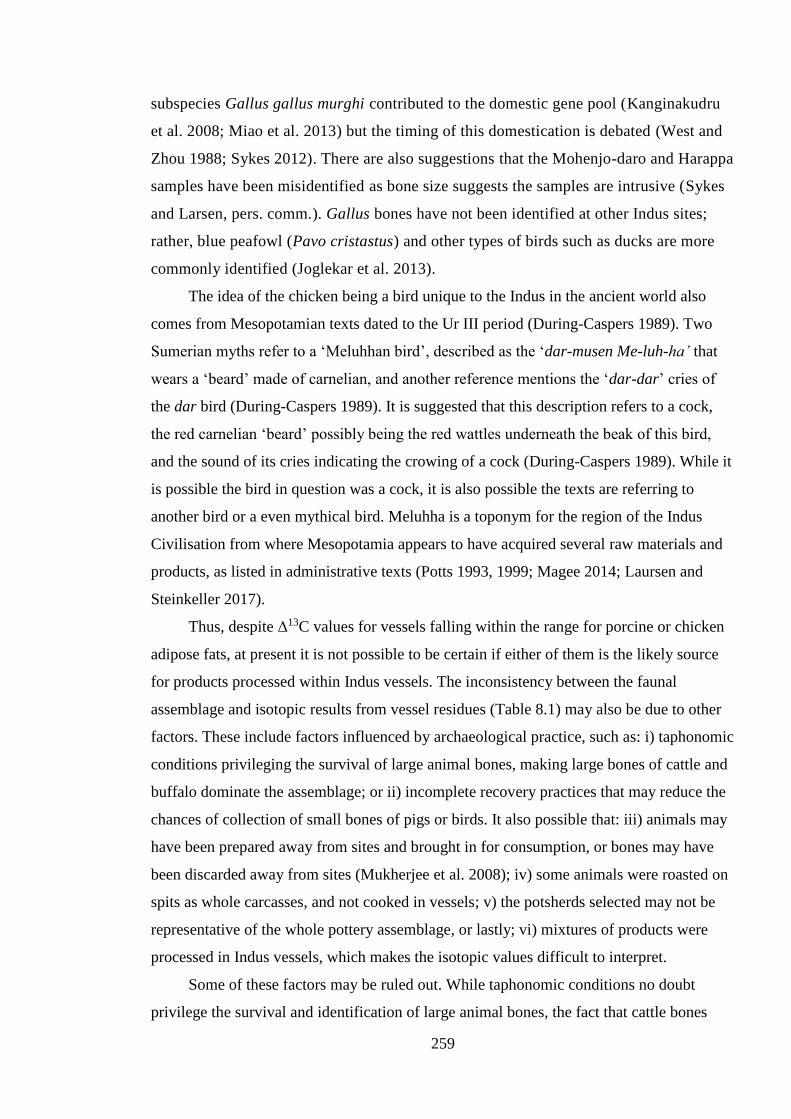
259
subspecies Gallus gallus murghi contributed to the domestic gene pool (Kanginakudru
et al. 2008; Miao et al. 2013) but the timing of this domestication is debated (West and
Zhou 1988; Sykes 2012). There are also suggestions that the Mohenjo-daro and Harappa
samples have been misidentified as bone size suggests the samples are intrusive (Sykes
and Larsen, pers. comm.). Gallus bones have not been identified at other Indus sites;
rather, blue peafowl (Pavo cristastus) and other types of birds such as ducks are more
commonly identified (Joglekar et al. 2013).
The idea of the chicken being a bird unique to the Indus in the ancient world also
comes from Mesopotamian texts dated to the Ur III period (During-Caspers 1989). Two
Sumerian myths refer to a ‘Meluhhan bird’, described as the ‘dar-musen Me-luh-ha’ that
wears a ‘beard’ made of carnelian, and another reference mentions the ‘dar-dar’ cries of
the dar bird (During-Caspers 1989). It is suggested that this description refers to a cock,
the red carnelian ‘beard’ possibly being the red wattles underneath the beak of this bird,
and the sound of its cries indicating the crowing of a cock (During-Caspers 1989). While it
is possible the bird in question was a cock, it is also possible the texts are referring to
another bird or a even mythical bird. Meluhha is a toponym for the region of the Indus
Civilisation from where Mesopotamia appears to have acquired several raw materials and
products, as listed in administrative texts (Potts 1993, 1999; Magee 2014; Laursen and
Steinkeller 2017).
Thus, despite Δ13C values for vessels falling within the range for porcine or chicken
adipose fats, at present it is not possible to be certain if either of them is the likely source
for products processed within Indus vessels. The inconsistency between the faunal
assemblage and isotopic results from vessel residues (Table 8.1) may also be due to other
factors. These include factors influenced by archaeological practice, such as: i) taphonomic
conditions privileging the survival of large animal bones, making large bones of cattle and
buffalo dominate the assemblage; or ii) incomplete recovery practices that may reduce the
chances of collection of small bones of pigs or birds. It also possible that: iii) animals may
have been prepared away from sites and brought in for consumption, or bones may have
been discarded away from sites (Mukherjee et al. 2008); iv) some animals were roasted on
spits as whole carcasses, and not cooked in vessels; v) the potsherds selected may not be
representative of the whole pottery assemblage, or lastly; vi) mixtures of products were
processed in Indus vessels, which makes the isotopic values difficult to interpret.
Some of these factors may be ruled out. While taphonomic conditions no doubt
privilege the survival and identification of large animal bones, the fact that cattle bones
260
dominate Indus zooarchaeological assemblages cannot be explained by coincidence or
taphonomy alone. Similarly, although archaeological recovery methods have focused on
the recovery of material culture and paid less attention to bioarchaeology, several
excavations in the region have dramatically improved sampling strategies for
archaeobotany and zooarchaeology and collect small remains such as fishbones and
charcoal during excavation. Furthermore, we have evidence for the butchering of a range
of different animals from several sites including Masudpur I, Masudpur VII and Farmana
(Joglekar et al. 2013, 2016, 2017; Channarayapatna 2014, 2018), including the presence of
a variety of skeletal elements, such as axial, forequarter, hindquarter and extremities such
as phalanges, within fills and pits inside settlements (Channarayapatna 2014). For example,
at Farmana, wild and domestic animals were butchered on-site, with no evidence for
disarticulation and removal of low meat-bearing parts of wild animals at a separate kill-site
(Channarayapatna 2014, 2018). It is thus unlikely that animals were prepared away from
sites and brought in for consumption or discarded outside sites. It is possible, however, that
animals were processed for consumption in different ways, or the potsherds selected were
not representative of the whole pottery assemblage, or that mixtures of products were
processed in Indus vessels, which makes the isotopic values difficult to interpret.
8.2.4. Mixtures of products
As highlighted in Chapter Three, Section 3.8.3., significant interpretative challenges exist
in resolving compound-specific isotopic data from contexts where both plants and animals
were processed in vessels. Hendy and colleagues (2018) demonstrated that mixtures of
ruminant adipose products and C3 plants could create Δ13C values similar to non-ruminant
fats. Given the diversity of resources that were available to Indus populations, it is highly
likely that individuals used vessels to process mixtures of plant and animal products to
create foodstuff, and that vessels were multi-functional throughout their life-histories.
The availability of C3 and C4 plants, and freshwater resources to Indus populations in
northwest India further adds to the complexity in resolving isotopic mixtures. Mixing plots
adapted from Hendy and colleagues (2018) are given below (Figure 8.2) that demonstrate
hypothetical Δ13C values created by mixing various animal and C3 and C4 plant products
using published references.
A) provides hypothetical Δ13C values generated by mixing C3 plants and C4 fed
ruminant dairy products, and B) provides hypothetical Δ13C values generated when C4
plants are mixed with C3 plant-fed ruminant carcass fats. A) demonstrates that equal
261
mixtures of C3 plants with C4 dairy products would generate values that fall between -1‰
and 3‰, which correspond to those obtained from most Indus vessels and those that plot
within ranges for ruminant and non-ruminant adipose fats. Conversely, B) demonstrates
how an equal mixture of a C4 plant, for example, millets, with ruminant meat fed on C3
plants would generate Δ13C values the same as those created by dairy fats.
A) offers an alternative potential explanation for the sources of the Δ13C values
obtained from most of the lipid extracts of Indus vessels. This suggests that mixtures of C3
plants and C4 dairy products (or mixtures of C3 plants and ruminant adipose fats, as in
Hendy et al. 2018) could have been processed in Indus vessels. Alternatively, B) suggests
that Δ13C values falling within the ‘global’ dairy range should no longer be considered as
equivocal evidence for the processing of dairy in vessels. In environments where there is
minimal evidence for availability/ consumption of C4 plants or for ruminant animals
grazing on C3 plants, however, Δ13C values under -3.3‰ are still likely to demonstrate
dairy processing. Within the Indus context, although there is evidence for the cropping of
C4 plants such as millets at multiple sites, enamel carbonate isotopic values from ruminants
suggests that both domestic and wild ruminants had at least some input from C4 plants in
their diet (Jones 2017; Lightfoot et al. in prep). As it is unlikely that ruminants were
entirely C3 plant-fed, Indus vessels with Δ13C values under -3.3‰ can probably be more
confidently associated with dairy processing, but they are few in number (Section 8.2.1).
In summary, the present evidence from lipid residues suggests that Indus vessels
were used to process a range of products. Unfortunately, most of the vessels have isotopic
values that are ambiguous, with equifinal interpretations. The current options include:
1) Non-ruminant fats (porcine or other omnivorous taxa),
2) Mixtures of C3 plants and dairy products from ruminants grazing on C3 and C4
plants (Hendy et al. 2018)
3) Mixtures of C3 plants and adipose fats from ruminants grazing on C4 dairy products
(Figure 8.2, A), or,
4) Mixtures of C3 and C4 plants with C3 and C4 fed ruminant adipose fats,
5) Mixtures of C4 plants and C3 ruminant adipose fats, as C4 plants are high in C16:0 and
C3 fed ruminant adipose fats are high in C18:0, which cause an offset as observed in
the ruminant adipose/non-ruminant fats range.
Out of all these options, options 2), 3) and 4) match the available bioarchaeological
evidence. Option 5) does not match the molecular evidence as there is minimal evidence
for direct plant-processing in the lipid extracts (except for a single vessel, RGR24). There
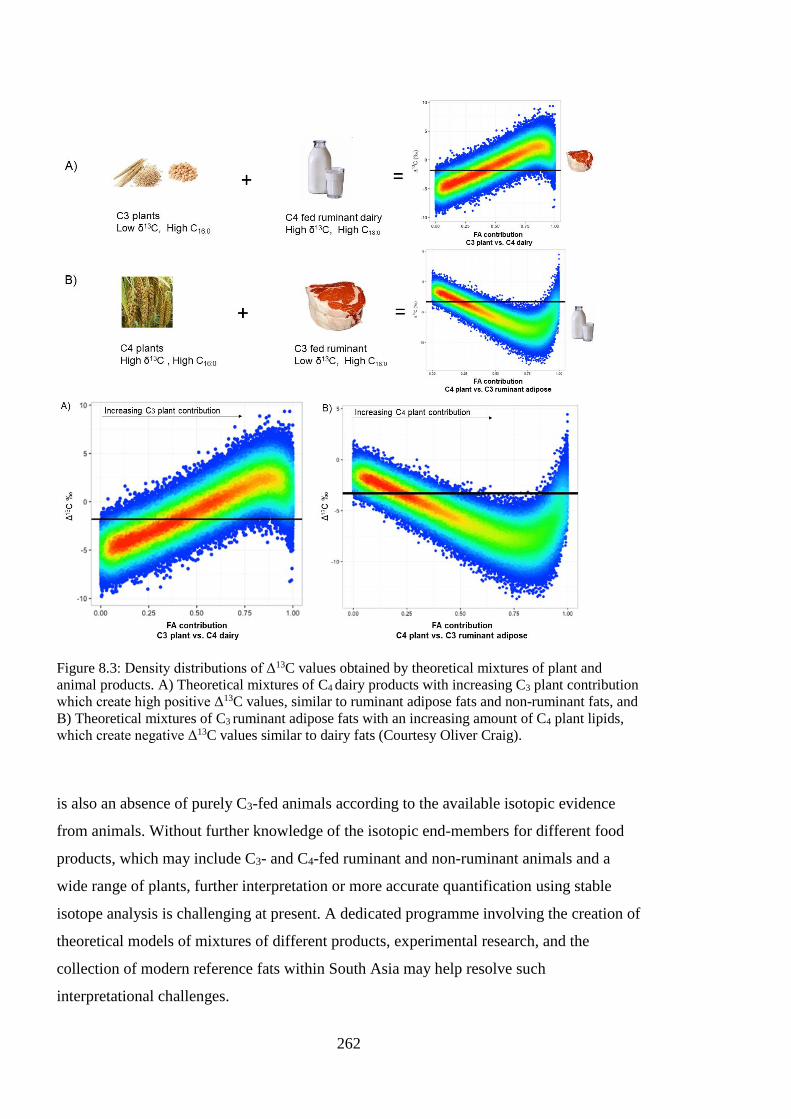
262
Figure 8.3: Density distributions of Δ13C values obtained by theoretical mixtures of plant and
animal products. A) Theoretical mixtures of C4 dairy products with increasing C3 plant contribution
which create high positive Δ13C values, similar to ruminant adipose fats and non-ruminant fats, and
B) Theoretical mixtures of C3 ruminant adipose fats with an increasing amount of C4 plant lipids,
which create negative Δ13C values similar to dairy fats (Courtesy Oliver Craig).
is also an absence of purely C3-fed animals according to the available isotopic evidence
from animals. Without further knowledge of the isotopic end-members for different food
products, which may include C3- and C4-fed ruminant and non-ruminant animals and a
wide range of plants, further interpretation or more accurate quantification using stable
isotope analysis is challenging at present. A dedicated programme involving the creation of
theoretical models of mixtures of different products, experimental research, and the
collection of modern reference fats within South Asia may help resolve such
interpretational challenges.
263
The interpretations offered by theoretical mixtures also dramatically alter traditional
interpretations offered by the Δ13C proxy. Crucially, these mixtures challenge
interpretations for sources of lipids in vessels in all environments with C3 and C4 plants.
This includes regions such as Africa and Anatolia, where assertions about early evidence
for dairying (Evershed et al. 2008; Dunne et al. 2012) may now be contested.
8.3. Food preparation in the Indus Civilisation
The results obtained from this thesis provide new ways to imagine a fundamental part of
the broad realm of culinary activity, or foodways, in the Indus Civilisation: the preparation
of food. Cooking or preparing foodstuff requires skills to coordinate the preparation and
input of ingredients in a particular order, the heating source and manipulation of vessels to
obtain the desired dish and taste, it also takes a considerable amount of time (D’Anna and
Jauss 2014; Nell 2014). This aspect of time and skill involved in cooking is rarely
discussed in archaeological literature. The complexities involved in cooking mean it is
usually assigned to certain persons who develop special skills in this activity (D’Anna and
Jauss 2014: 65). In many past societies and even today, the labour of cooking, especially in
domestic contexts, is deeply gendered and mostly carried out by women (Hastorf 1991,
2016; Bray 2003; Twiss 2012). Although we do not know if cooking was a gendered
practice in the Indus Civilisation, the preparation of food in the household in contemporary
Indian societies is often the sole responsibility of women. The gendered nature of
household labour is a vital characteristic of most agricultural or sedentary societies and is
important to keep in mind when thinking about ancient practice.
Some material aspects of the preparation of food may provide insight into the social
dimension of food preparation in the Indus Civilisation. The presence of open hearths and
ovens in architectural complexes (for example, at Farmana), suggests that cooking took
place within the household or in their close vicinity in open spaces like courtyards. As an
openly visible practice, people who cooked would have formed a loose community of
practice exchanging skills, techniques and recipes (after Wenger 1999; D’Anna and Jauss
2014: 75). Perhaps people not practicing cooking themselves would have been involved in
other ways and smelled the food being prepared (D’Anna and Jauss 2014:75). Small rooms
with hearths are found in some contexts (for example, at Alamgirpur, Masudpur VII,
Masudpur I and Farmana) (Shinde et al. 2011; Singh et al. 2013; Petrie et al. 2017). Indoor
264
cooking may have been a more restrictive activity or may have been practiced seasonally,
as evinced via ethnographic studies (Jordan 2003).
Cooked food, or specifically, food heated, stewed, or boiled in vessels was probably
one of many facets of Indus diet. Other techniques such as drying, fermenting, roasting, or
baking, may also have played a major part of Indus foodways. Although evidence for all of
these forms of food-processing is fragmentary, some examples have been found and may
have social implications. As noted in Section 2.2.3.3, a large proportion of animal bone at
Farmana, and small proportions at Masudpur I and Masudpur VII were charred or partially
charred (Channarayapatna 2014; Joglekar et al. 2016, 2017). At Farmana, it was observed
that all anatomical elements of cattle bones were charred to different degrees, whereas
specific elements (cranial fragments, ribs, scapula, vertebrae, and phalanges) of sheep/goat
were charred (Channarayapatna 2014). The extensive charring of ruminant bones might
suggest that their meat was processing via spit-roasting. The charring of bone may also
occur through its use as fuel (Théry‐Parisot 2012; Costa 2016) or through post-depositional
processes (Costa 2016), but the high percentages of charred bones in the assemblages of
these three sites suggests it may be connected to how animal carcasses were being
processed.
Finally, eating is, in all cultures, a social activity and commensality is undeniably
one of the most important articulations of human sociality (Twiss 2012; Kerner et al 2015;
Hastorf 2017). Levi Strauss (1966) has famously suggested that roasted food belongs to
“exo-cuisine” that which one offers to guests or large groups of people, whereas boiled
foods can most often be ascribed to what might be called “endo-cuisine”, prepared for
domestic use, destined to a small, closed group. Although not much is known about Indus
commensality, and explicit evidence for ‘feasting’ has not been discovered, it is possible
that the meat of small and large ruminants was preferentially prepared via spit-roasting in
Indus settlements in northwest India and consumed by larger groups of people, as the meat
produced would likely be too much to feed a small household. A distributive system of
meat-sharing was in place at Bagasara (Chase et al. 2014a), and possibly at Farmana
(Channarayapatna 2014), which suggests meat may have both been prepared within and
outside the household. As food preparation was perhaps executed in both public and
domestic settings, it constitutes a starting point to think about diverse spheres of Indus
commensality.
The consumption of unleavened breads from cereals such as wheat, barley, and
millet, and pulses such as chickpea was also probably common in the Indus Civilisation
265
(Weber 2003; García-Granero et al. 2017). Today, cereal grains are de-husked, cleaned,
and stone-ground to produce flour, and lentils are usually soaked, then dried and stone-
ground with the use of ‘sil batta’ (grinding stone and pestle). Tools similar to those found
in modern South Asian kitchens, such as grinding stones, mortars and pestles have been
located within many Indus settlement contexts (e.g. Shinde et al. 2011; Singh et al. 2013;
Joshi 2015), which have led to assumptions that flatbreads like modern-day rotis were
prepared in the Indus period (Nath 2014; Granero-Garcia et al. 2017). Starch-grains of
barley, mango, and small millet adhering to the surfaces of pounders and grinding stones
were found from Farmana (Kashyap and Weber 2010), and starch grains and phytoliths of
small millet and tropical pulses (horse gram and mung bean) have been found on grinding
stones from Indus period (and earlier) sites in Gujarat (García-Granero et al. 2017). The
available evidence thus suggests the use of grinding stones for the processing of cereals
and pulses for flour, and possible fruit (e.g. mango) for the creation of pastes. This realm of
plant-processing was likely to be more catered towards individual, or household
consumption rather than for large groups, but very large grinding stones have been found
in Rakhigarhi (Yadav, pers. comm.).
Organic residue analysis has shown the absence of millet biomarkers within the
ceramic vessels (Chapter Seven), which may suggest that millet seeds were more likely to
be processed as flour than boiled or cooked. Given the high C4 plant input in the diet of
ruminant animals, especially cattle/buffalo (Jones 2017; Lightfoot et al. in prep), it is
possible that millet was used primarily as fodder, although it is also possible that these
animals foraged on wild C4 plants. It is also probable that plants were cooked or boiled in
vessels, as suggested by mixing models. However, only a single vessel analysed for
Rakhigarhi in this thesis provides evidence for plant processing.
While it is not possible to be certain of the dishes prepared or preferred by Indus
populations, some broad suggestions can be made. Given the evidence, it appears that
either dairy-based stews mixed with pulses, cereals and vegetables, or alternatively,
porcine or avian meat were regularly processed in a range of different vessel-types. The
meat of cattle/buffalo, sheep/goat or wild deer may also have been prepared in vessels but
may have been preferentially prepared via spit roasting over fire. Finally, dairy products
were also processed in vessels, but only four vessels demonstrated clear evidence for dairy
processing.
266
8.4. Rural and urban food practice in northwest India
Chapter Two highlighted how studies on Indus agriculture and food production in the
urban period demonstrate that farmers inhabited diverse environments and grew a range of
crops across different regions of the Indus Civilisation (e.g. Vishnu‐Mittre and Savithri
1982; Possehl 1992; Weber 2003, 2010; Petrie et al. 2016; Petrie and Bates 2017).
Evidence confirms regional diversity in crop choices and relative proportions/reliance on
winter and/or summer crops in different regions (Petrie et al. 2016; Petrie and Bates 2017),
but the only urban settlement that has been studied in detail is Harappa. At Harappa,
strategies such as intensification and diversification of agricultural and pastoral resources
have been used as models to suggest how large urban settlements were sustained during the
Indus urban period (Miller 2004; Wright 2010). These strategies have also been discussed
in terms of their suitability for mitigating risks associated with changing environmental
conditions or food stress in the post-urban period (Miller 2006, 2015; Petrie 2017). These
models imply that diversity and diversification played an important role in Indus
agricultural practices (Petrie 2017: 51). Importantly, though, it appears that while there is
clear evidence of diversity in terms of plant products used, there is only a limited amount
of archaeobotanical evidence that provides clear insight into diversification of Indus
subsistence practices over time. Similarly, the evidence available from faunal assemblages
across the region suggests that Indus populations used a limited suite of domestic animals,
primarily cattle/buffalo, with limited evidence of variability across regions or change over
time. Our knowledge about subsistence practices is gradually increasing, especially in
northwest India and Gujarat, but nuanced characterisation of regional diversity (or
uniformity) of practices requires more dedicated studies and analysis.
Results from ceramic lipid analysis presented in Chapter Seven suggest there were
different types of products being processed in vessels in urban and rural settlements,
specifically in the Early Mature Harappan period (EMH), but with evidence of continuity
in the Late Mature Harappan (LMH), and Late Harappan period in northwest India. This
thesis thus provides us with an understanding of food practices in a whole range of
settlements: small villages, villages, towns, and cities in the region, and also suggests
evidence for homogeneity in terms of food choices.
Systematic surveys and calculations of site densities around Rakhigarhi in the urban
period have revealed linear concentrations of settlements extending towards the southwest
(Singh et al. 2010; Petrie et al. 2017; Green and Petrie 2018). Additionally, comprehensive
267
multi-sensor and multi-temporal approaches using remote sensing and computational
methods have revealed a vast network of palaeo-rivers and complex fluvial history in this
region (Orengo and Petrie 2017). It has been suggested that the location of these
settlements along water channels and their high density may have been a significant
feature, or a ‘signature landscape’ of the urban Indus period in this region (cf. Wilkinson
2003; Green and Petrie 2018). ‘Signature landscapes’ manifest differences in land use,
production, and cultivation practices that can reveal trends in subsistence practices and
social processes (Wilkinson 2003). It is thus possible the common environmental
landscape and shared network of possibly ephemeral watercourses, especially between
Rakhigarhi, Lohari Ragho I, Masudpur I, and Masudpur VII created access to similar plant
and animal resources, thus resulting in broadly similar culinary choices across settlements.
Additionally, fatty acid-specific isotopic values are likely indicative of animal
feeding patterns (Dunne et al. 2018; Whelton et al. 2018), which appear to be wide-ranging
within single sites in northwest India. Large variations in δ13C values at Masudpur VII
(small village), Masudpur I, Lohari Ragho I (villages) and Rakhigarhi (city), may be
indicative of the mobility of animals and diverse feeding strategies. Petrie (2017: 55)
suggests that settled populations may have been relatively mobile in order to survive a
constantly shifting hydrology. These results have implications for how we imagine rural
and city inhabitants managing and moving their animals in their surrounding landscape.
However, the precise mechanisms and management of different animals and crops at these
sites is yet not understood. As archaeobotanical and zooarchaeological analyses from
Rakhigarhi are ongoing, questions about how residents of Rakhigarhi sourced their food,
and whether they were reliant on their surrounding hinterland settlements for food
provisioning are yet to be answered.
The evidence presented in this thesis suggests that rural and urban inhabitants had
equally complex and varied animal management strategies and processed similar products
in vessels. Evidence from rural Indus settlements in northwest India already indicates the
presence of a unique, rural ceramic industry, which is influenced by, but visually distinct
from, the urban pottery repertoire (Parikh and Petrie 2017, 2018; Ceccarelli in prep.;
Parikh in prep.) This suggests that rural craftspeople were actively engaged in production
and consumption of pottery that set them apart from urban inhabitants in some way. This is
matched with further evidence of complex crop-processing choices made by rural
inhabitants, for example, at Masupdur I and VII (Bates 2016; Petrie and Bates 2017). To
what extent was the food they processed in vessels seen as ‘different’, or representative of
268
a rural identity? Did inhabitants at different settlements have distinctive concepts of
culinary identity? Were these linked with their rural character, or their proximity or
distance from urban settlements? Although at present these questions cannot be answered,
they are vital to broadening how the somewhat nebulous concept of ‘identity’ in the Indus
Civilisation can be conceptualised (e.g. Chase et al. 2014b).
The results from Chapter Seven also inform us about food and vessel usage practices
in the post-urban period/after 4.2 ka BP. The evidence from Alamgirpur suggest continuity
in vessel-use practices from 4.2 ka BP and onwards, whereas Masudpur VII has evidence
for the use of a wide range of products in vessels dating after 4.2 ka BP and also in the
Late Harappan period, with possible evidence of diversification of products compared to
the urban period. The results fit with other evidence from northwest India that
demonstrates the general continuity of cropping practices and watering regimes at rural
settlements during this period of cultural change (Petrie et al. 2016; Jones 2017; Petrie and
Bates 2017). It is possible that the diversity of products used in the urban period in rural
settlements allowed populations to compensate for potential reduction in resources or
cultural changes in the post-urban period. If rural populations were “optimising their
economic activities in a diverse ecology” (Wright 2010: 214) and were also well-versed
with the potential risks they faced due to changing environmental conditions, they may
have adapted to the hydrological unpredictability that was likely experienced during and
after 4.2 ka BP (Petrie 2017). No Late Harappan occupation has been reported from
Farmana or Rakhigarhi (Shinde et al. 2011; Vahia et al. 2016; Nath 2018), suggesting that
larger urban settlements may not have survived in the post-urban period, but such
occupation may underlie the large parts of Rakhigarhi that are buried under the modern
village that covers a large portion of the site (Vahia et al. 2016; Petrie 2017). While
concrete evidence is lacking, it is possible that urban settlements were unable to adequately
provision food for populations in the late urban period, resulting in abandonment of larger-
scale settlements. These results reiterate the importance of investigating rural, small
settlements across the Indus Civilisation and testing the relationship between large,
medium-sized and small rural settlements, particularly in terms of food-production. They
also highlight that regional patterns must be examined independently, and generalised
relationships between climate, subsistence and society in the region must be interrogated.
This thesis addresses gaps in previous research by studying food production and
vessel usage within large, medium-sized, and small, rural settlements in northwest India.
Vessels from the urban and post-urban periods have been examined via organic residue
269
analysis to examine how quotidian commensal practices were constructed within
settlements in the region, and if they changed over time. Importantly, this thesis also
focuses on addressing the interaction between Indus material culture and foodstuff, on a
regional, and local, site-specific scale.
8.5. Cautionary tales: preservation and interpretation
Chapter Three highlighted issues surrounding preservation of organic residues in hot, arid
and seasonally-wet environments. Low lipid recovery from vessels create significant
challenges and make interpretations about archaeological vessel-use difficult. Similarly,
the possibility of contamination from sediments, post-excavation practices, or during
laboratory processing add further complications to interpretation.
In this thesis, predicting the preservation of lipids was not possible. Mean lipid
concentrations across analysed samples were very low, creating interpretational challenges.
The similarity of results across multiple contexts, however, assert the reliability of the
results, and the range of lipid concentrations within vessel fragments recovered from the
same context suggest that the connection between lipid yield and archaeological use of the
vessel is valid. Combining chemical date with compound-specific isotopic analysis also
enables a way to cross-reference the results obtained. Attempts have been made to control
for contamination wherever possible, but these must be assessed at a case-by-case level.
It is highly likely that results from organic residue analysis are missing several
nuances of meal preparation as it is not possible to get down to details of ‘ingredients’
processed in vessels. For example, it was not possible to achieve species-specificity of
animal fats and confidently detect direct plant-processing in vessels. Thus, at present it is
not possible to know precisely how quotidian activities occurred in practice. It is also
possible that not all of these vessels were used to process food products; organic products
processed in vessels may have had other economic functions. This conceptual challenge is
similar to others faced by archaeologists called the ‘utilisation fallacy’, in which
everything recovered is interpreted into terms of some anthropogenic meaning. However,
as most vessel fragments analysed for this thesis were recovered from domestic contexts, it
is likely they were used on a day-today basis.
Finally, and critically, studies on Indus lifeways sometimes suggest an unchanging
connection between ancient and present-day practices of the subcontinent, particularly in
rural settlements. Ethnographic analogies can be highly relevant and informative (e.g.
Bhattacharya and Bhattacharya 2002), but scholars often uncritically apply ethnographic or
270
contemporary examples to explain archaeological data, implying long-term historical
continuities between the past and the present (e.g. Allchin and Allchin 1973; Kenoyer
1998). These discussions continue to exist and may be used to promote specific agendas. In
some cases, this is also true for studies on Indus food production and cuisine (e.g. Achaya
1998; Kashyap and Weber 2010; Lawler 2012, 2013). For example, anachronistic
references to ‘curry’ and ‘proto-curry’ (e.g. Lawler 2012, 2013; Bhutia 2018) are common,
but they are typically reductionist and irrelevant within the context of the Indus
Civilisation. Although it is well-documented that contemporary Indian communities
exhibit conservatism in food production and taste preferences (e.g., Appadurai 1998),
several of these food traditions have extremely complex historical trajectories and are
inextricably linked to religious and caste identity. Similarly, a number of ingredients have
been introduced to South Asia in recent historical periods and via colonial processes (e.g.
tomatoes, potatoes, chillies), which have irrevocably transformed South Asian cuisine
(Nandy 2004). Thus, while this thesis refocuses attention on Indus foodways, this is done
in order to centre investigations into the complex relationship between environment,
plants, and animals in the Indus Civilisation. A concerted effort has been made to not fall
into the conceptual ‘trap’ of drawing connections between modern South Asian cuisine and
how we imagine Indus food. While several ingredients important to South Asian cooking
today existed in the Indus period (e.g. summer and winter pulses), how they were brought
together to create specific recipes is not the focus of this thesis.
8.6. Chapter Summary
This chapter brings together the results from the organic residue analysis to conceptualise
food choice and vessel usage in the Indus Civilisation. It refocuses attention on foodways
in the Indus Civilisation, a topic that has been neglected in the past.
The results of the thesis provide empirical, direct evidence for the processing of a
variety of products in vessels from rural and urban Indus settlements in the urban period,
and rural settlements in the post-urban period in northwest India. Evidence points to the
multiple products being processed in vessels. However, a substantial quantity of the vessels
have compound-specific isotopic values that may have equivocal interpretations caused by
the challenges in resolving mixtures using organic residue analysis. Additionally, there was
limited evidence for the use of vessels for dairy processing, although the possibility of
vessels being used both for mixing dairy and other products cannot be excluded. The
similarity of the types of products processed in vessels at rural and urban settlements
271
indicate similarity of culinary choices in the region; while the lack of change in products
processed over time indicates diachronic continuity in food and vessel-use choices.
The results of this thesis have added to the existing evidence collected during the
Land, Water and Settlement and TwoRains projects (e.g. Bates 2016; Jones 2017;
Ceccarelli in prep. Lightfoot et al. in prep.; Parikh in prep.) that suggest the complexity of
rural food and ceramic production strategies in northwest India, and their continuity (with
small changes) in the post-urban period. The results of this thesis are encouraging and
create new avenues with which to imagine Indus food and culinary identity, but there is
inevitably a need for more bioarchaeological data from Indus settlements to explore
potential regional variations and make more nuanced interpretations about changes in
access to food sources over time. At present, the existence of entangled ecological and
cultural considerations perpetuates circular reasoning, ‘correlation-equals-causality’
arguments, and uncritical connections from contemporary South Asian lifeways. It is clear
that there is a need for more archaeological, geoarchaeological, archaeobotanical,
zooarchaeological and palaeoclimatic data from a broad range of environments across the
greater Indus region to test the relationship between climate, agriculture, pastoralism,
urbanism and foodways in the Indus Civilisation.
The next chapter summarises the aims, scope and results obtained from this thesis,
and discusses future research avenues within Indus archaeology and organic residue
analysis in South Asian archaeological contexts.
272
Chapter Nine
Towards an integrative approach for studying Indus
food: implications for Indus archaeology
9.1. Thesis Summary
This thesis sets out to test differences and/or similarities in vessel-use across settlements in
the Indus Civilisation, specifically in northwest India, by using ceramic lipid residue
analysis as a proxy for investigating food preparation in vessels. It also investigates
whether there was continuity or change in vessel-use practices in the post-urban period.
This research is rooted in questions critical to Indus archaeology that are centred on: 1)
understanding the nature of urbanism and rural-urban relationships, 2) understanding Indus
rural and urban food production, and 3) characterising the degree of change to Indus
lifeways in the post-urban period. This thesis particularly focused on investigating
foodstuff and food processing because as essential and quotidian practices, they are a
valuable lens by which to investigate the degree of variability in the urban period and
extent of change in the post-urban period.
Chapter Two demonstrated that there is still much to learn about the nature of
urbanism in the Indus Civilisation, as well as the degree of regional variability across the
greater Indus region in terms of ecological zones, crop availability, and access to rainfall
and water (Petrie 2013, 2017; Petrie and Bates 2017; Petrie et al. 2016, 2017, 2018).
Characterising regional variability affects how well we can understand and explain cultural
changes in the post-urban period. A ‘bottom-up’ consideration of evidence of local
climatic and agricultural strategies suggests sustainability and resilience of practices, but
there is simultaneous evidence for economic simplification through reduction in settlement
scale and reduced interaction networks (Petrie 2017). The current hypothesis proposes that
large urban settlements embedded in large networks may have become unsustainable in the
post-urban period while rural settlements were able to continue to thrive due to pre-
existing food diversity and sustainable practices, particularly in northwest India (Petrie
2017). Chapter Two also reviews current knowledge about agricultural and pastoral
practices in the Indus Civilisation in the urban period, with an emphasis on what it suggests
about social practice and foodways. At present, knowledge about food processing and food
273
choice when it comes to animal and/or secondary products is inadequate. Much more high-
resolution data is required to reach a comprehensive understanding of food procurement,
processing and consumption in the Indus urban and post-urban periods.
Chapter Three reviews the basic principles related to ceramic organic residue
analysis, including different types of lipids encountered in archaeological contexts, issues
about preservation and degradation, contamination, analyses and interpretation.
Interpretational challenges that are encountered later in the thesis are highlighted in Section
3.6.3.
Chapters Four and Five lay out the necessary archaeological and methodological
background information for the analyses conducted in this thesis, setting out key
palaeoecological, contextual and practical information that are necessary for the
interpretation of data.
Chapters Six and Seven present the results obtained from GC-MS and GC-c-IRMS
analyses and provide discussions of the results. As most study sites are located in
environments not particularly conducive to the survival of organic remains, it was
necessary to test the viability of organic residue analysis within the South Asian context.
Chapter Six presents the results of lipid yields obtained from Indus vessels collected from
1) collections with little to no contextual information (Group I), 2) recently-excavated
material with variable degrees of spatial contextual information (Group II), and finally, 3)
freshly-excavated material with detailed contextual information and adhering burial soil for
control (Group III). The results suggest that while lipids are preserved and extractable from
vessels collected from different types of contexts, overall lipid yields are relatively low,
and the degree to which one can confidently link lipid yield to archaeological use of the
vessel and adequately interpret the results is dependent on available contextual information
and post-excavation treatment details. Lack of local or regional modern reference fat
material also presents challenges to interpretation, as explored in Chapter Seven. Thus,
while preservation conditions and methodological challenges are an impediment to the
widespread use of organic residue analysis in Indus archaeology, the degradation of lipids
is not a predictable, linear process and should not discourage future researchers. Future
studies would benefit from more experimental work coupled with modern reference studies
to address methodological and interpretational uncertainties.
Chapter Seven presents the site-specific and vessel-specific results of organic residue
analysis. Combined with available contextual, archaeobotanical and zooarchaeological
evidence, they provide interesting new data on food production and processing from small,
274
medium-sized and large settlements in northwest India. Despite interpretational challenges,
the data provide the first clear evidence of secondary-products utilisation (although
minimal) at certain settlements, as well as clear evidence for meat-processing in vessels.
The results also hint at complex animal feeding practices at rural and urban settlements,
suggesting that organic residue analysis provides a practical avenue with which to develop
or test models of social and ecological change. The results demonstrate some variability in
vessel-usage across settlements, but there are no clear differences in products processed in
vessels between urban and rural settlements in the urban period, and rural settlements do
not demonstrate measurable change in vessel-usage in the post-urban period. A larger
sample, together with detailed, well-dated archaeological contextual information from
different sites located in different regions of Indus Civilisation would likely provide a more
refined understanding of regional diversity in food choice and processing in the Indus
context.
Chapter Eight provides a synthesis of the results obtained from the thesis to
problematise and more broadly consider their implications for Indus archaeology. It
demonstrates how concepts of food choice and foodways are productive avenues with
which to approach Indus environment, plants, and animals and their relationship with
space, sociality and identity.
The following sections discusses the specific ways in which this thesis opens up new
avenues to contribute to new understandings of the connections between environment and
society in Indus archaeology and biomolecular approaches in South Asia and other parts of
the world.
9.2. Developing new perspectives and approaches in Indus
archaeology
9.2.1. Theorising food in Indus archaeology
This thesis discusses how developing stronger theoretical approaches to Indus food are
relevant to Indus archaeology, South Asian history and contemporary ideas about ancient
cuisine and gastro-politics in South Asia. Moving away from static ideas of ‘subsistence’,
this thesis focuses on food production and processing as active and meaningful, driven by
choices made by inhabitants at different settlements. It takes a holistic approach by looking
at how both plant and animal products may have been conceptualised and consumed as
food.
275
An evidence-based, ‘bottom-up’ foodways approach in Indus archaeology would
require a great deal more of regionally nuanced data coupled with high spatial and
chronological resolution. This would include greater specificity about food acquisition,
such as how a variety of ingredients are grown, reared, collected and/or caught; food
processing and preparation, such as data on butchery (Chase 2010, 2012, 2014; Chase et al.
2014a), microbotanical and chemical evidence available from starch grains and phytoliths
(García-Granero et al. 2015, 2016) and organic compounds associated with tools and in
vessels; and finally food consumption via isotopic evidence from humans and animals
(Chakraborty et al. 2018; Chase et al. 2018; Lightfoot et al. in prep.). At present different
elements of the available data do not neatly fit into a single narrative and come with their
own methodological uncertainties and interpretational limitations. This suggests that this
approach will likely reveal many new aspects of Indus lifeways that are ill-defined or
unknown.
9.2.2. Refining models of Indus agriculture and pastoralism
The review of present evidence on Indus archaeobotany, and specifically, animal use and
pastoralism highlight that concepts of diversification, intensification and extensification in
the urban period and their possible transformation in the post-urban period in the Indus
Civilisation must be archaeologically tested. At present there are several assumptions about
change over time that have not been systematically investigated.
9.2.3. Biomolecular archaeology in South Asian archaeology
Already well-established in archaeology in Europe (and increasingly in other regions of the
world) as a means by which to investigate the relationship between material artefacts and
organic products (Evershed 1998, 2008a; Craig et al. 2011; Dunne et al. 2017; Whelton et
al. 2018), biomolecular techniques in Indus archaeology have seen limited application (e.g.
Bourgeois and Gouin 1995). As the first large-scale investigation into lipid residues from
Indus vessels, this thesis demonstrates the viability of organic residue analysis as a
technique by which to investigate food and the use of vessels in South Asian
archaeological contexts. The results from this thesis also provide a critical way to examine
previously published results of lipid residues from environments with isotopically wide-
ranging plant and animal resources. The possibility of mixtures of animal and plant
resources in vessels must be considered as alternative option for vessel-use in diverse
prehistoric and historic contexts.
276
However, it is important to acknowledge that certain limitations, such as poor lipid
preservation, the absence of reference fats, and interpretational challenges related to stable
isotopic analyses must be addressed for the success of any future study in South Asia.
Going forward, lipid residue research in South Asia would benefit from: 1) a dedicated
reference-collection programme of modern fats from a variety of ruminant and non-
ruminant animals in South Asia, following precautions detailed by Roffet-Salque and
others (2017); 2) a focus on regions in the area demonstrating good organic preservation
(such as regions with high aridity) for comparison with other regions; 3) experimental
research with modern cooking/mixing experiments as well as degradation experiments to
clarify the parameters that might affect future interpretation.
Current methodological advancements in the field of organic residue analysis may
also help problems related to low lipid recovery and contamination in South Asia be
addressed. For example, the use of supercritical fluids for higher rates of extraction of
lipids from ceramics (Deviese et al. 2018) or the use of vibrational spectroscopy techniques
to discriminate between natural and synthetic organic compounds used in conservation
(Casanova et al. 2016) could be instrumental in improving lipid yields and issues related to
the analysis of pottery from collections.
Future lipid residue analysis could also investigate a myriad of topics that would
contribute to a better understanding of major developments in South Asian prehistory and
protohistory. These include the origins of dairying in the subcontinent and the process of
neolithisation, as well as changes in culinary practices with the advent of religions with
varying food taboos in later historic periods. Other exciting developments in the field, such
as the direct compound-specific radiocarbon dating of residues in pottery vessels (Berstan
et al. 2008; Casanova et al. 2018) may be able to resolve long-standing debates about
chronologies for various types of pottery in the Indus Civilisation and later historic periods
in South Asia. Additionally, δ2H values of animal fat residues in vessels may reflect
variations in precipitation, providing a unique, extremely localised climate proxy (Roffet-
Salque et al. 2018). If such an approach could be utilised for the South Asian context, it
could potentially revolutionise our understanding of not only how Indus communities
adapted to climate change but also investigate human response to climate change in a wide
range of contexts.
The application of other biomolecular methods such as starch-grain analysis has
already been utilised within Indus archaeology to investigate Indus processing and artefact
use (e.g. García-Granero et al. 2015, 2016). Recent research suggests that proteins may
277
also be recovered from ceramics, providing species-specificity and extremely high-
resolution data about vessel-use (Cappellini et al. 2018; Hendy et al. 2018). If viable in
South Asia, the combination of starch-, lipid- and proteomics techniques would also yield
fascinating insights into the processing of organic products and human-artefact
relationships.
9.3. Final conclusions
This thesis poses questions about foodstuff processed in the Indus Civilisation, specifically
addressing how issues about food acquisition and processing are linked to concepts about
urbanism, ruralism, and our present knowledge about agricultural and pastoralism,
environment and climate change. This study uses a novel approach in South Asian
archaeology that focuses primarily on lipid residues in pottery, but combines the evidence
with archaeobotanical, faunal, and isotopic data to test, across a range of different Indus
settlements, what kinds of organic products were processed by inhabitants in quotidian
settings. Crucially, in using these discrete set of data, this study was able to assess the wide
range of commensal products and management strategies used by Indus populations on a
site-specific and chronologically-diverse scales.
Overall, this thesis provides important methodological and archaeological insights.
Firstly, the results suggest that ceramic lipid residue analysis is challenging to conduct in
arid, hot and seasonally-wet environments, and that low lipid preservation creates a serious
impediment to interpretation of data. This is an important finding for future researchers
conducting biomolecular analyses in South Asia. Crucially, however, this does not mean
that such analyses should not be undertaken in the region: rather, it is vital that we develop
more methodological means to investigate organic remains in challenging environments.
The obtained lipid and isotopic results also raise a number of important questions about the
degree of confidence with which we can interpret stable isotopic values from fatty acids in
lipid extracts. Secondly, the results provide a new means by which to investigate quotidian
practices of inhabitants at South Asia’s first urban civilisation. They provide new insights
into different organic products processed at a diverse range of Indus settlements. Although
some of the results are ambiguous and have equivocal interpretations, they raise crucial
questions about the scale and extent of dairying in the Indus Civilisation; the likelihood of
mixtures in vessels and complexities involved in resolving them; and the possibility of
specific culinary preferences for certain types of foodstuff, for example, roasting of meat
and boiling for vegetables/pulses and dairy. These are important findings and open up new
278
avenues for research into secondary product utilisation, foodways, and biomolecular
approaches across ancient South Asia.

279
280
Bibliography
Abbink, A. A. 1999. ‘Make It and Break It: The Cycles of Pottery’. PhD thesis, Leiden:
Leiden University.
Abbink, J. 2003. ‘Love and Death of Cattle: The Paradox in Suri Attitudes toward
Livestock’. Ethnos 68 (3): 341–64.
Achaya, K. T. 1998. A Historical Dictionary of Indian Food. Delhi: Oxford University
Press.
———.1994. Indian Food: A Historical Companion. Delhi: Oxford University Press.
Agrawal, D. P. 2007. The Indus Civilization: An Interdisciplinary Perspective. New Delhi:
Aryan Books International.
Ahuja, R. L., and M. Singh. 1983. Soils of Hisar District and Their Management. Hissar:
Department of Soils, Haryana Agricultural University.
Aillaud, S. 2002. ‘Field and Laboratory Studies of Diagentic Reactions Affecting Lipid
Residues Absorbed in Unglazed Archaeological Pottery Vessels’. PhD thesis,
Bristol: University of Bristol.
Allchin, F. R. 1979. ‘India: The Ancient Home of Distillation?’ Man 14 (1): 55–63.
Ameri, M. 2013. ‘Regional Diversity in the Harappan World: The Evidence of the Seals’.
In Connections and Complexity: New Approaches to the Archaeology of South Asia,
edited by S. A. Abraham, P. Gullapalli, T. P. Raczek, and U. Z. Rizvi, 355–74.
Walnut Creek: Left Coast Press.
Appadurai, A. 1988. ‘How to Make a National Cuisine: Cookbooks in Contemporary
India’. Comparative Studies in Society and History 30 (1): 3–24.
———. 1981. ‘Gastro-Politics in Hindu South Asia’. American Ethnologist 8 (3): 494–
511.
Arnold, D. 1985. Ceramic Theory and Cultural Process: New Studies in Archaeology.
Cambridge: Cambridge University Press.
281
Arthur, J. W. 2014. ‘Pottery Uniformity in a Stratified Society: An Ethnoarchaeological
Perspective from the Gamo of Southwest Ethiopia’. Journal of Anthropological
Archaeology 35 (September): 106–16.
Atalay, S., and C. A. Hastorf. 2006. ‘Food, Meals, and Daily Activities: Food Habitus at
Neolithic Çatalhöyük’. American Antiquity 71 (2): 283–319.
Avanzini, A., A. V. Sedov, and C. Condoluci. 2005. ‘Salut, Sultanate of Oman Report
(2004-2005)’. Egitto e Vicino Oriente 28: 339–89.
Bala, M. 2003. ‘The Pottery’. In Excavations at Kalibangan: The Early Harappans 1961-
1969, Memoirs of the Archaeological Survey of India No, 98 B., edited by B. B. Lal,
J. P. Joshi, B. K. Thapar, and M. Bala, 101–222. New Delhi: Archaeological Survey
of India.
Balasse, M. 2002. ‘Reconstructing Dietary and Environmental History from Enamel
Isotopic Analysis: Time Resolution of Intra-Tooth Sequential Sampling’.
International Journal of Osteoarchaeology 12 (3): 155–65.
Barker, A., J. Dombrosky, B. Venables, and S. Wolverton. 2018. ‘Taphonomy and
Negative Results: An Integrated Approach to Ceramic-Bound Protein Residue
Analysis’. Journal of Archaeological Science 94 (June): 32–43.
Barton, H. J., and R. Torrence. 2015. ‘Cooking up Recipes for Ancient Starch: Assessing
Current Methodologies and Looking to the Future’. Journal of Archaeological
Science 56: 194–201.
Bates, J. 2019. ‘Oilseeds, Spices, Fruits and Flavour in the Indus Civilisation’. Journal of
Archaeological Science: Reports 24 (April): 879–87.
———. 2016. ‘Social Organisation and Change in Bronze Age South Asia: A Multi-Proxy
Approach to Urbanisation, Deurbanisation and Village Life through Phytolith and
Macrobotanical Analysis’. Unpublished PhD thesis, Cambridge: University of
Cambridge.
Bates, J., C A. Petrie, and R. N. Singh. in prep. ‘Cereal Grains and Grain Pulses:
Reassessing the Archaeobotany of the Harappan and Painted Grey Ware Occupation
at Alamgirpur’.
282
Baudouin, J.-P. in prep. ‘Understanding rainfall pattern and variability in the Indus Valley,
4000 years ago’. Unpublished PhD thesis, Cambridge: University of Cambridge.
Belcher, W. R. 2003. ‘Fish Exploitation of the Indus Valley Tradition’. In Indus
Ethnobiology, edited by S. Weber and W. R. Belcher, 95–174. Oxford: Lexington
Books.
———. 1994. ‘Multiple Approaches toward Reconstructon of Fishing Technology: Net-
Making in the Indus Valley Tradition’. In From Sumer to Meluhha: Contributions to
the Archaeology of South and West Asia in Memory of George F. Dales, edited by J.
M. Kenoyer, 3:129–42. Madison: Wisconsin Archaeological Reports.
———.1991. ‘Fish Resources in an Early Urban Context at Harappa’. In Harappa
Excavations 1986-1990, edited by R. H. Meadow, 107–20. Monographs in World
Archaeology 3. Madison, Wisconsin: Prehistory Press
Bellini, C., C. Condoluci, G. Giachi, T. Gonnelli, and M. Mariotti Lippi. 2011.
‘Interpretative Scenarios Emerging from Plant Micro- and Macroremains in the Iron
Age Site of Salut, Sultanate of Oman’. Journal of Archaeological Science 38 (10):
2775–89.
Berkelhammer, M., A. Sinha, M. Mudelsee, H. Cheng, R. L. Edwards, and K. Cannariato.
2010. ‘Persistent Multidecadal Power of the Indian Summer Monsoon’. Earth and
Planetary Science Letters 290 (1): 166–72.
Berstan, R., A. W. Stott, S. Minnitt, C. Bronk-Ramsey, R. E. M. Hedges, and R. P.
Evershed. 2008. ‘Direct Dating of Pottery from Its Organic Residues: New Precision
Using Compound-Specific Carbon Isotopes’. Antiquity 82 (317): 702–13.
Bhan, S. 1975. Exacavation at Mitathal (1968) and Other Explorations in the Sutlej-
Yamuna Divide. Kurukshetra: Kurukshetra University.
Bharati, A. 1967. ‘Ideology and Content of Caste among the Indian of East Africa’. In
Caste in Overseas Indian Communities, edited by B. M. Schwartz, 283–320. San
Francisco: California: Chandler Publishing Company.
Bhattacharya, M. 2016. ‘How the World’s First Tandoori Chicken Was Cooked’. Daily O,
3 July 2016. https://www.dailyo.in/lifestyle/harappa-mohenjodaro-chanhudaro-
lothal-kalibangan-tandoori-chicken-mesopotamia/story/1/11538.html.
283
Bhattacharyya, D. K., and D. Bhattacharyya. 2002. ‘Agro-Pastoralism in Contemporary
Ethnography: Its Relevance in Explanation of Archaeological Material in India’. In
Indian Archaeology in Retrospect: Archaeology and Interactive Disciplines, edited
by R. Korisettar and S. Settar. Vol. 3. New Delhi: Manohar.
Bhutia, L. 2017. ‘What They Ate in the Indus Valley’. Open The Magazine, 8 June 2017.
https://openthemagazine.com/features/archaeology/what-they-ate-in-the-indus-
valley/.
Bisht, R. S. 2005. ‘The Water Structures and Engineering of the Harappans at Dholavira
(India)’. In South Asian Archaeology 2001, Vol. 1, edited by C. Jarrige and V.
Lefèvre, 11–26. Paris: CNRS.
———. 1991. ‘Dholavira: New Horizons of the Indus Civilization’. Puratattva 20: 71–81.
Boecklen, W. J., C. T. Yarnes, B. A. Cook, and A. C. James. 2011. ‘On the Use of Stable
Isotopes in Trophic Ecology’. Annual Review of Ecology, Evolution, and Systematics
42 (1): 411–40.
Bordieu, P. 1977. Outline of a Theory of Practice. New York: Cambridge University Press.
Bourgeois, G., and P. Gouin. 1995. ‘Résultats d’une analyse de traces organiques fossiles
dans une « faisselle » harappéenne’. Paléorient 21 (1): 125–28.
Bray, T. L., ed. 2003. The Archaeology and Politics of Food and Feasting in Early States
and Empires. New York: Kluwer Academic/Plenum.
Breitenbach, S. 2009. ‘Changes in monsoonal precipitation and atmospheric circulation
during the holocene reconstructed from stalagmites from Northeastern India’.
Unpublished PhD thesis, Potsdam: University of Potsdam.
Brittain, M., and N. Overton. 2013. ‘The Significance of Others: A Prehistory of Rhythm
and Interspecies Participation’. Society and Animals 21: 134–149.
Bronk Ramsey, C. 2009. ‘Bayesian Analysis of Radiocarbon Dates’. Radiocarbon 51 (1):
Bryant, J. D., P. N. Froelich, W. J. Showers, and B. J. Genna. 1996. ‘A Tale of Two
Quarries: Biologic and Taphonomic Signatures in the Oxygen Isotope Composition
of Tooth Enamel Phosphate from Modern and Miocene Equids’. PALAIOS 11 (4):
397–408.
284
Budja, M. 2014. ‘Neolithic Pottery and the Biomolecular Archaeology of Lipids’.
Documenta Praehistorica 41 (December): 196–224.
Bull, I. D., P. F. van Bergen, C. J. Nott, P. R. Poulton, and R. P. Evershed. 2000. ‘Organic
Geochemical Studies of Soils from the Rothamsted Classical Experiments: The Fate
of Lipids in Different Long-Term Experiments’. Organic Geochemistry, 20.
Bull, I. D., I. A. Simpson, P. F. van Bergen, and R. P. Evershed. 1999. ‘Muck “n”
Molecules: Organic Geochemical Methods for Detecting Ancient Manuring’.
Antiquity 73 (279): 86–96.
Cadwallader, L. 2013. ‘Investigating 1500 Years of Dietary Change in the Lower Ica
Valley, Peru Using an Isotopic Approach’. Unpublished PhD thesis, Cambridge:
University of Cambridge.
Camp, C. 1982. ‘Foodways in Everyday Life’. American Quarterly 34 (3): 278–89.
Cappellini, E., A. Prohaska, F. Racimo, F. Welker, M. W. Pedersen, M. E. Allentoft, P. de
Barros Damgaard, et al. 2018. ‘Ancient Biomolecules and Evolutionary Inference’.
Annual Review of Biochemistry 87 (1): 1029–60.
Casanova, E., T. D. J. Knowles, C. Williams, M. P. Crump, and R. P. Evershed. 2018.
‘Practical Considerations in High-Precision Compound-Specific Radiocarbon
Analyses: Eliminating the Effects of Solvent and Sample Cross-Contamination on
Accuracy and Precision’. Analytical Chemistry 90 (18): 11025–32.
Casanova, E., C. Pelé-Meziani, E. Guilminot, J-V Mevellec, C. Riquier-Bouclet, A.
Vinçotte, and G. Lemoine. 2016. ‘The Use of Vibrational Spectroscopy Techniques
as a Tool for the Discrimination and Identification of the Natural and Synthetic
Organic Compounds Used in Conservation’. Analytical Methods 8 (48): 8514–27.
Ceccarelli, A. in prep. ‘Ceramic Traditions and Ceramic Landscapes of the Indus
Civilisation: Investigating the Technologies and Socio-Economic Complexity of
Rural Pottery Production in Bronze Age Northwest India’. Unpublished PhD thesis,
Cambridge: University of Cambridge.
Ceccarelli, A., and C. A. Petrie. 2018. ‘Ceramic Analysis and the Indus Civilization: A
Review’. In Walking with the Unicorn: Social Organization and Material Culture in
Ancient South Asia, edited by D. Frenez, G. Jamison, R. W. Law, M. Vidale, and R.
285
H. Meadow, 90–103. Rome: ISMEO Associazione Internazionale di Studli sul
Mediterraneo e l’Oriente, Archaeopress.
Chakrabarti, D. 1999. India: An Archaeological History, Palaeolithic Beginnings to Early
Historic Foundations. New Delhi: Oxford University Press.
———. 1995. The Archaeology of Ancient Indian Cities. Delhi: Oxford University Press.
Chakraborty, K. S., S. Chakraborty, P. Le Roux, H. M.-L. Miller, P. Shirvalkar, and Y.
Rawat. 2018. ‘Enamel Isotopic Data from the Domesticated Animals at Kotada
Bhadli, Gujarat, Reveals Specialized Animal Husbandry during the Indus
Civilization’. Journal of Archaeological Science: Reports 21 (October): 183–99.
Channarayapatna, S. 2018. A Study of Animal Utilization Strategies from Early to Late
Harappan Periods in Haryana. South Asian Archaeology 3. Osaka: Research Group
for South Asian Archaeology Kansai University.
———. 2014. ‘A Study of Animal Utilization Strategies from Early to Late Harappan
Periods in Haryana’. Unpublished PhD thesis, Pune: Deccan College Post-graduate
and Research Institute.
Charters, S., R. P. Evershed, A. Quye, P. W. Blinkhorn, and V. Reeves. 1997. ‘Simulation
Experiments for Determining the Use of Ancient Pottery Vessels: The Behaviour of
Epicuticular Leaf Wax during Boiling of a Leafy Vegetable’. Journal of
Archaeological Science 24 (1): 1–7.
Charters, S., R. P. Evershed, V. Denham, and P. W. Blinkhorn. 1995. ‘Evidence for the
Mixing of Fats and Waxes in Archaeological Ceramics’. Archaeometry 37 (1): 113–
27.
Charters, S., R. P. Evershed, L. J. Goad, A. Leyden, P. W. Blinkhorn, and V. Denham.
1993. ‘Quantification and Distribution of Lipid in Archaeological Ceramics:
Implications for Sampling Potsherds for Organic Residue Analysis and Classification
of Vessel Use’. Archaeometry 35 (2): 211–23.
Chase, B. 2014. ‘On the Pastoral Economies of Harappan Gujarat: Faunal Analyses at
Shikarpur in Context. Heritage: Journal of Multidisciplinary Studies in Archaeology
2: 1-22.
286
———. 2012. ‘More than One Way to Skin a Goat? Domestic Technologies of the Indus
Civilization in Baluchistan and Gujarat’. In Melanges Offerts a Jean-Francois
Jarrige, edited by V. Lefèvre, 161–76. Turnhout: Brepols.
———. 2010. ‘Social Change at the Harappan Settlement of Gola Dhoro: A Reading from
Animal Bones’. Antiquity 84 (324): 528–43.
———. 2005. ‘Butchery Technology at Nausharo: An Experimental Approach’. In South
Asian Archaeology 2001, edited by J. F. Jarrige and C. Jarrige, 51–60. Paris: Editions
recherche sur les civilisations.
Chase, B., D. Meiggs, P. Ajithprasad, and P. A. Slater. 2018. ‘What is left behind:
Advancing interpretation of pastoral land-use in Harappan Gujarat using herbivore
dung to examine biosphere strontium isotope (87Sr/86Sr) variation’. Journal of
Archaeological Science 92 (April): 1–12.
Chase, B., D. Meiggs, P. Ajithprasad, and P. A. Slater. 2014a. ‘Pastoral Land-Use of the
Indus Civilization in Gujarat: Faunal Analyses and Biogenic Isotopes at Bagasra’.
Journal of Archaeological Science 50 (October): 1–15.
Chase, B., P. Ajithprasad, S. V. Rajesh, A. Patel, and B. Sharma. 2014b. ‘Materializing
Harappan Identities: Unity and Diversity in the Borderlands of the Indus
Civilization’. Journal of Anthropological Archaeology 35 (September): 63–78.
Childe, V. G. 1950. ‘The Urban Revolution’. Town Planning Review 21: 3–17.
Choyke, A. M. 2010. ‘The Bone Is the Beast: Animal Amulets and Ornaments in Power
and Magic’. In Anthropological Approaches to Zooarchaeology: Colonialism,
Complexity and Animal Transformations, edited by D. Campana, P. J. Crabtree, S. D.
DeFrance, J. Lev-Tov, and A. Choyke, 197–209. Oxford: Oxbow Books.
Christie, W. W. 2018. ‘The Lipid Web’. The Lipid Web. 2018.
http://www.lipidhome.co.uk
———. 1998. ‘Gas Chromatography-Mass Spectrometry Methods for Structural Analysis
of Fatty Acids’. Lipids 33 (4): 343–53.
———. 1989. Gas Chromatography and Lipids: A Practical Guide. Dundee: Oily Press.
287
Cleuziou, S. and Tosi, M. 2007. In the shadow of the ancestors: The prehistoric
foundations of the early Arabian civilization in Oman. Muscat: Ministry of Heritage
and Culture.
Codron, D., M. Clauss, J. Codron, and T. Tütken. 2018. ‘Within Trophic Level Shifts in
Collagen–Carbonate Stable Carbon Isotope Spacing Are Propagated by Diet and
Digestive Physiology in Large Mammal Herbivores’. Ecology and Evolution 8 (8):
3983–95.
Colombini, M. P., G. Giachi, F. Modugno, and E. Ribechini. 2005. ‘Characterisation of
Organic Residues in Pottery Vessels of the Roman Age from Antinoe (Egypt)’.
Microchemical Journal 79 (1–2): 83–90.
Colonese, A. C., A. Lucquin, E. P. Guedes, R. Thomas, J. Best, B. T. Fothergill, N. Sykes,
et al. 2017. ‘The Identification of Poultry Processing in Archaeological Ceramic
Vessels Using In-Situ Isotope References for Organic Residue Analysis’. Journal of
Archaeological Science 78 (February): 179–92.
Condamin, J., F. Formenti, M. O. Metais, M. Michel, and P. Blond. 1976. ‘The
Application of Gas-Chromatography to the Tracing of Oil in Ancient Amphorae’.
Archaeometry 18 (2): 195–201.
Connan, J., and T. van de Velde. 2010. ‘An Overview of Bitumen Trade in the Near East
from the Neolithic (c.8000 BC) to the Early Islamic Period’. Arabian Archaeology
and Epigraphy 21 (1): 1–19.
Coplen, Tyler B. 2011. ‘Guidelines and Recommended Terms for Expression of Stable-
Isotope-Ratio and Gas-Ratio Measurement Results’. Rapid Communications in Mass
Spectrometry 25 (17): 2538–60.
Coplen, T. B., W. A. Fairservis, M. Gehre, Manfred Gröning, H. A. J. Meijer, B. Toman,
and R. M. Verkouteren. 2006. ‘After Two Decades a Second Anchor for the VPDB
Δ13C Scale’. Rapid Communications in Mass Spectrometry 20 (21): 3165–66.
Copley, M. S., R. Berstan, S. N. Dudd, V. Straker, S. Payne, and R. P. Evershed. 2005a.
‘Dairying in Antiquity. I. Evidence from Absorbed Lipid Residues Dating to the
British Iron Age’. Journal of Archaeological Science 32 (4): 485–503.
Copley, M. S., R. Berstan, V. Straker, S. Payne, and R. P. Evershed. 2005b. ‘Dairying in
Antiquity. II. Evidence from Absorbed Lipid Residues Dating to the British Bronze
Age’. Journal of Archaeological Science 32 (4): 505–21.
288
Copley, M. S., R. Berstan, A. J. Mukherjee, S. N. Dudd, V. Straker, S. Payne, and R. P.
Evershed. 2005c. ‘Dairying in Antiquity. III. Evidence from Absorbed Lipid
Residues Dating to the British Neolithic’. Journal of Archaeological Science 32 (4):
523–46.
Copley, M. S., R. Berstan, S. N. Dudd, G. Docherty, A. J. Mukherjee, V. Straker, S. Payne,
and R. P. Evershed. 2003. ‘Direct Chemical Evidence for Widespread Dairying in
Prehistoric Britain’. Proceedings of the National Academy of Sciences 100 (4):
1524–29.
Copley, M. S. 2002. ‘Chemical Investigations of Pottery and Palaeoenvironmental Material
from Qasr Ibrim, Egypt.’ Unpublished PhD thesis, Bristol: University of Bristol.
Copley, M. S., P. J. Rose, A. Clapham, D. N. Edwards, M. C. Horton, and R. P. Evershed.
2001. ‘Detection of Palm Fruit Lipids in Archaeological Pottery from Qasr Ibrim,
Egyptian Nubia’. Proceedings of the Royal Society of London. Series B: Biological
Sciences 268 (1467): 593–97.
Cork, E. 2011. Rethinking the Indus: A Comparative Re-Evaluation of the Indus
Civilisation as an Alternative Paradigm in the Organisation and Structure of Early
Complex Societies. BAR International Series. Oxford: Archaeopress.
Correa-Ascencio, M., and R. P. Evershed. 2014. ‘High Throughput Screening of Organic
Residues in Archaeological Potsherds Using Direct Acidified Methanol Extraction’.
Analytical Methods 6 (5): 1330.
Correa-Ascencio, M., I. G. Robertson, O. Cabrera-Cortés, R. Cabrera-Castro, and R. P.
Evershed. 2014. ‘Pulque Production from Fermented Agave Sap as a Dietary
Supplement in Prehispanic Mesoamerica’. Proceedings of the National Academy of
Sciences 111 (39): 14223–28.
Costa, C. 2016. ‘The Use of Animal Bone as Fuel in the Third Millennium BC Walled
Enclosure of Castanheiro Do Vento (Northern Portugal)’. International Journal of
Osteoarchaeology 26 (5): 877–84.
Courel, B., P. Schaeffer, P. Adam, E. Motsch, Q. Ebert, E. Moser, C. Féliu, et al. 2017.
‘Molecular, Isotopic and Radiocarbon Evidence for Broomcorn Millet Cropping in
Northeast France since the Bronze Age’. Organic Geochemistry 110 (August): 13–
24.
Courty, M. A. 1995. ‘Late Quaternary Environmental Changes and Natural Contraints to
Ancient Land Use (Northwest India)’. In Ancient Peoples and Landscapes, edited by
E. Johnsoon, 105–26. Lubbock: Museum of Texas Tech University.
289
Crabtree, P. J. 1990. ‘Zooarchaeology and Complex Societies: Some Uses of Faunal
Analysis for the Study of Trade, Social Status, and Ethnicity’. Archaeological
Method and Theory 2: 155–205.
Craig, O. E., L.-M. Shillito, U. Albarella, S. Viner-Daniels, B. Chan, R. Cleal, R. Ixer, et
al. 2015. ‘Feeding Stonehenge: Cuisine and Consumption at the Late Neolithic Site
of Durrington Walls’. Antiquity 89 (347): 1096–1109.
Craig, O. E., H. Saul, A. Lucquin, Y. Nishida, K. Taché, L. Clarke, A. Thompson, et al.
2013. ‘Earliest Evidence for the Use of Pottery’. Nature 496 (7445): 351–54.
Craig, O. E., R. B. Allen, A. Thompson, R. E. Stevens, V. J. Steele, and C. P. Heron. 2012.
‘Distinguishing Wild Ruminant Lipids by Gas Chromatography/Combustion/Isotope
Ratio Mass Spectrometry: Distinguishing Ruminant Lipids’. Rapid Communications
in Mass Spectrometry 26 (19): 2359–64.
Craig, O. E., V. J. Steele, A. Fischer, S. Hartz, S. H. Andersen, P. Donohoe, A. Glykou, et
al. 2011. ‘Ancient Lipids Reveal Continuity in Culinary Practices across the
Transition to Agriculture in Northern Europe’. Proceedings of the National Academy
of Sciences 108 (44): 17910–15. https://doi.org/10.1073/pnas.1107202108.
Craig, O. E., M. Forster, S. H. Andersen, E. Koch, P. Crombé, N. J. Milner, B. Stern, G. N.
Bailey, and C. P. Heron. 2007. ‘Molecular and Isotopic Demonstration of the
Processing of Aquatic Products in Northern European Prehistoric Pottery’.
Archaeometry 49 (1): 135–52.
Craig, O. E., J. Chapman, C. P. Heron, L. H. Willis, L. Bartosiewicz, G. Taylor, A.
Whittle, and M. J. Collins. 2005. ‘Did the First Farmers of Central and Eastern
Europe Produce Dairy Foods?’ Antiquity 79 (306): 882–94.
Craig, O. E., G. D. Love, S. Isaksson, G. Taylor, and C. E. Snape. 2004. ‘Stable Carbon
Isotopic Characterisation of Free and Bound Lipid Constituents of Archaeological
Ceramic Vessels Released by Solvent Extraction, Alkaline Hydrolysis and Catalytic
Hydropyrolysis’. Journal of Analytical and Applied Pyrolysis 71 (2): 613–34.
Craig, O. E., J. Chapman, A. Figler, P. Patay, G. Taylor, and M. J. Collins. 2003. ‘“Milk
Jugs” and Other Myths of the Copper Age of Central Europe’’. European Journal of
Archaeology 6 (3): 251–65.
Cramp, L. 2008. ‘Foodways and Identity: Organic Residue Analysis of Roman Mortaria
and Other Pottery’. Unpublished PhD thesis, Reading: University of Reading.
290
Cramp, L. J. E., and R. P. Evershed. 2014. ‘Reconstructing Aquatic Resource Exploitation
in Human Prehistory Using Lipid Biomarkers and Stable Isotopes.’ Treatise on
Geochemistry 14: 319–39.
Cramp, L. J. E., J. Jones, A. Sheridan, J. Smyth, H. Whelton, J. Mulville, N. Sharples, and
R. P. Evershed. 2014. ‘Immediate Replacement of Fishing with Dairying by the
Earliest Farmers of the Northeast Atlantic Archipelagos’. Proceedings of the Royal
Society B: Biological Sciences 281 (1780): 20132372.
Cramp, L. J. E., R. P. Evershed, and H. Eckardt. 2011. ‘What Was a Mortarium Used for?
Organic Residues and Cultural Change in Iron Age and Roman Britain’. Antiquity 85
(330): 1339–52.
Crate, S. A. 2008. ‘Walking behind the Old Women: Sacred Sakha Cow Knowledge in the
21st Century’. Human Ecology Review 15 (2): 15.
Crowther, A., M. Haslam, N. Oakden, D. Walde, and J. Mercader. 2014. ‘Documenting
Contamination in Ancient Starch Laboratories’. Journal of Archaeological Science
49: 90–104.
Dales, G. F. 1965. ‘New Investigations at Mohenjo-Daro’. Archaeology 18 (2): 145–50.
Dales, G. F., and J. M. Kenoyer. 1986. Excavations at Mohenjo-Daro, Pakistan: The
Pottery, with an an Account of the Pottery from the 1950 Excavations of Sir
Mortimer Wheeler. Philadelphia, PA: University of Pennsylvania Museum.
Daniel, V. E. 1987. Fluid Signs: Being a Person the Tamil Way. London: University of
California Press.
D’Anna, M. B., and C. Jauss. 2015. ‘Cooking in the Fourth Millennium BCE:
Investigating the Social via the Material’. In Commensality, edited by S. Kerner, C.
Chou, and M. Warmind. London: Bloomsbury Publishing PLC.
Davis, S. J. M. 2008. ‘"Thou Shalt Take of the Ram … The Right Thigh; for It Is a Ram of
Consecration …” Some Zoo-Archaeological Examples of Body-Part Preferences’. In
Uomini, Piante E Animale Nella Dimensione Del Sacro, edited by J. d’Andrea, J. De
Grossi Mazzorin, and G. Fiorentino, 63–70. Bari: Edipuglia.
Debono Spiteri, C. 2012. ‘Pottery use at the transition to agriculture in the western
Mediterranean. Evidence from biomolecular and isotopic characterisation of organic
residues in Impressed/Cardial Ware vessels.’ Unpublished PhD thesis. York:
University of York.
Debono Spiteri, C., R. E. Gillis, M. Roffet-Salque, L. Castells Navarro, J. Guilaine, C.
Manen, I. M. Muntoni, et al. 2016. ‘Regional Asynchronicity in Dairy Production
291
and Processing in Early Farming Communities of the Northern Mediterranean’.
Proceedings of the National Academy of Sciences 113 (48): 13594–99.
Deepak, S. 2018. ‘There Is No Dalit Cuisine’. Popula, 2018.
https://popula.com/2018/11/20/there-is-no-dalit-cuisine/.
DeLaune, R. D., C. N. Reddy, and W. H. Jr Patrick. 1981. ‘Organic Matter Decomposition
in Soil as Influenced by PH and Redox Conditions’. Soil Biology and Biochemistry
13 (6): 533–34.
DeNiro, M. J. 1987. ‘Stable Isotopes and Archaeology’. American Scientist 75 (2): 182–91.
DeNiro, M. J., and S. Epstein. 1981. ‘Influence of Diet on the Distribution of Nitrogen
Isotopes in Animals’. Geochimica et Cosmochimica Acta 45 (3): 341–51.
DeNiro, Michael J., and S. Epstein. 1978. ‘Influence of Diet on the Distribution of Carbon
Isotopes in Animals’. Geochimica et Cosmochimica Acta 42 (5): 495–506.
Desai, A. 2008. ‘Subaltern Vegetarianism: Witchcraft, Embodiment and Sociality in
Central India’. South Asia: Journal of South Asian Studies 31 (1): 96–117.
Deshpande-Mukherjee, A. 1998. ‘Shellfishing and Shell Crafts during the Harappan Period
in Gujarat’. Man and Environment 23 (1): 63–80.
———. 1996. ‘Shell Remains’. In Kuntasi: A Harappan Emporium on the West Coast,
edited by M. K. Dhavalikar, M. R. Raval, and Y. M. Chitalwala, 331–47. Pune:
Deccan College.
Devièse, T., A. van Ham-Meert, V. J. Hare, J. Lundy, P. Hommel, V. Ivanovich
Bazaliiskii, and J. Orton. 2018. ‘Supercritical Fluids for Higher Extraction Yields of
Lipids from Archaeological Ceramics’. Analytical Chemistry 90 (4): 2420–24.
Diallo, B., M. Vanhaelen, and O. P. Gosselain. 1995. ‘Plant Constitutents Involved in
Coating Practices among Traditional African Potters’. Experientia 51 (1): 95–97.
Diefendorf, A> F., K. H. Freeman, S. L. Wing, and H. V. Graham. 2011. ‘Production of N-
Alkyl Lipids in Living Plants and Implications for the Geologic Past’. Geochimica et
Cosmochimica Acta 75 (23): 7472–85.
Dietler, M., and B. Hayden. 2010. Feasts: Archaeological and Ethnographic Perspectives
on Food, Politics, and Power. University of Alabama Press.
292
Dikshit, K. N. 1984. ‘The Sothi Complex: Old Records and Fresh Observation’. In
Frontiers of the Indus Civilization: Sir Mortimer Wheeler Commemoration Volume,
edited by B. B. Lal and S. P. Gupta, 531–37. New Delhi: Books and Books.
Dixit, Y., D. A. Hodell, A. Giesche, S. K. Tandon, F. Gázquez, H. S. Saini, L. C. Skinner,
et al. 2018. ‘Intensified Summer Monsoon and the Urbanization of Indus Civilization
in Northwest India’. Scientific Reports 8 (1): 4225.
Dixit, Y., D. A. Hodell, and C. A. Petrie. 2014a. ‘Abrupt Weakening of the Summer
Monsoon in Northwest India ~4100 Yr Ago’. Geology 42 (4): 339–42.
Dixit, Y., D. A. Hodell, R. Sinha, and C. A. Petrie. 2014b. ‘Abrupt Weakening of the
Indian Summer Monsoon at 8.2 Kyr B.P.’ Earth and Planetary Science Letters 391
(April): 16–23. https://doi.org/10.1016/j.epsl.2014.01.026.
Drieu, L. 2017. ‘Fabrication et Usages Des Poteries Durant Le Néolithique et La
Protohistoire En Europe: Les Apports de l’archéologie Biomoléculaire’. Unpublished
PhD thesis, Nice: L’univesrité Côte d’Azur.
Drieu, L., Horgnies, M., Binder, D., Pétrequin, P., Pétrequin, A. M., Peche-Quilichini, K.,
Lachenal, T. and M. Regert. 2019. ‘Influence of Porosity on Lipid Preservation in the
Wall of Archaeological Pottery’. Archaeometry 61(5): 1081-1096.
Dudd, S. N. 1999. ‘Molecular and Isotopic Characterisation of Animal Fats in
Archaeological Pottery’. PhD thesis, Bristol: University of Bristol.
Dudd, S. N., and R. P Evershed. 1998. ‘Direct Demonstration of Milk as an Element of
Archaeological Economies’. Science 282 (5393): 1478–81.
Dudd, S. N., R. P. Evershed, and A. M. Gibson. 1999. ‘Evidence for Varying Patterns of
Exploitation of Animal Products in Different Prehistoric Pottery Traditions Based on
Lipids Preserved in Surface and Absorbed Residues’. Journal of Archaeological
Science 26 (12): 1473–82.
Dudd, S. N., M. Regert, and R. P. Evershed. 1998. ‘Assessing Microbial Lipid
Contributions during Laboratory Degradations of Fats and Oils and Pure
Triacylglycerols Absorbed in Ceramic Potsherds’. Organic Geochemistry 29 (5–7):
1345–54.
293
Dunne, J., S. di Lernia, M. Chłodnicki, F. Kherbouche, and R. P. Evershed. 2018. ‘Timing
and Pace of Dairying Inception and Animal Husbandry Practices across Holocene
North Africa’. Quaternary International 471 (March): 147–59.
Dunne, J., A. M. Mercuri, R. P. Evershed, S. Bruni, and S. di Lernia. 2017. ‘Earliest Direct
Evidence of Plant Processing in Prehistoric Saharan Pottery’. Nature Plants 3 (1):
16194.
Dunne, J., R. P. Evershed, M. Salque, L. Cramp, S. Bruni, K. Ryan, S. Biagetti, and S. di
Lernia. 2012. ‘First Dairying in Green Saharan Africa in the Fifth Millennium Bc’.
Nature 486 (7403): 390–94.
During-Caspers, E. C. L. 1990. ‘...And Multi-Coloured Birds of Meluhha’. Proceedings of
the Seminar for Arabian Studies 20: 9–16.
Eckmeier, E., and G. L. B. Wiesenberg. 2009. ‘Short-Chain n-Alkanes (C16–20) in
Ancient Soil Are Useful Molecular Markers for Prehistoric Biomass Burning’.
Journal of Archaeological Science 36 (7): 1590–96.
Edens, C. 1992. ‘Dynamics of trade in the ancient Mesopotamian “World System”’,
American Anthropologist 94: 118 –139.
Eerkens, J. W. 2007. ‘Organic Residue Analysis and the Decomposition of Fatty Acids in
Ancient Potsherds’. In Theory and Practice in Archaeological Residue Analysis,
edited by H. Barnard and J. W. Eerkens, 90–98. BAR International Series 1650.
Oxford: Archaeopress.
———. 2005. ‘GC-MS Analysis and Fatty Acid Ratios of Archaeological Potsherds from
the Western Great Basin of North America’. Archaeometry 47 (1): 83–102.
Eglington, G., and G. A. Logan. 1991. ‘Molecular Preservation’. Philosophical
Transactions of the Royal Society of London. Series B: Biological Sciences 333
(1268): 315–28.
Eglinton, G., and R. J. Hamilton. 1967. ‘Leaf Epicuticular Waxes’. Science 156 (3780):
1322–35.
Eksambekar, S. P., S. R. Sainkar, and M. D. Kajale. 1999. ‘Phytolith Study Using
Scanning Electron Microscope (SEM): Some Initial Considerations’. Bulletin of the
Deccan College Post-Graduate Research Institute 58: 85–92.
294
Eltsov, P. A. 2008. From Harappa to Hastinapura: A Study of the Earliest South Asian
City and Civilization. Boston: Brill.
Evans, J. A., C. A. Chenery, and A. P. Fitzpatrick. 2006. ‘Bronze Age Childhood
Migration of Individuals Near Stonehenge, Revealed by Strontium and Oxygen
Isotope Tooth Enamel Analysis’. Archaeometry 48 (2): 309–21.
Evershed, R. P. 2008a. ‘Organic Residue Analysis in Archaeology: The Archaeological
Biomarker Revolution’. Archaeometry 50 (6): 895–924.
———. 2008b. ‘Experimental Approaches to the Interpretation of Absorbed Organic
Residues in Archaeological Ceramics’. World Archaeology 40 (1): 26–47.
———. 1993. ‘Biomolecular Archaeology and Lipids’. World Archaeology 25 (1,): 74–93.
Evershed, R. P., S. Payne, A. G. Sherratt, M. S. Copley, J. Coolidge, D. Urem-Kotsu, K.
Kotsakis, et al. 2008. ‘Earliest Date for Milk Use in the Near East and Southeastern
Europe Linked to Cattle Herding’. Nature 455 (7212): 528–31.
Evershed, R. P., S. N. Dudd, M. S. Copley, R. Berstan, A. W. Stott, H. Mottram, S. A.
Buckley, and Z. Crossman. 2002. ‘Chemistry of Archaeological Animal Fats’.
Accounts of Chemical Research 35 (8): 660–68.
Evershed, R. P., S. N. Dudd, S. Charters, H. Mottram, A. W. Stott, A. Raven, P. F. van
Bergen, H. A. Bland, M. Jones, and J. Bada. 1999. ‘Lipids as Carriers of
Anthropogenic Signals from Prehistory [and Discussion]’. Philosophical
Transactions: Biological Sciences 354 (1379): 19–31.
Evershed, R. P., H. R. Mottram, S. N. Dudd, S. Charters, A. W. Stott, G. J. Lawrence, A.
M. Gibson, A. Conner, P. W. Blinkhorn, and V. Reeves. 1997a. ‘New Criteria for the
Identification of Animal Fats Preserved in Archaeological Pottery’.
Naturwissenschaften 84 (9): 402–6.
Evershed, R. P., S. J. Vaughan, S. N. Dudd, and J. S. Soles. 1997b. ‘Fuel for Thought?
Beeswax in Lamps and Conical Cups from Late Minoan Crete’. Antiquity 71 (274):
979–85.
Evershed, R. P., A. W. Stott, A. Raven, S. N. Dudd, S. Charters, and A. Leyden. 1995.
‘Formation of Long-Chain Ketones in Ancient Pottery Vessels by Pyrolysis of Acyl
Lipids’. Tetrahedron Letters 36 (48): 8875–78.
295
Evershed, R. P., K. I. Arnot, J. Collister, G. Eglinton, and S. Charters. 1994. ‘Application
of Isotope Ratio Monitoring Gas Chromatography–Mass Spectrometry to the
Analysis of Organic Residues of Archaeological Origin’. The Analyst 119 (5): 909–
14.
Evershed, R. P., C. P. Heron, and L. J. Goad. 1992. ‘The Survival of Food Residues: New
Methods of Analysis, Interpretation and Application’. Proceedings of the British
Academy 77: 187–208.
———. 1990. ‘Analysis of Organic Residues of Archaeological Origin by High-
Temperature Gas Chromatography and Gas Chromatography-Mass Spectrometry’.
The Analyst 115 (10): 1339.
Fairservis, W. A. 1986. ‘Cattle and the Harappan Chiefdoms of the Indus Valley’.
Expedition 28 (2): 43–49.
———. 1971. The Roots of Indian Civilisation. New York: Macmillan.
———. 1967. ‘The Origin, Character and Decline of an Early Civilization’. American
Museum Novitates, no. 2302.
Farquhar, G. D., J. R. Ehleringer, and K.T. Hubick. 1989. ‘Carbon Isotope Discrimination
and Photosynthesis’. Annual Review of Plant Physiology and Plant Molecular
Biology 40 (1): 503–37.
Fernandes, R., Y. Eley, M. Brabec, A. Lucquin, A. Millard, and O. E. Craig. 2018.
‘Reconstruction of Prehistoric Pottery Use from Fatty Acid Carbon Isotope
Signatures Using Bayesian Inference’. Organic Geochemistry 117 (March): 31–42.
Fick, S. E., and R. J. Hijmans. 2017. ‘Worldclim 2: New 1-Km Spatial Resolution Climate
Surfaces for Global Land Areas’. International Journal of Climatology.
http://worldclim.org/version2.
Ficken, K. J., B. Li, D. L. Swain, and G. Eglinton. 2000. ‘An N-Alkane Proxy for the
Sedimentary Input of Submerged/Floating Freshwater Aquatic Macrophytes’.
Organic Geochemistry, 5.
Ficken, K. J., K. E. Barber, and G. Eglinton. 1998. ‘Lipid Biomarker, Δ13C and Plant
Macrofossil Stratigraphy of a Scottish Montane Peat Bog over the Last Two
Millennia’. Organic Geochemistry 28 (3): 217–37.
296
Fischer, G., F. Nachtergale, S. Prieler, H. van Velthuizen, L. Verelst, and D. Wiberge.
2008. Global Agro-Ecological Zones Assessment for Agriculture. Rome: FAO and
IIASA.
Flam, L. 1993. ‘Fluvial Geomorphology of the Lower Indus Basin (Sindh, Pakistan) and
the Indus Civilisation’. In Himalaya to the Sea: Geology, Geomorphology and the
Quaternary, edited by J. Shroder, 265–87. London: Routledge.
Frankel, E. N. 2005. Lipid Oxidation. 2nd edition. Bridgewater: The Oily Press.
Frenez, D., M. D. Esposti, S. Méry, and J. M. Kenoyer. 2016. ‘Bronze Age Salut (ST1) and
the Indus Civilization: Recent Discoveries and New Insights on Regional
Interaction’. In Proceedings of the Seminar for Arabian Studies, 46:107–24. Oxford:
Archaeopress.
Friedli, H., H. Lötscher, H. Oeschger, U. Siegenthaler, and B. Stauffer. 1986. ‘Ice Core
Record of the 13C/12C Ratio of Atmospheric CO2 in the Past Two Centuries’. Nature
324 (6094): 237–38.
Frith, J., R. Appleby, R. J. Stacey, and C. P. Heron. 2004. ‘Sweetness and Light: Chemical
Evidence of Beeswax and Tallow Candles at Fountains Abbey, North Yorkshire’.
Medieval Archaeology 48: 220–27.
Fujiwara, H. 1992. ‘Rice and Ragi at Harappa: Preliminary Results by Opal Plant
Phytoliths’. Pakistan Archaeology 27: 129–42.
Fuller, D. Q. 2011. ‘Pathways to Asian Civilizations: Tracing the Origins and Spread of
Rice and Rice Cultures’. Rice 4 (3): 78–92.
———. 2006. ‘Agricultural Origins and Frontiers in South Asia: A Working Synthesis’.
Journal of World Prehistory 20 (1): 1–86.
———. 2005. ‘Ceramics, Seeds and Culinary Change in Prehistoric India’. Antiquity 79
(306): 761–77.
———. 2003. ‘Indus and Non-Indus Agricultural Traditions: Local Developments and
Crop Adaptations on the Indian Peninsula’. In Indus Ethnobiology, edited by S.
Weber and W. R. Belcher, 343–96. Oxford: Lexington Books.
297
———. 2002. ‘Fifty Years of Archaebotanical Studies in India: Laying a Solid
Foundation’. In Indian Archaeology in Retrospect: Archaeology and Interactive
Disciplines, edited by R. Korisettar and S. Settar, 3:247–364. New Delhi: Manohar.
Fuller, D. Q., and L. Lucas. 2017. ‘Adapting Crops, Landscapes, and Food Choices:
Patterns in the Dispersal of Domesticated Plants across Eurasia’. In Human
Dispersal and Species Movement from Prehistory to the Present., edited by N.
Boivin, R. Crassard, and M. Petraglia, 304–31. Cambridge: Cambridge University
Press.
Fuller, D. Q., and C. J. Stevens. 2014. ‘Agriculture and the Development of Complex
Societies’. In From Foragers to Famers: Papers in Honour of Gordon C. Hillman,
edited by A. Fairburn and E. Weiss, 37–57. Oxford: Oxbow Books.
Fuller, Dorian Q., and M. Rowlands. 2011. ‘Ingestion and Food Technologies: Maintaining
Differences over the Long-Term in West, South and East Asia’. In Interweaving
Worlds-Systematic Interactions in Eurasia, 7th to 1st Millennia BC, 37–60. Oxford:
Oxbow Books.
———. 2009. ‘Towards a Long-Term Macro-Geography of Cultural Substances: Food and
Sacrifice Tradition in East, West and South Asia’. Chinese Review of Anthropology
12: 1–37.
Fuller, D. Q., and M. Madella. 2002. ‘Issues in Harappan Archaeobotany: Retrospect and
Prospect’. In Indian Archaeology in Retrospect: Protohistory, edited by R. Korisettar
and S. Settar, 2:317–90. New Delhi: Manohar.
Gallego Romero, I., C. Basu Mallick, A. Liebert, A. Crivellaro, G. Chaubey, Y. Itan, M.
Metspalu, et al. 2011. ‘Herders of Indian and European Cattle Share Their
Predominant Allele for Lactase Persistence.’ Molecular Biology and Evolution.
Ganzarolli, G., M. Alexander, A. C. Arnau, and O. E. Craig. 2018. ‘Direct Evidence from
Lipid Residue Analysis for the Routine Consumption of Millet in Early Medieval
Italy’. Journal of Archaeological Science 96 (August): 124–30.
García-Granero, J. J., M. Cubas, M. Madella, A. Suryanarayan, and O. E. Craig. in prep.
‘Prehistoric Foodways in Northern Gujarat, India: An Integrated Chemical and
Microbotanical Approach’.
298
García-Granero, J. J., C. Lancelotti, and M. Madella. 2017. ‘A Methodological Approach
to the Study of Microbotanical Remains from Grinding Stones: A Case Study in
Northern Gujarat (India)’. Vegetation History and Archaeobotany 26 (1): 43–57.
García-Granero, J. J. C. Lancelotti, M. Madella, and P. Ajithprasad. 2016. ‘Millets and
Herders: The Origins of Plant Cultivation in Semiarid North Gujarat (India)’.
Current Anthropology 57 (2): 149–73. https://doi.org/10.1086/685775.
García-Granero, J. J., C. Lancelotti, and M. Madella. 2015. ‘A Tale of Multi-Proxies:
Integrating Macro- and Microbotanical Remains to Understand Subsistence
Strategies’. Vegetation History and Archaeobotany 24 (1): 121–33.
Garge, T. 2010. ‘Sothi-Siswal Ceramic Assemblage: A Reappraisal’. Ancient India 2: 15–
40.
Gerbault, P., A. Liebert, Y. Itan, A. Powell, M. Currat, J. Burger, D. M. Swallow, and M.
G. Thomas. 2011. ‘Evolution of Lactase Persistence: An Example of Human Niche
Construction’. Philosophical Transactions of the Royal Society B: Biological
Sciences 366 (1566): 863–77.
Ghosh, A. 1952. ‘The Rajputana Desert: Its Archaeological Aspect’. Bulletin of the
National Institute of Science in India 1: 37–42.
Giesche, A., M. Staubwasser, C. A. Petrie, and D. A. Hodell. 2019. ‘Indian Winter and
Summer Monsoon Strength over the 4.2 BP Event in Foraminifer Isotope Records
from the Indus River Delta in the Arabian Sea’. Climate of the Past 15 (1): 73–90.
Giosan, L., P. D. Clift, M. G. Macklin, D. Q. Fuller, S. Constantinescu, J. A. Durcan, T.
Stevens, et al. 2012. ‘Fluvial Landscapes of the Harappan Civilization’. Proceedings
of the National Academy of Sciences 109 (26): E1688–94.
Gorringe, H., and D. Karthikeyan. 2014. ‘The Hidden Politics of Vegetarianism: Caste and
The Hindu Canteen’. Economic and Political Weekly 49 (20): 20–22.
Goudie, A. S. 1977. ‘Sodium Sulphate Weathering and the Disintegration of Mohenjo-
Daro, Pakistan’. Earth Surface Processes 2 (1): 75–86.
Gouin, P. 1992. ‘Cullier Harappannes: Technologie et Interpretation’. Paléorient 18: 143–
49.
299
———. 1990. ‘Rapes, jarres et faisselles : la production et l’exportation des produits
laitiers dans l’Indus du 3e millénaire.’ Paléorient 16 (2): 37–54.
Gowen, A. 2018. ‘“Cow Protection” Laws Create Growing Trouble for India’s Muslim
Cattle Traders’. The Washington Post, 16 July 2018.
https://www.washingtonpost.com/world/asia_pacific/cows-are-sacred-to-indias-
hindu-majority-for-muslims-who-trade-cattle-that-means-growing-
trouble/2018/07/15/9e4d7a50-591a-11e8-9889-
07bcc1327f4b_story.html?noredirect=on&utm_term=.15ee58c9c45a.
Goyal, P. 2017. ‘The Preparation and Discard of Animal Products at Kanmer’. Shodh
Patrika 68 (1–2): 52–61.
Grant, A. 1982. ‘The Use of Tooth Weat as a Guide to the Age of Domestic Ungulates’. In
Ageing and Sexing Animal Bones from Archaeological Sites, edited by B. Wilson, C.
Grigson, and S. Payne, 109:92–108. British Archaeological Reports Series. Oxford:
British Archaeological Reports.
Green, A. S. 2018. ‘Mohenjo-Daro’s Small Public Structures: Heterarchy, Collective
Action and a Re-Visitation of Old Interpretations with GIS and 3D Modelling’.
Cambridge Archaeological Journal 28 (2): 205–23.
Green, A. S., and C. A. Petrie. 2018. ‘Landscapes of Urbanization and De-Urbanization: A
Large-Scale Approach to Investigating the Indus Civilization’s Settlement
Distributions in Northwest India’. Journal of Field Archaeology 43 (4): 284–99.
Greenfield, H. J. 2010. ‘The Secondary Products Revolution: The Past, the Present and the
Future’. World Archaeology 42 (1): 29–54.
Gregg, M. W. 2009. ‘Organic Residue Analysis and the Earliest Uses of Pottery in the
Ancient Middle East’. Unpublished PhD thesis, Toronto: University of Toronto.
Gregg, M. W., and G. F. Slater. 2010. ‘A New Method for Extraction, Isolation and
Transesterification of Free Fatty Acids from Archaeological Pottery’. Archaeometry
52 (5): 833–54.
Gregg, M.W., E.B. Banning, K. Gibbs, and G.F. Slater. 2009. ‘Subsistence Practices and
Pottery Use in Neolithic Jordan: Molecular and Isotopic Evidence’. Journal of
Archaeological Science 36 (4): 937–46.
300
Guha, S. 1994. ‘Recognizing “Harappan”: A Critical Review of the Position of Hunter-
Gatherers Within Harappan Society’. South Asian Studies 10 (1): 91–97.
Gupta, A. K., D. M. Anderson, and J. T. Overpeck. 2003. ‘Abrupt Changes in the Asian
Southwest Monsoon during the Holocene and Their Links to the North Atlantic
Ocean’. Nature 421 (6921): 354–57.
Halstead, P. 1998. ‘Mortality Models and Milking: Problems of Uniformitarianism,
Optimality and Equifinality’. Anthropozoologica 27: 211–34.
Hammann, S., and L. J. E. Cramp. 2018. ‘Towards the Detection of Dietary Cereal
Processing through Absorbed Lipid Biomarkers in Archaeological Pottery’. Journal
of Archaeological Science 93 (May): 74–81.
Hansel, F. A., and R. P. Evershed. 2009. ‘Formation of Dihydroxy Acids from Z-
Monounsaturated Alkenoic Acids and Their Use as Biomarkers for the Processing of
Marine Commodities in Archaeological Pottery Vessels’. Tetrahedron Letters 40
(40): 5562–64.
Hansel, F. A., M. S. Copley, L. A.S. Madureira, and R. P. Evershed. 2004. ‘Thermally
Produced ω-(o-alkylphenyl)alkanoic Acids Provide Evidence for the Processing of
Marine Products in Archaeological Pottery Vessels’. Tetrahedron Letters 45 (14):
2999–3002.
Harfoot, C. G. 1978. ‘Lipid Metabolism in the Rumen’. Progress in Lipid Research 17 (1):
21–54.
Harris, M. 1998. Good to Eat: Riddles of Food and Culture. Prospect Heights: Waveland
Press.
Harwood, J. L. 1996. ‘Recent Advance in the Biosynthesis of Plant Fatty Acids’.
Biochimica et Biophysica Acta (BBA) 1301: 7–56.
Haslam, M. 2004. ‘The Decomposition of Starch Grains in Soils: Implications for
Archaeological Residue Analyses’. Journal of Archaeological Science 31 (12):
1715–34.
Hastorf, C. A. 2016. The Social Archaeology of Food. Cambridge: Cambridge University
Press.
301
———. 1991. ‘Gender, Space and Food in Prehistory’. In Engendering Archaeology:
Women and Prehistory, edited by J. M. Gero and M. W. Conkey, 132–59.
Cambridge, MA: Blackwell.
Heaton, T. H. E. 1999. ‘Spatial, Species, and Temporal Variations in the 13C/12C Ratios of
C3 Plants: Implications for Palaeodiet Studies’. Journal of Archaeological Science 26
(6): 637–49.
Hendy, J., A. C. Colonese, I. Franz, R. Fernandes, R. Fischer, D. Orton, A. Lucquin, et al.
2018. ‘Ancient Proteins from Ceramic Vessels at Çatalhöyük West Reveal the
Hidden Cuisine of Early Farmers’. Nature Communications 9 (1): 4064.
Henrickson, E. F., and M. M. A. McDonald. 1983. ‘Ceramic Form and Function: An
Ethnographic Search and an Archeological Application’. American Anthropologist
85 (3): 630–43.
Heron, C. P., S. Shoda, A. B. Barcons, J. Czebreszuk, Y. Eley, M. Gorton, W. Kirleis, et
al. 2016. ‘First Molecular and Isotopic Evidence of Millet Processing in Prehistoric
Pottery Vessels’. Scientific Reports 6 (1): 38767.
Heron, C. P., N. Nemcek, K. M. Bonfield, D. Dixon, and B. S. Ottaway. 1994. ‘The
Chemistry of Neolithic Beeswax’. Naturwissenschaften 81, 266–269.
Heron, C. P. and R. P. Evershed. 1993. ‘The Analysis of Organic Residues and the Study
of Pottery Use’. Archaeological Method and Theory, 247–84.
Heron, C., R. P. Evershed, and L.J. Goad. 1991. ‘Effects of Migration of Soil Lipids on
Organic Residues Associated with Buried Potsherds’. Journal of Archaeological
Science 18 (6): 641–59.
Horowitz, A. 1992. Palynology of Arid Lands. Amsterdam: Elsevier.
Hurst, W. J., R. A. Martin, S. M. Tarka, and G. D. Hall. 1989. ‘Authentication of Cocoa in
Maya Vessels Using High-Performance Liquid Chromatographic Techniques’.
Journal of Chromatography A 466 (January): 279–89.
IAR. 2007. Indian Archaeology, a Review, 2007-8. New Delhi: Archaeological Survey of
India.
302
Jacob, J., J.-R. Disnar, and G. Bardoux. 2008. ‘Carbon Isotope Evidence for Sedimentary
Miliacin as a Tracer of Panicum Miliaceum (Broomcorn Millet) in the Sediments of
Lake Le Bourget (French Alps)’. Organic Geochemistry 39 (8): 1077–80.
Jansen, B., and G. L. B. Wiesenberg. 2017. ‘Opportunities and Limitations Related to the
Application of Plant-Derived Lipid Molecular Proxies in Soil Science’. SOIL 3 (4):
211–34.
Jansen, M. 1999. ‘Mohenjo-Daro and the River Indus’. In The Indus River Biodiversity,
Resourcse, Humankind, 349–83. Karachi: Oxford University Press.
———. 1994. ‘Mohenjo-Daro, Type Site of the Earliest Urbanization Process in South
Asia: Ten Years of Research at Mohenjo-Daro, Pakistan’. In South Asian
Archaeology 1993, edited by A. Parpola and P. Koskikallio, 263–80. Helsinki:
Soumalainen Tiedeakatemia.
Jansen, M., and G. Urban. 1987. Inter Reports Vol. 2. Edited by M. Jansen and G. Urban.
Vol. 2. Rome, Aachen: Instituto Italiano per Il Medio Ed Estremo Oriente Roma.
———. 1984. Inter Reports Vol. I. Edited by M. Jansen and G. Urban. Vol. I. Rome,
Aachen: Instituto Italiano per Il Medio Ed Estremo Oriente Roma.
Joglekar, P. P., and S. Channarayapatna. 2018. ‘Animal Remains from the Mature
Harappan Contexts at Farmana, Rohtak District, Haryana, India’. Puratattva 47:
101–14.
Joglekar, P. P., R. N. Singh, and C. A. Petrie. 2017. ‘Faunal Remains from Sampolia Khera
(Masudpur I), Haryana’. Indian Journal of Archaeology 2 (1): 25–60.
———. 2016. ‘A Preliminary Report of Animal Remains from Bhimwada Jodha
(Masudpur VII), Haryana’. Bharati 39: 1–9.
Joglekar, P. P., S. Channarayapatna, and G. S. Abhayan. 2013. ‘Faunal Diversity during
the Harappan Period in Haryana’. Heritage: Journal of Multidisciplinary Studies in
Archaeology 1: 262–87.
Jones, A. 1999. ‘The World on a Plate: Ceramics, Food Technology and Cosmology in
Neolithic Orkney’. World Archaeology 31 (1): 55–77.
303
Jones, P. 2017. ‘Climate Change, Water Stress and Agriculture in the Indus Civilisation
3000-1500 BC’. Unpublished PhD thesis, Cambridge: University of Cambridge.
Jordan, P. D. 2003. Material Culture and Sacred Landscape: The Anthropology of the
Siberian Khanty. Walnut Creek: Rowman Altamira
Joseph, T. 2018. Early Indians: The Story of Our Ancestors and Where We Came From.
New Delhi: Juggernaut Publication.
Joshi, J. P. 2015a. ‘Crafts at Kalibangan’. In Excavations at Kalibangan: The Harappans,
edited by B. B. Lal, M. Bala, J. P. Joshi, K. S. Ramachandran, and A. S. Sharma,
714–29. New Delhi: Archaeological Survey of India.
———. 2015b. ‘Kitchen Equipments: Terracotta and Stone’. In Excavations at
Kalibangan: The Harappans, edited by B. B. Lal, M. Bala, J. P. Joshi, K. S.
Ramachandran, and A. S. Sharma, 823–56. New Delhi: Archaeological Survey of
India.
———.1993. Excavations at Bhagwanpura 1975-76 and Other Exploration &
Excavations 1975-81 in Haryana, Jammu & Kashmir and Punjab. New Delhi:
Archaeological Survey of India.
Kanginakudru, S., M. Metta, R. D. Jakati, and J. Nagaraju. 2008. ‘Genetic Evidence from
Indian Red Jungle Fowl Corroborates Multiple Domestication of Modern Day
Chicken’. BMC Evolutionary Biology 8 (1): 174.
Kashyap, A., and S. A. Weber. 2010. ‘Harappan Plant Use Revealed by Starch Grains from
Farmana, India’. Antiquity Project Gallery 84 (326).
Kenoyer, J. M. 2014. ‘The Indus Civilisation’. In The Cambridge World Prehistory. 2,
edited by C. Renfrew and P. Bahn. Cambridge: Cambridge University Press.
———. 2008. ‘Indus Urbanism: New Perspectives on Its Origin and Character’. In The
Ancient City New Perspectives in the Old and New World, edited by J. Marcus and J.
Sabloff, 85–109. Santa Fe: SAR.
———. 1998. Ancient Cities of the Indus Valley Civilization. Karachi; Islamabad: Oxford
University Press; American Institute of Pakistan Studies.
304
———. 1997. ‘Early City-States in South Asia: Comparing the Harappan Phase and the
Early Historic Period’. In The Archaeology of City-States, Cross-Cultural
Approaches, edited by D. L. Nichols and T. H. Charlton, 51–70. Washington D.C.:
Smithsonian Institute Press.
———. 1992. ‘Harappan Craft Specialization and the Question of Urban Segregation and
Stratification’. The Eastern Anthropologist 45 (1–2): 39–54.
———. 1989. ‘Socio-Economic Structures of the Indus Civilization as Reflected in
Specialised Crafts and the Question of Ritual Segregation’. In Old Problems and
New Perspectives in the Archaeology of South Asia, edited by J. M. Kenoyer, 183–
92. Madison: University of Wisconsin.
Kerner, S., C. Chou, and M. Warmind, eds. 2015. Commensality. London: Bloomsbury
Publishing PLC.
Khare, R. S. 1976a. Culture and Reality: Essays on the Hindu Systems of Managing Foods.
Simla: Indian Institute for Advanced Study.
———. 1976b. The Hindu Hearth and Home. New Delhi: Vikas.
Khoury, S., C. Canlet, M. Z. Lacroix, O. Berdeaux, J. Jouhet, and J. Bertrand-Michel.
2018. ‘Quantification of Lipids: Model, Reality, and Compromise’. Biomolecules 8
(4).
Killops, S. D., and V. J. Killops. 2013. Introduction to Organic Geochemistry. John Wiley
& Sons.
Kohn, M. J. 2010. ‘Carbon Isotope Compositions of Terrestrial C3 Plants as Indicators of
(Paleo)Ecology and (Paleo)Climate’. Proceedings of the National Academy of
Sciences 107 (46): 19691–95.
Kolattukudy, P. 1970. ‘Plant Waxes’. Lipids 5 (2): 9–275.
Krishnan, K. 2018. ‘Indus Ceramic Industries: Complexities, Challenges and Prospects’.
Indian Journal of History of Science 53 (3).
———. 1992. ‘An Analysis of Decorative Pigments and Slips on Harappan Pottery from
Gujarat’. South Asian Studies 8: 125–32.
305
Krishnan, K., I. C. Freestone, and A. Middleton. 2005. ‘Technology of “Glazed” Reserved
Slip Ware - a Fine Ceramic of the Harappan Period’. Archaeometry 47 (4): 691–703.
Krishnan, K., and K. T. M. Hegde. 1988. ‘Chemical and Petrographic Studies in Pottery of
Harappa Culture in Gujarat’. Journal of the University of Baroda (Humanities) 35–
36 (1): 27–56.
Kunst, L., and A. L. Samuels. 2003. ‘Biosynthesis and Secretion of Plant Cuticular Wax’.
Progress in Lipid Research 42 (1): 51–80.
Kuper, H. 1967. ‘Changes in Caste in South African Indians’. In Caste in Overseas Indian
Communities, edited by B. M. Schwartz, 237–65. San Fransisco: California:
Chandler Publishing Company.
Lal, B. B., M. Bala, J. P. Joshi, K. S. Ramachandran, and A. S. Sharma, eds. 2015.
Excavations at Kalibangan: The Harappans (1960-1969) Part II. New Delhi:
Archaeological Survey of India.
———, eds. 2003. Excavations at Kalibangan: The Harappans (1960-1969) Part I. New
Delhi: Archaeological Survey of India.
Lancelotti, C. 2018. ‘“Not All That Burns Is Wood”. A Social Perspective on Fuel
Exploitation and Use during the Indus Urban Period (2600-1900 BC)’. PLOS ONE
13 (3): e0192364.
———. 2010. ‘Fuelling Harappan Hearths: Human-Environment Interactions as Revealed
by Fuel Exploitation and Use’. Unpublished PhD thesis, Cambridge: University of
Cambridge.
Lancelotti, C., J. Ruiz-Pérez, and J. J. García-Granero. 2017. ‘Investigating Fuel and
Fireplaces with a Combination of Phytoliths and Multi-Element Analysis; an
Ethnographic Experiment’. Vegetation History and Archaeobotany 26 (1): 75–83.
Lancelotti, C., and M. Madella. 2012. ‘The “Invisible” Product: Developing Markers for
Identifying Dung in Archaeological Contexts’. Journal of Archaeological Science 39
(4): 953–63.
Laursen, S., and P. Steinkeller. 2017. Babylonia, the Gulf Region, and the Indus:
Archaeological and Textual Evidence for Contact in the Third and Early Second
Millennia BC University Park, PA: Eisenbrauns.
306
Law, R. W. 2011. Inter-Regional Interaction and Urbanism in the Ancient Indus Valley: A
Geologic Provenience Study of Harappa’s Rock and Mineral Assemblage.
Occasional Paper; Linguistics, Archaeology and the Human Past 11. Kyoto, Japan:
Indus Project, Research Institute for Humanity and Nature.
Lawler, A. 2013. ‘Where Did Curry Come From?’ Slate Magazine, 29 January 2013.
https://slate.com/human-interest/2013/01/indus-civilization-food-how-scientists-are-
figuring-out-what-curry-was-like-4500-years-ago.html.
———. 2012. ‘The Ingredients for a 4000-Year-Old Proto-Curry’. Science, 2012.
Lee-Thorp, J., and M. Sponheimer. 2003. ‘Three Case Studies Used to Reassess the
Reliability of Fossil Bone and Enamel Isotope Signals for Paleodietary Studies’.
Journal of Anthropological Archaeology 22 (3): 208–16.
Lee-Thorp, J. A., J. C. Sealy, and N. J. van der Merwe. 1989. ‘Stable Carbon Isotope Ratio
Differences between Bone Collagen and Bone Apatite, and Their Relationship to
Diet’. Journal of Archaeological Science 16 (6): 585–99.
Lévi-Strauss, C. 1966. The Savage Mind: (La Pensée Sauvage). London: Weidenfeld and
Nicolson.
Lightfoot, E., P. Jones, A. Nayak, T. C. O’Connell, R. Roberts, P. P. Joglekar, V. S.
Shinde, R. N. Singh, and C. A. Petrie. in prep. ‘On the Hoof: A Comparison of
Animal Management Practices at Indus Sites in Haryana Using Stable Isotope
Analysis’.
Lightfoot, E., and T. C. O’Connell. 2016. ‘On the Use of Biomineral Oxygen Isotope Data
to Identify Human Migrants in the Archaeological Record: Intra-Sample Variation,
Statistical Methods and Geographical Considerations’. PLOS ONE 11 (4): e0153850.
Liu, Y. P., G. S. Wu, Y. G. Yao, Y. W. Miao, G. Luikart, M. Baig, A. Beja-Pereira, Z. L.
Ding, M. G. Palanichamy, and Y. P. Zhang. 2006. ‘Multiple Maternal Origins of
Chickens: Out of the Asian Jungles.’ Molecular Phylogenetics and Evolution 38 (1):
12–19.
Lucquin, A., K. Gibbs, J. Uchiyama, H. Saul, M. Ajimoto, Y. Eley, A. Radini, et al. 2016.
‘Ancient Lipids Document Continuity in the Use of Early Hunter–Gatherer Pottery
307
through 9,000 Years of Japanese Prehistory’. Proceedings of the National Academy
of Sciences 113 (15): 3991–96.
Luthra, J. C. 1936. ‘Ancient Wheat and Its Viability’. Current Science 4: 489–90.
Mackay, E. J. H. 1938a. Die Induskultur. Leipzig: F. U. Brockhaus.
———. 1938b. Further Excavations at Mohenjo-Daro, Being an Official Account of
Archaeological Excavations at Mohenjo-Daro Carried Out by the Government of
India Between the Years 1927 and 1931. Delhi: Manager of Publications.
Madella, M. 2014. ‘Of Crops and Food: A Social Perspective on Rice in the Indus
Civilization’. In Ancient Plants and People: Contemporary Trends in Archaeology,
edited by M. Madella, C. Lancelotti, and M. Savard, 218–36. Tucson: Univeristy of
Arizona Press.
———. 2003. ‘Investigating Agriculture and Environment in South Asia: Present and
Future Contributions of Opal Phytoliths’. In Indus Ethnobiology, edited by S. Weber
and W. R. Belcher, 199–249. Oxford: Lexington Books.
———. 1997. ‘Phytolith Analysis from the Indus Valley Site of Kot Diji, Sindh, Pakistan’.
In Archaeological Sciences 1995, Oxbow Monograph, edited by A. Sinclair, E.
Slater, and J. Gowlett, 294–302. 64. Oxford: Oxbow Books.
———. 1995. ‘A Preliminary Study of Phytolith Analysis, Agriculture and Ue of Plants at
Kot Diji (Sindh, Pakistan)’. Ancient Sindh 2: 93–108.
Madella, M., and D. Q. Fuller. 2006. ‘Palaeoecology and the Harappan Civilisation of
South Asia: A Reconsideration’. Quaternary Science Reviews 25 (11): 1283–1301.
Magee, P. 2014. The Archaeology of Prehistoric Arabia: Adaptation and Social Formation
from the Neolithic to the Iron Age. Cambridge: Cambridge University Press.
Malainey, M. E. 2011. A Consumer’s Guide to Archaeological Science: Analytical
Techniques. Manuals in Archaeological Method, Theory and Technique. New York:
Springer-Verlag.
Malainey, M. E., R. Przybylski, and B. L. Sherriff. 1999. ‘The Effects of Thermal and
Oxidative Degradation on the Fatty Acid Composition of Food Plants and Animals
308
of Western Canada: Implications for the Identification of Archaeological Vessel
Residues’. Journal of Archaeological Science 26 (1): 95–103.
Malamoud, C. 1998. Cooking the World: Ritual and Thought in Ancient India. Delhi:
Oxford University Press.
Manuel, J. 2010. ‘The Enigmatic Mushtikas and the Associated Triangular Terracotta
Cakes: Some Observations’. Ancient Asia 2 (December): 41.
Marshall, J. 1931[2004]. Mohenjo-Daro and the Indus Civilization: Being and Official
Account of the Archaeological Excavations at Mohenjo-Daro Carried out by the
Government of India between the Years 1922 and 1927. New Delhi, Chennai: Asian
Educational Services.
Masih, F. 2018. ‘Ganweriwala - A New Perspective’. In Walking with the Unicorn: Social
Organization and Material Culture in Ancient South Asia, edited by D. Frenez, G.
Jamison, R. W. Law, M. Vidale, and R. H. Meadow, 377–83. Rome: ISMEO
Associazione Internazionale di Studli sul Mediterraneo e l’Oriente, Archaeopress.
Matlova, V., M. Roffet-Salque, I. Pavlu, J. Kyselka, I. Sedlarova, V. Filip, and R. P.
Evershed. 2017. ‘Defining Pottery Use and Animal Management at the Neolithic Site
of Bylany (Czech Republic)’. Journal of Archaeological Science: Reports 14
(August): 262–74.
Mazow, L., S. Grieve, and A. Kennedy. 2014. ‘Contamination in Organic Residue
Analysis: A Cautionary Tale’. Journal of Eastern Mediterranean Archaeology &
Heritage Studies 2 (2): 90–109.
McCorriston, J. 2011. Pilgrimage and Household in the Ancient Near East. Cambridge:
Cambridge University Press.
Meadow, R. H. 1996. ‘The Origins and Spread of Agriculture and Pastoralism in
Northwestern South Asia’. In The Origins and Spread of Agriculture and
Pastoralism in Eurasia, edited by D. Harris, 390–412. London: UCL Press.
———. 1993. ‘Animal Domestication in the Middle East: A Revised View from the
Eastern Margin’. In Harappan Civilization: A Recent Perspective, edited by G. L.
Possehl, 295–322. New Delhi: Oxford and IBH Publishing Co. Pvt. Ltd.
309
———. 1991a. ‘Faunal Remains and Urbanism at Harappa’. In Harappa Excavations
1986-1990, edited by R. H. Meadow, 89–106. Monographs in World Archaeology 3.
Madison, Wisconsin: Prehistory Press.
———, ed. 1991b. Harappa Excavations, 1986-1990: A Multidisciplinary Approach to
Third Millenium Urbanism. Monographs in World Archaeology, no. 3. Madison,
Wisconsin: Prehistory Press.
———. 1989. ‘Continuity and Change in the Agriculture of the Greater Indus Valley: The
Palaeoethnobotanical and Zooarchaeological Evidence’. In Old Problems and New
Perspectives in the Archaeology of South Asia, edited by J. M. Kenoyer, 61–74.
Madison: University of Wisconsin.
———. 1981. ‘Early Animal Domestication in South Asia: A First Report of the Faunal
Remains from Mehrgarh, Pakistan’. In South Asian Archaeology 1979, edited by H.
Hartel, 143–79. Berlin: Dietrich Reimer Verlag.
———. 1979. ‘Prehistoric Subsistence at Balakot: Initial Consideration of the Faunal
Remains’. In South Asian Archaeology 1977, edited by M. Taddei, 275–315. Naples:
Istituto Universitario Orientale.
Meadow, R. H., and J. M. Kenoyer. 2005. ‘Excavations at Harappa 2000-2001: New
Insights on Chronology and City Organisation’. In South Asian Archaeology 2001,
edited by C. Jarrige and V. Lefèvre, 207–25. Paris: Le Centre National de la
Recherche Scientifique
———.1997. ‘Excavations at Harappa 1994-1995: New Perspectives on the Indus Script,
Craft Activities and City Organisation’. In South Asian Archaeology 1995, edited by
F. R. Allchin and B. Allchin, 139–72. New Delhi: Oxford and IBH Publishing Co.
Pvt. Ltd.
Meadow, R. H., and A. Patel. 2003. ‘Prehistoric Pastoralism in Northwestern South Asia
from the Neolithic through the Harappan Period’. In Indus Ethnobiology, edited by S.
Weber and W. R. Belcher, 65–94. Oxford: Lexington Books.
———. 2002. ‘From Mehrgarh to Harappa and Dholavira: Prehistoric Pastoralism in
Northwestern South Asia through the Harappan Period’. In Indian Archaeology in
310
Retrospect: Protohistory, edited by S. Settar and R. Korisettar, 2:391–408. Delhi:
ICHR and Manohar.
Meeker, J. D., S. Sathyanarayana, and S. H. Swan. 2009. ‘Phthalates and Other Additives
in Plastics: Human Exposure and Associated Health Outcomes’. Philosophical
Transactions of the Royal Society B: Biological Sciences 364 (1526): 2097–2113.
Menon, S., and S. Mishra. 2018. ‘We Are All Harappans’. Outlook, 2018.
https://www.outlookindia.com/magazine/story/we-are-all-harappans/300463.
Méry, S., and M. J. Blackman. 2004. ‘Socio-Economical Patterns of a Ceramic Container:
The Harappan Black Slipped Jar’. In South Asian Archaeology 2001, edited by
Catherine Jarrige and V. Lefèvre: 226–235. Paris: ERC
———. 1999. ‘Harappa et Mohenjo-Daro : deux zones de production de jarres à engobe
noir au Pakistan à la Période Indus’. Paléorient 25 (2): 167–77.
———. 1996. ‘Black-Jars of Meluhha: Production and Diffusion of Indus Pottery Ware
during the Second Half of the 3rd Millennium BC’. Harappan Studies 2: 2–18.
Méry, S., and M. Tengberg. 2009. ‘Food for Eternity? The Analysis of a Date Offering
from a 3rd Millennium BC Grave at Hili N, Abu Dhabi (United Arab Emirates)’.
Journal of Archaeological Science 36 (9): 2012–17.
Miao, Y.-W., M.-S. Peng, G.-S. Wu, Y.-N. Ouyang, Z.-Y. Yang, N. Yu, J.-P. Liang, et al.
2013. ‘Chicken Domestication: An Updated Perspective Based on Mitochondrial
Genomes’. Heredity 110 (3): 277–82.
Miller, D. 1985. Artefacts as Categories: A Study of Ceramic Variability in Central India.
Cambridge: Cambridge University Press.
Miller, H. M.-L. 2015. ‘Surplus in the Indus Civilization: Agricultural Choices, Social
Relations, Political Effects’. In Surplus, edited by C. T. Morehart and K. De Lucia,
97–120. Colarado: University Press of Colorado
———. 2006. ‘Water Supply, Labor Organization and Land Ownership in Indus
Floodplain Agricultural Systems’. In Agriculture and Irrigation in Archaeology, 92–
128. Los Angeles: Cotsen Institute of Archaeology Press.
311
———. 2000. ‘Reassessing the Urban Structure of Harappa: Evidence of Craft Production
Distribution’. In South Asian Archaeology 1997, edited by M. Taddei and G. de
Marco, 77–100. Rome: Istituto Italiano per l’Africa e l’Oriente (IsIAO).
———. 1999. ‘Pyrotechnology and Society in the Cities of the Indus Valley’. Unpublished
PhD thesis, Madison, Wisconsin: University of Wisconsin-Madison.
Miller, L. J. 2004. ‘Urban Economies in Early States: The Secondary Products Revolution
in the Indus Civilization’. Unpublished PhD thesis, New York: New York
University.
———. 2003. ‘Secondary Products and Urbanism in South Asia: The Evidence for
Traction at Harappa’. In Indus Ethnobiology, edited by S. Weber and W. R. Belcher,
251–326. Oxford: Lexington Books.
Mills, J. S., and R. White. 1994. The Organic Chemistry of Museum Objects. 2nd edition.
London: Butterworth.
Mintz, S. W., and C. M. Du Bois. 2002. ‘The Anthropology of Food and Eating’. Annual
Review of Anthropology 31: 99–119.
Mlekuz, D. 2007. ‘'Sheep Are Your Mother’: Rhyta and the Interspecies Politics in the
Neolithic of the Eastern Adriatic’. Documenta Praehistorica 34: 267–80.
Mohanty, P., and J. Mishra. 2002. ‘Fifty Years of Ethno-Archaeological Research in India:
A Review’. In Indian Archaeology in Retrospect: Archaeology and Interactive
Disciplines, edited by S. Settar and R. Korisettar, 3:269–308. Delhi: Manohar.
Mondal, M. E. A., H. Wani, and B. Mondal. 2012. ‘Geochemical Signature of Provenance,
Tectonics and Chemical Weathering in the Quaternary Flood Plain Sediments of the
Hindon River, Gangetic Plain, India’. Tectonophysics 566–567 (September): 87–94.
Morrison, K. 2001. ‘Coercion, Resistance, and Hierarchy: Local Processes and Imperial
Strategies in the Vijayanagara Empire’. In Empires, edited by S. Alcock, T. N.
D’Altroy, K. Morrison, and C. Sinopoli, 252–78. New York: Cambridge University
Press.
———. 1994. ‘The Intensification of Production: Archaeological Approaches’. Journal of
Archaeological Method and Theory 1 (2): 111–59.
312
Mughal, M. R. 1997. Ancient Cholistan: Archaeology and Architecture. Lahore:
Ferozsons.
Mukherjee, A. J., A. M. Gibson, and R. P. Evershed. 2008. ‘Trends in Pig Product
Processing at British Neolithic Grooved Ware Sites Traced through Organic
Residues in Potsherds’. Journal of Archaeological Science 35 (7): 2059–73.
Mukherjee, A. J., R. Berstan, M. S. Copley, A. M. Gibson, and R. P. Evershed. 2007.
‘Compound-Specific Stable Carbon Isotopic Detection of Pig Product Processing in
British Late Neolithic Pottery’. Antiquity 81 (313): 743–54.
Mullin, M. H. 1999. ‘Mirrors and Windows: Sociocultural Studies of Human-Animal
Relationships’. Annual Review of Anthropology 28 (1): 201–24.
Murphy, C. A., and D. Q. Fuller. 2016. ‘The Transition to Agricultural Production in India:
South Asian Entanglements of Domestication’. In A Companion to South Asia in the
Past, edited by G. R. Schug and S. R. Walimbe, 344–57. Hoboken, NJ: John Wiley
& Sons, Inc.
Nandy, A. 2004. ‘The Changing Popular Culture of Indian Food: Preliminary Notes’.
South Asia Research 24 (1): 9–19.
Nath, A. 2018. ‘Chrono-Cultural Clue Ot the Rise of the Harappans in the Satluj-Yamuna
Plain’. Puratattva 48: 93–129.
———. 2014. Excavations at Rakhigarhi (1997-98 to 1999-2000). New Delhi:
Archaeological Survey of India.
———. 2001. ‘Rakhigarhi: 1999-2000’. Puratattva 31: 43–46.
———. 1998. ‘Rakhigarhi: A Harappan Metropolis in the Sarasvati-Drishadvati Divide’.
Puratattva 28: 39–45.
Nath, A., S. J. Walimbe, T. M. Garge, V. Mushrif-Tripathy, R. Dehuri, and A. Malik.
2015. ‘Harappan Internments at Rakhigarhi, Haryana’. Man and Environment XL
(2): 9–32.
Nayak, A. in prep. ‘Isotopic and proteomic approaches to early agricultural societies in
South Asia’. Unpublished PhD thesis, Jena, Germany: Max Planck Insitute for the
Science of Human History.
313
Neogi, S., C.A.I. French, J. Durcan. R.N. Singh and C. A. Petrie. in press.
‘Geoarchaeological Insights into the Location of Indus Settlements on the Plains of
northwest India’. Quaternary Research.
Neogi, S. 2013. ‘Geoarchaeological Investigations of Indus Settlements in the Plains of
North-Western India’. Unpublished PhD thesis, Cambridge: University of
Cambridge.
O’Connor, T. P. 2000. The Archaeology of Animal Bones. Sutton: Stroud.
O’Leary, M. H. 1981. ‘Carbon Isotope Fractionation in Plants’. Phytochemistry 20 (4):
553–67.
Oras, E., M. Tõrv, T. Jonuks, M. Malve, A. Radini, S. Isaksson, A. Gledhill, O. Kekišev,
S. Vahur, and I. Leito. 2018. ‘Social Food Here and Hereafter: Multiproxy Analysis
of Gender-Specific Food Consumption in Conversion Period Inhumation Cemetery
at Kukruse, NE-Estonia’. Journal of Archaeological Science 97 (September): 90–
101.
Orengo, H. A., and C. A. Petrie. 2017. ‘Large-Scale, Multi-Temporal Remote Sensing of
Palaeo-River Networks: A Case Study from Northwest India and Its Implications for
the Indus Civilisation’. Remote Sensing 9 (7): 735.
O’Toole, T. 2003. ‘Secularising the Sacred Cow: The Relationship between Religious
Reform and Hindu Nationalism’. In Hinduism in Public and Private: Reform,
Hindutva, Gender and Sampraday, edited by A. Copley, 84–109. New Delhi: Oxford
University Press.
Oudemans, T. F. M., and J. J. Boon. 1991. ‘Molecular Archaeology: Analysis of Charred
(Food) Remains from Prehistoric Pottery by Pyrolysis - Gas Chromatography/Mass
Spectrometry’. Journal of Analytical and Applied Pyrolysis 20 (1–2): 197–227.
Outram, A. K., N. A. Stear, A. Kasparov, E. Usmanova, V. Varfolomeev, and R. P.
Evershed. 2011. ‘Horses for the Dead: Funerary Foodways in Bronze Age
Kazakhstan’. Antiquity 85 (327): 116–28.
Outram, A. K., N. A. Stear, R. Bendrey, S. Olsen, A. Kasparov, V. Zaibert, N. Thorpe, and
R. P. Evershed. 2009. ‘The Earliest Horse Harnessing and Milking’. Science 323
(5919): 1332–35.
314
Parikh, D. in prep. ‘Influence, Interactions and Identity in the Indus Hinterland:
Understanding Village Life and the Urban-Rural Relationship in Northwest India
through Ceramic Production and Iconography’. PhD thesis, Cambridge: University
of Cambridge.
Parikh, D., and C. A Petrie. 2018. ‘“We Are Inheritors of a Rural Civilisation”: Rural
Complexity and the Ceramic Economy in the Indus Civilisation in Northwest India’.
World Archaeology (June) 1–21.
———. 2017. ‘Urban-Rural Dynamics and Indus Ceramic Production in Northwest India:
A Preliminary Analysis of the Pottery from Masudpur I and Masudpur VII’. In South
Asian Archaeology and Art 2012 Volume I, Man and Environment in Preshitoric and
Protohistoric South Asia: New Perspectives, edited by V. Lefèvre, A. Didier, and B.
Mutin, 221–41. Turnhout: Brepols.
Parveen, R. 2016. ‘Food to Remember: Culinary Practice and Diasporic Identity’. Oral
History 44 (1): 47–56.
Passi, S., M. C. Rothschild-Boros, P. Fasella, M. Nazzaro-Porro, and D. Whitehouse. 1981.
‘An Application of High Performance Liquid Chromatography to Analysis of Lipids
in Archaeological Samples’. Journal of Lipid Research 22 (5): 778–84.
Passi, S., M. Picardo, C. De Luca, M. Nazzaro-Porro, L. Rossi, and G. Rotilio. 1993.
‘Saturated Dicarboxylic Acids as Products of Unsaturated Fatty Acid Oxidation’.
Biochimica et Biophysica Acta (BBA) - Lipids and Lipid Metabolism 1168 (2): 190–
98.
Payne, S. 1973. ‘Kill-off Patterns in Sheep and Goats: The Mandibles from Asvan Kale’.
Anatolian Studies 23: 281–303.
Peres, T. M. 2017. ‘Foodways Archaeology: A Decade of Research from the Southeastern
United States’. Journal of Archaeological Research 25 (4): 421–60.
Petrie, C. A. 2017. ‘Crisis, What Crisis? Adaptation, Resilience and Transformation in the
Indus Civilisation’. In Crisis to Collapse: The Archaeology of Social Breakdown,
edited by T. Cunningham and J. Driessen, 43–64. UC Louvain: Aegis Publications.
———. 2013. ‘South Asia’. In Oxford Handbook of Cities in World History, edited by P.
Clark, 83–104. Oxford: Oxford University Press.
315
Petrie, C. A., and J. Bates. 2017. ‘“Multi-Cropping”, Intercropping and Adaptation to
Variable Environments in Indus South Asia’. Journal of World Prehistory 30 (2):
81–130.
Petrie, C. A., R. N. Singh, J. Bates, Y. Dixit, C. A. I. French, D. A. Hodell, P. J. Jones, et
al. 2017. ‘Adaptation to Variable Environments, Resilience to Climate Change:
Investigating Land, Water and Settlement in Indus Northwest India’. Current
Anthropology 58 (1): 1–30.
Petrie, C. A., J. Bates, T. Higham, and R. N. Singh. 2016. ‘Feeding Ancient Cities in South
Asia: Dating the Adoption of Rice, Millet and Tropical Pulses in the Indus
Civilisation’. Antiquity 90 (354): 1489–1504.
Petrie, C. A., R. N. Singh, and A. K. Singh. 2009. ‘Investigating Changing Settlement
Dynamics on the Plains: The 2009 Survey and Excavations at Masudpur (Hissar
District, Haryana)’. Puratattva 39: 38–49.
Pollard, A. M., and C. P. Heron. 2008. Archaeological Chemistry. Cambridge: Royal
Society of Chemistry.
Pollard, A. M., C. M. Batt, B. Stern, and S. M. M. Young. 2007. Analytical Chemistry in
Archaeology. Cambridge: Cambridge University Press.
Ponton, C., L. Giosan, T. I. Eglinton, D. Q. Fuller, J. E. Johnson, P. Kumar, and T. S.
Collett. 2012. ‘Holocene Aridification of India’. Geophysical Research Letters 39
(3).
Possehl, G. L. 2002. The Indus Civilzation: A Contemporary Perspective. Walnut Creek,
Lanham, New York, Oxford: AltaMira Press.
———. 1997. ‘The Transformation of the Indus Civilization’. Journal of World Prehistory
11 (4): 425–72.
———. 1992. ‘The Harappan Cultural Mosaic: Ecology Revisted’. In South Asian
Archaeology 1989, edited by Catherine Jarrige, 237–44. Madison: Prehistory Press.
———. 1982. ‘The Harappan Civilisation: A Contemporary Perspective’. In Harappan
Civilisation: A Contemporary Perspective, edited by G. L. Possehl, 15–28. New
Delhi: Oxford and IBH Publishing Co. Pvt. Ltd.
316
———. 1979. ‘Pastoral Nomadism in the Indus Civilization: A Hypothesis’. In South
Asian Archaeology 1977, edited by M. Taddei, 533–51. Naples: Istituto Universitario
Orientale.
———. 1977. ‘The End of a State and the Continuity of a Tradition’. In Realm and Region
in Traditional India, edited by R. Fox, 235–56. Durham: Carolina Academic Press.
Potts, D. T. 1993. ‘Rethinking Some Aspects of Trade in the Arabian Gulf’. World
Archaeology 24 (3): 423–40.
———. 1990. The Arabian Gulf in Antquity: From Prehistory to the Fall of the
Achaemenid Empire. Vol. I. Oxford: Clarendon Press.
Prasad, B. 1936. ‘Animal Remains from Harappa’. Memoirs of the Archaeological Survey
of India 51: 1–62.
Prasad, S., A. Anoop, N. Riedel, S. Sarkar, P. Menzel, N. Basavaiah, R. Krishnan, et al.
2014. ‘Prolonged Monsoon Droughts and Links to Indo-Pacific Warm Pool: A
Holocene Record from Lonar Lake, Central India’. Earth and Planetary Science
Letters 391 (April): 171–82.
Price, T. Douglas, J. H. Burton, P. D. Fullagar, L. E. Wright, J. E. Buikstra, and V. Tiesler.
2008. ‘Strontium Isotopes and the Study of Human Mobility in Ancient
Mesoamerica’. Latin American Antiquity 19 (2): 167–80.
Quivron, G. 2000. ‘The Evolution on the Mature Indus Pottery Style in the Light of the
Excavations at Nausharo, Pakistan’. East and West 50 (1/4): 147–90.
Raikes, R. 1979. ‘The Mohenjo-Daro Floods: The Debate Continues’. In South Asian
Archaeology 1977, edited by M Taddei, 561–66. Series Minor 6. Naples: Instituto
Univeristario Oriental, Seminario de Studi Asiatici.
———. 1968. ‘Kalibangan: Death from Natural Causes’. Antiquity 42 (168): 286–91.
———. 1964. ‘The End of the Ancient Cities of the Indus’. American Anthropologist 66
(2): 284–99.
Ratnagar, S. 2015. Understanding Harappa: Civilization in the Greater Indus Valley. New
Delhi: Tulika Books.
317
Raven, A. M., P. F. van Bergen, A.W. Stott, S. N. Dudd, and R. P. Evershed. 1997.
‘Formation of Long-Chain Ketones in Archaeological Pottery Vessels by Pyrolysis
of Acyl Lipids’. Journal of Analytical and Applied Pyrolysis 40–41 (May): 267–85.
Ray, K., and T. Srinivas. 2012. Curried Cultures: Globalization, Food, and South Asia.
Berkeley: University of California Press.
Reber, E. A., M. T. Kerr, H. L. Whelton, and R. P. Evershed. 2019. ‘Lipid Residues from
Low-Fired Pottery’. Archaeometry 61 (1): 131–44.
Reber, E. A., and J. P. Hart. 2008. ‘Pine Resins and Pottery Sealing: Analysis of Absorbed
and Visible Pottery Residues from Central New York State’. Archaeometry 50 (6):
999–1017.
Reber, E. A., and R. P. Evershed. 2004. ‘How Did Mississippians Prepare Maize? The
Application of Compound-Specific Carbon Isotope Analysis to Absorbed Pottery
Residues From Several Mississippi Valley Sites’. Archaeometry 46 (1): 19–33.
Redding, R. W. 1991. ‘The Role of Pig in the Subsistence System of Ancient Egypt: A
Parable on the Potential of Faunal Data’. In Animal Use and Culture Change, edited
by P. J. Crabtree and K. Ryan, 20–30. Philadelphia, PA: University of Pennsylvania,
Museum of Archaeology and Anthropology Research papers in Science and
Archaeology, MASCA 8.
Reddy, S. N. 2003. Discerning Palates of the Past: An Ethnoarchaeological Study of Crop
Cultivation and Plant Usage in India. Ethnoarchaeological Series. Ann Arbor,
Michigan: International Monographs in Prehistory.
———. 1994. ‘Plant Usage and Subsistence Modelling: An Ethnoarchaeological
Approach to the Late Harappan of Northwest India’. Unpublished PhD thesis,
Madison: University of Wisconsin-Madison.
Rege, S, D. Tak, D. Thosar and T. Aranha, eds. 2009. Isn’t This Plate Indian? Dalit
Histories and Memories of Food. Pune: Krantijyoti Savithribai Phule Women’s
Studies Centre, University of Pune.
Regert, M. 2011. ‘Analytical Strategies for Discriminating Archeological Fatty Substances
from Animal Origin’. Mass Spectrometry Reviews 30 (2): 177–220.
318
———. 2007. ‘Elucidating Pottery Function Using a Multi-Step Analytical Methodology
Combining Infrared Spectroscopy, Mass Spectrometry and Chromatographic
Procedures’. In Theory and Practice in Archaeological Residue Analysis, edited by
H. Barnard and J. W. Eerkens, 61–76. BAR International Series 1650. Oxford:
Archaeopress.
Regert, M., T. Devièse, A.-S. Le Hô, and A. Rougeulle. 2008. ‘Reconstructing Ancient
Yemeni Commercial Routes during the Middle Ages Using Structural
Characterization of Terpenoid Resins’. Archaeometry 50 (4): 668–95.
Regert, M., J. Langlois, and S. Colinart. 2005. ‘Characterisation of Wax Works of Art by
Gas Chromatographic Procedures’. Journal of Chromatography A 1091 (1): 124–36.
Regert, M., N. Garnier, O. Decavallas, C. Cren-Oliv, and C. Rolando. 2003. ‘Structural
Characterization of Lipid Constituents from Natural Substances Preserved in
Archaeological Environments’. Measurement Science and Technology 14 (9): 1620–
30.
Regert, M., S. N. Dudd, P. F. van Bergen, P. Pétrequin, and R. P. Evershed. 2001a.
‘Investigations of Solvent Extractable Lipids and Insoluble Polymeric Components:
Organic Residues in Neolithic Ceramic Vessels from Chalain (Jura, France)’. In
British Archaeological Reports, 78–90. 939.
Regert, M., S. Colinart, L. Degrand, and O. Decavallas. 2001b. ‘Chemical Alteration and
Use of Beeswax Through Time: Accelerated Ageing Tests and Analysis of
Archaeological Samples from Various Environmental Contexts’. Archaeometry 43
(4): 549–69.
Regert, M., H. A. Bland, S. N. Dudd, P. F. van Bergen, and R. P. Evershed. 1998. ‘Free
and Bound Fatty Acid Oxidation Products in Archaeological Ceramic Vessels’.
Proceedings: Biological Sciences 265 (1409): 2027–32.
Reimer, P. J., E. Bard, A. Bayliss, J. W. Beck, P. G. Blackwell, C. Bronk Ramsey, C. E.
Buck, et al. 2013. ‘IntCal13 and Marine13 Radiocarbon Age Calibration Curves 0–
50,000 Years Cal BP’. Radiocarbon 55 (4): 1869–87.
Reitz, E. J., and E. S. Wing. 1999. Zooarchaeology. Cambridge: Cambridge University
Press.
319
Rice, Prudence M. 1987. Pottery Analysis: A Source Book. Chicago, IL: University of
Chicago Press.
———. 1996. ‘Recent Ceramic Analysis: 1. Function, Style, and Origins’. Journal of
Archaeological Research 4 (2): 133–63.
Richards, M. P., and R. E. M. Hedges. 1999. ‘Stable Isotope Evidence for Similarities in
the Types of Marine Foods Used by Late Mesolithic Humans at Sites Along the
Atlantic Coast of Europe’. Journal of Archaeological Science 26 (6): 717–22.
Rissman, P. C. 1989. ‘The Organization of Stamp Seal Production in the Harappan
Civilization’. In Old Problems and New Perspectives in the Archaeology of South
Asia, edited by J. M. Kenoyer, 159–70. Madison: University of Wisconsin.
———. 1985. ‘The Oriyo Test Excavation and the End of the Harappan Tradition in
Gujarat’. In South Asian Archaeology 1983, edited by J. Schotmans and M. Taddei,
345–55. Naples: Istituto Universitario Orientale.
Roffet-Salque, M., A. Marciniak, P. J. Valdes, K. Pawłowska, J. Pyzel, L. Czerniak, M.
Krüger, C. N. Roberts, S. Pitter, and R. P. Evershed. 2018. ‘Evidence for the Impact
of the 8.2-KyBP Climate Event on Near Eastern Early Farmers’. Proceedings of the
National Academy of Sciences 115 (35): 8705–9.
Roffet-Salque, M., J. Dunne, D. T. Altoft, E. Casanova, L. J. E. Cramp, J. Smyth, H. L.
Whelton, and R. P. Evershed. 2017a. ‘From the inside out: Upscaling Organic
Residue Analyses of Archaeological Ceramics’. Journal of Archaeological Science:
Reports 16 (December): 627–40.
Roffet-Salque, M., M. R. F. Lee, A. Timpson, and R. P. Evershed. 2017b. ‘Impact of
Modern Cattle Feeding Practices on Milk Fatty Acid Stable Carbon Isotope
Compositions Emphasise the Need for Caution in Selecting Reference Animal
Tissues and Products for Archaeological Investigations’. Archaeological and
Anthropological Sciences 9 (7): 1343–48.
Roffet-Salque, M., M. Regert, R. P. Evershed, A. K. Outram, L. J. E. Cramp, O.
Decavallas, J. Dunne, et al. 2016. ‘Widespread Exploitation of the Honeybee by
Early Neolithic Farmers’. Nature 534 (7607): S17-18.
320
Roffet-Salque, M., P. I. Bogucki, J. Pyzel, I. Sobkowiak-Tabaka, R. Grygiel, M. Szmyt,
and R. P. Evershed. 2013. ‘Earliest Evidence for Cheese Making in the Sixth
Millennium Bc in Northern Europe’. Nature 493 (7433): 522–25.
Rouessac, F., and A. Rouessac. 2002. Chemical Analysis: Modern Instrumentation
Methods and Techniques, 2nd Edition. Chichester: Wiley.
Saini, H.S., and S.A.I. Mujtaba. 2012. ‘Depositional History and Palaeoclimatic Variations
at the Northeastern Fringe of Thar Desert, Haryana Plains, India’. Quaternary
International 250 (February): 37–48.
Saraswat, K. S., and A. K. Pokharia. 2002. ‘Palaeoethnobotanical Investigations at Early
Harappan Kunal’. Pragdhara 13 (March): 105–40.
———. 2001. ‘Harappan Plant Economy at Ancient Balu, Haryana’. Pragdhara 12
(February): 153–72.
———. 2000. ‘Palaeobotanical and Pollen Analytical Investigations’. Indian
Archaeological Review 1994-5, 96–97.
Sarkar, A., A. Deshpande-Mukherjee, M. K. Bera, B. Das, N. Juyal, P. Morthekai, R. D.
Deshpande, V. S. Shinde, and L. S. Rao. 2016. ‘Oxygen Isotope in Archaeological
Bioapatites from India: Implications to Climate Change and Decline of Bronze Age
Harappan Civilization’. Scientific Reports 6 (1): 26555.
Sarkar, S., S. Prasad, H. Wilkes, N. Riedel, M. Stebich, N. Basavaiah, and D. Sachse.
2015. ‘Monsoon Source Shifts during the Drying Mid-Holocene: Biomarker Isotope
Based Evidence from the Core “Monsoon Zone” (CMZ) of India’. Quaternary
Science Reviews 123 (September): 144–57.
Schulting, R. J., and M. P. Richards. 2002. ‘The Wet, the Wild and the Domesticated: The
Mesolithic— Neolithic Transition on the West Coast of Scotland’. European Journal
of Archaeology 5 (2): 147–89.
Sewell, R. B. S, and B. S. Guha. 1931. ‘Zoological Remains’. In Mohenjo-Daro and the
Indus Civilization, edited by J. H. Marshall, 649–72. London: Arthur Probstain.
Shaffer, J. G. 1992. ‘The Indus Valley, Blauchistan and Helmand Traditions: Neolithic
through Bronze Age’. In Chronologies of Old World Archaeology, edited by R. W.
Ehrich, 441–64. Chicago, IL: University of Chicago Press.
321
Sharma, Y. D. 1989. ‘Alamgirpur’. In An Encyclopaedia of Indian Archaeology, edited by
A. Ghosh. Vol. II. New Delhi: Munshiram Manoharlal Publishers.
Shinde, V. S. 2011. ‘Site and Its Environs’. In Excavations at Farmana: District Rohtak,
Haryana, India, 2006 - 2008, edited by V. S. Shinde, T. Osada, and M. Kumar, 5–19.
Kyoto, Japan: Research Institute for Humanity and Nature.
Shinde, Vasant, Toshiki Osada, and Vasant Shinde. 2008. A Report on Excavations at
Farmana 2007 - 2008. Linguistics, Archaeology and the Human Past, ... Kyoto:
Research Inst. for Humanity and Nature.
Shoda, S., A. Lucquin, C. I. Sou, Y. Nishida, G. Sun, H. Kitano, J.-H. Son, S. Nakamura,
and O. E. Craig. 2018. ‘Molecular and Isotopic Evidence for the Processing of
Starchy Plants in Early Neolithic Pottery from China’. Scientific Reports 8 (1):
17044.
Shoda, S., A. Lucquin, J.-H. Ahn, C.-J. Hwang, and O. E. Craig. 2017. ‘Pottery Use by
Early Holocene Hunter-Gatherers of the Korean Peninsula Closely Linked with the
Exploitation of Marine Resources’. Quaternary Science Reviews 170 (August): 164–
73.
Singh, R. N, C. A. Petrie, A. Alam, J. Bates, A. Ceccarelli, S. Chakraborty, S. Chakradhari,
et al. 2018. ‘Living in the Hinterland: Survey and Excavations at Lohari Ragho 2015-
2017’. Puratattva 48: 130–41.
Singh, R. N., A. K. Pandey, D. P. Singh, A. Ranjan, and S. Chakradhari. 2015.
‘Excavations at Khanak, Bhiwani 2014: A Preliminary Repot’. In Mani-Sushma:
Archaeology and Heritage (Dr B. R. Mani Festschrift, edited by V. Kumar and B.
Rawat, III:815–19. Delhi: B. R. Publishing Corporation.
Singh, R. N., C. A. Petrie, P. P. Joglekar, S. Neogi, C. Lancelotti, A. K. Pandey, and A.
Pathak. 2013. ‘Recent Excavations at Alamgirpur, Meerut District: A Preliminary
Report’. Man and Environment XXXVIII (1): 32–54.
Singh, R. N., C. A. Petrie, P. P. Joglekar, S. Neogi, C. Lancelotti, A. K. Pandey, V. Pawar,
M. Singh, and D. Parikh. 2010. ‘Changing Patterns of Settlement in the Rise and Fall
of Harappan Urbanism and Beyond: A Preliminary Report on the Rakhigarhi
Hinterland Survey 2009’. Man and Environment XXXVII (2): 37–53.
322
Singh, S. 2007. Hydrogeological Information Booklet of Hissar District, Haryana.
Chandigarh: Central Ground Water Board, Ministry of Water, North-western Region.
Skibo, J. M. 2013. ‘Understanding Pottery Function’. In Understanding Pottery Function,
edited by J. M. Skibo, 1–25. Manuals in Archaeological Method, Theory and
Technique. New York, NY: Springer New York.
Smith, B. N., and S. Epstein. 1971. ‘Two Categories of 13C/12C Ratios for Higher Plants I’.
Plant Physiology 47 (3): 380–84.
Smith, E. 2016. ‘An Investigation of Animal Diet through the Use of C Isotope Analysis,
from the Early to Mature Harappan in the Indus Civilisation, Focusing on the Sites of
Dabli Vas Chugta and Masudpur I’. Unpublished B.A. Thesis, Cambridge:
University of Cambridge.
Smith, M. L. 2006a. ‘The Archaeology of Food Preference’. American Anthropologist 108
(3): 480–93.
———. 2006b. ‘The Archaeology of South Asian Cities’. Journal of Archaeological
Research 14 (2): 97–142.
Šoberl, L., M. Horvat, A. Ž. Gašparič, M. Sraka, R. P. Evershed, and M. Budja. 2014.
‘Neolithic and Eneolithic Activities Inferred from Organic Residue Analysis of
Pottery from Mala Triglavca, Moverna Vas and Ajdovska Jama, Slovenia’.
Documenta Praehistorica 41 (December): 149–79.
Spangenberg, J. E., S. Jacomet, and J. Schibler. 2006. ‘Chemical Analyses of Organic
Residues in Archaeological Pottery from Arbon Bleiche 3, Switzerland – Evidence
for Dairying in the Late Neolithic’. Journal of Archaeological Science 33 (1): 1–13.
Spangenberg, J. E., I. Matuschik, S. Jacomet, and J. Schibler. 2008. ‘Direct Evidence for
the Existence of Dairying Farms in Prehistoric Central Europe (4th Millennium
BC)’. Isotopes in Environmental and Health Studies 44 (2): 189–200.
Stacey, R. J. 2009. ‘Organic Residues: Origins, Analysis and Scope – an Overview for the
Archaeological Ceramicist’. The Old Potter’s Almanack 14 (1): 1–8.
Stacey, R. J., C. Cartwright, and C. McEwan. 2006. ‘Chemical Characterization of Ancient
Mesoamerican “copal” Resins: Preliminary Results’. Archaeometry 48 (2): 323–40.
323
Staller, J., and M. Carrasco, eds. 2009. Pre-Columbian Foodways: Interdisciplinary
Approaches to Food, Culture, and Markets in Ancient Mesoamerica. New York:
Springer.
Staples, J. 2016. ‘Food, Commensality and Caste in India’. In The Handbook of Food and
Anthropology, edited by J. A. Klein and J. E. Watson. London, New York:
Bloomsbury Academic; Bloomsbury Publishing Plc.
———. 2008. ‘“Go on, Just Try Some!”: Meat and Meaning-Making among South Indian
Christians’. South Asia: Journal of South Asian Studies 31 (1): 36–55.
Staubwasser, M., F. Sirocko, P. M. Grootes, and M. Segl. 2003. ‘Climate Change at the 4.2
Ka BP Termination of the Indus Valley Civilization and Holocene South Asian
Monsoon Variability’. Geophysical Research Letters 30 (8).
Staubwasser, M., and H. Weiss. 2006. ‘Holocene Climate and Cultural Evolution in Late
Prehistoric–Early Historic West Asia’. Quaternary Research, Holocene Climate and
Cultural Evolution in Late Prehistoric-Early Historic West Asia, 66 (3): 372–87.
Steele, V. J., B. Stern, and A. W. Stott. 2010. ‘Olive Oil or Lard?: Distinguishing Plant
Oils from Animal Fats in the Archeological Record of the Eastern Mediterranean
Using Gas Chromatography/Combustion/Isotope Ratio Mass Spectrometry’. Rapid
Communications in Mass Spectrometry 24 (23): 3478–84.
Stern, B., C. P. Heron, L. Corr, M. Serpico, and J. Bourriau. 2003. ‘Compositional
Variations in Aged and Heated Pistacia Resin found in Late bronze Age Canaanite
Amphorae and Bowls from Amarna, Egypt’. Archaeometry 45 (3): 457–69.
Stern, B., C. P. Heron, M. Serpico, and J. Bourriau. 2000. ‘A Comparison of Methods for
Establishing Fatty Acid Concentration Gradients across Potsherds: A Case-Study
Using Late Bronze Age Cannanite Amphorae’. Archaeometry 42 (2): 399–414.
Sykes, N. 2014. Beastly Questions: Animal Answers to Archaeological Issues. Bloomsbury
Publishing.
———. 2012. ‘A Social Perspective on the Introduction of Exotic Animals: The Case of
the Chicken’. World Archaeology 44 (1): 158–69.
324
Taché, K., and O. E. Craig. 2015. ‘Cooperative Harvesting of Aquatic Resources and the
Beginning of Pottery Production in North-Eastern North America’. Antiquity 89
(343): 177–90.
Tambiah, S. J. 1969. ‘Animals Are Good to Think and Good to Prohibit’. Ethnology 8 (4):
423–59.
Tames-Demauras, M. 2018. ‘Animal Teeth from Farmana: Isotopic Analysis of Bovid
Teeth furing the Early Mature Harappan Periof of the Indus Valley Civilisation (c.
2600-2200 BCE)’. Unpublished MPhil. Thesis, Cambridge: University of
Cambridge.
Thapar, B. K. 1975. ‘Kalibangan: A Harappan Metropolis beyond the Indus Valley’.
Expedition 17 (2): 19–32.
Théry-Parisot, I. 2002. ‘Fuel Management (Bone and Wood) During the Lower
Aurignacian in the Pataud Rock Shelter (Lower Palaeolithic, Les Eyzies de Tayac,
Dordogne, France). Contribution of Experimentation’. Journal of Archaeological
Science 29 (12): 1415–21.
Thomas, P. K. 2002. ‘Investigations into the Archaeofauna of Harappan Sites in Western
India’. In Indian Archaeology in Retrospect: Protohistory, edited by Ravi Korisettar
and Shadakshari Settar, 2:409–20. New Delhi: ICHR and Manohar.
———. 1989. ‘Utilization of Domestic Animals in Pre- and Protohistoric India’. In The
Walking Larder: Patterns of Domestication, Pastoralism, and Predation, edited by J.
Clutton-Brock, 108–12. London: Unwin-Hyman.
Thomas, P. K., and P. P. Joglekar. 1994. ‘Holocene Faunal Studies’. Man and Environment
XIX: 179–204.
Tiwari, M., S. S. Nagoji, and R. S. Ganeshram. 2015. ‘Multi-Centennial Scale SST and
Indian Summer Monsoon Precipitation Variability since the Mid-Holocene and Its
Nonlinear Response to Solar Activity’. The Holocene 25 (9): 1415–24.
Twiss, K. C. 2015. ‘Methodological and Definitional Issues in the Archaeology of Food’.
In Commensality, edited by S. Kerner, C. Chou, and M. Warmind. London:
Bloomsbury Publishing PLC.
325
———. 2012. ‘The Archaeology of Food and Social Diversity’. Journal of Archaeological
Research 20 (4): 357–95.
Twiss, K. C., A. Bogaard, M. Charles, J. Henecke, N. Russell, L. Martin, and G. Jones.
2009. ‘Plants and Animals Together: Interpreting Organic Remains from Building 52
at Çatalhöyük’. Current Anthropology 50 (6): 885–95.
Uesugi, A. 2017. ‘Ceramic Sequence in the Ghaggar Plains from Pre-Indus to Post-Indus
Urban Periods’. In South Asian Archaeology and Art 2012, Volume 1: Man and
Environment in Preshitoric and Protohistoric South Asia - New Perspectives.
Turnhout: Brepol.
———. 2013. ‘A Note on the Diachrnoic Changes of Harappan Pottery - a Preliminary
Analysis’. Heritage: Journal of Multidisciplinary Studies in Archaeology 1: 356–71.
———. 2011a. ‘Pottery from the Cemetery’. In Excavations at Farmana, Rohtak District,
Haryana, India 2006-2008, edited by V. S. Shinde, T. Osada, and M. Kumar, 674–
800. Kyoto: Research Institute for Humanity and Nature.
———. 2011b. ‘Pottery from the Settlement Area’. In Excavations at Farmana, Rohtak
District, Haryana, India 2006-2008, edited by V. S. Shinde, T. Osada, and M.
Kumar, 168–368. Kyoto: Research Institute for Humanity and Nature.
Urem-Kotsou, D., B. Stern, C. P. Heron, and K. Kotsakis. 2002. ‘Birch-Bark Tar at
Neolithic Makriyalos, Greece’. Antiquity 76 (294): 962–67.
Vahia, M. N., P. Kumar, A. Bhogale, D. C. Kothari, S. Chopra, V. S. Shinde, N. Jadhav,
and R. Shastri. 2016. ‘Radiocarbon Dating of Charcoal Samples from Rakhigarhi
Using AMS’. Current Science 111 (1): 27–28.
Valentine, B. T. 2013. ‘Immigrant Identity in the Indus Civilization: A Multi-Isotopic
Mortuary Analysis’. Unpublished PhD thesis, Gainesville: University of Florida.
Valentine, B. T., G. D. Kamenov, J. M. Kenoyer, V. S. Shinde, V. Mushrif-Tripathy, E.
Otarola-Castillo, and J. Krigbaum. 2015. ‘Evidence for Patterns of Selective Urban
Migration in the Greater Indus Valley (2600-1900 BC): A Lead and Strontium
Isotope Mortuary Analysis’. PLOS ONE 10 (4): e0123103.
326
van de Velde, T. 2015. ‘Black Magic Bitumen: An Archaeometrical Approach to 5000
Years of Bitumen Imports in the Persian Gulf’. Unpublished PhD thesis, Ghent:
Ghent University.
van Klinken, G. J., H. van der Plicht, and R. E. M. Hedges. 1994. ‘Bond 13C/12C Ratios
Reflect (Palaeo-)Climatic Variations’. Geophysical Research Letters 21 (6): 445–48.
van Klinken, G. J., M. P. Richards, and R. E. M. Hedges. 2000. ‘An Overview of Causes
for Stable Isotopic Variations in Past European Human Populations: Environmental,
Ecophysiological, and Cultural Effects’. In Biogeochemical Approaches to
Palaeodietary Analysis, edited by S. H. Ambrose and M. A. Katzenberg, 39–63. New
York: Springer.
Verardi, G. 1987. ‘Preliminary Reports on the Stupa and Monastery of Mohenjo-Daro’. In
Interim Reports, edited by M. Jansen and G. Urban, 2:44–58. Aachen: IsMEO-
Aachen University Mission.
Verardi, G., and F. Barba. 2010. ‘The So-Called Stupa at Mohenjo-Daro and Its
Relationship with the Ancient Citadel’. Pragdhara 19: 147–70.
Vidale, M. 2010. ‘Aspects of Palace Life at Mohenjo-Daro’. South Asian Studies 26 (1):
59–76.
———. 2000. The Archaeology of Indus Crafts: Indus Craftspeople and Why We Study
Them. Rome: Istituto Italiano per l’Africa e l’Oriente.
Vidale, M., and H. M.-L. Miller. 2000. ‘On the Development of Indus Technical Virtuosity
and Its Relation to Social Structure’. In South Asian Archaeology 1997, edited by M.
Taddei and G. de Marco, 115–32. Naples, Rome: Istituto Italian per l’Africa e
l’Oriente (IsIAO) & Istituto Universitario Orientale.
Vieugué, J., Y. Garfinkel, O. Barzilai, and E. C. M. van den Brink. 2016. ‘Pottery Function
and Culinary Practices of Yarmukian Societies in the Late 7th Millennium Cal. BC:
First Results’. Paléorient 42 (2): 97–115.
Vishnu-Mittre, and R. Savithri. 1982. ‘Food Economy of the Harappans’. In Harappan
Civilisation, edited by G. L. Possehl, 205–21. New Delhi: Oxford and IBH
Publishing Co. Pvt. Ltd.
327
———. 1975. ‘Supposed Remains of Rice (Oryza sp.) in the Terracotta Cakes and Pai at
Kalibangan, Rajasthan’. The Palaeobotanist 22: 124–26.
von Rad, U., M. Schaaf, K. H. Michels, H. Schulz, W. H. Berger, and F. Sirocko. 1999. ‘A
5000-Yr Record of Climate Change in Varved Sediments from the Oxygen
Minimum Zone off Pakistan, Northeastern Arabian Sea’. Quaternary Research 51
(1): 39–53.
Wade, L. G. 2013. Organic Chemistry. Pearson.
Walker, J. R. in prep. ‘Human-Environment Interactions in the Indus Civilisation:
Reassesing the Role of Rivers, Rain and Climate Change in northwest India’.
Unpublished PhD thesis, Cambridge: University of Cambridge.
Warinner, C., N. Robles, and N. Tuross. 2013. ‘Maize, Beans and the Floral Isotopic
Diversity of Highland Oaxaca, Mexico’. Journal of Archaeological Science 40 (2):
868–73.
Weber, S. 2003. ‘Archaeobotany at Harappa: Indications for Change’. In Indus
Ethnobiology, edited by S. Weber and W. R. Belcher, 175–98. Oxford: Lexington
Books.
———. 1999. ‘Seeds of Urbanism: Palaeoethnobotany and the Indus Civilization’.
Antiquity 73 (282): 813–26.
———. 1991. Plants and Harappan Subsistence: An Example of Stability and Change
from Rojdi. New Delhi: Oxford and IBH Publishing Co. Pvt. Ltd.
Weber, S., A. Kashyap, and L. Mounce. 2011. ‘Archaeobotany at Farmana’. In
Excavations at Farmana, Rohtak District, Haryana, India 2006-2008, edited by V.
S. Shinde, T. Osada, and M. Kumar, 808–25. Kyoto: Research Institute for Humanity
and Nature.
Weber, S., T. Barela, and H. Lehman. 2010. ‘Ecological Continuity: An Explanation for
Agricultural Diversity in the Indus Civilisation and Beyond’. Man and Environment
35: 62–75.
Weber, S., and Vishnu-Mittre. 1989. ‘Palaeobotanical Research at Rojdi’. In Harappan
Civilization and Rojdi, edited by Gregory L. Possehl and M. H. Raval. Delhi: Oxford
and IBH Publishing Co. Pvt. Ltd.
328
Wenger, E. 1999. Communities of Practice: Learning, Meaning, and Identity. Cambridge
University Press.
West, B., and B.-X. Zhou. 1988. ‘Did Chickens Go North? New Evidence for
Domestication’. Journal of Archaeological Science 15 (5): 515–33.
Wheeler, Sir M. 1968. The Indus Civilization. Cambridge: Cambridge University Press.
———. 1966. Civilizations of the Indus Valley and Beyond. London: Thames and Hudson.
———. 1955. Still Digging: Interleaves from an Antiquary’s Notebook. London: M.
Joseph.
———. 1953. The Cambridge History of India: Supplementaty Volume, the Indus
Civilization. Cambridge: Cambridge University Press.
———. 1950. Five Thousand Years of Pakistan: An Archaeological Outline. London:
Royal India and Pakistan Society.
———. 1947. ‘Harappa 1946: The Defences and Cemetery R 37’. Ancient India, 59–130.
Whelton, H. L., M. Roffet-Salque, K. Kotsakis, D. Urem-Kotsou, and R. P. Evershed.
2018. ‘Strong Bias towards Carcass Product Processing at Neolithic Settlements in
Northern Greece Revealed through Absorbed Lipid Residues of Archaeological
Pottery’. Quaternary International 496 (December): 127–39.
Wilkinson, T. J. 2003. Archaeological Landscapes of the Near East. University of Arizona
Press.
Wright, R. P. 2010. The Ancient Indus. Cambridge: Cambridge University Press.
———. 1991. ‘Women’s Labor and Pottery Production in Prehistory’. In Engendering
Archaeology: Women and Prehistory, edited by J. Gero and M. Conkey, 194–223.
Oxford: Basil Blackwell.
Wright, R. P., R. A. Bryson, and J. Schuldenrein. 2008. ‘Water Supply and History:
Harappa and the Beas Regional Survey’. Antiquity 82 (315): 37–48.
Yoffee, N. 2005. Myths of the Archaic State: Evolution of the Earliest Cities, States and
Civilizations. New York: Cambridge University Press.
329
Zagorevski, D. V. and J. A. Loughmiller-Newman. 2012. ‘The Detection of Nicotine in a
Late Mayan Period Flask by Gas Chromatography and Liquid Chromatography Mass
Spectrometry Methods’. Rapid Communications in Mass Spectrometry: RCM 26 (4):
403–11.
Zarillo, S., N. Gaikwad, C. Larnaud, T. Powis, C. Viot, I. Lesur, O. Foouet, X. Argout, E.
Guichoux, F. Salin et al. 2018. ‘The Use and Domestication of Theobroma cacao
during the mid-Holocene in the Upper Amazon’. Nature Ecology and Evolution 2,
1879-1888.
Zeder, M. A. 2006. ‘Archaeological Approaches to Documenting Animal Domestication’.
In Documenting Domestication: New Genetic and Archaeological Paradigms, edited
by M. A. Zeder, D. G. Bradley, E. Emshwiller, and B. D. Smith, 181–206. Berkeley:
University of California Press.
———. 2003. ‘Food Provisioning in Urban Societies: A View from Northern
Mesopotamia’. In The Social Construction of Ancient Cities, edited by M. L. Smith,
156–83. Washington D.C.: Smithsonian Books.
——. 1996. ‘The Role of Pigs in Near Eastern Subsistence’. In Retrieving the Past: Essays
on Archaeological Research and Methdology in Honor of Gus W. Van Beek, edited
by J. D. Seger, 297–312. Eisenbrauns.
———. 1991. Feeding Cities: Specialized Animal Economy in the Ancient Near East.
Washington D.C.: Smithsonian Institution Press.
Zimmermann, F. 1999. The Jungle and the Aroma of Meats: An Ecological Theme in
Hindu Medicine. Delhi: Motilal Banarsidass.
Zorzi, C., M. F. S. Goñi, K. Anupama, S. Prasad, V. Hanquiez, J. Johnson, and L. Giosan.
2015. ‘Indian Monsoon Variations during Three Contrasting Climatic Periods: The
Holocene, Heinrich Stadial 2 and the Last Interglacial–Glacial Transition’.
Quaternary Science Reviews 125 (October): 50–60.
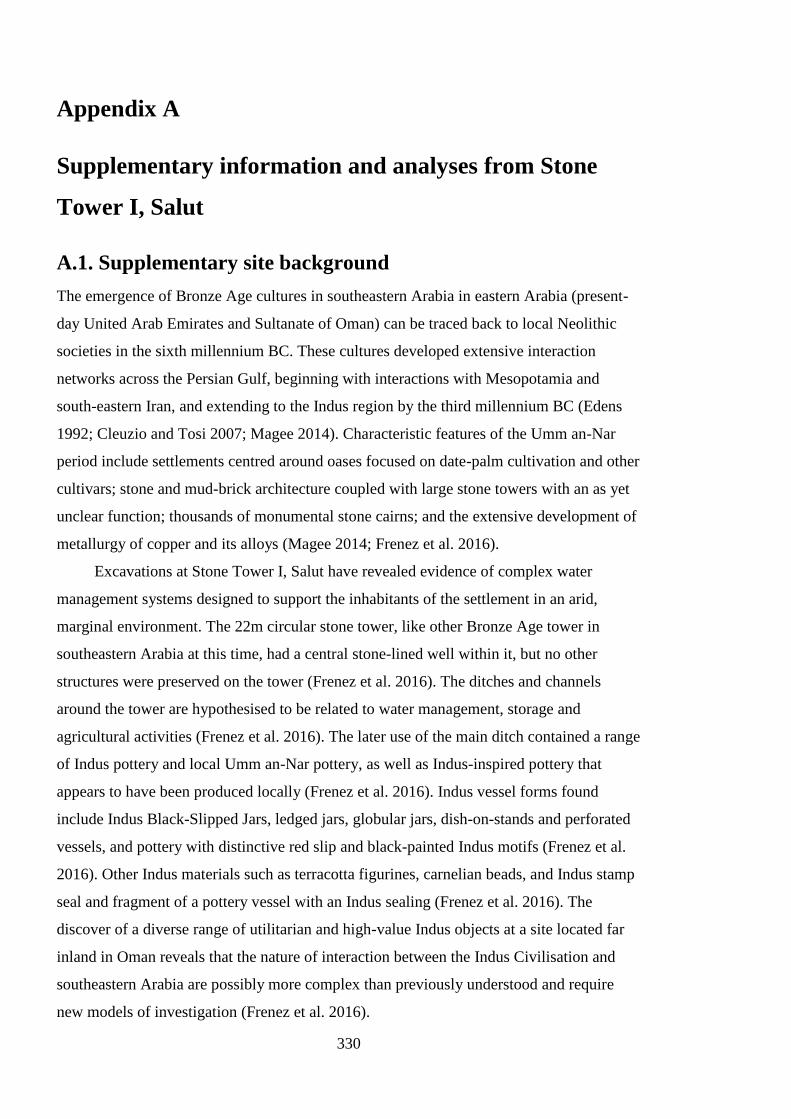
330
Appendix A
Supplementary information and analyses from Stone
Tower I, Salut
A.1. Supplementary site background
The emergence of Bronze Age cultures in southeastern Arabia in eastern Arabia (present-
day United Arab Emirates and Sultanate of Oman) can be traced back to local Neolithic
societies in the sixth millennium BC. These cultures developed extensive interaction
networks across the Persian Gulf, beginning with interactions with Mesopotamia and
south-eastern Iran, and extending to the Indus region by the third millennium BC (Edens
1992; Cleuzio and Tosi 2007; Magee 2014). Characteristic features of the Umm an-Nar
period include settlements centred around oases focused on date-palm cultivation and other
cultivars; stone and mud-brick architecture coupled with large stone towers with an as yet
unclear function; thousands of monumental stone cairns; and the extensive development of
metallurgy of copper and its alloys (Magee 2014; Frenez et al. 2016).
Excavations at Stone Tower I, Salut have revealed evidence of complex water
management systems designed to support the inhabitants of the settlement in an arid,
marginal environment. The 22m circular stone tower, like other Bronze Age tower in
southeastern Arabia at this time, had a central stone-lined well within it, but no other
structures were preserved on the tower (Frenez et al. 2016). The ditches and channels
around the tower are hypothesised to be related to water management, storage and
agricultural activities (Frenez et al. 2016). The later use of the main ditch contained a range
of Indus pottery and local Umm an-Nar pottery, as well as Indus-inspired pottery that
appears to have been produced locally (Frenez et al. 2016). Indus vessel forms found
include Indus Black-Slipped Jars, ledged jars, globular jars, dish-on-stands and perforated
vessels, and pottery with distinctive red slip and black-painted Indus motifs (Frenez et al.
2016). Other Indus materials such as terracotta figurines, carnelian beads, and Indus stamp
seal and fragment of a pottery vessel with an Indus sealing (Frenez et al. 2016). The
discover of a diverse range of utilitarian and high-value Indus objects at a site located far
inland in Oman reveals that the nature of interaction between the Indus Civilisation and
southeastern Arabia are possibly more complex than previously understood and require
new models of investigation (Frenez et al. 2016).
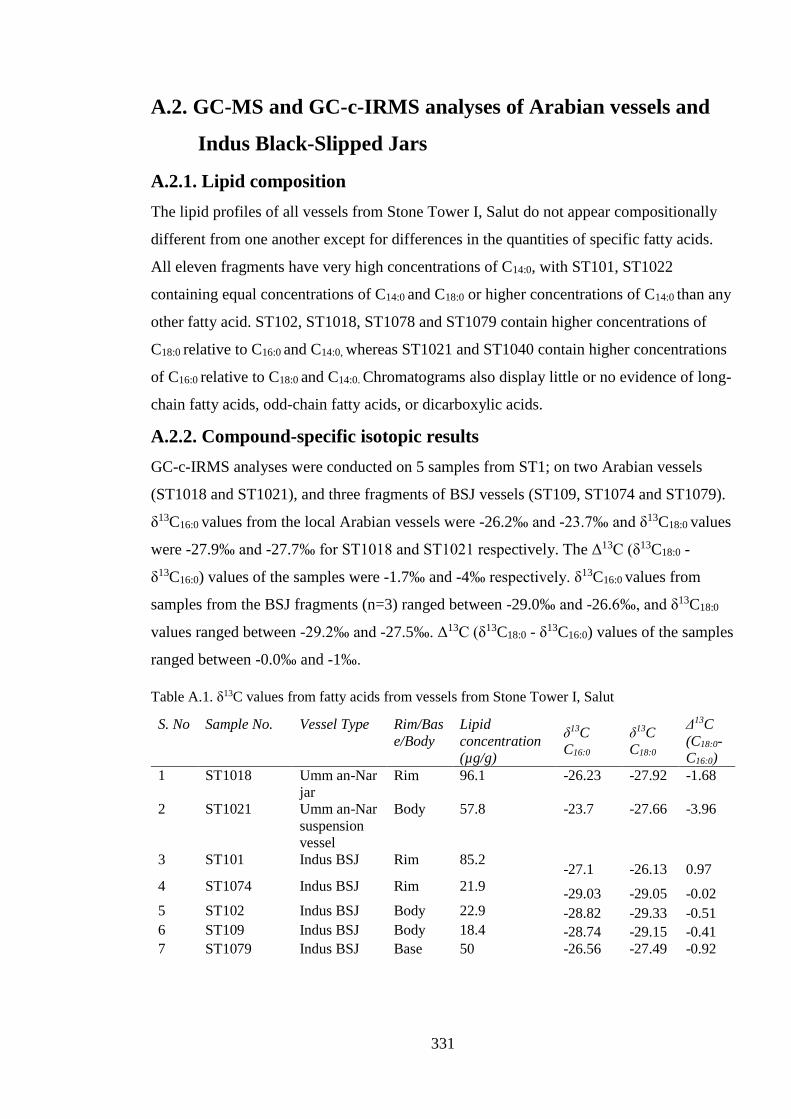
331
A.2. GC-MS and GC-c-IRMS analyses of Arabian vessels and
Indus Black-Slipped Jars
A.2.1. Lipid composition
The lipid profiles of all vessels from Stone Tower I, Salut do not appear compositionally
different from one another except for differences in the quantities of specific fatty acids.
All eleven fragments have very high concentrations of C14:0, with ST101, ST1022
containing equal concentrations of C14:0 and C18:0 or higher concentrations of C14:0 than any
other fatty acid. ST102, ST1018, ST1078 and ST1079 contain higher concentrations of
C18:0 relative to C16:0 and C14:0, whereas ST1021 and ST1040 contain higher concentrations
of C16:0 relative to C18:0 and C14:0. Chromatograms also display little or no evidence of long-
chain fatty acids, odd-chain fatty acids, or dicarboxylic acids.
A.2.2. Compound-specific isotopic results
GC-c-IRMS analyses were conducted on 5 samples from ST1; on two Arabian vessels
(ST1018 and ST1021), and three fragments of BSJ vessels (ST109, ST1074 and ST1079).
δ13C16:0 values from the local Arabian vessels were -26.2‰ and -23.7‰ and δ13C18:0 values
were -27.9‰ and -27.7‰ for ST1018 and ST1021 respectively. The Δ13C (δ13C18:0 -
δ13C16:0) values of the samples were -1.7‰ and -4‰ respectively. δ13C16:0 values from
samples from the BSJ fragments (n=3) ranged between -29.0‰ and -26.6‰, and δ13C18:0
values ranged between -29.2‰ and -27.5‰. Δ13C (δ13C18:0 - δ13C16:0) values of the samples
ranged between -0.0‰ and -1‰.
Table A.1. δ13C values from fatty acids from vessels from Stone Tower I, Salut
S. No Sample No. Vessel Type Rim/Bas
e/Body
Lipid
concentration
(µg/g)
δ13C
C16:0
δ13C
C18:0
Δ13C
(C18:0-
C16:0)
1 ST1018 Umm an-Nar
jar
Rim 96.1 -26.23
-27.92
-1.68
2 ST1021 Umm an-Nar
suspension
vessel
Body 57.8 -23.7
-27.66
-3.96
3 ST101 Indus BSJ Rim 85.2 -27.1 -26.13 0.97
4 ST1074 Indus BSJ Rim 21.9 -29.03 -29.05 -0.02
5 ST102 Indus BSJ Body 22.9 -28.82 -29.33 -0.51
6 ST109 Indus BSJ Body 18.4 -28.74 -29.15 -0.41
7 ST1079
Indus BSJ Base 50 -26.56
-27.49
-0.92
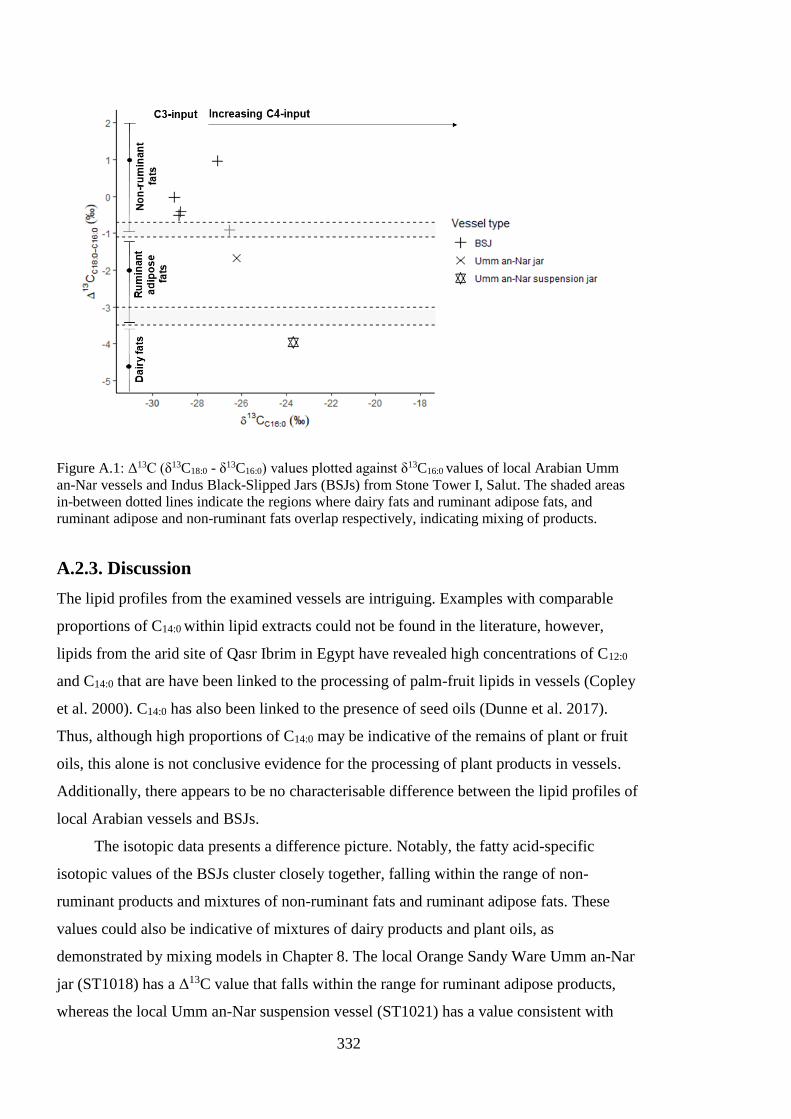
332
Figure A.1: Δ13C (δ13C18:0 - δ13C16:0) values plotted against δ13C16:0 values of local Arabian Umm
an-Nar vessels and Indus Black-Slipped Jars (BSJs) from Stone Tower I, Salut. The shaded areas
in-between dotted lines indicate the regions where dairy fats and ruminant adipose fats, and
ruminant adipose and non-ruminant fats overlap respectively, indicating mixing of products.
A.2.3. Discussion
The lipid profiles from the examined vessels are intriguing. Examples with comparable
proportions of C14:0 within lipid extracts could not be found in the literature, however,
lipids from the arid site of Qasr Ibrim in Egypt have revealed high concentrations of C12:0
and C14:0 that are have been linked to the processing of palm-fruit lipids in vessels (Copley
et al. 2000). C14:0 has also been linked to the presence of seed oils (Dunne et al. 2017).
Thus, although high proportions of C14:0 may be indicative of the remains of plant or fruit
oils, this alone is not conclusive evidence for the processing of plant products in vessels.
Additionally, there appears to be no characterisable difference between the lipid profiles of
local Arabian vessels and BSJs.
The isotopic data presents a difference picture. Notably, the fatty acid-specific
isotopic values of the BSJs cluster closely together, falling within the range of non-
ruminant products and mixtures of non-ruminant fats and ruminant adipose fats. These
values could also be indicative of mixtures of dairy products and plant oils, as
demonstrated by mixing models in Chapter 8. The local Orange Sandy Ware Umm an-Nar
jar (ST1018) has a Δ13C value that falls within the range for ruminant adipose products,
whereas the local Umm an-Nar suspension vessel (ST1021) has a value consistent with
333
reference ruminant dairy products. δ13C16:0 values of the lipid extracts suggest that the
(likely indirect) plant input in the vessels comes primarily from C3 plants, however,
ST1021 demonstrates evidence of a mixed C3 and C4 plant input. Comparison with
forthcoming archaebotanical and faunal data, and collection of reference fats from the
region may reveal further insight into what products were processed in these vessels.
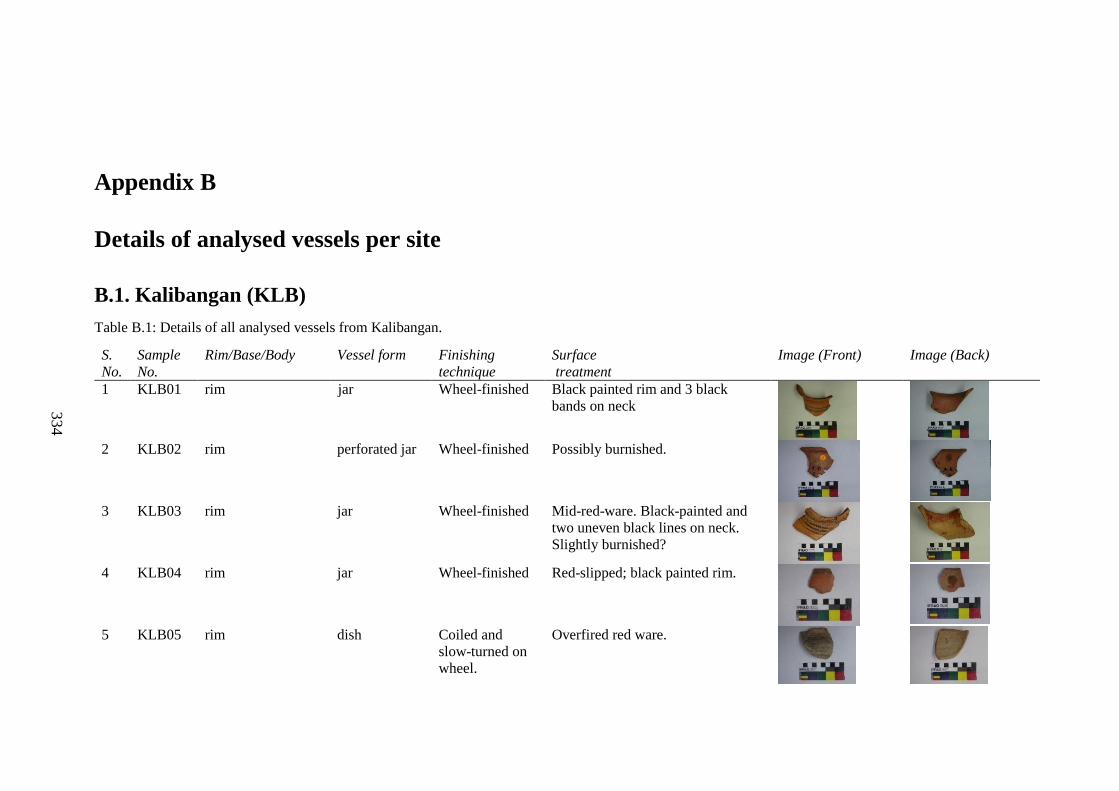
334
334
Appendix B
Details of analysed vessels per site
B.1. Kalibangan (KLB)
Table B.1: Details of all analysed vessels from Kalibangan.
S.
No.
Sample
No.
Rim/Base/Body Vessel form Finishing
technique
Surface
treatment
Image (Front) Image (Back)
1 KLB01 rim jar Wheel-finished Black painted rim and 3 black
bands on neck
2 KLB02 rim perforated jar Wheel-finished Possibly burnished.
3 KLB03 rim jar Wheel-finished Mid-red-ware. Black-painted and
two uneven black lines on neck.
Slightly burnished?
4 KLB04 rim jar Wheel-finished Red-slipped; black painted rim.
5 KLB05 rim dish Coiled and
slow-turned on
wheel.
Overfired red ware.
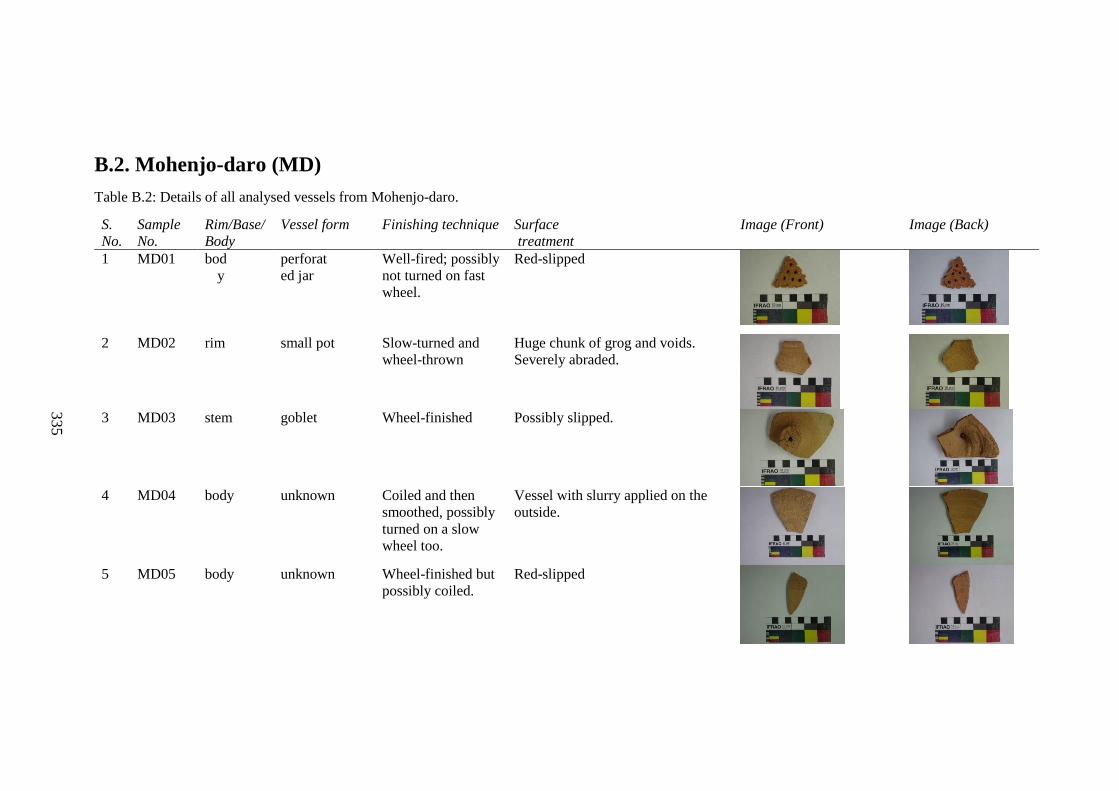
335
335
B.2. Mohenjo-daro (MD)
Table B.2: Details of all analysed vessels from Mohenjo-daro.
S.
No.
Sample
No.
Rim/Base/
Body
Vessel form Finishing technique Surface
treatment
Image (Front) Image (Back)
1 MD01 bod
y
perforat
ed jar
Well-fired; possibly
not turned on fast
wheel.
Red-slipped
2 MD02 rim small pot Slow-turned and
wheel-thrown
Huge chunk of grog and voids.
Severely abraded.
3 MD03 stem goblet Wheel-finished Possibly slipped.
4 MD04 body unknown Coiled and then
smoothed, possibly
turned on a slow
wheel too.
Vessel with slurry applied on the
outside.
5 MD05 body unknown Wheel-finished but
possibly coiled.
Red-slipped
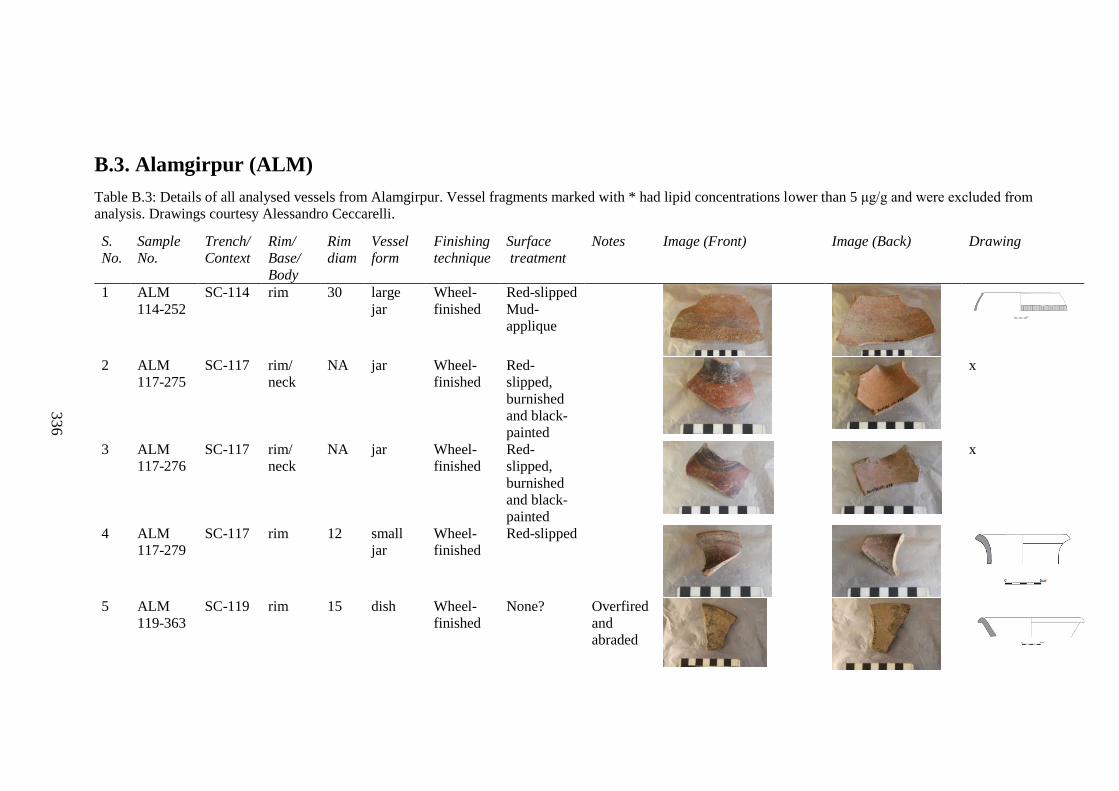
336
336
B.3. Alamgirpur (ALM)
Table B.3: Details of all analysed vessels from Alamgirpur. Vessel fragments marked with * had lipid concentrations lower than 5 μg/g and were excluded from
analysis. Drawings courtesy Alessandro Ceccarelli.
S.
No.
Sample
No.
Trench/
Context
Rim/
Base/
Body
Rim
diam
Vessel
form
Finishing
technique
Surface
treatment
Notes Image (Front) Image (Back) Drawing
1 ALM
114-252
SC-114 rim 30 large
jar
Wheel-
finished
Red-slipped
Mud-
applique
2 ALM
117-275
SC-117 rim/
neck
NA jar Wheel-
finished
Red-
slipped,
burnished
and black-
painted
x
3 ALM
117-276
SC-117 rim/
neck
NA jar Wheel-
finished
Red-
slipped,
burnished
and black-
painted
x
4 ALM
117-279
SC-117 rim 12 small
jar
Wheel-
finished
Red-slipped
5 ALM
119-363
SC-119 rim 15 dish Wheel-
finished
None? Overfired
and
abraded
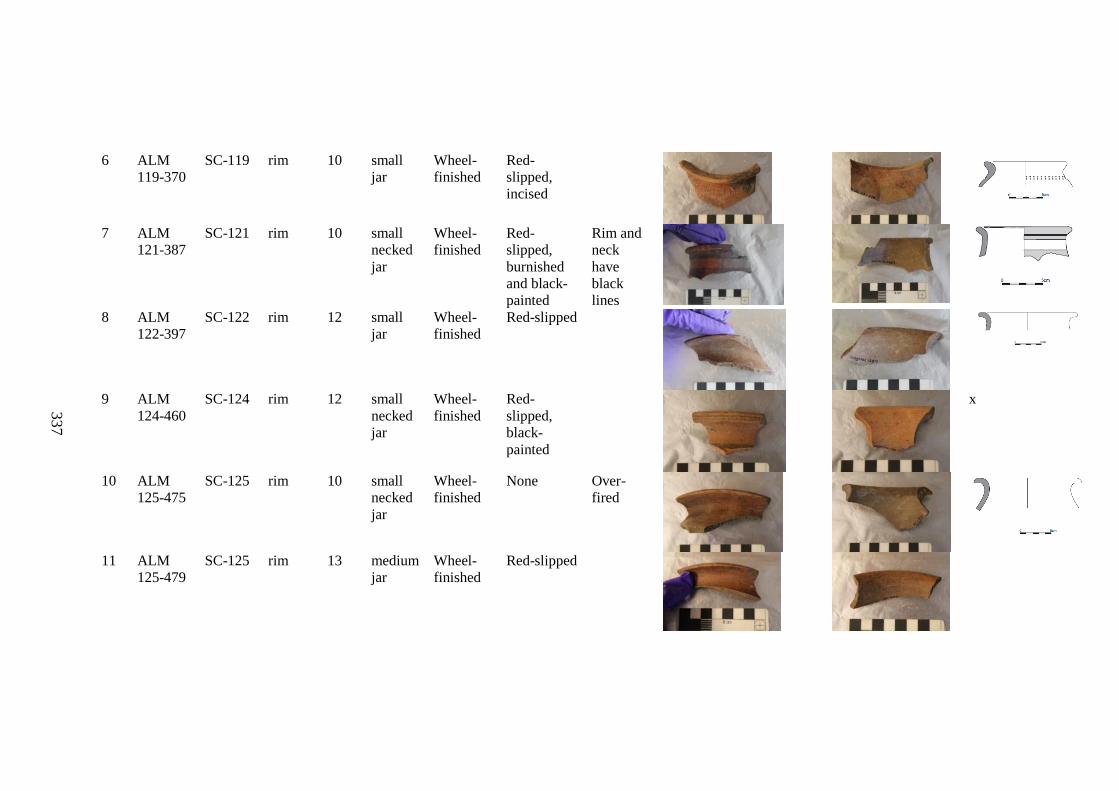
337
337
6 ALM
119-370
SC-119 rim 10 small
jar
Wheel-
finished
Red-
slipped,
incised
7 ALM
121-387
SC-121 rim 10 small
necked
jar
Wheel-
finished
Red-
slipped,
burnished
and black-
painted
Rim and
neck
have
black
lines
8 ALM
122-397
SC-122 rim 12 small
jar
Wheel-
finished
Red-slipped
9 ALM
124-460
SC-124 rim 12 small
necked
jar
Wheel-
finished
Red-
slipped,
black-
painted
x
10 ALM
125-475
SC-125 rim 10 small
necked
jar
Wheel-
finished
None Over-
fired
11 ALM
125-479
SC-125 rim 13 medium
jar
Wheel-
finished
Red-slipped
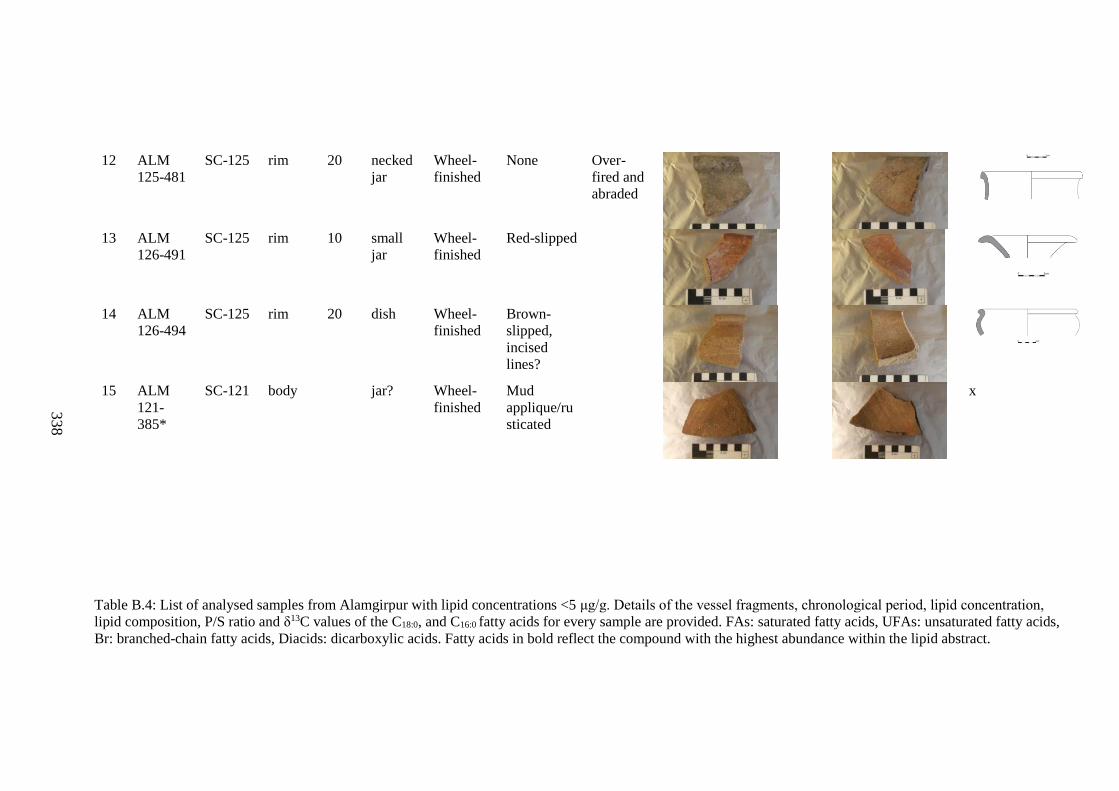
338
338
12 ALM
125-481
SC-125 rim 20 necked
jar
Wheel-
finished
None Over-
fired and
abraded
13 ALM
126-491
SC-125 rim 10 small
jar
Wheel-
finished
Red-slipped
14 ALM
126-494
SC-125 rim 20 dish Wheel-
finished
Brown-
slipped,
incised
lines?
15 ALM
121-
385*
SC-121 body jar? Wheel-
finished
Mud
applique/ru
sticated
x
Table B.4: List of analysed samples from Alamgirpur with lipid concentrations <5 μg/g. Details of the vessel fragments, chronological period, lipid concentration,
lipid composition, P/S ratio and δ13C values of the C18:0, and C16:0 fatty acids for every sample are provided. FAs: saturated fatty acids, UFAs: unsaturated fatty acids,
Br: branched-chain fatty acids, Diacids: dicarboxylic acids. Fatty acids in bold reflect the compound with the highest abundance within the lipid abstract.
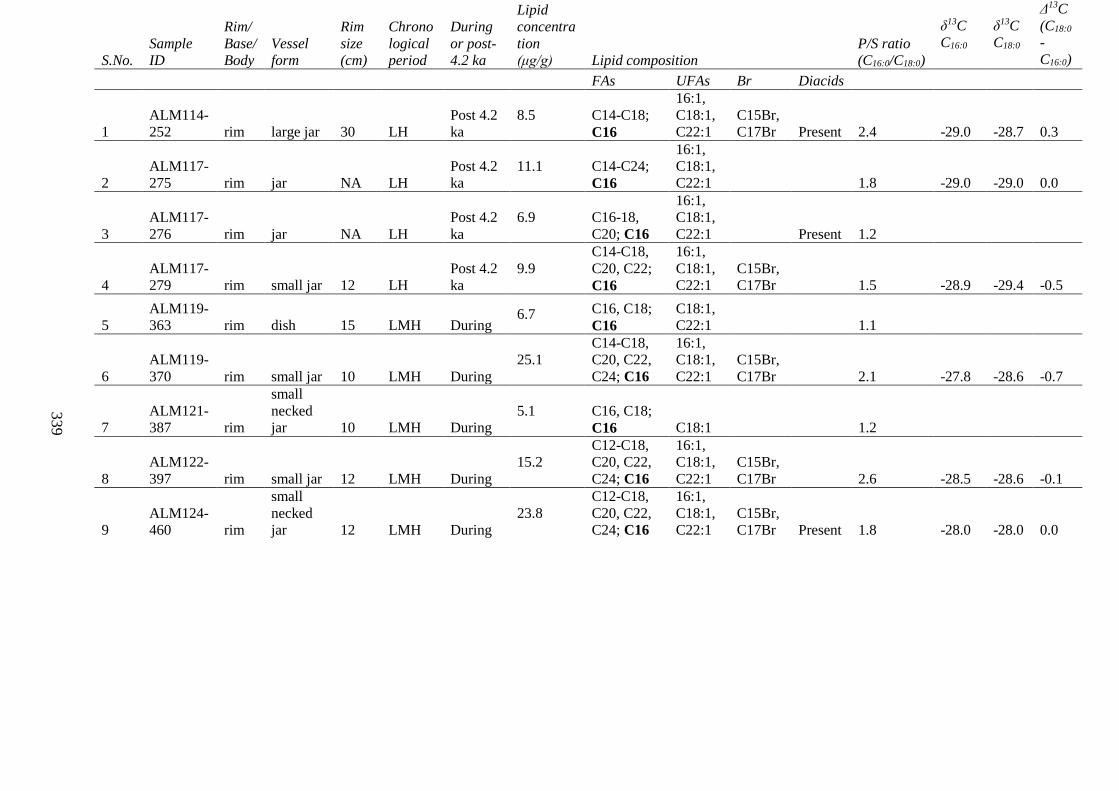
339
339
S.No.
Sample
ID
Rim/
Base/
Body
Vessel
form
Rim
size
(cm)
Chrono
logical
period
During
or post-
4.2 ka
Lipid
concentra
tion
(μg/g) Lipid composition
P/S ratio
(C16:0/C18:0)
δ13C
C16:0
δ13C
C18:0
Δ13C
(C18:0
-
C16:0)
FAs UFAs Br Diacids
1
ALM114-
252 rim large jar 30 LH
Post 4.2
ka
8.5 C14-C18;
C16
16:1,
C18:1,
C22:1
C15Br,
C17Br Present 2.4 -29.0 -28.7 0.3
2
ALM117-
275 rim jar NA LH
Post 4.2
ka
11.1 C14-C24;
C16
16:1,
C18:1,
C22:1 1.8 -29.0 -29.0 0.0
3
ALM117-
276 rim jar NA LH
Post 4.2
ka
6.9 C16-18,
C20; C16
16:1,
C18:1,
C22:1 Present 1.2
4
ALM117-
279 rim small jar 12 LH
Post 4.2
ka
9.9
C14-C18,
C20, C22;
C16
16:1,
C18:1,
C22:1
C15Br,
C17Br 1.5 -28.9 -29.4 -0.5
5
ALM119-
363 rim dish 15 LMH During 6.7 C16, C18;
C16
C18:1,
C22:1 1.1
6
ALM119-
370 rim small jar 10 LMH During
25.1
C14-C18,
C20, C22,
C24; C16
16:1,
C18:1,
C22:1
C15Br,
C17Br 2.1 -27.8 -28.6 -0.7
7
ALM121-
387 rim
small
necked
jar 10 LMH During
5.1 C16, C18;
C16 C18:1 1.2
8
ALM122-
397 rim small jar 12 LMH During
15.2
C12-C18,
C20, C22,
C24; C16
16:1,
C18:1,
C22:1
C15Br,
C17Br 2.6 -28.5 -28.6 -0.1
9
ALM124-
460 rim
small
necked
jar 12 LMH During
23.8
C12-C18,
C20, C22,
C24; C16
16:1,
C18:1,
C22:1
C15Br,
C17Br Present 1.8 -28.0 -28.0 0.0
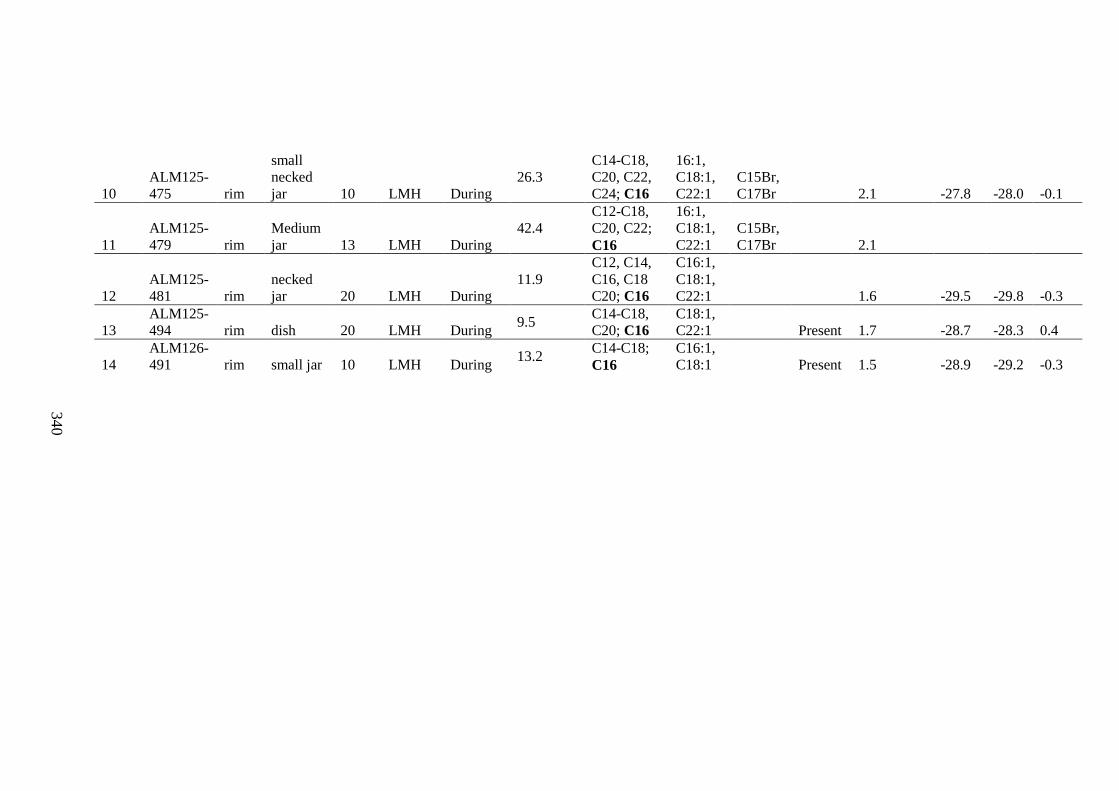
340
340
10
ALM125-
475 rim
small
necked
jar 10 LMH During
26.3
C14-C18,
C20, C22,
C24; C16
16:1,
C18:1,
C22:1
C15Br,
C17Br 2.1 -27.8 -28.0 -0.1
11
ALM125-
479 rim
Medium
jar 13 LMH During
42.4
C12-C18,
C20, C22;
C16
16:1,
C18:1,
C22:1
C15Br,
C17Br 2.1
12
ALM125-
481 rim
necked
jar 20 LMH During
11.9
C12, C14,
C16, C18
C20; C16
C16:1,
C18:1,
C22:1 1.6 -29.5 -29.8 -0.3
13
ALM125-
494 rim dish 20 LMH During 9.5
C14-C18,
C20; C16
C18:1,
C22:1 Present 1.7 -28.7 -28.3 0.4
14
ALM126-
491 rim small jar 10 LMH During 13.2
C14-C18;
C16
C16:1,
C18:1 Present 1.5 -28.9 -29.2 -0.3
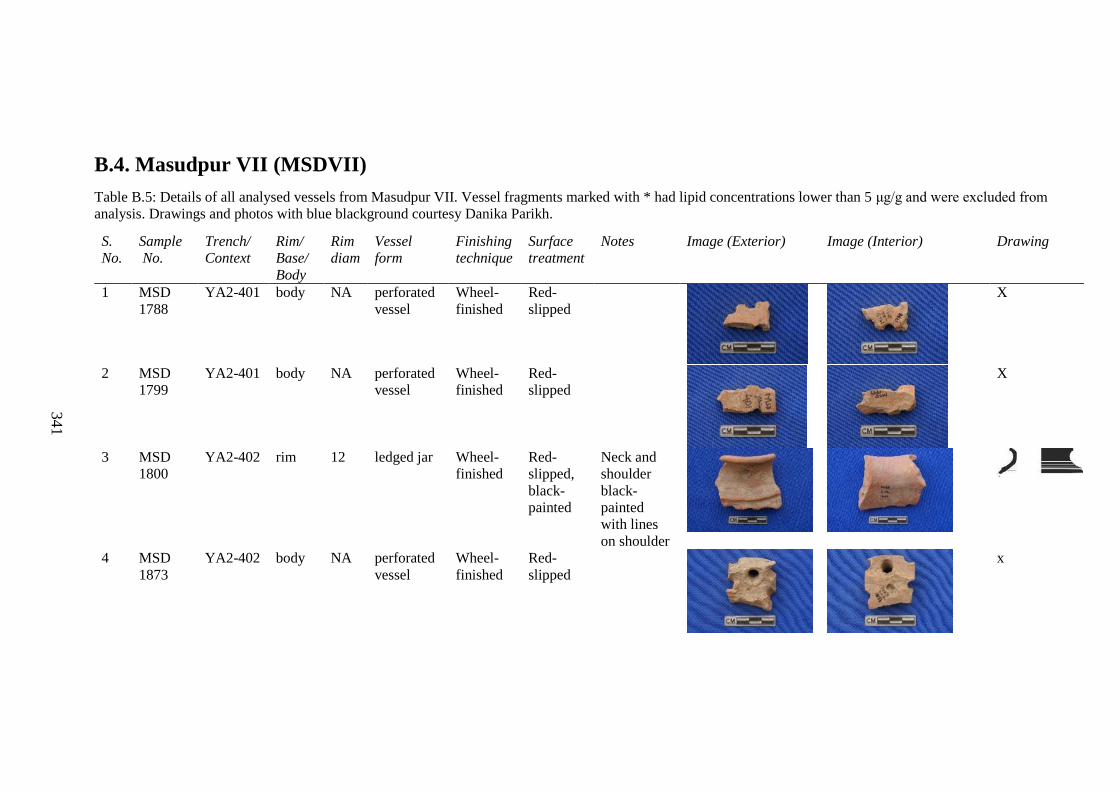
341
341
B.4. Masudpur VII (MSDVII)
Table B.5: Details of all analysed vessels from Masudpur VII. Vessel fragments marked with * had lipid concentrations lower than 5 μg/g and were excluded from
analysis. Drawings and photos with blue blackground courtesy Danika Parikh.
S.
No.
Sample
No.
Trench/
Context
Rim/
Base/
Body
Rim
diam
Vessel
form
Finishing
technique
Surface
treatment
Notes Image (Exterior) Image (Interior) Drawing
1 MSD
1788
YA2-401 body NA perforated
vessel
Wheel-
finished
Red-
slipped
X
2 MSD
1799
YA2-401 body NA perforated
vessel
Wheel-
finished
Red-
slipped
X
3 MSD
1800
YA2-402 rim 12 ledged jar Wheel-
finished
Red-
slipped,
black-
painted
Neck and
shoulder
black-
painted
with lines
on shoulder
4 MSD
1873
YA2-402 body NA perforated
vessel
Wheel-
finished
Red-
slipped
x
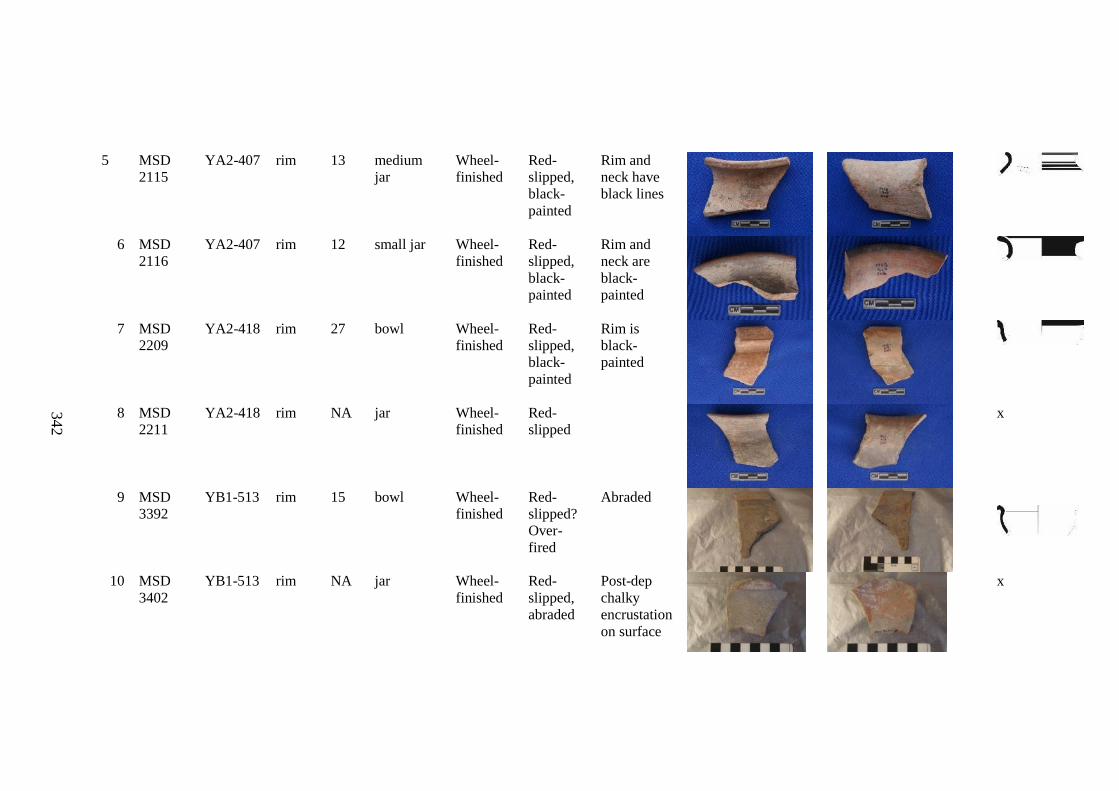
342
342
5 MSD
2115
YA2-407 rim 13 medium
jar
Wheel-
finished
Red-
slipped,
black-
painted
Rim and
neck have
black lines
6 MSD
2116
YA2-407 rim 12 small jar Wheel-
finished
Red-
slipped,
black-
painted
Rim and
neck are
black-
painted
7 MSD
2209
YA2-418 rim 27 bowl Wheel-
finished
Red-
slipped,
black-
painted
Rim is
black-
painted
8 MSD
2211
YA2-418 rim NA jar Wheel-
finished
Red-
slipped
x
9 MSD
3392
YB1-513 rim 15 bowl Wheel-
finished
Red-
slipped?
Over-
fired
Abraded
10 MSD
3402
YB1-513 rim NA jar Wheel-
finished
Red-
slipped,
abraded
Post-dep
chalky
encrustation
on surface
x
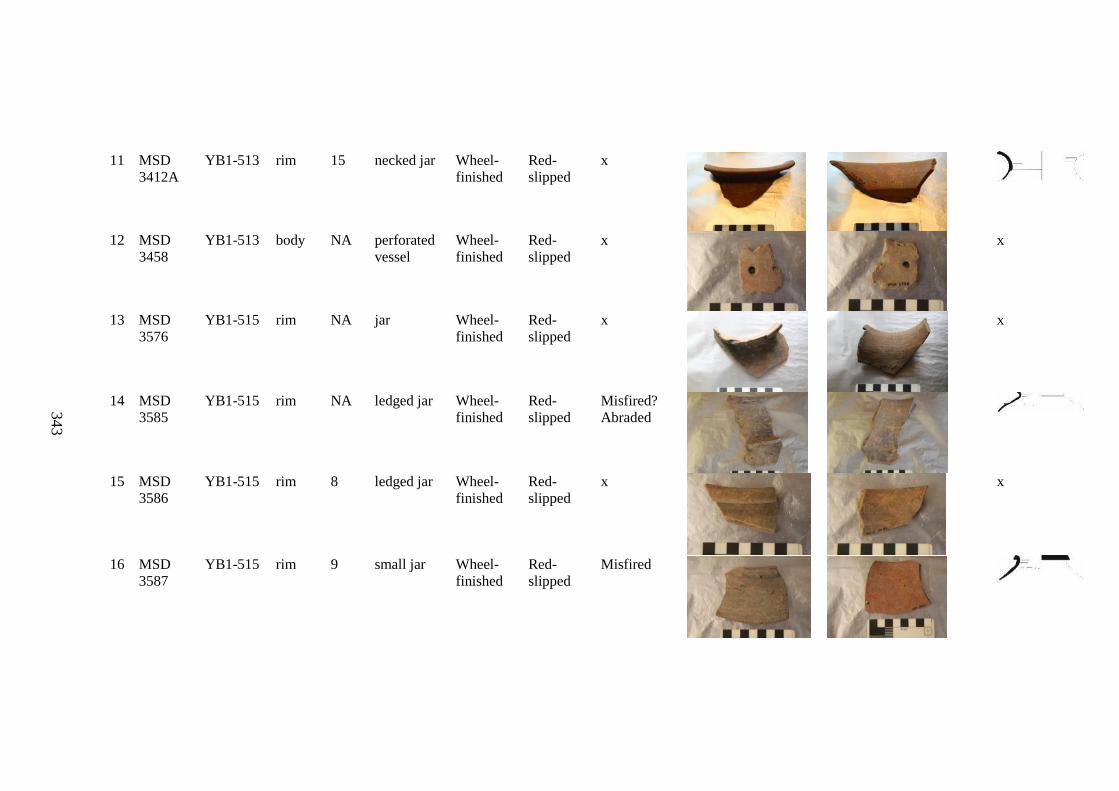
343
343
11 MSD
3412A
YB1-513 rim 15 necked jar Wheel-
finished
Red-
slipped
x
12 MSD
3458
YB1-513 body NA perforated
vessel
Wheel-
finished
Red-
slipped
x
x
13 MSD
3576
YB1-515 rim NA jar Wheel-
finished
Red-
slipped
x
x
14 MSD
3585
YB1-515 rim NA ledged jar Wheel-
finished
Red-
slipped
Misfired?
Abraded
15 MSD
3586
YB1-515 rim 8 ledged jar Wheel-
finished
Red-
slipped
x
x
16 MSD
3587
YB1-515 rim 9 small jar Wheel-
finished
Red-
slipped
Misfired
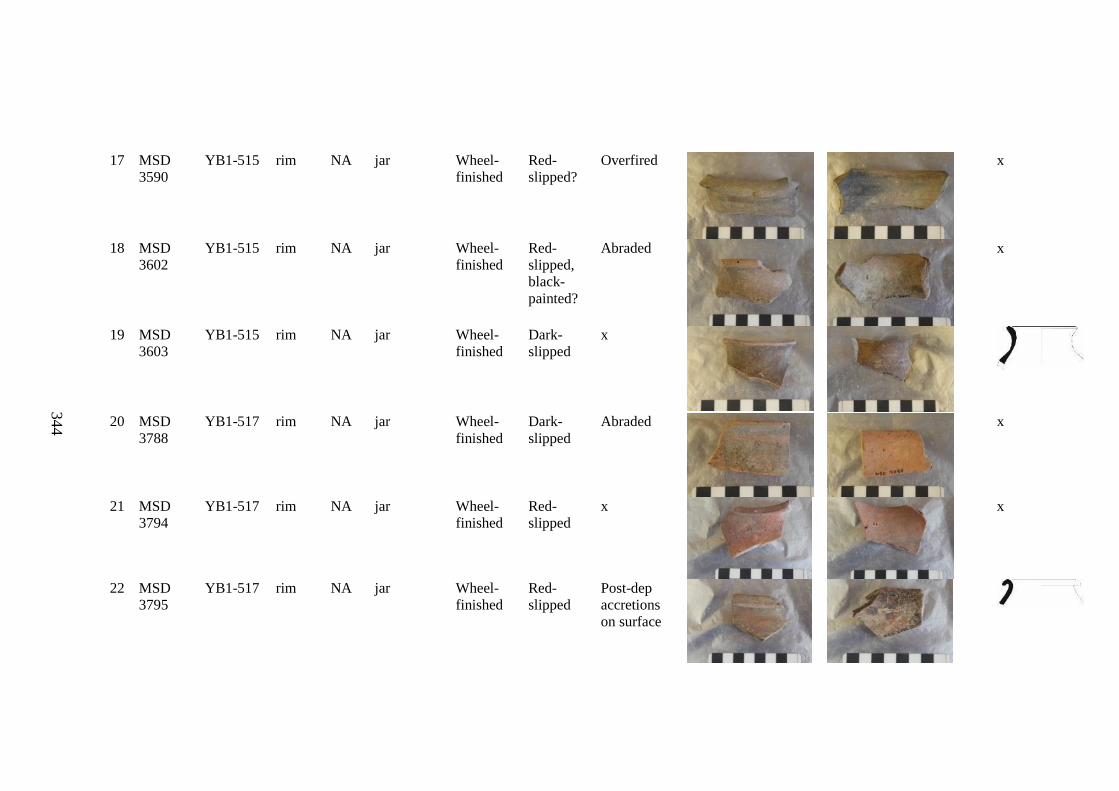
344
344
17 MSD
3590
YB1-515 rim NA jar Wheel-
finished
Red-
slipped?
Overfired
x
18 MSD
3602
YB1-515 rim NA jar Wheel-
finished
Red-
slipped,
black-
painted?
Abraded
x
19 MSD
3603
YB1-515 rim NA jar Wheel-
finished
Dark-
slipped
x
20 MSD
3788
YB1-517 rim NA jar Wheel-
finished
Dark-
slipped
Abraded
x
21 MSD
3794
YB1-517 rim NA jar Wheel-
finished
Red-
slipped
x
x
22 MSD
3795
YB1-517 rim NA jar Wheel-
finished
Red-
slipped
Post-dep
accretions
on surface
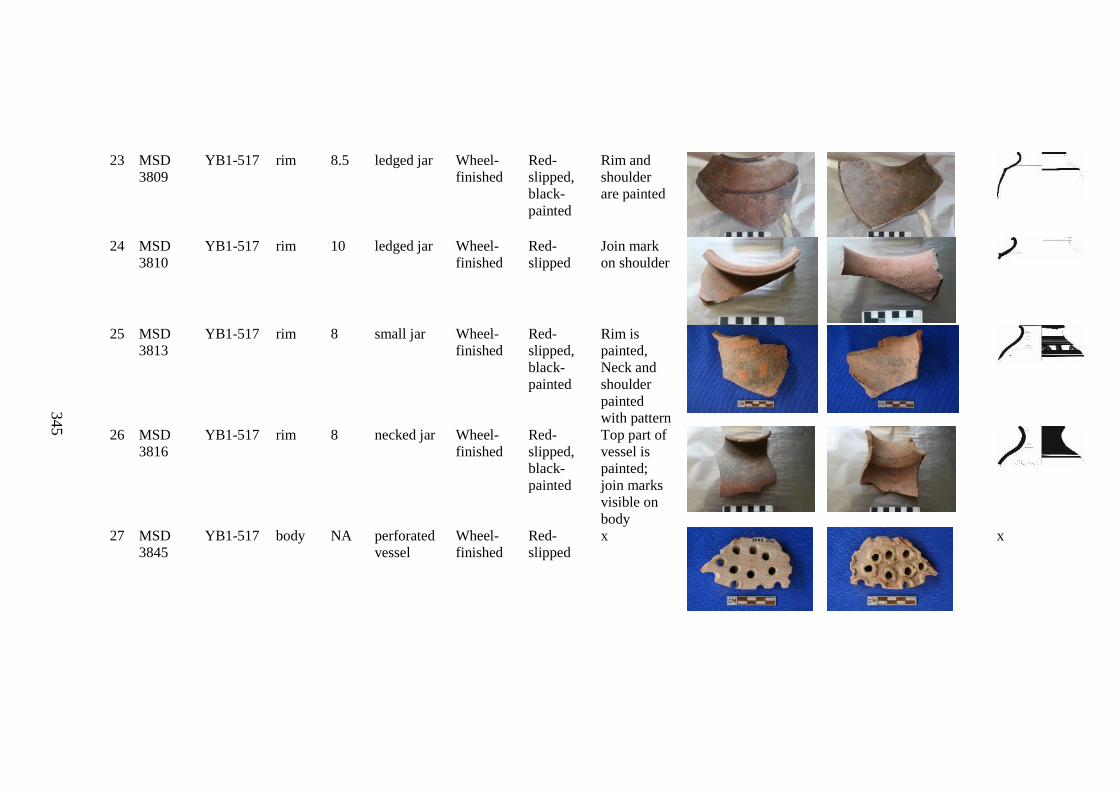
345
345
23 MSD
3809
YB1-517 rim 8.5 ledged jar Wheel-
finished
Red-
slipped,
black-
painted
Rim and
shoulder
are painted
24 MSD
3810
YB1-517 rim 10 ledged jar Wheel-
finished
Red-
slipped
Join mark
on shoulder
25 MSD
3813
YB1-517 rim 8 small jar Wheel-
finished
Red-
slipped,
black-
painted
Rim is
painted,
Neck and
shoulder
painted
with pattern
26 MSD
3816
YB1-517 rim 8 necked jar Wheel-
finished
Red-
slipped,
black-
painted
Top part of
vessel is
painted;
join marks
visible on
body
27 MSD
3845
YB1-517 body NA perforated
vessel
Wheel-
finished
Red-
slipped
x
x
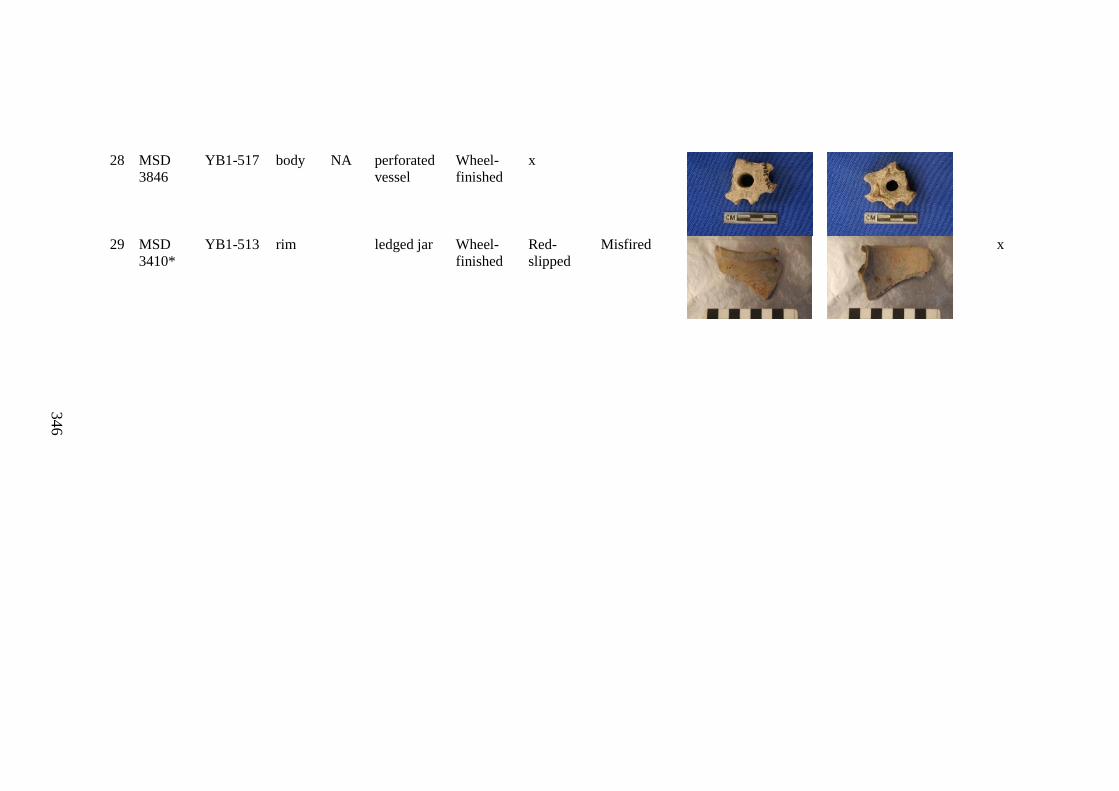
346
346
28 MSD
3846
YB1-517 body NA perforated
vessel
Wheel-
finished
x
29 MSD
3410*
YB1-513 rim ledged jar Wheel-
finished
Red-
slipped
Misfired
x
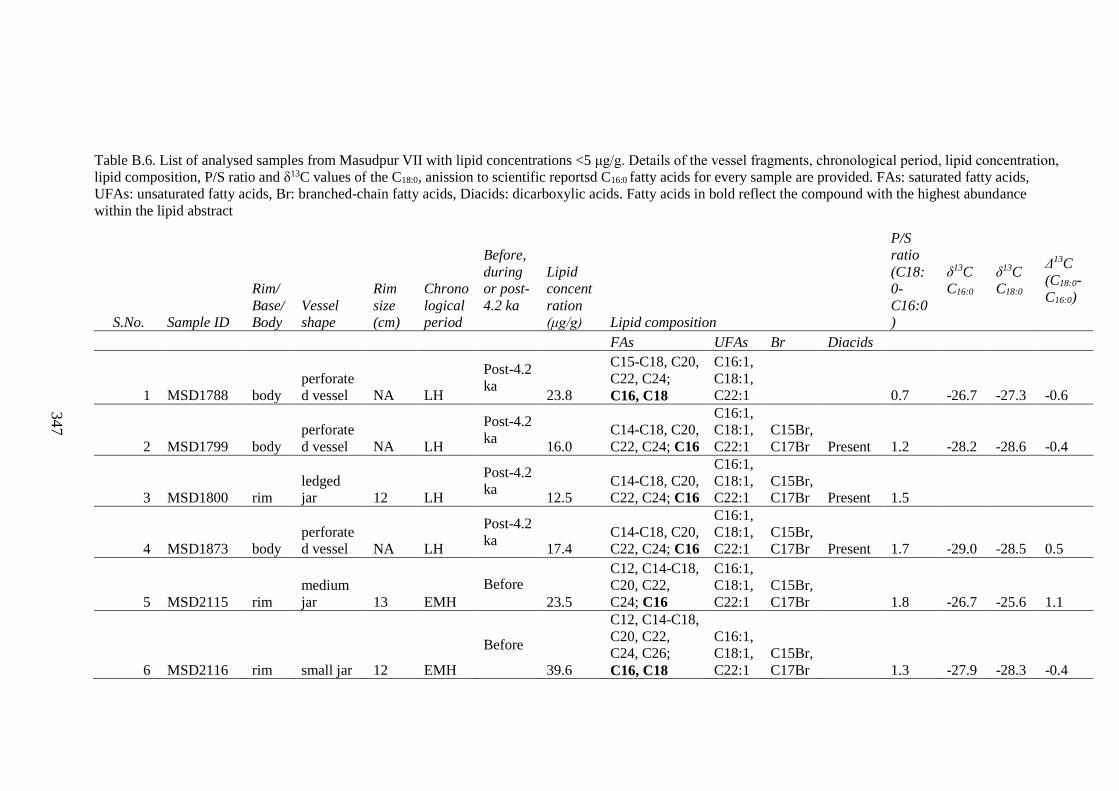
347
347
Table B.6. List of analysed samples from Masudpur VII with lipid concentrations <5 μg/g. Details of the vessel fragments, chronological period, lipid concentration,
lipid composition, P/S ratio and δ13C values of the C18:0, anission to scientific reportsd C16:0 fatty acids for every sample are provided. FAs: saturated fatty acids,
UFAs: unsaturated fatty acids, Br: branched-chain fatty acids, Diacids: dicarboxylic acids. Fatty acids in bold reflect the compound with the highest abundance
within the lipid abstract
S.No. Sample ID
Rim/
Base/
Body
Vessel
shape
Rim
size
(cm)
Chrono
logical
period
Before,
during
or post-
4.2 ka
Lipid
concent
ration
(μg/g) Lipid composition
P/S
ratio
(C18:
0-
C16:0
)
δ13C
C16:0
δ13C
C18:0
Δ13C
(C18:0-
C16:0)
FAs UFAs Br Diacids
1 MSD1788 body
perforate
d vessel NA LH
Post-4.2
ka 23.8
C15-C18, C20,
C22, C24;
C16, C18
C16:1,
C18:1,
C22:1 0.7 -26.7 -27.3 -0.6
2 MSD1799 body
perforate
d vessel NA LH
Post-4.2
ka 16.0
C14-C18, C20,
C22, C24; C16
C16:1,
C18:1,
C22:1
C15Br,
C17Br Present 1.2 -28.2 -28.6 -0.4
3 MSD1800 rim
ledged
jar 12 LH
Post-4.2
ka 12.5
C14-C18, C20,
C22, C24; C16
C16:1,
C18:1,
C22:1
C15Br,
C17Br Present 1.5
4 MSD1873 body
perforate
d vessel NA LH
Post-4.2
ka 17.4
C14-C18, C20,
C22, C24; C16
C16:1,
C18:1,
C22:1
C15Br,
C17Br Present 1.7 -29.0 -28.5 0.5
5 MSD2115 rim
medium
jar 13 EMH
Before
23.5
C12, C14-C18,
C20, C22,
C24; C16
C16:1,
C18:1,
C22:1
C15Br,
C17Br 1.8 -26.7 -25.6 1.1
6 MSD2116 rim small jar 12 EMH
Before
39.6
C12, C14-C18,
C20, C22,
C24, C26;
C16, C18
C16:1,
C18:1,
C22:1
C15Br,
C17Br 1.3 -27.9 -28.3 -0.4
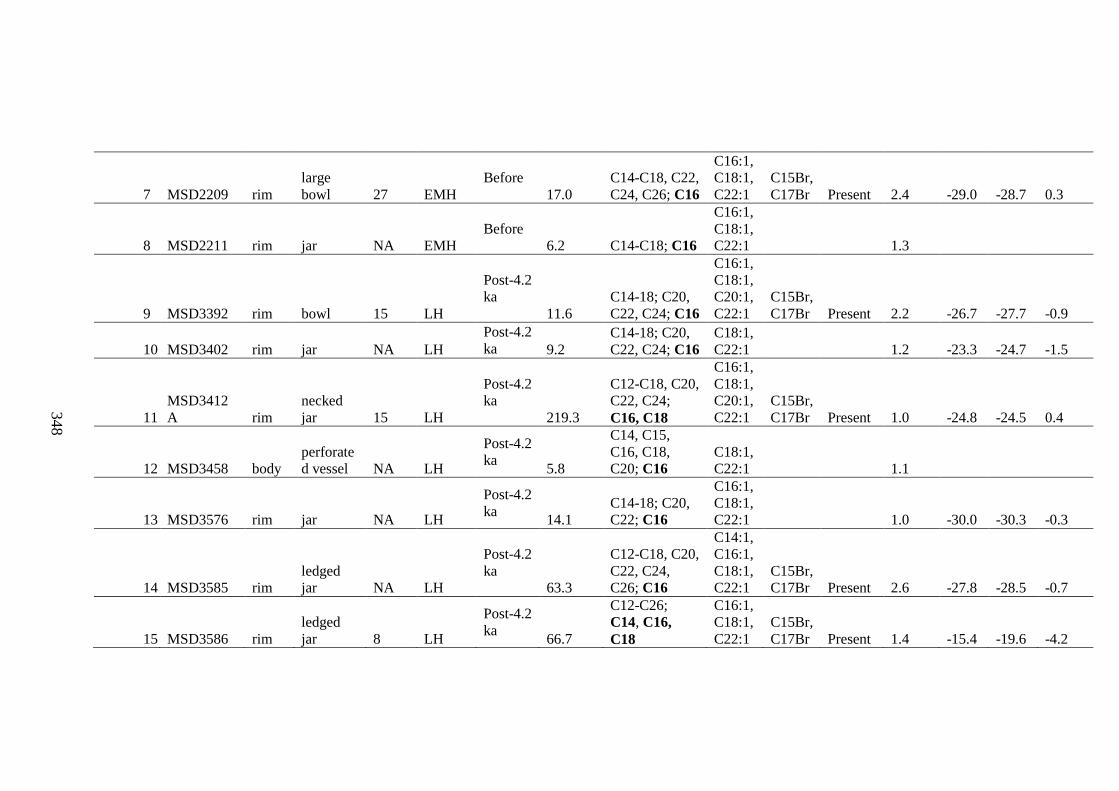
348
348
7 MSD2209 rim
large
bowl 27 EMH
Before
17.0
C14-C18, C22,
C24, C26; C16
C16:1,
C18:1,
C22:1
C15Br,
C17Br Present 2.4 -29.0 -28.7 0.3
8 MSD2211 rim jar NA EMH
Before
6.2 C14-C18; C16
C16:1,
C18:1,
C22:1 1.3
9 MSD3392 rim bowl 15 LH
Post-4.2
ka
11.6
C14-18; C20,
C22, C24; C16
C16:1,
C18:1,
C20:1,
C22:1
C15Br,
C17Br Present 2.2 -26.7 -27.7 -0.9
10 MSD3402 rim jar NA LH
Post-4.2
ka 9.2
C14-18; C20,
C22, C24; C16
C18:1,
C22:1 1.2 -23.3 -24.7 -1.5
11
MSD3412
A rim
necked
jar 15 LH
Post-4.2
ka
219.3
C12-C18, C20,
C22, C24;
C16, C18
C16:1,
C18:1,
C20:1,
C22:1
C15Br,
C17Br Present 1.0 -24.8 -24.5 0.4
12 MSD3458 body
perforate
d vessel NA LH
Post-4.2
ka 5.8
C14, C15,
C16, C18,
C20; C16
C18:1,
C22:1 1.1
13 MSD3576 rim jar NA LH
Post-4.2
ka 14.1
C14-18; C20,
C22; C16
C16:1,
C18:1,
C22:1 1.0 -30.0 -30.3 -0.3
14 MSD3585 rim
ledged
jar NA LH
Post-4.2
ka
63.3
C12-C18, C20,
C22, C24,
C26; C16
C14:1,
C16:1,
C18:1,
C22:1
C15Br,
C17Br Present 2.6 -27.8 -28.5 -0.7
15 MSD3586 rim
ledged
jar 8 LH
Post-4.2
ka 66.7
C12-C26;
C14, C16,
C18
C16:1,
C18:1,
C22:1
C15Br,
C17Br Present 1.4 -15.4 -19.6 -4.2
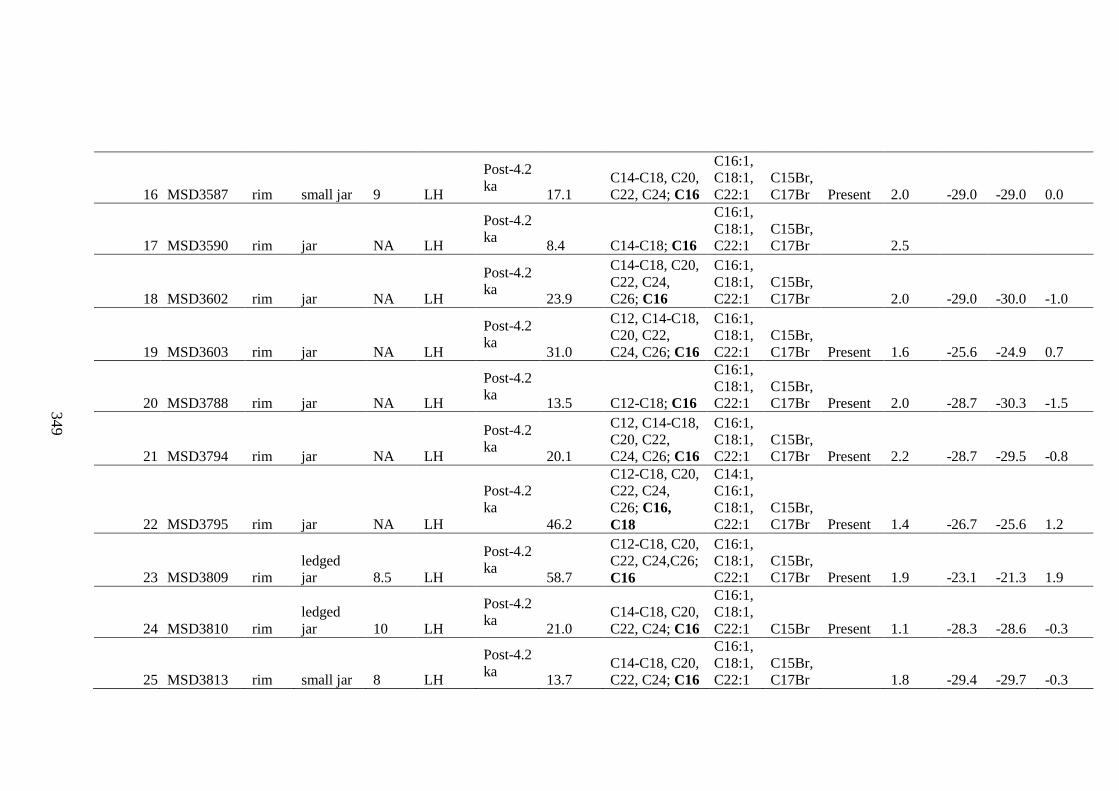
349
349
16 MSD3587 rim small jar 9 LH
Post-4.2
ka 17.1
C14-C18, C20,
C22, C24; C16
C16:1,
C18:1,
C22:1
C15Br,
C17Br Present 2.0 -29.0 -29.0 0.0
17 MSD3590 rim jar NA LH
Post-4.2
ka 8.4 C14-C18; C16
C16:1,
C18:1,
C22:1
C15Br,
C17Br 2.5
18 MSD3602 rim jar NA LH
Post-4.2
ka 23.9
C14-C18, C20,
C22, C24,
C26; C16
C16:1,
C18:1,
C22:1
C15Br,
C17Br 2.0 -29.0 -30.0 -1.0
19 MSD3603 rim jar NA LH
Post-4.2
ka 31.0
C12, C14-C18,
C20, C22,
C24, C26; C16
C16:1,
C18:1,
C22:1
C15Br,
C17Br Present 1.6 -25.6 -24.9 0.7
20 MSD3788 rim jar NA LH
Post-4.2
ka 13.5 C12-C18; C16
C16:1,
C18:1,
C22:1
C15Br,
C17Br Present 2.0 -28.7 -30.3 -1.5
21 MSD3794 rim jar NA LH
Post-4.2
ka 20.1
C12, C14-C18,
C20, C22,
C24, C26; C16
C16:1,
C18:1,
C22:1
C15Br,
C17Br Present 2.2 -28.7 -29.5 -0.8
22 MSD3795 rim jar NA LH
Post-4.2
ka
46.2
C12-C18, C20,
C22, C24,
C26; C16,
C18
C14:1,
C16:1,
C18:1,
C22:1
C15Br,
C17Br Present 1.4 -26.7 -25.6 1.2
23 MSD3809 rim
ledged
jar 8.5 LH
Post-4.2
ka 58.7
C12-C18, C20,
C22, C24,C26;
C16
C16:1,
C18:1,
C22:1
C15Br,
C17Br Present 1.9 -23.1 -21.3 1.9
24 MSD3810 rim
ledged
jar 10 LH
Post-4.2
ka 21.0
C14-C18, C20,
C22, C24; C16
C16:1,
C18:1,
C22:1 C15Br Present 1.1 -28.3 -28.6 -0.3
25 MSD3813 rim small jar 8 LH
Post-4.2
ka 13.7
C14-C18, C20,
C22, C24; C16
C16:1,
C18:1,
C22:1
C15Br,
C17Br 1.8 -29.4 -29.7 -0.3
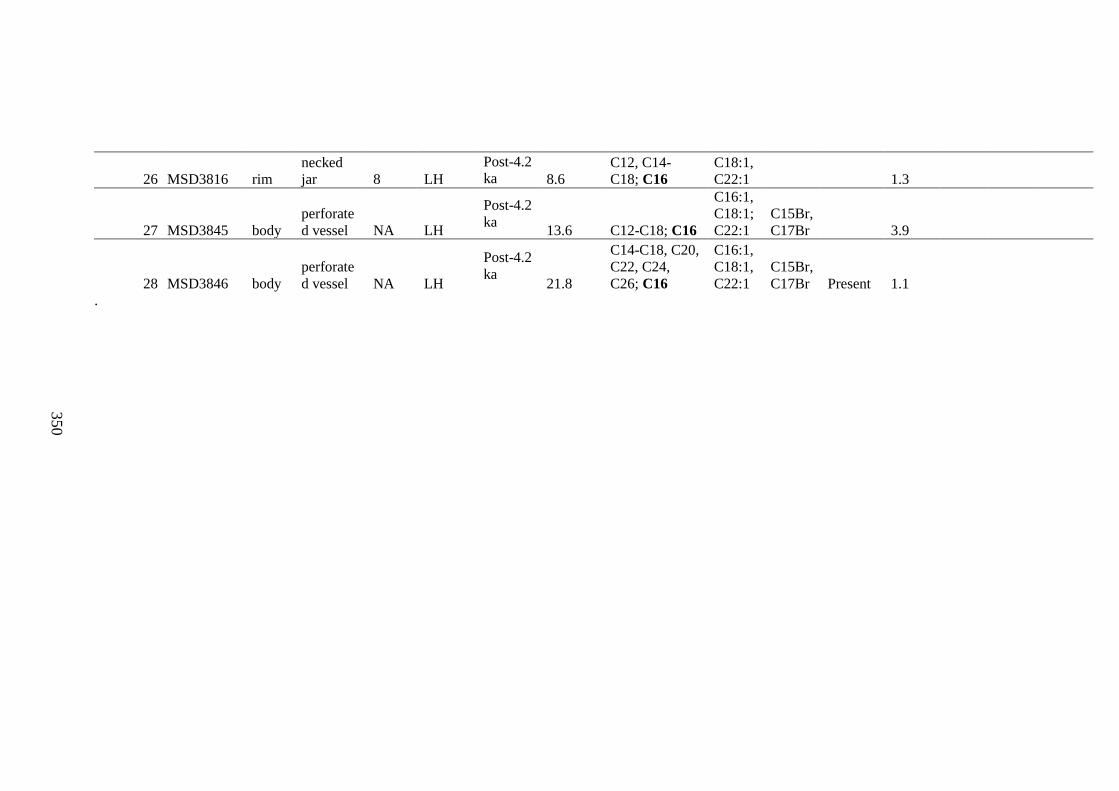
350
350
26 MSD3816 rim
necked
jar 8 LH
Post-4.2
ka 8.6
C12, C14-
C18; C16
C18:1,
C22:1 1.3
27 MSD3845 body
perforate
d vessel NA LH
Post-4.2
ka 13.6 C12-C18; C16
C16:1,
C18:1;
C22:1
C15Br,
C17Br 3.9
28 MSD3846 body
perforate
d vessel NA LH
Post-4.2
ka 21.8
C14-C18, C20,
C22, C24,
C26; C16
C16:1,
C18:1,
C22:1
C15Br,
C17Br Present 1.1
.
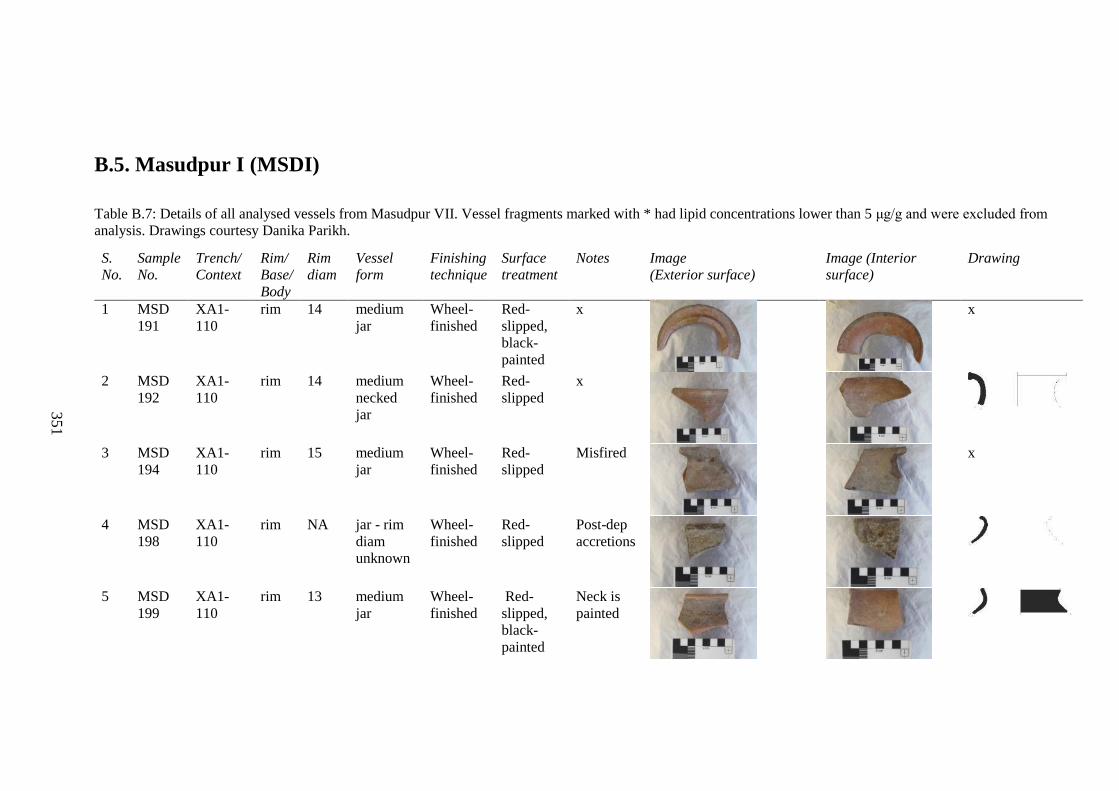
351
351
B.5. Masudpur I (MSDI)
Table B.7: Details of all analysed vessels from Masudpur VII. Vessel fragments marked with * had lipid concentrations lower than 5 μg/g and were excluded from
analysis. Drawings courtesy Danika Parikh.
S.
No.
Sample
No.
Trench/
Context
Rim/
Base/
Body
Rim
diam
Vessel
form
Finishing
technique
Surface
treatment
Notes Image
(Exterior surface)
Image (Interior
surface)
Drawing
1 MSD
191
XA1-
110
rim 14 medium
jar
Wheel-
finished
Red-
slipped,
black-
painted
x
x
2 MSD
192
XA1-
110
rim 14 medium
necked
jar
Wheel-
finished
Red-
slipped
x
3 MSD
194
XA1-
110
rim 15 medium
jar
Wheel-
finished
Red-
slipped
Misfired
x
4 MSD
198
XA1-
110
rim NA jar - rim
diam
unknown
Wheel-
finished
Red-
slipped
Post-dep
accretions
5 MSD
199
XA1-
110
rim 13 medium
jar
Wheel-
finished
Red-
slipped,
black-
painted
Neck is
painted
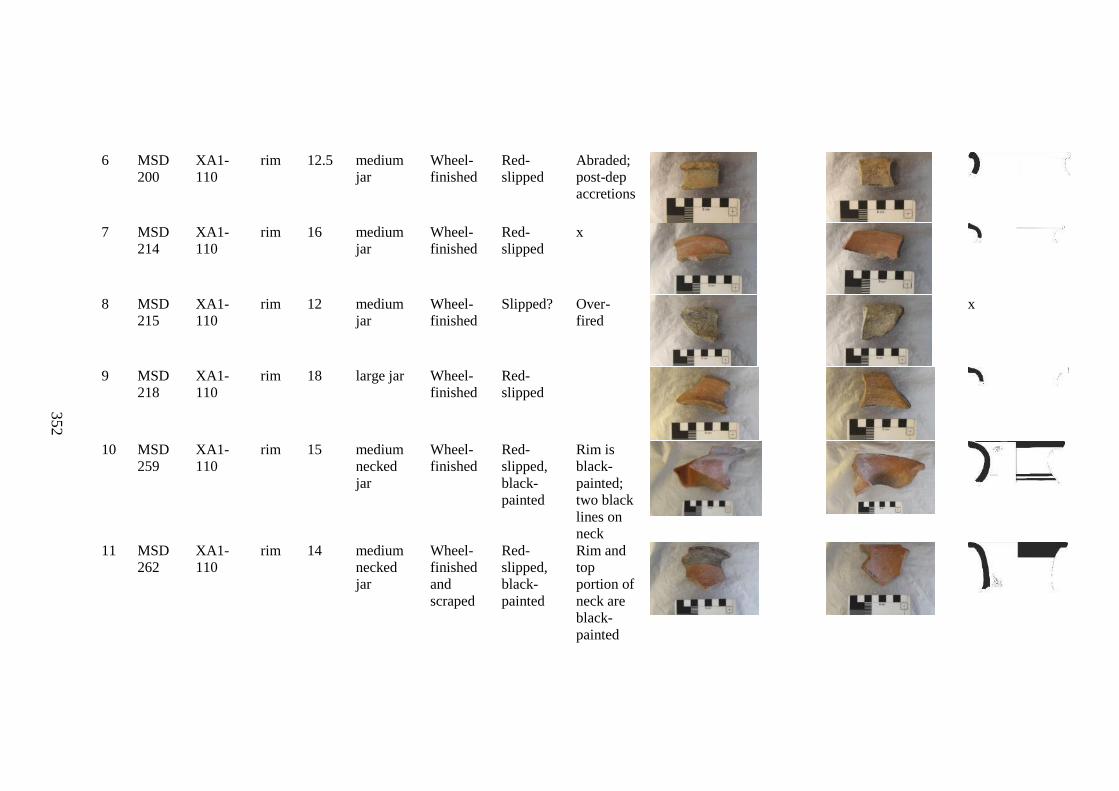
352
352
6 MSD
200
XA1-
110
rim 12.5 medium
jar
Wheel-
finished
Red-
slipped
Abraded;
post-dep
accretions
7 MSD
214
XA1-
110
rim 16 medium
jar
Wheel-
finished
Red-
slipped
x
8 MSD
215
XA1-
110
rim 12 medium
jar
Wheel-
finished
Slipped? Over-
fired
x
9 MSD
218
XA1-
110
rim 18 large jar Wheel-
finished
Red-
slipped
10 MSD
259
XA1-
110
rim 15 medium
necked
jar
Wheel-
finished
Red-
slipped,
black-
painted
Rim is
black-
painted;
two black
lines on
neck
11 MSD
262
XA1-
110
rim 14 medium
necked
jar
Wheel-
finished
and
scraped
Red-
slipped,
black-
painted
Rim and
top
portion of
neck are
black-
painted
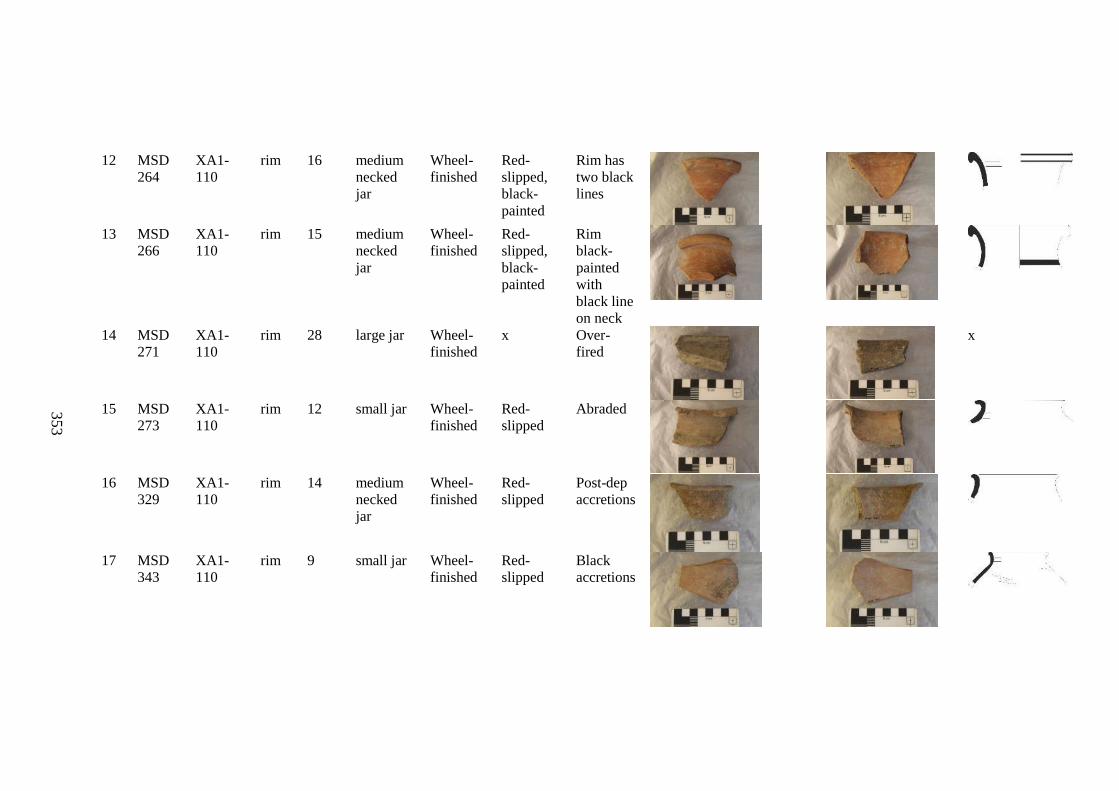
353
353
12 MSD
264
XA1-
110
rim 16 medium
necked
jar
Wheel-
finished
Red-
slipped,
black-
painted
Rim has
two black
lines
13 MSD
266
XA1-
110
rim 15 medium
necked
jar
Wheel-
finished
Red-
slipped,
black-
painted
Rim
black-
painted
with
black line
on neck
14 MSD
271
XA1-
110
rim 28 large jar Wheel-
finished
x Over-
fired
x
15 MSD
273
XA1-
110
rim 12 small jar Wheel-
finished
Red-
slipped
Abraded
16 MSD
329
XA1-
110
rim 14 medium
necked
jar
Wheel-
finished
Red-
slipped
Post-dep
accretions
17 MSD
343
XA1-
110
rim 9 small jar Wheel-
finished
Red-
slipped
Black
accretions
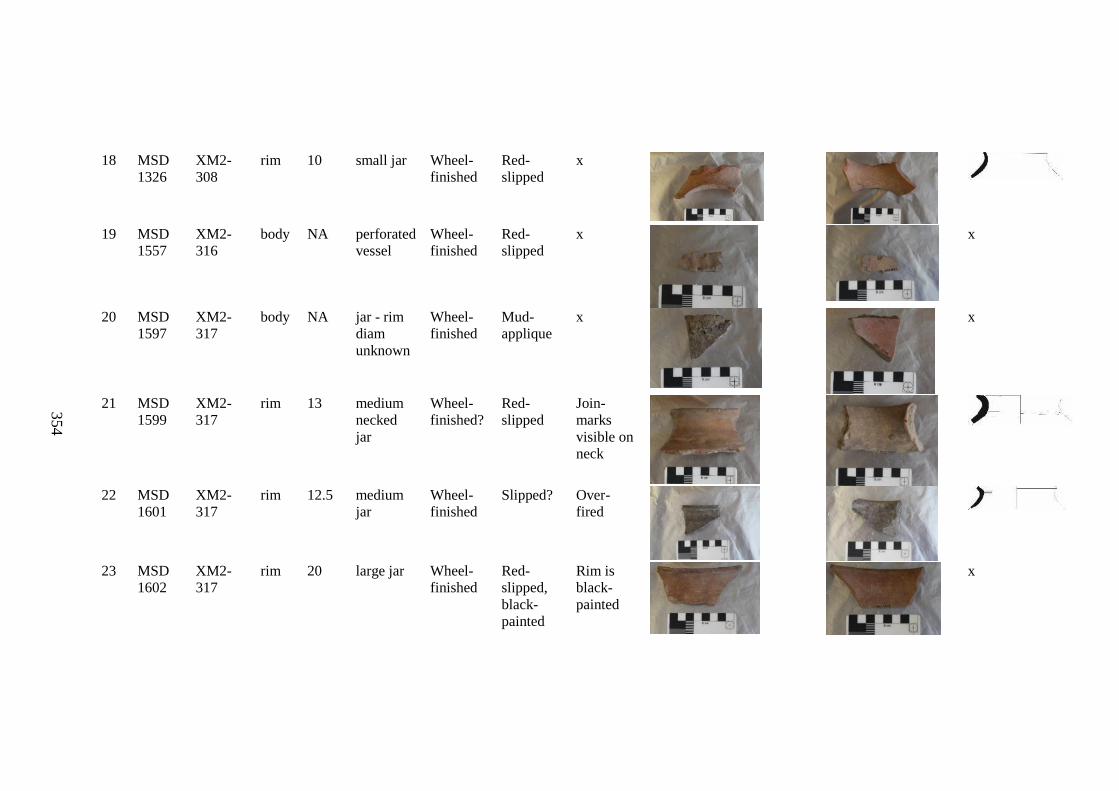
354
354
18 MSD
1326
XM2-
308
rim 10 small jar Wheel-
finished
Red-
slipped
x
19 MSD
1557
XM2-
316
body NA perforated
vessel
Wheel-
finished
Red-
slipped
x
x
20 MSD
1597
XM2-
317
body NA jar - rim
diam
unknown
Wheel-
finished
Mud-
applique
x
x
21 MSD
1599
XM2-
317
rim 13 medium
necked
jar
Wheel-
finished?
Red-
slipped
Join-
marks
visible on
neck
22 MSD
1601
XM2-
317
rim 12.5 medium
jar
Wheel-
finished
Slipped? Over-
fired
23 MSD
1602
XM2-
317
rim 20 large jar Wheel-
finished
Red-
slipped,
black-
painted
Rim is
black-
painted
x
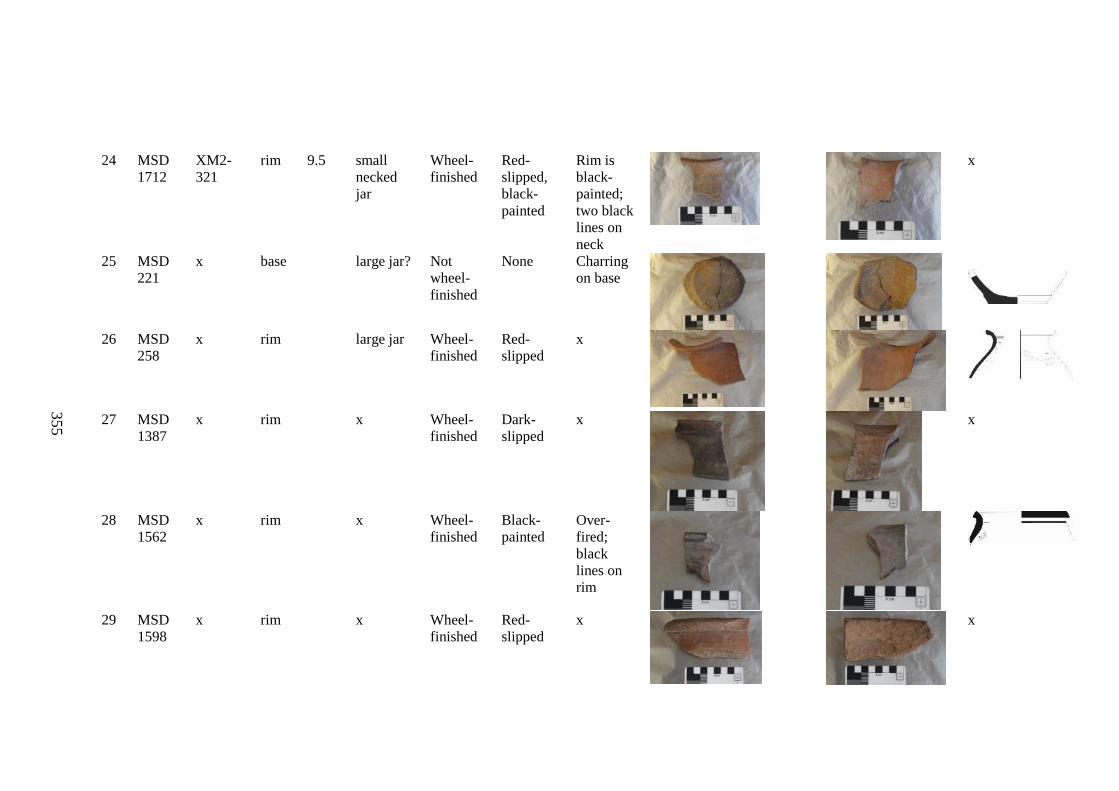
355
355
24 MSD
1712
XM2-
321
rim 9.5 small
necked
jar
Wheel-
finished
Red-
slipped,
black-
painted
Rim is
black-
painted;
two black
lines on
neck
x
25 MSD
221
x base large jar? Not
wheel-
finished
None Charring
on base
26 MSD
258
x rim large jar Wheel-
finished
Red-
slipped
x
27 MSD
1387
x rim x Wheel-
finished
Dark-
slipped
x
x
28 MSD
1562
x rim x Wheel-
finished
Black-
painted
Over-
fired;
black
lines on
rim
29 MSD
1598
x rim x Wheel-
finished
Red-
slipped
x
x
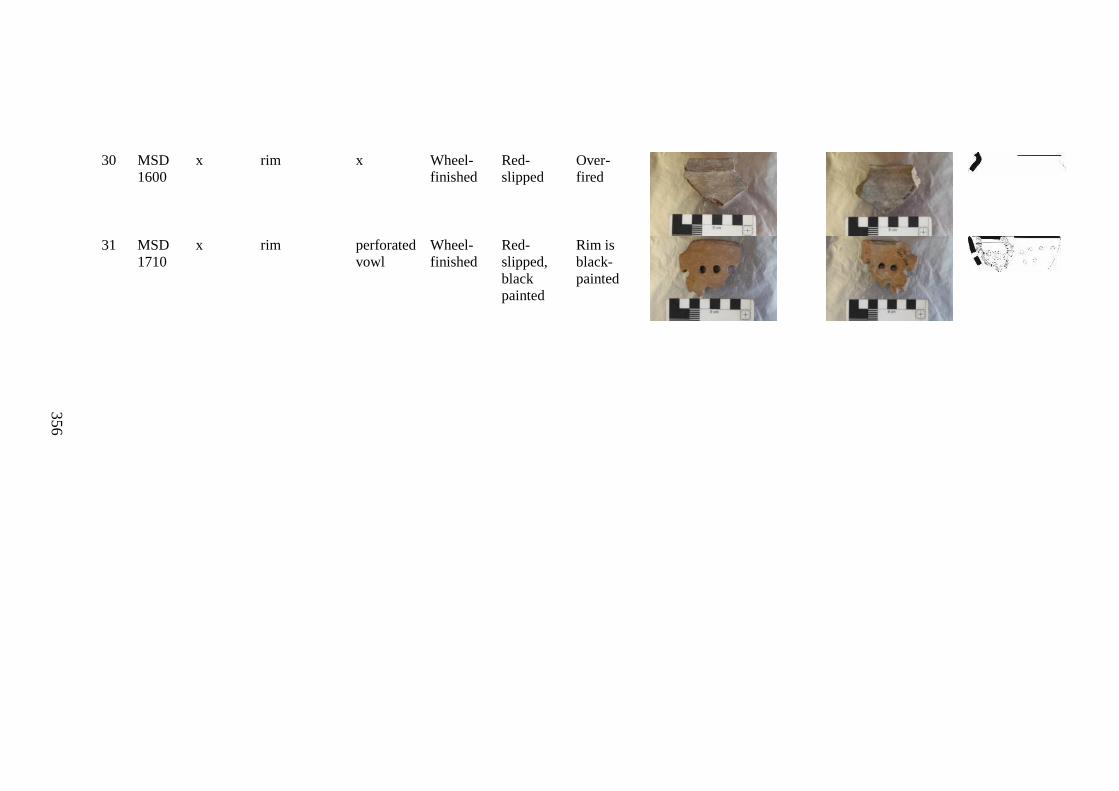
356
356
30 MSD
1600
x rim x Wheel-
finished
Red-
slipped
Over-
fired
31 MSD
1710
x rim perforated
vowl
Wheel-
finished
Red-
slipped,
black
painted
Rim is
black-
painted
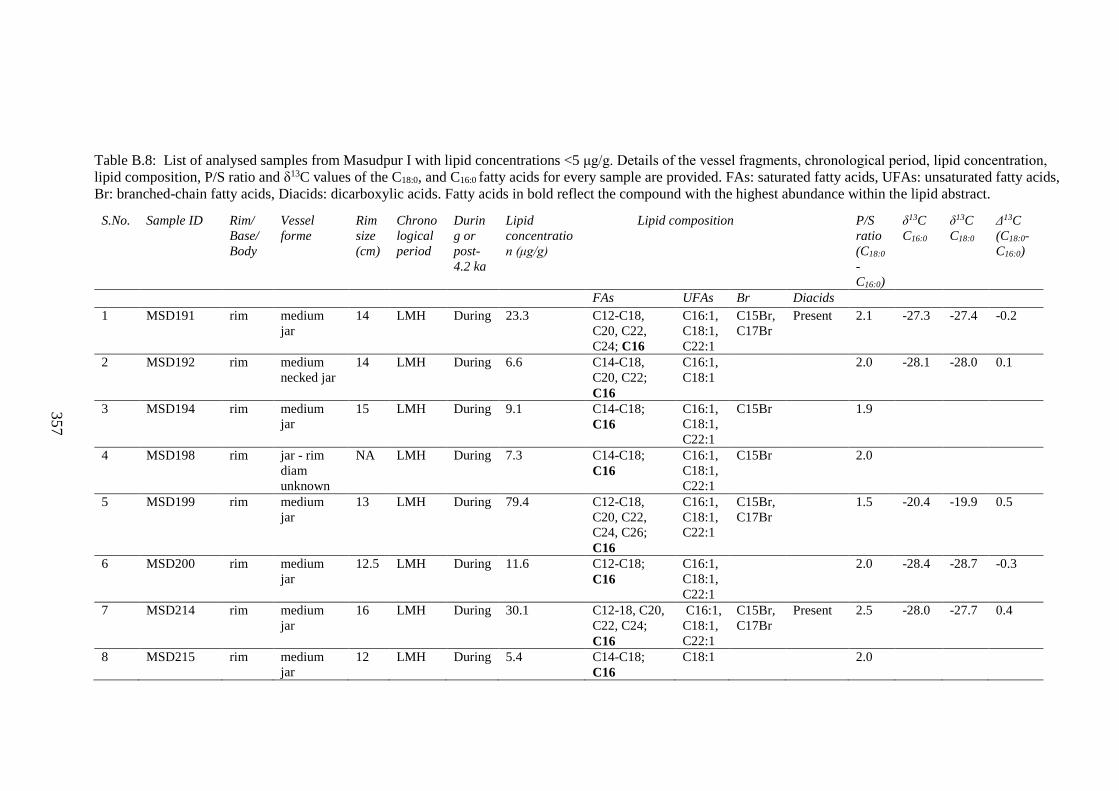
357
357
Table B.8: List of analysed samples from Masudpur I with lipid concentrations <5 μg/g. Details of the vessel fragments, chronological period, lipid concentration,
lipid composition, P/S ratio and δ13C values of the C18:0, and C16:0 fatty acids for every sample are provided. FAs: saturated fatty acids, UFAs: unsaturated fatty acids,
Br: branched-chain fatty acids, Diacids: dicarboxylic acids. Fatty acids in bold reflect the compound with the highest abundance within the lipid abstract.
S.No. Sample ID Rim/
Base/
Body
Vessel
forme
Rim
size
(cm)
Chrono
logical
period
Durin
g or
post-
4.2 ka
Lipid
concentratio
n (μg/g)
Lipid composition P/S
ratio
(C18:0
-
C16:0)
δ13C
C16:0
δ13C
C18:0
Δ13C
(C18:0-
C16:0)
FAs UFAs Br Diacids
1 MSD191 rim medium
jar
14 LMH During 23.3 C12-C18,
C20, C22,
C24; C16
C16:1,
C18:1,
C22:1
C15Br,
C17Br
Present 2.1 -27.3 -27.4 -0.2
2 MSD192 rim medium
necked jar
14 LMH During 6.6 C14-C18,
C20, C22;
C16
C16:1,
C18:1
2.0 -28.1 -28.0 0.1
3 MSD194 rim medium
jar
15 LMH During 9.1 C14-C18;
C16
C16:1,
C18:1,
C22:1
C15Br 1.9
4 MSD198 rim jar - rim
diam
unknown
NA LMH During 7.3 C14-C18;
C16
C16:1,
C18:1,
C22:1
C15Br 2.0
5 MSD199 rim medium
jar
13 LMH During 79.4 C12-C18,
C20, C22,
C24, C26;
C16
C16:1,
C18:1,
C22:1
C15Br,
C17Br
1.5 -20.4 -19.9 0.5
6 MSD200 rim medium
jar
12.5 LMH During 11.6 C12-C18;
C16
C16:1,
C18:1,
C22:1
2.0 -28.4 -28.7 -0.3
7 MSD214 rim medium
jar
16 LMH During 30.1 C12-18, C20,
C22, C24;
C16
C16:1,
C18:1,
C22:1
C15Br,
C17Br
Present 2.5 -28.0 -27.7 0.4
8 MSD215 rim medium
jar
12 LMH During 5.4 C14-C18;
C16
C18:1 2.0
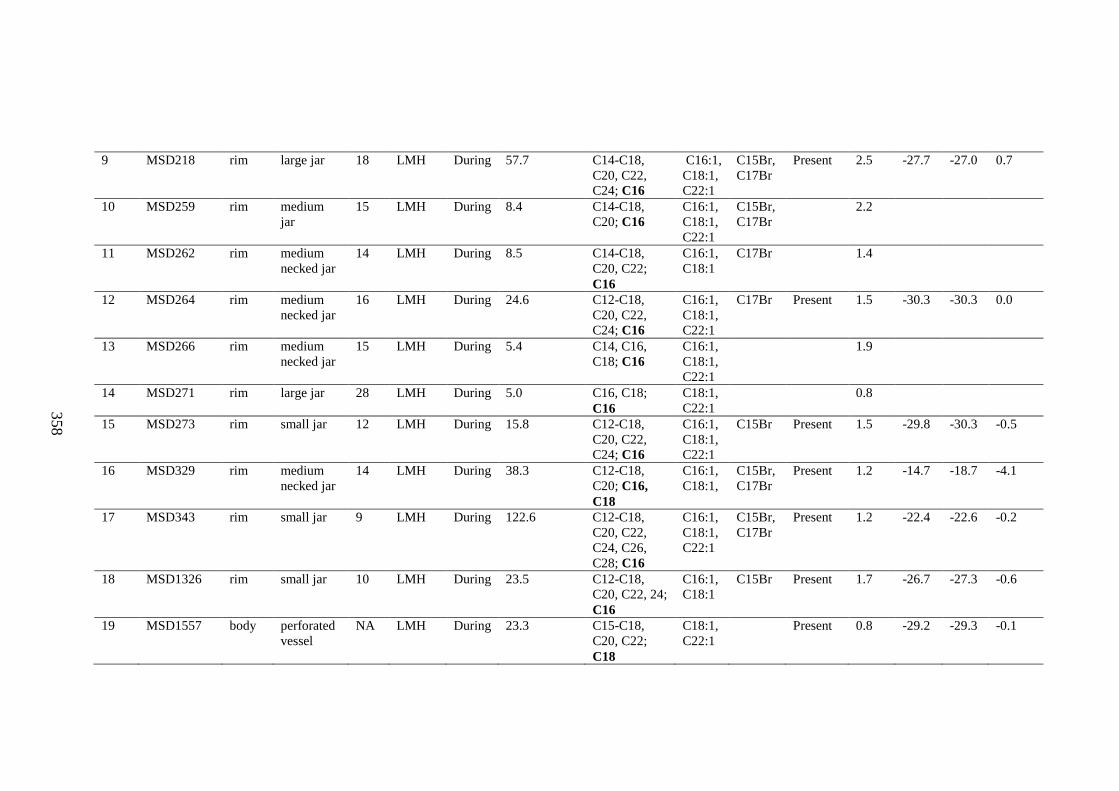
358
358
9 MSD218 rim large jar 18 LMH During 57.7 C14-C18,
C20, C22,
C24; C16
C16:1,
C18:1,
C22:1
C15Br,
C17Br
Present 2.5 -27.7 -27.0 0.7
10 MSD259 rim medium
jar
15 LMH During 8.4 C14-C18,
C20; C16
C16:1,
C18:1,
C22:1
C15Br,
C17Br
2.2
11 MSD262 rim medium
necked jar
14 LMH During 8.5 C14-C18,
C20, C22;
C16
C16:1,
C18:1
C17Br 1.4
12 MSD264 rim medium
necked jar
16 LMH During 24.6 C12-C18,
C20, C22,
C24; C16
C16:1,
C18:1,
C22:1
C17Br Present 1.5 -30.3 -30.3 0.0
13 MSD266 rim medium
necked jar
15 LMH During 5.4 C14, C16,
C18; C16
C16:1,
C18:1,
C22:1
1.9
14 MSD271 rim large jar 28 LMH During 5.0 C16, C18;
C16
C18:1,
C22:1
0.8
15 MSD273 rim small jar 12 LMH During 15.8 C12-C18,
C20, C22,
C24; C16
C16:1,
C18:1,
C22:1
C15Br Present 1.5 -29.8 -30.3 -0.5
16 MSD329 rim medium
necked jar
14 LMH During 38.3 C12-C18,
C20; C16,
C18
C16:1,
C18:1,
C15Br,
C17Br
Present 1.2 -14.7 -18.7 -4.1
17 MSD343 rim small jar 9 LMH During 122.6 C12-C18,
C20, C22,
C24, C26,
C28; C16
C16:1,
C18:1,
C22:1
C15Br,
C17Br
Present 1.2 -22.4 -22.6 -0.2
18 MSD1326 rim small jar 10 LMH During 23.5 C12-C18,
C20, C22, 24;
C16
C16:1,
C18:1
C15Br Present 1.7 -26.7 -27.3 -0.6
19 MSD1557 body perforated
vessel
NA LMH During 23.3 C15-C18,
C20, C22;
C18
C18:1,
C22:1
Present 0.8 -29.2 -29.3 -0.1
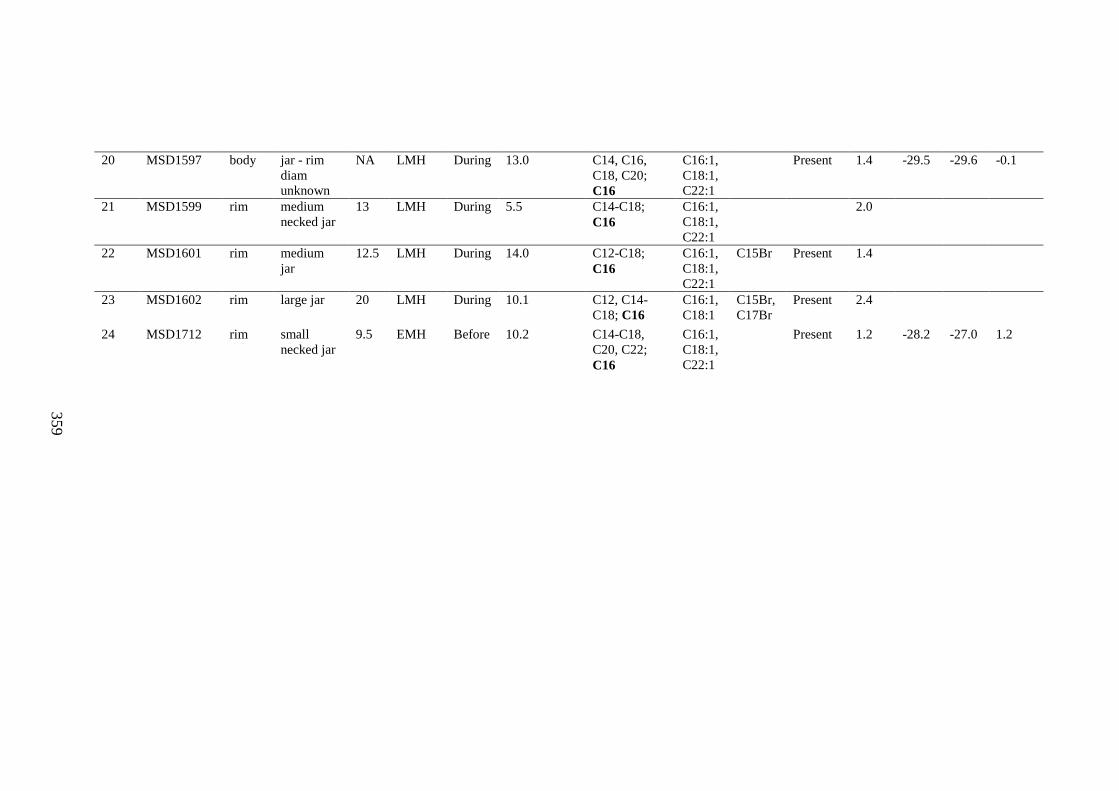
359
359
20 MSD1597 body jar - rim
diam
unknown
NA LMH During 13.0 C14, C16,
C18, C20;
C16
C16:1,
C18:1,
C22:1
Present 1.4 -29.5 -29.6 -0.1
21 MSD1599 rim medium
necked jar
13 LMH During 5.5 C14-C18;
C16
C16:1,
C18:1,
C22:1
2.0
22 MSD1601 rim medium
jar
12.5 LMH During 14.0 C12-C18;
C16
C16:1,
C18:1,
C22:1
C15Br Present 1.4
23 MSD1602 rim large jar 20 LMH During 10.1 C12, C14-
C18; C16
C16:1,
C18:1
C15Br,
C17Br
Present 2.4
24 MSD1712 rim small
necked jar
9.5 EMH Before 10.2 C14-C18,
C20, C22;
C16
C16:1,
C18:1,
C22:1
Present 1.2 -28.2 -27.0 1.2
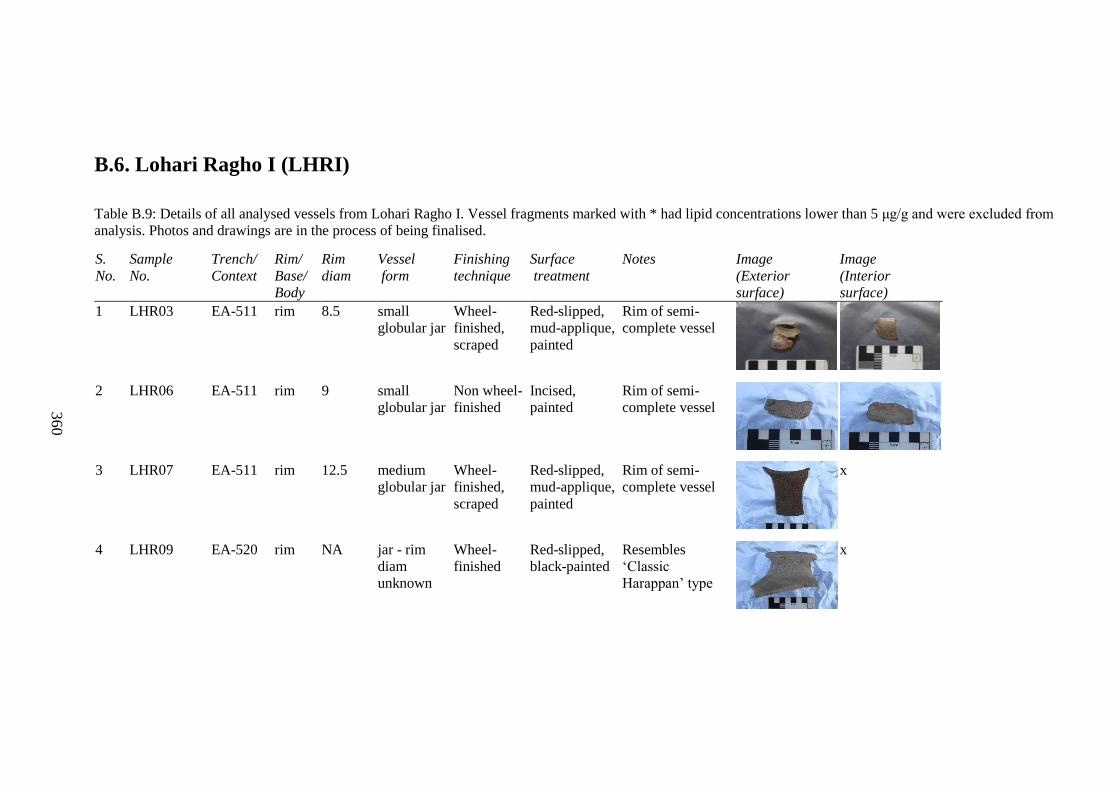
360
360
B.6. Lohari Ragho I (LHRI)
Table B.9: Details of all analysed vessels from Lohari Ragho I. Vessel fragments marked with * had lipid concentrations lower than 5 μg/g and were excluded from
analysis. Photos and drawings are in the process of being finalised.
S.
No.
Sample
No.
Trench/
Context
Rim/
Base/
Body
Rim
diam
Vessel
form
Finishing
technique
Surface
treatment
Notes Image
(Exterior
surface)
Image
(Interior
surface)
1 LHR03 EA-511 rim 8.5 small
globular jar
Wheel-
finished,
scraped
Red-slipped,
mud-applique,
painted
Rim of semi-
complete vessel
2 LHR06 EA-511 rim 9 small
globular jar
Non wheel-
finished
Incised,
painted
Rim of semi-
complete vessel
3 LHR07 EA-511 rim 12.5 medium
globular jar
Wheel-
finished,
scraped
Red-slipped,
mud-applique,
painted
Rim of semi-
complete vessel
x
4 LHR09 EA-520 rim NA jar - rim
diam
unknown
Wheel-
finished
Red-slipped,
black-painted
Resembles
‘Classic
Harappan’ type
x
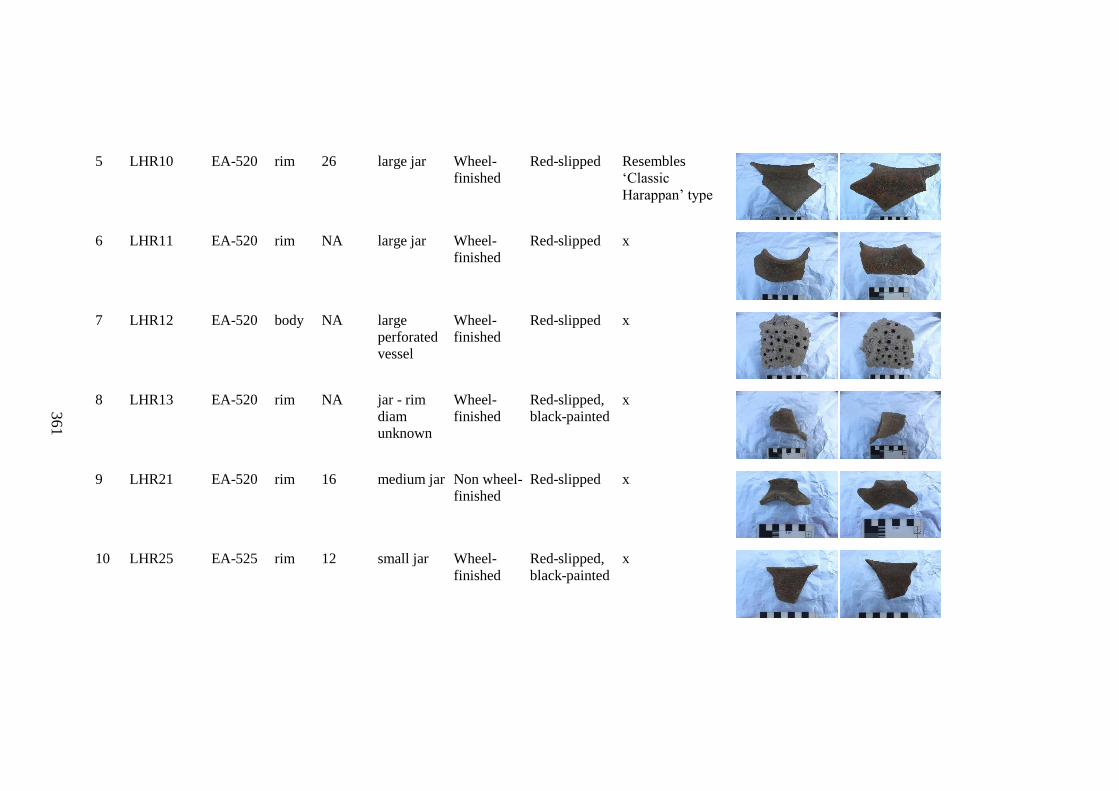
361
361
5 LHR10 EA-520 rim 26 large jar Wheel-
finished
Red-slipped Resembles
‘Classic
Harappan’ type
6 LHR11 EA-520 rim NA large jar Wheel-
finished
Red-slipped x
7 LHR12 EA-520 body NA large
perforated
vessel
Wheel-
finished
Red-slipped x
8 LHR13 EA-520 rim NA jar - rim
diam
unknown
Wheel-
finished
Red-slipped,
black-painted
x
9 LHR21 EA-520 rim 16 medium jar Non wheel-
finished
Red-slipped x
10 LHR25 EA-525 rim 12 small jar Wheel-
finished
Red-slipped,
black-painted
x
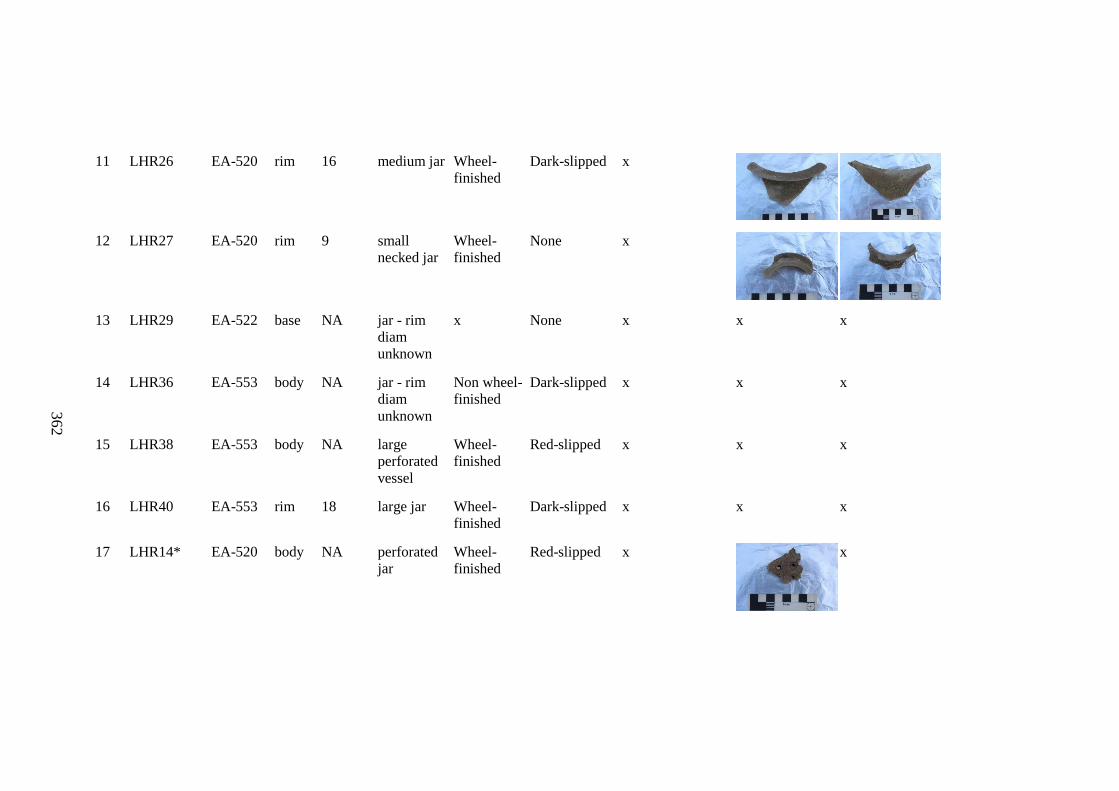
362
362
11 LHR26 EA-520 rim 16 medium jar Wheel-
finished
Dark-slipped x
12 LHR27 EA-520 rim 9 small
necked jar
Wheel-
finished
None x
13 LHR29 EA-522 base NA jar - rim
diam
unknown
x None x x x
14 LHR36 EA-553 body NA jar - rim
diam
unknown
Non wheel-
finished
Dark-slipped x x x
15 LHR38 EA-553 body NA large
perforated
vessel
Wheel-
finished
Red-slipped x x x
16 LHR40 EA-553 rim 18 large jar Wheel-
finished
Dark-slipped x x x
17 LHR14* EA-520 body NA perforated
jar
Wheel-
finished
Red-slipped x
x
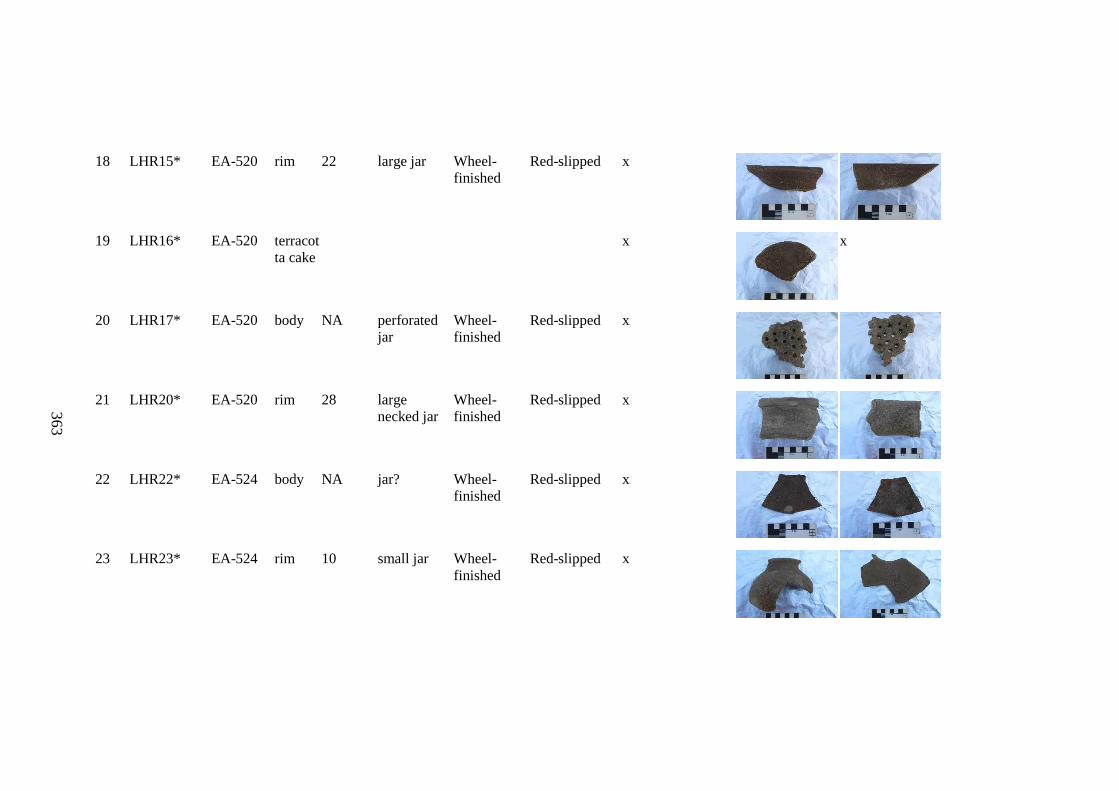
363
363
18 LHR15* EA-520 rim 22 large jar Wheel-
finished
Red-slipped x
19 LHR16* EA-520 terracot
ta cake
x
x
20 LHR17* EA-520 body NA perforated
jar
Wheel-
finished
Red-slipped x
21 LHR20* EA-520 rim 28 large
necked jar
Wheel-
finished
Red-slipped x
22 LHR22* EA-524 body NA jar? Wheel-
finished
Red-slipped x
23 LHR23* EA-524 rim 10 small jar Wheel-
finished
Red-slipped x
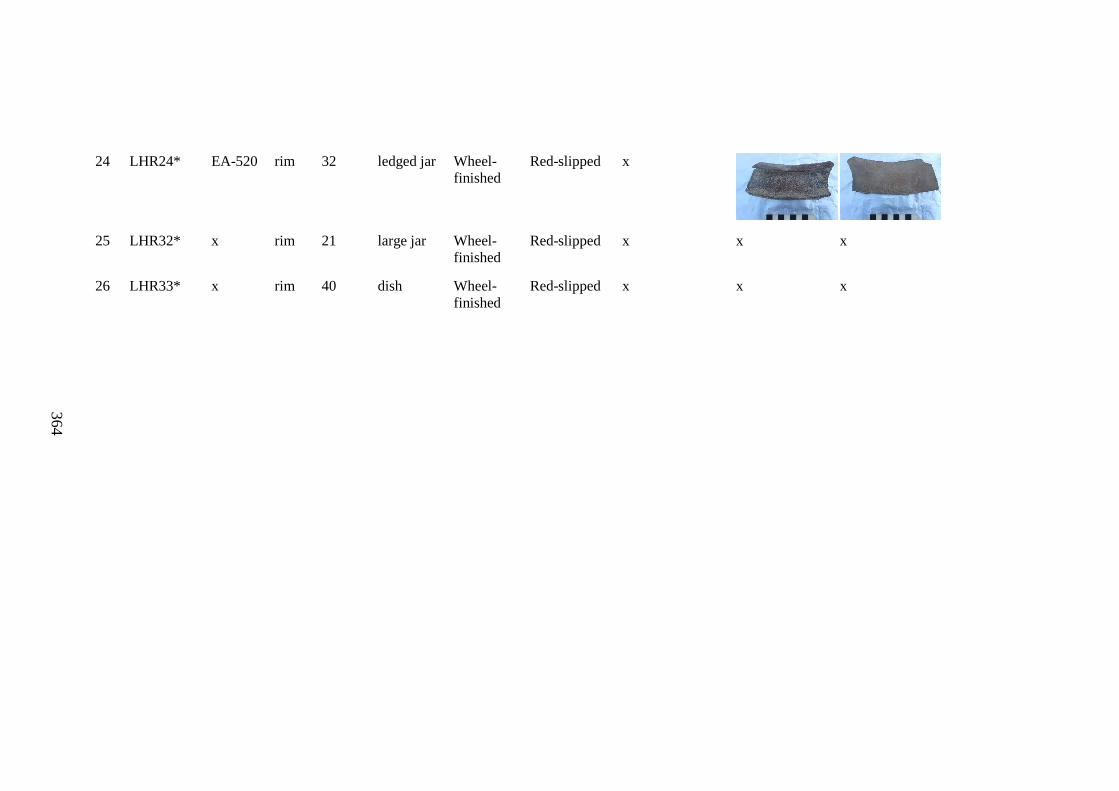
364
364
24 LHR24* EA-520 rim 32 ledged jar Wheel-
finished
Red-slipped x
25 LHR32* x rim 21 large jar Wheel-
finished
Red-slipped x x x
26 LHR33* x rim 40 dish Wheel-
finished
Red-slipped x x x
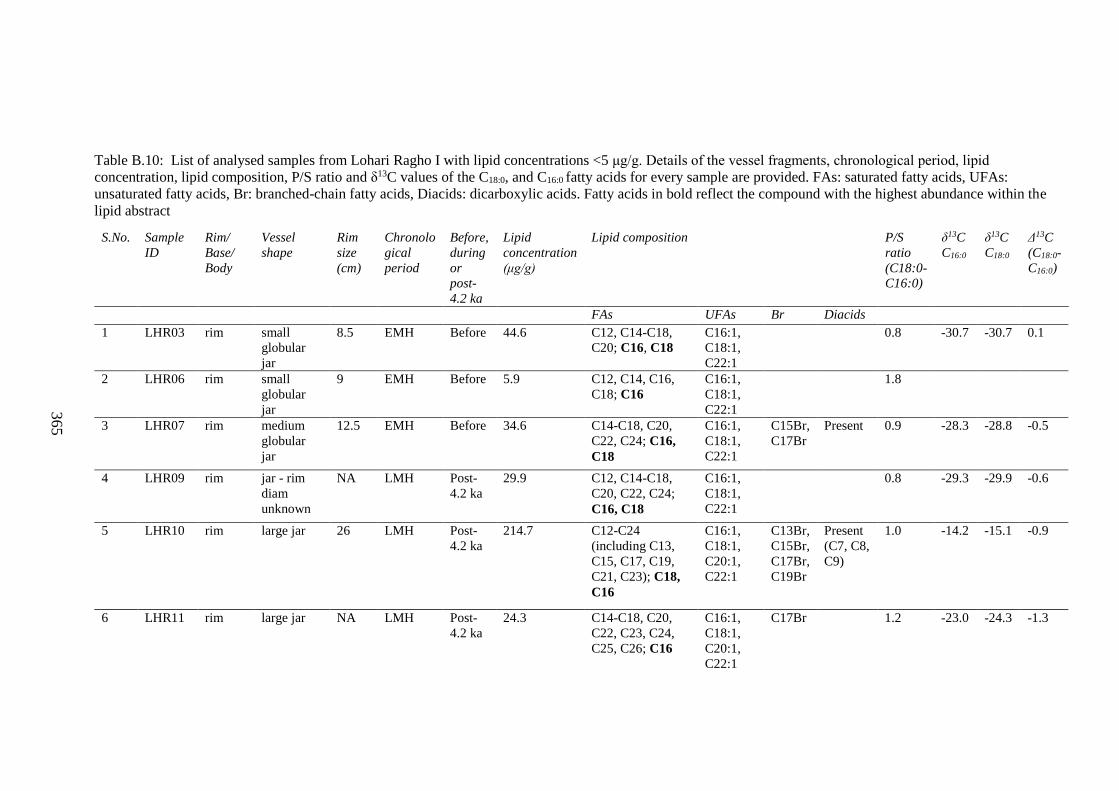
365
365
Table B.10: List of analysed samples from Lohari Ragho I with lipid concentrations <5 μg/g. Details of the vessel fragments, chronological period, lipid
concentration, lipid composition, P/S ratio and δ13C values of the C18:0, and C16:0 fatty acids for every sample are provided. FAs: saturated fatty acids, UFAs:
unsaturated fatty acids, Br: branched-chain fatty acids, Diacids: dicarboxylic acids. Fatty acids in bold reflect the compound with the highest abundance within the
lipid abstract
S.No. Sample
ID
Rim/
Base/
Body
Vessel
shape
Rim
size
(cm)
Chronolo
gical
period
Before,
during
or
post-
4.2 ka
Lipid
concentration
(μg/g)
Lipid composition P/S
ratio
(C18:0-
C16:0)
δ13C
C16:0
δ13C
C18:0
Δ13C
(C18:0-
C16:0)
FAs UFAs Br Diacids
1 LHR03 rim small
globular
jar
8.5 EMH Before 44.6 C12, C14-C18,
C20; C16, C18
C16:1,
C18:1,
C22:1
0.8 -30.7 -30.7 0.1
2 LHR06 rim small
globular
jar
9 EMH Before 5.9 C12, C14, C16,
C18; C16
C16:1,
C18:1,
C22:1
1.8
3 LHR07 rim medium
globular
jar
12.5 EMH Before 34.6 C14-C18, C20,
C22, C24; C16,
C18
C16:1,
C18:1,
C22:1
C15Br,
C17Br
Present 0.9 -28.3 -28.8 -0.5
4 LHR09 rim jar - rim
diam
unknown
NA LMH Post-
4.2 ka
29.9 C12, C14-C18,
C20, C22, C24;
C16, C18
C16:1,
C18:1,
C22:1
0.8 -29.3 -29.9 -0.6
5 LHR10 rim large jar 26 LMH Post-
4.2 ka
214.7 C12-C24
(including C13,
C15, C17, C19,
C21, C23); C18,
C16
C16:1,
C18:1,
C20:1,
C22:1
C13Br,
C15Br,
C17Br,
C19Br
Present
(C7, C8,
C9)
1.0 -14.2 -15.1 -0.9
6 LHR11 rim large jar NA LMH Post-
4.2 ka
24.3 C14-C18, C20,
C22, C23, C24,
C25, C26; C16
C16:1,
C18:1,
C20:1,
C22:1
C17Br 1.2 -23.0 -24.3 -1.3
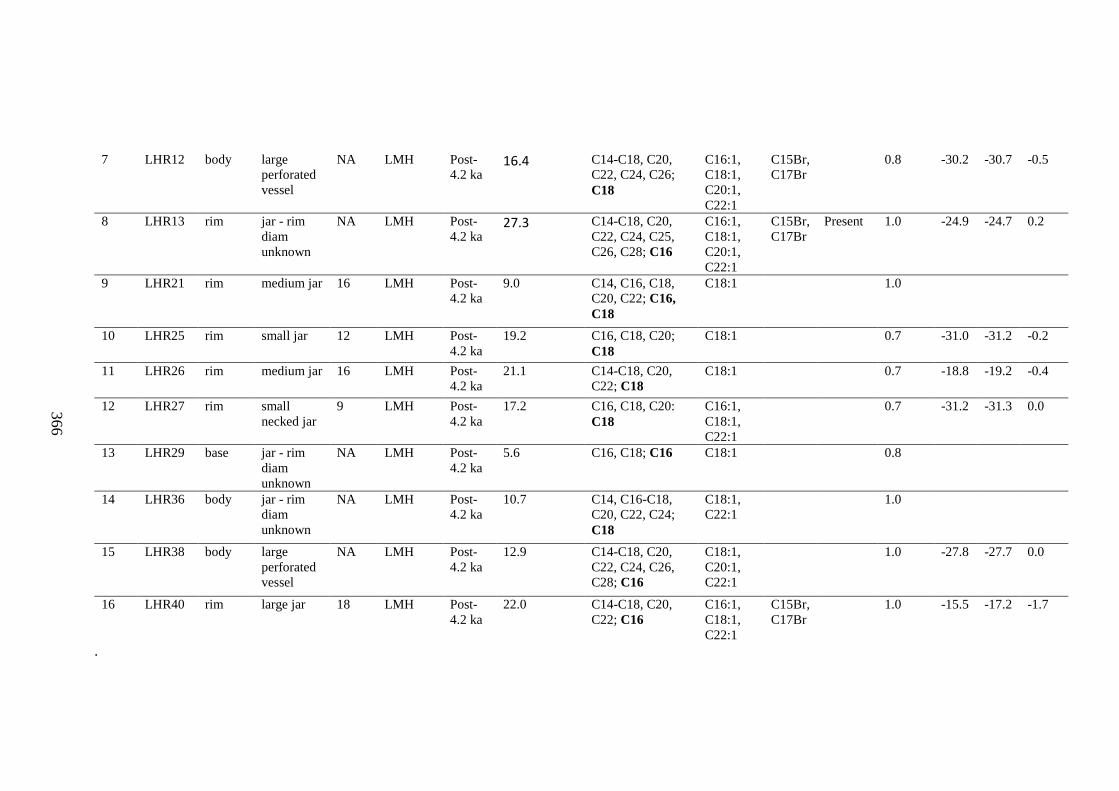
366
366
7 LHR12 body large
perforated
vessel
NA LMH Post-
4.2 ka 16.4 C14-C18, C20,
C22, C24, C26;
C18
C16:1,
C18:1,
C20:1,
C22:1
C15Br,
C17Br
0.8 -30.2 -30.7 -0.5
8 LHR13 rim jar - rim
diam
unknown
NA LMH Post-
4.2 ka 27.3 C14-C18, C20,
C22, C24, C25,
C26, C28; C16
C16:1,
C18:1,
C20:1,
C22:1
C15Br,
C17Br
Present 1.0 -24.9 -24.7 0.2
9 LHR21 rim medium jar 16 LMH Post-
4.2 ka
9.0 C14, C16, C18,
C20, C22; C16,
C18
C18:1 1.0
10 LHR25 rim small jar 12 LMH Post-
4.2 ka
19.2 C16, C18, C20;
C18
C18:1 0.7 -31.0 -31.2 -0.2
11 LHR26 rim medium jar 16 LMH Post-
4.2 ka
21.1 C14-C18, C20,
C22; C18
C18:1 0.7 -18.8 -19.2 -0.4
12 LHR27 rim small
necked jar
9 LMH Post-
4.2 ka
17.2 C16, C18, C20:
C18
C16:1,
C18:1,
C22:1
0.7 -31.2 -31.3 0.0
13 LHR29 base jar - rim
diam
unknown
NA LMH Post-
4.2 ka
5.6 C16, C18; C16 C18:1 0.8
14 LHR36 body jar - rim
diam
unknown
NA LMH Post-
4.2 ka
10.7 C14, C16-C18,
C20, C22, C24;
C18
C18:1,
C22:1
1.0
15 LHR38 body large
perforated
vessel
NA LMH Post-
4.2 ka
12.9 C14-C18, C20,
C22, C24, C26,
C28; C16
C18:1,
C20:1,
C22:1
1.0 -27.8 -27.7 0.0
16 LHR40 rim large jar 18 LMH Post-
4.2 ka
22.0 C14-C18, C20,
C22; C16
C16:1,
C18:1,
C22:1
C15Br,
C17Br
1.0 -15.5 -17.2 -1.7
.
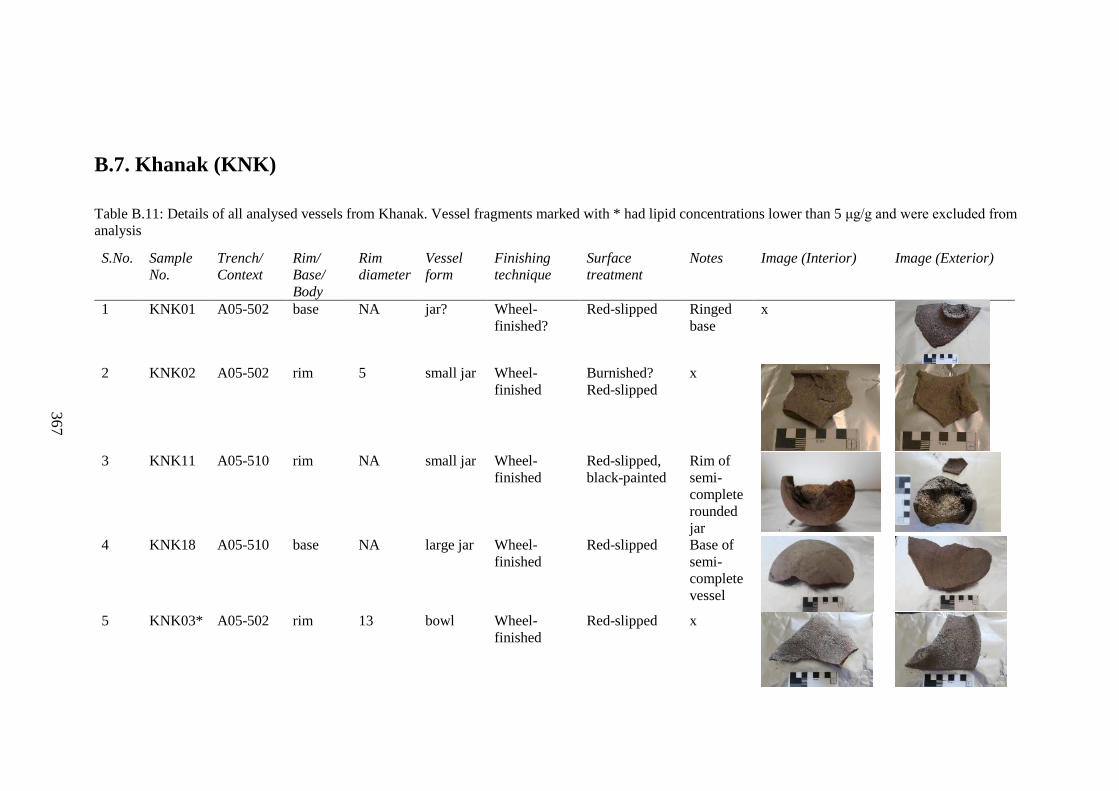
367
367
B.7. Khanak (KNK)
Table B.11: Details of all analysed vessels from Khanak. Vessel fragments marked with * had lipid concentrations lower than 5 μg/g and were excluded from
analysis
S.No. Sample
No.
Trench/
Context
Rim/
Base/
Body
Rim
diameter
Vessel
form
Finishing
technique
Surface
treatment
Notes Image (Interior) Image (Exterior)
1 KNK01 A05-502 base NA jar? Wheel-
finished?
Red-slipped Ringed
base
x
2 KNK02 A05-502 rim 5 small jar Wheel-
finished
Burnished?
Red-slipped
x
3 KNK11 A05-510 rim NA small jar Wheel-
finished
Red-slipped,
black-painted
Rim of
semi-
complete
rounded
jar
4 KNK18 A05-510 base NA large jar Wheel-
finished
Red-slipped Base of
semi-
complete
vessel
5 KNK03* A05-502 rim 13 bowl Wheel-
finished
Red-slipped x
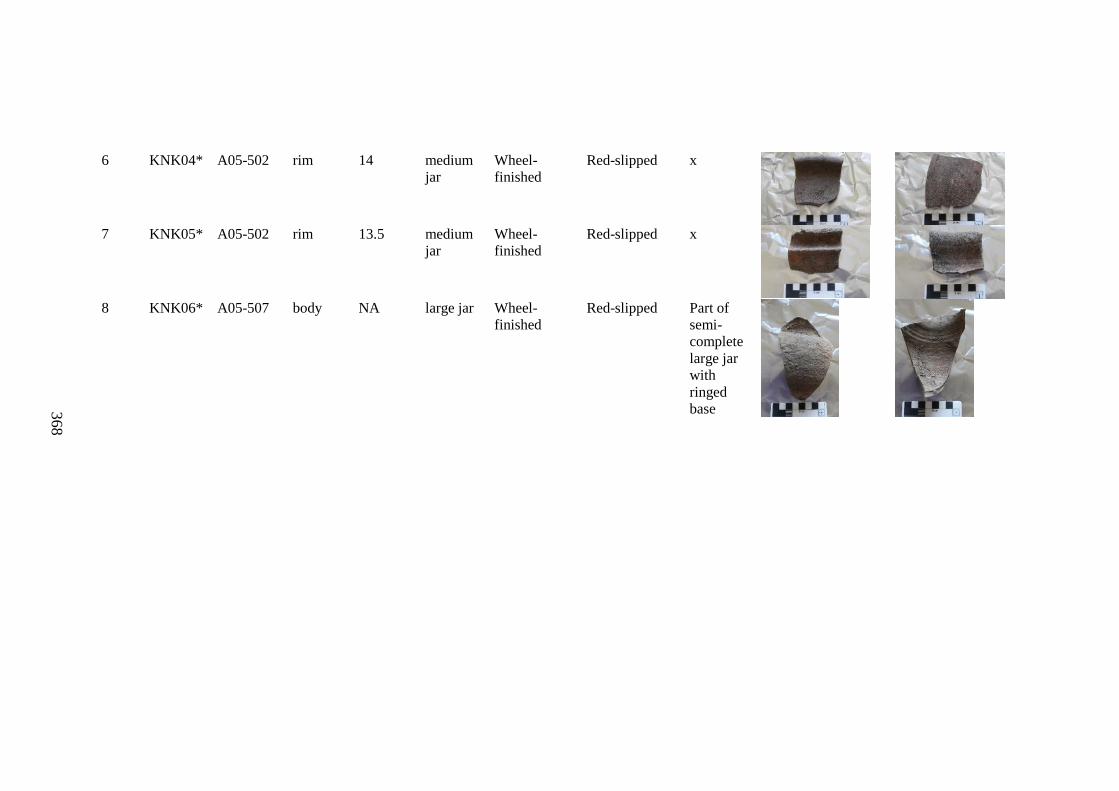
368
368
6 KNK04* A05-502 rim 14 medium
jar
Wheel-
finished
Red-slipped x
7 KNK05* A05-502 rim 13.5 medium
jar
Wheel-
finished
Red-slipped x
8 KNK06* A05-507 body NA large jar Wheel-
finished
Red-slipped Part of
semi-
complete
large jar
with
ringed
base
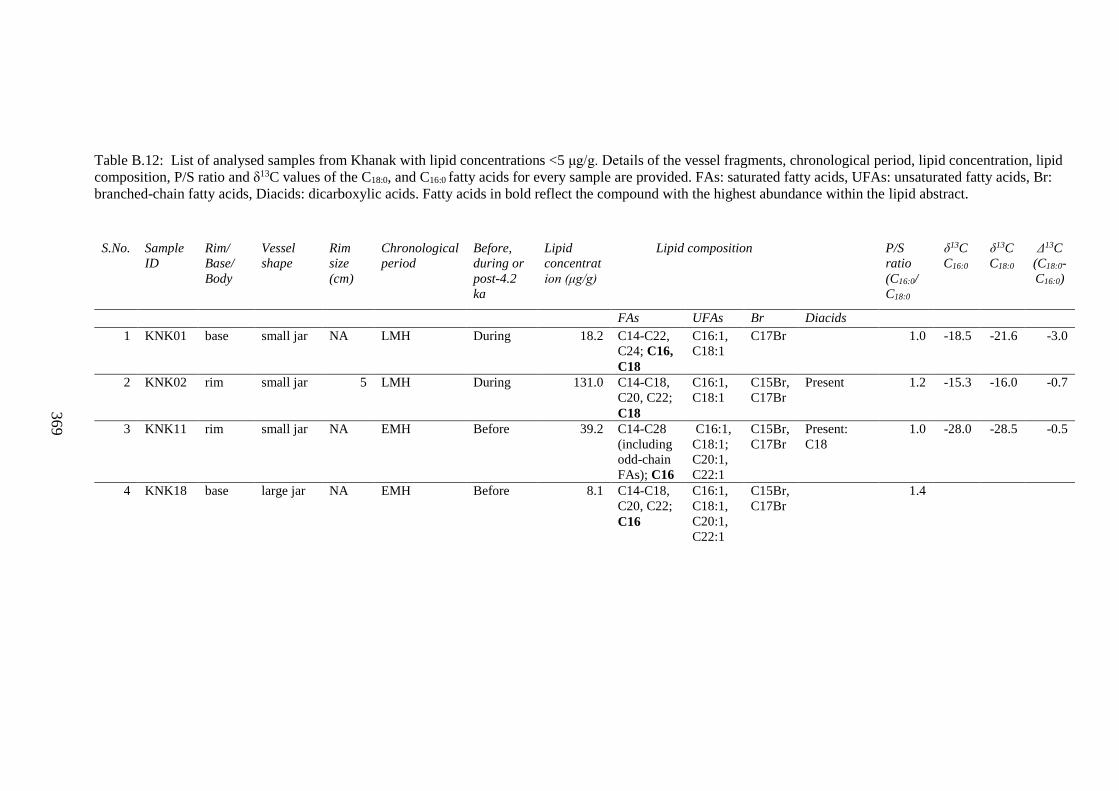
369
369
Table B.12: List of analysed samples from Khanak with lipid concentrations <5 μg/g. Details of the vessel fragments, chronological period, lipid concentration, lipid
composition, P/S ratio and δ13C values of the C18:0, and C16:0 fatty acids for every sample are provided. FAs: saturated fatty acids, UFAs: unsaturated fatty acids, Br:
branched-chain fatty acids, Diacids: dicarboxylic acids. Fatty acids in bold reflect the compound with the highest abundance within the lipid abstract.
S.No. Sample
ID
Rim/
Base/
Body
Vessel
shape
Rim
size
(cm)
Chronological
period
Before,
during or
post-4.2
ka
Lipid
concentrat
ion (μg/g)
Lipid composition P/S
ratio
(C16:0/
C18:0
δ13C
C16:0
δ13C
C18:0
Δ13C
(C18:0-
C16:0)
FAs UFAs Br Diacids
1 KNK01 base small jar NA LMH During 18.2 C14-C22,
C24; C16,
C18
C16:1,
C18:1
C17Br 1.0 -18.5 -21.6 -3.0
2 KNK02 rim small jar 5 LMH During 131.0 C14-C18,
C20, C22;
C18
C16:1,
C18:1
C15Br,
C17Br
Present 1.2 -15.3 -16.0 -0.7
3 KNK11 rim small jar NA EMH Before 39.2 C14-C28
(including
odd-chain
FAs); C16
C16:1,
C18:1;
C20:1,
C22:1
C15Br,
C17Br
Present:
C18
1.0 -28.0 -28.5 -0.5
4 KNK18 base large jar NA EMH Before 8.1 C14-C18,
C20, C22;
C16
C16:1,
C18:1,
C20:1,
C22:1
C15Br,
C17Br
1.4
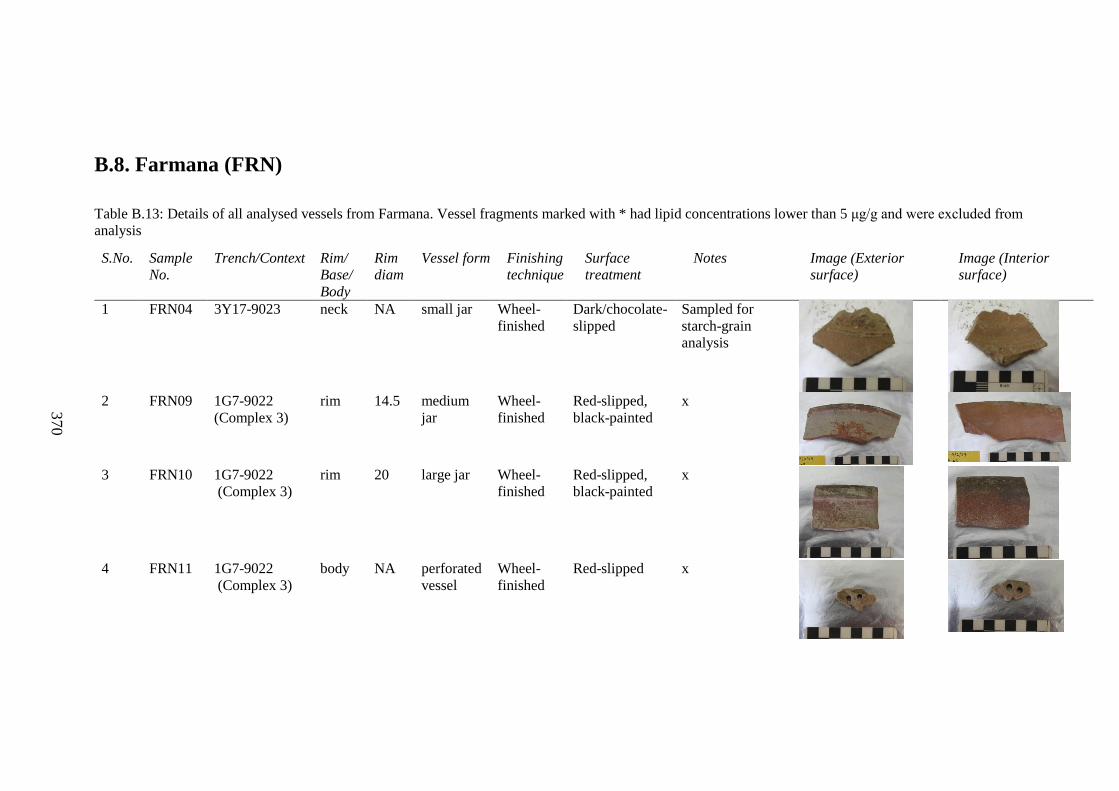
370
370
B.8. Farmana (FRN)
Table B.13: Details of all analysed vessels from Farmana. Vessel fragments marked with * had lipid concentrations lower than 5 μg/g and were excluded from
analysis
S.No. Sample
No.
Trench/Context Rim/
Base/
Body
Rim
diam
Vessel form Finishing
technique
Surface
treatment
Notes Image (Exterior
surface)
Image (Interior
surface)
1 FRN04 3Y17-9023 neck NA small jar Wheel-
finished
Dark/chocolate-
slipped
Sampled for
starch-grain
analysis
2 FRN09 1G7-9022
(Complex 3)
rim 14.5 medium
jar
Wheel-
finished
Red-slipped,
black-painted
x
3 FRN10 1G7-9022
(Complex 3)
rim 20 large jar Wheel-
finished
Red-slipped,
black-painted
x
4 FRN11 1G7-9022
(Complex 3)
body NA perforated
vessel
Wheel-
finished
Red-slipped x
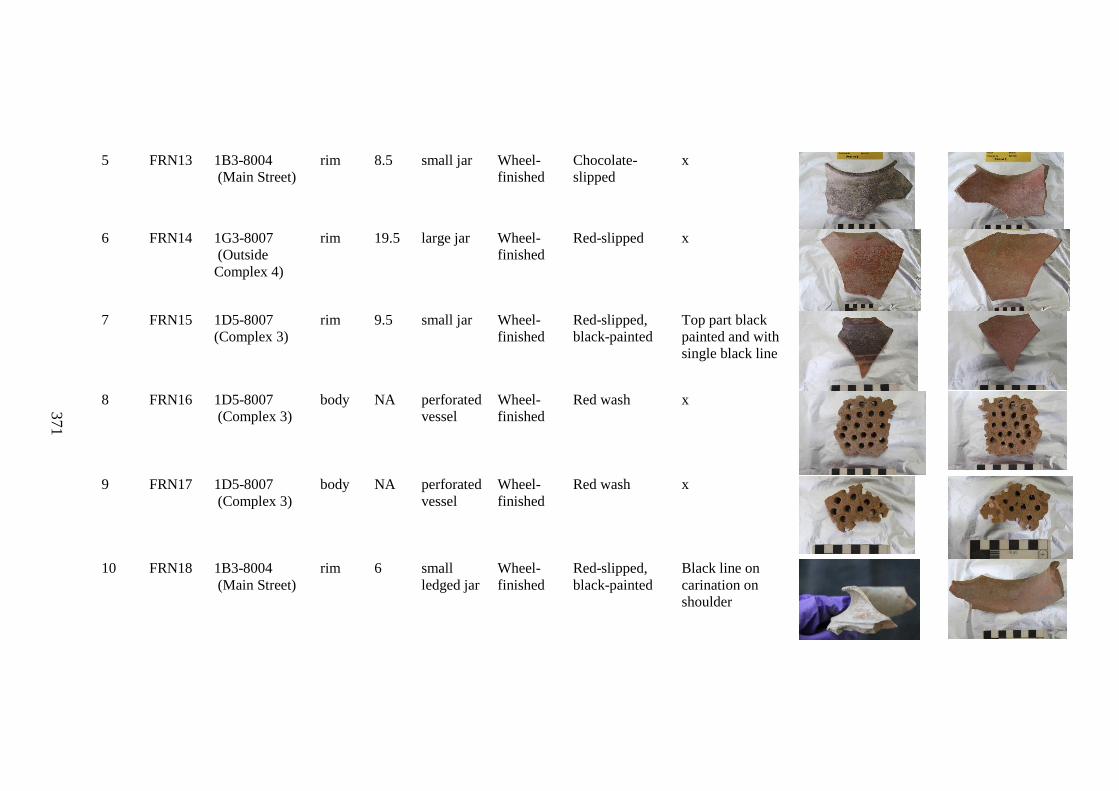
371
371
5 FRN13 1B3-8004
(Main Street)
rim 8.5 small jar Wheel-
finished
Chocolate-
slipped
x
6 FRN14 1G3-8007
(Outside
Complex 4)
rim 19.5 large jar Wheel-
finished
Red-slipped x
7 FRN15 1D5-8007
(Complex 3)
rim 9.5 small jar Wheel-
finished
Red-slipped,
black-painted
Top part black
painted and with
single black line
8 FRN16 1D5-8007
(Complex 3)
body NA perforated
vessel
Wheel-
finished
Red wash x
9 FRN17 1D5-8007
(Complex 3)
body NA perforated
vessel
Wheel-
finished
Red wash x
10 FRN18 1B3-8004
(Main Street)
rim 6 small
ledged jar
Wheel-
finished
Red-slipped,
black-painted
Black line on
carination on
shoulder
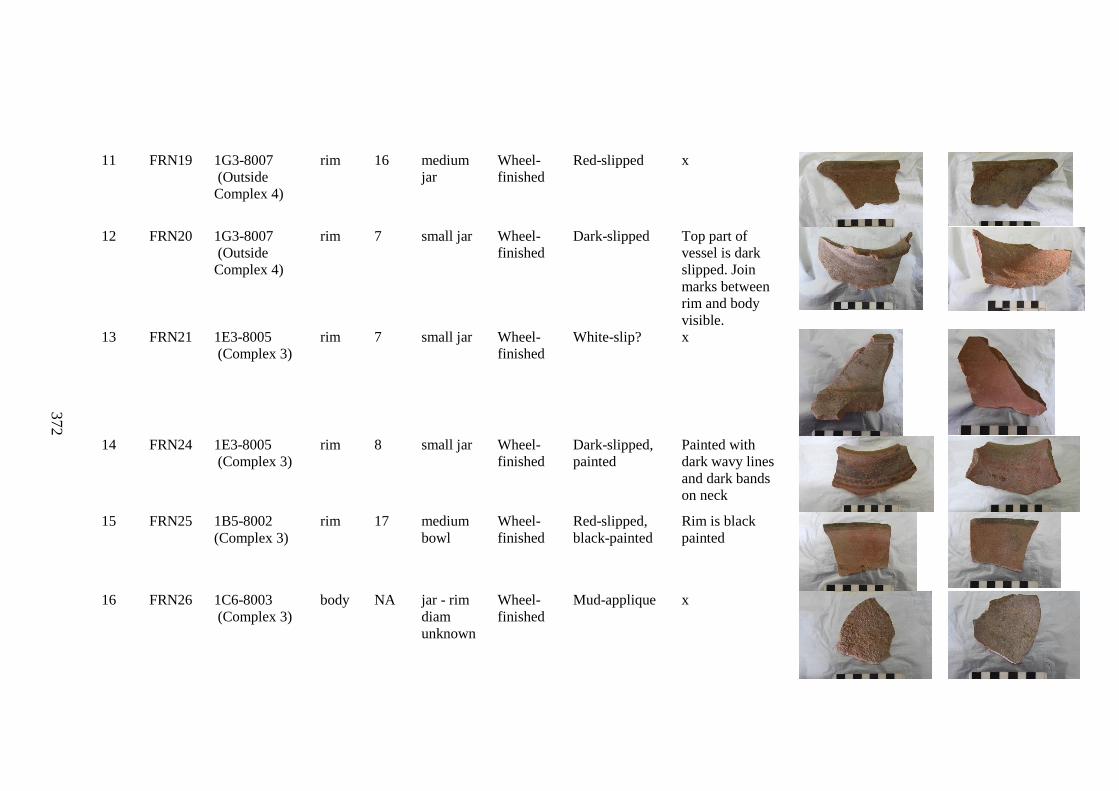
372
372
11 FRN19 1G3-8007
(Outside
Complex 4)
rim 16 medium
jar
Wheel-
finished
Red-slipped x
12 FRN20 1G3-8007
(Outside
Complex 4)
rim 7 small jar Wheel-
finished
Dark-slipped Top part of
vessel is dark
slipped. Join
marks between
rim and body
visible.
13 FRN21 1E3-8005
(Complex 3)
rim 7 small jar Wheel-
finished
White-slip? x
14 FRN24 1E3-8005
(Complex 3)
rim 8 small jar Wheel-
finished
Dark-slipped,
painted
Painted with
dark wavy lines
and dark bands
on neck
15 FRN25 1B5-8002
(Complex 3)
rim 17 medium
bowl
Wheel-
finished
Red-slipped,
black-painted
Rim is black
painted
16 FRN26 1C6-8003
(Complex 3)
body NA jar - rim
diam
unknown
Wheel-
finished
Mud-applique x
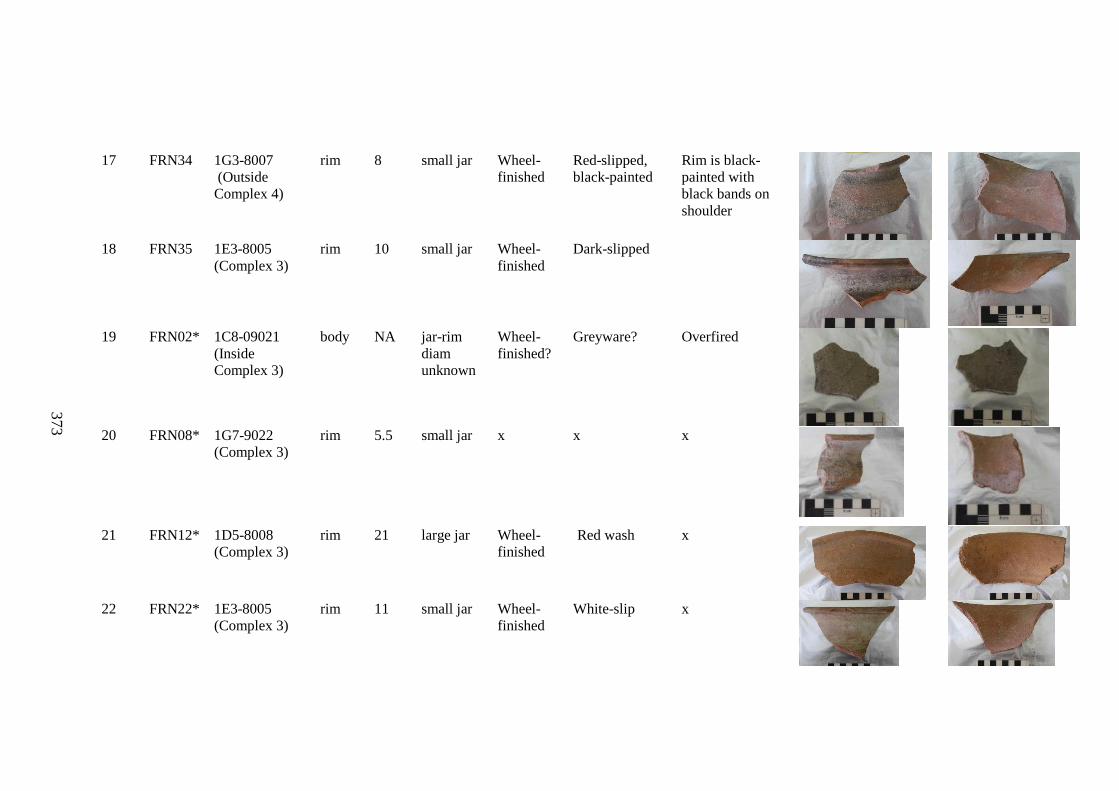
373
373
17 FRN34 1G3-8007
(Outside
Complex 4)
rim 8 small jar Wheel-
finished
Red-slipped,
black-painted
Rim is black-
painted with
black bands on
shoulder
18 FRN35 1E3-8005
(Complex 3)
rim 10 small jar Wheel-
finished
Dark-slipped
19 FRN02* 1C8-09021
(Inside
Complex 3)
body NA jar-rim
diam
unknown
Wheel-
finished?
Greyware? Overfired
20 FRN08* 1G7-9022
(Complex 3)
rim 5.5 small jar x x x
21 FRN12* 1D5-8008
(Complex 3)
rim 21 large jar Wheel- Red wash
finished
x
22 FRN22* 1E3-8005
(Complex 3)
rim 11 small jar Wheel-
finished
White-slip x
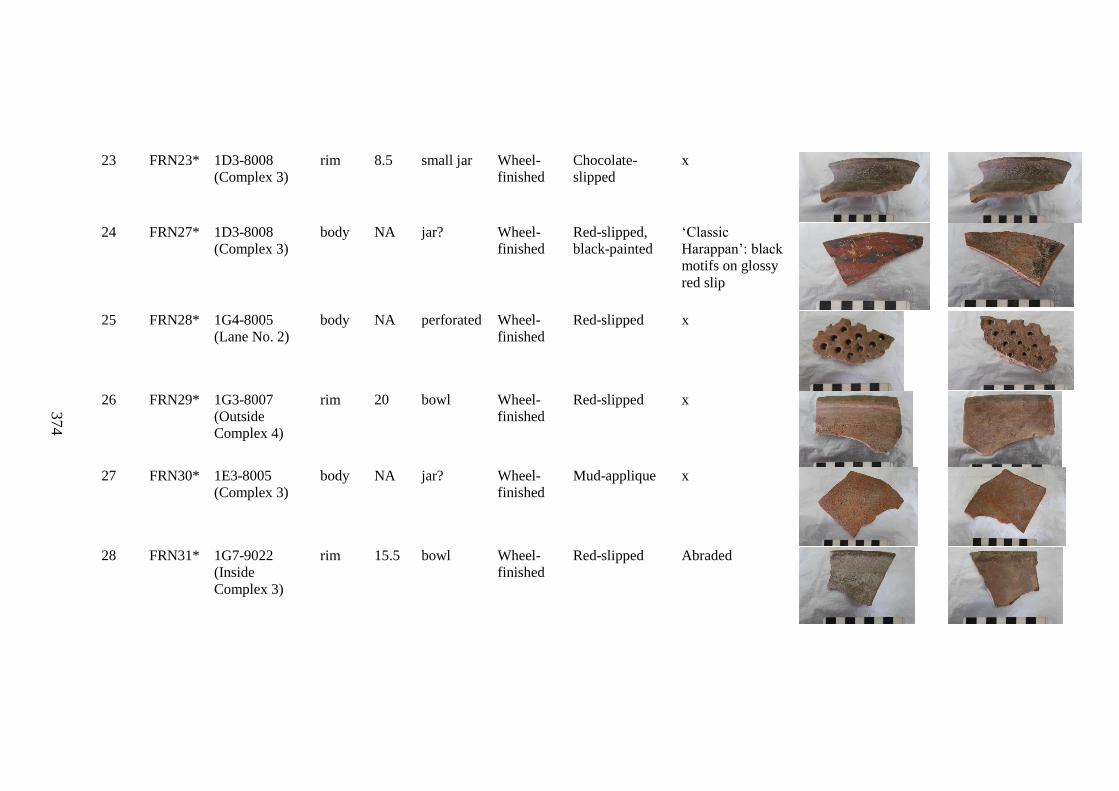
374
374
23 FRN23* 1D3-8008
(Complex 3)
rim 8.5 small jar Wheel-
finished
Chocolate-
slipped
x
24 FRN27* 1D3-8008
(Complex 3)
body NA jar? Wheel-
finished
Red-slipped,
black-painted
‘Classic
Harappan’: black
motifs on glossy
red slip
25 FRN28* 1G4-8005
(Lane No. 2)
body NA perforated Wheel-
finished
Red-slipped x
26 FRN29* 1G3-8007
(Outside
Complex 4)
rim 20 bowl Wheel-
finished
Red-slipped x
27 FRN30* 1E3-8005
(Complex 3)
body NA jar? Wheel-
finished
Mud-applique x
28 FRN31* 1G7-9022
(Inside
Complex 3)
rim 15.5 bowl Wheel-
finished
Red-slipped Abraded
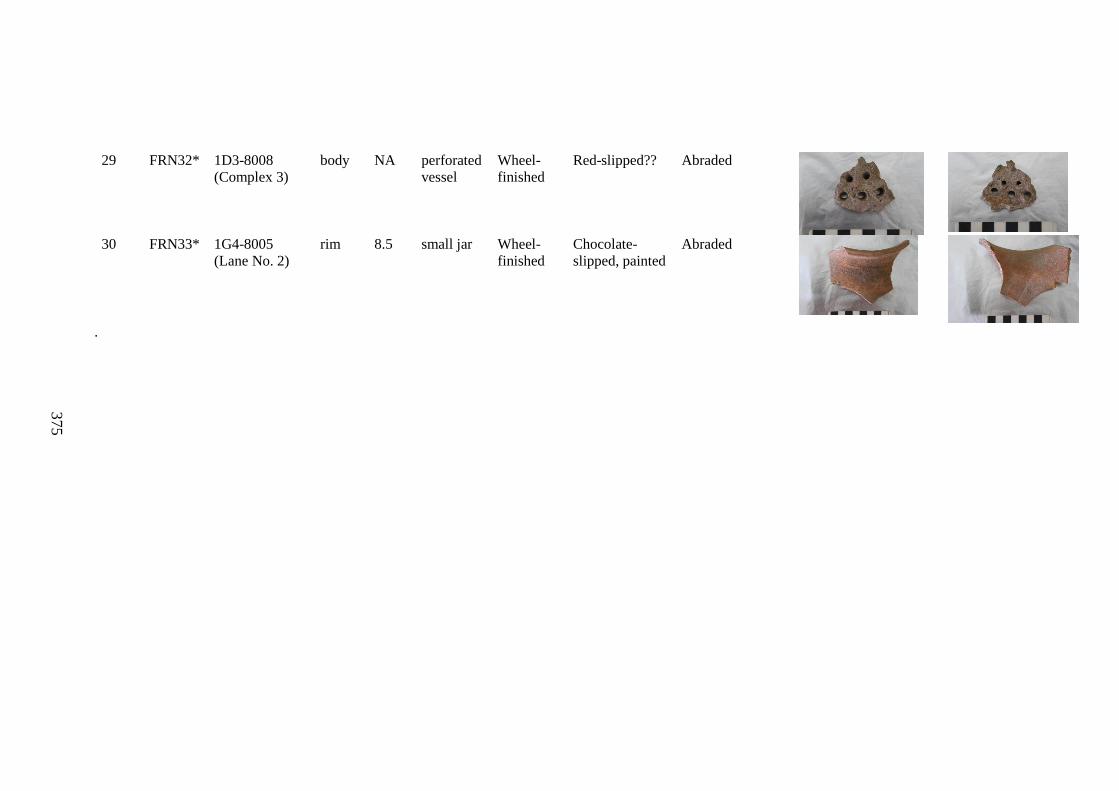
375
375
29 FRN32* 1D3-8008
(Complex 3)
body NA perforated
vessel
Wheel-
finished
Red-slipped?? Abraded
30 FRN33* 1G4-8005
(Lane No. 2)
rim 8.5 small jar Wheel-
finished
Chocolate-
slipped, painted
Abraded
.
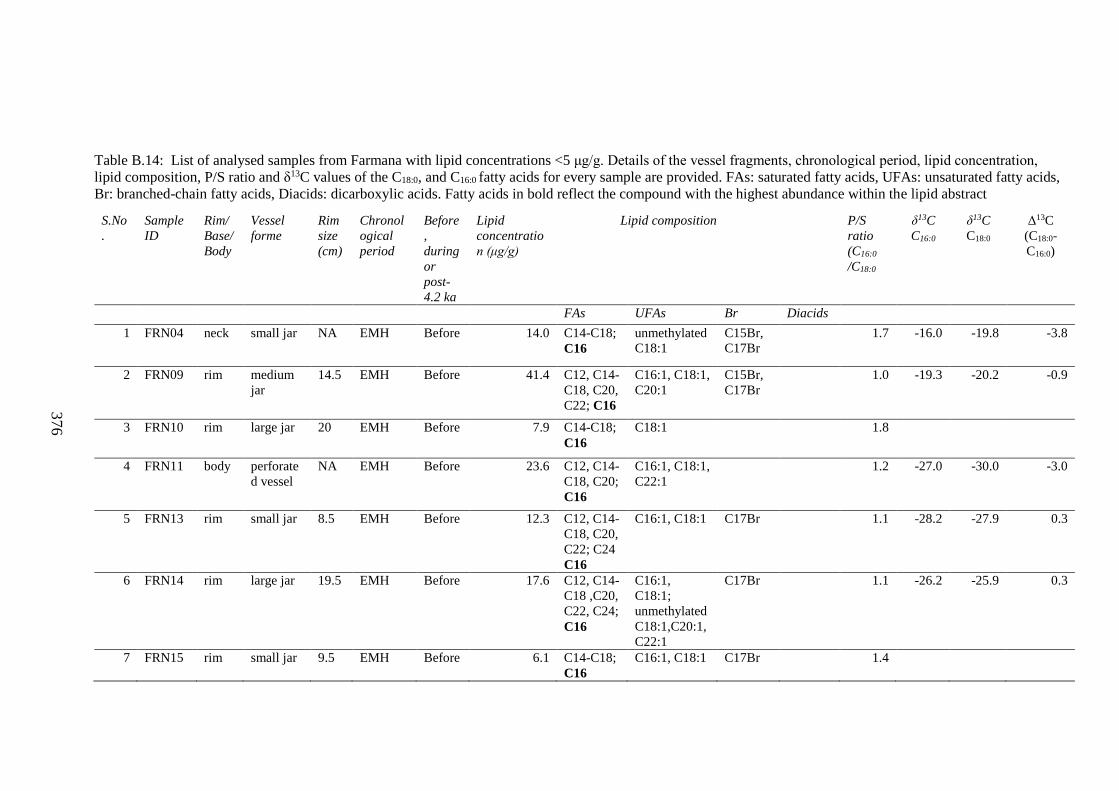
376
376
Table B.14: List of analysed samples from Farmana with lipid concentrations <5 μg/g. Details of the vessel fragments, chronological period, lipid concentration,
lipid composition, P/S ratio and δ13C values of the C18:0, and C16:0 fatty acids for every sample are provided. FAs: saturated fatty acids, UFAs: unsaturated fatty acids,
Br: branched-chain fatty acids, Diacids: dicarboxylic acids. Fatty acids in bold reflect the compound with the highest abundance within the lipid abstract
S.No
.
Sample
ID
Rim/
Base/
Body
Vessel
forme
Rim
size
(cm)
Chronol
ogical
period
Before
,
during
or
post-
4.2 ka
Lipid
concentratio
n (μg/g)
Lipid composition P/S
ratio
(C16:0
/C18:0
δ13C
C16:0
δ13C
C18:0
Δ13C
(C18:0-
C16:0)
FAs UFAs Br Diacids
1 FRN04 neck small jar NA EMH Before 14.0 C14-C18;
C16
unmethylated
C18:1
C15Br,
C17Br
1.7 -16.0 -19.8 -3.8
2 FRN09 rim medium
jar
14.5 EMH Before 41.4 C12, C14-
C18, C20,
C22; C16
C16:1, C18:1,
C20:1
C15Br,
C17Br
1.0 -19.3 -20.2 -0.9
3 FRN10 rim large jar 20 EMH Before 7.9 C14-C18;
C16
C18:1 1.8
4 FRN11 body perforate
d vessel
NA EMH Before 23.6 C12, C14-
C18, C20;
C16
C16:1, C18:1,
C22:1
1.2 -27.0 -30.0 -3.0
5 FRN13 rim small jar 8.5 EMH Before 12.3 C12, C14-
C18, C20,
C22; C24
C16
C16:1, C18:1 C17Br 1.1 -28.2 -27.9 0.3
6 FRN14 rim large jar 19.5 EMH Before 17.6 C12, C14-
C18 ,C20,
C22, C24;
C16
C16:1,
C18:1;
unmethylated
C18:1,C20:1,
C22:1
C17Br 1.1 -26.2 -25.9 0.3
7 FRN15 rim small jar 9.5 EMH Before 6.1 C14-C18;
C16
C16:1, C18:1 C17Br 1.4
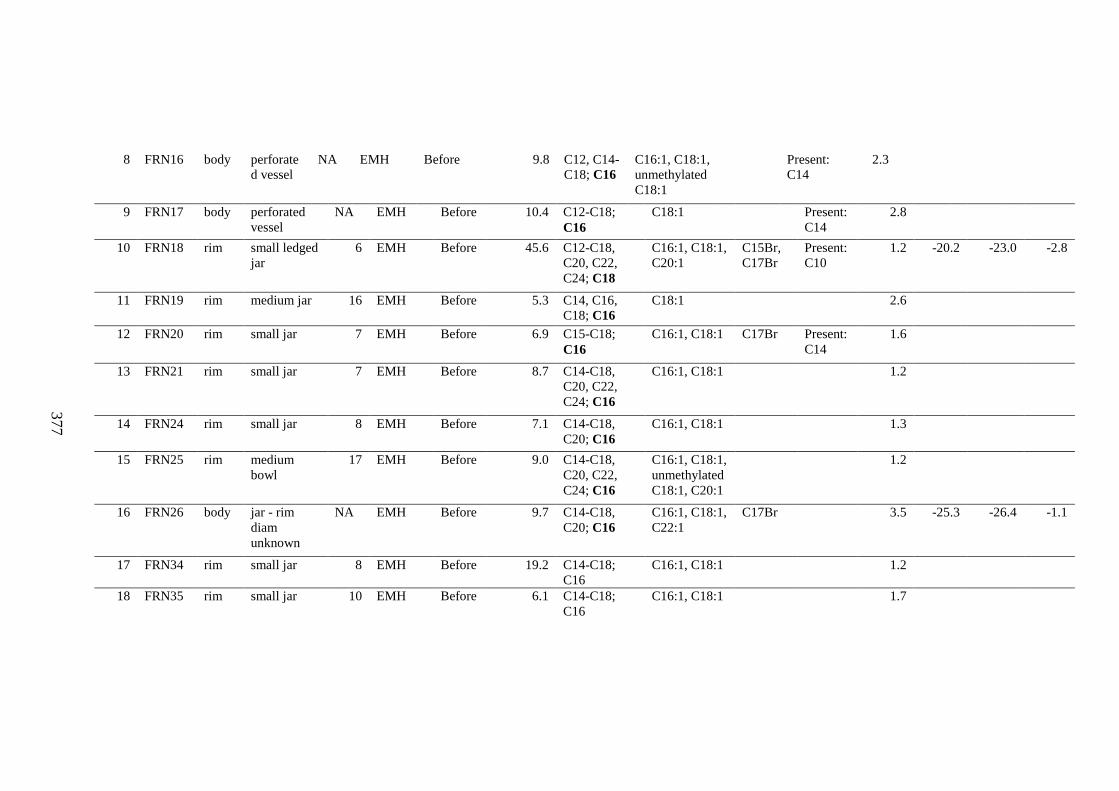
377
377
8 FRN16 body perforate
d vessel
NA EMH Before 9.8 C12, C14-
C18; C16
C16:1, C18:1,
unmethylated
C18:1
Present:
C14
2.3
9 FRN17 body perforated
vessel
NA EMH Before 10.4 C12-C18;
C16
C18:1 Present:
C14
2.8
10 FRN18 rim small ledged
jar
6 EMH Before 45.6 C12-C18,
C20, C22,
C24; C18
C16:1, C18:1,
C20:1
C15Br,
C17Br
Present:
C10
1.2 -20.2 -23.0 -2.8
11 FRN19 rim medium jar 16 EMH Before 5.3 C14, C16,
C18; C16
C18:1 2.6
12 FRN20 rim small jar 7 EMH Before 6.9 C15-C18;
C16
C16:1, C18:1 C17Br Present:
C14
1.6
13 FRN21 rim small jar 7 EMH Before 8.7 C14-C18,
C20, C22,
C24; C16
C16:1, C18:1 1.2
14 FRN24 rim small jar 8 EMH Before 7.1 C14-C18,
C20; C16
C16:1, C18:1 1.3
15 FRN25 rim medium
bowl
17 EMH Before 9.0 C14-C18,
C20, C22,
C24; C16
C16:1, C18:1,
unmethylated
C18:1, C20:1
1.2
16 FRN26 body jar - rim
diam
unknown
NA EMH Before 9.7 C14-C18,
C20; C16
C16:1, C18:1,
C22:1
C17Br 3.5 -25.3 -26.4 -1.1
17 FRN34 rim small jar 8 EMH Before 19.2 C14-C18;
C16
C16:1, C18:1 1.2
18 FRN35 rim small jar 10 EMH Before 6.1 C14-C18;
C16
C16:1, C18:1 1.7
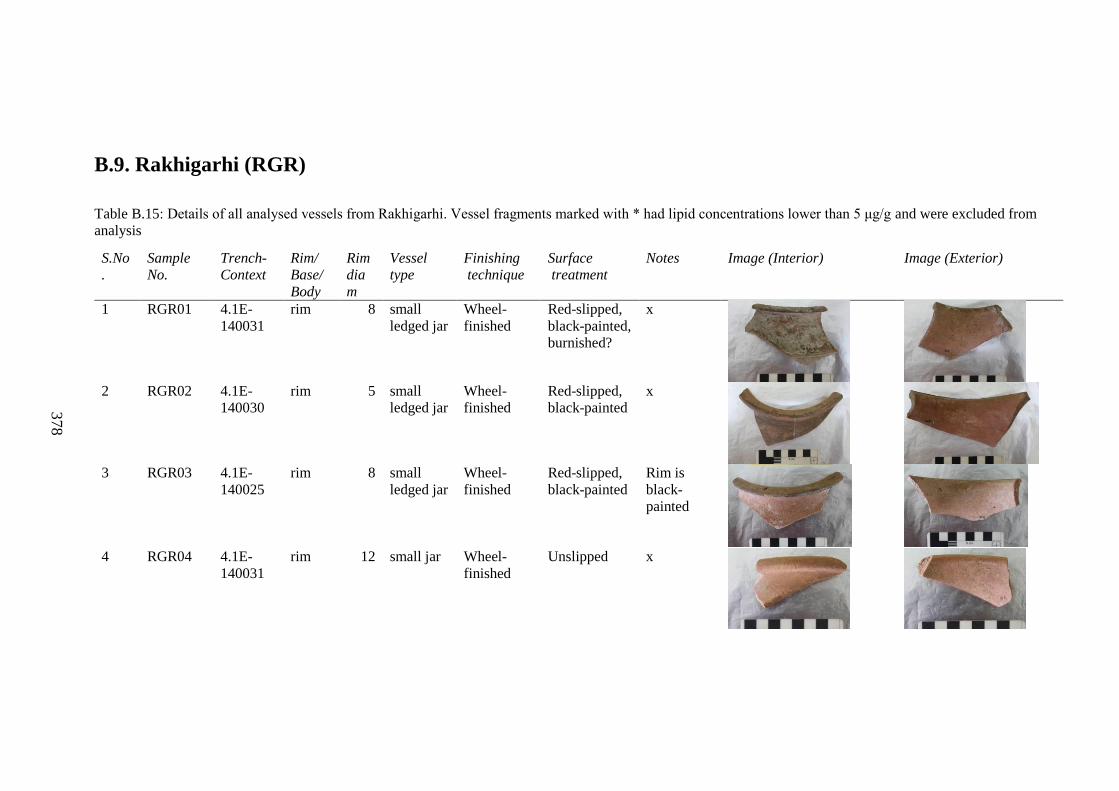
378
378
B.9. Rakhigarhi (RGR)
Table B.15: Details of all analysed vessels from Rakhigarhi. Vessel fragments marked with * had lipid concentrations lower than 5 μg/g and were excluded from
analysis
S.No
.
Sample
No.
Trench-
Context
Rim/
Base/
Body
Rim
dia
m
Vessel
type
Finishing
technique
Surface
treatment
Notes Image (Interior) Image (Exterior)
1 RGR01 4.1E-
140031
rim 8 small
ledged jar
Wheel-
finished
Red-slipped,
black-painted,
burnished?
x
2 RGR02 4.1E-
140030
rim 5 small
ledged jar
Wheel-
finished
Red-slipped,
black-painted
x
3 RGR03 4.1E-
140025
rim 8 small
ledged jar
Wheel-
finished
Red-slipped,
black-painted
Rim is
black-
painted
4 RGR04 4.1E-
140031
rim 12 small jar Wheel-
finished
Unslipped x
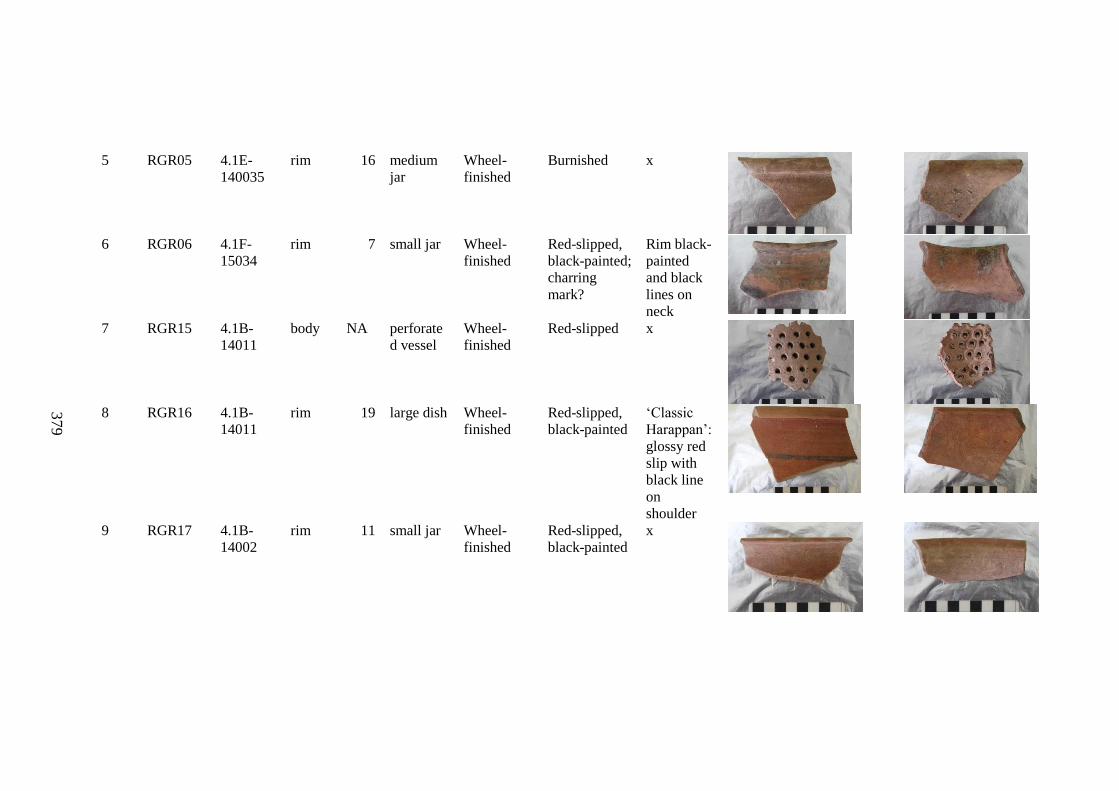
379
379
5 RGR05 4.1E-
140035
rim 16 medium
jar
Wheel-
finished
Burnished x
6 RGR06 4.1F-
15034
rim 7 small jar Wheel-
finished
Red-slipped,
black-painted;
charring
mark?
Rim black-
painted
and black
lines on
neck
7 RGR15 4.1B-
14011
body NA perforate
d vessel
Wheel-
finished
Red-slipped x
8 RGR16 4.1B-
14011
rim 19 large dish Wheel-
finished
Red-slipped,
black-painted
‘Classic
Harappan’:
glossy red
slip with
black line
on
shoulder
9 RGR17 4.1B-
14002
rim 11 small jar Wheel-
finished
Red-slipped,
black-painted
x
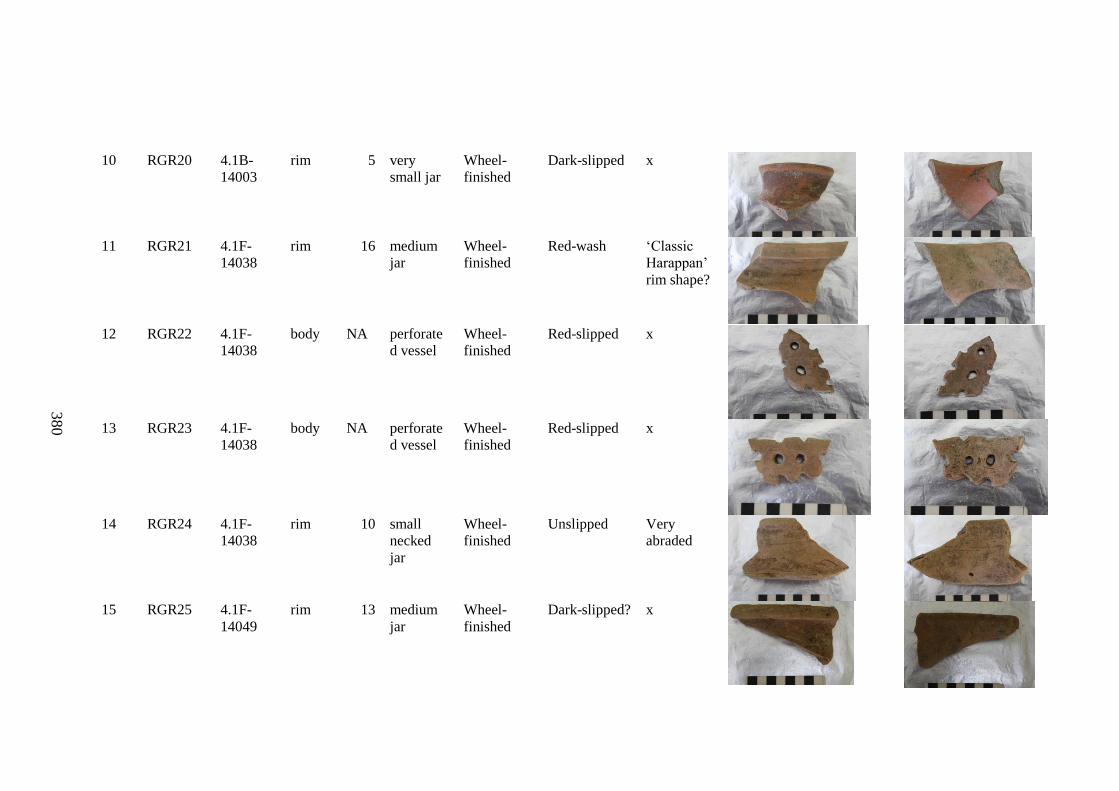
380
380
10 RGR20 4.1B-
14003
rim 5 very
small jar
Wheel-
finished
Dark-slipped x
11 RGR21 4.1F-
14038
rim 16 medium
jar
Wheel-
finished
Red-wash ‘Classic
Harappan’
rim shape?
12 RGR22 4.1F-
14038
body NA perforate
d vessel
Wheel-
finished
Red-slipped x
13 RGR23 4.1F-
14038
body NA perforate
d vessel
Wheel-
finished
Red-slipped x
14 RGR24 4.1F-
14038
rim 10 small
necked
jar
Wheel-
finished
Unslipped Very
abraded
15 RGR25 4.1F-
14049
rim 13 medium
jar
Wheel-
finished
Dark-slipped? x
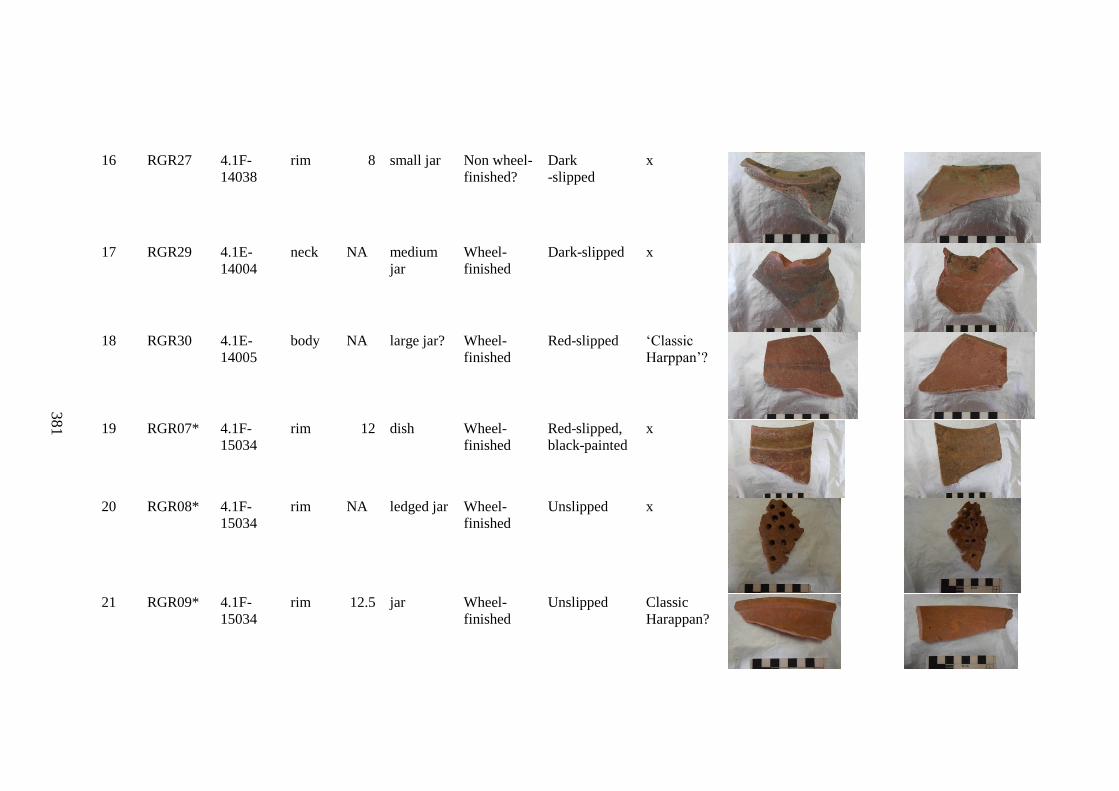
381
381
16 RGR27 4.1F-
14038
rim 8 small jar Non wheel-
finished?
Dark
-slipped
x
17 RGR29 4.1E-
14004
neck NA medium
jar
Wheel-
finished
Dark-slipped x
18 RGR30 4.1E-
14005
body NA large jar? Wheel-
finished
Red-slipped ‘Classic
Harppan’?
19 RGR07* 4.1F-
15034
rim 12 dish Wheel-
finished
Red-slipped,
black-painted
x
20 RGR08* 4.1F-
15034
rim NA ledged jar Wheel-
finished
Unslipped x
21 RGR09* 4.1F-
15034
rim 12.5 jar Wheel-
finished
Unslipped Classic
Harappan?
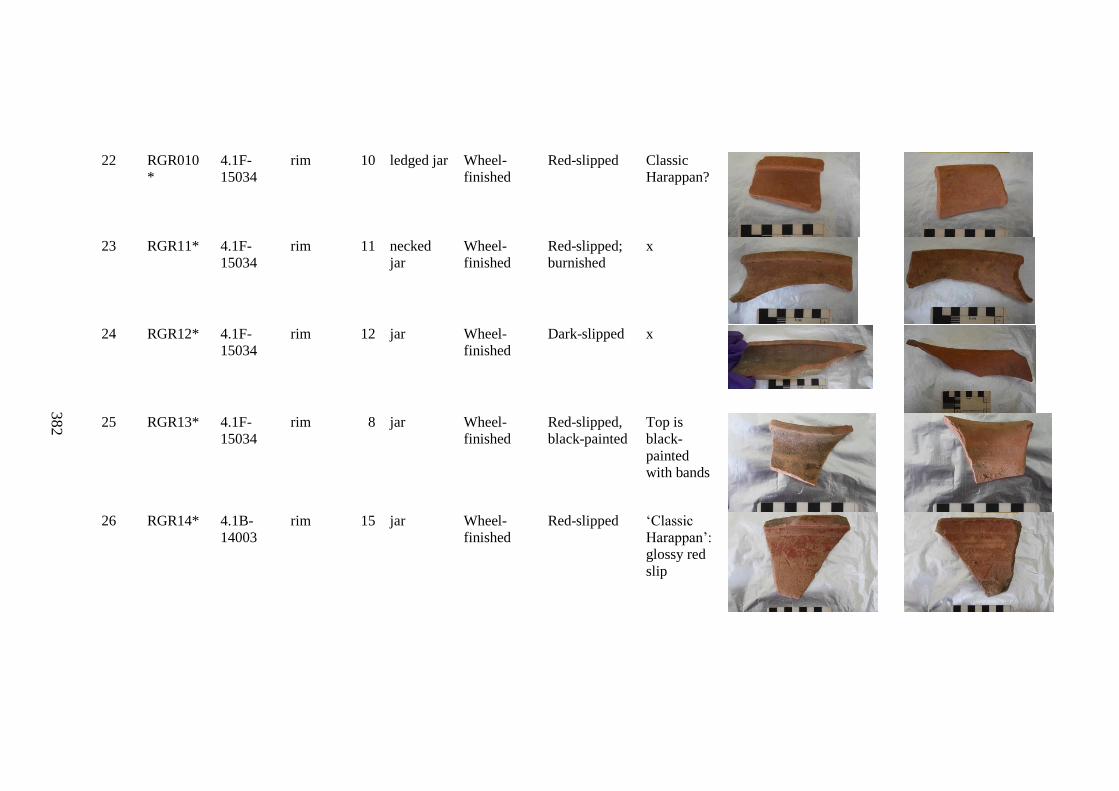
382
382
22 RGR010
*
4.1F-
15034
rim 10 ledged jar Wheel-
finished
Red-slipped Classic
Harappan?
23 RGR11* 4.1F-
15034
rim 11 necked
jar
Wheel-
finished
Red-slipped;
burnished
x
24 RGR12* 4.1F-
15034
rim 12 jar Wheel-
finished
Dark-slipped x
25 RGR13* 4.1F-
15034
rim 8 jar Wheel-
finished
Red-slipped,
black-painted
Top is
black-
painted
with bands
26 RGR14* 4.1B-
14003
rim 15 jar Wheel-
finished
Red-slipped ‘Classic
Harappan’:
glossy red
slip
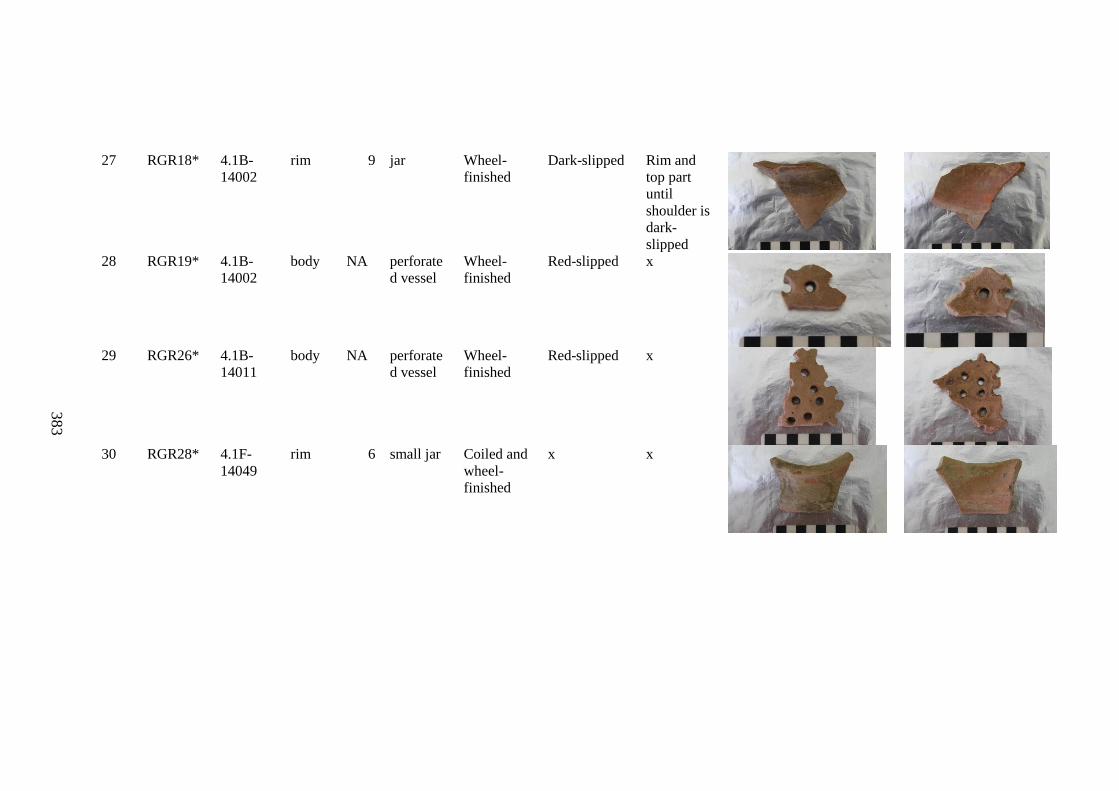
383
383
27 RGR18* 4.1B-
14002
rim 9 jar Wheel-
finished
Dark-slipped Rim and
top part
until
shoulder is
dark-
slipped
28 RGR19* 4.1B-
14002
body NA perforate
d vessel
Wheel-
finished
Red-slipped x
29 RGR26* 4.1B-
14011
body NA perforate
d vessel
Wheel-
finished
Red-slipped x
30 RGR28* 4.1F-
14049
rim 6 small jar Coiled and
wheel-
finished
x x
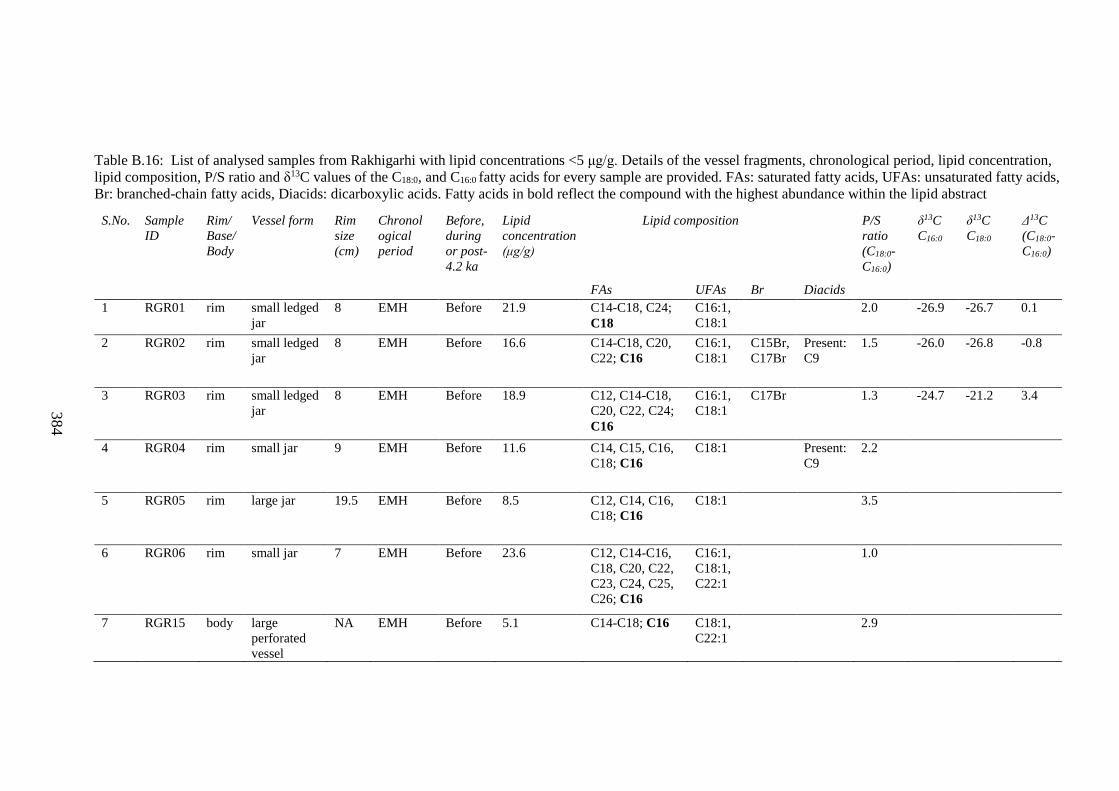
384
384
Table B.16: List of analysed samples from Rakhigarhi with lipid concentrations <5 μg/g. Details of the vessel fragments, chronological period, lipid concentration,
lipid composition, P/S ratio and δ13C values of the C18:0, and C16:0 fatty acids for every sample are provided. FAs: saturated fatty acids, UFAs: unsaturated fatty acids,
Br: branched-chain fatty acids, Diacids: dicarboxylic acids. Fatty acids in bold reflect the compound with the highest abundance within the lipid abstract
S.No. Sample
ID
Rim/
Base/
Body
Vessel form Rim
size
(cm)
Chronol
ogical
period
Before,
during
or post-
4.2 ka
Lipid
concentration
(μg/g)
Lipid composition P/S
ratio
(C18:0-
C16:0)
δ13C
C16:0
δ13C
C18:0
Δ13C
(C18:0-
C16:0)
FAs UFAs Br Diacids
1 RGR01 rim small ledged
jar
8 EMH Before 21.9 C14-C18, C24;
C18
C16:1,
C18:1
2.0 -26.9 -26.7 0.1
2 RGR02 rim small ledged
jar
8 EMH Before 16.6 C14-C18, C20,
C22; C16
C16:1,
C18:1
C15Br,
C17Br
Present:
C9
1.5 -26.0 -26.8 -0.8
3 RGR03 rim small ledged
jar
8 EMH Before 18.9 C12, C14-C18,
C20, C22, C24;
C16
C16:1,
C18:1
C17Br 1.3 -24.7 -21.2 3.4
4 RGR04 rim small jar 9 EMH Before 11.6 C14, C15, C16,
C18; C16
C18:1 Present:
C9
2.2
5 RGR05 rim large jar 19.5 EMH Before 8.5 C12, C14, C16,
C18; C16
C18:1 3.5
6 RGR06 rim small jar 7 EMH Before 23.6 C12, C14-C16,
C18, C20, C22,
C23, C24, C25,
C26; C16
C16:1,
C18:1,
C22:1
1.0
7 RGR15 body large
perforated
vessel
NA EMH Before 5.1 C14-C18; C16 C18:1,
C22:1
2.9
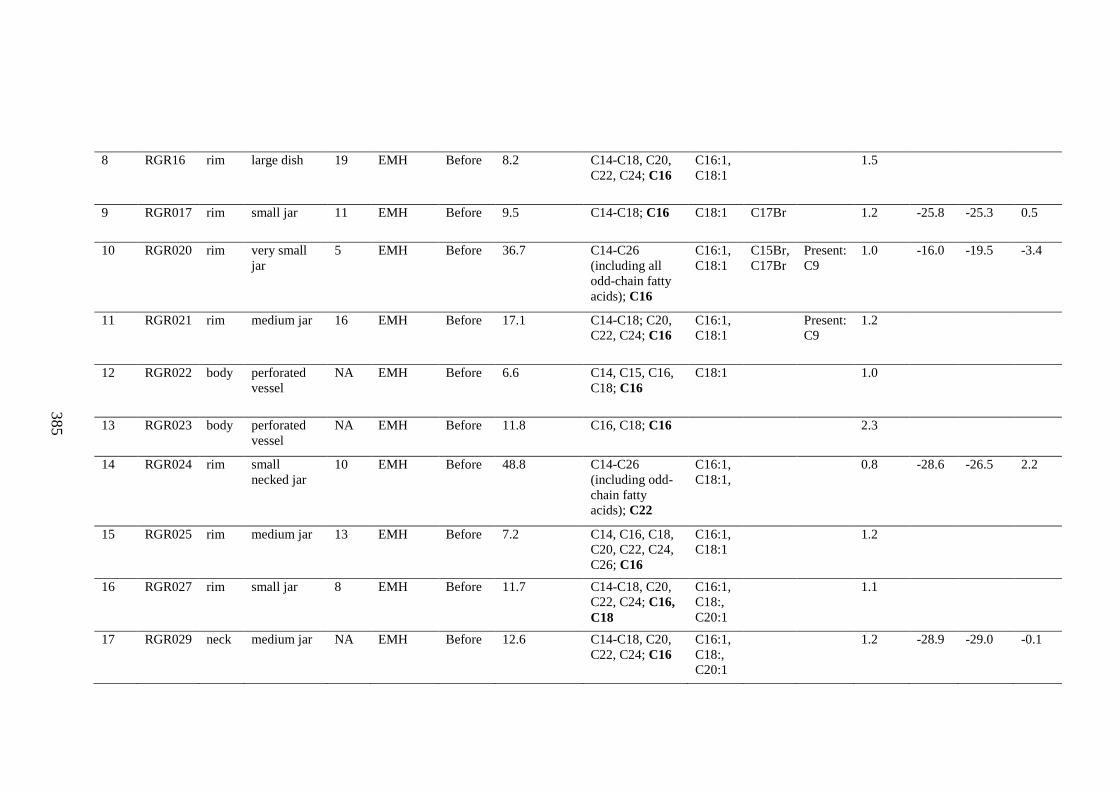
385
385
8 RGR16 rim large dish 19 EMH Before 8.2 C14-C18, C20,
C22, C24; C16
C16:1,
C18:1
1.5
9 RGR017 rim small jar 11 EMH Before 9.5 C14-C18; C16 C18:1 C17Br 1.2 -25.8 -25.3 0.5
10 RGR020 rim very small
jar
5 EMH Before 36.7 C14-C26
(including all
odd-chain fatty
acids); C16
C16:1,
C18:1
C15Br,
C17Br
Present:
C9
1.0 -16.0 -19.5 -3.4
11 RGR021 rim medium jar 16 EMH Before 17.1 C14-C18; C20,
C22, C24; C16
C16:1,
C18:1
Present:
C9
1.2
12 RGR022 body perforated
vessel
NA EMH Before 6.6 C14, C15, C16,
C18; C16
C18:1 1.0
13 RGR023 body perforated
vessel
NA EMH Before 11.8 C16, C18; C16 2.3
14 RGR024 rim small
necked jar
10 EMH Before 48.8 C14-C26
(including odd-
chain fatty
acids); C22
C16:1,
C18:1,
0.8 -28.6 -26.5 2.2
15 RGR025 rim medium jar 13 EMH Before 7.2 C14, C16, C18,
C20, C22, C24,
C26; C16
C16:1,
C18:1
1.2
16 RGR027 rim small jar 8 EMH Before 11.7 C14-C18, C20,
C22, C24; C16,
C18
C16:1,
C18:,
C20:1
1.1
17 RGR029 neck medium jar NA EMH Before 12.6 C14-C18, C20,
C22, C24; C16
C16:1,
C18:,
C20:1
1.2 -28.9 -29.0 -0.1
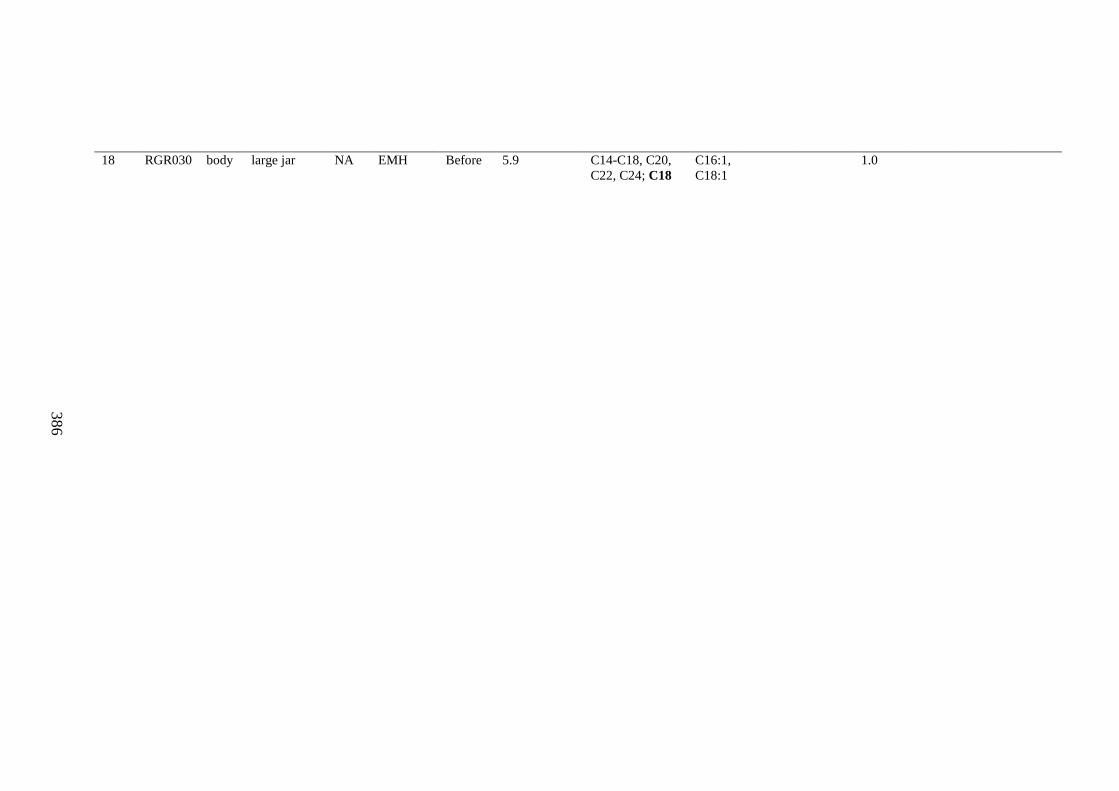
386
386
18 RGR030 body large jar NA EMH Before 5.9 C14-C18, C20,
C22, C24; C18
C16:1,
C18:1
1.0
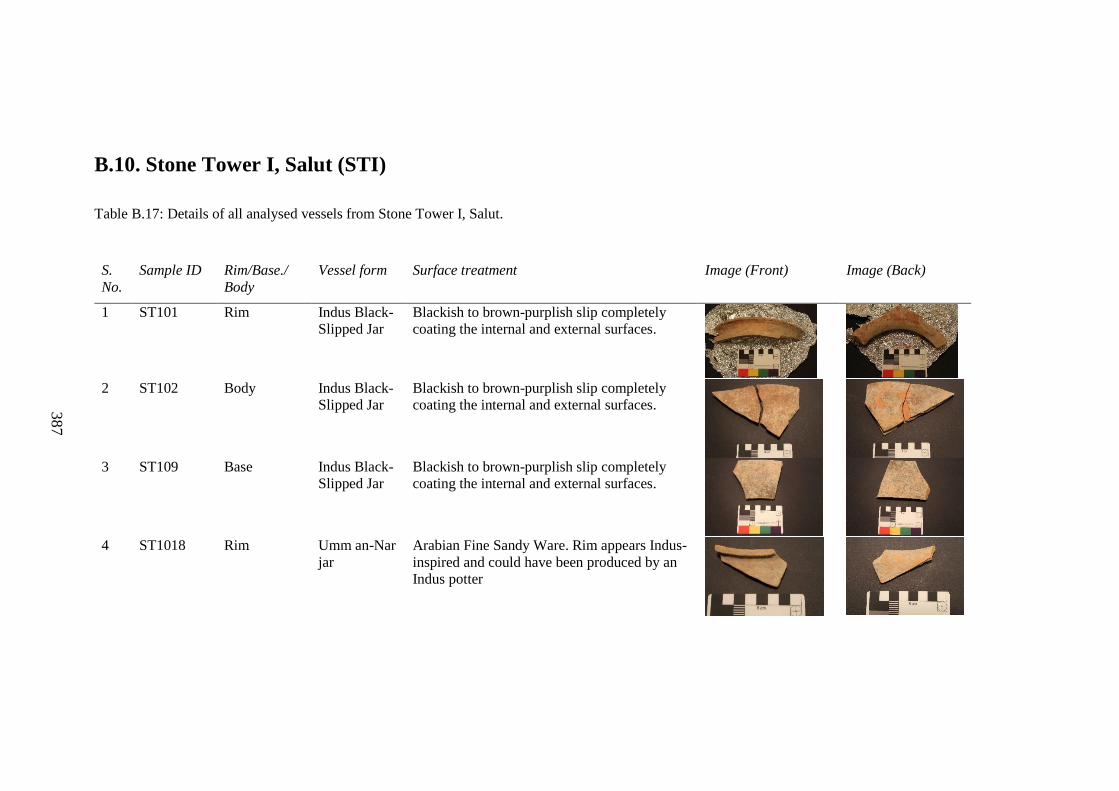
387
387
B.10. Stone Tower I, Salut (STI)
Table B.17: Details of all analysed vessels from Stone Tower I, Salut.
S.
No.
Sample ID Rim/Base./
Body
Vessel form Surface treatment Image (Front) Image (Back)
1 ST101 Rim Indus Black-
Slipped Jar
Blackish to brown-purplish slip completely
coating the internal and external surfaces.
2 ST102 Body Indus Black-
Slipped Jar
Blackish to brown-purplish slip completely
coating the internal and external surfaces.
3 ST109 Base Indus Black-
Slipped Jar
Blackish to brown-purplish slip completely
coating the internal and external surfaces.
4 ST1018 Rim Umm an-Nar
jar
Arabian Fine Sandy Ware. Rim appears Indus-
inspired and could have been produced by an
Indus potter
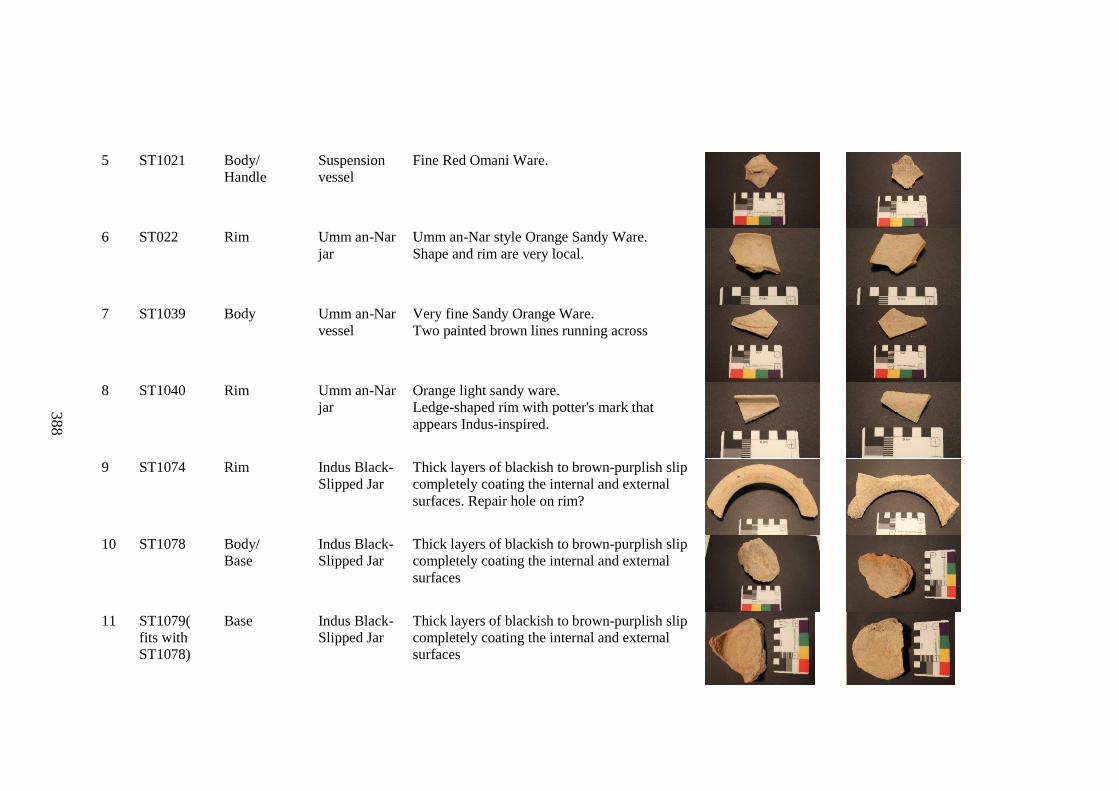
388
388
5 ST1021 Body/
Handle
Suspension
vessel
Fine Red Omani Ware.
6 ST022 Rim Umm an-Nar
jar
Umm an-Nar style Orange Sandy Ware.
Shape and rim are very local.
7 ST1039 Body Umm an-Nar
vessel
Very fine Sandy Orange Ware.
Two painted brown lines running across
8 ST1040 Rim Umm an-Nar
jar
Orange light sandy ware.
Ledge-shaped rim with potter's mark that
appears Indus-inspired.
9 ST1074 Rim Indus Black-
Slipped Jar
Thick layers of blackish to brown-purplish slip
completely coating the internal and external
surfaces. Repair hole on rim?
10 ST1078 Body/
Base
Indus Black-
Slipped Jar
Thick layers of blackish to brown-purplish slip
completely coating the internal and external
surfaces
11 ST1079(
fits with
ST1078)
Base Indus Black-
Slipped Jar
Thick layers of blackish to brown-purplish slip
completely coating the internal and external
surfaces

389
390
Appendix C
Protocol: Lipid extraction with acidified methanol
Bioarch, University of York
PRINCIPLE:
Acid extraction of lipid residues from pottery sherds.
SAMPLE TYPE:
Ceramic powder from pottery sherds
CAUTION:
Sulphuric acid and Methanol are toxic, use fume extraction at all times. Wear eye
protection, laboratory coat and gloves at all times when using sulfuric acid. Sulfuric acid
will degrade gloves over time, always monitor the condition of your gloves if splashing
occurs. All users of the Nitrogen blow down must be trained to use the gas cylinder and
blow down equipment before use.
MATERIALS REQUIRED:
Aluminium foil, Hach tubes, scintillation vials, auto-sample vials, Methanol (HPLC
grade), DCM (HPLC grade), Sulphuric acid, Hexane (HPLC grade), C16/C18 fatty acid
standard, C36 alkane standard, Pasteur pipettes, sterile glass wear, potassium carbonate
(extracted 3x with DCM and baked at 350°C), glass wool (extracted 3x with DCM).
1.0 PREPARATION PROCEDURES:
1.1 Make sure all glassware and tools are solvent rinsed (3x rinsing in DCM) between
samples, or sterile.
1.2 No more than 20 samples to be processed in one batch (18 samples + 1 C16/C18 STD
+ 1 method blank).
2.0 LABELLING:
2.1 Label both vial and lid with unique sherd identifier followed by I for interior surface
or E for exterior surface.
391
3.0 SAMPLE RETRIEVAL:
3.1 Drill if possible at least 1g of sherd from the interior/exterior surface using a
modelling drill with a tungsten carbide bit.
3.2 Drill to a depth of 2 to 4mm.
3.3 Collect sherd powder on aluminium foil and transfer to labelled Hach tube.
4.0 ACID EXTRACTION:
4.1 Accurately weigh about 1g sherd powder into a clean, labelled Hach tube,
leaving a portion of the sherd powder as a reserve sample if possible. Reserve
sample should be stored in freezer at −20°C.
4.2 Using syringe add 100μl of isotopically measured C16/C18 fatty acid standard to a
clean, labelled Hach tube and evaporate under nitrogen to dryness.4.3 Using
Pasteur pipette add approximately 4ml of MeOH to pottery samples + C16/C18
standard + method blank.
4.4 Sonicate for 15 minutes.
4.4 Using Pasteur pipette add 800μl of pure sulphuric acid (under fumehood, wearing
eye
protection).
4.5 Heat at 70ºC for 4 hours on the heating block.
4.6 Prepare a Pasteur pipette by sample packing glass wool enough to plug the pipette
and
adding cleaned potassium carbonate (about 5 mm). Clean it passing 1-2ml of DCM
through
it.
4.7 Centrifuge the samples at 3000rpm for 5 minutes and carefully pipette off the liquid
extract into a clean, labelled Hach tube.
4.8 Add 2ml hexane and use vortex to mix.
4.9 Allow the hexane layer (top layer) to separate out and pipette off carefully through
the prepared Pasteur pipette pack with potassium carbonate into a clean, labelled
Hach tube.
4.10 Repeat steps 4.8 and 4.9 twice more, combining the extracts.
392
4.11 Add 1ml of hexane through the pipette.
4.12 Evaporate to dryness under a very gentle stream of nitrogen with gentle warmth.
4.13 Add 1ml of hexane, mix with vortex and transfer to a clean hydrolysis vial.
4.14 Repeat the previous step combining in the same vial and vortex.
4.15 Evaporate very gently to dryness.
4.16 Store extracts in a freezer at −20°C until required for analysis.
BEFORE ANALYSIS:
4.16 Using syringe Add 90ul of Hexane to re-suspend the sample, roll the vial in order
to make sure the whole extract is suspended (including the neck).
4.17 Add 10µl of the C36 alkane standard (1µg.µl-1) to a clean, labelled auto-sampling
vial with 0.1ml conical insert.
4.18 Transfer the 90µl of hexane + extract to the auto-sampling vial using Pasteur
pipette or syringe. If using syringe clean the needle 10 times with hexane
between each sample.
4.19 Analyse by GC/GC-MS and/or store in a refrigerator at 4°C (short-term) or in a
freezer at −20°C (long term).
5.0 BLANKS:
5.1 For every run a method blank should be included.
5.2 GC/GC-MS analysis of blanks will provide a measure of contamination introduced
during the extraction of organic residues from sherds.

393
394
Appendix D
Protocol: Lipid extraction with solvent method
Bioarch, University of York
PRINCIPLE:
Solvent extraction of lipid residues from pottery sherds.
SAMPLE TYPE:
Pottery sherds, ceramics.
CAUTION:
DCM and Methanol are toxic; use fume extraction at all times. Wear eye protection,
laboratory coat and gloves at all times when using DCM. DCM will degrade gloves over
time, always monitor the condition of your gloves if splashing occurs. All users of the
Nitrogen blow down must be trained to use the gas cylinder and blow down equipment
before use.
MATERIALS REQUIRED:
Aluminium foil, scintillation vials, Dichloromethane (HPLC grade), Hexane (HPLC
grade), C34 alkane standard, Methanol (HPLC grade), Pasteur pipettes, sterile glass wear.
PROCEDURE:
All members of BioArCh wishing to use the GC in this way are responsible for ensuring
that the procedures detailed in the SOP are followed when carrying out solvent extraction
of organic residues from pottery sherds.
PREPARATION PROCEDURES:
1.1 Make sure all glassware and tools are solvent rinsed (3x rinsing in DCM) between
samples, or sterile.
1.2 No more than twelve samples to be processed in one batch (11 samples + 1 method
blank/10 samples + 1 method blank + 1 pottery blank).
2.0 LABELLING:
395
2.1 Label both vial and lid with unique sherd identifier followed by I for interior surface or
E for exterior surface.
3.0 SAMPLE RETRIEVAL:
3.1 Drill if possible at least 1g of sherd from the interior surface using a modelling drill
with a tungsten carbide bit.
3.2 Drill to a depth of 2-4mm.
3.3 Collect sherd powder on aluminium foil and transfer to labelled scintillation vial.
4.0 SOLVENT EXTRACTION:
4.1 Accurately weigh about 1g sherd powder into a clean, labelled scintillation vial,
leaving a portion of the sherd powder as a reserve sample if possible. Reserve sample
should be stored in freezer at −20°C. Add 10-100ul 1ul/g of the C34 alkane standard to the
powder.
4.2 Add approximately 5ml of DCM:MEOH 2/1 v/v.
4.3 Sonicate for 15 minutes at 25ºC.
4.4 Centrifuge at 3000rpm for 10 minutes.
4.5 Carefully pipette off the liquid extract into a clean, labelled (TLE) scintillation vial.
4.6 Repeat steps 4.2 to 4.5 twice more, combining the extracts.
4.7 Reduce volume of extracts to about 2ml under a stream of nitrogen with gentle heat.
4.8 Transfer to a clean, labelled, small vial and continue to evaporate under nitrogen to
dryness.
4.9 Store in a refrigerator at 4°C (short-term) or in a freezer at −20°C (long term).
5.0 EXTERIOR SURFACES:
5.1 For the extracting the residue from the exterior surface of the sherd repeat steps 1.0 to
4.0.
396
6.0 BLANKS:
6.1 For every run a method blank should be included. Eleven samples may be processed
with a method blank.
6.2 GC/GC-MS analysis of blanks will provide a measure of contamination introduced
during the extraction of organic residues from sherds.

397
398
Appendix E
Protocol: Silylation of organic residues fo GC/GC-MS
Bioarch, University of York
PRINCIPAL:
The derivatisation of organic residues of archaeological origin by silylation.
SAMPLE TYPE:
Pottery sherds, ceramics.
CAUTION:
DCM and Methanol are toxic; use fume extraction at all times. Wear eye protection,
laboratory coat and gloves at all times when using DCM. DCM will degrade gloves over
time, always monitor the condition of your gloves if splashing occurs. All users of the
Nitrogen blow down must be trained to use the gas cylinder and blow down equipment
before use.
MATERIALS REQUIRED:
Aluminium foil, C36 alkane standard, scintillation vials, Dichloromethane (HPLC grade),
Hexane (HPLC grade), Methanol (HPLC grade), Pasteur pipettes, sterile glass wear.
1.0 PRE-PREPARATION PROCEDURES:
1.1 Make sure all glassware and tools are solvent rinsed (3x rinsing in DCM) or sterilised.
1.2 Samples should be processed in batches of no more than twelve (11 samples + 1
method blank/10 samples + 1 method blank + 1 pottery blank).
2.0 LABELLING:
2.1 Make sure that labels are still legible on both vials and lids before starting this
procedure. Residues for silylation will be extracts A, B2 or C and should still be identified
by a unique sherd identifier, a letter indicating the origin of the residue and one of the
letters above.
399
3.0 SILYLATION PROCEDURE:
3.1 Add 50ul of Hexane to re-suspend the sample, roll the vial in order to make sure the
whole extract is suspended (including the neck), add four drops of N,O-bis(trimethylsilyl)
trifluoroacetamide (BSTFA) with 1% trimethyl-chlorosilane (TMCS) to each residue using
a sterile Pasteur pipette. Alternatively add 100μl BSTFA using a micro-syringe. If you
touch the needle onto the sample vial during this stage, dispose of the BSTFA and clean 10
times with hexane.
3.2 Heat at 70ºC for 60 minutes on the heating block.
3.3 Evaporate off excess BSTFA under nitrogen with gentle heat.
3.4 Add 10ul of the C36 alkane recovery standard to a clean auto-sampling vial with 0.1ml
conical insert, and 50ul of hexane to the sample vial, again rolling the vial to re-suspend
the material. Transfer the 50ul of hexane + extract to the auto-sampling vial. If you touch
the needle onto the sample vial during this stage, clean the needle times with hexane before
moving to the next sample.
3.5 Analyse by GC/GC-MS within 48 hours. If analysis cannot be performed within that
time, repeat steps 3.1 to 3.3.
4.0 BLANKS:
4.1 Blanks from the extraction of residues should be silylated with the same batch of
residues.
4.2 GC/GC-MS analysis of blanks will test for contamination introduced during the
preparation of samples.
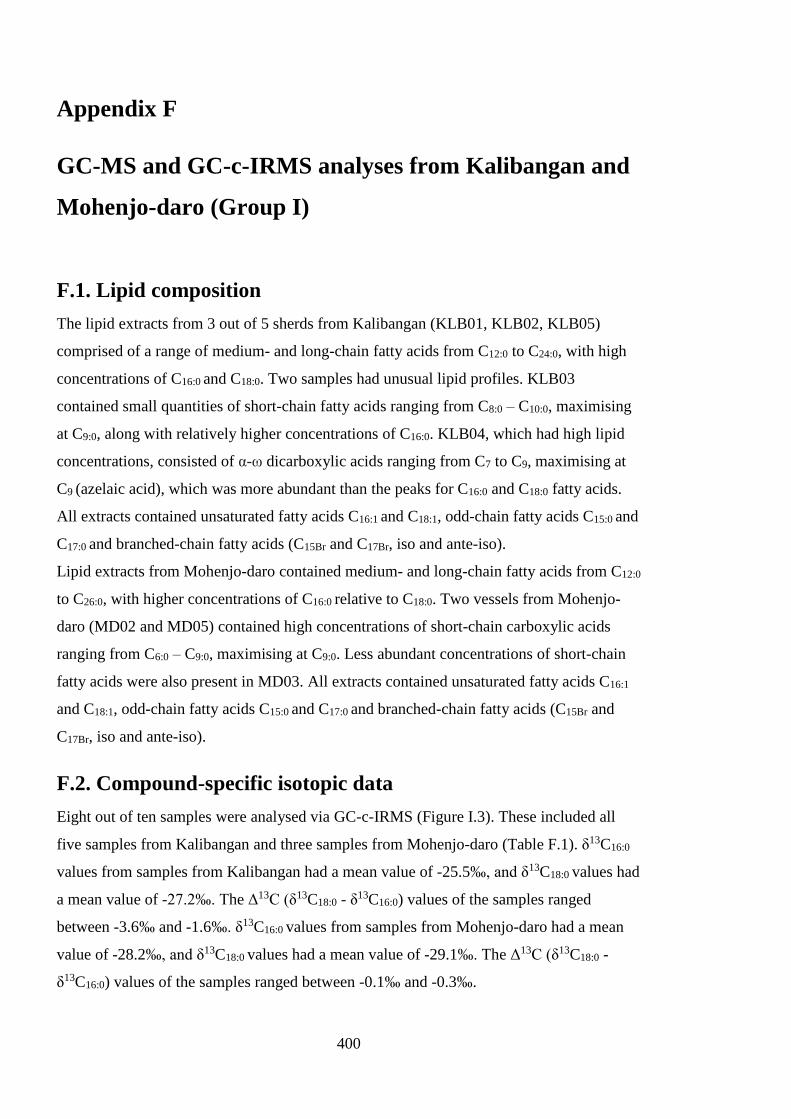
400
Appendix F
GC-MS and GC-c-IRMS analyses from Kalibangan and
Mohenjo-daro (Group I)
F.1. Lipid composition
The lipid extracts from 3 out of 5 sherds from Kalibangan (KLB01, KLB02, KLB05)
comprised of a range of medium- and long-chain fatty acids from C12:0 to C24:0, with high
concentrations of C16:0 and C18:0. Two samples had unusual lipid profiles. KLB03
contained small quantities of short-chain fatty acids ranging from C8:0 – C10:0, maximising
at C9:0, along with relatively higher concentrations of C16:0. KLB04, which had high lipid
concentrations, consisted of α-ω dicarboxylic acids ranging from C7 to C9, maximising at
C9 (azelaic acid), which was more abundant than the peaks for C16:0 and C18:0 fatty acids.
All extracts contained unsaturated fatty acids C16:1 and C18:1, odd-chain fatty acids C15:0 and
C17:0 and branched-chain fatty acids (C15Br and C17Br, iso and ante-iso).
Lipid extracts from Mohenjo-daro contained medium- and long-chain fatty acids from C12:0
to C26:0, with higher concentrations of C16:0 relative to C18:0. Two vessels from Mohenjo-
daro (MD02 and MD05) contained high concentrations of short-chain carboxylic acids
ranging from C6:0 – C9:0, maximising at C9:0. Less abundant concentrations of short-chain
fatty acids were also present in MD03. All extracts contained unsaturated fatty acids C16:1
and C18:1, odd-chain fatty acids C15:0 and C17:0 and branched-chain fatty acids (C15Br and
C17Br, iso and ante-iso).
F.2. Compound-specific isotopic data
Eight out of ten samples were analysed via GC-c-IRMS (Figure I.3). These included all
five samples from Kalibangan and three samples from Mohenjo-daro (Table F.1). δ13C16:0
values from samples from Kalibangan had a mean value of -25.5‰, and δ13C18:0 values had
a mean value of -27.2‰. The Δ13C (δ13C18:0 - δ13C16:0) values of the samples ranged
between -3.6‰ and -1.6‰. δ13C16:0 values from samples from Mohenjo-daro had a mean
value of -28.2‰, and δ13C18:0 values had a mean value of -29.1‰. The Δ13C (δ13C18:0 -
δ13C16:0) values of the samples ranged between -0.1‰ and -0.3‰.
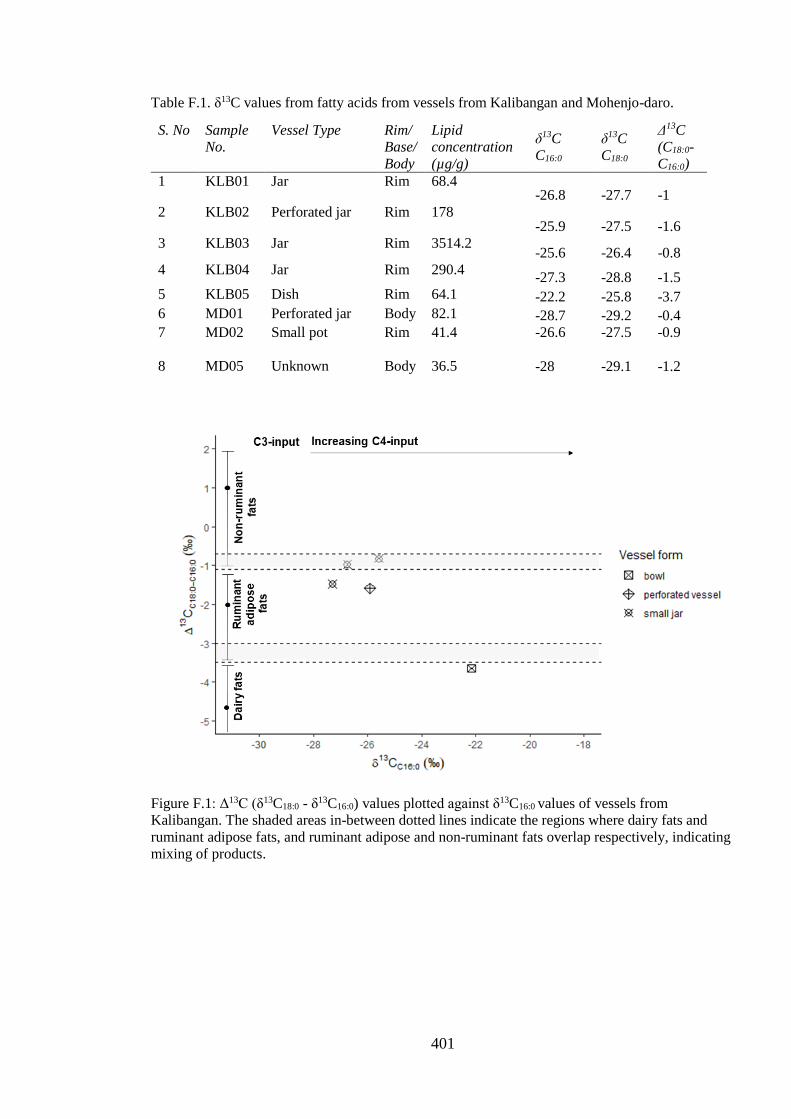
401
Table F.1. δ13C values from fatty acids from vessels from Kalibangan and Mohenjo-daro.
S. No Sample
No.
Vessel Type Rim/
Base/
Body
Lipid
concentration
(µg/g)
δ13C
C16:0
δ13C
C18:0
Δ13C
(C18:0-
C16:0)
1 KLB01 Jar Rim 68.4 -26.8 -27.7 -1
2 KLB02 Perforated jar Rim 178 -25.9 -27.5 -1.6
3 KLB03 Jar Rim 3514.2 -25.6 -26.4 -0.8
4 KLB04 Jar Rim 290.4 -27.3 -28.8 -1.5
5 KLB05 Dish Rim 64.1 -22.2 -25.8 -3.7
6 MD01 Perforated jar Body 82.1 -28.7 -29.2 -0.4
7 MD02
Small pot Rim 41.4 -26.6
-27.5
-0.9
8 MD05 Unknown Body 36.5 -28
-29.1
-1.2
Figure F.1: Δ13C (δ13C18:0 - δ13C16:0) values plotted against δ13C16:0 values of vessels from
Kalibangan. The shaded areas in-between dotted lines indicate the regions where dairy fats and
ruminant adipose fats, and ruminant adipose and non-ruminant fats overlap respectively, indicating
mixing of products.
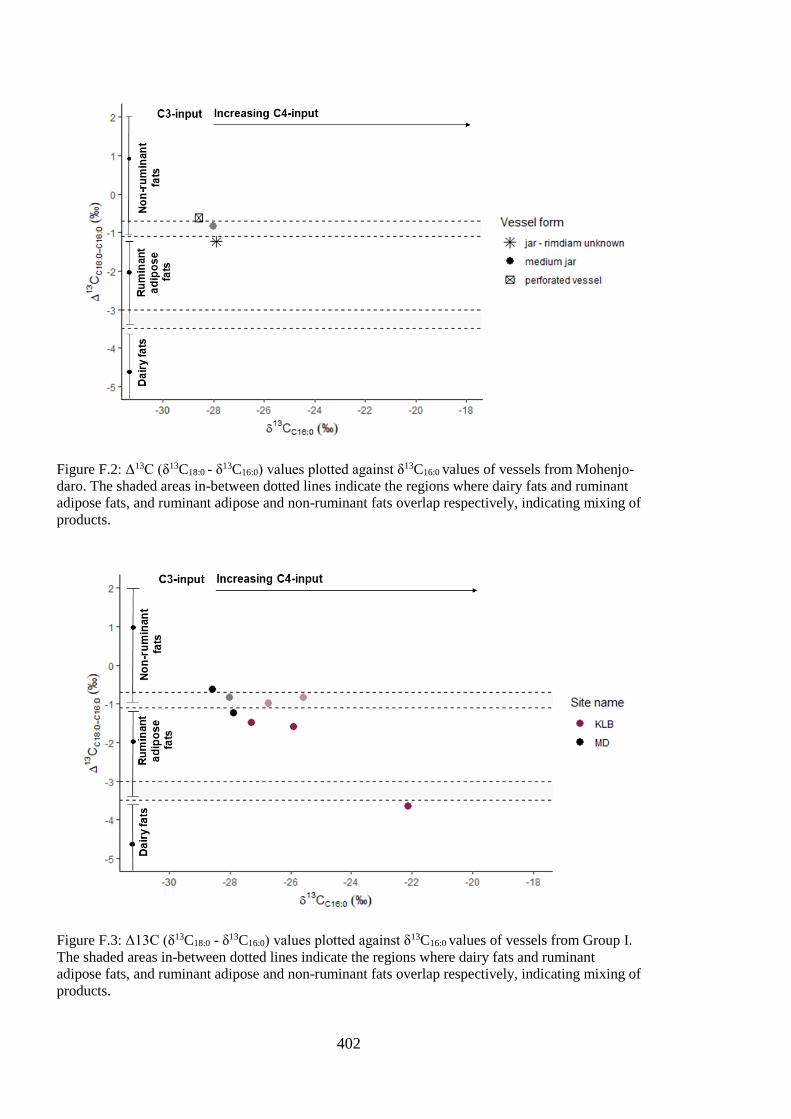
402
Figure F.2: Δ13C (δ13C18:0 - δ13C16:0) values plotted against δ13C16:0 values of vessels from Mohenjo-
daro. The shaded areas in-between dotted lines indicate the regions where dairy fats and ruminant
adipose fats, and ruminant adipose and non-ruminant fats overlap respectively, indicating mixing of
products.
Figure F.3: Δ13C (δ13C18:0 - δ13C16:0) values plotted against δ13C16:0 values of vessels from Group I.
The shaded areas in-between dotted lines indicate the regions where dairy fats and ruminant
adipose fats, and ruminant adipose and non-ruminant fats overlap respectively, indicating mixing of
products.
403
F.3. Discussion
The obtained lipid profiles from Kalibangan and Mohenjo-daro are ambiguous. The
presence of short-chain fatty acids in KLB04, MD02 and MD05 is interesting as short-
chain fatty acids rarely survive in archaeological contexts and are found in dairy fats, fruits
and flowers (Craig 2005; Rageot 2019). In this context, however, it is unclear what their
origin might be. Additionally, the high concentration of dicarboxylic acids in KLB04,
MD02 and MD05 is interesting. As is well-known, the predominance of azelaic acid
implies the precursor fatty acid bare a double-bond at the 9-position, suggesting the vessel
once contained unsaturated fatty acids that are common in plants (Regert et al. 1998;
Regert 2011). However, the absence of plant-derived ‘biomarkers’ or other compounds
characteristic of aquatic or marine products make it difficult to be certain of the origins of
the residue within these vessels. Overall, the lipid profiles from Kalibangan and Mohenjo-
daro were indicative of degraded animal fats, except for KLB04, MD02 and MD05, which
may have also contained plant-derived products.
The compound-specific isotopic data from fatty acids within extracts from Kalibangan and
Mohenjo-daro are clustered; with a difference of 4‰ between δ13C16:0 values and 3‰
between δ13C18:0 values from Kalibangan, and just 1‰ for both δ13C16:0 and δ13C18:0 values
for samples from Mohenjo-daro. The range in the values from vessels from Kalibangan can
be attributed to a single outlier, KLB05, a medium-sized bowl, which demonstrates
evidence for dairy processing based on its Δ13C value (-3.6‰) and evidence of a relatively
higher input of C4 plant based on its δ13C16:0 value (-22.1‰). Notably, this vessel’s lipid
extracts did not contain short-chain fatty acids, which are generally associated with milk
fats. The rest of the vessels from Kalibangan have Δ13C values that fall within the
reference range for ruminant animal adipose fats, with δ13C16:0 values indicating mixed C3-
C4 plant input. Two samples from Mohenjo-daro (MD02 and MD05) have Δ13C values that
fall within the range for ruminant adipose fats, however one sample (MD01, a perforated
vessel) has a Δ13C value that suggests it was used to process mixtures of non-ruminant and
ruminant adipose fats. The δ13C16:0 values of the samples suggest a mixed input of both C3
and C4 plants. In the absence of faunal data or solid archaeobotanical evidence from both
sites, however, the interpretation of these values is limited. Thus, preliminary
interpretations suggest that ruminant and non-ruminant products were dominantly
processed in the vessels from Kalibangan and Mohenjo-daro, with evidence for dairy-
404
processing in a single vessel from Kalibangan (KLB05, a medium-sized bowl). Notably,
the perforated vessels from both Mohenjo-daro and Kalibangan do not fall within the range
for dairy fats.
These results are comparable with those found from other sites in northwest India in
this thesis. It is possible the obtained isotopic results are also indicative of mixtures in
vessels (Chapter 8). Unfortunately, the lack of palaecological, archaebotanical and faunal
data from these sites makes interpretations challenging.
There are other problems associated with the interpretation of these lipid profiles and
compound-specific isotopic results. High concentrations of synthetic compounds within the
samples increase the likelihood of the coelution of peaks, making the identification of
peaks difficult. Furthermore, the uncertain collection history of these potsherds also
renders them unreliable, as their context is unknown, and so are the details of how they
were processed, or if they were exposed to any other organic compounds after they
removed from the site. Thus, the organic compounds and their respective fatty acid specific
isotopic composition may not be products of the use of the vessels in antiquity.

405
406
Appendix G
Vessel-specific GC-c-IRMS results
Results from the ranges and average concentrations of lipid yield presented in Chapter Six
suggest that certain vessels may have been used more frequently, or for the processing of
fatty- or oil-rich products. This section will discuss the results from the chemical and fatty
acid-specific isotopic analyses obtained for different vessel forms. In combination with
lipid yields, these reveal insights about the purported use of vessels in antiquity.
G.1. Small jars
Small and very small jars (ranging between 5-12cm rim diameters) with lipid quantities
above 5 µg/g made up 19.7% (n=27) of the total analysed assemblage. Lipid
concentrations averaged 25 μg/g, ranging between 6.1 μg/g to 131 μg/g.
Molecular evidence revealed that small jars contained medium and long-chain fatty
acids such as C12:0 up to C26:0, with high concentrations of C16:0 and C18:0 fatty acids
relative to other compounds. These compounds are generic to both plant and animal
products; and due to the lack of characteristic plant-derived compounds in the vessels, the
lipid profiles suggest that they are signatures of degraded animal fats.
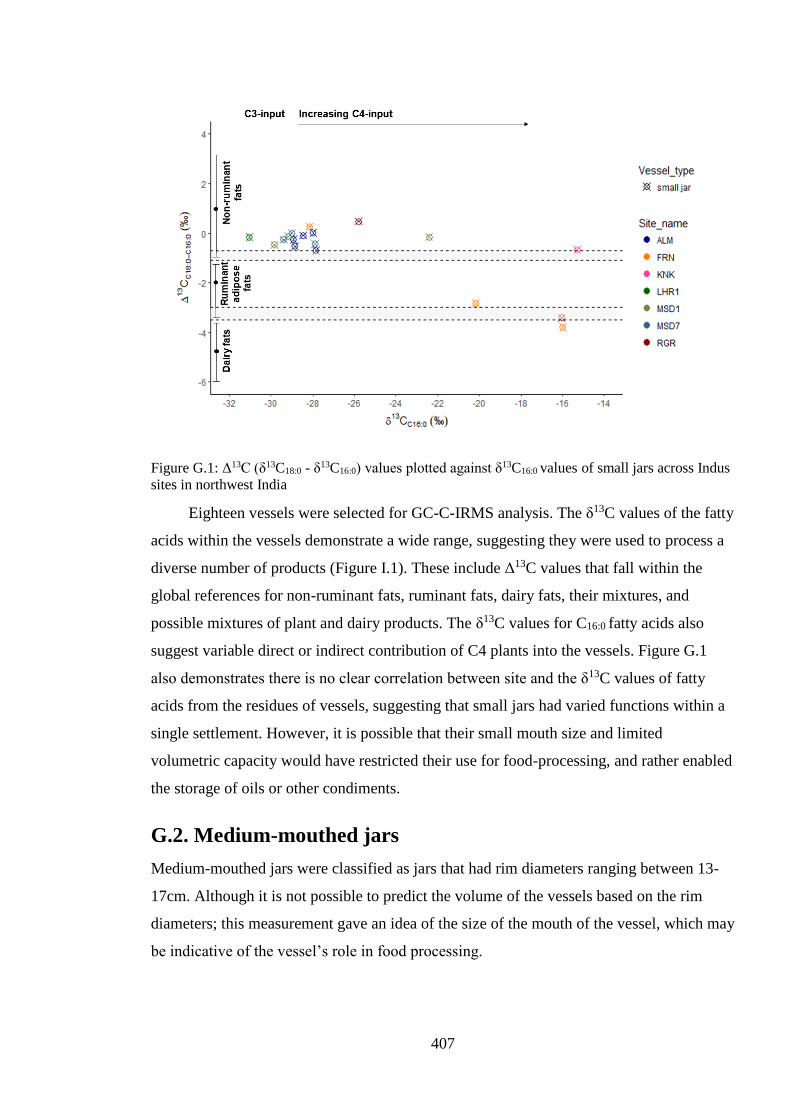
407
Figure G.1: Δ13C (δ13C18:0 - δ13C16:0) values plotted against δ13C16:0 values of small jars across Indus
sites in northwest India
Eighteen vessels were selected for GC-C-IRMS analysis. The δ13C values of the fatty
acids within the vessels demonstrate a wide range, suggesting they were used to process a
diverse number of products (Figure I.1). These include Δ13C values that fall within the
global references for non-ruminant fats, ruminant fats, dairy fats, their mixtures, and
possible mixtures of plant and dairy products. The δ13C values for C16:0 fatty acids also
suggest variable direct or indirect contribution of C4 plants into the vessels. Figure G.1
also demonstrates there is no clear correlation between site and the δ13C values of fatty
acids from the residues of vessels, suggesting that small jars had varied functions within a
single settlement. However, it is possible that their small mouth size and limited
volumetric capacity would have restricted their use for food-processing, and rather enabled
the storage of oils or other condiments.
G.2. Medium-mouthed jars
Medium-mouthed jars were classified as jars that had rim diameters ranging between 13-
17cm. Although it is not possible to predict the volume of the vessels based on the rim
diameters; this measurement gave an idea of the size of the mouth of the vessel, which may
be indicative of the vessel’s role in food processing.
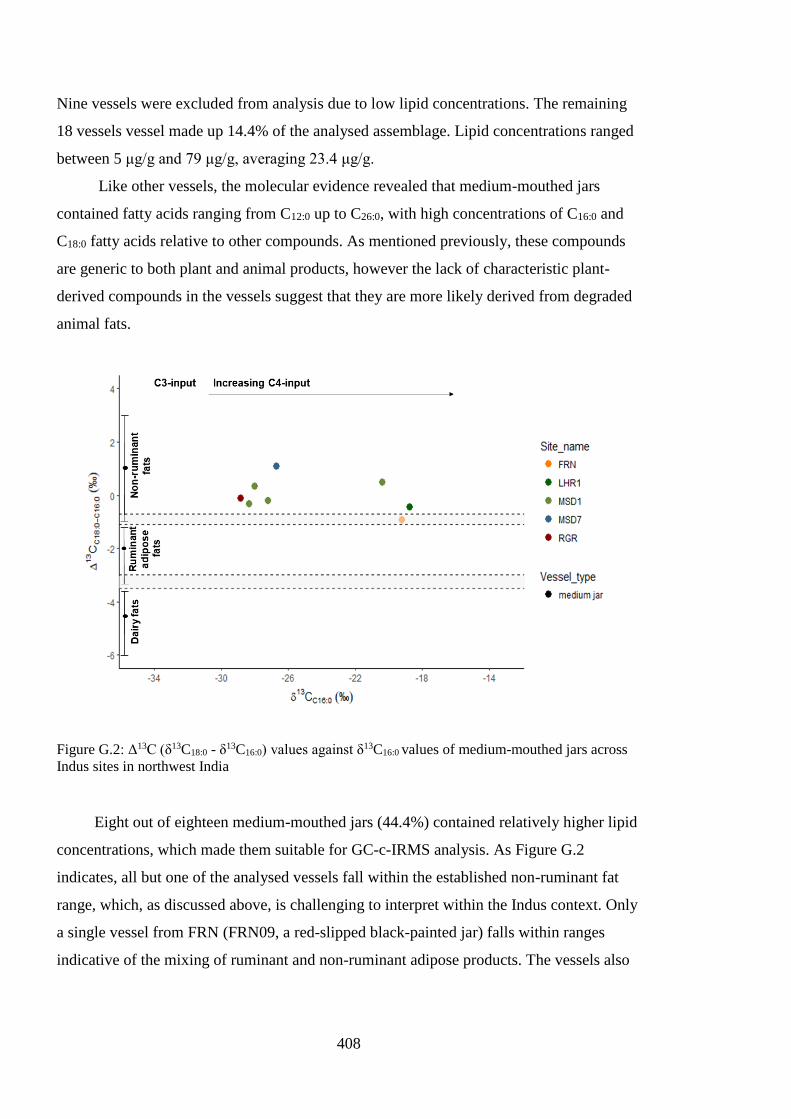
408
Nine vessels were excluded from analysis due to low lipid concentrations. The remaining
18 vessels vessel made up 14.4% of the analysed assemblage. Lipid concentrations ranged
between 5 μg/g and 79 μg/g, averaging 23.4 μg/g.
Like other vessels, the molecular evidence revealed that medium-mouthed jars
contained fatty acids ranging from C12:0 up to C26:0, with high concentrations of C16:0 and
C18:0 fatty acids relative to other compounds. As mentioned previously, these compounds
are generic to both plant and animal products, however the lack of characteristic plant-
derived compounds in the vessels suggest that they are more likely derived from degraded
animal fats.
Figure G.2: Δ13C (δ13C18:0 - δ13C16:0) values against δ13C16:0 values of medium-mouthed jars across
Indus sites in northwest India
Eight out of eighteen medium-mouthed jars (44.4%) contained relatively higher lipid
concentrations, which made them suitable for GC-c-IRMS analysis. As Figure G.2
indicates, all but one of the analysed vessels fall within the established non-ruminant fat
range, which, as discussed above, is challenging to interpret within the Indus context. Only
a single vessel from FRN (FRN09, a red-slipped black-painted jar) falls within ranges
indicative of the mixing of ruminant and non-ruminant adipose products. The vessels also
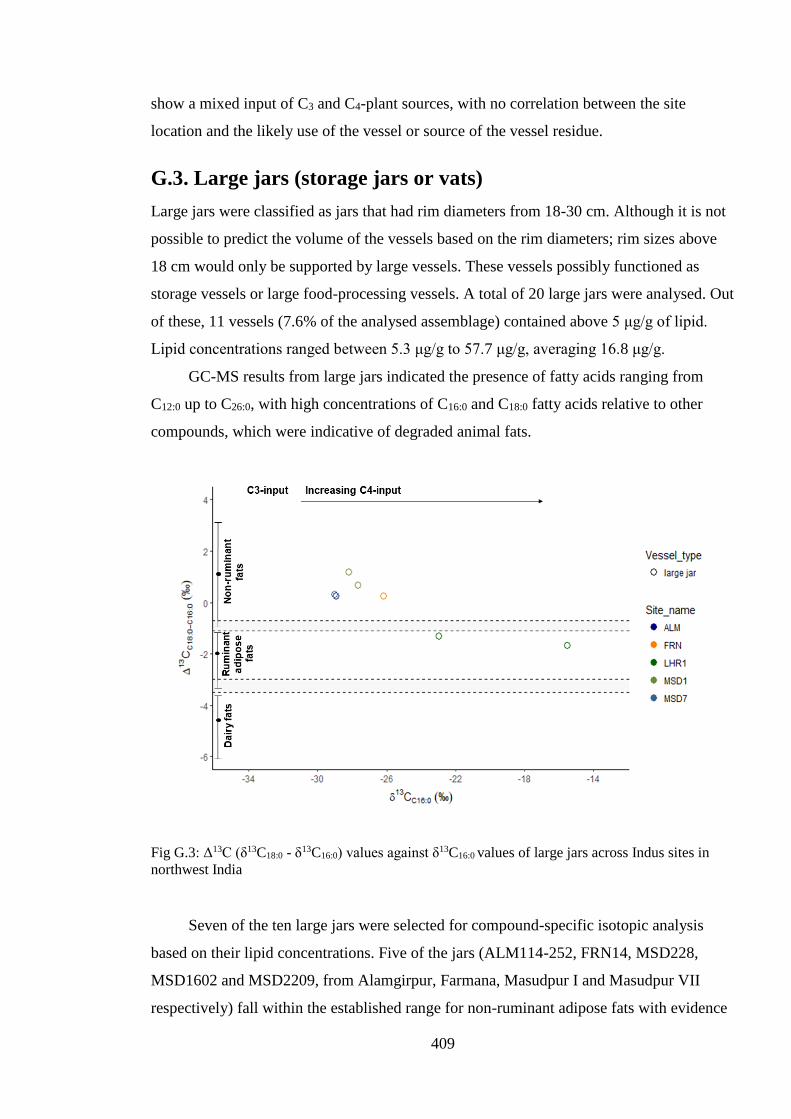
409
show a mixed input of C3 and C4-plant sources, with no correlation between the site
location and the likely use of the vessel or source of the vessel residue.
G.3. Large jars (storage jars or vats)
Large jars were classified as jars that had rim diameters from 18-30 cm. Although it is not
possible to predict the volume of the vessels based on the rim diameters; rim sizes above
18 cm would only be supported by large vessels. These vessels possibly functioned as
storage vessels or large food-processing vessels. A total of 20 large jars were analysed. Out
of these, 11 vessels (7.6% of the analysed assemblage) contained above 5 μg/g of lipid.
Lipid concentrations ranged between 5.3 μg/g to 57.7 μg/g, averaging 16.8 μg/g.
GC-MS results from large jars indicated the presence of fatty acids ranging from
C12:0 up to C26:0, with high concentrations of C16:0 and C18:0 fatty acids relative to other
compounds, which were indicative of degraded animal fats.
Fig G.3: Δ13C (δ13C18:0 - δ13C16:0) values against δ13C16:0 values of large jars across Indus sites in
northwest India
Seven of the ten large jars were selected for compound-specific isotopic analysis
based on their lipid concentrations. Five of the jars (ALM114-252, FRN14, MSD228,
MSD1602 and MSD2209, from Alamgirpur, Farmana, Masudpur I and Masudpur VII
respectively) fall within the established range for non-ruminant adipose fats with evidence
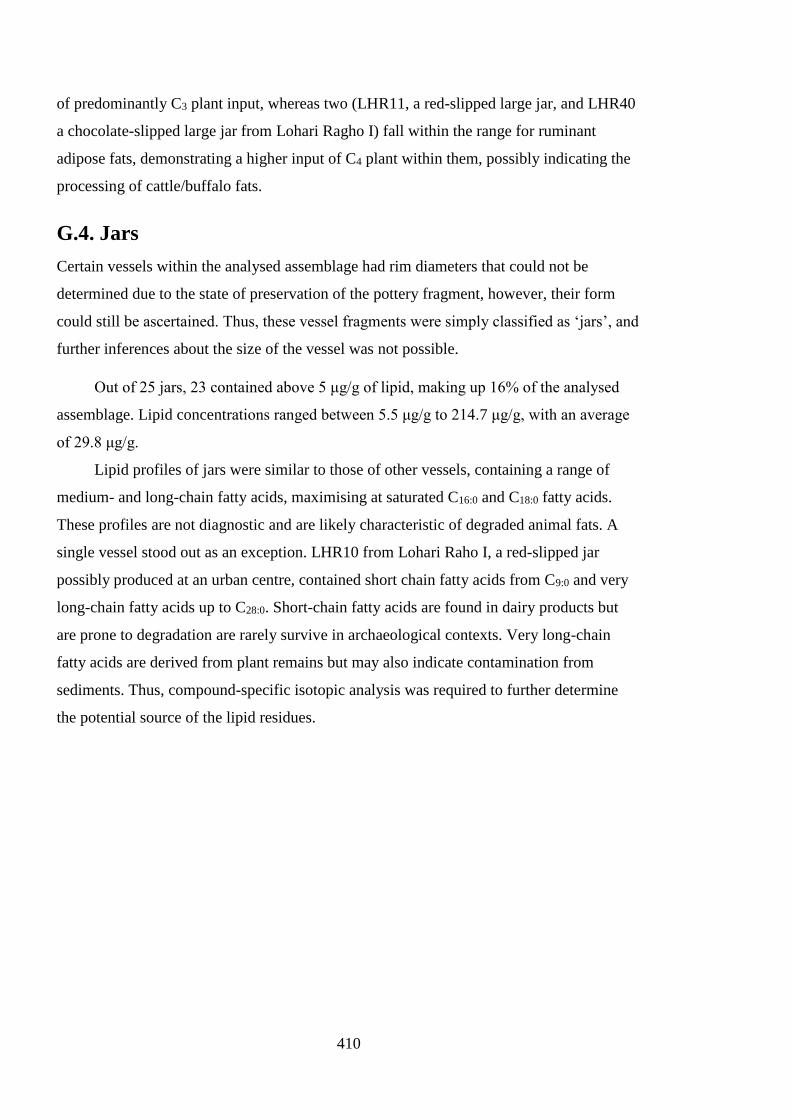
410
of predominantly C3 plant input, whereas two (LHR11, a red-slipped large jar, and LHR40
a chocolate-slipped large jar from Lohari Ragho I) fall within the range for ruminant
adipose fats, demonstrating a higher input of C4 plant within them, possibly indicating the
processing of cattle/buffalo fats.
G.4. Jars
Certain vessels within the analysed assemblage had rim diameters that could not be
determined due to the state of preservation of the pottery fragment, however, their form
could still be ascertained. Thus, these vessel fragments were simply classified as ‘jars’, and
further inferences about the size of the vessel was not possible.
Out of 25 jars, 23 contained above 5 μg/g of lipid, making up 16% of the analysed
assemblage. Lipid concentrations ranged between 5.5 μg/g to 214.7 μg/g, with an average
of 29.8 μg/g.
Lipid profiles of jars were similar to those of other vessels, containing a range of
medium- and long-chain fatty acids, maximising at saturated C16:0 and C18:0 fatty acids.
These profiles are not diagnostic and are likely characteristic of degraded animal fats. A
single vessel stood out as an exception. LHR10 from Lohari Raho I, a red-slipped jar
possibly produced at an urban centre, contained short chain fatty acids from C9:0 and very
long-chain fatty acids up to C28:0. Short-chain fatty acids are found in dairy products but
are prone to degradation are rarely survive in archaeological contexts. Very long-chain
fatty acids are derived from plant remains but may also indicate contamination from
sediments. Thus, compound-specific isotopic analysis was required to further determine
the potential source of the lipid residues.
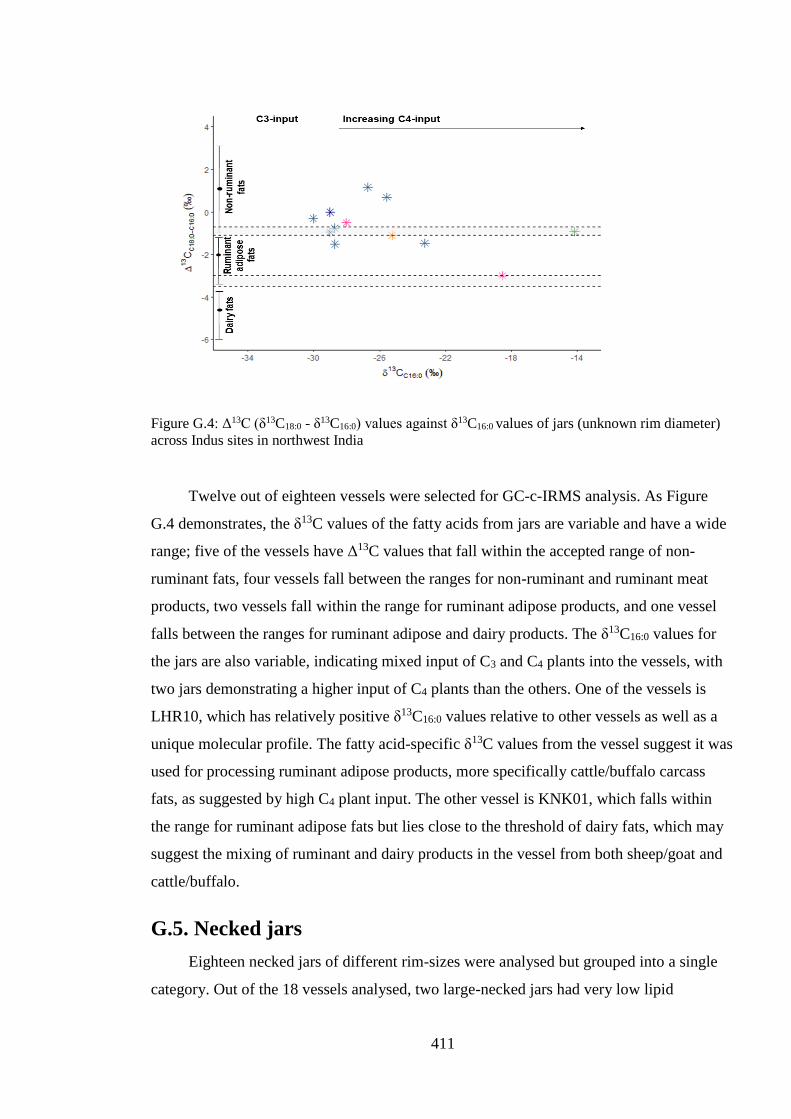
411
Figure G.4: Δ13C (δ13C18:0 - δ13C16:0) values against δ13C16:0 values of jars (unknown rim diameter)
across Indus sites in northwest India
Twelve out of eighteen vessels were selected for GC-c-IRMS analysis. As Figure
G.4 demonstrates, the δ13C values of the fatty acids from jars are variable and have a wide
range; five of the vessels have Δ13C values that fall within the accepted range of non-
ruminant fats, four vessels fall between the ranges for non-ruminant and ruminant meat
products, two vessels fall within the range for ruminant adipose products, and one vessel
falls between the ranges for ruminant adipose and dairy products. The δ13C16:0 values for
the jars are also variable, indicating mixed input of C3 and C4 plants into the vessels, with
two jars demonstrating a higher input of C4 plants than the others. One of the vessels is
LHR10, which has relatively positive δ13C16:0 values relative to other vessels as well as a
unique molecular profile. The fatty acid-specific δ13C values from the vessel suggest it was
used for processing ruminant adipose products, more specifically cattle/buffalo carcass
fats, as suggested by high C4 plant input. The other vessel is KNK01, which falls within
the range for ruminant adipose fats but lies close to the threshold of dairy fats, which may
suggest the mixing of ruminant and dairy products in the vessel from both sheep/goat and
cattle/buffalo.
G.5. Necked jars
Eighteen necked jars of different rim-sizes were analysed but grouped into a single
category. Out of the 18 vessels analysed, two large-necked jars had very low lipid
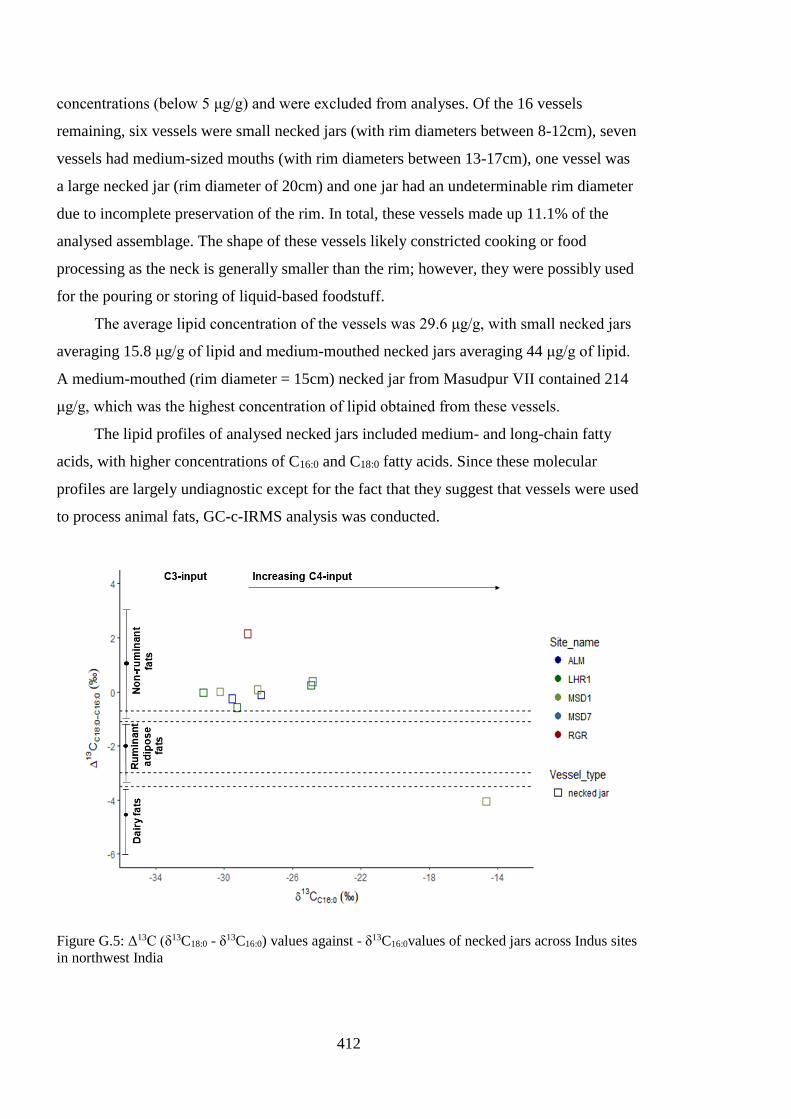
412
concentrations (below 5 μg/g) and were excluded from analyses. Of the 16 vessels
remaining, six vessels were small necked jars (with rim diameters between 8-12cm), seven
vessels had medium-sized mouths (with rim diameters between 13-17cm), one vessel was
a large necked jar (rim diameter of 20cm) and one jar had an undeterminable rim diameter
due to incomplete preservation of the rim. In total, these vessels made up 11.1% of the
analysed assemblage. The shape of these vessels likely constricted cooking or food
processing as the neck is generally smaller than the rim; however, they were possibly used
for the pouring or storing of liquid-based foodstuff.
The average lipid concentration of the vessels was 29.6 μg/g, with small necked jars
averaging 15.8 μg/g of lipid and medium-mouthed necked jars averaging 44 μg/g of lipid.
A medium-mouthed (rim diameter = 15cm) necked jar from Masudpur VII contained 214
μg/g, which was the highest concentration of lipid obtained from these vessels.
The lipid profiles of analysed necked jars included medium- and long-chain fatty
acids, with higher concentrations of C16:0 and C18:0 fatty acids. Since these molecular
profiles are largely undiagnostic except for the fact that they suggest that vessels were used
to process animal fats, GC-c-IRMS analysis was conducted.
Figure G.5: Δ13C (δ13C18:0 - δ13C16:0) values against - δ13C16:0values of necked jars across Indus sites
in northwest India
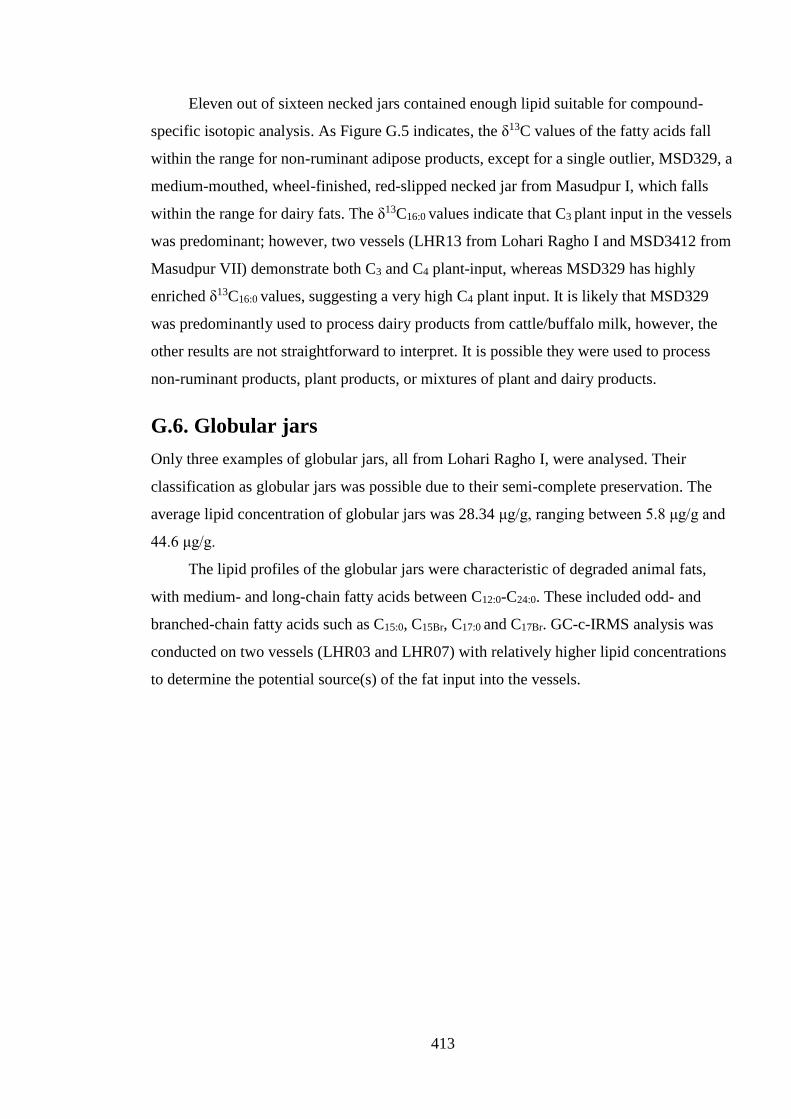
413
Eleven out of sixteen necked jars contained enough lipid suitable for compound-
specific isotopic analysis. As Figure G.5 indicates, the δ13C values of the fatty acids fall
within the range for non-ruminant adipose products, except for a single outlier, MSD329, a
medium-mouthed, wheel-finished, red-slipped necked jar from Masudpur I, which falls
within the range for dairy fats. The δ13C16:0 values indicate that C3 plant input in the vessels
was predominant; however, two vessels (LHR13 from Lohari Ragho I and MSD3412 from
Masudpur VII) demonstrate both C3 and C4 plant-input, whereas MSD329 has highly
enriched δ13C16:0 values, suggesting a very high C4 plant input. It is likely that MSD329
was predominantly used to process dairy products from cattle/buffalo milk, however, the
other results are not straightforward to interpret. It is possible they were used to process
non-ruminant products, plant products, or mixtures of plant and dairy products.
G.6. Globular jars
Only three examples of globular jars, all from Lohari Ragho I, were analysed. Their
classification as globular jars was possible due to their semi-complete preservation. The
average lipid concentration of globular jars was 28.34 μg/g, ranging between 5.8 μg/g and
44.6 μg/g.
The lipid profiles of the globular jars were characteristic of degraded animal fats,
with medium- and long-chain fatty acids between C12:0-C24:0. These included odd- and
branched-chain fatty acids such as C15:0, C15Br, C17:0 and C17Br. GC-c-IRMS analysis was
conducted on two vessels (LHR03 and LHR07) with relatively higher lipid concentrations
to determine the potential source(s) of the fat input into the vessels.
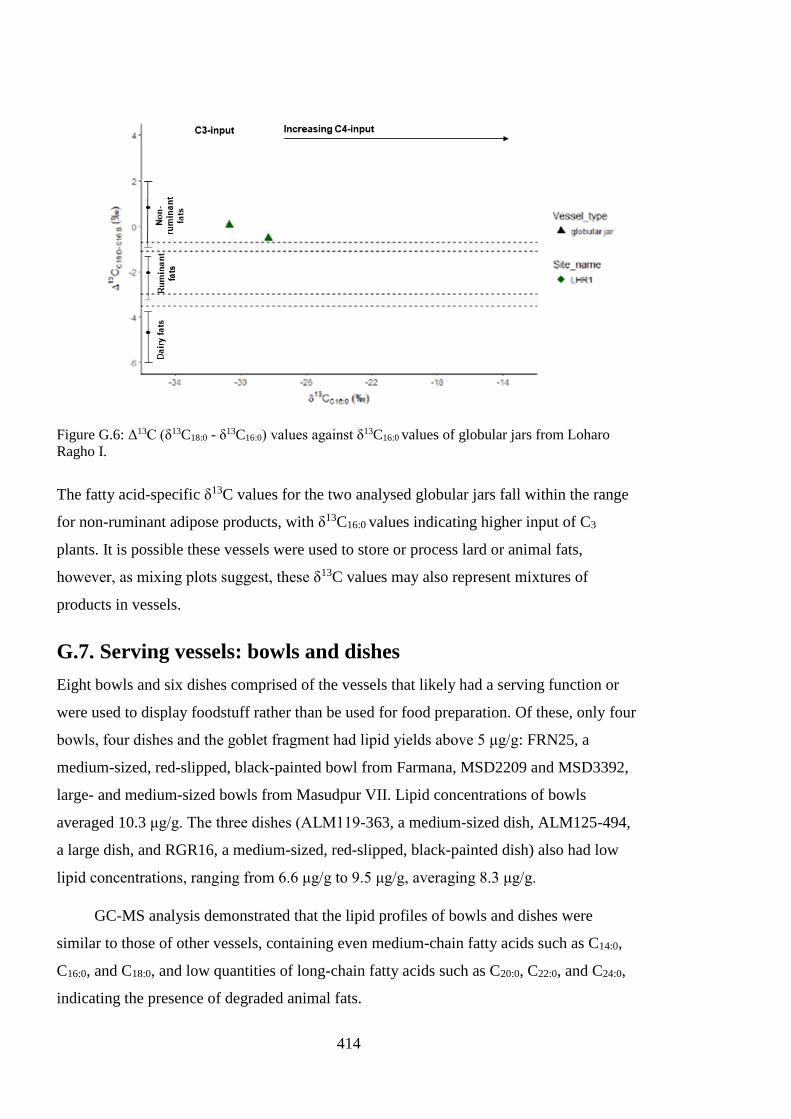
414
Figure G.6: Δ13C (δ13C18:0 - δ13C16:0) values against δ13C16:0 values of globular jars from Loharo
Ragho I.
The fatty acid-specific δ13C values for the two analysed globular jars fall within the range
for non-ruminant adipose products, with δ13C16:0 values indicating higher input of C3
plants. It is possible these vessels were used to store or process lard or animal fats,
however, as mixing plots suggest, these δ13C values may also represent mixtures of
products in vessels.
G.7. Serving vessels: bowls and dishes
Eight bowls and six dishes comprised of the vessels that likely had a serving function or
were used to display foodstuff rather than be used for food preparation. Of these, only four
bowls, four dishes and the goblet fragment had lipid yields above 5 μg/g: FRN25, a
medium-sized, red-slipped, black-painted bowl from Farmana, MSD2209 and MSD3392,
large- and medium-sized bowls from Masudpur VII. Lipid concentrations of bowls
averaged 10.3 μg/g. The three dishes (ALM119-363, a medium-sized dish, ALM125-494,
a large dish, and RGR16, a medium-sized, red-slipped, black-painted dish) also had low
lipid concentrations, ranging from 6.6 μg/g to 9.5 μg/g, averaging 8.3 μg/g.
GC-MS analysis demonstrated that the lipid profiles of bowls and dishes were
similar to those of other vessels, containing even medium-chain fatty acids such as C14:0,
C16:0, and C18:0, and low quantities of long-chain fatty acids such as C20:0, C22:0, and C24:0,
indicating the presence of degraded animal fats.
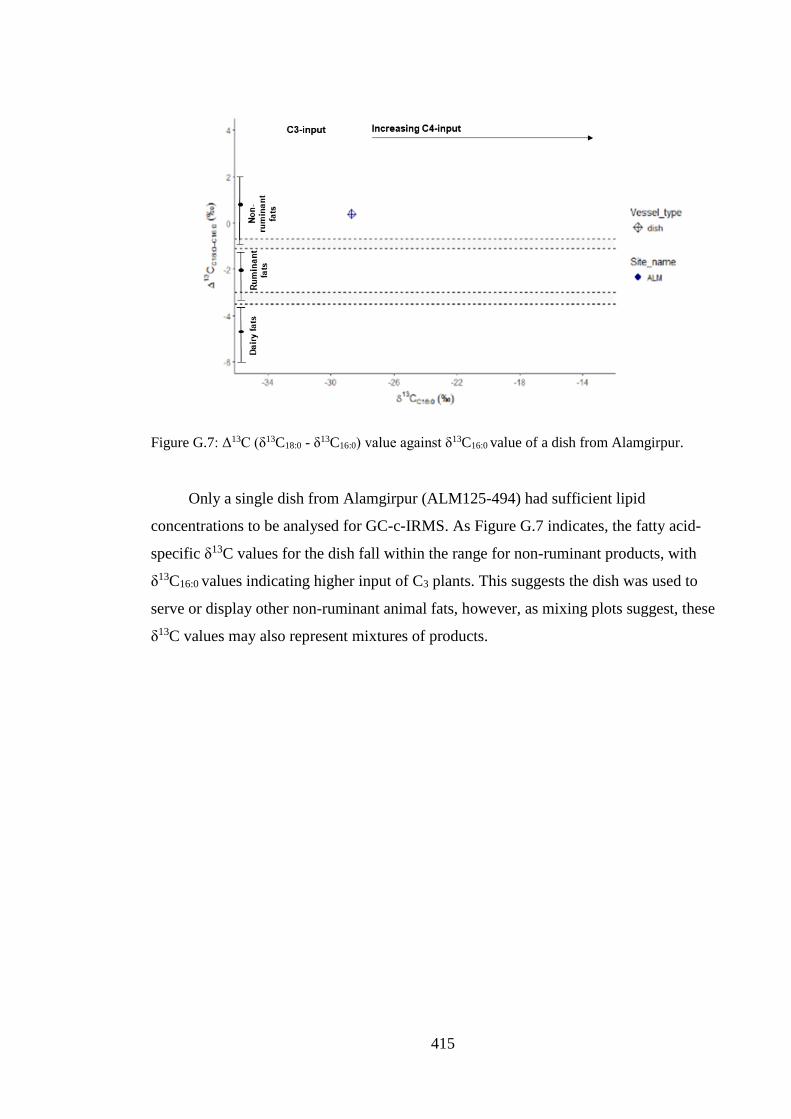
415
Figure G.7: Δ13C (δ13C18:0 - δ13C16:0) value against δ13C16:0 value of a dish from Alamgirpur.
Only a single dish from Alamgirpur (ALM125-494) had sufficient lipid
concentrations to be analysed for GC-c-IRMS. As Figure G.7 indicates, the fatty acid-
specific δ13C values for the dish fall within the range for non-ruminant products, with
δ13C16:0 values indicating higher input of C3 plants. This suggests the dish was used to
serve or display other non-ruminant animal fats, however, as mixing plots suggest, these
δ13C values may also represent mixtures of products.
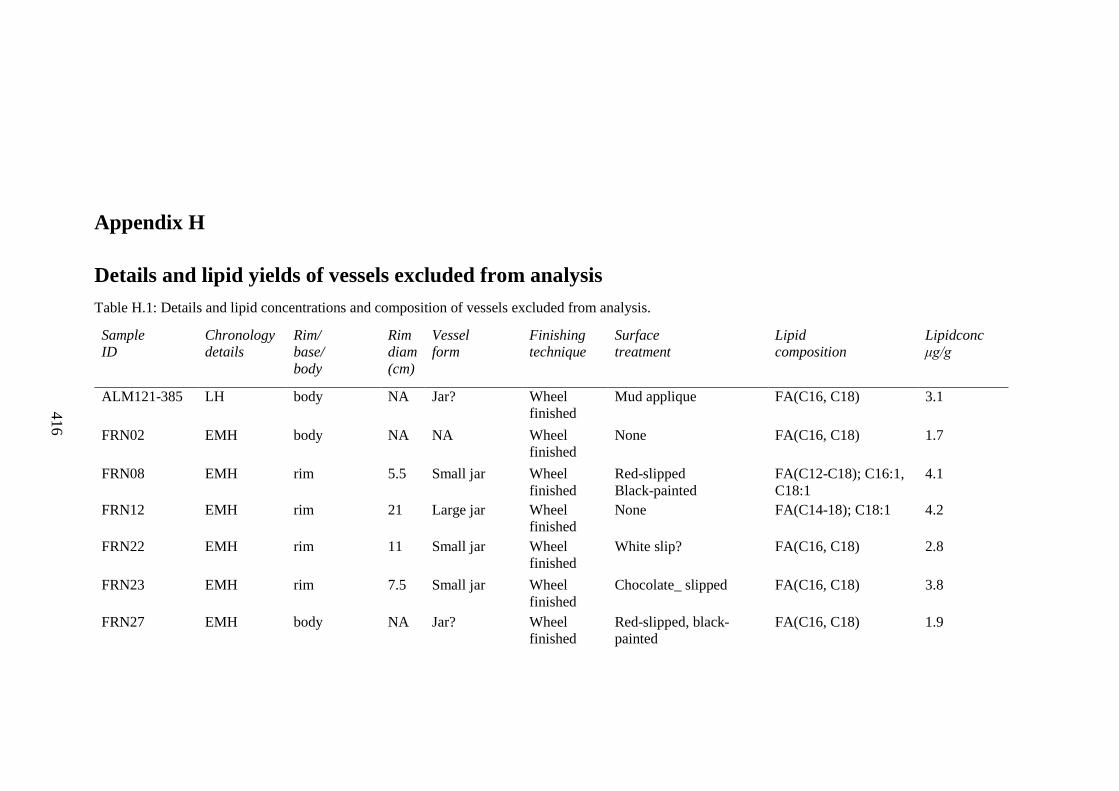
416
Appendix H
Details and lipid yields of vessels excluded from analysis
Table H.1: Details and lipid concentrations and composition of vessels excluded from analysis.
Sample
ID
Chronology
details
Rim/
base/
body
Rim
diam
(cm)
Vessel
form
Finishing
technique
Surface
treatment
Lipid
composition
Lipidconc μg/g
ALM121-385 LH body NA Jar? Wheel
finished
Mud applique FA(C16, C18) 3.1
FRN02 EMH body NA NA Wheel
finished
None FA(C16, C18) 1.7
FRN08 EMH rim 5.5 Small jar Wheel
finished
Red-slipped
Black-painted
FA(C12-C18); C16:1,
C18:1
4.1
FRN12 EMH rim 21 Large jar Wheel
finished
None FA(C14-18); C18:1 4.2
FRN22 EMH rim 11 Small jar Wheel
finished
White slip? FA(C16, C18) 2.8
FRN23 EMH rim 7.5 Small jar Wheel
finished
Chocolate_ slipped FA(C16, C18) 3.8
FRN27 EMH body NA Jar? Wheel
finished
Red-slipped, black-
painted
FA(C16, C18) 1.9
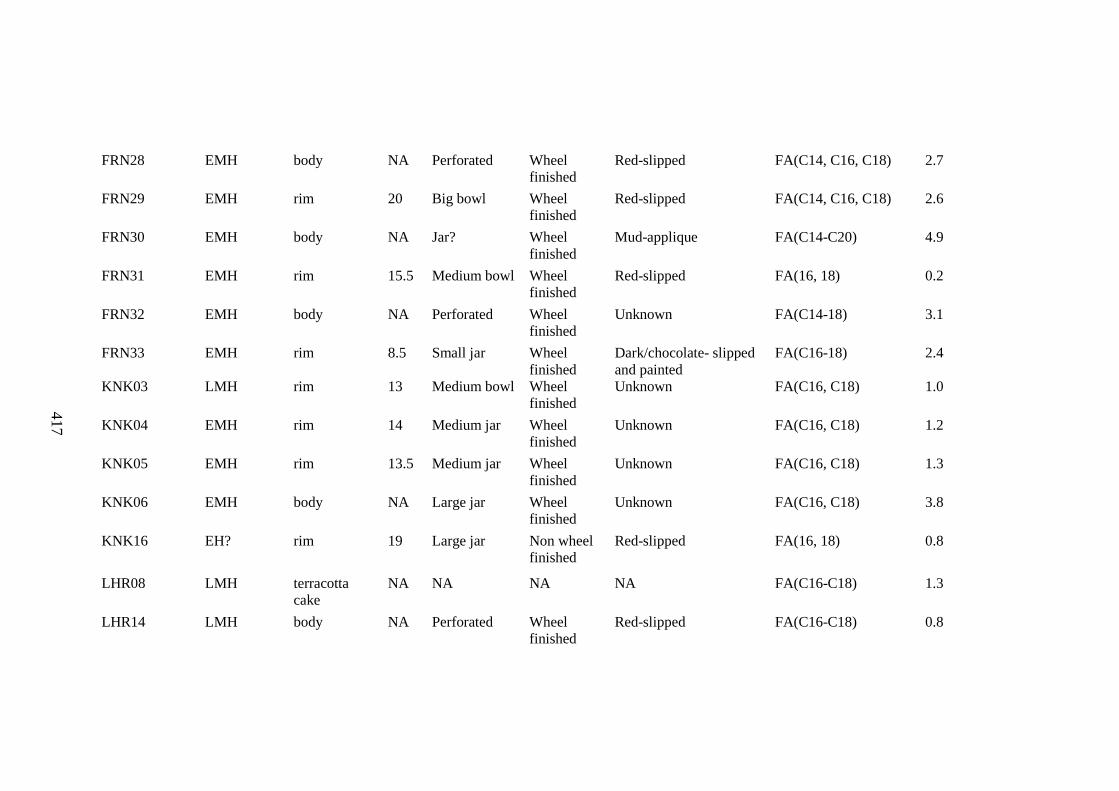
417
FRN28 EMH body NA Perforated Wheel
finished
Red-slipped FA(C14, C16, C18) 2.7
FRN29 EMH rim 20 Big bowl Wheel
finished
Red-slipped FA(C14, C16, C18) 2.6
FRN30 EMH body NA Jar? Wheel
finished
Mud-applique FA(C14-C20) 4.9
FRN31 EMH rim 15.5 Medium bowl Wheel
finished
Red-slipped FA(16, 18) 0.2
FRN32 EMH body NA Perforated Wheel
finished
Unknown FA(C14-18) 3.1
FRN33 EMH rim 8.5 Small jar Wheel
finished
Dark/chocolate- slipped
and painted
FA(C16-18) 2.4
KNK03 LMH rim 13 Medium bowl Wheel
finished
Unknown FA(C16, C18) 1.0
KNK04 EMH rim 14 Medium jar Wheel
finished
Unknown FA(C16, C18) 1.2
KNK05 EMH rim 13.5 Medium jar Wheel
finished
Unknown FA(C16, C18) 1.3
KNK06 EMH body NA Large jar Wheel
finished
Unknown FA(C16, C18) 3.8
KNK16 EH? rim 19 Large jar Non wheel
finished
Red-slipped FA(16, 18) 0.8
LHR08 LMH terracotta
cake
NA NA NA NA FA(C16-C18) 1.3
LHR14 LMH body NA Perforated Wheel
finished
Red-slipped FA(C16-C18) 0.8
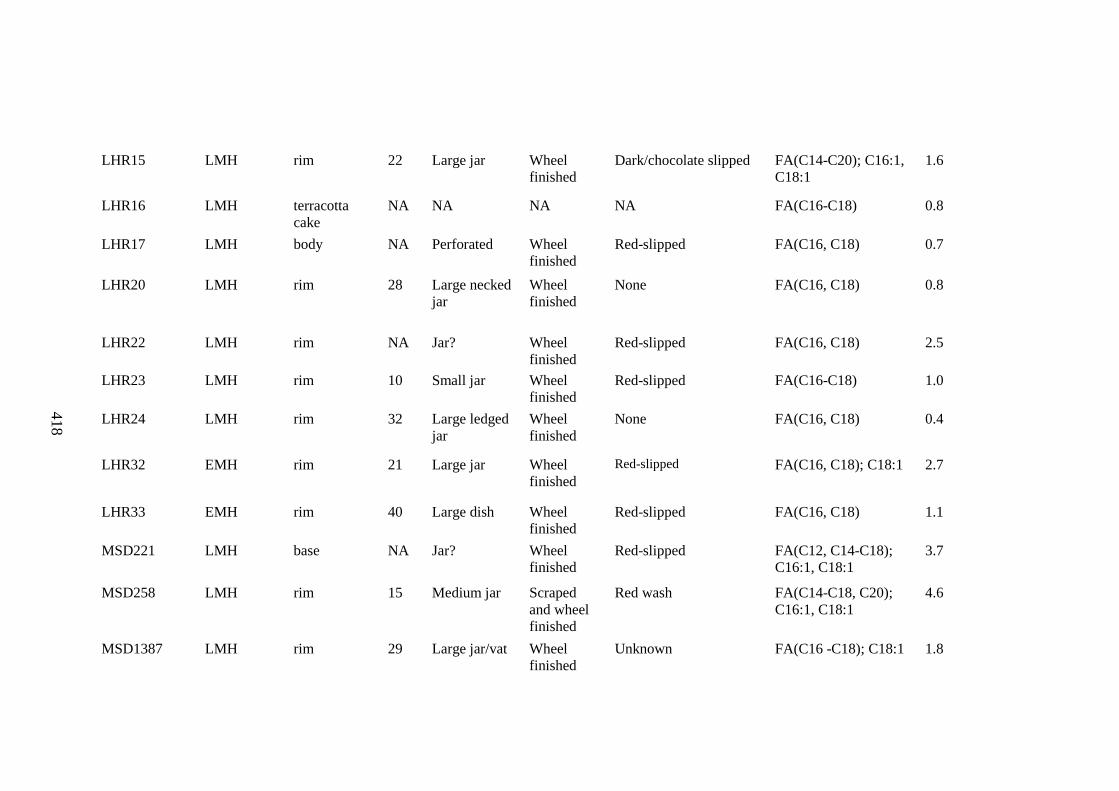
418
LHR15 LMH rim 22 Large jar Wheel
finished
Dark/chocolate slipped FA(C14-C20); C16:1,
C18:1
1.6
LHR16 LMH terracotta
cake
NA NA NA NA FA(C16-C18) 0.8
LHR17 LMH body NA Perforated Wheel
finished
Red-slipped FA(C16, C18) 0.7
LHR20 LMH rim 28 Large necked
jar
Wheel
finished
None FA(C16, C18) 0.8
LHR22 LMH rim NA Jar? Wheel
finished
Red-slipped FA(C16, C18) 2.5
LHR23 LMH rim 10 Small jar Wheel
finished
Red-slipped FA(C16-C18) 1.0
LHR24 LMH rim 32 Large ledged
jar
Wheel
finished
None FA(C16, C18) 0.4
LHR32 EMH rim 21 Large jar Wheel
finished
Red-slipped FA(C16, C18); C18:1 2.7
LHR33 EMH rim 40 Large dish Wheel
finished
Red-slipped FA(C16, C18) 1.1
MSD221 LMH base NA Jar? Wheel
finished
Red-slipped FA(C12, C14-C18);
C16:1, C18:1
3.7
MSD258 LMH rim 15 Medium jar Scraped
and wheel
finished
Red wash FA(C14-C18, C20);
C16:1, C18:1
4.6
MSD1387 LMH rim 29 Large jar/vat Wheel
finished
Unknown FA(C16 -C18); C18:1 1.8
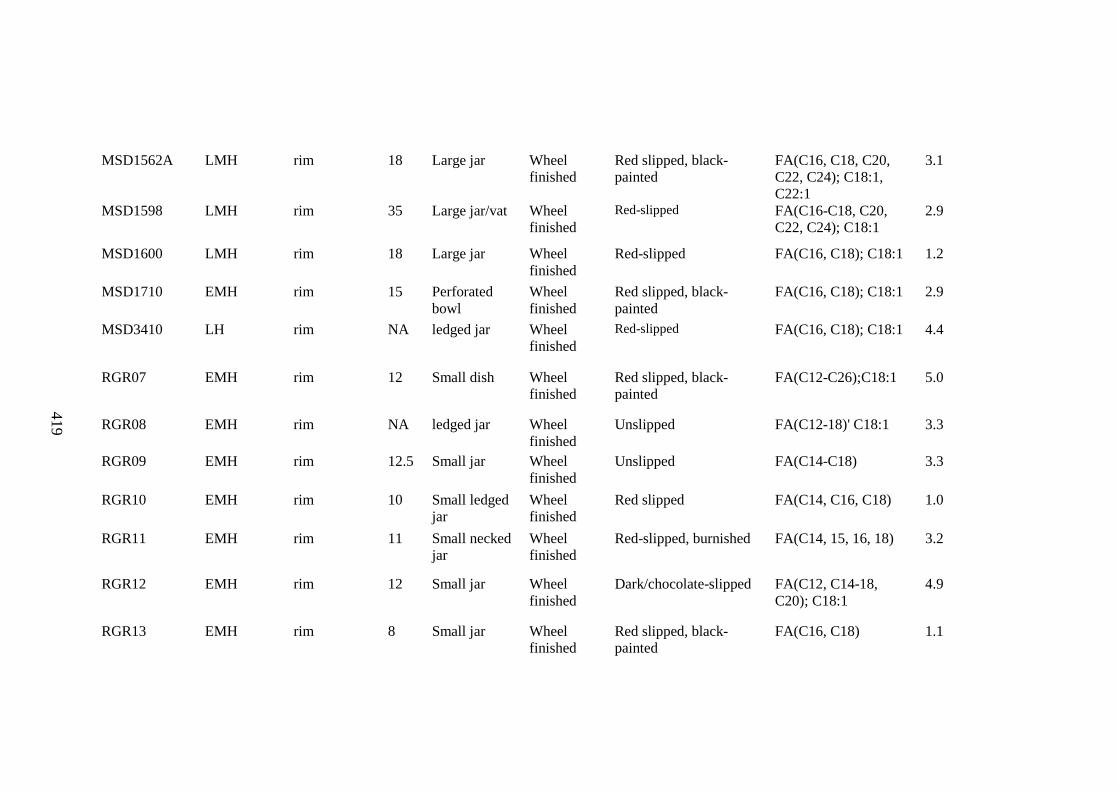
419
MSD1562A LMH rim 18 Large jar Wheel
finished
Red slipped, black-
painted
FA(C16, C18, C20,
C22, C24); C18:1,
C22:1
3.1
MSD1598 LMH rim 35 Large jar/vat Wheel
finished
Red-slipped FA(C16-C18, C20,
C22, C24); C18:1
2.9
MSD1600 LMH rim 18 Large jar Wheel
finished
Red-slipped FA(C16, C18); C18:1 1.2
MSD1710 EMH rim 15 Perforated
bowl
Wheel
finished
Red slipped, black-
painted
FA(C16, C18); C18:1 2.9
MSD3410 LH rim NA ledged jar Wheel
finished
Red-slipped FA(C16, C18); C18:1 4.4
RGR07 EMH rim 12 Small dish Wheel
finished
Red slipped, black-
painted
FA(C12-C26);C18:1 5.0
RGR08 EMH rim NA ledged jar Wheel
finished
Unslipped FA(C12-18)' C18:1 3.3
RGR09 EMH rim 12.5 Small jar Wheel
finished
Unslipped FA(C14-C18) 3.3
RGR10 EMH rim 10 Small ledged
jar
Wheel
finished
Red slipped FA(C14, C16, C18) 1.0
RGR11 EMH rim 11 Small necked
jar
Wheel
finished
Red-slipped, burnished FA(C14, 15, 16, 18) 3.2
RGR12 EMH rim 12 Small jar Wheel
finished
Dark/chocolate-slipped FA(C12, C14-18,
C20); C18:1
4.9
RGR13 EMH rim 8 Small jar Wheel
finished
Red slipped, black-
painted
FA(C16, C18) 1.1
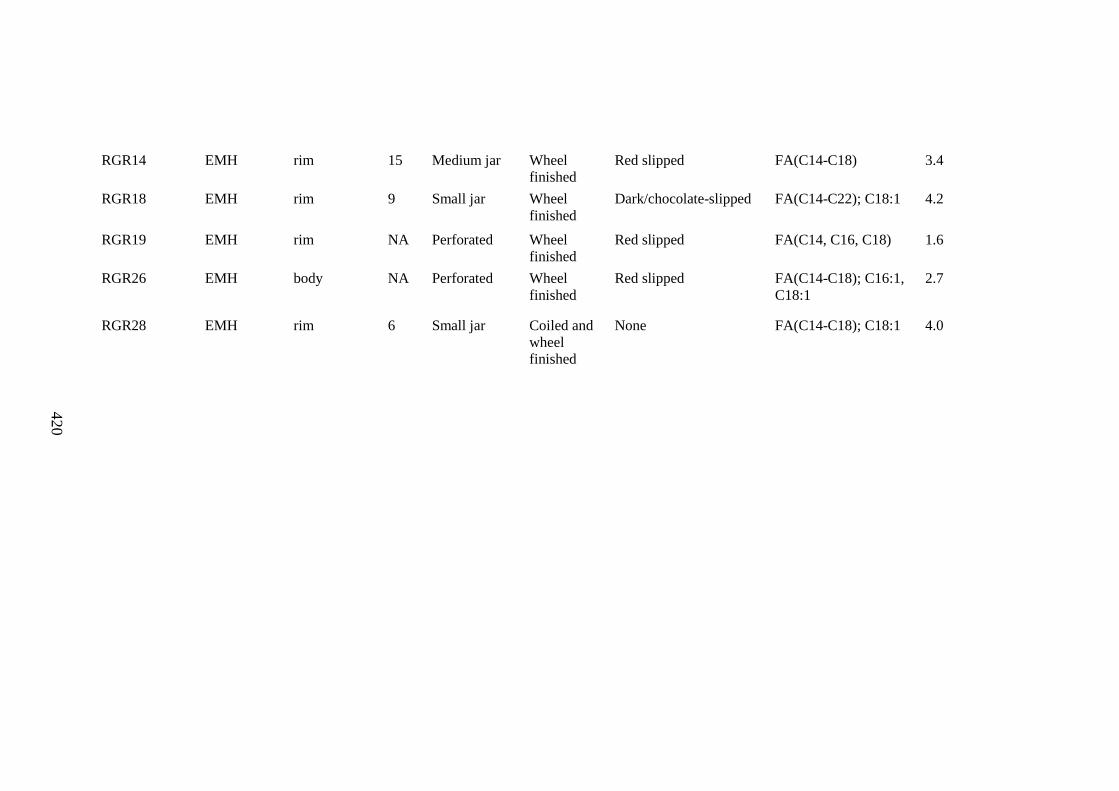
420
RGR14 EMH rim 15 Medium jar Wheel
finished
Red slipped FA(C14-C18) 3.4
RGR18 EMH rim 9 Small jar Wheel
finished
Dark/chocolate-slipped FA(C14-C22); C18:1 4.2
RGR19 EMH rim NA Perforated Wheel
finished
Red slipped FA(C14, C16, C18) 1.6
RGR26 EMH body NA Perforated Wheel
finished
Red slipped FA(C14-C18); C16:1,
C18:1
2.7
RGR28 EMH rim 6 Small jar Coiled and
wheel
finished
None FA(C14-C18); C18:1 4.0