Embed Size (px)
Citation preview

What impact does the alteration of timing to
slurry applications have on leaching of
nitrate, phosphate and bacterial pathogens?
A Rapid Evidence Assessment.
Authors: Alice Waterson and Nicola P Randall Centre for Evidence Based Agriculture, Harper Adams University, Newport Shropshire TF10 8NB Correspondence: [email protected] 44(0)1952 815347 This work was commissioned by the Department of Food and Rural Affairs (Defra) and was funded by the Natural Environment Research Council (NERC).

1
Executive summary
Background
Approximately 90 million tonnes of farm manures are applied to agricultural land in the UK each
year. This application of manures and slurries provides a highly valuable source of plant available
nutrients to agricultural soils with an estimated fertilizer value of £150 million per year, but there is
increasing concern about potential detrimental effects on the natural environment and water
quality. Slurry application poses significant risk of diffuse pollution to water courses, through nitrate,
ammonium, phosphate and microbial pathogen losses.
Regulations restrict the application of manures on all soil types in the late autumn-winter period in
order to minimise nitrate leaching (and other nutrient losses) following manure applications, with
the length of the ‘closed period’ varying according to soil type and land use.
REA Process
This Rapid Evidence Assessment (REA) aimed to compile and describe available evidence on the
effect of the alteration of slurry application timing for delivering an improved water environment
(focussing on nitrate, phosphate and bacterial pathogens as components of water pollution), to
establish a general consensus on the effectiveness of this intervention, to assess the quality of
available evidence and to identify potential gaps in current knowledge.
From an initial 7903 potentially relevant articles initially found, 34 relevant studies were collated
into a searchable database of research and the findings summarised. Eight studies were evaluated
for the robustness of research and effectiveness of interventions.
Key findings
Individual studies compared a wide variety of different timings, and often recorded variable or
unclear results for best application timing to reduce leaching. Many of the studies were only read to
abstract, or had confounding factors, but in very general terms autumn was most commonly
identified as the worst timing for leaching (particularly of Nitrates), and this confirmed in 7 of 8
studies that were available at full text and did not have confounding factors. Again in very general
terms, spring was most often identified as the best application time for reduced leaching. Winter
applications also reduced leaching when compared with autumn, although this was less frequently
studied than autumn versus spring timings.
Implications for policy and further research
The findings broadly support current policy that restricts slurry application during the autumn. The
research most frequently demonstrated that autumn application poses the most significant risks in

2
terms of nutrient and pollutant regulations. Winter applications were sometimes found to lead to
less leaching than autumn applications, but this REA did not consider other potential impacts of
winter applications (such as negative impacts of machinery on waterlogged soils etc.). Spring
applications were most frequently found to reduce the impacts of leaching when compared to
autumn applications.
The research found was dominated by studies into leaching of Nitrates following slurry applications.
This highlights a potential research gap, as Phosphates and Faecal Indicator Organisms also have the
potential to cause significant environmental and health impacts.
It would be useful for future studies to report changes to pollutants quantitatively (e.g. percentage
reduction).
The reporting and/or design of studies was such that it was often not possible to ascertain the study
whether or not impacts were due to the variations in slurry timings or to other factors investigated
in the same study. Clear reporting of study design and of individual interventions would increase the
value of future research.

3
Background
Application of fertilizers, both organic and inorganic, is commonplace in agricultural systems
worldwide. In England and Wales, approximately 16% of tilled land and approximately 48% of
grasslands receive annual applications of manures (Chambers et al. 2000). This process is highly
valuable in terms of soil quality, crop production and also as an effective means of waste
management.
Approximately 90 million tonnes of farm manures, supplying 450,000 tonnes of nitrogen are applied
to agricultural land in the UK each year (Williams et al. 2006). In addition to these quantities, it is
estimated that an additional 45 million tonnes of excreta are deposited directly onto land through
grazing livestock. This application of manures and slurries provides a highly valuable source of plant
available nutrients to agricultural soils. For example, in Spring 2014 an application of 30m3/ha pig
slurry equates to £130 fertiliser value/ha, and cattle farmyard manure applied at 40 tonnes/ha
equates to £259/ha (based on inorganic fertilizer trade costs).
Despite the benefits of these manures to the agricultural sector, there is increasing concern about
potential detrimental effects on the natural environment and water quality. Slurry application poses
significant risk of diffuse pollution to water courses, through nitrate, ammonium, phosphate and
microbial pathogen losses, and of air pollution through losses of ammonia and nitrous oxide
(Nicholson et al 2011). Water pollution from agricultural sources can have significant and
detrimental impacts on human health, water quality and the natural environment. High nitrate and
phosphate levels in drinking water are considered unsafe for human consumption. The presence of
microbial pathogens, known as faecal indicator organisms (FIOs), can also contaminate drinking
waters, along with bathing waters and shellfish production. High phosphorus and nitrate levels in the
environment can also lead to eutrophication, disturbing the balance of organisms present in an
ecosystem and ultimately can cause sections of water body being killed off as a result of oxygen
removal (Defra 2012a).
In recent decades, concerns regarding the extent of diffuse pollution as a result of agricultural
pollution have grown, with agricultural activities believed to contribute very significantly to levels of
aquatic pollution and estimated to be the source of 28% of phosphates, 70% of nitrates and 76% of
sediments in UK rivers (Collins et al. 2009, Edwards et al. 2008). UK catchments dominated by
agricultural land use also have elevated levels of bacterial pathogen counts (Kay et al. 2008).
Such concerns have contributed to the development and implementation of the European Water
Framework Directive (WFD), whereby European member states are legally committed to tackling

4
water pollution through this legislation and additional directives including the Nitrates Directives,
the Ground Water Directive and the Bathing Water Directive. Adopted in 2000, the overall aim of the
WFD is for the ‘water bodies’ and ‘protected areas’ within each River Basin District to achieve 'good
status' by 2015 (Natural England 2013).
The Nitrates Directive specifically targets agricultural pollution and aims to protect water quality
across Europe by preventing nitrates from agricultural sources polluting ground and surface waters
and by promoting the use of good farming practices (European Commission 2010). In the UK, Nitrate
Vulnerable Zones (NVZs) are used to implement some of this policy on a national scale (Defra 2011).
Substantially revised in 2008, the Nitrate Vulnerable Zone Action Programme covers approximately
58% of agricultural land in England(Defra 2013). This regulation requires the effective planning,
calculation, application and recording of mineral fertilizers and livestock manure in accordance with
the field limit, farm limit and crop nitrogen requirement, the effective and appropriate storage of
slurry and the restriction of slurry application during ‘closed periods’ (Defra, 2012b).
With particular focus on the timing of slurry application, NVZ regulations restrict the application of
manures with readily available nitrogen contents greater than 30% of total nitrogen (i.e. pig/cattle
slurries and poultry manures) on all soil types in the late autumn-winter period. The ‘closed
spreading periods’ are designed to minimise nitrate leaching (and other nutrient losses) following
manure applications, with the length of the ‘closed period’ varying according to soil type and land
use (Nicholson et al 2011). From a farm management perspective however, the timing of slurry
application is a difficult issue, with slurry storage capacity and the ability for heavy application
machinery to operate on potentially water-logged soils both needing consideration.
The timing of slurry application is thought to have an impact on the scale of subsequent nutrient and
microbial losses, and consequently the potential magnitude of pollution impact. Autumn
applications are widely considered to increase the risk of nitrate leaching losses, regardless of soil
type. Nitrogen uptake during the autumn and winter period is generally low, and typical seasonal
rainfall patterns can wash manure-derived nutrients and pathogens beyond crop rooting depth and
consequently lead to leaching (Nicholson et al 2011).

5
Objective of the review
This Rapid Evidence Assessment (REA) aimed to compile and describe available evidence on the
effect of the alteration of slurry application timing for delivering an improved water environment
(focussing on nitrate, phosphate and bacterial pathogens as components of water pollution), to
establish a general consensus on the effectiveness of this intervention, to assess the quality of
available evidence and to identify potential gaps in current knowledge.
Primary question
This study aimed to address the following question:
What impact does the alteration of timing to slurry applications have on leaching of nitrate,
phosphate and bacterial pathogens?
This is an impact question designed specifically to assess the effectiveness of alternating the timing
of slurry application as a policy driven intervention method, on the selected components of water
pollution.
This question can be broken down into its PICO components:
PICO element and definition PICO element within this REA
Population – the subject to which the
intervention is applied
Water pollutants (nitrate, ammonia, phosphates
and bacterial pathogens)
Intervention – the policy or related
intervention/exposure such as management
regime
Alteration of timing of slurry application
Comparator – control example of no
intervention or alternative
Absence of slurry application or application
during a different period
Outcome Impact on water quality
Primary outcomes measured were:
Nitrate, phosphate and bacterial pathogens as components of water pollution.
Methods
The method used in the development of the Rapid Evidence Assessment was based on draft
guidance for the production of Quick Scoping Reviews and Rapid Evidence Assessments produced by
the Department of Environment, Food and Rural Affairs (Defra) (Miller et al, 2013)

6
Searches
A comprehensive search was undertaken using multiple information sources in order to capture an
unbiased sample of literature. The search strategy was designed to identify both published
unpublished (grey) literature.
An initial scoping search was performed to test for specificity and sensitivity using the online
database Web of Knowledge. The results of the scoping search were used to inform the final search
strategy.
Wildcards (*) were used, where accepted by a database/search engine, to pick up multiple word
endings. For example pollut* would pick up pollutant, pollution. Keywords were made more
restrictive by the addition of a qualifier, or multiple qualifiers e.g. (slurry application AND
pollut*AND water). The combination of qualifiers and keywords varied for each outcome studied
based on the results of the scoping search. The exact keyword and qualifier combinations used for
each of the database and web searches are listed in Table 1.
The following online sources were searched to identify relevant literature:
Electronic databases:
ISI Web of Knowledge involving the following products: ISI Web of Science; ISI Proceedings
Science Direct
Wiley Online Library
Index to Theses Online
CAB Abstracts
Organisational websites:
Defra online databases
Environment Agency
Natural Environment Research Council Open Research Archive
Centre for Ecology and Hydrology
Countryside Council for Wales
Scottish Environment Agency
Northern Ireland Environment Agency

7
Search term String 1 String 2 Limiting string 3 Limiting string 4
1 Timing AND slurry AND pollut*
2 Timing AND slurry AND pollut* AND water
3 Timing AND slurry AND nitrate*
4 Timing AND slurry AND pathogen*
5 Timing AND slurry AND ammoni* AND water
6 Timing AND slurry AND ammonia volatilization
7 Timing AND slurry AND phosph* AND water
8 Timing AND slurry AND leach* AND water
9 Slurry appl* AND pollut*
10 Slurry appl* AND nitrate* AND pollut*
11 Slurry appl* AND pathogen*
12 Slurry appl* AND ammoni* AND pollut*
13 Slurry appl* AND ammoni* AND water
14 Slurry appl* AND
ammonia volatilization
15 Slurry appl* AND phosph* AND water
16 Slurry appl* AND leach* AND water
17 Timing AND slurry AND nitrate* AND water
18 Timing AND slurry AND pathogen* AND water
19 Timing AND slurry AND ammonia volatilization AND water
20 Slurry appl* AND pollut* AND water
21 Slurry appl* AND nitrate* AND water
22 Slurry appl* AND pathogen* AND water
23 Slurry appl* AND
ammonia volatilization AND water
24 Slurry appl* AND pollut* AND river
25 Timing AND slurry AND pollut* AND River
26 Slurry appl* AND pollut* AND catchment
27 Timing AND slurry AND pollut* AND catchment
28 Slurry appl* AND run off
29 Timing AND slurry AND run off
Table 1. Search terms used for the REA

8
In addition, web searches were performed using the search engines http://google.com and
http://scholar.google.com. The first 50 hits (.doc .txt.xls and .pdf documents where this could be
separated) from each data source were examined for appropriate data. No further links from the
captured website were followed.
Database and repository searches were conducted in the English language. The potential language
bias associated with this strategy was discussed with funders, and was considered acceptable for this
review.
The results of each search term on each database were imported into a separate EndNote X2TM
library file. Once the searching process was complete, all the database libraries were incorporated
into one library, and the number of references captured was recorded. Using the automatic function
in the EndNote software any duplicates were removed.
A record of each search was made to enable a re-run of the search if necessary.
Date search conducted
Database name
Search term
Number of hits
Notes
Study inclusion criteria
All retrieved studies were assessed for relevance using inclusion criteria developed in collaboration
with funders and with subject experts as follows:
Relevant subject(s): Studies that investigated at least one of the following aspects of water quality:
nitrate, phosphate or bacterial pathogen levels, as an effect of alteration to the timing of slurry
application were considered for inclusion, irrespective of scale. Stakeholders agreed that the study
should focus on temperate countries with similar farming systems to the UK. Those countries were:
UK, Ireland, France, Belgium, Switzerland, Germany, Holland, Luxembourg, Liechtenstein, Denmark,
Sweden, Norway, Finland, Austria, Slovakia, Poland, Hungary, Czech Republic, Romania, Lithuania,
Latvia, Estonia, Belarus, Ukraine, northern states of the USA, Canada and New Zealand.
Language: Studies published in English.
Date: No date restrictions were applied.
Types of comparator included: Variations in timing of slurry application. Studies that compared or
observed effects before and after the implementation of the intervention were also included.

9
Types of outcome: Differences in water quality measured as change in levels of nitrate, phosphate
and bacterial counts were considered.
Types of study: Any experimental or correlative research study that collected primary data to
investigate the effectiveness of varying the timing of slurry application for delivering an improved
water environment were considered.
Evidence refinement
The first stage of evidence refinement involved the application of the inclusion criteria in the study of
each article using only the title/abstract or headline/first paragraph. If there was any uncertainty or
where there was insufficient information to make an informed decision regarding a studies inclusion,
then relevance to the next stage of the review process (full text assessment) was assumed. The
refined list of search results went forward for use in the REA and the number of references excluded
was recorded. The inclusion criteria were applied by one reviewer to all potential articles, except
where there was any uncertainty, where a second reviewer examined the texts and a consensus
agreement was made.
Data extraction strategy
Database
Studies that passed the inclusion criteria were imported into a database. Each article was coded and
categorised using a combination of generic (e.g. country/s of study, publication date, length of study
etc.) and topic specific (e.g. application timings studied) keywords. Data regarding the study
characteristics, quality of design and results were recorded. A notes section was used to identify any
interesting or unexpected results, but this information was not included in further. Where there was
more than one article found for a study, each article was recorded and cross referenced in the
database.
The database was used to describe the extent of the research in the field and identify knowledge
gaps. It is searchable by topic and can be arranged according to topic areas, publication date,
pollutant type, country of study etc. Simple numerical accounts of the frequencies in each category
can be obtained from the systematic map.
Subject experts reviewed the completed map to ensure that all relevant categories had been
defined.
10
Quality assessment
Studies were assessed for the robustness of the study design in order to provide an indication
of the overall quality of the research evidence. The values assigned to each study are based on
the system outlined in Table 2.
Table 2- Scoring system used to provide a comparative value for study design
Category Score Hierarchy of evidence
Randomized 1
0
Yes - Randomized (includes partial)
Not Randomized
Control 3
2
1
0
Controlled BACI
Control
Comparator
None
Study length 1
0
Study length greater than or equal to a year
Study length less than a year
Replicates 2
1
0
Replicate temporal (includes time series) and spatial
Replicate temporal or spatial
No replicates
Study type 3
2
1
0
Manipulative study
Correlative study
Monitoring study
Sampling study
Adapted from: Donnison et al (2013)
No studies were excluded on the basis of study quality, but were categorised accordingly.
Data synthesis and presentation
Summary tables of study characteristics, study quality and results have been presented,
accompanied by a narrative synthesis.
Where either quantitative or qualitative information on the effectiveness of varying slurry
application timings was available for the studies assessed, the intervention was given a value for its
effectiveness according to the system in Table 3.

11
Table 3. Scoring system used to assess mitigation effectiveness calculated from values in map
Category Measure of effectiveness
2 Yes reduced -All forms of a measurement were reduced by the mitigation.
OR
Pollutant leakage not detected for any forms of measurement
1 Not clear – Outcome not clear as stated by authors, or not clear as mixed
outcome for forms of measurement (No and not clear)
OR
Pollutant leakage outcome not clear.
0 No – No forms of a measurement were reduced by the mitigation.
OR
Pollutant leakage detected for all forms of measurement
Adapted from Donnison et al (2013)

12
Results and discussion
Initial searches identified 7,903 potentially relevant articles. Studies that did not directly address the
question were removed through various stages of elimination, using keywords to exclude irrelevant
topics or the screening of titles and abstracts for relevant information, leaving 34 relevant studies
(Figure 1). These were placed in a database, which is searchable by topic. The database field and
records are summarised in Appendix 1.
Ide
nti
fica
tio
n Records identified through
database searching (n=7903)
Records after duplicates
removed (n=3207)
Scre
en
ing
Records after keyword
exclusion of irrelevant topics
e.g. mining, heavy metals and
medicine (n=380)
Records after screening on
title/abstract and manual
duplicate removal (n=40)
Elig
ibili
ty
An additional 3 studies
considered relevant included
from Google Scholar searches
Ass
ess
men
t
Total number of articles
included in database and
assessment process (n=34)
Records after screening on full
text/abstract: 34 articles
mapped, 20 at full text, 14 at
abstract
(n=40)
Figure 1. Map of the exclusion and screening processes

13
Reference type
Of the 34 studies identified as relevant to this REA, the majority were journal articles (24), with a
further eight conference proceedings and two book references.
Available at full text
Only 20 of the 34 studies included in the database were available at full text level. Of the unavailable
references (n=14), 6 were not available at full text level in the English language, and a further 5
conference proceedings, 1 book and 2 journal articles could not be obtained at full text during the
study period. This lack of availability of a large number of relevant articles created some difficulties
for further analysis and scoring of references.
Year of study
Figure 2. Distribution by year of articles included in the database
Figure 2 shows the distribution of research produced on the effects of the alteration of slurry
application timing on elements of water pollution. Numbers of study per year were low, with no
more than 1 per year between 1978 and 1997, with the frequency of study slightly increased
between 1998 and 2012. Figure 2 also indicates that the majority of research in the area was carried
out before 2008, when regulations regarding slurry application timing, as part of the NVZ
regulations, were introduced.
0
1
2
3
4
5
6
1978
1979
1980
1981
1982
1983
1984
1985
1986
1987
1988
1989
1990
1991
1992
1993
1994
1995
1996
1997
1998
1999
2000
2001
2002
2003
2004
2005
2006
2007
2008
2009
2010
2011
2012
Nu
mb
er
of
stu
die
s
Year of publication

14
Country of study
Figure 3 shows the distribution of country of study of the 34 studies included in the database. This
figure indicates that the UK has been the dominant country producing 10 of the 34 relevant studies
regarding the effects of this intervention on the assessed elements of water pollution. This
dominance may also be influenced by the English language bias in the search and inclusion
strategies. Six studies did not communicate information on the country of study, but all of these
studies were only available at abstract level.
Intervention studied
Studies were carried out across all four seasons and usually compared one or more seasons or
months of application, but reporting was variable. Some authors reported the timing of application
in months and others in seasons sometimes without specifying how months were classified into
seasons. Where it was not specified we categorised seasons as follows: Spring - March to May,
Summer - June to August, Autumn - September to October, and Winter – December to February.
Using this as a general guide, autumn and spring applications were the most commonly studied
seasons, with winter applications also being studied in approximately half of studies. Studies that
included summer applications were less frequent.
Figure 4a demonstrates that the alteration of slurry application timing alone was not the most
frequently studied intervention by a considerable margin. Alteration of timing was more frequently
combined with additional interventions which are detailed in Fig 4b. The inclusion of an additional
0
2
4
6
8
10
12
Nu
mb
er o
f st
ud
ies
Country of study
Figure 3 – Distribution of country of study

15
intervention or the inclusion of the alteration of slurry application rate was investigated in 26 of the
34 studies included in the database.
The study of the alteration of both slurry application timing and rate was as frequently investigated
as timing alone, with timing and timing and rate combined both being the intervention of focus in 7
studies.
Alteration ofslurry application
timing plusadditional
intervention
Alteration ofslurry application
timing
Alteration ofslurry application
rate and timing
Alteration ofslurry application
rate and timingplus additonalintervention
Not clear
0
2
4
6
8
10
12
14
16
Nu
mb
er o
f st
ud
ies
Intervention studied
Manure type orfertiliser type
Use ofnitrification
inhibitor
Soil type Crop type/landuse
Applicationtechnique
Incorporationmethod
0
2
4
6
8
10
12
Nu
mb
er o
f st
ud
ies
Additional interventions studied
Figure 4a – Distribution of interventions studied
Figure 4b – Distribution of additional interventions studied alongside timing of slurry
application timing

16
This inclusion of additional interventions in a study can often make results difficult to interpret, with
10 of the 20 full text studies (50%) having to be excluded from scoring for effectiveness and
hierarchy of evidence due to confounding factors (where it was not possible to tell which
intervention impacted on the outcome, either due to study design or to poor reporting). This issue
requires further thought in future research. Where more than one intervention is studied, testing of
each intervention independently would minimise the occurrence of confounding factors, and so
facilitate clearer conclusions and enable cause and effect relationship to be more easily established.
Study length
Figure 5 illustrates the variation in study lengths used in the 34 studies included in the database.
76% of studies were carried out over a period of one year or more with 38% of these studies being
carried out over a period of 4 years or more.
Outcome comparator
0
2
4
6
8
10
12
Not clear < 1 year 1-2 years 2-3 years 4-5 years > 5 years
Nu
mb
er o
f st
ud
ies
Study length
Study length
Figure 5 – Study design: study length
17
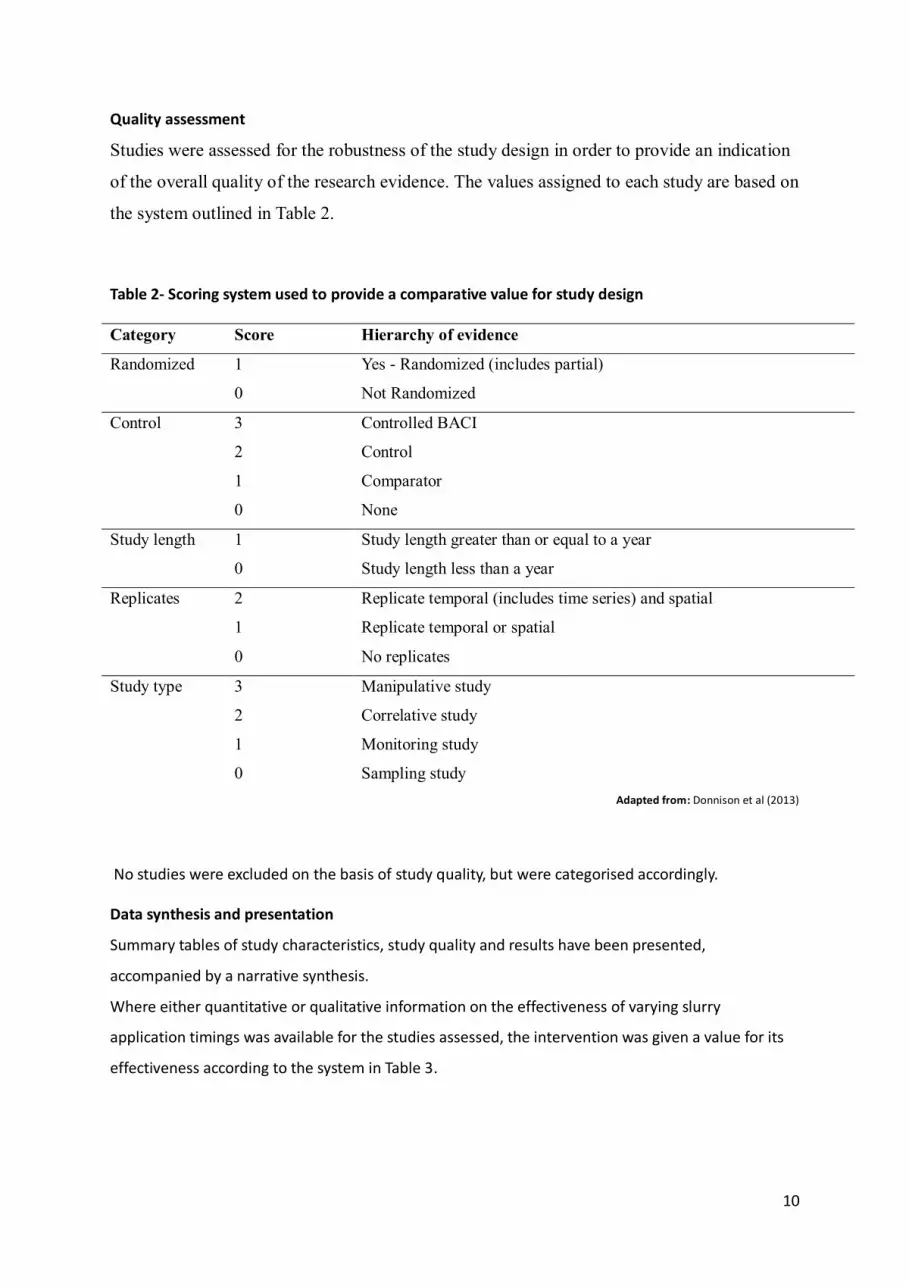
N leaching was the most frequently studied outcome comparator by a considerable margin, with 16
of the 34 studies investigating the impacts of the alteration of slurry application timing on N leaching
(Figure 6). Very little variation was observed in the number of studies produced for the remaining
comparators. Only two studies investigated the effects of the intervention on the leaching of faecal
indicator organisms (FIOs), highlighting a potential research gap with N, P and FIO’s all forming
important components of water pollution. These findings indicate a potential over-emphasis on the
study of N leaching in comparison to other important outcome comparators.
Of the studies that assess multiple pollutant outcomes (n=12), a considerable proportion of these
studies (n=7) either displayed unclear results or variable outcomes for the different pollutants
studied making overall conclusions particularly difficult to determine. This finding indicates the
importance in clear reporting of results in order for successful wider interpretation.
Study type
Over 60% of the 34 studies included in the database had a manipulative study design (Figure 7). For
11 studies, the study design was unclear, but all of these 11 were obtained at abstract only.
0
2
4
6
8
10
12
14
16
18
N leaching N + Pleaching
N leachingand
ammoniumleaching
P leaching N, K, PLeaching
N, P andammonium
leaching
Faecalorganism
leaching
N, P andfaecal
organismleaching
Not clear
Nu
mb
er
of
stu
die
s Outcome comparator
Figure 6 – Distribution of outcome comparators studied

18
Control
Figure 8 demonstrates that 38% of articles (n=13) included in the database reported using a control,
with 44% (n=15) using a comparator and the remaining 18% of studies either using no control or
unclear (all of the articles categorised as unclear were only available at abstract level).
No studies appeared to follow a BACI design, highlighting a potential research need to rigorously
assess the impact and effectiveness of the implementation of the NVZ regulations regarding slurry
application timing.
21
11
1 1
Manipulative Not clear Correlative Experimental
0
5
10
15
20
25
Nu
mb
er
of
stu
die
s Type of study
15
13
5 1
Control
Comparator
Control
Not clear
No
Figure 7 – Number of articles reporting different types of study design
Figure 8 – Number of articles reporting use of a control or comparator. All full text
articles reported presence or absence of controls and comparators. Those where ‘not
clear’ is reported were all obtained at abstract only.
19
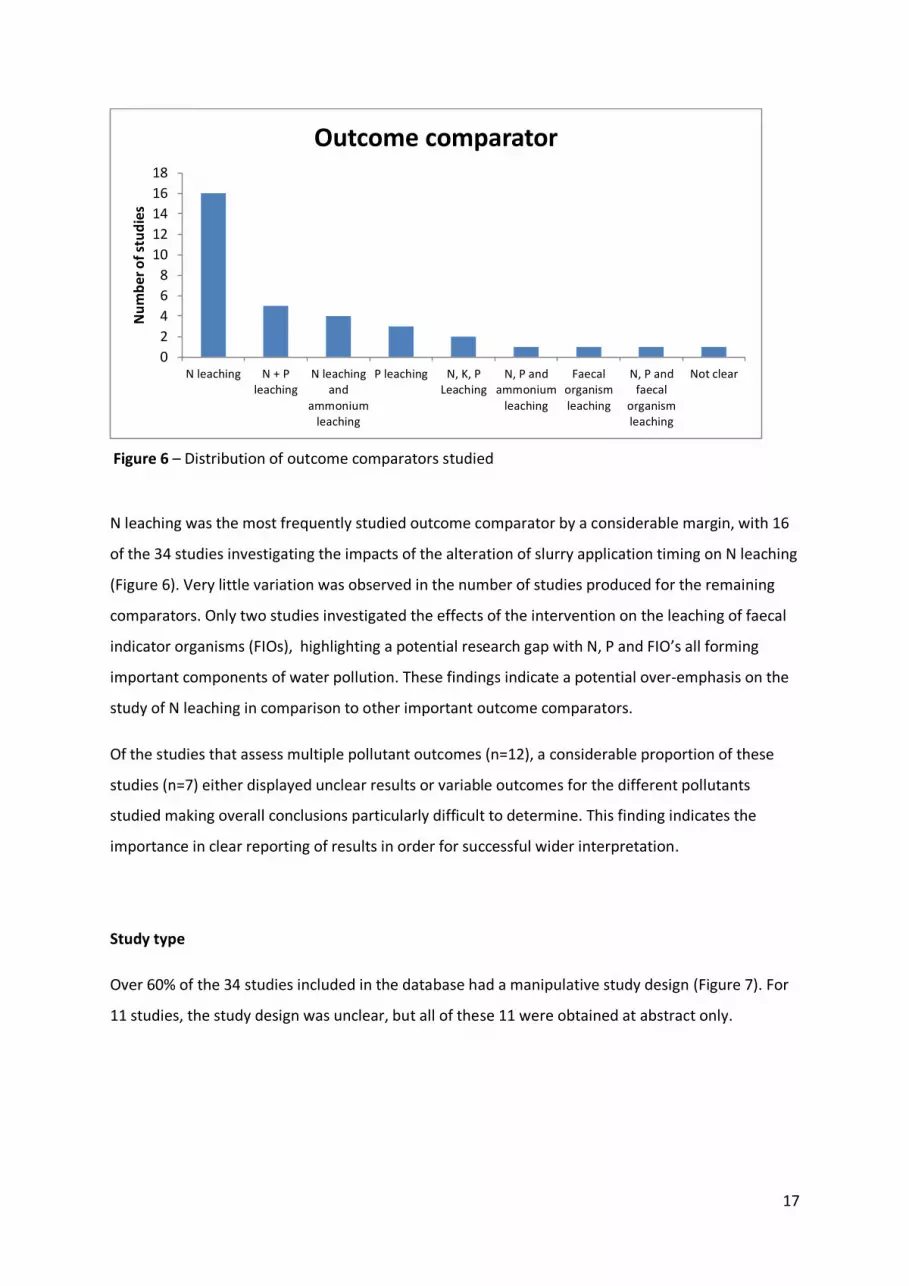
Randomization and replication
The presence of randomisation and replication was an important part of the hierarchy of evidence
scoring. Nine of the 20 full text studies reported randomisation, (for the 11 that did not, it was
assumed that randomisation did not take place), but replication was more common, with over half
of the 20 full text articles reporting both spatial and temporal replicates. A further 6 reported spatial
replicates only, and 2 reported temporal replicates only (Figure 9).
Soil type
11
2
6
1
temporal and spatialreplication
temporal replication only
spatial replication only
no replication/not clear
Figure 9 – Number of full text articles reporting use of replication in study design

20
Information on the soil type studied was frequently available (85% of the articles included in the
database, see Figure 10). No obvious relationship has been observed between soil type and the
effectiveness of the alteration of slurry application timing on minimising elements of water
pollution.
Quality and effectiveness assessment
Of the 34 studies included in the database, only 8 were scored for both robustness of evidence and
for the effectiveness of intervention. The remaining 24 studies were excluded due to poor reporting,
confounding factors, or the lack of availability of studies at the full-text level. The scores are
summarised in tables 4 and 5. Half of the included studies (n=4) had a value of 9 (from a maximum
of 10) for study design, and the remaining had values ranging from 6 to 8, indicating that the
evidence is likely to be fairly robust based on the generic indicators used.
Seven of the 8 studies found that the variation to timing of slurry spreading interventions were
effective. The details of the interventions used and the best and worst times are summarised in
Table 5.
0
2
4
6
8
10
12
14
16
Sand Clay Multiple soiltypes
Not clear Chalk
Nu
mb
er
of
stu
die
s Soil type
Figure 10 – Soil types studied

21
Table 4. Combined hierarchy of evidence and effectiveness scores for 8 studies investigating the impact of varying the timing of slurry applications on water
pollution.
HIERARCHY OF EVIDENCE VALUE
Study id no/1st author
STUDY LENGTH
STUDY TYPE
CONTROL RANDOMIZATION REPLICATES TOTAL VALUE FOR EFFECTIVENESS OF INTERVENTION
3/Beckwith, C. P. 1 3 2 1 2 9 2
8/Estavillo, J. M. 1 3 2 1 2 9 0
9/Froment, M. A. 0 3 2 1 2 8 2
12/Jayasundara 1 3 2 1 2 9 2
21/Smith, K. A. 2002
1 3 2 1 2 9 2
23/Smith, K. A. 2001b
1 3 1 1 1 7 2
25/Thomsen, I. K. 1 3 1 0 1 6 2
31/Harold, M. van Es
1 3 1 0 2 7 2
MAX. POSSIBLE VALUE
10 2
MEAN 8.00 1.75
SD 1.20 0.71

22
Table 5. The best and worst times for application of slurry as reported by authors of 8 studies tested for robustness of evidence and effectiveness of
intervention, using full text studies with no confounding factors.
Reference spring summer autumn winter
Leachate
measured
ID March April May June July August SeptemberOctober November December January February
3 N ** *********
8 no significant differences for leaching using 4 application timings N *********
9 N ** ********
12 N ** *********
21 N, ammonium ** *********
23 split application November/March better than November alone. ... P ** *******
25 N ** ******
31 ...Worst time for N loss on arable ...Worst time for P loss on grass N ** *******
….
Unclear result Least leaching occurred Most leaching occurred Most leaching occurred but clarification provided in table
Effectiveness
value (out of
2)
Hierarchy of
evidence value
(out of 10)
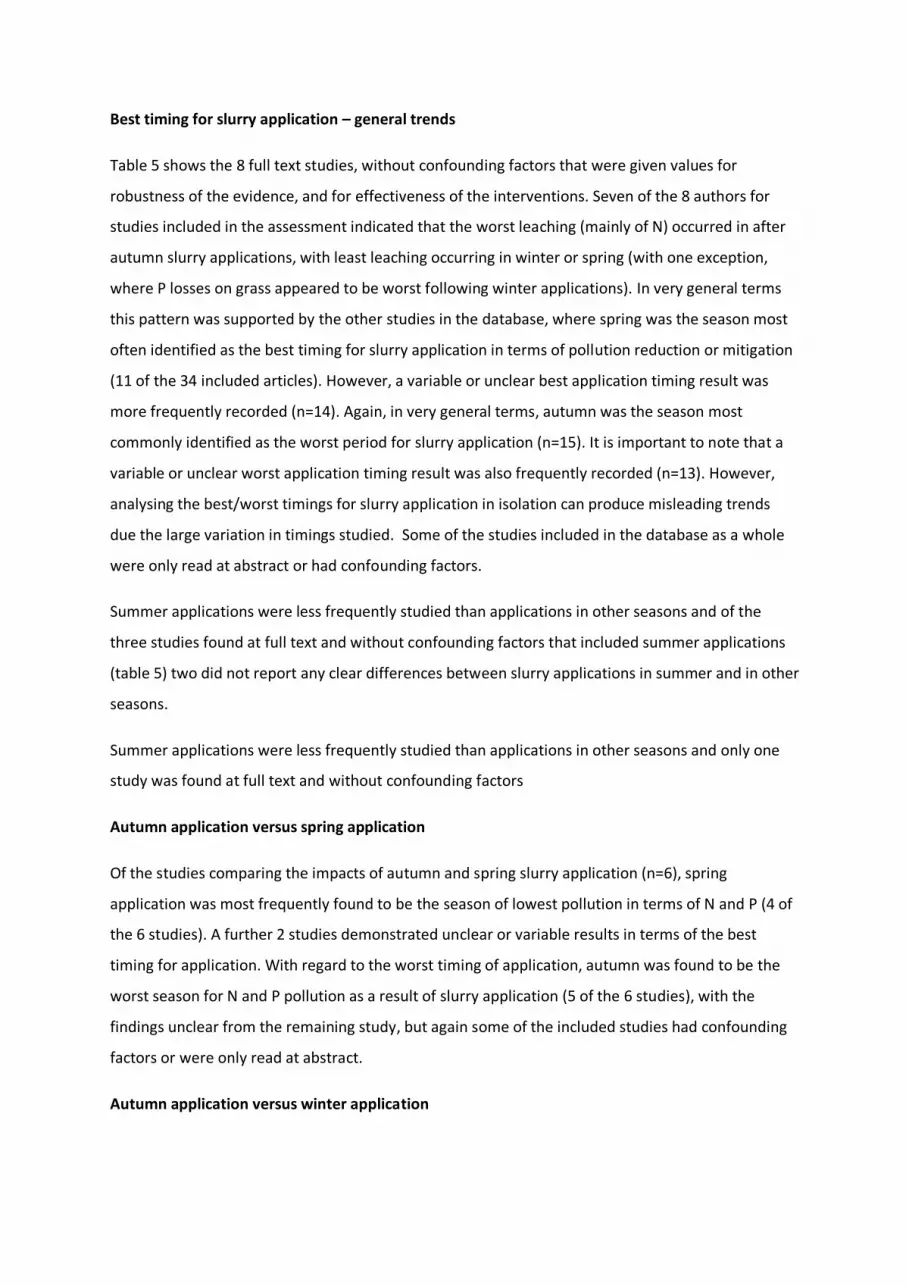
Best timing for slurry application – general trends
Table 5 shows the 8 full text studies, without confounding factors that were given values for
robustness of the evidence, and for effectiveness of the interventions. Seven of the 8 authors for
studies included in the assessment indicated that the worst leaching (mainly of N) occurred in after
autumn slurry applications, with least leaching occurring in winter or spring (with one exception,
where P losses on grass appeared to be worst following winter applications). In very general terms
this pattern was supported by the other studies in the database, where spring was the season most
often identified as the best timing for slurry application in terms of pollution reduction or mitigation
(11 of the 34 included articles). However, a variable or unclear best application timing result was
more frequently recorded (n=14). Again, in very general terms, autumn was the season most
commonly identified as the worst period for slurry application (n=15). It is important to note that a
variable or unclear worst application timing result was also frequently recorded (n=13). However,
analysing the best/worst timings for slurry application in isolation can produce misleading trends
due the large variation in timings studied. Some of the studies included in the database as a whole
were only read at abstract or had confounding factors.
Summer applications were less frequently studied than applications in other seasons and of the
three studies found at full text and without confounding factors that included summer applications
(table 5) two did not report any clear differences between slurry applications in summer and in other
seasons.
Summer applications were less frequently studied than applications in other seasons and only one
study was found at full text and without confounding factors
Autumn application versus spring application
Of the studies comparing the impacts of autumn and spring slurry application (n=6), spring
application was most frequently found to be the season of lowest pollution in terms of N and P (4 of
the 6 studies). A further 2 studies demonstrated unclear or variable results in terms of the best
timing for application. With regard to the worst timing of application, autumn was found to be the
worst season for N and P pollution as a result of slurry application (5 of the 6 studies), with the
findings unclear from the remaining study, but again some of the included studies had confounding
factors or were only read at abstract.
Autumn application versus winter application

24
Of the studies comparing the impacts of autumn and winter slurry application (n=4), the leaching of
N was found to be reduced under winter application in all of the studies, with autumn identified as
the worst application timing in terms of leaching of N (3 studies demonstrated an increase in N
leaching compared to winter application, with the results of one further study unclear).
Autumn application v winter application v spring application
Of the studies comparing the impacts of autumn, winter and spring slurry application (n=5), the
leaching of N and P was studied in 3 studies, and all produced variable and or unclear results for the
best timing of application. The leaching of N was studied in 2 studies, one of which suggested that
spring was the best application time and the other suggesting that winter or spring application lead
to reductions in N leaching. In terms of the worst timing for slurry application, autumn was
suggested to be the worst timing for slurry application for N leaching in 3 of the 5 studies. P leaching
was greatest after winter application as suggested by 1 study, and autumn and winter were both
quoted as the seasons for highest P and N leaching following slurry application in one study.
Split applications
The effect of splitting slurry applications between multiple seasons was investigated alongside single
applications at either spring or autumn in 8 studies. Of these, splitting applications between autumn
and spring (n=2) or single spring applications (n=3) appeared to be most effective in reducing
leaching of both N and P, with the findings of the remaining 3 studies unclear. The worst leaching of
N P and/or FIOs was following a single autumn application (n=5) with the findings of the remaining 3
studies unclear.
It is important to highlight that the analysis of the best and worst timing for slurry application as
detailed by the 34 studies included in the database does not include or compare all of the timings
studied. The large variation in timings studies, together with confounding factors made it particularly
difficult to generate comparisons.
Comparing the impact of alteration of timing on different pollution outcomes
It is important to determine whether the general trends in best and worst slurry application timing
were consistent between the various outcome comparators assessed. Of the 13 studies which
investigated P leaching and/or FIO leaching as at least one of the pollutant measurements
conducted, no considerable or obvious deviation from the general trends in best and worst timing
for slurry application was observed. However, one study (Turtola 1998) recorded high P leaching

25
rates following spring slurry application but also observed high leaching of both N and P following
autumn and winter application.
Percentage reductions of pollutants
Of the 34 studies included in the database, only 5 described percentage reductions in the pollutants
studied as a result of the alteration of slurry application timing. The figures reported for pollutant
reduction ranges from 11.5% up to 42.8%, with an average pollutant reduction of 24.6% following
spring slurry application (usually when compared with autumn). The extent of pollution reduction
was variable between studies and between the pollutants studied. The greatest pollution reduction
was observed for P leaching, with Miseviciene (2004) quoting a 42.8% reduction following spring
slurry application (abstract only). Although only reported in a small proportion of studies (and many
of these were not read at full text or had confounding factors), a mean pollutant reduction of 24.6%
following spring slurry application demonstrates significant support for the application of slurry in
the spring following winter storage.
Conclusions
Key findings
The collation of evidence in this database has allowed the effectiveness of the alteration of slurry
application timing as in intervention for delivering an improved water environment to be assessed.
General trends in the data assessed demonstrate that application of slurry in spring leads to lower
losses of the pollutants, N, P and FIOs as a result of leaching following application, suggesting that
spring is the best season for slurry application, although winter was also frequently found to be
preferable to autumn. Autumn application consistently led to higher levels of pollutant leaching,
suggesting that autumn is the worst season for slurry application, producing the greatest pollution
impact.
The data collated also demonstrates no obvious deviation from these general trends in best and
worst slurry application timings when a range of different pollutant outcome comparators and soil
types were studied.
Implications for policy and practice
The majority of available research demonstrated that autumn application poses the most significant
risks in terms of nutrient and pollutant leaching providing support for current NVZ regulations, as

26
part of the wider WFD policy, which prevents slurry application during the autumn and early winter
period. In terms of translation to farming practice, this finding also supports the practice of secure
slurry storage through the autumn and winter period for application to land to take place in the
following spring.
These findings would broadly support current NVZ restrictions on slurry application up until 31st
December or 15th January (depending on soil type). However, the leaching of nutrients and
pollutants was also frequently cited to be reduced following winter slurry application, when
compared with autumn but there were few comparisons between winter and spring, and this
evidence would be useful in order to further inform regulations. Although, it is worth noting that
even if demonstrated to be one of the best timings, in terms of farming practice winter application is
likely to be regularly unfeasible, with water logged soils creating difficultly for using heavy spreading
machinery and the greater risk of weather conditions such as frozen soils or heavy rains leading to
the failure to comply with other aspects of the NVZ slurry application regulations. These risks
therefore add further support to the conclusion that spring is the best season for slurry, both in
terms of farming practice and the associated water pollution impacts.
Implications for research
Although this REA demonstrates that there is a considerable amount of research available on the
effectiveness of this intervention, a number of areas where research and scientific evidence is
currently lacking have been highlighted.
The research found was dominated by the study of the effect of this intervention on the leaching of
N. The number of studies assessing the impact of the alteration of slurry application on P and FIO
pollution was considerably smaller, highlighting a potential research gap as both P and FIOs also
have the potential to cause significant environmental and human health impacts, although a
separate evidence review (Donnison et al 2013) found that FIOs reduce during slurry storage.
Studies comparing the effects of application throughout the year at each of the four seasons are
lacking. Although the vast majority of studies were carried out over a period of more than one year,
there was a considerable lack of research covering and comparing all four seasons. In particular, it
would be useful to compare winter and spring slurry applications.
The quality of evidence included in this REA was highly variable. Less than a third of studies were
able to be taken through to the scoring procedures due to issues with poor reporting, confounding
factors or a lack of availability of references at full-text. In future, the encouragement of more
accurate reporting of key features of study design such as randomization and replication would

27
allow more detailed assessment of study quality. Future studies should also report reductions
quantitatively (e.g. percentage reduction) for increased value.
The study of the alteration of slurry application timing in isolation, as opposed to the combination of
multiple interventions i.e. application timing and rate, would prove more effective, reducing the
potential impact of confounding factors and allowing more accurate conclusions to be drawn from
research. Alternatively, clearer reporting of the results for each intervention studied should be
encouraged.
The lack of BACI designed studies conducted on this topic as demonstrated by this REA, is also
identified as a potential research gap to be investigated in future. Studies of this design would
provide a more accurate assessment of the effectiveness of this intervention, also with the potential
to assess the effectiveness of the introduction of relevant policy i.e. NVZ regulations.
Although no obvious relationship was observed between the effectiveness of the alteration of slurry
application timing and soil type as part of this REA, the NVZs’ restrictions regarding closed periods
for slurry application are directly linked to soil type. Further research in this area would help to
establish if there is any link between best/worst slurry application timing and soil type, and whether
this variation in the NVZs’ restrictions is warranted.
Acknowledgements and competing interests
The authors have funded by the Natural Environment Research Council. The work was commissioned
by the Department of Environment Food and Rural Affairs. Thanks to Paul Lewis, Deborah Coughlin
and Stuart Kirk for their advice and comments on this work. Whilst we consider that this work has
been carried out in accordance with good industry practice, the University will not be liable for any
use which may be made, reliance which may be placed, nor advice or information given, in
connection with the results contained herein for commercial purposes.

28
References
Chambers, B. J., K. A. Smith, et al. (2000). Strategies to encourage better use of nitrogen in animal
manures. Soil Use and Management 16: 157-161.
Collins, A. L., et al. (2009). Predicting potential change in agricultural sediment inputs to rivers across
England and Wales by 2015. Marine and Freshwater Research 2009, 60:626-637.
Defra. (2009). Protecting our Water, Soil and Air: A Code of Good Agricultural Practice for farmers,
growers and land managers. [Online] Available from:
http://adlib.everysite.co.uk/resources/000/252/413/water_air_soil_code_2009.pdf [Accessed on
17/4/13].
Defra. (2011). Water for Life White Paper. UK: Department for Environment, Food and Rural Affairs.
Defra. (2012a). Catchment Sensitive Farming. [Online] Available from:
https://www.gov.uk/catchment-sensitive-farming#water-pollution-from-farming-and-how-to-
reduce-it [Accessed on 17/4/13].
Defra. (2012b). Nitrate Vulnerable Zones. [Online] Available from: https://www.gov.uk/nitrate-
vulnerable-zones#how-to-comply-with-nvz-rules [Accessed on 17/4/13].
Defra. (2013). Nitrates Directive. Q and A on Nitrates Regulations Effective 17th May 2013.
Department for Environment Food and Rural Affairs.

29
Donnison L.M., Lewis P.J., Smith B, and Randall N.P., (2013). How effective are slurry storage, cover
or catch crops, woodland creation, controlled trafficking or break-up of compacted layers, and buffer
strips as on-farm mitigation measures for delivering an improved water environment. WT0965 Draft
Report (Department for Environment Food and Rural Affairs
Edwards, A., Withers, P. (2008). Transport and delivery of suspended solids, nitrogen and
phosphorus from various sources to freshwaters in the UK. Journal of Hydrology, 350: 144-153.
European Commission. (2010). The EU Nitrates Directive. [Online] Available from:
http://ec.europa.eu/environment/pubs/pdf/factsheets/nitrates.pdf [Accessed on 17/4/13].
Kay, D. et al. (2008). Quantification and control of microbial pollution from agriculture: a new policy
challenge? Environmental Science & Policy, 11: 171-184.
Milar J, Coughlin D and Kirk S (2012) Guidance Document for the production of Quick Scoping
Reviews and Rapid Evidence Assessments (Beta Version 8). Department for Environment Food and
Rural Affairs
Misevičiene, S. (2004). Environmental evaluation of slurry applied on fields. / Trešimo skystuoju
mešlu gamtosauginis vertinimas. Water Management Engineering 26(46): 12-18.
Natural England. (2013). Water Framework Directive. [Online] Available from:
http://www.naturalengland.org.uk/ourwork/water/waterdirective.aspx [Accessed on 17/4/13].
Nicholson, F., et al. (2011). Pollutant losses following organic manure applications in the month
following the end of the closed period. Report for Defra project: WT0932 [Online] Available from:
https://www.gov.uk/government/uploads/system/uploads/attachment_data/file/82413/20111220n
itrates-directive-consult-evid6.pdf [Accessed on 17/4/13].

30
Turtola, E. (1998) "Nitrogen and phosphorus losses in surface run off and drainage water after
application of slurry and mineral fertilizer to perennial grass ley." Agricultural and Food Science in
Finland. 7: 569-581
Williams, J. (2006). Strategies to reduce diffuse nitrogen pollution from cattle slurry applications.
DIAS Report, 12th Ramiran International conference, Technology for Recycling of Manure and
Organic Residues in a Whole-Farm Perspective. Vol. I [Online] Available from:
http://www.ramiran.net/doc06/djfma122.pdf [Accessed on 17/4/13].

ID
1sr au
tho
r
year
reference
ref type
text read
linked
stud
y
interve
ntio
n
cou
ntry stu
dy
years of stu
dy
stud
y type
con
trol?
com
parato
r
rand
om
ized
spatial
replicate
temp
oral
replicate
stud
y scale
Locatio
n &
meth
od
soil typ
e
measu
rem
en
t
s con
du
cted
timin
gs
stud
ied
best tim
ing
wo
rst timin
g
redcu
tion
?
N re
du
ced
P red
uced
fio re
du
ced
com
me
nts o
n
po
lluta
nt
redu
ced
con
fou
nd
ing
factors
reason
s for
hetero
gen
eity
1
Aškin
is, S.
20
01
Aškinis, S., M. Čizauskiene, et al. (2001). "Nutritious matter leaching from the rotation fields applied with slurry." Vandens Ukio Inzinerija 14(36): 7-17.
Jnl
Ab
st
Alteratio
n o
f slurry
app
lication
timin
g
Lithu
ania
4
No
t clear
sprin
g v au
tum
n v
1/2
sprin
g 1/2
au
tum
n
NK
P leach
ing
No
t clear
No
t clear
No
t clear
No
t clear
No
t clear
Sand
y loa
m
N,K
,P, b
iog
enic
matter, so
il pressin
g
Sprin
g v au
tum
n v
half sp
ring h
alf au
tum
n
Sprin
g
Au
tum
n
Yes
In sp
ring
Differe
nt cro
p typ
es gro
wn
in each
stud
y
perio
d
2
Aškin
is, S.
20
03
Aškinis, S. and S. Misevičiene (2003). "Investigations on phosphorus leaching in crop rotation fields when slurry is applied. Vandens Ukio Inzinerija 22(44(1)): 58-66.
Jnl
Ab
st
Alteratio
n o
f slurry
app
lication
timin
g
No
t clear
4
No
t clear
sprin
g v au
tum
n v
half sp
ring h
alf au
tum
n
Ph
osp
hate
leachin
g
No
t clear
No
t clear
No
t clear
No
t clear
No
t clear
No
t clear
P leach
ing
Sprin
g v au
tum
n v
half sp
ring h
alf au
tum
n
Sprin
g
Au
tum
n
Yes
yes
In sp
ring
3
Beckw
ith, C
. P.
19
98
Beckwith, C. P., J. Cooper, et al. (1998). "Nitrate leaching loss following application of organic manures to sandy soils in arable cropping. I." Soil Use and Management 14(3): 123-130.
Jnl
Full te
xt
Man
ure typ
e,
alteration
of slu
rry ap
plicatio
n tim
ing,
nitrificn
inh
ibito
r
UK
4
Man
ipu
lative
no
man
ure
Nitrate leach
ing
Yes
Yes
Yes
Mu
lti-Site
Plo
t, Ceram
ic cup
Sand
y loa
m,
me
diu
m lo
am
N leach
ing, so
il
min
eral N, cro
p
up
take
Mo
nth
ly
app
lication
s Sept -
Jan
Dec - Ja
n
Sep - N
ov
Yes
yes
app
lication
in
autu
mn
& w
inter sig
increases N
leachin
g lo
ss (bu
t no
sprin
g
com
parato
r). Later ap
plicatio
n le
d to
lo
wer N
loss
4
Bo
uw
er, W.
19
91
Mitteilungen der Deutschen Bodenkundlichen Gesellschaft 66(2): 919-922.
Jnl
Ab
st
No
t clear
Germ
any
4
No
t clear
No
t clear
Nitrate leach
ing
No
t clear
No
t clear
No
t clear
No
t clear
Well
Po
dzo
ls, gley-
po
dzo
ls and
gleys
N leach
ing
No
t clear
No
t clear
No
t clear
no
t clear
5
Cam
eron
, K. C
.
20
04
Cameron, K. C. and H. J. Di (2004). "Nitrogen leaching losses from different forms and rates of farm effluent applied to a Templeton soil in Canterbury, New Zealand." New Zealand Journal of Agricultural Research 47(4): 429-437.
Jnl
Full te
xt
Man
ure typ
e, alteration
of
slurry ap
plicatio
n tim
ing
New
Zealand
No
t clear
Man
ipu
lative
autu
mn
v au
tum
n/sp
ring
v 4 an
nu
al app
lication
s
Nitrate leach
ing
No
t clear
No
Yes
Farm
Field, Lysim
eter
Sand
y loa
m
N leach
ing
Au
tum
n v au
tum
n an
d
sprin
g v 4 an
nu
al ap
plicatio
ns
2 an
nu
al ap
plicatio
ns
(autu
mn
& sp
ring) an
d 4
ann
ual ap
plicatio
ns
Yes
yes
Splittin
g app
lication
s into
2
or 4
po
rtion
s app
lied at
differe
nt tim
es red
uced
n
leache
d b
y c. 30
%
Rate a
nd
ma
nu
re type
Appendix 1. Summaru of 34 articles that present research into the impact of alteration of slurry timing on leaching of nitrates, phosphates and/or faecal indicator organisms.

31
ID
1sr au
tho
r
year
reference
ref type
text read
linked
stud
y
interve
ntio
n
cou
ntry stu
dy
years of stu
dy
stud
y type
con
trol?
com
parato
r
rand
om
ized
spatial
replicate
temp
oral
replicate
stud
y scale
Locatio
n &
meth
od
soil typ
e
measu
rem
en
t
s con
du
cted
timin
gs
stud
ied
best tim
ing
wo
rst timin
g
redcu
tion
?
N re
du
ced
P red
uced
fio re
du
ced
com
me
nts o
n
po
lluta
nt
redu
ced
con
fou
nd
ing
factors
reason
s for
hetero
gen
eity
6
Ch
amb
ers, B. J.
20
00
Chambers, B. J., K. A. Smith, et al. (2000). "Strategies to encourage better use of nitrogen in animal manures." Soil Use and Management 16: 157-161.
Jnl
Full te
xt
3
Man
ure typ
e,
alteration
of slu
rry ap
plicatio
n tim
ing,
app
lication
tech
niq
ue
UK
No
t clear
Man
ipu
lative
no
ma
nu
re
Nitrate leach
ing
No
t clear
No
t clear
No
t clear
Mu
lti-Site
Ceram
ic cup
Sand
y and
shallo
w,
over ch
alk
N leach
ing
Mo
nth
ly
app
lication
s Sept -
Jan
Jan
Yes
yes
7
Dijk, T
. A. v.
19
85
Dijk, T. A. v. (1985). Leaching of plant nutrients from arable land as affected by annual applications of cattle slurry. Report of an 8-year lysimeter experiment. Rapport, Instituut voor Bodemvruchtbaarheid: 61-61.
Bo
ok
Ab
st
Alteratio
n o
f slurry
app
lication
rate an
d
timin
g
No
t clear
8
No
t clear
sprin
g ap
plicatio
n v
autu
mn
app
lication
Cro
p u
ptake o
f N, C
rop
yield, N
itrate leach
ing
No
t clear
No
t clear
No
t clear
No
t clear
Lysimeter
Sand
y loa
m
N leach
ing, cro
p yield
,
crop
up
take o
f N
Sprin
g app
lication
v
autu
mn
app
lication
No
t clear
No
t clear
no
t clear
8
Estavillo, J. M
.
19
96
Estavillo, J. M., M. Rodriguez, et al. (1996). "Nitrogen losses by denitrification and leaching in grassland - The effect of cow slurry application." Fertilizer Research 43(1-3): 197-201.
Jnl
Full te
xt
11
Alteratio
n o
f slurry
app
lication
rate an
d
timin
g, fertilizer type
Spain
2
Man
ipu
lative
no
ma
nu
re o
r fertilizer
De
nitrificatio
n lo
sses,
Nitrate leach
ing
Yes
Yes
Yes
Site
Ace
tylene
inh
ibitio
n
techn
iqu
e C
eramic cu
p,
plo
t
Clay lo
am
N leach
ing ,
de
nitrificatio
n
4 an
nu
al ap
plicatio
ns
No
significan
t d
ifferen
ces b
etwee
n
treatmen
ts for N
leach
ing
Sprin
g and
au
tum
n are
high
est risk for
de
nitrificatio
n
No
t clear
no
t clear
No
significan
t d
ifferen
ces b
etwee
n
treatmen
ts for N
leach
ing
9
From
ent, M
. A.
19
92
Froment, M. A., A. G. Chalmers, et al. (1992). "Nitrate leaching from autumn and winter application of animal manures to grassland." Aspects of Applied Biology(30): 153-156.
Jnl
Full te
xt
Man
ure typ
e,
alteration
of slu
rry ap
plicatio
n tim
ing,
nitrificn
inh
ibito
r
UK
< 1 yr
Man
ipu
lative
no
ma
nu
re o
r
fertilizer
Nitrate leach
ing
Yes
Yes
Yes
Mu
lti-Site
Plo
t, Ceram
ic cup
Ch
alk
N leach
ing
Mo
nth
ly
app
lication
s Sept -
Jan
Decem
ber, Jan
uary
Septe
mb
er,
Octo
ber, N
ove
mb
er (u
p to
40
% o
f total
slury N
ap
plie
d
befo
re D
ecem
ber
was lo
st by
leachin
g)
Yes
yes
N leach
ing re
du
ced
in
Dece
mb
er an
d
Janu
ary
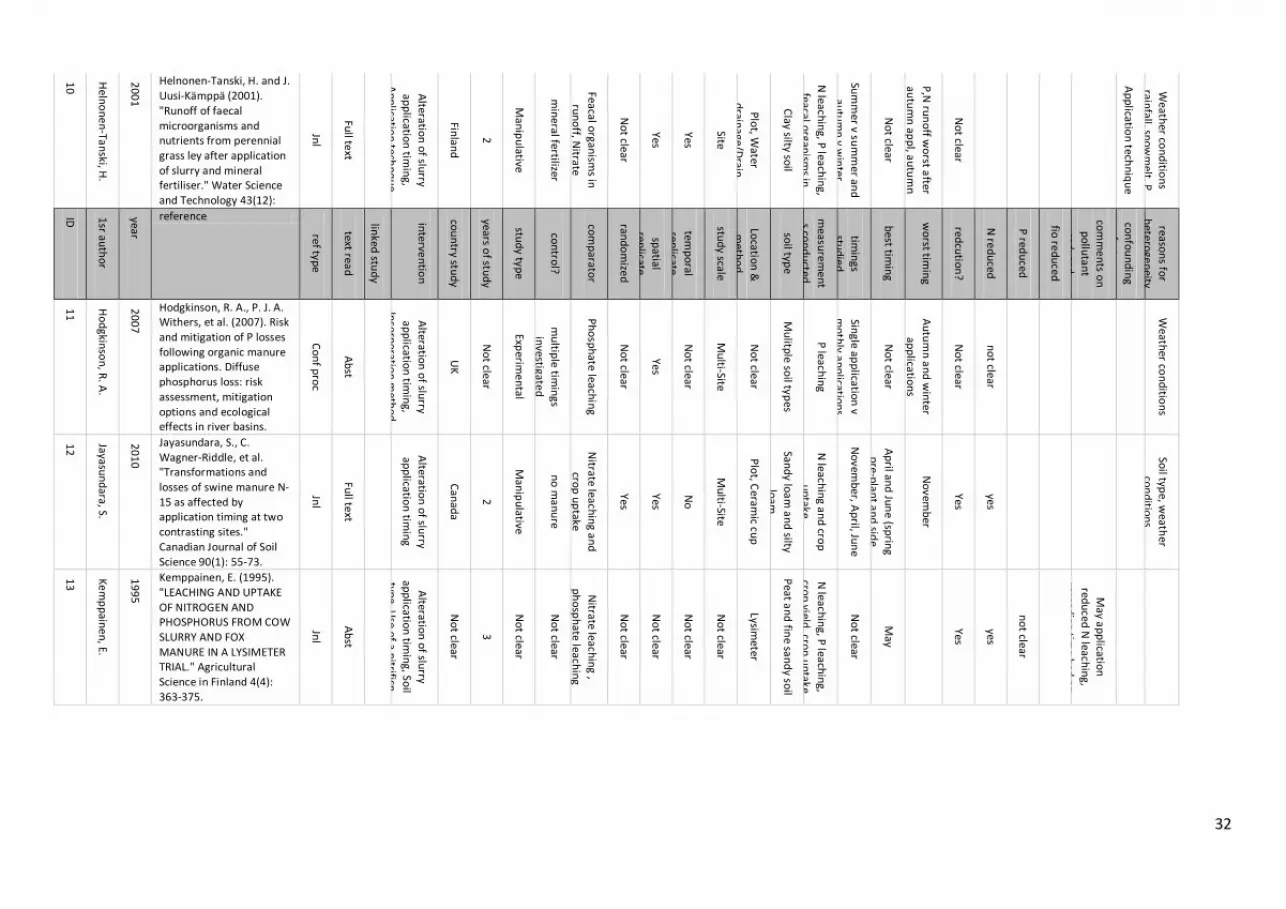
32
10
Heln
on
en
-Tan
ski, H.
20
01
Helnonen-Tanski, H. and J. Uusi-Kämppä (2001). "Runoff of faecal microorganisms and nutrients from perennial grass ley after application of slurry and mineral fertiliser." Water Science and Technology 43(12):
Jnl
Full te
xt
Alteratio
n o
f slurry
app
lication
timin
g, A
pp
lication
techn
qu
e,
fertilizer type
Finlan
d
2
Man
ipu
lative
min
eral fertilizer
Feacal organ
isms in
run
off, N
itrate
leachin
g, Ph
osp
hate
leachin
g
No
t clear
Yes
Yes
Site
Plo
t, Water
drain
age/Drain
Clay silty so
il
N leach
ing, P
leachin
g,
feacal organ
isms in
ru
no
ff
Sum
mer v su
mm
er and
autu
mn
v win
ter
No
t clear
P,N
run
off w
orst a
fter
autu
mn
app
l, au
tum
n
spread
ing
high
micro
bial levels ru
no
ff, sp
ring in
jection
high
micro
bial levels sn
ow
m
elt
No
t clear
Ap
plicatio
n tech
niq
ue
Weath
er con
ditio
ns
rainfall, sn
ow
melt, P
con
tent o
f cattle slu
rry u
sed
varied
betw
een
years
ID
1sr au
tho
r
year
reference
ref type
text read
linked
stud
y
interve
ntio
n
cou
ntry stu
dy
years of stu
dy
stud
y type
con
trol?
com
parato
r
rand
om
ized
spatial
replicate
temp
oral
replicate
stud
y scale
Locatio
n &
meth
od
soil typ
e
measu
rem
en
t
s con
du
cted
timin
gs
stud
ied
best tim
ing
wo
rst timin
g
redcu
tion
?
N re
du
ced
P red
uced
fio re
du
ced
com
me
nts o
n
po
lluta
nt
redu
ced
con
fou
nd
ing
factors
reason
s for
hetero
gen
eity
11
Ho
dgkin
son
, R. A
.
20
07
Hodgkinson, R. A., P. J. A. Withers, et al. (2007). Risk and mitigation of P losses following organic manure applications. Diffuse phosphorus loss: risk assessment, mitigation options and ecological effects in river basins.
Co
nf p
roc
Ab
st
Alteratio
n o
f slurry
app
lication
timin
g, In
corp
oratio
n m
etho
d
UK
No
t clear
Experim
en
tal
mu
ltiple
timin
gs
investigate
d
Ph
osp
hate
leachin
g
No
t clear
Yes
No
t clear
Mu
lti-Site
No
t clear
Mu
litple
soil typ
es
P leach
ing
Single ap
plicatio
n v
mo
thly a
pp
lication
s O
ct-Feb
v au
tum
n o
r
sprin
g app
lication
v top
d
ressing in
win
ter
No
t clear
Au
tum
n a
nd
win
ter
app
lication
s
No
t clear
no
t clear
Weath
er con
ditio
ns
12
Jayasun
dara, S.
20
10
Jayasundara, S., C. Wagner-Riddle, et al. "Transformations and losses of swine manure N-15 as affected by application timing at two contrasting sites." Canadian Journal of Soil Science 90(1): 55-73.
Jnl
Full te
xt
Alteratio
n o
f slurry
app
lication
timin
g
Can
ada
2
Man
ipu
lative
no
ma
nu
re
Nitrate leach
ing a
nd
crop
up
take
Yes
Yes
No
Mu
lti-Site
Plo
t, Ceram
ic cup
Sand
y loa
m a
nd
silty
loam
N leach
ing a
nd
crop
up
take
No
vemb
er, Ap
ril, Jun
e
Ap
ril and
Jun
e (sp
ring
pre-p
lan
t an
d sid
e
dress)
No
vemb
er
Yes
yes
Soil typ
e, weath
er co
nd
ition
s
13
Ke
mp
pain
en
, E.
19
95
Kemppainen, E. (1995). "LEACHING AND UPTAKE OF NITROGEN AND PHOSPHORUS FROM COW SLURRY AND FOX MANURE IN A LYSIMETER TRIAL." Agricultural Science in Finland 4(4): 363-375.
Jnl
Ab
st
Alteratio
n o
f slurry
app
lication
timin
g, Soil
type
, Use
of a
nitrificn
inh
ibito
r
No
t clear
3
No
t clear
No
t clear
Nitrate leach
ing ,
ph
osp
hate
leachin
g
No
t clear
No
t clear
No
t clear
No
t clear
Lysimeter
Peat a
nd
fine sa
nd
y soil
N leach
ing, P
leachin
g,
crop
yield, cro
p u
ptake
No
t clear
May
Yes
yes
no
t clear
May a
pp
lication
red
uced
N leach
ing,
spread
ing
time h
ad n
o
effect on
P leach
ing

33
14
Lewis, P
. J.
19
97
Lewis, P. J., C. P. Beckwith, et al. (1997). Effect of manure application timings and autumn/winter rainfall drainage patterns on nitrogen availability in cut grassland systems.
Co
nf p
roc
Full te
xt
3,7
Alteratio
n o
f slurry
app
lication
rate an
d
timin
g
UK
6
Man
ipu
lative
min
eral fertilizer,
Yes - no
ma
nu
re
Herb
age
pro
du
ction
, Nitrate
availab
ility, Nitrate
leachin
g
No
t clear
No
t clear
Yes
Site
Ceram
ic cup
Sand
y loa
m
N leach
ing,
amm
on
ium
leach
ing, h
erbage
pro
du
ction
Expt 1
-Jun
e,
mo
nth
ly ap
plicatio
ns Sep
t -
Jan an
d O
ctob
er (FYM
on
ly). Expt 2
-
Octo
ber, Fe
bru
ary, M
ay
Sprin
g
No
t clear
no
t clear
N reco
very in
creased
significan
tly with
later tim
ings o
f
slurry ap
plicatio
n
Rate
15
Misevicien
e, S.
20
05
Miseviciene, S. (2005). Pollution of drainage water with nitrogen when slurry is applied in crop rotation fields.
Bo
ok
Ab
st
Alteratio
n o
f slurry
app
lication
timin
g
Lithu
ania
4
No
t clear
sprin
g app
lication
v
autu
mn
app
lication
Nitrate leach
ing
No
t clear
No
t clear
No
t clear
No
t clear
No
t clear
No
t clear
N leach
ing
Sprin
g v au
tum
n
Sprin
g
Au
tum
n
Yes
yes
Sprin
g app
lication
red
uced
N leach
ing
by 1
1.5
%
ID
1sr au
tho
r
year
reference
ref type
text read
linked
stud
y
interve
ntio
n
cou
ntry stu
dy
years of stu
dy
stud
y type
con
trol?
com
parato
r
rand
om
ized
spatial
replicate
temp
oral
replicate
stud
y scale
Locatio
n &
meth
od
soil typ
e
measu
rem
en
t
s con
du
cted
timin
gs
stud
ied
best tim
ing
wo
rst timin
g
redcu
tion
?
N re
du
ced
P red
uced
fio re
du
ced
com
me
nts o
n
po
lluta
nt
redu
ced
con
fou
nd
ing
factors
reason
s for
hetero
gen
eity
16
Misevicien
e, S.
20
04
Misevičiene, S. (2004). "Environmental evaluation of slurry applied on fields. / Trešimo skystuoju mešlu gamtosauginis vertinimas." Water Management Engineering 26(46): 12-18.
Jnl
Ab
st
20
Alteratio
n o
f slurry
app
lication
timin
g
Lithu
ania
4
No
t clear
sprin
g app
lication
v
autu
mn
app
lication
NK
P leach
ing
No
t clear
No
t clear
No
t clear
No
t clear
No
t clear
No
t clear
N,K
,P lea
chin
g
Sprin
g v au
tum
n
Sprin
g
Au
tum
n
Yes
yes
yes
Sprin
g app
lication
red
uced
N b
y 11
.5%
,P
by 4
2.8
% an
d K
by 2
0%
17
Misevicien
e, S.
20
09
Misevičiene, S. (2009). Seasonal nitrogen leaching from fields applied by slurry. Annual 15th International Scientific Conference Proceedings "Research for Rural Development 2009", Latvia University of Agriculture
Co
nf p
roc
Ab
st
Alteratio
n o
f slurry
app
lication
timin
g
Lithu
ania
2
No
t clear
autu
mm
v win
ter v sprin
g
Nitrate leach
ing
No
t clear
No
t clear
No
t clear
No
t clear
No
t clear
No
t clear
N leach
ing
Au
tum
n v w
inter v sp
ring
Sprin
g
Au
tum
n
Yes
yes
38
.8%
mo
re N leach
ed
from
autu
mn
ap
plicatio
n
than
sprin
g ap
plicatio
n
34
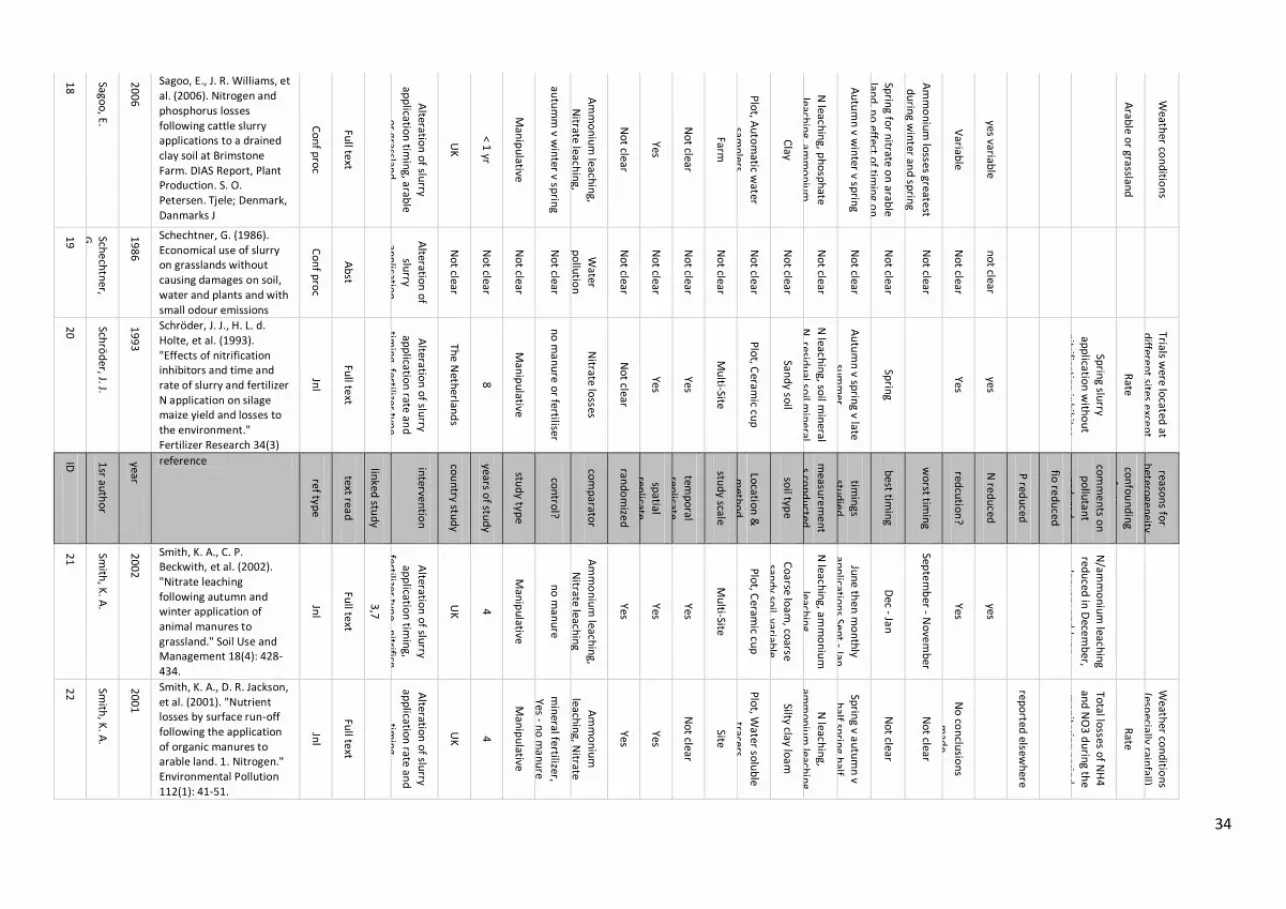
18
Sagoo
, E.
20
06
Sagoo, E., J. R. Williams, et al. (2006). Nitrogen and phosphorus losses following cattle slurry applications to a drained clay soil at Brimstone Farm. DIAS Report, Plant Production. S. O. Petersen. Tjele; Denmark, Danmarks J
Co
nf p
roc
Full te
xt
Alteratio
n o
f slurry
app
lication
timin
g, arable
o
r grassland
UK
< 1 yr
Man
ipu
lative
autu
mm
v win
ter v sprin
g
Am
mo
niu
m leach
ing,
Nitrate leach
ing,
Ph
osp
hate
leachin
g
No
t clear
Yes
No
t clear
Farm
Plo
t, Au
tom
atic water
samp
lers
Clay
N leach
ing, p
ho
sph
ate
leachin
g, am
mo
niu
m
leachin
g
Au
tum
n v w
inter v sp
ring
Sprin
g for n
itrate o
n arab
le lan
d, n
o effect o
f timin
g o
n
nitrate o
n grasslan
d,
ph
osp
hate
losses lo
wer in
au
tum
n o
n grasslan
d
Am
mo
niu
m lo
sses greatest
du
ring w
inter an
d sp
ring
on
grassland
, high
nitrate
losses in
au
tum
n o
n arab
le
Variab
le
yes variable
Arab
le or grasslan
d
Weath
er con
ditio
ns
19
Sche
chtn
er, G
.
19
86
Schechtner, G. (1986). Economical use of slurry on grasslands without causing damages on soil, water and plants and with small odour emissions
Co
nf p
roc
Ab
st
Alteratio
n o
f
slurry
app
lication
timin
g, M
ultip
le o
ther
interve
ntio
ns
assessed
No
t clear
No
t clear
No
t clear
No
t clear
Water
po
llutio
n
No
t clear
No
t clear
No
t clear
No
t clear
No
t clear
No
t clear
No
t clear
No
t clear
No
t clear
No
t clear
No
t clear
no
t clear
20
Schrö
der, J. J.
19
93
Schröder, J. J., H. L. d. Holte, et al. (1993). "Effects of nitrification inhibitors and time and rate of slurry and fertilizer N application on silage maize yield and losses to the environment." Fertilizer Research 34(3)
Jnl
Full te
xt
Alteratio
n o
f slurry
app
lication
rate an
d
timin
g, fertilizer type,
nitrificn
inh
ibito
r
The
Neth
erland
s
8
Man
ipu
lative
no
ma
nu
re o
r fertiliser
Nitrate lo
sses
No
t clear
Yes
Yes
Mu
lti-Site
Plo
t, Ceram
ic cup
Sand
y soil
N leach
ing, so
il min
eral
N, resid
ual so
il min
eral N
, dry m
atter
Au
tum
n v sp
ring v late
sum
mer
Sprin
g
Yes
yes
Sprin
g slurry
app
lication
with
ou
t
nitrificatio
n in
hib
itor
was o
n average
associate
d w
ith lo
w N
lo
sses an
d h
igher
maize
yields
Rate
Trials were lo
cated at
differe
nt sites e
xcep
t
for th
e gro
win
g season
1
98
6-1
98
9 w
hen
treatmen
ts were
return
ed to
the
same
plo
t each year
ID
1sr au
tho
r
year
reference
ref type
text read
linked
stud
y
interve
ntio
n
cou
ntry stu
dy
years of stu
dy
stud
y type
con
trol?
com
parato
r
rand
om
ized
spatial
replicate
temp
oral
replicate
stud
y scale
Locatio
n &
meth
od
soil typ
e
measu
rem
en
t
s con
du
cted
timin
gs
stud
ied
best tim
ing
wo
rst timin
g
redcu
tion
?
N re
du
ced
P red
uced
fio re
du
ced
com
me
nts o
n
po
lluta
nt
redu
ced
con
fou
nd
ing
factors
reason
s for
hetero
gen
eity
21
Smith
, K. A
.
20
02
Smith, K. A., C. P. Beckwith, et al. (2002). "Nitrate leaching following autumn and winter application of animal manures to grassland." Soil Use and Management 18(4): 428-434.
Jnl
Full te
xt
3,7
Alteratio
n o
f slurry
app
lication
timin
g, fertilizer typ
e, nitrificn
inh
ibito
r
UK
4
Man
ipu
lative
no
ma
nu
re
Am
mo
niu
m leach
ing,
Nitrate leach
ing
Yes
Yes
Yes
Mu
lti-Site
Plo
t, Ceram
ic cup
Co
arse loa
m, co
arse
sand
y soil, variab
le
chalky an
d flin
ty fine
silty loam
,
N leach
ing, am
mo
niu
m
leachin
g
Jun
e th
en
mo
nth
ly
app
lication
s Sept - Jan
Dec - Ja
n
Septe
mb
er - No
vem
ber
Yes
yes
N/am
mo
niu
m leach
ing
redu
ced in
Dece
mb
er,
Janu
ary and
Jun
e
22
Smith
, K. A
.
20
01
Smith, K. A., D. R. Jackson, et al. (2001). "Nutrient losses by surface run-off following the application of organic manures to arable land. 1. Nitrogen." Environmental Pollution 112(1): 41-51.
Jnl
Full te
xt
Alteratio
n o
f slurry
app
lication
rate an
d
timin
g
UK
4
Man
ipu
lative
min
eral fertilizer,
Yes - no
ma
nu
re
Am
mo
niu
m
leachin
g, Nitrate
leach
ing
Yes
Yes
No
t clear
Site
Plo
t, Water so
lub
le
tracers
Silty clay loa
m
N leach
ing,
amm
on
ium
leachin
g
Sprin
g v au
tum
n v
half sp
ring h
alf au
tum
n
No
t clear
No
t clear
No
con
clusio
ns
mad
e
repo
rted elsew
here
Total lo
sses of N
H4
an
d N
O3
du
ring th
e
mo
nito
ring p
eriod
w
ere insign
ificant in
agron
om
ic terms.
Rain
fall relevant
Rate
Weath
er con
ditio
ns
(especially rain
fall)

35
23
Smith
, K. A
.
20
01
Smith, K. A., D. R. Jackson, et al. (2001b). "Nutrient losses by surface run-off following the application of organic manures to arable land. 2. Phosphorus." Environmental Pollution 112(1): 53-60.
Jnl
Full te
xt
28
Alteratio
n o
f slurry
app
lication
timin
g
UK
4
Man
ipu
lative
min
eral fertilizer, Yes -
no
ma
nu
re
Ph
osp
hate
leachin
g
Yes
Yes
No
t clear
Site
Plo
t, Water so
lub
le
tracers
Silty clay loa
m
P leach
ing
Sprin
g v au
tum
n v h
alf
sprin
g half a
utu
mn
2 d
ressings - N
ove
mb
er an
d M
arch
Single ap
plicatio
n in
No
vemb
er
Yes
yes
P leach
ing re
du
ced b
y 2
dressin
gs -
No
vemeb
er an
d M
arch
24
Sore
nse
n, P
.
20
12
Sorensen, P. and G. H. Rubaek "Leaching of nitrate and phosphorus after autumn and spring application of separated solid animal manures to winter wheat." Soil Use and Management 28(1): 1-11.
Jnl
Full te
xt
Man
ure typ
e,
alteration
of slu
rry ap
plicatio
n tim
ing
De
nm
ark
2
Man
ipu
lative
min
eral fertilizer
Nitrate leach
ing,
Ph
osp
hate
leachin
g
No
t clear
Yes
Yes
Site
Lysimeter
Sand
y loa
m
N leach
ing, P
leachin
g
Sprin
g v au
tum
n
With
sprin
g ap
plicatio
n
the
rise in n
itrate
leachin
g du
ring th
e
follo
win
g autu
mn
–w
inter p
eriod
was
insign
ificant B
UT m
uch
h
igher risk o
f am
mo
nia
volatiizatio
n
High
risk of in
creased
nitrate leach
ing w
he
n
solid
man
ures are
app
lied b
efore so
win
g w
inter w
heat (2
3-2
5%
of m
anu
re N
)
Variab
le
no
t clear
no
t clear
com
bin
ation
of so
lid
man
ure a
nd
slurry
app
lication
(slurry o
nly
in sp
ring) so
con
fou
nd
ing facto
rs
man
ure typ
e
25
Tho
msen
, I. K.
20
05
Thomsen, I. K. (2005). "Crop N utilization and leaching losses as affected by time and method of application of farmyard manure." European Journal of Agronomy 22(1): 1-9.
Jnl
Full te
xt
Alteratio
n o
f slurry
app
lication
timin
g, A
pp
lication
techn
iqu
e
De
nm
ark
3
Man
ipu
lative
Sept, D
ec, Mar
app
lication
Cro
p u
ptake o
f N,
Nitrate leach
ing
No
t clear
Yes
No
t clear
Site
Lysimeter
Sand
y loa
m
N leach
ing, cro
p
yield, cro
p u
ptake
Sept, D
ec, Mar
Win
ter or sp
ring
Au
tum
n
Yes
yes
N leach
ing re
du
ced
in
win
ter and
sprin
g
ID
1sr au
tho
r
year
reference
ref type
text read
linked
stud
y
interve
ntio
n
cou
ntry stu
dy
years of stu
dy
stud
y type
con
trol?
com
parato
r
rand
om
ized
spatial
replicate
temp
oral
replicate
stud
y scale
Locatio
n &
meth
od
soil typ
e
measu
rem
en
t
s con
du
cted
timin
gs
stud
ied
best tim
ing
wo
rst timin
g
redcu
tion
?
N re
du
ced
P red
uced
fio re
du
ced
com
me
nts o
n
po
lluta
nt
redu
ced
con
fou
nd
ing
factors
reason
s for
hetero
gen
eity
26
Trind
ade, H
.
20
09
Trindade, H., J. Coutinho, et al. (2009). Grass and Forage Science 64(1): 2-11.
Jnl
Full te
xt
Alteratio
n o
f
slurry
app
lication
rate and
tim
ing
Po
rtugal
3
Man
ipu
lative
no
ma
nu
re o
r
fertilizer
Cro
p u
ptake o
f
N, C
rop
yield,
N leach
ing
po
tential
No
t clear
Yes
No
t clear
Site
Plo
t
Sand
y loa
m
Cro
p u
ptake o
f
N, C
rop
yield,
Nitrate
leachin
g p
oten
tial
May, Ju
ly,
Octo
ber,
Febru
ary
3 an
nu
al ap
plicatio
ns
Yes
yes
Yes leachin
g
po
tential
redu
ced
Rate
27
Trind
ade, H
.
20
06
Trindade, H., J. L. Pereira, et al. (2006). Effect of time and rate of cattle-slurry application on nitrate concentration of drainage water in a double-cropping forage system. DIAS Report, Plant Production. S. O. Petersen. Tjele; Denmark
Co
nf p
roc
Full te
xt
Alteratio
n o
f slurry
app
lication
rate an
d
timin
g
Po
rtugal
3
Man
ipu
lative
no
ma
nu
re
Nitrate leach
ing
Yes
Yes
Yes
Site
Plo
t, Ceram
ic cup
Sand
y loa
m
N co
ncen
tration
in
drain
age water
Ap
plicatio
n at so
win
g, 2
app
lication
s at sow
ing (1
m
aize, 1 ryegrass), 2
app
lication
s at sow
ing + 2
to
p d
ressin
gs, 3
app
lication
s (1 at so
win
g +
1 to
p d
ressings o
f each
crop
)
No
t clear
No
t clear
No
t clear
no
t clear
Rate

36
28
Vetter, H
.
19
78
Vetter, H. and G. Steffens (1978). "Influence of varying rates and application times of slurry on nutrient leaching into deep soil layers and groundwater. Landwirtschaftliche Forschung, Sonderheft 34(2): 238-246.
Jnl
Ab
st
Alteratio
n o
f slurry
app
lication
rate an
d
timin
g, Soil typ
e
No
t clear
No
t clear
No
t clear
No
t clear
Nitrate leach
ing
No
t clear
No
t clear
No
t clear
No
t clear
No
t clear
Sand
y soil an
d lo
am
y soil
N leach
ing
Octo
ber o
r Au
gust v
Febru
ary or M
arch
Febru
ary or M
arch
Octo
ber o
r Au
gust
Yes
yes
29
Vetter, H
.
19
81
Vetter, H. and G. Steffens (1981). "Displacement and leaching of nutrients into the shallow groundwater after slurry application. Zeitschrift fur Kulturtechnik und Flurbereinigung 22(3): 159-172.
Jnl
Ab
st
Alteratio
n o
f slurry
app
lication
rate an
d
timin
g, fertilizer type,
Soil typ
e
No
t clear
No
t clear
No
t clear
No
t clear
Nitrate leach
ing ,
ph
osp
hate
leachin
g
No
t clear
No
t clear
No
t clear
No
t clear
No
t clear
Sand
y soil an
d h
eavier
soils
N leach
ing, P
leachin
g
Sprin
g v au
tum
n
Sprin
g
Au
tum
n
Yes
yes
no
t clear
N leach
ing re
du
ced
2
3%
in sp
ring
30
William
s, J. R.
20
07
Williams, J. R., L. Sagoo, et al. (2007). The impact of slurry management practices to reduce nitrate leaching on phosphorus losses from a drained clay soil. The 5th International Phosphorus Workshop (IPW5) in Silkeborg
Co
nf p
roc
Ab
st
24
Alteratio
n o
f slurry
app
lication
timin
g, arab
le or grasslan
d
UK
2
Man
ipu
lative
autu
mm
v win
ter v
sprin
g
Nitrate leach
ing ,
ph
osp
hate
leachin
g
No
t clear
No
t clear
No
t clear
Farm
Water d
rainage/D
rain
Clay
N leach
ing, P
leachin
g
Au
tum
n v w
inter v
sprin
g
No
t clear
Win
ter for P
.
No
t clear
yes
no
t clear
N leach
ing m
ost in
au
tum
n o
n arab
le. P
leachin
g mo
st in w
inter
on
grass bu
t mayb
e
rainfall related
.
Weath
er con
ditio
ns
ID
1sr au
tho
r
year
reference
ref type
text read
linked
stud
y
interve
ntio
n
cou
ntry stu
dy
years of stu
dy
stud
y type
con
trol?
com
parato
r
rand
om
ized
spatial
replicate
temp
oral
replicate
stud
y scale
Locatio
n &
meth
od
soil typ
e
measu
rem
en
t
s con
du
cted
timin
gs
stud
ied
best tim
ing
wo
rst timin
g
redcu
tion
?
N re
du
ced
P red
uced
fio re
du
ced
com
me
nts o
n
po
lluta
nt
redu
ced
con
fou
nd
ing
factors
reason
s for
hetero
gen
eity
31
Haro
ld, M
. van
Es
20
06
Harold, M. van Es (2006) "Effect of Manure Application Timing, Crop, and Soil Type on Nitrate Leaching." J. Environ. Qual. 35: 670–679
Jnl
Full te
xt
Alteratio
n o
f slurry
app
lication
timin
g, C
rop
type
, Soil typ
e
USA
(New
Yo
rk)
3
Man
ipu
lative
min
eral fertilizer
Nitrate leach
ing
No
t clear
Yes
Yes
Site
Plo
t, Water
drain
age/Drain
Clay lo
am &
Stafford
loa
my fin
e
sand
N leach
ing, cro
p
yield
Sprin
g v au
tum
n v
sprin
g and
au
tum
n
v 2 sp
ring
app
lication
s
Single sp
ring
app
lication
Au
tum
n fo
r N
arable. W
inter fo
r P
grass.
Yes
yes
N leach
ing
significan
tly redu
ce
with
sprin
g ap
plicatio
n

37
32
Turto
la, E.
19
98
Turtola, E. (1998) "Nitrogen and phosphorus losses in surface run off and drainage water after application of slurry and mineral fertilizer to perennial grass ley." Agricultural and Food Science in Finland. 7: 569-581
Jou
rnal
Full te
xt
Alteratio
n o
f slurry
app
lication
rate an
d
timin
g
Finlan
d
4
Man
ipu
lative
no
man
ure o
r fertilizer
Nitrate leach
ing ,
ph
osp
hate
leachin
g
Yes
Yes
Yes
Site
Plo
t, Water
drain
age/Drain
Fine
sand
N leach
ing, P
leachin
g
Au
tum
n v w
inter v sp
ring
No
t clear as large P lo
sses w
ere also o
bservere
d in
sprin
g
Au
tum
n a
nd
win
ter (for
bo
th N
an
d P
)
yes
yes
yes
Rate
Soil co
mp
action
, weath
er co
nd
ition
s
33
Do
wn
ing, T
.W
20
08
Downing, T.W. (2008) "Case study: Impact of manure application timing in dairy pastures on the migration of nitrates to ground water." The Professional Animal Scientist. 24: 100-102
Jou
rnal
Full te
xt
Alteratio
n o
f slurry
app
lication
rate an
d
timin
g
USA
(Orego
n)
2
Co
rrelative
No
Nitrate leach
ing
No
t clear
Yes
Yes
Mu
lti-Farm
Plo
t, Lysime
ter
Clay lo
am
N leach
ing
No
t clear
No
t clear
No
t clear
No
t clear
no
t clear
Rate
Differe
nt cro
p typ
es an
d grazin
g system
s
34
Uu
si-Kä
mp
pä, J.
20
01
Uusi-Kämppä, J. and H. Heinonen-Tanski (2001). Runoff of nutrients and faecal micro-organisms from grassland after slurry application. DIAS Report, Animal Husbandry. H. B. Rom and C. G. Sorensen. Tjele; Denmark, Danish Institute of Agricultural Sciences.
Co
nf p
roc
Ab
st
14
Alteratio
n o
f slurry
app
lication
timin
g, Ap
pl tech
, fertilizer typ
e
Finlan
d
2
Man
ipu
lative
min
eral fertilizer
Feacal organ
isms in
run
off,
N, P
leachin
g
No
t clear
No
t clear
No
t clear
Site
No
t clear
Clay
N leach
ing, P
leachin
g, feacal
organ
isms in
run
off
Sum
mer v a
utu
mn
No
t clear
High
autu
mn
rainfall led
to
imm
ed
iate in
creases in
nu
trien
t loa
ds an
d FIO
levels
No
t clear
no
t clear
no
t clear
abstract o
nly a
nd
co
nfo
un
din
g factors
Weath
er con
ditio
ns