Embed Size (px)
Citation preview
Data Communication
Week 3 Data and Signals
Susmini I. Lestariningati, M.T3
Computer Engineering
Data Communication @lestariningati
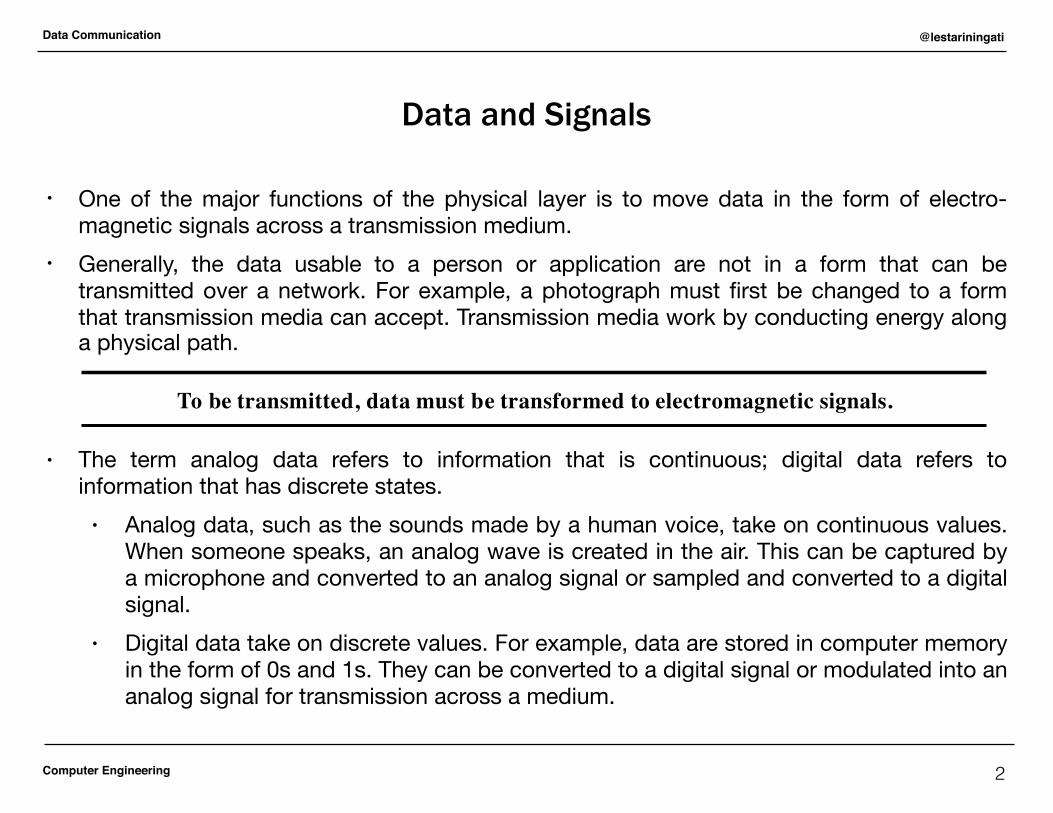
• One of the major functions of the physical layer is to move data in the form of electro- magnetic signals across a transmission medium.
• Generally, the data usable to a person or application are not in a form that can be transmitted over a network. For example, a photograph must first be changed to a form that transmission media can accept. Transmission media work by conducting energy along a physical path.
• The term analog data refers to information that is continuous; digital data refers to information that has discrete states. • Analog data, such as the sounds made by a human voice, take on continuous values.
When someone speaks, an analog wave is created in the air. This can be captured by a microphone and converted to an analog signal or sampled and converted to a digital signal.
• Digital data take on discrete values. For example, data are stored in computer memory in the form of 0s and 1s. They can be converted to a digital signal or modulated into an analog signal for transmission across a medium.
Data and Signals
2
CHAPTER 3
Data and Signals
One of the major functions of the physical layer is to move data in the form of electro-magnetic signals across a transmission medium. Whether you are collecting numericalstatistics from another computer, sending animated pictures from a design workstation,or causing a bell to ring at a distant control center, you are working with the transmis-sion of data across network connections.
Generally, the data usable to a person or application are not in a form that can betransmitted over a network. For example, a photograph must first be changed to a formthat transmission media can accept. Transmission media work by conducting energyalong a physical path.
To be transmitted, data must be transformed to electromagnetic signals.
3.1 ANALOG AND DIGITALBoth data and the signals that represent them can be either analog or digital in form.
Analog and Digital DataData can be analog or digital. The term analog data refers to information that is contin-uous; digital data refers to information that has discrete states. For example, an analogclock that has hour, minute, and second hands gives information in a continuous form;the movements of the hands are continuous. On the other hand, a digital clock thatreports the hours and the minutes will change suddenly from 8:05 to 8:06.
Analog data, such as the sounds made by a human voice, take on continuous values.When someone speaks, an analog wave is created in the air. This can be captured by amicrophone and converted to an analog signal or sampled and converted to a digitalsignal.
Digital data take on discrete values. For example, data are stored in computermemory in the form of Os and 1s. They can be converted to a digital signal or modu-lated into an analog signal for transmission across a medium.
57
Computer Engineering
Data Communication @lestariningati
Analog and Digital Signal
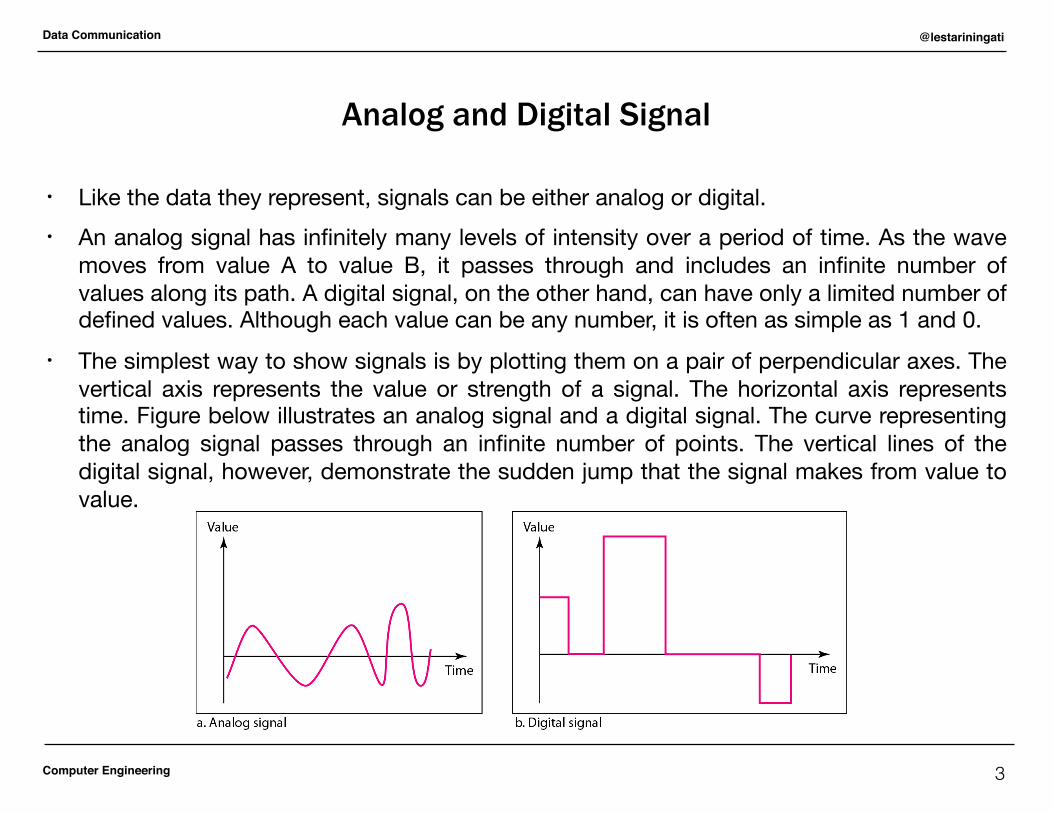
• Like the data they represent, signals can be either analog or digital. • An analog signal has infinitely many levels of intensity over a period of time. As the wave
moves from value A to value B, it passes through and includes an infinite number of values along its path. A digital signal, on the other hand, can have only a limited number of defined values. Although each value can be any number, it is often as simple as 1 and 0.
• The simplest way to show signals is by plotting them on a pair of perpendicular axes. The vertical axis represents the value or strength of a signal. The horizontal axis represents time. Figure below illustrates an analog signal and a digital signal. The curve representing the analog signal passes through an infinite number of points. The vertical lines of the digital signal, however, demonstrate the sudden jump that the signal makes from value to value.
3
Computer Engineering
Data Communication @lestariningati
Periodic and Non periodic Signals
• Both analog and digital signals can take one of two forms: periodic or nonperiodic (sometimes refer to as aperiodic, because the prefix a in Greek means "non"). • A periodic signal completes a pattern within a measurable time frame, called a
period, and repeats that pattern over subsequent identical periods. The completion of one full pattern is called a cycle.
• A non periodic signal changes without exhibiting a pattern or cycle that repeats over time.
• Both analog and digital signals can be periodic or non periodic. • In data communications, we commonly use periodic analog signals (because they
need less bandwidth, • and non periodic digital signals (because they can represent variation in data)
4
Computer Engineering
Data Communication @lestariningati
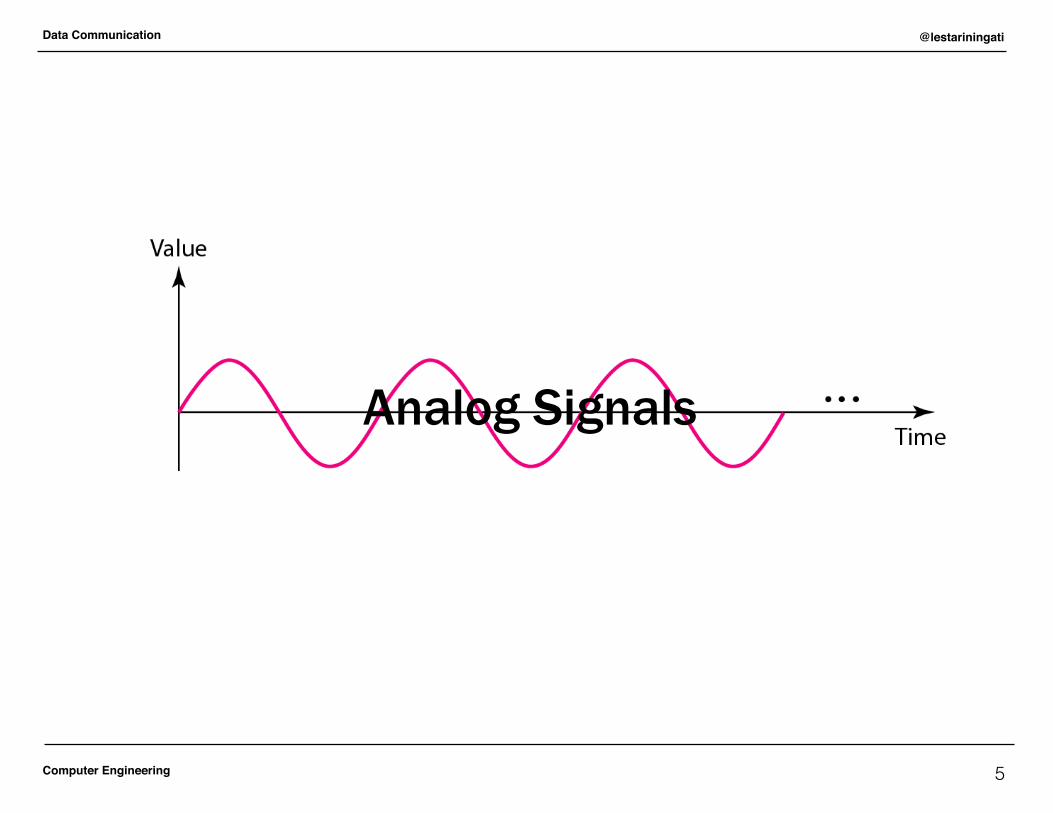
Analog Signals
5
Computer Engineering
Data Communication @lestariningati
Periodic Analog Signals
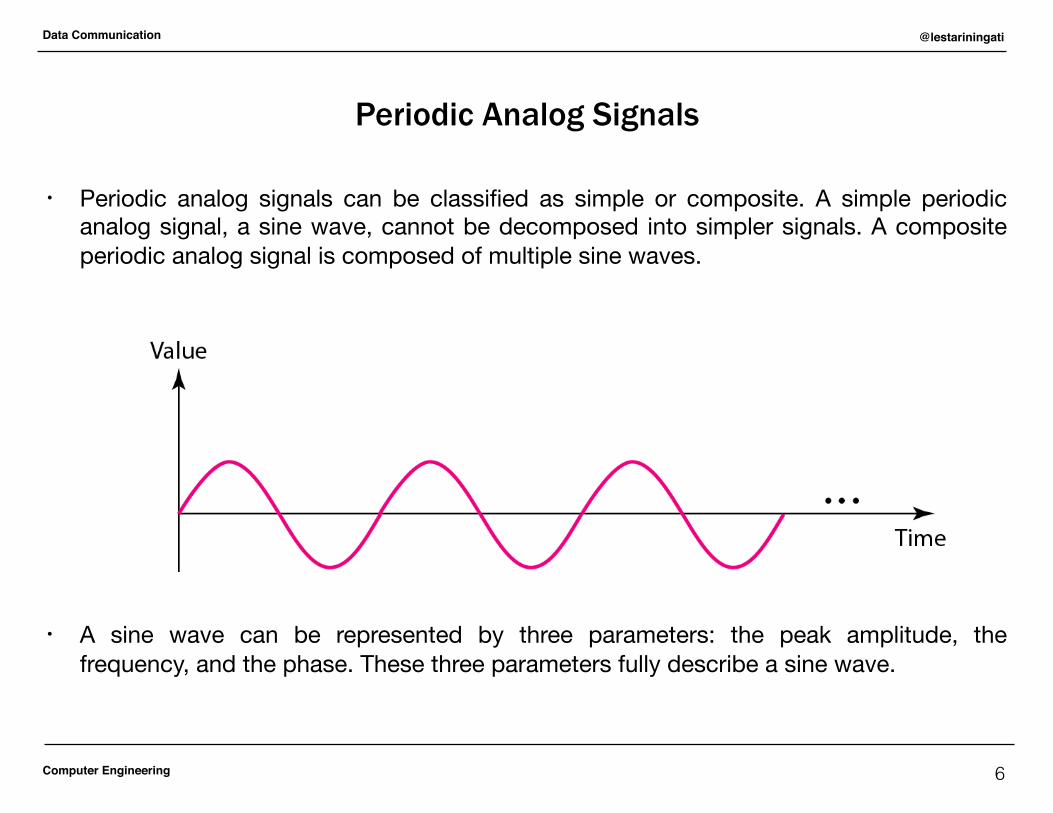
• Periodic analog signals can be classified as simple or composite. A simple periodic analog signal, a sine wave, cannot be decomposed into simpler signals. A composite periodic analog signal is composed of multiple sine waves.
• A sine wave can be represented by three parameters: the peak amplitude, the frequency, and the phase. These three parameters fully describe a sine wave.
6
Computer Engineering
Data Communication @lestariningati
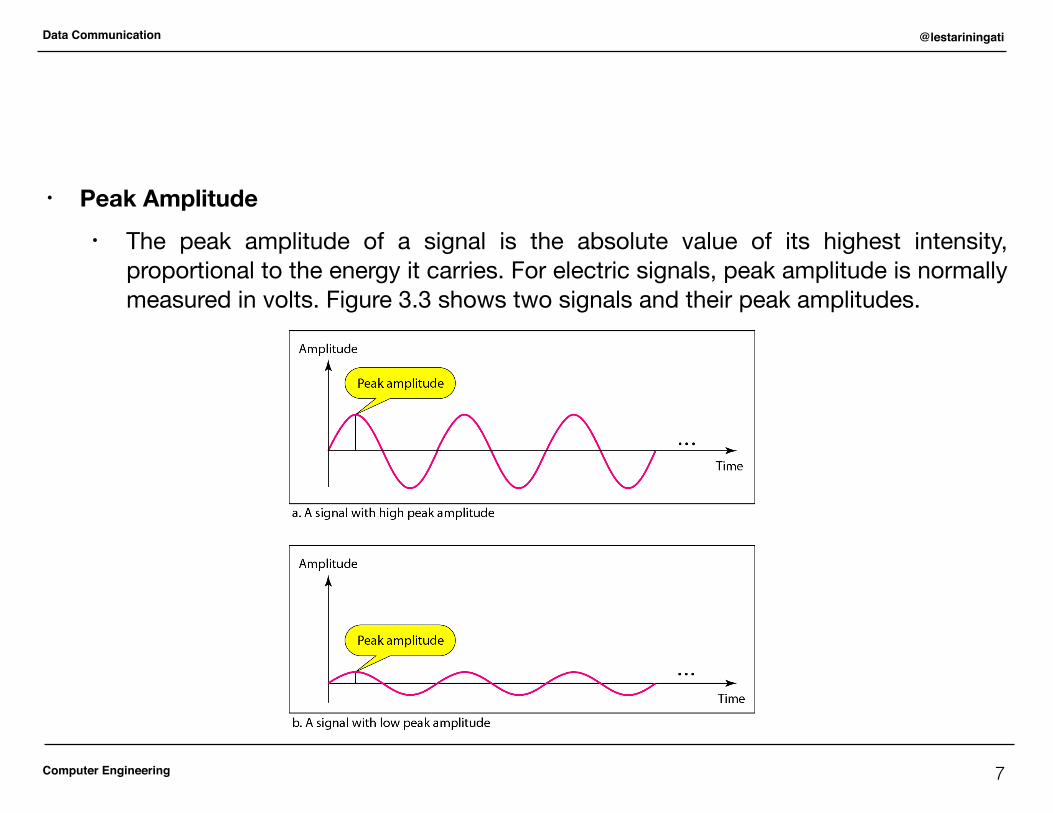
• Peak Amplitude • The peak amplitude of a signal is the absolute value of its highest intensity,
proportional to the energy it carries. For electric signals, peak amplitude is normally measured in volts. Figure 3.3 shows two signals and their peak amplitudes.
7
Computer Engineering
Data Communication @lestariningati
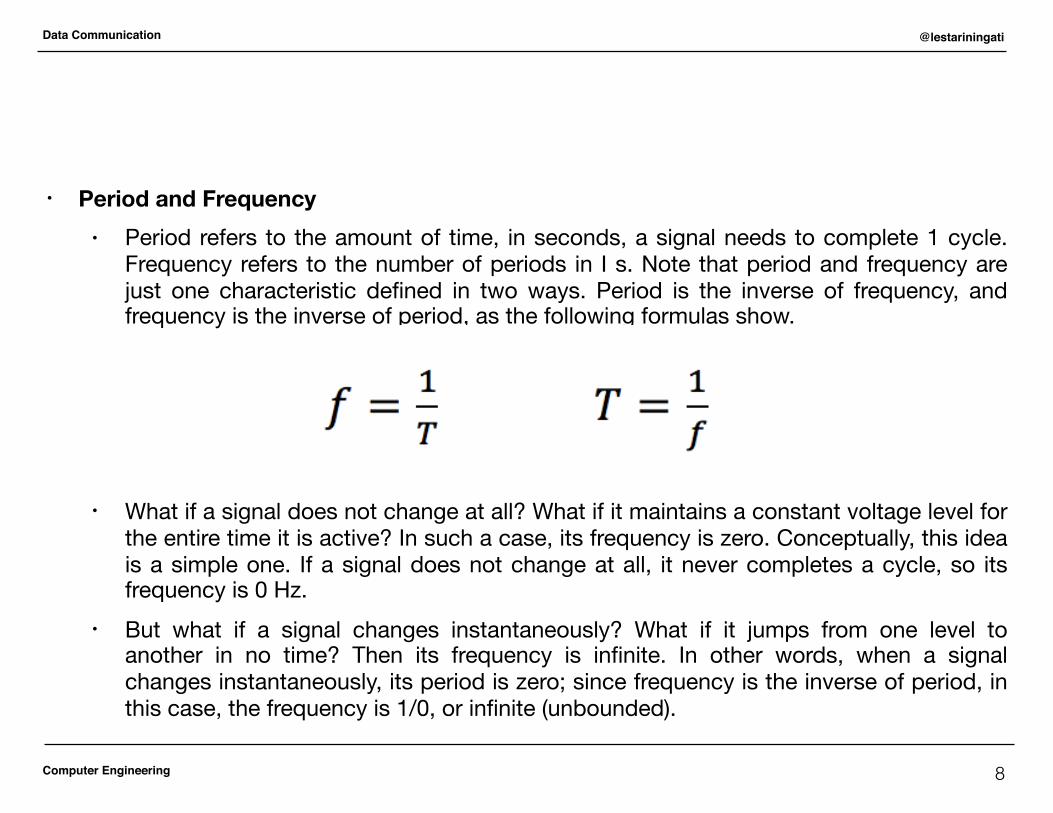
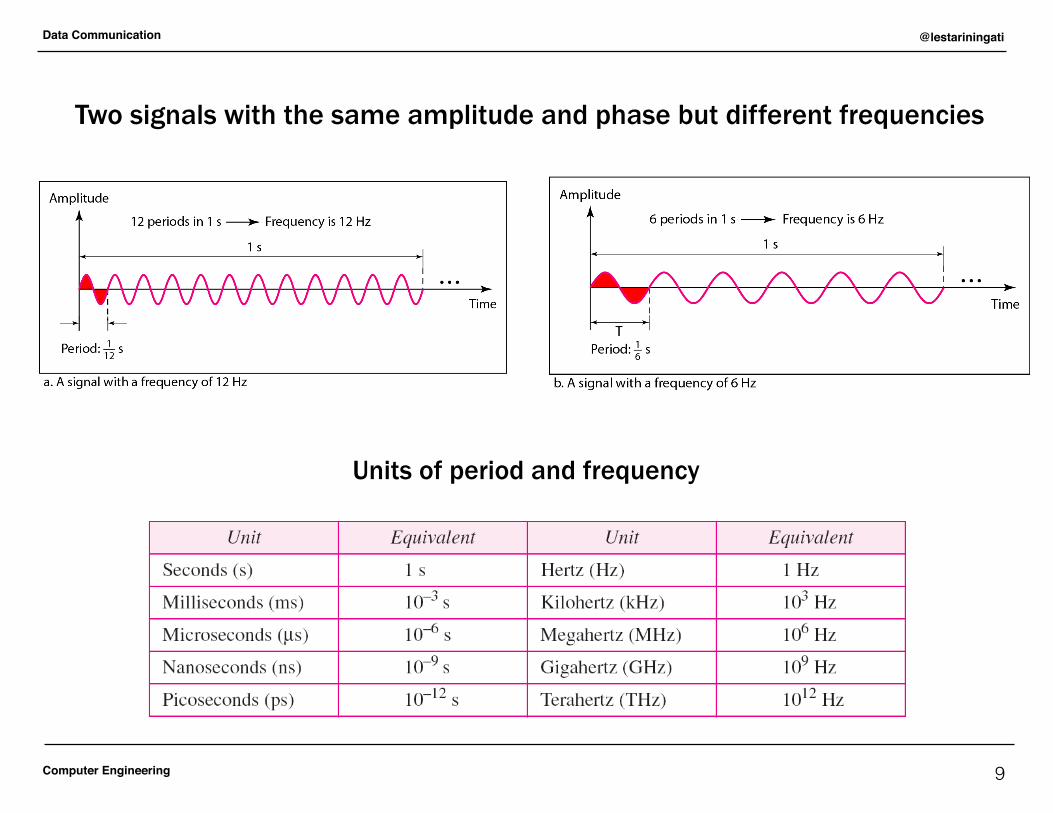
• Period and Frequency • Period refers to the amount of time, in seconds, a signal needs to complete 1 cycle.
Frequency refers to the number of periods in I s. Note that period and frequency are just one characteristic defined in two ways. Period is the inverse of frequency, and frequency is the inverse of period, as the following formulas show.
• What if a signal does not change at all? What if it maintains a constant voltage level for the entire time it is active? In such a case, its frequency is zero. Conceptually, this idea is a simple one. If a signal does not change at all, it never completes a cycle, so its frequency is 0 Hz.
• But what if a signal changes instantaneously? What if it jumps from one level to another in no time? Then its frequency is infinite. In other words, when a signal changes instantaneously, its period is zero; since frequency is the inverse of period, in this case, the frequency is 1/0, or infinite (unbounded).
8
Computer Engineering
Data Communication @lestariningati
Two signals with the same amplitude and phase but different frequencies
9
Units of period and frequency
Computer Engineering
Data Communication @lestariningati
• Phase • The term phase describes the position of the waveform relative to time 0. If we
think of the wave as something that can be shifted backward or forward along the time axis, phase describes the amount of that shift. It indicates the status of the first cycle.
• Phase is measured in degrees or radians [360° is 2∏ rad; 1° is 2∏/360 rad, and 1 rad is 360/(2∏)].
• A phase shift of 360° corresponds to a shift of a complete period; a phase shift of 180° corresponds to a shift of one-half of a period; and a phase shift of 90° corresponds to a shift of one-quarter of a period
10
Computer Engineering
Data Communication @lestariningati
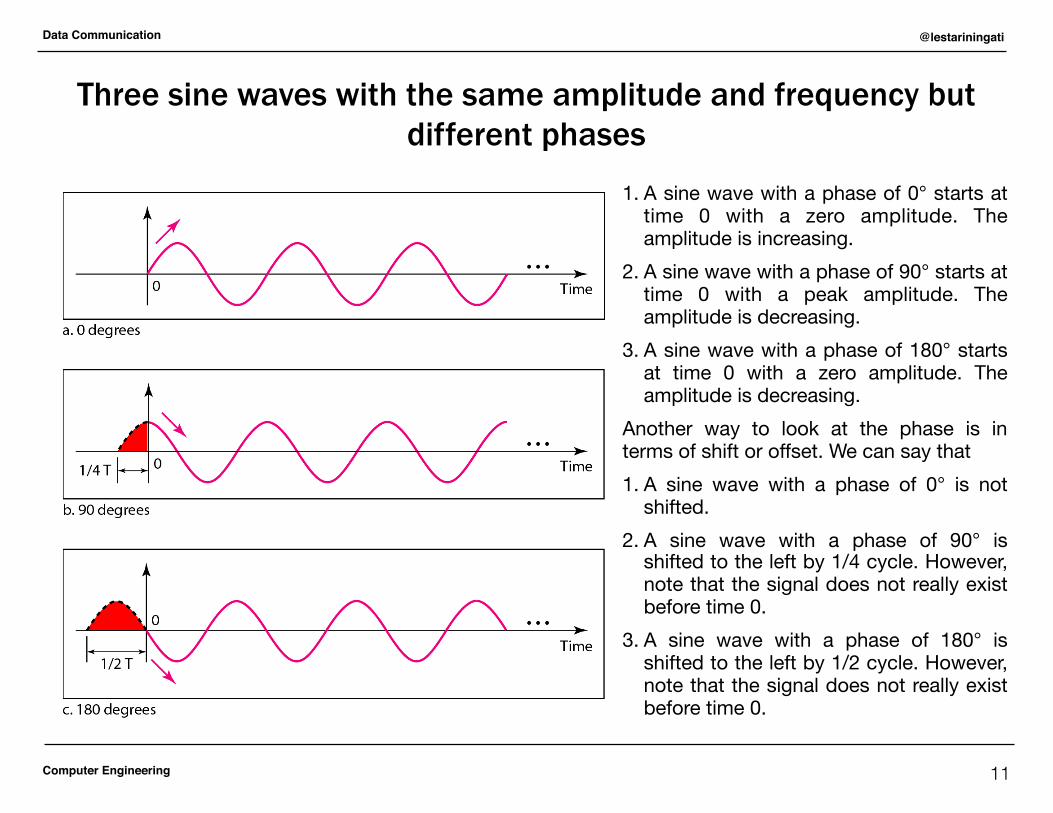
Three sine waves with the same amplitude and frequency but different phases
1. A sine wave with a phase of 0° starts at time 0 with a zero amplitude. The amplitude is increasing.
2. A sine wave with a phase of 90° starts at time 0 with a peak amplitude. The amplitude is decreasing.
3. A sine wave with a phase of 180° starts at time 0 with a zero amplitude. The amplitude is decreasing.
Another way to look at the phase is in terms of shift or offset. We can say that 1. A sine wave with a phase of 0° is not
shifted. 2. A sine wave with a phase of 90° is
shifted to the left by 1/4 cycle. However, note that the signal does not really exist before time 0.
3. A sine wave with a phase of 180° is shifted to the left by 1/2 cycle. However, note that the signal does not really exist before time 0.
11
Computer Engineering
Data Communication @lestariningati
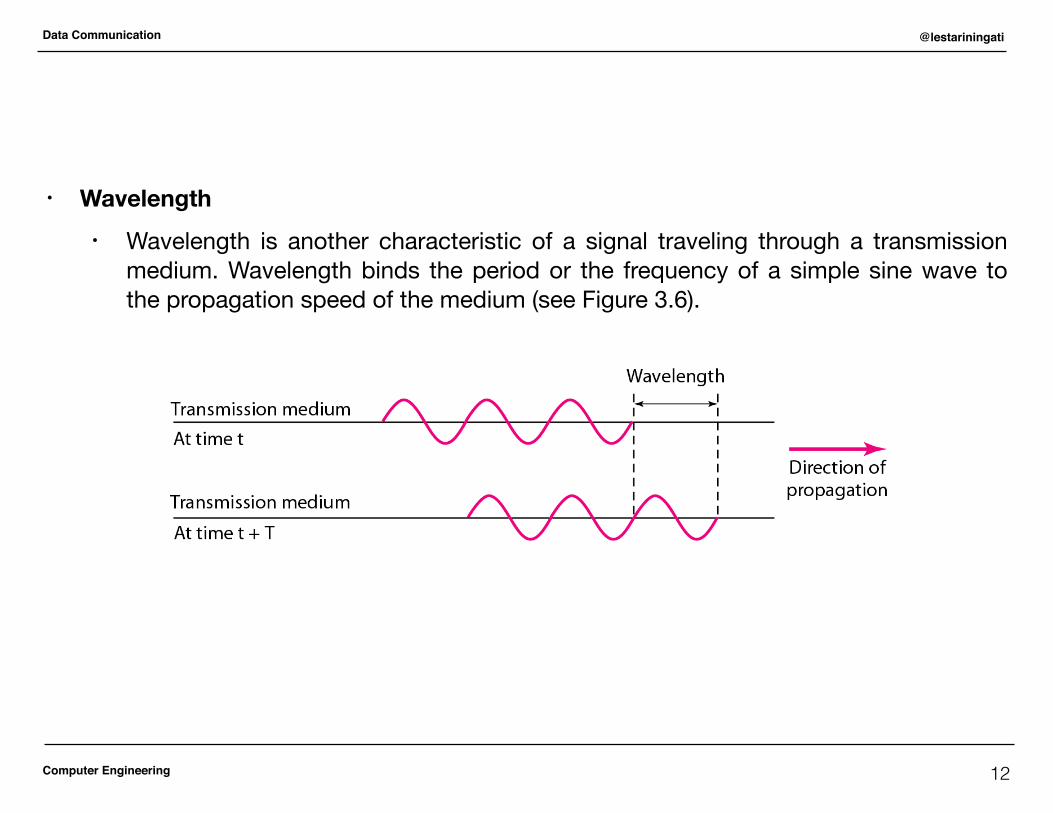
• Wavelength • Wavelength is another characteristic of a signal traveling through a transmission
medium. Wavelength binds the period or the frequency of a simple sine wave to the propagation speed of the medium (see Figure 3.6).
12
Computer Engineering
Data Communication @lestariningati
• While the frequency of a signal is independent of the medium, the wavelength depends on both the frequency and the medium. Wavelength is a property of any type of signal. In data communications, we often use wavelength to describe the transmission of light in an optical fiber. The wavelength is the distance a simple signal can travel in one period.
• Wavelength can be calculated if one is given the propagation speed (the speed of light) and the period of the signal. However, since period and frequency are related to each other, if we represent wavelength by 𝜆, propagation speed by c (speed of light), and frequency by f, we get
wavelength = propagation speed x period
• The propagation speed of electromagnetic signals depends on the medium and on the frequency of the signal. For example, in a vacuum, light is propagated with a speed of 3 x 10⁸ m/s. That speed is lower in air and even lower in cable.
• In a coaxial or fiber-optic cable, however, the wavelength is shorter (0.5μm) because the propagation speed in the cable is decreased.
13
Computer Engineering
Data Communication @lestariningati
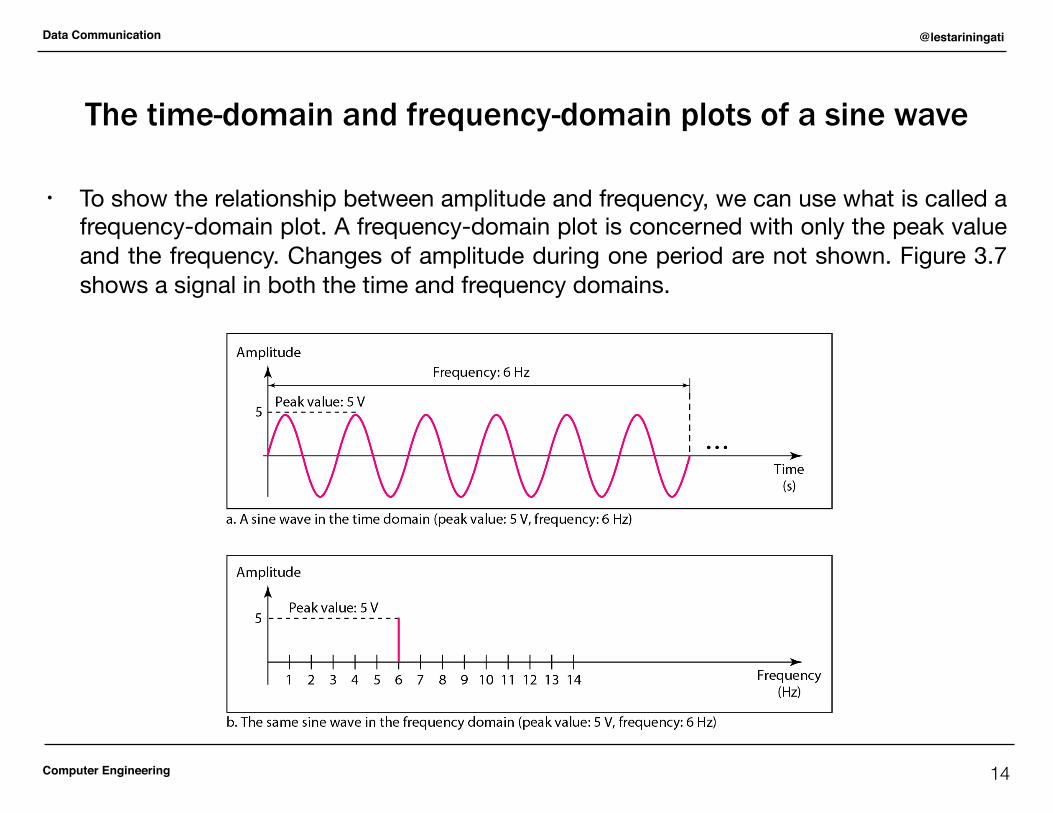
The time-domain and frequency-domain plots of a sine wave
• To show the relationship between amplitude and frequency, we can use what is called a frequency-domain plot. A frequency-domain plot is concerned with only the peak value and the frequency. Changes of amplitude during one period are not shown. Figure 3.7 shows a signal in both the time and frequency domains.
14
Computer Engineering
Data Communication @lestariningati
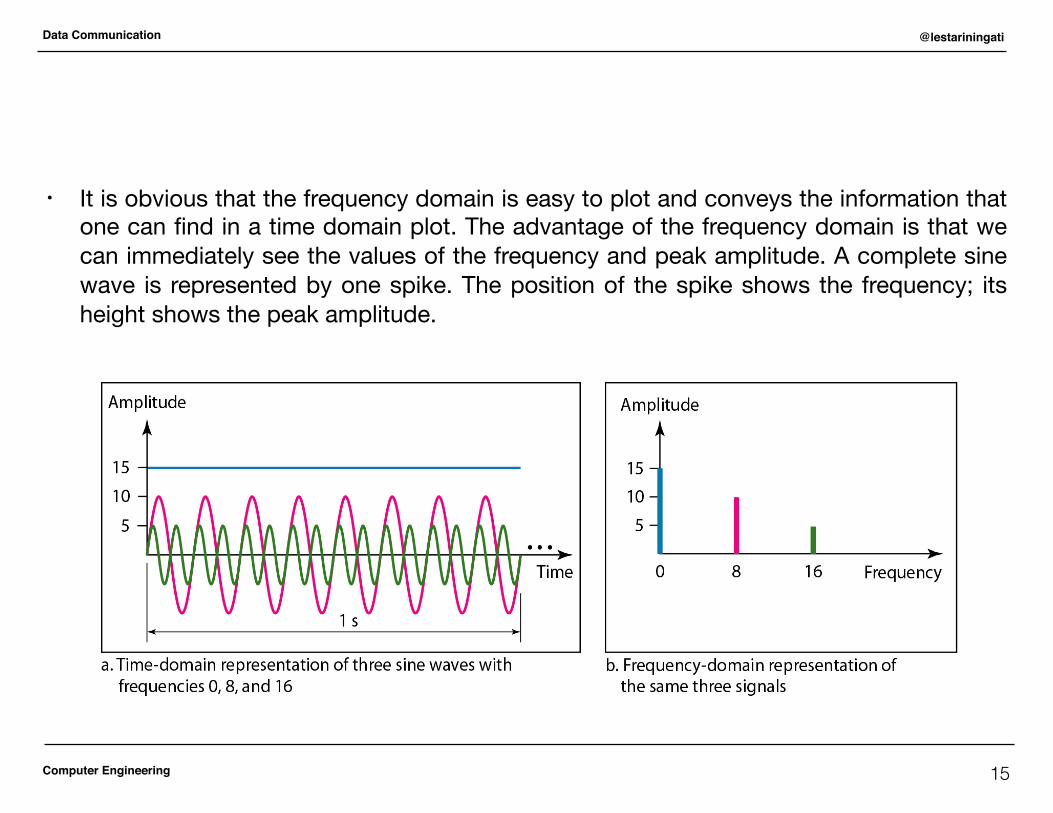
• It is obvious that the frequency domain is easy to plot and conveys the information that one can find in a time domain plot. The advantage of the frequency domain is that we can immediately see the values of the frequency and peak amplitude. A complete sine wave is represented by one spike. The position of the spike shows the frequency; its height shows the peak amplitude.
15
Computer Engineering
Data Communication @lestariningati
Composite Signals
• Simple sine waves have many applications in daily life. We can send a single sine wave to carry electric energy from one place to another. For example, the power company sends a single sine wave with a frequency of 60 Hz to distribute electric energy to houses and businesses. As another example, we can use a single sine wave to send an alarm to a security centre when a burglar opens a door or window in the house. In the first case, the sine wave is carrying energy; in the second, the sine wave is a signal of danger.
• If we had only one single sine wave to convey a conversation over the phone, it would make no sense and carry no information. We would just hear a buzz. As we will see in Chapters 4 and 5, we need to send a composite signal to communicate data. A composite signal is made of many simple sine waves.
16
Computer Engineering
Data Communication @lestariningati
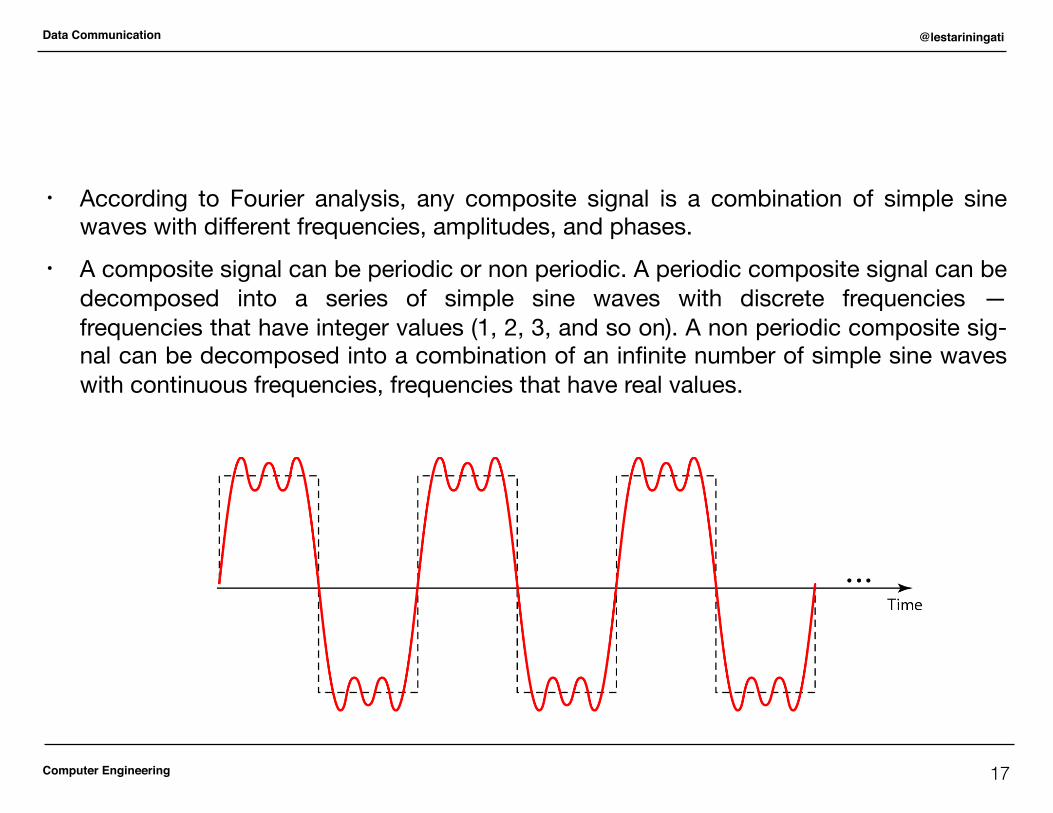
• According to Fourier analysis, any composite signal is a combination of simple sine waves with different frequencies, amplitudes, and phases.
• A composite signal can be periodic or non periodic. A periodic composite signal can be decomposed into a series of simple sine waves with discrete frequencies — frequencies that have integer values (1, 2, 3, and so on). A non periodic composite sig- nal can be decomposed into a combination of an infinite number of simple sine waves with continuous frequencies, frequencies that have real values.
17
Computer Engineering
Data Communication @lestariningati
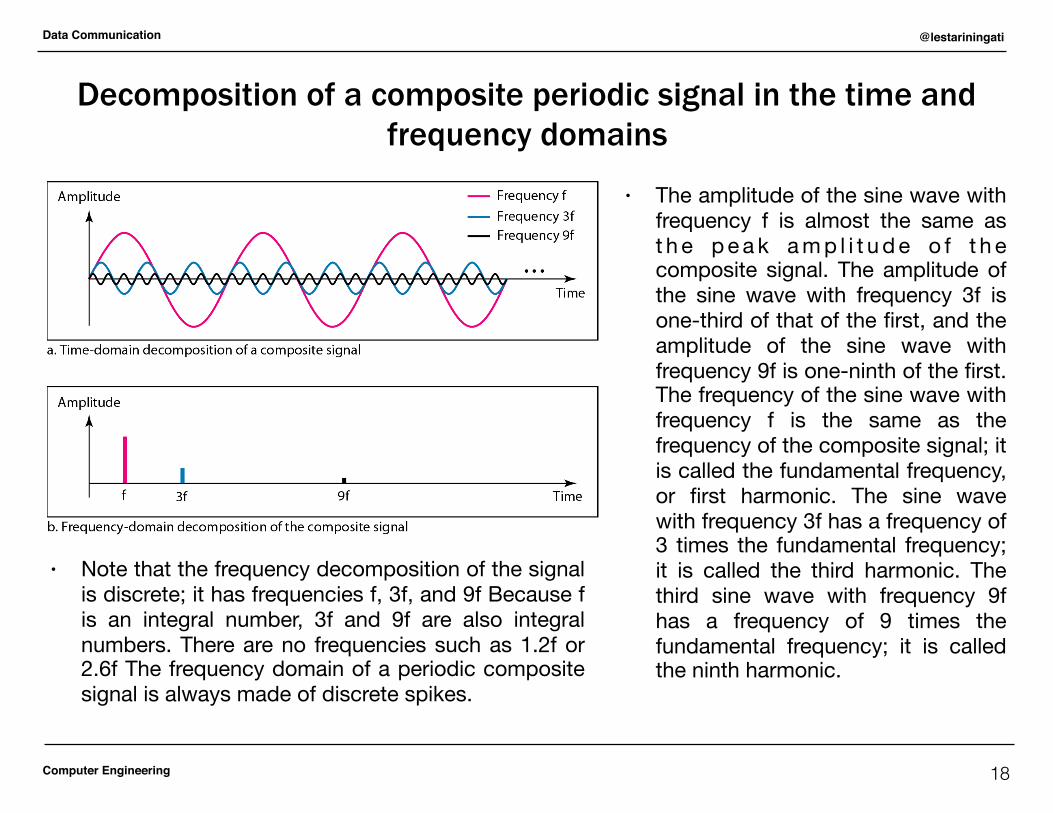
Decomposition of a composite periodic signal in the time and frequency domains
• The amplitude of the sine wave with frequency f is almost the same as t h e p e a k a m p l i t u d e o f t h e composite signal. The amplitude of the sine wave with frequency 3f is one-third of that of the first, and the amplitude of the sine wave with frequency 9f is one-ninth of the first. The frequency of the sine wave with frequency f is the same as the frequency of the composite signal; it is called the fundamental frequency, or first harmonic. The sine wave with frequency 3f has a frequency of 3 times the fundamental frequency; it is called the third harmonic. The third sine wave with frequency 9f has a frequency of 9 times the fundamental frequency; it is called the ninth harmonic.
18
• Note that the frequency decomposition of the signal is discrete; it has frequencies f, 3f, and 9f Because f is an integral number, 3f and 9f are also integral numbers. There are no frequencies such as 1.2f or 2.6f The frequency domain of a periodic composite signal is always made of discrete spikes.
Computer Engineering
Data Communication @lestariningati
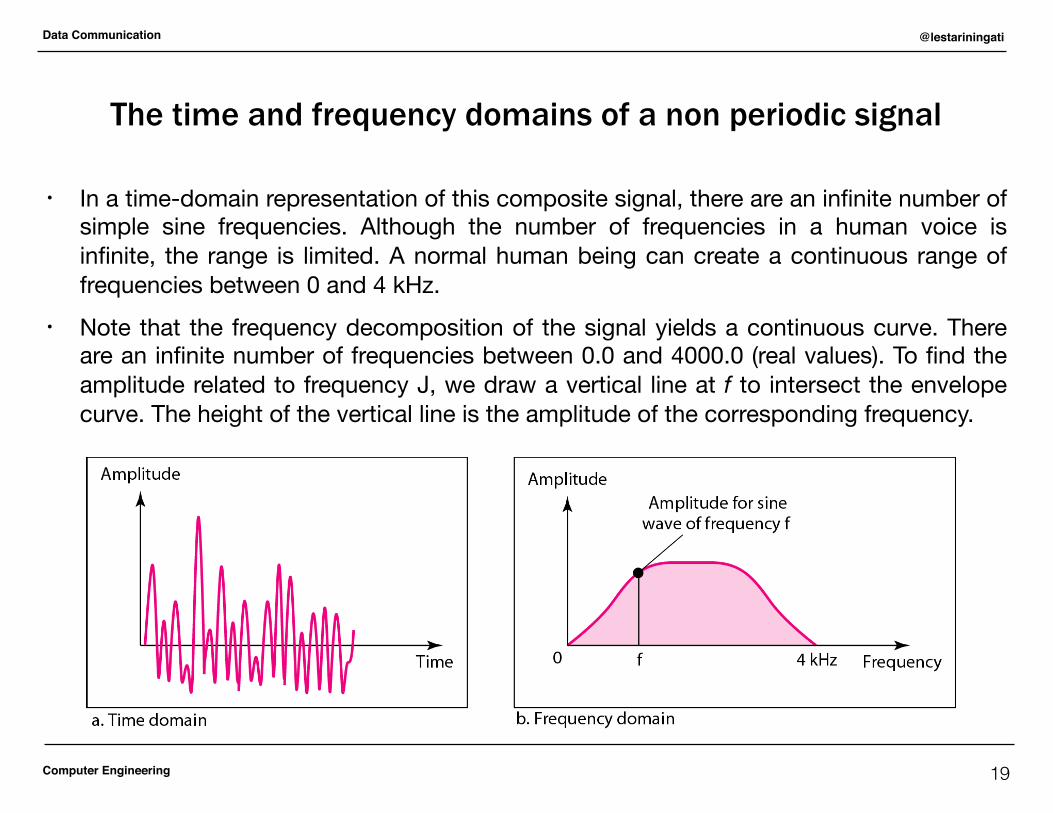
The time and frequency domains of a non periodic signal
• In a time-domain representation of this composite signal, there are an infinite number of simple sine frequencies. Although the number of frequencies in a human voice is infinite, the range is limited. A normal human being can create a continuous range of frequencies between 0 and 4 kHz.
• Note that the frequency decomposition of the signal yields a continuous curve. There are an infinite number of frequencies between 0.0 and 4000.0 (real values). To find the amplitude related to frequency J, we draw a vertical line at f to intersect the envelope curve. The height of the vertical line is the amplitude of the corresponding frequency.
19
Computer Engineering
Data Communication @lestariningati
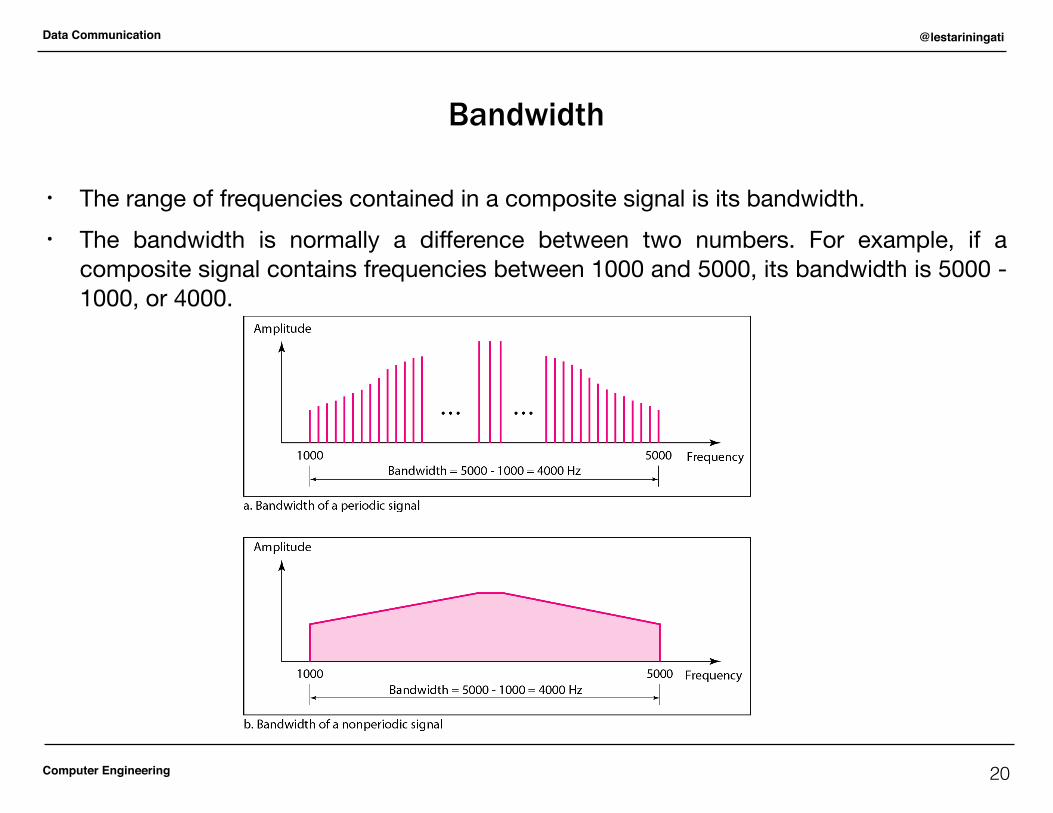
Bandwidth
• The range of frequencies contained in a composite signal is its bandwidth. • The bandwidth is normally a difference between two numbers. For example, if a
composite signal contains frequencies between 1000 and 5000, its bandwidth is 5000 - 1000, or 4000.
20
Computer Engineering
Data Communication @lestariningati
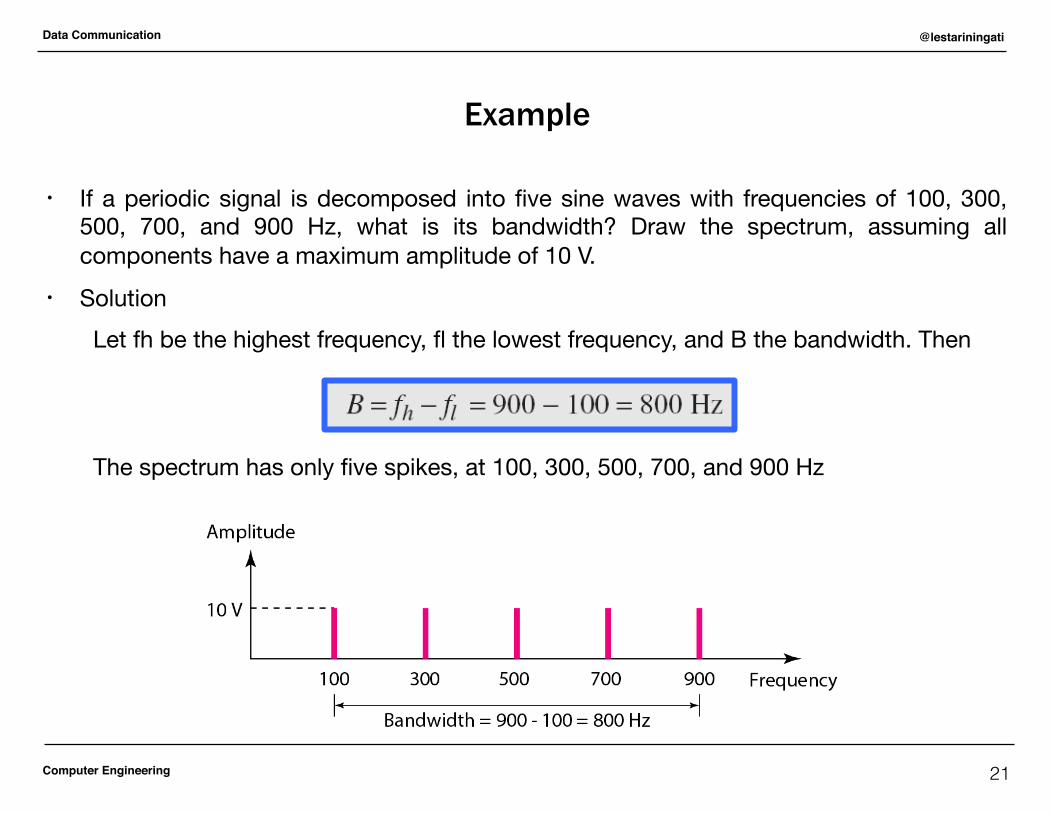
Example
• If a periodic signal is decomposed into five sine waves with frequencies of 100, 300, 500, 700, and 900 Hz, what is its bandwidth? Draw the spectrum, assuming all components have a maximum amplitude of 10 V.
• SolutionLet fh be the highest frequency, fl the lowest frequency, and B the bandwidth. Then
The spectrum has only five spikes, at 100, 300, 500, 700, and 900 Hz
21
Computer Engineering
Data Communication @lestariningati
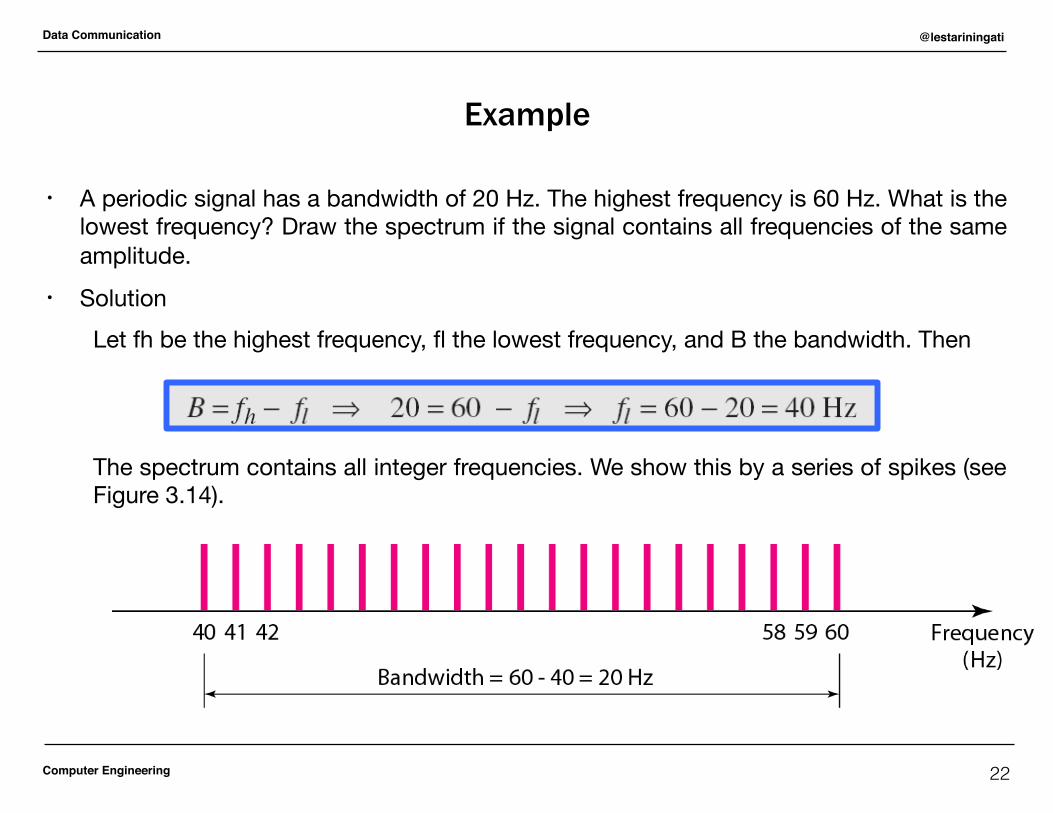
Example
• A periodic signal has a bandwidth of 20 Hz. The highest frequency is 60 Hz. What is the lowest frequency? Draw the spectrum if the signal contains all frequencies of the same amplitude.
• SolutionLet fh be the highest frequency, fl the lowest frequency, and B the bandwidth. Then
The spectrum contains all integer frequencies. We show this by a series of spikes (see Figure 3.14).
22
Computer Engineering
Data Communication @lestariningati
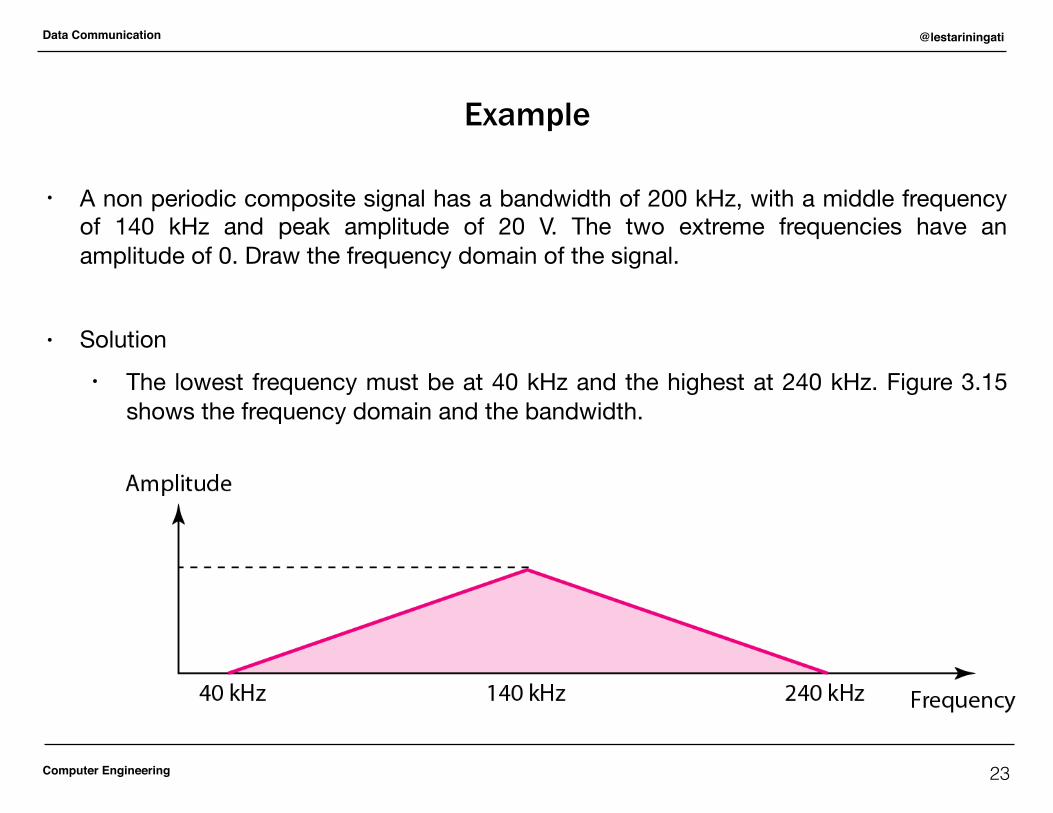
Example
• A non periodic composite signal has a bandwidth of 200 kHz, with a middle frequency of 140 kHz and peak amplitude of 20 V. The two extreme frequencies have an amplitude of 0. Draw the frequency domain of the signal.
• Solution• The lowest frequency must be at 40 kHz and the highest at 240 kHz. Figure 3.15
shows the frequency domain and the bandwidth.
23
Computer Engineering
Data Communication @lestariningati
Example
• An example of a non periodic composite signal is the signal propagated by an AM radio station. In the United States, each AM radio station is assigned a 10-kHz bandwidth. The total bandwidth dedicated to AM radio ranges from 530 to 1700 kHz. We will show the rationale behind this 10-kHz bandwidth in Chapter 5.
• Another example of a non periodic composite signal is the signal propagated by an FM radio station. In the United States, each FM radio station is assigned a 200-kHz bandwidth. The total bandwidth dedicated to FM radio ranges from 88 to 108 MHz. We will show the rationale behind this 200-kHz bandwidth in Chapter 5.
• Another example of a non periodic composite signal is the signal received by an old-fashioned analog black-and-white TV. A TV screen is made up of pixels. If we assume a resolution of 525 × 700, we have 367,500 pixels per screen. If we scan the screen 30 times per second, this is 367,500 × 30 = 11,025,000 pixels per second. The worst-case scenario is alternating black and white pixels. We can send 2 pixels per cycle. Therefore, we need 11,025,000 / 2 = 5,512,500 cycles per second, or Hz. The bandwidth needed is 5.5125 MHz.
24