Embed Size (px)
Citation preview
National Conference on Engineering Trends in Medical Science – NCETMS - 2014
ISSN: 2231-5381 http://www.ijettjournal.org Page 1
Web-Server Based Student
Attendance System Pooja S. Dhokane1,Sanghdeep Walake2 ,Prof. M.K.Gajghate3
1(FinalyearB.E(Electronics&Telecommunication),DBNCOETYavatmal,India)
2(Final YearB.E(Electronics &Telecommunication),DBNCOETYavatmal,India) 3(Asst.Prof,DBNCOETYavatmal,India)
Electronics&TelecommunicationDepartment
Abstract
Students' attendancerecords are important documents
for academic institutions thatreflect the
students'performancesand thecredibilityofthe
academic institutions.Nevertheless,the process of
managing these documentshad been done manually,
bypen andpapersthusmakingitlessefficient. This paper
discussesabout thedevelopmentof thenew
OnlineAttendanceSystem astheenhancementofthe
previous developed system named Attendance Register
Systemfor higher academic institutions.
The new online system Is being developed by
adapting the concept of the web-based system
architecture. The web-based system architecture used
in the development of this system involves integration
of various open source web-based technologies such as
MySQL,PHP and WebServer hence making the Online
Attendance System more efficient and cost effective.
The development of the Online Attendance System
involves four main phases which are the construction
of the conceptual framework where the scopes and
requirements as well as the target users of the system
had been identifie , developing the proposed system's
architecture by adapting to the web-based
architecture,and the construction ofthe logical design
and the physical design. The Online Attendance
System consists of automated processes such as able to
generate on line attendance reports, warning letters
and graph charts thus making the processes of
recording and reporting the students' attendances
more efficient and well-organized
Keywords: Microcontroller, GSM/GPRS Module,
WebServer.
I. INTRODUCTION
Now a day, the students are less motivated to come
to lecture, this emergence the development of
electronic attendance compared to traditional
method, and also, the information about the student
is readily available on the information super
highways (i.e.Internet).
Due to globalization and easy availability of almost
all information on the internet these days, students
are less motivated to come to the lecture rooms or
laboratory. Why students have to goto
school/college for attending a class, there are many
reasons that students have to go school and to
attend class. Some of the listed here: Something
they student missand never he/she can learn at
home without attending school such as discipline,
making friends, group learning, learning new
things, ideas, motivation etc. Most educational
institutions' administrators are concerned about
student irregular attendance. Because of, there is
often clear correlation relation between student‘s
attendance and over all academic performance.
Absenteeism can cause the institution to lose its
reputation as well as resulting in inadequate
learning on the part of the student. Higher authority
in school/universityalso demands that institutes
concerned with students and education keep a large
amount of data, including attendance and absence
levels, performance and agreements regarding
individual assistance. Traditionally-students
attendance made in attendance register, i.e.
registration of all students attendance made in
paperinclass.
Due to this, more time of the faculty is loss only
because the validation and insertion of data they
have to do manually.There may be chance for
tampering data. Due to large community of
Students and teachers, it is difficult to manage
manually. Due to this there arises a need for a more
efficient and effective method of solving this
problem.
II. SYSTEMOVERVIEW
The proposed system a generic application design
to automate and enhance the manual work of
recording and reporting in real-time, the Time and
Attendance System in Educational institutes.
With the development of science and technology,
there are varieties of attendance systems.Although
the products and technology of the exits attendance
systems have been relatively mature. Especially,
these attendance system are commonly used contact
less identification or biometric technology, it is
difficult to meet the characteristics about large
number of personel and the strong liquidity.
In order to solve the above problem,
combined with the specific circumstances of the
college classroom, the attendance system node of
student classroom based on web has been designed.
III. SYSTEMDESIGN
The web-based student attendance system
the technology promot essemi-automated recording
of student attendance, developed especially for the
university. Indrawing the system design number of
web-based methods and works have been seen and
referred. Our proposed system consists of three
main modules namely the switches, Controller
National Conference on Engineering Trends in Medical Science – NCETMS - 2014
ISSN: 2231-5381 http://www.ijettjournal.org Page 2
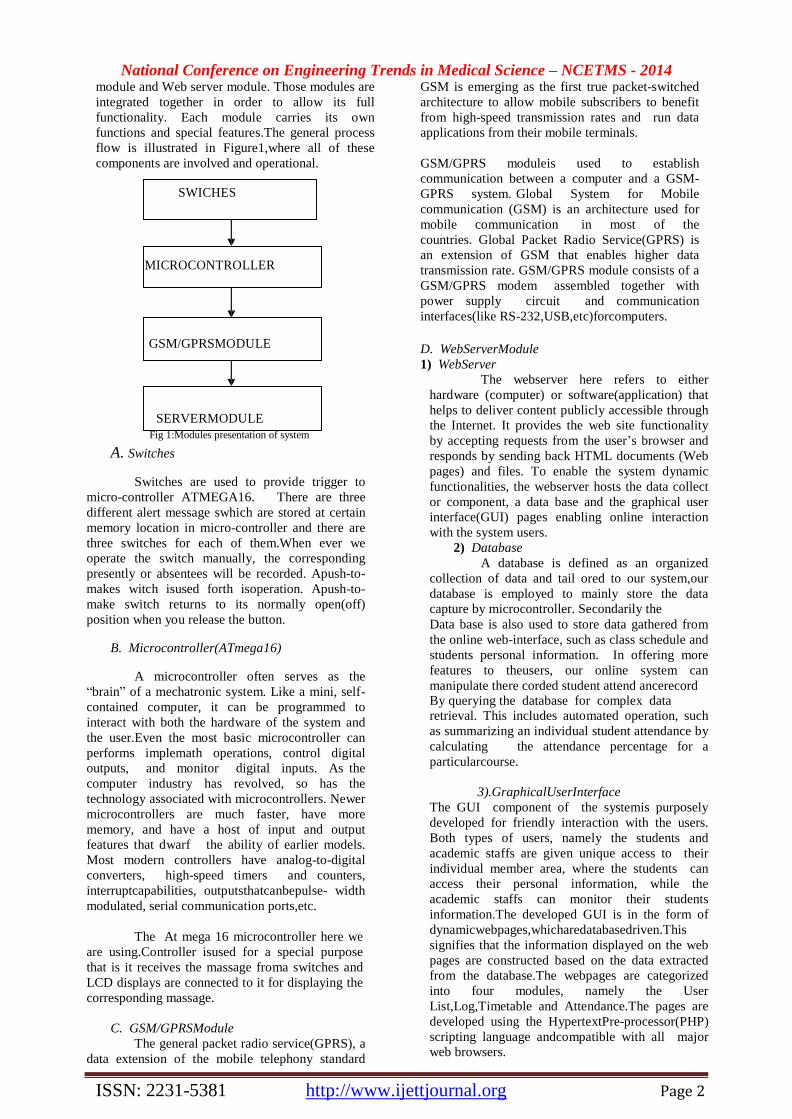
module and Web server module. Those modules are
integrated together in order to allow its full
functionality. Each module carries its own
functions and special features.The general process
flow is illustrated in Figure1,where all of these
components are involved and operational.
SWICHES
MICROCONTROLLER
GSM/GPRSMODULE
SERVERMODULE
Fig 1:Modules presentation of system
A. Switches
Switches are used to provide trigger to
micro-controller ATMEGA16. There are three
different alert message swhich are stored at certain
memory location in micro-controller and there are
three switches for each of them.When ever we
operate the switch manually, the corresponding
presently or absentees will be recorded. Apush-to-
makes witch isused forth isoperation. Apush-to-
make switch returns to its normally open(off)
position when you release the button.
B. Microcontroller(ATmega16)
A microcontroller often serves as the
“brain” of a mechatronic system. Like a mini, self-
contained computer, it can be programmed to
interact with both the hardware of the system and
the user.Even the most basic microcontroller can
performs implemath operations, control digital
outputs, and monitor digital inputs. As the
computer industry has revolved, so has the
technology associated with microcontrollers. Newer
microcontrollers are much faster, have more
memory, and have a host of input and output
features that dwarf the ability of earlier models.
Most modern controllers have analog-to-digital
converters, high-speed timers and counters,
interruptcapabilities, outputsthatcanbepulse- width
modulated, serial communication ports,etc.
The At mega 16 microcontroller here we
are using.Controller isused for a special purpose
that is it receives the massage froma switches and
LCD displays are connected to it for displaying the
corresponding massage.
C. GSM/GPRSModule
The general packet radio service(GPRS), a
data extension of the mobile telephony standard
GSM is emerging as the first true packet-switched
architecture to allow mobile subscribers to benefit
from high-speed transmission rates and run data
applications from their mobile terminals.
GSM/GPRS moduleis used to establish
communication between a computer and a GSM-
GPRS system. Global System for Mobile
communication (GSM) is an architecture used for
mobile communication in most of the
countries. Global Packet Radio Service(GPRS) is
an extension of GSM that enables higher data
transmission rate. GSM/GPRS module consists of a
GSM/GPRS modem assembled together with
power supply circuit and communication
interfaces(like RS-232,USB,etc)forcomputers.
D. WebServerModule
1) WebServer
The webserver here refers to either
hardware (computer) or software(application) that
helps to deliver content publicly accessible through
the Internet. It provides the web site functionality
by accepting requests from the user’s browser and
responds by sending back HTML documents (Web
pages) and files. To enable the system dynamic
functionalities, the webserver hosts the data collect
or component, a data base and the graphical user
interface(GUI) pages enabling online interaction
with the system users.
2) Database
A database is defined as an organized
collection of data and tail ored to our system,our
database is employed to mainly store the data
capture by microcontroller. Secondarily the
Data base is also used to store data gathered from
the online web-interface, such as class schedule and
students personal information. In offering more
features to theusers, our online system can
manipulate there corded student attend ancerecord By querying the database for complex data retrieval. This includes automated operation, such
as summarizing an individual student attendance by
calculating the attendance percentage for a
particularcourse.
3).GraphicalUserInterface
The GUI component of the systemis purposely
developed for friendly interaction with the users.
Both types of users, namely the students and
academic staffs are given unique access to their
individual member area, where the students can
access their personal information, while the
academic staffs can monitor their students
information.The developed GUI is in the form of
dynamicwebpages,whicharedatabasedriven.This
signifies that the information displayed on the web
pages are constructed based on the data extracted
from the database.The webpages are categorized
into four modules, namely the User
List,Log,Timetable and Attendance.The pages are
developed using the HypertextPre-processor(PHP)
scripting language andcompatible with all major
web browsers.

National Conference on Engineering Trends in Medical Science – NCETMS - 2014
ISSN: 2231-5381 http://www.ijettjournal.org Page 3
IV. SYSTEMIMPLEMENTATION
Based on the system design presented earlier,the
system implementation was carried out. Firs to fall we need to implement the hardware module which
contain microcontroller, switches , keyboard ,LCD displayetc.
1)Hardware Implementation
Hardware part will contain following module.
1. Microcontroller (ATmega16)
2. PowerSupply
3. LCDDisplay
4. GSM/GPRSModule
5. Keyboard
6. Switches
7. Memory
2)Software Implementation
A) WebDevelopment
The server is implemented in a PC.There
are three stages for to implement this one.First one
is to receive the data from the controller. The
second one is to store the data, taking attendance
and updating it. The third one is to develop a web-
application for to checking purpose or for editing
which is given control only for a lecturer.
B)Windows Application
The window sapplication is developed for to take the data from the controller while a person
takes the attendance of students. For this purpose
weareusingC#language andSQLserverforthe
designinganddatastoragepurpose.
C)DataBaseServer
The data fortheattendedstudents willbetakenand
storedbasedonthelecturer’s presenceonlyso
whenever alecturercameintotheclass the student’s
attendancewill betakenandstoredina serverwhich
isimplemented byusing SQLserver
andmanagementstudios.
D)Web-Application
Afteralltheabovework done,ifalecturer ora
studentwants tocheck theattendance, weneedto
developawebapplication inagraphicaluser
interfacemode.Throughthis thedetailswillbe
checkedandthelecturerhastherightstomodify
thedataalso.Thiswillbeimplemented byusing
ASP.Net,C# andSQLserver.
V. METHODOLOGY
Thestudents nameandrollnumbers ofrespective
classarewillbe savedinthememoryofthedevice.
Thefaculty oftherespectivesubjectwilltake
attendancemanually bymakingpushtothe switches.
Afterfinishingalltheattendance ofstudentsthe status
reportwill thensendontheweb by pressing switch‘send’.
Nowthedataonthewebwillautomaticallyupdate
withtime.
VI. OUTPUT SAMPLE OF SYSTEM
Fig 3:Students LoginPage
VII. CONCLUSION
The developed Web-Based Student AttendanceSystemtechnology willsignificantly Fig
2:Students Registration Page improve thecurrentmanualprocess ofstudent
attendance recording and tracking system,
especially inauniversity orschoolenvironment.
Thesystempromotesasemi-automatedapproach
incapturingthestudentattendance,i.e.byhaving

National Conference on Engineering Trends in Medical Science – NCETMS - 2014
ISSN: 2231-5381 http://www.ijettjournal.org Page 4
thestudents present or absent status from
controller.
In addition, a number of other advantages are
gainedbyhaving anonlineweb-based system,
actingasacentralrepository ofstudentattendance
record. Firstly all processes of managing the
student attendance record are performed online,
allowingadministratorsand lecturersto viewor modifytheusers’datathroughanycomputervia
thewebbrowser,aslongasthey areconnected to
theInternet.
Thisway,nospecificsoftware installation
isrequired.Thecapturedstudentattendancedata
arealsoprocessedandanalyzeautomatically with
lessriskofdataloss,compared toamanualfiling
approach.Specifictolecturersorteachers,theycan
easily monitor theirstudents’attendanceonline and
thiscouldimprovethequalityofteachingsinceless
timeisneededtomanagethestudent attendance
record.Thedevelopedsystem can beimprovedand
upgradedfurther, e.g.byextendingthesystem with
new featuresand modules or by improving the web-
interfacelayout withnewdisplaystyle.
REFERANCE
[1]V.B.GopalaKrishnaS.ChandraSekharN.RajeshBabuand
K.Sreenivasa Ravi:”The designofintelligentcampussecurity and
attendance system based on RFID,GSM, and Zig-bee”
IOSRJournal of engg.Volume2,Issue6June2012.
[2]SaifedinKardrry andMohamadSmaili:’WirelessAttendance ManagementSystem basedon iris recognization’Scintific ResearchandEssayvol.5(12),18June2010
[3]RanjanPatel ,NimishaPatel,Mona Gujjar:’Online attendance monitoring system inclassroomusing Radio Frequency
IdentificationTechnology ‘InternationalJournalofEmerging
Technology andAdvanceEngineering,Volume2Issue2 feb2012.
[4]Abdul Aziz MohamadandJyotiKameswari:”WebServer basedStudentAttendance Systemusing RFID technology”,
InternationalJournalofEngineeringTrendsand Technology,
Volume4Issue5-may2013
[5]OnoniwuG.Chiagozie andOkoraforG.Nwaji”Radio FrequencyIdentification Based Attendance Systemwith AutomaticDoorUnit”AcademicResearchInternationalVol2
March2012.
[6]ZhangYuru,ChenDelongandTanLiping:”TheResearch
andApplicationofCollege studentAttendance systembasedon RFIDTechnology”International JournalofControland Automation
vol6 2April 2013
[7]Nurbek Saparkhojayev and Selim Gurcin:”Attendance
Control system based on RFID technology “International Journal of Computer ScienceIssue vol.9 May2012
National Conference on Engineering Trends in Medical Science – NCETMS - 2014
ISSN: 2231-5381 http://www.ijettjournal.org Page 5
Voltage Stability Analysis In Hybrid AC-DC
Transmission System : A Review Ashish Dhar Diwan
1, K.E.Ch. Vidhya Shekhar
2
1 2 M-Tech Scholar, Electrical Engg. , Lovely Professional University, India
Abstract— As we all know, that now a days only
reliability of power is not needed in the system but the
quality of the power is also required for the appropriate
use of the equipment used at the load side. AC-DC
transmission system is analyzed in this paper for its
voltage stability and the power carrying capability for
transmission in the long EHV lines. This is a review
paper talking and reviewing the different papers
speaking about the same concept of AC-DC transmission
systems.
Key words—AC-DC, equipment, EHV, transmission.
I INTRODUCTION
Asthe demand is increasing rapidly with the growth of
requirements of utilities in the different areas of the daily
life. The power is often available at locations not close to
the growing load centers but at remote locations. These
locations are largely determined by regulatory policies,
environmental acceptability, and the cost of available
energy. The wheeling of this available energy through
existing long AC lines to load centers have a certain upper
limit due to stability considerations. Thus, these lines are
not loaded to their thermal limit to keep sufficient margin
against transient instability.
There were many papers talking about the same
concept which were read and justified. The present situation
demands the review of traditional power transmission
theory and practice, on the basis of new concepts that allow
full utilization of existing transmission facilities without
decreasing system availability and security. The flexible ac
transmission system (FACTS) concepts, based on applying
state-of-the-art power electronic technology to existing ac
transmission system, improve stability to achieve power
transmission close to its thermal limit .
The basic proof justifying the simultaneous ac–dc
power transmission is explained in reference[4]. In the
above references, simultaneous AC-DC power transmission
was first proposed through a single circuit ac transmission
line. In these proposals Mono-polar dc transmission with
ground as return path was used. There were certain
limitations due to use of ground as return path. Moreover,
the instantaneous value of each conductor voltage with
respect to ground becomes higher by the amount of the dc
voltage, and more discs are to be added in each insulator
string to withstand this increased voltage. However, there
was no change in the conductor separation distance, as the
line-to-line voltage remains unchanged. In this paper, the
feasibility study of conversion of a double circuit ac line to
composite ac–dc line without altering the original line
conductors, tower structures, and insulator strings has been
presented.
II CONCEPT OF SIMULTANEOUS AC-DC POWER
TRANSMISSION
In simultaneous ac-dc power transmission system,
the conductors are allowed to carry dc current superimposed
on ac current. AC and DC power flow independently and
the added dc power flow does not cause any transient
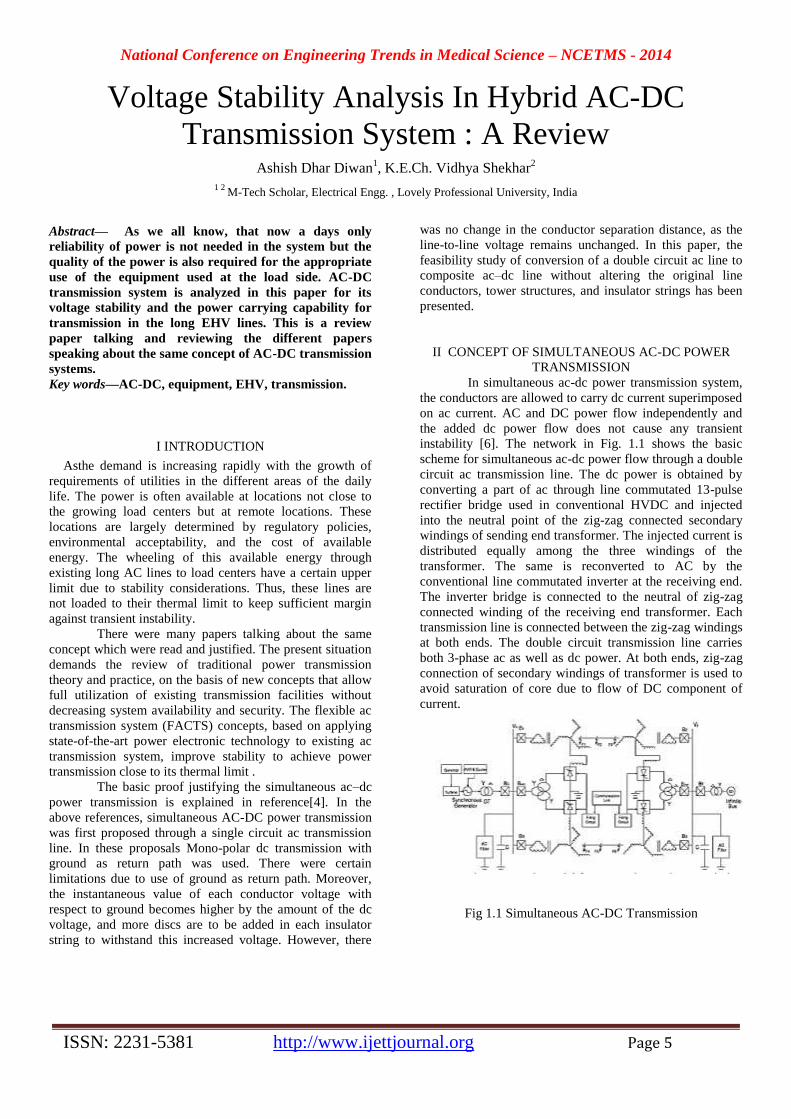
instability [6]. The network in Fig. 1.1 shows the basic
scheme for simultaneous ac-dc power flow through a double
circuit ac transmission line. The dc power is obtained by
converting a part of ac through line commutated 13-pulse
rectifier bridge used in conventional HVDC and injected
into the neutral point of the zig-zag connected secondary
windings of sending end transformer. The injected current is
distributed equally among the three windings of the
transformer. The same is reconverted to AC by the
conventional line commutated inverter at the receiving end.
The inverter bridge is connected to the neutral of zig-zag
connected winding of the receiving end transformer. Each
transmission line is connected between the zig-zag windings
at both ends. The double circuit transmission line carries
both 3-phase ac as well as dc power. At both ends, zig-zag
connection of secondary windings of transformer is used to
avoid saturation of core due to flow of DC component of
current.
Fig 1.1 Simultaneous AC-DC Transmission

National Conference on Engineering Trends in Medical Science – NCETMS - 2014
ISSN: 2231-5381 http://www.ijettjournal.org Page 6
III SELECTION OF POWER
Let us assume that the rectifier’s current control to
be remain as constant and inverter’s extinction angle control
be also as constant. Under normal operating conditions the
equivalent circuit can be shown as Fig.3.1. Return path of
the AC current only can be shown by the dotted lines in the
figure. [5]The DC power carried by each conductor of the
line will be (Id / 3) along with the AC current per phase and
the maximum values of rectifier and inverter side DC
voltages can be given by Edro and Edio respectively. Line
parameters in each phase of each line are R, L and C. Rcr
and Rci are the resistances which are commutating
resistances and α is the firing angle and γ is the extinction
angles of rectifier and inverter. The ground only carries the
full DC current and all the other conductor have only Id/3
along with the AC super imposed on it. The AC voltage
and current and the power equations in terms of A, B, C and
D parameters of each line can be given as, when there is
resistive drop in transformer winding and in the line
conductors due to DC current are neglected. The expression
can be given as[5]:
Sending end voltage:
Es = AER + BIR (3.1)
Sending end current:
Is = CER + DIR (3.3)
Sending end power:
Ps+ jQS = (- ES X ER)/B + (D X Es3/B) (3.3)
Receiving end power:
PR+jQR = (ES X ER)/B - (A X ER3/B) (3.4)
Now, the expressions for DC current and the DC power can
be given as shown below, when the ac resistive drop in the
line and transformer are neglected then,
Dc current:
Id = (Edrcosα - Edicosγ)/(Rer+(R/3) – Rci) (3.5)
Power in inverter:
Pdi = Edi x Id (3.6)
Power in rectifier:
Pdr = Edr x Id (3.7)
Where,
R = line resistance per conductor.
Rcr and Rci = commutating resistances.
α and γ = firing and extinction angles of rectifier
and inverter respectively.
Vdr and Vdi= maximum dc voltages of rectifier and
inverter side respectively.
Values of Edr and Edi are 1.35 times line to line tertiary
winding AC voltages of respective sides.
Reactive power required by the converters are:
Qdi = Pdi tanθI (3.8)
Qdr = Pdr tanθr (3.9)
CosθI = (cosγ + cos (γ + μi))/3 (3.10)
Cosθr = (cosα + cos (α + μr))/3 (3.11)
Where, μI and μr are commutation angles of inverter and
rectifier respectively and total active and reactive powers at
the two ends are
Pst = Ps + Pdr and Prt = PR + Pdi (3.13)
Qst = Qs + Qdr and Qrt = QR + Qdi (3.13)
Total transmission line loss is:
PL = (Ps + Pdr) – (PR + Pdi) (3.14)
Ia being the rms AC current per conductor at any point of
the line, total rms current per conductor in 3 phase becomes
:
I = √ and PL =3I3R (3.15)
If the rated conductor current corresponds to its allowable
temperature rise is Ith and
Ia = X x Ith ; X being less than one, the DC current gets to:
Id = 3 x ( ) Ith (3.16)
The total current I in any conductor is asymmetrical but two
natural zero-crossings in each cycle in current wave are
obtained for (Id/3Ia) <1.414.
The instant value of each conductor voltage with respect to
ground becomes the DC voltage Vd with a superimposed
sinusoidally varying AC voltages having rms value Eph and
the peak value being:
Emax = V + 1.414 Eph
Electric field produced by any conductor voltage have a DC
component which is superimposed with varying AC
component[7]. Though, the electric field polarity changes its
sign twice in cycle if (Vd/Eph) <1.414. So, higher creep age
distance requirement for insulator discs used for HVDC
lines are not required in this system. Each conductor is to be
insulated for maximum voltage (Emax) but the line to line
voltage has no DC component and ELL(max) = 3.45 Eph.
Therefore, separation between two conductor distance is
determined only by rated AC voltage of the line.
Let,
Vd/Eph = k
Pdc/Pac # (Vd * Id)/(3* Eph*Ia*cosT) = (k * )/(x*cosT) (3.17)
Total power can be given by
Pt = Pdc + Pac = (1+ [k x ]/(x * cosT)) * Pac
(3.18)
The full-fledged analysis of short current AC design of
protective scheme, currently the filters used in it are not the
scope of work going on right now, but the above expression
says that the combine hvdc and hvac systems can be used
for this purpose. In the case of any faults in the system all
National Conference on Engineering Trends in Medical Science – NCETMS - 2014
ISSN: 2231-5381 http://www.ijettjournal.org Page 7
the SCR are gated and block the fault current from causing
any damage to the system and also when the fault clears this
SCRs are released after the successful; work of protecting
the system. Circuit breakers are then tripped at both ends to
isolate the complete system and is mentioned earlier, if (Id
3Ia) <1.414 [5], there will be no requirement of special DC
circuit breakers. The circuit breakers which are used at both
the ends of transmission line will ensure to operate at zero
current. The security of transmission lines can be ensured by
giving proper tripping signals to the circuit breakers which
is given when the current signal crosses zero which is
determined by the zero crossing detector. Else, circuit
breakers which are connected to the other side of
transformer may be used to protect the system from faults.
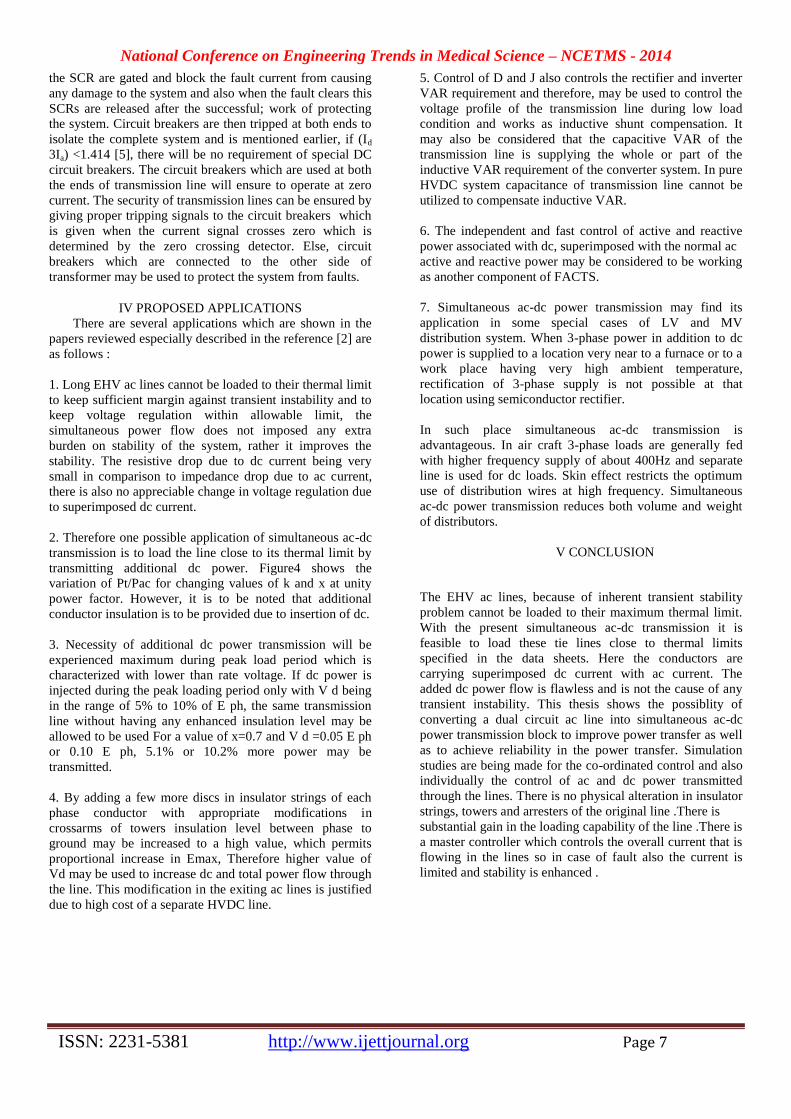
IV PROPOSED APPLICATIONS
There are several applications which are shown in the
papers reviewed especially described in the reference [2] are
as follows :
1. Long EHV ac lines cannot be loaded to their thermal limit
to keep sufficient margin against transient instability and to
keep voltage regulation within allowable limit, the
simultaneous power flow does not imposed any extra
burden on stability of the system, rather it improves the
stability. The resistive drop due to dc current being very
small in comparison to impedance drop due to ac current,
there is also no appreciable change in voltage regulation due
to superimposed dc current.
2. Therefore one possible application of simultaneous ac-dc
transmission is to load the line close to its thermal limit by
transmitting additional dc power. Figure4 shows the
variation of Pt/Pac for changing values of k and x at unity
power factor. However, it is to be noted that additional
conductor insulation is to be provided due to insertion of dc.
3. Necessity of additional dc power transmission will be
experienced maximum during peak load period which is
characterized with lower than rate voltage. If dc power is
injected during the peak loading period only with V d being
in the range of 5% to 10% of E ph, the same transmission
line without having any enhanced insulation level may be
allowed to be used For a value of x=0.7 and V d =0.05 E ph
or 0.10 E ph, 5.1% or 10.2% more power may be
transmitted.
4. By adding a few more discs in insulator strings of each
phase conductor with appropriate modifications in
crossarms of towers insulation level between phase to
ground may be increased to a high value, which permits
proportional increase in Emax, Therefore higher value of
Vd may be used to increase dc and total power flow through
the line. This modification in the exiting ac lines is justified
due to high cost of a separate HVDC line.
5. Control of D and J also controls the rectifier and inverter
VAR requirement and therefore, may be used to control the
voltage profile of the transmission line during low load
condition and works as inductive shunt compensation. It
may also be considered that the capacitive VAR of the
transmission line is supplying the whole or part of the
inductive VAR requirement of the converter system. In pure
HVDC system capacitance of transmission line cannot be
utilized to compensate inductive VAR.
6. The independent and fast control of active and reactive
power associated with dc, superimposed with the normal ac
active and reactive power may be considered to be working
as another component of FACTS.
7. Simultaneous ac-dc power transmission may find its
application in some special cases of LV and MV
distribution system. When 3-phase power in addition to dc
power is supplied to a location very near to a furnace or to a
work place having very high ambient temperature,
rectification of 3-phase supply is not possible at that
location using semiconductor rectifier.
In such place simultaneous ac-dc transmission is
advantageous. In air craft 3-phase loads are generally fed
with higher frequency supply of about 400Hz and separate
line is used for dc loads. Skin effect restricts the optimum
use of distribution wires at high frequency. Simultaneous
ac-dc power transmission reduces both volume and weight
of distributors.
V CONCLUSION
The EHV ac lines, because of inherent transient stability
problem cannot be loaded to their maximum thermal limit.
With the present simultaneous ac-dc transmission it is
feasible to load these tie lines close to thermal limits
specified in the data sheets. Here the conductors are
carrying superimposed dc current with ac current. The
added dc power flow is flawless and is not the cause of any
transient instability. This thesis shows the possiblity of
converting a dual circuit ac line into simultaneous ac-dc
power transmission block to improve power transfer as well
as to achieve reliability in the power transfer. Simulation
studies are being made for the co-ordinated control and also
individually the control of ac and dc power transmitted
through the lines. There is no physical alteration in insulator
strings, towers and arresters of the original line .There is
substantial gain in the loading capability of the line .There is
a master controller which controls the overall current that is
flowing in the lines so in case of fault also the current is
limited and stability is enhanced .

National Conference on Engineering Trends in Medical Science – NCETMS - 2014
ISSN: 2231-5381 http://www.ijettjournal.org Page 8
REFERENCES
[[1] T.Vijay Muni, T.Vinoditha, D.Kumar Swamy (2011) “Improvement
of Power System Stability by Simultaneous AC-DC Power Transmission”,
International Journal of Scientific & Engineering Research Volume 2, Issue
4, April-2011. [2] D. Povh, D. Retzmann, E. Teltsh U. Kerin, R. Mihalik , “Advantages of
Large AC/DC System Interconnections”, 21, rue d’Artois, F-75008 PARIS
B4-304 CIGRE 2006 [3] Abhishek Chaturvedi, V. K. Tripathi, T Vijay Muni, Neeraj Singh
(2013) “Power System Stability Enhancement by Simultaneous AC-DC
Power Transmission”, International Journal of Advanced Research in Electrical, Electronics and Instrumentation EngineeringVolume 2, Issue 5,
May-2013.
[4] H. Rahman “Upgradation of Existing EHVAC Line by Composite AC-DC Transmission”, international conference on communication, computer
and power (ICCCP'09), MUSCAT, FEBRUARY 15-18, 2009
[5] P. Vijay Kumar Babu, P. Bhaskara Prasad, M.Padma Lalitha “Power Upgrading of Transmission Line by Combining AC–DC
Transmission”,International Journal of Engineering Research and
Applications (IJERA) Vol. 2, Issue 6, November- December 2012,
pp.1699-1704. [6] C.GOPI, M.KISHOR, “Power Upgrading of Transmission Line by
Injecting DC Power in to AC Line with the help of ZIG-ZAG
Transformer”,International Journal of Engineering Research and Applications (IJERA) Vol. 2, Issue 3, May-Jun 2012, pp.1042-1047
[7] Vikash Choudhary, Abdul Kadir, Prathibha Gupta, “a novel idea:
simultaneous ac-dc power transmission” International Journal of Advanced Engineering Technology E-ISSN 0976-3945, IJAET/Vol. II/ Issue
IV/October-December, 2011/470-474.
[8] JARUPULA SOMLAL, “Power upgrading of Transmission Line by combining AC-DC Transmission”, LATEST TRENDS on SYSTEMS
(Volume I).
[9] U. STRAUMANN,C.M. FRANCK, “Discussion of Converting a Double-Circuit AC Overhead Line to an AC/DC Hybrid Line with Regard
to Audible Noise”, CIGRE 2006.
[10] V. Sitnikov, D. Povh, D. Retzmann,E. Teltsch, “solutions for large power system interconnections” 17– 19 Sept. 2003 St. Petersburg
[11] P. S. Kundur, Power System Stability and Control. New York: Mc-
Graw-Hill,1994
National Conference on Engineering Trends in Medical Science – NCETMS - 2014
ISSN: 2231-5381 http://www.ijettjournal.org Page 9
Detection of Skin Cancer Using ABCD Rule with
Assistance of MATLAB Sanket Manohar Gokhale*
1, Supriya S. Malvi
#2,#3
Prof. Apurva Rajankar#3
Departmentof Biomedical engineering, DBNCOET, Yavatmal
SGBAU, Amravati,(MH), India.
Abstract- This paper presents Detection of skin cancer in the
earlier stage is very critical and this paper proposes and
explains the implementation of automatic detection and
analysis Skin Cancer. By applying multi-level Wavelet
Transformation to the input image and then choosing a group
of sub-bands to be restored for best defect detection.
Asymmetry, Border Irregularity, Colour variation, Diameter
is the major symptoms which we will use in our processing
algorithm. We are calculating TDS Index for differentiating
and making final decision of non-cancerous (benign),
suspicious and cancerous (melanoma) image, which will help
patients/doctors/dermatologist/clinicians for taking further
medical treatment, which will ultimately saves patients
valuable time, money and life.
Keywords— skin cancer, Wavelet Transformation, Neural
Network,Segmentation.
I.INTRODUCTION
Skin Cancer is the cancer affecting the skin. Skin cancer
may appear as malignant or benign form. Benign Melanoma
issimply appearance of moles on skin. Malignant melanoma is the
appearance of sores that cause bleeding. Malignant Melanoma is
the deadliest form of all skin cancers. It arises from cancerous
growth in pigmented skin lesion. Malignant melanoma is named
after the cell from which it presumably arises, the melanocyte. If
diagnosed at the right time, this disease is curable. Melanoma
diagnosis is difficult and needs sampling and laboratory tests.
Melanoma can spread out to all parts of the body through
lymphatic system or blood.
The main problem to be considered dealing with
melanoma is that, the first affliction of the disease can pave the
way for future ones. Laboratory sampling often causes the
inflammation or even spread of lesion. So, there has always been
lack of less dangerous and time-consuming methods. Computer
based diagnosis can improve the speed of skin cancer diagnosis
which works according to the diseasesymptoms [4].
The similarities among skin lesions make the diagnosis
of malignant cells a difficult task. But, there are some unique
symptoms of skin cancer, such as: Asymmetry, Border
irregularity, Colour variation and Diameter. Those are popularly
known as ABCD parameters. ABCD parameters. Asymmetry,
Border irregularity, Colour , Diameter. Asymmetry is one half of
the tumour does not match the other half. Border Irregularity is
the unevenness of images. Colour intensity change in the lesioned
region is irregular. Malignant melanoma is having a diameter
greater than 6mm.
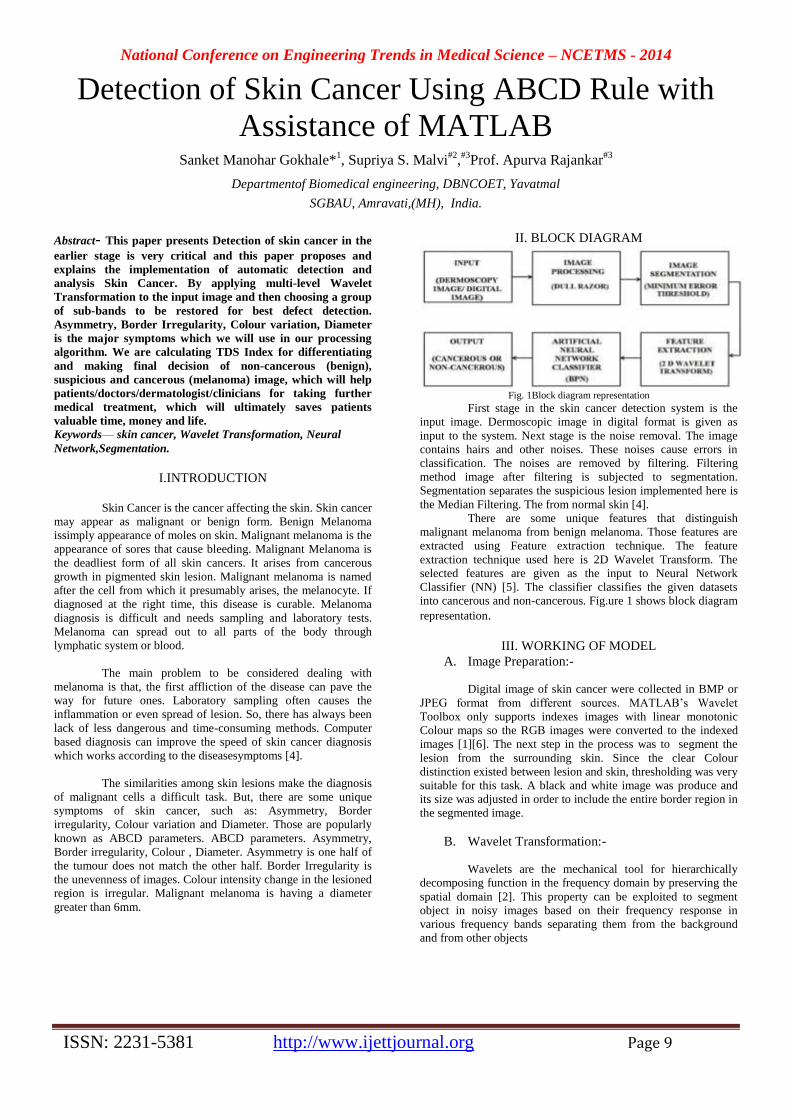
II. BLOCK DIAGRAM
Fig. 1Block diagram representation
First stage in the skin cancer detection system is the
input image. Dermoscopic image in digital format is given as
input to the system. Next stage is the noise removal. The image
contains hairs and other noises. These noises cause errors in
classification. The noises are removed by filtering. Filtering
method image after filtering is subjected to segmentation.
Segmentation separates the suspicious lesion implemented here is
the Median Filtering. The from normal skin [4].
There are some unique features that distinguish
malignant melanoma from benign melanoma. Those features are
extracted using Feature extraction technique. The feature
extraction technique used here is 2D Wavelet Transform. The
selected features are given as the input to Neural Network
Classifier (NN) [5]. The classifier classifies the given datasets
into cancerous and non-cancerous. Fig.ure 1 shows block diagram
representation.
III. WORKING OF MODEL
A. Image Preparation:-
Digital image of skin cancer were collected in BMP or
JPEG format from different sources. MATLAB’s Wavelet
Toolbox only supports indexes images with linear monotonic
Colour maps so the RGB images were converted to the indexed
images [1][6]. The next step in the process was to segment the
lesion from the surrounding skin. Since the clear Colour
distinction existed between lesion and skin, thresholding was very
suitable for this task. A black and white image was produce and
its size was adjusted in order to include the entire border region in
the segmented image.
B. Wavelet Transformation:-
Wavelets are the mechanical tool for hierarchically
decomposing function in the frequency domain by preserving the
spatial domain [2]. This property can be exploited to segment
object in noisy images based on their frequency response in
various frequency bands separating them from the background
and from other objects
National Conference on Engineering Trends in Medical Science – NCETMS - 2014
ISSN: 2231-5381 http://www.ijettjournal.org Page 10
C. Discrete Wavelet Transform:-
Discrete Wavelet Transform Implementation-The
discrete wavelet transform uses low-pass and high-pass filters,
h(n) and g(n), to expand a digital signal. They are referred to as
analysis filters [3]. The dilation performed for each scale is now
achieved by a decimator. The coefficients ck and dk are produced
by convolving thedigital signal, with each filter, and then
decimating the output. The ckcoefficients are produced by the
low-pass filter, h (n), and called coarse coefficients. The
dkcoefficients are produced by the high-pass filter and called
detail coefficients. Coarse coefficients provide information about
low frequencies, and detail coefficients provide information about
high frequencies. Coarse and detail coefficients are produced at
multiple scales by iterating the process on the coarse coefficients
of each scale. The entire process is computed using a tree-
structured filter bank, as seen in Figure
Fig.2: Synthesis Filter Bank. The high and low pass filters combine the
coefficients into the original signal.
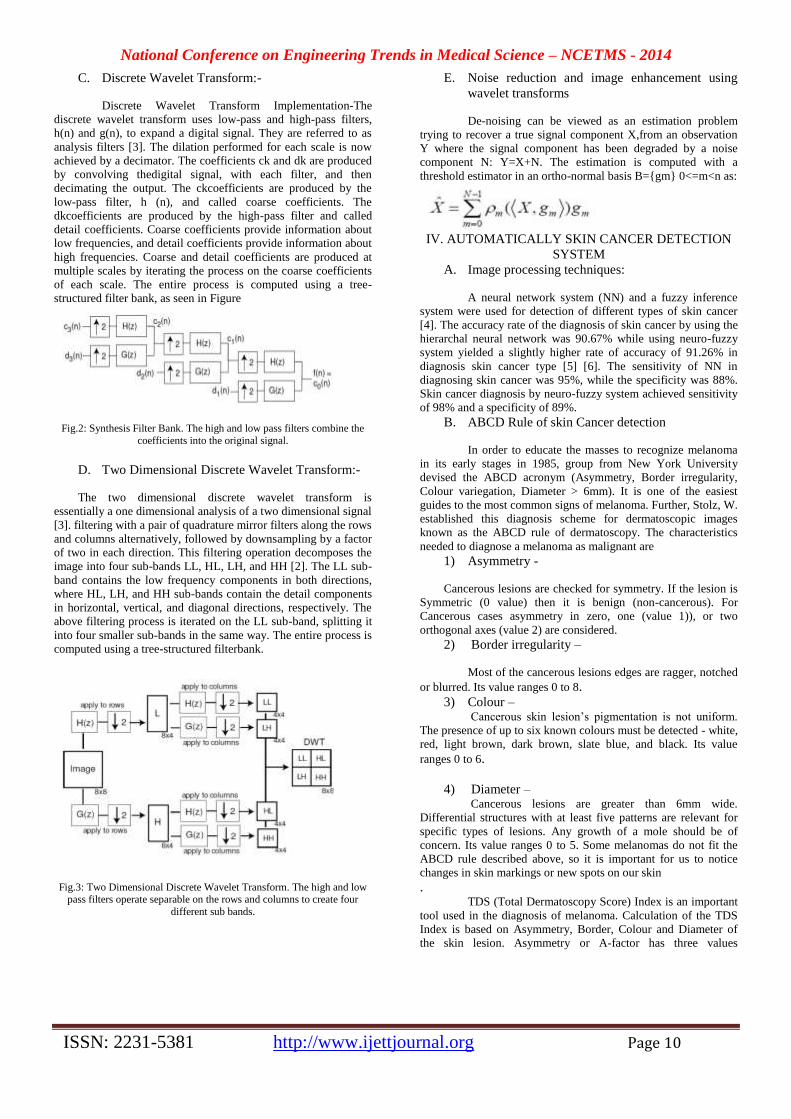
D. Two Dimensional Discrete Wavelet Transform:-
The two dimensional discrete wavelet transform is
essentially a one dimensional analysis of a two dimensional signal
[3]. filtering with a pair of quadrature mirror filters along the rows
and columns alternatively, followed by downsampling by a factor
of two in each direction. This filtering operation decomposes the
image into four sub-bands LL, HL, LH, and HH [2]. The LL sub-
band contains the low frequency components in both directions,
where HL, LH, and HH sub-bands contain the detail components
in horizontal, vertical, and diagonal directions, respectively. The
above filtering process is iterated on the LL sub-band, splitting it
into four smaller sub-bands in the same way. The entire process is
computed using a tree-structured filterbank.
Fig.3: Two Dimensional Discrete Wavelet Transform. The high and low pass filters operate separable on the rows and columns to create four
different sub bands.
E. Noise reduction and image enhancement using
wavelet transforms
De-noising can be viewed as an estimation problem
trying to recover a true signal component X,from an observation
Y where the signal component has been degraded by a noise
component N: Y=X+N. The estimation is computed with a
threshold estimator in an ortho-normal basis B={gm} 0<=m<n as:
IV. AUTOMATICALLY SKIN CANCER DETECTION
SYSTEM
A. Image processing techniques:
A neural network system (NN) and a fuzzy inference
system were used for detection of different types of skin cancer
[4]. The accuracy rate of the diagnosis of skin cancer by using the
hierarchal neural network was 90.67% while using neuro-fuzzy
system yielded a slightly higher rate of accuracy of 91.26% in
diagnosis skin cancer type [5] [6]. The sensitivity of NN in
diagnosing skin cancer was 95%, while the specificity was 88%.
Skin cancer diagnosis by neuro-fuzzy system achieved sensitivity
of 98% and a specificity of 89%.
B. ABCD Rule of skin Cancer detection
In order to educate the masses to recognize melanoma
in its early stages in 1985, group from New York University
devised the ABCD acronym (Asymmetry, Border irregularity,
Colour variegation, Diameter > 6mm). It is one of the easiest
guides to the most common signs of melanoma. Further, Stolz, W.
established this diagnosis scheme for dermatoscopic images
known as the ABCD rule of dermatoscopy. The characteristics
needed to diagnose a melanoma as malignant are
1) Asymmetry -
Cancerous lesions are checked for symmetry. If the lesion is
Symmetric (0 value) then it is benign (non-cancerous). For
Cancerous cases asymmetry in zero, one (value 1)), or two
orthogonal axes (value 2) are considered.
2) Border irregularity –
Most of the cancerous lesions edges are ragger, notched
or blurred. Its value ranges 0 to 8.
3) Colour – Cancerous skin lesion’s pigmentation is not uniform.
The presence of up to six known colours must be detected - white,
red, light brown, dark brown, slate blue, and black. Its value
ranges 0 to 6.
4) Diameter – Cancerous lesions are greater than 6mm wide.
Differential structures with at least five patterns are relevant for
specific types of lesions. Any growth of a mole should be of
concern. Its value ranges 0 to 5. Some melanomas do not fit the
ABCD rule described above, so it is important for us to notice
changes in skin markings or new spots on our skin
. TDS (Total Dermatoscopy Score) Index is an important
tool used in the diagnosis of melanoma. Calculation of the TDS
Index is based on Asymmetry, Border, Colour and Diameter of
the skin lesion. Asymmetry or A-factor has three values
National Conference on Engineering Trends in Medical Science – NCETMS - 2014
ISSN: 2231-5381 http://www.ijettjournal.org Page 11
(symmetry – 0, 1-axis asymmetry – 1, 2-axis asymmetry - 2).
Border or B-factor has 0 to 8 values. Colour or C-factor has six
values (Red, Blue, White, Black, light brown, dark brown).
Presence of each colour in the image leads to addition of value 1.
Diameter or D-factor has 0 to 5 values. Any skin lesion with
diameter greater than 6mm will be equal to value 5.
The TDC Index is computed using following formula. It
is also known as ABCD formula.
TDS = 1.3A + 0.1B + 0.5C + 0.5D
If the TDS Index is less than 4.75, it is benign (non-
cancerous) skin lesion. If TDS Index is greater than 4.75 and less
than 5.45, it is suspicious case of skin lesion. If TDS Index is
greater than 5.45, it is malignant melanoma (cancerous) skin
lesion.
ABCD rule has proven more accurate and effectiveness
in clinical practice with 76% diagnostic accuracy. The ABCD rule
is also used by the American Cancer [6] Society, American
Academy of Dermatology and others worldwide to provide
simple parameters for evaluation and identification of pigmented
lesions that may need further examination. But all melanomas do
not have all four ABCD features. It is the combination of features
(e.g., A+B, A+C, B+C, A+B+C, etc.) that render some lesions
most suspicious for early melanoma.
C: Image Transformation And Reconstruction Using
IDWT Inverse Discrete Wavelet Transform [3]Afteranalysing,
or processing, the signal in the wavelet domain it is often
necessary to return the signal back to its original domain. This is
achieved using synthesis filters and expanders.
The wavelet coefficients are applied to a synthesis
filter bank to restore the original signal, as seen in Figure.
Fig. 4: Synthesis Filter Bank. The high and low pass filters combine the coefficients into the original signal.
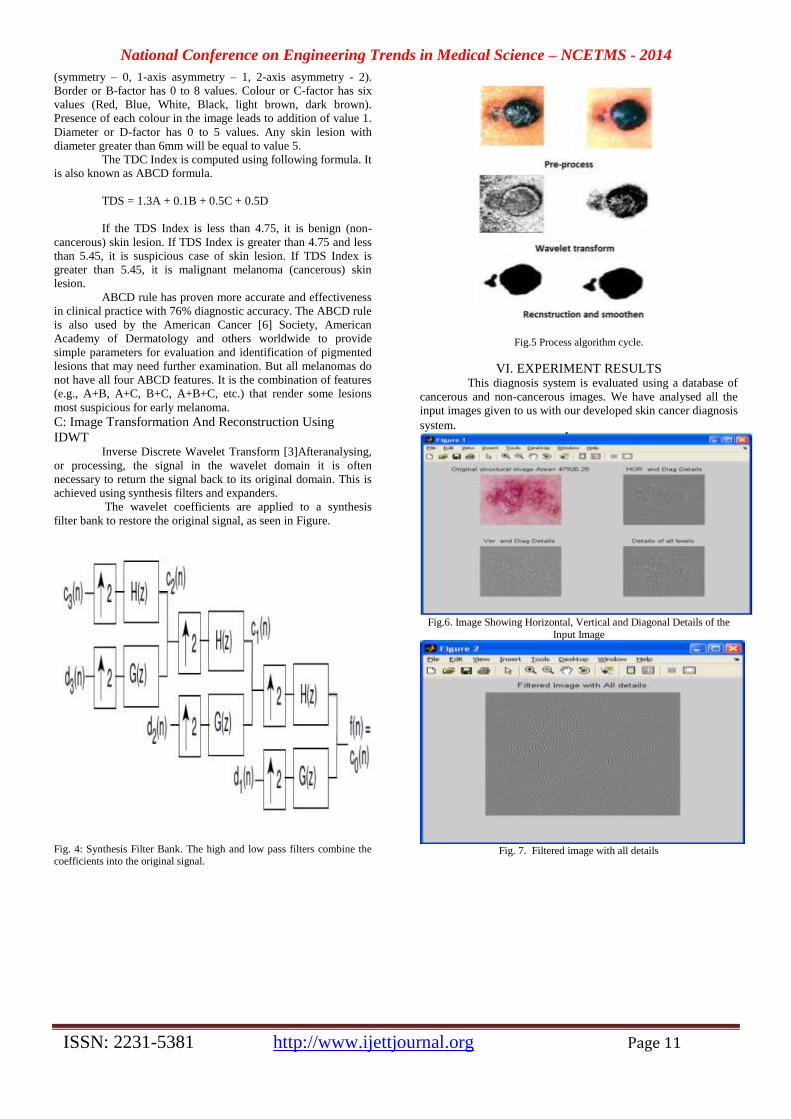
Fig.5 Process algorithm cycle.
VI. EXPERIMENT RESULTS This diagnosis system is evaluated using a database of
cancerous and non-cancerous images. We have analysed all the
input images given to us with our developed skin cancer diagnosis
system.
Fig.6. Image Showing Horizontal, Vertical and Diagonal Details of the
Input Image
Fig. 7. Filtered image with all details
National Conference on Engineering Trends in Medical Science – NCETMS - 2014
ISSN: 2231-5381 http://www.ijettjournal.org Page 12
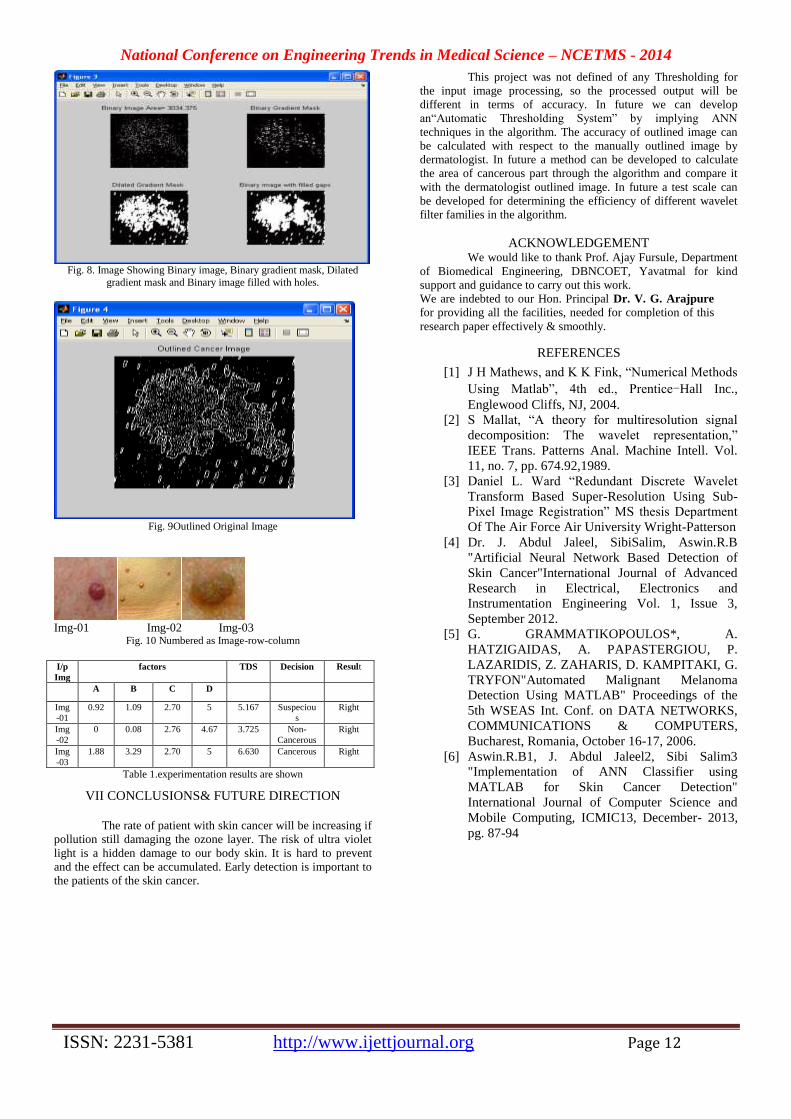
Fig. 8. Image Showing Binary image, Binary gradient mask, Dilated
gradient mask and Binary image filled with holes.
Fig. 9Outlined Original Image
Img-01 Img-02 Img-03
Fig. 10 Numbered as Image-row-column
Table 1.experimentation results are shown
VII CONCLUSIONS& FUTURE DIRECTION
The rate of patient with skin cancer will be increasing if
pollution still damaging the ozone layer. The risk of ultra violet
light is a hidden damage to our body skin. It is hard to prevent
and the effect can be accumulated. Early detection is important to
the patients of the skin cancer.
This project was not defined of any Thresholding for
the input image processing, so the processed output will be
different in terms of accuracy. In future we can develop
an“Automatic Thresholding System” by implying ANN
techniques in the algorithm. The accuracy of outlined image can
be calculated with respect to the manually outlined image by
dermatologist. In future a method can be developed to calculate
the area of cancerous part through the algorithm and compare it
with the dermatologist outlined image. In future a test scale can
be developed for determining the efficiency of different wavelet
filter families in the algorithm.
ACKNOWLEDGEMENT We would like to thank Prof. Ajay Fursule, Department
of Biomedical Engineering, DBNCOET, Yavatmal for kind
support and guidance to carry out this work.
We are indebted to our Hon. Principal Dr. V. G. Arajpure
for providing all the facilities, needed for completion of this
research paper effectively & smoothly.
REFERENCES
[1] J H Mathews, and K K Fink, “Numerical Methods
Using Matlab”, 4th ed., Prentice-Hall Inc.,
Englewood Cliffs, NJ, 2004.
[2] S Mallat, “A theory for multiresolution signal
decomposition: The wavelet representation,”
IEEE Trans. Patterns Anal. Machine Intell. Vol.
11, no. 7, pp. 674.92,1989.
[3] Daniel L. Ward “Redundant Discrete Wavelet
Transform Based Super-Resolution Using Sub-
Pixel Image Registration” MS thesis Department
Of The Air Force Air University Wright-Patterson
[4] Dr. J. Abdul Jaleel, SibiSalim, Aswin.R.B
"Artificial Neural Network Based Detection of
Skin Cancer"International Journal of Advanced
Research in Electrical, Electronics and
Instrumentation Engineering Vol. 1, Issue 3,
September 2012.
[5] G. GRAMMATIKOPOULOS*, A.
HATZIGAIDAS, A. PAPASTERGIOU, P.
LAZARIDIS, Z. ZAHARIS, D. KAMPITAKI, G.
TRYFON"Automated Malignant Melanoma
Detection Using MATLAB" Proceedings of the
5th WSEAS Int. Conf. on DATA NETWORKS,
COMMUNICATIONS & COMPUTERS,
Bucharest, Romania, October 16-17, 2006.
[6] Aswin.R.B1, J. Abdul Jaleel2, Sibi Salim3
"Implementation of ANN Classifier using
MATLAB for Skin Cancer Detection"
International Journal of Computer Science and
Mobile Computing, ICMIC13, December- 2013,
pg. 87-94
I/p
Img
factors TDS Decision Result
A B C D
Img
-01
0.92 1.09 2.70 5 5.167 Suspeciou
s
Right
Img
-02
0 0.08 2.76 4.67 3.725 Non-
Cancerous
Right
Img
-03
1.88 3.29 2.70 5 6.630 Cancerous Right
National Conference on Engineering Trends in Medical Science – NCETMS - 2014
ISSN: 2231-5381 http://www.ijettjournal.org Page 13
Hanumant R. Vani#1
, Rahul Dahiwale*2
,Mahesh Karlekar#3
# Student Department of Biomedical Engineering , Amravati university,Yavatmal,Maharastra,India
#Student Department of Biomedical Engineering , Amravati university,Yavatmal,Maharastra,India
#Student Department of Biomedical Engineering , Amravati university,Yavatmal,Maharastra,India
ABSTRACT For the people who suffer migraine , cluster headache ,and other
causes of chronic , excruciating head or facial pain ,the “ take
two aspirin and call me in the morning “ method is useless .
Doctor have long associated the most severe ,chronic forms of
headache with the sphenopalatine ganglion (SPG),
A facial nerve bundle , but haven’t yet found a treatment that
works on the SPG long-term .A technology under clinical
investigation at autonomic Technologies Inc., (Redwood City,
CA) is a patient-powered tool for blocking SPG signal at the first
sign of a headache . The system involve the permanent implant of
a small nerve stimulating device in the upper gum on the side of
the head normally affected by headache .The lead tip of the
implant connect with the SPG bundle, and when a patient senses
the implant . The resulting signals stimulate the SPG nerves and
block the pain-causing neurotransmitters
Keyword: Cluster headache, sphenopalatine ganglion,
neurostimulation, randomized controlled trial
Introduction Cluster headache (CH) is one of the most painful primary
headache disorders. It is characterized by daily or almost daily
attacks of unilateral excruciating peri orbital pain associated with
ipsilateral cranial autonomic symptoms, typically lasting between 15
and 180 minutes if untreated. While in the episodic form, bouts of CH
attacks are separated by headache-free intervals; chronic cluster
headache (CCH) is characterized by attacks occurring at least one
year without remission or with remissions lasting less than one
month (1). CH belongs to a group of neurovascular headaches.
Evidence, including limited human studies, indicates that CH path
physiology could involve a cross-talk between trigeminal inputs and
the cranial parasympathetic outflow from the superior salivary
nucleus that is understood to be mediated primarily through the
sphenopalatineganglion (SPG) (2–4). The SPG is a large extra
cranial parasympathetic ganglion located in the pterygopalatine
fosse (PPF). Post-ganglion parasympathetic fibres from the SPG
innervate facial structures and the cerebral and meningeal blood
vessels (5,6).
When activated, these fibers release neurotransmitters
and vasodilators that activate sensory trigeminal fibres causing
further activation of the trigeminal pain pathway, which, in turn,
causes further parasympathetic outflow, referred to as the
trigeminal-autonomic Reflex The most effective treatments for CH
attacks are injectable sumatriptan and oxygen inhalation .The former
is contraindicated in patients with cardiovascular disease; the latter
is hampered by impracticability in everyday life, while neither
decreases attack frequency. Preventive drug therapies for CH
include
several substances but their use may be limited by intolerance or
contraindications, and evidence of efficacy in CCH is poor.
Moreover, 10–20% of patients are not effectively treated by, or
become resistant to, these therapies. Given the excruciating pain of
this syndrome, alternative treatments are warranted. Since 1908,
when Slider performed the first pharmacological SPG block by
applying a 20% cocaine solution in its vicinity, various interventions
have targeted the SPG, including alcohol injection within the PPF,
transnasal injection of lidocaine and other agents, pulsed
radiofrequency ablations ,and radiofrequency lesions . Success rates
vary from 46% to 85%, but benefits are transient .
Neurostimulation-based therapies have been investigated for the
treatment of refractory CCH patients, including hypothalamic deep
brain stimulation (DBS) and occipital nerve stimulation (ONS). The
pioneering hypothalamic DBS work by Leone et al. was followed by
electrode implantation in 64 refractory CCH patients worldwide with
an overall favourable response rate reported to be 70% . All of the
DBS studies, however, were open studies with the notable exception
of a study in 11 CCH patients that found no difference between sham
and active DBS during the randomized phase . Unfortunately, DBS is
associated with significant surgical risks including death . ONS was
studied in 91 CCH patients worldwide with a reported 67% of
patients experiencing at least a 50% reduction in attack frequency .
However, all of the ONS studies were open, limited in size, and did
not include a concurrent sham control. In addition, ONS is
associated with a high frequency of lead migration, infection, battery
depletion, and lead breakage with the consequence of repeated
operations Recently, researchers have investigated the utility of SPG stimulation
in CH. Anserine et al. published a proof of concept study on the
response of CH patients to acute electrical stimulation of the SPG
(25). In six patients, effective abolition was reported in 11/18
spontaneous or induced CH attacks; partial (>50% reduction in
pain score) response was reported in an additional three headaches.
Based on these pathophysiological and therapeutic data, we aimed to
conduct a prospective, randomized, blinded, multicenter study to test
the efficacy and safety of acute electrical stimulation of the SPG
using the Autonomic Technologies, Inc. (ATI) Neurostimulation
System .
INTRODUCTION TO ELECTRONIC ASPIRIN
Electronic Aspirin is a Neuro stimulator , which is
implanted in patient who is suffering from Cluster
Headache .The Neuro stimulator is implanted via an oral
incision and placed along with maxilla , with the lead
placed at the SPG.
The Neuro stimulator contain no battery and is powered
controlled via a hand held remote controller and the
potential interest of patient with high frequency , high
disability migraine in having a SPG Neuro stimulator
implanted to tread migration is unknown
“New Way to Cure Cluster Headache Using Electronic Aspirin”
National Conference on Engineering Trends in Medical Science – NCETMS - 2014
ISSN: 2231-5381 http://www.ijettjournal.org Page 14
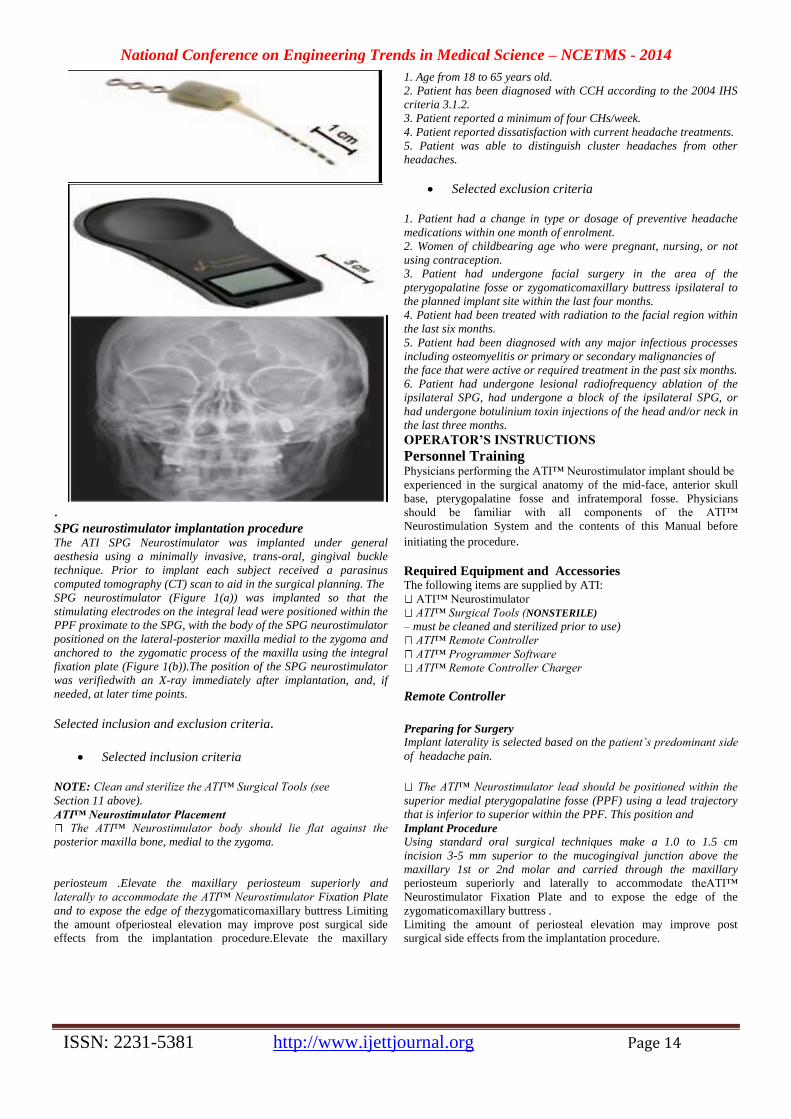
. SPG neurostimulator implantation procedure The ATI SPG Neurostimulator was implanted under general
aesthesia using a minimally invasive, trans-oral, gingival buckle
technique. Prior to implant each subject received a parasinus
computed tomography (CT) scan to aid in the surgical planning. The
SPG neurostimulator (Figure 1(a)) was implanted so that the
stimulating electrodes on the integral lead were positioned within the
PPF proximate to the SPG, with the body of the SPG neurostimulator
positioned on the lateral-posterior maxilla medial to the zygoma and
anchored to the zygomatic process of the maxilla using the integral
fixation plate (Figure 1(b)).The position of the SPG neurostimulator
was verifiedwith an X-ray immediately after implantation, and, if
needed, at later time points.
Selected inclusion and exclusion criteria.
Selected inclusion criteria
1. Age from 18 to 65 years old.
2. Patient has been diagnosed with CCH according to the 2004 IHS
criteria 3.1.2.
3. Patient reported a minimum of four CHs/week.
4. Patient reported dissatisfaction with current headache treatments.
5. Patient was able to distinguish cluster headaches from other
headaches.
Selected exclusion criteria
1. Patient had a change in type or dosage of preventive headache
medications within one month of enrolment.
2. Women of childbearing age who were pregnant, nursing, or not
using contraception.
3. Patient had undergone facial surgery in the area of the
pterygopalatine fosse or zygomaticomaxillary buttress ipsilateral to
the planned implant site within the last four months.
4. Patient had been treated with radiation to the facial region within
the last six months.
5. Patient had been diagnosed with any major infectious processes
including osteomyelitis or primary or secondary malignancies of
the face that were active or required treatment in the past six months.
6. Patient had undergone lesional radiofrequency ablation of the
ipsilateral SPG, had undergone a block of the ipsilateral SPG, or
had undergone botulinium toxin injections of the head and/or neck in
the last three months.
OPERATOR’S INSTRUCTIONS
Personnel Training Physicians performing the ATI™ Neurostimulator implant should be
experienced in the surgical anatomy of the mid-face, anterior skull
base, pterygopalatine fosse and infratemporal fosse. Physicians
should be familiar with all components of the ATI™
Neurostimulation System and the contents of this Manual before
initiating the procedure.
Required Equipment and Accessories The following items are supplied by ATI:
ATI™ Neurostimulator
ATI™ Surgical Tools (NONSTERILE)
– must be cleaned and sterilized prior to use)
ATI™ Remote Controller
ATI™ Programmer Software
ATI™ Remote Controller Charger
Remote Controller
Preparing for Surgery
Implant laterality is selected based on the patient’s predominant side
of headache pain.
NOTE: Clean and sterilize the ATI™ Surgical Tools (see
Section 11 above).
ATI™ Neurostimulator Placement
The ATI™ Neurostimulator body should lie flat against the
posterior maxilla bone, medial to the zygoma.
The ATI™ Neurostimulator lead should be positioned within the
superior medial pterygopalatine fosse (PPF) using a lead trajectory
that is inferior to superior within the PPF. This position and
Implant Procedure
Using standard oral surgical techniques make a 1.0 to 1.5 cm
incision 3-5 mm superior to the mucogingival junction above the
maxillary 1st or 2nd molar and carried through the maxillary
periosteum .Elevate the maxillary periosteum superiorly and
laterally to accommodate the ATI™ Neurostimulator Fixation Plate
and to expose the edge of thezygomaticomaxillary buttress Limiting
the amount ofperiosteal elevation may improve post surgical side
effects from the implantation procedure.Elevate the maxillary
periosteum superiorly and laterally to accommodate theATI™
Neurostimulator Fixation Plate and to expose the edge of the
zygomaticomaxillary buttress .
Limiting the amount of periosteal elevation may improve post
surgical side effects from the implantation procedure.
National Conference on Engineering Trends in Medical Science – NCETMS - 2014
ISSN: 2231-5381 http://www.ijettjournal.org Page 15
Care should be taken to avoid injury to the infra-orbital nerve
During the procedure.
Using fluoroscopy or other visualization, advance the ATI™
Surgical Introducer, SI-100 or SI-110, from the posterior-lateral
edge of the zygomaticomaxillary buttress towards the
pterygopalatine fossa (PPF) using gentle pressure (Figure 6-A).
The Surgical Introducer is advanced along the posterior maxilla
until the distal tip of the Surgical Introducer is within the
pterygomaxillary fissure, or just within the PPF. The ATI™
Surgical Introducers (SI-100 and SI-110) differ in the design of
the distal tip. Both tips are designed to maintain contact with the
posterior maxilla during the procedure. However, model SI-110 is
designed to promote guidance of the Neurostimulator Lead into
the PPF, if needed.
.NOTE: ATI™ Surgical Introducer placement at the
pterygomaxillaryfissure or just within the PPF may be confirmed
using standard intraoperativeimaging (e.g., Fluoroscopy).
Using the pre-operative facial bone/paranasal sinus Computed
Tomography (CT) scan to complete a 3D rendering of the surgical
anatomy and subsequent surface measurement can provide an
estimate of the appropriate ATI™ Neurostimulator length.
Alternatively, estimate the appropriate Neurostimulator length by
using the centimeter scale on the medial surface of the ATI™
Surgical Introducers (Figures 2-A and 6-B) once positioned
correctly at the pterygomaxillary fissure or within the PPF (Figure
7). This can be done by reading the distance from the start of the
scale on the proximal portion of the Surgical Introducer to the
posteriorlateral
edge of the zygomaticomaxillary buttress, and subtracting the
distance from 6.0 cm. Each solid/clear segment of the Surgical
Introducer scale represents 0.5 cm.
trajectory should ensure that at least one electrode is in close
proximity to the SPG.
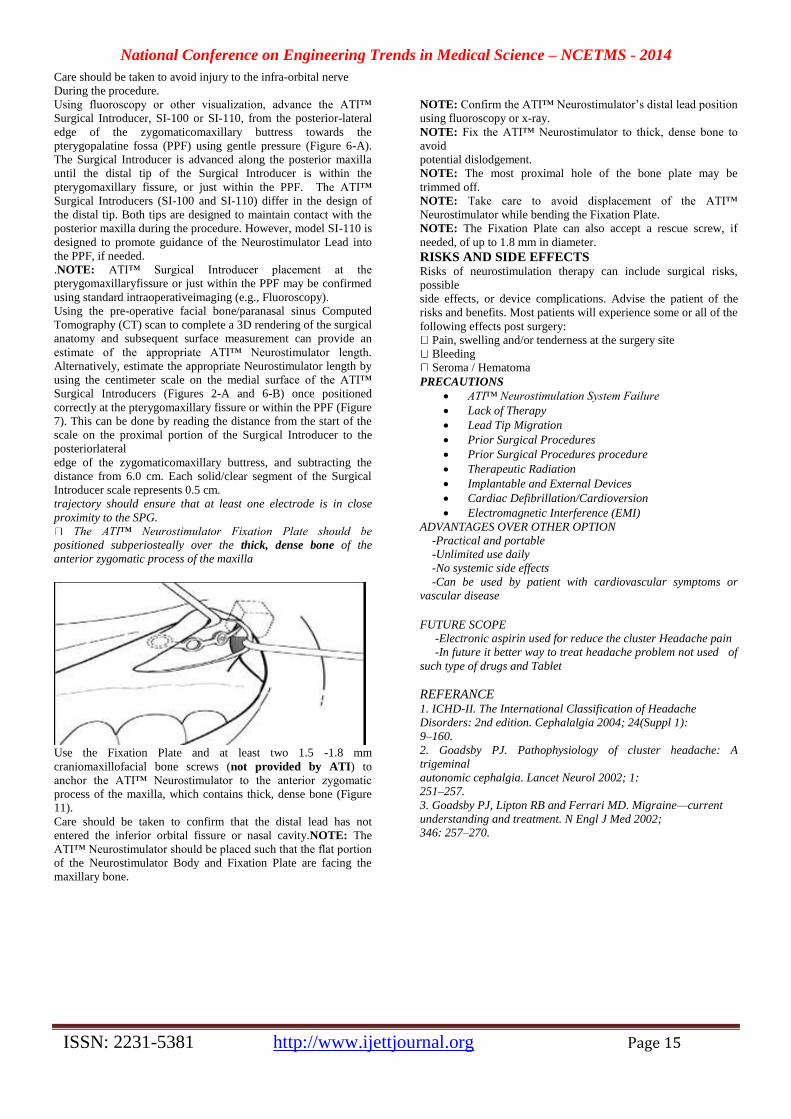
The ATI™ Neurostimulator Fixation Plate should be
positioned subperiosteally over the thick, dense bone of the
anterior zygomatic process of the maxilla
Use the Fixation Plate and at least two 1.5 -1.8 mm
craniomaxillofacial bone screws (not provided by ATI) to
anchor the ATI™ Neurostimulator to the anterior zygomatic
process of the maxilla, which contains thick, dense bone (Figure
11). Care should be taken to confirm that the distal lead has not
entered the inferior orbital fissure or nasal cavity.NOTE: The
ATI™ Neurostimulator should be placed such that the flat portion
of the Neurostimulator Body and Fixation Plate are facing the
maxillary bone.
NOTE: Confirm the ATI™ Neurostimulator’s distal lead position
using fluoroscopy or x-ray.
NOTE: Fix the ATI™ Neurostimulator to thick, dense bone to
avoid
potential dislodgement.
NOTE: The most proximal hole of the bone plate may be
trimmed off.
NOTE: Take care to avoid displacement of the ATI™
Neurostimulator while bending the Fixation Plate.
NOTE: The Fixation Plate can also accept a rescue screw, if
needed, of up to 1.8 mm in diameter.
RISKS AND SIDE EFFECTS Risks of neurostimulation therapy can include surgical risks,
possible
side effects, or device complications. Advise the patient of the
risks and benefits. Most patients will experience some or all of the
following effects post surgery:
Pain, swelling and/or tenderness at the surgery site
Bleeding
Seroma / Hematoma
PRECAUTIONS
ATI™ Neurostimulation System Failure
Lack of Therapy
Lead Tip Migration
Prior Surgical Procedures
Prior Surgical Procedures procedure
Therapeutic Radiation
Implantable and External Devices
Cardiac Defibrillation/Cardioversion
Electromagnetic Interference (EMI)
ADVANTAGES OVER OTHER OPTION
-Practical and portable
-Unlimited use daily
-No systemic side effects
-Can be used by patient with cardiovascular symptoms or
vascular disease
FUTURE SCOPE -Electronic aspirin used for reduce the cluster Headache pain
-In future it better way to treat headache problem not used of
such type of drugs and Tablet
REFERANCE 1. ICHD-II. The International Classification of Headache
Disorders: 2nd edition. Cephalalgia 2004; 24(Suppl 1):
9–160.
2. Goadsby PJ. Pathophysiology of cluster headache: A
trigeminal
autonomic cephalgia. Lancet Neurol 2002; 1:
251–257.
3. Goadsby PJ, Lipton RB and Ferrari MD. Migraine—current
understanding and treatment. N Engl J Med 2002;
346: 257–270.
National Conference on Engineering Trends in Medical Science – NCETMS - 2014
ISSN: 2231-5381 http://www.ijettjournal.org Page 16
Heterogeneous Face Recognition Piyush Hegu
1, Digamber Kale
2, Pradnya Suryawanshi
3
1M.Tech. (VLSI), Electronics Department, RTM Nagpur University, PCE Nagpur, M.S. (India)
2M.E. (D.E.), Electronics & Telecommunication Department, SGB Amravati University, DBNCOET Yavatmal, M.S. (India)
3Assistant Professor, Electronics Department, RTM Nagpur University, PCE Nagpur, M.S. (India)
Abstract— The most difficultchallengesin automatedface
recognition is computing facial similarities between face
images acquired in alternate
modalitiescalledheterogeneousfacerecognition (HFR), This
paper proposes several contributions to heterogeneous face
recognition algorithm. The heterogeneous face recognition
a l g o r i t h m presented here is not built f o r any specific
HFR scenario. Instead, it is designed t o generalize to any
HFR scenario. Further, this f r a m e w o r k c a n be used
for homogeneous face recognition (e.g. Visible to visibleface
recognition) as well. This property generalizes the
algorithm, called Prototype Random Sub spaces(P-
RS),toany HFR scenario.
The viability of this algorithm is demonstrated on
four separate HFR databases near infrared, thermal
infrared, forensic sketch, and viewed sketch. This paper
provides animprovementtothe
problemofheterogeneousfacerecognition.
Keywords—
HeterogeneousFaceRecognition,KernelSimilarities,ViolaJone
s,viewed sketches&photographs.
I. INTRODUCTION
The challengesindesigning automatedfacerecognition
algorithms a r e numerous. Charged with the task
ofoutputtingameasure ofsimilarity between agivenpair
offaceimages,suchchallengesmanifest inthe
followingstagesperformed bymost facerecognition
algorithms: (i)facedetection, (ii)facealignment,
(iii)appearance normalization, (iv)featuredescription,
(v)featureextraction, and(vi)matching.
This section provides an overview of each of the above
mentioned stages in automated face recognition,
andfollowsthesameorderingillustratedinFigure1.8.The
predominantfocuswillbeonthe
facerepresentationandfeature extractions t a g e s .
Thisisbecauseourresearchonheterogeneousface
recognitionhasgenerallyreliedon improvements
inthesetwostagestoincreaserecognitionaccuraciesbetweenhe
terogeneousfaceimages.
The motivation behind heterogeneous face recognition
is that circumstances exist in which face image to be
identified is available only in a particular modality. For
example, when a subject’s face can only be acquired in
night-time environments, the use of infrared imaging may
be the only modality for acquiring a useful face image of
the subject.
In this case a forensic sketch, drawn by a police artist
based on a verbal description provided by a witness or the
victim, is likely to be the only available source of a face
image. Most commercial off the shelf (COTS) face
recognition systems (FRS) are not designed to handle
HFR scenarios. The need for face recognition systems
specifically designed for the task of matching
heterogeneous face images is of substantial interest.
II. LITERATURE SURVEY
In the last few years, a considerable amount of
research has been conducted on face recognition tasks
[Chen, 2005], [Socolinsky, 2003], [Lu, 2003], [Wang,
2004], [Thomaz, 2005]. It was mostly based on the rapidly
increasing demand for alternative means for security and
authentication. Traditional means of identification such as
ID cards and passwords are vulnerable to compromise,
unlike face recognition, which offers “a non-intrusive, and
probably the most natural way of identification” [Kong,
2005]. The performance characteristics of the IR-160
imager provides a (160 ×120 pixel) camera are relatively
poor, the operational demands related to face imaging.
The face recognition research is based on visible
imaging, visual face recognition-based systems perform
poorly under poor illumination conditions and in
distinguishing skin-color variations [Prokoski, 2000]. An
alternative approach for illumination invariant face
recognition tasks is the thermal infrared (IR) imagery.
However, although it is a promising alternative, at
first it received little attention, due to the high cost of IR
cameras in conjunction with low-resolution image analysis.
Recently, IR camera technology has been significantly
improved, which led to improvements also in IR camera
sensitivity (i.e., higher resolution) and price reductions.
Indeed, it is those factors that boosted the IR face
recognition research[Socolinsky,2001], [Chen, 2003]. This
study is an extension of the research conducted by
[Domboulas,2004], which investigated a nonlinear kernel-
based classification scheme, the Generalized Discriminant
Analysis (GDA) proposed by Baudat and Anouar [Baudat,
2000].
National Conference on Engineering Trends in Medical Science – NCETMS - 2014
ISSN: 2231-5381 http://www.ijettjournal.org Page 17
III. METHODOLOGY OF HFR
A. Heterogeneous Face Recognition Related Work
A flurry of research has emerged providing solutions to
various heterogeneous face recognition problems. This
began with sketch recognition using viewed sketches1, and
has continued into other modalities such as near- infrared
(NIR) and forensic sketches. In this section we will
highlight a representative selection of studies in
heterogeneous face recognition as well as studies that use
kernel based approaches for classification.
B. Kernel Prototype Representation
The core of the proposed approach involves using a
relational feature representation for face images (illustrated
in Figure 2). By using kernel similarities between a novel
face pattern and a set of prototypes, we are able to exploit
the kernel trick [4], which allows us to generate a high
dimensional, non-linear representation of a face image
using compact feature vectors.
The benefit of a prototype-based approach is provided
by Balcan et al [4]. Given access to the data distribution
and a kernel similarity function, a prototype representation
is shown to approximately maintain the desired properties
of the high dimensional kernel space in a more efficient
representation by using the kernel trick.
The proposed kernel prototype approach is similar to
the object recognition method of Quattoni et al [2]. Kernel
PCA [3] and kernel LDA [5] [6], approaches to face
recognition have used a similar approach, where a face is
represented as the kernel similarity to a collection of
prototype images in a high dimensional space. These differ
from the proposed method because only a single prototype
is used per training subject, and our approach is designed
for heterogeneous face recognition.
C. Viola Jones Algorithm
The new algorithms and insights to construct a framework
for robust and extremely rapid visual detection. Toward
this end we have constructed a frontal face detection
system which achieves detection. There are three key
contributions. The first is the introduction of a new image
representation called the “Integral Image” which allows the
features used by our detector to be computed very quickly.
The second is a simple and efficient classifier which is
built using the AdaBoost learning algorithm to select a
small number of critical visual features from a very large
set of potential features. The third contribution is a method
for combining classifiers in a “cascade” which allows
background regions of the image to be quickly discarded
while spending more computation on promising face-like
regions. A set of experiments in the domain of face
detection is presented. This face detection system is most
clearly distinguished from previous approaches in its
ability to detect faces extremely rapidly. Operating on 384
by 288 pixel images.
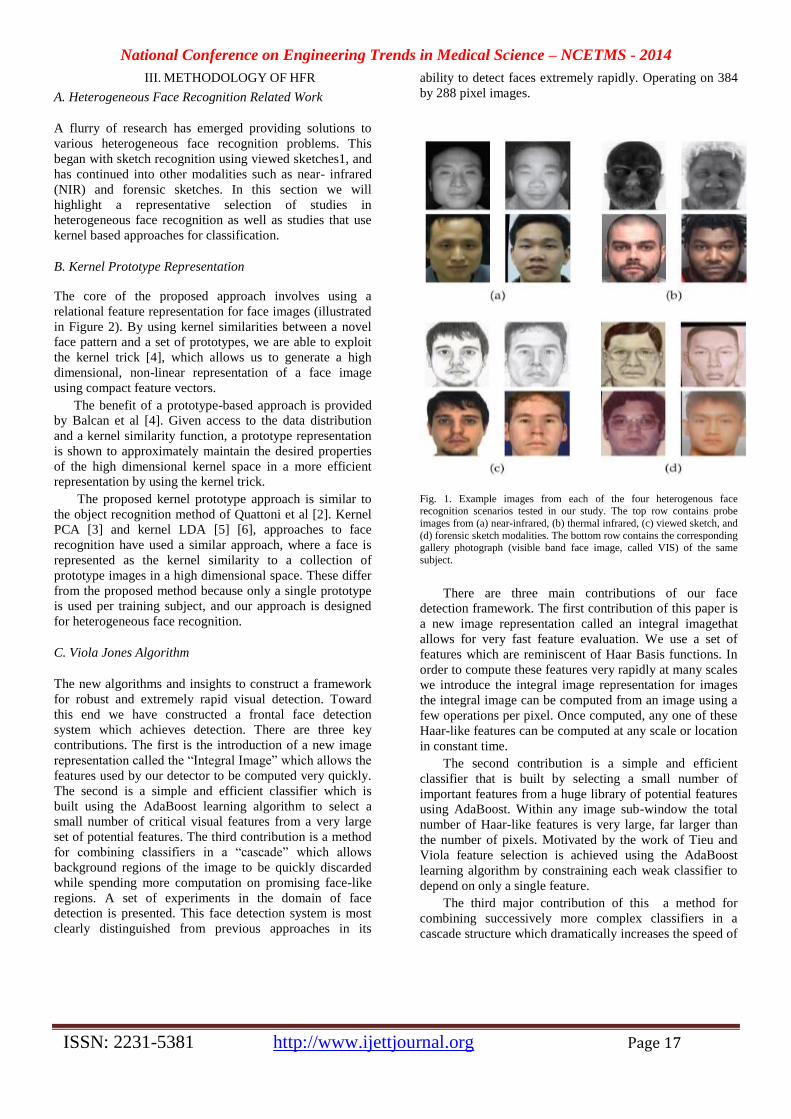
Fig. 1. Example images from each of the four heterogenous face recognition scenarios tested in our study. The top row contains probe
images from (a) near-infrared, (b) thermal infrared, (c) viewed sketch, and
(d) forensic sketch modalities. The bottom row contains the corresponding
gallery photograph (visible band face image, called VIS) of the same
subject.
There are three main contributions of our face
detection framework. The first contribution of this paper is
a new image representation called an integral imagethat
allows for very fast feature evaluation. We use a set of
features which are reminiscent of Haar Basis functions. In
order to compute these features very rapidly at many scales
we introduce the integral image representation for images
the integral image can be computed from an image using a
few operations per pixel. Once computed, any one of these
Haar-like features can be computed at any scale or location
in constant time.
The second contribution is a simple and efficient
classifier that is built by selecting a small number of
important features from a huge library of potential features
using AdaBoost. Within any image sub-window the total
number of Haar-like features is very large, far larger than
the number of pixels. Motivated by the work of Tieu and
Viola feature selection is achieved using the AdaBoost
learning algorithm by constraining each weak classifier to
depend on only a single feature.
The third major contribution of this a method for
combining successively more complex classifiers in a
cascade structure which dramatically increases the speed of
National Conference on Engineering Trends in Medical Science – NCETMS - 2014
ISSN: 2231-5381 http://www.ijettjournal.org Page 18
the detector by focusing attention on promising regions of
the image. The notion behind focus of attention approaches
is that it is often possible to rapidly determine where in an
image a face might occur.
IV. PROPOSED METHOD
The proposed method presents a new approach to
heterogeneous face recognition, and extends existing
methods in face recognition. The use of a kernel similarity
representation is well suited for the HFR problem because
a set of training subjects with an image from each modality
can be used as the prototypes, and, depending on the
modality of a new image (probe or gallery), the image from
each prototype subject can be selected from the
corresponding modality. Unlike previous feature- based
methods, where an image descriptor invariant to changes
between the two HFR modalities was needed, the proposed
framework only needs descriptors that are effective within
each domain. Further, the proposed method is effective
even when different feature descriptors are used in the
probe and gallery domains.
The accuracy of the HFR system is improved using a
random subspace framework in conjunction with linear
discriminate analysis. Experimental results on four
different heterogeneous face recognition scenarios
(thermal, near-infrared, viewed sketch, and forensic sketch)
are provided, and all the results are benchmarked with a
commercial face matcher.
The logic which is being used for matching the images as
per their prototypes:
[(fcu - fdb ) <1] cout = cf
[(fcu - fdb ) <1] cout = ce
[(fcu - fdb ) <1] cout = cn
[(fcu - fdb ) <1] cout = cm
Here we are comparing current image with database image
and ratio this two image should be less than 1. In kernel
prototype we count maximum matches from the database
image. Let use consider we found 5 database image for our
current input image from the database image maximum
count is found of eye, nose and mouth. But for face
Recognisation more priority is gives to face and eye.
A. Feature Representation
Thefeaturerepresentationstageencodesdifferent
facialcharacteristics(oftenimplicitly) inafeature
descriptorvector. Suchdescriptive
informationcanrangefroma
vectoroforderedimagepixelvalues,todistance
measurementsb e t w e e n facialcomponents ( e.g. The
distancef r o mthe nosetothe mouth), o r
toevenmorecomplex
featuressuchasconvolutionsofafaceimagewithasetofGaborfil
ters.
The rangeofrepresentationsusedinfacerecognition
isquite. Klare and Jain [1]developedanorganization
ofsuchfeaturestofacilitate studiesoffacialindividuality
andhelpstandardizethefacerecognitionprocess.
B. Detection, Alignment & Normalization
The firststep inautomatedfacerecognition isthe
detectiona n d alignmentofface images. Oftenviewedasapre-
processingstep,thisstageiscriticaltobothdetecting
thepresenceofafaceinadigitalimage,andalignmentoftheface
withthespatial coordinate
systemusedinthesucceedingfacedescription. Thefacedetector
proposedbyViolaandJones,whichusesacascadedclassifierinc
onjunctionwithimagesrepresented usingaverbosesetofHaar-
likefeatures, settheprecedent for
allmoderndetectorswithitsrobust accuracy
andscalablecomputationalcomplexity. Whilemany
methodshavebeenproposed toimproveupon
ViolaandJonesdetector, itstillservesasanoptimistic
baselineof state of theart performance.
Fig 2 :- Faceimagesbefore(leftcolumn) and after (rightcolumn) alignment
Facealignmentistypicallyperformedbyfirstdetecting
thelocationofsomefixed setofanthropometriclandmarks
o n theface. Initssimplestform,theselandmarks
arethecentersofthetwoeyes.Usingthetwoeyelocations,a2Daf
finetransformationisperformedtofix theangleanddistance
betweenthetwoeyes.Moreadvanced
methodsuse3Daffinetransformations,orProcustesalignmen
t,onamoreverboseset oflandmarks Thelandmarksa r e
generally detectedb y Active ShapeModels(ASM) oractive
appearance
models(AAM).Examplesoffaceimagealignmentareshownin
Figure.
Appearance normalizationseeks tocompensate
forvariations inillumination. A variety ofmethods have
been proposed to perform such compensation, including
the contrast equalization and differenceofGaussian filters
proposed by Tan and Triggs.
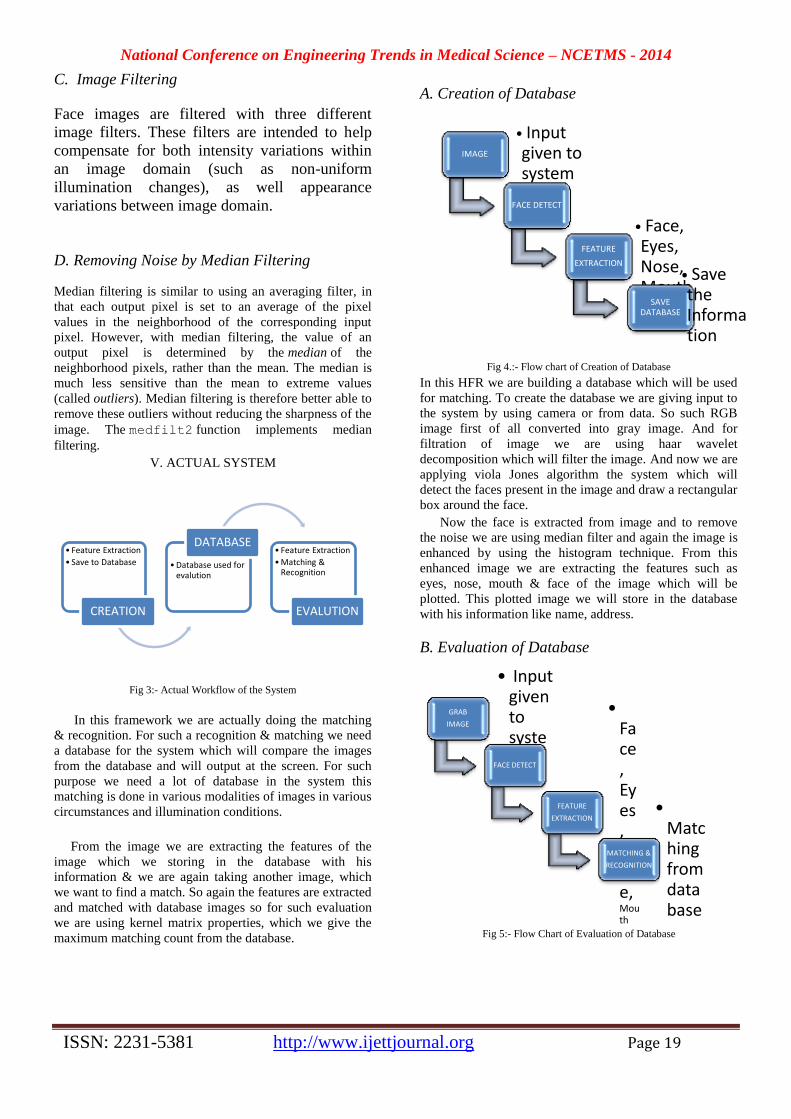
National Conference on Engineering Trends in Medical Science – NCETMS - 2014
ISSN: 2231-5381 http://www.ijettjournal.org Page 19
C. Image Filtering
Face images are filtered with three different
image filters. These filters are intended to help
compensate for both intensity variations within
an image domain (such as non-uniform
illumination changes), as well appearance
variations between image domain.
D. Removing Noise by Median Filtering
Median filtering is similar to using an averaging filter, in
that each output pixel is set to an average of the pixel
values in the neighborhood of the corresponding input
pixel. However, with median filtering, the value of an
output pixel is determined by the median of the
neighborhood pixels, rather than the mean. The median is
much less sensitive than the mean to extreme values
(called outliers). Median filtering is therefore better able to
remove these outliers without reducing the sharpness of the
image. The medfilt2 function implements median
filtering.
V. ACTUAL SYSTEM
Fig 3:- Actual Workflow of the System
In this framework we are actually doing the matching
& recognition. For such a recognition & matching we need
a database for the system which will compare the images
from the database and will output at the screen. For such
purpose we need a lot of database in the system this
matching is done in various modalities of images in various
circumstances and illumination conditions.
From the image we are extracting the features of the
image which we storing in the database with his
information & we are again taking another image, which
we want to find a match. So again the features are extracted
and matched with database images so for such evaluation
we are using kernel matrix properties, which we give the
maximum matching count from the database.
A. Creation of Database
Fig 4.:- Flow chart of Creation of Database
In this HFR we are building a database which will be used
for matching. To create the database we are giving input to
the system by using camera or from data. So such RGB
image first of all converted into gray image. And for
filtration of image we are using haar wavelet
decomposition which will filter the image. And now we are
applying viola Jones algorithm the system which will
detect the faces present in the image and draw a rectangular
box around the face.
Now the face is extracted from image and to remove
the noise we are using median filter and again the image is
enhanced by using the histogram technique. From this
enhanced image we are extracting the features such as
eyes, nose, mouth & face of the image which will be
plotted. This plotted image we will store in the database
with his information like name, address.
B. Evaluation of Database
Fig 5:- Flow Chart of Evaluation of Database
• Feature Extraction
• Save to Database
CREATION
• Database used for evalution
DATABASE • Feature Extraction
• Matching & Recognition
EVALUTION
IMAGE
• Input given to system
FACE DETECT
FEATURE
EXTRACTION
• Face, Eyes, Nose, Mouth
SAVE DATABASE
• Save the Information
GRAB
IMAGE
• Input given to system FACE DETECT
FEATURE
EXTRACTION
• Face, Eyes, Nose, Mouth
MATCHING &
RECOGNITION
• Matching from database

National Conference on Engineering Trends in Medical Science – NCETMS - 2014
ISSN: 2231-5381 http://www.ijettjournal.org Page 20
So the next part the system is to recognize or identify the
person in the image for that purpose we are using combine
method of viola Jones & kernel prototype. To evaluate or
to recognize the face we are giving input to the system by
using camera or from data. So such RGB image first of all
converted into gray image. And for filtration of image we
are using haar wavelet decomposition which will filter the
image. And now we are applying viola Jones algorithm the
system which will detect the faces present in the image and
draw a rectangular box around the face.
Now the face is extracted from image and to remove
the noise we are using median filter and again the image is
enhanced by using the histogram technique. From this
enhanced image we are extracting the features such as
eyes, nose, mouth & face of the image which will be
plotted. Now we are using the kernel prototype which will
evaluate the image from their set of prototype. And the
match can be found from the maximum count which is of
the number of pixels found from the extracted images of
face, eyes, nose & mouth. It will check the match every
image from the database & will shows the maximum
number of match found with the specific image.
C. Matching
The matching stage outputs ameasure ofsimilarity
(ordissimilarity) between two
faceimages,wherethefeaturevectorsusedtocompute
suchdissimilarities arethe outputs fromthefeatureextraction
stagediscussedabove. Mostsimply,matching
isperformedusingthenearest
neighbourclassificationalgorithm.That i s ,aprobe
(orquery)imageismatched
againstagallery(ordatabase)byfindingthefaceimage
inthegallerywiththeminimumdistance
(suchastheEuclideanorcosinedistance)
ormaximumsimilarity.
Oftenthematching stagecanbeaugmented byanadditional
stageof statistical learning.
Acommonnotionhereistomapthetaskofgeneratingameasureo
fsimilarity
betweentwofacesimagestoabinaryclassificationproblem that
determines whether ornottwofaceimages areofthe‘same
subject’or ‘different subject’. Thisnotioncan
easilyleverageahostofbinary classificationalgorithms
frommachinelearning
andpatternrecognitionliteraturebycreating new feature
vectors that are difference between extracted features of
two images.
VI. DATABASE
Fivedifferentmatching scenariosaretested inthischapter:
fourheterogeneous face
recognitionscenarios,andonestandard(homogeneous)facer
ecognitionscenario.ExampleimagesfromeachofHFRdatase
tcanbefoundinFigure3.1.Resultsshownon
eachdatasetaretheaveragerecognitionaccuracy.
Dataset1- Near-Infrared toVisible:-
Thefirstdatasetconsists of200subjects with probe
imagescaptured in the near-infrared spectrum and gallery
imagescaptured in the visiblespectrum.
Dataset2-ThermaltoVisible:-The thermal infrared
imageswerecollected usingaFLIR ReconIIIObservIR
camera, whichhassensitivity inthe range of3-5µmand 8-
12µm. The dataw a s split asfollows:nt1=333subjects
wereusedfortraining s e t T1,nt1=334subjects
wereusedfortraining
setT2,andtheremaining333subjectswereusedfortesting.
Dataset3-ViewedSketchtoVisible:- Thethird
datasetisthesketch dataset,whichwasusedbyTang
andWang. Thedatasetconsistsof606subjects
withaviewedsketch imageforprobeandavisible photograph
f o r gallery. Aviewedsketch isahand drawnsketch
ofafacewhichis drawnwhilelookingataphotographof
thesubject.
Dataset4 -ForensicSketchtoVisible: - The
fourthand final heterogeneousfacedatasetconsistsofreal-
worldforensicsketchesandmugshotphotosof159subjects.
Forensic sketchesaredrawn byanartist
b a s e d onlyonaneyewitnessdescription o f the subject.
Forensicsketchescontain incompleteinformationregarding
thesubject, andareoneofthemostdifficult
HFRscenariosbecausethesketchesoftendonotcloselyresemb
lethephotograph of thetruesuspect.
Here53differentsubjectseachareusedinT1,T2,andthetest set.
Dataset5:- Standard FaceRecognition:- Afifthnon-
heterogeneous (i.e.
Homogeneous)datasetisusedtodemonstratetheability
oftheproposedapproach tooperate
i n standardfacerecognition
scenarios .Galleryphotographwerefromaprivate
datasetcollectedatthe UniversityofYale. VII. RESULT
Fig 6.:- GUI window of creation of database
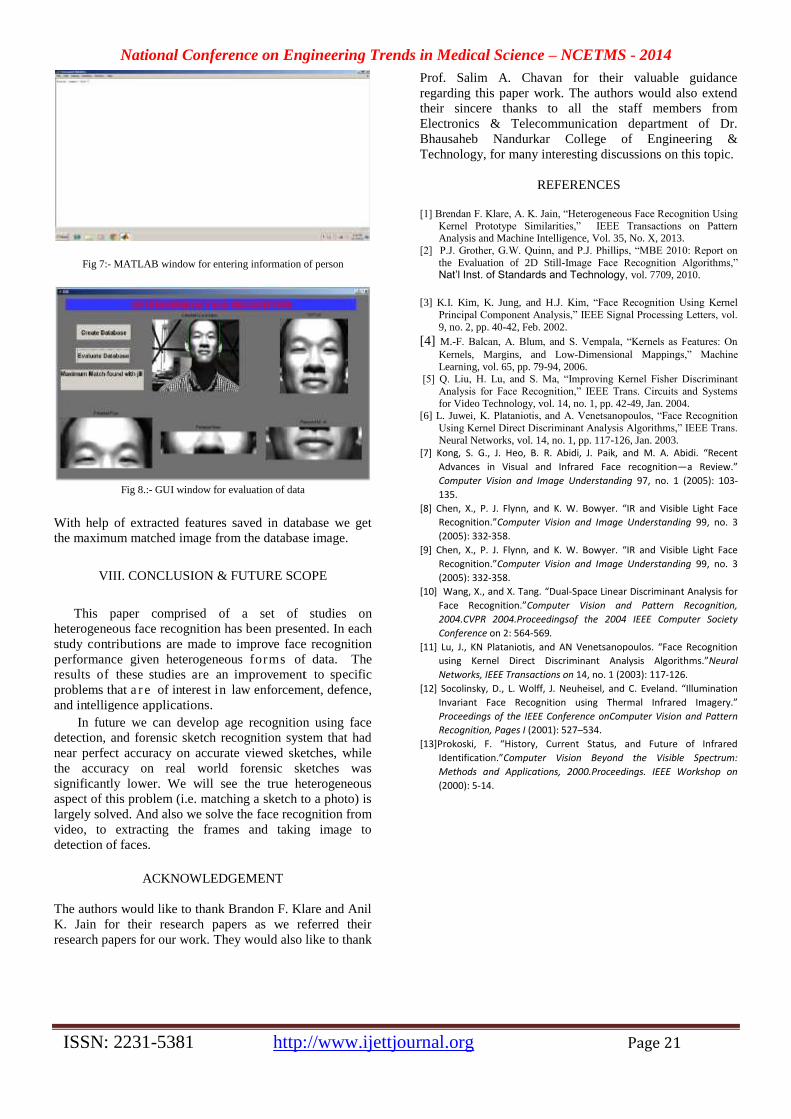
National Conference on Engineering Trends in Medical Science – NCETMS - 2014
ISSN: 2231-5381 http://www.ijettjournal.org Page 21
Fig 7:- MATLAB window for entering information of person
Fig 8.:- GUI window for evaluation of data
With help of extracted features saved in database we get
the maximum matched image from the database image.
VIII. CONCLUSION & FUTURE SCOPE
This paper comprised of a set of studies on
heterogeneous face recognition has been presented. In each
study contributions are made to improve face recognition
performance given heterogeneous forms of data. The
results of these studies are an improvement to specific
problems that a r e of interest in law enforcement, defence,
and intelligence applications.
In future we can develop age recognition using face
detection, and forensic sketch recognition system that had
near perfect accuracy on accurate viewed sketches, while
the accuracy on real world forensic sketches was
significantly lower. We will see the true heterogeneous
aspect of this problem (i.e. matching a sketch to a photo) is
largely solved. And also we solve the face recognition from
video, to extracting the frames and taking image to
detection of faces.
ACKNOWLEDGEMENT
The authors would like to thank Brandon F. Klare and Anil
K. Jain for their research papers as we referred their
research papers for our work. They would also like to thank
Prof. Salim A. Chavan for their valuable guidance
regarding this paper work. The authors would also extend
their sincere thanks to all the staff members from
Electronics & Telecommunication department of Dr.
Bhausaheb Nandurkar College of Engineering &
Technology, for many interesting discussions on this topic.
REFERENCES
[1] Brendan F. Klare, A. K. Jain, “Heterogeneous Face Recognition Using
Kernel Prototype Similarities,” IEEE Transactions on Pattern Analysis and Machine Intelligence, Vol. 35, No. X, 2013.
[2] P.J. Grother, G.W. Quinn, and P.J. Phillips, “MBE 2010: Report on
the Evaluation of 2D Still-Image Face Recognition Algorithms,” Nat’l Inst. of Standards and Technology, vol. 7709, 2010.
[3] K.I. Kim, K. Jung, and H.J. Kim, “Face Recognition Using Kernel
Principal Component Analysis,” IEEE Signal Processing Letters, vol.
9, no. 2, pp. 40-42, Feb. 2002.
[4] M.-F. Balcan, A. Blum, and S. Vempala, “Kernels as Features: On
Kernels, Margins, and Low-Dimensional Mappings,” Machine
Learning, vol. 65, pp. 79-94, 2006. [5] Q. Liu, H. Lu, and S. Ma, “Improving Kernel Fisher Discriminant
Analysis for Face Recognition,” IEEE Trans. Circuits and Systems
for Video Technology, vol. 14, no. 1, pp. 42-49, Jan. 2004. [6] L. Juwei, K. Plataniotis, and A. Venetsanopoulos, “Face Recognition
Using Kernel Direct Discriminant Analysis Algorithms,” IEEE Trans.
Neural Networks, vol. 14, no. 1, pp. 117-126, Jan. 2003.
[7] Kong, S. G., J. Heo, B. R. Abidi, J. Paik, and M. A. Abidi. “Recent
Advances in Visual and Infrared Face recognition—a Review.”
Computer Vision and Image Understanding 97, no. 1 (2005): 103-
135.
[8] Chen, X., P. J. Flynn, and K. W. Bowyer. “IR and Visible Light Face
Recognition.”Computer Vision and Image Understanding 99, no. 3
(2005): 332-358.
[9] Chen, X., P. J. Flynn, and K. W. Bowyer. “IR and Visible Light Face
Recognition.”Computer Vision and Image Understanding 99, no. 3
(2005): 332-358.
[10] Wang, X., and X. Tang. “Dual-Space Linear Discriminant Analysis for
Face Recognition.”Computer Vision and Pattern Recognition,
2004.CVPR 2004.Proceedingsof the 2004 IEEE Computer Society
Conference on 2: 564-569.
[11] Lu, J., KN Plataniotis, and AN Venetsanopoulos. “Face Recognition
using Kernel Direct Discriminant Analysis Algorithms.”Neural
Networks, IEEE Transactions on 14, no. 1 (2003): 117-126.
[12] Socolinsky, D., L. Wolff, J. Neuheisel, and C. Eveland. “Illumination
Invariant Face Recognition using Thermal Infrared Imagery.”
Proceedings of the IEEE Conference onComputer Vision and Pattern
Recognition, Pages I (2001): 527–534.
[13]Prokoski, F. “History, Current Status, and Future of Infrared
Identification.”Computer Vision Beyond the Visible Spectrum:
Methods and Applications, 2000.Proceedings. IEEE Workshop on
(2000): 5-14.
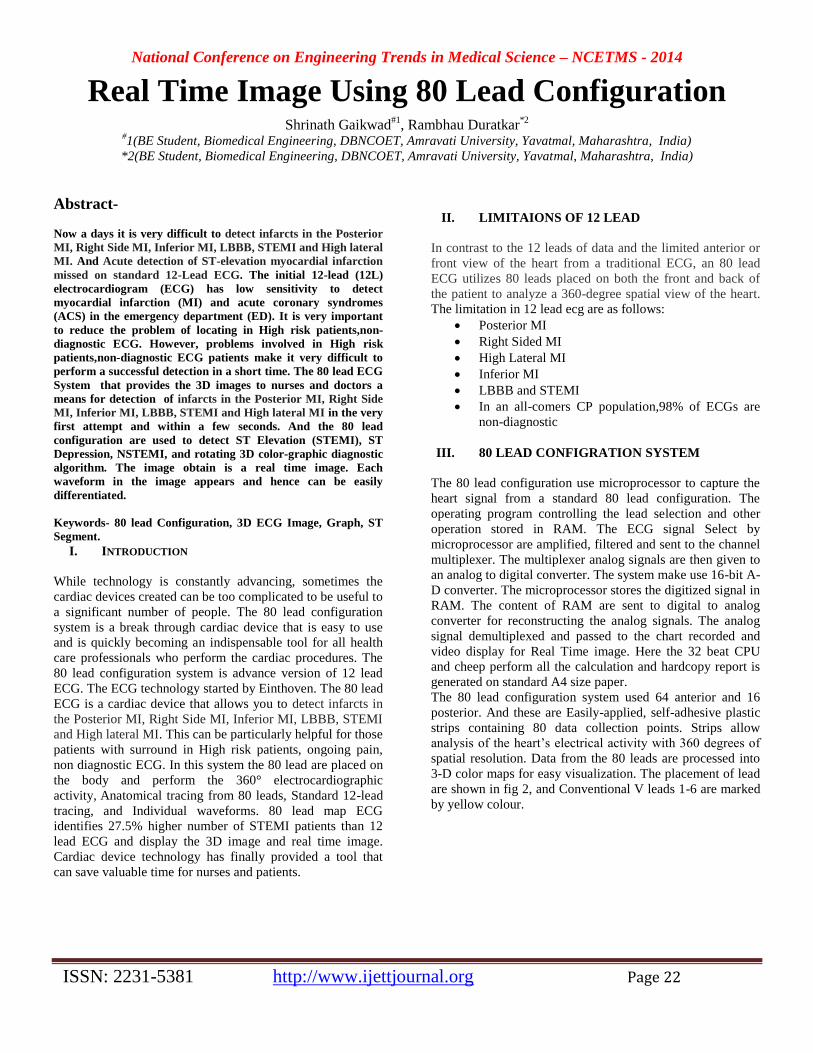
National Conference on Engineering Trends in Medical Science – NCETMS - 2014
ISSN: 2231-5381 http://www.ijettjournal.org Page 22
Real Time Image Using 80 Lead Configuration Shrinath Gaikwad
#1, Rambhau Duratkar
*2
#1(BE Student, Biomedical Engineering, DBNCOET, Amravati University, Yavatmal, Maharashtra, India)
*2(BE Student, Biomedical Engineering, DBNCOET, Amravati University, Yavatmal, Maharashtra, India)
Abstract-
Now a days it is very difficult to detect infarcts in the Posterior
MI, Right Side MI, Inferior MI, LBBB, STEMI and High lateral
MI. And Acute detection of ST-elevation myocardial infarction
missed on standard 12-Lead ECG. The initial 12-lead (12L)
electrocardiogram (ECG) has low sensitivity to detect
myocardial infarction (MI) and acute coronary syndromes
(ACS) in the emergency department (ED). It is very important
to reduce the problem of locating in High risk patients,non-
diagnostic ECG. However, problems involved in High risk
patients,non-diagnostic ECG patients make it very difficult to
perform a successful detection in a short time. The 80 lead ECG
System that provides the 3D images to nurses and doctors a
means for detection of infarcts in the Posterior MI, Right Side
MI, Inferior MI, LBBB, STEMI and High lateral MI in the very
first attempt and within a few seconds. And the 80 lead
configuration are used to detect ST Elevation (STEMI), ST
Depression, NSTEMI, and rotating 3D color-graphic diagnostic
algorithm. The image obtain is a real time image. Each
waveform in the image appears and hence can be easily
differentiated.
Keywords- 80 lead Configuration, 3D ECG Image, Graph, ST
Segment.
I. INTRODUCTION
While technology is constantly advancing, sometimes the
cardiac devices created can be too complicated to be useful to
a significant number of people. The 80 lead configuration
system is a break through cardiac device that is easy to use
and is quickly becoming an indispensable tool for all health
care professionals who perform the cardiac procedures. The
80 lead configuration system is advance version of 12 lead
ECG. The ECG technology started by Einthoven. The 80 lead
ECG is a cardiac device that allows you to detect infarcts in
the Posterior MI, Right Side MI, Inferior MI, LBBB, STEMI
and High lateral MI. This can be particularly helpful for those
patients with surround in High risk patients, ongoing pain,
non diagnostic ECG. In this system the 80 lead are placed on
the body and perform the 360° electrocardiographic
activity, Anatomical tracing from 80 leads, Standard 12-lead
tracing, and Individual waveforms. 80 lead map ECG
identifies 27.5% higher number of STEMI patients than 12
lead ECG and display the 3D image and real time image.
Cardiac device technology has finally provided a tool that
can save valuable time for nurses and patients.
II. LIMITAIONS OF 12 LEAD
In contrast to the 12 leads of data and the limited anterior or
front view of the heart from a traditional ECG, an 80 lead
ECG utilizes 80 leads placed on both the front and back of
the patient to analyze a 360-degree spatial view of the heart.
The limitation in 12 lead ecg are as follows:
Posterior MI
Right Sided MI
High Lateral MI
Inferior MI
LBBB and STEMI
In an all-comers CP population,98% of ECGs are
non-diagnostic
III. 80 LEAD CONFIGRATION SYSTEM
The 80 lead configuration use microprocessor to capture the
heart signal from a standard 80 lead configuration. The
operating program controlling the lead selection and other
operation stored in RAM. The ECG signal Select by
microprocessor are amplified, filtered and sent to the channel
multiplexer. The multiplexer analog signals are then given to
an analog to digital converter. The system make use 16-bit A-
D converter. The microprocessor stores the digitized signal in
RAM. The content of RAM are sent to digital to analog
converter for reconstructing the analog signals. The analog
signal demultiplexed and passed to the chart recorded and
video display for Real Time image. Here the 32 beat CPU
and cheep perform all the calculation and hardcopy report is
generated on standard A4 size paper.
The 80 lead configuration system used 64 anterior and 16
posterior. And these are Easily-applied, self-adhesive plastic
strips containing 80 data collection points. Strips allow
analysis of the heart’s electrical activity with 360 degrees of
spatial resolution. Data from the 80 leads are processed into
3-D color maps for easy visualization. The placement of lead
are shown in fig 2, and Conventional V leads 1-6 are marked
by yellow colour.
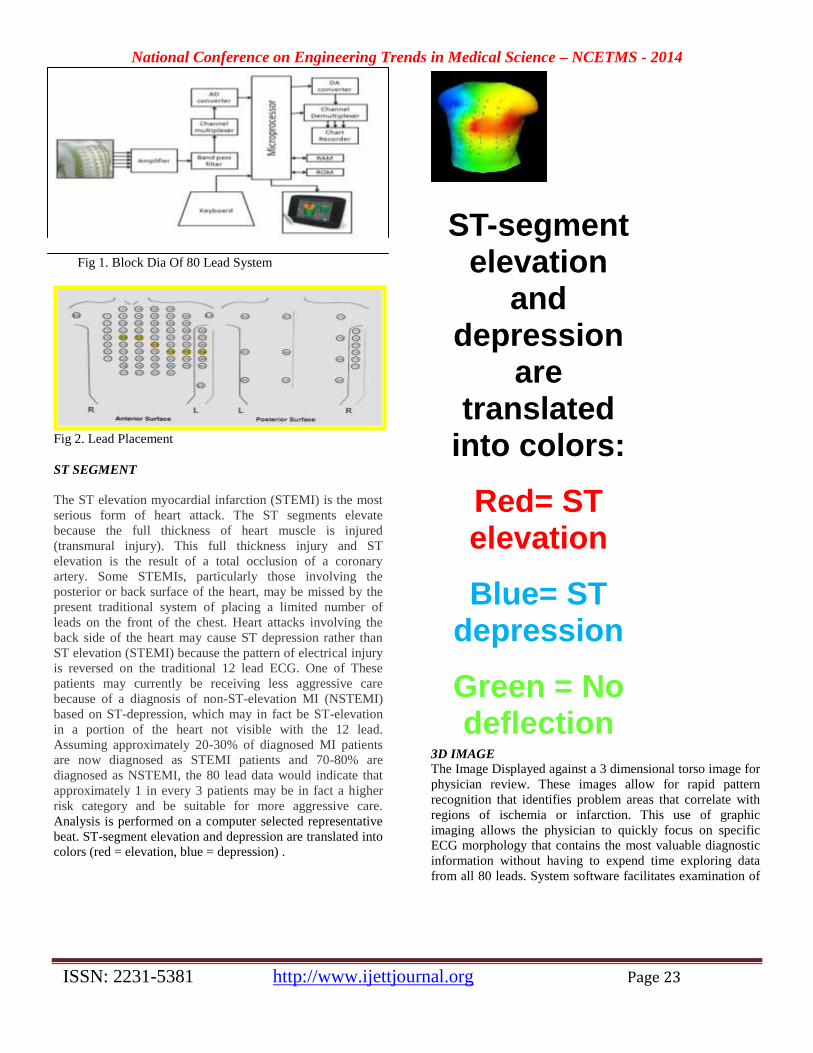
National Conference on Engineering Trends in Medical Science – NCETMS - 2014
ISSN: 2231-5381 http://www.ijettjournal.org Page 23
Fig 1. Block Dia Of 80 Lead System
Fig 2. Lead Placement
ST SEGMENT
The ST elevation myocardial infarction (STEMI) is the most
serious form of heart attack. The ST segments elevate
because the full thickness of heart muscle is injured
(transmural injury). This full thickness injury and ST
elevation is the result of a total occlusion of a coronary
artery. Some STEMIs, particularly those involving the
posterior or back surface of the heart, may be missed by the
present traditional system of placing a limited number of
leads on the front of the chest. Heart attacks involving the
back side of the heart may cause ST depression rather than
ST elevation (STEMI) because the pattern of electrical injury
is reversed on the traditional 12 lead ECG. One of These
patients may currently be receiving less aggressive care
because of a diagnosis of non-ST-elevation MI (NSTEMI)
based on ST-depression, which may in fact be ST-elevation
in a portion of the heart not visible with the 12 lead.
Assuming approximately 20-30% of diagnosed MI patients
are now diagnosed as STEMI patients and 70-80% are
diagnosed as NSTEMI, the 80 lead data would indicate that
approximately 1 in every 3 patients may be in fact a higher
risk category and be suitable for more aggressive care.
Analysis is performed on a computer selected representative
beat. ST-segment elevation and depression are translated into
colors (red = elevation, blue = depression) .
3D IMAGE
The Image Displayed against a 3 dimensional torso image for
physician review. These images allow for rapid pattern
recognition that identifies problem areas that correlate with
regions of ischemia or infarction. This use of graphic
imaging allows the physician to quickly focus on specific
ECG morphology that contains the most valuable diagnostic
information without having to expend time exploring data
from all 80 leads. System software facilitates examination of
ST-segment elevation
and depression
are translated
into colors:
Red= ST elevation
Blue= ST depression
Green = No deflection

National Conference on Engineering Trends in Medical Science – NCETMS - 2014
ISSN: 2231-5381 http://www.ijettjournal.org Page 24
the actual ECG trace for each of the 80 recordings. The user
places a cursor over the suspect area and a pop-up window
reveals the underlying electrode tracing and provides the
value of elevation or depression at that lead. Ten years of
clinical data and in-hospital experience have demonstrated an
increase in sensitivity over the 12 lead ECG in the range of
18% with no loss in specificity. As a result, there is the
potential to detect up to 40% more ST Elevation MIs (serious
heart attacks) than the traditional 12-leadECG.
GRAPH RESULTS
The 80 lead ecg configuration measures the 360°
electrocardiographic activity, Anatomical tracing from 80
leads, Standard 12-lead tracing, and Individual waveforms.
The waveform 1 Shown to the right is the 12 lead ECG in a
patient that presented with substernal chest pain. Note that
there are non diagnostic changes. There is no evidence of ST
segment elevation.
Waveform 1. 12 Lead
In waveform 2 An 80 lead ECG vest was then placed. Shown
to the right are the 80 EKG lead tracings displayed
individually. The anterior leads are displayed on the left had
side. The posterior or back of the heart leads are displayed on
the right hand side of the figure. For instance lead 68 shows
ST elevation. Posterior and right-sided leads reveal ST-
elevation, where the 12-lead was silent.
Waveform 2. 80 Lead
IV. APPLICATIONS
For those patients presenting with cardiovascular symptoms
(acute chest pain, abnormal rhythm, etc.),
Anterior MIs and ischemia outside of the 12-lead
view
Posterior MIs and ischemia outside of the 12-lead
view
Inferior or more lateral MIs outside of the 12-lead
view
MIs and ischemia in the presence of LBBBs
Earlier repolarization or hypertrophy, LVH
The 80 lead configuration 360⁰ Exam color-graphic
diagnostic algorithms help:
Identify the presence of cardiac ST Elevation
(STEMI), ST Depression, NSTEMI, and other heart
abnormalities
Detect more posterior and high anterior Acute
Myocardial Infarctions (AMIs) than traditional 12-
lead ECGs
Improve early diagnosis of AMI in the presence of
LBBB
Pinpoint patients with inferior wall AMI and right
ventricular or posterior wall infarction
V. CONCLUSION
For the Normal patients, there is no need of the device
because the diagnostic ecg is easy to detect. But the 80 lead
map ECG identifies 27.5% higher number of STEMI patients
than 12 lead ECG. 80 lead-only STEMI patients received
conservative and significantly delayed catheterization
strategy.
Even, 80 lead-only STEMI patients have clinical and
angiographic outcomes similar to 12 lead STEMI. The 80

National Conference on Engineering Trends in Medical Science – NCETMS - 2014
ISSN: 2231-5381 http://www.ijettjournal.org Page 25
lead ECG identifies a patient population which may benefit
from more aggressive care.
VI. FUTURE SCOPE
The 80 lead configuration system is a break through cardiac
device that is easy to use and is quickly becoming an
indispensable tool for all health care professionals who
perform the cardiac procedures. This Technology also it can
be used in Stress test technology.
VII. REFERANCES
The IEEE website. [Online]. Available:
http://www.ieee.org/
Cases in Cardiac Resynchronization Therapy –
Cheuk-Man Yu, David.
Stroke In Atrial Fibrillation, An Issue Of cardiac
Electrophysiology Clinics – Samuel J. Asirvatham.
Broundwold herat disease A text book of cardiovascular
medicine –Robert o. Bonow.MD
Handbook of Biomedical Instrumentation, Second
Edition – R S Khandpur.
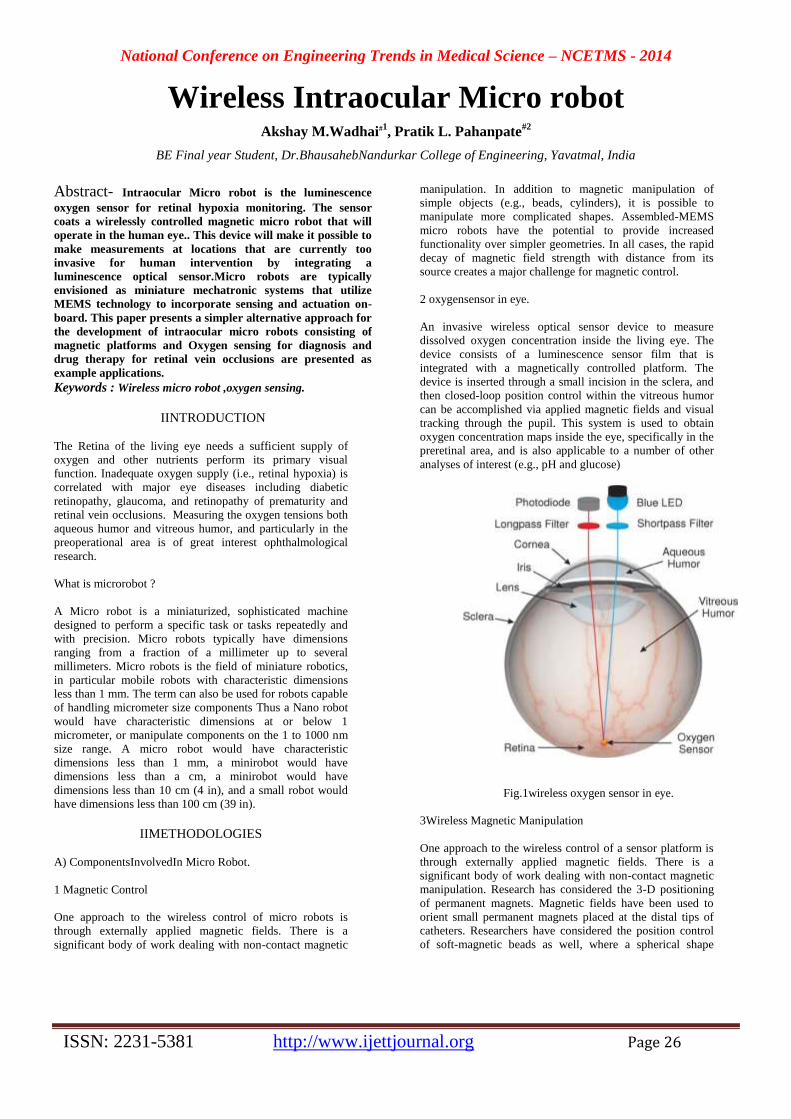
National Conference on Engineering Trends in Medical Science – NCETMS - 2014
ISSN: 2231-5381 http://www.ijettjournal.org Page 26
Wireless Intraocular Micro robot Akshay M.Wadhai#1
, Pratik L. Pahanpate#2
BE Final year Student, Dr.BhausahebNandurkar College of Engineering, Yavatmal, India
Abstract- Intraocular Micro robot is the luminescence
oxygen sensor for retinal hypoxia monitoring. The sensor
coats a wirelessly controlled magnetic micro robot that will
operate in the human eye.. This device will make it possible to
make measurements at locations that are currently too
invasive for human intervention by integrating a
luminescence optical sensor.Micro robots are typically
envisioned as miniature mechatronic systems that utilize
MEMS technology to incorporate sensing and actuation on-
board. This paper presents a simpler alternative approach for
the development of intraocular micro robots consisting of
magnetic platforms and Oxygen sensing for diagnosis and
drug therapy for retinal vein occlusions are presented as
example applications.
Keywords : Wireless micro robot ,oxygen sensing.
IINTRODUCTION
The Retina of the living eye needs a sufficient supply of
oxygen and other nutrients perform its primary visual
function. Inadequate oxygen supply (i.e., retinal hypoxia) is
correlated with major eye diseases including diabetic
retinopathy, glaucoma, and retinopathy of prematurity and
retinal vein occlusions. Measuring the oxygen tensions both
aqueous humor and vitreous humor, and particularly in the
preoperational area is of great interest ophthalmological
research.
What is microrobot ?
A Micro robot is a miniaturized, sophisticated machine
designed to perform a specific task or tasks repeatedly and
with precision. Micro robots typically have dimensions
ranging from a fraction of a millimeter up to several
millimeters. Micro robots is the field of miniature robotics,
in particular mobile robots with characteristic dimensions
less than 1 mm. The term can also be used for robots capable
of handling micrometer size components Thus a Nano robot
would have characteristic dimensions at or below 1
micrometer, or manipulate components on the 1 to 1000 nm
size range. A micro robot would have characteristic
dimensions less than 1 mm, a minirobot would have
dimensions less than a cm, a minirobot would have
dimensions less than 10 cm (4 in), and a small robot would
have dimensions less than 100 cm (39 in).
IIMETHODOLOGIES
A) ComponentsInvolvedIn Micro Robot.
1 Magnetic Control
One approach to the wireless control of micro robots is
through externally applied magnetic fields. There is a
significant body of work dealing with non-contact magnetic
manipulation. In addition to magnetic manipulation of
simple objects (e.g., beads, cylinders), it is possible to
manipulate more complicated shapes. Assembled-MEMS
micro robots have the potential to provide increased
functionality over simpler geometries. In all cases, the rapid
decay of magnetic field strength with distance from its
source creates a major challenge for magnetic control.
2 oxygensensor in eye.
An invasive wireless optical sensor device to measure
dissolved oxygen concentration inside the living eye. The
device consists of a luminescence sensor film that is
integrated with a magnetically controlled platform. The
device is inserted through a small incision in the sclera, and
then closed-loop position control within the vitreous humor
can be accomplished via applied magnetic fields and visual
tracking through the pupil. This system is used to obtain
oxygen concentration maps inside the eye, specifically in the
preretinal area, and is also applicable to a number of other
analyses of interest (e.g., pH and glucose)
Fig.1wireless oxygen sensor in eye.
3Wireless Magnetic Manipulation
One approach to the wireless control of a sensor platform is
through externally applied magnetic fields. There is a
significant body of work dealing with non-contact magnetic
manipulation. Research has considered the 3-D positioning
of permanent magnets. Magnetic fields have been used to
orient small permanent magnets placed at the distal tips of
catheters. Researchers have considered the position control
of soft-magnetic beads as well, where a spherical shape
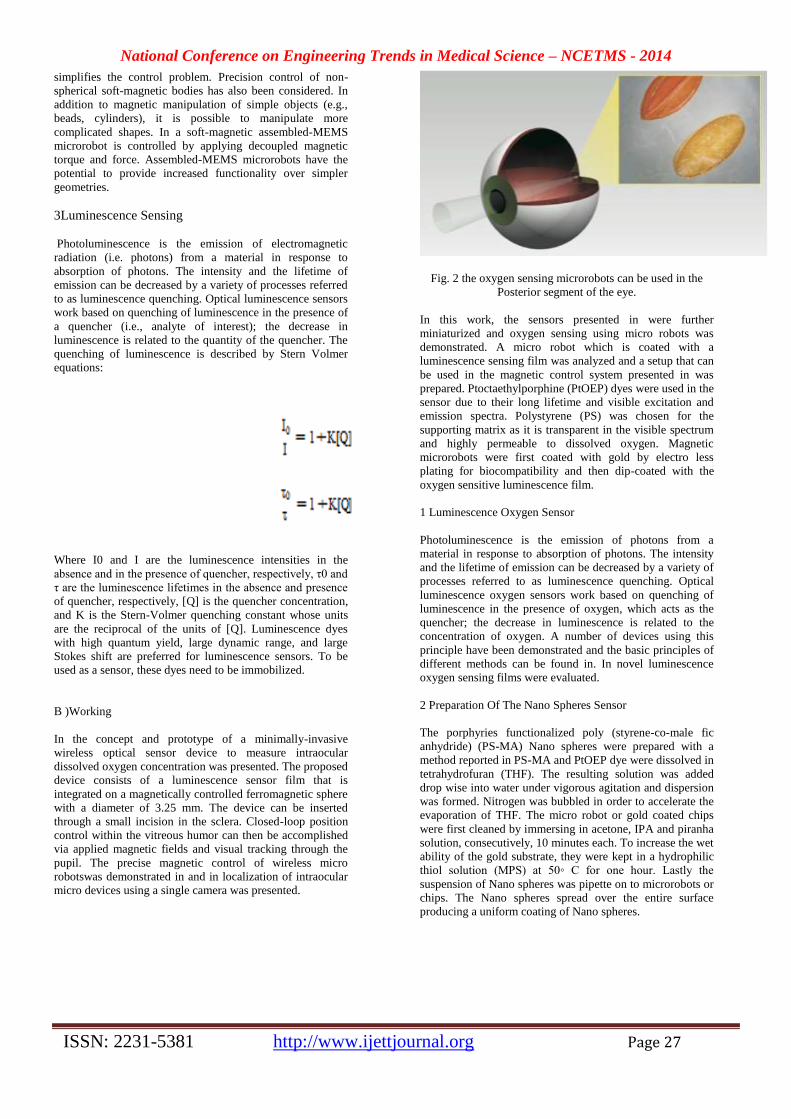
National Conference on Engineering Trends in Medical Science – NCETMS - 2014
ISSN: 2231-5381 http://www.ijettjournal.org Page 27
simplifies the control problem. Precision control of non-
spherical soft-magnetic bodies has also been considered. In
addition to magnetic manipulation of simple objects (e.g.,
beads, cylinders), it is possible to manipulate more
complicated shapes. In a soft-magnetic assembled-MEMS
microrobot is controlled by applying decoupled magnetic
torque and force. Assembled-MEMS microrobots have the
potential to provide increased functionality over simpler
geometries.
3Luminescence Sensing
Photoluminescence is the emission of electromagnetic
radiation (i.e. photons) from a material in response to
absorption of photons. The intensity and the lifetime of
emission can be decreased by a variety of processes referred
to as luminescence quenching. Optical luminescence sensors
work based on quenching of luminescence in the presence of
a quencher (i.e., analyte of interest); the decrease in
luminescence is related to the quantity of the quencher. The
quenching of luminescence is described by Stern Volmer
equations:
Where I0 and I are the luminescence intensities in the
absence and in the presence of quencher, respectively, τ0 and
τ are the luminescence lifetimes in the absence and presence
of quencher, respectively, [Q] is the quencher concentration,
and K is the Stern-Volmer quenching constant whose units
are the reciprocal of the units of [Q]. Luminescence dyes
with high quantum yield, large dynamic range, and large
Stokes shift are preferred for luminescence sensors. To be
used as a sensor, these dyes need to be immobilized.
B )Working
In the concept and prototype of a minimally-invasive
wireless optical sensor device to measure intraocular
dissolved oxygen concentration was presented. The proposed
device consists of a luminescence sensor film that is
integrated on a magnetically controlled ferromagnetic sphere
with a diameter of 3.25 mm. The device can be inserted
through a small incision in the sclera. Closed-loop position
control within the vitreous humor can then be accomplished
via applied magnetic fields and visual tracking through the
pupil. The precise magnetic control of wireless micro
robotswas demonstrated in and in localization of intraocular
micro devices using a single camera was presented.
Fig. 2 the oxygen sensing microrobots can be used in the
Posterior segment of the eye.
In this work, the sensors presented in were further
miniaturized and oxygen sensing using micro robots was
demonstrated. A micro robot which is coated with a
luminescence sensing film was analyzed and a setup that can
be used in the magnetic control system presented in was
prepared. Ptoctaethylporphine (PtOEP) dyes were used in the
sensor due to their long lifetime and visible excitation and
emission spectra. Polystyrene (PS) was chosen for the
supporting matrix as it is transparent in the visible spectrum
and highly permeable to dissolved oxygen. Magnetic
microrobots were first coated with gold by electro less
plating for biocompatibility and then dip-coated with the
oxygen sensitive luminescence film.
1 Luminescence Oxygen Sensor
Photoluminescence is the emission of photons from a
material in response to absorption of photons. The intensity
and the lifetime of emission can be decreased by a variety of
processes referred to as luminescence quenching. Optical
luminescence oxygen sensors work based on quenching of
luminescence in the presence of oxygen, which acts as the
quencher; the decrease in luminescence is related to the
concentration of oxygen. A number of devices using this
principle have been demonstrated and the basic principles of
different methods can be found in. In novel luminescence
oxygen sensing films were evaluated.
2 Preparation Of The Nano Spheres Sensor
The porphyries functionalized poly (styrene-co-male fic
anhydride) (PS-MA) Nano spheres were prepared with a
method reported in PS-MA and PtOEP dye were dissolved in
tetrahydrofuran (THF). The resulting solution was added
drop wise into water under vigorous agitation and dispersion
was formed. Nitrogen was bubbled in order to accelerate the
evaporation of THF. The micro robot or gold coated chips
were first cleaned by immersing in acetone, IPA and piranha
solution, consecutively, 10 minutes each. To increase the wet
ability of the gold substrate, they were kept in a hydrophilic
thiol solution (MPS) at 50◦ C for one hour. Lastly the
suspension of Nano spheres was pipette on to microrobots or
chips. The Nano spheres spread over the entire surface
producing a uniform coating of Nano spheres.
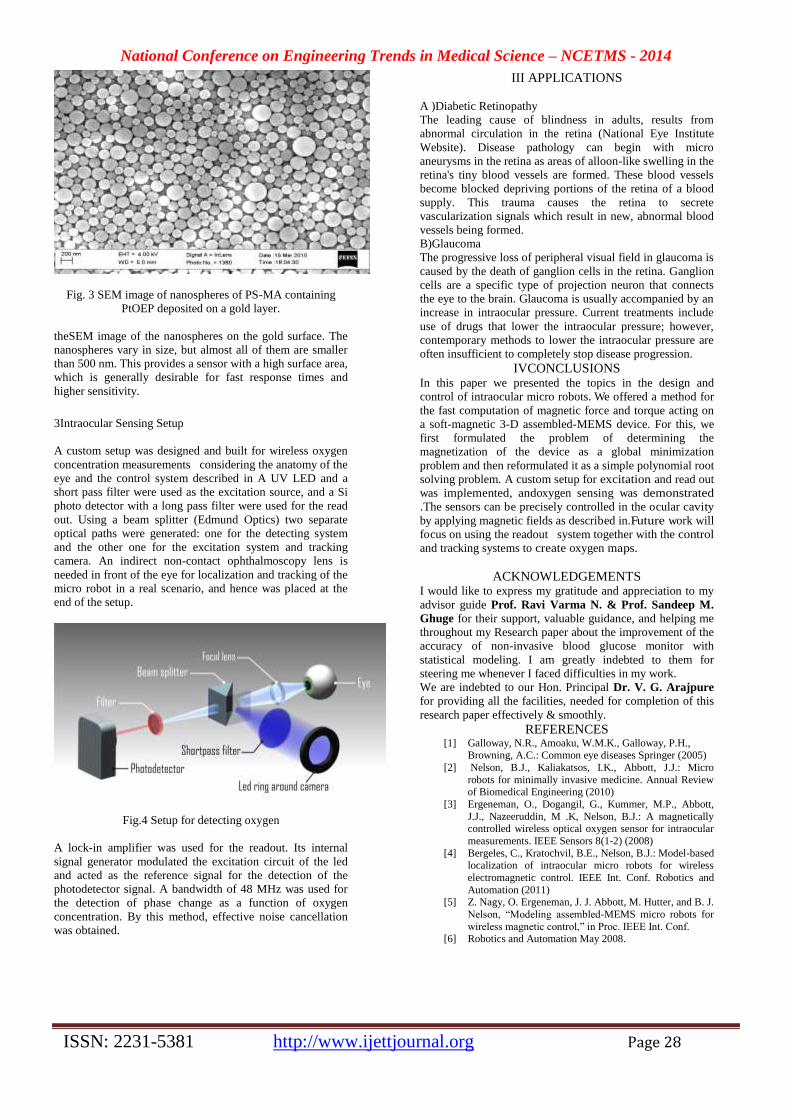
National Conference on Engineering Trends in Medical Science – NCETMS - 2014
ISSN: 2231-5381 http://www.ijettjournal.org Page 28
Fig. 3 SEM image of nanospheres of PS-MA containing
PtOEP deposited on a gold layer.
theSEM image of the nanospheres on the gold surface. The
nanospheres vary in size, but almost all of them are smaller
than 500 nm. This provides a sensor with a high surface area,
which is generally desirable for fast response times and
higher sensitivity.
3Intraocular Sensing Setup
A custom setup was designed and built for wireless oxygen
concentration measurements considering the anatomy of the
eye and the control system described in A UV LED and a
short pass filter were used as the excitation source, and a Si
photo detector with a long pass filter were used for the read
out. Using a beam splitter (Edmund Optics) two separate
optical paths were generated: one for the detecting system
and the other one for the excitation system and tracking
camera. An indirect non-contact ophthalmoscopy lens is
needed in front of the eye for localization and tracking of the
micro robot in a real scenario, and hence was placed at the
end of the setup.
Fig.4 Setup for detecting oxygen
A lock-in amplifier was used for the readout. Its internal
signal generator modulated the excitation circuit of the led
and acted as the reference signal for the detection of the
photodetector signal. A bandwidth of 48 MHz was used for
the detection of phase change as a function of oxygen
concentration. By this method, effective noise cancellation
was obtained.
III APPLICATIONS
A )Diabetic Retinopathy
The leading cause of blindness in adults, results from
abnormal circulation in the retina (National Eye Institute
Website). Disease pathology can begin with micro
aneurysms in the retina as areas of alloon-like swelling in the
retina's tiny blood vessels are formed. These blood vessels
become blocked depriving portions of the retina of a blood
supply. This trauma causes the retina to secrete
vascularization signals which result in new, abnormal blood
vessels being formed.
B)Glaucoma
The progressive loss of peripheral visual field in glaucoma is
caused by the death of ganglion cells in the retina. Ganglion
cells are a specific type of projection neuron that connects
the eye to the brain. Glaucoma is usually accompanied by an
increase in intraocular pressure. Current treatments include
use of drugs that lower the intraocular pressure; however,
contemporary methods to lower the intraocular pressure are
often insufficient to completely stop disease progression.
IVCONCLUSIONS In this paper we presented the topics in the design and
control of intraocular micro robots. We offered a method for
the fast computation of magnetic force and torque acting on
a soft-magnetic 3-D assembled-MEMS device. For this, we
first formulated the problem of determining the
magnetization of the device as a global minimization
problem and then reformulated it as a simple polynomial root
solving problem. A custom setup for excitation and read out
was implemented, andoxygen sensing was demonstrated
.The sensors can be precisely controlled in the ocular cavity
by applying magnetic fields as described in.Future work will
focus on using the readout system together with the control
and tracking systems to create oxygen maps.
ACKNOWLEDGEMENTS I would like to express my gratitude and appreciation to my
advisor guide Prof. Ravi Varma N. & Prof. Sandeep M.
Ghuge for their support, valuable guidance, and helping me
throughout my Research paper about the improvement of the
accuracy of non-invasive blood glucose monitor with
statistical modeling. I am greatly indebted to them for
steering me whenever I faced difficulties in my work.
We are indebted to our Hon. Principal Dr. V. G. Arajpure
for providing all the facilities, needed for completion of this
research paper effectively & smoothly.
REFERENCES [1] Galloway, N.R., Amoaku, W.M.K., Galloway, P.H.,
Browning, A.C.: Common eye diseases Springer (2005)
[2] Nelson, B.J., Kaliakatsos, I.K., Abbott, J.J.: Micro
robots for minimally invasive medicine. Annual Review of Biomedical Engineering (2010)
[3] Ergeneman, O., Dogangil, G., Kummer, M.P., Abbott,
J.J., Nazeeruddin, M .K, Nelson, B.J.: A magnetically controlled wireless optical oxygen sensor for intraocular
measurements. IEEE Sensors 8(1-2) (2008)
[4] Bergeles, C., Kratochvil, B.E., Nelson, B.J.: Model-based localization of intraocular micro robots for wireless
electromagnetic control. IEEE Int. Conf. Robotics and
Automation (2011) [5] Z. Nagy, O. Ergeneman, J. J. Abbott, M. Hutter, and B. J.
Nelson, “Modeling assembled-MEMS micro robots for
wireless magnetic control,” in Proc. IEEE Int. Conf. [6] Robotics and Automation May 2008.
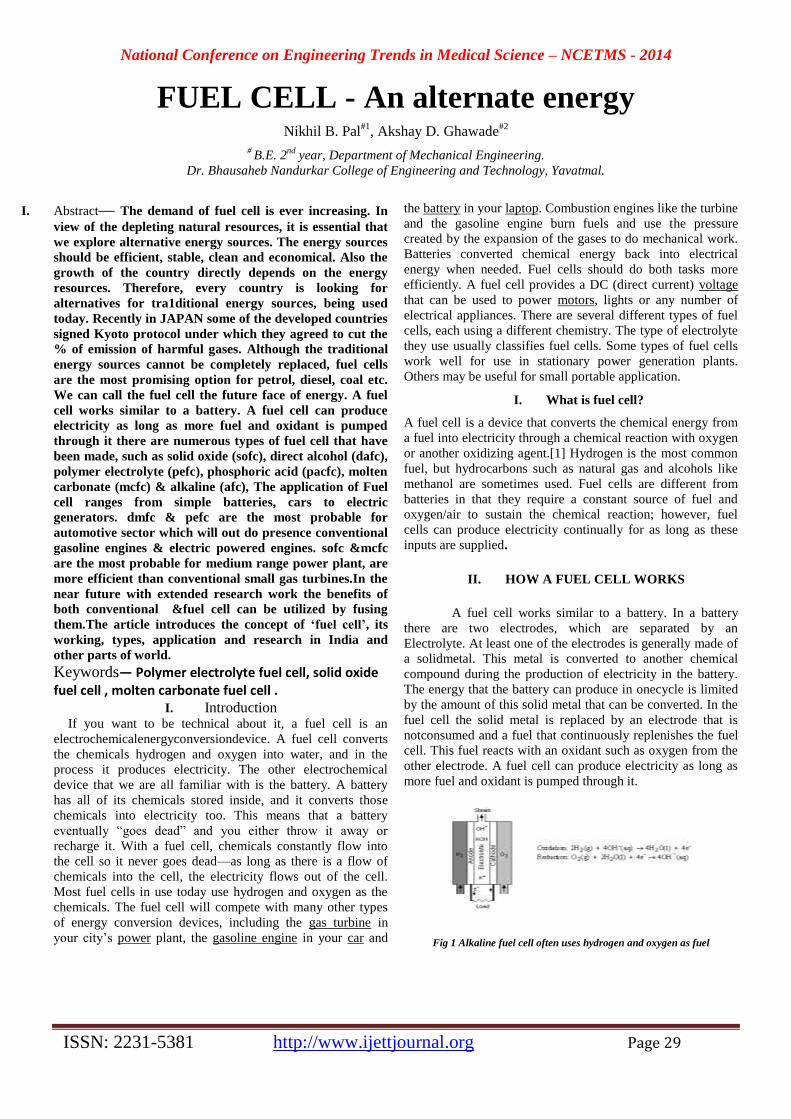
National Conference on Engineering Trends in Medical Science – NCETMS - 2014
ISSN: 2231-5381 http://www.ijettjournal.org Page 29
FUEL CELL - An alternate energy Nikhil B. Pal
#1, Akshay D. Ghawade
#2
# B.E. 2
nd year, Department of Mechanical Engineering.
Dr. Bhausaheb Nandurkar College of Engineering and Technology, Yavatmal.
I. Abstract— The demand of fuel cell is ever increasing. In
view of the depleting natural resources, it is essential that
we explore alternative energy sources. The energy sources
should be efficient, stable, clean and economical. Also the
growth of the country directly depends on the energy
resources. Therefore, every country is looking for
alternatives for tra1ditional energy sources, being used
today. Recently in JAPAN some of the developed countries
signed Kyoto protocol under which they agreed to cut the
% of emission of harmful gases. Although the traditional
energy sources cannot be completely replaced, fuel cells
are the most promising option for petrol, diesel, coal etc.
We can call the fuel cell the future face of energy. A fuel
cell works similar to a battery. A fuel cell can produce
electricity as long as more fuel and oxidant is pumped
through it there are numerous types of fuel cell that have
been made, such as solid oxide (sofc), direct alcohol (dafc),
polymer electrolyte (pefc), phosphoric acid (pacfc), molten
carbonate (mcfc) & alkaline (afc), The application of Fuel
cell ranges from simple batteries, cars to electric
generators. dmfc & pefc are the most probable for
automotive sector which will out do presence conventional
gasoline engines & electric powered engines. sofc &mcfc
are the most probable for medium range power plant, are
more efficient than conventional small gas turbines.In the
near future with extended research work the benefits of
both conventional &fuel cell can be utilized by fusing
them.The article introduces the concept of ‘fuel cell’, its
working, types, application and research in India and
other parts of world.
Keywords— Polymer electrolyte fuel cell, solid oxide fuel cell , molten carbonate fuel cell .
I. Introduction If you want to be technical about it, a fuel cell is an
electrochemicalenergyconversiondevice. A fuel cell converts
the chemicals hydrogen and oxygen into water, and in the
process it produces electricity. The other electrochemical
device that we are all familiar with is the battery. A battery
has all of its chemicals stored inside, and it converts those
chemicals into electricity too. This means that a battery
eventually “goes dead” and you either throw it away or
recharge it. With a fuel cell, chemicals constantly flow into
the cell so it never goes dead—as long as there is a flow of
chemicals into the cell, the electricity flows out of the cell.
Most fuel cells in use today use hydrogen and oxygen as the
chemicals. The fuel cell will compete with many other types
of energy conversion devices, including the gas turbine in
your city’s power plant, the gasoline engine in your car and
the battery in your laptop. Combustion engines like the turbine
and the gasoline engine burn fuels and use the pressure
created by the expansion of the gases to do mechanical work.
Batteries converted chemical energy back into electrical
energy when needed. Fuel cells should do both tasks more
efficiently. A fuel cell provides a DC (direct current) voltage
that can be used to power motors, lights or any number of
electrical appliances. There are several different types of fuel
cells, each using a different chemistry. The type of electrolyte
they use usually classifies fuel cells. Some types of fuel cells
work well for use in stationary power generation plants.
Others may be useful for small portable application.
I. What is fuel cell?
A fuel cell is a device that converts the chemical energy from
a fuel into electricity through a chemical reaction with oxygen
or another oxidizing agent.[1] Hydrogen is the most common
fuel, but hydrocarbons such as natural gas and alcohols like
methanol are sometimes used. Fuel cells are different from
batteries in that they require a constant source of fuel and
oxygen/air to sustain the chemical reaction; however, fuel
cells can produce electricity continually for as long as these
inputs are supplied.
II. HOW A FUEL CELL WORKS
A fuel cell works similar to a battery. In a battery
there are two electrodes, which are separated by an
Electrolyte. At least one of the electrodes is generally made of
a solidmetal. This metal is converted to another chemical
compound during the production of electricity in the battery.
The energy that the battery can produce in onecycle is limited
by the amount of this solid metal that can be converted. In the
fuel cell the solid metal is replaced by an electrode that is
notconsumed and a fuel that continuously replenishes the fuel
cell. This fuel reacts with an oxidant such as oxygen from the
other electrode. A fuel cell can produce electricity as long as
more fuel and oxidant is pumped through it.
Fig 1 Alkaline fuel cell often uses hydrogen and oxygen as fuel
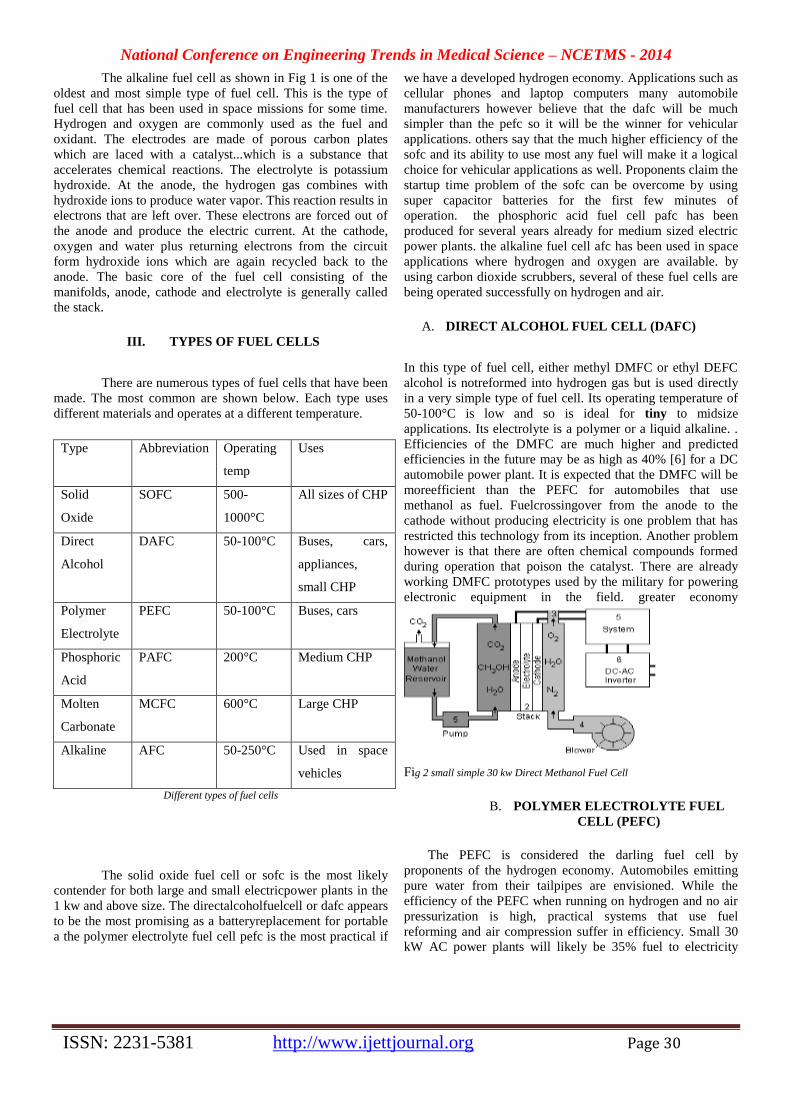
National Conference on Engineering Trends in Medical Science – NCETMS - 2014
ISSN: 2231-5381 http://www.ijettjournal.org Page 30
The alkaline fuel cell as shown in Fig 1 is one of the
oldest and most simple type of fuel cell. This is the type of
fuel cell that has been used in space missions for some time.
Hydrogen and oxygen are commonly used as the fuel and
oxidant. The electrodes are made of porous carbon plates
which are laced with a catalyst...which is a substance that
accelerates chemical reactions. The electrolyte is potassium
hydroxide. At the anode, the hydrogen gas combines with
hydroxide ions to produce water vapor. This reaction results in
electrons that are left over. These electrons are forced out of
the anode and produce the electric current. At the cathode,
oxygen and water plus returning electrons from the circuit
form hydroxide ions which are again recycled back to the
anode. The basic core of the fuel cell consisting of the
manifolds, anode, cathode and electrolyte is generally called
the stack.
III. TYPES OF FUEL CELLS
There are numerous types of fuel cells that have been
made. The most common are shown below. Each type uses
different materials and operates at a different temperature.
Type Abbreviation Operating
temp
Uses
Solid
Oxide
SOFC 500-
1000°C
All sizes of CHP
Direct
Alcohol
DAFC 50-100°C Buses, cars,
appliances,
small CHP
Polymer
Electrolyte
PEFC 50-100°C Buses, cars
Phosphoric
Acid
PAFC 200°C Medium CHP
Molten
Carbonate
MCFC 600°C Large CHP
Alkaline AFC 50-250°C Used in space
vehicles
Different types of fuel cells
The solid oxide fuel cell or sofc is the most likely
contender for both large and small electricpower plants in the
1 kw and above size. The directalcoholfuelcell or dafc appears
to be the most promising as a batteryreplacement for portable
a the polymer electrolyte fuel cell pefc is the most practical if
we have a developed hydrogen economy. Applications such as
cellular phones and laptop computers many automobile
manufacturers however believe that the dafc will be much
simpler than the pefc so it will be the winner for vehicular
applications. others say that the much higher efficiency of the
sofc and its ability to use most any fuel will make it a logical
choice for vehicular applications as well. Proponents claim the
startup time problem of the sofc can be overcome by using
super capacitor batteries for the first few minutes of
operation. the phosphoric acid fuel cell pafc has been
produced for several years already for medium sized electric
power plants. the alkaline fuel cell afc has been used in space
applications where hydrogen and oxygen are available. by
using carbon dioxide scrubbers, several of these fuel cells are
being operated successfully on hydrogen and air.
A. DIRECT ALCOHOL FUEL CELL (DAFC)
In this type of fuel cell, either methyl DMFC or ethyl DEFC
alcohol is notreformed into hydrogen gas but is used directly
in a very simple type of fuel cell. Its operating temperature of
50-100°C is low and so is ideal for tiny to midsize
applications. Its electrolyte is a polymer or a liquid alkaline. .
Efficiencies of the DMFC are much higher and predicted
efficiencies in the future may be as high as 40% [6] for a DC
automobile power plant. It is expected that the DMFC will be
moreefficient than the PEFC for automobiles that use
methanol as fuel. Fuelcrossingover from the anode to the
cathode without producing electricity is one problem that has
restricted this technology from its inception. Another problem
however is that there are often chemical compounds formed
during operation that poison the catalyst. There are already
working DMFC prototypes used by the military for powering
electronic equipment in the field. greater economy
Fig 2 small simple 30 kw Direct Methanol Fuel Cell
B. POLYMER ELECTROLYTE FUEL
CELL (PEFC)
The PEFC is considered the darling fuel cell by
proponents of the hydrogen economy. Automobiles emitting
pure water from their tailpipes are envisioned. While the
efficiency of the PEFC when running on hydrogen and no air
pressurization is high, practical systems that use fuel
reforming and air compression suffer in efficiency. Small 30
kW AC power plants will likely be 35% fuel to electricity
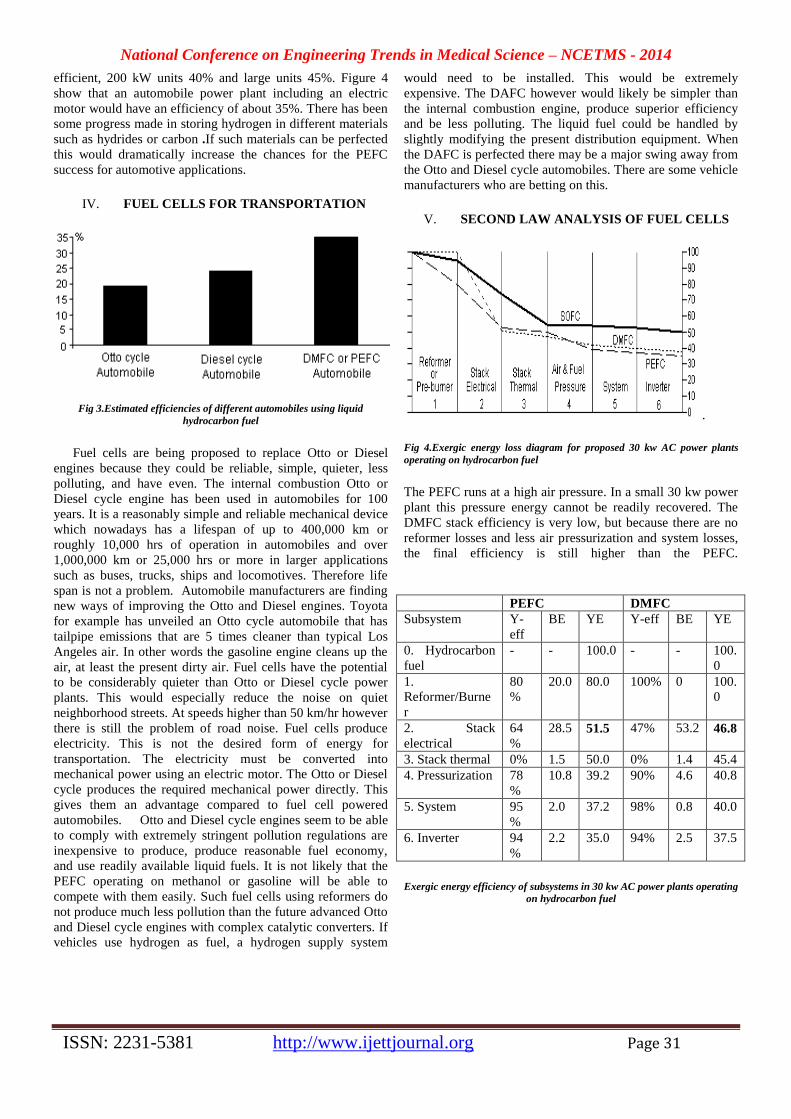
National Conference on Engineering Trends in Medical Science – NCETMS - 2014
ISSN: 2231-5381 http://www.ijettjournal.org Page 31
efficient, 200 kW units 40% and large units 45%. Figure 4
show that an automobile power plant including an electric
motor would have an efficiency of about 35%. There has been
some progress made in storing hydrogen in different materials
such as hydrides or carbon .If such materials can be perfected
this would dramatically increase the chances for the PEFC
success for automotive applications.
IV. FUEL CELLS FOR TRANSPORTATION
Fig 3.Estimated efficiencies of different automobiles using liquid
hydrocarbon fuel
Fuel cells are being proposed to replace Otto or Diesel
engines because they could be reliable, simple, quieter, less
polluting, and have even. The internal combustion Otto or
Diesel cycle engine has been used in automobiles for 100
years. It is a reasonably simple and reliable mechanical device
which nowadays has a lifespan of up to 400,000 km or
roughly 10,000 hrs of operation in automobiles and over
1,000,000 km or 25,000 hrs or more in larger applications
such as buses, trucks, ships and locomotives. Therefore life
span is not a problem. Automobile manufacturers are finding
new ways of improving the Otto and Diesel engines. Toyota
for example has unveiled an Otto cycle automobile that has
tailpipe emissions that are 5 times cleaner than typical Los
Angeles air. In other words the gasoline engine cleans up the
air, at least the present dirty air. Fuel cells have the potential
to be considerably quieter than Otto or Diesel cycle power
plants. This would especially reduce the noise on quiet
neighborhood streets. At speeds higher than 50 km/hr however
there is still the problem of road noise. Fuel cells produce
electricity. This is not the desired form of energy for
transportation. The electricity must be converted into
mechanical power using an electric motor. The Otto or Diesel
cycle produces the required mechanical power directly. This
gives them an advantage compared to fuel cell powered
automobiles. Otto and Diesel cycle engines seem to be able
to comply with extremely stringent pollution regulations are
inexpensive to produce, produce reasonable fuel economy,
and use readily available liquid fuels. It is not likely that the
PEFC operating on methanol or gasoline will be able to
compete with them easily. Such fuel cells using reformers do
not produce much less pollution than the future advanced Otto
and Diesel cycle engines with complex catalytic converters. If
vehicles use hydrogen as fuel, a hydrogen supply system
would need to be installed. This would be extremely
expensive. The DAFC however would likely be simpler than
the internal combustion engine, produce superior efficiency
and be less polluting. The liquid fuel could be handled by
slightly modifying the present distribution equipment. When
the DAFC is perfected there may be a major swing away from
the Otto and Diesel cycle automobiles. There are some vehicle
manufacturers who are betting on this.
V. SECOND LAW ANALYSIS OF FUEL CELLS
.
Fig 4.Exergic energy loss diagram for proposed 30 kw AC power plants
operating on hydrocarbon fuel
The PEFC runs at a high air pressure. In a small 30 kw power
plant this pressure energy cannot be readily recovered. The
DMFC stack efficiency is very low, but because there are no
reformer losses and less air pressurization and system losses,
the final efficiency is still higher than the PEFC.
PEFC DMFC
Subsystem Y-
eff
BE YE Y-eff BE YE
0. Hydrocarbon
fuel
- - 100.0 - - 100.
0
1.
Reformer/Burne
r
80
%
20.0 80.0 100% 0 100.
0
2. Stack
electrical
64
%
28.5 51.5 47% 53.2 46.8
3. Stack thermal 0% 1.5 50.0 0% 1.4 45.4
4. Pressurization 78
%
10.8 39.2 90% 4.6 40.8
5. System 95
%
2.0 37.2 98% 0.8 40.0
6. Inverter 94
%
2.2 35.0 94% 2.5 37.5
Exergic energy efficiency of subsystems in 30 kw AC power plants operating
on hydrocarbon fuel
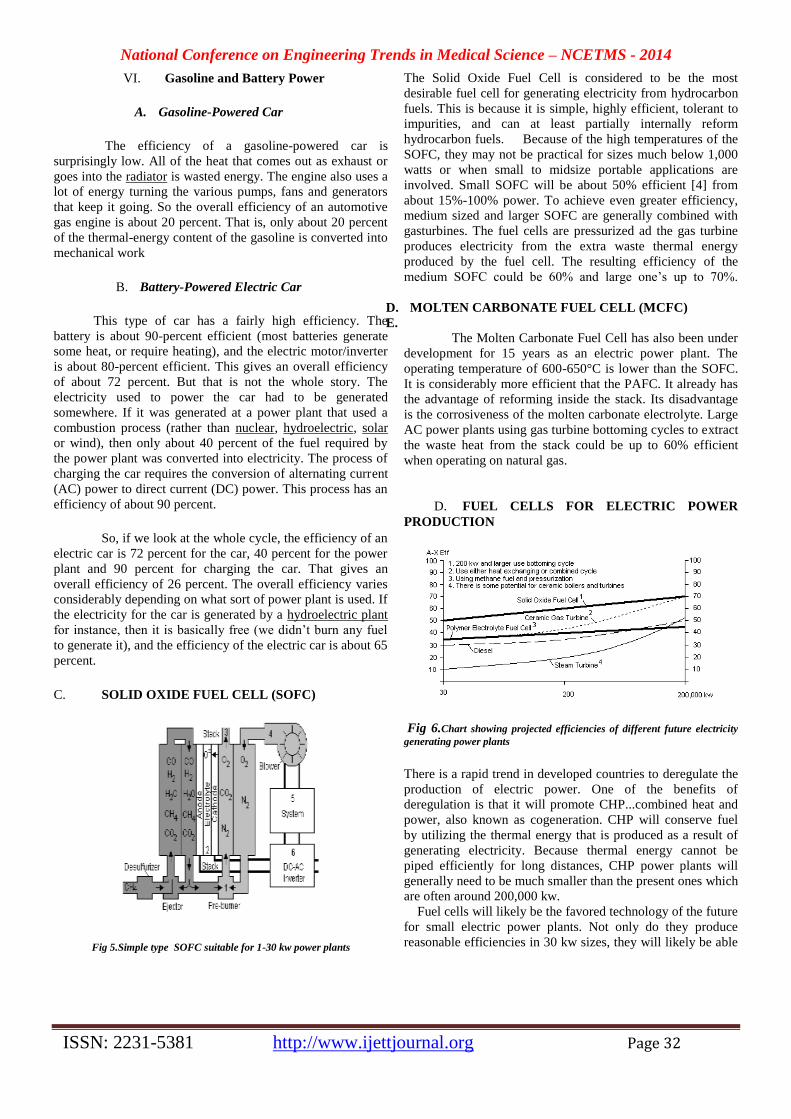
National Conference on Engineering Trends in Medical Science – NCETMS - 2014
ISSN: 2231-5381 http://www.ijettjournal.org Page 32
VI. Gasoline and Battery Power
A. Gasoline-Powered Car
The efficiency of a gasoline-powered car is
surprisingly low. All of the heat that comes out as exhaust or
goes into the radiator is wasted energy. The engine also uses a
lot of energy turning the various pumps, fans and generators
that keep it going. So the overall efficiency of an automotive
gas engine is about 20 percent. That is, only about 20 percent
of the thermal-energy content of the gasoline is converted into
mechanical work
B. Battery-Powered Electric Car
This type of car has a fairly high efficiency. The
battery is about 90-percent efficient (most batteries generate
some heat, or require heating), and the electric motor/inverter
is about 80-percent efficient. This gives an overall efficiency
of about 72 percent. But that is not the whole story. The
electricity used to power the car had to be generated
somewhere. If it was generated at a power plant that used a
combustion process (rather than nuclear, hydroelectric, solar
or wind), then only about 40 percent of the fuel required by
the power plant was converted into electricity. The process of
charging the car requires the conversion of alternating current
(AC) power to direct current (DC) power. This process has an
efficiency of about 90 percent.
So, if we look at the whole cycle, the efficiency of an
electric car is 72 percent for the car, 40 percent for the power
plant and 90 percent for charging the car. That gives an
overall efficiency of 26 percent. The overall efficiency varies
considerably depending on what sort of power plant is used. If
the electricity for the car is generated by a hydroelectric plant
for instance, then it is basically free (we didn’t burn any fuel
to generate it), and the efficiency of the electric car is about 65
percent.
C. SOLID OXIDE FUEL CELL (SOFC)
Fig 5.Simple type SOFC suitable for 1-30 kw power plants
The Solid Oxide Fuel Cell is considered to be the most
desirable fuel cell for generating electricity from hydrocarbon
fuels. This is because it is simple, highly efficient, tolerant to
impurities, and can at least partially internally reform
hydrocarbon fuels. Because of the high temperatures of the
SOFC, they may not be practical for sizes much below 1,000
watts or when small to midsize portable applications are
involved. Small SOFC will be about 50% efficient [4] from
about 15%-100% power. To achieve even greater efficiency,
medium sized and larger SOFC are generally combined with
gasturbines. The fuel cells are pressurized ad the gas turbine
produces electricity from the extra waste thermal energy
produced by the fuel cell. The resulting efficiency of the
medium SOFC could be 60% and large one’s up to 70%.
D. MOLTEN CARBONATE FUEL CELL (MCFC)
E.
The Molten Carbonate Fuel Cell has also been under
development for 15 years as an electric power plant. The
operating temperature of 600-650°C is lower than the SOFC.
It is considerably more efficient that the PAFC. It already has
the advantage of reforming inside the stack. Its disadvantage
is the corrosiveness of the molten carbonate electrolyte. Large
AC power plants using gas turbine bottoming cycles to extract
the waste heat from the stack could be up to 60% efficient
when operating on natural gas.
D. FUEL CELLS FOR ELECTRIC POWER
PRODUCTION
Fig 6.Chart showing projected efficiencies of different future electricity
generating power plants
There is a rapid trend in developed countries to deregulate the
production of electric power. One of the benefits of
deregulation is that it will promote CHP...combined heat and
power, also known as cogeneration. CHP will conserve fuel
by utilizing the thermal energy that is produced as a result of
generating electricity. Because thermal energy cannot be
piped efficiently for long distances, CHP power plants will
generally need to be much smaller than the present ones which
are often around 200,000 kw.
Fuel cells will likely be the favored technology of the future
for small electric power plants. Not only do they produce
reasonable efficiencies in 30 kw sizes, they will likely be able

National Conference on Engineering Trends in Medical Science – NCETMS - 2014
ISSN: 2231-5381 http://www.ijettjournal.org Page 33
to run quietly, need infrequent maintenance, emit little
pollution and have high efficiency even at part load
conditions. Electricity is used by many of our modern high
technology devices. Presently batteries are used in these
devices. Batteries do not have a long enough life for these
applications. Fuel cells could provide continuous power for
these devices. Fuel cells are most ideal for electric power
production because electricity is both the initial and final form
of energy that is produced.
VII. Future of fuel cell
In the future, medium and large power plants using
SOFC will be fuel cell gas turbine combined cycles. In this
way the benefits of each type of conversion technology is
utilized. Fuel cells are still a few years away from
commercialization on a large scale. It is very difficult to tell
which fuel and which technology will be predominant in the
future. There are some problems to be solved in the SOFC and
the DAFC. If these can be solved then these will become the
predominant fuel cells being developed in the future.
REFERENCES
Buswell, Clause, Cohen, Louie, Watkins 1994 Ballard US Patent 5,360,679
...Hydrocarbon Fueled Solid Polymer Fuel Cell Electric Power Generation
System Kordesch, K., Simader, G. 1996 Fuel Cells and their Applications VCH Press
NY USA
Stimming, U. et all 1997 Proceedings of the fifth International Symposium on Solid Oxide Fuel Cells Vol 97-40 pg 69 The Electrochemical Society NJ
USA.
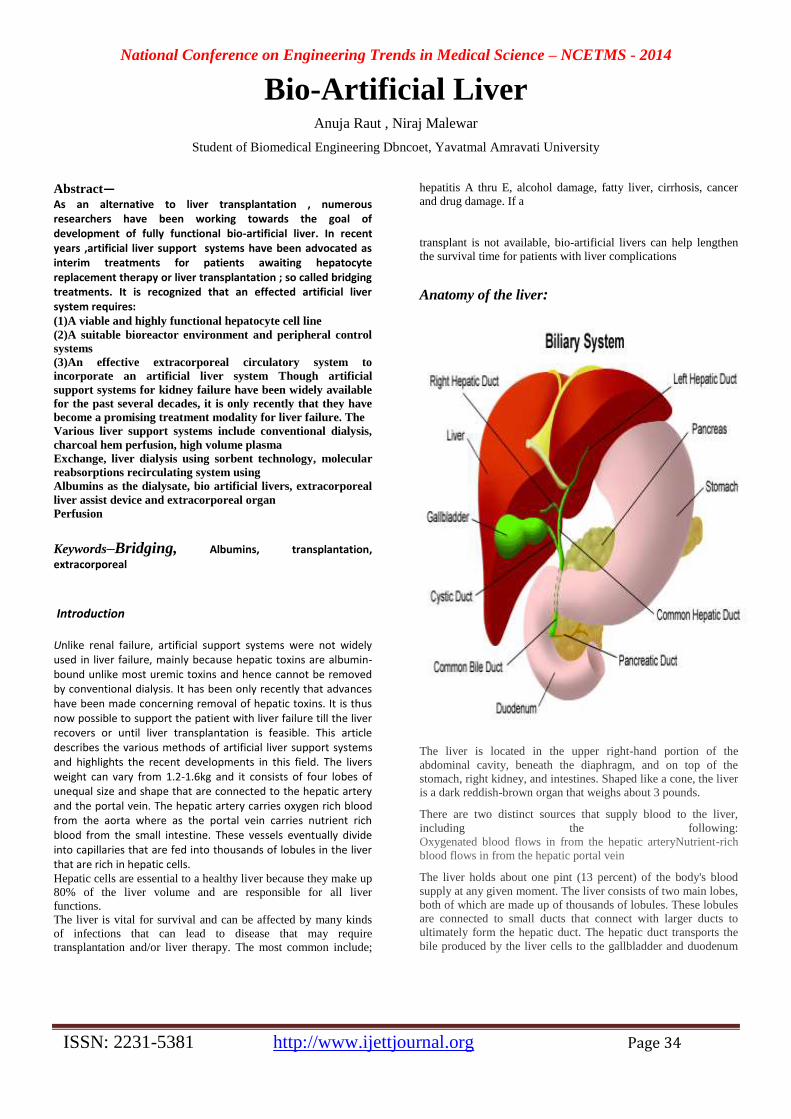
National Conference on Engineering Trends in Medical Science – NCETMS - 2014
ISSN: 2231-5381 http://www.ijettjournal.org Page 34
Bio-Artificial Liver Anuja Raut , Niraj Malewar
Student of Biomedical Engineering Dbncoet, Yavatmal Amravati University
Abstract— As an alternative to liver transplantation , numerous researchers have been working towards the goal of development of fully functional bio-artificial liver. In recent years ,artificial liver support systems have been advocated as interim treatments for patients awaiting hepatocyte replacement therapy or liver transplantation ; so called bridging treatments. It is recognized that an effected artificial liver system requires: (1)A viable and highly functional hepatocyte cell line
(2)A suitable bioreactor environment and peripheral control
systems
(3)An effective extracorporeal circulatory system to
incorporate an artificial liver system Though artificial
support systems for kidney failure have been widely available
for the past several decades, it is only recently that they have
become a promising treatment modality for liver failure. The
Various liver support systems include conventional dialysis,
charcoal hem perfusion, high volume plasma
Exchange, liver dialysis using sorbent technology, molecular
reabsorptions recirculating system using
Albumins as the dialysate, bio artificial livers, extracorporeal
liver assist device and extracorporeal organ
Perfusion
Keywords–Bridging, Albumins, transplantation,
extracorporeal
Introduction
Unlike renal failure, artificial support systems were not widely used in liver failure, mainly because hepatic toxins are albumin-bound unlike most uremic toxins and hence cannot be removed by conventional dialysis. It has been only recently that advances have been made concerning removal of hepatic toxins. It is thus now possible to support the patient with liver failure till the liver recovers or until liver transplantation is feasible. This article describes the various methods of artificial liver support systems and highlights the recent developments in this field. The livers weight can vary from 1.2-1.6kg and it consists of four lobes of unequal size and shape that are connected to the hepatic artery and the portal vein. The hepatic artery carries oxygen rich blood from the aorta where as the portal vein carries nutrient rich blood from the small intestine. These vessels eventually divide into capillaries that are fed into thousands of lobules in the liver that are rich in hepatic cells. Hepatic cells are essential to a healthy liver because they make up
80% of the liver volume and are responsible for all liver
functions.
The liver is vital for survival and can be affected by many kinds
of infections that can lead to disease that may require
transplantation and/or liver therapy. The most common include;
hepatitis A thru E, alcohol damage, fatty liver, cirrhosis, cancer
and drug damage. If a
transplant is not available, bio-artificial livers can help lengthen
the survival time for patients with liver complications
Anatomy of the liver:
The liver is located in the upper right-hand portion of the
abdominal cavity, beneath the diaphragm, and on top of the
stomach, right kidney, and intestines. Shaped like a cone, the liver
is a dark reddish-brown organ that weighs about 3 pounds.
There are two distinct sources that supply blood to the liver,
including the following:
Oxygenated blood flows in from the hepatic arteryNutrient-rich
blood flows in from the hepatic portal vein
The liver holds about one pint (13 percent) of the body's blood
supply at any given moment. The liver consists of two main lobes,
both of which are made up of thousands of lobules. These lobules
are connected to small ducts that connect with larger ducts to
ultimately form the hepatic duct. The hepatic duct transports the
bile produced by the liver cells to the gallbladder and duodenum
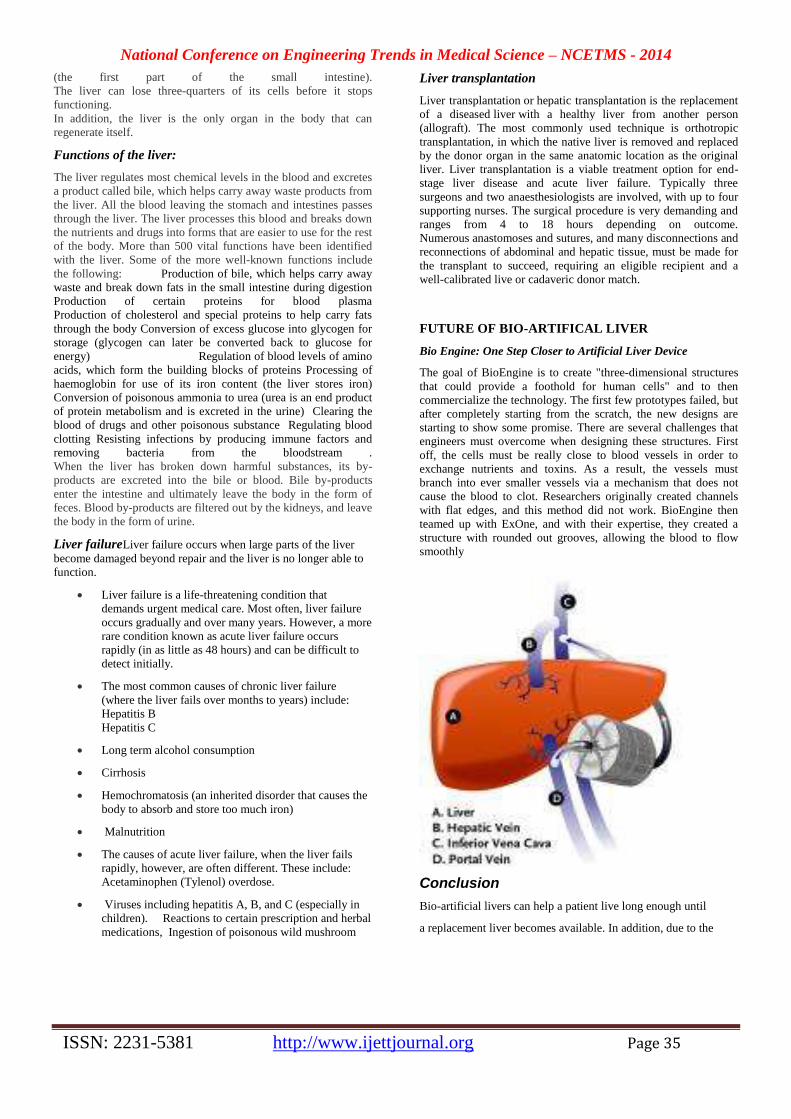
National Conference on Engineering Trends in Medical Science – NCETMS - 2014
ISSN: 2231-5381 http://www.ijettjournal.org Page 35
(the first part of the small intestine).
The liver can lose three-quarters of its cells before it stops
functioning.
In addition, the liver is the only organ in the body that can
regenerate itself.
Functions of the liver:
The liver regulates most chemical levels in the blood and excretes
a product called bile, which helps carry away waste products from
the liver. All the blood leaving the stomach and intestines passes
through the liver. The liver processes this blood and breaks down
the nutrients and drugs into forms that are easier to use for the rest
of the body. More than 500 vital functions have been identified
with the liver. Some of the more well-known functions include
the following: Production of bile, which helps carry away
waste and break down fats in the small intestine during digestion
Production of certain proteins for blood plasma
Production of cholesterol and special proteins to help carry fats
through the body Conversion of excess glucose into glycogen for
storage (glycogen can later be converted back to glucose for
energy) Regulation of blood levels of amino
acids, which form the building blocks of proteins Processing of
haemoglobin for use of its iron content (the liver stores iron)
Conversion of poisonous ammonia to urea (urea is an end product
of protein metabolism and is excreted in the urine) Clearing the
blood of drugs and other poisonous substance Regulating blood
clotting Resisting infections by producing immune factors and
removing bacteria from the bloodstream .
When the liver has broken down harmful substances, its by-
products are excreted into the bile or blood. Bile by-products
enter the intestine and ultimately leave the body in the form of
feces. Blood by-products are filtered out by the kidneys, and leave
the body in the form of urine.
Liver failureLiver failure occurs when large parts of the liver
become damaged beyond repair and the liver is no longer able to
function.
Liver failure is a life-threatening condition that
demands urgent medical care. Most often, liver failure
occurs gradually and over many years. However, a more
rare condition known as acute liver failure occurs
rapidly (in as little as 48 hours) and can be difficult to
detect initially.
The most common causes of chronic liver failure
(where the liver fails over months to years) include:
Hepatitis B
Hepatitis C
Long term alcohol consumption
Cirrhosis
Hemochromatosis (an inherited disorder that causes the
body to absorb and store too much iron)
Malnutrition
The causes of acute liver failure, when the liver fails
rapidly, however, are often different. These include:
Acetaminophen (Tylenol) overdose.
Viruses including hepatitis A, B, and C (especially in
children). Reactions to certain prescription and herbal
medications, Ingestion of poisonous wild mushroom
Liver transplantation
Liver transplantation or hepatic transplantation is the replacement
of a diseased liver with a healthy liver from another person
(allograft). The most commonly used technique is orthotropic
transplantation, in which the native liver is removed and replaced
by the donor organ in the same anatomic location as the original
liver. Liver transplantation is a viable treatment option for end-
stage liver disease and acute liver failure. Typically three
surgeons and two anaesthesiologists are involved, with up to four
supporting nurses. The surgical procedure is very demanding and
ranges from 4 to 18 hours depending on outcome.
Numerous anastomoses and sutures, and many disconnections and
reconnections of abdominal and hepatic tissue, must be made for
the transplant to succeed, requiring an eligible recipient and a
well-calibrated live or cadaveric donor match.
FUTURE OF BIO-ARTIFICAL LIVER
Bio Engine: One Step Closer to Artificial Liver Device
The goal of BioEngine is to create "three-dimensional structures
that could provide a foothold for human cells" and to then
commercialize the technology. The first few prototypes failed, but
after completely starting from the scratch, the new designs are
starting to show some promise. There are several challenges that
engineers must overcome when designing these structures. First
off, the cells must be really close to blood vessels in order to
exchange nutrients and toxins. As a result, the vessels must
branch into ever smaller vessels via a mechanism that does not
cause the blood to clot. Researchers originally created channels
with flat edges, and this method did not work. BioEngine then
teamed up with ExOne, and with their expertise, they created a
structure with rounded out grooves, allowing the blood to flow
smoothly
Conclusion
Bio-artificial livers can help a patient live long enough until
a replacement liver becomes available. In addition, due to the

National Conference on Engineering Trends in Medical Science – NCETMS - 2014
ISSN: 2231-5381 http://www.ijettjournal.org Page 36
livers unique regenerative abilities, bio-artificial livers can allow a
liver to heal itself by providing support in accomplishing the
natural functions of the liver. Although there is not currently an
artificial liver device on the market that can take the place of a
liver, bio-artificial livers ultimately serve as a means of therapy
for patients with liver diseases.
Bio-artificial livers in order to be successful must provide at
least 10% of liver functioning, which requires approximately
1010 hepatocytes. A major obstacle when considering patients
with liver complications can only have one liter of blood and
plasma drawn
REFERENCE
http://medicalcenter.osu.edu/patientcare/healthcare_serv
ices/liver_biliary_pancreatic_disease/liver_anatomy_fu
nction/Pages/index.aspx
http://onlinelibrary.wiley.com/journal/10.1002/(ISSN)1
527-6473
http://www.webmd.com/digestive-disorders/digestive-
diseases-liver-failure
http://en.wikipedia.org/wiki/Liver_failure
http://www.xconomy.com/boston/2007/09/20/bioengine
-one-step-closer-to-artificial-liver-device/
http://artificial-
liver.blogspot.in/2009_11_01_archive.html
www.biomedikal.com
www.google.com
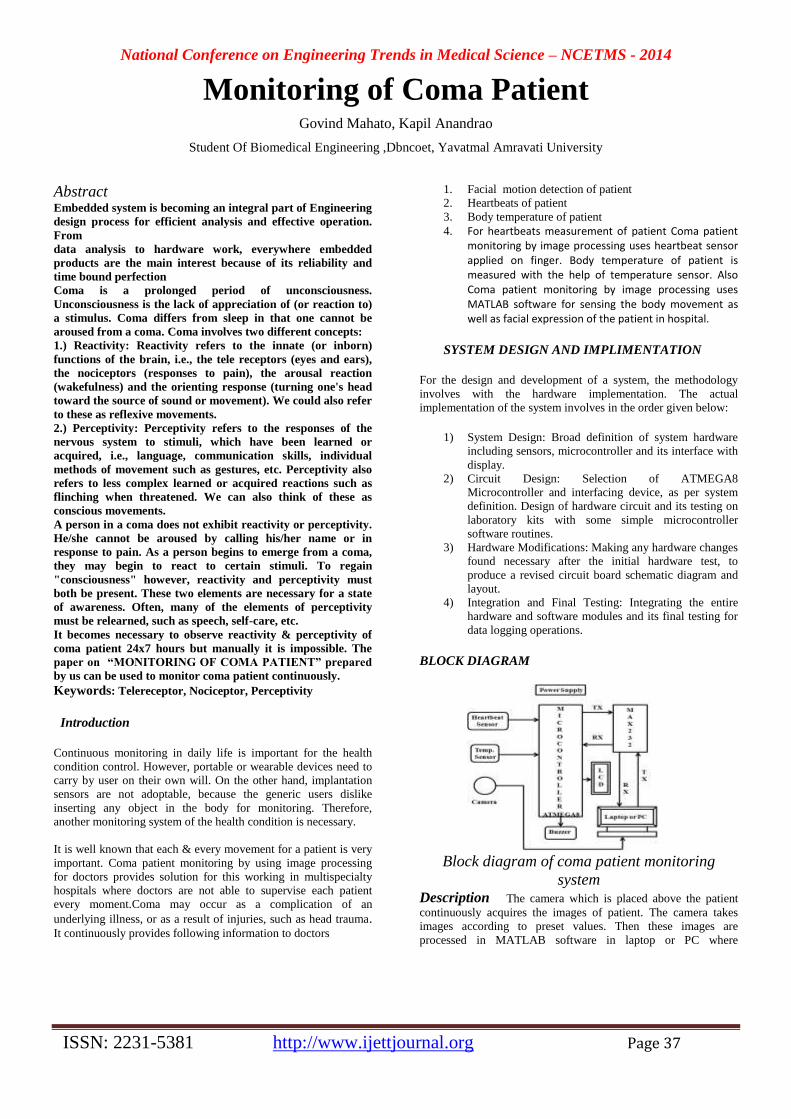
National Conference on Engineering Trends in Medical Science – NCETMS - 2014
ISSN: 2231-5381 http://www.ijettjournal.org Page 37
Monitoring of Coma Patient Govind Mahato, Kapil Anandrao
Student Of Biomedical Engineering ,Dbncoet, Yavatmal Amravati University
Abstract Embedded system is becoming an integral part of Engineering
design process for efficient analysis and effective operation.
From
data analysis to hardware work, everywhere embedded
products are the main interest because of its reliability and
time bound perfection
Coma is a prolonged period of unconsciousness.
Unconsciousness is the lack of appreciation of (or reaction to)
a stimulus. Coma differs from sleep in that one cannot be
aroused from a coma. Coma involves two different concepts:
1.) Reactivity: Reactivity refers to the innate (or inborn)
functions of the brain, i.e., the tele receptors (eyes and ears),
the nociceptors (responses to pain), the arousal reaction
(wakefulness) and the orienting response (turning one's head
toward the source of sound or movement). We could also refer
to these as reflexive movements.
2.) Perceptivity: Perceptivity refers to the responses of the
nervous system to stimuli, which have been learned or
acquired, i.e., language, communication skills, individual
methods of movement such as gestures, etc. Perceptivity also
refers to less complex learned or acquired reactions such as
flinching when threatened. We can also think of these as
conscious movements.
A person in a coma does not exhibit reactivity or perceptivity.
He/she cannot be aroused by calling his/her name or in
response to pain. As a person begins to emerge from a coma,
they may begin to react to certain stimuli. To regain
"consciousness" however, reactivity and perceptivity must
both be present. These two elements are necessary for a state
of awareness. Often, many of the elements of perceptivity
must be relearned, such as speech, self-care, etc.
It becomes necessary to observe reactivity & perceptivity of
coma patient 24x7 hours but manually it is impossible. The
paper on “MONITORING OF COMA PATIENT” prepared
by us can be used to monitor coma patient continuously.
Keywords: Telereceptor, Nociceptor, Perceptivity
Introduction
Continuous monitoring in daily life is important for the health
condition control. However, portable or wearable devices need to
carry by user on their own will. On the other hand, implantation
sensors are not adoptable, because the generic users dislike
inserting any object in the body for monitoring. Therefore,
another monitoring system of the health condition is necessary.
It is well known that each & every movement for a patient is very
important. Coma patient monitoring by using image processing
for doctors provides solution for this working in multispecialty
hospitals where doctors are not able to supervise each patient
every moment.Coma may occur as a complication of an
underlying illness, or as a result of injuries, such as head trauma. It continuously provides following information to doctors
1. Facial motion detection of patient
2. Heartbeats of patient
3. Body temperature of patient
4. For heartbeats measurement of patient Coma patient monitoring by image processing uses heartbeat sensor applied on finger. Body temperature of patient is measured with the help of temperature sensor. Also Coma patient monitoring by image processing uses MATLAB software for sensing the body movement as well as facial expression of the patient in hospital.
SYSTEM DESIGN AND IMPLIMENTATION
For the design and development of a system, the methodology
involves with the hardware implementation. The actual
implementation of the system involves in the order given below:
1) System Design: Broad definition of system hardware
including sensors, microcontroller and its interface with
display.
2) Circuit Design: Selection of ATMEGA8
Microcontroller and interfacing device, as per system
definition. Design of hardware circuit and its testing on
laboratory kits with some simple microcontroller
software routines.
3) Hardware Modifications: Making any hardware changes
found necessary after the initial hardware test, to
produce a revised circuit board schematic diagram and
layout.
4) Integration and Final Testing: Integrating the entire
hardware and software modules and its final testing for
data logging operations.
BLOCK DIAGRAM
Block diagram of coma patient monitoring
system Description The camera which is placed above the patient
continuously acquires the images of patient. The camera takes
images according to preset values. Then these images are
processed in MATLAB software in laptop or PC where
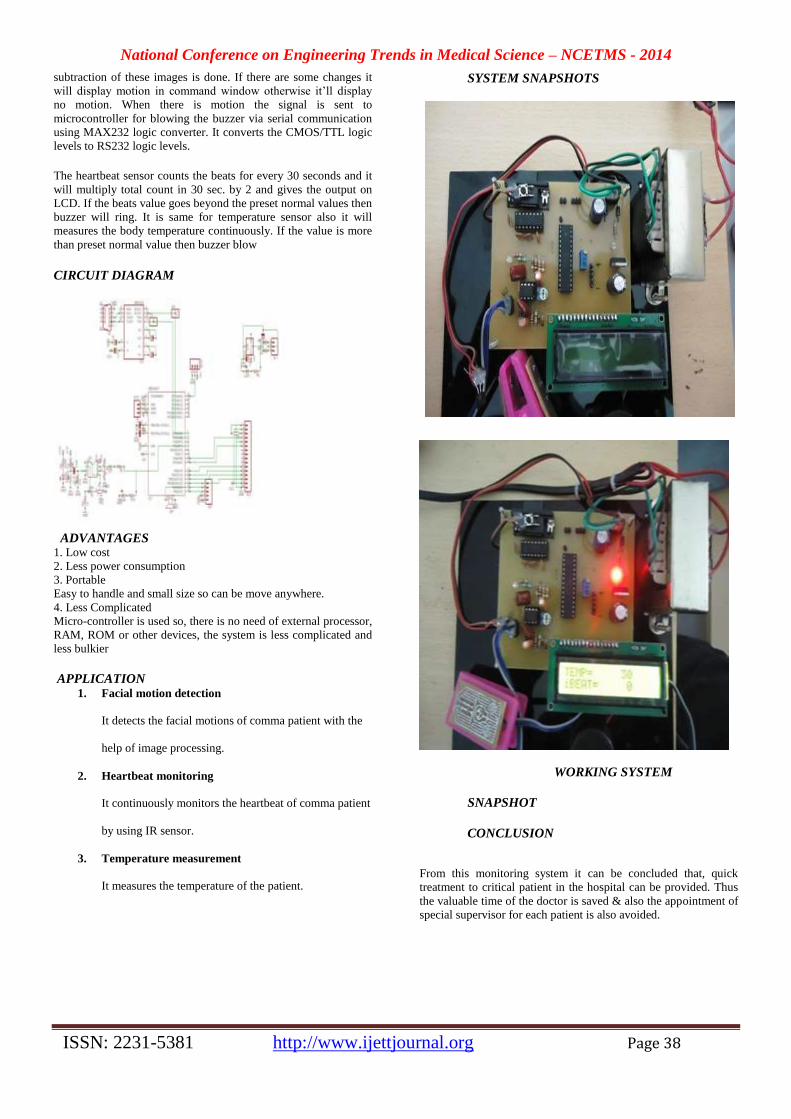
National Conference on Engineering Trends in Medical Science – NCETMS - 2014
ISSN: 2231-5381 http://www.ijettjournal.org Page 38
subtraction of these images is done. If there are some changes it
will display motion in command window otherwise it’ll display
no motion. When there is motion the signal is sent to
microcontroller for blowing the buzzer via serial communication
using MAX232 logic converter. It converts the CMOS/TTL logic
levels to RS232 logic levels.
The heartbeat sensor counts the beats for every 30 seconds and it
will multiply total count in 30 sec. by 2 and gives the output on
LCD. If the beats value goes beyond the preset normal values then
buzzer will ring. It is same for temperature sensor also it will
measures the body temperature continuously. If the value is more
than preset normal value then buzzer blow
CIRCUIT DIAGRAM
ADVANTAGES
1. Low cost
2. Less power consumption
3. Portable
Easy to handle and small size so can be move anywhere.
4. Less Complicated
Micro-controller is used so, there is no need of external processor,
RAM, ROM or other devices, the system is less complicated and
less bulkier
APPLICATION 1. Facial motion detection
It detects the facial motions of comma patient with the
help of image processing.
2. Heartbeat monitoring
It continuously monitors the heartbeat of comma patient
by using IR sensor.
3. Temperature measurement
It measures the temperature of the patient.
SYSTEM SNAPSHOTS
WORKING SYSTEM
SNAPSHOT
CONCLUSION
From this monitoring system it can be concluded that, quick
treatment to critical patient in the hospital can be provided. Thus
the valuable time of the doctor is saved & also the appointment of
special supervisor for each patient is also avoided.

National Conference on Engineering Trends in Medical Science – NCETMS - 2014
ISSN: 2231-5381 http://www.ijettjournal.org Page 39
FUTURE EXPANSIONS
Tele-monitoring system Tele-monitoring system is mainly used for communication as well
as monitoring purpose from distance place. In case of coma
patient monitoring system we can use this system as tele-
monitoring system by adding communication devices like CDMA
or Wi-Fi, so from anywhere the physicians or doctors can monitor
the patient and can take particular action.
Multipurpose system
This system can be added with multipara devices by doing some
advancement, which will continuous monitors patient, stores all
the data and application needing data connected directly to
monitoring devices.
REFERENCES www.mathworks.com
www.sunrom.com
www.national.com
Muhammad Ali Mazidi and Janice Gillispe Mazidi,
“The 8051microcontroller and embedded systems”,
Pearson education ltd., India, pp. 35-105, 2006
Nahed H. Solouma et al., “Robust computer-assisted
laser treatment using real time retinal tracking”
Proceedings of the 23rd anual EMBS international
conference, vol. 45, no.1, pp.105-117, 2001
Yan-Fang Li et al., “A low-power 20GHz static
frequency divider with programmable input
sensitivity”, proc. RFIC/IMS Symposium, pp. 235-238,
2003 A.Goswami, T.Bezboruah and K.C. Sarma, “Design of
an embedded system for monitoring and controlling
temperature and light”, proceedings. of IJEER, Vol 1,
No. 1, pp. 27-36, 2009
B.Yuksekkaya et al., “A GSM, Internet and Speech
Controlled Wireless Interactive Home Automation
System”, IEEE Transactions on Consumer Electronics,
Vol. 52, No. 3, August, 2011
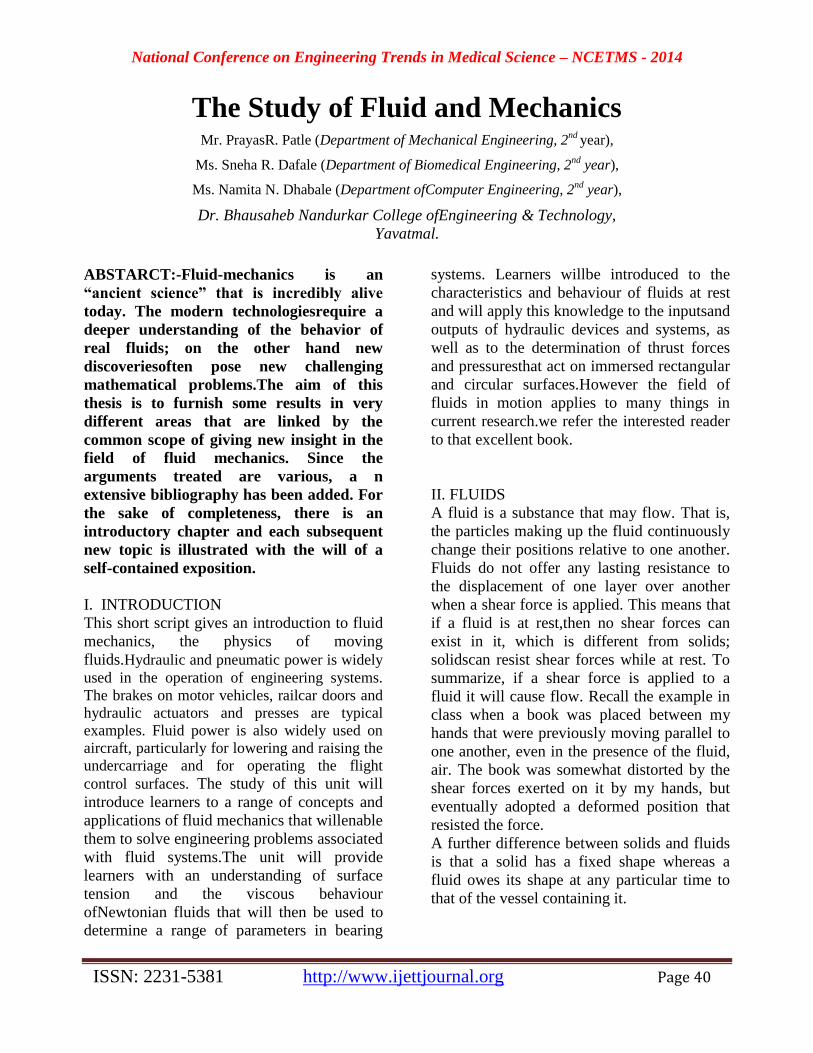
National Conference on Engineering Trends in Medical Science – NCETMS - 2014
ISSN: 2231-5381 http://www.ijettjournal.org Page 40
The Study of Fluid and Mechanics Mr. PrayasR. Patle (Department of Mechanical Engineering, 2
nd year),
Ms. Sneha R. Dafale (Department of Biomedical Engineering, 2nd
year),
Ms. Namita N. Dhabale (Department ofComputer Engineering, 2nd
year),
Dr. Bhausaheb Nandurkar College ofEngineering & Technology,
Yavatmal.
ABSTARCT:-Fluid-mechanics is an
“ancient science” that is incredibly alive
today. The modern technologiesrequire a
deeper understanding of the behavior of
real fluids; on the other hand new
discoveriesoften pose new challenging
mathematical problems.The aim of this
thesis is to furnish some results in very
different areas that are linked by the
common scope of giving new insight in the
field of fluid mechanics. Since the
arguments treated are various, a n
extensive bibliography has been added. For
the sake of completeness, there is an
introductory chapter and each subsequent
new topic is illustrated with the will of a
self-contained exposition.
I. INTRODUCTION
This short script gives an introduction to fluid
mechanics, the physics of moving
fluids.Hydraulic and pneumatic power is widely
used in the operation of engineering systems.
The brakes on motor vehicles, railcar doors and
hydraulic actuators and presses are typical
examples. Fluid power is also widely used on
aircraft, particularly for lowering and raising the
undercarriage and for operating the flight
control surfaces. The study of this unit will
introduce learners to a range of concepts and
applications of fluid mechanics that willenable
them to solve engineering problems associated
with fluid systems.The unit will provide
learners with an understanding of surface
tension and the viscous behaviour
ofNewtonian fluids that will then be used to
determine a range of parameters in bearing
systems. Learners willbe introduced to the
characteristics and behaviour of fluids at rest
and will apply this knowledge to the inputsand
outputs of hydraulic devices and systems, as
well as to the determination of thrust forces
and pressuresthat act on immersed rectangular
and circular surfaces.However the field of
fluids in motion applies to many things in
current research.we refer the interested reader
to that excellent book.
II. FLUIDS
A fluid is a substance that may flow. That is,
the particles making up the fluid continuously
change their positions relative to one another.
Fluids do not offer any lasting resistance to
the displacement of one layer over another
when a shear force is applied. This means that
if a fluid is at rest,then no shear forces can
exist in it, which is different from solids;
solidscan resist shear forces while at rest. To
summarize, if a shear force is applied to a
fluid it will cause flow. Recall the example in
class when a book was placed between my
hands that were previously moving parallel to
one another, even in the presence of the fluid,
air. The book was somewhat distorted by the
shear forces exerted on it by my hands, but
eventually adopted a deformed position that
resisted the force.
A further difference between solids and fluids
is that a solid has a fixed shape whereas a
fluid owes its shape at any particular time to
that of the vessel containing it.
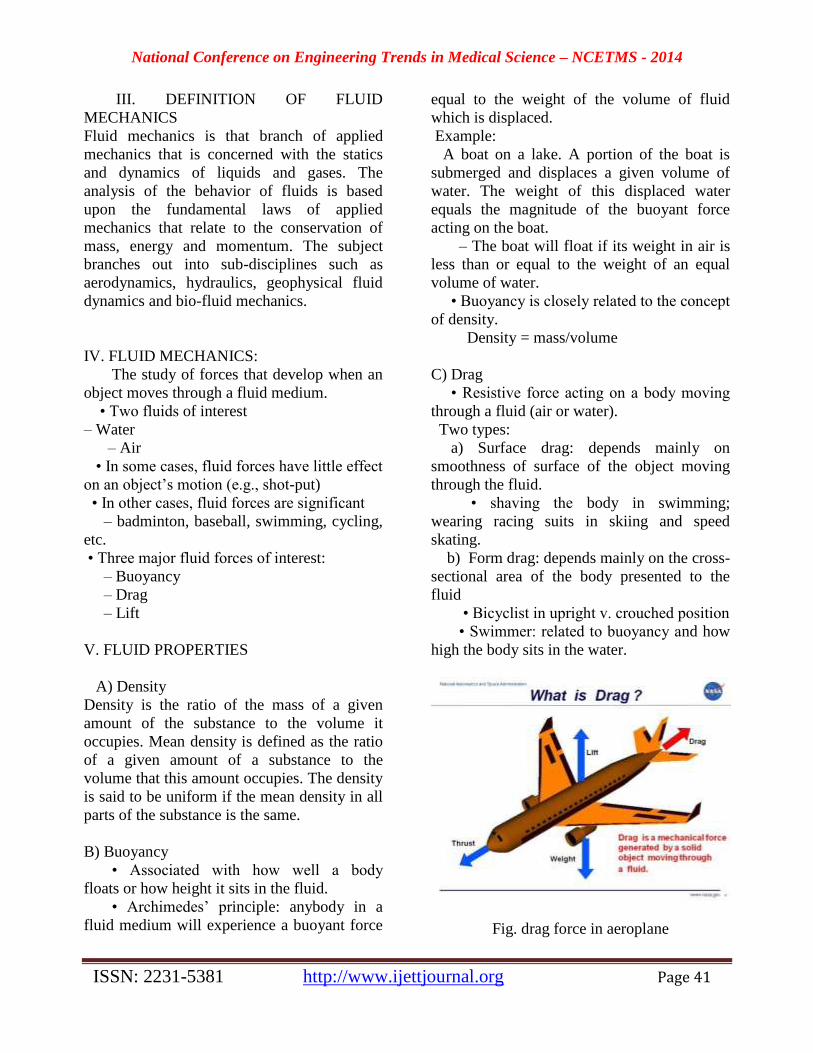
National Conference on Engineering Trends in Medical Science – NCETMS - 2014
ISSN: 2231-5381 http://www.ijettjournal.org Page 41
III. DEFINITION OF FLUID
MECHANICS
Fluid mechanics is that branch of applied
mechanics that is concerned with the statics
and dynamics of liquids and gases. The
analysis of the behavior of fluids is based
upon the fundamental laws of applied
mechanics that relate to the conservation of
mass, energy and momentum. The subject
branches out into sub-disciplines such as
aerodynamics, hydraulics, geophysical fluid
dynamics and bio-fluid mechanics.
IV. FLUID MECHANICS:
The study of forces that develop when an
object moves through a fluid medium.
• Two fluids of interest
– Water
– Air
• In some cases, fluid forces have little effect
on an object’s motion (e.g., shot-put)
• In other cases, fluid forces are significant
– badminton, baseball, swimming, cycling,
etc.
• Three major fluid forces of interest:
– Buoyancy
– Drag
– Lift
V. FLUID PROPERTIES
A) Density
Density is the ratio of the mass of a given
amount of the substance to the volume it
occupies. Mean density is defined as the ratio
of a given amount of a substance to the
volume that this amount occupies. The density
is said to be uniform if the mean density in all
parts of the substance is the same.
B) Buoyancy
• Associated with how well a body
floats or how height it sits in the fluid.
• Archimedes’ principle: anybody in a
fluid medium will experience a buoyant force
equal to the weight of the volume of fluid
which is displaced.
Example:
A boat on a lake. A portion of the boat is
submerged and displaces a given volume of
water. The weight of this displaced water
equals the magnitude of the buoyant force
acting on the boat.
– The boat will float if its weight in air is
less than or equal to the weight of an equal
volume of water.
• Buoyancy is closely related to the concept
of density.
Density = mass/volume
C) Drag
• Resistive force acting on a body moving
through a fluid (air or water).
Two types:
a) Surface drag: depends mainly on
smoothness of surface of the object moving
through the fluid.
• shaving the body in swimming;
wearing racing suits in skiing and speed
skating.
b) Form drag: depends mainly on the cross-
sectional area of the body presented to the
fluid
• Bicyclist in upright v. crouched position
• Swimmer: related to buoyancy and how
high the body sits in the water.
Fig. drag force in aeroplane
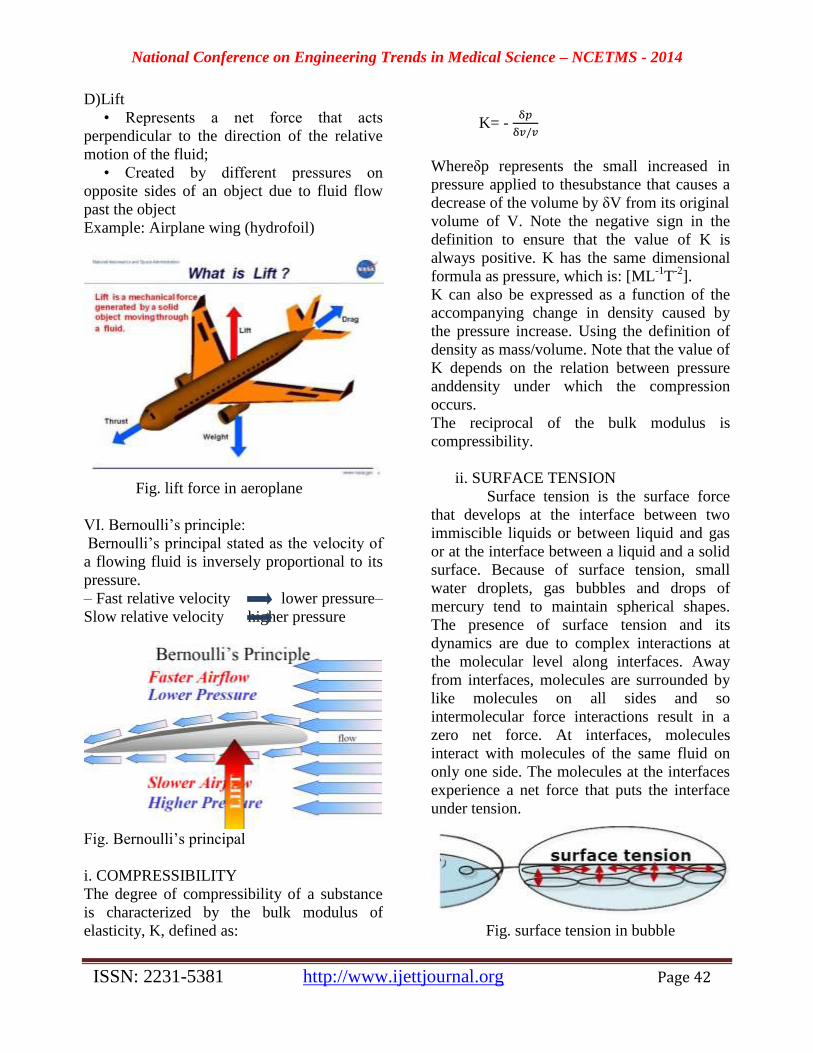
National Conference on Engineering Trends in Medical Science – NCETMS - 2014
ISSN: 2231-5381 http://www.ijettjournal.org Page 42
D)Lift
• Represents a net force that acts
perpendicular to the direction of the relative
motion of the fluid;
• Created by different pressures on
opposite sides of an object due to fluid flow
past the object
Example: Airplane wing (hydrofoil)
Fig. lift force in aeroplane
VI. Bernoulli’s principle:
Bernoulli’s principal stated as the velocity of
a flowing fluid is inversely proportional to its
pressure.
– Fast relative velocity lower pressure–
Slow relative velocity higher pressure
Fig. Bernoulli’s principal
i. COMPRESSIBILITY
The degree of compressibility of a substance
is characterized by the bulk modulus of
elasticity, K, defined as:
K= -
Whereδp represents the small increased in
pressure applied to thesubstance that causes a
decrease of the volume by δV from its original
volume of V. Note the negative sign in the
definition to ensure that the value of K is
always positive. K has the same dimensional
formula as pressure, which is: [ML-1
T-2
].
K can also be expressed as a function of the
accompanying change in density caused by
the pressure increase. Using the definition of
density as mass/volume. Note that the value of
K depends on the relation between pressure
anddensity under which the compression
occurs.
The reciprocal of the bulk modulus is
compressibility.
ii. SURFACE TENSION
Surface tension is the surface force
that develops at the interface between two
immiscible liquids or between liquid and gas
or at the interface between a liquid and a solid
surface. Because of surface tension, small
water droplets, gas bubbles and drops of
mercury tend to maintain spherical shapes.
The presence of surface tension and its
dynamics are due to complex interactions at
the molecular level along interfaces. Away
from interfaces, molecules are surrounded by
like molecules on all sides and so
intermolecular force interactions result in a
zero net force. At interfaces, molecules
interact with molecules of the same fluid on
only one side. The molecules at the interfaces
experience a net force that puts the interface
under tension.
Fig. surface tension in bubble

National Conference on Engineering Trends in Medical Science – NCETMS - 2014
ISSN: 2231-5381 http://www.ijettjournal.org Page 43
The ultimate magnitude and direction of this
tension force is determined not only by what
happens on either side of the interface, but by
the way molecules of the two fluids interact
with each other. Surface tension, therefore, is
specific to the participating fluids. Surface
tension forces are also sensitive to the physical
and chemical condition of the solid surface in
contact, such as its roughness, cleanliness, or
temperature.
Dimensional Formula:
[MLT-2
]/[L] = [MT-2
]
A common symbol for surface tension is σ.
iii.VAPOUR PRESSURE
At the surface of a liquid, molecules are
leaving and re-entering the liquid mass. The
activity of the molecules at the surface creates
a vapour pressure, which is a measure of the
rate at which the molecules leave the surface.
When the vapour pressure of the liquid is
equal to the partial pressure of the molecules
from the liquid which are in the gas above the
surface, the number of molecules leaving is
equal to the number entering. At this
equilibrium condition, the vapour pressure is
known as the saturation pressure.
The vapour pressure depends on the
temperature, because molecular activity
depends upon heat content. As the temperature
increases, the vapour pressure increases until
boiling is reached for the particular ambient
atmospheric pressure.
Dimensional Formula:
[ML-1T-2]
Fig. vapour pressure
iv. VISCOSITY
Viscosity can be thought of as the
internal “stickiness” of a fluid. It is one of the
properties that control the amount of fluid that
can be transported in a pipeline during a
specific period of time. It accounts for the
energy losses associated with the transport of
fluids in ducts, channels and pipes. Further,
viscosity plays an important role in the
generation of turbulence. Needless to say,
viscosity is an extremely important fluid
property in our study of fluid flows.
All real fluids resist any force tending to cause
one layer to move over another, but the
resistance occurs only when the movement is
taking place.From experiments with various
fluids, Sir Isaac Newton postulated that for the
straight and parallel motion of a given fluid,
the tangential stress between two adjoining
fluid layers is proportional to the velocity
gradient in a direction perpendicular to the
layers.
That is:
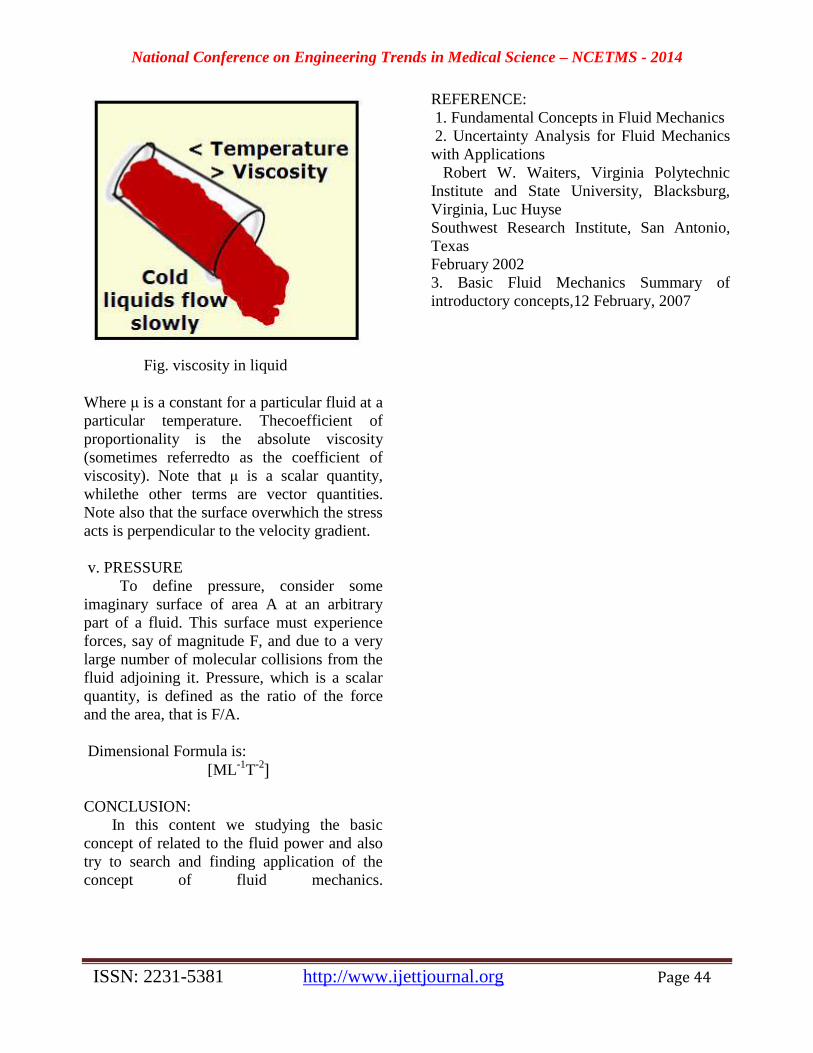
National Conference on Engineering Trends in Medical Science – NCETMS - 2014
ISSN: 2231-5381 http://www.ijettjournal.org Page 44
Fig. viscosity in liquid
Where μ is a constant for a particular fluid at a
particular temperature. Thecoefficient of
proportionality is the absolute viscosity
(sometimes referredto as the coefficient of
viscosity). Note that μ is a scalar quantity,
whilethe other terms are vector quantities.
Note also that the surface overwhich the stress
acts is perpendicular to the velocity gradient.
v. PRESSURE
To define pressure, consider some
imaginary surface of area A at an arbitrary
part of a fluid. This surface must experience
forces, say of magnitude F, and due to a very
large number of molecular collisions from the
fluid adjoining it. Pressure, which is a scalar
quantity, is defined as the ratio of the force
and the area, that is F/A.
Dimensional Formula is:
[ML-1
T-2
CONCLUSION:
In this content we studying the basic
concept of related to the fluid power and also
try to search and finding application of the
concept of fluid mechanics.
REFERENCE:
1. Fundamental Concepts in Fluid Mechanics
2. Uncertainty Analysis for Fluid Mechanics
with Applications
Robert W. Waiters, Virginia Polytechnic
Institute and State University, Blacksburg,
Virginia, Luc Huyse
Southwest Research Institute, San Antonio,
Texas
February 2002
3. Basic Fluid Mechanics Summary of
introductory concepts,12 February, 2007
National Conference on Engineering Trends in Medical Science – NCETMS - 2014
ISSN: 2231-5381 http://www.ijettjournal.org Page 45
Nanotechnology
Mr.Prashant P. Kalbande, Mr. Suhas V. Sadar
Department of Mechanical Engineering 2nd
year,
Dr. Bhausaheb Nandurkar College ofEngineering & Technology,
Yavatmal.
ABSTRACT:-Within The Wide Range Of
Issue Related To Nano Technology We
Highlight Some Segment Of Nanotechnology
That Will Be Based On Nano Science
Nanotechnology is one of the leading scientific
fields today since itcombines knowledge from
the fields of Physics, Chemistry, Biology,
Medicine, Informatics, and Engineering. It is
an emerging technological field with great
potential to lead in great breakthroughs that
can be applied in real life. investigate and tune
the properties, responses, and functions of
living and non-living matter, at sizes below100
nm. The application and use of nanomaterials
in electronic and mechanical devices, in
optical and magnetic components, quantum
computing, tissue engineering, and other
biotechnologies, with smallest features, widths
well below 100 nm, are the economically most
important parts of the nanotechnology
nowadays and presumably in the near future.
The number of nanoproducts is rapidly
growing since more and moreNano-engineered
materials are reaching the global market.
Keywords: Nanometrology, Nano science,
Nanoscale,Nanomaterials
I. INTRODUCTION
Nanotechnology is an exciting area of scientific
development which promises “more for less”. It
offers ways to create smaller, cheaper, lighter and
faster devices that can do more and cleverer
things, use less raw materials and consume less
energy.The term nanotechnology comes from the
combination of two words: the Greek numerical
prefix nano referring to a billionth and the word
technology. As an outcome, Nanotechnology or
Nano-scaled Technology is generally considered
to be at a size below 0:1 _m or 100 nm.
Nanoscale science (or nanoscience) studies the
phenomena, properties,and responses of materials
at atomic, molecular, and macromolecular scales,
and in general at sizes between 1 and 100 nm. In
this scale, and especially below 5 nm, the
properties ofmatter differ significantly (i.e.,
quantum-scale effects play an important role)
from that at a larger particulate scale.
Nanotechnology is then the design, the
manipulation, the building, the production and
application, by controlling the shape and size, the
properties-responses and functionality of
structures, and devices and systems of the order
or less than 100 nm.
Nanotechnology is considered an emerging
technology due to the possibility to advance well-
established products and to create new products
with totally new characteristics and functions
with enormous potential in a wide range of
applications. In addition to various industrial
uses, great innovations are foreseen in
information and communication technology, in
biology and biotechnology, in medicine and
medical technology, in metrology, etc.Novel
materials and new-engineered surfaces allow
making products that perform better.
Nanomaterials with unique properties such as:
nanoparticles carbon nanotubes, fullerenes,
quantum dots, quantum wires, nano-fibers, and
nano-composites allow completely new
applications to be found. Ethical and moral
concerns also need to be addressed in parallel
with the new developments.Nanotechnology is an
exciting area of scientific development which
promises ‘more for less’. It offers ways to create
smaller, cheaper, lighter and faster devices that
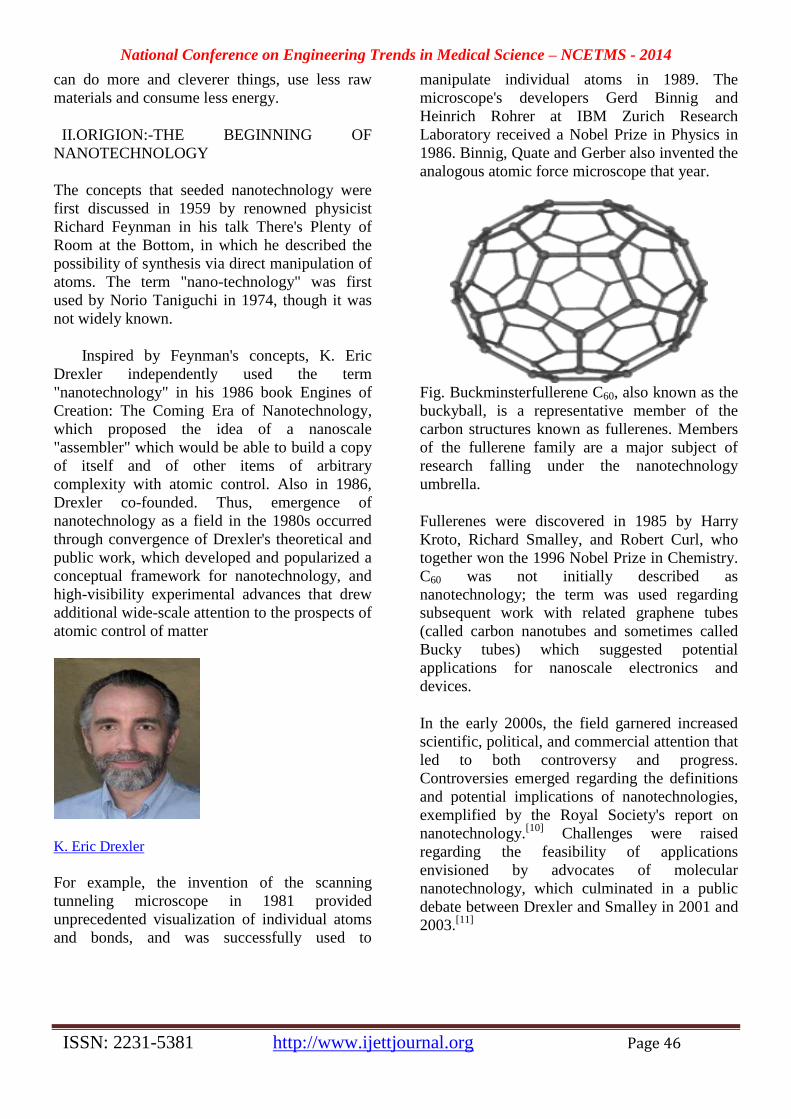
National Conference on Engineering Trends in Medical Science – NCETMS - 2014
ISSN: 2231-5381 http://www.ijettjournal.org Page 46
can do more and cleverer things, use less raw
materials and consume less energy.
II.ORIGION:-THE BEGINNING OF
NANOTECHNOLOGY
The concepts that seeded nanotechnology were
first discussed in 1959 by renowned physicist
Richard Feynman in his talk There's Plenty of
Room at the Bottom, in which he described the
possibility of synthesis via direct manipulation of
atoms. The term "nano-technology" was first
used by Norio Taniguchi in 1974, though it was
not widely known.
Inspired by Feynman's concepts, K. Eric
Drexler independently used the term
"nanotechnology" in his 1986 book Engines of
Creation: The Coming Era of Nanotechnology,
which proposed the idea of a nanoscale
"assembler" which would be able to build a copy
of itself and of other items of arbitrary
complexity with atomic control. Also in 1986,
Drexler co-founded. Thus, emergence of
nanotechnology as a field in the 1980s occurred
through convergence of Drexler's theoretical and
public work, which developed and popularized a
conceptual framework for nanotechnology, and
high-visibility experimental advances that drew
additional wide-scale attention to the prospects of
atomic control of matter
K. Eric Drexler
For example, the invention of the scanning
tunneling microscope in 1981 provided
unprecedented visualization of individual atoms
and bonds, and was successfully used to
manipulate individual atoms in 1989. The
microscope's developers Gerd Binnig and
Heinrich Rohrer at IBM Zurich Research
Laboratory received a Nobel Prize in Physics in
1986. Binnig, Quate and Gerber also invented the
analogous atomic force microscope that year.
Fig. Buckminsterfullerene C60, also known as the
buckyball, is a representative member of the
carbon structures known as fullerenes. Members
of the fullerene family are a major subject of
research falling under the nanotechnology
umbrella.
Fullerenes were discovered in 1985 by Harry
Kroto, Richard Smalley, and Robert Curl, who
together won the 1996 Nobel Prize in Chemistry.
C60 was not initially described as
nanotechnology; the term was used regarding
subsequent work with related graphene tubes
(called carbon nanotubes and sometimes called
Bucky tubes) which suggested potential
applications for nanoscale electronics and
devices.
In the early 2000s, the field garnered increased
scientific, political, and commercial attention that
led to both controversy and progress.
Controversies emerged regarding the definitions
and potential implications of nanotechnologies,
exemplified by the Royal Society's report on
nanotechnology.[10]
Challenges were raised
regarding the feasibility of applications
envisioned by advocates of molecular
nanotechnology, which culminated in a public
debate between Drexler and Smalley in 2001 and
2003.[11]
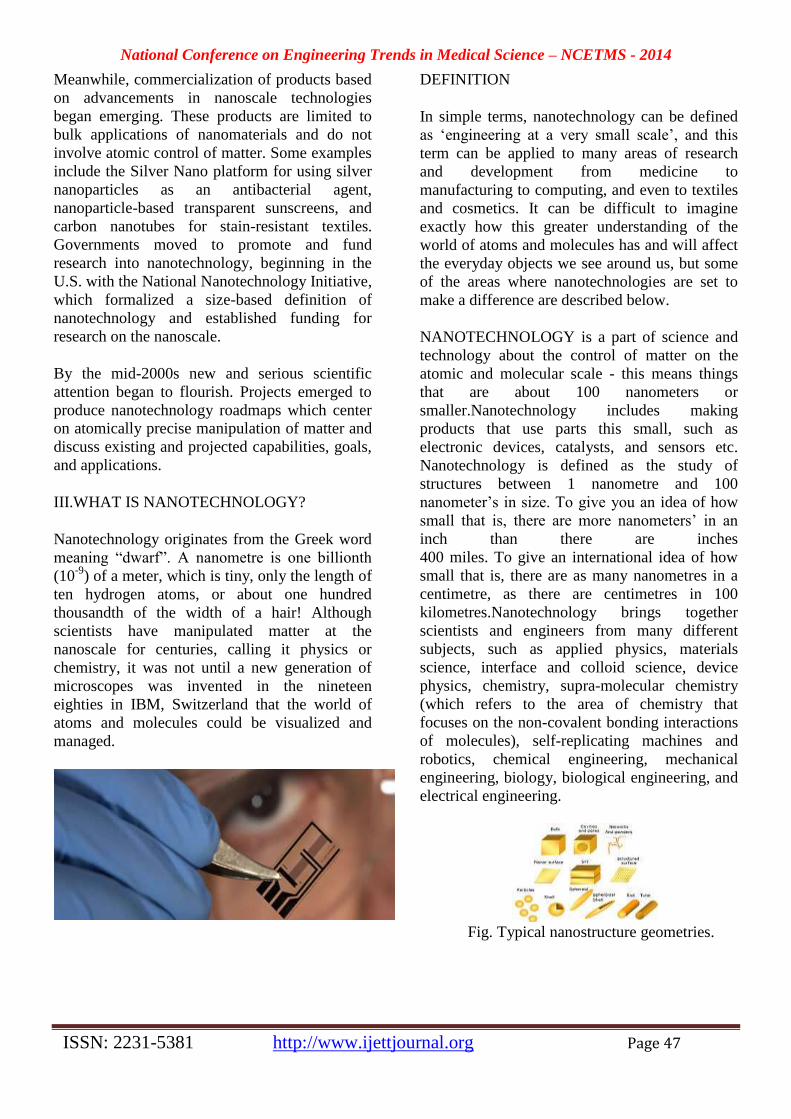
National Conference on Engineering Trends in Medical Science – NCETMS - 2014
ISSN: 2231-5381 http://www.ijettjournal.org Page 47
Meanwhile, commercialization of products based
on advancements in nanoscale technologies
began emerging. These products are limited to
bulk applications of nanomaterials and do not
involve atomic control of matter. Some examples
include the Silver Nano platform for using silver
nanoparticles as an antibacterial agent,
nanoparticle-based transparent sunscreens, and
carbon nanotubes for stain-resistant textiles.
Governments moved to promote and fund
research into nanotechnology, beginning in the
U.S. with the National Nanotechnology Initiative,
which formalized a size-based definition of
nanotechnology and established funding for
research on the nanoscale.
By the mid-2000s new and serious scientific
attention began to flourish. Projects emerged to
produce nanotechnology roadmaps which center
on atomically precise manipulation of matter and
discuss existing and projected capabilities, goals,
and applications.
III.WHAT IS NANOTECHNOLOGY?
Nanotechnology originates from the Greek word
meaning “dwarf”. A nanometre is one billionth
(10-9
) of a meter, which is tiny, only the length of
ten hydrogen atoms, or about one hundred
thousandth of the width of a hair! Although
scientists have manipulated matter at the
nanoscale for centuries, calling it physics or
chemistry, it was not until a new generation of
microscopes was invented in the nineteen
eighties in IBM, Switzerland that the world of
atoms and molecules could be visualized and
managed.
DEFINITION
In simple terms, nanotechnology can be defined
as ‘engineering at a very small scale’, and this
term can be applied to many areas of research
and development from medicine to
manufacturing to computing, and even to textiles
and cosmetics. It can be difficult to imagine
exactly how this greater understanding of the
world of atoms and molecules has and will affect
the everyday objects we see around us, but some
of the areas where nanotechnologies are set to
make a difference are described below.
NANOTECHNOLOGY is a part of science and
technology about the control of matter on the
atomic and molecular scale - this means things
that are about 100 nanometers or
smaller.Nanotechnology includes making
products that use parts this small, such as
electronic devices, catalysts, and sensors etc.
Nanotechnology is defined as the study of
structures between 1 nanometre and 100
nanometer’s in size. To give you an idea of how
small that is, there are more nanometers’ in an
inch than there are inches
400 miles. To give an international idea of how
small that is, there are as many nanometres in a
centimetre, as there are centimetres in 100
kilometres.Nanotechnology brings together
scientists and engineers from many different
subjects, such as applied physics, materials
science, interface and colloid science, device
physics, chemistry, supra-molecular chemistry
(which refers to the area of chemistry that
focuses on the non-covalent bonding interactions
of molecules), self-replicating machines and
robotics, chemical engineering, mechanical
engineering, biology, biological engineering, and
electrical engineering.
Fig. Typical nanostructure geometries.
National Conference on Engineering Trends in Medical Science – NCETMS - 2014
ISSN: 2231-5381 http://www.ijettjournal.org Page 48
Generally, when people talk about
nanotechnology, they mean structures of the size
100 nanometers or smaller. There are one million
nanometers in a millimeter. Nanotechnology tries
to make materials or machines of that size.People
are doing many different types of work in the
field of nanotechnology At the more "science
fiction" end of the field are attempts to make
small copies of bigger machines or really new
ideas for structures that make themselves.
Nanotechnology can help in solving serious
humanity problems such as energyadequacy,
climate change or fatal diseases:
“Nanotechnology” Alcatel-Lucent is an area
which has highly promising prospects for turning
fundamental research into successful innovations.
Not only to boost the competitiveness of our
industry but also to create new products that will
make positive changes in the lives of our citizens,
be it in medicine, environment, electronics or any
other field. Nanosciences and nanotechnologies
open up new avenues of research and lead to
new, useful, and sometimes unexpected
applications. The development of specific
guidance documents at a global level for the
safety evaluation of nanotechnology products is
strongly recommended. Ethical and moral
concerns also need to be addressed in parallel
with the new developments.
Huge aspirations are coupled to nano-
technological developments in modern medicine.
The potential medical applications are
predominantly in diagnostics (disease diagnosis
and imaging), monitoring, the availability of
more durable and better prosthetics, and new
drug-delivery systems for potentially harmful
drugs. While products based on nanotechnology
are actually reaching the market, sufficient
knowledge on the associated toxicological risks
is still lacking. Reducing the size of structures to
nano-level results in distinctly different
properties. As well as the chemical composition,
which largely dictates the intrinsic toxic
properties, very small size appears to be a
dominant indicator for drastic or toxic effects of
particles. From a regulatory point of view, a risk
management strategy is already a requirement for
all medical technology applications In order to
discuss the advances of nanotechnology in
nanostructured materials,
IV. FUNDAMENTAL CONCEPTS
Nanotechnology is the engineering of functional
systems at the molecular scale. This covers both
current work and concepts that are more
advanced. In its original sense, nanotechnology
refers to the projected ability to construct items
from the bottom up, using techniques and tools
being developed today to make complete, high
performance products. One nanometer (nm) is
one billionth, or 10−9
, of a meter. By comparison,
typical carbon-carbon bond lengths, or the
spacing between these atoms in a molecule, are
in the range 0.12–0.15 nm, and a DNA double-
helix has a diameter around 2 nm. On the other
hand, the smallest cellular life-forms, the bacteria
of the genus Mycoplasma, are around 200 nm in
length. By convention, nanotechnology is taken
as the scale range 1 to 100 nm following the
definition used by the National Nanotechnology
Initiative in the US.
The lower limit is set by the size of atoms
(hydrogen has the smallest atoms, which are
approximately a quarter of a nm diameter) since
nanotechnology must build its devices from
atoms and molecules. The upper limit is more or
less arbitrary but is around the size that
phenomena not observed in larger structures start
to become apparent and can be made use of in the
nano device. These new phenomena make
nanotechnology distinct from devices which are
merely miniaturized versions of an equivalent
macroscopic device; such devices are on a larger
scale and come under the description of micro
technology. To put that scale in another context,
the comparative size of a nanometer to a meter is
the same as that of a marble to the size of the
earth. Or another way of putting it: a nanometer
is the amount an average man's beard grows in
the time it takes him to raise the razor to his face.
Two main approaches are used in
nanotechnology. In the "bottom-up" approach,
materials and devices are built from molecular
components which assemble themselves
National Conference on Engineering Trends in Medical Science – NCETMS - 2014
ISSN: 2231-5381 http://www.ijettjournal.org Page 49
chemically by principles of molecular
recognition.
1) V. PHYSICAL CHARACTERISTIC OF
NANOMATERIAL
At Nano scale physical properties of system or
particles substantially change. Physical properties
such as quantum size effects where electrons
move different for very small sizes of particle.
Properties such as mechanical, electrical and
optical changes when macroscopic system
changes to microscopic one which is of utmost
importance. Nano materials and particles can act
as catalyst to increase the reaction rate along with
that produce better yield as compared to other
catalyst. Some of the most interesting properties
when particle gets converted to nano scale are
substances which usually stop light become
transparent (copper); it becomes possible to burn
some materials (aluminum); solids turn into
liquids at room temperature (gold); insulators
become conductors (silicon). A material such as
gold, which does not react with other chemicals
at normal scales, can be a powerful chemical
catalyst at nanoscales. These special properties
which we can only see at the nano scale are one
of the most interesting things about
nanotechnology.
VI. NANOMATERIALS
The nanomaterials field includes subfields which
develop or study materials having unique
properties arising from their nanoscale
dimension.Products containing engineered
nanomaterials are already in the market. The
range of commercial products available today is
very broad, including metals, ceramics,
polymers, smart textiles, cosmetics, sunscreens,
electronics, paints and varnishes. Nanomaterials
must be examined for potential effects on health
as a matter of precaution, and their possible
environmental impacts. The development of
specific guidance documents at a global level for
the safety evaluation of nanotechnology products
is strongly recommended.
1) Nanoscale materials can also be used for
bulk applications; most present commercial
applications of nanotechnology are of this
flavor.
2) Progress has been made in using these
materials for medical applications; see
Nanomedicine.
3) Nanoscale materials such as nanopillars are
sometimes used in solar cells which combats
the cost of traditional Silicon solar cells.
Development of applications incorporating
semiconductor nanoparticles to be used in the
next generation of products, such as display
technology, lighting, solar cells and biological
imaging; see quantum dots.
FACTS
1) One nanometer (nm) is 10–9
or
0.000,000,001 meter.
2) When two carbon atoms join together to
make a molecule the distance between
them is in the range of 0.12-0.15 nm.
3) DNA double: helix is about 2 nm from
one side to the other. It develops into a
new field of DNA nanotechnology. In
future DNA can be manipulated that can
lead to new revolution. Human genome
can be manipulated according to
requirements.
4) The bacterium is the smallest living thing
with a cell is about 200 nm long.
5) A nanometer and a meter can be
understood as the same size-difference as
between golf ball and the Earth.
6) One nanometer is about one twenty-five-
thousandth the diameter of a human hair.
7) Fingernails grow one nanometer per
second.
VII. NANOTECHNOLOGY TOOLS:
1. NANOMETROLOGY
National Conference on Engineering Trends in Medical Science – NCETMS - 2014
ISSN: 2231-5381 http://www.ijettjournal.org Page 50
The great development in Nanotechnology has
given birth to the need of knowingof the
dimensions that characterize its nanostructure.
This lead to the appearanceof a new scientific
field called Nanometrology. Nanometrology is
the science andpractice of measurement of
functionally important, mostly dimensional
parametersand components with at least one
critical dimension which is smaller than100 nm.
Success in nano-manufacturing of devices will
rely on new nanometrologiesneeded to measure
basic materials properties including their
sensitivitiesto environmental conditions and their
variations, to control the
nanofabricationprocesses and materials
functionalities, and to explore failure
mechanisms. In orderto study and explore the
complex nanosystems, highly sophisticated
experimental,theoretical, and modeling tools are
required.
VIII. EXPONENTIAL PROLIFERATION
WHY NANOTECHNOLOGY IMPORTANT?
Nanotechnology not only will allow making
many high-quality products at very low cost, but
it will allow making new nanofactories at the
same low cost and at the same rapid speed. This
unique (outside of biology, which is) ability to
reproduce its own means of production is why
nanotech is said to be an exponential technology.
It represents a manufacturing system that will be
able to make more manufacturing systems-
factories that can build factories rapidly, cheaply,
and cleanly.
IX. IS NANOTECHNOLOGY BAD OR
GOOD?
Nanotechnology offers great potential for benefit
to humankind, and also brings severe dangers.
While it is appropriate to examine carefully the
risks and possible toxicity of nanoparticles and
other products of nanoscale technology, the
greatest hazards are posed by malicious or
unwise use of molecular manufacturing. CRN's
focus is on designing and promoting mechanisms
for safe development and effective administration
of MM.
X.LOOKING TO THE FUTURE
The total societal impact of nanotechnology is
expected to be greater than the combined
influences that the silicon integrated circuit,
medical imaging, computer-aided
engineering,and man-made polymers have had in
this century. Significant improvements in
performance and changes of manufacturing
paradigms will lead to several industrial
revolutions in the 21st century. Nanotechnology
will change the nature of almost every human-
made object. The major questions now are how
soon will these revolutions arrive, who will
benefit the most, and who will be in position to
control or counter their negative aspects? How
can we embrace and facilitate the new industrial
revolution to maximize the benefit to US
citizens? We believe that a national initiative is
required to advance this goal because the needs
for and from nanotechnology transcend anything
that can be supplied by traditional academic
disciplines, national laboratories, or even entire
industries.
New medical treatments are emerging for fatal
diseases, such as brain tumours and Alzheimer’s
disease. Computers are built with nanoscale
components and improving their performance
depends upon shrinking these dimensions yet
further”
XI. APPLICATION:-
Further applications allow tennis balls to last
longer, golf balls to fly straighter and even
bowling balls to become more durable and have a
harder surface. Trousers and socks have been
infused with nanotechnology so that they will last
longer and keep people cool in the summer.
Bandages are being infused with silver
nanoparticles to heal cuts faster.[46]
Cars are
being manufactured with nanomaterials so they
may need fewer metals and less fuel to operate in
the future.Video game consoles and personal

National Conference on Engineering Trends in Medical Science – NCETMS - 2014
ISSN: 2231-5381 http://www.ijettjournal.org Page 51
computers may become cheaper, faster, and
contain more memory thanks to
nanotechnology.Nanotechnology may have the
ability to make existing medical applications
cheaper and easier to use in places like the
general practitioner's office and at home.
XII. REFERENCES
1. Drexler, K. Eric (1986). Engines Of Creation: The Coming Era
Of Nanotechnology. Doubleday.
2. Drexler, K. Eric (1992). Nanosystems: Molecular Machinery,
Manufacturing, And Computatin. New York: John Wiley &
Sons. 3. Introduction To Nanotechnologyhenrik Bruus
Mic–Department Of Micro And Nanotechnology, Technical
University Of Denmark
National Conference on Engineering Trends in Medical Science – NCETMS - 2014
ISSN: 2231-5381 http://www.ijettjournal.org Page 52
Rapid Prototyping Technology in Dentistry
Science- A Review Prof. Milind S. Bodkhe
*, Shubham A. Buradkar
1, Vivek S. Kumbalwad
2 ,
*Assistant Professor, Department of Mechanical Engineering,
Dr. Bhausaheb Nandurkar College of Engineering & Technology, Yavatmal. Maharashtra, India – 445001. 1, 2
B.E.Third year, Department of Mechanical Engineering,
Dr. Bhausaheb Nandurkar College of Engineering & Technology, Yavatmal, Maharashtra, India – 445001.
Abstract- This paper reviews and discusses the basics and
applications of RP techniques in dentistry: (1) construction of
a computer aided design (CAD) model, including data
acquisition, data processing, and the corresponding machines
and CAD packages, (2) typical RP systems and how to choose
them, and (3) current and potential use of RP techniques in
dentistry. Practical application examples of RP techniques in
dentistry are provided.The use of physical models provides
added values in these applications. Rapid prototyping (RP)
techniques have long been employed to build complex 3D
models in medicine. However, publications regarding the
dental application of RP technologies are still rare.
Biomedical Engineering is the application of
Engineering Principles and Techniques to the Medical fields.
It combines the design and problem solving skill of
Engineering with Medical and Biological Sciences to improve
healthcare, diagnosis and treatments. Medical imaging has
been used to provide information for diagnostic and
therapeutic purposes.
This paper gives an overview of the growth and
trend of the technology, area of application and its significant
benefits to Biomedical Engineering.
Keywords-Rapid Prototyping Technology; Computer Aided
Design; 3D Models; Biomedical Engineering; Rapid
Prototyping Application; Dentistry Science.
I. INTRODUCTION
In recent years, new techniques have been
developing to improve the healthcare facilities.
Technological development has improve the
quality of operations, reduce the risk to patients
and reduce the pain experienced by patients,
main technique like manually invasive surgery,
robot assisted operation, Computer assisted
surgery and virtual reality. This has helped
surgeons operate under difficult visual condition.
Rapid Prototyping (RP) Technology used in
Mechanical Engineering has also found
application in Medical Science. The RP
Technology able to fabricate a representative,
physical 3D model. The Technique aid improved
visualization of anatomical features,
communication between Doctor, rehearsal of
complex surgical procedure and prototype for
implants. The main advantage of RP is that
Medical modelscan be created that have
undercuts, voids, and complex internal
geometries, such as neurovascular canals or
sinuses.
The aim of the paper is to give an overview
of the relatively infant technology, its diverse
application, tremendous benefits to dentistry
Science in Biomedical Engineering and the
problems facing the technology. The paper
highlight the direction technology has taken in
nineties an indication of its significant
contribution to the dentistry Science.
II. RAPID PROTOTYPING TECHNOOGY OVERVIEW
Rapid prototyping (RP) is the automatic
construction of physical object using additive
manufacturing technology. The first technique of
rapid prototyping become available in the late
1980s and were used for a much range of
application and are even used to manufacture
production quality parts in relatively small
numbers. Some sculptors use the technology to
produce complex shapes of fine arts exhibitions.
A. RAPID PROTOTYPING PROCESS
They are made up of different processes some
of which are-
1. Stereo lithography (SL)
2. Selective Laser Sintering (SLS)
3. Laminated Object Manufacturing (LOM)

National Conference on Engineering Trends in Medical Science – NCETMS - 2014
ISSN: 2231-5381 http://www.ijettjournal.org Page 53
4. Fused Deposition Model (FDM)
5. Direct Shell Production (DSP)
6. 3D Printing.
The uses of Additive Manufacturing for Rapid
Prototyping takes virtual design from Computer
Aided Design (CAD) or Animation modeling
software transform them into thin virtual horizontal
cross section and then creates successive layer until
the model is complete.
B. RAPID PROTOTYPING LAYER MANUFACTURING
PROCESS
Almost all Rapid Prototyping processes,
either currently available commercially or under
development, are based on layered manufacturing
methodology in which object as a series of
horizontal cross section, each one being formed
individually from the relevant raw material, and
bonded to preceding layer until it is completed.
The main process stages involved in fabricating
parts are common to most of systems, but the
mechanisms by which the individual layers are
created obviously depends on the particular
system.
The common process stages are shown in
Fig.1. The starting point for any process is the
source of the abstract geometry of the object to
be built from which a data set describing that
geometry must then be compiled. This data must
be manipulated to generate the instruction
required to control the process in the final stage
of actually fabricating the components.
With additive manufacturing, the machine
reads in data from CAD drawing and lays down
successive layer of liquid, powder, or sheet
material, and in this way builds up the model
from series of cross sections. These layers, which
correspond to the virtual cross section from the
CAD model, are joined together or fused
automatically to create the final shape. RP
Process are shown in the Fig.2
The standard data interface between CAD
software and the machine is the STL file format.
An STL file approximates the shape of a part or
assembly using triangular facets. Smaller facets
produce a higher quality surface.
Fig. 1Main process stages common to most RP.
The word ‘Rapid’ is relative: construction of
a model with contemporary method can take
from several hours to several days, depending on
the method used and the size and complexity of
the model. Additive system for RP can typically
produce in a few hours, although it can vary
widely depending on the type of machine being
used and the size and number of models being
produce simultaneously.
Some solid freeform fabrication techniques
use two materials in the course of constructing
parts. The first material is the part material and
the second material is the support matter. The
support material is later removes by heat or
dissolved away with solvent water.
Traditional injection moulding can be less
expensive for manufacturing polymer product in
high qualities, but additive fabrication can be
faster and less expensive when producing
relatively small quantities of parts. 3D printer
gives designers and concept development teams
the ability to produces parts and concept models
using desktop size printer.
A large number of competing technologies
are available in the market place. As all are
additive technologies, their main difference is
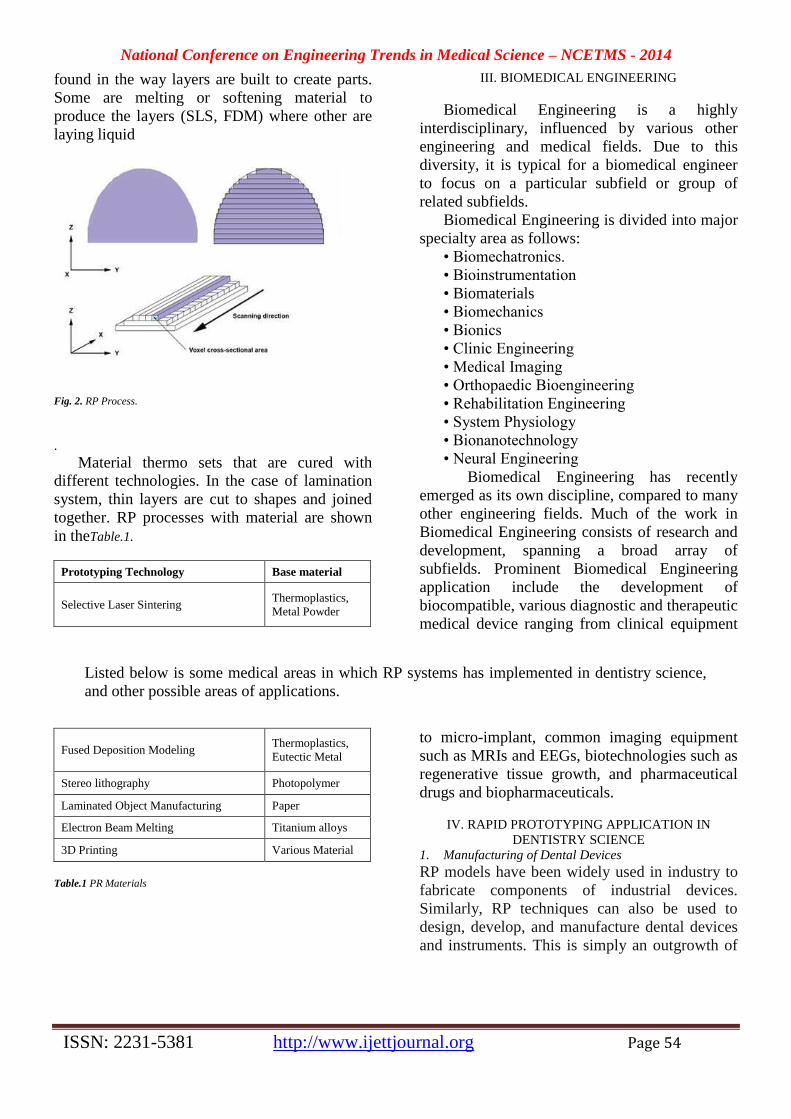
National Conference on Engineering Trends in Medical Science – NCETMS - 2014
ISSN: 2231-5381 http://www.ijettjournal.org Page 54
found in the way layers are built to create parts.
Some are melting or softening material to
produce the layers (SLS, FDM) where other are
laying liquid
Fig. 2. RP Process.
.
Material thermo sets that are cured with
different technologies. In the case of lamination
system, thin layers are cut to shapes and joined
together. RP processes with material are shown
in theTable.1.
Prototyping Technology Base material
Selective Laser Sintering Thermoplastics,
Metal Powder
Fused Deposition Modeling Thermoplastics,
Eutectic Metal
Stereo lithography Photopolymer
Laminated Object Manufacturing Paper
Electron Beam Melting Titanium alloys
3D Printing Various Material
Table.1 PR Materials
III. BIOMEDICAL ENGINEERING
Biomedical Engineering is a highly
interdisciplinary, influenced by various other
engineering and medical fields. Due to this
diversity, it is typical for a biomedical engineer
to focus on a particular subfield or group of
related subfields.
Biomedical Engineering is divided into major
specialty area as follows:
• Biomechatronics.
• Bioinstrumentation
• Biomaterials
• Biomechanics
• Bionics
• Clinic Engineering
• Medical Imaging
• Orthopaedic Bioengineering
• Rehabilitation Engineering
• System Physiology
• Bionanotechnology
• Neural Engineering
Biomedical Engineering has recently
emerged as its own discipline, compared to many
other engineering fields. Much of the work in
Biomedical Engineering consists of research and
development, spanning a broad array of
subfields. Prominent Biomedical Engineering
application include the development of
biocompatible, various diagnostic and therapeutic
medical device ranging from clinical equipment
to micro-implant, common imaging equipment
such as MRIs and EEGs, biotechnologies such as
regenerative tissue growth, and pharmaceutical
drugs and biopharmaceuticals.
IV. RAPID PROTOTYPING APPLICATION IN
DENTISTRY SCIENCE
1. Manufacturing of Dental Devices
RP models have been widely used in industry to
fabricate components of industrial devices.
Similarly, RP techniques can also be used to
design, develop, and manufacture dental devices
and instruments. This is simply an outgrowth of
Listed below is some medical areas in which RP systems has implemented in dentistry science,
and other possible areas of applications.
National Conference on Engineering Trends in Medical Science – NCETMS - 2014
ISSN: 2231-5381 http://www.ijettjournal.org Page 55
recognized engineering applications of the
technology. Recent dental devices, such as the
surgical fastener, have met with uncharacteristic
wide ranging acceptance in the medical
community partially because RP models have
enabled better feedback and assistance in
production [15]. To some extent, the use of RP
models can offer additional functionalities to
dental devices because RP models can have very
complex geometry, which is otherwise difficult
to fabricate using conventional methods [14]. 2. Customized implant design [11, 16–18]
Dental implants have become a common and
highly successful method in replacing missing
teeth. Previously, surgeries were carried out
using standard-sized implant parts selected from
a range provided by manufacturers. This works
satisfactorily for many cases, but not all. There
are always cases that are outside the standard
range, between sizes, or with special
requirements due to disease or genetics. The
standard implant needs to be customized for the
individual during surgery. A patient may be left
on the operating table for hours and is at risk for
surgical complications. The patient will suffer
more discomfort if the implant and/or fixture do
not fit well. Design of individual dental implants
and fixtures provides advantages. Using RP to
make implants is a potential alternative to
standard implants. The combination of CT/MRI
scanner or laser digitizer, rapid prototyping, and
CAD packages makes it possible to manufacture
customized implants and fixtures that precisely
fit a patient at a reasonable cost. Implants are
made to fit automatically, thus less time is wasted
trying to do this during surgery. No single RP
techniques dominant in dental implant
application. Many of the RP technologies have
been applied over a range of implant
applications.
3. Orthotics [16]
RP models can be used to design orthotic
devices with the specific patient’s tooth
alignment. By scanning a patient’s teeth using a
CT/MRI scanner or laser digitizer, a model of the
patient’s tooth condition can be precisely built.
The specific tooth alignment characteristics for
an individual are included in the prototype,
allowing for development of a biomechanically
correct geometry that improves the fit, comfort,
and stability. Through this process, the number of
times that orthotics have to be refitted is
decreased, thus cutting down the overall cost.
4. Prosthetics [19–21]
Until now, dental prosthesis (coping, crown,
bridge, fixture, etc.) fabrication has greatly
depended on the skills of dentists and
technicians. Fortuitously, RP techniques are
becoming an alternative way. For example,
patterns for dental crowns and implant structures
can be fabricated using an RP machine. Dental
crowns can be used to restore damaged or
missing teeth. A dental crown model can be
constructed from the inner surface to the outer.
The inner geometrical data can be obtained either
by scanning the surface of the tooth after tooth
preparation or based on the profile of the implant,
while the outer surface can be designed based on
the scanned data from neighbouring teeth and the
teeth on the opposite side of the mouth and
aesthetics consideration. After the construction of
the crown model, the model can be sliced and
transferred to an is then investment cast to a
metallic or ceramic crown. Through this process,
the feedback on the design of the dental crown
from the patient can be taken into consideration
before the dental crown is fabricated.
5. Anthropology [16]
RP models can be very beneficial to the
anthropologist. RP allows for replication of
jawbone and teeth so that moulding, measuring,
and dissecting of the remains can be done
without causing harm. In cases where only one or
two specimens exist, the RP models allow the
original model to be safely locked away without
hindering research done on the specimen. The
models that are built can also be used to show
changes in evolution.
National Conference on Engineering Trends in Medical Science – NCETMS - 2014
ISSN: 2231-5381 http://www.ijettjournal.org Page 56
6. Forensics [16, 22]
It is extremely important to keep or
reconstruct the scene to investigate a crime. RP is
a valuable tool in criminal investigation. RP
models can be kept as evidence in criminal
investigation and help investigators finds more
clues. RP models can be used to preserve
evidence before it further deteriorates. They are
accurate enough to see the effects of wounds.
Furthermore, accurate predictions of the forces,
implements and other key events can be
determined using these models. RP allows
production of simulated bones, so actual physical
models are something tangible that could be
presented in a court proceeding. These models
could help recreate the scene in the courtroom as
well as shine some light on what really happened.
7. Biologically active implants [12, 13, 23]
The manufacture of biologically active
implants is a brand new area of RP application.
Many investigations have been performed
recently, but it will take years for this technique
to be widely employed in practice [12, 13].
Similarly, in dentistry RP techniques have the
potential to manufacture biologically active
implants such as jawbones, which might be
damaged or otherwise malformed due to disease.
V. ADVANTAGE OF USING RAPID PROTOTYPING
SYSTEM [24]
1. Awareness: Allowing a surgeon, from the
outset, to know what to expect when a certain
surgical route is adopted. Thus, it reduces the
duration of the procedure and greatly reduces
the risk of infection and the problems of
uncertainly.
2. Accuracy: A mould part for artificial limbs
can be CT
3. Planning: Allowing surgical dry as well as
marking out vital areas to be avoided and
predicting complication that in the operation,
and reduces the search time of the correct
entry of surgical tools.
4. Validation: A prototype can be used to match
the physical dimension of the patient and
then, using the measurements, predict the
surgical outcome and assess post-operative
changes that might arise after surgery.
5. Copy: Multiple copies of the prototype can be
made for testing and planning before the
actual performance of the operation.
6. Messenger: The prototype can also be used to
communicate between surgeons, nurses and
even immediate family member of the
patient. Thus, the surgeon can better explain
the procedure through the RP model than by
2D X-ray slides.
7. Timed and cost: The operation time can be
greatly reduced hence reducing the use of
blood transfusion.
RP techniques have been substantially
employed in medicine; however, the applications
of RP in dental area are relatively rare.
This paper has discussed rapid prototyping
techniques and their applications in dentistry.
Every RP technique starts with a CAD model.
The construction of a CAD model and its
associated techniques are discussed, including the
data scanning modalities, data acquisition, data
processing, and use of CAD packages.Both
general purpose and specific software packages
commercially available greatly benefit the design
of CAD models. With the help of various RP
techniques, the fabrication of dental objects can
The following advantages can be derived from the use of
RP system in biomedical engineering;
VI. CONCLUSION
National Conference on Engineering Trends in Medical Science – NCETMS - 2014
ISSN: 2231-5381 http://www.ijettjournal.org Page 57
be done easily and rapidly. It is otherwise
difficult to generate them by NC machining
because of features like overhangs, sharp corners,
and undercuts in most dental objects. The
diversity of RP systems and corresponding build
materials makes it possible to generate dental
objects with different needs (colour,
transparency, and material) for different
applications like custom implant design. After
presentation of RP techniques, the current and
potential use of RP techniques in dental
application are reviewed and discussed. It is clear
that the use of RP models in dental application
will be expanded in the future with the ongoing
development of RP techniques. A number of
application examples have also been reviewed
and discussed, which demonstrate that RP
techniques are playing a more and more
important role in dental application. RP models
will benefit dentistry in many areas including
surgical planning, prosthesis design, and so on.
REFERENCES
[1] Jacobs, P. F. (1992), Rapid Prototyping Manufacturing-
Fundamentals of sterolithography, 1st edition, Society of
Manufacturing Engineers, Dearbon.
[2] J. Adachi, T. Hara, N. Kusa.(1993), Surgical simulation using Rapid Prototyping, Processing of the 4th International conference on Rapid
Prototyping, 14-17 June 1993, PP 135-142.
[3] Kai. C. C. (1994), Three Dimensional Rapid Prototyping and key [4] M. Mahoney, P. Diana. (1995), Rapid Prototyping in medical
computer graphics world, J18 (2): PP 42-48.
[5] C. K. Chau, K. F. Leong. (1997), Rapid Prototyping Principle and application in Manufacturing, John Wiley
[6] McAloon K. (1997), Rapid Prototyping Technology-A unique
approach to the diagnosis and planning of medical procedures, Society of Manufacturing Engineers, Dearbon.
[7] Hilton P. D Jacobs, P. F. (200), Rapid Tooling-Technologies and
industrial application, Deker, Newyork. [8] Cooper K. (2001), Rapid Prototyping Technology-Selection and,
Deker, Newyork.
[9] http://www.healtpointcapital.com/aboutus/
[10] http://www.rpc.msoe.edu/medical.
[11]Berry E, Brown JM, Connell M, Craven CM, Efford ND, Radjenovic A,
Smith MA (1997) Preliminary experience with medical Application
of rapid prototyping by selective laser sintering. MedEngPh 19(1):90-
36
[12] Zein I, Hutmacher DW, Tan KC, Teoh SH (2002) Fused deposition modeling of novel scaffold architech for tissue engineering
applications.
Biomaterials 23:1169-1185 [13] Xiong Z, Yan Y, Zhang R, Sun L (2001) Fabrication of porous
poly ( lactic acid) scaffolds for bone tissue engineering via precise
extr- usion. Scripta Material 45(7):773-779
[14] Jamieson R, Holmer B, Ashby A (1995) How rapid prototyping can
assist in the development of new orthopaedic products-a case study. Rapid Prototype J1(4):38-41
[15] http://www.cadalyst.com/
[16] http://www.rpc.msoe.edu/medical [17] Grenda E (2005) Medical Applications of Rapid Prototyping.
http://home.att.net/∼castleisland/med_lks.htm [18] Leong KF, Phua KKS, Chua CK, Du ZH, Teo KOM (2001)
Fabrication of porous polymeric matrix drug delivery devices using the selective
laser sintering technique. Proceedings of the Institution of
Mechanical Engineering, Part H. J Eng Med 215(2):191–201
[19] Jeng JY, Chen CY, Chen S, Chen R (2000) Application of a micro-
CT scan to tooth crown dimensions measurement and CAD model
construction for rapid prototyping. J Chin Soc Mech Eng
21(3):321– 324
[20] Jeng JY, Chang KY, Dong DR, Shih HS (2000) Tooth crown
fabrication using reverse engineering technology and model maker rapid
prototyping system. Rapid Prototyp J 6(2):136–145
[21] Chen CY (1998) The feasibility study of ct and rapid prototyping on dental crown fabrication. Dissertation, National Taiwan University
of
Science and Technology [22] Crockett RS, Zick R (2000) Forensic applications of solid freeform .
fabrucatuin In: Proceedings of the 11th Annual Solid Freeform
fabrication Symposium, Austin, TX, 8–10 August 2000, pp 549–554 [23] Hutmacher DW, Schantz T, Zein I, Ng KW, Teoh SH, Tan KC
(2001)
Mechanical properties and cell cultural response of polycaprolactone scaffolds designed and fabricated via fused deposition modeling. J
Biomed Mater Res 55(2):203–216
[24] M. S. Bodkhe*, N. M. Sawai # National Conference: “Rapid Prototyping
Technology in Biomedical Engg.-A Review” At Dr. Bhausaheb
Nandurkar College of Engg. & Tech., On the occasion of NCBEB-11
at, Yavatmal
__________________
National Conference on Engineering Trends in Medical Science – NCETMS - 2014
ISSN: 2231-5381 http://www.ijettjournal.org Page 58
Bone Assessment Using Vibration Technique
Mr. Santsakha K. Karemore1, Ms. Ankita M. Bhoot
2, Ms. Darshana M. Jibhkate
3,
4 Prof Sandip M. Ghuge
1,2,3,4 Department Of Biomedical Engineering
SGBAU, Amravati (MH), India
ABSTRACT Bone Mineral Density (BMD) is the amount of mineral per
square centimetre of bone. Osteoporosis is defined as a systemic
skeletal disease characterized by low bone mass and micro
architectural deterioration of bone tissue, with a consequent
increase in bone fragility and susceptibility to fracture. The
prime motive of our work is to produce a cost effective medical
instrument of the Bone Mineral Density (BMD). The developed
instrumentation for assessing bone quality utilizes the principle
of impulse response method. Device consists of an automated
hammer which knocks in the medial side of the proximal tibia.
The stress wave is propagated through the bone and it is picked
up by two triaxial MEMS accelerometers. Using this setup the
acceleration magnitude has been measured for various subjects
and the corresponding signals were obtained. The acquired
signals are fed into the computer.
Key words: MEMS, BMD, Impulse response.
I. INTRODUCTION
BMD measurements in conjunction with information about the
structure and elastic properties of bone will result in a good
indication of its mechanical condition and susceptibility to fracture.
Moreover, during accidental impact, our bones arc subjected to high
strain rate loading. Since bone is a viscoelastic material, its response
to this type of loading cannot be assumed to be the same as predicted
by a static analysis. Therefore, it is important to study dynamic
characteristics of bone under normal and diseased state in order to
understand its response to more realistic loading condition. The
change in Peak acceleration magnitude with age is also evaluated.
Osteoporosis is a disease of the bones. It happens when you lose too
much bone, make too little bone or both. As a result, bones become
weak and can break from a minor fall or in serious cases, even from
simple actions, like sneezing or bumping into furniture. The risk of
osteoporosis fractures can be reduced with lifestyle changes and in
those with previous osteoporosis related fractures medications.
Lifestyle change includes diet, exercise, and preventing falls. The
utility of calcium and vitamin D is questionable in most.
Bisphosphonates are useful in those with previous fractures from
osteoporosis but are of minimal benefit in those who have
osteoporosis but no previous fractures. The diagnosis of osteoporosis
can be made using conventional radiography and by measuring the
bone mineral density (BMD). The most popular method of measuring
BMD is dual-energy x-ray absorptiometry (DEXA). Bone quality is a
composite of properties that make bone resist fracture such as its
micro architecture accumulated microscopic damage the quality of
collagen mineral crystal size and bone turnover. The most prevalent
sequence is compression fractures of the vertebral bodies and
fractures of the ribs, proximal femur (hip), humerus and distal radius.
These fractures lead to deformity, loss of mobility, independence and
even death. With increasing population of elderly women, the
assessment and treatment of osteoporosis has become an important
problem in clinical gynaecology. Bone mineral loss occurs with
aging, menopause, and disuse. The decrease in biomechanical
strength of bone with age is much more pronounced than the loss of
bone mass due to perforations during the remodelling process.
Therefore, it is important to study dynamic characteristics of bone
under normal and diseased state in order to understand its response to
more realistic loading condition. The change in acceleration
magnitude with age is also evaluated.
II. SYSTEM DESCRIPTION
In the following subsections, we will describe the system
architecture, hardware and software components,
A. SYSTEM ARCHITECTURE
As shown in the figure 1, the architecture of the system
mainly consists of a mechanical section for producing knock
and a electrical section for automatically operate the hammer
to make knock on bone with predefined uniform force and
time duration and a Data Acquisition card for interfacing the
hardware part with PC. The mechanical section consists of a
less weight hammer which is driven by the motor. Two
actuators the accelerometer-I is placed on the fascies medialis
tibia at a distance of 6cm from the medical condoyle and
accelerometer-II placed at a distance of 18cm from the
accelerometer-I. The automated hammer that runs by the DC
motor hits the Medialisis Condolosis region in the leg. The
automated hammer is controlled by switches. When the
hammer hits the Medialisis Condolosis region, the impulse
response that propagates through the bone of the leg. The
accelerometers will receive the impulse responses that are
acquired from the hammer and are collected by the DAQ
(Data Acquisition card) system. Tracer DAQ software
included for acquiring and displaying data and generating
signals. From the signals, we can analyse the mechanical
strength of the bone.
B. HARDWARE COMPONENTS
The Hardware part consists of a microcontroller AT89552 is
used for controlling the knock as desired. The microprocessor
is running under the core of 8051 principle. Flash
programming which is used, so that it can be made rewritable
in order to increase or decrease the speed of the motor setup.
It has 4 ports namely PORT 0, PORT 1, PORT 2 and PORT 3.
PORT 0 is used for controlling the switches. PORT 1 is used
for controlling the Digital to Analog converter.
Microprocessor circuit consists of crystal oscillator used for
timing control purpose. The DAC 0808 is used which has 8
data output. From the microcontroller, PORT 1 is connected
to the DAC0808 combined with an Integrated circuit(IC)
operational amplifier 74, for the amplification purpose of the
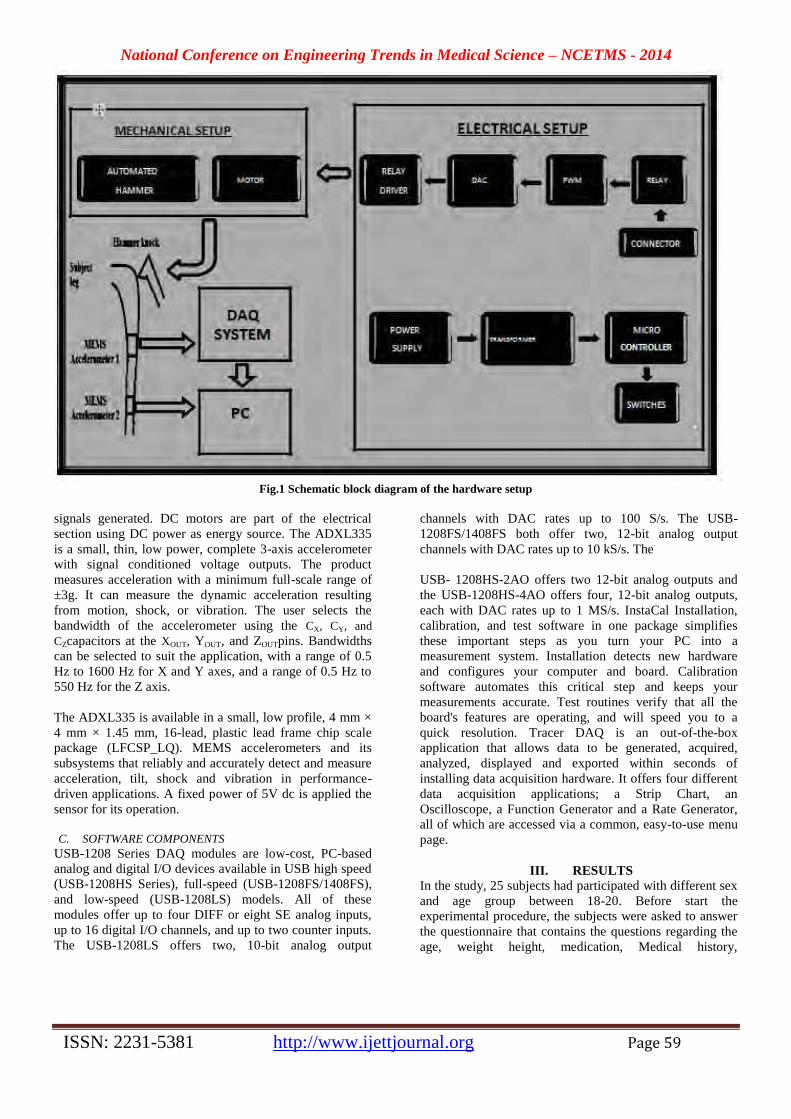
National Conference on Engineering Trends in Medical Science – NCETMS - 2014
ISSN: 2231-5381 http://www.ijettjournal.org Page 59
Fig.1 Schematic block diagram of the hardware setup
signals generated. DC motors are part of the electrical
section using DC power as energy source. The ADXL335
is a small, thin, low power, complete 3-axis accelerometer
with signal conditioned voltage outputs. The product
measures acceleration with a minimum full-scale range of
±3g. It can measure the dynamic acceleration resulting
from motion, shock, or vibration. The user selects the
bandwidth of the accelerometer using the CX, CY, and
CZcapacitors at the XOUT, YOUT, and ZOUTpins. Bandwidths
can be selected to suit the application, with a range of 0.5
Hz to 1600 Hz for X and Y axes, and a range of 0.5 Hz to
550 Hz for the Z axis.
The ADXL335 is available in a small, low profile, 4 mm ×
4 mm × 1.45 mm, 16-lead, plastic lead frame chip scale
package (LFCSP_LQ). MEMS accelerometers and its
subsystems that reliably and accurately detect and measure
acceleration, tilt, shock and vibration in performance-
driven applications. A fixed power of 5V dc is applied the
sensor for its operation.
C. SOFTWARE COMPONENTS
USB-1208 Series DAQ modules are low-cost, PC-based
analog and digital I/O devices available in USB high speed
(USB-1208HS Series), full-speed (USB-1208FS/1408FS),
and low-speed (USB-1208LS) models. All of these
modules offer up to four DIFF or eight SE analog inputs,
up to 16 digital I/O channels, and up to two counter inputs.
The USB-1208LS offers two, 10-bit analog output
channels with DAC rates up to 100 S/s. The USB-
1208FS/1408FS both offer two, 12-bit analog output
channels with DAC rates up to 10 kS/s. The
USB- 1208HS-2AO offers two 12-bit analog outputs and
the USB-1208HS-4AO offers four, 12-bit analog outputs,
each with DAC rates up to 1 MS/s. InstaCal Installation,
calibration, and test software in one package simplifies
these important steps as you turn your PC into a
measurement system. Installation detects new hardware
and configures your computer and board. Calibration
software automates this critical step and keeps your
measurements accurate. Test routines verify that all the
board's features are operating, and will speed you to a
quick resolution. Tracer DAQ is an out-of-the-box
application that allows data to be generated, acquired,
analyzed, displayed and exported within seconds of
installing data acquisition hardware. It offers four different
data acquisition applications; a Strip Chart, an
Oscilloscope, a Function Generator and a Rate Generator,
all of which are accessed via a common, easy-to-use menu
page.
III. RESULTS
In the study, 25 subjects had participated with different sex
and age group between 18-20. Before start the
experimental procedure, the subjects were asked to answer
the questionnaire that contains the questions regarding the
age, weight height, medication, Medical history,

National Conference on Engineering Trends in Medical Science – NCETMS - 2014
ISSN: 2231-5381 http://www.ijettjournal.org Page 60
occupation, exercising habit etc. From that we can screen
the subjects from normal and abnormal. The sampling time
and sampling rates are made constant for all the subjects
during acquisition of signals. We used 2 channels of the
DAQ card to acquire signals from 2 sensors in Y direction.
From the results obtained, we can concluded that the
acceleration value obtained in terms of milli volts in
channel 2 (Y-Axis of second accelerometer) is found low
magnitude compared to the output of channel -1 (Y-axis of
First accelerometer).
IV. CONCLUSION
A Instrumentation system is developed for assessing the
bone quality and described how this can be used to
diagnose and distinguish different subjects. By
incorporating the precision accelerometer sensor and the
automating knocking mechanism in the system good
response is obtained. The experimental results have shown
the usefulness of the system in assessing the quality of
bone. Moreover further analysis can be done using this
setup by selecting more parameters in order to strengthen
the results. The technique gives a better understanding of
the dynamic behaviour of bone under impact force. The
study is non-invasive, reliable, easy to operate, inexpensive
and has diagnostic potential in the assessment of bone
quality. Further analysis has to be done by obtaining more
number of data from older age group men and women
(with menopause stage) and also with abnormal cases as a
extension work in order to justify strongly that our system
is highly reliable and can be used as a diagnosing tool for
assessment of bone quality non-invasively it is required
too.
REFERENCES
1. Mrs.s.mythili,development and implementation of
instrumentation system for diagnosing bone quality
using vibration technique 2. World Health Organization: International Classification of
Impairments, Disabilities and Handicaps. WHO, Geneva, Switzerland, 1980.
3. N. Dorothy, R. Molloy and M. Kleerekoper, ―Prevalence of
osteoporosis in women referredfor bone density testing, J. Clin. Densitometer, 1, 5- 11, 1998.
4. Li. Mosekilde, Bone remodeling, pp.343-356, in Le Mosekilde
and Li Mosekilde (Ed.) Complexity Chaos and Biological Evolution, Plenum Press, New York, 1991
5. R.S. Lakes and S. Saha, ―Long term torsional creep in
compact bone. Biomech. Engng. 102,178- 180, 1980. 6. Evaluation and Assessment of Osteoporosis by Quantitative
Ultrasound (Kaufman and Einhorn, 1993
7. S. Cheng, J. Timonen and H. Suomincn ―Elastic wave propagation in bone in vivo: methodology of Biomechanics
28,471-478, 1995
8. P.D. Delinas, A. Schlemmer, E. Gineyts, B. Riis and C.Christiansen (1991) ―Urinary excretion of pyridinoline
cross links correlates with b tic turnover measured on iliac
crest biopsy in patients with vertebral osteoporosis, J. of Bone Min. Res., 6,639-644, 1991
9. J. A. McGowan ―Osteoporosis: assessment of bone loss and remodeling, Aging – Clinical and Experimental Research, 5,
81-93,1993.
10. M.S. Holi and S. Radhakrishnan, Comparison of ultrasound and dual energy x-ray absorptiometry (DEXA) methods in
estimation of low bone mass for the assessment of osteoporosis
fracture risk in Indian men and women, Acta of Bioeng. And Biomech. 4, 396-397, 2002.
11. Holi, M.S. Radhakrishnan, S. Invivo Assessment of
Osteoporosis by Impulse Response and Stress Wave Propagation Technique ,TENCON , vol.1395 2003. 11] Kao
WH, Kammerer CM, Schneider JL, Bauer RL, Mitchell BD
“Type 2 diabetes is associated with increased bone mineral density in Mexican-American women” Arch Med Res. Sep-
Oct;34(5):399-406,2003
National Conference on Engineering Trends in Medical Science – NCETMS - 2014
ISSN: 2231-5381 http://www.ijettjournal.org Page 61
Performance Comparison of Booth Multiplier and
Wallace Tree Multiplier
Rupesh N. Gurle1, Sanjivani P. Edakhe
2, Prof.Abhay R. Kasetwar
3
1B.E. final year, EXTC, DBNCOET, Yavatmal, Maharashtra, India – 445001.
2B.E. final year, EXTC, DBNCOET, Yavatmal, Maharashtra, India – 445001.
3Assistant Professor, EXTC, DBNCOET, Yavatmal, Maharashtra, India – 445001
Abstract- This paper proposes comparative analysis of booth
and Wallace tree multiplier. The multiplication operation is
present in many parts of digital system or digital computer,
most notably in signal processing, graphics and scientific
computation. With advances in technology, various
techniques have been proposed to design multipliers, which
offer high speed, low power consumption and lesser area.
Thus making them suitable for various high speed, low power
compact VLSI implementations. For arithmetic multiplication
various multiplication architectures like array multiplier,
Booth multiplier, Wallace tree multiplier and Booth Wallace
multiplier have been thoroughly discussed. It has been found
that Booth multiplier is most efficient among all, giving
optimum delay, power and area for multiplication.
Keywords: Booth multiplier (radix-2), Booth multiplier (radix-
4), Wallace tree multiplier.
I. INTRODUCTION
Multiplication is one of the basic functions
used in digital signal processing. It requires more
hardware resources and processing time than
addition and subtraction. In fact, 8.72% of all
instruction in atypical processing unit is
multiplier [1]. Most high performance digital
signal processing systems rely on hardware
multiplication to achieve high data throughput.
Multiplication is an important fundamental
arithmetic operation. Multiplication based
operations such as Multiply and Accumulate
(MAC) are currently implemented in many
digital signal processing applications such as
convolution, Fast Fourier Transform (FFT),
Filtering and in microprocessor in its arithmetic
and logic unit [2]. Since multiplication dominates
the execution time of most DSP algorithms, so
there is need of high speed multiplier. Currently,
the multiplication time is still dominant factor in
determining the instruction cycle time of a DSP
chip. The amount of circuitry involved is directly
proportional to square of its resolution i.e., a
multiplier of size of n bits has O (n2) gates. In the
past, many novel ideas for multipliers have been
proposed to achieve high performance. The
demand for high speed processing has been
increasing as a result of expanding computer
operation and signal processing applications.
Multiplication is a mathematical operation that is
an abbreviated process of adding an integer to
itself a specified number of times. A number
(multiplicand) is added to itself a number of
times as specified by another number (multiplier)
to form a result (product). The multiplicand is
multiplied by each digit of the multiplier
beginning with the rightmost, LSD. Intermediate
results (partial products) are placed one atop the
other, offset by one digits of the same weight.
The final product is determined by summation of
all the partial products. Multiplication involves
three main steps [3].
Partial product generation
Partial product reduction
Final addition
For the multiplication of an n-bit multiplicand
with an m-bit multiplier, m partial products are
generated and product formed is n+m bits along.
II. BOOTH MULTIPLIER Andrew D. Booth proposed the Booth
recoding, or Booth algorithm in 1951. This

National Conference on Engineering Trends in Medical Science – NCETMS - 2014
ISSN: 2231-5381 http://www.ijettjournal.org Page 62
method can be used to multiply two 2’s
complement number without the sign bit
extension. Booth observed that when strings of
‘1’ bits occur in the multiplicand the number of
partial products can be reduced by subtraction.
Table 1.1 shows the Booth algorithm operation.
TABLE 1
BOOTH ALGORITHM Xi Xi-1 Operation Comments Yi
0 0 Shift only String of
zeros
0
1 0 Sub and
shift
Beg of
string of
ones
1
1 1 Shift only String of
zeros
0
0 1 Add and
shift
End of
string of
ones
1
Booth classifieds group of bits into beginning,
middle or end of run. String of zeros avoid
arithmetic, so these can be left alone. Booth
algorithm changed the original algorithm by
looking at two bits of multiplier Conventional
array multiplier, like the Braun multiplier and
Baugh Woolley multiplier achieve comparatively
good performance but they require large area of
silicon, unlike the add-shift algorithms, which
requires less hardware and exhibit poorer
performance. The booth multipliers makes use of
booth encoding algorithms in order to reduce the
number of partial products by considering two
bits of the multiplier at a time, thereby achieving
a speed advantage over other multiplier
architectures. This algorithm is valid for both
signed and unsigned numbers. It accepts the
number in 2’s complement form, based on radix-
2 computation.
Booth multiplier reduces the number of
iteration step to perform multiplication as
compared to conventional step. Booth algorithm
‘scans’ the multiplier operand and skip chain of
this algorithm. Booth algorithm can reduce the
number of additions require to produce the result
compared to conventional multiplication
algorithms.
Fig 1. Architecture of booth multiplier
A. Booth Multiplier (Radix-2)
The Booth algorithm was invented by A. D.
Booth forms the base of Signed number
multiplication algorithms that are simple to
implement at the hardware level, and that have the
potential to speed up signed multiplication
considerably. Booth's algorithm is based upon
recoding the multiplier, y, to a recoded, value, z,
leaving the multiplicand, x, unchanged. In Booth
recoding, each digit of the multiplier can assume
negative as well as positive and zero values. There is
a special notation, called signed digit (SD) encoding,
to express these signed digits. In SD encoding +1 and
0 are expressed as 1 and 0, but -1 is expressed as 1.
The value of a 2s complement integer was
defined a by equation 1.
This equation says that in order to get the
value of a signed 2's complement number,
multiply the m-th digit by -2`-1, and multiply
each remaining digit i by +2g. For example, -7,
which are 1001 in 2's complement notation,
would be, in SD notation, 1001 = -8 + 0 + 0 + 1 =
-7.
For implementing booth algorithm most
important step is booth recoding. By booth
recoding we can replace string of 1s by 0s. For
example the value of strings of five 1s,
Hence if this number were to be used as the
multiplier in a multiplication, we could replace
five additions by one addition and one

National Conference on Engineering Trends in Medical Science – NCETMS - 2014
ISSN: 2231-5381 http://www.ijettjournal.org Page 63
subtraction. The Booth recoding procedure, then,
is as follows:
1. Working from LSB to MSB, replace each 0
digit of the original number with a 0 in the
recoded number until a 1 is encountered.
2. When a 1 is encountered, insert a 1 at that
position in the recoded number, and skip over
any succeeding I's until a 0 is encountered.
3. Replace that 0 with a 1 and continue. This
algorithm is expressed in tabular form in Table 1,
TABLE 2
BOOTH RECODING TABLE FOR RADIX-2
1) Radix-2Booth Algorithm
1. Add zero to the right of LSB multiplier to
make pairing of two bits from right to left and
mark corresponding multiplier,
2. 00 or 11: do nothing.
3. 01: marks the end of a string of 1s and add
multiplicand to partial product.
4. 10: marks the beginning of the string of 1s
subtract multiplicand from partial product.
Fig 2. 2 bit pairing as per booth recoding
One of the solutions for realizing high speed
multipliers is to enhance parallelism which helps
in decreasing the number of subsequent
calculation stages. The original version of Booth
multiplier (Radix-2) had two drawbacks [4].
1. The number of add/subtracts operations
become variable and hence became inconvenient
while designing parallel multipliers.
2. The algorithm become inefficient when there
are isolated 1s.
B. Booth Multiplier (Radix-4)
It is possible to reduce the number of
partial products by half by using the technique of
radix 4 booth recoding. The basic idea is that,
instead of shifting and adding for every column
of the multiplier term and multiplying by 1 or 0,
we only take every second column, and multiply
by ±1, ±2 or 0 to obtain the same result. Radix-4
booth encoder performs the process of encoding
the multiplicand based on multiplier bits. It will
compare 3 bits at a time with overlapping
technique. Grouping starts from the LSB, and the
first block only uses two bits of the multiplier
and assumes a zero for the third bit as shown in
fig.2
Fig 3.3 bit pairing as per booth recoding
The functional operation of radix-4 booth
encoder is shown in table 3. It consists of eight
different types of states and during these states
we can obtain the outcomes, which are
multiplication of multiplicand with 0, -1 and -2
consequently.
1) Radix-4 Booth Algorithm
1. Extend the sign bit 1 position necessary to
ensure that n is even.
2. Append 0 to the right of the LSB of the
multiplier.
3. According to the value of each vector, each
partial product will be 0, +y, -y or +2y, -2y.
The negative values of y are made by
taking the 2s complement and Carry Look Ahead
(CLA), fast adders are used for addition. The
multiplication of y is done by shifting y by one
bit to the left. Thus, in any case in designing n-
bit parallel multipliers only n/2 partial products
yi yi-1 zi-i Multiplier
value
Situation
0 0 0 0 String of
0s
0 1 1 +1 End of
string of
1s
1 0 1 -1 Begin
string of
1s
1 1 0 0 String of
1s
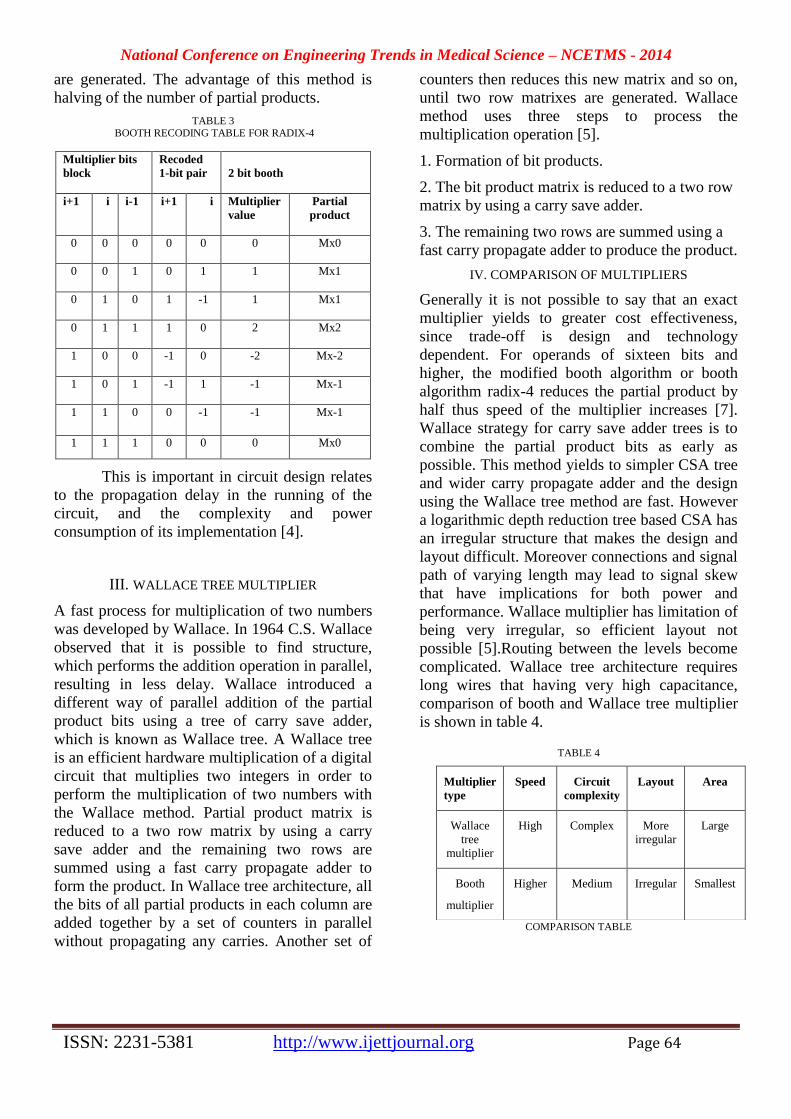
National Conference on Engineering Trends in Medical Science – NCETMS - 2014
ISSN: 2231-5381 http://www.ijettjournal.org Page 64
are generated. The advantage of this method is
halving of the number of partial products.
TABLE 3
BOOTH RECODING TABLE FOR RADIX-4
Multiplier bits
block
Recoded
1-bit pair
2 bit booth
i+1
i
i-1
i+1
i
Multiplier
value
Partial
product
0
0
0
0
0
0
Mx0
0
0
1
0
1
1
Mx1
0
1
0
1
-1
1
Mx1
0
1
1
1
0
2
Mx2
1
0
0
-1
0
-2
Mx-2
1
0
1
-1
1
-1
Mx-1
1
1
0
0
-1
-1
Mx-1
1 1 1 0 0 0 Mx0
This is important in circuit design relates
to the propagation delay in the running of the
circuit, and the complexity and power
consumption of its implementation [4].
III. WALLACE TREE MULTIPLIER
A fast process for multiplication of two numbers
was developed by Wallace. In 1964 C.S. Wallace
observed that it is possible to find structure,
which performs the addition operation in parallel,
resulting in less delay. Wallace introduced a
different way of parallel addition of the partial
product bits using a tree of carry save adder,
which is known as Wallace tree. A Wallace tree
is an efficient hardware multiplication of a digital
circuit that multiplies two integers in order to
perform the multiplication of two numbers with
the Wallace method. Partial product matrix is
reduced to a two row matrix by using a carry
save adder and the remaining two rows are
summed using a fast carry propagate adder to
form the product. In Wallace tree architecture, all
the bits of all partial products in each column are
added together by a set of counters in parallel
without propagating any carries. Another set of
counters then reduces this new matrix and so on,
until two row matrixes are generated. Wallace
method uses three steps to process the
multiplication operation [5].
1. Formation of bit products.
2. The bit product matrix is reduced to a two row
matrix by using a carry save adder.
3. The remaining two rows are summed using a
fast carry propagate adder to produce the product.
IV. COMPARISON OF MULTIPLIERS
Generally it is not possible to say that an exact
multiplier yields to greater cost effectiveness,
since trade-off is design and technology
dependent. For operands of sixteen bits and
higher, the modified booth algorithm or booth
algorithm radix-4 reduces the partial product by
half thus speed of the multiplier increases [7].
Wallace strategy for carry save adder trees is to
combine the partial product bits as early as
possible. This method yields to simpler CSA tree
and wider carry propagate adder and the design
using the Wallace tree method are fast. However
a logarithmic depth reduction tree based CSA has
an irregular structure that makes the design and
layout difficult. Moreover connections and signal
path of varying length may lead to signal skew
that have implications for both power and
performance. Wallace multiplier has limitation of
being very irregular, so efficient layout not
possible [5].Routing between the levels become
complicated. Wallace tree architecture requires
long wires that having very high capacitance,
comparison of booth and Wallace tree multiplier
is shown in table 4.
TABLE 4
COMPARISON TABLE
Multiplier
type
Speed Circuit
complexity
Layout Area
Wallace
tree
multiplier
High Complex More
irregular
Large
Booth
multiplier
Higher Medium Irregular Smallest
National Conference on Engineering Trends in Medical Science – NCETMS - 2014
ISSN: 2231-5381 http://www.ijettjournal.org Page 65
V. CONCLUSION
This paper attempts to give a clear concept of
booth multipliers and Wallace tree multiplier and
their comparison. We found that the booth
multipliers are better than the Wallace tree
multiplier. We concluded this from the
comparison based on different parameters such as
speed, circuit complexity, layout and the total
area. In case of booth multipliers, the total area is
much less than that of Wallace tree multipliers.
Hence the power consumption is also less. So we
always need to find a better solution in case of
multipliers. Preferably multipliers should always
consume less power and cover less area. So
through this paper we try to determine which of
the multiplier works the best. In the end we
determine that booth multiplier works the best.
VI. REFERNECES
[1] Pouya Asadi, and Keivan Navi, “A enw low power 32×32 bit
multiplier”, world applied science jourmal 2(4): 341-347, 2007
[2] Pururshottam D, Chidgupkar, and Mangesh T, Karad “The
implementation of algorithm in DSP” Global journal of
Engineering Education, vol 8, no.2 ,2004 UICEE Published in
Australia. [3] Rabey, Nikoli and
Chandrasekhran, “Digital Integrated Circuit: A Design
perspective,” 2nd Edition, Prentice Hall, PP 586-594, 2003
[4] Sukhmeet Kaur, Suman and Manpreet Singh manna
“Implementation of modified Booth algorithm (radix-4) and its
comparison with Booth algorithm (radix-2)” Advances in
Electronic and Electric Engineering ISSN 2231-1297, vol 3, Nov
6, 2013 pp 683-690
[5] Simran Kaur “ FPGA implementation of efficient modified
booth Wallace multiplier” june 20111.
[6] B Naga Vankata Satya Durga Jahnavi, Shivani Mupparaju, Dr.
L Padamsree “Design, Comparison and Implementation of
multipliers on FPGA ”. International Journal of Engineering and
Technical Research (IJETR) ISNN: 2321-0869, vol 1, issue-7 sept
2013. [7] S. Nagaraj, R.
Mallikarjuna Redy “FPGA Implementation of modified booth
multiplier”. International Journal of Engineering Research and
Applicatio. (IJERA) ISNN: 2248-9622, vol 3, Issue 2, March-
April 2013.
National Conference on Engineering Trends in Medical Science – NCETMS - 2014
ISSN: 2231-5381 http://www.ijettjournal.org Page 66
“The Genechip System Supports both DNA and
RNA Analysis”
Priti B. Walthare#1
, Pratikshya R. Gahane*2
,Shilpa H. Ambule*3
# Student Department of Biomedical Engineering , Amravati university,Yavatmal,Maharastra,India
#Student Department of Biomedical Engineering , Amravati university,Yavatmal,Maharastra,India
#Student Department of Biomedical Engineering , Amravati university,Yavatmal,Maharastra,India
ABSTRACT
Bioinformatics is an emerging scientific discipline
representing the combined power of Biology, Mathematics,
IT, Computer Science and Electronics to solve complex
problems in life sciences and particularly in biotechnology.
The GeneChip System supports both DNA and RNA analysis.
These chip are based on the electrical and electron charges
exhibited by the cells of the human body. In this paper it
aimed to show the relevance of electronics in a field of
bioinformatics, this paper deals with the analysis of cancer
using GeneChip (DNA microarrays).Gene chip are used for
Global understanding of abnormal gene expression
contributing to malignancy, prediction of drug side effects
during preclinical development and toxicology studies, which
predicts treatment success or failure.
Keyword: GeneChip ,DNA ,RNA prediction drug.
Introduction
Bioinformatics is an integrated multidisciplinary field. It
comprises molecular biology (biochemistry, genetics, structural
biology etc.), computer science (computational theory, artificial
intelligence, machine learning, dynamic programming etc.),
physical chemistry (thermodynamics, molecular modeling etc)
and mathematics (algorithms, modeling, probabilistic, statistics
etc.).It is hard to draw a clear line between the ‘exact disciplines’
of bioinformatics research because this is a broad and fast
growing field.
A new technology, called DNA
microarray, has attracted tremendous interests among biologists.
This technology promises to monitor the whole genome on a
single chip so that researchers can have a better picture of the
interactions among
thousands of genes simultaneously. Base pairing (i.e., A-T and G-
C for DNA; A-U and G-C for RNA) or hybridization is the
underlining principle of DNA microarray. An array is an orderly
arrangement of samples. It provides a medium for matching
known and unknown DNA samples based on base-pairing rules
and automating the process of identifying the unknowns. An array
experiment can make use of common assay systems such as
microplates or standard blotting membranes, and can be created
by hand or make use of robotics to deposit the sample. The
sample spot sizes in microarray are typically less than 200
microns in diameter and these arrays usually contain thousands of
spots. Microarrays require specialized robotics and imaging
equipment .DNA microarray, or DNA chips are fabricated by
high-speed robotics, generally on glass but sometimes on nylon
substrates. There are two major application forms for the DNA
microarray technology:
1) Identification of sequence (gene / gene mutation).
2) Determination of expression level (abundance) of genes
1. DNA Chip
Definition of DNA chip :
“ A high density array of short DNA molecules bound
to a solid surface for use in probing a biological sample to
determine gene expression, marker pattern or nucleotide
sequence of DNA/RNA ” . DNA chip is also called as “Gene
Chip” or “ DNA microarray”.Initially developed to enhance
genomic sequencing projects, especially the Human Genome
Project, DNA chips are finding applications throughout the
field of molecular biology. Gene scanning techniques that are
based on oligonucleotide arrays called DNA chips, provide a
rapid method to analyze thousands of genes simultaneously.
DNA chips are thus potentially very powerful tools for
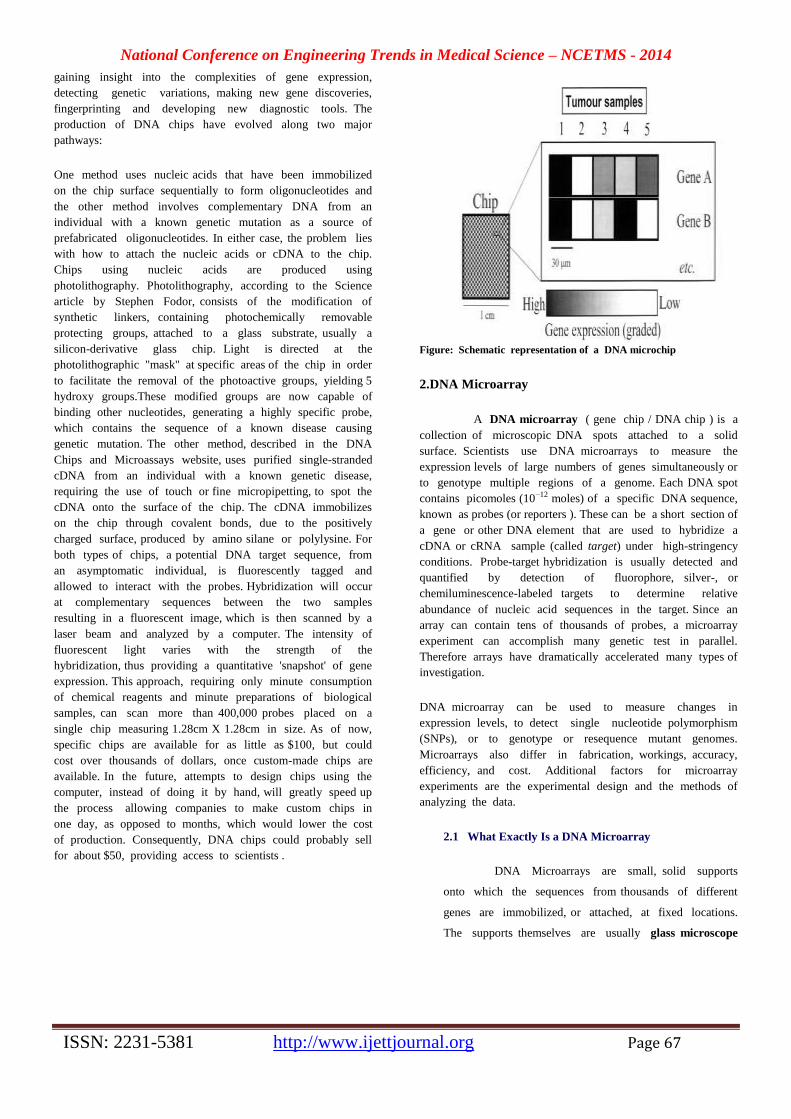
National Conference on Engineering Trends in Medical Science – NCETMS - 2014
ISSN: 2231-5381 http://www.ijettjournal.org Page 67
gaining insight into the complexities of gene expression,
detecting genetic variations, making new gene discoveries,
fingerprinting and developing new diagnostic tools. The
production of DNA chips have evolved along two major
pathways:
One method uses nucleic acids that have been immobilized
on the chip surface sequentially to form oligonucleotides and
the other method involves complementary DNA from an
individual with a known genetic mutation as a source of
prefabricated oligonucleotides. In either case, the problem lies
with how to attach the nucleic acids or cDNA to the chip.
Chips using nucleic acids are produced using
photolithography. Photolithography, according to the Science
article by Stephen Fodor, consists of the modification of
synthetic linkers, containing photochemically removable
protecting groups, attached to a glass substrate, usually a
silicon-derivative glass chip. Light is directed at the
photolithographic "mask" at specific areas of the chip in order
to facilitate the removal of the photoactive groups, yielding 5
hydroxy groups.These modified groups are now capable of
binding other nucleotides, generating a highly specific probe,
which contains the sequence of a known disease causing
genetic mutation. The other method, described in the DNA
Chips and Microassays website, uses purified single-stranded
cDNA from an individual with a known genetic disease,
requiring the use of touch or fine micropipetting, to spot the
cDNA onto the surface of the chip. The cDNA immobilizes
on the chip through covalent bonds, due to the positively
charged surface, produced by amino silane or polylysine. For
both types of chips, a potential DNA target sequence, from
an asymptomatic individual, is fluorescently tagged and
allowed to interact with the probes. Hybridization will occur
at complementary sequences between the two samples
resulting in a fluorescent image, which is then scanned by a
laser beam and analyzed by a computer. The intensity of
fluorescent light varies with the strength of the
hybridization, thus providing a quantitative 'snapshot' of gene
expression. This approach, requiring only minute consumption
of chemical reagents and minute preparations of biological
samples, can scan more than 400,000 probes placed on a
single chip measuring 1.28cm X 1.28cm in size. As of now,
specific chips are available for as little as $100, but could
cost over thousands of dollars, once custom-made chips are
available. In the future, attempts to design chips using the
computer, instead of doing it by hand, will greatly speed up
the process allowing companies to make custom chips in
one day, as opposed to months, which would lower the cost
of production. Consequently, DNA chips could probably sell
for about $50, providing access to scientists .
Figure: Schematic representation of a DNA microchip
2.DNA Microarray
A DNA microarray ( gene chip / DNA chip ) is a
collection of microscopic DNA spots attached to a solid
surface. Scientists use DNA microarrays to measure the
expression levels of large numbers of genes simultaneously or
to genotype multiple regions of a genome. Each DNA spot
contains picomoles (10−12 moles) of a specific DNA sequence,
known as probes (or reporters ). These can be a short section of
a gene or other DNA element that are used to hybridize a
cDNA or cRNA sample (called target) under high-stringency
conditions. Probe-target hybridization is usually detected and
quantified by detection of fluorophore, silver-, or
chemiluminescence-labeled targets to determine relative
abundance of nucleic acid sequences in the target. Since an
array can contain tens of thousands of probes, a microarray
experiment can accomplish many genetic test in parallel.
Therefore arrays have dramatically accelerated many types of
investigation.
DNA microarray can be used to measure changes in
expression levels, to detect single nucleotide polymorphism
(SNPs), or to genotype or resequence mutant genomes.
Microarrays also differ in fabrication, workings, accuracy,
efficiency, and cost. Additional factors for microarray
experiments are the experimental design and the methods of
analyzing the data.
2.1 What Exactly Is a DNA Microarray
DNA Microarrays are small, solid supports
onto which the sequences from thousands of different
genes are immobilized, or attached, at fixed locations.
The supports themselves are usually glass microscope

National Conference on Engineering Trends in Medical Science – NCETMS - 2014
ISSN: 2231-5381 http://www.ijettjournal.org Page 68
slides, the size of two side-by-side pinky fingers, but
can also be silicon chips or nylon membranes. The
DNA is printed, spotted, or actually synthesized directly
onto the support. With the aid of a computer, the
amount of mRNA bound to the spots on the
microarray is precisely measured, generating a profile of
gene expression in the cell.
The American Heritage Dictionary defines "array" as "
to place in an orderly arrangement". It is important that
the gene sequences in a microarray are attached to their
support in an orderly or fixed way , because a
researcher uses the location of each spot in the array
to identify a particular gene sequence. The spots
themselves can be DNA, cDNA, or oligonucleotides.
There are two major application forms for the DNA
microarray technology:
1) Identification of sequence (gene / gene mutation)
2) Determination of expression level (abundance) of
genes of one sample or comparing gene transcription in
two or more different kinds of cells.
2.2 Why Are Microarrays Important ?
Wha t are Microarrays will be described in the next
paragraph. Before the actual definition, it is important to
understand that microarrays are a significant advance both
because they may contain a very large number of genes and
because of their small size. Microarrays are therefore useful
when one wants to survey a large number of genes quickly
or when the sample to be studied is small. Microarrays may
be used to assay gene expression within a single sample or
to compare gene expression in two different cell types or
tissue samples, such as in healthy and diseased tissue.
Because a microarray can be used to examine the expression
of hundreds or thousands of genes at once, it promises to
revolutionize the way scientists examine gene expression.
General studies of the expression levels in various kinds of
cells represent an important and necessary first step in our
understanding and cataloging of the human genome.
As more information accumulates, scientists will be able to
use microarrays to ask increasingly complex questions and
perform more intricate experiments. With new advances,
researchers will be able to infer probable functions of new
genes based on similarities in expression patterns with those
of known genes . Ultimately, these studies promise to expand
the size of existing gene families, reveal new patterns of
coordinated gene expression across gene families, and
uncover entirely new categories of genes . Furthermore,
because the product of any one gene usually interacts with
those of many others, our understanding of how these genes
coordinate will become clearer through such analyses, and
precise knowledge of these inter-relationships will emerge.
The use of microarrays may also speed the identification of
genes involved in the development of various diseases by
enabling scientists to examine a much larger number of
genes. This technology will also aid the examination of the
integration o f gene expression and function at the cellular
level, revealing how multiple gene products work together to
produce physical and chemical responses to both static and
changing cellular needs.The microarray (DNA chip) technology
is having a significant impact on genomics study. Drug
discovery and toxicological research, will certainly benefit
from the use of DNA microarray technology.
3. Principle
The core principle behind microarrays is hybridization
between two DNA strands, the property of complementory
nucleic acid sequences to specifically pair with each other by
forming hydrogen bonds between complementary nucleotide
base pairs. A high number of complementary base pairs in a
nucleotide sequence mean s tighter non-covalent bonding
between the two strands. After washing off of non-specific
bonding sequences, only strongly paired strands will remain
hybridized. So fluorescently labeled target sequences that
bind to a probe sequence generate a signal that depends on
National Conference on Engineering Trends in Medical Science – NCETMS - 2014
ISSN: 2231-5381 http://www.ijettjournal.org Page 69
the strength of the hybridization determined by the number
of paired bases , the hybridization conditions (such as
temperature), and washing after hybridization. Total strength
of the signal, from a spot (feature), depends upon the
amount of target sample binding to the probes present on
that spot . Microarrays use relative quantization in which the
intensity of a feature is compared to the intensity of the
same feature under a different condition, and the identity of
t he feature is known by its position. Many types of array
exist and the broadest distinction is whether they are
spatially arranged on a surface or on coded beads:
The traditional solid-phase array is a collection of
orderly microscopic "spots", called features, each with a
specific probe attached to a solid surface, such as glass,
plastics or silicon biochips (commonly known as a
genome chip, DNA chip or gene array). Thousands of
them can be placed in known locations on a single
DNA microarray.
The alternative bead array is a collection of
microscopic polystyrene beads, each with a specific
probe and a ratio of two or more dyes, which do not
interfere with the fluorescent dyes used on the target
sequence.
4.DEVELOPMENT OF DNA-CHIP
4.1 Combinatorial approach
Multiple sequence alignments reveal conserved and
variable sequence regions. This distribution of sequence
variability reflects structural and functional constraints.
Regions that are tightly constrained are less free to vary
than regions which are not as constrained, all else
being equal. However, the relationship between
functional constraint and variability is not absolute.
Some regions can be functionally constrained, but still
free to vary for a subset of amino acids that do not
jeopardize function. For any given region, there is a
finite set of amino acid combinations that can be
substituted without changing structure or function. If we
could estimate this for all regions of a protein, we
could estimate all possible variants viable for a
particular protein’s function. This is the principle
underlying our gene-specific sequencing chip design.
Because ab initio prediction is not yet possible, we use
training data sets based on sequences that occur in
nature to estimate the sequences that would be viable
for a particular protein. A training set comprises a
multiple alignment of sequences taken from a diversity
of organisms for a given protein-coding gene. The
multiple alignment gives an immediate indication of the
locations and degree to which sites are free to vary.
For example, some sites may be variable but constrained
to vary within pyrimidines (C and T), while others may
be free to vary across both purine and pyrimidine
nucleotides (A, G, C and T). Multiple alignments based
on relatively few sequences can provide a surprisingly
good indication of the sequence variation that might
exist in nature through combinatoric permutation of the
observed sequence variation. Consider the two following
aligned sequences, variable at positions 1, 4 and 8:
12345678
GAAGCTTA
||||||||
CAACCTTG
There are eight ways (23) that the observed differences
between the two sequences might be permuted:
12345678
GAAGCTTA
GAAGCTTG
GAACCTTA
GAACCTTG
CAAGCTTA
CAAGCTTG
CAACCTTA
CAACCTTG
The number of combinations implied to be possible expands
exponentially as the number of variable sites increases. When
this kind of combinatorial expansion is applied to variation
that is typical for real data sets, a large number of
combinations can result. For example, a pairwise alignment
of sequences that vary at 10 sites yields 1024 (210)
combinations. A multiple alignment of eight sequences for
which 10 sites are variable for all four nucleotides (A, C, G
National Conference on Engineering Trends in Medical Science – NCETMS - 2014
ISSN: 2231-5381 http://www.ijettjournal.org Page 70
and T) yields 1048 576 (410) combinations. A multiple
alignment of eight sequences that shows sequence variation
restricted to pyrimidine nucleotides at four sites and among
all four different nucleotides at six sites would yield 65 536
(24 × 46) combinations. The number of combinatorial variants
implied by an alignment of a typical gene 1000 bp in length
for which only 10% of sites are variable would be far too
large to be represented on a chip. However, if the same
multiple alignment is broken down into sections of
approximately equal length, say between 15 and 30
nucleotides in length, and the implied variation associated
with each particular section is computed separately, the
number of variants needed to cover the variation implied by
the entire sequence alignment is reduced considerably. By
arranging oligonucleotides in a series of columns, each of
which corresponds to variation in one section of a gene, we
are able to circumvent the sequence reassembly problems
that are encountered by many alternative methods. This is
the essence of our approach.
5. APPLICATIONS
1. Genomic DNA from an individual is tested for hundreds
or thousands of genetic markers in a single hybridization.
This will yield a genetic fingerprint, which in turn may be
linked to the risk of developing single gene disorders or
particular common complex diseases.
2. Sequence variations of specific genes can be screened in a
test DNA sample, thereby greatly increasing the scope for
precise molecular diagnosis in single gene disorders or complex
genetic diseases.
3. DNA microarrays can be used to detect DNA , or detect RNA
(most commonly as cDNA after reverse transcription) that may or
may not be translated into proteins. The process of measuring
gene expression via cDNA is called expression analysis or
expression profing.
4. Finding genes underlying human diseases.
5. Identification diseases causing genes using microarray data
mining and gene ontology.
6.ADVANTAGES:
1.The DNA chip of Microarray technology shares the
problem of s tandardization with other molecular diagnostic
techniques.
2.Accuracy of diagnosis is 85% -90% .
3.Less time required for diagnosis as compared to other
molecular diagnostic technique.
4. Identification of genes and hence the associated proteins –
that are part of the disease process. Researchers could then
use that information to synthesize drugs that interact with
these proteins, thus reducing the disease's effect on the
body.
5.Use of this chip may improve treatment results, cut down
on side effects and reduce costs potentially spent on a priori
useless drugs.
6.An array is a technology that provides massively parallel
molecular-genetic information, usually in a visual format.
7.Recent studies demonstrate that chromosomal
rearrangements resulting in the loss of genes that play an
important role in preventing cells from becoming malignant,
a phenomenon known as loss of heterozygosity can be
efficiently detected with MicroArrays.
7.Open Access to a View of Systems Biology– All
GeneChip microarray content is designed from genomic
information in the public domain. The research community
has the opportunity to openly collaborate and share data
obtained on a single standardized platform.Arrays currently
under development show promise of extending these
capabilities even further.
8.CONCLUSION
DNA chip technology is the popping up in a varity of
application around the world. Each time the
technology is applied to biological question, it
typically replace much slower, more expensiv method
of obtaining answers, or it simply opens up a totally
new avenue of injury. DNA microarrays are used for
global understanding of abnormal gene expression
contributing to malignancy , discovery of new
prognostic or predictive indicators and biomarkers of
therapeutics response , prediction of drug side effects
during preclinical development and toxicology studies ,
which predicts treatment success or failure . Targeting
of therapy may improve treatment results , cut down
on side effects and reduce costs potentially spent on a
priori useless drugs.
9.REFERENCES : 1.www.gene-chip.com
2.www.cancer.org
3.www.bioinfotech.com 4.www.google.com
5.www.ncbi.com
National Conference on Engineering Trends in Medical Science – NCETMS - 2014
ISSN: 2231-5381 http://www.ijettjournal.org Page 71
Vampire Attacks: Draining Life from Wireless Ad-
Hoc Sensor Networks 1. Ravikant Singh, 2.Pallavi A. Mahajan, 3.Rupali R. Sonone, 4.Prof..Amit Tayade
1B.E. final year, CE, DBNCOET, Yavatmal, Maharashtra, India – 445001
.2B.E. final year, CE, DBNCOET, Yavatmal, Maharashtra, India – 445001.
3B.E ,final year CE, DBNCOET, Yavatmal, Maharashtra, India – 445001. 4Prof. CE,DEPT. DBNCOET, Yavatmal, Maharashtra, India – 445001.
Abstract — Ad-hoc low-power wireless networks are an
exciting research direction in sensing and pervasive
computing. Prior security work in this area has focused
primarily on denial of communication at the routing or
medium access control levels.This paper explores
resource depletion attacks at the routing protocol layer,
which permanently disable networks by quickly
draining nodes’ battery power. These “Vampire”
attacks are not specific to any specific protocol, but
rather rely on the properties of many popular classes of
routing protocols. We find that all examined protocols
are susceptible to Vampire attacks, which are
devastating, difficult to detect, and are easy to carry
outusing as few as one malicious insider sending only
protocol compliant messages. In the worst case, a single
Vampire can increase network-wide energy usage by a
factor of O(N), where N in the number of network
nodes. We discuss methods to mitigate these types of
attacks, including a new proof-of-concept protocol that
provably bounds the damage caused by Vampires
during the packet forwarding phase.
Keywords—Denial of service, security, routing, ad-hoc networks, sensor networks, wireless networks.
I. INTRODUCTION:
Ad-hoc wireless sensor networks (WSNs) promise exciting
new applications in the near future, such as ubiquitouson-
demand computing power, continuous connectivity,and
instantly-deployable communication for military and
firstresponders. Such networks already monitor
environmentalconditions, factory performance, and troop
deployment, toname a few applications. As WSNs become
more and morecrucial to the everyday functioning of
people and organizations,availability faults become less
tolerable — lack ofavailability can make the difference
between business as usualand lost productivity, power
outages, environmental disasters,and even lost lives; thus
high availability of these networksis a critical property, and
should hold even under maliciousconditions. Due to their
ad-hoc organization, wireless ad-hocnetworks are
particularly vulnerable to denial of service (DoS) attacks,
and a great deal of research has been done toenhance
survivability.While these schemes can prevent attacks on
the short-termavailability of a network, they do not address
attacks thataffect long-term availability — the most
permanent denialof service attack is to entirely deplete
nodes’ batteries. Thisis an instance of a resource depletion
attack, with batterypower as the resource of interest. In this
paper we considerhow routing protocols, even those
designed to be secure, lackprotection from these attacks,
which we call Vampire attacks,Ad-hoc wireless sensor
networks (WSNs) promise excitingnew applications in the
near future, such as ubiquitouson-demand computing
power, continuous connectivity,and instantly-deployable
communication for military and firstresponders. Such
networks already monitor environmentalconditions, factory
performance, and troop deployment, toname a few
applications. As WSNs become more and morecrucial to
the everyday functioning of people and
organizations,availability faults become less tolerable —
lack ofavailability can make the difference between
business as usualand lost productivity, power outages,
environmental disasters,and even lost lives; thus high
availability of these networksis a critical property, and
should hold even under maliciousconditions. Due to their
ad-hoc organization, wireless ad-hocnetworks are
particularly vulnerable to denial of service (DoS)attacks ,
and a great deal of research has been done toenhance
survivability.While these schemes can prevent attacks on
the short-termavailability of a network, they do not address
attacks thataffect long-term availability — the most
permanent denialof service attack is to entirely deplete
nodes’ batteries. Thisis an instance of a resource depletion
attack, with batterypower as the resource of interest. In this
paper we considerhow routing protocols, even those
designed to be secure, lackprotection from these attacks,
which we call Vampire attacks,since they drain the life
from networks nodes.
Protocols and assumptions:
In this paper we consider the effect of Vampire attacks
onlink-state, distance-vector, source routing, and
geographic and
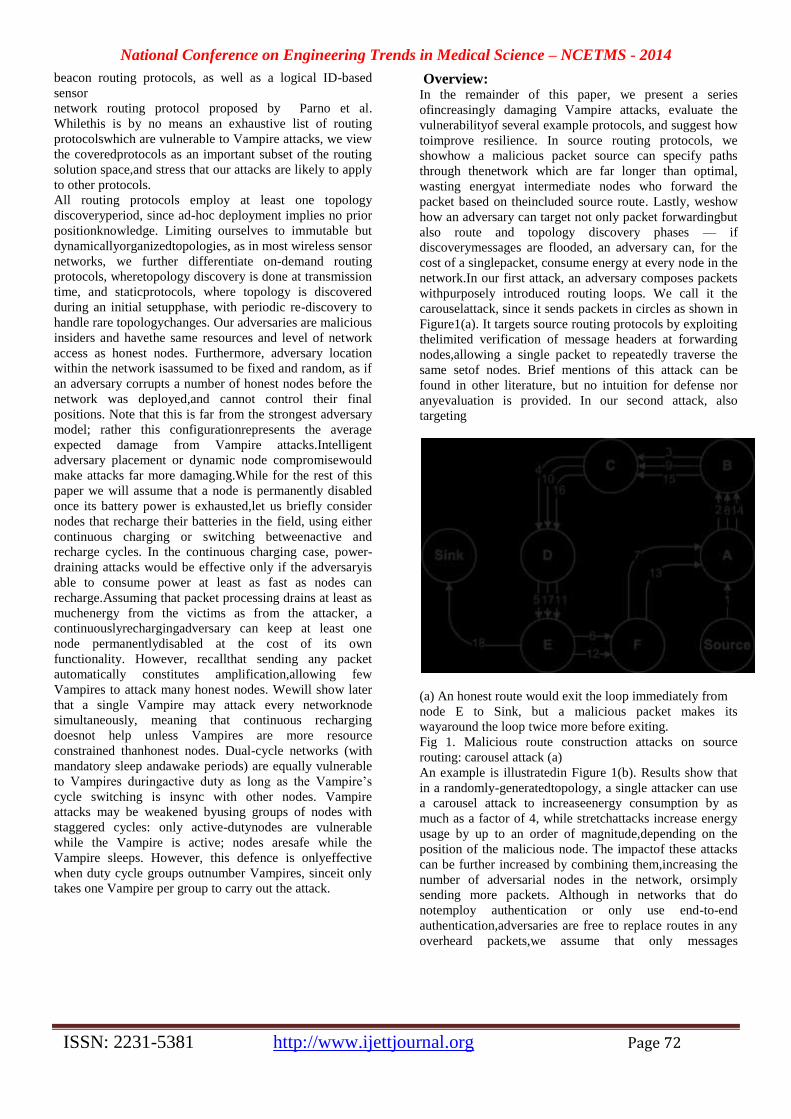
National Conference on Engineering Trends in Medical Science – NCETMS - 2014
ISSN: 2231-5381 http://www.ijettjournal.org Page 72
beacon routing protocols, as well as a logical ID-based
sensor
network routing protocol proposed by Parno et al.
Whilethis is by no means an exhaustive list of routing
protocolswhich are vulnerable to Vampire attacks, we view
the coveredprotocols as an important subset of the routing
solution space,and stress that our attacks are likely to apply
to other protocols.
All routing protocols employ at least one topology
discoveryperiod, since ad-hoc deployment implies no prior
positionknowledge. Limiting ourselves to immutable but
dynamicallyorganizedtopologies, as in most wireless sensor
networks, we further differentiate on-demand routing
protocols, wheretopology discovery is done at transmission
time, and staticprotocols, where topology is discovered
during an initial setupphase, with periodic re-discovery to
handle rare topologychanges. Our adversaries are malicious
insiders and havethe same resources and level of network
access as honest nodes. Furthermore, adversary location
within the network isassumed to be fixed and random, as if
an adversary corrupts a number of honest nodes before the
network was deployed,and cannot control their final
positions. Note that this is far from the strongest adversary
model; rather this configurationrepresents the average
expected damage from Vampire attacks.Intelligent
adversary placement or dynamic node compromisewould
make attacks far more damaging.While for the rest of this
paper we will assume that a node is permanently disabled
once its battery power is exhausted,let us briefly consider
nodes that recharge their batteries in the field, using either
continuous charging or switching betweenactive and
recharge cycles. In the continuous charging case, power-
draining attacks would be effective only if the adversaryis
able to consume power at least as fast as nodes can
recharge.Assuming that packet processing drains at least as
muchenergy from the victims as from the attacker, a
continuouslyrechargingadversary can keep at least one
node permanentlydisabled at the cost of its own
functionality. However, recallthat sending any packet
automatically constitutes amplification,allowing few
Vampires to attack many honest nodes. Wewill show later
that a single Vampire may attack every networknode
simultaneously, meaning that continuous recharging
doesnot help unless Vampires are more resource
constrained thanhonest nodes. Dual-cycle networks (with
mandatory sleep andawake periods) are equally vulnerable
to Vampires duringactive duty as long as the Vampire’s
cycle switching is insync with other nodes. Vampire
attacks may be weakened byusing groups of nodes with
staggered cycles: only active-dutynodes are vulnerable
while the Vampire is active; nodes aresafe while the
Vampire sleeps. However, this defence is onlyeffective
when duty cycle groups outnumber Vampires, sinceit only
takes one Vampire per group to carry out the attack.
Overview: In the remainder of this paper, we present a series
ofincreasingly damaging Vampire attacks, evaluate the
vulnerabilityof several example protocols, and suggest how
toimprove resilience. In source routing protocols, we
showhow a malicious packet source can specify paths
through thenetwork which are far longer than optimal,
wasting energyat intermediate nodes who forward the
packet based on theincluded source route. Lastly, weshow
how an adversary can target not only packet forwardingbut
also route and topology discovery phases — if
discoverymessages are flooded, an adversary can, for the
cost of a singlepacket, consume energy at every node in the
network.In our first attack, an adversary composes packets
withpurposely introduced routing loops. We call it the
carouselattack, since it sends packets in circles as shown in
Figure1(a). It targets source routing protocols by exploiting
thelimited verification of message headers at forwarding
nodes,allowing a single packet to repeatedly traverse the
same setof nodes. Brief mentions of this attack can be
found in other literature, but no intuition for defense nor
anyevaluation is provided. In our second attack, also
targeting
(a) An honest route would exit the loop immediately from
node E to Sink, but a malicious packet makes its
wayaround the loop twice more before exiting.
Fig 1. Malicious route construction attacks on source
routing: carousel attack (a)
An example is illustratedin Figure 1(b). Results show that
in a randomly-generatedtopology, a single attacker can use
a carousel attack to increaseenergy consumption by as
much as a factor of 4, while stretchattacks increase energy
usage by up to an order of magnitude,depending on the
position of the malicious node. The impactof these attacks
can be further increased by combining them,increasing the
number of adversarial nodes in the network, orsimply
sending more packets. Although in networks that do
notemploy authentication or only use end-to-end
authentication,adversaries are free to replace routes in any
overheard packets,we assume that only messages
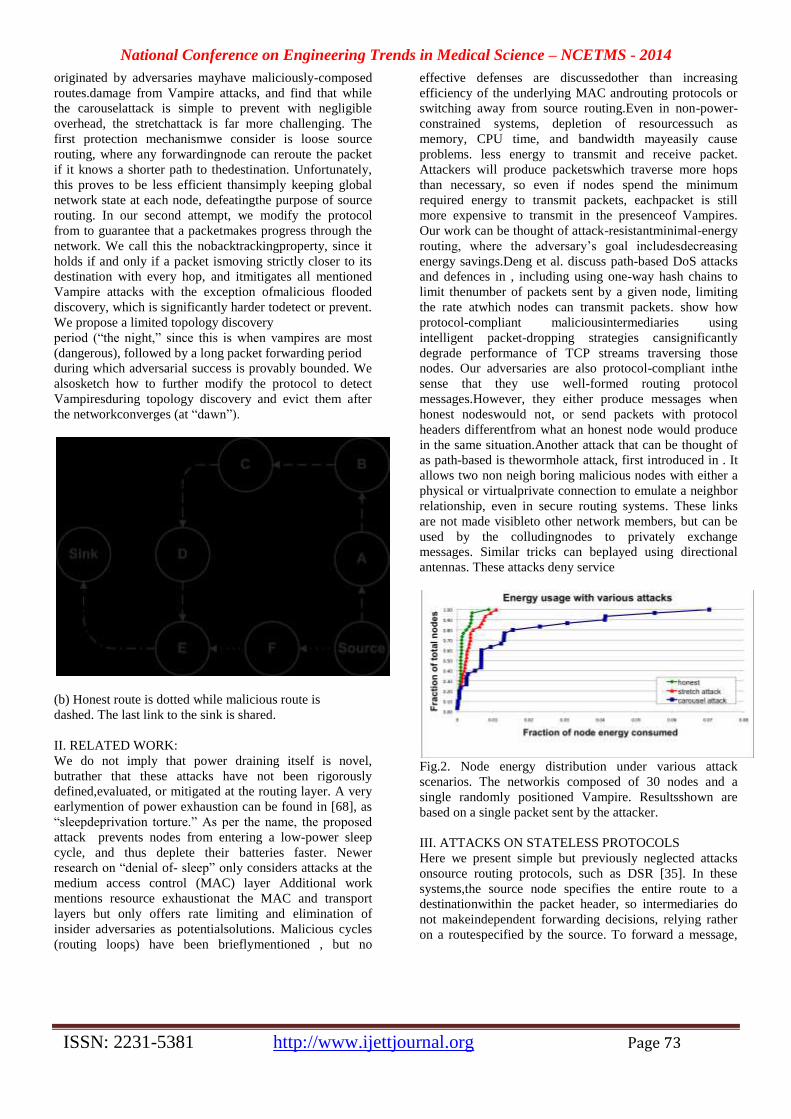
National Conference on Engineering Trends in Medical Science – NCETMS - 2014
ISSN: 2231-5381 http://www.ijettjournal.org Page 73
originated by adversaries mayhave maliciously-composed
routes.damage from Vampire attacks, and find that while
the carouselattack is simple to prevent with negligible
overhead, the stretchattack is far more challenging. The
first protection mechanismwe consider is loose source
routing, where any forwardingnode can reroute the packet
if it knows a shorter path to thedestination. Unfortunately,
this proves to be less efficient thansimply keeping global
network state at each node, defeatingthe purpose of source
routing. In our second attempt, we modify the protocol
from to guarantee that a packetmakes progress through the
network. We call this the nobacktrackingproperty, since it
holds if and only if a packet ismoving strictly closer to its
destination with every hop, and itmitigates all mentioned
Vampire attacks with the exception ofmalicious flooded
discovery, which is significantly harder todetect or prevent.
We propose a limited topology discovery
period (“the night,” since this is when vampires are most
(dangerous), followed by a long packet forwarding period
during which adversarial success is provably bounded. We
alsosketch how to further modify the protocol to detect
Vampiresduring topology discovery and evict them after
the networkconverges (at “dawn”).
(b) Honest route is dotted while malicious route is
dashed. The last link to the sink is shared.
II. RELATED WORK:
We do not imply that power draining itself is novel,
butrather that these attacks have not been rigorously
defined,evaluated, or mitigated at the routing layer. A very
earlymention of power exhaustion can be found in [68], as
“sleepdeprivation torture.” As per the name, the proposed
attack prevents nodes from entering a low-power sleep
cycle, and thus deplete their batteries faster. Newer
research on “denial of- sleep” only considers attacks at the
medium access control (MAC) layer Additional work
mentions resource exhaustionat the MAC and transport
layers but only offers rate limiting and elimination of
insider adversaries as potentialsolutions. Malicious cycles
(routing loops) have been brieflymentioned , but no
effective defenses are discussedother than increasing
efficiency of the underlying MAC androuting protocols or
switching away from source routing.Even in non-power-
constrained systems, depletion of resourcessuch as
memory, CPU time, and bandwidth mayeasily cause
problems. less energy to transmit and receive packet.
Attackers will produce packetswhich traverse more hops
than necessary, so even if nodes spend the minimum
required energy to transmit packets, eachpacket is still
more expensive to transmit in the presenceof Vampires.
Our work can be thought of attack-resistantminimal-energy
routing, where the adversary’s goal includesdecreasing
energy savings.Deng et al. discuss path-based DoS attacks
and defences in , including using one-way hash chains to
limit thenumber of packets sent by a given node, limiting
the rate atwhich nodes can transmit packets. show how
protocol-compliant maliciousintermediaries using
intelligent packet-dropping strategies cansignificantly
degrade performance of TCP streams traversing those
nodes. Our adversaries are also protocol-compliant inthe
sense that they use well-formed routing protocol
messages.However, they either produce messages when
honest nodeswould not, or send packets with protocol
headers differentfrom what an honest node would produce
in the same situation.Another attack that can be thought of
as path-based is thewormhole attack, first introduced in . It
allows two non neigh boring malicious nodes with either a
physical or virtualprivate connection to emulate a neighbor
relationship, even in secure routing systems. These links
are not made visibleto other network members, but can be
used by the colludingnodes to privately exchange
messages. Similar tricks can beplayed using directional
antennas. These attacks deny service
Fig.2. Node energy distribution under various attack
scenarios. The networkis composed of 30 nodes and a
single randomly positioned Vampire. Resultsshown are
based on a single packet sent by the attacker.
III. ATTACKS ON STATELESS PROTOCOLS
Here we present simple but previously neglected attacks
onsource routing protocols, such as DSR [35]. In these
systems,the source node specifies the entire route to a
destinationwithin the packet header, so intermediaries do
not makeindependent forwarding decisions, relying rather
on a routespecified by the source. To forward a message,
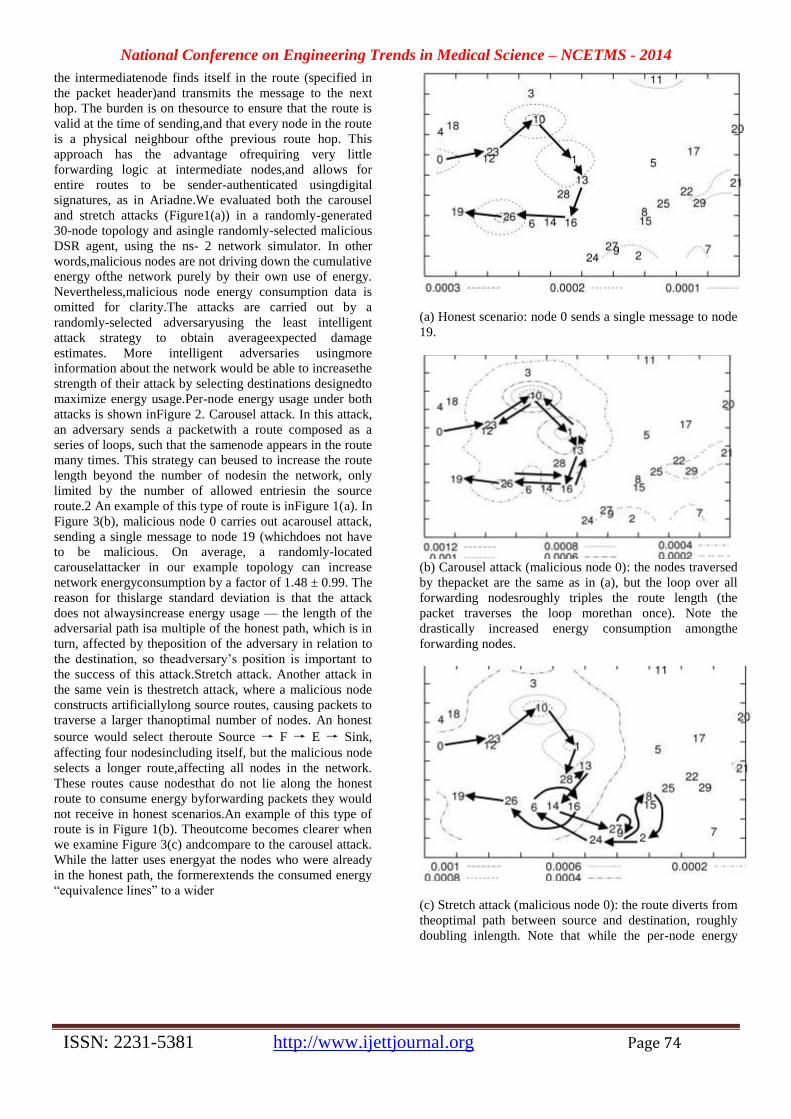
National Conference on Engineering Trends in Medical Science – NCETMS - 2014
ISSN: 2231-5381 http://www.ijettjournal.org Page 74
the intermediatenode finds itself in the route (specified in
the packet header)and transmits the message to the next
hop. The burden is on thesource to ensure that the route is
valid at the time of sending,and that every node in the route
is a physical neighbour ofthe previous route hop. This
approach has the advantage ofrequiring very little
forwarding logic at intermediate nodes,and allows for
entire routes to be sender-authenticated usingdigital
signatures, as in Ariadne.We evaluated both the carousel
and stretch attacks (Figure1(a)) in a randomly-generated
30-node topology and asingle randomly-selected malicious
DSR agent, using the ns- 2 network simulator. In other
words,malicious nodes are not driving down the cumulative
energy ofthe network purely by their own use of energy.
Nevertheless,malicious node energy consumption data is
omitted for clarity.The attacks are carried out by a
randomly-selected adversaryusing the least intelligent
attack strategy to obtain averageexpected damage
estimates. More intelligent adversaries usingmore
information about the network would be able to increasethe
strength of their attack by selecting destinations designedto
maximize energy usage.Per-node energy usage under both
attacks is shown inFigure 2. Carousel attack. In this attack,
an adversary sends a packetwith a route composed as a
series of loops, such that the samenode appears in the route
many times. This strategy can beused to increase the route
length beyond the number of nodesin the network, only
limited by the number of allowed entriesin the source
route.2 An example of this type of route is inFigure 1(a). In
Figure 3(b), malicious node 0 carries out acarousel attack,
sending a single message to node 19 (whichdoes not have
to be malicious. On average, a randomly-located
carouselattacker in our example topology can increase
network energyconsumption by a factor of 1.48 ± 0.99. The
reason for thislarge standard deviation is that the attack
does not alwaysincrease energy usage — the length of the
adversarial path isa multiple of the honest path, which is in
turn, affected by theposition of the adversary in relation to
the destination, so theadversary’s position is important to
the success of this attack.Stretch attack. Another attack in
the same vein is thestretch attack, where a malicious node
constructs artificiallylong source routes, causing packets to
traverse a larger thanoptimal number of nodes. An honest
source would select theroute Source → F → E → Sink,
affecting four nodesincluding itself, but the malicious node
selects a longer route,affecting all nodes in the network.
These routes cause nodesthat do not lie along the honest
route to consume energy byforwarding packets they would
not receive in honest scenarios.An example of this type of
route is in Figure 1(b). Theoutcome becomes clearer when
we examine Figure 3(c) andcompare to the carousel attack.
While the latter uses energyat the nodes who were already
in the honest path, the formerextends the consumed energy
“equivalence lines” to a wider
(a) Honest scenario: node 0 sends a single message to node
19.
(b) Carousel attack (malicious node 0): the nodes traversed
by thepacket are the same as in (a), but the loop over all
forwarding nodesroughly triples the route length (the
packet traverses the loop morethan once). Note the
drastically increased energy consumption amongthe
forwarding nodes.
(c) Stretch attack (malicious node 0): the route diverts from
theoptimal path between source and destination, roughly
doubling inlength. Note that while the per-node energy
National Conference on Engineering Trends in Medical Science – NCETMS - 2014
ISSN: 2231-5381 http://www.ijettjournal.org Page 75
consumption increase isnot as drastic as in (b), the region
of increased energy consumptionis larger. Overall energy
consumption is greater than in the carouselattack, but
spread more evenly over more network nodes.
Fig. 3. Energy map of the network in terms of fraction of
energy consumedper node. Black arrows show the packet
path through the network. Each dottedline represents an
“energy equivalence zone,” similar to an area of
equalelevation on a topological chart. Each line is marked
with the energy loss bya node as a fraction of total original
charge.
IV. ATTACKS ON STATEFUL PROTOCOLS
We now move on to stateful routing protocols, where
Network nodes are aware of the network topology and its
state,
and make local forwarding decisions based on that stored
state.Two important classes of statefulprotocols are link-
state anddistance-vector. In link-state protocols, such as
OLSR, nodes keep a record of the up-or-down state of links
in thenetwork, and flood routing updates every time a link
goesdown or a new link is enabled. Distance-vector
protocols likeDSDV keep track of the next hop to every
destination,indexed by a route cost metric, e.g. the number
of hops. Inthis scheme, only routing updates that change
the cost of agiven route need to be propagated.Routes in
link-state and distance-vector networks are
builtdynamically from many independent forwarding
decisions, soadversaries have limited power to affect
packet forwarding,making these protocols immune to
carousel and stretch attacks. While this may seem benign in
a dense obstaclefreetopology,worst-case bounds are no
better than in the caseof the stretch attack on DSR. For
instance, consider the specialcase of a ring topology:
forwarding a packet in the reversedirection causes it to
traverse every node in the network (orat least a significant
number, assuming the malicious nodeis not the packet
source but rather a forwarder), increasingour network-wide
energy consumption by a factor . It can be performed more
than once, depositingthe packet at various distant points in
the network, at theadditional cost to the adversary for each
use of the directionalantenna. Amalicious node has a
number of ways to induce a perceivedtopology change: it
may simply falsely claim that a link isdown, or claim a new
link to a non-existent node. Securitymeasures, such as
those proposed by Reffo et al. in maybe sufficient to
alleviate this particular problem. Therefore, let us
assumeclosed (Sybil-resistant) networks where link states
areauthenticated, similar to route authentication in Ariadne
or path-vector signatures in .Adding moremalicious nodes
to the mix increases the number of possibleroute
announce/withdrawal pairs. Packet Leashes [30]
cannotprevent this attack, with the reasoning being similar
to thedirectional antenna attack — since the originators are
themselvesmalicious, they would forward messages
through thewormhole, and return only seemingly valid (and
functional)routes in response to discovery.
V. CLEAN-SLATE SENSOR NETWORK ROUTING
In this section we show that a clean-slate secure
sensornetwork routing protocol by Parno, Luk, Gaustad,
and Perrig(“PLGP” from here on) [53] can be modified to
provablyresist Vampire attacks during the packet
forwarding phase.The original version of the protocol,
although designed forsecurity, is vulnerable to Vampire
attacks. PLGP consists ofa topology discovery phase,
followed by a packet forwardingphase, with the former
optionally repeated on a fixed scheduleto ensure that
topology information stays current. Throughout this
process, nodes build a tree of neighbour relationships and
group membership that will later be used foraddressing and
routing.All leaf nodes in the tree arephysical nodes in the
network, and their virtual addresses correspondto their
position in the tree (see Figure 6). All nodes learn each
others’ virtual addresses and cryptographic keys.The final
address tree is verifiable after network convergence,and all
forwarding decisions can be independently
verified.Furthermore, assuming each legitimate network
node has aunique certificate of membership (assigned
before network deployment),nodes who attempt to join
multiple groups, produceclones of themselves in multiple
locations, or otherwise cheatduring discovery can be
identified and evicted.
VI. PROVABLE SECURITY AGAINST VAMPIRE
ATTACKS
Here we modify the forwarding phase of PLGP to
provablyavoid the above-mentioned attacks. First we
introduce the nobacktrackingproperty, satisfied for a given
packet if and onlyif it consistently makes progress toward
its destination in thelogical network address space. More
formally:Definition 1. No-backtracking is satisfied if every
packetp traverses the same number of hops whether or not
anadversary is present in the network. (Maliciously-
inducedroute stretch is bounded to a factor of 1.). This does
not imply that every packet in the networkmust travel the
same number of hops regardless of sourceor destination,
but rather that a packet sent to node D by amalicious node
at location L will traverse the same numberof hops as a
packet sent to D by a node at location L that ishonest. The
only notable exceptions are when adversaries dropor
mangle packets en route, but since we are only
concernedwith packets initiated by adversaries, we can
safely ignore thissituation: “pre-mangled” packets achieve
the same result —they will be dropped by an honest
intermediary or destination.No-backtracking implies
Vampire resistance. It is notimmediately obvious why no-
backtracking prevents Vampireattacks in the forwarding
phase. Recall the reason for thesuccess of the stretch attack:
intermediate nodes in a sourceroute cannot check whether
the source-defined route is optimal,or even that it makes
progress toward the destination.When nodes make
independent routing decisions such asin link-state,
distance-vector, coordinate-based, or becanvasedprotocols,
National Conference on Engineering Trends in Medical Science – NCETMS - 2014
ISSN: 2231-5381 http://www.ijettjournal.org Page 76
packets cannot contain maliciously composedroutes. This
already means the adversary cannot performcarousel or
stretch attacks — no node may unilaterally specifya
suboptimal path through the network. However, a
sufficientlyclever adversary may still influence packet
progress. We canprevent this interference by independently
checking on packetprogress: if nodes keep track of route
“cost” or metric and,when forwarding a packet,
communicate the local cost to the next hop, that next hop
can verify that the remainingroute cost is lower than before,
and therefore the packetis making progress toward its
destination. PLGPdiffers from other protocols in that
packets paths are furtherbounded by a tree, forwarding
packets along the shortest routethrough the tree that is
allowed by the physical topology. Inother words, packet
paths are constrained both by physicalneighbour
relationships and the routing tree. To preserve no-
backtracking, we add a verifiable path historyto every
PLGP packet, similar to route authentications in Ariadne [
and path-vector signatures in. The resultingprotocol, PLGP
with attestations (PLGPa) uses thispacket history together
with PLGP’s tree routing structureso every node can
securely verify progress, preventing anysignificant
adversarial influence on the path taken by anypacket which
traverses at least one honest node.Ouradversary is assumed
to control m nodes in an N-nodenetwork (with their
corresponding identity certificates andother secret
cryptographic material) and has perfect knowledgeof the
network topology. Finally, the adversary cannot
affectconnectivity between any two honest nodes.
VII. PERFORMANCE CONSIDERATIONS
PLGP imposes increased setup cost over BVR [21],
butcompares favorably to in terms of packet forwarding
overhead.
While path stretch increases by a factor of 1.5–2,
messagedelivery success without resorting to localized
flooding is improved:PLGP never floods, while BVR must
flood 5–10% ofpackets depending on network size and
topology [53]. PLGPalso demonstrates more equitable
routing load distribution andpath diversity than BVR. Since
the forwarding phase shouldlast considerably longer than
setup, PLGP offers performancecomparable to BVR in the
average case.PLGPa includes path attestations, increasing
the size ofevery packet, incurring penalties in terms of
bandwidth use,and thus radio power. Adding extra packet
verification requirementsfor intermediate nodes also
increases processorutilization, requiring time and additional
power. Of coursethere is nothing to be gained in
completely non-adversarialenvironments, but in the
presence of even a small number ofmalicious nodes, the
increased overhead becomes worthwhilewhen considering
the potential damage of Vampire attacks.The bandwidth
overhead of our attestation scheme is minimal,as chain
signatures are compact (less than 30 bytes).Comparatively,
a minimum-size DSR route request packet withno route,
payload, or additional options is 12 bytes, weused 512-byte
data packets in our simulations. The additionalbandwidth,
therefore, is not significant, increasing per-packettransmit
power by about 4.8μJ, plus roughly half for additional
power required to receive. Energy expenditure for
cryptographic operations at intermediatehops is,
unfortunately, much greater than transmit orreceive
overhead, and much more dependent on the specificchipset
used to construct the sensor. However, we can make
aneducated guess about expected performance and power
costs.Highly-optimized software-only implementations of
AES-128,a common symmetric cryptographic primitive,
require about 10to 15 cycles per byte of data on modern
32-bit x86 processors without AES-specific instruction sets
or cryptographic coprocessors. Due to the rapid growth in
the mobile space and increased awareness of security
requirements, there hasbeen significant recent work in
evaluating symmetric andasymmetric cryptographic
performance on inexpensive andlow-power devices.
Theircircuitry uses 400 to 800 cycles per round (on 8- and
16-bitarchitectures, respectively) in the high-current
configuration(comparable in terms of clock cycles to AES
for RFID [20],but with half to one-tenth the gates and
vastly less power),and 1088 cycles when using about 6
times less current.Chain signatures are a somewhat more
exotic construction, M and require bilinear maps,
potentially requiring even morecostly computation than
other asymmetric cryptosystems.. Assuming a node
performs bothsignature verification as well as a signature
append operation,adding attestations to PLGP introduces
roughly the sameoverhead as increasing packet sizes by 90
bytes, taking intoaccount transmit power and cryptographic
operations. Withoutspecialized hardware, we estimate
cryptographic computation overhead, and thus increased
power utilization, of a factor of2–4 per packet on 32-bit
processors, but mostly independentof the route length or
the number of nodes in the network:while the hop record
and chain signature do grow, their sizeincrease is
negligible. In other words, the overhead is constant(O(1))
for a given network configuration (maximum pathlength),
and cannot be influenced by an adversary.
Fortunately,hardware cryptographic accelerators are
increasingly common
and inexpensive to compensate for increased security
demandson low-power devices, which lead to increased
computationalload and reduced battery life In total, the
overhead on the entire network of PLGPa (overPLGP)
when using 32-bit processors or dedicated
cryptographicaccelerator is the energy equivalent of 90
additionalbytes per packet, or a factor O(xλ), where λ is the
path lengthbetween source and destination and x is 1.2–7.5,
dependingon average packet size (512 and 12 bytes,
respectively.
VIII. SECURING THE DISCOVERY PHASE
Without fully solving the problem of malicious
topologydiscovery, we can still mitigate it by forcing

National Conference on Engineering Trends in Medical Science – NCETMS - 2014
ISSN: 2231-5381 http://www.ijettjournal.org Page 77
synchronous discoveryand ignoring discovery messages
during the interveningperiods. This can lead to some nodes
being separated fromthe network for a period of time, and
is essentially a formof rate limiting. Although we rejected
rate limiting before, itis acceptable here since discovery
should consume a smallfraction of running time compared
to packet forwarding. Wecan enforce rate limits in a
number of ways, such as neighbour throttling [35] or one-
way hash chains [14]. We can alsooptimize discovery
algorithms [32] to minimize our windowof vulnerability. If
a network survives the high-risk discoveryperiod, it is
unlikely to suffer serious damage from Vampiresduring
normal packet forwarding.While PLGPa is not vulnerable
to Vampire attacks duringthe forwarding phase, we cannot
make the same claim aboutdiscovery. However, we can
give some intuition as to howto further modify PLGPa to
bound damage from maliciousdiscovery. (The value of that
bound in practice remains anopen problem.) The major
issue is that malicious nodes canuse directional antennas to
masquerade neighbours to any or allnodes in the network,
and therefore look like a group of sizeone, with which
other groups will try to preferentially merge.Merge
requests are composed of the requested group’s ID aswell
as all the group members’ IDs, and the receiving nodewill
flood this request to other group members. Even
assuminggroups generate signed tokens that cost no energy
to verify,a Vampire would be able to flood its group with
every groupdescriptor it knows, and use its directional
antenna to snoopon broadcasts outside their neighbor
range, relaying mergerequests from entirely honest groups.
Since each Vampirewill start as a group of one, other
groups will issue mergerequests, which the Vampire can
deny. In PLGP, denials areonly allowed if another merge is
in progress, so if we modifythe reject message to include
the ID of the group with whichthe merge is in progress
(and a signature for non-repudiation),these messages can be
kept and replayed at the end of thetopology discovery
period, detecting and removing nodeswho incorrectly deny
merge requests. Therefore, Vampiresreject legitimate
merge requests at their own peril. Any groupcontaining a
Vampire can be made to serially join with a“group”
composed only of each Vampire in the network (allof them
would have to advertise themselves as neighbours ofeach
group). Even wholly honest groups can be fooled
usingdirectional antennas: Vampires could maintain the
illusion thatit is a neighbor of a given group. Since join
events requiremultiparty computation and are flooded
throughout the group,this makes for a fairly effective
attack. PLGP already providesfor the discovery of such
subterfuge upon termination oftopology discovery: a node
who is a member of multiplegroups will be detected once
those groups join (and all groupsare guaranteed to merge
by the end of the protocol).Since PLGP offers the chance to
detect active Vampiresonce the network converges,
successive re-discovery periodsbecome safer. This is more
than can be said of other protocols,where malicious
behaviour during discovery may go undetected,or at least
unpunished. However, the bound we can placeon malicious
discovery damage in PLGPa is still unknown.Moreover, if
we can conclude that a single malicious nodecauses a
factor of k energy increase during discovery (andis then
expelled), it is not clear how that value scales
undercollusion among multiple malicious nodes.
IX. CONCLUSION
In this paper we defined Vampire attacks, a new classof
resource consumption attacks that use routing protocols to
permanently disable ad-hoc wireless sensor networks
bydepleting nodes’ battery power. These attacks do not
dependon particular protocols or implementations, but
rather exposevulnerabilities in a number of popular
protocol classes.We showed a number of proof-of-concept
attacks againstrepresentative examples of existing routing
protocols usinga small number of weak adversaries, and
measured theirattack success on a randomly-generated
topology of 30 nodes.Simulation results show that
depending on the location of theadversary, network energy
expenditure during the forwardingphase increases from
between 50 to 1,000 percent. Theoreticalworst-case energy
usage can increase by as much as a factor ofO(N) per
adversary per packet, where N is the network size.We
proposed defenses against some of the forwarding-
phaseattacks and described PLGPa, the first sensor network
routingprotocol that provably bounds damage from
Vampire attacksby verifying that packets consistently make
progress towardtheir destinations. We have not offered a
fully satisfactorysolution for Vampire attacks during the
topology discoveryphase, but suggested some intuition
about damage limitationspossible with further
modifications to PLGPa. Derivation ofdamage bounds and
defenses for topology discovery, as wellas handling mobile
networks, is left for future work.
REFERANCES: [1]The network simulator — ns-2.http://www.isi.edu/nsnam/ns/.
[2] Imad Aad, Jean-Pierre Hubaux, and Edward W. Knightly, Denial ofservice resilience in ad hoc networks, MobiCom, 2004.
[3] Gergely Acs, Levente Buttyan, and Istvan Vajda, Provably secure
ondemandsource routing in mobile ad hoc networks, IEEE Transactionson Mobile Computing 05 (2006), no. 11.
[4] Tuomas Aura, Dos-resistant authentication with client puzzles,
Internationalworkshop on security protocols, 2001.
[5] John Bellardo and Stefan Savage, 802.11 denial-of-service attacks:
realvulnerabilities and practical solutions, USENIX security, 2003.
[6] Daniel Bernstein and Peter Schwabe, New AES software speed records,INDOCRYPT, 2008.
[7] Daniel J. Bernstein, Syn cookies, 1996. http://cr.yp.to/syncookies.html
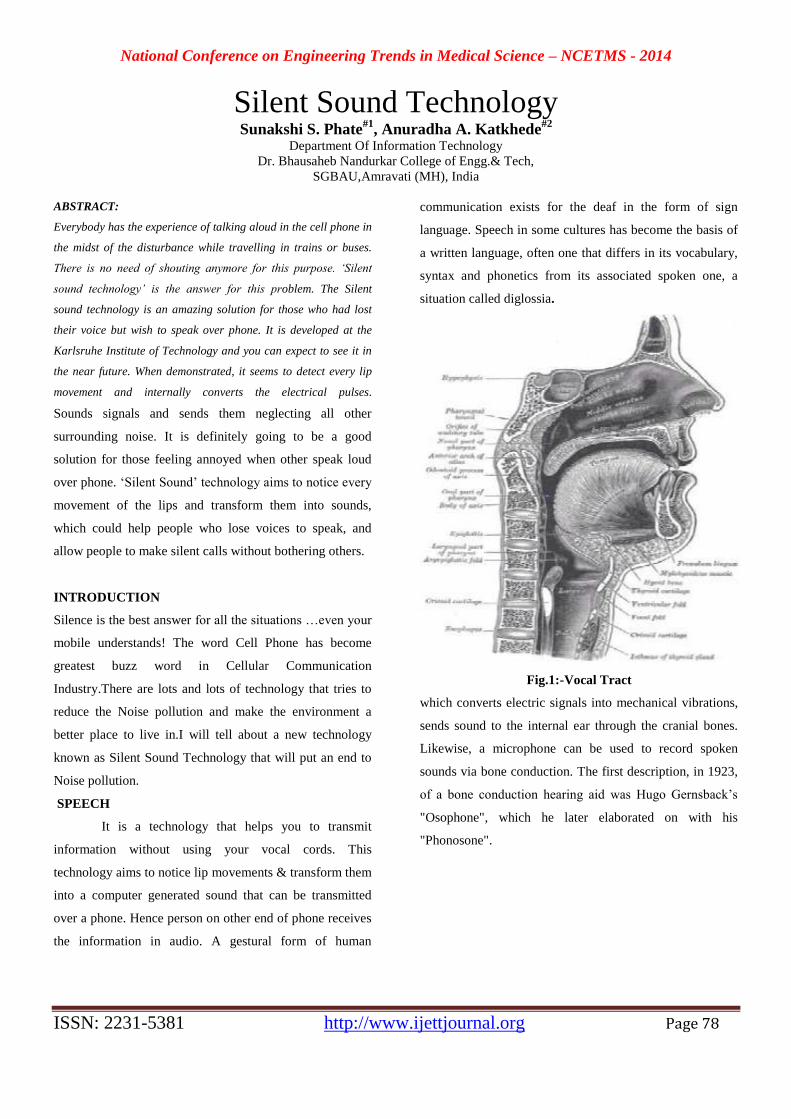
National Conference on Engineering Trends in Medical Science – NCETMS - 2014
ISSN: 2231-5381 http://www.ijettjournal.org Page 78
Silent Sound Technology Sunakshi S. Phate
#1, Anuradha A. Katkhede
#2
Department Of Information Technology
Dr. Bhausaheb Nandurkar College of Engg.& Tech,
SGBAU,Amravati (MH), India
ABSTRACT:
Everybody has the experience of talking aloud in the cell phone in
the midst of the disturbance while travelling in trains or buses.
There is no need of shouting anymore for this purpose. ‘Silent
sound technology’ is the answer for this problem. The Silent
sound technology is an amazing solution for those who had lost
their voice but wish to speak over phone. It is developed at the
Karlsruhe Institute of Technology and you can expect to see it in
the near future. When demonstrated, it seems to detect every lip
movement and internally converts the electrical pulses.
Sounds signals and sends them neglecting all other
surrounding noise. It is definitely going to be a good
solution for those feeling annoyed when other speak loud
over phone. ‘Silent Sound’ technology aims to notice every
movement of the lips and transform them into sounds,
which could help people who lose voices to speak, and
allow people to make silent calls without bothering others.
INTRODUCTION
Silence is the best answer for all the situations …even your
mobile understands! The word Cell Phone has become
greatest buzz word in Cellular Communication
Industry.There are lots and lots of technology that tries to
reduce the Noise pollution and make the environment a
better place to live in.I will tell about a new technology
known as Silent Sound Technology that will put an end to
Noise pollution.
SPEECH
It is a technology that helps you to transmit
information without using your vocal cords. This
technology aims to notice lip movements & transform them
into a computer generated sound that can be transmitted
over a phone. Hence person on other end of phone receives
the information in audio. A gestural form of human
communication exists for the deaf in the form of sign
language. Speech in some cultures has become the basis of
a written language, often one that differs in its vocabulary,
syntax and phonetics from its associated spoken one, a
situation called diglossia.
Fig.1:-Vocal Tract
which converts electric signals into mechanical vibrations,
sends sound to the internal ear through the cranial bones.
Likewise, a microphone can be used to record spoken
sounds via bone conduction. The first description, in 1923,
of a bone conduction hearing aid was Hugo Gernsback’s
"Osophone", which he later elaborated on with his
"Phonosone".
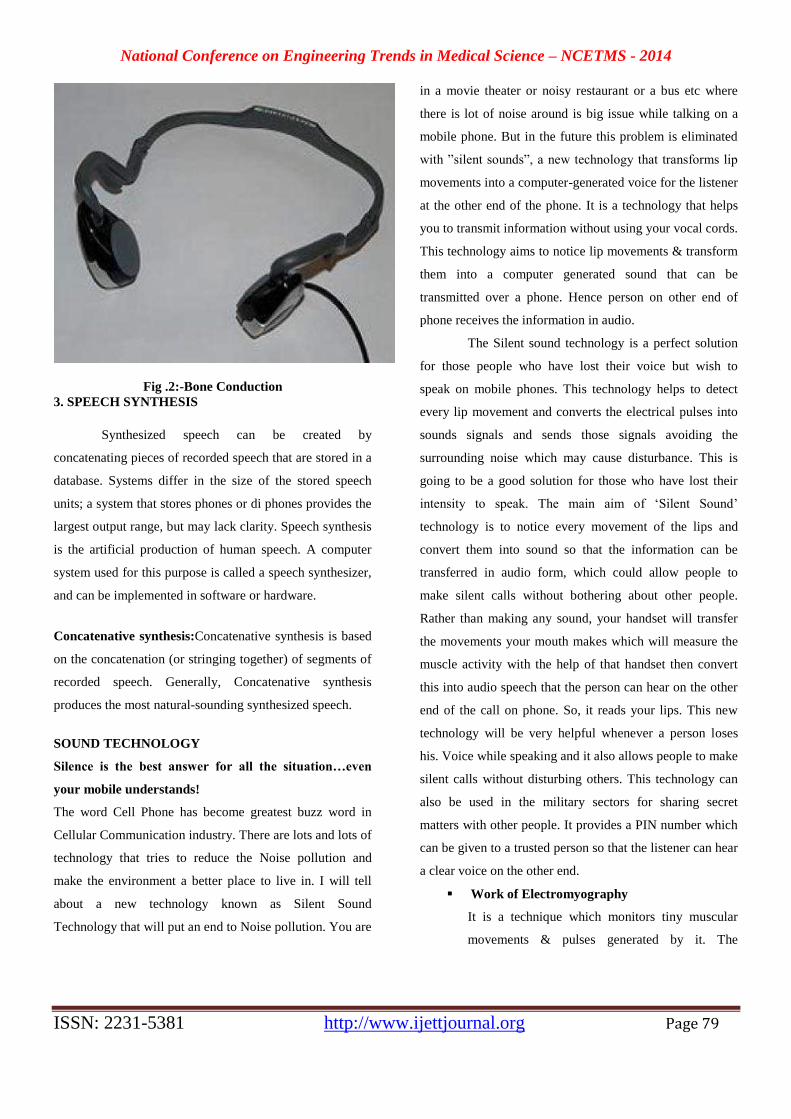
National Conference on Engineering Trends in Medical Science – NCETMS - 2014
ISSN: 2231-5381 http://www.ijettjournal.org Page 79
Fig .2:-Bone Conduction
3. SPEECH SYNTHESIS
Synthesized speech can be created by
concatenating pieces of recorded speech that are stored in a
database. Systems differ in the size of the stored speech
units; a system that stores phones or di phones provides the
largest output range, but may lack clarity. Speech synthesis
is the artificial production of human speech. A computer
system used for this purpose is called a speech synthesizer,
and can be implemented in software or hardware.
Concatenative synthesis:Concatenative synthesis is based
on the concatenation (or stringing together) of segments of
recorded speech. Generally, Concatenative synthesis
produces the most natural-sounding synthesized speech.
SOUND TECHNOLOGY
Silence is the best answer for all the situation…even
your mobile understands!
The word Cell Phone has become greatest buzz word in
Cellular Communication industry. There are lots and lots of
technology that tries to reduce the Noise pollution and
make the environment a better place to live in. I will tell
about a new technology known as Silent Sound
Technology that will put an end to Noise pollution. You are
in a movie theater or noisy restaurant or a bus etc where
there is lot of noise around is big issue while talking on a
mobile phone. But in the future this problem is eliminated
with ”silent sounds”, a new technology that transforms lip
movements into a computer-generated voice for the listener
at the other end of the phone. It is a technology that helps
you to transmit information without using your vocal cords.
This technology aims to notice lip movements & transform
them into a computer generated sound that can be
transmitted over a phone. Hence person on other end of
phone receives the information in audio.
The Silent sound technology is a perfect solution
for those people who have lost their voice but wish to
speak on mobile phones. This technology helps to detect
every lip movement and converts the electrical pulses into
sounds signals and sends those signals avoiding the
surrounding noise which may cause disturbance. This is
going to be a good solution for those who have lost their
intensity to speak. The main aim of ‘Silent Sound’
technology is to notice every movement of the lips and
convert them into sound so that the information can be
transferred in audio form, which could allow people to
make silent calls without bothering about other people.
Rather than making any sound, your handset will transfer
the movements your mouth makes which will measure the
muscle activity with the help of that handset then convert
this into audio speech that the person can hear on the other
end of the call on phone. So, it reads your lips. This new
technology will be very helpful whenever a person loses
his. Voice while speaking and it also allows people to make
silent calls without disturbing others. This technology can
also be used in the military sectors for sharing secret
matters with other people. It provides a PIN number which
can be given to a trusted person so that the listener can hear
a clear voice on the other end.
Work of Electromyography
It is a technique which monitors tiny muscular
movements & pulses generated by it. The
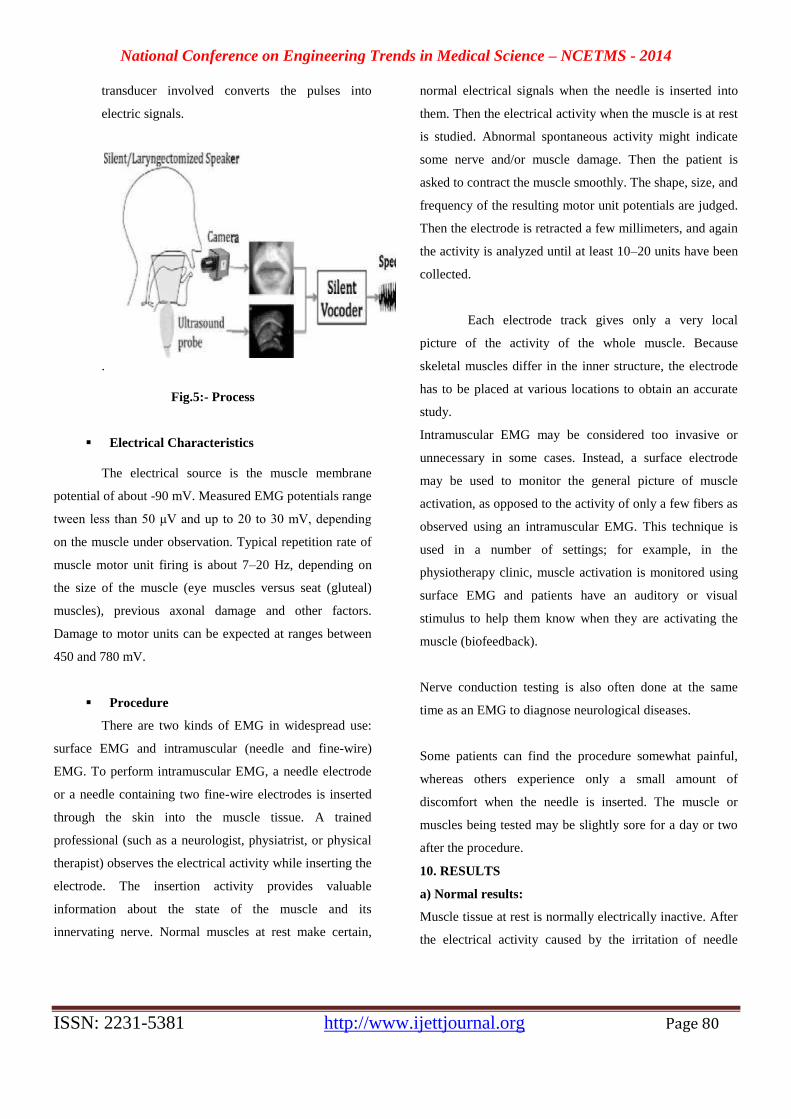
National Conference on Engineering Trends in Medical Science – NCETMS - 2014
ISSN: 2231-5381 http://www.ijettjournal.org Page 80
transducer involved converts the pulses into
electric signals.
.
Fig.5:- Process
Electrical Characteristics
The electrical source is the muscle membrane
potential of about -90 mV. Measured EMG potentials range
tween less than 50 μV and up to 20 to 30 mV, depending
on the muscle under observation. Typical repetition rate of
muscle motor unit firing is about 7–20 Hz, depending on
the size of the muscle (eye muscles versus seat (gluteal)
muscles), previous axonal damage and other factors.
Damage to motor units can be expected at ranges between
450 and 780 mV.
Procedure
There are two kinds of EMG in widespread use:
surface EMG and intramuscular (needle and fine-wire)
EMG. To perform intramuscular EMG, a needle electrode
or a needle containing two fine-wire electrodes is inserted
through the skin into the muscle tissue. A trained
professional (such as a neurologist, physiatrist, or physical
therapist) observes the electrical activity while inserting the
electrode. The insertion activity provides valuable
information about the state of the muscle and its
innervating nerve. Normal muscles at rest make certain,
normal electrical signals when the needle is inserted into
them. Then the electrical activity when the muscle is at rest
is studied. Abnormal spontaneous activity might indicate
some nerve and/or muscle damage. Then the patient is
asked to contract the muscle smoothly. The shape, size, and
frequency of the resulting motor unit potentials are judged.
Then the electrode is retracted a few millimeters, and again
the activity is analyzed until at least 10–20 units have been
collected.
Each electrode track gives only a very local
picture of the activity of the whole muscle. Because
skeletal muscles differ in the inner structure, the electrode
has to be placed at various locations to obtain an accurate
study.
Intramuscular EMG may be considered too invasive or
unnecessary in some cases. Instead, a surface electrode
may be used to monitor the general picture of muscle
activation, as opposed to the activity of only a few fibers as
observed using an intramuscular EMG. This technique is
used in a number of settings; for example, in the
physiotherapy clinic, muscle activation is monitored using
surface EMG and patients have an auditory or visual
stimulus to help them know when they are activating the
muscle (biofeedback).
Nerve conduction testing is also often done at the same
time as an EMG to diagnose neurological diseases.
Some patients can find the procedure somewhat painful,
whereas others experience only a small amount of
discomfort when the needle is inserted. The muscle or
muscles being tested may be slightly sore for a day or two
after the procedure.
10. RESULTS
a) Normal results:
Muscle tissue at rest is normally electrically inactive. After
the electrical activity caused by the irritation of needle
National Conference on Engineering Trends in Medical Science – NCETMS - 2014
ISSN: 2231-5381 http://www.ijettjournal.org Page 81
insertion subsides, the electromyography should detect no
abnormal spontaneous activity (i.e., a muscle at rest should
be electrically silent, with the exception of the area of the
neuromuscular junction, which is, under normal
circumstances, very spontaneously active). When the
muscle is voluntarily contracted, action potentials begin to
appear. As the strength of the muscle contraction is
increased, more and more muscle fibers produce action
potentials. When the muscle is fully contracted, there
should appear a disorderly group of action potentials of
varying rates and amplitudes (a complete recruitment and
interference pattern).
b) Abnormal results:
EMG is used to diagnose diseases that generally may be
classified into one of the following categories:
neuropathies, neuromuscular junction diseases and
sympathies.
Neuropathic disease has the following defining EMG
characteristics:
An action potential amplitude that is twice normal due to
the increased number of fibers per motor unit because
of reinnervation of denervated fibers
An increase in duration of the action potential
A decrease in the number of motor units in the muscle
(as found using motor unit
number estimation techniques)
Myopathic disease has these defining EMG characteristics:
A decrease in duration of the action potential.
A reduction in the area to amplitude ratio of the action
potential.
A decrease in the number of motor units in the muscle
(in extremely severe cases only).
Because of the individuality of each patient and disease,
some of these characteristics may not appear in every case.
11. EMG SIGNAL DECOMPOSITION
EMG signals are essentially made up of superimposed
motor unit action potentials (MUAPs) from several motor
units. For a thorough analysis, the measured EMG signals
can be decomposed into their constituent MUAPs. MUAPs
from different motor units tend to have different
characteristic shapes, while MUAPs recorded by the same
electrode from the same motor unit are typically similar.
Notably MUAP size and shape depend on where the
electrode is located with respect to the fibers and so can
appear to be different if the electrode moves position. EMG
decomposition is non-trivial, although many methods have
been proposed.
12. ADVANTAGES
Best suits for astronauts, as there was no medium
for communication of sound.
It is capable of translating into many languages as
the electrical signals are universal.
Silent sound technology has lifted the speech
recognition technology to the superior level.
Reduce noise.
13. DISADVANTAGES
Though silent sound technology has developed
with 99% of accuracy, still it is prone to some
errors.
Regarding the security, it is quite complicated to
accommodate.
Differentiating people across the world and
emotions are not recognized.
The user has a feel that talking to a robot when
they receiver final output.
It performs the function of translation but for
languages like Chinese has different tone in
critical situations it fails to translate with
accuracy.ch).

National Conference on Engineering Trends in Medical Science – NCETMS - 2014
ISSN: 2231-5381 http://www.ijettjournal.org Page 82
16. FUTURE WORK
The technology can also turn you into an instant polyglot.
Because the electrical pulses are universal, they can be
immediately transformed into the language of the user’s
choice.
“Native speakers can silently utter a sentence in their
language, and the receivers hear the translated sentence in
their language. It appears as if the native speaker produced
speech in a foreign language,” said Wand.
The translation technology works for languages like
English, French and German, but for languages like
Chinese, where different tones can hold many different
meanings, poses a problem, he added.“We are also working
on technology to be used in an office environment,” the
KIT scientist told AFP.
“But we’re working to overcome the remaining technical
difficulties. In five, maybe ten years, this will be useable,
everyday technology,
17.CONCLUSION
Thus Silent Sound Technology, one of the recent trends
in the field of information
Technology implements “Talking without Talking”.
It will be one of the innovation and useful technology
and in mere future this
technology will be use in our day to day life.
‘Silent Sound’ technology aims to notice every movement
of the lips and transform them into sounds, which could
help people who lose voices to speak, and allow people to
make silent calls without bothering others. Rather than
making any sounds, your handset would decipher the
movements your mouth makes by measuring muscle
activity, then convert this into speech that the person on the
other end of the call can hear. So, basically, it reads your
lips.
Engineers claim that the device is working with 99 percent
efficiency.
It is difficult to compare SSI technologies directly in a
meaningful way. Since many of the stems are still
preliminary, it would not make sense, for example, to
compare speech recognition scores or synthesis quality at
this stage.
With a few abstractions, however, it is possible to shed
light on the range of applicability and the potential for
future commercialization of the different method
18.REFERENCES
[1] Schultz T, Wand M. Modeling Co articulation in EMG-based
Continuous Speech Recognition.Speech Communication, 2010, 52, 341-
353
[2] Hueber T, Benaroya E-L, Chollet G, Denby B, Dreyfus G, Stone M,
Development of a silent speech interface driven by ultrasound and
optical images of the tongue and lips. Speech Communication, 2010, 52,
288–300
[3] Jorgensen C, Dusan S. Speech interfaces based upon surface
Electromyography. Speech Communication, 2010, 52, 354–366
[4] Denby B, Schultz T, Honda K, Hueber T, Gilbert J.M., Brumberg J.S.
(2010).Silentspeech interfaces. Speech Communication
[5] Hueber T, Benaroya E-L, Chollet G, Denby B, Dreyfus G, Stone M.
(2010) Development of a silent speech interface driven by ultrasound and
optical images of the tongue and lips. Speech Commun
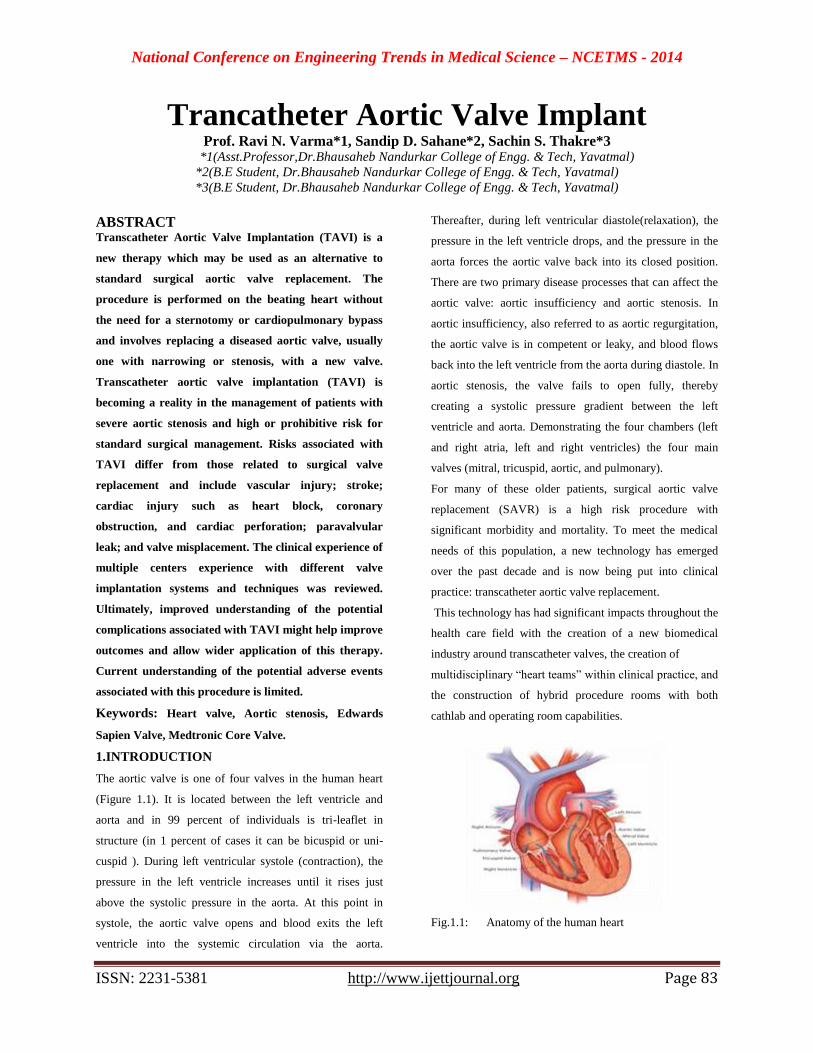
National Conference on Engineering Trends in Medical Science – NCETMS - 2014
ISSN: 2231-5381 http://www.ijettjournal.org Page 83
Trancatheter Aortic Valve Implant Prof. Ravi N. Varma*1, Sandip D. Sahane*2, Sachin S. Thakre*3
*1(Asst.Professor,Dr.Bhausaheb Nandurkar College of Engg. & Tech, Yavatmal)
*2(B.E Student, Dr.Bhausaheb Nandurkar College of Engg. & Tech, Yavatmal)
*3(B.E Student, Dr.Bhausaheb Nandurkar College of Engg. & Tech, Yavatmal)
ABSTRACT Transcatheter Aortic Valve Implantation (TAVI) is a
new therapy which may be used as an alternative to
standard surgical aortic valve replacement. The
procedure is performed on the beating heart without
the need for a sternotomy or cardiopulmonary bypass
and involves replacing a diseased aortic valve, usually
one with narrowing or stenosis, with a new valve.
Transcatheter aortic valve implantation (TAVI) is
becoming a reality in the management of patients with
severe aortic stenosis and high or prohibitive risk for
standard surgical management. Risks associated with
TAVI differ from those related to surgical valve
replacement and include vascular injury; stroke;
cardiac injury such as heart block, coronary
obstruction, and cardiac perforation; paravalvular
leak; and valve misplacement. The clinical experience of
multiple centers experience with different valve
implantation systems and techniques was reviewed.
Ultimately, improved understanding of the potential
complications associated with TAVI might help improve
outcomes and allow wider application of this therapy.
Current understanding of the potential adverse events
associated with this procedure is limited.
Keywords: Heart valve, Aortic stenosis, Edwards
Sapien Valve, Medtronic Core Valve.
1.INTRODUCTION
The aortic valve is one of four valves in the human heart
(Figure 1.1). It is located between the left ventricle and
aorta and in 99 percent of individuals is tri-leaflet in
structure (in 1 percent of cases it can be bicuspid or uni-
cuspid ). During left ventricular systole (contraction), the
pressure in the left ventricle increases until it rises just
above the systolic pressure in the aorta. At this point in
systole, the aortic valve opens and blood exits the left
ventricle into the systemic circulation via the aorta.
Thereafter, during left ventricular diastole(relaxation), the
pressure in the left ventricle drops, and the pressure in the
aorta forces the aortic valve back into its closed position.
There are two primary disease processes that can affect the
aortic valve: aortic insufficiency and aortic stenosis. In
aortic insufficiency, also referred to as aortic regurgitation,
the aortic valve is in competent or leaky, and blood flows
back into the left ventricle from the aorta during diastole. In
aortic stenosis, the valve fails to open fully, thereby
creating a systolic pressure gradient between the left
ventricle and aorta. Demonstrating the four chambers (left
and right atria, left and right ventricles) the four main
valves (mitral, tricuspid, aortic, and pulmonary).
For many of these older patients, surgical aortic valve
replacement (SAVR) is a high risk procedure with
significant morbidity and mortality. To meet the medical
needs of this population, a new technology has emerged
over the past decade and is now being put into clinical
practice: transcatheter aortic valve replacement.
This technology has had significant impacts throughout the
health care field with the creation of a new biomedical
industry around transcatheter valves, the creation of
multidisciplinary “heart teams” within clinical practice, and
the construction of hybrid procedure rooms with both
cathlab and operating room capabilities.
Fig.1.1: Anatomy of the human heart
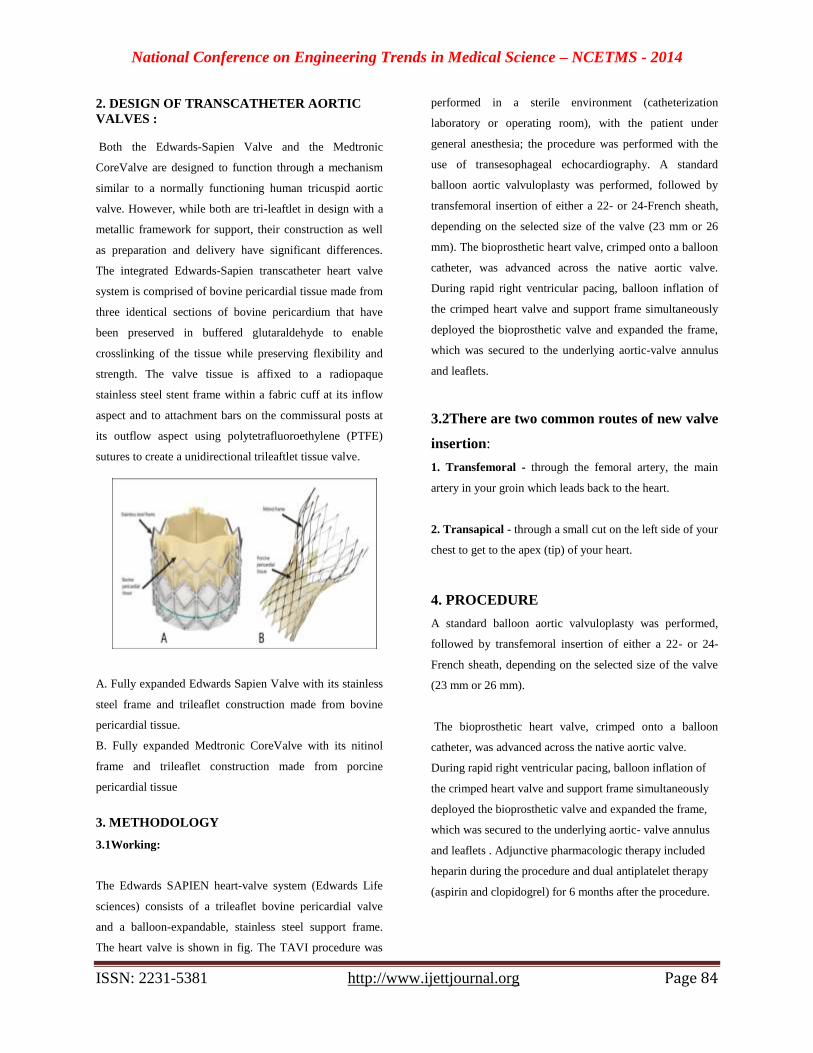
National Conference on Engineering Trends in Medical Science – NCETMS - 2014
ISSN: 2231-5381 http://www.ijettjournal.org Page 84
2. DESIGN OF TRANSCATHETER AORTIC
VALVES :
Both the Edwards-Sapien Valve and the Medtronic
CoreValve are designed to function through a mechanism
similar to a normally functioning human tricuspid aortic
valve. However, while both are tri-leaftlet in design with a
metallic framework for support, their construction as well
as preparation and delivery have significant differences.
The integrated Edwards-Sapien transcatheter heart valve
system is comprised of bovine pericardial tissue made from
three identical sections of bovine pericardium that have
been preserved in buffered glutaraldehyde to enable
crosslinking of the tissue while preserving flexibility and
strength. The valve tissue is affixed to a radiopaque
stainless steel stent frame within a fabric cuff at its inflow
aspect and to attachment bars on the commissural posts at
its outflow aspect using polytetrafluoroethylene (PTFE)
sutures to create a unidirectional trileaftlet tissue valve.
Fig. Sapien valve
A. Fully expanded Edwards Sapien Valve with its stainless
steel frame and trileaflet construction made from bovine
pericardial tissue.
B. Fully expanded Medtronic CoreValve with its nitinol
frame and trileaflet construction made from porcine
pericardial tissue
3. METHODOLOGY
3.1Working:
The Edwards SAPIEN heart-valve system (Edwards Life
sciences) consists of a trileaflet bovine pericardial valve
and a balloon-expandable, stainless steel support frame.
The heart valve is shown in fig. The TAVI procedure was
performed in a sterile environment (catheterization
laboratory or operating room), with the patient under
general anesthesia; the procedure was performed with the
use of transesophageal echocardiography. A standard
balloon aortic valvuloplasty was performed, followed by
transfemoral insertion of either a 22- or 24-French sheath,
depending on the selected size of the valve (23 mm or 26
mm). The bioprosthetic heart valve, crimped onto a balloon
catheter, was advanced across the native aortic valve.
During rapid right ventricular pacing, balloon inflation of
the crimped heart valve and support frame simultaneously
deployed the bioprosthetic valve and expanded the frame,
which was secured to the underlying aortic-valve annulus
and leaflets.
3.2There are two common routes of new valve
insertion:
1. Transfemoral - through the femoral artery, the main
artery in your groin which leads back to the heart.
2. Transapical - through a small cut on the left side of your
chest to get to the apex (tip) of your heart.
4. PROCEDURE
A standard balloon aortic valvuloplasty was performed,
followed by transfemoral insertion of either a 22- or 24-
French sheath, depending on the selected size of the valve
(23 mm or 26 mm).
The bioprosthetic heart valve, crimped onto a balloon
catheter, was advanced across the native aortic valve.
During rapid right ventricular pacing, balloon inflation of
the crimped heart valve and support frame simultaneously
deployed the bioprosthetic valve and expanded the frame,
which was secured to the underlying aortic- valve annulus
and leaflets . Adjunctive pharmacologic therapy included
heparin during the procedure and dual antiplatelet therapy
(aspirin and clopidogrel) for 6 months after the procedure.
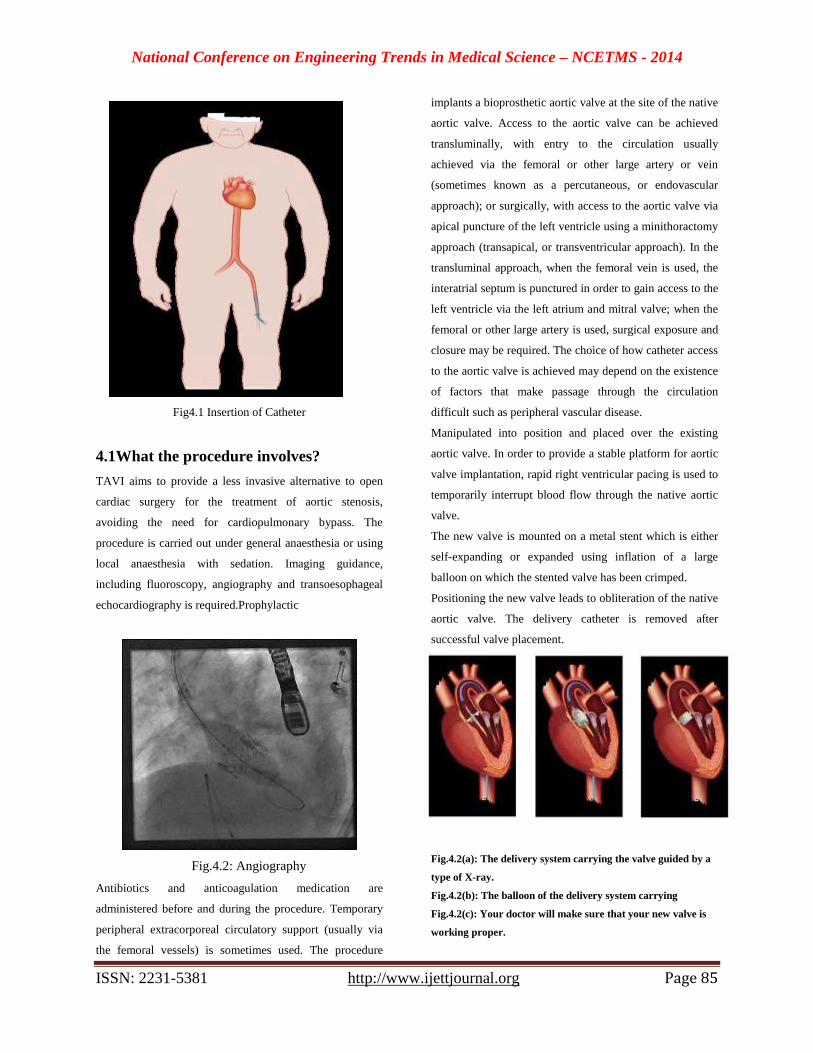
National Conference on Engineering Trends in Medical Science – NCETMS - 2014
ISSN: 2231-5381 http://www.ijettjournal.org Page 85
Fig4.1 Insertion of Catheter
4.1What the procedure involves?
TAVI aims to provide a less invasive alternative to open
cardiac surgery for the treatment of aortic stenosis,
avoiding the need for cardiopulmonary bypass. The
procedure is carried out under general anaesthesia or using
local anaesthesia with sedation. Imaging guidance,
including fluoroscopy, angiography and transoesophageal
echocardiography is required.Prophylactic
Fig.4.2: Angiography
Antibiotics and anticoagulation medication are
administered before and during the procedure. Temporary
peripheral extracorporeal circulatory support (usually via
the femoral vessels) is sometimes used. The procedure
implants a bioprosthetic aortic valve at the site of the native
aortic valve. Access to the aortic valve can be achieved
transluminally, with entry to the circulation usually
achieved via the femoral or other large artery or vein
(sometimes known as a percutaneous, or endovascular
approach); or surgically, with access to the aortic valve via
apical puncture of the left ventricle using a minithoractomy
approach (transapical, or transventricular approach). In the
transluminal approach, when the femoral vein is used, the
interatrial septum is punctured in order to gain access to the
left ventricle via the left atrium and mitral valve; when the
femoral or other large artery is used, surgical exposure and
closure may be required. The choice of how catheter access
to the aortic valve is achieved may depend on the existence
of factors that make passage through the circulation
difficult such as peripheral vascular disease.
Manipulated into position and placed over the existing
aortic valve. In order to provide a stable platform for aortic
valve implantation, rapid right ventricular pacing is used to
temporarily interrupt blood flow through the native aortic
valve.
The new valve is mounted on a metal stent which is either
self-expanding or expanded using inflation of a large
balloon on which the stented valve has been crimped.
Positioning the new valve leads to obliteration of the native
aortic valve. The delivery catheter is removed after
successful valve placement.
Fig.4.2(a): The delivery system carrying the valve guided by a
type of X-ray.
Fig.4.2(b): The balloon of the delivery system carrying
Fig.4.2(c): Your doctor will make sure that your new valve is
working proper.

National Conference on Engineering Trends in Medical Science – NCETMS - 2014
ISSN: 2231-5381 http://www.ijettjournal.org Page 86
5. Conclusions:
New recommendations and expert consensus
documents are being developed to help guide the
use of this new technology .
We are no longer in an era in which the old
boundaries between cardiac specialties apply.
To obtain the best outcome for the patient, there
must be a true collaboration between the
cardiothoracic surgeon and interventional
cardiologist, not only in evaluation of the patient
but in the procedure itself.
Just as with the development of the valve design,
the development of the “heart valve team” will
take time but is just as critical for the success of
this technology.
REFERENCES:
1. Leon MB, Smith CR, Mack M, et al. Transcatheter aortic-valve
implantation for aortic stenosis in patients who cannot undergo
surgery. N Engl J Med. 2010;363:1597---607.
2. Ryden L, Stokoe G, Breithardt G, et al., Task Force 2 of the
Cardiovascular Round Table of the European Society of
Cardiology. Patientaccess to medical technology across Europe.
Eur Heart J. 2004;25:611---6.
3. Smith CR, Leon MB, Mack MJ, et al. Transcatheter versus
surgical aortic-valve replacement in high-risk patients. N Engl J
Med. 2011;364
National Conference on Engineering Trends in Medical Science – NCETMS - 2014
ISSN: 2231-5381 http://www.ijettjournal.org Page 87
PSO Based Adaptive Filter for Unknown System
Identification Ketan W. Talmale
#1, Rupesh K. Sonone
*2, Chetan G. Thote
#3, Digambar Kale
#4
Department ofElectronics& Tele-communication Engineering
DBNCOET Yavatmal, Maharashtra India
Abstract— Particle swarm optimization is a heuristic
global optimization method and also an optimization
algorithm, which is based on swarm intelligence. It
comes from the research on the bird and fish flock
movement behaviour. The algorithm is widely used and
rapidly developed for its easy implementation and few
particles required to be tuned. This paper focuses on
the implementation of Adaptive Infinite Impulse
response (IIR) filter using Modified Particle Swarm
Optimization (PSO) Algorithm.
The application of particle swarm optimization
(PSO) technique to find the optimal location of flexible
AC transmission system (FACTS) devices with
minimum cost of installation of FACTS devices and to
improve system load ability (SL). While finding, size,
optimal location, thermal limit for the lines and voltage
limit for the buses are taken as FACTS devices used as
thyristor controlled series compensator
(TCSC).Structured stochastic optimization algorithms
that are effective on multimodal error surfaces are then
introduced, with particular attention to the Particle
Swarm Optimization (PSO) technique.
Keywords: Adaptive IIR Filter, System Identification,
Particle Swarm Optimization.
I. Introduction
Particle swarm optimization is a heuristic global optimization method put forward originally by Doctor Kennedy and E be hart in 1995(Kennedy J,Eberhart R,1995;Eberhart Kennedy J,1995) It is developed from swarm intelligence and is based on the research of bird and fish flock movement behaviour. While searching for food, the birds are either scattered or go together before they locate the place where they can find the food. While the birds are searching for food from one place to another, there is always a bird that can smell the food very well, that is, the bird is perceptible of the place where the food can be found, having the better food resource information. Because they are transmitting the information, especially the good information at any time
while searching the food from one place to another, conducted by the good information, the birds will eventually flock to the place where food can be found. As far as particle swarm optimization algorithm is concerned, solution swarm is compared to the bird swarm, the birds’ moving from one place to another is equal to the development of the solution swarm, good information is equal to the most optimist solution, and the food resource is equal to the most optimist solution during the whole course.
Adaptive filters have become vastly popular in the
area of digital signal processing. Adaptive direct modelling
or system identification and adaptive inverse modelling or
channel equalization find extensive applications in
telecommunication, control system, instrumentation.
Adaptive Infinite Impulse Response (IIR) systems are used
in modelling real world systems because of their reduced
number of coefficients and better performance over the
Finite Impulse Response (FIR) filter.
II. LITERATURE REVIEW
PSO is one of the optimization techniques and
belongs to evolutionary computation techniques.PSO is
basically developed through simulation of bird flocking in
two-dimension space. The position of each individual
(agent) .agent position is realized by the position and
velocity information. An optimization technique based on
the above concept can be described as follows: namely,
bird flocking optimizes a certain objective function. Each
agent knows its best value so far (pbest) and its XY
position. Moreover, each agent knows the best value so far
in the group (gbest) among pbestsagent tries to modify its
position. Cognition and social Current position. Based on
Darwinian evolutionary theory Population-based Members
of the population are called individuals Determine the
fitness (quality) of each individual using an objective
function Rank population according to fitness Produce new
population using best individuals Based on the social
interaction exhibited by animals Particle refers to a
potential solution Collection of particles is called swarm
Population-based Update particles using a cognitive and
social model Improve performance using different particle.
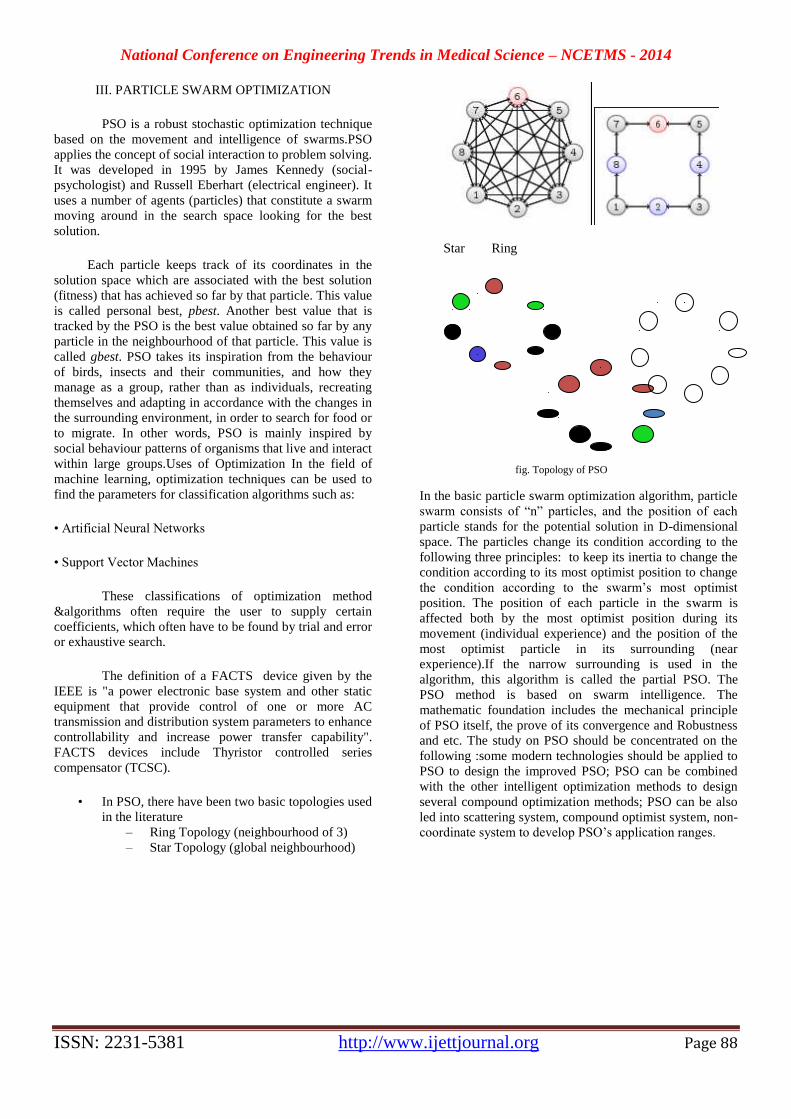
National Conference on Engineering Trends in Medical Science – NCETMS - 2014
ISSN: 2231-5381 http://www.ijettjournal.org Page 88
III. PARTICLE SWARM OPTIMIZATION
PSO is a robust stochastic optimization technique
based on the movement and intelligence of swarms.PSO
applies the concept of social interaction to problem solving.
It was developed in 1995 by James Kennedy (social-
psychologist) and Russell Eberhart (electrical engineer). It
uses a number of agents (particles) that constitute a swarm
moving around in the search space looking for the best
solution.
Each particle keeps track of its coordinates in the
solution space which are associated with the best solution
(fitness) that has achieved so far by that particle. This value
is called personal best, pbest. Another best value that is
tracked by the PSO is the best value obtained so far by any
particle in the neighbourhood of that particle. This value is
called gbest. PSO takes its inspiration from the behaviour
of birds, insects and their communities, and how they
manage as a group, rather than as individuals, recreating
themselves and adapting in accordance with the changes in
the surrounding environment, in order to search for food or
to migrate. In other words, PSO is mainly inspired by
social behaviour patterns of organisms that live and interact
within large groups.Uses of Optimization In the field of
machine learning, optimization techniques can be used to
find the parameters for classification algorithms such as:
• Artificial Neural Networks
• Support Vector Machines
These classifications of optimization method
&algorithms often require the user to supply certain
coefficients, which often have to be found by trial and error
or exhaustive search.
The definition of a FACTS device given by the
IEEE is "a power electronic base system and other static
equipment that provide control of one or more AC
transmission and distribution system parameters to enhance
controllability and increase power transfer capability".
FACTS devices include Thyristor controlled series
compensator (TCSC).
• In PSO, there have been two basic topologies used
in the literature
– Ring Topology (neighbourhood of 3)
– Star Topology (global neighbourhood)
Star Ring
fig. Topology of PSO
In the basic particle swarm optimization algorithm, particle
swarm consists of “n” particles, and the position of each
particle stands for the potential solution in D-dimensional
space. The particles change its condition according to the
following three principles: to keep its inertia to change the
condition according to its most optimist position to change
the condition according to the swarm’s most optimist
position. The position of each particle in the swarm is
affected both by the most optimist position during its
movement (individual experience) and the position of the
most optimist particle in its surrounding (near
experience).If the narrow surrounding is used in the
algorithm, this algorithm is called the partial PSO. The
PSO method is based on swarm intelligence. The
mathematic foundation includes the mechanical principle
of PSO itself, the prove of its convergence and Robustness
and etc. The study on PSO should be concentrated on the
following :some modern technologies should be applied to
PSO to design the improved PSO; PSO can be combined
with the other intelligent optimization methods to design
several compound optimization methods; PSO can be also
led into scattering system, compound optimist system, non-
coordinate system to develop PSO’s application ranges.
1
5
5
3
2
2
1
1
5
5 5
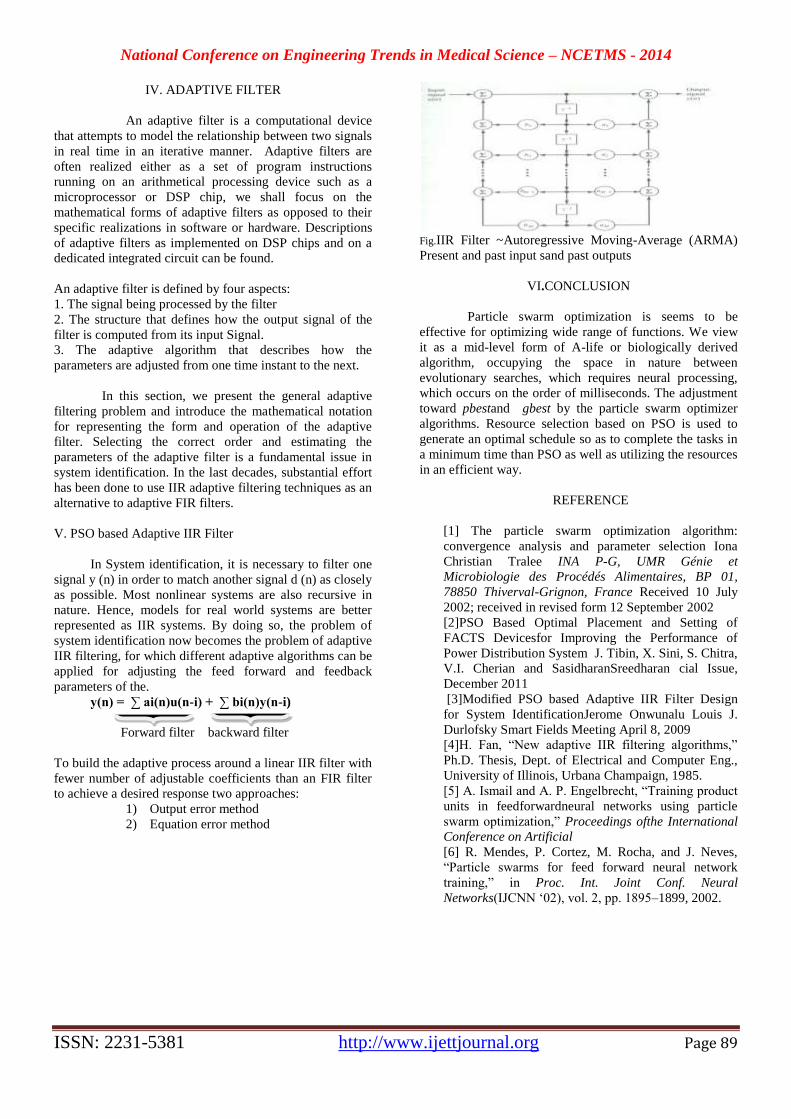
National Conference on Engineering Trends in Medical Science – NCETMS - 2014
ISSN: 2231-5381 http://www.ijettjournal.org Page 89
IV. ADAPTIVE FILTER
An adaptive filter is a computational device
that attempts to model the relationship between two signals
in real time in an iterative manner. Adaptive filters are
often realized either as a set of program instructions
running on an arithmetical processing device such as a
microprocessor or DSP chip, we shall focus on the
mathematical forms of adaptive filters as opposed to their
specific realizations in software or hardware. Descriptions
of adaptive filters as implemented on DSP chips and on a
dedicated integrated circuit can be found.
An adaptive filter is defined by four aspects:
1. The signal being processed by the filter
2. The structure that defines how the output signal of the
filter is computed from its input Signal.
3. The adaptive algorithm that describes how the
parameters are adjusted from one time instant to the next.
In this section, we present the general adaptive
filtering problem and introduce the mathematical notation
for representing the form and operation of the adaptive
filter. Selecting the correct order and estimating the
parameters of the adaptive filter is a fundamental issue in
system identification. In the last decades, substantial effort
has been done to use IIR adaptive filtering techniques as an
alternative to adaptive FIR filters.
V. PSO based Adaptive IIR Filter
In System identification, it is necessary to filter one
signal y (n) in order to match another signal d (n) as closely
as possible. Most nonlinear systems are also recursive in
nature. Hence, models for real world systems are better
represented as IIR systems. By doing so, the problem of
system identification now becomes the problem of adaptive
IIR filtering, for which different adaptive algorithms can be
applied for adjusting the feed forward and feedback
parameters of the.
y(n) = ∑ ai(n)u(n-i) + ∑ bi(n)y(n-i)
Forward filter backward filter
To build the adaptive process around a linear IIR filter with
fewer number of adjustable coefficients than an FIR filter
to achieve a desired response two approaches:
1) Output error method
2) Equation error method
Fig.IIR Filter ~Autoregressive Moving-Average (ARMA)
Present and past input sand past outputs
VI.CONCLUSION
Particle swarm optimization is seems to be
effective for optimizing wide range of functions. We view
it as a mid-level form of A-life or biologically derived
algorithm, occupying the space in nature between
evolutionary searches, which requires neural processing,
which occurs on the order of milliseconds. The adjustment
toward pbestand gbest by the particle swarm optimizer
algorithms. Resource selection based on PSO is used to
generate an optimal schedule so as to complete the tasks in
a minimum time than PSO as well as utilizing the resources
in an efficient way.
REFERENCE
[1] The particle swarm optimization algorithm:
convergence analysis and parameter selection Iona
Christian Tralee INA P-G, UMR Génie et
Microbiologie des Procédés Alimentaires, BP 01,
78850 Thiverval-Grignon, France Received 10 July
2002; received in revised form 12 September 2002
[2]PSO Based Optimal Placement and Setting of
FACTS Devicesfor Improving the Performance of
Power Distribution System J. Tibin, X. Sini, S. Chitra,
V.I. Cherian and SasidharanSreedharan cial Issue,
December 2011
[3]Modified PSO based Adaptive IIR Filter Design
for System IdentificationJerome Onwunalu Louis J.
Durlofsky Smart Fields Meeting April 8, 2009
[4]H. Fan, “New adaptive IIR filtering algorithms,”
Ph.D. Thesis, Dept. of Electrical and Computer Eng.,
University of Illinois, Urbana Champaign, 1985.
[5] A. Ismail and A. P. Engelbrecht, “Training product
units in feedforwardneural networks using particle
swarm optimization,” Proceedings ofthe International
Conference on Artificial
[6] R. Mendes, P. Cortez, M. Rocha, and J. Neves,
“Particle swarms for feed forward neural network
training,” in Proc. Int. Joint Conf. Neural
Networks(IJCNN ‘02), vol. 2, pp. 1895–1899, 2002.
National Conference on Engineering Trends in Medical Science – NCETMS - 2014
ISSN: 2231-5381 http://www.ijettjournal.org Page 90
Review on Routing Algorithm for 3D Network on
Chip Architecture Prof. A. W. Motikar*1, Shilpa P. Meshram2
M.E. (Digital Electronics), Amravati university, Yavatmal, India
Abstract— Three dimensional network on chip (3D NoC ) is
that the most thriving on chip connection design.That is network
on chip mesh design has been instructed as answer to
handle international communication trials in system on chip
(SoC) design. In this literature survey, the performance
improvement originating from the architecturaladvantages of 3D
network on chip are considerably increased. By emerging 3D IC
accomplish larger device integration and enhance the system
presentation at smaller cost and reduces communication distance
in 3D NoC. Additionally to its hasnumerous advantages in terms
of power utilization and system performance has chance to
implement an efficient design. During this survey, effective 3D
network on chip design is usually recommended with the
mechanism of congestion aware rule that optimizes the facility
utilization, system performance and minimize latency with the
help of routing algorithm and topology. In this survey basically
we focus on mesh and torus network. In supplement we
have integrated the reduced cost platform of
3D NoCdesign which might be effectively utilized for fault
tolerant and decreased traffic. Supported routing scheme for
3D NoC will facilitate to realize significant power utilization
and decreased the latency.
Keywords— 3D Integration, 3D Network on Chip,
Routing Algorithm, Selection Function, Direct Network
Topology.
Introduction
Global interconnects have become the principal
performance bottleneck high performance Systems on Chip
(SoCs)[1]. A typical bus based systems are not have
any longer reliable design for SoC owing to an absence
of scalability and correspondence integration, high latency and
power dissipation, and low throughput. Network on Chip
[1][9][18] is presented as a revolutionary technique that
may overcome these issues by presenting an
easy and scalable design platform, impressed by the
internet. whichNoC to produce a better bandwidth and better
performance.
In the past few years, three dimensional integrated
circuits (3D-ICs) [4] have attracted a lots of attention. Results
obtained as far show that 3D-ICs can
do higher performances, a lot of flexibility, and better
throughput compared to traditional ICs. This could provide a
chance to continue performance enhancements using CMOS
technology with smaller form factors, higher integration
densities, and supporting the conclusion of mixed technology
chips [2][3]. As Topol et al in [4] introduced, 3D-
IC will improve the performance even in absence
of scalability. Apart from this clear benefit of package density
is enhanced considerably, power is reduced from use of
shorter wires, and circuitry is a lot of immune to noise.
Combining the NoC structure with the advantages of
the 3D integration lead us to conclude 3D NoC as a
replacement design [4]. This structure responds to the scaling
demands for future SoC [1] exploiting the short vertical links
between the adjacent layers which will clearly enhance the
system performance. As per Feero et al [7], 3D NoC has the
flexibility to decrease the quantity of hops and necessary
issue to measure the system performance. 3D mesh
NOC has close to concerning absolutely less hops than
the 2D mesh NoC. This reduction will effectively increase
throughput and consequently latency decreases as a result
of flits traverse less hops whereas traveling from source to
destination. Another crucial issue have to measure the
performance of a system is power dissipation. Power
dissipation becomes more and more necessary in designing
efficient 3D NOC. In [6], results show that 3D NoC uses less
energy per packet than 2D NoC implementations. The
analysis results concerning 2D and 3D NoC
performance are explained in detailsin [7][6] and [8]. In term
of network topology D. Fick presented theimplementations of
the algorithm for 2D mesh and 2D torus networks, it presents
the solution routes around network failures by leveraging
redundancy inherent in on-Chip topologies and also results
torus topology for 3D NoC gives better performance than
mesh.[10][11].
Then again this survey shows, routing throughout the
network, which are used to verify the path of a packet from
the source to the destination. These algorithms are classified
as deterministic and adaptive. The implementations
of deterministic routing algorithm are easy however they
are unable to balance the load across the links in non-uniform
or bursty traffic [14][5]. Reconciling routing
algorithms are design to handle these limitations.
By better distributing load across links, adaptive algorithms
improve network performance and also provide tolerance if
link or router failure happens. In adaptive routing algorithms
[9][11], the path of a packet from the source to the
destination is decided by the network condition. An adaptive
routing algorithmic rule decreases the probability of passing a
packet from a congested or mal-function link. Despite its
implementation quality, the routing is attractive for
large NoCs especially when these NoCs facing with non-
uniform or bursty traffic[17][14].

National Conference on Engineering Trends in Medical Science – NCETMS - 2014
ISSN: 2231-5381 http://www.ijettjournal.org Page 91
II. THE BASICS OF NOC ARCHITECTURE
A typical NOC consists of computational processing
element (PEs), network interfaces (NIs), and routers. The
latter two comprise the communication architecture
[27].An NI is employed to packetize information before using
the router backbone to traverse the NoC. Each PE is
connected an NI and that connects the PE to a local router.
When a packet was sent from a source to a destination as
shown in Fig. 2.A., the packet is forwarded hop by hop on the
network via the choice made by each router. In
some NOC architectures that are equipped with error
control mechanisms, NIs are also accustomed encode
and decode the information by the error control code applied.
Fig. 2 A. Network on chip architecture
An NOC router consists of switches, registers,
and control logic that collectively perform routing and channel
arbitration to guide the flow of packets in the network as
illustrated in Fig.2.B for every router, the packet
is first received and stored in an input buffer. Then
the control logic within the router is responsible to make
routing decision and channel arbitration. Finally, the granted
packet can traverse through a crossbar
to destination router, and therefore the method repeats till the
packet arrives at its destination.
Packets delivered by routers are partitioned in a flit-by-flit
basis. Each flit of a packet arrives at a router and store in a
memory buffer until it can traverse to the next hop of the
route. The first flit in the buffer memory will be processed by
the control logic to determine whether it is allowed to be
forwarded and which output direction it should proceed to.
The decision made by the control unit is based on the
computation result of routing, arbitration, and the downstream
buffer space. After the control setup is done, the flit passes
through the crossbar switch to its desired output direction.
Fig 2 B. Typical NoC Router architecture
III. RELATED WORK:
The literature related to this paper is summarized in four
sub-sections: 3D Integration technology, 3D Network on Chip
Architectures, Topology and Routing Algorithm. These
sections offer a short survey on the exploration of attainable
architectural designs for three-dimensional NoC architectures
and discuss the tradeoffs among varied design choices.
A. 3D Integration Technology
Three-dimensional integration technology [2] is an
attractive option for overcoming the barriers in interconnect
scaling, offering an opportunity to continue the CMOS
performance trend. In a three-dimensional chip, multiple
device layers are stacked together. Various 3D integration
vertical interconnect technologies have been explored,
including wire bonded, micro bump, contactless (capacitive or
inductive), and through silicon-via vertical interconnect [2][3].
Through silicon-via interconnection has the potential to offer
the greatest vertical interconnect density and therefore is the
most promising one among these vertical interconnect
technologies. There are two different approaches to
implementing through-silicon-via 3D integration: the first one
involves sequential device process, in which the front-end
processing (to build the device layer) is repeated on a single
wafer to build multiple active device layers, before the
interconnects among devices are built. The second approach
processes each active device layer separately, using
conventional fabrication techniques, and then stacking these
multiple device layers together using wafer-bonding
technology [2].
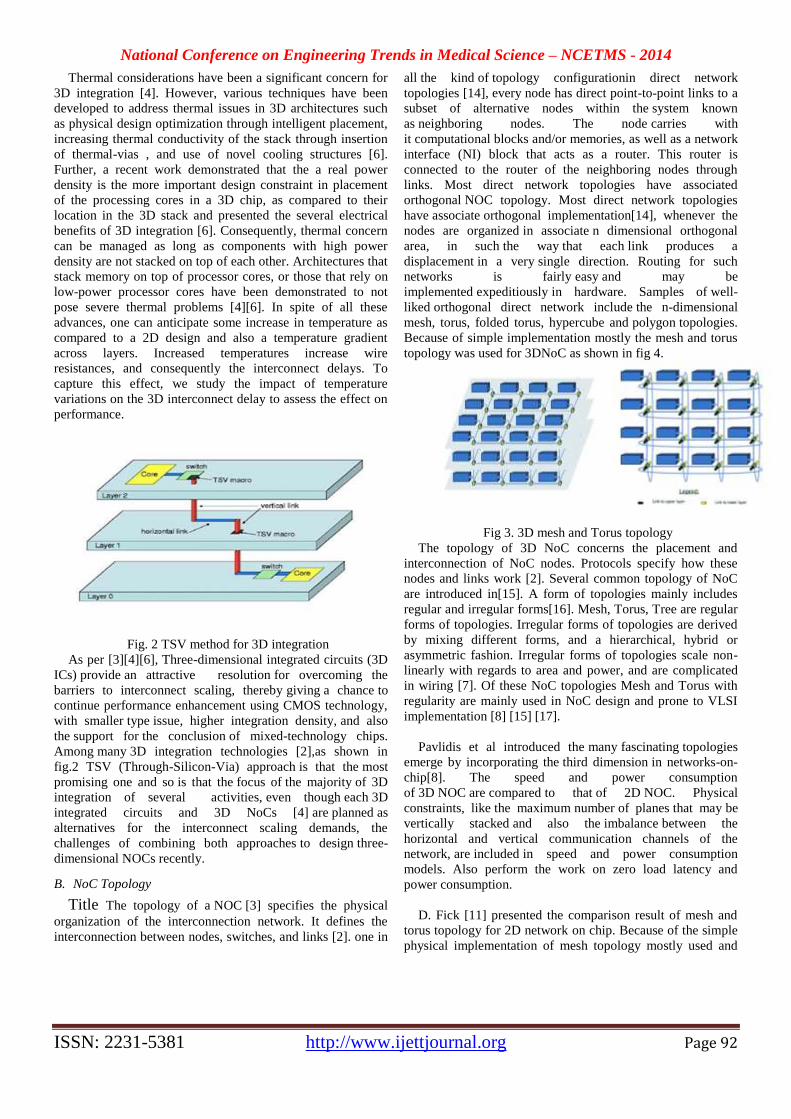
National Conference on Engineering Trends in Medical Science – NCETMS - 2014
ISSN: 2231-5381 http://www.ijettjournal.org Page 92
Thermal considerations have been a significant concern for
3D integration [4]. However, various techniques have been
developed to address thermal issues in 3D architectures such
as physical design optimization through intelligent placement,
increasing thermal conductivity of the stack through insertion
of thermal-vias , and use of novel cooling structures [6].
Further, a recent work demonstrated that the a real power
density is the more important design constraint in placement
of the processing cores in a 3D chip, as compared to their
location in the 3D stack and presented the several electrical
benefits of 3D integration [6]. Consequently, thermal concern
can be managed as long as components with high power
density are not stacked on top of each other. Architectures that
stack memory on top of processor cores, or those that rely on
low-power processor cores have been demonstrated to not
pose severe thermal problems [4][6]. In spite of all these
advances, one can anticipate some increase in temperature as
compared to a 2D design and also a temperature gradient
across layers. Increased temperatures increase wire
resistances, and consequently the interconnect delays. To
capture this effect, we study the impact of temperature
variations on the 3D interconnect delay to assess the effect on
performance.
Fig. 2 TSV method for 3D integration
As per [3][4][6], Three-dimensional integrated circuits (3D
ICs) provide an attractive resolution for overcoming the
barriers to interconnect scaling, thereby giving a chance to
continue performance enhancement using CMOS technology,
with smaller type issue, higher integration density, and also
the support for the conclusion of mixed-technology chips.
Among many 3D integration technologies [2],as shown in
fig.2 TSV (Through-Silicon-Via) approach is that the most
promising one and so is that the focus of the majority of 3D
integration of several activities, even though each 3D
integrated circuits and 3D NoCs [4] are planned as
alternatives for the interconnect scaling demands, the
challenges of combining both approaches to design three-
dimensional NOCs recently.
B. NoC Topology
Title The topology of a NOC [3] specifies the physical
organization of the interconnection network. It defines the
interconnection between nodes, switches, and links [2]. one in
all the kind of topology configurationin direct network
topologies [14], every node has direct point-to-point links to a
subset of alternative nodes within the system known
as neighboring nodes. The node carries with
it computational blocks and/or memories, as well as a network
interface (NI) block that acts as a router. This router is
connected to the router of the neighboring nodes through
links. Most direct network topologies have associated
orthogonal NOC topology. Most direct network topologies
have associate orthogonal implementation[14], whenever the
nodes are organized in associate n dimensional orthogonal
area, in such the way that each link produces a
displacement in a very single direction. Routing for such
networks is fairly easy and may be
implemented expeditiously in hardware. Samples of well-
liked orthogonal direct network include the n-dimensional
mesh, torus, folded torus, hypercube and polygon topologies.
Because of simple implementation mostly the mesh and torus
topology was used for 3DNoC as shown in fig 4.
Fig 3. 3D mesh and Torus topology
The topology of 3D NoC concerns the placement and
interconnection of NoC nodes. Protocols specify how these
nodes and links work [2]. Several common topology of NoC
are introduced in[15]. A form of topologies mainly includes
regular and irregular forms[16]. Mesh, Torus, Tree are regular
forms of topologies. Irregular forms of topologies are derived
by mixing different forms, and a hierarchical, hybrid or
asymmetric fashion. Irregular forms of topologies scale non-
linearly with regards to area and power, and are complicated
in wiring [7]. Of these NoC topologies Mesh and Torus with
regularity are mainly used in NoC design and prone to VLSI
implementation [8] [15] [17].
Pavlidis et al introduced the many fascinating topologies
emerge by incorporating the third dimension in networks-on-
chip[8]. The speed and power consumption
of 3D NOC are compared to that of 2D NOC. Physical
constraints, like the maximum number of planes that may be
vertically stacked and also the imbalance between the
horizontal and vertical communication channels of the
network, are included in speed and power consumption
models. Also perform the work on zero load latency and
power consumption.
D. Fick [11] presented the comparison result of mesh and
torus topology for 2D network on chip. Because of the simple
physical implementation of mesh topology mostly used and
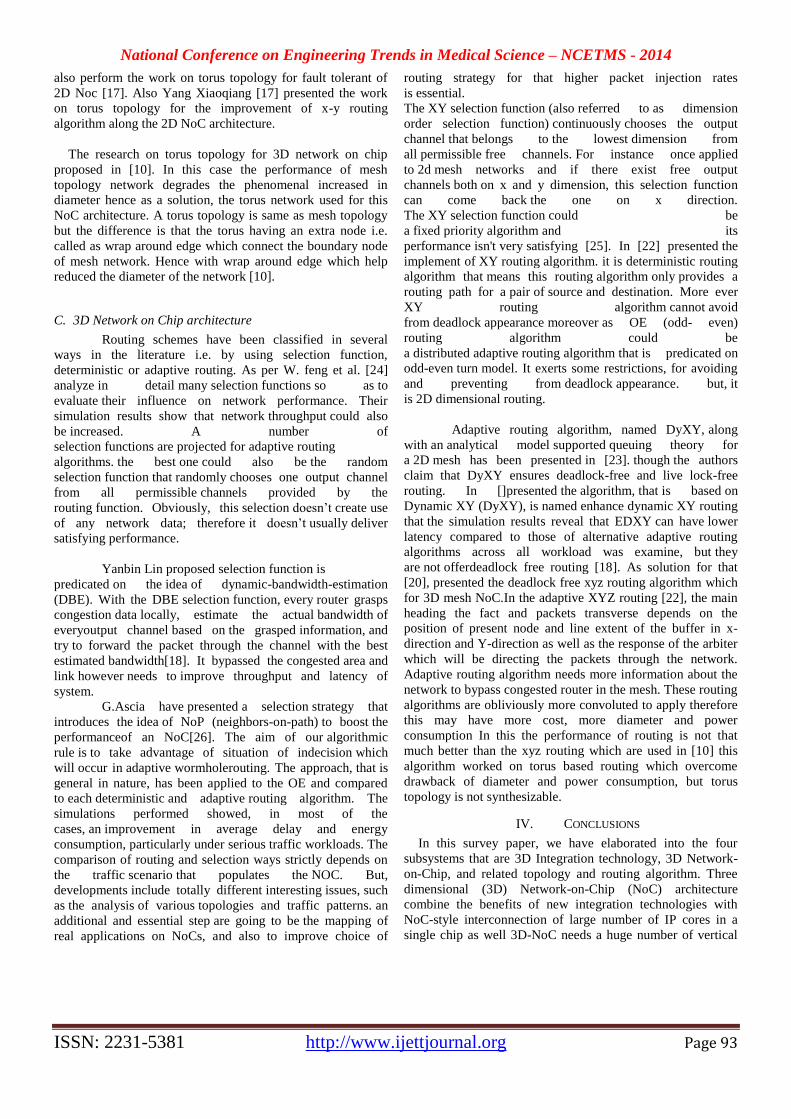
National Conference on Engineering Trends in Medical Science – NCETMS - 2014
ISSN: 2231-5381 http://www.ijettjournal.org Page 93
also perform the work on torus topology for fault tolerant of
2D Noc [17]. Also Yang Xiaoqiang [17] presented the work
on torus topology for the improvement of x-y routing
algorithm along the 2D NoC architecture.
The research on torus topology for 3D network on chip
proposed in [10]. In this case the performance of mesh
topology network degrades the phenomenal increased in
diameter hence as a solution, the torus network used for this
NoC architecture. A torus topology is same as mesh topology
but the difference is that the torus having an extra node i.e.
called as wrap around edge which connect the boundary node
of mesh network. Hence with wrap around edge which help
reduced the diameter of the network [10].
C. 3D Network on Chip architecture
Routing schemes have been classified in several
ways in the literature i.e. by using selection function,
deterministic or adaptive routing. As per W. feng et al. [24]
analyze in detail many selection functions so as to
evaluate their influence on network performance. Their
simulation results show that network throughput could also
be increased. A number of
selection functions are projected for adaptive routing
algorithms. the best one could also be the random
selection function that randomly chooses one output channel
from all permissible channels provided by the
routing function. Obviously, this selection doesn’t create use
of any network data; therefore it doesn’t usually deliver
satisfying performance.
Yanbin Lin proposed selection function is
predicated on the idea of dynamic-bandwidth-estimation
(DBE). With the DBE selection function, every router grasps
congestion data locally, estimate the actual bandwidth of
everyoutput channel based on the grasped information, and
try to forward the packet through the channel with the best
estimated bandwidth[18]. It bypassed the congested area and
link however needs to improve throughput and latency of
system.
G.Ascia have presented a selection strategy that
introduces the idea of NoP (neighbors-on-path) to boost the
performanceof an NoC[26]. The aim of our algorithmic
rule is to take advantage of situation of indecision which
will occur in adaptive wormholerouting. The approach, that is
general in nature, has been applied to the OE and compared
to each deterministic and adaptive routing algorithm. The
simulations performed showed, in most of the
cases, an improvement in average delay and energy
consumption, particularly under serious traffic workloads. The
comparison of routing and selection ways strictly depends on
the traffic scenario that populates the NOC. But,
developments include totally different interesting issues, such
as the analysis of various topologies and traffic patterns. an
additional and essential step are going to be the mapping of
real applications on NoCs, and also to improve choice of
routing strategy for that higher packet injection rates
is essential.
The XY selection function (also referred to as dimension
order selection function) continuously chooses the output
channel that belongs to the lowest dimension from
all permissible free channels. For instance once applied
to 2d mesh networks and if there exist free output
channels both on x and y dimension, this selection function
can come back the one on x direction.
The XY selection function could be
a fixed priority algorithm and its
performance isn't very satisfying [25]. In [22] presented the
implement of XY routing algorithm. it is deterministic routing
algorithm that means this routing algorithm only provides a
routing path for a pair of source and destination. More ever
XY routing algorithm cannot avoid
from deadlock appearance moreover as OE (odd- even)
routing algorithm could be
a distributed adaptive routing algorithm that is predicated on
odd-even turn model. It exerts some restrictions, for avoiding
and preventing from deadlock appearance. but, it
is 2D dimensional routing.
Adaptive routing algorithm, named DyXY, along
with an analytical model supported queuing theory for
a 2D mesh has been presented in [23]. though the authors
claim that DyXY ensures deadlock-free and live lock-free
routing. In []presented the algorithm, that is based on
Dynamic XY (DyXY), is named enhance dynamic XY routing
that the simulation results reveal that EDXY can have lower
latency compared to those of alternative adaptive routing
algorithms across all workload was examine, but they
are not offerdeadlock free routing [18]. As solution for that
[20], presented the deadlock free xyz routing algorithm which
for 3D mesh NoC.In the adaptive XYZ routing [22], the main
heading the fact and packets transverse depends on the
position of present node and line extent of the buffer in x-
direction and Y-direction as well as the response of the arbiter
which will be directing the packets through the network.
Adaptive routing algorithm needs more information about the
network to bypass congested router in the mesh. These routing
algorithms are obliviously more convoluted to apply therefore
this may have more cost, more diameter and power
consumption In this the performance of routing is not that
much better than the xyz routing which are used in [10] this
algorithm worked on torus based routing which overcome
drawback of diameter and power consumption, but torus
topology is not synthesizable.
IV. CONCLUSIONS
In this survey paper, we have elaborated into the four
subsystems that are 3D Integration technology, 3D Network-
on-Chip, and related topology and routing algorithm. Three
dimensional (3D) Network-on-Chip (NoC) architecture
combine the benefits of new integration technologies with
NoC-style interconnection of large number of IP cores in a
single chip as well 3D-NoC needs a huge number of vertical
National Conference on Engineering Trends in Medical Science – NCETMS - 2014
ISSN: 2231-5381 http://www.ijettjournal.org Page 94
links, the 3D Integration has a major limitation on the number
of vertical interconnects using TSVs to be exploited.
Additionally, 3D Integration enables the integration of
differently fabricated with CMOS technologies, but
constructing a homogeneous and regular network topology for
such a heterogeneous system is very challenging. In literature
survey in order to reduce the number of vertical links,
scalability throughput, latency and for congestion aware 3D
architecture the mesh and torus topology was used because of
its spurious benefits. In Future we have to work on 3D NoC
with mesh topology and XYZ routing algorithm in terms of
diameter, latency and power consumption.
ACKNOWLEDGMENT
We acknowledge our senior faculty who has
provided me their views in the selection of topic.
REFERENCES
[1] Luca Benini and G. De Micheli,― Networks on chips: A new
SoC paradigm,‖ computers, vol. 35, no. 1, Jan. 2002.
[2] W.R. Davis et al., ‘Demystifying 3D ICS: The Pros and Cons of
Going Vertical,‖ IEEE Design and Test of Computers’, vol. 22,
no. 6, Nov./Dec. 2005
[3] A. W. Topol, J. D. C. La Tulipe, L. Shi, D. J. Frank, K. Bernstein,
S. E. Steen, A. Kumar, G. U. Singco, A. M. Young, K. W.
Guarini, and M. Ieong, Three-dimensional integrated circuits,
IBM Journal of Research and Development, vol. 50, no. 4/5, pp.
491506, July 2006
[4] Ankur Jain,” Analytical and Numerical Modeling of the Thermal
Performance of Three-Dimensional
Integrated Circuits”, IEEE transactions on components and
packaging technologies, vol. 33, no. 1, march 2010
[5] L. P. Carloni, P. Pande, and Y. Xie, Networks-on-chip in
emerging interconnect paradigms: Advantages and challenges,
In Proceedings of the 3rd ACM/IEEE International Symposium
on Networks-on-Chip (NOCS09), San Diego,CA, May 2009, pp.
93-102.
[6] Zhuoyuan Li, Xianlong Hong, Qiang Zhou, Shan Zeng, Jinian
Bian, Wenjian Yu,Hannah H. Yang, Vijay Pitchumani, and
Chung-Kuan Cheng, “Efficient Thermal via Planning Approach
and Its Application in 3-D Floorplanning”, IEEE transactions on
computer-aided design of integrated circuits and systems, vol. 26,
no. 4, april 2007
[7] B. Feero, P. Pratim Pande, Performance Evaluation for Three-
Dimensional Networks-on-Chip, Proceedings of IEEE Computer
Society Annual Symposium on VLSI (ISVLSI), 9th- 11th May
2009, pp. 305-310.
[8] V. F. Pavlidis, E.G. Friedman, “3-D Topologies for Networkson-
chip”, IEEE transactions on very large scale integration (vlsi)
systems, vol. 15, no. 10, october 2007
[9] W.J. Dally, B. Towles,” Principles and Practices of
Interconnection Networks”, Morgan Kaufmann, 2004.
[10] Mohammad Ayoub Khan,” A Quadrant-XYZ Routing
Algorithm for 3-D Asymmetric Torus Network-on-Chip”,
Research Bulletin of Jordan ACM, ISSN: 2078-7952, Volume II.
2011
[11]D.Fick et al,” A Highly Resilient Routing Algorithm for
FaultTolerant NoCs”,
[12] J. Kim, C. Nicopoulos, D. Park, R. Das, Y. Xie, V. Narayanan,
M. S. Yousif, and C. R. Das, “A novel dimensionally-
decomposed router for on-chip communication in 3D
architectures,” in Proceedingsof the International Symposium on
Computer Architecture, 2007, pp. 138–149
[13] P. Lotfi-Kamran, A.-M. Rahmani, M. Daneshtalab, A. Afzali-
Kusha, and Z. Navabi, “EDXY - A low cost congestion-aware
routing algorithm for network-on-chips,” alsvier,Journal of
Systems Architecture, vol. 56, no. 7, pp. 256–264, 2010.
[14] M. E. Gomez,” A Routing Methodology for Achieving Fault
Tolerance in Direct Networks”, IEEE transactions on computers,
vol. 55, no. 4, april 2006
[15] A. Bartzas,” Exploration of Alternative Topologies for
Application Specific 3D Networks on Chip”, Development-
General Sec-retariat of Research and Technology.
[16]L. Guangshun”Mapping of Irregular IP onto NoC Architecture
with Optimal Energy Consumption”, tsinghua science and
technology ISSN 1007-0214 26/49 pp146-149Volume 12,
Number S1, July 2007.
[17]Yang Xiaoqiang,” A Node Encoding of Torus Topology and Its
Improved Routing Algorithm”, JOURNAL OF
COMMUNICATIONS, VOL. 3, NO. 6, NOVEMBER 2008
[18] Shan Yan and Bill Lin,” Design of Application-Specific 3D
Networks-on-Chip Architectures”, Integrated Circuits and
Systems, DOI 10.1007/978-1-4419-7618-5_8, © Springer
Science+Business Media, LLC 2011
[19]Amir-Mohammad Rahmani, Student Member, IEEE,”High-
Performance and Fault-Tolerant 3DNoC-Bus Hybrid
Architecture Using ARB-NET Based Adaptive Monitoring
Platform” IEEE transactions on computers, vol. xx, no. x, october
2011.
[20]Abbas Sheibanyrad, Maryam Bahmani ―A Deadlock-Free
Distributed Routing Algorithm for Vertically Partially Connected
3D-NoCs‖, IEEE TRANSACTIONS ON COMPUTERS, VOL.
62, NO. 3, MARCH 2013.
[21] Zhuoyuan Li, Xianlong Hong,” Efficient Thermal via Planning
Approach and Its Application in 3-D Floorplanning” , IEEE
TRANSACTIONS ON COMPUTER-AIDED DESIGN OF
INTEGRATED CIRCUITS AND SYSTEMS, VOL. 26, NO. 4,
APRIL 2007
[22] D. Park, S. Eachempati, R. Das, A. Mishra, Y. Xie, N.
Vijaykrishnan, and C. Das, ―MIRA: A Multi-layered On-Chip
Interconnect Router Architecture,‖ in Proceedings of the
International Symposium on Computer Architecture, 2008, pp.
251–261.
[23] H. Matsutani, M. Koibuchi, and H. Amano, -“Tightly-Coupled
Multi-Layer Topologies for 3-D NoCs,‖ in Proceedings of the
International Conference on Parallel Processing”, 2007, pp. 75–
84.
[24]W. Feng,’Impact of selection function of routing algorithms
performance in multilcomputer network’.
[25] G.Ascia, “Implementation and Analysis of a New Selection
Strategy for Adaptive Routing in Networks-on-Chip”, IEEE
TRANSACTIONS ON COMPUTERS, VOL. 57, NO. 6, JUNE
2008
[26]’Reconfigurable Network on chip’
http://Www.Springer.Com/978-1-4419-9340-3
National Conference on Engineering Trends in Medical Science – NCETMS - 2014
ISSN: 2231-5381 http://www.ijettjournal.org Page 95
Detecting and Prevention of DDOS Attack in
MANET using New Cracking Algorithm Ms. Jasmine.Patel
1, Ms. Priya Wadhai
2, Ms. Neha Agrawal
3, Ms. Gitanjali Gaikwad
4, Prof. Vaishnavi J. Deshmukh
5
1,2Student, Computer Engineering Department, D.B.N.C.O.E.T, Yavatmal
3Lecturer, Computer Engineering Department, D.B.N.C.O.E.T, Yavatmal
Maharashtra, India.
Abstract— Security could be a weak link of network systems.
The malicious usage and attacks have caused tremendous loss by
impairing the functionalities of the pc networks.. In an effort to
reinforce security in MANETs several researchers have prompt
and enforced new enhancements to the protocols and a few of
them have prompt new protocols. Existing.Manet routing
protocols, like unintentional On-Demand Distance Vector
Routing Protocol (AODV), don't offer enough security defense
capability. Distributed Denial of Service (DDoS) attack has
become a significant downside to networks. during this paper, we
have a tendency to introduce bottom-up approach, New
Cracking algorithmic program,Prevention algorithmic program
exploitation IDS node for sleuthing anddominant DDoS attack.
Keywords— Manet, Flooding attack, DDoS attack, Bottom Up, New Cracking algorithmic program, informatics Traceback.
II. INTRODUCTION
MANETs ar a sort of Wireless circumstantial network that
typically includes a routable networking atmosphere on high
of a Link Layer circumstantial network.A mobile
circumstantial network (MANET) could be a self-configuring
infrastructureless network of mobile devices connected by
wireless. every device in an unengaged to move severally in
any direction, and can so modification its links to different
devicesoftentimes. every should forward traffic unrelated to
its own use, and so be a router. the first challenge in building a
painter is arming every device to endlessly maintain the data
needed to properly route traffic. Such networks might operate
by themselves or could also be connected to the larger net.
[20] Distributed denial-of-service attack (DDoS attack) is an
effort to form a machine or network resource inaccessible to
its supposed users.[19]. painter could be a distributed system
that includes wireless mobile nodes that may freely and
dynamically self-organize into whimsical, temporary, and
circumstantial network topologies, permitting seamless
interconnections while not pre-existing communication
infrastructure and central administration. attributable toits
distinctive characteristics, painter is susceptible to numerous
security threats, and it's significantly at risk of the DDoS
attack.[4]
Security Challenges & problems with Manets
MANETs use wireless media for transmission,• that
introduces security flaws to the networks. primarily
anyonewith the correct instrumentation and data of the present
topology and also the protocols might acquireaccess to the
network. each active and passive attacks like impersonation,
eavesdrop-ping, message redirection, and traffic analysis, will
be per-formed by associate degree soul. [10]
In specific• eventualities, painter nodes could also be
scattered over an outsized space. Some nodes or network
elements could also be un-monitored or exhausting to watch,
and exposed to the physical attacks.[2]
• as a result of MANETs don't have any central authority,
this is often a serious barrier to security. the protection
mechanisms utilized in wired networks, like Public Key
Management, Node Authentication, and Determination of
Node Behaviour, ar in reality terribly troublesome to attain
with none central administration.
• circumstantial networks ar extremely dynamic in nature.
Node joins and departures aren't predictable . Moreover,
topology is often dynamic in circumstantial networks. [3].
III. MANET VULNERABILITY
Vulnerability could be a weakness in security system. a
selected system is also susceptible to unauthorized
information manipulation as a result of the system doesn't
verify a user’s identity before permitting information access.
painter is additional vulnerable than wired network. a number
of the vulnerabilities ar as follows:-
Lack of centralized management: painter doesn’t have a
centralized monitor server. The absence of management
makes the detection of attacks troublesome as a result of it's
not east to observe the traffic during a extremely dynamic and
enormous scale ad-hoc network.
Resource availableness: Resource availability could be a
major issue in painter. Providing secure communication in
such ever-changing surroundings moreover as protection
against specific threats and attacks, results in development of
assorted security schemes and architectures. cooperative ad-
hoc environments conjointly enable implementation of self-
organized security mechanism.
Scalability: attributable to quality of nodes, scale of ad-hoc
network ever-changing all the time. Therefore measurability
could be a major issue regarding security. Security mechanism
ought to be capable of handling an oversized network
moreover as tiny ones.
Cooperativeness: Routing algorithmic rule for MANETs
typically assumes that nodes ar cooperative and non-
malicious. As aresult a malicious wrongdoer will simply
become a very important routing agent and disrupt network
operation by disobeying the protocol specifications.
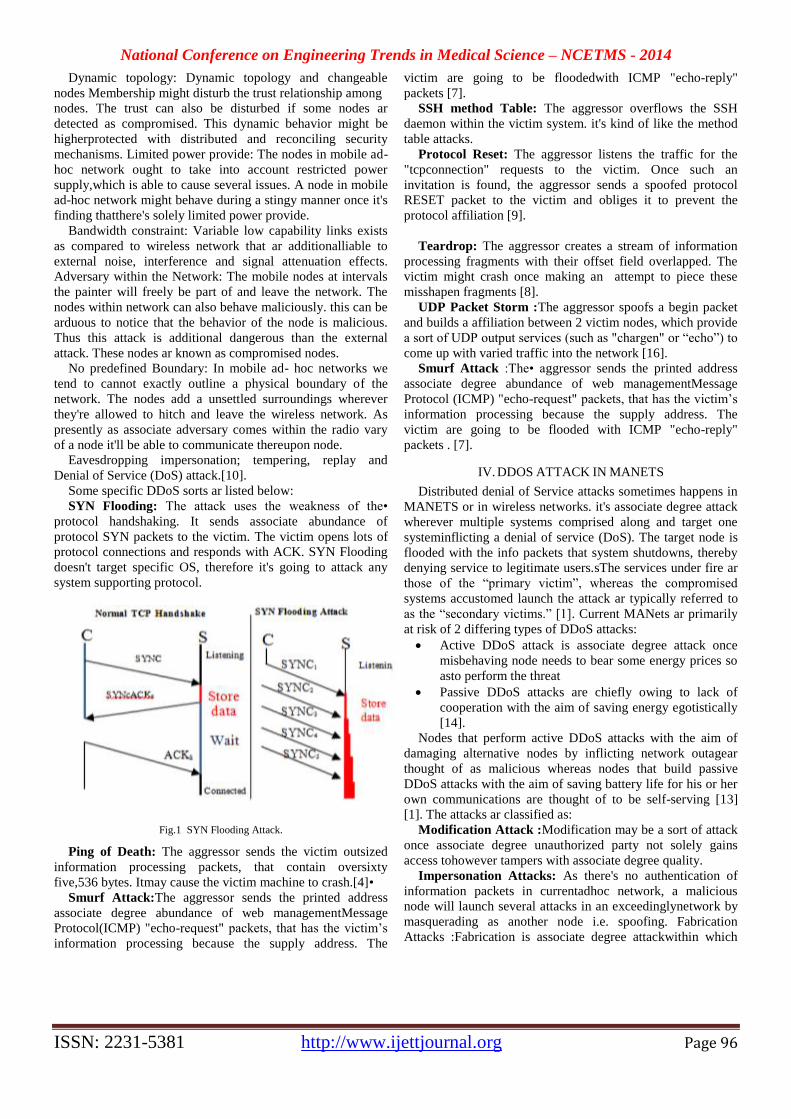
National Conference on Engineering Trends in Medical Science – NCETMS - 2014
ISSN: 2231-5381 http://www.ijettjournal.org Page 96
Dynamic topology: Dynamic topology and changeable
nodes Membership might disturb the trust relationship among
nodes. The trust can also be disturbed if some nodes ar
detected as compromised. This dynamic behavior might be
higherprotected with distributed and reconciling security
mechanisms. Limited power provide: The nodes in mobile ad-
hoc network ought to take into account restricted power
supply,which is able to cause several issues. A node in mobile
ad-hoc network might behave during a stingy manner once it's
finding thatthere's solely limited power provide.
Bandwidth constraint: Variable low capability links exists
as compared to wireless network that ar additionalliable to
external noise, interference and signal attenuation effects.
Adversary within the Network: The mobile nodes at intervals
the painter will freely be part of and leave the network. The
nodes within network can also behave maliciously. this can be
arduous to notice that the behavior of the node is malicious.
Thus this attack is additional dangerous than the external
attack. These nodes ar known as compromised nodes.
No predefined Boundary: In mobile ad- hoc networks we
tend to cannot exactly outline a physical boundary of the
network. The nodes add a unsettled surroundings wherever
they're allowed to hitch and leave the wireless network. As
presently as associate adversary comes within the radio vary
of a node it'll be able to communicate thereupon node.
Eavesdropping impersonation; tempering, replay and
Denial of Service (DoS) attack.[10].
Some specific DDoS sorts ar listed below:
SYN Flooding: The attack uses the weakness of the•
protocol handshaking. It sends associate abundance of
protocol SYN packets to the victim. The victim opens lots of
protocol connections and responds with ACK. SYN Flooding
doesn't target specific OS, therefore it's going to attack any
system supporting protocol.
Fig.1 SYN Flooding Attack.
Ping of Death: The aggressor sends the victim outsized
information processing packets, that contain oversixty
five,536 bytes. Itmay cause the victim machine to crash.[4]•
Smurf Attack:The aggressor sends the printed address
associate degree abundance of web managementMessage
Protocol(ICMP) "echo-request" packets, that has the victim’s
information processing because the supply address. The
victim are going to be floodedwith ICMP "echo-reply"
packets [7].
SSH method Table: The aggressor overflows the SSH
daemon within the victim system. it's kind of like the method
table attacks.
Protocol Reset: The aggressor listens the traffic for the
"tcpconnection" requests to the victim. Once such an
invitation is found, the aggressor sends a spoofed protocol
RESET packet to the victim and obliges it to prevent the
protocol affiliation [9].
Teardrop: The aggressor creates a stream of information
processing fragments with their offset field overlapped. The
victim might crash once making an attempt to piece these
misshapen fragments [8].
UDP Packet Storm :The aggressor spoofs a begin packet
and builds a affiliation between 2 victim nodes, which provide
a sort of UDP output services (such as "chargen" or “echo”) to
come up with varied traffic into the network [16].
Smurf Attack :The• aggressor sends the printed address
associate degree abundance of web managementMessage
Protocol (ICMP) "echo-request" packets, that has the victim’s
information processing because the supply address. The
victim are going to be flooded with ICMP "echo-reply"
packets . [7].
IV. DDOS ATTACK IN MANETS
Distributed denial of Service attacks sometimes happens in
MANETS or in wireless networks. it's associate degree attack
wherever multiple systems comprised along and target one
systeminflicting a denial of service (DoS). The target node is
flooded with the info packets that system shutdowns, thereby
denying service to legitimate users.sThe services under fire ar
those of the “primary victim”, whereas the compromised
systems accustomed launch the attack ar typically referred to
as the “secondary victims.” [1]. Current MANets ar primarily
at risk of 2 differing types of DDoS attacks:
Active DDoS attack is associate degree attack once
misbehaving node needs to bear some energy prices so
asto perform the threat
Passive DDoS attacks are chiefly owing to lack of
cooperation with the aim of saving energy egotistically
[14].
Nodes that perform active DDoS attacks with the aim of
damaging alternative nodes by inflicting network outagear
thought of as malicious whereas nodes that build passive
DDoS attacks with the aim of saving battery life for his or her
own communications are thought of to be self-serving [13]
[1]. The attacks ar classified as:
Modification Attack :Modification may be a sort of attack
once associate degree unauthorized party not solely gains
access tohowever tampers with associate degree quality.
Impersonation Attacks: As there's no authentication of
information packets in currentadhoc network, a malicious
node will launch several attacks in an exceedinglynetwork by
masquerading as another node i.e. spoofing. Fabrication
Attacks :Fabrication is associate degree attackwithin which
National Conference on Engineering Trends in Medical Science – NCETMS - 2014
ISSN: 2231-5381 http://www.ijettjournal.org Page 97
associate degree unauthorized party not solely gains the access
however additionally inserts counterfeit objects into the
system. [2].
V. ATTACK DETECTION WAYS IN MANET
Profile-based detection Profile-based detection is
additionally referred to as behaviour-based detection. Profile-
based detection defines a profile of traditional behaviour
classifies any deviation of that profile as an anomalythe belief
of this kind of detection is that attacks area unit events
distinguishable from traditional legitimate use of system
resources. though this kind of anomaly observe area unit ready
to detect novel attacks, they're prune to high false positive rate
owing to the issue of clear segmentation between traditional
and abnormal activities and also the use of lean or inadequate
options to profile traditional behaviours. Specification-based
detection Specification-based detection defines a group of
constraints that describe the proper operation of a program or
protocol and monitors the execution of the program with
reference to the outlined constraints. it's been show that
specification-based techniques live up to their promise of
detection referred to as well as unknown attacks,
whereasmaintaining a really low rate of false positives. Since,
the increasing quality of wireless networks to it of wired
networks, security is being thought-about as a serious threat in
them. Wireless network exposes a risk that Anunauthorized
user will exploit and severely compromise the network. There
may be completely different potential attacks in wireless
network viz., active and passive attacks. therefore there's a
desire for secured wireless system to research and observe
variety of attacks.[1,17]
VI. REVIEW OF EXISTING DDOS DEFENCE
TECHNIQUE
Bottom-up-Detection and Prevention Techniques:
This detection theme is split into three phases:
Phase–I : Quality Reduction primarily based Attacks once
associate degree offensive host send SYN(k) packet for brand
new association to victim server victim server allocates
memory for that host and sends SYN/ACK to it aggressor
consumes one sequence range and waits to receive for ACK
from offensive host. This state is named 0.5 open association
state. additional and additionalrequests can accumulate and
stock up the memory buffer at server aspect. aggressor send
sizable amount SYN packets with spoofed supply information
processing for preventing services to be granted to
alternativelegitimate requests. Therefore, no new request,
together with legitimate requests, is processed and also
theservices of the system area unit disabled.
Phase–II Bottom- up Approach for discoverion of protocol
SYN Flood Attack The detection algorithmic rule desires the
potential to detect any new beginning attacks not aboutthis
happening ones. Also, if the extracted knowledge
characteristics cannot match any signatures, those packets are
going to be thought to be traditional network traffic and also
the detection system ignores them. the entiredetection method
continues recursively until detection been terminated.
Phase–III hindrance Window-basedmanagement for
traditional 0.5 Open Connection: during this approach we tend
to planned a window limit per resource or per traffic
combination. this permits U.S.A. to regulate however an
explicit resource isconsumed by a traffic category at any given
time. once this limit is reached, incoming requests or packets
seeking this resource area unit born or delayed at the QOS
regulator till the server sends some quite indication
thatassociate degree earlier request from this traffic category
has freed its resources. once this happens, additionalflows or
requests is admitted. The windows limit quantifies the
resource availableness. TTL-based Packet Filtering Approach
for Abnormal 0.5 Open Connection: Filtering all packets
having an explicit TTL worth would end in the filtering of
legitimate furthermore as attack packets. Hence, our TTL-
based rate-limit theme includes rules fordistinctive traditional
from spoofed packets. It will this by observant protocol
tripartite handshakingbehaviours. throughout a standard 3
approach handshaking procedure, Syn(k), Ack(k + 1) + Syn(j
) and Ack(j +1)is captured at the victim aspect.[4]
LPN DDoS Attack Mitigation ways--Negative Protection
Node(LPN) protects the victim node of a DDoS attack.
TheLPN node filters all the assaultive packages within the
traffic whose destination is that the victim. additionally, the
LPN acknowledges the supply informatics addresses adore the
malicious traffic, An Attack Notification Message (ANM) is
shipped to the victim node. The ANM includes the supply
informatics addresses ofconcerned malicious attack agents.
Then, the victim node broadcasts AN Attack data Message
(AIM) packet towards the remote protection node (RPN).
With the data in AIM, the RPN nodes filter off all the
malicious packets at the supply facet. This mechanism aims to
recover the service for destination protection node and to
inform eachalternative node to drop the RREQ from the
malicious node. when doing this, the malicious nodes
cannottransport traffic or build a route.[5]
Clustering Based Prevention Techniques – during this
agglomeration technique the name and score worth of nodes
to elect a cluster head and once a Cluster-Head is subjected to
DDoS attack this is able to have manifolds consequences
because the Cluster Heads type a virtual backbone and will be
wont to maintain routing states data & route packets to nodes
in their cluster. The designworked in 3 phases specifically as
part I: name and Score based mostly Cluster Creation And
Cluster Headchoice part II: presents mentioning of a number
of DDoS attacks like message bombing and cache poisoning,
their detection ways part III: presents an impact frame packet
format which may be used as a line of defence to regulate and
mitigate from DDoS attacks over a name and score based
mostly painter.[12]
Detection Algorithm using IDS node –– during this rule
foremost we tend to produce AN IDS node during which we
tend to set AODV as a routing protocol. Then when the
creation, our IDS node check the network configuration and
capture sedimentation by finding that if any node is in its
National Conference on Engineering Trends in Medical Science – NCETMS - 2014
ISSN: 2231-5381 http://www.ijettjournal.org Page 98
radio vary and conjointly ensuing hop isn't null, then capture
all the data of nodes. Else nodes area unit out of vary or
destination inaccessible . With the assistanceof this data IDS
node creates a standard profile that contains data like form of
packet, in our case (protocol is AODV, pkt kind transmission
control protocol, UDP, CBR), time of packet send and receive
and threshold.hen making traditional profile and threshold
checking is finished within the network i.e. if network load is
smaller than or capable most limit and new profile is smaller
than or capable most threshold and new profile is bigger than
or capable minimum threshold then there's no any quite attack
gift. Else there's AN attack within the network and realize the
attack. For doing it compare traditional profile with every new
trace worth i.e. check packet kind, count unknown packet
kind, point in time of packet, sender of packet, receiver of
packet. And whendetection of any anomaly therein parameters
then block that packet sender node . The projected mechanism
eliminates the requirement for a centralized sure authority that
isn't sensible in ADHOC network attributable to their self
organizing nature. It protects the network through a self
organized, absolutely distributed and localized procedure. It
may also be applied for securing the network from alternative
routing attacks by dynamic the safety parameters in
accordance with the character of the attacks.[11]
New Cracking rule – during this rule a procedure is
formed to tackle the continual issues occur within the net
services. To avoid the continous logon to a selected data
processor, this rule maintains a standing table. therein it keeps
the informatics addresses of current users and their standing.
If the actual informatics address has been signed on for a
primary time, it makes the standing as real user. For 2, 3, four
it marks as traditional user. For the fifth time it makes the
actualinformatics address standing as aggressor. within the
time calculations we tend to area unit solelycontemplate five
times. User would like to server increase the time depends au
courant the applying. After that, the user cannot permit get the
service of that individual data processor. The service is denied
theretospecific informatics address. the essential plan behind
the projected system is to isolate ANd defend the netserver
from vast volumes of DDoS request once an attack happens.
conjointly a DDoS munition for shieldingthe net services is
additionally projected. once a DDoS attack happens, the
projected munition ensures that in an exceedingly net
connected server data area unit managed while not corruption.
This fresh designed system that effectively offers the
provision of net services even throughout severe DDoS
attacks. Our system issensible and simply deployable as a
result of it's clear to each net servers and shoppers and is
absolutelycompatible with all existing network protocols.[15]
.
IP Traceback Algorithm – informatics traceback is that
theability to seek out the supply of AN informatics packet
while not looking forward to the supplyinformatics field
within the packet, that is usually spoofed. This rule will trace
the supply (zombies) of the attack up to its native body
network. informatics traceback theme supported data metrics
will effectively trace all attacks till their own LANs
(zombies). last, our projected data metrics will considerably
improve the performance of low-rate DDoS attacks detection
and informatics traceback over the normal approaches. DDoS
attacks detection metric is combined with informatics
traceback rule and filtering technology along to create an
efficient cooperative defence against network security threats
in net. In hop-by-hop informatics tracing, the a lot of hops the
a lot of tracing processes, so the longer time are going to be
taken. so as to convenience forinformatics traceback rule
analysis, we tend to classify 2 styles of traffic as native traffic
and forward traffic. Thenative traffic of is that the traffic
generated from its local area network , the forward traffic of is
that the total of its native traffic and therefore the traffic
forwarded from its immediate upstream routers. This data
metrics willconsiderably improve the performance oflow-rate
DDoS attacks detection and informatics traceback over the
normal approaches.[16].
VII. CONCLUSIONS
There is associate degree horrific increase within the range
of DDoS attack incidents. Not only, DDoS incidentsarea unit
growing day by day however the technique to attack, botnet
size, and attack traffic are attaining new heights. Effective
defense measures required to stop and mitigate these attacks is
that the current would like of the hour. In this paper, we
introduce techniques for detection and dominant flooding and
DDoS attacks inManet. they need most of the issues of wired
networks and plenty of a lot of owing to their specific
features: dynamic topology, restricted resources, lack of
central management points. First, we've got conferred specific
vulnerabilities of this new surroundings. Then we've got
surveyed the attacks that exploit these vulnerabilities and also
the doable proactive and reactive solutions projected within
the literature. Attacks area unit classified into passive and
active attacks at the highest level. Then varied Preventive
measures area unit mentioned so as to mitigate the results of
DDOS attack in Manet. To conclude, Manet security may be a
complicated and difficulttopic.
REFERENCES
[2] J. Mirkovic, and P. Reiher, “A taxonomy of DDoS attack and DDoS
defense mechanisms,” Computer Journal of ACM SIGCOMM,vol. 34,
no. 2, pp. 39- 53, Apr. 2004. [3] J. Mirkovic, “D-WARD: source end defense against distributed denial
of service attacks,” Ph.D. thesis,University of California,2003.
[4] K. Sivakumar, Dr. G. Selvaraj,”Overview of various Attack in MANET and Countermeasures for Attack”, International Journal of
Computer Science and Management Research, Vol 2 Issue 1, January
2013. [5] Laxmi Bala, A.K. Vatsa, “Quality based Bottom-up-Detection and
Prevention Techniques for DDOS in MANET”,International Journal of
Computer Applications, Volume 55– No.2, October 2012. [6] Minda Xiang,Yu Chen,Wei-Shinn Ku, Zhou Su, “ Mitigating DDoS
Attacks using Protection Nodes in Mobile Ad Hoc Networks”, Dept. of
Computer Science & Software Engineering, Auburn University, Auburn, AL 36849.

National Conference on Engineering Trends in Medical Science – NCETMS - 2014
ISSN: 2231-5381 http://www.ijettjournal.org Page 99
[7] Mohan K Mali, Pramod A Jadhav, ” Review of DDoS and Flooding Attacks in MANET”, International Journal of Emerging Technology
and Advanced Engineering, Volume 3, Issue 5, May 2013.
[8] Maha Abdelhaq, Sami Serhan, Rred Alsqour and Rosilah Hassan (2011) IEEE sponsored International Conference on Electrical
Engineering & Informatics.
[9] Michael R. Lyu and Lorrien K.Y. Lau (2000) 24th International Computer Software and Applications Conference 116-121.
[10] M. Robinson, J. Mirkovic, M. Schnaider, S. Michel, and P. Reiher,
"Challenges and principles of DDoS defense," Computer Journal of ACM SIGCOMM, vol. 5, no. 2, pp. 148-152, 2003.
[11] Priyanka Goyal, Vinti Parmar, Rahul Rishi, ”Vulnerabilities,
Challenges, Attacks, Application”,International Journal of Computational Engineering & Management, Vol. 11, January 2011.
[12] Prajeet Sharma,Niresh Sharma,Rajdeep Singh,” A Secure Intrusion
detection system against DDOS attack in Wireless Mobile Ad-hoc Network”, International Journal of Computer Applications,Volume 41–
No.21, March 2012.
[13] Rizwan Khan , A. K. Vatsa, “Detection and Control of DDOS Attacks over Reputation and Score Based MANET”, Journal of Emerging
Trends in Computing and Information Sciences, VOL. 2, NO. 11,
October 2011. [14] T. Peng, C. Leckie, and K. Ramamohanarao,“Survey of network based
defense mechanisms countering the DoS and DDoS problems,”
Computer Journal of ACM Computing Surveys, vol. 39, no. 1,pp. 123-128, Apr. 2007.
[15] T. Roebuck. (2005) Crime-research.org, “Network security: DoS vs.
DDoS attacks,” [Online].Available: http:// www.crime-research.org/articles/network-security-dos-ddos-attacks.
[16] V.Priyadharshini, Dr.K.Kuppusamy, “ Prevention of DDOS Attacks
using New Cracking Algorithm”, International Journal of Engineering Research and Applications,Vol. 2, Issue 3, May-Jun 2012, pp.2263-
2267.
[17] Wang H., Zhang D. and Shin K. Delectating syn flooding attacks, in IEEE infocom. [17] Washington.edu, “A DNS reflection attack on
register.com,” [Online]. Available: http://
www.staff.washington.edu/dittrich/misc/ ddos/ [18] Yang Xiang,Wanlei Zhou, “Low-Rate DDOS Attack Detection and
Traceback with New Information Metrics”, IEEE TRANSACTIONS ON INFORMATION FORENSICS AND SECURITY, VOL. 6-NO. 2,
JUNE 2011.
[19] https://en.wikipedia.org/wiki/Denial-of-service_attack [20] http://en.wikipedia.org/wiki/Mobile_ad_hoc_network
National Conference on Engineering Trends in Medical Science – NCETMS - 2014
ISSN: 2231-5381 http://www.ijettjournal.org Page 100
“Audio Spotlighting System Using Ultrasonic
Energy” Monika Arkilwad
1, Aparna Rangari
2, Chetan Thote
3 Department of Electronics and Telecommunication Engineering,
Dr. Bhausaheb Nandurkar College ofEngineering & Technology, Yavatmal
Abstract- Audio spot lighting is a very recent technology that
creates focused beams of sound similar to light beams coming
out of a flashlight. By „shining sound to one location, specific
listeners can be targeted with sound without others nearby
hearing it. It uses a combination of non-linear acoustics and
some fancy mathematics. But it is real and is fine to knock the
socks of any conventional loud speaker. This acoustic device
comprises a speaker that fires inaudible ultrasound pulses
with very small wavelength which act in a manner very
similar to that of a narrow column. The ultra sound beam acts
as an airborne speaker and as the beam moves through the air
gradual distortion takes place in a predictable way due to the
property of non-linearity of air. This gives rise to audible
components that can be accurately predicted and precisely
controlled. Joseph Pompei‟ holosonic Research Labs invented
the Audio Spotlight that is made of a sound processor, an
amplifier and the transducer. The American Technology
Corporation developed the Hyper Sonic Sound-based
Directed Audio Sound System. Both use ultrasound based
solutions to beam sound into a focused beam. Audio spotlight
can be either directed at a particular listener or to a point
where it is reflected. The targeted or directed audio technology is going to
a huge commercial market in entertainment and consumer
electronics and technology developers are scrambling to tap in
to the market. Being the most recent and dramatic change in
the way we perceive sound since the invention of coil loud
speaker, audio spot light technology can do many miracles in
various fields like Private messaging system, Home theatre
audio system, Navy and military applications, museum
displays, ventriloquist systems etc. Thus audio spotlighting
helps us to control where sound comes from and where it
goes!
Keywords —Transducer, Ultrasonic amplifier
Ultrasonic Oscillator, Hypersonic sound technology.
I. INTRODUCTION
The Audio Spotlight & Hyper Sonic Sound Technology
(developed by American Technology Corporation), uses
ultrasonic energy to create extremely narrow beams of
sound that behaves like beams of light. Audio spotlighting
exploits the property of non-linearity of air. When
inaudible ultrasound pulses are fired into the air, it
spontaneously converts the inaudible ultrasound into
audible sound tones, hence proved that as with water,
sound propagation in air is just as non-linear, and can be
calculated mathematically. A device known as a parametric
array employs the non-linearity of the air to create audible
by-products from inaudible ultrasound, resulting in an
extremely directive, beamlike wide-band acoustical source.
This source can be projected about an area much like a
spotlight, and creates an actual specialized sound distant
from the transducer. The ultrasound column acts as an
airborne speaker, and as the beam moves through the air,
gradual distortion takes place in a predictable way.
This gives rise to audible components that can be
accurately predicted and precisely controlled. the sound
dispersion of the Audio Spotlight can be likened to a
directional beam of light, like a flashlight. Its best use is for
delivering sound to an isolated area. According to the
supplied Manual, the most present sound is at a distance of
around six feet while listening directly in front of the disc.
At fifteen feet away from the disc, the sound level drops by
about 9 decibels. Based on these specifications, its best use
would be in a small environment where sound “bleed” is an
issue. Museums utilize similar devices. In order to focus
sound into a narrow beam, you need to maintain a low
beam angle that is dictated by wavelength. The smaller the
wavelength, the less the beam angle, and hence, the more
focused the sound. Unfortunately, most of the human-
audible sound is a mixture of signals with varying
wavelengths—between 2cms to 17 meters (the human
hearing ranges from a frequency of 20 Hz to 20,000 Hz).
Hence, except for very low wavelengths, just about the
entire audible spectrum tends to spread out at 360 degrees.
To create a narrow sound beam, the aperture size of the
source also matters—a large loudspeaker will focus sound
over a smaller area. If the source loudspeaker can be made
several times bigger than the wavelength of the sound
transmitted, then a finely focused beam can be created. The
problem here is that this is not a very practical solution. To
ensure that the shortest audible wavelengths are focused
into a beam, a loudspeaker about 10 meters across is
required, and to guarantee that all the audible wavelengths
are focused, even bigger loudspeakers are needed.
Here comes the acoustical device “AUDIO
SPOTLIGHT” invented by Holosonics Labs founder Dr. F.
Joseph Pompei (while a graduate student at MIT), who is
the master brain behind the development of this
technology.
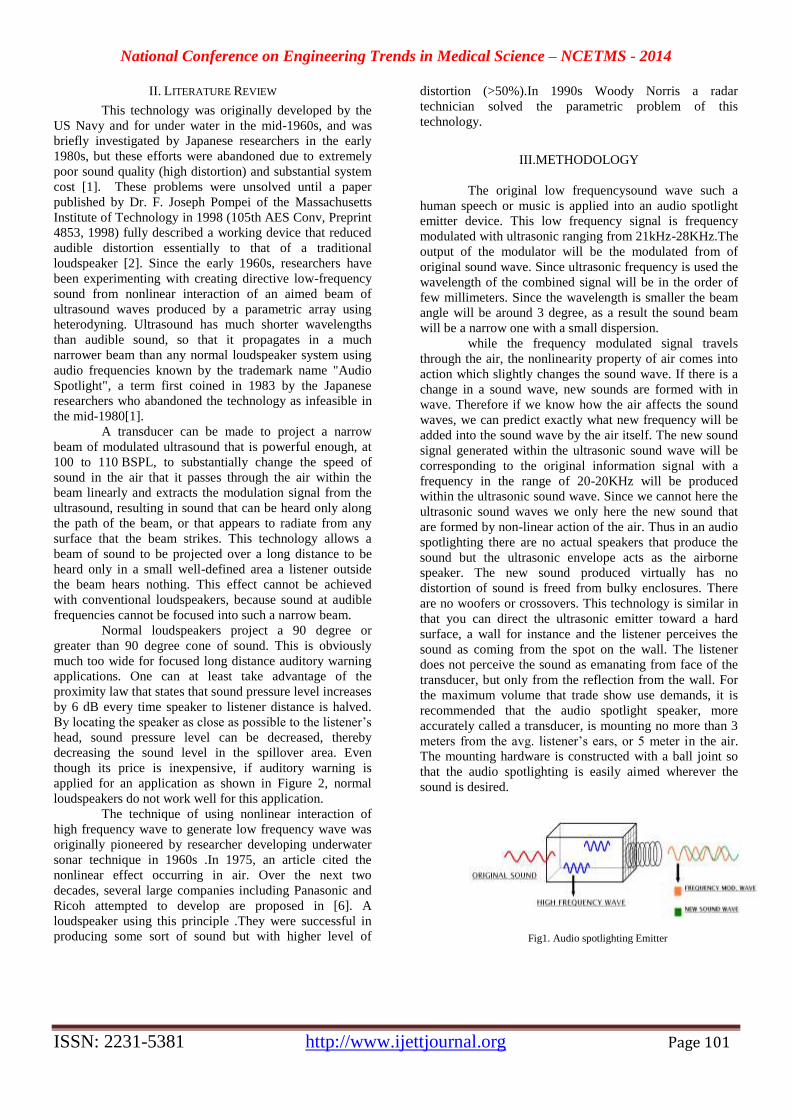
National Conference on Engineering Trends in Medical Science – NCETMS - 2014
ISSN: 2231-5381 http://www.ijettjournal.org Page 101
II. LITERATURE REVIEW
This technology was originally developed by the
US Navy and for under water in the mid-1960s, and was
briefly investigated by Japanese researchers in the early
1980s, but these efforts were abandoned due to extremely
poor sound quality (high distortion) and substantial system
cost [1]. These problems were unsolved until a paper
published by Dr. F. Joseph Pompei of the Massachusetts
Institute of Technology in 1998 (105th AES Conv, Preprint
4853, 1998) fully described a working device that reduced
audible distortion essentially to that of a traditional
loudspeaker [2]. Since the early 1960s, researchers have
been experimenting with creating directive low-frequency
sound from nonlinear interaction of an aimed beam of
ultrasound waves produced by a parametric array using
heterodyning. Ultrasound has much shorter wavelengths
than audible sound, so that it propagates in a much
narrower beam than any normal loudspeaker system using
audio frequencies known by the trademark name "Audio
Spotlight", a term first coined in 1983 by the Japanese
researchers who abandoned the technology as infeasible in
the mid-1980[1].
A transducer can be made to project a narrow
beam of modulated ultrasound that is powerful enough, at
100 to 110 BSPL, to substantially change the speed of
sound in the air that it passes through the air within the
beam linearly and extracts the modulation signal from the
ultrasound, resulting in sound that can be heard only along
the path of the beam, or that appears to radiate from any
surface that the beam strikes. This technology allows a
beam of sound to be projected over a long distance to be
heard only in a small well-defined area a listener outside
the beam hears nothing. This effect cannot be achieved
with conventional loudspeakers, because sound at audible
frequencies cannot be focused into such a narrow beam.
Normal loudspeakers project a 90 degree or
greater than 90 degree cone of sound. This is obviously
much too wide for focused long distance auditory warning
applications. One can at least take advantage of the
proximity law that states that sound pressure level increases
by 6 dB every time speaker to listener distance is halved.
By locating the speaker as close as possible to the listener’s
head, sound pressure level can be decreased, thereby
decreasing the sound level in the spillover area. Even
though its price is inexpensive, if auditory warning is
applied for an application as shown in Figure 2, normal
loudspeakers do not work well for this application.
The technique of using nonlinear interaction of
high frequency wave to generate low frequency wave was
originally pioneered by researcher developing underwater
sonar technique in 1960s .In 1975, an article cited the
nonlinear effect occurring in air. Over the next two
decades, several large companies including Panasonic and
Ricoh attempted to develop are proposed in [6]. A
loudspeaker using this principle .They were successful in
producing some sort of sound but with higher level of
distortion (>50%).In 1990s Woody Norris a radar
technician solved the parametric problem of this
technology.
III.METHODOLOGY
The original low frequencysound wave such a
human speech or music is applied into an audio spotlight
emitter device. This low frequency signal is frequency
modulated with ultrasonic ranging from 21kHz-28KHz.The
output of the modulator will be the modulated from of
original sound wave. Since ultrasonic frequency is used the
wavelength of the combined signal will be in the order of
few millimeters. Since the wavelength is smaller the beam
angle will be around 3 degree, as a result the sound beam
will be a narrow one with a small dispersion.
while the frequency modulated signal travels
through the air, the nonlinearity property of air comes into
action which slightly changes the sound wave. If there is a
change in a sound wave, new sounds are formed with in
wave. Therefore if we know how the air affects the sound
waves, we can predict exactly what new frequency will be
added into the sound wave by the air itself. The new sound
signal generated within the ultrasonic sound wave will be
corresponding to the original information signal with a
frequency in the range of 20-20KHz will be produced
within the ultrasonic sound wave. Since we cannot here the
ultrasonic sound waves we only here the new sound that
are formed by non-linear action of the air. Thus in an audio
spotlighting there are no actual speakers that produce the
sound but the ultrasonic envelope acts as the airborne
speaker. The new sound produced virtually has no
distortion of sound is freed from bulky enclosures. There
are no woofers or crossovers. This technology is similar in
that you can direct the ultrasonic emitter toward a hard
surface, a wall for instance and the listener perceives the
sound as coming from the spot on the wall. The listener
does not perceive the sound as emanating from face of the
transducer, but only from the reflection from the wall. For
the maximum volume that trade show use demands, it is
recommended that the audio spotlight speaker, more
accurately called a transducer, is mounting no more than 3
meters from the avg. listener’s ears, or 5 meter in the air.
The mounting hardware is constructed with a ball joint so
that the audio spotlighting is easily aimed wherever the
sound is desired.
Fig1. Audio spotlighting Emitter
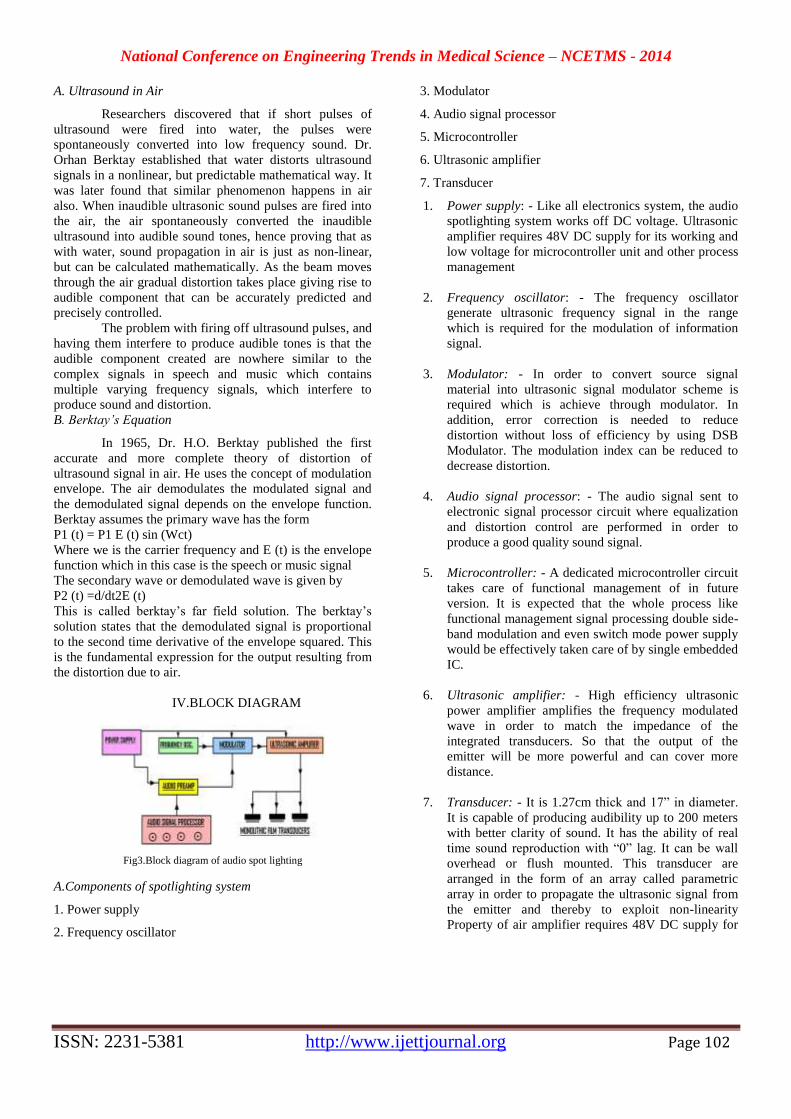
National Conference on Engineering Trends in Medical Science – NCETMS - 2014
ISSN: 2231-5381 http://www.ijettjournal.org Page 102
A. Ultrasound in Air
Researchers discovered that if short pulses of
ultrasound were fired into water, the pulses were
spontaneously converted into low frequency sound. Dr.
Orhan Berktay established that water distorts ultrasound
signals in a nonlinear, but predictable mathematical way. It
was later found that similar phenomenon happens in air
also. When inaudible ultrasonic sound pulses are fired into
the air, the air spontaneously converted the inaudible
ultrasound into audible sound tones, hence proving that as
with water, sound propagation in air is just as non-linear,
but can be calculated mathematically. As the beam moves
through the air gradual distortion takes place giving rise to
audible component that can be accurately predicted and
precisely controlled.
The problem with firing off ultrasound pulses, and
having them interfere to produce audible tones is that the
audible component created are nowhere similar to the
complex signals in speech and music which contains
multiple varying frequency signals, which interfere to
produce sound and distortion.
B. Berktay’s Equation
In 1965, Dr. H.O. Berktay published the first
accurate and more complete theory of distortion of
ultrasound signal in air. He uses the concept of modulation
envelope. The air demodulates the modulated signal and
the demodulated signal depends on the envelope function.
Berktay assumes the primary wave has the form
P1 (t) = P1 E (t) sin (Wct)
Where we is the carrier frequency and E (t) is the envelope
function which in this case is the speech or music signal
The secondary wave or demodulated wave is given by
P2 (t) =d/dt2E (t)
This is called berktay’s far field solution. The berktay’s
solution states that the demodulated signal is proportional
to the second time derivative of the envelope squared. This
is the fundamental expression for the output resulting from
the distortion due to air.
IV.BLOCK DIAGRAM
Fig3.Block diagram of audio spot lighting
A.Components of spotlighting system
1. Power supply
2. Frequency oscillator
3. Modulator
4. Audio signal processor
5. Microcontroller
6. Ultrasonic amplifier
7. Transducer
1. Power supply: - Like all electronics system, the audio
spotlighting system works off DC voltage. Ultrasonic
amplifier requires 48V DC supply for its working and
low voltage for microcontroller unit and other process
management
2. Frequency oscillator: - The frequency oscillator
generate ultrasonic frequency signal in the range
which is required for the modulation of information
signal.
3. Modulator: - In order to convert source signal
material into ultrasonic signal modulator scheme is
required which is achieve through modulator. In
addition, error correction is needed to reduce
distortion without loss of efficiency by using DSB
Modulator. The modulation index can be reduced to
decrease distortion.
4. Audio signal processor: - The audio signal sent to
electronic signal processor circuit where equalization
and distortion control are performed in order to
produce a good quality sound signal.
5. Microcontroller: - A dedicated microcontroller circuit
takes care of functional management of in future
version. It is expected that the whole process like
functional management signal processing double side-
band modulation and even switch mode power supply
would be effectively taken care of by single embedded
IC.
6. Ultrasonic amplifier: - High efficiency ultrasonic
power amplifier amplifies the frequency modulated
wave in order to match the impedance of the
integrated transducers. So that the output of the
emitter will be more powerful and can cover more
distance.
7. Transducer: - It is 1.27cm thick and 17” in diameter.
It is capable of producing audibility up to 200 meters
with better clarity of sound. It has the ability of real
time sound reproduction with “0” lag. It can be wall
overhead or flush mounted. This transducer are
arranged in the form of an array called parametric
array in order to propagate the ultrasonic signal from
the emitter and thereby to exploit non-linearity
Property of air amplifier requires 48V DC supply for
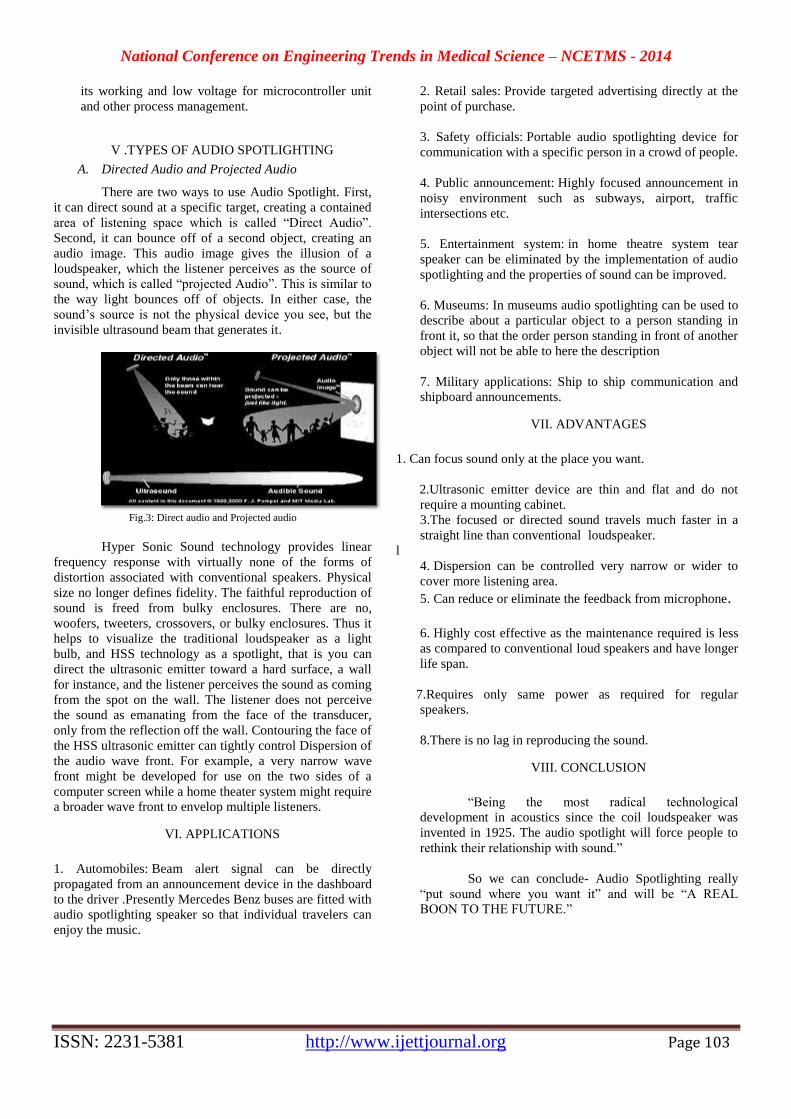
National Conference on Engineering Trends in Medical Science – NCETMS - 2014
ISSN: 2231-5381 http://www.ijettjournal.org Page 103
its working and low voltage for microcontroller unit
and other process management.
V .TYPES OF AUDIO SPOTLIGHTING
A. Directed Audio and Projected Audio
There are two ways to use Audio Spotlight. First,
it can direct sound at a specific target, creating a contained
area of listening space which is called “Direct Audio”.
Second, it can bounce off of a second object, creating an
audio image. This audio image gives the illusion of a
loudspeaker, which the listener perceives as the source of
sound, which is called “projected Audio”. This is similar to
the way light bounces off of objects. In either case, the
sound’s source is not the physical device you see, but the
invisible ultrasound beam that generates it.
Fig.3: Direct audio and Projected audio
Hyper Sonic Sound technology provides linear
frequency response with virtually none of the forms of
distortion associated with conventional speakers. Physical
size no longer defines fidelity. The faithful reproduction of
sound is freed from bulky enclosures. There are no,
woofers, tweeters, crossovers, or bulky enclosures. Thus it
helps to visualize the traditional loudspeaker as a light
bulb, and HSS technology as a spotlight, that is you can
direct the ultrasonic emitter toward a hard surface, a wall
for instance, and the listener perceives the sound as coming
from the spot on the wall. The listener does not perceive
the sound as emanating from the face of the transducer,
only from the reflection off the wall. Contouring the face of
the HSS ultrasonic emitter can tightly control Dispersion of
the audio wave front. For example, a very narrow wave
front might be developed for use on the two sides of a
computer screen while a home theater system might require
a broader wave front to envelop multiple listeners.
VI. APPLICATIONS
1. Automobiles: Beam alert signal can be directly
propagated from an announcement device in the dashboard
to the driver .Presently Mercedes Benz buses are fitted with
audio spotlighting speaker so that individual travelers can
enjoy the music.
2. Retail sales: Provide targeted advertising directly at the
point of purchase.
3. Safety officials: Portable audio spotlighting device for
communication with a specific person in a crowd of people.
4. Public announcement: Highly focused announcement in
noisy environment such as subways, airport, traffic
intersections etc.
5. Entertainment system: in home theatre system tear
speaker can be eliminated by the implementation of audio
spotlighting and the properties of sound can be improved.
6. Museums: In museums audio spotlighting can be used to
describe about a particular object to a person standing in
front it, so that the order person standing in front of another
object will not be able to here the description
7. Military applications: Ship to ship communication and
shipboard announcements.
VII. ADVANTAGES
1. Can focus sound only at the place you want.
2.Ultrasonic emitter device are thin and flat and do not
require a mounting cabinet.
3.The focused or directed sound travels much faster in a
straight line than conventional loudspeaker.
l
4. Dispersion can be controlled very narrow or wider to
cover more listening area.
5. Can reduce or eliminate the feedback from microphone.
6. Highly cost effective as the maintenance required is less
as compared to conventional loud speakers and have longer
life span.
7.Requires only same power as required for regular
speakers.
8.There is no lag in reproducing the sound.
VIII. CONCLUSION
“Being the most radical technological
development in acoustics since the coil loudspeaker was
invented in 1925. The audio spotlight will force people to
rethink their relationship with sound.”
So we can conclude- Audio Spotlighting really
“put sound where you want it” and will be “A REAL
BOON TO THE FUTURE.”

National Conference on Engineering Trends in Medical Science – NCETMS - 2014
ISSN: 2231-5381 http://www.ijettjournal.org Page 104
ACKNOWLEDGMENT
We avail this opportunity to express our deep sense of
gratitude and whole hearted thanks to Head of the
Department, Electronics and Tele-communication
Engineering, Prof. S. A. Chavan for their invaluable
guidance and encouragement to embark this paper.
We are thankful to whose esteemed suggestions and
encouragement from time to time have always been
unparalleled stimuli for us to travel eventually towards
completion of this seminar.
We also put sincere thanks to Dr. V. G. Arajpure
(Principal DBNCOET Yavatmal) for constant motivation
and providing necessary infrastructure
IX. REFFERENCE
[1]. M. Yoneyama and J. Fujimoto.The audio spotlight: An application
of nonlinear interaction of sound waves to a new type of loudspeaker
design, J. Acoustical Society of America, vol. 73, no. 5, pages 1532-1536,
May 1983.
[2].F. J. Pompei, “The Use of Airborne Ultrasonics for Generating
Audible Sound Beams ”J. Audio Eng. Soc., Vol. 47, No. 9, pp. 726–730,
1999.
[3]. F. J. Pompei, Sound from ultrasound: The parametric array as an
audible sound source, Doctor of Philosophy, Massachusetts Institute of Technology, Cambridge, MA, June 2002.
[4]. P. J. Westervelt, “Parametric Acoustic Array”, J. Acoust. Soc. Am, Vol. 35, pp. 535- 537, April 1963.
[5]. David I. Havelock and Anthony J. Brammer, “Directional Loudspeakers Using Sound Beams”, J. Audio Eng. Soc., Vol. 48, No. 10,
pp. 908-916, October 2000.
[6]. A. Ritty,“Directional Loudspeaker Using a Parametric Array”, Act
Polytechnica, Vol. 46, No. 4, 2000.
[7]. T. Chen, Guest Editor. The Past, Present, and Future of Audio Signal
Processing, IEEE Signal Processing Magazine, pages 30-57, September
1997.
National Conference on Engineering Trends in Medical Science – NCETMS - 2014
ISSN: 2231-5381 http://www.ijettjournal.org Page 105
An Overview of Audio Steganography
Techniques Using Phase Encoding and LSB Omkumar G. Paratkar
1, Aniket N. Kale
2
1 Student, Computer Engineering, SGBAU Amravati University, India
2Student, Computer Engineering, SGBAU Amravati University, India
Abstract– In this paper there is study of different techniques
of audio steganography exploitation totally different
algorithms likes LSB approach And Phase Coding. We’ve
tried to cover some approaches that help in audio
steganography. As we know that it is the art and science of
writing hidden messages in such a way that nobody, except
the sender and intended recipient, suspects the existence of
the message, a form of security through obscurity. In
steganography, the message used to hide secret message is
termed host message or cover message. Once the contents of
the host message or cover message are changed, the resultant
message is thought as stego message. In different words, stego
message is combination of host message and secret message.
Audio steganography needs a text or audio secret message to
be embedded inside a cover audio message. Due to availability
of redundancy, the cover audio message before
steganography, stego message once steganography remains
same for data hiding.
Keywords- Audio Data Hiding, Phase Coding, LSB, HAS
1. INTRODUCTION
The past few years have seen AN explosion within the use
of digital media. trade is creating important investments to
deliver digital audio, image, and video data to consumers
and customers. a brand new infrastructure of digital audio,
image, and video recorders and players, on-line services,
and electronic commerce is apace being deployed. At
constant time, major companies are changing their audio,
image, And video archives to an electronic kind. Digital
media provide many distinct benefits over analog media:
the standard of digital audio, image, and video signals is
beyond that of their analog counterparts. Editing is simple
as a result of one will access the precise distinct locations
that ought to be modified. Repetition is easy with no loss of
fidelity. A replica of a digital media is identical to the
initial. Digital audio, image, and videos are simply
transmitted over networked data systems. These benefits
have opened several new potentialities. In specific, it's
attainable to cover information (information) at intervals
digital audio, image, and video files.The knowledge is
hidden within the sense that it's perceptually and
statistically undetectable. With several schemes, the hidden
data can still be recovered if the host signal is compressed,
edited, or regenerate from digital to analog format and
back. Data embedding additionally provides a mechanism
For embedding important management, descriptive, or
reference data in a given signal.
To encode secret messages in audio is that the most
difficult technique to use once managing Steganography.
This can be as a result of the human auditory system (HAS)
has such a dynamic range that it will listen over. to place
this in perspective, the (HAS) perceives over a range of
power larger than one thousand thousand to at least one and
a spread of frequencies larger than one thousand to at least
one creating it extraordinarily exhausting to feature or take
away information from the original data structure. The only
weakness within the (HAS) comes at attempting to
differentiate sounds (loud sounds drown out quiet sounds)
and this can be what encode be exploited to write secret
messages in audio without being detected.Audio masking
is the effect by which a faint but audible sound becomes
inaudible in the presence of another louder audible sound,
i.e. the masker.
2.METHODS FOR HIDING INFORMATION:
There are various types of the methods that are used to hide
the information within any Digital media that may be
image, Audio and Video files etc. The two methods to hide
the information within the digital
media(Image,Audio,Video file)are Phase coding and LSB
respectively.
2.1 PHASE CODING:
Phase coding substitutes the phase of an initial
audioSegment with a reference phase that represents
theHidden information. this may be thought of, as kind of
an encryption for the audio signal by victimization what's
known as discrete Fourier transform (DFT), which is
nothing over a transformation algorithmic rule for the audio
signal. Human auditory system (HAS) can’t acknowledge
the phase change in audio signal as simple it will
acknowledge noise within the signal. The phase coding
methodology exploits this fact. this method encodes the
secret message bits as phase shifts within the phase
spectrum of a digital signal, achieving an inaudible
encoding in terms of signal-to- noise ratio.
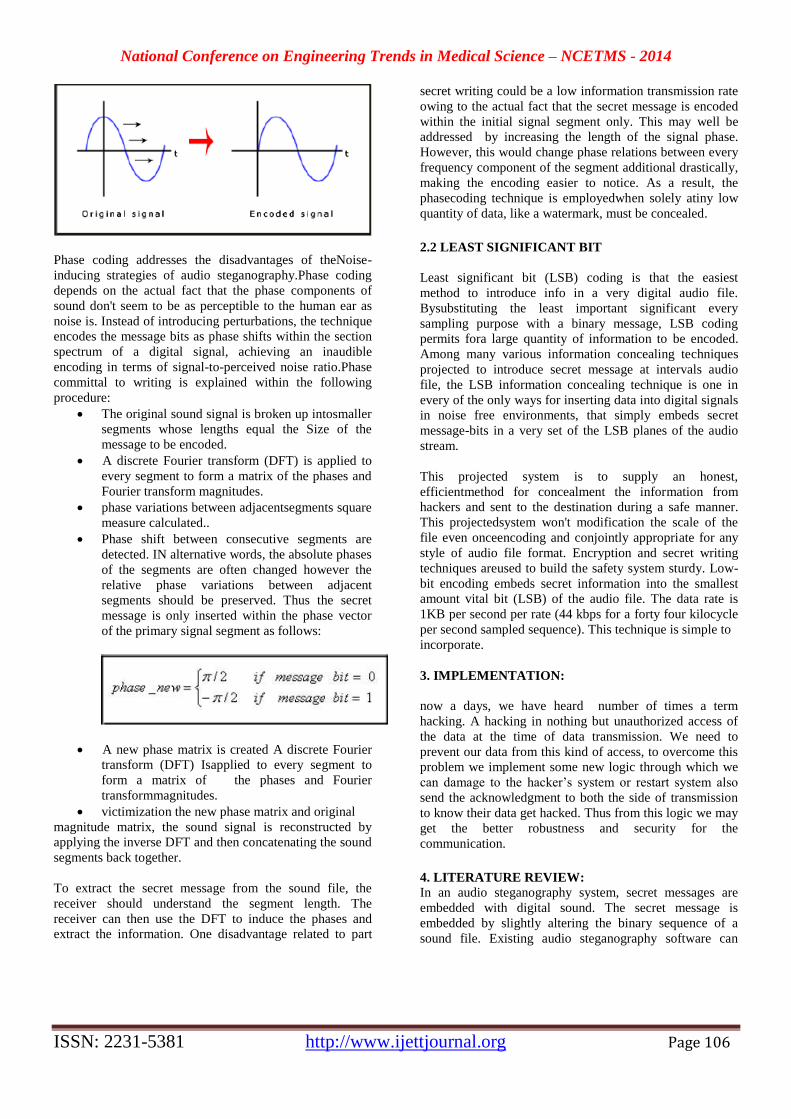
National Conference on Engineering Trends in Medical Science – NCETMS - 2014
ISSN: 2231-5381 http://www.ijettjournal.org Page 106
Phase coding addresses the disadvantages of theNoise-
inducing strategies of audio steganography.Phase coding
depends on the actual fact that the phase components of
sound don't seem to be as perceptible to the human ear as
noise is. Instead of introducing perturbations, the technique
encodes the message bits as phase shifts within the section
spectrum of a digital signal, achieving an inaudible
encoding in terms of signal-to-perceived noise ratio.Phase
committal to writing is explained within the following
procedure:
The original sound signal is broken up intosmaller
segments whose lengths equal the Size of the
message to be encoded.
A discrete Fourier transform (DFT) is applied to
every segment to form a matrix of the phases and
Fourier transform magnitudes.
phase variations between adjacentsegments square
measure calculated..
Phase shift between consecutive segments are
detected. IN alternative words, the absolute phases
of the segments are often changed however the
relative phase variations between adjacent
segments should be preserved. Thus the secret
message is only inserted within the phase vector
of the primary signal segment as follows:
A new phase matrix is created A discrete Fourier
transform (DFT) Isapplied to every segment to
form a matrix of the phases and Fourier
transformmagnitudes.
victimization the new phase matrix and original
magnitude matrix, the sound signal is reconstructed by
applying the inverse DFT and then concatenating the sound
segments back together.
To extract the secret message from the sound file, the
receiver should understand the segment length. The
receiver can then use the DFT to induce the phases and
extract the information. One disadvantage related to part
secret writing could be a low information transmission rate
owing to the actual fact that the secret message is encoded
within the initial signal segment only. This may well be
addressed by increasing the length of the signal phase.
However, this would change phase relations between every
frequency component of the segment additional drastically,
making the encoding easier to notice. As a result, the
phasecoding technique is employedwhen solely atiny low
quantity of data, like a watermark, must be concealed.
2.2 LEAST SIGNIFICANT BIT
Least significant bit (LSB) coding is that the easiest
method to introduce info in a very digital audio file.
Bysubstituting the least important significant every
sampling purpose with a binary message, LSB coding
permits fora large quantity of information to be encoded.
Among many various information concealing techniques
projected to introduce secret message at intervals audio
file, the LSB information concealing technique is one in
every of the only ways for inserting data into digital signals
in noise free environments, that simply embeds secret
message-bits in a very set of the LSB planes of the audio
stream.
This projected system is to supply an honest,
efficientmethod for concealment the information from
hackers and sent to the destination during a safe manner.
This projectedsystem won't modification the scale of the
file even onceencoding and conjointly appropriate for any
style of audio file format. Encryption and secret writing
techniques areused to build the safety system sturdy. Low-
bit encoding embeds secret information into the smallest
amount vital bit (LSB) of the audio file. The data rate is
1KB per second per rate (44 kbps for a forty four kilocycle
per second sampled sequence). This technique is simple to
incorporate.
3. IMPLEMENTATION:
now a days, we have heard number of times a term
hacking. A hacking in nothing but unauthorized access of
the data at the time of data transmission. We need to
prevent our data from this kind of access, to overcome this
problem we implement some new logic through which we
can damage to the hacker’s system or restart system also
send the acknowledgment to both the side of transmission
to know their data get hacked. Thus from this logic we may
get the better robustness and security for the
communication.
4. LITERATURE REVIEW:
In an audio steganography system, secret messages are
embedded with digital sound. The secret message is
embedded by slightly altering the binary sequence of a
sound file. Existing audio steganography software can
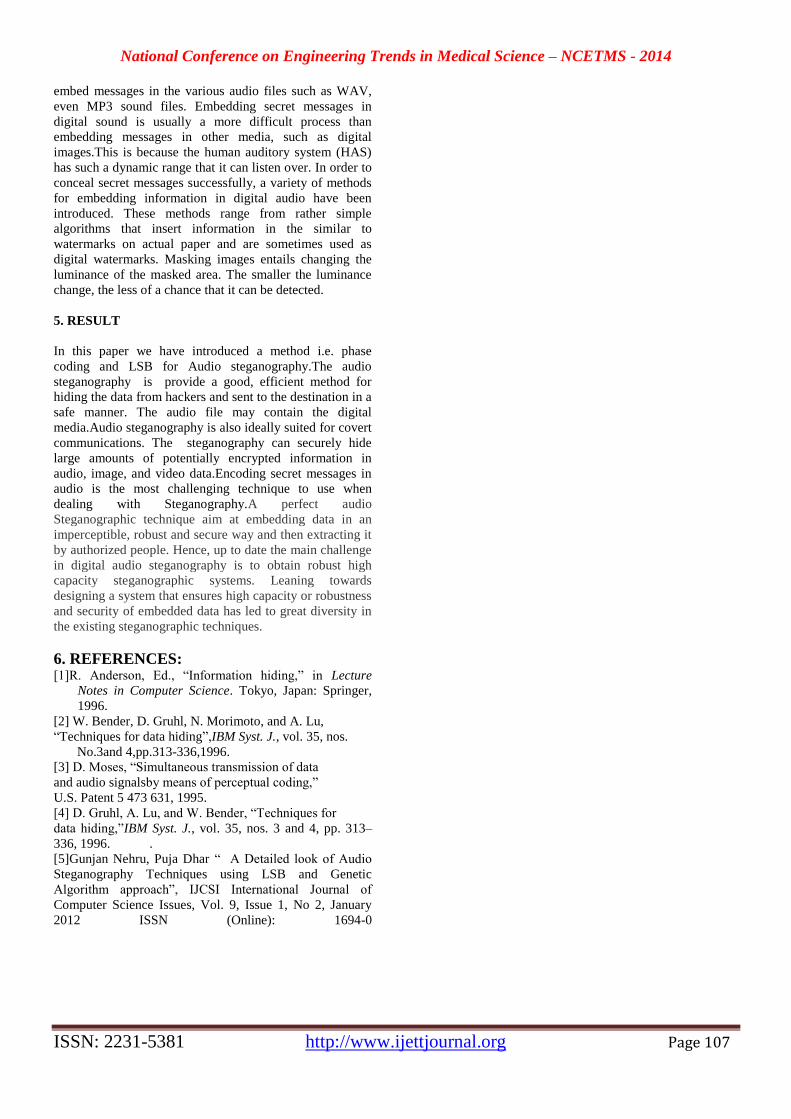
National Conference on Engineering Trends in Medical Science – NCETMS - 2014
ISSN: 2231-5381 http://www.ijettjournal.org Page 107
embed messages in the various audio files such as WAV,
even MP3 sound files. Embedding secret messages in
digital sound is usually a more difficult process than
embedding messages in other media, such as digital
images.This is because the human auditory system (HAS)
has such a dynamic range that it can listen over. In order to
conceal secret messages successfully, a variety of methods
for embedding information in digital audio have been
introduced. These methods range from rather simple
algorithms that insert information in the similar to
watermarks on actual paper and are sometimes used as
digital watermarks. Masking images entails changing the
luminance of the masked area. The smaller the luminance
change, the less of a chance that it can be detected.
5. RESULT
In this paper we have introduced a method i.e. phase
coding and LSB for Audio steganography.The audio
steganography is provide a good, efficient method for
hiding the data from hackers and sent to the destination in a
safe manner. The audio file may contain the digital
media.Audio steganography is also ideally suited for covert
communications. The steganography can securely hide
large amounts of potentially encrypted information in
audio, image, and video data.Encoding secret messages in
audio is the most challenging technique to use when
dealing with Steganography.A perfect audio
Steganographic technique aim at embedding data in an
imperceptible, robust and secure way and then extracting it
by authorized people. Hence, up to date the main challenge
in digital audio steganography is to obtain robust high
capacity steganographic systems. Leaning towards
designing a system that ensures high capacity or robustness
and security of embedded data has led to great diversity in
the existing steganographic techniques.
6. REFERENCES: [1]R. Anderson, Ed., “Information hiding,” in Lecture
Notes in Computer Science. Tokyo, Japan: Springer,
1996.
[2] W. Bender, D. Gruhl, N. Morimoto, and A. Lu,
“Techniques for data hiding”,IBM Syst. J., vol. 35, nos.
No.3and 4,pp.313-336,1996.
[3] D. Moses, “Simultaneous transmission of data
and audio signalsby means of perceptual coding,”
U.S. Patent 5 473 631, 1995.
[4] D. Gruhl, A. Lu, and W. Bender, “Techniques for
data hiding,”IBM Syst. J., vol. 35, nos. 3 and 4, pp. 313–
336, 1996. .
[5]Gunjan Nehru, Puja Dhar “ A Detailed look of Audio
Steganography Techniques using LSB and Genetic
Algorithm approach”, IJCSI International Journal of
Computer Science Issues, Vol. 9, Issue 1, No 2, January
2012 ISSN (Online): 1694-0

National Conference on Engineering Trends in Medical Science – NCETMS - 2014
ISSN: 2231-5381 http://www.ijettjournal.org Page 108
A Novel Lossless Image Compression
Algorithm Using Duplication Free Run
Length Coding Priyanka S. Burhan, Pujari Aishwarya R.
Abstract
This paper focuses on the lossless image
conpression without any duplication problem
by using duplication free run length coding.
When an image is stored in raw as an array of
pixels, the file size is usually large and
changes proportionally with the resolution and
number of color channels. For that, an image
is usually compressed for storage as well as
transmission purposes. Depending on the
application, an image can be compressed so
that a perfect reconstruction is possible (i.e.
lossless) or only an approximate of the
original image can be regenerated (i.e. lossy).
The existing method in first RLC algorithm
(Traditional RLC) is to encode two consecutive
pixels of same intensity into a single code word
hence gaining compression. However the
traditional RLC method suffers from
duplication problem. An entropy rule based
generative coding method is used to generate
variable length code words and these code
words are assigned to pixel intensity values
based on their probability of occurrence and
does not require flag bits for differentiation
between intensities and runs which is the case
of TRLC and hence overcomes duplication
problem.
1.Introduction
1.1IMAGE
Image is a collection of pixels which area
arranged in regular manner to form rectangular
patterns. Basically image is a two dimensional
light intensity function f(x , y) ,where x,y are
spatial coordinates and f(x , y) is a grey value
or intensity.An image is essentially a 2-D
signal processed
by the human visual system. The signals
representing images are usually in analog
form. However, for processing, storage and
transmission by computer applications, they
are converted from analog to digital form. A
digital image is basically a 2-Dimensional
array of pixels. Images form the significant
part of data, particularly in remote sensing,
biomedical and video conferencing
applications. The use of and dependence on
information and computers continue to grow,
so too does our need for efficient ways of
storing and transmitting large amounts of data
There are two types of images
1) Digital image
2) Binary image
1.2 DIGITAL IMAGE
An image is said to be digital image if the
amplitude of the image and spatial coordinates
are discrete quantities. A digital image is
composed by finite number of elements called
image elements or pixel elements or pixels
1.3 BINARY IMAGE
An image is said to a binary image if the
amplitude value is either one or zero i.e; binary
image consists of only black and white
colours. Binary image can be represented by a
set of ordered triplet.
2.Literature Review
The history of compression begins in the
1960s. An analogue videophone system had
been tried out in the 1960s, but it required a
wide bandwidth and the postcard-size black-
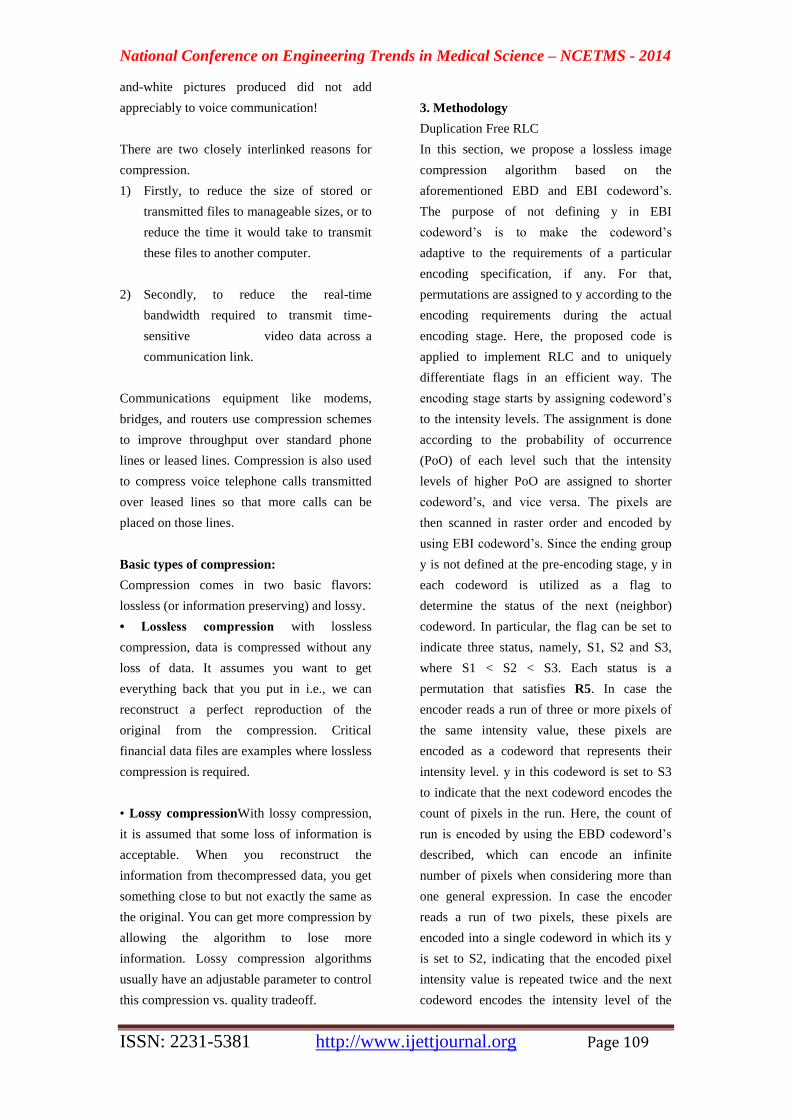
National Conference on Engineering Trends in Medical Science – NCETMS - 2014
ISSN: 2231-5381 http://www.ijettjournal.org Page 109
and-white pictures produced did not add
appreciably to voice communication!
There are two closely interlinked reasons for
compression.
1) Firstly, to reduce the size of stored or
transmitted files to manageable sizes, or to
reduce the time it would take to transmit
these files to another computer.
2) Secondly, to reduce the real-time
bandwidth required to transmit time-
sensitive video data across a
communication link.
Communications equipment like modems,
bridges, and routers use compression schemes
to improve throughput over standard phone
lines or leased lines. Compression is also used
to compress voice telephone calls transmitted
over leased lines so that more calls can be
placed on those lines.
Basic types of compression:
Compression comes in two basic flavors:
lossless (or information preserving) and lossy.
• Lossless compression with lossless
compression, data is compressed without any
loss of data. It assumes you want to get
everything back that you put in i.e., we can
reconstruct a perfect reproduction of the
original from the compression. Critical
financial data files are examples where lossless
compression is required.
• Lossy compressionWith lossy compression,
it is assumed that some loss of information is
acceptable. When you reconstruct the
information from thecompressed data, you get
something close to but not exactly the same as
the original. You can get more compression by
allowing the algorithm to lose more
information. Lossy compression algorithms
usually have an adjustable parameter to control
this compression vs. quality tradeoff.
3. Methodology
Duplication Free RLC
In this section, we propose a lossless image
compression algorithm based on the
aforementioned EBD and EBI codeword’s.
The purpose of not defining y in EBI
codeword’s is to make the codeword’s
adaptive to the requirements of a particular
encoding specification, if any. For that,
permutations are assigned to y according to the
encoding requirements during the actual
encoding stage. Here, the proposed code is
applied to implement RLC and to uniquely
differentiate flags in an efficient way. The
encoding stage starts by assigning codeword’s
to the intensity levels. The assignment is done
according to the probability of occurrence
(PoO) of each level such that the intensity
levels of higher PoO are assigned to shorter
codeword’s, and vice versa. The pixels are
then scanned in raster order and encoded by
using EBI codeword’s. Since the ending group
y is not defined at the pre-encoding stage, y in
each codeword is utilized as a flag to
determine the status of the next (neighbor)
codeword. In particular, the flag can be set to
indicate three status, namely, S1, S2 and S3,
where S1 < S2 < S3. Each status is a
permutation that satisfies R5. In case the
encoder reads a run of three or more pixels of
the same intensity value, these pixels are
encoded as a codeword that represents their
intensity level. y in this codeword is set to S3
to indicate that the next codeword encodes the
count of pixels in the run. Here, the count of
run is encoded by using the EBD codeword’s
described, which can encode an infinite
number of pixels when considering more than
one general expression. In case the encoder
reads a run of two pixels, these pixels are
encoded into a single codeword in which its y
is set to S2, indicating that the encoded pixel
intensity value is repeated twice and the next
codeword encodes the intensity level of the
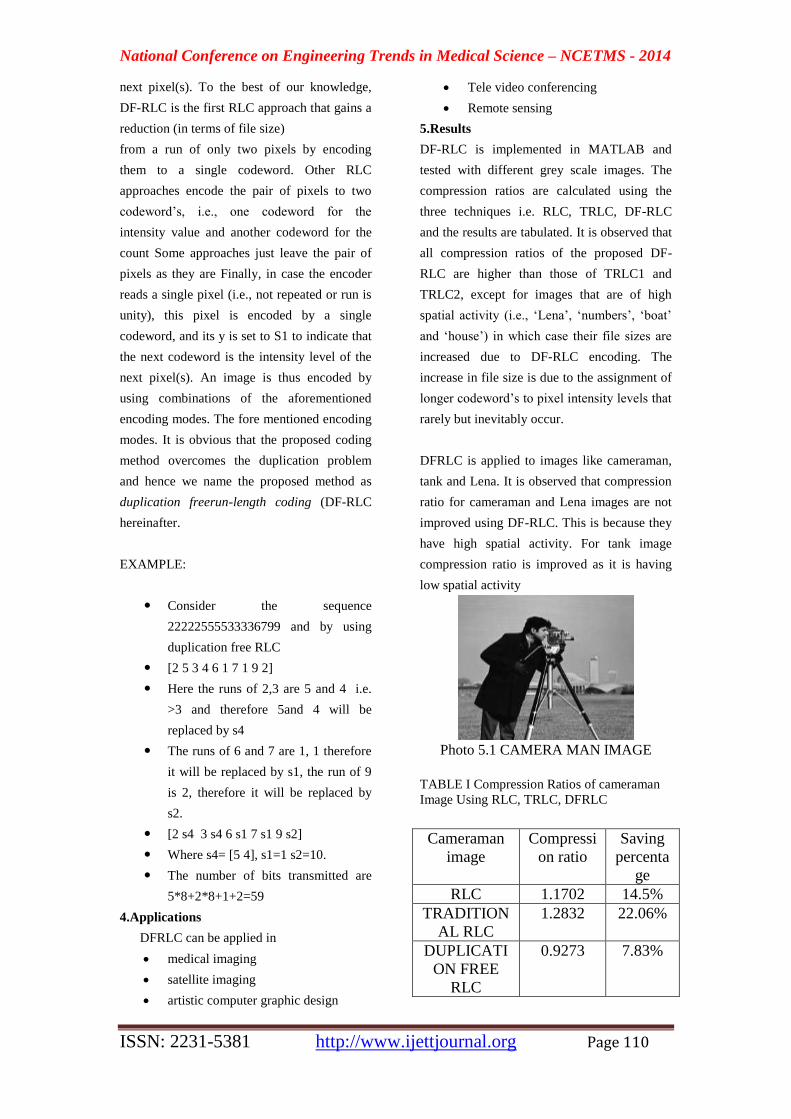
National Conference on Engineering Trends in Medical Science – NCETMS - 2014
ISSN: 2231-5381 http://www.ijettjournal.org Page 110
next pixel(s). To the best of our knowledge,
DF-RLC is the first RLC approach that gains a
reduction (in terms of file size)
from a run of only two pixels by encoding
them to a single codeword. Other RLC
approaches encode the pair of pixels to two
codeword’s, i.e., one codeword for the
intensity value and another codeword for the
count Some approaches just leave the pair of
pixels as they are Finally, in case the encoder
reads a single pixel (i.e., not repeated or run is
unity), this pixel is encoded by a single
codeword, and its y is set to S1 to indicate that
the next codeword is the intensity level of the
next pixel(s). An image is thus encoded by
using combinations of the aforementioned
encoding modes. The fore mentioned encoding
modes. It is obvious that the proposed coding
method overcomes the duplication problem
and hence we name the proposed method as
duplication freerun-length coding (DF-RLC
hereinafter.
EXAMPLE:
Consider the sequence
22222555533336799 and by using
duplication free RLC
[2 5 3 4 6 1 7 1 9 2]
Here the runs of 2,3 are 5 and 4 i.e.
>3 and therefore 5and 4 will be
replaced by s4
The runs of 6 and 7 are 1, 1 therefore
it will be replaced by s1, the run of 9
is 2, therefore it will be replaced by
s2.
[2 s4 3 s4 6 s1 7 s1 9 s2]
Where s4= [5 4], s1=1 s2=10.
The number of bits transmitted are
5*8+2*8+1+2=59
4.Applications
DFRLC can be applied in
medical imaging
satellite imaging
artistic computer graphic design
Tele video conferencing
Remote sensing
5.Results
DF-RLC is implemented in MATLAB and
tested with different grey scale images. The
compression ratios are calculated using the
three techniques i.e. RLC, TRLC, DF-RLC
and the results are tabulated. It is observed that
all compression ratios of the proposed DF-
RLC are higher than those of TRLC1 and
TRLC2, except for images that are of high
spatial activity (i.e., ‘Lena’, ‘numbers’, ‘boat’
and ‘house’) in which case their file sizes are
increased due to DF-RLC encoding. The
increase in file size is due to the assignment of
longer codeword’s to pixel intensity levels that
rarely but inevitably occur.
DFRLC is applied to images like cameraman,
tank and Lena. It is observed that compression
ratio for cameraman and Lena images are not
improved using DF-RLC. This is because they
have high spatial activity. For tank image
compression ratio is improved as it is having
low spatial activity
Photo 5.1 CAMERA MAN IMAGE TABLE I Compression Ratios of cameraman
Image Using RLC, TRLC, DFRLC
Cameraman
image
Compressi
on ratio
Saving
percenta
ge
RLC 1.1702 14.5%
TRADITION
AL RLC
1.2832 22.06%
DUPLICATI
ON FREE
RLC
0.9273 7.83%
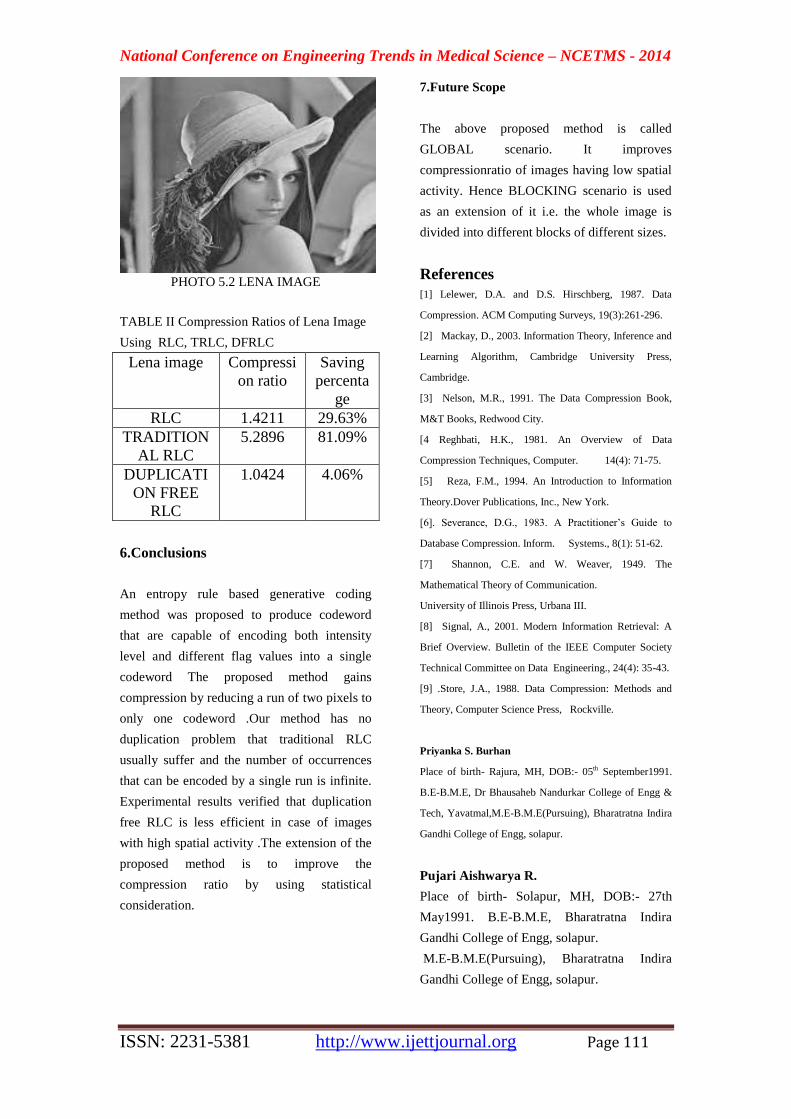
National Conference on Engineering Trends in Medical Science – NCETMS - 2014
ISSN: 2231-5381 http://www.ijettjournal.org Page 111
PHOTO 5.2 LENA IMAGE
TABLE II Compression Ratios of Lena Image
Using RLC, TRLC, DFRLC
Lena image Compressi
on ratio
Saving
percenta
ge
RLC 1.4211 29.63%
TRADITION
AL RLC
5.2896 81.09%
DUPLICATI
ON FREE
RLC
1.0424 4.06%
6.Conclusions
An entropy rule based generative coding
method was proposed to produce codeword
that are capable of encoding both intensity
level and different flag values into a single
codeword The proposed method gains
compression by reducing a run of two pixels to
only one codeword .Our method has no
duplication problem that traditional RLC
usually suffer and the number of occurrences
that can be encoded by a single run is infinite.
Experimental results verified that duplication
free RLC is less efficient in case of images
with high spatial activity .The extension of the
proposed method is to improve the
compression ratio by using statistical
consideration.
7.Future Scope
The above proposed method is called
GLOBAL scenario. It improves
compressionratio of images having low spatial
activity. Hence BLOCKING scenario is used
as an extension of it i.e. the whole image is
divided into different blocks of different sizes.
References
[1] Lelewer, D.A. and D.S. Hirschberg, 1987. Data
Compression. ACM Computing Surveys, 19(3):261-296.
[2] Mackay, D., 2003. Information Theory, Inference and
Learning Algorithm, Cambridge University Press,
Cambridge.
[3] Nelson, M.R., 1991. The Data Compression Book,
M&T Books, Redwood City.
[4 Reghbati, H.K., 1981. An Overview of Data
Compression Techniques, Computer. 14(4): 71-75.
[5] Reza, F.M., 1994. An Introduction to Information
Theory.Dover Publications, Inc., New York.
[6]. Severance, D.G., 1983. A Practitioner’s Guide to
Database Compression. Inform. Systems., 8(1): 51-62.
[7] Shannon, C.E. and W. Weaver, 1949. The
Mathematical Theory of Communication.
University of Illinois Press, Urbana III.
[8] Signal, A., 2001. Modern Information Retrieval: A
Brief Overview. Bulletin of the IEEE Computer Society
Technical Committee on Data Engineering., 24(4): 35-43.
[9] .Store, J.A., 1988. Data Compression: Methods and
Theory, Computer Science Press, Rockville.
Priyanka S. Burhan
Place of birth- Rajura, MH, DOB:- 05th September1991.
B.E-B.M.E, Dr Bhausaheb Nandurkar College of Engg &
Tech, Yavatmal,M.E-B.M.E(Pursuing), Bharatratna Indira
Gandhi College of Engg, solapur.
Pujari Aishwarya R.
Place of birth- Solapur, MH, DOB:- 27th
May1991. B.E-B.M.E, Bharatratna Indira
Gandhi College of Engg, solapur.
M.E-B.M.E(Pursuing), Bharatratna Indira
Gandhi College of Engg, solapur.
National Conference on Engineering Trends in Medical Science – NCETMS - 2014
ISSN: 2231-5381 http://www.ijettjournal.org Page 112
A 3GPP LTE-Advance Turbo Encoder and Turbo
Decoder
Manish G. Shingnare1, Rini D. Kedarpawar
2 ,Piyush D. Hegu
3 1,2
B.E. Final year, E&TC Department, SGB Amravati University, DBNCOET Yavatmal, M.S. (India) 3Assistant Professor, E&TC Department, SGB Amravati University, DBNCOET Yavatmal, M.S. (India)
Abstract—Thispaper presents the designingof a 3GPP LTE
Advanced Turbo Encoder and Decoder by using the
convolutional interleaver. The high-throughput 3GPP
Advance Turbo code requires Encoder and Decoder
architecture. Interleaver is known to be the main obstacle to
this implementation and introduces latency due to the
collisions introduced in accesses to memory. In this paper, we
propose a low-complexity Soft Input Soft Output (SISO)
Turbo Encoder and Decoder for memory architecture to
enable the turbo coding that achieves minimum latency.
Design trade-offs in terms of area and throughput efficiency
are explored to find the optimal architecture. The proposed
Turbo Encoder and Decoder has been modelled using
Simulink; various test cases are used to estimate the
performances. The results are analysed and achieved 50%
reduction in computation time along with reduced BER (e-3).
The hardware of the Turbo Encoder and Turbo Decoder has
been modelled in Verilog HDL, simulated in Modelsim,
synthesized using TSMC 65 nm Synopsys Design compiler.
Keywords:Convolutional Interleaver, Turbo decoder, VLSI,
3GPP LTE.
VIII. INTRODUCTION
A 3GPP Long Term Evolution (LTE) is a set of
enhancements to the 3G Universal Mobile
Telecommunications System (UMTS), has received
tremendous attention recently and is considered to be a
very promising 4G wireless technology. For example,
Verizon Wireless has decided to deploy LTE in their next
generation 4G evolution. One of the main advantages of
3GPP LTE is high throughput. For example, it provides a
peak data rate of 326.4 Mbps for a 4×4 antenna system, and
172.8 Mbps for a 2×2 antenna system for every 20 MHz of
spectrum. Furthermore, LTE-Advance, the further
evolution of LTE, promises to provide up to 1 Gbps peak
data rate. The channel coding scheme for LTE is Turbo
coding. The Turbo decoder is typically one of the major
blocks in a LTE wireless receiver. Turbo decoders suffer
from high decoding latency due to the iterative decoding
process, the forward– backward recursion in the maximum
a posteriori (MAP) decoding algorithm and the
interleaving/de-interleaving between iterations. Generally,
the task of an interleaver is to permute the soft values
generated by the MAP decoder and write them into random
or pseudo-random positions.
Long Term Evolution has long been seen as the
first advancement towards stronger, faster and more
efficient 4G data networks. The technology under LTE can
currently reach downlink peak rates of 100Mbps and uplink
speeds of 50Mbit/s. The LTE technology is also a scalable
bandwidth technology for carriers operating anywhere from
20 MHz town to 1.4 MHz Long Term Evolution offers
some excellent advantages over current 3G systems
including higher throughput, plug and play compatibility,
FDD (Frequency Division Duplexing) and TDD (Time
Division Duplexing), low latency and lower operating
expenditures. It also offers legacy modes to support devices
operating on GPRS systems, while supporting seamless
pass-through of technologies operating on other older
cellular towers. The authors of the (Global system for
mobile communications) and UMTS (Universal Mobile
Telecommunications System). The technologies put forth
by LTE will not only be implemented over time, they are
designed to be scalable. This scalability means the
company can slowly introduce LTE technologies over time,
without disrupting current services.
IX. LITERATURE REVIEW
Table 1 summarizes the measurement results of
the turbo decoder and provides a comparison to other
published LTE turbo decoders. At the maximum clock
frequency of 410MHz, the highest block size of 6144 is
processed with a throughput of 1013Mb/s at a code rate of
0.95 using a window size of 30 at 5.5 iterations. At low
code rates, optimum decoder performance can be achieved
with a window size of only 14, and the throughput
additionally boosted to 1161Mb/s with overlapping half-
iterations. At maximum throughput the power consumption
is 966mW, which corresponds to an unprecedented energy
efficiency of 0.17nJ/bit/iter. In strong contrast to the other
state-of-the-art implementations in TABLE 1, our decoder
has been optimized for the entire range of code rates, which
enables to maintain high throughput even for highest code
rates without any concessions in BER performance.
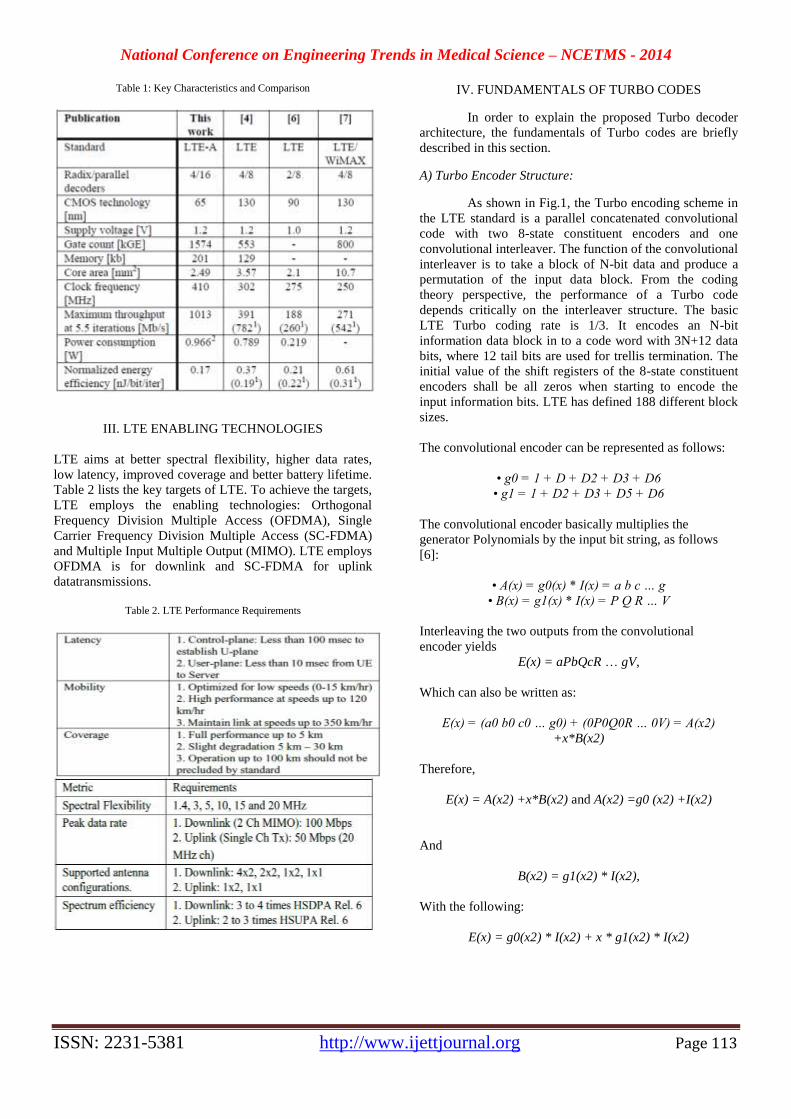
National Conference on Engineering Trends in Medical Science – NCETMS - 2014
ISSN: 2231-5381 http://www.ijettjournal.org Page 113
Table 1: Key Characteristics and Comparison
III. LTE ENABLING TECHNOLOGIES
LTE aims at better spectral flexibility, higher data rates,
low latency, improved coverage and better battery lifetime.
Table 2 lists the key targets of LTE. To achieve the targets,
LTE employs the enabling technologies: Orthogonal
Frequency Division Multiple Access (OFDMA), Single
Carrier Frequency Division Multiple Access (SC-FDMA)
and Multiple Input Multiple Output (MIMO). LTE employs
OFDMA is for downlink and SC-FDMA for uplink
datatransmissions.
Table 2. LTE Performance Requirements
IV. FUNDAMENTALS OF TURBO CODES
In order to explain the proposed Turbo decoder
architecture, the fundamentals of Turbo codes are briefly
described in this section.
A) Turbo Encoder Structure:
As shown in Fig.1, the Turbo encoding scheme in
the LTE standard is a parallel concatenated convolutional
code with two 8-state constituent encoders and one
convolutional interleaver. The function of the convolutional
interleaver is to take a block of N-bit data and produce a
permutation of the input data block. From the coding
theory perspective, the performance of a Turbo code
depends critically on the interleaver structure. The basic
LTE Turbo coding rate is 1/3. It encodes an N-bit
information data block in to a code word with 3N+12 data
bits, where 12 tail bits are used for trellis termination. The
initial value of the shift registers of the 8-state constituent
encoders shall be all zeros when starting to encode the
input information bits. LTE has defined 188 different block
sizes.
The convolutional encoder can be represented as follows:
• g0 = 1 + D + D2 + D3 + D6
• g1 = 1 + D2 + D3 + D5 + D6
The convolutional encoder basically multiplies the
generator Polynomials by the input bit string, as follows
[6]:
• A(x) = g0(x) * I(x) = a b c … g
• B(x) = g1(x) * I(x) = P Q R … V
Interleaving the two outputs from the convolutional
encoder yields
E(x) = aPbQcR … gV,
Which can also be written as:
E(x) = (a0 b0 c0 … g0) + (0P0Q0R … 0V) = A(x2)
+x*B(x2)
Therefore,
E(x) = A(x2) +x*B(x2) and A(x2) =g0 (x2) +I(x2)
And
B(x2) = g1(x2) * I(x2),
With the following:
E(x) = g0(x2) * I(x2) + x * g1(x2) * I(x2)
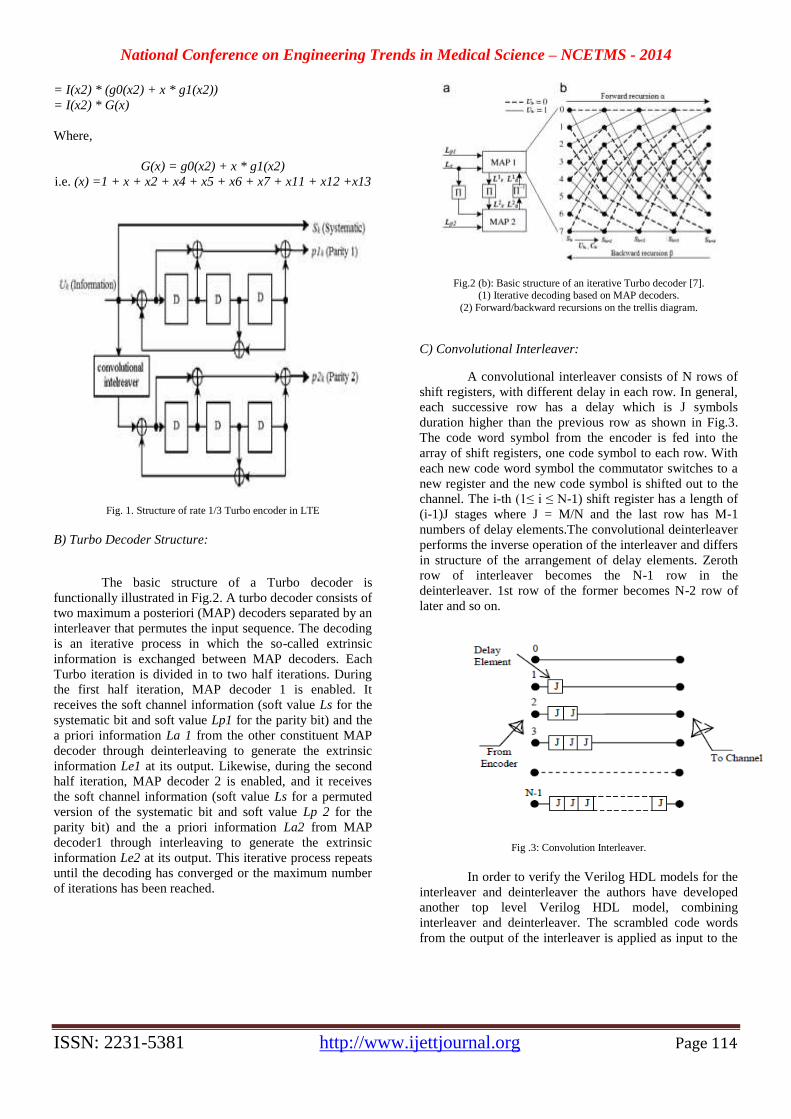
National Conference on Engineering Trends in Medical Science – NCETMS - 2014
ISSN: 2231-5381 http://www.ijettjournal.org Page 114
= I(x2) * (g0(x2) + x * g1(x2))
= I(x2) * G(x)
Where,
G(x) = g0(x2) + x * g1(x2)
i.e. (x) =1 + x + x2 + x4 + x5 + x6 + x7 + x11 + x12 +x13
Fig. 1. Structure of rate 1/3 Turbo encoder in LTE
B) Turbo Decoder Structure:
The basic structure of a Turbo decoder is
functionally illustrated in Fig.2. A turbo decoder consists of
two maximum a posteriori (MAP) decoders separated by an
interleaver that permutes the input sequence. The decoding
is an iterative process in which the so-called extrinsic
information is exchanged between MAP decoders. Each
Turbo iteration is divided in to two half iterations. During
the first half iteration, MAP decoder 1 is enabled. It
receives the soft channel information (soft value Ls for the
systematic bit and soft value Lp1 for the parity bit) and the
a priori information La 1 from the other constituent MAP
decoder through deinterleaving to generate the extrinsic
information Le1 at its output. Likewise, during the second
half iteration, MAP decoder 2 is enabled, and it receives
the soft channel information (soft value Ls for a permuted
version of the systematic bit and soft value Lp 2 for the
parity bit) and the a priori information La2 from MAP
decoder1 through interleaving to generate the extrinsic
information Le2 at its output. This iterative process repeats
until the decoding has converged or the maximum number
of iterations has been reached.
Fig.2 (b): Basic structure of an iterative Turbo decoder [7]. (1) Iterative decoding based on MAP decoders.
(2) Forward/backward recursions on the trellis diagram.
C) Convolutional Interleaver:
A convolutional interleaver consists of N rows of
shift registers, with different delay in each row. In general,
each successive row has a delay which is J symbols
duration higher than the previous row as shown in Fig.3.
The code word symbol from the encoder is fed into the
array of shift registers, one code symbol to each row. With
each new code word symbol the commutator switches to a
new register and the new code symbol is shifted out to the
channel. The i-th (1≤ i ≤ N-1) shift register has a length of
(i-1)J stages where J = M/N and the last row has M-1
numbers of delay elements.The convolutional deinterleaver
performs the inverse operation of the interleaver and differs
in structure of the arrangement of delay elements. Zeroth
row of interleaver becomes the N-1 row in the
deinterleaver. 1st row of the former becomes N-2 row of
later and so on.
Fig .3: Convolution Interleaver.
In order to verify the Verilog HDL models for the
interleaver and deinterleaver the authors have developed
another top level Verilog HDL model, combining
interleaver and deinterleaver. The scrambled code words
from the output of the interleaver is applied as input to the
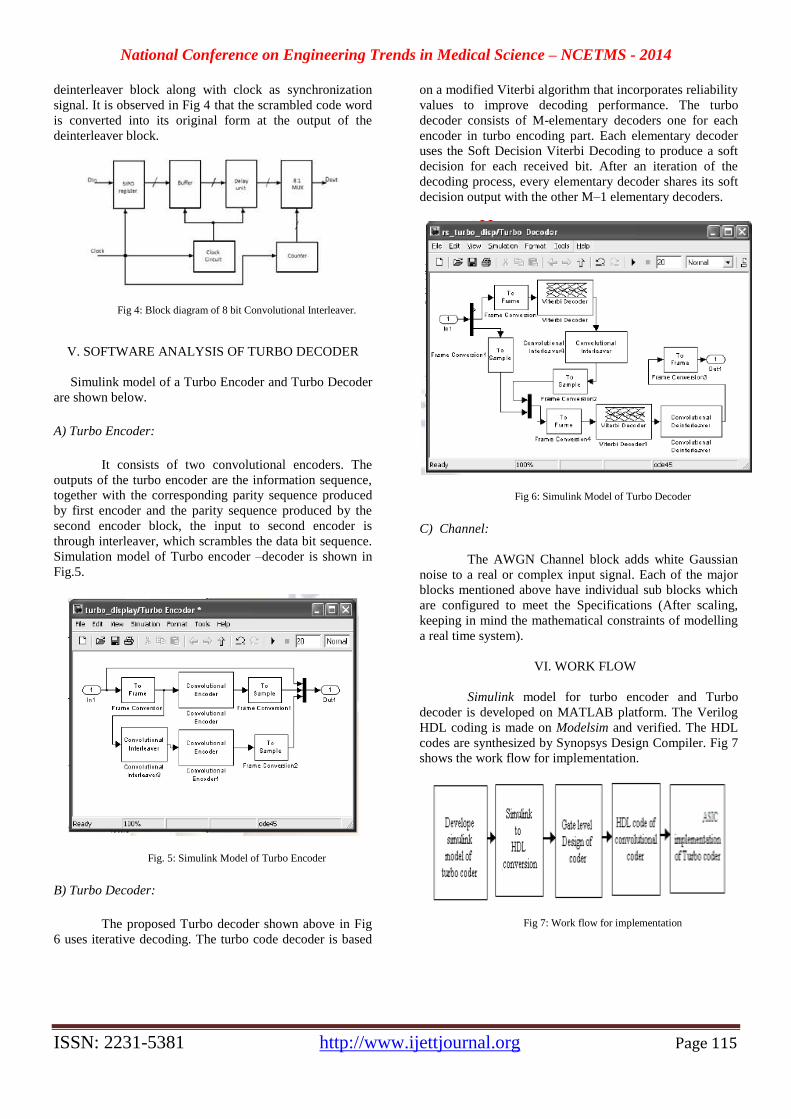
National Conference on Engineering Trends in Medical Science – NCETMS - 2014
ISSN: 2231-5381 http://www.ijettjournal.org Page 115
deinterleaver block along with clock as synchronization
signal. It is observed in Fig 4 that the scrambled code word
is converted into its original form at the output of the
deinterleaver block.
Fig 4: Block diagram of 8 bit Convolutional Interleaver.
V. SOFTWARE ANALYSIS OF TURBO DECODER
Simulink model of a Turbo Encoder and Turbo Decoder
are shown below.
A) Turbo Encoder:
It consists of two convolutional encoders. The
outputs of the turbo encoder are the information sequence,
together with the corresponding parity sequence produced
by first encoder and the parity sequence produced by the
second encoder block, the input to second encoder is
through interleaver, which scrambles the data bit sequence.
Simulation model of Turbo encoder –decoder is shown in
Fig.5.
Fig. 5: Simulink Model of Turbo Encoder
B) Turbo Decoder:
The proposed Turbo decoder shown above in Fig
6 uses iterative decoding. The turbo code decoder is based
on a modified Viterbi algorithm that incorporates reliability
values to improve decoding performance. The turbo
decoder consists of M-elementary decoders one for each
encoder in turbo encoding part. Each elementary decoder
uses the Soft Decision Viterbi Decoding to produce a soft
decision for each received bit. After an iteration of the
decoding process, every elementary decoder shares its soft
decision output with the other M–1 elementary decoders.
Fig 6: Simulink Model of Turbo Decoder
C) Channel:
The AWGN Channel block adds white Gaussian
noise to a real or complex input signal. Each of the major
blocks mentioned above have individual sub blocks which
are configured to meet the Specifications (After scaling,
keeping in mind the mathematical constraints of modelling
a real time system).
VI. WORK FLOW
Simulink model for turbo encoder and Turbo
decoder is developed on MATLAB platform. The Verilog
HDL coding is made on Modelsim and verified. The HDL
codes are synthesized by Synopsys Design Compiler. Fig 7
shows the work flow for implementation.
Fig 7: Work flow for implementation
National Conference on Engineering Trends in Medical Science – NCETMS - 2014
ISSN: 2231-5381 http://www.ijettjournal.org Page 116
VII. CONCLUSIONS
In this paper, presented a brief survey about turbo
codes, designed a turbo encoder and turbo decoder on
simulink and coded in Verilog HDL. The codes and coding
techniques are carried by Viterbi decoder. For turbo codes,
turbo decoders and their decoding algorithms like log-
MAP/SOVA are used. Based on the algebraic
constructions, the interleaver offers capability which
enables Turbo decoding by using MAP decoders working
concurrently. We proposed low complexity recursive
architecture for generating the convolutional interleaver
addresses on the fly. The convolution interleavers are
designed to operate at full speed with the MAP decoders.
The proposed architecture has been scaled and can be
tailored for different throughput requirements.
ACKNOWLEDGMENT
The authors would like to thank Manjunatha K N and
Prasanna Kumar Kfor their research papers as we referred
their research papers for our work. They would also like to
thank Prof. Salim A. Chavan for their valuable guidance
regarding this paper work. The authors would also extend
their sincere thanks to all the Teaching staff from
Electronics & Telecommunication department of Dr.
Bhausaheb Nandurkar College of Engineering &
Technology, for many interesting discussions on this topic.
REFERENCES
[1] Manjunatha K N, Kiran B, Prasanna Kumar. Design and ASIC
Implementation of a 3GPP LTE AdvanceTurbo Encoder and Turbo
Decoder.International Journal of Engineering Research and
Applications (IJERA) Vol. 2, Issue 4, July-August 2012, pp.006-010
[2] Patel Sneha Bhanubhai, Mary Grace Shajan, Upena
D.Dalal.“Performance of Turbo Encoder and Turbo Decoder for LTE.”International Journal of Engineering and Innovative
Technology (IJEIT) Volume 2, Issue 6, October 2012
[3] S. M. Chadchan, Member, IEEE and C. B. Akki.“3GPP LTE/SAE: An Overview.” International Journal of Computer and Electrical
Engineering, Vol. 2, No. 5, October, 2010 [4] Multiplexing and channel coding, 3GPP TS 36.212 version 8.4.0,
September 2008.
[5] Sandro Belfanti, Christoph Roth, Michael Gautschi, Christian Benkeser, and Qiuting Huang.“A 1Gbps LTE-Advanced Turbo-
Decoder ASIC in 65nm CMOS.”Integrated Systems Laboratory, ETH
Zurich, 8092 Zurich, Switzerland. [6] R. D. Raut, Dr. K.D. Kulat “International Journal of Computer
Applications”(0975 - 8887) Volume – No.24 ©2010.
[7] Y. Sun, J.R. Cavallaro,” Efficient hardware implementation of a highly-parallel 3GPPLTE/LTE advance turbo decoder”, Integration
VLSI J. (2010),doi:10.1016/j.vlsi.2010.07.001.
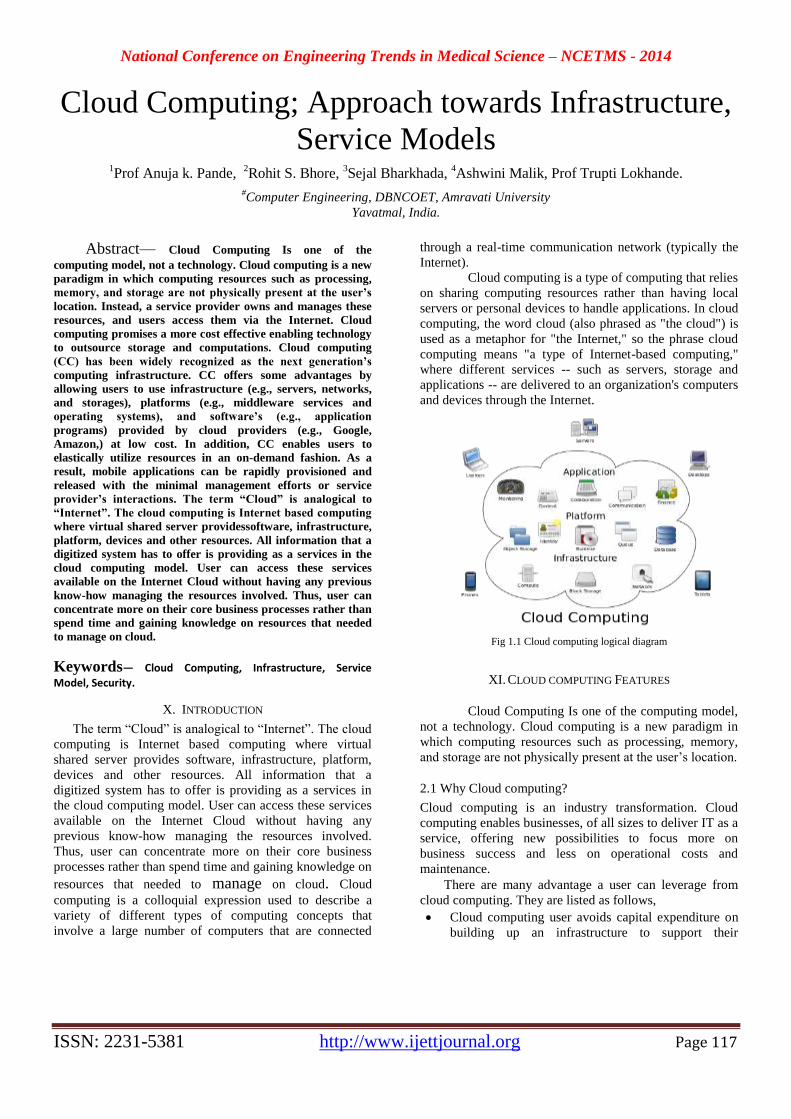
National Conference on Engineering Trends in Medical Science – NCETMS - 2014
ISSN: 2231-5381 http://www.ijettjournal.org Page 117
Cloud Computing; Approach towards Infrastructure,
Service Models 1Prof Anuja k. Pande,
2Rohit S. Bhore,
3Sejal Bharkhada,
4Ashwini Malik, Prof Trupti Lokhande.
#Computer Engineering, DBNCOET, Amravati University
Yavatmal, India.
Abstract— Cloud Computing Is one of the
computing model, not a technology. Cloud computing is a new
paradigm in which computing resources such as processing,
memory, and storage are not physically present at the user’s
location. Instead, a service provider owns and manages these
resources, and users access them via the Internet. Cloud
computing promises a more cost effective enabling technology
to outsource storage and computations. Cloud computing
(CC) has been widely recognized as the next generation’s
computing infrastructure. CC offers some advantages by
allowing users to use infrastructure (e.g., servers, networks,
and storages), platforms (e.g., middleware services and
operating systems), and software’s (e.g., application
programs) provided by cloud providers (e.g., Google,
Amazon,) at low cost. In addition, CC enables users to
elastically utilize resources in an on-demand fashion. As a
result, mobile applications can be rapidly provisioned and
released with the minimal management efforts or service
provider’s interactions. The term “Cloud” is analogical to
“Internet”. The cloud computing is Internet based computing
where virtual shared server providessoftware, infrastructure,
platform, devices and other resources. All information that a
digitized system has to offer is providing as a services in the
cloud computing model. User can access these services
available on the Internet Cloud without having any previous
know-how managing the resources involved. Thus, user can
concentrate more on their core business processes rather than
spend time and gaining knowledge on resources that needed
to manage on cloud.
Keywords— Cloud Computing, Infrastructure, Service
Model, Security.
X. INTRODUCTION
The term “Cloud” is analogical to “Internet”. The cloud
computing is Internet based computing where virtual
shared server provides software, infrastructure, platform,
devices and other resources. All information that a
digitized system has to offer is providing as a services in
the cloud computing model. User can access these services
available on the Internet Cloud without having any
previous know-how managing the resources involved.
Thus, user can concentrate more on their core business
processes rather than spend time and gaining knowledge on
resources that needed to manage on cloud. Cloud
computing is a colloquial expression used to describe a
variety of different types of computing concepts that
involve a large number of computers that are connected
through a real-time communication network (typically the
Internet).
Cloud computing is a type of computing that relies
on sharing computing resources rather than having local
servers or personal devices to handle applications. In cloud
computing, the word cloud (also phrased as "the cloud") is
used as a metaphor for "the Internet," so the phrase cloud
computing means "a type of Internet-based computing,"
where different services -- such as servers, storage and
applications -- are delivered to an organization's computers
and devices through the Internet.
Fig 1.1 Cloud computing logical diagram
XI. CLOUD COMPUTING FEATURES
Cloud Computing Is one of the computing model,
not a technology. Cloud computing is a new paradigm in
which computing resources such as processing, memory,
and storage are not physically present at the user’s location.
2.1 Why Cloud computing?
Cloud computing is an industry transformation. Cloud
computing enables businesses, of all sizes to deliver IT as a
service, offering new possibilities to focus more on
business success and less on operational costs and
maintenance.
There are many advantage a user can leverage from
cloud computing. They are listed as follows,
Cloud computing user avoids capital expenditure on
building up an infrastructure to support their
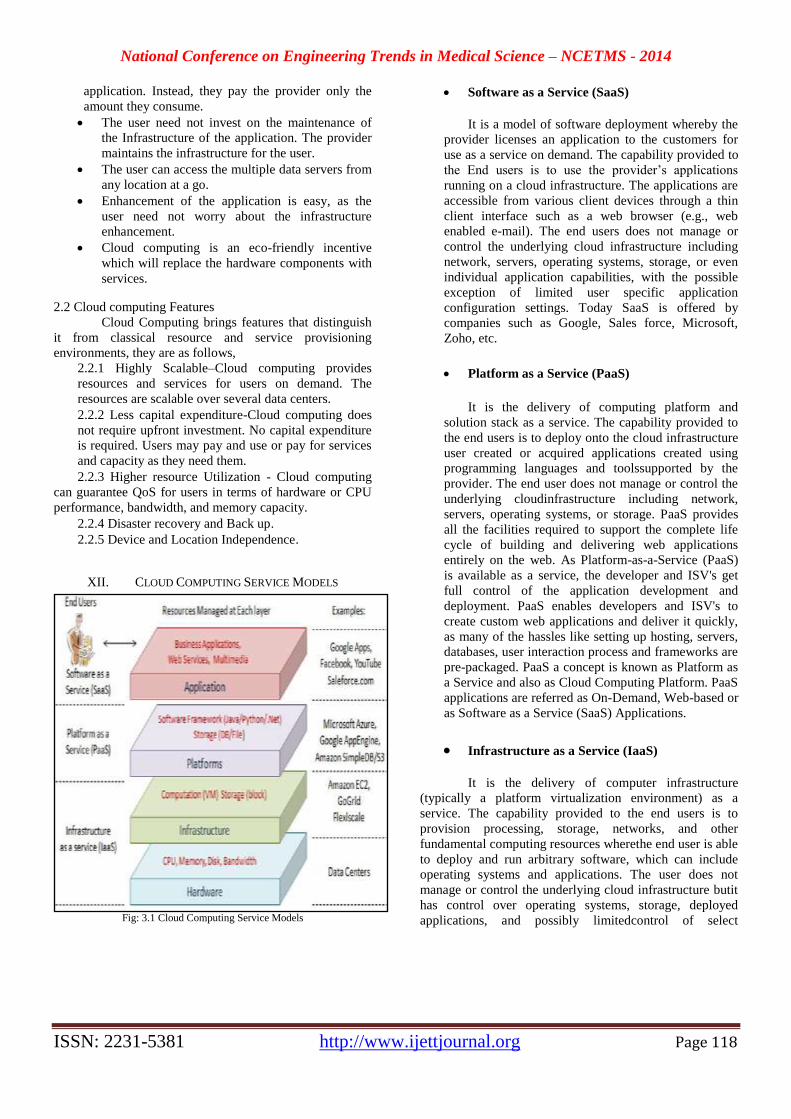
National Conference on Engineering Trends in Medical Science – NCETMS - 2014
ISSN: 2231-5381 http://www.ijettjournal.org Page 118
application. Instead, they pay the provider only the
amount they consume.
The user need not invest on the maintenance of
the Infrastructure of the application. The provider
maintains the infrastructure for the user.
The user can access the multiple data servers from
any location at a go.
Enhancement of the application is easy, as the
user need not worry about the infrastructure
enhancement.
Cloud computing is an eco-friendly incentive
which will replace the hardware components with
services.
2.2 Cloud computing Features
Cloud Computing brings features that distinguish
it from classical resource and service provisioning
environments, they are as follows,
2.2.1 Highly Scalable–Cloud computing provides
resources and services for users on demand. The
resources are scalable over several data centers.
2.2.2 Less capital expenditure-Cloud computing does
not require upfront investment. No capital expenditure
is required. Users may pay and use or pay for services
and capacity as they need them.
2.2.3 Higher resource Utilization - Cloud computing
can guarantee QoS for users in terms of hardware or CPU
performance, bandwidth, and memory capacity.
2.2.4 Disaster recovery and Back up.
2.2.5 Device and Location Independence.
XII. CLOUD COMPUTING SERVICE MODELS
Fig: 3.1 Cloud Computing Service Models
Software as a Service (SaaS)
It is a model of software deployment whereby the
provider licenses an application to the customers for
use as a service on demand. The capability provided to
the End users is to use the provider’s applications
running on a cloud infrastructure. The applications are
accessible from various client devices through a thin
client interface such as a web browser (e.g., web
enabled e-mail). The end users does not manage or
control the underlying cloud infrastructure including
network, servers, operating systems, storage, or even
individual application capabilities, with the possible
exception of limited user specific application
configuration settings. Today SaaS is offered by
companies such as Google, Sales force, Microsoft,
Zoho, etc.
Platform as a Service (PaaS)
It is the delivery of computing platform and
solution stack as a service. The capability provided to
the end users is to deploy onto the cloud infrastructure
user created or acquired applications created using
programming languages and toolssupported by the
provider. The end user does not manage or control the
underlying cloudinfrastructure including network,
servers, operating systems, or storage. PaaS provides
all the facilities required to support the complete life
cycle of building and delivering web applications
entirely on the web. As Platform-as-a-Service (PaaS)
is available as a service, the developer and ISV's get
full control of the application development and
deployment. PaaS enables developers and ISV's to
create custom web applications and deliver it quickly,
as many of the hassles like setting up hosting, servers,
databases, user interaction process and frameworks are
pre-packaged. PaaS a concept is known as Platform as
a Service and also as Cloud Computing Platform. PaaS
applications are referred as On-Demand, Web-based or
as Software as a Service (SaaS) Applications.
Infrastructure as a Service (IaaS)
It is the delivery of computer infrastructure
(typically a platform virtualization environment) as a
service. The capability provided to the end users is to
provision processing, storage, networks, and other
fundamental computing resources wherethe end user is able
to deploy and run arbitrary software, which can include
operating systems and applications. The user does not
manage or control the underlying cloud infrastructure butit
has control over operating systems, storage, deployed
applications, and possibly limitedcontrol of select
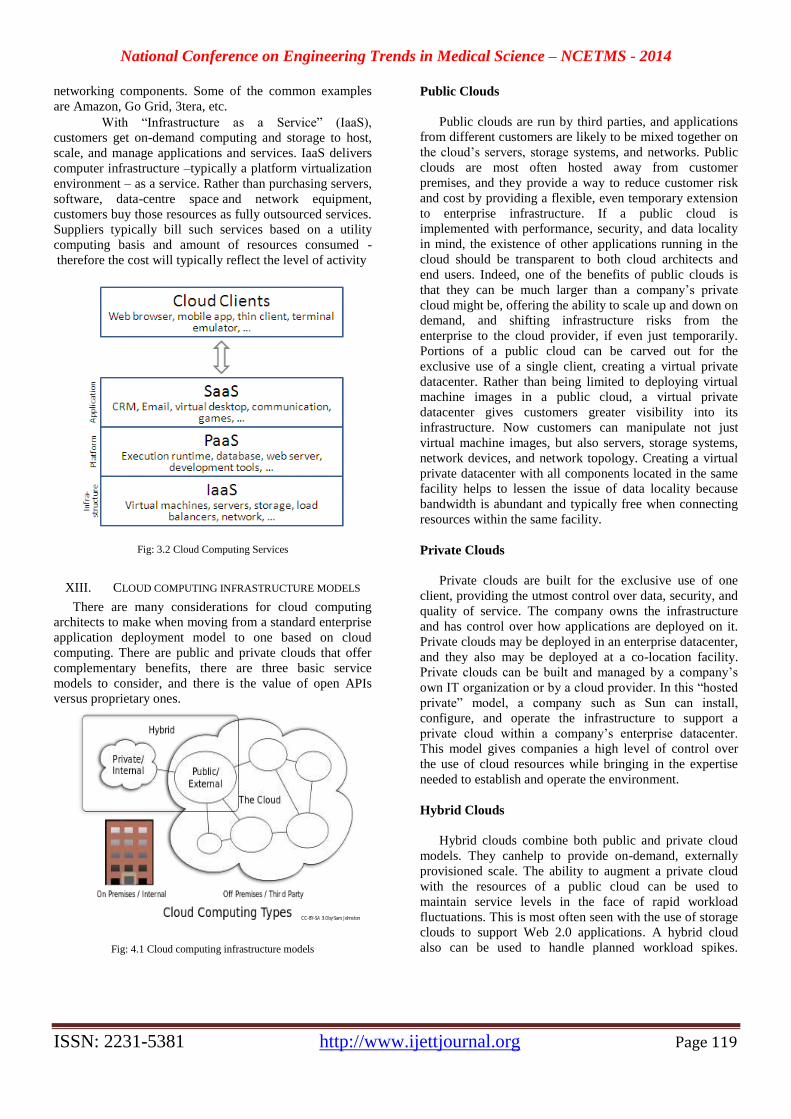
National Conference on Engineering Trends in Medical Science – NCETMS - 2014
ISSN: 2231-5381 http://www.ijettjournal.org Page 119
networking components. Some of the common examples
are Amazon, Go Grid, 3tera, etc.
With “Infrastructure as a Service” (IaaS),
customers get on-demand computing and storage to host,
scale, and manage applications and services. IaaS delivers
computer infrastructure –typically a platform virtualization
environment – as a service. Rather than purchasing servers,
software, data-centre space and network equipment,
customers buy those resources as fully outsourced services.
Suppliers typically bill such services based on a utility
computing basis and amount of resources consumed -
therefore the cost will typically reflect the level of activity
Fig: 3.2 Cloud Computing Services
XIII. CLOUD COMPUTING INFRASTRUCTURE MODELS
There are many considerations for cloud computing
architects to make when moving from a standard enterprise
application deployment model to one based on cloud
computing. There are public and private clouds that offer
complementary benefits, there are three basic service
models to consider, and there is the value of open APIs
versus proprietary ones.
Fig: 4.1 Cloud computing infrastructure models
Public Clouds
Public clouds are run by third parties, and applications
from different customers are likely to be mixed together on
the cloud’s servers, storage systems, and networks. Public
clouds are most often hosted away from customer
premises, and they provide a way to reduce customer risk
and cost by providing a flexible, even temporary extension
to enterprise infrastructure. If a public cloud is
implemented with performance, security, and data locality
in mind, the existence of other applications running in the
cloud should be transparent to both cloud architects and
end users. Indeed, one of the benefits of public clouds is
that they can be much larger than a company’s private
cloud might be, offering the ability to scale up and down on
demand, and shifting infrastructure risks from the
enterprise to the cloud provider, if even just temporarily.
Portions of a public cloud can be carved out for the
exclusive use of a single client, creating a virtual private
datacenter. Rather than being limited to deploying virtual
machine images in a public cloud, a virtual private
datacenter gives customers greater visibility into its
infrastructure. Now customers can manipulate not just
virtual machine images, but also servers, storage systems,
network devices, and network topology. Creating a virtual
private datacenter with all components located in the same
facility helps to lessen the issue of data locality because
bandwidth is abundant and typically free when connecting
resources within the same facility.
Private Clouds
Private clouds are built for the exclusive use of one
client, providing the utmost control over data, security, and
quality of service. The company owns the infrastructure
and has control over how applications are deployed on it.
Private clouds may be deployed in an enterprise datacenter,
and they also may be deployed at a co-location facility.
Private clouds can be built and managed by a company’s
own IT organization or by a cloud provider. In this “hosted
private” model, a company such as Sun can install,
configure, and operate the infrastructure to support a
private cloud within a company’s enterprise datacenter.
This model gives companies a high level of control over
the use of cloud resources while bringing in the expertise
needed to establish and operate the environment.
Hybrid Clouds
Hybrid clouds combine both public and private cloud
models. They canhelp to provide on-demand, externally
provisioned scale. The ability to augment a private cloud
with the resources of a public cloud can be used to
maintain service levels in the face of rapid workload
fluctuations. This is most often seen with the use of storage
clouds to support Web 2.0 applications. A hybrid cloud
also can be used to handle planned workload spikes.
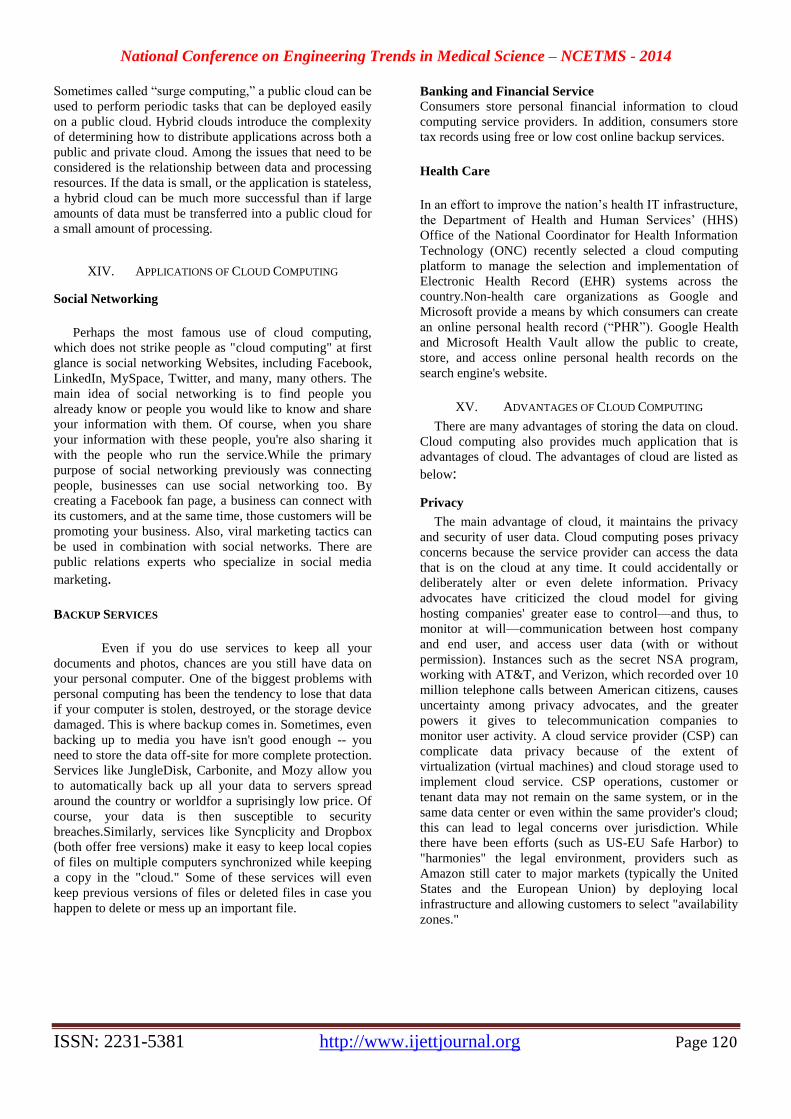
National Conference on Engineering Trends in Medical Science – NCETMS - 2014
ISSN: 2231-5381 http://www.ijettjournal.org Page 120
Sometimes called “surge computing,” a public cloud can be
used to perform periodic tasks that can be deployed easily
on a public cloud. Hybrid clouds introduce the complexity
of determining how to distribute applications across both a
public and private cloud. Among the issues that need to be
considered is the relationship between data and processing
resources. If the data is small, or the application is stateless,
a hybrid cloud can be much more successful than if large
amounts of data must be transferred into a public cloud for
a small amount of processing.
XIV. APPLICATIONS OF CLOUD COMPUTING
Social Networking
Perhaps the most famous use of cloud computing,
which does not strike people as "cloud computing" at first
glance is social networking Websites, including Facebook,
LinkedIn, MySpace, Twitter, and many, many others. The
main idea of social networking is to find people you
already know or people you would like to know and share
your information with them. Of course, when you share
your information with these people, you're also sharing it
with the people who run the service.While the primary
purpose of social networking previously was connecting
people, businesses can use social networking too. By
creating a Facebook fan page, a business can connect with
its customers, and at the same time, those customers will be
promoting your business. Also, viral marketing tactics can
be used in combination with social networks. There are
public relations experts who specialize in social media
marketing.
BACKUP SERVICES
Even if you do use services to keep all your
documents and photos, chances are you still have data on
your personal computer. One of the biggest problems with
personal computing has been the tendency to lose that data
if your computer is stolen, destroyed, or the storage device
damaged. This is where backup comes in. Sometimes, even
backing up to media you have isn't good enough -- you
need to store the data off-site for more complete protection.
Services like JungleDisk, Carbonite, and Mozy allow you
to automatically back up all your data to servers spread
around the country or worldfor a suprisingly low price. Of
course, your data is then susceptible to security
breaches.Similarly, services like Syncplicity and Dropbox
(both offer free versions) make it easy to keep local copies
of files on multiple computers synchronized while keeping
a copy in the "cloud." Some of these services will even
keep previous versions of files or deleted files in case you
happen to delete or mess up an important file.
Banking and Financial Service Consumers store personal financial information to cloud
computing service providers. In addition, consumers store
tax records using free or low cost online backup services.
Health Care
In an effort to improve the nation’s health IT infrastructure,
the Department of Health and Human Services’ (HHS)
Office of the National Coordinator for Health Information
Technology (ONC) recently selected a cloud computing
platform to manage the selection and implementation of
Electronic Health Record (EHR) systems across the
country.Non-health care organizations as Google and
Microsoft provide a means by which consumers can create
an online personal health record (“PHR”). Google Health
and Microsoft Health Vault allow the public to create,
store, and access online personal health records on the
search engine's website.
XV. ADVANTAGES OF CLOUD COMPUTING
There are many advantages of storing the data on cloud.
Cloud computing also provides much application that is
advantages of cloud. The advantages of cloud are listed as
below:
Privacy
The main advantage of cloud, it maintains the privacy
and security of user data. Cloud computing poses privacy
concerns because the service provider can access the data
that is on the cloud at any time. It could accidentally or
deliberately alter or even delete information. Privacy
advocates have criticized the cloud model for giving
hosting companies' greater ease to control—and thus, to
monitor at will—communication between host company
and end user, and access user data (with or without
permission). Instances such as the secret NSA program,
working with AT&T, and Verizon, which recorded over 10
million telephone calls between American citizens, causes
uncertainty among privacy advocates, and the greater
powers it gives to telecommunication companies to
monitor user activity. A cloud service provider (CSP) can
complicate data privacy because of the extent of
virtualization (virtual machines) and cloud storage used to
implement cloud service. CSP operations, customer or
tenant data may not remain on the same system, or in the
same data center or even within the same provider's cloud;
this can lead to legal concerns over jurisdiction. While
there have been efforts (such as US-EU Safe Harbor) to
"harmonies" the legal environment, providers such as
Amazon still cater to major markets (typically the United
States and the European Union) by deploying local
infrastructure and allowing customers to select "availability
zones."
National Conference on Engineering Trends in Medical Science – NCETMS - 2014
ISSN: 2231-5381 http://www.ijettjournal.org Page 121
Security As cloud computing is achieving increased
popularity, concerns are being voiced about the security
issues introduced through adoption of this new model. The
effectiveness and efficiency of traditional protection
mechanisms are being reconsidered as the characteristics of
this innovative deployment model can differ widely from
those of traditional architectures. An alternative perspective
on the topic of cloud security is that this is but another,
although quite broad, case of "applied security" and that
similar security principles that apply in shared multi-user
mainframe security models apply with cloud security.
The relative security of cloud computing services is a
contentious issue that may be delaying its adoption.
Physical control of the Private Cloud equipment is more
secure than having the equipment off site and under
someone else's control. Physical control and the ability to
visually inspect data links and access ports is required in
order to ensure data links are not compromised. Issues
barring the adoption of cloud computing are due in large
part to the private and public sectors' unease surrounding
the external management of security-based services. It is
the very nature of cloud computing-based services, private
or public, that promote external management of provided
services. This delivers great incentive to cloud computing
service providers to prioritize building and maintaining
strong management of secure services. Security issues have
been categorized into sensitive data access, data
segregation, privacy, bug exploitation, recovery,
accountability, malicious insiders, management console
security, account control, and multi-tenancy issues.
Solutions to various cloud security issues vary, from
cryptography, particularly public key infrastructure (PKI),
to use of multiple cloud providers, standardization of APIs,
and improving virtual machine support and legal support.
Legal
As with other changes in the landscape of computing,
certain legal issues arise with cloud computing, including
trademark infringement, security concerns and sharing of
proprietary data resources. If a cloud company is the
possessor of the data, the possessor has certain legal rights.
If the cloud company is the "custodian" of the data, then a
different set of rights would apply. The next problem in the
legalities of cloud computing is the problem of legal
ownership of the data. Many Terms of Service agreements
are silent on the question of ownership.These legal issues
are not confined to the time period in which the cloud
based application is actively being used. There must also be
consideration for what happens when the provider-
customer relationship ends. In most cases, this event will
be addressed before an application is deployed to the cloud.
However, in the case of provider insolvencies or
bankruptcy the state of the data may become blurred
Improving data storage capacity and processing power
Storage capacity is also a constraint for computing devices.
Cloud computing is developed to enable users to
store/access the large data on the cloud through wireless
networks. First example is the Amazon Simple Storage
Service (Amazon S3) which supports file storage service.
Another example is Image Exchange which utilizes the
large storage space in clouds for mobile users. This mobile
photo sharing service enables mobile users to upload
images to the clouds immediately after capturing. Users
may access all images from any devices. With cloud, the
users can save considerable amount of energy and storage
space on their mobile devices since all images are sent and
processed on the clouds. Facebook is the most successful
social network application today, and it is also a typical
example of using cloud in sharing images. Mobile
applications also are not constrained by storage capacity on
the devices because their data now is stored on the cloud.
XVI. LIMITATIONS OF CLOUD COMPUTING
Although highly promising, cloud computing for
multimedia applications is still in itsinfancy. There are
manyunsolved problems needto be investigated tofully
harvest its potential.Cloud Computing relies on wireless
networks (e.g., 3G and Wi-Fi) for data and control between
the cloud and other computing devices. Compared with
fixed and wired networks, wireless networks have limited
bandwidth, probably longer latency, and intermittent
connectivity. Moreover, under the presence of more mobile
devices, the bandwidth available to each device will be
further reduced, and network latency can go up and
response time for wireless network users can be larger.
Following are the some of the limitations of Cloud
Computing.
Availability
Various network failures and traffic congestion in the
network may hinder the mobile users to connect to the
cloud and access required services.If there are too
manyconcurrent requests,even if the powerfulcloud servers
are capableof serving therequests, the wirelesslinks will
surely fall shortof capacity.
Bandwidth Costs
Cloud computing, companies can save money on
hardware and software; however they couldincur higher
network bandwidth charges. Bandwidth cost may be low
for smallerInternet-based applications, which are not data
intensive, but could significantly grow fordata-intensive
applications.
Requires a constant Internet connection
Cloud computing is impossible if you cannot connect
to the Internet.
Since you use the Internet to connect to both your
applications and documents, if you do not have an
National Conference on Engineering Trends in Medical Science – NCETMS - 2014
ISSN: 2231-5381 http://www.ijettjournal.org Page 122
Internet connection you cannot access anything, even
your own documents.
A dead Internet connection means no work and in
areas where Internet connections are few or
inherently unreliable, this could be a deal-breaker.
XVII. CONCLUSION
Cloud Computing Is one of the computing model, not a
technology. Cloud computing is a new paradigm in which
computing resources such as processing, memory, and
storage are not physically present at the user’s location.
Instead, a service provider owns and manages these
resources, and users access them via the Internet. Cloud
computing promises a more cost effective enabling
technology to outsource storage and computations.
The applications supported by cloud computing
including social network, backup services, banking and
financial, healthcare have been discussed which clearly
show the applicability of the mobile cloud computing to a
wide range of services.Although devices geared toward
cloud computing will undoubtedly change technology
trends as well as our daily lives, some practical problems
remain to be resolved to structure a full cloud system.
ACKNOWLEDGMENT
We acknowledge our senior faculty who have provided us
their views in the selection of topic.
REFERENCES
[21] Amazon: Service level agreement for ec2
[http://aws.amazon.com/ec2-sla/] (2008)
[22] Andrieux, A., Czajkowski, K., Dan, A., Keahey, K., Ludwig, H.,
Pruyne, J.,
[23] Rofrano, J., Tuecke, S., Xu, M.: Web services agreement speci_cation (WS-
[24] Agreement). In: Global Grid Forum. (2004)
[25] Armbrust, M., Fox, A., Gri_th, R., Joseph, A.D., Katz, R.H., Konwinski, A., Lee,G., Patterson, D.A., Rabkin, A., Stoica, I.,
Zaharia, M.: Above the clouds:
[26] Aberkeley view of cloud computing. Technical Report UCB/EECS-2009-28, EECS
[27] Department, University of California, Berkeley (Feb 2009)
[28] Authors, V.J., Ibm, F.C., (editor, C.K., Microsoft, D.L., Ibm, A.N., Ibm, N.N., Bea,M.N., Riegen, C.V., Microsoft, J.S.: Web services
policy framework (wspolicy Tosic, V., Patel, K., Pagurek, B.:
Wsol-web service o_erings language. Lecturenotes in computer science (2002)
[29] Boley, H., Tabet, S., Wagner, G.: Design rationale of ruleml: A
markup languagefor semantic web rules. (2001) 381 [30] Cibran, M.A., Verheecke, B.: Modularizing web services
management.
[31] Foster, I., Zhao, Y., Raicu, I., Lu, S.: Cloud Computing and Grid Computing 360-Degree Compared. In: Grid Computing
Environments Workshop, 2008. GCE'08.(2008)
[32] Government, U.S.: Federal cloud computing initiative overviewHe, C., Gu, L., Du, B., Li, Z.: A WSLA-based monitoring system for
gridservice-GSMon. In: 2004 IEEE International Conference on
Services Computing, 2004.(SCC 2004).
National Conference on Engineering Trends in Medical Science – NCETMS - 2014
ISSN: 2231-5381 http://www.ijettjournal.org Page 123
Rapid Information Collection from a Wireless Sensor
Network Organised as Tree Nandkishor N. Bende
1, Mayur V.Guhe
2, A.W.Motikar
3
1B.E., Electronics & Telecommunication Engg,
2B.E., Electronics & Telecommunication Engg,
3Assistant prof.DBNCOET, Yavatmal
Sant Gadge Baba Amravati University, Amravati
DBNCOET Yavatmal, Maharashtra (INDIA)
Abstract- Fast and energy efficient data collection in an
energy constraint ad-hoc sensor network is alwaysa
challenging issue. The network topology and interferences
causes significant effects on data collection andhence on
sensors’ energy usage. Various approaches using single
channel, multichannel andconvergecasting had already been
proposed. Here in this paper we have shown data collection
performanceusing multi-frequency in channel assignment,
and effect of network topology, for moderate size networks
ofabout 50-100 nodes. For the study we have used some
realistic simulation models under many-to-
onecommunication paradigm called convergecast, a single
frequency channel and TDMA technique to haveminimum
time slots for convergecasting.
Key Terms: - Convergecast; Multi-channel; Topology;
Energy; TDMA
I. INTRODUCTION
A tree base sensor network is a collection of sensors nodes,
such as sink is the root of tree and leaves are the nodes.
Data in such topology flows from sensor nodes (leaves) to
the sink (root) of the tree. Collection of data from a set of
sensors to an intermediate parent (sink) in a tree is known
as converge-casting. The ‘delivery-time’
and ‘data-rate’ are application specific. As an example,
in oil and gas refineries the sensor devices and
controllers need to collect data from all the sensors within
a specific deadline [1] for any kind of leakage or
failures. Whereas applications like weather for-casting,
under-water observations needs continuous and fast data
delivery for analysis, for longer periods. Here in this paper
our emphasis is on such applications focusing on fast
data streaming from sensor to sink node. The two common
approaches for data collection [3] are –
aggregated-data convergecast where packets are
aggregated at each hop, and raw-data convergecast
where each data packet travel towards sink node
individually. First approach is most suitable where data
is highly co-related and
objective is to collect maximum sensor reading and second
approach is used where the reading of each sensor is
equally important. Further, interference and network
topology are the two prime limiting factors in wireless
sensor networks. Time Division Multiple Access (TDMA)
[2] protocol is well suited to periodic data traffic to have
contention free medium and to avoid collisions. The use
of multiple frequency channels can allow more concurrent
transmissions. Here we have shown that if multiple
frequencies are employed along with TDMA, the data
collection rate is affected by tree topology and not by
interferences. Thus, in this paper we identify the
effect of network topology on the schedule length, and
analyzed the performance of convergecast by using
multiple frequencies as compared to those trees using a
single frequency.
The rest of the paper is organized as follows: in
Section II, we discuss related works. In Section III, we
describe system modeling and some discussions. In
Section IV, we have shown multichannel scheduling for
Interference elimination. In Section V, we focus on impact
of network topology on data forwarding. Section VI gives
the evaluation work based on previous discussions. Finally
Section VII concludes the paper.
II. RELATED WORK
Gandham et al. [2] proposed a distributed time slot
assignment scheme, for a single channel in TDMA
schedule length. Fast data collection with minimum
schedule length for aggregated convergecast is discussed
by Chen et al. in [3]. Annamalai et al. [4] uses the concept
of orthogonal codes to remove interferences, where each
node has been assigned time slots from bottom to the top of
the tree such that a parent has to wait till it receives all the
data packet from its children. Pan and Tseng [5] described
a beacon period, assigned to every sensor node\ in Zigbee
network, scheme to reduce latency. A node can receive data
only in the allotted beacon period. Song et al.[6] described
a time-optimal energy efficient packet scheduling
algorithm for raw-data convergecast with periodic traffic.
They assumed a simple interference model in which
every node has a circular transmission range and
interferences from concurrent multiple senders is
neglected. Song et al. [6] further extended their work
and proposed a TDMA- based MAC protocol for high-
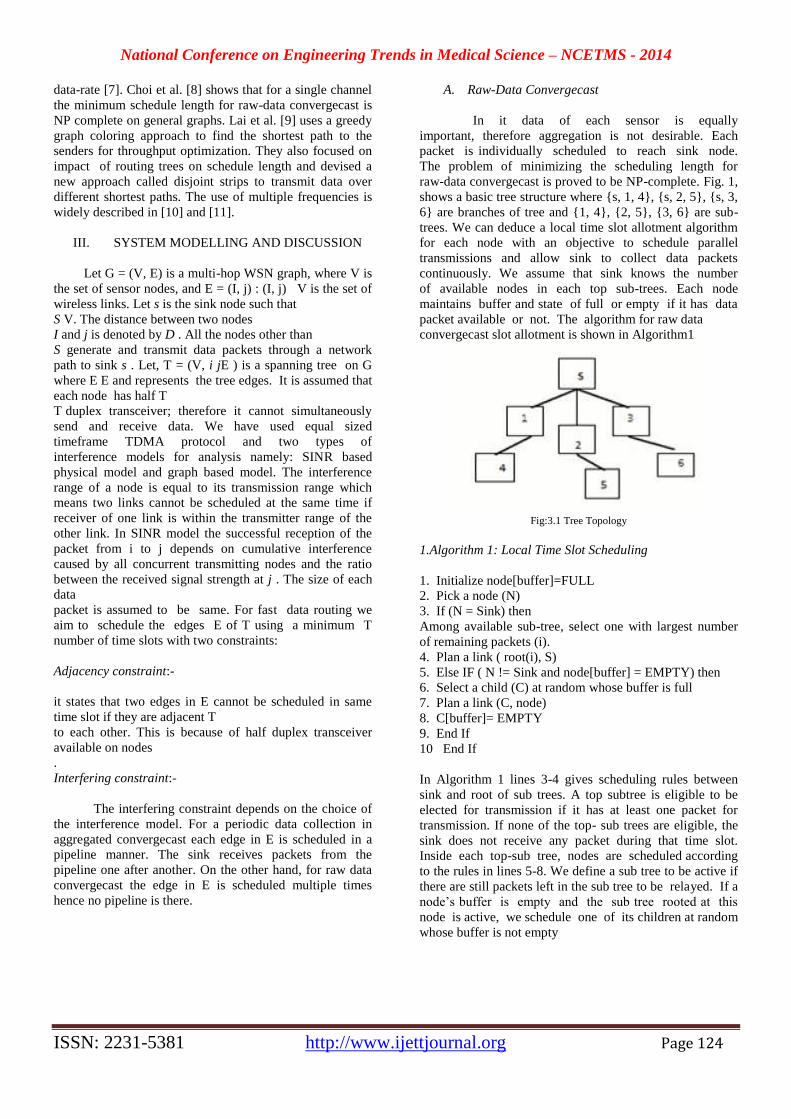
National Conference on Engineering Trends in Medical Science – NCETMS - 2014
ISSN: 2231-5381 http://www.ijettjournal.org Page 124
data-rate [7]. Choi et al. [8] shows that for a single channel
the minimum schedule length for raw-data convergecast is
NP complete on general graphs. Lai et al. [9] uses a greedy
graph coloring approach to find the shortest path to the
senders for throughput optimization. They also focused on
impact of routing trees on schedule length and devised a
new approach called disjoint strips to transmit data over
different shortest paths. The use of multiple frequencies is
widely described in [10] and [11].
III. SYSTEM MODELLING AND DISCUSSION
Let G = (V, E) is a multi-hop WSN graph, where V is
the set of sensor nodes, and E = (I, j) : (I, j) V is the set of
wireless links. Let s is the sink node such that
S V. The distance between two nodes
I and j is denoted by D . All the nodes other than
S generate and transmit data packets through a network
path to sink s . Let, T = (V, i jE ) is a spanning tree on G
where E E and represents the tree edges. It is assumed that
each node has half T
T duplex transceiver; therefore it cannot simultaneously
send and receive data. We have used equal sized
timeframe TDMA protocol and two types of
interference models for analysis namely: SINR based
physical model and graph based model. The interference
range of a node is equal to its transmission range which
means two links cannot be scheduled at the same time if
receiver of one link is within the transmitter range of the
other link. In SINR model the successful reception of the
packet from i to j depends on cumulative interference
caused by all concurrent transmitting nodes and the ratio
between the received signal strength at j . The size of each
data
packet is assumed to be same. For fast data routing we
aim to schedule the edges E of T using a minimum T
number of time slots with two constraints:
Adjacency constraint:-
it states that two edges in E cannot be scheduled in same
time slot if they are adjacent T
to each other. This is because of half duplex transceiver
available on nodes
.
Interfering constraint:-
The interfering constraint depends on the choice of
the interference model. For a periodic data collection in
aggregated convergecast each edge in E is scheduled in a
pipeline manner. The sink receives packets from the
pipeline one after another. On the other hand, for raw data
convergecast the edge in E is scheduled multiple times
hence no pipeline is there.
A. Raw-Data Convergecast
In it data of each sensor is equally
important, therefore aggregation is not desirable. Each
packet is individually scheduled to reach sink node.
The problem of minimizing the scheduling length for
raw-data convergecast is proved to be NP-complete. Fig. 1,
shows a basic tree structure where {s, 1, 4}, {s, 2, 5}, {s, 3,
6} are branches of tree and {1, 4}, {2, 5}, {3, 6} are sub-
trees. We can deduce a local time slot allotment algorithm
for each node with an objective to schedule parallel
transmissions and allow sink to collect data packets
continuously. We assume that sink knows the number
of available nodes in each top sub-trees. Each node
maintains buffer and state of full or empty if it has data
packet available or not. The algorithm for raw data
convergecast slot allotment is shown in Algorithm1
Fig:3.1 Tree Topology
1.Algorithm 1: Local Time Slot Scheduling
1. Initialize node[buffer]=FULL
2. Pick a node (N)
3. If (N = Sink) then
Among available sub-tree, select one with largest number
of remaining packets (i).
4. Plan a link ( root(i), S)
5. Else IF ( N != Sink and node[buffer] = EMPTY) then
6. Select a child (C) at random whose buffer is full
7. Plan a link (C, node)
8. C[buffer]= EMPTY
9. End If
10 End If
In Algorithm 1 lines 3-4 gives scheduling rules between
sink and root of sub trees. A top subtree is eligible to be
elected for transmission if it has at least one packet for
transmission. If none of the top- sub trees are eligible, the
sink does not receive any packet during that time slot.
Inside each top-sub tree, nodes are scheduled according
to the rules in lines 5-8. We define a sub tree to be active if
there are still packets left in the sub tree to be relayed. If a
node’s buffer is empty and the sub tree rooted at this
node is active, we schedule one of its children at random
whose buffer is not empty
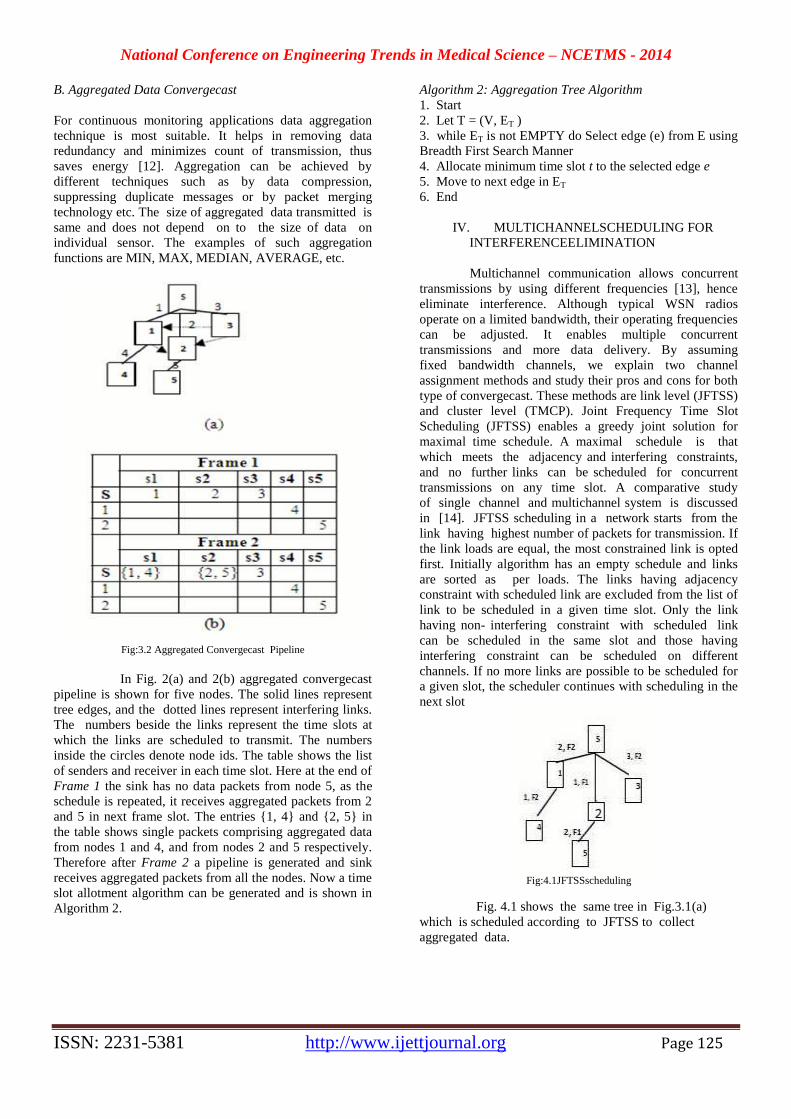
National Conference on Engineering Trends in Medical Science – NCETMS - 2014
ISSN: 2231-5381 http://www.ijettjournal.org Page 125
B. Aggregated Data Convergecast
For continuous monitoring applications data aggregation
technique is most suitable. It helps in removing data
redundancy and minimizes count of transmission, thus
saves energy [12]. Aggregation can be achieved by
different techniques such as by data compression,
suppressing duplicate messages or by packet merging
technology etc. The size of aggregated data transmitted is
same and does not depend on to the size of data on
individual sensor. The examples of such aggregation
functions are MIN, MAX, MEDIAN, AVERAGE, etc.
Fig:3.2 Aggregated Convergecast Pipeline
In Fig. 2(a) and 2(b) aggregated convergecast
pipeline is shown for five nodes. The solid lines represent
tree edges, and the dotted lines represent interfering links.
The numbers beside the links represent the time slots at
which the links are scheduled to transmit. The numbers
inside the circles denote node ids. The table shows the list
of senders and receiver in each time slot. Here at the end of
Frame 1 the sink has no data packets from node 5, as the
schedule is repeated, it receives aggregated packets from 2
and 5 in next frame slot. The entries {1, 4} and {2, 5} in
the table shows single packets comprising aggregated data
from nodes 1 and 4, and from nodes 2 and 5 respectively.
Therefore after Frame 2 a pipeline is generated and sink
receives aggregated packets from all the nodes. Now a time
slot allotment algorithm can be generated and is shown in
Algorithm 2.
Algorithm 2: Aggregation Tree Algorithm
1. Start
2. Let T = (V, ET )
3. while ET is not EMPTY do Select edge (e) from E using
Breadth First Search Manner
4. Allocate minimum time slot t to the selected edge e
5. Move to next edge in ET
6. End
IV. MULTICHANNELSCHEDULING FOR
INTERFERENCEELIMINATION
Multichannel communication allows concurrent
transmissions by using different frequencies [13], hence
eliminate interference. Although typical WSN radios
operate on a limited bandwidth, their operating frequencies
can be adjusted. It enables multiple concurrent
transmissions and more data delivery. By assuming
fixed bandwidth channels, we explain two channel
assignment methods and study their pros and cons for both
type of convergecast. These methods are link level (JFTSS)
and cluster level (TMCP). Joint Frequency Time Slot
Scheduling (JFTSS) enables a greedy joint solution for
maximal time schedule. A maximal schedule is that
which meets the adjacency and interfering constraints,
and no further links can be scheduled for concurrent
transmissions on any time slot. A comparative study
of single channel and multichannel system is discussed
in [14]. JFTSS scheduling in a network starts from the
link having highest number of packets for transmission. If
the link loads are equal, the most constrained link is opted
first. Initially algorithm has an empty schedule and links
are sorted as per loads. The links having adjacency
constraint with scheduled link are excluded from the list of
link to be scheduled in a given time slot. Only the link
having non- interfering constraint with scheduled link
can be scheduled in the same slot and those having
interfering constraint can be scheduled on different
channels. If no more links are possible to be scheduled for
a given slot, the scheduler continues with scheduling in the
next slot
Fig:4.1JFTSSscheduling
Fig. 4.1 shows the same tree in Fig.3.1(a)
which is scheduled according to JFTSS to collect
aggregated data.
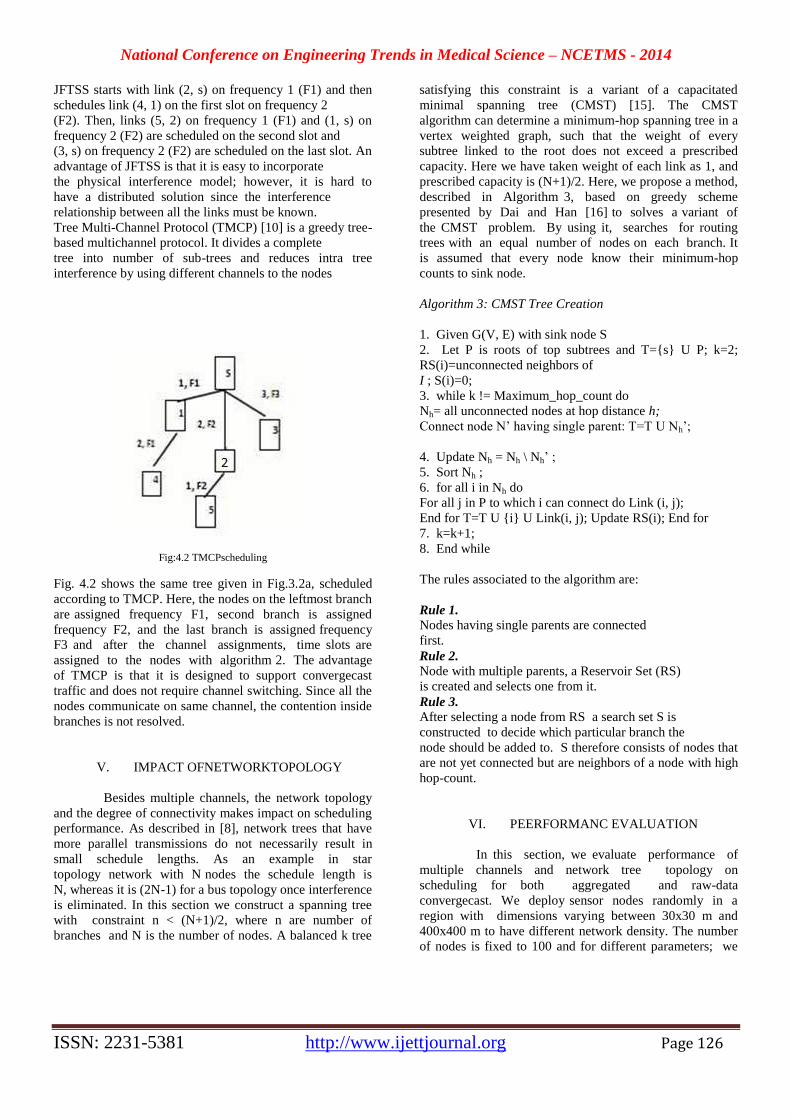
National Conference on Engineering Trends in Medical Science – NCETMS - 2014
ISSN: 2231-5381 http://www.ijettjournal.org Page 126
JFTSS starts with link (2, s) on frequency 1 (F1) and then
schedules link (4, 1) on the first slot on frequency 2
(F2). Then, links (5, 2) on frequency 1 (F1) and (1, s) on
frequency 2 (F2) are scheduled on the second slot and
(3, s) on frequency 2 (F2) are scheduled on the last slot. An
advantage of JFTSS is that it is easy to incorporate
the physical interference model; however, it is hard to
have a distributed solution since the interference
relationship between all the links must be known.
Tree Multi-Channel Protocol (TMCP) [10] is a greedy tree-
based multichannel protocol. It divides a complete
tree into number of sub-trees and reduces intra tree
interference by using different channels to the nodes
Fig:4.2 TMCPscheduling
Fig. 4.2 shows the same tree given in Fig.3.2a, scheduled
according to TMCP. Here, the nodes on the leftmost branch
are assigned frequency F1, second branch is assigned
frequency F2, and the last branch is assigned frequency
F3 and after the channel assignments, time slots are
assigned to the nodes with algorithm 2. The advantage
of TMCP is that it is designed to support convergecast
traffic and does not require channel switching. Since all the
nodes communicate on same channel, the contention inside
branches is not resolved.
V. IMPACT OFNETWORKTOPOLOGY
Besides multiple channels, the network topology
and the degree of connectivity makes impact on scheduling
performance. As described in [8], network trees that have
more parallel transmissions do not necessarily result in
small schedule lengths. As an example in star
topology network with N nodes the schedule length is
N, whereas it is (2N-1) for a bus topology once interference
is eliminated. In this section we construct a spanning tree
with constraint n < (N+1)/2, where n are number of
branches and N is the number of nodes. A balanced k tree
satisfying this constraint is a variant of a capacitated
minimal spanning tree (CMST) [15]. The CMST
algorithm can determine a minimum-hop spanning tree in a
vertex weighted graph, such that the weight of every
subtree linked to the root does not exceed a prescribed
capacity. Here we have taken weight of each link as 1, and
prescribed capacity is (N+1)/2. Here, we propose a method,
described in Algorithm 3, based on greedy scheme
presented by Dai and Han [16] to solves a variant of
the CMST problem. By using it, searches for routing
trees with an equal number of nodes on each branch. It
is assumed that every node know their minimum-hop
counts to sink node.
Algorithm 3: CMST Tree Creation
1. Given G(V, E) with sink node S
2. Let P is roots of top subtrees and T={s} U P; k=2;
RS(i)=unconnected neighbors of
I ; S(i)=0;
3. while k != Maximum_hop_count do
Nh= all unconnected nodes at hop distance h;
Connect node N’ having single parent: T=T U Nh’;
4. Update Nh = Nh \ Nh’ ;
5. Sort Nh ;
6. for all i in Nh do
For all j in P to which i can connect do Link (i, j);
End for T=T U {i} U Link(i, j); Update RS(i); End for
7. k=k+1;
8. End while
The rules associated to the algorithm are:
Rule 1. Nodes having single parents are connected
first.
Rule 2. Node with multiple parents, a Reservoir Set (RS)
is created and selects one from it.
Rule 3. After selecting a node from RS a search set S is
constructed to decide which particular branch the
node should be added to. S therefore consists of nodes that
are not yet connected but are neighbors of a node with high
hop-count.
VI. PEERFORMANC EVALUATION
In this section, we evaluate performance of
multiple channels and network tree topology on
scheduling for both aggregated and raw-data
convergecast. We deploy sensor nodes randomly in a
region with dimensions varying between 30x30 m and
400x400 m to have different network density. The number
of nodes is fixed to 100 and for different parameters; we
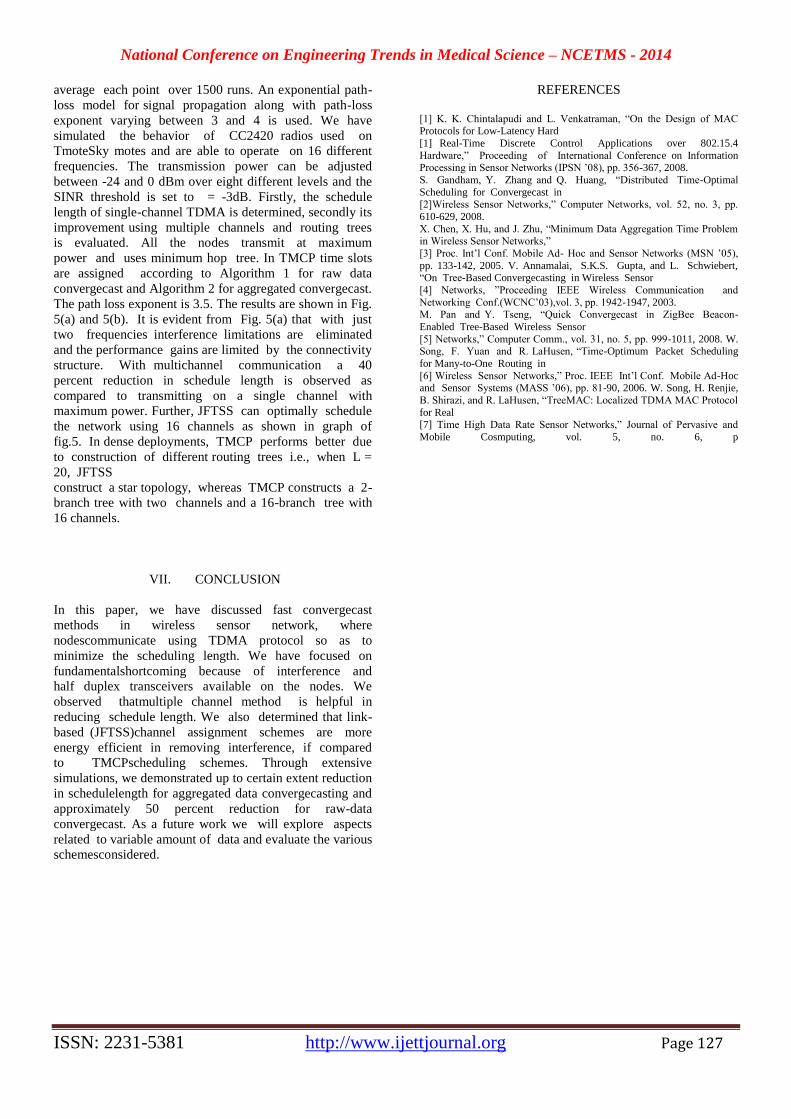
National Conference on Engineering Trends in Medical Science – NCETMS - 2014
ISSN: 2231-5381 http://www.ijettjournal.org Page 127
average each point over 1500 runs. An exponential path-
loss model for signal propagation along with path-loss
exponent varying between 3 and 4 is used. We have
simulated the behavior of CC2420 radios used on
TmoteSky motes and are able to operate on 16 different
frequencies. The transmission power can be adjusted
between -24 and 0 dBm over eight different levels and the
SINR threshold is set to = -3dB. Firstly, the schedule
length of single-channel TDMA is determined, secondly its
improvement using multiple channels and routing trees
is evaluated. All the nodes transmit at maximum
power and uses minimum hop tree. In TMCP time slots
are assigned according to Algorithm 1 for raw data
convergecast and Algorithm 2 for aggregated convergecast.
The path loss exponent is 3.5. The results are shown in Fig.
5(a) and 5(b). It is evident from Fig. 5(a) that with just
two frequencies interference limitations are eliminated
and the performance gains are limited by the connectivity
structure. With multichannel communication a 40
percent reduction in schedule length is observed as
compared to transmitting on a single channel with
maximum power. Further, JFTSS can optimally schedule
the network using 16 channels as shown in graph of
fig.5. In dense deployments, TMCP performs better due
to construction of different routing trees i.e., when L =
20, JFTSS
construct a star topology, whereas TMCP constructs a 2-
branch tree with two channels and a 16-branch tree with
16 channels.
VII. CONCLUSION
In this paper, we have discussed fast convergecast
methods in wireless sensor network, where
nodescommunicate using TDMA protocol so as to
minimize the scheduling length. We have focused on
fundamentalshortcoming because of interference and
half duplex transceivers available on the nodes. We
observed thatmultiple channel method is helpful in
reducing schedule length. We also determined that link-
based (JFTSS)channel assignment schemes are more
energy efficient in removing interference, if compared
to TMCPscheduling schemes. Through extensive
simulations, we demonstrated up to certain extent reduction
in schedulelength for aggregated data convergecasting and
approximately 50 percent reduction for raw-data
convergecast. As a future work we will explore aspects
related to variable amount of data and evaluate the various
schemesconsidered.
REFERENCES
[1] K. K. Chintalapudi and L. Venkatraman, “On the Design of MAC Protocols for Low-Latency Hard
[1] Real-Time Discrete Control Applications over 802.15.4
Hardware,” Proceeding of International Conference on Information Processing in Sensor Networks (IPSN ’08), pp. 356-367, 2008.
S. Gandham, Y. Zhang and Q. Huang, “Distributed Time-Optimal
Scheduling for Convergecast in [2]Wireless Sensor Networks,” Computer Networks, vol. 52, no. 3, pp.
610-629, 2008.
X. Chen, X. Hu, and J. Zhu, “Minimum Data Aggregation Time Problem in Wireless Sensor Networks,”
[3] Proc. Int’l Conf. Mobile Ad- Hoc and Sensor Networks (MSN ’05),
pp. 133-142, 2005. V. Annamalai, S.K.S. Gupta, and L. Schwiebert, “On Tree-Based Convergecasting in Wireless Sensor
[4] Networks, ”Proceeding IEEE Wireless Communication and
Networking Conf.(WCNC’03),vol. 3, pp. 1942-1947, 2003. M. Pan and Y. Tseng, “Quick Convergecast in ZigBee Beacon-
Enabled Tree-Based Wireless Sensor
[5] Networks,” Computer Comm., vol. 31, no. 5, pp. 999-1011, 2008. W. Song, F. Yuan and R. LaHusen, “Time-Optimum Packet Scheduling
for Many-to-One Routing in
[6] Wireless Sensor Networks,” Proc. IEEE Int’l Conf. Mobile Ad-Hoc and Sensor Systems (MASS ’06), pp. 81-90, 2006. W. Song, H. Renjie,
B. Shirazi, and R. LaHusen, “TreeMAC: Localized TDMA MAC Protocol
for Real [7] Time High Data Rate Sensor Networks,” Journal of Pervasive and
Mobile Cosmputing, vol. 5, no. 6, p
National Conference on Engineering Trends in Medical Science – NCETMS - 2014
ISSN: 2231-5381 http://www.ijettjournal.org Page 128
Patient Monitoring System using Wireless
Technology Priyanka More
1, PragatiDaroi
2, Amol Alkari
3
1Final Year B.E., Dept of EnTC, DBNCOET, Yavatmal (MS), India.
2Final Year B.E., Dept of EnTC, DBNCOET, Yavatmal (MS), India.
3Asstt. Prof.,Dept of EnTC, DBNCOET, Yavatmal (MS), India.
Abstract— In today’s fast phase of life where human
population is increasing and their health problems are also
increasing with them. Every day we see so many road accident,
people are suffering from so many diseases. This increases the
crowd in the hospital. Development of a system for monitoring
of multiple subject’s physiological parameters in a hospital on a
single monitor in doctors cabin and subjective workload
regardless of location has been presented. This allows an
occupational health and also provides the necessary platform to
monitor, analyze & control the system. For this purpose
modern acquisition systems are needed. A sensor electronics
module permits the acquisition of different physiological
parameters of different subjects on a single screen and their
online transmission to the other doctors in case of need. The
sensor electronics module constitutes a wireless personal area
network so that real time monitoring is possible & patient can
be helped on time. This electronic input of multiple patients is
better than manual documentation on papers.
Keywords— GPRS, sensor network, wireless
network, data acquisition.
I. INTRODUCTION
In this paper the development of a system for
monitoring of multiple subjects physiological parameters in a
hospital on a single monitor in doctors cabin is presented.In
view of the ever-growing age median among travelers, a
health monitoring application is becoming more of a
necessity in large capacity aircraft environments, providing
safety to passengers with actual or chronic risks, and
reducing risk and cost forLong-range aircraft operations.
ConsideringThe technological advancements in embedded
sensor devices a portable medical monitoring enclosure has
been developed to provide with the flexibility of low Cost
and high accuracy measurement equipment in avionic
environments.The patient physical states data acquisition
and communication system monitors the main physical
parameters & movement status continuously. The
information from data acquisition system is sent to other
hospital centers by wireless communication module. The
monitoring centers receive the information from each patient
and transmit it through GPRS technology. The data from
patient can be displayed as numeric or graph on monitor &
then the doctor can diagnose the patient according to
recorded continuous data. A sensor electronics module
permits the acquisition different physiological parameters so
that real time monitoring is possible & is helpful in worst
condition. If any patient is serious the red mark blinks on the
monitor, which takes attention of doctor on that.
II. LITERATURE REVIEW
In 1625, Santorio, who lived in Venice at the time,
published his methods for measuring body temperature with
the spirit thermometer and for timing the pulse (heart) rate
with a pendulum. The principles for both devices had been
established by Galileo.
In 1903, Willem Einthoven devised the string
galvanometer for measuring the ECG, for which he was
awarded the 1924 Nobel Prize in physiology. The ECG has
become an important adjunct to the clinician's inventory of
tests for both acutely and chronically ill patients. Continuous
measurement of physiological variables has become a
routine part of the monitoring of critically ill patients.
At the same time advances in monitoring were made
and major changes in the therapy of life-threatening
disorders were also occurring. Prompt quantitative
evaluation of measured physiological and biochemical
variables became essential in the decision making process as
physicians applied new therapeutic interventions. For
example, it is now possible and in many cases essential to
use ventilators when a patient cannot breathe independently,
cardiopulmonary bypass equipment when a patient
undergoes open-heart surgery, haemodialysis when a
patient’s kidneys fail, and intravenous (IV) nutritional and
electrolyte (for example, potassium andsodium) support
when a patient is unable to eat or drink.
The ICU or ICCU, in hospitals are designed to offer
the advantages of a low concentration of the equipment and
resources needed to take care of critically ill or seriously
injured patients. Hence, there should be specially trained
personnel who have physical resources, supplementing their
skills and abilities, to handle emergencies. As a part of this
concept a modular controller is designed to carry out
monitoring of some usual biological parameters.
In the current scenario the patient monitoring
system using GSM or GPS is introduced .This system are
designed to monitor the patient in network from remote
location. This system can be designed using different
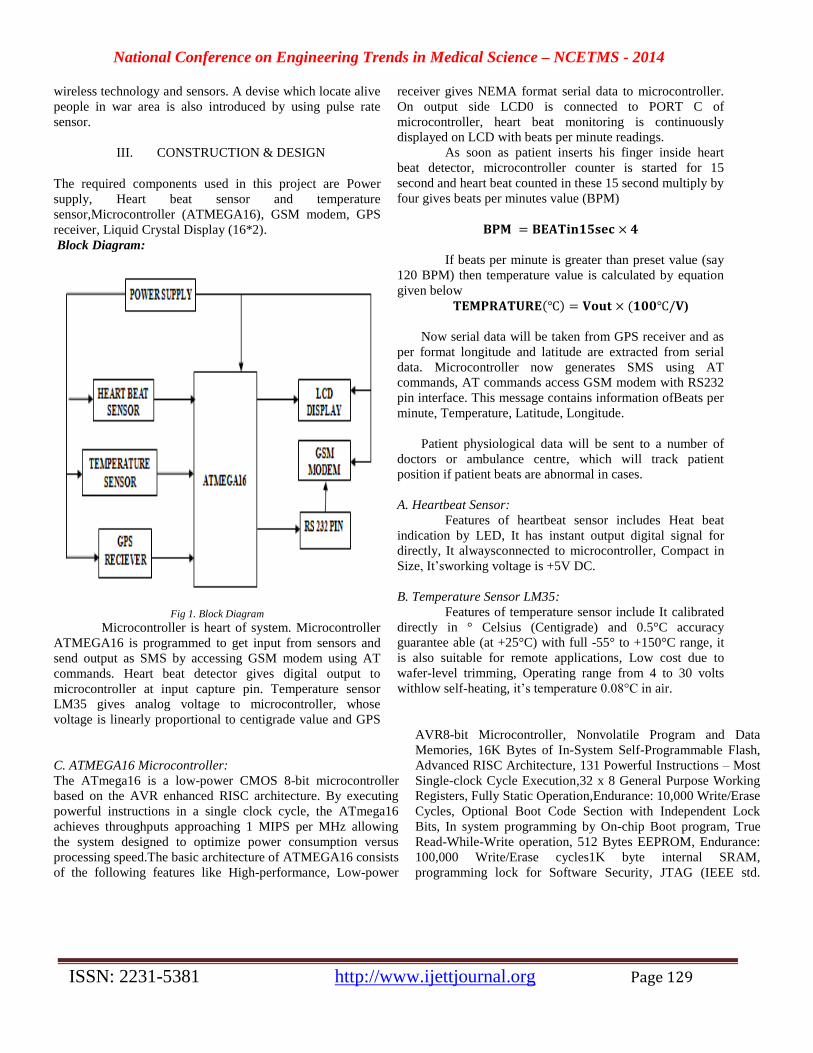
National Conference on Engineering Trends in Medical Science – NCETMS - 2014
ISSN: 2231-5381 http://www.ijettjournal.org Page 129
wireless technology and sensors. A devise which locate alive
people in war area is also introduced by using pulse rate
sensor.
III. CONSTRUCTION & DESIGN
The required components used in this project are Power
supply, Heart beat sensor and temperature
sensor,Microcontroller (ATMEGA16), GSM modem, GPS
receiver, Liquid Crystal Display (16*2).
Block Diagram:
Fig 1. Block Diagram
Microcontroller is heart of system. Microcontroller
ATMEGA16 is programmed to get input from sensors and
send output as SMS by accessing GSM modem using AT
commands. Heart beat detector gives digital output to
microcontroller at input capture pin. Temperature sensor
LM35 gives analog voltage to microcontroller, whose
voltage is linearly proportional to centigrade value and GPS
receiver gives NEMA format serial data to microcontroller.
On output side LCD0 is connected to PORT C of
microcontroller, heart beat monitoring is continuously
displayed on LCD with beats per minute readings.
As soon as patient inserts his finger inside heart
beat detector, microcontroller counter is started for 15
second and heart beat counted in these 15 second multiply by
four gives beats per minutes value (BPM)
If beats per minute is greater than preset value (say
120 BPM) then temperature value is calculated by equation
given below
)
Now serial data will be taken from GPS receiver and as
per format longitude and latitude are extracted from serial
data. Microcontroller now generates SMS using AT
commands, AT commands access GSM modem with RS232
pin interface. This message contains information ofBeats per
minute, Temperature, Latitude, Longitude.
Patient physiological data will be sent to a number of
doctors or ambulance centre, which will track patient
position if patient beats are abnormal in cases.
A. Heartbeat Sensor:
Features of heartbeat sensor includes Heat beat
indication by LED, It has instant output digital signal for
directly, It alwaysconnected to microcontroller, Compact in
Size, It’sworking voltage is +5V DC.
B. Temperature Sensor LM35:
Features of temperature sensor include It calibrated
directly in ° Celsius (Centigrade) and 0.5°C accuracy
guarantee able (at +25°C) with full -55° to +150°C range, it
is also suitable for remote applications, Low cost due to
wafer-level trimming, Operating range from 4 to 30 volts
withlow self-heating, it’s temperature 0.08°C in air.
C. ATMEGA16 Microcontroller:
The ATmega16 is a low-power CMOS 8-bit microcontroller
based on the AVR enhanced RISC architecture. By executing
powerful instructions in a single clock cycle, the ATmega16
achieves throughputs approaching 1 MIPS per MHz allowing
the system designed to optimize power consumption versus
processing speed.The basic architecture of ATMEGA16 consists
of the following features like High-performance, Low-power
AVR8-bit Microcontroller, Nonvolatile Program and Data
Memories, 16K Bytes of In-System Self-Programmable Flash,
Advanced RISC Architecture, 131 Powerful Instructions – Most
Single-clock Cycle Execution,32 x 8 General Purpose Working
Registers, Fully Static Operation,Endurance: 10,000 Write/Erase
Cycles, Optional Boot Code Section with Independent Lock
Bits, In system programming by On-chip Boot program, True
Read-While-Write operation, 512 Bytes EEPROM, Endurance:
100,000 Write/Erase cycles1K byte internal SRAM,
programming lock for Software Security, JTAG (IEEE std.
National Conference on Engineering Trends in Medical Science – NCETMS - 2014
ISSN: 2231-5381 http://www.ijettjournal.org Page 130
1149.1 Compliant) Interface, Boundary-scan capabilities
according to the JTAG Standard, Extensive On-chip debug
support, programming of Flash, EEPROM, Fuses, and Lock Bits
through the JTAG Interface. The another special Features of
Microcontroller are Power-on Reset and Programmable Brown-
out Detection, Internal Calibrated RC OscillatorI/O and
Packages, 32 Programmable I/O Lines,40-pin PDIP, 44-lead
TQFP, and 44-pad MLF, Operating Voltages : 4.5 - 5.5V for
ATmega16, Speed Grades0 - 16 MHz for ATmega16External
and Internal Interrupt Sources
D. Power Supply:
AC – DC Power Adaptor with DC Voltage: 12V
andDC Current: 1A ratings.
E. GPS Receiver:
Features of GPS Receiver are High sensitivity -160dbm, LED
indicating data output, Low power consumption,
GPS L1 C/A Code,Supports NMEA0183 V 3.01 data protocol,
Real time navigation for location based services, Works from
+5V DC signal and outputs 9600 bps serial data , Magnetic base
active antenna with 3 meter wire length for vehicle rooftop
installation.
F. GSM Modem:
This GSM modem is a highly flexible plug and play
quad band GSM modem for direct and easy integration to
RS232. Supports features like Voice, Data/Fax, SMS, GPRS and
integrated TCP/IP stack. Purpose of using GSM modem is to
increase range of transmission of patient data from anywhere to
hospital usually required.Feature of this modem areQuad Band
GSM/GPRS 850/900/1800/1900 MHz,Control via AT
commands(GSM 07.07, 07.05 and enhanced AT commands).
G. Liquid Crystal Display:
A liquid crystal display (LCD) is a thin, flat display device made
up of any number of color or monochrome pixels arrayed in
front of a light source or reflector. It uses very small amounts of
electric power, and is therefore suitable for use in battery
powered electronic devices. Each pixel consists of a column of
liquid crystal molecules suspended between two transparent
electrodes, and two polarizing filters, the axes of polarity of
which are perpendicular to each other. The liquid crystal twists
the polarization of light entering one filter to allow it to pass
through the other.
More microcontroller devices are using ‘smart LCD’ display to
output visual information. LCD displays designed are
inexpensive, easy to use, and it is even possible to produce a
read out using the 8*80 pixels of the display. LCD displays have
a standard ASCII set of characters plus Japanese, Greek
andmathematical symbols. For an 8-bit data bus, the display
requires a + 5V supply + 11 I/O lines.
I. IMPLIMENTATION
A. Wearable Sensors
The wearable sensors provide four functionalities:
vital signs monitoring locationtracking, medical record storage,
and triage status tracking. We integrated two types of non-
invasive vital signssensors – a pulse oximeter and a blood
pressure sensor. The pulse oximeter attaches to the patient’s
finger and measures heart rate (HR) and blood oxygenation
level (SpO2).A cuff pressure sensor on the patient’s upper arm
measures systolic and diastolic blood pressure. We also
integrated two types of location sensing capabilities – a GPS to
provide geolocation, and indoor location detection system to
provide location where the GPS signal cannot be reached. The
GPS sensor allows medics to track patients who are outdoors,
e.g. at the scene of the emergency, with accuracy of 3 meters
(CEP). The indoor location system, based on the Mote Track
project developed at Harvard University, requires the
installation of location beacons. Indoor location beacons are
being installed at a designated auxiliary care center near
Washington DC.Patients are admitted to an auxiliary care
center if nearby hospitals have reached their occupancy
capacities and cannot admit more patients. At an auxiliary care
center, which can often be short on staff and overfilled with
patients, the patients vital signs will continue to be monitored by
our system. Johns Hopkins University Applied Physics
Laboratory medics quickly locate a specific patient whose
conditions have deteriorated. With all the peripheral devices
turned on, the pulse and oxygenation reported every second, the
GPS location reported every 5 minutes, and the blood pressure
reported every 15 minutes, and the battery lifetime of the overall
system is approximately 6 hours. The blood pressure sensor
is the most power hungry peripheral, and when it is notused, the
battery life of the overall device increases to 1-2 days.
B. Vital Sign Monitor Algorithm
Software on the tablet device receives real-time patient
data from the mote and processes them to detect anomalies. If
the patient has a medical record that has been previously
entered, information from the medical record is used in the alert
detection algorithm. Table shows a partial list of physiological
conditions that cause alerts. The algorithm uses additional
information such as patient age and height toadjust its
thresholds. If additional information is notavailable, the
algorithm uses a set of default values.
C. Web Portal
An effective emergency response information system
should support the need for multiple parties to share
information about patients’ status and locations. Our web based
National Conference on Engineering Trends in Medical Science – NCETMS - 2014
ISSN: 2231-5381 http://www.ijettjournal.org Page 131
information portal allows different types of users to access the
patient information in real-time. When a user logs in, the
information displayed to that particular user is managed by
group-level permissions.
IV. CONCLUSIONS
We have designed and developed a real-time
patientmonitoring system that integrates vital signs sensors,
location sensors, ad-hoc networking, electronic patient records,
and web portal technology to allow remote monitoring of
patient. This system provide an exact condition of patient
situated in remote area. We can monitor multiple patients in a
hospital using single monitor in a doctor’s cabin. Limitations of
the previously used patient monitoring systems include the
measurement of each parameter using separate devices and
hence resulting in overcrowding of devices around the patient
which also disturbs the situation of patient. The patient
monitoring system developed in this project overcomes this
disadvantage by the construction of an integrated circuit
comprising of all the parameter measuring devices and
organized acquisition of data and their meaningful display.
REFERENCES
[1] Park Set al, “Real-time monitoring of patient on remote sites.” Proceedings
of the 20th annual international conference on IEEE EMBS, vol. 20, No.3; 1998.
[2]SushmitaNatarajan (41501106112)" Patient Monitoring Systems Using Bluetooth Technology"AnnaUniversity: Chennai - 600 025,may 2005.
[3]Rizzi Maria, etc. “A wireless sensor network for security systems adopting
the bluetoothtechnology”, WSEASTransactions on Circuits and Systems, vol.5, no.5,2006, p652-657
[4]“GSM Based Intelligent Wireless Mobile Patient Monitoring System Using
ZIGBEE Communication”International Journal of Computer & Communication Technology ISSN (PRINT): 0975 - 7449, Volume-3, Issue-5, 2012.
[5]International Journal of Electronics and Communication Engineering
&Technology (IJECET), ISSN 0976 –6464(Print), ISSN 0976 – 6472(Online) Volume 4, Issue 1, January- February (2013), © IAEME.
[6]Dr. M. Arumugam, ‘Bio-Medical Instrumentation.
[7] John G. Webster, ‘Medical Instrumentation Application and Design’ 3rdedition
[8] R.S.Khandpur, ‘Handbook of Bio-Medical Instrumentation’.
National Conference on Engineering Trends in Medical Science – NCETMS - 2014
ISSN: 2231-5381 http://www.ijettjournal.org Page 132
“Demonstration of Pulsed X-ray Machine
Radiography as an Alternative to Industry
Radiography Cameras,
Demonstration Pilot Project” Vitthal P. Shirsat
#1, Thaneshwar R. Patle
*2, Mukta R. Deshmukh
#3
#Students of Mechanical Engg.Dept. From Dr. Bhausaheb Nandurkar college of Engg.&Tech. Yavatmal in
Amravati University
Abstract—
In this Paper Presentation we conclude the
Conventional X ray machining related to Biomedical
and mechanical research. This will helps to new era of
technological aspects of the biomedical industries and
fulfill the lack of improved sources such as heating of
X ray machines, more efficiently uses of latest
technologies that will modify our lifestyle.This
research has been done according to the fundamentals
of Biomedical&Mechanical Engineering fields. And
helps to improve the patient’s condition according to
the related field and studies etc.This will also helps to
reduce the power consumption of the whole unit. And
helps to increase the machine life and overall life
cycle for the commercial purose. All the latest studies
regarding to this topic is as given below.
XVIII. INTRODUCTION
The Radiation Protection Division of the
Environmental Protection Agency (EPA) is dedicated
to minimizing incidences of lost radioactive sources
that enter into consumer metal supplies and the public
domain. Industrial devices and consumer products
containing radioactive sources routinely fall out of
regulatory control. Once out of regulatory control,
these devices and
products may be subjected to harsh conditions capable
of producing a breached source, with the
potential of harmful exposure incidents and
significant economic impacts to industry. Providing
alternative technologies for devices and products
which utilize radioactive sources is one approach to
minimize lost source incidences. The current focus of
EPA’s efforts in this regard is to conduct those studies
and assessments necessary to support the
implementation of such alternative technologies in
industrial practices – alternatives that are
technologically and economically advantageous. The
approach suggested by Southwest Research Institute®
(SwRI®) is to identify an industrial sector that
routinely uses isotopic radiation sources and to
demonstrate that an alternative technology to isotopic
sources can provide equivalent capability. One
industrial sector that regularly uses isotopic sources to
perform radiography of pipeline welds is the pipeline
industry.The industry uses Co60, Cs137, and Ir192
which have gamma ray energy lines of 1.17 and 1.33
MeV, 0.66 MeV, and 0.31, 0.47, and 0.60 MeV. Ir192
is perhaps the most often used source for pipeline
welds because the pipe wall thicknesses usually range
between 0.25 and 0.4 inches. Ir192 has a half life of
74.3 days. Sources are usually purchased with an
activity of approximately 100 curies. The radiography
conducted is usually double wall for detecting cracks,
inclusions, and porosity in the welds as illustrated in
Figure 1. To verify the quality of the radiography, the
code that regulates the radiographic inspection usually
calls for a“penetrameter” or “image quality indicator
(IQI)” and the image sensitivity required. In these
radiographs an IQI was used, and the quality
requirement was that all the wires had to be detected.
XIX. TECHNICAL APPROACH
The goal of this project was to demonstrate a
radiography technology for inspection of pipe welds
that does not require the use of isotopic sources. The
technical approach to be followed
included (1) developing procedures for inspection of
schedule 40 pipe in the range of 3 to 16 inches in
diameter, (2) producing radiographs with both an
Ir192 source and a pulsed, battery operated, portable
x-ray source with a peak x-ray energy of 270 kV and
(3) comparing the results obtained as well as the
operational issues associated with using the x-ray
source compared to the isotopic source.
Isotopic Source and Pulsed X-ray Source:
Isotopic sources (called “pills”) are very small, often
on the order of approximately ¼ inch diameter by ¾
inch long. The pill is usually contained in a shielded
housing usually called a “camera.” Although these
sources are highly regulated, because they are so
small they can easily be inadvertently or intentionally
removed from the regulatory information stream.
Isotopic source technology has a number of
advantages over existing large x-ray sources. For
example, the source technology employees a very
compact geometrical envelop and does not require
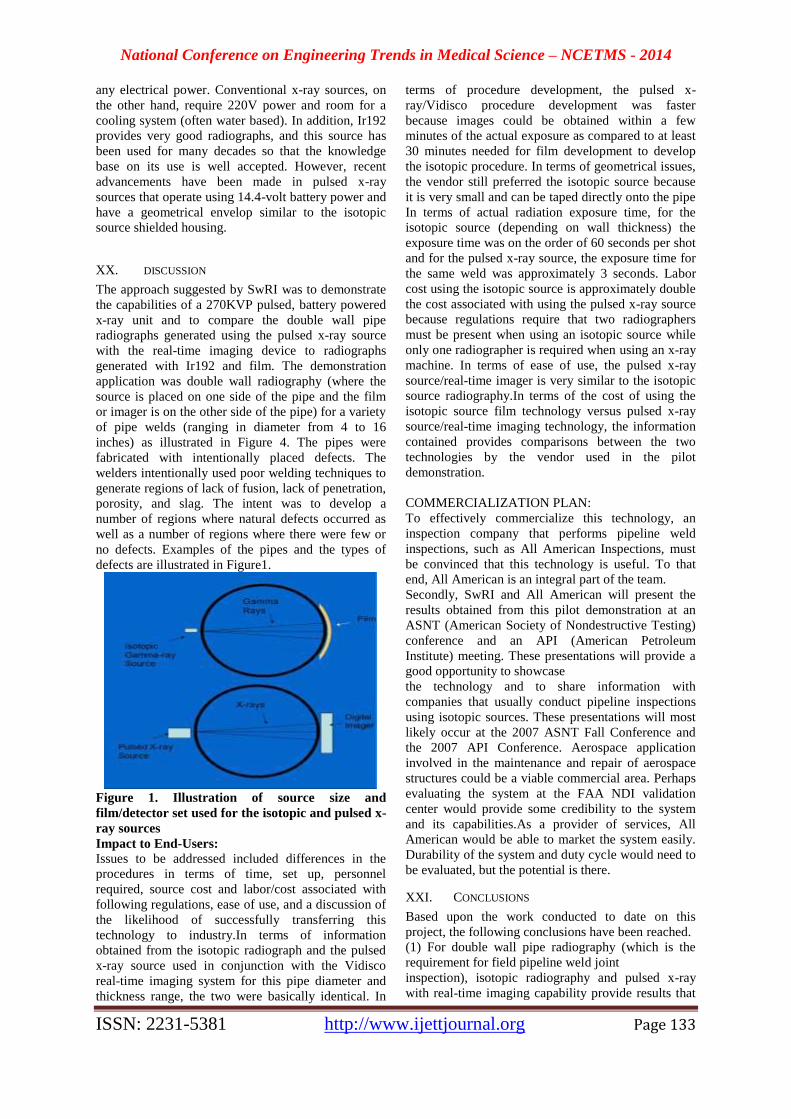
National Conference on Engineering Trends in Medical Science – NCETMS - 2014
ISSN: 2231-5381 http://www.ijettjournal.org Page 133
any electrical power. Conventional x-ray sources, on
the other hand, require 220V power and room for a
cooling system (often water based). In addition, Ir192
provides very good radiographs, and this source has
been used for many decades so that the knowledge
base on its use is well accepted. However, recent
advancements have been made in pulsed x-ray
sources that operate using 14.4-volt battery power and
have a geometrical envelop similar to the isotopic
source shielded housing.
XX. DISCUSSION
The approach suggested by SwRI was to demonstrate
the capabilities of a 270KVP pulsed, battery powered
x-ray unit and to compare the double wall pipe
radiographs generated using the pulsed x-ray source
with the real-time imaging device to radiographs
generated with Ir192 and film. The demonstration
application was double wall radiography (where the
source is placed on one side of the pipe and the film
or imager is on the other side of the pipe) for a variety
of pipe welds (ranging in diameter from 4 to 16
inches) as illustrated in Figure 4. The pipes were
fabricated with intentionally placed defects. The
welders intentionally used poor welding techniques to
generate regions of lack of fusion, lack of penetration,
porosity, and slag. The intent was to develop a
number of regions where natural defects occurred as
well as a number of regions where there were few or
no defects. Examples of the pipes and the types of
defects are illustrated in Figure1.
Figure 1. Illustration of source size and
film/detector set used for the isotopic and pulsed x-
ray sources
Impact to End-Users:
Issues to be addressed included differences in the
procedures in terms of time, set up, personnel
required, source cost and labor/cost associated with
following regulations, ease of use, and a discussion of
the likelihood of successfully transferring this
technology to industry.In terms of information
obtained from the isotopic radiograph and the pulsed
x-ray source used in conjunction with the Vidisco
real-time imaging system for this pipe diameter and
thickness range, the two were basically identical. In
terms of procedure development, the pulsed x-
ray/Vidisco procedure development was faster
because images could be obtained within a few
minutes of the actual exposure as compared to at least
30 minutes needed for film development to develop
the isotopic procedure. In terms of geometrical issues,
the vendor still preferred the isotopic source because
it is very small and can be taped directly onto the pipe
In terms of actual radiation exposure time, for the
isotopic source (depending on wall thickness) the
exposure time was on the order of 60 seconds per shot
and for the pulsed x-ray source, the exposure time for
the same weld was approximately 3 seconds. Labor
cost using the isotopic source is approximately double
the cost associated with using the pulsed x-ray source
because regulations require that two radiographers
must be present when using an isotopic source while
only one radiographer is required when using an x-ray
machine. In terms of ease of use, the pulsed x-ray
source/real-time imager is very similar to the isotopic
source radiography.In terms of the cost of using the
isotopic source film technology versus pulsed x-ray
source/real-time imaging technology, the information
contained provides comparisons between the two
technologies by the vendor used in the pilot
demonstration.
COMMERCIALIZATION PLAN:
To effectively commercialize this technology, an
inspection company that performs pipeline weld
inspections, such as All American Inspections, must
be convinced that this technology is useful. To that
end, All American is an integral part of the team.
Secondly, SwRI and All American will present the
results obtained from this pilot demonstration at an
ASNT (American Society of Nondestructive Testing)
conference and an API (American Petroleum
Institute) meeting. These presentations will provide a
good opportunity to showcase
the technology and to share information with
companies that usually conduct pipeline inspections
using isotopic sources. These presentations will most
likely occur at the 2007 ASNT Fall Conference and
the 2007 API Conference. Aerospace application
involved in the maintenance and repair of aerospace
structures could be a viable commercial area. Perhaps
evaluating the system at the FAA NDI validation
center would provide some credibility to the system
and its capabilities.As a provider of services, All
American would be able to market the system easily.
Durability of the system and duty cycle would need to
be evaluated, but the potential is there.
XXI. CONCLUSIONS
Based upon the work conducted to date on this
project, the following conclusions have been reached.
(1) For double wall pipe radiography (which is the
requirement for field pipeline weld joint
inspection), isotopic radiography and pulsed x-ray
with real-time imaging capability provide results that

National Conference on Engineering Trends in Medical Science – NCETMS - 2014
ISSN: 2231-5381 http://www.ijettjournal.org Page 134
meet the code requirements. The nominal code
requires that ASME IQI B wire (all wires) can be
detected.
(2) This system is excellent for the intended DOT
pipeline inspection, providing the adequate
sensitivities are achieved. Because of its portability
and reduced exposure time this seems to be a “great
fit”.
(3) Contacting ASTM and approaching their
radiographic committee in an effort to address
this type of system specifically would be a vehicle to
encourage its use industry wide.
References
[33] Ogelman, H. In Isolated pullser ((eds Van Riper,K.A.
Epsten¸R& Ho,C)98-102(Cambridge Univ. Press, 1993) [34] Goldreich, P>& Julian, W. Astrohys.J. 157,869-880(1969).
[35] Cheng, K.s., Ho, C& Ruderman, M Astrophy.J300,500-
539(1986) [36] Chiang ,J.& Romani, R. W.Astrophy.J.400,629-637(1992
[37] Page D.Astrophy. J>Suppl.Ser. 75,449-462(1991)
[38] Shibazaki, aaaaaan. A.& Lamb, F.k. Asrtophy .J.346,808-822
National Conference on Engineering Trends in Medical Science – NCETMS - 2014
ISSN: 2231-5381 http://www.ijettjournal.org Page 135
Cloud Computing – A Review
Prof. Hemant P. Moodliar Miss. Tejashri K. Lakhpati
Associate Prof. & Head, Department of Information Technology Student, Dept. of IT
Dr. BhausahebNandurkar Col. of Engg.& Tech.,Yavatmal DBNCOET, Yavatmal
Abstract- Cloud Computing has gained popularity in both research and industrial
communities. Cloud users can acquire computing resources on a need basis, achieving on
demand scalability; Cloud providers can maximize resource utilizations of data centres,
increasing their return on investments. While Cloud systems are usually hosted in large data
centres and are centrally managed, other types of Cloud architectures can be imagined.Cloud
computing platform is a set of scalable large-scale data server clusters, it provides computing
and storage services to customers. The basic study about the architecture of current cloud
computing system shows that it’s a central structured one; i.e. All the data nodes are indexed
by a master server, but when the number requests increases it may become bottle neck of the
system. This research paper is about a cloud storage architecture based on P2P with fault
tolerance. Here the central entity is removed and all servers are interconnected to form a ring
structure. When one of the servers fails, the work will be taken over by any of the best
performing servers. The confidentiality and integrity of data passed in between the servers is
also maintained using MAC algorithm.Cloud computing is set of resources and services
offered through the Internet. Cloud services are delivered from data centres located
throughout the world. Cloud computing facilitates its consumers by providing virtual
resources via internet. General example of cloud services is Google apps, provided by Google
and Microsoft SharePoint. The rapid growth in field of “cloud computing” also increases
severe security concerns. Security has remained a constant issue for Open Systems and
internet, when we are talking about security cloud really suffers.How the end users of cloud
computing know that their information is not having any availability and security issues?
Every one poses, Is their information secure? This study aims to identify the most vulnerable
security threats in cloud computing, which will enable both end users and vendors to know
about the key security threats associated with cloud computing. Our work will enable
researchers and security professionals to know about users and vendors concerns and critical
analysis about the different security models and tools proposed.
Index Term: cloud computing, P2P, storage, cloud computing security, secure cloud
computing.
National Conference on Engineering Trends in Medical Science – NCETMS - 2014
ISSN: 2231-5381 http://www.ijettjournal.org Page 136
INTRODUCTION
“Cloud computing” simply means Internet
computing, generally the internet is seen as
collection of clouds; thus the word cloud
computing can be defined as utilizing the internet
to provide technology enabled services to the
people and organizations. Cloud computing
enables consumers to access resources online
through the internet, from anywhere at any time
without worrying about technical/physical
management and maintenance issues of the
original resources. Besides, Resources of cloud
computing are dynamic and scalable. Cloud
computing is independent computing it is totally
different from grid and utility computing. Google
Apps is the paramount example of Cloud
computing, it enables to access services via the
browser and deployed on millions of machine
over the Internet. Resources are accessible from
the cloud atany time and from any place across
the globe using the internet. Cloud computing is
cheaper than other computing models; zero
maintenance cost is involved since the service
provider is responsible for the availability of
services and clients are free frommaintenance
and management problems of the resource
machines.
LITERATURE SURVEY
Due to feature, cloud computing is also known as
utility computing, or “IT on demand”. Scalability
is key attribute of cloud computing and is
achieved through server virtualization. This
fresh, web-based generation of computing uses
remote servers placed in extremely safe and
secure data centres for storage of data and
management, so organizations do not need to pay
for and look after their internal IT solutions.
cloud applications use large data centres and
powerful servers that host web applications and
web services. Anyone with a suitable Internet
connection and a standard browser can access a
cloud application.
The key features of the cloud computing are: 1. The cloud computing design is done in such a
way that the resources present in it will be
available from anywhere at anytime.
2. Since replication of data is done in cloud
computing, the resources are available even
during hardware failure.
3. Cloud computing provides greater speed in its
operation.
4. The on- demand application deployment
increases the resource utilization to a large
extend.
5. Low cost servers are available for storage and
services.
Cloud computing system [2] has the capability to hold
heavy load situations without much hardware support.
It makes use of the virtualization concept. For client
based transactions its better to store the data in cloud.
Google File System [4] is a scalable distributed file
system for large distributed data-intensive
applications. It provides fault tolerance while running
on inexpensive commodity hardware, and it delivers
high aggregate performance to a large number of
clients.The file system has successfully met different
storage needs. It is widely deployed within Google as
the storage platform for the generation and processing
of data used by our service as well as research and
development efforts that require large data sets.
The strength of their work is the proposed secure
provenance system and limitation of their work is
that their proposed scheme is difficult to
implement as it is based on complex
mathematical model which is very difficult to
understand. La’Quata Sumter et al. [2] says: The rise in the scope
of cloud computing‖ has brought fear about the
Internet Security‖ and the threat of security in cloud
computing‖ is continuously increasing.
Mladen [3] states that ―Cloud‖ computing is a recent
field, which came into existence after Years of
research in networking and different types of
computing.
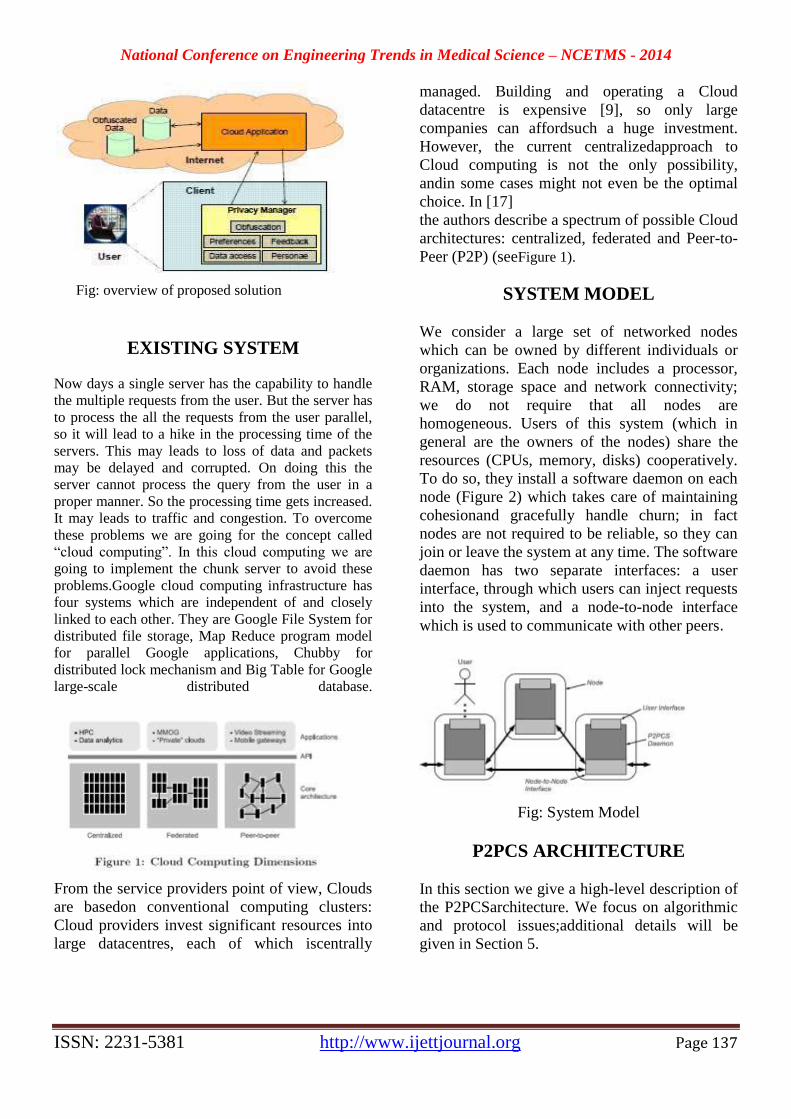
National Conference on Engineering Trends in Medical Science – NCETMS - 2014
ISSN: 2231-5381 http://www.ijettjournal.org Page 137
Fig: overview of proposed solution
EXISTING SYSTEM
Now days a single server has the capability to handle
the multiple requests from the user. But the server has
to process the all the requests from the user parallel,
so it will lead to a hike in the processing time of the
servers. This may leads to loss of data and packets
may be delayed and corrupted. On doing this the
server cannot process the query from the user in a
proper manner. So the processing time gets increased.
It may leads to traffic and congestion. To overcome
these problems we are going for the concept called
“cloud computing”. In this cloud computing we are
going to implement the chunk server to avoid these
problems.Google cloud computing infrastructure has
four systems which are independent of and closely
linked to each other. They are Google File System for
distributed file storage, Map Reduce program model
for parallel Google applications, Chubby for
distributed lock mechanism and Big Table for Google
large-scale distributed database.
From the service providers point of view, Clouds
are basedon conventional computing clusters:
Cloud providers invest significant resources into
large datacentres, each of which iscentrally
managed. Building and operating a Cloud
datacentre is expensive [9], so only large
companies can affordsuch a huge investment.
However, the current centralizedapproach to
Cloud computing is not the only possibility,
andin some cases might not even be the optimal
choice. In [17]
the authors describe a spectrum of possible Cloud
architectures: centralized, federated and Peer-to-
Peer (P2P) (seeFigure 1).
SYSTEM MODEL
We consider a large set of networked nodes
which can be owned by different individuals or
organizations. Each node includes a processor,
RAM, storage space and network connectivity;
we do not require that all nodes are
homogeneous. Users of this system (which in
general are the owners of the nodes) share the
resources (CPUs, memory, disks) cooperatively.
To do so, they install a software daemon on each
node (Figure 2) which takes care of maintaining
cohesionand gracefully handle churn; in fact
nodes are not required to be reliable, so they can
join or leave the system at any time. The software
daemon has two separate interfaces: a user
interface, through which users can inject requests
into the system, and a node-to-node interface
which is used to communicate with other peers.
Fig: System Model
P2PCS ARCHITECTURE
In this section we give a high-level description of
the P2PCSarchitecture. We focus on algorithmic
and protocol issues;additional details will be
given in Section 5.
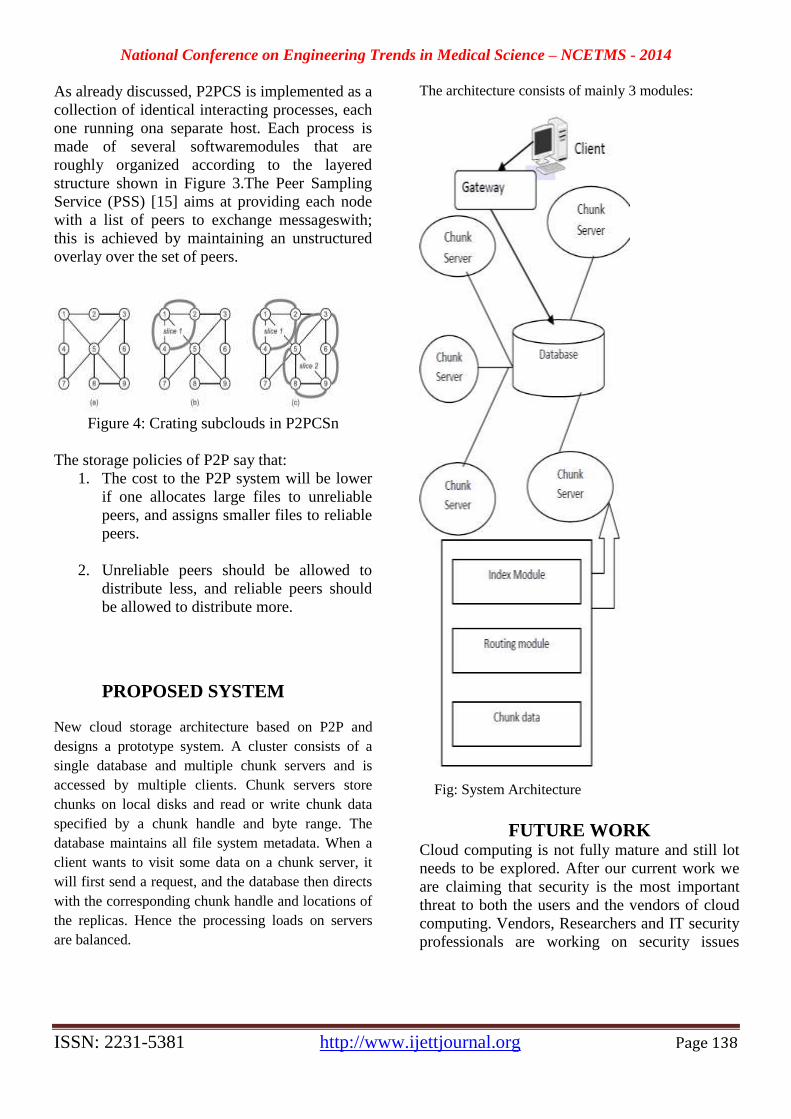
National Conference on Engineering Trends in Medical Science – NCETMS - 2014
ISSN: 2231-5381 http://www.ijettjournal.org Page 138
As already discussed, P2PCS is implemented as a
collection of identical interacting processes, each
one running ona separate host. Each process is
made of several softwaremodules that are
roughly organized according to the layered
structure shown in Figure 3.The Peer Sampling
Service (PSS) [15] aims at providing each node
with a list of peers to exchange messageswith;
this is achieved by maintaining an unstructured
overlay over the set of peers.
Figure 4: Crating subclouds in P2PCSn
The storage policies of P2P say that:
1. The cost to the P2P system will be lower
if one allocates large files to unreliable
peers, and assigns smaller files to reliable
peers.
2. Unreliable peers should be allowed to
distribute less, and reliable peers should
be allowed to distribute more.
PROPOSED SYSTEM
New cloud storage architecture based on P2P and
designs a prototype system. A cluster consists of a
single database and multiple chunk servers and is
accessed by multiple clients. Chunk servers store
chunks on local disks and read or write chunk data
specified by a chunk handle and byte range. The
database maintains all file system metadata. When a
client wants to visit some data on a chunk server, it
will first send a request, and the database then directs
with the corresponding chunk handle and locations of
the replicas. Hence the processing loads on servers
are balanced.
The architecture consists of mainly 3 modules:
Fig: System Architecture
FUTURE WORK Cloud computing is not fully mature and still lot
needs to be explored. After our current work we
are claiming that security is the most important
threat to both the users and the vendors of cloud
computing. Vendors, Researchers and IT security
professionals are working on security issues
National Conference on Engineering Trends in Medical Science – NCETMS - 2014
ISSN: 2231-5381 http://www.ijettjournal.org Page 139
associated with cloud computing. Different
models and tools have been proposed but still
nothing fruitful found. While doing research on
security issues of cloud computing we came to
know that there are no security standards
available for secure cloud computing. In our
future work we will work on security standards
for secure cloud computing.The future work of
this proposed system could to modify the system
performance by reducing the number servers
present in the network.
CONCLUSION In this study different security and privacy related
research papers were studied briefly. Cloud
services are used by both larger and smaller scale
organizations. Advantages of Cloud computing
are huge. But it‘s a global phenomenon that
everything in this world has advantages as well as
disadvantages.We propose a cloud computing
architecture based on P2P which provide a pure
distributed data storage environment without any
central entity for controlling the whole
processing. The advantage of this is architecture
is that it prevents the bottleneck problem that
arises in most of the client server
communications.The proposed system does its
operation based on the performance of the
system. It does the monitoring operation to find
out the best chunk servers within the P2P
network.It does this operation in order to perform
efficient resource utilization and load balancing
of the servers.In this paper we described the
architecture and prototypeimplementation of
P2PCS, a fully distributed IaaS Cloudsystem.
REFERENCES
[1] R. La‘Quata Sumter, ―Cloud Computing: Security Risk
Classification‖, ACMSE 2010, Oxford, USA.
[2] Mladen A. Vouch, ―Cloud Computing Issues, Research and
Implementations‖, Journal of Computing and Information Technology -
CIT 16, 2008, 4, 235–246
[3] Wenchaoet al, ―Towards a Data-centric View of Cloud
Security‖, CloudDB 2010, Toronto, Canada
[4] SorenBleikertz et al, ―Security Audits of Multi-tier Virtual
Infrastructures in Public Infrastructure Clouds‖, CCSW 2010, Chicago,
USA.
[5] Flavio Lombardi& Roberto Di Pietro, ―Transparent Security
for Cloud‖, SAC‘10 March 22-26, 2010, Sierre, Switzerland.
[6] Wayne A. Jansen, ―Cloud Hooks: Security and Privacy Issues
in Cloud Computing‖, 44th Hawaii International Conference on System
Sciesnces 2011 Jinpeng et al, ―Managing Security of Virtual Machine
Images in a Cloud Environment‖, CCSW, 2009, Chicago, USA
[7] Miranda &Siani, ―A Client-Based Privacy Manager for Cloud
Computing‖, COMSWARE‘09, 2009, Dublin, Ireland
[8] Dan Lin & Anna Squicciarini, ―Data Protection Models for
Service Provisioning in the Cloud‖, SACMAT‘10, 2010, Pittsburgh,
Pennsylvania, USA en.wikipedia.org/wiki/Locality_of_reference.
informationweek.com/news/storage/security/228300050219
[9] Clouds and peer-to-peer. URL, June 11 2009.
[10] http://berkeleyclouds.blogspot.com/2009/06/ cloudand-peer-to-
peer.html.
[11] Amazon. Amazon Simple Storage Service API Reference (API
Version 2006-03-01), Mar. 2006. Available at
http://docs.amazonwebservices.com/ computing and storage. In Proc. 5th
IEEE/ACM Int.Workshop on Grid Computing, GRID '04, pages4{10,
Washington, DC, USA, 2004.IEEE Computer Society.
[12] O. Babaoglu and M. Jelasity. Self-_ properties through gossiping. In
Philosophical Transactions A of the Royal Society, volume 366, pages
3747{3757.October 2008.
[13] O. Babaoglu, M. Jelasity, A.-M.Kermarrec,A. Montresor, and M. van
Steen. Managing clouds: a case for a fresh look at large unreliable
dynamic networks. SIGOPS Oper. Syst. Rev., 40:9{13, July 2006.
[14] V. Cunsolo, S.Distefano, A. Pulia_to, and M.Scarpa.Cloud@home:
Bridging the gap between volunteer and cloud computing. In D.-S. Huang,
K.-H. Jo, H.-H.Lee, H.-J. Kang, and V Bevilacqua, editors, Emerging
Intelligent Computing Technology and Applications, volume 5754 of
LNCS, pages 423{432. 2009
[15] V. D. Cunsolo, S. Distefano, A. Pulia_to, and M. Scarpa. Volunteer
computing and desktop cloud:The cloud@home paradigm.In Network
Computingand Applications, IEEE International Symposium on, pages
134{139, Los Alamitos, CA,USA, 2009. IEEE Computer Society.
[16] A. Greenberg, J. Hamilton, D. A. Maltz, and P. Patel. The cost of a
cloud: research problems in data center networks. SIGCOMM Comput.
Commun. Rev., 39:68{73, December 2008
[17 ] R. Hasan, Z. Anwar, W. Yurcik, L. Brumbaugh,and R. Campbell. A
survey of peer-to-peer storage techniques for distributed _le systems. In
Proceedings of the International Conference on Information Technology:
Coding and Computing (ITCC'05) - Volume II - Volume 02, ITCC '05,
pages 205{213, Washington, DC, USA, 2005. IEEE Computer Society.
[18] M. Jelasity and A.-M.Kermarrec. Ordered slicing of very large-scale
overlay networks. In Proceedings of the Sixth IEEE International
Conference on Peer-to-Peer Computing, pages 117{124, Washington, DC,
USA, 2006. IEEE Computer Society.
[19]M. Jelasity, A. Montresor, and O. Babaoglu.Gossip-based aggregation
in large dynamic networks. ACM Trans. Comput.Syst.,
23(3):219{252, 2005)
[20] M. Jelasity, A. Montresor, and O. Babaoglu. The bootstrapping
service. In Proceedings of the 26th IEEE International
Conference/Workshops on Distributed Computing Systems, ICDCSW'06,
pages 11{, Washington, DC, USA, 2006. IEEE Computer Society.
[21]M. Jelasity, A. Montresor, and O. Babaoglu. T Man: Gossip-based
fast overlay topology construction. Computer Networks,
3(13):2321{2339, 2009.
[22] M. Jelasity, S. Voulgaris, R. Guerraoui, A.-M.Kermarrec, and M. van
Steen. Gossip-based peer sampling. ACM Trans. Comput. Syst., 25(3),
2007.
[23] P. Mell and T. Grance. The NIST De_nition of Cloud Computing.
Special publication 800-145 (draft), Gaithersburg (MD), Jan. 2011.
[24] F. Panzieri, O. Babaoglu, V. Ghini, S. Ferretti, and M. Marzolla.
Distributed computing in the 21st century: Some aspects of cloud
computing. In Dependable and Historic Computing, volume 875of LNCS.
2011.

National Conference on Engineering Trends in Medical Science – NCETMS - 2014
ISSN: 2231-5381 http://www.ijettjournal.org Page 140
[25] V. Valancius, N. Laoutaris, L. Massouli_e, C Diotand
Rodriguez. Greening the internet with nano datacenters. In Proc. 5th Int.
Conf. on Emerging networking experiments and technologies, CoNEXT
09, pages 37{48, New York, NY, USA, 2009. ACM.
[26] K. Xu, M. Song, X. Zhang, and J. Song. A cloud computing platform
based on p2p. In IT in Medicine Education, 2009.ITIME '09. IEEE
International Symposium on, pages 427{432, Aug.
2009.
[27] Ben Y. Zhao, John Kubiatowicz, and Anthony Joseph,“Tapestry: An
Infrastructure for Fault-tolerantWide-areaLocation and Routing”,Technical
Report No.UCB/CSD -01-1141, University of California Berkeley.
[28] Francesco Maria Aymerich, Gianni Fenu, Simone Surcis. An
Approach to a Cloud Computing Network. 978-424426249/08/$25.00
©2008 IEEE conference.
[29] Boss G, Malladi P, Quan D, Legregni L, Hall H. Cloud computing.
IBM White Paper, 2007
[30] Ghemawat S, Gobioff H, Leung ST. The Google filesystem. In: Proc.
of the 19th ACM Symp. On Operating Systems Principles. New York:
ACM Press, 2003.29_43.
[31] KeXu, Meina Song, Xiaoqi Zhang,Junde Song, “A Cloud Computing
Platform Based on P2P”.
[32] Burrows M. The chubby lock service for loosely-coupled distributed
systems. In: Proc. of the 7th USENIX Symp.on Operating Systems Design
and Implementation. Berkeley: USENIX Association, 2006. 335_350.
[33] Oasis:M. Rodrig, and A. Lamarca,“Decentralized Weighted Voting
for P2P DataManagement,” in Proc. of the 3rd ACM International
Workshop on Data Engineering for Wireless and Mobile Access, pp.85–
92, 2003.
[34] Antony Rowstron and Peter Druschel, “Pastry: Scalable,
decentralized object location and routing for large-scale peer-to-peer
systems”, IFIP/ACM International Conference on Distributed Systems
Platforms.
[35] Sigma: S. Lin, Q. Lian, M. Chen, and Z. Zhang,“A practical
distributed mutual exclusion protocol in dynamic peer-to- peer systems,”
in Proc. of 3rd International Workshop on Peer-to-Peer Systems
(IPTPS’04)
National Conference on Engineering Trends in Medical Science – NCETMS - 2014
ISSN: 2231-5381 http://www.ijettjournal.org Page 141
Neuromorphic Brain Chips: Microchips That
Imitate the Brain Snehal D. Bajare
#1, Mohan H. Faltankar
*2, Imran S. Khan
#3
#UG student Department of Electronics & Telecommunication, DBNCOET, Yavatmal, SGBAU, Amravati,
(ms) India
*UG student Department of Electronics & Telecommunication, DBNCOET, Yavatmal, SGBAU, Amravati,
(ms)India #Assistant Professor, Department of Electronics & Telecommunication, DBNCOET, Yavatmal, SGBAU, Amravati,
(ms) India
Abstract— This document gives formatting instructions for
individuals with severe disabilities facing challenges performing
normal every-day tasks. No computer works as efficiently as the
human brain – so much so that building an artificial brain is the
goal of many scientists. The technology used is neurotechnology
with BCI(Brain Computer Interface). It has great results in the
upcoming years. The study of the human brain is, obviously, the
most complicated area of researc. It will be several years before
we see a practical application of the technology we've discussed.
Let's hope such technologies will be used for restoring the
prosperity and peace of the world and not to give the world a
devastating end.
XXII. INTRODUCTION
Thousands of people around the world suffer from paralysis,
rendering them dependent on others to perform even the most
basic tasks. But that could change, thanks to the latest
achievements in the Brain-Computer Interface, which could
help them regain a portion of their lost independence. A four-
millimetre square silicon chip studded with 100 hair-thin
microelectrodes, is embedded in the primary motor cortex -
the region of the Brain responsible for controlling movement.
When somebody thinks “move cursor upand left” his cortical
neurons fire in a distinctive pattern; the signal is transmitted
through the pedestal plug attached to the skull. The signal
travels to an amplifier where it is converted to optical data and
bounced by fibre-optic cable to a compute. Brain Gate learns
to associate patterns of brain activity with particularimagined
movements—up, down, left, right—and to connect those
movements to a cursor.Using BCI advancement wirelesschip
which is programmed is directly implanted inside the brain
called neuromorphic brain chip which allow a paralysed
person on wheelchair to stand on their own feet,deaf to
hear,blind to see.
XXIII. EARLY FINDINGS
Neurotechnology the application of electronic engineering
to the human nervous system, has now reached a level of
commercial and scientific maturity that will produce
enormous benefits to patients and profits to investors.
Hundreds of thousands of people have already been helped by
neurostimulation products that restore hearing todeaf people,
movement to individuals with paralysis, and relief to those
with chronic pain or neurological disorders. Please join us as
we monitor the growth of this new industry and track the
progress from medical technology to commercial products.
Neurotechnology is any technology that has a fundamental
influence on how people understand the brain and various
aspects of consciousness, thought, and higher order activities
in the brain. It also includes technologies that are designed to
improve and repair brain function and allow researchers and
clinicians to visualize the brain. The field of neurotechnology
has been around for nearly half a century but has only reached
maturity in the last twenty years. The advent
of brainimaging revolutionized the field, allowing researchers
to directly monitor the brain’s activities during experiments.
Neurodevices are any devices used to monitor or regulate
brain activity. The most common neurodevices are deep brain
stimulators (DBS) that are used to give electrical stimulation
to areas stricken by inactivity. Neurotechnology is the
application of medical technology, devices and treatments to
improve functions throughout many parts of the body.
Hundreds of thousands of people with neurological or
psychiatric disabilities have already been helped by
neurotechnology. For instance, cochlear implants help restore
hearing to the deaf, neural prosthesis provide movement to the
paralyzed, allow locked-in to communicate and spine
stimulators give relief to those with chronic pain. These are
just a few examples of the many medical technologies for
people with disabilities that are available today.
III. BRAIN-COMPUTER INTERFACE
A brain–computer interface (BCI), often called a mind-
machine interface (MMI), or sometimes called a direct neural
interface or a brain–machine interface (BMI), is a direct
communication pathway between the brain and an external
device. Brain Device Moves Objects by Thought.)BCI is a
new technology which can let human to control electronic
devices without lifting a finger. It simply reads brain activity.
Research on BCIs began in the 1970s at the University
ofCalifornia Los Angeles (UCLA) under a grant from
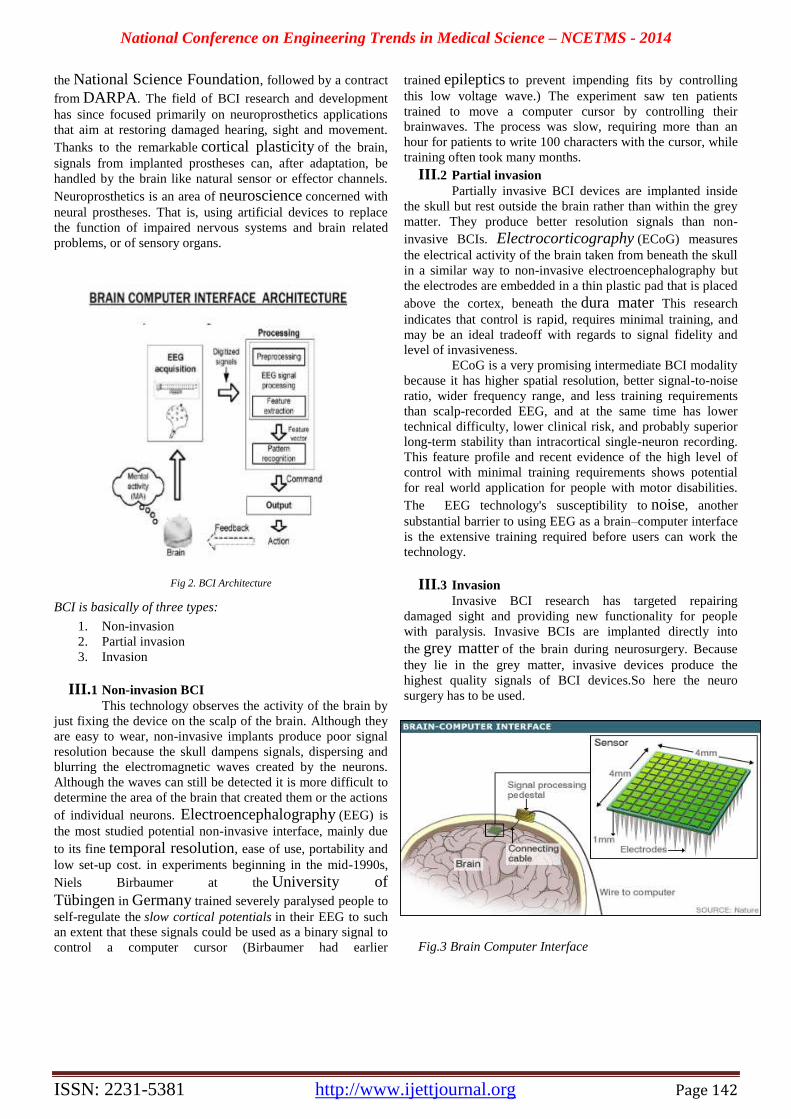
National Conference on Engineering Trends in Medical Science – NCETMS - 2014
ISSN: 2231-5381 http://www.ijettjournal.org Page 142
the National Science Foundation, followed by a contract
from DARPA. The field of BCI research and development
has since focused primarily on neuroprosthetics applications
that aim at restoring damaged hearing, sight and movement.
Thanks to the remarkable cortical plasticity of the brain,
signals from implanted prostheses can, after adaptation, be
handled by the brain like natural sensor or effector channels.
Neuroprosthetics is an area of neuroscience concerned with
neural prostheses. That is, using artificial devices to replace
the function of impaired nervous systems and brain related
problems, or of sensory organs.
Fig 2. BCI Architecture
BCI is basically of three types:
1. Non-invasion
2. Partial invasion
3. Invasion
III.1 Non-invasion BCI
This technology observes the activity of the brain by
just fixing the device on the scalp of the brain. Although they
are easy to wear, non-invasive implants produce poor signal
resolution because the skull dampens signals, dispersing and
blurring the electromagnetic waves created by the neurons.
Although the waves can still be detected it is more difficult to
determine the area of the brain that created them or the actions
of individual neurons. Electroencephalography (EEG) is
the most studied potential non-invasive interface, mainly due
to its fine temporal resolution, ease of use, portability and
low set-up cost. in experiments beginning in the mid-1990s,
Niels Birbaumer at the University of
Tübingen in Germany trained severely paralysed people to
self-regulate the slow cortical potentials in their EEG to such
an extent that these signals could be used as a binary signal to
control a computer cursor (Birbaumer had earlier
trained epileptics to prevent impending fits by controlling
this low voltage wave.) The experiment saw ten patients
trained to move a computer cursor by controlling their
brainwaves. The process was slow, requiring more than an
hour for patients to write 100 characters with the cursor, while
training often took many months.
III.2 Partial invasion
Partially invasive BCI devices are implanted inside
the skull but rest outside the brain rather than within the grey
matter. They produce better resolution signals than non-
invasive BCIs. Electrocorticography (ECoG) measures
the electrical activity of the brain taken from beneath the skull
in a similar way to non-invasive electroencephalography but
the electrodes are embedded in a thin plastic pad that is placed
above the cortex, beneath the dura mater This research
indicates that control is rapid, requires minimal training, and
may be an ideal tradeoff with regards to signal fidelity and
level of invasiveness.
ECoG is a very promising intermediate BCI modality
because it has higher spatial resolution, better signal-to-noise
ratio, wider frequency range, and less training requirements
than scalp-recorded EEG, and at the same time has lower
technical difficulty, lower clinical risk, and probably superior
long-term stability than intracortical single-neuron recording.
This feature profile and recent evidence of the high level of
control with minimal training requirements shows potential
for real world application for people with motor disabilities.
The EEG technology's susceptibility to noise, another
substantial barrier to using EEG as a brain–computer interface
is the extensive training required before users can work the
technology.
III.3 Invasion
Invasive BCI research has targeted repairing
damaged sight and providing new functionality for people
with paralysis. Invasive BCIs are implanted directly into
the grey matter of the brain during neurosurgery. Because
they lie in the grey matter, invasive devices produce the
highest quality signals of BCI devices.So here the neuro
surgery has to be used.
Fig.3 Brain Computer Interface
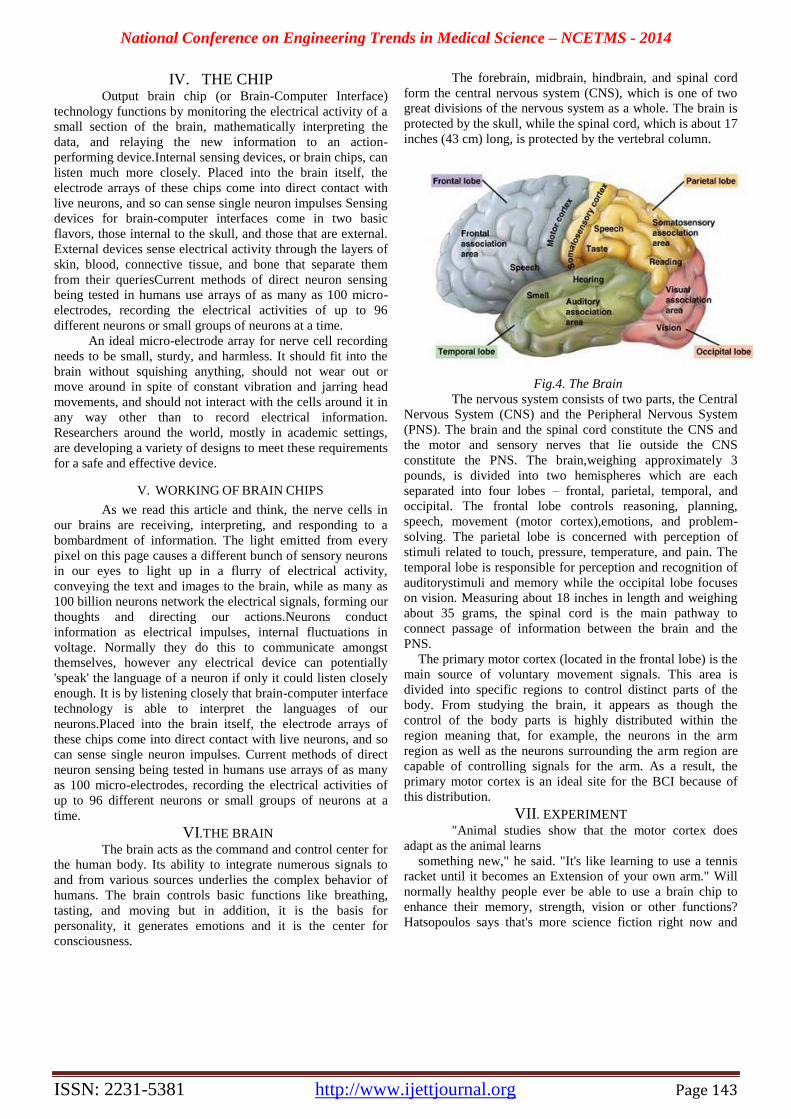
National Conference on Engineering Trends in Medical Science – NCETMS - 2014
ISSN: 2231-5381 http://www.ijettjournal.org Page 143
IV. THE CHIP Output brain chip (or Brain-Computer Interface)
technology functions by monitoring the electrical activity of a
small section of the brain, mathematically interpreting the
data, and relaying the new information to an action-
performing device.Internal sensing devices, or brain chips, can
listen much more closely. Placed into the brain itself, the
electrode arrays of these chips come into direct contact with
live neurons, and so can sense single neuron impulses Sensing
devices for brain-computer interfaces come in two basic
flavors, those internal to the skull, and those that are external.
External devices sense electrical activity through the layers of
skin, blood, connective tissue, and bone that separate them
from their queriesCurrent methods of direct neuron sensing
being tested in humans use arrays of as many as 100 micro-
electrodes, recording the electrical activities of up to 96
different neurons or small groups of neurons at a time.
An ideal micro-electrode array for nerve cell recording
needs to be small, sturdy, and harmless. It should fit into the
brain without squishing anything, should not wear out or
move around in spite of constant vibration and jarring head
movements, and should not interact with the cells around it in
any way other than to record electrical information.
Researchers around the world, mostly in academic settings,
are developing a variety of designs to meet these requirements
for a safe and effective device.
V. WORKING OF BRAIN CHIPS
As we read this article and think, the nerve cells in
our brains are receiving, interpreting, and responding to a
bombardment of information. The light emitted from every
pixel on this page causes a different bunch of sensory neurons
in our eyes to light up in a flurry of electrical activity,
conveying the text and images to the brain, while as many as
100 billion neurons network the electrical signals, forming our
thoughts and directing our actions.Neurons conduct
information as electrical impulses, internal fluctuations in
voltage. Normally they do this to communicate amongst
themselves, however any electrical device can potentially
'speak' the language of a neuron if only it could listen closely
enough. It is by listening closely that brain-computer interface
technology is able to interpret the languages of our
neurons.Placed into the brain itself, the electrode arrays of
these chips come into direct contact with live neurons, and so
can sense single neuron impulses. Current methods of direct
neuron sensing being tested in humans use arrays of as many
as 100 micro-electrodes, recording the electrical activities of
up to 96 different neurons or small groups of neurons at a
time.
VI.THE BRAIN
The brain acts as the command and control center for
the human body. Its ability to integrate numerous signals to
and from various sources underlies the complex behavior of
humans. The brain controls basic functions like breathing,
tasting, and moving but in addition, it is the basis for
personality, it generates emotions and it is the center for
consciousness.
The forebrain, midbrain, hindbrain, and spinal cord
form the central nervous system (CNS), which is one of two
great divisions of the nervous system as a whole. The brain is
protected by the skull, while the spinal cord, which is about 17
inches (43 cm) long, is protected by the vertebral column.
Fig.4. The Brain
The nervous system consists of two parts, the Central
Nervous System (CNS) and the Peripheral Nervous System
(PNS). The brain and the spinal cord constitute the CNS and
the motor and sensory nerves that lie outside the CNS
constitute the PNS. The brain,weighing approximately 3
pounds, is divided into two hemispheres which are each
separated into four lobes – frontal, parietal, temporal, and
occipital. The frontal lobe controls reasoning, planning,
speech, movement (motor cortex),emotions, and problem-
solving. The parietal lobe is concerned with perception of
stimuli related to touch, pressure, temperature, and pain. The
temporal lobe is responsible for perception and recognition of
auditorystimuli and memory while the occipital lobe focuses
on vision. Measuring about 18 inches in length and weighing
about 35 grams, the spinal cord is the main pathway to
connect passage of information between the brain and the
PNS.
The primary motor cortex (located in the frontal lobe) is the
main source of voluntary movement signals. This area is
divided into specific regions to control distinct parts of the
body. From studying the brain, it appears as though the
control of the body parts is highly distributed within the
region meaning that, for example, the neurons in the arm
region as well as the neurons surrounding the arm region are
capable of controlling signals for the arm. As a result, the
primary motor cortex is an ideal site for the BCI because of
this distribution.
VII. EXPERIMENT
"Animal studies show that the motor cortex does
adapt as the animal learns
something new," he said. "It's like learning to use a tennis
racket until it becomes an Extension of your own arm." Will
normally healthy people ever be able to use a brain chip to
enhance their memory, strength, vision or other functions?
Hatsopoulos says that's more science fiction right now and
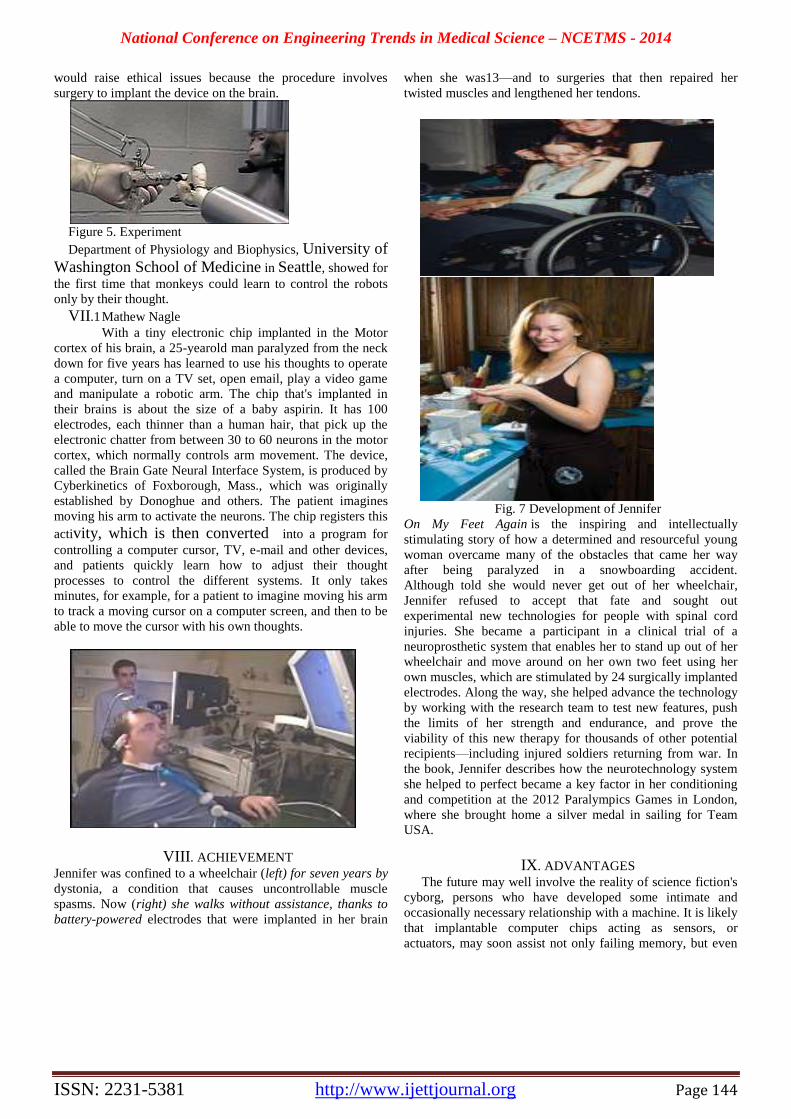
National Conference on Engineering Trends in Medical Science – NCETMS - 2014
ISSN: 2231-5381 http://www.ijettjournal.org Page 144
would raise ethical issues because the procedure involves
surgery to implant the device on the brain.
Figure 5. Experiment
Department of Physiology and Biophysics, University of
Washington School of Medicine in Seattle, showed for
the first time that monkeys could learn to control the robots
only by their thought.
VII.1 Mathew Nagle
With a tiny electronic chip implanted in the Motor
cortex of his brain, a 25-yearold man paralyzed from the neck
down for five years has learned to use his thoughts to operate
a computer, turn on a TV set, open email, play a video game
and manipulate a robotic arm. The chip that's implanted in
their brains is about the size of a baby aspirin. It has 100
electrodes, each thinner than a human hair, that pick up the
electronic chatter from between 30 to 60 neurons in the motor
cortex, which normally controls arm movement. The device,
called the Brain Gate Neural Interface System, is produced by
Cyberkinetics of Foxborough, Mass., which was originally
established by Donoghue and others. The patient imagines
moving his arm to activate the neurons. The chip registers this
activity, which is then converted into a program for
controlling a computer cursor, TV, e-mail and other devices,
and patients quickly learn how to adjust their thought
processes to control the different systems. It only takes
minutes, for example, for a patient to imagine moving his arm
to track a moving cursor on a computer screen, and then to be
able to move the cursor with his own thoughts.
VIII. ACHIEVEMENT
Jennifer was confined to a wheelchair (left) for seven years by
dystonia, a condition that causes uncontrollable muscle
spasms. Now (right) she walks without assistance, thanks to
battery-powered electrodes that were implanted in her brain
when she was13—and to surgeries that then repaired her
twisted muscles and lengthened her tendons.
Fig. 7 Development of Jennifer
On My Feet Again is the inspiring and intellectually
stimulating story of how a determined and resourceful young
woman overcame many of the obstacles that came her way
after being paralyzed in a snowboarding accident.
Although told she would never get out of her wheelchair,
Jennifer refused to accept that fate and sought out
experimental new technologies for people with spinal cord
injuries. She became a participant in a clinical trial of a
neuroprosthetic system that enables her to stand up out of her
wheelchair and move around on her own two feet using her
own muscles, which are stimulated by 24 surgically implanted
electrodes. Along the way, she helped advance the technology
by working with the research team to test new features, push
the limits of her strength and endurance, and prove the
viability of this new therapy for thousands of other potential
recipients—including injured soldiers returning from war. In
the book, Jennifer describes how the neurotechnology system
she helped to perfect became a key factor in her conditioning
and competition at the 2012 Paralympics Games in London,
where she brought home a silver medal in sailing for Team
USA.
IX. ADVANTAGES The future may well involve the reality of science fiction's
cyborg, persons who have developed some intimate and
occasionally necessary relationship with a machine. It is likely
that implantable computer chips acting as sensors, or
actuators, may soon assist not only failing memory, but even

National Conference on Engineering Trends in Medical Science – NCETMS - 2014
ISSN: 2231-5381 http://www.ijettjournal.org Page 145
bestow fluency in a new language, or enable "recognition" of
previously unmet individuals. The progress already made in
therapeutic devices, in prosthetics and in computer science
indicates that it may well be feasible to develop direct
interfaces between the brain and computers.
Computer scientists predict that within the next
twenty years neural interfaces will be designed that will not
only increase the dynamic range of senses, but will also
enhance memory and enable "cyberthink" - invisible
communication with others. This technology will facilitate
consistent and constant access to information when and where
it is needed.
The linkage of smaller, lighter, and more powerful
computer systems with radio technologies will enable users to
access information and communicate anywhere or anytime.
Through miniaturization of components, systems have been
generated that are wearable and nearly invisible, so that
individuals, supported by a personal information structure, can
move about and interact freely, as well as, through
networking, share experiences with others. The wearable
computer project envisions users accessing the Remembrance
Agent of a large communally based data source.
It will increase the dynamic ranging of senses.
Giving light to blind and giving paralyzed patients
full mental control of limbs.
Rescue missions (remote controlled rat).
It will enable “cyberthink”.
It will enable consistent and constant access to
information where and when it is needed.
The advantage of implants is that they take the
decision making power away from the addict. Chips
take away one's free will. It enables a person to make
a better choice not to take drugs at all.
X.FUTURE OF BRAIN CHIPS
Computerworld - By the year 2020, you won't need a
keyboard and mouse to control your computer, say Intel Corp.
researchers. Instead, users will open documents and surf the
Web using nothing more than their brain waves.
Scientists at Intel's research lab in Pittsburgh are
working to find ways to read and harness human brain
waves so they can be used to operate computers, television
sets and cell phones. The brain waves would be harnessed
with Intel-developed sensors implanted in people's brains.
The scientists say the plan is not a scene from a sci-fi
movie -- Big Brother won't be planting chips in your brain
against your will. Researchers expect that consumers will
want the freedom they will gain by using the implant.
Pomerleau said researchers are close to gaining the
ability to build brain sensing technology into a head set that
culd be used to manipulate a computer. The next step is
development of a tiny, far less cumbersome sensor that could
be implanted inside the brain.Such brain research isn't limited
to Intel and its university partners.
XI.CONCLUSION
The real application of brain chips lie in the medical
world .It acts as a boon for the mentally and physically
challenged people. Future could bring a revolution as brain
computer interfaces are constructed using neurotechnology It
offers the possibility unimaginable levels of independence for
the severely disabled. This, infact will be the perfect
amalgamation of the machines and minds.
REFERENCES
[39] The micro chip that will save your memory:Scientists set
to implant device to preserve experiences into BRAINS .
–by Daily mail Reporter Published:8May 2013
[40] http://members.tripod.com
[41] A New Chips Thinks Like a Brain- by Max Cacas
Published:March 1,2013
[42] www.informationweek.com/story/IWK20020124S0026
[43] www.bu.edu/wcp/Papers/Bioe/BioeMcGe.htm
[44] www.mercola.com/2001/sep/12/silicon_chips.htm
[45] Handa G (2006) "Neural Prosthesis – Past, Present and
Future" Indian Journal of Physical Medicine &
Rehabilitation 17(1)
[46] Topic: Emerging Brain Chip Technologies by Vinodini
Sundaram Ch.Rajyalakshmi
National Conference on Engineering Trends in Medical Science – NCETMS - 2014
ISSN: 2231-5381 http://www.ijettjournal.org Page 146
RF Based Inter Vehical Communication
Mr. Ambadas J. Gawande1, Mr. Sunil W. Raut
2, Mr. Digambar S. Kale
3
Department of Electronics and Telecommunication Engineering,
Dr. Bhausaheb Nandurkar College ofEngineering & Technology, Yavatmal.
Abstract— Many accidents occur today when
distant objects or roadway impediments are not quickly
detected. To avoid these accidents, longer-range safety
systems are needed with real time detection capability. In all
the field tests, a single unidirectional radio link is evaluated,
either between two vehicles or between a roadside unit and
vehicle. To avoid road traffic collisions, vehicles will be
required to periodically broadcast their position and speed to
nearby vehicles. There are selected attributes to have the
vehicular wireless safety system out of which the 902 MHz
DSRC system is the only system that:
Is dedicated for transportation sector.(Licensed band)
1 Provides low latency using direct V2V links.
2 Provides broadband, real time, long range, and bi-
directional communications
In the above said method, to implement vehicle safety
systems with one or two channels and using a single
transceiver, consideration must be given to how a group of
vehicles in a localized area becomes aware in real time of
potentially dangerous situation which enables vehicles to use
DSRC resources to synchronize with each other, receive
safety messages with low transmission latency. Emerging
systems for active vehicle safety use short range sensors with
LOS links, usually to detect vehicles or lane boundaries
immediately adjacent to the host vehicle. Typical applications
include forward collision warning, adaptive cruise control,
and lane keeping.
Keywords:
Radio frequency bands, MAC,ASDM, timeslot/code
allocation, Bluetooth, Zigbee, IEEE 802.11p and P1609.
I. INTRODUCTION
Road and traffic safety can be improved if drivers have
the ability to see further down the road and know if
acollision has occurred, or if they are approaching a traffic
jam. This can become possible if drivers andvehicles
communicate with each other and with roadside base
stations. If traffic information was provided todrivers,
police, and other authorities, the roads would be safer and
traveling on them would become moreefficient.It is
possible to build a multihop network among several
vehicles that have communication devices. Thesevehicles
would form a mobile ad hoc network, and could pass along
information about road conditions,accidents, and
congestion. A driver could be made aware of the
emergency braking of a preceding vehicle orthe presence of
an obstacle in the roadway. Such a network could also help
plotting vehicles (strings ofvehicles that communicate with
each other so they can maintain a tight inter-vehicle
spacing) utilize theroadways efficiently. It can also help
vehicles negotiate critical points like blind crossings
(intersectionswithout traffic lights) and entries to highways.
II. LITERATRE REVIEW
Traffic accidents and highway congestion continues to
remain a serious problem world-wide. Active safety
applications, that use autonomous vehicle sensors such as
radar, camera, etc., are being developed and deployed in
vehicles by automakers to address the crash problem.
Moreover, the FCC has recognized the importance of
having a dedicated wireless spectrum for improving traffic
safety and highway efficiency. In the US, the FCC has
allocated 902 MHz band as Dedicated Short Range
Communication (DSRC) for the primary purpose of
improving transportation safety and highway efficiency.
The reliability of DSRC vehicle-to-vehicle communication
is adequate since packet drops do not occur in bursts most
of the time. We also show that the application level
reliability of VSC applications based on DSRC
communication is quite satisfactory. significant
characteristics of DSRC communication for highly mobile
vehicle-to-vehicle wireless network, which will contribute
to better design and evaluation of communication protocols
for VSC applications in future.[3] Emerging systems for
active vehicle safety use short range sensors with LOS
links, usually to detect vehicles or lane boundaries
immediately adjacent to the host vehicle. Typical
applications include forward collision warning, adaptive
cruise control, and lane keeping. Longer-range vehicle
safety systems are needed to help reduce accidents
originating from more distant emergency events, roadway
impediments, blind corners, and cross traffic. To detect
these remote events, such systems may require up to 1000
meters of LOS coverage, and NLOS coverage to detect
dangerous events ahead, but out of view.
In many cases, the ability to detect an emergency
event occurring at some distance ahead is limited by the
inability of drivers to see past the vehicle in front of them.
The inability of drivers to react in time to emergency
situations often creates a potential for chain collisions, in
which an initial collision between two vehicles is followed
by a series of collisions involving the following vehicles.
The smaller frequency standard of DSRC i.e. 902 MHz can
provide real-time alerts to drivers who cannot see remote or
oncoming safety hazards [1]
The communication between two vehicles is
governed by wireless protocol 802.11[4][7] Requirement of
implementation of CCA is in the context of a vehicle-to-
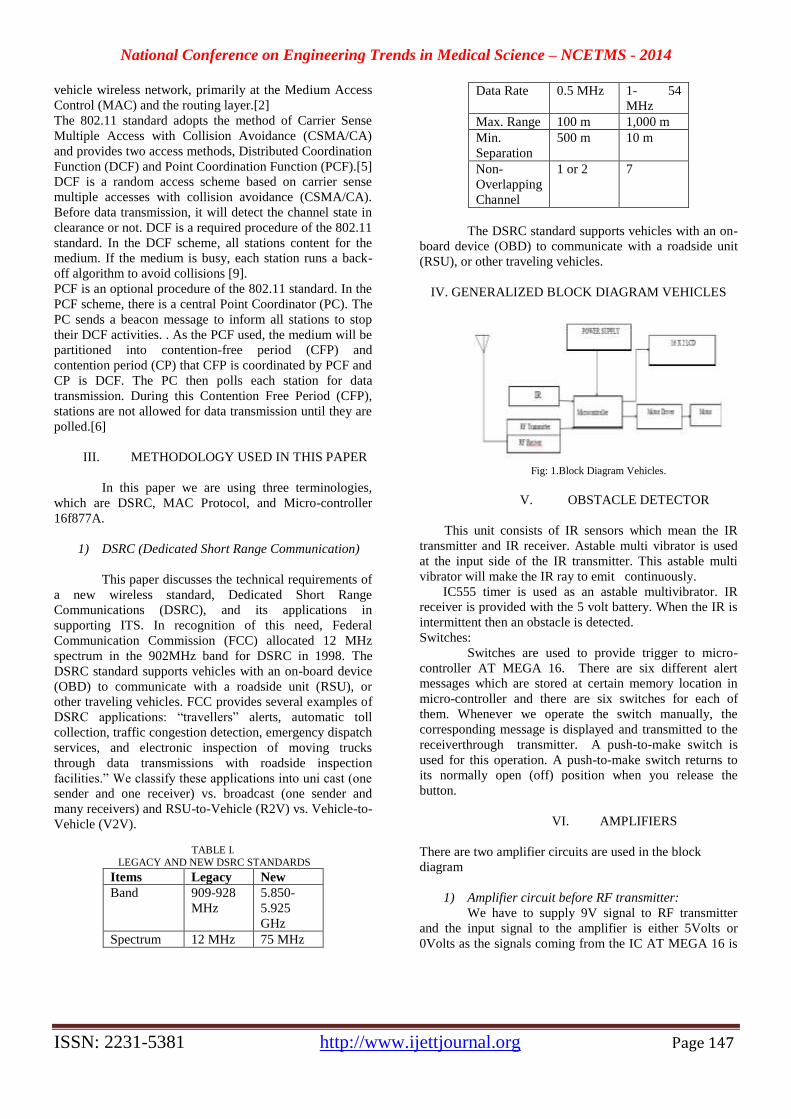
National Conference on Engineering Trends in Medical Science – NCETMS - 2014
ISSN: 2231-5381 http://www.ijettjournal.org Page 147
vehicle wireless network, primarily at the Medium Access
Control (MAC) and the routing layer.[2]
The 802.11 standard adopts the method of Carrier Sense
Multiple Access with Collision Avoidance (CSMA/CA)
and provides two access methods, Distributed Coordination
Function (DCF) and Point Coordination Function (PCF).[5]
DCF is a random access scheme based on carrier sense
multiple accesses with collision avoidance (CSMA/CA).
Before data transmission, it will detect the channel state in
clearance or not. DCF is a required procedure of the 802.11
standard. In the DCF scheme, all stations content for the
medium. If the medium is busy, each station runs a back-
off algorithm to avoid collisions [9].
PCF is an optional procedure of the 802.11 standard. In the
PCF scheme, there is a central Point Coordinator (PC). The
PC sends a beacon message to inform all stations to stop
their DCF activities. . As the PCF used, the medium will be
partitioned into contention-free period (CFP) and
contention period (CP) that CFP is coordinated by PCF and
CP is DCF. The PC then polls each station for data
transmission. During this Contention Free Period (CFP),
stations are not allowed for data transmission until they are
polled.[6]
III. METHODOLOGY USED IN THIS PAPER
In this paper we are using three terminologies,
which are DSRC, MAC Protocol, and Micro-controller
16f877A.
1) DSRC (Dedicated Short Range Communication)
This paper discusses the technical requirements of
a new wireless standard, Dedicated Short Range
Communications (DSRC), and its applications in
supporting ITS. In recognition of this need, Federal
Communication Commission (FCC) allocated 12 MHz
spectrum in the 902MHz band for DSRC in 1998. The
DSRC standard supports vehicles with an on-board device
(OBD) to communicate with a roadside unit (RSU), or
other traveling vehicles. FCC provides several examples of
DSRC applications: “travellers” alerts, automatic toll
collection, traffic congestion detection, emergency dispatch
services, and electronic inspection of moving trucks
through data transmissions with roadside inspection
facilities.” We classify these applications into uni cast (one
sender and one receiver) vs. broadcast (one sender and
many receivers) and RSU-to-Vehicle (R2V) vs. Vehicle-to-
Vehicle (V2V).
TABLE I.
LEGACY AND NEW DSRC STANDARDS
Items Legacy New
Band 909-928
MHz
5.850-
5.925
GHz
Spectrum 12 MHz 75 MHz
Data Rate 0.5 MHz 1- 54
MHz
Max. Range 100 m 1,000 m
Min.
Separation
500 m 10 m
Non-
Overlapping
Channel
1 or 2 7
The DSRC standard supports vehicles with an on-
board device (OBD) to communicate with a roadside unit
(RSU), or other traveling vehicles.
IV. GENERALIZED BLOCK DIAGRAM VEHICLES
Fig: 1.Block Diagram Vehicles.
V. OBSTACLE DETECTOR
This unit consists of IR sensors which mean the IR
transmitter and IR receiver. Astable multi vibrator is used
at the input side of the IR transmitter. This astable multi
vibrator will make the IR ray to emit continuously.
IC555 timer is used as an astable multivibrator. IR
receiver is provided with the 5 volt battery. When the IR is
intermittent then an obstacle is detected.
Switches:
Switches are used to provide trigger to micro-
controller AT MEGA 16. There are six different alert
messages which are stored at certain memory location in
micro-controller and there are six switches for each of
them. Whenever we operate the switch manually, the
corresponding message is displayed and transmitted to the
receiverthrough transmitter. A push-to-make switch is
used for this operation. A push-to-make switch returns to
its normally open (off) position when you release the
button.
VI. AMPLIFIERS
There are two amplifier circuits are used in the block
diagram
1) Amplifier circuit before RF transmitter:
We have to supply 9V signal to RF transmitter
and the input signal to the amplifier is either 5Volts or
0Volts as the signals coming from the IC AT MEGA 16 is
National Conference on Engineering Trends in Medical Science – NCETMS - 2014
ISSN: 2231-5381 http://www.ijettjournal.org Page 148
digital in which 1 is equivalent to 5V & 0 is equivalent to
0V. So we have to use amplifier circuit before RF
transmitter.
2) Amplifiercircuit after RF transmitter:
Strength of the received signal which is
transmitted from the RF transmitter has been reduced.
Therefore it is necessary to regain it by means of
amplification.RF Transmitter & Receiver.Radio Frequency
transmitter and receiver are being used for proper
transmission & reception of the signals. A 9Volts supply is
given to this section. RF transmitter and receiver module
provides frequency of 433 MHz
VII. LCD DISPLAY
The two LCD displays which are being used in two
vehicles are 16 Character x 2 Line LCDs. These are used to
display different alert messages. The most common type of
LCD controller is the Hitatchi 44780 which provides a
relatively simple interface between a microcontroller and
an LCD.
VIII. CIRCUIT EXPLANATION
1) Power Supply:
The simple 5V power supply used in the circuits is having
following features:
Brief description of operation: Gives out well
regulated +5V output, output current capability of
100 mA
Circuit protection: Built-in overheating protection
shuts down output when regulator IC gets too hot
Circuit complexity: Very simple and easy to build
Circuit performance: Very stable +5V output
voltage, reliable operation
Availability of components: Easy to get, uses only
very common basic components
Design testing: Based on datasheet example
circuit, I have used this circuit successfully as part
of many electronics papers
Applications: Part of electronics devices, small
laboratory power supply
Power supply voltage: Unregulated DC 8-18V
power supply
Power supply current: Needed output current +5
V.
2) Circuit Description:
This circuit is a small +5V power supply, which is useful
when experimenting with digital electronics. Small
inexpensive wall transformers with variable output voltage
are available from any electronics shop and supermarket.
Those transformers are easily available, but usually their
voltage regulation is very poor, which makes then not very
usable for digital circuit experimenter unless a better
regulation can be achieved in some way. This circuit can
give +5V output at about 150 mA current, but it can be
increased to 1 A when good cooling is added to 7805
regulator chip. The circuit has over overload and terminal
protection. The capacitors must have enough high voltage
rating to safely handle the input voltage feed to circuit. Pin
out of the 7805 regulator IC.
1. Unregulated voltage in
2. Ground
3. Regulated voltage out
3) Component list:
7805 regulator IC
100 uF electrolytic capacitor, at least 25V voltage
rating.
10 uF electrolytic capacitor, at least 6V voltage rating.
100 nF ceramic or polyester capacitor.
4) Other output voltages:
If we need other voltages than +5V, you can
modify the circuit by replacing the 7805 chips with another
regulator with different output voltage from regulator 78xx
chip family. The last numbers in the chip code tells the
output voltage. Remember that the input voltage must be at
least 3V greater than regulator output voltage otherwise the
regulator does not work well.
5) Features:
• Output Current up to 1A.
• Output Voltages of 5, 6, 8, 9, 10, 12, 15, 18, 24V.
• Thermal Overload Protection.
• Short Circuit Protection.
• Output Transistor Safe Operating Area Protection.
6) Description:
The KA78XX/KA78XXA series of three-terminal
positive regulator are available in the TO-220/D-PAK
package and with several fixed output voltages, making
them useful in a wide range of applications. Each type
employs internal current limiting, thermal shut down and
safe operating area protection, making it essentially
indestructible. If adequate heat sinking is provided, they
can deliver over 1A output current. Although designed
primarily as fixed voltage regulators, these devices can be
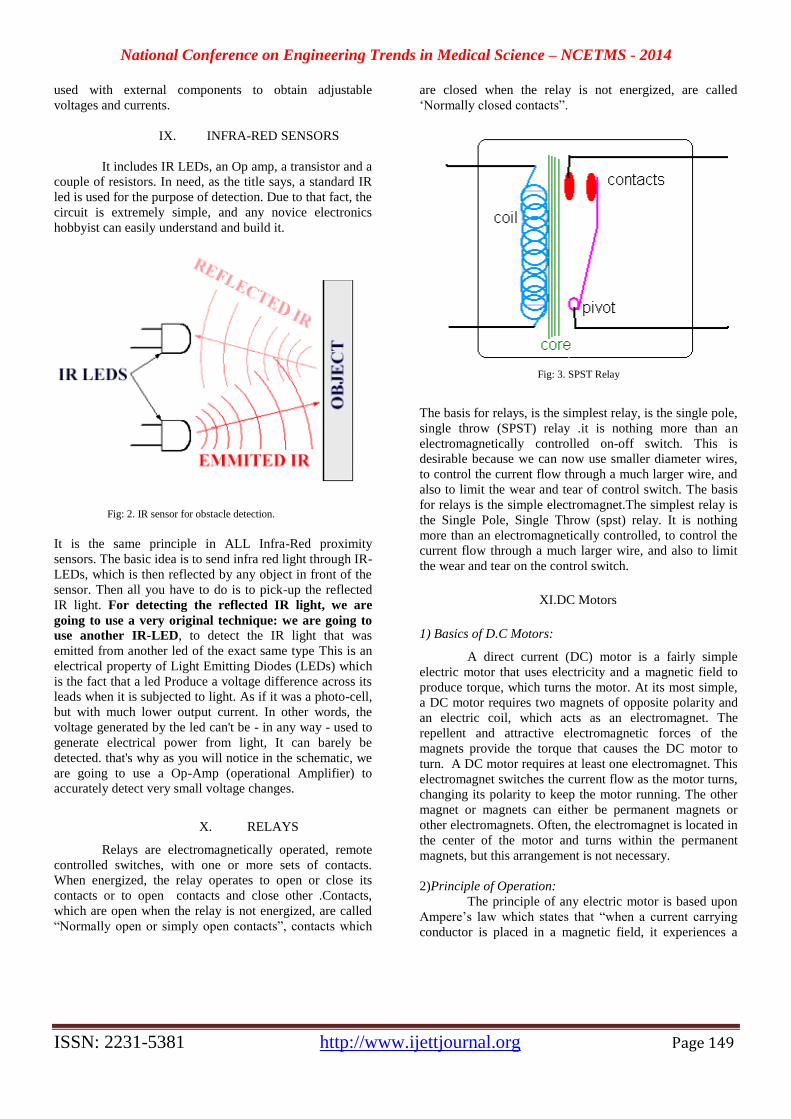
National Conference on Engineering Trends in Medical Science – NCETMS - 2014
ISSN: 2231-5381 http://www.ijettjournal.org Page 149
used with external components to obtain adjustable
voltages and currents.
IX. INFRA-RED SENSORS
It includes IR LEDs, an Op amp, a transistor and a
couple of resistors. In need, as the title says, a standard IR
led is used for the purpose of detection. Due to that fact, the
circuit is extremely simple, and any novice electronics
hobbyist can easily understand and build it.
Fig: 2. IR sensor for obstacle detection.
It is the same principle in ALL Infra-Red proximity
sensors. The basic idea is to send infra red light through IR-
LEDs, which is then reflected by any object in front of the
sensor. Then all you have to do is to pick-up the reflected
IR light. For detecting the reflected IR light, we are
going to use a very original technique: we are going to
use another IR-LED, to detect the IR light that was
emitted from another led of the exact same type This is an
electrical property of Light Emitting Diodes (LEDs) which
is the fact that a led Produce a voltage difference across its
leads when it is subjected to light. As if it was a photo-cell,
but with much lower output current. In other words, the
voltage generated by the led can't be - in any way - used to
generate electrical power from light, It can barely be
detected. that's why as you will notice in the schematic, we
are going to use a Op-Amp (operational Amplifier) to
accurately detect very small voltage changes.
X. RELAYS
Relays are electromagnetically operated, remote
controlled switches, with one or more sets of contacts.
When energized, the relay operates to open or close its
contacts or to open contacts and close other .Contacts,
which are open when the relay is not energized, are called
“Normally open or simply open contacts”, contacts which
are closed when the relay is not energized, are called
‘Normally closed contacts”.
Fig: 3. SPST Relay
The basis for relays, is the simplest relay, is the single pole,
single throw (SPST) relay .it is nothing more than an
electromagnetically controlled on-off switch. This is
desirable because we can now use smaller diameter wires,
to control the current flow through a much larger wire, and
also to limit the wear and tear of control switch. The basis
for relays is the simple electromagnet.The simplest relay is
the Single Pole, Single Throw (spst) relay. It is nothing
more than an electromagnetically controlled, to control the
current flow through a much larger wire, and also to limit
the wear and tear on the control switch.
XI.DC Motors
1) Basics of D.C Motors:
A direct current (DC) motor is a fairly simple
electric motor that uses electricity and a magnetic field to
produce torque, which turns the motor. At its most simple,
a DC motor requires two magnets of opposite polarity and
an electric coil, which acts as an electromagnet. The
repellent and attractive electromagnetic forces of the
magnets provide the torque that causes the DC motor to
turn. A DC motor requires at least one electromagnet. This
electromagnet switches the current flow as the motor turns,
changing its polarity to keep the motor running. The other
magnet or magnets can either be permanent magnets or
other electromagnets. Often, the electromagnet is located in
the center of the motor and turns within the permanent
magnets, but this arrangement is not necessary.
2)Principle of Operation:
The principle of any electric motor is based upon
Ampere’s law which states that “when a current carrying
conductor is placed in a magnetic field, it experiences a
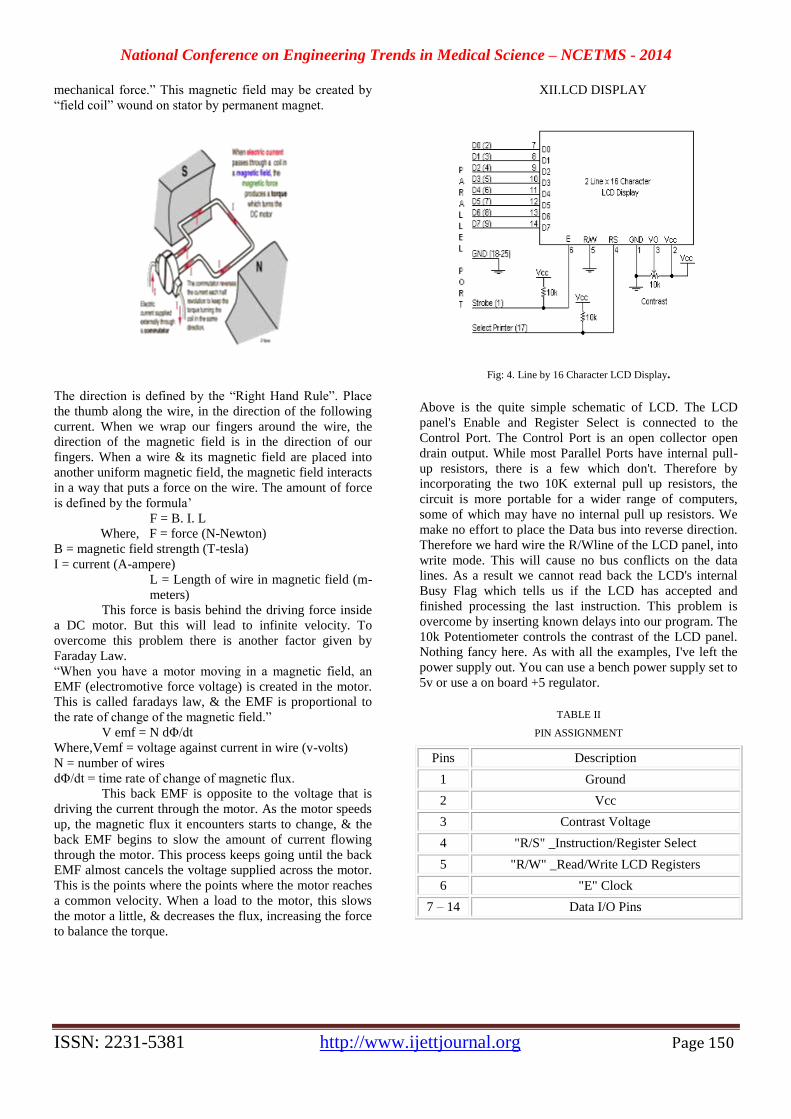
National Conference on Engineering Trends in Medical Science – NCETMS - 2014
ISSN: 2231-5381 http://www.ijettjournal.org Page 150
mechanical force.” This magnetic field may be created by
“field coil” wound on stator by permanent magnet.
The direction is defined by the “Right Hand Rule”. Place
the thumb along the wire, in the direction of the following
current. When we wrap our fingers around the wire, the
direction of the magnetic field is in the direction of our
fingers. When a wire & its magnetic field are placed into
another uniform magnetic field, the magnetic field interacts
in a way that puts a force on the wire. The amount of force
is defined by the formula’
F = B. I. L
Where, F = force (N-Newton)
B = magnetic field strength (T-tesla)
I = current (A-ampere)
L = Length of wire in magnetic field (m-
meters)
This force is basis behind the driving force inside
a DC motor. But this will lead to infinite velocity. To
overcome this problem there is another factor given by
Faraday Law.
“When you have a motor moving in a magnetic field, an
EMF (electromotive force voltage) is created in the motor.
This is called faradays law, & the EMF is proportional to
the rate of change of the magnetic field.”
V emf = N dΦ/dt
Where,Vemf = voltage against current in wire (v-volts)
N = number of wires
dΦ/dt = time rate of change of magnetic flux.
This back EMF is opposite to the voltage that is
driving the current through the motor. As the motor speeds
up, the magnetic flux it encounters starts to change, & the
back EMF begins to slow the amount of current flowing
through the motor. This process keeps going until the back
EMF almost cancels the voltage supplied across the motor.
This is the points where the points where the motor reaches
a common velocity. When a load to the motor, this slows
the motor a little, & decreases the flux, increasing the force
to balance the torque.
XII.LCD DISPLAY
Fig: 4. Line by 16 Character LCD Display.
Above is the quite simple schematic of LCD. The LCD
panel's Enable and Register Select is connected to the
Control Port. The Control Port is an open collector open
drain output. While most Parallel Ports have internal pull-
up resistors, there is a few which don't. Therefore by
incorporating the two 10K external pull up resistors, the
circuit is more portable for a wider range of computers,
some of which may have no internal pull up resistors. We
make no effort to place the Data bus into reverse direction.
Therefore we hard wire the R/Wline of the LCD panel, into
write mode. This will cause no bus conflicts on the data
lines. As a result we cannot read back the LCD's internal
Busy Flag which tells us if the LCD has accepted and
finished processing the last instruction. This problem is
overcome by inserting known delays into our program. The
10k Potentiometer controls the contrast of the LCD panel.
Nothing fancy here. As with all the examples, I've left the
power supply out. You can use a bench power supply set to
5v or use a on board +5 regulator.
TABLE II
PIN ASSIGNMENT
Pins Description
1 Ground
2 Vcc
3 Contrast Voltage
4 "R/S" _Instruction/Register Select
5 "R/W" _Read/Write LCD Registers
6 "E" Clock
7 – 14 Data I/O Pins
National Conference on Engineering Trends in Medical Science – NCETMS - 2014
ISSN: 2231-5381 http://www.ijettjournal.org Page 151
XIII. CONCLUSIONS
In this above discussion we are conclude that the system
based on RF based inter vehicles communication has wide
application such as Reduces traffic congestion, Reduces
accident rate, Reduces injuries and fatalities Provides
direct vehicle to vehicle communication ,Real time
communication .In future we can implement this system
on GSM as well as GPS.
REFERENCES
[1] [Hubaux04] Jean-Pierre Hubaux, "A Survey of Inter-Vehicle Communication," School of Computer andInter/Intra-Vehicle
WirelessCommunicationfile:///X:/wwwdocs/cse57406/ftp/vehi
culrwireless/index.html15 of 16 5/9/2006 7:32 PM [2] Communication Sciences, EPFL, CH-1015 Lausanne,
Switzerland, Technical Report IC/2004/24[Elbahhar05] F.
Elbahhar, "Using UWB Gaussian pulses for inter-vehicle communications," IEEE
Proceedings-Communications, Vol. 152, No. 2, April 2005.
[3] [Yamamoto05] A. Yamamoto, "Effect of Road Undulation on the Propagation Characteristics of Inter-Vehicle
Communications in the 60 GHz band," Wireless Communications and Applied ComputationalElectromagnetics,
2005. IEEE/ACES International Conference on 3-7 April 2005
[4] [Maurer04] J. Maurer, "A New Inter-Vehicle Communications (IVC) Channel Model," Vehicular TechnologyConference,
2004. VTC2004-Fall. 2004 IEEE 60th Volume 1, 26-29 Sept.
2004 [5] [Singh02] J. Singh, "Wireless LAN Performance under Varied
Stress Conditions in Vehicular Traffic Scenarios," IEEE
VEHICULAR TECHNOLOGY CONFERENCE, 2002.
[6] [Sadashivaiah05] M. Sadashivaiah, "Performance
evaluation of Directional MAC protocol for Inter-
vehicle Communication," Vehicular Technology Conference,
2005.VTC 2005-Spring. 2005 IEEE 61st Volume 4, 30May-1 June 2005.
[7] [Dobashi05] K. Dobashi, "Adaptive MAC Protocol for high-
load Inter-Vehicle Communication, “Wireless And Mobile Computing, Networking and Communications, 2005.
(WiMob’2005), IEEE InternationalConference on Volume 3,
22-24 Aug. 2005.
[8] [Biswas06] S. Biswas, "Vehicle-to-vehicle Wireless
Communication Protocols for Enhancing Highway. Traffic
Safety," Communications Magazine, IEEE Publication Date: Jan. 2006 Volume: 44, Issue: 1 page(s):74- 82.
[9] [Hartenstein01] H. Hartenstein, "Position-Aware Ad Hoc
Wireless Networks for Inter-Vehicle.
National Conference on Engineering Trends in Medical Science – NCETMS - 2014
ISSN: 2231-5381 http://www.ijettjournal.org Page 161
“Topology Control in Mobile Ad-Hoc
Network with Co-Operative
Communication”
Amol K.Tholbare1,Raul D.Maske
2 ,Prof. Sandip Asutkar
3
1(Final year B.E (Information Technology), DBNCOET Yavatmal, India)
2(Third Year B.E (Mechanical), DBNCOET Yavatmal, India)
3(Asst. Prof, DBNCOET Yavatmal, India)
ABSTRACT
Cooperative-communication has received
tremendous interests in wireless network most
existing works on cooperative communications are
focused on link-level physical layer issues.
Consequently, the impacts of cooperative
communications on network-level upper layer
issues, such as topology control, routing and
network capacity, are largely ignored. In this
paper, we propose a Capacity-Optimized
Cooperatives (COCO) topology control scheme to
improve the network capacity in MANETs by
jointly considering both upper layer network
capacity and physical layer cooperative
communications. Using simulation examples, we
show that physical layer cooperative
communicationshave significant impacts on the
performance of topology controland
networkcapacity, and the proposed topology
control scheme can substantially improve the
network capacity in MANETs with cooperative
communications.
Keywords:MANET,AD-HOC,COOPERATIVE
COMMUNICATION.
1. Introduction
1.1 Mobile Ad Hoc Networks (MANETs)
Mobile ad-hoc network is an independent system of
mobile nodes connected by wireless links forming a
short, live, on-the-fly network even when access to
the Internet is unavailable. Nodes in MANETs
generally operate on low power battery devices.
These nodes can function both as hosts and as
routers. As a host, nodes function as a source and
destination in the network and as a router, nodes act
as intermediate bridges between the source and the
destination giving store-and-forward services to all
the nodes.
1.2 The topology control problem in MANET In mobile ad hoc wireless communication, each node
of the network has a potential of varying the topology
through the adjustment of its power transmission in
relation to other nodes in the neighborhood. In
contrast, wired networks have fixed established pre-
configured infrastructure with centralizednetwork
management system structure in place. Therefore, the
fundamental reason for the topology control scheme
in MANET is to provide a control mechanism that
maintains the network connectivity and performance
optimization by prolonging network lifetime and
maximizing network throughput. A MANET
topology can depend on uncontrollable factors such
as node mobility, weather, interference, noise as well
as controllable factors such as transmission power,
directional antennas and multi-channel
communications.
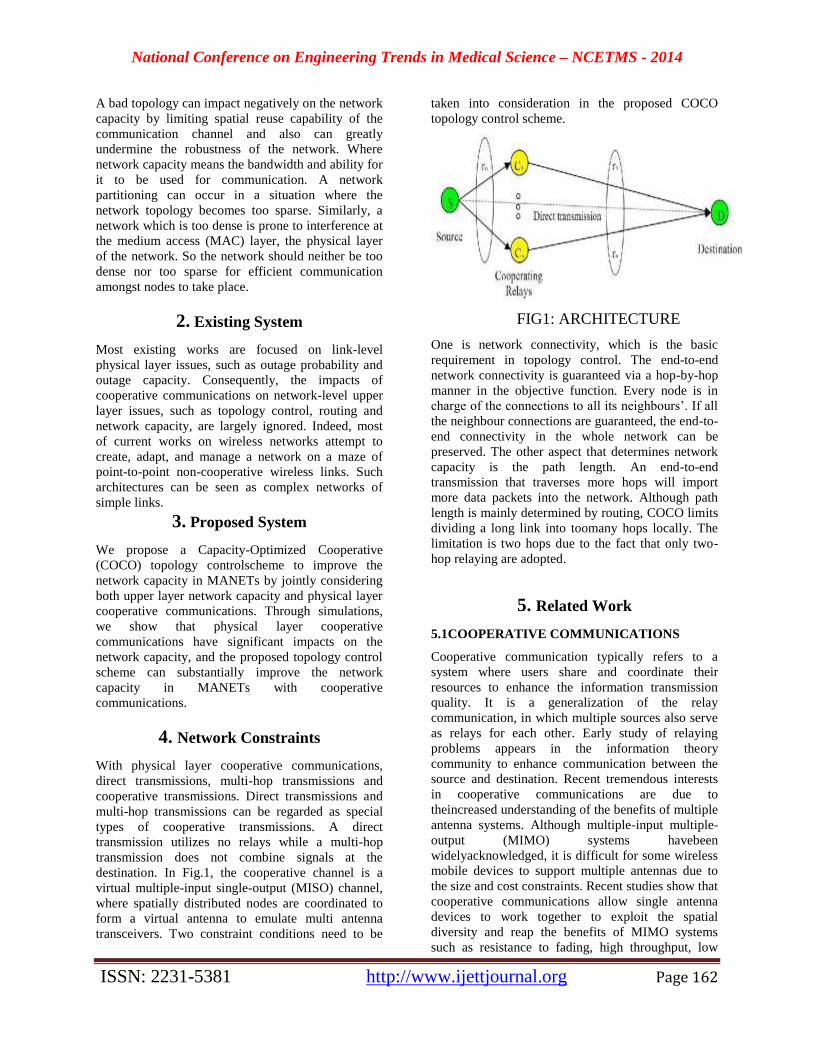
National Conference on Engineering Trends in Medical Science – NCETMS - 2014
ISSN: 2231-5381 http://www.ijettjournal.org Page 162
A bad topology can impact negatively on the network
capacity by limiting spatial reuse capability of the
communication channel and also can greatly
undermine the robustness of the network. Where
network capacity means the bandwidth and ability for
it to be used for communication. A network
partitioning can occur in a situation where the
network topology becomes too sparse. Similarly, a
network which is too dense is prone to interference at
the medium access (MAC) layer, the physical layer
of the network. So the network should neither be too
dense nor too sparse for efficient communication
amongst nodes to take place.
2. Existing System
Most existing works are focused on link-level
physical layer issues, such as outage probability and
outage capacity. Consequently, the impacts of
cooperative communications on network-level upper
layer issues, such as topology control, routing and
network capacity, are largely ignored. Indeed, most
of current works on wireless networks attempt to
create, adapt, and manage a network on a maze of
point-to-point non-cooperative wireless links. Such
architectures can be seen as complex networks of
simple links.
3. Proposed System
We propose a Capacity-Optimized Cooperative
(COCO) topology controlscheme to improve the
network capacity in MANETs by jointly considering
both upper layer network capacity and physical layer
cooperative communications. Through simulations,
we show that physical layer cooperative
communications have significant impacts on the
network capacity, and the proposed topology control
scheme can substantially improve the network
capacity in MANETs with cooperative
communications.
4. Network Constraints
With physical layer cooperative communications,
direct transmissions, multi-hop transmissions and
cooperative transmissions. Direct transmissions and
multi-hop transmissions can be regarded as special
types of cooperative transmissions. A direct
transmission utilizes no relays while a multi-hop
transmission does not combine signals at the
destination. In Fig.1, the cooperative channel is a
virtual multiple-input single-output (MISO) channel,
where spatially distributed nodes are coordinated to
form a virtual antenna to emulate multi antenna
transceivers. Two constraint conditions need to be
taken into consideration in the proposed COCO
topology control scheme.
FIG1: ARCHITECTURE
One is network connectivity, which is the basic
requirement in topology control. The end-to-end
network connectivity is guaranteed via a hop-by-hop
manner in the objective function. Every node is in
charge of the connections to all its neighbours’. If all
the neighbour connections are guaranteed, the end-to-
end connectivity in the whole network can be
preserved. The other aspect that determines network
capacity is the path length. An end-to-end
transmission that traverses more hops will import
more data packets into the network. Although path
length is mainly determined by routing, COCO limits
dividing a long link into toomany hops locally. The
limitation is two hops due to the fact that only two-
hop relaying are adopted.
5. Related Work
5.1COOPERATIVE COMMUNICATIONS
Cooperative communication typically refers to a
system where users share and coordinate their
resources to enhance the information transmission
quality. It is a generalization of the relay
communication, in which multiple sources also serve
as relays for each other. Early study of relaying
problems appears in the information theory
community to enhance communication between the
source and destination. Recent tremendous interests
in cooperative communications are due to
theincreased understanding of the benefits of multiple
antenna systems. Although multiple-input multiple-
output (MIMO) systems havebeen
widelyacknowledged, it is difficult for some wireless
mobile devices to support multiple antennas due to
the size and cost constraints. Recent studies show that
cooperative communications allow single antenna
devices to work together to exploit the spatial
diversity and reap the benefits of MIMO systems
such as resistance to fading, high throughput, low
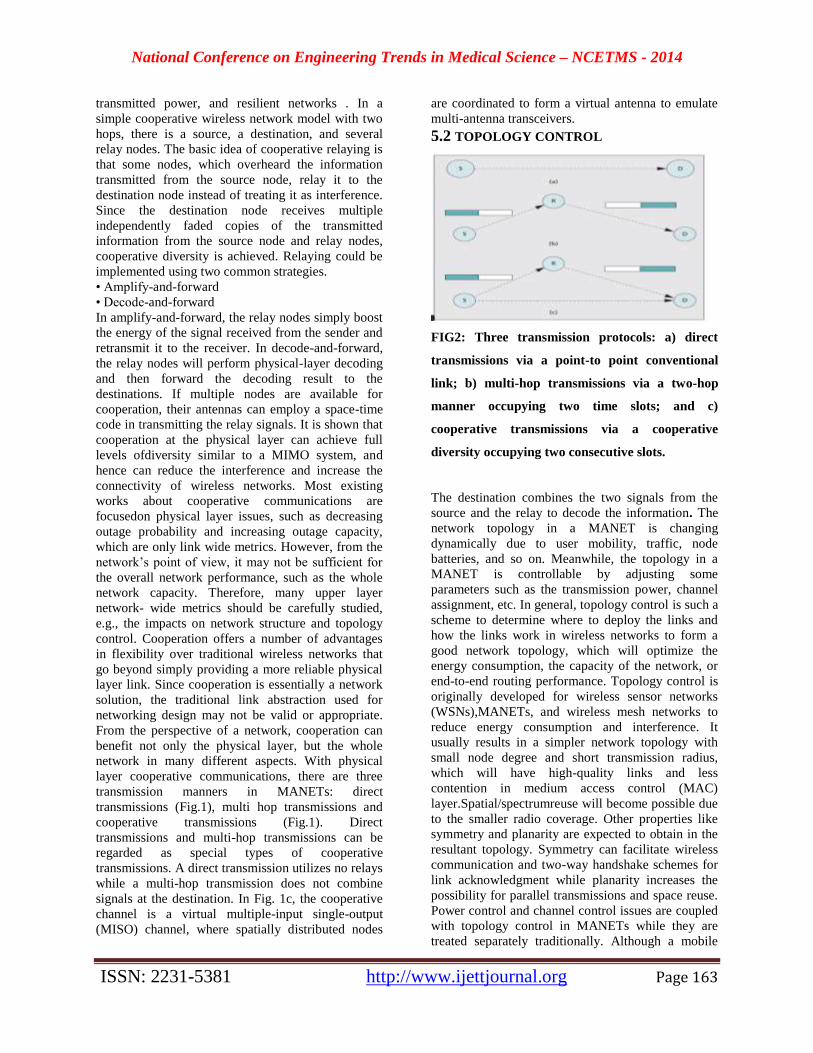
National Conference on Engineering Trends in Medical Science – NCETMS - 2014
ISSN: 2231-5381 http://www.ijettjournal.org Page 163
transmitted power, and resilient networks . In a
simple cooperative wireless network model with two
hops, there is a source, a destination, and several
relay nodes. The basic idea of cooperative relaying is
that some nodes, which overheard the information
transmitted from the source node, relay it to the
destination node instead of treating it as interference.
Since the destination node receives multiple
independently faded copies of the transmitted
information from the source node and relay nodes,
cooperative diversity is achieved. Relaying could be
implemented using two common strategies.
• Amplify-and-forward
• Decode-and-forward
In amplify-and-forward, the relay nodes simply boost
the energy of the signal received from the sender and
retransmit it to the receiver. In decode-and-forward,
the relay nodes will perform physical-layer decoding
and then forward the decoding result to the
destinations. If multiple nodes are available for
cooperation, their antennas can employ a space-time
code in transmitting the relay signals. It is shown that
cooperation at the physical layer can achieve full
levels ofdiversity similar to a MIMO system, and
hence can reduce the interference and increase the
connectivity of wireless networks. Most existing
works about cooperative communications are
focusedon physical layer issues, such as decreasing
outage probability and increasing outage capacity,
which are only link wide metrics. However, from the
network’s point of view, it may not be sufficient for
the overall network performance, such as the whole
network capacity. Therefore, many upper layer
network- wide metrics should be carefully studied,
e.g., the impacts on network structure and topology
control. Cooperation offers a number of advantages
in flexibility over traditional wireless networks that
go beyond simply providing a more reliable physical
layer link. Since cooperation is essentially a network
solution, the traditional link abstraction used for
networking design may not be valid or appropriate.
From the perspective of a network, cooperation can
benefit not only the physical layer, but the whole
network in many different aspects. With physical
layer cooperative communications, there are three
transmission manners in MANETs: direct
transmissions (Fig.1), multi hop transmissions and
cooperative transmissions (Fig.1). Direct
transmissions and multi-hop transmissions can be
regarded as special types of cooperative
transmissions. A direct transmission utilizes no relays
while a multi-hop transmission does not combine
signals at the destination. In Fig. 1c, the cooperative
channel is a virtual multiple-input single-output
(MISO) channel, where spatially distributed nodes
are coordinated to form a virtual antenna to emulate
multi-antenna transceivers.
5.2 TOPOLOGY CONTROL
FIG2: Three transmission protocols: a) direct
transmissions via a point-to point conventional
link; b) multi-hop transmissions via a two-hop
manner occupying two time slots; and c)
cooperative transmissions via a cooperative
diversity occupying two consecutive slots.
The destination combines the two signals from the
source and the relay to decode the information. The
network topology in a MANET is changing
dynamically due to user mobility, traffic, node
batteries, and so on. Meanwhile, the topology in a
MANET is controllable by adjusting some
parameters such as the transmission power, channel
assignment, etc. In general, topology control is such a
scheme to determine where to deploy the links and
how the links work in wireless networks to form a
good network topology, which will optimize the
energy consumption, the capacity of the network, or
end-to-end routing performance. Topology control is
originally developed for wireless sensor networks
(WSNs),MANETs, and wireless mesh networks to
reduce energy consumption and interference. It
usually results in a simpler network topology with
small node degree and short transmission radius,
which will have high-quality links and less
contention in medium access control (MAC)
layer.Spatial/spectrumreuse will become possible due
to the smaller radio coverage. Other properties like
symmetry and planarity are expected to obtain in the
resultant topology. Symmetry can facilitate wireless
communication and two-way handshake schemes for
link acknowledgment while planarity increases the
possibility for parallel transmissions and space reuse.
Power control and channel control issues are coupled
with topology control in MANETs while they are
treated separately traditionally. Although a mobile
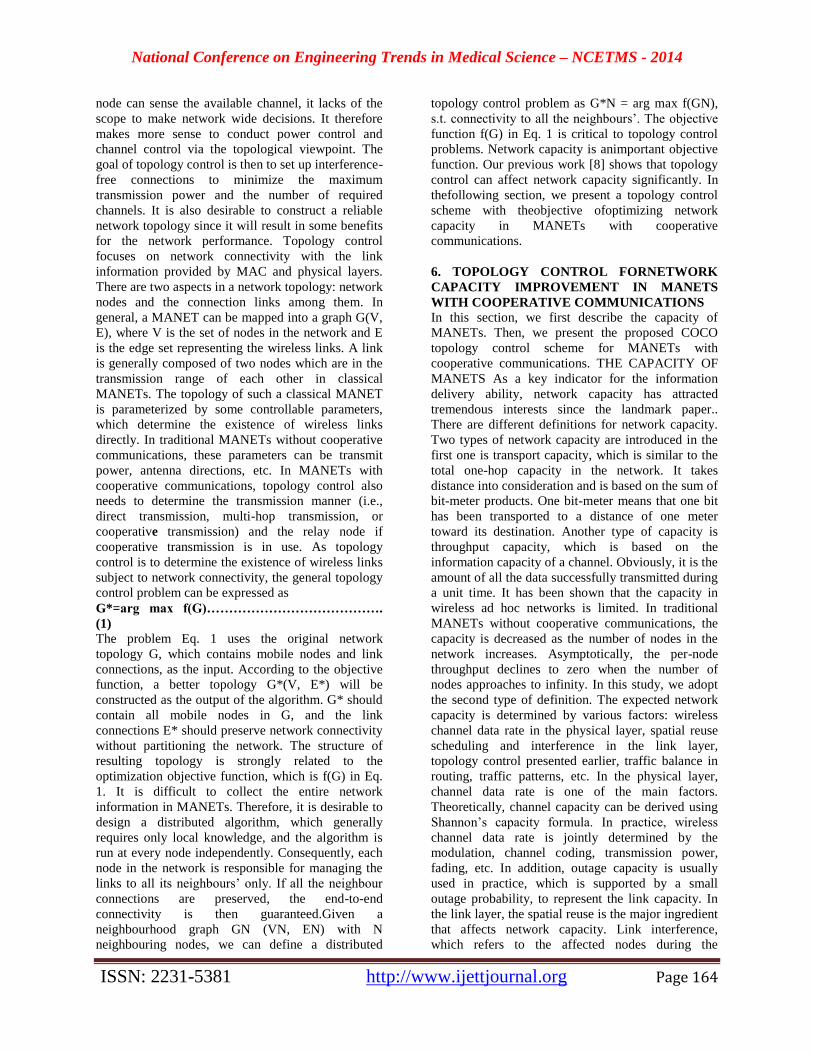
National Conference on Engineering Trends in Medical Science – NCETMS - 2014
ISSN: 2231-5381 http://www.ijettjournal.org Page 164
node can sense the available channel, it lacks of the
scope to make network wide decisions. It therefore
makes more sense to conduct power control and
channel control via the topological viewpoint. The
goal of topology control is then to set up interference-
free connections to minimize the maximum
transmission power and the number of required
channels. It is also desirable to construct a reliable
network topology since it will result in some benefits
for the network performance. Topology control
focuses on network connectivity with the link
information provided by MAC and physical layers.
There are two aspects in a network topology: network
nodes and the connection links among them. In
general, a MANET can be mapped into a graph G(V,
E), where V is the set of nodes in the network and E
is the edge set representing the wireless links. A link
is generally composed of two nodes which are in the
transmission range of each other in classical
MANETs. The topology of such a classical MANET
is parameterized by some controllable parameters,
which determine the existence of wireless links
directly. In traditional MANETs without cooperative
communications, these parameters can be transmit
power, antenna directions, etc. In MANETs with
cooperative communications, topology control also
needs to determine the transmission manner (i.e.,
direct transmission, multi-hop transmission, or
cooperative transmission) and the relay node if
cooperative transmission is in use. As topology
control is to determine the existence of wireless links
subject to network connectivity, the general topology
control problem can be expressed as
G*=arg max f(G)………………………………….
(1)
The problem Eq. 1 uses the original network
topology G, which contains mobile nodes and link
connections, as the input. According to the objective
function, a better topology G*(V, E*) will be
constructed as the output of the algorithm. G* should
contain all mobile nodes in G, and the link
connections E* should preserve network connectivity
without partitioning the network. The structure of
resulting topology is strongly related to the
optimization objective function, which is f(G) in Eq.
1. It is difficult to collect the entire network
information in MANETs. Therefore, it is desirable to
design a distributed algorithm, which generally
requires only local knowledge, and the algorithm is
run at every node independently. Consequently, each
node in the network is responsible for managing the
links to all its neighbours’ only. If all the neighbour
connections are preserved, the end-to-end
connectivity is then guaranteed.Given a
neighbourhood graph GN (VN, EN) with N
neighbouring nodes, we can define a distributed
topology control problem as G*N = arg max f(GN),
s.t. connectivity to all the neighbours’. The objective
function f(G) in Eq. 1 is critical to topology control
problems. Network capacity is animportant objective
function. Our previous work [8] shows that topology
control can affect network capacity significantly. In
thefollowing section, we present a topology control
scheme with theobjective ofoptimizing network
capacity in MANETs with cooperative
communications.
6. TOPOLOGY CONTROL FORNETWORK
CAPACITY IMPROVEMENT IN MANETS
WITH COOPERATIVE COMMUNICATIONS
In this section, we first describe the capacity of
MANETs. Then, we present the proposed COCO
topology control scheme for MANETs with
cooperative communications. THE CAPACITY OF
MANETS As a key indicator for the information
delivery ability, network capacity has attracted
tremendous interests since the landmark paper..
There are different definitions for network capacity.
Two types of network capacity are introduced in the
first one is transport capacity, which is similar to the
total one-hop capacity in the network. It takes
distance into consideration and is based on the sum of
bit-meter products. One bit-meter means that one bit
has been transported to a distance of one meter
toward its destination. Another type of capacity is
throughput capacity, which is based on the
information capacity of a channel. Obviously, it is the
amount of all the data successfully transmitted during
a unit time. It has been shown that the capacity in
wireless ad hoc networks is limited. In traditional
MANETs without cooperative communications, the
capacity is decreased as the number of nodes in the
network increases. Asymptotically, the per-node
throughput declines to zero when the number of
nodes approaches to infinity. In this study, we adopt
the second type of definition. The expected network
capacity is determined by various factors: wireless
channel data rate in the physical layer, spatial reuse
scheduling and interference in the link layer,
topology control presented earlier, traffic balance in
routing, traffic patterns, etc. In the physical layer,
channel data rate is one of the main factors.
Theoretically, channel capacity can be derived using
Shannon’s capacity formula. In practice, wireless
channel data rate is jointly determined by the
modulation, channel coding, transmission power,
fading, etc. In addition, outage capacity is usually
used in practice, which is supported by a small
outage probability, to represent the link capacity. In
the link layer, the spatial reuse is the major ingredient
that affects network capacity. Link interference,
which refers to the affected nodes during the
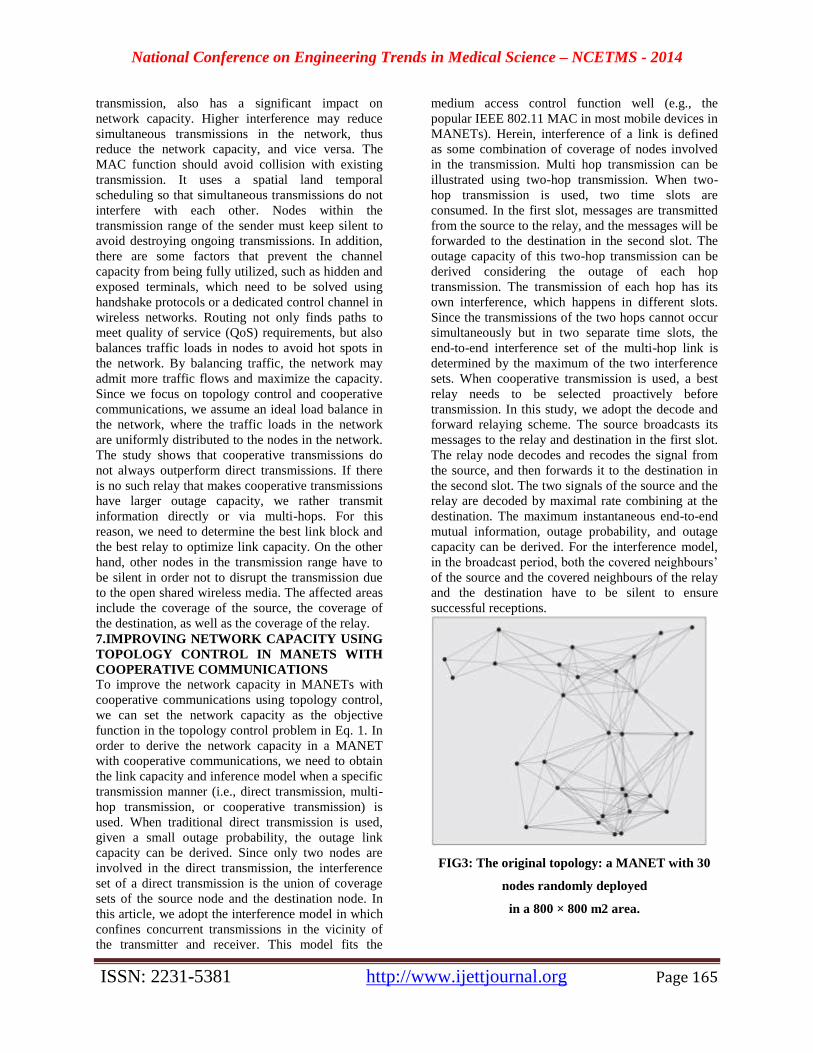
National Conference on Engineering Trends in Medical Science – NCETMS - 2014
ISSN: 2231-5381 http://www.ijettjournal.org Page 165
transmission, also has a significant impact on
network capacity. Higher interference may reduce
simultaneous transmissions in the network, thus
reduce the network capacity, and vice versa. The
MAC function should avoid collision with existing
transmission. It uses a spatial land temporal
scheduling so that simultaneous transmissions do not
interfere with each other. Nodes within the
transmission range of the sender must keep silent to
avoid destroying ongoing transmissions. In addition,
there are some factors that prevent the channel
capacity from being fully utilized, such as hidden and
exposed terminals, which need to be solved using
handshake protocols or a dedicated control channel in
wireless networks. Routing not only finds paths to
meet quality of service (QoS) requirements, but also
balances traffic loads in nodes to avoid hot spots in
the network. By balancing traffic, the network may
admit more traffic flows and maximize the capacity.
Since we focus on topology control and cooperative
communications, we assume an ideal load balance in
the network, where the traffic loads in the network
are uniformly distributed to the nodes in the network.
The study shows that cooperative transmissions do
not always outperform direct transmissions. If there
is no such relay that makes cooperative transmissions
have larger outage capacity, we rather transmit
information directly or via multi-hops. For this
reason, we need to determine the best link block and
the best relay to optimize link capacity. On the other
hand, other nodes in the transmission range have to
be silent in order not to disrupt the transmission due
to the open shared wireless media. The affected areas
include the coverage of the source, the coverage of
the destination, as well as the coverage of the relay.
7.IMPROVING NETWORK CAPACITY USING
TOPOLOGY CONTROL IN MANETS WITH
COOPERATIVE COMMUNICATIONS
To improve the network capacity in MANETs with
cooperative communications using topology control,
we can set the network capacity as the objective
function in the topology control problem in Eq. 1. In
order to derive the network capacity in a MANET
with cooperative communications, we need to obtain
the link capacity and inference model when a specific
transmission manner (i.e., direct transmission, multi-
hop transmission, or cooperative transmission) is
used. When traditional direct transmission is used,
given a small outage probability, the outage link
capacity can be derived. Since only two nodes are
involved in the direct transmission, the interference
set of a direct transmission is the union of coverage
sets of the source node and the destination node. In
this article, we adopt the interference model in which
confines concurrent transmissions in the vicinity of
the transmitter and receiver. This model fits the
medium access control function well (e.g., the
popular IEEE 802.11 MAC in most mobile devices in
MANETs). Herein, interference of a link is defined
as some combination of coverage of nodes involved
in the transmission. Multi hop transmission can be
illustrated using two-hop transmission. When two-
hop transmission is used, two time slots are
consumed. In the first slot, messages are transmitted
from the source to the relay, and the messages will be
forwarded to the destination in the second slot. The
outage capacity of this two-hop transmission can be
derived considering the outage of each hop
transmission. The transmission of each hop has its
own interference, which happens in different slots.
Since the transmissions of the two hops cannot occur
simultaneously but in two separate time slots, the
end-to-end interference set of the multi-hop link is
determined by the maximum of the two interference
sets. When cooperative transmission is used, a best
relay needs to be selected proactively before
transmission. In this study, we adopt the decode and
forward relaying scheme. The source broadcasts its
messages to the relay and destination in the first slot.
The relay node decodes and recodes the signal from
the source, and then forwards it to the destination in
the second slot. The two signals of the source and the
relay are decoded by maximal rate combining at the
destination. The maximum instantaneous end-to-end
mutual information, outage probability, and outage
capacity can be derived. For the interference model,
in the broadcast period, both the covered neighbours’
of the source and the covered neighbours of the relay
and the destination have to be silent to ensure
successful receptions.
FIG3: The original topology: a MANET with 30
nodes randomly deployed
in a 800 × 800 m2 area.
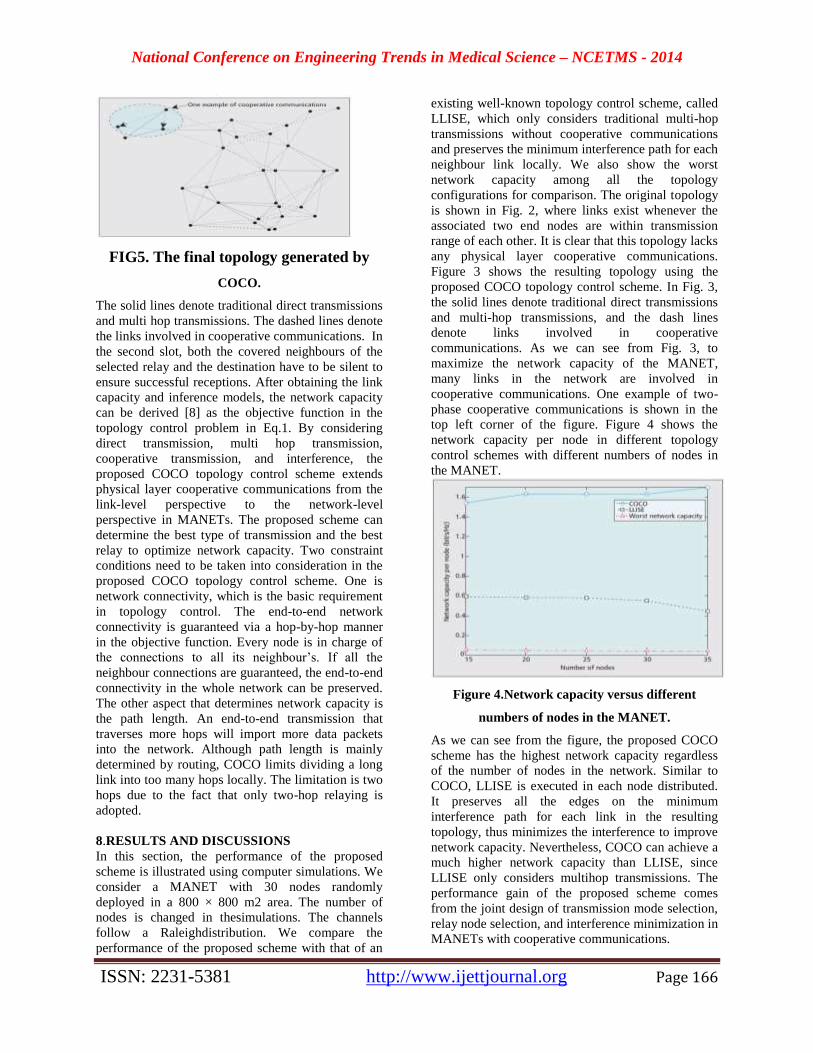
National Conference on Engineering Trends in Medical Science – NCETMS - 2014
ISSN: 2231-5381 http://www.ijettjournal.org Page 166
FIG5. The final topology generated by
COCO.
The solid lines denote traditional direct transmissions
and multi hop transmissions. The dashed lines denote
the links involved in cooperative communications. In
the second slot, both the covered neighbours of the
selected relay and the destination have to be silent to
ensure successful receptions. After obtaining the link
capacity and inference models, the network capacity
can be derived [8] as the objective function in the
topology control problem in Eq.1. By considering
direct transmission, multi hop transmission,
cooperative transmission, and interference, the
proposed COCO topology control scheme extends
physical layer cooperative communications from the
link-level perspective to the network-level
perspective in MANETs. The proposed scheme can
determine the best type of transmission and the best
relay to optimize network capacity. Two constraint
conditions need to be taken into consideration in the
proposed COCO topology control scheme. One is
network connectivity, which is the basic requirement
in topology control. The end-to-end network
connectivity is guaranteed via a hop-by-hop manner
in the objective function. Every node is in charge of
the connections to all its neighbour’s. If all the
neighbour connections are guaranteed, the end-to-end
connectivity in the whole network can be preserved.
The other aspect that determines network capacity is
the path length. An end-to-end transmission that
traverses more hops will import more data packets
into the network. Although path length is mainly
determined by routing, COCO limits dividing a long
link into too many hops locally. The limitation is two
hops due to the fact that only two-hop relaying is
adopted.
8.RESULTS AND DISCUSSIONS
In this section, the performance of the proposed
scheme is illustrated using computer simulations. We
consider a MANET with 30 nodes randomly
deployed in a 800 × 800 m2 area. The number of
nodes is changed in thesimulations. The channels
follow a Raleighdistribution. We compare the
performance of the proposed scheme with that of an
existing well-known topology control scheme, called
LLISE, which only considers traditional multi-hop
transmissions without cooperative communications
and preserves the minimum interference path for each
neighbour link locally. We also show the worst
network capacity among all the topology
configurations for comparison. The original topology
is shown in Fig. 2, where links exist whenever the
associated two end nodes are within transmission
range of each other. It is clear that this topology lacks
any physical layer cooperative communications.
Figure 3 shows the resulting topology using the
proposed COCO topology control scheme. In Fig. 3,
the solid lines denote traditional direct transmissions
and multi-hop transmissions, and the dash lines
denote links involved in cooperative
communications. As we can see from Fig. 3, to
maximize the network capacity of the MANET,
many links in the network are involved in
cooperative communications. One example of two-
phase cooperative communications is shown in the
top left corner of the figure. Figure 4 shows the
network capacity per node in different topology
control schemes with different numbers of nodes in
the MANET.
Figure 4.Network capacity versus different
numbers of nodes in the MANET.
As we can see from the figure, the proposed COCO
scheme has the highest network capacity regardless
of the number of nodes in the network. Similar to
COCO, LLISE is executed in each node distributed.
It preserves all the edges on the minimum
interference path for each link in the resulting
topology, thus minimizes the interference to improve
network capacity. Nevertheless, COCO can achieve a
much higher network capacity than LLISE, since
LLISE only considers multihop transmissions. The
performance gain of the proposed scheme comes
from the joint design of transmission mode selection,
relay node selection, and interference minimization in
MANETs with cooperative communications.
National Conference on Engineering Trends in Medical Science – NCETMS - 2014
ISSN: 2231-5381 http://www.ijettjournal.org Page 167
9.CONCLUSIONS AND FUTURE WORK
In this article, we have introduced physical layer
cooperative communications, topology control, and
network capacity in MANETs. To improve the
network capacity of MANETs with cooperative
communications, we have proposed a Capacity-
Optimized Cooperative (COCO) topology control
scheme that considers both upper layer network
capacity and physical layer relay selection in
cooperative communications. Simulation results have
shown that physical layer cooperative
communications techniques have significant impacts
on the network capacity, and the proposed topology
control scheme can substantially improve the
network capacity in MANETs with cooperative
communications. Future work is in progress to
consider dynamic traffic patterns in the proposed
scheme to further improve the performance of
MANETs with cooperative communications.
10. REFERENCES [1]. Quansheng Guan, South China University of Technology F.
Richard Yu, Carleton University, Ottawa Shengming jiang,
South China University of Technology victor c. . Leung, university of British Columbia Hamid Mehrvar, Ciena Inc.”TOPOLOGY
CONTROL IN MOBILE AD HOC NETWORKS WITH
COOPERATIVE COMMUNICATIONS”.
[2] Abhishek Majumder and Nityananda Sarma, “DEMAC: A
CLUSTER-BASED TOPOLOGY CONTROL FOR AD HOC NETWORKS”, International Journal of Computer Science Issues,
Vol. 7, Issue 5, September 2010, pp.82-
[3]. T.S.Asha Associate Professor Department of ECENSS
College of Engineering, Palakkad, Kerala,” NETWORK
CONNECTIVITY BASED TOPOLOGY CONTROL FOR MOBILE AD HOC NETWORKS”
[4] S. S. Dalu, , M. K. Naskar and C. K. Sarkar,” IMPLEMENTATION OF A TOPOLOGY CONTROL
ALGORITHM FOR MOBILE AD HOC NETWORKS USING
PURSUE MOBILITY MODEL”, Journal of Applied Computer Science, no.2 (2) /2008, Suceava, pp.14-20.
[5] S. Venkatesan and C. David Young , “A DISTRIBUTED TOPOLOGY CONTROL ALGORITHM FOR
MANETS”, pp.1-7.
[6] S. Karunakaran and P. Thangaraj, “TOPOLOGY
CONTROL USING EFFICIENT POWER MANAGEMENT”, journal of computer science 7 (4): 561-567, 2011, ISSN 1549-
3636, pp.561- 567.
[7] Avik Ray, Kanad Basu , Samir Biswas and
M.K.Naskar, “ A NOVEL DISTRIBUTED ALGORITHM FOR
TOPOLOGY MANAGEMENT IN MOBILE AD-HOC NETWORKS”, International Conference on Computers and
Devices for Communication (CODEC-06) Institute of Radio
Physics and Electronics, University of Calcutta, 2006, pp.189-192.
[8] Abhishek Majumder and Nityananda Sarma, “DEMAC: A
CLUSTER-BASED TOPOLOGY CONTROL FOR AD HOC NETWORKS”, International Journal of Computer Science Issues,
Vol. 7, Issue 5, September 2010, pp.82-88.


