Embed Size (px)
Citation preview
PROJECT
Free-surface turbulence
Technical Report
Waves generated by wind
Experiments carried out in wind tunnel II
CEAMA, Granada, Spain, July 2010
Luca Chiapponi*, Sandro Longo*, Simona Bramato**, Christian Mans**, Miguel A. Losada**
*Dipartimento di Ingegneria Civile, Ambiente, Territorio e
Architettura
Università degli Studi di Parma, Italy
**Centro Andaluz de Medio Ambiente
Universidad de Granada – Junta de Andalucía, Spain
March, 2011

I
Preface
This report is on the experimental activity carried out in Granada from March to July 2010. Sandro Longo was on sabbatic leave while the other participants were visitors, like Luca Chiapponi, or part of the permanent staff of CEAMA.
The aim of the report is to give a clear description of the activity and of the data collected. It is well known that after a short time, most information about the experiments and the details are lost if it is not properly recorded. For this reason, a description of the activity, general set‐up, procedure and software is given. Generally only successful activities are described; in this project we had only a failure in measurements while using multiplexing for the Ultrasound Doppler Velocimeter Profiler; it is itself a success, considering the huge amount of data collected and the variety of instruments used. The adopted technology was quite helpful in avoiding malfunctioning and only a single flooding of the lab occurred, due to the detachment between the glass and PVC (glue is never reliable in sticking these two materials); it would have been better no flooding at all, but we dealt with air and water which was not part of the wind tunnels original design: having dealt only with air, surely no flood would have occurred!
Many thanks to the persons in charge for the lab, Maria Clavero and Antonio Monino, for their support to the activity and a special thanks to Christian Mans who introduced the Italian group to the wind tunnel technology.
Parma, Granada, March 2011 The Authors

II
Index
1. Introduction.................................................................................................................................... 1
2. Experimental facilities and experiments ........................................................................................ 1
3. Laser set‐up .................................................................................................................................... 5
4. Probe set‐up ................................................................................................................................... 7
4.1. Transformation matrix........................................................................................................... 9
5. Data elaboration........................................................................................................................... 10
5.1. Measurements in water....................................................................................................... 11
5.2. Measurements in air............................................................................................................ 14
5.3. Measurements in air in section S‐1 as reference velocities ................................................ 19
6. Water level measurement............................................................................................................ 20
7. Measurements with Ultrasound Doppler velocimeter ................................................................ 25
8. Water level oscillation measurements......................................................................................... 32
8.1. Calibration of the ultrasonic sensor..................................................................................... 33
9. Comparison between LDV and UDVP velocity measurements .................................................... 36
10. References................................................................................................................................ 38
List of the Figures
Figure 1. Side view of the water tank in the wind tunnel ..................................................................................2
Figure 2. Tank geometry and position of the measurement sections. Side view ..............................................3
Figure 3. Automatic refilling circuit to control the mean water level in the tank at a fixed stage ....................3
Figure 4. Stage measurements system ..............................................................................................................4
Figure 5. Current flowing and overall power of the laser during running tests. LT means that a light intensity feedback control has been selected....................................................................................................6
Figure 6. Probe on the traverse system .............................................................................................................7
Figure 7. Set‐up of the LDV probe for measurements in air ..............................................................................8
Figure 8. Set‐up of the LDV probe for measurements in water.........................................................................8
Figure 9. External (x‐z) and LDV reference systems (θ is the probe angle) .......................................................9
Figure 10. Sketch for the coordinate transformation ......................................................................................10
Figure 11. Vertical velocity profiles in water for all tests.................................................................................12
Figure 12. Horizontal velocity profiles in water for all tests ............................................................................13
Figure 13. Reynolds tangential stresses in water for all tests..........................................................................13
III
Figure 14. Turbulent kinetic energy in water for all tests ................................................................................14
Figure 15. Vertical velocity profiles in air on water for all tests ......................................................................16
Figure 16. Horizontal velocity profiles in air on water for all tests ..................................................................16
Figure 17. Reynolds tangential stresses in air on water for all tests................................................................17
Figure 18. Turbulent kinetic energy in air on water for all tests......................................................................17
Figure 19. Vertical velocity profiles in air on rigid bottom for all tests............................................................18
Figure 20. Horizontal velocity profiles in air on rigid bottom for all tests .......................................................18
Figure 21. Reynolds tangential stresses in air on rigid bottom for all tests.....................................................19
Figure 22. Turbulent kinetic energy in air on rigid bottom for all tests ...........................................................19
Figure 23. Water level probe setup..................................................................................................................20
Figure 24. Calibration of the wave gauge in section S0 ...................................................................................40
Figure 25. Calibration of the wave gauge in section S1 ...................................................................................40
Figure 26. Calibration of the wave gauge in section S2 ...................................................................................41
Figure 27. Calibration of the wave gauge in section S3 ...................................................................................41
Figure 28. Calibration of the wave gauge in section S4 ...................................................................................42
Figure 29. Calibration of the wave gauge in section S5 ...................................................................................42
Figure 30. Calibration of the wave gauge in section S6 ...................................................................................43
Figure 31. Calibration of the wave gauge in section S7 ...................................................................................43
Figure 32. Water level measurements in section S0 and S7. Data from test 1006log1...................................23
Figure 33. Wave height (Hrms), wave crest (asup) and wave trough (ainf), root mean square values. Fan control voltage 9.5 V .................................................................................................................................24
Figure 34. Wave height (Hrms), wave crest (asup) and wave trough (ainf), root mean square values. Fan control voltage 6.5 V .................................................................................................................................24
Figure 35. Ultrasound Doppler Velocimeter probe set‐up ..............................................................................25
Figure 36. Instantaneous vertical velocity (circles are the raw data, solid line refers to the despiked velocity) and echo profile. At the interface, echo saturation occurs...............................................................28
Figure 37. Instantaneous water level as detected by the UDVP (dashed line). Filled symbols indicate the retained values after despiking..................................................................................................................29
Figure 38. Average and phasic average vertical velocity measured by UDVP in section S0, maximum fan speed..........................................................................................................................................................30
Figure 39. Ultrasonic water level gauge...........................................................................................................32
Figure 40. Ultrasonic water level gauge – long‐range calibration curve..........................................................33
Figure 41. Ultrasonic water level gauge – short‐range calibration curve ........................................................34

IV
Figure 42. Instantaneous water level measured by the US level sensor. Dashed line: raw data; solid line: despiked data ...........................................................................................................................................35
Figure 43. Instantaneous water level computed using the UDVP data (dashed line) and the US water level data (solid line) ........................................................................................................................................36
Figure 44 Comparison between the vertical fluid velocity at z = −10 mm measured by LDV and by UDVP ................................................................................................................................................................37
List of the Tables
Table 1. Measurements set in water ...............................................................................................................12
Table 2. Measurements set in air on water .....................................................................................................15
Table 3. Measurements set in air on rigid bottom ..........................................................................................15
Table 4. Measurements set in air on water in Section ‐1 ................................................................................20
Table 5. Files for calibration of the wave gauges.............................................................................................21
Table 6. Mean value of the output signal. The unit of measurement named iu means internal unit.............21
Table 7. Standard deviation value of the signal. The unit of measurement named iu means internal unit ...................................................................................................................................................................22
Table 8. Calibration equations. x is in DHI software internal units ..................................................................22
Table 9. Water level data set ...........................................................................................................................23
Table 10. Measurements with UDVP and with US water level gauge, data files.............................................31
Table 11. Ultrasonic water level characteristics ..............................................................................................33
Table 12. Section S0 in coincidence mode. Measurements in water. File Test_22_07_02_S0_acqua_CM.txt ..................................................................................................................40
Table 13. Section S3 in coincidence mode. Measurements in water. File Test_23_07_02_S3_acqua_CM.txt ..................................................................................................................46
Table 14. Section S5 in coincidence mode. Measurements in water. File Test_23_07_02_S5_acqua_CM.txt ..................................................................................................................47
Table 15. Section S6 in coincidence mode. Measurements in water. File Test_24_07_02_S6_acqua_CM.txt ..................................................................................................................48
Table 16. Section S0 in NON coincidence mode. Measurements in water. File Test_22_07_02_S0_acqua_NCM.txt................................................................................................................49
Table 17. Section S3 in NON coincidence mode. Measurements in water. File Test_23_07_02_S3_acqua_NCM.txt................................................................................................................51
Table 18. Section S5 in NON coincidence mode. Measurements in water. File Test_23_07_02_S5_acqua_NCM.txt................................................................................................................52
Table 19. Section S6 in NON coincidence mode. Measurements in water. File Test_24_07_02_S6_acqua_NCM.txt................................................................................................................53

V
Table 20. Section S0 in coincidence mode. Measurements in air on water. File Test_18_07_02_S0_aria_CM.txt ......................................................................................................................54
Table 21. Section S1 in coincidence mode. Measurements in air on water. File Test_10_07_02_S1_aria_CM.txt ......................................................................................................................55
Table 22. Section S2 in coincidence mode. Measurements in air on water. File Test_12_07_02_S2_aria_CM.txt ......................................................................................................................57
Table 23. Section S3 in coincidence mode. Measurements in air on water. File Test_13_07_02_S3_aria_CM.txt ......................................................................................................................58
Table 24. Section S4 in coincidence mode. Measurements in air on water. File Test_18_07_02_S4_aria_CM.txt ......................................................................................................................59
Table 25. Section S5 in coincidence mode. Measurements in air on water. File Test_19_07_02_S5_aria_CM.txt ......................................................................................................................60
Table 26. Section S6 in coincidence mode. Measurements in air on water. File Test_20_07_02_S6_aria_CM.txt ......................................................................................................................61
Table 27. Section S7 in coincidence mode. Measurements in air on water. File Test_21_07_02_S7_aria_CM.txt ......................................................................................................................62
Table 28. Section S0 in NON coincidence mode. Measurements in air on water. File Test_18_07_02_S0_aria_NCM.txt ...................................................................................................................63
Table 29. Section S1 in NON coincidence mode. Measurements in air on water. File Test_10_07_02_S1_aria_NCM.txt ...................................................................................................................64
Table 30. Section S2 in NON coincidence mode. Measurements in air on water. File Test_12_07_02_S2_aria_NCM.txt ...................................................................................................................66
Table 31. Section S3 in NON coincidence mode. Measurements in air on water. File Test_13_07_02_S3_aria_NCM.txt ...................................................................................................................67
Table 32. Section S4 in NON coincidence mode. Measurements in air on water. File Test_18_07_02_S4_aria_NCM.txt ...................................................................................................................68
Table 33. Section S5 in NON coincidence mode. Measurements in air on water. File Test_19_07_02_S5_aria_NCM.txt ...................................................................................................................69
Table 34. Section S6 in NON coincidence mode. Measurements in air on water. File Test_20_07_02_S6_aria_NCM.txt ...................................................................................................................70
Table 35. Section S7 in NON coincidence mode. Measurements in air on water. File Test_21_07_02_S7_aria_NCM.txt ...................................................................................................................71
Table 36. Section S0 in coincidence mode. Measurements in air on rigid bottom. File Test_29_07_02_S0_aria_piano_CM.txt...........................................................................................................72
Table 37. Section S1 in coincidence mode. Measurements in air on rigid bottom. File Test_30_07_02_S1_aria_piano_CM.txt...........................................................................................................73
Table 38. Section S2 in coincidence mode. Measurements in air on rigid bottom. File Test_30_07_02_S2_aria_piano_CM.txt...........................................................................................................74

VI
Table 39. Section S3 in coincidence mode. Measurements in air on rigid bottom. File Test_30_07_02_S3_aria_piano_CM.txt...........................................................................................................75
Table 40. Section S4 in coincidence mode. Measurements in air on rigid bottom. File Test_30_07_02_S4_aria_piano_CM.txt...........................................................................................................76
Table 41. Section S5 in coincidence mode. Measurements in air on rigid bottom. File Test_30_07_02_S5_aria_piano_CM.txt...........................................................................................................77
Table 42. Section S6 in coincidence mode. Measurements in air on rigid bottom. File Test_30_07_02_S6_aria_piano_CM.txt...........................................................................................................78
Table 43. Section S7 in coincidence mode. Measurements in air on rigid bottom. File Test_30_07_02_S7_aria_piano_CM.txt...........................................................................................................79
Table 44. Section S0 in NON coincidence mode. Measurements in air on rigid bottom. File Test_29_07_02_S0_aria_piano_CM.txt...........................................................................................................80
Table 45. Section S1 in NON coincidence mode. Measurements in air on rigid bottom. File Test_30_07_02_S1_aria_piano_CM.txt...........................................................................................................81
Table 46. Section S2 in NON coincidence mode. Measurements in air on rigid bottom. File Test_30_07_02_S2_aria_piano_CM.txt...........................................................................................................82
Table 47. Section S3 in NON coincidence mode. Measurements in air on rigid bottom. File Test_30_07_02_S3_aria_piano_CM.txt...........................................................................................................83
Table 48. Section S4 in NON coincidence mode. Measurements in air on rigid bottom. File Test_30_07_02_S4_aria_piano_CM.txt...........................................................................................................84
Table 49. Section S5 in NON coincidence mode. Measurements in air on rigid bottom. File Test_30_07_02_S5_aria_piano_CM.txt...........................................................................................................85
Table 50. Section S6 in NON coincidence mode. Measurements in air on rigid bottom. File Test_30_07_02_S6_aria_piano_CM.txt...........................................................................................................86
Table 51. Section S7 in NON coincidence mode. Measurements in air on rigid bottom. File Test_30_07_02_S7_aria_piano_CM.txt...........................................................................................................87
Table 52. Section S0. Measurements in air on water......................................................................................88
Table 53. Section S1. Measurements in air on water......................................................................................90
Table 54. Section S2. Measurements in air on water......................................................................................92
Table 55. Section S3. Measurements in air on water......................................................................................94
Table 56. Section S4. Measurements in air on water......................................................................................95
Table 57. Section S5. Measurements in air on water......................................................................................97
Table 58. Section S6. Measurements in air on water......................................................................................99
Table 59. Section S7. Measurements in air on water....................................................................................101
Table 60. Section S0. Measurements in water..............................................................................................103
Table 61. Section S3. Measurements in water..............................................................................................105

VII
Table 62. Section S5. Measurements in water..............................................................................................107
Table 63. Section S6. Measurements in water..............................................................................................109
Table 64. Section S0. Measurements in air on rigid bottom.........................................................................112
Table 65. Section S1. Measurements in air on rigid bottom.........................................................................113
Table 66. Section S2. Measurements in air on rigid bottom.........................................................................114
Table 67. Section S3. Measurements in air on rigid bottom.........................................................................115
Table 68. Section S4. Measurements in air on rigid bottom.........................................................................116
Table 69. Section S5. Measurements in air on rigid bottom.........................................................................117
Table 70. Section S6. Measurements in air on rigid bottom.........................................................................118
Table 71. Section S7. Measurements in air on rigid bottom.........................................................................119
Table 72. Section S‐1. Measurements in air on water as reference .............................................................120

VIII

Free‐surface turbulence, Waves generated by wind
1
1. Introduction The interface between water and air in the sea separates the atmospheric boundary layer and the sea boundary layer and is an essential intermediary for gas, chemical and mass exchange with a wide variety of length and time scales. Spray, bubbles, water drops, gravity waves, vortical structure coexist and interactively participate in the overall dynamics. The huge extension of the sea surface transforms minor local exchange phenomena into large quantities of exchanged matter or gas. For this reason all the details of the transfer mechanisms are important in order to have a correct balance at large scales. Wave climate itself is strongly influenced by the exchange mechanisms and some spectacular events like hurricanes and waterspouts requires accurate knowledge of the drag coefficients, enthalpy balance and mixing in the air‐sea boundary layers in order to be forecasted. Sea wave growth is crucially controlled by drag coefficients as well as by possible resonance phenomena between pulsating pressure in air and water body dynamics.
These are some of the motivations of the present experimental work. Literature on the topic is huge and covers several aspects from different point of views. The approach herein used is the analysis of both water and wind stream kinematic characteristics. Many different instruments have been used, (1) 2‐D Laser Doppler Velocimetry (LDV) in air and in water, (2) Ultrasound Doppler Velocimetry in water (UDVP), (3) free surface position measurements through resistive probes and (4) Ultrasound devices (US). The aim of the report is a detailed description of the experimental activity with a post‐processing of the data in order to validate them, and some data elaboration in order to present the results in synthesis. The detailed interpretation of the results is left for future analysis.
2. Experimental facilities and experiments The experimental apparatus is a small tank mounted inside a boundary layer wind tunnel with a PMMA structure having a testing section 36 cmx43 cm and 3.00 m long. It is a replica 1:5 of a larger wind tunnel available in CEAMA. Wind velocity, up to 20 m/s, is controlled by a variable frequency converter acting on the electric fan of maximum power equal to 2.2 kW. The water tank is constructed of PVC, having dimensions 395x970 mm and still water depth equal to 105 mm. The air flow section in the measuring area is connected to the wind tunnel through an upstream and a downstream contraction/expansion element (Figure 2). The upstream contraction avoids air flow separation and guarantees a stable thin boundary layer in the area of contact between air and water. The downstream expansion is required in order to reduce dissipations and to avoid large vortices which, in turn, can induce pulsating dissipation effects and consequent pulsating velocity in the air stream and to also maintain relatively smooth airflow at the downstream fan. In the downstream end of the tank, the PVC side is higher than the upstream side wall, in order to limit overtopping of the generated waves, and an absorbing system is realized in stainless steel wool in order to minimize wave reflection.

Free‐surface turbulence, Waves generated by wind
2
Figure 1. Overview of the replica wind tunnel
One side of the tank is constructed of glass (thickness 5 mm) to allow clear access for LDV measurements. Measurements were carried in several sections as shown in Figure 3.
Figure 2. Side view of the water tank in the wind tunnel

Free‐surface turbulence, Waves generated by wind
3
Figure 3. Tank geometry and position of the measurement sections. Side view
During tests it is expected a mean water level reduction due to evaporation and overtopping of the generated waves. In order to control the mean water level, the tank is connected to a circular sharp crest weir through a plastic pipe of limited diameter, in order to filter the water level fluctuations. The first attempt was to guarantee an automatic refilling of the water with a drop dispenser and a continuous overflowing of the weir. The weir was supported by a vertical brass bar controlled by a screw thread with movement recorded on a vernier scale (Figure 4). Modifying the vertical position of the crest (moving the crest by moving the entire weir) the stage control in the water tank could be achieved.
Figure 4. Automatic refilling circuit to control the mean water level in the tank at a fixed stage
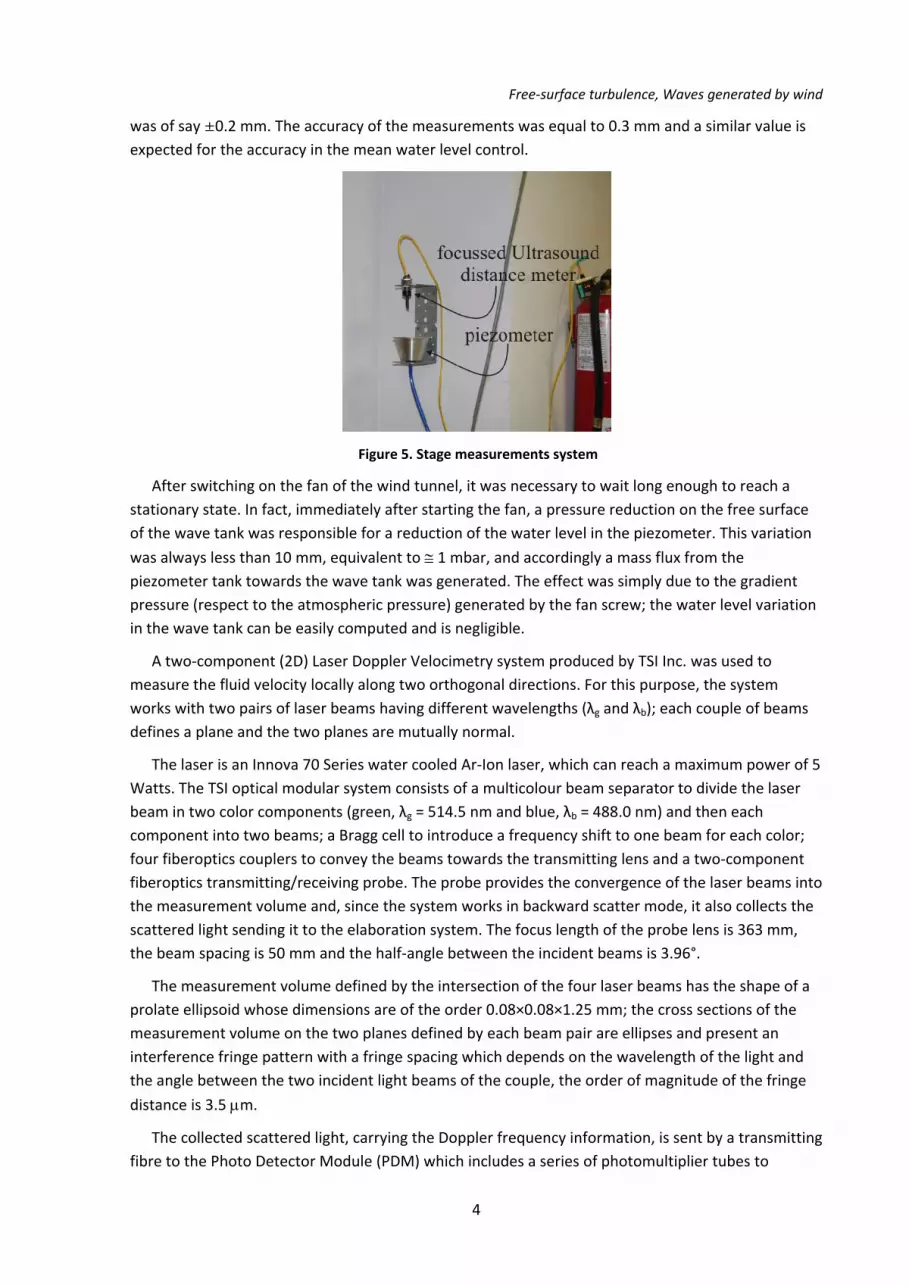
Unfortunately the surface tension effects were responsible for a strong hysteresis and the long pipes induced a strong inertia. The feedback system was hysteretic and with time‐delay, inherently unstable. The system was substituted with a manual system: an Ultrasound distance meter measured the water level in a piezometer (Figure 5) and a manual refilling through a second pipe was operated whenever necessary. The control could have been automatic but a manual control was preferred, with the operator reading periodically the water level in the piezometer as detected by the Ultrasound distance meter and ready to fill up the wave tank, through a second pipe, if the variation
Free‐surface turbulence, Waves generated by wind
4
was of say ≤0.2 mm. The accuracy of the measurements was equal to 0.3 mm and a similar value is expected for the accuracy in the mean water level control.
Figure 5. Stage measurements system
After switching on the fan of the wind tunnel, it was necessary to wait long enough to reach a stationary state. In fact, immediately after starting the fan, a pressure reduction on the free surface of the wave tank was responsible for a reduction of the water level in the piezometer. This variation
was always less than 10 mm, equivalent to ≅ 1 mbar, and accordingly a mass flux from the piezometer tank towards the wave tank was generated. The effect was simply due to the gradient pressure (respect to the atmospheric pressure) generated by the fan screw; the water level variation in the wave tank can be easily computed and is negligible.
A two‐component (2D) Laser Doppler Velocimetry system produced by TSI Inc. was used to measure the fluid velocity locally along two orthogonal directions. For this purpose, the system works with two pairs of laser beams having different wavelengths (λg and λb); each couple of beams defines a plane and the two planes are mutually normal.
The laser is an Innova 70 Series water cooled Ar‐Ion laser, which can reach a maximum power of 5 Watts. The TSI optical modular system consists of a multicolour beam separator to divide the laser beam in two color components (green, λg = 514.5 nm and blue, λb = 488.0 nm) and then each component into two beams; a Bragg cell to introduce a frequency shift to one beam for each color; four fiberoptics couplers to convey the beams towards the transmitting lens and a two‐component fiberoptics transmitting/receiving probe. The probe provides the convergence of the laser beams into the measurement volume and, since the system works in backward scatter mode, it also collects the scattered light sending it to the elaboration system. The focus length of the probe lens is 363 mm, the beam spacing is 50 mm and the half‐angle between the incident beams is 3.96°.
The measurement volume defined by the intersection of the four laser beams has the shape of a prolate ellipsoid whose dimensions are of the order 0.08×0.08×1.25 mm; the cross sections of the measurement volume on the two planes defined by each beam pair are ellipses and present an interference fringe pattern with a fringe spacing which depends on the wavelength of the light and the angle between the two incident light beams of the couple, the order of magnitude of the fringe
distance is 3.5 μm.
The collected scattered light, carrying the Doppler frequency information, is sent by a transmitting fibre to the Photo Detector Module (PDM) which includes a series of photomultiplier tubes to

Free‐surface turbulence, Waves generated by wind
5
identify and amplify the optical signal, a beam splitter and a high‐pass filter. Inside the PDM, the signal is detected, amplified and it has the pedestal removed; the elaborated signal is then sent to the signal processor Flow Size Analyzer (FSA) which processes the analogue burst signals and sends the results (Doppler frequency, velocity, time stamp, transit time, channel number) to a computer.
Uncertainties in LDV systems are due to velocity bias, inhomogeneous distribution of tracer particles, errors in the individual velocity measurements, occurrence of velocity gradients in the measurement volume, the presence of errors in the optical system, the resolution of the detector and the signal processing. These may be viewed as noise adding up to the wide bandwidth electric noise from stray light (reflections or scattering of laser light from walls, windows or optical components), the photomultiplier and the associated electronics.
A weighting function based on the transit time is applied to correct the velocity bias due to the dependence of the sampling on the velocity magnitude.
The hardware set‐up of the probe is:
• Probe model: TLN06‐363
• focal length: 363.00 mm
• beam separation: 50 mm
• beam diameter: 2.80 mm
It should be noted that, since the LDV system performs single‐point velocity measurements, it is important to accurately separate turbulence from background large scale motions.
3. Laser set‐up This section outlines the procedures performed to increase the data rate – the number of
particles crossing the measurement volume in a given time interval – and to improve the quality of the data.
First of all, the convergence of the laser beams was checked. A good convergence of the beams is, in fact, the main requirement for the achievement of high‐quality measurements and it implies three conditions:
− the two beams of each pair must intersect by at least the 80% of their diameter;
− the crossings of the two pairs must overlap by at least the 80% of their diameters;
− the crossing of the four beams must be aligned with the receiving fibre.
The first condition aims at achieving a minimum size of the measurement volume and, hence, a minimum number of fringes, which is important to obtain reliable velocity measurements. The second condition requires that the two measurement volumes defined by the two pairs of beams coincide. The third condition assures that the measurement volume and the viewing volume, namely the zone from which light is most efficiently collected by the receiving fibre, are aligned, so that the maximum of the light scattered by particles crossing the measurement volume is acquired by the system.
Since the initial configuration of the laser system did not fulfil the crossing and alignment requirements, a delicate procedure of beam steering was performed.
Free‐surface turbulence, Waves generated by wind
6
A second requirement, which should be satisfied to obtain good velocity measurements, is the balance of the beam power: the four beams should come out from the transmitting lens with sensibly equal intensity. In order to achieve this condition, attention must be paid in the procedure of aligning the heads of the transmitting fibres with the light beams emitted by the multi‐beam separator. This procedure was performed daily, before starting to run the tests.
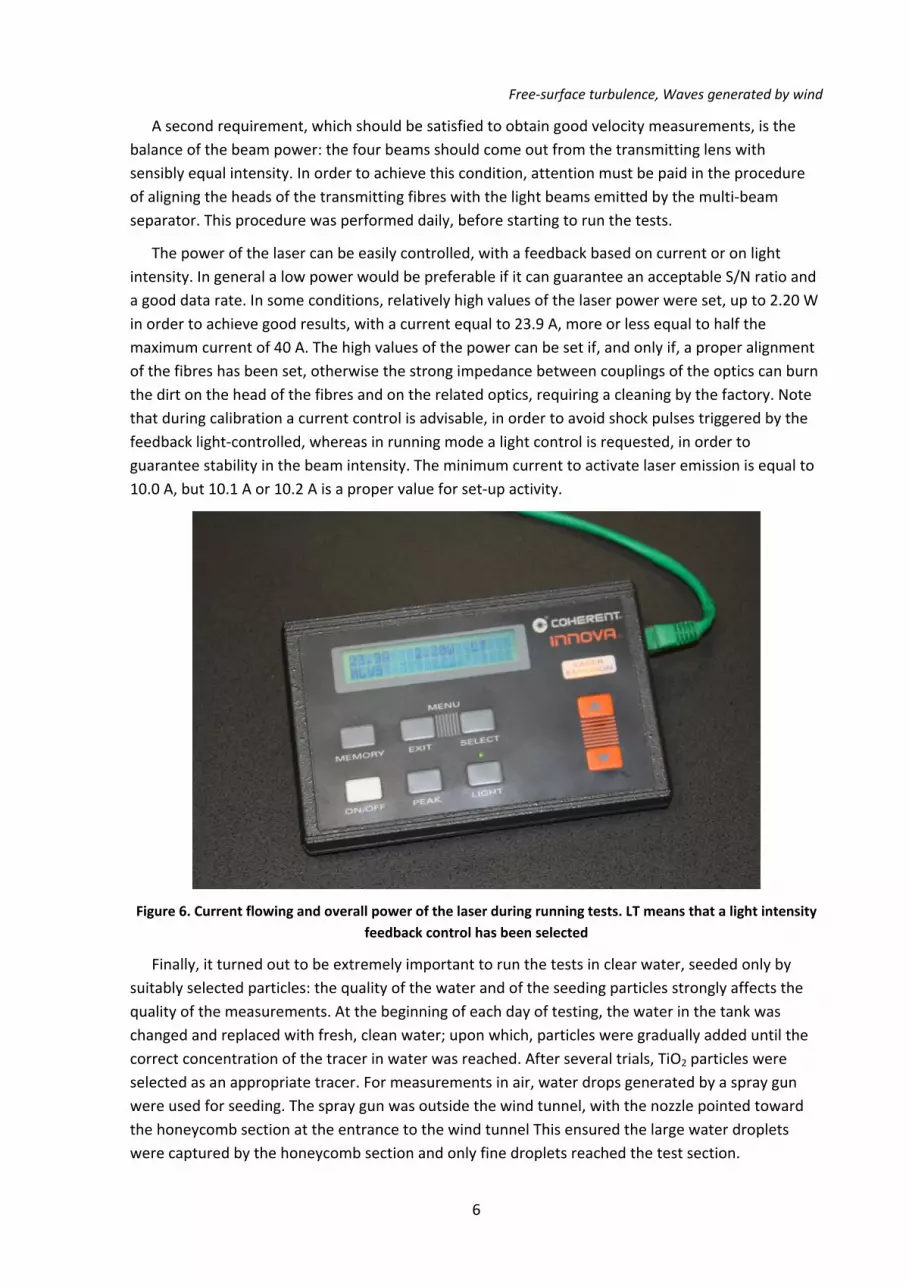
The power of the laser can be easily controlled, with a feedback based on current or on light intensity. In general a low power would be preferable if it can guarantee an acceptable S/N ratio and a good data rate. In some conditions, relatively high values of the laser power were set, up to 2.20 W in order to achieve good results, with a current equal to 23.9 A, more or less equal to half the maximum current of 40 A. The high values of the power can be set if, and only if, a proper alignment of the fibres has been set, otherwise the strong impedance between couplings of the optics can burn the dirt on the head of the fibres and on the related optics, requiring a cleaning by the factory. Note that during calibration a current control is advisable, in order to avoid shock pulses triggered by the feedback light‐controlled, whereas in running mode a light control is requested, in order to guarantee stability in the beam intensity. The minimum current to activate laser emission is equal to 10.0 A, but 10.1 A or 10.2 A is a proper value for set‐up activity.
Figure 6. Current flowing and overall power of the laser during running tests. LT means that a light intensity feedback control has been selected
Finally, it turned out to be extremely important to run the tests in clear water, seeded only by suitably selected particles: the quality of the water and of the seeding particles strongly affects the quality of the measurements. At the beginning of each day of testing, the water in the tank was changed and replaced with fresh, clean water; upon which, particles were gradually added until the correct concentration of the tracer in water was reached. After several trials, TiO2 particles were selected as an appropriate tracer. For measurements in air, water drops generated by a spray gun were used for seeding. The spray gun was outside the wind tunnel, with the nozzle pointed toward the honeycomb section at the entrance to the wind tunnel This ensured the large water droplets were captured by the honeycomb section and only fine droplets reached the test section.

Free‐surface turbulence, Waves generated by wind
7
It is well known that the system measures the velocity of the particles and not of the fluid; however for small light particles the motion of the particles is almost coincident with the fluid motion and a large volume of literature is available regarding the origin of uncertainties for this approximation.
4. Probe set‐up The transmitting/receiving probe of the LDV is mounted on an ISEL traverse system and placed adjacent to the wind tunnel. The traverse system allows horizontal (parallel to the wind tunnel) and vertical displacements of the probe, which are prompted and controlled by means of a MatLab program which transfer data to a Controller ISEL C142 4.1. The stepper has a resolution of 0.0125 mm (1 step = 0.0125 mm), a maximum length of 81239 steps equivalent to 1015 mm and a velocity ranging from 30 to 10 000 step/s, equivalent to 0.375‐125mm/s.
The reference system for the transverse displacements and, hence, for the velocity measurements, has its horizontal origin (x = 0) on the axis of the grid and its vertical origin (z = 0) at the still water level. The position of the still water level is defined at the beginning of each series of measurements and the crossing of the LDV beams is aligned to the free surface.
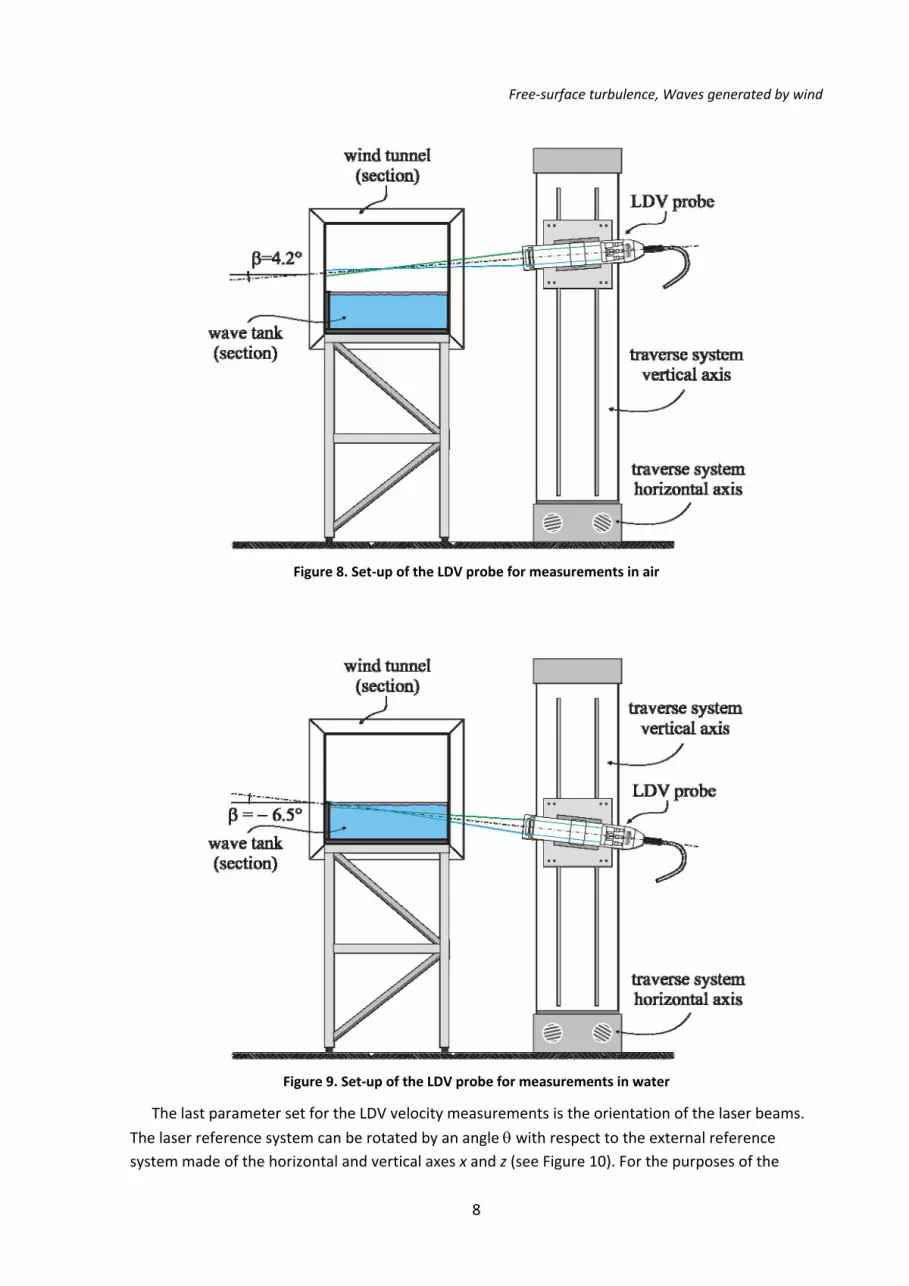
In addition to the position of the probe, its inclination (Figure 8 and Figure 9) with respect to the horizontal plane can also be changed. An angle of b = 0° favours a high data rate, as scattered light is intercepted more easily by the receiving optics and refraction effects on the beams overlap are negligible, but positive angles enable velocity measurements closer to the free surface in the air side, whereas negative angles enable velocity measurements closer to the free surface in the water side.
The adopted tilting angles are b = −6.5° in water and b = +4.2° in air. Larger values dramatically dropped the data rate, especially for the blue component (axis 2 in the LDV reference system).
Figure 7. Probe on the traverse system
Free‐surface turbulence, Waves generated by wind
8
Figure 8. Set‐up of the LDV probe for measurements in air
Figure 9. Set‐up of the LDV probe for measurements in water
The last parameter set for the LDV velocity measurements is the orientation of the laser beams.
The laser reference system can be rotated by an angle θ with respect to the external reference system made of the horizontal and vertical axes x and z (see Figure 10). For the purposes of the

Free‐surface turbulence, Waves generated by wind
9
present experiments, it is useful to introduce a rotation θ = 45° in order to reach points closer to the free surface. It should be noted that the LDV reference system is the system by which the velocity components are actually measured.
Figure 10. External (x‐z) and LDV reference systems (θ is the probe angle)
In most measurements the 4 laser beams cross only the glass window, but for measurements in sections 5‐6‐7 the laser beams cross both the PMMA walls of the wind tunnel and the glass window. For these last measurements the data rate and the overall quality of the signal is still acceptable.
4.1. Transformation matrix In order to transform the measured velocity into a velocity expressed in a fixed external coordinate system, it is necessary to evaluate the transformation matrix. Let us consider the intrinsic LDV coordinate system 1‐2‐3 and the external coordinate system x‐z‐y and assume their relative position as shown in Figure 11.
The plane 1‐2 is parallel to the plane of the lens of the probe and the axis 3 is the axis of the lens, passing through the measurement volume. The transformation matrix reads:
1
2
3
cos sin cos sin sinsin cos cos cos sin
0 sin cos
V UV VV W
θ θ β θ βθ θ β θ β
β β
−⎧ ⎫ ⎡ ⎤ ⎧ ⎫⎪ ⎪ ⎪ ⎪⎢ ⎥= −⎨ ⎬ ⎨ ⎬⎢ ⎥⎪ ⎪ ⎪ ⎪⎢ ⎥⎩ ⎭ ⎣ ⎦ ⎩ ⎭
(1)
and
1
2
3
cos sin 0sin cos cos cos sinsin sin cos sin cos
U VV VW V
θ θθ β θ β βθ β θ β β
⎧ ⎫ ⎡ ⎤ ⎧ ⎫⎪ ⎪ ⎪ ⎪⎢ ⎥= −⎨ ⎬ ⎨ ⎬⎢ ⎥⎪ ⎪ ⎪ ⎪⎢ ⎥−⎩ ⎭ ⎣ ⎦ ⎩ ⎭
(2)
where V1, V2 and V3 are the velocity as measured by the LDV, U, V and W are the velocity in the x‐z‐y reference system.

Free‐surface turbulence, Waves generated by wind
10
Figure 11. Sketch for the coordinate transformation
If the system is a 2D measuring only V1 and V2, some hypothesis on the structure of the flow field is necessary for a correct transformation. Assuming that the flow field has only components U and V,
results that V3 is equal to 3 sinV V β= and, hence, the second equation in (2) reads:
21 2 1 2
sin cossin cos cos cos sincos cos
V V V V V V Vθ θθ β θ β ββ β
= − + → = − (3)
The two‐dimensional transformation matrix becomes:
1
2
cos sinsin coscos cos
VUVV
θ θθ θβ β
⎡ ⎤⎧ ⎫⎧ ⎫ ⎢ ⎥=⎨ ⎬ ⎨ ⎬⎢ ⎥−⎩ ⎭ ⎩ ⎭⎢ ⎥⎣ ⎦
(4)
Note that the coordinate transformation is applied by software Flowsizer only if coincidence mode is set‐up (software or hardware). Also, turbulent kinetic energy and velocity cross‐correlation is computed by Flowsizer software only in coincidence mode (see next paragraph).
5. Data elaboration After acquisition, the measured data are post‐processed in order to evaluate the two velocity components. Two different modes are available: coincidence mode and non‐coincidence mode.
In coincidence mode only velocity signals from particles crossing both fringe patterns (1 and 2 axes) are retained. Virtually the signals are emitted by the same particle crossing the volume of measurements and intersecting the green generated and the blue generated fringes. These data are quite good for cross‐correlation evaluations, but their rate is usually very low.
In non‐coincidence mode all signals are processed and the timestamp and the data rate for the two channels are different. In order to use these data, characterized by a high data rate, it is necessary an interpolation in order to reduce them to two values (U and V) virtually captured at the

Free‐surface turbulence, Waves generated by wind
11
same timestamp. The best way was to interpolate U on V timestamp, to interpolate V on the original U timestamp and then to combine the original and the interpolated values. In this way, at each time stamp at least one of the two components is measured and the other one is merely estimated and the apparent mean data rate becomes equal to the sum of the two separate channels data rate.
Note that if seeding is effective, the timestamp of two or more sequent data can be equal (i.e. the time difference amongst the acquired data is below the resolution). Considering that most interpolating functions (e.g. the Matlab interpolating functions) require a monotonic sequence, it is necessary to force timestamp adding a very small value (10‐6 s was used) to the subsequent timestamp.
5.1. Measurements in water The matrix transformation to be inserted in the TSI post‐processing software is the transpose of the original matrix transformation (also coincident with the transpose, being orthogonal), i.e.
1
2
sincoscoscossincos
V UV V
θθβθθβ
⎡ ⎤⎢ ⎥⎧ ⎫ ⎧ ⎫⎢ ⎥=⎨ ⎬ ⎨ ⎬⎢ ⎥ ⎩ ⎭⎩ ⎭ −⎢ ⎥⎣ ⎦
(5)
and, for the LDV probe geometry adopted for measurements in water (θ = 45°, b = −6.5°) it reads
1
2
0.70711 0.711680.70711 0.71168
V UV V⎧ ⎫ ⎡ ⎤ ⎧ ⎫
=⎨ ⎬ ⎨ ⎬⎢ ⎥−⎣ ⎦ ⎩ ⎭⎩ ⎭ (6)
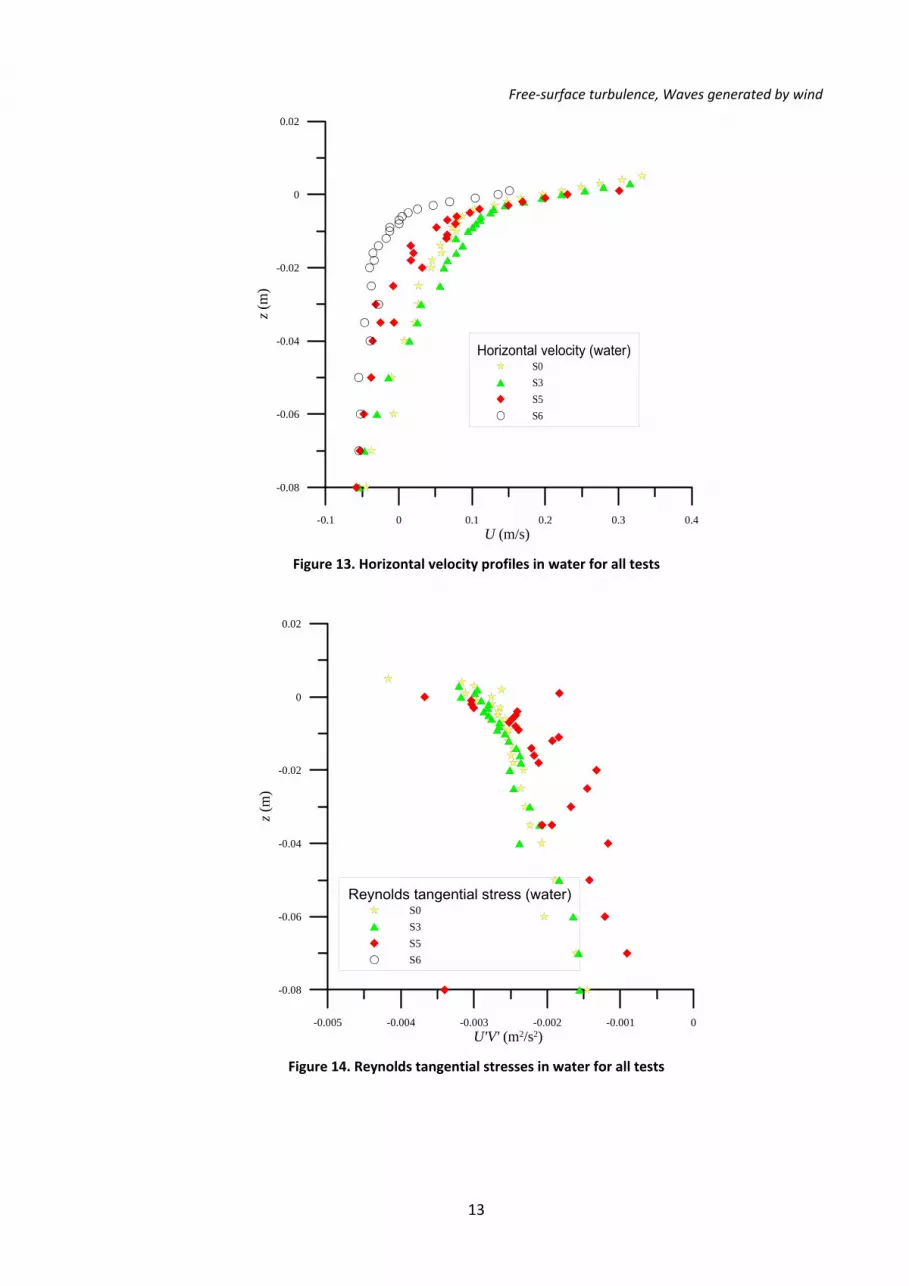
The horizontal (parallel to the wind direction) and the vertical velocities in water were measured in several points in the vertical and in sections S0, S3, S5 and S6. The Reynolds tangential stresses and the diagonal stresses (turbulent kinetic energy) were computed. The numerous tables in Appendix contains the main features of the tests.
The data are processed with two Matlab files, the programs counting_laser_*.m and counting_laser_*_bis.m which perform almost identical operations on files named test_*.txt and test_*_bis.txt; these files are the output of the TSI Flowsizer software, are in ASCII format and contain the data respectively for the NON coincidence mode and for the coincidence mode. After reading the files, the programs clean the data time series, removing the data acquired before triggering occurs (triggering signal is often sent to start data acquisition from LDV and other devices with the same initial timestamp); correct if timestamp has the same value for two different data, adding 0.000001 s to the second value; calculate the effective data rate, dividing the number of data by the interval time as recorded by timestamps, separately for the two channels. After adding two columns, i.e. datarate1 (Hz) and datarate2 (Hz), they write the results in ASCII format, in files with the same root of the source files and with the *.txt extension. They also open a new output file where the synthetic results for all files specified in input are given.
If the data are in NON coincidence mode, data interpolation is forced, linearly interpolating the data from Channel 1 to the timestamps from Channel 2, and vice versa. The new velocities (mixed from acquisition and interpolation) are stored in the variables VelocityInterpCh1_msec and VelocityInterpCh2_msec, whereas the variable TimeInterp contains the mixed progressive timestamps. A new check if timestamp has the same value for two different data is performed and eventually corrected. The output data are stored in Matlab files with the _elab.mat extension.

Free‐surface turbulence, Waves generated by wind
12
Some synthetic output are computed through Matlab *.m files, as elabora_S0_acqua.m, elabora_S3_acqua.m, elabora_S5_acqua.m, elabora_S6_acqua.m. They evaluate the turbulent
kinetic energy as ( )2 2rms rms
1 ' '2
k U V= + and the principal axis angle as:
( )1 rms2 2
rms rms
' '1 tan2 ' '
U VU V
φ − −⎛ ⎞= ⎜ ⎟
+⎝ ⎠, but only for the COINCIDENCE MODE files. The output data are in files
like Test_22_07_02_S0_acqua_CM.txt. For the NON COINCIDENCE MODE files, the output is in files like Test_22_07_02_S0_acqua_NCM.txt and only the measured data are transferred. The data for plotting the profiles are contained in files with the extension .txt.
Table 1. Measurements set in water
Section # LDV operation mode Figure File name (.txt) S0 Coincidence Mode Yes Test_22_07_02_S0_acqua_CM S0 Non Coincidence Mode No Test_22_07_02_S0_acqua_NCM S3 Coincidence Mode Yes Test_23_07_02_S3_acqua_CM S3 Non Coincidence Mode No Test_23_07_02_S3_acqua_NCM S5 Coincidence Mode Yes Test_23_07_02_S5_acqua_CM S5 Non Coincidence Mode No Test_23_07_02_S5_acqua_NCM S6 Coincidence Mode Yes Test_24_07_02_S6_acqua_CM S6 Non Coincidence Mode No Test_24_07_02_S6_acqua_NCM
-0.02 -0.01 0 0.01 0.02 0.03 0.04V (m/s)
-0.08
-0.06
-0.04
-0.02
0
0.02
z (m
)
Vertical velocity (water)S0S3S5S6
Figure 12. Vertical velocity profiles in water for all tests
Free‐surface turbulence, Waves generated by wind
13
-0.1 0 0.1 0.2 0.3 0.4U (m/s)
-0.08
-0.06
-0.04
-0.02
0
0.02
z (m
)
Horizontal velocity (water)S0S3S5S6
Figure 13. Horizontal velocity profiles in water for all tests
-0.005 -0.004 -0.003 -0.002 -0.001 0U'V' (m2/s2)
-0.08
-0.06
-0.04
-0.02
0
0.02
z (m
)
Reynolds tangential stress (water)S0S3S5S6
Figure 14. Reynolds tangential stresses in water for all tests

Free‐surface turbulence, Waves generated by wind
14
0 0.005 0.01 0.015 0.02 0.025 0.03k (m2/s2)
-0.08
-0.06
-0.04
-0.02
0
0.02
z (m
)
Turbulent kinetic energy (water)S0S3S5S6
Figure 15. Turbulent kinetic energy in water for all tests
5.2. Measurements in air The matrix transformation to be inserted in the TSI post‐processing software is the inverse of the original matrix transformation (also coincident with the transpose, being orthogonal), i.e.
1
2
sincoscoscossincos
V UV V
θθβθθβ
⎡ ⎤⎢ ⎥⎧ ⎫ ⎧ ⎫⎢ ⎥=⎨ ⎬ ⎨ ⎬⎢ ⎥ ⎩ ⎭⎩ ⎭ −⎢ ⎥⎣ ⎦
(7)
and, for the LDV probe geometry adopted for measurements in air (θ = 45°, b = 4.2°) it reads:
1
2
0.70711 0.70900.70711 0.7090
V UV V⎧ ⎫ ⎡ ⎤ ⎧ ⎫
=⎨ ⎬ ⎨ ⎬⎢ ⎥−⎣ ⎦ ⎩ ⎭⎩ ⎭ (8)
The horizontal (parallel to the wind direction) and vertical velocity components in air were measured in section S0, S1, S2, S3, S4, S5, S6 and S7. The measurements were performed with two different ground surfaces:
a) tank full of water with wind stress acting on the free surface;
b) empty tank with rigid surface to replace the water.
The Reynolds tangential stresses and the turbulent kinetic energy were computed. All the tests were performed with a fixed fan velocity. The data for plotting the profiles are contained in files with the extension .txt
Free‐surface turbulence, Waves generated by wind
15
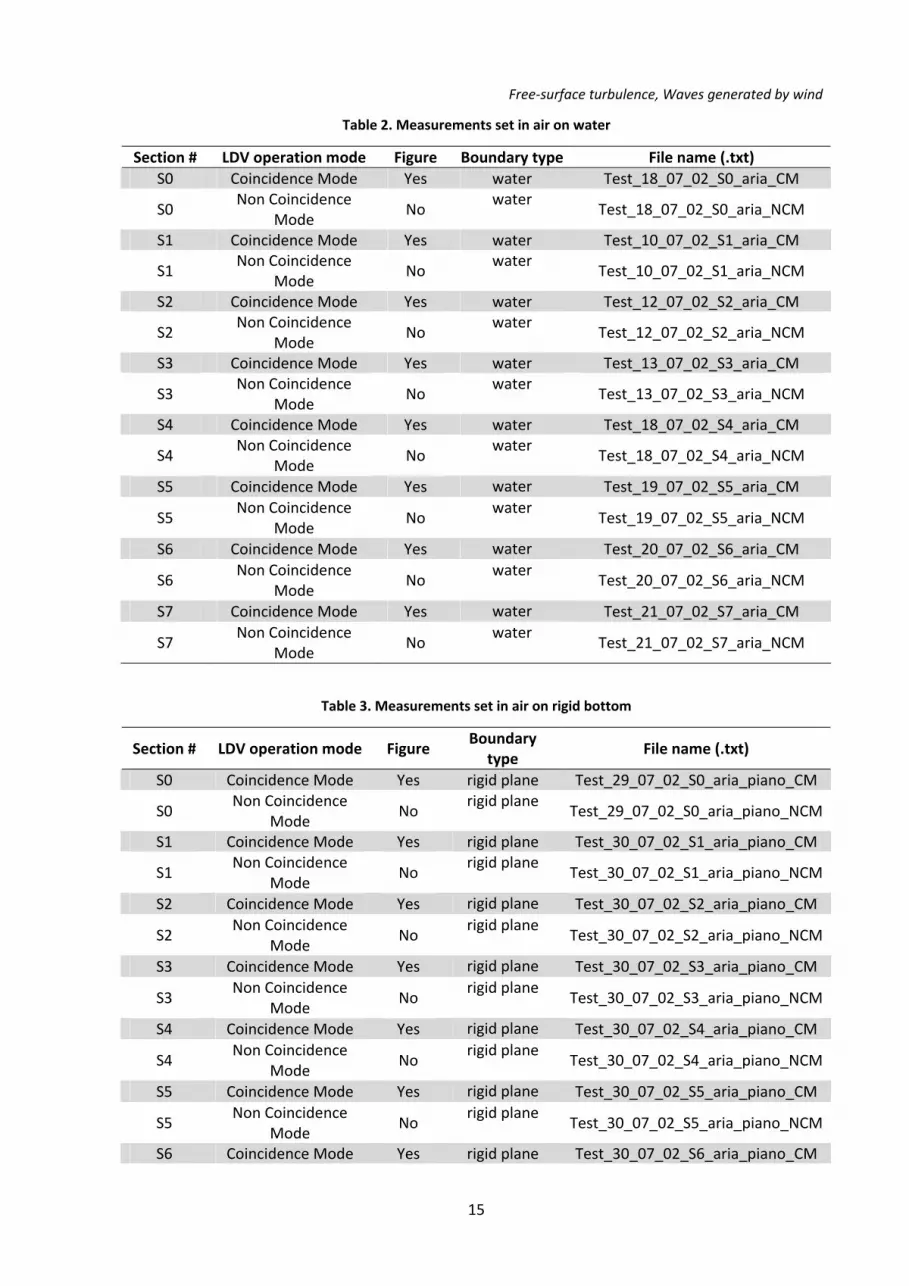
Table 2. Measurements set in air on water
Section # LDV operation mode Figure Boundary type File name (.txt) S0 Coincidence Mode Yes water Test_18_07_02_S0_aria_CM
S0 Non Coincidence
Mode No
water Test_18_07_02_S0_aria_NCM
S1 Coincidence Mode Yes water Test_10_07_02_S1_aria_CM
S1 Non Coincidence
Mode No
water Test_10_07_02_S1_aria_NCM
S2 Coincidence Mode Yes water Test_12_07_02_S2_aria_CM
S2 Non Coincidence
Mode No
water Test_12_07_02_S2_aria_NCM
S3 Coincidence Mode Yes water Test_13_07_02_S3_aria_CM
S3 Non Coincidence
Mode No
water Test_13_07_02_S3_aria_NCM
S4 Coincidence Mode Yes water Test_18_07_02_S4_aria_CM
S4 Non Coincidence
Mode No
water Test_18_07_02_S4_aria_NCM
S5 Coincidence Mode Yes water Test_19_07_02_S5_aria_CM
S5 Non Coincidence
Mode No
water Test_19_07_02_S5_aria_NCM
S6 Coincidence Mode Yes water Test_20_07_02_S6_aria_CM
S6 Non Coincidence
Mode No
water Test_20_07_02_S6_aria_NCM
S7 Coincidence Mode Yes water Test_21_07_02_S7_aria_CM
S7 Non Coincidence
Mode No
water Test_21_07_02_S7_aria_NCM
Table 3. Measurements set in air on rigid bottom
Section # LDV operation mode Figure Boundary
type File name (.txt)
S0 Coincidence Mode Yes rigid plane Test_29_07_02_S0_aria_piano_CM
S0 Non Coincidence
Mode No
rigid plane Test_29_07_02_S0_aria_piano_NCM
S1 Coincidence Mode Yes rigid plane Test_30_07_02_S1_aria_piano_CM
S1 Non Coincidence
Mode No
rigid plane Test_30_07_02_S1_aria_piano_NCM
S2 Coincidence Mode Yes rigid plane Test_30_07_02_S2_aria_piano_CM
S2 Non Coincidence
Mode No
rigid plane Test_30_07_02_S2_aria_piano_NCM
S3 Coincidence Mode Yes rigid plane Test_30_07_02_S3_aria_piano_CM
S3 Non Coincidence
Mode No
rigid plane Test_30_07_02_S3_aria_piano_NCM
S4 Coincidence Mode Yes rigid plane Test_30_07_02_S4_aria_piano_CM
S4 Non Coincidence
Mode No
rigid plane Test_30_07_02_S4_aria_piano_NCM
S5 Coincidence Mode Yes rigid plane Test_30_07_02_S5_aria_piano_CM
S5 Non Coincidence
Mode No
rigid plane Test_30_07_02_S5_aria_piano_NCM
S6 Coincidence Mode Yes rigid plane Test_30_07_02_S6_aria_piano_CM

Free‐surface turbulence, Waves generated by wind
16
S6 Non Coincidence
Mode No
rigid plane Test_30_07_02_S6_aria_piano_NCM
S7 Coincidence Mode Yes rigid plane Test_30_07_02_S7_aria_piano_CM
S7 Non Coincidence
Mode No
rigid plane Test_30_07_02_S7_aria_piano_NCM
-1.2 -0.8 -0.4 0 0.4V (m/s)
0.001
0.01
0.1
z (m
)Vertical velocity (air)
S7S6S5S4S3S2S1S0
Figure 16. Vertical velocity profiles in air on water for all tests
2 4 6 8 10 12U (m/s)
0.001
0.01
0.1
z (m
)
Horizontal velocity (air)S7S6S5S4S3S2S1S0
Figure 17. Horizontal velocity profiles in air on water for all tests

Free‐surface turbulence, Waves generated by wind
17
-2.5 -2 -1.5 -1 -0.5 0 0.5U'V' (m2/s2)
0.001
0.01
0.1
z (m
)
Reynolds tangential stressS7S6S5S4S3S2S1S0
Figure 18. Reynolds tangential stresses in air on water for all tests
0 1 2 3 4 5k (m2/s2)
0.001
0.01
0.1
z (m
)
Turbulent kinetic energyS7S6S5S4S3S2S1S0
Figure 19. Turbulent kinetic energy in air on water for all tests

Free‐surface turbulence, Waves generated by wind
18
-0.2 -0.1 0 0.1 0.2V (m/s)
0.001
0.01
0.1
z (m
)
Vertical velocity (air)- plane rigid bottom -
S7S6S5S4S3S2S1S0
Figure 20. Vertical velocity profiles in air on rigid bottom for all tests
6 7 8 9 10 11 12U (m/s)
0.001
0.01
0.1
z (m
)
Horizontal velocity (air)- plane rigid bottom -
S7S6S5S4S3S2S1S0
Figure 21. Horizontal velocity profiles in air on rigid bottom for all tests

Free‐surface turbulence, Waves generated by wind
19
-0.4 -0.3 -0.2 -0.1 0 0.1U'V' (m2/s2)
0.001
0.01
0.1
z (m
)
Reynolds tangential stress- plane rigid bottom -
S7S6S5S4S3S2S1S0
Figure 22. Reynolds tangential stresses in air on rigid bottom for all tests
0 0.4 0.8 1.2 1.6 2k (m2/s2)
0.001
0.01
0.1
z (m
)
Turbulent kinetic energy- plane rigid bottom -
S7S6S5S4S3S2S1S0
Figure 23. Turbulent kinetic energy in air on rigid bottom for all tests
5.3. Measurements in air in section S‐1 as reference velocities In order to have a reference velocity for the fluid level measurements (see paragraph on instantaneous water level measurements), several measurements in air have been carried out in
Free‐surface turbulence, Waves generated by wind
20
section S‐1 at z = 70 mm. For this set of measurements, the same geometry usually adopted for measurements in water has been used (there was no need to reach close to the interface). For the
LDV probe geometry adopted (θ = 45°, b = −6.5°) the transformation matrix reads
1
2
0.70711 0.711680.70711 0.71168
V UV V⎧ ⎫ ⎡ ⎤ ⎧ ⎫
=⎨ ⎬ ⎨ ⎬⎢ ⎥−⎣ ⎦ ⎩ ⎭⎩ ⎭ (9)
The set of experiment are reported in Table 4.
Table 4. Measurements set in air on water in Section ‐1
Section # Tension control for
the fan (V) z (mm)
File name (.txt)
S‐1 6.5 70 air Test_aria_205 S‐1 7.0 70 air Test_aria_206 S‐1 7.5 70 air Test_aria_207 S‐1 8.0 70 air Test_aria_208 S‐1 8.5 70 air Test_aria_209 S‐1 9.0 70 air Test_aria_210 S‐1 9.5 70 air Test_aria_211
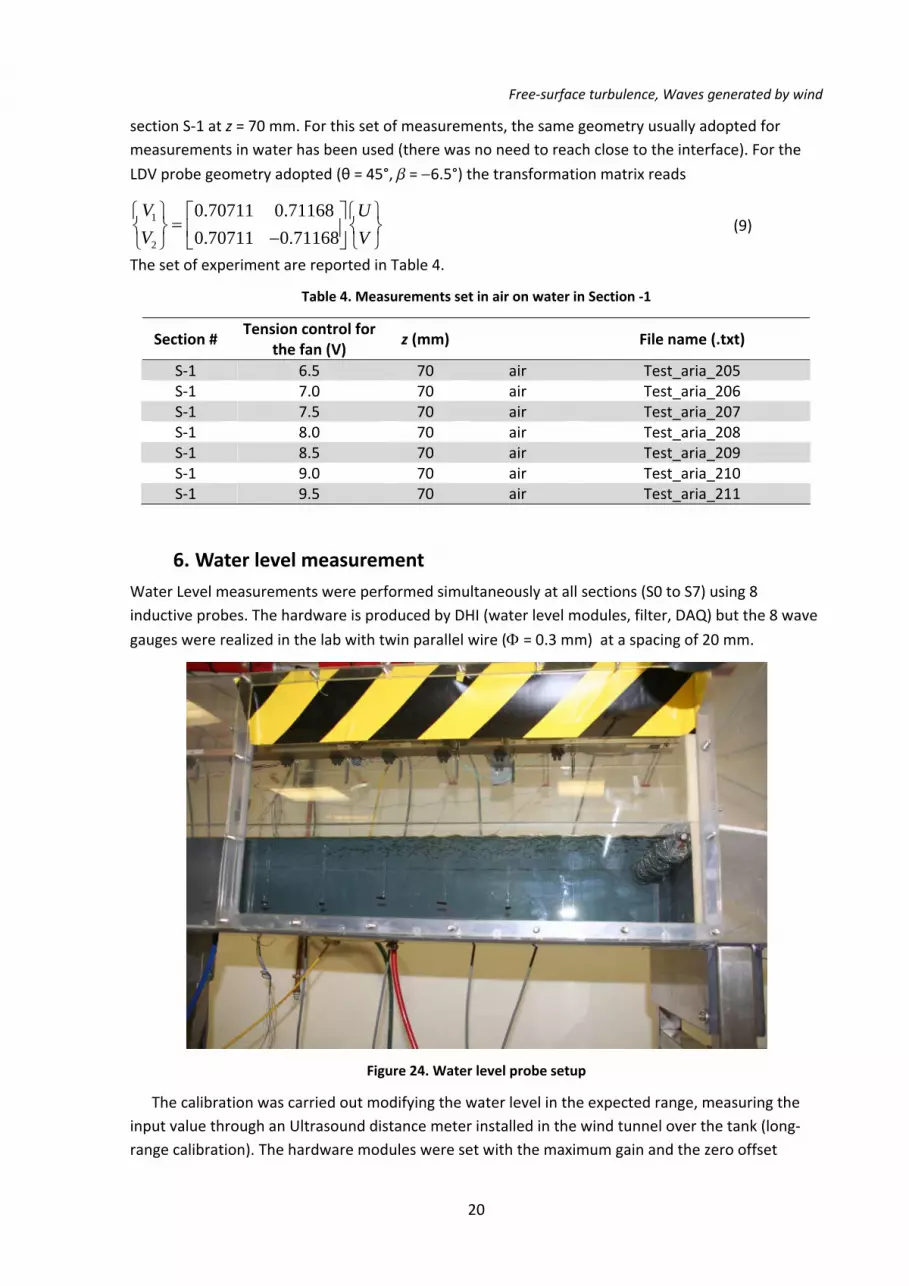
6. Water level measurement Water Level measurements were performed simultaneously at all sections (S0 to S7) using 8 inductive probes. The hardware is produced by DHI (water level modules, filter, DAQ) but the 8 wave
gauges were realized in the lab with twin parallel wire (Φ = 0.3 mm) at a spacing of 20 mm.
Figure 24. Water level probe setup
The calibration was carried out modifying the water level in the expected range, measuring the input value through an Ultrasound distance meter installed in the wind tunnel over the tank (long‐range calibration). The hardware modules were set with the maximum gain and the zero offset

Free‐surface turbulence, Waves generated by wind
21
corresponding to an empty tank. The calibration was realized forcing 11 different water levels in the tank, acquiring the output of the Ultrasound distance meter and of the wave gauges for 10 s, data rate equal to 40 Hz, analogic filter cut‐off frequency equal to 20 Hz. The output files have the extension *.daf and are in ASCII format, with the first column containing timestamp and the other columns containing the output of the DHI software in internal units.
Table 5. Files for calibration of the wave gauges
File name distance measured by the US distance meter
(mm) Data rate (Hz) Measurement type
0001log1.daf 224.9 40 Level 0002log1.daf 221.6 40 Level 0003log1.daf na na na 0004log1.daf 215.7 40 Level 0005log1.daf 210.0 40 Level 0006log1.daf 205.4 40 Level 0007log1.daf 200.6 40 level 0008log1.daf 196.6 40 Level 0009log1.daf 192.1 40 Level 0010log1.daf 188.9 40 Level 0011log1.daf 185.7 40 Level
zero_fin_log1.daf 184.2 40 Level 0012log1.daf 183.9 40 Level
The reference level is the still water level for a filled tank. The distance measured by the US distance meter at the reference level is equal to 184.2 mm, while the recorded signals from the wave gauges are stored in the file zero_fin_log1.daf. Table 6 contains the mean values of the recorded data, expressed in internal units of the DHI software. The files have been converted in Excel format with a further process in order to evaluate the standard deviation s, listed in Table 7.
Table 6. Mean value of the output signal. The unit of measurement named iu means internal unit
file US
distance (mm) z (mm)
S0 (iu)
S1 (iu)
S2 (iu)
S3 (iu)
S4 (iu)
S5 (iu)
S6 (iu)
S7 (iu)
0001log1.daf 224.9 ‐40.7 5.325 5.307 5.443 5.399 5.330 5.539 5.385 5.328 0002log1.daf 221.6 ‐37.4 5.619 5.780 5.745 5.693 5.609 5.842 5.691 5.601 0004log1.daf 215.7 ‐31.5 6.155 8.044 6.315 6.240 6.151 6.400 6.249 6.135 0005log1.daf 210.0 ‐25.8 6.697 9.207 6.871 6.777 6.665 6.948 6.800 6.643 0006log1.daf 205.4 ‐21.2 7.139 13.989 7.320 7.213 7.077 7.397 7.233 7.056 0007log1.daf 200.6 ‐16.4 7.576 14.869 7.794 7.669 7.514 7.862 7.704 7.490 0008log1.daf 196.6 ‐12.4 7.945 15.621 8.191 8.052 7.859 8.241 8.089 7.846 0009log1.daf 192.1 ‐7.9 8.341 16.426 8.612 8.445 8.249 8.662 8.519 8.265 0010log1.daf 188.9 ‐4.7 8.631 16.958 8.904 8.727 8.521 8.956 8.816 8.535 0011log1.daf 185.7 ‐1.5 8.918 17.614 9.224 9.041 8.815 9.276 9.146 8.832 0012log1.daf 183.9 0.3 9.086 17.943 9.395 9.204 8.969 9.451 9.331 8.982

Free‐surface turbulence, Waves generated by wind
22
Table 7. Standard deviation value of the signal. The unit of measurement named iu means internal unit
file US
distance (mm)
sz
(mm) S0 (iu)
S1 (iu)
S2 (iu)
S3 (iu)
S4 (iu)
S5 (iu)
S6 (iu)
S7 (iu)
0001log1.daf 224.9 0.3 0.105 0.162 0.081 0.074 0.068 0.076 0.073 0.0760002log1.daf 221.6 0.3 0.071 0.204 0.091 0.067 0.068 0.071 0.070 0.0600004log1.daf 215.7 0.3 0.113 0.230 0.080 0.067 0.076 0.066 0.074 0.0740005log1.daf 210.0 0.3 0.084 0.180 0.084 0.078 0.091 0.073 0.072 0.0710006log1.daf 205.4 0.3 0.095 0.171 0.066 0.077 0.082 0.076 0.084 0.0800007log1.daf 200.6 0.3 0.100 0.135 0.106 0.070 0.090 0.062 0.075 0.0850008log1.daf 196.6 0.3 0.096 0.200 0.073 0.083 0.073 0.071 0.074 0.1000009log1.daf 192.1 0.3 0.093 0.171 0.093 0.085 0.082 0.069 0.092 0.0750010log1.daf 188.9 0.3 0.079 0.213 0.088 0.077 0.078 0.066 0.064 0.0850011log1.daf 185.7 0.3 0.096 0.191 0.089 0.072 0.074 0.079 0.083 0.0840012log1.daf 183.9 0.3 0.091 0.180 0.072 0.075 0.084 0.083 0.086 0.076
The calibration curves (see the Appendix) are strongly linear and have similar gain and offset for all the probes except for probe in Section S1. For this probe, only the second branch of the data has been considered for computing the best fitting line.
Table 8. Calibration equations. x is in DHI software internal units
probe z (mm) gain offset
S0 z= 10.873 *x −98.597S1 z= 5.46 *x −97.592S2 z= 10.338 *x −96.881S3 z= 10.743 *x −98.649S4 z= 11.245 *x −100.674S5 z= 10.469 *x −98.604S6 z= 10.405 *x −96.593S7 z= 11.159 *x −99.994
The raw data have been processed applying the calibration equation to each wave gauge output. Then a de‐spiking toolbox has been used (using phase‐space method by Goring and Nikora, 2002 as modified by Mori, 2005) in order to remove spikes. The data have been reduced to a mean zero value and stored in binary files in Matlab format. The files, named with the same root of the files containing the raw data and with the extension .mat, store a matrix named datac containing in the first column the time stamps and in the other columns the converted data for the probe S0, S1,...,S7. They also contain a vector named medio with the mean value of the signal for each probe.
In a first set of 6 tests several files have been recorded with fixed velocity of the fan (the maximum allowed) in order to check the data repeatability and the effects of the data rate (see Table 9). A continuous shift of the mean water level is recorded over time, presumably due to dirty deposit
on the wires, equal to ∼1.5 mm in 30 minutes of testing but the major variation occurred during the first minutes of testing. The drift of the signal during a single test is very small and can be neglected. Then the fan velocity was set up at different values modifying the control voltage, obtaining 12 sets

Free‐surface turbulence, Waves generated by wind
23
(2 for each control voltage, see Table 9). The wind velocity was measured by LDV in section S‐1 at z = 70 mm.
Table 9. Water level data set
File name (raw data)
date File name
(converted data) Measurement
type Fan control voltage
Data rate (Hz)
duration(s)
1001log1.daf 26/07/2011 1001log1.mat Level 9.5 40 600 1002log1.daf 26/07/2011 1002log1.mat Level 9.5 40 600 1003log1.daf 26/07/2011 1003log1.mat Level 9.5 40 600 1004log1.daf 26/07/2011 1004log1.mat Level 9.5 40 600 1005log1.daf 26/07/2011 1005log1.mat Level 9.5 100 600 1006log1.daf 26/07/2011 1006log1.mat Level 9.5 200 600 1007log1.daf 26/07/2011 1007log1.mat level 6.5 200 600 1008log1.daf 26/07/2011 1008log1.mat Level 6.5 200 600 1009log1.daf 26/07/2011 1009log1.mat Level 7.0 200 600 1010log1.daf 26/07/2011 1010log1.mat Level 7.0 200 600 1011log1.daf 26/07/2011 1011log1.mat Level 7.5 200 600 1012log1.daf 26/07/2011 1012log1.mat Level 7.5 200 600 1013log1.daf 26/07/2011 1013log1.mat Level 8.0 200 600 1014log1.daf 26/07/2011 1014log1.mat Level 8.0 200 600 1015log1.daf 26/07/2011 1015log1.mat Level 8.5 200 600 1016log1.daf 26/07/2011 1016log1.mat Level 8.5 200 600 1017log1.daf 26/07/2011 1017log1.mat Level 9.0 200 600 1018log1.daf 26/07/2011 1018log1.mat Level 9.0 200 600
Figure 25. Water level measurements in section S0 and S7. Data from test 1006log1
The data have been analyzed in the time domain with a zero‐up‐crossing technique, in order to extract some statistical parameter. The value of the Hrms, of the crests and of the troughs are
Free‐surface turbulence, Waves generated by wind
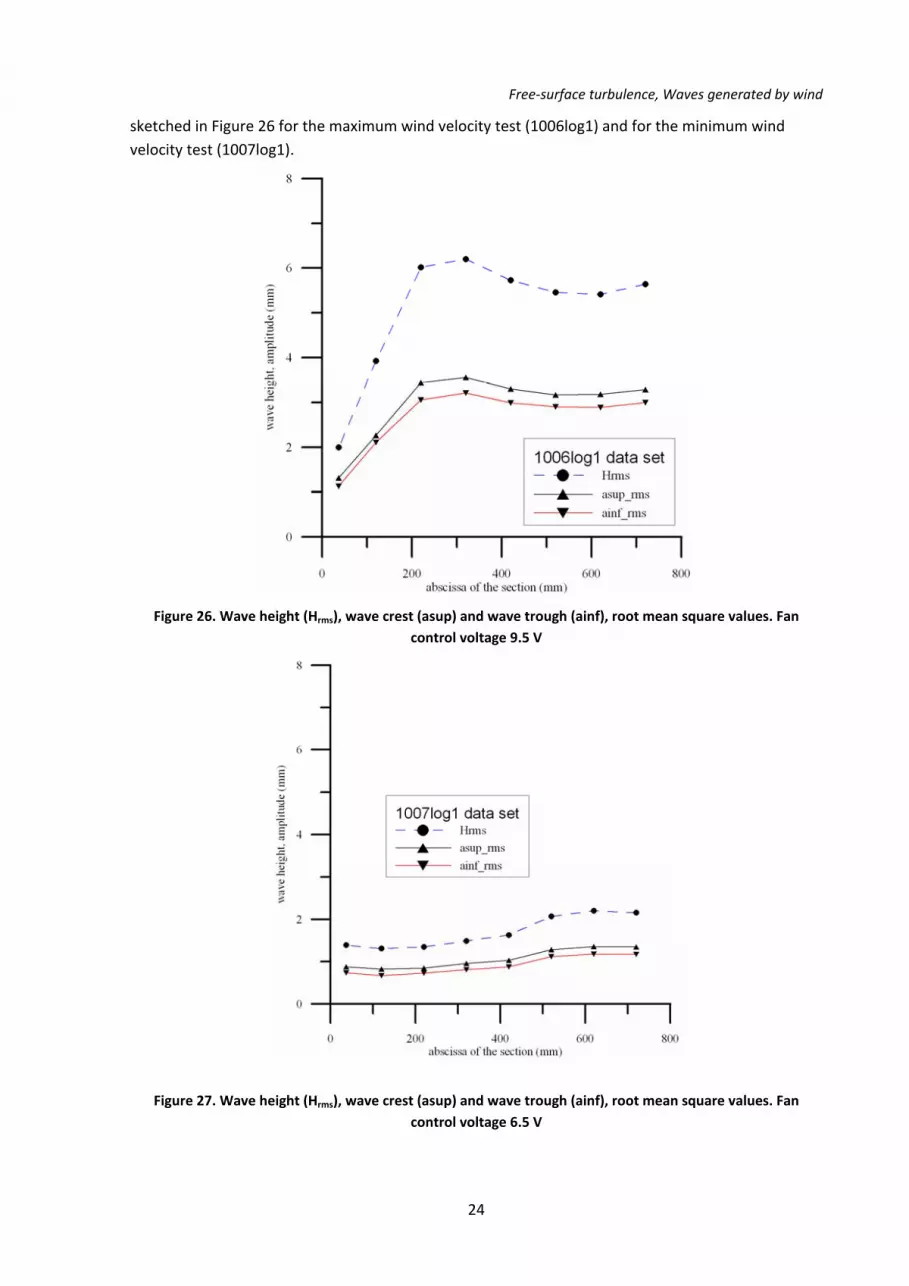
24
sketched in Figure 26 for the maximum wind velocity test (1006log1) and for the minimum wind velocity test (1007log1).
Figure 26. Wave height (Hrms), wave crest (asup) and wave trough (ainf), root mean square values. Fan control voltage 9.5 V
Figure 27. Wave height (Hrms), wave crest (asup) and wave trough (ainf), root mean square values. Fan
control voltage 6.5 V

Free‐surface turbulence, Waves generated by wind
25
7. Measurements with Ultrasound Doppler velocimeter Measurements of the fluid velocity below the free surface were taken using a single vertical probe
connected to an Ultrasonic Doppler Velocity Profiler (UDVP by Signal Processing, Switzerland, model DOP2000, 2005), and the carrier frequency of the probe was 8 MHz (TR0805LS). The arrangement of the probe is shown in Figure 28.
Figure 28. Ultrasound Doppler Velocimeter probe set‐up
The transducer had active element diameters of 5 mm in an 8 mm (diameter) cylindrical plastic housing. The origin of the measurements is at 38 mm above the bottom of the tank, i.e. 67 mm below the still water level. The arrangement of the probe was chosen to have the minimum possible number of gates, with the aim of mapping out the near‐surface flow field. To increase the S/N ratio, the water was seeded with TiO2 particles.
The transducer measured the axial velocity component as a function of the axial position. The velocity profile was measured in 100 spatial positions (gates), starting from 3 mm in front of the probe head. The measuring volume of a single gate was approximately disk‐shaped, with a thickness related to the operating condition and a diameter that was almost invariant (nominally equal to 5 mm in the near field zone, ~33 mm long for the probe used in water). The measuring volume increased in the far field progressively due to lateral spreading of the US energy, with a half diverging angle of 1.2° for the probe used in water.
The actual diameter of the measuring volume is smaller than the nominal volume if the correct sensitivity level and beam power are selected. In fact, a reduced sensitivity during the echo reception (i.e., a high level of energy of the echoes requested to process the signal) and a high power of the US beam favour the backscatter of the particles near the axis of the beam (the US power decreases in the radial direction as well as the axial direction) and thus focus the volume of measurements in the near‐axis region. Balancing this, multiple particles or micro‐eddies present in the volume of measurement scatter the echoes and broaden the spectral peak, whereas diffraction tends to enlarge the measurement volume. The thickness of the sampling volumes is assumed to be equal to half the wavelengths contained in a burst, unless the electronic bandwidth of the instrument is
Free‐surface turbulence, Waves generated by wind
26
limiting. In our experimental setup, this last variable is the limiting factor that determines the minimum thickness of the sampling volume (0.68 mm in water). The overall size of the measurement volumes allows only the detection and analysis of macroturbulence, but this limitation is outweighed by some advantages, such as the large number of measurement points that are almost simultaneously available. In addition, the larger dimension of the measurement volumes is in the horizontal plane, and, in the flow field of the present experiments, the fluid velocity has a moderate spatial gradient in the horizontal direction. The most important spatial gradient is expected in the vertical dimension, and the resolution in the vertical axis is comparable to the resolution obtained using Laser Doppler Velocimetry, Particle Image Velocimetry or Thermal Anemometry. The distance between two gates is equal to 0.75 mm, as measured along the beam axis using non‐overlapping measurement volumes. Each profile was obtained as an average of 32 emissions of a four‐wave
burst. The time lag of the pulse from one gate to another was kδz/c, where k is a coefficient (~2), δz is the distance between two gates and c is the ultrasound celerity in water. The velocity resolution
was 1/128 (1 Least Significant Bit) of the velocity range (∼0.8% FS). For all tests, this was better than 4 mm/s (the velocity measured along the probe axis).
There are some effects to be considered in evaluating the reliability of the measurements made using UDVP. The presence of the moving interface generates a Doppler shift that is highly energetic and can persist in the flow field as a stationary signal. The elimination of these stationary components by high‐pass filtering implies an increase in the dynamic of the analysed echoes and a reduction in the sensitivity of low velocity measurements. Unfortunately, the Doppler frequency shift induced by these mobile interfaces cannot be removed if its value is the same as that of the flowing particles. To balance all these effects, the presence of some artifacts is tolerated.
The main sources of uncertainty for the UDVP are Doppler noise, the presence of air bubbles or highly reflective interfaces, and the gradient of temperature in the liquid medium.
Doppler noise is essentially a Gaussian white noise and depends on the seeding particles and on the presence of gas bubbles. The effects of gas bubbles are quite dramatic: even though the celerity of the Ultrasound carrier is essentially not affected if the bubble void fraction is < 0.1, the UDVP system measures the bubbles’ velocities, and these can be much different from the fluid velocity if the bubbles are large. In the presence of bubbles or highly reflective interfaces, several velocity spikes are recorded that are not due to turbulence. For this reason, we limited the experiments to non‐aerated flows.
The uncertainty in the position of the gates and in the fluid velocity evaluation is due to the mean celerity of the Ultrasounds, which is affected by the temperature and density of the fluid. Considering pure water and assuming that the temperature varies linearly between the emitter and the gate, the relative uncertainty in the position of the gate is equal to:
2 21 0
20 04
c cLL c
−Δ=
(10)
Here, L0 is the distance of the gate from the emitter/receiver as measured at the nominal uniform celerity c0 (the celerity near the emitter/receiver with a fluid temperature Q0) and c1 is the celerity near the gate with a local fluid temperature equal to Q1. The uncertainty in travel time measurements has been neglected because the electronics allow for very accurate estimations of the

Free‐surface turbulence, Waves generated by wind
27
interval time. Assuming Q0 = 288 K and Q1 = Q0 ≤ 1 K, then c0 = 1462.8 m/s, c1 = 1462.8≤2.7 m/s, the relative uncertainty DL/L0 = 0.1% and the absolute uncertainty = ≤ 0.1 mm at a distance of 100 mm.
The evaluation of the uncertainty in fluid velocity evaluation requires a short description of the principle of the Ultrasonic Doppler Velocity Profiler that we used. In the UDVP adopted, the emitter periodically sends a short ultrasonic burst (four waves per burst in the setup used), and a receiver (coincident with the emitter) collects echo issues from targets that may be present in the path of the ultrasonic beam. By sampling the incoming echoes at the same time relative to the emission of the bursts, the displacements of scatters along the beam axis are detected, and from these, the fluid velocity along the beam axis (assumed equal to the velocity of the scatters) is computed as:
2 1( )2 prf
c t tut−
=
(11)
where tprf is the time between two subsequent pulses, t1 is the travel time of the first pulse and t2 is the travel time of the second pulse. Assuming that the two events, “travel of the first pulse” and “travel of the second pulse”, are not correlated, the absolute uncertainty in the velocity estimation can be computed as:
0 02 1
0 0
( )2 prf prf
L LL L Lut L t L
Δ − ΔΔ = =
(12)
This is very large for most of the operating conditions (e.g., setting tprf = 3ä10‐4 s for measurements in a gate at L0 = 100 mm and assuming DL/L0 = 0.1% results in Du = 0.33 m/s). In practical situations, if turbulence in the flow field has a time scale larger than tprf, the fluctuations of celerity along the path have a similar pattern for the two subsequent pulses and this results in
Δ(L2 − L1)<<2 ΔL. In addition, the velocity is estimated as the average of several bursts (32 in the present experimental setup), with a consequent reduction in the uncertainty.
A last source of uncertainty arises from the finite size of the measurement volumes, which affects the velocity measurements and the Reynolds stress estimates. Here, this uncertainty is negligible with respect to the other sources of uncertainty.
The overall accuracy in the velocity measurements under carefully controlled conditions can be assessed as 3% of the instantaneous value, with a minimum equal to 0.8% of the Full Scale (less than 4 mm/s for most tests).
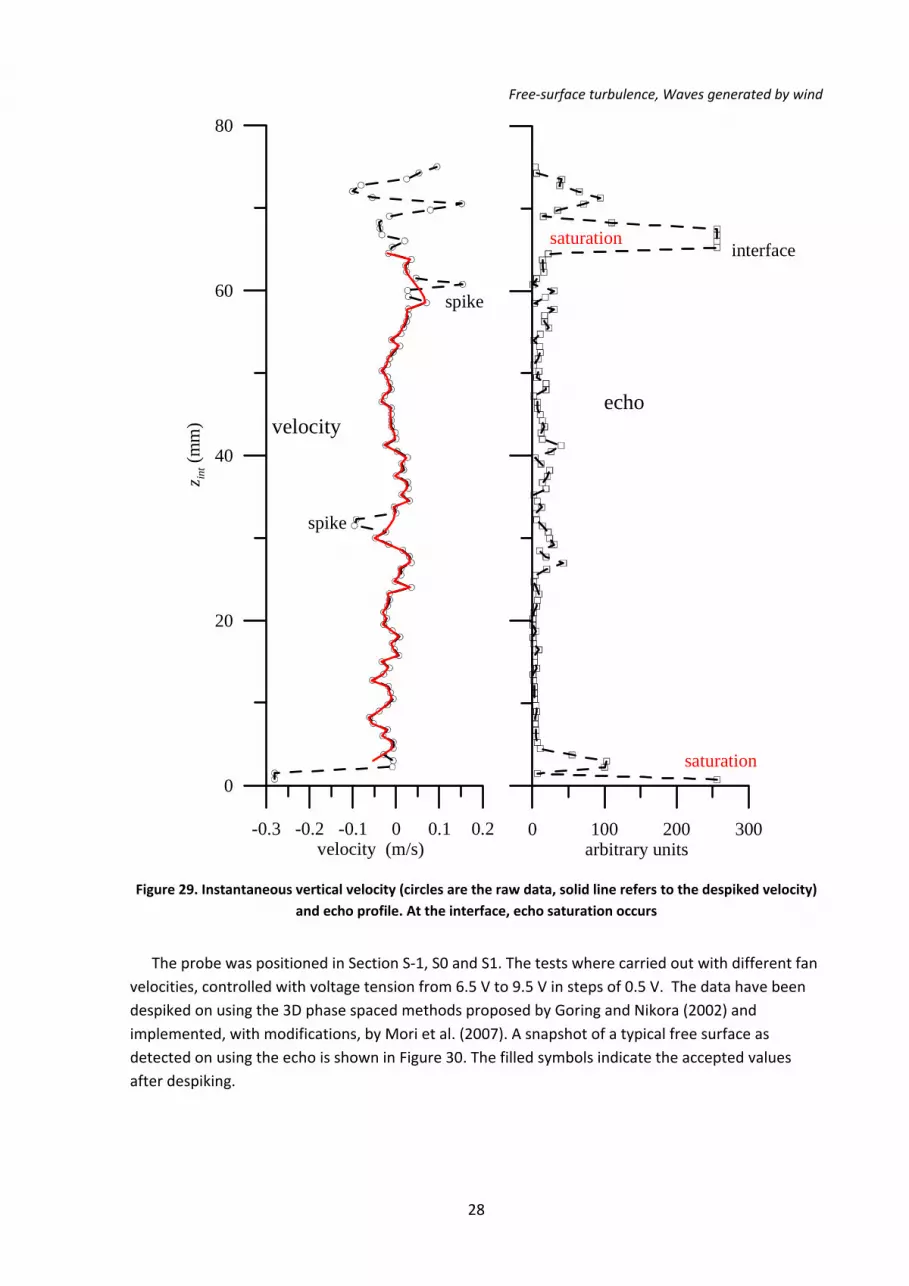
The signal can also be used to detect the instantaneous free surface. The echo shows a large increment (most of the time it is in saturation) due to the reflection of the moving surface (Figure 29) and a detecting algorithm can be used to evaluate the instantaneous free surface. The detecting algorithm performs two different operations: the first is the evaluation of the first gate towards the free surface where saturation occurs (it is necessary to start far from the near probe region where saturation occurs before ultrasonic field spreading); if nowhere saturation occurs, the algorithm evaluates the gate where the maximum echo is recorded.
The last gate of measurements is at 75 mm from the probe and the typical mean water level is at
∼ 65 mm. On the base of the wave statistics as elaborated using the water level probe, it is expected that the crests of the highest waves are missing, but their number is quite limited (less than 30 points for the highest fan velocity in section S‐1) and can be neglected. A total of 60 000 profiles were
recorded in each test for further analysis, with a data rate equal to ∼ 100 profiles per second.
Free‐surface turbulence, Waves generated by wind
28
-0.3 -0.2 -0.1 0 0.1 0.2velocity (m/s)
0
20
40
60
80
z int (
mm
)
0 100 200 300arbitrary units
interface
echovelocity
spike
spike
saturation
saturation
Figure 29. Instantaneous vertical velocity (circles are the raw data, solid line refers to the despiked velocity) and echo profile. At the interface, echo saturation occurs
The probe was positioned in Section S‐1, S0 and S1. The tests where carried out with different fan
velocities, controlled with voltage tension from 6.5 V to 9.5 V in steps of 0.5 V. The data have been despiked on using the 3D phase spaced methods proposed by Goring and Nikora (2002) and implemented, with modifications, by Mori et al. (2007). A snapshot of a typical free surface as detected on using the echo is shown in Figure 30. The filled symbols indicate the accepted values after despiking.
Free‐surface turbulence, Waves generated by wind
29
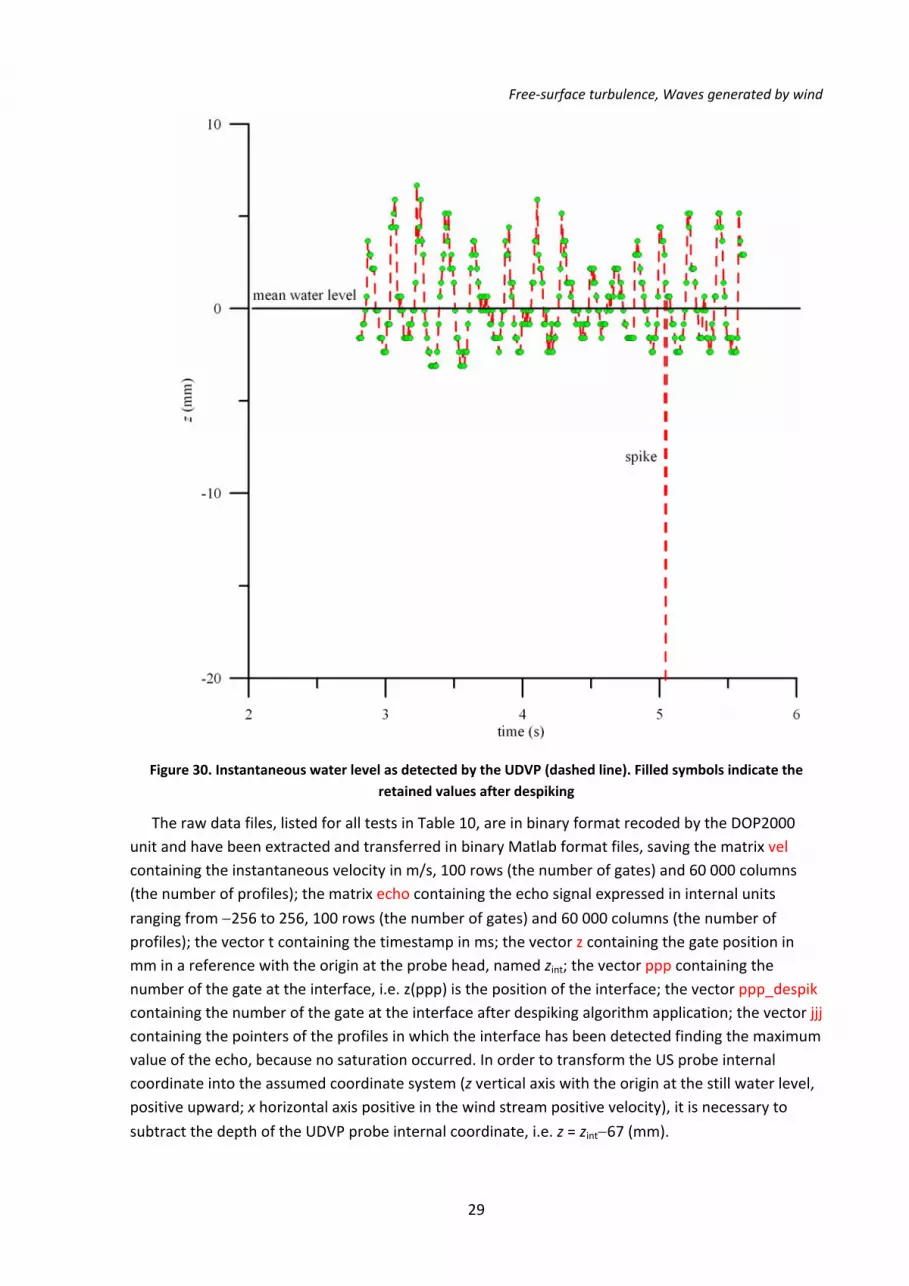
Figure 30. Instantaneous water level as detected by the UDVP (dashed line). Filled symbols indicate the retained values after despiking
The raw data files, listed for all tests in Table 10, are in binary format recoded by the DOP2000 unit and have been extracted and transferred in binary Matlab format files, saving the matrix vel containing the instantaneous velocity in m/s, 100 rows (the number of gates) and 60 000 columns (the number of profiles); the matrix echo containing the echo signal expressed in internal units
ranging from −256 to 256, 100 rows (the number of gates) and 60 000 columns (the number of profiles); the vector t containing the timestamp in ms; the vector z containing the gate position in mm in a reference with the origin at the probe head, named zint; the vector ppp containing the number of the gate at the interface, i.e. z(ppp) is the position of the interface; the vector ppp_despik containing the number of the gate at the interface after despiking algorithm application; the vector jjj containing the pointers of the profiles in which the interface has been detected finding the maximum value of the echo, because no saturation occurred. In order to transform the US probe internal coordinate into the assumed coordinate system (z vertical axis with the origin at the still water level, positive upward; x horizontal axis positive in the wind stream positive velocity), it is necessary to
subtract the depth of the UDVP probe internal coordinate, i.e. z = zint−67 (mm).

Free‐surface turbulence, Waves generated by wind
30
The average and the phase‐average velocity in section S0, maximum fan velocity, is shown in Figure 31.
Figure 31. Average and phasic average vertical velocity measured by UDVP in section S0, maximum fan speed
Free‐surface turbulence, Waves generated by wind
31
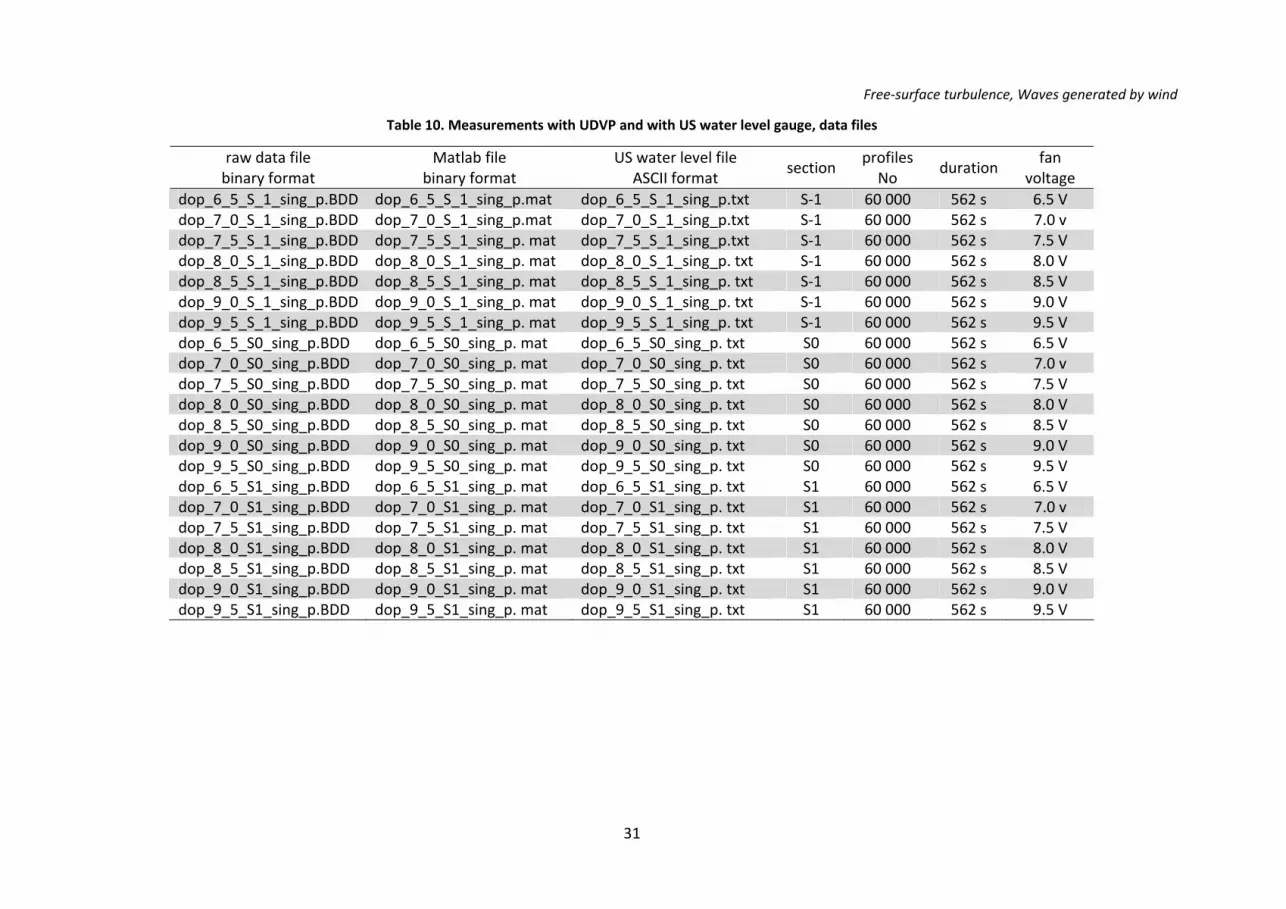
Table 10. Measurements with UDVP and with US water level gauge, data files
raw data file binary format
Matlab file binary format
US water level file ASCII format
sectionprofiles No
durationfan
voltage dop_6_5_S_1_sing_p.BDD dop_6_5_S_1_sing_p.mat dop_6_5_S_1_sing_p.txt S‐1 60 000 562 s 6.5 V dop_7_0_S_1_sing_p.BDD dop_7_0_S_1_sing_p.mat dop_7_0_S_1_sing_p.txt S‐1 60 000 562 s 7.0 v dop_7_5_S_1_sing_p.BDD dop_7_5_S_1_sing_p. mat dop_7_5_S_1_sing_p.txt S‐1 60 000 562 s 7.5 V dop_8_0_S_1_sing_p.BDD dop_8_0_S_1_sing_p. mat dop_8_0_S_1_sing_p. txt S‐1 60 000 562 s 8.0 V dop_8_5_S_1_sing_p.BDD dop_8_5_S_1_sing_p. mat dop_8_5_S_1_sing_p. txt S‐1 60 000 562 s 8.5 V dop_9_0_S_1_sing_p.BDD dop_9_0_S_1_sing_p. mat dop_9_0_S_1_sing_p. txt S‐1 60 000 562 s 9.0 V dop_9_5_S_1_sing_p.BDD dop_9_5_S_1_sing_p. mat dop_9_5_S_1_sing_p. txt S‐1 60 000 562 s 9.5 V dop_6_5_S0_sing_p.BDD dop_6_5_S0_sing_p. mat dop_6_5_S0_sing_p. txt S0 60 000 562 s 6.5 V dop_7_0_S0_sing_p.BDD dop_7_0_S0_sing_p. mat dop_7_0_S0_sing_p. txt S0 60 000 562 s 7.0 v dop_7_5_S0_sing_p.BDD dop_7_5_S0_sing_p. mat dop_7_5_S0_sing_p. txt S0 60 000 562 s 7.5 V dop_8_0_S0_sing_p.BDD dop_8_0_S0_sing_p. mat dop_8_0_S0_sing_p. txt S0 60 000 562 s 8.0 V dop_8_5_S0_sing_p.BDD dop_8_5_S0_sing_p. mat dop_8_5_S0_sing_p. txt S0 60 000 562 s 8.5 V dop_9_0_S0_sing_p.BDD dop_9_0_S0_sing_p. mat dop_9_0_S0_sing_p. txt S0 60 000 562 s 9.0 V dop_9_5_S0_sing_p.BDD dop_9_5_S0_sing_p. mat dop_9_5_S0_sing_p. txt S0 60 000 562 s 9.5 V dop_6_5_S1_sing_p.BDD dop_6_5_S1_sing_p. mat dop_6_5_S1_sing_p. txt S1 60 000 562 s 6.5 V dop_7_0_S1_sing_p.BDD dop_7_0_S1_sing_p. mat dop_7_0_S1_sing_p. txt S1 60 000 562 s 7.0 v dop_7_5_S1_sing_p.BDD dop_7_5_S1_sing_p. mat dop_7_5_S1_sing_p. txt S1 60 000 562 s 7.5 V dop_8_0_S1_sing_p.BDD dop_8_0_S1_sing_p. mat dop_8_0_S1_sing_p. txt S1 60 000 562 s 8.0 V dop_8_5_S1_sing_p.BDD dop_8_5_S1_sing_p. mat dop_8_5_S1_sing_p. txt S1 60 000 562 s 8.5 V dop_9_0_S1_sing_p.BDD dop_9_0_S1_sing_p. mat dop_9_0_S1_sing_p. txt S1 60 000 562 s 9.0 V dop_9_5_S1_sing_p.BDD dop_9_5_S1_sing_p. mat dop_9_5_S1_sing_p. txt S1 60 000 562 s 9.5 V
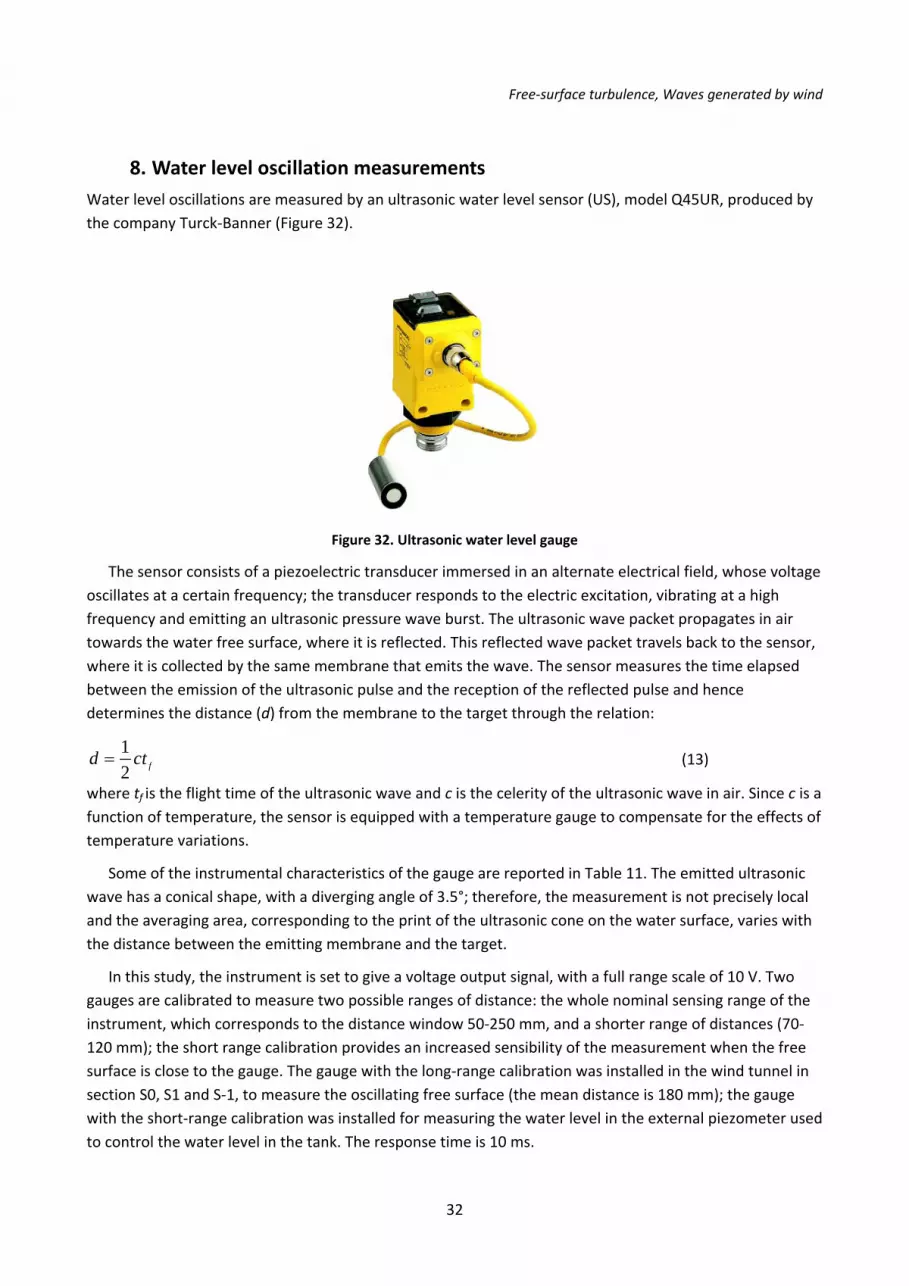
Free‐surface turbulence, Waves generated by wind
32
8. Water level oscillation measurements Water level oscillations are measured by an ultrasonic water level sensor (US), model Q45UR, produced by the company Turck‐Banner (Figure 32).
Figure 32. Ultrasonic water level gauge
The sensor consists of a piezoelectric transducer immersed in an alternate electrical field, whose voltage oscillates at a certain frequency; the transducer responds to the electric excitation, vibrating at a high frequency and emitting an ultrasonic pressure wave burst. The ultrasonic wave packet propagates in air towards the water free surface, where it is reflected. This reflected wave packet travels back to the sensor, where it is collected by the same membrane that emits the wave. The sensor measures the time elapsed between the emission of the ultrasonic pulse and the reception of the reflected pulse and hence determines the distance (d) from the membrane to the target through the relation:
12 fd ct= (13)
where tf is the flight time of the ultrasonic wave and c is the celerity of the ultrasonic wave in air. Since c is a function of temperature, the sensor is equipped with a temperature gauge to compensate for the effects of temperature variations.
Some of the instrumental characteristics of the gauge are reported in Table 11. The emitted ultrasonic wave has a conical shape, with a diverging angle of 3.5°; therefore, the measurement is not precisely local and the averaging area, corresponding to the print of the ultrasonic cone on the water surface, varies with the distance between the emitting membrane and the target.
In this study, the instrument is set to give a voltage output signal, with a full range scale of 10 V. Two gauges are calibrated to measure two possible ranges of distance: the whole nominal sensing range of the instrument, which corresponds to the distance window 50‐250 mm, and a shorter range of distances (70‐120 mm); the short range calibration provides an increased sensibility of the measurement when the free surface is close to the gauge. The gauge with the long‐range calibration was installed in the wind tunnel in section S0, S1 and S‐1, to measure the oscillating free surface (the mean distance is 180 mm); the gauge with the short‐range calibration was installed for measuring the water level in the external piezometer used to control the water level in the tank. The response time is 10 ms.

Free‐surface turbulence, Waves generated by wind
33
Table 11. Ultrasonic water level characteristics
Feature Range supply voltage 15‐24 V no‐load current ≤100 mA current analogue output 4‐20 mA voltage analogue output 0‐10 V load resistance <500 Ω sensing range 50‐250 mm resolution (nominal) 0.1 mm switching frequency (selectable) 3‐100 Hz
8.1. Calibration of the ultrasonic sensor The voltage output of the ultrasonic sensor must be related to a metric water level signal. The input – output relation (mm – V) is determined by measuring a number of known distances; to do so, the water level is kept still and the gauge is moved to known locations by means of a traverse system. For each location, the output signal is acquired for a time interval of 120 s, the mean voltage value is then computed and associated with the known distance from the water surface. The long‐range calibration curve is plotted in Figure 33; the calibration output is linear.
The short‐range calibration curve is plotted in Figure 34; the calibration output is linear for the most part of the measuring range but it shows a distinct knee between 6.75 and 7 V. The data conversion from tension to distance values is therefore performed interpolating linearly between each couple of points mapped during the calibration procedure, or using a table lookup.
Figure 33. Ultrasonic water level gauge – long‐range calibration curve

Free‐surface turbulence, Waves generated by wind
34
Figure 34. Ultrasonic water level gauge – short‐range calibration curve
The nominal resolution of the ultrasonic level sensor is 0.10 mm but due to several other sources of error it can be assumed equal to 0.3 mm. The long‐range sensor was positioned in the wind tunnel at roughly 180 mm from the still water level. The vertical alignment with the UDVP probe was obtained through the laser beam moved vertically with the traverse system. The data files have been acquired and stored in ASCII format already converted in distance of the reflective target from the sensor, and in binary DAQ format; in this last format, the timestamp in second and the tension in voltage can be retrieved by using the daqread command in Matlab. Water level acquisition through the US sensor and fluid velocity through the DOP2000 are triggered and have identical origin of the timestamp. It has been obtained using an output channel of the NIDAQ which send a TTL signal to the DOP2000; DOP2000 has an external BNC to receive this triggering signal and a proper selectable option to start data acquisition on triggering.
A snapshot of the raw data and of the despiked data is shown in Figure 35. There are numerous spikes due to several reasons. The first one is the non horizontal reflective surface shape for the US packets; it tends to diffuse the energy and to reflect the wave packets out of the receiver path, with consequent loss of signal. A second reason is due to the presence of the wind. The path of the US packets is not vertical but is shifted due to the relatively high air velocity. The horizontal shift after reflection is equal to
2 windU Lxc
Δ = (14)
where Uwind is the wind velocity, L is the distance between the emitter‐receiver and the reflective surface, c is the US velocity. Assuming Uwind = 10 m/s, L = 200 mm, c = 320 m/s results Δx = 12.5 mm, large enough to loose the emitter.
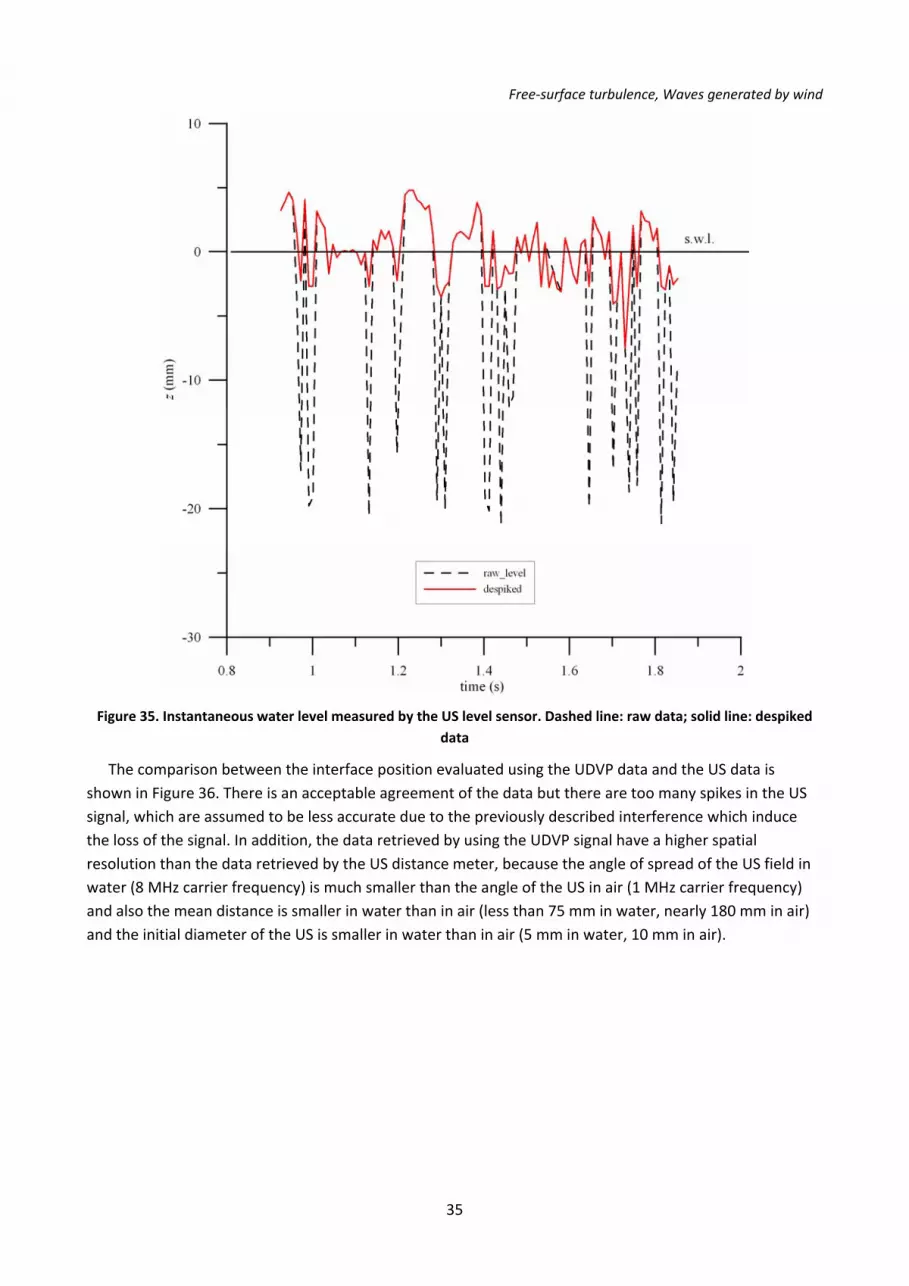
Free‐surface turbulence, Waves generated by wind
35
Figure 35. Instantaneous water level measured by the US level sensor. Dashed line: raw data; solid line: despiked data
The comparison between the interface position evaluated using the UDVP data and the US data is shown in Figure 36. There is an acceptable agreement of the data but there are too many spikes in the US signal, which are assumed to be less accurate due to the previously described interference which induce the loss of the signal. In addition, the data retrieved by using the UDVP signal have a higher spatial resolution than the data retrieved by the US distance meter, because the angle of spread of the US field in water (8 MHz carrier frequency) is much smaller than the angle of the US in air (1 MHz carrier frequency) and also the mean distance is smaller in water than in air (less than 75 mm in water, nearly 180 mm in air) and the initial diameter of the US is smaller in water than in air (5 mm in water, 10 mm in air).
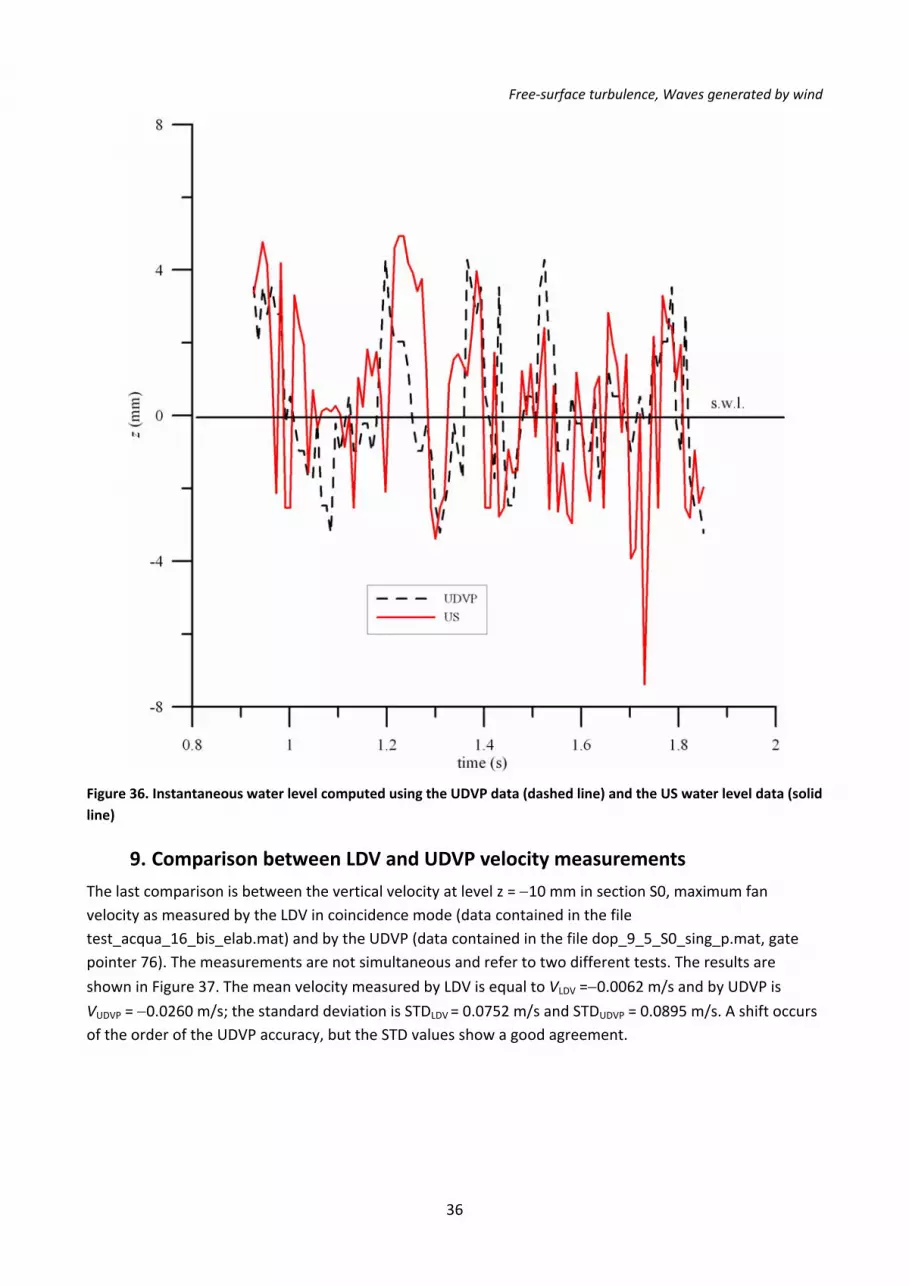
Free‐surface turbulence, Waves generated by wind
36
Figure 36. Instantaneous water level computed using the UDVP data (dashed line) and the US water level data (solid line)
9. Comparison between LDV and UDVP velocity measurements
The last comparison is between the vertical velocity at level z = −10 mm in section S0, maximum fan velocity as measured by the LDV in coincidence mode (data contained in the file test_acqua_16_bis_elab.mat) and by the UDVP (data contained in the file dop_9_5_S0_sing_p.mat, gate pointer 76). The measurements are not simultaneous and refer to two different tests. The results are
shown in Figure 37. The mean velocity measured by LDV is equal to VLDV =−0.0062 m/s and by UDVP is
VUDVP = −0.0260 m/s; the standard deviation is STDLDV = 0.0752 m/s and STDUDVP = 0.0895 m/s. A shift occurs of the order of the UDVP accuracy, but the STD values show a good agreement.

Free‐surface turbulence, Waves generated by wind
37
Figure 37 Comparison between the vertical fluid velocity at z = −10 mm measured by LDV and by UDVP

Free‐surface turbulence, Waves generated by wind
38
10. References Goring D. G., Nikora V. I, (2002), Despiking Acoustic Doppler Velocimeter Data, Journal of Hydraulic Engineering, Vol. 128, No. 1, 117‐126.
Mori N., Suzuki T., Kakuno S. (2007), Noise of Acoustic Doppler Velocimeter Data in Bubbly Flows. Journal of Engineering Mechanics, Vol. 133, No. 1, 122‐125.

39
APPENDIX

Appendix – partially elaborated data
40
Figure 38. Calibration of the wave gauge in section S0
Figure 39. Calibration of the wave gauge in section S1

Appendix – partially elaborated data
41
Figure 40. Calibration of the wave gauge in section S2
Figure 41. Calibration of the wave gauge in section S3

Appendix – partially elaborated data
42
Figure 42. Calibration of the wave gauge in section S4
Figure 43. Calibration of the wave gauge in section S5
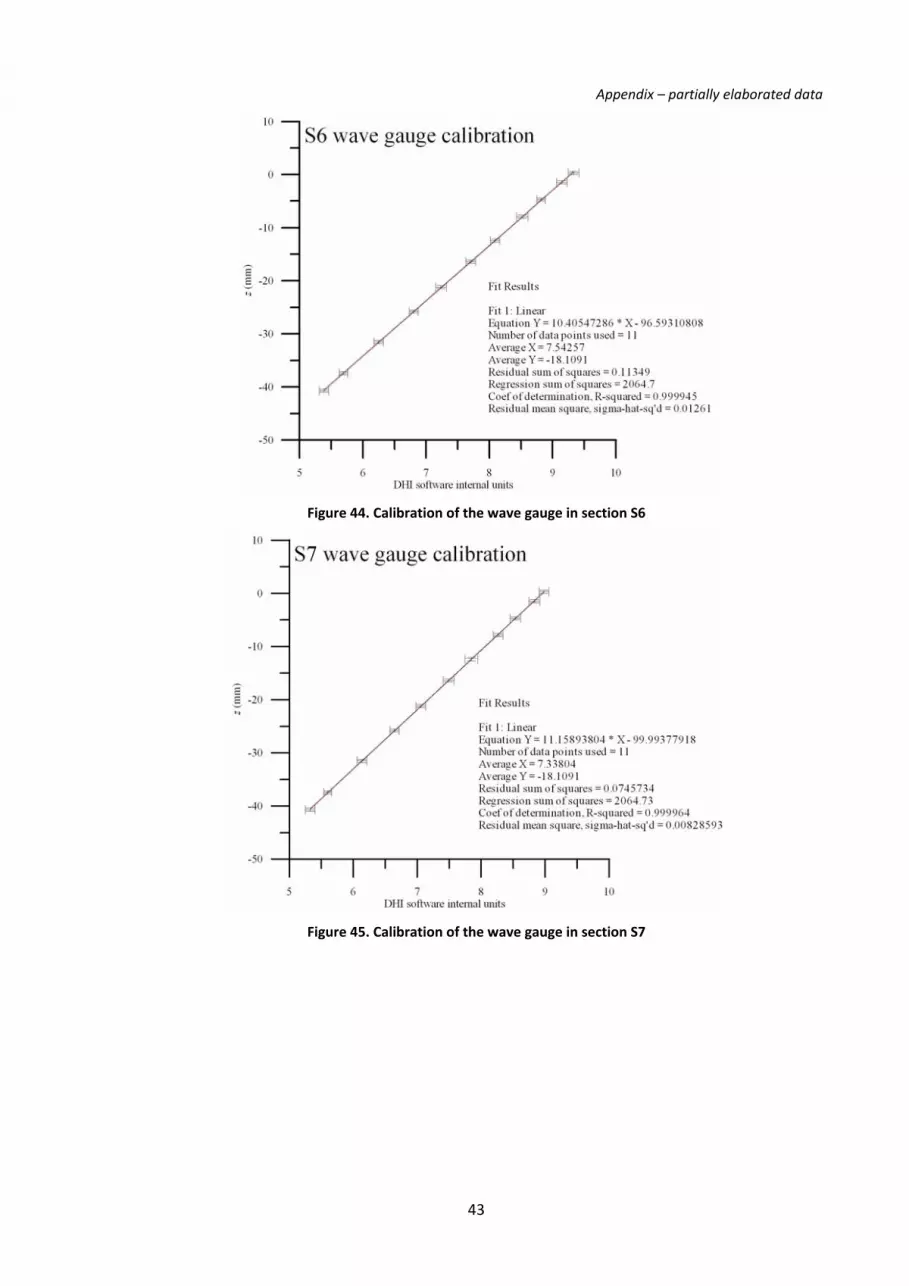
Appendix – partially elaborated data
43
Figure 44. Calibration of the wave gauge in section S6
Figure 45. Calibration of the wave gauge in section S7

Appendix – partially elaborated data
44
Table 12. Section S0 in coincidence mode. Measurements in water. File Test_22_07_02_S0_acqua_CM.txt
measured data transformed data z V1 V2 V1rms V2rms U V U’rms V’rms (U’V’)rms k φ
(m) (m/s) (m/s) (m/s) (m/s) (m/s) (m/s) (m/s) (m/s) (m2/s2) (m2/s2) (°) -0.080 -0.030 -0.034 0.034 0.046 -0.045 0.002 0.064 0.059 -0.0015 0.0038 34.014-0.070 -0.026 -0.030 0.035 0.050 -0.037 0.002 0.065 0.060 -0.0016 0.0039 34.332-0.060 -0.009 0.001 0.040 0.060 -0.007 -0.006 0.071 0.064 -0.0020 0.0046 32.033-0.050 -0.008 -0.005 0.039 0.055 -0.009 -0.002 0.069 0.062 -0.0019 0.0043 32.545-0.040 0.003 0.005 0.041 0.059 0.008 -0.003 0.072 0.063 -0.0021 0.0046 30.315-0.035 0.013 0.025 0.041 0.062 0.022 -0.009 0.075 0.065 -0.0022 0.0049 29.170-0.030 0.016 0.025 0.045 0.066 0.027 -0.009 0.078 0.067 -0.0023 0.0053 27.048-0.025 0.020 0.025 0.044 0.066 0.027 -0.004 0.077 0.067 -0.0024 0.0052 28.672-0.020 0.030 0.039 0.046 0.065 0.044 -0.006 0.078 0.069 -0.0023 0.0054 30.528-0.018 0.030 0.038 0.047 0.067 0.046 -0.006 0.080 0.069 -0.0025 0.0056 28.868-0.016 0.040 0.048 0.048 0.068 0.058 -0.008 0.081 0.071 -0.0025 0.0058 29.332-0.014 0.041 0.049 0.049 0.068 0.057 -0.004 0.082 0.072 -0.0025 0.0059 29.420-0.012 0.047 0.054 0.049 0.069 0.069 -0.007 0.081 0.074 -0.0025 0.0060 32.092-0.010 0.054 0.061 0.052 0.071 0.078 -0.006 0.083 0.075 -0.0026 0.0063 31.989-0.009 0.052 0.057 0.054 0.071 0.073 -0.004 0.083 0.076 -0.0025 0.0064 33.091-0.008 0.058 0.063 0.054 0.071 0.080 -0.005 0.084 0.078 -0.0026 0.0065 34.281-0.007 0.057 0.059 0.057 0.076 0.080 -0.002 0.086 0.080 -0.0026 0.0069 35.302-0.006 0.062 0.067 0.058 0.077 0.087 -0.003 0.086 0.082 -0.0026 0.0070 37.144-0.005 0.071 0.072 0.059 0.077 0.098 -0.003 0.087 0.084 -0.0027 0.0073 40.821-0.004 0.072 0.079 0.063 0.079 0.104 -0.004 0.090 0.089 -0.0027 0.0080 43.260-0.003 0.091 0.096 0.063 0.080 0.131 -0.005 0.087 0.092 -0.0026 0.0079 -35.592-0.002 0.102 0.107 0.067 0.085 0.148 -0.002 0.092 0.094 -0.0028 0.0087 -41.175-0.001 0.118 0.116 0.074 0.093 0.166 0.003 0.099 0.100 -0.0030 0.0099 -43.4750.000 0.133 0.143 0.072 0.090 0.197 -0.007 0.099 0.098 -0.0028 0.0097 43.5990.001 0.150 0.159 0.076 0.095 0.223 -0.004 0.103 0.099 -0.0031 0.0102 37.1960.002 0.170 0.180 0.082 0.094 0.249 -0.006 0.107 0.102 -0.0026 0.0108 34.4380.003 0.193 0.195 0.081 0.104 0.274 -0.002 0.110 0.101 -0.0030 0.0112 28.864

Appendix – partially elaborated data
45
0.004 0.205 0.214 0.087 0.103 0.305 -0.012 0.110 0.098 -0.0032 0.0109 26.4770.005 0.231 0.227 0.076 0.093 0.333 0.007 0.111 0.099 -0.0042 0.0111 29.298
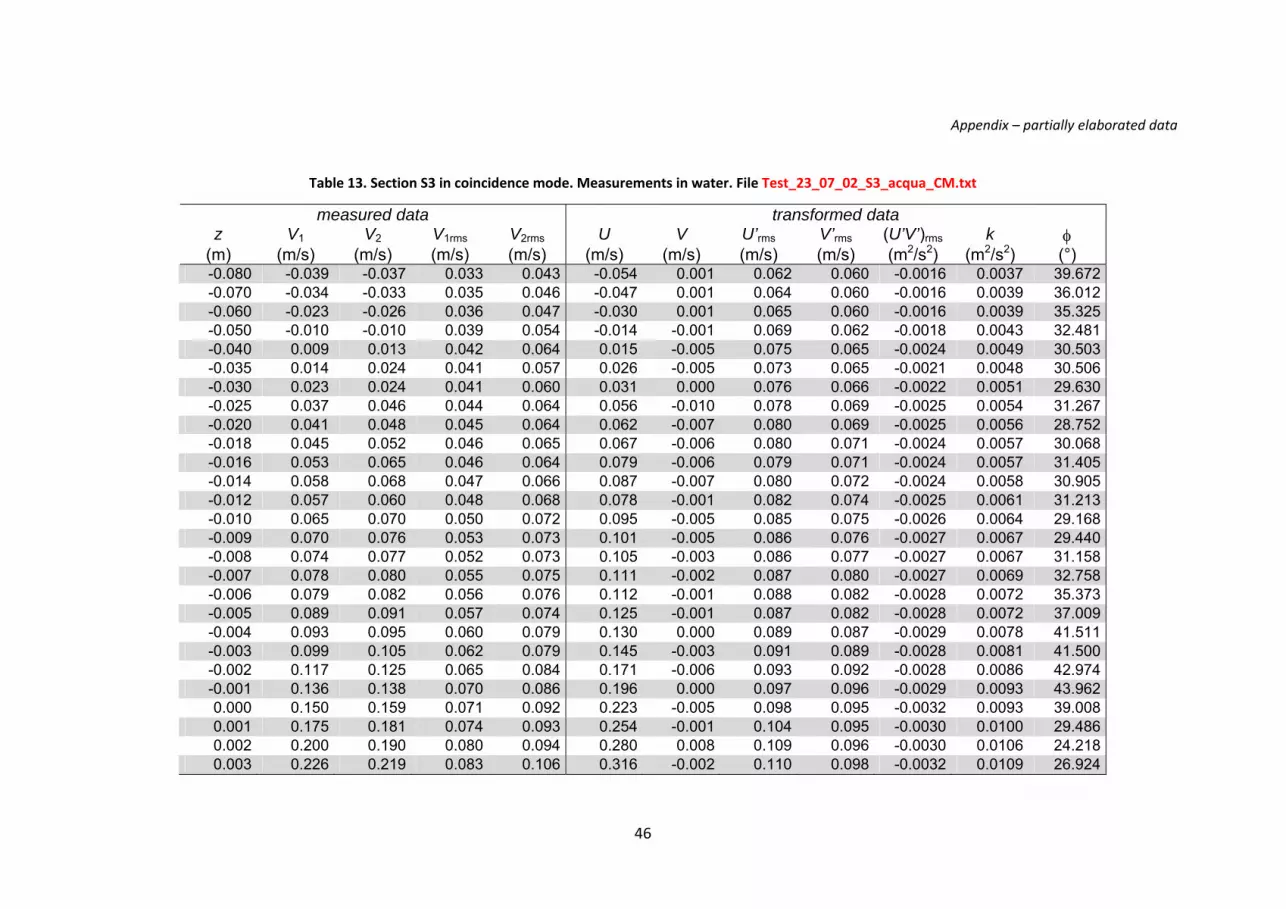
Appendix – partially elaborated data
46
Table 13. Section S3 in coincidence mode. Measurements in water. File Test_23_07_02_S3_acqua_CM.txt
measured data transformed data z V1 V2 V1rms V2rms U V U’rms V’rms (U’V’)rms k φ
(m) (m/s) (m/s) (m/s) (m/s) (m/s) (m/s) (m/s) (m/s) (m2/s2) (m2/s2) (°) -0.080 -0.039 -0.037 0.033 0.043 -0.054 0.001 0.062 0.060 -0.0016 0.0037 39.672-0.070 -0.034 -0.033 0.035 0.046 -0.047 0.001 0.064 0.060 -0.0016 0.0039 36.012-0.060 -0.023 -0.026 0.036 0.047 -0.030 0.001 0.065 0.060 -0.0016 0.0039 35.325-0.050 -0.010 -0.010 0.039 0.054 -0.014 -0.001 0.069 0.062 -0.0018 0.0043 32.481-0.040 0.009 0.013 0.042 0.064 0.015 -0.005 0.075 0.065 -0.0024 0.0049 30.503-0.035 0.014 0.024 0.041 0.057 0.026 -0.005 0.073 0.065 -0.0021 0.0048 30.506-0.030 0.023 0.024 0.041 0.060 0.031 0.000 0.076 0.066 -0.0022 0.0051 29.630-0.025 0.037 0.046 0.044 0.064 0.056 -0.010 0.078 0.069 -0.0025 0.0054 31.267-0.020 0.041 0.048 0.045 0.064 0.062 -0.007 0.080 0.069 -0.0025 0.0056 28.752-0.018 0.045 0.052 0.046 0.065 0.067 -0.006 0.080 0.071 -0.0024 0.0057 30.068-0.016 0.053 0.065 0.046 0.064 0.079 -0.006 0.079 0.071 -0.0024 0.0057 31.405-0.014 0.058 0.068 0.047 0.066 0.087 -0.007 0.080 0.072 -0.0024 0.0058 30.905-0.012 0.057 0.060 0.048 0.068 0.078 -0.001 0.082 0.074 -0.0025 0.0061 31.213-0.010 0.065 0.070 0.050 0.072 0.095 -0.005 0.085 0.075 -0.0026 0.0064 29.168-0.009 0.070 0.076 0.053 0.073 0.101 -0.005 0.086 0.076 -0.0027 0.0067 29.440-0.008 0.074 0.077 0.052 0.073 0.105 -0.003 0.086 0.077 -0.0027 0.0067 31.158-0.007 0.078 0.080 0.055 0.075 0.111 -0.002 0.087 0.080 -0.0027 0.0069 32.758-0.006 0.079 0.082 0.056 0.076 0.112 -0.001 0.088 0.082 -0.0028 0.0072 35.373-0.005 0.089 0.091 0.057 0.074 0.125 -0.001 0.087 0.082 -0.0028 0.0072 37.009-0.004 0.093 0.095 0.060 0.079 0.130 0.000 0.089 0.087 -0.0029 0.0078 41.511-0.003 0.099 0.105 0.062 0.079 0.145 -0.003 0.091 0.089 -0.0028 0.0081 41.500-0.002 0.117 0.125 0.065 0.084 0.171 -0.006 0.093 0.092 -0.0028 0.0086 42.974-0.001 0.136 0.138 0.070 0.086 0.196 0.000 0.097 0.096 -0.0029 0.0093 43.9620.000 0.150 0.159 0.071 0.092 0.223 -0.005 0.098 0.095 -0.0032 0.0093 39.0080.001 0.175 0.181 0.074 0.093 0.254 -0.001 0.104 0.095 -0.0030 0.0100 29.4860.002 0.200 0.190 0.080 0.094 0.280 0.008 0.109 0.096 -0.0030 0.0106 24.2180.003 0.226 0.219 0.083 0.106 0.316 -0.002 0.110 0.098 -0.0032 0.0109 26.924
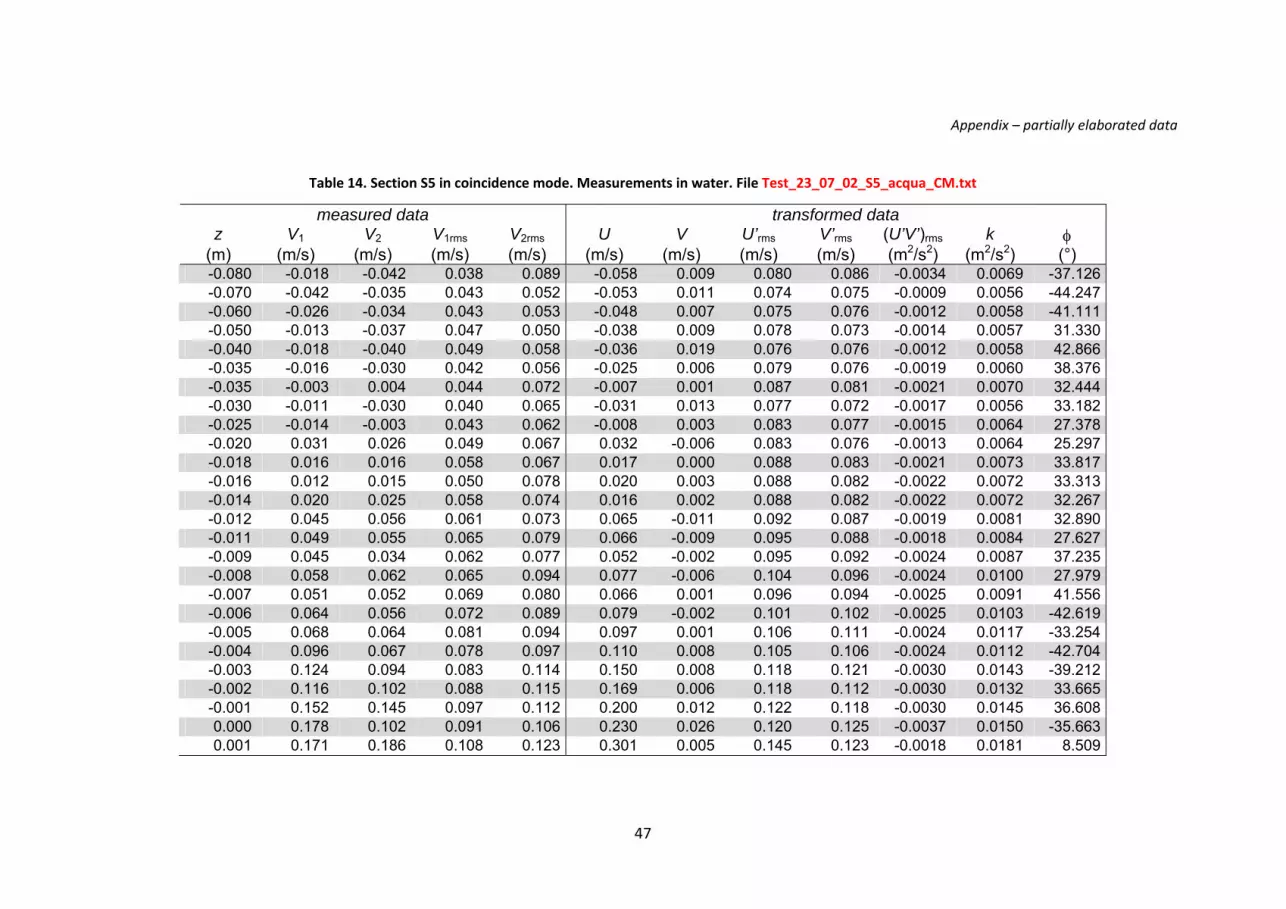
Appendix – partially elaborated data
47
Table 14. Section S5 in coincidence mode. Measurements in water. File Test_23_07_02_S5_acqua_CM.txt
measured data transformed data z V1 V2 V1rms V2rms U V U’rms V’rms (U’V’)rms k φ
(m) (m/s) (m/s) (m/s) (m/s) (m/s) (m/s) (m/s) (m/s) (m2/s2) (m2/s2) (°) -0.080 -0.018 -0.042 0.038 0.089 -0.058 0.009 0.080 0.086 -0.0034 0.0069 -37.126-0.070 -0.042 -0.035 0.043 0.052 -0.053 0.011 0.074 0.075 -0.0009 0.0056 -44.247-0.060 -0.026 -0.034 0.043 0.053 -0.048 0.007 0.075 0.076 -0.0012 0.0058 -41.111-0.050 -0.013 -0.037 0.047 0.050 -0.038 0.009 0.078 0.073 -0.0014 0.0057 31.330-0.040 -0.018 -0.040 0.049 0.058 -0.036 0.019 0.076 0.076 -0.0012 0.0058 42.866-0.035 -0.016 -0.030 0.042 0.056 -0.025 0.006 0.079 0.076 -0.0019 0.0060 38.376-0.035 -0.003 0.004 0.044 0.072 -0.007 0.001 0.087 0.081 -0.0021 0.0070 32.444-0.030 -0.011 -0.030 0.040 0.065 -0.031 0.013 0.077 0.072 -0.0017 0.0056 33.182-0.025 -0.014 -0.003 0.043 0.062 -0.008 0.003 0.083 0.077 -0.0015 0.0064 27.378-0.020 0.031 0.026 0.049 0.067 0.032 -0.006 0.083 0.076 -0.0013 0.0064 25.297-0.018 0.016 0.016 0.058 0.067 0.017 0.000 0.088 0.083 -0.0021 0.0073 33.817-0.016 0.012 0.015 0.050 0.078 0.020 0.003 0.088 0.082 -0.0022 0.0072 33.313-0.014 0.020 0.025 0.058 0.074 0.016 0.002 0.088 0.082 -0.0022 0.0072 32.267-0.012 0.045 0.056 0.061 0.073 0.065 -0.011 0.092 0.087 -0.0019 0.0081 32.890-0.011 0.049 0.055 0.065 0.079 0.066 -0.009 0.095 0.088 -0.0018 0.0084 27.627-0.009 0.045 0.034 0.062 0.077 0.052 -0.002 0.095 0.092 -0.0024 0.0087 37.235-0.008 0.058 0.062 0.065 0.094 0.077 -0.006 0.104 0.096 -0.0024 0.0100 27.979-0.007 0.051 0.052 0.069 0.080 0.066 0.001 0.096 0.094 -0.0025 0.0091 41.556-0.006 0.064 0.056 0.072 0.089 0.079 -0.002 0.101 0.102 -0.0025 0.0103 -42.619-0.005 0.068 0.064 0.081 0.094 0.097 0.001 0.106 0.111 -0.0024 0.0117 -33.254-0.004 0.096 0.067 0.078 0.097 0.110 0.008 0.105 0.106 -0.0024 0.0112 -42.704-0.003 0.124 0.094 0.083 0.114 0.150 0.008 0.118 0.121 -0.0030 0.0143 -39.212-0.002 0.116 0.102 0.088 0.115 0.169 0.006 0.118 0.112 -0.0030 0.0132 33.665-0.001 0.152 0.145 0.097 0.112 0.200 0.012 0.122 0.118 -0.0030 0.0145 36.6080.000 0.178 0.102 0.091 0.106 0.230 0.026 0.120 0.125 -0.0037 0.0150 -35.6630.001 0.171 0.186 0.108 0.123 0.301 0.005 0.145 0.123 -0.0018 0.0181 8.509

Appendix – partially elaborated data
48
Table 15. Section S6 in coincidence mode. Measurements in water. File Test_24_07_02_S6_acqua_CM.txt
measured data transformed data z V1 V2 V1rms V2rms U V U’rms V’rms (U’V’)rms k φ
(m) (m/s) (m/s) (m/s) (m/s) (m/s) (m/s) (m/s) (m/s) (m2/s2) (m2/s2) (°) -0.070 -0.030 -0.043 0.064 0.084 -0.055 0.010 0.135 0.133 -0.0057 0.0179 42.665-0.060 -0.024 -0.045 0.064 0.085 -0.053 0.012 0.130 0.129 -0.0047 0.0167 42.815-0.050 -0.028 -0.045 0.063 0.090 -0.055 0.015 0.136 0.134 -0.0067 0.0182 43.004-0.040 -0.017 -0.034 0.063 0.088 -0.039 0.013 0.137 0.135 -0.0067 0.0185 43.556-0.035 -0.019 -0.038 0.061 0.089 -0.047 0.014 0.137 0.134 -0.0071 0.0183 42.462-0.030 -0.010 -0.026 0.061 0.085 -0.028 0.011 0.133 0.133 -0.0064 0.0177 -44.910-0.025 -0.011 -0.035 0.080 0.106 -0.037 0.014 0.165 0.163 -0.0087 0.0269 42.889-0.020 -0.019 -0.031 0.065 0.086 -0.040 0.011 0.133 0.131 -0.0053 0.0175 42.389-0.018 -0.012 -0.028 0.065 0.091 -0.034 0.011 0.137 0.136 -0.0066 0.0186 42.944-0.016 -0.015 -0.028 0.065 0.093 -0.035 0.011 0.138 0.137 -0.0069 0.0190 43.286-0.014 -0.010 -0.026 0.070 0.090 -0.028 0.008 0.139 0.137 -0.0062 0.0191 42.732-0.012 -0.004 -0.015 0.069 0.090 -0.017 0.008 0.136 0.135 -0.0060 0.0183 43.221-0.010 -0.002 -0.013 0.067 0.097 -0.012 0.008 0.143 0.141 -0.0081 0.0202 43.604-0.009 -0.002 -0.010 0.068 0.100 -0.012 0.007 0.144 0.142 -0.0084 0.0205 43.033-0.008 0.005 -0.004 0.070 0.100 0.000 0.004 0.142 0.140 -0.0073 0.0199 43.109-0.007 0.009 -0.001 0.071 0.096 0.000 0.006 0.139 0.137 -0.0064 0.0191 43.361-0.006 0.011 0.003 0.076 0.106 0.005 0.006 0.145 0.143 -0.0079 0.0208 42.874-0.005 0.016 0.007 0.075 0.103 0.013 0.004 0.141 0.141 -0.0066 0.0198 -44.662-0.004 0.026 0.016 0.079 0.108 0.026 0.005 0.144 0.144 -0.0071 0.0208 -44.664-0.003 0.041 0.031 0.090 0.111 0.047 0.005 0.144 0.149 -0.0061 0.0215 -38.026-0.002 0.065 0.046 0.095 0.121 0.070 0.010 0.148 0.158 -0.0066 0.0234 -33.588-0.001 0.087 0.067 0.099 0.125 0.105 0.008 0.150 0.159 -0.0062 0.0240 -33.0040.000 0.114 0.076 0.108 0.131 0.136 0.016 0.155 0.161 -0.0061 0.0251 -36.3140.001 0.149 0.106 0.094 0.130 0.151 0.032 0.152 0.162 -0.0060 0.0248 -30.584

Appendix – partially elaborated data
49
Table 16. Section S0 in NON coincidence mode. Measurements in water. File Test_22_07_02_S0_acqua_NCM.txt
measured data z V1 V2 V1rms V2rms
(m) (m/s) (m/s) (m/s) (m/s) -0.080 -0.029 -0.031 0.035 0.053-0.070 -0.025 -0.027 0.036 0.056-0.060 -0.009 0.001 0.040 0.062-0.050 -0.007 -0.005 0.040 0.060-0.040 0.003 0.007 0.041 0.062-0.035 0.011 0.021 0.042 0.063-0.030 0.013 0.023 0.045 0.067-0.025 0.017 0.023 0.045 0.067-0.020 0.028 0.034 0.047 0.066-0.018 0.028 0.034 0.048 0.069-0.016 0.035 0.045 0.049 0.070-0.014 0.037 0.042 0.051 0.070-0.012 0.044 0.051 0.051 0.072-0.010 0.051 0.057 0.053 0.073-0.009 0.060 0.065 0.068 0.092-0.008 0.067 0.073 0.069 0.093-0.007 0.053 0.055 0.058 0.077-0.006 0.059 0.062 0.059 0.078-0.005 0.066 0.070 0.061 0.079-0.004 0.068 0.074 0.065 0.082-0.003 0.087 0.091 0.066 0.083-0.002 0.099 0.102 0.070 0.087-0.001 0.113 0.110 0.076 0.0930.000 0.129 0.138 0.076 0.0920.001 0.147 0.155 0.078 0.0970.002 0.164 0.172 0.082 0.1000.003 0.187 0.197 0.084 0.102

Appendix – partially elaborated data
50
0.004 0.202 0.211 0.086 0.1060.005 0.227 0.223 0.083 0.103

Appendix – partially elaborated data
51
Table 17. Section S3 in NON coincidence mode. Measurements in water. File Test_23_07_02_S3_acqua_NCM.txt
measured data z V1 V2 V1rms V2rms
(m) (m/s) (m/s) (m/s) (m/s) -0.080 -0.037 -0.038 0.034 0.052-0.070 -0.033 -0.031 0.037 0.054-0.060 -0.022 -0.022 0.037 0.056-0.050 -0.012 -0.007 0.040 0.060-0.040 0.008 0.014 0.043 0.066-0.035 0.013 0.022 0.043 0.063-0.030 0.020 0.022 0.044 0.064-0.025 0.032 0.044 0.047 0.069-0.020 0.039 0.044 0.047 0.068-0.018 0.042 0.048 0.048 0.068-0.016 0.050 0.059 0.048 0.069-0.014 0.068 0.080 0.061 0.087-0.012 0.054 0.056 0.050 0.071-0.010 0.061 0.067 0.054 0.076-0.009 0.067 0.072 0.055 0.076-0.008 0.072 0.075 0.054 0.076-0.007 0.076 0.078 0.056 0.078-0.006 0.078 0.080 0.058 0.079-0.005 0.085 0.088 0.059 0.079-0.004 0.089 0.090 0.062 0.083-0.003 0.098 0.103 0.065 0.085-0.002 0.114 0.122 0.069 0.087-0.001 0.133 0.132 0.072 0.0920.000 0.149 0.157 0.073 0.0940.001 0.172 0.175 0.076 0.0990.002 0.196 0.193 0.078 0.0980.003 0.221 0.217 0.086 0.103

Appendix – partially elaborated data
52
Table 18. Section S5 in NON coincidence mode. Measurements in water. File Test_23_07_02_S5_acqua_NCM.txt
measured data z V1 V2 V1rms V2rms
(m) (m/s) (m/s) (m/s) (m/s) -0.080 -0.032 -0.039 0.048 0.074-0.070 -0.032 -0.040 0.048 0.062-0.060 -0.025 -0.035 0.049 0.063-0.050 -0.017 -0.032 0.052 0.063-0.040 -0.013 -0.026 0.053 0.067-0.035 -0.012 -0.020 0.049 0.069-0.035 -0.004 -0.012 0.051 0.076-0.030 -0.007 -0.024 0.065 0.090-0.025 0.001 -0.008 0.055 0.073-0.020 0.020 0.024 0.057 0.076-0.018 0.014 0.012 0.056 0.076-0.016 0.017 0.013 0.056 0.077-0.014 0.018 0.015 0.059 0.080-0.012 0.040 0.050 0.063 0.083-0.011 0.040 0.048 0.064 0.085-0.009 0.034 0.031 0.066 0.085-0.008 0.054 0.057 0.069 0.090-0.007 0.049 0.047 0.070 0.091-0.006 0.054 0.050 0.074 0.095-0.005 0.068 0.066 0.079 0.099-0.004 0.084 0.075 0.084 0.101-0.003 0.103 0.086 0.096 0.108-0.002 0.122 0.106 0.098 0.111-0.001 0.150 0.138 0.102 0.1220.000 0.171 0.147 0.095 0.1200.001 0.201 0.178 0.124 0.133

Appendix – partially elaborated data
53
Table 19. Section S6 in NON coincidence mode. Measurements in water. File Test_24_07_02_S6_acqua_NCM.txt
measured data z V1 V2 V1rms V2rms
(m) (m/s) (m/s) (m/s) (m/s) -0.070 -0.029 -0.043 0.082 0.112-0.060 -0.025 -0.044 0.082 0.111-0.050 -0.026 -0.046 0.081 0.115-0.040 -0.017 -0.035 0.082 0.117-0.035 -0.020 -0.038 0.083 0.120-0.030 -0.010 -0.025 0.082 0.118-0.025 -0.013 -0.034 0.106 0.150-0.020 -0.018 -0.032 0.085 0.121-0.018 -0.013 -0.028 0.083 0.119-0.016 -0.015 -0.030 0.084 0.116-0.014 -0.011 -0.025 0.087 0.117-0.012 -0.003 -0.015 0.087 0.120-0.010 -0.001 -0.012 0.087 0.126-0.009 -0.002 -0.010 0.087 0.129-0.008 0.006 -0.002 0.089 0.129-0.007 0.008 0.000 0.090 0.126-0.006 0.011 0.003 0.093 0.132-0.005 0.016 0.007 0.092 0.130-0.004 0.025 0.017 0.097 0.135-0.003 0.041 0.030 0.105 0.139-0.002 0.061 0.043 0.112 0.158-0.001 0.086 0.062 0.117 0.1970.000 0.106 0.081 0.121 0.2130.001 0.126 0.091 0.116 0.323

Appendix – partially elaborated data
54
Table 20. Section S0 in coincidence mode. Measurements in air on water. File Test_18_07_02_S0_aria_CM.txt
measured data transformed data z V1 V2 V1rms V2rms U V U’rms V’rms (U’V’)rms k φ
(m) (m/s) (m/s) (m/s) (m/s) (m/s) (m/s) (m/s) (m/s) (m2/s2) (m2/s2) (°) 0.005 4.428 4.901 1.473 1.813 6.671 -0.404 2.101 1.115 -0.6505 2.8292 5.7950.006 4.404 4.564 1.398 1.869 6.758 -0.187 1.883 1.124 -0.6858 2.4046 8.3600.007 4.652 4.762 1.391 1.884 7.048 -0.170 1.836 1.184 -0.7087 2.3858 9.9100.008 4.948 5.091 1.301 1.782 7.468 -0.197 1.753 1.108 -0.6574 2.1502 9.8090.009 5.143 5.260 1.280 1.788 7.727 -0.192 1.731 1.086 -0.6487 2.0887 9.8240.010 5.314 5.431 1.177 1.685 7.911 -0.181 1.649 1.052 -0.6108 1.9122 10.3780.012 5.644 5.813 1.146 1.616 8.380 -0.192 1.582 1.015 -0.5740 1.7673 10.6440.015 6.032 6.138 1.008 1.500 8.765 -0.181 1.501 0.897 -0.5100 1.5284 9.6960.016 6.137 6.229 0.984 1.451 8.959 -0.137 1.411 0.890 -0.4747 1.3912 10.8180.018 6.381 6.490 0.944 1.368 9.284 -0.132 1.349 0.835 -0.4144 1.2589 10.1170.020 6.579 6.689 0.880 1.280 9.540 -0.123 1.257 0.781 -0.3584 1.0945 10.1470.025 7.008 7.110 0.724 1.051 10.076 -0.097 1.021 0.667 -0.2482 0.7441 11.2610.030 7.326 7.386 0.576 0.831 10.457 -0.058 0.788 0.555 -0.1486 0.4647 12.6720.035 7.549 7.598 0.459 0.648 10.737 -0.043 0.605 0.474 -0.0883 0.2949 16.0120.040 7.711 7.739 0.382 0.533 10.943 -0.022 0.500 0.430 -0.0726 0.2172 23.9690.050 7.715 7.691 0.210 0.264 10.894 0.023 0.257 0.264 -0.0175 0.0680 -39.2760.060 7.892 7.895 0.172 0.230 11.163 0.004 0.226 0.225 -0.0165 0.0508 44.2220.060 7.734 7.713 0.159 0.206 10.921 0.022 0.210 0.214 -0.0143 0.0451 -41.7800.070 7.743 7.734 0.143 0.197 10.942 0.014 0.206 0.204 -0.0155 0.0421 43.2870.080 7.835 7.818 0.146 0.213 11.067 0.018 0.223 0.200 -0.0184 0.0449 31.164

Appendix – partially elaborated data
55
Table 21. Section S1 in coincidence mode. Measurements in air on water. File Test_10_07_02_S1_aria_CM.txt
measured data transformed data z V1 V2 V1rms V2rms U V U’rms V’rms (U’V’)rms k φ
(m) (m/s) (m/s) (m/s) (m/s) (m/s) (m/s) (m/s) (m/s) (m2/s2) (m2/s2) (°) 0.000 2.335 3.010 1.596 2.136 3.741 -0.261 2.543 1.164 -0.9531 3.9099 5.2830.001 2.366 2.996 1.780 2.186 4.658 -0.266 2.586 1.032 -1.0663 3.8770 5.3670.002 4.073 3.848 1.190 1.601 5.951 -0.172 1.825 1.060 -0.6099 2.2279 7.7200.003 4.014 4.201 1.479 1.877 6.279 -0.196 1.977 1.097 -0.7442 2.5555 7.6910.004 4.395 4.352 1.656 2.286 6.384 -0.230 2.240 1.004 -0.5207 3.0122 3.7010.005 4.937 5.003 1.189 1.758 7.262 -0.195 1.844 1.068 -0.6356 2.2702 7.8630.006 5.158 5.221 1.144 1.647 7.581 -0.140 1.665 1.048 -0.6211 1.9342 10.1790.007 5.317 5.432 1.157 1.607 7.848 -0.153 1.619 0.998 -0.5608 1.8091 9.5200.008 5.558 5.695 1.120 1.579 8.184 -0.175 1.561 0.953 -0.5460 1.6727 9.8350.009 5.722 5.888 1.064 1.537 8.420 -0.187 1.532 0.949 -0.5274 1.6243 10.0060.012 6.179 6.371 0.938 1.372 9.020 -0.201 1.377 0.807 -0.4013 1.2730 8.9390.014 6.357 6.600 0.880 1.293 9.270 -0.230 1.293 0.787 -0.3707 1.1454 9.6950.016 6.712 7.004 0.715 1.004 9.756 -0.219 1.022 0.635 -0.2195 0.7241 9.4290.018 6.914 7.178 0.623 0.885 10.011 -0.199 0.896 0.580 -0.1836 0.5699 10.7390.020 6.980 7.307 0.532 0.753 10.129 -0.254 0.748 0.500 -0.1009 0.4048 9.0490.025 7.474 7.575 0.367 0.518 10.649 -0.066 0.504 0.419 -0.0536 0.2146 17.2350.030 7.613 7.713 0.277 0.339 10.841 -0.063 0.332 0.325 -0.0202 0.1079 38.1260.035 7.688 7.768 0.248 0.286 10.931 -0.047 0.288 0.288 -0.0112 0.0829 44.2080.040 7.745 7.841 0.228 0.249 11.018 -0.054 0.264 0.269 -0.0078 0.0712 -35.9060.050 7.691 7.775 0.216 0.211 10.934 -0.050 0.242 0.243 -0.0012 0.0587 -30.5150.050 7.509 7.697 0.217 0.197 10.753 -0.120 0.247 0.232 0.0004 0.0574 -1.3910.050 7.746 7.831 0.232 0.248 11.014 -0.048 0.262 0.274 -0.0074 0.0720 -24.9190.060 7.583 7.731 0.206 0.192 10.824 -0.097 0.231 0.232 -0.0004 0.0534 -18.5940.060 7.543 7.690 0.214 0.198 10.771 -0.093 0.239 0.237 0.0002 0.0569 -4.4840.060 7.848 7.873 0.196 0.249 11.116 -0.005 0.239 0.266 -0.0166 0.0638 -25.0870.070 7.652 7.758 0.188 0.192 10.899 -0.062 0.225 0.221 -0.0030 0.0499 29.9460.070 7.710 7.818 0.202 0.200 10.982 -0.067 0.231 0.228 -0.0028 0.0526 30.736

Appendix – partially elaborated data
56
0.080 7.796 7.871 0.184 0.211 11.077 -0.041 0.223 0.232 -0.0088 0.0518 -32.603

Appendix – partially elaborated data
57
Table 22. Section S2 in coincidence mode. Measurements in air on water. File Test_12_07_02_S2_aria_CM.txt
measured data transformed data z V1 V2 V1rms V2rms U V U’rms V’rms (U’V’)rms k φ
(m) (m/s) (m/s) (m/s) (m/s) (m/s) (m/s) (m/s) (m/s) (m2/s2) (m2/s2) (°) 0.001 2.708 3.463 1.553 1.071 5.131 -0.595 1.465 0.215 0.1724 1.0957 -2.3480.002 3.595 3.860 1.245 1.720 5.367 -0.268 1.937 1.145 -0.8060 2.5306 9.1380.003 3.288 3.216 1.585 2.308 5.337 -0.189 2.078 1.203 -0.6743 2.8825 6.6070.004 3.748 3.953 1.536 1.900 5.658 -0.375 2.404 1.142 -0.6445 3.5421 4.0980.004 3.914 4.274 1.456 2.080 6.035 -0.290 2.250 1.188 -1.0727 3.2361 8.1880.005 4.214 4.339 1.691 2.135 6.428 -0.224 2.309 1.093 -0.7141 3.2623 4.8990.007 4.856 5.115 1.470 1.860 7.418 -0.210 1.891 1.127 -0.6719 2.4234 8.1180.008 5.245 5.307 1.319 1.812 7.760 -0.144 1.793 1.113 -0.6386 2.2263 8.9650.008 5.216 5.357 1.288 1.755 7.790 -0.170 1.734 1.117 -0.6149 2.1275 9.6250.009 5.419 5.525 1.223 1.724 7.971 -0.150 1.745 1.093 -0.6533 2.1204 9.7260.010 5.606 5.762 1.170 1.642 8.245 -0.161 1.634 1.056 -0.6065 1.8925 10.6600.011 5.808 5.980 1.107 1.571 8.553 -0.184 1.536 0.998 -0.5376 1.6781 10.7620.014 6.347 6.526 0.990 1.408 9.275 -0.178 1.368 0.880 -0.4054 1.3232 10.1280.015 6.489 6.685 0.893 1.290 9.436 -0.174 1.271 0.810 -0.3621 1.1351 10.3470.017 6.678 6.858 0.836 1.206 9.690 -0.158 1.176 0.762 -0.3104 0.9821 10.5650.019 6.878 7.070 0.792 1.112 9.942 -0.153 1.100 0.720 -0.2662 0.8634 10.5300.021 7.077 7.239 0.711 0.992 10.191 -0.139 0.965 0.646 -0.1887 0.6742 10.0990.026 7.380 7.547 0.514 0.670 10.580 -0.122 0.659 0.510 -0.0774 0.3473 11.9390.031 7.571 7.702 0.384 0.468 10.815 -0.090 0.467 0.397 -0.0388 0.1880 16.3520.036 7.528 7.664 0.275 0.317 10.748 -0.090 0.318 0.310 -0.0145 0.0986 35.6780.041 7.530 7.646 0.229 0.265 10.734 -0.075 0.281 0.281 -0.0149 0.0787 -44.9850.051 7.518 7.648 0.176 0.211 10.725 -0.088 0.230 0.223 -0.0095 0.0511 35.7510.061 7.485 7.630 0.162 0.202 10.688 -0.097 0.220 0.212 -0.0099 0.0466 34.9900.071 7.473 7.626 0.163 0.195 10.676 -0.104 0.217 0.204 -0.0096 0.0443 29.7420.081 7.462 7.622 0.147 0.189 10.665 -0.109 0.211 0.202 -0.0098 0.0427 34.328

Appendix – partially elaborated data
58
Table 23. Section S3 in coincidence mode. Measurements in air on water. File Test_13_07_02_S3_aria_CM.txt
measured data transformed data z V1 V2 V1rms V2rms U V U’rms V’rms (U’V’)rms k φ
(m) (m/s) (m/s) (m/s) (m/s) (m/s) (m/s) (m/s) (m/s) (m2/s2) (m2/s2) (°) 0.001 2.561 4.152 1.353 1.731 5.600 -0.783 2.318 0.656 -0.7301 2.9021 4.2020.002 3.295 4.675 1.360 2.747 6.171 -0.920 2.432 1.239 -2.1769 3.7243 13.2190.003 4.112 4.568 1.701 2.032 5.740 -0.434 2.877 0.959 -1.1632 4.5998 4.4910.004 4.648 5.238 1.163 1.762 7.029 -0.428 1.997 1.221 -0.7371 2.7397 8.2170.005 4.692 5.062 1.661 1.989 7.148 -0.239 2.341 1.133 -0.7430 3.3820 5.0190.006 5.117 5.385 1.370 1.914 7.784 -0.312 1.891 1.161 -0.7601 2.4616 9.4230.007 5.423 5.470 1.282 1.969 8.115 -0.247 1.787 1.097 -0.6353 2.1981 8.8480.008 5.639 5.879 1.253 1.703 8.451 -0.269 1.694 1.069 -0.5521 2.0051 8.8660.009 6.000 6.258 1.190 1.647 8.945 -0.274 1.550 1.003 -0.4919 1.7038 9.7120.010 6.232 6.472 1.046 1.518 9.187 -0.252 1.452 0.932 -0.4357 1.4891 9.6710.013 6.636 6.899 0.872 1.262 9.698 -0.233 1.213 0.780 -0.2880 1.0402 9.2170.014 6.737 6.917 0.850 1.225 9.774 -0.189 1.176 0.757 -0.2816 0.9777 9.5980.016 6.993 7.233 0.750 1.022 10.145 -0.206 0.996 0.679 -0.1767 0.7269 9.1990.018 7.145 7.354 0.677 0.928 10.318 -0.175 0.886 0.634 -0.1425 0.5934 10.1910.020 7.288 7.475 0.576 0.776 10.476 -0.149 0.746 0.564 -0.1032 0.4378 11.7010.025 7.478 7.623 0.414 0.531 10.693 -0.104 0.502 0.439 -0.0429 0.2222 17.8820.030 7.586 7.709 0.293 0.370 10.821 -0.082 0.374 0.369 -0.0408 0.1380 42.1940.035 7.585 7.682 0.246 0.286 10.798 -0.063 0.293 0.292 -0.0127 0.0855 43.2510.040 7.600 7.704 0.221 0.268 10.825 -0.071 0.271 0.265 -0.0106 0.0719 37.4360.050 7.570 7.680 0.194 0.230 10.784 -0.073 0.252 0.231 -0.0090 0.0583 20.5630.060 7.531 7.622 0.164 0.209 10.715 -0.060 0.221 0.207 -0.0115 0.0458 31.1060.070 7.481 7.567 0.141 0.205 10.640 -0.057 0.215 0.206 -0.0141 0.0443 36.9220.080 7.463 7.550 0.132 0.208 10.615 -0.058 0.217 0.206 -0.0144 0.0447 35.792

Appendix – partially elaborated data
59
Table 24. Section S4 in coincidence mode. Measurements in air on water. File Test_18_07_02_S4_aria_CM.txt
measured data transformed data z V1 V2 V1rms V2rms U V U’rms V’rms (U’V’)rms k φ
(m) (m/s) (m/s) (m/s) (m/s) (m/s) (m/s) (m/s) (m/s) (m2/s2) (m2/s2) (°) 0.003 3.688 4.320 1.748 1.963 5.984 -0.201 2.300 1.153 -0.8781 3.3099 6.2480.004 4.248 4.679 1.554 1.987 6.643 -0.229 2.143 1.179 -0.8600 2.9913 7.5130.005 4.626 4.891 1.510 2.071 6.990 -0.209 2.083 1.281 -0.9237 2.9906 9.4450.006 5.165 5.470 1.345 1.785 7.702 -0.230 1.856 1.102 -0.7023 2.3289 8.7470.007 5.440 5.672 1.288 1.778 8.059 -0.171 1.804 1.074 -0.7358 2.2047 9.6480.008 5.683 5.970 1.147 1.646 8.398 -0.216 1.662 1.050 -0.6483 1.9318 10.6640.009 5.889 6.186 1.122 1.607 8.686 -0.246 1.624 0.987 -0.6165 1.8062 10.1670.010 6.105 6.356 1.035 1.507 8.957 -0.221 1.509 0.910 -0.5406 1.5521 10.2280.012 6.423 6.724 0.943 1.335 9.415 -0.243 1.336 0.837 -0.4097 1.2421 10.3490.014 6.811 7.058 0.772 1.124 9.845 -0.184 1.121 0.706 -0.2880 0.8777 10.4060.017 7.214 7.426 0.539 0.771 10.387 -0.156 0.739 0.548 -0.1438 0.4233 15.1850.018 7.286 7.452 0.522 0.731 10.442 -0.136 0.701 0.530 -0.1118 0.3857 13.9740.020 7.397 7.534 0.432 0.573 10.569 -0.107 0.549 0.458 -0.0675 0.2555 18.1440.025 7.499 7.643 0.273 0.334 10.712 -0.101 0.325 0.326 -0.0262 0.1061 -44.6260.030 7.511 7.666 0.237 0.276 10.732 -0.113 0.279 0.290 -0.0194 0.0810 -36.3580.035 7.531 7.689 0.210 0.235 10.756 -0.111 0.253 0.262 -0.0160 0.0663 -36.5980.040 7.568 7.688 0.195 0.205 10.770 -0.087 0.246 0.246 -0.0087 0.0605 44.7300.050 7.603 7.660 0.190 0.186 10.763 -0.052 0.230 0.233 -0.0116 0.0535 -41.1850.060 7.538 7.659 0.201 0.180 10.711 -0.098 0.228 0.230 -0.0099 0.0525 -43.1180.070 7.502 7.686 0.168 0.212 10.733 -0.132 0.242 0.234 -0.0204 0.0566 39.2990.080 7.443 7.621 0.143 0.183 10.643 -0.123 0.217 0.216 -0.0194 0.0470 44.216
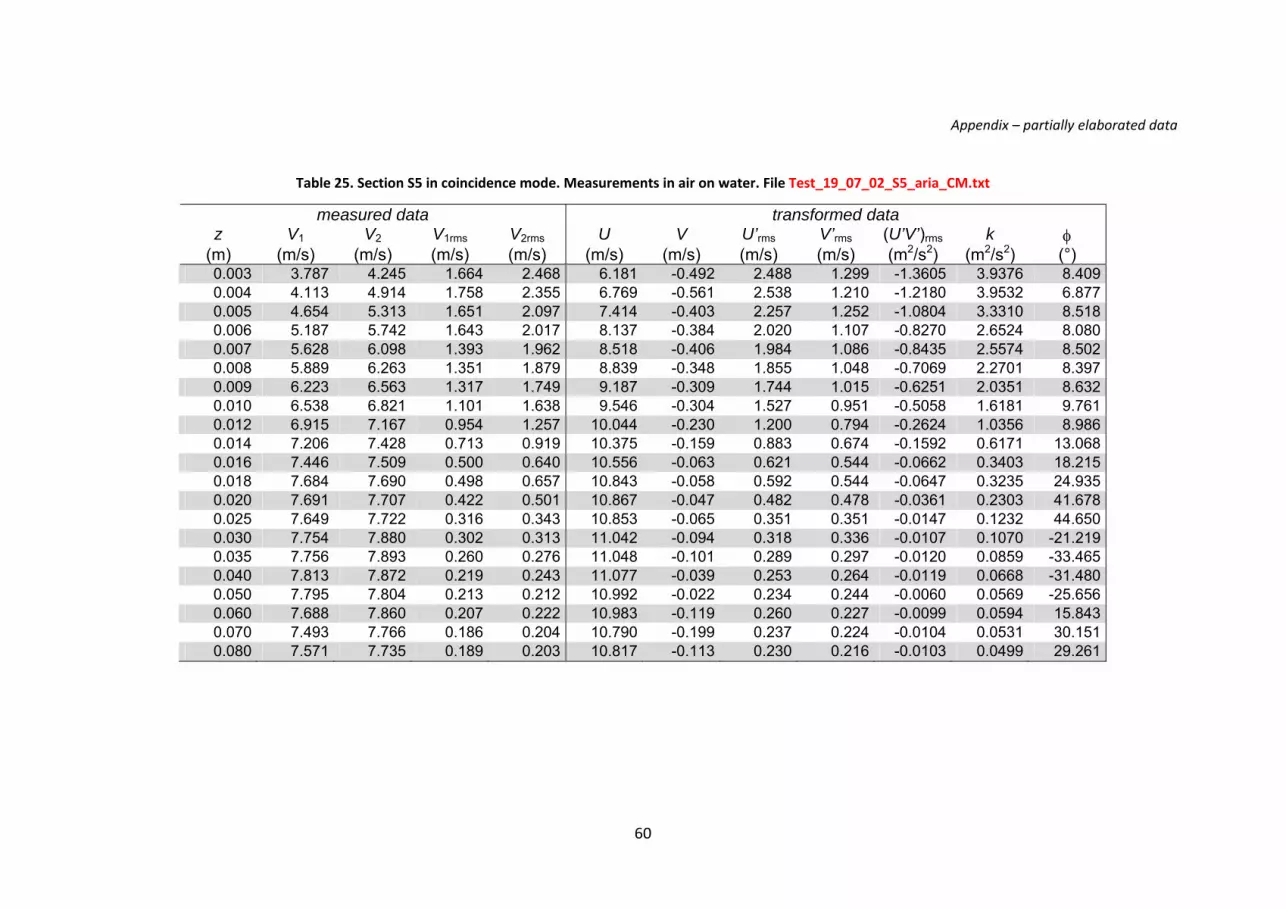
Appendix – partially elaborated data
60
Table 25. Section S5 in coincidence mode. Measurements in air on water. File Test_19_07_02_S5_aria_CM.txt
measured data transformed data z V1 V2 V1rms V2rms U V U’rms V’rms (U’V’)rms k φ
(m) (m/s) (m/s) (m/s) (m/s) (m/s) (m/s) (m/s) (m/s) (m2/s2) (m2/s2) (°) 0.003 3.787 4.245 1.664 2.468 6.181 -0.492 2.488 1.299 -1.3605 3.9376 8.4090.004 4.113 4.914 1.758 2.355 6.769 -0.561 2.538 1.210 -1.2180 3.9532 6.8770.005 4.654 5.313 1.651 2.097 7.414 -0.403 2.257 1.252 -1.0804 3.3310 8.5180.006 5.187 5.742 1.643 2.017 8.137 -0.384 2.020 1.107 -0.8270 2.6524 8.0800.007 5.628 6.098 1.393 1.962 8.518 -0.406 1.984 1.086 -0.8435 2.5574 8.5020.008 5.889 6.263 1.351 1.879 8.839 -0.348 1.855 1.048 -0.7069 2.2701 8.3970.009 6.223 6.563 1.317 1.749 9.187 -0.309 1.744 1.015 -0.6251 2.0351 8.6320.010 6.538 6.821 1.101 1.638 9.546 -0.304 1.527 0.951 -0.5058 1.6181 9.7610.012 6.915 7.167 0.954 1.257 10.044 -0.230 1.200 0.794 -0.2624 1.0356 8.9860.014 7.206 7.428 0.713 0.919 10.375 -0.159 0.883 0.674 -0.1592 0.6171 13.0680.016 7.446 7.509 0.500 0.640 10.556 -0.063 0.621 0.544 -0.0662 0.3403 18.2150.018 7.684 7.690 0.498 0.657 10.843 -0.058 0.592 0.544 -0.0647 0.3235 24.9350.020 7.691 7.707 0.422 0.501 10.867 -0.047 0.482 0.478 -0.0361 0.2303 41.6780.025 7.649 7.722 0.316 0.343 10.853 -0.065 0.351 0.351 -0.0147 0.1232 44.6500.030 7.754 7.880 0.302 0.313 11.042 -0.094 0.318 0.336 -0.0107 0.1070 -21.2190.035 7.756 7.893 0.260 0.276 11.048 -0.101 0.289 0.297 -0.0120 0.0859 -33.4650.040 7.813 7.872 0.219 0.243 11.077 -0.039 0.253 0.264 -0.0119 0.0668 -31.4800.050 7.795 7.804 0.213 0.212 10.992 -0.022 0.234 0.244 -0.0060 0.0569 -25.6560.060 7.688 7.860 0.207 0.222 10.983 -0.119 0.260 0.227 -0.0099 0.0594 15.8430.070 7.493 7.766 0.186 0.204 10.790 -0.199 0.237 0.224 -0.0104 0.0531 30.1510.080 7.571 7.735 0.189 0.203 10.817 -0.113 0.230 0.216 -0.0103 0.0499 29.261

Appendix – partially elaborated data
61
Table 26. Section S6 in coincidence mode. Measurements in air on water. File Test_20_07_02_S6_aria_CM.txt
measured data transformed data z V1 V2 V1rms V2rms U V U’rms V’rms (U’V’)rms k φ
(m) (m/s) (m/s) (m/s) (m/s) (m/s) (m/s) (m/s) (m/s) (m2/s2) (m2/s2) (°) 0.003 5.323 5.556 1.407 1.802 7.843 -0.187 2.099 0.952 -0.6534 2.6552 5.2900.004 5.628 5.902 1.764 1.930 8.460 -0.049 2.025 0.925 -0.6310 2.4792 5.5000.005 5.381 6.256 2.615 1.637 8.954 0.054 1.878 0.819 -0.4362 2.0980 4.3420.005 6.498 6.485 0.980 1.349 9.223 0.023 1.392 0.840 -0.4242 1.3212 9.5100.006 6.842 6.597 0.859 1.271 9.552 0.141 1.267 0.812 -0.3713 1.1321 10.7300.007 7.140 6.862 0.721 1.069 9.890 0.168 1.041 0.720 -0.2789 0.8015 13.1400.007 7.174 6.905 0.616 0.960 9.943 0.178 0.895 0.689 -0.2319 0.6383 17.7170.008 7.401 7.094 0.527 0.752 10.202 0.202 0.703 0.584 -0.1402 0.4180 21.2280.009 7.536 7.146 0.482 0.688 10.343 0.237 0.626 0.551 -0.0997 0.3479 24.3380.010 7.585 7.216 0.431 0.598 10.420 0.238 0.546 0.513 -0.0791 0.2804 33.1970.013 7.686 7.350 0.358 0.435 10.599 0.240 0.419 0.411 -0.0365 0.1726 39.8300.014 7.548 7.257 0.318 0.385 10.460 0.232 0.377 0.375 -0.0276 0.1411 43.4310.016 7.596 7.223 0.279 0.334 10.465 0.270 0.338 0.324 -0.0172 0.1097 30.8760.018 7.697 7.345 0.271 0.328 10.607 0.255 0.336 0.316 -0.0198 0.1063 28.3480.020 7.690 7.321 0.256 0.293 10.595 0.254 0.312 0.289 -0.0137 0.0903 22.6480.020 7.690 7.316 0.259 0.298 10.585 0.260 0.315 0.294 -0.0146 0.0926 24.5780.025 7.721 7.353 0.227 0.259 10.644 0.255 0.281 0.263 -0.0125 0.0742 25.7800.030 7.627 7.320 0.215 0.235 10.557 0.218 0.265 0.240 -0.0100 0.0638 19.1830.035 7.615 7.366 0.217 0.235 10.573 0.182 0.265 0.238 -0.0099 0.0635 17.7730.040 7.517 7.324 0.202 0.218 10.483 0.136 0.246 0.227 -0.0102 0.0560 24.1200.050 7.414 7.293 0.189 0.213 10.389 0.090 0.243 0.217 -0.0108 0.0531 20.7450.060 7.435 7.361 0.186 0.222 10.457 0.057 0.255 0.220 -0.0129 0.0568 18.9900.070 7.316 7.295 0.188 0.227 10.344 0.022 0.249 0.221 -0.0147 0.0556 24.1480.080 7.301 7.349 0.180 0.227 10.363 -0.015 0.253 0.214 -0.0168 0.0548 21.172

Appendix – partially elaborated data
62
Table 27. Section S7 in coincidence mode. Measurements in air on water. File Test_21_07_02_S7_aria_CM.txt
measured data transformed data z V1 V2 V1rms V2rms U V U’rms V’rms (U’V’)rms k φ
(m) (m/s) (m/s) (m/s) (m/s) (m/s) (m/s) (m/s) (m/s) (m2/s2) (m2/s2) (°) 0.000 2.520 3.271 1.673 1.964 4.962 -0.364 2.358 0.595 -0.7113 2.9566 3.8910.001 4.415 4.568 1.295 1.782 6.812 -0.310 1.793 0.926 -0.5225 2.0356 6.2510.002 5.918 6.454 0.731 1.046 8.843 -0.411 1.088 0.484 -0.2047 0.7087 6.0830.003 6.476 6.890 0.514 0.729 9.495 -0.304 0.754 0.391 -0.1078 0.3608 7.2780.004 6.776 7.126 0.380 0.522 9.847 -0.240 0.554 0.345 -0.0581 0.2129 8.5900.005 6.947 7.261 0.325 0.426 10.053 -0.210 0.452 0.318 -0.0395 0.1529 10.4370.006 7.066 7.336 0.303 0.374 10.176 -0.182 0.408 0.293 -0.0255 0.1262 8.8000.007 7.095 7.404 0.295 0.358 10.240 -0.217 0.392 0.294 -0.0232 0.1200 9.5880.008 7.101 7.392 0.272 0.330 10.229 -0.210 0.360 0.282 -0.0201 0.1046 10.8600.009 7.123 7.398 0.264 0.325 10.256 -0.199 0.354 0.277 -0.0223 0.1011 12.3770.010 7.185 7.391 0.258 0.318 10.289 -0.152 0.348 0.272 -0.0226 0.0975 12.7440.012 7.261 7.448 0.257 0.302 10.386 -0.142 0.332 0.264 -0.0185 0.0899 12.3320.014 7.192 7.463 0.272 0.321 10.331 -0.205 0.341 0.302 -0.0215 0.1037 20.4440.016 7.085 7.423 0.237 0.277 10.252 -0.217 0.299 0.260 -0.0175 0.0784 19.4190.018 7.093 7.409 0.233 0.264 10.268 -0.207 0.289 0.256 -0.0152 0.0743 20.1660.020 7.104 7.399 0.227 0.256 10.268 -0.196 0.279 0.250 -0.0137 0.0701 21.2680.025 7.208 7.383 0.203 0.248 10.309 -0.120 0.262 0.247 -0.0165 0.0649 32.6120.030 7.242 7.346 0.202 0.224 10.313 -0.077 0.239 0.240 -0.0103 0.0574 -42.9940.035 7.251 7.313 0.199 0.231 10.299 -0.050 0.244 0.245 -0.0126 0.0598 -43.4770.040 7.275 7.245 0.197 0.233 10.274 0.028 0.242 0.243 -0.0129 0.0587 -43.5430.050 7.324 7.193 0.196 0.230 10.286 0.113 0.242 0.241 -0.0134 0.0583 44.3210.060 7.355 7.231 0.164 0.225 10.317 0.099 0.227 0.227 -0.0177 0.0515 44.6480.070 7.381 7.251 0.174 0.212 10.344 0.098 0.224 0.223 -0.0119 0.0500 44.1490.080 7.384 7.237 0.155 0.199 10.350 0.106 0.214 0.215 -0.0147 0.0460 -44.401
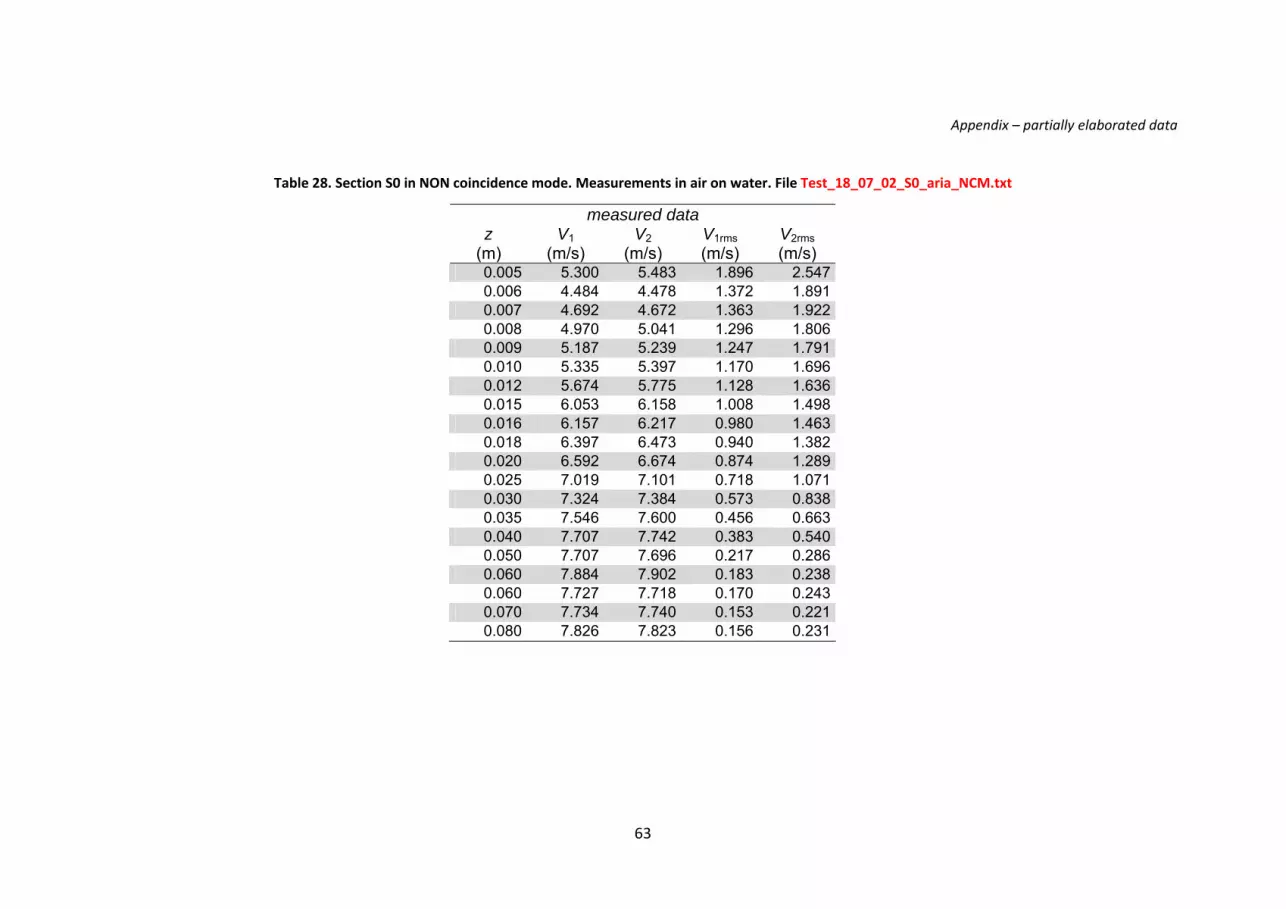
Appendix – partially elaborated data
63
Table 28. Section S0 in NON coincidence mode. Measurements in air on water. File Test_18_07_02_S0_aria_NCM.txt
measured data z V1 V2 V1rms V2rms
(m) (m/s) (m/s) (m/s) (m/s) 0.005 5.300 5.483 1.896 2.5470.006 4.484 4.478 1.372 1.8910.007 4.692 4.672 1.363 1.9220.008 4.970 5.041 1.296 1.8060.009 5.187 5.239 1.247 1.7910.010 5.335 5.397 1.170 1.6960.012 5.674 5.775 1.128 1.6360.015 6.053 6.158 1.008 1.4980.016 6.157 6.217 0.980 1.4630.018 6.397 6.473 0.940 1.3820.020 6.592 6.674 0.874 1.2890.025 7.019 7.101 0.718 1.0710.030 7.324 7.384 0.573 0.8380.035 7.546 7.600 0.456 0.6630.040 7.707 7.742 0.383 0.5400.050 7.707 7.696 0.217 0.2860.060 7.884 7.902 0.183 0.2380.060 7.727 7.718 0.170 0.2430.070 7.734 7.740 0.153 0.2210.080 7.826 7.823 0.156 0.231

Appendix – partially elaborated data
64
Table 29. Section S1 in NON coincidence mode. Measurements in air on water. File Test_10_07_02_S1_aria_NCM.txt
measured data z V1 V2 V1rms V2rms
(m) (m/s) (m/s) (m/s) (m/s) 0.000 2.580 2.722 1.651 2.0750.001 2.912 3.252 1.678 2.0850.002 3.664 3.854 1.489 2.0240.003 4.105 4.152 1.471 1.9290.004 4.560 4.113 1.415 2.1330.005 4.895 4.824 1.293 1.8530.006 5.145 5.135 1.165 1.6850.007 5.331 5.363 1.143 1.6150.008 5.578 5.613 1.101 1.5810.009 5.730 5.826 1.064 1.5730.012 6.173 6.290 0.944 1.3900.014 6.369 6.479 0.880 1.3480.016 6.727 6.881 0.715 1.0900.018 6.931 7.066 0.623 0.9570.020 6.985 7.227 0.537 0.8310.025 7.471 7.535 0.389 0.5530.030 7.612 7.702 0.284 0.3610.035 7.682 7.767 0.257 0.2940.040 7.739 7.833 0.239 0.2600.050 7.684 7.779 0.224 0.2190.050 7.502 7.700 0.225 0.2060.050 7.738 7.829 0.242 0.2630.060 7.576 7.733 0.215 0.2010.060 7.536 7.693 0.223 0.2250.060 7.836 7.862 0.209 0.2580.070 7.645 7.762 0.199 0.2230.070 7.703 7.822 0.212 0.207

Appendix – partially elaborated data
65
0.080 7.790 7.873 0.199 0.254

Appendix – partially elaborated data
66
Table 30. Section S2 in NON coincidence mode. Measurements in air on water. File Test_12_07_02_S2_aria_NCM.txt
measured data z V1 V2 V1rms V2rms
(m) (m/s) (m/s) (m/s) (m/s) 0.001 2.380 2.449 1.564 2.1840.002 3.360 3.502 1.582 2.0500.003 3.351 3.446 1.634 2.2570.004 3.587 3.852 1.722 2.1800.004 3.783 4.010 1.657 2.0510.005 4.296 4.247 1.518 2.1070.007 4.869 4.995 1.497 1.9590.008 5.221 5.219 1.367 1.8670.008 5.256 5.321 1.278 1.7650.009 5.421 5.457 1.235 1.7490.010 5.627 5.682 1.166 1.6900.011 5.816 5.946 1.108 1.5830.014 6.356 6.495 0.988 1.4270.015 6.490 6.653 0.892 1.3130.017 6.684 6.843 0.841 1.2250.019 6.893 7.046 0.786 1.1430.021 7.088 7.236 0.706 0.9970.026 7.384 7.549 0.517 0.6920.031 7.570 7.708 0.385 0.4760.036 7.523 7.667 0.284 0.3270.041 7.525 7.653 0.244 0.2810.051 7.514 7.654 0.196 0.2370.061 7.479 7.636 0.184 0.2190.071 7.467 7.633 0.180 0.2060.081 7.456 7.628 0.166 0.206
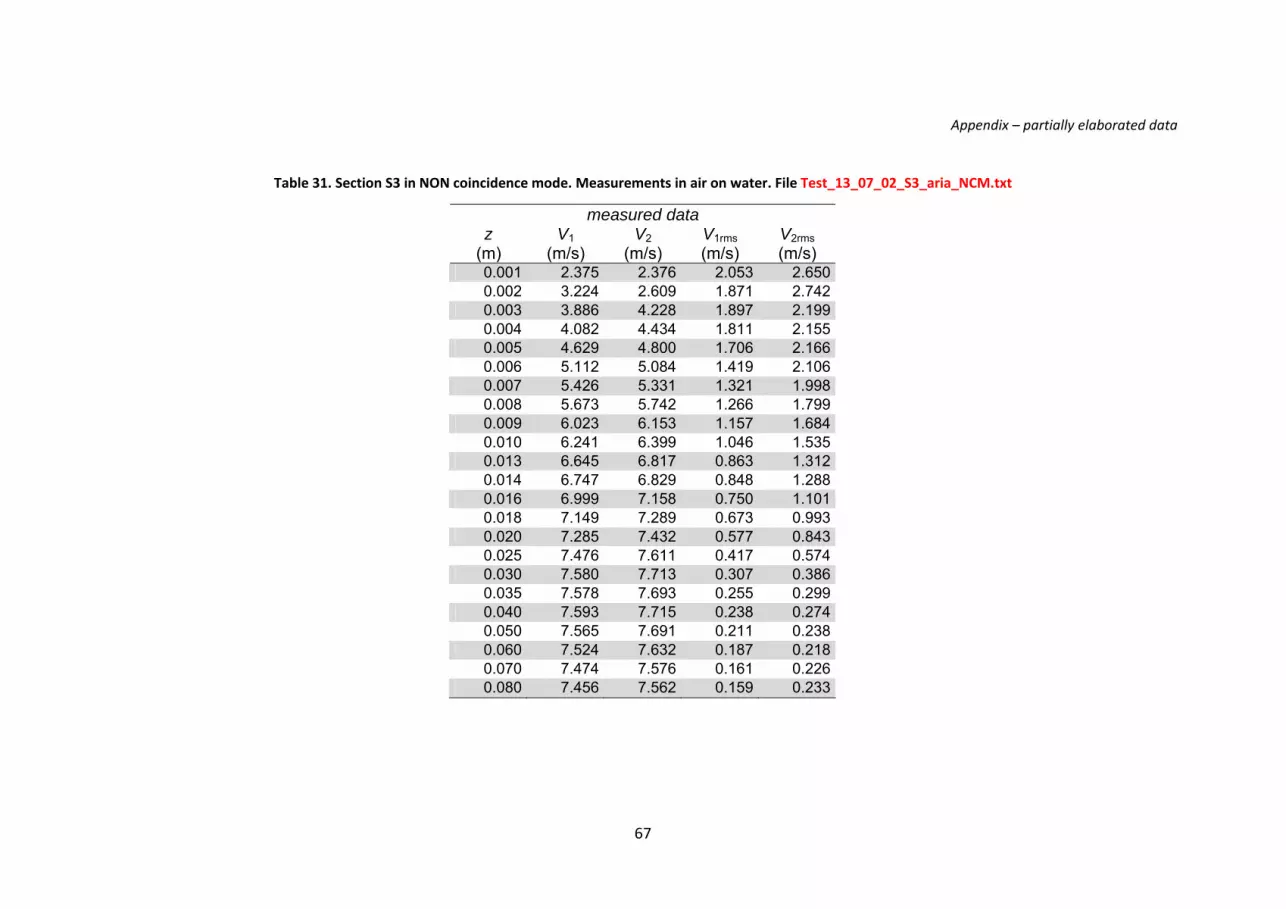
Appendix – partially elaborated data
67
Table 31. Section S3 in NON coincidence mode. Measurements in air on water. File Test_13_07_02_S3_aria_NCM.txt
measured data z V1 V2 V1rms V2rms
(m) (m/s) (m/s) (m/s) (m/s) 0.001 2.375 2.376 2.053 2.6500.002 3.224 2.609 1.871 2.7420.003 3.886 4.228 1.897 2.1990.004 4.082 4.434 1.811 2.1550.005 4.629 4.800 1.706 2.1660.006 5.112 5.084 1.419 2.1060.007 5.426 5.331 1.321 1.9980.008 5.673 5.742 1.266 1.7990.009 6.023 6.153 1.157 1.6840.010 6.241 6.399 1.046 1.5350.013 6.645 6.817 0.863 1.3120.014 6.747 6.829 0.848 1.2880.016 6.999 7.158 0.750 1.1010.018 7.149 7.289 0.673 0.9930.020 7.285 7.432 0.577 0.8430.025 7.476 7.611 0.417 0.5740.030 7.580 7.713 0.307 0.3860.035 7.578 7.693 0.255 0.2990.040 7.593 7.715 0.238 0.2740.050 7.565 7.691 0.211 0.2380.060 7.524 7.632 0.187 0.2180.070 7.474 7.576 0.161 0.2260.080 7.456 7.562 0.159 0.233

Appendix – partially elaborated data
68
Table 32. Section S4 in NON coincidence mode. Measurements in air on water. File Test_18_07_02_S4_aria_NCM.txt
measured data z V1 V2 V1rms V2rms
(m) (m/s) (m/s) (m/s) (m/s) 0.003 3.974 4.122 1.596 2.0780.004 4.333 4.419 1.533 2.1250.005 4.727 4.801 1.468 2.1030.006 5.184 5.251 1.313 1.9490.007 5.470 5.520 1.252 1.8670.008 5.705 5.818 1.143 1.7560.009 5.914 6.029 1.099 1.7360.010 6.127 6.260 1.012 1.5810.012 6.429 6.621 0.928 1.4520.014 6.811 6.961 0.748 1.2210.017 7.202 7.412 0.527 0.8280.018 7.271 7.432 0.521 0.7950.020 7.381 7.531 0.426 0.6320.025 7.480 7.648 0.274 0.3640.030 7.494 7.667 0.242 0.2980.035 7.523 7.691 0.219 0.2650.040 7.553 7.688 0.202 0.2220.050 7.556 7.680 0.185 0.2330.060 7.511 7.685 0.182 0.2330.070 7.480 7.691 0.173 0.3020.080 7.460 7.631 0.160 0.221

Appendix – partially elaborated data
69
Table 33. Section S5 in NON coincidence mode. Measurements in air on water. File Test_19_07_02_S5_aria_NCM.txt
measured data z V1 V2 V1rms V2rms
(m) (m/s) (m/s) (m/s) (m/s) 0.003 3.831 3.926 1.715 2.4630.004 4.375 4.423 1.639 2.5570.005 4.782 4.928 1.605 2.4000.006 5.345 5.497 1.467 2.1940.007 5.680 5.848 1.355 2.1290.008 5.966 6.068 1.282 2.0670.009 6.220 6.386 1.258 1.9370.010 6.524 6.698 1.081 1.7550.012 6.917 7.093 0.898 1.3850.014 7.207 7.345 0.670 1.1440.016 7.396 7.502 0.497 0.7780.018 7.633 7.686 0.495 0.6970.020 7.632 7.712 0.428 0.5280.025 7.629 7.721 0.318 0.3610.030 7.763 7.874 0.300 0.3240.035 7.753 7.888 0.264 0.3430.040 7.784 7.868 0.227 0.2510.050 7.735 7.825 0.214 0.2280.060 7.651 7.860 0.213 0.2340.070 7.546 7.768 0.198 0.2170.080 7.565 7.739 0.197 0.211

Appendix – partially elaborated data
70
Table 34. Section S6 in NON coincidence mode. Measurements in air on water. File Test_20_07_02_S6_aria_NCM.txt
measured data z V1 V2 V1rms V2rms
(m) (m/s) (m/s) (m/s) (m/s) 0.003 5.362 5.230 1.402 2.1280.004 5.834 5.639 1.455 2.0240.005 5.963 6.121 2.011 1.6940.005 6.502 6.297 0.979 1.5450.006 6.825 6.531 0.920 1.3700.007 7.128 6.748 0.722 1.1830.007 7.174 6.863 0.608 1.0440.008 7.376 7.053 0.512 0.8420.009 7.498 7.132 0.477 0.7260.010 7.551 7.204 0.428 0.6300.013 7.657 7.347 0.354 0.4670.014 7.567 7.276 0.320 0.4140.016 7.569 7.254 0.280 0.3520.018 7.669 7.346 0.273 0.3370.020 7.664 7.332 0.257 0.3130.020 7.662 7.324 0.259 0.3100.025 7.680 7.355 0.238 0.2690.030 7.603 7.326 0.225 0.2440.035 7.581 7.370 0.227 0.2540.040 7.507 7.325 0.210 0.2290.050 7.402 7.299 0.198 0.2200.060 7.429 7.390 0.192 0.2330.070 7.333 7.301 0.193 0.2350.080 7.320 7.355 0.187 0.238

Appendix – partially elaborated data
71
Table 35. Section S7 in NON coincidence mode. Measurements in air on water. File Test_21_07_02_S7_aria_NCM.txt
measured data z V1 V2 V1rms V2rms
(m) (m/s) (m/s) (m/s) (m/s) 0.000 2.521 3.013 1.653 1.9810.001 4.391 4.640 1.368 1.7260.002 7.391 7.967 0.917 1.3880.003 6.478 6.859 0.504 0.7720.004 6.771 7.113 0.379 0.5610.005 6.939 7.253 0.325 0.4400.006 7.037 7.336 0.308 0.3840.007 7.053 7.407 0.300 0.3680.008 7.048 7.392 0.280 0.3490.009 7.084 7.395 0.270 0.3320.010 7.136 7.390 0.267 0.3490.012 7.222 7.436 0.258 0.3110.014 7.181 7.448 0.267 0.3260.016 7.102 7.421 0.235 0.3180.018 7.122 7.406 0.238 0.2810.020 7.131 7.394 0.230 0.2900.025 7.207 7.379 0.214 0.2960.030 7.237 7.352 0.211 0.2450.035 7.248 7.323 0.210 0.2400.040 7.274 7.256 0.204 0.2480.050 7.325 7.214 0.190 0.2410.060 9.179 9.045 0.217 0.2930.070 7.362 7.272 0.182 0.2200.080 7.380 7.240 0.164 0.212

Appendix – partially elaborated data
72
Table 36. Section S0 in coincidence mode. Measurements in air on rigid bottom. File Test_29_07_02_S0_aria_piano_CM.txt
measured data transformed data z V1 V2 V1rms V2rms U V U’rms V’rms (U’V’)rms k φ
(m) (m/s) (m/s) (m/s) (m/s) (m/s) (m/s) (m/s) (m/s) (m2/s2) (m2/s2) (°) 0.001 4.561 4.536 0.943 1.248 6.646 -0.080 1.489 0.404 -0.2915 1.1901 4.0390.003 5.836 5.885 0.645 0.992 8.377 -0.075 1.030 0.568 -0.2750 0.6918 10.2060.003 5.785 5.895 0.648 0.974 8.329 -0.077 1.045 0.540 -0.2699 0.6922 9.3140.006 6.618 6.694 0.569 0.885 9.477 -0.085 0.916 0.528 -0.2244 0.5588 10.9220.010 7.338 7.444 0.472 0.717 10.483 -0.088 0.736 0.429 -0.1336 0.3626 10.2500.015 7.810 7.859 0.314 0.451 11.086 -0.037 0.470 0.314 -0.0529 0.1596 11.7310.020 7.968 8.000 0.211 0.298 11.292 -0.020 0.310 0.260 -0.0288 0.0819 22.7630.025 8.003 8.039 0.183 0.246 11.345 -0.022 0.257 0.227 -0.0172 0.0588 25.1650.030 7.978 8.011 0.187 0.239 11.305 -0.019 0.253 0.231 -0.0153 0.0588 27.6540.030 8.001 8.039 0.198 0.179 11.338 -0.018 0.237 0.209 -0.0009 0.0499 2.0470.035 7.989 8.030 0.193 0.171 11.324 -0.022 0.228 0.206 -0.0004 0.0474 1.3190.040 7.960 8.010 0.191 0.174 11.287 -0.029 0.228 0.208 -0.0019 0.0477 6.3840.050 7.962 8.007 0.185 0.182 11.287 -0.025 0.238 0.220 -0.0097 0.0525 25.4360.060 7.968 8.003 0.168 0.178 11.289 -0.019 0.218 0.197 -0.0071 0.0433 19.7220.070 7.990 8.008 0.165 0.185 11.306 -0.007 0.225 0.194 -0.0086 0.0441 16.4110.080 8.021 8.033 0.165 0.195 11.348 -0.002 0.237 0.191 -0.0110 0.0463 14.660

Appendix – partially elaborated data
73
Table 37. Section S1 in coincidence mode. Measurements in air on rigid bottom. File Test_30_07_02_S1_aria_piano_CM.txt
measured data transformed data z V1 V2 V1rms V2rms U V U’rms V’rms (U’V’)rms k φ
(m) (m/s) (m/s) (m/s) (m/s) (m/s) (m/s) (m/s) (m/s) (m2/s2) (m2/s2) (°) 0.001 4.556 4.696 0.920 1.186 6.746 -0.084 1.420 0.408 -0.274 1.091 4.2150.003 5.837 5.955 0.643 0.978 8.395 -0.085 1.032 0.557 -0.272 0.688 9.8880.006 6.635 6.767 0.580 0.882 9.507 -0.089 0.916 0.520 -0.218 0.555 10.4910.010 7.352 7.465 0.484 0.703 10.496 -0.076 0.752 0.407 -0.129 0.366 8.9640.015 7.862 7.918 0.312 0.432 11.162 -0.036 0.474 0.314 -0.059 0.162 12.5150.020 8.021 8.053 0.215 0.269 11.365 -0.016 0.303 0.224 -0.018 0.071 11.7700.025 8.060 8.078 0.182 0.221 11.410 -0.008 0.255 0.216 -0.010 0.056 14.1570.030 8.088 8.107 0.179 0.202 11.452 -0.006 0.230 0.201 -0.009 0.047 17.680

Appendix – partially elaborated data
74
Table 38. Section S2 in coincidence mode. Measurements in air on rigid bottom. File Test_30_07_02_S2_aria_piano_CM.txt
measured data transformed data z V1 V2 V1rms V2rms U V U’rms V’rms (U’V’)rms k φ
(m) (m/s) (m/s) (m/s) (m/s) (m/s) (m/s) (m/s) (m/s) (m2/s2) (m2/s2) (°) 0.001 4.696 4.850 0.885 1.194 6.929 -0.101 1.403 0.463 -0.3225 1.0917 5.2090.003 5.944 6.076 0.643 0.994 8.578 -0.098 1.042 0.560 -0.2793 0.6996 9.9470.006 6.794 6.926 0.549 0.835 9.742 -0.094 0.881 0.502 -0.2020 0.5138 10.5310.010 7.505 7.629 0.442 0.629 10.712 -0.079 0.675 0.385 -0.1016 0.3021 9.1150.015 7.915 7.968 0.283 0.373 11.230 -0.035 0.405 0.271 -0.0310 0.1189 9.4260.020 8.017 8.073 0.197 0.237 11.372 -0.034 0.268 0.212 -0.0128 0.0584 12.7110.025 8.040 8.097 0.181 0.210 11.408 -0.034 0.242 0.208 -0.0106 0.0510 17.3260.030 8.037 8.100 0.177 0.195 11.409 -0.037 0.228 0.205 -0.0083 0.0470 19.469

Appendix – partially elaborated data
75
Table 39. Section S3 in coincidence mode. Measurements in air on rigid bottom. File Test_30_07_02_S3_aria_piano_CM.txt
measured data transformed data z V1 V2 V1rms V2rms U V U’rms V’rms (U’V’)rms k φ
(m) (m/s) (m/s) (m/s) (m/s) (m/s) (m/s) (m/s) (m/s) (m2/s2) (m2/s2) (°) 0.002 5.451 5.544 0.756 1.103 7.900 -0.076 1.210 0.504 -0.2950 0.8593 6.8430.003 6.149 6.270 0.625 0.942 8.843 -0.079 0.995 0.535 -0.2468 0.6382 9.6690.006 6.957 7.078 0.531 0.787 9.962 -0.084 0.835 0.466 -0.1696 0.4567 9.7360.010 7.593 7.697 0.379 0.516 10.824 -0.066 0.555 0.337 -0.0622 0.2106 8.8890.015 7.855 7.927 0.215 0.259 11.155 -0.044 0.295 0.232 -0.0148 0.0703 12.1280.020 7.891 7.953 0.181 0.204 11.198 -0.036 0.237 0.205 -0.0087 0.0492 15.7620.025 7.899 7.980 0.176 0.185 11.223 -0.049 0.227 0.205 -0.0064 0.0466 17.1160.030 7.904 7.982 0.176 0.171 11.228 -0.047 0.219 0.203 -0.0042 0.0447 16.2030.035 7.875 7.953 0.178 0.175 11.184 -0.047 0.216 0.211 -0.0038 0.0455 29.0760.040 7.876 7.961 0.172 0.168 11.192 -0.051 0.207 0.207 -0.0042 0.0428 43.7130.050 7.868 7.952 0.172 0.169 11.179 -0.051 0.212 0.205 -0.0054 0.0435 31.4260.060 7.861 7.935 0.165 0.163 11.163 -0.044 0.206 0.195 -0.0051 0.0403 24.9900.070 7.848 7.914 0.157 0.166 11.140 -0.039 0.210 0.192 -0.0067 0.0406 21.5610.080 7.868 7.915 0.152 0.165 11.156 -0.026 0.212 0.189 -0.0088 0.0404 22.350

Appendix – partially elaborated data
76
Table 40. Section S4 in coincidence mode. Measurements in air on rigid bottom. File Test_30_07_02_S4_aria_piano_CM.txt
measured data transformed data z V1 V2 V1rms V2rms U V U’rms V’rms (U’V’)rms k φ
(m) (m/s) (m/s) (m/s) (m/s) (m/s) (m/s) (m/s) (m/s) (m2/s2) (m2/s2) (°) 0.001 5.114 5.231 0.932 1.205 7.438 -0.029 1.436 0.435 -0.3081 1.1252 4.6720.003 6.412 6.484 0.610 0.936 9.132 -0.054 0.993 0.525 -0.2514 0.6303 9.7510.006 7.273 7.295 0.548 0.768 10.313 -0.002 0.826 0.448 -0.1514 0.4413 8.7480.010 7.885 7.887 0.344 0.439 11.138 0.005 0.482 0.308 -0.0389 0.1637 7.8860.015 8.063 7.986 0.248 0.269 11.338 0.048 0.317 0.243 -0.0089 0.0797 6.0380.020 8.024 7.981 0.231 0.239 11.317 0.026 0.281 0.223 -0.0057 0.0642 5.5370.025 7.987 7.983 0.237 0.224 11.307 0.014 0.274 0.229 -0.0043 0.0638 5.4920.030 7.983 8.018 0.240 0.219 11.322 -0.009 0.272 0.225 -0.0005 0.0622 0.559

Appendix – partially elaborated data
77
Table 41. Section S5 in coincidence mode. Measurements in air on rigid bottom. File Test_30_07_02_S5_aria_piano_CM.txt
measured data transformed data z V1 V2 V1rms V2rms U V U’rms V’rms (U’V’)rms k φ
(m) (m/s) (m/s) (m/s) (m/s) (m/s) (m/s) (m/s) (m/s) (m2/s2) (m2/s2) (°) 0.001 5.366 5.427 0.951 1.244 7.748 -0.033 1.439 0.452 -0.3134 1.1378 4.7630.003 6.619 6.639 0.657 0.941 9.365 -0.043 1.027 0.514 -0.2245 0.6599 7.9290.006 7.522 7.489 0.511 0.699 10.588 0.004 0.754 0.420 -0.1055 0.3729 7.5220.010 8.023 7.887 0.321 0.381 11.201 0.080 0.418 0.303 -0.0222 0.1332 7.4730.015 8.041 7.937 0.259 0.283 11.279 0.064 0.327 0.241 -0.0068 0.0827 3.9490.020 8.032 7.940 0.248 0.245 11.282 0.058 0.297 0.233 -0.0030 0.0714 2.4870.025 8.055 7.947 0.240 0.244 11.303 0.071 0.287 0.233 -0.0059 0.0683 5.9230.030 8.068 7.986 0.243 0.229 11.337 0.053 0.276 0.229 -0.0018 0.0642 2.151

Appendix – partially elaborated data
78
Table 42. Section S6 in coincidence mode. Measurements in air on rigid bottom. File Test_30_07_02_S6_aria_piano_CM.txt
measured data transformed data z V1 V2 V1rms V2rms U V U’rms V’rms (U’V’)rms k φ
(m) (m/s) (m/s) (m/s) (m/s) (m/s) (m/s) (m/s) (m/s) (m2/s2) (m2/s2) (°) 0.001 5.181 5.298 1.030 1.276 7.574 -0.059 1.529 0.445 -0.3125 1.2681 4.1540.003 6.775 6.843 0.772 1.019 9.657 -0.060 1.123 0.521 -0.2209 0.7664 6.2940.005 7.343 7.347 0.575 0.753 10.360 -0.017 0.831 0.430 -0.1084 0.4381 6.0440.008 7.903 7.792 0.301 0.365 11.052 0.067 0.403 0.295 -0.0198 0.1248 7.2980.010 7.958 7.817 0.262 0.301 11.108 0.085 0.345 0.265 -0.0111 0.0947 6.4260.012 7.931 7.877 0.253 0.295 11.127 0.036 0.330 0.263 -0.0127 0.0890 8.9530.015 8.003 7.866 0.243 0.267 11.177 0.080 0.309 0.248 -0.0070 0.0784 5.9160.020 7.962 7.850 0.234 0.237 11.158 0.073 0.281 0.233 -0.0039 0.0665 4.4490.025 7.870 7.809 0.228 0.212 11.087 0.043 0.264 0.220 -0.0010 0.0591 1.3860.030 7.874 7.859 0.226 0.203 11.105 0.018 0.261 0.217 0.0002 0.0575 -0.3090.035 7.821 7.789 0.223 0.198 11.032 0.029 0.252 0.216 0.0008 0.0551 -1.2950.040 7.766 7.777 0.223 0.201 10.996 0.003 0.252 0.219 0.0003 0.0558 -0.5170.050 7.667 7.738 0.220 0.197 10.917 -0.027 0.247 0.224 0.0002 0.0555 -0.4930.060 7.584 7.810 0.235 0.196 10.902 -0.121 0.253 0.224 0.0037 0.0573 -7.4990.070 7.661 7.792 0.221 0.207 10.924 -0.074 0.258 0.217 -0.0032 0.0570 4.6220.080 7.866 7.847 0.185 0.219 11.084 0.034 0.255 0.200 -0.0115 0.0525 12.388

Appendix – partially elaborated data
79
Table 43. Section S7 in coincidence mode. Measurements in air on rigid bottom. File Test_30_07_02_S7_aria_piano_CM.txt
measured data transformed data z V1 V2 V1rms V2rms U V U’rms V’rms (U’V’)rms k φ
(m) (m/s) (m/s) (m/s) (m/s) (m/s) (m/s) (m/s) (m/s) (m2/s2) (m2/s2) (°) 0.001 5.114 5.198 1.139 1.356 7.446 -0.101 1.642 0.507 -0.2860 1.4763 3.3440.002 6.534 6.586 0.942 1.088 9.307 -0.050 1.324 0.482 -0.1863 0.9926 3.4920.003 7.348 7.338 0.689 0.810 10.366 -0.008 0.960 0.397 -0.0931 0.5393 3.4760.004 7.758 7.593 0.482 0.562 10.802 0.076 0.676 0.343 -0.0433 0.2872 3.6310.005 7.918 7.757 0.377 0.464 11.031 0.093 0.515 0.318 -0.0351 0.1834 6.0200.006 8.018 7.827 0.334 0.394 11.143 0.110 0.438 0.303 -0.0184 0.1417 5.2020.008 8.086 7.877 0.308 0.320 11.229 0.126 0.372 0.289 -0.0077 0.1111 3.9960.010 8.121 7.856 0.268 0.308 11.248 0.159 0.346 0.272 -0.0139 0.0968 8.4330.015 8.036 7.758 0.266 0.306 11.172 0.176 0.339 0.260 -0.0163 0.0914 9.5350.025 7.995 7.757 0.235 0.246 11.167 0.177 0.273 0.246 -0.0074 0.0675 14.0680.030 7.937 7.751 0.245 0.228 11.126 0.142 0.269 0.243 0.0001 0.0659 -0.196

Appendix – partially elaborated data
80
Table 44. Section S0 in NON coincidence mode. Measurements in air on rigid bottom. File Test_29_07_02_S0_aria_piano_CM.txt
measured data z V1 V2 V1rms V2rms
(m) (m/s) (m/s) (m/s) (m/s) 0.001 4.560 4.567 0.945 1.2150.003 5.847 5.869 0.645 1.0010.003 5.789 5.875 0.649 0.9840.006 6.627 6.679 0.575 0.8950.010 7.339 7.430 0.474 0.8130.015 7.806 7.859 0.318 0.4670.020 7.957 8.008 0.226 0.3420.025 7.995 8.049 0.196 0.2770.030 7.966 8.023 0.198 0.2630.030 7.990 8.044 0.208 0.1840.035 7.977 8.035 0.204 0.1770.040 7.949 8.015 0.202 0.1810.050 7.952 8.012 0.196 0.1850.060 7.959 8.008 0.181 0.1840.070 7.977 8.013 0.178 0.1900.080 8.013 8.037 0.178 0.201

Appendix – partially elaborated data
81
Table 45. Section S1 in NON coincidence mode. Measurements in air on rigid bottom. File Test_30_07_02_S1_aria_piano_CM.txt
measured data z V1 V2 V1rms V2rms
(m) (m/s) (m/s) (m/s) (m/s) 0.001 4.567 4.677 0.968 1.1890.003 5.829 5.941 0.645 0.9760.006 6.617 6.758 0.578 0.8780.010 7.339 7.461 0.490 0.7080.015 7.850 7.922 0.323 0.4300.020 8.009 8.057 0.227 0.2770.025 8.054 8.082 0.193 0.2260.030 8.082 8.110 0.185 0.206

Appendix – partially elaborated data
82
Table 46. Section S2 in NON coincidence mode. Measurements in air on rigid bottom. File Test_30_07_02_S2_aria_piano_CM.txt
measured data z V1 V2 V1rms V2rms
(m) (m/s) (m/s) (m/s) (m/s) 0.001 4.711 4.817 0.960 1.2110.003 5.942 6.062 0.642 1.0020.006 6.783 6.925 0.555 0.8400.010 7.499 7.630 0.448 0.6330.015 7.900 7.969 0.309 0.3800.020 8.009 8.076 0.209 0.2410.025 8.033 8.101 0.191 0.2150.030 8.030 8.106 0.187 0.200

Appendix – partially elaborated data
83
Table 47. Section S3 in NON coincidence mode. Measurements in air on rigid bottom. File Test_30_07_02_S3_aria_piano_CM.txt
measured data z V1 V2 V1rms V2rms
(m) (m/s) (m/s) (m/s) (m/s) 0.0015 5.451 5.523 0.757 1.113
0.003 6.140 6.256 0.629 0.9500.006 6.953 7.073 0.536 0.7950.010 7.583 7.697 0.384 0.5210.015 7.845 7.930 0.224 0.2650.020 7.880 7.957 0.194 0.2250.025 7.890 7.984 0.187 0.1910.030 7.896 7.986 0.188 0.1770.035 7.866 7.957 0.190 0.1800.040 7.869 7.964 0.186 0.1740.050 7.860 7.955 0.185 0.1760.060 7.852 7.938 0.177 0.1700.070 7.838 7.918 0.171 0.1760.080 7.859 7.919 0.165 0.171

Appendix – partially elaborated data
84
Table 48. Section S4 in NON coincidence mode. Measurements in air on rigid bottom. File Test_30_07_02_S4_aria_piano_CM.txt
measured data z V1 V2 V1rms V2rms
(m) (m/s) (m/s) (m/s) (m/s) 0.001 5.113 5.169 0.900 1.2120.003 6.338 6.450 0.615 0.9410.006 7.201 7.265 0.536 0.7790.010 7.802 7.878 0.363 0.4540.015 8.001 7.992 0.258 0.2740.020 7.983 7.983 0.240 0.2410.025 7.953 7.985 0.243 0.2250.030 7.939 8.017 0.248 0.222

Appendix – partially elaborated data
85
Table 49. Section S5 in NON coincidence mode. Measurements in air on rigid bottom. File Test_30_07_02_S5_aria_piano_CM.txt
measured data z V1 V2 V1rms V2rms
(m) (m/s) (m/s) (m/s) (m/s) 0.001 5.326 5.374 0.926 1.2450.003 6.568 6.611 0.649 0.9650.006 7.477 7.475 0.512 0.7110.010 7.930 7.884 0.328 0.3850.015 7.975 7.938 0.271 0.2830.020 7.984 7.943 0.255 0.2480.025 8.013 7.951 0.245 0.2440.030 8.009 7.986 0.256 0.229

Appendix – partially elaborated data
86
Table 50. Section S6 in NON coincidence mode. Measurements in air on rigid bottom. File Test_30_07_02_S6_aria_piano_CM.txt
measured data z V1 V2 V1rms V2rms
(m) (m/s) (m/s) (m/s) (m/s) 0.001 5.179 5.256 0.992 1.2880.003 6.731 6.817 0.742 1.0350.005 7.284 7.319 0.583 0.7780.008 7.855 7.789 0.308 0.3680.010 7.895 7.818 0.272 0.3040.012 7.885 7.876 0.260 0.2990.015 7.928 7.867 0.259 0.2680.020 7.909 7.851 0.244 0.2380.025 7.841 7.813 0.235 0.2140.030 7.838 7.858 0.236 0.2110.035 7.800 7.792 0.230 0.2000.040 7.762 7.779 0.228 0.2040.050 7.670 7.741 0.226 0.2010.060 7.632 7.810 0.239 0.1960.070 7.698 7.788 0.225 0.2080.080 7.839 7.841 0.198 0.222

Appendix – partially elaborated data
87
Table 51. Section S7 in NON coincidence mode. Measurements in air on rigid bottom. File Test_30_07_02_S7_aria_piano_CM.txt
measured data z V1 V2 V1rms V2rms
(m) (m/s) (m/s) (m/s) (m/s) 0.001 5.085 5.122 1.137 1.3850.002 6.476 6.551 0.918 1.1070.003 7.277 7.298 0.691 0.8280.004 7.662 7.574 0.501 0.6030.005 7.834 7.748 0.377 0.4580.006 7.931 7.817 0.337 0.3960.008 8.008 7.872 0.309 0.3250.010 8.044 7.852 0.288 0.3100.015 7.967 7.762 0.276 0.3070.025 7.948 7.768 0.246 0.2470.030 7.934 7.760 0.244 0.231

Appendix – partially elaborated data
88
Table 52. Section S0. Measurements in air on water
file name
(non
coinc. m
ode)
file name
(coinc. m
ode)
date (gg/mm/aaaa)
section
relativ
e level (mm)
duratio
n (s)
datarate ch1
(Hz)
datarate ch2
(Hz)
datarate coinc. (Hz)
commen
ts
test_aria_116 test_aria_116_bis 18/07/2010 S0 5 606 7 2 0 test_aria_117 test_aria_117_bis 18/07/2010 S0 6 520 160 87 22
test_aria_118 test_aria_118_bis 18/07/2010 S0 7 540 221 118 41 coincidence mode only
for the first 160 s test_aria_119 test_aria_119_bis 18/07/2010 S0 8 n.a. 238 158 82 test_aria_120 test_aria_120_bis 18/07/2010 S0 9 456 244 161 85 test_aria_121 test_aria_121_bis 18/07/2010 S0 10 645 232 154 84 test_aria_122 test_aria_122_bis 18/07/2010 S0 12 305 331 218 120
test_aria_123 test_aria_123_bis 18/07/2010 S0 15 302 113 97 28 glass junction at 14
mm test_aria_124 test_aria_124_bis 18/07/2010 S0 16 313 383 245 131 test_aria_125 test_aria_125_bis 18/07/2010 S0 18 301 498 312 172 test_aria_126 test_aria_126_bis 18/07/2010 S0 20 320 447 286 156 test_aria_127 test_aria_127_bis 18/07/2010 S0 25 305 621 377 214 test_aria_128 test_aria_128_bis 18/07/2010 S0 30 301 596 362 203 test_aria_129 test_aria_129_bis 18/07/2010 S0 35 300 805 455 264 test_aria_130 test_aria_130_bis 18/07/2010 S0 40 132 859 518 288 data overflow test_aria_131 test_aria_131_bis 18/07/2010 S0 50 232 915 557 313 data overflow test_aria_132 test_aria_132_bis 18/07/2010 S0 60 62 887 518 289 data overflow (invalid)

Appendix – partially elaborated data
89
test_aria_133 test_aria_133_bis 18/07/2010 S0 70 301 1064 654 370 test_aria_134 test_aria_134_bis 18/07/2010 S0 80 143 976 587 327 data overflow test_aria_135 test_aria_135_bis 18/07/2010 S0 60 169 1602 936 529 data overflow

Appendix – partially elaborated data
90
Table 53. Section S1. Measurements in air on water
file name
(non
coinc. m
ode)
file name
(coinc. m
ode)
date (gg/mm/aaaa)
section
relativ
e level (mm)
duratio
n (s)
datarate ch1
(Hz)
datarate ch2
(Hz)
datarate coinc. (Hz)
commen
ts
test_aria_18 test_aria_18_bis 02/07/2010 S1 5 630 11 13 3 double peak spectrum test_aria_19 test_aria_19_bis 02/07/2010 S1 4 615 2 8 0 test_aria_20 test_aria_20_bis 02/07/2010 S1 3 608 32 27 9 test_aria_21 test_aria_21_bis 02/07/2010 S1 2 600 13 8 0 test_aria_22 test_aria_22_bis 02/07/2010 S1 1 608 11 7 0 test_aria_23 test_aria_23_bis 02/07/2010 S1 0 602 15 6 0 test_aria_24 test_aria_24_bis 02/07/2010 S1 6 607 61 55 23 test_aria_25 test_aria_25_bis 02/07/2010 S1 7 631 68 60 26 test_aria_26 test_aria_26_bis 02/07/2010 S1 8 613 74 66 28 test_aria_27 test_aria_27_bis 02/07/2010 S1 9 611 86 63 30 test_aria_28 test_aria_28_bis 02/07/2010 S1 12 604 58 52 20 glass junction at 10 and
11 mm test_aria_29 test_aria_29_bis 02/07/2010 S1 14 604 43 44 16 test_aria_30 test_aria_30_bis 02/07/2010 S1 16 635 59 54 20 test_aria_31 test_aria_31_bis 02/07/2010 S1 18 622 62 65 21 test_aria_32 test_aria_32_bis 02/07/2010 S1 20 605 26 59 11 test_aria_33 test_aria_33_bis 02/07/2010 S1 25 604 23 20 9 test_aria_34 test_aria_34_bis 02/07/2010 S1 30 605 45 35 17 test_aria_35 test_aria_35_bis 02/07/2010 S1 35 608 53 40 20

Appendix – partially elaborated data
91
test_aria_36 test_aria_36_bis 02/07/2010 S1 40 621 28 24 11 test_aria_37 test_aria_37_bis 02/07/2010 S1 50 266 264 170 95 data overflow test_aria_38 test_aria_38_bis 02/07/2010 S1 50 617 158 112 61 test_aria_39 test_aria_39_bis 02/07/2010 S1 60 486 633 399 237 data overflow test_aria_40 test_aria_40_bis 02/07/2010 S1 60 665 281 185 106 test_aria_41 test_aria_41_bis 02/07/2010 S1 70 604 153 113 59 test_aria_42 test_aria_42_bis 02/07/2010 S1 80 614 41 43 17 test_aria_43 test_aria_43_bis 02/07/2010 S1 60 603 18 20 7 test_aria_44 test_aria_44_bis 02/07/2010 S1 50 601 95 69 36 test_aria_45 test_aria_45_bis 02/07/2010 S1 70 603 158 110 60 data overflow

Appendix – partially elaborated data
92
Table 54. Section S2. Measurements in air on water
file name
(non
coinc. m
ode)
file name
(coinc. m
ode)
date (gg/mm/aaaa)
section
relativ
e level (mm)
duratio
n (s)
datarate ch1
(Hz)
datarate ch2
(Hz)
datarate coinc. (Hz)
commen
ts
test_aria_46 test_aria_46_bis 12/07/2010 S2 5 602 24 14 1 test_aria_47 test_aria_47_bis 12/07/2010 S2 4 600 11 4 0 test_aria_48 test_aria_48_bis 12/07/2010 S2 4 597 10 3 0 presumably the
transverse system has lost the step
test_aria_49 test_aria_49_bis 12/07/2010 S2 3 630 8 3 0 test_aria_50 test_aria_50_bis 12/07/2010 S2 2 n.a. na na 0 invalid test_aria_51 test_aria_51_bis 12/07/2010 S2 1 613 1 0 0 test_aria_52 test_aria_52_bis 12/07/2010 S2 7 639 71 40 22 test_aria_53 test_aria_53_bis 12/07/2010 S2 8 n.a. 68 52 24 invalid test_aria_54 test_aria_54_bis 12/07/2010 S2 9 601 79 60 30 test_aria_55 test_aria_55_bis 12/07/2010 S2 10 600 97 72 37 test_aria_56 test_aria_56_bis 12/07/2010 S2 8 n.a. 148 94 25 test_aria_57 test_aria_57_bis 12/07/2010 S2 11 604 123 84 47 test_aria_58 test_aria_58_bis 12/07/2010 S2 14 607 190 124 70 test_aria_59 test_aria_59_bis 12/07/2010 S2 15 605 216 138 78 test_aria_60 test_aria_60_bis 12/07/2010 S2 2 612 9 3 0 test_aria_61 test_aria_61_bis 12/07/2010 S2 17 289 292 177 103 test_aria_62 test_aria_62_bis 12/07/2010 S2 19 338 126 85 46
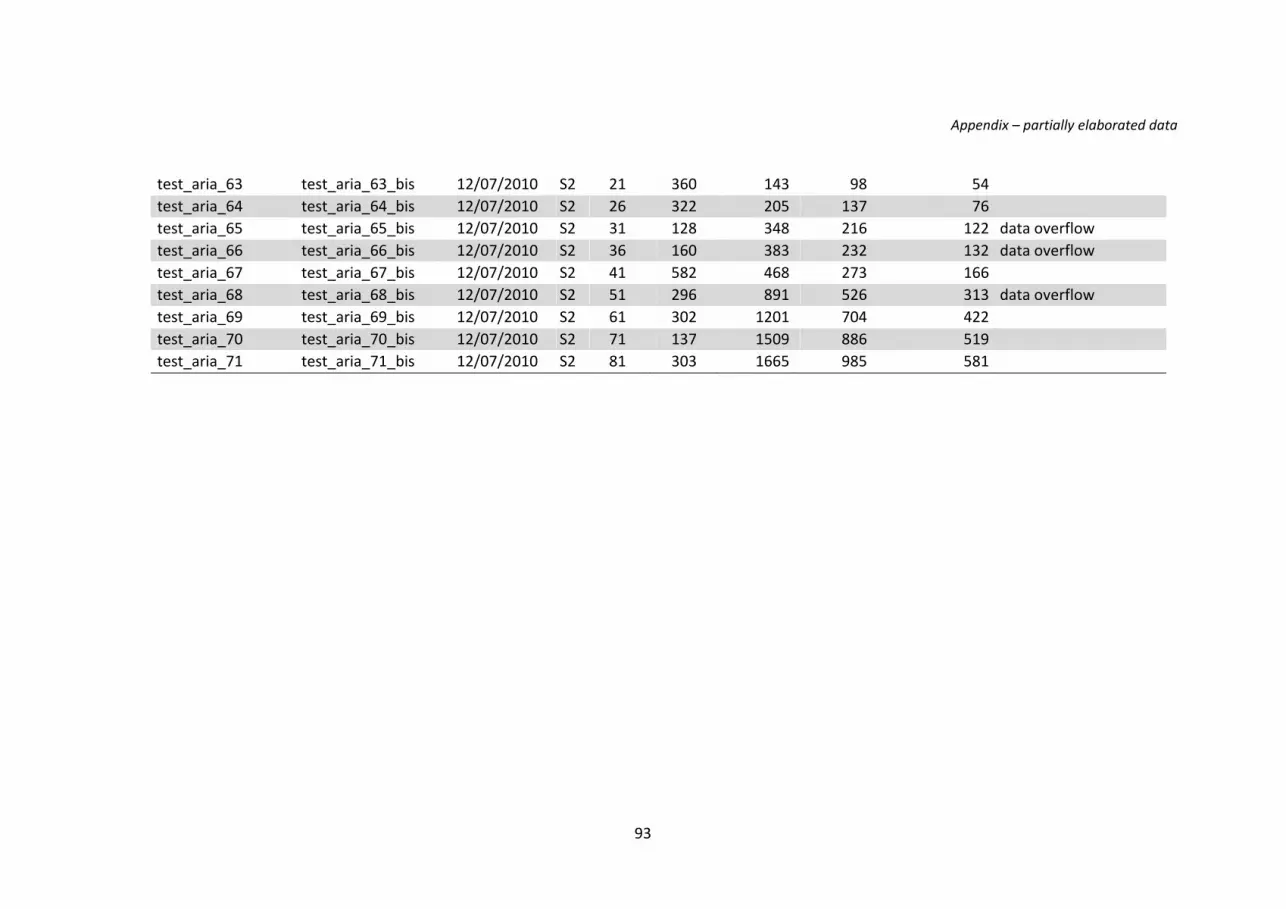
Appendix – partially elaborated data
93
test_aria_63 test_aria_63_bis 12/07/2010 S2 21 360 143 98 54 test_aria_64 test_aria_64_bis 12/07/2010 S2 26 322 205 137 76 test_aria_65 test_aria_65_bis 12/07/2010 S2 31 128 348 216 122 data overflow test_aria_66 test_aria_66_bis 12/07/2010 S2 36 160 383 232 132 data overflow test_aria_67 test_aria_67_bis 12/07/2010 S2 41 582 468 273 166 test_aria_68 test_aria_68_bis 12/07/2010 S2 51 296 891 526 313 data overflow test_aria_69 test_aria_69_bis 12/07/2010 S2 61 302 1201 704 422 test_aria_70 test_aria_70_bis 12/07/2010 S2 71 137 1509 886 519 test_aria_71 test_aria_71_bis 12/07/2010 S2 81 303 1665 985 581

Appendix – partially elaborated data
94
Table 55. Section S3. Measurements in air on water
file name
(non
coinc. m
ode)
file name
(coinc. m
ode)
date (gg/mm/aaaa)
section
relativ
e level (mm)
duratio
n (s)
datarate ch1
(Hz)
datarate ch2
(Hz)
datarate coinc. (Hz)
commen
ts
test_aria_72 test_aria_72_bis 13/07/2010 S3 5 605 18 9 4 test_aria_73 test_aria_73_bis 13/07/2010 S3 3 610 2 1 0 test_aria_74 test_aria_74_bis 13/07/2010 S3 4 613 4 2 0 test_aria_75 test_aria_75_bis 13/07/2010 S3 2 579 1 0 0 test_aria_76 test_aria_76_bis 13/07/2010 S3 1 651 0 0 0 test_aria_77 test_aria_77_bis 13/07/2010 S3 6 603 22 25 9 test_aria_78 test_aria_78_bis 13/07/2010 S3 7 601 23 26 9 double peak spectrum test_aria_79 test_aria_79_bis 13/07/2010 S3 8 606 29 29 12 test_aria_80 test_aria_80_bis 13/07/2010 S3 9 608 33 35 14 test_aria_81 test_aria_81_bis 13/07/2010 S3 10 609 38 34 16 test_aria_82 test_aria_82_bis 13/07/2010 S3 13 615 36 35 14 test_aria_83 test_aria_83_bis 13/07/2010 S3 14 600 51 51 21 test_aria_84 test_aria_84_bis 13/07/2010 S3 16 601 61 57 26 test_aria_85 test_aria_85_bis 13/07/2010 S3 18 602 72 71 31 test_aria_86 test_aria_86_bis 13/07/2010 S3 20 607 85 84 37 test_aria_87 test_aria_87_bis 13/07/2010 S3 25 607 117 110 51 test_aria_88 test_aria_88_bis 13/07/2010 S3 30 307 181 153 75 test_aria_89 test_aria_89_bis 13/07/2010 S3 35 351 265 216 110 test_aria_90 test_aria_90_bis 13/07/2010 S3 40 309 296 240 121

Appendix – partially elaborated data
95
test_aria_91 test_aria_91_bis 13/07/2010 S3 50 304 437 353 182 test_aria_92 test_aria_92_bis 13/07/2010 S3 60 187 592 467 243 data overflow test_aria_93 test_aria_93_bis 13/07/2010 S3 70 274 642 509 265 data overflow test_aria_94 test_aria_94_bis 13/07/2010 S3 80 517 486 406 206
Table 56. Section S4. Measurements in air on water
file name
(non
coinc. m
ode)
file name
(coinc. m
ode)
date (gg/mm/aaaa)
section
relativ
e level (mm)
duratio
n (s)
datarate ch1
(Hz)
datarate ch2
(Hz)
datarate coinc. (Hz)
commen
ts
test_aria_95 test_aria_95_bis 18/07/2010 S4 5 n.a. 69 24 8 lost time steps but data are correct
test_aria_96 test_aria_96_bis 18/07/2010 S4 4 650 53 19 8 test_aria_97 test_aria_97_bis 18/07/2010 S4 3 612 20 6 2 test_aria_98 test_aria_98_bis 18/07/2010 S4 6 608 57 42 12 test_aria_99 test_aria_99_bis 18/07/2010 S4 7 610 52 38 11 test_aria_100 test_aria_100_bis 18/07/2010 S4 8 606 67 55 15 test_aria_101 test_aria_101_bis 18/07/2010 S4 9 613 80 60 19 test_aria_102 test_aria_102_bis 18/07/2010 S4 10 609 129 60 21 test_aria_103 test_aria_103_bis 18/07/2010 S4 12 603 196 92 36 test_aria_104 test_aria_104_bis 18/07/2010 S4 14 602 103 67 18 test_aria_105 test_aria_105_bis 18/07/2010 S4 17 641 364 240 96 glass junction at 16
mm

Appendix – partially elaborated data
96
test_aria_106 test_aria_106_bis 18/07/2010 S4 18 607 285 265 96 test_aria_107 test_aria_107_bis 18/07/2010 S4 20 607 376 385 128 test_aria_108 test_aria_108_bis 18/07/2010 S4 27 207 801 642 246 data overflow test_aria_109 test_aria_109_bis 18/07/2010 S4 30 317 774 591 246 test_aria_110 test_aria_110_bis 18/07/2010 S4 35 360 736 478 218 test_aria_111 test_aria_111_bis 18/07/2010 S4 40 316 568 514 191 test_aria_112 test_aria_112_bis 18/07/2010 S4 50 421 342 516 101 test_aria_113 test_aria_113_bis 18/07/2010 S4 60 329 172 458 50 test_aria_114 test_aria_114_bis 18/07/2010 S4 70 302 581 277 89 test_aria_115 test_aria_115_bis 18/07/2010 S4 80 302 737 349 100

Appendix – partially elaborated data
97
Table 57. Section S5. Measurements in air on water
file name
(non
coinc. m
ode)
file name
(coinc. m
ode)
date (gg/mm/aaaa)
section
relativ
e level (mm)
duratio
n (s)
datarate ch1
(Hz)
datarate ch2
(Hz)
datarate coinc. (Hz)
commen
ts
test_aria_136 test_aria_136_bis 19/07/2010 S5 5 600 26 12 3 lost time step but data are correct
test_aria_137 test_aria_137_bis 19/07/2010 S5 4 600 24 11 2 test_aria_138 test_aria_138_bis 19/07/2010 S5 3 600 20 9 2 test_aria_139 test_aria_139_bis 19/07/2010 S5 6 662 32 24 5 test_aria_140 test_aria_140_bis 19/07/2010 S5 7 603 41 34 8 test_aria_141 test_aria_141_bis 19/07/2010 S5 8 592 32 30 8 test_aria_142 test_aria_142_bis 19/07/2010 S5 9 604 77 89 19 test_aria_143 test_aria_143_bis 19/07/2010 S5 10 625 103 110 27 test_aria_144 test_aria_144_bis 19/07/2010 S5 12 620 89 96 26 test_aria_145 test_aria_145_bis 19/07/2010 S5 14 616 33 62 7 test_aria_146 test_aria_146_bis 19/07/2010 S5 16 582 22 121 6 low data rate for ch1
due to glass juntion test_aria_147 test_aria_147_bis 19/07/2010 S5 18 610 63 69 21 test_aria_148 test_aria_148_bis 19/07/2010 S5 20 611 96 79 30 test_aria_149 test_aria_149_bis 19/07/2010 S5 25 475 136 100 44 test_aria_150 test_aria_150_bis 19/07/2010 S5 30 475 41 28 13 test_aria_151 test_aria_151_bis 19/07/2010 S5 35 300 67 46 22 test_aria_152 test_aria_152_bis 19/07/2010 S5 40 337 55 42 19

Appendix – partially elaborated data
98
test_aria_153 test_aria_153_bis 19/07/2010 S5 50 307 54 61 18 test_aria_154 test_aria_154_bis 19/07/2010 S5 60 307 77 46 19 test_aria_155 test_aria_155_bis 19/07/2010 S5 70 309 83 36 14 test_aria_156 test_aria_156_bis 19/07/2010 S5 80 320 49 28 15

Appendix – partially elaborated data
99
Table 58. Section S6. Measurements in air on water
file name
(non
coinc. m
ode)
file name
(coinc. m
ode)
date (gg/mm/aaaa)
section
relativ
e level (mm)
duratio
n (s)
datarate ch1
(Hz)
datarate ch2
(Hz)
datarate coinc. (Hz)
commen
ts
test_aria_157 test_aria_157_bis 20/07/2010 S6 5 631 6 12 1 test_aria_158 test_aria_158_bis 20/07/2010 S6 4 615 8 10 1 test_aria_159 test_aria_159_bis 20/07/2010 S6 3 625 5 8 1 test_aria_160 test_aria_160_bis 20/07/2010 S6 6 602 14 18 3 test_aria_161 test_aria_161_bis 20/07/2010 S6 7 600 19 38 6 test_aria_162 test_aria_162_bis 20/07/2010 S6 8 605 30 29 8 test_aria_163 test_aria_163_bis 20/07/2010 S6 9 600 26 27 8 test_aria_164 test_aria_164_bis 20/07/2010 S6 10 602 22 24 7 test_aria_165 test_aria_165_bis 20/07/2010 S6 13 614 32 35 11 glass junction at 12
mm test_aria_166 test_aria_166_bis 20/07/2010 S6 14 604 12 26 3 test_aria_167 test_aria_167_bis 20/07/2010 S6 16 602 19 45 6 test_aria_168 test_aria_168_bis 20/07/2010 S6 18 605 69 75 26 test_aria_169 test_aria_169_bis 20/07/2010 S6 20 612 87 88 32 test_aria_170 test_aria_170_bis 20/07/2010 S6 25 304 131 104 42 test_aria_171 test_aria_171_bis 20/07/2010 S6 30 302 229 175 81 test_aria_172 test_aria_172_bis 20/07/2010 S6 35 301 224 180 78 test_aria_173 test_aria_173_bis 20/07/2010 S6 40 243 393 269 125 data overflow test_aria_174 test_aria_174_bis 20/07/2010 S6 50 302 310 255 118

Appendix – partially elaborated data
100
test_aria_175 test_aria_175_bis 20/07/2010 S6 60 323 166 163 46 test_aria_176 test_aria_176_bis 20/07/2010 S6 70 305 254 184 74 test_aria_177 test_aria_177_bis 20/07/2010 S6 80 352 159 122 54 test_aria_178 test_aria_178_bis 20/07/2010 S6 5 650 10 12 2 test_aria_179 test_aria_179_bis 20/07/2010 S6 20 621 68 71 26 test_aria_180 test_aria_180_bis 20/07/2010 S6 7 634 18 23 6

Appendix – partially elaborated data
101
Table 59. Section S7. Measurements in air on water
file name
(non
coinc. m
ode)
file name
(coinc. m
ode)
date (gg/mm/aaaa)
section
relativ
e level (mm)
duratio
n (s)
datarate ch1
(Hz)
datarate ch2
(Hz)
datarate coinc. (Hz)
commen
ts
test_aria_181 test_aria_181_bis 21/07/2010 S7 5 602 105 90 34 test_aria_182 test_aria_182_bis 21/07/2010 S7 4 623 99 95 33 test_aria_183 test_aria_183_bis 21/07/2010 S7 3 628 69 69 24 test_aria_184 test_aria_184_bis 21/07/2010 S7 2 742 38 43 14 test_aria_185 test_aria_185_bis 21/07/2010 S7 1 n.a. 11 15 5 lost time step but data
are correct test_aria_186 test_aria_186_bis 21/07/2010 S7 0 605 11 7 2 test_aria_187 test_aria_187_bis 21/07/2010 S7 6 692 88 83 29 test_aria_188 test_aria_188_bis 21/07/2010 S7 7 600 87 79 27 test_aria_189 test_aria_189_bis 21/07/2010 S7 8 604 140 111 40 test_aria_190 test_aria_190_bis 21/07/2010 S7 9 666 142 98 42 test_aria_191 test_aria_191_bis 21/07/2010 S7 10 616 157 109 47 test_aria_192 test_aria_192_bis 21/07/2010 S7 12 642 141 97 42 test_aria_193 test_aria_193_bis 21/07/2010 S7 14 615 29 26 4 test_aria_194 test_aria_194_bis 21/07/2010 S7 16 625 109 74 30 test_aria_195 test_aria_195_bis 21/07/2010 S7 18 601 209 150 69 test_aria_196 test_aria_196_bis 21/07/2010 S7 20 605 159 124 58 test_aria_197 test_aria_197_bis 21/07/2010 S7 25 661 115 96 41 test_aria_198 test_aria_198_bis 21/07/2010 S7 30 338 99 120 38

Appendix – partially elaborated data
102
test_aria_199 test_aria_199_bis 21/07/2010 S7 35 490 99 84 34 test_aria_200 test_aria_200_bis 21/07/2010 S7 40 403 100 85 35 test_aria_201 test_aria_201_bis 21/07/2010 S7 50 346 82 52 24 test_aria_202 test_aria_202_bis 21/07/2010 S7 60 309 88 62 29 test_aria_203 test_aria_203_bis 21/07/2010 S7 70 300 44 40 15 test_aria_204 test_aria_204_bis 21/07/2010 S7 80 330 42 28 12

Appendix – partially elaborated data
103
Table 60. Section S0. Measurements in water
file name
(non
coinc. m
ode)
file name
(coinc. m
ode)
date (gg/mm/aaaa)
section
relativ
e level (mm)
duratio
n (s)
datarate ch1
(Hz)
datarate ch2
(Hz)
datarate coinc. (Hz)
commen
ts
test_acqua_1 test_acqua_1_bis 22/07/2010 S0 ‐5 385 1370 1022 98 time step lost after 385 s, but data are correct
test_acqua_2 test_acqua_2_bis 22/07/2010 S0 ‐4 656 1255 959 104 test_acqua_3 test_acqua_3_bis 22/07/2010 S0 ‐3 608 1034 797 85 test_acqua_4 test_acqua_4_bis 22/07/2010 S0 ‐2 600 861 643 74 test_acqua_5 test_acqua_5_bis 22/07/2010 S0 ‐1 646 641 488 57 test_acqua_6 test_acqua_6_bis 22/07/2010 S0 0 620 411 306 36 test_acqua_7 test_acqua_7_bis 22/07/2010 S0 1 601 261 196 22 test_acqua_8 test_acqua_8_bis 22/07/2010 S0 2 635 153 113 13 test_acqua_9 test_acqua_9_bis 22/07/2010 S0 3 621 91 69 8 test_acqua_10 test_acqua_10_bis 22/07/2010 S0 4 630 34 26 2 test_acqua_11 test_acqua_11_bis 22/07/2010 S0 5 610 11 7 0 test_acqua_12 test_acqua_12_bis 22/07/2010 S0 ‐6 610 1359 1052 118 test_acqua_13 test_acqua_13_bis 22/07/2010 S0 ‐7 607 1363 1057 115 test_acqua_14 test_acqua_14_bis 22/07/2010 S0 ‐8 632 1345 1088 120 test_acqua_15 test_acqua_15_bis 22/07/2010 S0 ‐9 607 1354 1094 116 test_acqua_16 test_acqua_16_bis 22/07/2010 S0 ‐10 602 1350 1074 118 test_acqua_17 test_acqua_17_bis 22/07/2010 S0 ‐12 606 1342 1081 116 test_acqua_18 test_acqua_18_bis 22/07/2010 S0 ‐14 622 1322 1076 114

Appendix – partially elaborated data
104
test_acqua_19 test_acqua_19_bis 22/07/2010 S0 ‐16 789 1299 1074 118 test_acqua_20 test_acqua_20_bis 22/07/2010 S0 ‐18 635 1305 1065 115 test_acqua_21 test_acqua_21_bis 22/07/2010 S0 ‐20 602 1276 1091 108 test_acqua_22 test_acqua_22_bis 22/07/2010 S0 ‐25 607 1198 1047 107 test_acqua_23 test_acqua_23_bis 22/07/2010 S0 ‐30 602 1200 1018 102 test_acqua_24 test_acqua_24_bis 22/07/2010 S0 ‐35 606 1166 968 94 test_acqua_25 test_acqua_25_bis 22/07/2010 S0 ‐40 602 1136 969 92 test_acqua_26 test_acqua_26_bis 22/07/2010 S0 ‐50 604 1066 877 82 test_acqua_27 test_acqua_27_bis 22/07/2010 S0 ‐60 606 1002 859 80 test_acqua_28 test_acqua_28_bis 22/07/2010 S0 ‐70 612 1018 918 86 test_acqua_29 test_acqua_29_bis 22/07/2010 S0 ‐80 603 1098 997 100

Appendix – partially elaborated data
105
Table 61. Section S3. Measurements in water
file name
(non
coinc. m
ode)
file name
(coinc. m
ode)
date (gg/mm/aaaa)
section
relativ
e level (mm)
duratio
n (s)
datarate ch1
(Hz)
datarate ch2
(Hz)
datarate coinc. (Hz)
commen
ts
test_acqua_30 test_acqua_30_bis 23/07/2010 S3 ‐5 603 1098 997 100 test_acqua_30 test_acqua_31 test_acqua_31_bis 23/07/2010 S3 ‐6 1046 648 676 74 test_acqua_31 test_acqua_32 test_acqua_32_bis 23/07/2010 S3 ‐7 634 778 642 86 test_acqua_32 test_acqua_33 test_acqua_33_bis 23/07/2010 S3 ‐4 608 784 683 85 test_acqua_33 test_acqua_34 test_acqua_34_bis 23/07/2010 S3 ‐3 612 713 626 77 test_acqua_34 test_acqua_35 test_acqua_35_bis 23/07/2010 S3 ‐2 603 638 558 71 test_acqua_35 test_acqua_36 test_acqua_36_bis 23/07/2010 S3 ‐1 602 492 416 52 test_acqua_36 test_acqua_37 test_acqua_37_bis 23/07/2010 S3 0 606 341 287 37 test_acqua_37 test_acqua_38 test_acqua_38_bis 23/07/2010 S3 1 624 211 187 23 test_acqua_38 test_acqua_39 test_acqua_39_bis 23/07/2010 S3 2 603 117 102 12 test_acqua_39 test_acqua_40 test_acqua_40_bis 23/07/2010 S3 3 603 52 49 5 test_acqua_40 test_acqua_41 test_acqua_41_bis 23/07/2010 S3 ‐8 710 24 21 2 test_acqua_41 test_acqua_42 test_acqua_42_bis 23/07/2010 S3 ‐9 650 783 676 85 test_acqua_42 test_acqua_43 test_acqua_43_bis 23/07/2010 S3 ‐10 602 772 693 84 test_acqua_43 test_acqua_44 test_acqua_44_bis 23/07/2010 S3 ‐12 606 758 688 81 test_acqua_44 test_acqua_45 test_acqua_45_bis 23/07/2010 S3 ‐14 600 714 682 74 test_acqua_45 test_acqua_46 test_acqua_46_bis 23/07/2010 S3 ‐16 601 736 673 77 test_acqua_46 test_acqua_47 test_acqua_47_bis 23/07/2010 S3 ‐18 602 717 658 75 test_acqua_47 test_acqua_48 test_acqua_48_bis 23/07/2010 S3 ‐20 302 684 635 68 test_acqua_48

Appendix – partially elaborated data
106
test_acqua_49 test_acqua_49_bis 23/07/2010 S3 ‐25 306 720 652 63 test_acqua_49 test_acqua_50 test_acqua_50_bis 23/07/2010 S3 ‐30 302 713 595 62 test_acqua_50 test_acqua_51 test_acqua_51_bis 23/07/2010 S3 ‐35 311 662 602 55 test_acqua_51 test_acqua_52 test_acqua_52_bis 23/07/2010 S3 ‐40 309 705 621 58 test_acqua_52 test_acqua_53 test_acqua_53_bis 23/07/2010 S3 ‐50 313 644 615 59 test_acqua_53 test_acqua_54 test_acqua_54_bis 23/07/2010 S3 ‐60 332 659 654 62 test_acqua_54 test_acqua_55 test_acqua_55_bis 23/07/2010 S3 ‐70 308 607 591 56 test_acqua_55 test_acqua_56 test_acqua_56_bis 23/07/2010 S3 ‐80 313 576 523 48 test_acqua_56

Appendix – partially elaborated data
107
Table 62. Section S5. Measurements in water
file name
(non
coinc. m
ode)
file name
(coinc. m
ode)
date (gg/mm/aaaa)
section
relativ
e level (mm)
duratio
n (s)
datarate ch1
(Hz)
datarate ch2
(Hz)
datarate coinc. (Hz)
commen
ts
test_acqua_57 test_acqua_57_bis 23/07/2010 S5 ‐5 619 137 128 8 test_acqua_58 test_acqua_58_bis 23/07/2010 S5 ‐6 611 178 137 8 test_acqua_59 test_acqua_59_bis 23/07/2010 S5 ‐7 600 180 134 9 test_acqua_60 test_acqua_60_bis 23/07/2010 S5 ‐4 603 134 140 8 test_acqua_61 test_acqua_61_bis 23/07/2010 S5 ‐3 600 79 97 4 test_acqua_62 test_acqua_62_bis 23/07/2010 S5 ‐2 604 87 69 4 test_acqua_63 test_acqua_63_bis 23/07/2010 S5 ‐1 600 49 41 2 test_acqua_64 test_acqua_64_bis 23/07/2010 S5 0 n.a. 20 24 1 test_acqua_65 test_acqua_65_bis 23/07/2010 S5 1 600 3 10 0 test_acqua_66 test_acqua_66_bis 23/07/2010 S5 ‐8 717 100 111 4 test_acqua_67 test_acqua_67_bis 23/07/2010 S5 ‐11 707 123 104 4 low data rate on ch2 at
‐10 mm test_acqua_68 test_acqua_68_bis 23/07/2010 S5 ‐12 608 131 115 5 test_acqua_69 test_acqua_69_bis 23/07/2010 S5 ‐9 604 105 109 6 test_acqua_70 test_acqua_70_bis 23/07/2010 S5 ‐14 613 184 129 6 test_acqua_71 test_acqua_71_bis 23/07/2010 S5 ‐16 600 179 136 6 test_acqua_72 test_acqua_72_bis 23/07/2010 S5 ‐18 601 123 127 4 test_acqua_73 test_acqua_73_bis 23/07/2010 S5 ‐20 301 156 75 4 test_acqua_74 test_acqua_74_bis 23/07/2010 S5 ‐25 309 101 55 2

Appendix – partially elaborated data
108
test_acqua_75 test_acqua_75_bis 23/07/2010 S5 ‐30 303 145 82 5 test_acqua_76 test_acqua_76_bis 23/07/2010 S5 ‐35 304 163 74 4 test_acqua_77 test_acqua_77_bis 23/07/2010 S5 ‐35 300 157 82 3 test_acqua_78 test_acqua_78_bis 23/07/2010 S5 ‐40 311 127 100 4 test_acqua_79 test_acqua_79_bis 23/07/2010 S5 ‐50 317 109 87 2 test_acqua_80 test_acqua_80_bis 23/07/2010 S5 ‐60 302 172 105 4 test_acqua_81 test_acqua_81_bis 23/07/2010 S5 ‐70 311 142 112 3 test_acqua_82 test_acqua_82_bis 23/07/2010 S5 ‐80 303 102 32 1 test_acqua_114 test_acqua_114 24/07/2010 S5 ‐20 322 na na na LDV set up as for
test_acqua 113 to check the output

Appendix – partially elaborated data
109
Table 63. Section S6. Measurements in water
file name
(non
coinc. m
ode)
file name
(coinc. m
ode)
date (gg/mm/aaaa)
section
relativ
e level (mm)
duratio
n (s)
datarate ch1
(Hz)
datarate ch2
(Hz)
datarate coinc. (Hz)
commen
ts
test_acqua_83 test_acqua_83_bis 24/07/2010 S6 ‐5 583 2042 1386 169 run ended (low number of maximum points)
test_acqua_84 test_acqua_84_bis 24/07/2010 S6 ‐6 541 2247 1448 182 run ended (low number of maximum points)
test_acqua_85 test_acqua_85_bis 24/07/2010 S6 ‐4 605 2100 1230 169 test_acqua_86 test_acqua_86_bis 24/07/2010 S6 ‐3 681 1340 1068 111 test_acqua_87 test_acqua_87_bis 24/07/2010 S6 ‐2 604 698 539 54 test_acqua_88 test_acqua_88_bis 24/07/2010 S6 ‐1 601 241 179 18 test_acqua_89 test_acqua_89_bis 24/07/2010 S6 0 608 63 49 3 test_acqua_90 test_acqua_90_bis 24/07/2010 S6 1 611 16 9 0 test_acqua_91 test_acqua_91_bis 24/07/2010 S6 ‐7 427 1916 1476 147 run ended (low
number of maximum points)
test_acqua_92 test_acqua_92_bis 24/07/2010 S6 ‐8 604 1968 1226 127 test_acqua_93 test_acqua_93_bis 24/07/2010 S6 ‐9 619 2412 1353 189 test_acqua_94 test_acqua_94_bis 24/07/2010 S6 ‐10 625 2223 1335 166 test_acqua_95 test_acqua_95_bis 24/07/2010 S6 ‐12 638 1830 1561 166

Appendix – partially elaborated data
110
test_acqua_96 test_acqua_96_bis 24/07/2010 S6 ‐14 627 1824 1968 140 test_acqua_97 test_acqua_97_bis 24/07/2010 S6 ‐16 620 2535 2052 208 test_acqua_98 test_acqua_98_bis 24/07/2010 S6 ‐18 617 2281 1754 194 test_acqua_99 test_acqua_99_bis 24/07/2010 S6 ‐20 326 1977 1512 113 test_acqua_100 test_acqua_100_bis 24/07/2010 S6 ‐25 307 1953 1375 117 test_acqua_101 test_acqua_101_bis 24/07/2010 S6 ‐30 324 2559 1615 164 test_acqua_102 test_acqua_102_bis 24/07/2010 S6 ‐35 307 2559 1571 156 test_acqua_103 test_acqua_103_bis 24/07/2010 S6 ‐40 356 2617 2028 197 test_acqua_104 test_acqua_104_bis 24/07/2010 S6 ‐50 308 3485 2153 194 test_acqua_105 test_acqua_105_bis 24/07/2010 S6 ‐60 301 2669 2521 207 test_acqua_106 test_acqua_106_bis 24/07/2010 S6 ‐70 305 2685 2671 204 test_acqua_107 test_acqua_107_bis 24/07/2010 S6 ‐80 235 na na na fan and traverse
system stopped for electric shock
test_acqua_108 na 24/07/2010 S6 ‐25 618 na na na invalid due to stop of traverse system
test_acqua_109 na 24/07/2010 S6 ‐30 620 na na na invalid due to stop of traverse system
test_acqua_110 na 24/07/2010 S6 ‐20 324 na na na invalid due to stop of traverse system
test_acqua_111 test_acqua_111_bis 24/07/2010 S6 ‐25 623 na na na to check the time acquisition effect vs test_acqua_100
test_acqua_112 test_acqua_112_bis 24/07/2010 S6 ‐30 623 na na na to check the time acquisition effect vs test_acqua_101
test_acqua_113 test_acqua_113_bis 24/07/2010 S6 ‐20 313 na na na LDV setup as for test_acqua_73, to

Appendix – partially elaborated data
111
check the effect on output

Appendix – partially elaborated data
112
Table 64. Section S0. Measurements in air on rigid bottom
file name
(non
coinc. m
ode)
file name
(coinc. m
ode)
date (gg/mm/aaaa)
section
relativ
e level (mm)
duratio
n (s)
datarate ch1
(Hz)
datarate ch2
(Hz)
datarate coinc. (Hz)
commen
ts
test_aria_212 test_aria_212_bis 29/07/2011 S0 1 729 27 76 15 test_aria_213 test_aria_213_bis 29/07/2011 S0 3 347 74 62 26 test_aria_214 test_aria_214_bis 29/07/2011 S0 6 357 151 116 55 test_aria_215 test_aria_215_bis 29/07/2011 S0 10 305 210 123 72 test_aria_216 test_aria_216_bis 29/07/2011 S0 15 335 301 199 106 test_aria_217 test_aria_217_bis 29/07/2011 S0 20 303 349 225 121 test_aria_218 test_aria_218_bis 29/07/2011 S0 25 327 327 213 112 test_aria_219 test_aria_219_bis 29/07/2011 S0 30 303 411 287 146 test_aria_220 test_aria_220_bis 29/07/2011 S0 30 345 331 198 128 similar to previous but
with modification to BSA
test_aria_221 test_aria_221_bis 29/07/2011 S0 35 312 437 255 168 test_aria_222 test_aria_222_bis 29/07/2011 S0 40 317 498 285 190 test_aria_223 test_aria_223_bis 29/07/2011 S0 50 411 451 260 176 test_aria_224 test_aria_224_bis 29/07/2011 S0 60 305 523 299 198 test_aria_225 test_aria_225_bis 29/07/2011 S0 70 321 447 256 169 test_aria_226 test_aria_226_bis 29/07/2011 S0 80 302 329 184 123

Appendix – partially elaborated data
113
Table 65. Section S1. Measurements in air on rigid bottom
file name
(non
coinc. m
ode)
file name
(coinc. m
ode)
date (gg/mm/aaaa)
section
relativ
e level (mm)
duratio
n (s)
datarate ch1
(Hz)
datarate ch2
(Hz)
datarate coinc. (Hz)
commen
ts
test_aria_267 test_aria_267_bis 30/07/2011 S1 1 303 55 43 21 test_aria_268 test_aria_268_bis 30/07/2011 S1 3 316 65 35 21 test_aria_269 test_aria_269_bis 30/07/2011 S1 6 301 64 33 20 test_aria_270 test_aria_270_bis 30/07/2011 S1 10 305 117 65 42 test_aria_271 test_aria_271_bis 30/07/2011 S1 15 329 106 56 37 test_aria_272 test_aria_272_bis 30/07/2011 S1 20 300 102 55 35 test_aria_273 test_aria_273_bis 30/07/2011 S1 25 327 100 52 34 test_aria_274 test_aria_274_bis 30/07/2011 S1 30 301 75 38 24 Note: limited set of measurements due to limited available time

Appendix – partially elaborated data
114
Table 66. Section S2. Measurements in air on rigid bottom
file name
(non
coinc. m
ode)
file name
(coinc. m
ode)
date (gg/mm/aaaa)
section
relativ
e level (mm)
duratio
n (s)
datarate ch1
(Hz)
datarate ch2
(Hz)
datarate coinc. (Hz)
commen
ts
test_aria_259 test_aria_259_bis 30/07/2011 S2 1 301 68 44 24 test_aria_260 test_aria_260_bis 30/07/2011 S2 3 322 84 46 28 test_aria_261 test_aria_261_bis 30/07/2011 S2 6 308 102 58 36 test_aria_262 test_aria_262_bis 30/07/2011 S2 10 303 98 55 35 test_aria_263 test_aria_263_bis 30/07/2011 S2 15 302 117 65 42 test_aria_264 test_aria_264_bis 30/07/2011 S2 20 300 160 84 56 test_aria_265 test_aria_265_bis 30/07/2011 S2 25 331 127 68 44 test_aria_266 test_aria_266_bis 30/07/2011 S2 30 na 214 120 78 Note: limited set of measurements due to limited available time
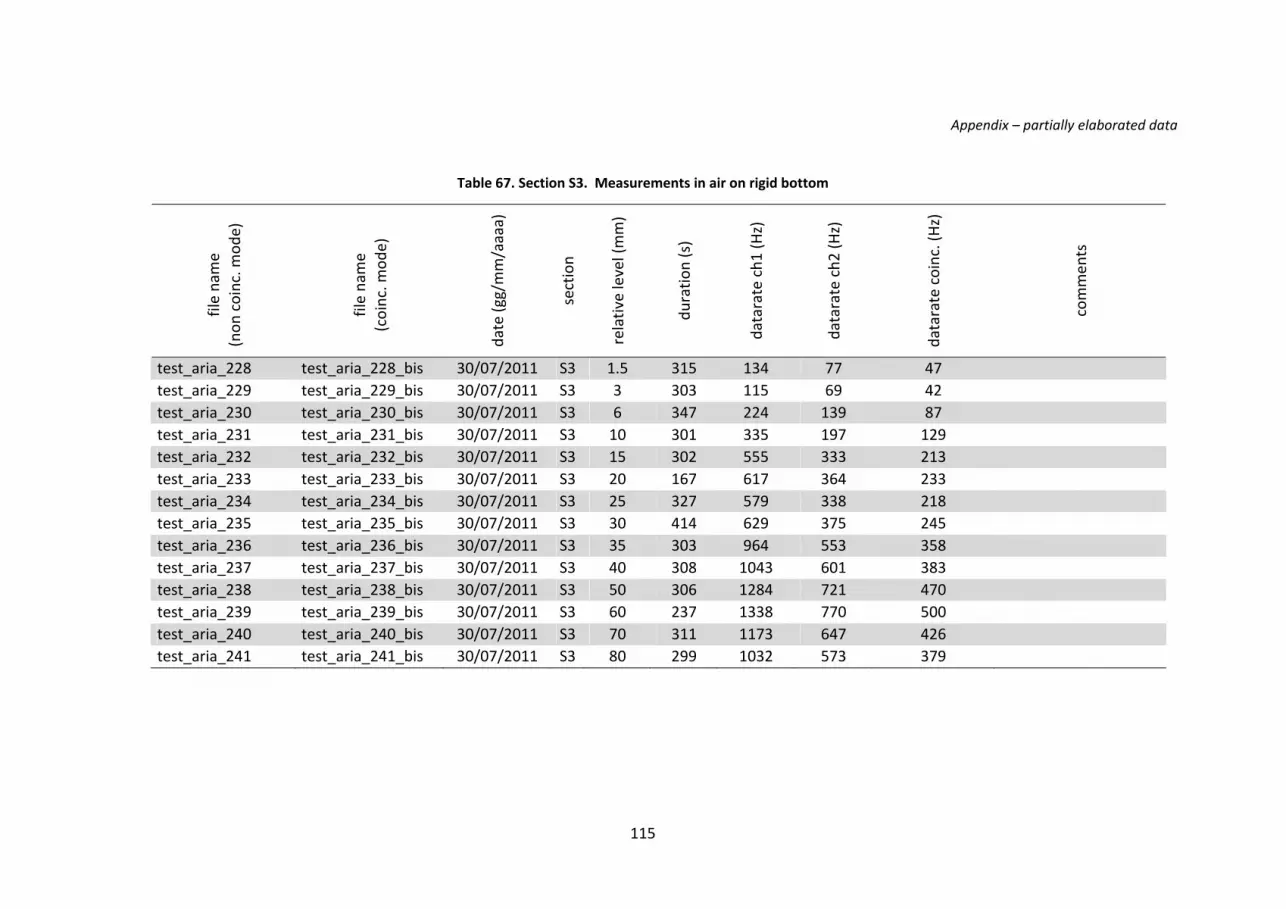
Appendix – partially elaborated data
115
Table 67. Section S3. Measurements in air on rigid bottom
file name
(non
coinc. m
ode)
file name
(coinc. m
ode)
date (gg/mm/aaaa)
section
relativ
e level (mm)
duratio
n (s)
datarate ch1
(Hz)
datarate ch2
(Hz)
datarate coinc. (Hz)
commen
ts
test_aria_228 test_aria_228_bis 30/07/2011 S3 1.5 315 134 77 47 test_aria_229 test_aria_229_bis 30/07/2011 S3 3 303 115 69 42 test_aria_230 test_aria_230_bis 30/07/2011 S3 6 347 224 139 87 test_aria_231 test_aria_231_bis 30/07/2011 S3 10 301 335 197 129 test_aria_232 test_aria_232_bis 30/07/2011 S3 15 302 555 333 213 test_aria_233 test_aria_233_bis 30/07/2011 S3 20 167 617 364 233 test_aria_234 test_aria_234_bis 30/07/2011 S3 25 327 579 338 218 test_aria_235 test_aria_235_bis 30/07/2011 S3 30 414 629 375 245 test_aria_236 test_aria_236_bis 30/07/2011 S3 35 303 964 553 358 test_aria_237 test_aria_237_bis 30/07/2011 S3 40 308 1043 601 383 test_aria_238 test_aria_238_bis 30/07/2011 S3 50 306 1284 721 470 test_aria_239 test_aria_239_bis 30/07/2011 S3 60 237 1338 770 500 test_aria_240 test_aria_240_bis 30/07/2011 S3 70 311 1173 647 426 test_aria_241 test_aria_241_bis 30/07/2011 S3 80 299 1032 573 379

Appendix – partially elaborated data
116
Table 68. Section S4. Measurements in air on rigid bottom
file name
(non
coinc. m
ode)
file name
(coinc. m
ode)
date (gg/mm/aaaa)
section
relativ
e level (mm)
duratio
n (s)
datarate ch1
(Hz)
datarate ch2
(Hz)
datarate coinc. (Hz)
commen
ts
test_aria_275 test_aria_275_bis 30/07/2011 S4 1 308 67 26 13 test_aria_276 test_aria_276_bis 30/07/2011 S4 3 310 50 20 11 test_aria_277 test_aria_277_bis 30/07/2011 S4 6 303 50 23 12 test_aria_278 test_aria_278_bis 30/07/2011 S4 10 315 68 33 20 test_aria_279 test_aria_279_bis 30/07/2011 S4 15 307 113 52 31 test_aria_280 test_aria_280_bis 30/07/2011 S4 20 228 115 55 34 test_aria_281 test_aria_281_bis 30/07/2011 S4 25 317 101 43 28 test_aria_282 test_aria_282_bis 30/07/2011 S4 30 301 122 51 32

Appendix – partially elaborated data
117
Table 69. Section S5. Measurements in air on rigid bottom
file name
(non
coinc. m
ode)
file name
(coinc. m
ode)
date (gg/mm/aaaa)
section
relativ
e level (mm)
duratio
n (s)
datarate ch1
(Hz)
datarate ch2
(Hz)
datarate coinc. (Hz)
commen
ts
test_aria_283 test_aria_283_bis 30/07/2011 S5 1 305 66 30 15 test_aria_284 test_aria_284_bis 30/07/2011 S5 3 310 51 28 14 test_aria_285 test_aria_285_bis 30/07/2011 S5 6 301 54 29 16 test_aria_286 test_aria_286_bis 30/07/2011 S5 10 300 78 40 23 test_aria_287 test_aria_287_bis 30/07/2011 S5 15 311 97 47 28 test_aria_288 test_aria_288_bis 30/07/2011 S5 20 205 129 60 36 test_aria_289 test_aria_289_bis 30/07/2011 S5 25 304 93 44 28 test_aria_290 test_aria_290_bis 30/07/2011 S5 30 306 90 40 25

Appendix – partially elaborated data
118
Table 70. Section S6. Measurements in air on rigid bottom
file name
(non
coinc. m
ode)
file name
(coinc. m
ode)
date (gg/mm/aaaa)
section
relativ
e level (mm)
duratio
n (s)
datarate ch1
(Hz)
datarate ch2
(Hz)
datarate coinc. (Hz)
commen
ts
test_aria_242 test_aria_242_bis 30/07/2010 S6 1 302 96 35 18 test_aria_243 test_aria_243_bis 30/07/2010 S6 3 302 90 36 18 test_aria_244 test_aria_244_bis 30/07/2010 S6 6 308 invalid file test_aria_245 test_aria_245_bis 30/07/2010 S6 4.5 331 133 61 31 test_aria_246 test_aria_246_bis 30/07/2010 S6 8 302 173 89 48 test_aria_247 test_aria_247_bis 30/07/2010 S6 10 309 220 94 52 test_aria_248 test_aria_248_bis 30/07/2010 S6 11.5 314 363 146 84 glass junction at 13
mm test_aria_249 test_aria_249_bis 30/07/2010 S6 15 303 449 208 119 test_aria_250 test_aria_250_bis 30/07/2010 S6 20 304 702 351 208 test_aria_251 test_aria_251_bis 30/07/2010 S6 25 302 776 377 231 test_aria_252 test_aria_252_bis 30/07/2010 S6 30 304 769 360 223 test_aria_253 test_aria_253_bis 30/07/2010 S6 35 301 742 330 206 test_aria_254 test_aria_254_bis 30/07/2010 S6 40 304 756 329 206 test_aria_255 test_aria_255_bis 30/07/2010 S6 50 302 812 355 204 test_aria_256 test_aria_256_bis 30/07/2010 S6 60 302 915 448 259 test_aria_257 test_aria_257_bis 30/07/2010 S6 70 344 687 300 174 test_aria_258 test_aria_258_bis 30/07/2010 S6 80 342 453 181 113

Appendix – partially elaborated data
119
Table 71. Section S7. Measurements in air on rigid bottom
file name
(non
coinc. m
ode)
file name
(coinc. m
ode)
date (gg/mm/aaaa)
section
relativ
e level (mm)
duratio
n (s)
datarate ch1
(Hz)
datarate ch2
(Hz)
datarate coinc. (Hz)
commen
ts
test_aria_291 test_aria_291_bis 30/07/2011 S7 1 301 16 8 3 test_aria_292 test_aria_292_bis 30/07/2011 S7 3 272 43 21 10 test_aria_293 test_aria_293_bis 30/07/2011 S7 2 303 27 13 6 test_aria_294 test_aria_294_bis 30/07/2011 S7 4 310 41 20 10 test_aria_295 test_aria_295_bis 30/07/2011 S7 5 304 54 30 15 test_aria_296 test_aria_296_bis 30/07/2011 S7 6 310 44 24 12 test_aria_297 test_aria_297_bis 30/07/2011 S7 8 307 38 22 11 test_aria_298 test_aria_298_bis 30/07/2011 S7 10 372 76 43 23 test_aria_299 test_aria_299_bis 30/07/2011 S7 15 302 109 54 31 test_aria_300 test_aria_300_bis 30/07/2011 S7 20 302 invalid file test_aria_301 test_aria_301_bis 30/07/2011 S7 25 306 121 46 27 test_aria_302 test_aria_302_bis 30/07/2011 S7 30 302 76 28 16
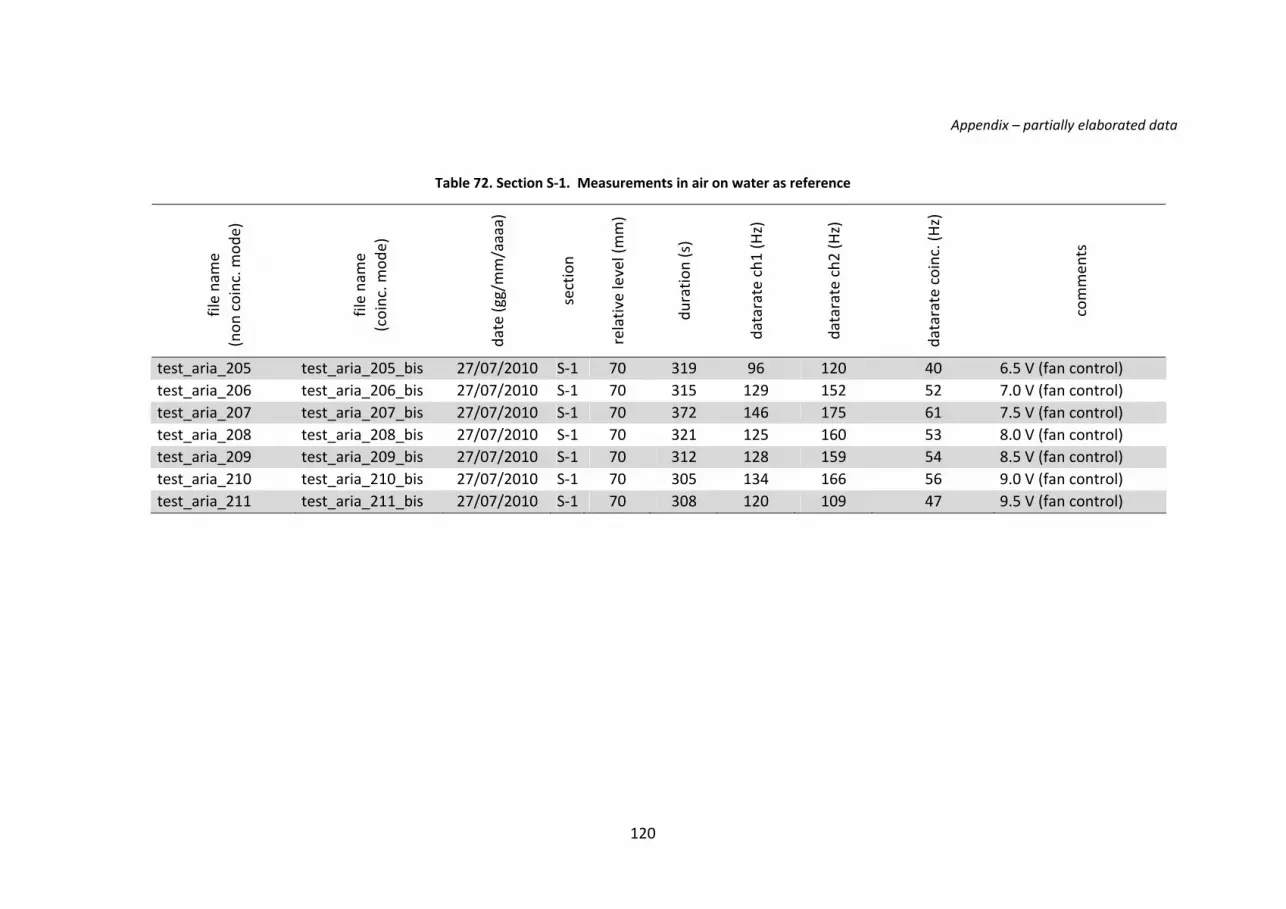
Appendix – partially elaborated data
120
Table 72. Section S‐1. Measurements in air on water as reference
file name
(non
coinc. m
ode)
file name
(coinc. m
ode)
date (gg/mm/aaaa)
section
relativ
e level (mm)
duratio
n (s)
datarate ch1
(Hz)
datarate ch2
(Hz)
datarate coinc. (Hz)
commen
ts
test_aria_205 test_aria_205_bis 27/07/2010 S‐1 70 319 96 120 40 6.5 V (fan control) test_aria_206 test_aria_206_bis 27/07/2010 S‐1 70 315 129 152 52 7.0 V (fan control) test_aria_207 test_aria_207_bis 27/07/2010 S‐1 70 372 146 175 61 7.5 V (fan control) test_aria_208 test_aria_208_bis 27/07/2010 S‐1 70 321 125 160 53 8.0 V (fan control) test_aria_209 test_aria_209_bis 27/07/2010 S‐1 70 312 128 159 54 8.5 V (fan control) test_aria_210 test_aria_210_bis 27/07/2010 S‐1 70 305 134 166 56 9.0 V (fan control) test_aria_211 test_aria_211_bis 27/07/2010 S‐1 70 308 120 109 47 9.5 V (fan control)


