Embed Size (px)
Citation preview

THE JOURNAL OF COMPARATIVE NEUROLOGY 346253-275 ( 1994)
Visual System of the Fossorial Mole-Lemmings, Ellobius talpinus and
Ellobius lutescens
M. HERBIN, J. REPERANT, AND H.M. COOPER Cerveau et Vision, I.N.S.E.R.M. Unite 371, 69500 Bron, France (M.H., H.M.C.);
Laboratoire D’Anatomie Comparee, Museum National D’Histoire Naturelle, 75005 Paris, France (J.R.); I.N.S.E.R.M. Unite 106, Neuromorphologie, Developpement, Evolution,
75651 Paris, France (J.R.)
ABSTRACT Ocular regression in subterranean species has been shown to be associated with a number
of alterations in the retina and in retinal pathways. In order to examine the consequences of eye reduction, the visual system was studied in two species of the murine genus, Ellobius, a specialized fossorial rodent, The axial length of the eye is only 2.2 mm in E. lutescens and 2.9 mm in E. talpinus. The mean soma size of ganglion cells in Nissl-stained flatmounts is approximately 10 pm in E. lutescens and 12 pm in E. talpinus. The soma size distribution in both species appears unimodal and falls within a range of 6-17 pm in diameter. The topographic distribution of ganglion cells shows a weak centroperipheral gradient, and an area centralis cannot be distinguished. The total number of neurons in the ganglion cell layer in Nissl-stained flat mounts is 12,000 in E . lutescens and 28,500 in E. talpinus and, following injection of retrograde tracers in the superior colliculus, is, respectively, 3,600 and 20,000. Based on the axial length and maximum ganglion cell density, the calculated retinal magnification factor (20-26 pmldegree) and spatial resolution (0.4-0.9 cyclesldegree) of these minute eyes are extremely reduced. Retinofugal projections, demonstrated by autoradiography and horseradish peroxidase histochemistry, are similar to those in other rodents. The superior colliculus is well developed and receives a predominantly contralateral projection. Ganglion cells projecting to the contralateral colliculus are distributed over the entire retina, while cells that project ipsilaterally are restricted to the ventrotemporal region. The dorsal lateral geniculate nucleus has clearly defined binocular and monocular segments, including a partial segregation of regions receiving ipsilateral or contralateral retinal innervation. In addition, a localized region of label is observed medial to the geniculate nucleus. The retina also sends a bilateral projection to the suprachiasmatic nucleus; the intergeniculate leaflet; the pretectum; and the medial, lateral, and dorsal terminal nuclei of the accessory optic system. Sparse retinal projections were also seen in the bed nucleus of the stria terminalis, the anterior thalamus, and the inferior colliculus. A substantial retinal projection is observed in the basal telencephalon, including the cortical amygdaloid region, the diagonal band of Broca, the olfactory tubercle, and the piriform cortex. The results suggest that the morphological constraints of reduced eye size are reflected in the retina by a generally homogeneous organization but that central visual projections are not substantially modified as in some more specialized, strictly subterranean rodents. o 1994 Wiley-Liss, Inc
Key words: retinal ganglion cells, retinal projections, lateral geniculate nucleus, superior colliculus, suprachiasmatic nucleus
Reduction of the eye and the visual system is a commonly observed feature in both vertebrate and invertebrate spe- cies inhabiting underground, light-deprived environments (Dubost, 1968; Poulson and White, 1969). In mammals, over 250 fossorial species have been described, including members of the Rodent% Insectivora, and a single species of Marsupialia, occurring on all continents except Antarc-
tica (Nevo, 1979, 1991; Nowak and Paradiso, 1983). These species show a number of convergent morphological and physiological adaptations, commonly referred to as troglo-
Accepted J~~~~~~ 7, 1994, Address reprint requests to Dr. H.M. Cooper, Cerveau et Vision,
I.N.S.E.R.M. Unit6 371,18, Avenue Doyen Lepine, 69500-Bron, France.
O 1994 WILEY-LISS, INC.

254 M. HERBIN ET AL.
morphy. Ocular regression occurs to varying degrees in all populations, depending on whether the animal is strictly subterranean or occasionally emerges above ground for foraging.
Although morphological regression of visual sensory organs has been considered to result from random evolution- ary events (Brace, 1963; Wright, 1964; Poulson and White, 1969; Wilkens, 1971), it has also been argued that in obscure environments, in which visual function is nearly superfluous, a quantitative reduction of the eye can be of selective advantage (Jones and Culver, 1989; Cooper et al., 1993a,b). Atrophy of the eye and associated neuronal systems that are of low adaptive value can confer increased fitness in terms of metabolic economy, which in subterra- nean environments is an important limiting factor (Arieli, 1990; Cooper et al., 1993a). As a consequence of the diminished dimensions of the eye, visual abilities are usu- ally limited to a simple light-dark discrimination (Lund and Lund, 1965; Johannesson-Gross, 1988). This sensory loss is often associated with an expansion of other sensory sys- tems and in particular somatosensory pathways (Jones et al., 1992; Necker et al., 1992; Catania et al., 1993).
Regardless of the underlying causes, eye reduction has been shown to be associated with a number of morphologi- cal modifications, both in the retina and in central visual pathways. In species with minute eyes, primary visual nuclei are often severely atrophied, and some components have been reported to be entirely lacking (superior collicu- lus: Lund and Lund, 1965; Kudo et al., 1988; dorsal lateral geniculate nucleus: Bronchti et al., 1991; accessory optic system: Lund and Lund, 1965; Kudo et al., 1988; Bronchti et al., 1991; suprachiasmatic nucleus: Lund and Lund, 1965). Ipsilateral projections are also sparse, although a bilateral retinal projection to the suprachiasmatic nucleus is maintained (Bronchti et al., 1991; Kudo et al., 1991; Cooper et al., 1993a,b). In nonmammalian species, a similar reduction of retinal input, accompanied by a loss of stratifi- cation in the superior colliculus, has been described in microphthalmic snakes (Typhlops: Halpern, 1973; Cala- baria: Reperant et al., 1987), blind amphibians (Zchthyo- phis: Clairambault et al., 1980; Fritzsch et al., 1985; Typhlonectes: Himstedt and Manteuffel, 19851, and the blind cave fish (Astyanax: Voneida and Sligar, 1976).
Fewer studies have been concerned with the retina of small-eyed mammals. A study by Pettigrew et al. (1988) reported that in echolocating microchiropteran bats, rela- tively few retinal ganglion cells are present, and both the topographic distribution and the soma size range are relatively homogeneous. Strictly subterranean mammals with rudimentary eyes have an extremely sparse number of retinal ganglion cells (Rochon-Duvigneaud, 1943; Cei, 1946; Sanyal et al., 1990; Cooper et al., 199333) or fibers in the optic nerve (Quilliam, 1964, 1966; Bremiller et al., 1986; Herbin et al., 1993). In these species, ganglion cells are characterized by an immature morphological appearance (Cooper et al., 1993b), and several ocular and nonocular components (iris-ciliary complex, lens, eye muscles) display an aberrant structural organization or fail to develop (Cei, 1946; Sanyal et al., 1990; de Jong et al., 1990).
In this study we investigated the visual system in the mole-lemming, Ellobius, a highly specialized member of the rodent family, Muridae, which also includes laboratory mice and rats. Only two species of mole-lemmings are described: E. talpinus from Russia and the slightly larger E. lutescens from Armenia (Nowak and Paradiso, 1983). Al-
though not exclusively subterranean, the majority of behav- iors occur underground (Grzimek, 1975). Ellobius forms large colonies that occupy extensive underground burrow systems including storage, feeding, and reproductive cham- bers. Although the social organization is not as rigidly organized, this underground architecture is similar to the tunnel systems of some Bathyergid mole rats (Jarvis, 1981; Burda, 1989). Little is known of the biology of Ellobius, and specimens are rare in museum collections. Eye size is moderately reduced but not to the extent observed in insectivore moles or other mole rats. In that these animals are partly fossorial, we thought that it would be interesting to compare the distribution and morphology of retinal ganglion cells and the organization of retinal projections of Ellobius with that of some of the more specialized subterra- nean species of moles and mole rats.
MATERIALS AND METHODS Animals and general procedures
Six E. talpinus and two E. lutescens were used in these experiments. The animals were collected by the Sechenov Institute of St. Petersburg. Individuals were housed in the laboratory in metal housing and maintained on a diet of apples, carrots, and rodent pellets. For the experiments, animals were anesthetized with an intraperitoneal injection of ketamine hydrochloride (30 mgikg) and rompun (xyla- zine; 2 mglkg). Additional doses of anesthetic were adminis- tered as required. Supplemental local anesthetic (lidocaine) was injected subcutaneously or intramuscularly prior to surgical incisions. During all procedures, heart rate and respiration were monitored and body temperature main- tained at 3536°C with a homeothermic blanket. After surgery, animals received a subcutaneous injection of anti- biotic (terramycin) and were returned to their cages to recover.
Intraocular injections and histological treatment
Two E. talpinus received an intraocular injection of 2-3 ~1 of 0.2% cholera toxin subunit B conjugated with horse- radish peroxidase (CT-HRP; List Biological Laboratories), and one E. talpims received an intraocular injection of 3 11.1 of 3H-proline (200 mCi). A local anesthetic (oxybuprocaine) was applied to the eye and the pupil dilated with atropine. A small hole was made with a sharpened pipette near the corneal-scleral margin and the solution of CT-HRP or amino acid injected into the vitreous using a glass pipette (50 pl tip) sealed to the needle of a 10 r~.l Hamilton syringe.
The animals survived for periods of 48-72 hours before perfusion. For fixation, animals received a lethal dose of sodium pentobarbitol and were perfused through the heart with 100 ml of warm saline (0.9%) followed by 800 ml of cold 4% paraformaldehyde in phosphate buffer (0.1 M; pH 7.4). In the case of HRP histochemistry, this was followed by a postfixation rinse of 10% sucrose in same buffer. The brain was removed and stored in 30% buffered sucrose at 4°C prior to sectioning.
For HRP histochemistry, the brains were sectioned on a freezing microtome in the coronal plane at a thickness of 30 mm. One series of sections was processed with TMB as a chromogen, according to the method of Mesulam (1978) as modified by Gibson et al. (1984). In the second series, terramethylbenzidine (TMB) was stabilized with ammo- nium heptamolybdate as described by Olucha et al. (1985)

MOLE-LEMMING VISUAL SYSTEM 255
and modified by Cooper and Cowey (1990a) and Cooper et al., (1993a). Briefly, frozen sections were collected in 0.1 M sodium phosphate buffer, pH 7.4. Floating sections were then rinsed in distilled water, and in two baths of 0.1 M sodium phosphate buffer, pH 6.0. Sections were then preincubated during 30 minutes at 4”C, in a solution of 97.5 parts of 0.25% ammonium heptamolybdate in 0.1 M phos- phate buffer, pH 6.0., and 2.5 parts TMB dissolved in 100% alcohol. The sections were then incubated in the same solution by addition of 1 ml0.3% HzOz per 100 ml solution, every five minutes during 35 minutes. The reaction was then allowed to continue for an additional 2-4 hours. Sections were then briefly rinsed in the same phosphate buffer, mounted on gelatinized slides, and allowed to dry overnight. Slides were then cleared for 5 minutes in two changes of methyl salicylate, followed by 2 x 5 minutes in xylene, before coverslipping with Depex.
The brain of the animal that received an intraocular injection of amino acid was prepared for autoradiography according to the method of Cowan et al. (1972). The brain was embedded in paraffin and sectioned at 10 km in the frontal plane. Sections were mounted on gelatinized slides, defatted, coated with Ilford L4 emulsion, and exposed in the dark (4°C) for 25 weeks. Slides were developed in Ilford PL-12, and one of three was counterstained with cresyl violet.
Collicular injections and retinal flat mounts One animal of each species received an injection of
retrograde fluorescent tracers in the superior colliculus. A small opening was made in the skull above the occipital region, the dura was deflected, and several injections (0.1- 0.2 p1) of fast blue or fluororuby were made into the superior colliculus. Injections were made through micropi- pettes by a system that delivered calibrated pulses of air at constant pressure. E. talpinus was injected on one side of the brain, while E. lutescens was injected bilaterally. After 7 days survival, animals were perfused as described above. The oriented eyes were excised, measured, and sectioned at the level of the ora serrata. The posterior eyecups were immersed in 4% paraformaldehyde for a few hours, the retinas dissected free, and whole mounts prepared follow- ing the procedure described by Stone (1981).
In addition to the animals injected with retrograde tracers, five retinas from three other individuals of E. talpinus were flat mounted and stained with 0.1% cresyl violet. After observation, the fluorescent-labeled retinas were also counterstained and coverslipped with Depex.
The distribution of ganglion cells was obtained by count- ing neurons in the ganglion cell layer within 130 pm2 areas, spaced 250 pm apart. In each retina, 50-80 areas were sampled. Soma sizes (equivalent diameter) were measured with a x 50 oil-immersion objective and a commercial image analysis system (Biocom, Les Ulis, France). The observed field was 90 x 120 pm in size. About 20 areas were sampled, covering different regions of the retinal surface.
Image analysis and plotting system The density of retinal projections was quantified accord-
ing to a previously described method (Magnin et al., 1989; Cooper et al., 1993a). Briefly, the surface area of antero- grade label in visual structures was measured using a computerized image analysis system coupled to a micro- scope. A ~ 6 . 3 objective was used, and pixel size was 1.792 x 1.451 pm within a field measuring 1,210 x 660 pm.
Sections visualized with TMB were examined under dark- field polarized light and autoradiographic material under brightfield illumination. Only the surface area of pixels with density values four times higher than background were used. All brain sections containing anterograde label were examined. Thus, each measure provided an approxima- tion of the total surface area or quantity of retinal projec- tions within each primary visual structure. Total volumes of labeled regions, or structures, were obtained by multiply- ing the sum of all surface areas by the section thickness. The relative amount of terminal label compared to the total label was determined for each structure as well as the relative degree of bilateral innervation.
Retinal projections and the location of HRP- or fluores- cent-labeled cells were plotted by means of a computerized plotting system developed in the laboratory. The system included a Leitz microscope equipped with a motorized X Y stage. A digitized pad enabled precise displacement of the XY stage. An interface from the stage to the computer allowed recording of X Y coordinates of the outlines of different structures or the position of labeled cells. Data stored in files could then be used for morphometric analy- sis, cell counts, serial reconstruction of sections, and output to a laser printer for final illustration.
RESULTS Retinal projections
Suprachiasmatic nucleus, hypothalamus. The supra- chiasmatic nucleus (SCN) is a cytoarchitecturally distinct, paired structure located in the rostral hypothalamus above the optic chiasm and below the third ventricle. The SCN measures 540 pm in length, 390 pm in width, and 410 pm in height. In the rostralmost region, the SCN appears flattened along the mediolateral axis. Subsequently, the central part of the nucleus becomes oval and enlarged and presents a lateral extension of label which lies close to the optic tract (Fig. lA,B). In the midregion, the nucleus expands from the round central core of the nucleus into a triangular cap of label, extending outwards along each side of the third ventricle (Fig. lC,D). The density of label, however, remains greatest in the ventral part of the nucleus. Farther caudally, the lateral extension becomes progressively reduced and the distribution of label is concen- trated in the ventral and medial part of the nucleus (Fig. IE). Near the caudal pole of the SCN, the nucleus becomes elongated dorsoventrally within the space situated between the optic chiasm and the third ventricle (Fig. lF,G). In this region, the two halves of the nucleus are interconnected by a dense band of horizontally oriented fibers. As the third ventricle becomes displaced further dorsally, the caudal- most pole of the SCN appears distinctly “U” shaped and gradually fuses into a single, bilaterally labeled midline structure. Although the entire SCN receives an overlapping bilateral innervation, retinal input is distinctly preponder- ant contralateral to the injected eye (see quantitative results below).
This pattern, a predominance of label in the ventral and medial region of the SCN as well as the fusion of both halves into a single nucleus at the caudal pole, was consistent in all three animals. From inspection of the autoradiographic sections counterstained with cresyl violet, it was clear that the distribution of anterograde label closely corresponded with the cytoarchitecturally definable borders of the SCN (Fig. 1H). Within the nucleus, the ventral region contained

256 M. HERBIN ET AL.
Fig. 1. Two rostrocaudal series of coronal sections illustrating the bilateral distribution of label in the SCN following intraocular injection of CT-HRP (darkfield; A,C,E,G) or tritiated amino acids (brightfield; B,D,F). Rostra1 is above and caudal is below. Note that the two halves
of the SCN join in the midline (F,G). H Cytoarchitecture of the SCN within the hypothalamic region in Nissl stain (section adjacent to D). AHA, anterior hypothalamic area; OC, optic chiasm; SCN, suprachias- matic nucleus. Scale bar = 500 Nm.
MOLE-LEMMING VISUAL SYSTEM 257
smaller, more densely packed neurons than the dorsolateral region. In addition, the distribution of cells in the SCN was not homogeneous and distinct clumps of five to seven neurons were evident, particularly in the ventromedial and central parts of the nucleus.
Adjacent to the SCN, a few labeled retinal fibers were also evident in the lateral and anterior hypothalamic regions. Only scant retinal fibers were seen in the subparaventricu- lar zone and retrochiasmatic area.
Several olfactory regions were observed to contain retinal fibers (Fig. 2). In the chiasmatic region, these fibers diverge from the dorsolateral aspect of the optic tract and course rostral and lateral within the basal telencephalon. The fibers initially course around the supraoptic nucleus (SON) and spread in the lateral hypotha- lamic area (LHA). Subsequently, labeled fibers stream out from the lateral margin of the optic tract and are distrib- uted within the cortical region of the medial amygdala and the mediocaudal region of the olfactory tubercle (Fig. 2B) below the horizontal limb of the diagonal band of Broca (DBh). These fibers are clearly seen occupying the superfi- cial bulge formed by the tubercle on the ventral surface of the brain, within the region of the islands of Callega. Retinal fibers also continue farther laterally and, passing dorsally over the lateral olfactory tract, penetrate into the piriform cortex (Fig. 2A,B). Within the piriform region, labeled fibers extend laterally for at least 1 mm beyond the olfactory tract. In all these olfactory regions, retinal fibers remain in the superficialmost layer of the basal telencepha- lon (layer I of the olfactory tubercle and plexiform layer Ia,b of piriform cortex). The retinal fibers do not terminate in distinct focal regions but rather appear to form a sparse net of axons, diffusely spread within the basal telencencepha- lon. Label within these olfactory areas was bilateral, pre- dominantly located contralateral to the injected eye, and was evident mainly in the animals in which CT-HRP was used as the anterograde tracer.
Bed nucleus of the stria terminalis, anterior thalamus. In the dorsal thalamic region, a discrete group of retinal fibers is seen coursing rostrally from the region of the lateral geniculate nucleus to join the fibers of the stria terminalis. From the stria terminalis, labeled fibers invade the bed nucleus of the stria terminalis (BNST) and adjacent rostral thalamic nuclei. Within the BNST, label is restricted to the dorsal part of the encapsulated region of the bed nucleus (Fig. 3). A few retinal fibers are also present in the anteroventral nucleus and to a lesser degree in the an- terodorsal nucleus, immediately rostral to the BNST. A few sparse fibers also extend medially to the thalamic paraven- tricular nucleus along the wall of the third ventricle (Fig. 3A). Scant fibers were also observed in the lateral division of the lateral habenula. Label in all these regions was clearly predominant contralaterally, although in the autora- diographic sections label was more bilaterally distributed.
The dorsal lateral geniculate nucleus (dLGN) is fairly well developed in Ellobius, and the pattern of binocular input to the nucleus resembles that of other rodents such as the mouse and hamster (Drager, 1974; Frost et al., 1979). In the region where the nucleus is most prominent, the width attains 480-500 p.m. The dLGN is cytoarchitecturally distinct and, in addition, shows a pattern of complementary retinal innervation (Figs. 4,6).
On the contralateral side the dLGN is densely labeled except for an elongated oval shaped area in the mediodorsal
Basal telencephalon.
Dorsal lateral geniculate nucleus.
region, which is largely devoid of label (Fig. 4). Within the dLGN, the distribution of anterograde label is heteroge- neous. Label is densest superficially, resulting in a distinct layer-like band located adjacent to the optic tract (Fig. 6). The medial region of the dLGN contains a more diffuse distribution of label, punctuated, however, by dense irregu- lar clusters of label suggestive of a weak laminar organiza- tion.
The topographic distribution of label ipsilateral to the eye injection is complementary to that on the contralateral side (Figs. 4, 6). Ipsilateral retinal innervation is present only in the rostral pole of the dLGN, suggesting that the represen- tation of binocular vision, which occupies less than a quarter of the volume of nucleus, is located in this part of the nucleus. The dorsolateral region, which contralaterally is practically devoid of label, contains one or two dense patches of label. Cytoarchitecturally, this region is sepa- rated from the remainder of the nucleus by a cell sparse neuropil. Cell morphology and packing density are neverthe- less homogeneous throughout the nucleus, except in the region adjacent to the optic tract, where the cells appear more elongate and compact. However, this appearance could be due to the orientation and packing density of the cells in this part of the nucleus, rather than a difference in cell type.
In addition to the above, a conspicuous region of terminal label is evident contralaterally, deep to the optic tract and medial to the fibers of the external medullary lamina at the rostral level of the dLGN (Fig. 5). Cytoarchitecturally, this focus of label corresponds to a small group of round, densely stained cells located medial to the fiber capsule of the dLGN. This labeled region is initially distinct from the dLGN (Fig. 5A), but, at more caudal levels, a group of labeled fibers bridges the intervening gap (Fig. 5B,C).
The ventral lateral geniculate nucleus (vLGN) is situated ventral to the dLGN and first appears at the level of the midregion of the latter nucleus (Fig. 6). The vLGN contains several subdivisions, and, since different terminologies have previously been used to describe the vLGN, herein we follow the recent description by Conley and Friederich-Ecsy (19931, which is derived from the earlier descriptions of Niimi (1963) and Hickey and Spear (1976). The lateral region of the vLGN lies adjacent to the optic tract and can be subdivided into external and internal subdivisions (vLGNe, vlGNi; Fig. 6). Cytoarchitecturally, cells in the vLGNe, juxtaposed to and oriented parallel to the optic tract, are more densely packed and elongate than those in the vLGNi in Ellobius. Neurons in the vLGNi are larger, more rounded, and less closely packed. The medial region (vLGNm) lies deep to the lateral region, and, although the cells are similar to those of the vLGNi, this region is distinctly reticulate in appearance. In our material, we could not subdivide this region further, as in some other species (Conley and Friederich-Ecsy, 1993). The intergeniculate leaflet (IGL) is a distinctive component, consisting of a slender band of cells situated between the vLGN and the dLGN.
Label in the contralateral vLGN, initially appearing in the internal subdivision (vLGNi), forms a dense, oval patch lying adjacent to the optic tract. Farther caudally, a second, larger and more diffuse zone of label becomes prominent slightly more ventrally in the vLGNi (Fig. 6A). These two labeled areas are separated from each other by a narrow space, which is relatively free of label. Proceeding caudally, the ventral area of label gradually enlarges and becomes
Ventral lateral geniculate nucleus.

258
B
M. HERBIN ET AL.
CAUDAL ,?
ROSTRAL Fig. 2. Distribution of labeled retinal fibers in the basal telencepha-
Ion following injection of the tracer CT-HRP in the contralateral eye. A Darkfield illustration of labeled fibers in the piriform cortex (small arrows) lateral to the olfactory tract. B: Series of line drawings made from serial coronal sections showing the course and distribution of fibers in several olfactory structures (the second section from the top corresponds to the section shown in A). Note that these fibers remain
superficial to the surface of the basal telencephalon. DBh, diagonal hand of Broca, horizontal limb; LHA, lateral hypothalamic area; LOT, lateral olfactory tract; MPO, median preoptic nucleus; OC, optic chiasm; OT, optic tract, PIR, piriform cortex, SCN, suprachiasmatic nucleus; SON, supraoptic nucleus; TU, olfactory tubercle; 111, third ventricle. Scale bar in A = 500 pm.
MOLE-LEMMING VISUAL SYSTEM 259
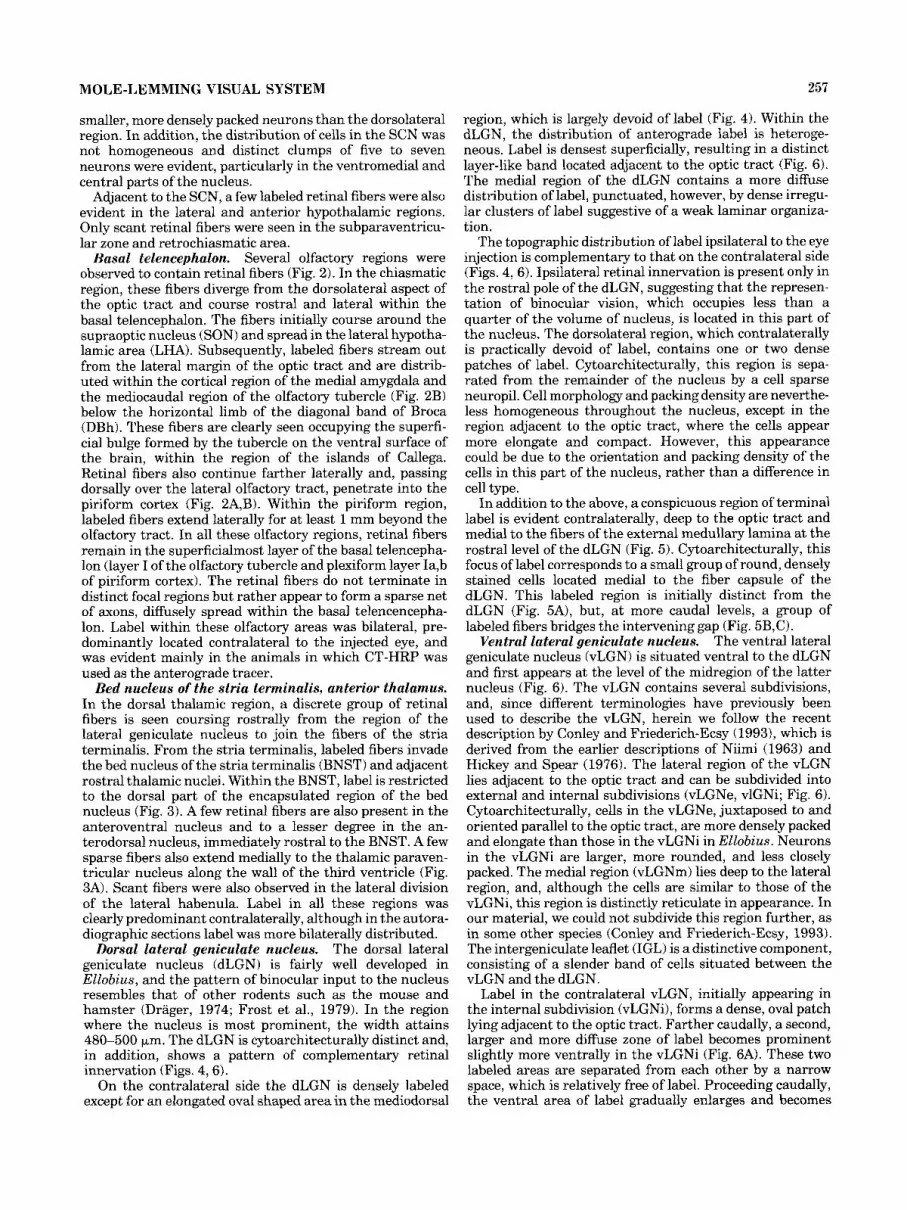
Fig. 3. A Labeled retinal fibers in the stria terminalis, which extend medially towards the thalamic paraventicular nucleus (PVA) along the wall of the third ventricle. B: Dense plexus of fine fihers in the encapsulated region of the BNST. The cytoarchitecture of this region is shown in C in an adjacent Nissl-stained coronal section. The region in
brackets in C corresponds to the illustration in B. Results are from an animal injected intraocularly with CT-HRP in the contralateral eye (A and B are darkfield photomicrographs). BNST, bed nucleus of the stria terminalis; PVA, thalamic paraventricular nucleus; sm, stria medu- laris; st, stria terminalis. Scale bar = 500 IJ-m.
displaced medially, being replaced by several dense, irregu- lar patches of label forming a thin lamina within the vLGNe, closely bordering the optic tract (Fig. 6B). The vLGNe and vLGNi always remain clearly separated by a narrow, unlabeled, interlaminar region. Medially, the vLGNm is devoid of retinal terminals, although numerous labeled fibers coursing ventrodorsally traverse this region (Fig. 6A-C). Near the caudal pole of the nucleus, an isolated patch of label, which could not be associated with a cytoarchitecturally definable cell group, was also seen slightly medial to the vLGNm (Fig. 6C, asterisk).
Label in the ipsilateral vLGN is similar to that described above but is generally less dense and shows a more limited topographical distribution (Figs. 4, 6). Label in the vLGNi is also more diffuse and is restricted to the dorsal half of the nucleus. However, toward the caudal pole, below the IGL, the density of label considerably increases in the vLGNi and even appears to exceed the degree of label in the correspond- ing area on the contralateral side. Label in the vLGNe is also more circumscribed and discontinuous and consists of fewer individual patches. It was difficult to determine from coronal sections alone whether the vLGN is organized in segregated alternating lamina innervated by one or the other retina. However, it clearly appears that, at least in the
vLGNi, there is substantial overlap of retinal projections from both eyes.
The IGL appears in the midregion of the nucleus, interca- lated between the dLGN and the vLGN. A horizontally oriented blood vessel lies parallel to the IGL and delimits this nucleus from the dLGN (Fig. 6C, bv). Label in the IGL initially appears fibrous in aspect but subsequently evolves to form a dense focus of terminal label. Some fibers also extend farther medially from the IGL toward the zona incerta. Caudal to the dLGN, the lateral and medial subdivi- sions of the vLGN become progressively reduced, whereas the IGL continues for some distance ventral to the medial geniculate nucleus and dorsal to the cerebral peduncle. This is followed by a zone of transition in which the LTN gradually replaces the IGL (Fig. 10A). The bilateral distribu- tion of label in the IGL differs from that of the remainder of the nucleus in that the density of label is equivalent on both sides of the brain and ipsilateral and contralateral label are completely overlapping.
In the rostra1 pretectal region, the olivary pretectal nucleus (OPN) is densely labeled and appears as a distinct oval nucleus (Fig. 7A,B). The OPN is initially located medially, above the posterior commissure, but subsequently is reduced in size as the nucleus becomes
Pretectum.

260 M. HERBIN ET AL.
Fig. 4. Comparison of the distribution of anterograde label in the contralateral and ipsilateral dLGN following intraocular injection of CT-HRP (darkfield; A,B) or of tritiated amino acids (brightfield; C,D). The patch of label in A shown by the small arrows corresponds to the
region shown in Figure 5. E,F: Bilateral label in the vLGN in brightfield autoradiographic sections. For details, see text and Figure 6 . dLGN, dorsal lateral geniculate nucleus; vLGN, ventral lateral geniculate nucleus. Coronal sections. Scale bar = 500 +m.
displaced laterally. The OPN shows a tail-like extension, which in some coronal sections appears as a patch of label separate from the central core of the OPN. The nucleus of the optic tract (NOT) is located slightly caudal to the OPN and consists of several dense superficial patches of label within or ventral to the fibers of the optic tract. These patches cover the mediolateral extent of the pretectum and merge together further caudally. A few sparse fibers also invade the anterior pretectal region and the medial pretec- tal nucleus.
Ipsilaterally, label in the OPN is mainly located a t the periphery of the nucleus and the tail of the OPN is more
clearly visible due to the presence of fewer fibers within the ipsilateral optic tract (Fig. 7A,B). The OPN and the NOT both receive a bilateral innervation, although label in the OPN is more bilaterally balanced.
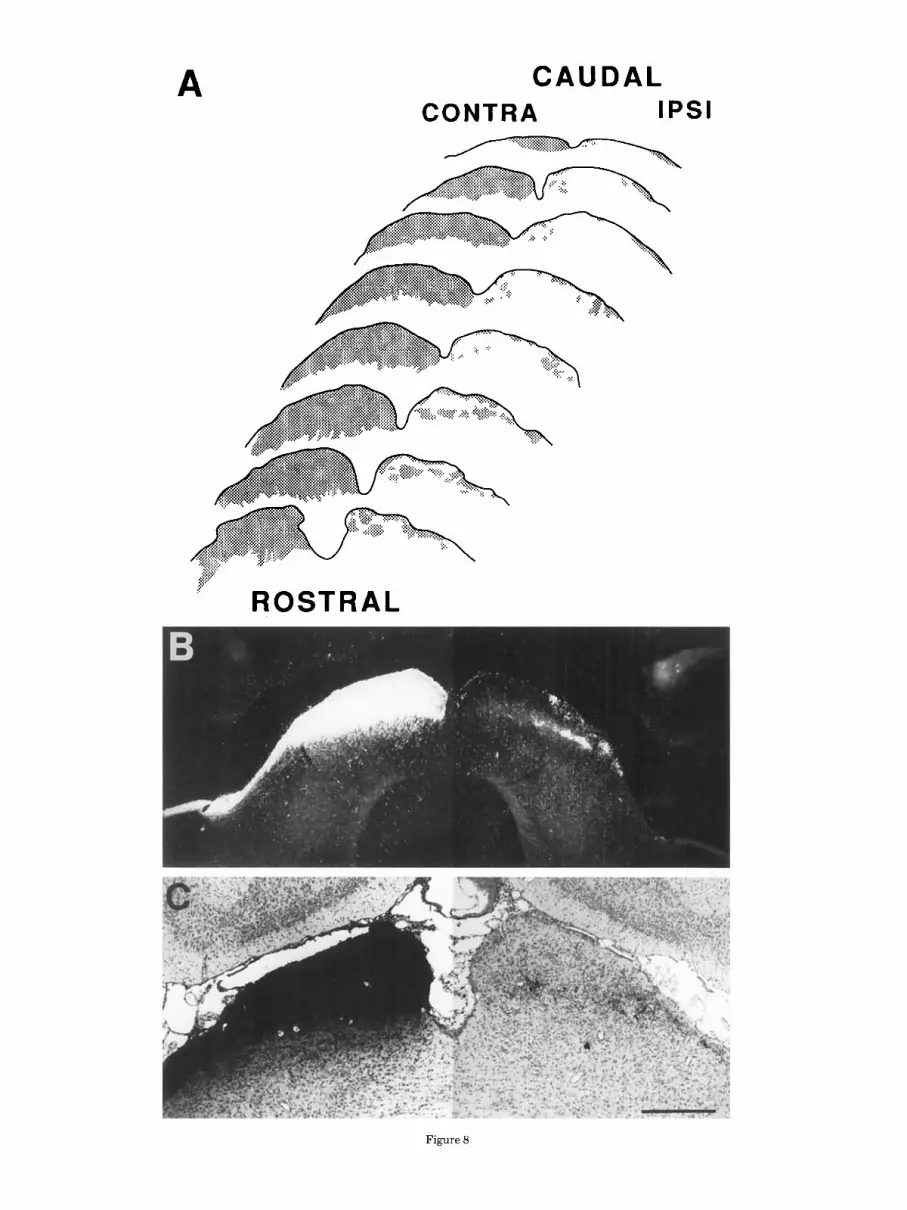
The superior colliculus is a well developed, laminated structure in Ello- bius that receives a bilateral projection from the retina. Contralaterally, the entire rostrocaudal extent of the collicu- lus is densely labeled (Fig. 8A). Labeled fibers are seen penetrating from the brachium of the superior colliculus into the stratum opticum prior to distributing within the stratum griseum superficiale. The stratum zonale also
Superior colliculus, inferior collicuha.

MOLE-LEMMING VISUAL SYSTEM 261
Fig. 5. A series of rostrocaudal (A-C) photomicrographs showing the distribution of label (arrows) medial to the dLGN following an intraocular injection of CT-HRP. Initially separate from the dLGN (A), this focus of label subsequently fuses with the nucleus via a band of labeled fibers (C). Scale bar = 500 Fm.
contains dense label. In the midportion of the colliculus, these layers attain their greatest width (380 km).
Ipsilaterally, several discontinuous patches of label are present medially in the stratum griseum superficiale near the rostral pole of the colliculus (Fig. 8B,C). Slightly caudal, these patches of label increase in size, occupying the entire mediolateral extent of the colliculus. Towards the midre- gion, label gradually diminishes and becomes restricted to the medial and lateral borders of the colliculus. Retinal fibers are subsequently restricted to the extreme lateral margin before disappearing at the caudal pole. Retinal fibers are located in both the stratum zonale and in the stratum griseum but are more widespread and extend further caudally in the stratum zonale.
Contralateral to the injected eye, a small contingent of superficial retinal fibers also continues caudally from the superior colliculus to the inferior colliculus in both the CT-HRP and autoradiographic cases. These fibers are distinctly visible on the dorsal surface of the inferior colliculus, and, in the most caudal sections, descend along the medial and ventral borders of the nucleus (Fig. 9A,B). Fibers could be followed for about 1 mm beyond the caudal limit of the superior colliculus.
Accessory optic system. The accessory optic system (AOS) is particularly well developed in Ellobius (Fig. 10). The three terminal nuclei of this system are all bilaterally labeled, although the density of label is clearly predominant on the contralateral side.
The dorsal terminal nucleus (DTN) is located below the brachium of the superior colliculus and the pretectum and above the medial geniculate nucleus (MG). The DTN forms a small, densely labeled nucleus, which is seen as a distinct bulge on the surface, medial to the MG (Fig. 10A,B). Fibers of the accessory optic tract (AOT) innervate the DTN via the posterior fiber branch of the superior fasciculus (SF-pfl, which separates from the main optic tract in the region of the brachium.
The lateral terminal nucleus (LTN) is located ventrome- dial to the MG and dorsolateral to the cerebral peduncle (Fig. 10A,B,D). In the rostralmost region, the transition between the caudal pole of the IGL and the LTN is indistinct. Fibers of the AOT course from the DTN to the LTN by at least two pathways (Fig. 10D). The main
pathway is provided by the SF-pf, which forms a thick superficial tract, coursing around the external surface of the MG. Other fibers remain deep to the MG and descend around the medial margin of this nucleus directly from the DTN to the LTN.
The medial terminal nucleus (MTN) is situated superfi- cially in the midbrain at the base of cerebral peduncle, rostral to the emergence of the oculomotor nerve. This terminal nucleus is the largest and most densely innervated structure of the AOS. Both the ventral (MTNv) and dorsal (MTNd) components of the terminal nucleus can be clearly distinguished (Fig. 10A,C,G). Rostrally, the MTNv is ini- tially triangular in shape but subsequently extends caudola- terally above the cerebral peduncle and substantia nigra to form the dorsal portion of the nucleus. Farther caudally, the MTNd appears as a densely labeled oval-shaped nucleus. Although label in the MTN is predominantly contralateral, this structure shows a degree of ipsilateral label greater than that seen in other species (Fig. 1OC).
The MTN receives fibers from both the superior and the inferior fasciculi of the AOT. Fibers of the SF-pf descend from the LTN to the MTNv along the superficial aspect of the cerebral peduncle. Within this fiber branch, a small interstitial nucleus of the SF-pf could also be observed. Other fibers, located medial to the cerebral peduncle, course directly from the LTN to the MTNd. Finally, many fine fibers penetrate diffusely at several locations directly through the peduncle to the MTNd.
The inferior fasciculus (IF) was also distinct. This fiber pathway separates from the ventromedial margin of the optic tract in the postchiasmatic region (Fig. 10E-G). The IF remains on the superficial ventral surface of the brain, lagging medial to the main optic tract, which becomes displaced more dorsally at subsequent caudal levels. The IF courses along the ventromedial border of the cerebral peduncle and could be followed without difficulty to the MTNv.
In both animals injected with CT-HRP, two to five retrogradely labeled neurons were observed in the oculomotor nucleus. These cells apparently were labeled as a result of uptake of the tracer following leakage out of the ocular globe. This represents relatively few cells compared to the number
Retrograde label: Oeulomotor nucleus.

262 M. HERBIN ET AL.
ROSTRAL A CONTRA IPS1
v l p OT
B
vLGN e vLGN e
CAUDAL
Fig. 6. A-C: Line drawings made from a rostrocaudal series of coronal sections to illustrate the bilateral distribution of anterograde label in the vLGN and dLGN. Fibers are shown as fine lines, and terminal label is represented by dots. The lateral region of the vLGN contains an external (vLGNe) and an internal (vLGNi) subdivision. The
medial region (vLGNm) is located further internal to the optic tract. The intergeniculate leaflet (IGL) separates the vLGN from the dLGN. bv, Blood vessel; OT, optic tract; the asterisk marks an unidentified focus of medial label. See Figure 4 for size.
normally observed following HRP intraocular injections in other species. Cytoarchitecturally, the oculomotor nucleus is distinguishable in Ellobius but is small and contains only 10-12 neurons per section in Nissl-stained material.
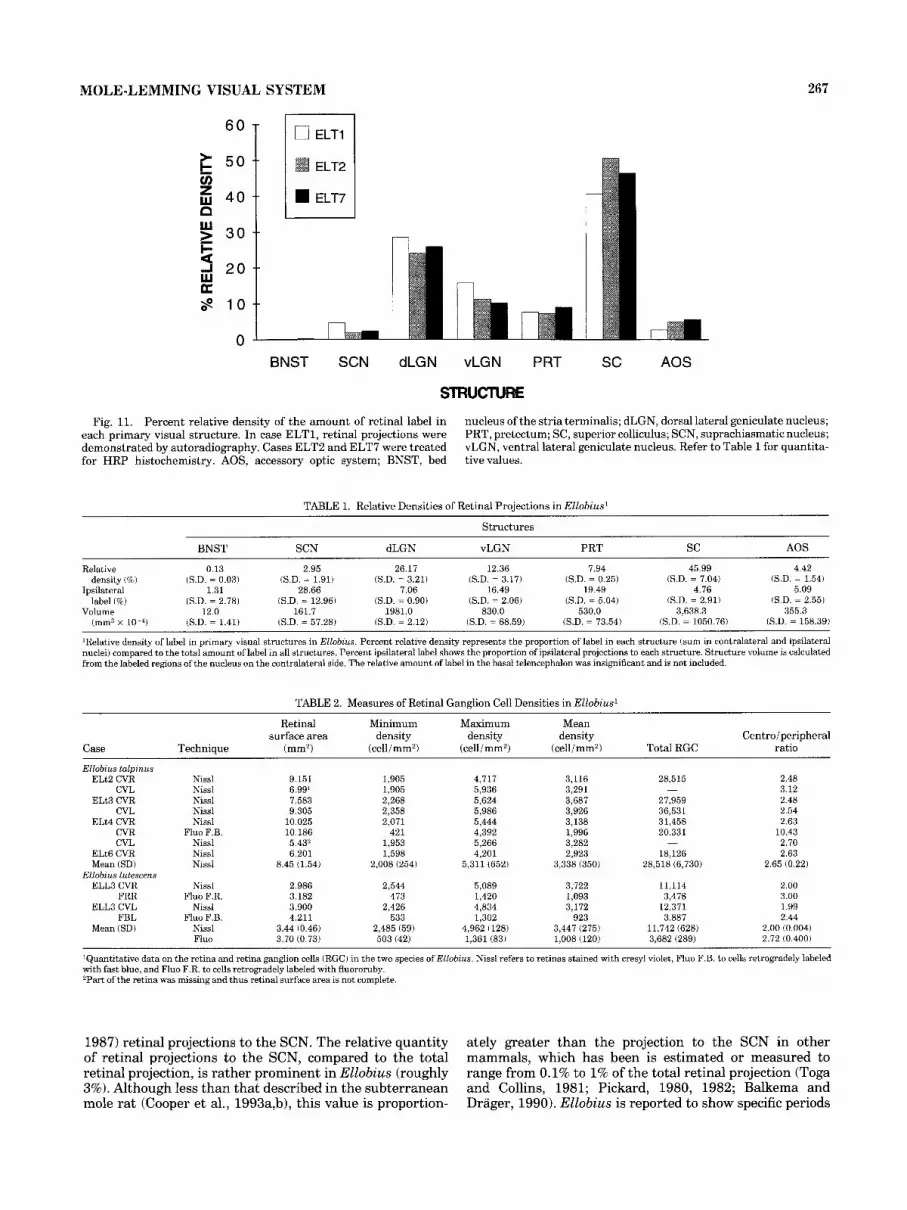
Quantitative analysis of the relative density of retinal projections, as estimated from measures of the total surface area of label in each nucleus, shows that the major proportion of label is found in the superior colliculus (Fig. 11, Table 1). The
Relative density of retinal projections.
dLGN also receives a substantial innervation, followed by the vLGN, the pretectum, and the AOS. The density of label in the SCN represents almost 3% of the total amount of label, while the region of the BNST and anterior thalamus show only a minute innervation.
The relative proportion of total contralateral anterograde label is nearly 92%. The SCN receives the most balanced bilateral projection (30-70% ipsilateral label) along with the pretectum (20%) and the vLGN (17%). In the vLGN,

MOLE-LEMMING VISUAL SYSTEM 263
Fig. 7. Autoradiographic (brightfield; A) and CT-HRP labeled (dark- field; B), coronal sections showing the distribution of retinal fibers in the pretectum. Note the distinct ringed-shaped appearance of the OPN
ipsilaterally in A and the tail like extension of the OPN ipsilaterally in A and B. NOT, nucleus of the optic tract; OPN, olivary pretectal nucleus. Scale bar = 500 km.
however, label in the IGL appeared more bilaterally equiva- lent than in the other subdivisions of the nucleus. The ipsilateral projection to the dLGN represents 7% of the total projection to this structure. The projection to the superior colliculus and AOS is mainly predominant contra- laterally (5% and 2.1%, respectively).
morphological features allowed amacrine cells to be distin- guished from small ganglion cells. The distribution of ganglion cells is fairly homogeneous in both species and is characterized by a relative flat density gradient (Fig. 12). In E. talpinus, the mean centroperipheral ratio is 2.65 (SD = 0.221; maximum density = 5,311 cells/mm2, minimum
Retina and retinal ganglion cells Eye and retina. The eye of Ellobius is nearly spherical
and has an axial length of 2.95 mm in E. talpinus and 2.29 mm in E. lutescens. This is not related to a difference in body size, since E. talpinus (45 g) is smaller than E. lutescens (60 g). The pupil is circular, and eye muscles appear to be poorly developed. The optic nerve, measured in semithin sections, has a diameter of 269.0 km in E. talpinus compared to 196.2 km in E. lutescens.
The retina is vascularized and, in flat mounts (following dehydration), has a surface area of 8.45 mm2 (SD = 1.54 mm2, n = 5 ) in E. talpinus and a significantly smaller value of 3.44 mm2 (SD = 0.46 mm2, n = 2) in E. lutescens (see Table 2).
In Nissl-stained flat mounts of both species, ganglion cells form a single layer even in the regions of greatest density. The criteria for distinguishing ganglion cells were based on those described for other species (Hughes, 1975; Stone, 1965, 1978). Ganglion cells had a distinct nucleus and nucleolus surrounded by a generally abundant cyto- plasm and punctuated with dense Nissl substance. No
density = 2,008 cells/mm2). This ratio is even less accentu- ated in E. lutescens (ratio = 2.00, SD = 0.004; maximum density = 4,962 cells/mm2, minimum density = 2,485 cells/mm2). Local increases in density in some retinas (Fig. 12A,D) were due to occasional folds related to tissue retraction following flattening and subsequent dehydra- tion.
Mean ganglion cell density is similar for both species (E. talpinus = 3,338 cells/mm2, SD = 350, n = 7; E. lutes- cens = 3,447 cells/mm2, SD = 275, n = 2). However, the total number of neurons in the ganglion cell layer, esti- mated by multiplying the mean density by retinal surface area, is significantly greater in E. talpinus (mean = 28,518, SD = 6,730) than in E. lutescens (mean = 11,742, SD = 289).
Ganglion cells labeled following injection of retrograde tracers in the superior colliculus showed a distribution similar to that of Nissl-stained retinas. In E. talpinus, the injection included the entire colliculus except for the most medial region (Fig. 12F). Contralateral to the injection, ganglion cells were distributed throughout the entire retina, with a region of maximum density located in the ventrotem
A CAUDAL CONTRA IPS1
ROSTRAL
Figure 8
MOLE-LEMMING VISUAL SYSTEM 265
Fig. 9. Labeled retinal fibers coursing on the dorsal surface (A) and further caudally along the dorsomedial margin of the contralateral inferior colliculus (B). Coronal section from an animal injected in the eye with CT-HRP. Scale bar = 500 pm.
poral region (4,392 cells/mm2; Fig. 12B). The total number of ganglion cells in this retina was estimated to be 20,331. Ipsilaterally, ganglion cells were restricted to a crescent in the ventrotemporal region and showed a low, homogeneous density (139 cells/mm2; Fig. 12C). The total number of retrogradely labeled cells in the ipsilateral retina was 273. E. lutescens received a bilateral injection of a different retrograde tracer in each colliculus. Leakage between both injections sites prevented an analysis of the bilateral distri- bution of afferent retinal ganglion cells, and only fluorescent- labeled cells in the contralateral retinas were considered. Both retinas showed similar results. The nearly homoge- neous distribution of ganglion cells resembles that seen in Nissl-stained retinas, although cell density in all regions is considerably less (maximum density = 1,420 cells/mm2; Fig. 12E, Table 2). The total number of ganglion cells in these retinas was estimated to be 3,682. Comparison of these results with counts from Nissl-stained retinas sug- gests that, in the ganglion cell layer, 36.4% of the cells in E. talpinus, and 68.5% in E. lutescens, are displaced amacrine cells. However, due to the incompleteness of the collicular injections, especially in the latter case, these values may underestimate the actual proportion of ganglion cells.
In Nissl-stained reti- nas, the soma size diameters of ganglion cells (Fig. 13) ranged from 6.41 to 23.48 pm in E. talpinus (mean = 11.93; SD = 2.44, n = 610) and from 6.04 to 16.61 pm in E. lutescens (mean = 10.15; SD = 1.91, n = 572). Cells above 16 pm in diameter were rare in E. talpinus (2-3% of the total population), and the frequency distribution for soma sizes appeared unimodal. The mean soma sizes are significantly different between the two species. In E. lute- scens, the slightly larger mean soma sizes (mean = 12.08 pm; SD = 2.15, n = 472) observed in the fluorescent- labeled material appeared to be related to both shrinkage following dehydration during Nissl staining as well as the
Retinal ganglion cell morphology.
Fig. 8. Retinal projections to the superior colliculus. A A serial reconstruction of coronal sections shows the bilateral distribution of label throughout the complete rostrocaudal extent of the colliculus. B,C: Laminar distribution of label in animals injected with CT-HRP (darkfield, B) or tritiated amino acids (brightfield, C). Scale bar = 500 pm.
less distinct outline of the bright fluorescent cells. In addition, small amacrine cells were not included in the sample of retrogradely labeled cells. In all cases, soma size range or means did not vary according to the sampling location in central or peripheral regions of the retina.
DISCUSSION Retinal projections
The general organization of retinal projections in the mole-lemming resembles that of other small rodents (Drager, 1974; Frost et al., 1979, 1984; Godement et al., 1984; Dreher et al., 1985) and insectivores (Sato, 1977; Dinopoulos et al., 1987; Kunzle, 1988; Mizuno et al., 1991). The predominantly fossorial, but not exclusive, under- ground life-style is correlated with a relatively small eye, although this has not resulted in the profound regressive modifications observed in more strictly subterranean spe- cies (Lund and Lund, 1965; Kudo et al., 1988; Bronchti et al., 1991; Cooper et al., 1993a,b).
The size, cytoarchitecture, and retinal innervation of the SCN are similar to those in other species (Moore, 1973; Lydic et al., 1982; Cassone et al., 1988). Retinal input terminates mainly in the ventral part of the nucleus, with the density of retinal fibers decreasing toward the dorsal region (Pick- ard and Silverman, 1981; Youngstrom and Nunez, 1986; Cassone et al., 1988; Levine et al., 1991; Youngstrom et al., 1991). The SCN in Ellobius receives a dense, bilateral retinal innervation, which is contralaterally predominant (ipsilateral/contralateral ratio = 0.44). Compared to other rodents in which qualitative observations or quantitative measures have been made, Ellobius shows a degree of bilateral distribution similar to that of the rat and the squirrel (Hendrickson et al., 1972; Cooper et al., 1987; Magnin et al., 1989; Smale et al., 1991). In contrast, the SCN in the hamster and mouse receives a completely balanced bilateral input (Drager, 1974; Pickard and Silver- man, 1981; Pickard, 1982; Cassone et al., 1988; Magnin et al., 1989). Species with reduced eyes are reported to have ipsilaterally predominant (Kudo et al., 1991; Mizuno et al., 19911, bilaterally equivalent (Kunzle, 1988; Mizuno et al., 19911, or contralaterally predominant (Dinopoulos et al.,
Hypothalamus, bed nucleus, basal telencephalon.

266
Fig. 10. The accessory optic system (AOS) in EZlobius. A,B: The major terminal nuclei of the AOS in coronal autoradiographic sections counterstained with cresyl violet. In A, the region of transition from the caudal IGL to the rostral part of the LTN is shown. C: The bilateral label of the MTNv is clearly evident. D: Illustration of the fiber pathways of the AOS from the DTN to the LTN. The SF-pf courses superficially around the external margin of the MG, while the medial branch of the superior fasciculus (arrows) lies deep to the MG. The IF of
M. HERBIN ET AL.
the AOS is shown by the arrows in E-G. CP, cerebral peduncle; DTN, dorsal terminal nucleus; IF, inferior fasciculus of the AOT; LTN, lateral terminal nucleus; LTNIIGL, transition zone between the intergenicu- late nucleus and the lateral terminal nucleus; OT, optic tract; MG, medial geniculate nucleus; MTNd, dorsal subdivision of the medial terminal nucleus; MTNv, ventral subdivision medial terminal nucleus; Sf-pf, posterior fiber branch of the superior fasciculus. Scale bars = 500 w.
MOLE-LEMMING VISUAL SYSTEM 267
BNST SCN dLGN vLGN PRT sc AOS
STRUCTME
Fig. 11. Percent relative density of the amount of retinal label in each primary visual structure. In case ELT1, retinal projections were demonstrated by autoradiography. Cases ELT2 and ELT7 were treated for HRP histochemistry. AOS, accessory optic system; BNST, bed
nucleus of the stria terminalis; dLGN, dorsal lateral geniculate nucleus; PRT, pretectum; SC, superior colliculus; SCN, suprachiasmatic nucleus; vLGN, ventral lateral geniculate nucleus. Refer to Table 1 for quantita- tive values.
TABLE 1. Relative Densities of Retinal Projections in EZZobius'
Structures
BNST SCN dLGN vLGN PRT sc AOS
Relative 0.13 2.95 26.17 12.36 7.94 45.99 4.42
Ipsilateral 1.31 28.66 7.06 16.49 19.49 4.76 5.09 (S.D. = 1.54) density (%) iS.D. = 0.03) iS.D. = 1.91) (S.D. = 3.21) iS.D. = 3.17)
label 1%) lS.D. = 2.78) (S.D. = 12.96) (S.D. = 0.90) iS.D. = 2.06) iS.D. = 5.04) (S.D. = 2.91) is D. = 2.55)
(S.D. = 7.04) iS.D. = 0.25)
Volume 12 0 161 7 1981 0 830 0 530 0 3,638 3 355 3 (mm3 x 1 0 - 4 ) (S D = 141) (S D = 57 28) 6 D = 2 12) is D = 68 59) (S D = 73 541 (S D = 1050 76) iS D = 158 39)
'Relative density of label in primary visual structures in Ellobius. Percent relative density represents the proportion of label in each structure (sum in contralateral and ipsilateral nuclei) compared to the total amount of label in all structures. Percent ipsilateral label shows the proportion of ipsilateral projections to each structure. Structure volume is calculated from the labeled regions of the nucleus on the contralateral side. The relative amount of label in the basal telencepbalon was insignificant and is not included.
TABLE 2. Measures of Retinal Ganglion Cell Densities in Ellobius'
Retinal Minimum Maximum Mean surface area density density density Centroiperipheral
Case Technique (mm2) (cell/mm2) (cell / mm2) (cell/mm2) Total RGC ratio
Ellobius talpinus ELt2 CVR
CVL ELt3 CVR
CVL ELt4 CVR
CVR CVL
ELt6 CVR Mean (SD)
ELL3 CVR FRR
ELL3 CVL FBL
Mean (SD)
Ellobius lutescens
Nissl Nissl Nissl Nissl Nissl
Fluo F.B. Nissl Nissl Nissl
Nissl Fluo F.R.
Nissl Fluo F.B.
Nissl Flu0
9.151 6.99l 7.583 9.305
10.025 10.186 5.432 6.201
8.45 (1.54)
2.986 3.182 3.900 4.211
3.44 (0.46) 3.70 (0.73)
1,905 1,905 2,268 2,358 2,071
421 1,953 1,598
2,008 (254)
2,544 473
2,426 533
2,485 (59) 503 (42)
4,717 5,936 5,624 5,986 5,444 4,392 5,266 4,201
5,311 (652)
5,089 1,420 4,834 1,302
4,962 (128) 1,361 (83)
3,116 3,291 3,687 3,926 3,138 1,996 3,282 2,923
3,338 (350)
3,722 1,093 3,172
923 3,447 (275) 1,008 (120)
28,515
27,959 36,531 31,458 20,331
18,126 28,518 (6,730)
11,114 3,478
12,371 3,887
11,742 (628) 3,682 (289)
-
-
2.48 3.12 2.48 2 54 2.63
10.43 2.70 2.63
2.65 10.22)
2.00 3.00 1.99 2.44
2.00 (0.004) 2.72 i0.400)
'Quantitative data on the retina and retina ganglion cells (RGC) in the two species of Ellobius. Nissl refers to retinas stained with cresyl violet, Fluo F.B. to cells retrogradely labeled with fast blue, and Fluo F.R. to cells retrogradely labeled with fluororuby. *Part of the retina was missing and thus retinal surface area is not complete.
1987) retinal projections to the SCN. The relative quantity ately greater than the projection to the SCN in other of retinal projections to the SCN, compared to the total mammals, which has been is estimated or measured to retinal projection, is rather prominent in Ellobius (roughly range from 0.1% to 1% of the total retinal projection (Toga 3%). Although less than that described in the subterranean and Collins, 1981; Pickard, 1980, 1982; Balkema and mole rat (Cooper et al., 1993a,b), this value is proportion- Drager, 1990). Ellobius is reported to show specific periods

268
C M. HERBIN ET AL.
IPS1 CONTRA
V
. .. . 0 .
D
T+ V l m m -
E . 2-30001
3-4m1 0 4-50001
. . . . . . . . .
N
rostra1 w Fig. 12. Distribution of retinal ganglion cells (RGC) in E. talpinus
(A-C) and E. lutescens (D-E). A and D show density distribution maps for neuron counts in the ganglion cell layer in Nissl-stained whole mounts. The distribution of retrogradely labeled ganglion cells follow- ing an injection in the colliculus is illustrated for the contralateral (B) and ipsilateral retina (C) in E. talpinus and in E for the contralateral
retina in E. lutescens. The injection site in E. talpinus is depicted in the drawings in F (dark shading, area of dense tracer diffusion; light shading, area of light tracer diffusion). The legend for ganglion cell density is shown in the center. The crosses indicate the orientation of the retinas: D, dorsal; V, ventral; N, nasal; T, temporal. The star represents the location of the optic nerve.
of daily activity (Grzimek, 1975), which may be synchro- nized by brief exposure to light above ground via the retinohypothalamic tract.
As was recently observed in several other species, retinal projections to structures other than the classical primary visual areas, including the BNST, the adjacent anterodorsal and anteroventral nuclei, and the thalamic paraventricular nucleus, are observed in Ellobius. A retinal projection to the BNST has also been described in rat (Levine et al., 19911, hamster (Levine et al., 1991), mink (Martinet et al., 1992), and the blind mole rat (Cooper et al., 1993a,b1. The bed nucleus, which has a complex chemo- and cytoarchitecture (Ju and Swanson, 1989a,b); is interconnected with several hypothalamic, septal, and amygdalian regions (Saper et al., 1976; Krettek and Price, 1978); and is known to participate in the modulation of sexual and reproductive behaviors (Emery and Sachs, 1976; Novotny, 1977; Valcourt and Sanchs, 1979; Beltramino and Taleisnik, 1980; Han and Ju, 1990). Retinal input to the BNST can thus provide photic
information to cell groups involved in various aspects of cyclic neuroendocrine regulation. The BNST also plays a crucial role in seasonal temperature regulation (Pevet et al., 1987), and retinal innervation of the BNST may be related to the mediation of this response by photoperiodic influ- ences.
Although the projection to the basal telencephalon is relatively sparse in most mammals (Cooper et al., 1989; Levine et al., 1991; Youngstrom et al., 1991; Martinet et al., 1992; Cooper et al., 1993a,b; Mick et al., 1993), in Ellobius this pathway is quite extensive. The variations in the density and extent of retinotelencephalic projections be- tween animals may primarily be related to methodology rather than to actual species differences. There is, however, no question that this pathway is a characteristic feature in mammals. Since these regions also receive projections from the olfactory bulb (Scalia and Winans, 1976; Skeen and Hall, 19771, converging sensory input to this region may be related to the integration of visual and olfactory informa-

MOLE-LEMMING VISUAL SYSTEM 269
A
Elt2cv (n=303)
5 7 9 1 1 13 15 17 19 21 23 25
SOMA DIAMETER pm
B
E113fl (n9472)
a
0 #
LL 40- - \
#
#
# 30- 7 '#'
# # 0 U : 20- W > U F 10- 4 = 0 . 7 : - I
5 7 9 1 1 13 15 17 19 21 23 25
SOMA DIAMETER p
Fig. 13. Histograms of soma sizes and photomicrographs of retinal ganglion cells (RGC) in two species of Ellobius. In E. talpinus (A), frequency histograms of soma sizes (equivalent diameter) are shown for two cases of Nissl stained retinas (see photomicrograph in A). In E. Eutescens (Bi, soma sizes are compared for fluorescent retrogradely
labeled retinotectal ganglion cells (dark shading and photomicrograph in B), and neurons in the ganglion cell layer of the same retina subsequently stained with cresyl violet (light shading). In both species, note the unimodal distribution of soma diameters and the hoinoge- neous morphology of ganglion cells. Scale bar = 50 pm.
tion in relation to the photoperiodic control of seasonal reproduction (Pieper et al., 1987; Bittman et al., 1989). For example, olfactory bulbectomy disrupts reproductive re- sponses to light cycles by preventing gonadal regression, which normally occurs under the influence of short photope- riods in hamsters (Pieper et al., 1984, 1989). In addition, removal of the olfactory bulbs can phase shift activity rhythms modifying the normal circadian response of the animal to light cycles (Possidente et al., 1990) and in rats
can unmask photoperiodic responsiveness (Nelson and Zucker, 1981).
The pat- tern of retinal projections to the thalamus is comparable to that seen in other small rodents: mouse (Drager, 1974; Godement et al., 1984), hamster (Frost et al., 1979; Frost, 1984), and rat (Dreher et al., 1985). The size and the volume of the dLGN is roughly equivalent to that in the mouse (Heumann and Rabinowicz, 1980). As in the tenrec
Dorsal and ventral lateral geniculate nuclei.

270 M. HERBIN ET AL.
(Kunzle, 19881, the contralateral projection displays an uneven distribution of terminal label, although no distinct layering is obvious. The regions innervated by each retina show a weak cytoarchitectural differentiation similar to that described in other mammals with relatively normal sized eyes (Drager, 1974; Hickey and Spear, 1976; Frost et al., 1979; Godement et al., 1984; Dinopoulos et al., 1987) or relatively reduced eyes (Pentney and Cotter, 1976; Cotter and Pentney, 1979; Kunzle, 1988; Reimer, 1989; Pettigrew et al., 1989). In the dLGN of Ellobius, binocular and monocular segments are clearly definable, with partial segregation of ipsilateral and contralateral terminal fields in complementary regions of the nucleus. The ratio of ipsilateral and contralateral label is also comparable to that in other rodents (LaVail et al., 1978; Toga and Collins, 1981; Cooper et al., 1993a). This differs from species with highly reduced eyes in which the retinogeniculate projec- tion is almost exclusively contralateral (Lund and Lund, 1965; Kudo et al., 1988; Mizuno et al., 1991; Cooper et al., 1993a,b).
In Ellobius, the isolated region of label located ventrome- dial to the rostral dLGN poses some problems of interpreta- tion. Areas of retinal innervation medial to the dLGN have variously been described as the beta segment of the dLGN (rabbit: Holcombe and Guillery, 1984; marsupials: Sander- son et al., 1984; hamster: Frost et al., 1979; Frost, 1984; tenrec: Kunzle, 19881, a retinorecipient region of the lateroposterior or pulvinar nucleus (moles: Kudo et al., 1988; carnivores: Guillery et al., 1980; rabbit: Takahashi et al., 1985; marsupials: Royce et al., 1977; tree shrew: Hubel, 1975; megachiropteran bats: Cotter, 1979; primates: Mizuno et al., 1982;) or the medial intralaminar nucleus (carni- vores: Guillery et al., 1980; ungulates: Pettigrew et al., 1984). Another possibility is that this projection represents a remnant of the transient neonatal projection to the ventrobasal complex (Frost, 1984). In the absence of fur- ther morphological or physiological criteria, we find it difficult to decide conclusively between these alternative interpretations. However, the fact that in Ellobius this label is located medial to the external medullary lamina suggests that this area corresponds to a nuclear region distinct from the dLGN.
The vLGN is well differentiated and, on the basis of cytoarchitecture and distribution of retinal afferents, can be divided into medial and lateral regions, including several internal subdivisions (Niimi et al., 1963; Hickey and Spear, 1976; Conley and Friederich-Ecsy, 1993). This complexity is related to the extensive afferent and efferent connections of the vLGN with structures involved in oculomotor, vestibular, and circadian functions (Jones, 1985). In most parts of the nucleus, ipsilateral and contralateral label appears to be superimposed rather than segregated in distinct lamina as in some other species (Hickey and Spear, 1976; Royce et al., 1986; Frost et al., 1979; Dinopoulos et al., 1987; Kunzle, 1988). However, as was pointed out by Holcombe and Guillery (1984), it is difficult to appreciate the respective topographic distribution of label from only a single plane of section. Although the anatomical organiza- tion of the vLGN in Ellobius is fairly complex, other species with highly reduced eyes show little or no differentiation of the vLGN coupled with a minute ipsilateral projection (Lund and Lund, 1965; Cotter and Pentney, 1979; Kudo et al., 1988; Reimer, 1989; Mizuno et al., 1991; Cooper et al., 1993a,b).
The IGL receives an equivalent bilateral and topographi- cally superimposed retinal innervation in the mole-lem- ming. As in the hamster (Morin et al., 1992), this nucleus shows a significant rostrocaudal extent and at the most caudal region is difficult to distinguish from the rostral part of the LTN. The IGL is a distinct subdivision of the vLGN that receives collateral projections from a proportion of the retinal ganglion cells that innervate the SCN (Pickard, 19851, shares reciprocal connections with this nucleus (Card and Moore, 1989; Zhang and Rusak, 1989), and participates in the modulation of photoperiodic responses (Harrington and Rusak, 1986; Pickard et al., 1987; Pickard, 1989; Rusak et al., 1989). The distinct morphological development both of these components in Ellobius suggests the presence of a functional photoperiodic detection system involved in the mediation of circadian ryhtmicity.
Pretectum, superior and inferior colliculus, accessory optic system. In the pretectum, both the OPN and the NOT can be distinguished in Ellobius. Minor projections were also present to the medial and posterior pretectal areas. Even in animals with reduced eyes, the pretectum has been recognized as receiving a substantial bilateral but contralaterally predominant retinal innervation (Cotter and Pentney, 1979; Dinopoulos et al., 1987; Kudo et al., 1988; Kunzle, 1988; Mizuno et al., 1991; Cooper et al., 1993a,b). In the mole, Lund and Lund (1965) considered that conservation of a retinal innervation of the pretectum could be explained by a putative role of this structure in luminance discrimination.
The superior colliculus is well differentiated, receives a robust projection from the retina, and displays a typical nonprimate pattern of retinal innervation (Allman, 1977; Vanegas, 1984; Pettigrew et al., 1989). Ganglion cells that project to the colliculus are distributed throughout the contralateral retina, while the ipsilateral projection arises from ganglion cells restricted to the ventrotemporal cres- cent. The ratio of ipsilateralicontralateral label (2.1%) was similar to the ratio of retrogradely labeled ganglion cells following injection in the colliculus (1.3%). Ipsilateral reti- nal fibers are distributed in discontinuous patches within the midregion of the colliculus, sparing the most rostral and caudal regions. This spatial distribution suggests an or- dered representation of the entire contralateral retinal field, including binocular and monocular fields, with part of the ipsilateral field mapped in the rostral most region. In contrast, other mammals with reduced eyes have been reported to have either an extremely sparse ipsilateral projection (Cotter and Pentney, 1979; Kunzle, 1988; Rei- mer, 1989; Mizuno et al., 1991; Cooper et al., 1993a,b) or to lack entirely any retinal innervation of the colliculus (Lund and Lund, 1965; Kudo et al., 1988).
Labeled retinal fibers were also distinctly visible in the inferior colliculus. The possible role of a visual input to the inferior colliculus is obscure, but similar projections have been reported in tenrecs (Kunzle, 19881, monkey (Itaya and Van Hoesen, 1982), rat (Yamauchi and Yamadori, 1979; Itaya and Van Hoesen, 1982), mouse (Godement et al., 1979), hamster (Jen et al., 1984), and cat (Paloff et al., 1985). In the opinion of other authors, this projection is only transiently expressed during neonatal development and normally disappears at subsequent periods (Paloff et al., 1985; Cooper and Cowey, 1990a,b).
All three terminal AOS nuclei are represented and re- ceive a well organized retinal projection, via clearly defined fiber tracts of the AOT. Both the inferior fasciculus, and
MOLE-LEMMING VISUAL SYSTEM 271
several branches of the superior fasciculus, can be distin- guished. The presence of the inferior fasciculus is remark- able, since this fiber tract is usually rather difficult to identify (Bellonici, 1888; Hayhow et al., 1960; Hayhow, 1966; Giolli and Guthrie, 1969; Cooper and Magnin, 1986). The MTN is the most conspicuous of the terminal nuclei and shows a distinct bilateral distribution of label, although contralateral input is largely predominant. In mammals, the AOS is involved in the detection of whole-field visual displacements and, via connections with the pretectum, vestibular, and oculomotor structures, represents an impor- tant link in visual and vestibulooculomotor functions (Brecha et al., 1980; Simpson, 1984). The large size of the AOS in Ellobius is thus surprising, since oculomotor muscles are poorly developed, eye movements appear to be weak or absent, and the oculomotor nucleus is highly reduced in size. The role of the AOS may thus be more preponderant in the sensory detection of whole-field movement than in oculomotor reflex coordination and output. Although the AOS has been shown to be present in all mammals (Simp- son, 1984; Cooper and Magnin, 1986; Cooper et d., 1990), in some species the MTN or DTN is described as highly reduced or absent (Kunzle, 1988; Reimer, 1989; Mizuno et al., 1991; Cooper et al., 1993a,b). Reports that certain species entirely lack an AOS (Lund and Lund, 1965; Kudo et al., 1988; Bronchti et al., 1991; Mizuno et al., 1991) may be related to methodological problems.
Retina and retinal ganglion cells Although cells in the ganglion cell layer form a simple
monolayer, overall neuron density remains relatively high in Ellobius. Comparison of the counts obtained from Nissl- stained retinas and from retrogradely labeled ganglion cells indicates that displaced amacrine cells constitute a consider- able proportion of neurons in the ganglion cell layer (36.4% in E. talpinus and 68.5% in E. lutescens), although these values may slightly overestimate the actual proportion of displaced amacrines due to the size of the injection sites. The proportion of amacrines is, however, similar to values obtained in other rodents (hamster 44-48%: Linden and Esberard, 1987; Sengelaub et al., 1983; rat 5043%: Perry, 1981; Linden and Perry, 1983). Soma cell sizes are also similar to those of hamster (Tiao and Blakemore, 1976), rat (Bunt et al., 1974; Fukuda, 19771, and mouse (Drager and Olsen, 1981). In E. lutesecens, with a small-diameter eye, the soma size range is more restricted and the frequency histograms suggest a unimodal distribution. The limited information available following retrograde collicular injec- tions also suggests a morphologically homogeneous popula- tion of ganglion cells.
The total number of ganglion cells in both species of Ellobius is relatively reduced compared to that in other nocturnal rodents with larger eyes and thus more extensive retinal areas. For example, the mouse is reported to have 65,000 ganglion cells (AL = 3.4 mm: Balkema and Drager, 1990), the hamster 72,000-114,000 ganglion cells (AL = 5.3 mm: Tiao and Blakemore, 1976; Sengelaub et al., 1983; Linden and Esberard, 1987), and the rat 115,000-118,000 ganglion cells (AL = 6.3 mm: Forrester and Peters, 1967; Fukuda, 1977). Large Hystricomorph rodents, in which the axial length can exceed 18 mm, show even higher total ganglion cell numbers (230,000-550,000: Silveira et al., 1989). The size of the eye and therefore the retinal surface area seem to be closely related to total ganglion cell number. For example, echolocating microchiropteran bats with an
eye size similar to those of E. lutescens have a comparable ganglion cell population (R. rouxi and R. gouldi, 4,500- 10,000 ganglion cells for an AL of 1.8-1.9 mm: Pettigrew et al., 1988). Subterranean mammals with rudimentary eyes are reported to have even lower numbers of ganglion cells (Rochon-Duvigneaud, 1943; Cei, 1946; Quilliam, 1964, 1966; Sanyal et al., 1990; Cooper et al., 1993a,b; Herbin et al., 1993).
In addition to the limited number of ganglion cells, both species of Ellobius show a relatively homogeneous topo- graphic distribution. In E. talpinus, a tendency toward a region of slightly higher density is expressed in the ventro- temporal region of the retina. A ventrotemporal area is present in other rodents (Tiao and Blakemore, 1976; Fukuda, 1977; Hughes, 1977; Silveira et al., 1983; Balkema and Drager, 1990), although, in E. talpinus, the centroper- ipheral gradient is less pronounced. In E. lutescens, with an axial length 70% less than that in E. talpinus, no systematic regional variation in density was observed in the retina. It is interesting to note that the mean ganglion cell density is similar for both species. This suggests that, while the retina in both species follows a similar course of development, the difference in the total ganglion cell population results uniquely from the difference in eye size and concomitant decrease in retinal surface area. Thus, a single genetic mechanism affecting the size of the ocular globe during development could explain this species difference. This difference is not allometrically related to body size because the larger species ofEllobius has the smaller eye.
The weak density gradients may also explain the lack of variation in soma diameters between different retinal re- gions. In species with sharp density gradients, ganglion cells tend to be smaller in central regions of high density, due to a crowding effect, as compared to more peripheral, low-density areas (Linden and Perry, 1982; Rapaport and Stone, 1983; Dreher et al., 1984). This tendency is evident in species such as the cat, in which cell density in the area centralis reaches 10,000 cells/mm2, falling off to 250 cells1 mm2 at the periphery (Wassle and Illing, 1980). In E. lutescens, with relatively high densities in both central (5,000 cells/mm2) and peripheral (2,500 cells/mm2) re- gions, the narrow range of soma sizes may reflect the impact of a crowding effect over the entire retina.
Consequences of reduced eye size The small size of the eye and the lack of a distinct central
area in these subterranean species also suggest that visual abilities are severely limited. The retinal magnification factor and spatial resolution of the eye of Ellobius was estimated using the criteria of Pettigrew et al. (1988). In view of the small axial length of the eye, the retinal magnification factor is very small: 26 pmidegree in E. talpinus and 20.6 pmldegree in E. lutescens. Using this value and the maximum ganglion cell density, counted in Nissl- and in fluorescent-stained retinas, the theoretical spatial resolution was calculated to be between 0.89 and 0.95 cyclesldegree for E. talpinus and 0.39-0.73 cycles/ degree for E. lutescens. Apart from some of the smaller eyed microchiropteran bats (Pettigrew et al., 1988) and some large-eyed cetaceans (Mass and Supin, 1989, 19901, these values of visual acuity are the lowest observed among mammals.
Despite this poor spatial resolution, the presence of bilateral and partially segregated retinal inputs in the dLGN and superior colliculus of Ellobius suggests that the

272 M. HERBIN ET AL.
anatomical substrate for binocular vision is present. How- ever, in the laboratory, Ellobius appears oblivious to the presence of both stationary or moving objets in the visual field. The apparent lack of an overt behavioral reaction can only be considered as anecdotal as we did not actually investigate behavioral abilities, but it raises the question of the actual visual capacities of Ellobius and other mammals of fossorial habit in which visually guided behaviors may have limited function. The Bathyergid mole rat, Cryptomys, with an eye length of 1.8 mm (Eloff, 1958; personal observation) has been reported to be completely blind to visual stimuli or even to large transient changes in global light levels (Eloff, 1958). The blind mole rat, Spalax, with a minute subcutaneous eye, is also unresponsive to light, although circadian rhythms can be effectively entrained to the external light cycle. In contrast, the insectivore mole, Talpa, possesses rudimentary luminance discrimination abilities (Lund and Lund, 1965; Johannesson-Gross, 1988). The eye of Talpa is only 0.9 pm in length (Rochon- Duvigneaud, 1943; Herbin et al., 19931, and fewer than 4,000 optic fibers are reported to be present in the optic nerve (Quilliam, 1964, 1966).
The results suggest that a number of morphological trends leading to a relatively homogeneous retinal organiza- tion are associated with a reduction in eye size. Compared to species with large eyes, the range of ganglion cell soma diameters is reduced, and ganglion cells appear morphologi- cally uniform in Nissl-stained or retrogradely labeled mate- rial. The topographic distribution of ganglion cells is also homogeneous, with low centroperipheral gradients and the lack of a recognizable area centralis or region of high ganglion cell density. This trend is more noticeable in E. lutescens compared to E. talpinus. These features are also shared with some microchiropteran bats and other subter- ranean mammals with reduced eyes (Pettigrew et al., 1988; Cooper et al., 1993b). While most of these characteristics can be systematically observed in mammals with small retinas, some features such as homogeneous soma sizes or a uniform topographical distribution of ganglion cells are also found in species with large eyes. For example, the echidna (Stone, 19831, opossum (Rapaport et al., 19811, and hedge- hog (Hughes, 1977) all have low centroperipheral gradients. However, these species differ from animals with small eyes in that overall cell densities are generally low, whereas the range of soma diameters is greater.
Although the above characteristics may reflect morpho- logical constraints resulting from reduction of the retina in mammals, the same constraints may not apply to nonmam- malian vertebrates. Certain Perciforme fish with minute eyes (AL = 1.04 mm) nevertheless have a highly organized retina characterized by a distinct fovea and foveal pit, an extremely high ganglion cell density (150,000 cells/mm2), and a sharp centroperipheral gradient (Collin and Collin, 1988). These features are also seen in some highly visual plethodontid salamanders (Roth et al., 1988). In these species, for which visually guided movements are essential, the high ganglion cell density could compensate for the small retinal magnification factor to provide for greater acuity. In contrast to mammals, high cell density in these small animals is achieved through a multiple layering of ganglion cells and a reduction in the minimum and average soma size. In this species of fish, ganglion cells are as minute as 3 pm in diameter, while in mammals the smallest ganglion cells measure at least 6-7 pm in diameter (Collin and Collin, 1988).
The reduced reliance on visual cues is correlated with the predominantly underground activity in Ellobius. The behav- ioral requirements for high visual acuity and accurate movement detection are less crucial than the basic percep- tion of the presence or absence of light or of photoperiodic variations. The capacity to detect global light variations during occassional emergence above ground would not be impaired by the low spatial resolution of the eye. Since both light and sound (Burda et al., 1989) penetrate poorly within the underground environment, visual orientation and com- munication is replaced in fossorial species by alternative sensory pathways involving somatosensory adaptations (Necker et al., 1992; Catania et al., 19931, magnetic orienta- tion (Burda et al., 19901, and seismic communication (Nevo et al., 1991).
ACKNOWLEDGMENTS We are grateful to P.P. Gambarian (Institute Sechenov,
St. Petersburg, Ruussia) and Jean-Pierre Gasc (M.N.H.N., Paris, France) for kindly providing the animals. We thank Sandrine Richard and Anne Giroud for excellent assistance with histology. Ghislaine Clain and Pierre Fiquet provided attentive care for the animals. The photographs and illustra- tions were done by Jean-Louis Borach and Pascal Giroud. The plotting program was developed by Christian Urquizar and Christophe Bullier. This work was supported by grants to H.M.C. from the Rhone-Alpes Neuroscience Program, I.N.S.E.R.M., C.N.R.S., and to M.H. from the Cannes Blanches (Lyon) the Federation des Aveugles de France, and the Museum D’Histoire Naturelle, Paris, B.Q.R. 1993.
LITERATURE CITED Allman, J. (1977) Evolution of the visual system in early primates. In:
Progress in Psychobiology and Physiological Psychology, Val. 7. New York: Academic Press, pp. 1-53.
Arieli, R. (1990) Adaptation of the mammalian gas transport system to subterranean life. In E. Nevo and O.A. Reig (eds) : Evolution of Suhterra- nean Mammals a t the Organismal and Molecular Levels. New York: Alan R. Liss, Inc., pp. 251-268.
Balkema, G.W., and U.C. Drager (1990) Origins of uncrossed retinofugal projections in normal and hypopigmented mice. Vis. Neurosci. 4;593- 604.
Bellonici, J. (1888) Uber die zentrale Endigung des Nerws opticus bei den Vertebraten. Zeitschr. Wissensch. Zool. 47: 1 4 6 .
Beltramino, C., and S. Taleisnik (1980) Dual action of electrochemical stimulation of the bed nucleus of the stria terminalis on the release of LH. Neuroendocrinology 30:238-242.
Bittman, I.L., R.G. Crandell, and M.N. Lehman (1989) Influences of the paraventricular and suprachiasmatic nuclei and olfactory bulhs on melatonin responses in the golden hamster. Biol. Reprod. 40: 118-126.
Brace, C.L. (1963) Structural reduction in evolution. Am. Naturalist 97:39- 49.
Brecha, N., H.J. Karten, and S.P. Hunt (1980) Projections of the nucleus of the basal optic root in the pigeon: An autoradiographic and horseradish peroxidase study. J. Comp. Neurol. 189r615-670.
Bremiller, R., J. Terkel, E. Schabtach, and G.E. Pickard (1986) The subterranean mole rat: an analysis of the subdermal eye. Soe. Neurosci. Abstr. 12:292.15.
Bronchti, G., R. Rado, J. Terkel, and Z. Wollberg (1991) Retinal projections in the blind mole rat: A WGA-HPR tracing study of a natural degenera- tion. Dev. Brain Res. 58:159-170.
Bunt, A.H., R.D. Lund, and J.S. Lund (1974) Retrograde axonal transport of horseradish peroxidase by ganglion cells of the albino rat retina. Brain Res. 73:215-228.
Burda, H. (1989) Reproductive biology (behavior, breeding, and postnatal development) in subterranean mole-rats (Cryptomys hottentotus; Bathy- ergidae). J. Saugetierkunde 54;360-376.
Burda, H., V. Bruns, and M. Muller (1989) Sensory adaptations in subterra-
MOLE-LEMMING VISUAL SYSTEM 273
nean mammals. In E. Nevo and O.A. Reig (eds.): Evolution of Suhterra- nean Mammals at the Organismal and and Molecular Levels. New York: Alan R. Liss, Inc., pp. 269-293.
Burda, H., S. Marhold, T. Westenburger, W. Wiltschko, and R. Wiltschko (1990) Magnetic compass orientation in the subterranean rodent Crypto- mys hottentotus (Batyergidae, Rodentia). Experientia 46:528-530.
Card, J.P., and R.W. Moore (1989) Organization of lateral geniculate- hypothalamic connections in the rat. J. Comp. Neurol. 284t135-147.
Cassone, V.M., J.C. Speh, J.P. Card, and R.Y. Moore (1988) Comparative anatomy of the mammalian hypothalamic suprachiasmatic nucleus. J. Biol. Rhythms 3t71-91.
Catania, K.C., R.G. Northcutt, J.H. Kaas, and P.P. Beck (1993) Stripes in the brain of the star-nosed mole. Nature 364: 493.
Cei, G. (1946) Ortogenesi parallela e degenerazione degli organi dello visto negli Spalacidi. Monitore Zool. Ital. 5569-88.
Clairambault, P., M.-J. Cordier-Picouet, and C. Pairault (1980) Premieres donnks sur les projections visuelles d’un amphibien Apode (Typhlo- nectes compressicazrde). C.R. Acad. Sci. 291:283-286.
Collin, S.P., and H.B. Collin (1988) Topographic analysis of the retinal ganglion cell layer and the optic nerve in the sandlance Lirnnichthyes fasciatus (Creeiidae, Perciformes). J. Comp. Neurol. 278:226-241.
Conley, M., and B. Friederich-Ecsy (1993) Functional-organization of the ventral lateral geniculate complex of the tree shrew U‘upaia belangeri). I) Nuclear subdivisions and retinal projections. J. Comp. Neurol. 328:l- 20.
Cooper, A.M., and A. Cowey (1990a) Development and retraction of a crossed retinal projection to the inferior colliculus in neonatal pigmented rats. Neuroscience 35t335-344.
Cooper, A.M., and A. Cowey (1990h) Retinal topography of the neonatal crossed abberant exuberant projection to the inferior colliculus in the pigmented rat. Neuroscience 35345-354.
Cooper, H.M., and M. Magnin (1986) A common mammalian plan of accessory optic system organization revealed in all primates. Nature .324:45 7 4 5 9 .
Cooper, H.M., G. Mick, and M. Magnin (1987) Retinohypothalamic pathway revisited in mammals: An unusual ipsilateral asymmetry in primates. SOC. Neurosci. Ahstr. 133363.
Cooper, H.M., G. Mick, and M. Magnin (1989) Retinal projection to mammalian telencephalon. Brain Res. 477:350-357.
Cooper, H.M., C. Baleydier, and M. Magnin (1990) Macaque accessory optic system: I. Definition of the medial terminal nucleus. J. Comp. Neurol. 302:384404.
Cooper, H.M., M. Herbin, and E. Nevo (1993a) The visual system of a naturally microphthalmic mammal: The blind mole rat, Spalm ehren- berghi. J. Comp. Neurol. 328r313-350.
Cooper, H.M., M. Herhin, and E. Nevo (199313) Ocular regression conceals adaptive progression of the visual system in a blind subterranean mammal. Nature 361:156-159.
Cotter, J.R., and R.J.P. Pentney (1979) Retinofugal projections of nonecholo- cating (Pteropus giganteus) and echolocating (Myotis lucifugus) hats. J. Comp. Neurol. 184r381-400.
Cowan, W.M., D.I. Gottleib, A.E. Hendrickson, J.L. Price, and T.A. Woolsey (1972) The autoradiographic demonstration of axonal connections in the central nervous system. Brain Res. 37.2-51.
de Jong, W.W., W. Hendriks, S. Sanyal, and E. Nevo (1990) The eye of the blind mole rat (Spalm ehrenbergi): Regressive evolution a t the molecu- lar level. In E. Nevo and O.A. Reig (eds): Evolution of Subterranean Mammals at the Organismal and Molecular Levels. New York: Alan R. Liss, Inc., pp. 383-395.
Dinopoulos, A., A.N. Karamanlidis, H. Michaloudi, J. Antonopoulos, and G. Papadopoulos (1987) Retinal projections in the hedgehog (Erinaceus europaeus). An autoradiographic and horseradish peroxidase study. Anat. Embryol. 176:65-70.
Drager, U.C. (1974) Autoradiography of tritiated proline and fucose trans- ported transneuronally from the eye to the visual cortex in pigmented and albino mice. Brain Res. 82:284-292.
Drager, U.C., and J.F. Olsen (1981) Ganglion cell distribution in the retinaof the mouse. Invest. Ophthalmol. Vis. Sci. 20:285-293.
Dreher, B., R.A. Potts, S.Y.K. Ni, and M.R. Bennett (1984) The development of heterogeneities in distribution and soma sizes of rat retinal ganglion cells. In J. Stone, B. Dreher, and D.H. Rapaport (eds): Development of Visual Pathways in Mammals. New York: Alan R. Liss, Inc., pp. 39-58.
Dreher, B., A.J. Sefton, S.Y.K. Ni, and G. Nisbitt (1985) The morphology, number, distribution and central projections of class I retinal ganglion cells in albino and hooded rats. Brain Behav. Evol. 26:1048.
Duhost, G. (1968) Les mammiferes souterains. Rev. Ecol. Biol. Sol. 5:99- 197.
Eloff, G. (1958) Functional and structural degeneration of the eye of the south African rodent mole, Cryptomys bigalkei and Bathyergus rnariti- mus. S . Afr. J. Sci. 54:292-302.
Emery, D.E., and B.D. Sachs (1976) Copulatory behavior in male rats with lesions in the bed nucleus of the stria terminalis. Physiol. Behav. 172303-806.
Forrester, J., and A. Peters (1967) Nerves fibers in the optic nerve of rat. Nature 214:245-247.
Fritzsch, B., W. Himstedt, and M.D. Capron de Caprona (1985) Visual projections in the larval Zchthyophis kohtaoensis (Amphihia: Gymnoph- iona). Dev. Brain Res. 23:201-210.
Frost, D.O. (1984) Axonal growth and target selection during development: Retinal projections to the ventrohasal complex and other “nonvisual” structures in neonatal Syrian hamsters. J. Comp. Neurol. 230:576-592.
Frost, D.O., K.-F. So, and G.E. Schneider (1979) Postnatal development of retinal projections in Syrian hamsters: A study using autoradiographic and anterograde degeneration techniques. Neuroscience 4: 1649-1677.
Fukuda, Y. (1977) A three-group classification of rat retinal ganglion cells: Histological and physiological studies. Brain Res. 11 9:327-344.
Gibson, A.R., D.I. Hansma, J.C. Houk, and F.R. Robinson (1984) A sensitive low artifact TMB procedure for the demonstration of WGA-HRP in the CNS. Brain Res. 298.235-241.
Giolli, R.A. and M.D. Guthrie (1969) The primary optic projections in the rabbit. An experimental degeneration study. 5. Comp. Neurol. 136:99- 126.
Godement, P., P. Saillour, and M. Imbert (1979) Thalamic f ierents to the visual cortex in congenitally anophthalmic mice. Neurosci. Lett. 13:271- 278.
Godement, P., J. Salaiin, and M. Imbert (1984) Prenatal and postnatal development of retinogeniculate and retinocollicular projections in the mouse. J. Comp. Neurol. 230:552-575.
Grzimek, B. (1975) Grzimek’s animal life encyclopedia. Mammals. I-IV. New York: Van Nostrand Reinhold.
Guillery, R.W., E.E. Geisert Jr., E.H. Polley, and C.A. Mason (1980) An analysis of the retinal afferents to the cat’s medial interlaminar nucleus and to its rostra1 thalamic extension, the “geniculate wing.” J. Comp. Neurol. 194: 11 7-142.
Halpern, M. (1973) Retinal projections in blind snakes. Science 182390- 391.
Han, Z . 3 . and G. J u (1990) Effects of electrical stimulation on the central nucleus of the amygdala and the lateral hypothalamic area on the oval nucleus of the bed nuclei of the stria terminalis and its adjacent areas in the rat. Brain Res. 536:56-62.
Harrington, M.E., and B. Rusak (1986) Lesions of the thalamic intergenicu- late leaflet alter hamster circadian rhythms. J. Biol. Rhythms 1~309- 325.
Hayhow, W.R. (1966) The accessory optic system in the marsupial phalanger, Trichosurus uulpecula. An experimental degenration study. J. Comp. Neurol. 126653-672.
Hayhow, W.R., C. Webb, and A. Jervie (1960) The accessory optic fiber system in the rat. J. Comp. Neurol. 115:187-215.
Hendrickson, A.E., N. Wagoner, and W.N. Cowan (1972) An autoradio- graphic and electron microscopic study of retinohypothalamic projec- tions. Z. Zellforsch. 135: 1-26.
Herhin, M., J.P. Rio, J. Reperant, H.M. Cooper, and M. Lemire (1993) Ultrastructural study of the optic nerve in a microphthalmic rodent (Spalax leucodon). C.R. Acad. Sci. Ser. III.316t251-258.
Heumann, D., and T. Rabinowicz (1980) Postnatal development of the dorsal lateral geniculate nucleus in the normal and enucleated albino mouse. Exp. Brain Res. 38175-85.
Hickey, T.L., and P.D. Spear (1976) Retinogeniculate projections in hooded and albino rats: An autoradiographic study. Exp. Brain Res. 24:523-529.
Himstedt, W., and G. Manteuffel (1985) Retinal projections in the caecilian Zchthyophis kohtaoensis (Amphibia; Gynophiona). Cell Tissue Res. 239: 689-692.
Holcombe, V., and R.W. Guillery (1984) The organization of retinal maps within the dorsal and ventral lateral geniculate nuclei of the rabbit. J. Comp. Neurol. 225:469491.
Hughes, A. (1975) A quantitative analysis of the cat retinal ganglion cell topography. J. Comp. Neurol. 163t107-128.
Hughes, A. (1977) The topography of vision in mammals of contrasting lifestyle. In F. Cresitelli (ed): The Visual System of Vertebrates. Hand-

274 M. HERBIN ET AL.
book of Sensory Physiology, Vol. VIII5. Berlin: Springer-Verlag, pp. 614-756.
Itaya, S.K., and G.W. Van Hoesen (1982) Retinal innervation of the inferior colliculus in rat and monkey. Brain Res. 233:45-52.
Jarvis, J.U.M. (1981) Eusociality in a mammal: Cooperative breeding in naked mole rat colonies. Science212:571-573.
Jen, L.S., K.F. So, and H.H. Woe (1984) An anterogrvde HRP study of the retinocollicular pathways in normal hamsters and hamsters with one eye enucleated at birth. Brain Res. 294:169-173.
Johannesson-Gross, K. (1988) Brightness discrimination of the mole (Talpa- Europaea L) in learning experiments applying a modified tube-maze method. Z. Saugetierkunde Int. J. 53:193-201.
Jones, E.J. (1985) The Thalamus. New York: Plenum Press. Jones, R., and D.C. Culver (1989) Evidence for selection on sensory
structures in a cave population of Gammarus minus (Amphipoda). Evolution 46688-693.
Jones, R., D.C. Culver, and T.C. Kane (1992) Are parallel morphologies of cave organisms the result of similar selection pressures? Evolution 46:353-365.
Ju, G., and L.W. Swanson (1989a) Studies on the cellular architecture of the bed nuclei of the stria terminalis in the rat: I. Cytoarchitecture. J. Comp. Neurol. 28Ot587-602.
Ju, G., L.W. Swanson, and R.B. Simerly (1989b) Studies on the cellular architecture of the bed nuclei of the stria terminalis in the rat: 11. Chemoarchitecture. J. Comp. Neurol. 280:603-62 1.
Krettek, J.E., and J.L. Price (1978) Amygdaloid projections to subcortical structures within the basal forebrain and brainstem in the rat and cat. J. Comp. Neurol. 178:225-254.
Kudo, M., Y. Kitao, T. Morizumi, Y. Nakamura, and H. Tokuno (1988) Direct retinal projections to the lateroposterior thalamic nucleus (LP) in the mole. Neurosci. Lett. 93t176180.
Kudo, M., M. Yamamoto, and Y. Nakamura (1991) Suprachiasmatic nucleus and retinohypothalamic projections in moles. Brain Behav. Evol. 38:332- 338.
Kunzle, H. (1988) Retinofugal projections in hedgehog-tenrecs (Echinops telfuiri and Setifer setosus). Anat. Embryol. 178t77-93.
LaVail, J.H., R.A. Nixon, and R.L. Sidman (1978) Genetic control of retinal ganglion cell projections. J. Comp. Neurol. 182399-342.
Levine, J.D., M.L. Weiss, A.M. Rosenwasser, and R.R. Miselis (1991) Retinohypothalamic tract in the female albino rat: A study using horseradish peroxidase conjugated to cholera toxin. J. Comp. Neurol.
Linden, R., and V.H. Perry (1982) Ganglion cell death within the developing retina: A regulatory role for the retinal dendrites? Neurosci. 7.2813- 2827.
Linden, R., and C.E.L. Esberard (1987) Displaced amacrine cells in the ganglion cell layer of the hamster retina. Vision Res. 7:1071-1076.
Linden. R., and V.H. Perry (1983) Massive retinotectal projection in rats. Brain Res. 272145-149.
Lund, R.D., and J.S. Lund (1965) The visual system of the mole, Talpa europaea. Exp. Neurol. 13r302-316.
Lydic, R.L., H.E. Alhers, B. Tepper, and M.C. Moore-Ede (1982) Three dimensional structure of the mammalian suprachiasmatic nuclei: A comparative study of five species. J. Comp. Neurol. 204:225-237.
Magnin, M., H.M. Cooper, and G. Mick (1989) Retinohypothalamic pathway: A breach in the law of Newton-Muller-Gudden? Brain Res. 488:390-397.
Martinet, L., J . Serviere, and J. Peytevin (1992) Direct projections of the “non-image forming” system to the hypothalamus, anterodorsal thala- mus and basal telencephalon of mink. Exp. Brain Res. 89t373-382.
Mass, A.M., and A.Y. Supin (1989) Distribution of ganglion cells in the retina of an amazon river dolphin Iniugeofrensis. Aquat. Mam. 15:49-56.
Mass, A.M., and A.Y. Supin (1990) Best vision zones in some cetaceans. In R. Kastelein and J. Thomas (eds): Sensory Abilities of Cetaceans. New York: Plenum Press, pp. 505-517.
Mesulam, M.M. (1978) Tetramethyl benzidine for horseradish peroxidase neurohistochemistry: An noncarcinogenic blue reaction product with superior sensitivity for visualizing neural afferents and efferents. J. Histochem. Cytochem. 26: 106-117.
Mick, G., H. Cooper, and M. Magnin (1993) Retinal projection to the olfactory tubercle and hasal telencephalon in primates. J. Comp. Neurol. 327:205-219.
Mizuno, N., M-U. Sumi, T. Tashiro, 0. Takahashi, and T. Satoda (1991) Retinofugal projections in the house musk shrew, Suncus murinus. Neurosci. Lett. 125t133-135.
306:344-360.
Moore, R.Y. (1973) Retinohypothalamic projections in mammals. A compara- tive study. Brain Res. 49:403409.
Morin, L.P., J. Blanchard, R.Y. Moore (1992) Intergeniculate leaflet and suprachiasmatic nucleus organization and connections in the golden hamster. Vis. Neurosci. 8:219-230.
Necker, R., G. Rehkamper, and E. Nevo (1992) Electrophysiological mapping of body representation in the cortex of the blind mole rat. NeuroReport 3:505-508.
Nelson, R.J., and I. Zucker (1981) Photoperiodic control of reproduction in olfactory-bulbectomized rats. Neuroendocrinology 32:266-271.
Nevo, E. (1979) Adaptive convergence and divergence of subterranean mammals. Annu. Rev. Ecol. Syst. 10:269-308.
Nevo, E. (1991) Evolutionag theory and processes of active speciation in subterranean mole rats, Spalax ehrenbgrgi superspecies in Israel. In M.K. Hecht, B. Wallace, and R.J. MacIntyre (eds): Evolutionary Biology, Vol. 25. New York: Plenum Press, pp. 1-125.
Nevo, E. , G. Heth, and H. Pratt (1991) Seismic communication in a blind subterranean mammal-A major somatosensory mechanism in adaptive evolution underground. Proc. Natl. Acad. Sci. USA 88: 12561260.
Niimi, K., T. Kanaseka, and T. Takimoto (1963) The comparative anatomy of the ventral nucleus of the lateral geniculate body in mammals. J. Comp. Neurol. 121:313-323.
Novotny, G.E.K. (1977) A ventral tract from the bed nucleus of the stria terminalis to the amagdaloid complex in the monkey Macaca fascicu- laris: A possible pathway in the regulation of ovulation. J. Physiol. 25513-14.
Nowak, R.M., and J.L. Paradiso (1983) Walker’s Mammals of the World. Baltimore: John Hopkins University Press.
Olucha, F., F. Martinez-Garcia, and C. Lopez-Garcia (1985) A new stabiliz- ing agent for the tetramethyl benzidine (TMB) reaction product in the histochemical detection of horseradish peroxidase (HRP). J. Neurosci. Methods 13:131-138.
Paloff, A.M., K.G. Usunoff, D.V. Hinova-Palova, and D.P. Ivanov (1985) Retinal innervation of the inferior colliculus in adult cats: Electron microscopic observations. Neurosci. Lett. 54:339-344.
Pentney, R.P., and J.R. Cotter (1976) Retinofugal projections in an echolocat- ing bat. Brain Res. 115:479484.
Perry, V.H. (1981) Evidence for an amacrine cell system in the ganglion cell layer of the rat retina. Neuroscience 6t931-944.
Pettigrew, J.D., V.S. Ramachandran, and H. Bravo (1984) Some neural connections subserving binocular vision in ungulates. Brain Behav. Evol. 24:65-93.
Pettigrew, J.D., B. Dreher, C.S. Hopkins, M.J. McCall, and M. Brown (1988) Peak density and distribution of ganglion cells in the retinae of microchi- ropteran bats: Implications for visual acuity. Brain Behav. Evol. 32.39- 56.
Pettigrew, J.D., B.G.M. Jamieson, S.K. Robson, L.S. Hall, K.I. McAnally, and H.M. Cooper (1989) Phylogenetic relations hetween microbats, megabats and primates (Mammalia: Chiroptera and Primates). Phil. Trans. R. SOC. London [Biol.] 325t489-559.
PQvet, P., R.M. Buijs, M. Masson-Pevet, and B. Canguilhem (1987) Pineal and photoperiodic control of different seasonal functions in the european hamster: Importance of goandal steroids and of the central vasopressin- ergic innervation. In G.P. Trentini, C. de Gaetani, and P. PQvet (eds): Fundamentals and Clinics in Pineal Research. New York: Raven Press, pp. 221-235.
Pickard, G.E. (1980) Morphological characteristics of retinal ganglion cells projecting to the suprachiasmatic nucleus: A horseradish peroxidase study. Brain Res. 183:458-465.
Pickard, G.E. (1982) The afferent connections of the suprachiasmatic nucleus of the golden hamster with emphasis on the retinohypothalamic projection. J. Comp. Neurol. 21 1:65-83.
Pickard, G.E. (1985) Bifurcating axons of retinal ganglion cells terminate in the hypothalamic suprachiasmatic nucleus and the intergeniculate leaflet of the thalamus. Neurosci. Lett. 55:211-217.
Pickard, G.E. (1989) Entrainement of the circadian rhythm of wheel running activity is phase shifted by ablation of the intergeniculate leaflet. Brain Res. 494t151-154.
Pickard, G.E., and A-J. Silverman (1981) Direct retinal projections to the hypothalamus, piriform cortex, and accessory optic nuclei in the golden hamster as demonstrated by a sensitive anterograde horseradish peroxi- dase technique. J. Comp. Neurol. 196:155-172.
Pickard, G.E., M.R. Ralph, and M. Menaker (1987) The intergeniculate leaflet partially mediates effects of light on circadian rhythms. J. Biol. Rhythms 235-56.

MOLE-LEMMING VISUAL SYSTEM 275
Pieper, D.R., Y.-K. Tang, T.P. Lipski, M.G. Subramanian, and S.W. Newman (1984) Olfactory hulhectomy prevents the gonadal regression associated with short photoperiod in male golden hamsters. Brain Res. 321t183- 186.
Pieper, D.R., P.D. Unthank, D.A. Shuttie, C.A. Lohocki, J.M. Swann, S. Newman, and M.G. Subramanian (1987) Olfactory bulbs influence testosterone feedback on gonadotropin secretion in male hamsters on long or short photoperiod. Neuroendocrinology 46:318-323.
Pieper, D.R., S.W. Newman, C.A. Lobocki, and G. Gogola (1989) Bilateral transection of the lateral olfactory tract but not removal of the vomerona- sal organs inhibits short-photoperiod induced testicular regression in golden hamsters. Brain Res. 485:382-390.
Possidente, B., A.R. Lumia, M.Y. McGinnis, M.H. Teicher, E. delomos, L. Sterner, and L. Deros (1990) Olfactory bulb control of circadian activity rhythm in mice. Brain Res. 513:325-328.
Poulson, T.L., and W.B. White (1969) The cave environment. Science 165t971-980.
Quilliam, T.A. (1964) Special features of the eye of the mole (Talpa europaea). Anat. Rec. 148~396.
Quilliam, T.A. (1966) The mole’s sensory apparatus. J. Zool. 146t76-88. Rapaport, D.H., and J. Stone (1983) Time course of morphological differen-
ciation of cat retinal ganglion cells: Influences on soma sizes. J. Comp. Neurol. 221t42-52. Rapaport, D.H., P.D. Wilson, and M.H. Rowe (1981) The distribution of ganglion cells in the retina of the North American opossum (Didelphis uirginiana). J. Comp. Neurol. 199t465-480.
Reimer, K. (1989) Retinofugal projections in the rufous horseshoe hat, Rhinolophus rouxi. Anat. Embryol. 180:89-98.
Reperant, J., D. Miceli, J.-P. Rio, and C. Weidner (1987) The primary optic system in a microphthalmic snake (Calabaria reinhardti). Brain Res. 408233-238.
Rochon-Duvigneaud, A. (1943) Les Yeux et la Vision des Vertkbres. Paris: Masson.
Roth, G., B. Rottluff, and R. Linke (1988) Miniaturization, genome size and the origin of functional constraints in the visual system of salamanders. Naturwissenschaften 75297-304.
Royce, G.J., J.P. Ward, and J.K. Harting (1976) Retinofugal pathways in two marsupials. 3. Comp. Neurol. 170:391414.
Rusak, B., J.H. Meijer, and M.E. Harrington (1989) Hamster circadian rhythms are phase shifted by electrical stimulation of the geniculo- hypothalamic tract. Brain Res. 493283-291.
Sanderson, K.J., J.R. Haight, and J.D. Pettigrew (1984) The dorsal lateral geniculate nucleus of Macropodid marsupials: Cytoarchitecture and retinal projections. J. Comp. Neurol. 224.85-106.
Sanyal, S., H.G. Jansen, W.J. De Grip, E. Nevo, and W.W. de Jong (1990) The eye of the blind mole rat, Spalax ehrenberghi. Rudiment with hidden function? Invest. Ophthalmol. Vis. Sci. 31r1398-1404.
Saper, C.B., L.W. Swanson, and W.M. Cowan (1976) The efferent connec- tions of the ventromedial nucleus of the hypothalamus in the rat. J. Comp. Neurol. 179r409-444.
Sato, Y. (1977) Comparative morphologV of the visual system of some Japanese species of Soricoidea (superfamily) in relation to life habits. J. Hirnforsch. 18:531-546.
Scalia, F., and S.S. Winans (1976) The differential projections of the olfactorv bulb and accessorv olfactorv bulb in mammals. J. Comn.
Sengelauh, D.R., M.S. Windrem, and B.L. Finlay (1983) Increased cell number in the adult hamster retinal ganglion cell layer after early removal of one eye. Exp. Brain Res. 52t269-276.
Silveira, L.C.L., A.C. Botelho, C.W. PicanGo-Diniz, and E. Oswaldo-Cruz (1983) DistribuiGao das celulas ganglionares retinianas do Proechimys. Cihcia Cultura Supl. 35:615.
Silveira, L.C.L., C.W. PicanGo-Diniz, and E. Oswaldo-Cruz (1989) Distrihu- tion and size of ganglion cells in the retinae of large Amazon rodents. Vis. Neurosci. 2.221-235.
Simpson, J.I. (1984) The accessory optic system. Annu. Rev. Neurosci. 7; 134 1.
Skeen, L.C., and W.C. Hall (1977) Efferent projections of the main and accessory olfactory bulb in the tree shrew. J. Comp. Neurol. 1721-36.
Smale, L., J. Blanchard, R.Y. Moore, and L.P. Morin (1991) Immunocyto- chemical characterization of the suprachiasmatic nucleus and the inter- geniculate leaflet in the diurnal ground squirrel, Spermophzlus lateralis. Brain Res. 563.77-86.
Stone, J. (1965) A quantitative analysis of the distribution of ganglion cells in the cat’s retina. J. Comp. Neurol. 224:337-352. Stone, J. (1978) The number and distribution of ganglion cells in the cat’s retina. J. Comp. Neurol. 18Ot753-772.
Stone, J. (1981) The whole mount handbook: A guide to the preparation and analysis of retina wholemounts. Sydney: Maitland Publications.
Stone, J. (1983) Topographical organisation of the retina in a monotreme: Australian spiny anteater Tuchyglossus aculeatus. Brain Behav. Evol. 22: 175-184.
Takahashi, T. (1985) The organization of the lateral thalamus of the hooded rat. J. Comp. Neurol. 231:281-309.
Tiao, Y.C., and C. Blakemore (1976) Regional specialization in the golden hamster’s retina. J. Comp. Neurol. 168t439-458.
Toga, A.W., and R.C. Collins (1981) Metabolic response of optic centers to visual stimuli in the albino rat: Anatomical and physiological consider- ations. J. Comp. Neurol. 299:443464.
Valcourt, R.J., and B.D. Sanchs (1979) Penile reflexes and copulatory behavior in male rats following lesions in the bed nucleus of the stria terminalis. Brain Res. Bull. 4:131-133.
Vanegas, H. (1984) Comparative Neurology of the Optic Tectum. New York Plenum Press.
Voneida, T.J., and C.M. Sligar (1976) A comparative neuroanatomical study of retinal projections in two fish: Astyanux hubbsi (the blind cave fish) and Astyanax mexicanus. J. Comp. Neurol. 165t89-106.
Wassle, H., and R.-B. Illing (1980) The retinal projection to the superior colliculus in the cat: A quantitative study with HRP. J. Comp. Neurol. 190:333-356.
Wilkens, H. (1971) Genetic interpretation of regressive evolutionary pro- cesses: Studies on hybrid eyes of two Astyanax cave populations (Chara- cidae, Pisces). Evolution 25:530-544.
Wright, S. (1964) Pleiotropy in the evolution of structural reduction and of dominance. Am. Naturalist 98:65-69.
Yamauchi, K., and T. Yamadori (1979) Retinal projection to the inferior colliculus in the rat. ActaAnat. 114t355-360.
Youngstrom, T.G., and A.A. Nunez (1986) Comparative anatomy of the retino-hypothalamic tract in photoperiodic and nonphotoperiodic ro- dents. Brain Res. Bull. 17t485-492.
Youngstrom, T.G., M.L. Weiss, and A.A. Nunez (1991) Retinofugal projec- tions to the hypothalamus, anterior thalamus and basal forebrain in hamsters. Brain Res. Bull. 26t403-411.
Zhang, D.X., and B. Rusak (1989) Photic sensitivity of geniculate neurons that project to the suprachiasmatic nuclei or the contralateral genicu-
Neurol. 161:31-56. late. Brain Res. 504:161-164


