Embed Size (px)
Citation preview
Visual Pattern-Driven Exploration of Big DataMichael BehrischHarvard UniversityCambridge, USA
Tobias SchreckGraz University of Technology
Graz, [email protected]
Robert KrugerHarvard UniversityCambridge, USA
Nils GehlenborgHarvard Medical School
Cambridge, [email protected]
Fritz LekschasHarvard UniversityCambridge, USA
Hanspeter PfisterHarvard UniversityCambridge, USA
Abstract—Pattern extraction algorithms are enabling insightsinto the ever-growing amount of today’s datasets by translatingreoccurring data properties into compact representations. Yet,a practical problem arises: With increasing data volumes andcomplexity also the number of patterns increases, leaving the an-alyst with a vast result space. Current algorithmic and especiallyvisualization approaches often fail to answer central overviewquestions essential for a comprehensive understanding of patterndistributions and support, their quality, and relevance to theanalysis task. To address these challenges, we contribute a visualanalytics pipeline targeted on the pattern-driven explorationof result spaces in a semi-automatic fashion. Specifically, wecombine image feature analysis and unsupervised learning topartition the pattern space into interpretable, coherent chunks,which should given priority in a subsequent in-depth analysis.In our analysis scenarios, no ground-truth is given. Thus, weemploy and evaluate novel quality metrics derived from thedistance distributions of our image feature vectors and thederived cluster model to guide the feature selection process. Wevisualize our results interactively, allowing the user to drill downfrom overview to detail into the pattern space and demonstrateour techniques in a case study on biomedical genomic data.
Index Terms—Pattern Analysis, Pattern-Driven Exploration,Quality Metrics, Visual Analytics, User Guidance
I. INTRODUCTION
Pattern analysis is becoming an increasingly important topicin many research domains ranging from natural sciences withsubjects of physics, chemistry, and biology, to social sciencessuch as economics, public health, and sociology. Often, patternanalysis focuses on relationships between objects or phenomena.For example, in genomics, biomedical researchers study pair-wise physical interactions between regions on the genomes [11].They are interested in areas that are frequently in closecontact, forming re-occurring structures [26], to understandthe functional consequence of the spatial organization of thegenome. Sociologists study connection and diffusion patternsin social networks [6] to understand information spreading andhuman relationships. In the transportation domain movementsare analyzed to reveal frequent traffic patterns between citiesand suburbs and optimize the infrastructure accordingly [54].
Thanks to nowadays’s sensor, recording, and storage tech-nology, scientists can rely on large datasets that may comprise
valuable insights into their object of research. Hence, patternmining in databases becomes more and more important butdue to growing data sizes and complexity also increasinglychallenging. Even when a suitable detection method is applied,patterns may be tough to interpret. Often hundreds or thousandsof patterns are found, leaving it unclear which of them encodevaluable information for the application domain, and how muchsupport they have in the data.
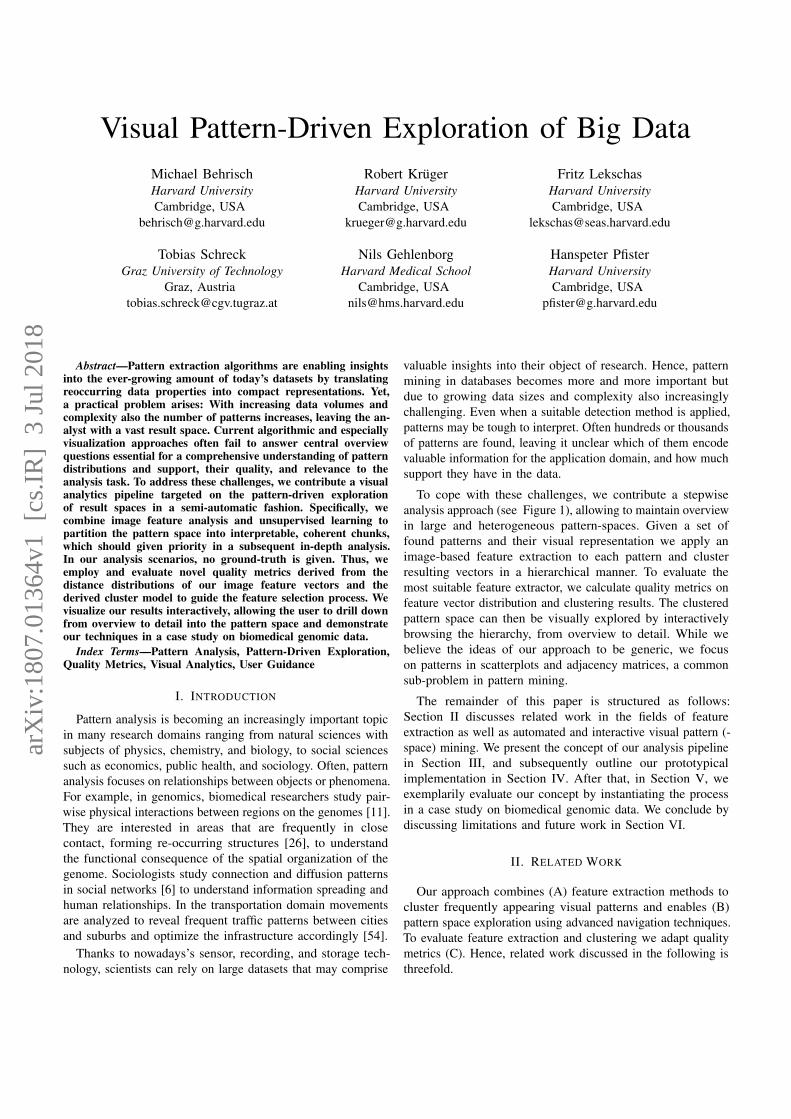
To cope with these challenges, we contribute a stepwiseanalysis approach (see Figure 1), allowing to maintain overviewin large and heterogeneous pattern-spaces. Given a set offound patterns and their visual representation we apply animage-based feature extraction to each pattern and clusterresulting vectors in a hierarchical manner. To evaluate themost suitable feature extractor, we calculate quality metrics onfeature vector distribution and clustering results. The clusteredpattern space can then be visually explored by interactivelybrowsing the hierarchy, from overview to detail. While webelieve the ideas of our approach to be generic, we focuson patterns in scatterplots and adjacency matrices, a commonsub-problem in pattern mining.
The remainder of this paper is structured as follows:Section II discusses related work in the fields of featureextraction as well as automated and interactive visual pattern (-space) mining. We present the concept of our analysis pipelinein Section III, and subsequently outline our prototypicalimplementation in Section IV. After that, in Section V, weexemplarily evaluate our concept by instantiating the processin a case study on biomedical genomic data. We conclude bydiscussing limitations and future work in Section VI.
II. RELATED WORK
Our approach combines (A) feature extraction methods tocluster frequently appearing visual patterns and enables (B)pattern space exploration using advanced navigation techniques.To evaluate feature extraction and clustering we adapt qualitymetrics (C). Hence, related work discussed in the following isthreefold.
arX
iv:1
807.
0136
4v1
[cs
.IR
] 3
Jul
201
8
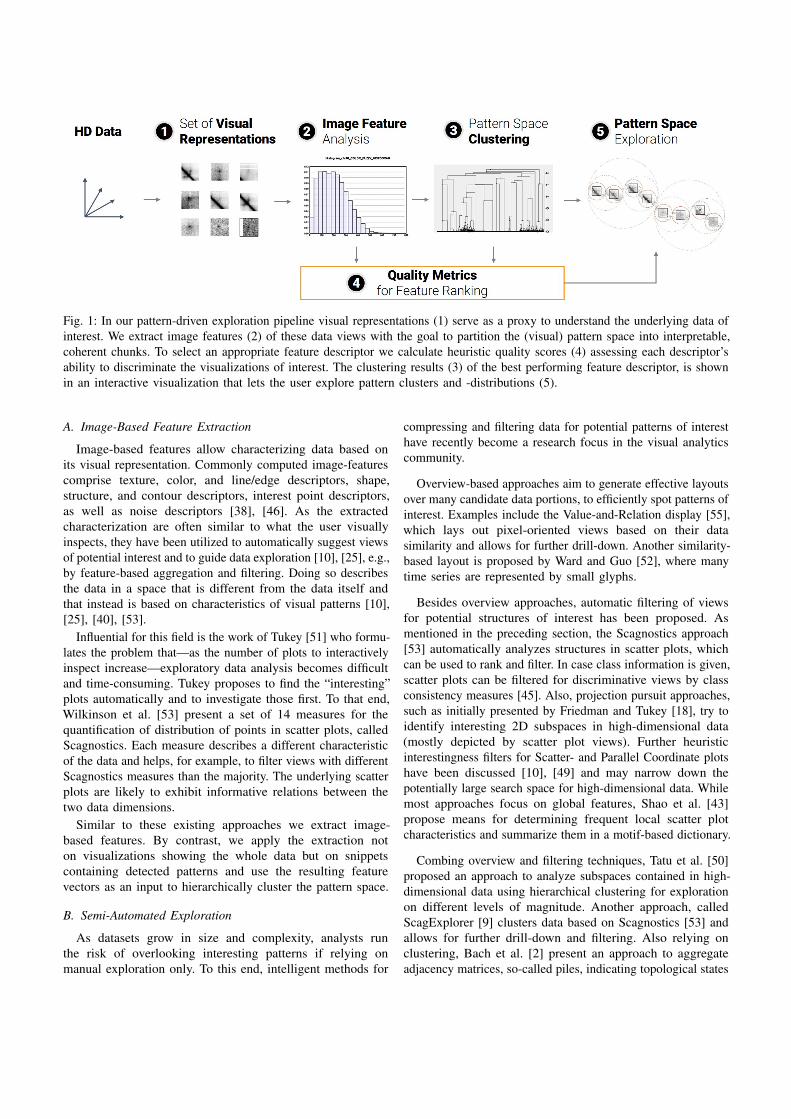
Fig. 1: In our pattern-driven exploration pipeline visual representations (1) serve as a proxy to understand the underlying data ofinterest. We extract image features (2) of these data views with the goal to partition the (visual) pattern space into interpretable,coherent chunks. To select an appropriate feature descriptor we calculate heuristic quality scores (4) assessing each descriptor’sability to discriminate the visualizations of interest. The clustering results (3) of the best performing feature descriptor, is shownin an interactive visualization that lets the user explore pattern clusters and -distributions (5).
A. Image-Based Feature Extraction
Image-based features allow characterizing data based onits visual representation. Commonly computed image-featurescomprise texture, color, and line/edge descriptors, shape,structure, and contour descriptors, interest point descriptors,as well as noise descriptors [38], [46]. As the extractedcharacterization are often similar to what the user visuallyinspects, they have been utilized to automatically suggest viewsof potential interest and to guide data exploration [10], [25], e.g.,by feature-based aggregation and filtering. Doing so describesthe data in a space that is different from the data itself andthat instead is based on characteristics of visual patterns [10],[25], [40], [53].
Influential for this field is the work of Tukey [51] who formu-lates the problem that—as the number of plots to interactivelyinspect increase—exploratory data analysis becomes difficultand time-consuming. Tukey proposes to find the “interesting”plots automatically and to investigate those first. To that end,Wilkinson et al. [53] present a set of 14 measures for thequantification of distribution of points in scatter plots, calledScagnostics. Each measure describes a different characteristicof the data and helps, for example, to filter views with differentScagnostics measures than the majority. The underlying scatterplots are likely to exhibit informative relations between thetwo data dimensions.
Similar to these existing approaches we extract image-based features. By contrast, we apply the extraction noton visualizations showing the whole data but on snippetscontaining detected patterns and use the resulting featurevectors as an input to hierarchically cluster the pattern space.
B. Semi-Automated Exploration
As datasets grow in size and complexity, analysts runthe risk of overlooking interesting patterns if relying onmanual exploration only. To this end, intelligent methods for
compressing and filtering data for potential patterns of interesthave recently become a research focus in the visual analyticscommunity.
Overview-based approaches aim to generate effective layoutsover many candidate data portions, to efficiently spot patterns ofinterest. Examples include the Value-and-Relation display [55],which lays out pixel-oriented views based on their datasimilarity and allows for further drill-down. Another similarity-based layout is proposed by Ward and Guo [52], where manytime series are represented by small glyphs.
Besides overview approaches, automatic filtering of viewsfor potential structures of interest has been proposed. Asmentioned in the preceding section, the Scagnostics approach[53] automatically analyzes structures in scatter plots, whichcan be used to rank and filter. In case class information is given,scatter plots can be filtered for discriminative views by classconsistency measures [45]. Also, projection pursuit approaches,such as initially presented by Friedman and Tukey [18], try toidentify interesting 2D subspaces in high-dimensional data(mostly depicted by scatter plot views). Further heuristicinterestingness filters for Scatter- and Parallel Coordinate plotshave been discussed [10], [49] and may narrow down thepotentially large search space for high-dimensional data. Whilemost approaches focus on global features, Shao et al. [43]propose means for determining frequent local scatter plotcharacteristics and summarize them in a motif-based dictionary.
Combing overview and filtering techniques, Tatu et al. [50]proposed an approach to analyze subspaces contained in high-dimensional data using hierarchical clustering for explorationon different levels of magnitude. Another approach, calledScagExplorer [9] clusters data based on Scagnostics [53] andallows for further drill-down and filtering. Also relying onclustering, Bach et al. [2] present an approach to aggregateadjacency matrices, so-called piles, indicating topological states
in brain connectivity and to explore them at different levels ofmagnitude.
Similarly, our approach extracts features from patterns inmatrices and clusters them to explore the result space. A maincontrast to the work by Bach et al. is that our approach utilizesand evaluates image-based features to characterize and clusterthe data and does not rely on a temporal order.
C. Clustering Comparison
The quality of clustering results depends on a dataset’scharacteristics and distributions but also on multiple consecutivedata processing steps such as extracted features, distancemeasures, and the clustering strategy. In such a pipeline interimresults add up and can lead to significant different clusterings.Researchers thus developed several statistical methods toevaluate and compare clustering quality, as summarized byRodriguez et al. [35]. One widely used metric is the silhouettecoefficient [37] comparing intra cluster cohesion to inter clusterseparation. Another class of clustering comparison approaches,e.g., often used in the bioinformatics domain, make use oflabeled reference data, where cluster memberships are alreadyknown [19], or they rely on domain knowledge to judge thequality of the clustering [14].
Our approach considers situations where no ground truthis given. Similar to measures summarized by Rodriguez etal. [35], we apply quality metrics to rank clustering results.However, instead of calculating metrics for one partitioning,we measure and compare the quality of the whole clusteringhierarchy by recursively computing coefficients for all levels.
III. VISUAL PATTERN-DRIVEN EXPLORATION CONCEPT
Our goal is to analyze large amounts of high-dimensionaldata in a pattern-driven fashion. While the collected data maybe rich in information, the exploration challenge is to finddata decompositions, e.g., subspaces or data intervals, whichexpose the underlying core dataset characteristics. Findingand understanding these central patterns requires not onlyautomated data analysis techniques but also the analysts’understanding, background knowledge, and experience. Figure 1depicts our conceptual pipeline for supporting analysts in apattern-driven exploration of large high-dimensional (HD)datasets.
(1) Set of Representations
Large-scale HD data analysis can hardly be accomplishedon the raw data objects, and visual representation can helpto facilitate a mental model. Hence, we center our analysispipeline on the basic idea to regard the visual representationsas a proxy to the data of interest, and base similarity andrelevance computation tasks on the visual data representation,instead of the original (raw) data. Our aim in doing so is toprovide user-friendly, interpretable and interactive assessmentfunctions as a basis for search and analysis tasks.
In this work, we do not focus on the question “Which visualrepresentation is the best for the underlying dataset?”, butrather start from the hypothesis that a data representation is
Fig. 2: Image Feature Analysis. Top: The standard featureextraction operates on the raw data and is typically defined in astatic and heuristic way. Bottom: Our approach extracts featuresfrom a visual representation. The approach is able to visuallyrepresent why objects are similar and provides a starting pointfor navigation and visual pattern space exploration.
established in the current analysis domain. In many domains,such as in the biomedical sector where results are frequentlyrepresented in heatmap displays [13], [23], [26], [27], or theenvironmental sciences, which oftentimes rely on scatterplot orline charts [7], [42], [44], analysts are oftentimes trained overyears to see and retrieve patterns in a particular visualizationtype. While this assumption is not generally pertinent for allscientific domains, we claim that our exploration pipeline (Fig-ure 1) is still applicable for the general task of understandingdistributions in pattern spaces for a given data representation.
(2) Image Feature Analysis
Searching and analyzing are key tasks for retrieving, relatingand reusing complex data sets. The standard approach tosimilarity computation extracts feature representations fromthe raw data (see Figure 2 (Top)). We propose to extractfeature representations from the visual transformation of inputdata (Figure 2 (Bottom)). This approach may provide severaladvantages. First, a visual transformation of data is naturallylinked with the user interface: visualization of the data isused in many applications, and it can be intuitively shownwhy two data representations are considered similar, e.g.,by representing corresponding visual features in the visualdata representation. A second main advantage is that onecan implement visual analysis interfaces that allow the userto explore visual similarity of many data instances. We willdevelop this idea further in the steps (3) Clustering and (4)Quality Metrics for Feature Ranking. Finally, the similaritynotion can flexibly adapt to user needs: different visualabstractions give rise to different similarity notions and featureextraction approaches and is thus a flexible means to adapt theexploration pipeline to the context of the user task.
One of the cornerstones of our pipeline is to employimage-based feature descriptors into the process. Many featuredescriptors were proposed to automatically extract the mostdescriptive feature set from a given image or visual represen-tation, among them novel visual descriptors that try to mimichuman perception aspects. Applied in our context, these so-called *-gnostics approaches [3], [10], [25], [40], [53] canhelp the user to improve the interactive query specification andresult interpretation stages of the visual analysis process.
(3) Pattern Space Clustering
Cluster-based navigation systems divide the explorationspace into a range of distinctive clusters, such that eachgrouping corresponds to a meaningful data sub-selection. Inthe case of visual pattern-driven exploration, a “good” featureencoding applied on a clustering approach will result ingroupings that reflect pattern-cluster memberships.
In this work, the central analysis task is to partition thepattern space into interpretable, coherent chunks. These chunksshould expose similar visual patterns and guide the analyststo beneficial exploration paths for a subsequent in-depthanalysis. Hierarchical or density-based cluster approaches [36]are consequently the data analysis method of choice sinceit allows the analysts to perceive (dis-)similarity of patterns,assess the pattern-to-noise ratio, and the pattern-distributionwithout predetermining a k-fold pattern space partitioning asdone by, e.g., k-means clustering [29].
(4) Quality Metrics for Feature Ranking
The extraction of relevant information from high-dimensionaldata, is complex and time consuming. In that respect thenotion curse of dimensionality represents a whole set of issuesencountered in the analysis of these data sets: finding relevantdata attributes, selecting meaningful and descriptive dimensions,removing noise represent are just a few of them.
Researchers have been trying to solve the aforementionedanalysis problems through either automatic data analysisor interactive visualization approaches. However, we claimthat integrated visual analytics approaches, where a machinesearches automatically through a large number of potentiallyinteresting data transformations and mappings based on qualitymetrics, and the user interactively steers the process andexplores the output through visualizations will outperformisolated approaches.
Our work represents a specific example for the aforemen-tioned quality metrics-driven exploration. We rely on a “good”image-feature extraction algorithm to derive an interpretableand useful pattern space clustering. One central assumptionof our pipeline is that at least one image feature descriptoris capable to describe visual patterns. Earlier research hasvalidated this hypothesis on relational data [3].
(5) Pattern Space Exploration
As mentioned before pattern space exploration is a human-centered analysis approach in which the automatic analysisshould support critical parameters, i.e., the feature descriptorselection. On the other hand, finding an appropriate partitioningof the pattern space is not enough. These approaches need toinvolve an analyst who can make sense of the results and givethem meaning in their respective analysis domain.
A visual interface for navigating in stratified pattern spaceclusters is hence necessary. Ideally, such a system providesOverview+Detail functionality, i.e., it allows to perceive patterndistributions, feature descriptor, and cluster uncertainty, andallows an interactive exploration of the pattern space for
unexpected findings. We showcase an exemplary interactiveexploration prototype in this work as depicted in Figure 4.
IV. PROTOTYPICAL IMPLEMENTATION
We found that a range of implementation challenges needto be tackled to instantiate our analysis pipeline presentedin Section III. The findings that we derived during theimplementation of our prototype will structure this sectionand outline potentially beneficial research directions.
A. Quality Metrics Implementation
One general challenge of pattern space exploration is thatno ground truth data is available, making standard externalevaluation metrics, such as precision or recall, inapplica-ble. Also, the exploratory nature of our analysis lets theuser develop experience-based heuristics earliest after gettingintermediate results. In order to bootstrap the analysis forretrieving interpretable—intermediate—results we developedquality metrics to rank our set of 26 feature descriptors for theirability to (1) differentiate visual patterns and to (2) produce(visually) coherent groupings of patterns.
1) Pattern Discriminability: We approximate a featuredescriptor’s ability to differentiate visual patterns by calculatingstatistics on the normalized Euclidean distance scores:
σ2(FD) =1
n2
∑
1≤i≤n
∑
1≤j≤n
(ndist(FD(i),FD(j)) − x)2 (1)
where FD(i) calculates the feature vector of the ith image inthe dataset, ndist() represents a normalized Euclidean distanceand x corresponds to the average of all distance combinations.This variance calculation is a coarse-grained heuristic thatsolely allows the following conclusion: If there is a low distancescore variance between the data feature vectors, the respectivefeature descriptor is not able to differentiate the inherent (visual)features; given the assumption that there are actually (human-)discriminable visual patterns.
Pattern discriminability for image feature descriptors hasbeen initially studied, for example, in [3] in the context ofmatrix pattern research. However, more future research couldbe devoted for developing more fine-grained approximations.As an example, a correlation analysis of the image feature di-mensions would be computationally more expensive but mightresult in potentially better retrieval of dimension subspacesthat help in this context.
2) Clustering Structure Quality Metric: Pattern discrim-inability enables us to reject inappropriate feature descriptorsearly on, but it does not allow us to assess how well a featuredescriptor can partition the feature space. We derive, therefore,a hierarchical clustering based on this feature descriptor andquantify its cluster separation and cohesion. A range of externalmeasures quantifying the “accuracy” were presented in the past,such as the Rand index [32], the Fowlkes-Mallows index [16],and the Jaccard index [22], [30], which are only applicableto labeled datasets. In our case, however, we have to rely on
internal quality measures that base their quality understandingon (dis-)similarities of feature vectors.
While also here a range of quality measures exist, i.e., theDunn index [12] or the Calinski-Harabasz score [8], we chosesilhouette coefficient [21], because it is represents an establishedand intuitive measure for both cohesion and separation ofclusters. In our evaluation section (Section V-A) we presenta comparative evaluation of the quality computations basedon the Dunn index and the Calinski-Harabasz score. For ourscenarios we found that the silhouette coefficient is well-suited.Its silhouette score bases on the mean intra-cluster distance andthe mean nearest-cluster distance for each item in the dataset.A silhouette coefficient SC for a partition with k clusters iscalculated by averaging the k individual silhouette scores:
SC =1
n
∑
1≤i≤n
b(FD(i) − a(FD(i))
max(a(FD(i), b(FD(i)))(2)
where a(FD(i)) is the average dissimilarity between FD(i)and all other points in the same cluster and b(FD(i)) is theaverage dissimilarity between FD(i) and the data points inthe nearest neighbor cluster. Since the number of clusters kis unknown in our analysis we introduce a cut-level balancedsilhouette coefficient with the following formula:
φ(SC) =∑
1≤k≤h
1
2(k−1)× SCk (3)
where h is the height of the clustering dendrogram tree. Thescore calculates for all hierarchical clustering cut-levels thesilhouette coefficients and aggregates them with a weightingscore depending on the cut-level depth. The intuition for thiscalculation is the following: A clustering dendrogram thatshows many well-separated, but highly coherent, clusters onthe higher levels should be favored over degenerated treesthat show coherence, but little separation. Since our scoreaggregates over all clustering levels and most dendrogramscontain long, degenerated sub-trees we weight their influencedepending on the cut-level depth.
Our quality score bases on considerations about hierarchicalclustering results. While this quality metric could potentiallyalso be used for density-based clustering methods, futureresearch and experiments should be devoted to proof it’sgeneralizable.
3) Compound Quality Score: Both scores above are equallyweighted and aggregated to derive a final quality score.
QM(FD) = 0.5 × σ2(FD) + 0.5 × φ(SC) (4)
In a future prototype, we are planning to let the user decideon the weighting and composition of the factors. With sucha flexible understanding of quality, analysts could express—for example—their preference in scenarios where quality issacrificed for faster computation times.
B. Understanding Clustering Results
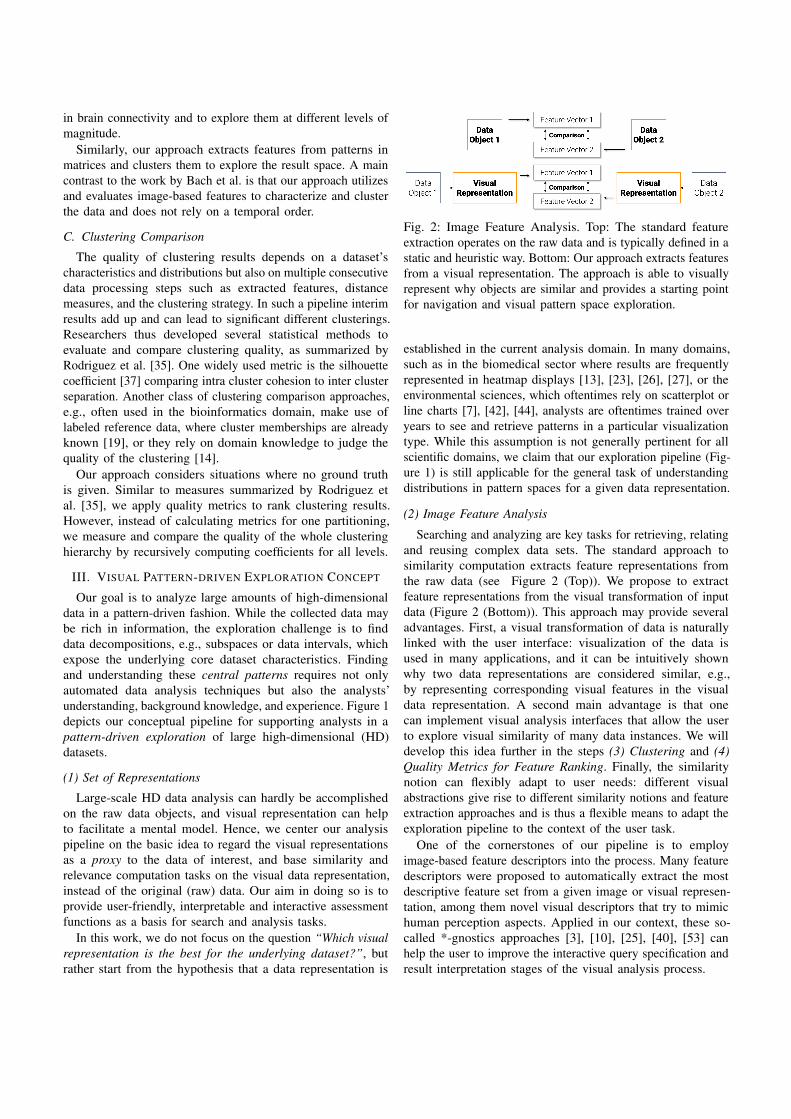
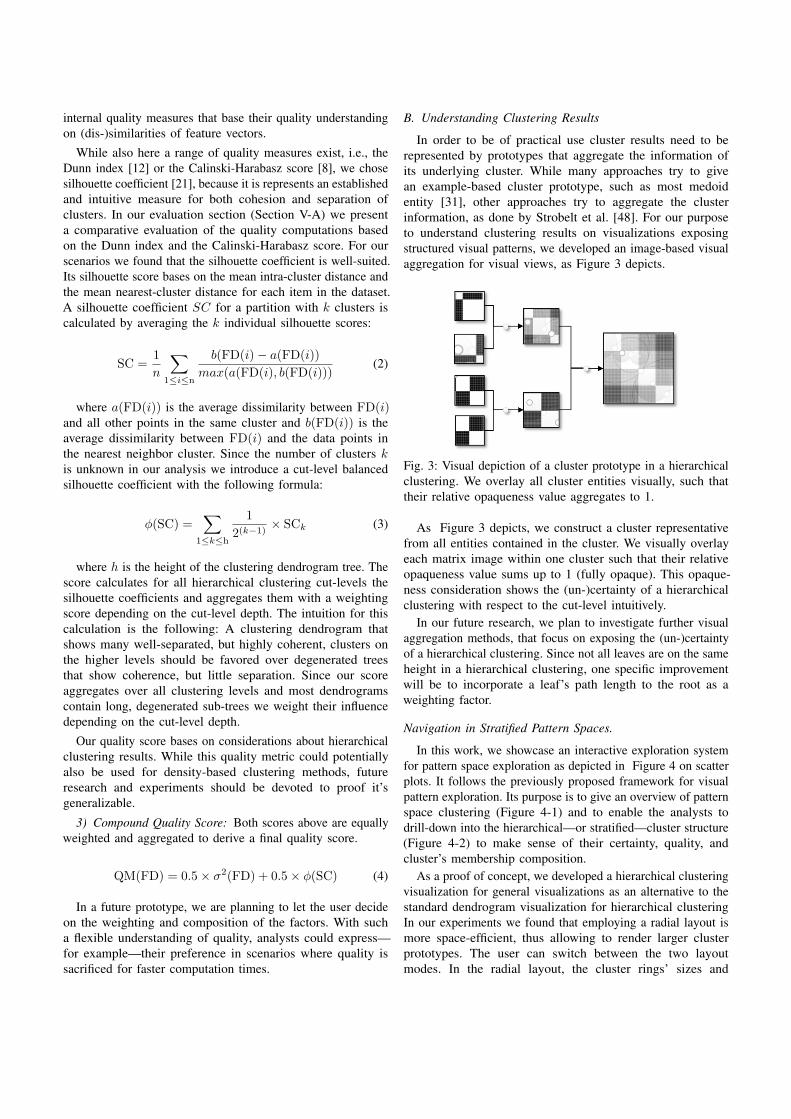
In order to be of practical use cluster results need to berepresented by prototypes that aggregate the information ofits underlying cluster. While many approaches try to givean example-based cluster prototype, such as most medoidentity [31], other approaches try to aggregate the clusterinformation, as done by Strobelt et al. [48]. For our purposeto understand clustering results on visualizations exposingstructured visual patterns, we developed an image-based visualaggregation for visual views, as Figure 3 depicts.
Fig. 3: Visual depiction of a cluster prototype in a hierarchicalclustering. We overlay all cluster entities visually, such thattheir relative opaqueness value aggregates to 1.
As Figure 3 depicts, we construct a cluster representativefrom all entities contained in the cluster. We visually overlayeach matrix image within one cluster such that their relativeopaqueness value sums up to 1 (fully opaque). This opaque-ness consideration shows the (un-)certainty of a hierarchicalclustering with respect to the cut-level intuitively.
In our future research, we plan to investigate further visualaggregation methods, that focus on exposing the (un-)certaintyof a hierarchical clustering. Since not all leaves are on the sameheight in a hierarchical clustering, one specific improvementwill be to incorporate a leaf’s path length to the root as aweighting factor.
Navigation in Stratified Pattern Spaces.
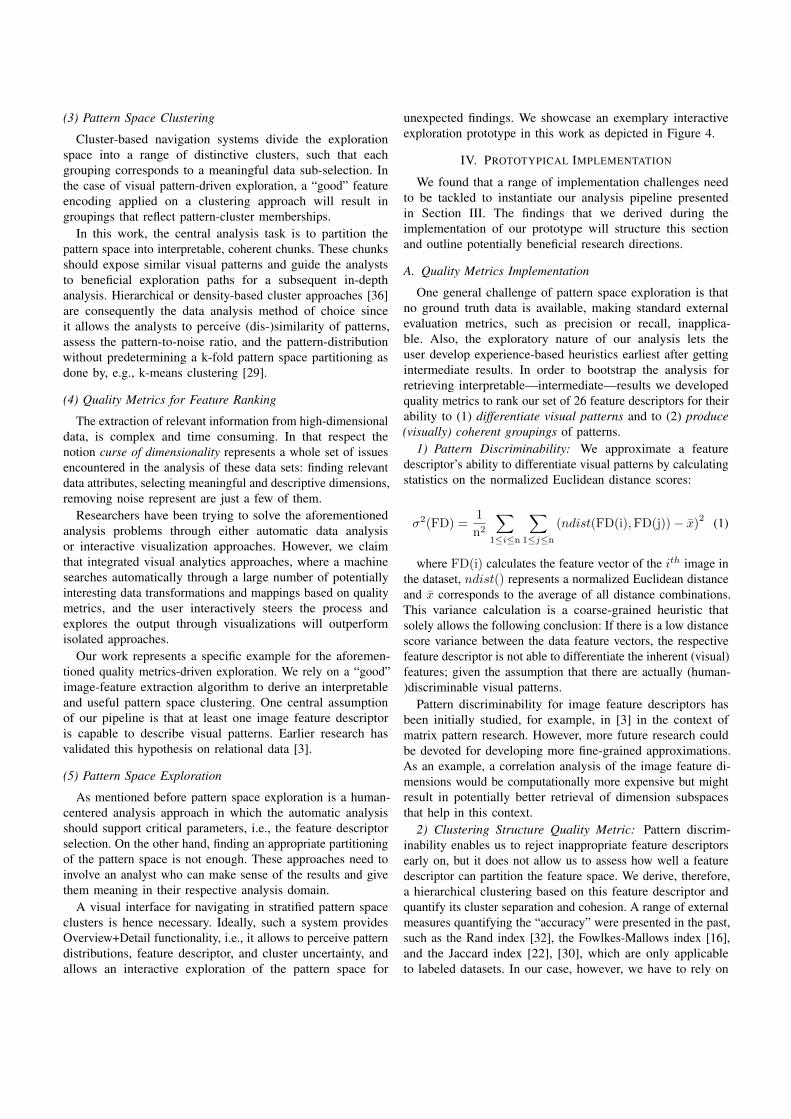
In this work, we showcase an interactive exploration systemfor pattern space exploration as depicted in Figure 4 on scatterplots. It follows the previously proposed framework for visualpattern exploration. Its purpose is to give an overview of patternspace clustering (Figure 4-1) and to enable the analysts todrill-down into the hierarchical—or stratified—cluster structure(Figure 4-2) to make sense of their certainty, quality, andcluster’s membership composition.
As a proof of concept, we developed a hierarchical clusteringvisualization for general visualizations as an alternative to thestandard dendrogram visualization for hierarchical clusteringIn our experiments we found that employing a radial layout ismore space-efficient, thus allowing to render larger clusterprototypes. The user can switch between the two layoutmodes. In the radial layout, the cluster rings’ sizes and
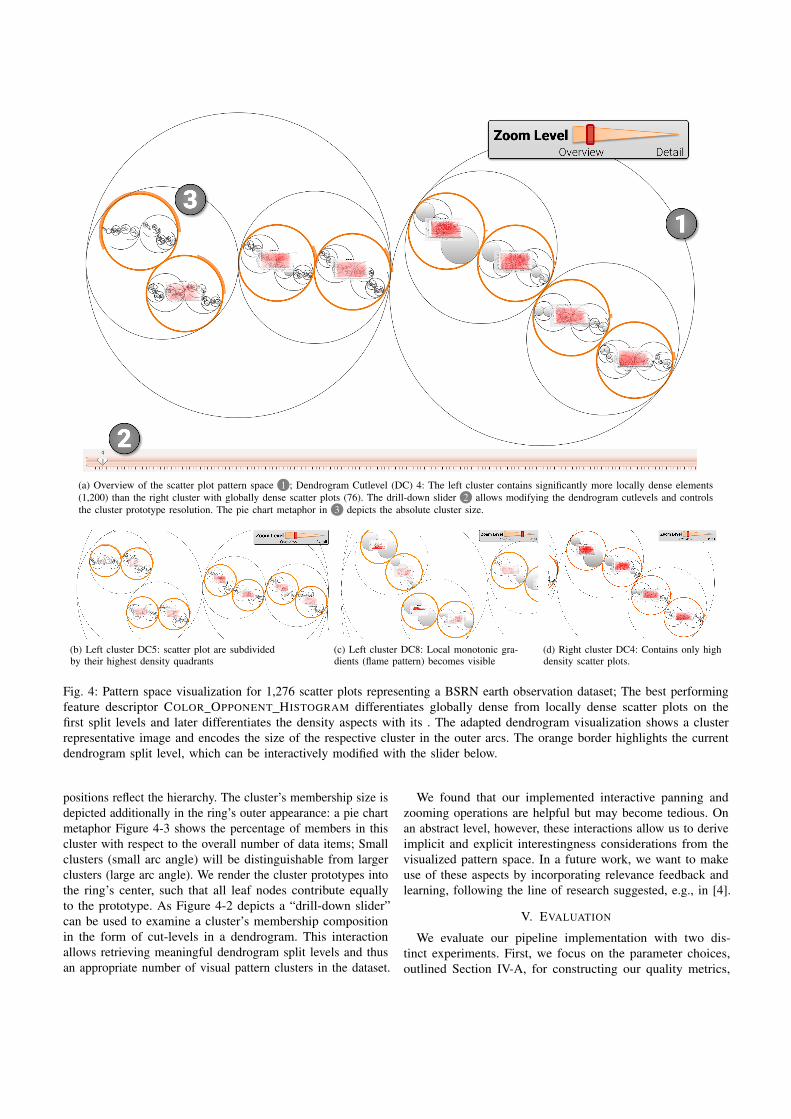
(a) Overview of the scatter plot pattern space 1 ; Dendrogram Cutlevel (DC) 4: The left cluster contains significantly more locally dense elements(1,200) than the right cluster with globally dense scatter plots (76). The drill-down slider 2 allows modifying the dendrogram cutlevels and controlsthe cluster prototype resolution. The pie chart metaphor in 3 depicts the absolute cluster size.
(b) Left cluster DC5: scatter plot are subdividedby their highest density quadrants
(c) Left cluster DC8: Local monotonic gra-dients (flame pattern) becomes visible
(d) Right cluster DC4: Contains only highdensity scatter plots.
Fig. 4: Pattern space visualization for 1,276 scatter plots representing a BSRN earth observation dataset; The best performingfeature descriptor COLOR OPPONENT HISTOGRAM differentiates globally dense from locally dense scatter plots on thefirst split levels and later differentiates the density aspects with its . The adapted dendrogram visualization shows a clusterrepresentative image and encodes the size of the respective cluster in the outer arcs. The orange border highlights the currentdendrogram split level, which can be interactively modified with the slider below.
positions reflect the hierarchy. The cluster’s membership size isdepicted additionally in the ring’s outer appearance: a pie chartmetaphor Figure 4-3 shows the percentage of members in thiscluster with respect to the overall number of data items; Smallclusters (small arc angle) will be distinguishable from largerclusters (large arc angle). We render the cluster prototypes intothe ring’s center, such that all leaf nodes contribute equallyto the prototype. As Figure 4-2 depicts a “drill-down slider”can be used to examine a cluster’s membership compositionin the form of cut-levels in a dendrogram. This interactionallows retrieving meaningful dendrogram split levels and thusan appropriate number of visual pattern clusters in the dataset.
We found that our implemented interactive panning andzooming operations are helpful but may become tedious. Onan abstract level, however, these interactions allow us to deriveimplicit and explicit interestingness considerations from thevisualized pattern space. In a future work, we want to makeuse of these aspects by incorporating relevance feedback andlearning, following the line of research suggested, e.g., in [4].
V. EVALUATION
We evaluate our pipeline implementation with two dis-tinct experiments. First, we focus on the parameter choices,outlined Section IV-A, for constructing our quality metrics,
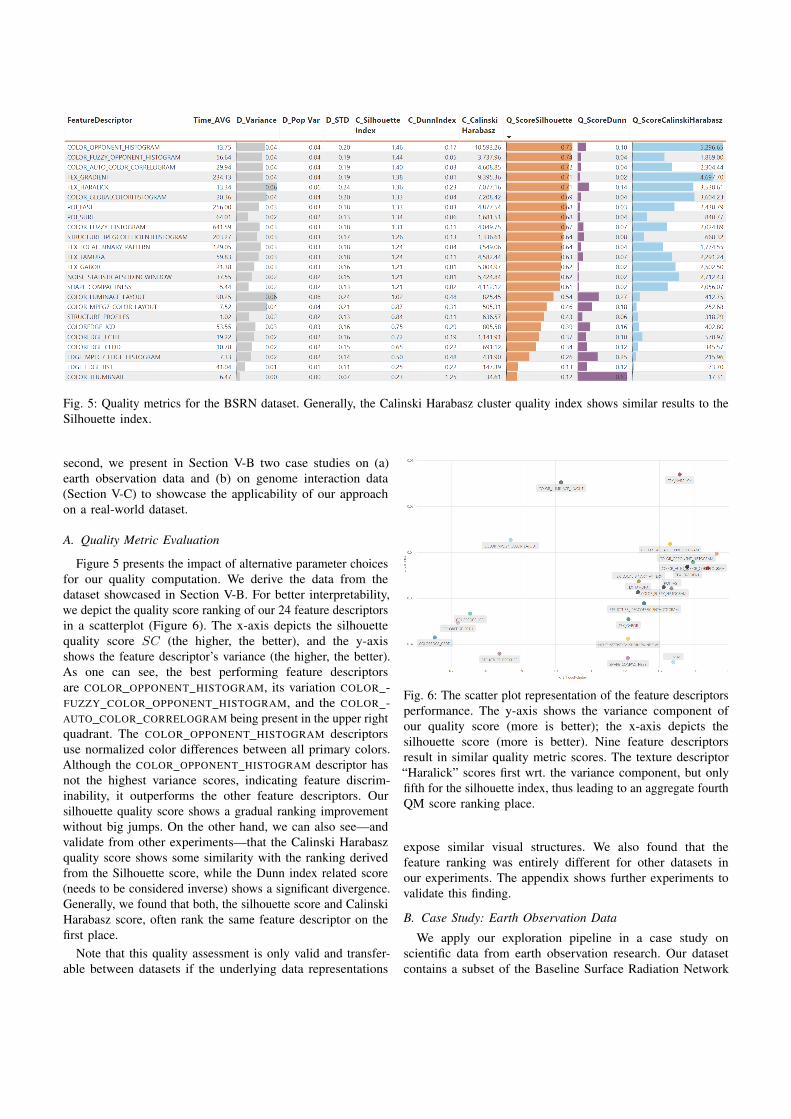
Fig. 5: Quality metrics for the BSRN dataset. Generally, the Calinski Harabasz cluster quality index shows similar results to theSilhouette index.
second, we present in Section V-B two case studies on (a)earth observation data and (b) on genome interaction data(Section V-C) to showcase the applicability of our approachon a real-world dataset.
A. Quality Metric Evaluation
Figure 5 presents the impact of alternative parameter choicesfor our quality computation. We derive the data from thedataset showcased in Section V-B. For better interpretability,we depict the quality score ranking of our 24 feature descriptorsin a scatterplot (Figure 6). The x-axis depicts the silhouettequality score SC (the higher, the better), and the y-axisshows the feature descriptor’s variance (the higher, the better).As one can see, the best performing feature descriptorsare COLOR OPPONENT HISTOGRAM, its variation COLOR -FUZZY COLOR OPPONENT HISTOGRAM, and the COLOR -AUTO COLOR CORRELOGRAM being present in the upper rightquadrant. The COLOR OPPONENT HISTOGRAM descriptorsuse normalized color differences between all primary colors.Although the COLOR OPPONENT HISTOGRAM descriptor hasnot the highest variance scores, indicating feature discrim-inability, it outperforms the other feature descriptors. Oursilhouette quality score shows a gradual ranking improvementwithout big jumps. On the other hand, we can also see—andvalidate from other experiments—that the Calinski Harabaszquality score shows some similarity with the ranking derivedfrom the Silhouette score, while the Dunn index related score(needs to be considered inverse) shows a significant divergence.Generally, we found that both, the silhouette score and CalinskiHarabasz score, often rank the same feature descriptor on thefirst place.
Note that this quality assessment is only valid and transfer-able between datasets if the underlying data representations
Fig. 6: The scatter plot representation of the feature descriptorsperformance. The y-axis shows the variance component ofour quality score (more is better); the x-axis depicts thesilhouette score (more is better). Nine feature descriptorsresult in similar quality metric scores. The texture descriptor“Haralick” scores first wrt. the variance component, but onlyfifth for the silhouette index, thus leading to an aggregate fourthQM score ranking place.
expose similar visual structures. We also found that thefeature ranking was entirely different for other datasets inour experiments. The appendix shows further experiments tovalidate this finding.
B. Case Study: Earth Observation Data
We apply our exploration pipeline in a case study onscientific data from earth observation research. Our datasetcontains a subset of the Baseline Surface Radiation Network
(BSRN) repository, maintained by the World Climate ResearchProgramme [39]. The repository hosts data on measurementsof water, sediment, ice and atmosphere, among others.
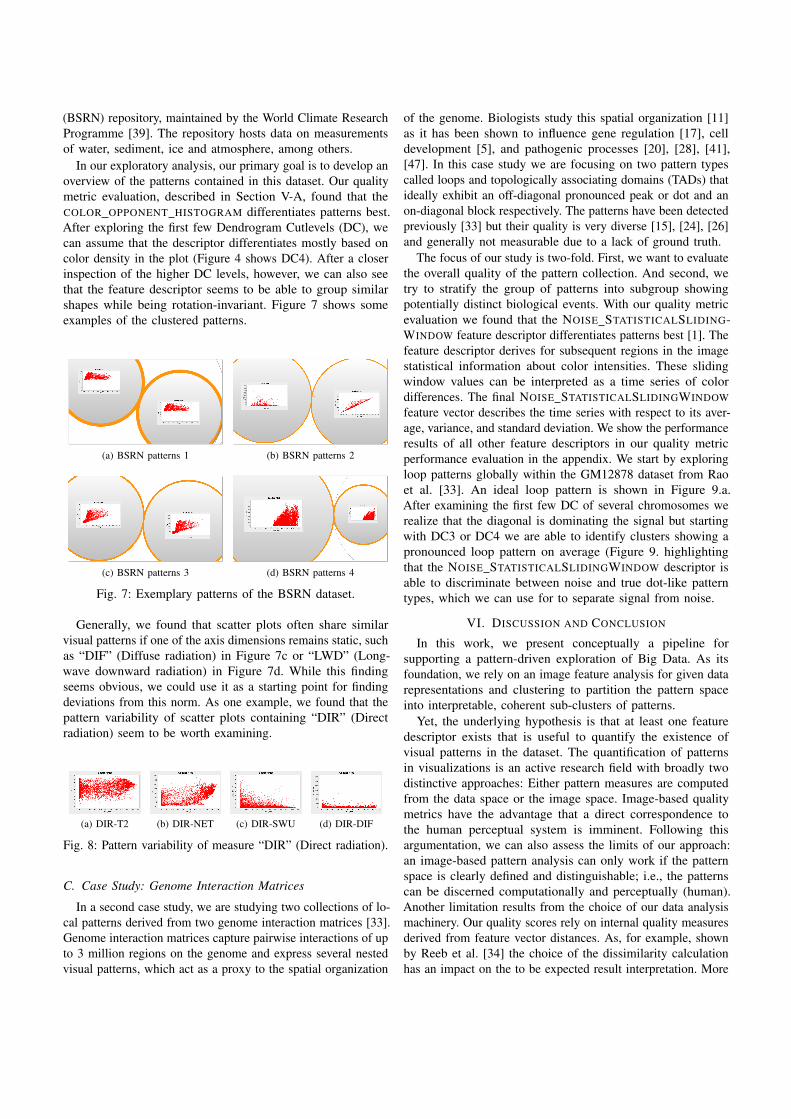
In our exploratory analysis, our primary goal is to develop anoverview of the patterns contained in this dataset. Our qualitymetric evaluation, described in Section V-A, found that theCOLOR OPPONENT HISTOGRAM differentiates patterns best.After exploring the first few Dendrogram Cutlevels (DC), wecan assume that the descriptor differentiates mostly based oncolor density in the plot (Figure 4 shows DC4). After a closerinspection of the higher DC levels, however, we can also seethat the feature descriptor seems to be able to group similarshapes while being rotation-invariant. Figure 7 shows someexamples of the clustered patterns.
(a) BSRN patterns 1 (b) BSRN patterns 2
(c) BSRN patterns 3 (d) BSRN patterns 4
Fig. 7: Exemplary patterns of the BSRN dataset.
Generally, we found that scatter plots often share similarvisual patterns if one of the axis dimensions remains static, suchas “DIF” (Diffuse radiation) in Figure 7c or “LWD” (Long-wave downward radiation) in Figure 7d. While this findingseems obvious, we could use it as a starting point for findingdeviations from this norm. As one example, we found that thepattern variability of scatter plots containing “DIR” (Directradiation) seem to be worth examining.
(a) DIR-T2 (b) DIR-NET (c) DIR-SWU (d) DIR-DIF
Fig. 8: Pattern variability of measure “DIR” (Direct radiation).
C. Case Study: Genome Interaction Matrices
In a second case study, we are studying two collections of lo-cal patterns derived from two genome interaction matrices [33].Genome interaction matrices capture pairwise interactions of upto 3 million regions on the genome and express several nestedvisual patterns, which act as a proxy to the spatial organization
of the genome. Biologists study this spatial organization [11]as it has been shown to influence gene regulation [17], celldevelopment [5], and pathogenic processes [20], [28], [41],[47]. In this case study we are focusing on two pattern typescalled loops and topologically associating domains (TADs) thatideally exhibit an off-diagonal pronounced peak or dot and anon-diagonal block respectively. The patterns have been detectedpreviously [33] but their quality is very diverse [15], [24], [26]and generally not measurable due to a lack of ground truth.
The focus of our study is two-fold. First, we want to evaluatethe overall quality of the pattern collection. And second, wetry to stratify the group of patterns into subgroup showingpotentially distinct biological events. With our quality metricevaluation we found that the NOISE STATISTICALSLIDING-WINDOW feature descriptor differentiates patterns best [1]. Thefeature descriptor derives for subsequent regions in the imagestatistical information about color intensities. These slidingwindow values can be interpreted as a time series of colordifferences. The final NOISE STATISTICALSLIDINGWINDOWfeature vector describes the time series with respect to its aver-age, variance, and standard deviation. We show the performanceresults of all other feature descriptors in our quality metricperformance evaluation in the appendix. We start by exploringloop patterns globally within the GM12878 dataset from Raoet al. [33]. An ideal loop pattern is shown in Figure 9.a.After examining the first few DC of several chromosomes werealize that the diagonal is dominating the signal but startingwith DC3 or DC4 we are able to identify clusters showing apronounced loop pattern on average (Figure 9. highlightingthat the NOISE STATISTICALSLIDINGWINDOW descriptor isable to discriminate between noise and true dot-like patterntypes, which we can use for to separate signal from noise.
VI. DISCUSSION AND CONCLUSION
In this work, we present conceptually a pipeline forsupporting a pattern-driven exploration of Big Data. As itsfoundation, we rely on an image feature analysis for given datarepresentations and clustering to partition the pattern spaceinto interpretable, coherent sub-clusters of patterns.
Yet, the underlying hypothesis is that at least one featuredescriptor exists that is useful to quantify the existence ofvisual patterns in the dataset. The quantification of patternsin visualizations is an active research field with broadly twodistinctive approaches: Either pattern measures are computedfrom the data space or the image space. Image-based qualitymetrics have the advantage that a direct correspondence tothe human perceptual system is imminent. Following thisargumentation, we can also assess the limits of our approach:an image-based pattern analysis can only work if the patternspace is clearly defined and distinguishable; i.e., the patternscan be discerned computationally and perceptually (human).Another limitation results from the choice of our data analysismachinery. Our quality scores rely on internal quality measuresderived from feature vector distances. As, for example, shownby Reeb et al. [34] the choice of the dissimilarity calculationhas an impact on the to be expected result interpretation. More
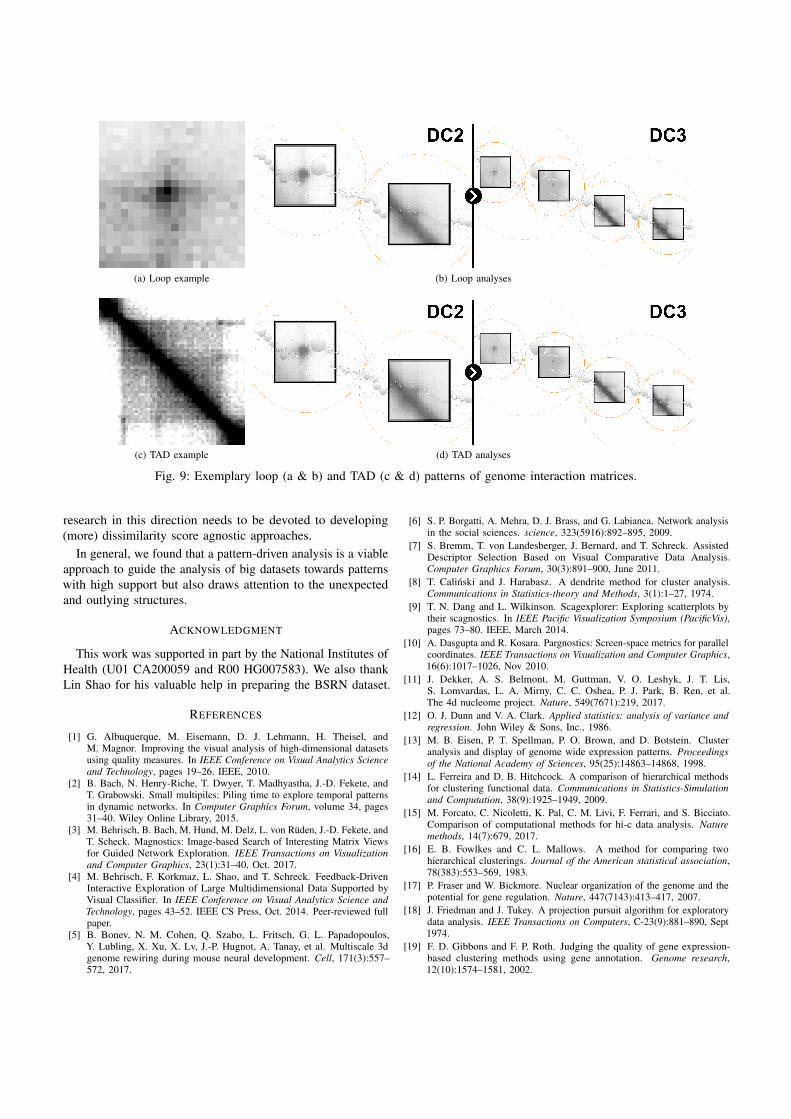
(a) Loop example (b) Loop analyses
(c) TAD example (d) TAD analyses
Fig. 9: Exemplary loop (a & b) and TAD (c & d) patterns of genome interaction matrices.
research in this direction needs to be devoted to developing(more) dissimilarity score agnostic approaches.
In general, we found that a pattern-driven analysis is a viableapproach to guide the analysis of big datasets towards patternswith high support but also draws attention to the unexpectedand outlying structures.
ACKNOWLEDGMENT
This work was supported in part by the National Institutes ofHealth (U01 CA200059 and R00 HG007583). We also thankLin Shao for his valuable help in preparing the BSRN dataset.
REFERENCES
[1] G. Albuquerque, M. Eisemann, D. J. Lehmann, H. Theisel, andM. Magnor. Improving the visual analysis of high-dimensional datasetsusing quality measures. In IEEE Conference on Visual Analytics Scienceand Technology, pages 19–26. IEEE, 2010.
[2] B. Bach, N. Henry-Riche, T. Dwyer, T. Madhyastha, J.-D. Fekete, andT. Grabowski. Small multipiles: Piling time to explore temporal patternsin dynamic networks. In Computer Graphics Forum, volume 34, pages31–40. Wiley Online Library, 2015.
[3] M. Behrisch, B. Bach, M. Hund, M. Delz, L. von Ruden, J.-D. Fekete, andT. Scheck. Magnostics: Image-based Search of Interesting Matrix Viewsfor Guided Network Exploration. IEEE Transactions on Visualizationand Computer Graphics, 23(1):31–40, Oct. 2017.
[4] M. Behrisch, F. Korkmaz, L. Shao, and T. Schreck. Feedback-DrivenInteractive Exploration of Large Multidimensional Data Supported byVisual Classifier. In IEEE Conference on Visual Analytics Science andTechnology, pages 43–52. IEEE CS Press, Oct. 2014. Peer-reviewed fullpaper.
[5] B. Bonev, N. M. Cohen, Q. Szabo, L. Fritsch, G. L. Papadopoulos,Y. Lubling, X. Xu, X. Lv, J.-P. Hugnot, A. Tanay, et al. Multiscale 3dgenome rewiring during mouse neural development. Cell, 171(3):557–572, 2017.
[6] S. P. Borgatti, A. Mehra, D. J. Brass, and G. Labianca. Network analysisin the social sciences. science, 323(5916):892–895, 2009.
[7] S. Bremm, T. von Landesberger, J. Bernard, and T. Schreck. AssistedDescriptor Selection Based on Visual Comparative Data Analysis.Computer Graphics Forum, 30(3):891–900, June 2011.
[8] T. Calinski and J. Harabasz. A dendrite method for cluster analysis.Communications in Statistics-theory and Methods, 3(1):1–27, 1974.
[9] T. N. Dang and L. Wilkinson. Scagexplorer: Exploring scatterplots bytheir scagnostics. In IEEE Pacific Visualization Symposium (PacificVis),pages 73–80. IEEE, March 2014.
[10] A. Dasgupta and R. Kosara. Pargnostics: Screen-space metrics for parallelcoordinates. IEEE Transactions on Visualization and Computer Graphics,16(6):1017–1026, Nov 2010.
[11] J. Dekker, A. S. Belmont, M. Guttman, V. O. Leshyk, J. T. Lis,S. Lomvardas, L. A. Mirny, C. C. Oshea, P. J. Park, B. Ren, et al.The 4d nucleome project. Nature, 549(7671):219, 2017.
[12] O. J. Dunn and V. A. Clark. Applied statistics: analysis of variance andregression. John Wiley & Sons, Inc., 1986.
[13] M. B. Eisen, P. T. Spellman, P. O. Brown, and D. Botstein. Clusteranalysis and display of genome wide expression patterns. Proceedingsof the National Academy of Sciences, 95(25):14863–14868, 1998.
[14] L. Ferreira and D. B. Hitchcock. A comparison of hierarchical methodsfor clustering functional data. Communications in Statistics-Simulationand Computation, 38(9):1925–1949, 2009.
[15] M. Forcato, C. Nicoletti, K. Pal, C. M. Livi, F. Ferrari, and S. Bicciato.Comparison of computational methods for hi-c data analysis. Naturemethods, 14(7):679, 2017.
[16] E. B. Fowlkes and C. L. Mallows. A method for comparing twohierarchical clusterings. Journal of the American statistical association,78(383):553–569, 1983.
[17] P. Fraser and W. Bickmore. Nuclear organization of the genome and thepotential for gene regulation. Nature, 447(7143):413–417, 2007.
[18] J. Friedman and J. Tukey. A projection pursuit algorithm for exploratorydata analysis. IEEE Transactions on Computers, C-23(9):881–890, Sept1974.
[19] F. D. Gibbons and F. P. Roth. Judging the quality of gene expression-based clustering methods using gene annotation. Genome research,12(10):1574–1581, 2002.
[20] D. Hnisz, A. S. Weintraub, D. S. Day, A.-L. Valton, R. O. Bak, C. H. Li,J. Goldmann, B. R. Lajoie, Z. P. Fan, A. A. Sigova, J. Reddy, D. Borges-Rivera, T. I. Lee, R. Jaenisch, M. H. Porteus, J. Dekker, and R. A.Young. Activation of proto-oncogenes by disruption of chromosomeneighborhoods. Science, 351(6280):1454–1458, 2016.
[21] P. K. Hopke and L. Kaufman. The use of sampling to cluster large datasets. Chemometrics and Intelligent Laboratory Systems, 8(2):195 – 204,1990.
[22] L. Hubert and P. Arabie. Comparing partitions. Journal of Classification,2(1):193–218, Dec 1985.
[23] P. Kerpedjiev, N. Abdennur, F. Lekschas, C. McCallum, K. Dinkla,H. Strobelt, J. M. Luber, S. B. Ouellette, A. Ahzir, N. Kumar, J. Hwang,B. H. Alver, H. Pfister, L. A. Mirny, P. J. Park, and N. Gehlenborg.Higlass: Web-based visual comparison and exploration of genomeinteraction maps. bioRxiv, 2017.
[24] P. Kerpedjiev, N. Abdennur, F. Lekschas, C. McCallum, K. Dinkla,H. Strobelt, J. M. Luber, S. B. Ouellette, A. Azhir, N. Kumar, et al.Higlass: Web-based visual exploration and analysis of genome interactionmaps. bioRxiv, page 121889, 2018.
[25] D. J. Lehmann, F. Kemmler, T. Zhyhalava, M. Kirschke, and H. Theisel.Visualnostics: Visual guidance pictograms for analyzing projections ofhigh-dimensional data. Computer Graphics Forum, 34(3):291–300, 2015.
[26] F. Lekschas, B. Bach, P. Kerpedjiev, N. Gehlenborg, and H. Pfister.Hipiler: Visual exploration of large genome interaction matrices withinteractive small multiples. IEEE transactions on visualization andcomputer graphics, 24(1):522–531, 2018.
[27] A. Lex, M. Streit, H.-J. Schulz, C. Partl, D. Schmalstieg, P. J. Park, andN. Gehlenborg. Stratomex: Visual analysis of large-scale heterogeneousgenomics data for cancer subtype characterization. In Computer graphicsforum, volume 31, pages 1175–1184. Wiley Online Library, 2012.
[28] D. G. Lupianez, K. Kraft, V. Heinrich, P. Krawitz, F. Brancati,E. Klopocki, D. Horn, H. Kayserili, J. M. Opitz, R. Laxova, et al.Disruptions of topological chromatin domains cause pathogenic rewiringof gene-enhancer interactions. Cell, 161(5):1012–1025, 2015.
[29] J. Mackinlay. Automating the design of graphical presentations ofrelational information. ACM Transactions On Graphics (TOG), 5(2):110–141, 1986.
[30] G. W. Milligan and M. C. Cooper. A study of the comparability ofexternal criteria for hierarchical cluster analysis. Multivariate behavioralresearch, 21 4:441–58, 1986.
[31] S. M. Paley and P. D. Karp. The pathway tools cellular overview diagramand omics viewer. Nucleic Acids Research, 34(13):3771–3778, 2006.
[32] W. M. Rand. Objective criteria for the evaluation of clustering methods.Journal of the American Statistical association, 66(336):846–850, 1971.
[33] S. S. Rao, M. H. Huntley, N. C. Durand, E. K. Stamenova, I. D. Bochkov,J. T. Robinson, A. L. Sanborn, I. Machol, A. D. Omer, E. S. Lander,et al. A 3d map of the human genome at kilobase resolution revealsprinciples of chromatin looping. Cell, 159(7):1665–1680, 2014.
[34] P. D. Reeb, S. J. Bramardi, and J. P. Steibel. Assessing dissimilaritymeasures for sample-based hierarchical clustering of rna sequencing datausing plasmode datasets. PLOS ONE, 10(7):1–18, 07 2015.
[35] M. Z. Rodriguez, C. H. Comin, D. Casanova, O. M. Bruno, D. R.Amancio, F. A. Rodrigues, and L. d. F. Costa. Clustering algorithms: Acomparative approach. arXiv preprint arXiv:1612.08388, 2016.
[36] L. Rokach and O. Maimon. Clustering methods. In Data mining andknowledge discovery handbook, pages 321–352. Springer, 2005.
[37] P. J. Rousseeuw. Silhouettes: a graphical aid to the interpretation andvalidation of cluster analysis. Journal of computational and appliedmathematics, 20:53–65, 1987.
[38] Y. Rui, T. S. Huang, and S.-F. Chang. Image retrieval: Current techniques,promising directions, and open issues. Journal of visual communicationand image representation, 10(1):39–62, 1999.
[39] M. Scherer, T. v. Landesberger, and T. Schreck. A benchmark for content-based retrieval in bivariate data collections. In Conference on Theoryand Practice of Digital Libraries, pages 286–297, 2012.
[40] J. Schneidewind, M. Sips, and D. A. Keim. Pixnostics: Towards measuringthe value of visualization. In IEEE Symposium on Visual Analytics Scienceand Technology, pages 199–206. IEEE, Oct 2006.
[41] L. Seaman, H. Chen, M. Brown, D. Wangsa, G. Patterson, J. Camps,G. S. Omenn, T. Ried, and I. Rajapakse. Nucleome analysis revealsstructure–function relationships for colon cancer. Molecular CancerResearch, 15(7):821–830, 2017.
[42] L. Shao, T. Schleicher, M. Behrisch, T. Schreck, I. Sipiran, and D. Keim.Guiding the exploration of scatter plot data using motif-based interestmeasures. In IEEE Symposium on Big Data Visual Analytics, 2015.
[43] L. Shao, T. Schleicher, M. Behrisch, T. Schreck, I. Sipiran, and D. A.Keim. Guiding the exploration of scatter plot data using motif-basedinterest measures. J. Vis. Lang. Comput., 36:1–12, 2016.
[44] M. Sips, P. Kthur, A. Unger, H.-C. Hege, and D. Dransch. A VisualAnalytics Approach to Multiscale Exploration of Environmental TimeSeries. IEEE Transactions on Visualization and Computer Graphics,18(12):2899–2907, Dec. 2012.
[45] M. Sips, B. Neubert, J. P. Lewis, and P. Hanrahan. Selecting good viewsof high-dimensional data using class consistency. Computer GraphicsForum, 28(3):831–838, 2009.
[46] A. W. Smeulders, M. Worring, S. Santini, A. Gupta, and R. Jain. Content-based image retrieval at the end of the early years. IEEE Transactionson pattern analysis and machine intelligence, 22(12):1349–1380, 2000.
[47] M. Spielmann, D. G. Lupianez, and S. Mundlos. Structural variation inthe 3d genome. Nature Reviews Genetics, 2018.
[48] H. Strobelt, E. Bertini, J. Braun, O. Deussen, U. Groth, T. Mayer, andD. Merhof. Hitsee knime: a visualization tool for hit selection and analysisin high-throughput screening experiments for the knime platform. BMCBioinformatics, 13(Suppl 8):S4, Dec. 2012.
[49] A. Tatu, G. Albuquerque, M. Eisemann, P. Bak, H. Theisel, M. A.Magnor, and D. A. Keim. Automated analytical methods to supportvisual exploration of high-dimensional data. IEEE Transactions onVisualization and Computer Graphics, 17(5):584–597, May 2011.
[50] A. Tatu, F. Maass, I. Faerber, E. Bertini, T. Schreck, T. Seidl, and D. A.Keim. Subspace Search and Visualization to Make Sense of AlternativeClusterings in High-Dimensional Data. In IEEE Conference on VisualAnalytics Science and Technology, pages 63–72. IEEE, IEEE CS Press,Oct 2012.
[51] J. W. Tukey and P. A. Tukey. Computer graphics and exploratorydata analysis: An introduction. The Collected Works of John W. Tukey:Graphics: 1965-1985, 5:419, 1988.
[52] M. O. Ward and Z. Guo. Visual exploration of time-series data withshape space projections. Computer Graphics Forum, 30(3):701–710,2011.
[53] L. Wilkinson, A. Anand, and R. Grossman. Graph-theoretic scagnostics.In IEEE Symposium on Information Visualization, volume 5, pages 157–164. IEEE Computer Society, Oct 2005.
[54] J. Wood, A. Slingsby, and J. Dykes. Visualizing the dynamics of London’sbicycle-hire scheme. Cartographica: The International Journal forGeographic Information and Geovisualization, 46(4):239–251, 2011.
[55] J. Yang, D. Hubball, M. O. Ward, E. A. Rundensteiner, and W. Ribarsky.Value and relation display: Interactive visual exploration of large datasets with hundreds of dimensions. IEEE Transactions on Visualizationand Computer Graphics, 13(3):494–507, 2007.


