Embed Size (px)
Citation preview
Author's personal copy
Available online at www.sciencedirect.com
International Journal of Mass Spectrometry 269 (2008) 196–209
Vibrational signatures of sodiated oligopeptides (GG–Na+, GGG–Na+,AA–Na+ and AAA–Na+) in the gas phase
O.-P. Balaj a, C. Kapota a, J. Lemaire b, G. Ohanessian a,∗a Laboratoire des Mecanismes Reactionnels, Departement de Chimie, Ecole Polytechnique, CNRS, 91128 Palaiseau Cedex, France
b Laboratoire de Chimie Physique, Universite Paris-Sud 11, CNRS, 91405 Orsay Cedex, France
Received 6 July 2007; received in revised form 12 October 2007; accepted 15 October 2007Available online 23 October 2007
Abstract
The structures of the sodium complexes of oligoglycines (GG–Na+, GGG–Na+) and oligoalanines (AA–Na+, AAA–Na+) have been studied byinfrared spectroscopy in the gas phase. Two different experimental set-ups have been used to generate, trap and analyze the ions. In the first, thecomplexes were generated by MALDI and analyzed in the cell of a home built FT-ICR mass spectrometer. In the second an external electrospraysource was coupled to a Paul type ion trap. Following their trapping, the ions are irradiated in both cases with intense, tunable infrared light in the1000–2000 cm−1 range, leading to sodium ion detachment and ion fragmentation via the absorption of multiple photons. The resulting experimentalspectra are compared to theoretical linear absorption spectra to assign structures. In agreement with calculations, peptide attachment to Na+ isfound to have a strong structuring effect: the lowest energy structures involve binding of all carbonyl oxygens to the cation. Detailed comparison ofexperimental and computed spectra shows that the IRMPD spectroscopy of such gaseous ions allows the differentiation between structures whichdo not have the same number of carbonyl oxygens bound to Na+, and structures in which the peptide is either wrapped around the ion or cappedby it.© 2007 Elsevier B.V. All rights reserved.
Keywords: IRMPD; Sodium; Oligoglycine; Oligoalanine; Mass spectrometry
1. Introduction
Mass spectrometry has been shown over the years to be ableto detect and analyze molecules of virtually all types, with highselectivity and sensitivity. While the information on ion massis extremely reliable, only limited information on the struc-ture of gaseous ions can be obtained. Many approaches havebeen developed in order to infer structural features, includinglow- and high-energy collision-activated dissociation, specificion–molecule reactions and ionmobility among others. Yet noneis of general use and and they provide limited direct informationon the three-dimensional structures, including functional groupidentification to distinguish between isomers, hydrogen bondingpatterns, and local interactions of charged sites.
∗ Corresponding author at: Laboratoire des Mecanismes Reactionnels - UMRCNRS 7651, Departement de Chimie - Ecole Polytechnique, 91128 PalaiseauCedex, France. Tel.: +33 1 69 33 35 03; fax: +33 1 69 33 30 41.
E-mail address: [email protected] (G. Ohanessian).
Another approach started to be recently explored with thecoupling of infrared spectroscopy to mass spectrometry. Themanipulation of ions in the gas phase is easy, ions can be selectedin mass before being spectroscopically characterized, howeverthe ion densities are small. As a result classical absorption spec-troscopy through the measurement of the photon attenuationcannot be achieved.Akind of action spectroscopy has to be used,probing the photon absorption by monitoring its consequenceon the mass spectrum. The absorption of photons increases theinternal energy of the ions and it may lead to ion fragmenta-tion if the number of absorbed photons is sufficient. Detectingsuch fragment ions, even when present in very small quantities,is made possible by the high sensitivity of mass spectrometry.Using ion trap devices such as RF traps or Fourier transform-ion cyclotron resonance (FT-ICR) traps it has been shown thatthe multiple photons absorption spectra of gaseous ions in theIR can be obtained and yields structural information in a wayvery similar to the more traditional one photon IR absorptionspectroscopy.As the energy required for dissociation is often much higher
than the energy of a single photon, the ions must absorb up to
1387-3806/$ – see front matter © 2007 Elsevier B.V. All rights reserved.doi:10.1016/j.ijms.2007.10.004
Author's personal copy
O.-P. Balaj et al. / International Journal of Mass Spectrometry 269 (2008) 196–209 197
several tens of IR photons in order to fragment. This is madepossible when using intense laser sources allowing for infraredmultiple-photon dissociation (IRMPD). Although IRMPD wasevidenced as early as 1978 [1], subsequent studies were severelylimited by the wavelength range and tunability of the availablelaser sources.With the advent of infrared free electron lasers (IRFEL) in 1981, sources offering both wide tunability and highpeak power became available. The free electron laser facilitiesCLIO [2] and FELIX [3] offer an output in the 500–2500 cm−1range, making them very well suited for IRMPD experiments.The first IRMPD spectra of gaseous ions using a FEL were
obtained for polyaromatic ions at FELIX [4]. In the follow-ing years, a rapidly growing number of studies on organic,organometallic and biological molecular ions showed that theIRMPD technique using a FEL is a powerful tool yielding struc-tural information, allowing to distinguish between isomers andsometimes also conformers for a wide range of ion types [5–28].Due to their biological relevance as models of structural or
catalytic sites in proteins, the structure of cationized amino acidsand peptides have been studied before using other mass spectro-metric techniques [29–44], but there was limited and sometimescontradictory evidence on the gas phase structures (or the cationstructuring effect). Recently several IRMPD studies focused onsuch species, in order to get a direct structural identification fromtheir vibrational fingerprints. The working strategy consists incomparing the recorded experimental “action” spectrum and theabsorption spectrum predicted by ab initio or DFT calculations.In the case of sodiated amino acids, the remarkable agree-
ment between the two, allowed for a clear identification of thesalt-bridge (SB) isomer in the case P–Na+ [6]. In contrast, forG–Na+ the charge solvation (CS) structure is favored [6]. Anal-ogous conclusions in favor of charge solvation structures werereached for F–K+ and Y–K+ in the fingerprint range [9], andfor W cationized with all five alkali cations [7]. For W–Na+,it was further shown that H/D exchange via ion–molecule reac-tion with a neutral molecule such as CH3OH or NH3 may induceisomerization between CS and SB isomers [8]. A CS-type struc-ture has also been determined for V–Li+, however in this lattercase experiments were carried out in theN–H/O–H stretch range[45]. The stepwise hydration of the V–Li+ was shown to occurpreferentially at the lithium ion for addition of the first threewater molecules [45]. Even more recently, a SB structure wasinferred for R–Na+ in the same frequency range [46].Experiments were also carried out on the potassiated pep-
tides bradykinin fragments 1–5 (RPPGF) and [l]-enkephalin(YGGFL) [9]. Although spectral congestion was larger than foramino acid complexes, charge solvation vs. salt bridge structuresappeared to remain distinguishable. While for the potassiumtagged bradykinin fragments 1–5 the IRMPD spectrum sug-gests a SB structure, there is evidence that the potassium tagged[l]-enkephalin seems to favor a CS although the presence ofsome SB ions could not be excluded. Even for the large (104amino acids) K+-tagged multi-charged cytochrome c protein,the IRMPD spectrum displays clear bands in the amide I andII regions [11]. The spectra clearly showed a structural changeas a function of the protein charge state. Deconvolution of theamide I band, as is usually done for absorption spectra recorded
in solution, was found to be compatible with the existence of ahelical portion [11].In the present study we describe the IRMPD results
obtained for small sodiated oligopeptides (GG–Na+,GGG–Na+,AA–Na+ and AAA–Na+) using two different experimentalsetups. We also explore the capabilities of IRMPD to differ-entiate between three-dimensional structures of these ions.
2. Experimental and computational methods
2.1. Infrared free electron laser (IR FEL) and massspectrometer (MS) operation parameters
The ions have been generated and analyzed using two experi-mental setups, a transportable FT-ICRmass spectrometer calledMICRA [48,49] and a modified Bruker Esquire 3000+ ion trapmass spectrometer [25] coupled to the FEL.The IR FEL CLIO is based on a linear electron accelerator
delivering electron kinetic energies in the 10–50MeV range,and an undulator placed in an optical cavity. Electrons gener-ate IR light in the cavity, and continuous tunability over a largespectral range (�λ/λ= 2.5) is obtained by scanning the ondu-lator gap. By tuning the length of the optical cavity, the FELbandwidth can be adjusted. The laser wavelength profile wasmonitored, at each reading while recording the spectra, witha monochromator associated with a pyroelectric array detector(SpiriconTM). The accessible wavelength range goes from 3 to120�m and has a high peak power (20MW per micropulse,3 kW per macropulse), well suited for IR multiple photon disso-ciation studies. In the present experiments, the long-wavelengthcutoff was ca. 19�m due to the absorption of the ZnSe entrancewindow. The light is delivered in 8�s long macropulses firedat a repetition rate of 25Hz. Each macropulse contains 500 pslong micropulses. The mean IR power was about 500mW cor-responding to micropulse and macropulse energies of 40�J and20mJ, respectively. For the experiments described herein, wehave used an electron energy of 45MeV which allows access towavelengths in the 1000–1900 cm−1 range.The first experimental set-up, MICRA, is a FT-ICR mass
spectrometer based on a modified cubic cell situated in a 1.24 Tpermanent magnet. With the magnet geometry used the ionsmust be generated either in the cell or near the cell. TheMALDIsample was deposited on a stainless steel holder, which wasmounted 6mm away from the middle of one of the trappingplate. The ions formed by laser vaporization of the MALDIsample with a non-focalized Nd:YAG laser enter the ICR cell,are stored with a background gas pressure of ca. 10−9 mbar forabout 1 s, mass selected and then exposed to the FEL light. Theinfrared laser beam is focused in the middle of the ICR cell witha 1m focal length spherical mirror. Although the laser beamdimension in the middle of the cell is smaller than the ion cloud,when irradiating ions for more than 1 s photo-fragmentationratios as high as 80% can be observed, indicating that mostions eventually interact with the IR beam. The irradiation timeis controlled by a fast electromechanical shutter, synchronizedwith the FEL. In the present study, peptide–Na+ ions were massselected 600–800ms after their formation, irradiated with the
Author's personal copy
198 O.-P. Balaj et al. / International Journal of Mass Spectrometry 269 (2008) 196–209
IR beam for one to a few seconds, the resulting ions were thendetected and the cell emptied by applying a quench pulse on thetrapping plates. Such a sequence was repeated 25 times, and themass spectrum was the Fourier transform of the accumulatedion signal. Due to difficulties in producing the ions for a longtime by MALDI, the IRMPD spectrum is the result of multiplescans, using smaller scan steps (10 cm−1) in the region of theIRMPD bands.The second experimental set-up is based on amodifiedBruker
Esquire 3000+ ion trap mass spectrometer. The modificationconsists in a 0.7mm hole drilled in the ring electrode to allowthe irradiation of the ions with the focalized CLIO beam. Theions are generated by an electrospray ion source, transferredfrom atmospheric pressure to the trap by two octopoles. Uponentering the trap the ions are stabilized by collisions with the Hebath gas at a pressure of 10−3 mbar. After a rapid thermalizationthe ions are confined in a very small volume in the center of thetrap. Following a 0.5 s relaxation time, they aremass selected andfragmented by one to five macropulses of IR light. As a directconsequence, there is a better overlap of the ion cloud with theIR FEL light than in the ICR cell, resulting in increased frag-mentation efficiency. The 1000–1900 cm−1 wavenumber rangewas obtained using an electron energy of 45MeV.In the case of the FT-ICR experiments, the IRMPD spec-
tra are plotted using the fragmentation yield R defined as:R=−log[IParent/(IParent +�IFragment)]. In the case of the ion trapexperiments this was not possible as wewere not able to observethe primary fragment and parent depletion spectra are presented.Depletion IRMPD spectra are intrinsicallymore noisy than frag-mentation IRMPD spectra since ion signal fluctuations appeardirectly in the absolute, rather than relative intensities used. Thisis why the spectra derived from the ion trap experiments are oflower quality than those fromFT-ICR experiments in the presentcase.
2.2. Sample preparation
The samples used for MICRA experiments were prepared asdescribed in detail elsewhere [6]. For those experiments the ionswere produced internally by MALDI using a pulsed Nd:YAGlaser at tripled frequency of 355 nm. The best signals wereobtained using a four-layer sample prepared using the sandwichtechnique [47]. The first and fourth layers were deposited fromthe solution of a matrix dissolved to 3.75× 10⁻² mol/L. Wehave mainly used as matrix the 4-hydroxy-�-cyano cinnamicacid (4-HCCA) in 1/3 water/acetone solvent. In the case ofGGG–Na+ the 2,5-dihydroxy benzoic acid (DHB) in water waspreferred, due to the mass similarity of 4-HCCA–Na+ and thesodiated peptide molecular ion. The NaCl was deposited in thesecond layer from a 10−2 mol/L aqueous solution while the pep-tides were deposited in the third layer in the same conditions asNaCl. Each new layer was allowed to dry before the next wasadded.In the case of ion trap experiments, the ions were obtained by
electrospray of diluted sample solutions. First, 10mL peptidestock solutions were prepared using 1mL 10% formic acid and9mL H2O/MeOH 50:50 in order to dissolve the 10mg of solid
peptide. Ten to 50�L of stock solution (10−3 M) were mixed1:1 with NaCl solution (10−3 M) and diluted to 1.0mL withH2O/MeOH 50:50 with 2% formic acid. This protocol producedsamples with concentrations of peptide in the�Mrange, leadingto the formation of the sodiated peptide ion as the dominantspecies in the gas phase.
2.3. Computational details
The structures of all sodiated peptides considered hereinhave been studied previously [37,50–54]. In our previous work[52–55], preliminary Monte Carlo searches using the Amber94force field were used to explore the potential energy surfaces,leading to a large number of structures. A subset of these struc-tures was then subjected to geometry optimization at the HartreeFock level with the 6-31G(d) basis set, and final energeticswere obtained at the MP2(full)/6-311+G(2d,2p)//HF/6-31G(d))level. Geometry optimization at the MP2/6-31G(d) level wasused as well. In that work our focus was on the sodium–peptideinteraction energies, while here calculations are used to assignIRMPD spectra. Hybrid DFT methods such as B3LYP havebeen shown to outperform HF and MP2, as well as local orgradient-corrected DFT, in predicting infrared intensities [56].Thus we have used B3LYP calculations to re-optimize geome-tries and obtain vibrational spectra, at the B3LYP/6-31G(d)level. Although not of direct interest, refined energeticswere cal-culated at the B3LYP/6-311+G(2d,2p)//B3LYP/6-31G(d) level.There are some differences found between the various lev-els used, for instance relative energies may differ by up to5–7 kJmol−1. However the features that are relevant to thepresent study remain unchanged, i.e., that the lowest energystructures have all carbonyl groups interacting with Na+, andthe assignment of the experimental bands are the same. Allcalculations used the Gaussian03 package [57].A scaling factor of 0.96 was applied to B3LYP/6-31G*
frequencies as is commonly done in the 1000–2000 cm−1region. The same scaling factor was derived from the com-parison of experimental and B3LYP/6-31G* frequencies in the800–1800 cm−1 range in the IRMPD spectra of Fe(I) complexes[48,49].
3. Results and discussion
3.1. Calculated structures
3.1.1. GG–Na+
The sodium cation favors electrostatic interactions thereforebinding to the polar carbonyl groups is most favorable. Bindingto the terminal amine is also possible. Three conformers of lowenergywere identified in our calculations and their structures arepresented in Fig. 1 following the nomenclature used in Ref. [52].The conformer Gly2–Na+ I has a coordination of sodium withthe two oxygens and with the terminal amine. Since the coor-dination of sodium is pyramidal, it is a stereogenic center. Anumber of structures thus exist as pairs of enantiomers. In struc-ture II the sodium ion is coordinated only to the two oxygens
Author's personal copy
O.-P. Balaj et al. / International Journal of Mass Spectrometry 269 (2008) 196–209 199
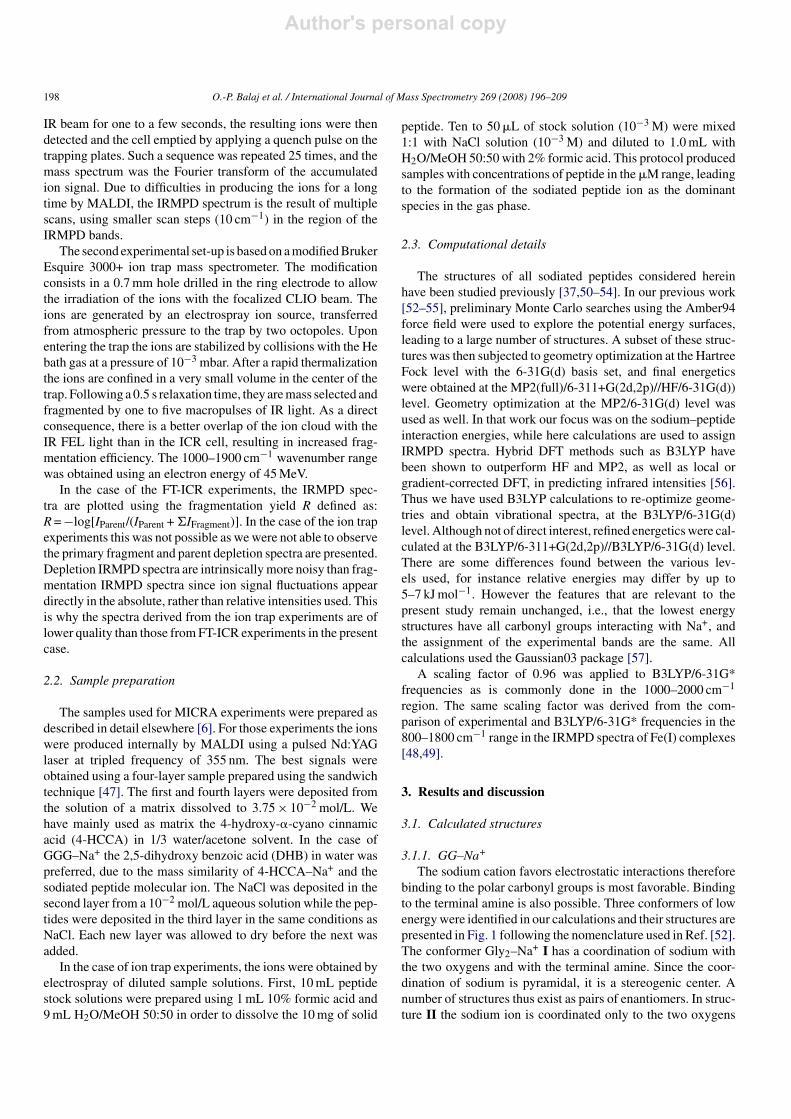
Fig. 1. Computed structures for the most stable structures of GG–Na+ at the B3LYP/6-31G* level. The enthalpies (relative to that of structure 1) are in kJ/mol, ascalculated at the B3LYP/6-311+G(2d,2p)//B3LYP/6-31G* level. Bonds distances are given in A.
(O1O2), while the N atom of the terminal amine interacts withthe hydrogen of the peptide amide forming a five-memberedC5 motif (N2H→N1). Finally, in conformer IV, the sodium iscoordinated only to one residue by the terminal amine and thepeptidic carbonyl (O1N1). The structure is analogous to structureCS1 of G–Na+ [6] with the second residue bearing a hydrogenbond between the amide hydrogen and the carbonyl oxygen ofthe acid forming a C5 cycle (N2H→O2).The energetics were calculated at the B3LYP/6-
311+G(2d,2p)//B3LYP/6-31G* level. The two lowest energyconformers are I and II, with II slightly more stable while thereverse ordering was obtained at the MP2 level. At both levels,structure IV is higher in energy. In conclusion the most stablestructure has both carbonyl oxygens bound to sodium, and theconformation at the N terminus leads to two conformations ofsimilar energies.
3.1.2. AA–Na+
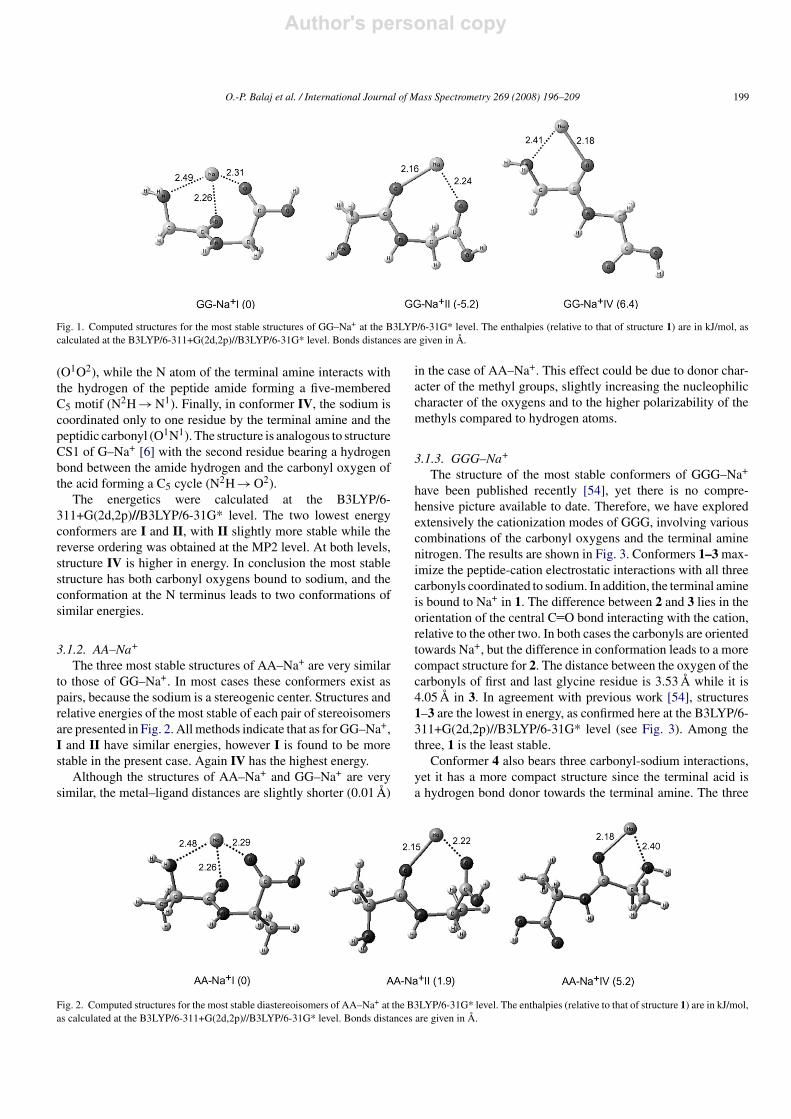
The three most stable structures of AA–Na+ are very similarto those of GG–Na+. In most cases these conformers exist aspairs, because the sodium is a stereogenic center. Structures andrelative energies of the most stable of each pair of stereoisomersare presented in Fig. 2. All methods indicate that as for GG–Na+,I and II have similar energies, however I is found to be morestable in the present case. Again IV has the highest energy.Although the structures of AA–Na+ and GG–Na+ are very
similar, the metal–ligand distances are slightly shorter (0.01 A)
in the case of AA–Na+. This effect could be due to donor char-acter of the methyl groups, slightly increasing the nucleophiliccharacter of the oxygens and to the higher polarizability of themethyls compared to hydrogen atoms.
3.1.3. GGG–Na+
The structure of the most stable conformers of GGG–Na+
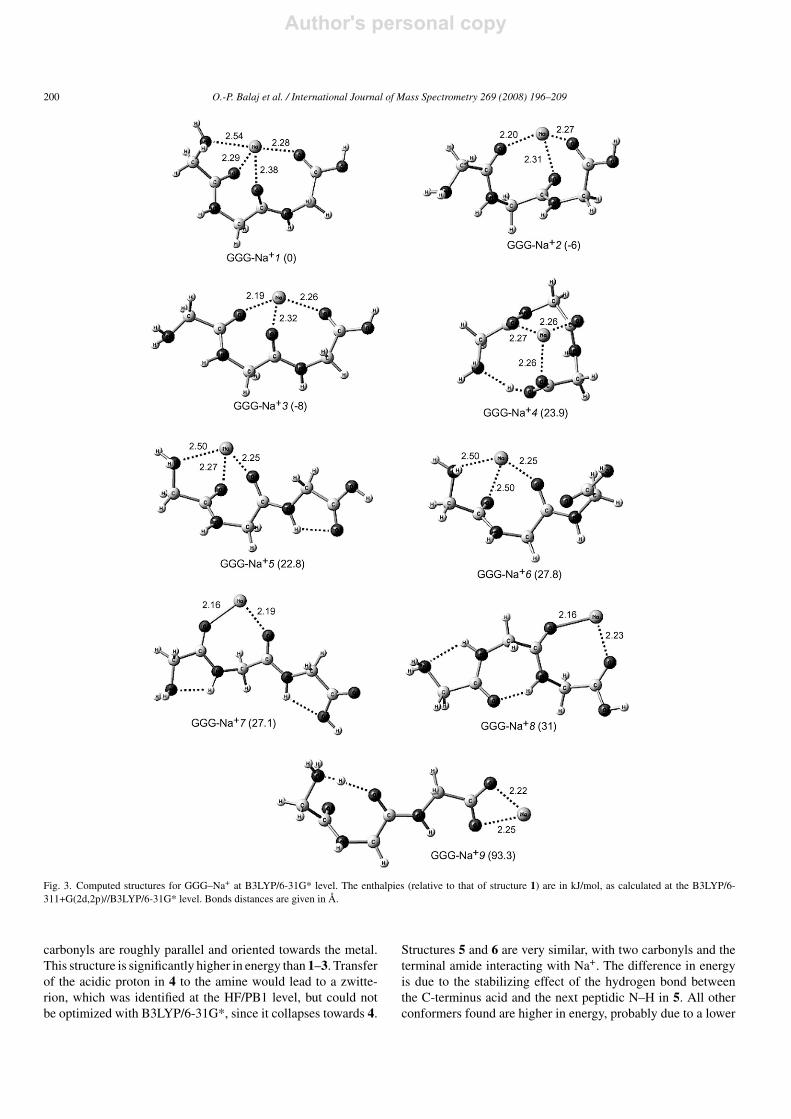
have been published recently [54], yet there is no compre-hensive picture available to date. Therefore, we have exploredextensively the cationization modes of GGG, involving variouscombinations of the carbonyl oxygens and the terminal aminenitrogen. The results are shown in Fig. 3. Conformers 1–3max-imize the peptide-cation electrostatic interactions with all threecarbonyls coordinated to sodium. In addition, the terminal amineis bound to Na+ in 1. The difference between 2 and 3 lies in theorientation of the central C O bond interacting with the cation,relative to the other two. In both cases the carbonyls are orientedtowards Na+, but the difference in conformation leads to a morecompact structure for 2. The distance between the oxygen of thecarbonyls of first and last glycine residue is 3.53 A while it is4.05 A in 3. In agreement with previous work [54], structures1–3 are the lowest in energy, as confirmed here at the B3LYP/6-311+G(2d,2p)//B3LYP/6-31G* level (see Fig. 3). Among thethree, 1 is the least stable.Conformer 4 also bears three carbonyl-sodium interactions,
yet it has a more compact structure since the terminal acid isa hydrogen bond donor towards the terminal amine. The three
Fig. 2. Computed structures for the most stable diastereoisomers of AA–Na+ at the B3LYP/6-31G* level. The enthalpies (relative to that of structure 1) are in kJ/mol,as calculated at the B3LYP/6-311+G(2d,2p)//B3LYP/6-31G* level. Bonds distances are given in A.
Author's personal copy
200 O.-P. Balaj et al. / International Journal of Mass Spectrometry 269 (2008) 196–209
Fig. 3. Computed structures for GGG–Na+ at B3LYP/6-31G* level. The enthalpies (relative to that of structure 1) are in kJ/mol, as calculated at the B3LYP/6-311+G(2d,2p)//B3LYP/6-31G* level. Bonds distances are given in A.
carbonyls are roughly parallel and oriented towards the metal.This structure is significantly higher in energy than 1–3. Transferof the acidic proton in 4 to the amine would lead to a zwitte-rion, which was identified at the HF/PB1 level, but could notbe optimized with B3LYP/6-31G*, since it collapses towards 4.
Structures 5 and 6 are very similar, with two carbonyls and theterminal amide interacting with Na+. The difference in energyis due to the stabilizing effect of the hydrogen bond betweenthe C-terminus acid and the next peptidic N–H in 5. All otherconformers found are higher in energy, probably due to a lower
Author's personal copy
O.-P. Balaj et al. / International Journal of Mass Spectrometry 269 (2008) 196–209 201
coordination number to the metal ion. For example, the struc-ture of conformer 9 is a salt-bridge in which the sodium interactsonly with the two oxygens of the carboxylate, and where a H-bond is formed between the ammonium and the oxygen of thecentral C O bond. It is 93.3 kJ/mol higher in enthalpy than 1.Other salt-bridge structures with a folded chain to allow a directinteraction of ammonium with one of the oxygen atoms of thecarboxylate are even less stable.In conclusion, conformers 1–3 are the most stable for
GGG–Na+ and in all three structures,Na+ interactswith the threecarbonyl oxygens. Changing the conformation at theN-terminusleads to small energy changes.
3.1.4. AAA–Na+
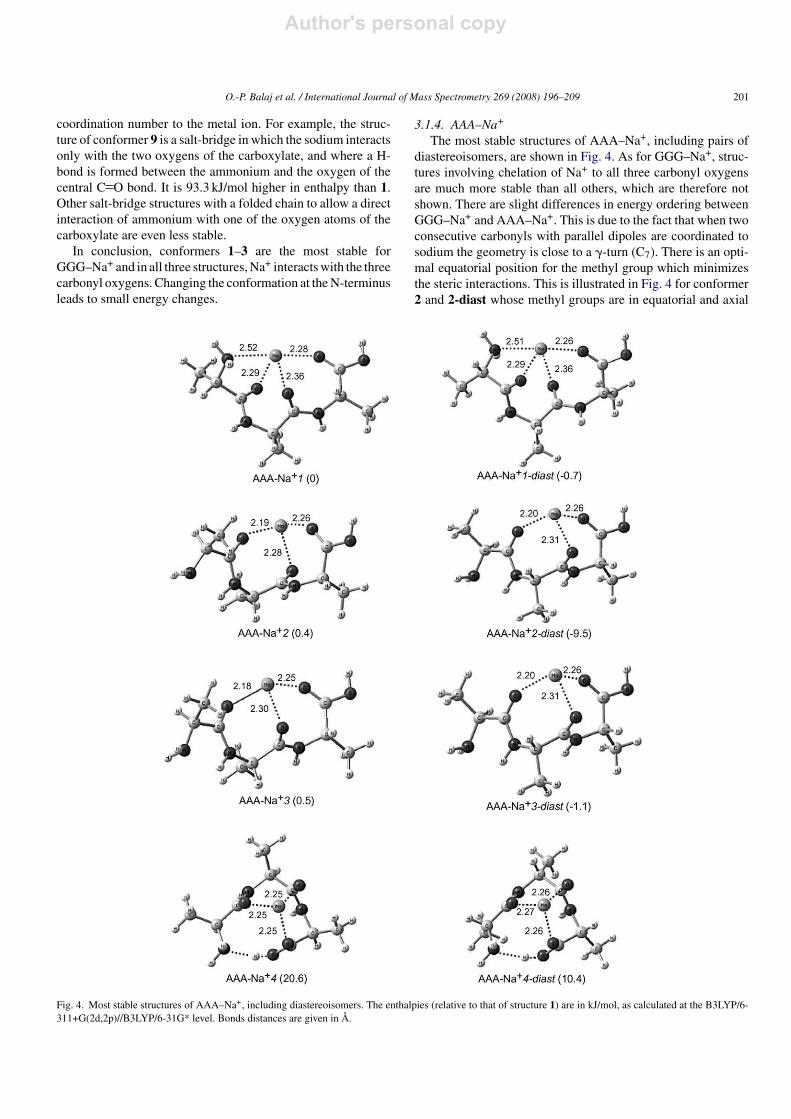
The most stable structures of AAA–Na+, including pairs ofdiastereoisomers, are shown in Fig. 4. As for GGG–Na+, struc-tures involving chelation of Na+ to all three carbonyl oxygensare much more stable than all others, which are therefore notshown. There are slight differences in energy ordering betweenGGG–Na+ and AAA–Na+. This is due to the fact that when twoconsecutive carbonyls with parallel dipoles are coordinated tosodium the geometry is close to a �-turn (C7). There is an opti-mal equatorial position for the methyl group which minimizesthe steric interactions. This is illustrated in Fig. 4 for conformer2 and 2-diast whose methyl groups are in equatorial and axial
Fig. 4. Most stable structures of AAA–Na+, including diastereoisomers. The enthalpies (relative to that of structure 1) are in kJ/mol, as calculated at the B3LYP/6-311+G(2d,2p)//B3LYP/6-31G* level. Bonds distances are given in A.
Author's personal copy
202 O.-P. Balaj et al. / International Journal of Mass Spectrometry 269 (2008) 196–209
position, respectively. In the case of the two diastereoisomersof 1, the carbonyls interacting with the cation have non-paralleldipole moments, the C7 cycle is deformed and there is no clearlystabilizing or destabilizing position for the methyls (see Fig. 4).Conformer 4 is also shown. Its relative energy is very similarto its analogue for GGG–Na+. However here again, the morefavorable axial positions of the methyls make its diastereoiso-mer 4-diastmuch more stable, although it is still 20 kJ/mol lessstable than 2-diast.
3.2. IRMPD spectra obtained in FT-ICR and RF trapexperiments
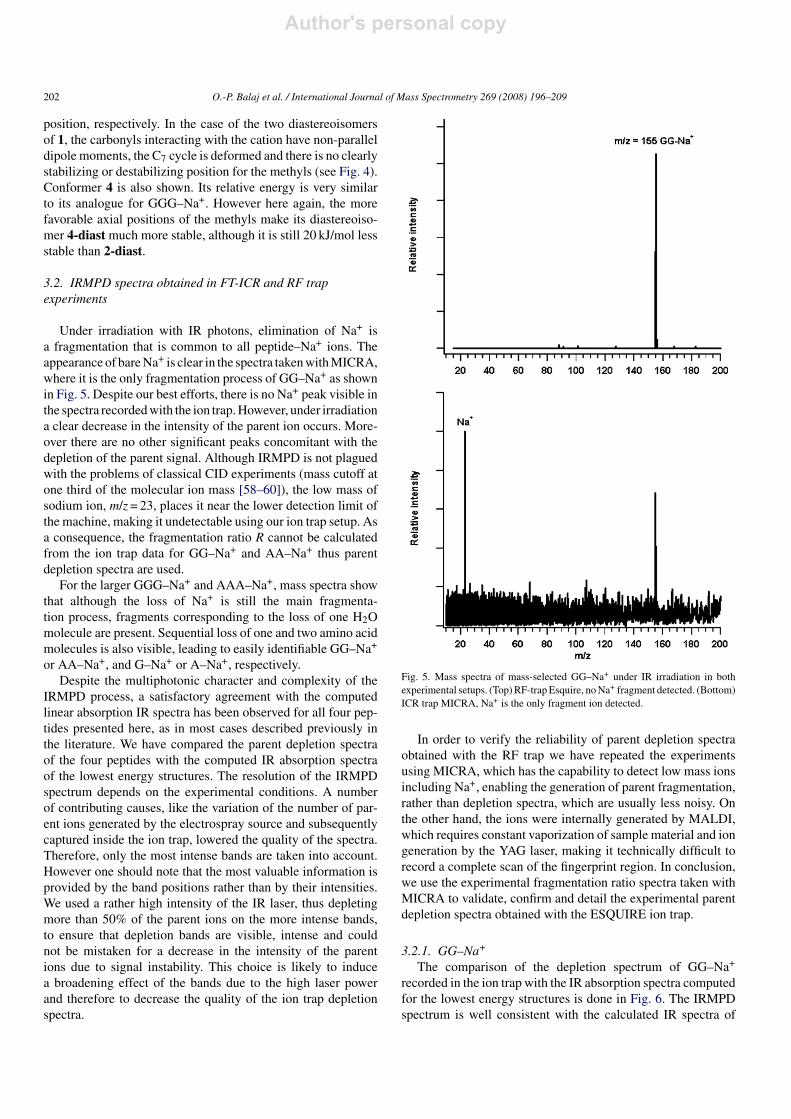
Under irradiation with IR photons, elimination of Na+ isa fragmentation that is common to all peptide–Na+ ions. Theappearance of bareNa+ is clear in the spectra takenwithMICRA,where it is the only fragmentation process of GG–Na+ as shownin Fig. 5. Despite our best efforts, there is no Na+ peak visible inthe spectra recordedwith the ion trap.However, under irradiationa clear decrease in the intensity of the parent ion occurs. More-over there are no other significant peaks concomitant with thedepletion of the parent signal. Although IRMPD is not plaguedwith the problems of classical CID experiments (mass cutoff atone third of the molecular ion mass [58–60]), the low mass ofsodium ion, m/z= 23, places it near the lower detection limit ofthe machine, making it undetectable using our ion trap setup. Asa consequence, the fragmentation ratio R cannot be calculatedfrom the ion trap data for GG–Na+ and AA–Na+ thus parentdepletion spectra are used.For the larger GGG–Na+ and AAA–Na+, mass spectra show
that although the loss of Na+ is still the main fragmenta-tion process, fragments corresponding to the loss of one H2Omolecule are present. Sequential loss of one and two amino acidmolecules is also visible, leading to easily identifiable GG–Na+
or AA–Na+, and G–Na+ or A–Na+, respectively.Despite the multiphotonic character and complexity of the
IRMPD process, a satisfactory agreement with the computedlinear absorption IR spectra has been observed for all four pep-tides presented here, as in most cases described previously inthe literature. We have compared the parent depletion spectraof the four peptides with the computed IR absorption spectraof the lowest energy structures. The resolution of the IRMPDspectrum depends on the experimental conditions. A numberof contributing causes, like the variation of the number of par-ent ions generated by the electrospray source and subsequentlycaptured inside the ion trap, lowered the quality of the spectra.Therefore, only the most intense bands are taken into account.However one should note that the most valuable information isprovided by the band positions rather than by their intensities.We used a rather high intensity of the IR laser, thus depletingmore than 50% of the parent ions on the more intense bands,to ensure that depletion bands are visible, intense and couldnot be mistaken for a decrease in the intensity of the parentions due to signal instability. This choice is likely to inducea broadening effect of the bands due to the high laser powerand therefore to decrease the quality of the ion trap depletionspectra.
Fig. 5. Mass spectra of mass-selected GG–Na+ under IR irradiation in bothexperimental setups. (Top)RF-trapEsquire, noNa+ fragment detected. (Bottom)ICR trap MICRA, Na+ is the only fragment ion detected.
In order to verify the reliability of parent depletion spectraobtained with the RF trap we have repeated the experimentsusing MICRA, which has the capability to detect low mass ionsincluding Na+, enabling the generation of parent fragmentation,rather than depletion spectra, which are usually less noisy. Onthe other hand, the ions were internally generated by MALDI,which requires constant vaporization of sample material and iongeneration by the YAG laser, making it technically difficult torecord a complete scan of the fingerprint region. In conclusion,we use the experimental fragmentation ratio spectra taken withMICRA to validate, confirm and detail the experimental parentdepletion spectra obtained with the ESQUIRE ion trap.
3.2.1. GG–Na+
The comparison of the depletion spectrum of GG–Na+
recorded in the ion trap with the IR absorption spectra computedfor the lowest energy structures is done in Fig. 6. The IRMPDspectrum is well consistent with the calculated IR spectra of
Author's personal copy
O.-P. Balaj et al. / International Journal of Mass Spectrometry 269 (2008) 196–209 203
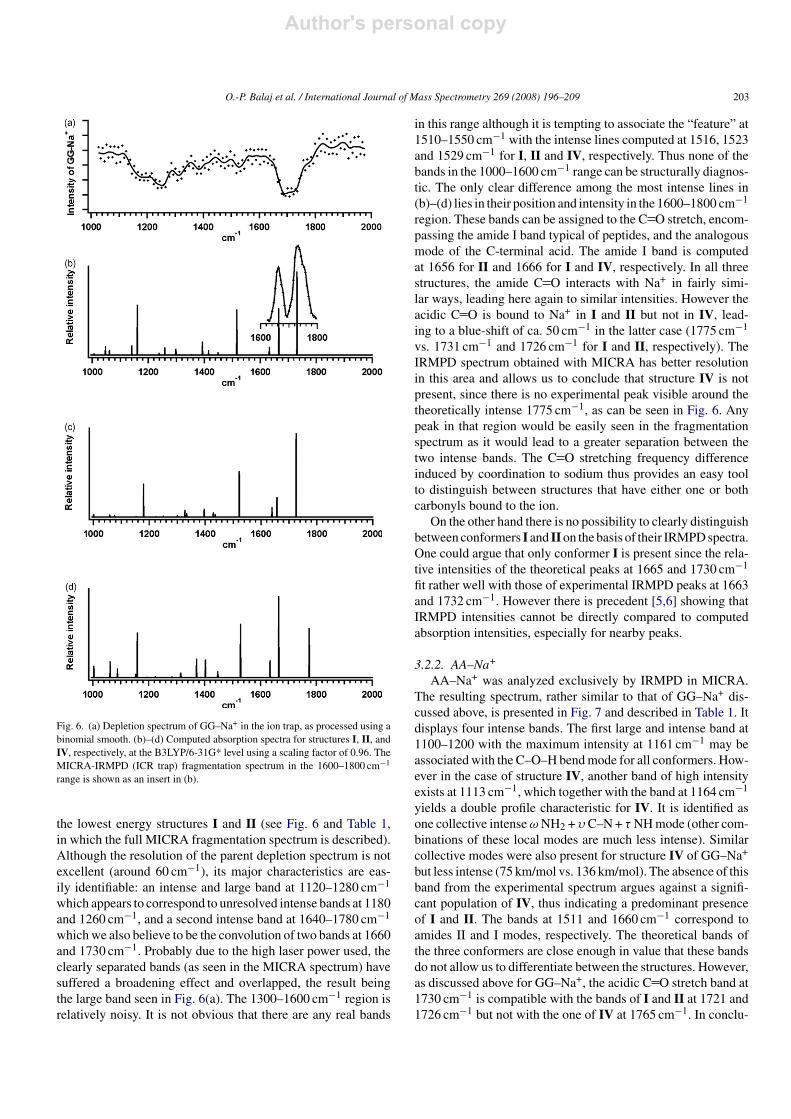
Fig. 6. (a) Depletion spectrum of GG–Na+ in the ion trap, as processed using abinomial smooth. (b)–(d) Computed absorption spectra for structures I, II, andIV, respectively, at the B3LYP/6-31G* level using a scaling factor of 0.96. TheMICRA-IRMPD (ICR trap) fragmentation spectrum in the 1600–1800 cm−1range is shown as an insert in (b).
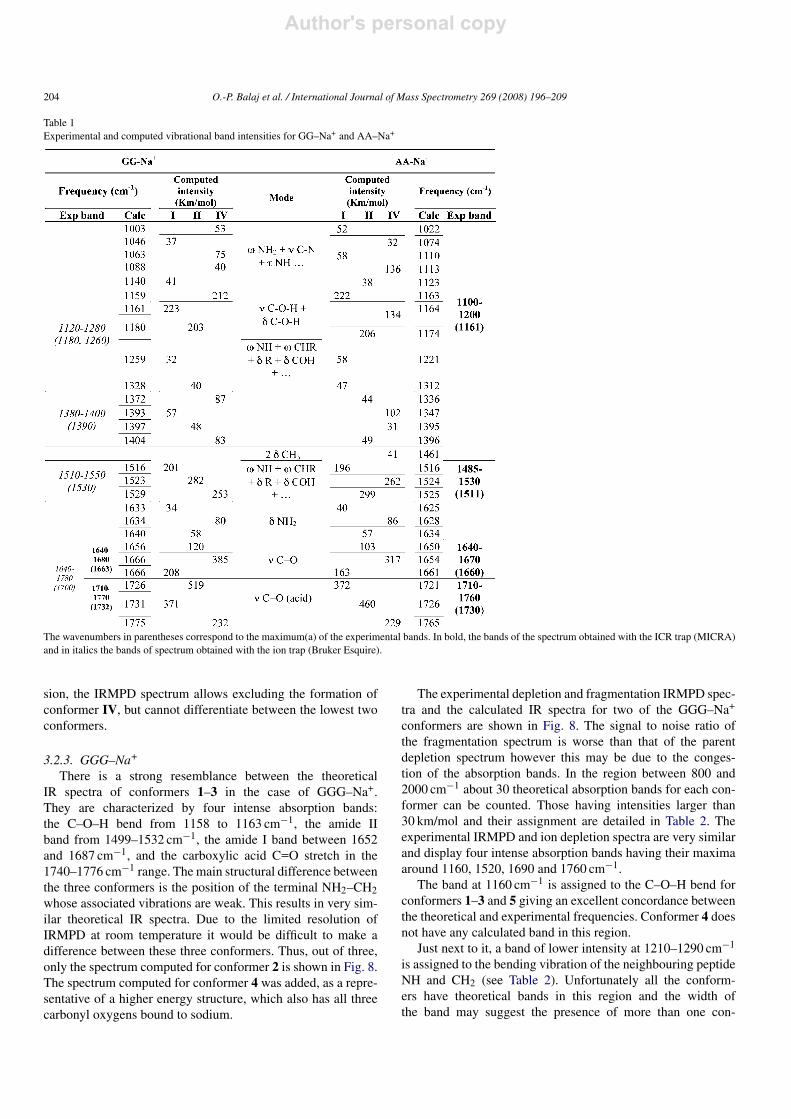
the lowest energy structures I and II (see Fig. 6 and Table 1,in which the full MICRA fragmentation spectrum is described).Although the resolution of the parent depletion spectrum is notexcellent (around 60 cm−1), its major characteristics are eas-ily identifiable: an intense and large band at 1120–1280 cm−1which appears to correspond to unresolved intense bands at 1180and 1260 cm−1, and a second intense band at 1640–1780 cm−1whichwe also believe to be the convolution of two bands at 1660and 1730 cm−1. Probably due to the high laser power used, theclearly separated bands (as seen in the MICRA spectrum) havesuffered a broadening effect and overlapped, the result beingthe large band seen in Fig. 6(a). The 1300–1600 cm−1 region isrelatively noisy. It is not obvious that there are any real bands
in this range although it is tempting to associate the “feature” at1510–1550 cm−1 with the intense lines computed at 1516, 1523and 1529 cm−1 for I, II and IV, respectively. Thus none of thebands in the 1000–1600 cm−1 range can be structurally diagnos-tic. The only clear difference among the most intense lines in(b)–(d) lies in their position and intensity in the 1600–1800 cm−1region. These bands can be assigned to the C O stretch, encom-passing the amide I band typical of peptides, and the analogousmode of the C-terminal acid. The amide I band is computedat 1656 for II and 1666 for I and IV, respectively. In all threestructures, the amide C O interacts with Na+ in fairly simi-lar ways, leading here again to similar intensities. However theacidic C O is bound to Na+ in I and II but not in IV, lead-ing to a blue-shift of ca. 50 cm−1 in the latter case (1775 cm−1vs. 1731 cm−1 and 1726 cm−1 for I and II, respectively). TheIRMPD spectrum obtained with MICRA has better resolutionin this area and allows us to conclude that structure IV is notpresent, since there is no experimental peak visible around thetheoretically intense 1775 cm−1, as can be seen in Fig. 6. Anypeak in that region would be easily seen in the fragmentationspectrum as it would lead to a greater separation between thetwo intense bands. The C O stretching frequency differenceinduced by coordination to sodium thus provides an easy toolto distinguish between structures that have either one or bothcarbonyls bound to the ion.On the other hand there is no possibility to clearly distinguish
between conformers I and IIon the basis of their IRMPDspectra.One could argue that only conformer I is present since the rela-tive intensities of the theoretical peaks at 1665 and 1730 cm−1fit rather well with those of experimental IRMPD peaks at 1663and 1732 cm−1. However there is precedent [5,6] showing thatIRMPD intensities cannot be directly compared to computedabsorption intensities, especially for nearby peaks.
3.2.2. AA–Na+
AA–Na+ was analyzed exclusively by IRMPD in MICRA.The resulting spectrum, rather similar to that of GG–Na+ dis-cussed above, is presented in Fig. 7 and described in Table 1. Itdisplays four intense bands. The first large and intense band at1100–1200 with the maximum intensity at 1161 cm−1 may beassociated with the C–O–H bendmode for all conformers. How-ever in the case of structure IV, another band of high intensityexists at 1113 cm−1, which together with the band at 1164 cm−1yields a double profile characteristic for IV. It is identified asone collective intenseωNH2 + υ C–N+ τ NHmode (other com-binations of these local modes are much less intense). Similarcollective modes were also present for structure IV of GG–Na+
but less intense (75 km/mol vs. 136 km/mol). The absence of thisband from the experimental spectrum argues against a signifi-cant population of IV, thus indicating a predominant presenceof I and II. The bands at 1511 and 1660 cm−1 correspond toamides II and I modes, respectively. The theoretical bands ofthe three conformers are close enough in value that these bandsdo not allow us to differentiate between the structures. However,as discussed above for GG–Na+, the acidic C O stretch band at1730 cm−1 is compatible with the bands of I and II at 1721 and1726 cm−1 but not with the one of IV at 1765 cm−1. In conclu-
Author's personal copy
204 O.-P. Balaj et al. / International Journal of Mass Spectrometry 269 (2008) 196–209
Table 1Experimental and computed vibrational band intensities for GG–Na+ and AA–Na+
The wavenumbers in parentheses correspond to the maximum(a) of the experimental bands. In bold, the bands of the spectrum obtained with the ICR trap (MICRA)and in italics the bands of spectrum obtained with the ion trap (Bruker Esquire).
sion, the IRMPD spectrum allows excluding the formation ofconformer IV, but cannot differentiate between the lowest twoconformers.
3.2.3. GGG–Na+
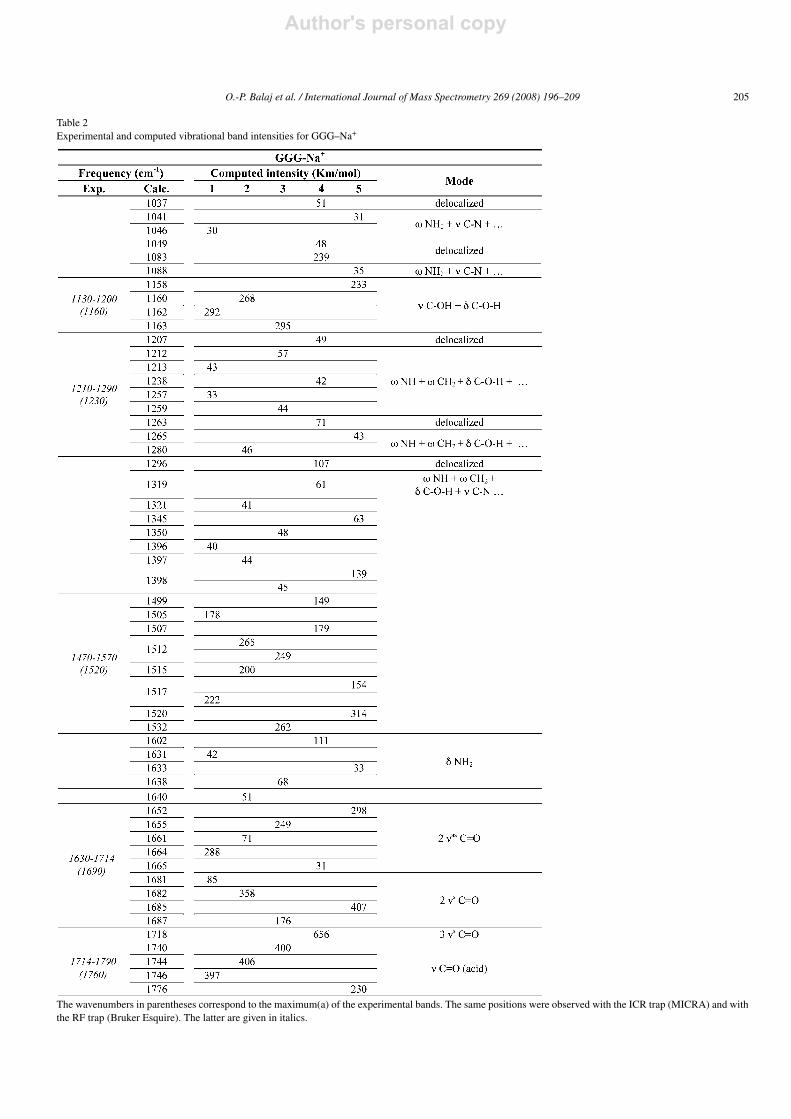
There is a strong resemblance between the theoreticalIR spectra of conformers 1–3 in the case of GGG–Na+.They are characterized by four intense absorption bands:the C–O–H bend from 1158 to 1163 cm−1, the amide IIband from 1499–1532 cm−1, the amide I band between 1652and 1687 cm−1, and the carboxylic acid C O stretch in the1740–1776 cm−1 range. The main structural difference betweenthe three conformers is the position of the terminal NH2–CH2whose associated vibrations are weak. This results in very sim-ilar theoretical IR spectra. Due to the limited resolution ofIRMPD at room temperature it would be difficult to make adifference between these three conformers. Thus, out of three,only the spectrum computed for conformer 2 is shown in Fig. 8.The spectrum computed for conformer 4 was added, as a repre-sentative of a higher energy structure, which also has all threecarbonyl oxygens bound to sodium.
The experimental depletion and fragmentation IRMPD spec-tra and the calculated IR spectra for two of the GGG–Na+
conformers are shown in Fig. 8. The signal to noise ratio ofthe fragmentation spectrum is worse than that of the parentdepletion spectrum however this may be due to the conges-tion of the absorption bands. In the region between 800 and2000 cm−1 about 30 theoretical absorption bands for each con-former can be counted. Those having intensities larger than30 km/mol and their assignment are detailed in Table 2. Theexperimental IRMPD and ion depletion spectra are very similarand display four intense absorption bands having their maximaaround 1160, 1520, 1690 and 1760 cm−1.The band at 1160 cm−1 is assigned to the C–O–H bend for
conformers 1–3 and 5 giving an excellent concordance betweenthe theoretical and experimental frequencies. Conformer 4 doesnot have any calculated band in this region.Just next to it, a band of lower intensity at 1210–1290 cm−1
is assigned to the bending vibration of the neighbouring peptideNH and CH2 (see Table 2). Unfortunately all the conform-ers have theoretical bands in this region and the width ofthe band may suggest the presence of more than one con-
Author's personal copy
O.-P. Balaj et al. / International Journal of Mass Spectrometry 269 (2008) 196–209 205
Table 2Experimental and computed vibrational band intensities for GGG–Na+
The wavenumbers in parentheses correspond to the maximum(a) of the experimental bands. The same positions were observed with the ICR trap (MICRA) and withthe RF trap (Bruker Esquire). The latter are given in italics.
Author's personal copy
206 O.-P. Balaj et al. / International Journal of Mass Spectrometry 269 (2008) 196–209
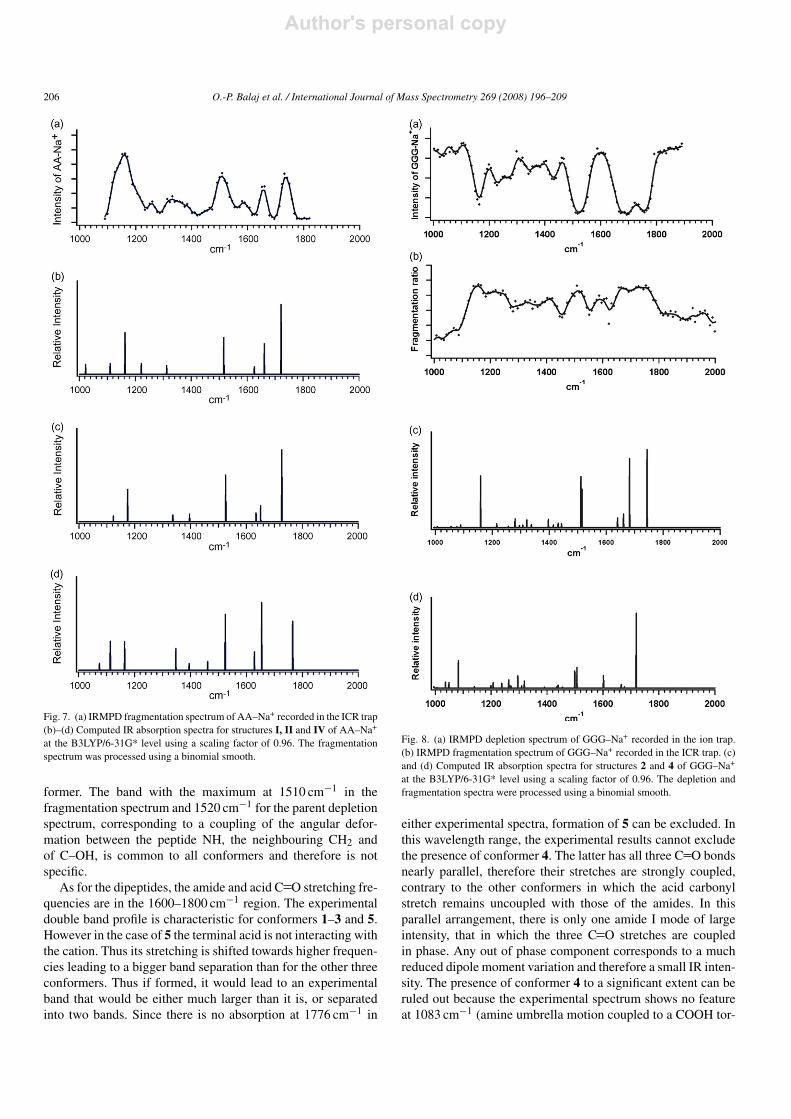
Fig. 7. (a) IRMPD fragmentation spectrum of AA–Na+ recorded in the ICR trap(b)–(d) Computed IR absorption spectra for structures I, II and IV of AA–Na+
at the B3LYP/6-31G* level using a scaling factor of 0.96. The fragmentationspectrum was processed using a binomial smooth.
former. The band with the maximum at 1510 cm−1 in thefragmentation spectrum and 1520 cm−1 for the parent depletionspectrum, corresponding to a coupling of the angular defor-mation between the peptide NH, the neighbouring CH2 andof C–OH, is common to all conformers and therefore is notspecific.As for the dipeptides, the amide and acid C O stretching fre-
quencies are in the 1600–1800 cm−1 region. The experimentaldouble band profile is characteristic for conformers 1–3 and 5.However in the case of 5 the terminal acid is not interacting withthe cation. Thus its stretching is shifted towards higher frequen-cies leading to a bigger band separation than for the other threeconformers. Thus if formed, it would lead to an experimentalband that would be either much larger than it is, or separatedinto two bands. Since there is no absorption at 1776 cm−1 in
Fig. 8. (a) IRMPD depletion spectrum of GGG–Na+ recorded in the ion trap.(b) IRMPD fragmentation spectrum of GGG–Na+ recorded in the ICR trap. (c)and (d) Computed IR absorption spectra for structures 2 and 4 of GGG–Na+
at the B3LYP/6-31G* level using a scaling factor of 0.96. The depletion andfragmentation spectra were processed using a binomial smooth.
either experimental spectra, formation of 5 can be excluded. Inthis wavelength range, the experimental results cannot excludethe presence of conformer 4. The latter has all three C O bondsnearly parallel, therefore their stretches are strongly coupled,contrary to the other conformers in which the acid carbonylstretch remains uncoupled with those of the amides. In thisparallel arrangement, there is only one amide I mode of largeintensity, that in which the three C O stretches are coupledin phase. Any out of phase component corresponds to a muchreduced dipole moment variation and therefore a small IR inten-sity. The presence of conformer 4 to a significant extent can beruled out because the experimental spectrum shows no featureat 1083 cm−1 (amine umbrella motion coupled to a COOH tor-
Author's personal copy
O.-P. Balaj et al. / International Journal of Mass Spectrometry 269 (2008) 196–209 207
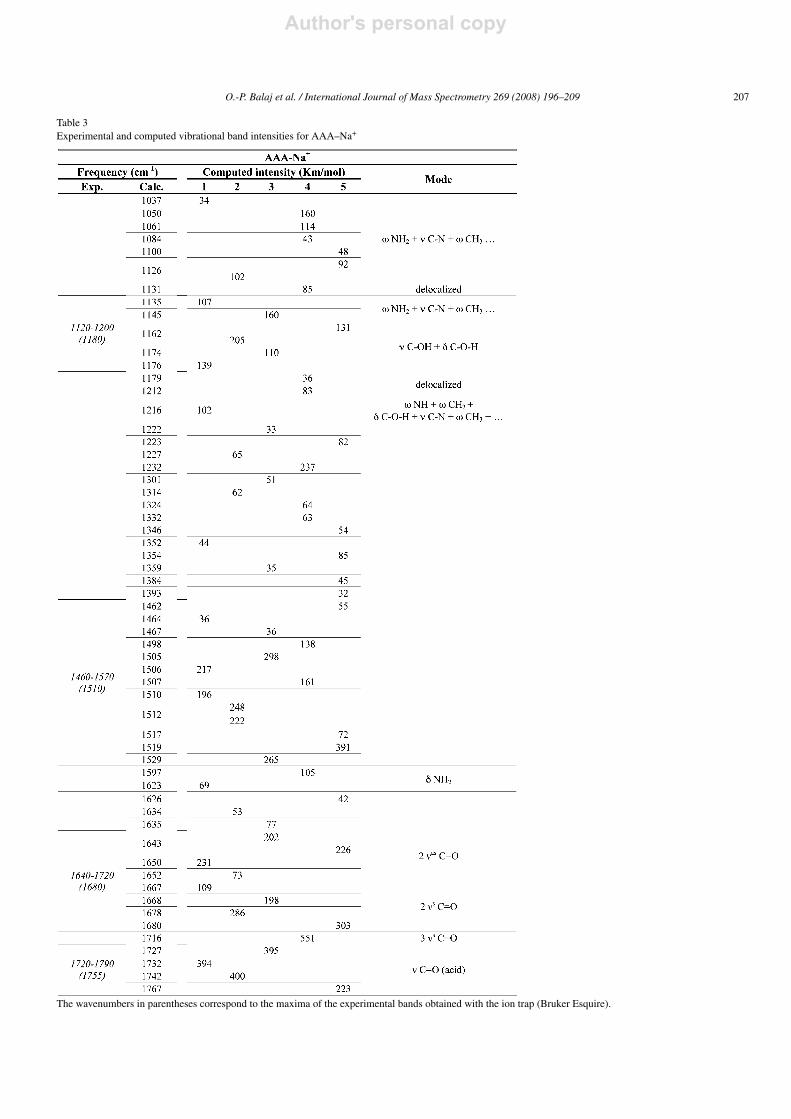
Table 3Experimental and computed vibrational band intensities for AAA–Na+
The wavenumbers in parentheses correspond to the maxima of the experimental bands obtained with the ion trap (Bruker Esquire).
Author's personal copy
208 O.-P. Balaj et al. / International Journal of Mass Spectrometry 269 (2008) 196–209
sion), where it is predicted to have significant absorption, while1–3 do not.As a result, although we can eliminate conformers 4 and
possibly 5, we cannot differentiate between conformers 1–3.The high energy of 5 makes its presence rather unlikely,however.
3.2.4. AAA–Na+
As for GGG–Na+, the IR theoretical spectra of 1–3 conform-ers are remarkably similar as can be seen in Table 3. Thereare four most intense absorption bands common to all threeconformers: the C–O–H bend in the 1162–1176 cm−1 region,the amide II mode from 1498 to 1529 cm−1, the amide I modebetween 1643 and 1680 cm−1 and the acidic C O stretch from1727 to 1742 cm−1 (see Table 3). There are small differences
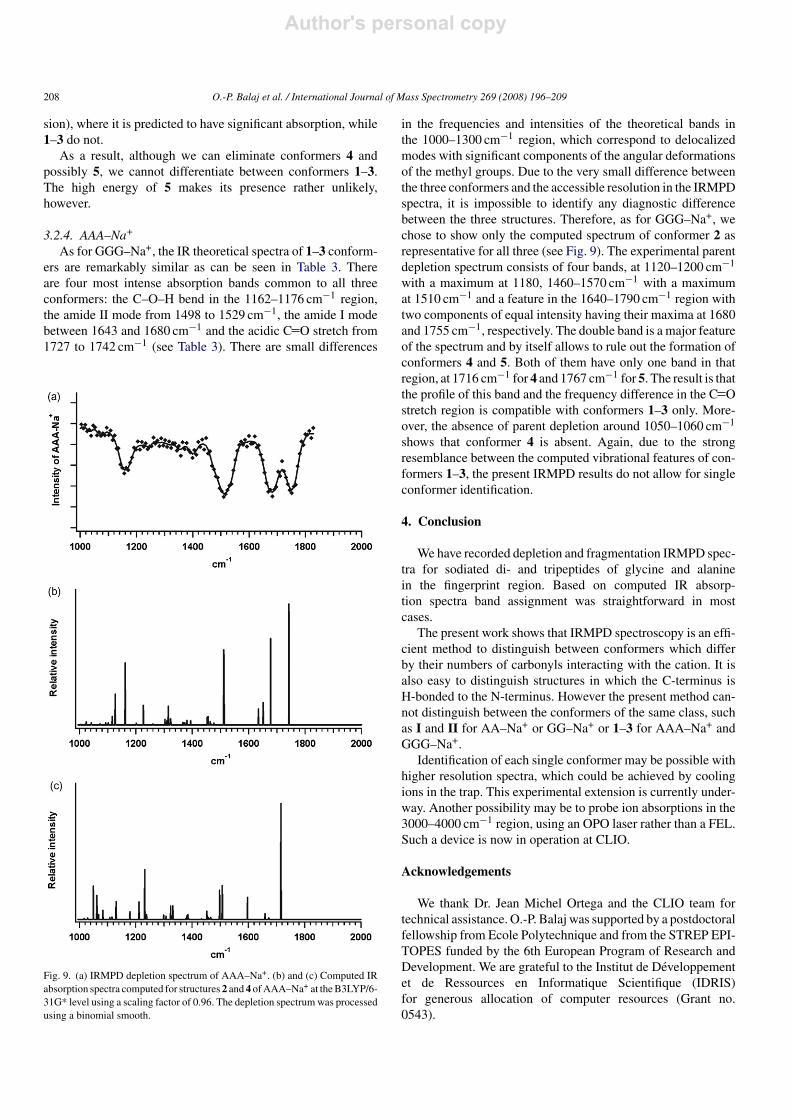
Fig. 9. (a) IRMPD depletion spectrum of AAA–Na+. (b) and (c) Computed IRabsorption spectra computed for structures 2 and 4 ofAAA–Na+ at theB3LYP/6-31G* level using a scaling factor of 0.96. The depletion spectrumwas processedusing a binomial smooth.
in the frequencies and intensities of the theoretical bands inthe 1000–1300 cm−1 region, which correspond to delocalizedmodes with significant components of the angular deformationsof the methyl groups. Due to the very small difference betweenthe three conformers and the accessible resolution in the IRMPDspectra, it is impossible to identify any diagnostic differencebetween the three structures. Therefore, as for GGG–Na+, wechose to show only the computed spectrum of conformer 2 asrepresentative for all three (see Fig. 9). The experimental parentdepletion spectrum consists of four bands, at 1120–1200 cm−1with a maximum at 1180, 1460–1570 cm−1 with a maximumat 1510 cm−1 and a feature in the 1640–1790 cm−1 region withtwo components of equal intensity having their maxima at 1680and 1755 cm−1, respectively. The double band is a major featureof the spectrum and by itself allows to rule out the formation ofconformers 4 and 5. Both of them have only one band in thatregion, at 1716 cm−1 for 4 and 1767 cm−1 for 5. The result is thatthe profile of this band and the frequency difference in the C Ostretch region is compatible with conformers 1–3 only. More-over, the absence of parent depletion around 1050–1060 cm−1shows that conformer 4 is absent. Again, due to the strongresemblance between the computed vibrational features of con-formers 1–3, the present IRMPD results do not allow for singleconformer identification.
4. Conclusion
We have recorded depletion and fragmentation IRMPD spec-tra for sodiated di- and tripeptides of glycine and alaninein the fingerprint region. Based on computed IR absorp-tion spectra band assignment was straightforward in mostcases.The present work shows that IRMPD spectroscopy is an effi-
cient method to distinguish between conformers which differby their numbers of carbonyls interacting with the cation. It isalso easy to distinguish structures in which the C-terminus isH-bonded to the N-terminus. However the present method can-not distinguish between the conformers of the same class, suchas I and II for AA–Na+ or GG–Na+ or 1–3 for AAA–Na+ andGGG–Na+.Identification of each single conformer may be possible with
higher resolution spectra, which could be achieved by coolingions in the trap. This experimental extension is currently under-way. Another possibility may be to probe ion absorptions in the3000–4000 cm−1 region, using an OPO laser rather than a FEL.Such a device is now in operation at CLIO.
Acknowledgements
We thank Dr. Jean Michel Ortega and the CLIO team fortechnical assistance. O.-P. Balaj was supported by a postdoctoralfellowship from Ecole Polytechnique and from the STREP EPI-TOPES funded by the 6th European Program of Research andDevelopment. We are grateful to the Institut de Developpementet de Ressources en Informatique Scientifique (IDRIS)for generous allocation of computer resources (Grant no.0543).
Author's personal copy
O.-P. Balaj et al. / International Journal of Mass Spectrometry 269 (2008) 196–209 209
References
[1] R.L.Woodin, D.S. Bomse, J.L. Beauchamp, J. Am. Chem. Soc. 100 (1978)3248.
[2] R. Prazeres, F. Glotin, C. Insa, D. Jaroszynski, J.M. Ortega, Eur. Phys. J.D 3 (1998) 87.
[3] D. Oepts, A.F.G. van der Meer, P.W. van Amersfoort, Infrared Phys. Tech-nol. 36 (1995) 297.
[4] J. Oomens, A.J.A. van Roij, G. Meijer, G. von Helden, Astrophys. J. 542(2000) 404.
[5] J. Oomens, B.G. Sartakov, G.Meijer, G. vonHelden, Int. J.Mass Spectrom.254 (2006) 1.
[6] C. Kapota, J. Lemaire, P. Maıtre, G. Ohanessian, J. Am. Chem. Soc. 126(2004) 1836.
[7] N.C. Polfer, J. Oomens, R.C. Dunbar, Phys. Chem. Chem. Phys. 8 (2006)2744.
[8] N.C. Polfer, R.C. Dunbar, J. Oomens, J. Am. Soc. Mass Spectrom. 18(2007) 512.
[9] N.C. Polfer, B. Paizs, L.C. Snoek, I. Compagnon, S. Suhai, G. Meijer, G.von Helden, J. Oomens, J. Am. Chem. Soc. 127 (2005) 8571.
[10] N.C. Polfer, J. Oomens, D.T. Moore, G. von Helden, G. Meijer, R.C.Dunbar, J. Am. Chem. Soc. 128 (2006) 517.
[11] J. Oomens, N.C. Polfer, D.T. Moore, L. van der Meer, A.G. Marshall, J.R.Eyler, G. Meijer, G. von Helden, Phys. Chem. Chem. Phys. 7 (2005) 1345.
[12] J. Oomens, D.T. Moore, G. von Helden, G. Meijer, R.C. Dunbar, J. Am.Chem. Soc. 3 (2004) 724.
[13] J. Oomens, G. von Helden, G. Meijer, J. Phys. Chem. A 108 (2004) 8273.[14] D.T.Moore, J. Oomens, J.R. Eyler, G. vonHelden, G.Meijer, R.C. Dunbar,
J. Am. Chem. Soc. 127 (2005) 7243.[15] D.T. Moore, J. Oomens, J.R. Eyler, G. von Helden, G. Meijer, D.P. Ridge,
J. Am. Chem. Soc. 126 (2004) 14726.[16] G.S. Groenewold, A.K. Gianotto, K.C. Cossel, M.J. Van Stipdonk, D.T.
Moore, N.C. Polfer, J. Oomens, W.A. de Jong, L. Visscher, J. Am. Chem.Soc. 128 (2006) 4802.
[17] R.C. Dunbar, D.T. Moore, J. Oomens, J. Phys. Chem. A 110 (2006) 8316.[18] T.D. Fridgen, T.B.McMahon, L.MacAleese, J. Lemaire, P.Maitre, J. Phys.
Chem. A 108 (2004) 9008.[19] B. Chiavarino, M.E. Crestoni, S. Fornarini, J. Lemaire, L. MacAleese, P.
Maitre, Chem. Phys. Chem. 5 (2004) 1679.[20] A. Simon, W. Jones, J.M. Ortega, P. Boissel, J. Lemaire, P. Maitre, J. Am.
Chem. Soc. 126 (2004) 11666.[21] O. Dopfer, N. Solca, J. Lemaire, P. Maitre, M.E. Crestoni, S. Fornarini, J.
Phys. Chem. A 109 (2005) 7881.[22] T.D. Fridgen, T.B. McMahon, P. Maitre, J. Lemaire, J. Phys. Chem. Chem.
Phys. 8 (2006) 2483.[23] B. Chiavarino, M.E. Crestoni, S. Fornarini, J. Lemaire, P. Maitre, L.
MacAleese, J. Am. Chem. Soc. 128 (2006) 12553.[24] B. Chiavarino, M.E. Crestoni, S. Fornarini, F. Lanucara, J. Lemaire, P.
Maitre, Angew. Chem. Int. Ed. 46 (2007) 1995.[25] L. MacAleese, A. Simon, T.B. McMahon, J.M. Ortega, D. Scuderi, J.
Lemaire, P. Maitre, Int. J. Mass Spectrom. 249 (2006) 14.[26] B. Lucas, G. Gregoire, J. Lemaire, P. Maitre, J.M. Ortega, A. Rupenyan,
B. Reimann, J.P. Schermann, C. Desfrancois, Phys. Chem. Chem. Phys. 6(2004) 2659.
[27] B. Lucas, G. Gregoire, J. Lemaire, P. Maitre, F. Glotin, J.P. Schermann, C.Desfrancois, Int. J. Mass Spectrom. 243 (2005) 105.
[28] D.C. Marinica, G. Gregoire, C. Desfrancois, J.P. Schermann, D. Borgis,M.P. Gaigeot, J. Phys. Chem. A 110 (2006) 8802.
[29] R.P. Grese, R.L. Cerny, M.L. Gross, J. Am. Chem. Soc. 111 (1989) 2835.[30] R.P. Grese, M.L. Gross, J. Am. Chem. Soc. 112 (1990) 5098.[31] L.M. Teesch, J. Adams, J. Am. Chem. Soc. 112 (1990) 4110.[32] L.M. Teesch, J. Adams, J. Am. Chem. Soc. 113 (1991) 812.[33] L.M. Teesch, R.C. Orlando, J. Adams, J. Am. Chem. Soc. 113 (1991) 3668.[34] H. Zhao, A. Reiter, L.M. Teesch, J. Adams, J. Am. Chem. Soc. 115 (1993)
2854.
[35] T. Lin, G.L. Glish, Anal. Chem. 70 (1998) 5162.[36] T. Lin, A.H. Payne, G.L. Glish, J. Am. Soc. Mass Spectrom. 12 (2001)
497.[37] T. Wyttenbach, J.E. Bushnell, M.T. Bowers, J. Am. Chem. Soc. 120 (1998)
5098.[38] T. Shoeib, A.C. Hopkinson, K.W.M. Siu, J. Phys. Chem. B 105 (2001)
12399.[39] W.Y. Feng, S. Gronert, K.A. Fletcher, A.Warres, C.B. Lebrilla, Int. J. Mass
Spectrom. 222 (2003) 117.[40] H.A. Cox, R.R. Julian, S.-W. Lee, J.L. Beauchamp, J. Am. Chem. Soc. 126
(2004) 6485.[41] V. Anbalagan, B.A. Perera, A.T.M. Silva, A.L. Gallardo, M. Barber, J.M.
Barr, S.M. Terkarli, E.R. Talaty, M.J. Van Stipdonk, J. Mass Spectrom. 37(2002) 910.
[42] V. Anbalagan, A.T.M. Silva, S. Rajagopalachary, K. Bulleigh, E.R. Talaty,M.J. Van Stipdonk, J. Mass Spectrom. 39 (2004) 495.
[43] V.Anbalagan, J.N. Patel, G. Niyakorn,M.J. Van Stipdonk, Rapid Commun.Mass Spectrom. 17 (2003) 291.
[44] K. Bulleigh, A. Howard, T. Do, Q. Wu, V. Anbalagan, M.J. Van Stipdonk,Rapid Commun. Mass Spectrom. 20 (2006) 227.
[45] A. Kamariotis, O.V. Boyarkin, S.R. Mercier, R.D. Beck, M.F. Bush, E.R.Williams, T.R. Rizzo, J. Am. Chem. Soc. 128 (2006) 905.
[46] M.F. Bush, J.T. O’Brien, J.S. Prell, R.J. Saykally, E.R. Williams, J. Am.Chem. Soc. 129 (2007) 1612.
[47] M. Kussmann, E. Nordhoff, H. Rahbek-Nielsen, S. Haebel, M. Rossel-Larsen, L. Jakobsen, J. Gobom, E. Mirgorodskaya, A. Kroll-Kristensen, L.Palm, P. Roepstorff, J. Mass Spectrom. 32 (1997) 593.
[48] J. Lemaire, P. Boissel, M. Heninger, G.Mauclaire, G. Bellec, H.Mestdagh,A. Simon, S.L. Caer, J.M. Ortega, F. Glotin, P. Maitre, Phys. Rev. Lett. 89(2002) 273002.
[49] P. Maitre, S. Le Caer, A. Simon, W.D. Jones, J. Lemaire, H. Mestdagh,M. Heninger, G. Mauclaire, P. Boissel, R. Prazeres, F. Glotin, J.M. Ortega,Nucl. Instrum. Methods Phys. Res. A 507 (2003) 541.
[50] C.H.S. Wong, N.L. Ma, C.W. Tsang, Chem. Eur. J. 8 (2002) 4909.[51] M. Benzakour, M. Mcharfi, A. Cartier, A. Daoudi, J. Mol. Struct.:
Theochem 710 (2004) 169.[52] B.A. Cerda, S. Hoyau, G. Ohanessian, C. Wesdemiotis, J. Am. Chem. Soc.
120 (1998) 2437.[53] M.M. Kish, C. Wesdemiotis, G. Ohanessian, J. Phys. Chem. B 108 (2004)
3086.[54] P. Wang, C. Wesdemiotis, C. Kapota, G. Ohanessian, J. Am. Soc. Mass
Spectrom. 18 (2007) 541.[55] C. Kapota, G. Ohanessian, Phys. Chem. Chem. Phys. 7 (2005) 3744.[56] M.D. Halls, H.B. Schlegel, J. Chem. Phys. 109 (1998) 10587.[57] M.J. Frisch, G.W. Trucks, H.B. Schlegel, G.E. Scuseria, M.A. Robb, J.R.
Cheeseman, J.A. Montgomery Jr., T. Vreven, K.N. Kudin, J.C. Burant,J.M. Millam, S.S. Iyengar, J. Tomasi, V. Barone, B. Mennucci, M. Cossi,G. Scalmani, N. Rega, G.A. Petersson, H. Nakatsuji, M. Hada, M. Ehara,K. Toyota, R. Fukuda, J. Hasegawa, M. Ishida, T. Nakajima, Y. Honda,O. Kitao, H. Nakai, M. Klene, X. Li, J.E. Knox, H.P. Hratchian, J.B.Cross, V. Bakken, C. Adamo, J. Jaramillo, R. Gomperts, R.E. Stratmann,O. Yazyev, A.J. Austin, R. Cammi, C. Pomelli, J.W. Ochterski, P.Y. Ayala,K. Morokuma, G.A. Voth, P. Salvador, J.J. Dannenberg, V.G. Zakrzewski,S. Dapprich, A.D. Daniels, M.C. Strain, O. Farkas, D.K. Malick, A.D.Rabuck, K. Raghavachari, J.B. Foresman, J.V. Ortiz, Q. Cui, A.G. Baboul,S.Clifford, J. Cioslowski, B.B. Stefanov,G.Liu,A.Liashenko, P. Piskorz, I.Komaromi, R.L. Martin, D.J. Fox, T. Keith, M.A. Al-Laham, C.Y. Peng, A.Nanayakkara, M. Challacombe, P.M.W. Gill, B. Johnson, W. Chen, M.W.Wong, C. Gonzalez, J.A. Pople, Gaussian 03, Revision C02, Gaussian, Inc.,Wallingford, CT, 2004.
[58] K.R. Jonscher, J.R. Yates, Anal. Biochem. 244 (1997) 1.[59] A. Colorado, J.X.X. Shen, V.H. Vartanian, J. Brodbelt, Anal. Chem. 68
(1996) 4033.[60] M.C. Crowe, J.S. Brodbelt, Anal. Chem. 77 (2005) 5726.


