Embed Size (px)
Citation preview
VALUE CHAIN PRIORITIZATION AND GAPS ASSESSMENT USAID ECONOMIC SECURITY PROGRAM
AUGUST 2019
This publication was produced for review by the United States Agency for International Development. It was
prepared by DAI Global.
VALUE CHAIN PRIORITIZATION AND GAPS ASSESSMENT USAID ECONOMIC SECURITY PROGRAM
DO Number and Name: DO2 – Inclusive and sustainable economic growth
Activity Start and End Dates: April 17, 2019 – April 16, 2024
AOR/COR/Activity Manager Name & Office: David Tsiklauri, USAID/Georgia Economic Growth
Implemented by: DAI Global
Subcontractors: Solimar, PMCG
Submission Date: August 15, 2019
The authors’ views expressed in this publication do not necessarily reflect the views of the United States
Agency for International Development or the United States Government.
VALUE CHAIN PRIORITIZATION AND GAPS ASSESSMENT iii
CONTENTS
ABBREVIATIONS VI
I. EXECUTIVE SUMMARY 1
Overview of Findings ......................................................................................................................................... 1
Case Studies ......................................................................................................................................................... 8
II. INTRODUCTION 9
Program Overview ............................................................................................................................................. 9
Report Objective ................................................................................................................................................ 9
III. SECTOR AND VALUE CHAIN PRIORITIZATION 10
Step 1: Sector /VC Identification and Grouping ........................................................................................ 12
Step 2: Data Collection ................................................................................................................................... 13
Step 3: Trend Analysis and Value Chain Scoring ....................................................................................... 15
Step 4: Narrowing the Focus – Value Chain Assessments ..................................................................... 19
IV. SECTOR ASSESSMENT AND GAP ANALYSIS 21
TOURISM SECTOR (ADVENTURE TOURISM, GASTRONOMIC TOURISM, CULTURAL TOURISM) .. 21
SHARED INTELLECTUAL SERVICES SECTOR.................................................................................. 29
Business Process Outsourcing Value Chain (Customer Relationship Management, Finance and
Accounting, Architecture and Engineering, Human Resources, and Information Technology) ..... 29
CREATIVE INDUSTRIES SECTOR .................................................................................................... 39
Production Value Chain (Film, Television) ................................................................................................. 39
Post-Production Value Chain (Sound, Visual Effects, Animation, Editing) .......................................... 45
Artisan Value Chain .......................................................................................................................................... 50
LIGHT MANUFACTURING SECTOR ................................................................................................ 54
Furniture Value Chain (Custom, High-End Products, Contract Manufacturing, Cabinets and
Counters) ........................................................................................................................................................... 54
Packaging Value Chain (Cardboard, Plastic, and Crates/Containers) .................................................. 62
V. INVESTMENT ECO-SYSTEM, PUBLIC-PRIVATE PARTNERSHIPS AND
INVESTMENT OPPORTUNITIES 69
OVERVIEW OF THE FINANCIAL SECTOR AND INVESTMENT ECO-SYSTEM ................................... 69
PUBLIC-PRIVATE PARTNERSHIPS AND INVESTMENT OPPORTUNITIES ........................................ 80
VI. CONCLUSIONS 85
VALUE CHAIN PRIORITIZATION AND GAPS ASSESSMENT iv
ANNEX 1: TOURISM SECTOR ASSESSMENT
ANNEX 2: BPO VALUE CHAIN ASSESSMENT
ANNEX 3: FILM AND POST-PRODUCTION VALUE CHAIN ASSESSMENT
ANNEX 4: FURNITURE VALUE CHAIN ASSESSMENT
ANNEX 5: PACKAGING VALUE CHAIN ASSESSMENT
ANNEX 6: MAPPING OF PRIVATE SECTOR INVESTMENT FUNDS
ANNEX 7: CAM SCORING DEFINITIONS
ANNEX 8: POTENTIAL IMPACT AND PERCENTAGE OF PROGRAM SUPPORT
VALUE CHAIN PRIORITIZATION AND GAPS ASSESSMENT v
TABLES AND FIGURES
TABLE
Table 1: Global Overview of Recommended Sectors and Value Chains ..................................................... 4
Table 2: Potential for Growth in Recommended Sectors and Value Chains ................................................ 6
Table 3: Selection Criteria and Weights ...................................................................................................... 10
Table 4: Sector and Value Chain Exploration Process ............................................................................... 12
Table 5: Sectors and VCs Targeted for Data Collection ............................................................................. 13
Table 6: Target Organizations for Data Collection Process ........................................................................ 14
Table 7: VC Selection Elements ................................................................................................................. 15
Table 8: Market Analysis of High Value Markets for Georgia ..................................................................... 21
Table 9: Growth Rates in Selected Origin Markets for Visitors to Georgia – 2018..................................... 23
Table 10: Primary Business Activities in Selected Value Chains ............................................................... 24
Table 11: Georgian Market Share of Selected HVMs (Current and Target) ............................................... 25
Table 12: Total Expenditure per Origin Market (2018) ............................................................................... 26
Table 13: Categories of Investors and their Investment Profiles ................................................................ 71
Table 14: Potential Project Opportunities over the Long, Medium and Short term. ................................... 83
FIGURE
Figure 1: Red Ocean and Blue Ocean Characteristics .............................................................................................. 1
Figure 2: Georgia’s Red Ocean vs. Blue Ocean Value Chains ................................................................................ 3
Figure 3: VC Assessment Approach ............................................................................................................................ 12
Figure 4: Competitiveness Appraisal Matrix ............................................................................................................. 17
Figure 5: Priority HVMs selected by GNTA and Economic Security Program ................................................. 23
Figure 6: Market Share of HVMs v TMVs – Arrivals and Expenditure (2018) .................................................. 26
Figure 7: Investment and Business Support Ecosystem .......................................................................................... 72
Figure 8: PDF Funding and Implementation Cycle ................................................................................................... 81
Figure 9: Investment Opportunity Timeline .............................................................................................................. 83
VALUE CHAIN PRIORITIZATION AND GAPS ASSESSMENT vi
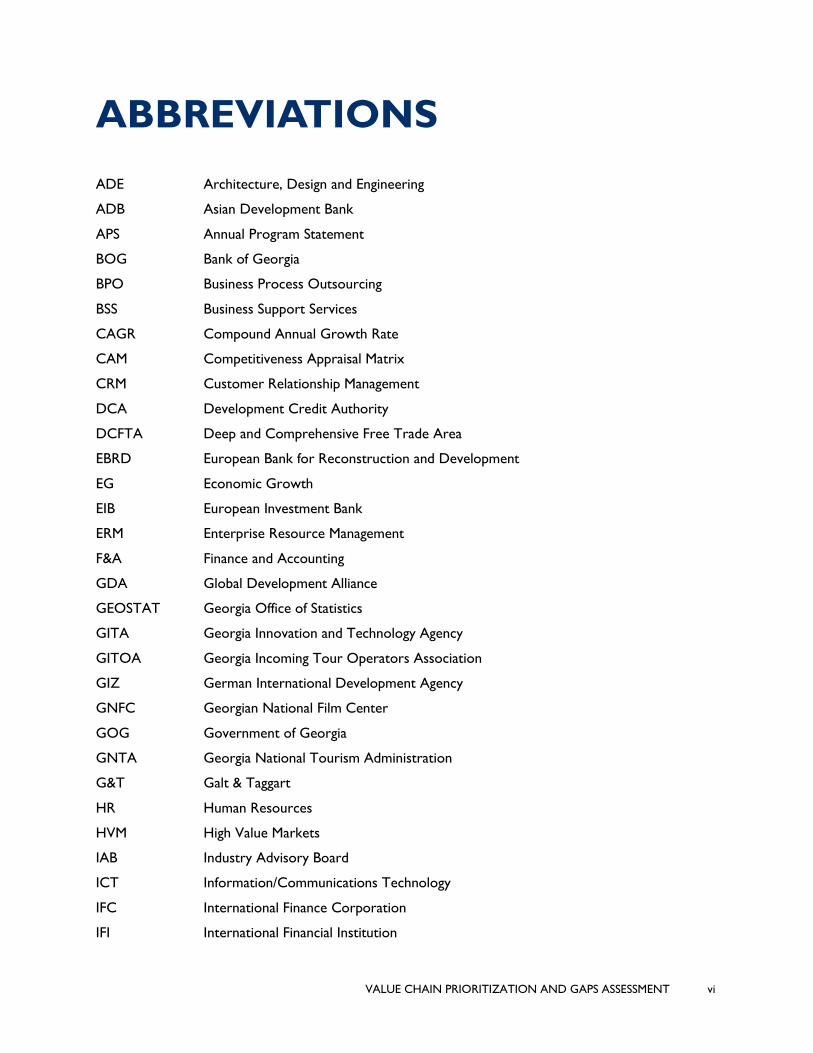
ABBREVIATIONS
ADE Architecture, Design and Engineering
ADB Asian Development Bank
APS Annual Program Statement
BOG Bank of Georgia
BPO Business Process Outsourcing
BSS Business Support Services
CAGR Compound Annual Growth Rate
CAM Competitiveness Appraisal Matrix
CRM Customer Relationship Management
DCA Development Credit Authority
DCFTA Deep and Comprehensive Free Trade Area
EBRD European Bank for Reconstruction and Development
EG Economic Growth
EIB European Investment Bank
ERM Enterprise Resource Management
F&A Finance and Accounting
GDA Global Development Alliance
GEOSTAT Georgia Office of Statistics
GITA Georgia Innovation and Technology Agency
GITOA Georgia Incoming Tour Operators Association
GIZ German International Development Agency
GNFC Georgian National Film Center
GOG Government of Georgia
GNTA Georgia National Tourism Administration
G&T Galt & Taggart
HR Human Resources
HVM High Value Markets
IAB Industry Advisory Board
ICT Information/Communications Technology
IFC International Finance Corporation
IFI International Financial Institution
VALUE CHAIN PRIORITIZATION AND GAPS ASSESSMENT vii
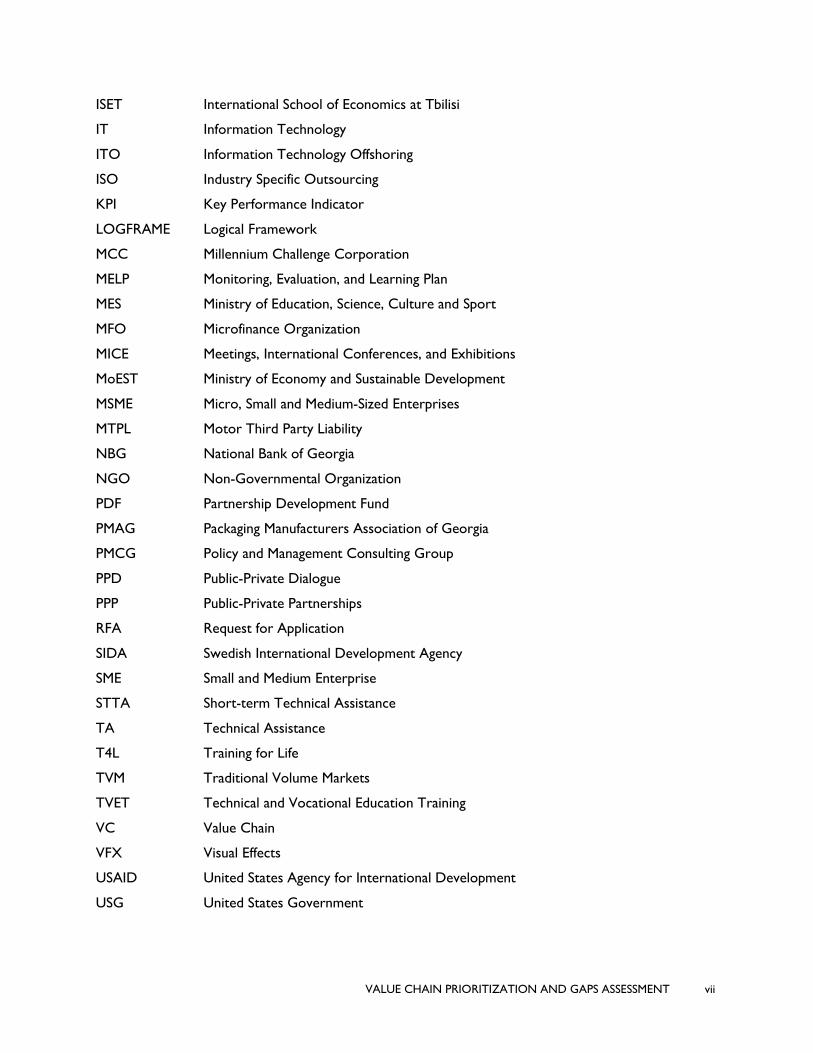
ISET International School of Economics at Tbilisi
IT Information Technology
ITO Information Technology Offshoring
ISO Industry Specific Outsourcing
KPI Key Performance Indicator
LOGFRAME Logical Framework
MCC Millennium Challenge Corporation
MELP Monitoring, Evaluation, and Learning Plan
MES Ministry of Education, Science, Culture and Sport
MFO Microfinance Organization
MICE Meetings, International Conferences, and Exhibitions
MoEST Ministry of Economy and Sustainable Development
MSME Micro, Small and Medium-Sized Enterprises
MTPL Motor Third Party Liability
NBG National Bank of Georgia
NGO Non-Governmental Organization
PDF Partnership Development Fund
PMAG Packaging Manufacturers Association of Georgia
PMCG Policy and Management Consulting Group
PPD Public-Private Dialogue
PPP Public-Private Partnerships
RFA Request for Application
SIDA Swedish International Development Agency
SME Small and Medium Enterprise
STTA Short-term Technical Assistance
TA Technical Assistance
T4L Training for Life
TVM Traditional Volume Markets
TVET Technical and Vocational Education Training
VC Value Chain
VFX Visual Effects
USAID United States Agency for International Development
USG United States Government
VALUE CHAIN PRIORITIZATION AND GAPS ASSESSMENT 1
I. EXECUTIVE SUMMARY
OVERVIEW OF FINDINGS As a baseline for its work to build competitiveness in Georgia through facilitation of investment,
high(er)-value job creation, and/or revenue increases, the Program was asked to conduct assessments of
value chains within targeted sectors. Its methodology for doing so is addressed comprehensively within
this report.
In assessing the potential competitiveness of Georgian sectors and value chains, the Program adopted a
market analysis approach that focused largely on demand-side opportunities for Georgian products and
services. It did this for two reasons. First, most of Georgia’s sectors and many of its value chains have
undergone extensive assessments in previous years. Most of these reports, however, focused on
strengths, weaknesses, opportunities, and threats within specific sectors and value chains rather than
assessing market demand, both globally and regionally. Second, even a cursory assessment of Georgia’s
sectors and value chains reveals significant disconnects in the understanding of export markets and how
to reach them. This has created a vacuum of information among Georgian companies and even the
Government of Georgia that has led to over-concentration on domestic and regional markets and a lack
of attention to major global opportunities in key sectors and value chains. Market analysis is the primary
way to bridge this knowledge gap.
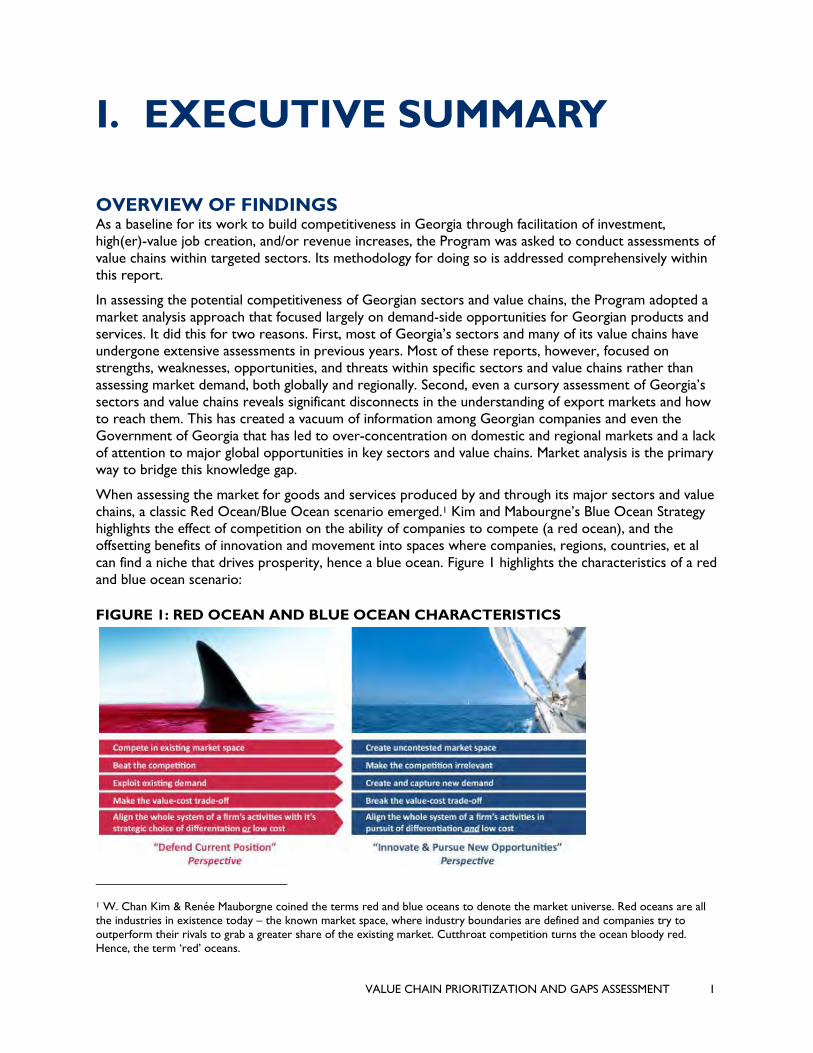
When assessing the market for goods and services produced by and through its major sectors and value
chains, a classic Red Ocean/Blue Ocean scenario emerged.1 Kim and Mabourgne’s Blue Ocean Strategy
highlights the effect of competition on the ability of companies to compete (a red ocean), and the
offsetting benefits of innovation and movement into spaces where companies, regions, countries, et al
can find a niche that drives prosperity, hence a blue ocean. Figure 1 highlights the characteristics of a red
and blue ocean scenario:
FIGURE 1: RED OCEAN AND BLUE OCEAN CHARACTERISTICS
1 W. Chan Kim & Renée Mauborgne coined the terms red and blue oceans to denote the market universe. Red oceans are all
the industries in existence today – the known market space, where industry boundaries are defined and companies try to
outperform their rivals to grab a greater share of the existing market. Cutthroat competition turns the ocean bloody red.
Hence, the term ‘red’ oceans.
VALUE CHAIN PRIORITIZATION AND GAPS ASSESSMENT 2
Kim and Mauborgne postulate that sectors and value chains in a “Red Ocean” are those that try to
compete head-to-head on the regional or global markets in the same space as numerous others. This
typically creates a scenario where competition becomes so acute that it turns the ocean red with the
“blood” of dying companies. The quintessential “red ocean” scenario is survival of the fittest, and it is
extremely difficult for small or under-capacity companies to thrive in this situation. “Blue Ocean”
sectors and value chains are those that transcend competition because they have either created
something that does not exist (e.g. Amazon, Facebook) or have a differentiating factor that makes
competition irrelevant (e.g. Tesla). This differentiating factor might be a product, a brand, or a market
niche that places a company, sector, or value chain in a blue ocean. On a country scale, examples of
these scenarios about. For instance, New Zealand is virtually in a “Blue Ocean” in terms of yacht
making/retrofitting because they offer reputation, prices, and quality that transcend the market. Cyprus,
on the other hand, is in a “Red Ocean” in terms of sand and sea tourism because of severe regional
competition and no differentiating factors.
Utilizing this scenario, it became apparent to the Programs Value Chain Assessment teams that many of
Georgia’s sectors and value chains were classic examples of the Red Ocean perspective. For decades,
some of the country’s most visible sectors and value chains have been defending their position against
mounting competition by exploiting existing domestic and regional demand that has been both
inconsistent and unsustainable. This has put these sectors and value chains within a Red Ocean scenario
as competition now surrounds them, leaving “blood in the water” in terms of strategy, sales, and market
access. For this reason, the Program is not recommending a focus on some very high visibility value
chains that have and are being touted by both the private sector and the Government of Georgia as
significant. In-depth market analysis actually shows that the opposite is true…these value chains and
sectors, while still having potential, are becoming more competitive, their markets constricted, and their
margins diminished in terms of Georgia’s competitive positioning.
On the other hand, the Programs Value Chain Assessment and Gap Analysis highlighted a number of
sectors and value chains that can provide the country with differentiators that lead to competitiveness,
hence a Blue Ocean scenario. Most of these sectors and value chains are not new to the country, but
they have been largely under-developed or have not yet been able to access a growing export market
that will allow it to exploit its differentiators and thus establish niches that either overcome the
competition or make it irrelevant. Figure 2 highlights the Georgian value chains that, in the Program’s
analysis, are in a Red Ocean or Blue Ocean.
VALUE CHAIN PRIORITIZATION AND GAPS ASSESSMENT 3
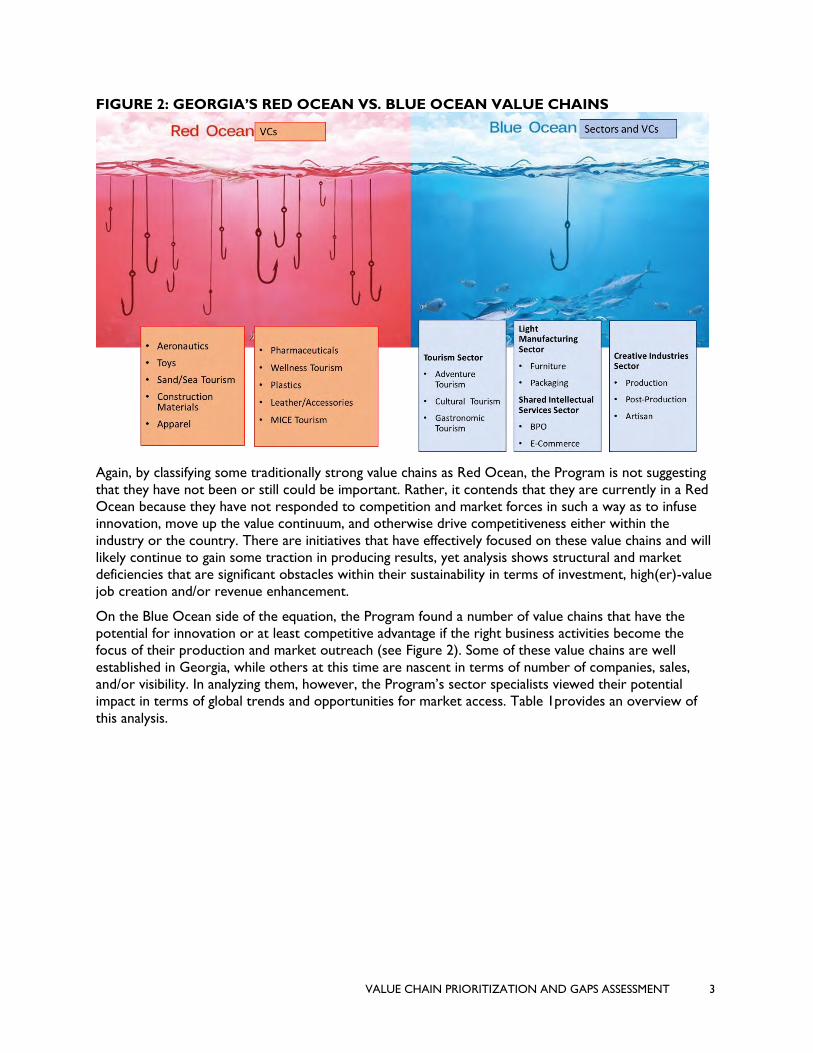
FIGURE 2: GEORGIA’S RED OCEAN VS. BLUE OCEAN VALUE CHAINS
Again, by classifying some traditionally strong value chains as Red Ocean, the Program is not suggesting
that they have not been or still could be important. Rather, it contends that they are currently in a Red
Ocean because they have not responded to competition and market forces in such a way as to infuse
innovation, move up the value continuum, and otherwise drive competitiveness either within the
industry or the country. There are initiatives that have effectively focused on these value chains and will
likely continue to gain some traction in producing results, yet analysis shows structural and market
deficiencies that are significant obstacles within their sustainability in terms of investment, high(er)-value
job creation and/or revenue enhancement.
On the Blue Ocean side of the equation, the Program found a number of value chains that have the
potential for innovation or at least competitive advantage if the right business activities become the
focus of their production and market outreach (see Figure 2). Some of these value chains are well
established in Georgia, while others at this time are nascent in terms of number of companies, sales,
and/or visibility. In analyzing them, however, the Program’s sector specialists viewed their potential
impact in terms of global trends and opportunities for market access. Table 1provides an overview of
this analysis.
VALUE CHAIN PRIORITIZATION AND GAPS ASSESSMENT 4
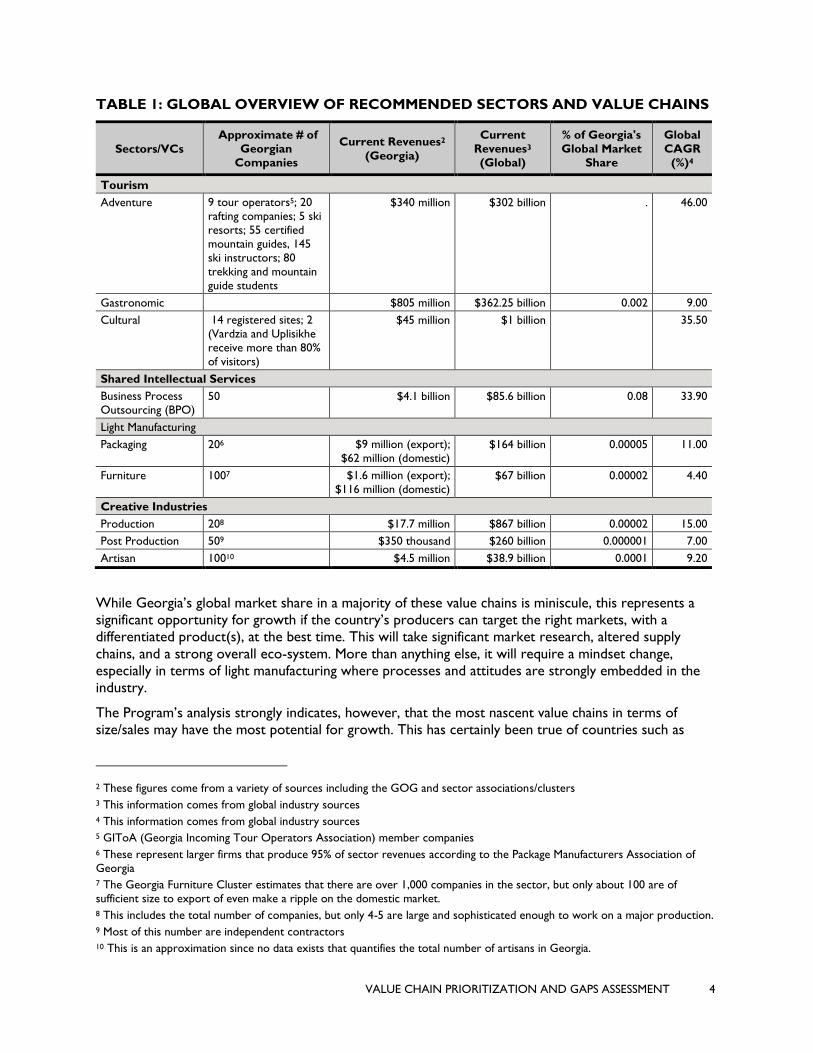
TABLE 1: GLOBAL OVERVIEW OF RECOMMENDED SECTORS AND VALUE CHAINS
Sectors/VCs
Approximate # of
Georgian
Companies
Current Revenues2
(Georgia)
Current
Revenues3
(Global)
% of Georgia's
Global Market
Share
Global
CAGR
(%)4
Tourism
Adventure 9 tour operators5; 20
rafting companies; 5 ski
resorts; 55 certified
mountain guides, 145
ski instructors; 80
trekking and mountain
guide students
$340 million $302 billion . 46.00
Gastronomic $805 million $362.25 billion 0.002 9.00
Cultural 14 registered sites; 2
(Vardzia and Uplisikhe
receive more than 80%
of visitors)
$45 million $1 billion 35.50
Shared Intellectual Services
Business Process
Outsourcing (BPO) 50 $4.1 billion $85.6 billion 0.08 33.90
Light Manufacturing
Packaging 206 $9 million (export);
$62 million (domestic) $164 billion 0.00005 11.00
Furniture 1007 $1.6 million (export);
$116 million (domestic) $67 billion 0.00002 4.40
Creative Industries
Production 208 $17.7 million $867 billion 0.00002 15.00
Post Production 509 $350 thousand $260 billion 0.000001 7.00
Artisan 10010 $4.5 million $38.9 billion 0.0001 9.20
While Georgia’s global market share in a majority of these value chains is miniscule, this represents a
significant opportunity for growth if the country’s producers can target the right markets, with a
differentiated product(s), at the best time. This will take significant market research, altered supply
chains, and a strong overall eco-system. More than anything else, it will require a mindset change,
especially in terms of light manufacturing where processes and attitudes are strongly embedded in the
industry.
The Program’s analysis strongly indicates, however, that the most nascent value chains in terms of
size/sales may have the most potential for growth. This has certainly been true of countries such as
2 These figures come from a variety of sources including the GOG and sector associations/clusters
3 This information comes from global industry sources
4 This information comes from global industry sources 5 GIToA (Georgia Incoming Tour Operators Association) member companies
6 These represent larger firms that produce 95% of sector revenues according to the Package Manufacturers Association of
Georgia 7 The Georgia Furniture Cluster estimates that there are over 1,000 companies in the sector, but only about 100 are of
sufficient size to export of even make a ripple on the domestic market.
8 This includes the total number of companies, but only 4-5 are large and sophisticated enough to work on a major production.
9 Most of this number are independent contractors 10 This is an approximation since no data exists that quantifies the total number of artisans in Georgia.
VALUE CHAIN PRIORITIZATION AND GAPS ASSESSMENT 5
Romania and Jordan that went from no presence on the global scale in terms of creative industries to
significant players (see case studies below).
The Program’s analysis, therefore, focuses on specific business activities within these value chains that
have the most potential for growth.
• Tourism: The Program’s analysis identified three primary value chains in the tourism sector,
namely adventure, cultural, and gastronomic. Within these value chains, specific business activities
hold the most potential for investment, high(er)-value job creation, and/or increased revenues.
Within the adventure tourism value chain, rafting, hiking, trekking, birding, and eco-tourism hold the
most potential. Skiing, while long a staple of Georgia’s winter tourism offerings, will continue to have
growth potential, but over-development, lack of investment in infrastructure, and increased
competition are eroding the business activity’s competitiveness. Cultural tourism includes religious
and historical attractions. It remains strong though there are definite gaps in infrastructure (e.g.
maintenance of attractions), support facilities, and marketing. Also, it is the lowest value of the three
identified value chains due to its core demographic, which is mass (bus) tourism where travelers
spend proportionately less money than individual travelers. The final value chain in tourism,
gastronomic, contains two business activities: culinary and wine. This segment of Georgia’s tourism
is a major differentiator and will continue to provide economic opportunities in terms of revenues
and overall visibility. The “Achilles Heel” of this value chain, however, is weak supply chains and
overall spotty customer services that erodes the visitor experience.
• Shared Intellectual Services: This sector focuses on the Business Process Outsourcing (BPO)
value chain that includes six specific business activities that are potential differentiators for Georgia:
Customer Relationship Management (CRM), Architecture, Design, and Engineering (ADE)11, Human
Resources (HR), Finance and Accounting (F&A), and Information Technology (IT). The challenges in
the BPO value chain center on increasing competition and lack of language skills among others.
Both of these can be overcome, however, with focused interventions. Georgia’s e-commerce value
chain is currently very small but has great potential especially when linked with the artisan value
chain as a cross-cutting enabler.
• Light Manufacturing12: The analysis of Georgia’s light manufacturing sector revealed significant
challenges throughout the eco-system, from weak, unsustainable associations to skills gaps to lack of
market access, aging equipment, and low-value production. Only two value chains, furniture and
packaging, seem to have potential for growth on a global scale and within them certain business
activities are the most promising. In packaging, carboard, plastic wrapping (industrial), and paper
cups and bags are potential differentiators both in terms of exports and import substitution. In
furniture, contract production (private label), custom made, high value wood furnishings, and high-
end cabinets and counters are potentially significant business activities. The challenge even in these
value chains, though, is that the amount of investment required to compete on a global scale, as well
as the past unwillingness of the furniture industry to focus on exports. In addition, investment in
11 ADE is a specialty value chain. In traditional architecture the synergies would be few, however, architecture firms in Georgia are looking into expanding into providing a wider range of services, especially around interior design, for foreign clients. In these areas there would be overlap, but at this time, architecture firms that are outsourcing-not yet providing much design service – though they want to do so and have the capacity to do so.
12 Several value chains were evaluated within this sector and while certain business activities in furniture and packaging have the most potential for impact in terms of investment, job creation, and revenue growth, there are business activities within other value chains, such as cabling and synthetic construction materials, that have potential. For this reason, the Program will discuss with USAID potential support for light manufacturing opportunities that have potential to meet its objectives. This support would likely be in the form of market linkages and/or technical assistance rather than financial support.
VALUE CHAIN PRIORITIZATION AND GAPS ASSESSMENT 6
equipment, which could provide furniture producers with significant global opportunities, typically
means reductions in employment. This would further comprehend Georgia’s already high
unemployment and under-employment rates. These value chains and business activities, however,
have a significant upside in terms of increased revenues and investment is Georgian companies are
willing to change their processes and focus on niche products.
• Creative Industries: Three value chains were identified within creative industries, namely
production, post-production, and artisans. In the case of production, business activities such as film
and TV series. In post-production, the business activities with the most potential are sound, visual
effects and editing. The artisan value chain will link artisans in fashion and jewelry design, wood
carving, stone carving, painting and ceramics into an e-commerce platform that will provide them a
point-of-sale on the global market as well as a distribution network. The challenge for the sector in
general and particular these value chains is their lack of mass. Currently, much of Georgia’s success
in this sector has come through small production houses that have little global visibility. Also, the
country has nascent skilled labor available in the production and post-production value chains. This
being said, countries such as Romania and Jordan were in the same situation, but used strategy,
targeted workforce interventions, and incentives to generate exponential growth. The Program’s
analysis indicates that the Creative Industries sector and target value chains have substantial ability
to become a differentiator for Georgia.
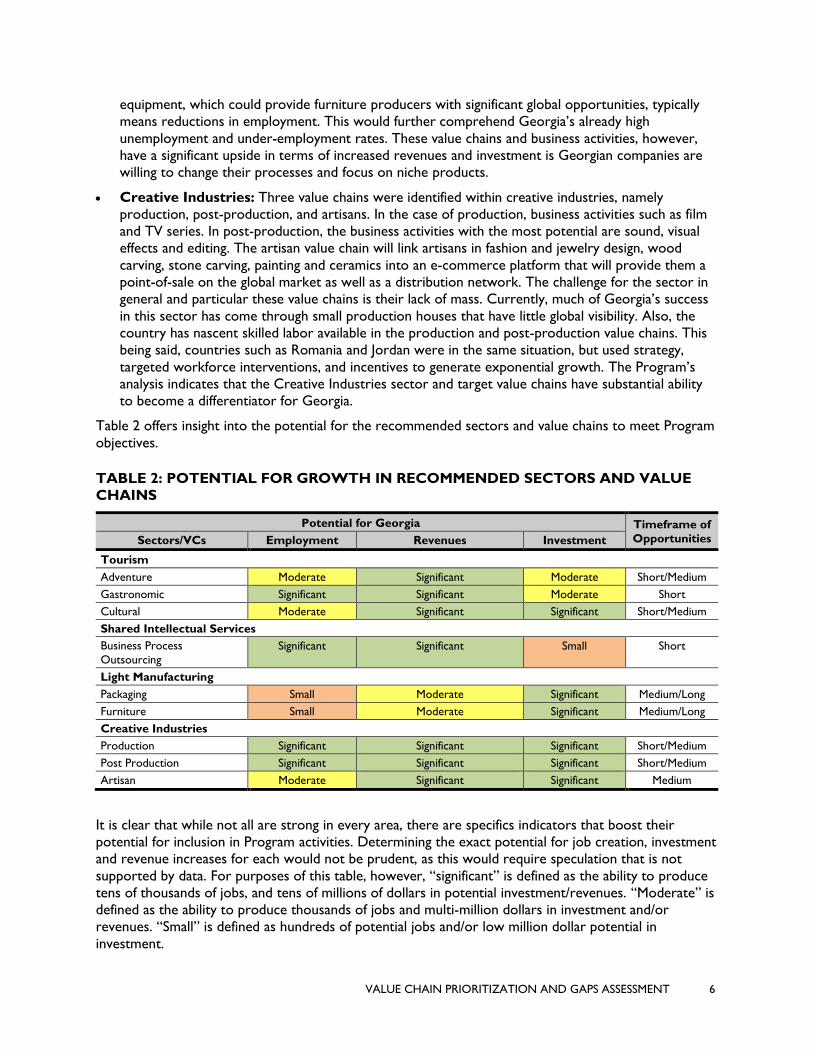
Table 2 offers insight into the potential for the recommended sectors and value chains to meet Program
objectives.
TABLE 2: POTENTIAL FOR GROWTH IN RECOMMENDED SECTORS AND VALUE
CHAINS
Potential for Georgia Timeframe of
Opportunities Sectors/VCs Employment Revenues Investment
Tourism
Adventure Moderate Significant Moderate Short/Medium
Gastronomic Significant Significant Moderate Short
Cultural Moderate Significant Significant Short/Medium
Shared Intellectual Services
Business Process
Outsourcing
Significant Significant Small Short
Light Manufacturing
Packaging Small Moderate Significant Medium/Long
Furniture Small Moderate Significant Medium/Long
Creative Industries
Production Significant Significant Significant Short/Medium
Post Production Significant Significant Significant Short/Medium
Artisan Moderate Significant Significant Medium
It is clear that while not all are strong in every area, there are specifics indicators that boost their
potential for inclusion in Program activities. Determining the exact potential for job creation, investment
and revenue increases for each would not be prudent, as this would require speculation that is not
supported by data. For purposes of this table, however, “significant” is defined as the ability to produce
tens of thousands of jobs, and tens of millions of dollars in potential investment/revenues. “Moderate” is
defined as the ability to produce thousands of jobs and multi-million dollars in investment and/or
revenues. “Small” is defined as hundreds of potential jobs and/or low million dollar potential in
investment.
VALUE CHAIN PRIORITIZATION AND GAPS ASSESSMENT 7
Each value chain analysis (see Annex 1-6) offers specific targets/interventions for investment, high(er)-
value job creation and/or revenue enhancement, but the following table aggregates them to provide
overall perspective:13
The VC Assessment Team developed growth targets for each sector and value chain based on its
analysis of domestic and global trends as well as emerging opportunities. These targets are included in
the Annex (in each VC Assessment Report) but is disaggregated by sector and impact type in Annex 8.
During its analysis, the Program’s VC Assessment Team reviewed Information and Communications
Technology and Logistics and Transportation as cross-cutting enablers rather than potential
sectors/value chains. Since information technology permeates every sector and value chain, it was not
prudent to assess it as a silo, but rather to integrate it into the overall analysis of all sectors and value
chains considered. Transport and logistics, when assessed as a sector, require significant up-front
investment that mega-projects are required to provide traction. This being the case, the Program felt
that it was best considered as an enabler for other sectors and value chains.
E-Commerce also provide linkages to all value chains. As a matter of fact, the Value Chain Assessment
Team believes that based on global market demand, it may provide the best opportunity to scale
opportunities within target sectors and value chains.
As indicated in Table 8, e-commerce was originally reviewed as a business activity under ICT. The VC
Assessment team’s analysis, however, highlighted that a) globally e-commerce is viewed as a sector
under Shared Intellectual Services rather than a business activity, b) it is one of the fastest-growing value
chains globally, c) there are a number of emerging e-commerce processes/opportunities in Georgia, d)
the enabling environment for e-commerce in Georgia is being put in place, and e) viewing e-commerce
as simply a business activity would limit the Program’s interventions to cross-cutting linkages rather than
allowing the ability to explore e-commerce as a driver of investment, high(er)-value job creation, and
revenue increases. This mindset is consistent with global standards in terms of pursuing e-commerce
opportunities.
Globally, e-commerce is one of the fastest growing value chains in existence and is expected to produce
more than $4.8 trillion in revenues by 2021. Its CAGR is 17.8%. Unfortunately, Georgia has not been
able to capitalize on the e-commerce phenomenon, becoming consumers of on-line goods and services
instead of producers of them. This being said, the country is positioned to gain traction in e-commerce,
as it has already introduced elements of this phenomenon into society. A case in point is e-payment of
bills through a kiosk system as well as e-banking, both of which merge elements of e-commerce with
social services. In 2018, Georgians carried out 14.4 million electronic transactions worth more than
$630 million, 96% of which were in-country transactions.
Internet penetration throughout Georgia is increasing rapidly (nearly 70% in 2018) and it tops 90% for
countries that would be the targets for Georgia’s e-commerce platforms. In addition, there are 8.5
million debit cards and 700,000 credit cards in use by Georgians and the amount is growing
exponentially each year. Georgia is harmonizing the electronic flow of information among key players in
logistics, shipping and transport industries by launching the Trade Facilitation System (TFS). The TFS
enables traders, customs brokers, freight forwarders, shipping lines and other players in international
trade to submit information through a single entry point. The Ministry of Economy and Sustainable
Development (MoESD) is also engaged in developing a draft law on e-Commerce. In addition, e-
13These figures are based on the Program’s market assessments and are estimated using internationally-accepted average
CAGR data by sector. This only highlights impact that could be generated through Program interventions, not the overall
potential for the growth of these value chains in Georgia. The latter would require speculation based on insufficient data and
prognostication of global trends.
VALUE CHAIN PRIORITIZATION AND GAPS ASSESSMENT 8
commerce sites such as Phubber (a site for buying, selling, and trading vintage and name-brand clothing)
are making significant headway on the domestic market and have the opportunity to scale globally.
Even Georgia’s ability to capture .00001% of the global e-commerce market would produce $48 million
in annual revenues for Georgian companies. This is possible if a) the legal and regulatory environment is
put in place, b) e-commerce sites are developed by Georgian companies, c) logistics/shipping and e-
commerce are linked to allow Georgian companies to get to market, and d) secure payment through
credit/debit cards or other mechanisms is ensured.
CASE STUDIES During its assessment of potential sectors and value chains, the Program looked extensively at examples
from other countries, which have been successful in the recommended areas of focus. The following are
brief case studies of two:
Jordan (Creative Industries): The Jordanian film industry has expanded rapidly since the
establishment of the Royal Film Commission (RFC) in 2003, which led to increased support for writers
and directors. The RFC has also partnered with the University of Southern California's School of
Cinematic Arts to establish the Red Sea Institute of Cinematic Arts—which provides training for
students from across the Middle East in all aspects of film-making. Jordan had produced five feature films
prior to 2003 but has subsequently produced 150—a measure of the progress that has been made. The
RFC has also helped to market Jordan as a location for a number of high-budget US films, including the
Oscar-winning The Hurt Locker. Jordan’s entire creative services space was buoyed by support from
USAID through implementing partners. These interventions focused on support for the Red Sea School
of Cinematic Arts, as well as in e-gaming and animation. Both of the latter are now significant
employment and revenue generators in Jordan.
Poland (Offshoring/BPO): A late comer to the Offshoring space, Poland has made up for lost time.
Over the last ten years, it has gone from a nascent position to being the home of over 1,000 BPO
centers that employ more than 200,000 workers. The CAGR for offshoring in Poland is 20%, making it
one of the country’s fastest growing industries. Warsaw has the largest number of Offshoring centers,
but Krakow has the most employees. The country also has 40 Business Support Service (BSS) centers
throughout the country that provide higher-value services to clients. This growth has not been confined
to the country’s large cities, however, as in Katowice, PricewaterhouseCoopers entered into a lease
agreement for over 2,000 sq/m in the Silisia Business Park. It increased employment in its BSS operation
by over 300 people. This shared services center in Katowice provides services in the field of financial
audit, taxation and internal departments services. Over a thousand people work at PWCs offices in the
city center.
These case studies are examples of what can occur when a country focuses on the right sectors/value
chains, as well as differentiators through niche business activities. The Program believes the same can
occur in Georgia, making it a global example of innovation and competitiveness.
VALUE CHAIN PRIORITIZATION AND GAPS ASSESSMENT 9
II. INTRODUCTION
PROGRAM OVERVIEW The purpose of the USAID Economic Security Program is to accelerate broad-based growth of sectors
outside of agriculture that show strong potential to create jobs, to increase incomes, to increase micro,
small, and medium enterprise (MSME) revenues, and to support diversification to more productive
economic activities, including tourism and up to three additional sectors.
In fulfilling this purpose, the Program focuses on sectors and value chains that have the most potential to
produce investment that will create high-value jobs for Georgians. This requires identifying and
improving the eco-system for each value chain, including both the supply and demand-sides, as well as
skills development of the workforce, strengthening of institutions that support these value chains, and
establishment of co-funding partnerships that catalyze investment and strengthen MSME positioning
within the value chains.
The Program scales up impact through synergy, strategic partnerships and investments, while building
collaborative alliances between government, the private sector, and civil society. Its innovative and
empowering approach creates Georgian solutions to the country’s challenges by encouraging co-design
and constructive dialogue. The Program will create at least 4,000 new jobs, support at least 600 MSMEs,
increase sales of assisted enterprises by $50 million, and leverage $15 million in investment through
partnerships.
REPORT OBJECTIVE The objective of this report is to prioritize up to three additional sectors outside of tourism for
Program support, and to propose high potential value chains within these sectors and the tourism
sector which will be targeted by the Program for support. Report identifies high potential market
growth opportunities in these value chains and constraints to growth/significant gaps in realizing these
opportunities; proposes interventions to overcome these constraints, including cost-shared grants and
technical assistance; and identifies GOG, donor, private sector resources available that can be accessed
in order to leverage and maximize the impact of program assistance, including possibilities for developing
public-private partnerships, Global Development Alliances and other partnerships.
The report first provides an overview of the methodology and outcome of sector and value chain
prioritization. Then it provides a summary of findings for each priority value chain, including overview of
key market opportunities, the business case and expected impact, along with identified gaps and
proposed actions. For each priority value chain, a detailed value chain analysis report is included in the
Annex. The report concludes with an analysis of investment eco-system, mapping of industry leaders and
private sector investment funds and identification of opportunities to access funding for priority
investment needs in targeted value chains, including potential public-private partnership opportunities.
VALUE CHAIN PRIORITIZATION AND GAPS ASSESSMENT 10
III. SECTOR AND VALUE CHAIN PRIORITIZATION
Part and parcel of the Program’s overall approach to competitiveness is the identification of sectors and
value chains that hold the most potential for investment and high(er)-value employment. The value chain
assessments lay the foundation for the Program’s work to embrace opportunities, establish market
linkages, structure Public-Private Partnerships (PPPs) and much more.
To identify and prioritize high potential sectors and value chains within them, the Economic Security
Program used the DAI’s Competitiveness Appraisal Matrix (CAM) methodology. This methodology has
been used around the world to gauge overall competitiveness and investment/job creation potential of
sectors and value chains. It is consistent with international best practices, having been developed by
some of the foremost experts in international economic development.14 This methodology uses a pre-
defined set of selection criteria and sub-criteria with pre-assigned weights. The CAM is then used to
score all potential value chains on a 1-7 scale to determine overall scores and rankings to allow for cross
value chain comparisons using numeric scores.
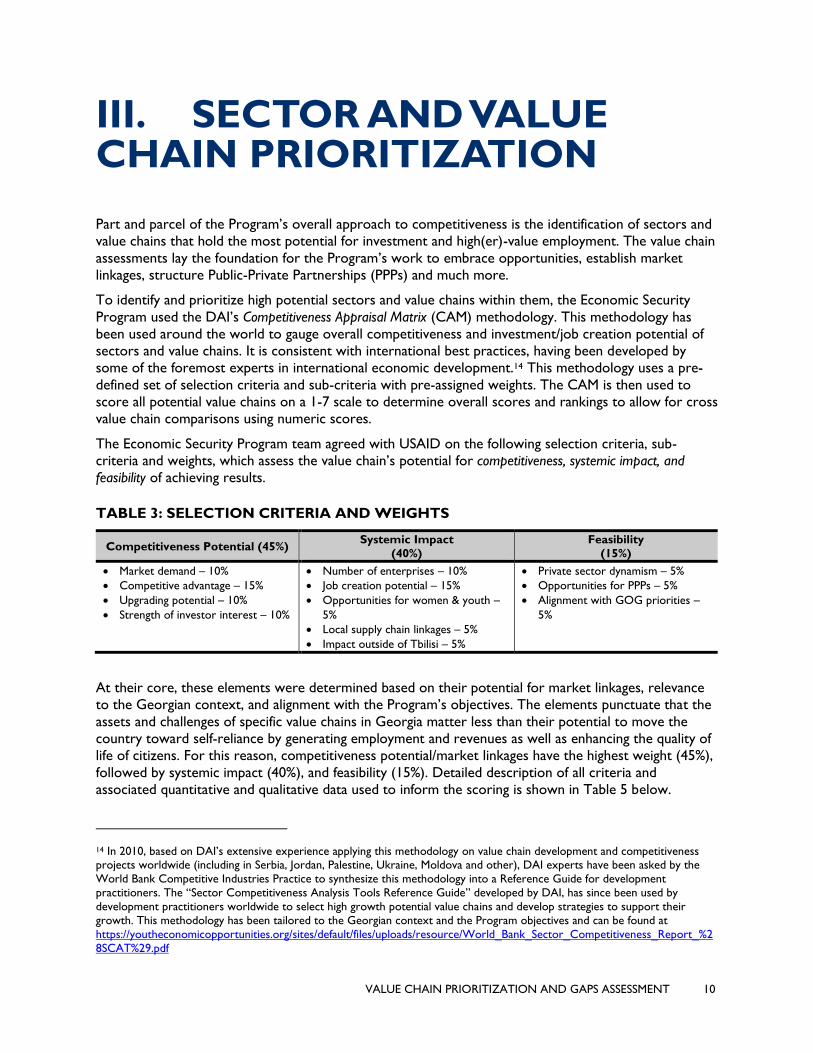
The Economic Security Program team agreed with USAID on the following selection criteria, sub-
criteria and weights, which assess the value chain’s potential for competitiveness, systemic impact, and
feasibility of achieving results.
TABLE 3: SELECTION CRITERIA AND WEIGHTS
Competitiveness Potential (45%) Systemic Impact
(40%)
Feasibility
(15%)
• Market demand – 10%
• Competitive advantage – 15%
• Upgrading potential – 10%
• Strength of investor interest – 10%
• Number of enterprises – 10%
• Job creation potential – 15%
• Opportunities for women & youth –
5%
• Local supply chain linkages – 5%
• Impact outside of Tbilisi – 5%
• Private sector dynamism – 5%
• Opportunities for PPPs – 5%
• Alignment with GOG priorities –
5%
At their core, these elements were determined based on their potential for market linkages, relevance
to the Georgian context, and alignment with the Program’s objectives. The elements punctuate that the
assets and challenges of specific value chains in Georgia matter less than their potential to move the
country toward self-reliance by generating employment and revenues as well as enhancing the quality of
life of citizens. For this reason, competitiveness potential/market linkages have the highest weight (45%),
followed by systemic impact (40%), and feasibility (15%). Detailed description of all criteria and
associated quantitative and qualitative data used to inform the scoring is shown in Table 5 below.
14 In 2010, based on DAI’s extensive experience applying this methodology on value chain development and competitiveness projects worldwide (including in Serbia, Jordan, Palestine, Ukraine, Moldova and other), DAI experts have been asked by the
World Bank Competitive Industries Practice to synthesize this methodology into a Reference Guide for development
practitioners. The “Sector Competitiveness Analysis Tools Reference Guide” developed by DAI, has since been used by
development practitioners worldwide to select high growth potential value chains and develop strategies to support their
growth. This methodology has been tailored to the Georgian context and the Program objectives and can be found at
https://youtheconomicopportunities.org/sites/default/files/uploads/resource/World_Bank_Sector_Competitiveness_Report_%2
8SCAT%29.pdf
VALUE CHAIN PRIORITIZATION AND GAPS ASSESSMENT 11
The Program’s focus is on those value chains that it believes have the most potential to generate
investment, increased employment opportunities, and enhanced revenues for enterprises. Based on
global experience, the Program’s leadership believes that taking a broad view of potential opportunities
is the key to finding niche areas (differentiators) that might be the quickest and most productive path to
achieving program goals. With this in mind, the Program first identified a long-list of sectors and value
chain groupings within them that have traditionally been important to Georgia and/or that could have
market potential based on current trends.
These value chains were then subject to in-depth data collection and were scored using the CAM based
on the data collected. As a result, several value chains were selected for in-depth value chain
assessments. These assessments focused on identifying specific market niche opportunities (business
activities) that provide the best opportunity for differentiation and thus the ability to generate
investment and increase employment.
In-depth value chain assessments focused on identifying market opportunities, key constraints to growth,
and interventions to address these constraints, including opportunities for public-private partnerships. In
each assessment, the team looked at the entire eco-system of a value chain, to determine how each area
can be linked to provide the clearest path to investment and job creation. In examining the eco-system,
team members looked carefully at the elements that lay the groundwork for investment such as: a)
workforce, b) infrastructure, c) access to finance, d) current visibility, e) market size, f) global demand, g)
business services, h) policy and enabling environment, and i) potential market linkages. The objective of
the assessments was to move beyond a simple categorization of assets and challenges in each value
chain, but instead to identify high potential market opportunities with investment and job creation
potential and develop a business case for each. Throughout this process the team consulted with end
market information sources and experts to ensure that analysis is grounded in global market trends and
requirements.
Throughout the value chain prioritization and in-depth analysis, the team used the following definitions:
• Sector is defined as a broad categorization of related business activities and groups of firms
producing same or similar products or services.
• Value chain is defined as a chain of activities required to bring a particular product or a set of
related products from inputs to end markets, where the product passes through each activity in a
value chain and gains some value at each stage.
• Business activity is a specific industry/product or service segment within a value chain which is
defined by a specific end market niche/opportunity.
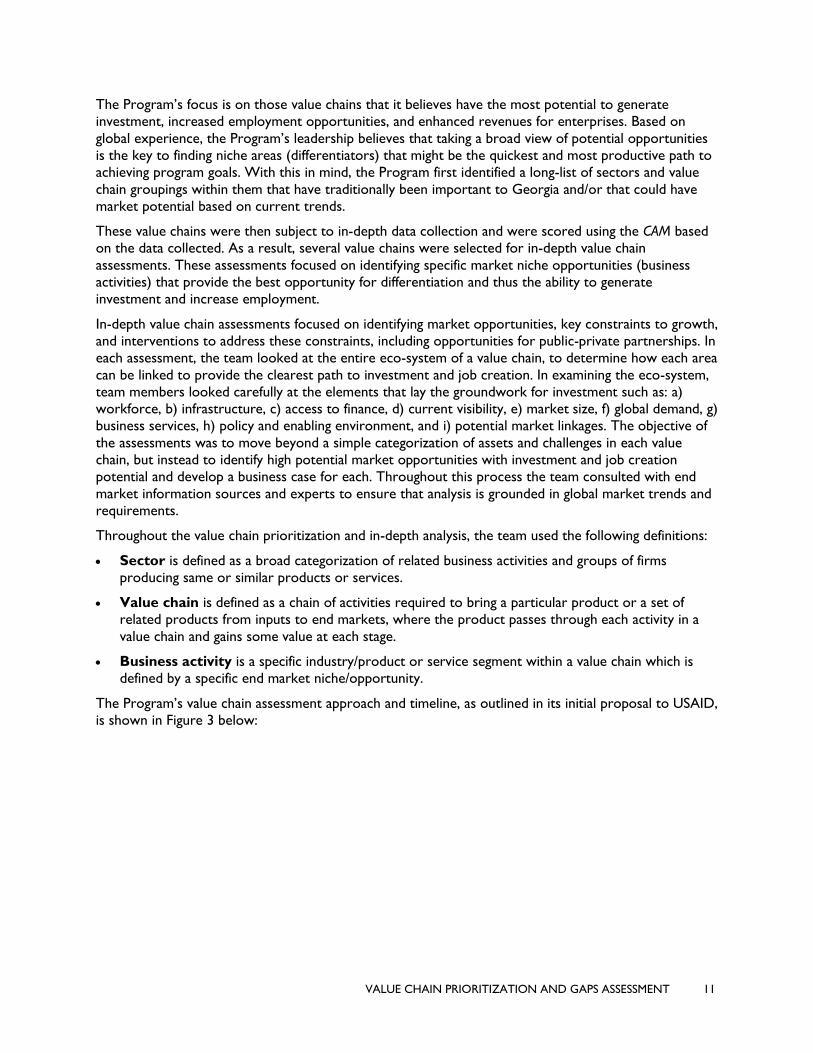
The Program’s value chain assessment approach and timeline, as outlined in its initial proposal to USAID,
is shown in Figure 3 below:
VALUE CHAIN PRIORITIZATION AND GAPS ASSESSMENT 12
FIGURE 3: VC ASSESSMENT APPROACH
The Program’s approach to conducting the value chain assessments was based on the following multi-
step process designed to ensure thorough analysis as well as assessment of market potential.
TABLE 4: SECTOR AND VALUE CHAIN EXPLORATION PROCESS
Process
Step Focus Outcome
1 Sector/VC Identification
and Grouping
Identification of sectors/VCs that may have the most potential
2 Data Collection Collection of quantitative and qualitative data on identified sectors/VCs
3 Trend Analysis and
Scoring
Initial analysis of sector/VC trends and scoring based on data collected
4 Narrowing the Focus –
Value Chain Assessments
Targeting value chains for full assessment to identify value chains and business
activities with the most potential
5 Finalization of Value
Chain Prioritization and
Gaps Assessment Report
Development and submission of Value Chain Prioritization and Gaps
Assessment Report to USAID
STEP 1: SECTOR /VC IDENTIFICATION AND GROUPING The first step of the Program’s approach was to identify those sectors and value chains that have
traditionally been important to Georgia and/or that could have market potential based on current
trends. The Program then developed broad sector categories under which to group specific value chains
(see Table 3 below). These categories might not align with those classified by the GOG or donor
organizations in the past, but based on DAI’s global experience, these groupings allowed for the
emergence of an eco-system under each sector that frames the analysis.
Industry analysis
Select Sectors and Value Chains Value Chain Gaps Assessments
Competitiveness Appraisal Matrix
VC Strategies and Action Plans
End market trends and niche market segments
Competitiveness Potential
Systemic Impact
Feasibility
Stakeholder interviewsReview existing reports
Data analysis: trade, production and importsFDI data and key investors
Data on enterprises and employmentEnd market expert interviews
Review of key government strategies
Structure of the Value Chain and service providers
Constraints to growth
Skill needs and youth economic opportunities in targeted VCs
May
Stakeholder interviews and focus group discussionsEnd market analysis and interviewsTeam “Pause and Reflect” sessions
Financial analysis
Stakeholder validation discussionsTeam workplanning sessions
Mapping of industry leaders and private sector investment funds
Interventions
High potential market niches (business activities) in VCs
Sustainability Strategy
June July August
Cross-sectoral AssessmentsPartnerships/Investment
Linkages
Steps 1-3 Step 4 Step 5
VALUE CHAIN PRIORITIZATION AND GAPS ASSESSMENT 13
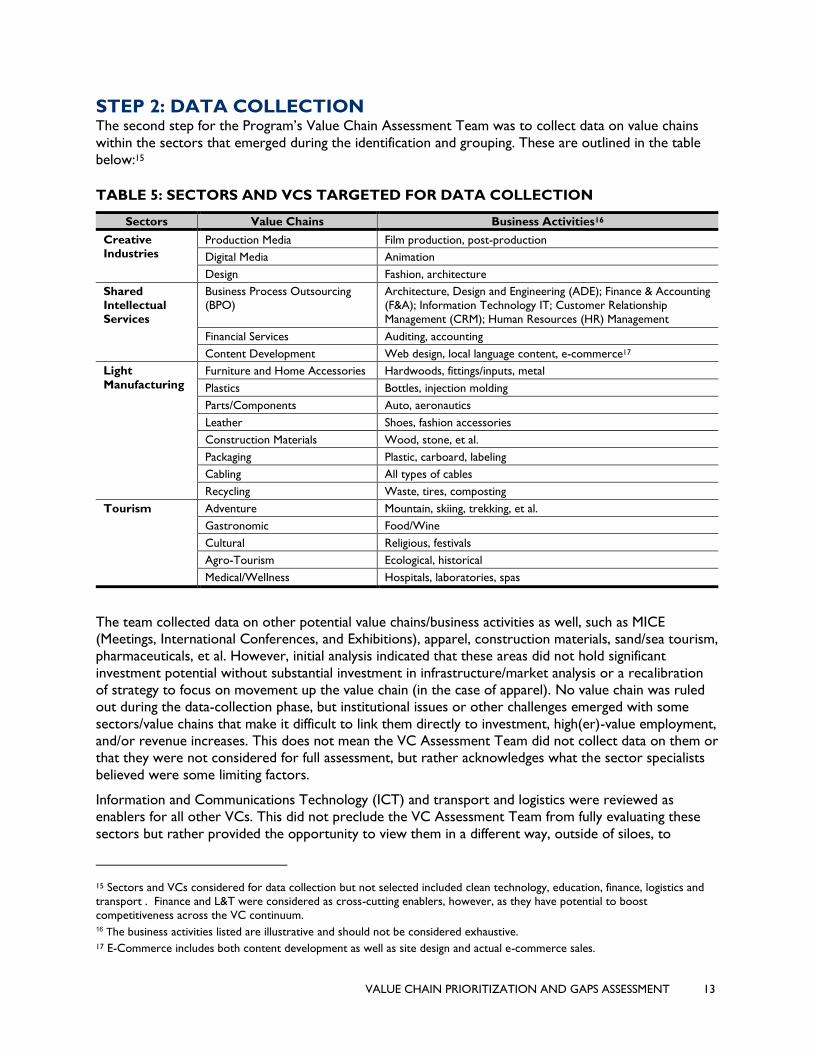
STEP 2: DATA COLLECTION The second step for the Program’s Value Chain Assessment Team was to collect data on value chains
within the sectors that emerged during the identification and grouping. These are outlined in the table
below:15
TABLE 5: SECTORS AND VCS TARGETED FOR DATA COLLECTION
Sectors Value Chains Business Activities16
Creative
Industries Production Media Film production, post-production
Digital Media Animation
Design Fashion, architecture
Shared
Intellectual
Services
Business Process Outsourcing
(BPO)
Architecture, Design and Engineering (ADE); Finance & Accounting
(F&A); Information Technology IT; Customer Relationship
Management (CRM); Human Resources (HR) Management
Financial Services Auditing, accounting
Content Development Web design, local language content, e-commerce17
Light
Manufacturing
Furniture and Home Accessories Hardwoods, fittings/inputs, metal
Plastics Bottles, injection molding
Parts/Components Auto, aeronautics
Leather Shoes, fashion accessories
Construction Materials Wood, stone, et al.
Packaging Plastic, carboard, labeling
Cabling All types of cables
Recycling Waste, tires, composting
Tourism Adventure Mountain, skiing, trekking, et al.
Gastronomic Food/Wine
Cultural Religious, festivals
Agro-Tourism Ecological, historical
Medical/Wellness Hospitals, laboratories, spas
The team collected data on other potential value chains/business activities as well, such as MICE
(Meetings, International Conferences, and Exhibitions), apparel, construction materials, sand/sea tourism,
pharmaceuticals, et al. However, initial analysis indicated that these areas did not hold significant
investment potential without substantial investment in infrastructure/market analysis or a recalibration
of strategy to focus on movement up the value chain (in the case of apparel). No value chain was ruled
out during the data-collection phase, but institutional issues or other challenges emerged with some
sectors/value chains that make it difficult to link them directly to investment, high(er)-value employment,
and/or revenue increases. This does not mean the VC Assessment Team did not collect data on them or
that they were not considered for full assessment, but rather acknowledges what the sector specialists
believed were some limiting factors.
Information and Communications Technology (ICT) and transport and logistics were reviewed as
enablers for all other VCs. This did not preclude the VC Assessment Team from fully evaluating these
sectors but rather provided the opportunity to view them in a different way, outside of siloes, to
15 Sectors and VCs considered for data collection but not selected included clean technology, education, finance, logistics and
transport . Finance and L&T were considered as cross-cutting enablers, however, as they have potential to boost
competitiveness across the VC continuum. 16 The business activities listed are illustrative and should not be considered exhaustive. 17 E-Commerce includes both content development as well as site design and actual e-commerce sales.
VALUE CHAIN PRIORITIZATION AND GAPS ASSESSMENT 14
explore their full potential as integrated parts of an overall VC eco-system. They were considered in the
data collection phase as stand-alone sectors, but the market analysis of particular sectors and value
chains would not have been complete without also considering ICT and transport and logistics as cross-
cutting enablers.
As enablers, the Program will recommend support for logistics and transportation and ICT when this
will create or enhance opportunities in priority sectors and value chains. For instance, ICT applications
within tourism (such as CRM applications, research/analysis, etc.) could add significant value to the
sector and its target VCs, thus making it an important potential intervention. Logistics and
transportation (specifically shipping/package delivery) can likewise be important to the sectors such as
artisans, which links multiple enablers. This cross-cutting approach will allow the Program to support
specific interventions that build the potential of all sectors and VCs, while not becoming embedded in a
quagmire of mega-projects that take too long to matriculate (e.g. the development of logistics hubs).
The initial data collection included both quantitative (national statistics, reports, global trade data
analysis, et al.) and qualitative (interviews, expert analysis, et al.) data. The analysis of the data collected
provided the teams with input as to which value chains within the identified sectors should be the
subject of a full assessment (see Step 3 below). As part of its due diligence, the VC Assessment Team
collected quantitative and qualitative data from a variety of sources, and focused on prior studies,
research and/or assessments that have been conducted within the identified sectors. The Program also
conducted a stakeholder mapping exercise as part of the data collection process to determine the major
players (e.g. government, national and international organizations) in each sector and value chain under
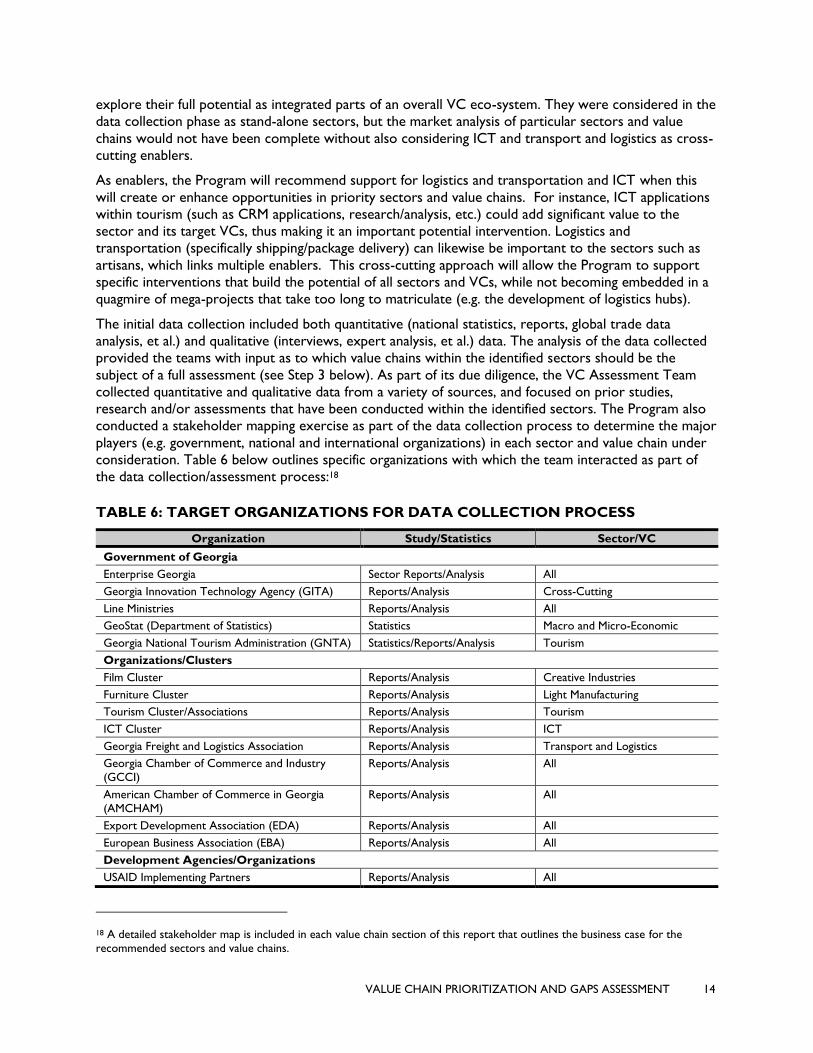
consideration. Table 6 below outlines specific organizations with which the team interacted as part of
the data collection/assessment process:18
TABLE 6: TARGET ORGANIZATIONS FOR DATA COLLECTION PROCESS
Organization Study/Statistics Sector/VC
Government of Georgia
Enterprise Georgia Sector Reports/Analysis All
Georgia Innovation Technology Agency (GITA) Reports/Analysis Cross-Cutting
Line Ministries Reports/Analysis All
GeoStat (Department of Statistics) Statistics Macro and Micro-Economic
Georgia National Tourism Administration (GNTA) Statistics/Reports/Analysis Tourism
Organizations/Clusters
Film Cluster Reports/Analysis Creative Industries
Furniture Cluster Reports/Analysis Light Manufacturing
Tourism Cluster/Associations Reports/Analysis Tourism
ICT Cluster Reports/Analysis ICT
Georgia Freight and Logistics Association Reports/Analysis Transport and Logistics
Georgia Chamber of Commerce and Industry
(GCCI) Reports/Analysis All
American Chamber of Commerce in Georgia
(AMCHAM) Reports/Analysis All
Export Development Association (EDA) Reports/Analysis All
European Business Association (EBA) Reports/Analysis All
Development Agencies/Organizations
USAID Implementing Partners Reports/Analysis All
18 A detailed stakeholder map is included in each value chain section of this report that outlines the business case for the
recommended sectors and value chains.
VALUE CHAIN PRIORITIZATION AND GAPS ASSESSMENT 15
GIZ Reports/Analysis Tourism, Furniture, Creative
Industries
Austrian Embassy Technical Cooperation Reports/Analysis Mountain (Adventure) Tourism
Millennium Challenge Corporation (MCC) Reports/Analysis All
Swedish International Development Agency (Sida) Reports/Analysis Apparel
Education
International School of Economics (ISET) Statistics/Research/Analysis All
Universities and TVET Institutions Statistics/Research/Analysis All
International/Research Organizations
World Bank Statistics/Reports/Analysis Macro and Sector-Specific
United Nations Development Program Statistics/Reports/Analysis Macro and Sector-Specific
Research Organizations
Harvard Business School Statistics/Reports/Analysis Macro and Sector-Specific
Oxford Group Statistics/Reports/Analysis All
World Travel and Tourism Council Statistics/Reports/Analysis Tourism
TCI Network Statistics/Reports/Analysis All
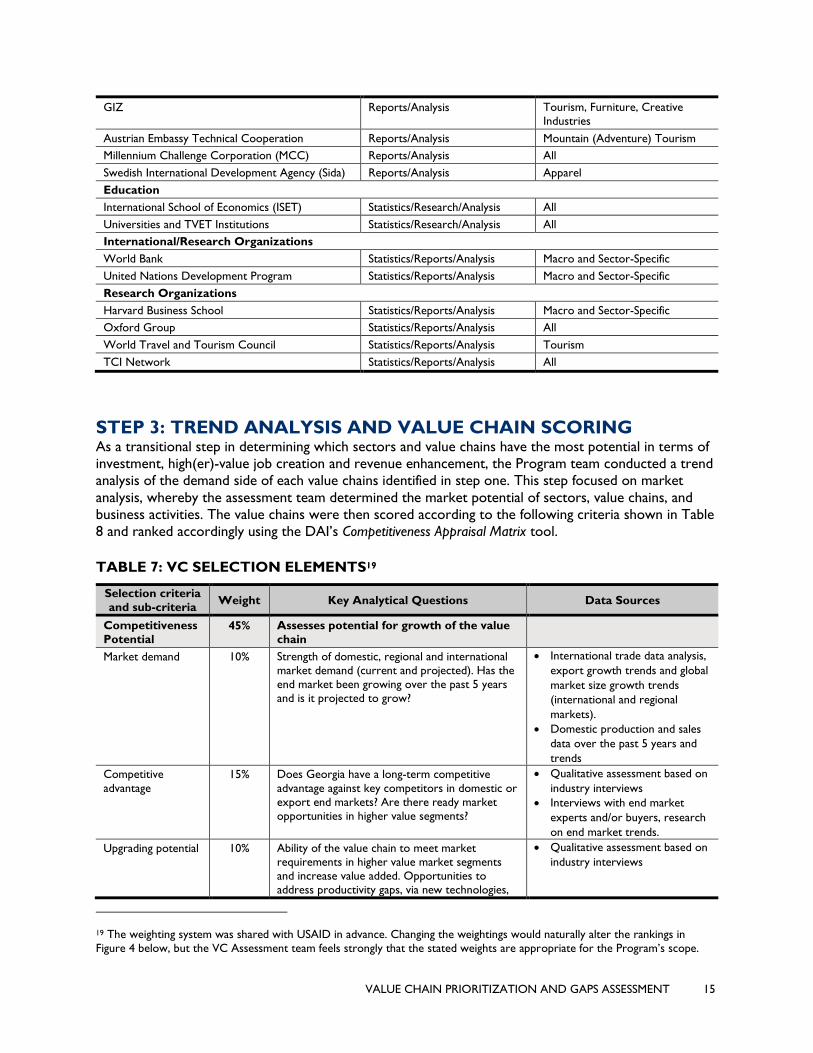
STEP 3: TREND ANALYSIS AND VALUE CHAIN SCORING As a transitional step in determining which sectors and value chains have the most potential in terms of
investment, high(er)-value job creation and revenue enhancement, the Program team conducted a trend
analysis of the demand side of each value chains identified in step one. This step focused on market
analysis, whereby the assessment team determined the market potential of sectors, value chains, and
business activities. The value chains were then scored according to the following criteria shown in Table
8 and ranked accordingly using the DAI’s Competitiveness Appraisal Matrix tool.
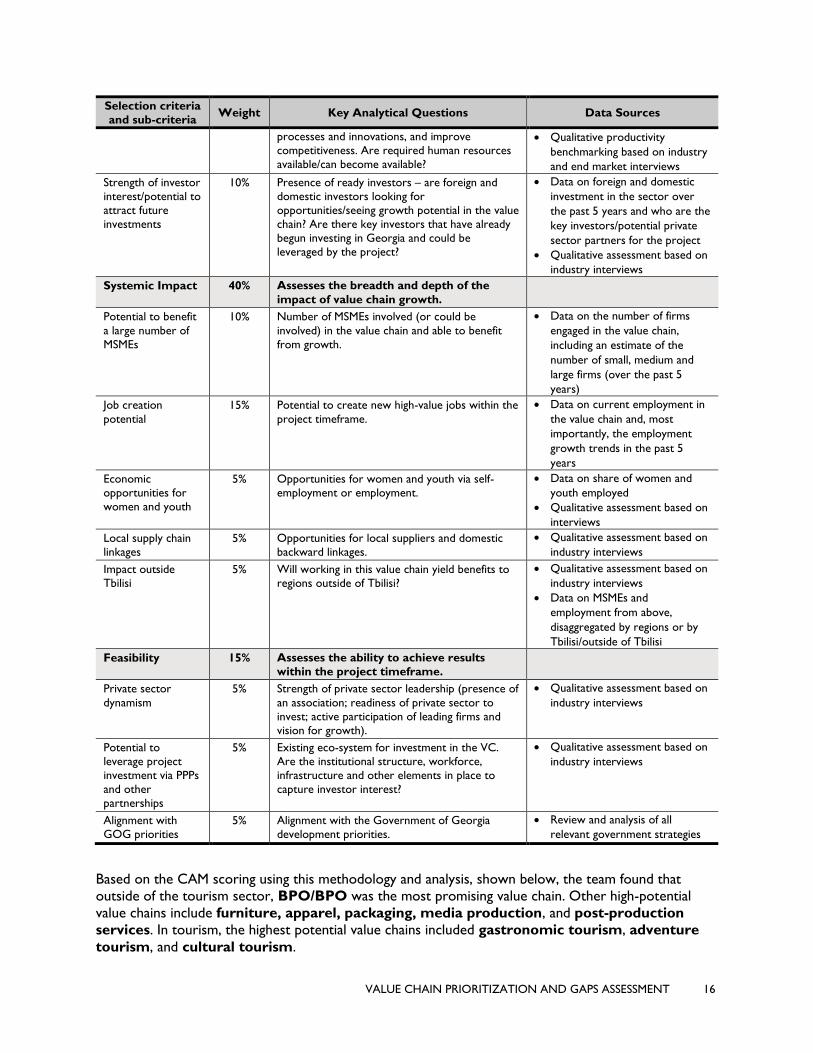
TABLE 7: VC SELECTION ELEMENTS19
Selection criteria
and sub-criteria Weight Key Analytical Questions Data Sources
Competitiveness
Potential 45% Assesses potential for growth of the value
chain
Market demand 10% Strength of domestic, regional and international
market demand (current and projected). Has the
end market been growing over the past 5 years
and is it projected to grow?
• International trade data analysis,
export growth trends and global
market size growth trends
(international and regional
markets).
• Domestic production and sales
data over the past 5 years and
trends
Competitive
advantage
15% Does Georgia have a long-term competitive
advantage against key competitors in domestic or
export end markets? Are there ready market
opportunities in higher value segments?
• Qualitative assessment based on
industry interviews
• Interviews with end market
experts and/or buyers, research
on end market trends.
Upgrading potential 10% Ability of the value chain to meet market
requirements in higher value market segments
and increase value added. Opportunities to
address productivity gaps, via new technologies,
• Qualitative assessment based on
industry interviews
19 The weighting system was shared with USAID in advance. Changing the weightings would naturally alter the rankings in
Figure 4 below, but the VC Assessment team feels strongly that the stated weights are appropriate for the Program’s scope.
VALUE CHAIN PRIORITIZATION AND GAPS ASSESSMENT 16
Selection criteria
and sub-criteria Weight Key Analytical Questions Data Sources
processes and innovations, and improve
competitiveness. Are required human resources
available/can become available?
• Qualitative productivity
benchmarking based on industry
and end market interviews
Strength of investor
interest/potential to
attract future
investments
10% Presence of ready investors – are foreign and
domestic investors looking for
opportunities/seeing growth potential in the value
chain? Are there key investors that have already
begun investing in Georgia and could be
leveraged by the project?
• Data on foreign and domestic
investment in the sector over
the past 5 years and who are the
key investors/potential private
sector partners for the project
• Qualitative assessment based on
industry interviews
Systemic Impact 40% Assesses the breadth and depth of the
impact of value chain growth.
Potential to benefit
a large number of
MSMEs
10% Number of MSMEs involved (or could be
involved) in the value chain and able to benefit
from growth.
• Data on the number of firms
engaged in the value chain,
including an estimate of the
number of small, medium and
large firms (over the past 5
years)
Job creation
potential
15% Potential to create new high-value jobs within the
project timeframe.
• Data on current employment in
the value chain and, most
importantly, the employment
growth trends in the past 5
years
Economic
opportunities for
women and youth
5% Opportunities for women and youth via self-
employment or employment.
• Data on share of women and
youth employed
• Qualitative assessment based on
interviews
Local supply chain
linkages 5% Opportunities for local suppliers and domestic
backward linkages.
• Qualitative assessment based on
industry interviews
Impact outside
Tbilisi 5% Will working in this value chain yield benefits to
regions outside of Tbilisi?
• Qualitative assessment based on
industry interviews
• Data on MSMEs and
employment from above,
disaggregated by regions or by
Tbilisi/outside of Tbilisi
Feasibility 15% Assesses the ability to achieve results
within the project timeframe.
Private sector
dynamism
5% Strength of private sector leadership (presence of
an association; readiness of private sector to
invest; active participation of leading firms and
vision for growth).
• Qualitative assessment based on
industry interviews
Potential to
leverage project
investment via PPPs
and other
partnerships
5% Existing eco-system for investment in the VC.
Are the institutional structure, workforce,
infrastructure and other elements in place to
capture investor interest?
• Qualitative assessment based on
industry interviews
Alignment with
GOG priorities 5% Alignment with the Government of Georgia
development priorities.
• Review and analysis of all
relevant government strategies
Based on the CAM scoring using this methodology and analysis, shown below, the team found that
outside of the tourism sector, BPO/BPO was the most promising value chain. Other high-potential
value chains include furniture, apparel, packaging, media production, and post-production
services. In tourism, the highest potential value chains included gastronomic tourism, adventure
tourism, and cultural tourism.
VALUE CHAIN PRIORITIZATION AND GAPS ASSESSMENT 17
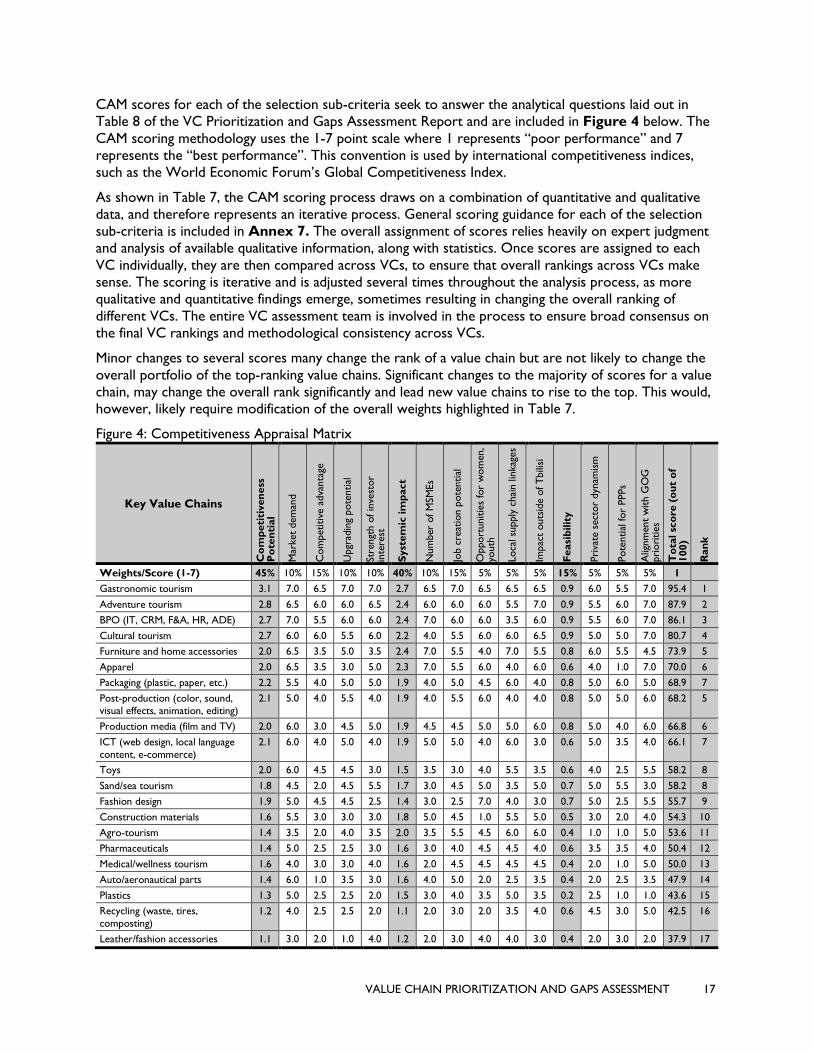
CAM scores for each of the selection sub-criteria seek to answer the analytical questions laid out in
Table 8 of the VC Prioritization and Gaps Assessment Report and are included in Figure 4 below. The
CAM scoring methodology uses the 1-7 point scale where 1 represents “poor performance” and 7
represents the “best performance”. This convention is used by international competitiveness indices,
such as the World Economic Forum’s Global Competitiveness Index.
As shown in Table 7, the CAM scoring process draws on a combination of quantitative and qualitative
data, and therefore represents an iterative process. General scoring guidance for each of the selection
sub-criteria is included in Annex 7. The overall assignment of scores relies heavily on expert judgment
and analysis of available qualitative information, along with statistics. Once scores are assigned to each
VC individually, they are then compared across VCs, to ensure that overall rankings across VCs make
sense. The scoring is iterative and is adjusted several times throughout the analysis process, as more
qualitative and quantitative findings emerge, sometimes resulting in changing the overall ranking of
different VCs. The entire VC assessment team is involved in the process to ensure broad consensus on
the final VC rankings and methodological consistency across VCs.
Minor changes to several scores many change the rank of a value chain but are not likely to change the
overall portfolio of the top-ranking value chains. Significant changes to the majority of scores for a value
chain, may change the overall rank significantly and lead new value chains to rise to the top. This would,
however, likely require modification of the overall weights highlighted in Table 7.
Figure 4: Competitiveness Appraisal Matrix
Key Value Chains
Co
mp
eti
tiven
ess
P
ote
nti
al
Mar
ket
dem
and
Com
petitive
adva
nta
ge
Upgr
adin
g pote
ntial
Str
engt
h o
f in
vest
or
inte
rest
Syst
em
ic im
pact
Num
ber
of M
SM
Es
Job c
reat
ion p
ote
ntial
Opport
unitie
s fo
r w
om
en,
youth
Loca
l su
pply
chai
n lin
kag
es
Impac
t outs
ide o
f T
bili
si
Feasi
bilit
y
Pri
vate
sect
or
dyn
amis
m
Pote
ntial
for
PPPs
Alig
nm
ent
with G
OG
pri
ori
ties
To
tal sc
ore
(o
ut
of
100)
Ran
k
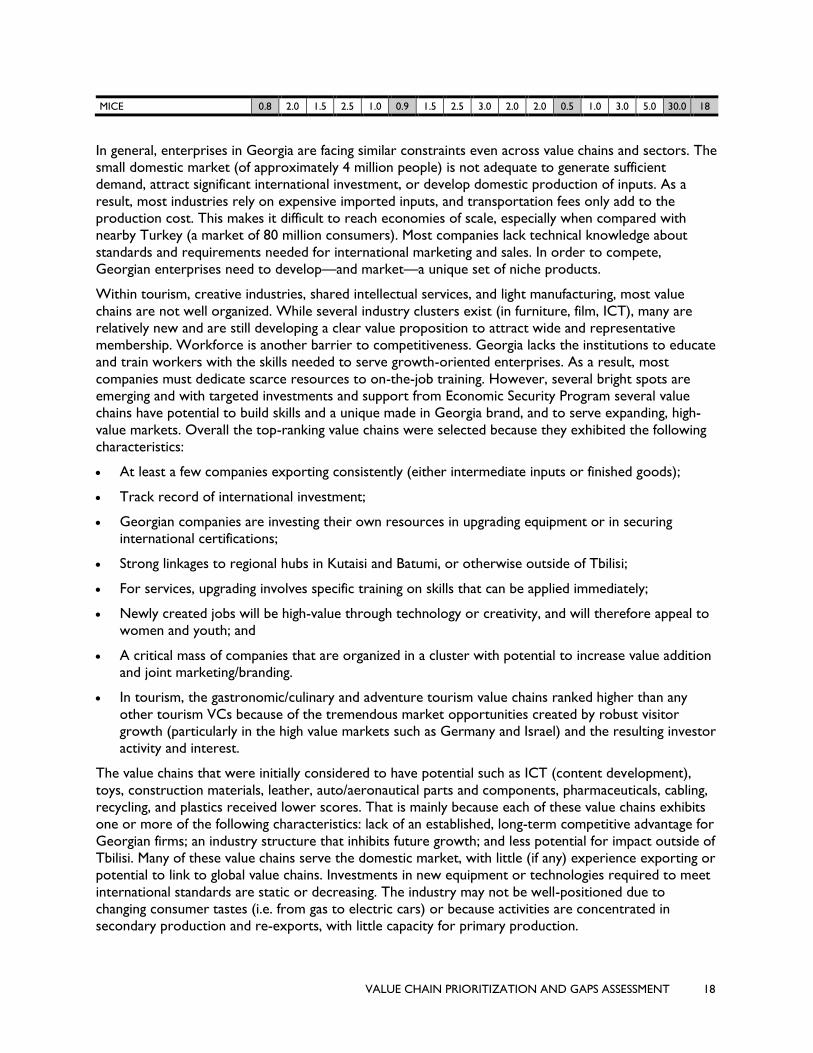
Weights/Score (1-7) 45% 10% 15% 10% 10% 40% 10% 15% 5% 5% 5% 15% 5% 5% 5% 1
Gastronomic tourism 3.1 7.0 6.5 7.0 7.0 2.7 6.5 7.0 6.5 6.5 6.5 0.9 6.0 5.5 7.0 95.4 1
Adventure tourism 2.8 6.5 6.0 6.0 6.5 2.4 6.0 6.0 6.0 5.5 7.0 0.9 5.5 6.0 7.0 87.9 2
BPO (IT, CRM, F&A, HR, ADE) 2.7 7.0 5.5 6.0 6.0 2.4 7.0 6.0 6.0 3.5 6.0 0.9 5.5 6.0 7.0 86.1 3
Cultural tourism 2.7 6.0 6.0 5.5 6.0 2.2 4.0 5.5 6.0 6.0 6.5 0.9 5.0 5.0 7.0 80.7 4
Furniture and home accessories 2.0 6.5 3.5 5.0 3.5 2.4 7.0 5.5 4.0 7.0 5.5 0.8 6.0 5.5 4.5 73.9 5
Apparel 2.0 6.5 3.5 3.0 5.0 2.3 7.0 5.5 6.0 4.0 6.0 0.6 4.0 1.0 7.0 70.0 6
Packaging (plastic, paper, etc.) 2.2 5.5 4.0 5.0 5.0 1.9 4.0 5.0 4.5 6.0 4.0 0.8 5.0 6.0 5.0 68.9 7
Post-production (color, sound,
visual effects, animation, editing)
2.1 5.0 4.0 5.5 4.0 1.9 4.0 5.5 6.0 4.0 4.0 0.8 5.0 5.0 6.0 68.2 5
Production media (film and TV) 2.0 6.0 3.0 4.5 5.0 1.9 4.5 4.5 5.0 5.0 6.0 0.8 5.0 4.0 6.0 66.8 6
ICT (web design, local language
content, e-commerce)
2.1 6.0 4.0 5.0 4.0 1.9 5.0 5.0 4.0 6.0 3.0 0.6 5.0 3.5 4.0 66.1 7
Toys 2.0 6.0 4.5 4.5 3.0 1.5 3.5 3.0 4.0 5.5 3.5 0.6 4.0 2.5 5.5 58.2 8
Sand/sea tourism 1.8 4.5 2.0 4.5 5.5 1.7 3.0 4.5 5.0 3.5 5.0 0.7 5.0 5.5 3.0 58.2 8
Fashion design 1.9 5.0 4.5 4.5 2.5 1.4 3.0 2.5 7.0 4.0 3.0 0.7 5.0 2.5 5.5 55.7 9
Construction materials 1.6 5.5 3.0 3.0 3.0 1.8 5.0 4.5 1.0 5.5 5.0 0.5 3.0 2.0 4.0 54.3 10
Agro-tourism 1.4 3.5 2.0 4.0 3.5 2.0 3.5 5.5 4.5 6.0 6.0 0.4 1.0 1.0 5.0 53.6 11
Pharmaceuticals 1.4 5.0 2.5 2.5 3.0 1.6 3.0 4.0 4.5 4.5 4.0 0.6 3.5 3.5 4.0 50.4 12
Medical/wellness tourism 1.6 4.0 3.0 3.0 4.0 1.6 2.0 4.5 4.5 4.5 4.5 0.4 2.0 1.0 5.0 50.0 13
Auto/aeronautical parts 1.4 6.0 1.0 3.5 3.0 1.6 4.0 5.0 2.0 2.5 3.5 0.4 2.0 2.5 3.5 47.9 14
Plastics 1.3 5.0 2.5 2.5 2.0 1.5 3.0 4.0 3.5 5.0 3.5 0.2 2.5 1.0 1.0 43.6 15
Recycling (waste, tires,
composting) 1.2 4.0 2.5 2.5 2.0 1.1 2.0 3.0 2.0 3.5 4.0 0.6 4.5 3.0 5.0 42.5 16
Leather/fashion accessories 1.1 3.0 2.0 1.0 4.0 1.2 2.0 3.0 4.0 4.0 3.0 0.4 2.0 3.0 2.0 37.9 17
VALUE CHAIN PRIORITIZATION AND GAPS ASSESSMENT 18
MICE 0.8 2.0 1.5 2.5 1.0 0.9 1.5 2.5 3.0 2.0 2.0 0.5 1.0 3.0 5.0 30.0 18
In general, enterprises in Georgia are facing similar constraints even across value chains and sectors. The
small domestic market (of approximately 4 million people) is not adequate to generate sufficient
demand, attract significant international investment, or develop domestic production of inputs. As a
result, most industries rely on expensive imported inputs, and transportation fees only add to the
production cost. This makes it difficult to reach economies of scale, especially when compared with
nearby Turkey (a market of 80 million consumers). Most companies lack technical knowledge about
standards and requirements needed for international marketing and sales. In order to compete,
Georgian enterprises need to develop—and market—a unique set of niche products.
Within tourism, creative industries, shared intellectual services, and light manufacturing, most value
chains are not well organized. While several industry clusters exist (in furniture, film, ICT), many are
relatively new and are still developing a clear value proposition to attract wide and representative
membership. Workforce is another barrier to competitiveness. Georgia lacks the institutions to educate
and train workers with the skills needed to serve growth-oriented enterprises. As a result, most
companies must dedicate scarce resources to on-the-job training. However, several bright spots are
emerging and with targeted investments and support from Economic Security Program several value
chains have potential to build skills and a unique made in Georgia brand, and to serve expanding, high-
value markets. Overall the top-ranking value chains were selected because they exhibited the following
characteristics:
• At least a few companies exporting consistently (either intermediate inputs or finished goods);
• Track record of international investment;
• Georgian companies are investing their own resources in upgrading equipment or in securing
international certifications;
• Strong linkages to regional hubs in Kutaisi and Batumi, or otherwise outside of Tbilisi;
• For services, upgrading involves specific training on skills that can be applied immediately;
• Newly created jobs will be high-value through technology or creativity, and will therefore appeal to
women and youth; and
• A critical mass of companies that are organized in a cluster with potential to increase value addition
and joint marketing/branding.
• In tourism, the gastronomic/culinary and adventure tourism value chains ranked higher than any
other tourism VCs because of the tremendous market opportunities created by robust visitor
growth (particularly in the high value markets such as Germany and Israel) and the resulting investor
activity and interest.
The value chains that were initially considered to have potential such as ICT (content development),
toys, construction materials, leather, auto/aeronautical parts and components, pharmaceuticals, cabling,
recycling, and plastics received lower scores. That is mainly because each of these value chains exhibits
one or more of the following characteristics: lack of an established, long-term competitive advantage for
Georgian firms; an industry structure that inhibits future growth; and less potential for impact outside of
Tbilisi. Many of these value chains serve the domestic market, with little (if any) experience exporting or
potential to link to global value chains. Investments in new equipment or technologies required to meet
international standards are static or decreasing. The industry may not be well-positioned due to
changing consumer tastes (i.e. from gas to electric cars) or because activities are concentrated in
secondary production and re-exports, with little capacity for primary production.
VALUE CHAIN PRIORITIZATION AND GAPS ASSESSMENT 19
Structural factors also contributed to lower scores for these value chains. Many are characterized by
only a few active companies, largely small-scale and without an industry leader, though some are
dominated by a few international firms with little need for donor support. In general, there are no
existing clusters or associations to support dissemination of technical knowledge, professional training
opportunities, or pool resources for trade fairs or other promotional activities. Existing companies may
be operating in competitive environments where such significant investment is needed to make them
competitive that the Program’s interventions would likely not make an impact. Employment is either
stable or shrinking, and new jobs are likely to be highly automated, low-skill positions. Finally, these
value chains are not effectively linked to other, related industries that could help them to capitalize on
economies of scale. Because they are concentrated in and around Tbilisi, they are not likely to create
linkages to outlying areas and therefore have little potential to impact areas outside the capital.
Potential however has been noted for e-commerce, as an emerging niche within the BPO value chain. In
addition, while fashion design on its own was not considered a viable value chains, in subsequent
explorations the team determined that broader artisanal value chain (including fashion design, high-end
home accessories, interior design) presents potential growth opportunities. Therefore, while these value
chains where not selected for in-depth assessment, they were nevertheless explored by the team in
subsequent analyses and discussions with private sector stakeholders and potential investors. Initial
findings are included in this report.
STEP 4: NARROWING THE FOCUS – VALUE CHAIN ASSESSMENTS Following the CAM scoring, all top-ranking value chains were selected for in-depth assessment with the
exception of apparel. Since GIZ provides support to the apparel sector, , additional interventions from
Economic Security Program could dilute the effectiveness of support and would require close ongoing
coordination with GIZ to minimize duplication of efforts. With a rather small cohort of export-ready
(or near export-ready) companies in apparel, the value to the industry of simultaneous support by two
different donors is questionable. In addition, the current status of the apparel sector in Georgia is clearly
“Red Ocean” in most value chains, focusing primarily on cut-and-sew processes where it will be
increasingly difficult for Georgian producers to compete with global competition. At that level of the
value continuum, success revolves primarily around price competitiveness, which will be difficult for
Georgian apparel firms to maintain.
While Information and Communications Technology (ICT) and Transport and Logistics were not
selected as stand-alone value chains for support, they were reviewed as enablers for all other value
chains and constraints/opportunities related to those areas where evaluated as part of the overall eco-
system for targeted value chains.
As part of assessing the value chains, VC Assessment Team looked carefully at specific business activities
that provided the best opportunity for differentiation and thus the ability to generate investment and
increase employment. VC assessments identified market opportunities, key constraints to growth, and
interventions to address these constraints. In each assessment, the team looked at the entire eco-
system of a value chain, to determine how each area could be linked to provide the clearest path to
investment and job creation. The VC Assessment Team looked at each broad sector and the value
chains within them through the lens of a potential investor. This allowed them to move beyond a simple
categorization of assets and challenges in each, and instead see its investment and job creation potential.
As part of each value chain assessment, the Program also conducted a private sector mapping exercise
for each sector and value chain that included potential partners, investors, GOG entities and potential
PPP and GDA partners. In addition, cross-value chain mapping of industry leaders and private sector
investment funds were conducted in order to identify those individuals and companies that can address
investment, job creation, and revenue growth needs in each value chain.
VALUE CHAIN PRIORITIZATION AND GAPS ASSESSMENT 20
In addition to the market potential of each recommended value chain, the Assessment Team evaluated
them in terms of ADS 225.3.1 “Relocation of U.S. Jobs.” DAI will comply fully with the ADS regulation
prohibiting support for activities that could potentially relocate U.S. jobs or compete with U.S. interests.
In doing so, it will carefully analyze each potential opportunity in terms of whether it is “permitted”
under the regulation, “not permitted,” or considered a “gray area activity.” In terms of the former, the
Program will consider the opportunity on its merits based on the approved modality for evaluation (e.g.
grants manual or PDF approval matrix). Opportunities that fall in the “not permitted” category will not
be pursued regardless of their merits. “Gray area” activities will be fully vetted to ensure that no
potential to negatively impact U.S. jobs exists. In doing so, it will utilize the guidance under ADS
225.3.1.6. Should this analysis find that the opportunity is indeed “not permitted” under the ADS
regulation, the Program will not recommend it for support. In terms of opportunities that are
supported by grants, the grant agreement will the relevant clause or provision prohibited the recipient
or contractor from implementing prohibited activities. This will also apply agreements with private
entities and government institutions.
The Program’s findings are included in this report, which justifies the selection of priority sectors, value
chains, and business activities for inclusion in the Program’s implementation. A summary of market
analysis for the value chains within each sector and a business case for each of the high potential
business activities within these value chains is included in the following sections. In-depth assessments
for each of the value chains are included in the Annex.
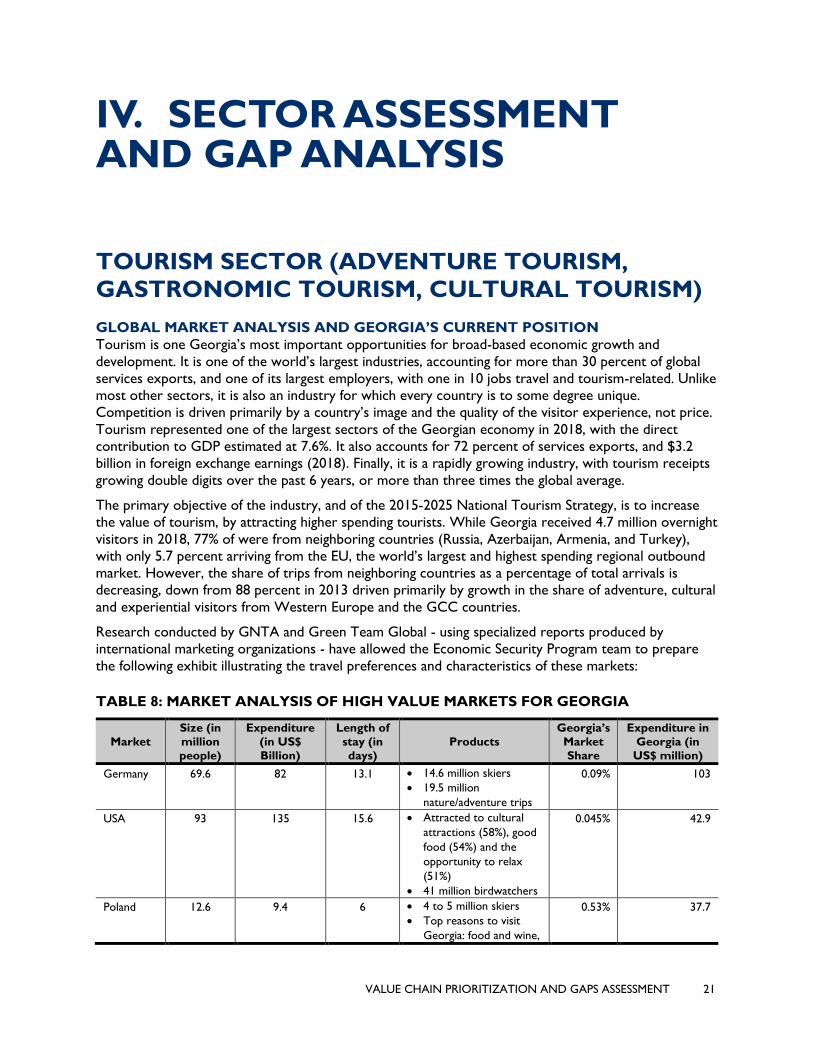
VALUE CHAIN PRIORITIZATION AND GAPS ASSESSMENT 21
IV. SECTOR ASSESSMENT AND GAP ANALYSIS
TOURISM SECTOR (ADVENTURE TOURISM,
GASTRONOMIC TOURISM, CULTURAL TOURISM)
GLOBAL MARKET ANALYSIS AND GEORGIA’S CURRENT POSITION
Tourism is one Georgia’s most important opportunities for broad-based economic growth and
development. It is one of the world’s largest industries, accounting for more than 30 percent of global
services exports, and one of its largest employers, with one in 10 jobs travel and tourism-related. Unlike
most other sectors, it is also an industry for which every country is to some degree unique.
Competition is driven primarily by a country’s image and the quality of the visitor experience, not price.
Tourism represented one of the largest sectors of the Georgian economy in 2018, with the direct
contribution to GDP estimated at 7.6%. It also accounts for 72 percent of services exports, and $3.2
billion in foreign exchange earnings (2018). Finally, it is a rapidly growing industry, with tourism receipts
growing double digits over the past 6 years, or more than three times the global average.
The primary objective of the industry, and of the 2015-2025 National Tourism Strategy, is to increase
the value of tourism, by attracting higher spending tourists. While Georgia received 4.7 million overnight
visitors in 2018, 77% of were from neighboring countries (Russia, Azerbaijan, Armenia, and Turkey),
with only 5.7 percent arriving from the EU, the world’s largest and highest spending regional outbound
market. However, the share of trips from neighboring countries as a percentage of total arrivals is
decreasing, down from 88 percent in 2013 driven primarily by growth in the share of adventure, cultural
and experiential visitors from Western Europe and the GCC countries.
Research conducted by GNTA and Green Team Global - using specialized reports produced by
international marketing organizations - have allowed the Economic Security Program team to prepare
the following exhibit illustrating the travel preferences and characteristics of these markets:
TABLE 8: MARKET ANALYSIS OF HIGH VALUE MARKETS FOR GEORGIA
Market
Size (in
million
people)
Expenditure
(in US$
Billion)
Length of
stay (in
days)
Products
Georgia’s
Market
Share
Expenditure in
Georgia (in
US$ million)
Germany 69.6 82 13.1 • 14.6 million skiers
• 19.5 million
nature/adventure trips
0.09% 103
USA 93 135 15.6 • Attracted to cultural
attractions (58%), good
food (54%) and the
opportunity to relax
(51%)
• 41 million birdwatchers
0.045% 42.9
Poland 12.6 9.4 6 • 4 to 5 million skiers
• Top reasons to visit
Georgia: food and wine,
0.53% 37.7
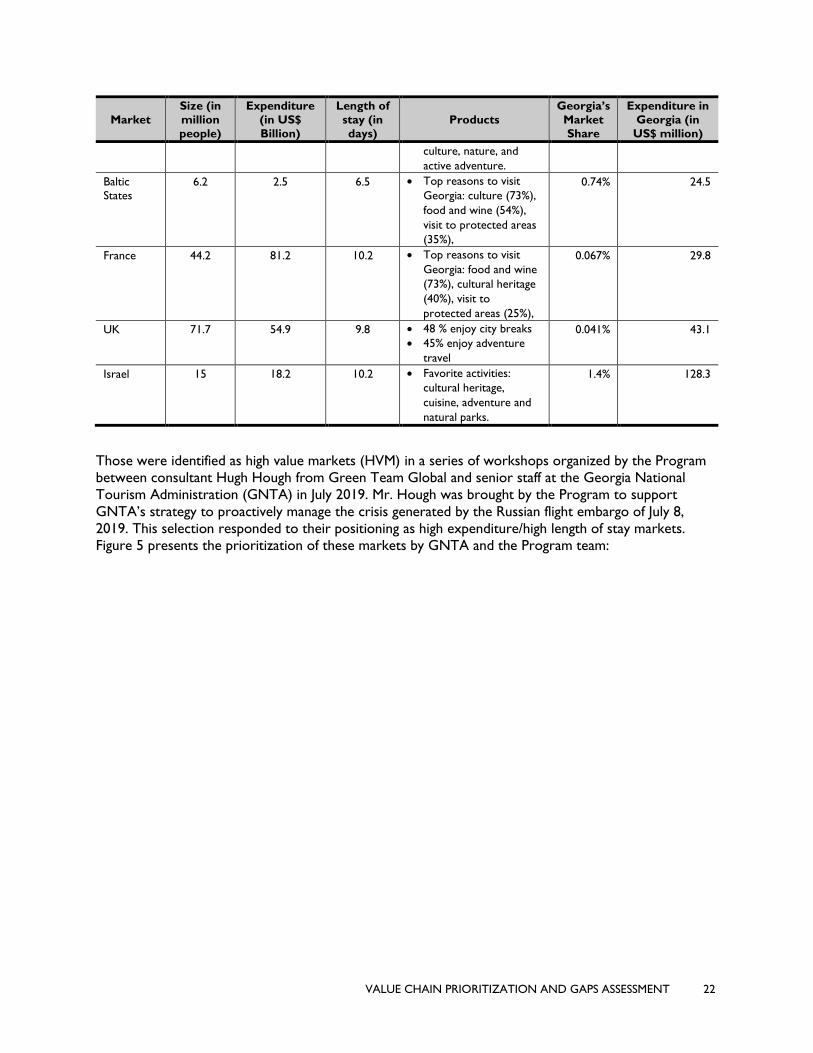
VALUE CHAIN PRIORITIZATION AND GAPS ASSESSMENT 22
Market
Size (in
million
people)
Expenditure
(in US$
Billion)
Length of
stay (in
days)
Products
Georgia’s
Market
Share
Expenditure in
Georgia (in
US$ million)
culture, nature, and
active adventure.
Baltic
States 6.2 2.5 6.5 • Top reasons to visit
Georgia: culture (73%),
food and wine (54%),
visit to protected areas
(35%),
0.74% 24.5
France 44.2 81.2 10.2 • Top reasons to visit
Georgia: food and wine
(73%), cultural heritage
(40%), visit to
protected areas (25%),
0.067% 29.8
UK 71.7 54.9 9.8 • 48 % enjoy city breaks
• 45% enjoy adventure
travel
0.041% 43.1
Israel 15 18.2 10.2 • Favorite activities:
cultural heritage,
cuisine, adventure and
natural parks.
1.4% 128.3
Those were identified as high value markets (HVM) in a series of workshops organized by the Program
between consultant Hugh Hough from Green Team Global and senior staff at the Georgia National
Tourism Administration (GNTA) in July 2019. Mr. Hough was brought by the Program to support
GNTA’s strategy to proactively manage the crisis generated by the Russian flight embargo of July 8,
2019. This selection responded to their positioning as high expenditure/high length of stay markets.
Figure 5 presents the prioritization of these markets by GNTA and the Program team:
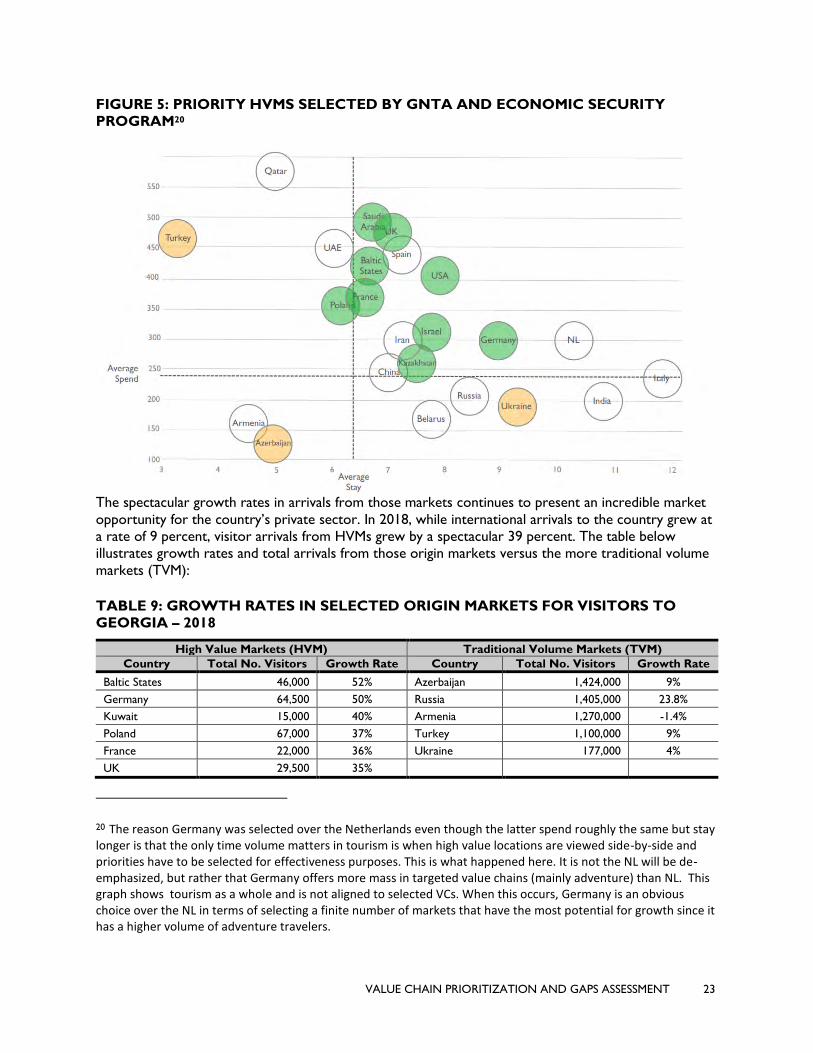
VALUE CHAIN PRIORITIZATION AND GAPS ASSESSMENT 23
FIGURE 5: PRIORITY HVMS SELECTED BY GNTA AND ECONOMIC SECURITY
PROGRAM20
The spectacular growth rates in arrivals from those markets continues to present an incredible market
opportunity for the country’s private sector. In 2018, while international arrivals to the country grew at
a rate of 9 percent, visitor arrivals from HVMs grew by a spectacular 39 percent. The table below
illustrates growth rates and total arrivals from those origin markets versus the more traditional volume
markets (TVM):
TABLE 9: GROWTH RATES IN SELECTED ORIGIN MARKETS FOR VISITORS TO
GEORGIA – 2018
High Value Markets (HVM) Traditional Volume Markets (TVM)
Country Total No. Visitors Growth Rate Country Total No. Visitors Growth Rate
Baltic States 46,000 52% Azerbaijan 1,424,000 9%
Germany 64,500 50% Russia 1,405,000 23.8%
Kuwait 15,000 40% Armenia 1,270,000 -1.4%
Poland 67,000 37% Turkey 1,100,000 9%
France 22,000 36% Ukraine 177,000 4%
UK 29,500 35%
20 The reason Germany was selected over the Netherlands even though the latter spend roughly the same but stay longer is that the only time volume matters in tourism is when high value locations are viewed side-by-side and priorities have to be selected for effectiveness purposes. This is what happened here. It is not the NL will be de-emphasized, but rather that Germany offers more mass in targeted value chains (mainly adventure) than NL. This graph shows tourism as a whole and is not aligned to selected VCs. When this occurs, Germany is an obvious choice over the NL in terms of selecting a finite number of markets that have the most potential for growth since it has a higher volume of adventure travelers.
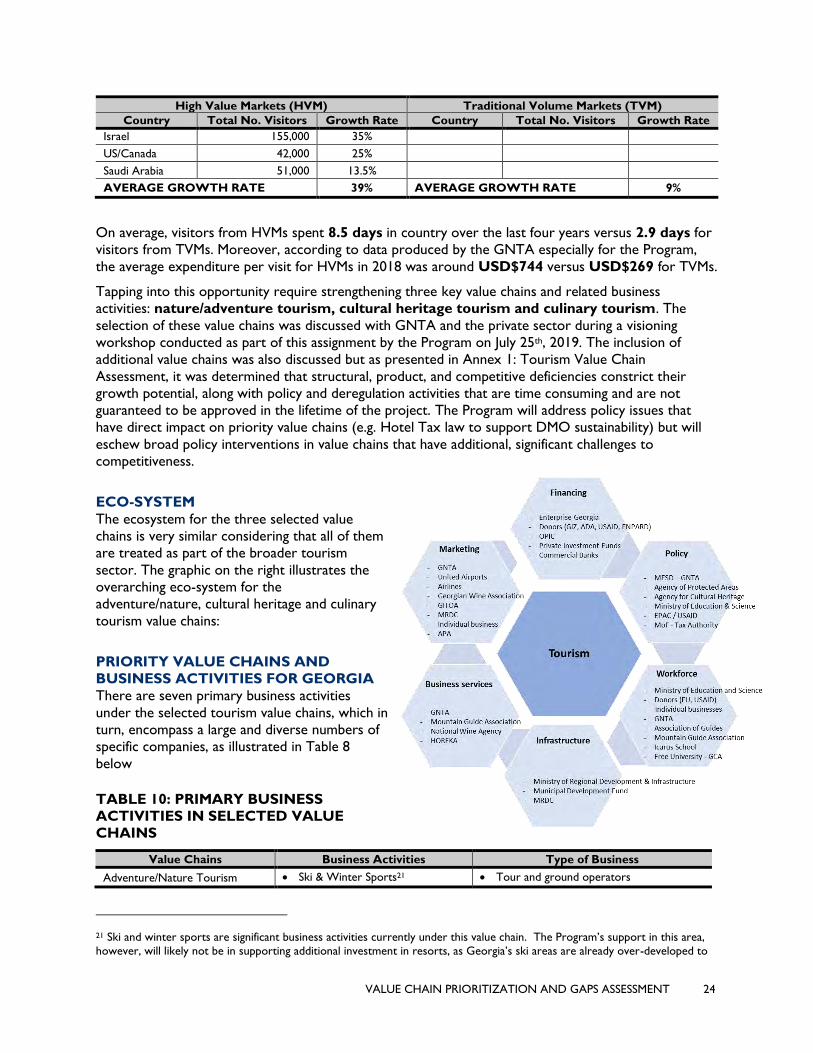
VALUE CHAIN PRIORITIZATION AND GAPS ASSESSMENT 24
High Value Markets (HVM) Traditional Volume Markets (TVM)
Country Total No. Visitors Growth Rate Country Total No. Visitors Growth Rate
Israel 155,000 35%
US/Canada 42,000 25%
Saudi Arabia 51,000 13.5%
AVERAGE GROWTH RATE 39% AVERAGE GROWTH RATE 9%
On average, visitors from HVMs spent 8.5 days in country over the last four years versus 2.9 days for
visitors from TVMs. Moreover, according to data produced by the GNTA especially for the Program,
the average expenditure per visit for HVMs in 2018 was around USD$744 versus USD$269 for TVMs.
Tapping into this opportunity require strengthening three key value chains and related business
activities: nature/adventure tourism, cultural heritage tourism and culinary tourism. The
selection of these value chains was discussed with GNTA and the private sector during a visioning
workshop conducted as part of this assignment by the Program on July 25th, 2019. The inclusion of
additional value chains was also discussed but as presented in Annex 1: Tourism Value Chain
Assessment, it was determined that structural, product, and competitive deficiencies constrict their
growth potential, along with policy and deregulation activities that are time consuming and are not
guaranteed to be approved in the lifetime of the project. The Program will address policy issues that
have direct impact on priority value chains (e.g. Hotel Tax law to support DMO sustainability) but will
eschew broad policy interventions in value chains that have additional, significant challenges to
competitiveness.
ECO-SYSTEM
The ecosystem for the three selected value
chains is very similar considering that all of them
are treated as part of the broader tourism
sector. The graphic on the right illustrates the
overarching eco-system for the
adventure/nature, cultural heritage and culinary
tourism value chains:
PRIORITY VALUE CHAINS AND
BUSINESS ACTIVITIES FOR GEORGIA
There are seven primary business activities
under the selected tourism value chains, which in
turn, encompass a large and diverse numbers of
specific companies, as illustrated in Table 8
below
TABLE 10: PRIMARY BUSINESS
ACTIVITIES IN SELECTED VALUE
CHAINS
Value Chains Business Activities Type of Business
Adventure/Nature Tourism • Ski & Winter Sports21 • Tour and ground operators
21 Ski and winter sports are significant business activities currently under this value chain. The Program’s support in this area,
however, will likely not be in supporting additional investment in resorts, as Georgia’s ski areas are already over-developed to
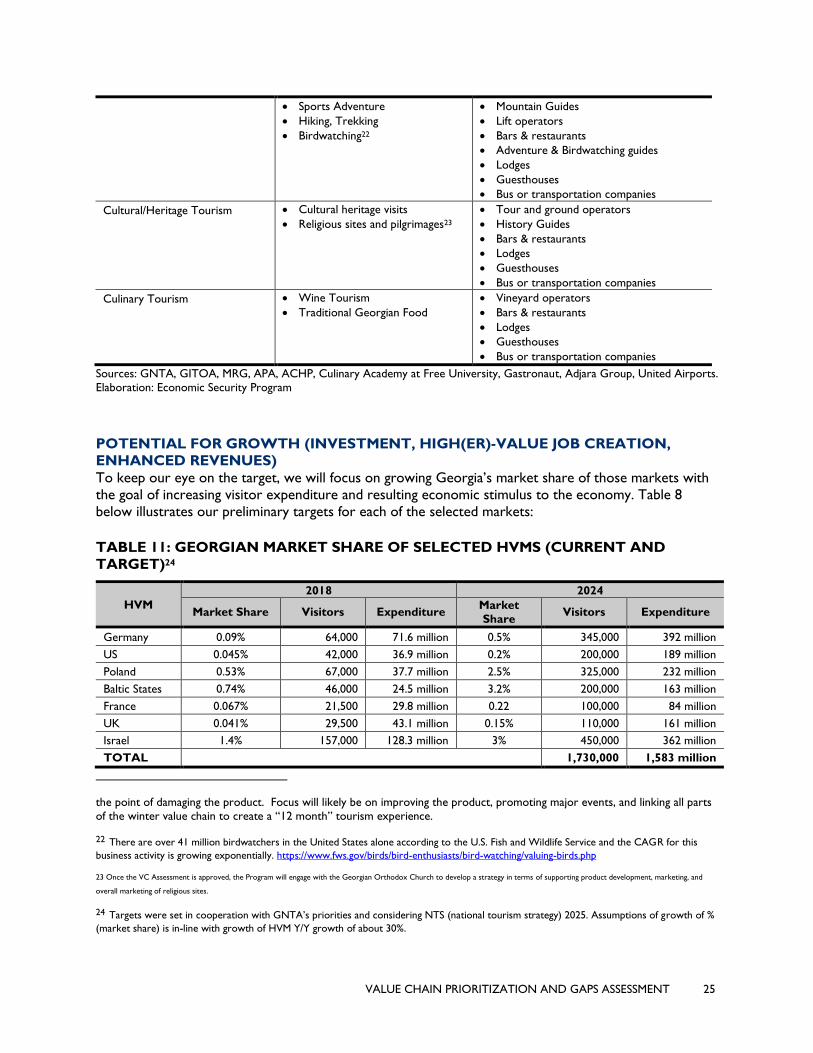
VALUE CHAIN PRIORITIZATION AND GAPS ASSESSMENT 25
• Sports Adventure
• Hiking, Trekking
• Birdwatching22
• Mountain Guides
• Lift operators
• Bars & restaurants
• Adventure & Birdwatching guides
• Lodges
• Guesthouses
• Bus or transportation companies
Cultural/Heritage Tourism • Cultural heritage visits
• Religious sites and pilgrimages23
• Tour and ground operators
• History Guides
• Bars & restaurants
• Lodges
• Guesthouses
• Bus or transportation companies
Culinary Tourism • Wine Tourism
• Traditional Georgian Food
• Vineyard operators
• Bars & restaurants
• Lodges
• Guesthouses
• Bus or transportation companies
Sources: GNTA, GITOA, MRG, APA, ACHP, Culinary Academy at Free University, Gastronaut, Adjara Group, United Airports.
Elaboration: Economic Security Program
POTENTIAL FOR GROWTH (INVESTMENT, HIGH(ER)-VALUE JOB CREATION,
ENHANCED REVENUES)
To keep our eye on the target, we will focus on growing Georgia’s market share of those markets with
the goal of increasing visitor expenditure and resulting economic stimulus to the economy. Table 8
below illustrates our preliminary targets for each of the selected markets:
TABLE 11: GEORGIAN MARKET SHARE OF SELECTED HVMS (CURRENT AND
TARGET)24
HVM
2018 2024
Market Share Visitors Expenditure Market
Share Visitors Expenditure
Germany 0.09% 64,000 71.6 million 0.5% 345,000 392 million
US 0.045% 42,000 36.9 million 0.2% 200,000 189 million
Poland 0.53% 67,000 37.7 million 2.5% 325,000 232 million
Baltic States 0.74% 46,000 24.5 million 3.2% 200,000 163 million
France 0.067% 21,500 29.8 million 0.22 100,000 84 million
UK 0.041% 29,500 43.1 million 0.15% 110,000 161 million
Israel 1.4% 157,000 128.3 million 3% 450,000 362 million
TOTAL 1,730,000 1,583 million
the point of damaging the product. Focus will likely be on improving the product, promoting major events, and linking all parts
of the winter value chain to create a “12 month” tourism experience.
22 There are over 41 million birdwatchers in the United States alone according to the U.S. Fish and Wildlife Service and the CAGR for this
business activity is growing exponentially. https://www.fws.gov/birds/bird-enthusiasts/bird-watching/valuing-birds.php
23 Once the VC Assessment is approved, the Program will engage with the Georgian Orthodox Church to develop a strategy in terms of supporting product development, marketing, and
overall marketing of religious sites.
24 Targets were set in cooperation with GNTA’s priorities and considering NTS (national tourism strategy) 2025. Assumptions of growth of %
(market share) is in-line with growth of HVM Y/Y growth of about 30%.
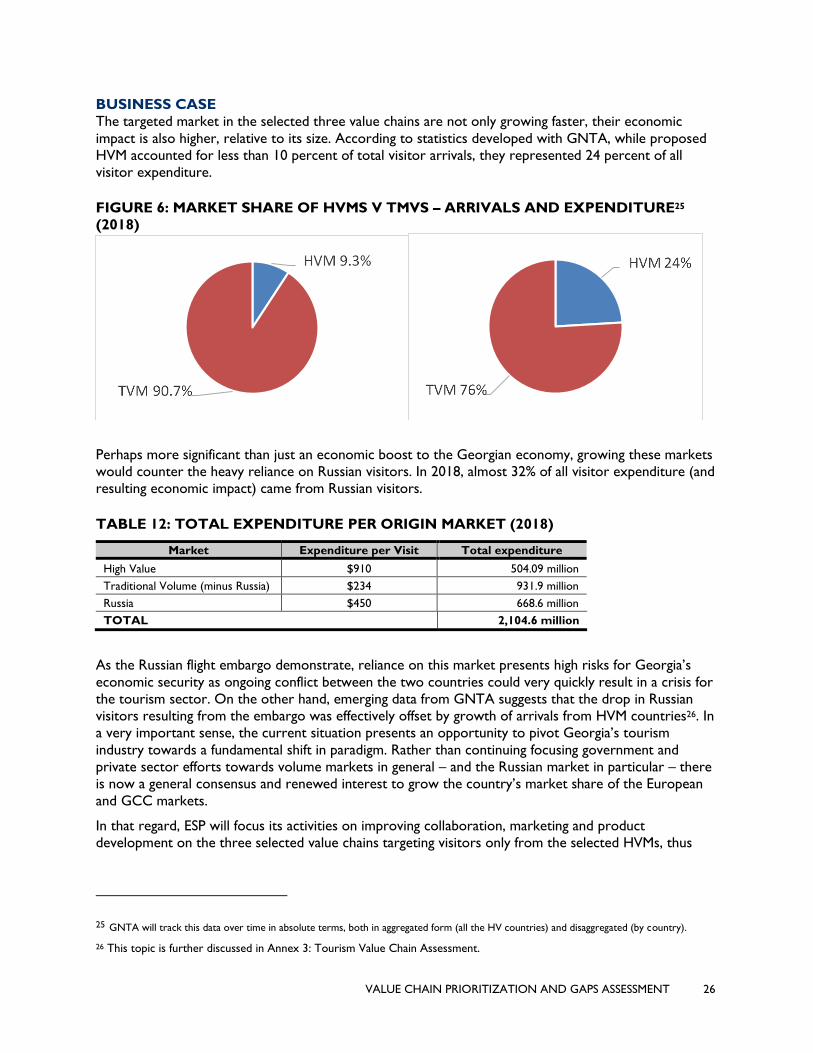
VALUE CHAIN PRIORITIZATION AND GAPS ASSESSMENT 26
BUSINESS CASE
The targeted market in the selected three value chains are not only growing faster, their economic
impact is also higher, relative to its size. According to statistics developed with GNTA, while proposed
HVM accounted for less than 10 percent of total visitor arrivals, they represented 24 percent of all
visitor expenditure.
FIGURE 6: MARKET SHARE OF HVMS V TMVS – ARRIVALS AND EXPENDITURE25
(2018)
Perhaps more significant than just an economic boost to the Georgian economy, growing these markets
would counter the heavy reliance on Russian visitors. In 2018, almost 32% of all visitor expenditure (and
resulting economic impact) came from Russian visitors.
TABLE 12: TOTAL EXPENDITURE PER ORIGIN MARKET (2018)
Market Expenditure per Visit Total expenditure
High Value $910 504.09 million
Traditional Volume (minus Russia) $234 931.9 million
Russia $450 668.6 million
TOTAL 2,104.6 million
As the Russian flight embargo demonstrate, reliance on this market presents high risks for Georgia’s
economic security as ongoing conflict between the two countries could very quickly result in a crisis for
the tourism sector. On the other hand, emerging data from GNTA suggests that the drop in Russian
visitors resulting from the embargo was effectively offset by growth of arrivals from HVM countries26. In
a very important sense, the current situation presents an opportunity to pivot Georgia’s tourism
industry towards a fundamental shift in paradigm. Rather than continuing focusing government and
private sector efforts towards volume markets in general – and the Russian market in particular – there
is now a general consensus and renewed interest to grow the country’s market share of the European
and GCC markets.
In that regard, ESP will focus its activities on improving collaboration, marketing and product
development on the three selected value chains targeting visitors only from the selected HVMs, thus
25 GNTA will track this data over time in absolute terms, both in aggregated form (all the HV countries) and disaggregated (by country).
26 This topic is further discussed in Annex 3: Tourism Value Chain Assessment.
VALUE CHAIN PRIORITIZATION AND GAPS ASSESSMENT 27
building the country’s economic resilience to political shocks arising from the volatile relationship with
its powerful neighbor to the north.
KEY GAPS IN PRIORITY BUSINESS ACTIVITIES
• Disarticulated use of healthy marketing budgets. While GoG agencies involved in marketing
activities (GNTA, NWA and MRG) enjoy healthy budgets; these are implemented with varying
degrees of efficiency. There is little coordination among agencies and between them and the private
sector.
• Dispersed investment in tourism marketing. GNTA serves a long list of 25 markets through hired
publicity, campaigns, participation in travel fairs, study tours and FAM trips, all of which is done in
isolation from the private sector. As a result, they are stretched thin and the impact of their
significant investment is limited on the targeted HVMs.
• Lack of certification and liability insurance. While most visitors from HVMs to Georgia are
independent travelers, the use of tour operators among them is twice as high as all visitors to the
country (12% v 4.5%, respectively). The lack of third-party liability insurance among Georgian
inbound tour operators and ground handlers for adventure tourism products limits their ability to
reach important segments of the HMVs who have higher than average expenditures rates.
• Lack of a Georgia brand tailored to HMVs. While GNTA has invested significantly in the
development of marketing campaigns, it lacks a brad development strategy and marketing plan
specifically tailored to the HMVs. All four departments at GNTA work in silos and there’s a need
for strategic guidance supporting product development and infrastructure development.
• Unreliable and substandard visitor transportation services. 88% of all HMV visitors are
independent travelers. Moreover, demographic changes - such as the increase of the “millennials”
share of the travel market – anticipate that this trend will continue. However, Georgia lacks a
reliable visitor transportation system facilitating the movement and distribution of independent
travelers to areas with high potential.
• Lack of appropriate facilities and services in protected areas and cultural heritage sites.
Visitors from HMVs represent the largest share of arrivals to protected areas in Georgia with 48%
of the total. Increasing their numbers will require a solid strategy for the development of improved
interpretation, guiding, camping, and other types of services and facilities at the most popular and
high potential sites.
• Lack of commercial loans tailored to the needs of tourism MSMEs. Commercial financial
organizations have not developed financial products specifically targeted to the tourism sector.
Therefore, capital investment and operational capital for businesses comes from grants, profits or
personal loans (typically mortgages guaranteed through properties), making extremely difficult for
small business to upgrade facilities or operations.
• Misalignment between educational curricula and industry needs. With the exception of a
couple of private sector-driven initiatives (such as the Adventure Sports Academy and the Culinary
Academy), there is a severe misalignment between what education organizations produce and the
needs of the industry. This gap is addressed through training workshops but does not meet the
needs of a rapidly expanding tourism industry.
PRIORITY INTERVENTIONS
To grow this business activity, the Economic Security Program will facilitate catalytic investments in
workforce training, create pathways to youth into entry level jobs in the tourism sector , facilitate
VALUE CHAIN PRIORITIZATION AND GAPS ASSESSMENT 28
investments into the sector and strengthen industry collaboration to address joint concerns. For
example, the Program will:
Support to update National Tourism Strategy 2025 and operationalize Tourism Action Plan.
Rather than just providing technical assistance to develop more reports, the program will guide the
process of creating a series of theme-specific working groups with just the right number of stakeholders
from the public and private sector. These solution-focused working groups will address issues like
improved selection and participation of GNTA and the private sector in trade shows or the opening of a
specific historical site for tourism purposes. By building trust among these stakeholders, the Program
will support the implementation of an articulated, multi-stakeholder Action Plan for the tourism sector
in the upcoming years.
B2B Market Linkages program for ‘export ready’ tour operators and event organizers. Building a
Georgia brand requires consistent and reliable links between international tour operators and Georgian
inbound operators. The Economic Security Program will work with GNTA to improve operational
marketing activities to include effective B2B elements and build commercial networks in HVMs. We will
also work with GITOA and other tour operators to improve their offer and marketing activities to
better align them with market priorities.
Tourism association led product development and marketing support. Visitors from HVMs will not
be able to spend more money unless there are more products and services for them to use. The
development of these services, however, will require technical and financial support to Georgian MSMEs
along the selected value chains to being them up to European standards and develop consistent
relationships with tour operators and travel media in HVMs.
Investment promotion of natural and cultural themed tourism services. In 2018, more than 1
million people visited protected areas for the first time. Of all protected areas in Georgia, 2 of them
accounted for almost 35% of all visits. There is an urgent need to diversify the number of popular sites
to decongest Prometheus Cave and Kazbegi National Park by implementing a tourism concessions and
commercial services strategy for the system. This strategy and accompanying policies and regulations
would promote private sector investment in badly needed infrastructure and management upgrades.
Matching Tourism Industry Labor Demand with Supply while Strengthening Training Providers.
Using the successful model of the Mountain Guide Association and the Adventure Sports Academy, the
Economic Security Program will support the private sector in the implementation of embedded training
and capacity building initiatives that could be institutionalized and not rely on donor funding for its
continued operations. For example, we will work with GITOA to improve the quality of service
providers in rural areas where they operate and with Airbnb Experiences to ensure that service
provision meets a minimum criterion of safety and reliability.
Exploration of the Creation of a Tourism Alliance. The Program will explore the potential for
development of a Tourism Alliance, but its initial focus will be on creating informal mechanisms for
public-private dialogue and cooperation that will build the level of trust necessary to develop this level of
collaboration. The GOG has been “hot and cold” on the development of such an alliance and its
formation must be organic rather than contrived.
PUBLIC-PRIVATE PARTNERSHIP OPPORTUNITIES
• REI and Columbia Sportswear: Building on partner GTG’s existing relationships with REI and
Columbia Sportswear, the Economic Security Program will engage these companies to cost-share
promotional activities such as Media Trip and Sweeps Promotional Campaigns to promote Georgia
among their global customer base.
• Marriott International: The Program has already engaged Marriott International and local
investors in a GDA opportunity for the development of the new Courtyard Marriott in Kutaisi.
VALUE CHAIN PRIORITIZATION AND GAPS ASSESSMENT 29
Using the Program’s Partnership Development Fund, we will support training of local youth and
women in Marriott’s international service standards with the commitment that they will be
employed as soon as the hotel opens in 2023.
• Airbnb: Working with local providers and Airbnb to develop a “guest experience platform” that
highlights high-end Georgian properties for top-tier consumers. Airbnb would provide the platform
and marketing, while the Program would work with local providers to build capacity and increase
standards.
SHARED INTELLECTUAL SERVICES SECTOR
BUSINESS PROCESS OUTSOURCING VALUE CHAIN (CUSTOMER RELATIONSHIP MANAGEMENT, FINANCE AND ACCOUNTING, ARCHITECTURE AND ENGINEERING, HUMAN RESOURCES, AND INFORMATION TECHNOLOGY)
GLOBAL MARKET ANALYSIS AND GEORGIA’S CURRENT POSITION
Shared Intellectual Services are defined as exported services conducted by a business in one country and
consumed by a business in another country – as part of a firm’s strategy to perform functions globally27.
These strategic decisions to de-couple corporate services, such as customer management, information
technology, finance and accounting, design, and human resource management -and perform them
anywhere in the world- have played the key role in the formation of the BPO value chain28. Globally, the
structure of the BPO value chain consists of three main verticals: general business services that can be
provided across all industries known as business process offshoring, information technology services
that can be provided across all industries known as information technology offshoring (ITO), as well as
services that are industry specific BPO (ISO). Within each of these vertical activity groups are the
specific business activities (CRM, ADE, F&A, IT, HR).
The global market for outsourced services is growing and will continue to grow. In 2018 outsourced
service revenue was $85.6 billion and is expected to grow to $343.2 billion by 2025. This will continue
the steady global growth of the sector which has almost doubled since 2000 when it was a $45.6 billion
global market. In 2018 BPO accounted for 28% of revenue of the overall global BPO value chain at $23.6
billion. The lowest end of BPO consists of transactional tasks within CRM, accounting for only 3% of the
total market. The middle range of BPO comprises repetitive yet judgement-based activities. Here most
revenue is derived from processes highly connected to trade in goods and commodities (Supply Chain
Management), accounting for 81% of the BPO segment.29 KPO services are the highest value-added
horizontal segment of BPO.30 Of these the global legal process outsourcing market was estimated at
$2.3 billion in 2015, with 80% of the projects being offshored.31 The rest of the processes pertaining to
BPO capture less than one fourth of the total market segment. In 2018 ITO accounted for 68% of
27 Global Value Chains Center at Duke University. https://gvcc.duke.edu/ 28 BPO is used in the context of this report to describe a tier of services that traditionally are referred to as ‘back office
operations.’ The rise and increasing sophistication of IT and communications platforms and networks have allowed an ever
growing number of services to be moved from the back office to international service providers.
29 Statista. https://www.statista.com/statistics/189800/global-outsourcing-industry-revenue-by-service-type/
30 KPO is Knowledge Process Outsourcing (e.g. financial processes, programming) 31 Grand View Research. https://www.grandviewresearch.com/industry-analysis/legal-process-outsourcing-lpo-market
VALUE CHAIN PRIORITIZATION AND GAPS ASSESSMENT 30
revenue the global BPO value chain at $62 billion. 32 The lowest end of the segment, infrastructure,
accounts for around half of the global segment market size, while tasks within the middle-end of the ITO
segment, such as IT Consulting and Software, account for 31%. The highest value-added sub-segment,
Software R&D, accounts for 17% of the ITO segment. Industry Specific Outsourcing (ISO) is much
harder to get accurate data on considering the fragmented nature of the channel.
Georgia currently participates in the global market for Business Process Outsourcing via several
business activities:
• Client Relationship Management (CRM). There are a number of small, medium and large CRM
companies in Georgia providing CRM services. They deliver a variety of customer-facing services
that focus on managing a company's relationships and interactions with current and potential
customers. CRM represents 90% of employment for the BPO Value chain with call centers the most
common CRM service offering in Georgia. Companies also offer higher-value forms of customer
interaction services including live-chat and email. The primary market that Georgian CRM firms
serve is Europe, with CRM services targeted at their client’s customers also residing in Europe.
Most firms provide more than one type of CRM service, but provide those services for only one
client – acting as a captive contractor. Some firms are in the process of leveraging CRM platforms
and client relationships to move into higher-value Enterprise Resource Management (ERM).
• Finance and Accounting (F&A). As the name implies there are two main types of service
offerings in the F&A business activity – those pertaining to finance which represent money
management and the process of businesses acquiring needed funds for investment or operations;
and those services pertaining to accounting which represent summarizing, analyzing and reporting
business financial transactions to regulators, oversight and tax collection agencies. Larger finance and
accounting firms generally provide both types of services, smaller firms focus more on accounting
services. There are hundreds of registered finance and accounting firms in Georgia, however the
vast majority are serving local companies. There are two primary reasons for this, first, accounting
services especially as they pertain to tax and other regulatory environments are location specific, i.e.
each jurisdiction has different tax and other regulations necessitating local expertise and difficult to
offshore. Second, new tax and accounting rules coming into effect in Georgia means large firms
(those most likely to provide BPO) are at full capacity handling domestic client’s near-term
compliance needs. While capabilities exist for F&A, capacity is being stretched by domestic demand.
• Architecture, Design and Engineering (ADE). The ADE sector is well developed in Georgia
with both local and international firms providing a wide range of services. ADE is the largest
business activity by revenue, however the vast majority of it is earned in the domestic market.
Within ADE, it is Architecture services that are being exported by small companies leveraging a
skilled Tbilisi-based workforce at relatively low wage rates, typically 4x-5x lower than in Western
Europe. For those firms that do provide architectural-related services, the most common include
3D modeling, rendering, and design services. Georgian Architecture providers typically take design
concepts from a partner firm abroad, and then perform the bulk of the manual work turning those
ideas onto actual drawings, models, renderings, and the instructions necessary for construction.
These are then sent back to the BPO partner firm for final alignment with local regulations and local
approval. Building and engineering codes are guided by local regulations and almost always need local
sign-off prior to construction – complicating the offshoring process.
• Human Resource Management (HRM). The HR sector in Georgia is small with total sector
turnover not more than $20 million, including both domestic and international sales. Those firms
that are providing services to foreign clients are primarily engaged in recruiting and consulting
services and are mostly doing so for foreign firms looking to locate in Georgia, not as a BPO service.
32 Statista. https://www.statista.com/statistics/189800/global-outsourcing-industry-revenue-by-service-type/
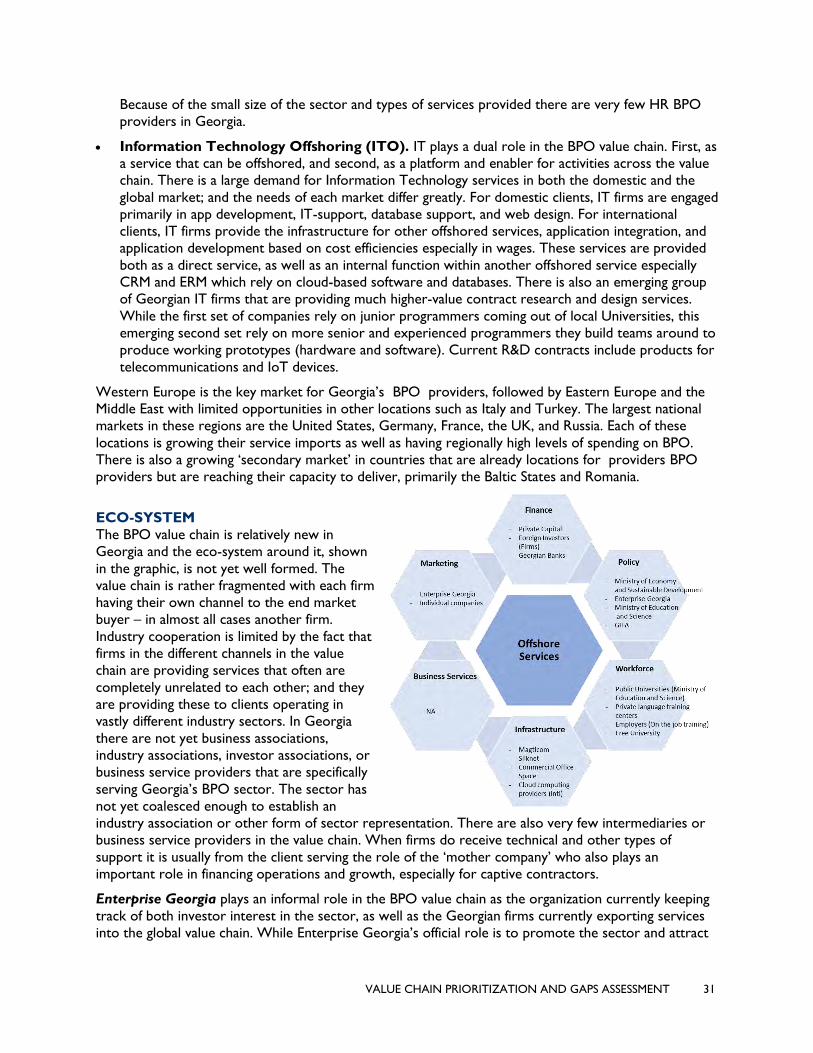
VALUE CHAIN PRIORITIZATION AND GAPS ASSESSMENT 31
Because of the small size of the sector and types of services provided there are very few HR BPO
providers in Georgia.
• Information Technology Offshoring (ITO). IT plays a dual role in the BPO value chain. First, as
a service that can be offshored, and second, as a platform and enabler for activities across the value
chain. There is a large demand for Information Technology services in both the domestic and the
global market; and the needs of each market differ greatly. For domestic clients, IT firms are engaged
primarily in app development, IT-support, database support, and web design. For international
clients, IT firms provide the infrastructure for other offshored services, application integration, and
application development based on cost efficiencies especially in wages. These services are provided
both as a direct service, as well as an internal function within another offshored service especially
CRM and ERM which rely on cloud-based software and databases. There is also an emerging group
of Georgian IT firms that are providing much higher-value contract research and design services.
While the first set of companies rely on junior programmers coming out of local Universities, this
emerging second set rely on more senior and experienced programmers they build teams around to
produce working prototypes (hardware and software). Current R&D contracts include products for
telecommunications and IoT devices.
Western Europe is the key market for Georgia’s BPO providers, followed by Eastern Europe and the
Middle East with limited opportunities in other locations such as Italy and Turkey. The largest national
markets in these regions are the United States, Germany, France, the UK, and Russia. Each of these
locations is growing their service imports as well as having regionally high levels of spending on BPO.
There is also a growing ‘secondary market’ in countries that are already locations for providers BPO
providers but are reaching their capacity to deliver, primarily the Baltic States and Romania.
ECO-SYSTEM
The BPO value chain is relatively new in
Georgia and the eco-system around it, shown
in the graphic, is not yet well formed. The
value chain is rather fragmented with each firm
having their own channel to the end market
buyer – in almost all cases another firm.
Industry cooperation is limited by the fact that
firms in the different channels in the value
chain are providing services that often are
completely unrelated to each other; and they
are providing these to clients operating in
vastly different industry sectors. In Georgia
there are not yet business associations,
industry associations, investor associations, or
business service providers that are specifically
serving Georgia’s BPO sector. The sector has
not yet coalesced enough to establish an
industry association or other form of sector representation. There are also very few intermediaries or
business service providers in the value chain. When firms do receive technical and other types of
support it is usually from the client serving the role of the ‘mother company’ who also plays an
important role in financing operations and growth, especially for captive contractors.
Enterprise Georgia plays an informal role in the BPO value chain as the organization currently keeping
track of both investor interest in the sector, as well as the Georgian firms currently exporting services
into the global value chain. While Enterprise Georgia’s official role is to promote the sector and attract
VALUE CHAIN PRIORITIZATION AND GAPS ASSESSMENT 32
foreign direct investment, as the leading organization working across the BPO value chain, they have
become a de-facto sector representative.
While the skills profile of workers in each of the four business activities varies, in general each business
activity requires a relatively high level of skill and a University Degree is typically a de facto requirement
across all four business activities. Each business activity has sector-specific technical skill needs that will
vary based on the requirements the sector. Common across them is a requirement for strong
foundational skills of reading, writing, numeracy, critical thinking, and communication. Foreign languages,
while not a foundational skill are important in all four business activities. Georgia has 75 Higher
Education Institutions and 125 VET Institutions spread throughout the country. Amongst these
institutions there are public and private Universities offering degrees relevant for all four business
activities. However, all employers across the four business activities felt that the skills young people
possess upon graduation are not relevant enough to start working without further training. To get
young people up to the level they need to be able to deliver the services clients demand, all employers
engaged in some type of on-the-job training for new employees.
PRIORITY BUSINESS ACTIVITIES FOR GEORGIA
Of the five broad business activities within the BPO value chain represented in Georgia, four (CRM,
ADE, IT, F&A) are offering offshoring services for international clients. In HR, Georgian HR firms are
small and primarily serve domestic clients (some of whom are international firms) and is not at this time
viewed as a potential niche market with high growth potential for Georgia. Four high potential niche
business activities have been prioritized for Georgia:
• Higher Quality CRM and Contact Centers. Traditional CRM consists mostly of call centers
where operators answer basic customer questions often following a script. These call centers rely
on low cost locations and high volume. As the retail industry transforms and moves increasingly
online, retailers are looking for CRM to provide higher level of interactions with customers, better
customer service, and do this through new mediums of communication including email, chat, SMS,
and twitter. It is difficult to grow these services in most of the lowest-cost locations because of the
lack of language skills, cultural sensitivities, and customer mindset within the labor force. Also,
interacting with customers in a written form requires higher level language skills than in call centers.
These higher-level CRM services are being nearshored and provide an opportunity for higher value
growth in nearshore locations despite CRM being a mature service. Buyers require high level
language skills in the customer’s primary language, cultural understanding and sensitivity of the
customer, customer service and problem-solving mindset, sufficient class A office space office for
adding staff and IT platform with reliable and high-speed international internet connectivity that is
‘always up’. Georgia is well positioned to provide contact center services. Georgia has the client
contacts, the relevant skills (human resources) and is located near Western Europe. While many of
Georgia’s competitors in Eastern Europe and the Baltics also have these assets, Georgia can offer
the same high quality services at a lower cost. Salaries in higher-level CRM are also higher than entry
level jobs for youth in retail or other sectors where youth typically get their first job.
• Enterprise Resource Management (ERM). Globally the largest segment of business process
outsourcing (BPO) is not client relations management (CRM), it is enterprise resource management
(ERM), and within ERM it is activities that are related to supply chain management that generate the
most revenue for outsource service providers. Historically supply chain management had been
outsourced, but not offshored, as it was seen as too complex, data centric, and requiring real-time
response to be effectively managed from a global location. With the emergence of cloud computing
and robotic process automation (RPA) companies are increasingly looking to foreign providers to
take on greater responsibilities and step-up from CRM to ERM provision as an integrated service
package - from the first customer interaction, through the re-stocking and warehousing of the
VALUE CHAIN PRIORITIZATION AND GAPS ASSESSMENT 33
product, to shipping and any problem resolution. This simplifies services for firms as they are dealing
with fewer vendors, rationalizing vendor management, and investing in those that are trusted and
reliable and can support increased competitiveness and cost reductions. Firms are increasingly
looking to existing BPO providers to provide more integrated service packages. They are looking
for existing and trusted relationships with clients, knowledge of the internal and external supply
chain processes, IT platforms and workforce that supports supply chain management, in addition to
language and communication skills. Georgia-based CRM already have the relationships and trust
through existing CRM contracts, as well as the language and communication skills. Georgian Services
Group is the leader in stepping-up from CRM to ERM but others have not yet followed and Georgia
still lags competitors in Eastern Europe and the Baltics.
• Mid-stream Architecture Contract Services. The architecture field is late to the outsourcing
revolution. Very specific architecture related functions do have a history of being outsourced,
typically those associated with a computer program such as AutoCAD or similar around drawing
and rendering programs. This is changing as companies look to outsource more of the architecture
process including design, modeling, and development; retaining only initial concept and final
regulatory approval in the home office. Providing complete-package services to architecture firms is
attractive as costs tend to be five times higher in developed markets for architecture services. As
more of the process is outsourced, the specific computer program that is used in drawing and
rendering becomes less important. If the provider needs to interface directly with the client firm as
a piece of the process, they need to use the exact same software – and knowledge and training of
the most in-demand programs by international clients such as REVIT and ArchiCAD is still lacking in
Georgia. However, when the BPO company provides the entire service, there is no IT integration
and the program used is much less relevant. This is an emerging market for Georgia with current
providers tending to provide program-specific rendering services, with an emerging but small group
providing integrated services. Georgia has the education system and human talent to provide both
the stand-alone and integrated service packages but are not yet training in the most current
programs and technologies.
• IT Software and Hardware Product Development. There is a significant global labor shortage
for IT professionals – especially for those with knowledge of the latest programming languages and
design methods. It is estimated that by 2020 the technology, media, and telecommunications sectors
will be short 1.1 million workers.33 This talent shortage, coupled with the explosion of remote and
contract work (which can be performed from anywhere in the world), has driven up wage rates
globally – it no longer matters where the work is performed. This has led to the explosion in
programming and other types of skills and training programs in new locations. As IT services are
increasingly offshored to these new locations as part of the desperate search for talent, many of the
legal and regulatory frameworks in these new locations do not provide the types of protections for
intellectual and other property that are necessary for firms to move beyond contracting-out to
programmers, and into contracting full service research and design product development. Buyers are
looking for critical mass of senior programmers, project managers, and junior programmers in order
to implement agile IT project teams, as well as strong legal and regulatory frameworks for
intellectual and other property protections along with transparent enforcement mechanisms.
Ukraine is the regional leader in IT service provision, however, many firms are looking beyond
Ukraine for higher-value product development as Ukraine’s intellectual property protections are
weak, have poor infrastructure, and are running out of software engineers. Georgia will never be
able to provide the volume of IT professional that Ukraine can, but it does have the regulatory
framework within which projects can be based and run even utilizing contract labor from other
33 LinkedIn research.
VALUE CHAIN PRIORITIZATION AND GAPS ASSESSMENT 34
locations. Labor is mobile, regulatory frameworks and enforcement are not. This is not a typically
Offshored Service but is an opportunity for Georgia in a relevant sector.
POTENTIAL FOR GROWTH (INVESTMENT, HIGH(ER)-VALUE JOB CREATION,
ENHANCED REVENUES)
The BPO value chain is positioned to grow significantly in Georgia over the next few years attracting
foreign and domestic investment and creating employment growth for skilled young people – driving this
growth will be customer relations management (CRM). BPO value chain is unique in that it needs no
material inputs (imported or domestic); has limited regulatory barriers to entry; its service exports flow
freely into international markets; and relies primarily upon the knowledge, skills and attitudes of
Georgia’s workforce to create value.
In Western Europe, Germany is the key market for Georgian BPO providers. In 2017 the German BPO
market spend was $2.4 billion. Firms in Russia and other Russian-speaking countries traditionally have
been clients of Georgian firms, primarily due to Russian language skills in Georgia, but the size of the
Russian market at $300 million is relatively small compared to that of Western Europe $16 billion
Obtaining accurate and granular data on the Georgian BPO value chain is difficult as the Georgian
National Statistics Office (Geostat) does not collect BPO value chain specific data. Where data is
collected by Geostat, it is not at a sufficiently disaggregated level in order to provide a useful basis of
analysis for the BPO value chain. However, services play an outsized role in Georgia’s economic
performance representing 58% of Georgian exports by revenue; in 2017 Georgia exported products
worth $3.21 billion34, while at the same time exporting service worth $4.49 billion35. When viewed
through the lens of GDP, the global average share of Trade in Services as a percent of GDP is 13% in
2017 for all countries, while for Georgia it is 42% of GDP.36 Georgia outperforms the world when it
comes to the growth of service exports, growing faster than the global growth average every year
except for 2014. For the years 2010-2018 global growth in service exports averaged 6% per year.
Georgia has outperformed global growth in services by 3% over that period, averaging 9% growth per
year. At the same time Georgia’s global market share for service exports has doubled from .04% to
.08%.
BUSINESS CASE
Traditional growth of BPO has been driven by firms as a cost cutting-measure, but that is starting to
change. Businesses are increasingly looking to their BPO partners to do more. Powered by cloud
computing they are looking for service providers as key business enablers and to support business
transformation, in addition to cost savings. However, cost is still an important factor in the global BPO
market. Potential clients for Georgian firms who are looking to corporate services are looking for
locations with proximity to the European market at the nexus of low wages for skilled human resources,
while having a liberal investment and tax regulations with low location costs. As costs rise in the Baltics
and Eastern Europe, firms are increasingly looking to Georgia to locate their labor-intensive BPO
operations – especially CRM. At the other end of the spectrum, firms are also looking to invest in IT,
both to support CRM operations and provide a wider range of contract IT services. This IT growth is
driven by a global shortage of skilled programmers and Georgia’s relatively low wages for skilled
workers.
Georgia has implemented a suite of liberal tax, labor and investment regulations to attract foreign direct
investment. This has resulted in a 2018 Ease of Doing Business ranking of 6th out of 190 nations; ranking
34 Atlas of Economic Complexity 35 WTO Trade in Services Database 36 World bank. https://data.worldbank.org/indicator/BG.GSR.NFSV.GD.ZS
VALUE CHAIN PRIORITIZATION AND GAPS ASSESSMENT 35
2nd in both “starting a business” and “protecting minority investors.” Consequently, Georgia ranks highly
on lists of investment-friendly countries prepared by site selection firms working to re-locate BPO.
Specific regulations and policies include the creation of virtual information technology trade zones that
exempts investors from taxes or duties on the revenue earned when selling their product or service
outside of Georgia, and does not require licenses, permits or any other regulatory document to carry
out business activities in the Georgia. Georgia also has flexible labor codes including no minimum wage,
no social-security type tax for employers, and flexible contract termination. In addition to these specific
policies, Georgia is relatively corruption-free and politically stable.
Value creation in BPO is driven by human resources and information technology; and Georgia has a
well-educated workforce with many of the cross-cutting skills necessary for the service industry.
Georgians have high rates of educational attainment with 75 Higher Education Institutions and 125 VET
Institutions, spread throughout the country. Georgia also benefits from a legacy of foreign language
learning throughout the country. Almost 20% of young people have University degrees, while around
56% complete upper secondary general education. More girls than boys attend university, resulting in a
higher share of young women with higher education. The educational attainment of young people is
improving compared to educational attainment levels of those aged 15+.37 It is not just a skilled labor
force that is drawing service-exporting firms to Georgia, it is this skilled pool of people against a
background of relatively low wages in a tight regional labor market for in-demand skills. Several BPO
providers described the current potential for CRM growth as essentially ‘unlimited’ were it not for the
constraints placed by the limited pool of workers in Georgia.
KEY GAPS IN PRIORITY BUSINESS ACTIVITIES
The following are key constraints that exist in each of high potential business activities. In addition,
several cross-cutting constraints to the BPO value chain as a whole have been identified.
Higher Quality CRM and Contact Centers. The global market for high quality nearshored CRM
services is growing and Georgia has the opportunity to grow along with it. CRM providers in Georgia,
specifically call and contact center operators, all described growth as potentially unlimited in the near
term were it not for two key constraints, quantity human resources and office space. While further
growth in the longer term will require access to new markets particularly the US market.
• Lack of human resources. There is sufficient existing demand from European clients for CRM
(particularly call and contact centers) to grow over the next 2-4 years. What limits growth is the
number of potential employees available in the labor market. CRM production has a one-to- one,
customer-to-bodies growth trajectory. Additional service requires additional people regardless of
size. CRM firms need people with foreign language skills. Foreign language skills take a long time to
develop and training is not provided by employers. Finding ways to upgrade language skills, and
employ those outside major cities with language skills, can help address gaps in the short term.
Longer term will require improvements in the education system.
• Insufficient office space available: Every CRM provider is planning to hire more people and grow.
A typical call center requires 10 square meters per person, not including hallways, break and dining
rooms, etc. This space represents a significant investment, yet the investment is not the constraint,
it is finding the space itself. While vacant office space is available, CRM firms need Class A space that
is customizable to their business needs (at European standards). CRM companies experience that
there is very limited actual Class A space available in Tbilisi and none at all that exists outside of
Tbilisi that is move-in ready. This should not be confused with the availability of “brownfield” sites,
which is an industrial term. Also, the lack of space (as identified by CRM companies themselves)
37 ETF. Youth Transition to Work in Georgia. 2018.
VALUE CHAIN PRIORITIZATION AND GAPS ASSESSMENT 36
refers to top quality, move-in-ready space. This type of space in sufficient size is in extremely short
supply outside of Tbilisi and some other major cities.
• Lack of access to new markets. Georgian CRM firms are almost exclusively serving European and
regional clients. The relationship with the market depends on the firm structure and personal
relationships – captive contractors interact very differently with their client than do contract service
providers. For providers who do not have a captive market, contracts with clients tend to be
relationship and personality driven, primarily based on personal connections with the client. These
personalized relationships limit Georgian firm’s ability to engage with and attract new clients,
especially in new markets. This lack of professional marketing limits firm’s ability to grow. Many
firms are serving the European market, necessitating European languages, yet Georgia’s strongest
asset is probably the wide-spread adoption of English, which helps but is of limited utility in Europe.
The biggest CRM market, and the one which can best tap in to Georgia’s strong English-language
capabilities is the US, the market most firms want to access, but are not currently doing so.
Enterprise Resource Management. The key constraint to moving from CRM to ERM is that few
Georgian firms are providing ERM services and Georgia does not have a reputation in the market for
this work. In addition, for firms that want to upgrade their service offerings and begin to provide ERM
service there are no technical resources or financial products in Georgia to help them do so.
Mid-stream Architecture Contract Services. Architecture faces both short term and longer term
constraints.
• Lack of modern skills. Georgian Universities are not training students in modern computer design
skills demanded by international clients in drawing and rendering, especially REVIT and ArchiCAD.
This is a constraint that can be addressed in the short term.
• Lack of strategic partnerships in key end markets. Each national/local architecture market is
unique due to the local nature of building and construction regulations. This makes it difficult to
contract out certain services. To ensure compliance with local regulations and sign-off from local
authorities requires a local partner architecture firm. Georgian Architecture firms do not have the
necessary strategic partnerships in new markets that will allow them to perform work there.
• Lack of marketing. Most Georgian architecture firms have little experience planning longer term
marketing strategies outside of design competitions and have a complete lack of local market
understanding to develop the needed market linkages for sales into local architecture markets in
Europe and Asia. Current architecture-related BPO service contracts are built upon personal
relationships within a specific market and there are no systematic efforts to understand or enter
new markets.
IT Software and Hardware Product Development. There are few market access issues as
standards are global across the industry. There is no Georgia IT brand yet. However, the primary
constraint is around skills and technologies. Given the high labor requirements of programming to deal
with increased project volumes, firms will require new employees at both senior and junior levels. In
addition, the foreign clients will require techniques, tools, and programming languages that are above the
capacity of many smaller IT firms.
• Lack of higher-level human resources and skills. Georgian Universities are not training students
in the skills demanded by international clients in automation services (cloud computing, NetOps,
DevOps, DatOps); or embedded services (Linux, hardware design, FPGA-MDL). In addition, scrum
and other project management techniques common in managing IT projects in developed markets
are not common in Georgia. There is also a lack of senior programmers in the Georgian market
around which project teams can be built and who young people can learn from.
VALUE CHAIN PRIORITIZATION AND GAPS ASSESSMENT 37
• Outdated technologies. Domestic demand coming from banks, telecommunications, and gaming is
for a lower quality (different techniques and languages) service and product. These old programming
languages and database technologies are not appropriate for international clients, making it difficult
for Georgian firms to leverage experiences from domestic market sales and services into
international contracts.
CROSS-CUTTING CONSTRAINTS TO GROWTH OF BPO
• Lack of marketing and international brand. Georgian BPO providers lack experience in
marketing and sales and there is lack of market knowledge and contacts in the global BPO value
chain - in Europe - and beyond. In addition, there is not yet any brand around the Georgian BPO
sector
• Insufficient information available for potential investors. Georgia has gotten a lot right when it
comes to the business enabling environment, even more so when it comes to information and
related technology. Georgia often ends up towards the top of the lists of site selection companies
when they are searching for locations for foreign investment. However, when these firms investigate
further, Georgia cannot provide them with the location specific information they need on the skills
in the labor force and the operational costs for running the business, which competitor countries
are able to provide. This information gap precludes may potential investors in CRM and other labor-
intensive industries from selecting Georgia for their operations.
• Lack of incentive programs. Competing countries, especially those in the Balkans and Eastern
Europe, have well developed incentive programs for CRM firms to locate in their countries. Georgia
has none. Enterprise Georgia is under resourced when it comes to pro-active investment
promotion. At the same time the BPO value chain is still to fragmented to take on that role itself.
PRIORITY INTERVENTIONS
The Program will support the following activities across all high potential business activities.
Higher Quality CRM and Contact Centers • Support short and long-term skills development. Support short term courses in partnership with
University and Language training centers to help language learners take a ‘step up’ from the B1
foreign language skill level they are likely to have post- secondary school to the B2 or B3 level
required for CRM. For longer term skill development, work with secondary school systems to
quality assure and certify language learning at all levels ensuring graduates have market relevant
language skills.
• Develop a new soft skills / customer service learning module in partnership with CRM providers
and aligned with Georgian learning standards at the secondary level. This will include experiential
learning modules where young adults can experience an actual workplace, internship and
apprenticeship programs.
• Support CRM expansion outside of Tbilisi. Identify locations with concentrations of foreign
language skills and work with firms to bring CRM services to new locations outside of Tbilisi.
Potential locations include Kutaisi, Telavi, Batumi, and Zugdidi.
• Support the development of cooperation schemes between smaller BPO providers in Georgia,
to allow them to become a member of an international BPO association and be visible on
international radar, where most sales take place.
VALUE CHAIN PRIORITIZATION AND GAPS ASSESSMENT 38
Enterprise Resource Management • Increase awareness of ERM opportunities. Work with Georgian providers to develop a series of
‘success stories’ that highlight the business case for using Georgian firms for higher value BPO
services such as ERM.
• Provide capacity building and technical training for a core group of emerging Georgian CRM
firms that is tied to grants and technical assistance for providing the new ERM services in new
markets.
Mid-stream Architecture Contract Services • Develop new Architecture technology courses with Universities and the private sector that can
be delivered anywhere, in the classroom or on the job, that are aligned to international standards.
• Improve international marketing: Support Georgian architecture firms to participate in European
design competitions and design salons to build a reputation and connections to Architecture and
related firms in European markets. In addition, conduct a market survey of international, national
and local architecture markets and train architecture firm management teams on marketing and
sales strategies.
IT Software and Hardware Product Development • Improve training opportunities. Working with IT degree granting Universities, either through
their standard curricula, or their demand-driven training centers, provide increased technical
training for small firm staff and management training for firm owners/managers on Agile, Scrum and
similar project management techniques. Develop new IT courses with the private sector that can be
delivered anywhere, in the classroom or on the job.
• Support the temporary import of senior programmers and IT specialists. This will create a
spillover effect with Georgian junior programmers. Program would be a 3-6 month stay/work
program placed within a Georgian firm. One senior programmer can facilitate professional
development of at least ten Georgian workers, who later cascade that learning to others. Actively
engage diaspora to participate in this program.
Cross-cutting • Provide market linkage support to Georgian providers. In cooperation with Enterprise Georgia
help Georgian firms participate in international trade fairs (e.g. Web Summit in Portugal) to acquire
knowledge about modern trends, develop contacts and sell their services. Provide technical training
for small CRM and other BPO companies management and staff on marketing to international
clients. Working with an international marketing firm with experience in the CRM sector develop a
Georgia-specific CRM slogan and market a brand that draws upon the quality and closeness of
Georgia to developed markets.
• Improve information services to investors. Work with Enterprise Georgia to establish a labor
market observatory which would collect information on regional skills profiles, operational costs,
among other critical pieces of information and be the platform for sharing that info with potential
investors and the public. Conduct a market survey on investment promotion schemes from
competitors. Provide technical assistance to the Ministry of Economy and Sustainable Development
to develop investment promotion packages.
Public-Private Partnership Opportunities Partnership opportunities in BPO include:
VALUE CHAIN PRIORITIZATION AND GAPS ASSESSMENT 39
• Online retailer and Majorel. Majorel has rapidly grown to over 1,200 employees with plans to
expand to 4,000 employees over the next 4 years, but to do so they need to expand beyond Tbilisi.
Of the five major language learning areas in Georgia, Majorel has already invested in Tbilisi, Kutaisi,
and Batumi – only Zugdidi and Telavi remain. To support continued expansion Telavi could be the
next location for expansion as the Telavi Iakob Gogebashvili state university already offers German
language learning. The project would work with Majorel to set up a German language call center in
Telavi and create a pipeline of local work-ready German-speaking youth into employment.
CREATIVE INDUSTRIES SECTOR
PRODUCTION VALUE CHAIN (FILM, TELEVISION)
GLOBAL MARKET ANALYSIS AND GEORGIA’S CURRENT POSITION
The global film box office revenues are forecasted to reach $50 billion in 202038, with the United States
and China being the largest film markets in the world, followed by the UK, Japan and India. In 2018,
8,204 feature films and 496 original series were produced worldwide, representing a 10% and 86%
growth rates between 2014 and 2018 respectively. According to conservative estimates39, the value of
international feature film production made outside of California was $4.6 billion in 2015. The market for
independent lower budget films is shrinking, while the six major Hollywood film studios (Warner
Brothers, Disney, Fox, Paramount, Sony and Universal) continue to dominate the global box office. US
represents the biggest film market with the largest number of films produced and highest film
production budgets. Chinese film market has been growing significantly and is expected to overtake the
US in 2020 in terms of box office revenues.
Georgia participates in the global film value chain as both a film producer and as a film production
service provider, as represented by its two main business activities:
• Film Production (co-production): Georgia produces an increasing number of feature films,
short films, documentaries, and short animated films each year. International film festival circuit is
the main distribution channel for these films and they usually do not generate commercial revenues.
Georgian film production is publicly funded by the Georgian National Film Center (GNFC) and
usually co-produced with other European countries, due to GNFC’s limited annual budget. Even
though few movies shown at international film festivals globally enjoy commercial success, increased
film production is an important feature in maintaining Georgia’s reputation as a film producing
country. 2018 was a successful year for Georgia with several awards at international film festivals
and the first Georgian film for which Netflix purchased global distribution rights.
• Film Production Services for Feature Films and TV Series: Georgia is emerging on the
global film industry map as a filming location and Georgian film production companies are
increasingly offering production services to international film studios and independent film makers.
These services include finding a location, managing production process, providing rental equipment,
hiring local crew, stunt services, special effects services, rental of sound stages and facilities, set
design, construction and decoration, organizing logistics (transport, accommodation), providing
security, hair and make-up services, catering, laundry/dry-cleaning, etc. The industry grew
significantly in the past three years, as a result of the 20-25% cash rebate incentive by the Film in
Georgia program of Enterprise Georgia introduced in 2016, as well as heavy marketing efforts with
38 https://www.statista.com/topics/964/film/ 39 “Global Film Production Incentives”, White paper by Olsberg SPI, June 2019
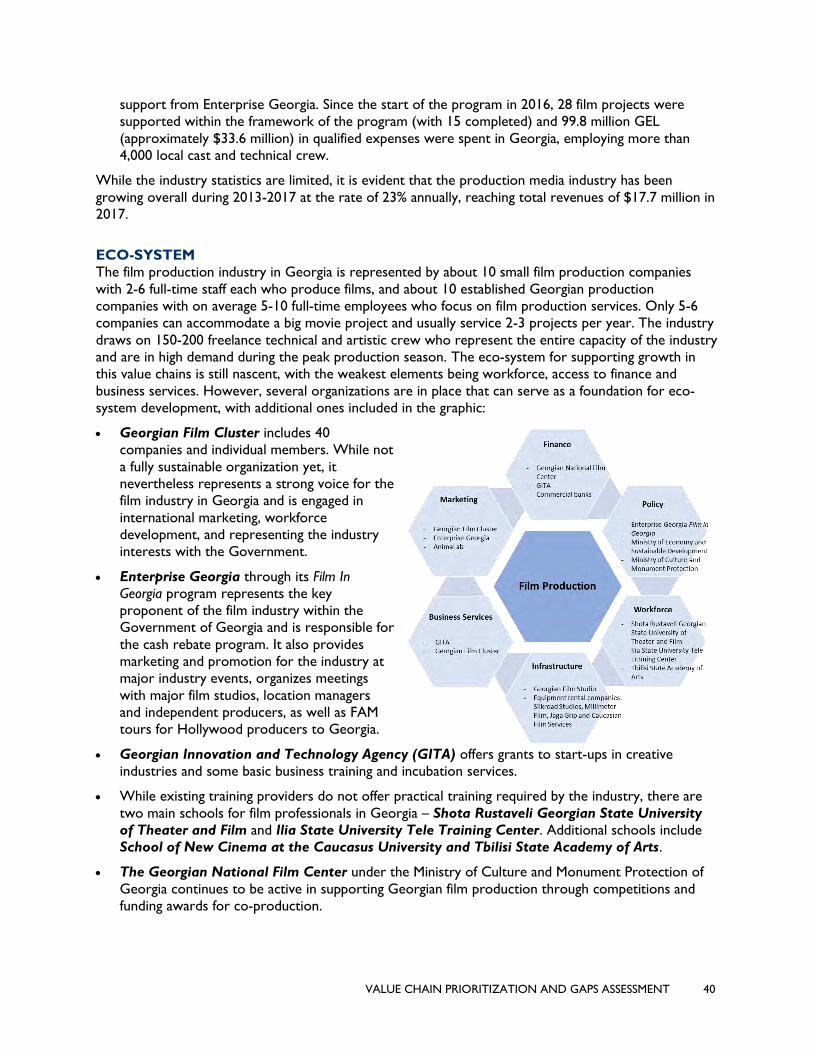
VALUE CHAIN PRIORITIZATION AND GAPS ASSESSMENT 40
support from Enterprise Georgia. Since the start of the program in 2016, 28 film projects were
supported within the framework of the program (with 15 completed) and 99.8 million GEL
(approximately $33.6 million) in qualified expenses were spent in Georgia, employing more than
4,000 local cast and technical crew.
While the industry statistics are limited, it is evident that the production media industry has been
growing overall during 2013-2017 at the rate of 23% annually, reaching total revenues of $17.7 million in
2017.
ECO-SYSTEM
The film production industry in Georgia is represented by about 10 small film production companies
with 2-6 full-time staff each who produce films, and about 10 established Georgian production
companies with on average 5-10 full-time employees who focus on film production services. Only 5-6
companies can accommodate a big movie project and usually service 2-3 projects per year. The industry
draws on 150-200 freelance technical and artistic crew who represent the entire capacity of the industry
and are in high demand during the peak production season. The eco-system for supporting growth in
this value chains is still nascent, with the weakest elements being workforce, access to finance and
business services. However, several organizations are in place that can serve as a foundation for eco-
system development, with additional ones included in the graphic:
• Georgian Film Cluster includes 40
companies and individual members. While not
a fully sustainable organization yet, it
nevertheless represents a strong voice for the
film industry in Georgia and is engaged in
international marketing, workforce
development, and representing the industry
interests with the Government.
• Enterprise Georgia through its Film In
Georgia program represents the key
proponent of the film industry within the
Government of Georgia and is responsible for
the cash rebate program. It also provides
marketing and promotion for the industry at
major industry events, organizes meetings
with major film studios, location managers
and independent producers, as well as FAM
tours for Hollywood producers to Georgia.
• Georgian Innovation and Technology Agency (GITA) offers grants to start-ups in creative
industries and some basic business training and incubation services.
• While existing training providers do not offer practical training required by the industry, there are
two main schools for film professionals in Georgia – Shota Rustaveli Georgian State University
of Theater and Film and Ilia State University Tele Training Center. Additional schools include
School of New Cinema at the Caucasus University and Tbilisi State Academy of Arts.
• The Georgian National Film Center under the Ministry of Culture and Monument Protection of
Georgia continues to be active in supporting Georgian film production through competitions and
funding awards for co-production.
VALUE CHAIN PRIORITIZATION AND GAPS ASSESSMENT 41
PRIORITY BUSINESS ACTIVITIES FOR GEORGIA
Due to extremely competitive nature of the international film market, the main growth opportunities
for Georgia include capturing a share of the film production budget spent worldwide, rather than
competing directly in the consumer distribution segment. Therefore, the most promising business
activity for Georgia is the film production services. Georgia can increase its current revenue share
from film production services offered to major film studios and independent film makers in export
markets, with a particular focus on attracting more clients (particularly major film studios) from higher
value markets – US and China, as opposed to current lower budget Indian market. This market
opportunity is supported by the following global market trends:
• The industry has reached a “tipping point”, where earlier marketing efforts are paying off and
prominent film studios are coming to Georgia. Until recently, the main markets for Georgia included
India and European countries (France, UK, Norway, Sweden, Ireland), with lower budget films, and
one Chinese movie filmed in Georgia. But in 2019 the industry achieved a breakthrough by
attracting the first major US Hollywood film studio, Universal Pictures, to film Fast and Furious 9 in
Georgia in the summer of 2019, which could open up potential future opportunities with both
Universal and other high budget Hollywood film studios.
• Industry experts believe that major film studios will remain in strong position and the global cinema
industry is expected to experience a steady increase in revenues over the next five years.
Hollywood-made films will continue to dominate global box office and these films will increasingly
both be set and shot abroad40. Film studios will be more and more looking for new and unique
locations, with the US film studios accounting for the largest market share and highest film
production budgets.
• Chinese market demand for film will continue to grow and China is projected to overtake the US
market in 2020 in terms of the box office revenue. The first and only Chinese movie filmed in
Georgia, The Mask, accounted for the largest amount spent in Georgia so far (over $4 million) and
the highest number of people hired by a single movie (1,900). This represents a lucrative high-value
market for Georgia.
POTENTIAL FOR GROWTH (INVESTMENT, HIGH(ER)-VALUE JOB CREATION,
ENHANCED REVENUES)
Economic impact of film production services is significant due to 1) number of people employed during
film shooting, even on contract basis, 2) supply chain spillovers into auxiliary services (tourism,
transportation, catering, construction, accommodation, restaurants, etc.), and 3) proven links to growth
in tourism based on international benchmarks. International experience shows, that film industries were
able to grow substantially within the span of just several years as a result of financial incentive programs.
Film production spending in Hungary grew from $1 million in 2003 to $400 million in 2017. In the Czech
Republic the introduction of the 20% incentive grew the film industry foreign investments from $40
million in 2008 to $260 million in 2017. Georgia’s film industry growth trends in the past 2-3 years,
confirm that such growth is possible in Georgia as well.
This business activity offers opportunities for higher value jobs. Even though these are seasonal
contract-based jobs (usually up to 40 days), salaries in this industry are higher than the current average
salary for Georgian employees which is 1,124 GEL/month (approximately $410/month).41 Film industry
also offers opportunities for entry level unskilled jobs. Number of people hired per movie has ranged
between 100 and 400 people. (The Chinese movie The Mask, used more than 1,900 people.) Full-time
40 Global Entertainment and Media Outlook: 2019-2023, PwC 41 Source: GeoStat: https://www.geostat.ge/en/modules/categories/39/wages
VALUE CHAIN PRIORITIZATION AND GAPS ASSESSMENT 42
employment is limited to full-time staff of production companies, which is currently estimated at less
than 100 people, but companies estimate that full-time employment could double with doubled
production. Doubling the volume of films produced would also double the volume of film
professionals/crew required, currently estimated at 150-200.
In addition to hiring of local crew and other film professionals, there is significant spillover impact in
terms of money spent on auxiliary industries and services – hotels, restaurants, catering, transportation,
carpenters, designers, car rental, etc. In addition to spending during the film shooting, international
statistics show proven impact on subsequent growth of tourism following the success of international
film productions, since 15% of world tourism is film tourism42.
BUSINESS CASE
In 2018 8,204 feature films and 496 original series were produced worldwide, with the value of
international feature film production made outside of California estimated conservatively at $4.6 billion
in 2015. Film budgets for a major film studio range from $70 million to $300 million and average $5-8
million for an independent film, with production costs representing the largest cost category which can
be as high as 50% of the total budget43. The United States is the key market for film production services
with by far the largest number of movies produced and the highest movie budgets, followed by China
and the UK. China and US represent the most lucrative higher value markets globally, compared to large
volume, but lower budget Indian Bollywood movies.
Between 2016-2018, Georgia captured approximately 29.9 million EUR (or approximately $33.6 million)
in local spending from 28 foreign films. While this represents a rather small share of the total market
value for film production, examples of high budget film spending in Georgia, demonstrate the magnitude
of the value that Georgia could capture in the future. Chinese film The Mask spent more than 3.6 million
EUR/over $4 million in Georgia, hiring 1,900 people. Universal Pictures, set to shoot in August 2019, is
planning to spend approximately 9.7 million EUR/$ 10.7 million during 5 weeks of filming of Fast and
Furious 9, employing around 1,000 people, including 200 crew members44.
When location scouts for international film production companies or film studios are looking for
suitable film production locations they are first looking at production costs/budgets, qualified workforce,
and favorable regulatory environment. Additional considerations include security, easy logistics, suitable
locations and easy communication with the local production company. The Film in Georgia cash rebate
program represents a major incentive for attracting international film projects to Georgia, combined
with lower costs, variety of locations and landscapes, flexible and simplified rebate process, lack of
licenses for filming, and film friendly society. Georgia’s key competitors as a filming location include
Eastern European countries – Hungary, Bulgaria, Serbia, Croatia, Romania, all of which offer some form
of financial incentives for foreign film companies. However, filming costs in Georgia are reportedly 30-
40% cheaper than in Hungary and Romania. In addition, Georgia offers a variety of landscapes and
locations, which can appeal to film studios that are looking for new and unique locations.
While Georgia is slowly gaining reputation, it is still new on the film industry map and does not have the
established relationships with film studios that its competitors do. In addition, Georgia’s main bottleneck
to growing the industry is lack of sufficient supply of trained and experienced crew members. As more
42 For example, “Mission Impossible 2” increased the number of tourists in Sydney national parks by 200%; filming of “Lord of
the Rings” generated $7 billion in tourism revenues for the New Zealand economy; the screening of “Brave Heart” increased
the number of tourists in Scotland the following year by 300%. This places even higher importance on attracting major film
studios which are likely to become a box office success.
43 50% share includes actor fees which vary significantly. 44 https://www.filmneweurope.com/news/georgia-news/item/118467-production-fast-and-furious-9-to-be-partially-shot-in-
georgia
VALUE CHAIN PRIORITIZATION AND GAPS ASSESSMENT 43
film companies come to shoot in Georgia, Georgia not only has an opportunity to take advantage of the
growing market demand, but also has an imperative to deliver on existing contracts and not damage
reputation with new higher value Hollywood buyers.
It is estimated that with support from Economic Security Program, the film production industry business
activity segment could attract additional $30 million in qualified expenditures as part of the cash rebate
program. Film production companies could generate additional $15 million in sale revenues and create
between 100-150 FTE jobs for film professionals, and up to 200 additional FTE jobs in auxiliary services.
There are potential opportunities to facilitate at least 2 PPPs with international film studios for
workforce capacity building.
KEY GAPS IN PRIORITY BUSINESS ACTIVITIES
The Georgian film industry is stretched to keep up with the increased demand during the high
production season (May-September) and is lacking the required supply capacity to meet the growing
demand. Lack of qualified technical and artistic crew, limited equipment base and limited
capacity/number of local production companies - all put Georgia at risk of not meeting the expectations
of international “buyers”. This has already become apparent as both Universal, two large Indian and one
UK production are set to be filmed at the same time in August 2019. The industry overall has the
maximum capacity to service 2-3 film productions at the same time. Other constraints to long-term
growth include:
• Insufficient supply of qualified technical crew: Most in demand skills include line producers
(script supervisors), location scouts, and location managers. The technical skills of the “below-the-
line”45 crew are insufficient and they lack proper training in modern equipment. Georgia also lacks
skilled heads of departments, production managers, production assistants, audio engineers, light
technicians, gaffers, grips, makeup artists, and production designers.
• Lack of practical training options: Existing training programs focus on film directing and script
writing and there are no vocational education programs that teach practical skills. According to
industry stakeholders, Shota Rustaveli Georgian State University of Theater and Film and Ilia State
University are not viable candidates for development of practical training programs. Skills building in
this business activity requires practical on the set training.
• Limited access to finance options: Limited equipment base in the industry, with only four
equipment rental companies, is going to constrain growth in the long term. The industry needs to
grow the equipment base to be able to grow film production services. This is constrained by high
interest rates and collateral requirements for bank business loans. Banks do not have equipment
loan products and leasing products are not developed as there is limited secondary market for film
equipment.
• Burdensome VAT taxation: The Georgian Film Cluster has extensively lobbied the government on
an amendment to the VAT law that results in “double taxation” for the film industry. When
purchasing local services, such as accommodation or catering, film production companies pay the
18% VAT tax and the 25% income tax on all services purchased.
• Delays in cash rebate reimbursement: According to the cash rebate program rules, rebates of up
to 1 million GEL (approximately $400,000) are approved automatically, while projects requesting
higher rebates need special approval from the Government of Georgia in order to receive
45 In film/TV there are two categories of crew: “above the-line” refers to the product’s creative influencers – the screenwriter,
director, actors, cinematographer and the producer; while “below-the-line” refers to those responsible for making the product
– project manager, gaffer (lighting), grip (holding, moving, elevating the camera operator), lighting, sound, set design, costume
design, hair and make-up and a range or other skill sets.
VALUE CHAIN PRIORITIZATION AND GAPS ASSESSMENT 44
reimbursement. Some companies have reported delays in getting approval for rebates exceeding 1
million GEL. As bigger budget movies come to Georgia, more companies might encounter this issue.
• Weak general business skills: Film businesses need to improve their understanding of international
requirements of major film studios and marketing, as well as develop legal, accounting, financial
management and contract negotiation skills.
PRIORITY INTERVENTIONS
To grow this business activity, Economic Security Program will facilitate catalytic investments in
workforce training, create pathways to youth into entry level jobs in the film industry, facilitate
investments into the sector and strengthen industry collaboration to address joint concerns. For
example, the Program will:
• Facilitate partnerships with foreign film studios for on the job workforce training to allow
local staff to observe and be trained during the shoot. In addition, work with Film in Georgia to
build in a training requirement into agreements with future foreign film companies and/or adding
training of local staff into the “cultural component” of the cash rebate program where film
companies qualify for an additional 1-2 % rebate.
• Build pathways for youth into the sector targeting unemployed youth that may not see itself
immediately associated with the film industry, but may have relevant non-technical skills that are
suited for entry level jobs during production, such as set construction/carpentry, transportation,
catering, design, etc. Work with film production companies to identify top entry level needs and
look at potential options for increasing awareness of opportunities among youth, potentially in
collaboration with the main online job portals.
• Improve access to finance options though various mechanisms, such as working with Enterprise
Georgia Film in Georgia program to offer subsidized loans for the film industry for business upgrading
and equipment purchases; developing leasing products for the film industry; working with
commercial banks to develop equipment and other loan products or line of credit targeting the film
industry; and exploring opportunities together with Start-up Georgia under the Partnership Fund to
support start-up businesses interested in opening up equipment rental facilities.
• Strengthen industry collaboration around business services, marketing and advocacy through
building capacity of the Georgian Film Cluster to develop and offer sustainable services for the film
industry, such as marketing, training and advocacy. Support advocacy efforts and public-private
dialogue around the changes for the VAT taxation regime and increasing threshold for automatic
reimbursement under the cash rebate program.
PUBLIC-PRIVATE PARTNERSHIP OPPORTUNITIES
Contracts with major film studios present opportunities to leverage investment from these film studios
who have an incentive in building the required workforce in Georgia. In the global film industry, skills
building in film production can only take place on the set, so such a practical on set training from leading
film studios is a unique opportunity for Georgia.
• Universal Pictures: The Program has already engaged in discussions with Universal Pictures,
which is willing to allow “on the job training” during the Fast and Furious 9 filming in August 2019 and
is ready to co-finance the training costs because they believe this will be a long-term cost-saving for
future shootings. A possibility also includes sponsoring training of Georgian post-production
professionals abroad. 200 experienced crew members from Universal will arrive in Georgia and
“learning by doing” alongside those professionals will be a once in a lifetime opportunity for aspiring
film makers and crew members. The Economic Security Program is currently developing a concept
VALUE CHAIN PRIORITIZATION AND GAPS ASSESSMENT 45
note for partnership with Universal which will be focused on developing the country’s workforce in
film production and post-production value chains.
POST-PRODUCTION VALUE CHAIN (SOUND, VISUAL EFFECTS, ANIMATION, EDITING)
GLOBAL MARKET ANALYSIS AND GEORGIA’S CURRENT POSITION
Georgia’s post-production/audio-visual services value chain is nascent and currently its participation in
the global market occurs on a rather small scale. The global market opportunities however are
significant and the markets for post-production/audio-visual services are growing at a rapid pace.
Globally the film, animation, video gaming and advertising industries are key markets for post-
production/audio-visual services - video editing, sound and music composition, visual effects, color
grading, and animation.
The global film market, particularly the film production segment, is expected to grow at 6% CAGR
in 2019-2023. The global film box office revenues are forecasted to reach $50 billion in 202046, with the
United States and China being the largest film markets in the world, followed by the UK, Japan and India.
In 2018, 8,204 feature films and 496 original series were produced worldwide, representing a 10% and
86% growth rates between 2014 and 2018 respectively. According to conservative estimates47, the value
of international feature film production made outside of California was $4.6 billion in 2015.
Global animation and video gaming industry had grown to $254 billion in 2017 and is projected
to reach $270 billion by 2020. The global animation industry is dominated by the US, where the
animation industry is supported by the Hollywood film base. Video gaming market globally, as a segment
of global animation industry, represents the largest consumer of audio-visual services and is projected to
grow at 6% CAGR during 2019-2023. In 2018, video gaming market was worth approximately $115
billion, up from $78.6 billion in 2017, and is projected to surpass $138 billion by 2021. Asia Pacific is the
largest gaming market with revenues of $51.2 billion in 2017.
Global advertising spending has been growing steadily and is estimated at $563 billion for 2019, an
4.6% increase compared to 2018. In particular, the internet advertising industry is projected to grow at
9% CAGR for 2019-2023 reaching a value of $160.8 billion. The United States remains the largest global
internet advertising market, valued $107.5 billion in 2018. The Georgian domestic advertising market in
2017 was worth $48.4 million, where TV advertising was valued $35.3 million and digital online
advertising - $5 million. The advertising market was forecasted to grow by 5 percent and reach $51
million in 2018. Georgia’s online advertising market has doubled in 2017 compared to 2014 and was
projected to grow at another 25 percent in 2018.
The post-production value chain in Georgia is currently very small and post-production companies are
serving markets primarily outside of the film production industry, namely commercials and video games.
The industry is mainly domestic market focused (estimated 90-95% of revenues) and serving mainly
advertising companies and corporate clients, in addition to some limited post-production work for
Georgian films. There is a small but fast-growing demand in export markets from advertising and video
gaming companies both in the region (Azerbaijan, Kazakhstan, Russia) and internationally (US, UK,
France), which accounts for 5-10% of current revenues. In addition, according to industry stakeholders
there is an emerging demand from film post-production companies in Czech Republic, Germany,
Belgium, UK, US, Canada, China that are looking to outsource post-production work to locations that
46 https://www.statista.com/topics/964/film/ 47 “Global Film Production Incentives”, White paper by Olsberg SPI, June 2019
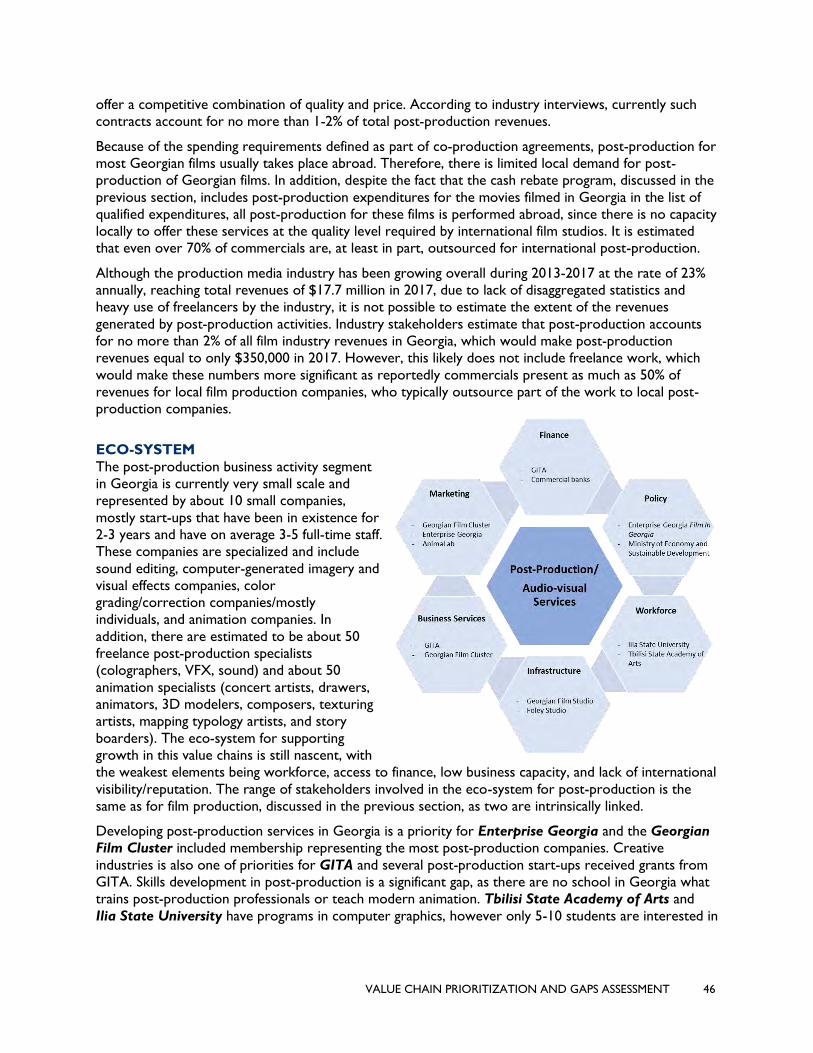
VALUE CHAIN PRIORITIZATION AND GAPS ASSESSMENT 46
offer a competitive combination of quality and price. According to industry interviews, currently such
contracts account for no more than 1-2% of total post-production revenues.
Because of the spending requirements defined as part of co-production agreements, post-production for
most Georgian films usually takes place abroad. Therefore, there is limited local demand for post-
production of Georgian films. In addition, despite the fact that the cash rebate program, discussed in the
previous section, includes post-production expenditures for the movies filmed in Georgia in the list of
qualified expenditures, all post-production for these films is performed abroad, since there is no capacity
locally to offer these services at the quality level required by international film studios. It is estimated
that even over 70% of commercials are, at least in part, outsourced for international post-production.
Although the production media industry has been growing overall during 2013-2017 at the rate of 23%
annually, reaching total revenues of $17.7 million in 2017, due to lack of disaggregated statistics and
heavy use of freelancers by the industry, it is not possible to estimate the extent of the revenues
generated by post-production activities. Industry stakeholders estimate that post-production accounts
for no more than 2% of all film industry revenues in Georgia, which would make post-production
revenues equal to only $350,000 in 2017. However, this likely does not include freelance work, which
would make these numbers more significant as reportedly commercials present as much as 50% of
revenues for local film production companies, who typically outsource part of the work to local post-
production companies.
ECO-SYSTEM
The post-production business activity segment
in Georgia is currently very small scale and
represented by about 10 small companies,
mostly start-ups that have been in existence for
2-3 years and have on average 3-5 full-time staff.
These companies are specialized and include
sound editing, computer-generated imagery and
visual effects companies, color
grading/correction companies/mostly
individuals, and animation companies. In
addition, there are estimated to be about 50
freelance post-production specialists
(colographers, VFX, sound) and about 50
animation specialists (concert artists, drawers,
animators, 3D modelers, composers, texturing
artists, mapping typology artists, and story
boarders). The eco-system for supporting
growth in this value chains is still nascent, with
the weakest elements being workforce, access to finance, low business capacity, and lack of international
visibility/reputation. The range of stakeholders involved in the eco-system for post-production is the
same as for film production, discussed in the previous section, as two are intrinsically linked.
Developing post-production services in Georgia is a priority for Enterprise Georgia and the Georgian
Film Cluster included membership representing the most post-production companies. Creative
industries is also one of priorities for GITA and several post-production start-ups received grants from
GITA. Skills development in post-production is a significant gap, as there are no school in Georgia what
trains post-production professionals or teach modern animation. Tbilisi State Academy of Arts and
Ilia State University have programs in computer graphics, however only 5-10 students are interested in
VALUE CHAIN PRIORITIZATION AND GAPS ASSESSMENT 47
this field annually. The Georgian Film Studio is an old Soviet film studio which however is still in use by
post-production companies. It has good foley studio but is lacking sound mixing stages.
PRIORITY BUSINESS ACTIVITIES FOR GEORGIA
Although currently the Georgian post-production industry is relying heavily on domestic advertising
market demand, due to its small size and lower value, the local market does not represent a viable long-
term market. industry stakeholders see growth potential in developing post-production/audio-visual
services for export markets in sound, color grading, VFX, and potentially animation, if
Georgia could develop the required capacity. Market demand and opportunities exist to 1) increase the
volume of sales to high-value clients in export markets – namely the US and Europe - focusing on post-
production services for film (sound, VFX) and video games (VFX, animation), and 2) capture a larger
share of contracts in the advertising industry with clients in Europe and the region (Central Asia,
Ukraine, Caucasus), as well as domestic contracts that are currently being outsourced abroad.
This market opportunity is supported by the following global market trends:
• Due to rising costs of film post-production globally, many post-production companies are
outsourcing some tasks to cheaper destinations with good quality. Georgia appears to have growing
capacity and some competitive advantages in sound editing. However, in visual effects (VFX) Georgia
will face strong competition from India which has recently been attracting a lot of the VFX work
globally.
• Global demand for VFX and animation is growing rapidly from both video gaming industry and
animated movies. The growth in the animation industry globally is driven by high budget allocation
to animated movies. Production costs per animation movie are estimated between $20 million and
$300 million and as costs increase, animation studios are seeking strategic partnerships and
outsourcing opportunities to lower production costs. According to industry stakeholders in Georgia
there is growing global demand for animation services and one animation company already had
contracts for outsourced production of animated videos for Walt Disney and Nickelodeon
productions. Demand also grows from video gaming companies in the US and Europe for VFX. This
opportunity however is largely aspirational at the moment, as Georgia lacks required capacity in
animation and has only limited capacity in VFX at this time.
• Contracts with international advertising companies currently account for about 10% of Georgia’s
post-production revenues, which however are growing fast. For Georgian post-production
companies already working for the domestic advertising industry there are opportunities to increase
their export market share, either directly to export markets or via contracts with local production
companies.
POTENTIAL FOR GROWTH (INVESTMENT, HIGH(ER)-VALUE JOB CREATION,
ENHANCED REVENUES)
Post-production represents a higher value segment of the film industry, which is relatively labor
intensive (particularly VFX), with higher value technology-based jobs. The salaries are significantly higher
than the current average salary of 1,124 GEL/month (approximately $410/month).48 The industry has
few constraints to employment of women. With sufficient volume of contracts this business activity
could generate year-round full-time jobs. Currently, an estimated 45 people are employed full time, plus
50-100 freelancers. Companies believe that if they doubled their revenues, they would need to double
their full-time staff and the number of freelancers they hire per project.
48 Source: GeoStat: https://www.geostat.ge/en/modules/categories/39/wages
VALUE CHAIN PRIORITIZATION AND GAPS ASSESSMENT 48
While the market demand is significant, the growth potential of this business activity at the moment is
still aspirational due to lack of qualified professionals that are trained up to international standards and
lack of modern technologies and facilities. There is however, a strong desire to grow from the industry
from the private sector side. This work can be performed remotely for distant end markets and can
create jobs quickly. Change in this industry will take time and will not yield large numbers on terms of
jobs and sales. However, because this is higher value opportunity in a market that is growing globally,
Economic Security Program will take an opportunistic approach and look for opportunities to draw
catalytic investment in the sector business and skills development which can be a game changer. It is
estimated that with support from Economic Security Program, Georgian post-production companies
could generate additional $500,000 in sale revenues and create approximately 80 FTE jobs. There are
potential opportunities to facilitate at least 2 PPPs with international film studios and animation
companies with benefits to workforce capacity building.
BUSINESS CASE
For film post-production, the market size is determined by the number of movies produced and their
average budget. In 2018 8,204 feature films and 496 original series were produced worldwide, with film
budgets ranging from $5-6 million for independent films to $70 - $300 million for a major film studio
movie. The value of international feature film production made outside of California was $4.6 billion in
2015. Post-production that includes VFX, usually accounts for 20-30% of the film production budget.
Production cost per animated film is estimated between $20 million and $300 million. The addressable
market size for Georgia in the $254 billion global market for animation and video gaming and in the
$160.8 billion internet advertising market is difficult to quantify, as Georgia’s current revenues from
post-production/audio-visual services, are estimated to be less than $1 million annually and few
companies can secure steady steams of work. However, the growth in global market demand is evident.
Buyers for post-production/audio-visual services in higher value export markets, such as US, UK, France,
are looking for a combination of quality and price. Quality is the first and foremost requirement, but
buyers are also looking to outsource work to more cost-competitive locations. Georgia’s key
competitors in post-production and audio-visual services include Romania, Ukraine, Russia, and India
(for VFX). According to industry interviews, the cost to do sound in Georgia is three times cheaper
than in the US or Europe, and two times cheaper than regional competitors, like Romania. The quality of
the post-production work in Georgia is considered good. It is not cheaper than India or China, but
reportedly Georgia is considered culturally closer and more reliable by buyers. Costs are comparable to
Ukraine, Russia, Poland. However, in VFX Georgia will face strong competition from India.
According to industry interviews, Georgia has the highest competitiveness potential in sound. Georgian
professionals can perform music composition and record “foley” sound in an existing foley studio.
However, the main competitive disadvantage is that only 80% of the work can be performed in Georgia
at the moment, as there are no sound mixing studios. The sound editing work needs to be finished
abroad, usually in the Czech Republic, Russia, Ukraine, Romania, Germany, France, Turkey. In addition,
Georgia, does not have a Dolby Atmos studio, so the sound editing for major film studios cannot be
performed in Georgia and the required level of sound quality. In visual effects, the scale of work is too
limited to determine whether Georgia can compete with India. In animation, the industry stakeholders
believe that Georgia is not yet cost competitive. The industry in general is not yet organized and has not
realized the need to respond to global competitive pressures. While Georgians believe to offer better
quality that Indian and Chinese animators, they charge higher prices and are not yet on the map of the
animation industry globally.
KEY GAPS IN PRIORITY BUSINESS ACTIVITIES
Georgia’s main bottleneck in developing post-production capacity, is the sheer small number of
companies and freelancers with the required skills to perform the work, as well as limited access to
VALUE CHAIN PRIORITIZATION AND GAPS ASSESSMENT 49
financing and limited scale of post-production companies. Industry stakeholders believe they would not
be able to absorb significant amount of additional contract work due to lack of workforce.
• Lack of qualified workforce and modern skills: Most post-production professionals in Georgia
are self-taught, are often not familiar with international standards and terminology, and lack proper
training in modern digital techniques, processing software, and equipment. In addition, there is sheer
lack of qualified post-production professionals, with an estimated 50-70 professionals in the entire
country. Key skills missing include modern technical skills in sound editing, color correction, VFX
and digital imaging. In animation, no modern animation is currently taught in Georgia, and key
skills/professions missing include drawers, animators, 3D Modelers, texturing artists, mapping
typology artists, story boarders.
• Limited investment in modern technologies and facilities: Post-production industry is lacking
modern, digital technologies and facilities. About 70% of initial start-up expenses are for equipment
and software; however, these are not affordable for many start-up companies. Internal cash flow is
an issue as many start-ups have one off contracts and are struggling to secure continued flow of
work. With regards to facilities, currently the post-production industry lacks specialized sound
mixing studios, which cost from $100,000-500,000. As a result, only 80% of sound editing can be
performed in Georgia and the work needs to be finalized abroad, usually in Eastern Europe (Prague,
Bucharest, Warsaw).
• Weak market linkages and business scale: Georgian post-production industry is still lacking
international reputation. Although post-production companies are starting to attract international
clients, Georgia is not yet on the international map for post-production and animation work.
• Need for inclusion of post-production outsourcing services into the cash rebate incentive
program: Post-production work is included in qualified expenditures within the cash rebate
program. However, it only applies to the content shot in Georgia as part of the cash rebate
program, and currently, the industry does not meet the quality requirements of these film
productions. Post-production companies have been requesting the Government to extend the cash
rebate program to include all post-production outsourcing services.
• Lack of enforcement of intellectual property rights: Currently, the majority of the companies
and freelancers use pirated software. International buyers are concerned about security of their
media content in Georgia.
PRIORITY INTERVENTIONS
To grow this business activity, improvements are needed in a range of capacity areas from investment in
facilities and equipment, to creating a skilled workforce base, to international marketing and raising
Georgia’s reputation in post-production. This is a longer horizon investment for Georgia and Economic
Security Program will take an opportunistic approach to support this business activity and will look for
opportunities to draw in catalytic investment into the sector, rather than working to tackle individual
constraints. Justification for working in this sector to the Program will be dependent on attracting
catalytic investment into the sector workforce development which can be a game changer. Should a
catalytic partnership be attracted into the sector, potential areas for Program assistance could include:
• Support private sector-led models for workforce training: Support development of internship
and apprenticeship programs with Georgia post-production companies, who have already expressed
interest in initiating own training programs for youth interested in audio-visual fields, particularly
computer graphics and animation. Work with Tbilisi State Academy of Arts and Ilia State University
to identify interested youth with computer graphic design and art background and incorporate
practical training in curricula.
VALUE CHAIN PRIORITIZATION AND GAPS ASSESSMENT 50
• Improve access to finance for investment in sector infrastructure: Approach banks (specifically
ProCredit, TBC and Bank of Georgia) as well as Enterprise Georgia to co-finance asset loans (or
leases depending on timing) to help companies access finance for needed investments in new
equipment. Together with investment advisory groups like Galt & Taggart and Gazelle Finance, and
possibly leading commercial banks, explore possibilities of attracting investors into sound mixing
studios, upgrading for post-production studios and other larger scale facilities. Link post-production
start-ups to microfinance institutions for small scale loans. Provide advice to post-production
companies on banking finance and meeting requirements of financial institutions, either directly via
the Program or via the EBRD Advice for Small Businesses program.
• Support international marketing: Provide cost-shared support for international marketing
activities for post-production companies, integrated with the broader marketing initiatives for the
film industry, via the Georgian Film Cluster and Enterprise Georgia Film In Georgia program.
• Expand cash rebate program to include post-production outsourcing work: Support Georgian
Film Cluster to lobby Enterprise Georgia for inclusion of post-production outsourcing work into
eligible expenditures under the cash rebate program.
PUBLIC-PRIVATE PARTNERSHIP OPPORTUNITIES
Two potential PPP opportunities are being evaluated by the Program:
• Foreign direct investment in animation: A potential partnership opportunity is being explored
with an animation company in Jordan that is interested in developing a niche micro-site (50
employees or less) outside of Jordan and is considering Georgia as a potential location. The
company will be looking for individuals with basic art/drawing skills and can teach them animation,
graphics and storyboarding.
• Universal Pictures: The Program is in discussions with Universal Pictures, which is willing to allow
“on the job training” during the Fast and Furious 9 filming in August 2019 and is ready to co-finance
the training costs. Initial discussions with Universal included potential sponsorship by the studio of
training abroad for Georgian post-production professionals.
ARTISAN VALUE CHAIN49
GLOBAL MARKET ANALYSIS AND GEORGIA’S CURRENT POSITION
Georgia’s artisans are among the best in the region, with significant skills in business activities such as
fashion design, jewelry design, architectural design, woodcarving, painting, and stone carving among
others. The business activities within the artisanal value chain are not home crafts or those that adorn
most gift shops in tourist areas of Tbilisi, Batumi, and other sites in the country. Rather, artisanal
business activities focus on high-end, custom creations that are designed by discerning customers.
The current global market for crafts produced by artisans is $38.96 billion and this amount is expected
to grow $50.91 billion by the end of 2024. Demand for high-end, customized artisanal products is
highest in the United States and Western Europe, but there is also significant demand within the GCC
depending on the items. Discerning customers around are increasingly focused not just on the beauty
and value of products produced by artisans, but also the story behind them. Socially-conscious programs
featuring products produced by artisans have proliferated over the last several years, with initiatives
49 Artisan is a term used to denote luxury, custom-made articles that are valued by high-end consumers. This is not to be
confused with handicrafts, which likely do not have the potential outside of mass tourism to build the country’s competitive
positioning.
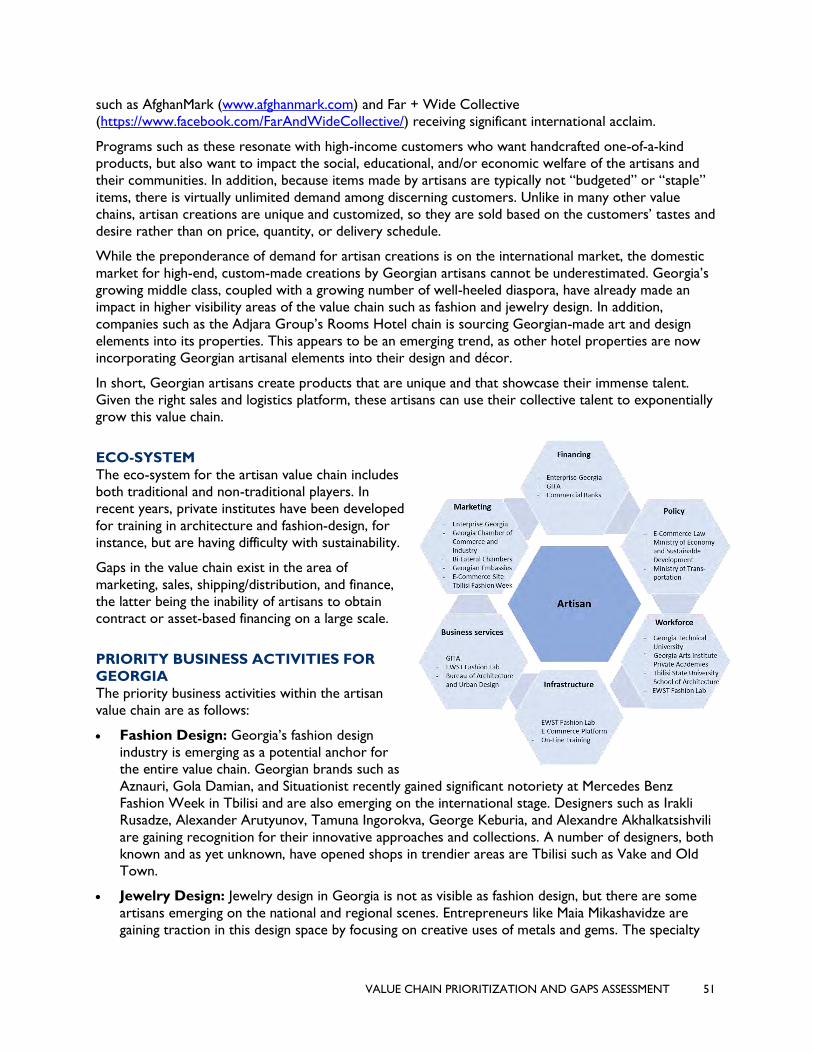
VALUE CHAIN PRIORITIZATION AND GAPS ASSESSMENT 51
such as AfghanMark (www.afghanmark.com) and Far + Wide Collective
(https://www.facebook.com/FarAndWideCollective/) receiving significant international acclaim.
Programs such as these resonate with high-income customers who want handcrafted one-of-a-kind
products, but also want to impact the social, educational, and/or economic welfare of the artisans and
their communities. In addition, because items made by artisans are typically not “budgeted” or “staple”
items, there is virtually unlimited demand among discerning customers. Unlike in many other value
chains, artisan creations are unique and customized, so they are sold based on the customers’ tastes and
desire rather than on price, quantity, or delivery schedule.
While the preponderance of demand for artisan creations is on the international market, the domestic
market for high-end, custom-made creations by Georgian artisans cannot be underestimated. Georgia’s
growing middle class, coupled with a growing number of well-heeled diaspora, have already made an
impact in higher visibility areas of the value chain such as fashion and jewelry design. In addition,
companies such as the Adjara Group’s Rooms Hotel chain is sourcing Georgian-made art and design
elements into its properties. This appears to be an emerging trend, as other hotel properties are now
incorporating Georgian artisanal elements into their design and décor.
In short, Georgian artisans create products that are unique and that showcase their immense talent.
Given the right sales and logistics platform, these artisans can use their collective talent to exponentially
grow this value chain.
ECO-SYSTEM
The eco-system for the artisan value chain includes
both traditional and non-traditional players. In
recent years, private institutes have been developed
for training in architecture and fashion-design, for
instance, but are having difficulty with sustainability.
Gaps in the value chain exist in the area of
marketing, sales, shipping/distribution, and finance,
the latter being the inability of artisans to obtain
contract or asset-based financing on a large scale.
PRIORITY BUSINESS ACTIVITIES FOR
GEORGIA
The priority business activities within the artisan
value chain are as follows:
• Fashion Design: Georgia’s fashion design
industry is emerging as a potential anchor for
the entire value chain. Georgian brands such as
Aznauri, Gola Damian, and Situationist recently gained significant notoriety at Mercedes Benz
Fashion Week in Tbilisi and are also emerging on the international stage. Designers such as Irakli
Rusadze, Alexander Arutyunov, Tamuna Ingorokva, George Keburia, and Alexandre Akhalkatsishvili
are gaining recognition for their innovative approaches and collections. A number of designers, both
known and as yet unknown, have opened shops in trendier areas are Tbilisi such as Vake and Old
Town.
• Jewelry Design: Jewelry design in Georgia is not as visible as fashion design, but there are some
artisans emerging on the national and regional scenes. Entrepreneurs like Maia Mikashavidze are
gaining traction in this design space by focusing on creative uses of metals and gems. The specialty
VALUE CHAIN PRIORITIZATION AND GAPS ASSESSMENT 52
niche for Georgian artisans in this space is the luxury jewelry market, as discerning buyers
increasingly want one-of-a-kind and culturally important pieces.
• Wood Carving: Georgia has a long history in high-quality wood carving, both for home décor and
in terms of art. Unfortunately, the number of carvers has receded over the years due to lack of
opportunities. Many wood artisans are now focusing on home décor goods and high-end
construction with a cultural flair.
• Architectural Design: Young architects like Nikoloz Lekveishvili are spurring the visibility and
growth of this business activity. In October 2018, Georgia held its first architectural biennial which
featured designs from local architects. At present, many Georgian architects are gaining experience
by working as sub-contractors on international projects in the country, but a small core are
emerging as prime contractors or lead designers.
• Ceramics: Georgia has a history of ceramics and pottery that dates back thousands of years, as
pottery was used as receptacles for wine production. In modern times, however, Georgian artisans
have introduced new techniques for the creation of high-end pottery for the home consumer
market, as well as for discerning customers. Unlike other business activities within the artisan value
chain, wood carving and pottery are those most linked to medium to upper-income buyers for
home consumption, though specific pieces of ornamental pottery are interesting to high-income
buyers.
• Painting: Georgian artists such as Alexander Berdysheff, Ana Chaduneli, Eka Abuladze, and Kote
Jincharadze are part of group of emerging young contemporary painters that are positioning
Georgia’s art industry for growth. These painters are using different colors, textures and styles to
create unique Georgian-centric art that is in demand throughout the country and the region. Most
of this art is sold locally through their galleries, but there are opportunities for wider distribution
that will create visibility and increase sales.
POTENTIAL FOR GROWTH (INVESTMENT, HIGH(ER)-VALUE JOB CREATION,
ENHANCED REVENUES)
There is moderate potential for growth within the artisan value chain as long as a) designers from
different fields and genres can be persuaded to cooperate, b) there is a unified sales mechanism (e-
commerce site) where Georgian creations can be offered to the world, c) significant marketing is
conducted to brand the site, establish a socially-conscious sales strategy, and to promote the uniqueness
of Georgian products, and d) a logistics/transportation platform is developed to facilitate delivery of
artisanal pieces to customers around the world. If Georgian artisans could capture a small portion of the
overall global demand for expensive, one-of-a-kind creations (.1%) it could generate more than $3.8
million per year in sales and catalyze the value chain. An important strategy in capturing market share
will be to get Georgian artisans in front of major buyers and media outlets to promote their products
and develop a band image.
BUSINESS CASE
The global demand for luxury, one-of-a-kind products is growing, with a CAGR of 9.2% annually through
2024. While the number of potential customers for high-end artisanal products from Georgia is
relatively small, the revenue they could generate is significant. To capture a portion of the global market,
however, Georgian artisans will have to cooperate to create enough mass to gain visibility under a
unified brand.
Discerning customers are now looking for non-traditional markets for luxury, one-of-a-kind creations.
Traditionally, in the European context, designers in Italy, France, Greece, and Spain controlled the
market in certain areas of artistry, whether in fashion design or art. This trend is changing as the target
VALUE CHAIN PRIORITIZATION AND GAPS ASSESSMENT 53
demographic for luxury goods is getting younger and there are more sources of visibility and sales
opportunities by artisans in emerging markets.
KEY GAPS IN PRIORITY BUSINESS ACTIVITIES
• Lack of mass: The challenge for these artisans has been that none of these business activities is
large enough on its own to move beyond one-off sales at local shops, exhibitions, or showrooms.
Fashion and jewelry design have obtained assistance from some international donor organizations
such as SIDA and some fashion and jewelry designers have shops in trendy areas of Tbilisi and
Batumi. Even so, there is not enough visibility or mass among these or other artisanal business
activities to establish a niche that could lead to competitiveness.
• Lack of sales platform: There is no e-commerce platform in Georgia that provides artisans in
different field and genres the ability to market their goods to global customers. Most are existing on
sales from the local/regional market or by focusing more on mass production than artisanal design.
Georgia’s regulatory environment allows for the development of e-commerce sites, so the way is
paved to move forward in this area.
• Lack of logistics/distribution network: Even if an e-commerce existed, Georgian artisans do not
have a way to get their creations to market on a global scale. A shipping network is needed that
when linked to an e-commerce platform can provide artisans with both sales and shipping
opportunities to target customers.
• Lack of visibility: Most Georgian artisans suffer from lack of visibility on a global scale and thus are
forced to market one-off pieces at exhibitions and fairs throughout the region. Visibility is crucial to
developing a global presence and ultimately a brand.
PRIORITY INTERVENTIONS
The USAID Economic Security Program can greatly enhance the competitiveness of the artisan value
chain by:
• Facilitating cooperation: Georgian artisans in all genres must come together to develop an overall
brand for their creations, as well as to cooperate on marketing, sales, and logistics. The Program can
facilitate this developing an “Artisan Network” that links designers with potential markets and
demographics. The Network will also provide training and support to assist designers in better
understanding their customer base and they types of creations these customers desire.
• Facilitating the creation of an e-commerce platform: The Program will facilitate the creation of
an e-commerce platform to showcase Georgian artisan creations under a unified, socially-conscious
brand. The site will provide direct payment to artisans and will be sustained by a 3% fee assessed on
every purchase, of which 1% will go into a marketing fund to create visibility for the site and the
artisans. The Program will work with the local ICT community to identify a company(s) that can
design and manage such a site. It will also explore linkage of Georgian artisan creations to existing
global e-commerce sites as a bridge to launching and promoting one on the national level.
• Facilitating the development of shipping and payment platforms that links to the e-
commerce site: The Program will work with the e-commerce site designer(s) to facilitate the
creation of payment and shipping mechanisms to ensure timely delivery of goods and sustainability of
the site.
VALUE CHAIN PRIORITIZATION AND GAPS ASSESSMENT 54
PUBLIC-PRIVATE PARTNERSHIP OPPORTUNITIES
• PPP: Potential PPPs exist with both ICT companies that wish to develop an e-commerce platform
for artisans, as well as with existing global sites that already have pricing and delivery mechanisms in
place.
• GDA: Potential GDAs exist by linking promotion of Georgian artisan creations to high-visibility
tourism initiatives such as the proposed GDA with Columbia Sportswear that will generate millions
of followers on social media sites.
LIGHT MANUFACTURING SECTOR
FURNITURE VALUE CHAIN (CUSTOM, HIGH-END PRODUCTS, CONTRACT MANUFACTURING, CABINETS AND COUNTERS)
GLOBAL MARKET ANALYSIS AND GEORGIA’S CURRENT POSITION
Georgia’s furniture sector is established, but its progression over the decades is a complicated study in
both market forces and human nature. Georgian furniture companies have been slow to change,
reluctant to embrace new technology, and for the most part unwilling to invest in new processes and
products that might make them more palatable for export. This being said, the VC Assessment Team’s
analysis highlights specific opportunities within specific business activities defined below, as there are a
core group of companies/designers that are willing and able to pursue them. Continued focus on specific
business activities within the furniture value chain makes sense when examining global market potential.
Global furniture imports amounted to more than $67 billion in 2018, with the United States generating
more than a third of this total at $25 billion.50 The United States and Germany imported more all wood
furniture than any countries in the world at $6.3 billion and $2.1 billion in 2018, but the UK, France and
the Netherlands are also significant importers. Georgian furniture producers captured virtually none of
either the global or niche import markets.51
China is by far the largest furniture exporter, with over $28 billion in sales in 201852, but much of this is
processed and low-end furniture for the mass consumer market. In terms of all wood furniture, China is
still the largest exporter at $7.2 billion in 2018 but is at the low end of the consumer market.
Even though the numbers are small, there are three main export market segments of relevance to
Georgian furniture producers. The export market segment that has historically been the most important
is the regional export market—mainly to Caucasus countries and Central Asian countries like
Kazakhstan. Until the last few years, Georgia exported cabinet pieces and individual furniture to supply
mainly hotel construction and supply a few retail stores in Armenia, Azerbaijan and Kazakhstan.
The second main export market segment is what may be termed the international niche market. This
market is for specific niche products other than the major high-volume market-leading mass-produced
items that dominate in the high-volume consumer market. Niche products now being exported include
reclaimed wood wall cladding and flooring, finger-joint boards, small volumes of wooden toys and some
outdoor and children’s furniture
The third international market segment is for contract furniture market. This segment consists of large-
scale international retailers and designers/manufacturers that market their own brands of furniture.
50 Source: Global Trade Atlas
51 Ditto 52 Source: Global Trade Atlas
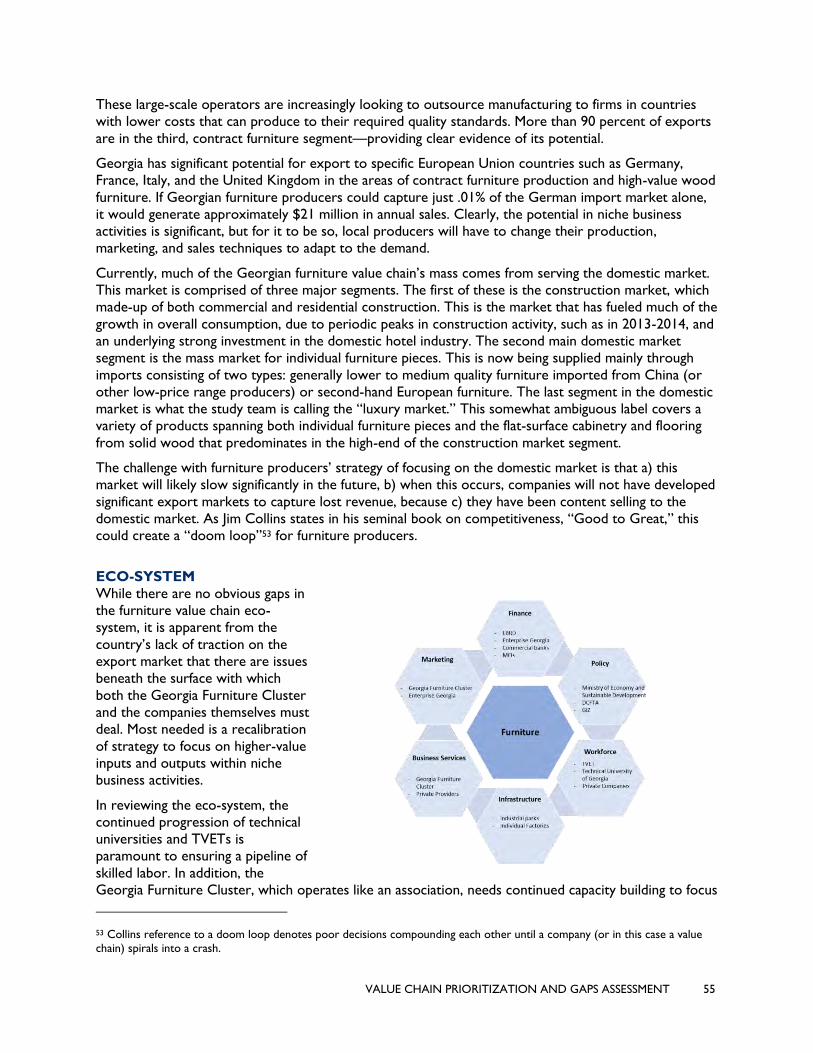
VALUE CHAIN PRIORITIZATION AND GAPS ASSESSMENT 55
These large-scale operators are increasingly looking to outsource manufacturing to firms in countries
with lower costs that can produce to their required quality standards. More than 90 percent of exports
are in the third, contract furniture segment—providing clear evidence of its potential.
Georgia has significant potential for export to specific European Union countries such as Germany,
France, Italy, and the United Kingdom in the areas of contract furniture production and high-value wood
furniture. If Georgian furniture producers could capture just .01% of the German import market alone,
it would generate approximately $21 million in annual sales. Clearly, the potential in niche business
activities is significant, but for it to be so, local producers will have to change their production,
marketing, and sales techniques to adapt to the demand.
Currently, much of the Georgian furniture value chain’s mass comes from serving the domestic market.
This market is comprised of three major segments. The first of these is the construction market, which
made-up of both commercial and residential construction. This is the market that has fueled much of the
growth in overall consumption, due to periodic peaks in construction activity, such as in 2013-2014, and
an underlying strong investment in the domestic hotel industry. The second main domestic market
segment is the mass market for individual furniture pieces. This is now being supplied mainly through
imports consisting of two types: generally lower to medium quality furniture imported from China (or
other low-price range producers) or second-hand European furniture. The last segment in the domestic
market is what the study team is calling the “luxury market.” This somewhat ambiguous label covers a
variety of products spanning both individual furniture pieces and the flat-surface cabinetry and flooring
from solid wood that predominates in the high-end of the construction market segment.
The challenge with furniture producers’ strategy of focusing on the domestic market is that a) this
market will likely slow significantly in the future, b) when this occurs, companies will not have developed
significant export markets to capture lost revenue, because c) they have been content selling to the
domestic market. As Jim Collins states in his seminal book on competitiveness, “Good to Great,” this
could create a “doom loop”53 for furniture producers.
ECO-SYSTEM
While there are no obvious gaps in
the furniture value chain eco-
system, it is apparent from the
country’s lack of traction on the
export market that there are issues
beneath the surface with which
both the Georgia Furniture Cluster
and the companies themselves must
deal. Most needed is a recalibration
of strategy to focus on higher-value
inputs and outputs within niche
business activities.
In reviewing the eco-system, the
continued progression of technical
universities and TVETs is
paramount to ensuring a pipeline of
skilled labor. In addition, the
Georgia Furniture Cluster, which operates like an association, needs continued capacity building to focus
53 Collins reference to a doom loop denotes poor decisions compounding each other until a company (or in this case a value
chain) spirals into a crash.
VALUE CHAIN PRIORITIZATION AND GAPS ASSESSMENT 56
on a new reality for the value chain…one that will enhance exports in niche areas instead of focusing on
past approaches.
PRIORITY BUSINESS ACTIVITIES FOR GEORGIA
Georgian furniture producers, while currently focused on low value added production, have some
niches that can be explored:
• Contract Furniture Production: The example of GEOP shows the clear potential of the
international contract furniture market. In only four years, once the market linkages were made
with the key private label client and its production line established, GEOP was able to grow rapidly
and now provides over 90 percent of Georgia’s furniture export sales. This shows the potential of
international contract work that is de-linked from the local market and its slower growing demand
path. Previous consulting work commissioned by GIZ has identified possible market linkages for
Georgian manufacturers with good products in such area as outdoor and children’s furniture. To
access these markets, Georgian manufacturers and designers will need substantial assistance in
making market linkages, product development and testing, and in plant improvement and investment.
• Custom, High-Value Wood Furniture: While there is some original design work being done
for individual furniture pieces, it is not yet linked to any sort of larger commercial strategy for
product development and sales either into the domestic luxury market or, more realistically, into
the international niche market for higher quality or original furniture pieces. Georgia has some of
the key ingredients to succeed in the international niche furniture market. It has talented designers,
a good supply of an emblematic local raw material (solid local wood), increasing international
visibility from a thriving tourism industry with the potential to benefit from cross marketing between
furniture and tourism,54 and easy access to EU markets due to a free trade agreement and excellent
shipment logistics. Obstacles exist in the form of a lack of strong collaboration between new
product designers and furniture manufacturers, the long pipeline for product development, testing
and market penetration, and the general low profile of design-oriented furniture in Georgia.
• Cabinets and Counters: While overall growth in the domestic furniture market is steadily
trending upward at a slow pace, the market for hotel construction is growing at a much faster pace
than the market as a whole. At least for the next two to three years, there is quite likely to be an
exponential increase in construction firm demand for furniture and cabinets to fill new projects in
the hotel sector. While some of this is likely to come through to the luxury market in the form of
increased demand for high quality furniture and interior spaces, the largest part of this demand will
be in the form of more basic and lower-cost flat-surface cabinetry and counters. This creates a clear
opportunity for Georgian firms in both the low-cost cabinetry market and the higher-value luxury
furniture market. To capitalize on this opportunity, it will be necessary to address serious capacity
constraints at the level of smaller cabinet makers, as well as market organization challenges that will
require new forms of cooperation between firms in the sector to respond to tenders and to handle
increased volumes of work.
POTENTIAL FOR GROWTH (INVESTMENT, HIGH(ER)-VALUE JOB CREATION,
ENHANCED REVENUES)
The potential for growth in the furniture value chain is high in some business activities and not as much
in others. Overall, the value chain will likely achieve a CAGR of 4.40% through 2024, which is not overly
54 Some firms are already promoting “wine furniture” which consists of wine accessories, carts and buffets and special purpose
tasting table/chair ensembles.
VALUE CHAIN PRIORITIZATION AND GAPS ASSESSMENT 57
significant. Some business activities, like those highlighted as potential niches for Georgian producers,
have a much higher CAGR, however, with estimates from 6.1-10.2%.
The takeaway in terms of growth potential, however, is that Georgia’s current products and markets
have relatively limited potential. Transition to lower volume, craftsmanship, and contract manufacturing,
however, can lay the groundwork for sustained growth. Domestic sales are likely to slow over the
coming years, so Georgian producers must improve their export potential by accessing new markets
and focusing on new product offerings.
BUSINESS CASE
The business case for Georgia’s furniture value chain is not clear-cut in terms of its traditional focus.
The Program’s analysis of the value chain reflects a future that has to be dramatically different from the
past if furniture is to provide a competitive advantage for Georgia. The value chain’s current positioning
as the producer of lower-end furniture for mass-production, focus on assembly and fittings, and
manufacturing for domestic consumption has left it vulnerable to market forces. Competitors in these
business activities, namely China and Turkey, provide formidable and likely insurmountable competition
for a demographic that is not consistent with the Georgia furniture sector’s core competencies.
Regrettably, past studies and interventions within the sector have focused technical assistance, grants,
and other support mechanisms on the same business activities that hold limited potential. After analyzing
the market, three business activities emerged as potential differentiators for Georgian producers.
The contract furniture production market is growing exponentially and provides Georgian furniture
companies with the opportunity to do custom and private label products for key retailers around the
world, such as IKEA. This segment of the furniture value chain continues to expand and could allow
Georgian manufacturers the maneuverability to take advantage of market niches. To do so, however,
the value chain will need significant upgrades in equipment, marketing, and skills development. In the
case of equipment, this will likely lead to contracting employment, but increased revenues and
investment as precision manufacturing requires fewer people but has higher efficiency.
Custom, high-value wood furniture is a definite niche for Georgian manufacturers as it is a growing
segment within the value chain within high net worth customers. This niche merges Georgian design
with a high-value segment of the value chain that could provide low volume, but significant revenue per
piece. The key in this business activity will be the ability of Georgian producers to position themselves in
a way that promotes visibility and access to markets.
Cabinets and counters have been a core business for Georgian producers in the past, but mostly on the
domestic market. This focus is finite in that it is dependent on a high rate of new construction that may
not be sustainable. By focusing on wood-based treatments and high-quality custom cabinetry for high-
value consumers as well as contract manufacturing, Georgian producers my generate fewer overall sales
by volume, but increase revenues exponentially.
In short, the path for Georgian furniture producers is to focus on high-value niches and tap into a
growing export market. By capturing 1% of the German furniture import market alone, the country’s
producers could eclipse their total exports over the past few years.
KEY GAPS IN PRIORITY BUSINESS ACTIVITIES
Constraints to growth is the high potential business activities have been informed and prioritized based
on market requirements and Georgia’s competitive positioning discussed in the previous section.
The section below presents the main constraints to value creation in the furniture value chain. Rather
than presenting an exhaustive list of constraints to the whole value chain, it is organized by the three

VALUE CHAIN PRIORITIZATION AND GAPS ASSESSMENT 58
Business Activities so that constraints are mapped to specific business activities and specific actors in the
value chain map.
Contract Furniture Production: The significant potential of international private label contract
furniture sales has been amply demonstrated by the GEOP/Zoo Plus example. The challenge under this
business activity will be to replicate this for other furniture product manufacturers and lines with other
international clients such as IKEA and Habitat. Major constraints standing in the way of the realization of
this business activity are:
• A lack of market knowledge and contacts in the international contract furniture market.
Georgian furniture manufacturers lack both the marketing capacity and market knowledge to
navigate through the complicated maze of international contact furniture relationships to identify
both promising product lines and potential buyers at different market levels in target countries.
Without assistance in this regard, there is little that they can do on their own to penetrate this
market.
• Georgian furniture manufacturers lack experience in product development to fulfill
international contracts. Once product and client opportunities have been identified, Georgian
furniture manufacturers still face a long process of prototype development, testing and production
planning for larger volumes of production than they are used to handling.
• Production facilities will require significant upgrading and investments in new production
equipment. Moving to expanded contract manufacturing means that successful manufacturers will
almost certainly need to expand into new factory space and open new production lines.55 They will
also likely need to attain international GMP and/or ISO certifications if required by buyers as well as
re-engineer their process flows to accommodate larger volumes of production.
Custom, High-Value Wood Furniture: This Business Activity seeks to create value by developing
commercially viable projects built around designer-led high-quality individual furniture pieces. It targets
lower volume international specialty niche retailers and direct-to-consumer international marketing,
although sales into the Georgian luxury market are an important ancillary objective (and maybe even a
first step in a phased implementation plan). This is basically an attempt to ‘commercialize’ and scale-up
the existing limited-edition designer-transaction channels. Major constraints to achieving this include:
• Poor collaboration between designers and furniture manufacturers. Currently furniture
manufacturers have a purely utilitarian view of design---they view it as a tool they use to replicate
existing designs. Similarly, designers only collaborate with manufacturers to produce for very small
orders or for prototypes for design exhibitions. There is no longer-vision of developing original
designs for Georgian firm branded products that have a potential for larger-scale production runs
backed-up by a longer-term marketing plan.
• Low appreciation and visibility for quality and original design furniture pieces in Georgia.
One contributing factor to the lack of collaboration between designers and furniture manufacturers
is the low level of appreciation for original design in Georgia. The lack of a solid ‘home base’ of
support for design in Georgia makes it harder both to develop an export market for original
furniture pieces and to interest manufacturers in investing in design-intensive higher quality
production runs.
• A lack of Georgian solid wood suitable for high quality furniture use with appropriate
certifications for sale into high-end environmentally-conscious international markets.
55 Furniture factories in Georgia are generally in quite poor condition and virtually all would require some rehabilitation to
comply with expected international buyer standards for contract work and many would require moving to or building new
production facilities altogether. This is detailed in J. Murray, “Regional Analysis of Furniture and Wood Processing Sector in
Georgia,” Ligna Group, 2018.
VALUE CHAIN PRIORITIZATION AND GAPS ASSESSMENT 59
Georgia’s natural advantage in original growth forest wood (particularly beechwood which is
excellent for furniture uses) is under-exploited due to a lack of high quality treatment after
harvesting and due to a lack of sustainable forest management certification, such as that available
under the international Forest Stewardship Council guidelines.
• A Lack of international marketing expertise and buyer contacts in destination markets.
Accessing international niche markets is especially challenging due to the highly fragmented and local
nature of specialty retailers in different countries. The challenge is magnified by the fact that most
Georgian furniture makers have little experience planning longer-term international marketing
campaigns (even in Georgia) and have a complete lack of market understanding and language
capacity to develop the needed market linkages for sales into specialty high quality retail networks in
Europe and Asia.
• Inadequate production facilities for increased volumes of high quality exports. While most
generalist furniture manufacturers and high-quality craftsmen have the capacity to produce the very
small limited-edition production runs that design houses need to fulfil individual client orders, to
scale such production to make large-sized production runs to overseas clients who will want to see
the production process, most manufacturers will need to make sizeable new investments in
upgraded factories and production lines and to obtain standard international certifications like those
available through ISO.
Cabinets and Counters: The fundamental challenge in this business activity is to upgrade the capacity
of small cabinet makers in terms of quantity and quality to allow them to handle an increased workflow.
It will also be important to foster greater cooperation between smaller cabinet makers and the higher-
capacity general furniture manufacturers and solid wood specialists who deal in flat surface panels, as the
latter have much greater managerial and financial capacity to respond to construction firm tenders. They
may also require punctual additions to capacity that can be provided by smaller firm subcontractors.
Specific constraints that are relevant for this Business Activity include:
• Low technical skills among current employees and a lack of technically trained prospective
employees available to small cabinet manufacturers. Many small cabinet makers have a small
core of senior level trained employees with a larger circle of more junior occasional employees.
Given the high labor requirements of furniture making to deal with increased volumes and possibly
moving to two-shifts, firms will require new employees at both senior and junior levels.
• Low business skills among small cabinet makers. Most small cabinet maker firm owners are
technicians and carpenters. Many are not comfortable with common administrative tasks and formal
requirements for participating in competitive tenders. Even more rare are the business skills
required to manage firms through a growth process.
• A lack of basic design services and skills available to small cabinet makers. To respond to
formal tender offers, particularly the larger ones, cabinet makers need proper design drawings and
product specifications. Some firm owners make use of standard software packages to attempt this,
but there is a clear need for wider diffusion or competent basic design assistance for firms at this
level.
• Difficulty accessing investment financing for firm-level upgrading. Small cabinet makers who
are seeking to upgrade their quality levels and increase capacity will need to make substantial new
investments—both in equipment and in plant facilities.
• Many small cabinet makers have difficulty in participating in formal construction
procurements. Due to limited administrative capacity and size, many smaller cabinet makers are
unable to submit responses to construction tenders. GIZ had foreseen a role for the Ligna Group in
submitting for such tenders that would be subcontracted out to smaller cabinet makers in the GFC
and Craftsmen City networks. With the recent cessation of GIZ support, no such plan now exists.
VALUE CHAIN PRIORITIZATION AND GAPS ASSESSMENT 60
PRIORITY INTERVENTIONS
Contract Furniture Production: Interventions under this activity will be organized around an initial
market assessment to determine the potential market demand and its requirements matched against
Georgian manufacturers’ capacities. Following this, detailed individual firm-specific action plans will be
developed with phased steps and targets for firms judged to have the potential to access the
international contract furniture market. This activity will be led by an international contract furniture
market specialist, with a deep knowledge of the European market and contractual practices. Specific
interventions appear below.
• Conduct a market assessment of the potential of Georgian furniture manufacturers to access
the international contract furniture market. This business activity will commence by the
engagement of an expert in the European contract furniture market—who must have an extensive
knowledge of the procurement modes of such chain retailers as IKEA and international hotel chains.
• Develop and implement detailed firm-level action plans to guide needed steps to enter the
international contract furniture market. Following the initial assessment, the contract furniture
market expert will work with an array of five to seven firms to assist them in developing realistic
action plans with phased implementation steps and target dates by which they should be
accomplished.
• Provide financing assistance to furniture manufacturers for equipment and plant upgrades.
Few or no Georgian furniture manufacturers have production lines and facilities that will meet the
quality standard of international contract buyers. They will require, at a minimum, line retooling and
more likely, given the potential for large scale orders, relocation to or construction of new factories.
Since these investments are likely to be downstream of many prior requirements in different firms’
action plans, the Program can consider offering grants support to leverage other sources of funding
only with firms that have demonstrated real potential by achieving a number of prior-benchmark
actions. In addition, assistance can be given in identifying other sources of funding or, potentially,
new investors.
Custom, High-Value Wood Furniture: This activity aims to create totally new original design-based
high-quality export products for the international niche market. This is a process that will require time
to achieve its end goal, since the base from which it is starting is not well developed. It will require a
certain amount of work in Georgia to raise the visibility of the role of design and raise awareness of the
commercial potential of original design furniture, along with an international discovery phase in which
product development can take place. This will require work with manufacturer and designers coming
together to develop prototypes with an eye to both international market receptivity and the scaling of
manufacturing processes in Georgia to meet anticipated volumes. Underlying the whole process is the
imperative to create fruitful modes of collaboration between Georgian designers and design houses and
furniture manufacturers, which are sorely lacking. Interventions to achieve these goals are outlined
below.
• Raise awareness of the potential for design-led furniture. Georgian furniture owners have, in
general, little appreciation of the market potential for original design furniture. Much of this is due to
the low visibility of original design furniture and general lack of public appreciation. To create a
more fertile environment for design, and furniture design in particular, the Program can work with
the newly created Design Georgia Association to publicize original design products more widely.
• Develop new original design furniture products with commercial potential. To spur the
development of original design prototypes and start building a basis of collaboration between
designers and manufacturers, the Program will engage an international furniture market specialist
with a background in new product development, ideally with a specialty in wood products (given its
importance in most furniture pieces). This marketing expert will work with the Association Design
VALUE CHAIN PRIORITIZATION AND GAPS ASSESSMENT 61
Georgia, various higher education design schools, and the GFC to canvass manufacturers and
furniture designers and work with them to develop viable prototypes of original design furniture
with materials and production processes that will be amenable to scaled-up production runs.
• Provide market linkage support for new original design products in the pipeline. The Program
will work with manufacturers/design houses to help them identify viable buyers and distributors in
target markets. This effort, to which the international furniture market specialist identified above
will contribute, will include the identification and prospection of interest of brokers and relevant
niche retailers in key target markets and tailored preparation for sales visits that could be part of the
awards offered to winners of the original design prototype contest mentioned above. The Program
will also work with the Design Georgia Association and/or GFC to set up direct e-commerce links
and social networking strategies to promote direct sales of designer furniture to individuals in
Europe and elsewhere.
• Promote investment in necessary wood supply chain improvements. Georgian furniture
manufacturers are unable to derive the full benefits from Georgia’s considerable advantage in
producing wood, particularly beechwood, from its original growth forests because of poor post-
harvest treatment. To support improvements in wood quality, the Program will seek to promote
investment in improved wood treatment facilities at saw mills and possibly furniture manufacturers
(if appropriate).
• Provide financing assistance to furniture manufacturers for equipment and plant upgrades.
As sales of original design pieces take-off, the furniture manufacturers engaged in their production
will require new investment to expand or retool their production lines to ensure higher quality
production. Also, in all likelihood, they will need to make improvements to their plants to qualify for
international certification that are likely to be required by buyers. The Program will help such actors
access financing and investment to fund these improvements. This could include possible grant
support to reduce funding amounts and attract co-financing from donor or commercial sources.
Cabinets and Counters: The strategic focus of this business activity is mainly on strengthening the
capacity of smaller cabinet maker firms to help them capture a large share of the anticipated increase in
demand for furniture emanating from the expected increase in hotel construction. A secondary focus
will be on supporting linkages between smaller cabinet makers and medium sized generalist
manufacturers and solid wood specialist to form consortia for responding to hotel construction firm
tenders. Interventions to achieve these objectives are listed below.
• Provide increased technical training for small cabinet firm staff and management training for
firm owners/managers. To deal with increased workflows, small cabinet makers will need more
trained staff who are familiar with different types of raw materials and who can operating CNC
routers and edge banders and conduct required finishing operations. Such a training program will
accelerate the process of on-boarding new workers.
• Initiate a design service center for small cabinet manufacturers. In tandem with the training
activity cited above the Program could work with the Craftsmen City/GFC to open-up a designer
window in the Craftsmen City complex to offer schematic design drawings and specification sheets
as a service to small cabinet makers and other furniture manufacturers.
• Provide market linkage and contracting assistance to small cabinet manufacturers for the
local construction market. Given the highly atomized nature of the construction contracting
environment and the lack of preparation of many small cabinet making firms, some level of market-
linkage assistance will be required to facilitate them taking a greater role in the expanding hotel
construction market. To do this, the Program could provide technical assistance through an
embedded advisor, with either the Craftsmen City or the GFC, who would be tasked with
VALUE CHAIN PRIORITIZATION AND GAPS ASSESSMENT 62
developing ‘consortia’ of furniture firms and small cabinet craftsmen to respond to tenders from
hotel construction firms (and others).
• Provide support to small cabinet makers in accessing loans. To aid small cabinet makers in the
Craftsmen City and beyond in accessing loans from commercial banks and other lenders, the
Program could work with Craftsmen City management and/or the GFC to link these firms and
lenders with suitable loan products and credit approaches.
• Initiate a “star firm” accelerator program for small cabinet makers with high-growth
potential. The whole body of interventions identified above will be building to a larger objective—
raising a pool of high potential small cabinet makers that will transform themselves into larger, more
structured furniture manufacturers. In support of this objective, the Program could put into place a
specific accelerator initiative, in which high potential small cabinet manufacturers who are successful
in expanding their output and showing an aptitude for growth, can receive tailored assistance in
customized areas that will boost sales.
PUBLIC-PRIVATE PARTNERSHIP OPPORTUNITIES
The furniture value chain lends itself to a number of partnerships that will build its competitive
positioning:
• International Furniture Manufacturers: There may be an opportunity to engage with
international furniture manufacturers to provide equipment and technical support for Georgian
furniture producers to increase standards and become certified suppliers/contractors. This could
provide support for the integration of Georgian producers into the contract manufacturing space.
• Hotel Partnerships: A number of hotels have already expressed interest in partnering to source
custom-made furniture from local producers that is both stylish and culturally significant. Such a
partnership could link the creative industries, light manufacturing, and tourism sectors while
providing highly-visible examples of Georgian craftsmanship.
PACKAGING VALUE CHAIN (CARDBOARD, PLASTIC, AND CRATES/CONTAINERS)
GLOBAL MARKET ANALYSIS AND GEORGIA’S CURRENT POSITION
Like the furniture value chain, the real potential in packaging comes at the business activity level (defined
below). These activities primarily focus on industrial and logistics use for both domestic and global
consumption, though the real opportunity comes from capturing even small segments of the
international market. Agriculture packaging for local and regional consumption is a possible niche, but
this is best explored by the USAID Agriculture Project. The critical mass in packaging can come through
the willingness and ability of Georgian companies to capture segments of the global market which have
either been vacated by big competitors or where local firms can gain cost/value advantage. The business
activities outlined below are those where the VC Assessment Team believes this can occur since there
would need to be a minimum of retooling and up-front investment. Market linkages is the key to gaining
traction in these business activities. The upside of pursuing targeted interventions in packaging is its
continued global appeal.
Packaging is an $164 billion industry globally, with the United States leading all importers with $24 billion
in purchases in 2018. France, Germany, and the Netherlands follow the United States in terms of global
imports of packaging. Georgia is capturing less than .00001% of the demand from these three countries
alone.
VALUE CHAIN PRIORITIZATION AND GAPS ASSESSMENT 63
China and the Germany are the largest exporters of paper/cardboard packaging at $4.5 billion and $3.4
billion in sales in 2018. With only $9 million in exports in 2018 from all packaging sources, Georgia’s
share of the global and regional markets is nascent. Virtually all of Georgia’s packaging exports are
plastics. A large majority of exports go to Armenia and Azerbaijan.
Exports of packaging materials have progressed greatly in the last few years, exceeding over $1 million
for the first time ever in 2012 and growing to almost $9 million in 2018. Exports of plastics packaging
grew by 31.2% from 2017 to 2018, largely because of increased regional demand.
Virtually all packaging exports are shipped to Georgia’s two main regional neighbors—Armenia and
Azerbaijan. This growth is the result of two similar trends in each country—a rapid growth in the local
demand for plastic packaging materials and a growth in Georgia’s market share. In Azerbaijan, overall
imports of plastic packaging materials increased by 60% between 2013 and 2018 (over $12.2 million in
absolute terms) with Georgia’s market share growing from 7% to 17%. A similar trend is evident in
Armenia with a 2013 to 2018 import growth of 55% (which corresponds to an absolute growth of $5.1
million) and a growth in Georgian plastic packaging exporters’ market share from 9% to 14% of total
imports.
For reaching these markets, Georgia possesses some important competitive advantages by virtue of its
geographic location. A key factor in the competitiveness of packaging firms is their ability to access raw
materials at a low cost and with easy logistical access so as to minimize the need for large quantities of
raw plastic materials stocks that eat-up working capital and generate financial charges that raise product
cost. With its easy access to Black Sea supply routes and European transport networks, Georgia
possesses a considerable advantage in this regard compared to packaging manufacturers in Armenia and
Azerbaijan. The small size of the Armenian market also tends to make it reliant on outside suppliers of
capital intensive products such as packaging.
While the above analysis shows the potential for plastic packaging exports, Georgian manufacturers of
paper-based packaging products may also enjoy similar advantages. The same fundamental supply route
advantages exist for accessing the needed supplies of craft paper that are used to manufacture paper
sacks, cups and corrugated cardboard boxes.
The demand for packaging products is dependent on the growth and structure of business that need
these products. Domestic sales of packaging products have been quite strong with more the $62 million
in domestic production. One indicator of the value chain’s health is that GDP increased only from $ 15.8
billion to $16.2 billion in Georgia over the 2012 to 2018 period (2.5% total growth over six years).56
Such an anemic pace of growth would not normally produce a significant growth in business demand for
packaging. This does not account, however, for the structural changes that are underway in the
Georgian economy. These changes are producing a much stronger demand for packaging than would be
predicted from just looking at overall rates of GDP growth.
56 Growth rates are much higher when measured in GEL. However, we have used USD measures throughout this report as a
more accurate indication of real values, given depreciations in the value of the Lari.
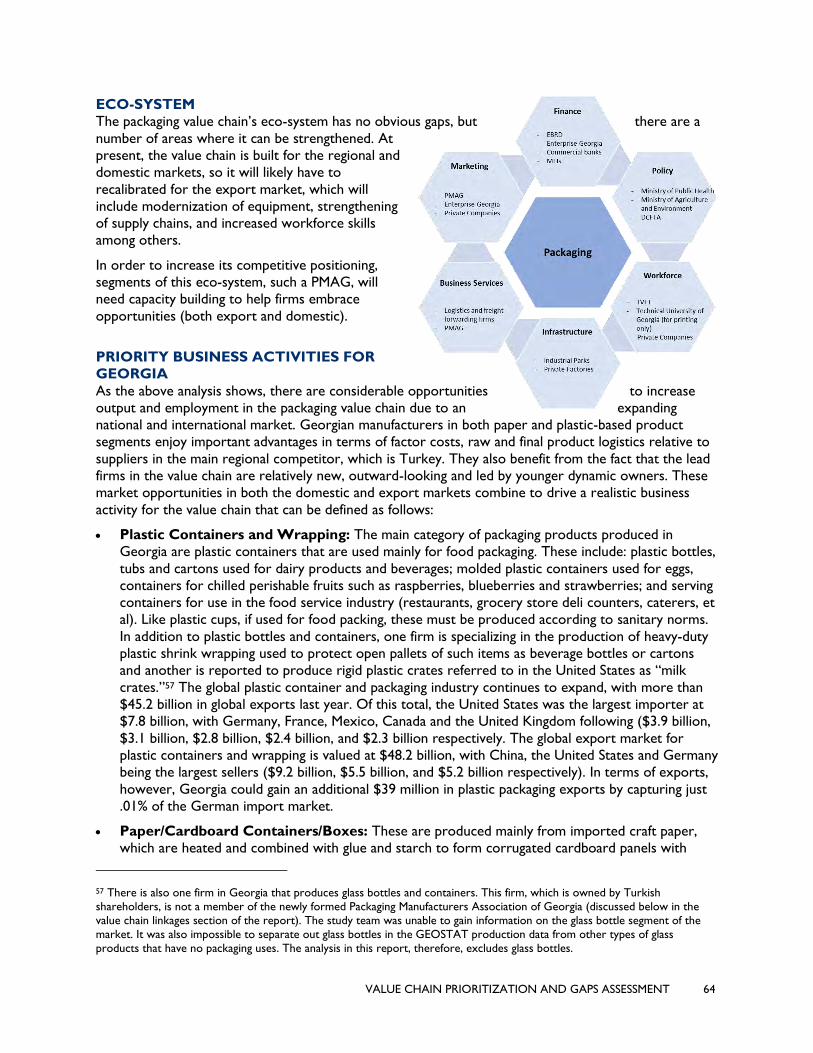
VALUE CHAIN PRIORITIZATION AND GAPS ASSESSMENT 64
ECO-SYSTEM
The packaging value chain’s eco-system has no obvious gaps, but there are a
number of areas where it can be strengthened. At
present, the value chain is built for the regional and
domestic markets, so it will likely have to
recalibrated for the export market, which will
include modernization of equipment, strengthening
of supply chains, and increased workforce skills
among others.
In order to increase its competitive positioning,
segments of this eco-system, such a PMAG, will
need capacity building to help firms embrace
opportunities (both export and domestic).
PRIORITY BUSINESS ACTIVITIES FOR
GEORGIA
As the above analysis shows, there are considerable opportunities to increase
output and employment in the packaging value chain due to an expanding
national and international market. Georgian manufacturers in both paper and plastic-based product
segments enjoy important advantages in terms of factor costs, raw and final product logistics relative to
suppliers in the main regional competitor, which is Turkey. They also benefit from the fact that the lead
firms in the value chain are relatively new, outward-looking and led by younger dynamic owners. These
market opportunities in both the domestic and export markets combine to drive a realistic business
activity for the value chain that can be defined as follows:
• Plastic Containers and Wrapping: The main category of packaging products produced in
Georgia are plastic containers that are used mainly for food packaging. These include: plastic bottles,
tubs and cartons used for dairy products and beverages; molded plastic containers used for eggs,
containers for chilled perishable fruits such as raspberries, blueberries and strawberries; and serving
containers for use in the food service industry (restaurants, grocery store deli counters, caterers, et
al). Like plastic cups, if used for food packing, these must be produced according to sanitary norms.
In addition to plastic bottles and containers, one firm is specializing in the production of heavy-duty
plastic shrink wrapping used to protect open pallets of such items as beverage bottles or cartons
and another is reported to produce rigid plastic crates referred to in the United States as “milk
crates.”57 The global plastic container and packaging industry continues to expand, with more than
$45.2 billion in global exports last year. Of this total, the United States was the largest importer at
$7.8 billion, with Germany, France, Mexico, Canada and the United Kingdom following ($3.9 billion,
$3.1 billion, $2.8 billion, $2.4 billion, and $2.3 billion respectively. The global export market for
plastic containers and wrapping is valued at $48.2 billion, with China, the United States and Germany
being the largest sellers ($9.2 billion, $5.5 billion, and $5.2 billion respectively). In terms of exports,
however, Georgia could gain an additional $39 million in plastic packaging exports by capturing just
.01% of the German import market.
• Paper/Cardboard Containers/Boxes: These are produced mainly from imported craft paper,
which are heated and combined with glue and starch to form corrugated cardboard panels with
57 There is also one firm in Georgia that produces glass bottles and containers. This firm, which is owned by Turkish
shareholders, is not a member of the newly formed Packaging Manufacturers Association of Georgia (discussed below in the
value chain linkages section of the report). The study team was unable to gain information on the glass bottle segment of the
market. It was also impossible to separate out glass bottles in the GEOSTAT production data from other types of glass
products that have no packaging uses. The analysis in this report, therefore, excludes glass bottles.
VALUE CHAIN PRIORITIZATION AND GAPS ASSESSMENT 65
different thicknesses and finishes. These can then be printed with designs and text as an option
before being cut to size and pressed to create pre-marked folds to result in boxes of the desire
shape and size. These boxes are put on pallets and shipped to clients in non-assembled form. The
global carboard and paper packaging industry has contracted slightly over the last few years, with
imports of more than $18.6 billion in 2017 versus $19.2 billion in 2013. Even so, the United States
imports more than $2.7 billion in cardboard packaging per year followed by France, Germany, and
the Netherlands at $1.9 billion, $1.6 billion, and $1.2 billion respectively. This represents a sizable
opportunity for Georgian packaging producers if they can meet international standards. Simply
capturing .01% of the French market for cardboard and paper packaging would bring in $19 million
in export revenue annually.
• Paper Cups/Bags: These are also made from rolls of imported craft paper. Bags are simply heated
and cut to form. Paper cups go through a molding process. A key part of the production process of
these products is printing of the paper before it goes through the cutting and molding stage to
produce custom printed cups and bags in response to client demands. Paper cups can be made from
just paper, in which case they are used for cold drinks, or they can undergo a process that imparts a
thin layer of plastic polyethylene on the interior surface that makes them suitable for hot drinks like
tea and coffee. Paper cups need to be produced in a food-grade line with sanitary handling
procedures and an automated process that keeps surfaces that touch food free from any human
contact. The paper cup and bag business activity generates $1.7 billion in imports globally with the
United States, Canada, and Germany being the largest importers of these goods at $380 million,
$223 million, and $146 million respectively. Simply capturing .1% of the German import market for
paper bags and cups would generate $14.6 million in annual revenue for Georgian producers.
To do this, the Program will need to work on both the firm and value chain levels to help manufacturers
address constraints that are preventing them from expanding and accessing new market segments. A key
focus of this will be on helping plastic and paper-based manufacturers to meet the market requirements
of buyers in the food industry, in which demand is expanding most rapidly. This will include working on
needed certifications to enter into procurement relationships with international chain restaurants and
supermarkets with food service offerings who are operating in Georgia, in the region and even in the
European Union. Constraints and interventions to achieve the objective of this business activity are
outlined in the final two sections of this report.
POTENTIAL FOR GROWTH (INVESTMENT, HIGH(ER)-VALUE JOB CREATION,
ENHANCED REVENUES)
The three main types of manufacturers shown in the value chain map fall into two major categories:
plastic-based and paper-based manufacturers. The two types of paper based manufacturers both use
imported craft paper rolls as their fundamental input.
Plastic packaging good manufacturers use a process that heats and forms the desired items out of
different types of raw plastic inputs. Many use a two-step process in which raw plastic resin pellets are
transformed in to sheets of desired thickness through a heating and pressing process. These sheets then
are printed with desired labels and imagery (if required) and molded into the final products.
A key part of the production process for both plastic and paper-based packaging products is printing.
The selection of the type of printing process used is a key element of firm-level specialization and
business strategy. Historically, printing firms have used off-set printing using plates and rotary printers
that produce high quality printing in large volumes.
Both plastic and paper based production processes are capital intensive. The larger and most efficient
manufacturers in both categories have investments in plants and equipment that easily top $4.0 million in
capital expenditure. At the lower end of the manufacturing size spectrum, there are smaller carboard
VALUE CHAIN PRIORITIZATION AND GAPS ASSESSMENT 66
box manufacturers with one or two lines for producing different gauges of cardboard and a single flexi-
graphic printing station that are operating with fixed investment of less than $1.0 million.
The high capital intensity of packaging manufacturing means that is essential for firms to operate as
efficiently as possible, with minimal plant downtime and low variable costs to maximize total gross
margin in order to cover the significant fixed-costs of getting into the business. Thus key elements of
firm level competitive advantage include: minimizing the wastage of raw materials; ensuring maximum
capacity utilization (most firms operate on two production shifts) of equipment at which production
bottlenecks occur; and offering an attractive range of final products (which often means investment in
different production lines) to avoid over-dependence on a single product or client and increase
attractivity to those clients who demand multiple products (such as fast-food chains).
BUSINESS CASE
The competitiveness positioning of Georgia’s packaging value chain depends on a focus on differentiating
business activities that provide the most direct path to investment, high(er)-value job creation, and/or
revenue increases.
• Retailer Needs: Retailer packaging needs are mainly for providing and conditioning products for
sale for customers. By far the largest such product is bags for grocery stores and other retailers that
sell assorted small-sized items. Wrapping paper is another such product. Occasionally retailers will
also need cardboard sheets for padding or stacking heavy products—such as furniture. The most
common goods shipment product is simply corrugated carboard boxes, that are cut to order to
reflect buyer size requirements and set to specific thickness levels depending on buyer durability
requirements.
• Food Packaging Needs: Food packaging needs arise when manufacturers and food service outlets
need to place food in some type of packaging in order to transfer it to a consumer. In these cases,
the food comes in direct physical contact with the packaging, which means it is subject to regulations
governing food safety and, in many cases, to stricter buyer requirements as a way of limiting firms’
consumer liability exposure. Products in the food packaging category include paper-based products,
mainly cups and individual serving containers mainly for fast-food restaurants. Plastic- based products
include many types of retail containers used by dairy and other food manufacturers or suppliers that
require some type of refrigeration and which must have good durability.
• Goods Shipment: Goods shipment in the packaging value chain has a broad connotation, as it
encompasses everything from cold chain transport to shipping containers. The sheer volume of
transportation mechanisms around the world creates space for manufacturers to produce a plethora
of products that are conducive to ease of shipment.
KEY GAPS IN PRIORITY BUSINESS ACTIVITIES
The primary gaps/constraints to value creation in the packaging value chain, focusing on the key
constraints that stand in the way of successful implementation of the business activities listed above.58
Key individual constraints are listed below.
• Manufacturers require up-dated equipment, production lines and improved plants. Although
there has been much investment and new market entry into the packaging business over the last five
years, many firms have evolved to the point where they now understand the market and have
acquired enough technical expertise to see what further investments are required to allow them to
58 These constraints are not delineated by business activity because they are common to all of those listed.
VALUE CHAIN PRIORITIZATION AND GAPS ASSESSMENT 67
grow and expand market share in specific segments—such as the food and beverage segment and
with international chain supermarkets and restaurants.
• A lack of qualified machine operators and skilled packaging operations managers and
supervisors hinders growth in output. As noted above, there is a very small base of skilled
workers and managers who know both technical operational skills and who have sufficient
understanding of the economics of production to maximize overall profitability. All the people who
can do this already employed by the firms in the sector and there are no functional training
programs to provide skills to new employees. Most firms have sought to enlist the help of
international equipment vendors to overcome this obstacle, as mentioned above, although this is a
strategy that is hit or miss and is more likely to produce good results at the skilled-worker level
than at the production manager level.
• Many firms need to obtain international certifications. As noted above, the PMAG and UKAID
had begun an effort to assist packaging firms with obtaining international certification needed to
export. That effort has now come to a halt. Without such certifications, it will be hard for these
companies to access international procurements with food and supermarket chains, as well as to
even begin supplying chain outlets that are now active in Georgia.
• Firms will lack sufficient capital to make needed improvements in plants, equipment and
operations. Improvements to plants and equipment will not only entail developing strategic and
technical plans, it will require increases in investment and working capital. Manufacturers in the value
chain have shown some ability to access long-term loans from banks and in some cases from
Enterprise Georgia. However, the scale of the investment required to obtain international
certifications will easily surpass $1 million and maybe even $2-4 million if a completely new factory
building is required.
PRIORITY INTERVENTIONS
The Program will focus on the following interventions to build the packaging value chain’s
competitiveness:
• Assist individual firms in elaborating and implementing firm-level upgrading plans. The
Program could recruit and-engage one or two international short-term experts in packaging to
serve a continuing role as technical and strategic advisors to Georgian packaging firms who have
realistic prospects for upgrading their operations and expanding their sales base.
• Develop a roster of qualified technical experts to assist Georgian packaging firms and
provide cost-share support for needed training and technical assistance. As noted in the
constraints section, firms have tended to link their needs for technical training with their choices of
equipment suppliers. While not unreasonable, this strategy has its limitations in that it may not give
firms as much exposure to a broader range of technical and strategic options. To help address this
constraint, the Program could work with PMAG to identify and vet a cadre of international technical
consultants in relevant fields who are available for training and advisory work for individual firms and
who may also be engaged to provide common trainings for multiple firms on such topics as
optimizing raw materials procurement and production planning, cost accounting approaches and
software packages for managing plastic and paper-based production processes; waste management
and good environmental practices; etc. The Program could coordinate with PMAG to implement
this activity, with PMAG taking a role in developing and maintain the roster, collecting feedback on
consultants, and even in contracting with consultants to provide common trainings to multiple firms.
• Provide assistance to Georgian firms to help them obtain international certifications. A key
part of many firms’ upgrading plans will be to obtain one or more of the major certifications
required by buyers, particularly international food service chains (including supermarkets). These
VALUE CHAIN PRIORITIZATION AND GAPS ASSESSMENT 68
certifications (including mainly different ISO and British Retail Council certifications) are very likely
to require changes to plants and equipment lines as well as to operational procedures and
procurement practices. To support this effort, the Program could contract with a qualified
certification consultant or a firm to conduct initial pre-certification assessments of firms working on
upgrading plans, as soon as a critical mass of firms have progressed to the point where they have
fine-tuned their exact certification requirements based on their sales objectives.
• Assist packaging firms that are implementing upgrading plans with financing. As noted in the
constraints section, virtually all firms implementing upgrading plans will need to make significant
additions to plant and equipment. Although some firms may only require a few pieces of equipment
for less than $1 million, many more firms will require investment in the $1 to $4 million range.
Significant investments on this scale will likely require a mixture of different types of financing—from
working capital, to longer-term debt and eventually even equity or pseudo-equity investments. To
help packaging firms implementing upgrading plans to source the needed financing, the Program
could engage a local financial advisor or management consultancy firm to work with each company
to develop a tailored approach to funding that includes different levels of finance.
PUBLIC-PRIVATE PARTNERSHIP OPPORTUNITIES
• Partnership with Local Retail Firms: The Program will work with local retail firms (e.g.
supermarkets) to better understand their packaging needs and to develop co-designed partnerships
between them and Georgian packaging manufacturers.
• Research and Development: The Program will work with the Association of Packaging and
Processing Technologies, a global representative of the packaging industry, to co-design market
linkage and volunteer expert interventions that will enhance the knowledge and experience of
Georgian packaging firms.
Partnerships will be explored in this value chain based on industry-led requirements for integration of
standards, technology, and supply chains.
VALUE CHAIN PRIORITIZATION AND GAPS ASSESSMENT 69
V. INVESTMENT ECO-SYSTEM, PUBLIC-PRIVATE PARTNERSHIPS AND INVESTMENT OPPORTUNITIES
OVERVIEW OF THE FINANCIAL SECTOR AND
INVESTMENT ECO-SYSTEM Georgia has become one of the most business-friendly countries in the world, rising up the ranks from
9th to 6th best country in the world in terms of economic development and ease of doing business
among 190 countries in 201859. This progress has come as a result of deep reforms across the economy
that have fueled robust growth over the past decade averaging 4.5 percent. Among these reforms are
the simplification of registration procedures to start a business, the improvement of process to make
paying taxes easier and the improvement of contract enforcement. These reforms combined with
improvements in governance have enabled Georgia to become an attractive market for investment.
Government of Georgia ministries and agencies, particularly the Ministry of Economy and Sustainable
Development and its sub-agency, Enterprise Georgia, are motivated to affect change, particularly for
SMEs and start-ups. They do this by proactively partnering with local and international investors and
providing a variety of financial and other incentives to build new and expand business growth in key
industries, with an emphasis on those industries located outside of Tbilisi including tourism, hospitality,
and meetings, incentives and exhibitions (MICE), manufacturing, film, information and communication
technologies/innovation, business process outsourcing and industries that enable the export of products
from Georgia.
Indeed, Georgia boasts one of the most robust and stable financial sectors in the Eastern European
region, albeit conservative, and heavily dominated by banks. In fact, banks account for 90 percent of all
financial sector assets, with total banking sector assets at around 41 billion GEL (approximately $14.1
billion) as of May 201960. The two largest banks, TBC Bank and Bank of Georgia (BOG), both partially
foreign-owned, account for 75 percent of total banking sector assets. Both are listed on the London
Stock Exchange and are part of the FTSE 250 Index. Given no legal limitations in Georgia that ring fence
corporate and investment banking (as has been done in the US with the Glass-Steagall Act61), both TBC
and BOG have both developed investment holding companies, TBC Group and BGEO Group, that
expand beyond corporate and retail banking to include investment and advisory activities.
59 Doing Business Rankings 2018. World Bank. 60 Financial Sector Review: Analytical Tables and Charts. National Bank of Georgia. July 2019. 61 The US Glass Steagall Act prohibited commercial banks from participating in the investment banking business and vice versa. Glass-Steagall
lost its power in recent decades and was partially repealed in 1999. Recent financial crises have led to talk in political and economic circles of reviving the act.
VALUE CHAIN PRIORITIZATION AND GAPS ASSESSMENT 70
In addition to the banking market, there is a small non-bank financial sector which includes microfinance
organizations (MFOs) and credit unions that provides small loans to microenterprises and individuals
which make up the majority of businesses, particularly outside of the capital. As of the end of 2018, total
assets for the microfinance sector totaled 1.5 billion GEL62. There are also insurance companies and
leasing companies, neither of which is regulated by the central bank; both segments have legal and
regulatory limitations that limit their ability to invest and lease to businesses.
Outside of banking, the Georgian investment ecosystem is small. Georgian capital markets are not well
developed, comprised only of two stock exchanges, one central securities deposit, eight brokerage
companies and securities registrars that are licensed to carry out activities in the securities market.
There is little to no trading happening on the stock exchanges. The National Bank of Georgia (NBG)
serves as the mega-regulator of the financial sector, regulating and supervising the banking sector, the
non-bank financial sector and capital markets; it does not regulate the insurance sector63. Given its
primary focus on banking, it has been more measured and gradual in developing capital markets’
instruments. These steps have included developing money and interbank markets, then government
paper/treasuries, and then local currency bonds, the first of which was issued by the European Bank for
Reconstruction and Development in 2014. More recently, other international financial institutions (IFIs)
including the Asian Development Bank (ADB), the International Finance Corporation (IFC)64 and
commercial banks have issued Euro bonds, and some larger companies have begun issuing corporate
bonds, all in local currency. That said, Georgian bond issuances have been quite limited to date, although
use of these instruments is expected to grow as has been the trend in the rest of Central and Eastern
Europe. The World Bank continues to support the Government and the NBG to develop other fixed
income securities for the local market.
Georgian equity markets also remain small and relatively illiquid. Securing financing for start-ups is
severely limited. There are only a handful of local equity investors, including a small number of
internationally affiliated investment groups, bank-affiliated investment groups, and others associated with
wealthy and politically connected individuals. Institutional investing from pension funds and insurance
companies remains limited given the nascent legal frameworks. On the pension side, the Georgian
parliament passed legislation enabling a mandatory accumulating pension system in July 2018 (Pillar II
under the European system) and much work is now being done to set up the enabling regulations and
structures. With respect to insurance, there is no institutional investment happening from the insurance
sector in part due to a limited roll out of motor third party liability (MTPL) insurance to only transit
vehicles (and thereby limited premiums collected, only 30 million GEL in the year and a half since the
law was implemented.) The Georgian Insurance Association is currently lobbying on behalf of industry
for a full implementation of the Motor Third Party Obligatory Insurance Law in Georgia, a draft of which
currently sits in the parliament. Passage of this law could open up a new source of investment capital as
well as need for long term investment mechanisms. However, passage of this law in the short term is
highly uncertain.
It is important to recognize that development finance institutions, donor projects and public-sector
support institutions and programs have increased focus on finance and investment in Georgia, notably
for tourism and hospitality. Table 12 below highlights some of the idiosyncrasies of these investors, their
preferences with respect to return versus impact, risk appetite and investment outlook.
62 Georgia’s Microfinance Sector. Galt & Taggart. January 2019. Note: since the publication of the research, total assets have fallen given new regulations that set interest rate caps and has required more comprehensive borrower indebtedness analysis, thereby pushing several MFOs
out of the market. 63 Note: since 2013 the Insurance State Supervision Service of Georgia (ISSSG) has taken over the regulation of insurance companies and pension funds. 64 Gattini, Luca Gattini, and Tamar Baiashvili. Neighbourhood SME Financing in Georgia. European Investment Bank. February 2016.
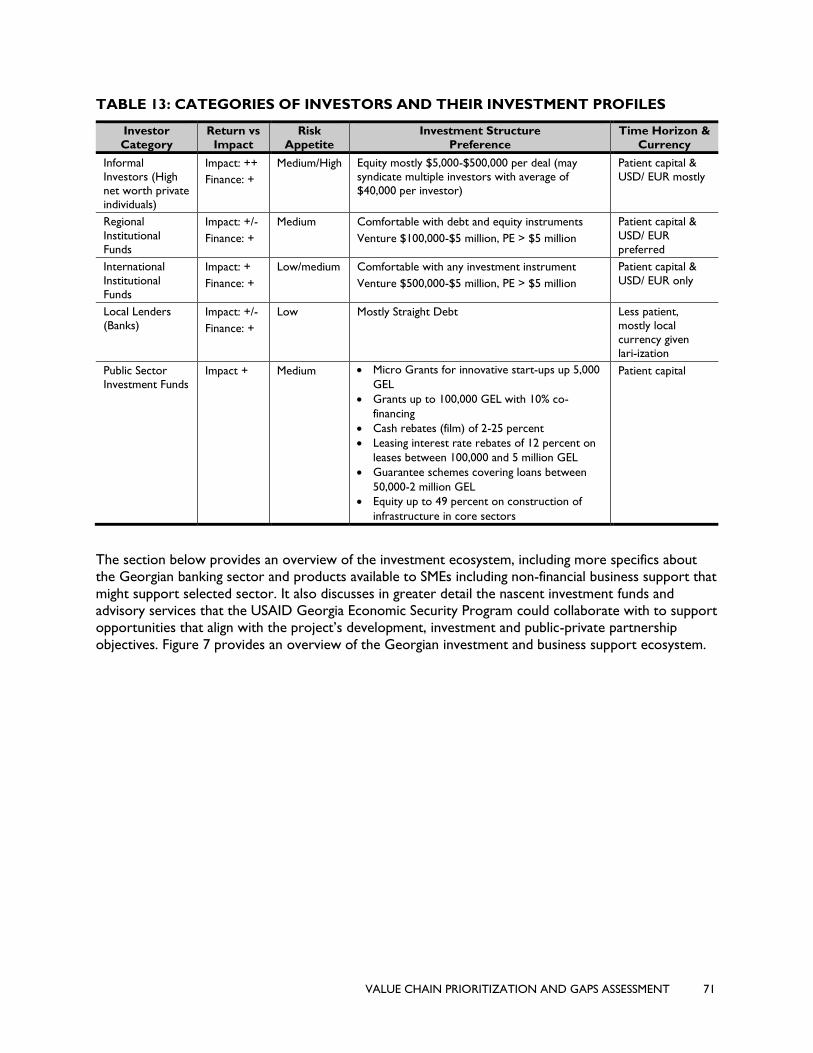
VALUE CHAIN PRIORITIZATION AND GAPS ASSESSMENT 71
TABLE 13: CATEGORIES OF INVESTORS AND THEIR INVESTMENT PROFILES
Investor
Category
Return vs
Impact
Risk
Appetite
Investment Structure
Preference
Time Horizon &
Currency
Informal
Investors (High
net worth private
individuals)
Impact: ++
Finance: +
Medium/High Equity mostly $5,000-$500,000 per deal (may
syndicate multiple investors with average of
$40,000 per investor)
Patient capital &
USD/ EUR mostly
Regional
Institutional
Funds
Impact: +/-
Finance: +
Medium Comfortable with debt and equity instruments
Venture $100,000-$5 million, PE > $5 million
Patient capital &
USD/ EUR
preferred
International
Institutional
Funds
Impact: +
Finance: +
Low/medium Comfortable with any investment instrument
Venture $500,000-$5 million, PE > $5 million
Patient capital &
USD/ EUR only
Local Lenders
(Banks) Impact: +/-
Finance: +
Low Mostly Straight Debt Less patient,
mostly local
currency given
lari-ization
Public Sector
Investment Funds Impact + Medium • Micro Grants for innovative start-ups up 5,000
GEL
• Grants up to 100,000 GEL with 10% co-
financing
• Cash rebates (film) of 2-25 percent
• Leasing interest rate rebates of 12 percent on
leases between 100,000 and 5 million GEL
• Guarantee schemes covering loans between
50,000-2 million GEL
• Equity up to 49 percent on construction of
infrastructure in core sectors
Patient capital
The section below provides an overview of the investment ecosystem, including more specifics about
the Georgian banking sector and products available to SMEs including non-financial business support that
might support selected sector. It also discusses in greater detail the nascent investment funds and
advisory services that the USAID Georgia Economic Security Program could collaborate with to support
opportunities that align with the project’s development, investment and public-private partnership
objectives. Figure 7 provides an overview of the Georgian investment and business support ecosystem.
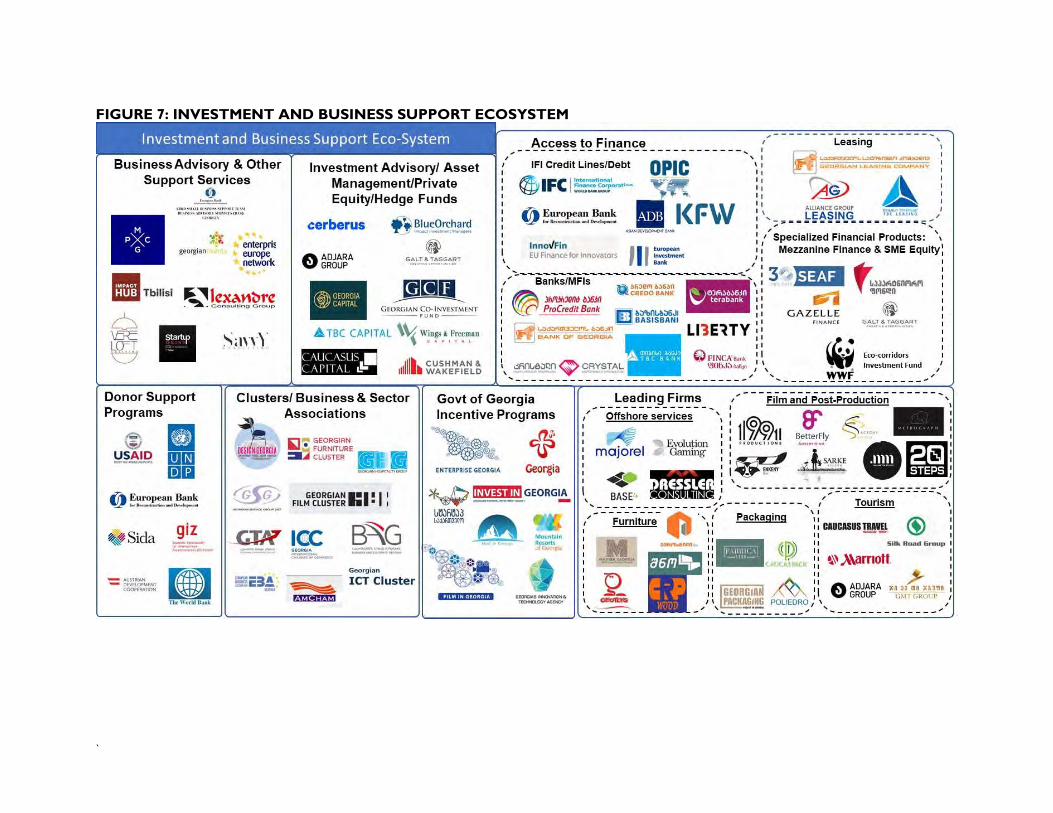
`
FIGURE 7: INVESTMENT AND BUSINESS SUPPORT ECOSYSTEM
VALUE CHAIN PRIORITIZATION AND GAPS ASSESSMENT 73
BANKING SECTOR
Banking is one of the fastest growing sectors of the Georgian economy, as illustrated by the 20.4
percent growth in assets annually and 20 percent growth in deposits65. Sixteen commercial banks
operate in Georgia, eight of them fully foreign-owned and five with a majority participation from foreign
investors. However, as noted above, the sector is concentrated in two banks, TBC and BOG, which
dominate the landscape and compete heavily across all areas of lending including increasingly for the SME
sector. Of the two, TBC currently has the largest share of the SME market, but BOG is aggressively
targeting SMEs (they currently have more than 90,000 microenterprise borrowers and feel this is a base
from which to grow), particularly outside of Tbilisi, Kutaisi and Batumi. A third largest bank, ProCredit,
a German bank focused predominantly on SME lending, captures a much smaller percentage of the
market but is viewed as an emerging player, particularly for SMEs. ProCredit lacks the branch network
of TBC and BOG utilizing its digital platform to expand its market share. Additionally, two banks, FINCA
and CREDO, are former microfinance organizations that restructured and became licensed as full-
fledged banks, though continue to target more down-market lending and often work in coordination
with donors and IFIs to promote sector specific lending aimed at growing smaller or women-owned
enterprises. More extensive description of several of the largest banks and those lending to
microenterprises and SMEs can be found in Annex 6.
In the past five years, bank lending has expanded substantially. Credit to GDP ratios which have grown
from 45 to 59 percent from 2014 to 201766. 2019 has seen increase in lending (3.9 percent) particularly
in GEL loans. In recent years, however, a substantial part of this growth was in retail (consumer) lending
including substantial growth in this segment by non-banks (see microfinance below). Regulatory changes
imposed by the NBG including interest rate caps (first at 100 percent in 2017, then to 50 percent in
2018) and then in 2019, requiring lenders to ensure that loan sizes do not exceed a threshold ratio of
the individual’s total indebtedness measured against income and that retail loans of less than 100,000
GEL must be made in local currency. These changes have had a significant impact on the market in two
ways: it reduced lending for mortgages (which were classified as retail loans) and also impacted the
portfolios of banks and MFOs, shrinking the number of retail loans made as well as having some
portfolio impacts on those retail shops (particularly those in the consumer electronics space) who saw a
decline in business as a result. Also, in 2016, the GoG and the NBG jointly created a 10-point lari-ization
plan with the aim of increasing access to local currency loans, minimizing foreign exchange risks and
adjusting lari pricing in the market.
In terms of interest rates, there has been a downward decline in interest rates for both dollar and GEL-
denominated loans and the sense that banks are passing on efficiencies to the end client over the past
five years. Interest rates have declined from a high of 21.7 percent on GEL loans in 2013 to 12 percent
in 2019. In general, all the banks beyond the big two have limited access to local currency because they
do not attract deposits like TBC and BOG. As a result. their cost of funds and therefore interest rates
are slightly higher. There are efforts afloat to issue local currency bonds that would raise capital for
these banks.
On the collateral side, there is no secured transaction law that would allow enterprises to pledge assets
other than real estate collateral. Work on a draft law has been slow. However, its passage could open
up opportunities particularly for smaller banks.
65 Doing Business in Georgia: Commercial Guide for Investors. Grant Thornton. 2018. 66 Giucci, Ricardo, Alexander Lehmann, Giorgi Mzhavanadze, and Anne Mdinaradze. Banking Sector Monitoring Georgia 2018. German Economic
Team Georgia. March 2018.
VALUE CHAIN PRIORITIZATION AND GAPS ASSESSMENT 74
SME Lending Although definitions for SMEs differ from institution to institution (and are not consistent from financial
institutions to the NBG), SME lending has grown substantially over the past decade given the
competitive pressures of the banking system, and access to credit facilities and credit enhancements
from IFIs. Credit extended to SMEs has grown from 21 percent of all credit extended in 2016 to 23
percent in 201767. Also, with the NBG’s lari-ization program, more local currency loans are available to
SMEs, reducing the currency mismatch that many faced back in 2014 and earlier when banks lent largely
in foreign currencies68.
Of the two largest banks, SMEs make up a core part of new lending. Below are brief descriptions of the
products and terms they offer, as well as specific strategies and priority areas for the coming years:
• TBC provides a range of products for SMEs including trade finance, letters of credit, guarantees, and
factoring products. TBC staff noted their interest in geographic expansion outside of Tbilisi as well
as into neighboring markets. One of TBC’s differentiators is its interest and focus on start-ups,
particularly greenfield investment, including start-ups outside the technology/innovation space. They
also provide a “maternity/paternity” cover for employees who wish to take time off to start-up tech
related businesses. It has numerous clients in the tourism and hospitality sectors, particularly travel
agents. TBC offers competitive interest rates on lari, USD and Euro loans, ranging in cost between
10-12 percent, 7-10 percent and 5+ percent for each currency, respectively. With assessing the
business and its assets/collateral, TBC does take into consideration other assets including grants
coming into a potential SME client for specific projects.
• BOG provides a range of products for SMEs similar to those of TBC. The Bank has taken a keen
interest in the tourism and hospitality sector and is currently evaluating several technology-based
platforms that allow hotels and guest houses to manage client services as well as a real estate
platform that integrates developers and investors interested in financing new tourism properties.
Also, since 2015 the bank has been a co-sponsor with the Georgia National Tourism Administration
of the Welcome to Georgia National Tourism Awards. This program has brought together national
and local authorities, hotels, restaurants, tour operators, travel agencies, wine companies and more,
many of which have gone on to become clients of the bank. BOG noted that last year it financed
more than 150 million GEL in tourism, largely to SMEs and this market segment is growing. As a
result of the bank’s growing interest in tourism, it has launched a special start-up hotel loan with a
15-year term (and two-year grace period), providing financing of between 40-50 million GEL. This is
particularly attractive to investors who also take advantage of the GOG program, Host in Georgia’s
interest rate subsidies for properties outside Tbilisi.
Several IFIs including EBRD, the European Investment Bank (EIB) and the ADB have made lines of credit
available to commercial banks for onlending as well as credit guarantees to reduce risk. TBC and BOG
have been the primary recipients of these credit lines and guarantees, although ProCredit, CREDO and
FINCA have also utilized these facilities to reach SMEs, firms exporting to the EU under the Deep and
Comprehensive Free Trade Area (DCFTA) and women-owned firms. Unfortunately, most SME loans (an
estimated 80 percent by one industry expert) are provided to businesses in Tbilisi.
Credit Guarantees In Georgia there are several partial credit guarantees (usually portfolio guarantees) offered by IFIs,
USAID and the government aimed at helping local entrepreneurs access financing by sharing the risk of
lending with the local bank. Longer term aim of these guarantees is to demonstrate the commercial
67 Annual Report. National Bank of Georgia. 2017. Note. More current statistics are not available in English. 68 Gattini, Luca Gattini, and Tamar Baiashvili. Neighbourhood SME Financing in Georgia. European Investment Bank. February 2016.
VALUE CHAIN PRIORITIZATION AND GAPS ASSESSMENT 75
viability of lending to underserved markets and sectors. In Georgia, there are several credit guarantee
schemes available for local SMEs and entrepreneurs through the banking sector.
• USAID through the Office of Development Credit has extended a Development Credit Authority
(DCA) portfolio guarantee to TBC Bank to expand lending to SMEs, microenterprises and
agricultural businesses. The guarantee provides 50 percent coverage of realized loss of principal. The
facility extends until 2022. Other banks in Georgia have had DCA guarantees in the past including
Crystal Microfinance, Basis Bank and Oikocredit. BOG has expressed interest in accessing the
guarantee, as has the investment firm, Gazelle Finance69.
• The EIB has provided portfolio guarantees to stimulate SME lending to TBC and Procredit banks.
The guarantee which covers up to 80 percent of a maximum loan of Euros 100 million. Through the
InnovFin program, EIB also provides a 50 percent first loss guarantee to innovative start-up engaged
in research and innovation activities.
• Under the Government of Georgia, Enterprise Georgia launched a new guarantee facility which will
provide a 70 percent first loss coverage for loans to a variety of sectors including hospitality,
manufacturing, process, education, export, high tech, medical and service. The guarantee facility had
in theory been available in the past, but banks did not utilize it in the past due to concerns over its
payout. Enterprise Georgia has now provided participating banks with a 10 million GEL liquidity
facility. The cost of the facility will add an additional percentage point to the loan. As of late July, a
majority of banks had signed up for the program including BOG, Procredit and Liberty banks.
Microenterprise lending Until 2010 Georgian MFOs were focused on the provision of credit to informal micro businesses and
agricultural enterprises, bolstered in part by the 2006 law that required their licensing and supervision
by the NBG. MFOs are limited to making loans up to 100,000 GEL in local currency. Interest rates
currently hover around 26 percent on average.
The microfinance market changed substantially around 2010 when several foreign commercial MFOs
came into the market and started up new online operations providing expensive, rapidly disbursed
retail/consumer finance to low income individuals. This trend has been seen throughout Eastern Europe
and in some cases, has driven business credit providers out of the market and driven up household
indebtedness, particularly for lower income clients. Another big shift in the microfinance sector has
been the transformation of some MFOs to commercial banks. CREDO, the largest MFO, for example,
applied for and received a banking license in 2017; before CREDO, FINCA transformed into a bank in
2013. Finally, the market has also been impacted by the entrance of banks lending to businesses in this
market. For example, BOG has begun issuing loans for microenterprises, and given its capital base, faces
fewer liquidity constraints. As a result, the number of MFOs in the market has gone down from a high of
72 to 5570. Also, “classical microfinance institutions” have also begun to rebrand themselves as
responsible finance providers, advertising their adoption of high consumer protection standards in line
with international standards set by the SMART Campaign and re-emphasizing their interests to extend
credit to businesses.
In terms of lending to target markets identified in this value chain prioritization and gaps assessment
report, some MFOs, such as Crystal Microfinance, see tourism and hospitality as an important sector,
hiring and training loan officers with specific knowledge of the sector. Some also lend to furniture
manufacturers and are open to opportunities in other sectors, particularly creative industries. Their
portfolios are geographically more diverse and dispersed than banks as they have branch networks that
69 Note: the DCA guarantee facility is the process of being shifted to the new US Development Finance Corporation which will be created out of the current Overseas Private Investment Corporation (OPIC). 70 Statistics from conversation with CEO of Crystal Microfinance.
VALUE CHAIN PRIORITIZATION AND GAPS ASSESSMENT 76
serve micro and small enterprises and entrepreneurs across the country. MFOs also appear to be
flexible, and more apt to address other constraints of their microenterprise borrowers. For example,
Crystal Microfinance is partnering with USAID’s Young Entrepreneur School (YES) to build up the
capabilities of young entrepreneurs. Some of the IFIs have extended lines of credit to MFOs. Similarly,
they have developed green financing loans in partnership with FMO to deliver finance for boilers,
heaters, energy efficient briquettes and other energy-saving equipment. Crystal Microfinance has also
issued a corporate bond to raise financing women owned microenterprises. The ADB is also currently
working on a line of credit for Crystal Microfinance.
Leasing and Factoring Both leasing and factoring/receivables finance as products and sectors are underdeveloped in Georgia;
neither has a legal framework to address their operations nor is licensed or regulated by the central
bank.
Leasing is broadly covered under the Civil Code. According to the Georgian Leasing Association,
without a proper legal framework, the sector currently faces several legal and implementation challenges
including:
• An interest rate cap of 50 percent that includes insurance and fees;
• Confusion in the law with respect to language that equates leasing with lending. This translates into a
number of challenges including how companies source capital as well as how judges make rulings
(often inaccurate ones) due to lack of knowledge of the product;
• Leases larger than 200,000 GEL can only be made in local currency, irrespective if the lessor is an
individual or a legal entity; and
• Dubious clauses in the law regarding penalties and fine for cars/drivers of leased vehicles which puts
lessors at a greater disadvantage than owners71.
Currently, there are only three leasing companies focused on the corporate and SME market: TBC
Leasing, Georgia Leasing Company and Alliance Group Leasing; two of these are affiliated with BOG and
TBC Bank. Several other smaller companies focused on retail leasing, and Crystal Microfinance has plans
to create a leasing subsidiary which they believe will be an important source of asset financing. Of the
three, TBC Leasing captures 74 percent of the market. In general, the companies are limited in their
ability to raise capital because they cannot borrow from the banking sector. The head of the Leasing
Association also noted that banks often compete with their leasing subsidiaries.
In terms of interest rates on leases, leasing is about 3-5 points higher than commercial bank loans.
However, clients are uneducated about the product, not knowing that VAT is not charged on the lease
of an asset, only its purchase. Also, leases are not treated as leverage, enabling a company to borrow
funds for other purposes including working capital.
In addition to the few companies, Enterprise Georgia has offered leasing finance for up to 5 million GEL
for two years with co-financing that covers 12 percent of the interest rate for the first 24 months for
leases from 100,000 GEL up to 5 million GEL. However, the program has not been particularly popular
given higher interest rates on the product.
According to the Leasing Association, the estimated size of the market is currently about $200 million,
up 100 percent since 201772. According to the association, it should be a $3 billion industry if its
legislation and financing terms could improve. To date, leasing companies have largely focused on large
71 Georgia Leasing Market Overview. Georgia Leasing Association. 2017. 72 Ibid
VALUE CHAIN PRIORITIZATION AND GAPS ASSESSMENT 77
economic sector such as construction and real estate, transport, medicine and power engineering. A few
industry experts noted great potential in the market, particularly in light of a new law under
development by the Ministry of Finance that would allow a more appropriate legal framework and tax
incentives, and shift licensing and supervision to the NBG. Moreover, it could help businesses in tourism
(including medical tourism), the healthcare sector and manufacturing source more modern equipment
and further build out fleets for tour companies who engage in operational leasing of rental cars, yachts,
and scooters.
Like leasing, factoring does not have a separate legal framework but is covered in the Civil Code and
Law No. 121 on Activities of Commercial Banks (written in the mid-1990s). There are no licensing nor
capital adequacy requirements under the law. Moreover, Georgia is not a member of the UNIDROIT
Convention on International Factoring or United Nations Convention on Assignment of Receivables in
International Trade73. There are no special foreign exchange rules applicable to factoring transactions
and thus, export receivables denominated in foreign currency can be factored between Georgian firms
across border without any restrictions. Factoring is also exempt from VAT like other types of financial
services. That said, without an explicit framework, there is limited factoring taking place in Georgia and
largely within the confines of commercial banking.
EBRD is helping to support the new leasing and factoring laws. Passage of new legal frameworks for
leasing and factoring might also enable the Program to engage leasing companies around the
development of leasing products for light manufacturing companies in furniture making and packaging as
well as in the film and post-production industry. Similarly, access to factoring products for SMEs who
have regular receivables from lead firms in their value chains, for example, packaging firms or suppliers
to the hospitality sector, could benefit from this product in the long term.
INVESTMENT FUNDS, PRIVATE EQUITY AND VENTURE CAPITAL
In 2013, the GOG established a new Law of Investment Funds, which now provides a stronger
ability to fund local businesses. The current legislation provides for the creation of different types of
investment funds and investor classes who can register. Despite a framework, there are few
Georgian private equity, investment management or venture capital firms in Georgia in part due to the
very small size of the market. The Program Team met with several private and public sector firms as
part of the mapping, including Wings & Freeman, Galt & Taggart (G&T), the Partnership Fund, the
Caucasus Growth Fund/SEAF, Enterprise Georgia and the Georgia Innovation and Technology Agency
(GITA). Each of these firms/funds and others are described in greater detail in Annex 6. Several firms
confirmed interest in working with the Program. Already one firm, Wings & Freeman, is collaborating
with the Program as the lead investor on its first deal note through the Partnership Development Fund.
The Team was also unable to locate many angel investors, although noted on social media the Georgian
Business Angels Associations formed in March 2017 with the aim of raising public awareness about the
business angel market and the success stories of investments, addressing the problem of information
asymmetry, to make it easy for entrepreneurs and investors to find each other and providing training
and coaching to entrepreneurs and investors. The organization now appears to be defunct.
Foreign Investment and Export Promotion According to the Georgian National Statistics Office, Georgia received $1.346 billion in foreign direct
investment. Investments were made largely in transport, communication and construction74. Enterprise
Georgia is the lead agency for investment promotion (it took over the Invest in Georgia program) as
well as for export promotion. On export promotion, Enterprise Georgia is helping companies to
73 Factoring Survey in EBRD Countries of Operation. European Bank for Reconstruction and Development. Third Edition. September 2018. 74 Karelidze, Tamara. “Investing in Georgia.” Emerging Europe. March 2, 2018.
VALUE CHAIN PRIORITIZATION AND GAPS ASSESSMENT 78
improve export readiness and attend exhibitions by providing access to subsidies for space/exhibitions at
trade fairs and by providing technical assistance. Last year they supported more than 500 companies to
attend 50 exhibitions which yield more than 66 million GEL in revenue for their 7 million GEL
investment. Among the exhibition attended were the Gulfoods (the world’s largest food and beverage
expo which takes place annually in Dubai), Paris Fashion Week and China Import and Export. Current
priority sectors include tourism and hospitality, creative industries, manufacturing and BPO.
There are opportunities to expand visibility to outside investors through other venues, although not all
investment fora have been successful in doing so in the past. One opportunity for further consideration
in the future is the Welcome Challenge. Last year Georgia hosted this global competition focused on
identifying innovative ideas in the hospitality sector. The final event was held in Tbilisi and brought in
investors/angels to meet with start-ups and innovators from all over. Georgian companies could make a
bigger play at the next event as well as use the event to position Georgian in global tourism.
Private Equity Of the few equity providers, most have been formed in the past 8-10 years. As noted earlier, two of the
largest are affiliated with the two big banking groups. The other prominent players, namely Gazelle
Finance and Caucasus Growth Fund, were formed with equity provided by IFIs and other concessional
finance providers/donors to serve as a demonstration effect to the market. Indeed, these organizations
have had an important role to play in building the investment market. The two latter firms make
investments largely in SMEs in the range of $200,000- $3 million across a range of sectors including
tourism and hospitality, healthcare, construction, light industry/manufacturing, agricultural processing,
education and supermarkets75. Average investments have been around $1.5 million. Several of the larger
funds have focused largely on real estate investments; in some instances, they are tied to current and
former politicians.
The GOG’s Partnership Fund, a state-owned investment fund, established in 2011, is one of the larger
equity investors in Georgia, providing co-financing equity, mezzanine, etc. to projects at their initial stage
of development. The majority of its investments have been in large scale infrastructure development
(energy, transport). More recently, they have invested in hotels and other types of light and heavy
industry manufacturing. Partnership Fund participation is limited to minority share (up to 50 percent)
but has the added benefit of enabling projects to attract senior financing from commercial sources or
IFIs.
Mezzanine Finance76 Although the product is not well known or utilized in the market, a small handful of firms and state
companies offer mezzanine finance in Georgia including Gazelle Finance, G&T and the Partnership Fund.
In mid-2015, G&T announced the launch of a $50 million fund that targets high potential, growth
companies seeking $2-8 million in investment. However, marketing of the firm was curtailed until
recently and now seems to be picking up steam.
Institutional Investment As noted earlier, institutional investment is very nascent but could grow in the coming years with the
stand-up and expansion of the Georgian accumulating pension fund. The system requires mandatory
enrollment for legally employed people under 40, and will work based on a 2+2+2 scheme, where
employees contribute two per cent of their salaries towards their pension, matched by employers and
75 Note: Caucasus Growth Fund makes only equity investments while Gazelle also uses debt and mezzanine instruments. 76 Mezzanine financing is a hybrid of debt and equity financing that gives the lender the right to convert to an equity interest in the company in
case of default, generally, after venture capital companies and other senior lenders are paid. https://www.investopedia.com/terms/m/mezzaninefinancing.asp
VALUE CHAIN PRIORITIZATION AND GAPS ASSESSMENT 79
the government with an additional two percent each77. As of July 2019, an accumulating fund had been
set up with more than 750 million GEL collected and on deposit in commercial banks. The board has
been selected but the pension fund was still recruiting for a Chief Investment Officer and Chief Risk
Officer. Next steps include finalizing its investment strategy (by the end of 2019). Similarly, changes in
the insurance market with the expansion of MTPL insurance to all citizens (not just tourists) and
revisions to the law could open up a market for institutional investment that could include longer term
capital for larger businesses and SMEs.
Capital Markets Georgian capital markets have been and will likely continue their nascent development for some time.
Bond markets may be the one area where there are further opportunities to raise capital for SMEs.
Crystal Microfinance’s issuance of a bond to raise financing for women entrepreneurs and those raised
by other IFIs offer an innovative example to expand financing, particularly for specific sectors or classes
of businesses, particularly in light of limited opportunities for SMEs to list and raise funding on local
stock exchanges.
BUSINESS SUPPORT SERVICES
Several donors including the European Union through EBRD and the Swedish International
Development Agency (SIDA) are providing advisory services for SMEs including women owned firms.
These programs offer access to a network of specialized firms that provide support across a wide range
of business topics including marketing, finance, financial reporting including IFRS, human resources,
quality assurance, investment readiness and legal among others. The EBRD Advisory Services for
Business (ASB) program has operated since 2003 and provides two types of cost-shared advisory
services to SMEs and larger corporates. These include:
• Access to a network of local consultancies co-financed up to 50 percent and capped at Euro 10,000;
• Access to international sectoral experts from developed economies who provide targeted technical
assistance over a 12-18 month period though 10-12 one-week trips during which experts work with
C-suite executives in the Georgian company to address everything from engineering, supplier and
buyer markets. For this latter service, EBRD provides a larger cost share with the firms covering 12-
16 percent of the total cost.
In addition to donor funded programs, Gazelle Finance has a limited technical assistance (TA) budget
which can help finance ISO certification. Also, Enterprise Georgia’s Produce in Georgia program
provides entrepreneurs and business owners with technical assistance to grow and optimize their
businesses. Companies can take advantage of these services for a value up to 10,000 GEL with an
expectation of 10 percent co-financing.
PRIORITY INTERVENTIONS FOR THE PROJECT
Going forward, the Program will consider support to a few key sector investments in the financial sector
including:
• Support to the development of leasing and factoring legislation (in alignment with EBRD). With
an improved legal framework for both leasing and factoring, the Program could support initiatives
that educate SMEs on these products and services and support smaller banks to roll out the
products to SMEs in furniture, packaging and film/production companies (for leasing) and to MSME
suppliers to the tourism and hospitality sector (factoring).
77 “Georgian Parliament Approves Law on Accumulative Pension.” Agenda.ge. July 22, 2018 https://agenda.ge/en/news/2018/1553
VALUE CHAIN PRIORITIZATION AND GAPS ASSESSMENT 80
• Serve as a co-sponsor for the Welcome Challenge with the aim of also introducing international
investors to Georgia’s tourism sector. This support will be well-coordinated with the Georgian
National Tourism Administration.
• Continue to engage with investment advisory firms, Wings & Freeman, Gazelle Finance, G&T
and others as well as the GOG’s Partnership Fund on specific opportunities across Program’s core
sectors. Already these firms have been engaged by Program management on new opportunities,
some of which are highlighted in Table 13 in the coming section.
• Starting in 2020, work with new US Development Finance Company (formerly OPIC) to
extend a new DCA facility to other banks or debt providers such as BOG and Gazelle Finance. A
guarantee mechanism would enable Gazelle or new banks to mitigate some risk to newer SME
target firm borrowers.
• Monitor the development of institutional investment possibilities with the Georgian Fund or
MTLP. Where feasible, the Program will help the GOG develop investment criteria and regulations
which might include a percentage (up to 10 or 15 percent) for investment in SMEs.
PUBLIC-PRIVATE PARTNERSHIPS AND
INVESTMENT OPPORTUNITIES Against the backdrop of Georgia’s investment climate and financial landscape, the Georgia Economic
Security Program is expected harness the country’s growing market dynamism and catalyze problem-
solving and co-investment from a variety of private and public sector partners to drive the country’s
competitiveness, improve productivity and the availability of industry required skills. Program
partnerships will leverage $15 million in investments through at least 14 PPPs and GDAs; the program
broadly must also catalyze $50 million in new sales and create 4,000 full-time jobs. Through the value
chain assessments and initial start-up activities, the Program has already identified a variety of potential
partnerships that it will consider for program investment through the Partnership Development Fund
(PDF). Already one deal note has been presented and approved during the start-up phase. We anticipate
that future partnerships may also be identified through the issuance of an annual program statement
(APS) and through co-creation with private sector and government stakeholders and will follow the PDF
Funding and Implementation Cycle as illustrated in Figure 8.
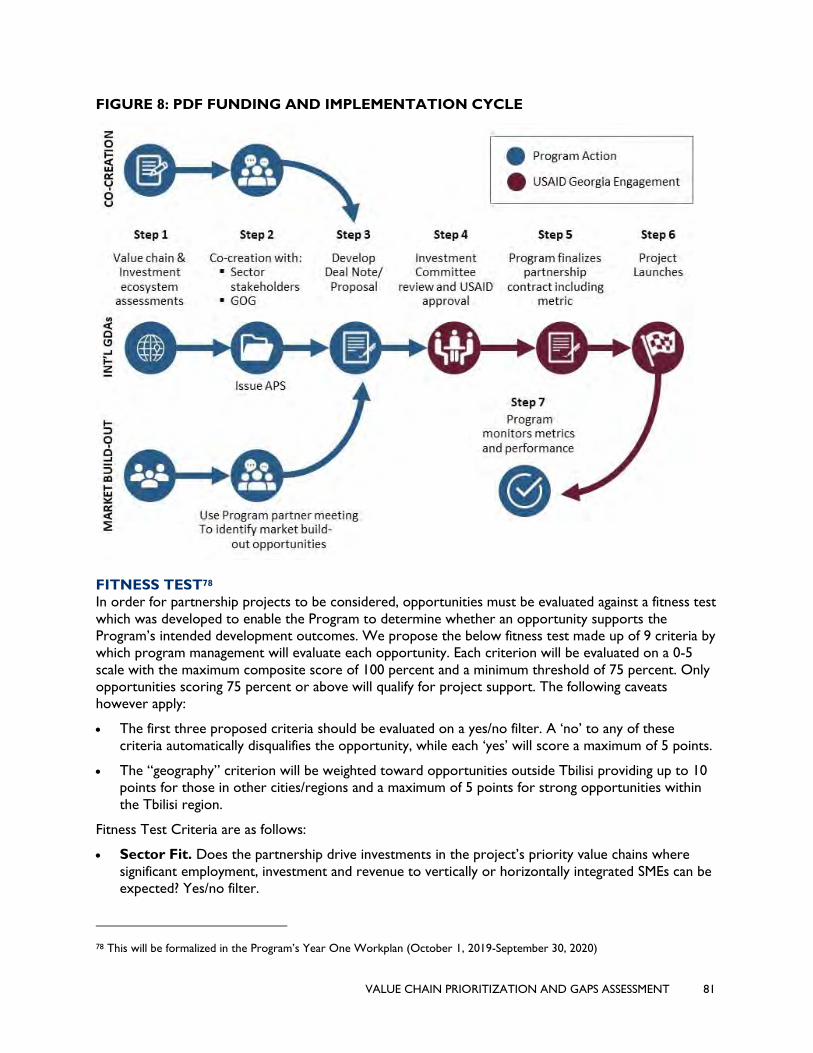
VALUE CHAIN PRIORITIZATION AND GAPS ASSESSMENT 81
FIGURE 8: PDF FUNDING AND IMPLEMENTATION CYCLE
FITNESS TEST78
In order for partnership projects to be considered, opportunities must be evaluated against a fitness test
which was developed to enable the Program to determine whether an opportunity supports the
Program’s intended development outcomes. We propose the below fitness test made up of 9 criteria by
which program management will evaluate each opportunity. Each criterion will be evaluated on a 0-5
scale with the maximum composite score of 100 percent and a minimum threshold of 75 percent. Only
opportunities scoring 75 percent or above will qualify for project support. The following caveats
however apply:
• The first three proposed criteria should be evaluated on a yes/no filter. A ‘no’ to any of these
criteria automatically disqualifies the opportunity, while each ‘yes’ will score a maximum of 5 points.
• The “geography” criterion will be weighted toward opportunities outside Tbilisi providing up to 10
points for those in other cities/regions and a maximum of 5 points for strong opportunities within
the Tbilisi region.
Fitness Test Criteria are as follows:
• Sector Fit. Does the partnership drive investments in the project’s priority value chains where
significant employment, investment and revenue to vertically or horizontally integrated SMEs can be
expected? Yes/no filter.
78 This will be formalized in the Program’s Year One Workplan (October 1, 2019-September 30, 2020)
VALUE CHAIN PRIORITIZATION AND GAPS ASSESSMENT 82
• Financing structure. Does the investment from the partner/partners meet or exceed the
expected 1:1 match of the project’s investment? Yes/no filter.
• Timing. Will the partnership be realized and demonstrate measurable benefits within the five years
of the project’s life cycle? Yes/no filter.
• Geography. Does the opportunity consider create economic opportunities outside of Tbilisi?
• Gender, Youth, and Social Inclusion. Does the opportunity positively empower female
stakeholders, youth, and other vulnerable populations as entrepreneurs, employees, or
individuals/groups benefitting from investments?
• Impact/Feasibility. Is there a likelihood of success, the potential for transformative developmental
impact in terms of job creation (on direct and indirect beneficiaries), increased external investment
and increased revenues to impacted MSMEs?
• Resources versus Results. Are the funds and/or staff time allocated to this partnership sufficient
to unlock or leverage additional jobs, investment, or revenues for MSMEs? Will the results of the
project’s investment result in significant contributions to project targets?
• Positive Economic Externalities. Will investment mobilized contribute to great indirect
economic impact including indirect jobs, SME growth, exports and other development impacts
generated? Does the opportunity offer the potential for scale and crowding in or catalyzing
additional investments? Does the opportunity expand the potential for on-lending to SMEs by new
financial institution partners?
• Environmental Best Practice (crosscutting requirement). Does the opportunity ensure
compliance with U.S. Government environmental procedures? In addition to standard USAID
compliance, will the opportunity align with other Environmental, Social and Governance criteria
recognized in the investment community?
We recommend that the Program review the weight of each criterion and adjust over time based on
learning and a review of data generated by the Monitoring, Evaluation and Learning Plan (MELP).
TIMING
The Program’s management recognizes that not all projects will start, be implemented and end within
the same time horizon and that timing is critical given the Program’s five-year duration. Some
partnerships will begin, be completed and show results within a short time horizon but others will
require as much as two or three years to show results. The project will seek to balance partnership
opportunities that show results in the short, medium and long term, as outlined in Figure 9.
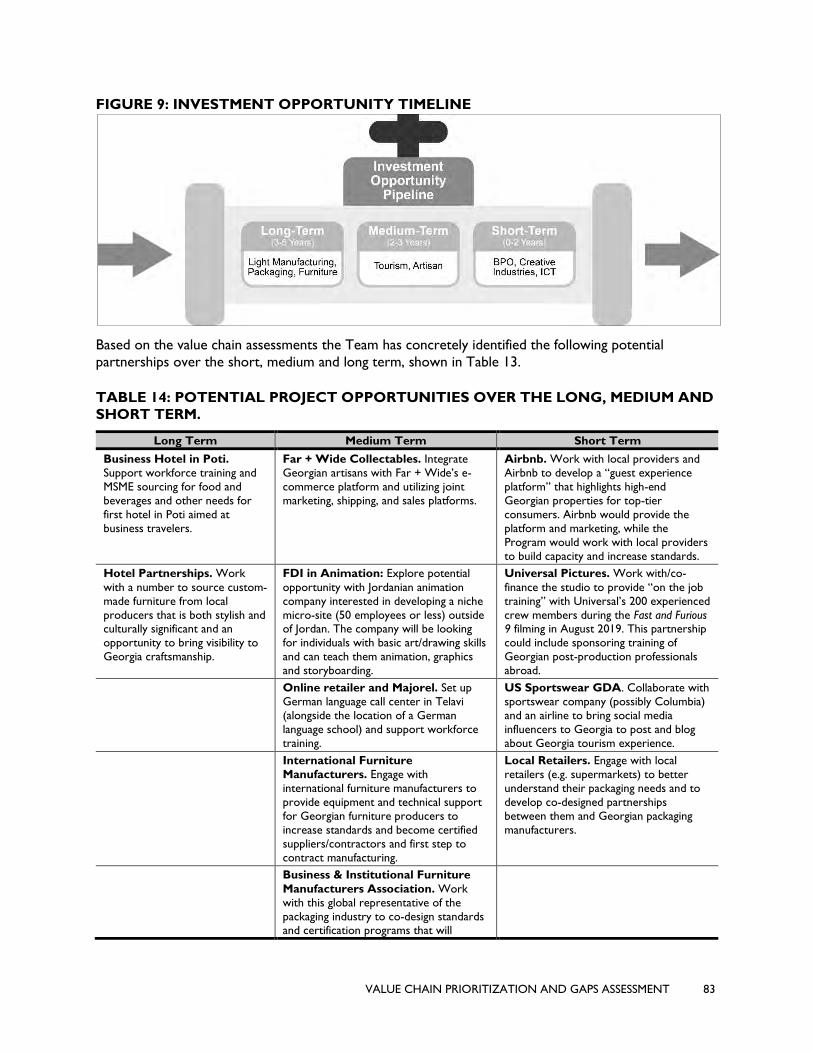
VALUE CHAIN PRIORITIZATION AND GAPS ASSESSMENT 83
FIGURE 9: INVESTMENT OPPORTUNITY TIMELINE
Based on the value chain assessments the Team has concretely identified the following potential
partnerships over the short, medium and long term, shown in Table 13.
TABLE 14: POTENTIAL PROJECT OPPORTUNITIES OVER THE LONG, MEDIUM AND
SHORT TERM.
Long Term Medium Term Short Term
Business Hotel in Poti.
Support workforce training and
MSME sourcing for food and
beverages and other needs for
first hotel in Poti aimed at
business travelers.
Far + Wide Collectables. Integrate
Georgian artisans with Far + Wide’s e-
commerce platform and utilizing joint
marketing, shipping, and sales platforms.
Airbnb. Work with local providers and
Airbnb to develop a “guest experience
platform” that highlights high-end
Georgian properties for top-tier
consumers. Airbnb would provide the
platform and marketing, while the
Program would work with local providers
to build capacity and increase standards.
Hotel Partnerships. Work
with a number to source custom-
made furniture from local
producers that is both stylish and culturally significant and an
opportunity to bring visibility to
Georgia craftsmanship.
FDI in Animation: Explore potential
opportunity with Jordanian animation
company interested in developing a niche
micro-site (50 employees or less) outside of Jordan. The company will be looking
for individuals with basic art/drawing skills
and can teach them animation, graphics
and storyboarding.
Universal Pictures. Work with/co-
finance the studio to provide “on the job
training” with Universal’s 200 experienced
crew members during the Fast and Furious 9 filming in August 2019. This partnership
could include sponsoring training of
Georgian post-production professionals
abroad.
Online retailer and Majorel. Set up
German language call center in Telavi
(alongside the location of a German
language school) and support workforce
training.
US Sportswear GDA. Collaborate with
sportswear company (possibly Columbia)
and an airline to bring social media
influencers to Georgia to post and blog
about Georgia tourism experience.
International Furniture
Manufacturers. Engage with
international furniture manufacturers to
provide equipment and technical support
for Georgian furniture producers to
increase standards and become certified
suppliers/contractors and first step to
contract manufacturing.
Local Retailers. Engage with local
retailers (e.g. supermarkets) to better
understand their packaging needs and to
develop co-designed partnerships
between them and Georgian packaging
manufacturers.
Business & Institutional Furniture
Manufacturers Association. Work
with this global representative of the
packaging industry to co-design standards and certification programs that will

VALUE CHAIN PRIORITIZATION AND GAPS ASSESSMENT 84
Long Term Medium Term Short Term
enhance the knowledge and experience of
Georgian packaging firms.
VALUE CHAIN PRIORITIZATION AND GAPS ASSESSMENT 85
VI. CONCLUSIONS
The Program’s Value Chain Assessment Team spent months in the preparation of this document,
attending dozens of meetings, conducting countless hours of research and meeting with hundreds of
stakeholders. Even after its comprehensive analysis, however, the Program’s leadership realizes the
inexact nature of competitiveness in general. While its assumptions in this report are based on solid
data, fluidity in global markets, unwillingness of countries to change course, government actions (or
inaction) and the inability of the private sector to adapt to new realities are just a few of the challenges
that might prove insurmountable to competitiveness in some of the sectors and value chains. For this
reason, the Program will continually monitor indicators within each and will launch practical
interventions to provide each with the opportunity to become game-changers for Georgia.
Each quarter, the Program will report on indicators specific to each sector and value chain and will at
such a time as it may be necessary, advise the client to either increase or decrease focus on certain
ones. It is important to note, however, that building competitive sectors and value chains takes time,
resources, and coordinated actions. It will be important for the Program, and USAID, to have the
patience and willingness to “take the journey” with these sectors and value chains in order to provide
them the best chance to succeed. It will also be important for the Program and USAID to identify and
take advantage of emerging trends in these and other sectors and to move swiftly and strategically into
and out of sectors and value chains based on these trends.
Virtually every country that has succeeded in building competitiveness through the development of
sectors and value chains that are direct links to investment, high(er)-value job creation, and revenue
increases have done so by linking all elements of the value chain. This requires being willing to do the
“heavy lifting” in terms of strategy, policy, skills development, marketing, et al in order to lay the
foundation for success. It is for this reason that competitiveness for Georgia’s priority sectors and value
chains will be a journey, not a destination.


