Embed Size (px)
Citation preview
VALUATION OF TESLA MOTORS, INC. Master Thesis, Copenhagen Business School, 12th of May 2016
Torbjørn Strand Husevåg Helge Johan Rød Flinder
MSc. Finance & Strategic Management MSc. Finance & Investments
Supervisor: Bent Jesper Christensen
Number of Pages: 118
Number of Characters (with spaces): 193.336
-
100.000
200.000
300.000
400.000
500.000
2012 2013 2014 2015 2016 2017 2018 2019 2020
Number of cars
Annual Production of Cars
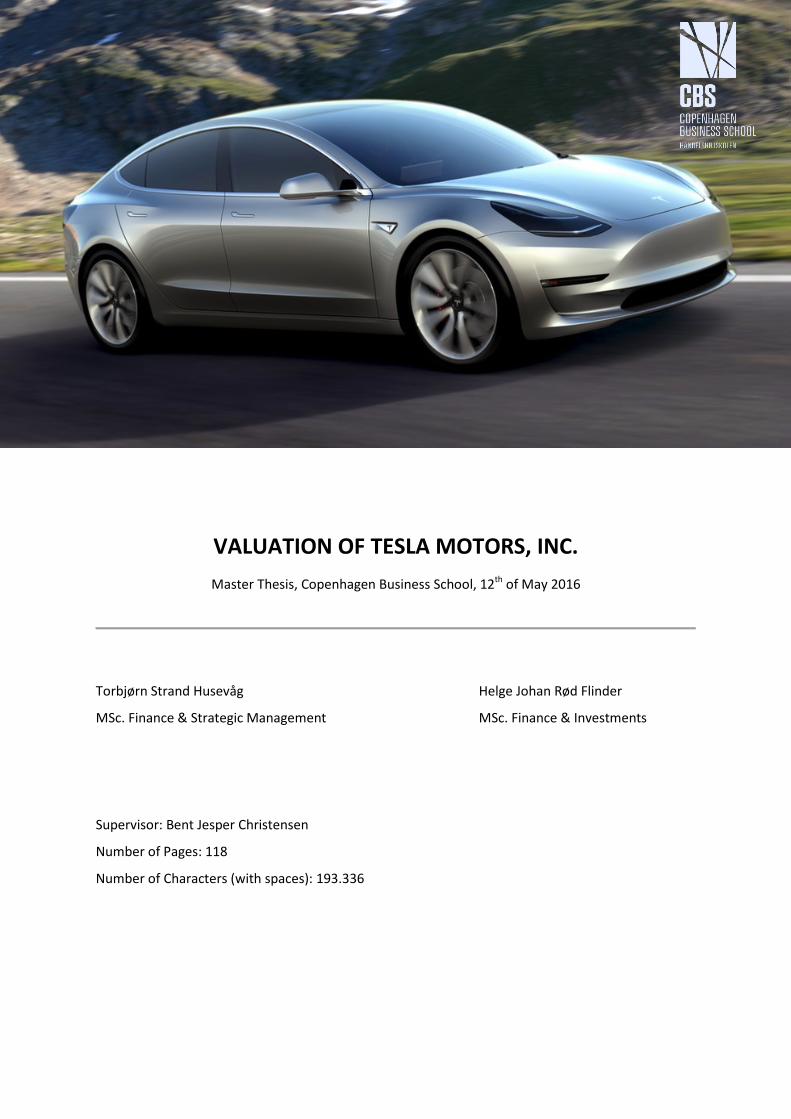
Highlights 2015 E2016 E2017 E2018 E2019 E2020 E2021 E2022 E2023 E2024 E2025 Cars sold in 1000´s 51 73 113 156 259 400 510 631 788 993 1.260 Revenue bUSD 4,0 7,1 10,8 12,8 16,9 22,3 26,3 30,8 37,4 46,2 57,7 NOPAT bUSD -0,7 0,2 0,5 1,5 2,3 3,0 3,8 4,3 5,5 7,1 9,2 Revenue growth 27% 75% 52% 19% 32% 32% 18% 17% 22% 23% 25% EBITDA-margin -7% 12% 14% 21% 25% 26% 27% 26% 27% 27% 27% ROIC -36% 6% 9% 16% 18% 17% 18% 17% 18% 20% 22%
The purpose of this thesis is to find the value of the US premium electric automotive company Tesla Motors, Inc. based on a strategic and financial analysis.
Strategic analysis: Government support schemes play a key role in the electric vehicle (EV) market. However, due to declining battery costs, EVs are set to challenge gasoline vehicles in the near future. The premium vehicle segment is highly competitive, dominated by the major brands BMW, Mercedes and Audi. The competition in the EV market is expected to increase after Tesla’s Model 3 launch in 2017. We believe Tesla posits several sustainable competitive advantages, providing confidence in strong future earning capabilities. This includes their upcoming Gigafactory, Supercharger network, demand for Model 3 and CEO Elon Musk.
Financial analysis: Tesla has never been profitable, due to its low economies of scale and high investments aimed to fuel future growth. However, this is about to change, as we expect a continued strong revenue growth while operational margins improve. We expect Tesla to become highly profitable after the launch of Model 3. In the near future we define Tesla´s main bottleneck to production capacity, not demand. Their guided annual production is 500.000 vehicles by 2020, representing a tenfold increase in just five years.
Valuation: Per 1st of May 2016, one Tesla share traded at $ 240 on the Nasdaq Stock Exchange. By using the Economic Value Added-model, we estimate a price per share of $ 350 per 1st of May 2016. This 45 percent upside potential indicates that Tesla´s future earnings potential is not fully priced into the share.
Executive Summary
Analysts: Torbjørn Strand Husevåg Helge Johan Rød Flinder
Supervisor: Bent Jesper Christensen
Table of Contents
0 EXECUTIVE SUMMARY ....................................................................................................................................... 1
1 INTRODUCTION .................................................................................................................................................. 4
1.1 MOTIVATION ......................................................................................................................................................... 4 1.2 PROBLEM FORMULATION ......................................................................................................................................... 6
1.2.1 Structure of thesis ......................................................................................................................................... 7 1.2.2 Delimitation .................................................................................................................................................. 7 1.2.3 Methodology ................................................................................................................................................. 8
1.3 CASE COMPANY INTRODUCTION: TESLA MOTORS, INC. .................................................................................................. 9 1.3.1 History of Tesla Motors ................................................................................................................................. 9 1.3.2 Segments ..................................................................................................................................................... 12 1.3.3 Products ...................................................................................................................................................... 17 1.3.4 Governance ................................................................................................................................................. 19 1.3.5 Peers and peer group definition .................................................................................................................. 22
2 STRATEGIC ANALYSIS ........................................................................................................................................26
2.1 ENVIRONMENTAL ANALYSIS .................................................................................................................................... 26 2.1.1 Political & legal factors ............................................................................................................................... 27 2.1.2 Economic factors ......................................................................................................................................... 30 2.1.3 Social & environmental factors ................................................................................................................... 32 2.1.4 Technological factors .................................................................................................................................. 33 2.1.5 Sub-conclusion: Environmental analysis ..................................................................................................... 34
2.2 INDUSTRY ANALYSIS .............................................................................................................................................. 35 2.2.1 The global automobile industry .................................................................................................................. 35 2.2.2 Porter´s 5 forces .......................................................................................................................................... 49 2.2.3 Sub-conclusion: Industry analysis................................................................................................................ 54
2.3 INTERNAL ANALYSIS .............................................................................................................................................. 55 2.3.1 Supporting activities ................................................................................................................................... 55 2.3.2 Primary activities ........................................................................................................................................ 59 2.3.1 VRIO ............................................................................................................................................................ 63 2.3.2 Sub-conclusion: Internal analysis ................................................................................................................ 64
2.4 SWOT ............................................................................................................................................................... 64
3 FINANCIAL ANALYSIS .........................................................................................................................................65
3.1 HISTORICAL FINANCIAL ANALYSIS ............................................................................................................................. 65 3.1.1 Reformulation of income statement ........................................................................................................... 65 3.1.2 Reformulation of balance sheet .................................................................................................................. 66 3.1.3 Historical performance and profitability ..................................................................................................... 68 3.1.4 Liquidity Risk ............................................................................................................................................... 76 3.1.5 Sub-conclusion: historical financial analysis ............................................................................................... 78
3.2 FINANCIAL FORECASTING ....................................................................................................................................... 78 3.2.1 Budget period .............................................................................................................................................. 78 3.2.2 Terminal period ........................................................................................................................................... 78 3.2.3 Pro forma income statement ...................................................................................................................... 79 3.2.4 Pro forma Balance Sheet ............................................................................................................................. 96
2
3.2.5 ROIC ............................................................................................................................................................ 99 3.2.6 Sub-conclusion: financial forecasting ........................................................................................................ 100
3.3 COST OF CAPITAL ............................................................................................................................................... 100 3.3.1 Peers for estimation purposes................................................................................................................... 101 3.3.2 Required Cost of Equity - CAPM ................................................................................................................ 102 3.3.3 Cost of Debt............................................................................................................................................... 105 3.3.4 Capital Structure and WACC ..................................................................................................................... 106 3.3.5 Sub-conclusion of cost of capital ............................................................................................................... 107
4 VALUATION ..................................................................................................................................................... 108
4.1 APPLICATION OF VALUATION MODELS ..................................................................................................................... 108 4.1.1 Economic Value Added (EVA) .................................................................................................................... 108 4.1.2 Discounted Cash Flow (DCF): Free Cash Flow to Firm ............................................................................... 109 4.1.3 Multiple analyses ...................................................................................................................................... 110 4.1.4 Sub-conclusion: application of valuation models ...................................................................................... 113
4.2 SENSITIVITY ANALYSIS .......................................................................................................................................... 113 4.2.1 Changes in key forecast estimates ............................................................................................................ 113 4.2.2 Changes in cost of capital ......................................................................................................................... 114 4.2.3 Sub-conclusion: sensitivity analysis ........................................................................................................... 115
4.3 OVERALL CONCLUSION OF VALUATION – BUY/SELL (PER 1ST OF MAY 2016) ................................................................... 115
5 CONCLUSION ................................................................................................................................................... 116
5.1 OVERVIEW OF SUB-CONCLUSIONS .......................................................................................................................... 116 5.2 FINAL CONCLUSION ............................................................................................................................................. 117 5.3 DISCUSSION ...................................................................................................................................................... 117
6 BIBLIOGRAPHY ................................................................................................................................................ 119
7 APPENDIX ........................................................................................................................................................ 124
3
1 Introduction
1.1 Motivation Disruptive innovation in a mature industry: Tesla’s mission is to accelerate the world’s transition to
sustainable energy1. This transition is doomed inevitable by Tesla CEO Elon Musk, due to the exhaustive
nature of fossil fuels and the technological advances of E-mobility. After decades of failed attempts to
commercialize alternative fuel vehicles, Tesla successfully proved the revenge of the electric car with the
Model S in 2012. Today´s gasoline fuel automotive industry was created by the Ford Model T when
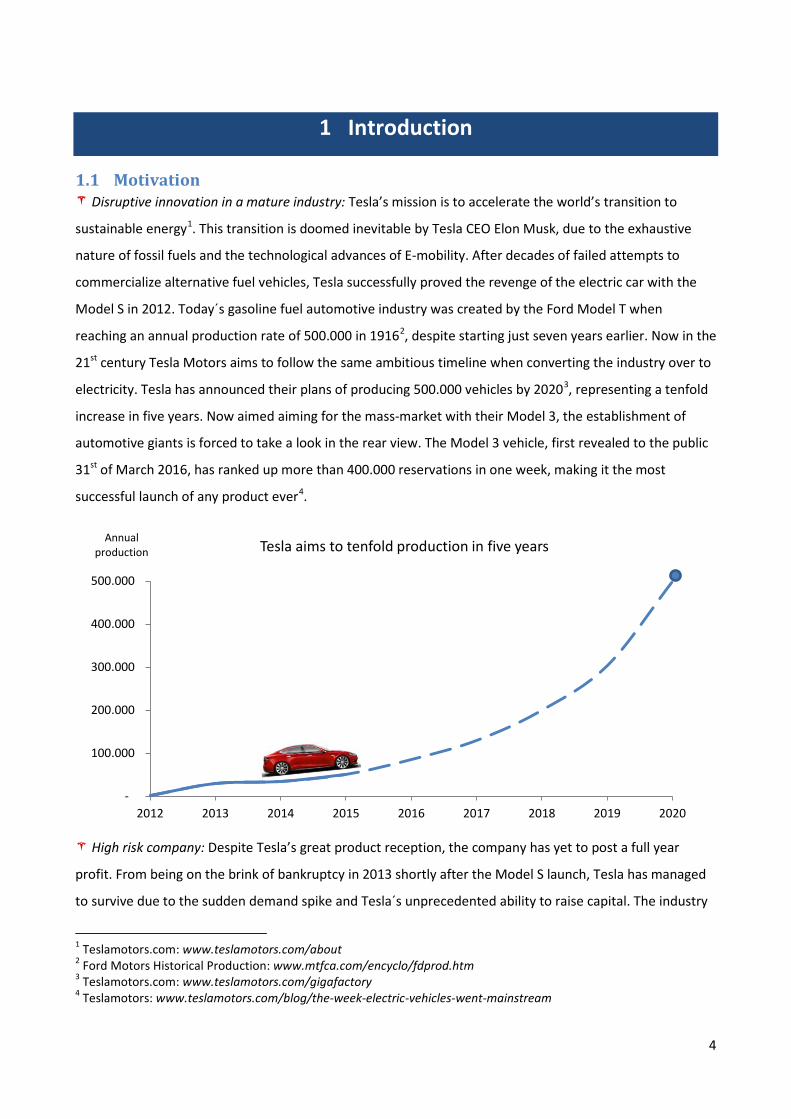
reaching an annual production rate of 500.000 in 19162, despite starting just seven years earlier. Now in the
21st century Tesla Motors aims to follow the same ambitious timeline when converting the industry over to
electricity. Tesla has announced their plans of producing 500.000 vehicles by 20203, representing a tenfold
increase in five years. Now aimed aiming for the mass-market with their Model 3, the establishment of
automotive giants is forced to take a look in the rear view. The Model 3 vehicle, first revealed to the public
31st of March 2016, has ranked up more than 400.000 reservations in one week, making it the most
successful launch of any product ever4.
High risk company: Despite Tesla’s great product reception, the company has yet to post a full year
profit. From being on the brink of bankruptcy in 2013 shortly after the Model S launch, Tesla has managed
to survive due to the sudden demand spike and Tesla´s unprecedented ability to raise capital. The industry
1 Teslamotors.com: www.teslamotors.com/about 2 Ford Motors Historical Production: www.mtfca.com/encyclo/fdprod.htm 3 Teslamotors.com: www.teslamotors.com/gigafactory 4 Teslamotors: www.teslamotors.com/blog/the-week-electric-vehicles-went-mainstream
-
100.000
200.000
300.000
400.000
500.000
2012 2013 2014 2015 2016 2017 2018 2019 2020
Annual production Tesla aims to tenfold production in five years
4
is known for its fierce capital intensity, and this is part why the last successful automotive start-up was
Chrysler in 1925.5 Tesla´s high cash burn rate has therefore been of a great concern for investors, due to
the huge capital expenditures required in developing and producing a mass-market vehicle. Still, Tesla is a
financial light-weight6 compared to its current and possible future industry rivals. Therefore, we believe the
risk to being whipped out of existence by automotive giants such as BMW or Daimler, still is present.
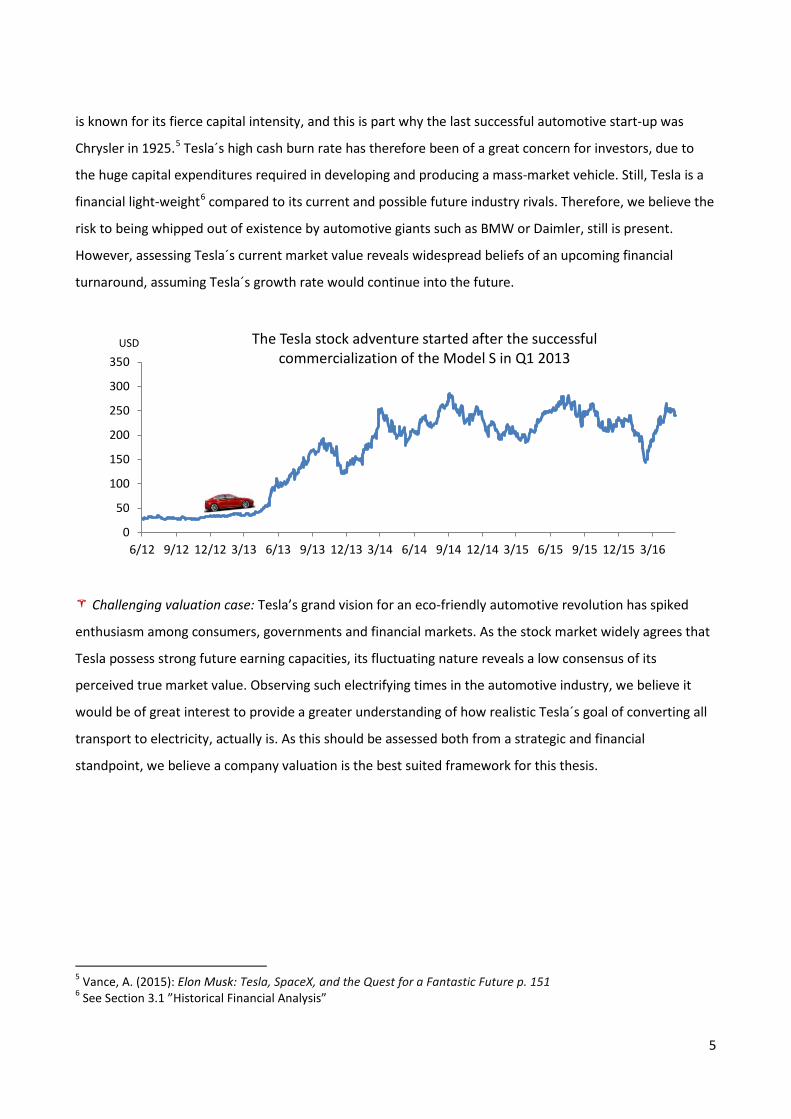
However, assessing Tesla´s current market value reveals widespread beliefs of an upcoming financial
turnaround, assuming Tesla´s growth rate would continue into the future.
Challenging valuation case: Tesla’s grand vision for an eco-friendly automotive revolution has spiked
enthusiasm among consumers, governments and financial markets. As the stock market widely agrees that
Tesla possess strong future earning capacities, its fluctuating nature reveals a low consensus of its
perceived true market value. Observing such electrifying times in the automotive industry, we believe it
would be of great interest to provide a greater understanding of how realistic Tesla´s goal of converting all
transport to electricity, actually is. As this should be assessed both from a strategic and financial
standpoint, we believe a company valuation is the best suited framework for this thesis.
5 Vance, A. (2015): Elon Musk: Tesla, SpaceX, and the Quest for a Fantastic Future p. 151 6 See Section 3.1 ”Historical Financial Analysis”
0
50
100
150
200
250
300
350
6/12 9/12 12/12 3/13 6/13 9/13 12/13 3/14 6/14 9/14 12/14 3/15 6/15 9/15 12/15 3/16
USD The Tesla stock adventure started after the successful commercialization of the Model S in Q1 2013
5
1.2 Problem formulation The main aim of this thesis is to estimate the fair market value of one Tesla Motors share per 1st of May
2016 We will answer this research question through a series of sub-questions, divided into a strategic and
financial analysis as described in the table below.
All these eight sub-questions will be reintroduced though-out the thesis in the beginning of each relevant
section. Subsequently, they will be discussed in the respective sub-conclusion completing each of the eight
sections.
Reseach question • What is the true market value of one share per 1st of May 2016?
Part 1: Strategic analysis • Q1: How do environmental factors affect the share price? • Q2: How do industry specific factors affect the share price? • Q3: How do internal factors affect the share price?
Part 2: Financial analysis • Q4: How does historical performance predict future performance? • Q5: How will key financial value drivers develop within the budget period? • Q6: What is appropriate cost of capital?
Part 3: Valuation • Q7: What is the market value per share using revelant valuation models? • Q8: How is the valuation affected by changes in key estimates?
6
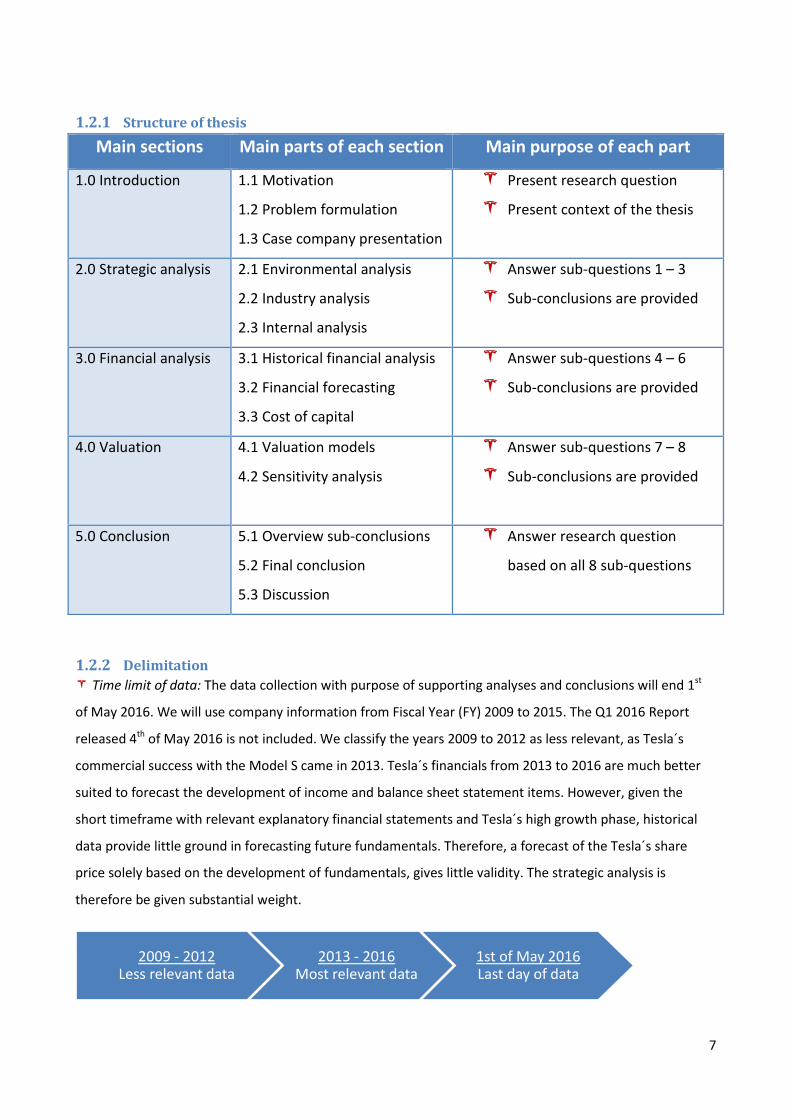
1.2.1 Structure of thesis
Main sections Main parts of each section Main purpose of each part
1.0 Introduction 1.1 Motivation
1.2 Problem formulation
1.3 Case company presentation
Present research question
Present context of the thesis
2.0 Strategic analysis 2.1 Environmental analysis
2.2 Industry analysis
2.3 Internal analysis
Answer sub-questions 1 – 3
Sub-conclusions are provided
3.0 Financial analysis 3.1 Historical financial analysis
3.2 Financial forecasting
3.3 Cost of capital
Answer sub-questions 4 – 6
Sub-conclusions are provided
4.0 Valuation 4.1 Valuation models
4.2 Sensitivity analysis
Answer sub-questions 7 – 8
Sub-conclusions are provided
5.0 Conclusion 5.1 Overview sub-conclusions
5.2 Final conclusion
5.3 Discussion
Answer research question
based on all 8 sub-questions
1.2.2 Delimitation Time limit of data: The data collection with purpose of supporting analyses and conclusions will end 1st
of May 2016. We will use company information from Fiscal Year (FY) 2009 to 2015. The Q1 2016 Report
released 4th of May 2016 is not included. We classify the years 2009 to 2012 as less relevant, as Tesla´s
commercial success with the Model S came in 2013. Tesla´s financials from 2013 to 2016 are much better
suited to forecast the development of income and balance sheet statement items. However, given the
short timeframe with relevant explanatory financial statements and Tesla´s high growth phase, historical
data provide little ground in forecasting future fundamentals. Therefore, a forecast of the Tesla´s share
price solely based on the development of fundamentals, gives little validity. The strategic analysis is
therefore be given substantial weight.
2009 - 2012 Less relevant data
2013 - 2016 Most relevant data
1st of May 2016 Last day of data
7
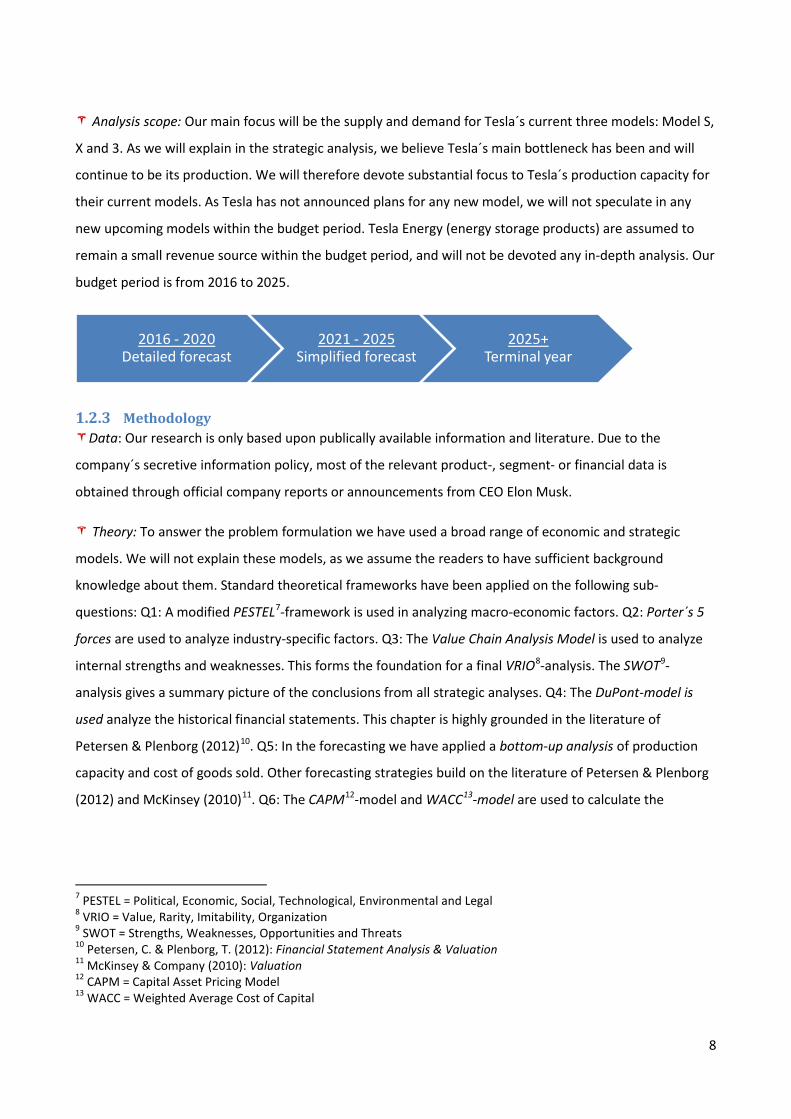
Analysis scope: Our main focus will be the supply and demand for Tesla´s current three models: Model S,
X and 3. As we will explain in the strategic analysis, we believe Tesla´s main bottleneck has been and will
continue to be its production. We will therefore devote substantial focus to Tesla´s production capacity for
their current models. As Tesla has not announced plans for any new model, we will not speculate in any
new upcoming models within the budget period. Tesla Energy (energy storage products) are assumed to
remain a small revenue source within the budget period, and will not be devoted any in-depth analysis. Our
budget period is from 2016 to 2025.
1.2.3 Methodology Data: Our research is only based upon publically available information and literature. Due to the
company´s secretive information policy, most of the relevant product-, segment- or financial data is
obtained through official company reports or announcements from CEO Elon Musk.
Theory: To answer the problem formulation we have used a broad range of economic and strategic
models. We will not explain these models, as we assume the readers to have sufficient background
knowledge about them. Standard theoretical frameworks have been applied on the following sub-
questions: Q1: A modified PESTEL7-framework is used in analyzing macro-economic factors. Q2: Porter´s 5
forces are used to analyze industry-specific factors. Q3: The Value Chain Analysis Model is used to analyze
internal strengths and weaknesses. This forms the foundation for a final VRIO8-analysis. The SWOT9-
analysis gives a summary picture of the conclusions from all strategic analyses. Q4: The DuPont-model is
used analyze the historical financial statements. This chapter is highly grounded in the literature of
Petersen & Plenborg (2012)10. Q5: In the forecasting we have applied a bottom-up analysis of production
capacity and cost of goods sold. Other forecasting strategies build on the literature of Petersen & Plenborg
(2012) and McKinsey (2010)11. Q6: The CAPM12-model and WACC13-model are used to calculate the
7 PESTEL = Political, Economic, Social, Technological, Environmental and Legal 8 VRIO = Value, Rarity, Imitability, Organization 9 SWOT = Strengths, Weaknesses, Opportunities and Threats 10 Petersen, C. & Plenborg, T. (2012): Financial Statement Analysis & Valuation 11 McKinsey & Company (2010): Valuation 12 CAPM = Capital Asset Pricing Model 13 WACC = Weighted Average Cost of Capital
2016 - 2020 Detailed forecast
2021 - 2025 Simplified forecast
2025+ Terminal year
8
appropriate cost of capital. Q7: The valuation is based on the EVA14 model, supplemented with the FCFF15-
model and a multiple analysis. Q8: Our valuation estimates are discussed through a sensitivity analysis.
1.3 Case company introduction: Tesla Motors, Inc. A presentation of the case company Tesla Motors, Inc. (hereafter only called Tesla) is provided in order to
improve the reader’s comprehension of the strategic analysis. We believe greater knowledge of Tesla´s
history, segments, products, governance and peers would be highly beneficial for this purpose.
1.3.1 History of Tesla Motors The revenge of the electric car: Tesla Motors was started in 2003 in Palo Alto (California, USA) by a group
of engineers in Silicon Valley who wanted to prove that electric cars could be better than gasoline-powered
cars16. Based on the head-start discovery of how far lithium-ion technology had progressed in recent
years17, Tesla started designing a pure electric powertrain 18 using a lithium-ion battery from scratch. In
2005 Tesla produced their first driving car by supergluing hundreds of lithium-ion batteries and replacing it
with the gasoline engine in a Lotus Elise-car. The Tesla Roadster was presented to the public in July 2006
with great feedback. A gorgeous two-seater convertible that could go from 0 – 100 km/h in approx. 4
seconds made the public rethink their perception of what an electric vehicle could be. Even though the last
successful automotive start-up was Chrysler in 1925, Tesla had raised $ 189 million in equity by January
2009. $ 70 million came from Musk himself19. This happened in the midst of the post-financial crisis
recession and at a time where car sales had dropped approx. 28 % from 2007 to 200920. Tesla had at that
time only delivered 147 vehicles of the Tesla Roadster. In June, Tesla received a loan of $ 465 million from
the US Department of Energy21. This enabled the engineering and production of the Model S, and the
development of commercial powertrain technology. In need of greater infrastructure, Tesla struck a
14 EVA = Economic Value Added 15 FCFF = Free Cash Flow to Firm 16 Teslamotors.com: www.teslamotors.com/about 17 Vance, A. (2015): Elon Musk: Tesla, SpaceX, and the Quest for a Fantastic Future p. 148 18 Powertrains: The main components generating power to the wheels. See part: 2.3.1.2.1 “Powertrains. 19 Crunchbase.com: www.crunchbase.com/organization/tesla-motors#/entity 20 Statistica.com: www.statista.com/statistics/199974/us-car-sales-since-1951/ 21 Bizjournals.com: www.bizjournals.com/pacific/stories/2009/06/22/daily33.html
Case company introduction
History Segments Products Governance Peers
9
bargain in buying their current Fremont Factory with a capacity of 500.000 vehicles from Toyota. Due to
Toyota’s hard blow during the recession, Tesla got the factory once worth $1 billion, for only $51 million22.
Tesla was now ready to start their mass-market manufacturing. The company went public on NASDAQ in
June 2010 under the ticker TSLA, raising $226 million.
Making the world’s greatest car: According to Musk, car ads have for decades competed on the exact
same thing: a bit more room, a few extra miles per gallon, better handling or an extra cup holder.23
Innovation was incremental and competition was based on details. When Tesla started shipping the Model
S in late 2012, they stunned their peers in the automotive industry. With the car’s unprecedented
performance, comfort and design, compared to other alternative fuel vehicles, it was truly a disruptive
innovation. It has won several awards such as the prestigious Motor Trend´s “Car of the year” in 2012 and
highest car rating in history from Consumer Reports in 201324. This was an important victory for Tesla. After
decades of criticism against the electric car, Tesla had managed to not only produce the best electric
vehicle, but the best vehicle even when compared to its gasoline fuel rivals.
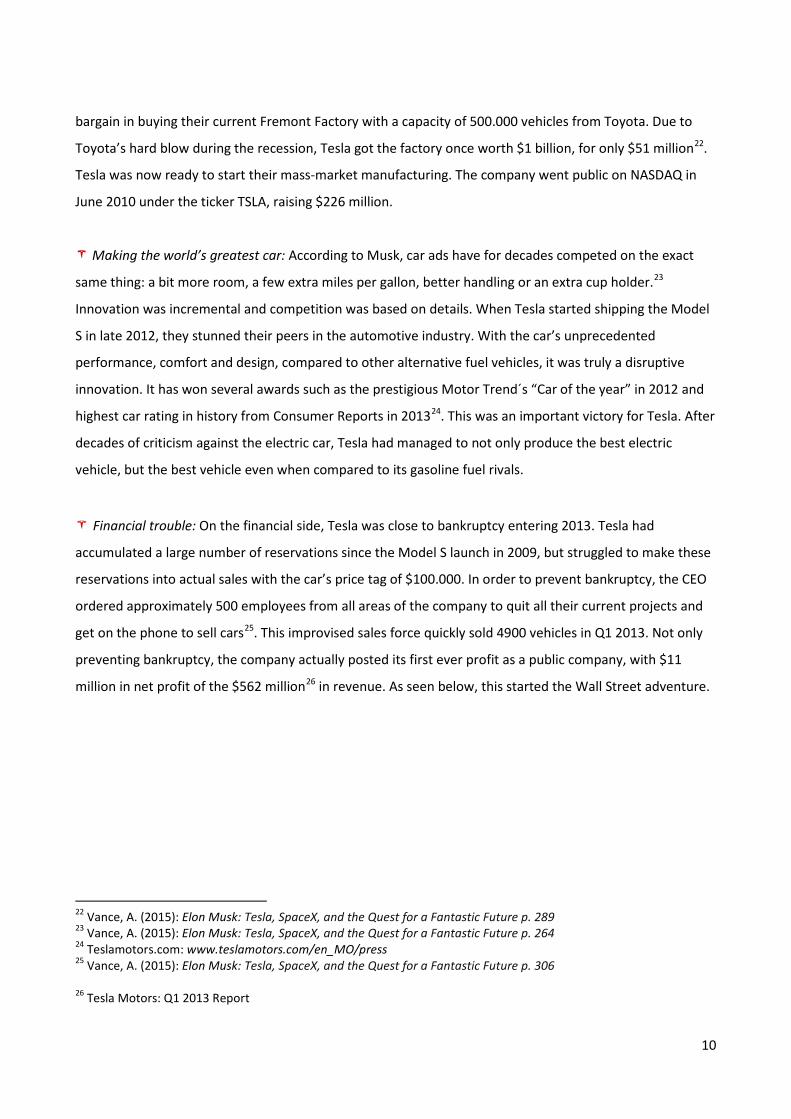
Financial trouble: On the financial side, Tesla was close to bankruptcy entering 2013. Tesla had
accumulated a large number of reservations since the Model S launch in 2009, but struggled to make these
reservations into actual sales with the car’s price tag of $100.000. In order to prevent bankruptcy, the CEO
ordered approximately 500 employees from all areas of the company to quit all their current projects and
get on the phone to sell cars25. This improvised sales force quickly sold 4900 vehicles in Q1 2013. Not only
preventing bankruptcy, the company actually posted its first ever profit as a public company, with $11
million in net profit of the $562 million26 in revenue. As seen below, this started the Wall Street adventure.
22 Vance, A. (2015): Elon Musk: Tesla, SpaceX, and the Quest for a Fantastic Future p. 289 23 Vance, A. (2015): Elon Musk: Tesla, SpaceX, and the Quest for a Fantastic Future p. 264 24 Teslamotors.com: www.teslamotors.com/en_MO/press 25 Vance, A. (2015): Elon Musk: Tesla, SpaceX, and the Quest for a Fantastic Future p. 306 26 Tesla Motors: Q1 2013 Report
10
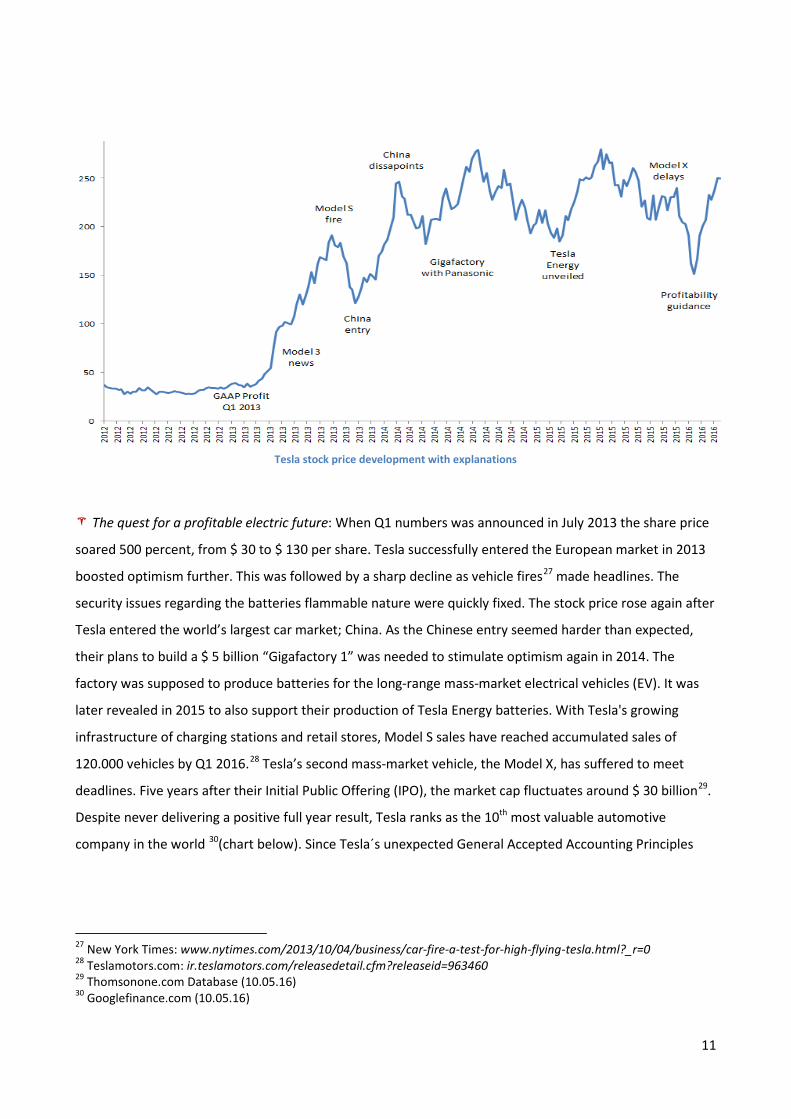
Tesla stock price development with explanations
The quest for a profitable electric future: When Q1 numbers was announced in July 2013 the share price
soared 500 percent, from $ 30 to $ 130 per share. Tesla successfully entered the European market in 2013
boosted optimism further. This was followed by a sharp decline as vehicle fires27 made headlines. The
security issues regarding the batteries flammable nature were quickly fixed. The stock price rose again after
Tesla entered the world’s largest car market; China. As the Chinese entry seemed harder than expected,
their plans to build a $ 5 billion “Gigafactory 1” was needed to stimulate optimism again in 2014. The
factory was supposed to produce batteries for the long-range mass-market electrical vehicles (EV). It was
later revealed in 2015 to also support their production of Tesla Energy batteries. With Tesla's growing
infrastructure of charging stations and retail stores, Model S sales have reached accumulated sales of
120.000 vehicles by Q1 2016.28 Tesla’s second mass-market vehicle, the Model X, has suffered to meet
deadlines. Five years after their Initial Public Offering (IPO), the market cap fluctuates around $ 30 billion29.
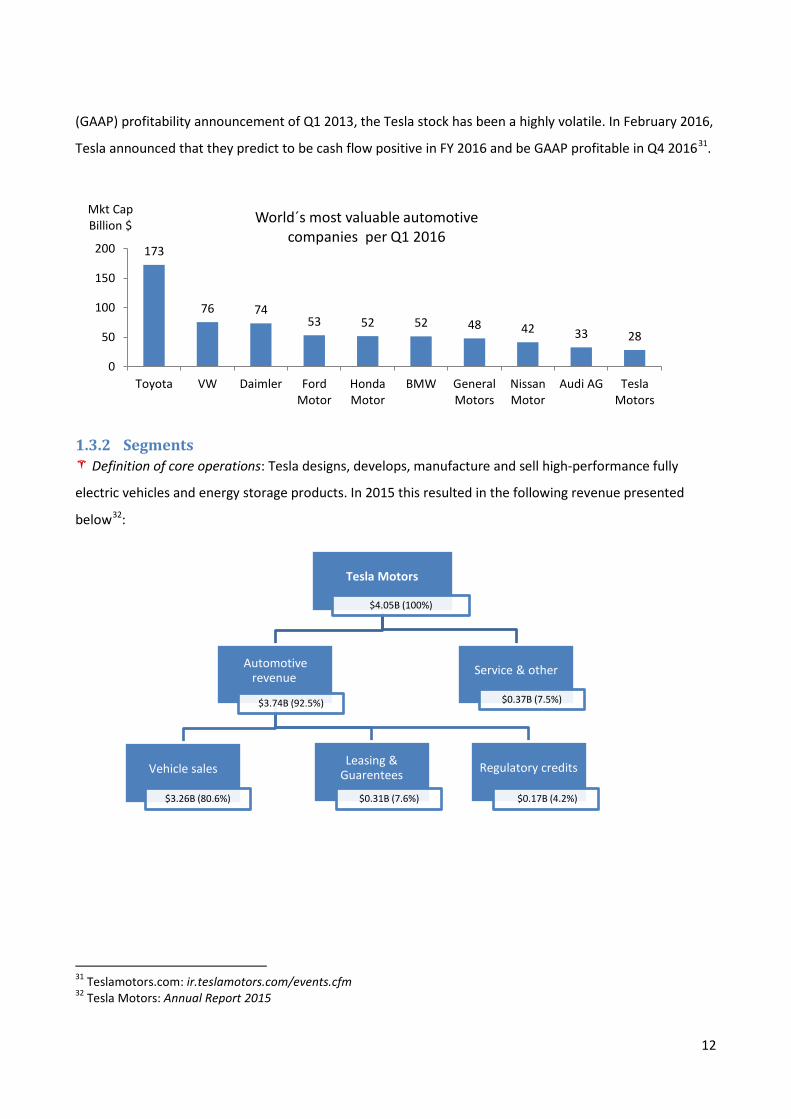
Despite never delivering a positive full year result, Tesla ranks as the 10th most valuable automotive
company in the world 30(chart below). Since Tesla´s unexpected General Accepted Accounting Principles
27 New York Times: www.nytimes.com/2013/10/04/business/car-fire-a-test-for-high-flying-tesla.html?_r=0 28 Teslamotors.com: ir.teslamotors.com/releasedetail.cfm?releaseid=963460 29 Thomsonone.com Database (10.05.16) 30 Googlefinance.com (10.05.16)
11
(GAAP) profitability announcement of Q1 2013, the Tesla stock has been a highly volatile. In February 2016,
Tesla announced that they predict to be cash flow positive in FY 2016 and be GAAP profitable in Q4 201631.
1.3.2 Segments Definition of core operations: Tesla designs, develops, manufacture and sell high-performance fully
electric vehicles and energy storage products. In 2015 this resulted in the following revenue presented
below32:
31 Teslamotors.com: ir.teslamotors.com/events.cfm 32 Tesla Motors: Annual Report 2015
173
76 74 53 52 52 48 42 33 28
0
50
100
150
200
Toyota VW Daimler FordMotor
HondaMotor
BMW GeneralMotors
NissanMotor
Audi AG TeslaMotors
Mkt Cap Billion $ World´s most valuable automotive
companies per Q1 2016
Tesla Motors
$4.05B (100%)
Automotive revenue
$3.74B (92.5%)
Vehicle sales
$3.26B (80.6%)
Leasing & Guarentees
$0.31B (7.6%)
Regulatory credits
$0.17B (4.2%)
Service & other
$0.37B (7.5%)
12
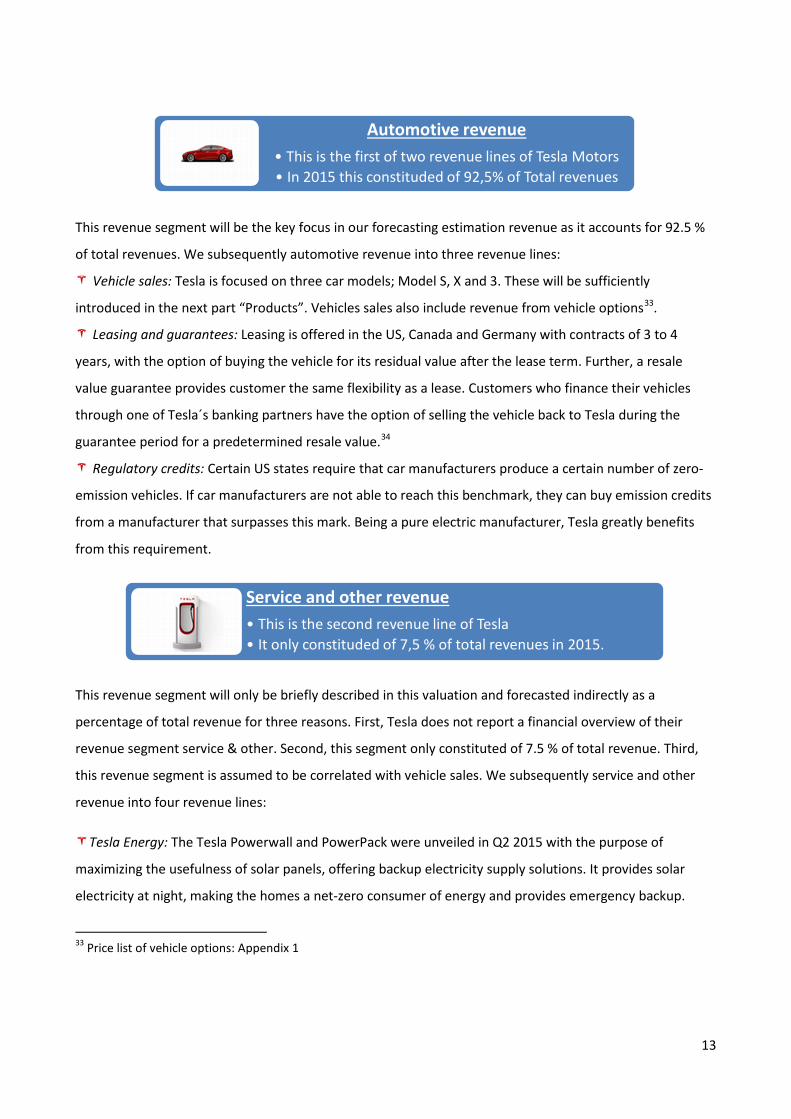
This revenue segment will be the key focus in our forecasting estimation revenue as it accounts for 92.5 %
of total revenues. We subsequently automotive revenue into three revenue lines:
Vehicle sales: Tesla is focused on three car models; Model S, X and 3. These will be sufficiently
introduced in the next part “Products”. Vehicles sales also include revenue from vehicle options33.
Leasing and guarantees: Leasing is offered in the US, Canada and Germany with contracts of 3 to 4
years, with the option of buying the vehicle for its residual value after the lease term. Further, a resale
value guarantee provides customer the same flexibility as a lease. Customers who finance their vehicles
through one of Tesla´s banking partners have the option of selling the vehicle back to Tesla during the
guarantee period for a predetermined resale value.34
Regulatory credits: Certain US states require that car manufacturers produce a certain number of zero-
emission vehicles. If car manufacturers are not able to reach this benchmark, they can buy emission credits
from a manufacturer that surpasses this mark. Being a pure electric manufacturer, Tesla greatly benefits
from this requirement.
This revenue segment will only be briefly described in this valuation and forecasted indirectly as a
percentage of total revenue for three reasons. First, Tesla does not report a financial overview of their
revenue segment service & other. Second, this segment only constituted of 7.5 % of total revenue. Third,
this revenue segment is assumed to be correlated with vehicle sales. We subsequently service and other
revenue into four revenue lines:
Tesla Energy: The Tesla Powerwall and PowerPack were unveiled in Q2 2015 with the purpose of
maximizing the usefulness of solar panels, offering backup electricity supply solutions. It provides solar
electricity at night, making the homes a net-zero consumer of energy and provides emergency backup.
33 Price list of vehicle options: Appendix 1
Automotive revenue • This is the first of two revenue lines of Tesla Motors • In 2015 this constituded of 92,5% of Total revenues
Service and other revenue • This is the second revenue line of Tesla • It only constituded of 7,5 % of total revenues in 2015.
13
Tesla Energy products are charged with solar cell panels; however not provided by Tesla. Tesla did not
quantify any revenues from these products in their 2015 annual report.
Powertrain & development services: Tesla develops, manufacture and sell EV´s powertrain components
to other EV-manufacturers. Previously this included both the Research and Development (R&D) and
production behind Daimler´s EV and Toyota’s RAV4 EV. Tesla still records revenue from the sales of electric
powertrains, however at a diminishing scale.
Repair, maintenance and service: The standard prepaid maintenance program for Model S, includes
maintenance for a maximum eight years or 100.000 miles. This includes annual inspections and
replacements of wear and tear parts, but tires and the battery.
Sales of pre-owned car: In addition to reselling pre-owned Tesla´s through the resale value guarantee,
Tesla also records net sales of non-Tesla vehicle trade-ins.
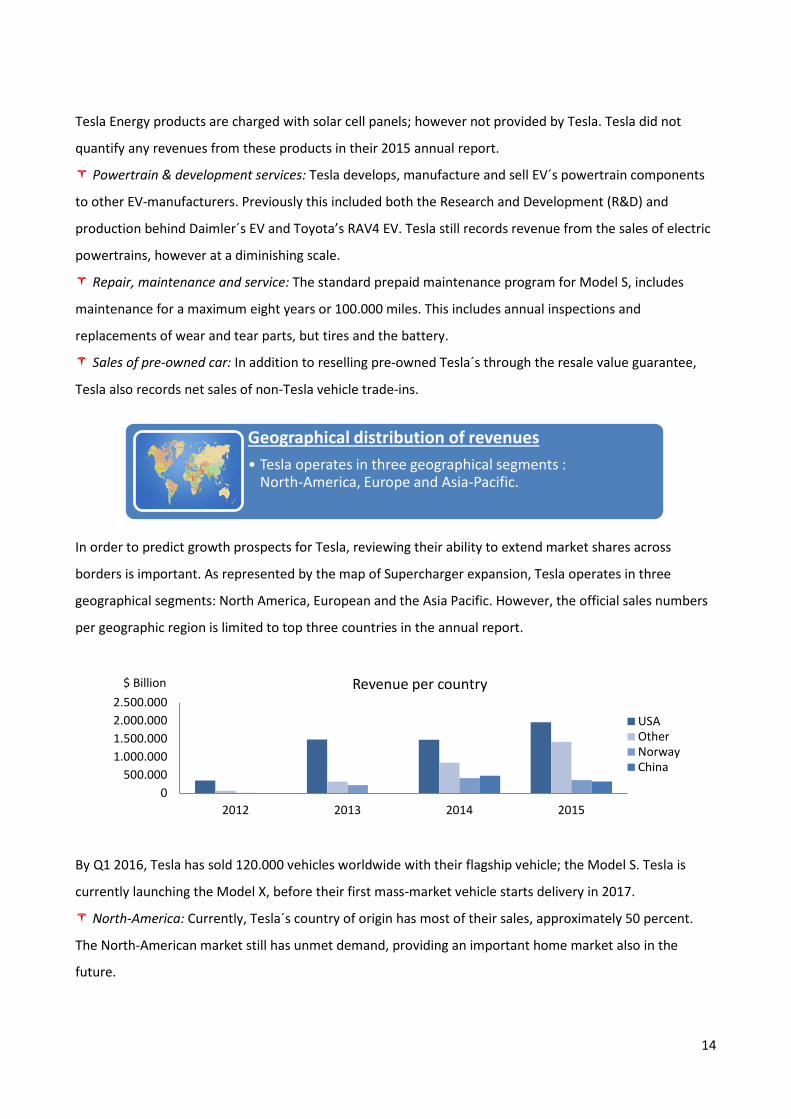
In order to predict growth prospects for Tesla, reviewing their ability to extend market shares across
borders is important. As represented by the map of Supercharger expansion, Tesla operates in three
geographical segments: North America, European and the Asia Pacific. However, the official sales numbers
per geographic region is limited to top three countries in the annual report.
By Q1 2016, Tesla has sold 120.000 vehicles worldwide with their flagship vehicle; the Model S. Tesla is
currently launching the Model X, before their first mass-market vehicle starts delivery in 2017.
North-America: Currently, Tesla´s country of origin has most of their sales, approximately 50 percent.
The North-American market still has unmet demand, providing an important home market also in the
future.
Geographical distribution of revenues • Tesla operates in three geographical segments :
North-America, Europe and Asia-Pacific.
0500.000
1.000.0001.500.0002.000.0002.500.000
2012 2013 2014 2015
$ Billion Revenue per country
USAOtherNorwayChina
14
Europe: After the United States, Norway is second largest market in the world with an average of 11
percent of sales the past three years. This is the result of powerful government incentives favoring electric
cars and early development of Supercharger infrastructure.35
Asia-Pacific: In third place comes China with 8 percent of total revenues, a decline from 15 percent in
2014. The world’s most important automotive market in the years to come is China, with the increasing
number of wealthy consumers with a growing appetite for luxury vehicles36. Electric vehicles might also be
a solution for the air pollution in major cities. Tesla´s entry into China has been severely complicated,
resulting in disappointing sales numbers. The target for 2015 of 10.000 car sales, but only 4000 was
realized. Tesla´s target for 2016 is adjusted to 5000 cars37.
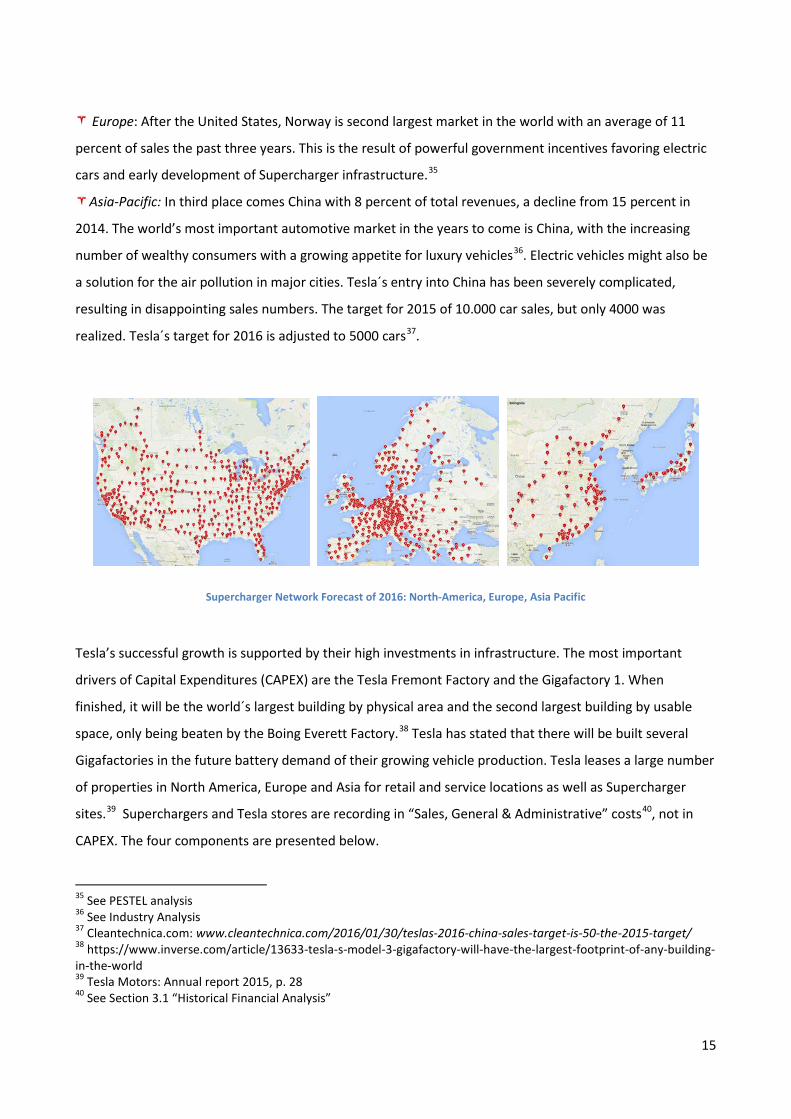
Supercharger Network Forecast of 2016: North-America, Europe, Asia Pacific
Tesla’s successful growth is supported by their high investments in infrastructure. The most important
drivers of Capital Expenditures (CAPEX) are the Tesla Fremont Factory and the Gigafactory 1. When
finished, it will be the world´s largest building by physical area and the second largest building by usable
space, only being beaten by the Boing Everett Factory.38 Tesla has stated that there will be built several
Gigafactories in the future battery demand of their growing vehicle production. Tesla leases a large number
of properties in North America, Europe and Asia for retail and service locations as well as Supercharger
sites.39 Superchargers and Tesla stores are recording in “Sales, General & Administrative” costs40, not in
CAPEX. The four components are presented below.
35 See PESTEL analysis 36 See Industry Analysis 37 Cleantechnica.com: www.cleantechnica.com/2016/01/30/teslas-2016-china-sales-target-is-50-the-2015-target/ 38 https://www.inverse.com/article/13633-tesla-s-model-3-gigafactory-will-have-the-largest-footprint-of-any-building-in-the-world 39 Tesla Motors: Annual report 2015, p. 28 40 See Section 3.1 “Historical Financial Analysis”
15
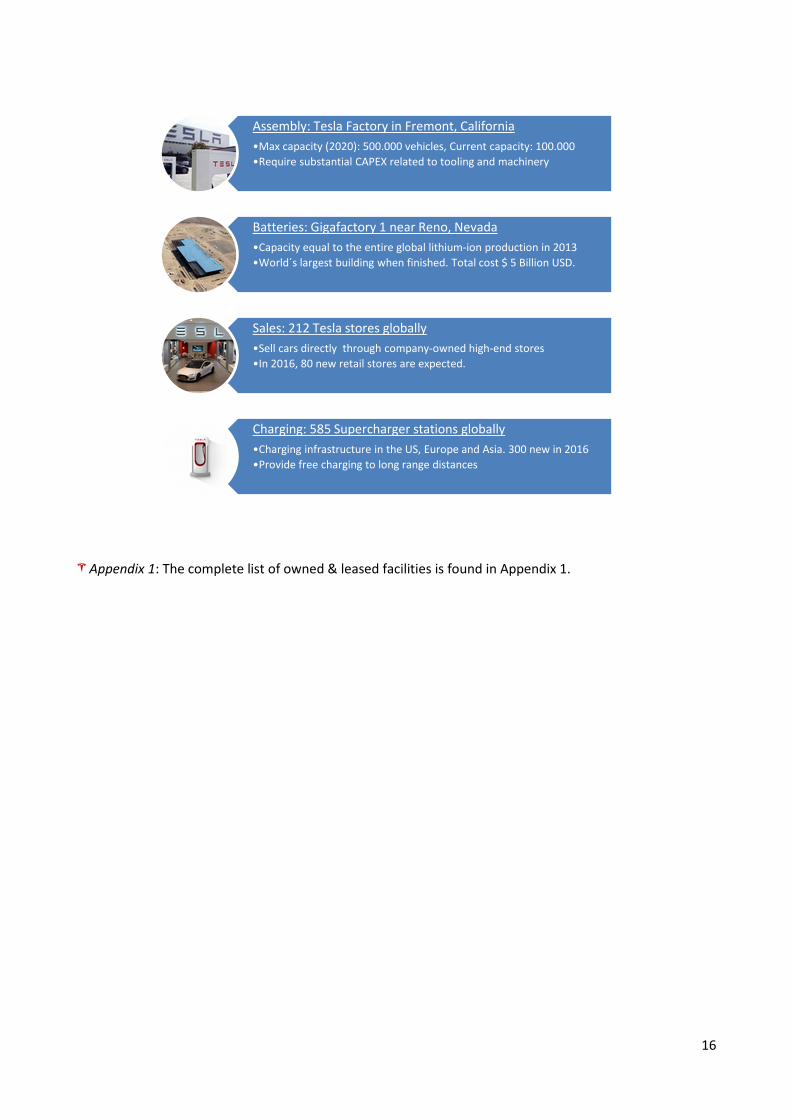
Appendix 1: The complete list of owned & leased facilities is found in Appendix 1.
Assembly: Tesla Factory in Fremont, California •Max capacity (2020): 500.000 vehicles, Current capacity: 100.000 •Require substantial CAPEX related to tooling and machinery
Batteries: Gigafactory 1 near Reno, Nevada •Capacity equal to the entire global lithium-ion production in 2013 •World´s largest building when finished. Total cost $ 5 Billion USD.
Sales: 212 Tesla stores globally •Sell cars directly through company-owned high-end stores •In 2016, 80 new retail stores are expected.
Charging: 585 Supercharger stations globally •Charging infrastructure in the US, Europe and Asia. 300 new in 2016 •Provide free charging to long range distances
16
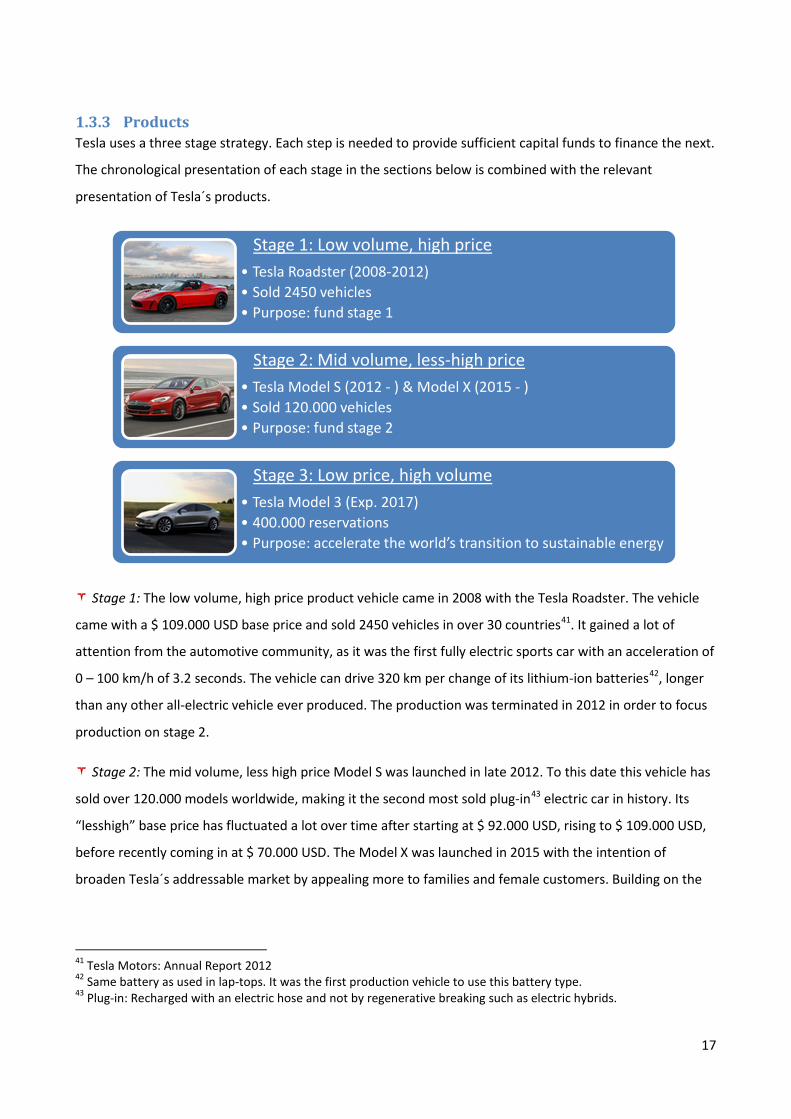
1.3.3 Products Tesla uses a three stage strategy. Each step is needed to provide sufficient capital funds to finance the next.
The chronological presentation of each stage in the sections below is combined with the relevant
presentation of Tesla´s products.
Stage 1: The low volume, high price product vehicle came in 2008 with the Tesla Roadster. The vehicle
came with a $ 109.000 USD base price and sold 2450 vehicles in over 30 countries41. It gained a lot of
attention from the automotive community, as it was the first fully electric sports car with an acceleration of
0 – 100 km/h of 3.2 seconds. The vehicle can drive 320 km per change of its lithium-ion batteries42, longer
than any other all-electric vehicle ever produced. The production was terminated in 2012 in order to focus
production on stage 2.
Stage 2: The mid volume, less high price Model S was launched in late 2012. To this date this vehicle has
sold over 120.000 models worldwide, making it the second most sold plug-in43 electric car in history. Its
“lesshigh” base price has fluctuated a lot over time after starting at $ 92.000 USD, rising to $ 109.000 USD,
before recently coming in at $ 70.000 USD. The Model X was launched in 2015 with the intention of
broaden Tesla´s addressable market by appealing more to families and female customers. Building on the
41 Tesla Motors: Annual Report 2012 42 Same battery as used in lap-tops. It was the first production vehicle to use this battery type. 43 Plug-in: Recharged with an electric hose and not by regenerative breaking such as electric hybrids.
Stage 1: Low volume, high price • Tesla Roadster (2008-2012) • Sold 2450 vehicles • Purpose: fund stage 1
Stage 2: Mid volume, less-high price • Tesla Model S (2012 - ) & Model X (2015 - ) • Sold 120.000 vehicles • Purpose: fund stage 2
Stage 3: Low price, high volume • Tesla Model 3 (Exp. 2017) • 400.000 reservations • Purpose: accelerate the world’s transition to sustainable energy
17
platform of its predecessor, the Model X is a high-performance seven seat SUV44. By also being a mid-
volume, less high price product, the vehicle is later named “the stage 2.5”. The base price is $ 92.000 USD
with a backlog 35.000 reservations. The vehicle has suffered from substantial production delays with only
507 produced and 208 sold vehicles in 2015. Critics claim the delays stem from having over-engineered the
vehicle with its signature “falcon wing” doors. Still the production is anticipated to fully start in Q2 2016.
Stage 3: Tesla´s high volume, affordable price product was unveiled 31 March 2016. In the long-run, the
high-end luxury segment is too small for Tesla´s grand volume ambitions. In order to create a mass-market
car, Tesla needs a mass market price. Tesla´s model 3 will therefore compete in the small premium market
with the price tag of $ 35.000. The average price of a new car is $ 31.000 USD and therefore serves as a
benchmark for a mass market product. Model 3 starts shipping in late 2017 according to Tesla’s guided
production schedule. The vehicle had a staggering 115.000 reservations before anyone had seen it. A week
after it’s unveiling the list had grown to 325.000 reservations. According to Tesla this is “the single biggest
one-week launch of any product ever”, beating both the company´s and the stock market’s expectations.
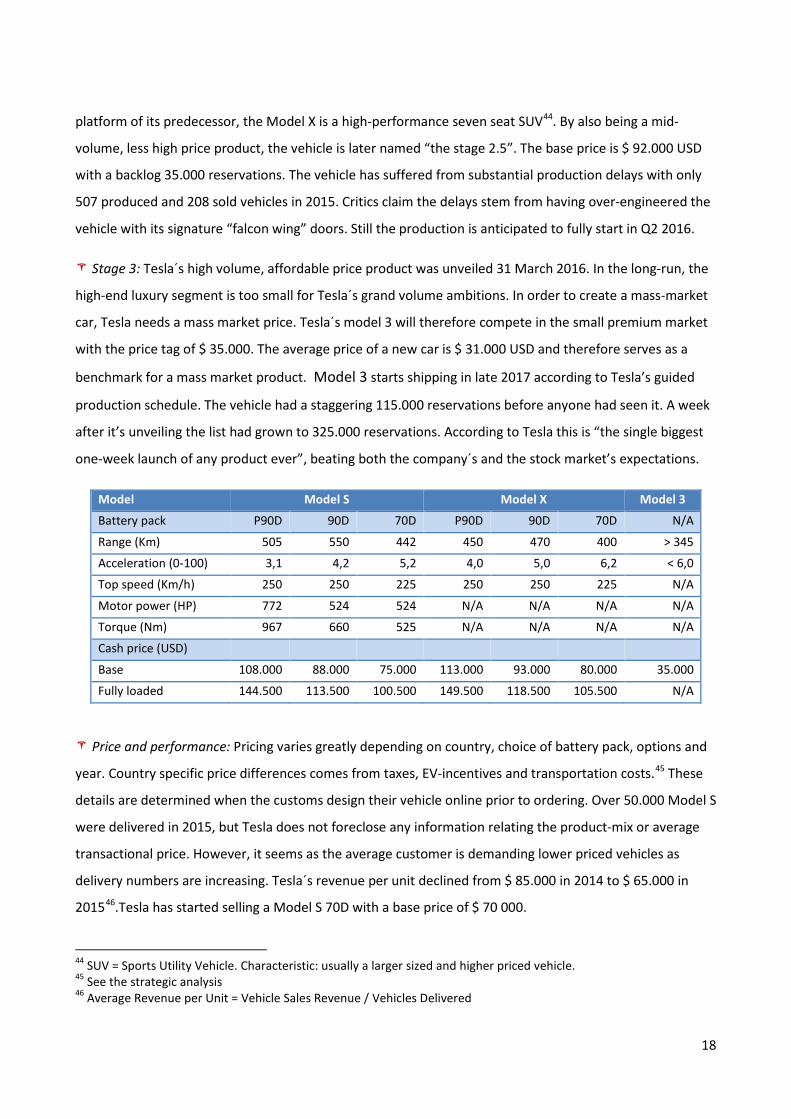
Model Model S Model X Model 3
Battery pack P90D 90D 70D P90D 90D 70D N/A
Range (Km) 505 550 442 450 470 400 > 345
Acceleration (0-100) 3,1 4,2 5,2 4,0 5,0 6,2 < 6,0
Top speed (Km/h) 250 250 225 250 250 225 N/A
Motor power (HP) 772 524 524 N/A N/A N/A N/A
Torque (Nm) 967 660 525 N/A N/A N/A N/A
Cash price (USD)
Base 108.000 88.000 75.000 113.000 93.000 80.000 35.000
Fully loaded 144.500 113.500 100.500 149.500 118.500 105.500 N/A
Price and performance: Pricing varies greatly depending on country, choice of battery pack, options and
year. Country specific price differences comes from taxes, EV-incentives and transportation costs.45 These
details are determined when the customs design their vehicle online prior to ordering. Over 50.000 Model S
were delivered in 2015, but Tesla does not foreclose any information relating the product-mix or average
transactional price. However, it seems as the average customer is demanding lower priced vehicles as
delivery numbers are increasing. Tesla´s revenue per unit declined from $ 85.000 in 2014 to $ 65.000 in
201546.Tesla has started selling a Model S 70D with a base price of $ 70 000.
44 SUV = Sports Utility Vehicle. Characteristic: usually a larger sized and higher priced vehicle. 45 See the strategic analysis 46 Average Revenue per Unit = Vehicle Sales Revenue / Vehicles Delivered
18
Appendix 2 & 3: Comments to numbers presented in the table above is found in Appendix 2. The
complete list of standard equipment and options are found in Appendix 3.
1.3.4 Governance The most interesting valuation aspect of the Tesla stock is the company’s governance. Therefore,
understanding Tesla´s vision, strategy and leadership is of high importance in understanding their current
market value.
This mission is strongly supported by Elon Musk. At the same time Tesla intends to make profit for its
owners. The separation of ownership and control47 in companies creates a demand for corporate
governance mechanisms in order to preserve the shareholders’ interests. Therefore we will analyze the
ownership identify and structure.
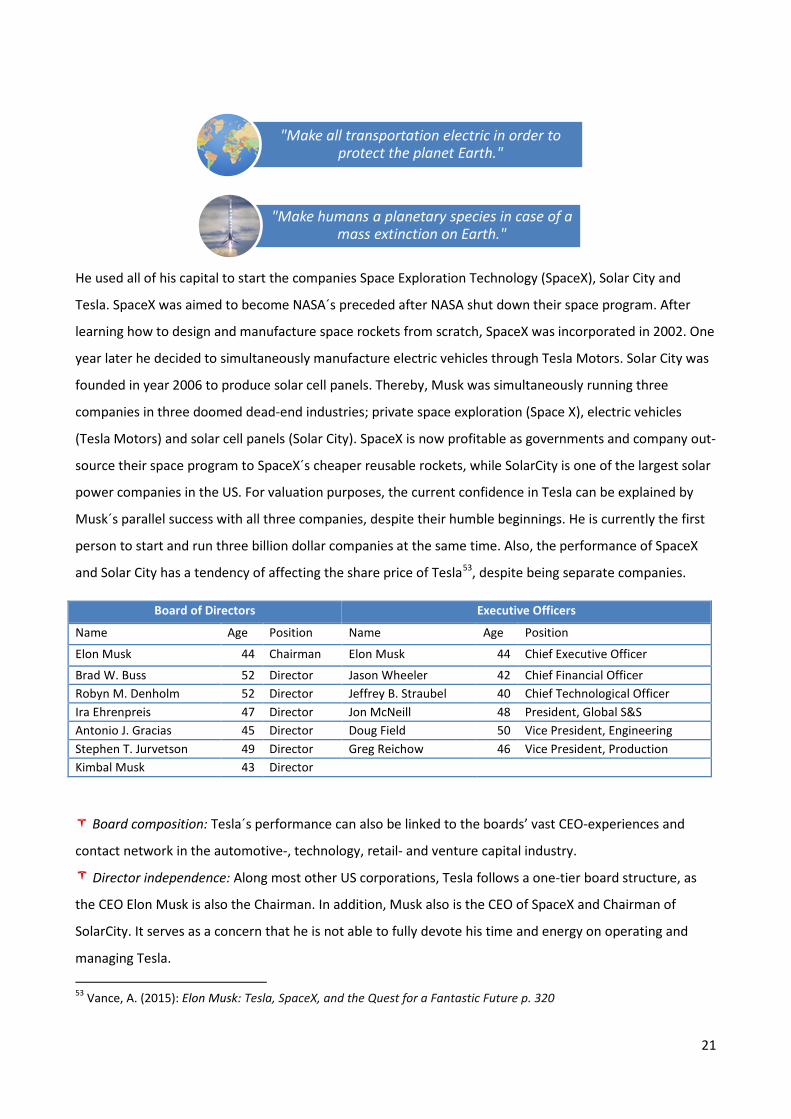
Identity: Institutional investors consist of 66.18 percent of Tesla´s total ownership.48 They invest large
amounts of money on the behalf of others and their performance is often measured in terms of financial
success. Their objectives in Tesla are subsequently most likely shareholder value and liquidity49, not
protecting the environment. This provides confidence in the future profitability of Tesla.
47 Berle & Means (1932): The Modern Corporation and Private Property 48 Nasdaq.com Database 49 Conyon & Thomson (2012): Corporate Governance Mechanism
Mission statement • Tesla’s mission is to accelerate the world’s
transition to sustainable transport.
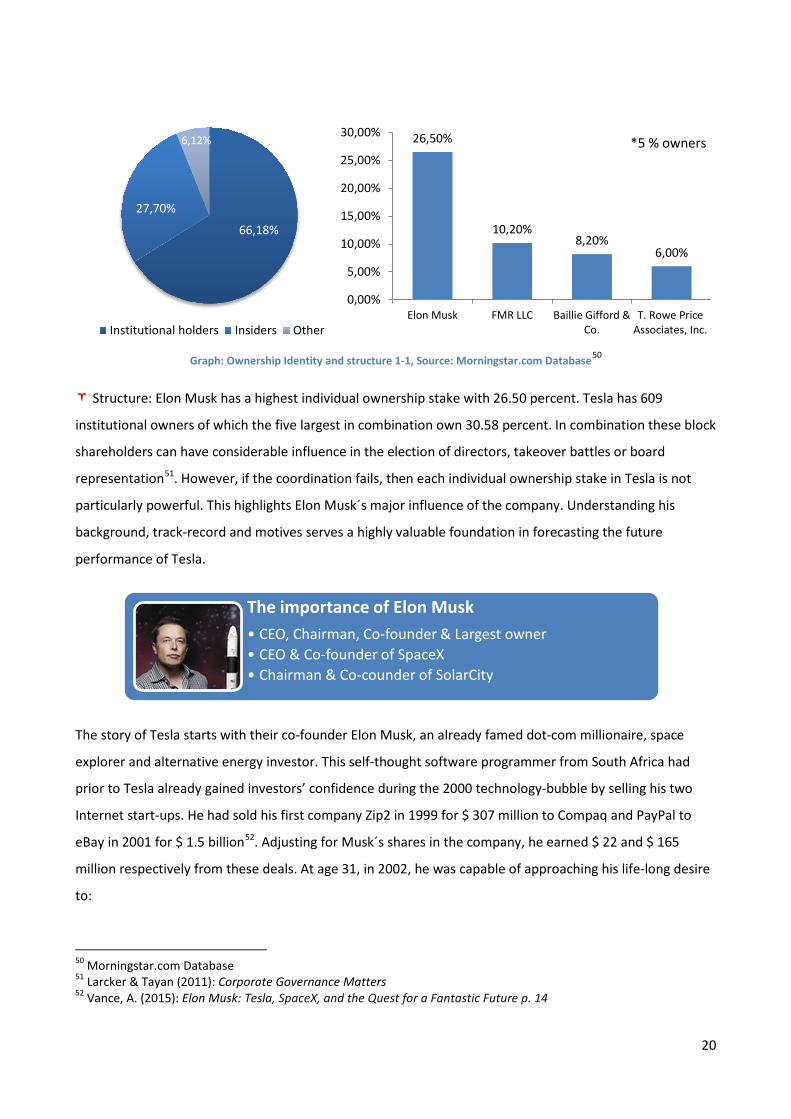
Ownership
Identity Structure
19
Graph: Ownership Identity and structure 1-1, Source: Morningstar.com Database50
Structure: Elon Musk has a highest individual ownership stake with 26.50 percent. Tesla has 609
institutional owners of which the five largest in combination own 30.58 percent. In combination these block
shareholders can have considerable influence in the election of directors, takeover battles or board
representation51. However, if the coordination fails, then each individual ownership stake in Tesla is not
particularly powerful. This highlights Elon Musk´s major influence of the company. Understanding his
background, track-record and motives serves a highly valuable foundation in forecasting the future
performance of Tesla.
The story of Tesla starts with their co-founder Elon Musk, an already famed dot-com millionaire, space
explorer and alternative energy investor. This self-thought software programmer from South Africa had
prior to Tesla already gained investors’ confidence during the 2000 technology-bubble by selling his two
Internet start-ups. He had sold his first company Zip2 in 1999 for $ 307 million to Compaq and PayPal to
eBay in 2001 for $ 1.5 billion52. Adjusting for Musk´s shares in the company, he earned $ 22 and $ 165
million respectively from these deals. At age 31, in 2002, he was capable of approaching his life-long desire
to:
50 Morningstar.com Database 51 Larcker & Tayan (2011): Corporate Governance Matters 52 Vance, A. (2015): Elon Musk: Tesla, SpaceX, and the Quest for a Fantastic Future p. 14
66,18%
27,70%
6,12%
Institutional holders Insiders Other
26,50%
10,20% 8,20%
6,00%
0,00%
5,00%
10,00%
15,00%
20,00%
25,00%
30,00%
Elon Musk FMR LLC Baillie Gifford &Co.
T. Rowe PriceAssociates, Inc.
*5 % owners
The importance of Elon Musk • CEO, Chairman, Co-founder & Largest owner • CEO & Co-founder of SpaceX • Chairman & Co-counder of SolarCity
20
He used all of his capital to start the companies Space Exploration Technology (SpaceX), Solar City and
Tesla. SpaceX was aimed to become NASA´s preceded after NASA shut down their space program. After
learning how to design and manufacture space rockets from scratch, SpaceX was incorporated in 2002. One
year later he decided to simultaneously manufacture electric vehicles through Tesla Motors. Solar City was
founded in year 2006 to produce solar cell panels. Thereby, Musk was simultaneously running three
companies in three doomed dead-end industries; private space exploration (Space X), electric vehicles
(Tesla Motors) and solar cell panels (Solar City). SpaceX is now profitable as governments and company out-
source their space program to SpaceX´s cheaper reusable rockets, while SolarCity is one of the largest solar
power companies in the US. For valuation purposes, the current confidence in Tesla can be explained by
Musk´s parallel success with all three companies, despite their humble beginnings. He is currently the first
person to start and run three billion dollar companies at the same time. Also, the performance of SpaceX
and Solar City has a tendency of affecting the share price of Tesla53, despite being separate companies.
Board composition: Tesla´s performance can also be linked to the boards’ vast CEO-experiences and
contact network in the automotive-, technology, retail- and venture capital industry.
Director independence: Along most other US corporations, Tesla follows a one-tier board structure, as
the CEO Elon Musk is also the Chairman. In addition, Musk also is the CEO of SpaceX and Chairman of
SolarCity. It serves as a concern that he is not able to fully devote his time and energy on operating and
managing Tesla.
53 Vance, A. (2015): Elon Musk: Tesla, SpaceX, and the Quest for a Fantastic Future p. 320
"Make all transportation electric in order to protect the planet Earth."
"Make humans a planetary species in case of a mass extinction on Earth."
Board of Directors Executive Officers
Name Age Position Name Age Position
Elon Musk 44 Chairman Elon Musk 44 Chief Executive Officer
Brad W. Buss 52 Director Jason Wheeler 42 Chief Financial Officer Robyn M. Denholm 52 Director Jeffrey B. Straubel 40 Chief Technological Officer Ira Ehrenpreis 47 Director Jon McNeill 48 President, Global S&S Antonio J. Gracias 45 Director Doug Field 50 Vice President, Engineering Stephen T. Jurvetson 49 Director Greg Reichow 46 Vice President, Production Kimbal Musk 43 Director
21
1.3.5 Peers and peer group definition To find suitable peers for Tesla, we have to identify what kind of company Tesla is. A perfect peer would be
a company that operates in the same industry, same geographic area and deliver comparable products. It is
also benefit that a peer is at the same maturity stage as the selected company and has a similar outlook for
long-term growth and return on invested capital.54 There is two ways to view Tesla; the premium car
company and the technology company.55 However, as Tesla’s revenue is generated by automotive sales, we
will mainly consider Tesla as a premium car company, rather than a technology company.
Premium automakers peers 1.3.5.1BMW, Audi and MB are the world’s three largest premium car manufacturers, respectively.5657 BMW is a
part of BMW Group together with MINI and Rolls-Royce, Audi is one of Volkswagen’s many brands, and MB
is under the Daimler umbrella.5859
They all target the premium car market on a global scale.6061 Currently these brands do not offer electric
vehicles comparable with the Model S. Tesla therefore compete with the ICE 62vehicles presented below.
And Tesla will in 2017 with the Model S meet direct competition from the wide range of vehicles they offer.
The table below shows some of the cars that are considered similar to that of the Tesla-models.
54 McKinsey & Company (2010): Valuation, p. 315 55 Teslamotors.com: www.teslamotors.com/about 56 Statistica.com Database: www.statista.com/statistics/262921/global-production-of-luxury-cars-by-make/ 57 Bloomberg.com: www.bloomberg.com/news/articles/2015-09-10/mercedes-beats-audi-to-take-second-place-in-luxury-car-sales 58 BMW.com: www.bmw.com/com/en/insights/corporation/bmwgroup/content.html 59 Wolkswagnenag.com: www.volkswagenag.com/content/vwcorp/content/en/brands_and_products.html 60 Audi.com: www.audi.com/corporate/en/company/corporate-strategy.html 61 Securitystocks.net: www.securitiesstocks.net/article/276458861/audi-vs-mercedes-who-is-winning-/ 62 ICE = Internal Combustion Engine. These vehicles are fueled by gasoline not electricity.
22
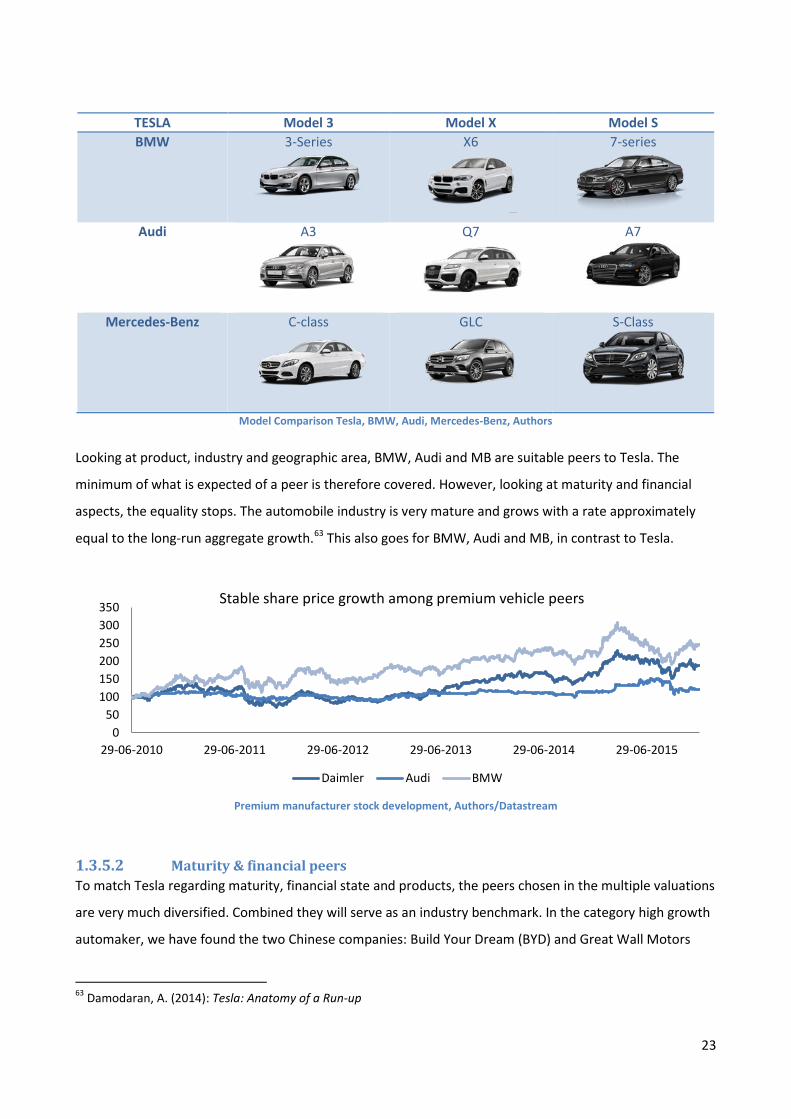
TESLA Model 3 Model X Model S BMW 3-Series
X6
7-series
Audi A3
Q7
A7
Mercedes-Benz C-class
GLC
S-Class
Model Comparison Tesla, BMW, Audi, Mercedes-Benz, Authors
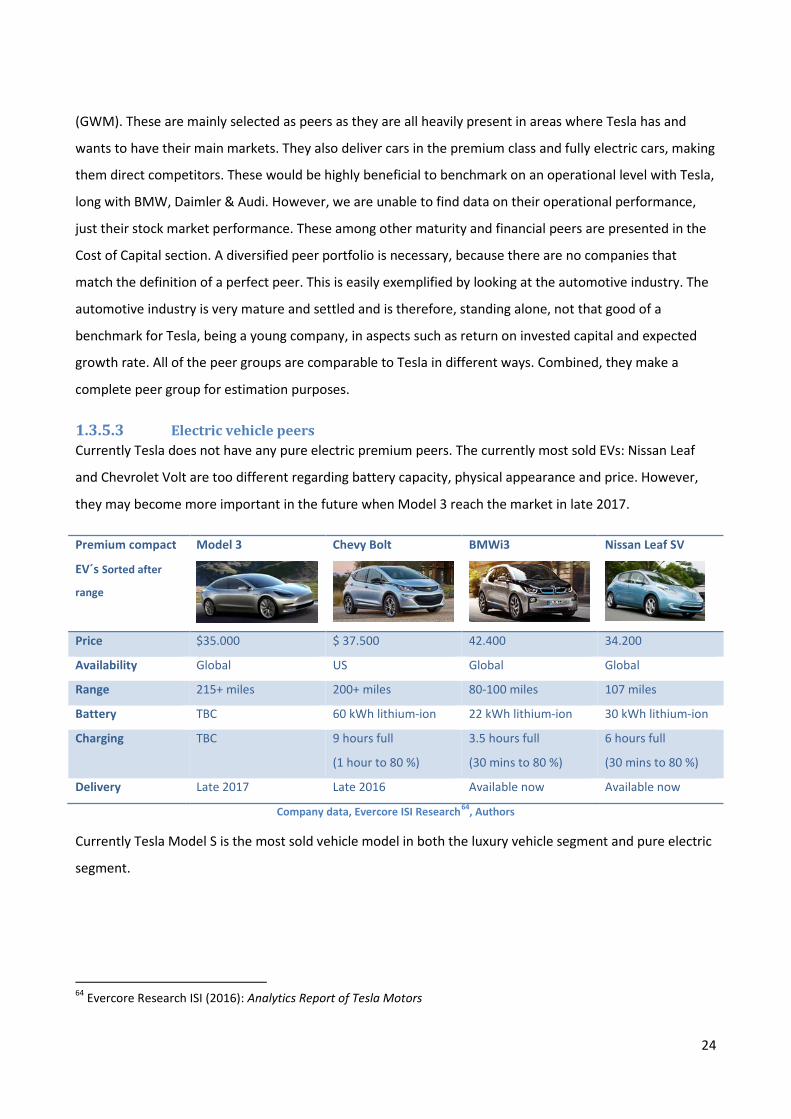
Looking at product, industry and geographic area, BMW, Audi and MB are suitable peers to Tesla. The
minimum of what is expected of a peer is therefore covered. However, looking at maturity and financial
aspects, the equality stops. The automobile industry is very mature and grows with a rate approximately
equal to the long-run aggregate growth.63 This also goes for BMW, Audi and MB, in contrast to Tesla.
Premium manufacturer stock development, Authors/Datastream
Maturity & financial peers 1.3.5.2To match Tesla regarding maturity, financial state and products, the peers chosen in the multiple valuations
are very much diversified. Combined they will serve as an industry benchmark. In the category high growth
automaker, we have found the two Chinese companies: Build Your Dream (BYD) and Great Wall Motors
63 Damodaran, A. (2014): Tesla: Anatomy of a Run-up
050
100150200250300350
29-06-2010 29-06-2011 29-06-2012 29-06-2013 29-06-2014 29-06-2015
Stable share price growth among premium vehicle peers
Daimler Audi BMW
23
(GWM). These are mainly selected as peers as they are all heavily present in areas where Tesla has and
wants to have their main markets. They also deliver cars in the premium class and fully electric cars, making
them direct competitors. These would be highly beneficial to benchmark on an operational level with Tesla,
long with BMW, Daimler & Audi. However, we are unable to find data on their operational performance,
just their stock market performance. These among other maturity and financial peers are presented in the
Cost of Capital section. A diversified peer portfolio is necessary, because there are no companies that
match the definition of a perfect peer. This is easily exemplified by looking at the automotive industry. The
automotive industry is very mature and settled and is therefore, standing alone, not that good of a
benchmark for Tesla, being a young company, in aspects such as return on invested capital and expected
growth rate. All of the peer groups are comparable to Tesla in different ways. Combined, they make a
complete peer group for estimation purposes.
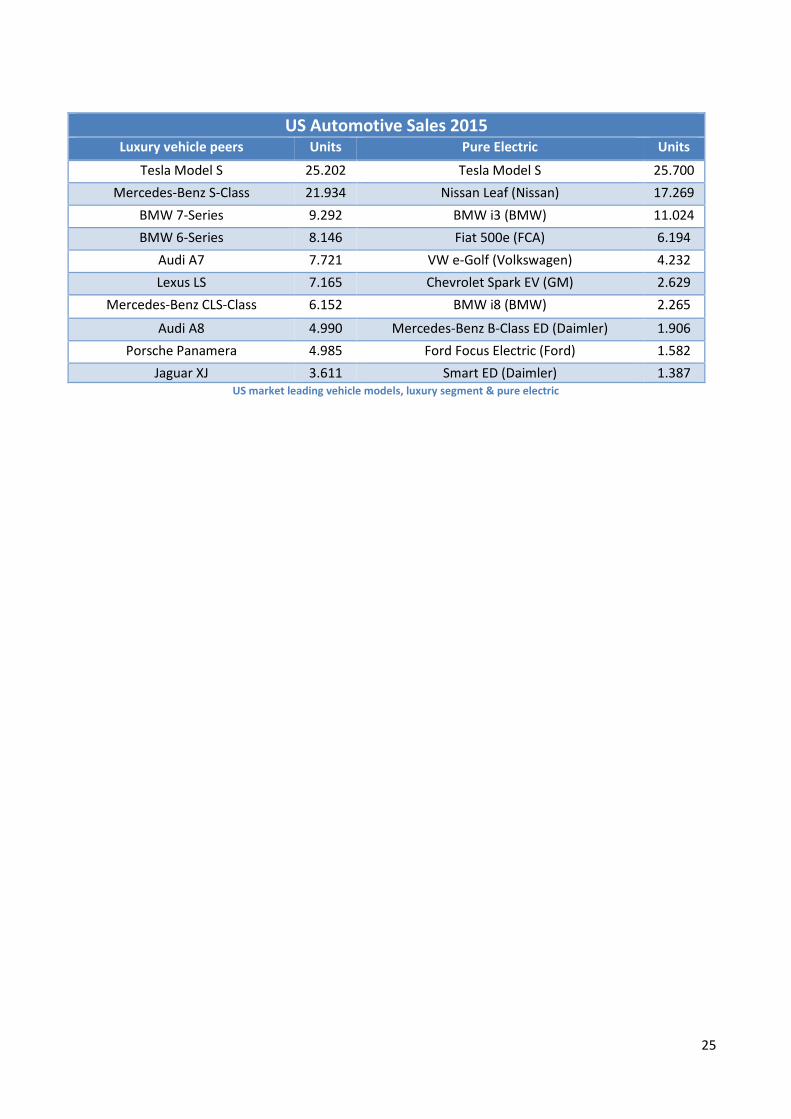
Electric vehicle peers 1.3.5.3Currently Tesla does not have any pure electric premium peers. The currently most sold EVs: Nissan Leaf
and Chevrolet Volt are too different regarding battery capacity, physical appearance and price. However,
they may become more important in the future when Model 3 reach the market in late 2017.
Premium compact
EV´s Sorted after
range
Model 3
Chevy Bolt
BMWi3
Nissan Leaf SV
Price $35.000 $ 37.500 42.400 34.200
Availability Global US Global Global
Range 215+ miles 200+ miles 80-100 miles 107 miles
Battery TBC 60 kWh lithium-ion 22 kWh lithium-ion 30 kWh lithium-ion
Charging TBC 9 hours full
(1 hour to 80 %)
3.5 hours full
(30 mins to 80 %)
6 hours full
(30 mins to 80 %)
Delivery Late 2017 Late 2016 Available now Available now
Company data, Evercore ISI Research64, Authors
Currently Tesla Model S is the most sold vehicle model in both the luxury vehicle segment and pure electric
segment.
64 Evercore Research ISI (2016): Analytics Report of Tesla Motors
24
US Automotive Sales 2015 Luxury vehicle peers Units Pure Electric Units
Tesla Model S 25.202 Tesla Model S 25.700 Mercedes-Benz S-Class 21.934 Nissan Leaf (Nissan) 17.269
BMW 7-Series 9.292 BMW i3 (BMW) 11.024 BMW 6-Series 8.146 Fiat 500e (FCA) 6.194
Audi A7 7.721 VW e-Golf (Volkswagen) 4.232 Lexus LS 7.165 Chevrolet Spark EV (GM) 2.629
Mercedes-Benz CLS-Class 6.152 BMW i8 (BMW) 2.265
Audi A8 4.990 Mercedes-Benz B-Class ED (Daimler) 1.906 Porsche Panamera 4.985 Ford Focus Electric (Ford) 1.582
Jaguar XJ 3.611 Smart ED (Daimler) 1.387 US market leading vehicle models, luxury segment & pure electric
25
2 Strategic Analysis The strategic analysis is divided into three parts, environmental analysis, industry analysis and internal
analysis. The two first mentioned are external analysis, focusing on macro factors affecting the valuation of
Tesla Motors.
2.1 Environmental analysis
In this section we aim to analyze the following question (Q1): “How do environmental factors affect the
share price?”
We aim to answer this through a modified PESTEL65-framework, where Political & Legal and Social &
Environmental factors have been merged. The PESTEL framework evaluates the macro factors that may
affect Tesla´s performance while being out of the company´s control.66 Macro factors affect industries and
companies differently, so it´s important to understand which macro factors are likely to affect a company´s
cash flows and risks, now and in the future.67
The market for alternative fuel vehicles is relatively new and rapidly evolving, characterized by rapidly
changing technologies, competition, evolving government regulation and industry standards, frequent new
vehicle announcements and changing consumer demands and behaviors.68 Currently, batteries account for
approximately one third of the company COGS. Therefore, the widespread adoption of EVs must be
supported by a minimum of these four factors:69
65 Political, Economic, Social, Technological, Environmental and Legal 66 Petersen, C. & Plenborg, T. (2012): Financial Statement Analysis & Valuation p. 188 67 Petersen, C. & Plenborg, T. (2012): Financial Statement Analysis & Valuation p. 189 68 Tesla Motors: Q3 Report 2015, p. 32 69 Bloomberg.com: www.bloomberg.com/features/2016-ev-oil-crisis/
2.1 Environmental analysis
2.2 Industry analysis
2.3 Internal analysis
26
Government incentives lowering the cost of ownership and/ or production
Manufacturers operate with very low or negative margins
Customers accept to pay a premium for driving EV´s
Battery costs decline through scale economies and technological advancements
In the start-phase of alternative fuel vehicles, the first three factors are the drivers of early adoption.
However, these factors cannot be sustained in the long run. Factor four, declining battery costs, is
therefore the only solution for EVs. But as forecasted by Bloomberg New Energy Finance, the lowered
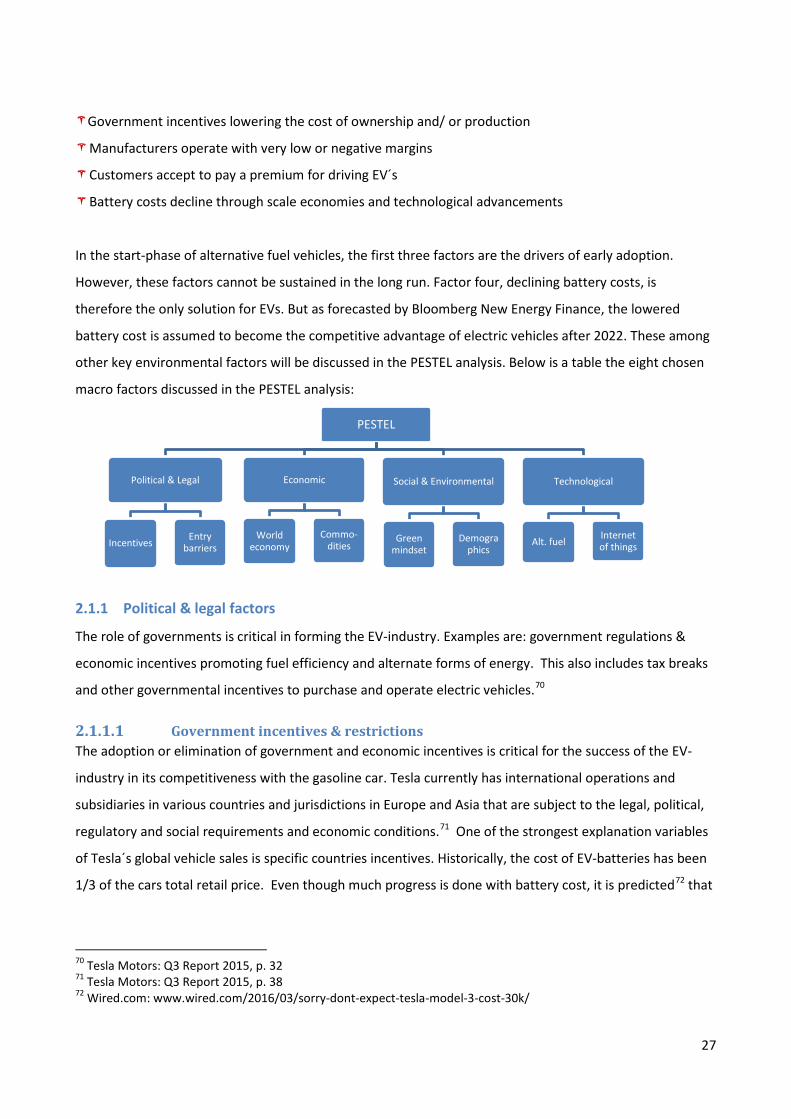
battery cost is assumed to become the competitive advantage of electric vehicles after 2022. These among
other key environmental factors will be discussed in the PESTEL analysis. Below is a table the eight chosen
macro factors discussed in the PESTEL analysis:
2.1.1 Political & legal factors
The role of governments is critical in forming the EV-industry. Examples are: government regulations &
economic incentives promoting fuel efficiency and alternate forms of energy. This also includes tax breaks
and other governmental incentives to purchase and operate electric vehicles.70
Government incentives & restrictions 2.1.1.1The adoption or elimination of government and economic incentives is critical for the success of the EV-
industry in its competitiveness with the gasoline car. Tesla currently has international operations and
subsidiaries in various countries and jurisdictions in Europe and Asia that are subject to the legal, political,
regulatory and social requirements and economic conditions.71 One of the strongest explanation variables
of Tesla´s global vehicle sales is specific countries incentives. Historically, the cost of EV-batteries has been
1/3 of the cars total retail price. Even though much progress is done with battery cost, it is predicted72 that
70 Tesla Motors: Q3 Report 2015, p. 32 71 Tesla Motors: Q3 Report 2015, p. 38 72 Wired.com: www.wired.com/2016/03/sorry-dont-expect-tesla-model-3-cost-30k/
PESTEL
Political & Legal
Incentives Entry barriers
Economic
World economy
Commo-dities
Social & Environmental
Green mindset
Demographics
Technological
Alt. fuel Internet of things
27
the unsubsidized total cost of ownership of EVs not will fall below ICE cars before 2022.73 Leading forward
to this date, we expect prices of EVs to decline in order to become directly competitive with ICE-cars. By
this stage, government incentives would be gone, as they no longer are needed.
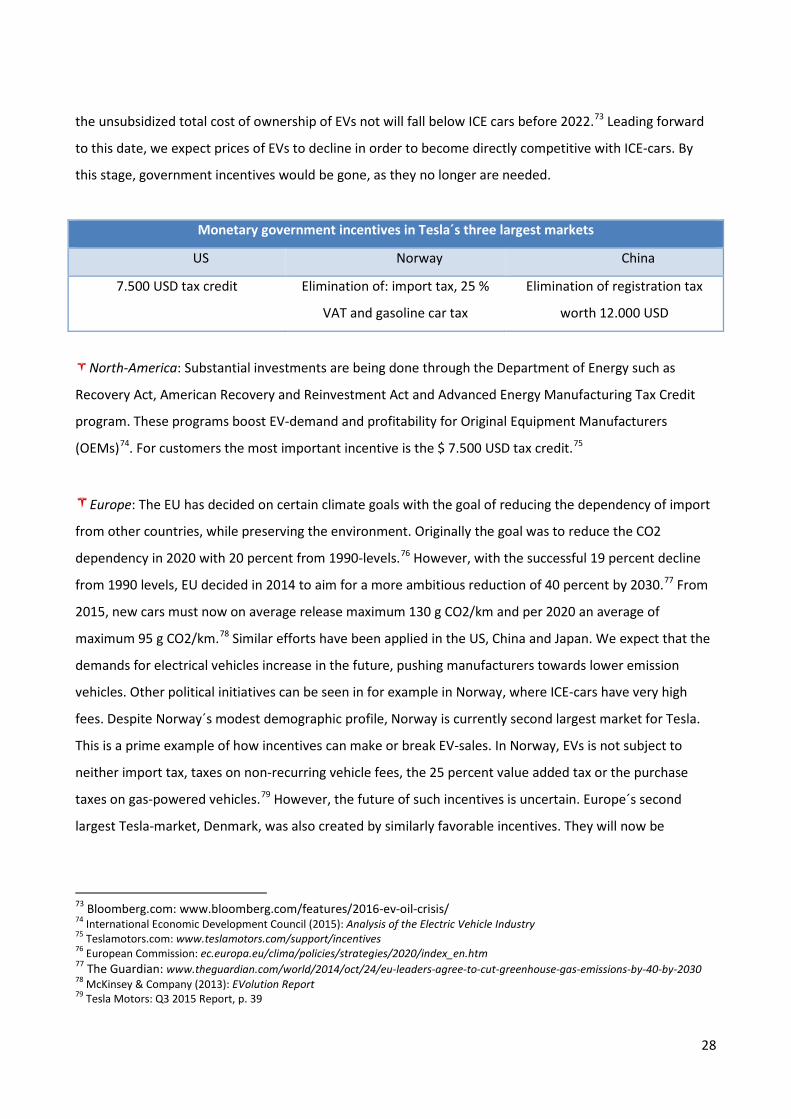
Monetary government incentives in Tesla´s three largest markets
US Norway China
7.500 USD tax credit Elimination of: import tax, 25 %
VAT and gasoline car tax
Elimination of registration tax
worth 12.000 USD
North-America: Substantial investments are being done through the Department of Energy such as
Recovery Act, American Recovery and Reinvestment Act and Advanced Energy Manufacturing Tax Credit
program. These programs boost EV-demand and profitability for Original Equipment Manufacturers
(OEMs)74. For customers the most important incentive is the $ 7.500 USD tax credit.75
Europe: The EU has decided on certain climate goals with the goal of reducing the dependency of import
from other countries, while preserving the environment. Originally the goal was to reduce the CO2
dependency in 2020 with 20 percent from 1990-levels.76 However, with the successful 19 percent decline
from 1990 levels, EU decided in 2014 to aim for a more ambitious reduction of 40 percent by 2030.77 From
2015, new cars must now on average release maximum 130 g CO2/km and per 2020 an average of
maximum 95 g CO2/km.78 Similar efforts have been applied in the US, China and Japan. We expect that the
demands for electrical vehicles increase in the future, pushing manufacturers towards lower emission
vehicles. Other political initiatives can be seen in for example in Norway, where ICE-cars have very high
fees. Despite Norway´s modest demographic profile, Norway is currently second largest market for Tesla.
This is a prime example of how incentives can make or break EV-sales. In Norway, EVs is not subject to
neither import tax, taxes on non-recurring vehicle fees, the 25 percent value added tax or the purchase
taxes on gas-powered vehicles.79 However, the future of such incentives is uncertain. Europe´s second
largest Tesla-market, Denmark, was also created by similarly favorable incentives. They will now be
73 Bloomberg.com: www.bloomberg.com/features/2016-ev-oil-crisis/ 74 International Economic Development Council (2015): Analysis of the Electric Vehicle Industry 75 Teslamotors.com: www.teslamotors.com/support/incentives 76 European Commission: ec.europa.eu/clima/policies/strategies/2020/index_en.htm 77 The Guardian: www.theguardian.com/world/2014/oct/24/eu-leaders-agree-to-cut-greenhouse-gas-emissions-by-40-by-2030 78 McKinsey & Company (2013): EVolution Report 79 Tesla Motors: Q3 2015 Report, p. 39
28
reduced80, as Tesla´s retail price will be subject to a 150 percent increase leading forward to 2020, as a
result of taxes and fees on electric vehicles.81
Asia: Similar incentives are being done in China where owners of Tesla-vehicles don’t have to pay
registration fees, saving them up to $ 12.000 dollars per car.82 The Chinese government have aim to make
30 percent of all public vehicles driven by alternative energy by 2016.83 In China, there are restrictions on
new vehicles through lotteries and auctions in order to reduce vehicle volume. This is done to prevent the
rising risk of extremely high air pollution and reduce the dependency of fuel import.
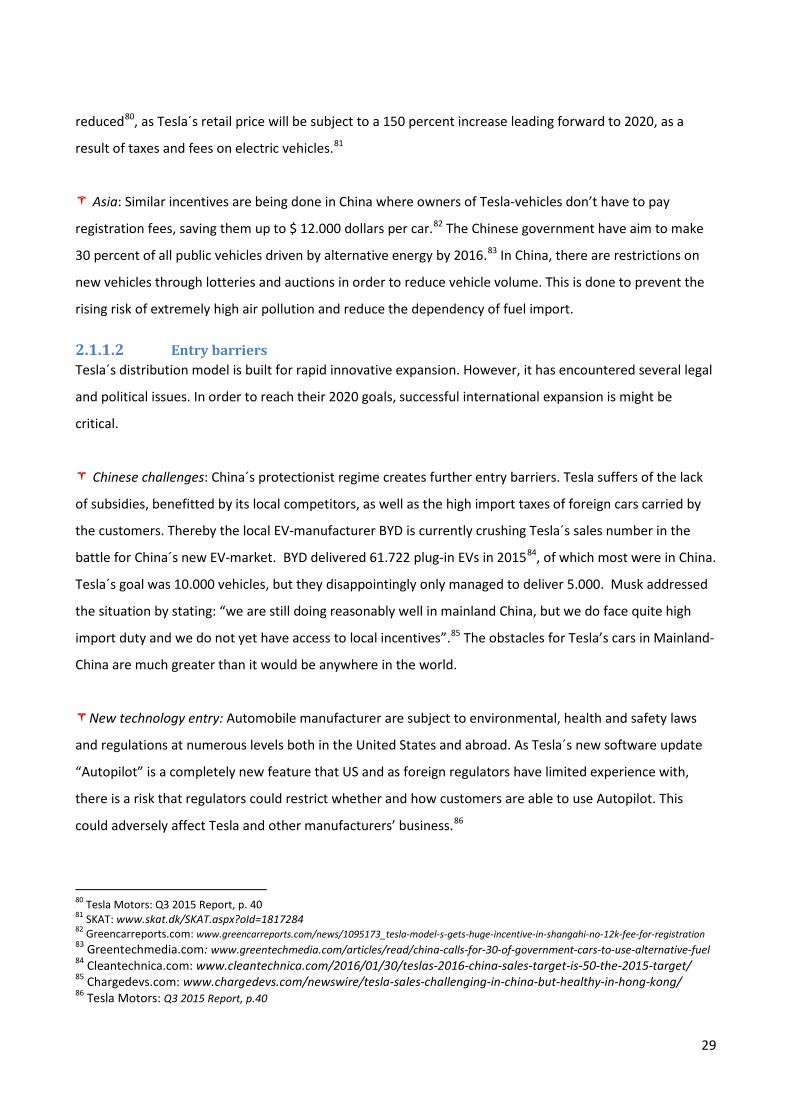
Entry barriers 2.1.1.2Tesla´s distribution model is built for rapid innovative expansion. However, it has encountered several legal
and political issues. In order to reach their 2020 goals, successful international expansion is might be
critical.
Chinese challenges: China´s protectionist regime creates further entry barriers. Tesla suffers of the lack
of subsidies, benefitted by its local competitors, as well as the high import taxes of foreign cars carried by
the customers. Thereby the local EV-manufacturer BYD is currently crushing Tesla´s sales number in the
battle for China´s new EV-market. BYD delivered 61.722 plug-in EVs in 201584, of which most were in China.
Tesla´s goal was 10.000 vehicles, but they disappointingly only managed to deliver 5.000. Musk addressed
the situation by stating: “we are still doing reasonably well in mainland China, but we do face quite high
import duty and we do not yet have access to local incentives”.85 The obstacles for Tesla’s cars in Mainland-
China are much greater than it would be anywhere in the world.
New technology entry: Automobile manufacturer are subject to environmental, health and safety laws
and regulations at numerous levels both in the United States and abroad. As Tesla´s new software update
“Autopilot” is a completely new feature that US and as foreign regulators have limited experience with,
there is a risk that regulators could restrict whether and how customers are able to use Autopilot. This
could adversely affect Tesla and other manufacturers’ business.86
80 Tesla Motors: Q3 2015 Report, p. 40 81 SKAT: www.skat.dk/SKAT.aspx?oId=1817284 82 Greencarreports.com: www.greencarreports.com/news/1095173_tesla-model-s-gets-huge-incentive-in-shangahi-no-12k-fee-for-registration 83 Greentechmedia.com: www.greentechmedia.com/articles/read/china-calls-for-30-of-government-cars-to-use-alternative-fuel 84 Cleantechnica.com: www.cleantechnica.com/2016/01/30/teslas-2016-china-sales-target-is-50-the-2015-target/ 85 Chargedevs.com: www.chargedevs.com/newswire/tesla-sales-challenging-in-china-but-healthy-in-hong-kong/ 86 Tesla Motors: Q3 2015 Report, p.40
29
2.1.2 Economic factors
The capital goods sector tends to benefit on a strong and growing economy. If the economic condition
worsens, the demand for capital goods is among the first to disappear.87 Tesla can be categorized as a
capital good meaning that their future sales figures are affected by the consumer’s disposable income.
Hence, the sector is pro-cyclical.
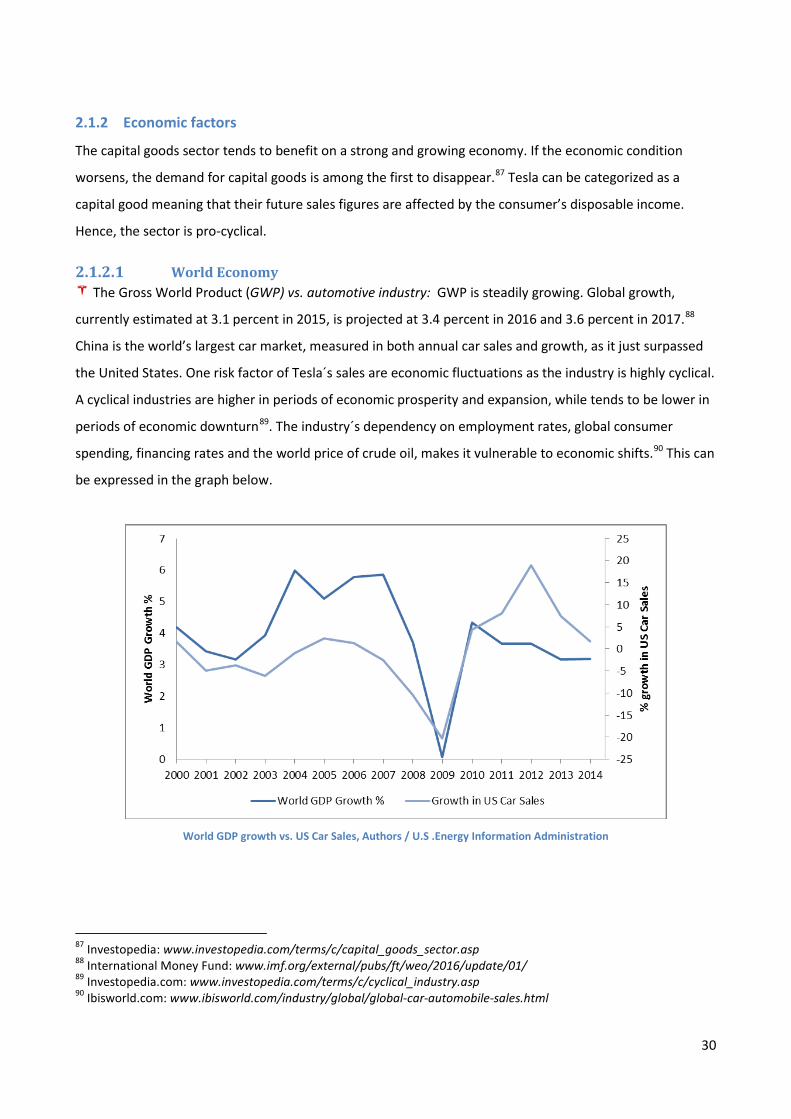
World Economy 2.1.2.1 The Gross World Product (GWP) vs. automotive industry: GWP is steadily growing. Global growth,
currently estimated at 3.1 percent in 2015, is projected at 3.4 percent in 2016 and 3.6 percent in 2017.88
China is the world’s largest car market, measured in both annual car sales and growth, as it just surpassed
the United States. One risk factor of Tesla´s sales are economic fluctuations as the industry is highly cyclical.
A cyclical industries are higher in periods of economic prosperity and expansion, while tends to be lower in
periods of economic downturn89. The industry´s dependency on employment rates, global consumer
spending, financing rates and the world price of crude oil, makes it vulnerable to economic shifts.90 This can
be expressed in the graph below.
World GDP growth vs. US Car Sales, Authors / U.S .Energy Information Administration
87 Investopedia: www.investopedia.com/terms/c/capital_goods_sector.asp 88 International Money Fund: www.imf.org/external/pubs/ft/weo/2016/update/01/ 89 Investopedia.com: www.investopedia.com/terms/c/cyclical_industry.asp 90 Ibisworld.com: www.ibisworld.com/industry/global/global-car-automobile-sales.html
30
Exchange rates: The recent strengthening of the U.S. dollar therefore has reduced, and any further
strengthening of the U.S. dollar would tend to further reduce, Tesla´s revenues as measured in U.S. dollars.
As Tesla´s operations to a larger extent will occur in markets outside the US, exchange rates will be a
greater risk factor for Tesla. Currently, Tesla has much higher revenues than costs denominated in other
currencies such as the euro, Norwegian kroner, Chinese yuan and Canadian dollar.91
Borrowing rates: It is common to finance cars purchases though loans. If borrowing rates are too high,
this would have a negative effect on new car sales, as consumers rather maintain their existing vehicles.92
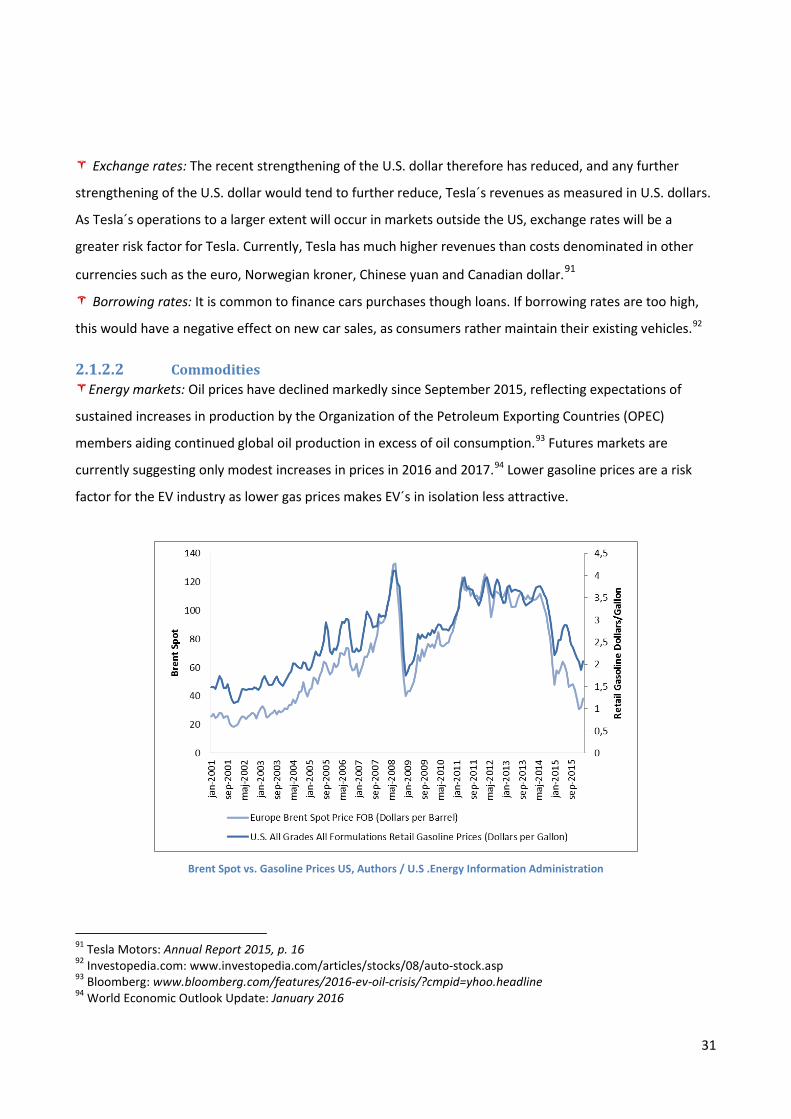
Commodities 2.1.2.2Energy markets: Oil prices have declined markedly since September 2015, reflecting expectations of
sustained increases in production by the Organization of the Petroleum Exporting Countries (OPEC)
members aiding continued global oil production in excess of oil consumption.93 Futures markets are
currently suggesting only modest increases in prices in 2016 and 2017.94 Lower gasoline prices are a risk
factor for the EV industry as lower gas prices makes EV´s in isolation less attractive.
Brent Spot vs. Gasoline Prices US, Authors / U.S .Energy Information Administration
91 Tesla Motors: Annual Report 2015, p. 16 92 Investopedia.com: www.investopedia.com/articles/stocks/08/auto-stock.asp 93 Bloomberg: www.bloomberg.com/features/2016-ev-oil-crisis/?cmpid=yhoo.headline 94 World Economic Outlook Update: January 2016
31
Raw materials: Increasing raw material prices cannot, due to competitive reasons be carried over to the
customers. Price increases would therefore pressure Tesla´s margins. Raw material availability is probably
the biggest challenge facing the Gigafactory 1 outside of the need for basic demand.95 It is also the only
part of Tesla´s value chain that the company does not control. Tesla incurs significant costs related to
procurement of raw materials for manufacturing high-performance electric cars and assembling vehicles.
The key input factors are iron and steel castings, forgings, alloy wheels, fuel injection systems, batteries,
electrical wiring systems and electronic information systems.96 Tesla also uses interior systems such as
plastic finishers, glass, consumables and fuels. The rising input costs could have a major impact on the
operational costs of the company. These costs are not easily transferred to the customers due the intense
price competition. We therefore incorporate increasing raw material costs in the forecast of COGS97.
Lithium: Tesla´s lithium-ion battery technology relies on the supply of lithium. Cutting Tesla’s battery
cost by 30 percent requires a secure long term supply of lithium. 70 percent of the world’s lithium is found
in Chile, Argentina and Bolivia. The global increase in lithium demand might cause a shortage. According to
FMC Lithium, Tesla will likely pay high market prices for lithium by the end of this decade.98 However, we
assume constant lithium prices in the forecast period.
2.1.3 Social & environmental factors
Green mindset 2.1.3.1Due to the increasing awareness of global warming and pollution, lower emission vehicles naturally
increase in demand. This comes from both political requests described above, but also environmentally
conscious consumers themselves. However, the adoption of EVs depend on consumers perceptions about
electric vehicle quality, safety (in particular with respect to lithium-ion battery packs), design, performance
and cost.99Further, a common concern among consumers is the limited range over which electric vehicles
may be driven on a single battery charge. We estimate this to be more important purchasing criteria than
simply “going green”. In the industry analysis we argue that Tesla first and foremost compete with other
premium priced vehicles, rather than other EVs.
95 Financial Times: www.ft.com/cms/s/0/4a924a64-99df-11e5-987b-d6cdef1b205c.html#axzz45i1yXXHy 96 Tesla Motors: Annual Report 2015, p. 17 97 COGS = Cost of Goods Sold 98 Financial Times: www.ft.com/intl/cms/s/0/4a924a64-99df-11e5-987b-d6cdef1b205c.html 99 Tesla Motors: Q3 2015 Report, p. 34
32
National preferences 2.1.3.2 Chinese challenges: One major problem of the Chinese entry is consumers’ range anxiety. Consumers
fear running out of power in the major traffic jams bothering Chinese cities, supported by the poor Chinese
charging infrastructure.100 To counter this problem in the short term Tesla aims to calm Chinese customers
of the convenience of home charging, before a sufficient Supercharger network is in place. Another market
complication is that the Chinese upper class capable of the Model S price tag, likes to be chauffeured
around, of which the Model S back-seat experience did not live up to desired comfort levels. Tesla tries to
counter the disappointing back seat experience with the option of a $ 2000 luxury upgrade.
German patriotism: Germany is the largest economy and most populous country in Europe. The country
is also the world´s leading premium vehicle manufacturer. However, German consumers rather prefer to
buy German cars; over the American Tesla´s.101 Tesla´s sales numbers have therefore been very low in
Germany. But a recent survey revealed that 66 percent of German consumers would be willing to buy a
Tesla Model 3.102
2.1.4 Technological factors
Alternative fuel vehicles 2.1.4.1The most technically challenging aspect of EVs is the battery pack. On the performance side, manufacturers
aim to produce batteries who are safe, provide long range and withstand temperature changes. At the
same time, manufacturers are dependent on cost reductions in order to make vehicles at a competitive
price comparably to ICE-cars. Cost reductions will come in the form of economies of scale and technological
advancements. Currently batteries make up an average 1/3 of total EV costs. 103 As battery costs continue
to fall, demand for EVs will rise. This will be further discussed in the industry analysis.
100 Bloomberg: www.bloomberg.com/news/articles/2015-03-29/musk-reboots-tesla-china-strategy-as-range-anxiety-crimps-sales 101 Bgr.com: bgr.com/2015/09/20/model-s-sales-germany/ 102 Cleantechnica.com: cleantechnica.com/2016/04/11/66-of-germans-would-consider-a-tesla-model-3-according-to-poll/ 103 Bloomberg.com: www.bloomberg.com/features/2016-ev-oil-crisis/
33
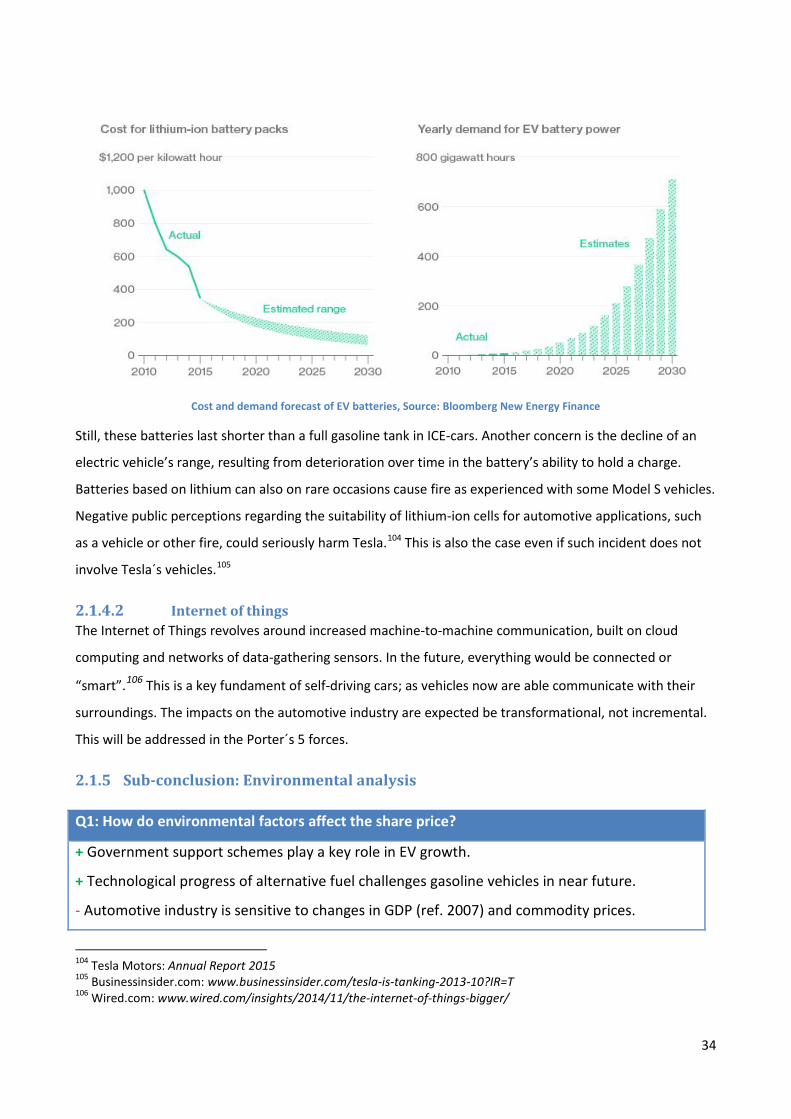
Cost and demand forecast of EV batteries, Source: Bloomberg New Energy Finance
Still, these batteries last shorter than a full gasoline tank in ICE-cars. Another concern is the decline of an
electric vehicle’s range, resulting from deterioration over time in the battery’s ability to hold a charge.
Batteries based on lithium can also on rare occasions cause fire as experienced with some Model S vehicles.
Negative public perceptions regarding the suitability of lithium-ion cells for automotive applications, such
as a vehicle or other fire, could seriously harm Tesla.104 This is also the case even if such incident does not
involve Tesla´s vehicles.105
Internet of things 2.1.4.2The Internet of Things revolves around increased machine-to-machine communication, built on cloud
computing and networks of data-gathering sensors. In the future, everything would be connected or
“smart”.106 This is a key fundament of self-driving cars; as vehicles now are able communicate with their
surroundings. The impacts on the automotive industry are expected be transformational, not incremental.
This will be addressed in the Porter´s 5 forces.
2.1.5 Sub-conclusion: Environmental analysis Q1: How do environmental factors affect the share price?
+ Government support schemes play a key role in EV growth.
+ Technological progress of alternative fuel challenges gasoline vehicles in near future.
- Automotive industry is sensitive to changes in GDP (ref. 2007) and commodity prices.
104 Tesla Motors: Annual Report 2015 105 Businessinsider.com: www.businessinsider.com/tesla-is-tanking-2013-10?IR=T 106 Wired.com: www.wired.com/insights/2014/11/the-internet-of-things-bigger/
34
2.2 Industry analysis In this section we aim to analyze the following question (Q2): “How do industry specific factors affect the
share price?”
The industry analysis is divided into two parts. First, to gain a broad perspective of Tesla’s current
competitive landscape, we analyze the size and trends of the global automotive industry. Secondly, we
analyze the size and trends in the luxury vehicle ($ 30 000 +) and alternative fuel segments where Tesla
competes.
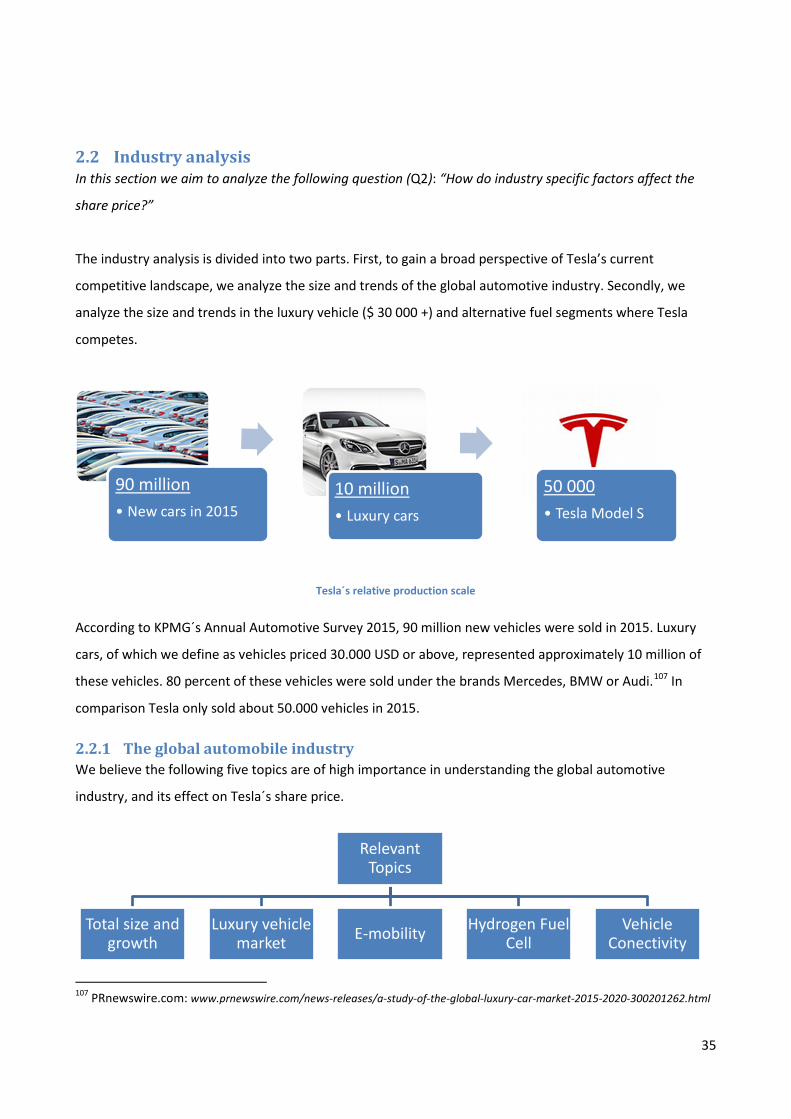
Tesla´s relative production scale
According to KPMG´s Annual Automotive Survey 2015, 90 million new vehicles were sold in 2015. Luxury
cars, of which we define as vehicles priced 30.000 USD or above, represented approximately 10 million of
these vehicles. 80 percent of these vehicles were sold under the brands Mercedes, BMW or Audi.107 In
comparison Tesla only sold about 50.000 vehicles in 2015.
2.2.1 The global automobile industry We believe the following five topics are of high importance in understanding the global automotive
industry, and its effect on Tesla´s share price.
107 PRnewswire.com: www.prnewswire.com/news-releases/a-study-of-the-global-luxury-car-market-2015-2020-300201262.html
90 million • New cars in 2015
10 million • Luxury cars
50 000 • Tesla Model S
Relevant Topics
Total size and growth
Luxury vehicle market E-mobility Hydrogen Fuel
Cell Vehicle
Conectivity
35
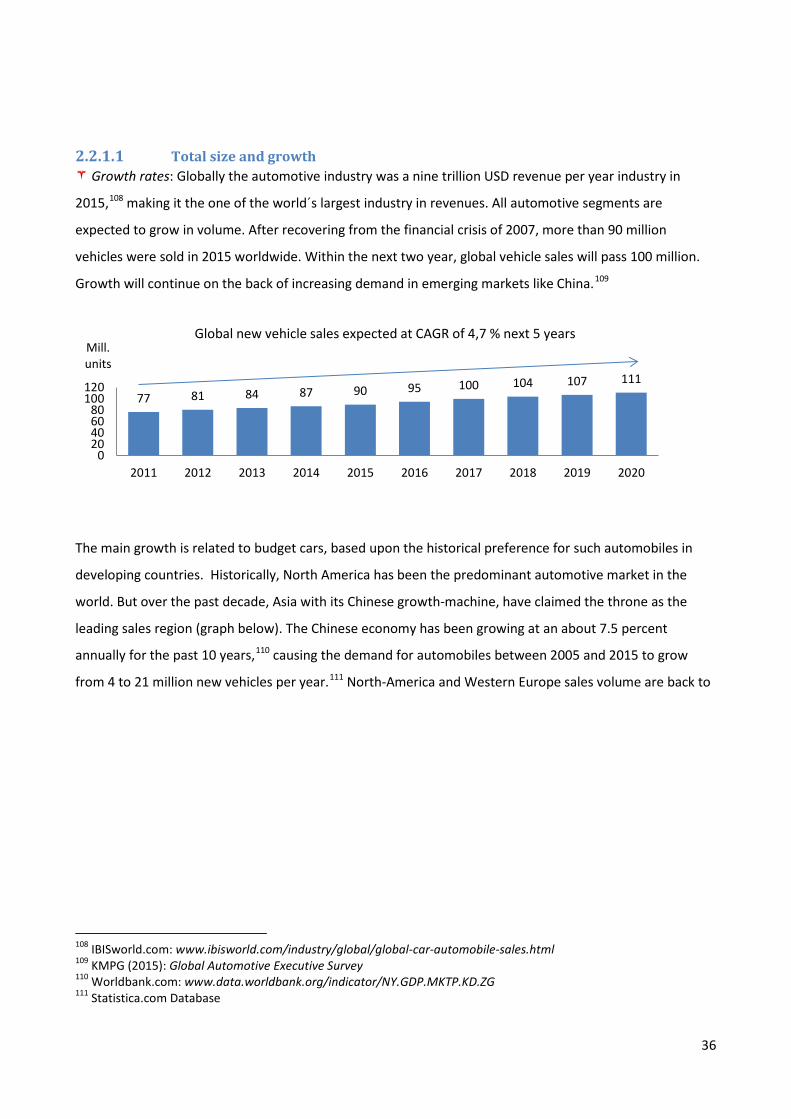
Total size and growth 2.2.1.1 Growth rates: Globally the automotive industry was a nine trillion USD revenue per year industry in
2015,108 making it the one of the world´s largest industry in revenues. All automotive segments are
expected to grow in volume. After recovering from the financial crisis of 2007, more than 90 million
vehicles were sold in 2015 worldwide. Within the next two year, global vehicle sales will pass 100 million.
Growth will continue on the back of increasing demand in emerging markets like China.109
The main growth is related to budget cars, based upon the historical preference for such automobiles in
developing countries. Historically, North America has been the predominant automotive market in the
world. But over the past decade, Asia with its Chinese growth-machine, have claimed the throne as the
leading sales region (graph below). The Chinese economy has been growing at an about 7.5 percent
annually for the past 10 years,110 causing the demand for automobiles between 2005 and 2015 to grow
from 4 to 21 million new vehicles per year.111 North-America and Western Europe sales volume are back to
108 IBISworld.com: www.ibisworld.com/industry/global/global-car-automobile-sales.html 109 KMPG (2015): Global Automotive Executive Survey 110 Worldbank.com: www.data.worldbank.org/indicator/NY.GDP.MKTP.KD.ZG 111 Statistica.com Database
77 81 84 87 90 95 100 104 107 111
020406080
100120
2011 2012 2013 2014 2015 2016 2017 2018 2019 2020
Mill. units
Global new vehicle sales expected at CAGR of 4,7 % next 5 years
36
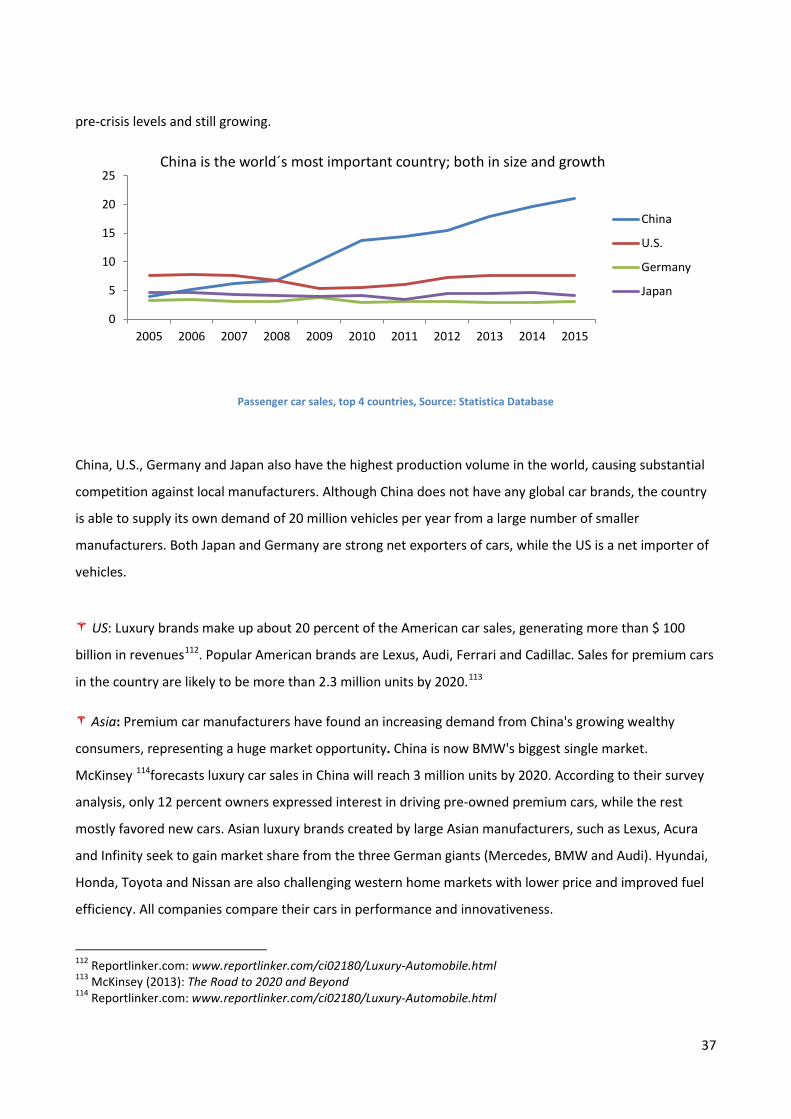
pre-crisis levels and still growing.
Passenger car sales, top 4 countries, Source: Statistica Database
China, U.S., Germany and Japan also have the highest production volume in the world, causing substantial
competition against local manufacturers. Although China does not have any global car brands, the country
is able to supply its own demand of 20 million vehicles per year from a large number of smaller
manufacturers. Both Japan and Germany are strong net exporters of cars, while the US is a net importer of
vehicles.
US: Luxury brands make up about 20 percent of the American car sales, generating more than $ 100
billion in revenues112. Popular American brands are Lexus, Audi, Ferrari and Cadillac. Sales for premium cars
in the country are likely to be more than 2.3 million units by 2020.113
Asia: Premium car manufacturers have found an increasing demand from China's growing wealthy
consumers, representing a huge market opportunity. China is now BMW's biggest single market.
McKinsey 114forecasts luxury car sales in China will reach 3 million units by 2020. According to their survey
analysis, only 12 percent owners expressed interest in driving pre-owned premium cars, while the rest
mostly favored new cars. Asian luxury brands created by large Asian manufacturers, such as Lexus, Acura
and Infinity seek to gain market share from the three German giants (Mercedes, BMW and Audi). Hyundai,
Honda, Toyota and Nissan are also challenging western home markets with lower price and improved fuel
efficiency. All companies compare their cars in performance and innovativeness.
112 Reportlinker.com: www.reportlinker.com/ci02180/Luxury-Automobile.html 113 McKinsey (2013): The Road to 2020 and Beyond 114 Reportlinker.com: www.reportlinker.com/ci02180/Luxury-Automobile.html
0
5
10
15
20
25
2005 2006 2007 2008 2009 2010 2011 2012 2013 2014 2015
China is the world´s most important country; both in size and growth
China
U.S.
Germany
Japan
37
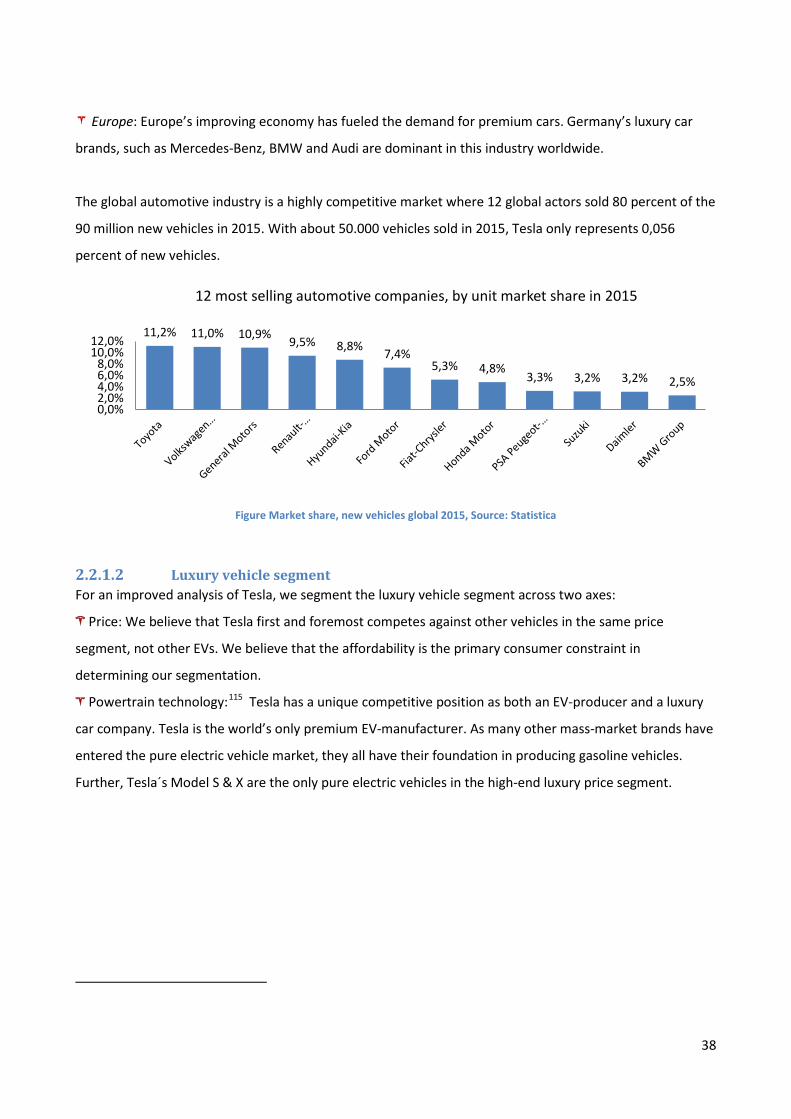
Europe: Europe’s improving economy has fueled the demand for premium cars. Germany’s luxury car
brands, such as Mercedes-Benz, BMW and Audi are dominant in this industry worldwide.
The global automotive industry is a highly competitive market where 12 global actors sold 80 percent of the
90 million new vehicles in 2015. With about 50.000 vehicles sold in 2015, Tesla only represents 0,056
percent of new vehicles.
Figure Market share, new vehicles global 2015, Source: Statistica
Luxury vehicle segment 2.2.1.2For an improved analysis of Tesla, we segment the luxury vehicle segment across two axes:
Price: We believe that Tesla first and foremost competes against other vehicles in the same price
segment, not other EVs. We believe that the affordability is the primary consumer constraint in
determining our segmentation.
Powertrain technology:115 Tesla has a unique competitive position as both an EV-producer and a luxury
car company. Tesla is the world’s only premium EV-manufacturer. As many other mass-market brands have
entered the pure electric vehicle market, they all have their foundation in producing gasoline vehicles.
Further, Tesla´s Model S & X are the only pure electric vehicles in the high-end luxury price segment.
11,2% 11,0% 10,9% 9,5% 8,8% 7,4% 5,3% 4,8%
3,3% 3,2% 3,2% 2,5%
0,0%2,0%4,0%6,0%8,0%
10,0%12,0%
12 most selling automotive companies, by unit market share in 2015
38
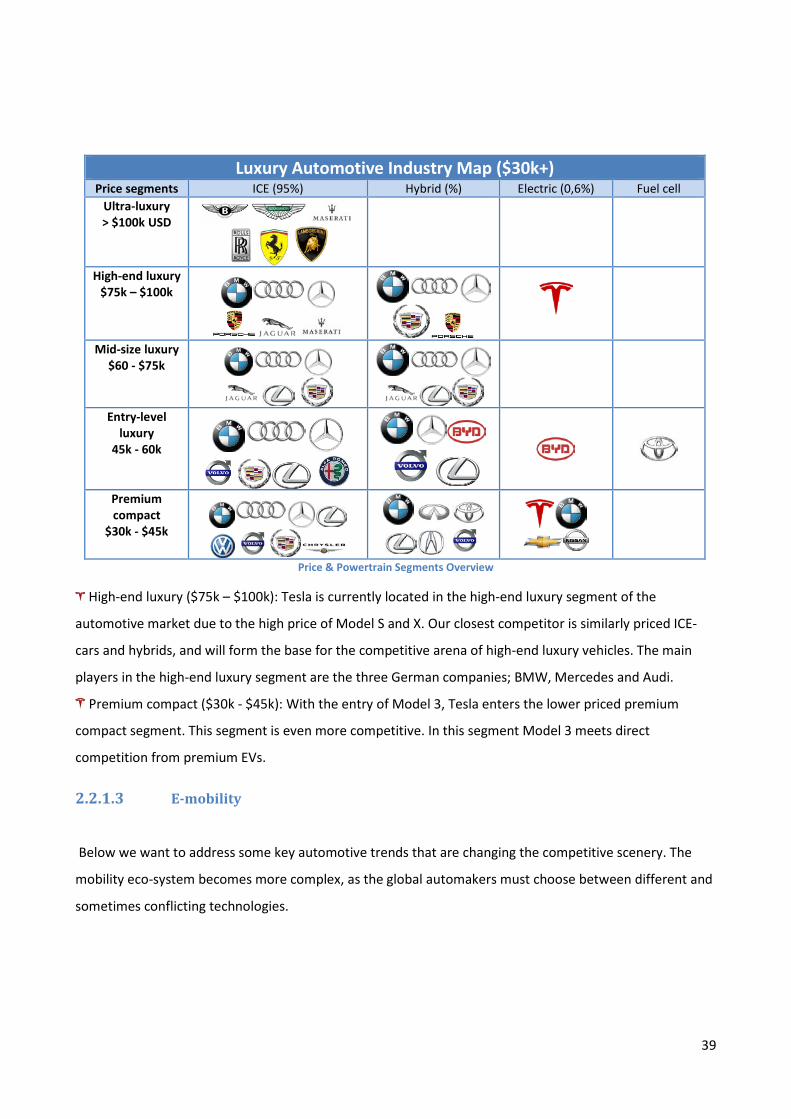
Luxury Automotive Industry Map ($30k+) Price segments ICE (95%) Hybrid (%) Electric (0,6%) Fuel cell
Ultra-luxury > $100k USD
High-end luxury $75k – $100k
Mid-size luxury $60 - $75k
Entry-level luxury
45k - 60k
Premium compact
$30k - $45k
Price & Powertrain Segments Overview
High-end luxury ($75k – $100k): Tesla is currently located in the high-end luxury segment of the
automotive market due to the high price of Model S and X. Our closest competitor is similarly priced ICE-
cars and hybrids, and will form the base for the competitive arena of high-end luxury vehicles. The main
players in the high-end luxury segment are the three German companies; BMW, Mercedes and Audi.
Premium compact ($30k - $45k): With the entry of Model 3, Tesla enters the lower priced premium
compact segment. This segment is even more competitive. In this segment Model 3 meets direct
competition from premium EVs.
E-mobility 2.2.1.3
Below we want to address some key automotive trends that are changing the competitive scenery. The
mobility eco-system becomes more complex, as the global automakers must choose between different and
sometimes conflicting technologies.
39
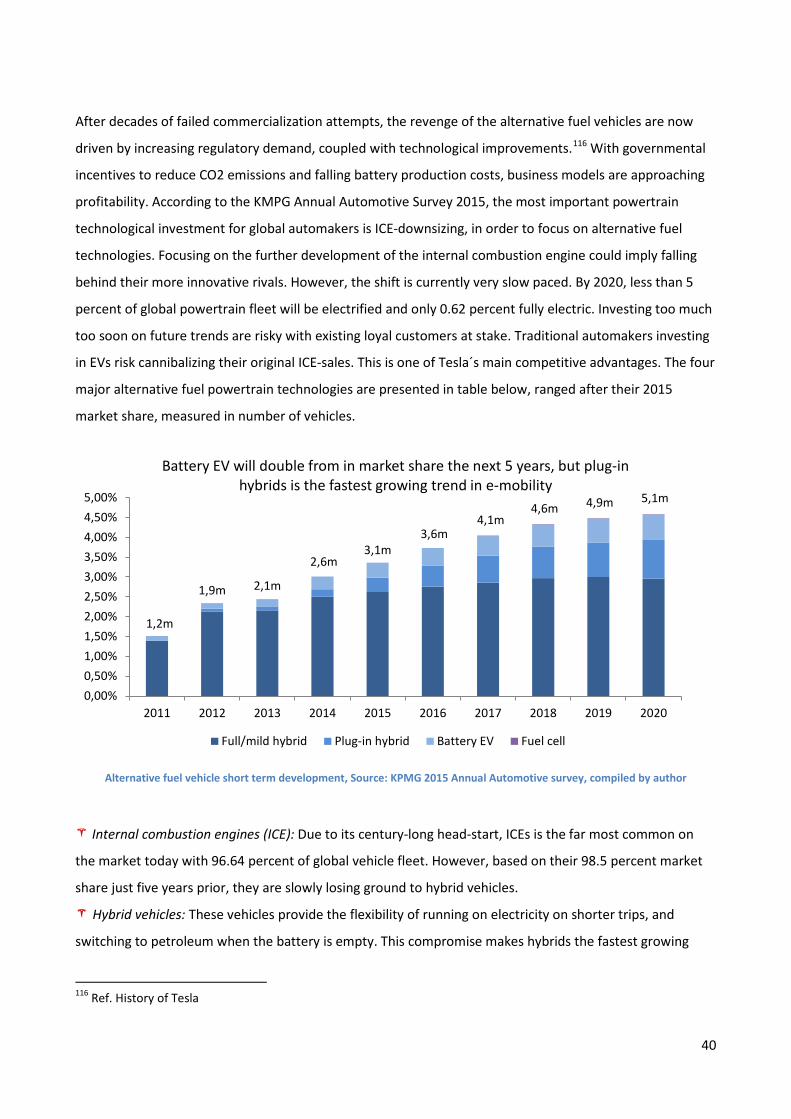
After decades of failed commercialization attempts, the revenge of the alternative fuel vehicles are now
driven by increasing regulatory demand, coupled with technological improvements.116 With governmental
incentives to reduce CO2 emissions and falling battery production costs, business models are approaching
profitability. According to the KMPG Annual Automotive Survey 2015, the most important powertrain
technological investment for global automakers is ICE-downsizing, in order to focus on alternative fuel
technologies. Focusing on the further development of the internal combustion engine could imply falling
behind their more innovative rivals. However, the shift is currently very slow paced. By 2020, less than 5
percent of global powertrain fleet will be electrified and only 0.62 percent fully electric. Investing too much
too soon on future trends are risky with existing loyal customers at stake. Traditional automakers investing
in EVs risk cannibalizing their original ICE-sales. This is one of Tesla´s main competitive advantages. The four
major alternative fuel powertrain technologies are presented in table below, ranged after their 2015
market share, measured in number of vehicles.
Alternative fuel vehicle short term development, Source: KPMG 2015 Annual Automotive survey, compiled by author
Internal combustion engines (ICE): Due to its century-long head-start, ICEs is the far most common on
the market today with 96.64 percent of global vehicle fleet. However, based on their 98.5 percent market
share just five years prior, they are slowly losing ground to hybrid vehicles.
Hybrid vehicles: These vehicles provide the flexibility of running on electricity on shorter trips, and
switching to petroleum when the battery is empty. This compromise makes hybrids the fastest growing
116 Ref. History of Tesla
1,2m
1,9m 2,1m
2,6m 3,1m
3,6m 4,1m
4,6m 4,9m 5,1m
0,00%0,50%1,00%1,50%2,00%2,50%3,00%3,50%4,00%4,50%5,00%
2011 2012 2013 2014 2015 2016 2017 2018 2019 2020
Battery EV will double from in market share the next 5 years, but plug-in hybrids is the fastest growing trend in e-mobility
Full/mild hybrid Plug-in hybrid Battery EV Fuel cell
40
powertrain technology.
Pure electric vehicles: Pure electric vehicles are more fuel saving and eco-friendly than hybrids. On the
downside EVs suffer from short range, long charging time and high production cost of battery packs.
Fuel cells vehicles: Hydrogen as a fuel has not yet reached the mass market, but is expected to gain a
0,01 percent market share of total vehicle fleet in 2017. These vehicles charge batteries with the
conversion of hydrogen to electricity within the vehicle powertrain.
Type Mkt % ICE Battery Fueling method ICE 96,64 Yes No Petrolium hose 1) Hybrid electric 2,62 Yes Yes Petroleum hose + Regenerative breaking 2) Plug-in hybrid 0,36 Yes Yes Petroleum hose + Electric hose 3) Pure electric 0,38 No Yes Electric hose 4) Fuel cell 0,00 No Yes Hydrogen hose117
The most important trend is the hybrid segment. This segment provides the flexibility of a gasoline vehicle,
but with battery usage for shorter trips. Still, hybrids are excluded from Tesla´s product line. CEO Elon Musk
explains that hybrids are too much of a compromise, and that they will eventually be replaced with fully
electric vehicles.118 The key issue for electric cars has been the batteries. However, this is about to change
with the new lithium batteries produced by Tesla. The much anticipated fuel cell vehicles might only
represent 0.01 percent of the world vehicle sales by 2020, totaling at 16.000 vehicles per annum.
- Current price issue: The key challenge today is the cost of electric vehicles. Mass-market cars need mass-
market prices. The average price of a new car in the US was $ 31.000 USD.119 We use this as a benchmark
for how low EVs must be priced in order to realize Tesla´s vision of transitioning mobility from gasoline to
117 See further explanation in section “Hydrogen fuel cell vehicles” 118 Teslamotors.com: www.teslamotors.com/blog/secret-tesla-motors-master-plan-just-between-you-and-me 119 Bloomberg.com: www.bloomberg.com/news/articles/2016-02-09/will-the-tesla-model-3-really-sell-for-25-000
The current price challenge of EV´s • Currently EV´s cost more and perform less • However we expect this to change by 2022
41
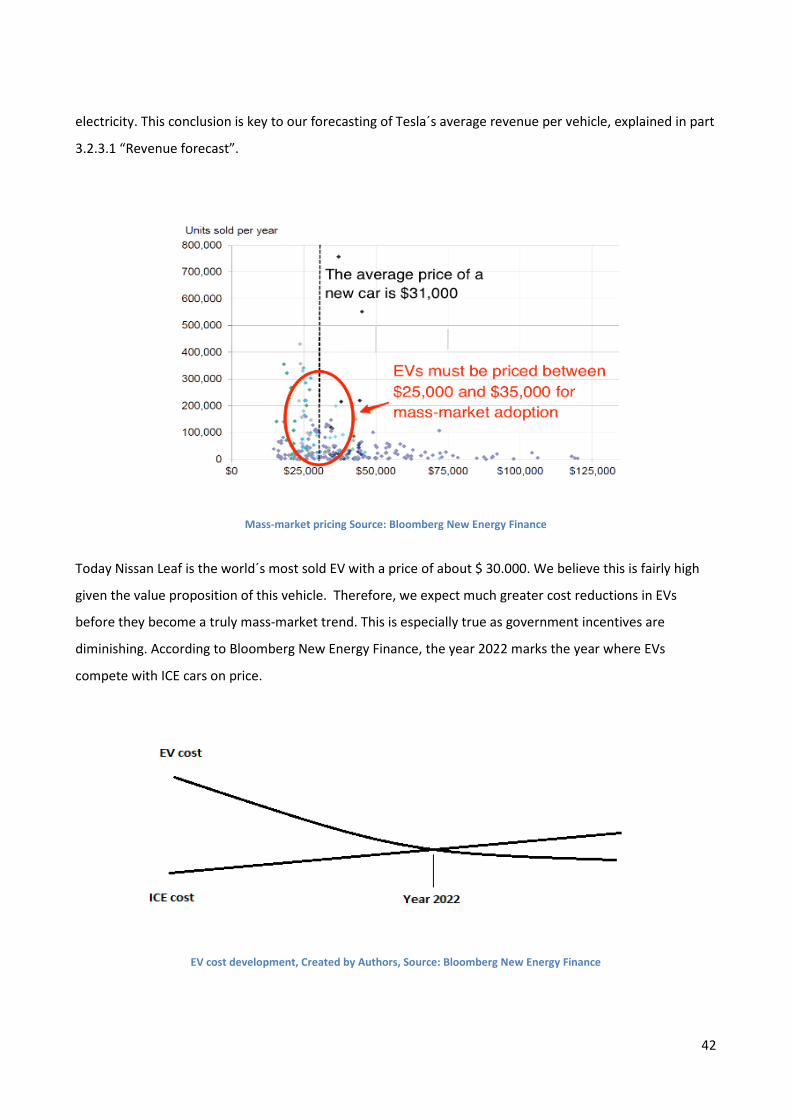
electricity. This conclusion is key to our forecasting of Tesla´s average revenue per vehicle, explained in part
3.2.3.1 “Revenue forecast”.
Mass-market pricing Source: Bloomberg New Energy Finance
Today Nissan Leaf is the world´s most sold EV with a price of about $ 30.000. We believe this is fairly high
given the value proposition of this vehicle. Therefore, we expect much greater cost reductions in EVs
before they become a truly mass-market trend. This is especially true as government incentives are
diminishing. According to Bloomberg New Energy Finance, the year 2022 marks the year where EVs
compete with ICE cars on price.
EV cost development, Created by Authors, Source: Bloomberg New Energy Finance
42
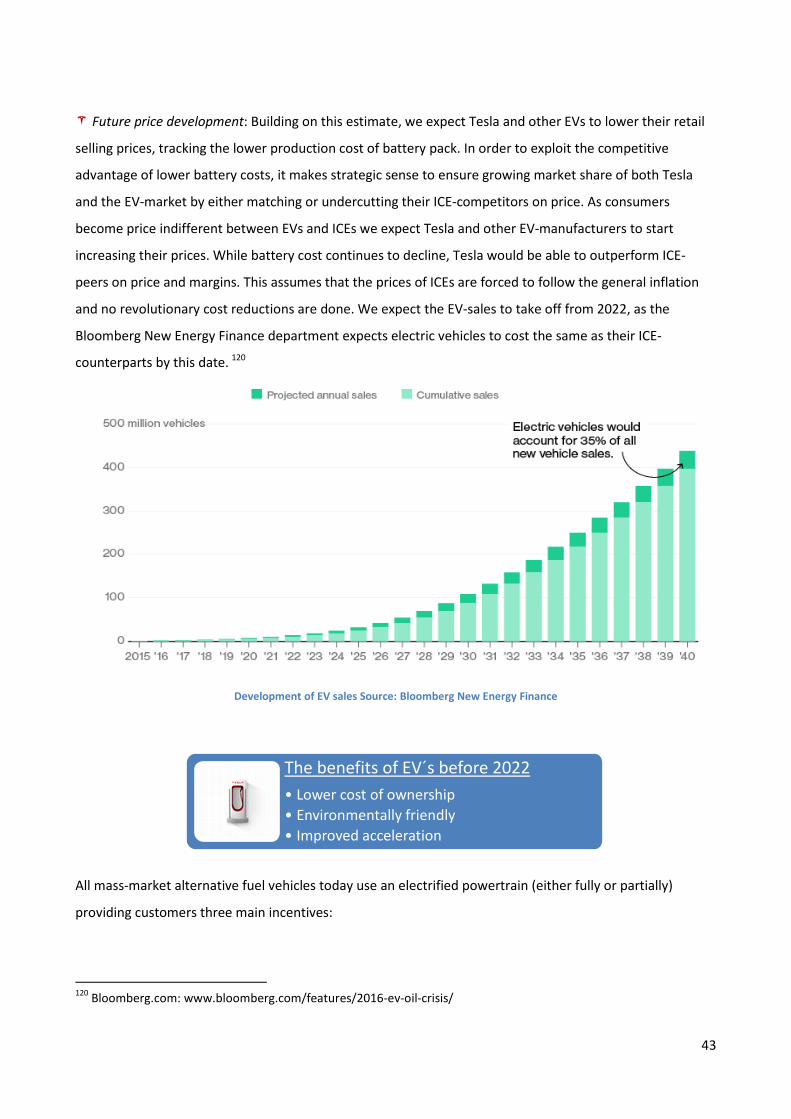
Future price development: Building on this estimate, we expect Tesla and other EVs to lower their retail
selling prices, tracking the lower production cost of battery pack. In order to exploit the competitive
advantage of lower battery costs, it makes strategic sense to ensure growing market share of both Tesla
and the EV-market by either matching or undercutting their ICE-competitors on price. As consumers
become price indifferent between EVs and ICEs we expect Tesla and other EV-manufacturers to start
increasing their prices. While battery cost continues to decline, Tesla would be able to outperform ICE-
peers on price and margins. This assumes that the prices of ICEs are forced to follow the general inflation
and no revolutionary cost reductions are done. We expect the EV-sales to take off from 2022, as the
Bloomberg New Energy Finance department expects electric vehicles to cost the same as their ICE-
counterparts by this date. 120
Development of EV sales Source: Bloomberg New Energy Finance
All mass-market alternative fuel vehicles today use an electrified powertrain (either fully or partially)
providing customers three main incentives:
120 Bloomberg.com: www.bloomberg.com/features/2016-ev-oil-crisis/
The benefits of EV´s before 2022 • Lower cost of ownership • Environmentally friendly • Improved acceleration
43
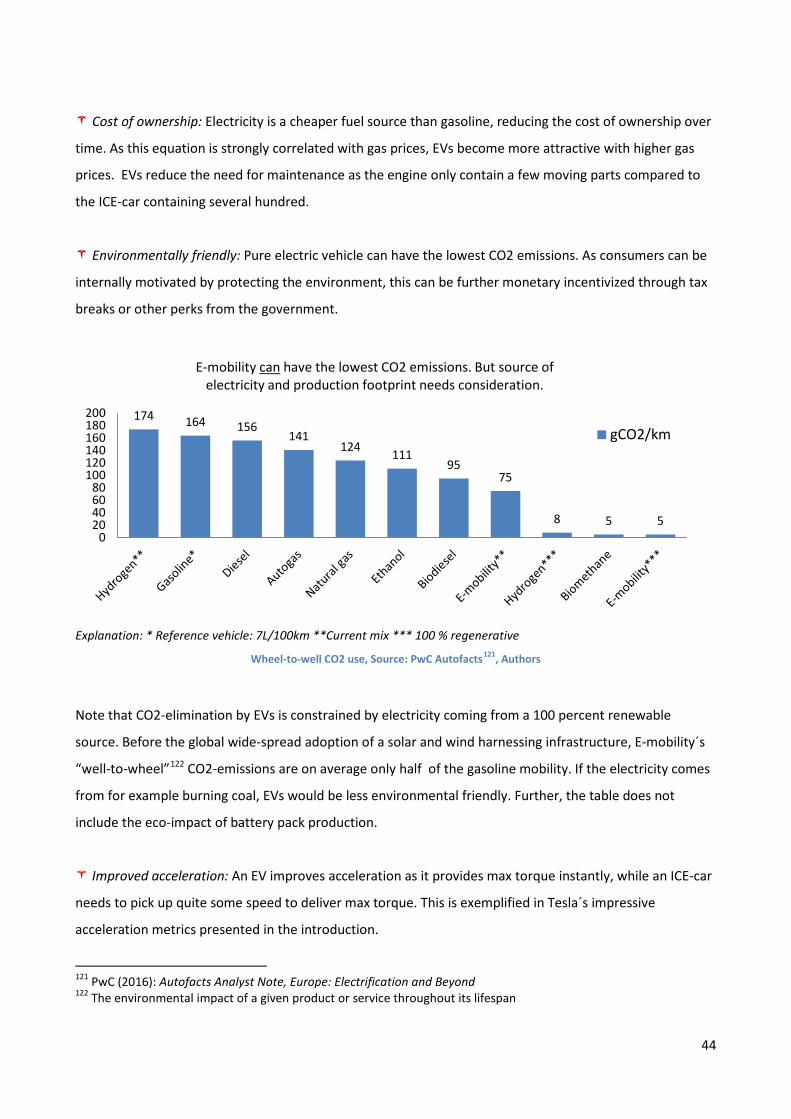
Cost of ownership: Electricity is a cheaper fuel source than gasoline, reducing the cost of ownership over
time. As this equation is strongly correlated with gas prices, EVs become more attractive with higher gas
prices. EVs reduce the need for maintenance as the engine only contain a few moving parts compared to
the ICE-car containing several hundred.
Environmentally friendly: Pure electric vehicle can have the lowest CO2 emissions. As consumers can be
internally motivated by protecting the environment, this can be further monetary incentivized through tax
breaks or other perks from the government.
Explanation: * Reference vehicle: 7L/100km **Current mix *** 100 % regenerative
Wheel-to-well CO2 use, Source: PwC Autofacts121, Authors
Note that CO2-elimination by EVs is constrained by electricity coming from a 100 percent renewable
source. Before the global wide-spread adoption of a solar and wind harnessing infrastructure, E-mobility´s
“well-to-wheel”122 CO2-emissions are on average only half of the gasoline mobility. If the electricity comes
from for example burning coal, EVs would be less environmental friendly. Further, the table does not
include the eco-impact of battery pack production.
Improved acceleration: An EV improves acceleration as it provides max torque instantly, while an ICE-car
needs to pick up quite some speed to deliver max torque. This is exemplified in Tesla´s impressive
acceleration metrics presented in the introduction.
121 PwC (2016): Autofacts Analyst Note, Europe: Electrification and Beyond 122 The environmental impact of a given product or service throughout its lifespan
174 164 156 141
124 111 95
75
8 5 5 0
20406080
100120140160180200
E-mobility can have the lowest CO2 emissions. But source of electricity and production footprint needs consideration.
gCO2/km
44
Hydrogen fuel cell vehicles 2.2.1.4The hydrogen fuel cell car is driven by an electric engine, just as the conventional electric car. The
difference between the two is how the electricity to power the engine is stored. In Tesla Model S the
electricity comes from a huge battery pack, while in the hydrogen car, Toyota Mirai, electricity is generated
thorough a chemical proses between hydrogen and oxygen. The use of a hydrogen car leaves zero
emission, as the Mirai only produces water and heat. It is necessary to identify if, and to what extent, the
hydrogen car is a threat to Tesla, when predicting future growth in later sections. This section explains why
the hydrogen car is not considered a threat to Tesla within our budget period.
Toyota is the largest car company in the world123, and is also leading the evolution of hydrogen fuel cell
cars. They believe that hydrogen is the future energy source, and invests a lot of resources in their
hydrogen projects.124 In an interview with Financial Times in October 2015, chief engineer of the Toyota
Mirai, Yoshikazu Tanaka, said that it is not good enough to have only the battery vehicles or only the
hydrogen vehicles in the future, and that we need to make sure to get the full potential from both
alternatives.125 Today the price of a standard hydrogen car is approximately the same as the Model S. It is
difficult to see that someone who could afford a premium electric family sports car would settle on a basic
car model to the same price. The hydrogen car is also approximately 50 percent more expensive than the
same model with ICE.
Infrastructure: One advantage for the hydrogen car relative to the battery car is that refueling is takes
under five minutes, just as the traditional car with an ICE. Its limitations lie in the availability of refueling
stations. Hamburg has four stations which is the same as in the entire UK.126 Norway, an important market
for Tesla has six hydrogen stations. Electricity is a necessary part of our infrastructure and is more or less
available anywhere as opposed to hydrogen. For a wide spread adoption of EV, infrastructure of EV-
charging stations is a critical component. EVs must provide a compelling price, range and
reliability. Today´s gasoline charging network has a leap start to EV. However, EVs has a
competitive advantage to gasoline vehicles as they can be recharged for free. Solar energy is an
abundant energy source that can be harnessed through solar cell panels connected to charging stations. As
EV-market leader Tesla is shaping the global landscape of EV-charging stations. However, they have a long
way to go in relation to charging time, range and expansion. This is especially the case in China.
123 See chart of the world’s most valuable automotive companies in the introduction 124 Toyota-global.com: www.toyota-global.com/innovation/environmental_technology/fuelcell_vehicle/ 125 Financial Times: www.ft.com/cms/s/2/a2d9151e-7427-11e5-a129-3fcc4f641d98.html#axzz415NeirkM 126 Financial Times: www.ft.com/cms/s/2/a2d9151e-7427-11e5-a129-3fcc4f641d98.html#axzz415NeirkM
45
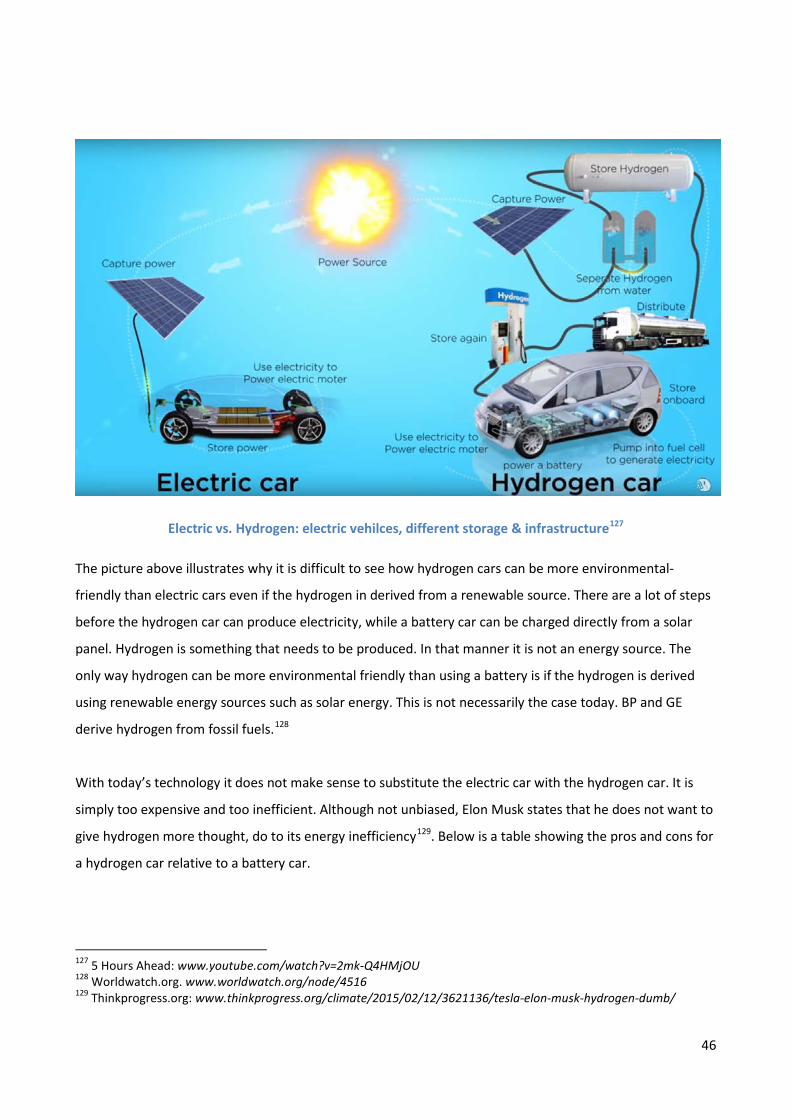
Electric vs. Hydrogen: electric vehilces, different storage & infrastructure127
The picture above illustrates why it is difficult to see how hydrogen cars can be more environmental-
friendly than electric cars even if the hydrogen in derived from a renewable source. There are a lot of steps
before the hydrogen car can produce electricity, while a battery car can be charged directly from a solar
panel. Hydrogen is something that needs to be produced. In that manner it is not an energy source. The
only way hydrogen can be more environmental friendly than using a battery is if the hydrogen is derived
using renewable energy sources such as solar energy. This is not necessarily the case today. BP and GE
derive hydrogen from fossil fuels.128
With today’s technology it does not make sense to substitute the electric car with the hydrogen car. It is
simply too expensive and too inefficient. Although not unbiased, Elon Musk states that he does not want to
give hydrogen more thought, do to its energy inefficiency129. Below is a table showing the pros and cons for
a hydrogen car relative to a battery car.
127 5 Hours Ahead: www.youtube.com/watch?v=2mk-Q4HMjOU 128 Worldwatch.org. www.worldwatch.org/node/4516 129 Thinkprogress.org: www.thinkprogress.org/climate/2015/02/12/3621136/tesla-elon-musk-hydrogen-dumb/
46
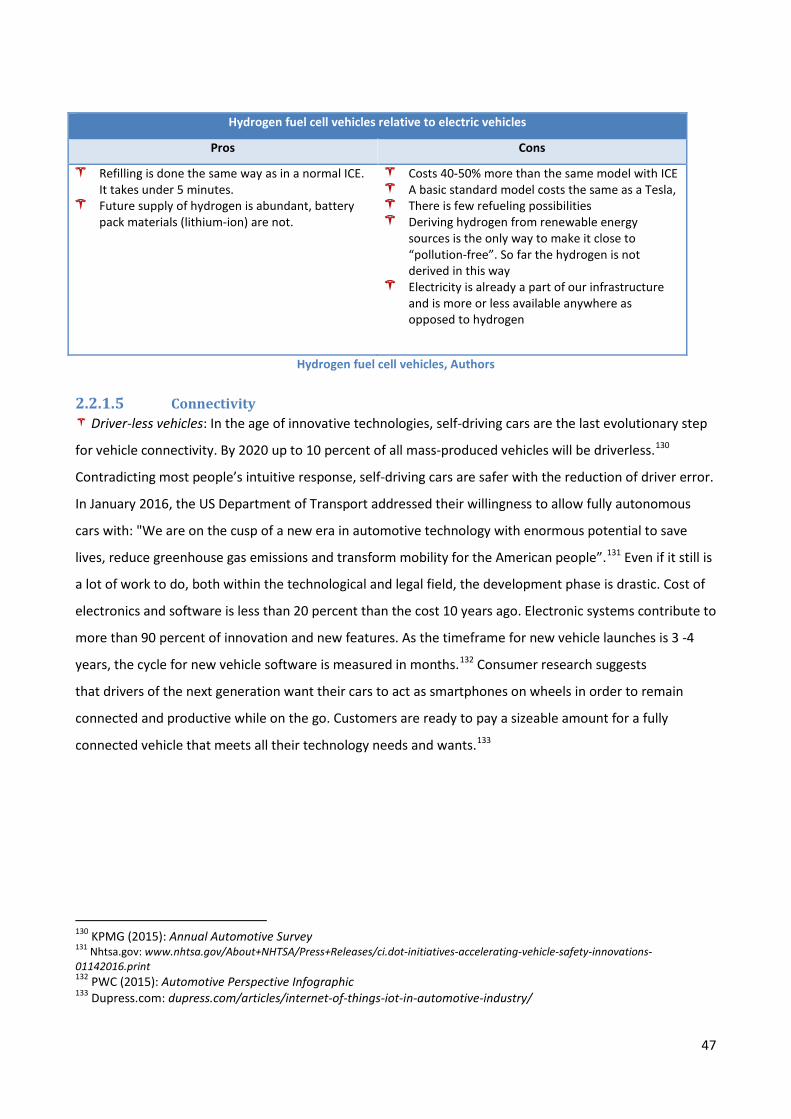
Hydrogen fuel cell vehicles relative to electric vehicles
Pros Cons
Refilling is done the same way as in a normal ICE. It takes under 5 minutes.
Future supply of hydrogen is abundant, battery pack materials (lithium-ion) are not.
Costs 40-50% more than the same model with ICE A basic standard model costs the same as a Tesla, There is few refueling possibilities Deriving hydrogen from renewable energy
sources is the only way to make it close to “pollution-free”. So far the hydrogen is not derived in this way
Electricity is already a part of our infrastructure and is more or less available anywhere as opposed to hydrogen
Hydrogen fuel cell vehicles, Authors
Connectivity 2.2.1.5 Driver-less vehicles: In the age of innovative technologies, self-driving cars are the last evolutionary step
for vehicle connectivity. By 2020 up to 10 percent of all mass-produced vehicles will be driverless.130
Contradicting most people’s intuitive response, self-driving cars are safer with the reduction of driver error.
In January 2016, the US Department of Transport addressed their willingness to allow fully autonomous
cars with: "We are on the cusp of a new era in automotive technology with enormous potential to save
lives, reduce greenhouse gas emissions and transform mobility for the American people”.131 Even if it still is
a lot of work to do, both within the technological and legal field, the development phase is drastic. Cost of
electronics and software is less than 20 percent than the cost 10 years ago. Electronic systems contribute to
more than 90 percent of innovation and new features. As the timeframe for new vehicle launches is 3 -4
years, the cycle for new vehicle software is measured in months.132 Consumer research suggests
that drivers of the next generation want their cars to act as smartphones on wheels in order to remain
connected and productive while on the go. Customers are ready to pay a sizeable amount for a fully
connected vehicle that meets all their technology needs and wants.133
130 KPMG (2015): Annual Automotive Survey 131 Nhtsa.gov: www.nhtsa.gov/About+NHTSA/Press+Releases/ci.dot-initiatives-accelerating-vehicle-safety-innovations-01142016.print 132 PWC (2015): Automotive Perspective Infographic 133 Dupress.com: dupress.com/articles/internet-of-things-iot-in-automotive-industry/
47
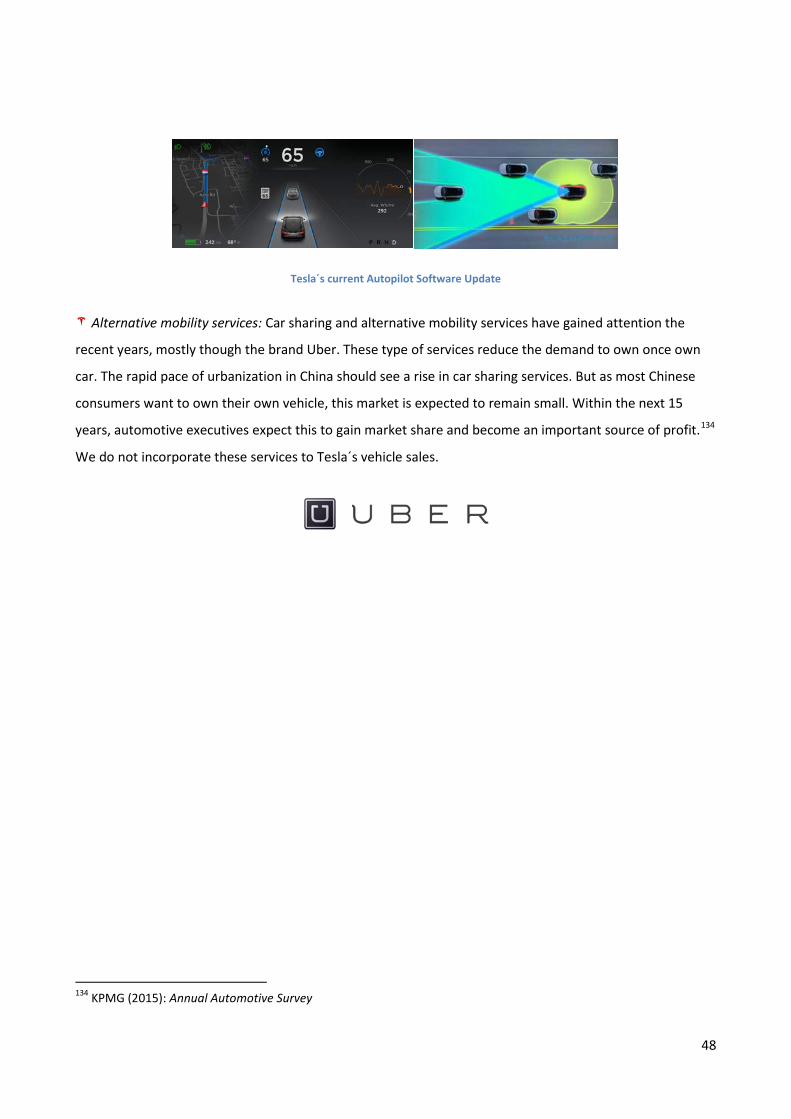
Tesla´s current Autopilot Software Update
Alternative mobility services: Car sharing and alternative mobility services have gained attention the
recent years, mostly though the brand Uber. These type of services reduce the demand to own once own
car. The rapid pace of urbanization in China should see a rise in car sharing services. But as most Chinese
consumers want to own their own vehicle, this market is expected to remain small. Within the next 15
years, automotive executives expect this to gain market share and become an important source of profit.134
We do not incorporate these services to Tesla´s vehicle sales.
134 KPMG (2015): Annual Automotive Survey
48
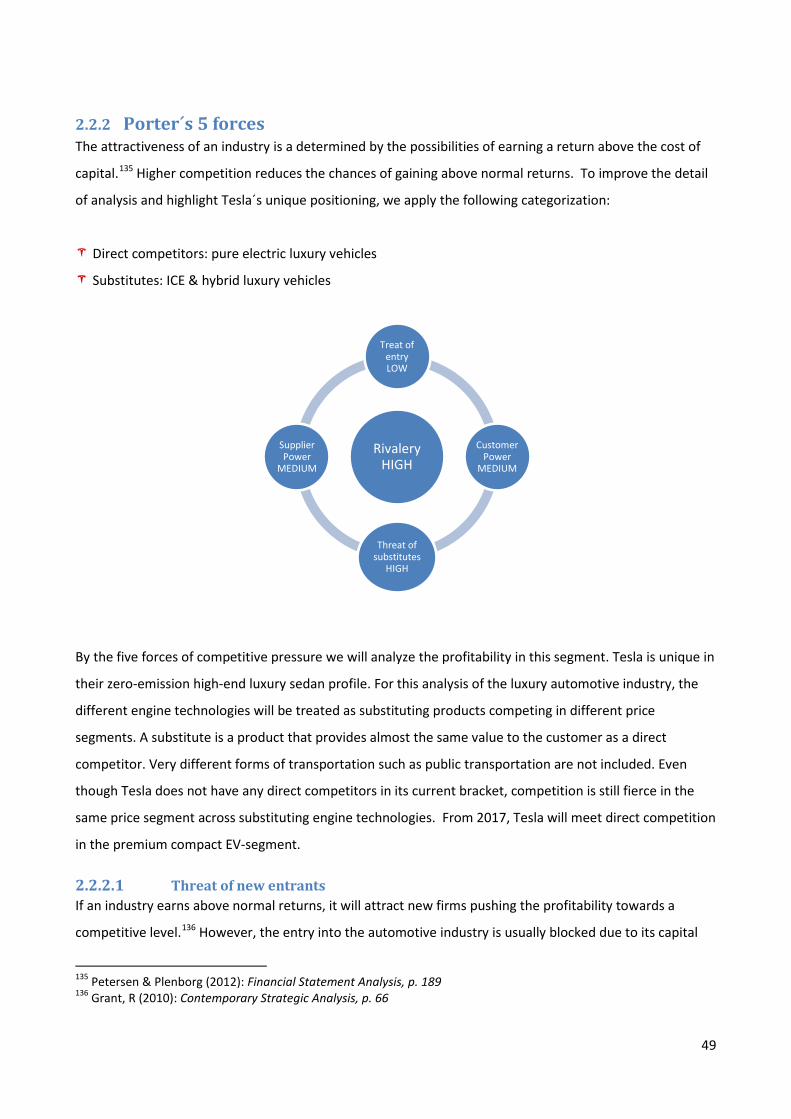
2.2.2 Porter´s 5 forces The attractiveness of an industry is a determined by the possibilities of earning a return above the cost of
capital.135 Higher competition reduces the chances of gaining above normal returns. To improve the detail
of analysis and highlight Tesla´s unique positioning, we apply the following categorization:
Direct competitors: pure electric luxury vehicles
Substitutes: ICE & hybrid luxury vehicles
By the five forces of competitive pressure we will analyze the profitability in this segment. Tesla is unique in
their zero-emission high-end luxury sedan profile. For this analysis of the luxury automotive industry, the
different engine technologies will be treated as substituting products competing in different price
segments. A substitute is a product that provides almost the same value to the customer as a direct
competitor. Very different forms of transportation such as public transportation are not included. Even
though Tesla does not have any direct competitors in its current bracket, competition is still fierce in the
same price segment across substituting engine technologies. From 2017, Tesla will meet direct competition
in the premium compact EV-segment.
Threat of new entrants 2.2.2.1If an industry earns above normal returns, it will attract new firms pushing the profitability towards a
competitive level.136 However, the entry into the automotive industry is usually blocked due to its capital
135 Petersen & Plenborg (2012): Financial Statement Analysis, p. 189 136 Grant, R (2010): Contemporary Strategic Analysis, p. 66
Rivalery HIGH
Treat of entry LOW
Customer Power
MEDIUM
Threat of substitutes
HIGH
Supplier Power
MEDIUM
49
intensity and fierce competition. Other protective factors are the high degree of product differentiation and
of competition in the industry, which make it less attractive. A positive factor for new entrants is that the
switching costs of customers are not prohibitively high.
CAPEX & Scale Economies: Auto manufacturing is one of the most capital-intensive industries on earth,
which is a major reason why there hasn't been a successful new US auto entrant in nearly a century other
than Tesla.137 Tesla´s has rarely generated positive free cash flow. The initial investments in R&D and
manufacturing capabilities can reach $ 1 Billion. This is a reason why most new entries into the premium
segment have been from large manufacturers such as Toyota (with Lexus) and Nissan (with Infinity). The
capital requirements of the automotive industry might block all but a few of the world’s largest companies
such as Google and Apple.
According to Elon Musk, Apple is currently working on their own electric car, although not publicly
announced. Apple has reportedly hired a number of engineers, software programmers, and other experts
from the automobile segment over the last year.138 The typically high investments in R&D, production
facilities and marketing must be amortized over a large volume of automobiles in order to achieve cost
efficiencies. This poses an obvious barrier to the typical low volume automobile start-up. Currently BMW,
Daimler, Nissan, Fiat, Ford and Mitsubishi have electric vehicles on the market. Porsche, Lexus, Audi,
Volkswagen and Volvo are in the development phase. Chinese manufacturers have started producing EVs
for the Chinese market, and some of these are expected to enter the US market, such as BYD (funded by
Warren Buffet). General Motors GM has partnered with a Korean electronics company LG to produce
lithium-ion car batteries. Also, Faraday Future, an electric car manufacturer based in California, has teamed
up with Chinese technology company Letv to build a $ 1 billion lithium-ion battery facility. Both of these
partnerships pose a serious threat to Tesla’s domination of the electric vehicle market.139
Brand: The brand equity is regarded as the second most important entry barrier. Customers in the
premium segment buy the symbols of exclusivity, superior quality and performance. Several Asian
manufacturers have created luxury brands to compete with the European and American brands for
decades, but overcoming decades of prestige and history is hard. Toyota´s Lexus have been able to make
137 Fool.com: www.fool.com/investing/general/2016/01/18/is-bob-lutz-wrong-about-tesla-motors.aspx?source=eogyholnk0000001&utm_source=yahoo&utm_medium=feed&utm_campaign=article 138 Yahoo Finance: finance.yahoo.com/news/apple-entering-electric-car-market-160616749.html 139 Yahoo Finance: finance.yahoo.com/news/panasonic-backs-teslas-gigafactory-investing-190107913.html
50
their entry in the US luxury market, but the German trio still dominates 80 percent of the market due to
their strong brands.
Government and legal barriers: Complying with regulatory requirements such as environmental and
safety standards might weigh more heavily on incumbents due to economies of scale. However, by focusing
on environment friendly EVs and safety improving autopilot functions, barriers might be lower due to
governmental subsidies. This might both protect and fuel the growth of Tesla and other high-tech EV-
manufacturer. Across borders, governments tend to protect and support national OEMs, as these are often
extremely important for the national economy and labor force.
Our conclusion is that the threat of new entrants is medium
Threat of substitutes 2.2.2.2
Price segments: A luxury vehicle provides two basic needs; transportation and the assortment of the
privileged status of the driver. A substitute for premium vehicles would be shifting either one step up or
down the price segment. The distinction between luxury vehicle segmentation is sometimes unclear. The
cash price of each model can vary up to 50 percent depending on option choices, as in Tesla´s case. Further,
the vast technological progress made in the automotive industry makes previously luxury features available
also in-luxury vehicles. This includes driving assistance systems and touch screens. Luxury vehicles are
forced to innovate rapidly to maintain their exclusivity. Further, a worse economic situation might lead
customers towards cheaper vehicles or even used cars, as their disposable income decreases or financing
options become more expensive.
Powertrain technology: Tesla primarily competes in the extremely competitive premium sedan market
with more established internal combustion manufacturers.140 The competition from BMW, Audi, and
Mercedes are a direct threat to Tesla´s market and profits. Further, hybrid vehicles are expected to grow in
popularity over the next years. As discussed in the PESTEL analysis, hydrogen is not considered to be a treat
in the near future.
Our conclusion is that the threat of substitutes is extremely high
140 Tesla Motors: Annual Report 2015
51
Supplier bargaining power 2.2.2.3The automotive supply business is highly fragmented. Many suppliers depend on one or two automakers
for their products. If an automaker wants to switch supplier, this is devastating for the actual supplier. In
the luxury segment suppliers are less weak, since luxury cars require exclusive materials and manufactured
parts of high quality, which only a smaller number of suppliers are able to deliver. This makes the switching
costs for luxury car makers higher than those of mass-market manufacturers. International sourcing is less
of a threat too, since the need to preserve an image of excellence and prestige can restrict the ability to
purchase parts from firms located in emerging countries. Tesla´s vehicles use over 3000 parts sourced from
350 suppliers. Like many other luxury automotive manufacturers, many of these are sourced from a single
supplier. The most critical items are battery packs and lithium.
Battery packs: Tesla has fully qualified only one cell for battery packs used in production vehicles. But as
battery production becomes in-house, this improves the Tesla´s bargaining power.
Lithium: Tesla needs the lithium industry. Lithium is the only part of the supply chain that Tesla has not
arranged any contracts.
Our conclusion is that supplier bargaining power is medium.
Customer bargaining power 2.2.2.4In the automotive industry, customers generally have high bargain power given many suppliers of relatively
homogenous products and high degree of information. This is almost true also for the luxury segment.
However, the customers in the pure electric segment looking for any of the additional luxury features
(premium performance, long range, charging infrastructure, status and comfort) have only on option. Tesla
is the only pure electric luxury manufacturer. Customers’ lack of options in this niche category reduces
customer bargaining power to medium.
Generally customers have substantial power, mainly because of the large variety of luxury brands and
products to choose from, and because of the presence of substitutes. The market offers customers many
different brands and car models, with widely differing performance, quality, appearance, pricing and
additional features. The customer can freely choose the product that best fits his / hers preferences, status
and lifestyle among many. The Internet has improved customers’ access to information about the
characteristics of car models, and to the experience and reviews of past users and experts. That forces
premium car makers to continuously improve quality in order to not fail to meet the high expectations of
customers and also to not fall behind competitors’ innovations. On the other hand, once a customer has
52
bought a car, there are moderate switching costs to change to another, since the current car’s value wills is
reduced when it is sold in the used car market or returned to the car-dealer. Brand loyalty in the luxury car
segment is higher than for lower-end cars, since customers tend to develop a closer emotional relationship
between their self-image and their car’s brand (provided that the expectations are being met). Another
favorable factor for car-companies is that the size of buyers and of their individual orders is small, since
most of the customers buy only one car every some years, reducing the significance of the behavior of an
individual customer. The presence of many substitutes to luxury cars enhances significantly the bargaining
power of potential customers. Customers may choose to use any of a wide range of transportation devices
instead of luxury cars to move; for instance in a period of economic recession or slowdown such as that of
2007-2012, potential buyers are likely become more cost conscious and switch to less glamorous, but
cheaper and more “normal” cars.
Our conclusion is that customer bargaining power is medium.
Rivalry in the industry 2.2.2.5Rivalry is a consequence of one or more of the players in an industry wanting to change and promote their
position in the competitive landscape. High rivalry indicates that the potential for profits are limited.141
Premium segment: The worldwide automotive market is highly competitive. The global market leaders
as BMW, Mercedes and Audi compete intensely, with Lexus getting a foothold in the US Luxury market. The
competition is to a larger degree extending to emerging markets, where companies hope to get buyers
from the growing middle class of China.
In a vehicle model perspective, Tesla´s flagship vehicle the Model S, is US market leader in both the EV and
the luxury cars segment. However, on a company level Tesla remains an incumbent automotive
manufacturer without the financial muscles, brand value or customer base of their peers. Therefore, many
of Tesla´s current and future competitors many have greater financial, manufacturing, technical, marketing
and other resources. By this these competitors may be able to devote greater resources to the design,
development, manufacturing, distribution, promotion, sale and support of their products. Further these
companies have greater customer bases, industry ties, operating histories and name recognition.142 Linked
to the high entry barriers, the high sunk costs generate high exit barriers. Companies in loss may stay in the
market increasing the rivalry.
141 Petersen & Plenborg 2012, Financial Statement Analysis 142 Tesla Motors: Q3 Report 2015, p. 36
53
Premium automotive manufacturers also compete to become the technological leader. More non-premium
vehicles gain technological features previously behold of premium vehicles. Premium manufacturers are
answering with upgrading their technological features in order to preserve their premium attribute. The
market for “connectivity” is expected to be the next big thing. Tesla is regarded as one of the market
leaders in this development. In this field BMW, Daimler, GM, Volkswagen, Toyota and Tesla are regards as
the leading.143
Alternative fuel: The market for alternative fuel is particularly competitive. The hybrid segment is
expected to take market share from the ICE segment in the years to come. In the hybrid market, GM,
Toyota, Ford and Honda are strong competitors. Tesla is expected to become even more competitive as the
lower priced vehicle model 3 is released in 2017.144 (See table in introduction). Unlike the Model S & X,
there are direct competitors in sight. Specifications look very competitive, however as beauty is in the eye
of the beholder, Tesla a significant esthetic advantage. Brand equity, price and range will also be key
competitive factors. It is reasonable that by the time Model 3 reach the same scale production as their EV-
competitors in 2-3 years, the competitors presented above would most likely have improved in
performance and maybe also price. EV-manufacturers will benefit from the growing market of alternative
fuel vehicles. Market growth is driven by oil concerns, carbon dioxide emissions, rapid technology advances
and growing congestion.
Our conclusion is that rivalry in the industry is high
2.2.3 Sub-conclusion: Industry analysis
Q2: How do industry specific factors affect the share price?
+ The global industry CAGR 145 of ~4.7 %, mainly driven by China. The increasing Chinese
demand represents an opportunity for Tesla, despite the current high entry barriers.
+ EV´s expected to be competitive with gasoline cars by 2022, due to low battery costs. After
this, the low battery cost is expected to become a competitive advantage of EV´s.
- The premium vehicle and EV segments are highly competitive. We expect competition to
further increase in the EV-segment after Model 3 in 2017.
143 KMPG (2015): Annual Automotive Survey 144 Tesla Motors: Annual Report 2015 145 CAGR = Compounded Annual Growth Rate
54
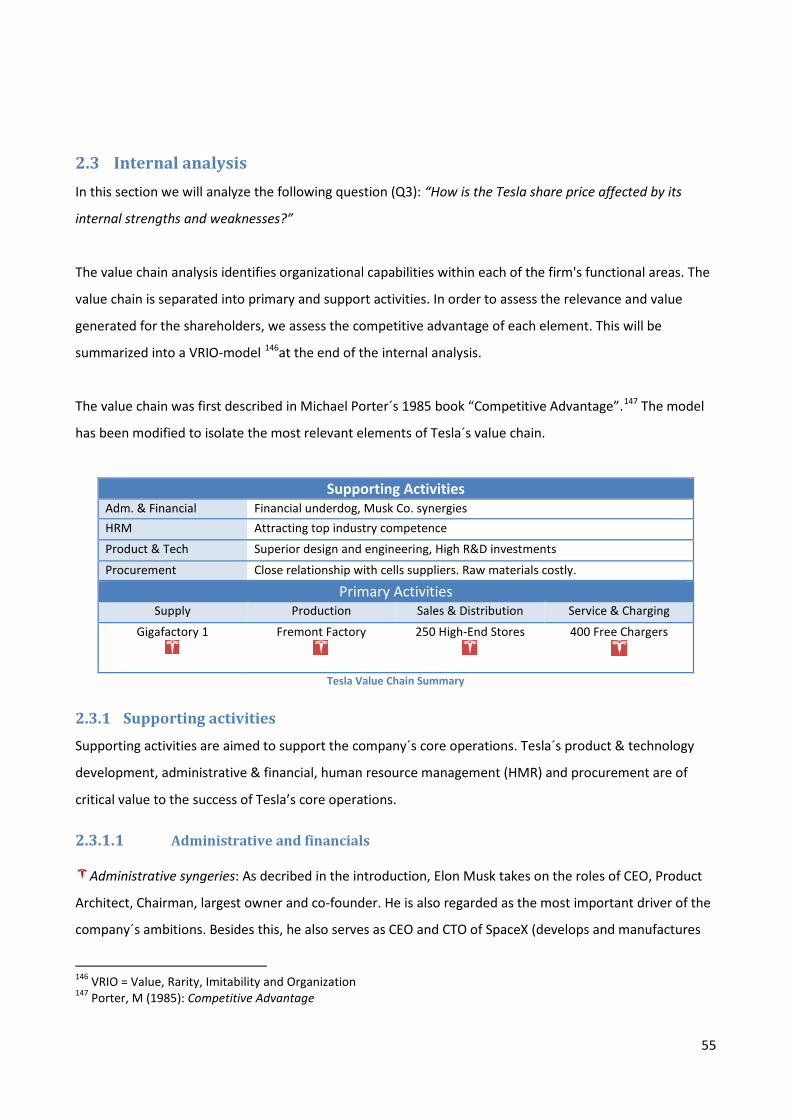
2.3 Internal analysis In this section we will analyze the following question (Q3): “How is the Tesla share price affected by its
internal strengths and weaknesses?”
The value chain analysis identifies organizational capabilities within each of the firm's functional areas. The
value chain is separated into primary and support activities. In order to assess the relevance and value
generated for the shareholders, we assess the competitive advantage of each element. This will be
summarized into a VRIO-model 146at the end of the internal analysis.
The value chain was first described in Michael Porter´s 1985 book “Competitive Advantage”.147 The model
has been modified to isolate the most relevant elements of Tesla´s value chain.
Supporting Activities Adm. & Financial Financial underdog, Musk Co. synergies HRM Attracting top industry competence Product & Tech Superior design and engineering, High R&D investments
Procurement Close relationship with cells suppliers. Raw materials costly.
Primary Activities Supply Production Sales & Distribution Service & Charging
Gigafactory 1
Fremont Factory
250 High-End Stores
400 Free Chargers
Tesla Value Chain Summary
2.3.1 Supporting activities
Supporting activities are aimed to support the company´s core operations. Tesla´s product & technology
development, administrative & financial, human resource management (HMR) and procurement are of
critical value to the success of Tesla’s core operations.
Administrative and financials 2.3.1.1
Administrative syngeries: As decribed in the introduction, Elon Musk takes on the roles of CEO, Product
Architect, Chairman, largest owner and co-founder. He is also regarded as the most important driver of the
company´s ambitions. Besides this, he also serves as CEO and CTO of SpaceX (develops and manufactures
146 VRIO = Value, Rarity, Imitability and Organization 147 Porter, M (1985): Competitive Advantage
55
space launch vehicles) and the Chairman of Solar City (solar provider). Tesla and SpaceX shares operational
similarities as they both are high-tech manufacturing companies. Tesla does part of its design and
engineering in the SpaceX rocket factory in Hawthorne, California. Tesla and SolarCity both relate to
renewable energy. Tesla are benefitting greatly from the supply of solar cell panels from SolarCity,
providing the Superchargers with free electricity. This infrastructure is however not fully developed.
Even though Musk is highly active in Tesla´s management, he cannot devote his whole time to the
company. Musk splits his time almost 50 – 50 between Tesla and SpaceX. Still, the time limitations caused
by his level of multitasking might be compensated by the synergies of running such interconnected
companies. As this is regarded as a competitive advantage, Musk is not promised to stick around after
model 3 hits the market. We regard the dependency of Musk and certain other high-ranging executives as a
critical risk factor for Tesla.
Companies Run By Elon Musk
Financials: Tesla has historically strong funding capabilities. This is needed to cover the huge
investments and day-to-day cash burn rate. According to Thilo Koslowski, the vice president and
automotive practice leader at technology research firm Gartner Inc. “Tesla won’t have any problems raising
funds. There are plenty of people out there who believe in Musk’s vision.”148 However, Tesla is an industry
light-weight. Their financial infrastructure is similar to that one of a start-up. Tesla is primarily equity
financed due to their high-risk profile. Still, they are investing heavily in manufacturing and R&D in order to
reach their 500.000 vehicle goal for 2020. Compared to the more mature Original Equipment’s
Manufacturers (OEMs) Tesla has relatively small financial muscles to tackle financial hurdles and
challenges. In case of a mass scale recall of Tesla vehicles (for example due to safety issues related to either
batteries or technology), Tesla might go bankrupt. Similarly, if the market adoption of their vehicles is lower
than expected Tesla operates with a relatively smaller margin of safety.
Product and technology development 2.3.1.2Tesla´s core competence is powertrain engineering, vehicle engineering and innovative manufacturing. The
core intellectual property is contained within the electric powertrain and the development of vehicles that
capitalizes on the “uniqueness of an electric powertrain”. Tesla has high investments in R&D related to the
148 Ibtimes.com: www.ibtimes.com/tesla-motors-secures-750m-credit-it-desperately-needs-cover-daily-costs-it-burns-1965838
56
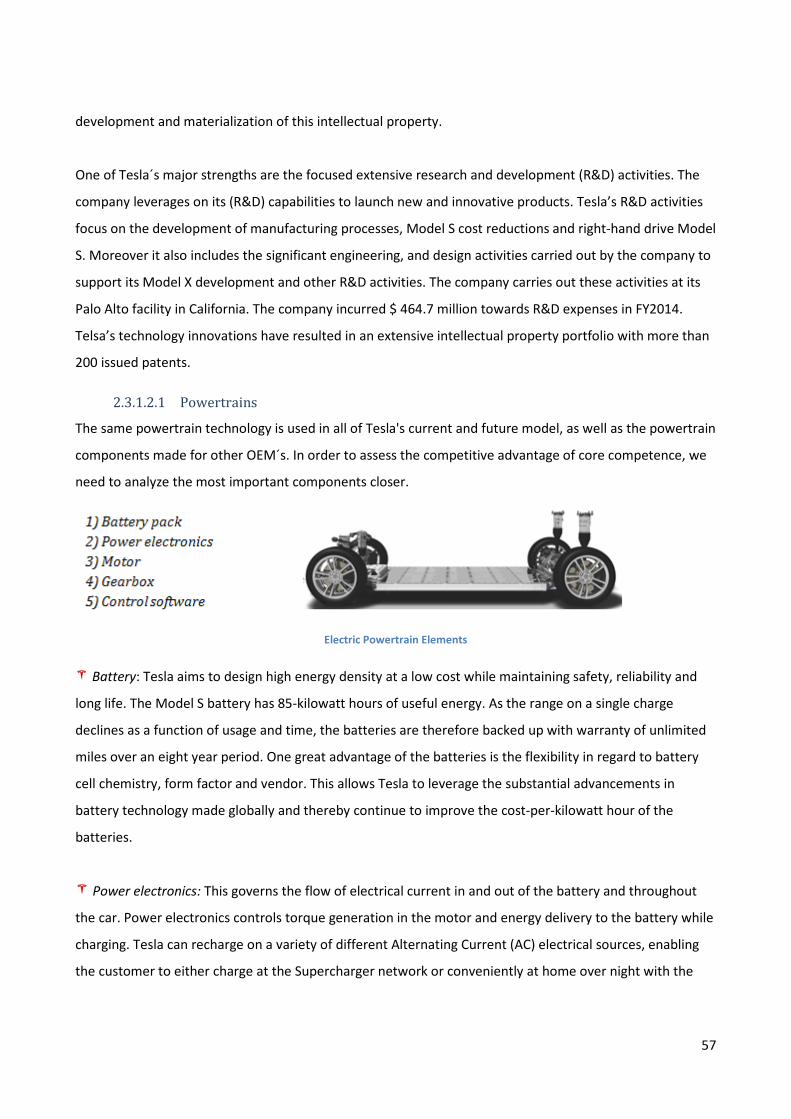
development and materialization of this intellectual property.
One of Tesla´s major strengths are the focused extensive research and development (R&D) activities. The
company leverages on its (R&D) capabilities to launch new and innovative products. Tesla’s R&D activities
focus on the development of manufacturing processes, Model S cost reductions and right-hand drive Model
S. Moreover it also includes the significant engineering, and design activities carried out by the company to
support its Model X development and other R&D activities. The company carries out these activities at its
Palo Alto facility in California. The company incurred $ 464.7 million towards R&D expenses in FY2014.
Telsa’s technology innovations have resulted in an extensive intellectual property portfolio with more than
200 issued patents.
2.3.1.2.1 Powertrains
The same powertrain technology is used in all of Tesla's current and future model, as well as the powertrain
components made for other OEM´s. In order to assess the competitive advantage of core competence, we
need to analyze the most important components closer.
Electric Powertrain Elements
Battery: Tesla aims to design high energy density at a low cost while maintaining safety, reliability and
long life. The Model S battery has 85-kilowatt hours of useful energy. As the range on a single charge
declines as a function of usage and time, the batteries are therefore backed up with warranty of unlimited
miles over an eight year period. One great advantage of the batteries is the flexibility in regard to battery
cell chemistry, form factor and vendor. This allows Tesla to leverage the substantial advancements in
battery technology made globally and thereby continue to improve the cost-per-kilowatt hour of the
batteries.
Power electronics: This governs the flow of electrical current in and out of the battery and throughout
the car. Power electronics controls torque generation in the motor and energy delivery to the battery while
charging. Tesla can recharge on a variety of different Alternating Current (AC) electrical sources, enabling
the customer to either charge at the Supercharger network or conveniently at home over night with the
57
Tesla Mobile Connector.
Vehicle control & infotainment systems: In order to leverage performance and safety systems of the
vehicles and battery packs, advanced control software is required. The numerous processors in the car
require custom software algorithms providing control traction, stability, sustained acceleration and
regenerative breaking. Almost all of this software is developed internally providing a smoother interface.
Tesla also delivers autopilot systems that include road tracking, lane changing, automatic parking, driver
warning systems and automatic braking functions.
Tesla now has years of experience in powertrain development to both self and other OEMs, with a huge
leap to its competitors. This leap is regarded as a sustainable competitive advantage.
2.3.1.2.2 Design and engineering
Tesla has developed significant in-house abilities to both design and engineer EVs and has core
competencies in computer aided design and crash test simulations. This reduces the time-to-market for
new models. Several sub-systems of traditional automobiles need substantial redesign to work with an
electrical powertrain. This includes the Heating, Ventilation and Air Conditioning (HVAC) system to match
the different heat generation between EVs and ICE cars, as well as reducing the weight of the car to
maximize range. The cars are built with a lightweight aluminum body and chassis. The design and
engineering is a competitive advantage.
The company leverages on its core competencies which include powertrain, vehicle engineering and
innovative manufacturing. These capabilities provide the company a competitive edge over its peers.
Tesla’s core intellectual property comprises the electric powertrain. The electric powertrain consists of the
battery pack, power electronics, motor, and gearbox and control software. The company’s battery pack
system store significant amount of energy to power and run the electric car. The battery packs have a
modular design enabling them to leverage technology developments for different vehicles and other
products. The battery pack system includes cooling systems, safety systems, charge balancing systems,
battery engineering for vibration and environmental durability, robotic manufacturing processes,
customized motor design and the software and electronics management systems for managing the
performance of its battery systems. The electric powertrain also comprises power electronics which
manage the flow of electrical current throughout the car. Furthermore, the powertrain also includes
sophisticated control software which monitors the performance and safety of its system. These are
integrated to form a complete system for driving the electric vehicles. Tesla’s powertrain and battery pack
58
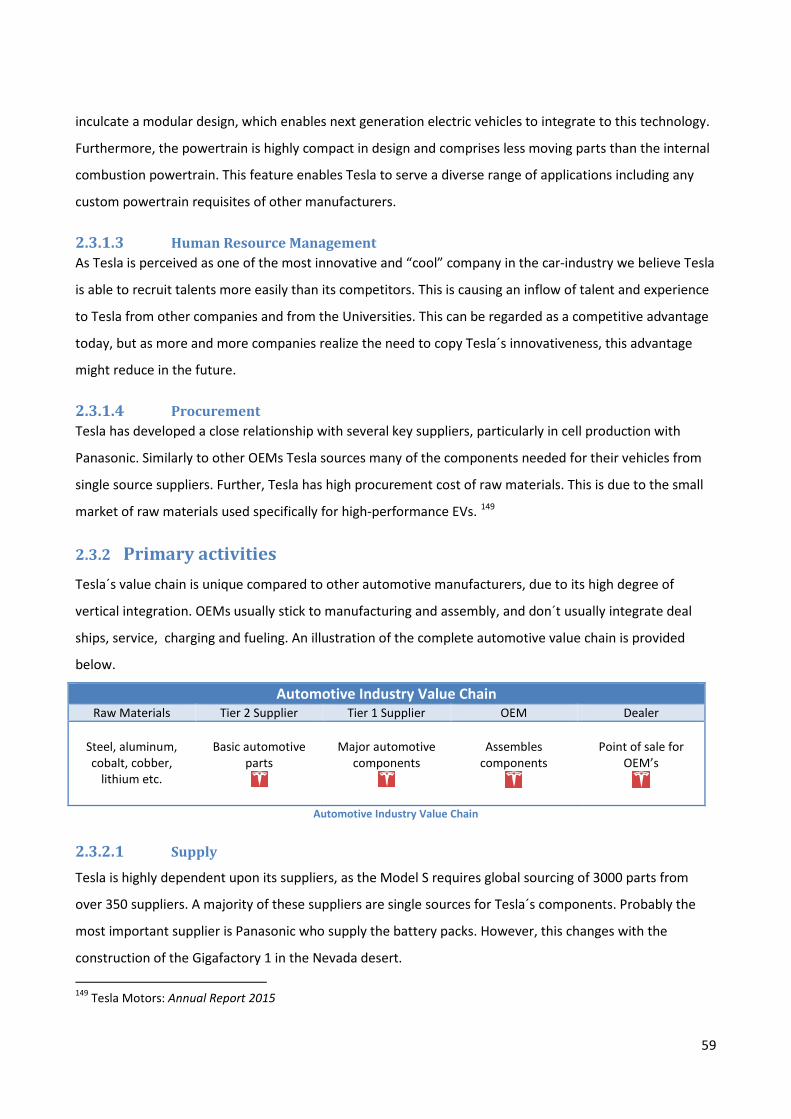
inculcate a modular design, which enables next generation electric vehicles to integrate to this technology.
Furthermore, the powertrain is highly compact in design and comprises less moving parts than the internal
combustion powertrain. This feature enables Tesla to serve a diverse range of applications including any
custom powertrain requisites of other manufacturers.
Human Resource Management 2.3.1.3As Tesla is perceived as one of the most innovative and “cool” company in the car-industry we believe Tesla
is able to recruit talents more easily than its competitors. This is causing an inflow of talent and experience
to Tesla from other companies and from the Universities. This can be regarded as a competitive advantage
today, but as more and more companies realize the need to copy Tesla´s innovativeness, this advantage
might reduce in the future.
Procurement 2.3.1.4Tesla has developed a close relationship with several key suppliers, particularly in cell production with
Panasonic. Similarly to other OEMs Tesla sources many of the components needed for their vehicles from
single source suppliers. Further, Tesla has high procurement cost of raw materials. This is due to the small
market of raw materials used specifically for high-performance EVs. 149
2.3.2 Primary activities Tesla´s value chain is unique compared to other automotive manufacturers, due to its high degree of
vertical integration. OEMs usually stick to manufacturing and assembly, and don´t usually integrate deal
ships, service, charging and fueling. An illustration of the complete automotive value chain is provided
below.
Automotive Industry Value Chain Raw Materials Tier 2 Supplier Tier 1 Supplier OEM Dealer
Steel, aluminum, cobalt, cobber,
lithium etc.
Basic automotive
parts
Major automotive
components
Assembles
components
Point of sale for
OEM’s
Automotive Industry Value Chain
Supply 2.3.2.1Tesla is highly dependent upon its suppliers, as the Model S requires global sourcing of 3000 parts from
over 350 suppliers. A majority of these suppliers are single sources for Tesla´s components. Probably the
most important supplier is Panasonic who supply the battery packs. However, this changes with the
construction of the Gigafactory 1 in the Nevada desert.
149 Tesla Motors: Annual Report 2015
59
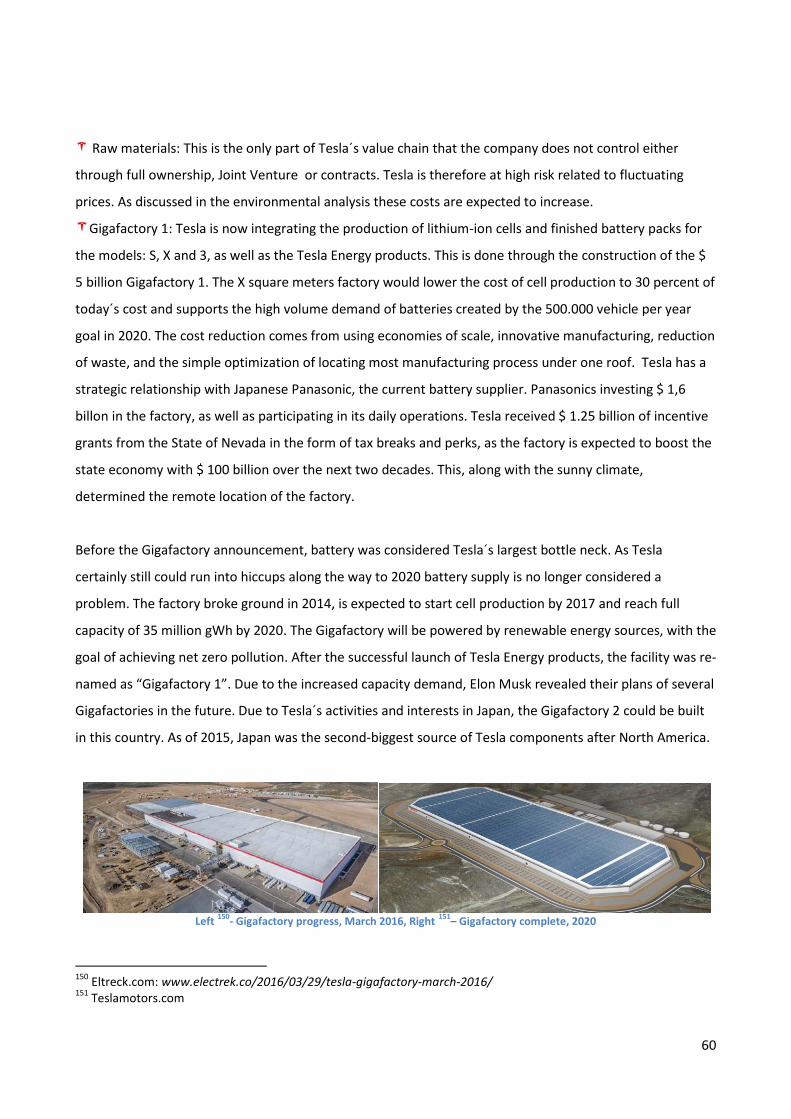
Raw materials: This is the only part of Tesla´s value chain that the company does not control either
through full ownership, Joint Venture or contracts. Tesla is therefore at high risk related to fluctuating
prices. As discussed in the environmental analysis these costs are expected to increase.
Gigafactory 1: Tesla is now integrating the production of lithium-ion cells and finished battery packs for
the models: S, X and 3, as well as the Tesla Energy products. This is done through the construction of the $
5 billion Gigafactory 1. The X square meters factory would lower the cost of cell production to 30 percent of
today´s cost and supports the high volume demand of batteries created by the 500.000 vehicle per year
goal in 2020. The cost reduction comes from using economies of scale, innovative manufacturing, reduction
of waste, and the simple optimization of locating most manufacturing process under one roof. Tesla has a
strategic relationship with Japanese Panasonic, the current battery supplier. Panasonics investing $ 1,6
billon in the factory, as well as participating in its daily operations. Tesla received $ 1.25 billion of incentive
grants from the State of Nevada in the form of tax breaks and perks, as the factory is expected to boost the
state economy with $ 100 billion over the next two decades. This, along with the sunny climate,
determined the remote location of the factory.
Before the Gigafactory announcement, battery was considered Tesla´s largest bottle neck. As Tesla
certainly still could run into hiccups along the way to 2020 battery supply is no longer considered a
problem. The factory broke ground in 2014, is expected to start cell production by 2017 and reach full
capacity of 35 million gWh by 2020. The Gigafactory will be powered by renewable energy sources, with the
goal of achieving net zero pollution. After the successful launch of Tesla Energy products, the facility was re-
named as “Gigafactory 1”. Due to the increased capacity demand, Elon Musk revealed their plans of several
Gigafactories in the future. Due to Tesla´s activities and interests in Japan, the Gigafactory 2 could be built
in this country. As of 2015, Japan was the second-biggest source of Tesla components after North America.
Left 150- Gigafactory progress, March 2016, Right 151– Gigafactory complete, 2020
150 Eltreck.com: www.electrek.co/2016/03/29/tesla-gigafactory-march-2016/ 151 Teslamotors.com
60
Both the cost and complexity of building and operating such an enormous factory might exceed current
anticipations. Tesla´s CEO is known for setting highly ambitious deadlines. Further, Tesla´s has no direct
experience of producing lithium-ion batteries themselves, or building a facility of this size. Any delays or
problems would affect Tesla´s brand, financial conditions and operating result. As this timely completion
remains one of company´s main risk factor the coming years, the complete Gigafactory will remain one of
Tesla´s most important sustainable competitive advantages.
Production 2.3.2.2 Fremont factory (Assembly): Tesla manufactures their cars in their self-owned Fremont Factory, close to
the Palo Alto Headquarter. The factory contains 5.3 million square feet of manufacturing and office space,
currently able to produce 100.000 vehicles annually. GM and Toyota once owned the factory in a joint
venture operation with the peak production 500.000 vehicles per year. By being the single owner, Tesla has
secured the production capacity to reach their 500.000 vehicle goal. Tesla also owns a manufacturing
facility in Lathrop, California, to produce various aluminum components. The factory is continuously
improved in order to ramp up production. The past year $ 1,6 billion have been invested in the factory to
expand and improve its robotic assembly line. At the same time, head count has increased with 29 percent
now totaling at 13,058152 The ramping production of Model X and 3 (of which the latter is intended to
support the basis of their 2020 sales goals) might experience significant delays or other complications. The
disappointing Model X delivery statistics in 2015 of only 208 vehicles, warn shareholders of such a risk
factor. The Model X and 3 share their production facility with Model S. With the simultaneous production
of current and future models, as well as Tesla Energy products, delays remain a key risk factor.
Sales and distribution 2.3.2.3Tesla´s distribution model is significantly different from other Original Equipment Manufacturers (OEMs).
While other OEMs rely on external automotive dealerships to sell their vehicles, Tesla sells their vehicles
through their company-owned Tesla Store and over the Internet.
Company owned stores & Internet sales: There are several challenges related to Tesla´s vertical
integration. First, it imposes a slower expansion in addition to more expenditure, while other OEMs have
more established distribution channels. Second, the zero inventory strategy imposes a long waiting time
for customers. As the waiting time takes several months, this can eliminate the most impatient customers.
However, experience of entering a Tesla store, located in either high-end malls or "affluent suburbs", is
152 Teslarati.com: www.teslarati.com/analysts-tour-tesla-factory-cite-stunning-progress/
61
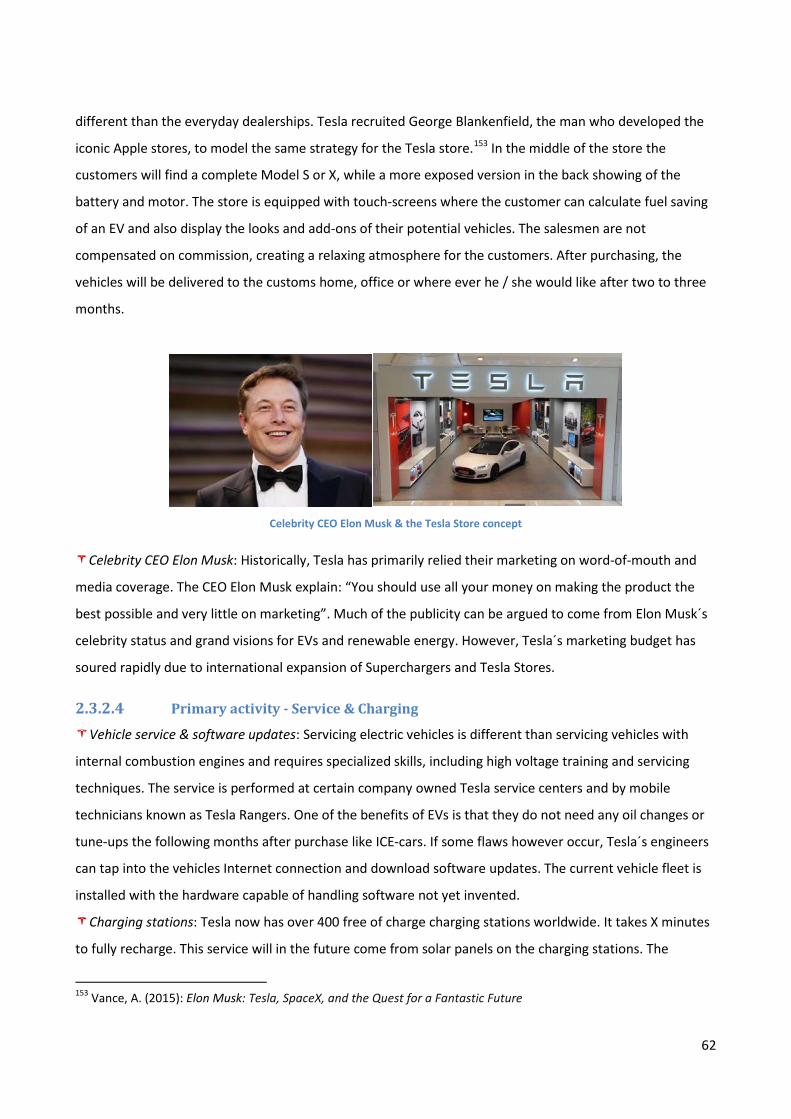
different than the everyday dealerships. Tesla recruited George Blankenfield, the man who developed the
iconic Apple stores, to model the same strategy for the Tesla store.153 In the middle of the store the
customers will find a complete Model S or X, while a more exposed version in the back showing of the
battery and motor. The store is equipped with touch-screens where the customer can calculate fuel saving
of an EV and also display the looks and add-ons of their potential vehicles. The salesmen are not
compensated on commission, creating a relaxing atmosphere for the customers. After purchasing, the
vehicles will be delivered to the customs home, office or where ever he / she would like after two to three
months.
Celebrity CEO Elon Musk & the Tesla Store concept
Celebrity CEO Elon Musk: Historically, Tesla has primarily relied their marketing on word-of-mouth and
media coverage. The CEO Elon Musk explain: “You should use all your money on making the product the
best possible and very little on marketing”. Much of the publicity can be argued to come from Elon Musk´s
celebrity status and grand visions for EVs and renewable energy. However, Tesla´s marketing budget has
soured rapidly due to international expansion of Superchargers and Tesla Stores.
Primary activity - Service & Charging 2.3.2.4Vehicle service & software updates: Servicing electric vehicles is different than servicing vehicles with
internal combustion engines and requires specialized skills, including high voltage training and servicing
techniques. The service is performed at certain company owned Tesla service centers and by mobile
technicians known as Tesla Rangers. One of the benefits of EVs is that they do not need any oil changes or
tune-ups the following months after purchase like ICE-cars. If some flaws however occur, Tesla´s engineers
can tap into the vehicles Internet connection and download software updates. The current vehicle fleet is
installed with the hardware capable of handling software not yet invented.
Charging stations: Tesla now has over 400 free of charge charging stations worldwide. It takes X minutes
to fully recharge. This service will in the future come from solar panels on the charging stations. The
153 Vance, A. (2015): Elon Musk: Tesla, SpaceX, and the Quest for a Fantastic Future
62
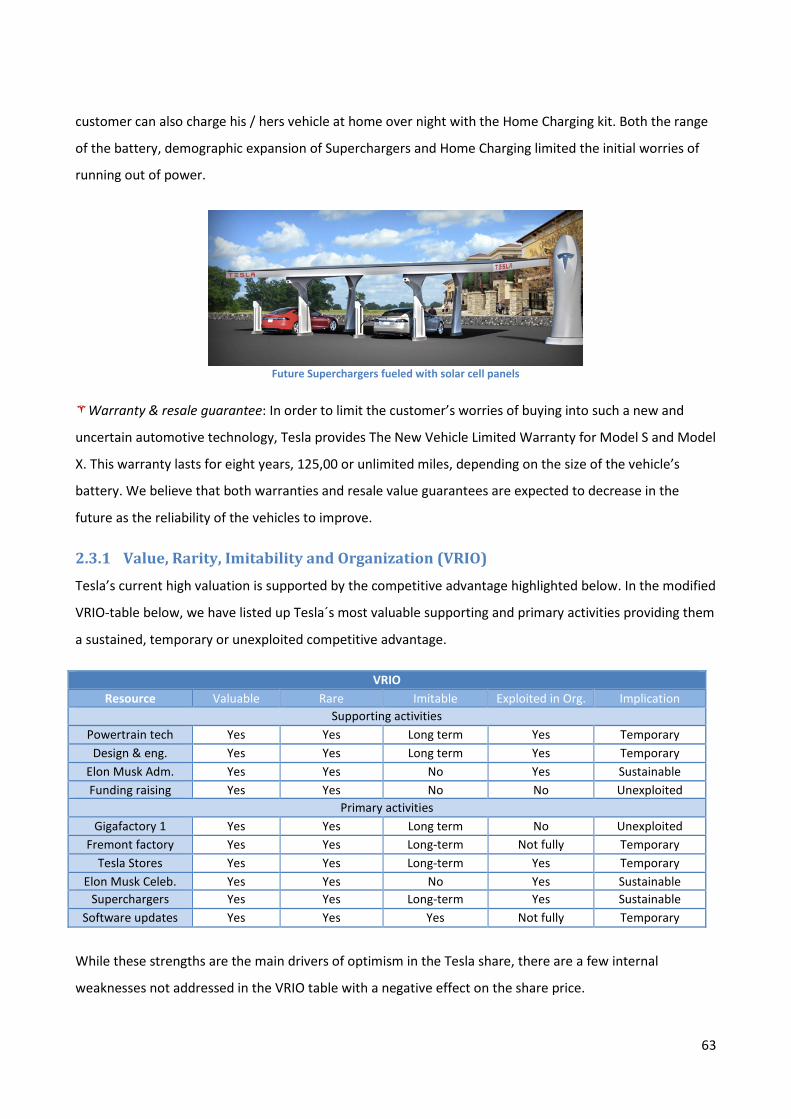
customer can also charge his / hers vehicle at home over night with the Home Charging kit. Both the range
of the battery, demographic expansion of Superchargers and Home Charging limited the initial worries of
running out of power.
Future Superchargers fueled with solar cell panels
Warranty & resale guarantee: In order to limit the customer’s worries of buying into such a new and
uncertain automotive technology, Tesla provides The New Vehicle Limited Warranty for Model S and Model
X. This warranty lasts for eight years, 125,00 or unlimited miles, depending on the size of the vehicle’s
battery. We believe that both warranties and resale value guarantees are expected to decrease in the
future as the reliability of the vehicles to improve.
2.3.1 Value, Rarity, Imitability and Organization (VRIO)
Tesla’s current high valuation is supported by the competitive advantage highlighted below. In the modified
VRIO-table below, we have listed up Tesla´s most valuable supporting and primary activities providing them
a sustained, temporary or unexploited competitive advantage.
VRIO Resource Valuable Rare Imitable Exploited in Org. Implication
Supporting activities Powertrain tech Yes Yes Long term Yes Temporary
Design & eng. Yes Yes Long term Yes Temporary Elon Musk Adm. Yes Yes No Yes Sustainable Funding raising Yes Yes No No Unexploited
Primary activities Gigafactory 1 Yes Yes Long term No Unexploited
Fremont factory Yes Yes Long-term Not fully Temporary Tesla Stores Yes Yes Long-term Yes Temporary
Elon Musk Celeb. Yes Yes No Yes Sustainable Superchargers Yes Yes Long-term Yes Sustainable
Software updates Yes Yes Yes Not fully Temporary
While these strengths are the main drivers of optimism in the Tesla share, there are a few internal
weaknesses not addressed in the VRIO table with a negative effect on the share price.
63
Industry underdog: Despite strong funding capabilities, Tesla is as highlighted in the industry analysis
one of the smallest automotive manufacturer. Despite being highly skilled and efficient in design,
production, R&D, marketing and talent recruitment, their industry competitors can out-compete Tesla by
sheer volume. Tesla’s lower budget, economies of scale, less established brand, fewer current customers
and distribution channels are currently negative factors for the share price.
2.3.2 Sub-conclusion: Internal analysis
Q3: How do internal factors affect the share price?
+ Strong supporting activities: Technology, design & engineering and Elon Musk.
+ Strong primary activities: Gigafactory, Tesla Factory, Tesla Stores, Superchargers, Software.
We regard these as Tesla´s main sustainable competitive advantages.
- Tesla is an industry underdog with lower budget, low economies of scale, new brand & fewer
customers. This represents a risk factor within the budget period. However, within the budget
period we see production, not demand, as the main bottleneck.
2.4 SWOT The conclusions in the strategic analysis are of great importance as they now will be quantified in the
financial forecast, serving the basis of Tesla´s valuation. Our key findings from the strategic analysis are
presented in the SWOT below.
Strength High quality technology & products
Large infrastructure investments Elon Musk
Opportunities
Growing EV market 400.000 Model 3 reservations
Chinese market
Weaknesses Low market share of Tesla & EV market
Deep pocket competition Short range & high price of EVs vs ICE
Threats Large OEM´s developing EV's
Loss of government subsidies to early Battery costs stop declining
SWOT
64
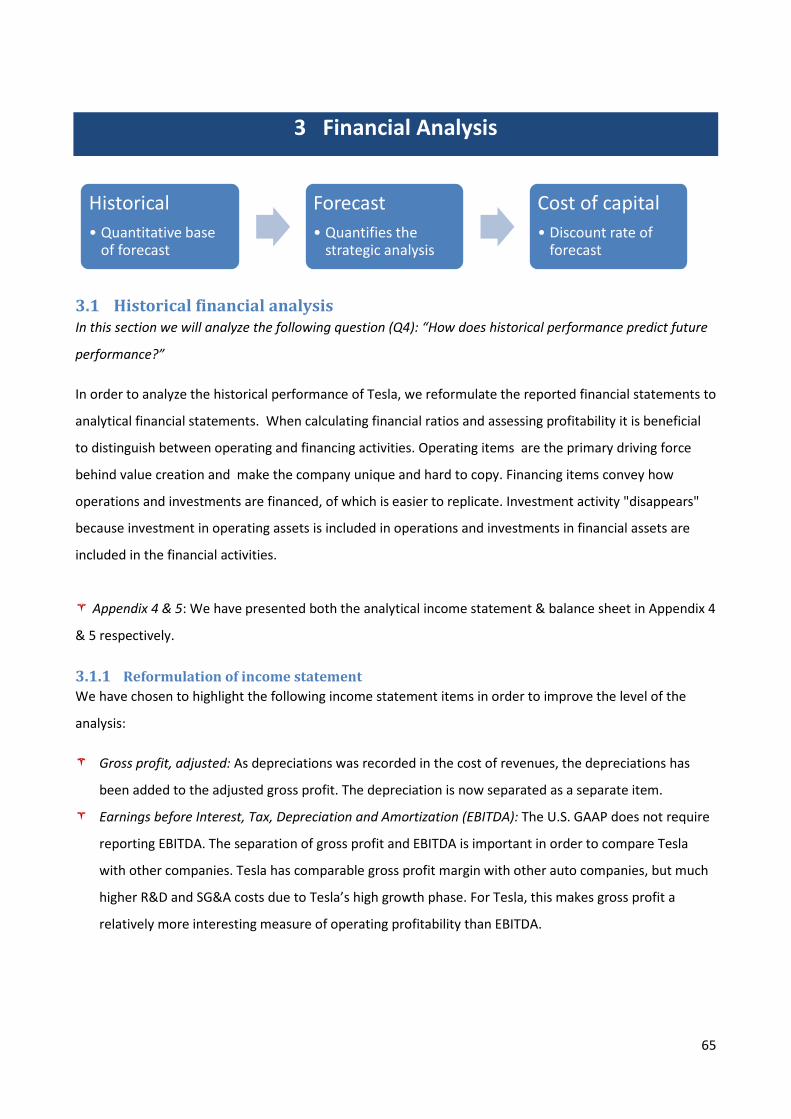
3 Financial Analysis
3.1 Historical financial analysis In this section we will analyze the following question (Q4): “How does historical performance predict future
performance?”
In order to analyze the historical performance of Tesla, we reformulate the reported financial statements to
analytical financial statements. When calculating financial ratios and assessing profitability it is beneficial
to distinguish between operating and financing activities. Operating items are the primary driving force
behind value creation and make the company unique and hard to copy. Financing items convey how
operations and investments are financed, of which is easier to replicate. Investment activity "disappears"
because investment in operating assets is included in operations and investments in financial assets are
included in the financial activities.
Appendix 4 & 5: We have presented both the analytical income statement & balance sheet in Appendix 4
& 5 respectively.
3.1.1 Reformulation of income statement We have chosen to highlight the following income statement items in order to improve the level of the
analysis:
Gross profit, adjusted: As depreciations was recorded in the cost of revenues, the depreciations has
been added to the adjusted gross profit. The depreciation is now separated as a separate item.
Earnings before Interest, Tax, Depreciation and Amortization (EBITDA): The U.S. GAAP does not require
reporting EBITDA. The separation of gross profit and EBITDA is important in order to compare Tesla
with other companies. Tesla has comparable gross profit margin with other auto companies, but much
higher R&D and SG&A costs due to Tesla’s high growth phase. For Tesla, this makes gross profit a
relatively more interesting measure of operating profitability than EBITDA.
Historical • Quantitative base
of forecast
Forecast • Quantifies the
strategic analysis
Cost of capital • Discount rate of
forecast
65
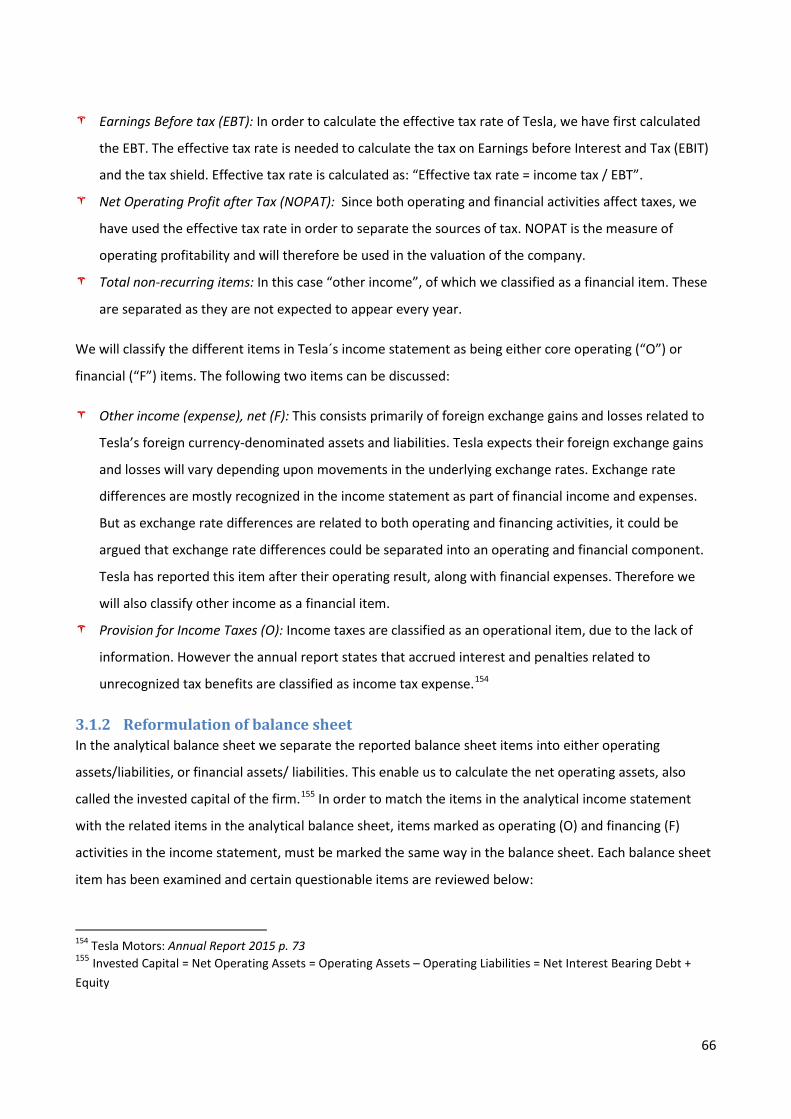
Earnings Before tax (EBT): In order to calculate the effective tax rate of Tesla, we have first calculated
the EBT. The effective tax rate is needed to calculate the tax on Earnings before Interest and Tax (EBIT)
and the tax shield. Effective tax rate is calculated as: “Effective tax rate = income tax / EBT”.
Net Operating Profit after Tax (NOPAT): Since both operating and financial activities affect taxes, we
have used the effective tax rate in order to separate the sources of tax. NOPAT is the measure of
operating profitability and will therefore be used in the valuation of the company.
Total non-recurring items: In this case “other income”, of which we classified as a financial item. These
are separated as they are not expected to appear every year.
We will classify the different items in Tesla´s income statement as being either core operating (“O”) or
financial (“F”) items. The following two items can be discussed:
Other income (expense), net (F): This consists primarily of foreign exchange gains and losses related to
Tesla’s foreign currency-denominated assets and liabilities. Tesla expects their foreign exchange gains
and losses will vary depending upon movements in the underlying exchange rates. Exchange rate
differences are mostly recognized in the income statement as part of financial income and expenses.
But as exchange rate differences are related to both operating and financing activities, it could be
argued that exchange rate differences could be separated into an operating and financial component.
Tesla has reported this item after their operating result, along with financial expenses. Therefore we
will also classify other income as a financial item.
Provision for Income Taxes (O): Income taxes are classified as an operational item, due to the lack of
information. However the annual report states that accrued interest and penalties related to
unrecognized tax benefits are classified as income tax expense.154
3.1.2 Reformulation of balance sheet In the analytical balance sheet we separate the reported balance sheet items into either operating
assets/liabilities, or financial assets/ liabilities. This enable us to calculate the net operating assets, also
called the invested capital of the firm.155 In order to match the items in the analytical income statement
with the related items in the analytical balance sheet, items marked as operating (O) and financing (F)
activities in the income statement, must be marked the same way in the balance sheet. Each balance sheet
item has been examined and certain questionable items are reviewed below:
154 Tesla Motors: Annual Report 2015 p. 73 155 Invested Capital = Net Operating Assets = Operating Assets – Operating Liabilities = Net Interest Bearing Debt + Equity
66
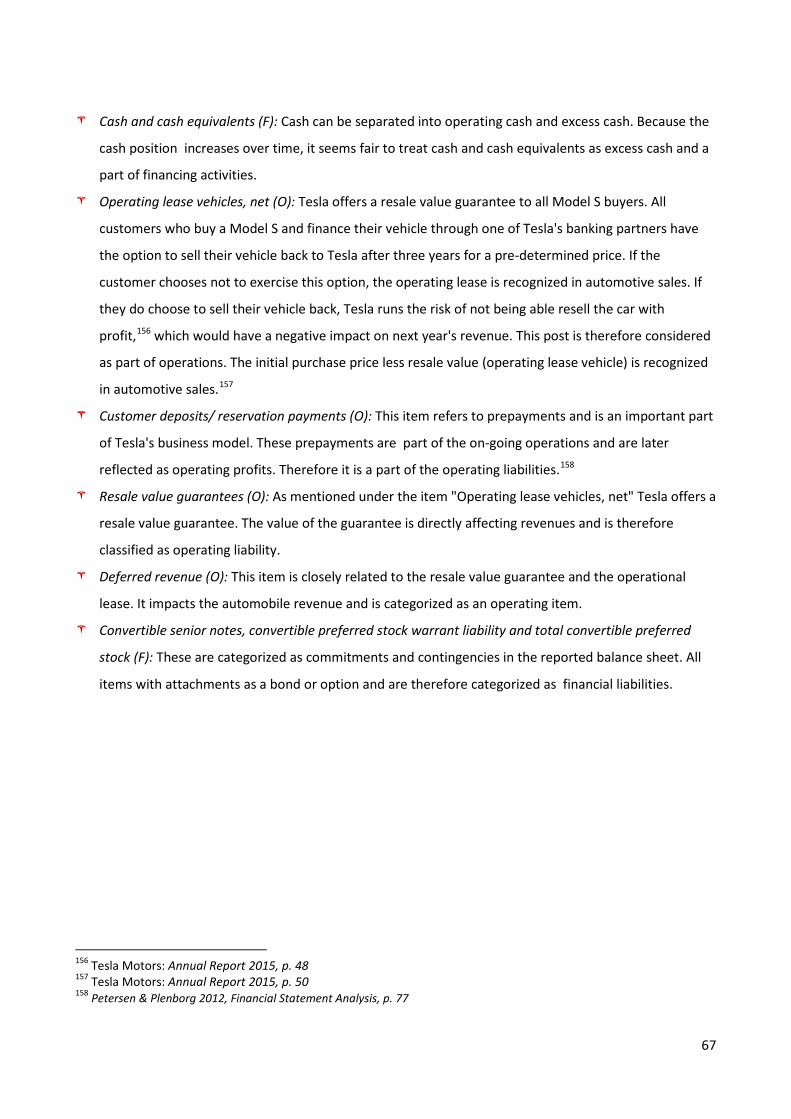
Cash and cash equivalents (F): Cash can be separated into operating cash and excess cash. Because the
cash position increases over time, it seems fair to treat cash and cash equivalents as excess cash and a
part of financing activities.
Operating lease vehicles, net (O): Tesla offers a resale value guarantee to all Model S buyers. All
customers who buy a Model S and finance their vehicle through one of Tesla's banking partners have
the option to sell their vehicle back to Tesla after three years for a pre-determined price. If the
customer chooses not to exercise this option, the operating lease is recognized in automotive sales. If
they do choose to sell their vehicle back, Tesla runs the risk of not being able resell the car with
profit,156 which would have a negative impact on next year's revenue. This post is therefore considered
as part of operations. The initial purchase price less resale value (operating lease vehicle) is recognized
in automotive sales.157
Customer deposits/ reservation payments (O): This item refers to prepayments and is an important part
of Tesla's business model. These prepayments are part of the on-going operations and are later
reflected as operating profits. Therefore it is a part of the operating liabilities.158
Resale value guarantees (O): As mentioned under the item "Operating lease vehicles, net" Tesla offers a
resale value guarantee. The value of the guarantee is directly affecting revenues and is therefore
classified as operating liability.
Deferred revenue (O): This item is closely related to the resale value guarantee and the operational
lease. It impacts the automobile revenue and is categorized as an operating item.
Convertible senior notes, convertible preferred stock warrant liability and total convertible preferred
stock (F): These are categorized as commitments and contingencies in the reported balance sheet. All
items with attachments as a bond or option and are therefore categorized as financial liabilities.
156 Tesla Motors: Annual Report 2015, p. 48 157 Tesla Motors: Annual Report 2015, p. 50 158 Petersen & Plenborg 2012, Financial Statement Analysis, p. 77
67
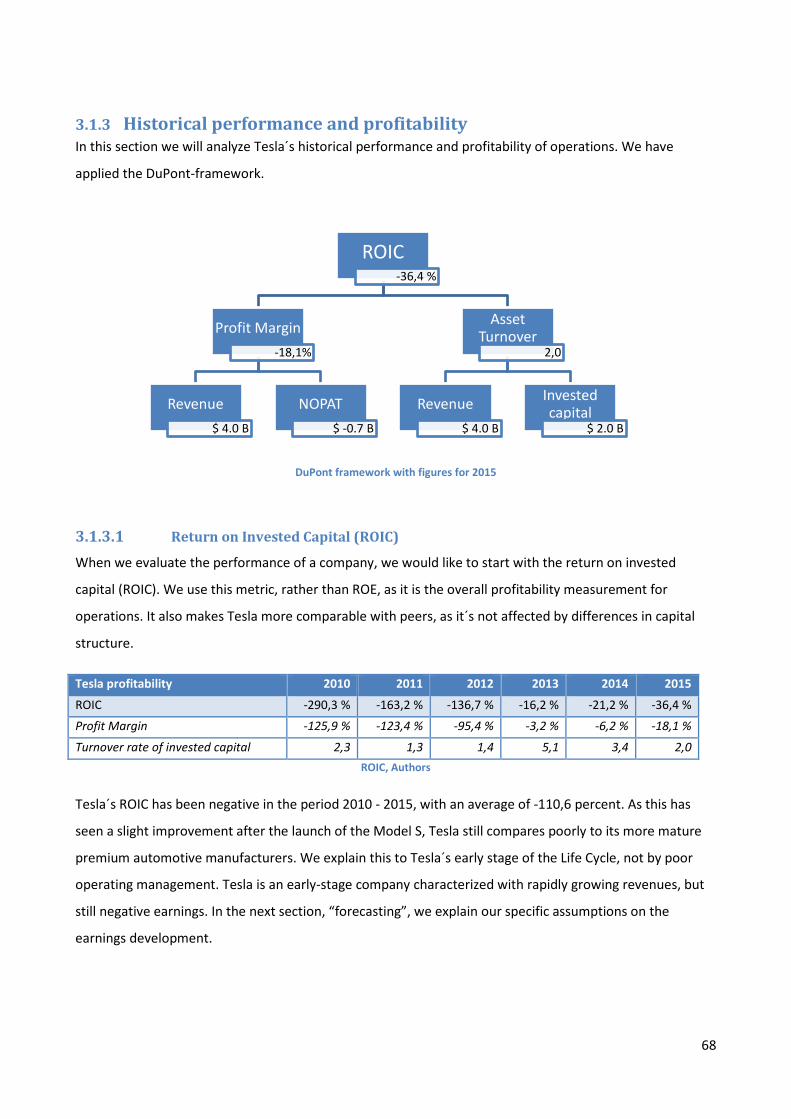
3.1.3 Historical performance and profitability In this section we will analyze Tesla´s historical performance and profitability of operations. We have
applied the DuPont-framework.
DuPont framework with figures for 2015
Return on Invested Capital (ROIC) 3.1.3.1When we evaluate the performance of a company, we would like to start with the return on invested
capital (ROIC). We use this metric, rather than ROE, as it is the overall profitability measurement for
operations. It also makes Tesla more comparable with peers, as it´s not affected by differences in capital
structure.
Tesla profitability 2010 2011 2012 2013 2014 2015
ROIC -290,3 % -163,2 % -136,7 % -16,2 % -21,2 % -36,4 %
Profit Margin -125,9 % -123,4 % -95,4 % -3,2 % -6,2 % -18,1 %
Turnover rate of invested capital 2,3 1,3 1,4 5,1 3,4 2,0 ROIC, Authors
Tesla´s ROIC has been negative in the period 2010 - 2015, with an average of -110,6 percent. As this has
seen a slight improvement after the launch of the Model S, Tesla still compares poorly to its more mature
premium automotive manufacturers. We explain this to Tesla´s early stage of the Life Cycle, not by poor
operating management. Tesla is an early-stage company characterized with rapidly growing revenues, but
still negative earnings. In the next section, “forecasting”, we explain our specific assumptions on the
earnings development.
ROIC -36,4 %
Profit Margin -18,1%
Revenue $ 4.0 B
NOPAT $ -0.7 B
Asset Turnover
2,0
Revenue $ 4.0 B
Invested capital
$ 2.0 B
68
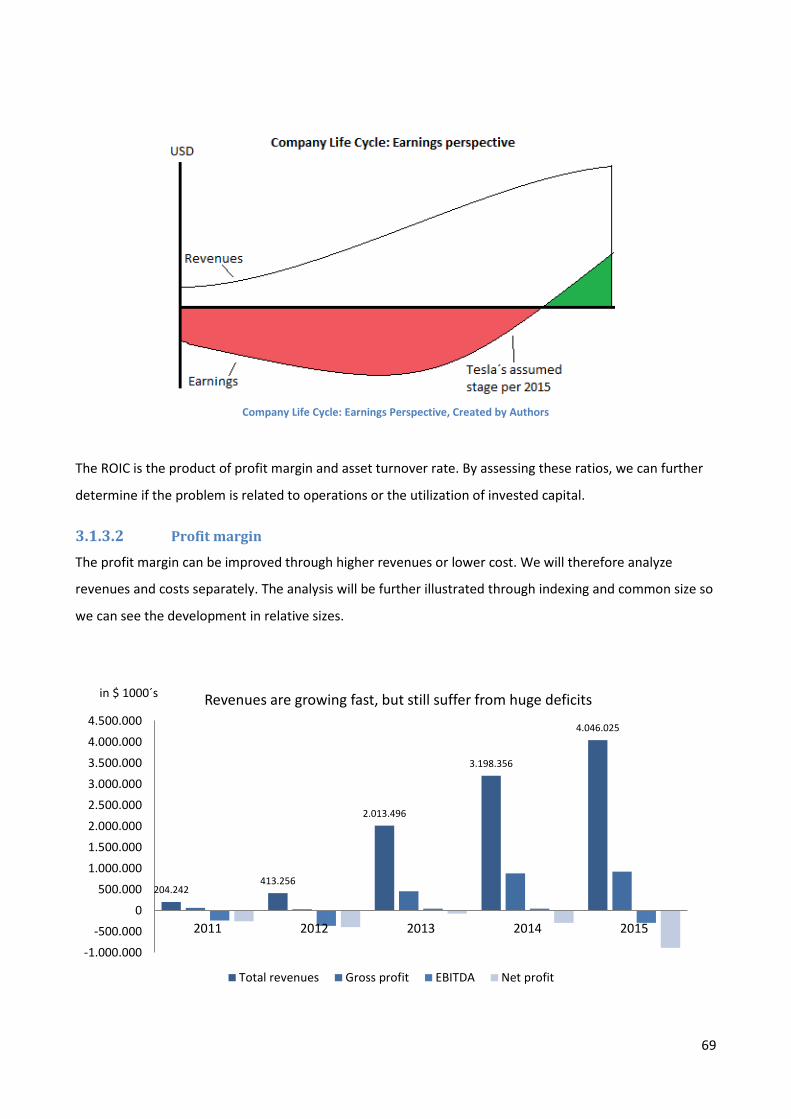
Company Life Cycle: Earnings Perspective, Created by Authors
The ROIC is the product of profit margin and asset turnover rate. By assessing these ratios, we can further
determine if the problem is related to operations or the utilization of invested capital.
Profit margin 3.1.3.2The profit margin can be improved through higher revenues or lower cost. We will therefore analyze
revenues and costs separately. The analysis will be further illustrated through indexing and common size so
we can see the development in relative sizes.
204.242 413.256
2.013.496
3.198.356
4.046.025
-1.000.000
-500.000
0
500.000
1.000.000
1.500.000
2.000.000
2.500.000
3.000.000
3.500.000
4.000.000
4.500.000
2011 2012 2013 2014 2015
in $ 1000´s Revenues are growing fast, but still suffer from huge deficits
Total revenues Gross profit EBITDA Net profit
69
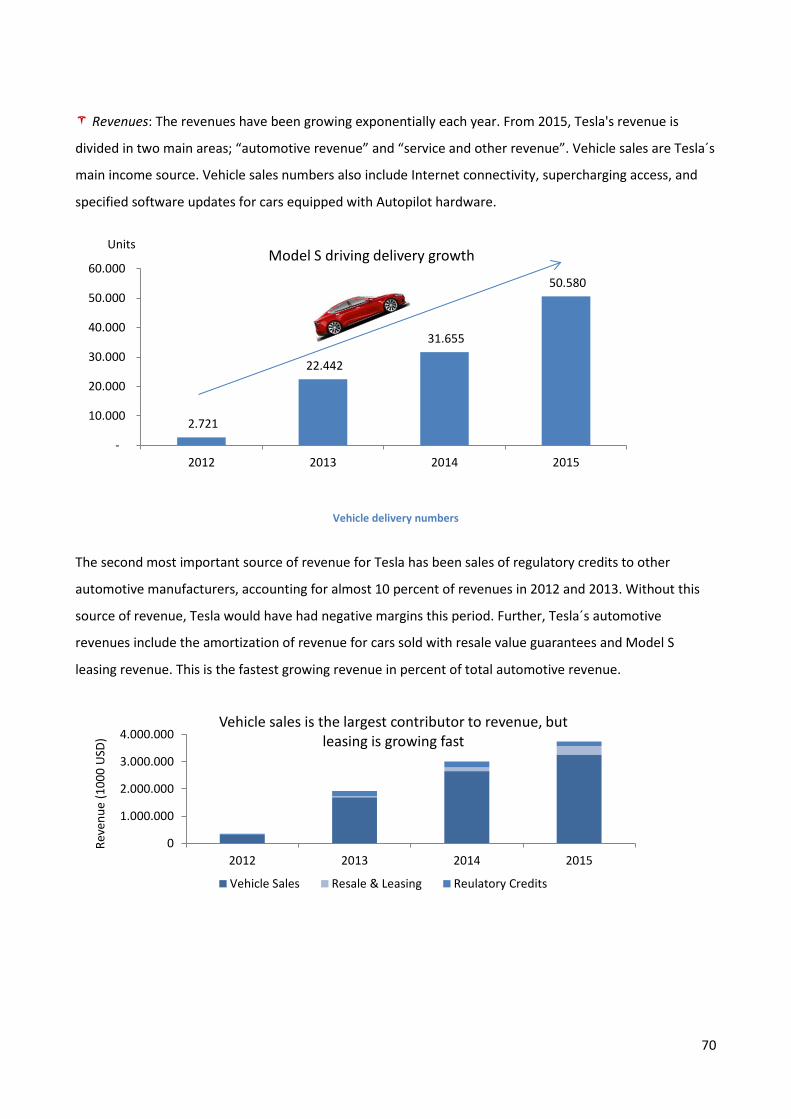
Revenues: The revenues have been growing exponentially each year. From 2015, Tesla's revenue is
divided in two main areas; “automotive revenue” and “service and other revenue”. Vehicle sales are Tesla´s
main income source. Vehicle sales numbers also include Internet connectivity, supercharging access, and
specified software updates for cars equipped with Autopilot hardware.
Vehicle delivery numbers
The second most important source of revenue for Tesla has been sales of regulatory credits to other
automotive manufacturers, accounting for almost 10 percent of revenues in 2012 and 2013. Without this
source of revenue, Tesla would have had negative margins this period. Further, Tesla´s automotive
revenues include the amortization of revenue for cars sold with resale value guarantees and Model S
leasing revenue. This is the fastest growing revenue in percent of total automotive revenue.
2.721
22.442
31.655
50.580
-
10.000
20.000
30.000
40.000
50.000
60.000
2012 2013 2014 2015
Units Model S driving delivery growth
0
1.000.000
2.000.000
3.000.000
4.000.000
2012 2013 2014 2015
Reve
nue
(100
0 U
SD)
Vehicle sales is the largest contributor to revenue, but leasing is growing fast
Vehicle Sales Resale & Leasing Reulatory Credits
70
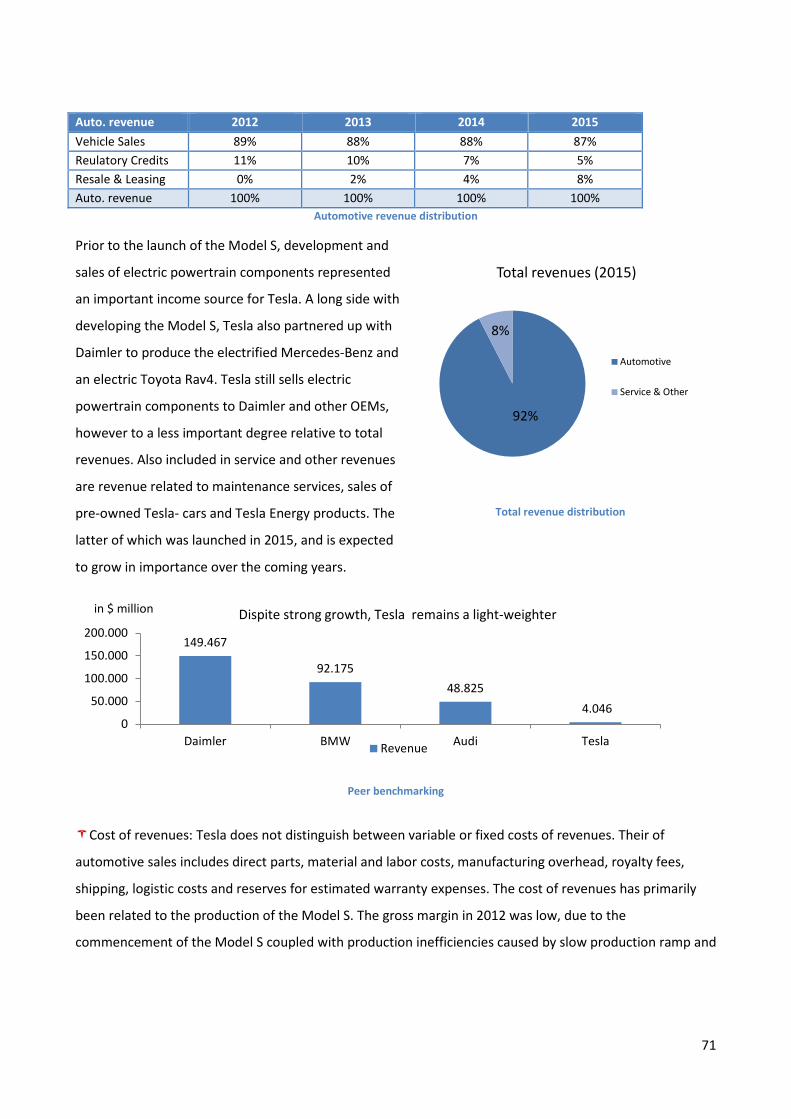
Auto. revenue 2012 2013 2014 2015 Vehicle Sales 89% 88% 88% 87% Reulatory Credits 11% 10% 7% 5% Resale & Leasing 0% 2% 4% 8% Auto. revenue 100% 100% 100% 100%
Automotive revenue distribution
Prior to the launch of the Model S, development and
sales of electric powertrain components represented
an important income source for Tesla. A long side with
developing the Model S, Tesla also partnered up with
Daimler to produce the electrified Mercedes-Benz and
an electric Toyota Rav4. Tesla still sells electric
powertrain components to Daimler and other OEMs,
however to a less important degree relative to total
revenues. Also included in service and other revenues
are revenue related to maintenance services, sales of
pre-owned Tesla- cars and Tesla Energy products. The
latter of which was launched in 2015, and is expected
to grow in importance over the coming years.
Peer benchmarking
Cost of revenues: Tesla does not distinguish between variable or fixed costs of revenues. Their of
automotive sales includes direct parts, material and labor costs, manufacturing overhead, royalty fees,
shipping, logistic costs and reserves for estimated warranty expenses. The cost of revenues has primarily
been related to the production of the Model S. The gross margin in 2012 was low, due to the
commencement of the Model S coupled with production inefficiencies caused by slow production ramp and
149.467
92.175 48.825
4.046 0
50.000
100.000
150.000
200.000
Daimler BMW Audi Tesla
in $ million Dispite strong growth, Tesla remains a light-weighter
Revenue
92%
8%
Total revenues (2015)
Automotive
Service & Other
Total revenue distribution
71
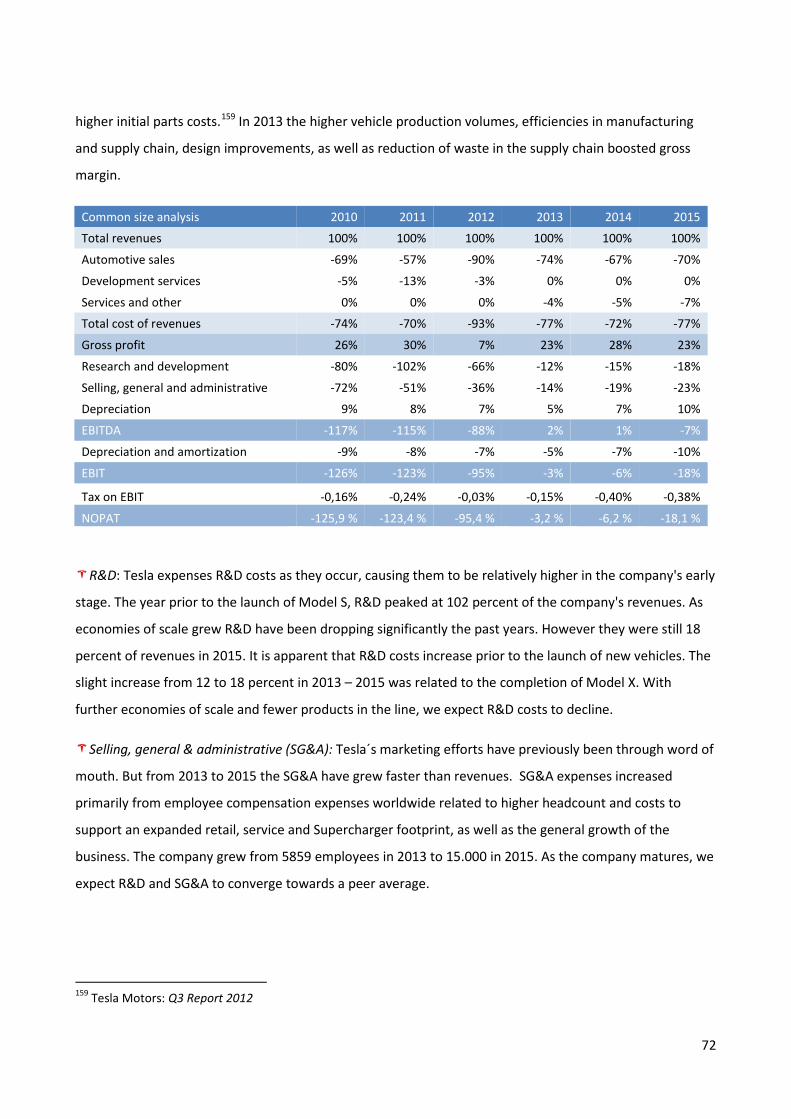
higher initial parts costs.159 In 2013 the higher vehicle production volumes, efficiencies in manufacturing
and supply chain, design improvements, as well as reduction of waste in the supply chain boosted gross
margin.
Common size analysis 2010 2011 2012 2013 2014 2015
Total revenues 100% 100% 100% 100% 100% 100%
Automotive sales -69% -57% -90% -74% -67% -70%
Development services -5% -13% -3% 0% 0% 0%
Services and other 0% 0% 0% -4% -5% -7%
Total cost of revenues -74% -70% -93% -77% -72% -77%
Gross profit 26% 30% 7% 23% 28% 23%
Research and development -80% -102% -66% -12% -15% -18%
Selling, general and administrative -72% -51% -36% -14% -19% -23%
Depreciation 9% 8% 7% 5% 7% 10%
EBITDA -117% -115% -88% 2% 1% -7%
Depreciation and amortization -9% -8% -7% -5% -7% -10%
EBIT -126% -123% -95% -3% -6% -18%
Tax on EBIT -0,16% -0,24% -0,03% -0,15% -0,40% -0,38%
NOPAT -125,9 % -123,4 % -95,4 % -3,2 % -6,2 % -18,1 %
R&D: Tesla expenses R&D costs as they occur, causing them to be relatively higher in the company's early
stage. The year prior to the launch of Model S, R&D peaked at 102 percent of the company's revenues. As
economies of scale grew R&D have been dropping significantly the past years. However they were still 18
percent of revenues in 2015. It is apparent that R&D costs increase prior to the launch of new vehicles. The
slight increase from 12 to 18 percent in 2013 – 2015 was related to the completion of Model X. With
further economies of scale and fewer products in the line, we expect R&D costs to decline.
Selling, general & administrative (SG&A): Tesla´s marketing efforts have previously been through word of
mouth. But from 2013 to 2015 the SG&A have grew faster than revenues. SG&A expenses increased
primarily from employee compensation expenses worldwide related to higher headcount and costs to
support an expanded retail, service and Supercharger footprint, as well as the general growth of the
business. The company grew from 5859 employees in 2013 to 15.000 in 2015. As the company matures, we
expect R&D and SG&A to converge towards a peer average.
159 Tesla Motors: Q3 Report 2012
72
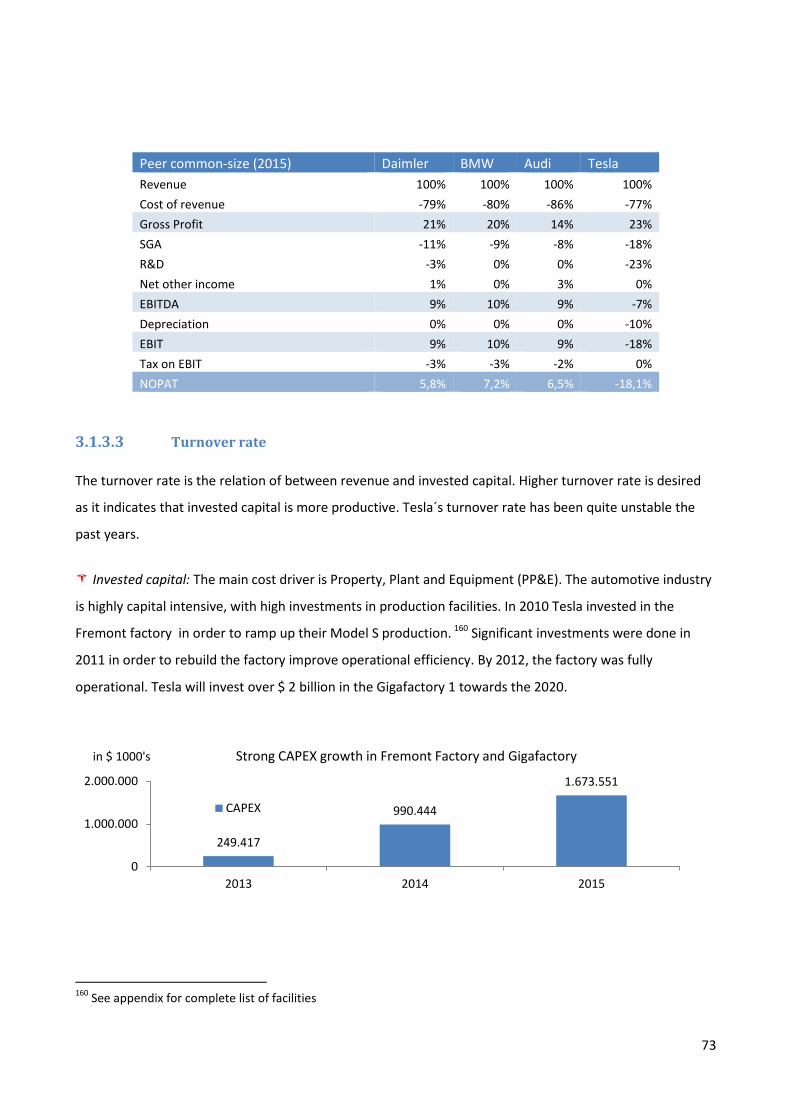
Peer common-size (2015) Daimler BMW Audi Tesla Revenue 100% 100% 100% 100% Cost of revenue -79% -80% -86% -77% Gross Profit 21% 20% 14% 23% SGA -11% -9% -8% -18% R&D -3% 0% 0% -23% Net other income 1% 0% 3% 0% EBITDA 9% 10% 9% -7% Depreciation 0% 0% 0% -10% EBIT 9% 10% 9% -18% Tax on EBIT -3% -3% -2% 0% NOPAT 5,8% 7,2% 6,5% -18,1%
Turnover rate 3.1.3.3
The turnover rate is the relation of between revenue and invested capital. Higher turnover rate is desired
as it indicates that invested capital is more productive. Tesla´s turnover rate has been quite unstable the
past years.
Invested capital: The main cost driver is Property, Plant and Equipment (PP&E). The automotive industry
is highly capital intensive, with high investments in production facilities. In 2010 Tesla invested in the
Fremont factory in order to ramp up their Model S production. 160 Significant investments were done in
2011 in order to rebuild the factory improve operational efficiency. By 2012, the factory was fully
operational. Tesla will invest over $ 2 billion in the Gigafactory 1 towards the 2020.
160 See appendix for complete list of facilities
249.417
990.444
1.673.551
0
1.000.000
2.000.000
2013 2014 2015
in $ 1000's Strong CAPEX growth in Fremont Factory and Gigafactory
CAPEX
73
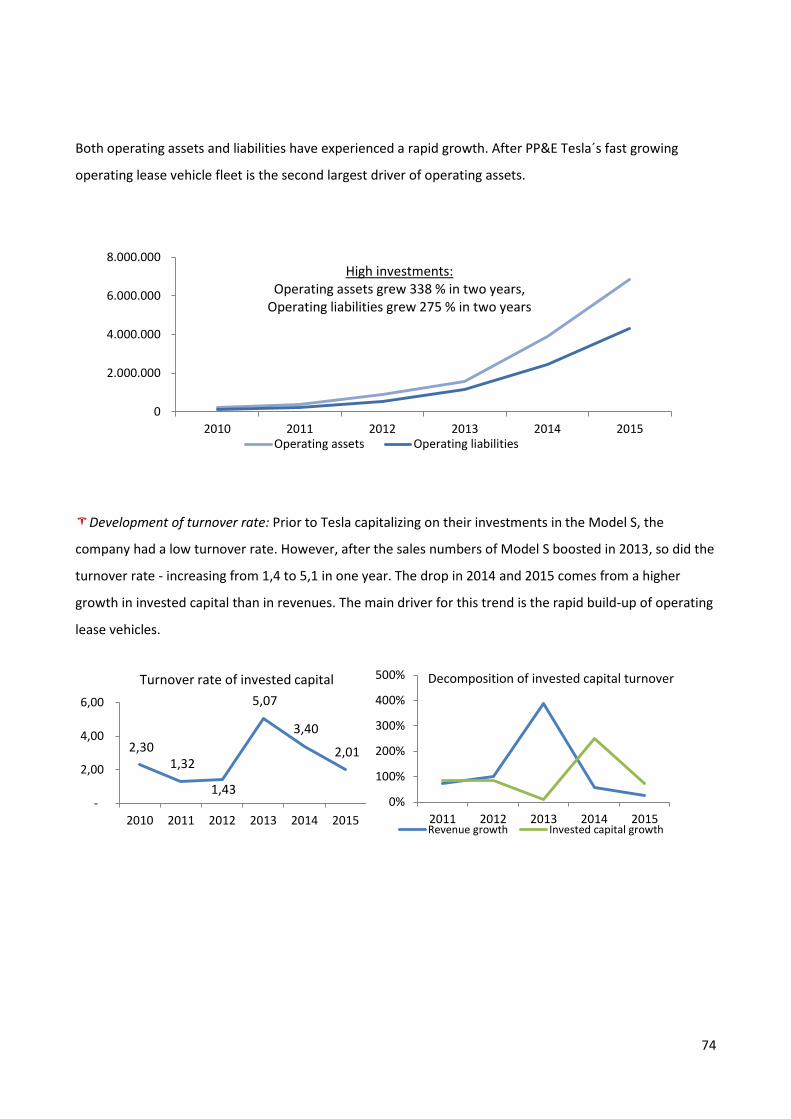
Both operating assets and liabilities have experienced a rapid growth. After PP&E Tesla´s fast growing
operating lease vehicle fleet is the second largest driver of operating assets.
Development of turnover rate: Prior to Tesla capitalizing on their investments in the Model S, the
company had a low turnover rate. However, after the sales numbers of Model S boosted in 2013, so did the
turnover rate - increasing from 1,4 to 5,1 in one year. The drop in 2014 and 2015 comes from a higher
growth in invested capital than in revenues. The main driver for this trend is the rapid build-up of operating
lease vehicles.
0
2.000.000
4.000.000
6.000.000
8.000.000
2010 2011 2012 2013 2014 2015
High investments: Operating assets grew 338 % in two years,
Operating liabilities grew 275 % in two years
Operating assets Operating liabilities
2,30 1,32
1,43
5,07
3,40
2,01
-
2,00
4,00
6,00
2010 2011 2012 2013 2014 2015
Turnover rate of invested capital
0%
100%
200%
300%
400%
500%
2011 2012 2013 2014 2015
Decomposition of invested capital turnover
Revenue growth Invested capital growth
74
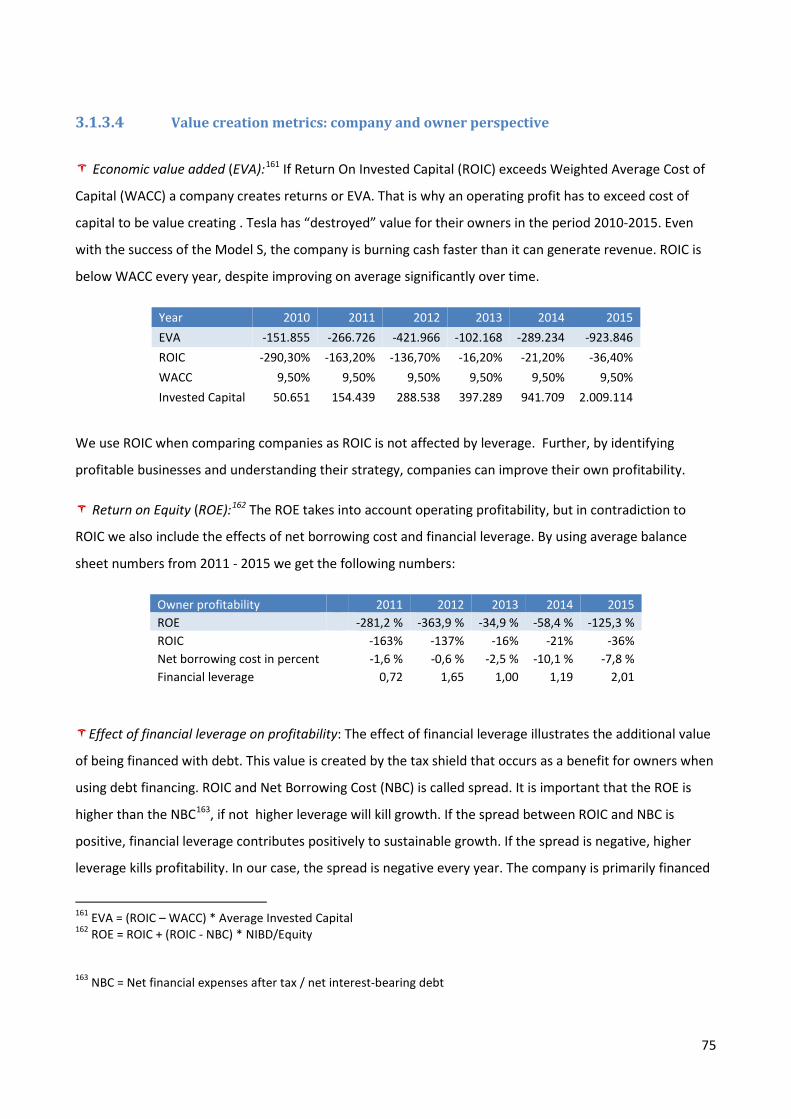
Value creation metrics: company and owner perspective 3.1.3.4
Economic value added (EVA):161 If Return On Invested Capital (ROIC) exceeds Weighted Average Cost of
Capital (WACC) a company creates returns or EVA. That is why an operating profit has to exceed cost of
capital to be value creating . Tesla has “destroyed” value for their owners in the period 2010-2015. Even
with the success of the Model S, the company is burning cash faster than it can generate revenue. ROIC is
below WACC every year, despite improving on average significantly over time.
Year 2010 2011 2012 2013 2014 2015 EVA -151.855 -266.726 -421.966 -102.168 -289.234 -923.846 ROIC -290,30% -163,20% -136,70% -16,20% -21,20% -36,40% WACC 9,50% 9,50% 9,50% 9,50% 9,50% 9,50% Invested Capital 50.651 154.439 288.538 397.289 941.709 2.009.114
We use ROIC when comparing companies as ROIC is not affected by leverage. Further, by identifying
profitable businesses and understanding their strategy, companies can improve their own profitability.
Return on Equity (ROE):162 The ROE takes into account operating profitability, but in contradiction to
ROIC we also include the effects of net borrowing cost and financial leverage. By using average balance
sheet numbers from 2011 - 2015 we get the following numbers:
Owner profitability 2011 2012 2013 2014 2015 ROE -281,2 % -363,9 % -34,9 % -58,4 % -125,3 % ROIC
-163% -137% -16% -21% -36%
Net borrowing cost in percent
-1,6 % -0,6 % -2,5 % -10,1 % -7,8 % Financial leverage
0,72 1,65 1,00 1,19 2,01
Effect of financial leverage on profitability: The effect of financial leverage illustrates the additional value
of being financed with debt. This value is created by the tax shield that occurs as a benefit for owners when
using debt financing. ROIC and Net Borrowing Cost (NBC) is called spread. It is important that the ROE is
higher than the NBC163, if not higher leverage will kill growth. If the spread between ROIC and NBC is
positive, financial leverage contributes positively to sustainable growth. If the spread is negative, higher
leverage kills profitability. In our case, the spread is negative every year. The company is primarily financed
161 EVA = (ROIC – WACC) * Average Invested Capital 162 ROE = ROIC + (ROIC - NBC) * NIBD/Equity
163 NBC = Net financial expenses after tax / net interest-bearing debt
75
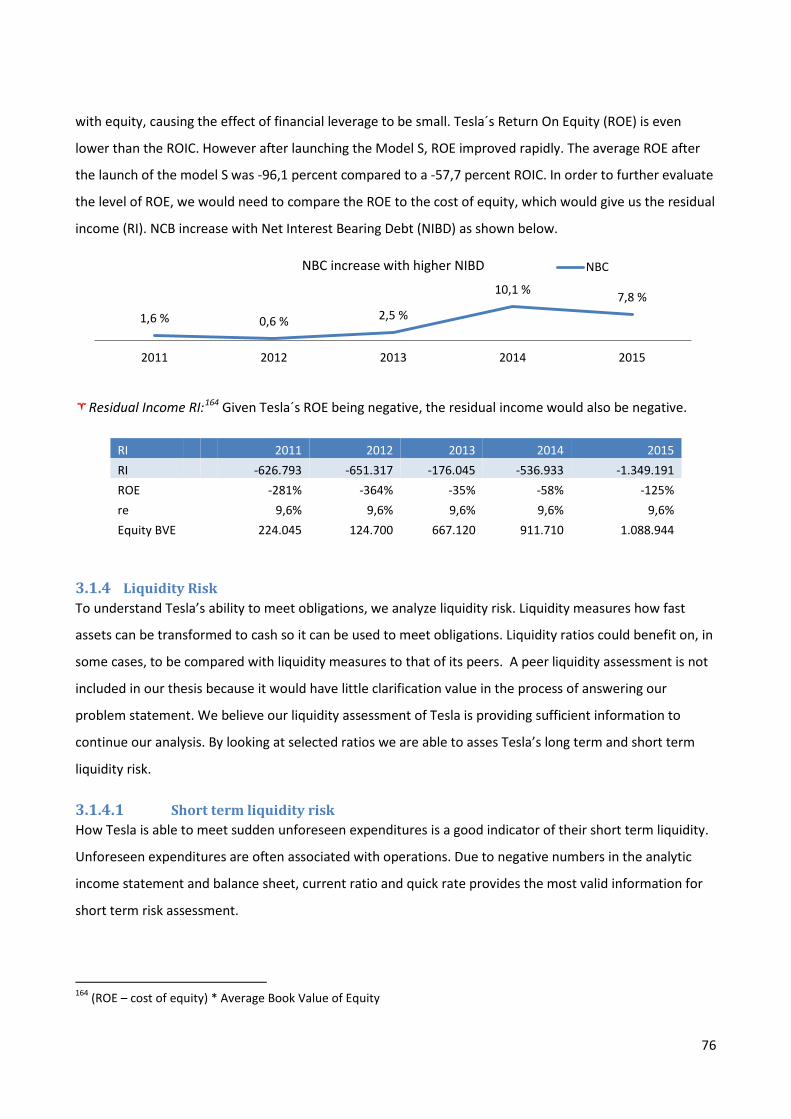
with equity, causing the effect of financial leverage to be small. Tesla´s Return On Equity (ROE) is even
lower than the ROIC. However after launching the Model S, ROE improved rapidly. The average ROE after
the launch of the model S was -96,1 percent compared to a -57,7 percent ROIC. In order to further evaluate
the level of ROE, we would need to compare the ROE to the cost of equity, which would give us the residual
income (RI). NCB increase with Net Interest Bearing Debt (NIBD) as shown below.
Residual Income RI:164 Given Tesla´s ROE being negative, the residual income would also be negative.
RI 2011 2012 2013 2014 2015 RI -626.793 -651.317 -176.045 -536.933 -1.349.191 ROE
-281% -364% -35% -58% -125%
re
9,6% 9,6% 9,6% 9,6% 9,6% Equity BVE
224.045 124.700 667.120 911.710 1.088.944
3.1.4 Liquidity Risk To understand Tesla’s ability to meet obligations, we analyze liquidity risk. Liquidity measures how fast
assets can be transformed to cash so it can be used to meet obligations. Liquidity ratios could benefit on, in
some cases, to be compared with liquidity measures to that of its peers. A peer liquidity assessment is not
included in our thesis because it would have little clarification value in the process of answering our
problem statement. We believe our liquidity assessment of Tesla is providing sufficient information to
continue our analysis. By looking at selected ratios we are able to asses Tesla’s long term and short term
liquidity risk.
Short term liquidity risk 3.1.4.1How Tesla is able to meet sudden unforeseen expenditures is a good indicator of their short term liquidity.
Unforeseen expenditures are often associated with operations. Due to negative numbers in the analytic
income statement and balance sheet, current ratio and quick rate provides the most valid information for
short term risk assessment.
164 (ROE – cost of equity) * Average Book Value of Equity
1,6 % 0,6 % 2,5 %
10,1 % 7,8 %
2011 2012 2013 2014 2015
NBC increase with higher NIBD NBC
76
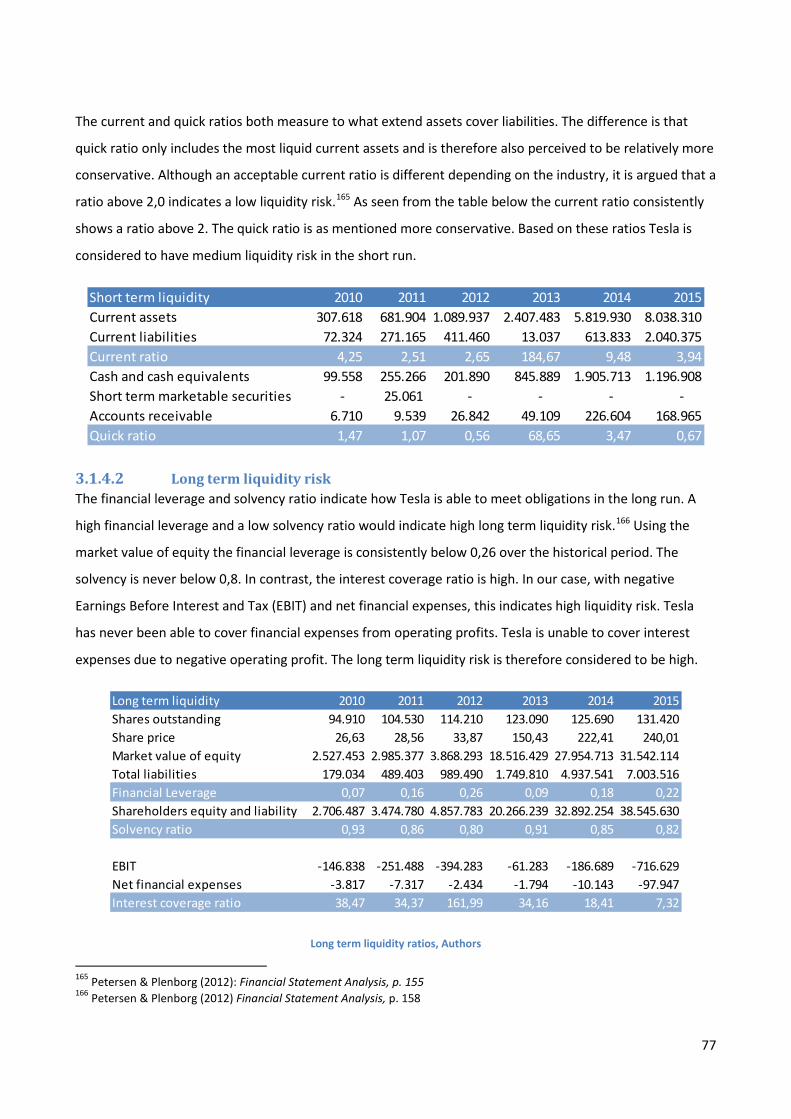
The current and quick ratios both measure to what extend assets cover liabilities. The difference is that
quick ratio only includes the most liquid current assets and is therefore also perceived to be relatively more
conservative. Although an acceptable current ratio is different depending on the industry, it is argued that a
ratio above 2,0 indicates a low liquidity risk.165 As seen from the table below the current ratio consistently
shows a ratio above 2. The quick ratio is as mentioned more conservative. Based on these ratios Tesla is
considered to have medium liquidity risk in the short run.
Long term liquidity risk 3.1.4.2The financial leverage and solvency ratio indicate how Tesla is able to meet obligations in the long run. A
high financial leverage and a low solvency ratio would indicate high long term liquidity risk.166 Using the
market value of equity the financial leverage is consistently below 0,26 over the historical period. The
solvency is never below 0,8. In contrast, the interest coverage ratio is high. In our case, with negative
Earnings Before Interest and Tax (EBIT) and net financial expenses, this indicates high liquidity risk. Tesla
has never been able to cover financial expenses from operating profits. Tesla is unable to cover interest
expenses due to negative operating profit. The long term liquidity risk is therefore considered to be high.
Long term liquidity ratios, Authors
165 Petersen & Plenborg (2012): Financial Statement Analysis, p. 155 166 Petersen & Plenborg (2012) Financial Statement Analysis, p. 158
Short term liquidity 2010 2011 2012 2013 2014 2015Current assets 307.618 681.904 1.089.937 2.407.483 5.819.930 8.038.310Current liabilities 72.324 271.165 411.460 13.037 613.833 2.040.375Current ratio 4,25 2,51 2,65 184,67 9,48 3,94Cash and cash equivalents 99.558 255.266 201.890 845.889 1.905.713 1.196.908Short term marketable securities - 25.061 - - - - Accounts receivable 6.710 9.539 26.842 49.109 226.604 168.965Quick ratio 1,47 1,07 0,56 68,65 3,47 0,67
Long term liquidity 2010 2011 2012 2013 2014 2015Shares outstanding 94.910 104.530 114.210 123.090 125.690 131.420Share price 26,63 28,56 33,87 150,43 222,41 240,01Market value of equity 2.527.453 2.985.377 3.868.293 18.516.429 27.954.713 31.542.114Total liabilities 179.034 489.403 989.490 1.749.810 4.937.541 7.003.516Financial Leverage 0,07 0,16 0,26 0,09 0,18 0,22Shareholders equity and liability 2.706.487 3.474.780 4.857.783 20.266.239 32.892.254 38.545.630Solvency ratio 0,93 0,86 0,80 0,91 0,85 0,82
EBIT -146.838 -251.488 -394.283 -61.283 -186.689 -716.629Net financial expenses -3.817 -7.317 -2.434 -1.794 -10.143 -97.947Interest coverage ratio 38,47 34,37 161,99 34,16 18,41 7,32
77
3.1.5 Sub-conclusion: historical financial analysis
Q4: How does historical performance predict future performance?
+ Positive revenue trend and high investments fuel future growth.
- Tesla has negative ROIC due to high COGS, R&D and SG&A.
3.2 Financial forecasting In this section we will analyze the following question (Q5): “How will key financial value drivers develop within the budget period?” We aim to answer this question by quantifying and explaining our conclusions from the strategic analysis.
Appendix 6, 7 & 8: The complete pro forma income, balance and cash flow statement forecast is presented in appendix 6, 7 & 8 respectively.
3.2.1 Budget period Although the future is unknowable, careful analysis can yield insights into how a company may develop
(McKinsey, 2010). The budget period is the period where items are assumed not to be constant. We see the
budget period as 2016 to 2025. After this period we believe Tesla will reach a steady state period. To
simplify the model and avoid the error of false precision, we split the budget period into two periods:
1. A detailed 2016 to 2020 forecast, which develops complete balance sheets and income
statements with as many links to real variables (e.g., unit volumes, cost per unit) as possible.
2. A simplified forecast for 2021 - 2025, focusing on a few important variables, such as revenue
growth, margins and invested capital turnover.
This approach not only simplifies the forecast, but it also forces focusing on the business’ long-term
economics, rather than the individual line items of the forecast.
3.2.2 Terminal period The terminal period is the year where the company reaches steady state. This is defined by McKinseyas the
time when:
2016 - 2020 Detailed
2021 - 2025 Simplified
2025+ Terminal
78
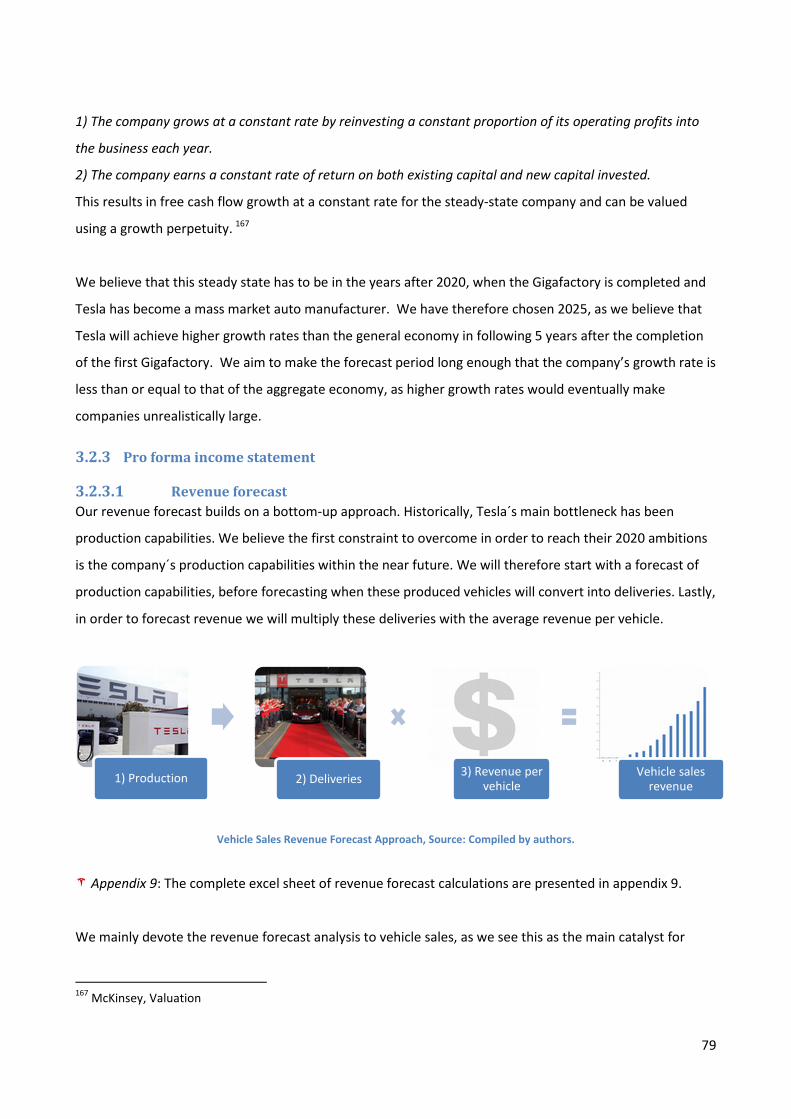
1) The company grows at a constant rate by reinvesting a constant proportion of its operating profits into
the business each year.
2) The company earns a constant rate of return on both existing capital and new capital invested.
This results in free cash flow growth at a constant rate for the steady-state company and can be valued
using a growth perpetuity. 167
We believe that this steady state has to be in the years after 2020, when the Gigafactory is completed and
Tesla has become a mass market auto manufacturer. We have therefore chosen 2025, as we believe that
Tesla will achieve higher growth rates than the general economy in following 5 years after the completion
of the first Gigafactory. We aim to make the forecast period long enough that the company’s growth rate is
less than or equal to that of the aggregate economy, as higher growth rates would eventually make
companies unrealistically large.
3.2.3 Pro forma income statement
Revenue forecast 3.2.3.1Our revenue forecast builds on a bottom-up approach. Historically, Tesla´s main bottleneck has been
production capabilities. We believe the first constraint to overcome in order to reach their 2020 ambitions
is the company´s production capabilities within the near future. We will therefore start with a forecast of
production capabilities, before forecasting when these produced vehicles will convert into deliveries. Lastly,
in order to forecast revenue we will multiply these deliveries with the average revenue per vehicle.
Vehicle Sales Revenue Forecast Approach, Source: Compiled by authors.
Appendix 9: The complete excel sheet of revenue forecast calculations are presented in appendix 9.
We mainly devote the revenue forecast analysis to vehicle sales, as we see this as the main catalyst for
167 McKinsey, Valuation
1) Production 2) Deliveries 3) Revenue per vehicle
Vehicle sales revenue
79
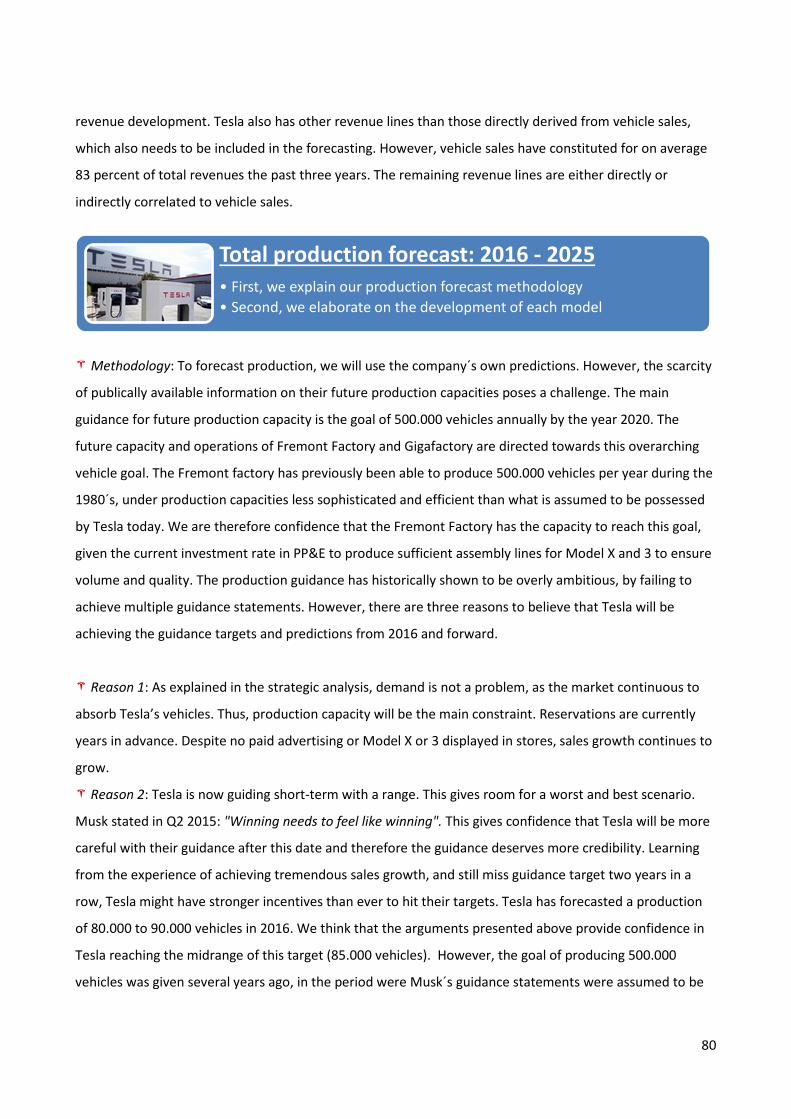
revenue development. Tesla also has other revenue lines than those directly derived from vehicle sales,
which also needs to be included in the forecasting. However, vehicle sales have constituted for on average
83 percent of total revenues the past three years. The remaining revenue lines are either directly or
indirectly correlated to vehicle sales.
Methodology: To forecast production, we will use the company´s own predictions. However, the scarcity
of publically available information on their future production capacities poses a challenge. The main
guidance for future production capacity is the goal of 500.000 vehicles annually by the year 2020. The
future capacity and operations of Fremont Factory and Gigafactory are directed towards this overarching
vehicle goal. The Fremont factory has previously been able to produce 500.000 vehicles per year during the
1980´s, under production capacities less sophisticated and efficient than what is assumed to be possessed
by Tesla today. We are therefore confidence that the Fremont Factory has the capacity to reach this goal,
given the current investment rate in PP&E to produce sufficient assembly lines for Model X and 3 to ensure
volume and quality. The production guidance has historically shown to be overly ambitious, by failing to
achieve multiple guidance statements. However, there are three reasons to believe that Tesla will be
achieving the guidance targets and predictions from 2016 and forward.
Reason 1: As explained in the strategic analysis, demand is not a problem, as the market continuous to
absorb Tesla’s vehicles. Thus, production capacity will be the main constraint. Reservations are currently
years in advance. Despite no paid advertising or Model X or 3 displayed in stores, sales growth continues to
grow.
Reason 2: Tesla is now guiding short-term with a range. This gives room for a worst and best scenario.
Musk stated in Q2 2015: "Winning needs to feel like winning". This gives confidence that Tesla will be more
careful with their guidance after this date and therefore the guidance deserves more credibility. Learning
from the experience of achieving tremendous sales growth, and still miss guidance target two years in a
row, Tesla might have stronger incentives than ever to hit their targets. Tesla has forecasted a production
of 80.000 to 90.000 vehicles in 2016. We think that the arguments presented above provide confidence in
Tesla reaching the midrange of this target (85.000 vehicles). However, the goal of producing 500.000
vehicles was given several years ago, in the period were Musk´s guidance statements were assumed to be
Total production forecast: 2016 - 2025 • First, we explain our production forecast methodology • Second, we elaborate on the development of each model
80
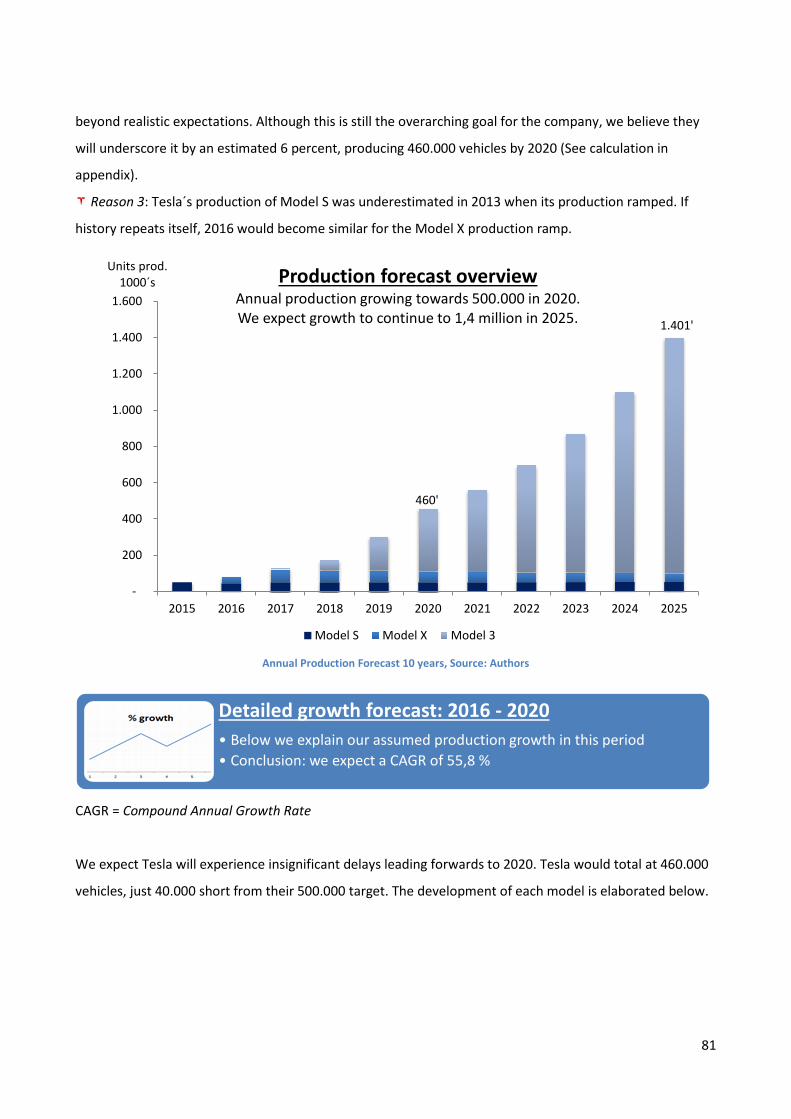
beyond realistic expectations. Although this is still the overarching goal for the company, we believe they
will underscore it by an estimated 6 percent, producing 460.000 vehicles by 2020 (See calculation in
appendix).
Reason 3: Tesla´s production of Model S was underestimated in 2013 when its production ramped. If
history repeats itself, 2016 would become similar for the Model X production ramp.
Annual Production Forecast 10 years, Source: Authors
CAGR = Compound Annual Growth Rate
We expect Tesla will experience insignificant delays leading forwards to 2020. Tesla would total at 460.000
vehicles, just 40.000 short from their 500.000 target. The development of each model is elaborated below.
460'
1.401'
-
200
400
600
800
1.000
1.200
1.400
1.600
2015 2016 2017 2018 2019 2020 2021 2022 2023 2024 2025
Units prod. 1000´s Production forecast overview
Annual production growing towards 500.000 in 2020. We expect growth to continue to 1,4 million in 2025.
Model S Model X Model 3
Detailed growth forecast: 2016 - 2020 • Below we explain our assumed production growth in this period • Conclusion: we expect a CAGR of 55,8 %
81
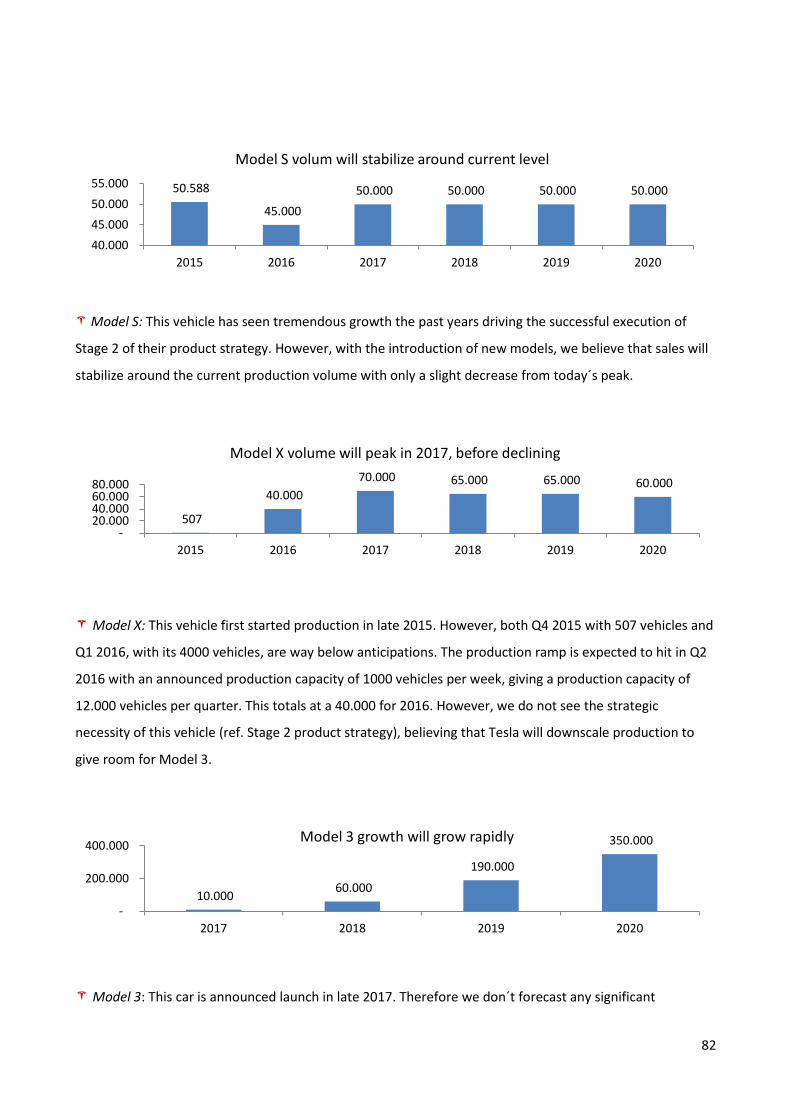
Model S: This vehicle has seen tremendous growth the past years driving the successful execution of
Stage 2 of their product strategy. However, with the introduction of new models, we believe that sales will
stabilize around the current production volume with only a slight decrease from today´s peak.
Model X: This vehicle first started production in late 2015. However, both Q4 2015 with 507 vehicles and
Q1 2016, with its 4000 vehicles, are way below anticipations. The production ramp is expected to hit in Q2
2016 with an announced production capacity of 1000 vehicles per week, giving a production capacity of
12.000 vehicles per quarter. This totals at a 40.000 for 2016. However, we do not see the strategic
necessity of this vehicle (ref. Stage 2 product strategy), believing that Tesla will downscale production to
give room for Model 3.
Model 3: This car is announced launch in late 2017. Therefore we don´t forecast any significant
50.588
45.000 50.000 50.000 50.000 50.000
40.000 45.000 50.000 55.000
2015 2016 2017 2018 2019 2020
Model S volum will stabilize around current level
507
40.000 70.000 65.000 65.000 60.000
- 20.000 40.000 60.000 80.000
2015 2016 2017 2018 2019 2020
Model X volume will peak in 2017, before declining
10.000 60.000
190.000
350.000
-
200.000
400.000
2017 2018 2019 2020
Model 3 growth will grow rapidly
82
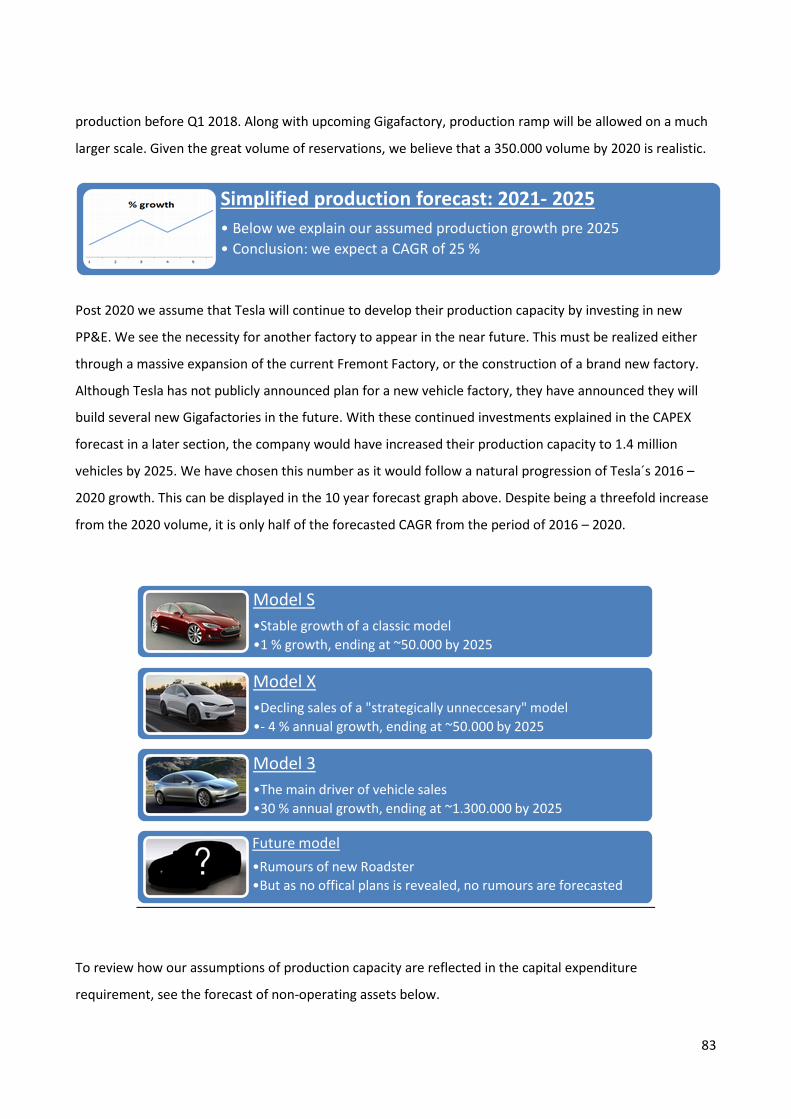
production before Q1 2018. Along with upcoming Gigafactory, production ramp will be allowed on a much
larger scale. Given the great volume of reservations, we believe that a 350.000 volume by 2020 is realistic.
Post 2020 we assume that Tesla will continue to develop their production capacity by investing in new
PP&E. We see the necessity for another factory to appear in the near future. This must be realized either
through a massive expansion of the current Fremont Factory, or the construction of a brand new factory.
Although Tesla has not publicly announced plan for a new vehicle factory, they have announced they will
build several new Gigafactories in the future. With these continued investments explained in the CAPEX
forecast in a later section, the company would have increased their production capacity to 1.4 million
vehicles by 2025. We have chosen this number as it would follow a natural progression of Tesla´s 2016 –
2020 growth. This can be displayed in the 10 year forecast graph above. Despite being a threefold increase
from the 2020 volume, it is only half of the forecasted CAGR from the period of 2016 – 2020.
To review how our assumptions of production capacity are reflected in the capital expenditure
requirement, see the forecast of non-operating assets below.
Simplified production forecast: 2021- 2025 • Below we explain our assumed production growth pre 2025 • Conclusion: we expect a CAGR of 25 %
Model S •Stable growth of a classic model •1 % growth, ending at ~50.000 by 2025
Model X •Decling sales of a "strategically unneccesary" model •- 4 % annual growth, ending at ~50.000 by 2025
Model 3 •The main driver of vehicle sales •30 % annual growth, ending at ~1.300.000 by 2025
Future model •Rumours of new Roadster •But as no offical plans is revealed, no rumours are forecasted
83
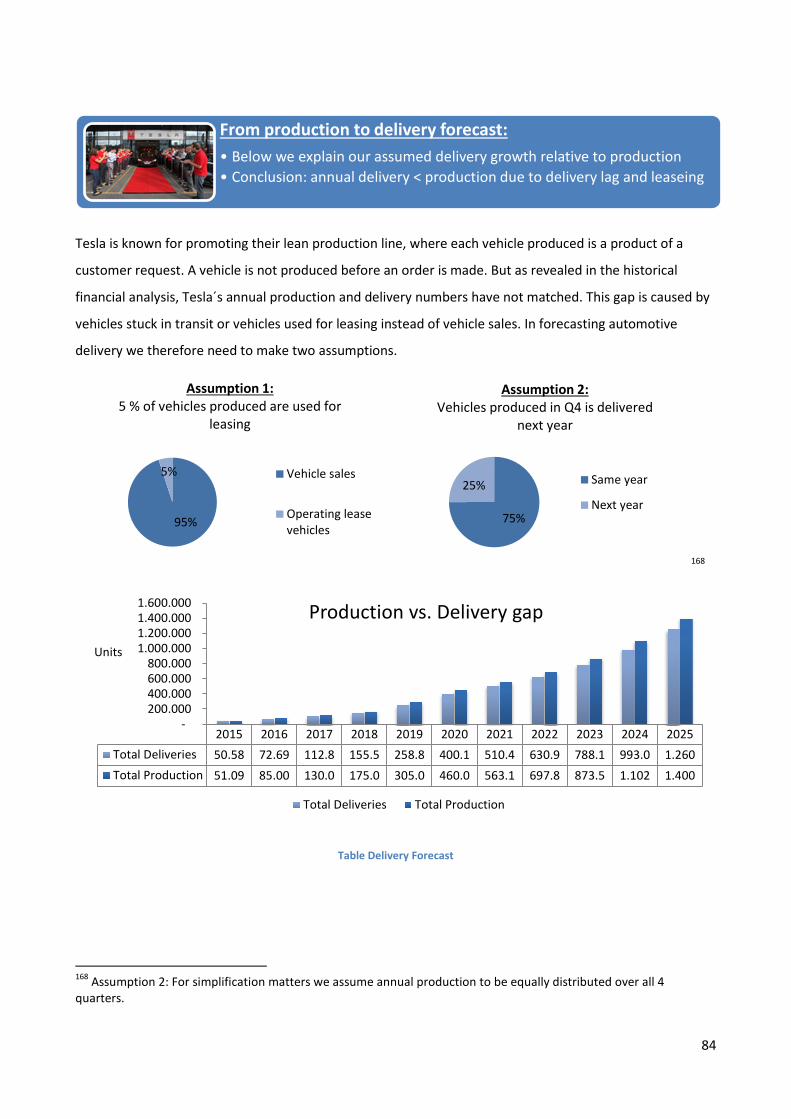
Tesla is known for promoting their lean production line, where each vehicle produced is a product of a
customer request. A vehicle is not produced before an order is made. But as revealed in the historical
financial analysis, Tesla´s annual production and delivery numbers have not matched. This gap is caused by
vehicles stuck in transit or vehicles used for leasing instead of vehicle sales. In forecasting automotive
delivery we therefore need to make two assumptions.
168
Table Delivery Forecast
168 Assumption 2: For simplification matters we assume annual production to be equally distributed over all 4 quarters.
From production to delivery forecast: • Below we explain our assumed delivery growth relative to production • Conclusion: annual delivery < production due to delivery lag and leaseing
95%
5%
Assumption 1: 5 % of vehicles produced are used for
leasing
Vehicle sales
Operating leasevehicles
75%
25%
Assumption 2: Vehicles produced in Q4 is delivered
next year
Same year
Next year
2015 2016 2017 2018 2019 2020 2021 2022 2023 2024 2025Total Deliveries 50.58 72.69 112.8 155.5 258.8 400.1 510.4 630.9 788.1 993.0 1.260Total Production 51.09 85.00 130.0 175.0 305.0 460.0 563.1 697.8 873.5 1.102 1.400
- 200.000 400.000 600.000 800.000
1.000.000 1.200.000 1.400.000 1.600.000
Units
Production vs. Delivery gap
Total Deliveries Total Production
84
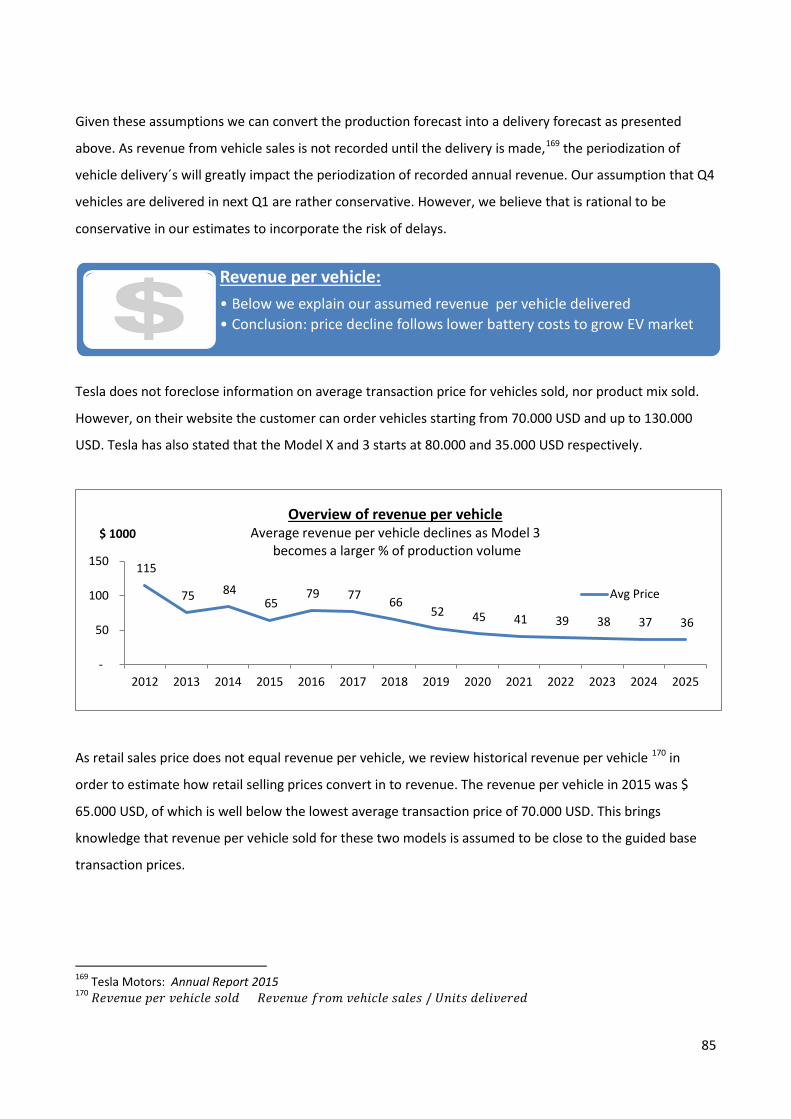
Given these assumptions we can convert the production forecast into a delivery forecast as presented
above. As revenue from vehicle sales is not recorded until the delivery is made,169 the periodization of
vehicle delivery´s will greatly impact the periodization of recorded annual revenue. Our assumption that Q4
vehicles are delivered in next Q1 are rather conservative. However, we believe that is rational to be
conservative in our estimates to incorporate the risk of delays.
Tesla does not foreclose information on average transaction price for vehicles sold, nor product mix sold.
However, on their website the customer can order vehicles starting from 70.000 USD and up to 130.000
USD. Tesla has also stated that the Model X and 3 starts at 80.000 and 35.000 USD respectively.
As retail sales price does not equal revenue per vehicle, we review historical revenue per vehicle 170 in
order to estimate how retail selling prices convert in to revenue. The revenue per vehicle in 2015 was $
65.000 USD, of which is well below the lowest average transaction price of 70.000 USD. This brings
knowledge that revenue per vehicle sold for these two models is assumed to be close to the guided base
transaction prices.
169 Tesla Motors: Annual Report 2015 170 𝑅𝑅𝑅𝑅𝑅𝑅𝑅𝑅𝑅𝑅𝑅𝑅𝑅𝑅 𝑝𝑝𝑅𝑅𝑝𝑝 𝑅𝑅𝑅𝑅ℎ𝑖𝑖𝑖𝑖𝑖𝑖𝑅𝑅 𝑠𝑠𝑠𝑠𝑖𝑖𝑠𝑠 = 𝑅𝑅𝑅𝑅𝑅𝑅𝑅𝑅𝑅𝑅𝑅𝑅𝑅𝑅 𝑓𝑓𝑝𝑝𝑠𝑠𝑓𝑓 𝑅𝑅𝑅𝑅ℎ𝑖𝑖𝑖𝑖𝑖𝑖𝑅𝑅 𝑠𝑠𝑠𝑠𝑖𝑖𝑅𝑅𝑠𝑠 / 𝑈𝑈𝑅𝑅𝑖𝑖𝑈𝑈𝑠𝑠 𝑠𝑠𝑅𝑅𝑖𝑖𝑖𝑖𝑅𝑅𝑅𝑅𝑝𝑝𝑅𝑅𝑠𝑠
Revenue per vehicle: • Below we explain our assumed revenue per vehicle delivered • Conclusion: price decline follows lower battery costs to grow EV market
115
75 84 65
79 77 66 52 45 41 39 38 37 36
-
50
100
150
2012 2013 2014 2015 2016 2017 2018 2019 2020 2021 2022 2023 2024 2025
$ 1000 Overview of revenue per vehicle
Average revenue per vehicle declines as Model 3 becomes a larger % of production volume
Avg Price
85
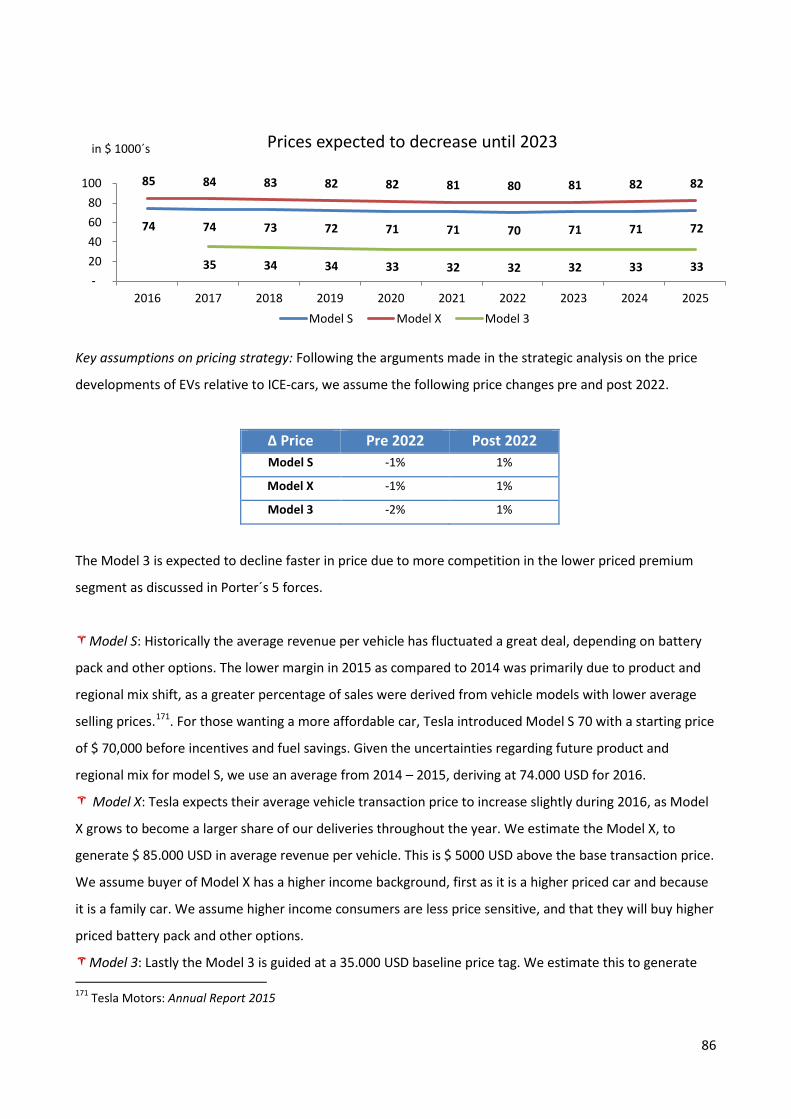
Key assumptions on pricing strategy: Following the arguments made in the strategic analysis on the price
developments of EVs relative to ICE-cars, we assume the following price changes pre and post 2022.
Δ Price Pre 2022 Post 2022 Model S -1% 1%
Model X -1% 1%
Model 3 -2% 1%
The Model 3 is expected to decline faster in price due to more competition in the lower priced premium
segment as discussed in Porter´s 5 forces.
Model S: Historically the average revenue per vehicle has fluctuated a great deal, depending on battery
pack and other options. The lower margin in 2015 as compared to 2014 was primarily due to product and
regional mix shift, as a greater percentage of sales were derived from vehicle models with lower average
selling prices.171. For those wanting a more affordable car, Tesla introduced Model S 70 with a starting price
of $ 70,000 before incentives and fuel savings. Given the uncertainties regarding future product and
regional mix for model S, we use an average from 2014 – 2015, deriving at 74.000 USD for 2016.
Model X: Tesla expects their average vehicle transaction price to increase slightly during 2016, as Model
X grows to become a larger share of our deliveries throughout the year. We estimate the Model X, to
generate $ 85.000 USD in average revenue per vehicle. This is $ 5000 USD above the base transaction price.
We assume buyer of Model X has a higher income background, first as it is a higher priced car and because
it is a family car. We assume higher income consumers are less price sensitive, and that they will buy higher
priced battery pack and other options.
Model 3: Lastly the Model 3 is guided at a 35.000 USD baseline price tag. We estimate this to generate
171 Tesla Motors: Annual Report 2015
74 74 73 72 71 71 70 71 71 72
85 84 83 82 82 81 80 81 82 82
35 34 34 33 32 32 32 33 33 -
20 40 60 80
100
2016 2017 2018 2019 2020 2021 2022 2023 2024 2025
in $ 1000´s Prices expected to decrease until 2023
Model S Model X Model 3
86
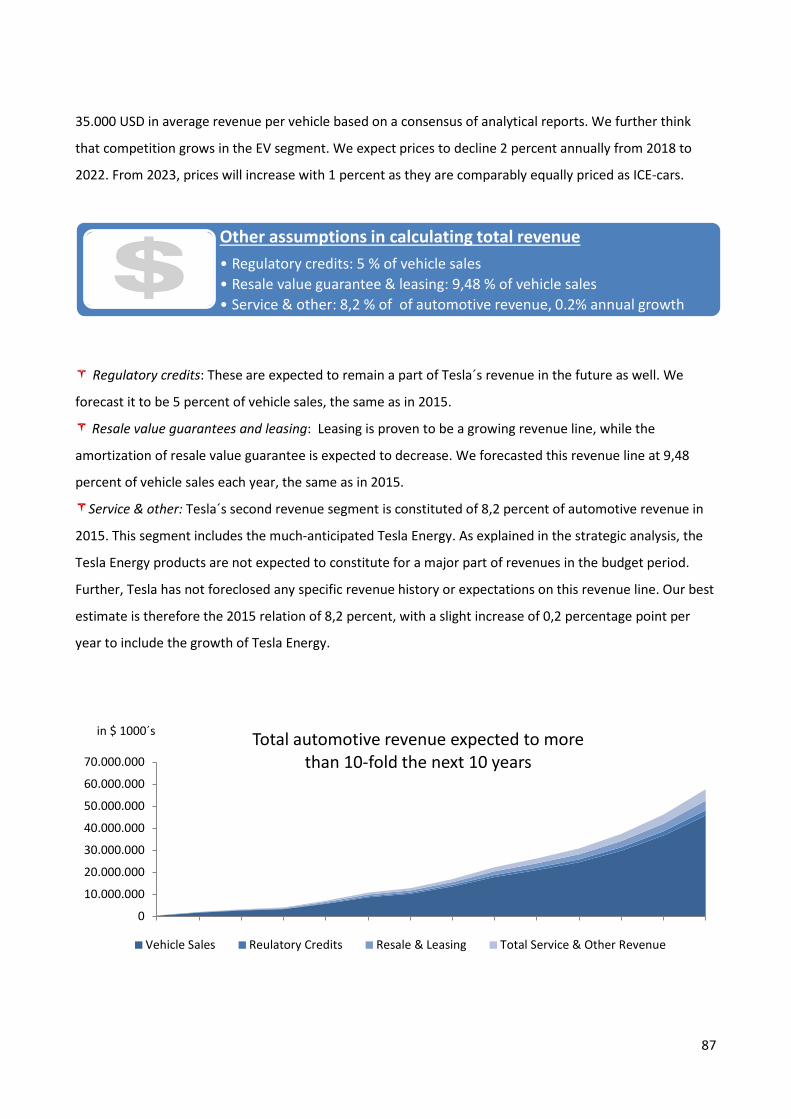
35.000 USD in average revenue per vehicle based on a consensus of analytical reports. We further think
that competition grows in the EV segment. We expect prices to decline 2 percent annually from 2018 to
2022. From 2023, prices will increase with 1 percent as they are comparably equally priced as ICE-cars.
Regulatory credits: These are expected to remain a part of Tesla´s revenue in the future as well. We
forecast it to be 5 percent of vehicle sales, the same as in 2015.
Resale value guarantees and leasing: Leasing is proven to be a growing revenue line, while the
amortization of resale value guarantee is expected to decrease. We forecasted this revenue line at 9,48
percent of vehicle sales each year, the same as in 2015.
Service & other: Tesla´s second revenue segment is constituted of 8,2 percent of automotive revenue in
2015. This segment includes the much-anticipated Tesla Energy. As explained in the strategic analysis, the
Tesla Energy products are not expected to constitute for a major part of revenues in the budget period.
Further, Tesla has not foreclosed any specific revenue history or expectations on this revenue line. Our best
estimate is therefore the 2015 relation of 8,2 percent, with a slight increase of 0,2 percentage point per
year to include the growth of Tesla Energy.
Other assumptions in calculating total revenue • Regulatory credits: 5 % of vehicle sales • Resale value guarantee & leasing: 9,48 % of vehicle sales • Service & other: 8,2 % of of automotive revenue, 0.2% annual growth • Conclusion: price decline follows lower battery costs to grow EV market
0
10.000.000
20.000.000
30.000.000
40.000.000
50.000.000
60.000.000
70.000.000
in $ 1000´s Total automotive revenue expected to more than 10-fold the next 10 years
Vehicle Sales Reulatory Credits Resale & Leasing Total Service & Other Revenue
87
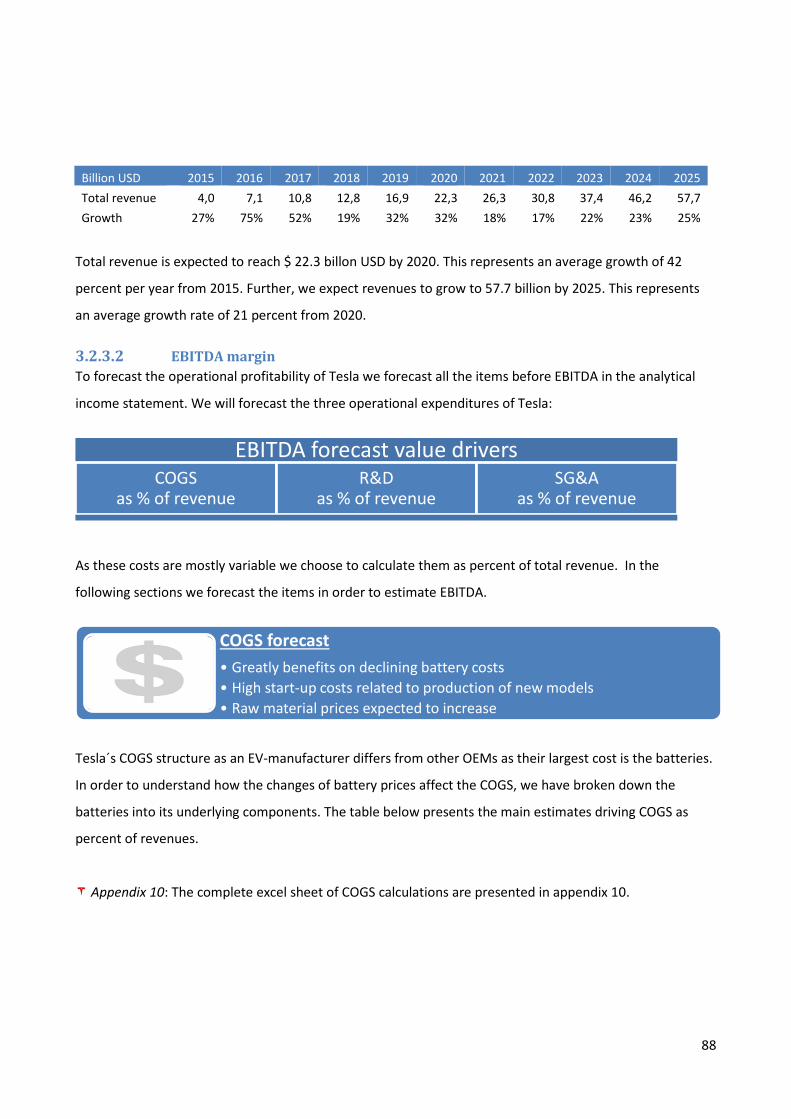
Billion USD 2015 2016 2017 2018 2019 2020 2021 2022 2023 2024 2025 Total revenue 4,0 7,1 10,8 12,8 16,9 22,3 26,3 30,8 37,4 46,2 57,7 Growth 27% 75% 52% 19% 32% 32% 18% 17% 22% 23% 25%
Total revenue is expected to reach $ 22.3 billon USD by 2020. This represents an average growth of 42
percent per year from 2015. Further, we expect revenues to grow to 57.7 billion by 2025. This represents
an average growth rate of 21 percent from 2020.
EBITDA margin 3.2.3.2To forecast the operational profitability of Tesla we forecast all the items before EBITDA in the analytical
income statement. We will forecast the three operational expenditures of Tesla:
As these costs are mostly variable we choose to calculate them as percent of total revenue. In the
following sections we forecast the items in order to estimate EBITDA.
Tesla´s COGS structure as an EV-manufacturer differs from other OEMs as their largest cost is the batteries.
In order to understand how the changes of battery prices affect the COGS, we have broken down the
batteries into its underlying components. The table below presents the main estimates driving COGS as
percent of revenues.
Appendix 10: The complete excel sheet of COGS calculations are presented in appendix 10.
EBITDA forecast value drivers COGS
as % of revenue R&D
as % of revenue SG&A
as % of revenue
COGS forecast • Greatly benefits on declining battery costs • High start-up costs related to production of new models • Raw material prices expected to increase
88
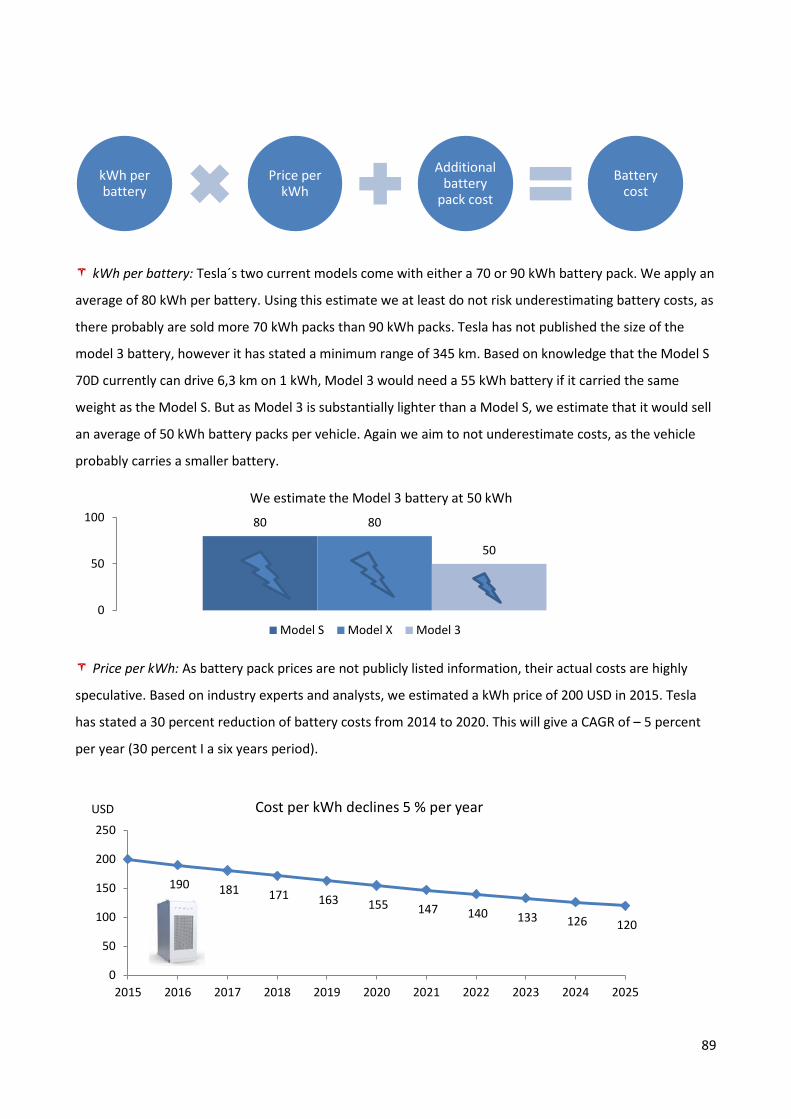
kWh per battery: Tesla´s two current models come with either a 70 or 90 kWh battery pack. We apply an
average of 80 kWh per battery. Using this estimate we at least do not risk underestimating battery costs, as
there probably are sold more 70 kWh packs than 90 kWh packs. Tesla has not published the size of the
model 3 battery, however it has stated a minimum range of 345 km. Based on knowledge that the Model S
70D currently can drive 6,3 km on 1 kWh, Model 3 would need a 55 kWh battery if it carried the same
weight as the Model S. But as Model 3 is substantially lighter than a Model S, we estimate that it would sell
an average of 50 kWh battery packs per vehicle. Again we aim to not underestimate costs, as the vehicle
probably carries a smaller battery.
Price per kWh: As battery pack prices are not publicly listed information, their actual costs are highly
speculative. Based on industry experts and analysts, we estimated a kWh price of 200 USD in 2015. Tesla
has stated a 30 percent reduction of battery costs from 2014 to 2020. This will give a CAGR of – 5 percent
per year (30 percent I a six years period).
kWh per battery
Price per kWh
Additional battery
pack cost
Battery cost
80 80
50
0
50
100We estimate the Model 3 battery at 50 kWh
Model S Model X Model 3
190 181 171 163 155 147 140 133 126 120
0
50
100
150
200
250
2015 2016 2017 2018 2019 2020 2021 2022 2023 2024 2025
USD Cost per kWh declines 5 % per year
89
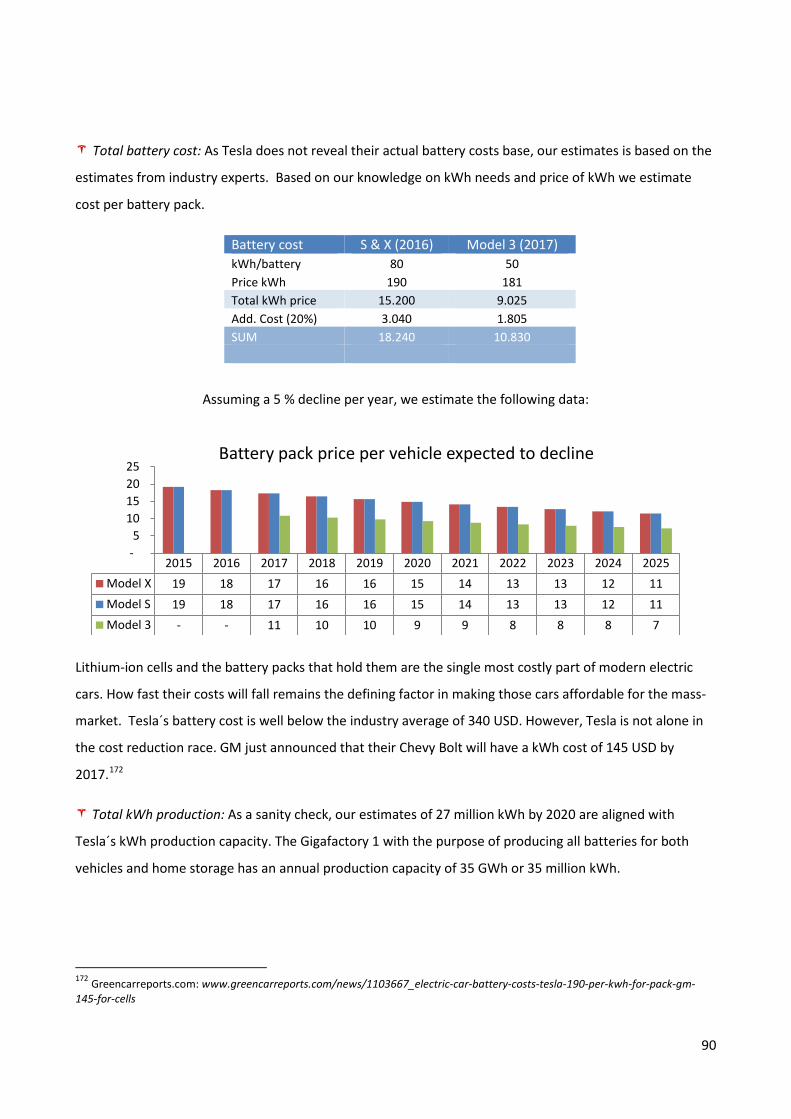
Total battery cost: As Tesla does not reveal their actual battery costs base, our estimates is based on the
estimates from industry experts. Based on our knowledge on kWh needs and price of kWh we estimate
cost per battery pack.
Battery cost S & X (2016) Model 3 (2017) kWh/battery 80 50 Price kWh 190 181 Total kWh price 15.200 9.025 Add. Cost (20%) 3.040 1.805 SUM 18.240 10.830
Assuming a 5 % decline per year, we estimate the following data:
Lithium-ion cells and the battery packs that hold them are the single most costly part of modern electric
cars. How fast their costs will fall remains the defining factor in making those cars affordable for the mass-
market. Tesla´s battery cost is well below the industry average of 340 USD. However, Tesla is not alone in
the cost reduction race. GM just announced that their Chevy Bolt will have a kWh cost of 145 USD by
2017.172
Total kWh production: As a sanity check, our estimates of 27 million kWh by 2020 are aligned with
Tesla´s kWh production capacity. The Gigafactory 1 with the purpose of producing all batteries for both
vehicles and home storage has an annual production capacity of 35 GWh or 35 million kWh.
172 Greencarreports.com: www.greencarreports.com/news/1103667_electric-car-battery-costs-tesla-190-per-kwh-for-pack-gm-145-for-cells
2015 2016 2017 2018 2019 2020 2021 2022 2023 2024 2025Model X 19 18 17 16 16 15 14 13 13 12 11Model S 19 18 17 16 16 15 14 13 13 12 11Model 3 - - 11 10 10 9 9 8 8 8 7
- 5
10 15 20 25
Battery pack price per vehicle expected to decline
90
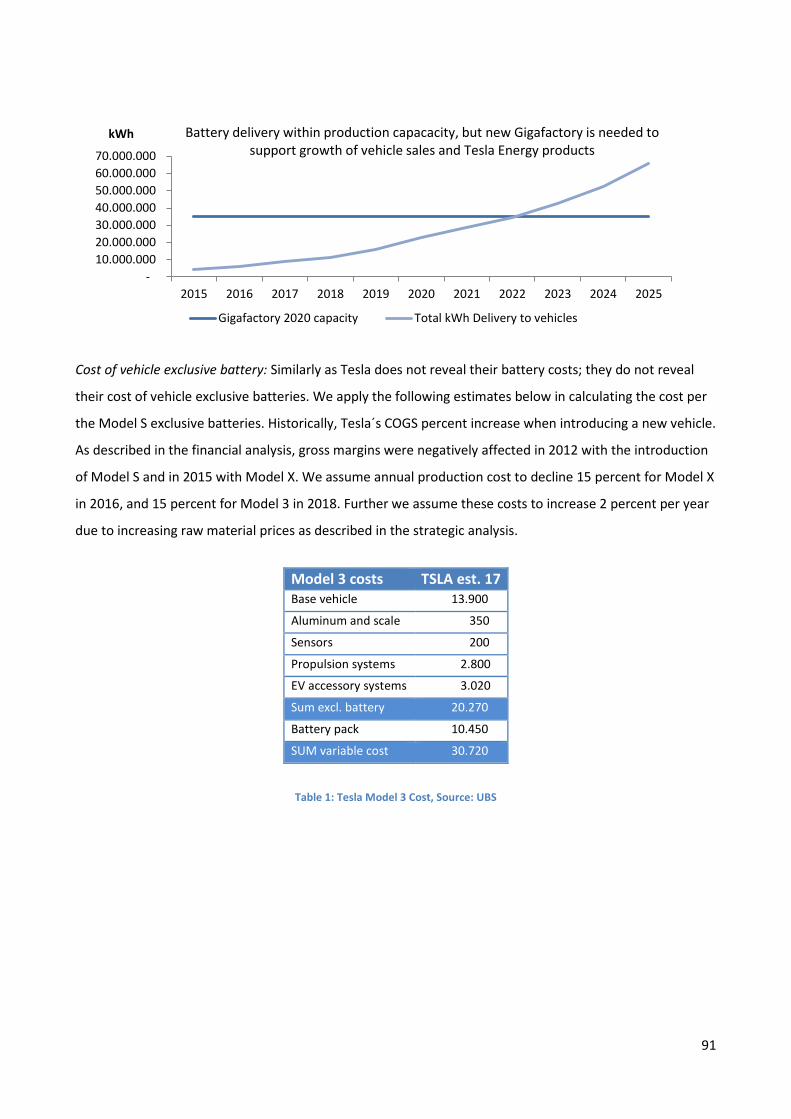
Cost of vehicle exclusive battery: Similarly as Tesla does not reveal their battery costs; they do not reveal
their cost of vehicle exclusive batteries. We apply the following estimates below in calculating the cost per
the Model S exclusive batteries. Historically, Tesla´s COGS percent increase when introducing a new vehicle.
As described in the financial analysis, gross margins were negatively affected in 2012 with the introduction
of Model S and in 2015 with Model X. We assume annual production cost to decline 15 percent for Model X
in 2016, and 15 percent for Model 3 in 2018. Further we assume these costs to increase 2 percent per year
due to increasing raw material prices as described in the strategic analysis.
Table 1: Tesla Model 3 Cost, Source: UBS
- 10.000.000 20.000.000 30.000.000 40.000.000 50.000.000 60.000.000 70.000.000
2015 2016 2017 2018 2019 2020 2021 2022 2023 2024 2025
kWh Battery delivery within production capacacity, but new Gigafactory is needed to support growth of vehicle sales and Tesla Energy products
Gigafactory 2020 capacity Total kWh Delivery to vehicles
Model 3 costs TSLA est. 17 Base vehicle 13.900
Aluminum and scale 350
Sensors 200
Propulsion systems 2.800
EV accessory systems 3.020
Sum excl. battery 20.270
Battery pack 10.450
SUM variable cost 30.720
91
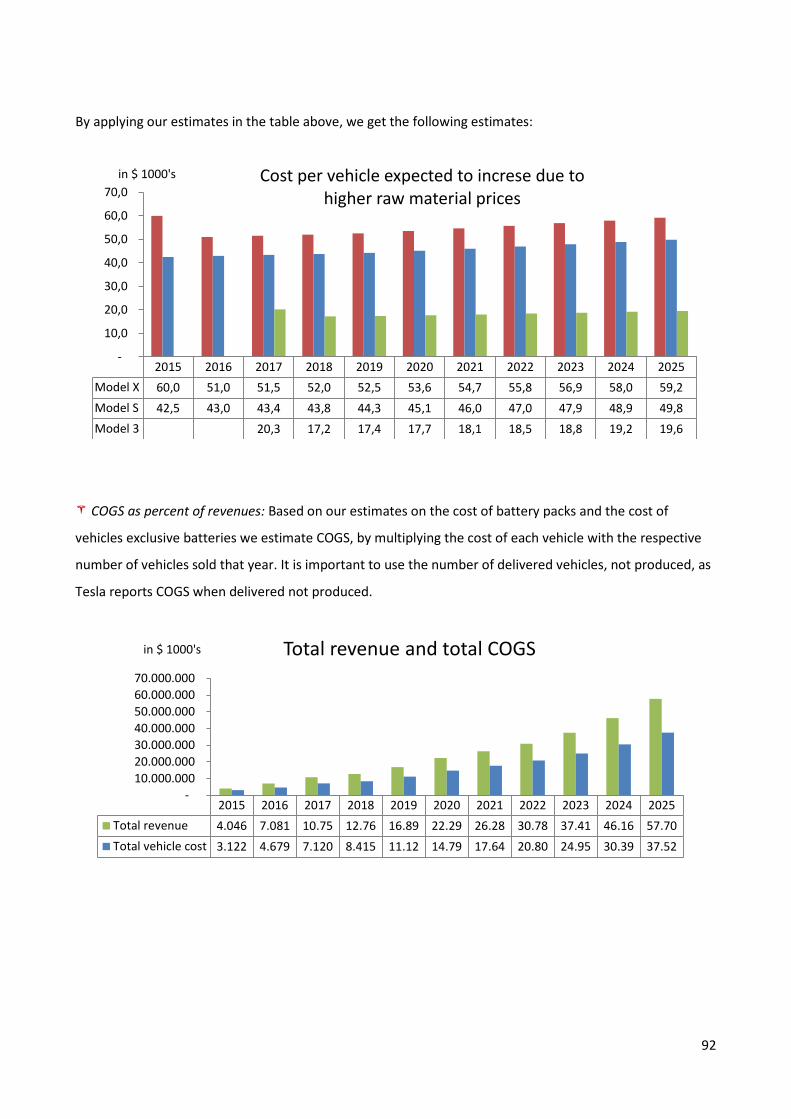
By applying our estimates in the table above, we get the following estimates:
COGS as percent of revenues: Based on our estimates on the cost of battery packs and the cost of
vehicles exclusive batteries we estimate COGS, by multiplying the cost of each vehicle with the respective
number of vehicles sold that year. It is important to use the number of delivered vehicles, not produced, as
Tesla reports COGS when delivered not produced.
2015 2016 2017 2018 2019 2020 2021 2022 2023 2024 2025Model X 60,0 51,0 51,5 52,0 52,5 53,6 54,7 55,8 56,9 58,0 59,2Model S 42,5 43,0 43,4 43,8 44,3 45,1 46,0 47,0 47,9 48,9 49,8Model 3 20,3 17,2 17,4 17,7 18,1 18,5 18,8 19,2 19,6
-
10,0
20,0
30,0
40,0
50,0
60,0
70,0in $ 1000's Cost per vehicle expected to increse due to
higher raw material prices
2015 2016 2017 2018 2019 2020 2021 2022 2023 2024 2025Total revenue 4.046 7.081 10.75 12.76 16.89 22.29 26.28 30.78 37.41 46.16 57.70Total vehicle cost 3.122 4.679 7.120 8.415 11.12 14.79 17.64 20.80 24.95 30.39 37.52
- 10.000.000 20.000.000 30.000.000 40.000.000 50.000.000 60.000.000 70.000.000
in $ 1000's Total revenue and total COGS
92
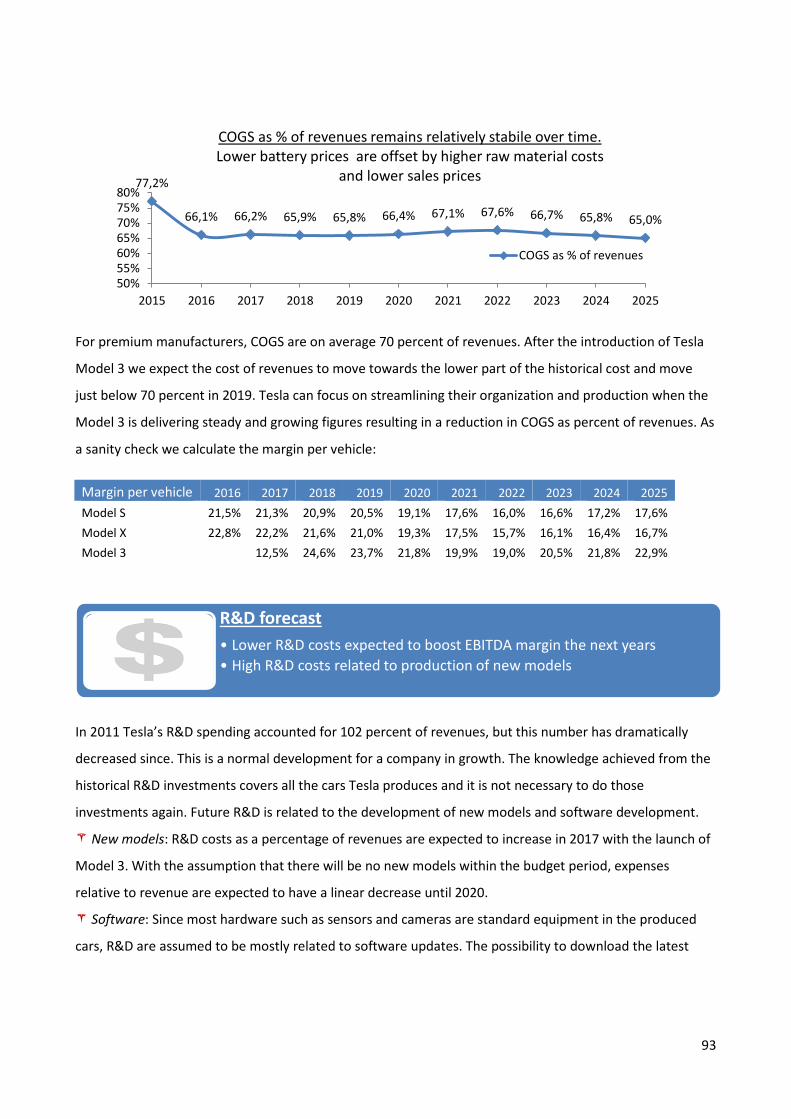
For premium manufacturers, COGS are on average 70 percent of revenues. After the introduction of Tesla
Model 3 we expect the cost of revenues to move towards the lower part of the historical cost and move
just below 70 percent in 2019. Tesla can focus on streamlining their organization and production when the
Model 3 is delivering steady and growing figures resulting in a reduction in COGS as percent of revenues. As
a sanity check we calculate the margin per vehicle:
Margin per vehicle 2016 2017 2018 2019 2020 2021 2022 2023 2024 2025 Model S 21,5% 21,3% 20,9% 20,5% 19,1% 17,6% 16,0% 16,6% 17,2% 17,6% Model X 22,8% 22,2% 21,6% 21,0% 19,3% 17,5% 15,7% 16,1% 16,4% 16,7% Model 3
12,5% 24,6% 23,7% 21,8% 19,9% 19,0% 20,5% 21,8% 22,9%
In 2011 Tesla’s R&D spending accounted for 102 percent of revenues, but this number has dramatically
decreased since. This is a normal development for a company in growth. The knowledge achieved from the
historical R&D investments covers all the cars Tesla produces and it is not necessary to do those
investments again. Future R&D is related to the development of new models and software development.
New models: R&D costs as a percentage of revenues are expected to increase in 2017 with the launch of
Model 3. With the assumption that there will be no new models within the budget period, expenses
relative to revenue are expected to have a linear decrease until 2020.
Software: Since most hardware such as sensors and cameras are standard equipment in the produced
cars, R&D are assumed to be mostly related to software updates. The possibility to download the latest
77,2%
66,1% 66,2% 65,9% 65,8% 66,4% 67,1% 67,6% 66,7% 65,8% 65,0%
50%55%60%65%70%75%80%
2015 2016 2017 2018 2019 2020 2021 2022 2023 2024 2025
COGS as % of revenues remains relatively stabile over time. Lower battery prices are offset by higher raw material costs
and lower sales prices
COGS as % of revenues
R&D forecast • Lower R&D costs expected to boost EBITDA margin the next years • High R&D costs related to production of new models
93
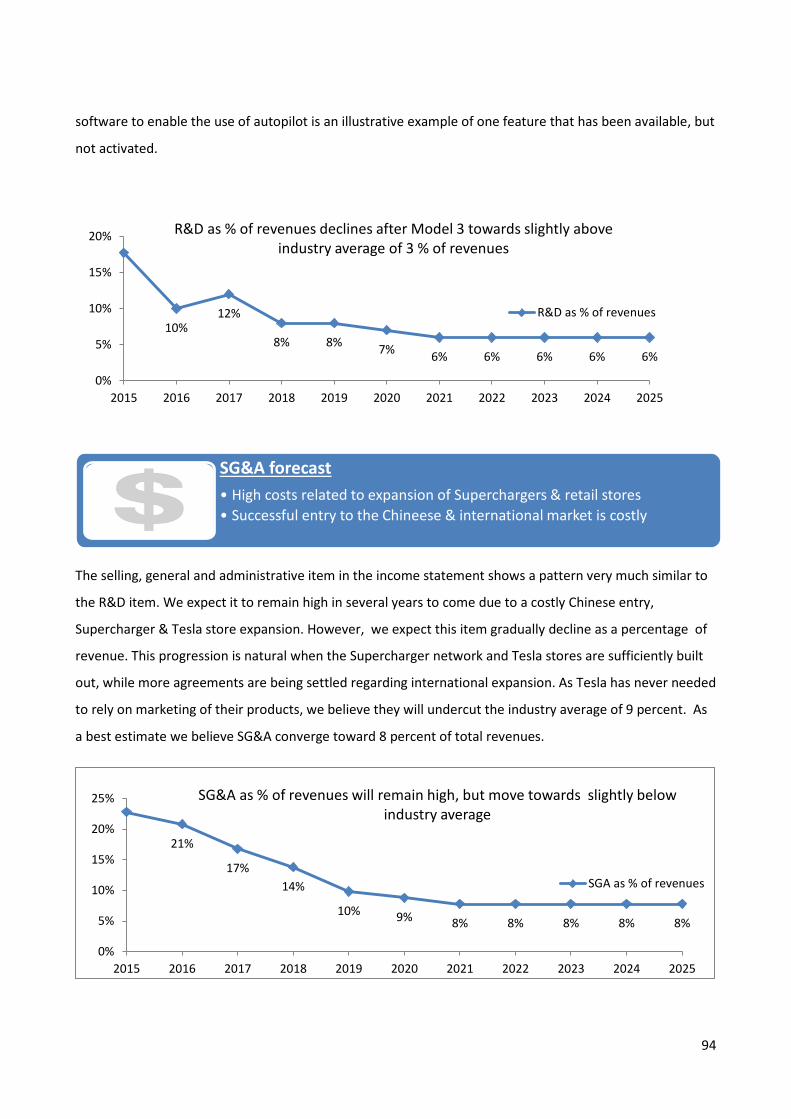
software to enable the use of autopilot is an illustrative example of one feature that has been available, but
not activated.
The selling, general and administrative item in the income statement shows a pattern very much similar to
the R&D item. We expect it to remain high in several years to come due to a costly Chinese entry,
Supercharger & Tesla store expansion. However, we expect this item gradually decline as a percentage of
revenue. This progression is natural when the Supercharger network and Tesla stores are sufficiently built
out, while more agreements are being settled regarding international expansion. As Tesla has never needed
to rely on marketing of their products, we believe they will undercut the industry average of 9 percent. As
a best estimate we believe SG&A converge toward 8 percent of total revenues.
10% 12%
8% 8% 7% 6% 6% 6% 6% 6%
0%
5%
10%
15%
20%
2015 2016 2017 2018 2019 2020 2021 2022 2023 2024 2025
R&D as % of revenues declines after Model 3 towards slightly above industry average of 3 % of revenues
R&D as % of revenues
SG&A forecast • High costs related to expansion of Superchargers & retail stores • Successful entry to the Chineese & international market is costly
21%
17% 14%
10% 9% 8% 8% 8% 8% 8%
0%
5%
10%
15%
20%
25%
2015 2016 2017 2018 2019 2020 2021 2022 2023 2024 2025
SG&A as % of revenues will remain high, but move towards slightly below industry average
SGA as % of revenues
94
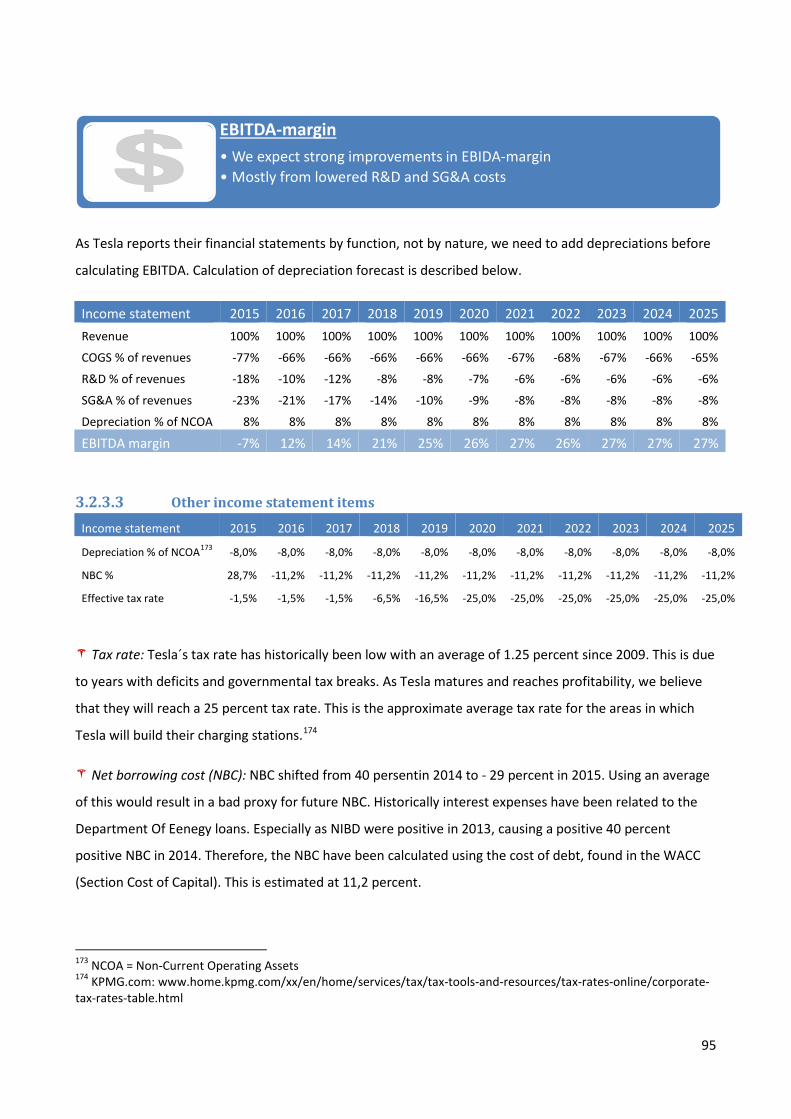
As Tesla reports their financial statements by function, not by nature, we need to add depreciations before
calculating EBITDA. Calculation of depreciation forecast is described below.
Income statement 2015 2016 2017 2018 2019 2020 2021 2022 2023 2024 2025 Revenue 100% 100% 100% 100% 100% 100% 100% 100% 100% 100% 100%
COGS % of revenues -77% -66% -66% -66% -66% -66% -67% -68% -67% -66% -65%
R&D % of revenues -18% -10% -12% -8% -8% -7% -6% -6% -6% -6% -6%
SG&A % of revenues -23% -21% -17% -14% -10% -9% -8% -8% -8% -8% -8%
Depreciation % of NCOA 8% 8% 8% 8% 8% 8% 8% 8% 8% 8% 8%
EBITDA margin -7% 12% 14% 21% 25% 26% 27% 26% 27% 27% 27%
Other income statement items 3.2.3.3Income statement 2015 2016 2017 2018 2019 2020 2021 2022 2023 2024 2025
Depreciation % of NCOA173 -8,0% -8,0% -8,0% -8,0% -8,0% -8,0% -8,0% -8,0% -8,0% -8,0% -8,0%
NBC % 28,7% -11,2% -11,2% -11,2% -11,2% -11,2% -11,2% -11,2% -11,2% -11,2% -11,2%
Effective tax rate -1,5% -1,5% -1,5% -6,5% -16,5% -25,0% -25,0% -25,0% -25,0% -25,0% -25,0%
Tax rate: Tesla´s tax rate has historically been low with an average of 1.25 percent since 2009. This is due
to years with deficits and governmental tax breaks. As Tesla matures and reaches profitability, we believe
that they will reach a 25 percent tax rate. This is the approximate average tax rate for the areas in which
Tesla will build their charging stations.174
Net borrowing cost (NBC): NBC shifted from 40 persentin 2014 to - 29 percent in 2015. Using an average
of this would result in a bad proxy for future NBC. Historically interest expenses have been related to the
Department Of Eenegy loans. Especially as NIBD were positive in 2013, causing a positive 40 percent
positive NBC in 2014. Therefore, the NBC have been calculated using the cost of debt, found in the WACC
(Section Cost of Capital). This is estimated at 11,2 percent.
173 NCOA = Non-Current Operating Assets 174 KPMG.com: www.home.kpmg.com/xx/en/home/services/tax/tax-tools-and-resources/tax-rates-online/corporate-tax-rates-table.html
EBITDA-margin • We expect strong improvements in EBIDA-margin • Mostly from lowered R&D and SG&A costs
95
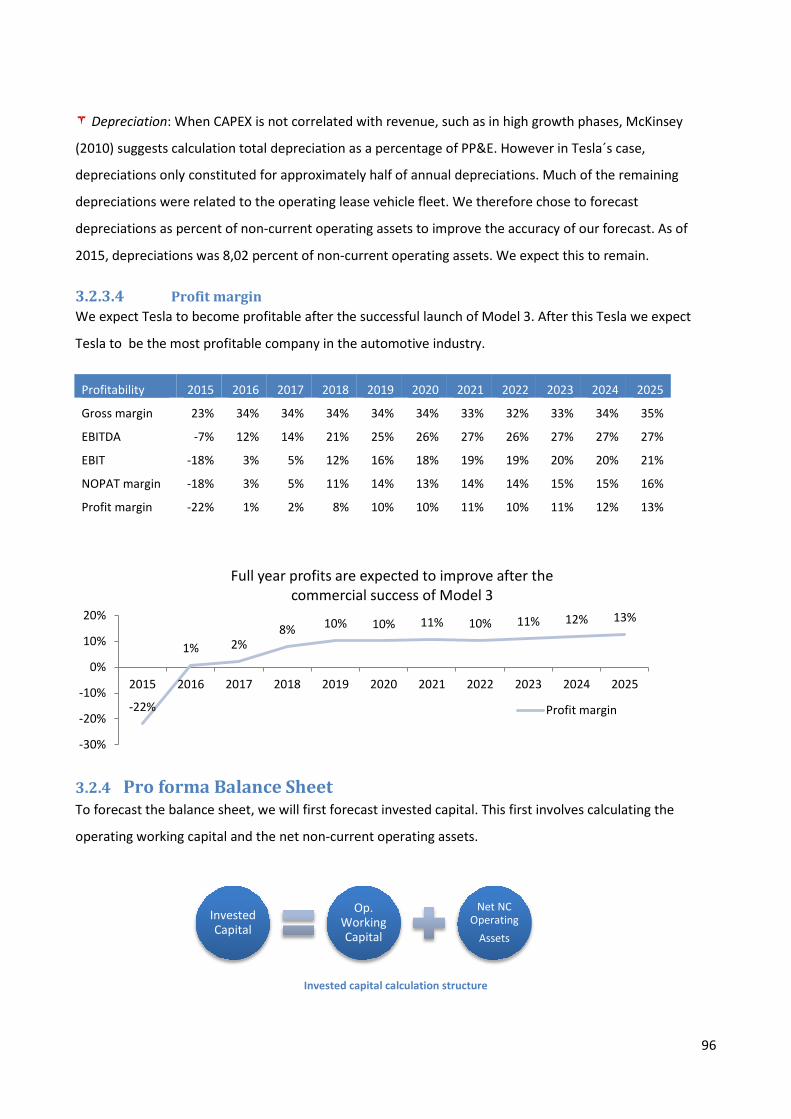
Depreciation: When CAPEX is not correlated with revenue, such as in high growth phases, McKinsey
(2010) suggests calculation total depreciation as a percentage of PP&E. However in Tesla´s case,
depreciations only constituted for approximately half of annual depreciations. Much of the remaining
depreciations were related to the operating lease vehicle fleet. We therefore chose to forecast
depreciations as percent of non-current operating assets to improve the accuracy of our forecast. As of
2015, depreciations was 8,02 percent of non-current operating assets. We expect this to remain.
Profit margin 3.2.3.4We expect Tesla to become profitable after the successful launch of Model 3. After this Tesla we expect
Tesla to be the most profitable company in the automotive industry.
Profitability 2015 2016 2017 2018 2019 2020 2021 2022 2023 2024 2025
Gross margin 23% 34% 34% 34% 34% 34% 33% 32% 33% 34% 35%
EBITDA -7% 12% 14% 21% 25% 26% 27% 26% 27% 27% 27%
EBIT -18% 3% 5% 12% 16% 18% 19% 19% 20% 20% 21%
NOPAT margin -18% 3% 5% 11% 14% 13% 14% 14% 15% 15% 16%
Profit margin -22% 1% 2% 8% 10% 10% 11% 10% 11% 12% 13%
3.2.4 Pro forma Balance Sheet To forecast the balance sheet, we will first forecast invested capital. This first involves calculating the
operating working capital and the net non-current operating assets.
Invested capital calculation structure
-22%
1% 2% 8% 10% 10% 11% 10% 11% 12% 13%
-30%
-20%
-10%
0%
10%
20%
2015 2016 2017 2018 2019 2020 2021 2022 2023 2024 2025
Full year profits are expected to improve after the commercial success of Model 3
Profit margin
Invested Capital
Op. Working Capital
Net NC Operating
Assets
96
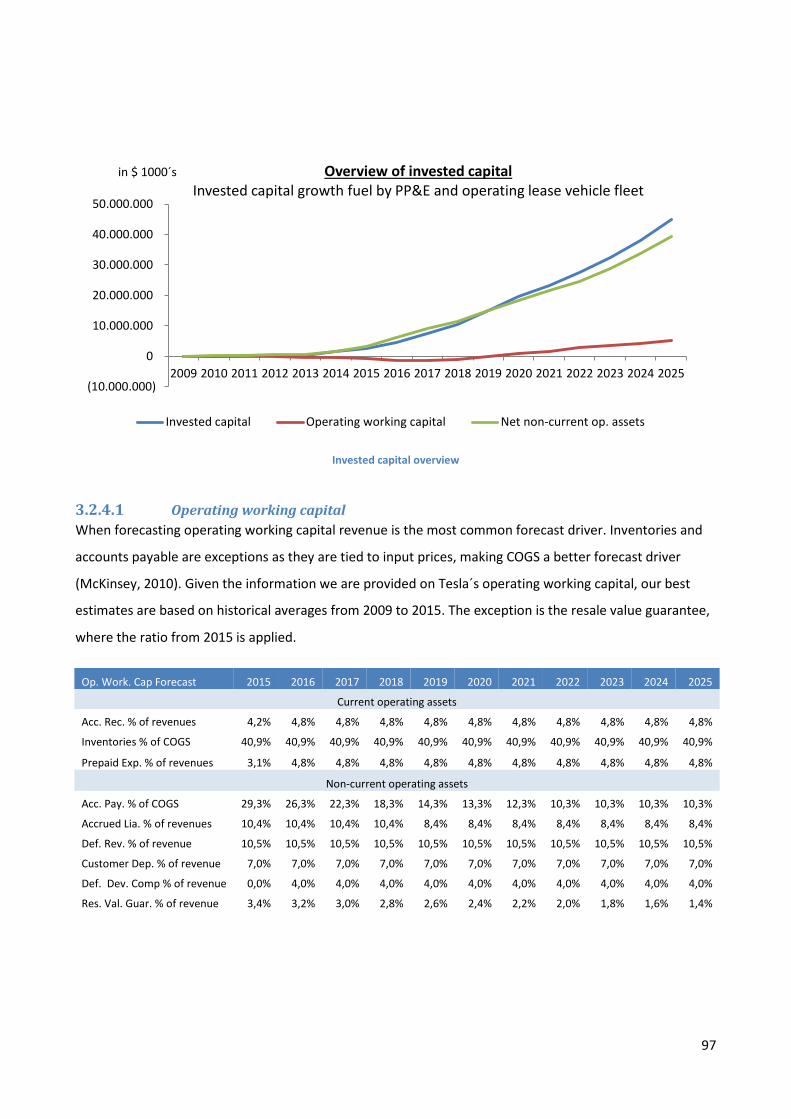
Invested capital overview
Operating working capital 3.2.4.1When forecasting operating working capital revenue is the most common forecast driver. Inventories and
accounts payable are exceptions as they are tied to input prices, making COGS a better forecast driver
(McKinsey, 2010). Given the information we are provided on Tesla´s operating working capital, our best
estimates are based on historical averages from 2009 to 2015. The exception is the resale value guarantee,
where the ratio from 2015 is applied.
Op. Work. Cap Forecast 2015 2016 2017 2018 2019 2020 2021 2022 2023 2024 2025
Current operating assets
Acc. Rec. % of revenues 4,2% 4,8% 4,8% 4,8% 4,8% 4,8% 4,8% 4,8% 4,8% 4,8% 4,8%
Inventories % of COGS 40,9% 40,9% 40,9% 40,9% 40,9% 40,9% 40,9% 40,9% 40,9% 40,9% 40,9%
Prepaid Exp. % of revenues 3,1% 4,8% 4,8% 4,8% 4,8% 4,8% 4,8% 4,8% 4,8% 4,8% 4,8%
Non-current operating assets
Acc. Pay. % of COGS 29,3% 26,3% 22,3% 18,3% 14,3% 13,3% 12,3% 10,3% 10,3% 10,3% 10,3%
Accrued Lia. % of revenues 10,4% 10,4% 10,4% 10,4% 8,4% 8,4% 8,4% 8,4% 8,4% 8,4% 8,4%
Def. Rev. % of revenue 10,5% 10,5% 10,5% 10,5% 10,5% 10,5% 10,5% 10,5% 10,5% 10,5% 10,5%
Customer Dep. % of revenue 7,0% 7,0% 7,0% 7,0% 7,0% 7,0% 7,0% 7,0% 7,0% 7,0% 7,0%
Def. Dev. Comp % of revenue 0,0% 4,0% 4,0% 4,0% 4,0% 4,0% 4,0% 4,0% 4,0% 4,0% 4,0%
Res. Val. Guar. % of revenue 3,4% 3,2% 3,0% 2,8% 2,6% 2,4% 2,2% 2,0% 1,8% 1,6% 1,4%
(10.000.000)
0
10.000.000
20.000.000
30.000.000
40.000.000
50.000.000
2009 2010 2011 2012 2013 2014 2015 2016 2017 2018 2019 2020 2021 2022 2023 2024 2025
in $ 1000´s Overview of invested capital Invested capital growth fuel by PP&E and operating lease vehicle fleet
Invested capital Operating working capital Net non-current op. assets
97
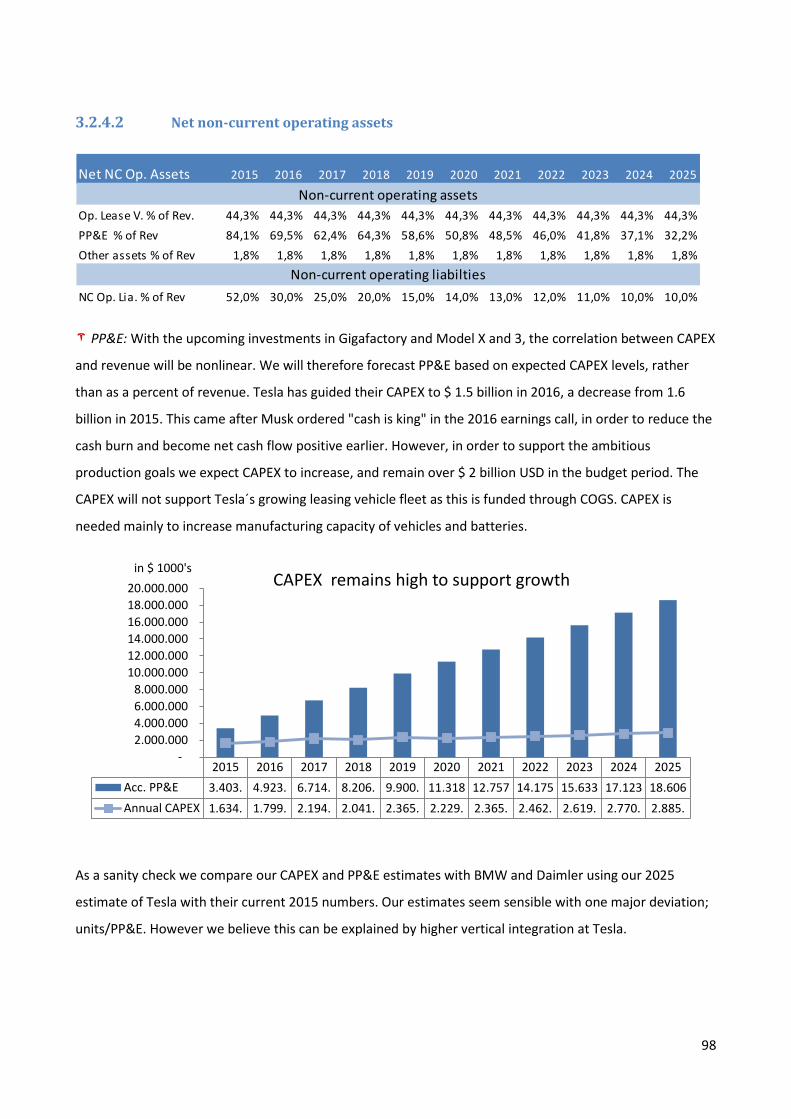
Net non-current operating assets 3.2.4.2
PP&E: With the upcoming investments in Gigafactory and Model X and 3, the correlation between CAPEX
and revenue will be nonlinear. We will therefore forecast PP&E based on expected CAPEX levels, rather
than as a percent of revenue. Tesla has guided their CAPEX to $ 1.5 billion in 2016, a decrease from 1.6
billion in 2015. This came after Musk ordered "cash is king" in the 2016 earnings call, in order to reduce the
cash burn and become net cash flow positive earlier. However, in order to support the ambitious
production goals we expect CAPEX to increase, and remain over $ 2 billion USD in the budget period. The
CAPEX will not support Tesla´s growing leasing vehicle fleet as this is funded through COGS. CAPEX is
needed mainly to increase manufacturing capacity of vehicles and batteries.
As a sanity check we compare our CAPEX and PP&E estimates with BMW and Daimler using our 2025
estimate of Tesla with their current 2015 numbers. Our estimates seem sensible with one major deviation;
units/PP&E. However we believe this can be explained by higher vertical integration at Tesla.
Net NC Op. Assets 2015 2016 2017 2018 2019 2020 2021 2022 2023 2024 2025
Op. Lease V. % of Rev. 44,3% 44,3% 44,3% 44,3% 44,3% 44,3% 44,3% 44,3% 44,3% 44,3% 44,3%PP&E % of Rev 84,1% 69,5% 62,4% 64,3% 58,6% 50,8% 48,5% 46,0% 41,8% 37,1% 32,2%Other assets % of Rev 1,8% 1,8% 1,8% 1,8% 1,8% 1,8% 1,8% 1,8% 1,8% 1,8% 1,8%
NC Op. Lia. % of Rev 52,0% 30,0% 25,0% 20,0% 15,0% 14,0% 13,0% 12,0% 11,0% 10,0% 10,0%
Non-current operating assets
Non-current operating liabilties
2015 2016 2017 2018 2019 2020 2021 2022 2023 2024 2025Acc. PP&E 3.403. 4.923. 6.714. 8.206. 9.900. 11.318 12.757 14.175 15.633 17.123 18.606Annual CAPEX 1.634. 1.799. 2.194. 2.041. 2.365. 2.229. 2.365. 2.462. 2.619. 2.770. 2.885.
- 2.000.000 4.000.000 6.000.000 8.000.000
10.000.000 12.000.000 14.000.000 16.000.000 18.000.000 20.000.000
in $ 1000's CAPEX remains high to support growth
98
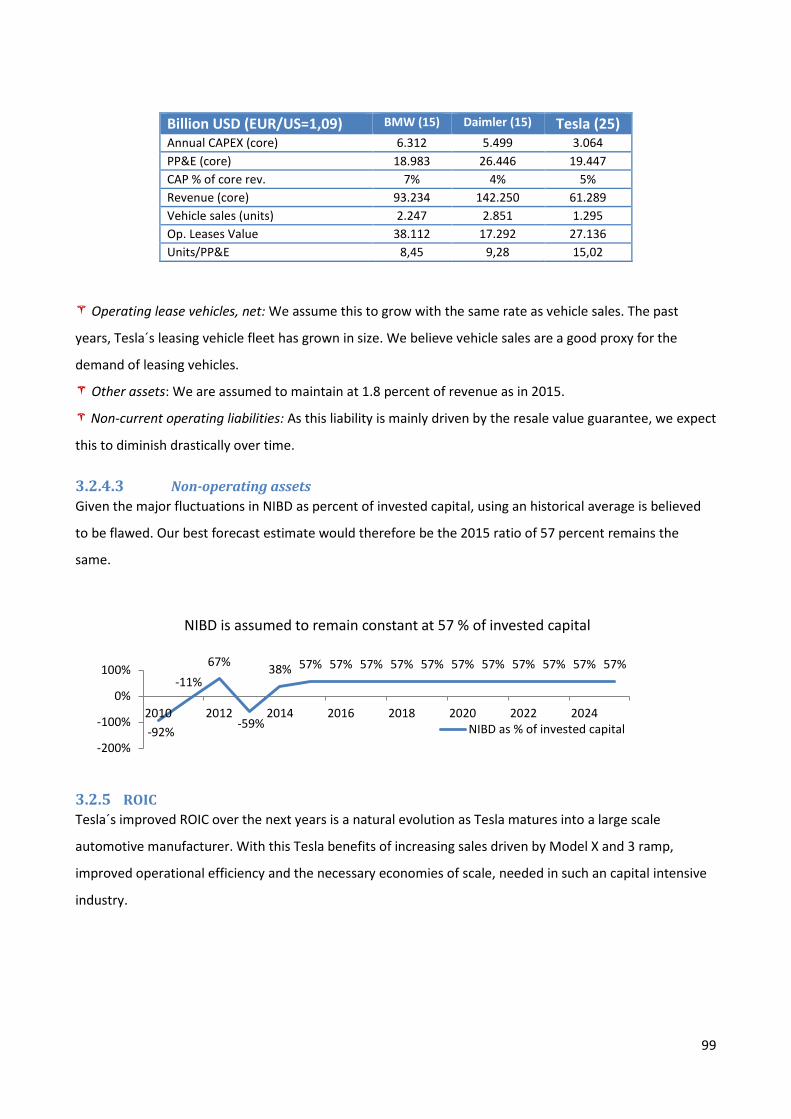
Billion USD (EUR/US=1,09) BMW (15) Daimler (15) Tesla (25) Annual CAPEX (core) 6.312 5.499 3.064 PP&E (core) 18.983 26.446 19.447 CAP % of core rev. 7% 4% 5% Revenue (core) 93.234 142.250 61.289 Vehicle sales (units) 2.247 2.851 1.295 Op. Leases Value 38.112 17.292 27.136 Units/PP&E 8,45 9,28 15,02
Operating lease vehicles, net: We assume this to grow with the same rate as vehicle sales. The past
years, Tesla´s leasing vehicle fleet has grown in size. We believe vehicle sales are a good proxy for the
demand of leasing vehicles.
Other assets: We are assumed to maintain at 1.8 percent of revenue as in 2015.
Non-current operating liabilities: As this liability is mainly driven by the resale value guarantee, we expect
this to diminish drastically over time.
Non-operating assets 3.2.4.3Given the major fluctuations in NIBD as percent of invested capital, using an historical average is believed
to be flawed. Our best forecast estimate would therefore be the 2015 ratio of 57 percent remains the
same.
3.2.5 ROIC Tesla´s improved ROIC over the next years is a natural evolution as Tesla matures into a large scale
automotive manufacturer. With this Tesla benefits of increasing sales driven by Model X and 3 ramp,
improved operational efficiency and the necessary economies of scale, needed in such an capital intensive
industry.
-92%
-11% 67%
-59%
38% 57% 57% 57% 57% 57% 57% 57% 57% 57% 57% 57%
-200%
-100%
0%
100%
2010 2012 2014 2016 2018 2020 2022 2024
NIBD is assumed to remain constant at 57 % of invested capital
NIBD as % of invested capital
99
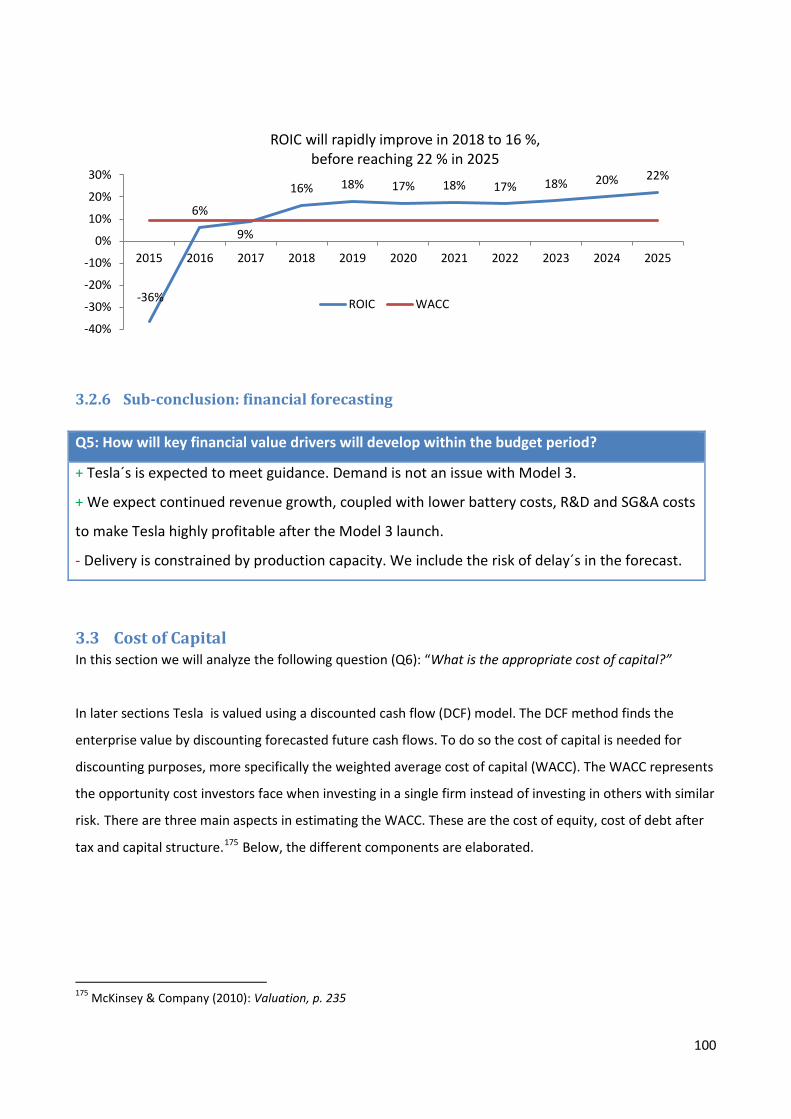
3.2.6 Sub-conclusion: financial forecasting
Q5: How will key financial value drivers will develop within the budget period?
+ Tesla´s is expected to meet guidance. Demand is not an issue with Model 3.
+ We expect continued revenue growth, coupled with lower battery costs, R&D and SG&A costs
to make Tesla highly profitable after the Model 3 launch.
- Delivery is constrained by production capacity. We include the risk of delay´s in the forecast.
3.3 Cost of Capital In this section we will analyze the following question (Q6): “What is the appropriate cost of capital?”
In later sections Tesla is valued using a discounted cash flow (DCF) model. The DCF method finds the
enterprise value by discounting forecasted future cash flows. To do so the cost of capital is needed for
discounting purposes, more specifically the weighted average cost of capital (WACC). The WACC represents
the opportunity cost investors face when investing in a single firm instead of investing in others with similar
risk. There are three main aspects in estimating the WACC. These are the cost of equity, cost of debt after
tax and capital structure.175 Below, the different components are elaborated.
175 McKinsey & Company (2010): Valuation, p. 235
-36%
6%
9%
16% 18% 17% 18% 17% 18% 20% 22%
-40%
-30%
-20%
-10%
0%
10%
20%
30%
2015 2016 2017 2018 2019 2020 2021 2022 2023 2024 2025
ROIC will rapidly improve in 2018 to 16 %, before reaching 22 % in 2025
ROIC WACC
100
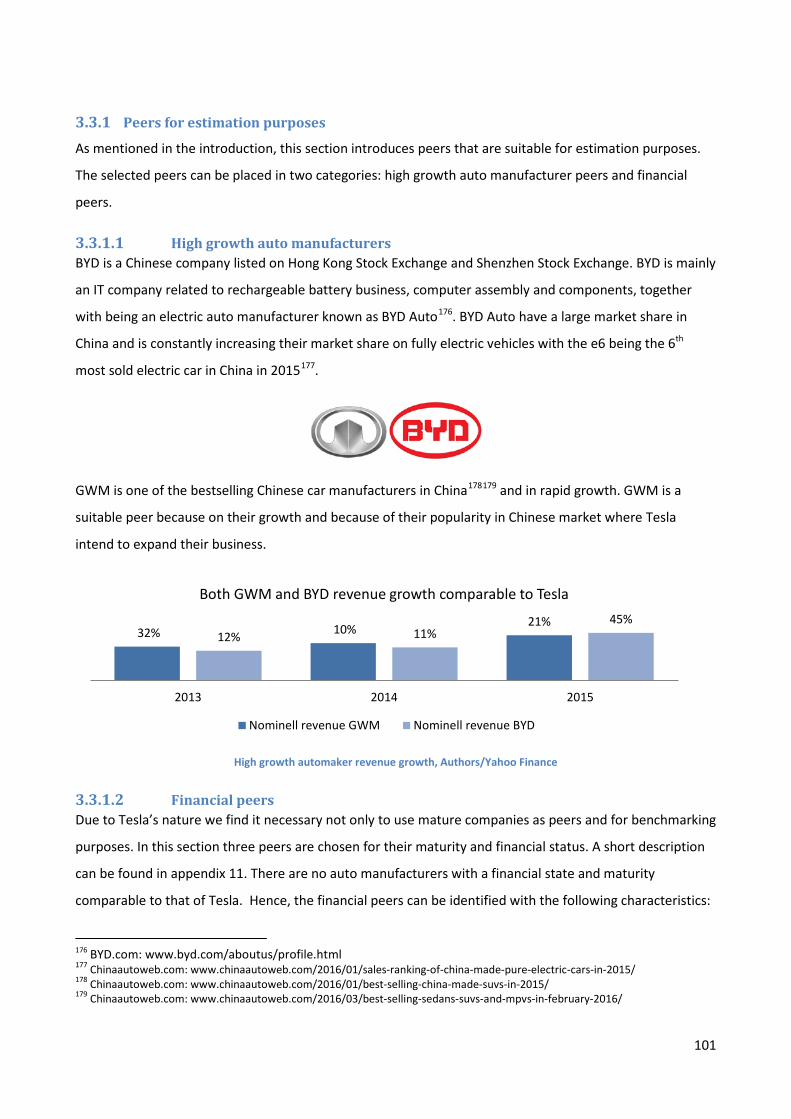
3.3.1 Peers for estimation purposes
As mentioned in the introduction, this section introduces peers that are suitable for estimation purposes.
The selected peers can be placed in two categories: high growth auto manufacturer peers and financial
peers.
High growth auto manufacturers 3.3.1.1BYD is a Chinese company listed on Hong Kong Stock Exchange and Shenzhen Stock Exchange. BYD is mainly
an IT company related to rechargeable battery business, computer assembly and components, together
with being an electric auto manufacturer known as BYD Auto176. BYD Auto have a large market share in
China and is constantly increasing their market share on fully electric vehicles with the e6 being the 6th
most sold electric car in China in 2015177.
GWM is one of the bestselling Chinese car manufacturers in China178179 and in rapid growth. GWM is a
suitable peer because on their growth and because of their popularity in Chinese market where Tesla
intend to expand their business.
High growth automaker revenue growth, Authors/Yahoo Finance
Financial peers 3.3.1.2Due to Tesla’s nature we find it necessary not only to use mature companies as peers and for benchmarking
purposes. In this section three peers are chosen for their maturity and financial status. A short description
can be found in appendix 11. There are no auto manufacturers with a financial state and maturity
comparable to that of Tesla. Hence, the financial peers can be identified with the following characteristics:
176 BYD.com: www.byd.com/aboutus/profile.html 177 Chinaautoweb.com: www.chinaautoweb.com/2016/01/sales-ranking-of-china-made-pure-electric-cars-in-2015/ 178 Chinaautoweb.com: www.chinaautoweb.com/2016/01/best-selling-china-made-suvs-in-2015/ 179 Chinaautoweb.com: www.chinaautoweb.com/2016/03/best-selling-sedans-suvs-and-mpvs-in-february-2016/
32% 10% 21% 12% 11%
45%
2013 2014 2015
Both GWM and BYD revenue growth comparable to Tesla
Nominell revenue GWM Nominell revenue BYD
101
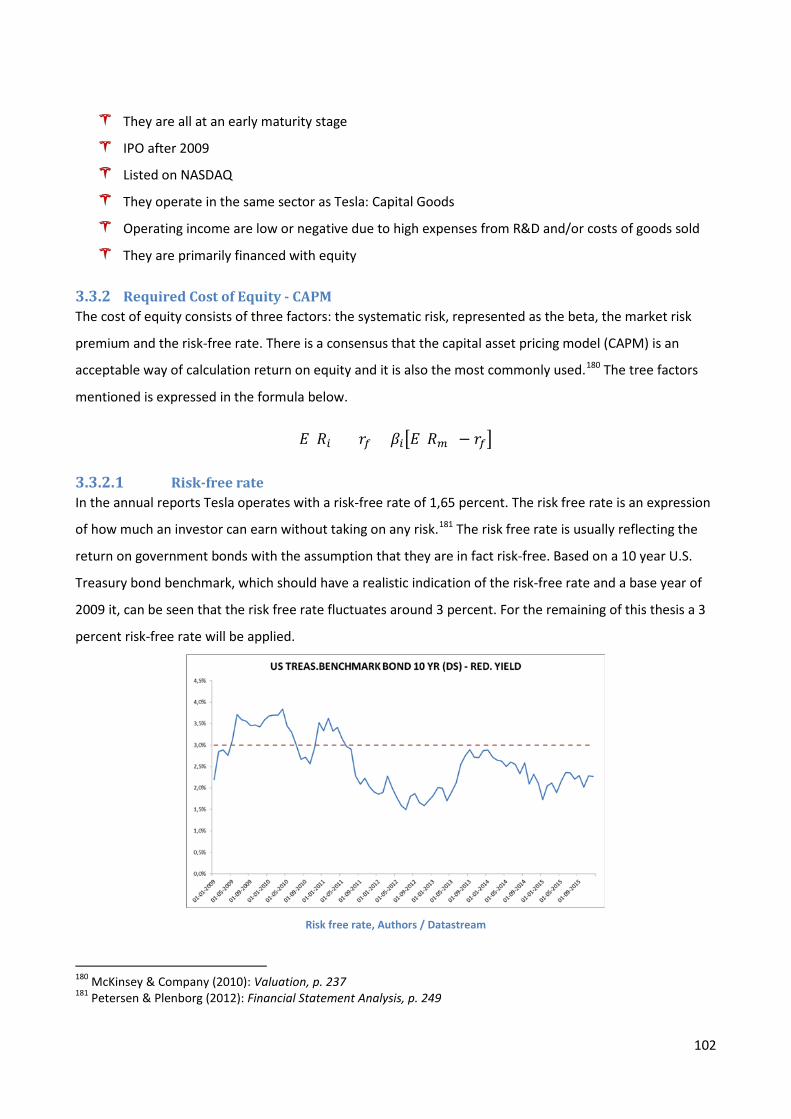
They are all at an early maturity stage
IPO after 2009
Listed on NASDAQ
They operate in the same sector as Tesla: Capital Goods
Operating income are low or negative due to high expenses from R&D and/or costs of goods sold
They are primarily financed with equity
3.3.2 Required Cost of Equity - CAPM The cost of equity consists of three factors: the systematic risk, represented as the beta, the market risk
premium and the risk-free rate. There is a consensus that the capital asset pricing model (CAPM) is an
acceptable way of calculation return on equity and it is also the most commonly used.180 The tree factors
mentioned is expressed in the formula below.
𝐸𝐸(𝑅𝑅𝑖𝑖) = 𝑝𝑝𝑓𝑓 + 𝛽𝛽𝑖𝑖�𝐸𝐸(𝑅𝑅𝑚𝑚) − 𝑝𝑝𝑓𝑓�
Risk-free rate 3.3.2.1In the annual reports Tesla operates with a risk-free rate of 1,65 percent. The risk free rate is an expression
of how much an investor can earn without taking on any risk.181 The risk free rate is usually reflecting the
return on government bonds with the assumption that they are in fact risk-free. Based on a 10 year U.S.
Treasury bond benchmark, which should have a realistic indication of the risk-free rate and a base year of
2009 it, can be seen that the risk free rate fluctuates around 3 percent. For the remaining of this thesis a 3
percent risk-free rate will be applied.
Risk free rate, Authors / Datastream
180 McKinsey & Company (2010): Valuation, p. 237 181 Petersen & Plenborg (2012): Financial Statement Analysis, p. 249
102
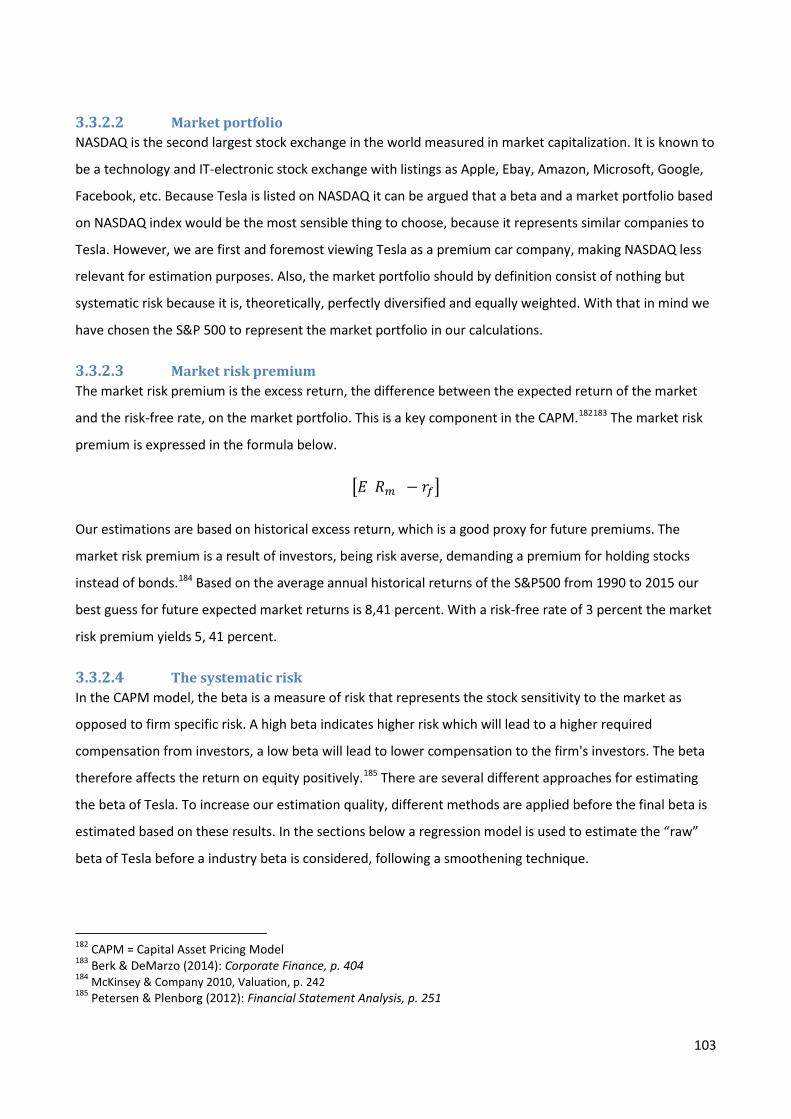
Market portfolio 3.3.2.2NASDAQ is the second largest stock exchange in the world measured in market capitalization. It is known to
be a technology and IT-electronic stock exchange with listings as Apple, Ebay, Amazon, Microsoft, Google,
Facebook, etc. Because Tesla is listed on NASDAQ it can be argued that a beta and a market portfolio based
on NASDAQ index would be the most sensible thing to choose, because it represents similar companies to
Tesla. However, we are first and foremost viewing Tesla as a premium car company, making NASDAQ less
relevant for estimation purposes. Also, the market portfolio should by definition consist of nothing but
systematic risk because it is, theoretically, perfectly diversified and equally weighted. With that in mind we
have chosen the S&P 500 to represent the market portfolio in our calculations.
Market risk premium 3.3.2.3The market risk premium is the excess return, the difference between the expected return of the market
and the risk-free rate, on the market portfolio. This is a key component in the CAPM.182183 The market risk
premium is expressed in the formula below.
�𝐸𝐸(𝑅𝑅𝑚𝑚) − 𝑝𝑝𝑓𝑓�
Our estimations are based on historical excess return, which is a good proxy for future premiums. The
market risk premium is a result of investors, being risk averse, demanding a premium for holding stocks
instead of bonds.184 Based on the average annual historical returns of the S&P500 from 1990 to 2015 our
best guess for future expected market returns is 8,41 percent. With a risk-free rate of 3 percent the market
risk premium yields 5, 41 percent.
The systematic risk 3.3.2.4In the CAPM model, the beta is a measure of risk that represents the stock sensitivity to the market as
opposed to firm specific risk. A high beta indicates higher risk which will lead to a higher required
compensation from investors, a low beta will lead to lower compensation to the firm's investors. The beta
therefore affects the return on equity positively.185 There are several different approaches for estimating
the beta of Tesla. To increase our estimation quality, different methods are applied before the final beta is
estimated based on these results. In the sections below a regression model is used to estimate the “raw”
beta of Tesla before a industry beta is considered, following a smoothening technique.
182 CAPM = Capital Asset Pricing Model 183 Berk & DeMarzo (2014): Corporate Finance, p. 404 184 McKinsey & Company 2010, Valuation, p. 242 185 Petersen & Plenborg (2012): Financial Statement Analysis, p. 251
103
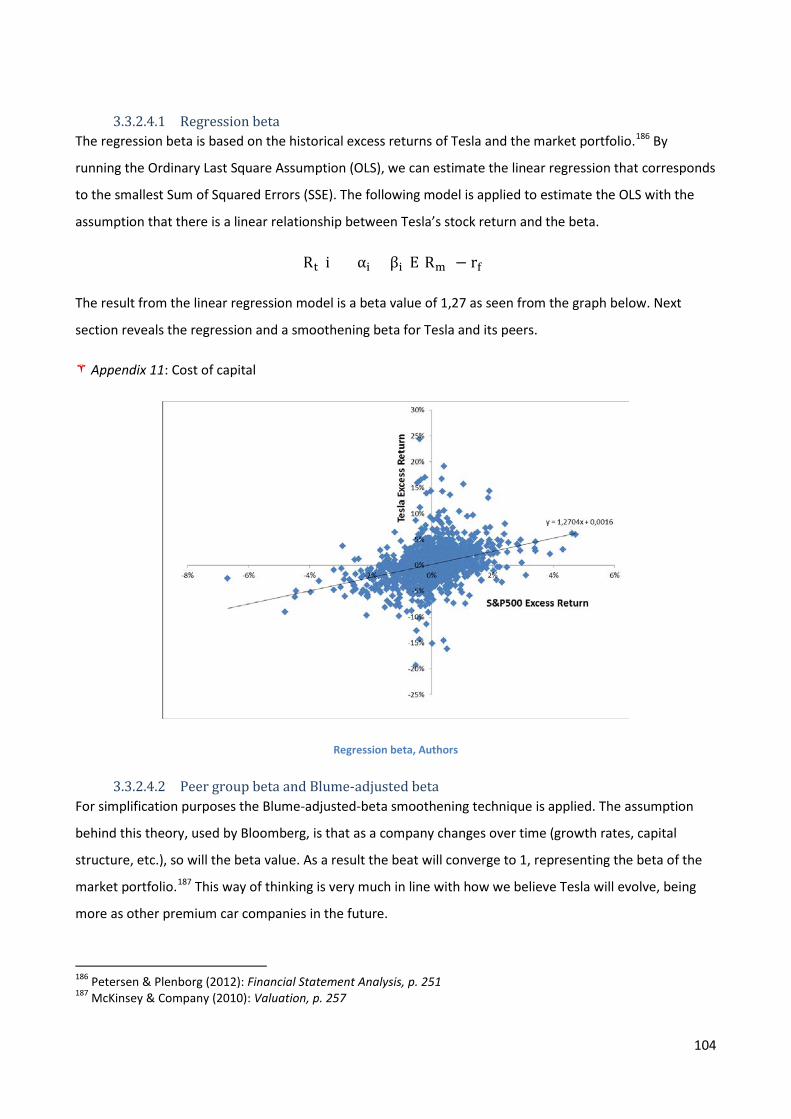
3.3.2.4.1 Regression beta The regression beta is based on the historical excess returns of Tesla and the market portfolio.186 By
running the Ordinary Last Square Assumption (OLS), we can estimate the linear regression that corresponds
to the smallest Sum of Squared Errors (SSE). The following model is applied to estimate the OLS with the
assumption that there is a linear relationship between Tesla’s stock return and the beta.
Rt(i) = αi + βi(E[Rm] − rf)
The result from the linear regression model is a beta value of 1,27 as seen from the graph below. Next
section reveals the regression and a smoothening beta for Tesla and its peers.
Appendix 11: Cost of capital
Regression beta, Authors
3.3.2.4.2 Peer group beta and Blume-adjusted beta For simplification purposes the Blume-adjusted-beta smoothening technique is applied. The assumption
behind this theory, used by Bloomberg, is that as a company changes over time (growth rates, capital
structure, etc.), so will the beta value. As a result the beat will converge to 1, representing the beta of the
market portfolio.187 This way of thinking is very much in line with how we believe Tesla will evolve, being
more as other premium car companies in the future.
186 Petersen & Plenborg (2012): Financial Statement Analysis, p. 251 187 McKinsey & Company (2010): Valuation, p. 257
104
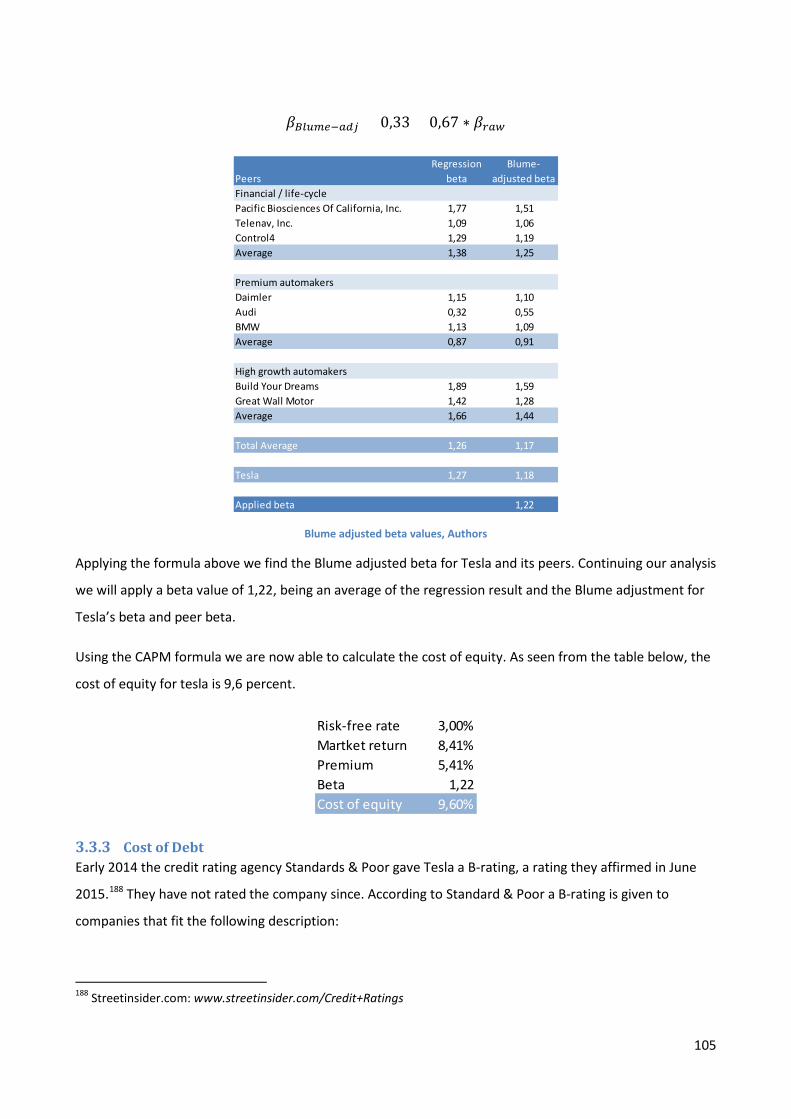
𝛽𝛽𝐵𝐵𝐵𝐵𝐵𝐵𝑚𝑚𝐵𝐵−𝑎𝑎𝑎𝑎𝑎𝑎 = 0,33 + 0,67 ∗ 𝛽𝛽𝑟𝑟𝑎𝑎𝑟𝑟
Blume adjusted beta values, Authors
Applying the formula above we find the Blume adjusted beta for Tesla and its peers. Continuing our analysis
we will apply a beta value of 1,22, being an average of the regression result and the Blume adjustment for
Tesla’s beta and peer beta.
Using the CAPM formula we are now able to calculate the cost of equity. As seen from the table below, the
cost of equity for tesla is 9,6 percent.
3.3.3 Cost of Debt Early 2014 the credit rating agency Standards & Poor gave Tesla a B-rating, a rating they affirmed in June
2015.188 They have not rated the company since. According to Standard & Poor a B-rating is given to
companies that fit the following description:
188 Streetinsider.com: www.streetinsider.com/Credit+Ratings
PeersRegression
betaBlume-
adjusted betaFinancial / life-cyclePacific Biosciences Of California, Inc. 1,77 1,51Telenav, Inc. 1,09 1,06Control4 1,29 1,19Average 1,38 1,25
Premium automakersDaimler 1,15 1,10Audi 0,32 0,55BMW 1,13 1,09Average 0,87 0,91
High growth automakersBuild Your Dreams 1,89 1,59Great Wall Motor 1,42 1,28Average 1,66 1,44
Total Average 1,26 1,17
Tesla 1,27 1,18
Applied beta 1,22
Risk-free rate 3,00%Martket return 8,41%Premium 5,41%Beta 1,22Cost of equity 9,60%
105
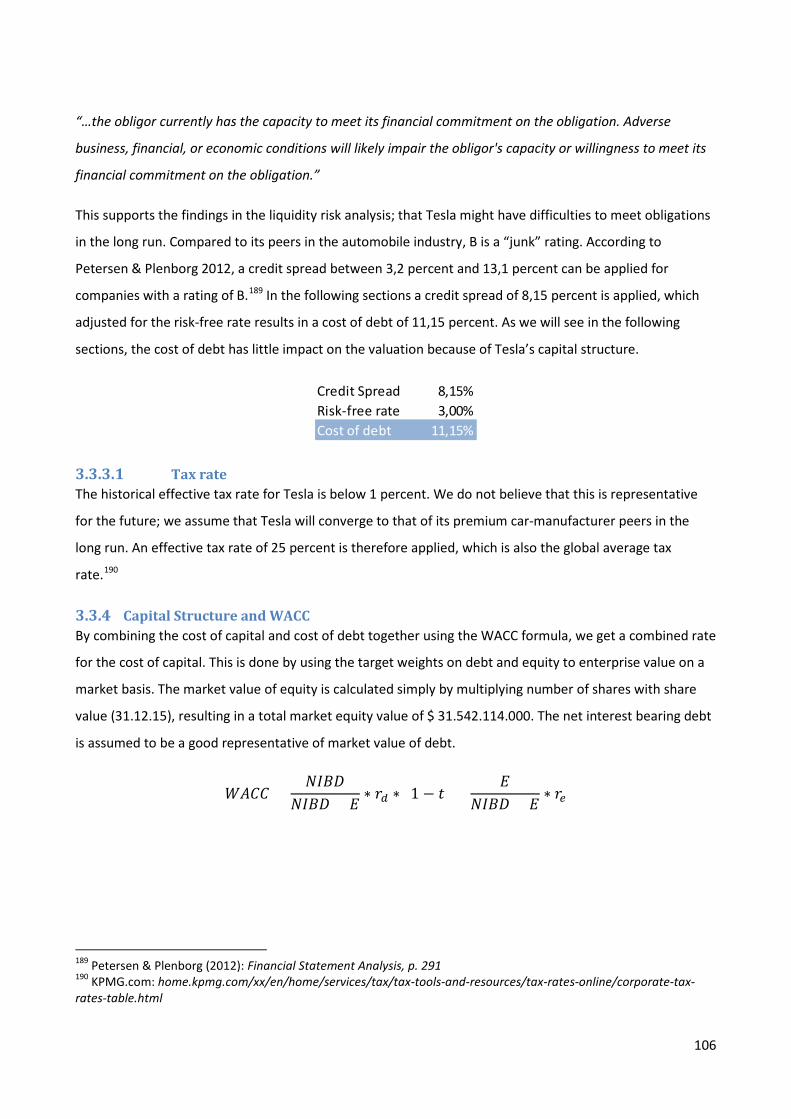
“…the obligor currently has the capacity to meet its financial commitment on the obligation. Adverse
business, financial, or economic conditions will likely impair the obligor's capacity or willingness to meet its
financial commitment on the obligation.”
This supports the findings in the liquidity risk analysis; that Tesla might have difficulties to meet obligations
in the long run. Compared to its peers in the automobile industry, B is a “junk” rating. According to
Petersen & Plenborg 2012, a credit spread between 3,2 percent and 13,1 percent can be applied for
companies with a rating of B.189 In the following sections a credit spread of 8,15 percent is applied, which
adjusted for the risk-free rate results in a cost of debt of 11,15 percent. As we will see in the following
sections, the cost of debt has little impact on the valuation because of Tesla’s capital structure.
Tax rate 3.3.3.1The historical effective tax rate for Tesla is below 1 percent. We do not believe that this is representative
for the future; we assume that Tesla will converge to that of its premium car-manufacturer peers in the
long run. An effective tax rate of 25 percent is therefore applied, which is also the global average tax
rate.190
3.3.4 Capital Structure and WACC By combining the cost of capital and cost of debt together using the WACC formula, we get a combined rate
for the cost of capital. This is done by using the target weights on debt and equity to enterprise value on a
market basis. The market value of equity is calculated simply by multiplying number of shares with share
value (31.12.15), resulting in a total market equity value of $ 31.542.114.000. The net interest bearing debt
is assumed to be a good representative of market value of debt.
𝑊𝑊𝑊𝑊𝑊𝑊𝑊𝑊 =𝑁𝑁𝑁𝑁𝑁𝑁𝑁𝑁
𝑁𝑁𝑁𝑁𝑁𝑁𝑁𝑁 + 𝐸𝐸∗ 𝑝𝑝𝑎𝑎 ∗ (1 − 𝑈𝑈) +
𝐸𝐸𝑁𝑁𝑁𝑁𝑁𝑁𝑁𝑁 + 𝐸𝐸
∗ 𝑝𝑝𝐵𝐵
189 Petersen & Plenborg (2012): Financial Statement Analysis, p. 291 190 KPMG.com: home.kpmg.com/xx/en/home/services/tax/tax-tools-and-resources/tax-rates-online/corporate-tax-rates-table.html
Credit Spread 8,15%Risk-free rate 3,00%Cost of debt 11,15%
106
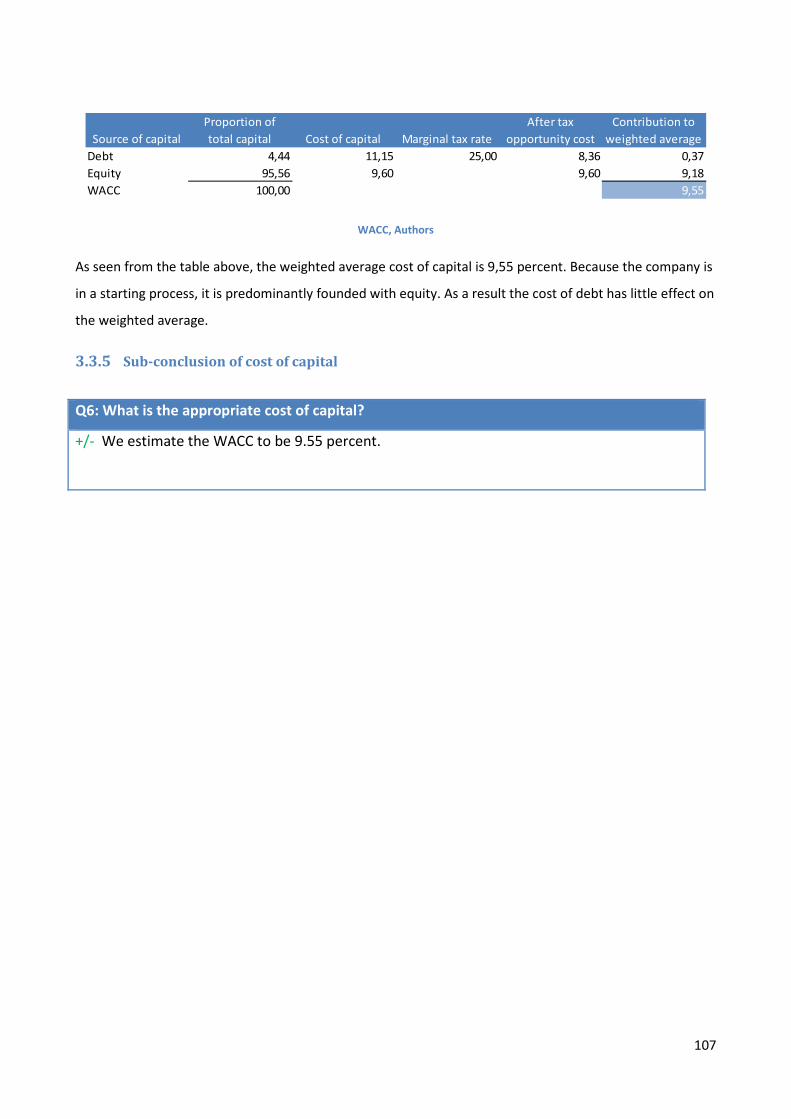
WACC, Authors
As seen from the table above, the weighted average cost of capital is 9,55 percent. Because the company is
in a starting process, it is predominantly founded with equity. As a result the cost of debt has little effect on
the weighted average.
3.3.5 Sub-conclusion of cost of capital
Q6: What is the appropriate cost of capital?
+/- We estimate the WACC to be 9.55 percent.
Debt 4,44 11,15 25,00 8,36 0,37Equity 95,56 9,60 9,60 9,18WACC 100,00 9,55
Source of capitalProportion of total capital Cost of capital Marginal tax rate
After tax opportunity cost
Contribution to weighted average
107
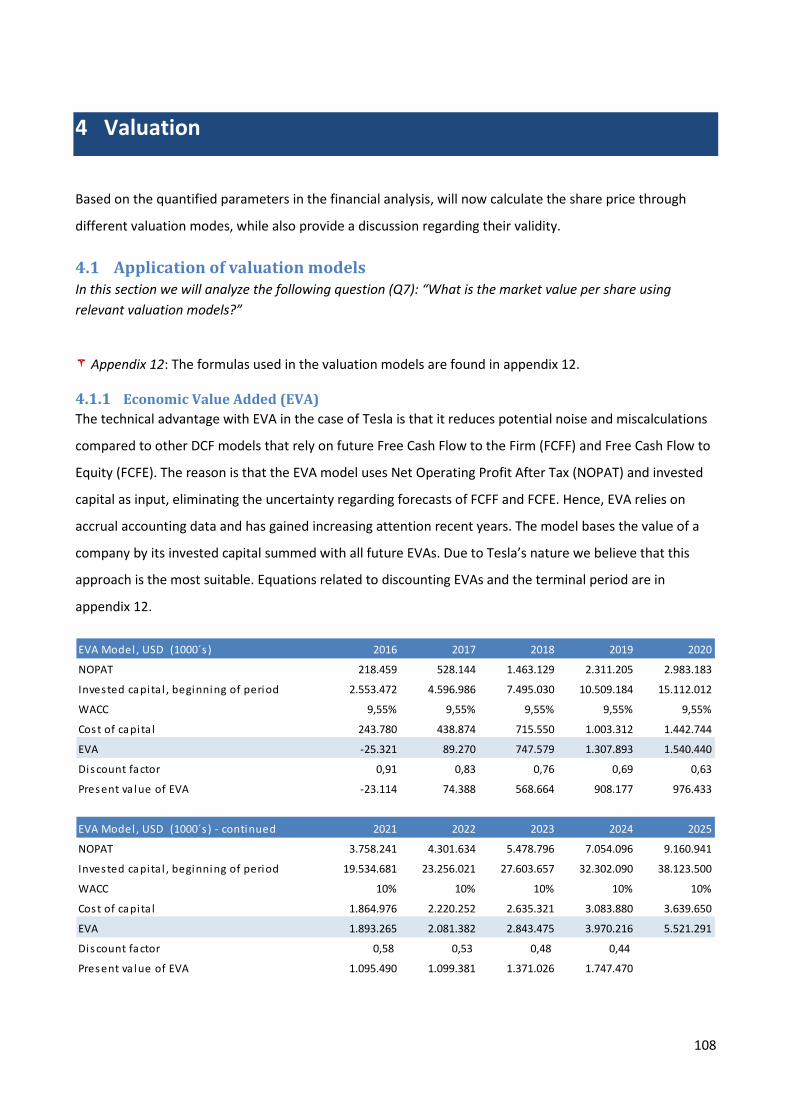
4 Valuation
Based on the quantified parameters in the financial analysis, will now calculate the share price through
different valuation modes, while also provide a discussion regarding their validity.
4.1 Application of valuation models In this section we will analyze the following question (Q7): “What is the market value per share using relevant valuation models?”
Appendix 12: The formulas used in the valuation models are found in appendix 12.
4.1.1 Economic Value Added (EVA) The technical advantage with EVA in the case of Tesla is that it reduces potential noise and miscalculations
compared to other DCF models that rely on future Free Cash Flow to the Firm (FCFF) and Free Cash Flow to
Equity (FCFE). The reason is that the EVA model uses Net Operating Profit After Tax (NOPAT) and invested
capital as input, eliminating the uncertainty regarding forecasts of FCFF and FCFE. Hence, EVA relies on
accrual accounting data and has gained increasing attention recent years. The model bases the value of a
company by its invested capital summed with all future EVAs. Due to Tesla’s nature we believe that this
approach is the most suitable. Equations related to discounting EVAs and the terminal period are in
appendix 12.
EVA Model , USD (1000´s ) 2016 2017 2018 2019 2020
NOPAT 218.459 528.144 1.463.129 2.311.205 2.983.183
Invested capi ta l , beginning of period 2.553.472 4.596.986 7.495.030 10.509.184 15.112.012
WACC 9,55% 9,55% 9,55% 9,55% 9,55%
Cost of capi ta l 243.780 438.874 715.550 1.003.312 1.442.744
EVA -25.321 89.270 747.579 1.307.893 1.540.440
Discount factor 0,91 0,83 0,76 0,69 0,63
Present va lue of EVA -23.114 74.388 568.664 908.177 976.433
EVA Model , USD (1000´s ) - continued 2021 2022 2023 2024 2025
NOPAT 3.758.241 4.301.634 5.478.796 7.054.096 9.160.941
Invested capi ta l , beginning of period 19.534.681 23.256.021 27.603.657 32.302.090 38.123.500
WACC 10% 10% 10% 10% 10%
Cost of capi ta l 1.864.976 2.220.252 2.635.321 3.083.880 3.639.650
EVA 1.893.265 2.081.382 2.843.475 3.970.216 5.521.291
Discount factor 0,58 0,53 0,48 0,44 -
Present va lue of EVA 1.095.490 1.099.381 1.371.026 1.747.470 0
108
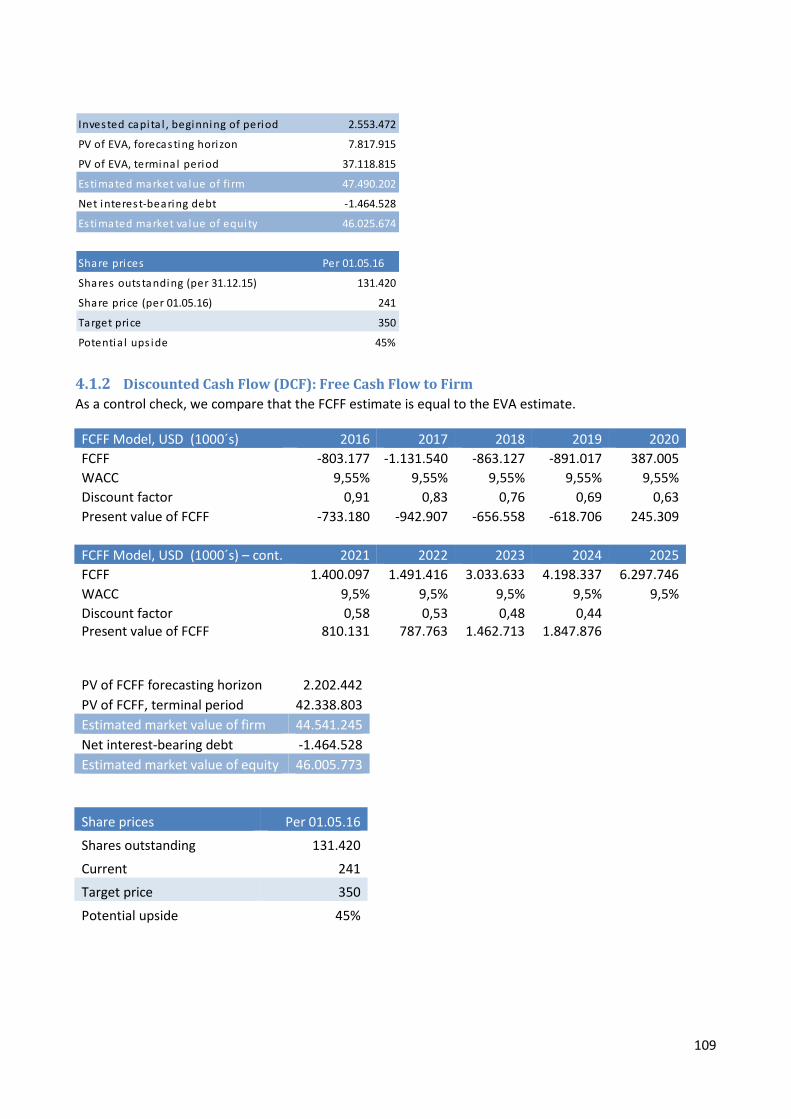
4.1.2 Discounted Cash Flow (DCF): Free Cash Flow to Firm As a control check, we compare that the FCFF estimate is equal to the EVA estimate.
FCFF Model, USD (1000´s) 2016 2017 2018 2019 2020 FCFF -803.177 -1.131.540 -863.127 -891.017 387.005 WACC 9,55% 9,55% 9,55% 9,55% 9,55% Discount factor 0,91 0,83 0,76 0,69 0,63 Present value of FCFF -733.180 -942.907 -656.558 -618.706 245.309
FCFF Model, USD (1000´s) – cont. 2021 2022 2023 2024 2025 FCFF 1.400.097 1.491.416 3.033.633 4.198.337 6.297.746 WACC 9,5% 9,5% 9,5% 9,5% 9,5% Discount factor 0,58 0,53 0,48 0,44 - Present value of FCFF 810.131 787.763 1.462.713 1.847.876 -
PV of FCFF forecasting horizon 2.202.442 PV of FCFF, terminal period 42.338.803 Estimated market value of firm 44.541.245 Net interest-bearing debt -1.464.528 Estimated market value of equity 46.005.773
Share prices Per 01.05.16
Shares outstanding 131.420
Current 241
Target price 350
Potential upside 45%
Invested capi ta l , beginning of period 2.553.472
PV of EVA, forecasting horizon 7.817.915
PV of EVA, terminal period 37.118.815
Estimated market va lue of fi rm 47.490.202
Net interest-bearing debt -1.464.528
Estimated market va lue of equity 46.025.674
Share prices Per 01.05.16
Shares outstanding (per 31.12.15) 131.420
Share price (per 01.05.16) 241
Target price 350
Potentia l ups ide 45%
109
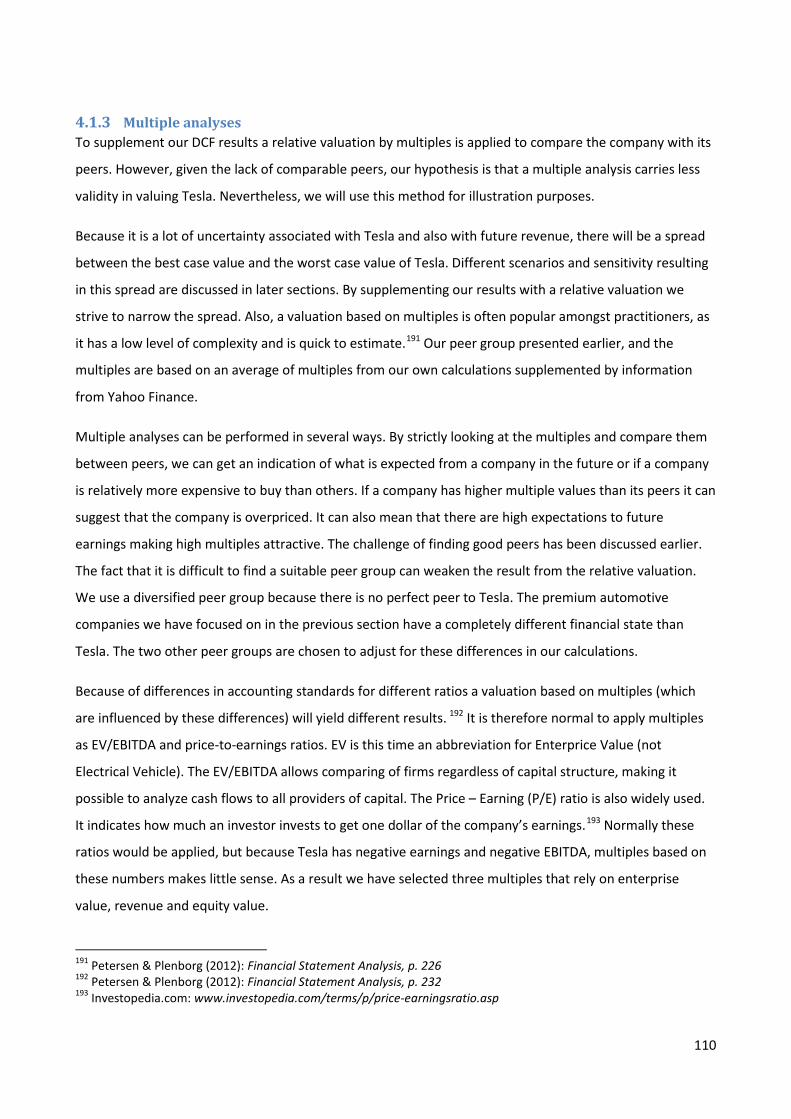
4.1.3 Multiple analyses To supplement our DCF results a relative valuation by multiples is applied to compare the company with its
peers. However, given the lack of comparable peers, our hypothesis is that a multiple analysis carries less
validity in valuing Tesla. Nevertheless, we will use this method for illustration purposes.
Because it is a lot of uncertainty associated with Tesla and also with future revenue, there will be a spread
between the best case value and the worst case value of Tesla. Different scenarios and sensitivity resulting
in this spread are discussed in later sections. By supplementing our results with a relative valuation we
strive to narrow the spread. Also, a valuation based on multiples is often popular amongst practitioners, as
it has a low level of complexity and is quick to estimate.191 Our peer group presented earlier, and the
multiples are based on an average of multiples from our own calculations supplemented by information
from Yahoo Finance.
Multiple analyses can be performed in several ways. By strictly looking at the multiples and compare them
between peers, we can get an indication of what is expected from a company in the future or if a company
is relatively more expensive to buy than others. If a company has higher multiple values than its peers it can
suggest that the company is overpriced. It can also mean that there are high expectations to future
earnings making high multiples attractive. The challenge of finding good peers has been discussed earlier.
The fact that it is difficult to find a suitable peer group can weaken the result from the relative valuation.
We use a diversified peer group because there is no perfect peer to Tesla. The premium automotive
companies we have focused on in the previous section have a completely different financial state than
Tesla. The two other peer groups are chosen to adjust for these differences in our calculations.
Because of differences in accounting standards for different ratios a valuation based on multiples (which
are influenced by these differences) will yield different results. 192 It is therefore normal to apply multiples
as EV/EBITDA and price-to-earnings ratios. EV is this time an abbreviation for Enterprice Value (not
Electrical Vehicle). The EV/EBITDA allows comparing of firms regardless of capital structure, making it
possible to analyze cash flows to all providers of capital. The Price – Earning (P/E) ratio is also widely used.
It indicates how much an investor invests to get one dollar of the company’s earnings.193 Normally these
ratios would be applied, but because Tesla has negative earnings and negative EBITDA, multiples based on
these numbers makes little sense. As a result we have selected three multiples that rely on enterprise
value, revenue and equity value.
191 Petersen & Plenborg (2012): Financial Statement Analysis, p. 226 192 Petersen & Plenborg (2012): Financial Statement Analysis, p. 232 193 Investopedia.com: www.investopedia.com/terms/p/price-earningsratio.asp
110
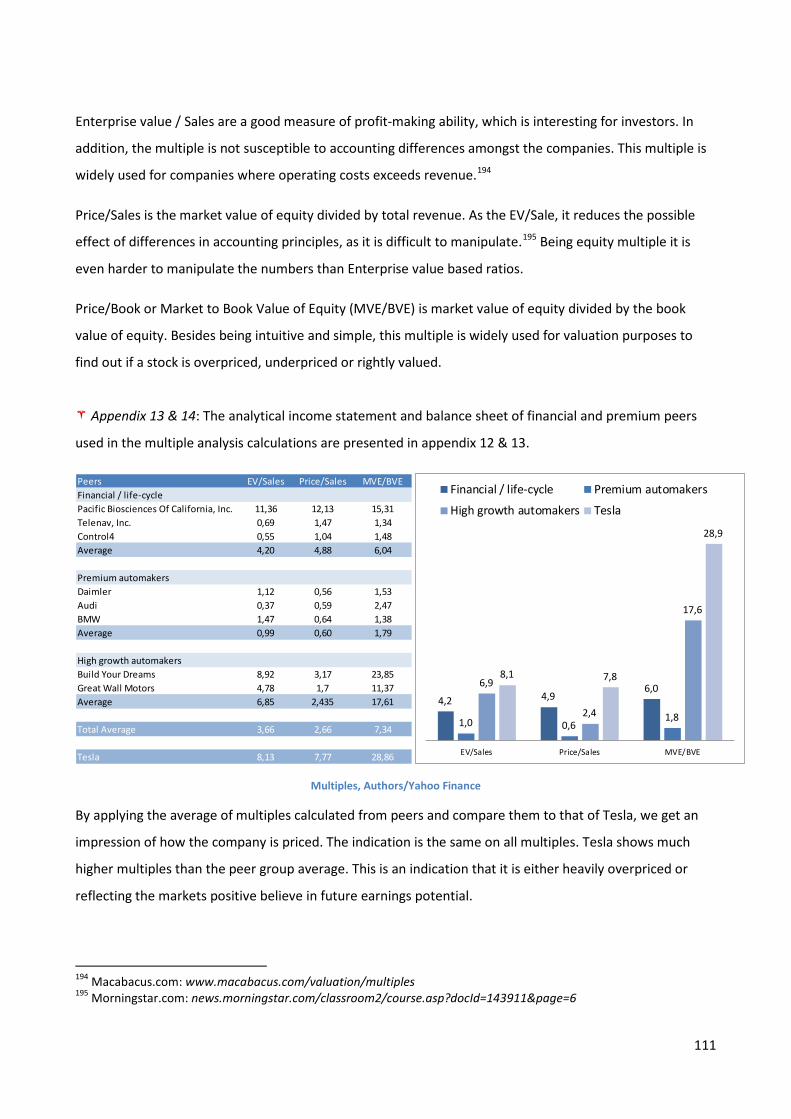
Enterprise value / Sales are a good measure of profit-making ability, which is interesting for investors. In
addition, the multiple is not susceptible to accounting differences amongst the companies. This multiple is
widely used for companies where operating costs exceeds revenue.194
Price/Sales is the market value of equity divided by total revenue. As the EV/Sale, it reduces the possible
effect of differences in accounting principles, as it is difficult to manipulate.195 Being equity multiple it is
even harder to manipulate the numbers than Enterprise value based ratios.
Price/Book or Market to Book Value of Equity (MVE/BVE) is market value of equity divided by the book
value of equity. Besides being intuitive and simple, this multiple is widely used for valuation purposes to
find out if a stock is overpriced, underpriced or rightly valued.
Appendix 13 & 14: The analytical income statement and balance sheet of financial and premium peers
used in the multiple analysis calculations are presented in appendix 12 & 13.
Multiples, Authors/Yahoo Finance
By applying the average of multiples calculated from peers and compare them to that of Tesla, we get an
impression of how the company is priced. The indication is the same on all multiples. Tesla shows much
higher multiples than the peer group average. This is an indication that it is either heavily overpriced or
reflecting the markets positive believe in future earnings potential.
194 Macabacus.com: www.macabacus.com/valuation/multiples 195 Morningstar.com: news.morningstar.com/classroom2/course.asp?docId=143911&page=6
Peers EV/Sales Price/Sales MVE/BVEFinancial / life-cyclePacific Biosciences Of California, Inc. 11,36 12,13 15,31Telenav, Inc. 0,69 1,47 1,34Control4 0,55 1,04 1,48Average 4,20 4,88 6,04
Premium automakersDaimler 1,12 0,56 1,53Audi 0,37 0,59 2,47BMW 1,47 0,64 1,38Average 0,99 0,60 1,79
High growth automakersBuild Your Dreams 8,92 3,17 23,85Great Wall Motors 4,78 1,7 11,37Average 6,85 2,435 17,61
Total Average 3,66 2,66 7,34
Tesla 8,13 7,77 28,86
4,2 4,96,0
1,0 0,61,8
6,9
2,4
17,6
8,1 7,8
28,9
EV/Sales Price/Sales MVE/BVE
Financial / life-cycle Premium automakers
High growth automakers Tesla
111
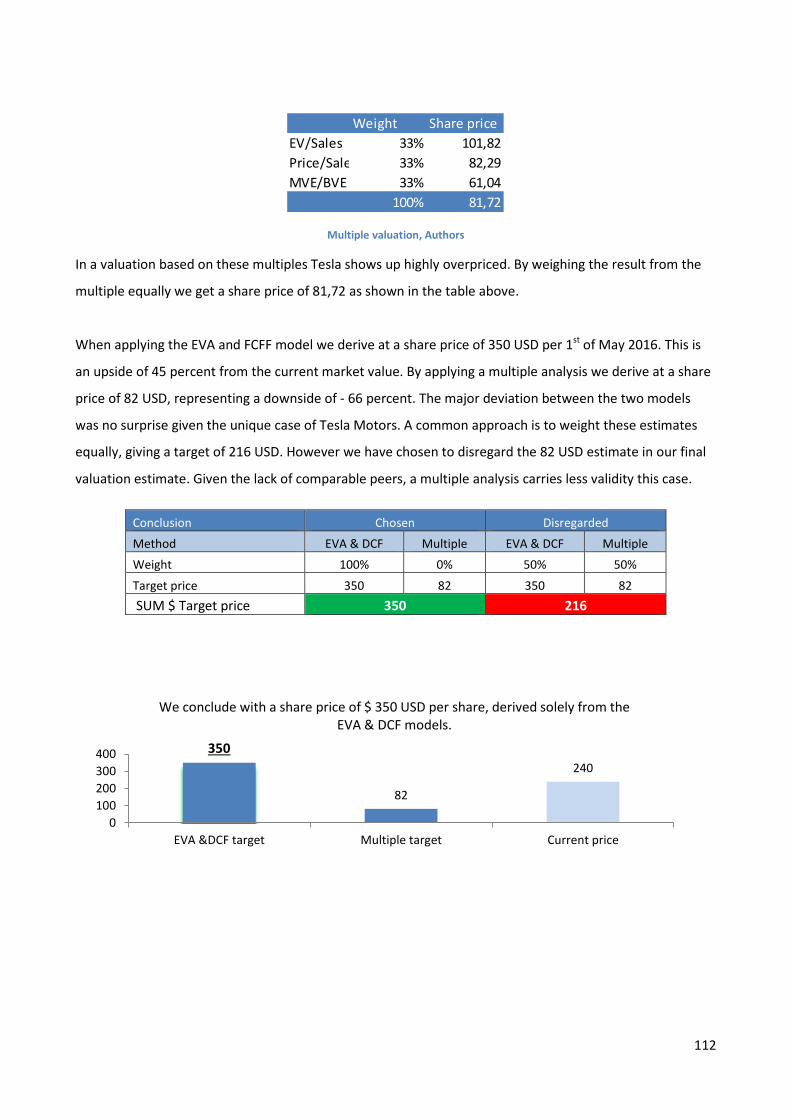
Multiple valuation, Authors
In a valuation based on these multiples Tesla shows up highly overpriced. By weighing the result from the
multiple equally we get a share price of 81,72 as shown in the table above.
When applying the EVA and FCFF model we derive at a share price of 350 USD per 1st of May 2016. This is
an upside of 45 percent from the current market value. By applying a multiple analysis we derive at a share
price of 82 USD, representing a downside of - 66 percent. The major deviation between the two models
was no surprise given the unique case of Tesla Motors. A common approach is to weight these estimates
equally, giving a target of 216 USD. However we have chosen to disregard the 82 USD estimate in our final
valuation estimate. Given the lack of comparable peers, a multiple analysis carries less validity this case.
Conclusion Chosen Disregarded Method EVA & DCF Multiple EVA & DCF Multiple Weight 100% 0% 50% 50%
Target price 350 82 350 82 SUM $ Target price 350 216
Weight Share priceEV/Sales 33% 101,82Price/Sale 33% 82,29MVE/BVE 33% 61,04
100% 81,72
350
82
240
0100200300400
EVA &DCF target Multiple target Current price
We conclude with a share price of $ 350 USD per share, derived solely from the EVA & DCF models.
112
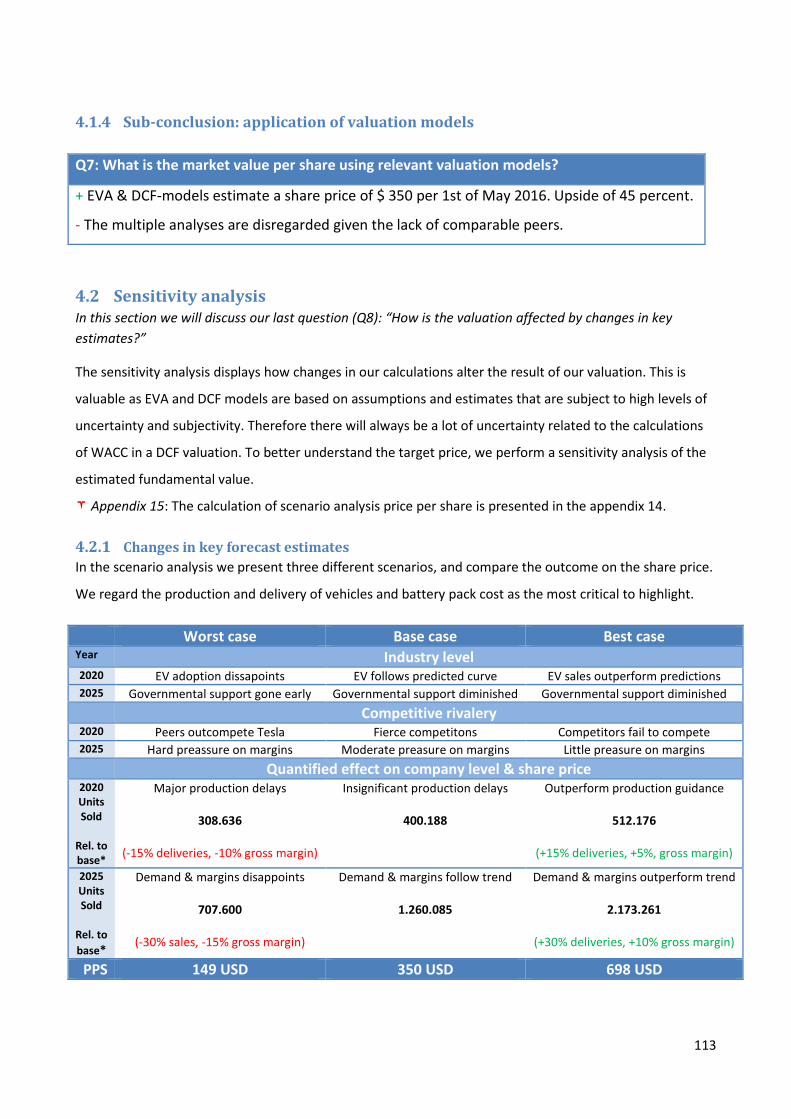
4.1.4 Sub-conclusion: application of valuation models
Q7: What is the market value per share using relevant valuation models?
+ EVA & DCF-models estimate a share price of $ 350 per 1st of May 2016. Upside of 45 percent.
- The multiple analyses are disregarded given the lack of comparable peers.
4.2 Sensitivity analysis In this section we will discuss our last question (Q8): “How is the valuation affected by changes in key estimates?”
The sensitivity analysis displays how changes in our calculations alter the result of our valuation. This is
valuable as EVA and DCF models are based on assumptions and estimates that are subject to high levels of
uncertainty and subjectivity. Therefore there will always be a lot of uncertainty related to the calculations
of WACC in a DCF valuation. To better understand the target price, we perform a sensitivity analysis of the
estimated fundamental value.
Appendix 15: The calculation of scenario analysis price per share is presented in the appendix 14.
4.2.1 Changes in key forecast estimates In the scenario analysis we present three different scenarios, and compare the outcome on the share price.
We regard the production and delivery of vehicles and battery pack cost as the most critical to highlight.
Worst case Base case Best case Year Industry level 2020 EV adoption dissapoints EV follows predicted curve EV sales outperform predictions 2025 Governmental support gone early Governmental support diminished Governmental support diminished
Competitive rivalery 2020 Peers outcompete Tesla Fierce competitons Competitors fail to compete 2025 Hard preassure on margins Moderate preasure on margins Little preasure on margins
Quantified effect on company level & share price 2020 Units Sold
Rel. to base*
Major production delays
308.636
(-15% deliveries, -10% gross margin)
Insignificant production delays
400.188
Outperform production guidance
512.176
(+15% deliveries, +5%, gross margin)
2025 Units Sold
Rel. to base*
Demand & margins disappoints
707.600
(-30% sales, -15% gross margin)
Demand & margins follow trend
1.260.085
Demand & margins outperform trend
2.173.261
(+30% deliveries, +10% gross margin)
PPS 149 USD 350 USD 698 USD
113
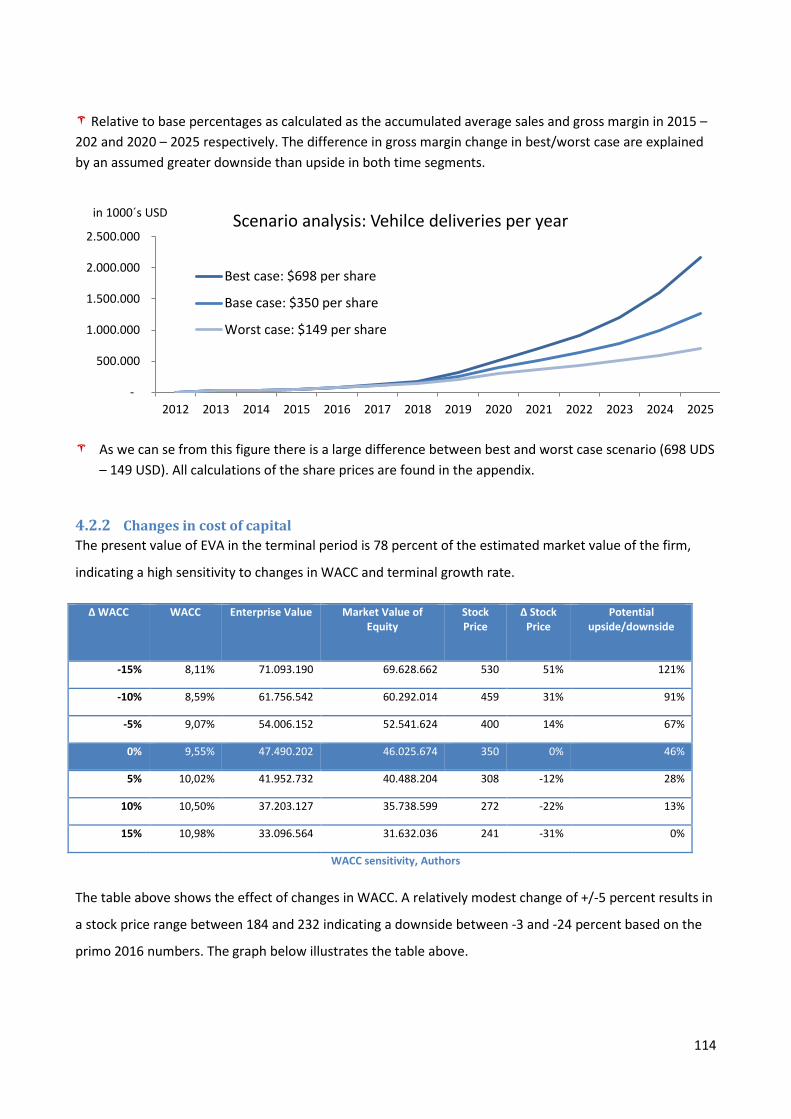
Relative to base percentages as calculated as the accumulated average sales and gross margin in 2015 – 202 and 2020 – 2025 respectively. The difference in gross margin change in best/worst case are explained by an assumed greater downside than upside in both time segments.
As we can se from this figure there is a large difference between best and worst case scenario (698 UDS – 149 USD). All calculations of the share prices are found in the appendix.
4.2.2 Changes in cost of capital The present value of EVA in the terminal period is 78 percent of the estimated market value of the firm,
indicating a high sensitivity to changes in WACC and terminal growth rate.
Δ WACC WACC Enterprise Value Market Value of Equity
Stock Price
Δ Stock Price
Potential upside/downside
-15% 8,11% 71.093.190 69.628.662 530 51% 121%
-10% 8,59% 61.756.542 60.292.014 459 31% 91%
-5% 9,07% 54.006.152 52.541.624 400 14% 67%
0% 9,55% 47.490.202 46.025.674 350 0% 46%
5% 10,02% 41.952.732 40.488.204 308 -12% 28%
10% 10,50% 37.203.127 35.738.599 272 -22% 13%
15% 10,98% 33.096.564 31.632.036 241 -31% 0%
WACC sensitivity, Authors
The table above shows the effect of changes in WACC. A relatively modest change of +/-5 percent results in
a stock price range between 184 and 232 indicating a downside between -3 and -24 percent based on the
primo 2016 numbers. The graph below illustrates the table above.
-
500.000
1.000.000
1.500.000
2.000.000
2.500.000
2012 2013 2014 2015 2016 2017 2018 2019 2020 2021 2022 2023 2024 2025
in 1000´s USD Scenario analysis: Vehilce deliveries per year
Best case: $698 per share
Base case: $350 per share
Worst case: $149 per share
114
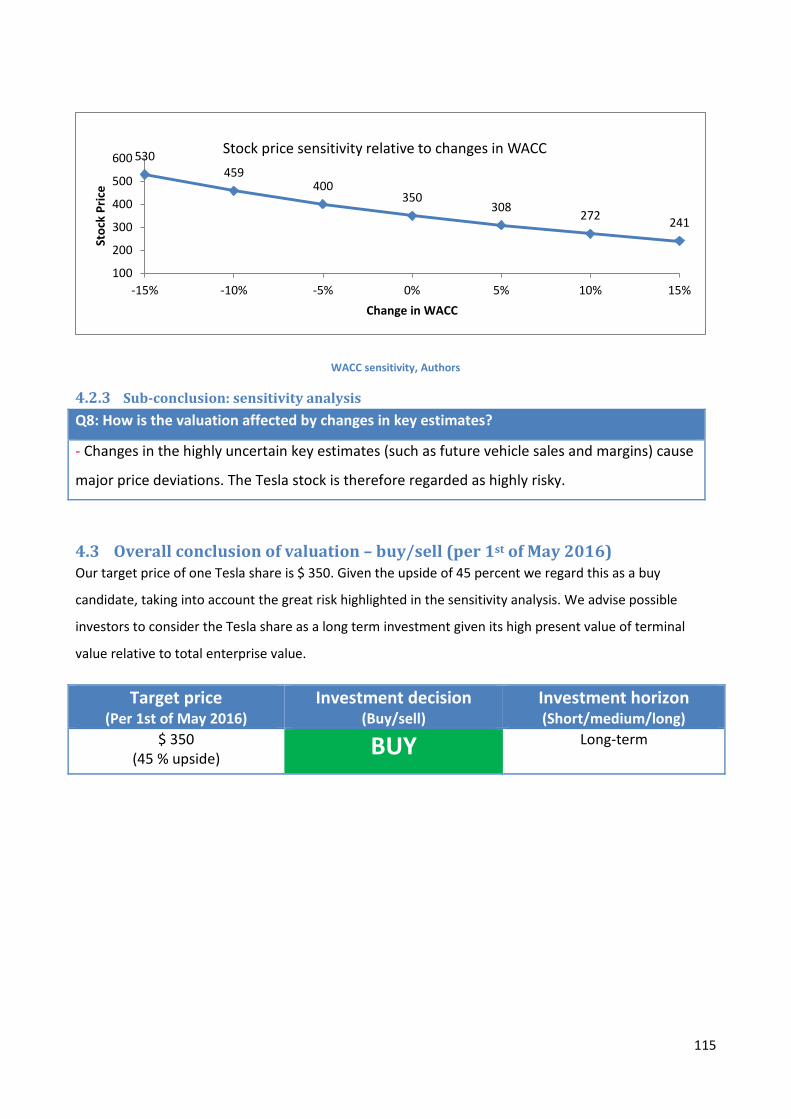
WACC sensitivity, Authors
4.2.3 Sub-conclusion: sensitivity analysis Q8: How is the valuation affected by changes in key estimates?
- Changes in the highly uncertain key estimates (such as future vehicle sales and margins) cause
major price deviations. The Tesla stock is therefore regarded as highly risky.
4.3 Overall conclusion of valuation – buy/sell (per 1st of May 2016) Our target price of one Tesla share is $ 350. Given the upside of 45 percent we regard this as a buy
candidate, taking into account the great risk highlighted in the sensitivity analysis. We advise possible
investors to consider the Tesla share as a long term investment given its high present value of terminal
value relative to total enterprise value.
Target price (Per 1st of May 2016)
Investment decision (Buy/sell)
Investment horizon (Short/medium/long)
$ 350 (45 % upside) BUY Long-term
530 459
400 350
308 272 241
100
200
300
400
500
600
-15% -10% -5% 0% 5% 10% 15%
Stoc
k Pr
ice
Change in WACC
Stock price sensitivity relative to changes in WACC
115
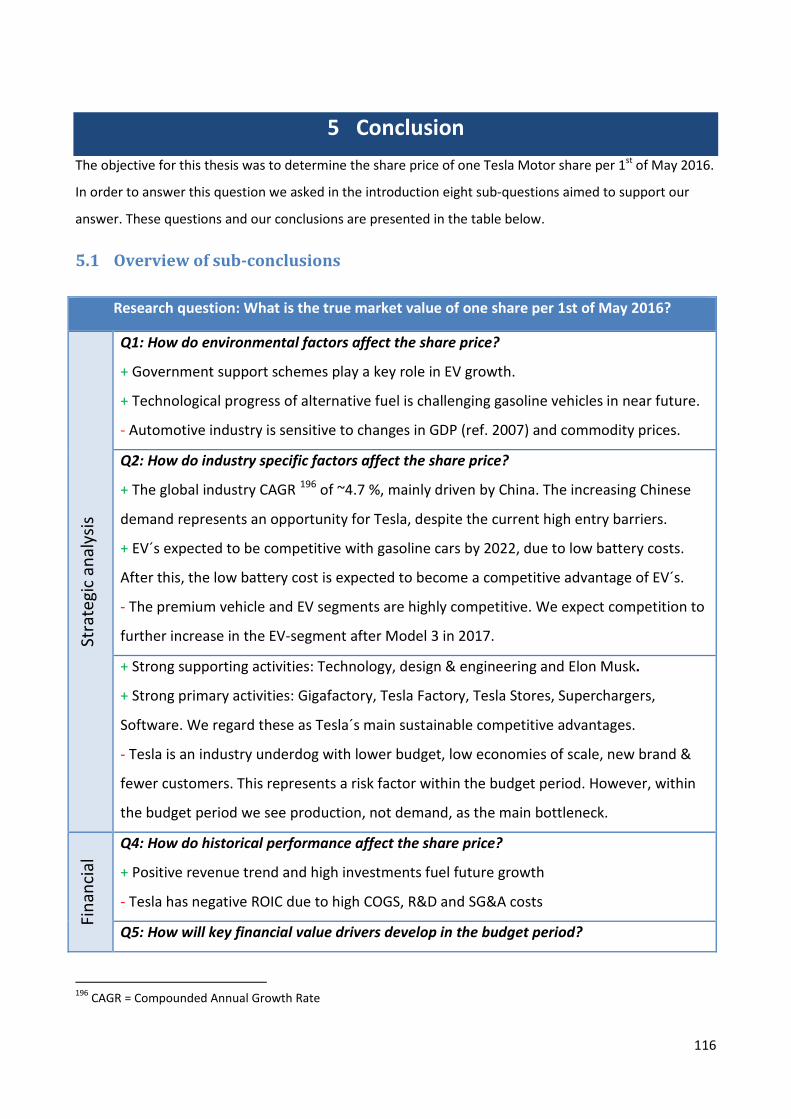
5 Conclusion The objective for this thesis was to determine the share price of one Tesla Motor share per 1st of May 2016.
In order to answer this question we asked in the introduction eight sub-questions aimed to support our
answer. These questions and our conclusions are presented in the table below.
5.1 Overview of sub-conclusions Research question: What is the true market value of one share per 1st of May 2016?
Stra
tegi
c an
alys
is
Q1: How do environmental factors affect the share price?
+ Government support schemes play a key role in EV growth.
+ Technological progress of alternative fuel is challenging gasoline vehicles in near future.
- Automotive industry is sensitive to changes in GDP (ref. 2007) and commodity prices.
Q2: How do industry specific factors affect the share price?
+ The global industry CAGR 196 of ~4.7 %, mainly driven by China. The increasing Chinese
demand represents an opportunity for Tesla, despite the current high entry barriers.
+ EV´s expected to be competitive with gasoline cars by 2022, due to low battery costs.
After this, the low battery cost is expected to become a competitive advantage of EV´s.
- The premium vehicle and EV segments are highly competitive. We expect competition to
further increase in the EV-segment after Model 3 in 2017.
+ Strong supporting activities: Technology, design & engineering and Elon Musk.
+ Strong primary activities: Gigafactory, Tesla Factory, Tesla Stores, Superchargers,
Software. We regard these as Tesla´s main sustainable competitive advantages.
- Tesla is an industry underdog with lower budget, low economies of scale, new brand &
fewer customers. This represents a risk factor within the budget period. However, within
the budget period we see production, not demand, as the main bottleneck.
Fina
ncia
l
Q4: How do historical performance affect the share price?
+ Positive revenue trend and high investments fuel future growth
- Tesla has negative ROIC due to high COGS, R&D and SG&A costs
Q5: How will key financial value drivers develop in the budget period?
196 CAGR = Compounded Annual Growth Rate
116
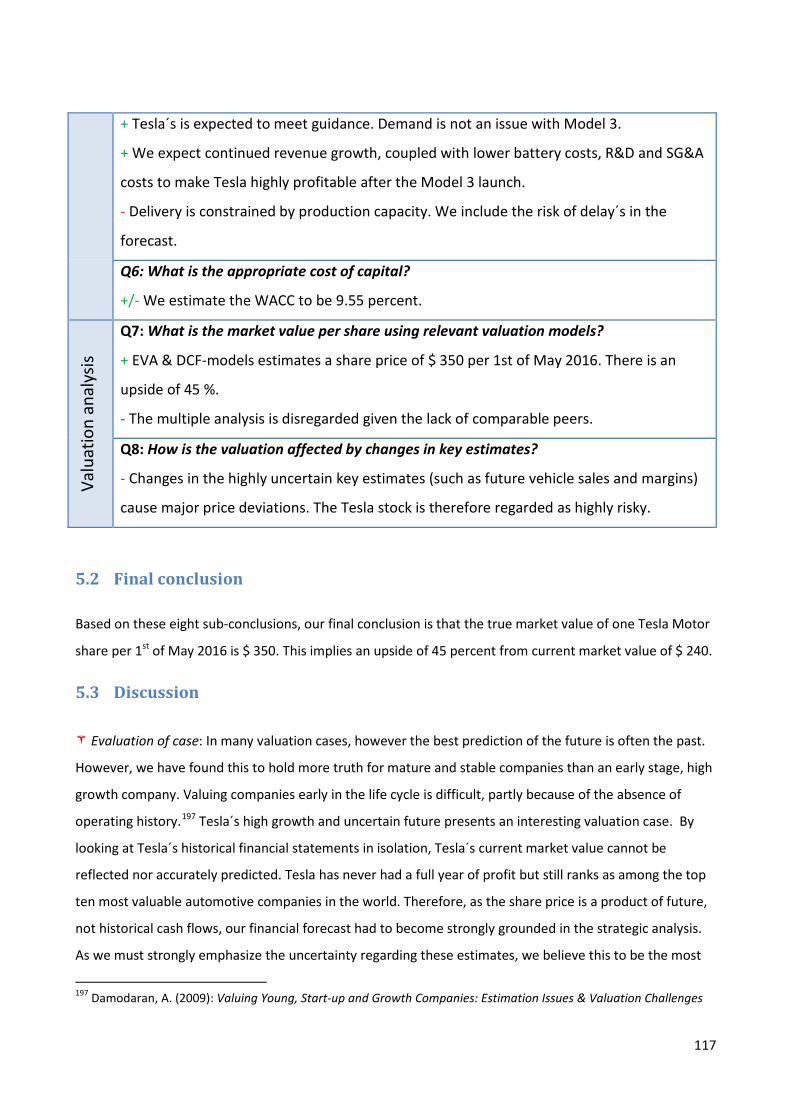
+ Tesla´s is expected to meet guidance. Demand is not an issue with Model 3.
+ We expect continued revenue growth, coupled with lower battery costs, R&D and SG&A
costs to make Tesla highly profitable after the Model 3 launch.
- Delivery is constrained by production capacity. We include the risk of delay´s in the
forecast.
Q6: What is the appropriate cost of capital?
+/- We estimate the WACC to be 9.55 percent.
Valu
atio
n an
alys
is
Q7: What is the market value per share using relevant valuation models?
+ EVA & DCF-models estimates a share price of $ 350 per 1st of May 2016. There is an
upside of 45 %.
- The multiple analysis is disregarded given the lack of comparable peers.
Q8: How is the valuation affected by changes in key estimates?
- Changes in the highly uncertain key estimates (such as future vehicle sales and margins)
cause major price deviations. The Tesla stock is therefore regarded as highly risky.
5.2 Final conclusion
Based on these eight sub-conclusions, our final conclusion is that the true market value of one Tesla Motor
share per 1st of May 2016 is $ 350. This implies an upside of 45 percent from current market value of $ 240.
5.3 Discussion
Evaluation of case: In many valuation cases, however the best prediction of the future is often the past.
However, we have found this to hold more truth for mature and stable companies than an early stage, high
growth company. Valuing companies early in the life cycle is difficult, partly because of the absence of
operating history.197 Tesla´s high growth and uncertain future presents an interesting valuation case. By
looking at Tesla´s historical financial statements in isolation, Tesla´s current market value cannot be
reflected nor accurately predicted. Tesla has never had a full year of profit but still ranks as among the top
ten most valuable automotive companies in the world. Therefore, as the share price is a product of future,
not historical cash flows, our financial forecast had to become strongly grounded in the strategic analysis.
As we must strongly emphasize the uncertainty regarding these estimates, we believe this to be the most
197 Damodaran, A. (2009): Valuing Young, Start-up and Growth Companies: Estimation Issues & Valuation Challenges
117
likely outcome based on the arguments presented in our strategic and financial analysis. The estimation of
the company value is based on a bottom-up analysis on the production capacity to 2020, as we see this as
the company´s bottle neck. By taking this approach we have been able to estimate how future key financial
value drivers will develop. Our main focus has been on production capacity and COGS 198development. We
conclude that Tesla will experience strong growth the next years, reaching their 2020 goals to a sufficient
degree. We assume production will reach 1.4 million units per 2025. As COGS continue to be pressured
downwards by lower kWh cost in batteries, we are confident Tesla is approaching profitability.
Looking forward: The company has grown substantially since the commercial success of the Model S.
With last year sales surpassing 50.000 vehicles, Tesla stay focused on the grand ambition of a tenfold
increase by 2020. Confidence is strong in the company, despite ever delivering a positive full year result.
The future success of Tesla depends on several macroeconomic, industry-specific and internal factors which
are impossible to accurately forecast. However, grounded by the arguments presented in this analysis, we
are confident in the rapid development of the electrical vehicle industry and the sustainable competitive
advantages possessed by Tesla. Therefore, we believe that the company is well positioned to accelerate the
world´s transition towards electric mobility and sustainable energy.
198 COGS = Cost of Goods Sold
118
6 Bibliography
Books
Berk & DeMarzo (2014): Corporate Finance
Berle & Means (1932): The Modern Corporation and Private Property
Conyon & Thomson (2012): Corporate Governance Mechanism
Grant, R (2010): Contemporary Strategic Analysis
Larcker & Tayan (2011): Corporate Governance Matters
McKinsey & Company (2010): Valuation
Petersen & Plenborg (2012) Financial Statement Analysis
Porter, M (1985): Competitive Advantage
Vance, A. (2015): Elon Musk: Tesla, SpaceX, and the Quest for a Fantastic Future
Reports
Audi: Annual Report 2015
BMW: Annual Report 2015
Control4 Corporation: Annual Report 2011-2015
Daimler: Annual Report 2015
Damodaran, A. (2009): Valuing Young, Start-up and Growth Companies: Estimation Issues & Valuation Challenges
Damodaran, A. (2014): Tesla: Anatomy of a Run-up
Evercore Research ISI (2016): Analytics Report of Tesla Motors
International Economic Development Council (2015): Analysis of the Electric Vehicle Industry
KMPG (2015): Annual Automotive Survey
KMPG (2015): Global Automotive Executive Survey
McKinsey & Company (2013): Evolution Report
119
McKinsey (2013): The Road to 2020 and Beyond
Pacific Biosciences of California, Inc.: Annual Report 2010-2015
PWC (2015): Automotive Perspective Infographic
PWC (2016): Autofacts Analyst Note, Europe: Electrification and Beyond
Telenav, Inc.: Annual Report 2011-2015
Tesla Motors: Annual Report 2009-2015
Tesla Motors: Quarterly reports
World Economic Outlook Update: January 2016
Database
Datastream
Google Finance
Moorningstar
Nasdaq
Statistica
Thomson One Banker
U.S. Energy Information Administration
Yahoo Finance
Web/articles
Audi www.audi.com/corporate/en/company/corporate-strategy.html
Bgr.com bgr.com/2015/09/20/model-s-sales-germany/
Bizjournals.com www.bizjournals.com/pacific/stories/2009/06/22/daily33.html
Bloomberg www.bloomberg.com/features/2016-ev-oil-crisis/ www.bloomberg.com/news/articles/2015-09-10/mercedes-beats-audi-to-take-second-place-in-luxury-car-sales www.bloomberg.com/news/articles/2016-02-09/will-the-tesla-model-3-really-sell-for-25-000
120
www.bloomberg.com/news/articles/2015-03-29/musk-reboots-tesla-china-strategy-as-range-anxiety-crimps-sales
BMW www.bmw.com/com/en/insights/corporation/bmwgroup/content.html
Businessinsider.com www.businessinsider.com/tesla-is-tanking-2013-10?IR=T
Build Your Dream www.byd.com/aboutus/profile.html
Chargedevs.com www.chargedevs.com/newswire/tesla-sales-challenging-in-china-but-healthy-in-hong-kong/
Chinaautoweb.com: www.chinaautoweb.com/2016/01/best-selling-china-made-suvs-in-2015/ www.chinaautoweb.com/2016/01/sales-ranking-of-china-made-pure-electric-cars-in-2015/ www.chinaautoweb.com/2016/03/best-selling-sedans-suvs-and-mpvs-in-february-2016/
Cleantechnica.com www.cleantechnica.com/2016/04/11/66-of-germans-would-consider-a-tesla-model-3-according-to-poll/ www.cleantechnica.com/2016/01/30/teslas-2016-china-sales-target-is-50-the-2015-target/
Crunchbase.com www.crunchbase.com/organization/tesla-motors#/entity
Dupress.com dupress.com/articles/internet-of-things-iot-in-automotive-industry/
Eltreck.com www.electrek.co/2016/03/29/tesla-gigafactory-march-2016/
European Commission ec.europa.eu/clima/policies/strategies/2020/index_en.htm
Financial Times www.ft.com/cms/s/0/4a924a64-99df-11e5-987b-d6cdef1b205c.html#axzz45i1yXXHy www.ft.com/cms/s/2/a2d9151e-7427-11e5-a129-3fcc4f641d98.html#axzz415NeirkM www.ft.com/intl/cms/s/0/4a924a64-99df-11e5-987b-d6cdef1b205c.html
Fool.com www.fool.com/investing/general/2016/01/18/is-bob-lutz-wrong-about-tesla-motors.aspx?source=eogyholnk0000001&utm_source=yahoo&utm_medium=feed&utm_campaign=article
Ford Motors Historical Production www.mtfca.com/encyclo/fdprod.htm
Great Wall Motors http://www.gwm-global.com/
Greencarreports.com www.greencarreports.com/news/1095173_tesla-model-s-gets-huge-incentive-in-shangahi-no-12k-fee-for-registration www.greencarreports.com/news/1103667_electric-car-battery-costs-tesla-190-per-kwh-for-pack-gm-145-for-cells
Greentechmedia.com www.greentechmedia.com/articles/read/china-calls-for-30-of-government-cars-to-use-alternative-fuel
Inverese.com www.inverse.com/article/13633-tesla-s-model-3-gigafactory-will-have-the-largest-footprint-of-any-building-in-the-world
Ibisworld.com
121
www.ibisworld.com/industry/global/global-car-automobile-sales.html Ibtimes.com:
www.ibtimes.com/tesla-motors-secures-750m-credit-it-desperately-needs-cover-daily-costs-it-burns-1965838
International Money Fund www.imf.org/external/pubs/ft/weo/2016/update/01/
Investopedia.com www.investopedia.com/articles/stocks/08/auto-stock.asp www.investopedia.com/terms/c/cyclical_industry.asp www.investopedia.com/terms/p/price-earningsratio.asp www.investopedia.com/terms/c/capital_goods_sector.asp
KPMG home.kpmg.com/xx/en/home/services/tax/tax-tools-and-resources/tax-rates-online/corporate-tax-rates-table.html www.home.kpmg.com/xx/en/home/services/tax/tax-tools-and-resources/tax-rates-online/corporate-tax-rates-table.html
Macabacus.com www.macabacus.com/valuation/multiples
Morningstar news.morningstar.com/classroom2/course.asp?docId=143911&page=6
New York Times www.nytimes.com/2013/10/04/business/car-fire-a-test-for-high-flying-tesla.html?_r=0
The National Highway Traffic Safety Administration (NHTSA) www.nhtsa.gov/About+NHTSA/Press+Releases/ci.dot-initiatives-accelerating-vehicle-safety-innovations-01142016.print
PRnewswire.com www.prnewswire.com/news-releases/a-study-of-the-global-luxury-car-market-2015-2020-300201262.html
Reportlinker.com www.reportlinker.com/ci02180/Luxury-Automobile.html
Securitystocks.net www.securitiesstocks.net/article/276458861/audi-vs-mercedes-who-is-winning-/
SKAT.DK www.skat.dk/SKAT.aspx?oId=1817284
Statistica.com www.statista.com/statistics/262921/global-production-of-luxury-cars-by-make/ www.statista.com/statistics/199974/us-car-sales-since-1951/
Streetinsider.com: www.streetinsider.com/Credit+Ratings
Teslamotors.com ir.teslamotors.com/events.cfm ir.teslamotors.com/releasedetail.cfm?releaseid=963460 www.teslamotors.com/about www.teslamotors.com/blog/secret-tesla-motors-master-plan-just-between-you-and-me www.teslamotors.com/en_MO/press www.teslamotors.com/gigafactory www.teslamotors.com/support/incentives www.teslamotors.com/blog/the-week-electric-vehicles-went-mainstream
Teslarati.com www.teslarati.com/analysts-tour-tesla-factory-cite-stunning-progress/
122
The Guardian www.theguardian.com/world/2014/oct/24/eu-leaders-agree-to-cut-greenhouse-gas-emissions-by-40-by-2030
Thinkprogress.org www.thinkprogress.org/climate/2015/02/12/3621136/tesla-elon-musk-hydrogen-dumb/
Toyota www.toyota-global.com/innovation/environmental_technology/fuelcell_vehicle/
Wired.com www.wired.com/2016/03/sorry-dont-expect-tesla-model-3-cost-30k/ www.wired.com/insights/2014/11/the-internet-of-things-bigger/
Volkswagen www.volkswagenag.com/content/vwcorp/content/en/brands_and_products.html
Worldbank www.data.worldbank.org/indicator/NY.GDP.MKTP.KD.ZG
Worldwatch www.worldwatch.org/node/4516
Yahoo Finance finance.yahoo.com/news/apple-entering-electric-car-market-160616749.html
finance.yahoo.com/news/panasonic-backs-teslas-gigafactory-investing-190107913.html
123
7 Appendix
Appendix 1: Global operative facilities overview ...................................................................................... 125
Appendix 2: Comments to performance and price metrics ...................................................................... 125
Appendix 3: Standard equipment and option pricelist.............................................................................. 126
Appendix 4: Tesla, Analytical Income Statement ...................................................................................... 127
Appendix 5: Tesla, Analytical Balance Sheet ............................................................................................. 128
Appendix 6: Forecast of Analytical Income Statement .............................................................................. 130
Appendix 7: Forecast of Analytical Balance Sheet ..................................................................................... 132
Appendix 8: Forecast of Cash Flow Statement .......................................................................................... 136
Appendix 9: Revenue Forecast .................................................................................................................. 137
Appendix 10: Forecast of COGS as % of revenue .................................................................................... 139
Appendix 11: Cost of capital .................................................................................................................... 141
Appendix 12: EVA & FCFF valuation formulas ......................................................................................... 142
Appendix 13: Analytical Statements, Financial Peers .............................................................................. 142
Appendix 14: Analytical Statements, Premium Peers ............................................................................. 148
Appendix 15: Best case and worst case valuation ................................................................................... 154
124
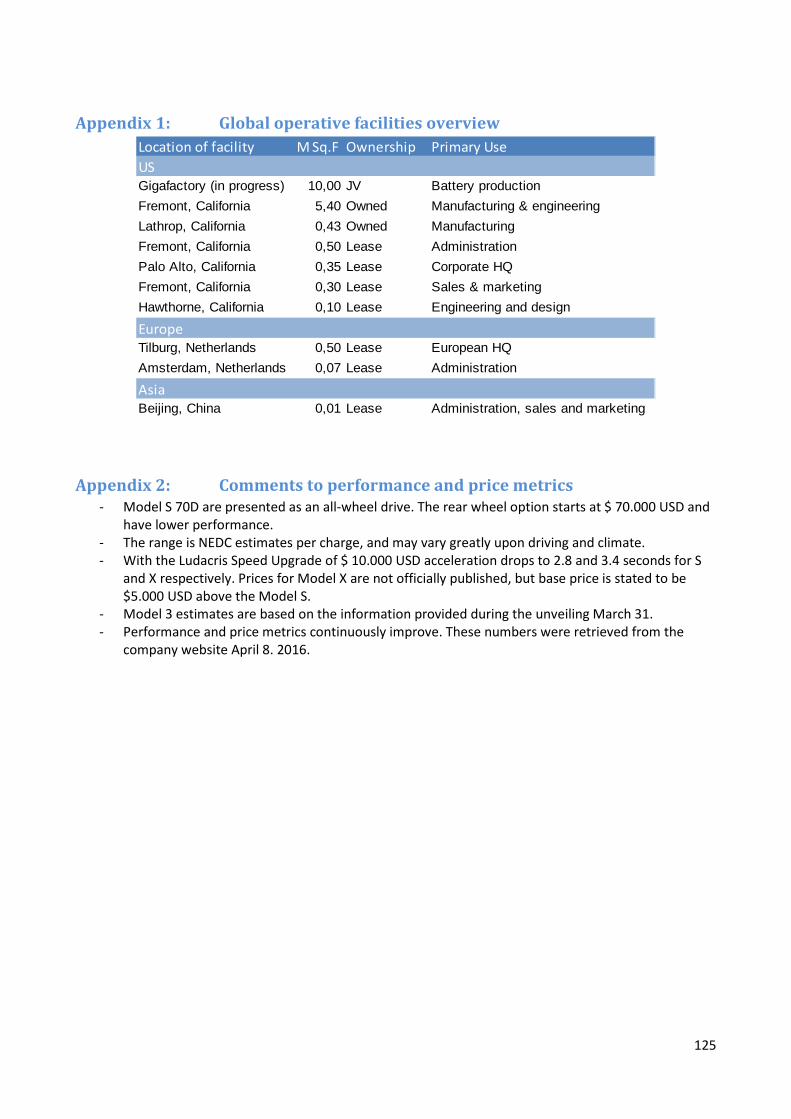
Appendix 1: Global operative facilities overview
Appendix 2: Comments to performance and price metrics
- Model S 70D are presented as an all-wheel drive. The rear wheel option starts at $ 70.000 USD and have lower performance.
- The range is NEDC estimates per charge, and may vary greatly upon driving and climate. - With the Ludacris Speed Upgrade of $ 10.000 USD acceleration drops to 2.8 and 3.4 seconds for S
and X respectively. Prices for Model X are not officially published, but base price is stated to be $5.000 USD above the Model S.
- Model 3 estimates are based on the information provided during the unveiling March 31. - Performance and price metrics continuously improve. These numbers were retrieved from the
company website April 8. 2016.
Location of facility M Sq.F Ownership Primary UseUSGigafactory (in progress) 10,00 JV Battery productionFremont, California 5,40 Owned Manufacturing & engineering Lathrop, California 0,43 Owned ManufacturingFremont, California 0,50 Lease AdministrationPalo Alto, California 0,35 Lease Corporate HQ Fremont, California 0,30 Lease Sales & marketingHawthorne, California 0,10 Lease Engineering and design
EuropeTilburg, Netherlands 0,50 Lease European HQAmsterdam, Netherlands 0,07 Lease Administration
AsiaBeijing, China 0,01 Lease Administration, sales and marketing
125
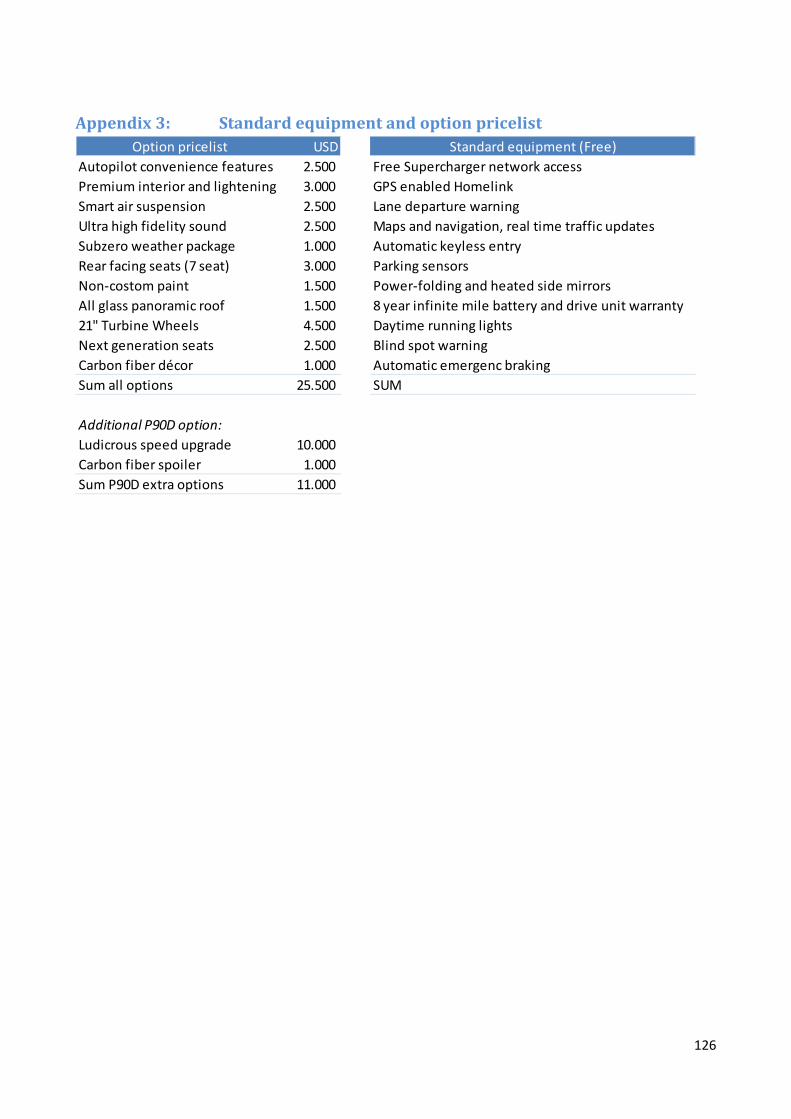
Appendix 3: Standard equipment and option pricelist
Option pricelist USD Standard equipment (Free)Autopilot convenience features 2.500 Free Supercharger network accessPremium interior and lightening 3.000 GPS enabled HomelinkSmart air suspension 2.500 Lane departure warningUltra high fidelity sound 2.500 Maps and navigation, real time traffic updatesSubzero weather package 1.000 Automatic keyless entryRear facing seats (7 seat) 3.000 Parking sensorsNon-costom paint 1.500 Power-folding and heated side mirrorsAll glass panoramic roof 1.500 8 year infinite mile battery and drive unit warranty21" Turbine Wheels 4.500 Daytime running lightsNext generation seats 2.500 Blind spot warningCarbon fiber décor 1.000 Automatic emergenc brakingSum all options 25.500 SUM
Additional P90D option:Ludicrous speed upgrade 10.000 Carbon fiber spoiler 1.000 Sum P90D extra options 11.000
126
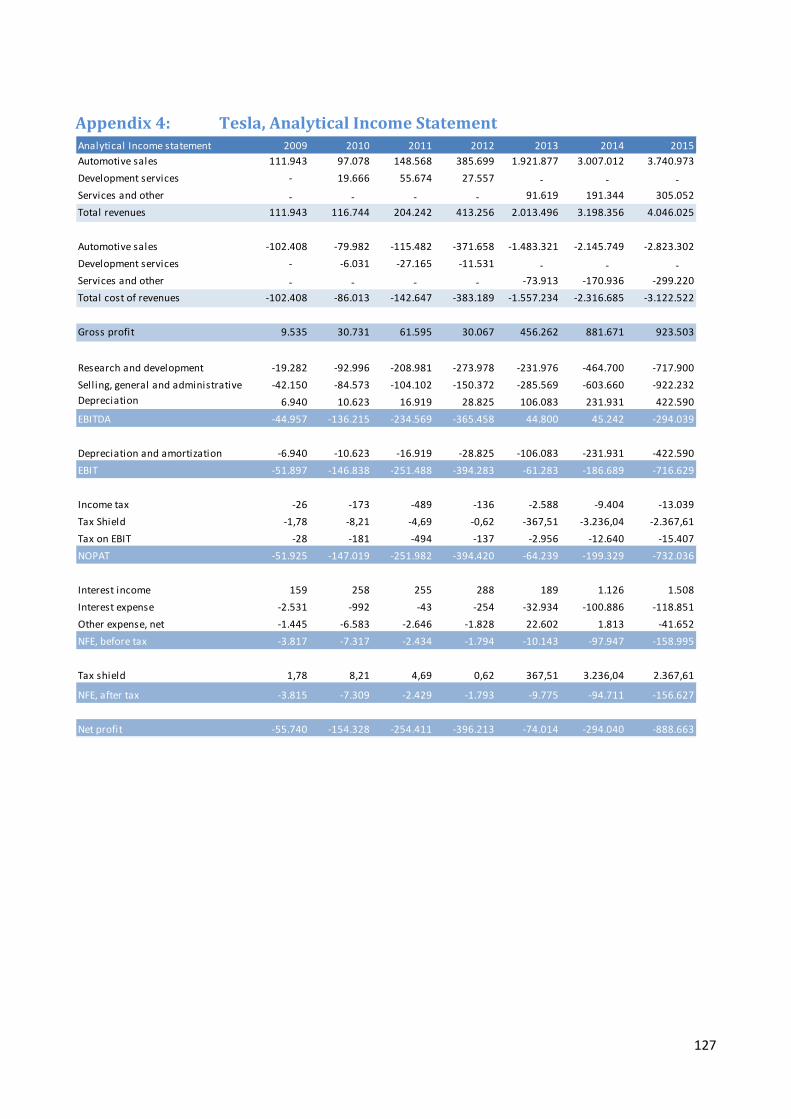
Appendix 4: Tesla, Analytical Income Statement
Analytical Income statement 2009 2010 2011 2012 2013 2014 2015Automotive sales 111.943 97.078 148.568 385.699 1.921.877 3.007.012 3.740.973Development services - 19.666 55.674 27.557 - - - Services and other - - - - 91.619 191.344 305.052Total revenues 111.943 116.744 204.242 413.256 2.013.496 3.198.356 4.046.025
Automotive sales -102.408 -79.982 -115.482 -371.658 -1.483.321 -2.145.749 -2.823.302Development services - -6.031 -27.165 -11.531 - - - Services and other - - - - -73.913 -170.936 -299.220Total cost of revenues -102.408 -86.013 -142.647 -383.189 -1.557.234 -2.316.685 -3.122.522
Gross profit 9.535 30.731 61.595 30.067 456.262 881.671 923.503
Research and development -19.282 -92.996 -208.981 -273.978 -231.976 -464.700 -717.900Sell ing, general and administrative -42.150 -84.573 -104.102 -150.372 -285.569 -603.660 -922.232Depreciation 6.940 10.623 16.919 28.825 106.083 231.931 422.590EBITDA -44.957 -136.215 -234.569 -365.458 44.800 45.242 -294.039
Depreciation and amortization -6.940 -10.623 -16.919 -28.825 -106.083 -231.931 -422.590EBIT -51.897 -146.838 -251.488 -394.283 -61.283 -186.689 -716.629
Income tax -26 -173 -489 -136 -2.588 -9.404 -13.039Tax Shield -1,78 -8,21 -4,69 -0,62 -367,51 -3.236,04 -2.367,61Tax on EBIT -28 -181 -494 -137 -2.956 -12.640 -15.407NOPAT -51.925 -147.019 -251.982 -394.420 -64.239 -199.329 -732.036
Interest income 159 258 255 288 189 1.126 1.508Interest expense -2.531 -992 -43 -254 -32.934 -100.886 -118.851Other expense, net -1.445 -6.583 -2.646 -1.828 22.602 1.813 -41.652NFE, before tax -3.817 -7.317 -2.434 -1.794 -10.143 -97.947 -158.995
Tax shield 1,78 8,21 4,69 0,62 367,51 3.236,04 2.367,61
NFE, after tax -3.815 -7.309 -2.429 -1.793 -9.775 -94.711 -156.627
Net profit -55.740 -154.328 -254.411 -396.213 -74.014 -294.040 -888.663
127
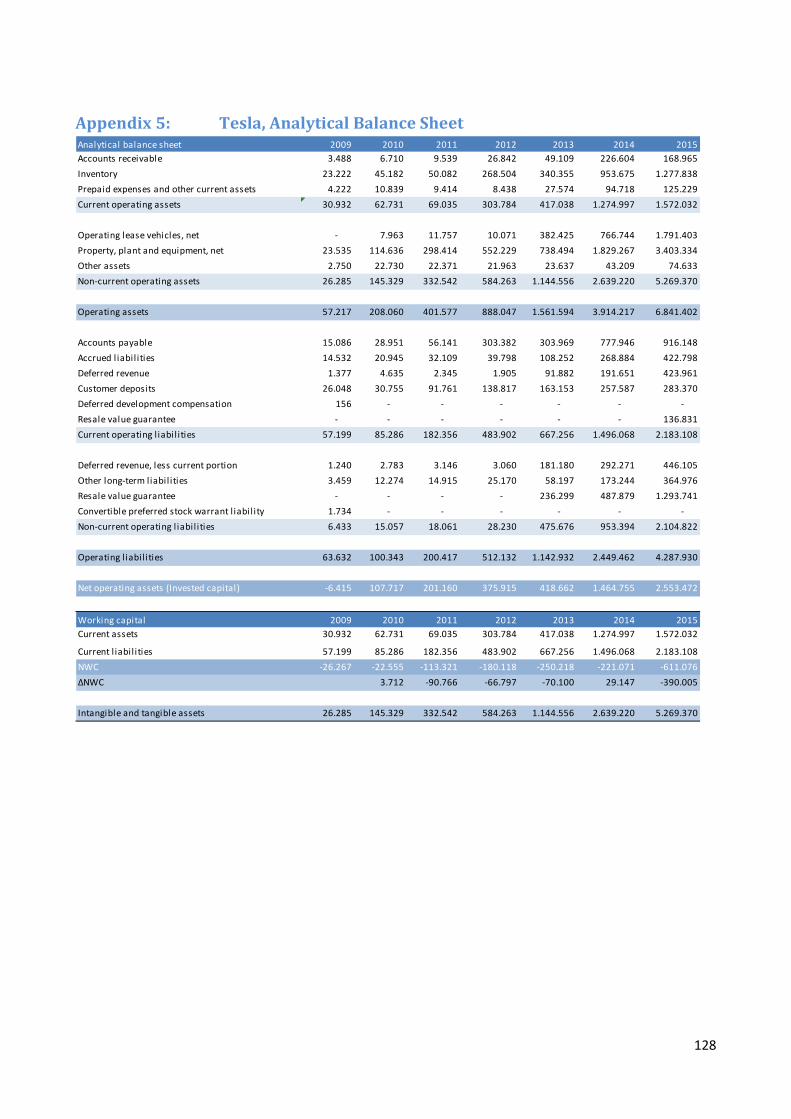
Appendix 5: Tesla, Analytical Balance Sheet
Analytical balance sheet 2009 2010 2011 2012 2013 2014 2015Accounts receivable 3.488 6.710 9.539 26.842 49.109 226.604 168.965Inventory 23.222 45.182 50.082 268.504 340.355 953.675 1.277.838Prepaid expenses and other current assets 4.222 10.839 9.414 8.438 27.574 94.718 125.229Current operating assets 30.932 62.731 69.035 303.784 417.038 1.274.997 1.572.032
Operating lease vehicles, net - 7.963 11.757 10.071 382.425 766.744 1.791.403Property, plant and equipment, net 23.535 114.636 298.414 552.229 738.494 1.829.267 3.403.334Other assets 2.750 22.730 22.371 21.963 23.637 43.209 74.633Non-current operating assets 26.285 145.329 332.542 584.263 1.144.556 2.639.220 5.269.370
Operating assets 57.217 208.060 401.577 888.047 1.561.594 3.914.217 6.841.402
Accounts payable 15.086 28.951 56.141 303.382 303.969 777.946 916.148Accrued liabil ities 14.532 20.945 32.109 39.798 108.252 268.884 422.798Deferred revenue 1.377 4.635 2.345 1.905 91.882 191.651 423.961Customer deposits 26.048 30.755 91.761 138.817 163.153 257.587 283.370Deferred development compensation 156 - - - - - - Resale value guarantee - - - - - - 136.831Current operating l iabil ities 57.199 85.286 182.356 483.902 667.256 1.496.068 2.183.108
Deferred revenue, less current portion 1.240 2.783 3.146 3.060 181.180 292.271 446.105Other long-term liabil ities 3.459 12.274 14.915 25.170 58.197 173.244 364.976Resale value guarantee - - - - 236.299 487.879 1.293.741Convertible preferred stock warrant l iabil ity 1.734 - - - - - - Non-current operating l iabil ities 6.433 15.057 18.061 28.230 475.676 953.394 2.104.822
Operating l iabil ities 63.632 100.343 200.417 512.132 1.142.932 2.449.462 4.287.930
Net operating assets (Invested capital) -6.415 107.717 201.160 375.915 418.662 1.464.755 2.553.472
Working capital 2009 2010 2011 2012 2013 2014 2015Current assets 30.932 62.731 69.035 303.784 417.038 1.274.997 1.572.032
Current l iabil ities 57.199 85.286 182.356 483.902 667.256 1.496.068 2.183.108NWC -26.267 -22.555 -113.321 -180.118 -250.218 -221.071 -611.076ΔNWC 3.712 -90.766 -66.797 -70.100 29.147 -390.005
Intangible and tangible assets 26.285 145.329 332.542 584.263 1.144.556 2.639.220 5.269.370
128
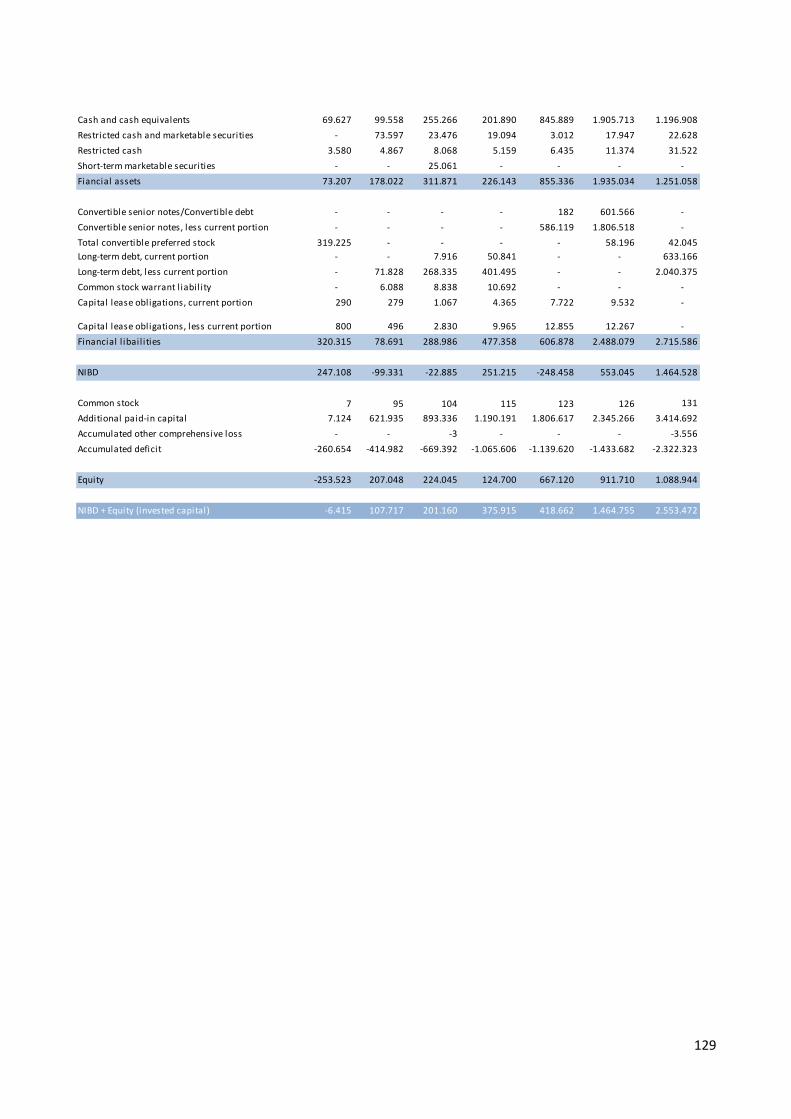
Cash and cash equivalents 69.627 99.558 255.266 201.890 845.889 1.905.713 1.196.908Restricted cash and marketable securities - 73.597 23.476 19.094 3.012 17.947 22.628Restricted cash 3.580 4.867 8.068 5.159 6.435 11.374 31.522Short-term marketable securities - - 25.061 - - - - Fiancial assets 73.207 178.022 311.871 226.143 855.336 1.935.034 1.251.058
Convertible senior notes/Convertible debt - - - - 182 601.566 - Convertible senior notes, less current portion - - - - 586.119 1.806.518 - Total convertible preferred stock 319.225 - - - - 58.196 42.045Long-term debt, current portion - - 7.916 50.841 - - 633.166Long-term debt, less current portion - 71.828 268.335 401.495 - - 2.040.375Common stock warrant l iabil ity - 6.088 8.838 10.692 - - - Capital lease obligations, current portion 290 279 1.067 4.365 7.722 9.532 -
Capital lease obligations, less current portion 800 496 2.830 9.965 12.855 12.267 - Financial l ibail ities 320.315 78.691 288.986 477.358 606.878 2.488.079 2.715.586
NIBD 247.108 -99.331 -22.885 251.215 -248.458 553.045 1.464.528
Common stock 7 95 104 115 123 126 131Additional paid-in capital 7.124 621.935 893.336 1.190.191 1.806.617 2.345.266 3.414.692Accumulated other comprehensive loss - - -3 - - - -3.556Accumulated deficit -260.654 -414.982 -669.392 -1.065.606 -1.139.620 -1.433.682 -2.322.323
Equity -253.523 207.048 224.045 124.700 667.120 911.710 1.088.944
NIBD + Equity (invested capital) -6.415 107.717 201.160 375.915 418.662 1.464.755 2.553.472
129
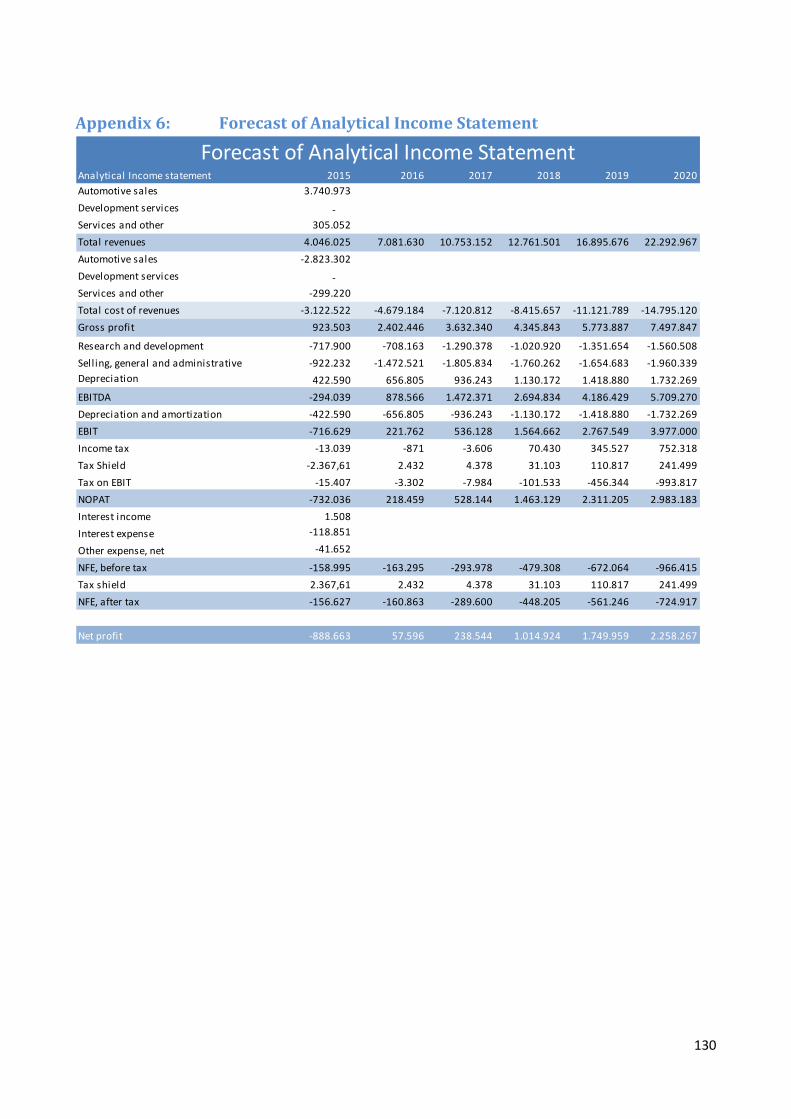
Appendix 6: Forecast of Analytical Income Statement
Analytical Income statement 2015 2016 2017 2018 2019 2020Automotive sales 3.740.973Development services - Services and other 305.052Total revenues 4.046.025 7.081.630 10.753.152 12.761.501 16.895.676 22.292.967Automotive sales -2.823.302Development services - Services and other -299.220Total cost of revenues -3.122.522 -4.679.184 -7.120.812 -8.415.657 -11.121.789 -14.795.120Gross profit 923.503 2.402.446 3.632.340 4.345.843 5.773.887 7.497.847
Research and development -717.900 -708.163 -1.290.378 -1.020.920 -1.351.654 -1.560.508Sell ing, general and administrative -922.232 -1.472.521 -1.805.834 -1.760.262 -1.654.683 -1.960.339Depreciation 422.590 656.805 936.243 1.130.172 1.418.880 1.732.269EBITDA -294.039 878.566 1.472.371 2.694.834 4.186.429 5.709.270Depreciation and amortization -422.590 -656.805 -936.243 -1.130.172 -1.418.880 -1.732.269EBIT -716.629 221.762 536.128 1.564.662 2.767.549 3.977.000Income tax -13.039 -871 -3.606 70.430 345.527 752.318Tax Shield -2.367,61 2.432 4.378 31.103 110.817 241.499Tax on EBIT -15.407 -3.302 -7.984 -101.533 -456.344 -993.817NOPAT -732.036 218.459 528.144 1.463.129 2.311.205 2.983.183Interest income 1.508Interest expense -118.851
Other expense, net -41.652
NFE, before tax -158.995 -163.295 -293.978 -479.308 -672.064 -966.415Tax shield 2.367,61 2.432 4.378 31.103 110.817 241.499NFE, after tax -156.627 -160.863 -289.600 -448.205 -561.246 -724.917
Net profit -888.663 57.596 238.544 1.014.924 1.749.959 2.258.267
Forecast of Analytical Income Statement
130
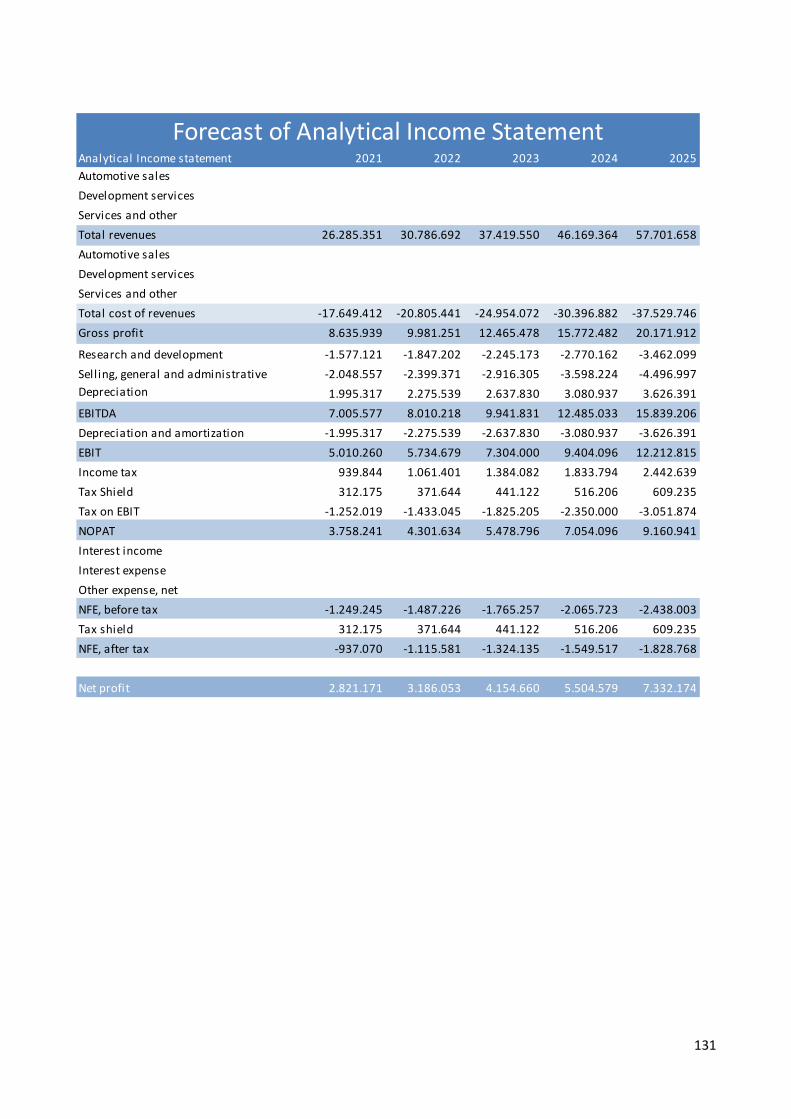
Analytical Income statement 2021 2022 2023 2024 2025Automotive salesDevelopment servicesServices and otherTotal revenues 26.285.351 30.786.692 37.419.550 46.169.364 57.701.658Automotive salesDevelopment servicesServices and otherTotal cost of revenues -17.649.412 -20.805.441 -24.954.072 -30.396.882 -37.529.746Gross profit 8.635.939 9.981.251 12.465.478 15.772.482 20.171.912
Research and development -1.577.121 -1.847.202 -2.245.173 -2.770.162 -3.462.099Sell ing, general and administrative -2.048.557 -2.399.371 -2.916.305 -3.598.224 -4.496.997Depreciation 1.995.317 2.275.539 2.637.830 3.080.937 3.626.391EBITDA 7.005.577 8.010.218 9.941.831 12.485.033 15.839.206Depreciation and amortization -1.995.317 -2.275.539 -2.637.830 -3.080.937 -3.626.391EBIT 5.010.260 5.734.679 7.304.000 9.404.096 12.212.815Income tax 939.844 1.061.401 1.384.082 1.833.794 2.442.639Tax Shield 312.175 371.644 441.122 516.206 609.235Tax on EBIT -1.252.019 -1.433.045 -1.825.205 -2.350.000 -3.051.874NOPAT 3.758.241 4.301.634 5.478.796 7.054.096 9.160.941Interest incomeInterest expenseOther expense, netNFE, before tax -1.249.245 -1.487.226 -1.765.257 -2.065.723 -2.438.003Tax shield 312.175 371.644 441.122 516.206 609.235NFE, after tax -937.070 -1.115.581 -1.324.135 -1.549.517 -1.828.768
Net profit 2.821.171 3.186.053 4.154.660 5.504.579 7.332.174
Forecast of Analytical Income Statement
131
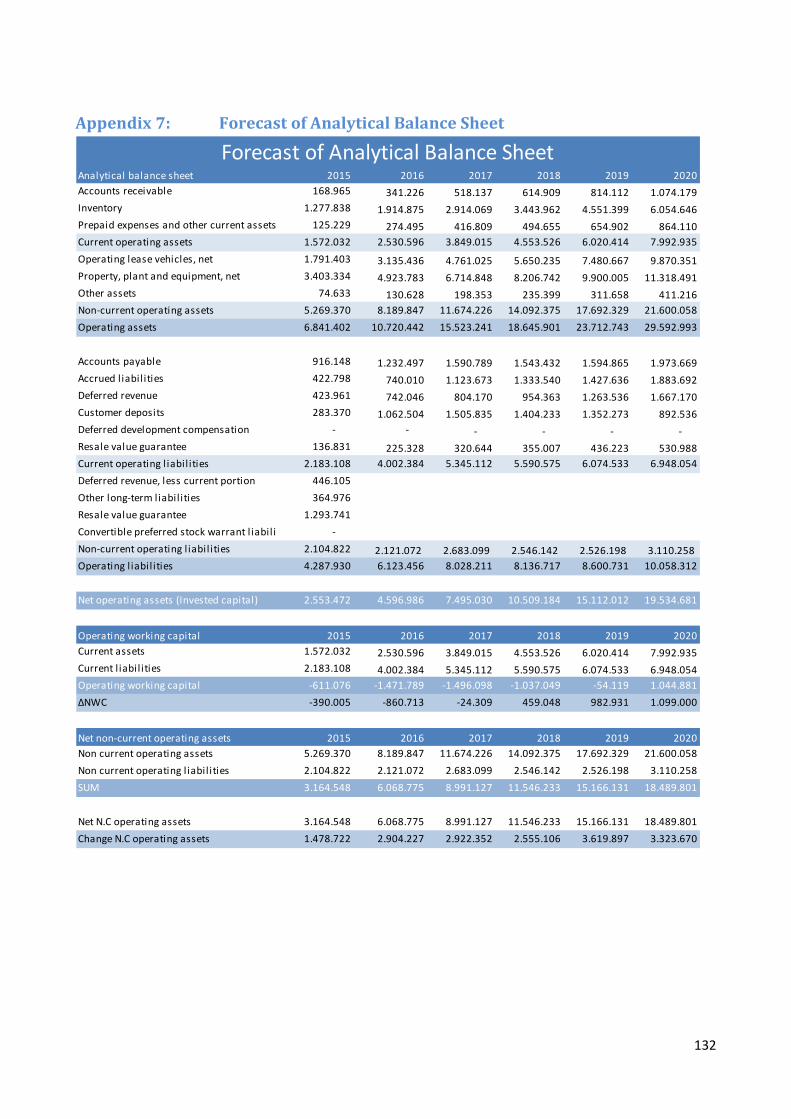
Appendix 7: Forecast of Analytical Balance Sheet
Analytical balance sheet 2015 2016 2017 2018 2019 2020Accounts receivable 168.965 341.226 518.137 614.909 814.112 1.074.179Inventory 1.277.838 1.914.875 2.914.069 3.443.962 4.551.399 6.054.646Prepaid expenses and other current assets 125.229 274.495 416.809 494.655 654.902 864.110Current operating assets 1.572.032 2.530.596 3.849.015 4.553.526 6.020.414 7.992.935Operating lease vehicles, net 1.791.403 3.135.436 4.761.025 5.650.235 7.480.667 9.870.351Property, plant and equipment, net 3.403.334 4.923.783 6.714.848 8.206.742 9.900.005 11.318.491Other assets 74.633 130.628 198.353 235.399 311.658 411.216Non-current operating assets 5.269.370 8.189.847 11.674.226 14.092.375 17.692.329 21.600.058Operating assets 6.841.402 10.720.442 15.523.241 18.645.901 23.712.743 29.592.993
Accounts payable 916.148 1.232.497 1.590.789 1.543.432 1.594.865 1.973.669Accrued liabil ities 422.798 740.010 1.123.673 1.333.540 1.427.636 1.883.692Deferred revenue 423.961 742.046 804.170 954.363 1.263.536 1.667.170Customer deposits 283.370 1.062.504 1.505.835 1.404.233 1.352.273 892.536Deferred development compensation - - - - - - Resale value guarantee 136.831 225.328 320.644 355.007 436.223 530.988Current operating l iabil ities 2.183.108 4.002.384 5.345.112 5.590.575 6.074.533 6.948.054Deferred revenue, less current portion 446.105Other long-term liabil ities 364.976Resale value guarantee 1.293.741Convertible preferred stock warrant l iabil i - Non-current operating l iabil ities 2.104.822 2.121.072 2.683.099 2.546.142 2.526.198 3.110.258 Operating l iabil ities 4.287.930 6.123.456 8.028.211 8.136.717 8.600.731 10.058.312
Net operating assets (Invested capital) 2.553.472 4.596.986 7.495.030 10.509.184 15.112.012 19.534.681
Operating working capital 2015 2016 2017 2018 2019 2020Current assets 1.572.032 2.530.596 3.849.015 4.553.526 6.020.414 7.992.935Current l iabil ities 2.183.108 4.002.384 5.345.112 5.590.575 6.074.533 6.948.054Operating working capital -611.076 -1.471.789 -1.496.098 -1.037.049 -54.119 1.044.881ΔNWC -390.005 -860.713 -24.309 459.048 982.931 1.099.000
Net non-current operating assets 2015 2016 2017 2018 2019 2020Non current operating assets 5.269.370 8.189.847 11.674.226 14.092.375 17.692.329 21.600.058Non current operating l iabil ities 2.104.822 2.121.072 2.683.099 2.546.142 2.526.198 3.110.258SUM 3.164.548 6.068.775 8.991.127 11.546.233 15.166.131 18.489.801
Net N.C operating assets 3.164.548 6.068.775 8.991.127 11.546.233 15.166.131 18.489.801Change N.C operating assets 1.478.722 2.904.227 2.922.352 2.555.106 3.619.897 3.323.670
Forecast of Analytical Balance Sheet
132
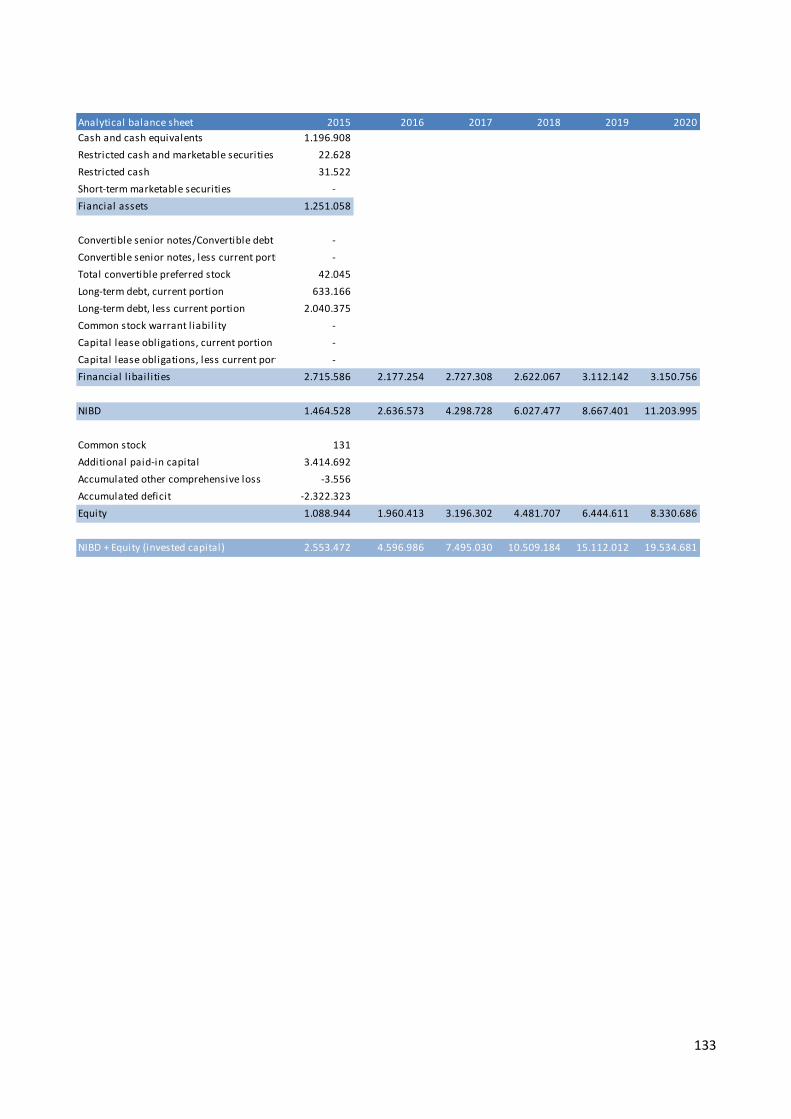
Analytical balance sheet 2015 2016 2017 2018 2019 2020Cash and cash equivalents 1.196.908Restricted cash and marketable securities 22.628Restricted cash 31.522Short-term marketable securities - Fiancial assets 1.251.058
Convertible senior notes/Convertible debt - Convertible senior notes, less current porti - Total convertible preferred stock 42.045Long-term debt, current portion 633.166Long-term debt, less current portion 2.040.375Common stock warrant l iabil ity - Capital lease obligations, current portion - Capital lease obligations, less current port - Financial l ibail ities 2.715.586 2.177.254 2.727.308 2.622.067 3.112.142 3.150.756
NIBD 1.464.528 2.636.573 4.298.728 6.027.477 8.667.401 11.203.995
Common stock 131Additional paid-in capital 3.414.692Accumulated other comprehensive loss -3.556Accumulated deficit -2.322.323Equity 1.088.944 1.960.413 3.196.302 4.481.707 6.444.611 8.330.686
NIBD + Equity (invested capital) 2.553.472 4.596.986 7.495.030 10.509.184 15.112.012 19.534.681
133
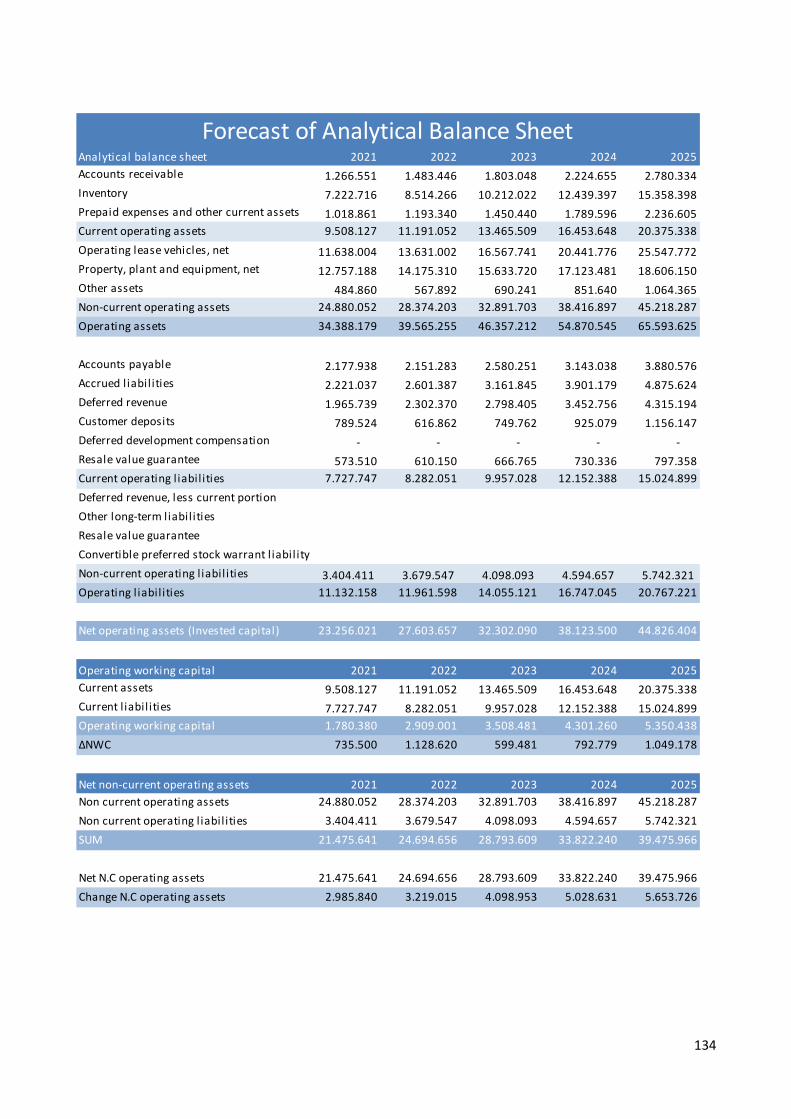
Analytical balance sheet 2021 2022 2023 2024 2025Accounts receivable 1.266.551 1.483.446 1.803.048 2.224.655 2.780.334Inventory 7.222.716 8.514.266 10.212.022 12.439.397 15.358.398Prepaid expenses and other current assets 1.018.861 1.193.340 1.450.440 1.789.596 2.236.605Current operating assets 9.508.127 11.191.052 13.465.509 16.453.648 20.375.338Operating lease vehicles, net 11.638.004 13.631.002 16.567.741 20.441.776 25.547.772Property, plant and equipment, net 12.757.188 14.175.310 15.633.720 17.123.481 18.606.150Other assets 484.860 567.892 690.241 851.640 1.064.365Non-current operating assets 24.880.052 28.374.203 32.891.703 38.416.897 45.218.287Operating assets 34.388.179 39.565.255 46.357.212 54.870.545 65.593.625
Accounts payable 2.177.938 2.151.283 2.580.251 3.143.038 3.880.576Accrued liabil ities 2.221.037 2.601.387 3.161.845 3.901.179 4.875.624Deferred revenue 1.965.739 2.302.370 2.798.405 3.452.756 4.315.194Customer deposits 789.524 616.862 749.762 925.079 1.156.147Deferred development compensation - - - - - Resale value guarantee 573.510 610.150 666.765 730.336 797.358Current operating l iabil ities 7.727.747 8.282.051 9.957.028 12.152.388 15.024.899Deferred revenue, less current portionOther long-term liabil itiesResale value guaranteeConvertible preferred stock warrant l iabil ityNon-current operating l iabil ities 3.404.411 3.679.547 4.098.093 4.594.657 5.742.321 Operating l iabil ities 11.132.158 11.961.598 14.055.121 16.747.045 20.767.221
Net operating assets (Invested capital) 23.256.021 27.603.657 32.302.090 38.123.500 44.826.404
Operating working capital 2021 2022 2023 2024 2025Current assets 9.508.127 11.191.052 13.465.509 16.453.648 20.375.338Current l iabil ities 7.727.747 8.282.051 9.957.028 12.152.388 15.024.899Operating working capital 1.780.380 2.909.001 3.508.481 4.301.260 5.350.438ΔNWC 735.500 1.128.620 599.481 792.779 1.049.178
Net non-current operating assets 2021 2022 2023 2024 2025Non current operating assets 24.880.052 28.374.203 32.891.703 38.416.897 45.218.287Non current operating l iabil ities 3.404.411 3.679.547 4.098.093 4.594.657 5.742.321SUM 21.475.641 24.694.656 28.793.609 33.822.240 39.475.966
Net N.C operating assets 21.475.641 24.694.656 28.793.609 33.822.240 39.475.966Change N.C operating assets 2.985.840 3.219.015 4.098.953 5.028.631 5.653.726
Forecast of Analytical Balance Sheet
134
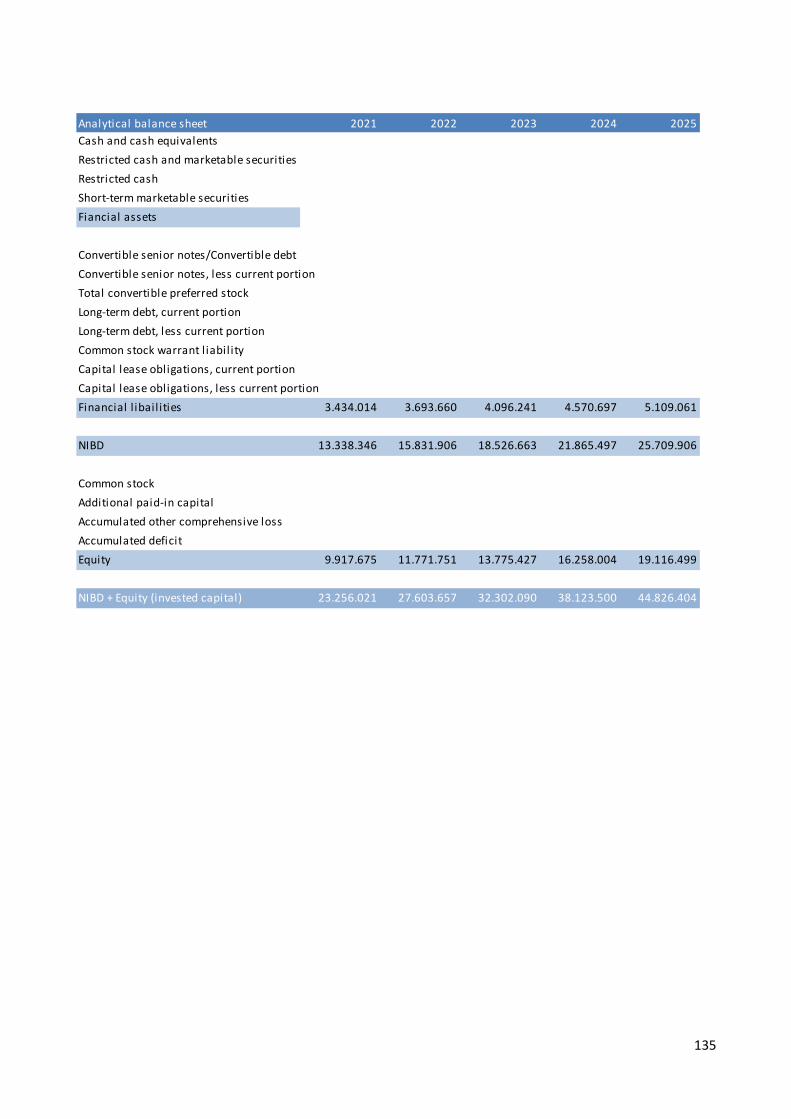
Analytical balance sheet 2021 2022 2023 2024 2025Cash and cash equivalentsRestricted cash and marketable securitiesRestricted cashShort-term marketable securitiesFiancial assets
Convertible senior notes/Convertible debtConvertible senior notes, less current portionTotal convertible preferred stockLong-term debt, current portionLong-term debt, less current portionCommon stock warrant l iabil ityCapital lease obligations, current portionCapital lease obligations, less current portionFinancial l ibail ities 3.434.014 3.693.660 4.096.241 4.570.697 5.109.061
NIBD 13.338.346 15.831.906 18.526.663 21.865.497 25.709.906
Common stockAdditional paid-in capitalAccumulated other comprehensive lossAccumulated deficitEquity 9.917.675 11.771.751 13.775.427 16.258.004 19.116.499
NIBD + Equity (invested capital) 23.256.021 27.603.657 32.302.090 38.123.500 44.826.404
135
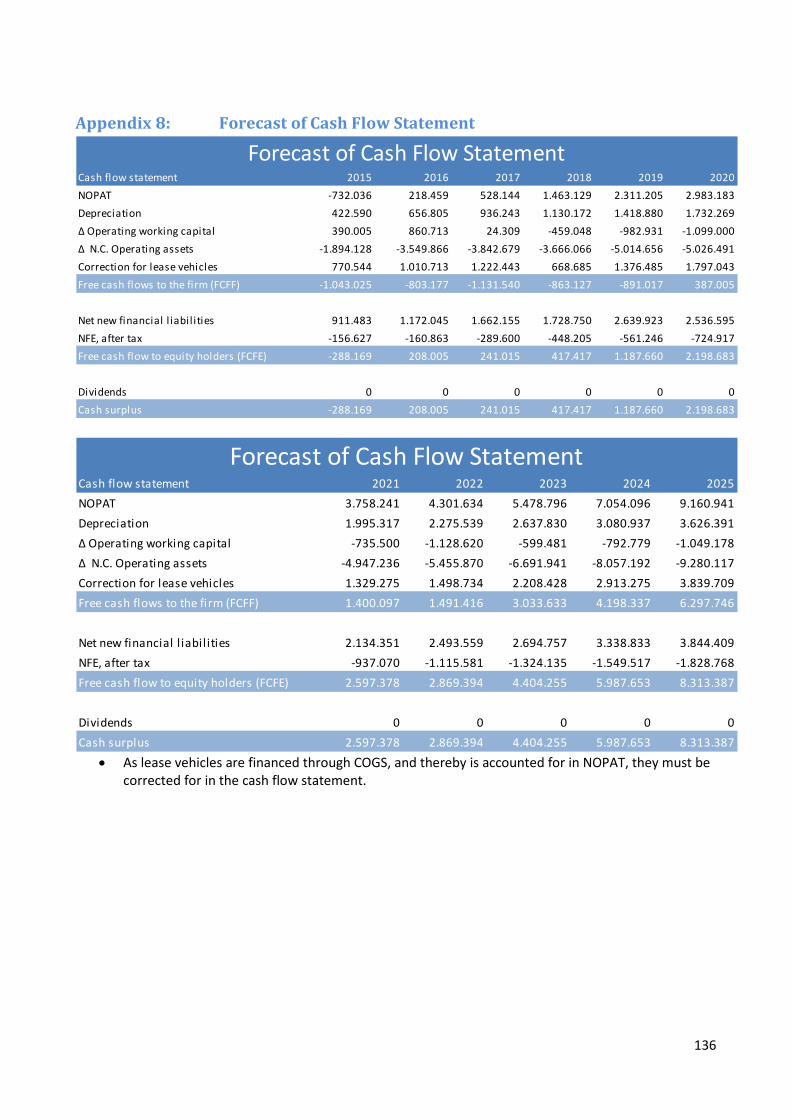
Appendix 8: Forecast of Cash Flow Statement
• As lease vehicles are financed through COGS, and thereby is accounted for in NOPAT, they must be
corrected for in the cash flow statement.
Cash flow statement 2015 2016 2017 2018 2019 2020NOPAT -732.036 218.459 528.144 1.463.129 2.311.205 2.983.183Depreciation 422.590 656.805 936.243 1.130.172 1.418.880 1.732.269Δ Operating working capital 390.005 860.713 24.309 -459.048 -982.931 -1.099.000Δ N.C. Operating assets -1.894.128 -3.549.866 -3.842.679 -3.666.066 -5.014.656 -5.026.491Correction for lease vehicles 770.544 1.010.713 1.222.443 668.685 1.376.485 1.797.043Free cash flows to the firm (FCFF) -1.043.025 -803.177 -1.131.540 -863.127 -891.017 387.005
Net new financial l iabil ities 911.483 1.172.045 1.662.155 1.728.750 2.639.923 2.536.595NFE, after tax -156.627 -160.863 -289.600 -448.205 -561.246 -724.917Free cash flow to equity holders (FCFE) -288.169 208.005 241.015 417.417 1.187.660 2.198.683
Dividends 0 0 0 0 0 0Cash surplus -288.169 208.005 241.015 417.417 1.187.660 2.198.683
Forecast of Cash Flow Statement
Cash flow statement 2021 2022 2023 2024 2025NOPAT 3.758.241 4.301.634 5.478.796 7.054.096 9.160.941Depreciation 1.995.317 2.275.539 2.637.830 3.080.937 3.626.391Δ Operating working capital -735.500 -1.128.620 -599.481 -792.779 -1.049.178Δ N.C. Operating assets -4.947.236 -5.455.870 -6.691.941 -8.057.192 -9.280.117Correction for lease vehicles 1.329.275 1.498.734 2.208.428 2.913.275 3.839.709Free cash flows to the firm (FCFF) 1.400.097 1.491.416 3.033.633 4.198.337 6.297.746
Net new financial l iabil ities 2.134.351 2.493.559 2.694.757 3.338.833 3.844.409NFE, after tax -937.070 -1.115.581 -1.324.135 -1.549.517 -1.828.768Free cash flow to equity holders (FCFE) 2.597.378 2.869.394 4.404.255 5.987.653 8.313.387
Dividends 0 0 0 0 0Cash surplus 2.597.378 2.869.394 4.404.255 5.987.653 8.313.387
Forecast of Cash Flow Statement
136
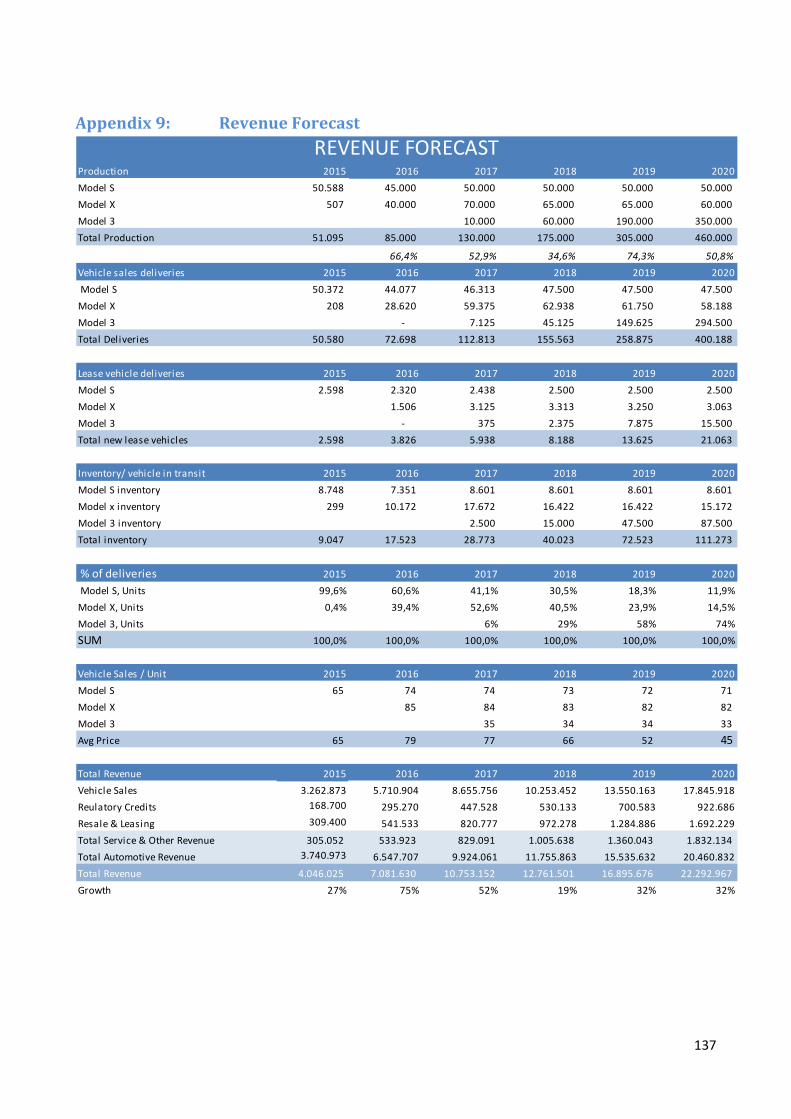
Appendix 9: Revenue Forecast
Production 2015 2016 2017 2018 2019 2020Model S 50.588 45.000 50.000 50.000 50.000 50.000 Model X 507 40.000 70.000 65.000 65.000 60.000 Model 3 10.000 60.000 190.000 350.000 Total Production 51.095 85.000 130.000 175.000 305.000 460.000
66,4% 52,9% 34,6% 74,3% 50,8%Vehicle sales deliveries 2015 2016 2017 2018 2019 2020Model S 50.372 44.077 46.313 47.500 47.500 47.500
Model X 208 28.620 59.375 62.938 61.750 58.188 Model 3 - 7.125 45.125 149.625 294.500 Total Deliveries 50.580 72.698 112.813 155.563 258.875 400.188
Lease vehicle deliveries 2015 2016 2017 2018 2019 2020Model S 2.598 2.320 2.438 2.500 2.500 2.500 Model X 1.506 3.125 3.313 3.250 3.063 Model 3 - 375 2.375 7.875 15.500 Total new lease vehicles 2.598 3.826 5.938 8.188 13.625 21.063
Inventory/ vehicle in transit 2015 2016 2017 2018 2019 2020Model S inventory 8.748 7.351 8.601 8.601 8.601 8.601 Model x inventory 299 10.172 17.672 16.422 16.422 15.172 Model 3 inventory 2.500 15.000 47.500 87.500 Total inventory 9.047 17.523 28.773 40.023 72.523 111.273
% of deliveries 2015 2016 2017 2018 2019 2020Model S, Units 99,6% 60,6% 41,1% 30,5% 18,3% 11,9%
Model X, Units 0,4% 39,4% 52,6% 40,5% 23,9% 14,5%Model 3, Units 6% 29% 58% 74%SUM 100,0% 100,0% 100,0% 100,0% 100,0% 100,0%
Vehicle Sales / Unit 2015 2016 2017 2018 2019 2020Model S 65 74 74 73 72 71 Model X 85 84 83 82 82 Model 3 35 34 34 33 Avg Price 65 79 77 66 52 45
Total Revenue 2015 2016 2017 2018 2019 2020Vehicle Sales 3.262.873 5.710.904 8.655.756 10.253.452 13.550.163 17.845.918Reulatory Credits 168.700 295.270 447.528 530.133 700.583 922.686Resale & Leasing 309.400 541.533 820.777 972.278 1.284.886 1.692.229Total Service & Other Revenue 305.052 533.923 829.091 1.005.638 1.360.043 1.832.134 Total Automotive Revenue 3.740.973 6.547.707 9.924.061 11.755.863 15.535.632 20.460.832Total Revenue 4.046.025 7.081.630 10.753.152 12.761.501 16.895.676 22.292.967Growth 27% 75% 52% 19% 32% 32%
REVENUE FORECAST
137
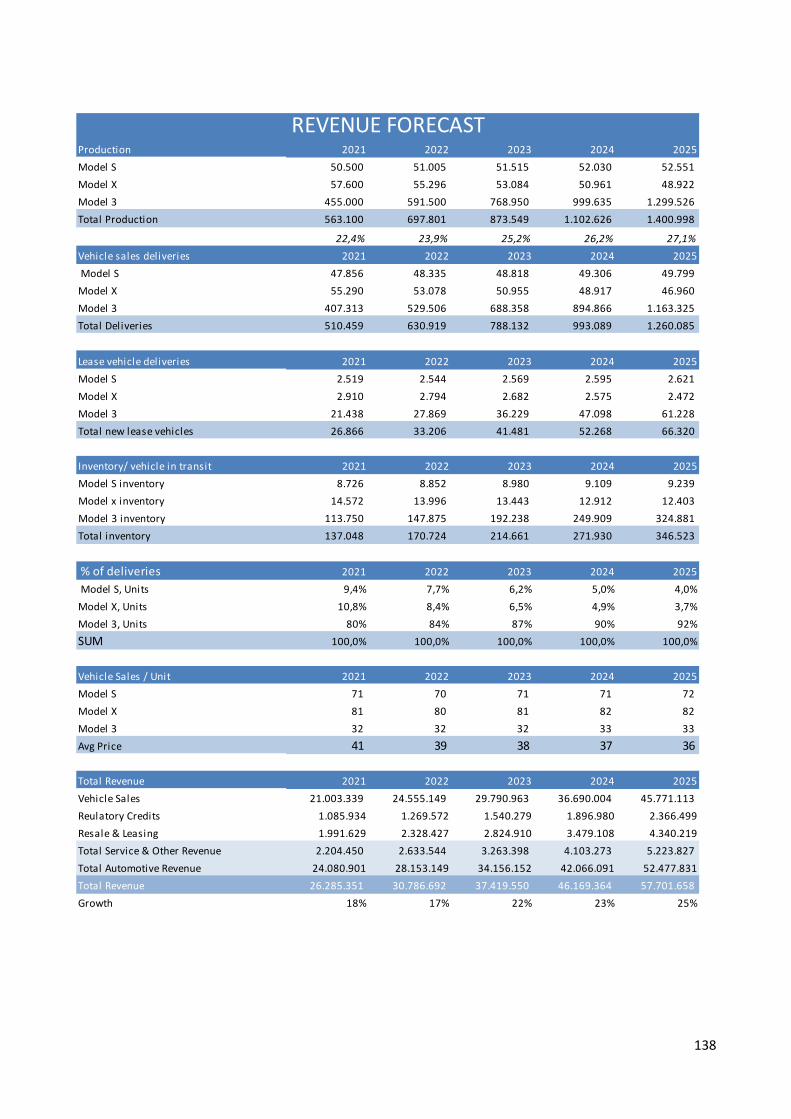
Production 2021 2022 2023 2024 2025Model S 50.500 51.005 51.515 52.030 52.551 Model X 57.600 55.296 53.084 50.961 48.922 Model 3 455.000 591.500 768.950 999.635 1.299.526 Total Production 563.100 697.801 873.549 1.102.626 1.400.998
22,4% 23,9% 25,2% 26,2% 27,1%Vehicle sales deliveries 2021 2022 2023 2024 2025Model S 47.856 48.335 48.818 49.306 49.799
Model X 55.290 53.078 50.955 48.917 46.960 Model 3 407.313 529.506 688.358 894.866 1.163.325 Total Deliveries 510.459 630.919 788.132 993.089 1.260.085
Lease vehicle deliveries 2021 2022 2023 2024 2025Model S 2.519 2.544 2.569 2.595 2.621 Model X 2.910 2.794 2.682 2.575 2.472 Model 3 21.438 27.869 36.229 47.098 61.228 Total new lease vehicles 26.866 33.206 41.481 52.268 66.320
Inventory/ vehicle in transit 2021 2022 2023 2024 2025Model S inventory 8.726 8.852 8.980 9.109 9.239 Model x inventory 14.572 13.996 13.443 12.912 12.403 Model 3 inventory 113.750 147.875 192.238 249.909 324.881 Total inventory 137.048 170.724 214.661 271.930 346.523
% of deliveries 2021 2022 2023 2024 2025Model S, Units 9,4% 7,7% 6,2% 5,0% 4,0%
Model X, Units 10,8% 8,4% 6,5% 4,9% 3,7%Model 3, Units 80% 84% 87% 90% 92%SUM 100,0% 100,0% 100,0% 100,0% 100,0%
Vehicle Sales / Unit 2021 2022 2023 2024 2025Model S 71 70 71 71 72 Model X 81 80 81 82 82 Model 3 32 32 32 33 33 Avg Price 41 39 38 37 36
Total Revenue 2021 2022 2023 2024 2025Vehicle Sales 21.003.339 24.555.149 29.790.963 36.690.004 45.771.113 Reulatory Credits 1.085.934 1.269.572 1.540.279 1.896.980 2.366.499Resale & Leasing 1.991.629 2.328.427 2.824.910 3.479.108 4.340.219Total Service & Other Revenue 2.204.450 2.633.544 3.263.398 4.103.273 5.223.827 Total Automotive Revenue 24.080.901 28.153.149 34.156.152 42.066.091 52.477.831Total Revenue 26.285.351 30.786.692 37.419.550 46.169.364 57.701.658Growth 18% 17% 22% 23% 25%
REVENUE FORECAST
138
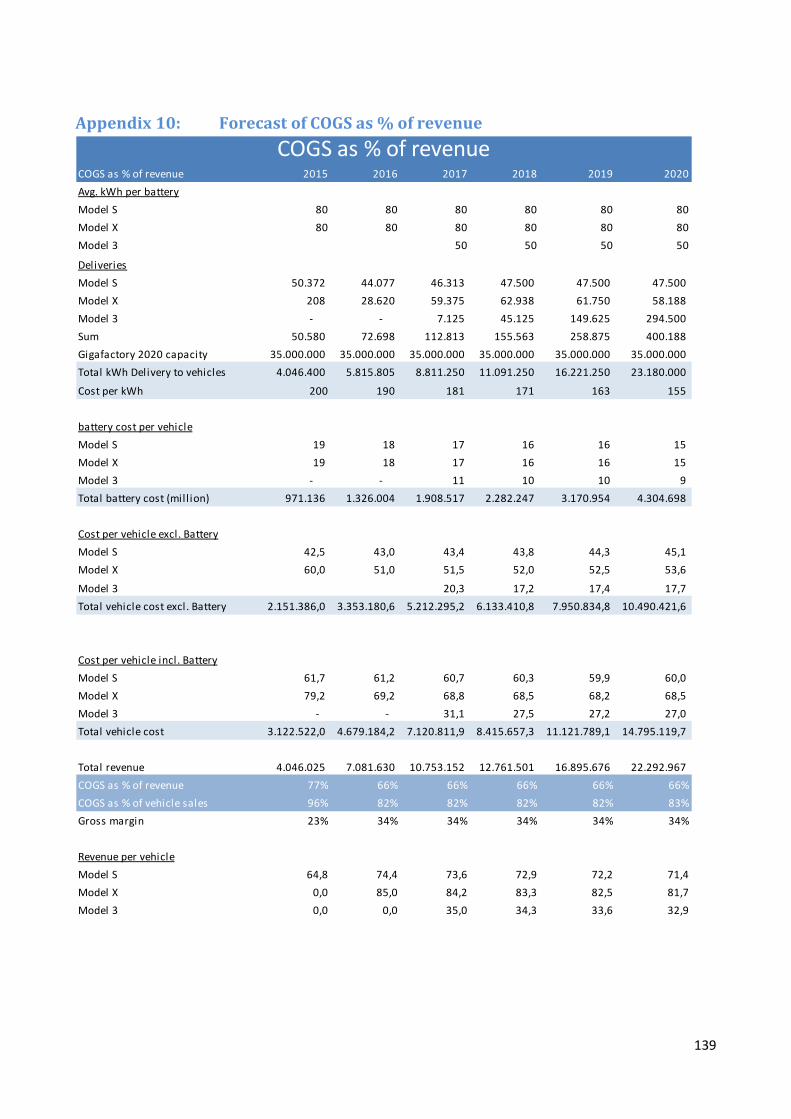
Appendix 10: Forecast of COGS as % of revenue
COGS as % of revenue 2015 2016 2017 2018 2019 2020Avg. kWh per batteryModel S 80 80 80 80 80 80Model X 80 80 80 80 80 80Model 3 50 50 50 50
DeliveriesModel S 50.372 44.077 46.313 47.500 47.500 47.500 Model X 208 28.620 59.375 62.938 61.750 58.188 Model 3 - - 7.125 45.125 149.625 294.500 Sum 50.580 72.698 112.813 155.563 258.875 400.188 Gigafactory 2020 capacity 35.000.000 35.000.000 35.000.000 35.000.000 35.000.000 35.000.000 Total kWh Delivery to vehicles 4.046.400 5.815.805 8.811.250 11.091.250 16.221.250 23.180.000
Cost per kWh 200 190 181 171 163 155
battery cost per vehicleModel S 19 18 17 16 16 15 Model X 19 18 17 16 16 15 Model 3 - - 11 10 10 9 Total battery cost (mill ion) 971.136 1.326.004 1.908.517 2.282.247 3.170.954 4.304.698
Cost per vehicle excl. BatteryModel S 42,5 43,0 43,4 43,8 44,3 45,1 Model X 60,0 51,0 51,5 52,0 52,5 53,6
Model 3 20,3 17,2 17,4 17,7 Total vehicle cost excl. Battery 2.151.386,0 3.353.180,6 5.212.295,2 6.133.410,8 7.950.834,8 10.490.421,6
Cost per vehicle incl. BatteryModel S 61,7 61,2 60,7 60,3 59,9 60,0 Model X 79,2 69,2 68,8 68,5 68,2 68,5 Model 3 - - 31,1 27,5 27,2 27,0 Total vehicle cost 3.122.522,0 4.679.184,2 7.120.811,9 8.415.657,3 11.121.789,1 14.795.119,7
Total revenue 4.046.025 7.081.630 10.753.152 12.761.501 16.895.676 22.292.967 COGS as % of revenue 77% 66% 66% 66% 66% 66%COGS as % of vehicle sales 96% 82% 82% 82% 82% 83%Gross margin 23% 34% 34% 34% 34% 34%
Revenue per vehicleModel S 64,8 74,4 73,6 72,9 72,2 71,4Model X 0,0 85,0 84,2 83,3 82,5 81,7Model 3 0,0 0,0 35,0 34,3 33,6 32,9
COGS as % of revenue
139
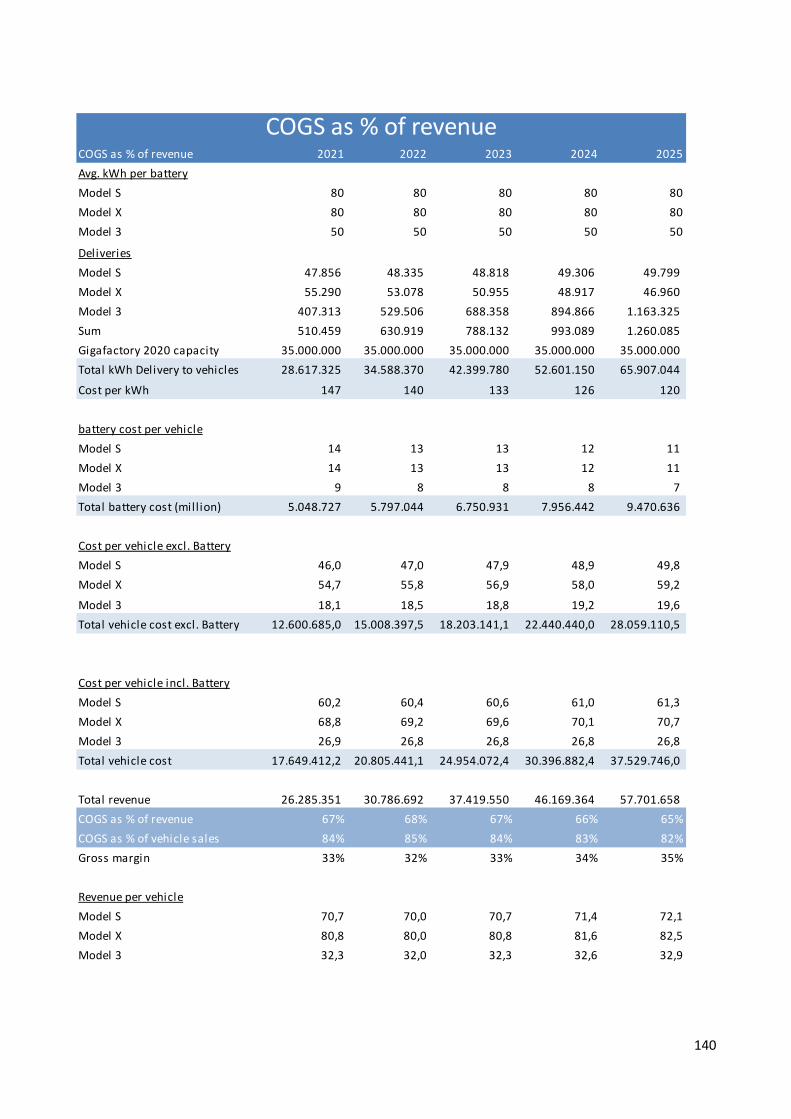
COGS as % of revenue 2021 2022 2023 2024 2025Avg. kWh per batteryModel S 80 80 80 80 80Model X 80 80 80 80 80Model 3 50 50 50 50 50
DeliveriesModel S 47.856 48.335 48.818 49.306 49.799 Model X 55.290 53.078 50.955 48.917 46.960 Model 3 407.313 529.506 688.358 894.866 1.163.325 Sum 510.459 630.919 788.132 993.089 1.260.085 Gigafactory 2020 capacity 35.000.000 35.000.000 35.000.000 35.000.000 35.000.000 Total kWh Delivery to vehicles 28.617.325 34.588.370 42.399.780 52.601.150 65.907.044
Cost per kWh 147 140 133 126 120
battery cost per vehicleModel S 14 13 13 12 11 Model X 14 13 13 12 11 Model 3 9 8 8 8 7 Total battery cost (mill ion) 5.048.727 5.797.044 6.750.931 7.956.442 9.470.636
Cost per vehicle excl. BatteryModel S 46,0 47,0 47,9 48,9 49,8 Model X 54,7 55,8 56,9 58,0 59,2
Model 3 18,1 18,5 18,8 19,2 19,6 Total vehicle cost excl. Battery 12.600.685,0 15.008.397,5 18.203.141,1 22.440.440,0 28.059.110,5
Cost per vehicle incl. BatteryModel S 60,2 60,4 60,6 61,0 61,3 Model X 68,8 69,2 69,6 70,1 70,7 Model 3 26,9 26,8 26,8 26,8 26,8 Total vehicle cost 17.649.412,2 20.805.441,1 24.954.072,4 30.396.882,4 37.529.746,0
Total revenue 26.285.351 30.786.692 37.419.550 46.169.364 57.701.658 COGS as % of revenue 67% 68% 67% 66% 65%COGS as % of vehicle sales 84% 85% 84% 83% 82%Gross margin 33% 32% 33% 34% 35%
Revenue per vehicleModel S 70,7 70,0 70,7 71,4 72,1Model X 80,8 80,0 80,8 81,6 82,5Model 3 32,3 32,0 32,3 32,6 32,9
COGS as % of revenue
140
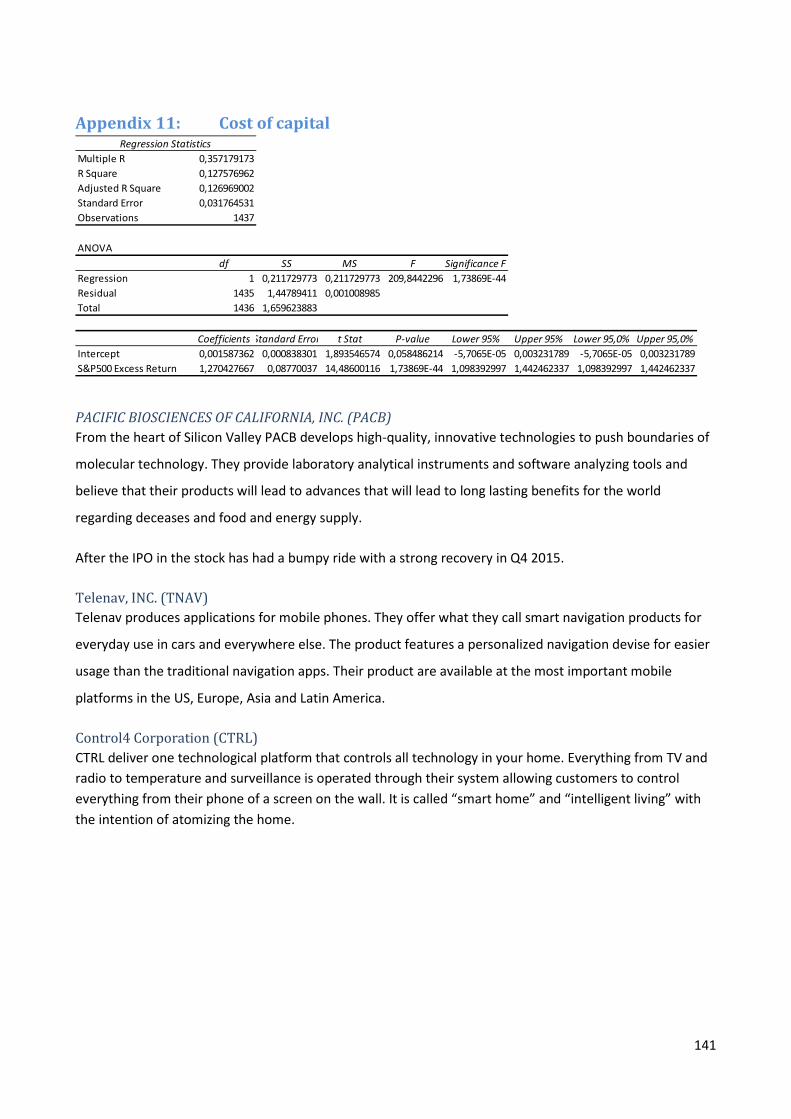
Appendix 11: Cost of capital
PACIFIC BIOSCIENCES OF CALIFORNIA, INC. (PACB) From the heart of Silicon Valley PACB develops high-quality, innovative technologies to push boundaries of
molecular technology. They provide laboratory analytical instruments and software analyzing tools and
believe that their products will lead to advances that will lead to long lasting benefits for the world
regarding deceases and food and energy supply.
After the IPO in the stock has had a bumpy ride with a strong recovery in Q4 2015.
Telenav, INC. (TNAV) Telenav produces applications for mobile phones. They offer what they call smart navigation products for
everyday use in cars and everywhere else. The product features a personalized navigation devise for easier
usage than the traditional navigation apps. Their product are available at the most important mobile
platforms in the US, Europe, Asia and Latin America.
Control4 Corporation (CTRL) CTRL deliver one technological platform that controls all technology in your home. Everything from TV and radio to temperature and surveillance is operated through their system allowing customers to control everything from their phone of a screen on the wall. It is called “smart home” and “intelligent living” with the intention of atomizing the home.
Regression StatisticsMultiple R 0,357179173R Square 0,127576962Adjusted R Square 0,126969002Standard Error 0,031764531Observations 1437
ANOVAdf SS MS F Significance F
Regression 1 0,211729773 0,211729773 209,8442296 1,73869E-44Residual 1435 1,44789411 0,001008985Total 1436 1,659623883
Coefficients Standard Error t Stat P-value Lower 95% Upper 95% Lower 95,0% Upper 95,0%Intercept 0,001587362 0,000838301 1,893546574 0,058486214 -5,7065E-05 0,003231789 -5,7065E-05 0,003231789S&P500 Excess Return 1,270427667 0,08770037 14,48600116 1,73869E-44 1,098392997 1,442462337 1,098392997 1,442462337
141
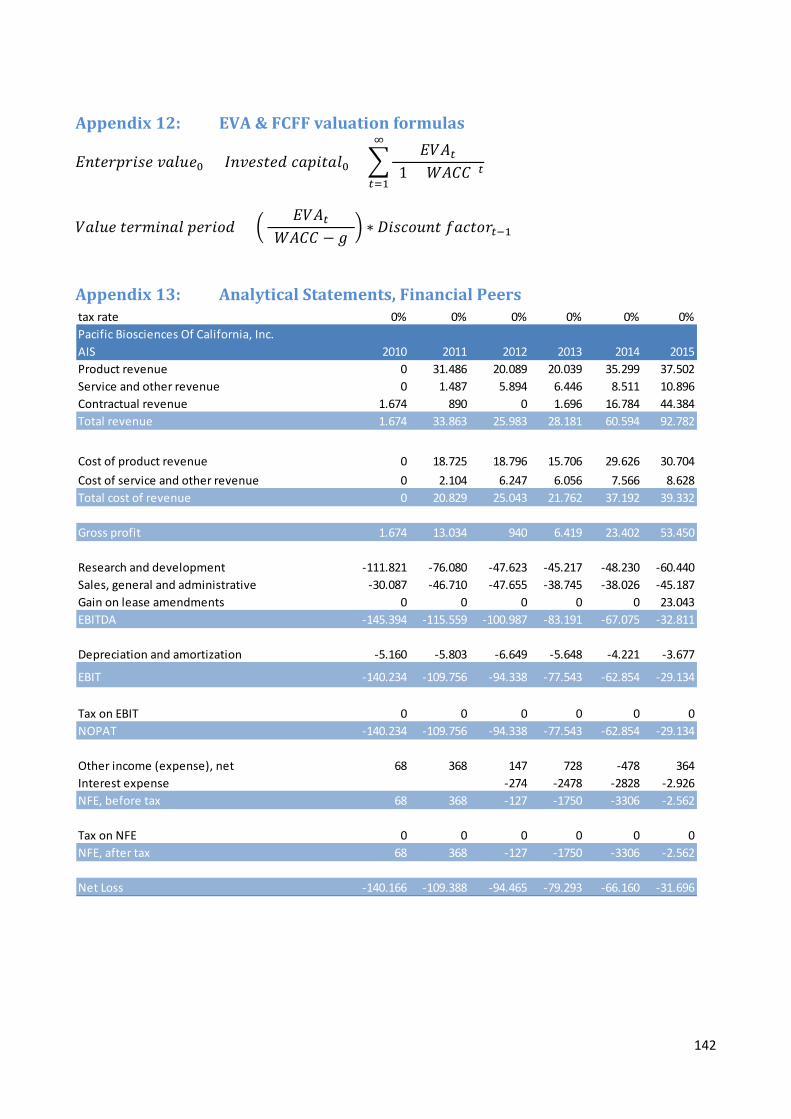
Appendix 12: EVA & FCFF valuation formulas
𝐸𝐸𝐸𝐸𝐸𝐸𝐸𝐸𝐸𝐸𝐸𝐸𝐸𝐸𝐸𝐸𝐸𝐸𝐸𝐸 𝑣𝑣𝑣𝑣𝑣𝑣𝑣𝑣𝐸𝐸0 = 𝐼𝐼𝐸𝐸𝑣𝑣𝐸𝐸𝐸𝐸𝐸𝐸𝐸𝐸𝐼𝐼 𝑐𝑐𝑣𝑣𝐸𝐸𝐸𝐸𝐸𝐸𝑣𝑣𝑣𝑣0 + �𝐸𝐸𝐸𝐸𝐴𝐴𝑡𝑡
(1 + 𝑊𝑊𝐴𝐴𝑊𝑊𝑊𝑊)𝑡𝑡
∞
𝑡𝑡=1
𝐸𝐸𝑣𝑣𝑣𝑣𝑣𝑣𝐸𝐸 𝐸𝐸𝐸𝐸𝐸𝐸𝑡𝑡𝐸𝐸𝐸𝐸𝑣𝑣𝑣𝑣 𝐸𝐸𝐸𝐸𝐸𝐸𝐸𝐸𝑝𝑝𝐼𝐼 = � 𝐸𝐸𝐸𝐸𝐴𝐴𝑡𝑡
(𝑊𝑊𝐴𝐴𝑊𝑊𝑊𝑊 − 𝑔𝑔)� ∗ 𝐷𝐷𝐸𝐸𝐸𝐸𝑐𝑐𝑝𝑝𝑣𝑣𝐸𝐸𝐸𝐸 𝑓𝑓𝑣𝑣𝑐𝑐𝐸𝐸𝑝𝑝𝐸𝐸𝑡𝑡−1
Appendix 13: Analytical Statements, Financial Peers
tax rate 0% 0% 0% 0% 0% 0%Pacific Biosciences Of California, Inc.AIS 2010 2011 2012 2013 2014 2015Product revenue 0 31.486 20.089 20.039 35.299 37.502Service and other revenue 0 1.487 5.894 6.446 8.511 10.896Contractual revenue 1.674 890 0 1.696 16.784 44.384Total revenue 1.674 33.863 25.983 28.181 60.594 92.782
Cost of product revenue 0 18.725 18.796 15.706 29.626 30.704Cost of service and other revenue 0 2.104 6.247 6.056 7.566 8.628Total cost of revenue 0 20.829 25.043 21.762 37.192 39.332
Gross profit 1.674 13.034 940 6.419 23.402 53.450
Research and development -111.821 -76.080 -47.623 -45.217 -48.230 -60.440Sales, general and administrative -30.087 -46.710 -47.655 -38.745 -38.026 -45.187Gain on lease amendments 0 0 0 0 0 23.043EBITDA -145.394 -115.559 -100.987 -83.191 -67.075 -32.811
Depreciation and amortization -5.160 -5.803 -6.649 -5.648 -4.221 -3.677
EBIT -140.234 -109.756 -94.338 -77.543 -62.854 -29.134
Tax on EBIT 0 0 0 0 0 0NOPAT -140.234 -109.756 -94.338 -77.543 -62.854 -29.134
Other income (expense), net 68 368 147 728 -478 364Interest expense -274 -2478 -2828 -2.926NFE, before tax 68 368 -127 -1750 -3306 -2.562
Tax on NFE 0 0 0 0 0 0NFE, after tax 68 368 -127 -1750 -3306 -2.562
Net Loss -140.166 -109.388 -94.465 -79.293 -66.160 -31.696
142
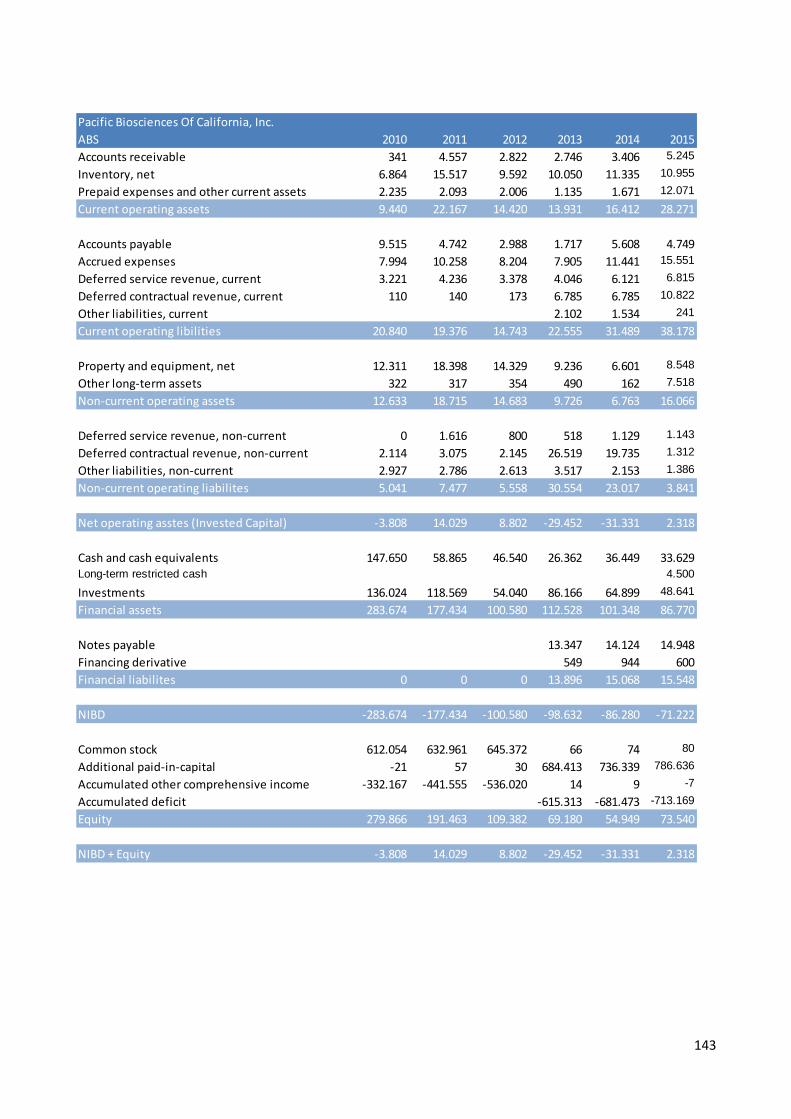
Pacific Biosciences Of California, Inc.ABS 2010 2011 2012 2013 2014 2015Accounts receivable 341 4.557 2.822 2.746 3.406 5.245
Inventory, net 6.864 15.517 9.592 10.050 11.335 10.955
Prepaid expenses and other current assets 2.235 2.093 2.006 1.135 1.671 12.071
Current operating assets 9.440 22.167 14.420 13.931 16.412 28.271
Accounts payable 9.515 4.742 2.988 1.717 5.608 4.749Accrued expenses 7.994 10.258 8.204 7.905 11.441 15.551
Deferred service revenue, current 3.221 4.236 3.378 4.046 6.121 6.815
Deferred contractual revenue, current 110 140 173 6.785 6.785 10.822
Other liabilities, current 2.102 1.534 241
Current operating libilities 20.840 19.376 14.743 22.555 31.489 38.178
Property and equipment, net 12.311 18.398 14.329 9.236 6.601 8.548
Other long-term assets 322 317 354 490 162 7.518
Non-current operating assets 12.633 18.715 14.683 9.726 6.763 16.066
Deferred service revenue, non-current 0 1.616 800 518 1.129 1.143
Deferred contractual revenue, non-current 2.114 3.075 2.145 26.519 19.735 1.312
Other liabilities, non-current 2.927 2.786 2.613 3.517 2.153 1.386
Non-current operating liabilites 5.041 7.477 5.558 30.554 23.017 3.841
Net operating asstes (Invested Capital) -3.808 14.029 8.802 -29.452 -31.331 2.318
Cash and cash equivalents 147.650 58.865 46.540 26.362 36.449 33.629Long-term restricted cash 4.500
Investments 136.024 118.569 54.040 86.166 64.899 48.641
Financial assets 283.674 177.434 100.580 112.528 101.348 86.770
Notes payable 13.347 14.124 14.948Financing derivative 549 944 600Financial liabilites 0 0 0 13.896 15.068 15.548
NIBD -283.674 -177.434 -100.580 -98.632 -86.280 -71.222
Common stock 612.054 632.961 645.372 66 74 80
Additional paid-in-capital -21 57 30 684.413 736.339 786.636
Accumulated other comprehensive income -332.167 -441.555 -536.020 14 9 -7
Accumulated deficit -615.313 -681.473 -713.169
Equity 279.866 191.463 109.382 69.180 54.949 73.540
NIBD + Equity -3.808 14.029 8.802 -29.452 -31.331 2.318
143
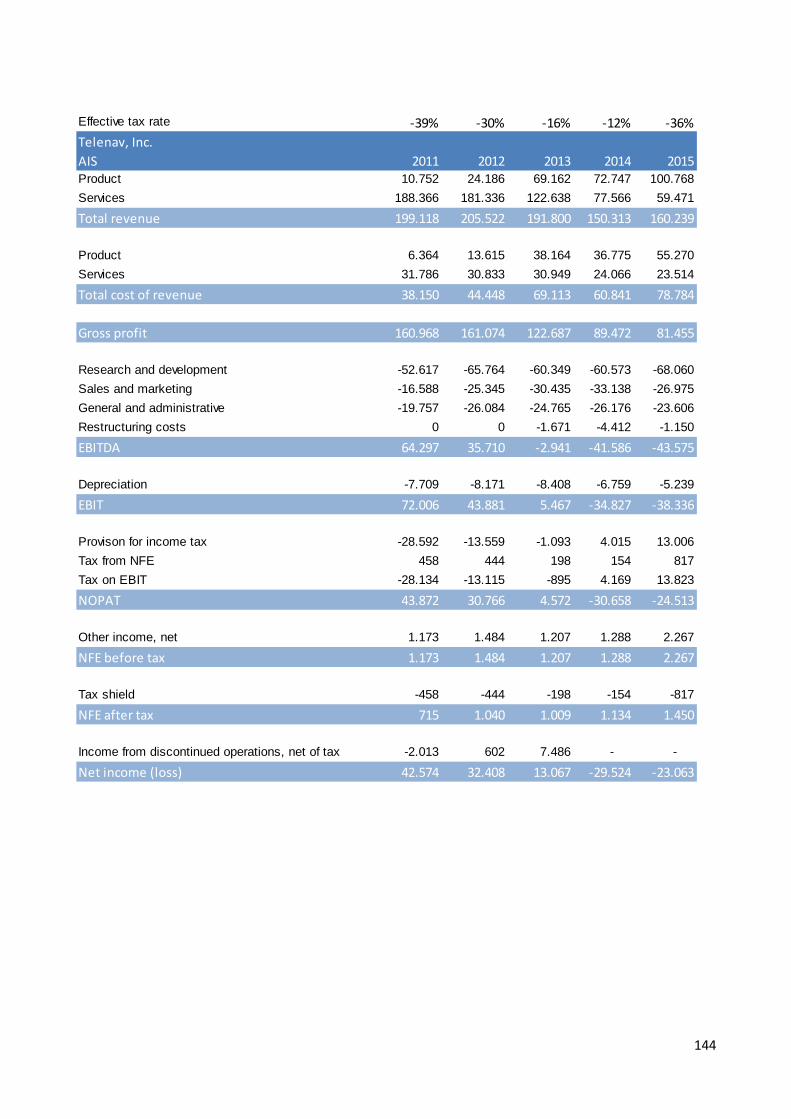
Effective tax rate -39% -30% -16% -12% -36%Telenav, Inc.AIS 2011 2012 2013 2014 2015Product 10.752 24.186 69.162 72.747 100.768Services 188.366 181.336 122.638 77.566 59.471
Total revenue 199.118 205.522 191.800 150.313 160.239
Product 6.364 13.615 38.164 36.775 55.270Services 31.786 30.833 30.949 24.066 23.514
Total cost of revenue 38.150 44.448 69.113 60.841 78.784
Gross profit 160.968 161.074 122.687 89.472 81.455
Research and development -52.617 -65.764 -60.349 -60.573 -68.060Sales and marketing -16.588 -25.345 -30.435 -33.138 -26.975General and administrative -19.757 -26.084 -24.765 -26.176 -23.606Restructuring costs 0 0 -1.671 -4.412 -1.150
EBITDA 64.297 35.710 -2.941 -41.586 -43.575
Depreciation -7.709 -8.171 -8.408 -6.759 -5.239
EBIT 72.006 43.881 5.467 -34.827 -38.336
Provison for income tax -28.592 -13.559 -1.093 4.015 13.006Tax from NFE 458 444 198 154 817Tax on EBIT -28.134 -13.115 -895 4.169 13.823
NOPAT 43.872 30.766 4.572 -30.658 -24.513
Other income, net 1.173 1.484 1.207 1.288 2.267
NFE before tax 1.173 1.484 1.207 1.288 2.267
Tax shield -458 -444 -198 -154 -817
NFE after tax 715 1.040 1.009 1.134 1.450
Income from discontinued operations, net of tax -2.013 602 7.486 - -
Net income (loss) 42.574 32.408 13.067 -29.524 -23.063
144
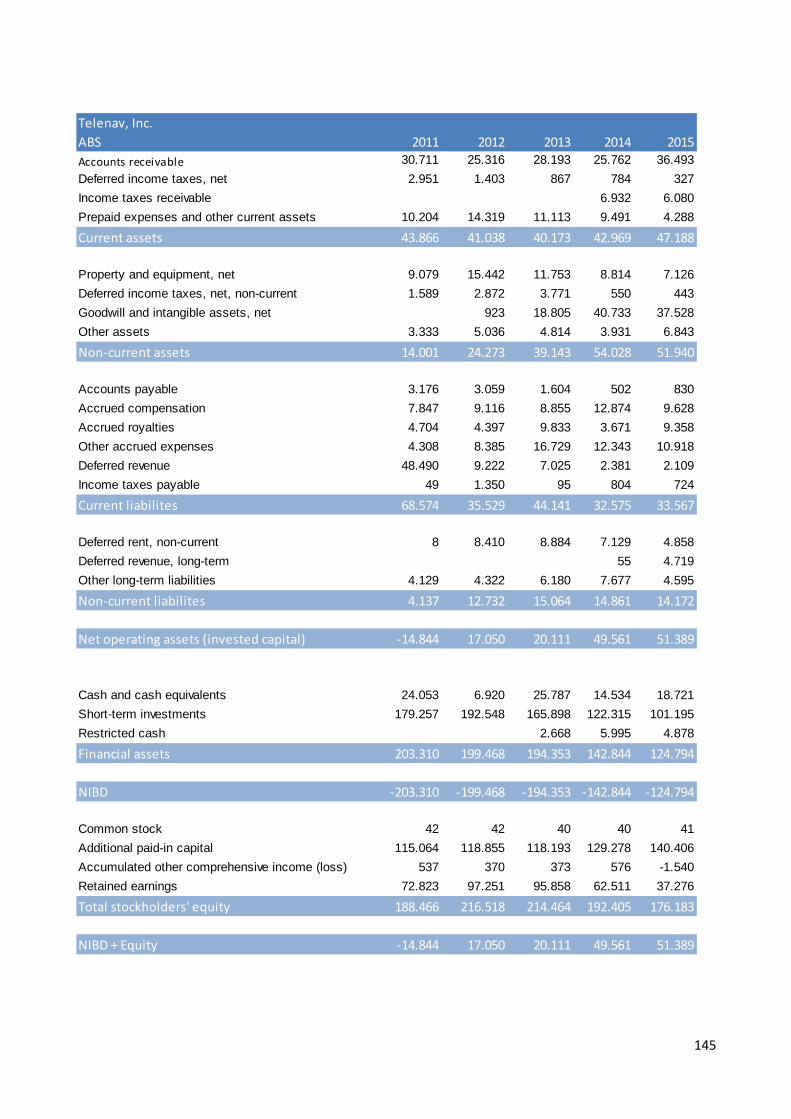
Telenav, Inc.ABS 2011 2012 2013 2014 2015Accounts receivable 30.711 25.316 28.193 25.762 36.493Deferred income taxes, net 2.951 1.403 867 784 327Income taxes receivable 6.932 6.080Prepaid expenses and other current assets 10.204 14.319 11.113 9.491 4.288
Current assets 43.866 41.038 40.173 42.969 47.188
Property and equipment, net 9.079 15.442 11.753 8.814 7.126Deferred income taxes, net, non-current 1.589 2.872 3.771 550 443Goodwill and intangible assets, net 923 18.805 40.733 37.528Other assets 3.333 5.036 4.814 3.931 6.843
Non-current assets 14.001 24.273 39.143 54.028 51.940
Accounts payable 3.176 3.059 1.604 502 830Accrued compensation 7.847 9.116 8.855 12.874 9.628Accrued royalties 4.704 4.397 9.833 3.671 9.358Other accrued expenses 4.308 8.385 16.729 12.343 10.918Deferred revenue 48.490 9.222 7.025 2.381 2.109Income taxes payable 49 1.350 95 804 724
Current liabilites 68.574 35.529 44.141 32.575 33.567
Deferred rent, non-current 8 8.410 8.884 7.129 4.858Deferred revenue, long-term 55 4.719Other long-term liabilities 4.129 4.322 6.180 7.677 4.595
Non-current liabilites 4.137 12.732 15.064 14.861 14.172
Net operating assets (invested capital) -14.844 17.050 20.111 49.561 51.389
Cash and cash equivalents 24.053 6.920 25.787 14.534 18.721Short-term investments 179.257 192.548 165.898 122.315 101.195Restricted cash 2.668 5.995 4.878
Financial assets 203.310 199.468 194.353 142.844 124.794
NIBD -203.310 -199.468 -194.353 -142.844 -124.794
Common stock 42 42 40 40 41Additional paid-in capital 115.064 118.855 118.193 129.278 140.406Accumulated other comprehensive income (loss) 537 370 373 576 -1.540Retained earnings 72.823 97.251 95.858 62.511 37.276
Total stockholders' equity 188.466 216.518 214.464 192.405 176.183
NIBD + Equity -14.844 17.050 20.111 49.561 51.389
145
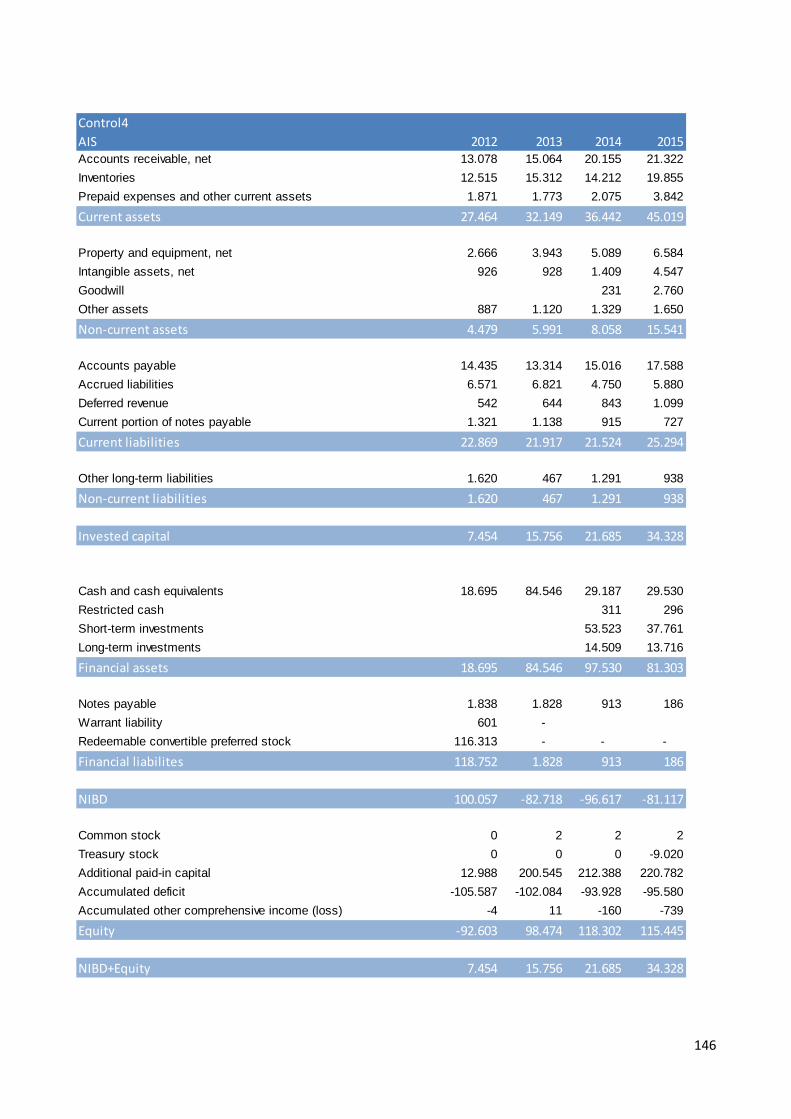
Control4AIS 2012 2013 2014 2015Accounts receivable, net 13.078 15.064 20.155 21.322Inventories 12.515 15.312 14.212 19.855Prepaid expenses and other current assets 1.871 1.773 2.075 3.842
Current assets 27.464 32.149 36.442 45.019
Property and equipment, net 2.666 3.943 5.089 6.584Intangible assets, net 926 928 1.409 4.547Goodwill 231 2.760Other assets 887 1.120 1.329 1.650
Non-current assets 4.479 5.991 8.058 15.541
Accounts payable 14.435 13.314 15.016 17.588Accrued liabilities 6.571 6.821 4.750 5.880Deferred revenue 542 644 843 1.099Current portion of notes payable 1.321 1.138 915 727
Current liabilities 22.869 21.917 21.524 25.294
Other long-term liabilities 1.620 467 1.291 938
Non-current liabilities 1.620 467 1.291 938
Invested capital 7.454 15.756 21.685 34.328
Cash and cash equivalents 18.695 84.546 29.187 29.530Restricted cash 311 296Short-term investments 53.523 37.761Long-term investments 14.509 13.716
Financial assets 18.695 84.546 97.530 81.303
Notes payable 1.838 1.828 913 186Warrant liability 601 - Redeemable convertible preferred stock 116.313 - - -
Financial liabilites 118.752 1.828 913 186
NIBD 100.057 -82.718 -96.617 -81.117
Common stock 0 2 2 2Treasury stock 0 0 0 -9.020Additional paid-in capital 12.988 200.545 212.388 220.782Accumulated deficit -105.587 -102.084 -93.928 -95.580Accumulated other comprehensive income (loss) -4 11 -160 -739
Equity -92.603 98.474 118.302 115.445
NIBD+Equity 7.454 15.756 21.685 34.328
146
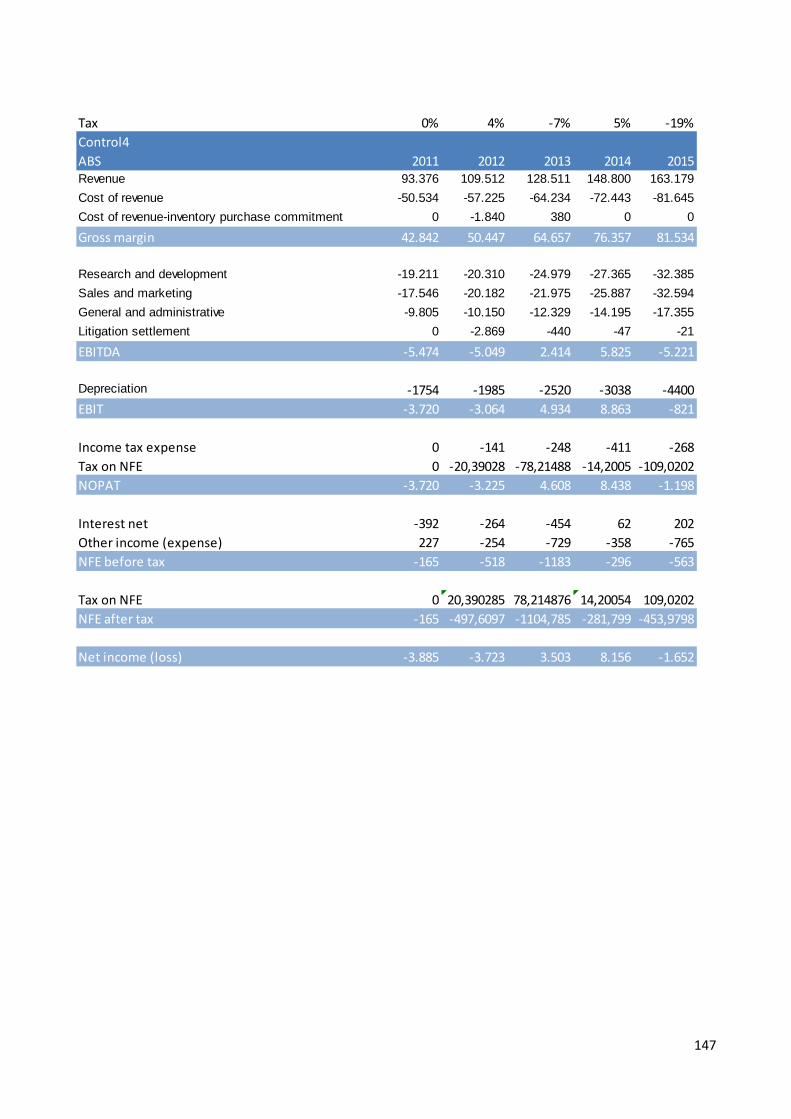
Tax 0% 4% -7% 5% -19%Control4ABS 2011 2012 2013 2014 2015Revenue 93.376 109.512 128.511 148.800 163.179Cost of revenue -50.534 -57.225 -64.234 -72.443 -81.645Cost of revenue-inventory purchase commitment 0 -1.840 380 0 0
Gross margin 42.842 50.447 64.657 76.357 81.534
Research and development -19.211 -20.310 -24.979 -27.365 -32.385Sales and marketing -17.546 -20.182 -21.975 -25.887 -32.594General and administrative -9.805 -10.150 -12.329 -14.195 -17.355Litigation settlement 0 -2.869 -440 -47 -21
EBITDA -5.474 -5.049 2.414 5.825 -5.221
Depreciation -1754 -1985 -2520 -3038 -4400EBIT -3.720 -3.064 4.934 8.863 -821
Income tax expense 0 -141 -248 -411 -268Tax on NFE 0 -20,39028 -78,21488 -14,2005 -109,0202NOPAT -3.720 -3.225 4.608 8.438 -1.198
Interest net -392 -264 -454 62 202Other income (expense) 227 -254 -729 -358 -765NFE before tax -165 -518 -1183 -296 -563
Tax on NFE 0 20,390285 78,214876 14,20054 109,0202NFE after tax -165 -497,6097 -1104,785 -281,799 -453,9798
Net income (loss) -3.885 -3.723 3.503 8.156 -1.652
147
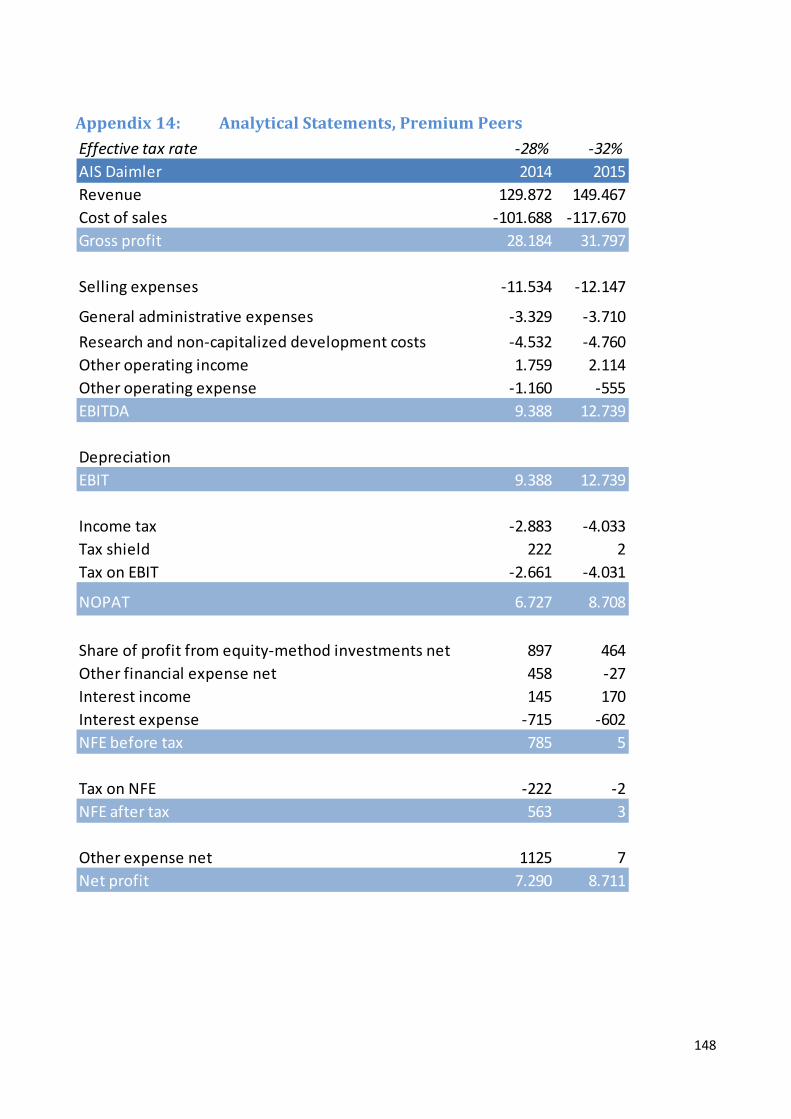
Appendix 14: Analytical Statements, Premium Peers
Effective tax rate -28% -32%AIS Daimler 2014 2015Revenue 129.872 149.467Cost of sales -101.688 -117.670Gross profit 28.184 31.797
Selling expenses -11.534 -12.147
General administrative expenses -3.329 -3.710Research and non-capitalized development costs -4.532 -4.760Other operating income 1.759 2.114Other operating expense -1.160 -555EBITDA 9.388 12.739
DepreciationEBIT 9.388 12.739
Income tax -2.883 -4.033Tax shield 222 2Tax on EBIT -2.661 -4.031
NOPAT 6.727 8.708
Share of profit from equity-method investments net 897 464Other financial expense net 458 -27Interest income 145 170Interest expense -715 -602NFE before tax 785 5
Tax on NFE -222 -2NFE after tax 563 3
Other expense net 1125 7Net profit 7.290 8.711
148
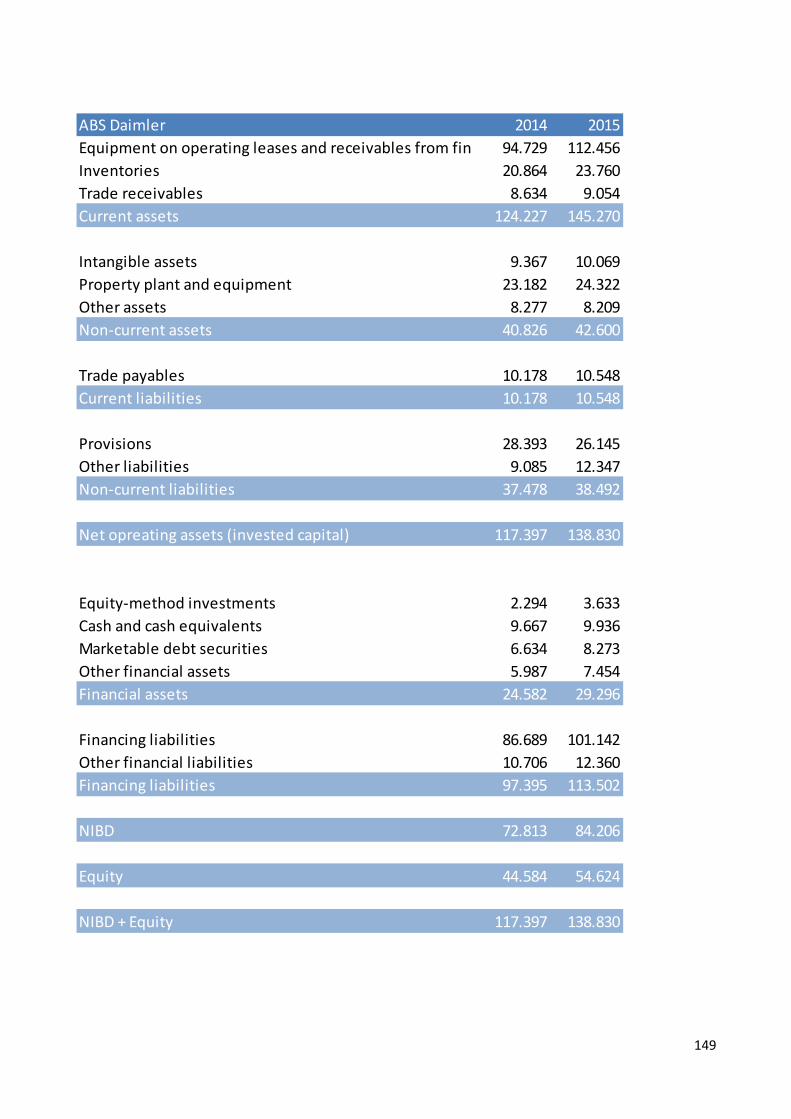
ABS Daimler 2014 2015Equipment on operating leases and receivables from fin 94.729 112.456Inventories 20.864 23.760Trade receivables 8.634 9.054Current assets 124.227 145.270
Intangible assets 9.367 10.069Property plant and equipment 23.182 24.322Other assets 8.277 8.209Non-current assets 40.826 42.600
Trade payables 10.178 10.548Current liabilities 10.178 10.548
Provisions 28.393 26.145Other liabilities 9.085 12.347Non-current liabilities 37.478 38.492
Net opreating assets (invested capital) 117.397 138.830
Equity-method investments 2.294 3.633Cash and cash equivalents 9.667 9.936Marketable debt securities 6.634 8.273Other financial assets 5.987 7.454Financial assets 24.582 29.296
Financing liabilities 86.689 101.142Other financial liabilities 10.706 12.360Financing liabilities 97.395 113.502
NIBD 72.813 84.206
Equity 44.584 54.624
NIBD + Equity 117.397 138.830
149
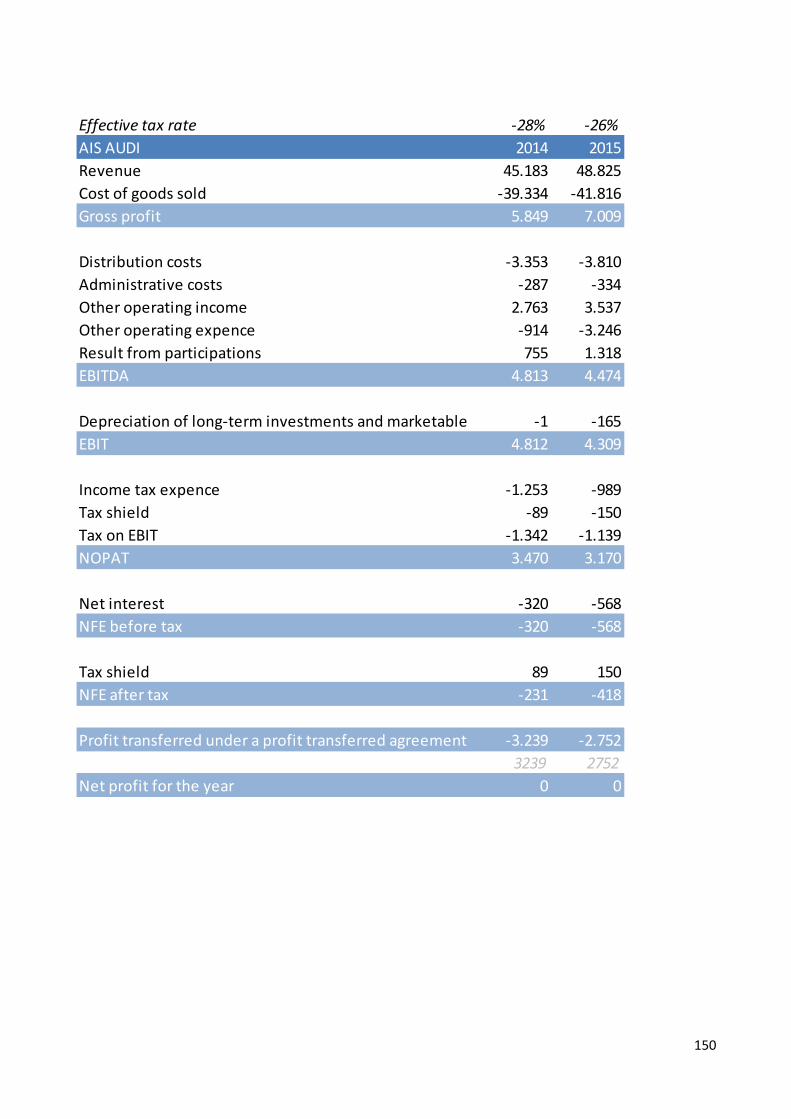
Effective tax rate -28% -26%AIS AUDI 2014 2015Revenue 45.183 48.825Cost of goods sold -39.334 -41.816Gross profit 5.849 7.009
Distribution costs -3.353 -3.810Administrative costs -287 -334Other operating income 2.763 3.537Other operating expence -914 -3.246Result from participations 755 1.318EBITDA 4.813 4.474
Depreciation of long-term investments and marketable s -1 -165EBIT 4.812 4.309
Income tax expence -1.253 -989Tax shield -89 -150Tax on EBIT -1.342 -1.139NOPAT 3.470 3.170
Net interest -320 -568NFE before tax -320 -568
Tax shield 89 150NFE after tax -231 -418
Profit transferred under a profit transferred agreement -3.239 -2.7523239 2752
Net profit for the year 0 0
150
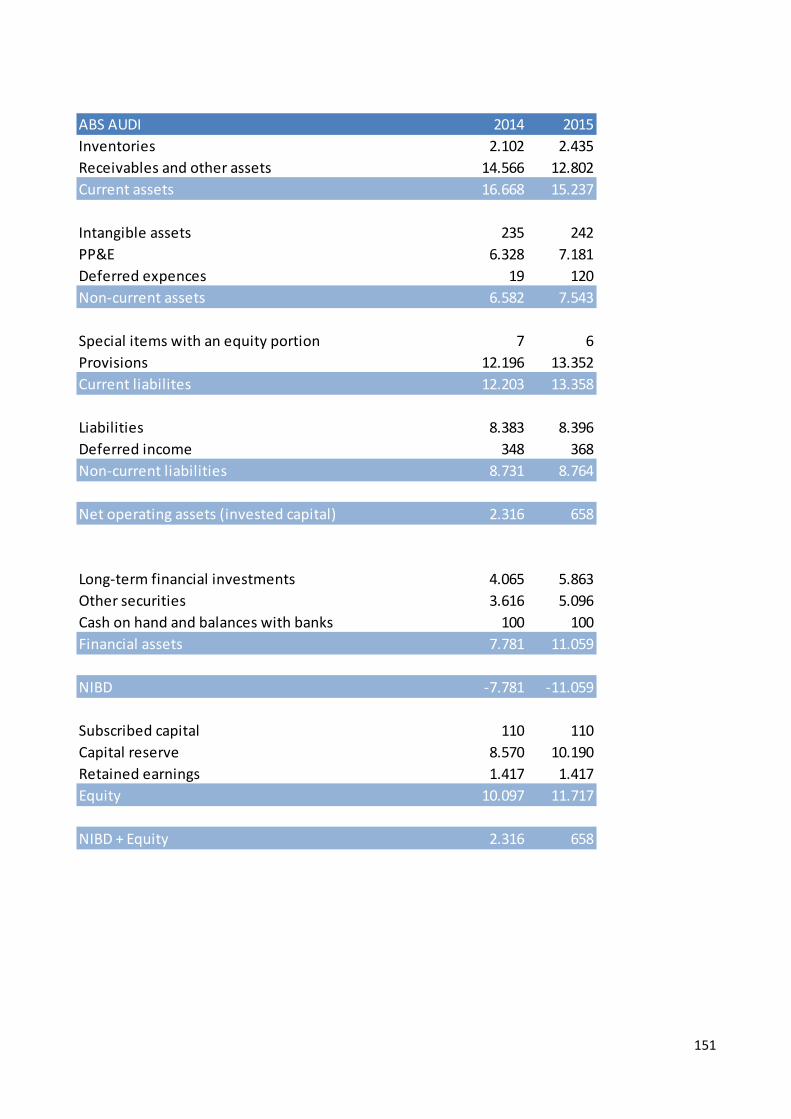
ABS AUDI 2014 2015Inventories 2.102 2.435Receivables and other assets 14.566 12.802Current assets 16.668 15.237
Intangible assets 235 242PP&E 6.328 7.181Deferred expences 19 120Non-current assets 6.582 7.543
Special items with an equity portion 7 6Provisions 12.196 13.352Current liabilites 12.203 13.358
Liabilities 8.383 8.396Deferred income 348 368Non-current liabilities 8.731 8.764
Net operating assets (invested capital) 2.316 658
Long-term financial investments 4.065 5.863Other securities 3.616 5.096Cash on hand and balances with banks 100 100Financial assets 7.781 11.059
NIBD -7.781 -11.059
Subscribed capital 110 110Capital reserve 8.570 10.190Retained earnings 1.417 1.417Equity 10.097 11.717
NIBD + Equity 2.316 658
151
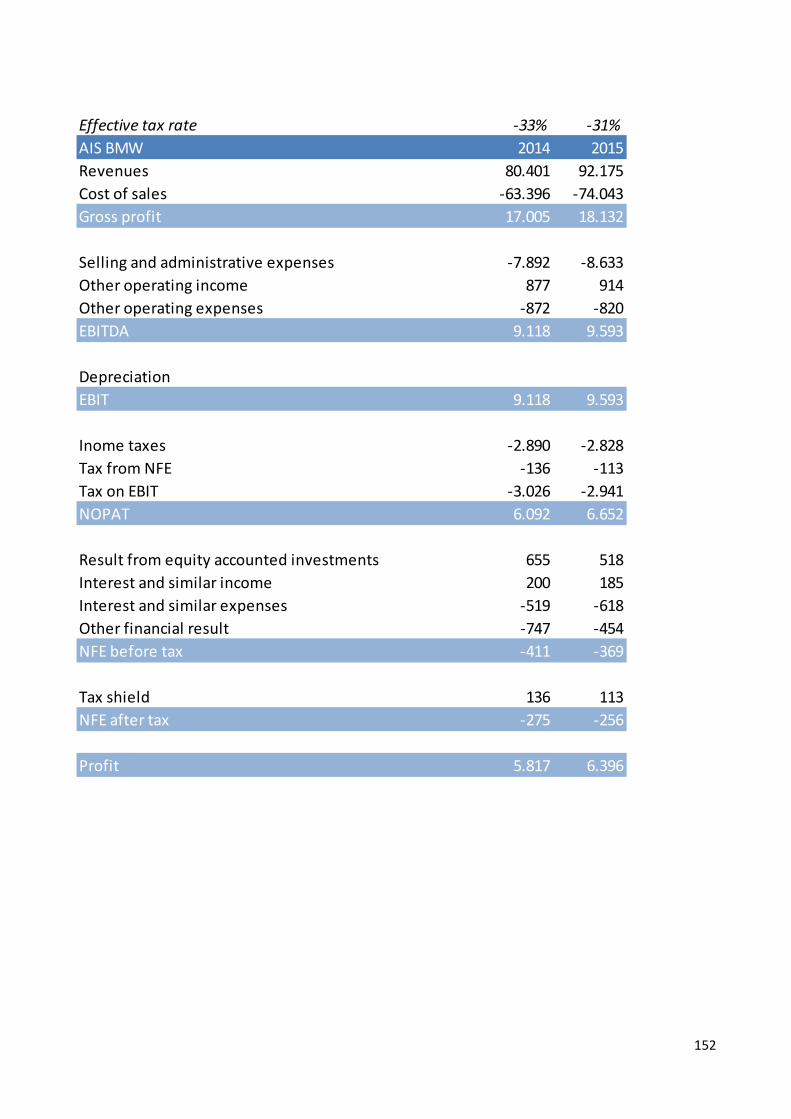
Effective tax rate -33% -31%AIS BMW 2014 2015Revenues 80.401 92.175Cost of sales -63.396 -74.043Gross profit 17.005 18.132
Selling and administrative expenses -7.892 -8.633Other operating income 877 914Other operating expenses -872 -820EBITDA 9.118 9.593
DepreciationEBIT 9.118 9.593
Inome taxes -2.890 -2.828Tax from NFE -136 -113Tax on EBIT -3.026 -2.941NOPAT 6.092 6.652
Result from equity accounted investments 655 518Interest and similar income 200 185Interest and similar expenses -519 -618Other financial result -747 -454NFE before tax -411 -369
Tax shield 136 113NFE after tax -275 -256
Profit 5.817 6.396
152
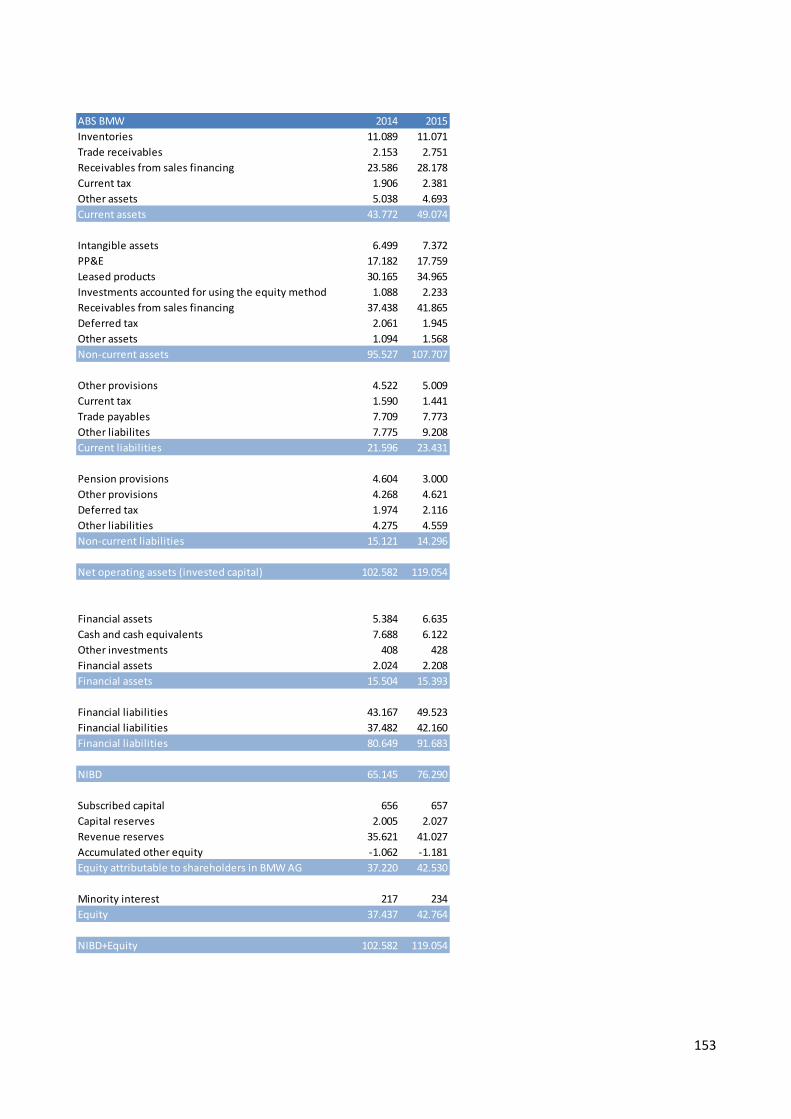
ABS BMW 2014 2015Inventories 11.089 11.071Trade receivables 2.153 2.751Receivables from sales financing 23.586 28.178Current tax 1.906 2.381Other assets 5.038 4.693Current assets 43.772 49.074
Intangible assets 6.499 7.372PP&E 17.182 17.759Leased products 30.165 34.965Investments accounted for using the equity method 1.088 2.233Receivables from sales financing 37.438 41.865Deferred tax 2.061 1.945Other assets 1.094 1.568Non-current assets 95.527 107.707
Other provisions 4.522 5.009Current tax 1.590 1.441Trade payables 7.709 7.773Other liabilites 7.775 9.208Current liabilities 21.596 23.431
Pension provisions 4.604 3.000Other provisions 4.268 4.621Deferred tax 1.974 2.116Other liabilities 4.275 4.559Non-current liabilities 15.121 14.296
Net operating assets (invested capital) 102.582 119.054
Financial assets 5.384 6.635Cash and cash equivalents 7.688 6.122Other investments 408 428Financial assets 2.024 2.208Financial assets 15.504 15.393
Financial liabilities 43.167 49.523Financial liabilities 37.482 42.160Financial liabilities 80.649 91.683
NIBD 65.145 76.290
Subscribed capital 656 657Capital reserves 2.005 2.027Revenue reserves 35.621 41.027Accumulated other equity -1.062 -1.181Equity attributable to shareholders in BMW AG 37.220 42.530
Minority interest 217 234Equity 37.437 42.764
NIBD+Equity 102.582 119.054
153
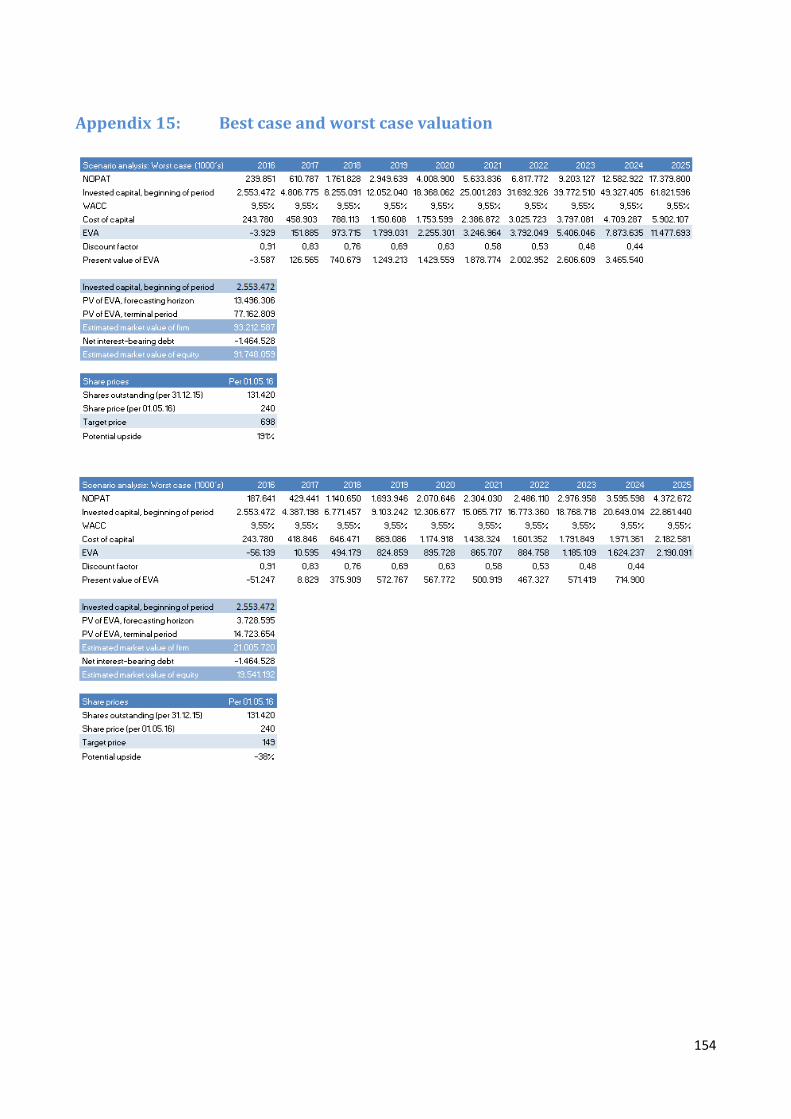
Appendix 15: Best case and worst case valuation
154