Embed Size (px)
Citation preview
• r ,
E L S E V I E R International Journal of Industrial Ergonomics 20 (1997) 441 461
In te rna t iona l Journ~ l of
Industrial Ergonomics
Validity and reliability of rating scales for seated pressure discomfort
Wenqi Shen*, Kenneth C. Parsons Department (?/Human Sciences, Loughborough Universi~ t~[" Technology, Ashby Road, Loughborough, Leicestershire LE11 3TU, UK
Received 1 December 1995; revised 30 August 1996
Abstract
To investigate seated pressure discomfort requires a valid and reliable technique to measure discomfort. The aims of this study were to test the validity and reliability of several rating scales and select the best for investigation of pressure discomfort. Six scales were tested: a category partitioning scale, the Borg CR-10 scale, the Corlett discomfort scale, an 8-point ordinal scale, a modified intensity and discomfort scale, and a 21-point ratio scale. Twelve subjects took part in the repeated measures test in two sessions, one week apart. A test seating device generated interface pressure from underneath a foam cushion. Four levels of stimulus, 60, 85, 120, and 165 mmHg, were presented to the seated mid-thigh region. Perceived pressure intensity, discomfort level due to the pressure, and overall discomfort were reported using each of the six scales. Reliability was examined by test-retest correlation, relative rating change and coefficient of variations, and validity examined by absoluteness of rating and the functional consistency. Generally, subjects were capable of reporting their sensation of pressure intensity and discomfort by using the rating scale technique. However, the accuracy of rating strongly depended upon the properties of the scale. The category partitioning scale was found to be highly reliable and most valid for rating pressure intensity and perceived discomfort. This scale was also preferred by subjects when compared with the other five scales. Properties of all the six scales were defined and summarised.
Relevance to industry
The psychometric properties of the six scales provide a basis for industrial engineers and ergonomists in selecting rating instruments for product usability as well as seating comfort. The validated category partitioning scale is very sensitive and accurate. It will find wide application in comfort evaluation and in industrial benchmarking activities.
Keywords." Pressure sensation; Psychophysics; Scaling methods; Seating; Subjective judgment
1. Introduction
Pressure dis tr ibut ion measuremen t on the seat- occupan t interface is a p r imary tool for seating
* Corresponding author. Tel.: (810) 986-9760; fax: (810) 986-7292; e-mail: [email protected].
comfor t evaluat ion (Lee et al., 1990; Zacharkow, 1988; Schneider and Ricci, 1989). If the interface pressure in any region on the interface is excessive for pro longed sitting, it will induce compress ion discomfort (Hertzberg, 1958, 1972; Chow and Odell, 1978; D r u m m o n d et al., 1982; Bader, 1986). Applied research and industrial benchmark ing in
0169-8141/97/$17.00 Copyright :.~! 1997 Elsevier Science B.V, All rights reserved PII S01 69-8 1 4 1 ( 9 6 ) 0 0 0 6 8 - 6

442 W. Shen, K.C. Parsons / International Journal of Industrial Ergonomics 20 (1997) 44l 461
seat development give much attention to pressure discomfort. Reducing pressure magnitude and uni- formly distributing pressure have been included as main specifications in seat design (Congleton, 1983; Matsuoka and Hanai, 1988). However, it is not an easy task to establish the relationship between sur- face pressure and seated discomfort. Measurement of surface pressure is an obvious obstacle and, until recent years, no reliable and accurate pressure sys- tems were available. Other sources of seated dis- comfort, such as vibration, thermal condition and posture incur formidable "ambient noise" on pres- sure discomfort studies.
The fundamental problem is the measurement of discomfort itself. Discomfort is a generic and sub- jective sensation that arises when human physiolo- gical homeostasis, psychological well-being, or both, are negatively affected. Pressure-induced dis- comfort is a physiological aspect of human discom- fort. The measurement of pressure discomfort is a psychophysical problem. Rating-scale technique is a natural and convenient approach and it has been widely used for intensity and comfort or dis- comfort assessment. By adopting this technique, we assume that subjects are capable of making a direct judgement of sensations, with no need for a stan- dard contrast stimulus. However, ratings are easily biased due to shortcomings in scale structure, in- struction, stimulus context, and so on (Poulton, 1982). An appropriate rating scale will help reduce the measurement error of discomfort. Unfortunate- ly we found no literature on the scaling properties of rating scales for postural and seating discomfort.
The objectives of this study were to investigate the validity and reliability of a number of rating scales and choose the best for pressure intensity and discomfort in seated human thigh area. Valid- ity concerns whether the scale measures what it is intended to. As seating comfort is multidimen- sional, inappropriate scales and testing procedures may elicit ratings on some subjective trait other than comfort or discomfort. Reliability refers to the extent to which the scale could produce the same score in similar circumstances, The most valid and reliable scale will be chosen for further investiga- tions on the psychophysical functions of pressure discomfort, in order to quantify the contribution of external pressure to overall seated discomfort.
2. Selection of scales for rating intensity and discomfort
Pitrella and K/ippler (1988) summarized 14 rat- ing-scale design principles: (1) use continuous scales rather than category scale formats; (2) use both verbal descriptors and numbers at scale points: (3) use descriptors at all major scale markings; (4) use horizontal rather than vertical scale formats; (5) either use extreme or no descriptors at end points; (6) use short, precise, and value-unloaded descrip- tors; (7) use empirically determined rank-ordered descriptors; (8) select and use equidistant descrip- tors; (9) use psychologically scaled descriptors; (10t use positive numbers only; (11) have desirable qual- ities increase to the right; (12) use descriptors free of evaluation demands and biases; (13) use 11 or more scale points as available descriptors permit; (14) minimize rater workload with suitable aids. For clarity, some principles such as items (7), (8), (9), and items (6) and (12), can be combined. These prin- ciples provide a detailed checklist for scale design, depending upon task requirements.
In selecting rating scales for pressure discomfort. aspects pertinent to test validity and reliability must be observed. There are numerous rating scales for comfort and discomfort, or other intensities such as exertion, workload, physical stress, and pain. Some of the scales, while useful in practical situations, were not suitable for the purpose of rating pressure intensity and discomfort. Initial se- lection of scales for this study were based on the following considerations: 1. The scales should measure only one dimension,
i.e. discomfort or pressure intensity. A bipolar comfort-discomfort scale might be appropriate for general seat evaluation, but a study of pres- sure-induced sensation is concerned with dis- comfort only. The bipolarity of a comfort- discomfort scale may alter the construct and reduce the available rating space for discomfort on the scale, inducing ranging effect (Poulton, 1977). The general comfort rating scale by Shackel et al. (1969) was thus not included.
2. The scales should have face validity. They should appear to measure what is intended, which is discomfort or pressure intensity. Scales such as Borg's (1970) 15-point RPE scale are not
W. Shen, K.C. Parsons / International Journal of lndustrial Ergonomics 20 (1997) 441 461 443
included because their numbering from 6 to 20 is specifically valid for rating physical exertion or efforts in relation to heart rates. The results would be difficult to interpret if such a scale is used for rating pressure discomfort.
3. The structure of scales before anchoring should allow for paired ratings of both pressure inten- sity and perceived discomfort. A study by Oborne and Clarke (1975) indicated that the type of anchoring phrases, which define the con- struct to be measured, do not differentially affect rating reliability in any significant way, as long as each type of anchoring consistently denotes the same construct.
4. The scales should be capable of quantifying, rather than just ranking, the intensity of pressure and discomfort. Sensitivity is essential. Coarse scales may suffer from serious ceiling or range effect. Ordinal scales and 3- or 5-point interval scales are thus excluded. Several scales for discomfort and other inten-
sities are selected for review. Corlett and Bishop (1976), Body Part DiscomJbrt
Scale. The body part discomfort (BPD) scale was developed as an element of the BPD rating proced- ure by Corlett and Bishop (1976). During a study of the effect of posture on discomfort in spot welding, subjects were asked lo indicate, on a body map with 12 body areas, the most uncomfortable body area(s), at ¼ hour intervals throughout a 3 h work- ing period. A 5-point scale was used, from "0 = no discomfort" to "5 = extreme discomfort". The scale however was not graphically depicted. The concept of the BPD scale was based on the work of Kirk and Sadoyama (1973), where a 5-point scale ranging from "just noticeable discomfort" to "ex- tremely uncomfortable" was used. Pain intensities for holding arms at varied angles were reported to be proportional to the holding time, i.e. pain inten- sity linearly related to the duration. The scale can thus be used as a linear scale with time (Corlett, 1991}. However, whether the BPD scale validly measures discomfort at different load levels is still unknown, Corlett (in Wilson and Corlett, 1991) found that ratings deviated from linearity at high load levels, indicating a bias due to range effect.
The BPD scale has been extensively used for chair and seat evaluation. There are different modi-
fled versions. Drury and Coury (1982) used the BPD scale to evaluate a manual handling task and a prototype chair. Rating on the scale was defined as obtaining "a response from 1 (just noticeable pain/discomfort) to 5 (intolerable pain/discom- fort)". The scale was reportedly easy to use and required almost no training for the subjects. Con- gleton (1983) and Thomas et al. (1991) modified the BPD scale. Subjects were instructed to place an "x" on the horizontal scale of 10 cm long. The distance between "x" and the left end of the scale represented the level of discomfort. The left end of the line was assigned as 1 for "just noticeable" discomfort. If no mark was placed, a zero value was given indicating no pain/discomfort.
Borg (1982), Category-Ratio Scale ( C R- I O ). Since 1962, Borg (1962, 1970, 1982) has developed differ- ent numerical scales for perceived exertion (RPE) and other physical intensities. The most accepted is the RPE scale developed in 1970, which used 15 points as opposed to the previous 21-point scale (Borg, 1962). Validity and reliability of the scale in evaluating physical and mental exertion and phys- ical ability of athletes have been extensively tested (Skinner et al., 1973; L611gen et al., 1975). Borg (1982) recently developed a 10-point category-ratio scale (CR-10), aimed at intensity ratings in wider psychophysical dimensions. It was claimed that, for rating perceived exertion, the CR-10 scale produc- ed data that fit a power function. The greyness test indicated that the individuals had enough know- ledge to use the scale (Johansson and Ljunggren, 1989). Correlations between the colour intensities and the ratings were reportedly high (r > 0.90). Gustafson-SSderman (1987) however used the CR- 10 scale to assess local discomfort from the back and neck-shoulder regions in building crane oper- ators and found that most of the ratings were lower than 2. It seems that the sensitivity of the scale was low. No reports on its validity and reliability were found.
Category Partitioning Scale (CP-50). This scale is used with its unique rating procedure. Heller (1980, 1985, cited from Ellermeie; and Westpha], 1991) developed this scaling procedure for rating pain intensity. Arranged vertically, the scale has a start- ing point, 0 = no, and 5 categories: very' slight, slight, medium, severe, very severe. Each of the

444 W. Shen, K.C. Parsons / International Journal q[ lndustrial Ergonomics 20 (1997) 441 461
categories is further divided into 10 scale points. Points above 50 are provided to avoid the ceiling effect on ratings for any extreme intensity. Subjects were directed to categorize stimuli in reference to their daily experience with pain intensity rather than simply ordering experimental stimuli. This is achieved through a two-step procedure, in which subjects first have to name the category to which the stimulus "belongs", and then may fine tune using numerical subdivisions. The scale has be- haved in an "absolute" way (Ellermeier and Wes- tphal, 1991), without stimulus context bias. A test (G6bel et al., 1988) on the reliability and validity of the scale for pain rating proved that the scale is appropriate for quantifying pain intensity.
Four scales were thus selected from current liter- ature. Scale A is the CP-50 scale, Scale B was modified by Congleton (1983) from Corlett and Bishop (1976), Scale C is the 8-point discomfort scale used by Yu et al. (1988), Yu and Keyserling (1989), and Scale D is the Borg CR-10 scale. Scale E was used by the authors in an unpublished study on sitting discomfort, and introduced here to compare with Scale B, as they have different left end anchors. Suggested by a pilot experiment on psychophysical functions of pressure sensation, we also constructed Scale F to possess ratio properties for rating inten- sity and discomfort. A complete set of selected scales with instructions is provided in the appendix.
3. Method
3.1. Subjects"
Twelve subjects, six male and six female, were recruited as paid volunteers for the two-session experiment. The anthropometric statistics are listed in Table 1. No subjects had previous experience in scaling pressure sensations. All subjects filled out a consent form. Subjects wore boxer type shorts for the test in order to apply the pressure stimuli to the bare mid-thigh.
3.2. Apparatus and stimuli
All test sessions were carried out in a controlled laboratory. The room temperature was 23 + 2°C
Table 1 Subject characteristics tn = 12)
Mean S.D. Min. Max.
Age 35.5 14.44 18 58 Weight (kg) 68.9 10.20 52.6 83 Height (mm) 1703.7 82.62 1546 1823 Popliteal height (ram) 454.1 26.37 411 488 Buttock-popliteal length (mm) 478.9 21.81 446 510 Sitting height (ram) 903.6 45.63 809 973
and the relative humidity was between 48% and 60%.
Stimulus pressure was presented by means of a test seat. The seat cushion consisted of a wooden base and a piece of urethane foam having a density of 50 kg/m 3 and a stiffness of 90-105 N (Hairlok Ltd., UK). The wooden base consisted of slices of different width. On the stimulus slice there was a hole to accommodate a circular block of 65 mm in diameter. This stimulus block, with a flat top surface, was slowly pushed up or lowered from the wooden base level by a lead screw, which was in turn coupled to a flexible driving shaft and driven by an electric screw driver (Black and Decker, 9019 Type 2). To apply pressure stimuli on the thigh when a subject was seated, the stimulus block was driven up from underneath the foam. By arranging the sequence of base slices, the stimulus slice could be placed at any anterior-posterior location. By moving the stimulus slice from one side to the other, the stimulus block could be at any lateral- medial location. Therefore, pressure stimulus could be applied on any seated body region in contact with the seat cushion.
Since the stimuli block had a nominal area of 3318 mm 2, the nature of the stimuli was surface pressure as opposed to a sharp localized pressure or hydrostatic pressure. The stimulus magnitude was measured on the subject-cushion interface, us- ing a Talley pressure monitor system (TPM, Talley Group Ltd., UK). The sensor pad consisted of 96 pressure sensors and was arranged on the cushion surface. Each sensor was 20 mm in diameter, and the central distance from adjacent sensors was 28 mm. The calibrated repeatability of measure- ment was within + 3 mmHg. The stimulus area
W. Shen, K. C. Parsons / International Journal of Industrial Ergonomics 20 (1997) 441 461 445
was covered with 4 adjacent cells, and the largest reading among the four was taken as the stimulus magnitude. A micro-computer was connected to the TPM to download data for further analysis.
The stimulus was applied at half the distance between the buttock and popliteal length under the right thigh. The stimulus block was adjusted ac- cording to individual buttock-popliteal length. Footrest height was adjusted for the subject to rest the foot while the thighs were naturally horizontal on the seat cushion. During the test, subjects were required to sit upright, without using the backrest.
3.3. Subjective judgements
The rating-scale method was used. The items for paired rating included the sensations of • pressure intensity; • discomfort level due to the stimulus, and • overall discomfort on the whole seat surface.
The experimenter presented the stimulus under the right thigh. When the pressure reached the required level and stabilized for 60 s, the subject reported his or her sensations of the three items by either giving verbal ratings, as for Scales A, C, D and F, or drawing backslashes on the graphic scales, as for Scales B and E. At the end of the experiment, each subject gave his or her preference of the scales by completing the last sheet in the questionnaire. Any sensations under the left thigh where no stimuli were applied, were also reported for the purpose of balance.
3.4. Experimental design
The experiment consisted of two sessions. Two series of stimulus pressure levels were used, each involving three levels that were geometrically spaced. Those levels were equivalent to the range of typical interface pressures under the ischium. The high series was 85, 120, and 165 mmHg, and the low series was 60, 85, and 120mmHg. The two overlapping levels were for eliciting test-retest cor- relation.
The twelve subjects were divided into two groups. One group received the high series of stimulus levels in the first session followed by the low series in the second session. The other group
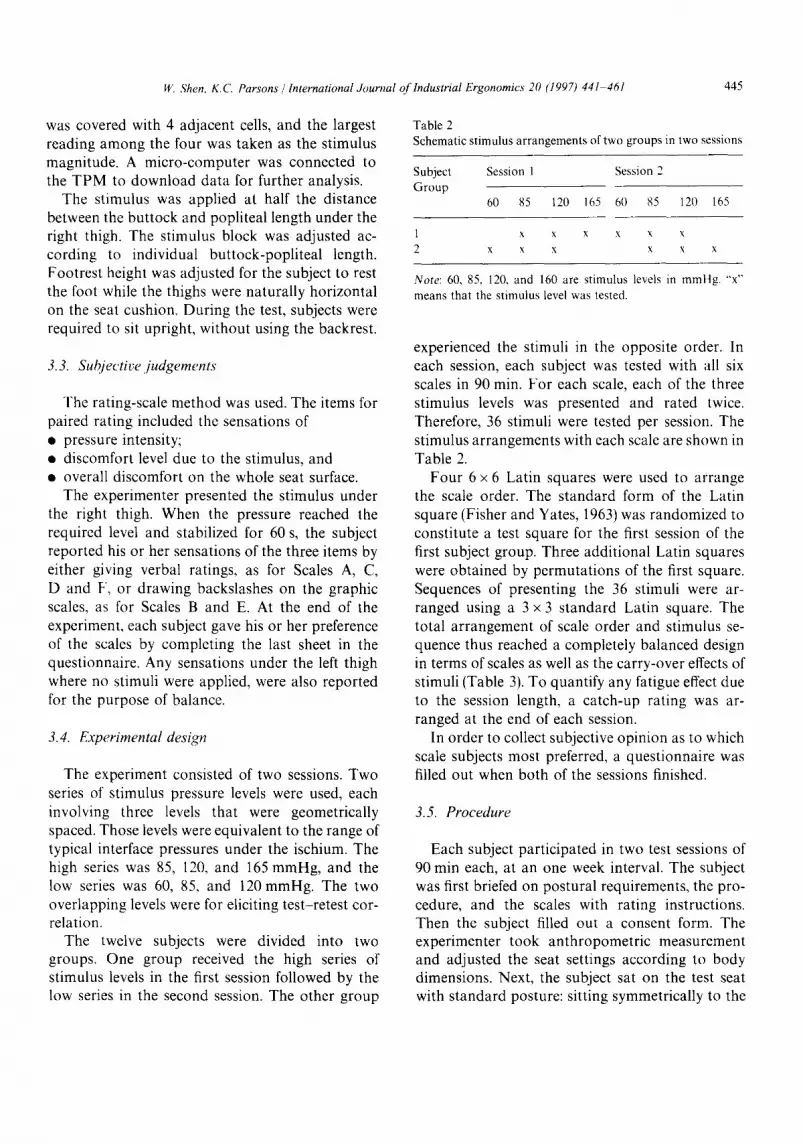
Table 2 Schematic st imulus arrangements of two groups in two sessions
Subject Session 1 Session 2 Group
60 85 120 165 60 85 120 165
1 X X X X X X
2 x x X x X X
Note: 60, 85, 120, and 160 are stimulus levels in mmttg . ~'x'" means that the st imulus level was tested.
experienced the stimuli in the opposite order. In each session, each subject was tested with all six scales in 90 min. For each scale, each of the three stimulus levels was presented and rated twice. Therefore, 36 stimuli were tested per session. The stimulus arrangements with each scale are shown in Table 2.
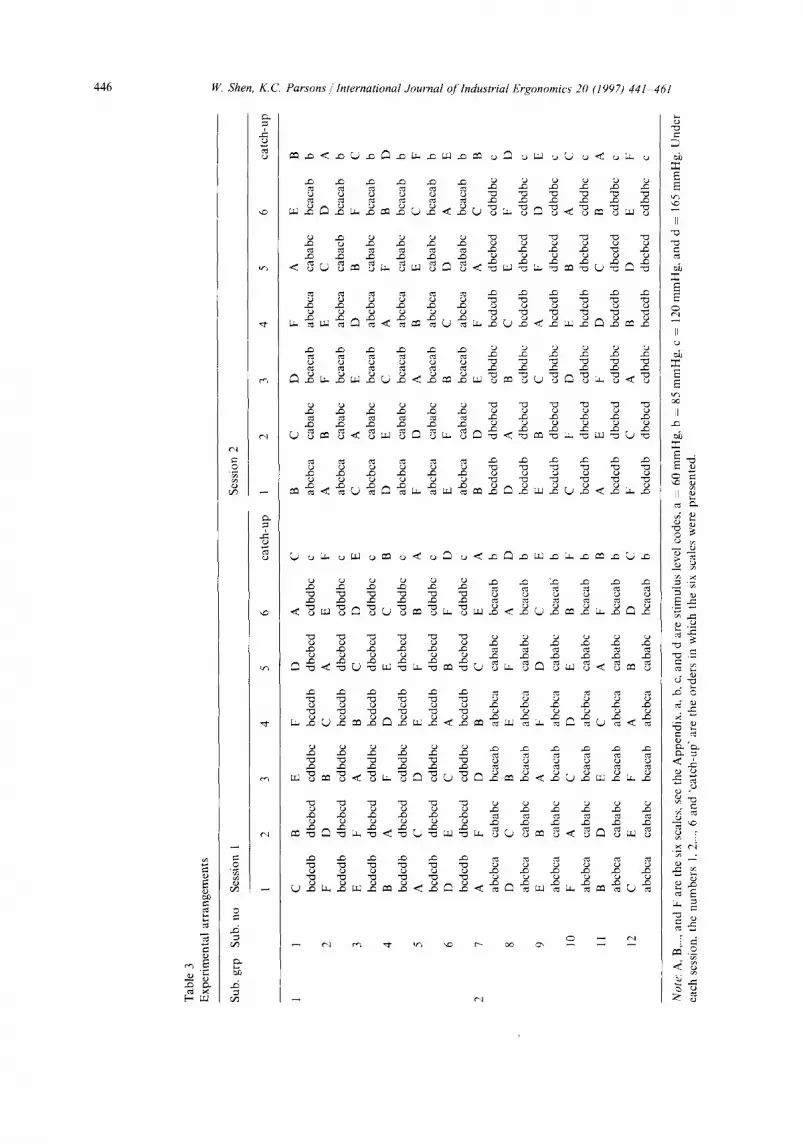
Four 6 x 6 Latin squares were used to arrange the scale order. The standard form of the Latin square (Fisher and Yates, 1963) was randomized to constitute a test square for the first session of the first subject group. Three additional Latin squares were obtained by permutations of the first square. Sequences of presenting the 36 stimuli were ar- ranged using a 3 x 3 standard Latin square. The total arrangement of scale order and stimulus se- quence thus reached a completely balanced design in terms of scales as well as the carry-over effects of stimuli (Table 3). To quantify any fatigue effect due to the session length, a catch-up rating was ar- ranged at the end of each session.
In order to collect subjective opinion as to which scale subjects most preferred, a questionnaire was filled out when both of the sessions finished.
3.5. Procedure
Each subject participated in two test sessions of 90 min each, at an one week interval. The subject was first briefed on postural requirements, the pro- cedure, and the scales with rating instructions. Then the subject filled out a consent form. The experimenter took anthropometric measurement and adjusted the seat settings according to body dimensions. Next, the subject sat on the test seat with standard posture: sitting symmetrically to the
446 W. Shen, K. C. Parsons /International Journal o[' lndustrial Ergonomics 20 (1997) 44l 461
e~
¢xl
0
0
.6 ~3
.6
~.~ ,o r, ~ ~ ~ ~ ~ ,< ~ ~ ,.~ .el. ~ ~ . ~ ~ ..~ ', ~ ,'~ .tz ~ . ~
~.) . ~ r, ~ pd .t~ t ~ ~ ~ . ~ £~ .t~ ., ~ ~ t ~ ~ ~ ~ ~ ,~ ~ ~ ~.)
-.j
E
H
E
.v
II
.r.
..~ o
<.&
'Yn _.:
E
W. Shen, K.C. Parsons / International Journal of Industrial Ergonomics 20 (1997) 441- 461 447
central line on the seat surface; keeping the back upright and not using the backrest; keeping feet horizontal on the footrest with gauged thickness; maintaining the distance between under-knee and the front edge of the seat at about 10 mm so that the thigh-leg angle was 95 . Position of the stimulus block on seat cushion was adjusted relative to the measured buttock-popliteal length to ensure the center of the block at the mid-thigh. Two sample stimuli were applied on the subject's thigh for trial rating. The scale sheets were prepared in the par- ticular order for each subject, and placed on a stand at 0.75 m in front of the subject's eye level.
To present pressure, the stimulus block was driven up under the seated thigh. Pressure level was monitored through the TPM, and tuned by man- ually turning the screwdriver. The stimulus was presented for 60 s from the moment the pressure stimulus stabilized. The subject then reported his or her ratings in terms of pressure intensity, discom- fort level due to the stimulus, and overall discom- fort on the seat cushion before rising from the seat for step tests. The step tests, lasting 30 s, involved going up and down two steps, at heights of 140 and 280 mm, respectively. The rhythm was controlled by a metronome at 48 beats/min. Meanwhile, the experimenter re-adjusted the pressure monitor and the stimulus board. On finishing the step test, the subject returned to the seat for the next stimulus.
The period of actual testing then started. Alto- gether 36 stimuli, 6 for each scale, were applied to the subject's under-thigh and rated. Each stimulus rating and step test cycle took 2 rain. The second session was conducted at the same time one week later. There was no pre-test period. When all 36 stimuli of the other series had been presented, the subject filled out the questionnaire regarding scale preferences.
4. Results
Rating scores were extracted when each session finished. Ratings on the four category scales, Scale A, C, D and F, were voted by subjects. Ratings on Scale E were obtained by measuring the line length, in cm, from left most point to the marked point. Ratings on Scale B were treated differently
(Congleton, 1983): if it was "no sensation at all", the rating was 0; otherwise, any rating between "just noticeable" to "extreme" was scored as the sum of 0.5 cm and the actual line length, in cm. Statistical analysis including reliability test, was conducted using SPSS(R) for Windows TM (Norusis, 1993). Rat- ings of sensations on the left thigh were all zero or close to zero, therefore no analysis was conducted.
4.1. Reliability
The reliability of the rating scales was evaluated in terms of three aspects: (1) test-retest correlation, (2) between-session change of ratings, and (3) aver- age coefficients of variation. While the first two aspects indicate the consistency of ratings over the time interval, the third measure provides an index of internal consistency in each subject.
Test-retest correlation. Test retest correlation was computed from the subject's summed ratings of two replications on each of the two common stimu- lus levels, 85 and 120 mmHg. In the first session, the two stimulus levels for sub-group one were extrac- ted from the higher stimulus series of 85, 120, and 165 mmHg, and for subgroup two from the low stimulus series of 60, 85, and 120 mmHg. In the second session the range was reversed. The correla- tion coefficients are listed in Table 4.
Scale A had the highest correlation for pressure intensity, discomfort level, and overall discomfort ratings. Scale D had high correlation for the overall discomfort rating, but not for pressure intensity and discomfort level ratings. The correlation coeffi- cients did not differ much between stimulus levels of 85 and 120 mmHg, suggesting that the repeat- ability of ratings was independent of the stimulus magnitude. This property is desirable for practical applications.
The highest correlation coefficients of Scale A, if converted into the intraclass correlation coefficient (ICC), is equivalent to an ICC of 0.67. According to Fleiss (1986), this shows a "good" but not "excel- lent" reproducibility. An excellent reproducibility should give an ICC greater than 0.75. The principal reason for this is that the test-retest was conducted on two different stimulus ranges instead of being on the same range. For relative comparison among different scales, the result is valid and Scale A is the

448 t~ Shen, K. C. Parsons / International Journal of Industrial Ergonomics 20 (1997) 441 461
Table 4 Pearson correlation coefficients of test-retest ratings on the six scales
Scale Pressure intensity Discomfort level Overall discomfort
85 120 Avg 85 120 Avg 85 120 Avg
A 0.71" 0.71 '° 0.71"" 0.365 0.692" 0.529 0.592" 0.604" 0.598' B 0.103 0.236 0.169 0.26 0.072 0.166 0.413 0.245 0.329 C 0.389 0.348 0.368 0.214 0.158 0.186 0.334 0.228 0.28l D 0.644' 0.471 0.558 0.547 0.373 0.46 0.762'" 0.658' 0.71"* E 0.084 0.056 0.07 0.374 - 0.121 0.126 0.594" 0.023 0.309 F 0.149 0.122 0.136 0.315 0.307 0.311 0.34 0.59" 0.465
Note: Computed from the summed ratings of two replications, n - 12. d.f. = 10, **p < 0.01; *p < 0.05.
Table 5 Medians (n = 12) of between-session change in ratings (in %)
Scale Pressure intensity Discomfort level Overall discomfort
85 120 Avg 85 120 Avg 85 120 Avg
A 12.6 17.1 14.8 25.7 31.8 28.7 30.8 34.3 32.5 B 28.5 26.5 27.5 41.4 21.7 31.5 31.5 23.7 27.6 C 43.8 31.8 37.8 100.0 65.2 82.6 58.3 79.2 68.8 D 28.6 33.3 31.0 36.7 25.0 30.8 35.4 19. l 27.3 E 36.1 24.2 30.1 29.5 29.2 29.3 46.7 32.2 39.4 F 46.9 59.6 53.2 56.3 50.0 53.1 55.8 71.8 63.8
Note: The between-session change is the ratio of the average rating difference between two sessions to the mean rating in the first session.
most reliable in terms of its test-retest reproducibil- ity.
Between-session change of ratings. The between- session change is the ratio of difference in ratings between two sessions to the rating in the first ses- sion. A smaller change indicates higher consistency in ratings. Medians of the between-session changes are presented in Table 5.
For pressure intensity, Scale A exhibited an aver- age between-session change of 14.8% as the lowest, while the scale F suffered the highest between- session change of 53.2%. The ANOVA result, for d.f. = 1 and 5, F - -6 .54 , and p < 0.05, indicated that the between-session change in ratings is signifi- cantly different among scales, but not between the two stimulus levels. Duncan's multiple range test revealed the homogeneous subsets of scales (p < 0.05) are Scales A, B, E and D; Scales B, E, D and C; Scales C and F. For discomfort level,
Scales A, E, D and B had less between-session change than Scales F and C. The ANOVA result (d.f. = 1 and 5, F = 8.69, p < 0.05) indicated that there are significant differences in between-session change among scales, but not between stimulus levels. Duncan's test gave the homogenous subsets as Scales A, E, D, B and F; Scales F and C. For overall discomfort, Scales D, B, A, and E suffered less between-session change as compared to Scales F and C, although the changes ( > 27%) are gener- ally larger than those for pressure intensity ratings. Duncan's multiple range test showed that the homogenous subsets are Scales D, B, A, and E; Scales E and F; Scales F and C.
In summary, Scale A showed the smallest be- tween-session change for all three rated items. Scales B, E and D are almost at the same level, and Scales F and C are the least reliable in terms of between-session changes.

W. Shen, K. C, Parsons /International Journal of lndustrial Ergonomics 20 (1997) 441-461
Table 6 Coefficients of variation (CV) of rating scores using the six scales (in %)
449
Rated item Scale Intra-individual Inter-individual
Session I Session 2 Session 1 Session 2
85 120 85 120 Avg 85 120 85 120 Avg
lntra-/inter ratio
Pressure A 14.6 10.0 10.9 8.6 11.0 21.4 23.3 27.0 21.7 23.3 47.3 intensity B 18.9 11.7 16.1 10.4 14.3 28.6 22.0 29.2 23.9 25.9 55.1
C 39.3 16.4 20.9 17.3 23.5 53.2 36.2 40.1 24.6 38.5 61.0 D 33.7 23.4 36.3 15.2 27.1 48.4 26.2 47,9 40.2 40.7 66.7 E 34.9 18.3 21.7 20.9 24.0 40.5 28.2 40.6 25.4 33.7 71.2 F 25.5 21.2 21.9 27.7 24.1 50.3 57.1 57.8 47.3 53.1 45.3
Local A 20.0 12.2 14.3 5.1 12.9 31.5 35.1 32.3 22.8 30.4 42.4 discomforl B 31.0 13.3 29.7 16.9 22.7 35.1 22.5 34.0 22.8 28.6 79.4 level C 50.1 36.4 28.0 22.1 34.1 72.9 59.4 58.4 32.6 55.8 61.1
D 47.6 17.6 27.3 15.5 27.0 64.0 26.8 39.1 36.9 41.7 64,7 E 40.8 25.8 31.2 21.7 29.9 56.7 40.3 47.4 26.8 42.8 69.8 F 21.3 24.9 25.5 23.8 23.9 72.4 69.5 72.4 48.2 65.6 36,4
Overall A 24.0 16.4 18.0 11.6 17.5 45.0 46.0 39.2 25.6 38.9 44.9 discomfort B 22.4 13.0 35.9 18.5 22.4 40.0 30.9 45.3 26.3 35.6 63.0
C 51.0 20.0 29.4 21.3 30.4 9 l. 1 83.4 63.2 36.1 68.4 44.4 D 27.7 17.3 38.3 18.2 25.4 67.8 36.9 50.0 36.4 47.8 53.1 E 43.5 39.3 43.0 24.5 37.6 68.3 53.1 63.3 34.9 54.9 68.4 F 40.3 28.0 43.0 26.2 34.4 97.8 88.6 62.2 48.5 74.3 46.3
Note: lntraindividual CV was the mean of 12 subjects' individual CVs which were computed from and interindividual CV was computed from the averaged ratings of all subjects, lntra-/inter- intraindividual CVs as compared to interindividual CVs.
the replicated ratings of each subject, ratio was the relative percentage of
Variability of ratings. Standard deviation of rat- ing scores is commonly used to express the indi- vidual consistency in using a scale. However, since each scale has its own scaling dimension, the stan- dard deviations cannot be compared directly. Coef- ficient of variation (CV), the ratio between standard deviation and the mean score, were thus computed. Table 6 summarises the coefficients of variation (in %) both intra- and inter-individually. Intra-indi- vidual CV depended on each subject's internal con- sistency in using a scale and is computed as the average of 12 subjects' individual CVs. Inter-indi- vidual CV was due to the heterogeneity of the subject group or the large between-subject differ- ence in sensations, and was computed from the averaged ratings of all subjects. The intra-/inter- ratio indicates the relative magnitude of intra-indi- vidual CVs as compared to inter-individual CVs. A small intra-/inter-ratio suggests high capability
of the scale in revealing individual differences in judgement.
Scale A exhibited the smallest intra-individual and inter-individual variations among the six scales. Its intra-/inter- ratio is also small. Therefore this scale has the best internal consistency and is good for identifying individual differences in pres- sure sensation. Among the three rated items, the degree of variation is: pressure intensity < discom- fort level < overall discomfort. Subjects had larger individual differences in judging discomfort than in judging pressure intensity. According to a two- stage model of magnitude estimation (Gescheider, 1988), ratings of pressure intensity may depend more on the judgement at the sensory stage, while ratings of discomfort level depends more on the judgement at the cognitive stage which is more subjective. Scales C, D, E and F have more intra- individual variability, suggesting that subjects are
450 W. Shen, K, C Parsons / International Journal o/" lndustrial Ergonomics 20 (1997) 441-461
less consistent in using these scales for rating pres- sure.
Coefficients of variation in rating the higher stimulus level, 120 mmHg, were generally smaller than those for the lower pressure stimulus level, 85 mmHg. Since the mean ratings for the high level were larger than those for the low level, the de- crease in CV suggests the standard deviations var- ied little across pressure stimulus levels. This property is relatively independent of the scale types.
4.2. Validity
The validity of scales is examined on mean rat- ings of subject groups by looking at the functional relationships between the stimulus and sensations. Three aspects were investigated: • Intra-group stimulus range shift for the "abso-
luteness" of scaling, which is concerned with whether judgements of different intensity ranges presented to the entire subject group remain consistent over time. The smaller the shift, the more absolute and more valid the scale is in measuring stimulus;
• Inter-group comparison, which tests the abso- luteness of scaling over different subject groups presented with different stimulus ranges; and
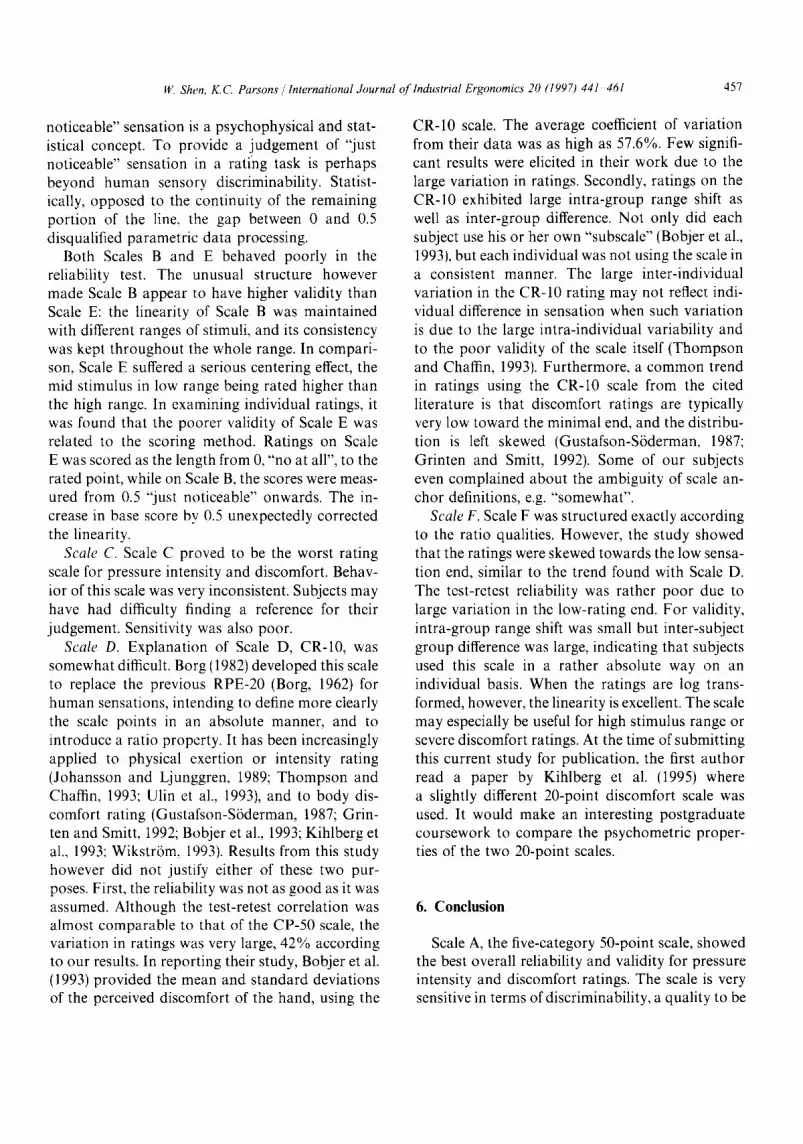
• Linearity of psychophysical functions. Intra-group stimulus range sh!ft. This tests the
differences in mean ratings of the whole subject group between the high stimulus range and the low range. Ratings by group 1 in session 1 were merged with those by group 2 in session 2 to represent the high stimulus range, and ratings by group 1 in session 2 and by group 2 in session 1 were merged for the low range.
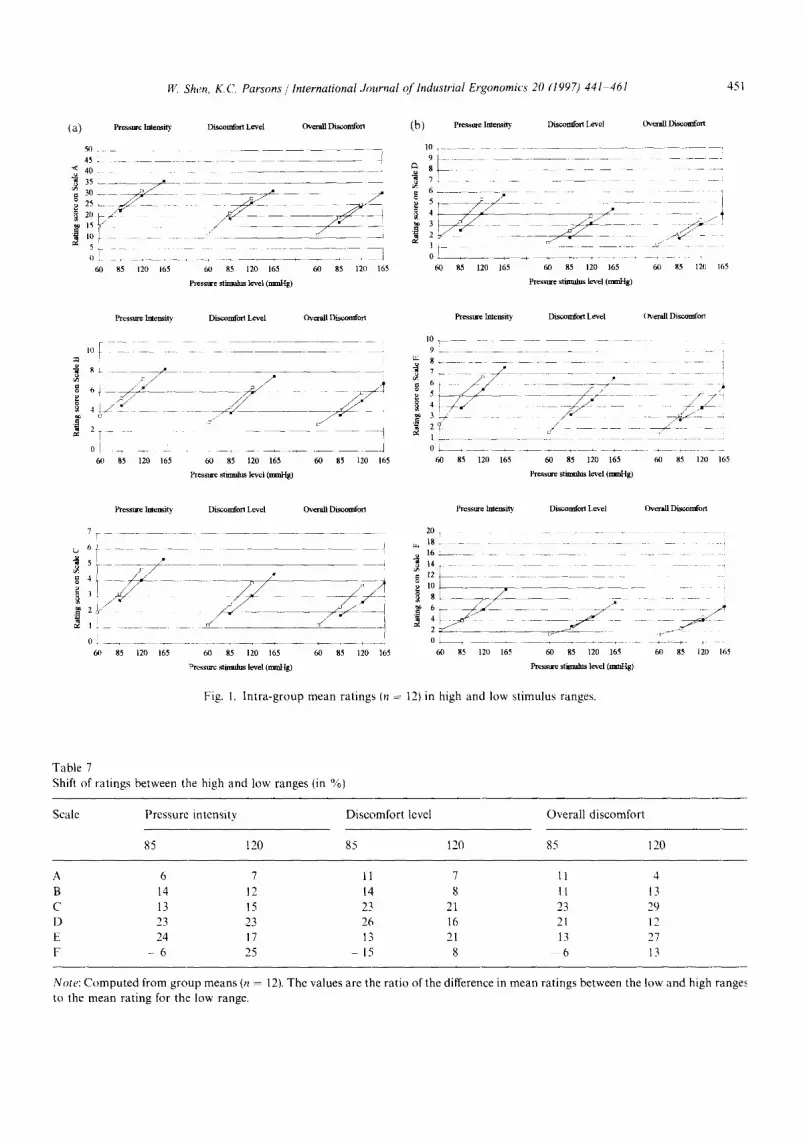
Mean ratings on both stimulus ranges for each scale are depicted in Fig. 1. Clearly, the range effect exists in all six scales. Stimuli in the low range are judged higher than those in the high range. The degree of the range shift, however, varies among scales. Table 7 shows the mean rating shifts (in %) at each common stimulus level due to difference in stimulus ranges.
Scale A is the best in terms of its small range shift with an average of about 9% for all three rated items, i.e. pressure intensity, discomfort level, and the overall discomfort. It therefore possesses an
excellent property of "'absoluteness" in pressure intensity and discomfort scaling. Scale C, D and E generally exhibited less "absolute" scaling prop- erties. Scale F behaves differently at 85 mmHg from the other five scales. The mean ratings for the low range were actually smaller than the mean for the high range. This may suggest that Scale F has different properties due to its geometrically spaced anchors as compared to other scales.
A two-factor repeated measures ANOVA was conducted, the two factors being pressure stimulus levels, 85 and 120 mmHg, and pressure stimulus ranges, high and low. Significance values are listed in Table 8. ANOVA results confirm the previous findings. All six scales were significantly sensitive to pressure stimulus levels. The range shift effect was not significant for Scales A, B and C. However, Scales D and E were significantly or strongly in- fluenced by the range shift in all or some of the three rated items, which degrades their validity. Scale F was not significantly influenced by the range shift, but the interaction between stimulus levels and the range factor was significant for pres- sure intensity ratings. This interaction manifests a change of psychophysical functions with stimulus ranges.
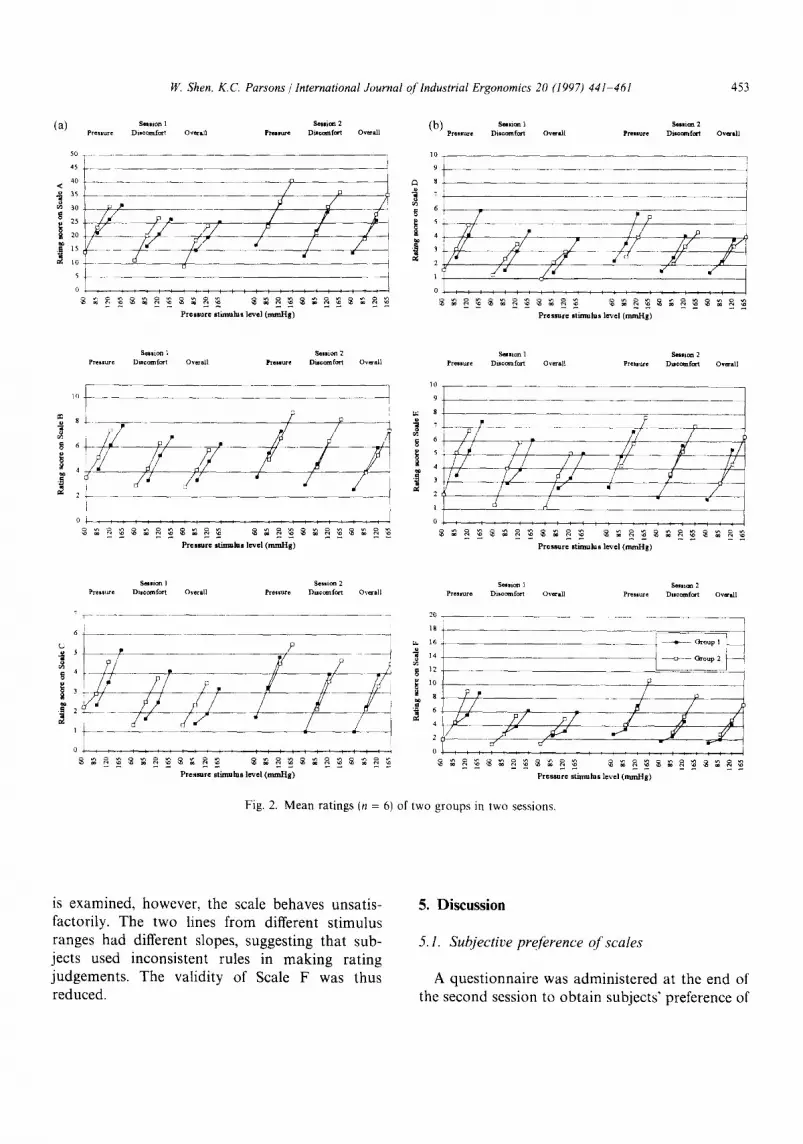
Inter-group comparison. Inter-group comparison assesses the difference in mean ratings between two subject groups, each experiencing a different stimu- lus rang e in the same session. Fig. 2 presents the mean ratings of the two subject groups in both sessions using the six scales. In both sessions, rat- ings of the two subject groups followed similar psychophysical functions, although the two groups were presented with different stimulus ranges. Table 9 summarizes the differences (in %) in mean ratings between the two subject groups, at two common stimulus levels in different ranges.
In the first session, the inter-group range shifts were generally higher than the intra-group range shifts, as is seen by comparing session 1 in Table 9 with Table 7. For example, the differences in mean ratings between groups on Scale A were 9% at 85 mmHg and 15% at 120 mmHg, but the intra- group differences were only 6% and 7%, respec- tively. Comparing the six scales, Scale A exhibited the smallest inter-group difference in ratings. In the second session, ratings formed another pattern.
W. Shen, K.C. Parsons / International Journal of lndustrial Ergonomics 20 (1997) 441 461 451
( a ) Pressure lmensity Discomfort Level Overall Discomforl
5 ~ I
45 ~ . . . . . . ! < 4 0 .
,o _ ----
,, - i 5 1 _ 2 1 2 7 2~ . . . . . . , - - 1 60 85 120 165 60 85 120 165 60 85 120 165
thesst~e stimulus level (mmlJg)
(b) ~ linenS- Discomfort Level Overall "-,Dism~ffort
10 . . . . . . . . . . . . . . . . . . . .
6 . . . . . . . . . .
! ' 60 85 120 165 60 85 120 165 60 85 12(I 165
Pressme stimulus level (mmttg)
Presstnx: Intensity Discomfort Level Overall Discomfort
I0 [ - !
~ . . . . _?.~_ _
~. 21 . . . . . . . j 01 . . . . . . . . . . . . . . . . . . . . J
61) 85 120 165 60 85 120 165 60 85 120 165
Pressm-e slimulus level (mmttg)
Pressure Intensity Disco~ort Level Overall Disc.on,on
10 . ~ . . . . .
9 L . . . . . . . . . I
, 6 i / / Y f " / / " _ _ _ < ~ - - - / , i~
1 . . . . . . . 0~ ÷ - . . . . . . .
60 85 120 165 60 85 120 165 60 85 120 165
Pressure sti~aalus level (mmng)
Pressm-e Intensity
7 T
Discomfort Level Overall Discomfort
" / f <
64) 85 120 165 60 85 120 165 60 85 120 165
Pressm-e stmmlus level (nmlHg)
Presstme lulensily Discomfort Level (~ernll 1)is~mfort
20 , . . . . . . . . . . . . . . . . . . . . . . . . . . . . . . . . . . . . . . . . . . . . . . . . . . . . . . . . . . . . . . . . . . . . . . . . .
,a 16 + . . . . . . . . . .
1 4 ) . . . . . 1 2 ~ . . . . . . ,= 10 L - -
0 1 , . . . . . . . . . . . . . + . . . . + _ ~
60 85 120 165 60 85 120 165 61) 85 120 165
Pressure stkmdus level (mm~tg)
Fig. 1. Intra-group mean ratings (n = 12) in high and low stimulus ranges.
Table 7
Shift of ra t ings between the high and low ranges (in %)
Scale Pressure intensi ty Discomfor t level Overa l l d i scomfor t
85 120 85 120 85 120
A 6 7 11 7 11 4
B 14 12 14. 8 11 13
C 13 15 23 21 23 29 D 23 23 26 16 21 12 E 24 17 13 21 13 27
F - 6 25 - 15 8 6 13
Note: C o m p u t e d from group means (n = 12). The values are the ra t io of the difference in mean ra t ings between the low and h igh ranges to the mean ra t ing for the low range.

452 W. Shen, K.C Parsons / International Journal oj'lndustrial Ergonomics 20 (1997) 441 46l
Table 8 Significance values for stimulus range shifts
Scale Pressure intensity Discomfort level Overall discomfort
Stimulus Range S. Level x range Stimulus Range S. Level x range Stimulus Range level level level
S. Level × range
A 0.00 0.26 0.54 0.00 0.36 0.74 0.00 0.50 B 0.00 0.12 0.73 0.00 0.29 0.81 0.00 0.14 C 0.00 0.22 0.34 0.00 0.20 0.46 0.00 0.12 D 0.00 0.00 0. l 9 0.00 0.03 0.98 0.00 0.10 E 0.00 0.06 0.98 0.00 0.18 0.06 0.00 0.08 F 0.00 0.42 0.01 0.00 0.99 0.21 0,00 0.79
0.45 0.47 0.17 0.83 0.04 0.09
Note: When the significance level is marked as 0.00, it indicates a value smaller than 0.01.
With the exception of the pressure intensity rating on Scale D, the differences in ratings between groups on the other five scales were remarkably reduced. Mean ratings on Scale A from both of the groups almost lie on the same line, which denotes that a unified psychophysical function governs the ratings even though the stimulus ranges are different.
The differences in mean ratings for the inter- group comparison involve contributions from the range shift and the inter-group difference. Since the experimental conditions between the two ses- sions were the same except for a one week interval, the attenuation in differences may be due to the training effect in the first session. None of the 12 subjects had any experience in using the six scales for pressure related ratings prior to the first session. Correction of psychophysical functions due to memory is not likely to occur, because the two sessions were one week apart and the stimulus ranges were shifted. Bias due to range effect is therefore partially corrected by the rating experi- ence in the first session.
In summarizing the inter-group comparison, Scale A distinguishes itself from the others with the smallest between-group difference in ratings. Scales C, D and E suffered from large inter-group differ- ences and range effects. A training effect is identifi- able on all six scales. Relative differences in ratings between groups were greatly reduced in the second session.
Linearity and consistency ~[psychophysical Jimc- tions. Good linearity of the stimulus-sensation rela- tionship implies that subjects are able to quantify and rate each stimulus on the scale, by following an inherent psychophysical function as predetermined by the structure of the scale. However, a scale with excellent linearity within one stimulus range may have a different slope of the relationship when the stimulus context changes. This problem of consist- ency can be examined through stimulus range shifts or through temporal shifts.
Regression analysis can be an appropriate ap- proach to define the linearity and consistency, but a graphic examination is sufficient for a compari- son purpose. Figs. 1 and 2 show that Scale A had excellent log-linearity and consistency in its psy- chophysical function. Scale C exhibited fair lin- earity but poor consistency. The slope of the function was influenced by the stimulus range. Scale D was developed to possess a ratio property (Borg, 1982), but the result of this study did not support the assumption. The log-linearity was poor, although the consistency of its function is fair. Scale E suffered from severe centering bias, as the mid-level in the low stimulus range was rated high- er than the mid-level in the high range. This bias was more prominent for ratings in the first session. Scale F was intended to be a ratio category scale and the result confirmed this property. After the mean ratings were log-transformed, linearity of the functions was excellent. When the consistency
W. Shen, K.C. Parsons / International Journal of Industrial Ergonomics 20 (1997) 441 461 453
Set iiorl 1 Sel|ion 2 , a . P . . . . . . . D t t o o t a f o r t Oversll P . . . . D i t ©ore for t 0 v~'all (b) ~ . . . . . .
S o l t i o ~ 1 ~ ) | i t m 2
Diatom f~'t Ov~all pret~ure Dtteom fort Ova'all
40 <
~° 25
10
5
Pr©s~r© stinmlus level (nmffIg)
r~
10
, !
, i
- a /
Pressure st imulus level (mmHg)
S~tion 1 8~nion 2 Pr¢,t~e Dmcomf~t Ovmall pretture Disccml f~t Ov~all
10 f 1 0
2
P r © s ~ stimnlu~ level ( m m H g )
Set ~ion l Set,ton 2 Preslure Di~eom fcxt Overall Ptet~ure Diteeatt fort O v e r a l l
5
2
I
0
Prc~ur© sthlmlus level (mmHg)
Station I S e u i ~ 2 Pre*t~e Discomfit Overall Pressure Dtt¢om fort Overall
20
Presmtr© st imulus level ( m m H g )
S~sion 1 Ses*a~m 2 Pressure Di,comf~t Ov~all PreBsure Diwc~nf~t Ov~all
- q
j ~ GT~Up I i~
4
2
0
Pr©ssur¢ stimulus level ( m m t t g )
Fig. 2. Mean ratings (n = 6) of two groups in two sessions,
is examined, however, the scale behaves unsatis- factorily. The two lines from different stimulus ranges had different slopes, suggesting that sub- jects used inconsistent rules in making rating judgements. The validity of Scale F was thus reduced.
5. Discussion
5.1. Subjective preference of scales
A questionnaire was administered at the end of the second session to obtain subjects' preference of
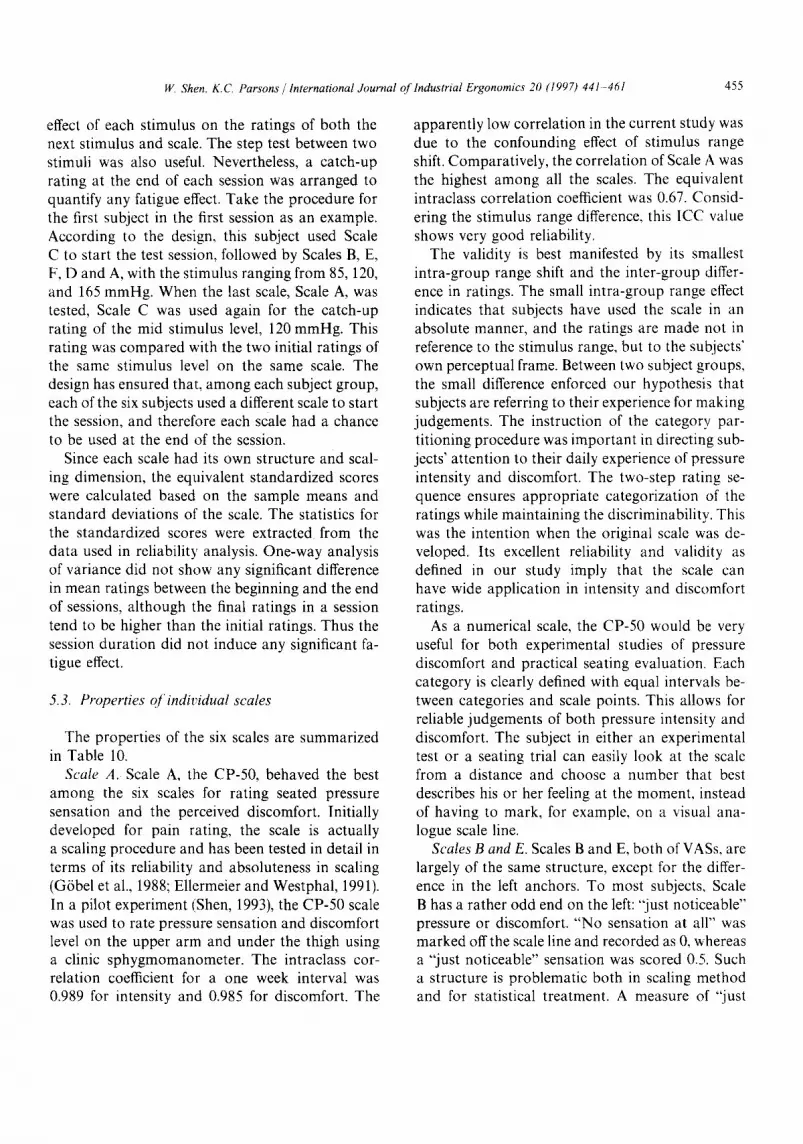
454 W. Shen, K. C. Parsons /International Journal of'Industrial Ergonomics 20 (1997) 441-461
Table 9 Relative differences in mean ratings between the two subject groups (in %)
Rated Scale Session 1 Session 2 items
85 120 Avg 85 120 Avg
Pressure A 9 15 12 3 - 2 2.5 intensity B 18 16 17 l0 8 9
C 20 23 21.5 6 7 6.5 D 19 15 17 27 3(1 28.5 E 32 22 27 15 13 14 F 5 39 22 - 19 7 13
Discomfort A 19 22 20.5 4 - 7 5.5 level B 22 16 19 6 0 3
C 34 33 33.5 12 9 10.5 D 34 14 24 17 18 17.5 E 27 34 30.5 5 8 6.5 F - 6 28 17 24 16 20
Overall A 19 17 18 3 - 8 5.5 Discomfort B 20 16 18 3 10 6.5
C 40 45 42.5 5 15 10 D 34 11 22.5 8 12 10 E 26 35 30.5 -- ~ 20 I I F 15 36 25.5 38 15 • 26.5
Note: Computed by dividing the difference in the mean ratings between the two groups by the mean rating of the group which experienced the lower range of stimuli.
[~ Clarity I
• Precision [
• Overs]l i
A B C D E F Scale
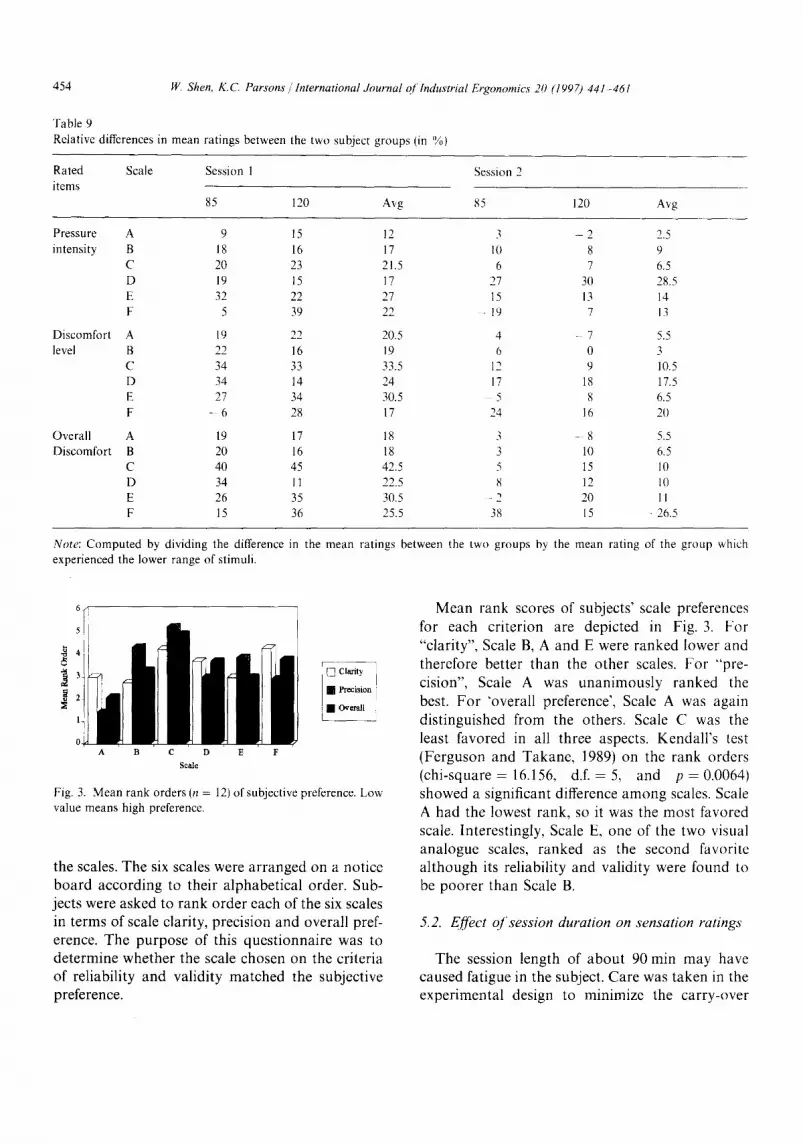
Fig. 3. Mean rank orders (n = 12) of subjective preference. Low' value means high preference.
the scales. T h e six scales were a r r a n g e d on a no t i ce
b o a r d a c c o r d i n g to the i r a l p h a b e t i c a l o rder . Sub-
j ec t s were a sked to r a n k o r d e r each o f the six scales
in t e rms of scale clar i ty , p rec i s ion a n d overa l l pref-
erence. T h e p u r p o s e of this q u e s t i o n n a i r e was to
d e t e r m i n e w h e t h e r the scale chosen on the cr i te r ia
o f re l iab i l i ty and va l id i ty m a t c h e d the sub jec t ive
preference .
M e a n r a n k scores of sub jec t s ' scale preferences
for each c r i t e r ion are dep i c t ed in Fig. 3. F o r
"c la r i ty" , Scale B, A a n d E were r a n k e d l ower and
the re fo re be t t e r than the o t h e r scales. F o r "pre -
c i s ion" , Scale A was u n a n i m o u s l y r a n k e d the
best. F o r ' ove ra l l p reference ' , Scale A was aga in
d i s t i ngu i shed f rom the others . Scale C was the
least f avo red in all th ree aspects . K e n d a l l ' s test
( F e r g u s o n and T a k a n e , 1989) on the r ank o rde r s
( ch i - square = 16.156, d.f. = 5, and p = 0.0064)
s h o w e d a s igni f icant d i f ference a m o n g scales. Scale
A had the lowes t rank , so it was the m o s t f avo red
scale. In te res t ing ly , Scale E, one of the two visual
a n a l o g u e scales, r a n k e d as the s econd favor i t e
a l t h o u g h its re l iabi l i ty a n d va l id i ty were found to
be p o o r e r t han Scale B.
5.2. Effect o / s e s s ion duration on sensation ratings"
T h e sess ion l eng th of a b o u t 90 min m a y have
caused fa t igue in the subject . C a r e was t a k e n in the
e x p e r i m e n t a l des ign to m i n i m i z e the c a r r y - o v e r
W. Shen, K.C. Parsons / International Journal of lndustrial Ergonomics 20 (1997) 441 46l 455
effect of each stimulus on the ratings of both the next stimulus and scale. The step test between two stimuli was also useful. Nevertheless, a catch-up rating at the end of each session was arranged to quantify any fatigue effect. Take the procedure for the first subject in the first session as an example. According to the design, this subject used Scale C to start the test session, followed by Scales B, E, F, D and A, with the stimulus ranging from 85, 120, and 165 mmHg. When the last scale, Scale A, was tested, Scale C was used again for the catch-up rating of the mid stimulus level, 120 mmHg. This rating was compared with the two initial ratings of the same stimulus level on the same scale. The design has ensured that, among each subject group, each of the six subjects used a different scale to start the session, and therefore each scale had a chance to be used at the end of the session.
Since each scale had its own structure and scal- ing dimension, the equivalent standardized scores were calculated based on the sample means and standard deviations of the scale. The statistics for the standardized scores were extracted from the data used in reliability analysis. One-way analysis of variance did not show any significant difference in mean ratings between the beginning and the end of sessions, although the final ratings in a session tend to be higher than the initial ratings. Thus the session duration did not induce any significant fa- tigue effect.
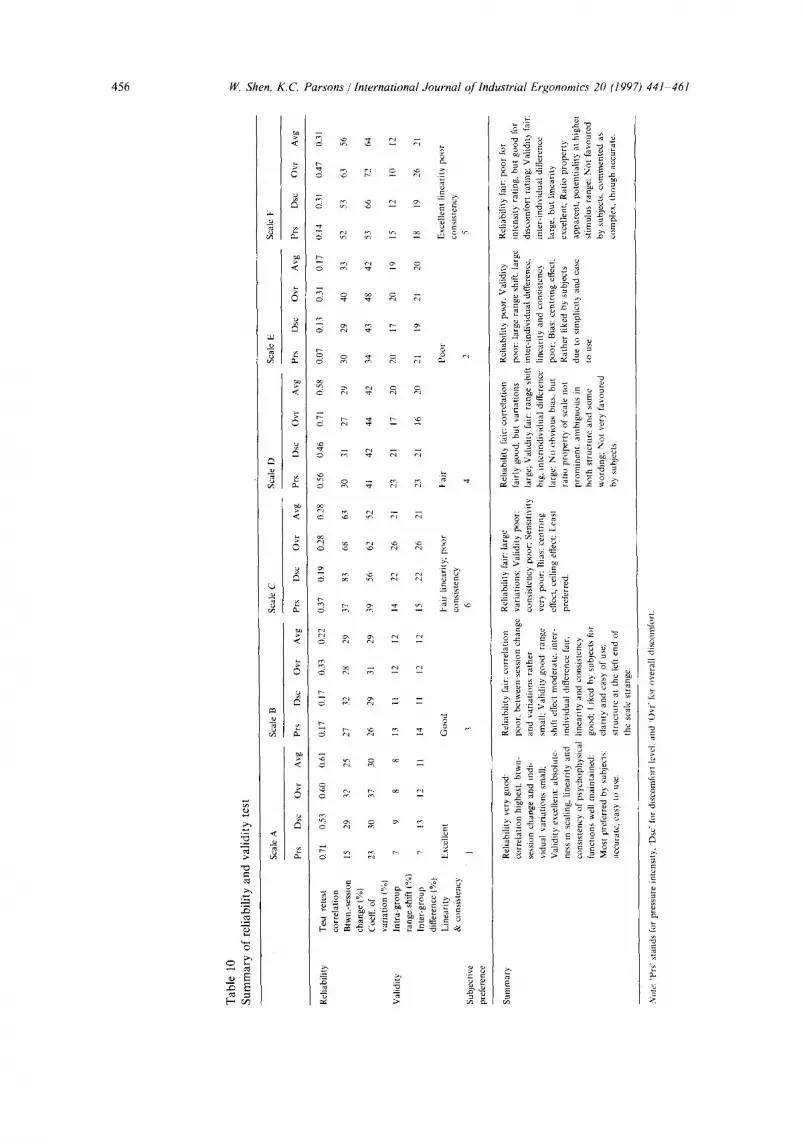
5.3. Properties of individual scales
The properties of the six scales are summarized in Table 10.
Scale A. Scale A, the CP-50, behaved the best among the six scales for rating seated pressure sensation and the perceived discomfort. Initially developed for pain rating, the scale is actually a scaling procedure and has been tested in detail in terms of its reliability and absoluteness in scaling (G6bel et al., 1988; Ellermeier and Westphal, 1991). In a pilot experiment (Shen, 1993), the CP-50 scale was used to rate pressure sensation and discomfort level on the upper arm and under the thigh using a clinic sphygmomanometer. The intraclass cor- relation coefficient for a one week interval was 0.989 for intensity and 0.985 for discomfort. The
apparently low correlation in the current study was due to the confounding effect of stimulus range shift. Comparatively, the correlation of Scale A was the highest among all the scales. The equivalent intraclass correlation coefficient was 0.67. Consid- ering the stimulus range difference, this ICC value shows very good reliability.
The validity is best manifested by its smallest intra-group range shift and the inter-group differ- ence in ratings. The small intra-group range effect indicates that subjects have used the scale in an absolute manner, and the ratings are made not in reference to the stimulus range, but to the subjects' own perceptual frame. Between two subject groups, the small difference enforced our hypothesis that subjects are referring to their experience for making judgements. The instruction of the category par- titioning procedure was important in directing sub- jects' attention to their daily experience of pressure intensity and discomfort. The two-step rating se- quence ensures appropriate categorization of the ratings while maintaining the discriminability. This was the intention when the original scale was de- veloped. Its excellent reliability and validity as defined in our study imply that the scale can have wide application in intensity and discomfort ratings.
As a numerical scale, the CP-50 would be very useful for both experimental studies of pressure discomfort and practical seating evaluation. Each category is clearly defined with equal intervals be- tween categories and scale points. This allows for reliable judgements of both pressure intensity and discomfort. The subject in either an experimental test or a seating trial can easily look at the scale from a distance and choose a number that best describes his or her feeling at the moment, instead of having to mark, for example, on a visual ana- logue scale line.
Scales B and E. Scales B and E, both of VASs, are largely of the same structure, except for the differ- ence in the left anchors. To most subjects, Scale B has a rather odd end on the left: ' just noticeable" pressure or discomfort. "No sensation at all" was marked offthe scale line and recorded as 0, whereas a ' just noticeable" sensation was scored 0.5. Such a structure is problematic both in scaling method and for statistical treatment. A measure of ' just
456 W. Shen, K.C. Parsons / International Journal of Industrial Ergonomics' 20 12997) 441 461
:-,5
o b
o ~ ,.g ~ gl,
g. >,
=
= ~
r - -
c5 ,.~ ,,~ " - o,
S
g.
bq
- ~ ~ ~
-~
,q
r - -
- - e4 ~ - -
7~
'~, e.~ oc e4
. =
- - -~ ~. > .~
& . g a d '
~ ~ ~ ~ '° .= ~ g
B -a
~ . ~ ' ~ N 24
g o -4 g .~ g
>,
• . ~=~ .~4-~ ,~ ~ > ~'
= o . , t-
,->,
c F= =
~ " 4 " 4 , 5 " ~ ~ - * o . - = =
,z., , N ~ ~,'4-J E :5 ,.:..- '~ _ > , ' = ¢ = '-' .g.= =- =,2, o ~ : ~
:= = > >-, ~a =
'~ ~ g '~ '74 o ~
>,
E E
o E
8
"y. P
oE ~5
=
E
2 .
~ Shen, K. C. Parsons / International Journal o)C lndustrial Ergonomics 20 (1997) 44l 461 457
noticeable" sensation is a psychophysical and stat- istical concept. To provide a judgement of "just noticeable" sensation in a rating task is perhaps beyond human sensory discriminability. Statist- ically, opposed to the continuity of the remaining portion of the line, the gap between 0 and 0.5 disqualified parametric data processing.
Both Scales B and E behaved poorly in the reliability test. The unusual structure however made Scale B appear to have higher validity than Scale E: the linearity of Scale B was maintained with different ranges of stimuli, and its consistency was kept throughout the whole range. In compari- son, Scale E suffered a serious centering effect, the mid stimulus in low range being rated higher than the high range. In examining individual ratings, it was found that the poorer validity of Scale E was related to the scoring method. Ratings on Scale E was scored as the length from 0, "no at all", to the rated point, while on Scale B, the scores were meas- ured from 0.5 "just noticeable" onwards. The in- crease in base score bv 0.5 unexpectedly corrected the linearity.
Scale C. Scale C proved to be the worst rating scale for pressure intensity and discomfort. Behav- ior of this scale was very inconsistent. Subjects may have had difficulty finding a reference for their judgement. Sensitivity was also poor.
Scale D. Explanation of Scale D, CR-10, was somewhat difficult. Borg (1982) developed this scale to replace the previous RPE-20 (Borg, 1962) for human sensations, intending to define more clearly the scale points in an absolute manner, and to introduce a ratio property. It has been increasingly applied to physical exertion or intensity rating (Johansson and Ljunggren, 1989; Thompson and Chaffin, 1993; Ulin et al., 1993), and to body dis- comfort rating (Gustafson-SiSderman, 1987; Grin- ten and Smitt, 1992; Bobjer et al., 1993; Kihlberg et al., 1993; WikstriSm, 1993). Results from this study however did not justify either of these two pur- poses. First, the reliability was not as good as it was assumed. Although the test-retest correlation was almost comparable to that of the CP-50 scale, the variation in ratings was very large, 42% according to our results. In reporting their study, Bobjer et al. (1993) provided the mean and standard deviations of the perceived discomfort of the hand, using the
CR-10 scale. The average coefficient of variation from their data was as high as 57.6%. Few signifi- cant results were elicited in their work due to the large variation in ratings. Secondly, ratings on the CR-10 exhibited large intra-group range shift as well as inter-group difference. Not only did each subject use his or her own "subscale" (Bobjer et al., 1993), but each individual was not using the scale in a consistent manner. The large inter-individual variation in the CR-10 rating may not reflect indi- vidual difference in sensation when such variation is due to the large intra-individual variability and to the poor validity of the scale itself (Thompson and Chaffin, 1993). Furthermore, a common trend in ratings using the CR-10 scale from the cited literature is that discomfort ratings are typically very low toward the minimal end, and the distribu- tion is left skewed (Gustafson-SiSderman, 1987; Grinten and Smitt, 1992). Some of our subjects even complained about the ambiguity of scale an- chor definitions, e.g. "somewhat".
Scale F. Scale F was structured exactly according to the ratio qualities. However, the study showed that the ratings were skewed towards the low sensa- tion end, similar to the trend found with Scale D. The test-retest reliability was rather poor due to large variation in the low-rating end. For validity, intra-group range shift was small but inter-subject group difference was large, indicating that subjects used this scale in a rather absolute way on an individual basis. When the ratings are log trans- formed, however, the linearity is excellent. The scale may especially be useful for high stimulus range or severe discomfort ratings. At the time of submitting this current study for publication, the first author read a paper by Kihlberg et al. (1995) where a slightly different 20-point discomfort scale was used. It would make an interesting postgraduate coursework to compare the psychometric proper- ties of the two 20-point scales.
6. Conclusion
Scale A, the five-category 50-point scale, showed the best overall reliability and validity for pressure intensity and discomfort ratings. The scale is very sensitive in terms of discriminability, a quality to be
458 ~ Shen, K.C. Parsons/International Journal of Industrial Ergonomics 20 (1997) 441 461
expected for psychophysical studies. Moreover, variation of ratings on this scale is basically con- stant, and the distribution of rating scores is nor- mal, which justifies parametric statistical treatments. It is believed that the CP-50 scale would be appropriate for ratings on other intensity sensation and related subjective constructs.
Acknowledgements
The study was supported by a British Council award. The authors would also like to acknowledge the enormous assistance from the Institute for Con- sumer Ergonomics during this study.
Appendix. Rating scales and instructions
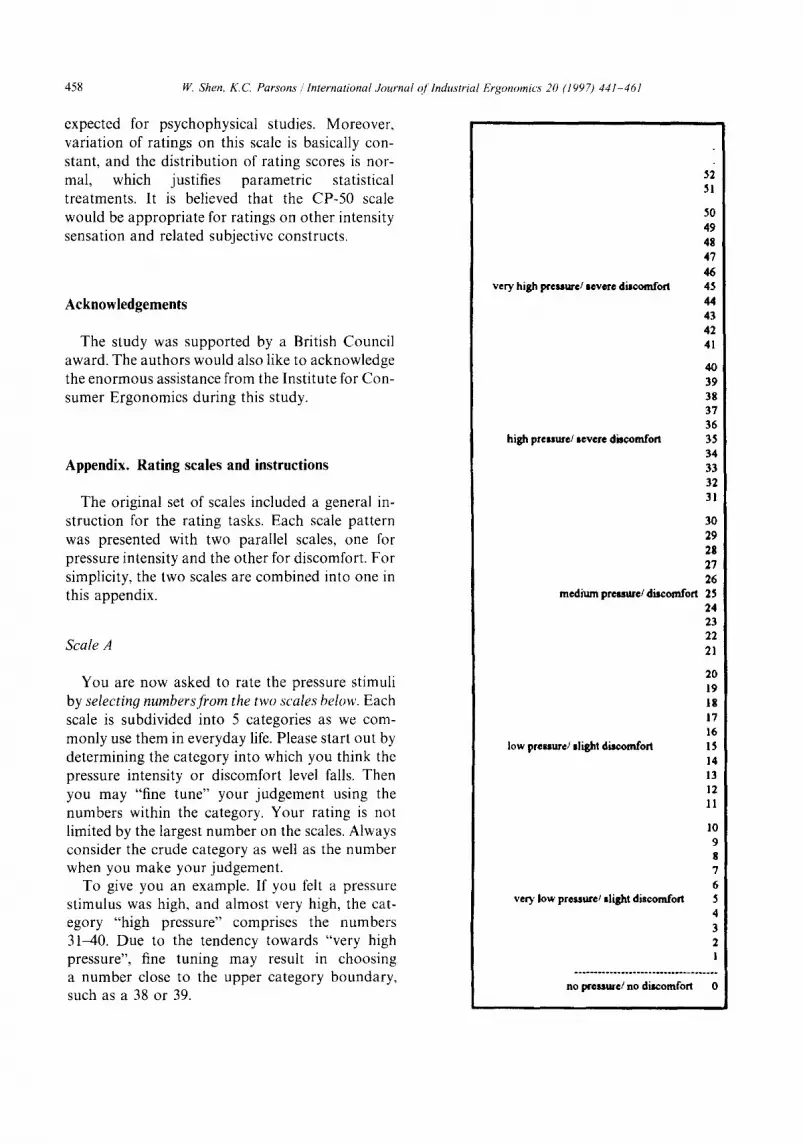
The original set of scales included a general in- struction for the rating tasks. Each scale pattern was presented with two parallel scales, one for pressure intensity and the other for discomfort. For simplicity, the two scales are combined into one in this appendix.
Scale A
You are now asked to rate the pressure stimuli by selectin9 numbers fiom the two scales below. Each scale is subdivided into 5 categories as we com- monly use them in everyday life. Please start out by determining the category into which you think the pressure intensity or discomfort level falls. Then you may "fine tune" your judgement using the numbers within the category. Your rating is not limited by the largest number on the scales. Always consider the crude category as well as the number when you make your judgement.
To give you an example. If you felt a pressure stimulus was high, and almost very high, the cat- egory "high pressure" comprises the numbers 31-40. Due to the tendency towards "very high pressure", fine tuning may result in choosing a number close to the upper category boundary, such as a 38 or 39.
very high preumr¢/severe discomfort
52 51
50 49 48 47 46 45 44 43 42 41
40 39 38 37 36
high pressure/severe discomfort 35 34 33 32 31
30 29 28 27 26
medium preuur¢/discomfort 25 24 23 22 21
20 19 18 17 16
low pressure/.,light discomfort 15 14 13 12 11
10 9 8 7 6
very low pressure/slight dlscomfoll 5 4 3 2 1
no pressure/no discomfort 0

W. Shen, K+C. Parsons /'International Journal of Industrial Ergonomics 20 (1997)44l 461 459
Scale B
You are now asked to rate the pressure stimuli by marking a backslash " / ' across the horizontal line of the scales below. Please read the words under the line first and then decide your rating. If you feel that there is no pressure or discomfort at all, write a zero "0" on the most left end of the scale.
just noticeable medium extreme pressure pressure pressure /discomfort /discomfort /discomfort
I I I
Scale C
You are now asked to rate the pressure stimuli by choosing a number among from "0" to "7" on the scales below. Please read the words on the scale first and then decide your rating.
n o e x t r e m e
p r e s s u r e p r e s s u r e
/ d i s c o m f o r t / d i s c o m f o r t
0 . . . . . . I . . . . . . 2 . . . . . . 3 . . . . . . 4 . . . . . . 5 . . . . . . 6 . . . . . . 7 i
Scale D
You are now asked to rate the pressure stimuli by choosing a number on the scales below. You are permitted to use decimals and also go beyond 10 or 0.5 if you feel necessary. Please first read the words on the scale and then decide your rating.
0 0.5 1 2 3 4 5 6 7 8 9 10
None at all Very, very low ptesatre/slight discomfort Very low presane/slight disconffort Low pressure/slight discomfort Moderate pressure/discomfort Somewhat high pressure/severe discomfort High pressure/severe discomfort
Very high pressure/severe discomfort
Vet),, very high pressure/severe discomfort
(just noticeable)
(almost max)
• Maximal
460 ~ Shen, K.C. Parsons /International Journal of Industrial Ergonomics 20 (1997) 441 461
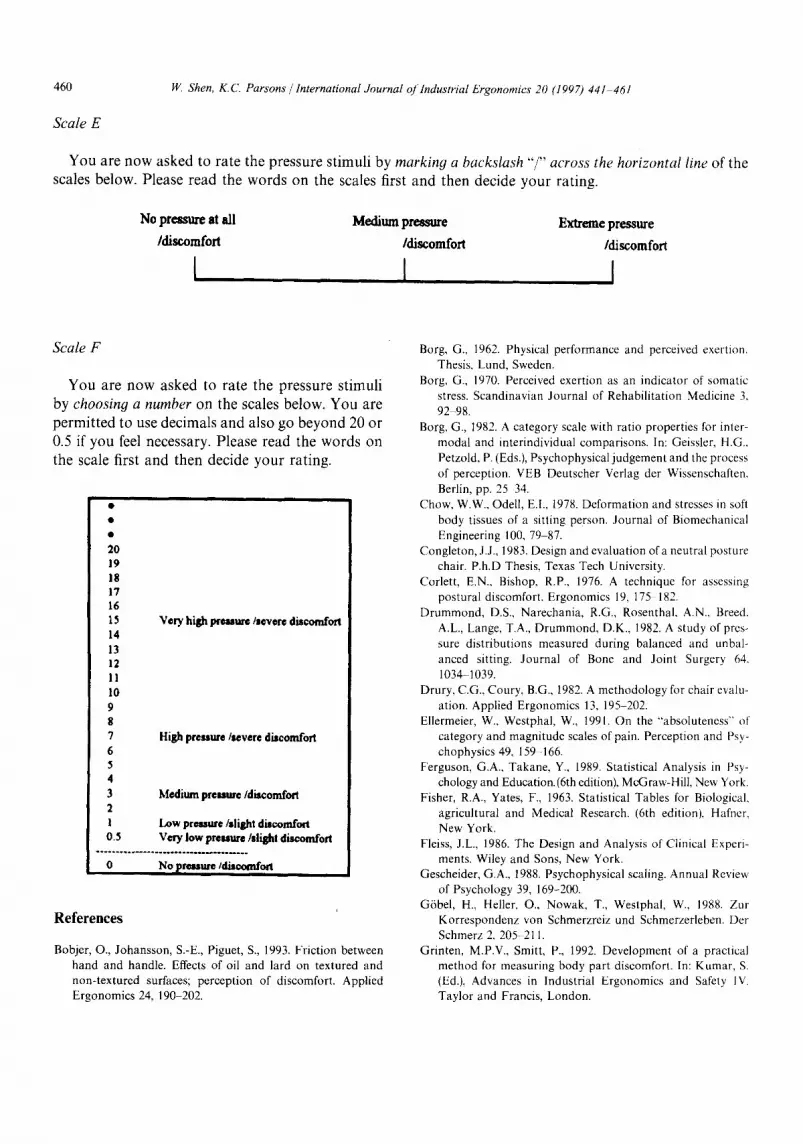
Scale E
You are now asked to rate the pressure stimuli by markin9 a backslash "/" across the horizontal line of the scales below. Please read the words on the scales first and then decide your rating.
No pressure at all Medium pressure Extreme pressure
/discomfort /discomfort /discomfort
I 1 I
Scale F
You are now asked to rate the pressure stimuli by choosin9 a number on the scales below. You are permitted to use decimals and also go beyond 20 or 0.5 if you feel necessary. Please read the words on the scale first and then decide your rating.
20 19 18 17 16 15 14 13 12 11 10 9 8 7 High preuur©/severe all.comfort 6 5 4 3 Medium preuute/discomfort 2 1 Low preHuse/slight discomfort 0.5 Very low preuure/slight discomfort
. . . . . . . . . . . . . . . . . . . . . . . . . . . . . . . . . . . . . .
0 No pressure/disoomfo~l
V©ry high premur©/s©verc discomfort
References
Bobjer, O., Johansson, S.-E., Piguet, S., 1993. Friction between hand and handle. Effects of oil and lard on textured and non-textured surfaces; perception of discomfort. Applied Ergonomics 24, 190-202.
Borg, G., 1962. Physical performance and perceived exertion. Thesis, Lurid, Sweden.
Borg, G., 1970. Perceived exertion as an indicator of somatic stress. Scandinavian Journal of Rehabilitation Medicine 3, 92-98.
Borg, G., 1982. A category scale with ratio properties for inter- modal and interindividual comparisons. In: Geissler, H.G., Petzold, P. (Eds.), Psychophysical judgement and the process of perception. VEB Deutscher Verlag der Wissenschaften, Berlin, pp. 25 34.
Chow, W.W., Odell, E.I., 1978. Deformation and stresses in soft body tissues of a sitting person. Journal of Biomechanical Engineering 100, 79 87.
Congleton, J.J., 1983. Design and evaluation of a neutral posture chair. P.h.D Thesis, Texas Tech University.
Corlen, E.N., Bishop, R,P., 1976. A technique for assessing postural discomfort. Ergonomics 19, 175 182.
Drummond, D.S., Narechania, R.G., Rosenthak A.N., Breed. A.L., Lange, T.A., Drummond, D.K., 1982. A study of pres- sure distributions measured during balanced and unbal- anced sitting. Journal of Bone and Joint Surgery 64~ 1034- 1039.
Drury, C.G., Coury, B.G., 1982. A methodology for chair evalu- ation. Applied Ergonomics 13, 195 202.
Ellermeier, W., Westphal, W., 1991. On the "absoluteness" of category and magnitude scales of pain. Perception and Psy- chophysics 49, 159-166.
Ferguson, G.A., Takane, Y., 1989. Statistical Analysis in Psy- chology and Education. (6th edition), McGraw-Hill, New York.
Fisher, R.A., Yates, F., 1963. Statistical Tables for Biological, agricultural and Medical Research. (6th edition), Hafner. New York.
Fleiss, J.L., 1986. The Design and Analysis of Clinical Experi- ments. Wiley and Sons, New York.
Gescheider, G.A., 1988. Psychophysical scaling. Annual Review of Psychology 39, 169-200.
G6bel, H., Heller, O., Nowak, T., Westphal, W., 1988. Zur Korrespondenz yon Schmerzreiz und Schmerzerleben. Der Schmerz 2, 205- 2l 1.
Grinten, M.P.V., Smitt, P., 1992. Development of a practical method for measuring body part discomfort. In: Kumar, S. (Ed.), Advances in Industrial Ergonomics and Safety IV. Taylor and Francis, London.
W. Shen, K. C. Parsons / International Journal of Industrial Ergonomics 20 (1997) 441-461 461
Gustafson-Sbderman, U., 1987. The effect of an adjustable sit- ting angle on the perceived discomfort from the back and neck-shoulder regions in building crane operators. Applied Ergonomics 18, 297-304.
Hertzberg, H.T.E., 1972. The human buttocks in sitting: Pres- sures, patterns, and palliatives. SAE Report No. 720005.
Hertzberg, H.T.E., 1958. Seat comfort. In: H.T.E. Hertzberg (Ed.), Annotated Bibliography of Applied Physical Anthro- pology in Human Engineering, WADC Technical Report 56-30, Appendix 1, pp. 297 300.
Johansson, S.-E., Ljunggren, G., 1989. Perceived exertion during a self-imposed pace of work for a group of cleaners. Applied Ergonomics 20, 307-312.
Kihlberg, S., Kjellberg, A., Lindbeck, L., 1993. Pneumatic tool torque reaction: reaction forces, displacement, muscle activ- ity and discomfort in the hand-arm system. Applied Ergo- nomics 24, 165-173.
Kihlberg, S., Kjellberg, A., Lindbeck, L., 1995. Discomfort from pneumatic tool torque reaction: acceptability limits. Interna- tional Journal of Industrial Ergonomics 15, 411~,26.
Kirk, N.S., Sadoyama, T., 1973. A relationship between endur- ance and discomfort in static work. Department of Human Sciences, Loughborougb University of Technology.
Lee, NS., Schneider, L.W., Ricci, L.L., 1990. Review of selected literature related to seating discomfort. UMTRI-90-12, PB90-224809, Ann Arbor, Michigan.
L~511gen, H., Ulmer, H.-V., Gross, R., Wibert, G., Nieding, G.v., 1975. Methodical aspects of perceived exertion rating and its relation to pedalling rate and rotating mass. European Jour- nal of Applied Physiology 34, 205-215.
Matsuoka, Y., Hanai, T., 1988. Study of comfortable sitting posture. SAE Report No. 880054.
Norusis, M.J., 1993. SPSS for Windows: Advanced Statistics. SPSS Inc., Chicago.
Oborne, D.J., Clarke, M.J., 1975. The effect of rating scale parameters on the assessment of vibration intensity. Ergo- nomics 18, 67-79.
Pitrella, F.D., K~ippler, W.-D., 1988. Identification and evalu- ation of scale design principles in the development of the extended range, sequential judgement scale. Forscbungsgel- lschafl fiir Angewandte Naturwissenschaften e.V. Forschun- gsinstitut fiir Anthropotechnik, Wachtberg, Germany.
Poulton, E.C., 1977. Quantitative subjective assessments are almost always biased, sometimes completely misleading. British Journal of Psychology 68, 409425.
Poulton, E.C., 1982. Biases in quantitative judgements. Applied Ergonomics 13, 31-42.
Schneider, L.W., Ricci, L., 1989. Survey of driver seating discom- fort and related factors. Report No. UMTR1-8%2L Ann Arbor, Michigan.
Shackel, B., Chidsey, K.D., Shipley, P., 1969. The assessment of chair comfort. Ergonomics 12, 269-306.
Shen, W., 1993. Pilot for pressure stimuli and sensation. Internal Report, Department of Human Sciences, Loughborough University of Technology.
Skinner, J.S., Hustler, R., Bergsteinova, V., Buskirk, E.R., 1973. The validity and reliability of a rating scale of perceived exertion. Medical Science and Sports 5, 94 96.
Thomas, R.E., Congleton, J.J., Hukingtom R,D., Whiteley, J.R., Rodrigues, C.C., 1991. An investigation of relationships be- tween driver comfort, performance and automobile seat type during short term driving tasks. International Journal of Industrial Ergonomics 8, 103-114.
Thompson, D.D., Chaffin, D.B., 1993. Can biomechanically de- termined stress be perceived? In: Proceedings Human Fac- tors and Ergonomics Society 37th Annual meeting, Vol. 2, 11-15 October, Seattle, Washington, DC, pp. 789-792.
Ulin, S.S., Armstrong, T.J., Snook, S.H., Monroe-Kerseriing, W,, 1993, Examination of the effect of tool mass and work postures on perceived exertion for a screw driving task. International Journal of Industrial Ergonomics 12, 105- 115.
WikstriSm, B.-O., 1993. Effects from twisted postures and whole-body vibration during driving. International Journal of Industrial Ergonomics 12, 61-75.
Wilson, J.R., Corlett, E.N., 1991. Evaluation of Human Work. Taylor & Francis, London.
Yu, C.-Y., Keyserling, W.M., 1989. Evaluation of a new work seat for industrial sewing operations. Applied Ergonomics 20, 17-25.
Yu, C.-Y., Keyserling, W.M., Chaffin, D.B., 1988. Development of a work seat for industrial sewing operations: Results of a laboratory study. Ergonomics 31, 1765 1786.
Zacharkow, D., 1988. Posture: Sitting, Standing, Chair Design and Exercise. Thomas, Springfield, Illinois.


