Embed Size (px)
Citation preview
Oracle® Retail Predictive Application ServerUser Guide for the Fusion Client
Release 14.0.1
E52877-01
May 2014

Oracle Retail Predictive Application Server User Guide for the Fusion Client, Release 14.0.1
E52877-01
Copyright © 2014, Oracle and/or its affiliates. All rights reserved.
Primary Author: Bernadette Goodman
This software and related documentation are provided under a license agreement containing restrictions on use and disclosure and are protected by intellectual property laws. Except as expressly permitted in your license agreement or allowed by law, you may not use, copy, reproduce, translate, broadcast, modify, license, transmit, distribute, exhibit, perform, publish, or display any part, in any form, or by any means. Reverse engineering, disassembly, or decompilation of this software, unless required by law for interoperability, is prohibited.
The information contained herein is subject to change without notice and is not warranted to be error-free. If you find any errors, please report them to us in writing.
If this is software or related documentation that is delivered to the U.S. Government or anyone licensing it on behalf of the U.S. Government, the following notice is applicable:
U.S. GOVERNMENT END USERS: Oracle programs, including any operating system, integrated software, any programs installed on the hardware, and/or documentation, delivered to U.S. Government end users are "commercial computer software" pursuant to the applicable Federal Acquisition Regulation and agency-specific supplemental regulations. As such, use, duplication, disclosure, modification, and adaptation of the programs, including any operating system, integrated software, any programs installed on the hardware, and/or documentation, shall be subject to license terms and license restrictions applicable to the programs. No other rights are granted to the U.S. Government.
This software or hardware is developed for general use in a variety of information management applications. It is not developed or intended for use in any inherently dangerous applications, including applications that may create a risk of personal injury. If you use this software or hardware in dangerous applications, then you shall be responsible to take all appropriate fail-safe, backup, redundancy, and other measures to ensure its safe use. Oracle Corporation and its affiliates disclaim any liability for any damages caused by use of this software or hardware in dangerous applications.
Oracle and Java are registered trademarks of Oracle and/or its affiliates. Other names may be trademarks of their respective owners.
Intel and Intel Xeon are trademarks or registered trademarks of Intel Corporation. All SPARC trademarks are used under license and are trademarks or registered trademarks of SPARC International, Inc. AMD, Opteron, the AMD logo, and the AMD Opteron logo are trademarks or registered trademarks of Advanced Micro Devices. UNIX is a registered trademark of The Open Group.
This software or hardware and documentation may provide access to or information on content, products, and services from third parties. Oracle Corporation and its affiliates are not responsible for and expressly disclaim all warranties of any kind with respect to third-party content, products, and services. Oracle Corporation and its affiliates will not be responsible for any loss, costs, or damages incurred due to your access to or use of third-party content, products, or services.
Value-Added Reseller (VAR) Language
Oracle Retail VAR Applications
The following restrictions and provisions only apply to the programs referred to in this section and licensed to you. You acknowledge that the programs may contain third party software (VAR applications) licensed to Oracle. Depending upon your product and its version number, the VAR applications may include:
(i) the MicroStrategy Components developed and licensed by MicroStrategy Services Corporation (MicroStrategy) of McLean, Virginia to Oracle and imbedded in the MicroStrategy for Oracle Retail Data Warehouse and MicroStrategy for Oracle Retail Planning & Optimization applications.
(ii) the Wavelink component developed and licensed by Wavelink Corporation (Wavelink) of Kirkland, Washington, to Oracle and imbedded in Oracle Retail Mobile Store Inventory Management.
(iii) the software component known as Access Via™ licensed by Access Via of Seattle, Washington, and imbedded in Oracle Retail Signs and Oracle Retail Labels and Tags.
(iv) the software component known as Adobe Flex™ licensed by Adobe Systems Incorporated of San Jose, California, and imbedded in Oracle Retail Promotion Planning & Optimization application.
You acknowledge and confirm that Oracle grants you use of only the object code of the VAR Applications. Oracle will not deliver source code to the VAR Applications to you. Notwithstanding any other term or condition of the agreement and this ordering document, you shall not cause or permit alteration of any VAR Applications. For purposes of this section, “alteration” refers to all alterations, translations, upgrades, enhancements, customizations or modifications of all or any portion of the VAR Applications including all reconfigurations, reassembly or reverse assembly, re-engineering or reverse engineering and recompilations or reverse compilations of the VAR Applications or any derivatives of the VAR Applications. You

acknowledge that it shall be a breach of the agreement to utilize the relationship, and/or confidential information of the VAR Applications for purposes of competitive discovery.
The VAR Applications contain trade secrets of Oracle and Oracle's licensors and Customer shall not attempt, cause, or permit the alteration, decompilation, reverse engineering, disassembly or other reduction of the VAR Applications to a human perceivable form. Oracle reserves the right to replace, with functional equivalent software, any of the VAR Applications in future releases of the applicable program.

v
Contents
List of TablesList of Figures
Send Us Your Comments .................................................................................................................... xxvii
Preface ............................................................................................................................................................. xxix
Audience................................................................................................................................................... xxixDocumentation Accessibility ................................................................................................................. xxixRelated Documents ................................................................................................................................. xxixCustomer Support ................................................................................................................................... xxixReview Patch Documentation ............................................................................................................... xxxImproved Process for Oracle Retail Documentation Corrections .................................................... xxxOracle Retail Documentation on the Oracle Technology Network ................................................. xxxConventions ............................................................................................................................................. xxxi
1 Getting Started
Overview .................................................................................................................................................... 1-1Where Does the RPAS Fusion Client Fit in an Retail Enterprise ................................................ 1-2
Basic Concepts of RPAS .......................................................................................................................... 1-2Multidimensionality .......................................................................................................................... 1-2Dimensions.......................................................................................................................................... 1-3Measures.............................................................................................................................................. 1-3Domains and Workbooks ................................................................................................................. 1-3
Terminology Differences Between Clients ......................................................................................... 1-4Setting Up Your Browser......................................................................................................................... 1-4
Cache Settings..................................................................................................................................... 1-5Security Settings for Internet Explorer............................................................................................ 1-5
Logging in to the Fusion Client ............................................................................................................. 1-7Logging in with Single Sign-On....................................................................................................... 1-9Accessing through Guided Launch................................................................................................. 1-9Concurrent Sessions........................................................................................................................ 1-10Multiple Sessions............................................................................................................................. 1-10
Understanding the Taskflow............................................................................................................... 1-11Access Based Visibility ................................................................................................................... 1-15Switching Between Multiple Tasks .............................................................................................. 1-15
Opening a Workbook ........................................................................................................................... 1-16Understanding the Open Workbook Window ........................................................................... 1-17

vi
Creating a New Workbook .................................................................................................................. 1-18Deleting a Workbook............................................................................................................................ 1-20Renaming a Workbook......................................................................................................................... 1-21Understanding the Workbook Wizard Window ............................................................................. 1-22
Saving and Loading Favorites....................................................................................................... 1-24Saving Favorites .............................................................................................................................. 1-24
Saving Calendar Positions as Favorites ................................................................................ 1-25Editing Favorites ............................................................................................................................. 1-26Loading Favorites............................................................................................................................ 1-26Deleting Favorites ........................................................................................................................... 1-26
Extra Measures ....................................................................................................................................... 1-27Tasks with Extra Measures ............................................................................................................ 1-27Using Extra Measures..................................................................................................................... 1-28
Plug-Ins from External Applications................................................................................................. 1-28Overview of Plug-Ins from Other applications .......................................................................... 1-28Configuring the Plug-In to Display in the Fusion Client .......................................................... 1-28Adding Plug-Ins to RPAS .............................................................................................................. 1-29
Launching from the RPAS Fusion Client Home Page........................................................ 1-29Adding to the Task Flow ........................................................................................................ 1-29Launching from Within a RPAS Worksheet ........................................................................ 1-30
Locating the Commit Status ................................................................................................................ 1-30Viewing an Announcement................................................................................................................. 1-31Locating the Version Number ............................................................................................................. 1-32Accessing Online Help......................................................................................................................... 1-32
Contents ........................................................................................................................................... 1-33Figures and Tables .......................................................................................................................... 1-33Index.................................................................................................................................................. 1-34Search ................................................................................................................................................ 1-34
Logging Out of the Application ......................................................................................................... 1-35
2 Understanding the User Interface
Quick Access Toolbar .............................................................................................................................. 2-2File Menu Options.............................................................................................................................. 2-3Edit Menu Options............................................................................................................................. 2-4View Menu Options........................................................................................................................... 2-5Format Menu Options ....................................................................................................................... 2-6
Contents Area............................................................................................................................................ 2-7View Title Bar ..................................................................................................................................... 2-8
Maximizing or Restoring a View.............................................................................................. 2-8Minimizing a View ..................................................................................................................... 2-8Moving a View ............................................................................................................................ 2-9Renaming a View ........................................................................................................................ 2-9Making a Copy of a View .......................................................................................................... 2-9Deleting a View ........................................................................................................................ 2-10
Page Edge and Dimension Tiles Area.......................................................................................... 2-10Understanding Paging/Position Navigation ...................................................................... 2-11
View Toolbar.................................................................................................................................... 2-12
vii
View Area......................................................................................................................................... 2-13Rotating or Pivoting Dimensions .......................................................................................... 2-14
Views Docking Area ....................................................................................................................... 2-16Resizing Pivot Table Row and Column ....................................................................................... 2-17
Resizing Single Row and Column......................................................................................... 2-17Resizing Multiple Rows and Columns ................................................................................. 2-18
3 Workbooks
Loading Data to Workbooks................................................................................................................... 3-1Saving Workbooks ................................................................................................................................... 3-2
Permissible File Names ..................................................................................................................... 3-2Save As Option ................................................................................................................................... 3-3
Auto-Save..................................................................................................................................... 3-4Renaming Workbooks ............................................................................................................................. 3-4Calculating Workbooks........................................................................................................................... 3-5Refreshing Workbooks............................................................................................................................ 3-6Committing Workbooks.......................................................................................................................... 3-8
Viewing Commit Statuses.............................................................................................................. 3-10Synchronized Page Edge Scrolling .................................................................................................... 3-12
4 Cells
Select and Manipulate Cells .................................................................................................................. 4-1Navigation Shortcuts for Editing Cells ................................................................................................ 4-2Enter or Change Values in a Cell........................................................................................................... 4-3Modify Data with Cell Formulas .......................................................................................................... 4-4
Using Math Formulas ........................................................................................................................ 4-4Overriding Spread Methods...................................................................................................... 4-4
Replicate: [value] r .............................................................................................................. 4-5Evenly: [value] e .................................................................................................................. 4-5Proportionally: [value] p .................................................................................................... 4-5Delta: [value] d .................................................................................................................... 4-5
Enter Measure Data Using a Scaling Factor ................................................................................... 4-5Clear and Fill Cells in a View ................................................................................................................ 4-7
Clear ..................................................................................................................................................... 4-8Clear Cells .................................................................................................................................... 4-8Clear a Dimension Level............................................................................................................ 4-9Clear a Slice............................................................................................................................... 4-10Undo Clear ................................................................................................................................ 4-11
Fill ...................................................................................................................................................... 4-11Fill from Pivot Table Toolbar (Quick Fill) ............................................................................ 4-14
Spread Method.................................................................................................................. 4-16Undo Fill.................................................................................................................................... 4-18
Modifying Cell Data ............................................................................................................................. 4-18Revert Cell ........................................................................................................................................ 4-19Protection Processing...................................................................................................................... 4-19
Measure Protection Processing .............................................................................................. 4-19
viii
Dimension Protection Processing.......................................................................................... 4-20Single Hierarchy Select ........................................................................................................................ 4-21Cut, Copy, and Paste ............................................................................................................................. 4-22
Cut ..................................................................................................................................................... 4-23Copy .................................................................................................................................................. 4-24Paste .................................................................................................................................................. 4-26
Cut, Copy, and Paste Special ............................................................................................................... 4-27Cut Special........................................................................................................................................ 4-27Copy Special..................................................................................................................................... 4-28Paste Special..................................................................................................................................... 4-29
Copy to External and Paste from External ........................................................................................ 4-31Copy to External.............................................................................................................................. 4-31Paste from External ......................................................................................................................... 4-32
Read-only Measures ............................................................................................................................. 4-33Locking and Unlocking........................................................................................................................ 4-34
Cells ................................................................................................................................................... 4-34Measures........................................................................................................................................... 4-34Positions............................................................................................................................................ 4-35Locking and Unlocking Methods ................................................................................................. 4-36
Locking through the Right-click Context Menu.................................................................. 4-36Locking through the Edit Menu ............................................................................................ 4-37Locking with the Lock Icon .................................................................................................... 4-39
5 Formatting
Default Cell Formats................................................................................................................................ 5-1Modify Formatting ................................................................................................................................... 5-2
Using the Filter to Find Measures.................................................................................................... 5-4Modifying Measure Styles ................................................................................................................ 5-6
Applying Measure Formats....................................................................................................... 5-6Modifying Number Formatting ....................................................................................................... 5-7
Applying Number Formats ....................................................................................................... 5-8Modifying Date/Time ....................................................................................................................... 5-9
Applying Date/Time Formatting.......................................................................................... 5-10Modifying Exceptions..................................................................................................................... 5-11
Applying Exception Formatting ............................................................................................ 5-11Modifying Alert Styles ................................................................................................................... 5-12
Applying Alert Formatting..................................................................................................... 5-13Modifying Dimension Styles ......................................................................................................... 5-13
Applying Dimension Styles.................................................................................................... 5-14Saving Formats....................................................................................................................................... 5-14
Format Levels .................................................................................................................................. 5-15Saving Options ................................................................................................................................ 5-15
Save Changes Only .................................................................................................................. 5-16Save All...................................................................................................................................... 5-16Inheritance Formatting............................................................................................................ 5-16
Deleting Formats ................................................................................................................................... 5-17
ix
6 Dimensions, Levels, and Positions
Showing/Hiding Levels .......................................................................................................................... 6-1Using the Right-Click Menu............................................................................................................. 6-1Using the Dimension Dialog Box .................................................................................................... 6-2
Expanding and Collapsing Levels ........................................................................................................ 6-3Using the Right-Click Menu............................................................................................................. 6-3Using the Dimension Dialog Box..................................................................................................... 6-4
Level Splitting........................................................................................................................................... 6-5Creating a New Split.......................................................................................................................... 6-6Clearing a Split ................................................................................................................................ 6-10Selecting a Split................................................................................................................................ 6-11Editing a Split .................................................................................................................................. 6-13
Showing/Hiding Positions .................................................................................................................. 6-13
7 Measures
Showing/Hiding/Reordering Measures............................................................................................... 7-1Insert Measures......................................................................................................................................... 7-3
Insert Measures Dialog Box .............................................................................................................. 7-4Accessing the Insert Measures Dialog Box.............................................................................. 7-4
Inserting a Measure ........................................................................................................................... 7-6About Inserted Measures .................................................................................................................. 7-8
8 Measure Profiles
Creating a Measure Profile ..................................................................................................................... 8-1Applying Measure Profiles .................................................................................................................... 8-4Updating Measure Profiles..................................................................................................................... 8-5Deleting Measure Profiles ...................................................................................................................... 8-5
Deleting a Measure Profile: Method 1............................................................................................. 8-6Deleting a Measure Profile: Method 2............................................................................................. 8-6
9 Dynamic Position Maintenance
DPM Restrictions .................................................................................................................................... 9-1Add New Positions to a Dimension ..................................................................................................... 9-2Modify an Informal Position ................................................................................................................. 9-8Delete an Informal Position ................................................................................................................... 9-9Using the DPM Search Feature........................................................................................................... 9-11
10 Dynamic Attributes
Accessing the Define New Attribute Dialog Box ........................................................................... 10-1Creating Dynamic Attributes.............................................................................................................. 10-2Managing Dynamic Attributes ........................................................................................................... 10-5
Accessing the Manage Dynamic Attributes Dialog Box............................................................ 10-6Editing Dynamic Attributes .......................................................................................................... 10-7Copying Dynamic Attributes ........................................................................................................ 10-8Renaming Dynamic Attributes ..................................................................................................... 10-9
x
Deleting Dynamic Attributes ...................................................................................................... 10-10Updating Attribute Values ................................................................................................................ 10-10
11 Sort, Find, and Position Queries
Sort ........................................................................................................................................................... 11-1Simple Sort ....................................................................................................................................... 11-1
Sorting By Column Headers................................................................................................... 11-4Sorting with the Toolbar Icons............................................................................................... 11-5Sorting in Outline Mode and Block Mode ........................................................................... 11-5
Outline Mode..................................................................................................................... 11-5Block Mode ........................................................................................................................ 11-6
Sorting Across Page Edge ....................................................................................................... 11-6............................................................................................................................................. 11-8
Undo Sort Using the Context Menu...................................................................................... 11-8Attribute Sorting ................................................................................................................................... 11-9
Select Attributes for Display.......................................................................................................... 11-9Displaying Attributes in Views................................................................................................... 11-11
Outline View........................................................................................................................... 11-11Views ................................................................................................................................ 11-11Merge/Split ..................................................................................................................... 11-12
Block View .............................................................................................................................. 11-14Page Edge................................................................................................................................ 11-15
Reordering Attributes .................................................................................................... 11-15Hiding Attributes............................................................................................................ 11-16
Attribute Based Sort...................................................................................................................... 11-17Find ........................................................................................................................................................ 11-18
Find from the Right-Click Context Menu.................................................................................. 11-18Find from Edit Menu or Ctrl + F................................................................................................. 11-20Find from the View Toolbar ........................................................................................................ 11-20
Position Query ..................................................................................................................................... 11-21Using Position Queries................................................................................................................. 11-22
Position Query Filtering Without Calculating................................................................... 11-23Updating Measure Data in Position Queries ..................................................................... 11-24Scrolling in Position Queries ................................................................................................ 11-24
Using Position Queries with Auto Evaluate ............................................................................. 11-26Updating Measure Data with Auto Evaluate .................................................................... 11-26Scrolling with Auto Evaluate ............................................................................................... 11-27
No Position Query Matches......................................................................................................... 11-28Position Filtering ................................................................................................................................. 11-29Working with Position Filters ........................................................................................................... 11-30
Initiating Position Filtering.......................................................................................................... 11-30Selecting from Page Edge Position...................................................................................... 11-30Selecting from Rows or Columns ........................................................................................ 11-31Selecting from Cells ............................................................................................................... 11-32
Using Position Filters.................................................................................................................... 11-32Tiling Views ............................................................................................................................ 11-33Basic Example of Applying Position Filters....................................................................... 11-34

xi
Additional Example of Applying Position Filtering......................................................... 11-35Page Edge Synchronization.................................................................................................. 11-39
Position Filtering and Charts....................................................................................................... 11-40Position Filtering and Chart Drilling .................................................................................. 11-41
Factors Affecting the Use of Position Filters ............................................................................. 11-41Position Filtering and Hidden Positions ............................................................................ 11-41Show Members by Batch Alert Option ............................................................................... 11-42
Removing Position Filters ............................................................................................................ 11-42Copying and Saving with Position Filtering............................................................................. 11-43
Copying Workbooks.............................................................................................................. 11-43Saving Workbooks................................................................................................................. 11-43
12 Working With Charts
Viewing Charts ...................................................................................................................................... 12-1Working with Charts............................................................................................................................. 12-4
Charts View User Interface............................................................................................................ 12-4Editing Data Through a Chart....................................................................................................... 12-5
Editing Data without Drilling Operation Enabled.............................................................. 12-5Editing Data with Drilling Operation Enabled ................................................................... 12-7
Customizing a Chart....................................................................................................................... 12-7Understanding the Chart Formatting Window................................................................... 12-8
Saving a Chart as an Image.......................................................................................................... 12-12Available Chart Types .................................................................................................................. 12-13
Area Chart............................................................................................................................... 12-14Bar Chart ................................................................................................................................. 12-16Bubble Chart ........................................................................................................................... 12-16Column Chart ......................................................................................................................... 12-18Combination Chart ................................................................................................................ 12-21Line Chart................................................................................................................................ 12-22Pareto Chart ............................................................................................................................ 12-26Pie Chart .................................................................................................................................. 12-26Ring Chart ............................................................................................................................... 12-27Radar Chart............................................................................................................................. 12-27Scatter Chart ........................................................................................................................... 12-28
Charting and Drilling ................................................................................................................... 12-29Introduction ............................................................................................................................ 12-29Restrictions on Drilling ......................................................................................................... 12-30Drilling Down ........................................................................................................................ 12-31Drilling Back (Reversing Drilling Operation).................................................................... 12-32Page Edge Navigation........................................................................................................... 12-33Formatting Options ............................................................................................................... 12-34Editing Data Values............................................................................................................... 12-34Refreshing the Chart.............................................................................................................. 12-35
13 Images
Associating Images with a Position ................................................................................................... 13-1
xii
Deleting Images..................................................................................................................................... 13-3Viewing Image from a View................................................................................................................ 13-4
Viewing Images - Method 1........................................................................................................... 13-4Viewing Images - Method 2........................................................................................................... 13-5
Comparing Images ................................................................................................................................ 13-5
14 Print and Export
Page Setup............................................................................................................................................... 14-2Page Tab ........................................................................................................................................... 14-3Margin Tab....................................................................................................................................... 14-3Header/Footer................................................................................................................................. 14-4Sheet .................................................................................................................................................. 14-5Page Breaks ...................................................................................................................................... 14-6
Export ....................................................................................................................................................... 14-7Export to a Text File ........................................................................................................................ 14-7Export to Excel............................................................................................................................... 14-11
Option 1: Export Option in the File Menu ......................................................................... 14-11Option 2: Export Icon in the Toolbar................................................................................... 14-15
Print........................................................................................................................................................ 14-17Option 1: Print Option in the File Menu.................................................................................... 14-17Option 2: Print Icon in the Toolbar ............................................................................................. 14-20
15 Special RPAS Fusion Client Features
Overview of Alerts ................................................................................................................................ 15-1Batch Alerts............................................................................................................................................. 15-1
Show Members with Batch Alert .................................................................................................. 15-3Show/Open the Alert Manager Window.................................................................................... 15-3Building a Workbook Using Batch Alerts ................................................................................... 15-4Inserting a Batch Alert in an Existing Workbook....................................................................... 15-8Finding Batch Alerts ....................................................................................................................... 15-9Resolving Batch Alerts ................................................................................................................... 15-9
Real Time Alerts .................................................................................................................................. 15-10Configuring Real Time Alerts ..................................................................................................... 15-10Working with Real Time Alerts .................................................................................................. 15-11
Alerts on the Toolbar............................................................................................................. 15-11Navigating to Alerts Using the View Menu ...................................................................... 15-12Other Alert Options on the View Menu ............................................................................. 15-13Customizing Alert Appearance ........................................................................................... 15-17Setting the Alert Priorities .................................................................................................... 15-18Working with Real Time Alerts ........................................................................................... 15-20
Extended Measures ............................................................................................................................. 15-21Absolute Percent of Parent .......................................................................................................... 15-22Relative ........................................................................................................................................... 15-26Comparing Absolute and Relative Percent of Parent Measures ............................................ 15-28
Creating a Ranking Measure............................................................................................................. 15-29Creating a Cumulative Sum .............................................................................................................. 15-31Creating a Cumulative Percent ......................................................................................................... 15-33
xiii
Select All ............................................................................................................................................... 15-35Select All: Method 1 ...................................................................................................................... 15-36Select All: Method 2 ...................................................................................................................... 15-36
Replicate Selections ............................................................................................................................ 15-36Using Replicate Selections to Copy and Paste .......................................................................... 15-38Using Replicate Selections for the Chart View ......................................................................... 15-41
Creating a Consumer Decision Tree ................................................................................................ 15-44Accessing the Consumer Decision Tree Editor Workbook..................................................... 15-44Navigating Page Edge .................................................................................................................. 15-44Creating a New Consumer Decision Tree ................................................................................. 15-44
Consumer Decision Tree Editor View ................................................................................ 15-45Adding Nodes to the Tree .................................................................................................... 15-45Editing Nodes......................................................................................................................... 15-47Deleting Nodes....................................................................................................................... 15-47Copying/Pasting in Consumer Decision Tree Editor ..................................................... 15-47
Viewing a Consumer Decision Tree ........................................................................................... 15-47Expanding and Collapsing of Nodes or Branches ............................................................ 15-47Moving the Tree ..................................................................................................................... 15-48Zooming the Tree................................................................................................................... 15-48
Copying/Pasting Consumer Decision Trees in the Consumer Decision Tree Explorer .... 15-48Group Pasting......................................................................................................................... 15-49
Multi-Select Pasting........................................................................................................ 15-49SKU Counts and Weights in the Consumer Decision Tree..................................................... 15-49
SKU Counts............................................................................................................................. 15-49SKU Weights........................................................................................................................... 15-50The XML Button..................................................................................................................... 15-50Effect of Editing on CDT....................................................................................................... 15-50
Saving a Consumer Decision Tree .............................................................................................. 15-50Committing a Consumer Decision Tree .................................................................................... 15-50Printing a Consumer Decision Tree ........................................................................................... 15-50
A Available Menu Shortcuts

xiv
xv
List of Tables
1–1 Terminology in the Fusion Client and Classic Client ........................................................... 1-41–2 Parameters in the Security Settings Window......................................................................... 1-71–3 Browser Multiple Session Handling .................................................................................... 1-111–4 Description of Icons in the Taskflow.................................................................................... 1-141–5 Open Workbook Window User Interface Components.................................................... 1-171–6 Workbook Wizard Window User Interface Components................................................. 1-232–1 Workbook User Interface Screen Components...................................................................... 2-12–2 Quick Access Toolbar Components ........................................................................................ 2-22–3 Components in the Contents Area .......................................................................................... 2-82–4 Components in the View Toolbar......................................................................................... 2-124–1 Navigation Options ................................................................................................................... 4-34–2 Copied Data ............................................................................................................................. 4-255–1 Default Formats.......................................................................................................................... 5-15–2 Quick Format Options............................................................................................................... 5-912–1 Charting Icons in the View Toolbar ..................................................................................... 12-412–2 Fields on the General Tab ...................................................................................................... 12-912–3 Fields on the Axis Tab .......................................................................................................... 12-1012–4 Fields on the Series Tab........................................................................................................ 12-1112–5 Fields on the Quadrant Tab................................................................................................. 12-1215–1 Consumer Decision Tree Commands ................................................................................ 15-45

xvi
xvii
List of Figures
1–1 RPAS Fusion Client in a Retail Enterprise .............................................................................. 1-21–2 Internet Options - Security Tab ................................................................................................ 1-51–3 Local Intranet Window - Add Website to the Zone............................................................... 1-61–4 Security Settings - Local Intranet Zone Window ................................................................... 1-61–5 Fusion Client Login Page........................................................................................................... 1-81–6 RPAS Fusion Client Homepage ................................................................................................ 1-81–7 Guided Launch............................................................................................................................ 1-91–8 Concurrent Session Message.................................................................................................. 1-101–9 Illustration of Activity Group, Activity, Task, and Step .................................................... 1-121–10 Taskflow ................................................................................................................................... 1-131–11 Icons in the Taskflow .............................................................................................................. 1-141–12 Show List of Workbooks Icon ................................................................................................ 1-161–13 Open Workbook Window ...................................................................................................... 1-161–14 Open Workbook Window User Interface Components..................................................... 1-171–15 Create New Workbook Icon................................................................................................... 1-181–16 Domain Selection Dialog ........................................................................................................ 1-191–17 Workbook Wizard ................................................................................................................... 1-201–18 Delete Warning Message ........................................................................................................ 1-201–19 Renaming a Workbook............................................................................................................ 1-211–20 Rename Workbook Dialog Box.............................................................................................. 1-211–21 Renamed Workbook................................................................................................................ 1-221–22 Workbook Wizard ................................................................................................................... 1-221–23 Save and Load Favorites Icons............................................................................................... 1-241–24 Save Favorites Window .......................................................................................................... 1-241–25 Save Favorites – Calendar Dimension .................................................................................. 1-251–26 Load Favorites Window.......................................................................................................... 1-261–27 Workbook Wizard - Extra Measures Stage .......................................................................... 1-271–28 Extra Measures - Taskflow and Views Docking Area ........................................................ 1-281–29 Adding Plug-In to Home Page............................................................................................... 1-291–30 Adding Non-RPAS Plug-In to Taskflow .............................................................................. 1-301–31 Launching Plug-In from Right Click Menu ......................................................................... 1-301–32 Commit Status Link................................................................................................................. 1-311–33 Commit Status Dialog Box...................................................................................................... 1-311–34 Announcement Link................................................................................................................ 1-311–35 Announcement Dialog Box .................................................................................................... 1-321–36 About Link ................................................................................................................................ 1-321–37 About Oracle RPAS Fusion Client Dialog Box .................................................................... 1-321–38 Online Help Link ..................................................................................................................... 1-321–39 Online Help Window, Book Field ......................................................................................... 1-331–40 Help Topic within Online Help ............................................................................................. 1-331–41 Online Help: Figure List ......................................................................................................... 1-341–42 Online Help: Index................................................................................................................... 1-341–43 Online Help: Search................................................................................................................. 1-351–44 Logout Link............................................................................................................................... 1-352–1 Workbook User Interface........................................................................................................... 2-12–2 Quick Access Toolbar Components ......................................................................................... 2-22–3 Content Area Components ....................................................................................................... 2-72–4 Maximize Icon on the View Title Bar....................................................................................... 2-82–5 Restore Icon on the View Title Bar ........................................................................................... 2-82–6 Minimize Icon on the View Title Bar ....................................................................................... 2-92–7 Move Icon on the View Title Bar .............................................................................................. 2-92–8 Rename View Option in the View Options Menu ................................................................. 2-92–9 Copy View Option in the View Options Menu................................................................... 2-102–10 Delete View Option in the View Options Menu ................................................................. 2-10

xviii
2–11 Page Edge Displaying the Current Position ........................................................................ 2-112–12 Collapse and Restore Icons in the Page Edge and Dimension Tiles Area....................... 2-112–13 Paging Navigation Icons......................................................................................................... 2-112–14 View Toolbar ............................................................................................................................ 2-122–15 Illustration of the Block View................................................................................................. 2-132–16 Illustration of the Outline View ............................................................................................. 2-142–17 Pivot Move in the Page Edge ................................................................................................. 2-142–18 Pivot Move in the Pivot Table................................................................................................ 2-152–19 Pivot Swap in the Page Edge.................................................................................................. 2-152–20 Example of a Pivot Swap Action ........................................................................................... 2-162–21 Example of a Views Docking Area with Three Views........................................................ 2-162–22 Resize the Width of a Single Column ................................................................................... 2-172–23 Width Increased for a Single Column................................................................................... 2-172–24 Resize the Height of a Single Row......................................................................................... 2-172–25 Height Increased for a Single Row ........................................................................................ 2-182–26 Select Multiple Columns......................................................................................................... 2-182–27 Resize the Width of Multiple Columns ................................................................................ 2-192–28 Width Increased for Multiple Columns................................................................................ 2-192–29 Resize the Width of a Single Column with Multiple Columns Selected ......................... 2-192–30 Width Decreased for a Single Column with Multiple Columns Selected ....................... 2-192–31 Resize the Height of Multiple Rows...................................................................................... 2-202–32 Height Increased for Multiple Rows..................................................................................... 2-202–33 Resize the Height of a Single Row with Multiple Rows Selected..................................... 2-202–34 Height Increased for a Single Row with Multiple Rows Selected .................................... 2-213–1 Save Icon on the Toolbar............................................................................................................ 3-23–2 Save Option in the File Menu.................................................................................................... 3-23–3 Save As Dialog Box..................................................................................................................... 3-33–4 Rename Option in the File Menu.............................................................................................. 3-53–5 Rename Workbook Dialog Box................................................................................................. 3-53–6 Renamed Workbook................................................................................................................... 3-53–7 Calculate Option on the Quick Access Toolbar and Edit Menu .......................................... 3-63–8 Single Refresh .............................................................................................................................. 3-73–9 Multiple Refresh ......................................................................................................................... 3-83–10 Commit Icon on the Toolbar ..................................................................................................... 3-93–11 Commit Option in the File Menu ............................................................................................. 3-93–12 Commit Status Information Icon ........................................................................................... 3-103–13 Commit Status Icon on the File Menu................................................................................... 3-103–14 Commit Status Dialog Box...................................................................................................... 3-113–15 View Menu in the Commit Status Dialog Box..................................................................... 3-113–16 Reorder Columns Window..................................................................................................... 3-123–17 Synchronize Page Edge Option in the View Menu............................................................. 3-133–18 Synchronized Views ................................................................................................................ 3-133–19 Navigation Arrows .................................................................................................................. 3-134–1 Non-Contiguous Cells................................................................................................................ 4-24–2 Select Date and Time Dialog Box.............................................................................................. 4-44–3 Number Formats Option in the Right-Click Context Menu................................................. 4-64–4 Setting the Scale Option in the Number Formatting Tab...................................................... 4-64–5 Using the Scale Option for Percentages................................................................................... 4-74–6 Fill and Clear in the Edit Menu ................................................................................................ 4-84–7 Cells Selected to be Cleared....................................................................................................... 4-84–8 Cleared Cells................................................................................................................................ 4-94–9 Clearing Dimension Levels ....................................................................................................... 4-94–10 Clear Dialog Box ...................................................................................................................... 4-104–11 Clear Entire Slice Message...................................................................................................... 4-104–12 Fill/Clear Message: Ignored Read-only Cells...................................................................... 4-10
xix
4–13 Fill Dialog Box in the Block View .......................................................................................... 4-114–14 Fill Dialog Box in the Outline View ...................................................................................... 4-114–15 Selecting a Cell to Fill .............................................................................................................. 4-124–16 Fill Dialog Box .......................................................................................................................... 4-134–17 Fill Value Distributed Among Lower Levels....................................................................... 4-144–18 Quick Fill Toolbar Icon............................................................................................................ 4-144–19 Quick Fill Selected Cells.......................................................................................................... 4-154–20 Quick Fill Updated Cells......................................................................................................... 4-154–21 Quick Fill Warning Message Example 1............................................................................... 4-164–22 Quick Fill Warning Message Example 2............................................................................... 4-164–23 Quick Fill Warning Message Example 3............................................................................... 4-164–24 Quick Fill Initial Values .......................................................................................................... 4-174–25 Quick Fill with Value Entered in Top Left Cell ................................................................... 4-174–26 Quick Fill Updated Cells......................................................................................................... 4-184–27 Quick Fill Cells After Calculate ............................................................................................. 4-184–28 Location Dimension Example for Dimension Protection Processing............................... 4-204–29 Single Hierarchy Select ........................................................................................................... 4-214–30 Single Hierarchy Search .......................................................................................................... 4-214–31 Single Hierarchy Search Dialog Box, Advanced ................................................................. 4-224–32 Single Hierarchy Search Dialog Box, Basic .......................................................................... 4-224–33 Edit Menu – Cut ....................................................................................................................... 4-244–34 Right-click Menu – Cut ........................................................................................................... 4-244–35 Edit Menu – Copy .................................................................................................................... 4-254–36 Right-click Menu – Copy ........................................................................................................ 4-254–37 Edit Menu – Paste .................................................................................................................... 4-264–38 Right-click Menu – Paste......................................................................................................... 4-264–39 Edit Menu – Cut Special.......................................................................................................... 4-274–40 Cut Special Menu..................................................................................................................... 4-274–41 Edit Menu – Copy Special ...................................................................................................... 4-284–42 Copy Special Menu.................................................................................................................. 4-294–43 Edit Menu – Paste Special....................................................................................................... 4-304–44 Paste Special Menu .................................................................................................................. 4-304–45 Selecting Cells for Copy to External...................................................................................... 4-314–46 Edit Menu – Copy to External................................................................................................ 4-314–47 Copy to External Source Dialog Box ..................................................................................... 4-324–48 Edit Menu – Copy to External................................................................................................ 4-324–49 Paste from External Source Dialog Box ................................................................................ 4-334–50 Read-only and Writable Measures ........................................................................................ 4-334–51 Locked Positions ...................................................................................................................... 4-354–52 Locking: Right-click Context Menu....................................................................................... 4-364–53 Lock Symbol Shown in a Locked Measure .......................................................................... 4-374–54 Locking Options in the Edit Menu ........................................................................................ 4-374–55 Locking through the Edit Menu ............................................................................................ 4-384–56 Locking Options in the Edit Menu ........................................................................................ 4-384–57 Locking with the Lock Icon .................................................................................................... 4-395–1 Default Cell Formats................................................................................................................... 5-25–2 Format Menu ............................................................................................................................... 5-35–3 Format Option in the Right-Click Context Menu................................................................... 5-35–4 Format Dialog Box ...................................................................................................................... 5-45–5 Filtering Measures ...................................................................................................................... 5-55–6 Filter Results ................................................................................................................................ 5-55–7 Measure Styles Tab of the Format Dialog Box........................................................................ 5-65–8 Select Measures ........................................................................................................................... 5-65–9 Formatted Measures ................................................................................................................... 5-75–10 Number Tab of the Format Dialog Box ................................................................................... 5-8
xx
5–11 Select Measures ........................................................................................................................... 5-85–12 Date/Time Tab of the Format Dialog Box............................................................................ 5-105–13 Select Date Measures ............................................................................................................... 5-105–14 Exceptions Tab of the Format Dialog Box ............................................................................ 5-115–15 Select Measures ........................................................................................................................ 5-115–16 Alert Styles Tab of the Format Dialog Box........................................................................... 5-135–17 Dimension Styles Tab of the Format Dialog Box................................................................. 5-145–18 Save Format .............................................................................................................................. 5-155–19 Save Format Options ............................................................................................................... 5-166–1 Right-Click Menu........................................................................................................................ 6-26–2 Dimensions Dialog Box, Levels Tab......................................................................................... 6-36–3 Expand Level and Collapse Level Options in the Right-click Menu .................................. 6-46–4 Dimensions Dialog Box, Levels Tab......................................................................................... 6-46–5 Expand/Collapse Shortcut Menu............................................................................................. 6-56–6 Level Splitting Example ............................................................................................................. 6-66–7 Level Splitting Icon ..................................................................................................................... 6-76–8 Level Splitting Option in the Right-Click Context Menu ..................................................... 6-76–9 New Split Dialog Box ................................................................................................................. 6-86–10 New Level Split ........................................................................................................................... 6-86–11 Split Dimension on Different Axis ........................................................................................... 6-96–12 Split Dimension on Page Edge.................................................................................................. 6-96–13 A Split with Two Attributes ................................................................................................... 6-106–14 Clearing a Split with the Level Splitting Icon ...................................................................... 6-106–15 Clearing a Split with the Right-Click Context Menu.......................................................... 6-116–16 Select Split: Level Splitting Icon............................................................................................. 6-116–17 Select Split: Right-Click Context Menu................................................................................. 6-126–18 Select Split Dialog Box............................................................................................................. 6-126–19 Existing Split Warning ............................................................................................................ 6-136–20 Editing a Level Split................................................................................................................. 6-136–21 Dimension Dialog Box, Show and Hide Tab ....................................................................... 6-147–1 Measure Tile ................................................................................................................................ 7-17–2 Measure Dimension Dialog Box, Show and Hide Tab .......................................................... 7-27–3 Measure Dimension Pop-up > Show/Hide Tab .................................................................... 7-37–4 Insert Measures Dialog Box Menu ........................................................................................... 7-47–5 Insert Measures Option in Edit Menu ..................................................................................... 7-57–6 Insert Measures Option in Right-Click Context Menu.......................................................... 7-57–7 Measure Tile ................................................................................................................................ 7-57–8 Insert Measures Option on Show/Hide Tab ......................................................................... 7-67–9 Measure Dimension Tile ............................................................................................................ 7-67–10 Selected Measure in the Show and Hide Tab ......................................................................... 7-77–11 Insert Measures Option on Show/Hide Tab ......................................................................... 7-77–12 Inserted Measure......................................................................................................................... 7-78–1 Measure Dimension Tile ............................................................................................................ 8-18–2 Moving Measures to the Visible Measures Box...................................................................... 8-28–3 Measure Profile Name Field...................................................................................................... 8-28–4 Measure Profile Icon................................................................................................................... 8-38–5 Measure Profile Menu: Save...................................................................................................... 8-38–6 Save Profile Dialog Box.............................................................................................................. 8-38–7 Measure Profile Warning Message........................................................................................... 8-48–8 Measure Profile Icon................................................................................................................... 8-48–9 Measure Profile Menu: Select.................................................................................................... 8-48–10 Measure Tile ................................................................................................................................ 8-58–11 Measure Profile List.................................................................................................................... 8-58–12 Update Measure Profile Warning Message ............................................................................ 8-58–13 Measure Profile Icon................................................................................................................... 8-6
xxi
8–14 Measure Profile Menu: Delete................................................................................................... 8-68–15 Measure Profile Warning Message: Deleting Profile............................................................. 8-68–16 Deleting from the Save Profile Dialog Box.............................................................................. 8-79–1 Position Maintenance Option in Edit Menu ........................................................................... 9-29–2 Adding a Dynamic Position ...................................................................................................... 9-39–3 Add Dynamic Position Window .............................................................................................. 9-39–4 Add Position Dialog Box, Lowest Level .................................................................................. 9-49–5 Add Position Dialog Box, Higher Levels................................................................................. 9-59–6 Added Dynamic Position........................................................................................................... 9-69–7 Modifying the Parent Level....................................................................................................... 9-69–8 Selecting an Existing Parent Level............................................................................................ 9-79–9 Creating a New Dynamic Parent.............................................................................................. 9-79–10 New Dynamic Position in View................................................................................................ 9-89–11 Modifying a Dynamic Position ................................................................................................. 9-99–12 Modify Dynamic Position Window ......................................................................................... 9-99–13 Deleting a Dynamic Position.................................................................................................. 9-109–14 Delete Dynamic Position Dialog Box .................................................................................... 9-119–15 Using the DPM Search Feature .............................................................................................. 9-119–16 Search Link for DPM Search................................................................................................... 9-129–17 Search and Result Dialog Box ................................................................................................ 9-139–18 DPM Search Results................................................................................................................. 9-1410–1 Attributes Icon.......................................................................................................................... 10-110–2 Create New Attribute: From the Right-Click Context Menu ............................................ 10-210–3 Create New Attribute: From the Dimension Dialog Box ................................................... 10-210–4 Define New Attribute Dialog Box ......................................................................................... 10-310–5 Dynamic Attribute: Clustering Example.............................................................................. 10-410–6 Define New Attribute: No Clustering .................................................................................. 10-510–7 Dynamic Attribute: Non-Clustering Example..................................................................... 10-510–8 Filtering Attributes .................................................................................................................. 10-610–9 Manage Dynamic Attributes .................................................................................................. 10-710–10 Manage Dynamic Attributes Dialog Box.............................................................................. 10-710–11 Editing a Dynamic Attribute .................................................................................................. 10-810–12 Edit Attribute Dialog Box ....................................................................................................... 10-810–13 Copying a Dynamic Attribute................................................................................................ 10-910–14 Copy Attribute Dialog Box ..................................................................................................... 10-910–15 Renaming a Dynamic Attribute............................................................................................. 10-910–16 Rename Attribute Dialog Box .............................................................................................. 10-1010–17 Deleting a Dynamic Attribute .............................................................................................. 10-1010–18 Delete Attribute Dialog Box ................................................................................................. 10-1010–19 Update Attribute Values Option ........................................................................................ 10-1110–20 Update Attribute Values Icon ............................................................................................. 10-1111–1 Sort Arrows............................................................................................................................... 11-211–2 Sort Ascending ......................................................................................................................... 11-311–3 Sort Descending ....................................................................................................................... 11-311–4 Uncalculated Cells Warning Message .................................................................................. 11-411–5 Sort Icons in Column Header................................................................................................. 11-411–6 Sort Icons in Column Header After Sort .............................................................................. 11-511–7 Sort Icons in Toolbar................................................................................................................ 11-511–8 Sorting in Outline Mode ......................................................................................................... 11-611–9 Sorting in Block Mode............................................................................................................. 11-611–10 Two Unsorted Slices ................................................................................................................ 11-711–11 Sorted Slices, Default Setting.................................................................................................. 11-711–12 Resort Positions on Pagination .............................................................................................. 11-811–13 Sorted Slices with Resort Pagination..................................................................................... 11-811–14 Undo Sort in Context Menu ................................................................................................... 11-9
xxii
11–15 Dimension Tiles........................................................................................................................ 11-911–16 Show Attributes and Sort Tab.............................................................................................. 11-1011–17 Attributes Shown in a View ................................................................................................. 11-1111–18 Outline View: Attributes in Row Edge ............................................................................... 11-1111–19 Outline View: Attributes in Column Edge......................................................................... 11-1211–20 Merging Attributes ................................................................................................................ 11-1311–21 Merged Attributes.................................................................................................................. 11-1311–22 Splitting Attributes ................................................................................................................ 11-1411–23 Block View: Attributes in Row Edge................................................................................... 11-1411–24 Block View: Attributes in Column Edge ............................................................................ 11-1511–25 Attributes on the Page Edge................................................................................................. 11-1511–26 Reordering Attributes ........................................................................................................... 11-1611–27 Reordered Attributes............................................................................................................. 11-1611–28 Hiding Attributes................................................................................................................... 11-1711–29 Find in the Right-Click Context Menu................................................................................ 11-1811–30 Find Window.......................................................................................................................... 11-1911–31 Match Shaded Gray by Find Feature .................................................................................. 11-2011–32 No Matches Found Message ................................................................................................ 11-2011–33 Find Field in the View Toolbar ............................................................................................ 11-2111–34 Position Query Icon ............................................................................................................... 11-2211–35 Position Query Rollover Status............................................................................................ 11-2211–36 Position Query Example, Filter Off ..................................................................................... 11-2311–37 Position Query Example, Filter On ..................................................................................... 11-2311–38 Position Query Warning for Edited Cells .......................................................................... 11-2311–39 Updating Measure Data in a Position Query..................................................................... 11-2411–40 Scrolling with Position Queries ........................................................................................... 11-2511–41 Position Query Scrolled to New Slice ................................................................................. 11-2511–42 Position Query Reapplied to a New Slice .......................................................................... 11-2611–43 Automatically Evaluate Position Queries .......................................................................... 11-2611–44 Updating Measure Data with Auto Evaluate .................................................................... 11-2711–45 Measure Data Updated with Auto Evaluate...................................................................... 11-2711–46 Scrolling with Auto Evaluate ............................................................................................... 11-2811–47 Position Query Scrolled to New Slice with Auto Evaluate.............................................. 11-2811–48 Scrolling with No Position Query Matches....................................................................... 11-2811–49 Position Filtering in a Single View ...................................................................................... 11-2911–50 Position Filtering in Two Views........................................................................................... 11-2911–51 Regressive Position Filters .................................................................................................... 11-3011–52 Right Click Menu - Position Filtering from Page Edge .................................................... 11-3111–53 Right Click Menu - Position Filtering from Row or Column .......................................... 11-3211–54 Right Click Menu - Selecting Position Filtering from Cells ............................................. 11-3211–55 Right Click Menu - Example of Available Views.............................................................. 11-3311–56 Example of Tiling................................................................................................................... 11-3411–57 Basic Example of Position Filtering - Stage 1 ..................................................................... 11-3411–58 Basic Example of Position Filtering - Stage 2 ..................................................................... 11-3511–59 Additional Example of Position Filtering - Stage 1........................................................... 11-3611–60 Additional Example of Position Filtering - Second Stage ................................................ 11-3711–61 Additional Example of Position Filtering - Third Stage................................................... 11-3811–62 Additional Example of Position Filtering - Final Result .................................................. 11-3911–63 Position Filtering - Page Edge Synchronization Example................................................ 11-3911–64 Chart Before Position Filter is Applied............................................................................... 11-4011–65 Chart After Position filter is Applied.................................................................................. 11-4011–66 Chart After Position filter is Reapplied .............................................................................. 11-4111–67 Dimensions Dialog Box - Show and Hide Tab .................................................................. 11-4111–68 View Menu - Manage Alerts Option................................................................................... 11-4211–69 Right Click Menu - Remove Filter Option Enabled. ......................................................... 11-43
xxiii
12–1 Select Chart Type Icon on the View Toolbar ....................................................................... 12-212–2 Switch to Chart View Icon on the View Toolbar................................................................. 12-212–3 Switch to Split View Icon on the View Toolbar................................................................... 12-212–4 Switch to Pivot Table View Icon on the View Toolbar....................................................... 12-212–5 Example of Cells Selected Before Viewing a Chart............................................................. 12-312–6 Example of Squared Selection After the Chart Appears .................................................... 12-412–7 Charting Icons in the View Toolbar ...................................................................................... 12-412–8 Example of a Series Highlighted in Area Chart .................................................................. 12-512–9 Example of Value to be Selected in the Area Chart ............................................................ 12-612–10 Chart Editor Window.............................................................................................................. 12-612–11 Chart Formatting Icon in the View Toolbar......................................................................... 12-712–12 Chart Formatting Window ..................................................................................................... 12-712–13 General Tab on the Chart Formatting Window .................................................................. 12-812–14 Axis Tab on the Chart Formatting Window ........................................................................ 12-912–15 Series Tab on the Chart Formatting Window .................................................................... 12-1112–16 Quadrant Tab on the Chart Formatting Window ............................................................. 12-1212–17 Save Chart to Image Icon on the View Toolbar................................................................. 12-1212–18 Drop-down Menu on the Save Chart to Image Icon......................................................... 12-1312–19 File Download Dialog Box.................................................................................................... 12-1312–20 Absolute Area Chart with a Single Y-Axis......................................................................... 12-1412–21 Absolute Area Chart with a Split Dual Y-Axis.................................................................. 12-1512–22 Stacked Area Chart with a Single Y-Axis ........................................................................... 12-1512–23 Stacked Area Chart with a Split Dual Y-Axis .................................................................... 12-1612–24 Percentage Area Chart .......................................................................................................... 12-1612–25 Bubble Chart with a Single Y-Axis ...................................................................................... 12-1712–26 Bubble Chart with a Dual Y-Axis ........................................................................................ 12-1812–27 Clustered Column Chart with Single Y-Axis..................................................................... 12-1812–28 Clustered Column Chart with Dual Y-Axis....................................................................... 12-1912–29 Clustered Column Chart with Split Dual Y-Axis.............................................................. 12-1912–30 Stacked Column Chart with a Single Y-Axis ..................................................................... 12-2012–31 Stacked Column Chart with a Dual Y-Axis ....................................................................... 12-2012–32 Stacked Column Chart with a Split Dual Y-Axis .............................................................. 12-2112–33 Percentage Column Chart..................................................................................................... 12-2112–34 Combination Chart with Single Y-Axis .............................................................................. 12-2212–35 Combination Chart with Dual Y-Axis ................................................................................ 12-2212–36 Absolute Line Chart Single Y-Axis...................................................................................... 12-2312–37 Absolute Line Chart Dual Y-Axis........................................................................................ 12-2312–38 Absolute Line Chart Split Dual Y-Axis............................................................................... 12-2412–39 Stacked Line Chart Single Y-Axis........................................................................................ 12-2412–40 Stacked Line Chart Dual Y-Axis .......................................................................................... 12-2512–41 Stacked Line Chart Split Dual Y-Axis ................................................................................. 12-2512–42 Percentage Line Chart ........................................................................................................... 12-2612–43 Pareto Chart ............................................................................................................................ 12-2612–44 Pie Chart .................................................................................................................................. 12-2712–45 Ring Chart ............................................................................................................................... 12-2712–46 Radar Chart............................................................................................................................. 12-2812–47 Scatter Chart with a Single Y-Axis ...................................................................................... 12-2812–48 Scatter Chart with a Dual Y-Axis......................................................................................... 12-2912–49 Drill Down Example Before ................................................................................................. 12-2912–50 Drill Down Example After ................................................................................................... 12-3012–51 Selecting Dimensions ............................................................................................................ 12-3112–52 Drilling Down Methods ........................................................................................................ 12-3212–53 Drilling Back Methods .......................................................................................................... 12-3312–54 Page Edge Position ................................................................................................................ 12-3312–55 Editing Data - Right Click Menu ......................................................................................... 12-35
xxiv
12–56 Pop-up Menu for Editing Data ............................................................................................ 12-3512–57 Toolbar - Refresh Option ...................................................................................................... 12-3513–1 Manage Images Icon ............................................................................................................... 13-113–2 Manage Images Option .......................................................................................................... 13-213–3 Loading Images ........................................................................................................................ 13-313–4 View Image Option in the Right-Click Context Menu ....................................................... 13-413–5 Delete Button ............................................................................................................................ 13-413–6 View Image Option in the Right-Click Context Menu ....................................................... 13-513–7 Dragging an Image to the Compare Area ............................................................................ 13-613–8 Images as Thumbnails in the Compare Area....................................................................... 13-714–1 Page Setup, Print, and Export Options ................................................................................. 14-114–2 Print and Export Icons............................................................................................................. 14-214–3 Page Setup Option in the File Menu ..................................................................................... 14-214–4 Page Setup Dialog Box ............................................................................................................ 14-214–5 Page Setup Dialog Box: Page Tab .......................................................................................... 14-314–6 Page Setup Dialog Box: Margin Tab...................................................................................... 14-414–7 Page Setup Dialog Box: Header/Footer Tab........................................................................ 14-514–8 Page Setup Dialog Box: Sheet Tab ......................................................................................... 14-614–9 Page Setup Dialog Box: Page Breaks Tab ............................................................................. 14-714–10 Export Option ........................................................................................................................... 14-814–11 Edited Cells Warning Message .............................................................................................. 14-814–12 Export Dialog Box: Text .......................................................................................................... 14-914–13 Separator: Others Option...................................................................................................... 14-1014–14 File Download Dialog Box.................................................................................................... 14-1014–15 Data in Text File ..................................................................................................................... 14-1114–16 Export Option ......................................................................................................................... 14-1114–17 Edited Cells Warning ............................................................................................................ 14-1214–18 Export Dialog Box: Excel....................................................................................................... 14-1214–19 Export Dialog Box .................................................................................................................. 14-1414–20 Slice in Microsoft Excel ......................................................................................................... 14-1514–21 Export Icon.............................................................................................................................. 14-1514–22 Edited Cells Warning ............................................................................................................ 14-1614–23 File Download Dialog Box.................................................................................................... 14-1614–24 Slice in Microsoft Excel ......................................................................................................... 14-1714–25 Print Option ............................................................................................................................ 14-1814–26 Edited Cells Warning ............................................................................................................ 14-1814–27 Print Dialog Box ..................................................................................................................... 14-1914–28 File Download Dialog Box.................................................................................................... 14-1914–29 Slice in Microsoft Excel ......................................................................................................... 14-2014–30 Print Icon in Microsoft Excel ................................................................................................ 14-2014–31 Print Icon ................................................................................................................................. 14-2014–32 Edited Cells Warning ............................................................................................................ 14-2114–33 Export Dialog Box .................................................................................................................. 14-2114–34 Slice in Microsoft Excel ......................................................................................................... 14-2214–35 Print Icon in Microsoft Excel ................................................................................................ 14-2215–1 Batch Alert Manager on the Home Page .............................................................................. 15-215–2 Alert Options - View Menu .................................................................................................... 15-415–3 Alert Manager, New Workbook Icon.................................................................................... 15-415–4 Alert Manager Workbook Wizard: Additional Alerts........................................................ 15-515–5 Alert Manager Workbook Wizard: Workbook Template .................................................. 15-515–6 Alert Manager Workbook Wizard: Range and Hide.......................................................... 15-615–7 Batch Alert Manager Workbook Wizard: Position Selection ............................................ 15-715–8 Alert Worksheet Selection ...................................................................................................... 15-715–9 Alert Options - View Menu .................................................................................................... 15-815–10 Alert Manager Dialog Box for Batch Alerts ......................................................................... 15-9
xxv
15–11 Select Batch Alert and Find Next and Previous Batch Alerts Icons ................................. 15-915–12 Resolving a Batch Alert ......................................................................................................... 15-1015–13 Toolbar - Current Alerts........................................................................................................ 15-1115–14 Toolbar - Outstanding Alerts ............................................................................................... 15-1215–15 View Menu - Select Alert Options....................................................................................... 15-1315–16 View Menu - Cross View Alerts Option............................................................................. 15-1415–17 View Menu - Apply Filter by Alert ..................................................................................... 15-1515–18 Worksheet View Before Applying Filters........................................................................... 15-1515–19 Worksheet View After Applying Filters............................................................................. 15-1615–20 View Menu - Reapply Filter by Alert Option .................................................................... 15-1715–21 Format Menu - Alert Styles Option..................................................................................... 15-1715–22 Format Dialog Box - Alert Styles Tab.................................................................................. 15-1815–23 View Menu - Manage Alerts Option................................................................................... 15-1915–24 Manage Alerts Dialog Box.................................................................................................... 15-1915–25 Prioritize Dialog Box ............................................................................................................. 15-2015–26 Open Workbook Dialog Box ................................................................................................ 15-2015–27 Example of Color Coded Cells and Tooltip ....................................................................... 15-2115–28 Absolute Extended Measure ................................................................................................ 15-2315–29 Create Extended Measure Option ....................................................................................... 15-2315–30 Create Extended Measure Dialog Box ................................................................................ 15-2415–31 Create Extended Measure - Absolute ................................................................................. 15-2515–32 Absolute Extended Measure ................................................................................................ 15-2515–33 Create Extended Measure Option ....................................................................................... 15-2615–34 Create Extended Measure Dialog Box ................................................................................ 15-2715–35 Relative Extended Measure.................................................................................................. 15-2715–36 Comparing Absolute and Relative Percent of Parent Measures..................................... 15-2815–37 Comparing Absolute and Relative Extended Measures at Half ..................................... 15-2915–38 Create Extended Measure Option ....................................................................................... 15-2915–39 Create Extended Measure Dialog Box ................................................................................ 15-3015–40 Ranking Extended Measure ................................................................................................. 15-3115–41 Create Extended Measure Option ....................................................................................... 15-3215–42 Create Extended Measure Dialog Box ................................................................................ 15-3215–43 Cumulative Sum Extended Measure .................................................................................. 15-3315–44 Create Extended Measure Option ....................................................................................... 15-3415–45 Create Extended Measure Dialog Box ................................................................................ 15-3415–46 Cumulative Percent Extended Measure ............................................................................. 15-3515–47 Select All Option in Toolbar ................................................................................................. 15-3515–48 Select All Option in Right-click Context Menu ................................................................. 15-3615–49 Replicating Selections ........................................................................................................... 15-3715–50 Replicate Selections Option .................................................................................................. 15-3715–51 Replicated Selections in the View........................................................................................ 15-3815–52 Using Replicate Selections to Copy and Paste................................................................... 15-3915–53 Replicate Selections Option .................................................................................................. 15-4015–54 Replicated Selections in the View........................................................................................ 15-4015–55 Replicated Selections ............................................................................................................ 15-4115–56 Replicate Selections Option .................................................................................................. 15-4215–57 Replicated Selections in the View........................................................................................ 15-4215–58 Switch to Chart View Icon .................................................................................................... 15-4315–59 Replicated Selections in Chart View ................................................................................... 15-4315–60 Page Edge in Consumer Decision Tree Editor Workbook window ............................... 15-4415–61 New CDT window................................................................................................................. 15-4415–62 Consumer Decision Tree Editor Layout Window............................................................. 15-4515–63 New Consumer Decision Tree Editor Category window ................................................ 15-4615–64 Add CDT Node window ...................................................................................................... 15-4615–65 Pan Control Tool .................................................................................................................... 15-48

xxvi
15–66 Zoom Control Tool ................................................................................................................ 15-4815–67 Example CDT with SKU Counts and Weights .................................................................. 15-4915–68 Example of SKU Counts........................................................................................................ 15-49
xxvii
Send Us Your Comments
Oracle Retail Predictive Application Server User Guide for the Fusion Client, Release 14.0.1
Oracle welcomes customers' comments and suggestions on the quality and usefulness of this document.
Your feedback is important, and helps us to best meet your needs as a user of our products. For example:
■ Are the implementation steps correct and complete?
■ Did you understand the context of the procedures?
■ Did you find any errors in the information?
■ Does the structure of the information help you with your tasks?
■ Do you need different information or graphics? If so, where, and in what format?
■ Are the examples correct? Do you need more examples?
If you find any errors or have any other suggestions for improvement, then please tell us your name, the name of the company who has licensed our products, the title and part number of the documentation and the chapter, section, and page number (if available).
Send your comments to us using the electronic mail address: [email protected]
Please give your name, address, electronic mail address, and telephone number (optional).
If you need assistance with Oracle software, then please contact your support representative or Oracle Support Services.
If you require training or instruction in using Oracle software, then please contact your Oracle local office and inquire about our Oracle University offerings. A list of Oracle offices is available on our web site at http://www.oracle.com.
Note: Before sending us your comments, you might like to check that you have the latest version of the document and if any concerns are already addressed. To do this, access the Online Documentation available on the Oracle Technology Network web site. It contains the most current Documentation Library plus all documents revised or released recently.

xxviii

xxix
Preface
This document describes the Oracle Retail Predictive Application Server user interface. It provides step-by-step instructions to complete most tasks that can be performed through the user interface.
AudienceThis document is for users and administrators of Oracle Retail Predictive Application Server. This includes merchandisers, buyers, business analysts, and administrative personnel.
Documentation AccessibilityFor information about Oracle's commitment to accessibility, visit the Oracle Accessibility Program website at http://www.oracle.com/pls/topic/lookup?ctx=acc&id=docacc.
Access to Oracle SupportOracle customers have access to electronic support through My Oracle Support. For information, visit http://www.oracle.com/pls/topic/lookup?ctx=acc&id=info or visit http://www.oracle.com/pls/topic/lookup?ctx=acc&id=trs if you are hearing impaired.
Related DocumentsFor more information, see the following documents in the Oracle Retail Predictive Application Server Release 14.0.1 documentation set:
■ Oracle Retail Predictive Application Server Administration Guide for the Classic Client
■ Oracle Retail Predictive Application Server Administration Guide for the Fusion Client
■ Oracle Retail Predictive Application Server Installation Guide
■ Oracle Retail Predictive Application Server Release Notes
Customer SupportTo contact Oracle Customer Support, access My Oracle Support at the following URL:
https://support.oracle.com
xxx
When contacting Customer Support, please provide the following:
■ Product version and program/module name
■ Functional and technical description of the problem (include business impact)
■ Detailed step-by-step instructions to re-create
■ Exact error message received
■ Screen shots of each step you take
Review Patch DocumentationWhen you install the application for the first time, you install either a base release (for example, 14.0) or a later patch release (for example, 14.0.1). If you are installing the base release or additional patch releases, read the documentation for all releases that have occurred since the base release before you begin installation. Documentation for patch releases can contain critical information related to the base release, as well as information about code changes since the base release.
Improved Process for Oracle Retail Documentation CorrectionsTo more quickly address critical corrections to Oracle Retail documentation content, Oracle Retail documentation may be republished whenever a critical correction is needed. For critical corrections, the republication of an Oracle Retail document may at times not be attached to a numbered software release; instead, the Oracle Retail document will simply be replaced on the Oracle Technology Network Web site, or, in the case of Data Models, to the applicable My Oracle Support Documentation container where they reside.
This process will prevent delays in making critical corrections available to customers. For the customer, it means that before you begin installation, you must verify that you have the most recent version of the Oracle Retail documentation set. Oracle Retail documentation is available on the Oracle Technology Network at the following URL:
http://www.oracle.com/technetwork/documentation/oracle-retail-100266.html
An updated version of the applicable Oracle Retail document is indicated by Oracle part number, as well as print date (month and year). An updated version uses the same part number, with a higher-numbered suffix. For example, part number E123456-02 is an updated version of an document with part number E123456-01.
If a more recent version of the document is available, that version supersedes all previous versions.
Oracle Retail Documentation on the Oracle Technology NetworkDocumentation is packaged with each Oracle Retail product release. Oracle Retail product documentation is also available on the following web site:
http://www.oracle.com/technetwork/documentation/oracle-retail-100266.html
(Data Model documents are not available through Oracle Technology Network. These documents are packaged with released code, or you can obtain them through My Oracle Support.)
xxxi
Documentation should be available on this web site within a month after a product release.
ConventionsThe following text conventions are used in this document:
Convention Meaning
boldface Boldface type indicates graphical user interface elements associated with an action, or terms defined in text or the glossary.
italic Italic type indicates book titles, emphasis, or placeholder variables for which you supply particular values.
monospace Monospace type indicates commands within a paragraph, URLs, code in examples, text that appears on the screen, or text that you enter.

xxxii
Getting Started 1-1
1Getting Started
Welcome to Oracle Retail RPAS Fusion Client. This chapter provides an overview of the application and includes information that help you get started with the application. It includes the following sections:
■ Overview
■ Basic Concepts of RPAS
■ Terminology Differences Between Clients
■ Setting Up Your Browser
■ Logging in to the Fusion Client
■ Understanding the Taskflow
■ Opening a Workbook
■ Creating a New Workbook
■ Deleting a Workbook
■ Renaming a Workbook
■ Extra Measures
■ Plug-Ins from External Applications
■ Understanding the Workbook Wizard Window
■ Accessing Online Help
■ Logging Out of the Application
OverviewThe RPAS Fusion Client is a web-based rich client for the Retail Predictive Application Server (RPAS) platform developed using the latest Oracle Application Development Framework (ADF).
Planning is one of the most important and complex processes in a retail business. It typically involves a complex set of activities that need to be followed as part of a workflow. Unlike the RPAS Windows-based Classic Client, the Fusion Client includes a taskflow feature that provides a robust workflow capability to make each planning activity easier to track and maintain.
The Fusion Client uses the same RPAS server as the RPAS Windows-based Classic Client. In addition to the enhanced user experience, the Fusion Client provides access to a larger number of users and a greater degree of platform independence.
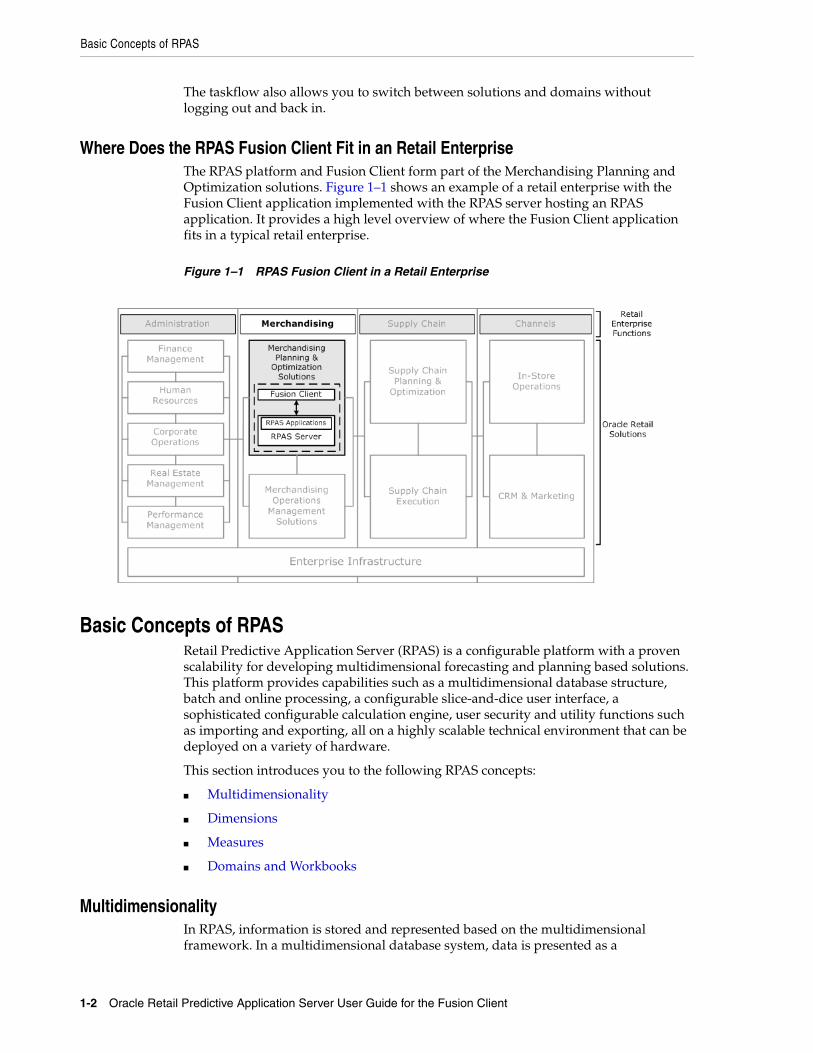
Basic Concepts of RPAS
1-2 Oracle Retail Predictive Application Server User Guide for the Fusion Client
The taskflow also allows you to switch between solutions and domains without logging out and back in.
Where Does the RPAS Fusion Client Fit in an Retail EnterpriseThe RPAS platform and Fusion Client form part of the Merchandising Planning and Optimization solutions. Figure 1–1 shows an example of a retail enterprise with the Fusion Client application implemented with the RPAS server hosting an RPAS application. It provides a high level overview of where the Fusion Client application fits in a typical retail enterprise.
Figure 1–1 RPAS Fusion Client in a Retail Enterprise
Basic Concepts of RPASRetail Predictive Application Server (RPAS) is a configurable platform with a proven scalability for developing multidimensional forecasting and planning based solutions. This platform provides capabilities such as a multidimensional database structure, batch and online processing, a configurable slice-and-dice user interface, a sophisticated configurable calculation engine, user security and utility functions such as importing and exporting, all on a highly scalable technical environment that can be deployed on a variety of hardware.
This section introduces you to the following RPAS concepts:
■ Multidimensionality
■ Dimensions
■ Measures
■ Domains and Workbooks
MultidimensionalityIn RPAS, information is stored and represented based on the multidimensional framework. In a multidimensional database system, data is presented as a
Basic Concepts of RPAS
Getting Started 1-3
multidimensional array, where each individual data value is contained within a cell accessible by multiple indexes.
Multidimensional database systems are a complementary technology to entity relational systems and achieve performance levels above the relational database systems. Applications that run on RPAS identify data through dimensional relationships. Dimensions are qualities of an item (such as a product, location, or time) or components of a dimension that define the structure and roll up within the dimension.
DimensionsDimensions describe the top-to-bottom relationship between the levels or positions of the dimensions in RPAS. They reflect the dimensions set up at your business and being used by the merchandising solutions.
RPAS supports many alternative dimensions that provide different roll ups and help analyze the data from a different perspective.
MeasuresMeasures represent the events or measurements that are recorded, while the positions in the dimensions provide a context for the measurement. Measures are defined based on the business rules set in the application. The dimensionality of a measure is configured through the definition of its base intersection, which is the collection of levels (one per appropriate dimension) defining the lowest level at which the information is stored for the measure.
Measure names are completely configurable and typically named using a convention that identifies each component and the meaning of the measure.
Domains and WorkbooksRPAS stores information in a persistent multidimensional data cache that is optimized for large volumes and dimensional or time series data access requirements, typically required by multidimensional solutions. This central repository is called a domain. The domain also includes central definitions of metadata for the solution and provides a single update point.
When you use an RPAS solution, you interact with the solution through a personal data repository called a workbook. A workbook contains the subset of the data (and metadata) from the domain and its scope is constrained by the access rights available to a user. Workbooks are stored on the RPAS server, and can be built using an online wizard process or scheduled to be built in a batch process automatically.
Although the data and metadata in the workbook are copied from the domain, the data remains independent of the domain.
With a mutli-solution taskflow, you do not log in to a domain. You are logged in to a solution. When you pick a particular task, you will be directed to a specific domain based on a few settings. First, there is a task setting that indicates whether it is accessible via the master domain only, local domain only, or both. If the setting is local domain only or both, the specific domain you are launched into will be based on the position level security on the partition dimension. If you have access to only a single local domain, you will be logged in to that specific local domain. If you have access to more than one local domain, you will be prompted to select the positions you want to work with, and based on that, you will be logged in to a specific local domain or the master domain.
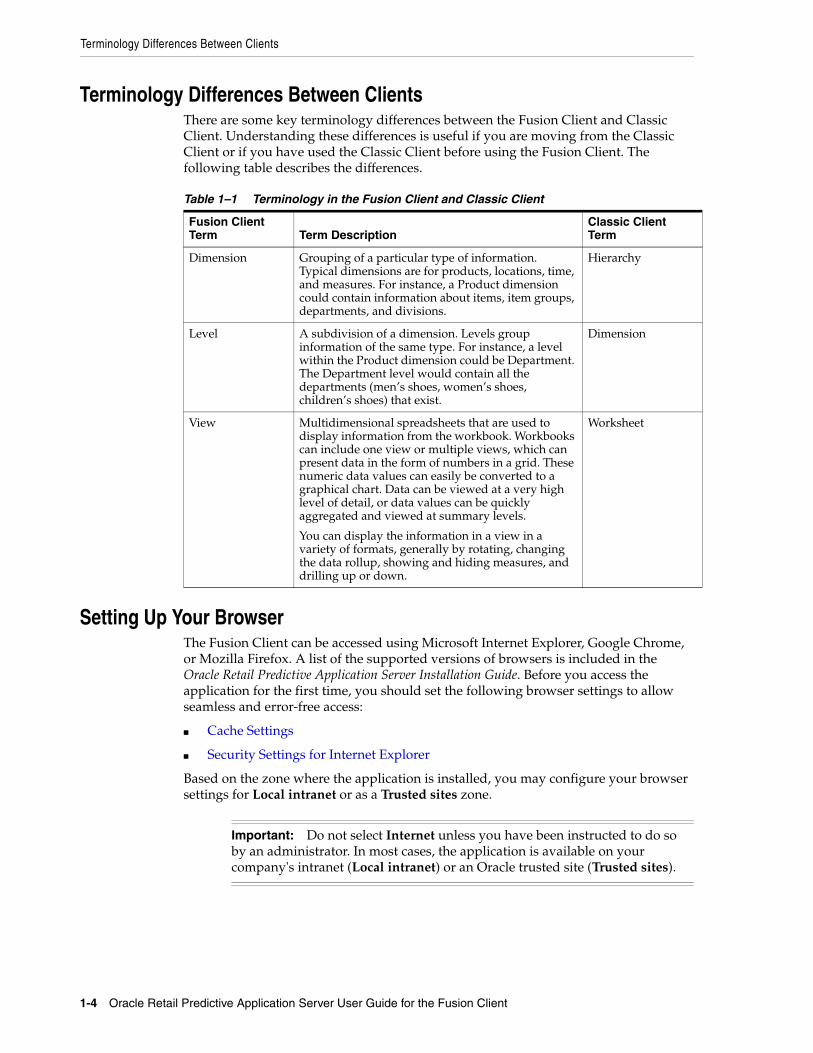
Terminology Differences Between Clients
1-4 Oracle Retail Predictive Application Server User Guide for the Fusion Client
Terminology Differences Between ClientsThere are some key terminology differences between the Fusion Client and Classic Client. Understanding these differences is useful if you are moving from the Classic Client or if you have used the Classic Client before using the Fusion Client. The following table describes the differences.
Setting Up Your BrowserThe Fusion Client can be accessed using Microsoft Internet Explorer, Google Chrome, or Mozilla Firefox. A list of the supported versions of browsers is included in the Oracle Retail Predictive Application Server Installation Guide. Before you access the application for the first time, you should set the following browser settings to allow seamless and error-free access:
■ Cache Settings
■ Security Settings for Internet Explorer
Based on the zone where the application is installed, you may configure your browser settings for Local intranet or as a Trusted sites zone.
Table 1–1 Terminology in the Fusion Client and Classic Client
Fusion Client Term Term Description
Classic Client Term
Dimension Grouping of a particular type of information. Typical dimensions are for products, locations, time, and measures. For instance, a Product dimension could contain information about items, item groups, departments, and divisions.
Hierarchy
Level A subdivision of a dimension. Levels group information of the same type. For instance, a level within the Product dimension could be Department. The Department level would contain all the departments (men’s shoes, women’s shoes, children’s shoes) that exist.
Dimension
View Multidimensional spreadsheets that are used to display information from the workbook. Workbooks can include one view or multiple views, which can present data in the form of numbers in a grid. These numeric data values can easily be converted to a graphical chart. Data can be viewed at a very high level of detail, or data values can be quickly aggregated and viewed at summary levels.
You can display the information in a view in a variety of formats, generally by rotating, changing the data rollup, showing and hiding measures, and drilling up or down.
Worksheet
Important: Do not select Internet unless you have been instructed to do so by an administrator. In most cases, the application is available on your company's intranet (Local intranet) or an Oracle trusted site (Trusted sites).
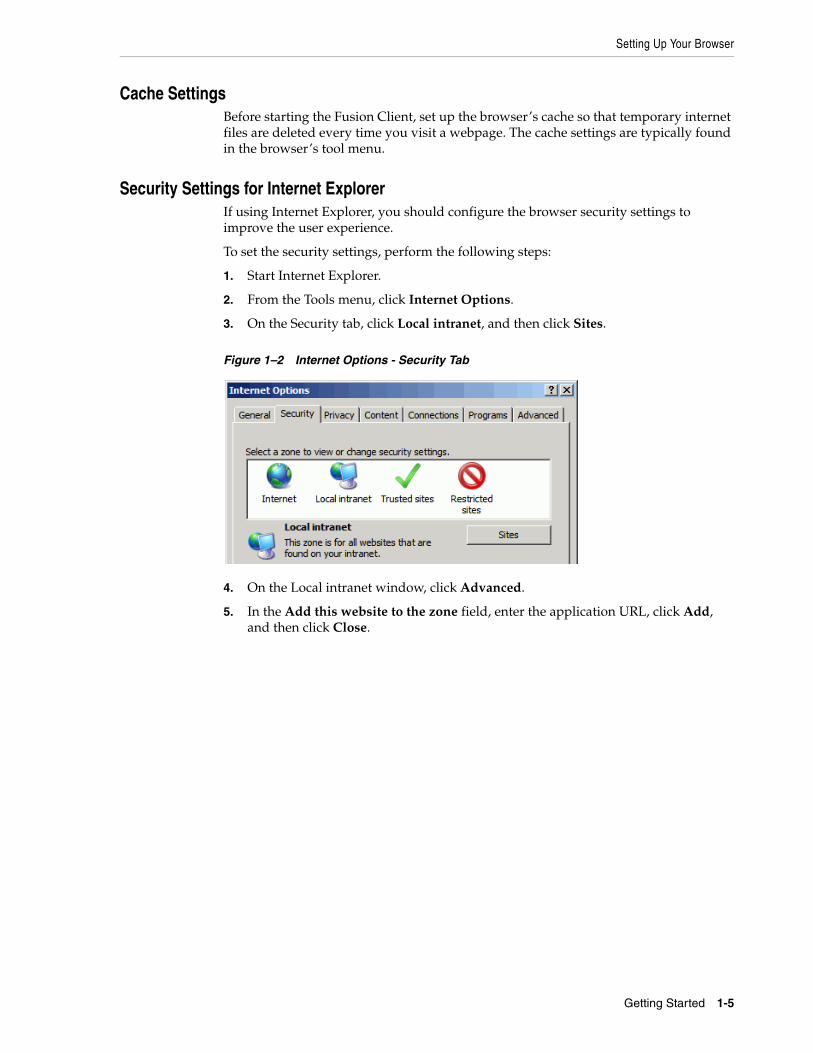
Setting Up Your Browser
Getting Started 1-5
Cache SettingsBefore starting the Fusion Client, set up the browser’s cache so that temporary internet files are deleted every time you visit a webpage. The cache settings are typically found in the browser’s tool menu.
Security Settings for Internet ExplorerIf using Internet Explorer, you should configure the browser security settings to improve the user experience.
To set the security settings, perform the following steps:
1. Start Internet Explorer.
2. From the Tools menu, click Internet Options.
3. On the Security tab, click Local intranet, and then click Sites.
Figure 1–2 Internet Options - Security Tab
4. On the Local intranet window, click Advanced.
5. In the Add this website to the zone field, enter the application URL, click Add, and then click Close.
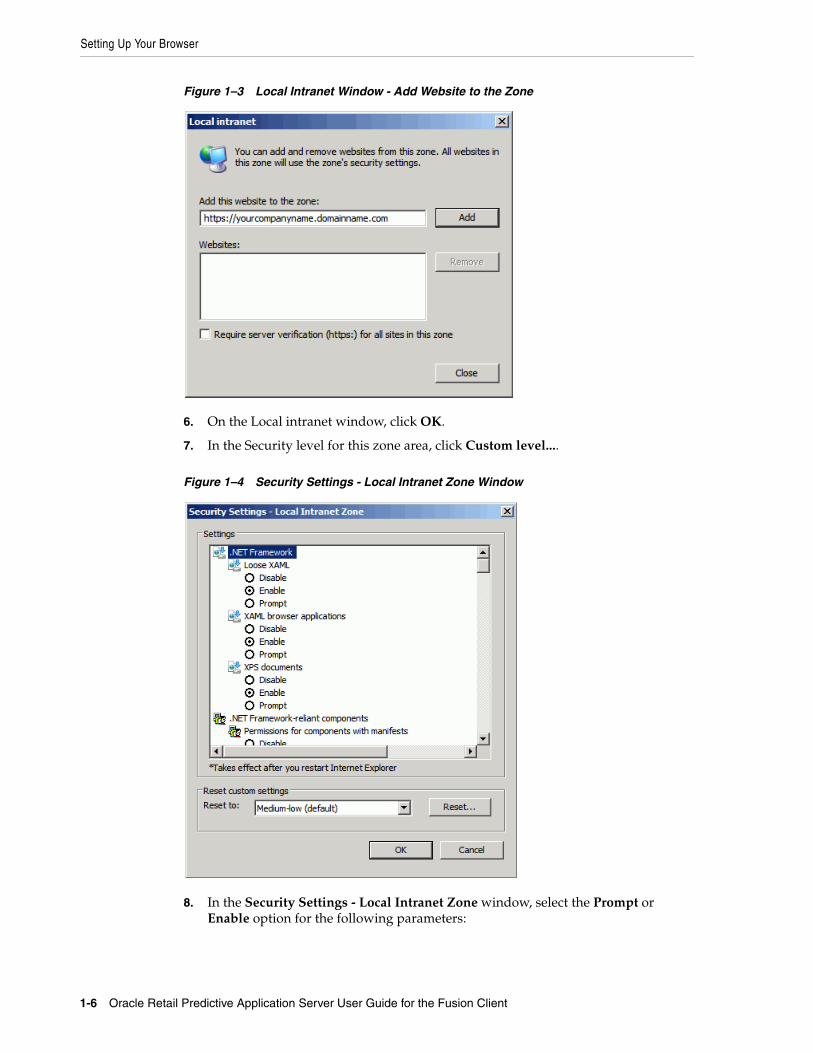
Setting Up Your Browser
1-6 Oracle Retail Predictive Application Server User Guide for the Fusion Client
Figure 1–3 Local Intranet Window - Add Website to the Zone
6. On the Local intranet window, click OK.
7. In the Security level for this zone area, click Custom level....
Figure 1–4 Security Settings - Local Intranet Zone Window
8. In the Security Settings - Local Intranet Zone window, select the Prompt or Enable option for the following parameters:
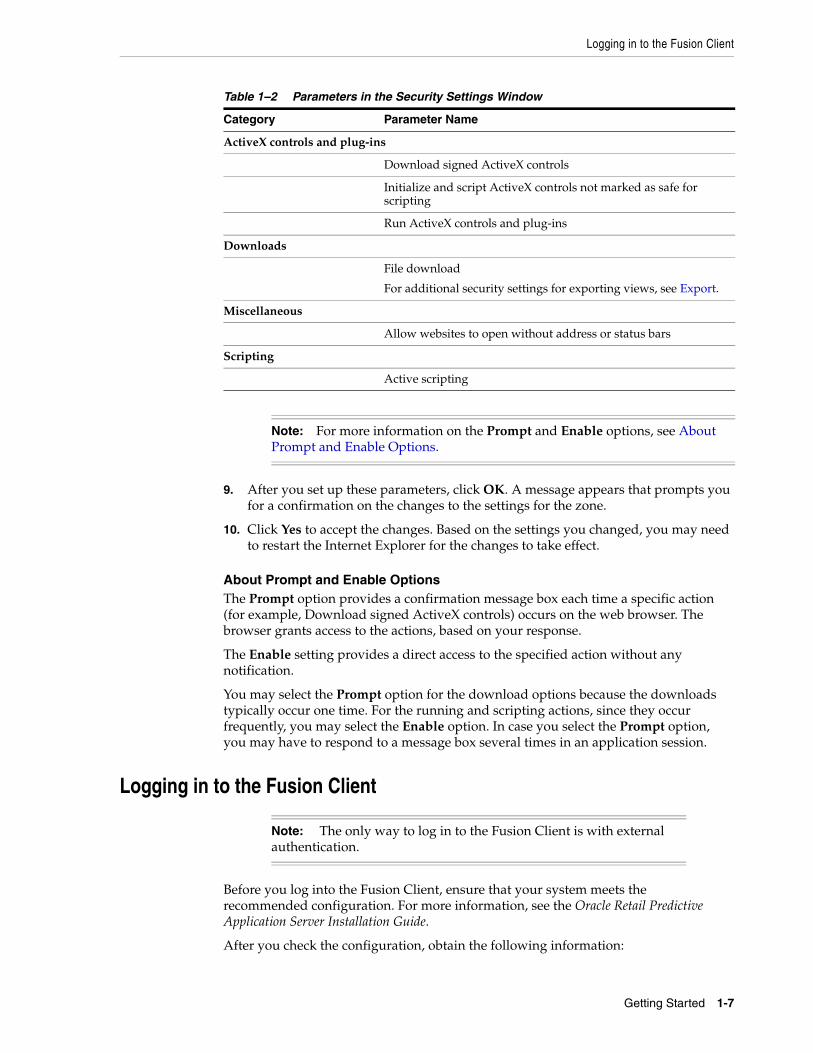
Logging in to the Fusion Client
Getting Started 1-7
9. After you set up these parameters, click OK. A message appears that prompts you for a confirmation on the changes to the settings for the zone.
10. Click Yes to accept the changes. Based on the settings you changed, you may need to restart the Internet Explorer for the changes to take effect.
About Prompt and Enable OptionsThe Prompt option provides a confirmation message box each time a specific action (for example, Download signed ActiveX controls) occurs on the web browser. The browser grants access to the actions, based on your response.
The Enable setting provides a direct access to the specified action without any notification.
You may select the Prompt option for the download options because the downloads typically occur one time. For the running and scripting actions, since they occur frequently, you may select the Enable option. In case you select the Prompt option, you may have to respond to a message box several times in an application session.
Logging in to the Fusion Client
Before you log into the Fusion Client, ensure that your system meets the recommended configuration. For more information, see the Oracle Retail Predictive Application Server Installation Guide.
After you check the configuration, obtain the following information:
Table 1–2 Parameters in the Security Settings Window
Category Parameter Name
ActiveX controls and plug-ins
Download signed ActiveX controls
Initialize and script ActiveX controls not marked as safe for scripting
Run ActiveX controls and plug-ins
Downloads
File download
For additional security settings for exporting views, see Export.
Miscellaneous
Allow websites to open without address or status bars
Scripting
Active scripting
Note: For more information on the Prompt and Enable options, see About Prompt and Enable Options.
Note: The only way to log in to the Fusion Client is with external authentication.
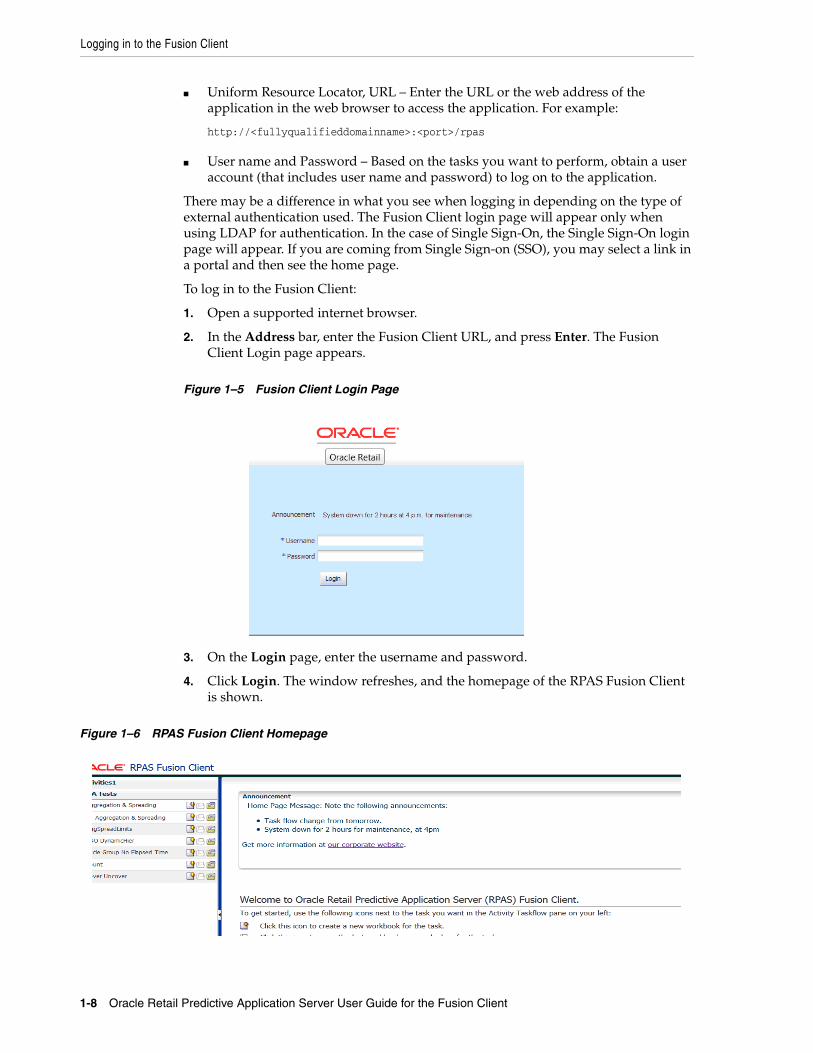
Logging in to the Fusion Client
1-8 Oracle Retail Predictive Application Server User Guide for the Fusion Client
■ Uniform Resource Locator, URL – Enter the URL or the web address of the application in the web browser to access the application. For example:
http://<fullyqualifieddomainname>:<port>/rpas
■ User name and Password – Based on the tasks you want to perform, obtain a user account (that includes user name and password) to log on to the application.
There may be a difference in what you see when logging in depending on the type of external authentication used. The Fusion Client login page will appear only when using LDAP for authentication. In the case of Single Sign-On, the Single Sign-On login page will appear. If you are coming from Single Sign-on (SSO), you may select a link in a portal and then see the home page.
To log in to the Fusion Client:
1. Open a supported internet browser.
2. In the Address bar, enter the Fusion Client URL, and press Enter. The Fusion Client Login page appears.
Figure 1–5 Fusion Client Login Page
3. On the Login page, enter the username and password.
4. Click Login. The window refreshes, and the homepage of the RPAS Fusion Client is shown.
Figure 1–6 RPAS Fusion Client Homepage
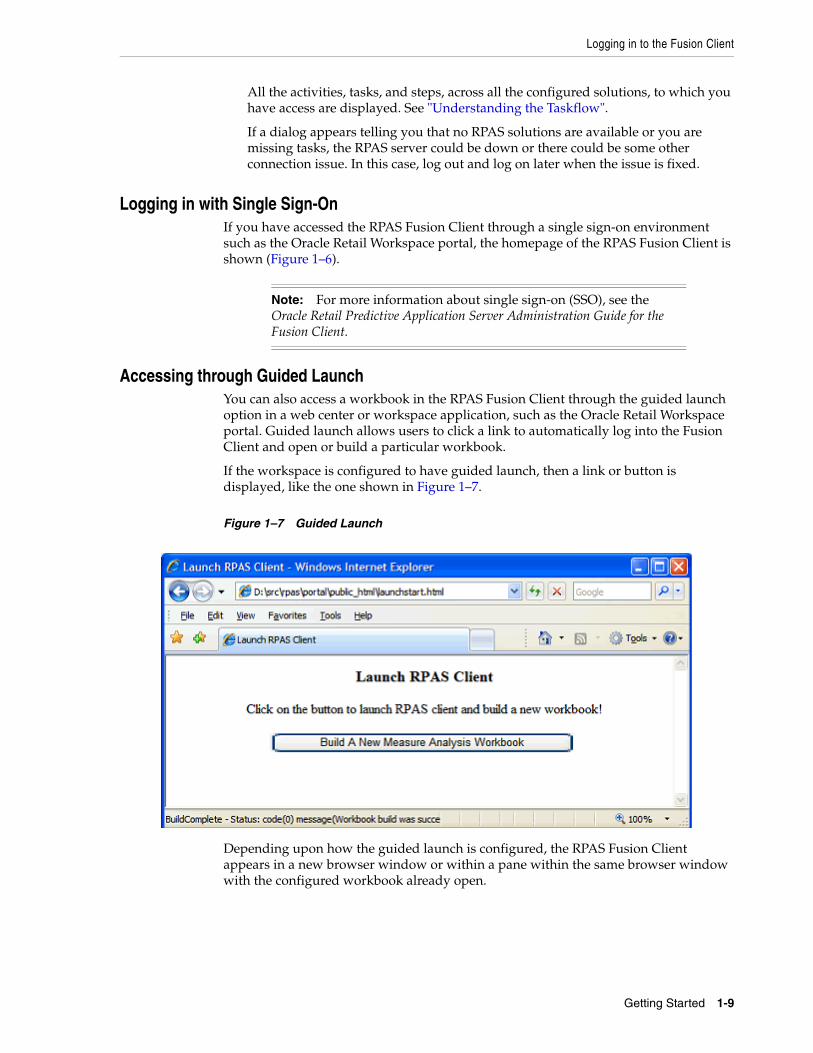
Logging in to the Fusion Client
Getting Started 1-9
All the activities, tasks, and steps, across all the configured solutions, to which you have access are displayed. See "Understanding the Taskflow".
If a dialog appears telling you that no RPAS solutions are available or you are missing tasks, the RPAS server could be down or there could be some other connection issue. In this case, log out and log on later when the issue is fixed.
Logging in with Single Sign-OnIf you have accessed the RPAS Fusion Client through a single sign-on environment such as the Oracle Retail Workspace portal, the homepage of the RPAS Fusion Client is shown (Figure 1–6).
Accessing through Guided LaunchYou can also access a workbook in the RPAS Fusion Client through the guided launch option in a web center or workspace application, such as the Oracle Retail Workspace portal. Guided launch allows users to click a link to automatically log into the Fusion Client and open or build a particular workbook.
If the workspace is configured to have guided launch, then a link or button is displayed, like the one shown in Figure 1–7.
Figure 1–7 Guided Launch
Depending upon how the guided launch is configured, the RPAS Fusion Client appears in a new browser window or within a pane within the same browser window with the configured workbook already open.
Note: For more information about single sign-on (SSO), see the Oracle Retail Predictive Application Server Administration Guide for the Fusion Client.
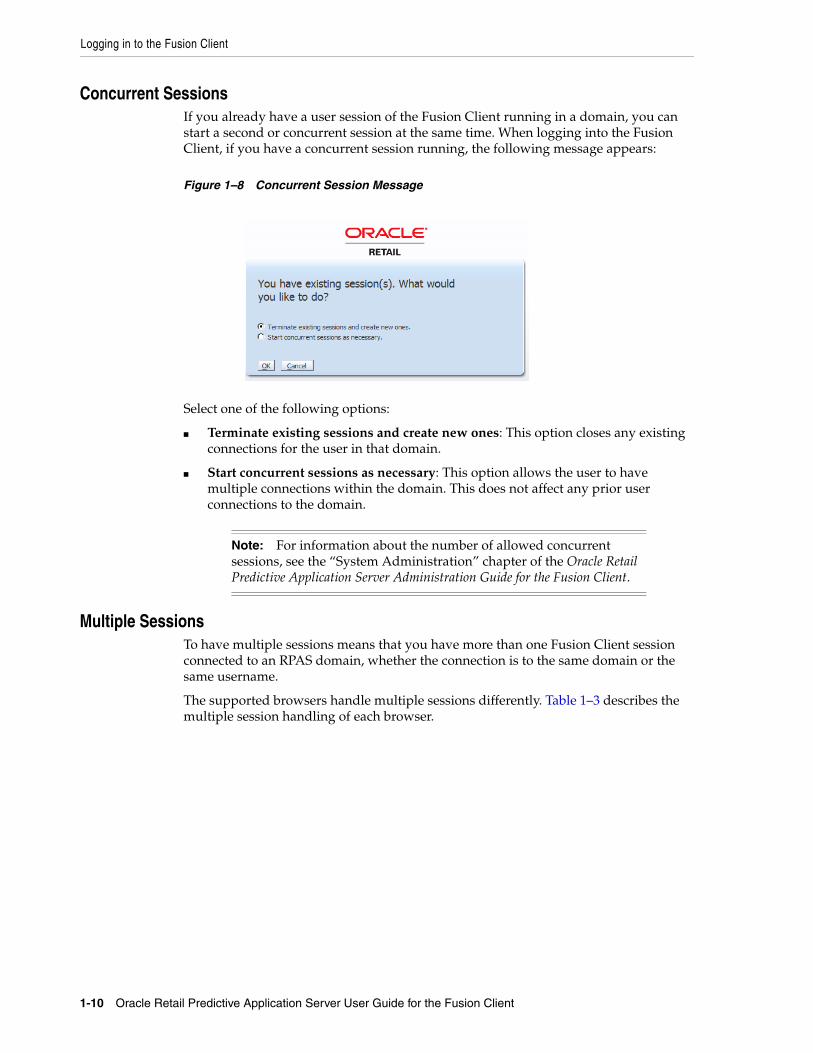
Logging in to the Fusion Client
1-10 Oracle Retail Predictive Application Server User Guide for the Fusion Client
Concurrent SessionsIf you already have a user session of the Fusion Client running in a domain, you can start a second or concurrent session at the same time. When logging into the Fusion Client, if you have a concurrent session running, the following message appears:
Figure 1–8 Concurrent Session Message
Select one of the following options:
■ Terminate existing sessions and create new ones: This option closes any existing connections for the user in that domain.
■ Start concurrent sessions as necessary: This option allows the user to have multiple connections within the domain. This does not affect any prior user connections to the domain.
Multiple SessionsTo have multiple sessions means that you have more than one Fusion Client session connected to an RPAS domain, whether the connection is to the same domain or the same username.
The supported browsers handle multiple sessions differently. Table 1–3 describes the multiple session handling of each browser.
Note: For information about the number of allowed concurrent sessions, see the “System Administration” chapter of the Oracle Retail Predictive Application Server Administration Guide for the Fusion Client.
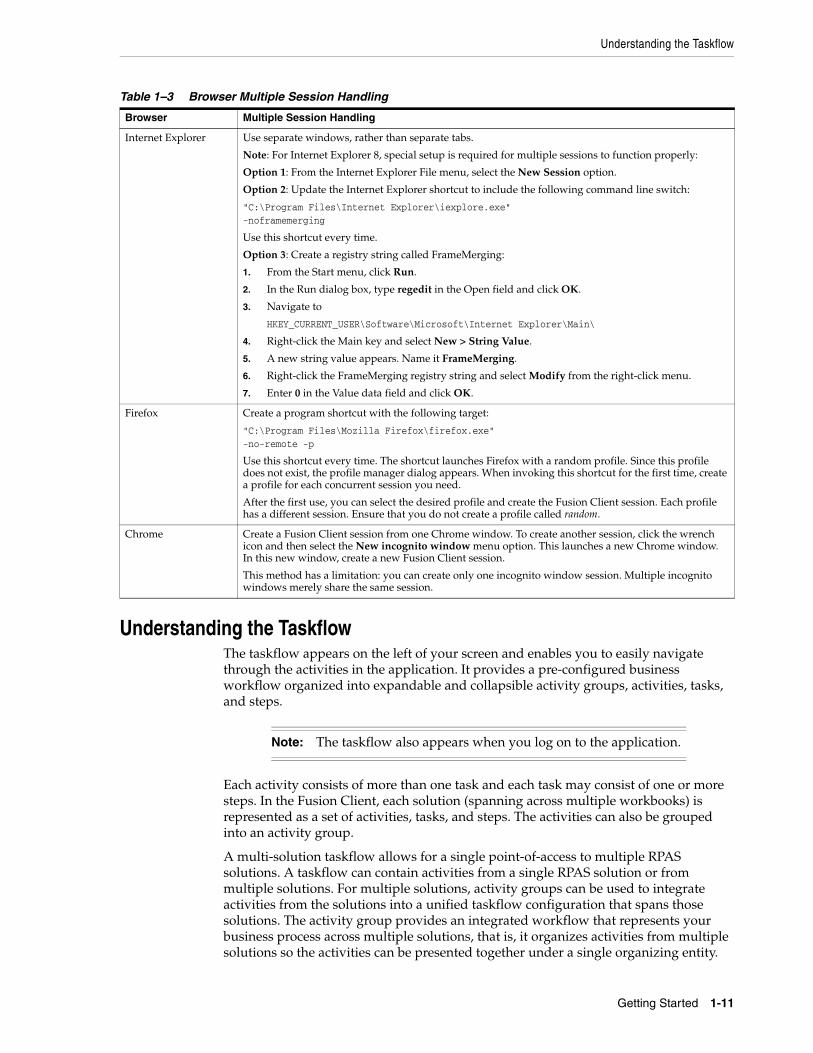
Understanding the Taskflow
Getting Started 1-11
Understanding the TaskflowThe taskflow appears on the left of your screen and enables you to easily navigate through the activities in the application. It provides a pre-configured business workflow organized into expandable and collapsible activity groups, activities, tasks, and steps.
Each activity consists of more than one task and each task may consist of one or more steps. In the Fusion Client, each solution (spanning across multiple workbooks) is represented as a set of activities, tasks, and steps. The activities can also be grouped into an activity group.
A multi-solution taskflow allows for a single point-of-access to multiple RPAS solutions. A taskflow can contain activities from a single RPAS solution or from multiple solutions. For multiple solutions, activity groups can be used to integrate activities from the solutions into a unified taskflow configuration that spans those solutions. The activity group provides an integrated workflow that represents your business process across multiple solutions, that is, it organizes activities from multiple solutions so the activities can be presented together under a single organizing entity.
Table 1–3 Browser Multiple Session Handling
Browser Multiple Session Handling
Internet Explorer Use separate windows, rather than separate tabs.
Note: For Internet Explorer 8, special setup is required for multiple sessions to function properly:
Option 1: From the Internet Explorer File menu, select the New Session option.
Option 2: Update the Internet Explorer shortcut to include the following command line switch:
"C:\Program Files\Internet Explorer\iexplore.exe"-noframemerging
Use this shortcut every time.
Option 3: Create a registry string called FrameMerging:
1. From the Start menu, click Run.
2. In the Run dialog box, type regedit in the Open field and click OK.
3. Navigate to
HKEY_CURRENT_USER\Software\Microsoft\Internet Explorer\Main\
4. Right-click the Main key and select New > String Value.
5. A new string value appears. Name it FrameMerging.
6. Right-click the FrameMerging registry string and select Modify from the right-click menu.
7. Enter 0 in the Value data field and click OK.
Firefox Create a program shortcut with the following target:
"C:\Program Files\Mozilla Firefox\firefox.exe"-no-remote -p
Use this shortcut every time. The shortcut launches Firefox with a random profile. Since this profile does not exist, the profile manager dialog appears. When invoking this shortcut for the first time, create a profile for each concurrent session you need.
After the first use, you can select the desired profile and create the Fusion Client session. Each profile has a different session. Ensure that you do not create a profile called random.
Chrome Create a Fusion Client session from one Chrome window. To create another session, click the wrench icon and then select the New incognito window menu option. This launches a new Chrome window. In this new window, create a new Fusion Client session.
This method has a limitation: you can create only one incognito window session. Multiple incognito windows merely share the same session.
Note: The taskflow also appears when you log on to the application.
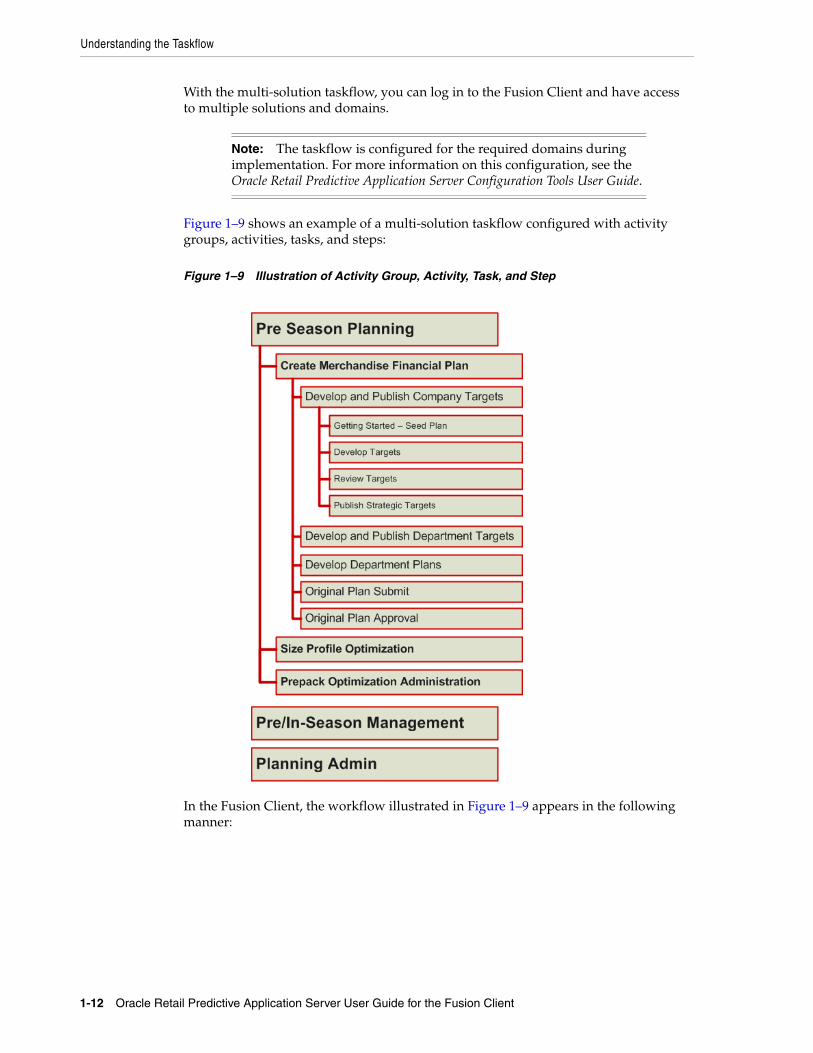
Understanding the Taskflow
1-12 Oracle Retail Predictive Application Server User Guide for the Fusion Client
With the multi-solution taskflow, you can log in to the Fusion Client and have access to multiple solutions and domains.
Figure 1–9 shows an example of a multi-solution taskflow configured with activity groups, activities, tasks, and steps:
Figure 1–9 Illustration of Activity Group, Activity, Task, and Step
In the Fusion Client, the workflow illustrated in Figure 1–9 appears in the following manner:
Note: The taskflow is configured for the required domains during implementation. For more information on this configuration, see the Oracle Retail Predictive Application Server Configuration Tools User Guide.
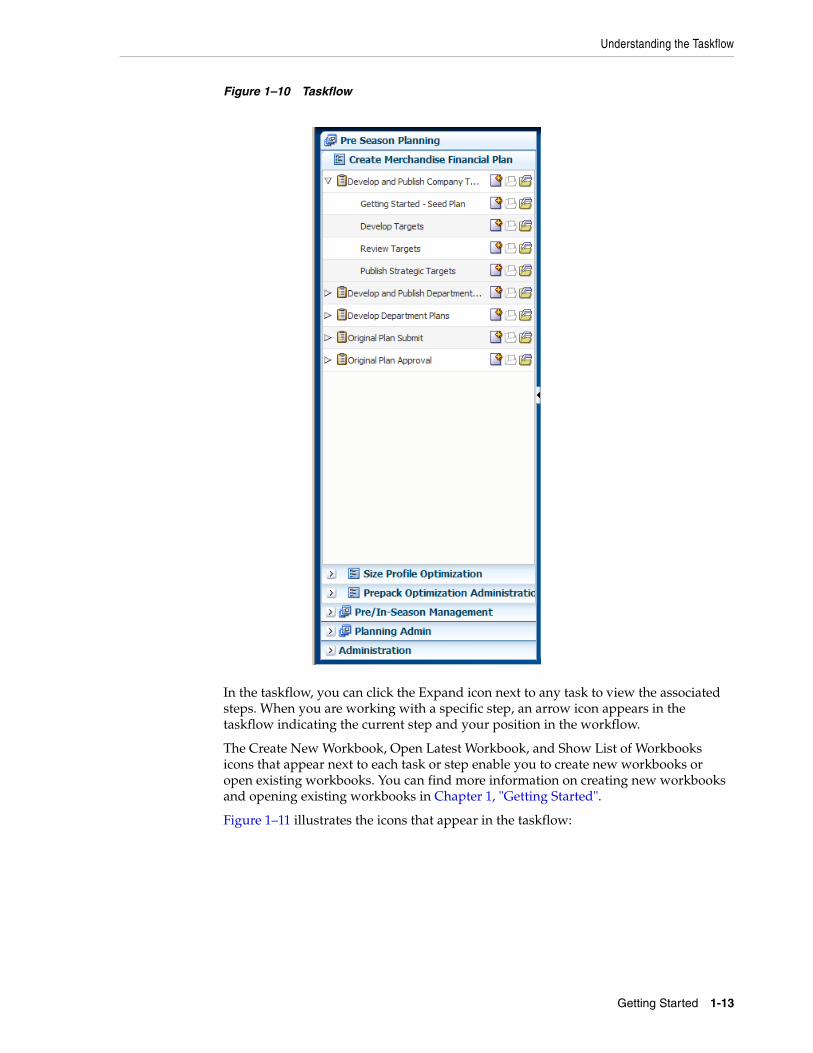
Understanding the Taskflow
Getting Started 1-13
Figure 1–10 Taskflow
In the taskflow, you can click the Expand icon next to any task to view the associated steps. When you are working with a specific step, an arrow icon appears in the taskflow indicating the current step and your position in the workflow.
The Create New Workbook, Open Latest Workbook, and Show List of Workbooks icons that appear next to each task or step enable you to create new workbooks or open existing workbooks. You can find more information on creating new workbooks and opening existing workbooks in Chapter 1, "Getting Started".
Figure 1–11 illustrates the icons that appear in the taskflow:
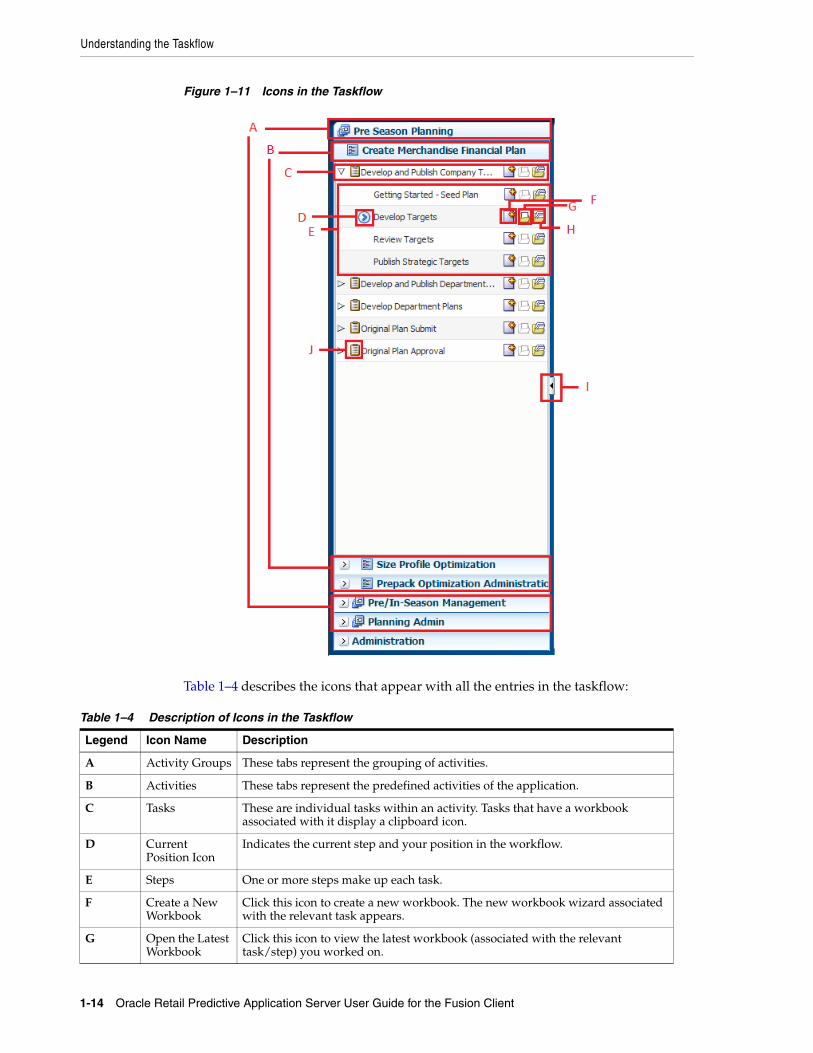
Understanding the Taskflow
1-14 Oracle Retail Predictive Application Server User Guide for the Fusion Client
Figure 1–11 Icons in the Taskflow
Table 1–4 describes the icons that appear with all the entries in the taskflow:
Table 1–4 Description of Icons in the Taskflow
Legend Icon Name Description
A Activity Groups These tabs represent the grouping of activities.
B Activities These tabs represent the predefined activities of the application.
C Tasks These are individual tasks within an activity. Tasks that have a workbook associated with it display a clipboard icon.
D Current Position Icon
Indicates the current step and your position in the workflow.
E Steps One or more steps make up each task.
F Create a New Workbook
Click this icon to create a new workbook. The new workbook wizard associated with the relevant task appears.
G Open the Latest Workbook
Click this icon to view the latest workbook (associated with the relevant task/step) you worked on.
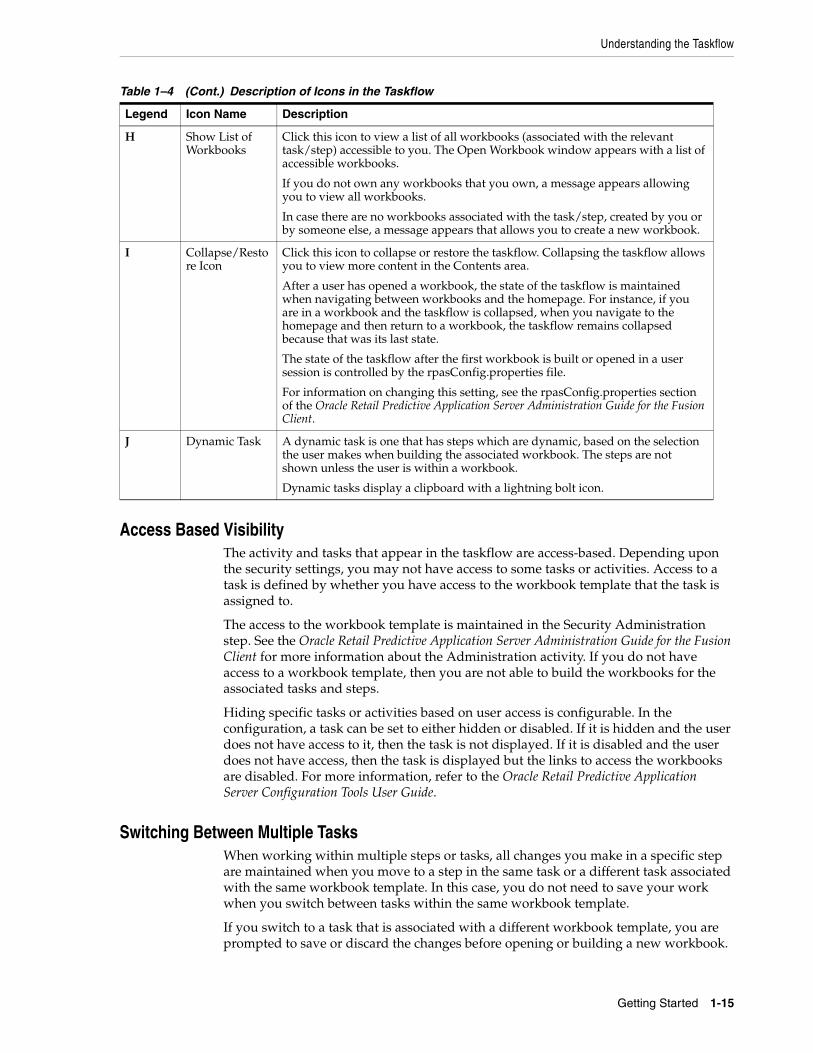
Understanding the Taskflow
Getting Started 1-15
Access Based VisibilityThe activity and tasks that appear in the taskflow are access-based. Depending upon the security settings, you may not have access to some tasks or activities. Access to a task is defined by whether you have access to the workbook template that the task is assigned to.
The access to the workbook template is maintained in the Security Administration step. See the Oracle Retail Predictive Application Server Administration Guide for the Fusion Client for more information about the Administration activity. If you do not have access to a workbook template, then you are not able to build the workbooks for the associated tasks and steps.
Hiding specific tasks or activities based on user access is configurable. In the configuration, a task can be set to either hidden or disabled. If it is hidden and the user does not have access to it, then the task is not displayed. If it is disabled and the user does not have access, then the task is displayed but the links to access the workbooks are disabled. For more information, refer to the Oracle Retail Predictive Application Server Configuration Tools User Guide.
Switching Between Multiple TasksWhen working within multiple steps or tasks, all changes you make in a specific step are maintained when you move to a step in the same task or a different task associated with the same workbook template. In this case, you do not need to save your work when you switch between tasks within the same workbook template.
If you switch to a task that is associated with a different workbook template, you are prompted to save or discard the changes before opening or building a new workbook.
H Show List of Workbooks
Click this icon to view a list of all workbooks (associated with the relevant task/step) accessible to you. The Open Workbook window appears with a list of accessible workbooks.
If you do not own any workbooks that you own, a message appears allowing you to view all workbooks.
In case there are no workbooks associated with the task/step, created by you or by someone else, a message appears that allows you to create a new workbook.
I Collapse/Restore Icon
Click this icon to collapse or restore the taskflow. Collapsing the taskflow allows you to view more content in the Contents area.
After a user has opened a workbook, the state of the taskflow is maintained when navigating between workbooks and the homepage. For instance, if you are in a workbook and the taskflow is collapsed, when you navigate to the homepage and then return to a workbook, the taskflow remains collapsed because that was its last state.
The state of the taskflow after the first workbook is built or opened in a user session is controlled by the rpasConfig.properties file.
For information on changing this setting, see the rpasConfig.properties section of the Oracle Retail Predictive Application Server Administration Guide for the Fusion Client.
J Dynamic Task A dynamic task is one that has steps which are dynamic, based on the selection the user makes when building the associated workbook. The steps are not shown unless the user is within a workbook.
Dynamic tasks display a clipboard with a lightning bolt icon.
Table 1–4 (Cont.) Description of Icons in the Taskflow
Legend Icon Name Description
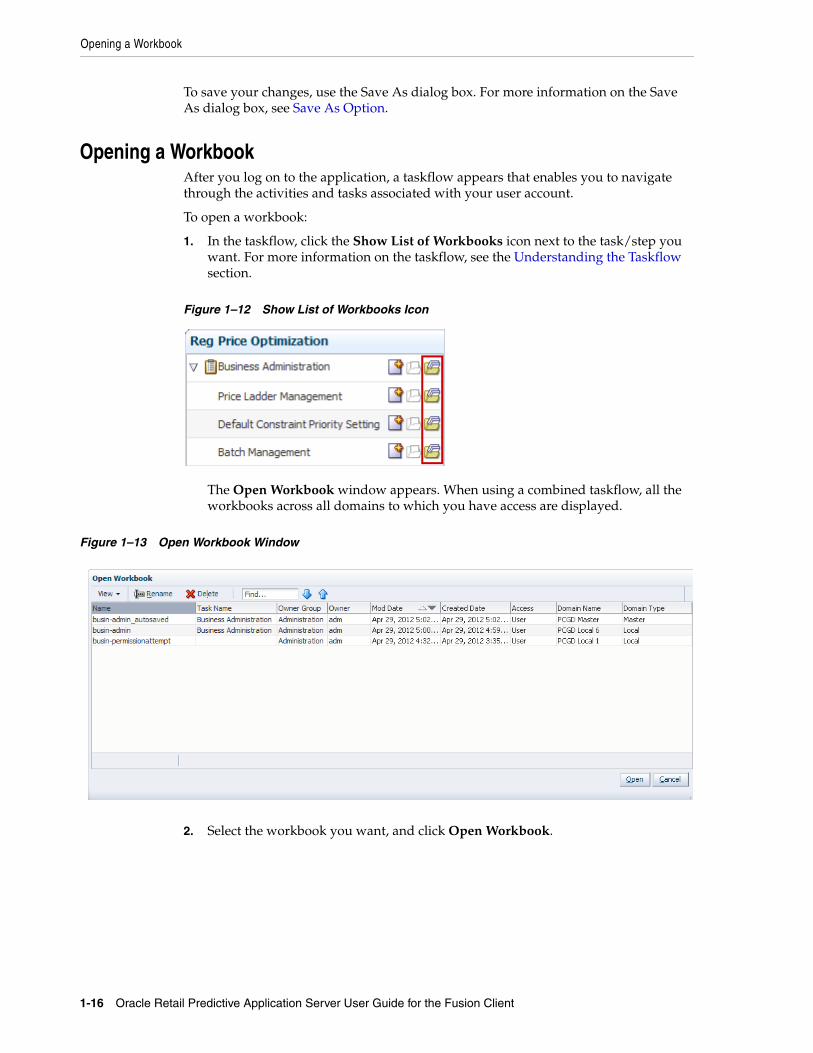
Opening a Workbook
1-16 Oracle Retail Predictive Application Server User Guide for the Fusion Client
To save your changes, use the Save As dialog box. For more information on the Save As dialog box, see Save As Option.
Opening a WorkbookAfter you log on to the application, a taskflow appears that enables you to navigate through the activities and tasks associated with your user account.
To open a workbook:
1. In the taskflow, click the Show List of Workbooks icon next to the task/step you want. For more information on the taskflow, see the Understanding the Taskflow section.
Figure 1–12 Show List of Workbooks Icon
The Open Workbook window appears. When using a combined taskflow, all the workbooks across all domains to which you have access are displayed.
Figure 1–13 Open Workbook Window
2. Select the workbook you want, and click Open Workbook.
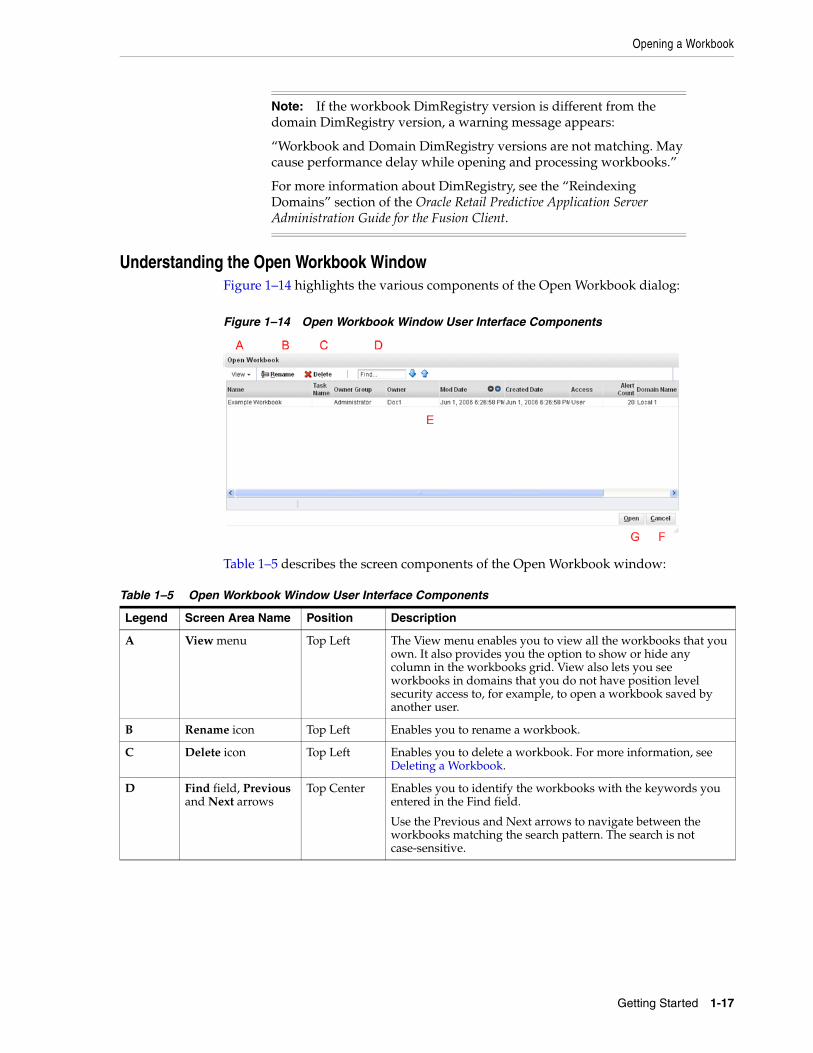
Opening a Workbook
Getting Started 1-17
Understanding the Open Workbook WindowFigure 1–14 highlights the various components of the Open Workbook dialog:
Figure 1–14 Open Workbook Window User Interface Components
Table 1–5 describes the screen components of the Open Workbook window:
Note: If the workbook DimRegistry version is different from the domain DimRegistry version, a warning message appears:
“Workbook and Domain DimRegistry versions are not matching. May cause performance delay while opening and processing workbooks.”
For more information about DimRegistry, see the “Reindexing Domains” section of the Oracle Retail Predictive Application Server Administration Guide for the Fusion Client.
Table 1–5 Open Workbook Window User Interface Components
Legend Screen Area Name Position Description
A View menu Top Left The View menu enables you to view all the workbooks that you own. It also provides you the option to show or hide any column in the workbooks grid. View also lets you see workbooks in domains that you do not have position level security access to, for example, to open a workbook saved by another user.
B Rename icon Top Left Enables you to rename a workbook.
C Delete icon Top Left Enables you to delete a workbook. For more information, see Deleting a Workbook.
D Find field, Previous and Next arrows
Top Center Enables you to identify the workbooks with the keywords you entered in the Find field.
Use the Previous and Next arrows to navigate between the workbooks matching the search pattern. The search is not case-sensitive.
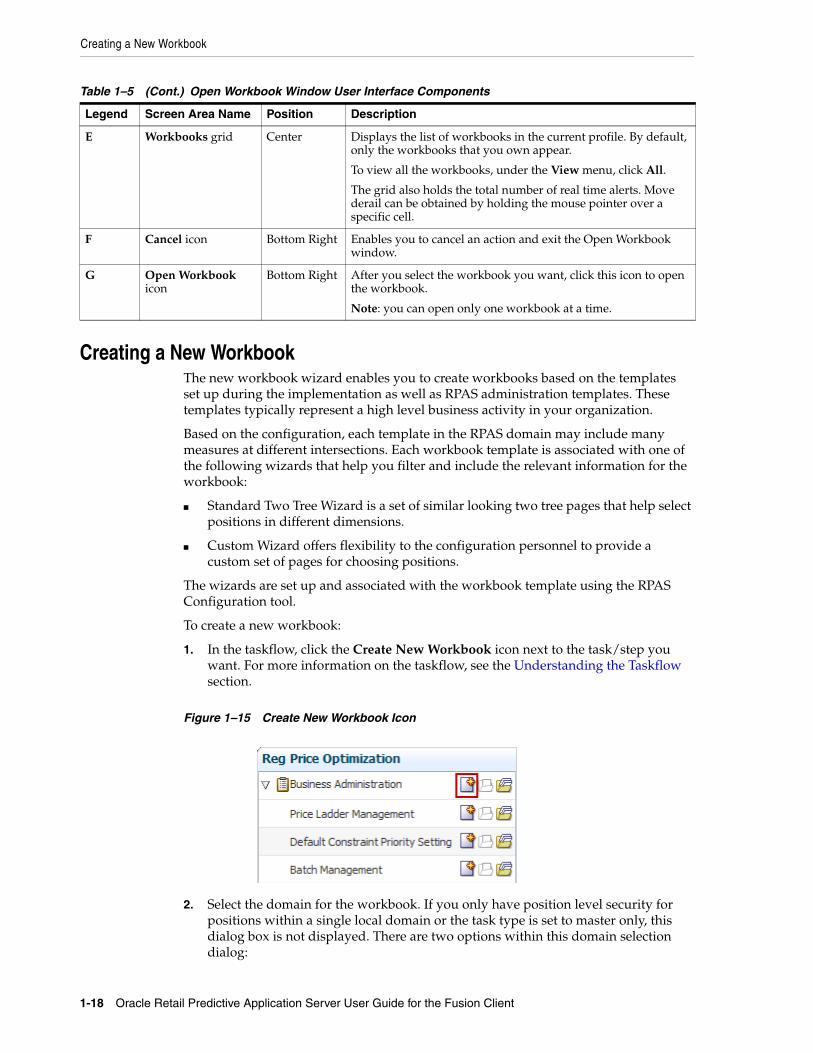
Creating a New Workbook
1-18 Oracle Retail Predictive Application Server User Guide for the Fusion Client
Creating a New WorkbookThe new workbook wizard enables you to create workbooks based on the templates set up during the implementation as well as RPAS administration templates. These templates typically represent a high level business activity in your organization.
Based on the configuration, each template in the RPAS domain may include many measures at different intersections. Each workbook template is associated with one of the following wizards that help you filter and include the relevant information for the workbook:
■ Standard Two Tree Wizard is a set of similar looking two tree pages that help select positions in different dimensions.
■ Custom Wizard offers flexibility to the configuration personnel to provide a custom set of pages for choosing positions.
The wizards are set up and associated with the workbook template using the RPAS Configuration tool.
To create a new workbook:
1. In the taskflow, click the Create New Workbook icon next to the task/step you want. For more information on the taskflow, see the Understanding the Taskflow section.
Figure 1–15 Create New Workbook Icon
2. Select the domain for the workbook. If you only have position level security for positions within a single local domain or the task type is set to master only, this dialog box is not displayed. There are two options within this domain selection dialog:
E Workbooks grid Center Displays the list of workbooks in the current profile. By default, only the workbooks that you own appear.
To view all the workbooks, under the View menu, click All.
The grid also holds the total number of real time alerts. Move derail can be obtained by holding the mouse pointer over a specific cell.
F Cancel icon Bottom Right Enables you to cancel an action and exit the Open Workbook window.
G Open Workbook icon
Bottom Right After you select the workbook you want, click this icon to open the workbook.
Note: you can open only one workbook at a time.
Table 1–5 (Cont.) Open Workbook Window User Interface Components
Legend Screen Area Name Position Description
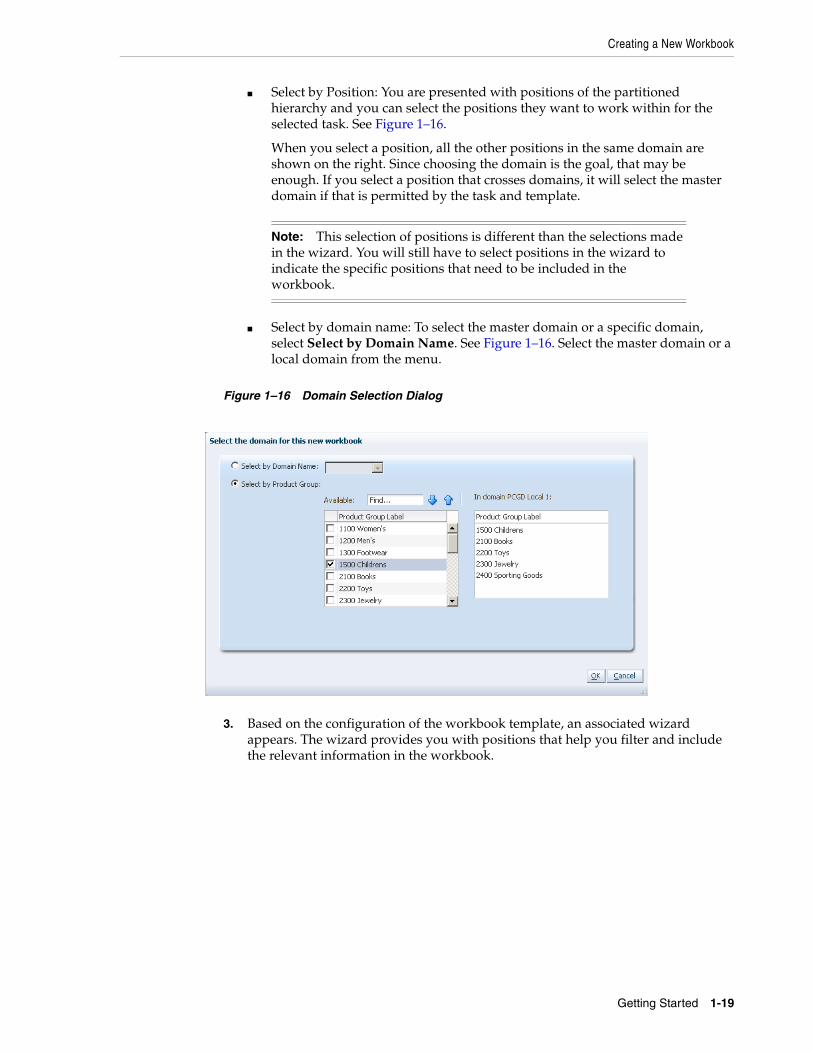
Creating a New Workbook
Getting Started 1-19
■ Select by Position: You are presented with positions of the partitioned hierarchy and you can select the positions they want to work within for the selected task. See Figure 1–16.
When you select a position, all the other positions in the same domain are shown on the right. Since choosing the domain is the goal, that may be enough. If you select a position that crosses domains, it will select the master domain if that is permitted by the task and template.
■ Select by domain name: To select the master domain or a specific domain, select Select by Domain Name. See Figure 1–16. Select the master domain or a local domain from the menu.
Figure 1–16 Domain Selection Dialog
3. Based on the configuration of the workbook template, an associated wizard appears. The wizard provides you with positions that help you filter and include the relevant information in the workbook.
Note: This selection of positions is different than the selections made in the wizard. You will still have to select positions in the wizard to indicate the specific positions that need to be included in the workbook.
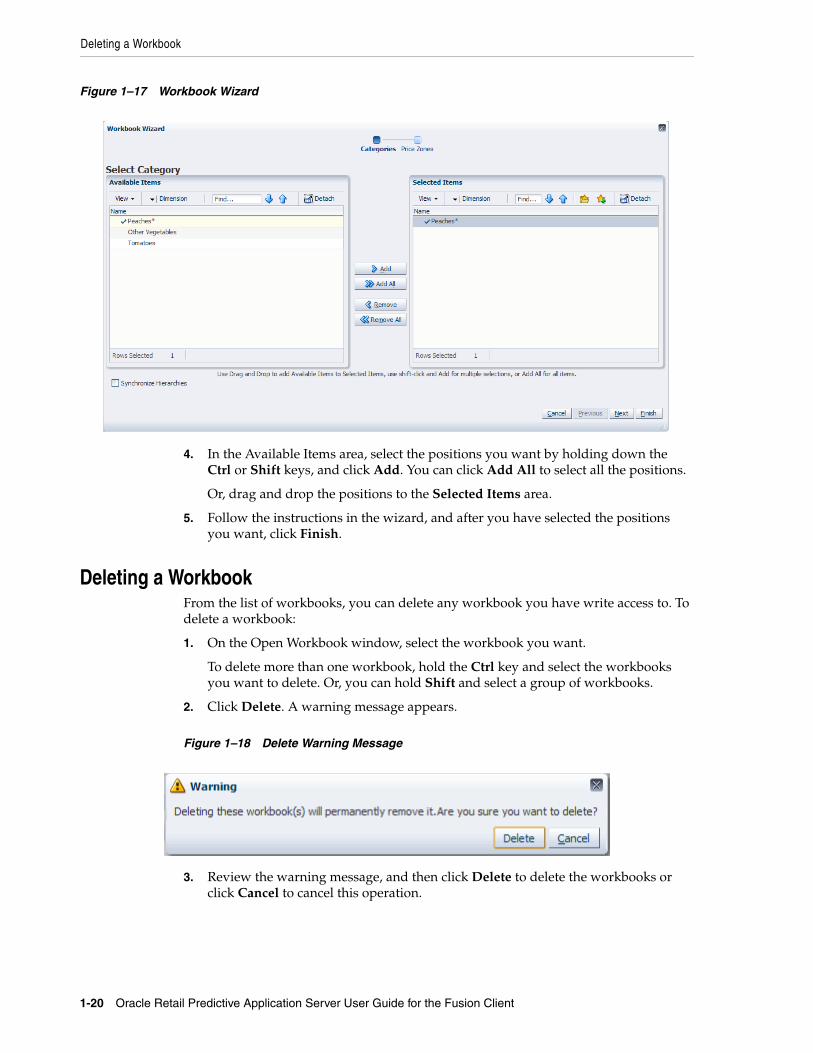
Deleting a Workbook
1-20 Oracle Retail Predictive Application Server User Guide for the Fusion Client
Figure 1–17 Workbook Wizard
4. In the Available Items area, select the positions you want by holding down the Ctrl or Shift keys, and click Add. You can click Add All to select all the positions.
Or, drag and drop the positions to the Selected Items area.
5. Follow the instructions in the wizard, and after you have selected the positions you want, click Finish.
Deleting a WorkbookFrom the list of workbooks, you can delete any workbook you have write access to. To delete a workbook:
1. On the Open Workbook window, select the workbook you want.
To delete more than one workbook, hold the Ctrl key and select the workbooks you want to delete. Or, you can hold Shift and select a group of workbooks.
2. Click Delete. A warning message appears.
Figure 1–18 Delete Warning Message
3. Review the warning message, and then click Delete to delete the workbooks or click Cancel to cancel this operation.
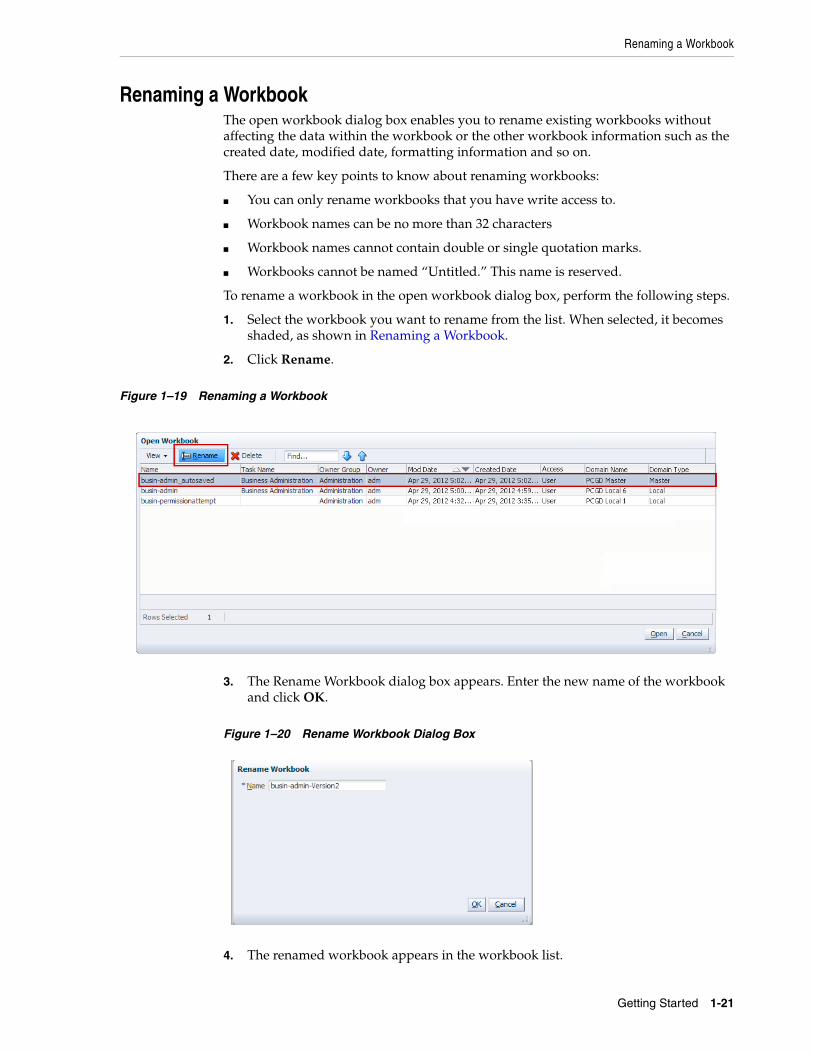
Renaming a Workbook
Getting Started 1-21
Renaming a WorkbookThe open workbook dialog box enables you to rename existing workbooks without affecting the data within the workbook or the other workbook information such as the created date, modified date, formatting information and so on.
There are a few key points to know about renaming workbooks:
■ You can only rename workbooks that you have write access to.
■ Workbook names can be no more than 32 characters
■ Workbook names cannot contain double or single quotation marks.
■ Workbooks cannot be named “Untitled.” This name is reserved.
To rename a workbook in the open workbook dialog box, perform the following steps.
1. Select the workbook you want to rename from the list. When selected, it becomes shaded, as shown in Renaming a Workbook.
2. Click Rename.
Figure 1–19 Renaming a Workbook
3. The Rename Workbook dialog box appears. Enter the new name of the workbook and click OK.
Figure 1–20 Rename Workbook Dialog Box
4. The renamed workbook appears in the workbook list.
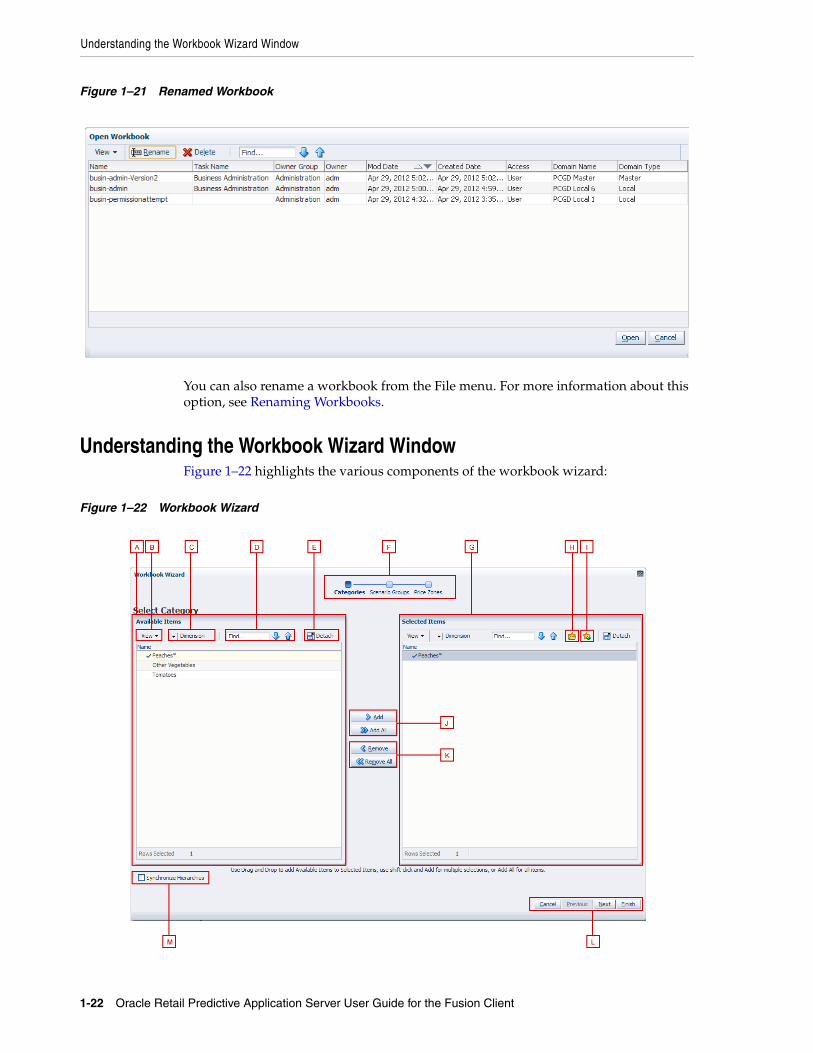
Understanding the Workbook Wizard Window
1-22 Oracle Retail Predictive Application Server User Guide for the Fusion Client
Figure 1–21 Renamed Workbook
You can also rename a workbook from the File menu. For more information about this option, see Renaming Workbooks.
Understanding the Workbook Wizard WindowFigure 1–22 highlights the various components of the workbook wizard:
Figure 1–22 Workbook Wizard
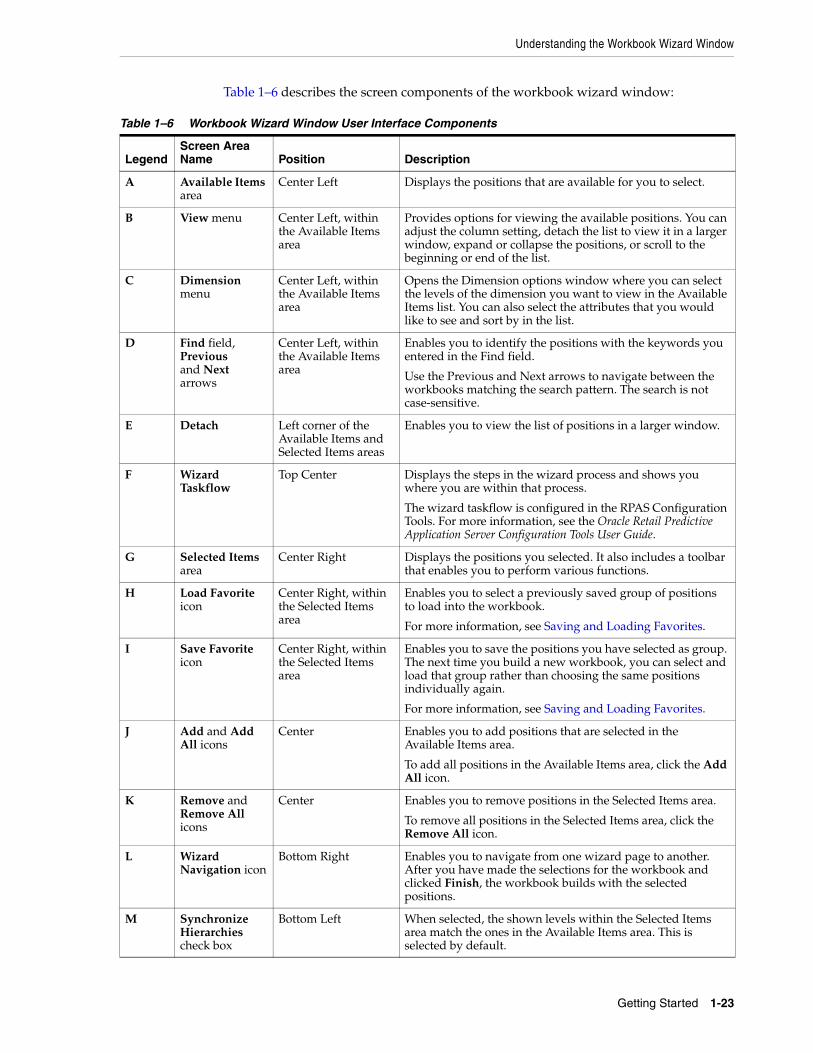
Understanding the Workbook Wizard Window
Getting Started 1-23
Table 1–6 describes the screen components of the workbook wizard window:
Table 1–6 Workbook Wizard Window User Interface Components
LegendScreen Area Name Position Description
A Available Items area
Center Left Displays the positions that are available for you to select.
B View menu Center Left, within the Available Items area
Provides options for viewing the available positions. You can adjust the column setting, detach the list to view it in a larger window, expand or collapse the positions, or scroll to the beginning or end of the list.
C Dimension menu
Center Left, within the Available Items area
Opens the Dimension options window where you can select the levels of the dimension you want to view in the Available Items list. You can also select the attributes that you would like to see and sort by in the list.
D Find field, Previous and Next arrows
Center Left, within the Available Items area
Enables you to identify the positions with the keywords you entered in the Find field.
Use the Previous and Next arrows to navigate between the workbooks matching the search pattern. The search is not case-sensitive.
E Detach Left corner of the Available Items and Selected Items areas
Enables you to view the list of positions in a larger window.
F Wizard Taskflow
Top Center Displays the steps in the wizard process and shows you where you are within that process.
The wizard taskflow is configured in the RPAS Configuration Tools. For more information, see the Oracle Retail Predictive Application Server Configuration Tools User Guide.
G Selected Items area
Center Right Displays the positions you selected. It also includes a toolbar that enables you to perform various functions.
H Load Favorite icon
Center Right, within the Selected Items area
Enables you to select a previously saved group of positions to load into the workbook.
For more information, see Saving and Loading Favorites.
I Save Favorite icon
Center Right, within the Selected Items area
Enables you to save the positions you have selected as group. The next time you build a new workbook, you can select and load that group rather than choosing the same positions individually again.
For more information, see Saving and Loading Favorites.
J Add and Add All icons
Center Enables you to add positions that are selected in the Available Items area.
To add all positions in the Available Items area, click the Add All icon.
K Remove and Remove All icons
Center Enables you to remove positions in the Selected Items area.
To remove all positions in the Selected Items area, click the Remove All icon.
L Wizard Navigation icon
Bottom Right Enables you to navigate from one wizard page to another. After you have made the selections for the workbook and clicked Finish, the workbook builds with the selected positions.
M Synchronize Hierarchies check box
Bottom Left When selected, the shown levels within the Selected Items area match the ones in the Available Items area. This is selected by default.

Understanding the Workbook Wizard Window
1-24 Oracle Retail Predictive Application Server User Guide for the Fusion Client
Saving and Loading FavoritesAfter you have selected the positions that you want to appear in the workbook you are building, you can save that collection of positions for future use by using the Save Favorite and Load Favorite features. You can save the collection of positions for each dimension presented in the workbook wizard.
Saving FavoritesTo save the selected positions as a favorite, perform the following:
1. After you have moved the positions to the Selected Items area, click the Save Favorite icon or select Save Favorites from the View menu. See Figure 1–23.
Figure 1–23 Save and Load Favorites Icons
2. The Save Favorites window appears. Enter the name of the favorite in the Label field. In the Access field, choose one of the following:
■ User: This option makes the favorite available to only the user who created it.
■ World: This option makes the favorite available to all users.
Note that previously saved favorites are listed in the table.
Figure 1–24 Save Favorites Window
3. When finished, click Save. If you would like to abandon the changes, click Cancel.
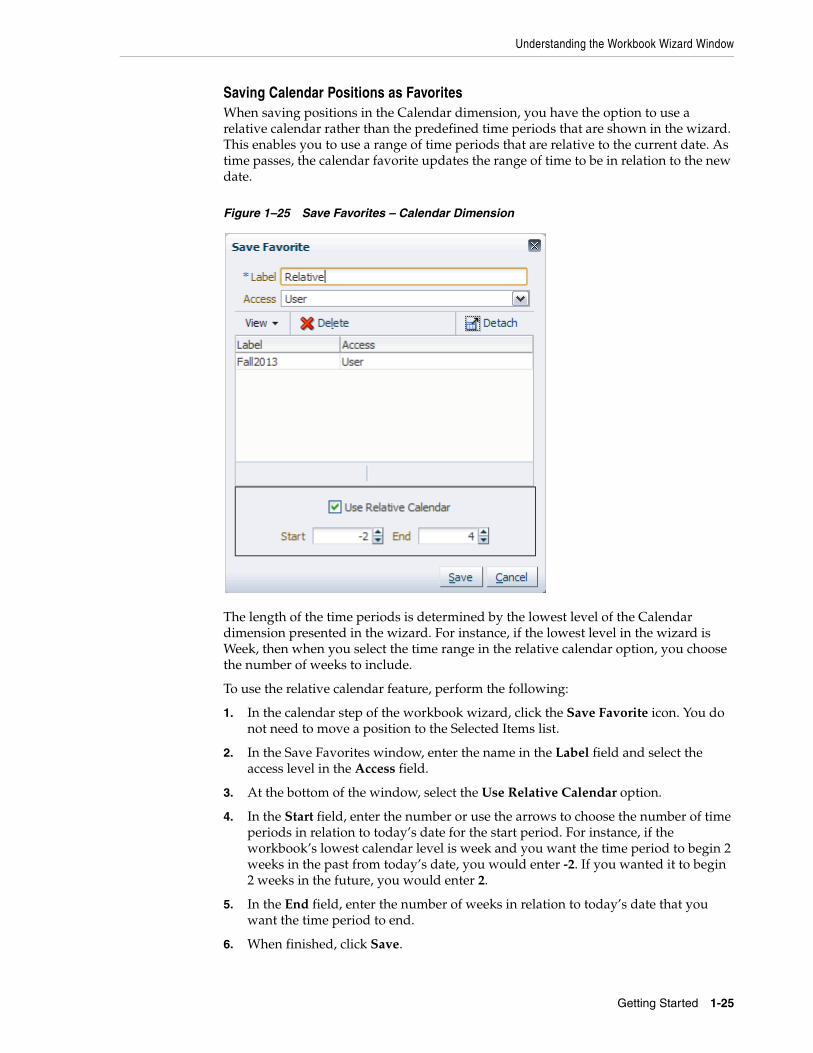
Understanding the Workbook Wizard Window
Getting Started 1-25
Saving Calendar Positions as FavoritesWhen saving positions in the Calendar dimension, you have the option to use a relative calendar rather than the predefined time periods that are shown in the wizard. This enables you to use a range of time periods that are relative to the current date. As time passes, the calendar favorite updates the range of time to be in relation to the new date.
Figure 1–25 Save Favorites – Calendar Dimension
The length of the time periods is determined by the lowest level of the Calendar dimension presented in the wizard. For instance, if the lowest level in the wizard is Week, then when you select the time range in the relative calendar option, you choose the number of weeks to include.
To use the relative calendar feature, perform the following:
1. In the calendar step of the workbook wizard, click the Save Favorite icon. You do not need to move a position to the Selected Items list.
2. In the Save Favorites window, enter the name in the Label field and select the access level in the Access field.
3. At the bottom of the window, select the Use Relative Calendar option.
4. In the Start field, enter the number or use the arrows to choose the number of time periods in relation to today’s date for the start period. For instance, if the workbook’s lowest calendar level is week and you want the time period to begin 2 weeks in the past from today’s date, you would enter -2. If you wanted it to begin 2 weeks in the future, you would enter 2.
5. In the End field, enter the number of weeks in relation to today’s date that you want the time period to end.
6. When finished, click Save.

Understanding the Workbook Wizard Window
1-26 Oracle Retail Predictive Application Server User Guide for the Fusion Client
Editing FavoritesTo change or update a favorite, perform the following:
1. Move the updated set of positions to the Selected Items area.
2. Click the Save Favorite icon or select Save Favorites from the View menu.
3. In the Save Favorites window, select the favorite that you want to edit from the list.
4. Update the Access level if necessary.
5. Click Save. The favorite now includes the new set of positions.
Loading FavoritesAfter you have saved a favorite, you can load it into to the workbook wizard. Loading favorites into the wizard rather than selecting individual positions from the wizard every time you create a workbook will save you time.
To load a favorite, perform the following:
1. In the workbook wizard, click the Load Favorite icon.
2. The Load Favorites window appears. Click the favorite you want to load. The Load Favorites window automatically closes.
Figure 1–26 Load Favorites Window
3. In the workbook wizard, the positions from the favorite now appear in the Selected Items area.
Deleting FavoritesTo delete a favorite, perform the following steps:
1. Click the Save Favorite icon or select Save Favorites from the View menu.
2. Select the favorite you want to delete from the list.
3. Click Delete. The favorite is deleted and no longer appears in the list.
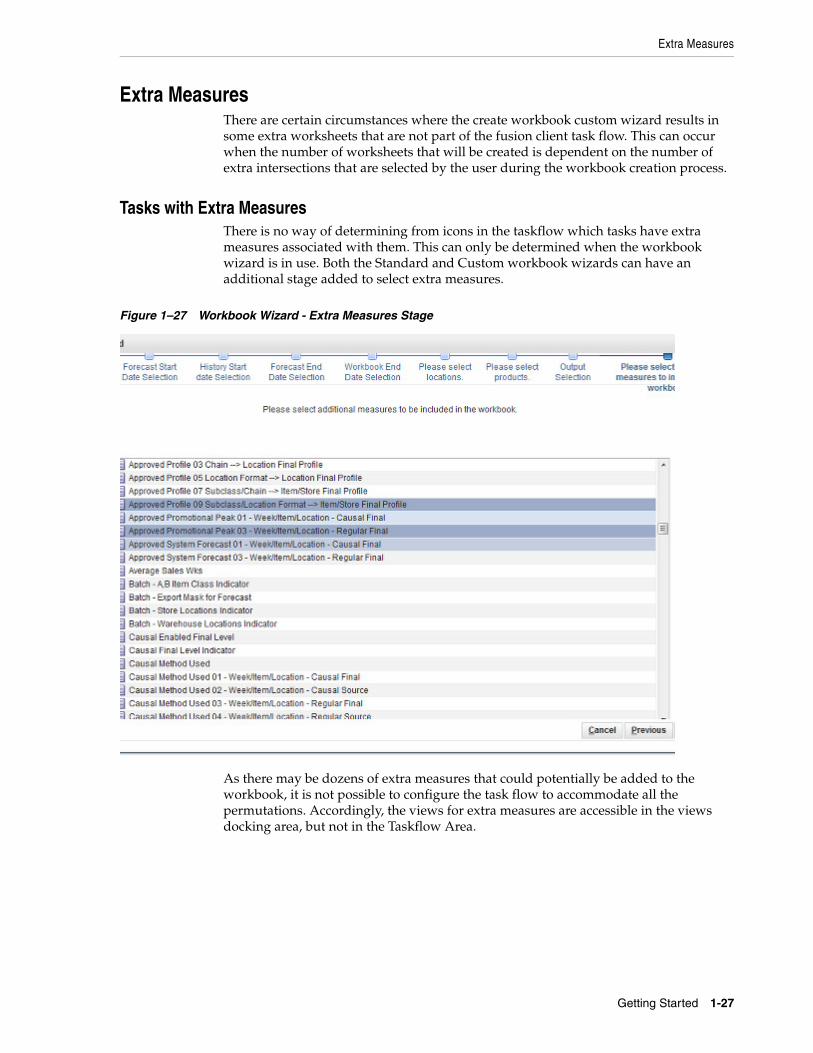
Extra Measures
Getting Started 1-27
Extra MeasuresThere are certain circumstances where the create workbook custom wizard results in some extra worksheets that are not part of the fusion client task flow. This can occur when the number of worksheets that will be created is dependent on the number of extra intersections that are selected by the user during the workbook creation process.
Tasks with Extra MeasuresThere is no way of determining from icons in the taskflow which tasks have extra measures associated with them. This can only be determined when the workbook wizard is in use. Both the Standard and Custom workbook wizards can have an additional stage added to select extra measures.
Figure 1–27 Workbook Wizard - Extra Measures Stage
As there may be dozens of extra measures that could potentially be added to the workbook, it is not possible to configure the task flow to accommodate all the permutations. Accordingly, the views for extra measures are accessible in the views docking area, but not in the Taskflow Area.

Plug-Ins from External Applications
1-28 Oracle Retail Predictive Application Server User Guide for the Fusion Client
Figure 1–28 Extra Measures - Taskflow and Views Docking Area
Using Extra MeasuresWorking with extra measures in the activity flow is similar to working with steps than can be selected from the task flow - the sole difference being that steps associated with extra measures can only be selected from the Views Docking Area. The following conditions apply:
■ If the task has a single step assigned to it in the taskflow, any additional worksheets will be assigned to that step.
■ If the worksheet has a single task and multiple steps, the additional worksheets will be accessible from each step.
■ If one or more steps of a task have been configured with tabs, then all the configured tabs will display the additional worksheets.
Plug-Ins from External ApplicationsRPAS has the ability to display Plug-Ins from other applications.
Overview of Plug-Ins from Other applicationsAs well as displaying information from other RPAS domains in the Fusion Client via the standard client/server relationship, the capability exists to integrate plug-ins from external applications into RPAS. This allows data to be used from other sources.
An example would be a plug-in configured to read data out of a relational database and present it in read only form to a user in RPAS. That user could then use the information to update data within RPAS.
Configuring the Plug-In to Display in the Fusion ClientIn order for these plug-ins to be visible in the Fusion client, a series of preparatory actions have to be carried out. A brief overview is as follows:
■ Develop Package
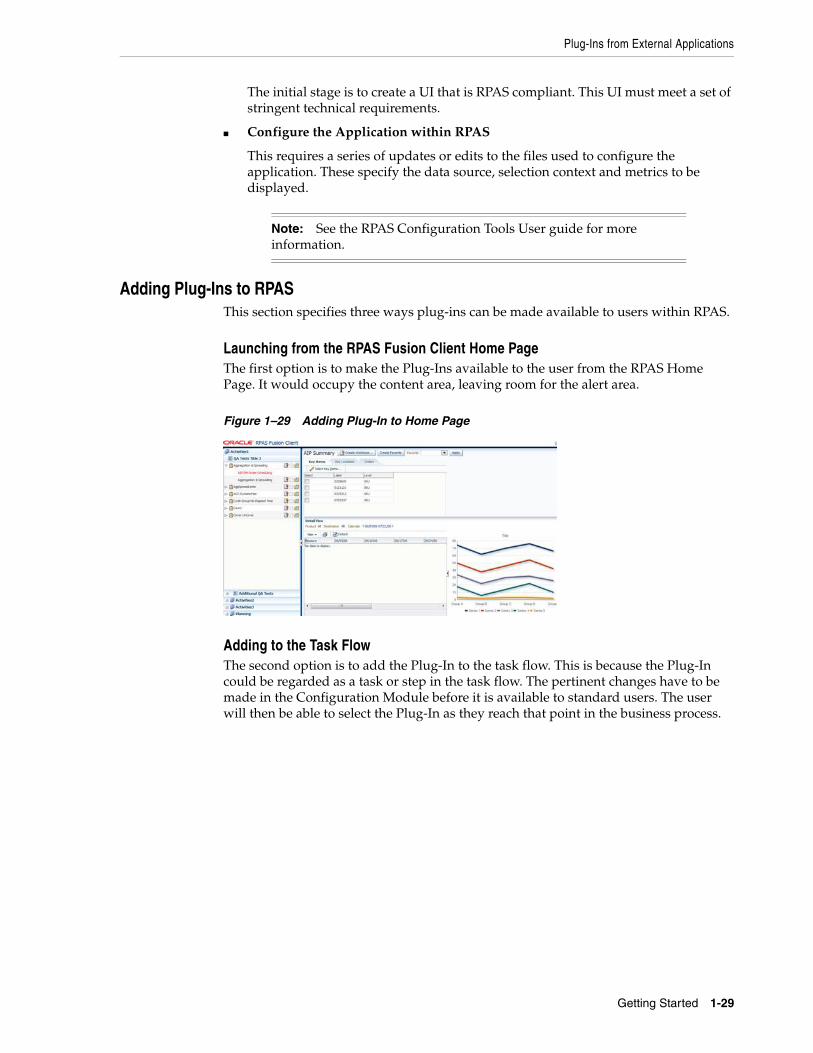
Plug-Ins from External Applications
Getting Started 1-29
The initial stage is to create a UI that is RPAS compliant. This UI must meet a set of stringent technical requirements.
■ Configure the Application within RPAS
This requires a series of updates or edits to the files used to configure the application. These specify the data source, selection context and metrics to be displayed.
Adding Plug-Ins to RPASThis section specifies three ways plug-ins can be made available to users within RPAS.
Launching from the RPAS Fusion Client Home PageThe first option is to make the Plug-Ins available to the user from the RPAS Home Page. It would occupy the content area, leaving room for the alert area.
Figure 1–29 Adding Plug-In to Home Page
Adding to the Task FlowThe second option is to add the Plug-In to the task flow. This is because the Plug-In could be regarded as a task or step in the task flow. The pertinent changes have to be made in the Configuration Module before it is available to standard users. The user will then be able to select the Plug-In as they reach that point in the business process.
Note: See the RPAS Configuration Tools User guide for more information.
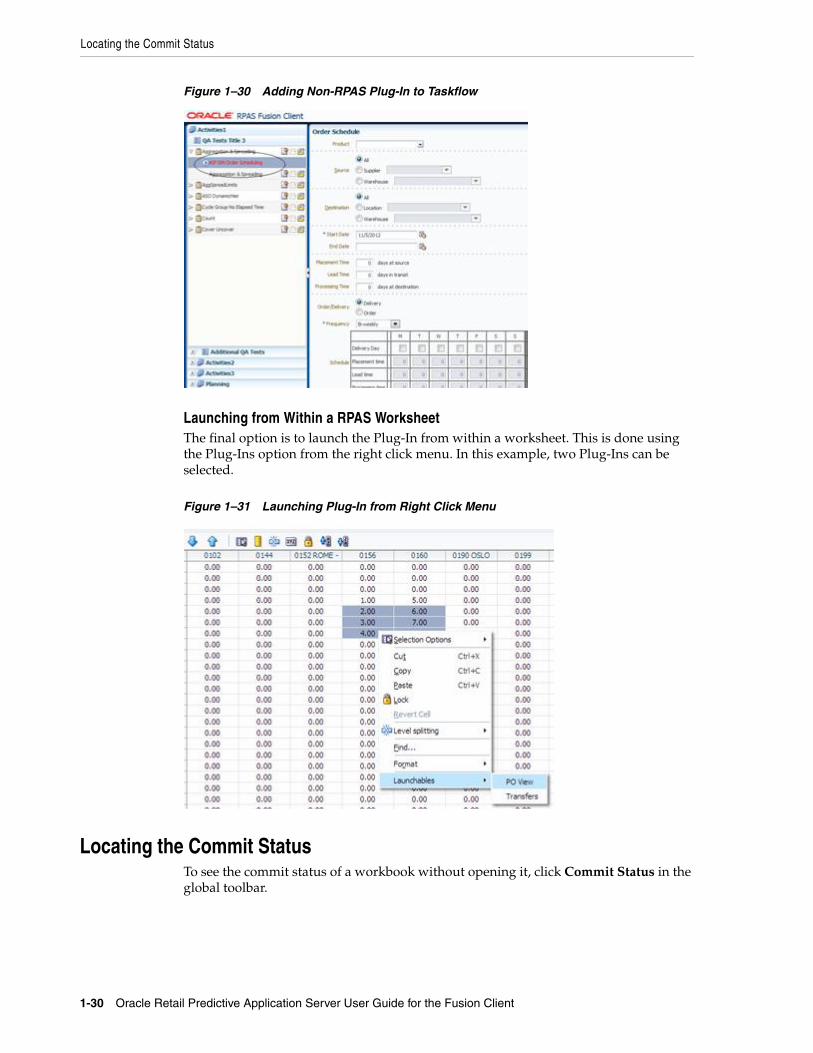
Locating the Commit Status
1-30 Oracle Retail Predictive Application Server User Guide for the Fusion Client
Figure 1–30 Adding Non-RPAS Plug-In to Taskflow
Launching from Within a RPAS WorksheetThe final option is to launch the Plug-In from within a worksheet. This is done using the Plug-Ins option from the right click menu. In this example, two Plug-Ins can be selected.
Figure 1–31 Launching Plug-In from Right Click Menu
Locating the Commit StatusTo see the commit status of a workbook without opening it, click Commit Status in the global toolbar.
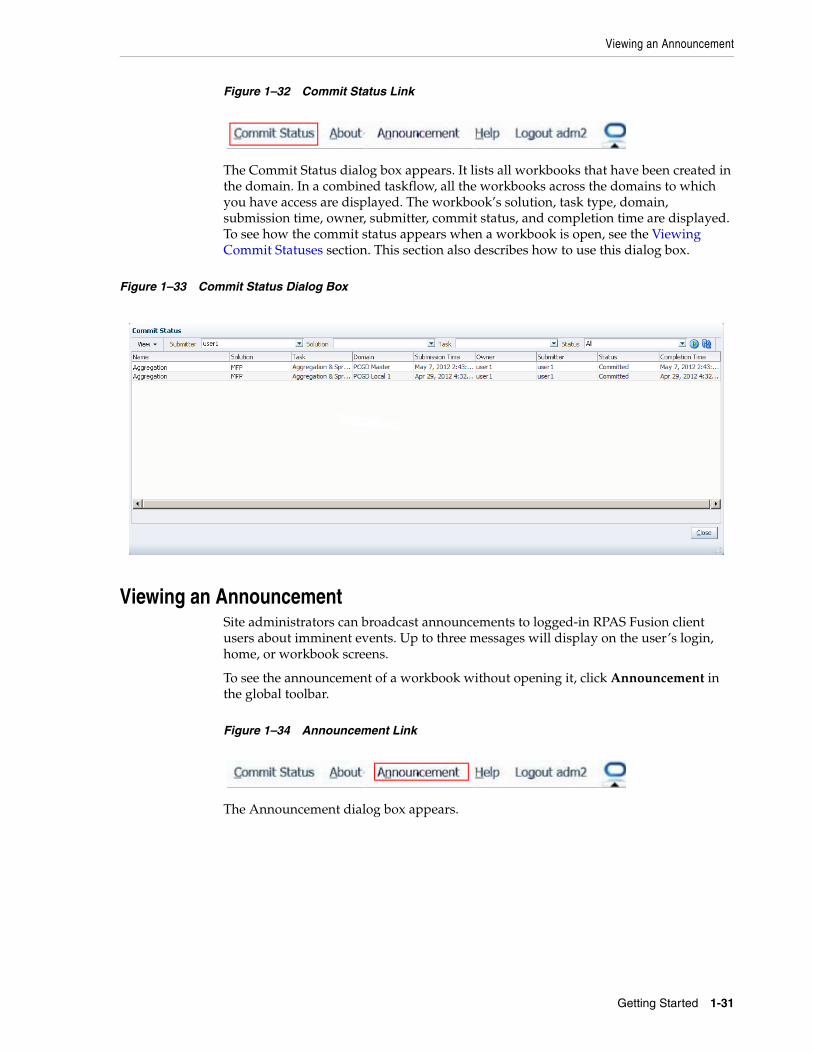
Viewing an Announcement
Getting Started 1-31
Figure 1–32 Commit Status Link
The Commit Status dialog box appears. It lists all workbooks that have been created in the domain. In a combined taskflow, all the workbooks across the domains to which you have access are displayed. The workbook’s solution, task type, domain, submission time, owner, submitter, commit status, and completion time are displayed. To see how the commit status appears when a workbook is open, see the Viewing Commit Statuses section. This section also describes how to use this dialog box.
Figure 1–33 Commit Status Dialog Box
Viewing an AnnouncementSite administrators can broadcast announcements to logged-in RPAS Fusion client users about imminent events. Up to three messages will display on the user’s login, home, or workbook screens.
To see the announcement of a workbook without opening it, click Announcement in the global toolbar.
Figure 1–34 Announcement Link
The Announcement dialog box appears.
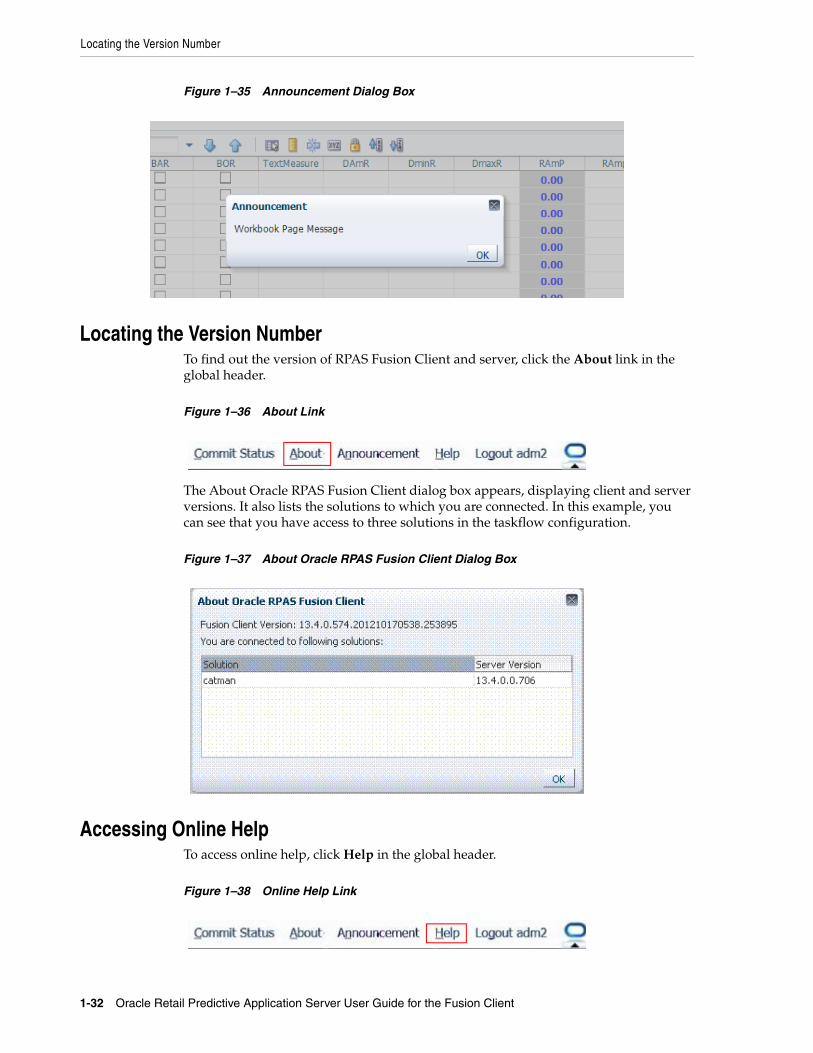
Locating the Version Number
1-32 Oracle Retail Predictive Application Server User Guide for the Fusion Client
Figure 1–35 Announcement Dialog Box
Locating the Version NumberTo find out the version of RPAS Fusion Client and server, click the About link in the global header.
Figure 1–36 About Link
The About Oracle RPAS Fusion Client dialog box appears, displaying client and server versions. It also lists the solutions to which you are connected. In this example, you can see that you have access to three solutions in the taskflow configuration.
Figure 1–37 About Oracle RPAS Fusion Client Dialog Box
Accessing Online HelpTo access online help, click Help in the global header.
Figure 1–38 Online Help Link
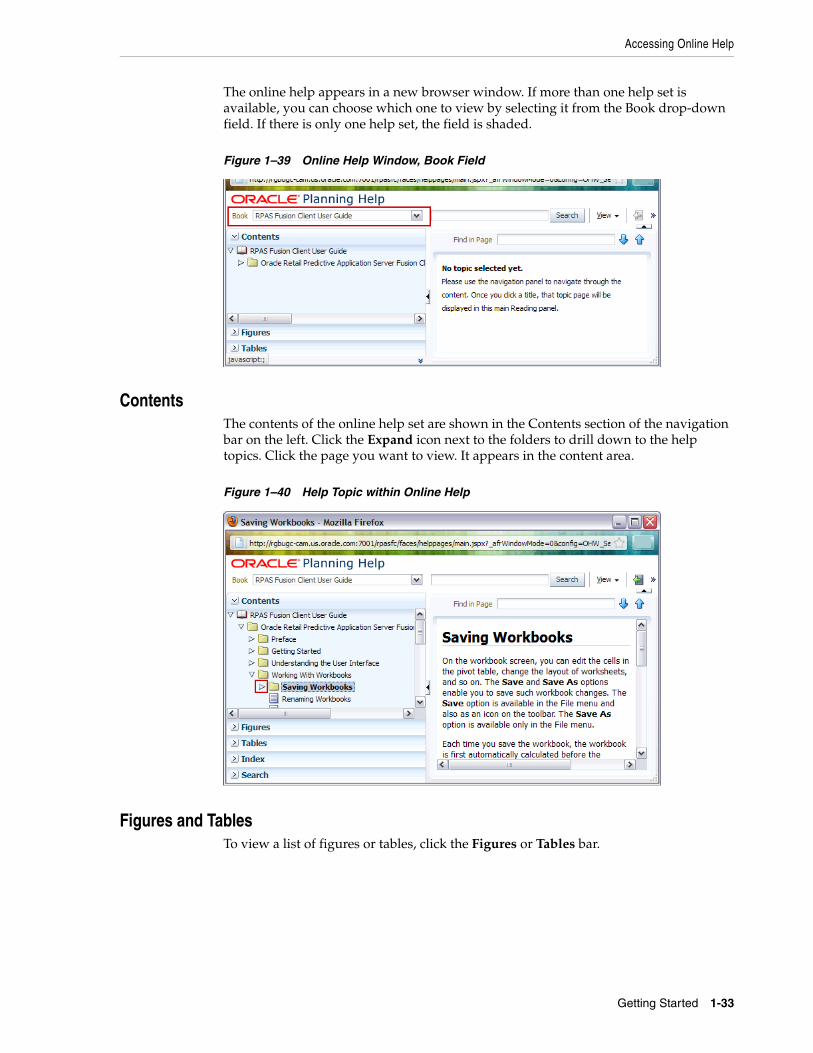
Accessing Online Help
Getting Started 1-33
The online help appears in a new browser window. If more than one help set is available, you can choose which one to view by selecting it from the Book drop-down field. If there is only one help set, the field is shaded.
Figure 1–39 Online Help Window, Book Field
Contents The contents of the online help set are shown in the Contents section of the navigation bar on the left. Click the Expand icon next to the folders to drill down to the help topics. Click the page you want to view. It appears in the content area.
Figure 1–40 Help Topic within Online Help
Figures and TablesTo view a list of figures or tables, click the Figures or Tables bar.
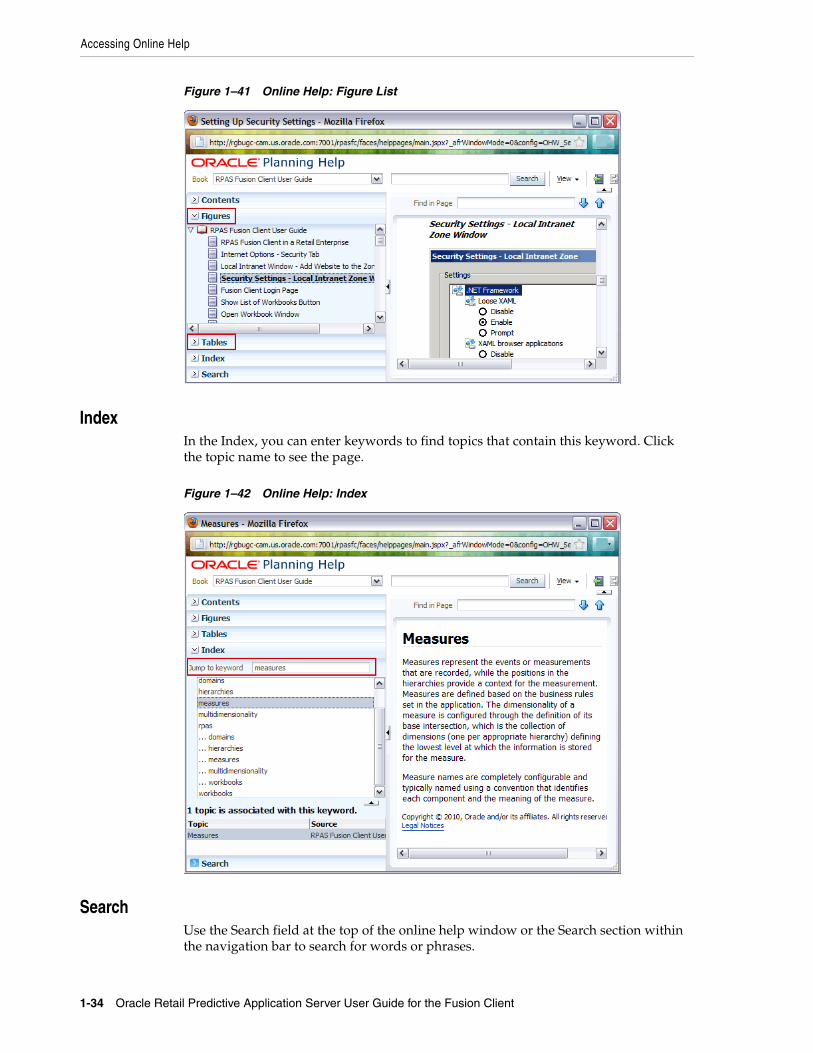
Accessing Online Help
1-34 Oracle Retail Predictive Application Server User Guide for the Fusion Client
Figure 1–41 Online Help: Figure List
IndexIn the Index, you can enter keywords to find topics that contain this keyword. Click the topic name to see the page.
Figure 1–42 Online Help: Index
SearchUse the Search field at the top of the online help window or the Search section within the navigation bar to search for words or phrases.
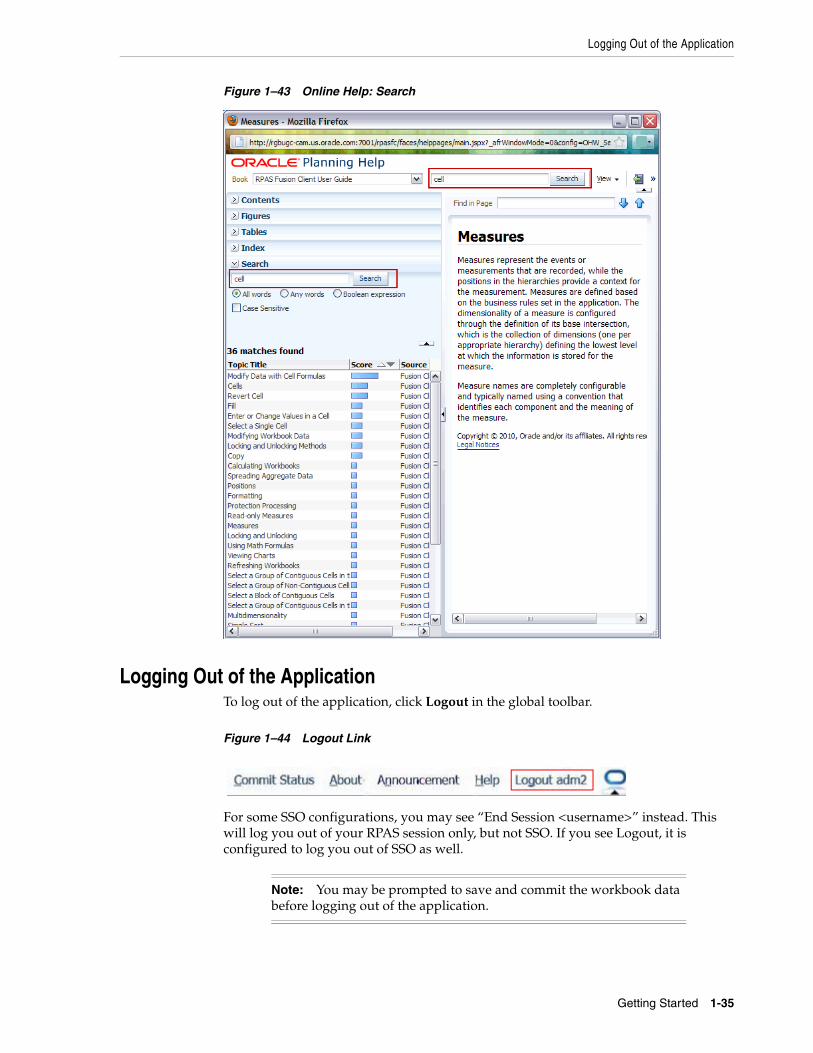
Logging Out of the Application
Getting Started 1-35
Figure 1–43 Online Help: Search
Logging Out of the ApplicationTo log out of the application, click Logout in the global toolbar.
Figure 1–44 Logout Link
For some SSO configurations, you may see “End Session <username>” instead. This will log you out of your RPAS session only, but not SSO. If you see Logout, it is configured to log you out of SSO as well.
Note: You may be prompted to save and commit the workbook data before logging out of the application.

Logging Out of the Application
1-36 Oracle Retail Predictive Application Server User Guide for the Fusion Client

Understanding the User Interface 2-1
2Understanding the User Interface
This chapter introduces you to the workbook user interface and describes the following screen components:
■ Quick Access Toolbar
■ Contents Area
Figure 2–1 highlights the various components of the workbook user interface:
Figure 2–1 Workbook User Interface
Table 2–1 describes the user interface components in the workbook user interface:
Table 2–1 Workbook User Interface Screen Components
Screen Component Description
Global Header Displayed at the top of the screen, this area appears across all the business applications and custom pages. It includes the application branding and links for the Home page, About window, Online Help, changing a password, and logging out of the application.
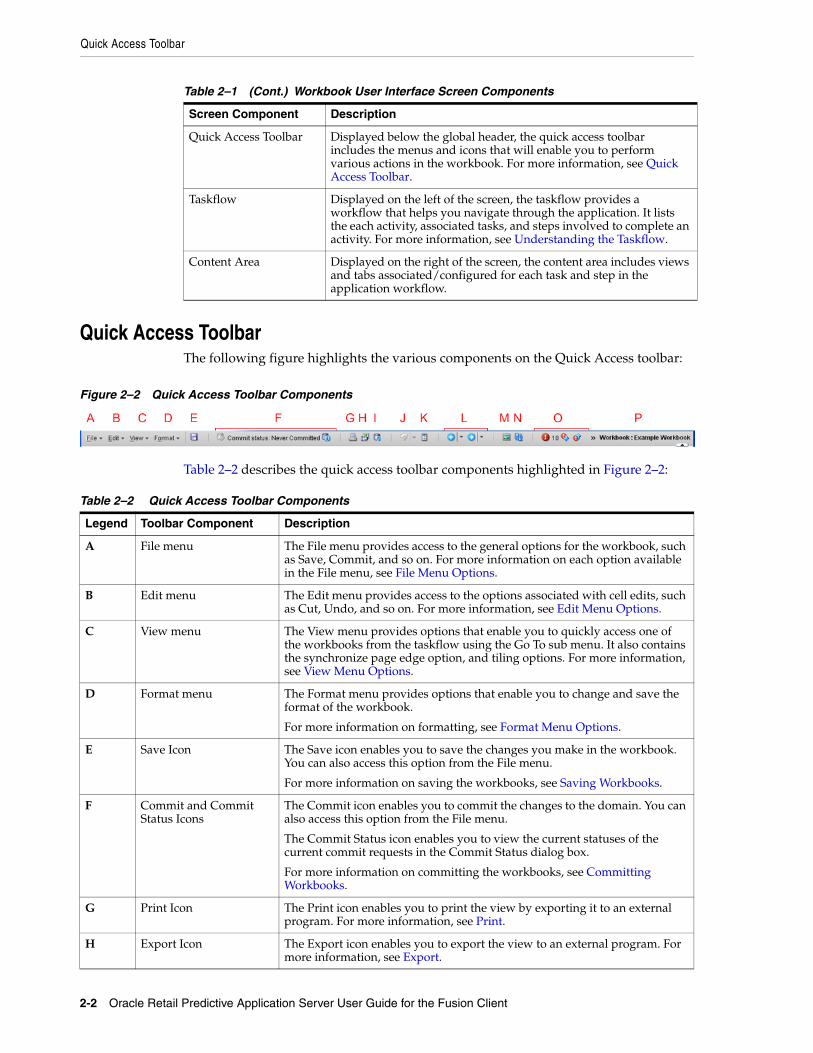
Quick Access Toolbar
2-2 Oracle Retail Predictive Application Server User Guide for the Fusion Client
Quick Access ToolbarThe following figure highlights the various components on the Quick Access toolbar:
Figure 2–2 Quick Access Toolbar Components
Table 2–2 describes the quick access toolbar components highlighted in Figure 2–2:
Quick Access Toolbar Displayed below the global header, the quick access toolbar includes the menus and icons that will enable you to perform various actions in the workbook. For more information, see Quick Access Toolbar.
Taskflow Displayed on the left of the screen, the taskflow provides a workflow that helps you navigate through the application. It lists the each activity, associated tasks, and steps involved to complete an activity. For more information, see Understanding the Taskflow.
Content Area Displayed on the right of the screen, the content area includes views and tabs associated/configured for each task and step in the application workflow.
Table 2–2 Quick Access Toolbar Components
Legend Toolbar Component Description
A File menu The File menu provides access to the general options for the workbook, such as Save, Commit, and so on. For more information on each option available in the File menu, see File Menu Options.
B Edit menu The Edit menu provides access to the options associated with cell edits, such as Cut, Undo, and so on. For more information, see Edit Menu Options.
C View menu The View menu provides options that enable you to quickly access one of the workbooks from the taskflow using the Go To sub menu. It also contains the synchronize page edge option, and tiling options. For more information, see View Menu Options.
D Format menu The Format menu provides options that enable you to change and save the format of the workbook.
For more information on formatting, see Format Menu Options.
E Save Icon The Save icon enables you to save the changes you make in the workbook. You can also access this option from the File menu.
For more information on saving the workbooks, see Saving Workbooks.
F Commit and Commit Status Icons
The Commit icon enables you to commit the changes to the domain. You can also access this option from the File menu.
The Commit Status icon enables you to view the current statuses of the current commit requests in the Commit Status dialog box.
For more information on committing the workbooks, see Committing Workbooks.
G Print Icon The Print icon enables you to print the view by exporting it to an external program. For more information, see Print.
H Export Icon The Export icon enables you to export the view to an external program. For more information, see Export.
Table 2–1 (Cont.) Workbook User Interface Screen Components
Screen Component Description

Quick Access Toolbar
Understanding the User Interface 2-3
File Menu OptionsThe file menu includes the following options:
■ Save – Allows you to save all information in the workbook. This includes information on the current layout of views and charts. You can also click the Save icon on the toolbar. For more information, see Saving Workbooks.
■ Save As – Allows you to save the workbook with a name and access you want. For more information, see Save As Option.
■ Rename – Allows you to rename the workbook. For more information, see Renaming Workbooks.
I Refresh Workbook The Refresh Workbook icon allows you to update a workbook with the data that is currently stored in the domain. This allows you to work with the most current data without having to rebuild the workbook. Workbooks can be refreshed with a single refresh rule group or a multiple ones. For more information, see Refreshing Workbooks.
J Undo Icon and Drop-down List
The Undo icon enables you to undo actions you performed within the entire workbook (not just the current view). You can also access this option from the Edit menu. When more than one action has been performed, a drop-down list of the last performed actions is available. From that list you can select the actions to undo.
K Calculate Icon After you edit the cells within the workbook, use the Calculate icon to calculate and update the associated cells within the workbook. You can also access this option from the Edit menu. For more information, see Calculating Workbooks.
L Previous and Next Icons
The Previous and Next icons enable you to navigate to the previous or next task/step in the taskflow. You can also click the down arrow (next to both the icons) to quickly jump to a specific task or step within the workflow.
M View/Manage Images The View/Manage Images icon enables you to associate images with specific dimension positions. This feature is especially useful for the product and location dimensions. For instance, you can associate an item with a image of what it should look like displayed on the shelf. You can associate stores with images of the store front or interior. For more information, see Images.
N Update Attribute Values and Level Splits Icon
After you edit user-defined attributes, you can update the attributes and level splits with this icon. Clicking this icon recalculates all sort attributes and dimension splits displayed in the workbook since the attribute or dimension split was applied to the data. This icon is enabled only when there are attributes displayed that need to be recomputed based on user edits. For more information, see Updating Attribute Values.
O Alerts This section of the toolbar gives information on Batch Alerts and Real Time Alerts. These enable users to focus on information that needs their attention. These icons will only be visible if the workbook has been configured to have Batch Alerts and Real Time Alerts. for more information see Overview of Alerts.
P Workbook Name This area displays the name of the currently open workbook.
Note: The Save option does not commit the changes to master domain.
Table 2–2 (Cont.) Quick Access Toolbar Components
Legend Toolbar Component Description
Quick Access Toolbar
2-4 Oracle Retail Predictive Application Server User Guide for the Fusion Client
■ Commit – This option allows you to commit the changes to the master domain. After the changes are committed, all other users with access to the workbook will notice the changes as well. For more information, see Committing Workbooks.
■ Commit Status – This option allows you to view the status of committed workbooks. For more information, see Committing Workbooks.
■ Page Setup – Enables you to change the orientation, scaling, margins, header, footer, and page breaks for the page when printing.
■ Print – Enables you to print the view by exporting it to Microsoft Excel. For more information, see Print.
■ Export – Enables you to export to Microsoft Excel. For more information, see Export.
■ Refresh – Allows you to update a workbook with the data that is currently stored in the domain. This allows you to work with the most current data without having to rebuild the workbook. Workbooks can be refreshed with a single refresh rule group or a multiple ones.
■ Revert – Closes an open workbook without saving it and reopens it. This removes any changes made to the workbook and resets it to the last saved value.
Edit Menu OptionsThe Edit menu includes the following options:
■ Undo – Allows you to undo the last action you performed within the workbook (not just the current view).
■ Calculate – Allows you to submit the edited data to the server for processing.
■ Cut – Allows you to copy and remove data from the cells of a view in order to move the data to cells in the same view, cells in another view, or other applications. For more information, see Cut.
■ Copy – Copies selected data to the application clipboard. It keeps data in a clipboard which you can use to transfer data within RPAS as well as to an outside application such as Excel. For more information, see Copy.
■ Paste – Pastes the data was last placed on the clipboard into the selected cells within the RPAS Fusion Client. For more information, see Paste.
■ Cut Special – Cuts data at the base level or higher level intersection across page slices. If multiple levels (product group, style, etc.) are represented in the pivot table selections, the cut option is performed at the lowest level actually selected. For more information, see Cut Special.
■ Copy Special – Copies data at the base level or higher level intersection across page slices. You can view data at an aggregate level while copying data at a dimensional level not currently displayed or while selecting data from the current slice while copying data from all slices. For more information, see Copy Special.
■ Paste Special – Allows you to view data at an aggregate level while pasting it at the base level which is not displayed in the current slices. It provides a dialog where the user can specify options for specialized paste functions. For more information, see Paste Special.
■ Copy to External - Copies data in the Fusion Client to be pasted in external applications. This feature is useful when the browser's security restriction prevents the Fusion Client from copying to and pasting from the clipboard. For more information, see Copy to External.

Quick Access Toolbar
Understanding the User Interface 2-5
■ Paste from External - Pastes data into the Fusion Client from external applications. This feature is useful when the browser's security restriction prevents the Fusion Client from copying to and pasting from the clipboard. For more information, see Paste from External.
■ Fill – Enables you to quickly populate many cells of a writable measure at a time.
■ Clear –Enables you to quickly clear the contents of cells in a view and set them to their NA value. You can clear one or more cells, a dimension level, or an entire slice.
■ Lock – Protects cells, measures, and positions from being edited. For more information, see Locking and Unlocking.
■ Unlock – Allows you to remove the protection of cells, measures, and positions so that they can be edited. For more information, see Locking and Unlocking.
■ Unlock All – Allows you to remove the protection from all cells, measures, or positions so that they can be edited. For more information, see Locking and Unlocking.
■ Insert Measures – Allows you to add measures to an existing workbook that were not initially included in the configuration. A measure can be inserted to a single view and is available to all the windows for that view. For more information, see Insert Measures.
■ Position Maintenance – Enables you to dynamically add, edit, or remove positions to a non-calendar position while working in a workbook. These user-defined or informal positions are updated in both the domain and workbook dimensions. For more information, see Dynamic Position Maintenance.
■ Find – Enables you to search for phrases within the rows, column, and page axis of an active view. The search does not include the data within the view. For more information, see Find.
View Menu OptionsThe View menu includes the following options:
■ Go To submenu – In addition to the Previous and Next icons on the Quick Access toolbar, the Go To submenu enables you to navigate through the workflow or to a specific step.
■ Synchronize Page Edge – Enables you to simultaneously scroll through the page edge of multiple views. It is useful when you want to compare multiple views containing the same page or slice dimension. For more information, see Synchronized Page Edge Scrolling.
■ Automatically Evaluate Position Queries – Allows position queries to automatically reevaluate data after a calculate, refresh, or slice move. When enabled, the query is updated and the view refreshes with only the positions that meet the requirements of the position query. For more information, see Using Position Queries with Auto Evaluate.
■ Resort Positions on Pagination – Reapplies the sort order when paging through positions along the page-axis. For more information, see Sorting Across Page Edge.
■ Manage Images – Enables you to associate images with specific dimension positions. This feature is especially useful for the product and location dimensions. For instance, you can associate an item with a image of what it should look like
Quick Access Toolbar
2-6 Oracle Retail Predictive Application Server User Guide for the Fusion Client
displayed on the shelf. You can associate stores with images of the store front or interior. For more information, see Images.
■ Attributes submenu– Enables you to create and manage attributes and level splits after you have edited user-defined attributes. The Update Attribute Values option recalculates all sort attributes and dimension splits displayed in the workbook since the attribute or dimension split was applied to the data. For more information, see Updating Attribute Values.
■ Manage Alerts – Allows you to navigate to and address both batch and real time alerts. Both forms of alert are ways of identifying circumstances where data in a workbook or view infringes predetermined rules. For more information see Overview of Alerts.
In addition to the Manage Alerts option, a series of navigation controls are available:
– Find Next Alert – Moves the user forward to the next alert of that type.
– Find Previous Alert – Moves the user back to the previous alert of that type.
– Select Active Alert – Both Batch and Real Time Alerts come in different sub-types. this option allows users to focus on a specific sub-type.
– Allow Find Alerts to Cross Views – If multiple views are open and this option is selected, musing the Find Next Alert or Find Previous Alert will move users to the next or previous view if appropriate. If this option is not active, the Next and Previous options will be confined to the current view.
– Apply Filter by Alert – This option give users the option of only showing the rows, columns or pages with active alerts.
– Remove Filter By Alert – This option removes any filtering that confines the displayed information to rows, columns od pages containing active alerts.
■ Tile Vertically – Allows you to view multiple views by placing them side by side.
■ Tile Horizontally – Allows you to view multiple views by placing them in rows.
■ Tile – Allows you to view multiple views by placing them as tiles.
Format Menu OptionsThe Format menu includes the following options:
■ Measure Styles – Opens the Format dialog box. In the Format dialog box, you can set and clear formats that apply to measures or dimensions. You can make changes to single or multiple measures and dimensions and apply those changes across one, many, or all views in the workbook. For more information, see Formatting.
■ Number – Allows you to modify the number formatting for measures. For more information, see Modifying Number Formatting.
■ Date/Time - Allows you to configure how the date and time is displayed for measures. For more information, see Modifying Date/Time.
■ Exceptions – Exception formatting is used for numeric measure types. Exception formatting defines the styles to be applied to a cell’s value when it falls outside a defined range. For more information, see Modifying Exceptions.
■ Alert Styles – Users have the option of configuring the appearance of alerts to suit their personal preferences. For more information see Customizing Alert Appearance.
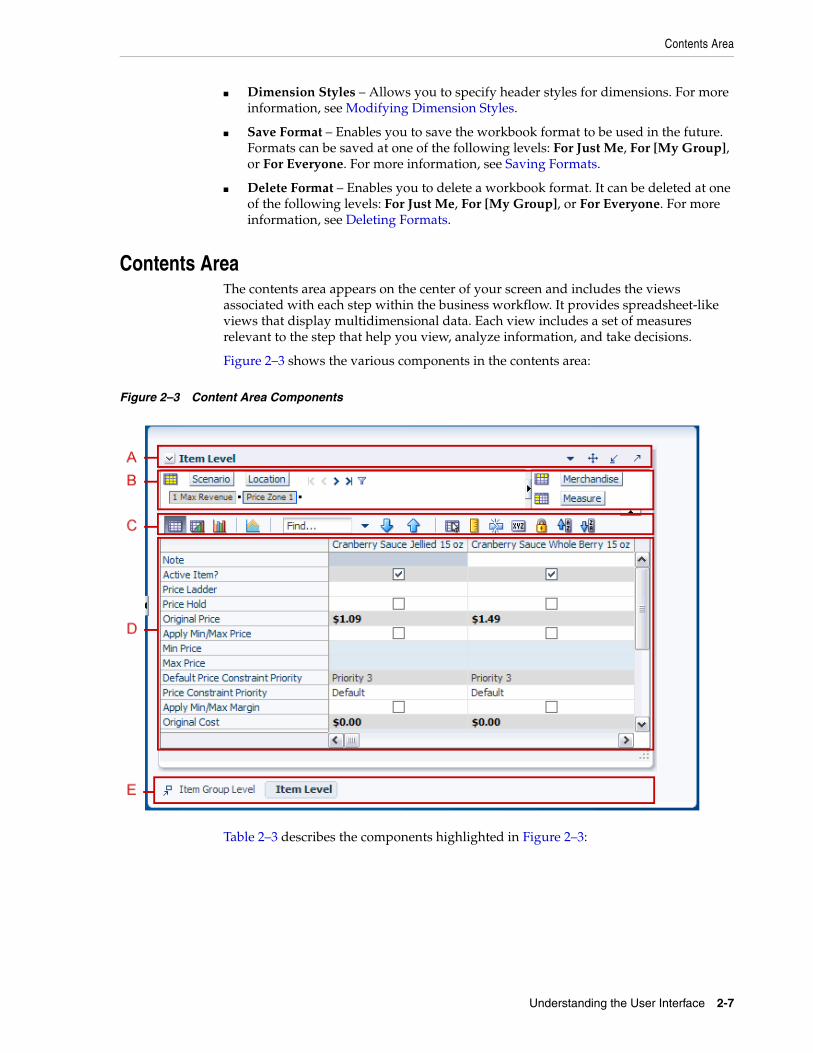
Contents Area
Understanding the User Interface 2-7
■ Dimension Styles – Allows you to specify header styles for dimensions. For more information, see Modifying Dimension Styles.
■ Save Format – Enables you to save the workbook format to be used in the future. Formats can be saved at one of the following levels: For Just Me, For [My Group], or For Everyone. For more information, see Saving Formats.
■ Delete Format – Enables you to delete a workbook format. It can be deleted at one of the following levels: For Just Me, For [My Group], or For Everyone. For more information, see Deleting Formats.
Contents AreaThe contents area appears on the center of your screen and includes the views associated with each step within the business workflow. It provides spreadsheet-like views that display multidimensional data. Each view includes a set of measures relevant to the step that help you view, analyze information, and take decisions.
Figure 2–3 shows the various components in the contents area:
Figure 2–3 Content Area Components
Table 2–3 describes the components highlighted in Figure 2–3:
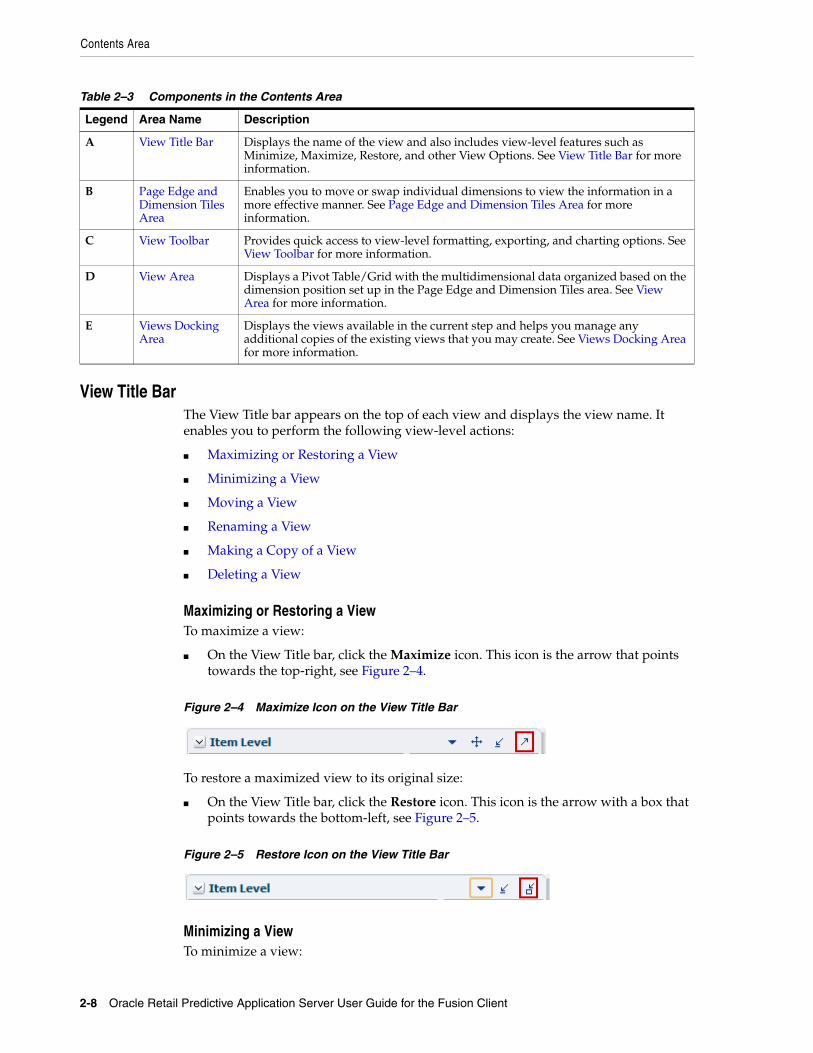
Contents Area
2-8 Oracle Retail Predictive Application Server User Guide for the Fusion Client
View Title BarThe View Title bar appears on the top of each view and displays the view name. It enables you to perform the following view-level actions:
■ Maximizing or Restoring a View
■ Minimizing a View
■ Moving a View
■ Renaming a View
■ Making a Copy of a View
■ Deleting a View
Maximizing or Restoring a ViewTo maximize a view:
■ On the View Title bar, click the Maximize icon. This icon is the arrow that points towards the top-right, see Figure 2–4.
Figure 2–4 Maximize Icon on the View Title Bar
To restore a maximized view to its original size:
■ On the View Title bar, click the Restore icon. This icon is the arrow with a box that points towards the bottom-left, see Figure 2–5.
Figure 2–5 Restore Icon on the View Title Bar
Minimizing a ViewTo minimize a view:
Table 2–3 Components in the Contents Area
Legend Area Name Description
A View Title Bar Displays the name of the view and also includes view-level features such as Minimize, Maximize, Restore, and other View Options. See View Title Bar for more information.
B Page Edge and Dimension Tiles Area
Enables you to move or swap individual dimensions to view the information in a more effective manner. See Page Edge and Dimension Tiles Area for more information.
C View Toolbar Provides quick access to view-level formatting, exporting, and charting options. See View Toolbar for more information.
D View Area Displays a Pivot Table/Grid with the multidimensional data organized based on the dimension position set up in the Page Edge and Dimension Tiles area. See View Area for more information.
E Views Docking Area
Displays the views available in the current step and helps you manage any additional copies of the existing views that you may create. See Views Docking Area for more information.
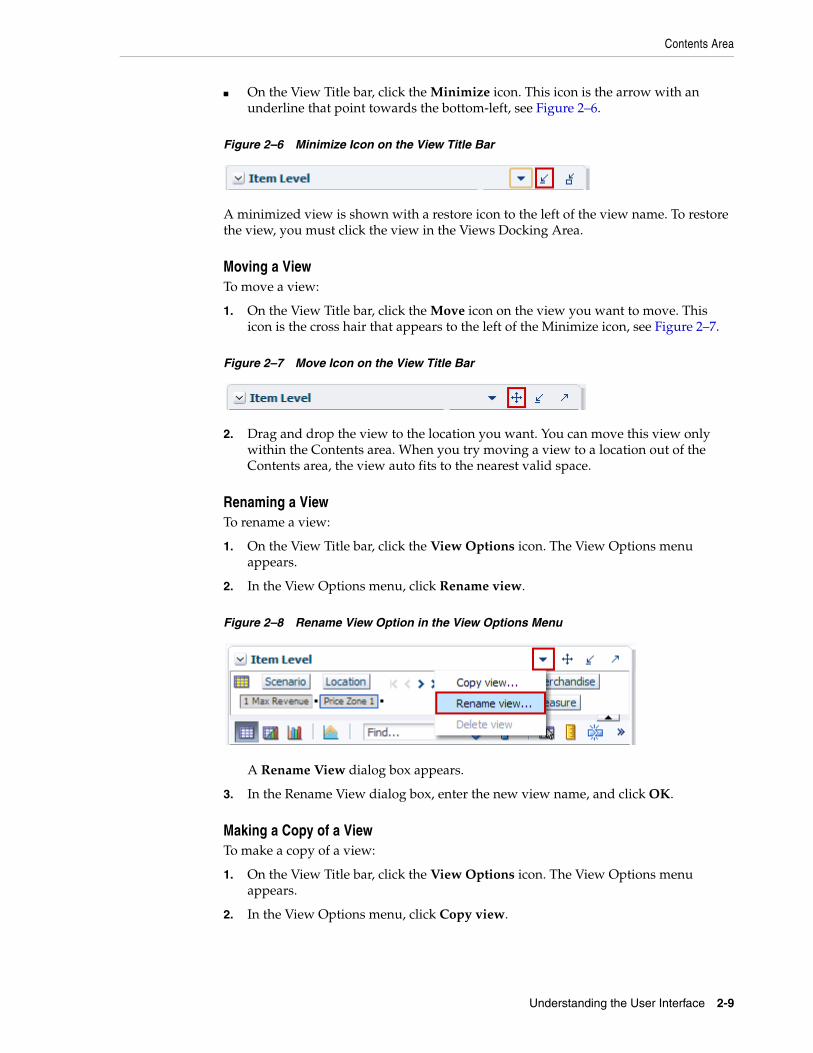
Contents Area
Understanding the User Interface 2-9
■ On the View Title bar, click the Minimize icon. This icon is the arrow with an underline that point towards the bottom-left, see Figure 2–6.
Figure 2–6 Minimize Icon on the View Title Bar
A minimized view is shown with a restore icon to the left of the view name. To restore the view, you must click the view in the Views Docking Area.
Moving a ViewTo move a view:
1. On the View Title bar, click the Move icon on the view you want to move. This icon is the cross hair that appears to the left of the Minimize icon, see Figure 2–7.
Figure 2–7 Move Icon on the View Title Bar
2. Drag and drop the view to the location you want. You can move this view only within the Contents area. When you try moving a view to a location out of the Contents area, the view auto fits to the nearest valid space.
Renaming a ViewTo rename a view:
1. On the View Title bar, click the View Options icon. The View Options menu appears.
2. In the View Options menu, click Rename view.
Figure 2–8 Rename View Option in the View Options Menu
A Rename View dialog box appears.
3. In the Rename View dialog box, enter the new view name, and click OK.
Making a Copy of a ViewTo make a copy of a view:
1. On the View Title bar, click the View Options icon. The View Options menu appears.
2. In the View Options menu, click Copy view.

Contents Area
2-10 Oracle Retail Predictive Application Server User Guide for the Fusion Client
Figure 2–9 Copy View Option in the View Options Menu
A Copy View dialog box appears.
3. In the Copy View dialog box, enter or accept the new view name, and click OK.
Deleting a ViewTo delete a view:
1. On the View Title bar, click the View Options icon. The View Option menu appears.
2. In the View Options menu, click Delete view.
Figure 2–10 Delete View Option in the View Options Menu
A warning message appears.
3. Review the warning message and click Delete to remove the view.
Page Edge and Dimension Tiles AreaThe Page Edge area appears on top of the View area and displays the dimensions on the page edge axis with its current position in the dimension. The Dimension Tiles area displays the dimensions, as tiles, that appear in the row and column axes.
On the Page Edge, the current position appears below the dimension name, horizontally with the highest visible level on the left to the lowest visible level on the right. You can hover the mouse cursor over the position to view the name of the level (displayed as a tool tip).
Note: Deleting a view removes the view from the user interface permanently.
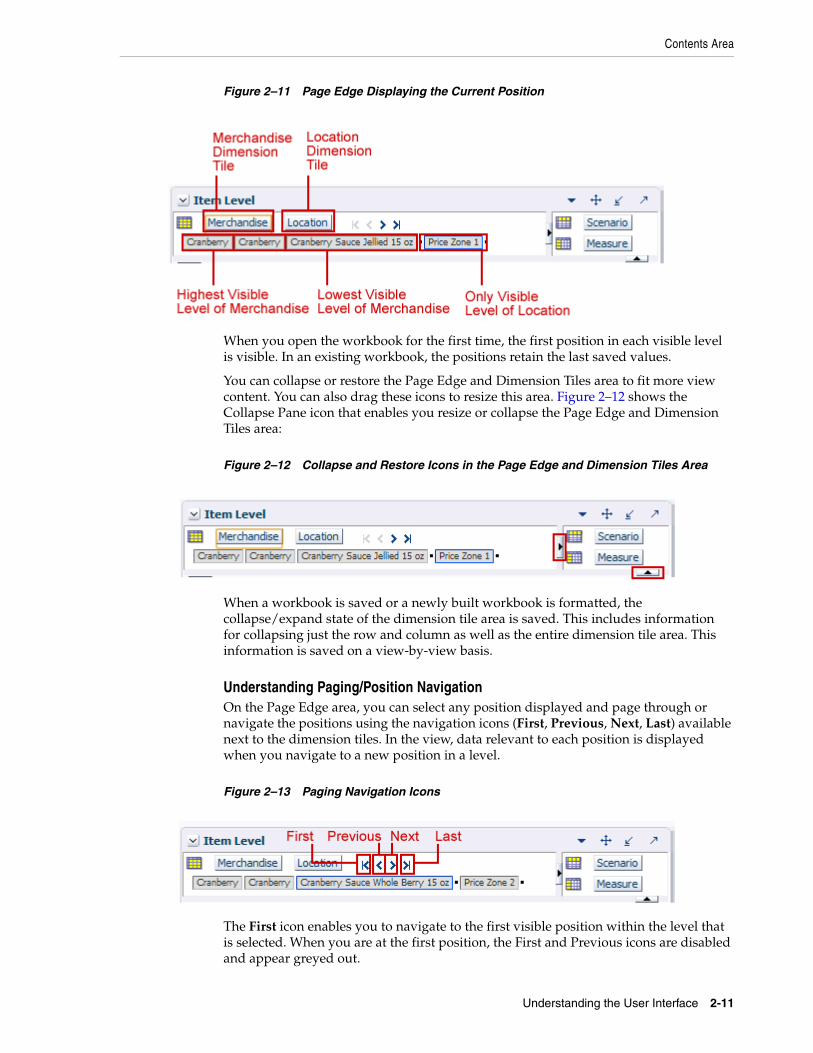
Contents Area
Understanding the User Interface 2-11
Figure 2–11 Page Edge Displaying the Current Position
When you open the workbook for the first time, the first position in each visible level is visible. In an existing workbook, the positions retain the last saved values.
You can collapse or restore the Page Edge and Dimension Tiles area to fit more view content. You can also drag these icons to resize this area. Figure 2–12 shows the Collapse Pane icon that enables you resize or collapse the Page Edge and Dimension Tiles area:
Figure 2–12 Collapse and Restore Icons in the Page Edge and Dimension Tiles Area
When a workbook is saved or a newly built workbook is formatted, the collapse/expand state of the dimension tile area is saved. This includes information for collapsing just the row and column as well as the entire dimension tile area. This information is saved on a view-by-view basis.
Understanding Paging/Position NavigationOn the Page Edge area, you can select any position displayed and page through or navigate the positions using the navigation icons (First, Previous, Next, Last) available next to the dimension tiles. In the view, data relevant to each position is displayed when you navigate to a new position in a level.
Figure 2–13 Paging Navigation Icons
The First icon enables you to navigate to the first visible position within the level that is selected. When you are at the first position, the First and Previous icons are disabled and appear greyed out.
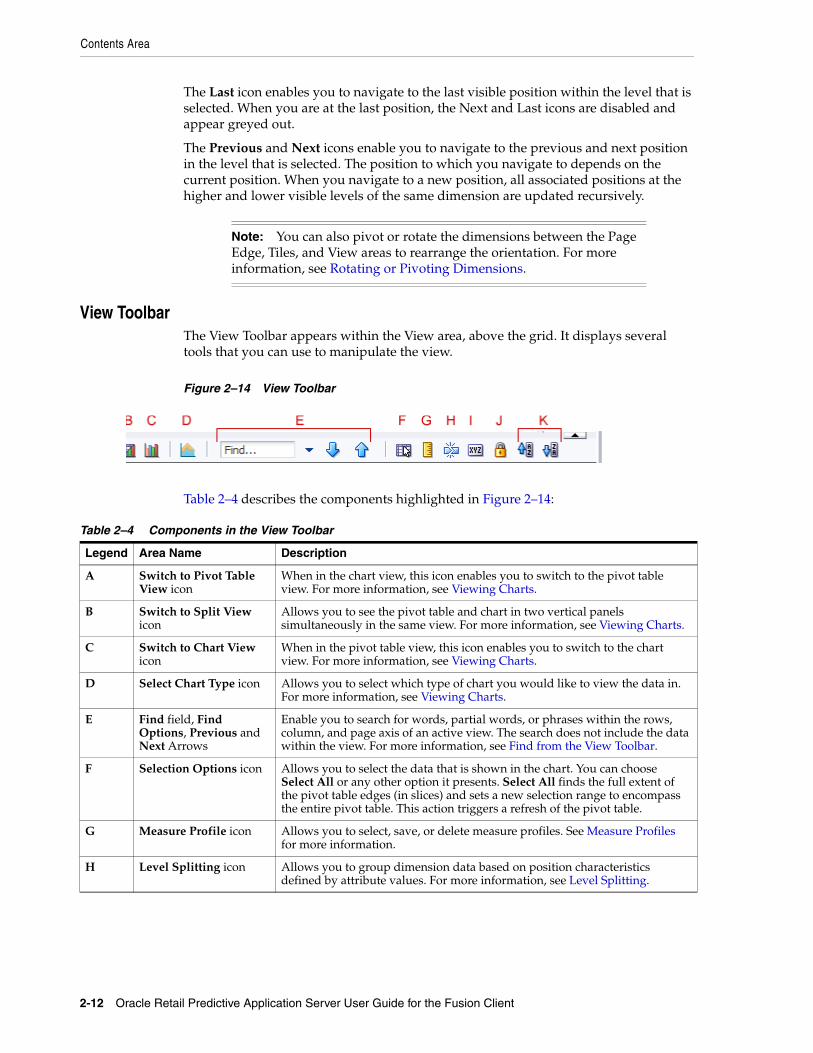
Contents Area
2-12 Oracle Retail Predictive Application Server User Guide for the Fusion Client
The Last icon enables you to navigate to the last visible position within the level that is selected. When you are at the last position, the Next and Last icons are disabled and appear greyed out.
The Previous and Next icons enable you to navigate to the previous and next position in the level that is selected. The position to which you navigate to depends on the current position. When you navigate to a new position, all associated positions at the higher and lower visible levels of the same dimension are updated recursively.
View ToolbarThe View Toolbar appears within the View area, above the grid. It displays several tools that you can use to manipulate the view.
Figure 2–14 View Toolbar
Table 2–4 describes the components highlighted in Figure 2–14:
Note: You can also pivot or rotate the dimensions between the Page Edge, Tiles, and View areas to rearrange the orientation. For more information, see Rotating or Pivoting Dimensions.
Table 2–4 Components in the View Toolbar
Legend Area Name Description
A Switch to Pivot Table View icon
When in the chart view, this icon enables you to switch to the pivot table view. For more information, see Viewing Charts.
B Switch to Split View icon
Allows you to see the pivot table and chart in two vertical panels simultaneously in the same view. For more information, see Viewing Charts.
C Switch to Chart View icon
When in the pivot table view, this icon enables you to switch to the chart view. For more information, see Viewing Charts.
D Select Chart Type icon Allows you to select which type of chart you would like to view the data in. For more information, see Viewing Charts.
E Find field, Find Options, Previous and Next Arrows
Enable you to search for words, partial words, or phrases within the rows, column, and page axis of an active view. The search does not include the data within the view. For more information, see Find from the View Toolbar.
F Selection Options icon Allows you to select the data that is shown in the chart. You can choose Select All or any other option it presents. Select All finds the full extent of the pivot table edges (in slices) and sets a new selection range to encompass the entire pivot table. This action triggers a refresh of the pivot table.
G Measure Profile icon Allows you to select, save, or delete measure profiles. See Measure Profiles for more information.
H Level Splitting icon Allows you to group dimension data based on position characteristics defined by attribute values. For more information, see Level Splitting.
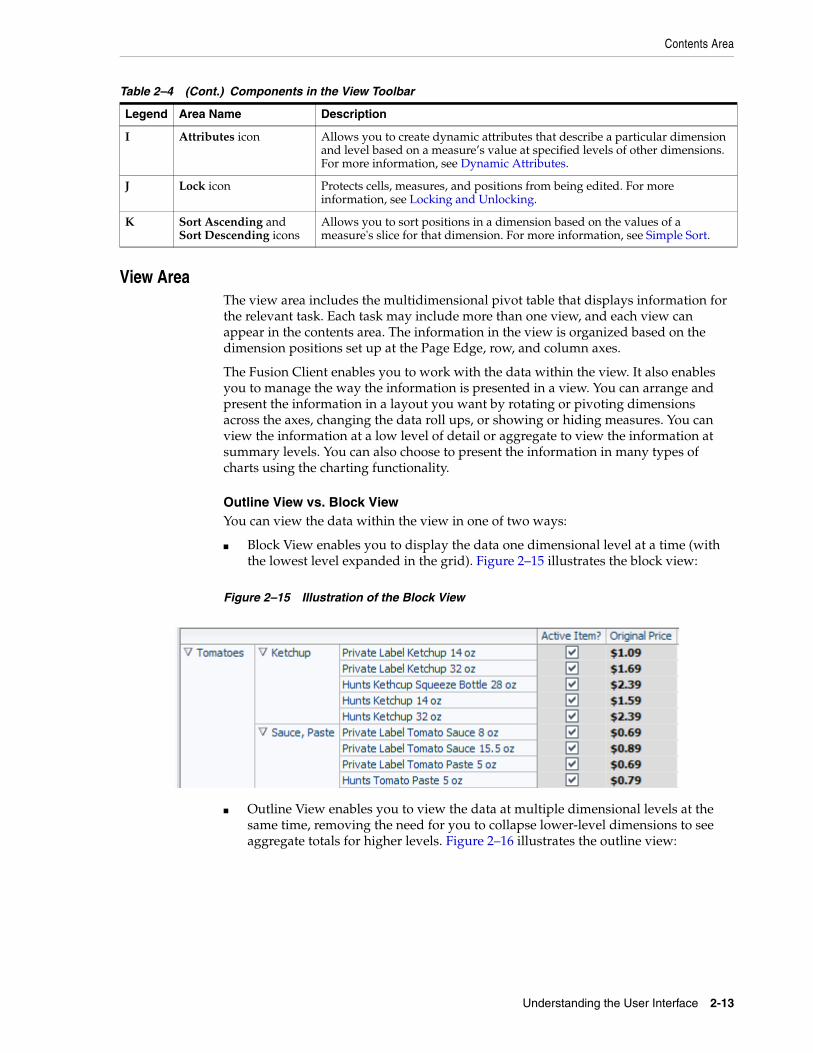
Contents Area
Understanding the User Interface 2-13
View AreaThe view area includes the multidimensional pivot table that displays information for the relevant task. Each task may include more than one view, and each view can appear in the contents area. The information in the view is organized based on the dimension positions set up at the Page Edge, row, and column axes.
The Fusion Client enables you to work with the data within the view. It also enables you to manage the way the information is presented in a view. You can arrange and present the information in a layout you want by rotating or pivoting dimensions across the axes, changing the data roll ups, or showing or hiding measures. You can view the information at a low level of detail or aggregate to view the information at summary levels. You can also choose to present the information in many types of charts using the charting functionality.
Outline View vs. Block ViewYou can view the data within the view in one of two ways:
■ Block View enables you to display the data one dimensional level at a time (with the lowest level expanded in the grid). Figure 2–15 illustrates the block view:
Figure 2–15 Illustration of the Block View
■ Outline View enables you to view the data at multiple dimensional levels at the same time, removing the need for you to collapse lower-level dimensions to see aggregate totals for higher levels. Figure 2–16 illustrates the outline view:
I Attributes icon Allows you to create dynamic attributes that describe a particular dimension and level based on a measure’s value at specified levels of other dimensions. For more information, see Dynamic Attributes.
J Lock icon Protects cells, measures, and positions from being edited. For more information, see Locking and Unlocking.
K Sort Ascending and Sort Descending icons
Allows you to sort positions in a dimension based on the values of a measure's slice for that dimension. For more information, see Simple Sort.
Table 2–4 (Cont.) Components in the View Toolbar
Legend Area Name Description
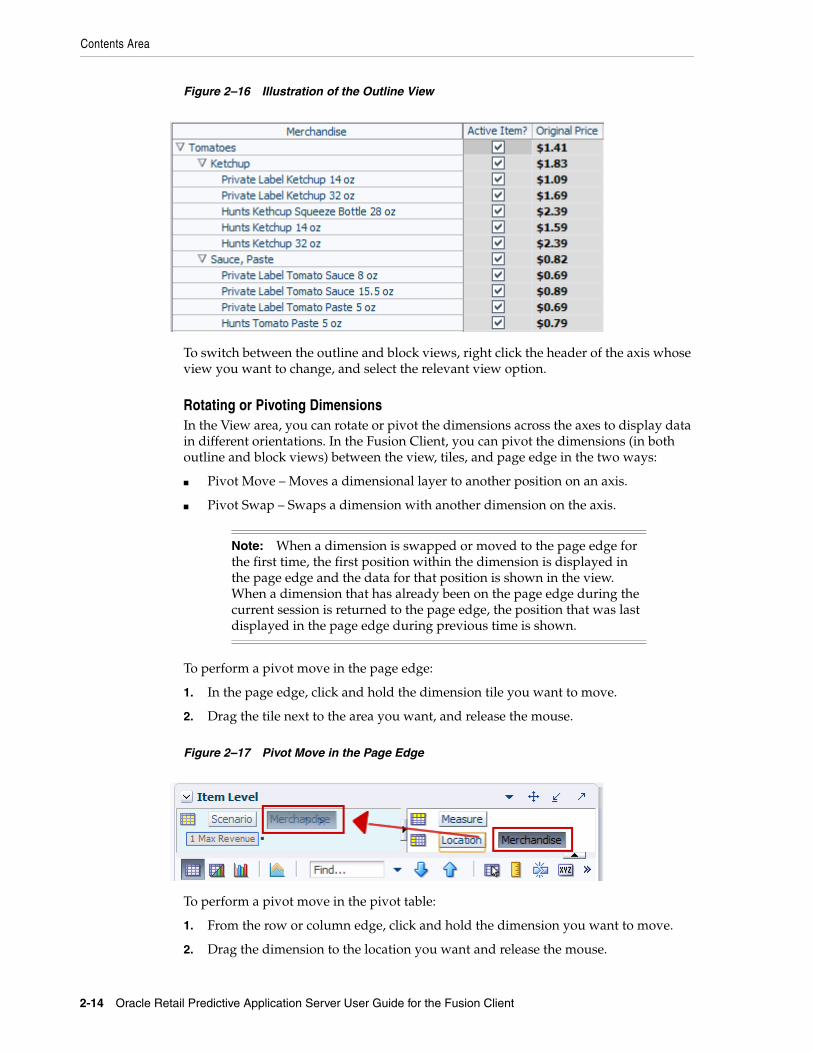
Contents Area
2-14 Oracle Retail Predictive Application Server User Guide for the Fusion Client
Figure 2–16 Illustration of the Outline View
To switch between the outline and block views, right click the header of the axis whose view you want to change, and select the relevant view option.
Rotating or Pivoting DimensionsIn the View area, you can rotate or pivot the dimensions across the axes to display data in different orientations. In the Fusion Client, you can pivot the dimensions (in both outline and block views) between the view, tiles, and page edge in the two ways:
■ Pivot Move – Moves a dimensional layer to another position on an axis.
■ Pivot Swap – Swaps a dimension with another dimension on the axis.
To perform a pivot move in the page edge:
1. In the page edge, click and hold the dimension tile you want to move.
2. Drag the tile next to the area you want, and release the mouse.
Figure 2–17 Pivot Move in the Page Edge
To perform a pivot move in the pivot table:
1. From the row or column edge, click and hold the dimension you want to move.
2. Drag the dimension to the location you want and release the mouse.
Note: When a dimension is swapped or moved to the page edge for the first time, the first position within the dimension is displayed in the page edge and the data for that position is shown in the view. When a dimension that has already been on the page edge during the current session is returned to the page edge, the position that was last displayed in the page edge during previous time is shown.
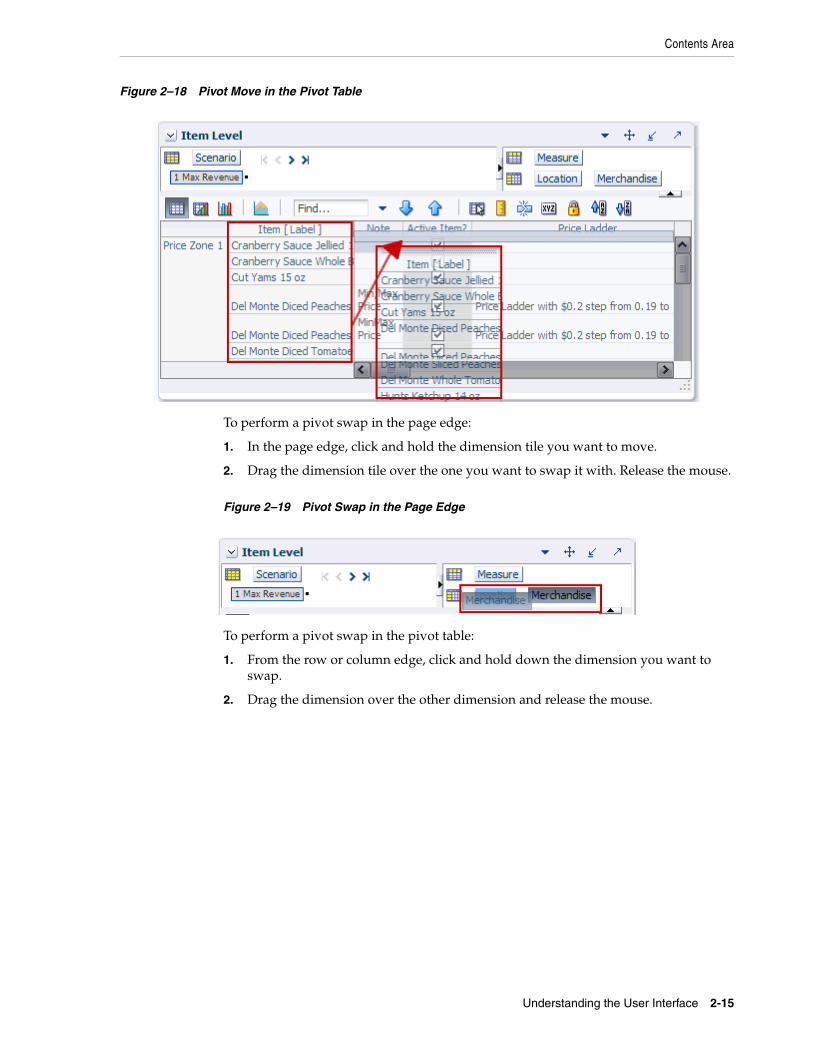
Contents Area
Understanding the User Interface 2-15
Figure 2–18 Pivot Move in the Pivot Table
To perform a pivot swap in the page edge:
1. In the page edge, click and hold the dimension tile you want to move.
2. Drag the dimension tile over the one you want to swap it with. Release the mouse.
Figure 2–19 Pivot Swap in the Page Edge
To perform a pivot swap in the pivot table:
1. From the row or column edge, click and hold down the dimension you want to swap.
2. Drag the dimension over the other dimension and release the mouse.
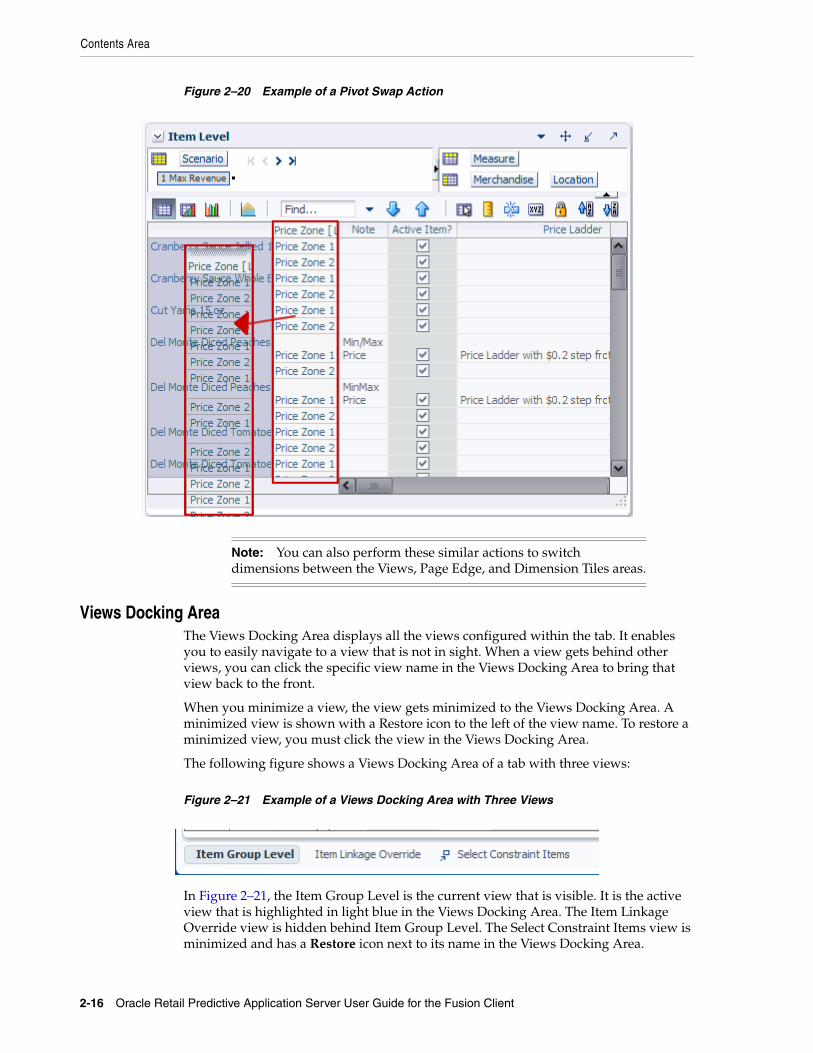
Contents Area
2-16 Oracle Retail Predictive Application Server User Guide for the Fusion Client
Figure 2–20 Example of a Pivot Swap Action
Views Docking AreaThe Views Docking Area displays all the views configured within the tab. It enables you to easily navigate to a view that is not in sight. When a view gets behind other views, you can click the specific view name in the Views Docking Area to bring that view back to the front.
When you minimize a view, the view gets minimized to the Views Docking Area. A minimized view is shown with a Restore icon to the left of the view name. To restore a minimized view, you must click the view in the Views Docking Area.
The following figure shows a Views Docking Area of a tab with three views:
Figure 2–21 Example of a Views Docking Area with Three Views
In Figure 2–21, the Item Group Level is the current view that is visible. It is the active view that is highlighted in light blue in the Views Docking Area. The Item Linkage Override view is hidden behind Item Group Level. The Select Constraint Items view is minimized and has a Restore icon next to its name in the Views Docking Area.
Note: You can also perform these similar actions to switch dimensions between the Views, Page Edge, and Dimension Tiles areas.
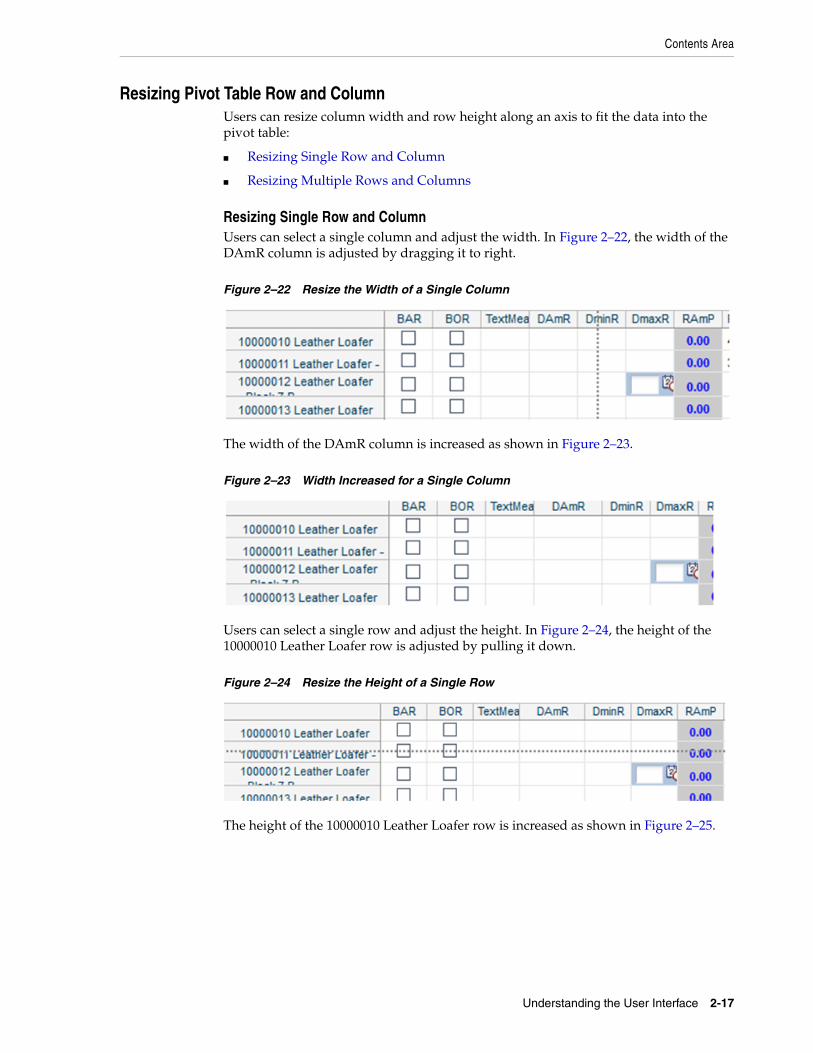
Contents Area
Understanding the User Interface 2-17
Resizing Pivot Table Row and ColumnUsers can resize column width and row height along an axis to fit the data into the pivot table:
■ Resizing Single Row and Column
■ Resizing Multiple Rows and Columns
Resizing Single Row and ColumnUsers can select a single column and adjust the width. In Figure 2–22, the width of the DAmR column is adjusted by dragging it to right.
Figure 2–22 Resize the Width of a Single Column
The width of the DAmR column is increased as shown in Figure 2–23.
Figure 2–23 Width Increased for a Single Column
Users can select a single row and adjust the height. In Figure 2–24, the height of the 10000010 Leather Loafer row is adjusted by pulling it down.
Figure 2–24 Resize the Height of a Single Row
The height of the 10000010 Leather Loafer row is increased as shown in Figure 2–25.

Contents Area
2-18 Oracle Retail Predictive Application Server User Guide for the Fusion Client
Figure 2–25 Height Increased for a Single Row
The row height and column width changes are persisted by saving the workbook. These changes can also be saved as formatting settings. For more information, see "Saving Formats" in Chapter 5.
Resizing Multiple Rows and ColumnsUsers can select multiple columns and adjust the width. The columns can be contiguous or non-contiguous. In Figure 2–26, the RminD and RminE columns are selected.
Figure 2–26 Select Multiple Columns
In Figure 2–27, the widths of the RminD and RminE columns are adjusted by dragging one of the columns to the right. In this figure, the RminE column is dragged to the right to adjust the width of both columns.
Note: If there are no members on the X or Y axis, the row height or column width adjustments are not persisted.

Contents Area
Understanding the User Interface 2-19
Figure 2–27 Resize the Width of Multiple Columns
The widths of the selected columns are increased as shown in Figure 2–28.
Figure 2–28 Width Increased for Multiple Columns
If a user changes the width for a single column which is not part of the selection, the behavior is same as a single column width change. In Figure 2–29, the RminE column, which is not part of the selection, is dragged to the left.
Figure 2–29 Resize the Width of a Single Column with Multiple Columns Selected
Only the RminE column is adjusted as shown in Figure 2–30.
Figure 2–30 Width Decreased for a Single Column with Multiple Columns Selected
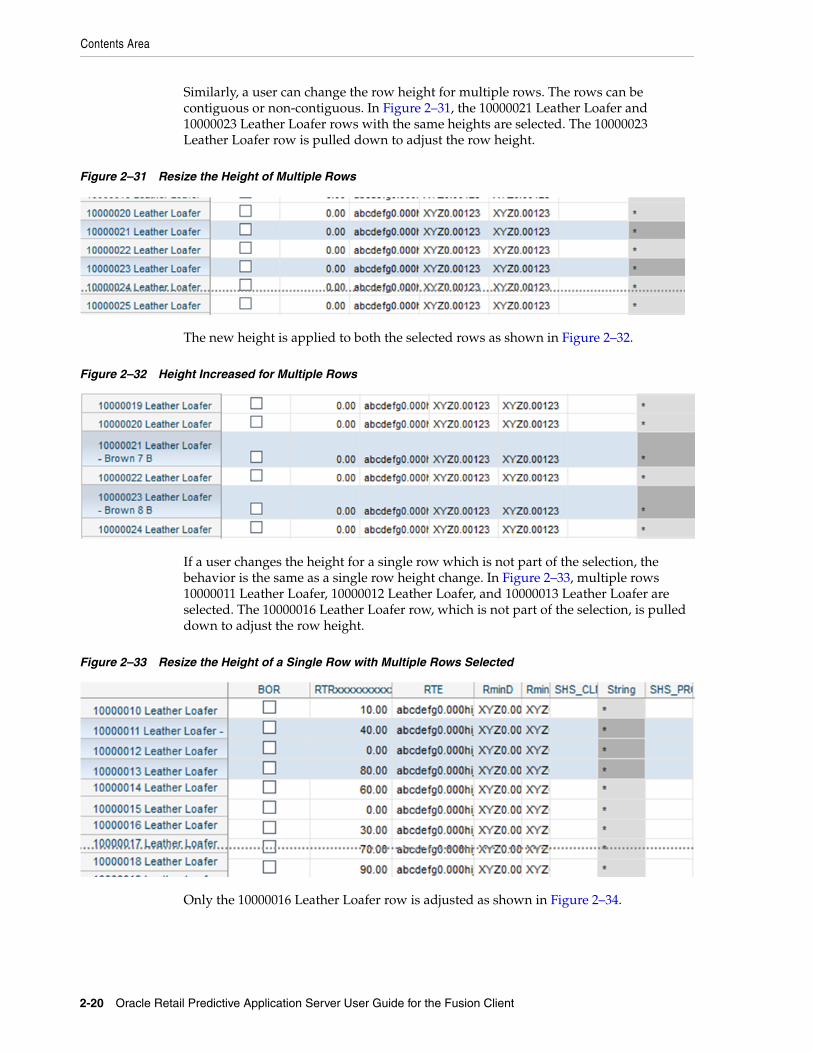
Contents Area
2-20 Oracle Retail Predictive Application Server User Guide for the Fusion Client
Similarly, a user can change the row height for multiple rows. The rows can be contiguous or non-contiguous. In Figure 2–31, the 10000021 Leather Loafer and 10000023 Leather Loafer rows with the same heights are selected. The 10000023 Leather Loafer row is pulled down to adjust the row height.
Figure 2–31 Resize the Height of Multiple Rows
The new height is applied to both the selected rows as shown in Figure 2–32.
Figure 2–32 Height Increased for Multiple Rows
If a user changes the height for a single row which is not part of the selection, the behavior is the same as a single row height change. In Figure 2–33, multiple rows 10000011 Leather Loafer, 10000012 Leather Loafer, and 10000013 Leather Loafer are selected. The 10000016 Leather Loafer row, which is not part of the selection, is pulled down to adjust the row height.
Figure 2–33 Resize the Height of a Single Row with Multiple Rows Selected
Only the 10000016 Leather Loafer row is adjusted as shown in Figure 2–34.
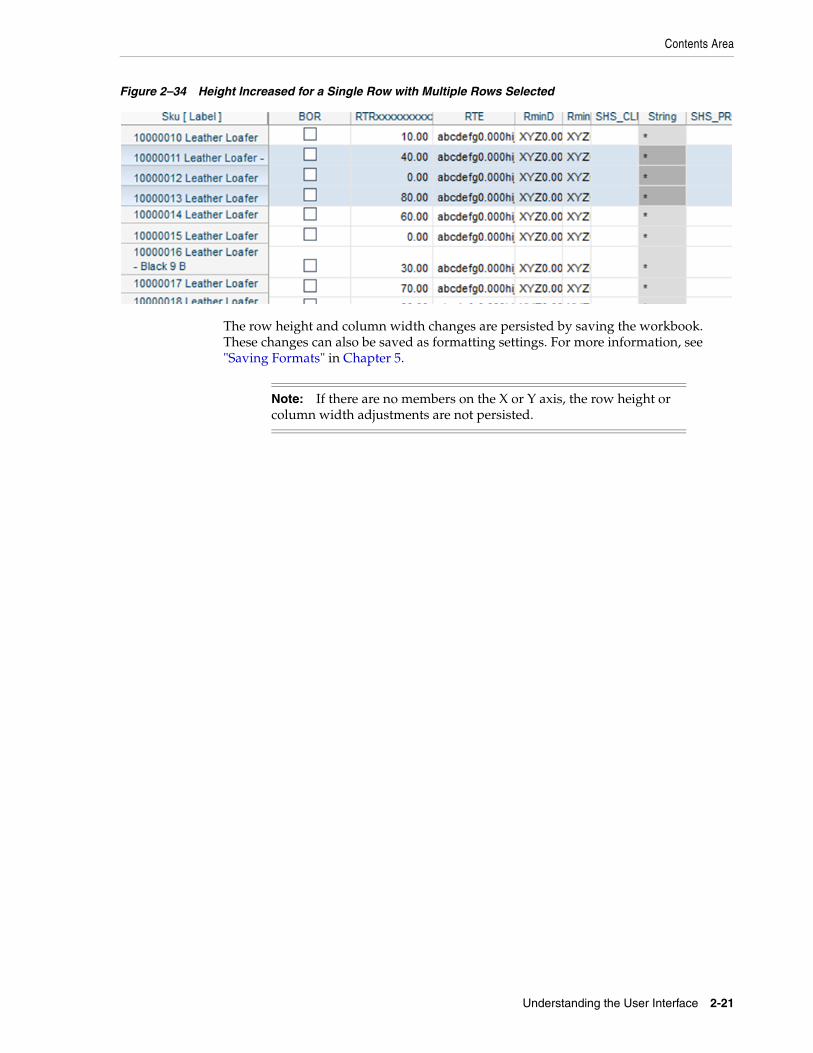
Contents Area
Understanding the User Interface 2-21
Figure 2–34 Height Increased for a Single Row with Multiple Rows Selected
The row height and column width changes are persisted by saving the workbook. These changes can also be saved as formatting settings. For more information, see "Saving Formats" in Chapter 5.
Note: If there are no members on the X or Y axis, the row height or column width adjustments are not persisted.

Contents Area
2-22 Oracle Retail Predictive Application Server User Guide for the Fusion Client

Workbooks 3-1
3Workbooks
When you use an RPAS solution, you interact with the solution through a personal data repository called a workbook. A workbook contains the subset of the data (and metadata) from the domain and its scope is constrained by the access rights available to a user. Workbooks are stored on the RPAS server, and can be built using an online wizard process or scheduled to be built in a batch process automatically.
This chapter describes the various tasks you can perform with the data in the workbooks. It includes the following sections:
■ Saving Workbooks
■ Renaming Workbooks
■ Calculating Workbooks
■ Refreshing Workbooks
■ Committing Workbooks
■ Synchronized Page Edge Scrolling
Loading Data to WorkbooksWhen a workbook is opened the pivot table loads with a block of data from the server. If, during workbook use, the user scrolls to a cell outside the limits of that block of data, a new block of data is loaded from the server. The size of the block of data loaded is controlled by settings in the rpasConfigure.properties file. (This file is only accessible to users with permissions to configure settings governing operation of the application).
The size of the block of data loaded affects the performance of the application.
■ If a large block of data is loaded, the workbook is slower to open but once loaded, the user can scroll further before reaching cells where another block of data needs to be loaded.
■ If a smaller block of data is loaded, the workbook will open relatively quicker, but the user will not be able to scroll as far before another block of data needs to be loaded.
This will affect the performance of the RPAS solutions from the perspective of the ordinary user. The optimum settings depends on the amount of data that atypical user
Note: See the RPAS Administration Guide for the Fusion Client for more information.

Saving Workbooks
3-2 Oracle Retail Predictive Application Server User Guide for the Fusion Client
will need to access when completing workbook tasks. These settings will vary from retailer to retailer and should be discussed when the application is being configured. This will ensure the best user experience for day to day use.
Saving WorkbooksOn the workbook screen, you can edit the cells in the pivot table, change the layout of views, and so on. The Save and Save As options enable you to save such workbook changes.
The Save option is available in the File menu and also as an icon on the toolbar. The Save As option is available only in the File menu.
Each time you save the workbook, the workbook is first automatically calculated before the changes are saved. If the calculate or save operation fails, an error message appears.
To save a workbook:
■ After you perform the changes you want, click the Save icon on the toolbar.
Figure 3–1 Save Icon on the Toolbar
or
■ From the File menu, click Save.
Figure 3–2 Save Option in the File Menu
Permissible File NamesWhen saving a workbook (or saving a copy using the Save As command), there are restrictions on the length of the file name and the characters that can be used,
■ The file name can be a maximum of 32 characters.
■ The filename can contain the following standard characters:
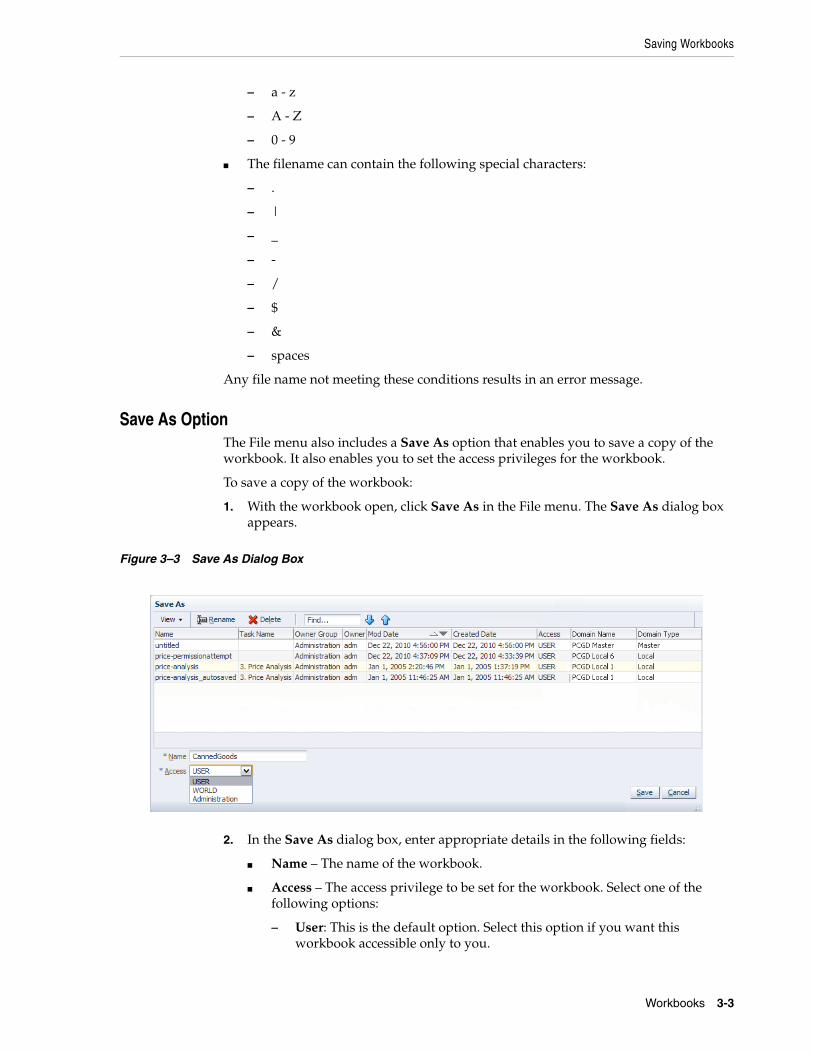
Saving Workbooks
Workbooks 3-3
– a - z
– A - Z
– 0 - 9
■ The filename can contain the following special characters:
– .
– |
– _
– -
– /
– $
– &
– spaces
Any file name not meeting these conditions results in an error message.
Save As OptionThe File menu also includes a Save As option that enables you to save a copy of the workbook. It also enables you to set the access privileges for the workbook.
To save a copy of the workbook:
1. With the workbook open, click Save As in the File menu. The Save As dialog box appears.
Figure 3–3 Save As Dialog Box
2. In the Save As dialog box, enter appropriate details in the following fields:
■ Name – The name of the workbook.
■ Access – The access privilege to be set for the workbook. Select one of the following options:
– User: This is the default option. Select this option if you want this workbook accessible only to you.
Renaming Workbooks
3-4 Oracle Retail Predictive Application Server User Guide for the Fusion Client
– [Group Name]: Select a group if you want to allow access to all users in that group, who have access to this workbook template.
These other users may have to use “View / All” or “View / Other Domain” to see these workbooks they do not own, and are perhaps in a domain the users do not normally work in.
– World: Select this option if you want to allow access to all the users set up for the application, who have access to this workbook template.
3. Click Save.
By default, the Name and Access fields retain the values set for the workbook that were saved previously. You can also select a different workbook from the list and then update it to make it a unique name.
Auto-SaveThe RPAS Fusion Client has an Auto-Save workbook feature that saves a copy of an open workbook automatically. Auto-saved workbooks contain all the changes up to the last Calculate and Custom menu actions.
The auto-save workbook feature enables you to quickly resume your work in case one of the following events occur:
■ The web browser window is closed before logging out from the RPAS Fusion Client.
■ The web browser window stops responding and closes abruptly.
■ The network is disconnected or the web server stops responding.
When one of these events occurs, an auto-save takes place and a copy of the existing workbook is made. This copy has the same name of the workbook with _autosaved appended.
After one of these events occurs, you should first notify your administrator. After the issue is fixed and the servers are restored, you can open a new web browser window, log on to your domain again, and start using the auto-saved workbook or your last saved revision of the workbook.
Renaming WorkbooksWhen you have a workbook open, you can rename it at any time without affecting the data within the workbook or the other workbook information such as the created date, modified date, formatting information and so on.
There are a few key points to know about renaming workbooks:
■ You can only rename workbooks to which you have write access.
Note: Uncalculated cell edits and formatting changes made in the previous session are not saved in the auto-saved workbooks.
Note: In case your implementation uses a clustered configuration and the web server stops responding, you will be re-directed to the RPAS Fusion Client login page on another managed server that is acting as a fail-over server. You can then log on to your domain and resume work using the auto-saved workbook.
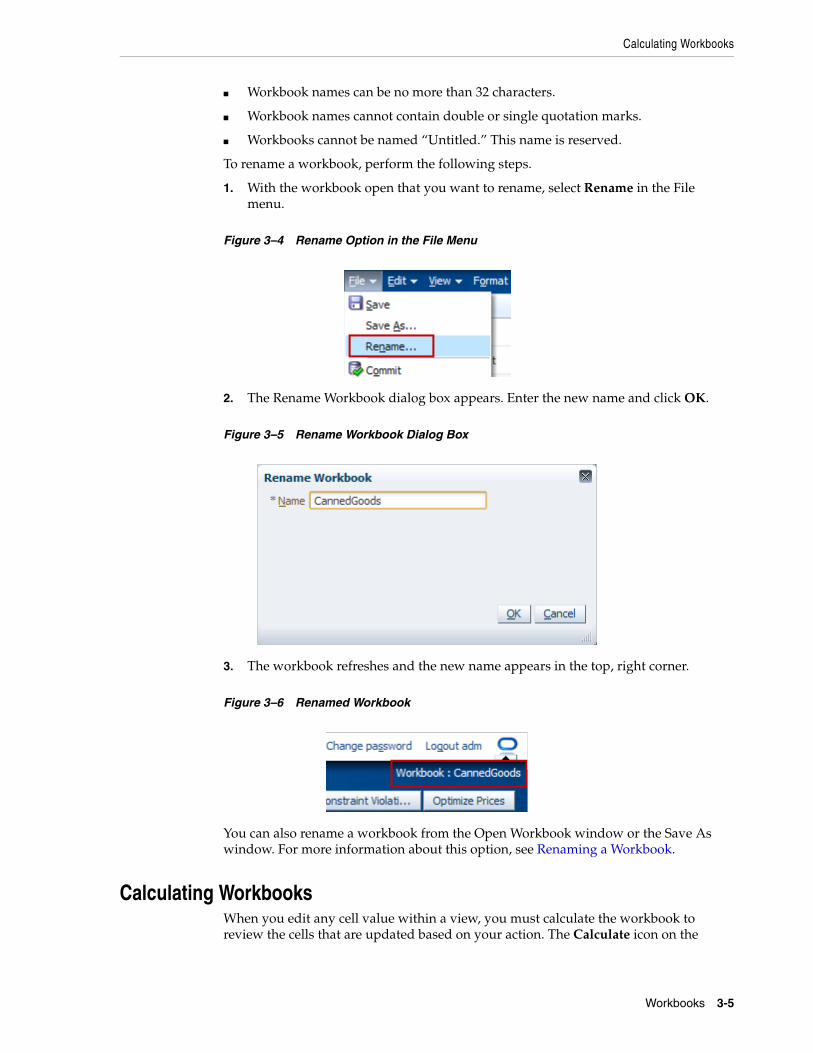
Calculating Workbooks
Workbooks 3-5
■ Workbook names can be no more than 32 characters.
■ Workbook names cannot contain double or single quotation marks.
■ Workbooks cannot be named “Untitled.” This name is reserved.
To rename a workbook, perform the following steps.
1. With the workbook open that you want to rename, select Rename in the File menu.
Figure 3–4 Rename Option in the File Menu
2. The Rename Workbook dialog box appears. Enter the new name and click OK.
Figure 3–5 Rename Workbook Dialog Box
3. The workbook refreshes and the new name appears in the top, right corner.
Figure 3–6 Renamed Workbook
You can also rename a workbook from the Open Workbook window or the Save As window. For more information about this option, see Renaming a Workbook.
Calculating WorkbooksWhen you edit any cell value within a view, you must calculate the workbook to review the cells that are updated based on your action. The Calculate icon on the
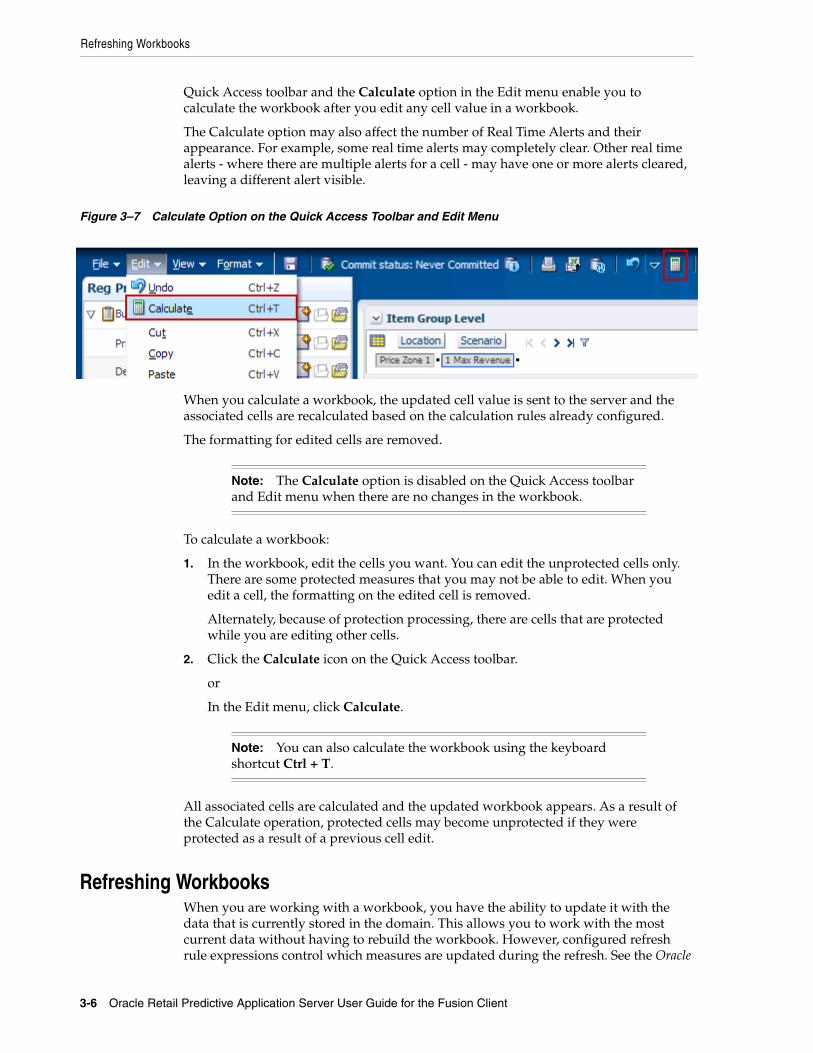
Refreshing Workbooks
3-6 Oracle Retail Predictive Application Server User Guide for the Fusion Client
Quick Access toolbar and the Calculate option in the Edit menu enable you to calculate the workbook after you edit any cell value in a workbook.
The Calculate option may also affect the number of Real Time Alerts and their appearance. For example, some real time alerts may completely clear. Other real time alerts - where there are multiple alerts for a cell - may have one or more alerts cleared, leaving a different alert visible.
Figure 3–7 Calculate Option on the Quick Access Toolbar and Edit Menu
When you calculate a workbook, the updated cell value is sent to the server and the associated cells are recalculated based on the calculation rules already configured.
The formatting for edited cells are removed.
To calculate a workbook:
1. In the workbook, edit the cells you want. You can edit the unprotected cells only. There are some protected measures that you may not be able to edit. When you edit a cell, the formatting on the edited cell is removed.
Alternately, because of protection processing, there are cells that are protected while you are editing other cells.
2. Click the Calculate icon on the Quick Access toolbar.
or
In the Edit menu, click Calculate.
All associated cells are calculated and the updated workbook appears. As a result of the Calculate operation, protected cells may become unprotected if they were protected as a result of a previous cell edit.
Refreshing WorkbooksWhen you are working with a workbook, you have the ability to update it with the data that is currently stored in the domain. This allows you to work with the most current data without having to rebuild the workbook. However, configured refresh rule expressions control which measures are updated during the refresh. See the Oracle
Note: The Calculate option is disabled on the Quick Access toolbar and Edit menu when there are no changes in the workbook.
Note: You can also calculate the workbook using the keyboard shortcut Ctrl + T.
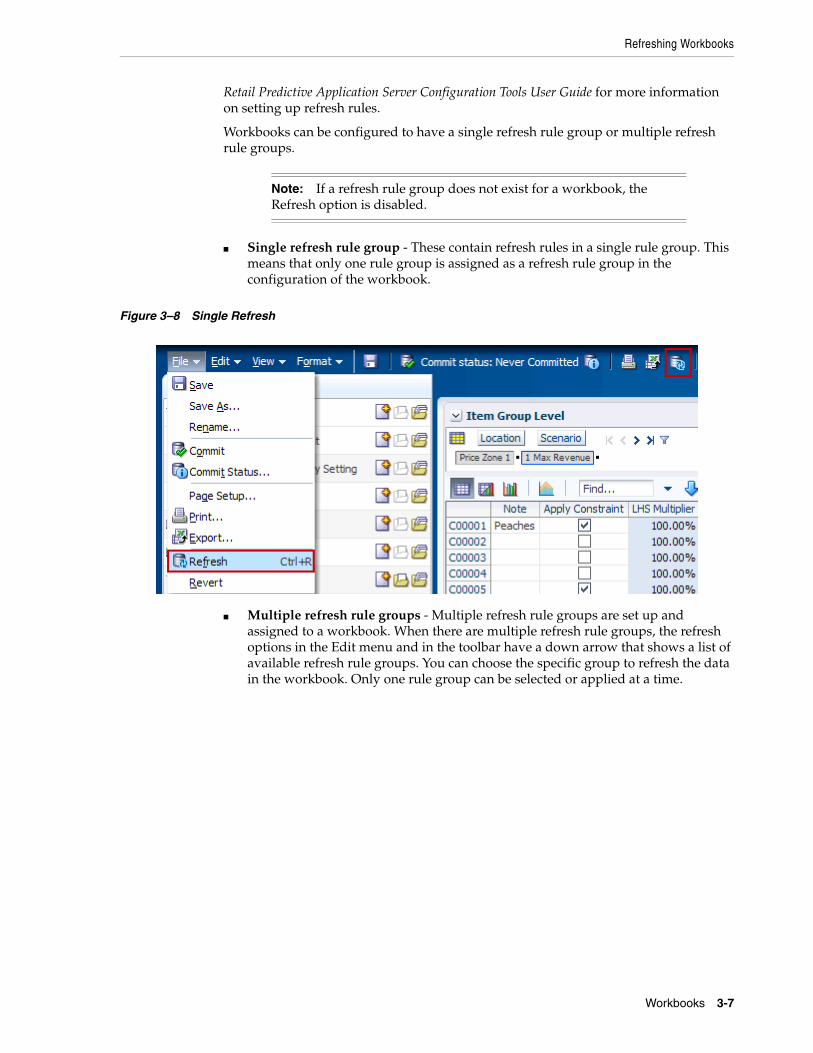
Refreshing Workbooks
Workbooks 3-7
Retail Predictive Application Server Configuration Tools User Guide for more information on setting up refresh rules.
Workbooks can be configured to have a single refresh rule group or multiple refresh rule groups.
■ Single refresh rule group - These contain refresh rules in a single rule group. This means that only one rule group is assigned as a refresh rule group in the configuration of the workbook.
Figure 3–8 Single Refresh
■ Multiple refresh rule groups - Multiple refresh rule groups are set up and assigned to a workbook. When there are multiple refresh rule groups, the refresh options in the Edit menu and in the toolbar have a down arrow that shows a list of available refresh rule groups. You can choose the specific group to refresh the data in the workbook. Only one rule group can be selected or applied at a time.
Note: If a refresh rule group does not exist for a workbook, the Refresh option is disabled.
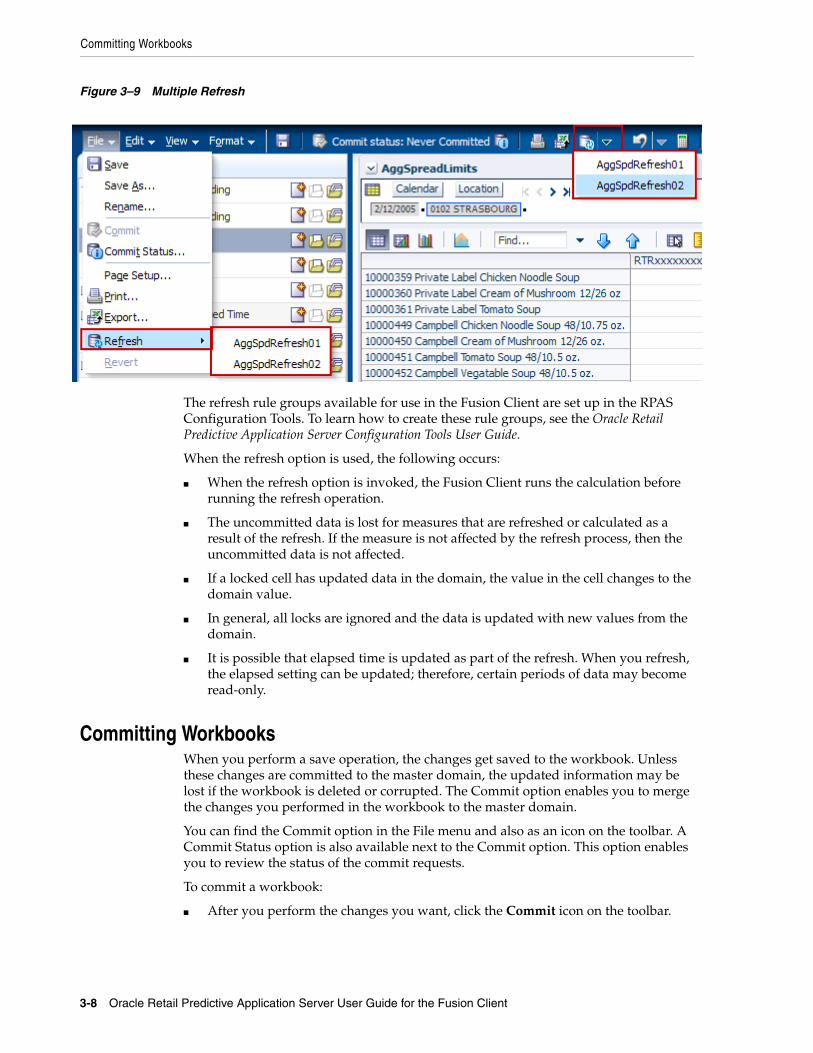
Committing Workbooks
3-8 Oracle Retail Predictive Application Server User Guide for the Fusion Client
Figure 3–9 Multiple Refresh
The refresh rule groups available for use in the Fusion Client are set up in the RPAS Configuration Tools. To learn how to create these rule groups, see the Oracle Retail Predictive Application Server Configuration Tools User Guide.
When the refresh option is used, the following occurs:
■ When the refresh option is invoked, the Fusion Client runs the calculation before running the refresh operation.
■ The uncommitted data is lost for measures that are refreshed or calculated as a result of the refresh. If the measure is not affected by the refresh process, then the uncommitted data is not affected.
■ If a locked cell has updated data in the domain, the value in the cell changes to the domain value.
■ In general, all locks are ignored and the data is updated with new values from the domain.
■ It is possible that elapsed time is updated as part of the refresh. When you refresh, the elapsed setting can be updated; therefore, certain periods of data may become read-only.
Committing WorkbooksWhen you perform a save operation, the changes get saved to the workbook. Unless these changes are committed to the master domain, the updated information may be lost if the workbook is deleted or corrupted. The Commit option enables you to merge the changes you performed in the workbook to the master domain.
You can find the Commit option in the File menu and also as an icon on the toolbar. A Commit Status option is also available next to the Commit option. This option enables you to review the status of the commit requests.
To commit a workbook:
■ After you perform the changes you want, click the Commit icon on the toolbar.
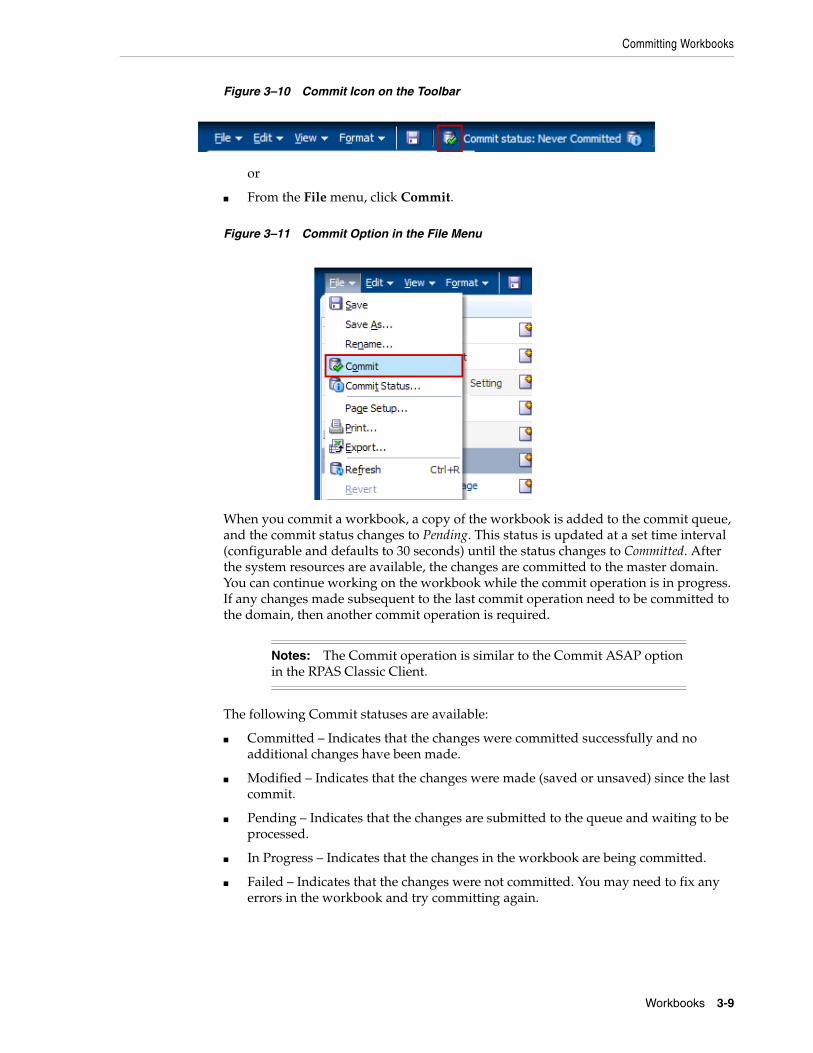
Committing Workbooks
Workbooks 3-9
Figure 3–10 Commit Icon on the Toolbar
or
■ From the File menu, click Commit.
Figure 3–11 Commit Option in the File Menu
When you commit a workbook, a copy of the workbook is added to the commit queue, and the commit status changes to Pending. This status is updated at a set time interval (configurable and defaults to 30 seconds) until the status changes to Committed. After the system resources are available, the changes are committed to the master domain. You can continue working on the workbook while the commit operation is in progress. If any changes made subsequent to the last commit operation need to be committed to the domain, then another commit operation is required.
The following Commit statuses are available:
■ Committed – Indicates that the changes were committed successfully and no additional changes have been made.
■ Modified – Indicates that the changes were made (saved or unsaved) since the last commit.
■ Pending – Indicates that the changes are submitted to the queue and waiting to be processed.
■ In Progress – Indicates that the changes in the workbook are being committed.
■ Failed – Indicates that the changes were not committed. You may need to fix any errors in the workbook and try committing again.
Notes: The Commit operation is similar to the Commit ASAP option in the RPAS Classic Client.
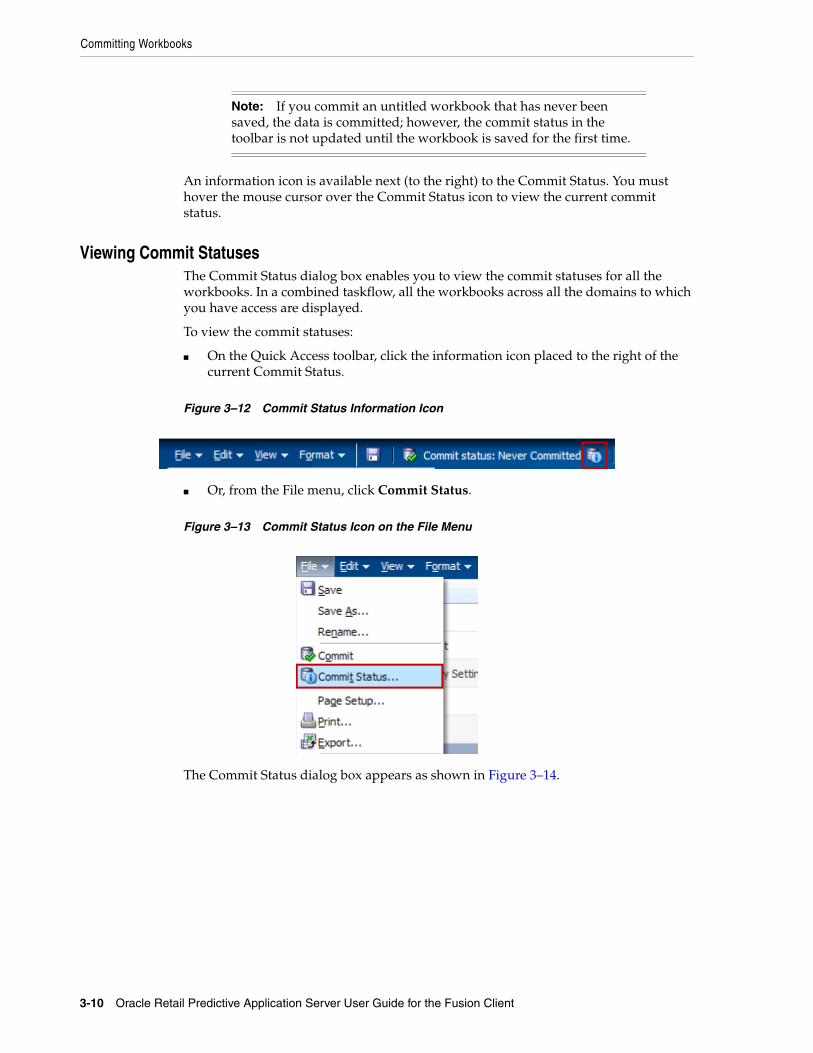
Committing Workbooks
3-10 Oracle Retail Predictive Application Server User Guide for the Fusion Client
An information icon is available next (to the right) to the Commit Status. You must hover the mouse cursor over the Commit Status icon to view the current commit status.
Viewing Commit StatusesThe Commit Status dialog box enables you to view the commit statuses for all the workbooks. In a combined taskflow, all the workbooks across all the domains to which you have access are displayed.
To view the commit statuses:
■ On the Quick Access toolbar, click the information icon placed to the right of the current Commit Status.
Figure 3–12 Commit Status Information Icon
■ Or, from the File menu, click Commit Status.
Figure 3–13 Commit Status Icon on the File Menu
The Commit Status dialog box appears as shown in Figure 3–14.
Note: If you commit an untitled workbook that has never been saved, the data is committed; however, the commit status in the toolbar is not updated until the workbook is saved for the first time.
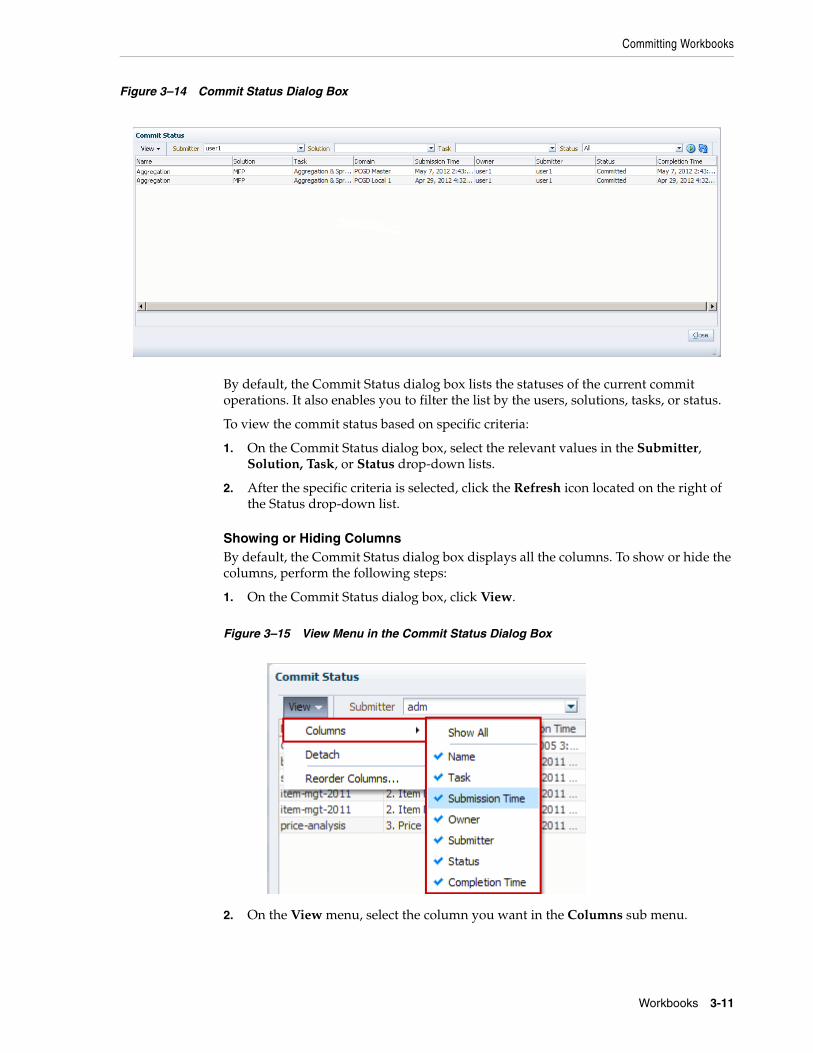
Committing Workbooks
Workbooks 3-11
Figure 3–14 Commit Status Dialog Box
By default, the Commit Status dialog box lists the statuses of the current commit operations. It also enables you to filter the list by the users, solutions, tasks, or status.
To view the commit status based on specific criteria:
1. On the Commit Status dialog box, select the relevant values in the Submitter, Solution, Task, or Status drop-down lists.
2. After the specific criteria is selected, click the Refresh icon located on the right of the Status drop-down list.
Showing or Hiding ColumnsBy default, the Commit Status dialog box displays all the columns. To show or hide the columns, perform the following steps:
1. On the Commit Status dialog box, click View.
Figure 3–15 View Menu in the Commit Status Dialog Box
2. On the View menu, select the column you want in the Columns sub menu.
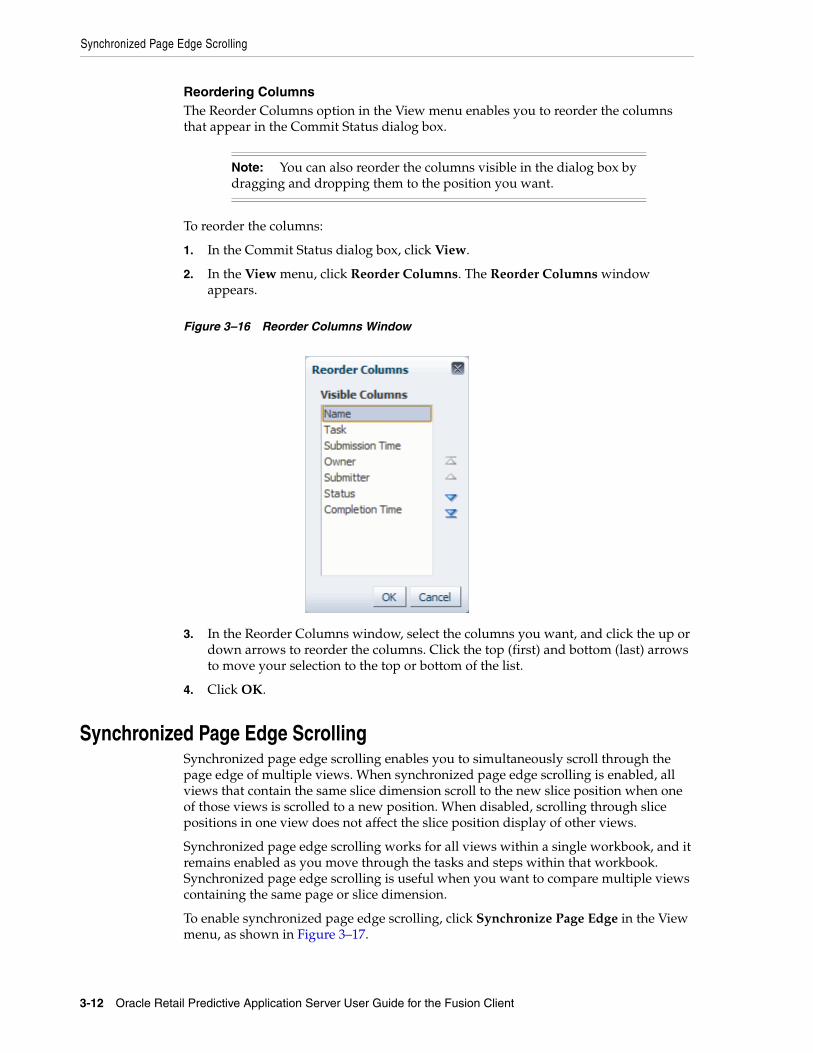
Synchronized Page Edge Scrolling
3-12 Oracle Retail Predictive Application Server User Guide for the Fusion Client
Reordering ColumnsThe Reorder Columns option in the View menu enables you to reorder the columns that appear in the Commit Status dialog box.
To reorder the columns:
1. In the Commit Status dialog box, click View.
2. In the View menu, click Reorder Columns. The Reorder Columns window appears.
Figure 3–16 Reorder Columns Window
3. In the Reorder Columns window, select the columns you want, and click the up or down arrows to reorder the columns. Click the top (first) and bottom (last) arrows to move your selection to the top or bottom of the list.
4. Click OK.
Synchronized Page Edge ScrollingSynchronized page edge scrolling enables you to simultaneously scroll through the page edge of multiple views. When synchronized page edge scrolling is enabled, all views that contain the same slice dimension scroll to the new slice position when one of those views is scrolled to a new position. When disabled, scrolling through slice positions in one view does not affect the slice position display of other views.
Synchronized page edge scrolling works for all views within a single workbook, and it remains enabled as you move through the tasks and steps within that workbook. Synchronized page edge scrolling is useful when you want to compare multiple views containing the same page or slice dimension.
To enable synchronized page edge scrolling, click Synchronize Page Edge in the View menu, as shown in Figure 3–17.
Note: You can also reorder the columns visible in the dialog box by dragging and dropping them to the position you want.
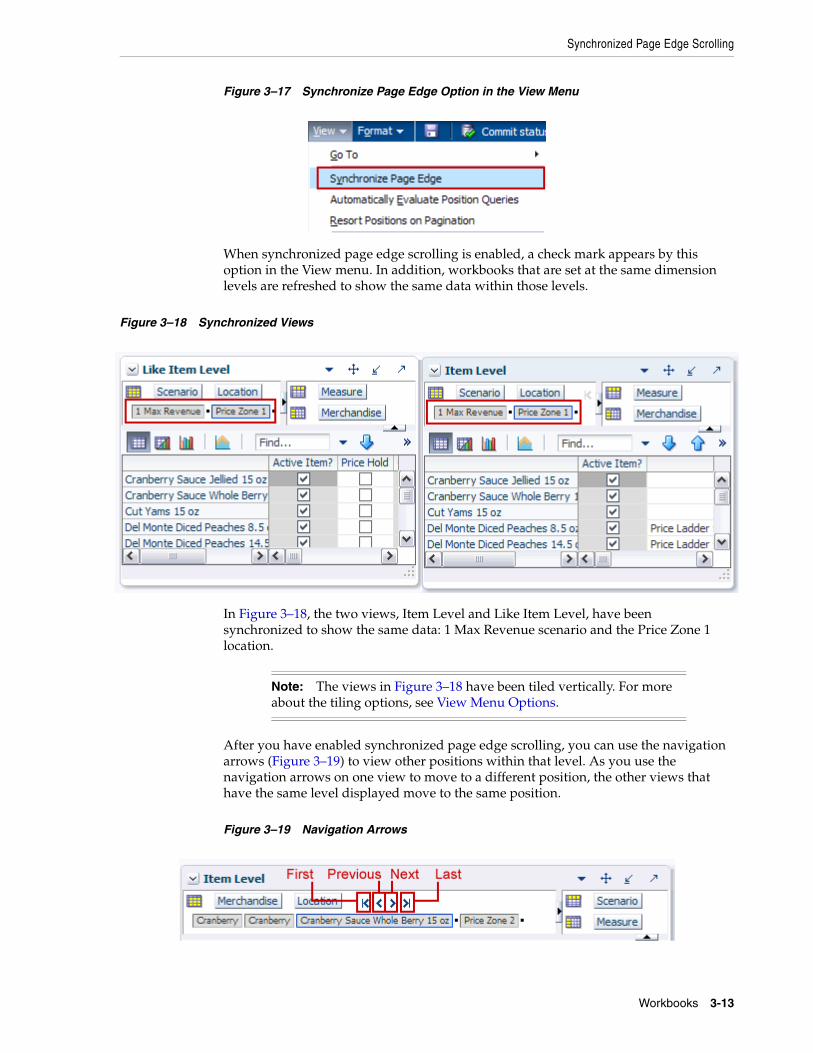
Synchronized Page Edge Scrolling
Workbooks 3-13
Figure 3–17 Synchronize Page Edge Option in the View Menu
When synchronized page edge scrolling is enabled, a check mark appears by this option in the View menu. In addition, workbooks that are set at the same dimension levels are refreshed to show the same data within those levels.
Figure 3–18 Synchronized Views
In Figure 3–18, the two views, Item Level and Like Item Level, have been synchronized to show the same data: 1 Max Revenue scenario and the Price Zone 1 location.
After you have enabled synchronized page edge scrolling, you can use the navigation arrows (Figure 3–19) to view other positions within that level. As you use the navigation arrows on one view to move to a different position, the other views that have the same level displayed move to the same position.
Figure 3–19 Navigation Arrows
Note: The views in Figure 3–18 have been tiled vertically. For more about the tiling options, see View Menu Options.

Synchronized Page Edge Scrolling
3-14 Oracle Retail Predictive Application Server User Guide for the Fusion Client
If you save the workbook with the synchronized page edge option turned on, it is saved with the workbook. Therefore, when you open the workbook again, the synchronized option is still enabled.
Note: When views do not share the same lowest level of a dimension, the views do not scroll together.
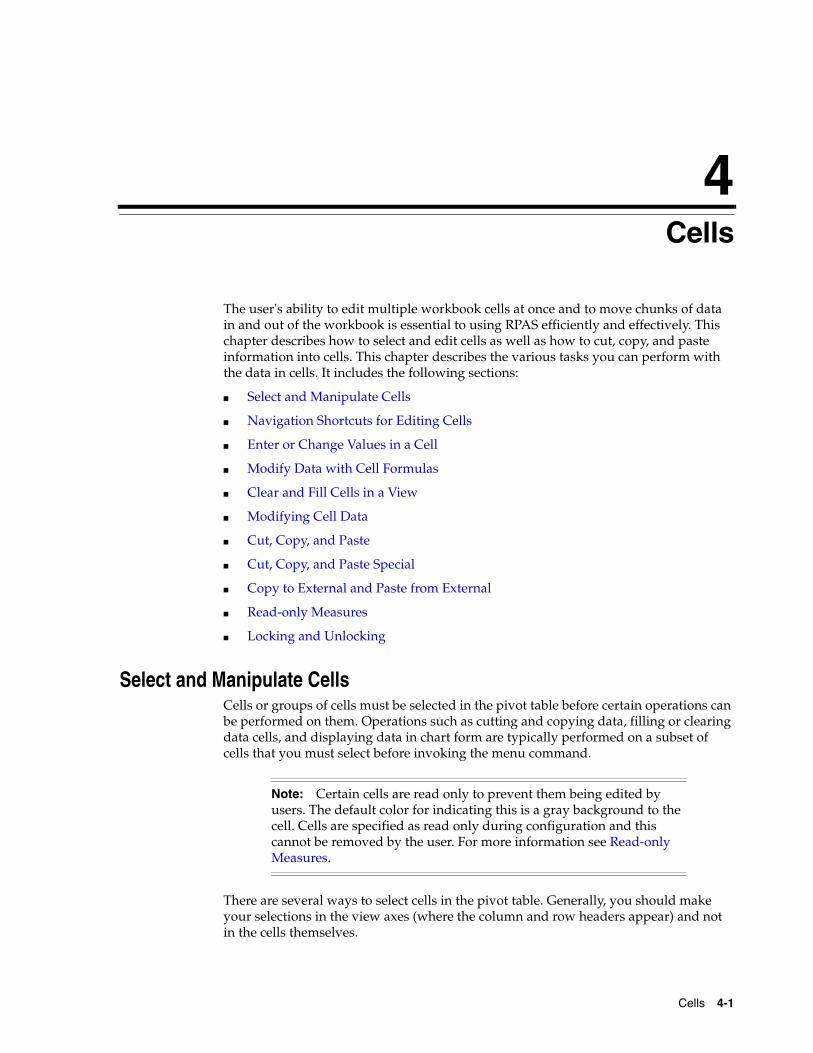
Cells 4-1
4Cells
The user's ability to edit multiple workbook cells at once and to move chunks of data in and out of the workbook is essential to using RPAS efficiently and effectively. This chapter describes how to select and edit cells as well as how to cut, copy, and paste information into cells. This chapter describes the various tasks you can perform with the data in cells. It includes the following sections:
■ Select and Manipulate Cells
■ Navigation Shortcuts for Editing Cells
■ Enter or Change Values in a Cell
■ Modify Data with Cell Formulas
■ Clear and Fill Cells in a View
■ Modifying Cell Data
■ Cut, Copy, and Paste
■ Cut, Copy, and Paste Special
■ Copy to External and Paste from External
■ Read-only Measures
■ Locking and Unlocking
Select and Manipulate CellsCells or groups of cells must be selected in the pivot table before certain operations can be performed on them. Operations such as cutting and copying data, filling or clearing data cells, and displaying data in chart form are typically performed on a subset of cells that you must select before invoking the menu command.
There are several ways to select cells in the pivot table. Generally, you should make your selections in the view axes (where the column and row headers appear) and not in the cells themselves.
Note: Certain cells are read only to prevent them being edited by users. The default color for indicating this is a gray background to the cell. Cells are specified as read only during configuration and this cannot be removed by the user. For more information see Read-only Measures.

Navigation Shortcuts for Editing Cells
4-2 Oracle Retail Predictive Application Server User Guide for the Fusion Client
Select a Single CellClick inside the cell. When selected, the cell is shaded. Alternatively, press the F2 key when the focus is on the cell. This is typically used when the user has used the cursor keys to navigate from a read only cell into an editable one.
Select all Cells in a RowClick the row header for that row of cells.
Select all Cells in a ColumnClick the column header for that column of cells.
Select a Group of Contiguous Cells in the Same Row1. Click the first cell in the row of cells you want to select.
2. Hold the Shift key and click the last cell in the group. The cells become shaded.
Select a Group of Contiguous Cells in the Same Column1. Click the first cell in the column of cells you want to select.
2. Hold the Shift key and click the last cell in the group. The cells become shaded.
Select a Block of Contiguous Cells1. Click the top-most, left-most cell in the block you want to select.
2. Hold down the mouse and drag the cursor to the bottom-most, right-most cell in the block that you want to select.
Select a Group of Non-Contiguous Cells1. Click the first cell you want to select. The selected cell becomes shaded.
2. Hold down the Ctrl key and click the other cells you want to select. All selected cells become shaded.
Figure 4–1 Non-Contiguous Cells
See the Paste section for information about copying and pasting non-contiguous cells.
Navigation Shortcuts for Editing CellsWhen editing cells in a pivot view, there are a number of navigation options to assist the user to move to the next cell. When in a cell that is in editing mode these are:
Note: You cannot select multiple cells for copying or cutting when an edit is in progress. While an edit is in progress, only the current edited text is copied. To copy multiple selected cells, click Escape to exit and then select the multiple cells again.

Enter or Change Values in a Cell
Cells 4-3
When using these options, the cell the user navigates to will be opened in editable mode (unless the cell is read-only). To exit editable mode, use the Escape key.
When navigating read only cells, or to move to cells when not in editable mode, the cursor keys can be used.
Enter or Change Values in a CellThe following are descriptions of actions you can take to change individual values in the pivot table.
Numbers: Enter or overwrite a numeric value. Some cells may have constraints on the maximum values that can be entered. Exceeding this will result in an error message.
Alphanumeric Values or Plain Text: Enter or overwrite an alphanumeric value. Text may be entered up to a maximum value of 4096 characters. Any text string that exceeds this length will be truncated to this value.
Drop-Down List Items: Select the desired option from the drop-down list. Click the arrow and select an item from the drop-down list. For information about selecting dimension values in drop-down lists, see Single Hierarchy Select.
Check Box (Toggle) Items: Click the check box to change the status of the item (yes or no, on or off).
Math Operations: To increment the value in a cell using a mathematical formula, see Modify Data with Cell Formulas.
Date and Time Items: Select the desired date and time. (Some measures may be formatted to display only the date. You can only set the time when the date measure is formatted to display time.)
Click within the cell to display the Select Date and Time dialog box. Click the appropriate arrow keys to change the year, month, day, hour, minute, second, and AM/PM. (The AM/PM option buttons are available only if the measure has been configured to use the 12-hour format.)
You cannot enter dates or times outside of the lower and upper bounds for the measure.
Table 4–1 Navigation Options
Action Effect
Tab Move to next editable cell to right
Shift + Tab Move to next editable cell to left
Enter Move to next editable cell below
Shift + Enter Move to next editable cell above
Note: Use the Escape key to exit Editable mode. Use the Escape sequence (!#) to revert an edited value and exit Editable mode.
Note: Cells have the type of data they can accept predefined. Attempts to enter another type of data into the cell will result in an error message.
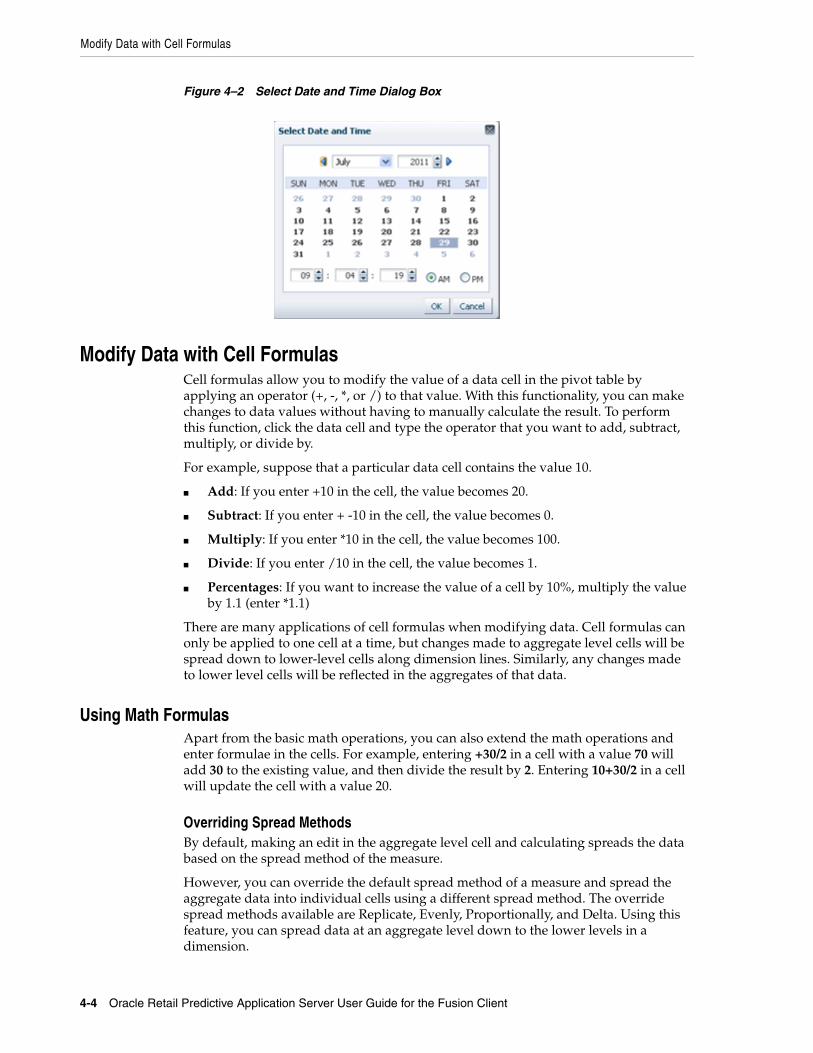
Modify Data with Cell Formulas
4-4 Oracle Retail Predictive Application Server User Guide for the Fusion Client
Figure 4–2 Select Date and Time Dialog Box
Modify Data with Cell FormulasCell formulas allow you to modify the value of a data cell in the pivot table by applying an operator (+, -, *, or /) to that value. With this functionality, you can make changes to data values without having to manually calculate the result. To perform this function, click the data cell and type the operator that you want to add, subtract, multiply, or divide by.
For example, suppose that a particular data cell contains the value 10.
■ Add: If you enter +10 in the cell, the value becomes 20.
■ Subtract: If you enter + -10 in the cell, the value becomes 0.
■ Multiply: If you enter *10 in the cell, the value becomes 100.
■ Divide: If you enter /10 in the cell, the value becomes 1.
■ Percentages: If you want to increase the value of a cell by 10%, multiply the value by 1.1 (enter *1.1)
There are many applications of cell formulas when modifying data. Cell formulas can only be applied to one cell at a time, but changes made to aggregate level cells will be spread down to lower-level cells along dimension lines. Similarly, any changes made to lower level cells will be reflected in the aggregates of that data.
Using Math FormulasApart from the basic math operations, you can also extend the math operations and enter formulae in the cells. For example, entering +30/2 in a cell with a value 70 will add 30 to the existing value, and then divide the result by 2. Entering 10+30/2 in a cell will update the cell with a value 20.
Overriding Spread MethodsBy default, making an edit in the aggregate level cell and calculating spreads the data based on the spread method of the measure.
However, you can override the default spread method of a measure and spread the aggregate data into individual cells using a different spread method. The override spread methods available are Replicate, Evenly, Proportionally, and Delta. Using this feature, you can spread data at an aggregate level down to the lower levels in a dimension.
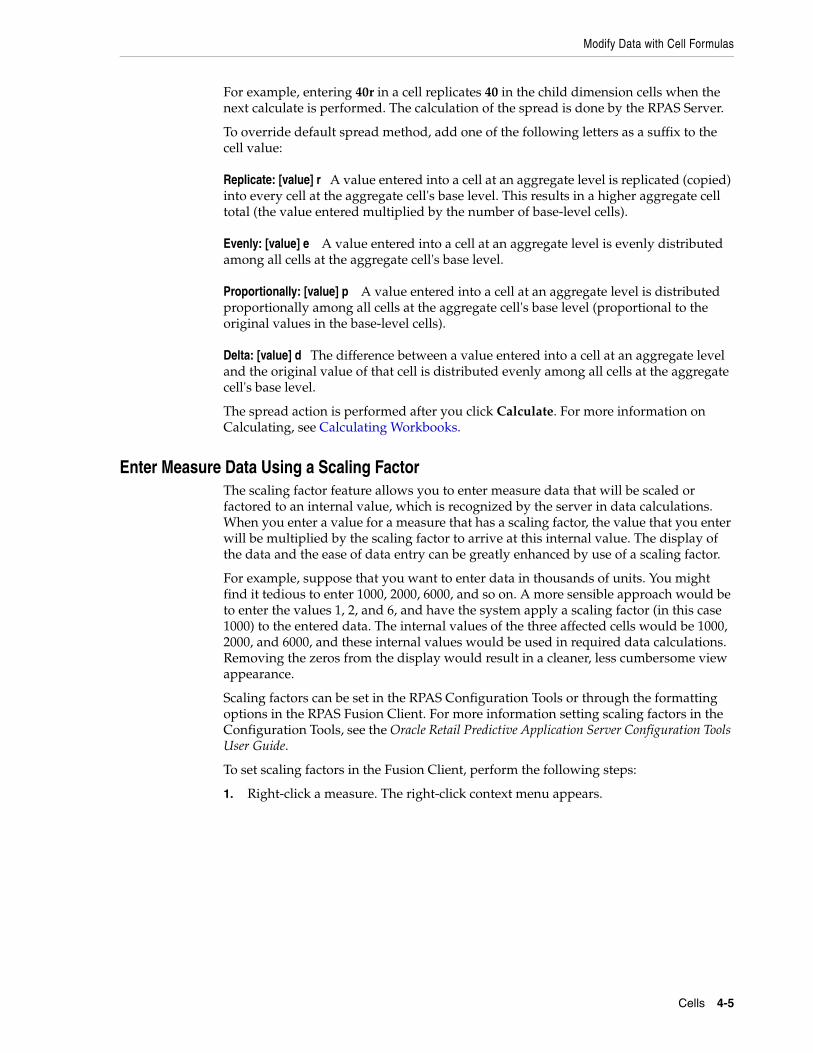
Modify Data with Cell Formulas
Cells 4-5
For example, entering 40r in a cell replicates 40 in the child dimension cells when the next calculate is performed. The calculation of the spread is done by the RPAS Server.
To override default spread method, add one of the following letters as a suffix to the cell value:
Replicate: [value] r A value entered into a cell at an aggregate level is replicated (copied) into every cell at the aggregate cell's base level. This results in a higher aggregate cell total (the value entered multiplied by the number of base-level cells).
Evenly: [value] e A value entered into a cell at an aggregate level is evenly distributed among all cells at the aggregate cell's base level.
Proportionally: [value] p A value entered into a cell at an aggregate level is distributed proportionally among all cells at the aggregate cell's base level (proportional to the original values in the base-level cells).
Delta: [value] d The difference between a value entered into a cell at an aggregate level and the original value of that cell is distributed evenly among all cells at the aggregate cell's base level.
The spread action is performed after you click Calculate. For more information on Calculating, see Calculating Workbooks.
Enter Measure Data Using a Scaling FactorThe scaling factor feature allows you to enter measure data that will be scaled or factored to an internal value, which is recognized by the server in data calculations. When you enter a value for a measure that has a scaling factor, the value that you enter will be multiplied by the scaling factor to arrive at this internal value. The display of the data and the ease of data entry can be greatly enhanced by use of a scaling factor.
For example, suppose that you want to enter data in thousands of units. You might find it tedious to enter 1000, 2000, 6000, and so on. A more sensible approach would be to enter the values 1, 2, and 6, and have the system apply a scaling factor (in this case 1000) to the entered data. The internal values of the three affected cells would be 1000, 2000, and 6000, and these internal values would be used in required data calculations. Removing the zeros from the display would result in a cleaner, less cumbersome view appearance.
Scaling factors can be set in the RPAS Configuration Tools or through the formatting options in the RPAS Fusion Client. For more information setting scaling factors in the Configuration Tools, see the Oracle Retail Predictive Application Server Configuration Tools User Guide.
To set scaling factors in the Fusion Client, perform the following steps:
1. Right-click a measure. The right-click context menu appears.
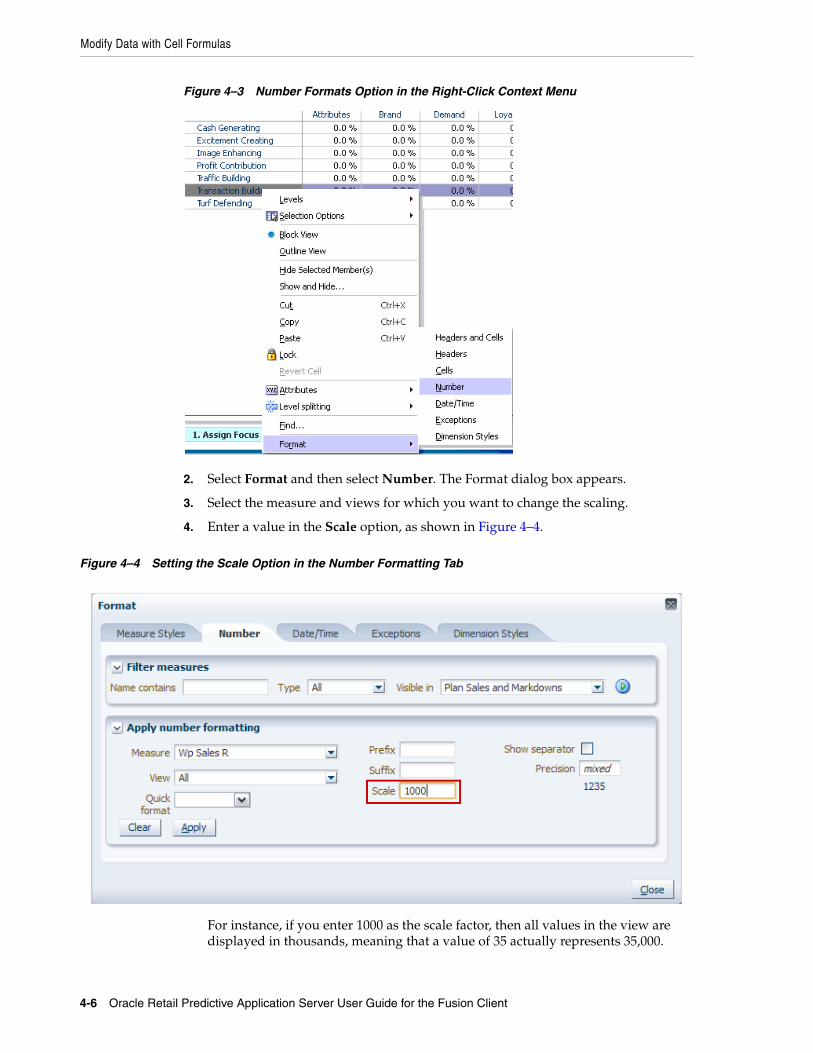
Modify Data with Cell Formulas
4-6 Oracle Retail Predictive Application Server User Guide for the Fusion Client
Figure 4–3 Number Formats Option in the Right-Click Context Menu
2. Select Format and then select Number. The Format dialog box appears.
3. Select the measure and views for which you want to change the scaling.
4. Enter a value in the Scale option, as shown in Figure 4–4.
Figure 4–4 Setting the Scale Option in the Number Formatting Tab
For instance, if you enter 1000 as the scale factor, then all values in the view are displayed in thousands, meaning that a value of 35 actually represents 35,000.
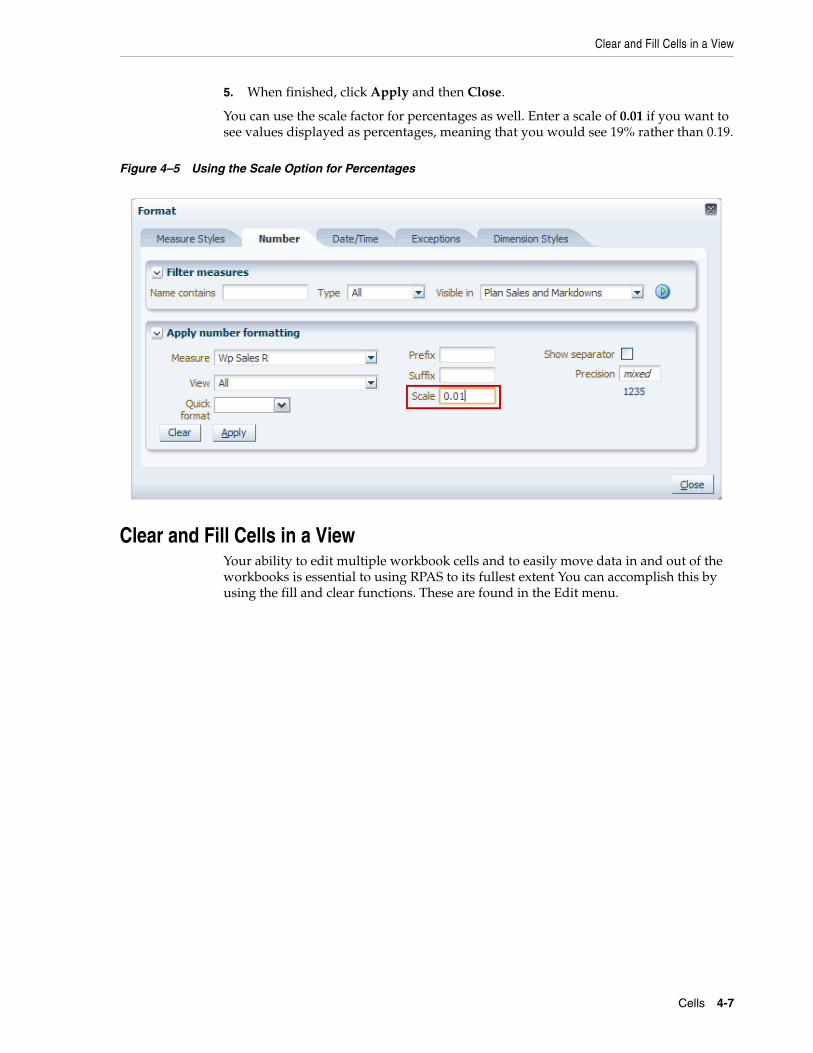
Clear and Fill Cells in a View
Cells 4-7
5. When finished, click Apply and then Close.
You can use the scale factor for percentages as well. Enter a scale of 0.01 if you want to see values displayed as percentages, meaning that you would see 19% rather than 0.19.
Figure 4–5 Using the Scale Option for Percentages
Clear and Fill Cells in a ViewYour ability to edit multiple workbook cells and to easily move data in and out of the workbooks is essential to using RPAS to its fullest extent You can accomplish this by using the fill and clear functions. These are found in the Edit menu.
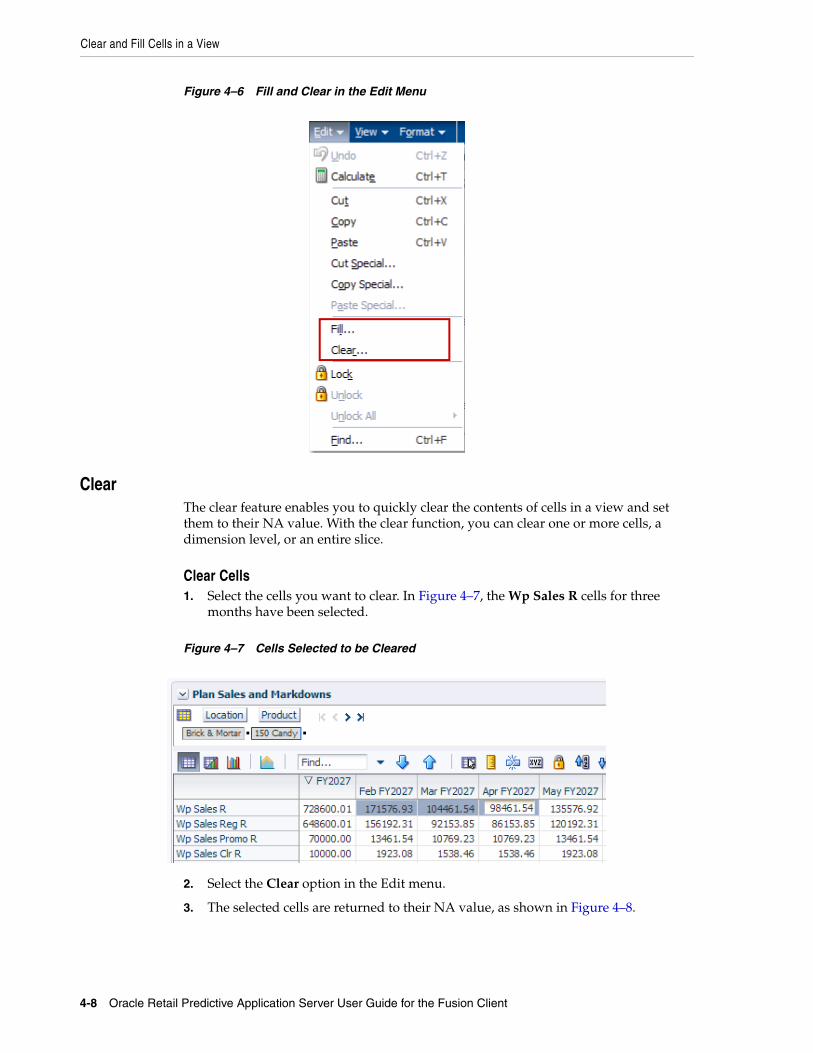
Clear and Fill Cells in a View
4-8 Oracle Retail Predictive Application Server User Guide for the Fusion Client
Figure 4–6 Fill and Clear in the Edit Menu
ClearThe clear feature enables you to quickly clear the contents of cells in a view and set them to their NA value. With the clear function, you can clear one or more cells, a dimension level, or an entire slice.
Clear Cells1. Select the cells you want to clear. In Figure 4–7, the Wp Sales R cells for three
months have been selected.
Figure 4–7 Cells Selected to be Cleared
2. Select the Clear option in the Edit menu.
3. The selected cells are returned to their NA value, as shown in Figure 4–8.
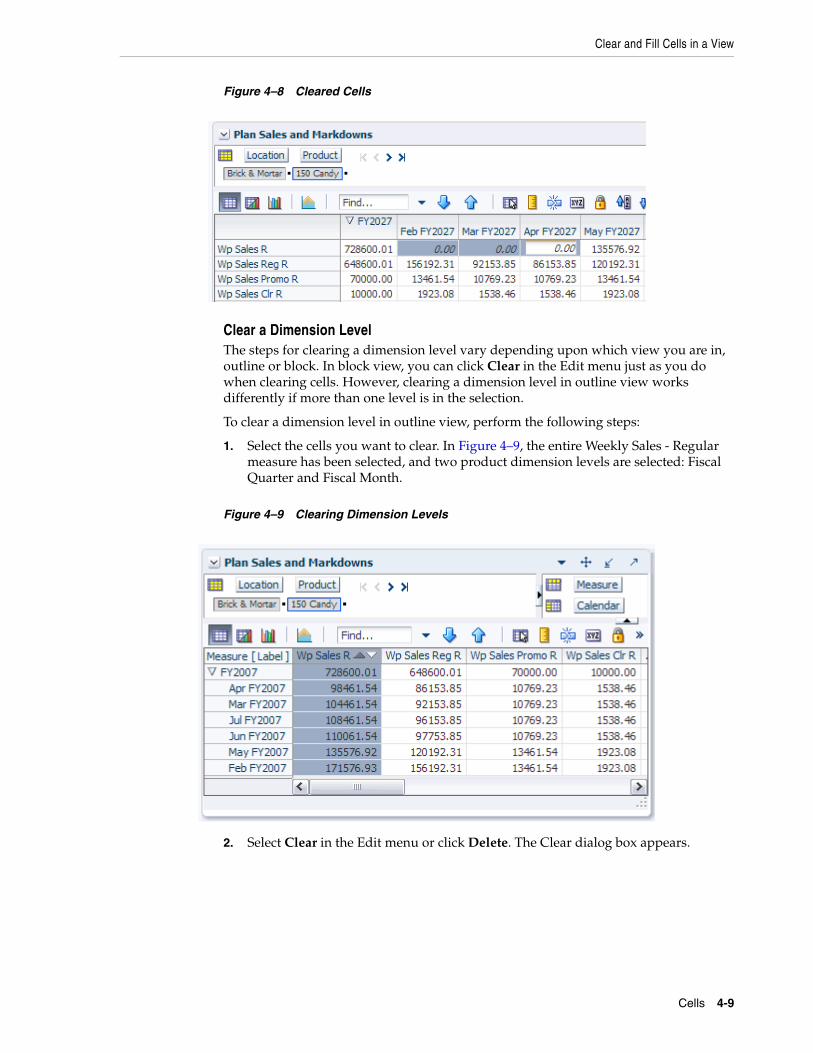
Clear and Fill Cells in a View
Cells 4-9
Figure 4–8 Cleared Cells
Clear a Dimension LevelThe steps for clearing a dimension level vary depending upon which view you are in, outline or block. In block view, you can click Clear in the Edit menu just as you do when clearing cells. However, clearing a dimension level in outline view works differently if more than one level is in the selection.
To clear a dimension level in outline view, perform the following steps:
1. Select the cells you want to clear. In Figure 4–9, the entire Weekly Sales - Regular measure has been selected, and two product dimension levels are selected: Fiscal Quarter and Fiscal Month.
Figure 4–9 Clearing Dimension Levels
2. Select Clear in the Edit menu or click Delete. The Clear dialog box appears.
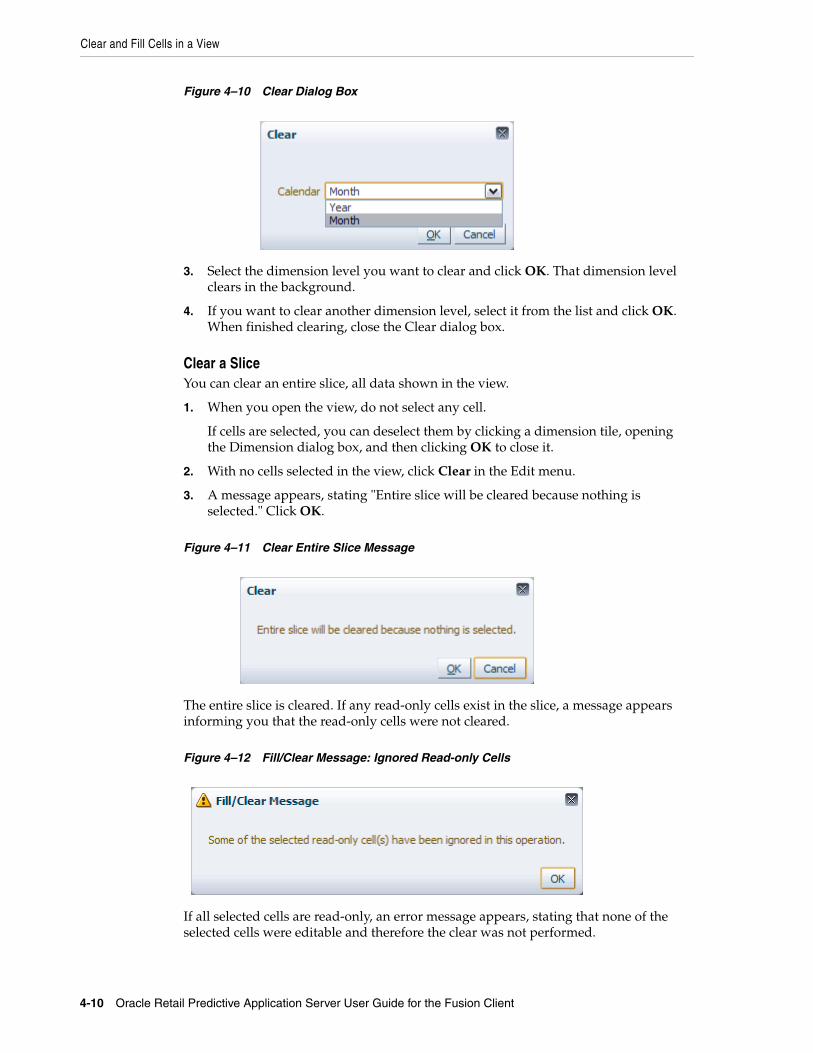
Clear and Fill Cells in a View
4-10 Oracle Retail Predictive Application Server User Guide for the Fusion Client
Figure 4–10 Clear Dialog Box
3. Select the dimension level you want to clear and click OK. That dimension level clears in the background.
4. If you want to clear another dimension level, select it from the list and click OK. When finished clearing, close the Clear dialog box.
Clear a SliceYou can clear an entire slice, all data shown in the view.
1. When you open the view, do not select any cell.
If cells are selected, you can deselect them by clicking a dimension tile, opening the Dimension dialog box, and then clicking OK to close it.
2. With no cells selected in the view, click Clear in the Edit menu.
3. A message appears, stating "Entire slice will be cleared because nothing is selected." Click OK.
Figure 4–11 Clear Entire Slice Message
The entire slice is cleared. If any read-only cells exist in the slice, a message appears informing you that the read-only cells were not cleared.
Figure 4–12 Fill/Clear Message: Ignored Read-only Cells
If all selected cells are read-only, an error message appears, stating that none of the selected cells were editable and therefore the clear was not performed.
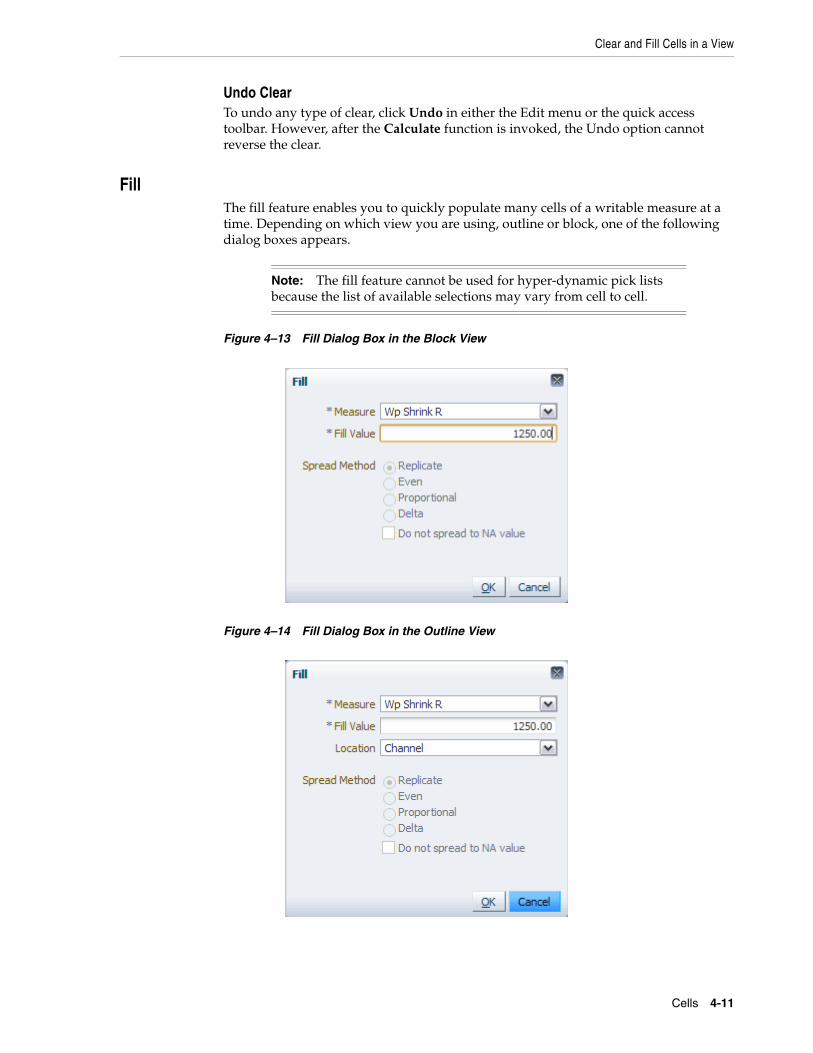
Clear and Fill Cells in a View
Cells 4-11
Undo ClearTo undo any type of clear, click Undo in either the Edit menu or the quick access toolbar. However, after the Calculate function is invoked, the Undo option cannot reverse the clear.
FillThe fill feature enables you to quickly populate many cells of a writable measure at a time. Depending on which view you are using, outline or block, one of the following dialog boxes appears.
Figure 4–13 Fill Dialog Box in the Block View
Figure 4–14 Fill Dialog Box in the Outline View
Note: The fill feature cannot be used for hyper-dynamic pick lists because the list of available selections may vary from cell to cell.
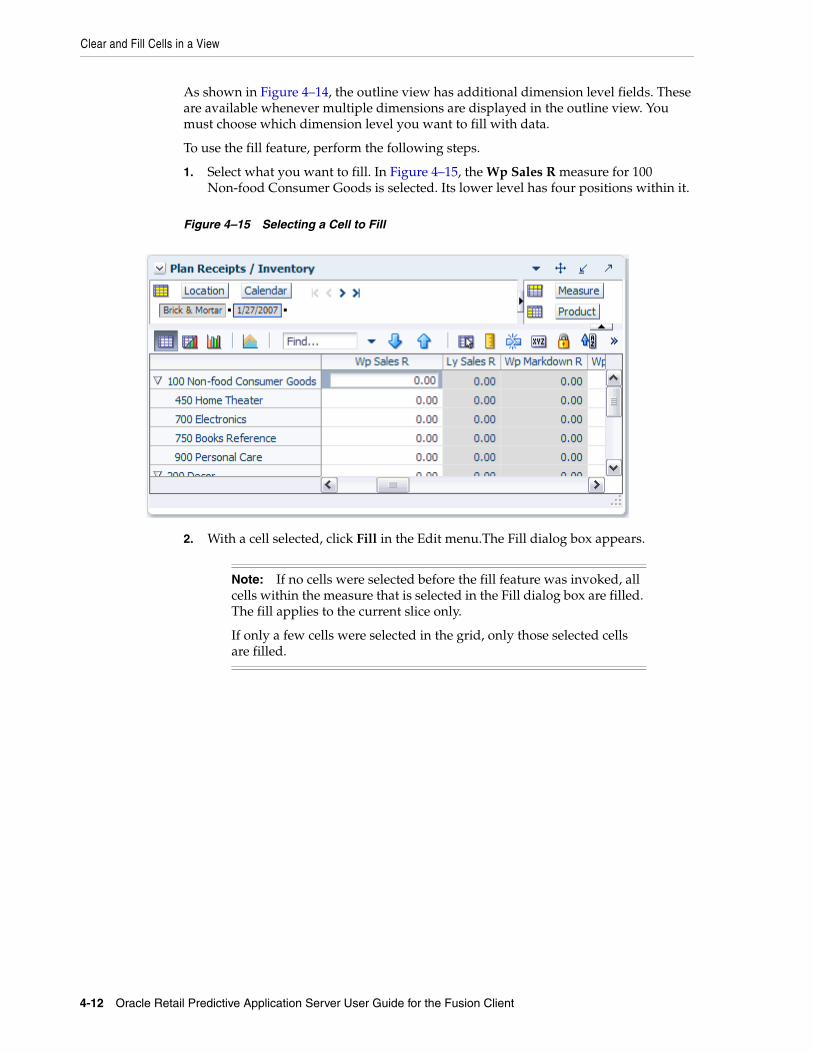
Clear and Fill Cells in a View
4-12 Oracle Retail Predictive Application Server User Guide for the Fusion Client
As shown in Figure 4–14, the outline view has additional dimension level fields. These are available whenever multiple dimensions are displayed in the outline view. You must choose which dimension level you want to fill with data.
To use the fill feature, perform the following steps.
1. Select what you want to fill. In Figure 4–15, the Wp Sales R measure for 100 Non-food Consumer Goods is selected. Its lower level has four positions within it.
Figure 4–15 Selecting a Cell to Fill
2. With a cell selected, click Fill in the Edit menu.The Fill dialog box appears.
Note: If no cells were selected before the fill feature was invoked, all cells within the measure that is selected in the Fill dialog box are filled. The fill applies to the current slice only.
If only a few cells were selected in the grid, only those selected cells are filled.
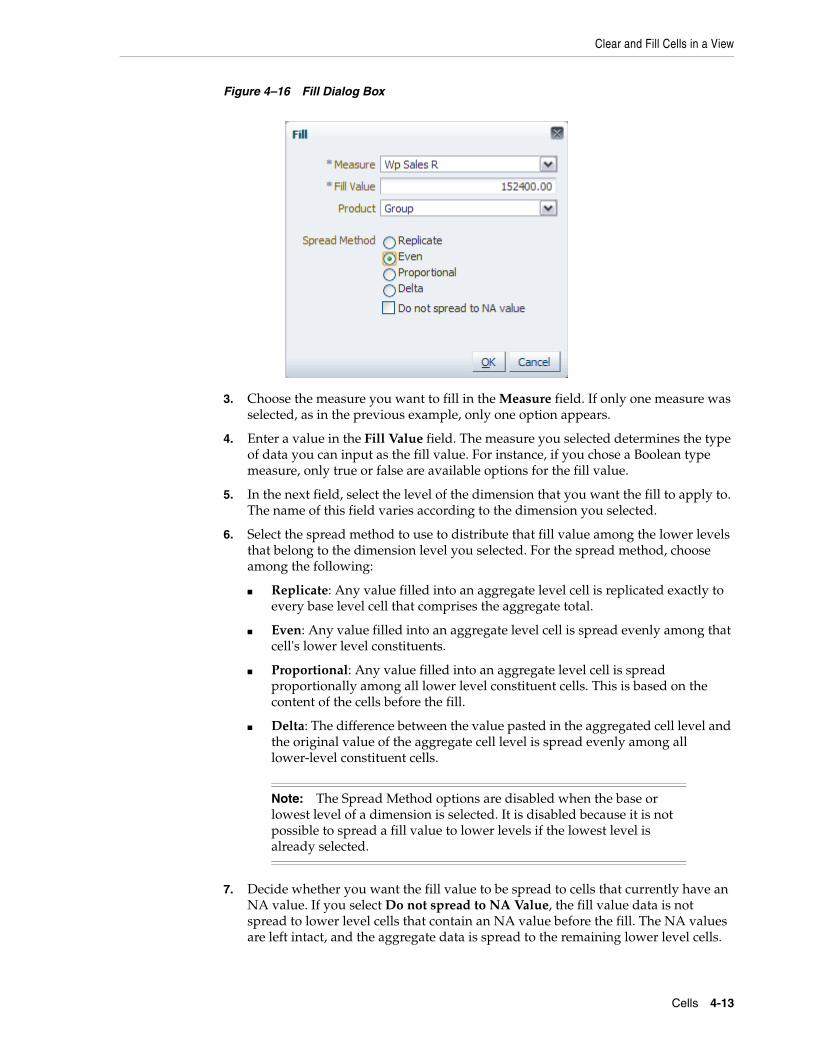
Clear and Fill Cells in a View
Cells 4-13
Figure 4–16 Fill Dialog Box
3. Choose the measure you want to fill in the Measure field. If only one measure was selected, as in the previous example, only one option appears.
4. Enter a value in the Fill Value field. The measure you selected determines the type of data you can input as the fill value. For instance, if you chose a Boolean type measure, only true or false are available options for the fill value.
5. In the next field, select the level of the dimension that you want the fill to apply to. The name of this field varies according to the dimension you selected.
6. Select the spread method to use to distribute that fill value among the lower levels that belong to the dimension level you selected. For the spread method, choose among the following:
■ Replicate: Any value filled into an aggregate level cell is replicated exactly to every base level cell that comprises the aggregate total.
■ Even: Any value filled into an aggregate level cell is spread evenly among that cell's lower level constituents.
■ Proportional: Any value filled into an aggregate level cell is spread proportionally among all lower level constituent cells. This is based on the content of the cells before the fill.
■ Delta: The difference between the value pasted in the aggregated cell level and the original value of the aggregate cell level is spread evenly among all lower-level constituent cells.
7. Decide whether you want the fill value to be spread to cells that currently have an NA value. If you select Do not spread to NA Value, the fill value data is not spread to lower level cells that contain an NA value before the fill. The NA values are left intact, and the aggregate data is spread to the remaining lower level cells.
Note: The Spread Method options are disabled when the base or lowest level of a dimension is selected. It is disabled because it is not possible to spread a fill value to lower levels if the lowest level is already selected.
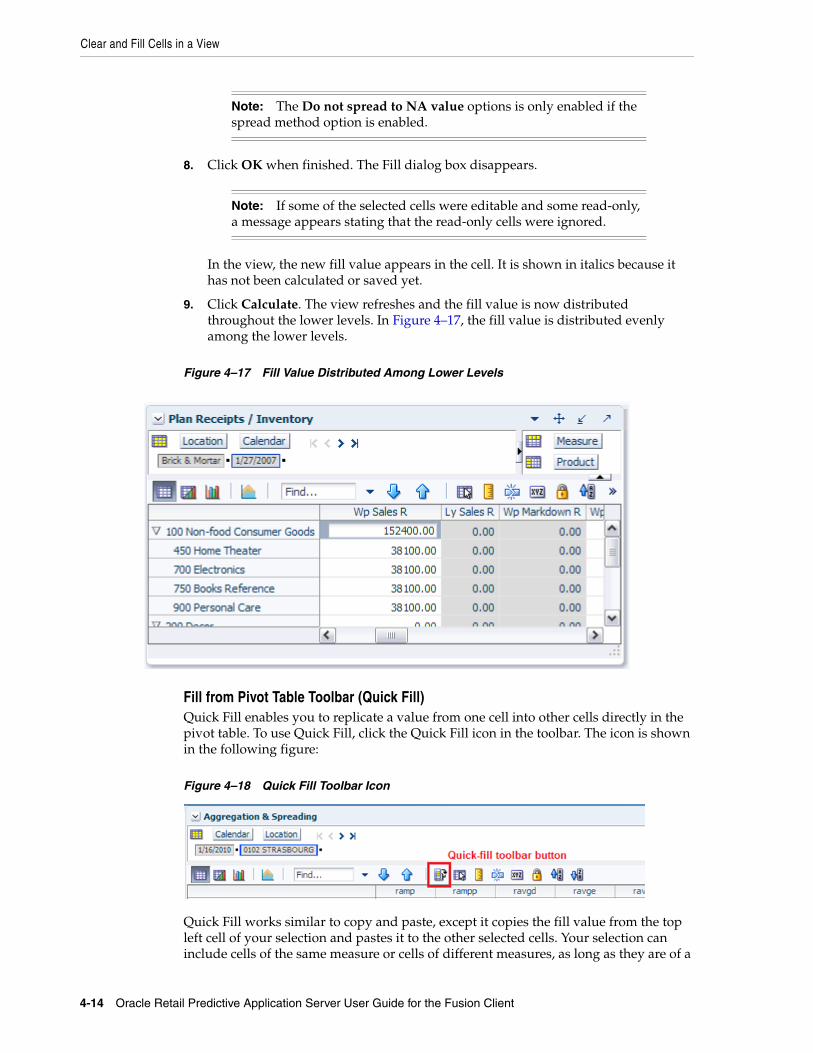
Clear and Fill Cells in a View
4-14 Oracle Retail Predictive Application Server User Guide for the Fusion Client
8. Click OK when finished. The Fill dialog box disappears.
In the view, the new fill value appears in the cell. It is shown in italics because it has not been calculated or saved yet.
9. Click Calculate. The view refreshes and the fill value is now distributed throughout the lower levels. In Figure 4–17, the fill value is distributed evenly among the lower levels.
Figure 4–17 Fill Value Distributed Among Lower Levels
Fill from Pivot Table Toolbar (Quick Fill)Quick Fill enables you to replicate a value from one cell into other cells directly in the pivot table. To use Quick Fill, click the Quick Fill icon in the toolbar. The icon is shown in the following figure:
Figure 4–18 Quick Fill Toolbar Icon
Quick Fill works similar to copy and paste, except it copies the fill value from the top left cell of your selection and pastes it to the other selected cells. Your selection can include cells of the same measure or cells of different measures, as long as they are of a
Note: The Do not spread to NA value options is only enabled if the spread method option is enabled.
Note: If some of the selected cells were editable and some read-only, a message appears stating that the read-only cells were ignored.
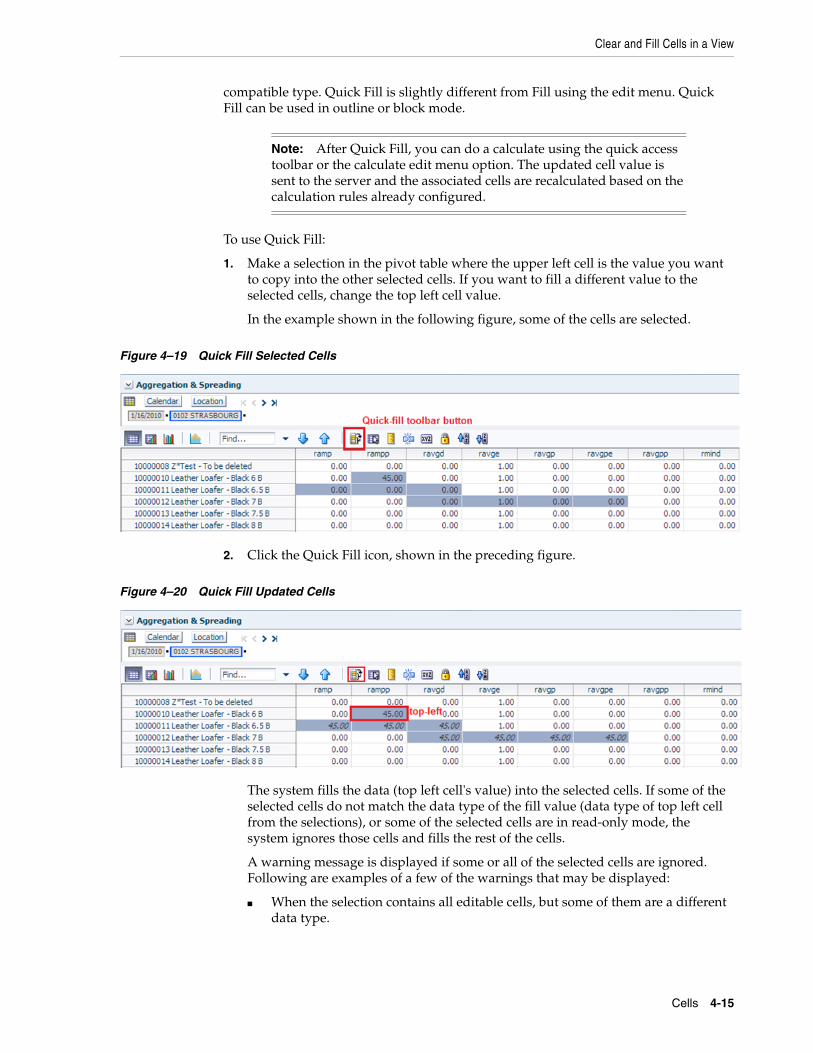
Clear and Fill Cells in a View
Cells 4-15
compatible type. Quick Fill is slightly different from Fill using the edit menu. Quick Fill can be used in outline or block mode.
To use Quick Fill:
1. Make a selection in the pivot table where the upper left cell is the value you want to copy into the other selected cells. If you want to fill a different value to the selected cells, change the top left cell value.
In the example shown in the following figure, some of the cells are selected.
Figure 4–19 Quick Fill Selected Cells
2. Click the Quick Fill icon, shown in the preceding figure.
Figure 4–20 Quick Fill Updated Cells
The system fills the data (top left cell's value) into the selected cells. If some of the selected cells do not match the data type of the fill value (data type of top left cell from the selections), or some of the selected cells are in read-only mode, the system ignores those cells and fills the rest of the cells.
A warning message is displayed if some or all of the selected cells are ignored. Following are examples of a few of the warnings that may be displayed:
■ When the selection contains all editable cells, but some of them are a different data type.
Note: After Quick Fill, you can do a calculate using the quick access toolbar or the calculate edit menu option. The updated cell value is sent to the server and the associated cells are recalculated based on the calculation rules already configured.
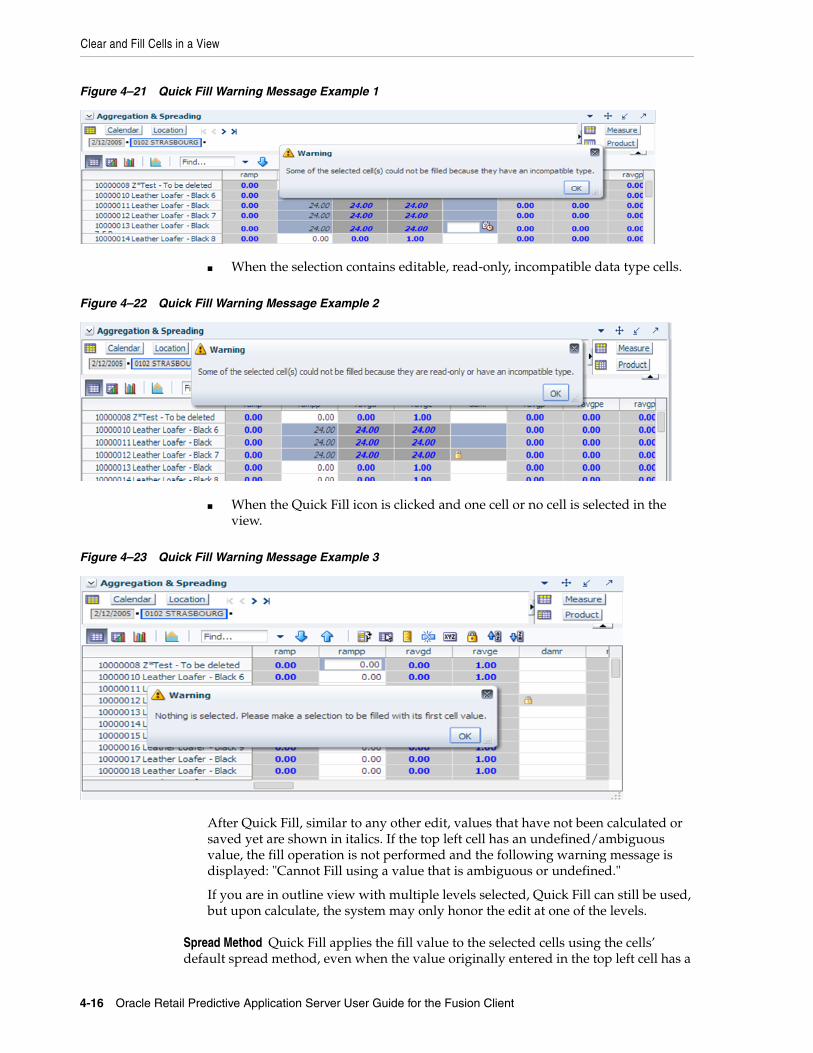
Clear and Fill Cells in a View
4-16 Oracle Retail Predictive Application Server User Guide for the Fusion Client
Figure 4–21 Quick Fill Warning Message Example 1
■ When the selection contains editable, read-only, incompatible data type cells.
Figure 4–22 Quick Fill Warning Message Example 2
■ When the Quick Fill icon is clicked and one cell or no cell is selected in the view.
Figure 4–23 Quick Fill Warning Message Example 3
After Quick Fill, similar to any other edit, values that have not been calculated or saved yet are shown in italics. If the top left cell has an undefined/ambiguous value, the fill operation is not performed and the following warning message is displayed: "Cannot Fill using a value that is ambiguous or undefined."
If you are in outline view with multiple levels selected, Quick Fill can still be used, but upon calculate, the system may only honor the edit at one of the levels.
Spread Method Quick Fill applies the fill value to the selected cells using the cells’ default spread method, even when the value originally entered in the top left cell has a
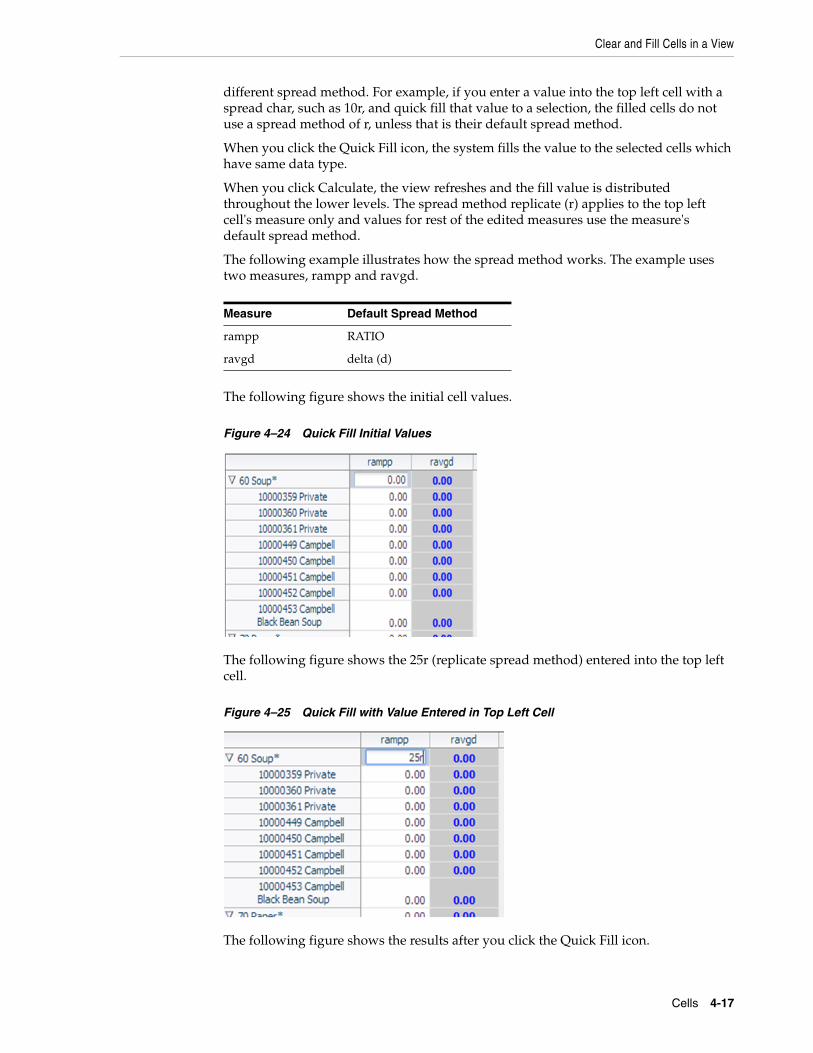
Clear and Fill Cells in a View
Cells 4-17
different spread method. For example, if you enter a value into the top left cell with a spread char, such as 10r, and quick fill that value to a selection, the filled cells do not use a spread method of r, unless that is their default spread method.
When you click the Quick Fill icon, the system fills the value to the selected cells which have same data type.
When you click Calculate, the view refreshes and the fill value is distributed throughout the lower levels. The spread method replicate (r) applies to the top left cell's measure only and values for rest of the edited measures use the measure's default spread method.
The following example illustrates how the spread method works. The example uses two measures, rampp and ravgd.
The following figure shows the initial cell values.
Figure 4–24 Quick Fill Initial Values
The following figure shows the 25r (replicate spread method) entered into the top left cell.
Figure 4–25 Quick Fill with Value Entered in Top Left Cell
The following figure shows the results after you click the Quick Fill icon.
Measure Default Spread Method
rampp RATIO
ravgd delta (d)
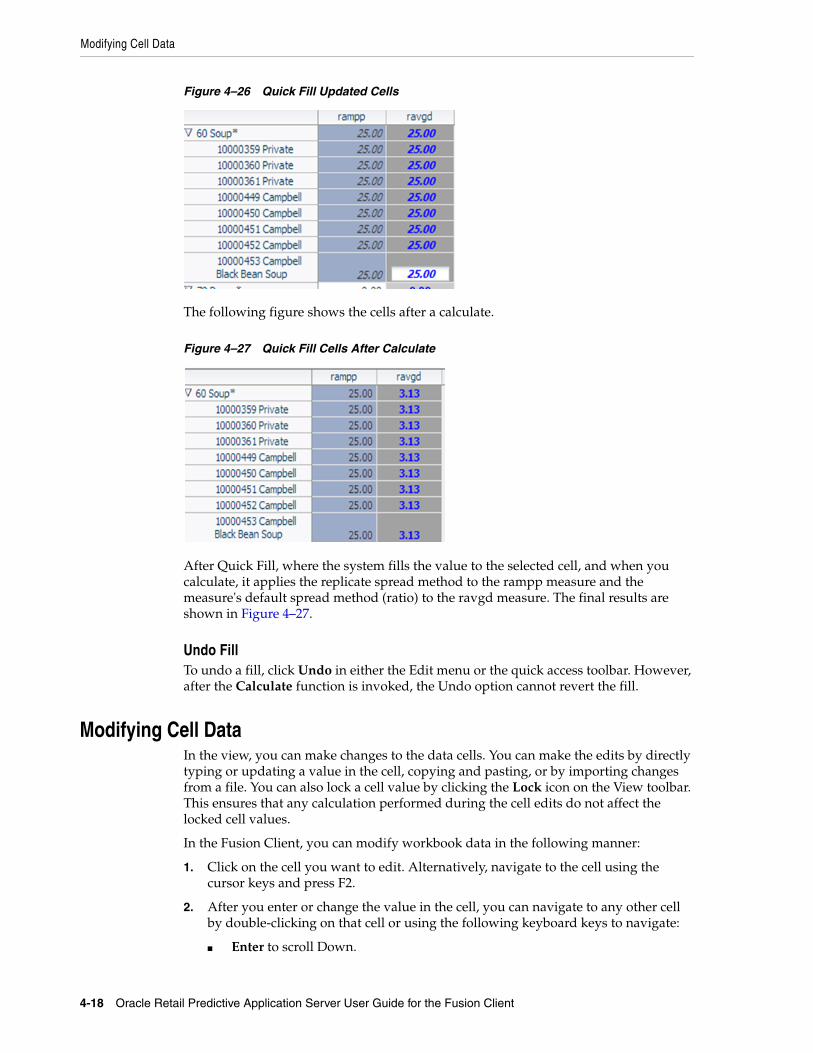
Modifying Cell Data
4-18 Oracle Retail Predictive Application Server User Guide for the Fusion Client
Figure 4–26 Quick Fill Updated Cells
The following figure shows the cells after a calculate.
Figure 4–27 Quick Fill Cells After Calculate
After Quick Fill, where the system fills the value to the selected cell, and when you calculate, it applies the replicate spread method to the rampp measure and the measure's default spread method (ratio) to the ravgd measure. The final results are shown in Figure 4–27.
Undo FillTo undo a fill, click Undo in either the Edit menu or the quick access toolbar. However, after the Calculate function is invoked, the Undo option cannot revert the fill.
Modifying Cell DataIn the view, you can make changes to the data cells. You can make the edits by directly typing or updating a value in the cell, copying and pasting, or by importing changes from a file. You can also lock a cell value by clicking the Lock icon on the View toolbar. This ensures that any calculation performed during the cell edits do not affect the locked cell values.
In the Fusion Client, you can modify workbook data in the following manner:
1. Click on the cell you want to edit. Alternatively, navigate to the cell using the cursor keys and press F2.
2. After you enter or change the value in the cell, you can navigate to any other cell by double-clicking on that cell or using the following keyboard keys to navigate:
■ Enter to scroll Down.
Modifying Cell Data
Cells 4-19
■ Shift + Enter to scroll Up.
■ Tab to scroll Right.
■ Shift + Tab to scroll Left.
To learn how to modify data with math formulas, see Modify Data with Cell Formulas.
Revert CellAfter an edit action, you can revert the cell to the last calculated value using the Revert Cell option in the right-click context menu. The Revert Cell feature is on a cell-by-cell basis. When you click Revert Cell, the edited cell reverts to the last saved or calculated value. Changes up to the last saved or calculated value are available in the Undo list.
Protection ProcessingProtection processing is the process that makes some cells within a workbook read-only to ensure that during edits no conflicts occur within the RPAS engine in a Calculation Cycle. There are two types of protection processing:
■ Measure Protection Processing - Locks cells in all the displayed views based on the measures that have been edited.
■ Dimension Protection Processing - Locks cells based on the dimension intersections that have been edited.
Protection processing runs each time when a workbook with any locked cell/measure is opened, a cell is edited, a cell or measure is locked, and after each cell revert action. It runs only once when a group of cells are updated in one action. Protected cells or measures appear highlighted in a different color in the view. This is configurable feature.
Measure Protection ProcessingIn Measure protection processing, cells become read-only when you make changes to enough measures. This ensures that there are no more possible changes which may cause conflicts.
For example, consider six measures (A, B, C, D, and E) set up with the following two rules:
■ Rule 1 - A = B + C
■ Rule 2 - B = D + E
In this scenario, both A and B are read-only before any edits are applied. Although B appears to be editable, since there are no reciprocal expressions for B's relation to D and E, it is not editable. Measures C, D, and E, however, are editable.
Typically, rule definitions are set up to include all equivalent derivations of any expression. This ensures that you can edit all of the measures contained in any expression in the rule.
Considering the previous example, Rules 1 and 2 will be configured as:
■ Rule 1 A=B+C, B=A-C, C=A-B
■ Rule 2 B=D+E, D=B-E, E=B-D
In this case, all measures are editable before you make any changes and the measures remain editable based on the edits you make.
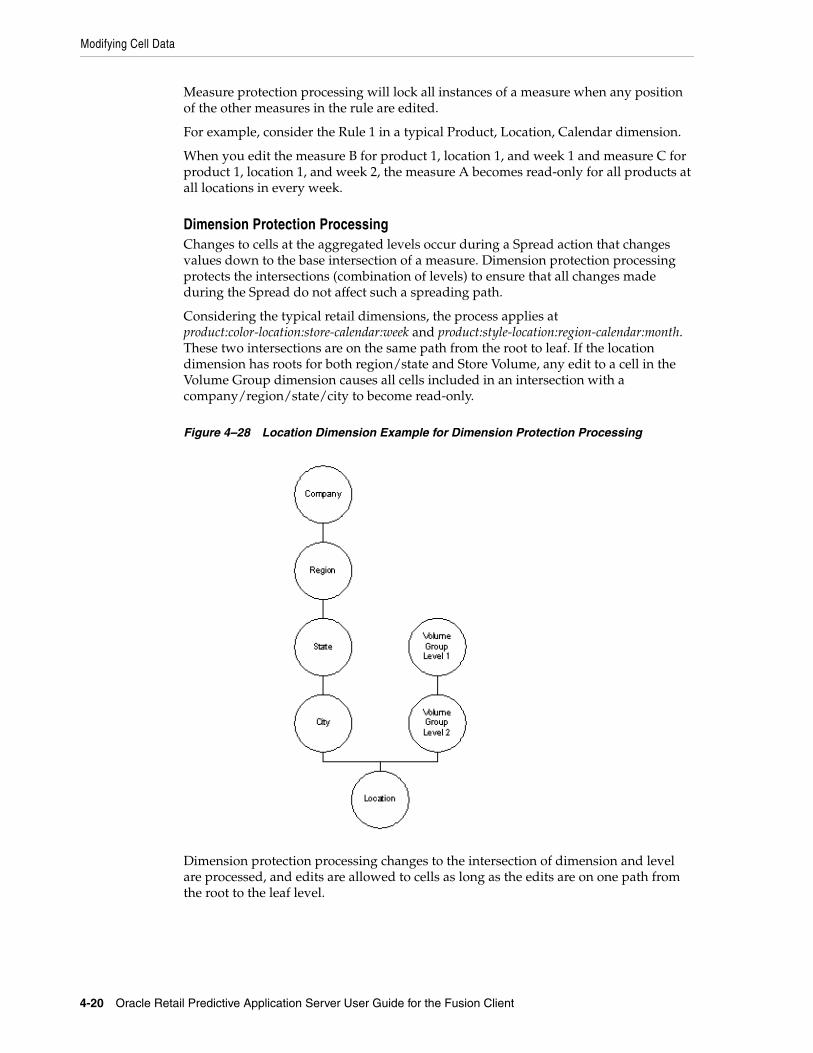
Modifying Cell Data
4-20 Oracle Retail Predictive Application Server User Guide for the Fusion Client
Measure protection processing will lock all instances of a measure when any position of the other measures in the rule are edited.
For example, consider the Rule 1 in a typical Product, Location, Calendar dimension.
When you edit the measure B for product 1, location 1, and week 1 and measure C for product 1, location 1, and week 2, the measure A becomes read-only for all products at all locations in every week.
Dimension Protection ProcessingChanges to cells at the aggregated levels occur during a Spread action that changes values down to the base intersection of a measure. Dimension protection processing protects the intersections (combination of levels) to ensure that all changes made during the Spread do not affect such a spreading path.
Considering the typical retail dimensions, the process applies at product:color-location:store-calendar:week and product:style-location:region-calendar:month. These two intersections are on the same path from the root to leaf. If the location dimension has roots for both region/state and Store Volume, any edit to a cell in the Volume Group dimension causes all cells included in an intersection with a company/region/state/city to become read-only.
Figure 4–28 Location Dimension Example for Dimension Protection Processing
Dimension protection processing changes to the intersection of dimension and level are processed, and edits are allowed to cells as long as the edits are on one path from the root to the leaf level.
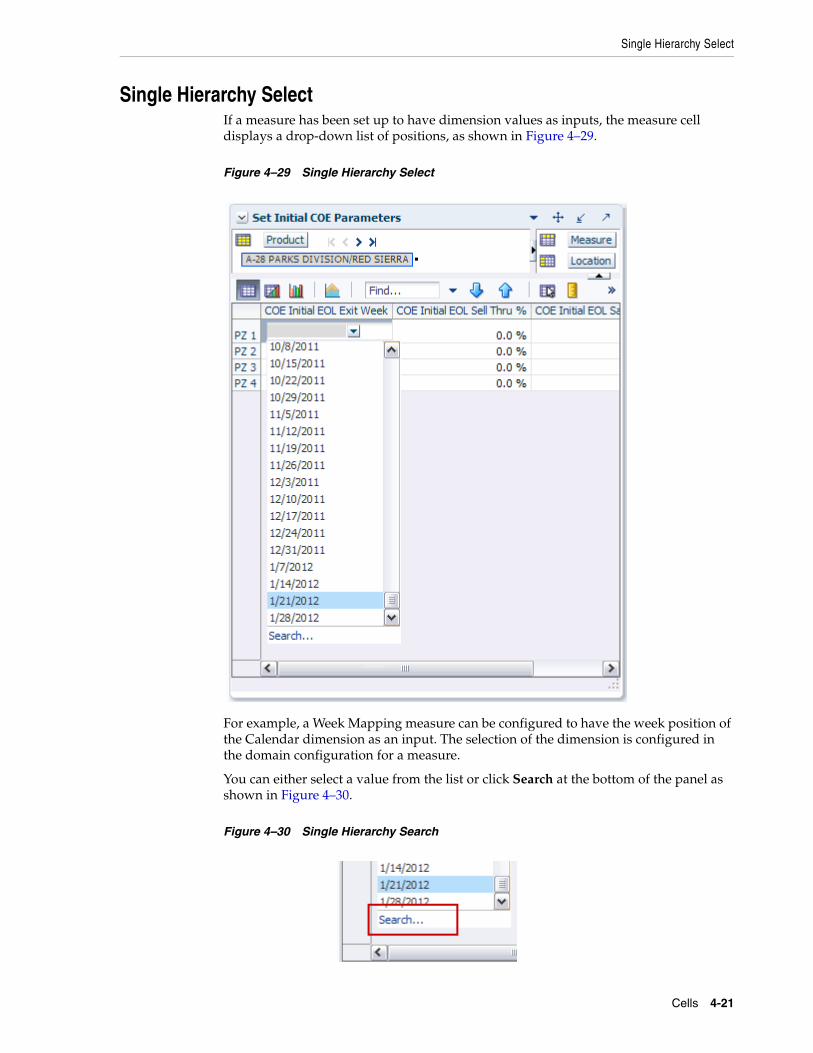
Single Hierarchy Select
Cells 4-21
Single Hierarchy SelectIf a measure has been set up to have dimension values as inputs, the measure cell displays a drop-down list of positions, as shown in Figure 4–29.
Figure 4–29 Single Hierarchy Select
For example, a Week Mapping measure can be configured to have the week position of the Calendar dimension as an input. The selection of the dimension is configured in the domain configuration for a measure.
You can either select a value from the list or click Search at the bottom of the panel as shown in Figure 4–30.
Figure 4–30 Single Hierarchy Search

Cut, Copy, and Paste
4-22 Oracle Retail Predictive Application Server User Guide for the Fusion Client
The Search link launches the Search dialog box where you can search for specific values. The search dialog box automatically opens on the Advanced search option (Figure 4–31).
Figure 4–31 Single Hierarchy Search Dialog Box, Advanced
To use the basic search, click Basic. The Search dialog box refreshes with the basic search tools (Figure 4–32).
Figure 4–32 Single Hierarchy Search Dialog Box, Basic
Cut, Copy, and PasteThe cut, copy, and paste features provide flexibility to edit the workbook according to the business needs and transfer data from external applications (such as Microsoft Excel) to the system as well as from RPAS to those other applications.
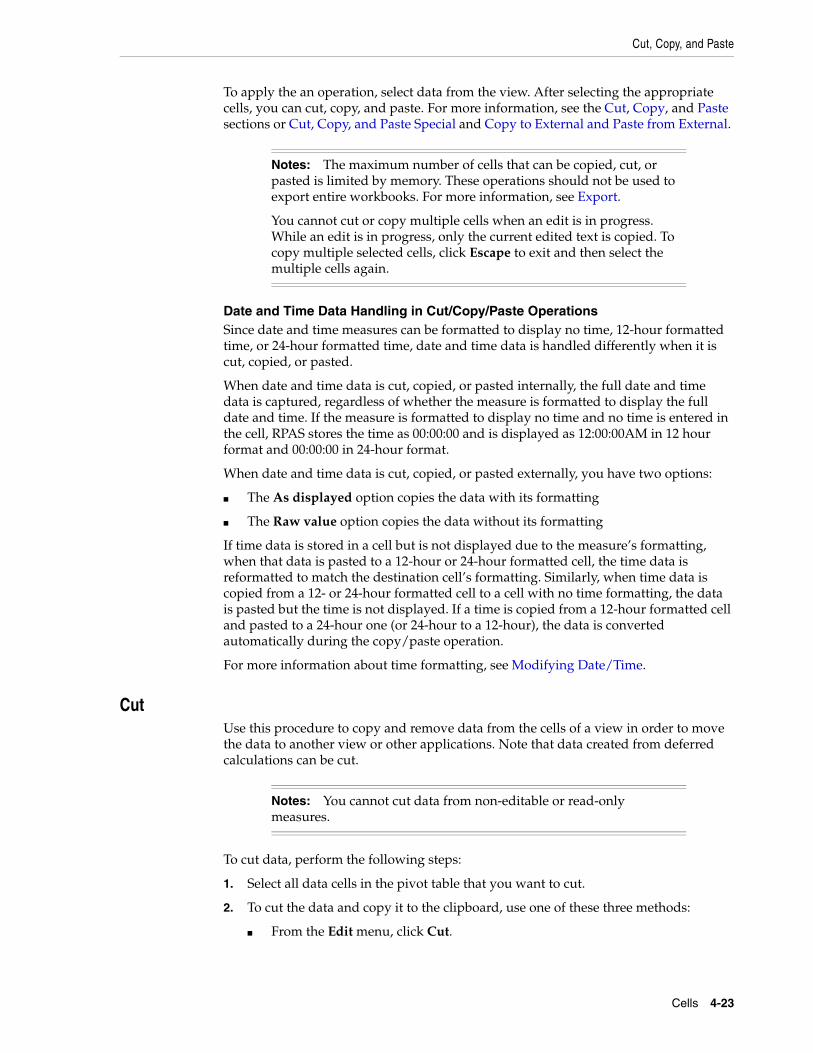
Cut, Copy, and Paste
Cells 4-23
To apply the an operation, select data from the view. After selecting the appropriate cells, you can cut, copy, and paste. For more information, see the Cut, Copy, and Paste sections or Cut, Copy, and Paste Special and Copy to External and Paste from External.
Date and Time Data Handling in Cut/Copy/Paste OperationsSince date and time measures can be formatted to display no time, 12-hour formatted time, or 24-hour formatted time, date and time data is handled differently when it is cut, copied, or pasted.
When date and time data is cut, copied, or pasted internally, the full date and time data is captured, regardless of whether the measure is formatted to display the full date and time. If the measure is formatted to display no time and no time is entered in the cell, RPAS stores the time as 00:00:00 and is displayed as 12:00:00AM in 12 hour format and 00:00:00 in 24-hour format.
When date and time data is cut, copied, or pasted externally, you have two options:
■ The As displayed option copies the data with its formatting
■ The Raw value option copies the data without its formatting
If time data is stored in a cell but is not displayed due to the measure’s formatting, when that data is pasted to a 12-hour or 24-hour formatted cell, the time data is reformatted to match the destination cell’s formatting. Similarly, when time data is copied from a 12- or 24-hour formatted cell to a cell with no time formatting, the data is pasted but the time is not displayed. If a time is copied from a 12-hour formatted cell and pasted to a 24-hour one (or 24-hour to a 12-hour), the data is converted automatically during the copy/paste operation.
For more information about time formatting, see Modifying Date/Time.
CutUse this procedure to copy and remove data from the cells of a view in order to move the data to another view or other applications. Note that data created from deferred calculations can be cut.
To cut data, perform the following steps:
1. Select all data cells in the pivot table that you want to cut.
2. To cut the data and copy it to the clipboard, use one of these three methods:
■ From the Edit menu, click Cut.
Notes: The maximum number of cells that can be copied, cut, or pasted is limited by memory. These operations should not be used to export entire workbooks. For more information, see Export.
You cannot cut or copy multiple cells when an edit is in progress. While an edit is in progress, only the current edited text is copied. To copy multiple selected cells, click Escape to exit and then select the multiple cells again.
Notes: You cannot cut data from non-editable or read-only measures.
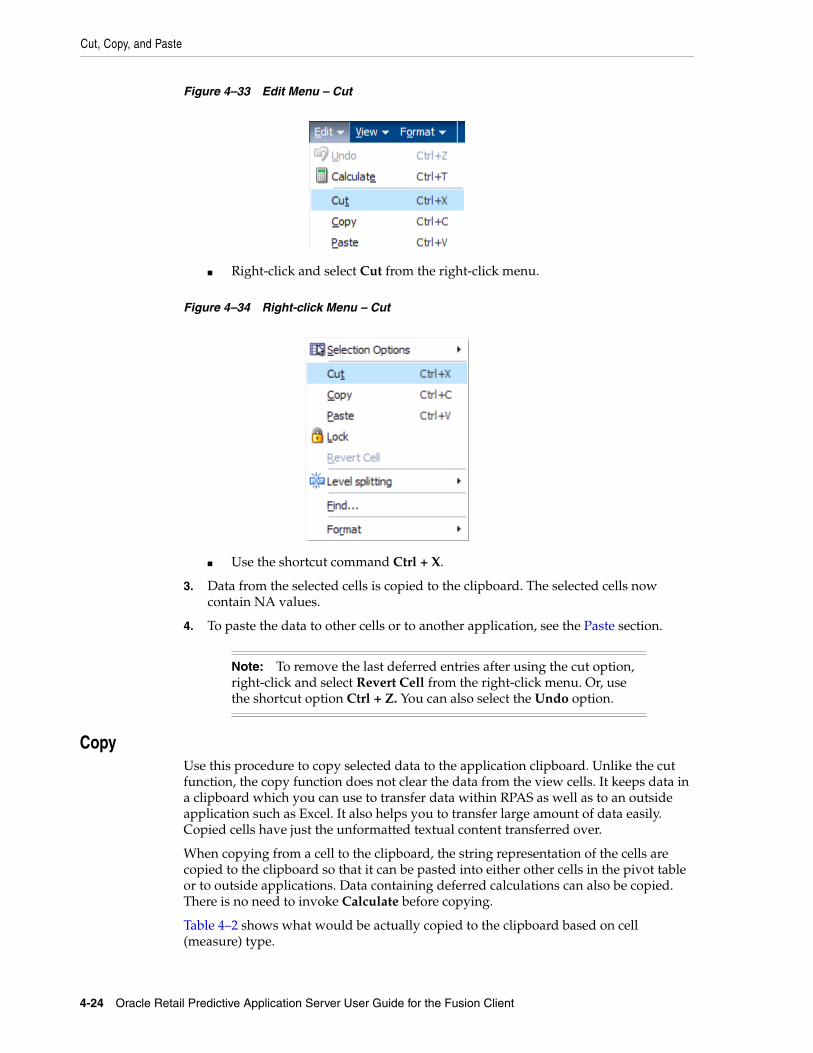
Cut, Copy, and Paste
4-24 Oracle Retail Predictive Application Server User Guide for the Fusion Client
Figure 4–33 Edit Menu – Cut
■ Right-click and select Cut from the right-click menu.
Figure 4–34 Right-click Menu – Cut
■ Use the shortcut command Ctrl + X.
3. Data from the selected cells is copied to the clipboard. The selected cells now contain NA values.
4. To paste the data to other cells or to another application, see the Paste section.
CopyUse this procedure to copy selected data to the application clipboard. Unlike the cut function, the copy function does not clear the data from the view cells. It keeps data in a clipboard which you can use to transfer data within RPAS as well as to an outside application such as Excel. It also helps you to transfer large amount of data easily. Copied cells have just the unformatted textual content transferred over.
When copying from a cell to the clipboard, the string representation of the cells are copied to the clipboard so that it can be pasted into either other cells in the pivot table or to outside applications. Data containing deferred calculations can also be copied. There is no need to invoke Calculate before copying.
Table 4–2 shows what would be actually copied to the clipboard based on cell (measure) type.
Note: To remove the last deferred entries after using the cut option, right-click and select Revert Cell from the right-click menu. Or, use the shortcut option Ctrl + Z. You can also select the Undo option.
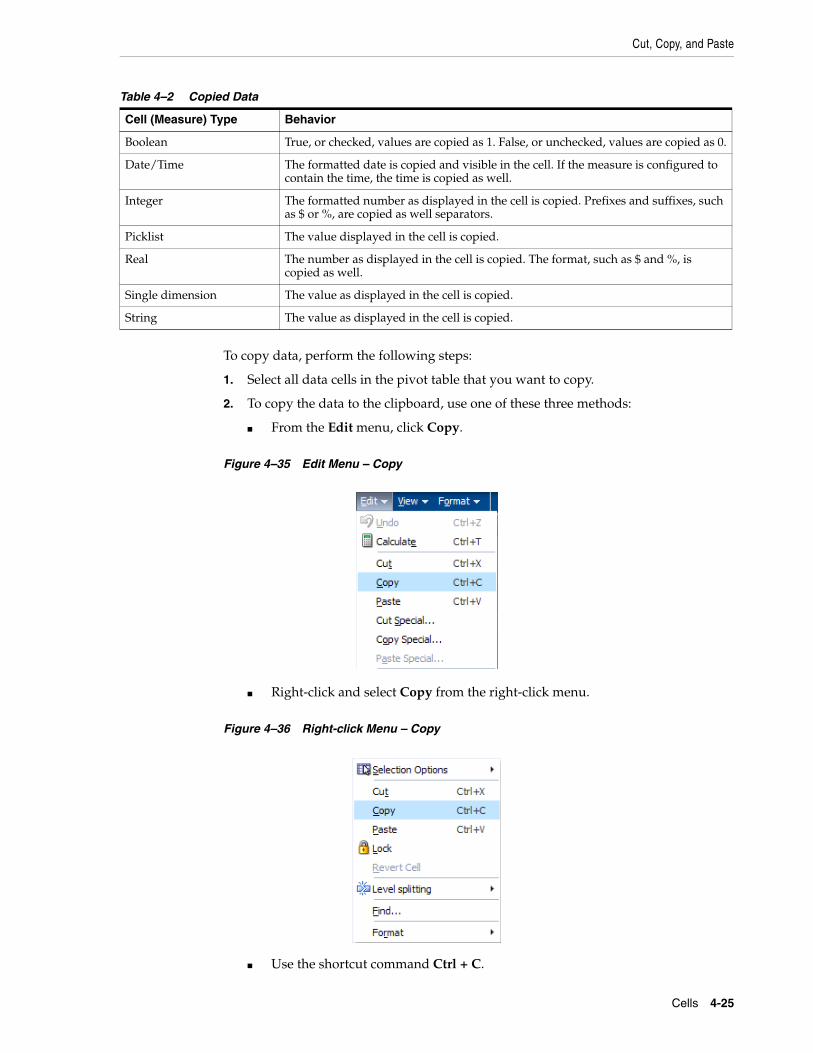
Cut, Copy, and Paste
Cells 4-25
To copy data, perform the following steps:
1. Select all data cells in the pivot table that you want to copy.
2. To copy the data to the clipboard, use one of these three methods:
■ From the Edit menu, click Copy.
Figure 4–35 Edit Menu – Copy
■ Right-click and select Copy from the right-click menu.
Figure 4–36 Right-click Menu – Copy
■ Use the shortcut command Ctrl + C.
Table 4–2 Copied Data
Cell (Measure) Type Behavior
Boolean True, or checked, values are copied as 1. False, or unchecked, values are copied as 0.
Date/Time The formatted date is copied and visible in the cell. If the measure is configured to contain the time, the time is copied as well.
Integer The formatted number as displayed in the cell is copied. Prefixes and suffixes, such as $ or %, are copied as well separators.
Picklist The value displayed in the cell is copied.
Real The number as displayed in the cell is copied. The format, such as $ and %, is copied as well.
Single dimension The value as displayed in the cell is copied.
String The value as displayed in the cell is copied.
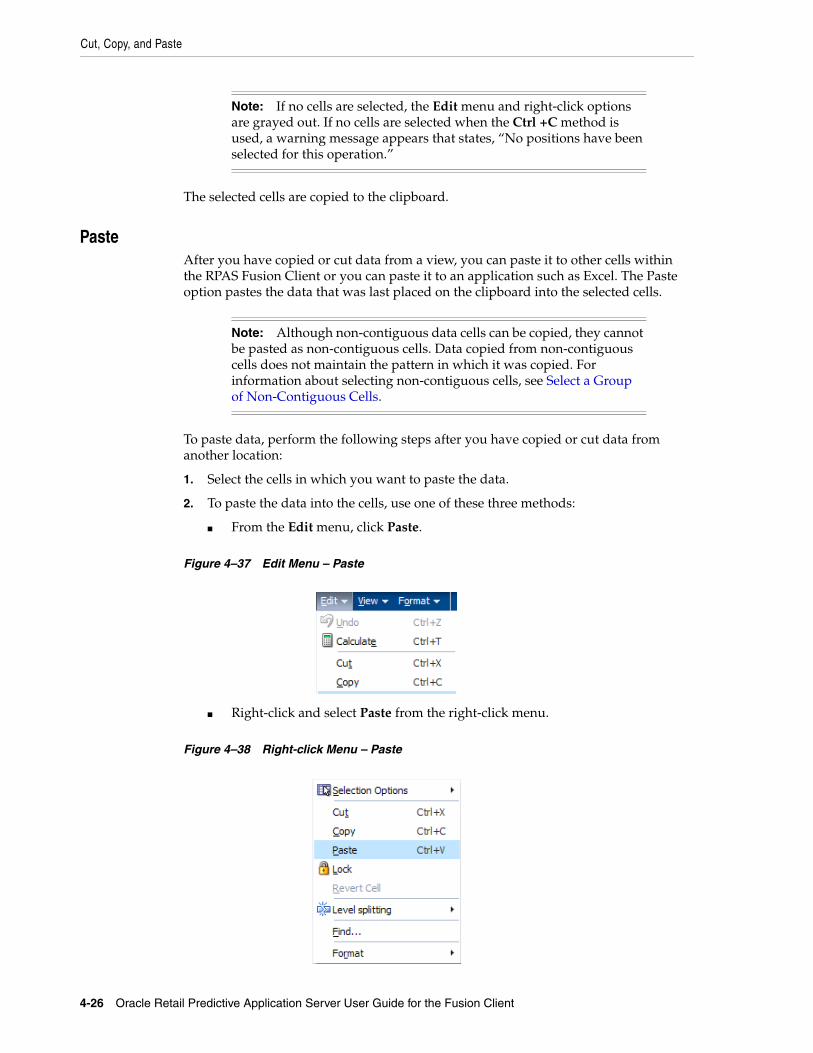
Cut, Copy, and Paste
4-26 Oracle Retail Predictive Application Server User Guide for the Fusion Client
The selected cells are copied to the clipboard.
PasteAfter you have copied or cut data from a view, you can paste it to other cells within the RPAS Fusion Client or you can paste it to an application such as Excel. The Paste option pastes the data that was last placed on the clipboard into the selected cells.
To paste data, perform the following steps after you have copied or cut data from another location:
1. Select the cells in which you want to paste the data.
2. To paste the data into the cells, use one of these three methods:
■ From the Edit menu, click Paste.
Figure 4–37 Edit Menu – Paste
■ Right-click and select Paste from the right-click menu.
Figure 4–38 Right-click Menu – Paste
Note: If no cells are selected, the Edit menu and right-click options are grayed out. If no cells are selected when the Ctrl +C method is used, a warning message appears that states, “No positions have been selected for this operation.”
Note: Although non-contiguous data cells can be copied, they cannot be pasted as non-contiguous cells. Data copied from non-contiguous cells does not maintain the pattern in which it was copied. For information about selecting non-contiguous cells, see Select a Group of Non-Contiguous Cells.
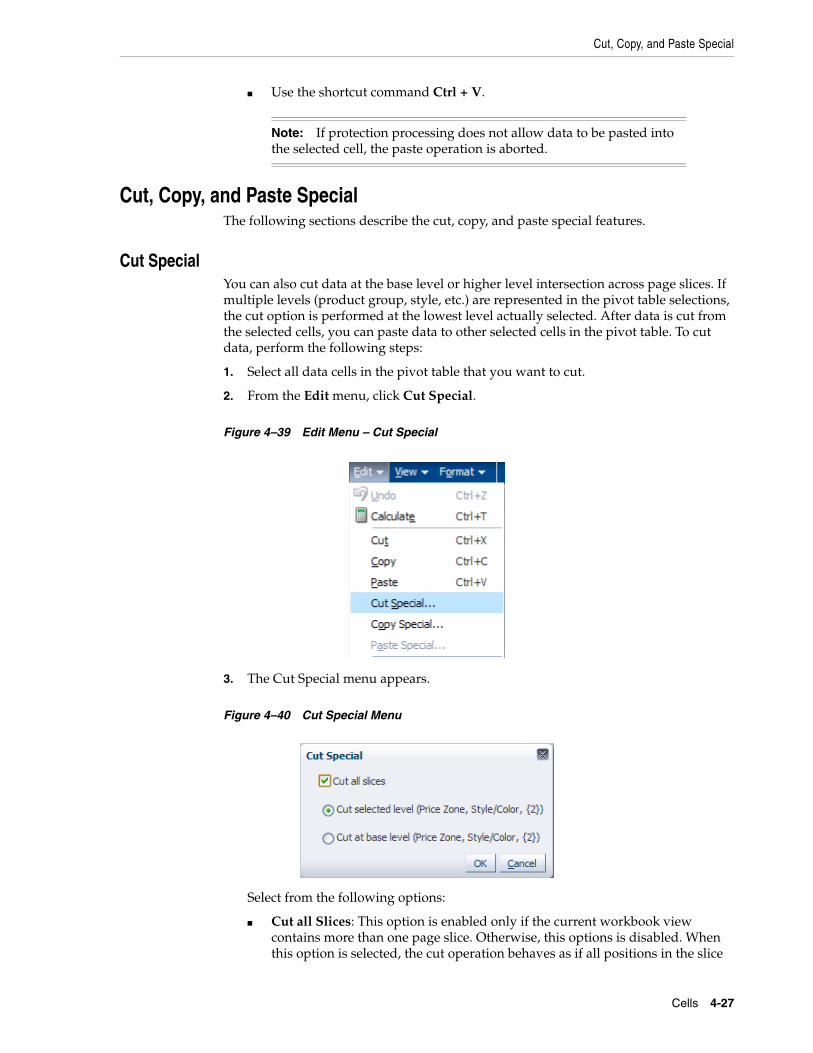
Cut, Copy, and Paste Special
Cells 4-27
■ Use the shortcut command Ctrl + V.
Cut, Copy, and Paste SpecialThe following sections describe the cut, copy, and paste special features.
Cut SpecialYou can also cut data at the base level or higher level intersection across page slices. If multiple levels (product group, style, etc.) are represented in the pivot table selections, the cut option is performed at the lowest level actually selected. After data is cut from the selected cells, you can paste data to other selected cells in the pivot table. To cut data, perform the following steps:
1. Select all data cells in the pivot table that you want to cut.
2. From the Edit menu, click Cut Special.
Figure 4–39 Edit Menu – Cut Special
3. The Cut Special menu appears.
Figure 4–40 Cut Special Menu
Select from the following options:
■ Cut all Slices: This option is enabled only if the current workbook view contains more than one page slice. Otherwise, this options is disabled. When this option is selected, the cut operation behaves as if all positions in the slice
Note: If protection processing does not allow data to be pasted into the selected cell, the paste operation is aborted.

Cut, Copy, and Paste Special
4-28 Oracle Retail Predictive Application Server User Guide for the Fusion Client
dimension’s levels were selected prior to the cut. If the box is left unchecked, only the data from the current slice position is cleared and copied.
■ Cut selected level: This option cuts only the selected level of data.
■ Cut at base level: This option allows you to cut the data at the measure’s lowest intersection.Although the cut function is performed at the base level, it seems that the aggregated level data has been cut since the data is rolled up.
Copy SpecialYou can also copy data at the base level or higher level intersection across page slices. After data is copied from the selected cells, you can paste data to other selected cells in the pivot table. This feature allows you to view data at an aggregate level while copying data at a dimensional level not currently displayed or while selecting data from the current slice while copying data from all slices. You can copy data at the base level only or copy from all slices without selecting the base level data or without selecting data from entire slices.
To copy data, perform the following steps:
1. Select all data cells in the pivot table that you want to copy.
2. From the Edit menu, click Copy Special.
Figure 4–41 Edit Menu – Copy Special
Note: Data copied using the Copy Special option is not copied to the clipboard. It is copied to the RPAS server.

Cut, Copy, and Paste Special
Cells 4-29
3. The Copy Special menu appears.
Figure 4–42 Copy Special Menu
Select from the following options:
■ Copy all slices: This option is enabled only if the current workbook view contains more than one page slice. Otherwise, this options is disabled. When this option is selected, the copy operation behaves as if all positions in the slice dimension’s levels were selected prior to the copy. If the box is left unchecked, only the data from the current slice position is copied.
■ Copy selected level: This option allows you to copy the level of data shown in the pivot table. The base level data from which the displayed data is created is not copied.
■ Copy at base level: This option allows you to copy the base level data, which is the measure’s lowest intersection, which may not be displayed in the pivot table. If this option is not selected, the data is copied for the selected dimension level only.
4. The selected data is copied to the RPAS server. It is not copied to the clipboard. You can paste the copied data to other selected cells in the workbook multiple times. The copied data is available to the RPAS server until the workbook is closed.
Paste SpecialPaste Special allows you to view data at an aggregate level while pasting it at the base level which is not displayed in the current slices. It provides a dialog where user can specify options for specialized paste functions.
If the levels of multiple dimensions are represented in the pivot table selections, the default paste option is performed at the lowest level.
To use special paste, perform the following steps:
1. Before using paste, you have placed data in clipboard using Cut Special or Copy Special from the Edit menu.
2. Select Paste Special from the Edit menu.
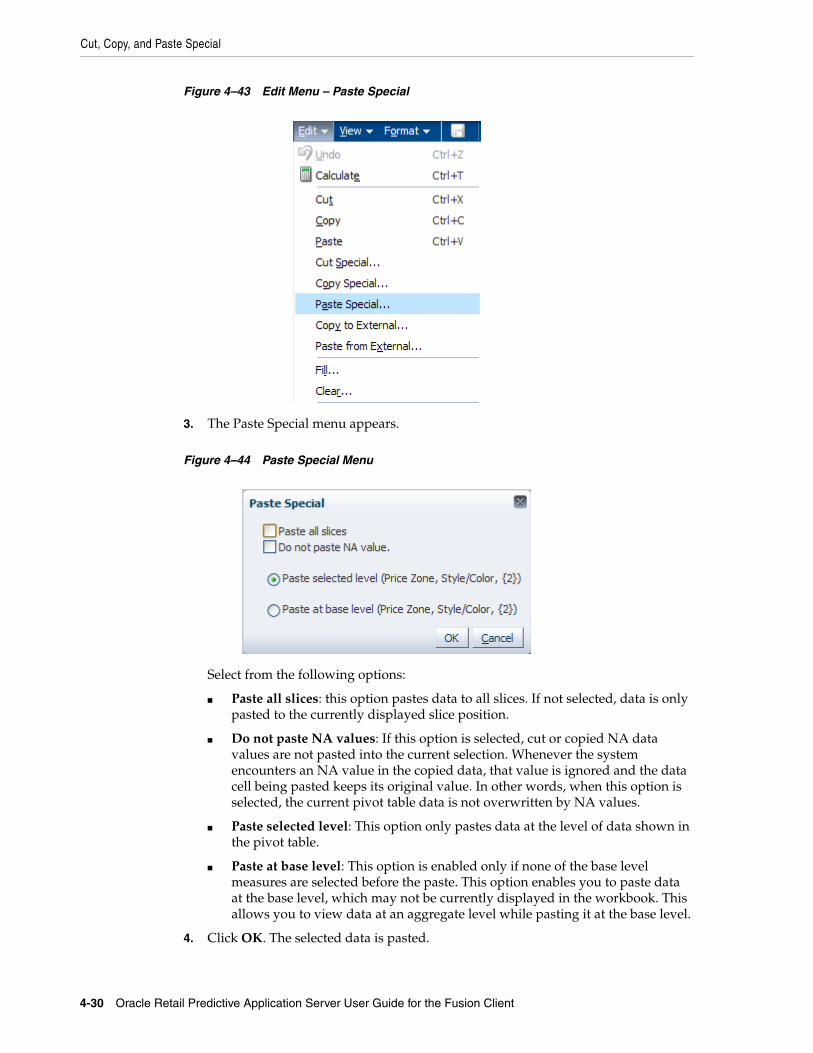
Cut, Copy, and Paste Special
4-30 Oracle Retail Predictive Application Server User Guide for the Fusion Client
Figure 4–43 Edit Menu – Paste Special
3. The Paste Special menu appears.
Figure 4–44 Paste Special Menu
Select from the following options:
■ Paste all slices: this option pastes data to all slices. If not selected, data is only pasted to the currently displayed slice position.
■ Do not paste NA values: If this option is selected, cut or copied NA data values are not pasted into the current selection. Whenever the system encounters an NA value in the copied data, that value is ignored and the data cell being pasted keeps its original value. In other words, when this option is selected, the current pivot table data is not overwritten by NA values.
■ Paste selected level: This option only pastes data at the level of data shown in the pivot table.
■ Paste at base level: This option is enabled only if none of the base level measures are selected before the paste. This option enables you to paste data at the base level, which may not be currently displayed in the workbook. This allows you to view data at an aggregate level while pasting it at the base level.
4. Click OK. The selected data is pasted.
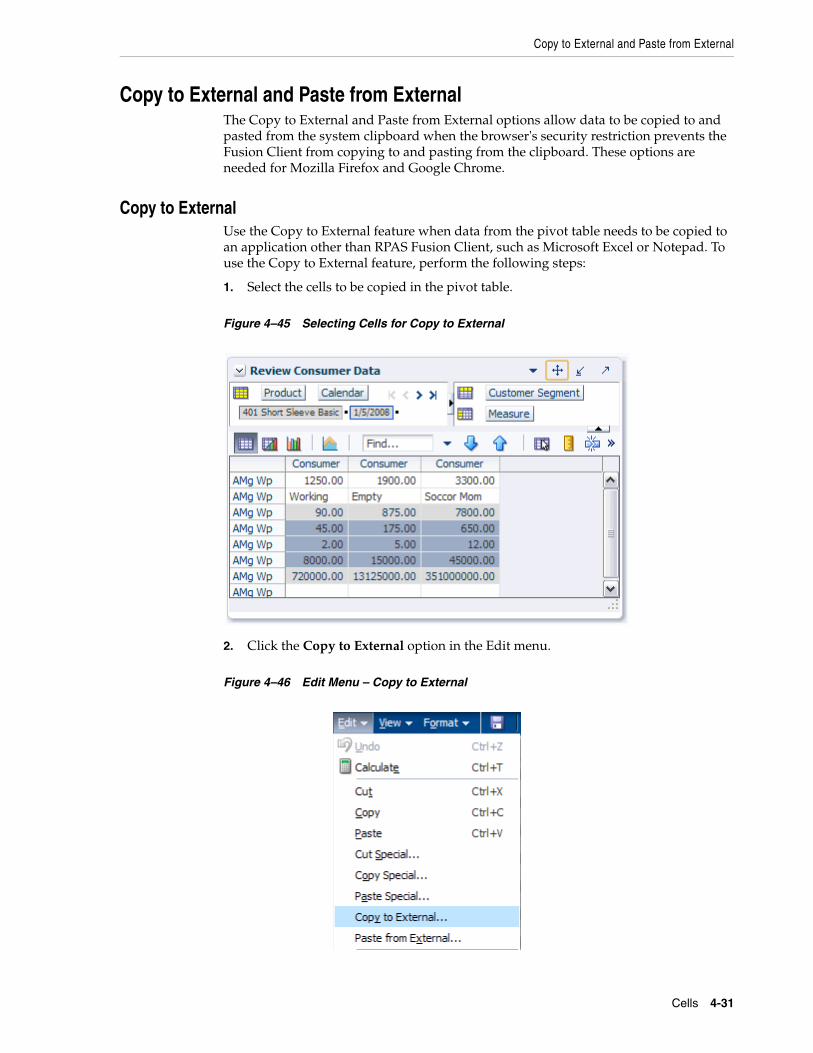
Copy to External and Paste from External
Cells 4-31
Copy to External and Paste from ExternalThe Copy to External and Paste from External options allow data to be copied to and pasted from the system clipboard when the browser's security restriction prevents the Fusion Client from copying to and pasting from the clipboard. These options are needed for Mozilla Firefox and Google Chrome.
Copy to ExternalUse the Copy to External feature when data from the pivot table needs to be copied to an application other than RPAS Fusion Client, such as Microsoft Excel or Notepad. To use the Copy to External feature, perform the following steps:
1. Select the cells to be copied in the pivot table.
Figure 4–45 Selecting Cells for Copy to External
2. Click the Copy to External option in the Edit menu.
Figure 4–46 Edit Menu – Copy to External
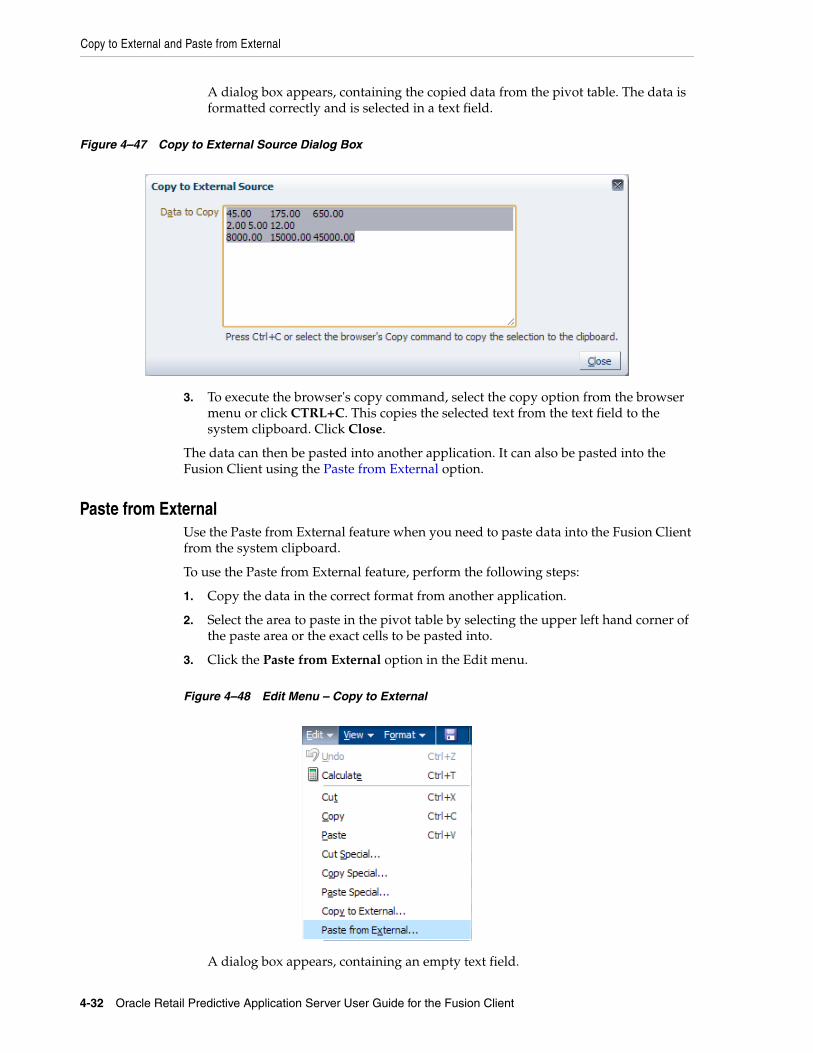
Copy to External and Paste from External
4-32 Oracle Retail Predictive Application Server User Guide for the Fusion Client
A dialog box appears, containing the copied data from the pivot table. The data is formatted correctly and is selected in a text field.
Figure 4–47 Copy to External Source Dialog Box
3. To execute the browser's copy command, select the copy option from the browser menu or click CTRL+C. This copies the selected text from the text field to the system clipboard. Click Close.
The data can then be pasted into another application. It can also be pasted into the Fusion Client using the Paste from External option.
Paste from ExternalUse the Paste from External feature when you need to paste data into the Fusion Client from the system clipboard.
To use the Paste from External feature, perform the following steps:
1. Copy the data in the correct format from another application.
2. Select the area to paste in the pivot table by selecting the upper left hand corner of the paste area or the exact cells to be pasted into.
3. Click the Paste from External option in the Edit menu.
Figure 4–48 Edit Menu – Copy to External
A dialog box appears, containing an empty text field.
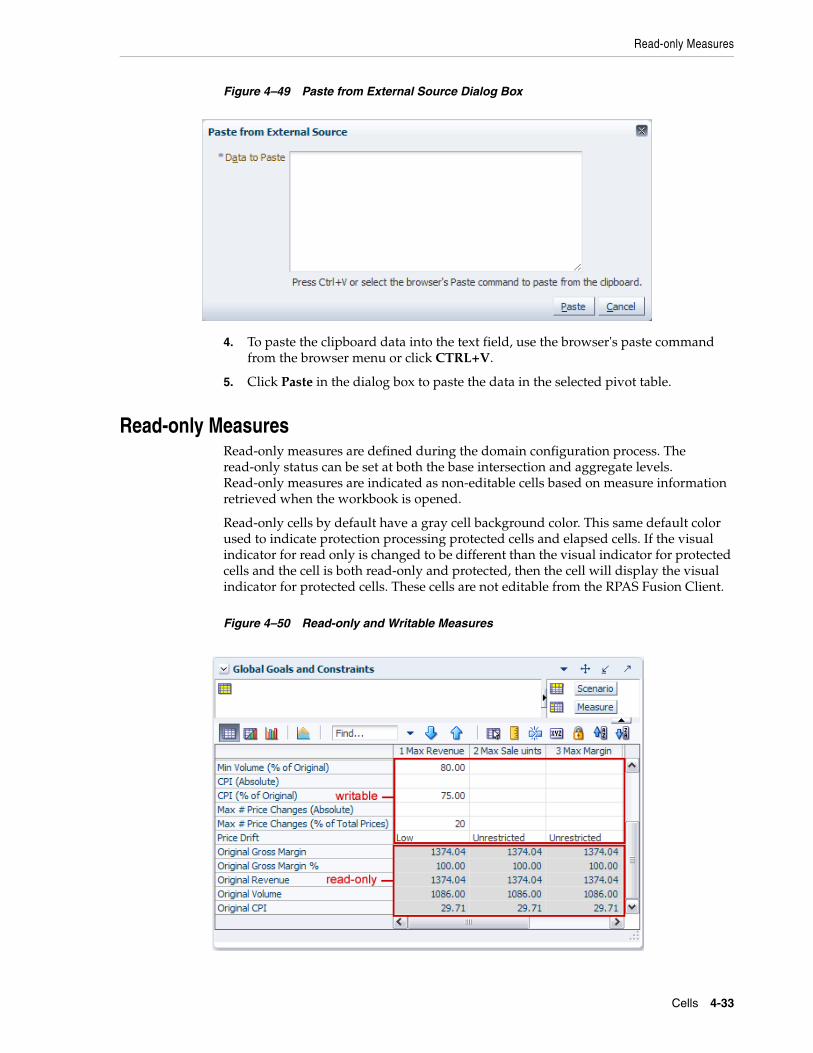
Read-only Measures
Cells 4-33
Figure 4–49 Paste from External Source Dialog Box
4. To paste the clipboard data into the text field, use the browser's paste command from the browser menu or click CTRL+V.
5. Click Paste in the dialog box to paste the data in the selected pivot table.
Read-only MeasuresRead-only measures are defined during the domain configuration process. The read-only status can be set at both the base intersection and aggregate levels. Read-only measures are indicated as non-editable cells based on measure information retrieved when the workbook is opened.
Read-only cells by default have a gray cell background color. This same default color used to indicate protection processing protected cells and elapsed cells. If the visual indicator for read only is changed to be different than the visual indicator for protected cells and the cell is both read-only and protected, then the cell will display the visual indicator for protected cells. These cells are not editable from the RPAS Fusion Client.
Figure 4–50 Read-only and Writable Measures
Locking and Unlocking
4-34 Oracle Retail Predictive Application Server User Guide for the Fusion Client
Locking and UnlockingIn addition to read-only workbooks and measures, the RPAS Fusion Client also provides a locking function in order to protect information. The locking function can be performed on cells, measures, and positions.
Cell locking is available on any editable cell and invokes protection processing.
Measure locking is available on any measure and invokes protection processing.
Position locking is available on non-calendar dimensions and does not invoke protection processing.
CellsThe cell locking feature allows you to lock one or more editable cells in the pivot table. When a table cell is locked, calculations performed as a result of data manipulations do not affect the locked data values. This functionality allows you examine various what-if scenarios to determine the best course of action for planning or forecasting.
The RPAS Fusion Client iterates through the selected cells by measure, then by column, then by row. Locked cell information is immediately transferred to the RPAS Server. The locked cell information is saved with the workbook and locked cells continue to be locked upon reopening the workbook.
The locked status of a cell is indicated by the presence of a picture of a lock in the cell's left portion. After an eligible cell is locked, the system determines whether the remaining table cells are eligible or ineligible to be locked. For instance, if all the children cells of any parent cell are locked, the parent cell cannot be locked. Instead, any edits to the parent cell are spread to the children cells based on the ratio of the values locked into the cells. If a cell becomes ineligible to be locked, the right-click menu associated with that cell does not contain the Lock option. Furthermore, any read/write cells that become ineligible for locking are made read-only.
You may choose to lock a data cell at any time to protect that cell from forced recalculations due to data manipulations elsewhere in the workbook. For example, you may want to see the effect of a change to sales value on inventory levels without forcing a change to receipts. Another example would be to change sales value at an aggregate level (such as month) and spread the result to only three of the four weeks that comprise that month. In this case, you could effectively hold the second week's sales value constant while spreading the aggregate-level increase among the remaining three weeks.
Protection processing executes against locked cells as if they were edited to their current value. Cell locks do not appear in the Undo list, which appears next to the Undo icon in the toolbar when more than one edit has been made. In addition, cell locks are not affected by the Undo option from the menus. Only cell value edit changes appear in the Undo list. Cell lock or unlock actions do not force a calculation cycle to execute.
MeasuresThe measure locking feature enables you to simultaneously lock all of the cells that are associated with a given measure in a view. A measure can be locked or unlocked when
Note: Locks are not recognized when performing operations such as custom menus and refresh. Locks are only observed when performing a workbook calculation.
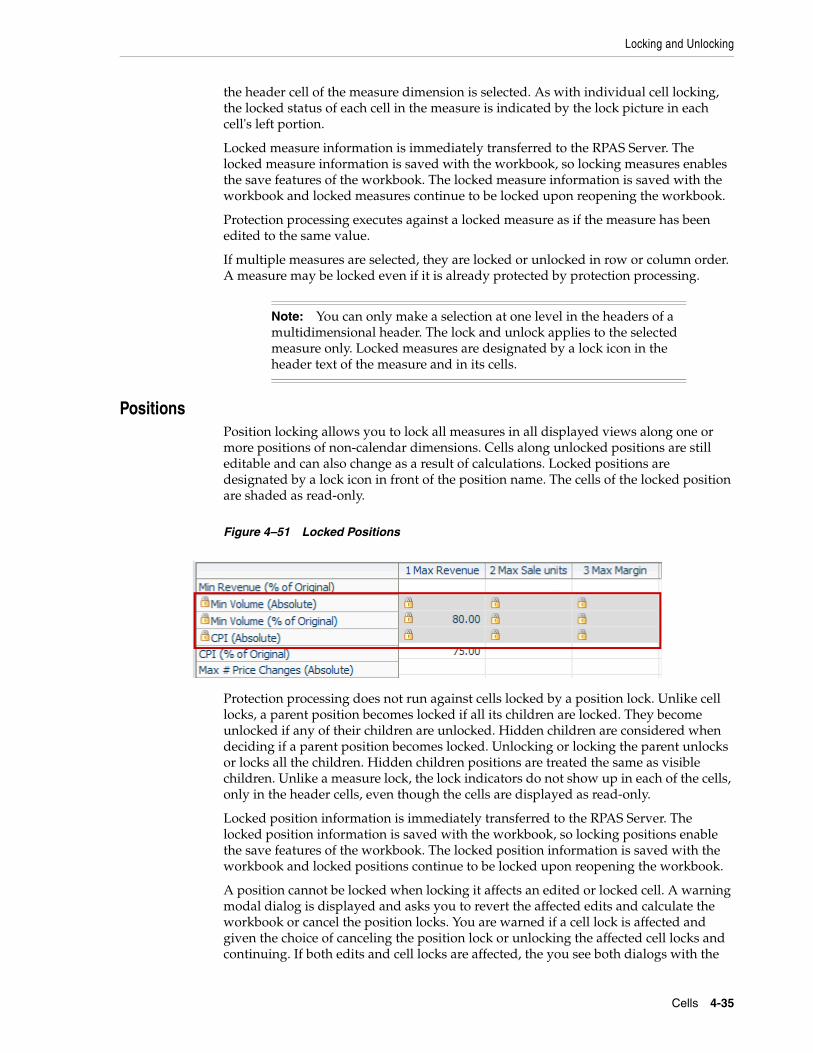
Locking and Unlocking
Cells 4-35
the header cell of the measure dimension is selected. As with individual cell locking, the locked status of each cell in the measure is indicated by the lock picture in each cell's left portion.
Locked measure information is immediately transferred to the RPAS Server. The locked measure information is saved with the workbook, so locking measures enables the save features of the workbook. The locked measure information is saved with the workbook and locked measures continue to be locked upon reopening the workbook.
Protection processing executes against a locked measure as if the measure has been edited to the same value.
If multiple measures are selected, they are locked or unlocked in row or column order. A measure may be locked even if it is already protected by protection processing.
PositionsPosition locking allows you to lock all measures in all displayed views along one or more positions of non-calendar dimensions. Cells along unlocked positions are still editable and can also change as a result of calculations. Locked positions are designated by a lock icon in front of the position name. The cells of the locked position are shaded as read-only.
Figure 4–51 Locked Positions
Protection processing does not run against cells locked by a position lock. Unlike cell locks, a parent position becomes locked if all its children are locked. They become unlocked if any of their children are unlocked. Hidden children are considered when deciding if a parent position becomes locked. Unlocking or locking the parent unlocks or locks all the children. Hidden children positions are treated the same as visible children. Unlike a measure lock, the lock indicators do not show up in each of the cells, only in the header cells, even though the cells are displayed as read-only.
Locked position information is immediately transferred to the RPAS Server. The locked position information is saved with the workbook, so locking positions enable the save features of the workbook. The locked position information is saved with the workbook and locked positions continue to be locked upon reopening the workbook.
A position cannot be locked when locking it affects an edited or locked cell. A warning modal dialog is displayed and asks you to revert the affected edits and calculate the workbook or cancel the position locks. You are warned if a cell lock is affected and given the choice of canceling the position lock or unlocking the affected cell locks and continuing. If both edits and cell locks are affected, the you see both dialogs with the
Note: You can only make a selection at one level in the headers of a multidimensional header. The lock and unlock applies to the selected measure only. Locked measures are designated by a lock icon in the header text of the measure and in its cells.

Locking and Unlocking
4-36 Oracle Retail Predictive Application Server User Guide for the Fusion Client
edit dialog appearing first. If you cancel the position lock from either dialog, then no action is taken against either locked or edited cells.
Locking and Unlocking MethodsYou can initiate locks by selecting a cell, measure, or position within the pivot table and then selecting one of three options to initiate a lock or unlock action. Locking and unlocking can be done through the following:
■ Locking through the Right-click Context Menu
■ Locking through the Edit Menu
■ Locking with the Lock Icon
Locking through the Right-click Context MenuOne way that you can lock or unlock a cell, measure, or position is through the right-click context menu. Depending upon what is selected, the context menu determines whether the Lock or Unlock option is shown.
Figure 4–52 Locking: Right-click Context Menu
To lock using the context menu, perform the following:
1. Select a cell, measure or position. After it is selected, it is shaded.
2. Right-click the mouse. The context menu appears. If the cell, measure, or position is not already locked, the Lock option appears in the menu.
3. Select the Lock option.
4. The selected item or items show a lock symbol.
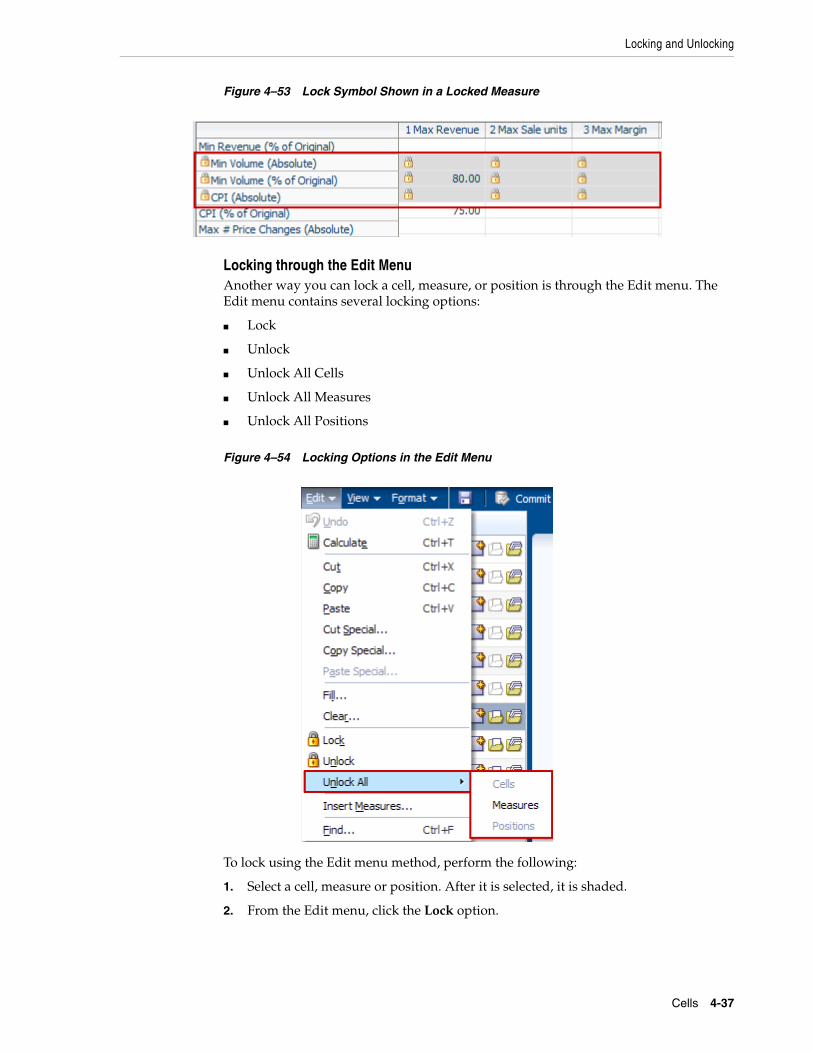
Locking and Unlocking
Cells 4-37
Figure 4–53 Lock Symbol Shown in a Locked Measure
Locking through the Edit MenuAnother way you can lock a cell, measure, or position is through the Edit menu. The Edit menu contains several locking options:
■ Lock
■ Unlock
■ Unlock All Cells
■ Unlock All Measures
■ Unlock All Positions
Figure 4–54 Locking Options in the Edit Menu
To lock using the Edit menu method, perform the following:
1. Select a cell, measure or position. After it is selected, it is shaded.
2. From the Edit menu, click the Lock option.
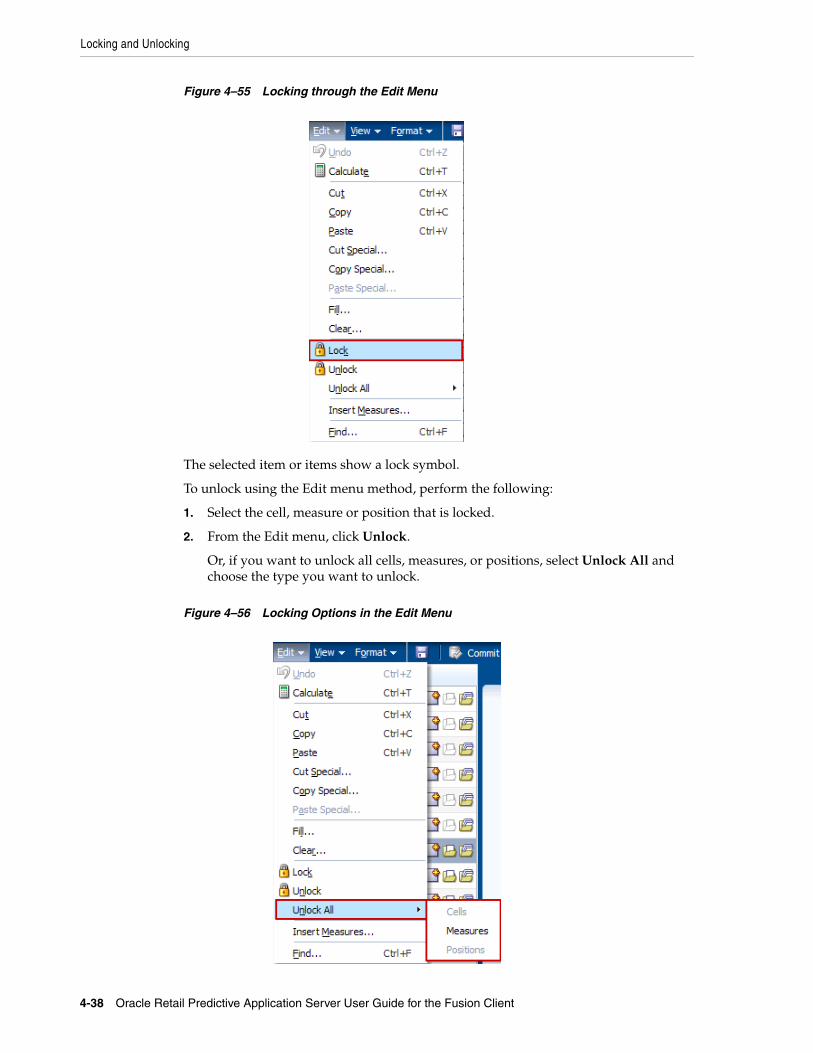
Locking and Unlocking
4-38 Oracle Retail Predictive Application Server User Guide for the Fusion Client
Figure 4–55 Locking through the Edit Menu
The selected item or items show a lock symbol.
To unlock using the Edit menu method, perform the following:
1. Select the cell, measure or position that is locked.
2. From the Edit menu, click Unlock.
Or, if you want to unlock all cells, measures, or positions, select Unlock All and choose the type you want to unlock.
Figure 4–56 Locking Options in the Edit Menu
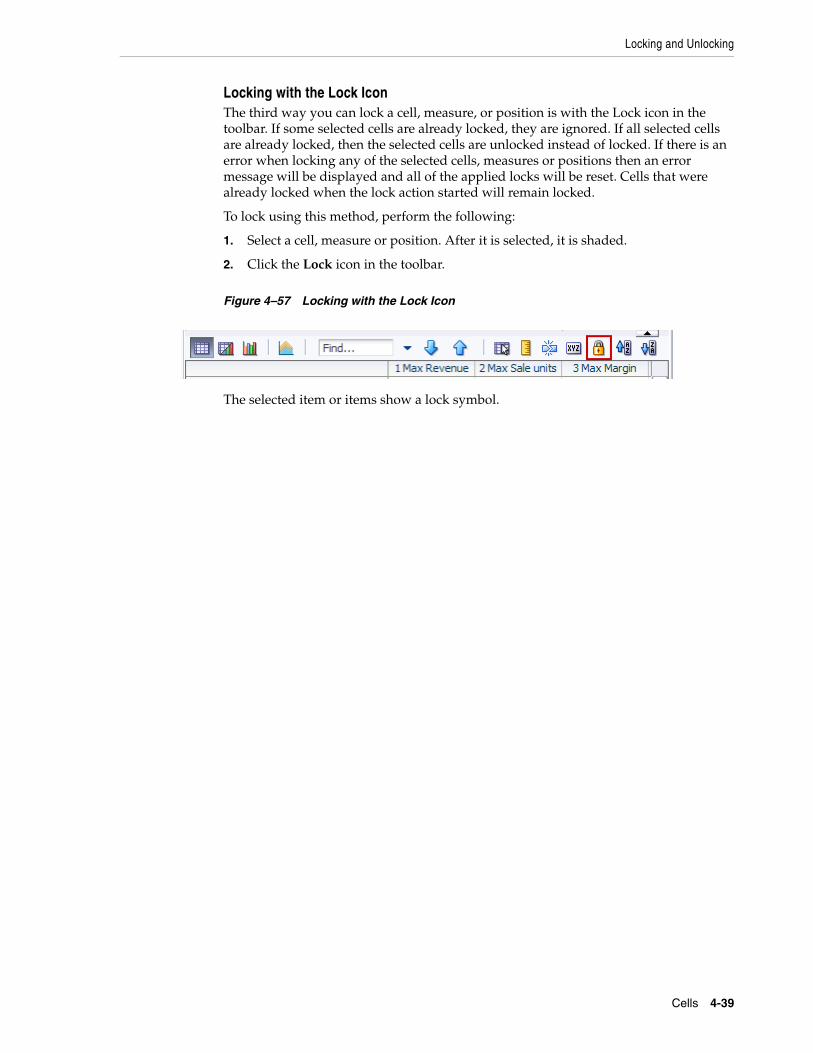
Locking and Unlocking
Cells 4-39
Locking with the Lock IconThe third way you can lock a cell, measure, or position is with the Lock icon in the toolbar. If some selected cells are already locked, they are ignored. If all selected cells are already locked, then the selected cells are unlocked instead of locked. If there is an error when locking any of the selected cells, measures or positions then an error message will be displayed and all of the applied locks will be reset. Cells that were already locked when the lock action started will remain locked.
To lock using this method, perform the following:
1. Select a cell, measure or position. After it is selected, it is shaded.
2. Click the Lock icon in the toolbar.
Figure 4–57 Locking with the Lock Icon
The selected item or items show a lock symbol.

Locking and Unlocking
4-40 Oracle Retail Predictive Application Server User Guide for the Fusion Client

Formatting 5-1
5Formatting
RPAS enables you to configure formatting settings of workbooks and save those settings for future use. You can configure some formatting within the Fusion Client as well as through the RPAS Configuration Tools. For more information configuring formatting with the Configuration Tools, see the Oracle Retail Predictive Application Server Configuration Tools User Guide.
Formatting settings are created in the Format dialog box. In the Format dialog box, you can set and clear formats that apply to measures or dimensions. You can make changes to single or multiple measures and dimensions and apply those changes across one, many, or all views in the workbook.
Default Cell FormatsSome formatting cannot be altered in the Fusion Client. Read-only and protected cells as well as edited cells have default formats that are configured in a property file for the entire solution. The default formats are shown in Table 5–1.
Read-only cells are those which cannot be edited for any reason. In Figure 5–1, the cells of the Ly Sales R measure are read-only since the data is from last year and cannot be changed because it occurred in the past.
Note: The following formatting choices do not apply in the Fusion Client: Text Font, Text Size, Border Style, and Border Color.
Table 5–1 Default Formats
Cell State Configurable Style Default Style
Read-only cells Cell Style Light grey background color.
Protected cells Cell Style Light grey background color.
Invalid cells Cell Style Dark grey background color.
Editable Cells Cell Style None (white background color).
Edited Cells Text Style Italic font, white background color.
Note: These default styles can be changed by editing the PivotTableStyles.properties file. For instructions on editing this file, see the “PivotTableStyles.properties File” section in the Oracle Retail Predictive Application Server Administration Guide for the Fusion Client.
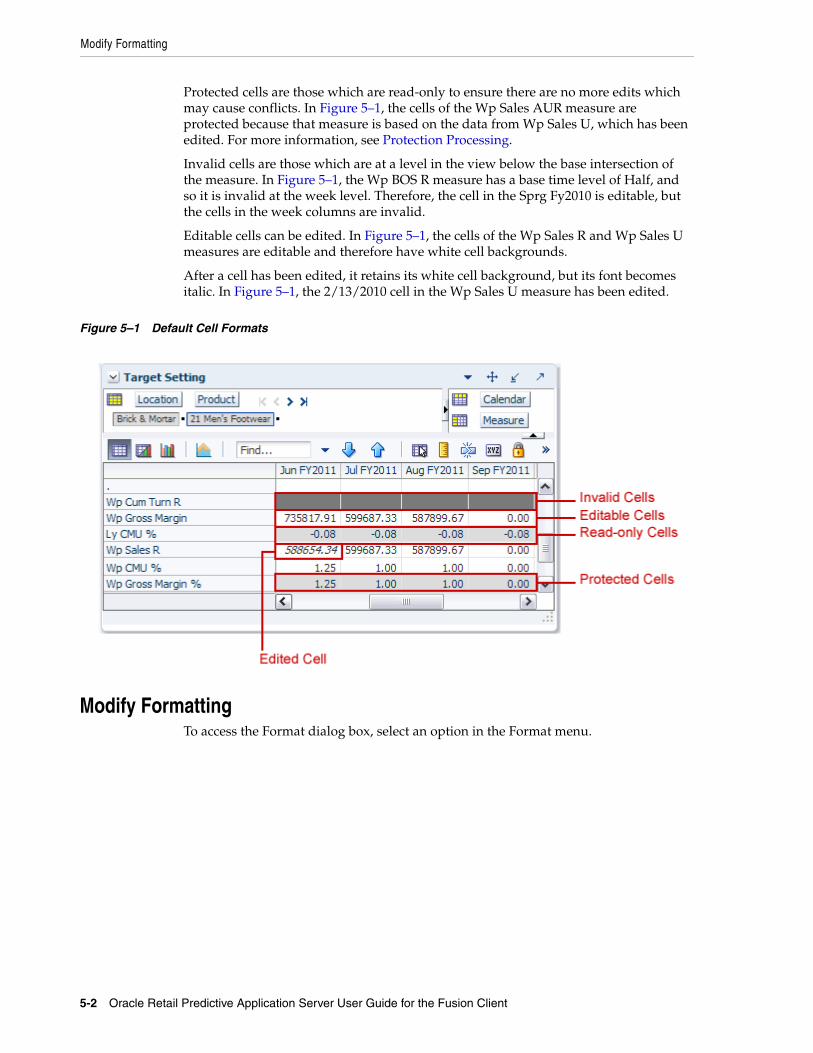
Modify Formatting
5-2 Oracle Retail Predictive Application Server User Guide for the Fusion Client
Protected cells are those which are read-only to ensure there are no more edits which may cause conflicts. In Figure 5–1, the cells of the Wp Sales AUR measure are protected because that measure is based on the data from Wp Sales U, which has been edited. For more information, see Protection Processing.
Invalid cells are those which are at a level in the view below the base intersection of the measure. In Figure 5–1, the Wp BOS R measure has a base time level of Half, and so it is invalid at the week level. Therefore, the cell in the Sprg Fy2010 is editable, but the cells in the week columns are invalid.
Editable cells can be edited. In Figure 5–1, the cells of the Wp Sales R and Wp Sales U measures are editable and therefore have white cell backgrounds.
After a cell has been edited, it retains its white cell background, but its font becomes italic. In Figure 5–1, the 2/13/2010 cell in the Wp Sales U measure has been edited.
Figure 5–1 Default Cell Formats
Modify FormattingTo access the Format dialog box, select an option in the Format menu.

Modify Formatting
Formatting 5-3
Figure 5–2 Format Menu
Or, right-click a dimension position in the page edge, column axis, or row axis.
Figure 5–3 Format Option in the Right-Click Context Menu
The Format dialog box appears. From the Format dialog box, you can modify measure styles, number formatting, exceptions, and dimension styles.
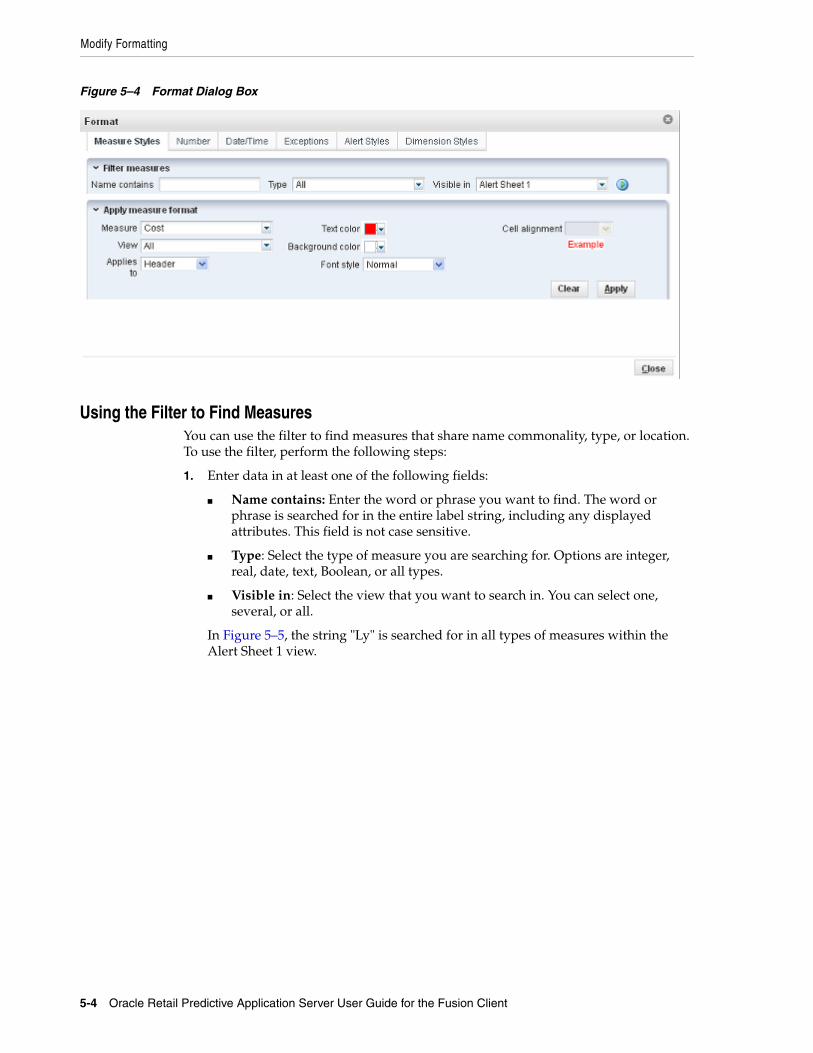
Modify Formatting
5-4 Oracle Retail Predictive Application Server User Guide for the Fusion Client
Figure 5–4 Format Dialog Box
Using the Filter to Find MeasuresYou can use the filter to find measures that share name commonality, type, or location. To use the filter, perform the following steps:
1. Enter data in at least one of the following fields:
■ Name contains: Enter the word or phrase you want to find. The word or phrase is searched for in the entire label string, including any displayed attributes. This field is not case sensitive.
■ Type: Select the type of measure you are searching for. Options are integer, real, date, text, Boolean, or all types.
■ Visible in: Select the view that you want to search in. You can select one, several, or all.
In Figure 5–5, the string "Ly" is searched for in all types of measures within the Alert Sheet 1 view.
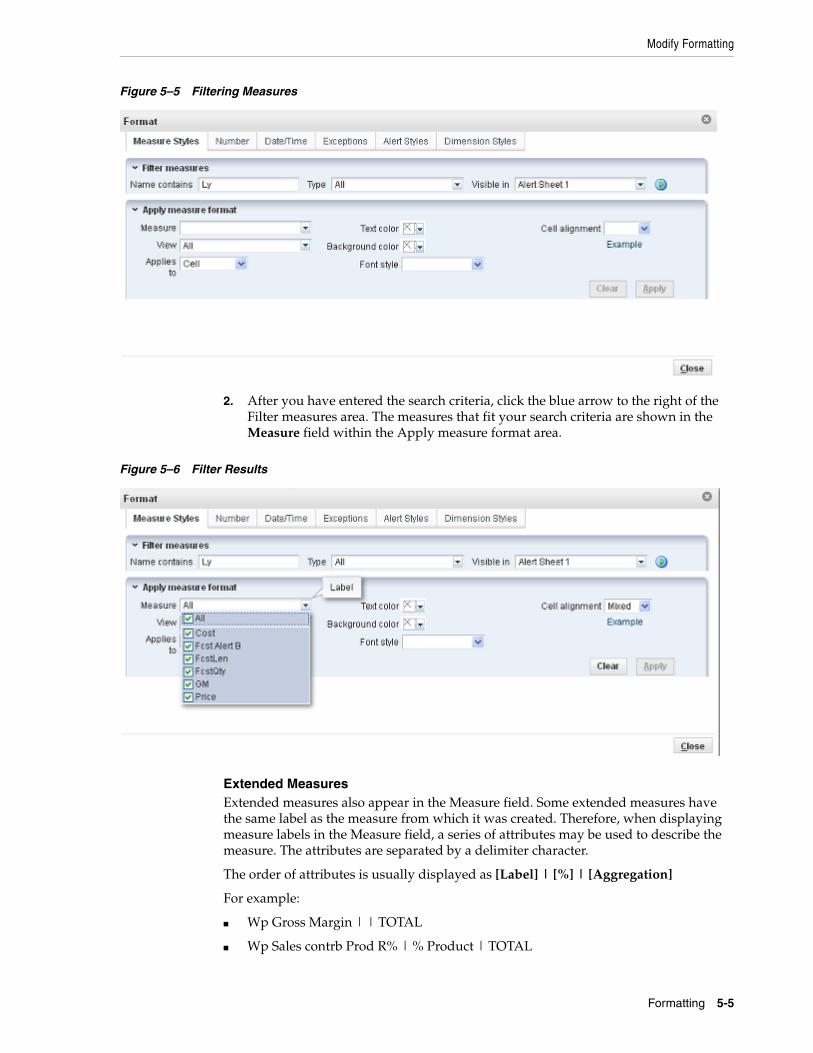
Modify Formatting
Formatting 5-5
Figure 5–5 Filtering Measures
2. After you have entered the search criteria, click the blue arrow to the right of the Filter measures area. The measures that fit your search criteria are shown in the Measure field within the Apply measure format area.
Figure 5–6 Filter Results
Extended MeasuresExtended measures also appear in the Measure field. Some extended measures have the same label as the measure from which it was created. Therefore, when displaying measure labels in the Measure field, a series of attributes may be used to describe the measure. The attributes are separated by a delimiter character.
The order of attributes is usually displayed as [Label] | [%] | [Aggregation]
For example:
■ Wp Gross Margin | | TOTAL
■ Wp Sales contrb Prod R% | % Product | TOTAL
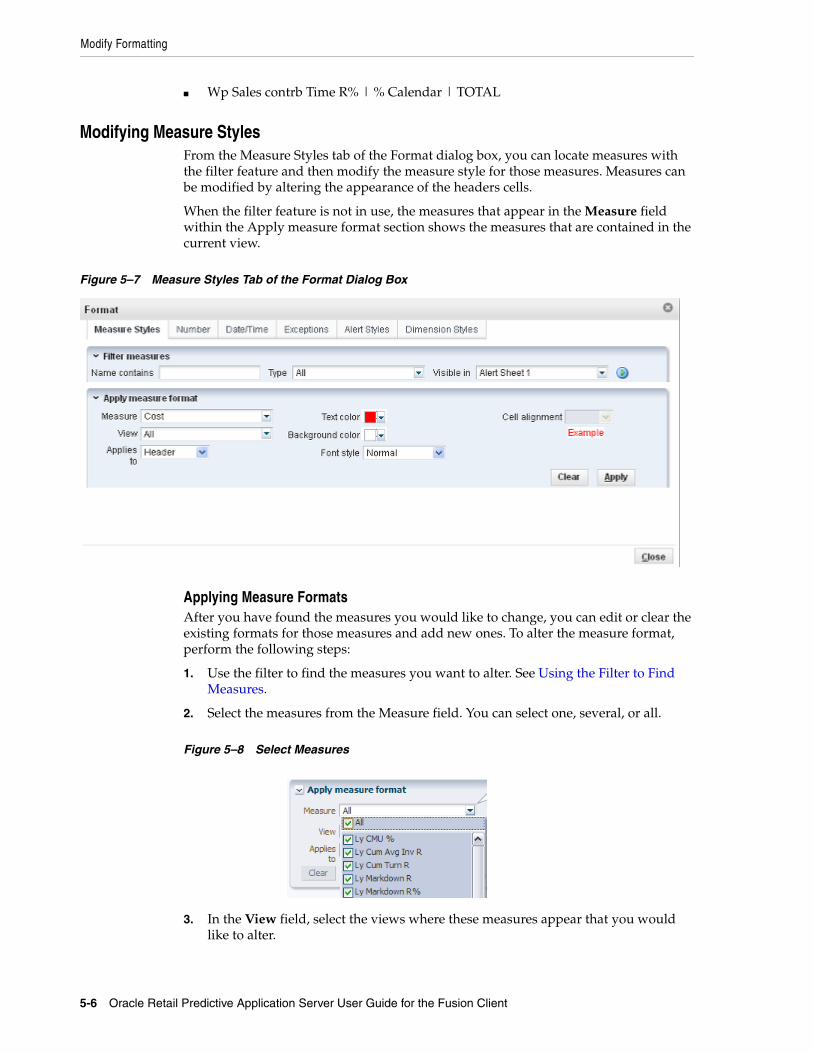
Modify Formatting
5-6 Oracle Retail Predictive Application Server User Guide for the Fusion Client
■ Wp Sales contrb Time R% | % Calendar | TOTAL
Modifying Measure StylesFrom the Measure Styles tab of the Format dialog box, you can locate measures with the filter feature and then modify the measure style for those measures. Measures can be modified by altering the appearance of the headers cells.
When the filter feature is not in use, the measures that appear in the Measure field within the Apply measure format section shows the measures that are contained in the current view.
Figure 5–7 Measure Styles Tab of the Format Dialog Box
Applying Measure FormatsAfter you have found the measures you would like to change, you can edit or clear the existing formats for those measures and add new ones. To alter the measure format, perform the following steps:
1. Use the filter to find the measures you want to alter. See Using the Filter to Find Measures.
2. Select the measures from the Measure field. You can select one, several, or all.
Figure 5–8 Select Measures
3. In the View field, select the views where these measures appear that you would like to alter.

Modify Formatting
Formatting 5-7
4. In the Applies to field, select the part of the measure formatting that you would like to alter.
5. In the Text color, Background color, Cell alignment, and Font style fields, choose the settings you want to apply.
6. When finished, click Apply and Close.
The Format dialog box closes. In the view the new formatting is visible.
Figure 5–9 Formatted Measures
Modifying Number FormattingFrom the Number tab of the Format dialog box, you can locate measures with the filter feature and then modify the number formatting for those measures. When the filter feature is not in use, the measures that appear in the Measure field within the Apply measure format section shows the measures that are contained in the current view.
Note: The cell background for read-only measures cannot be altered.
Note: Mixed appears as a formatting option when two positions have different formatting settings. For instance, if a user has selected bold as the font style for one measure and italics for another, when the user selects both measures at once, the font style drop-down displays mixed. The mixed option occurs only when there are multiple selections on the left side, and the properties on the right side contain a drop-down list.
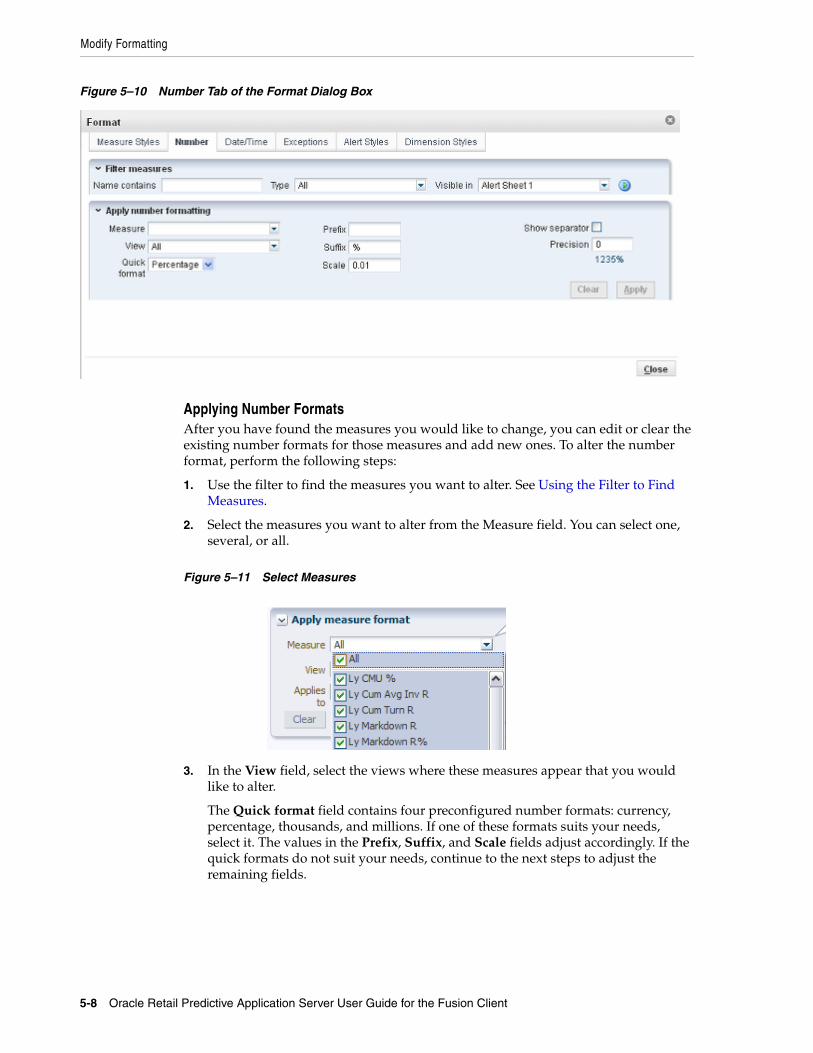
Modify Formatting
5-8 Oracle Retail Predictive Application Server User Guide for the Fusion Client
Figure 5–10 Number Tab of the Format Dialog Box
Applying Number FormatsAfter you have found the measures you would like to change, you can edit or clear the existing number formats for those measures and add new ones. To alter the number format, perform the following steps:
1. Use the filter to find the measures you want to alter. See Using the Filter to Find Measures.
2. Select the measures you want to alter from the Measure field. You can select one, several, or all.
Figure 5–11 Select Measures
3. In the View field, select the views where these measures appear that you would like to alter.
The Quick format field contains four preconfigured number formats: currency, percentage, thousands, and millions. If one of these formats suits your needs, select it. The values in the Prefix, Suffix, and Scale fields adjust accordingly. If the quick formats do not suit your needs, continue to the next steps to adjust the remaining fields.
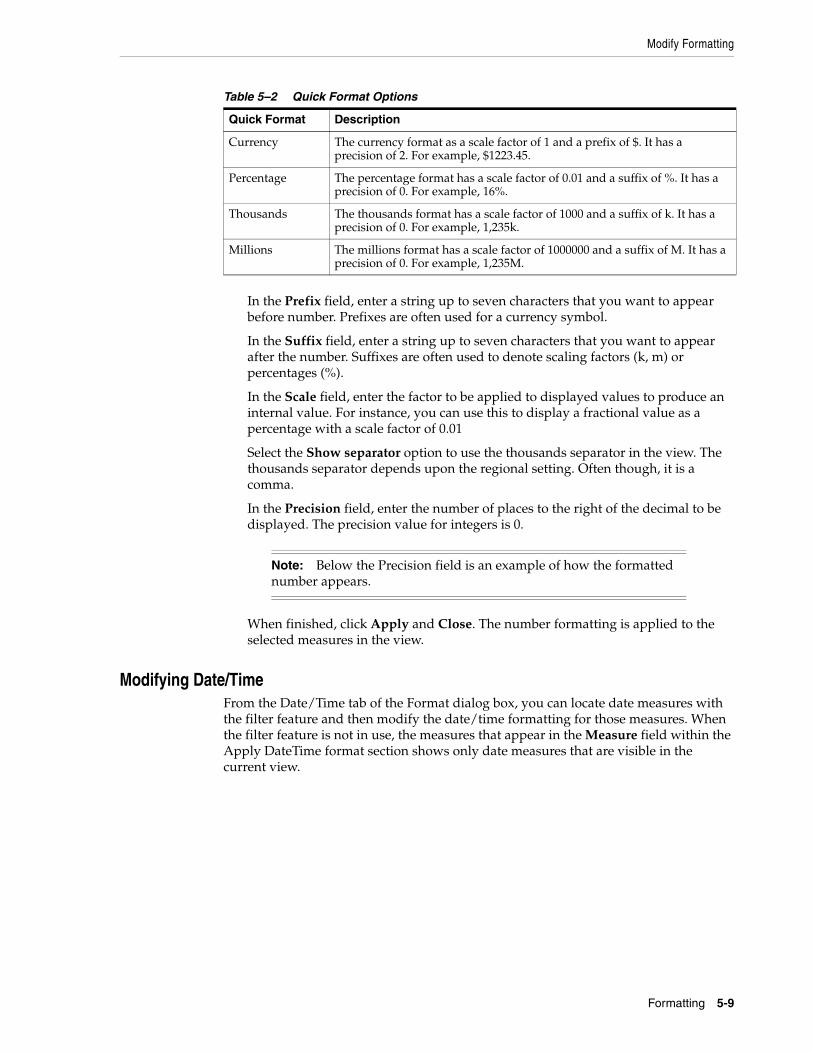
Modify Formatting
Formatting 5-9
In the Prefix field, enter a string up to seven characters that you want to appear before number. Prefixes are often used for a currency symbol.
In the Suffix field, enter a string up to seven characters that you want to appear after the number. Suffixes are often used to denote scaling factors (k, m) or percentages (%).
In the Scale field, enter the factor to be applied to displayed values to produce an internal value. For instance, you can use this to display a fractional value as a percentage with a scale factor of 0.01
Select the Show separator option to use the thousands separator in the view. The thousands separator depends upon the regional setting. Often though, it is a comma.
In the Precision field, enter the number of places to the right of the decimal to be displayed. The precision value for integers is 0.
When finished, click Apply and Close. The number formatting is applied to the selected measures in the view.
Modifying Date/TimeFrom the Date/Time tab of the Format dialog box, you can locate date measures with the filter feature and then modify the date/time formatting for those measures. When the filter feature is not in use, the measures that appear in the Measure field within the Apply DateTime format section shows only date measures that are visible in the current view.
Table 5–2 Quick Format Options
Quick Format Description
Currency The currency format as a scale factor of 1 and a prefix of $. It has a precision of 2. For example, $1223.45.
Percentage The percentage format has a scale factor of 0.01 and a suffix of %. It has a precision of 0. For example, 16%.
Thousands The thousands format has a scale factor of 1000 and a suffix of k. It has a precision of 0. For example, 1,235k.
Millions The millions format has a scale factor of 1000000 and a suffix of M. It has a precision of 0. For example, 1,235M.
Note: Below the Precision field is an example of how the formatted number appears.
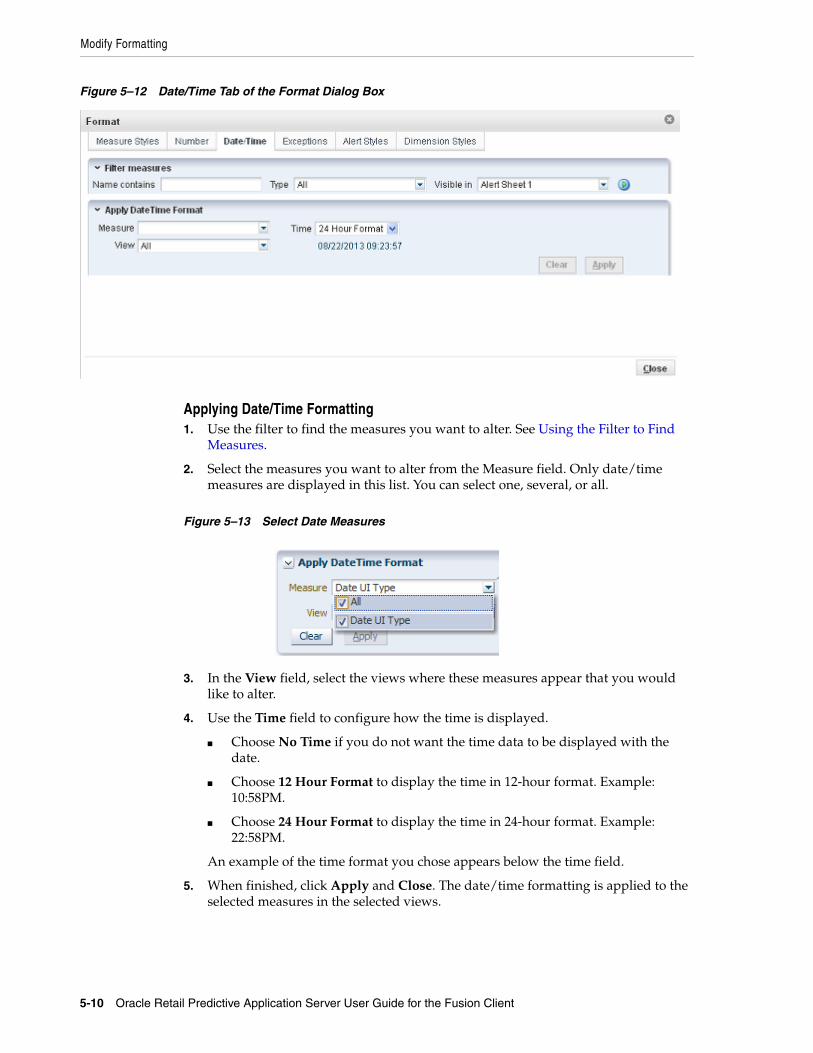
Modify Formatting
5-10 Oracle Retail Predictive Application Server User Guide for the Fusion Client
Figure 5–12 Date/Time Tab of the Format Dialog Box
Applying Date/Time Formatting1. Use the filter to find the measures you want to alter. See Using the Filter to Find
Measures.
2. Select the measures you want to alter from the Measure field. Only date/time measures are displayed in this list. You can select one, several, or all.
Figure 5–13 Select Date Measures
3. In the View field, select the views where these measures appear that you would like to alter.
4. Use the Time field to configure how the time is displayed.
■ Choose No Time if you do not want the time data to be displayed with the date.
■ Choose 12 Hour Format to display the time in 12-hour format. Example: 10:58PM.
■ Choose 24 Hour Format to display the time in 24-hour format. Example: 22:58PM.
An example of the time format you chose appears below the time field.
5. When finished, click Apply and Close. The date/time formatting is applied to the selected measures in the selected views.
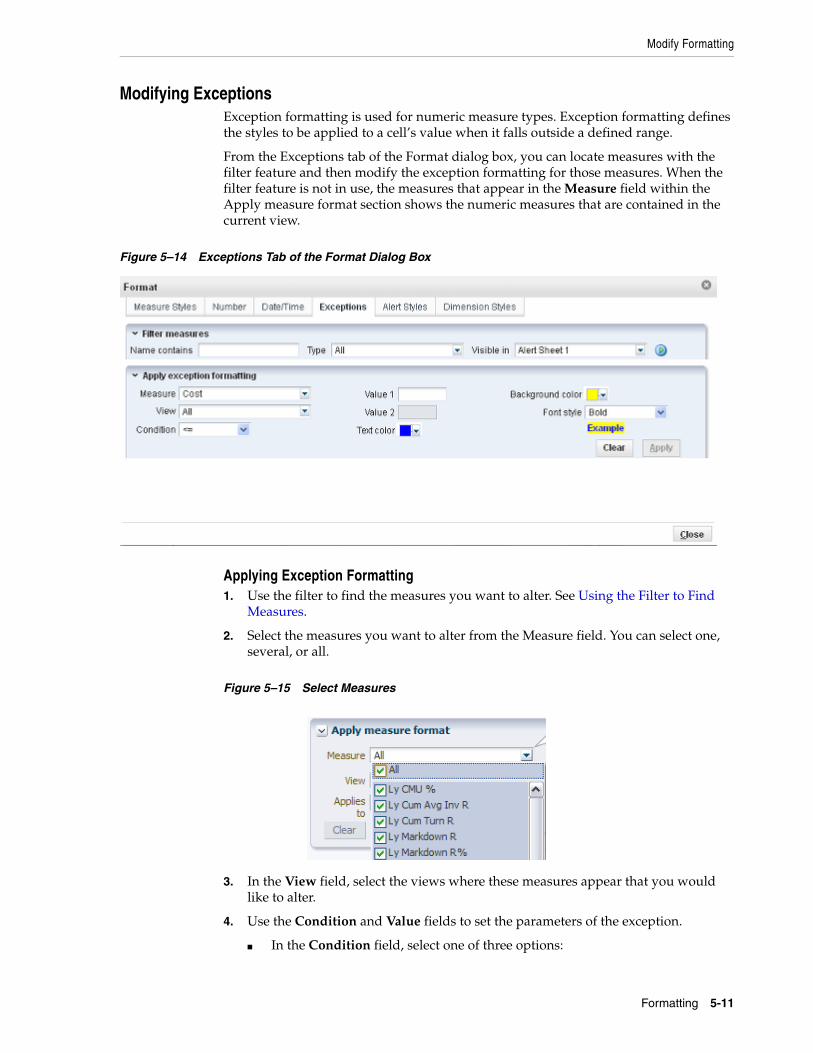
Modify Formatting
Formatting 5-11
Modifying ExceptionsException formatting is used for numeric measure types. Exception formatting defines the styles to be applied to a cell’s value when it falls outside a defined range.
From the Exceptions tab of the Format dialog box, you can locate measures with the filter feature and then modify the exception formatting for those measures. When the filter feature is not in use, the measures that appear in the Measure field within the Apply measure format section shows the numeric measures that are contained in the current view.
Figure 5–14 Exceptions Tab of the Format Dialog Box
Applying Exception Formatting1. Use the filter to find the measures you want to alter. See Using the Filter to Find
Measures.
2. Select the measures you want to alter from the Measure field. You can select one, several, or all.
Figure 5–15 Select Measures
3. In the View field, select the views where these measures appear that you would like to alter.
4. Use the Condition and Value fields to set the parameters of the exception.
■ In the Condition field, select one of three options:

Modify Formatting
5-12 Oracle Retail Predictive Application Server User Guide for the Fusion Client
– < =: Use this to select values that are less than or equal to Value 1.
– > =: Use this to select values that are greater than or equal to Value 1.
– Not between: Use this option to select values that do not fall between Value 1 and Value 2. This is a way to set both the <= and >= conditions to have the same formatting styles.
■ In the Value fields, enter the following:
– If you chose <= or >= as the Condition, enter the value in Value 1 that the exception needs to be greater or less than.
– If you chose Not between as the Condition, enter the values that the exception should not fall between in Value 1 and Value 2.
5. In the Text color, Background color, and Font style fields, choose the settings you want to apply.
6. When finished, click Apply and Close. The exception formatting is applied to the selected measures in the view.
Modifying Alert StylesThe alert styles can be modified for Real Time Alerts. This enables users to customize their visual appearance. This option will only be available if Real Time Alerts are present in the workbook. The changes will apply to the specific workbook the alert is in.
Notes:
■ If entering a value that has a scale factor, such as a percentage, enter the raw value. For example, if you want to enter 10%, you should enter .1.
■ Exceptions applied to integer measures must have integer values for Value 1 and Value 2. Otherwise an error occurs.
Note: Below the Font Style field is an example of how the formatted exception appears.
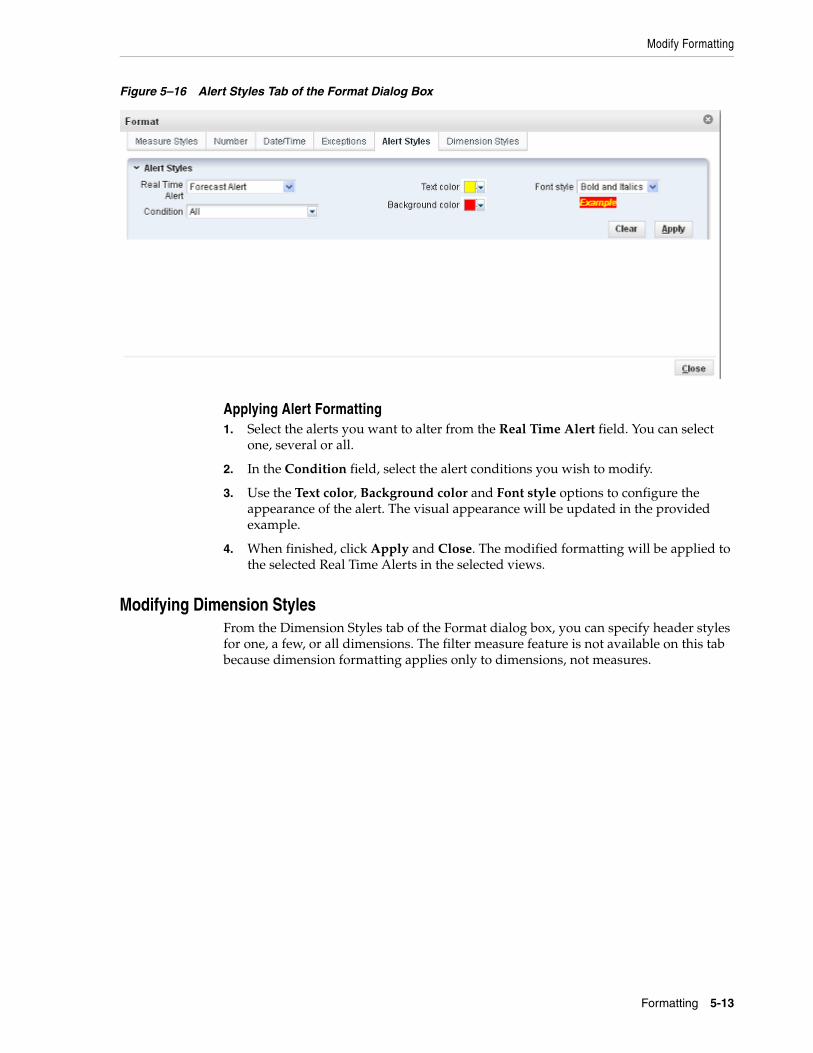
Modify Formatting
Formatting 5-13
Figure 5–16 Alert Styles Tab of the Format Dialog Box
Applying Alert Formatting1. Select the alerts you want to alter from the Real Time Alert field. You can select
one, several or all.
2. In the Condition field, select the alert conditions you wish to modify.
3. Use the Text color, Background color and Font style options to configure the appearance of the alert. The visual appearance will be updated in the provided example.
4. When finished, click Apply and Close. The modified formatting will be applied to the selected Real Time Alerts in the selected views.
Modifying Dimension StylesFrom the Dimension Styles tab of the Format dialog box, you can specify header styles for one, a few, or all dimensions. The filter measure feature is not available on this tab because dimension formatting applies only to dimensions, not measures.
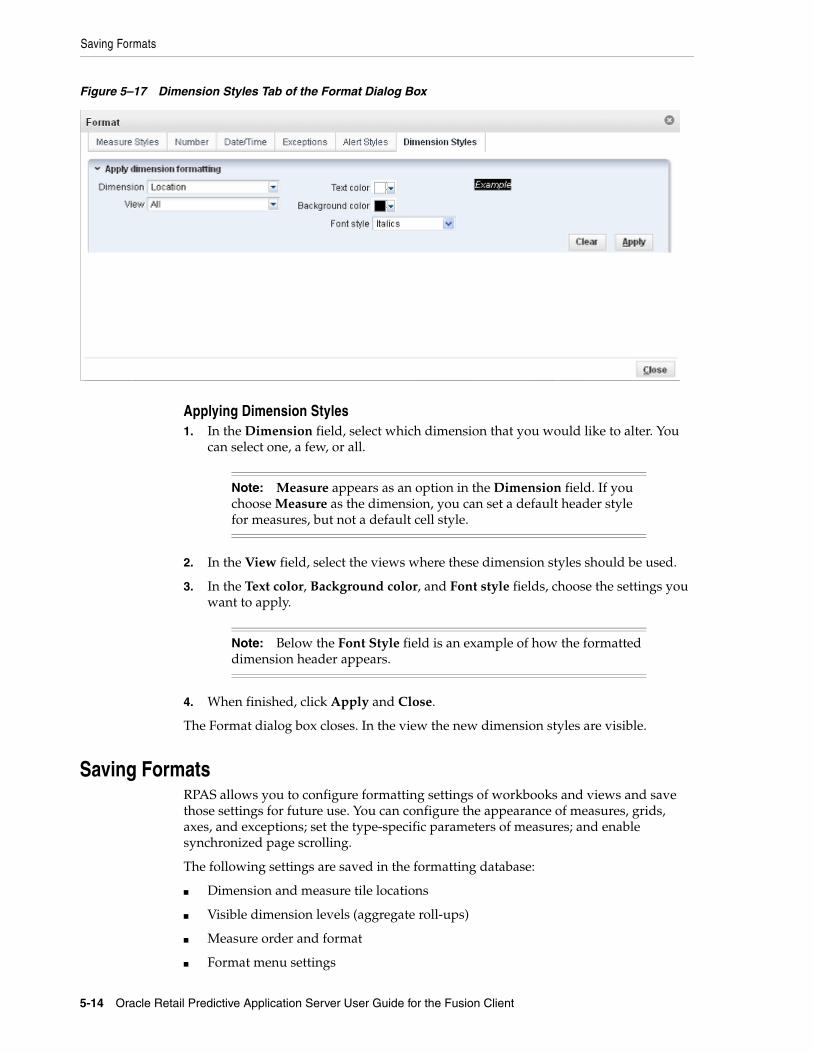
Saving Formats
5-14 Oracle Retail Predictive Application Server User Guide for the Fusion Client
Figure 5–17 Dimension Styles Tab of the Format Dialog Box
Applying Dimension Styles1. In the Dimension field, select which dimension that you would like to alter. You
can select one, a few, or all.
2. In the View field, select the views where these dimension styles should be used.
3. In the Text color, Background color, and Font style fields, choose the settings you want to apply.
4. When finished, click Apply and Close.
The Format dialog box closes. In the view the new dimension styles are visible.
Saving FormatsRPAS allows you to configure formatting settings of workbooks and views and save those settings for future use. You can configure the appearance of measures, grids, axes, and exceptions; set the type-specific parameters of measures; and enable synchronized page scrolling.
The following settings are saved in the formatting database:
■ Dimension and measure tile locations
■ Visible dimension levels (aggregate roll-ups)
■ Measure order and format
■ Format menu settings
Note: Measure appears as an option in the Dimension field. If you choose Measure as the dimension, you can set a default header style for measures, but not a default cell style.
Note: Below the Font Style field is an example of how the formatted dimension header appears.
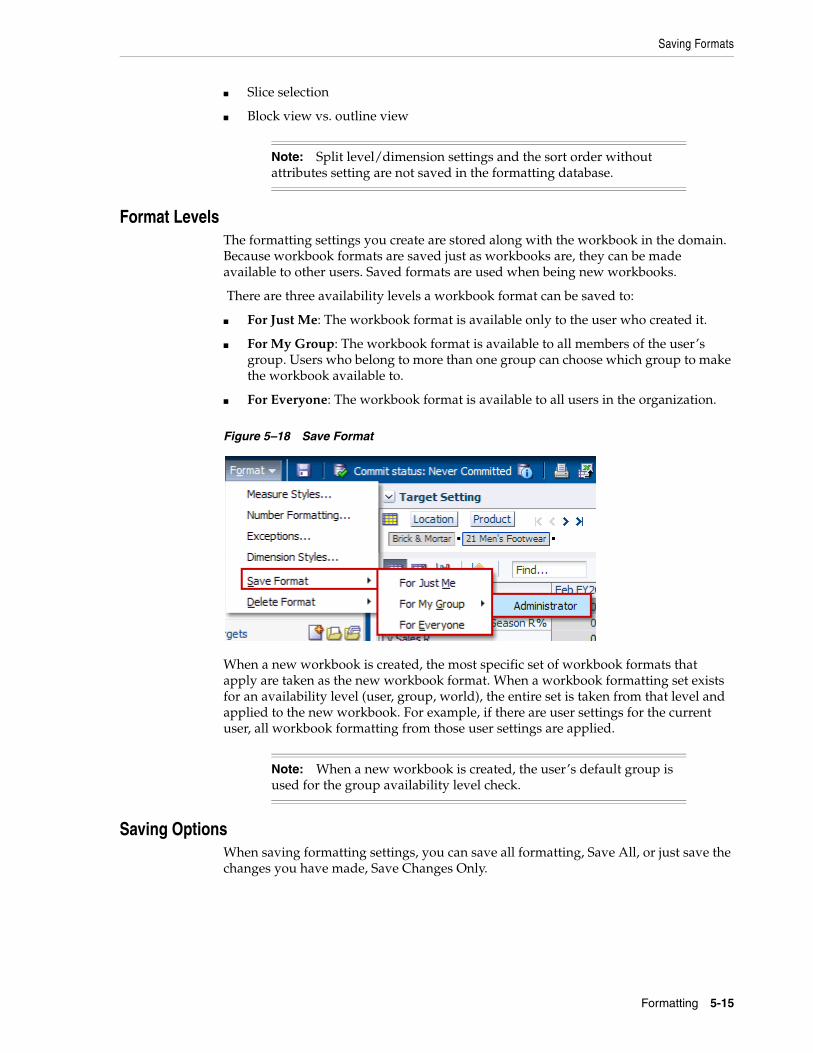
Saving Formats
Formatting 5-15
■ Slice selection
■ Block view vs. outline view
Format LevelsThe formatting settings you create are stored along with the workbook in the domain. Because workbook formats are saved just as workbooks are, they can be made available to other users. Saved formats are used when being new workbooks.
There are three availability levels a workbook format can be saved to:
■ For Just Me: The workbook format is available only to the user who created it.
■ For My Group: The workbook format is available to all members of the user’s group. Users who belong to more than one group can choose which group to make the workbook available to.
■ For Everyone: The workbook format is available to all users in the organization.
Figure 5–18 Save Format
When a new workbook is created, the most specific set of workbook formats that apply are taken as the new workbook format. When a workbook formatting set exists for an availability level (user, group, world), the entire set is taken from that level and applied to the new workbook. For example, if there are user settings for the current user, all workbook formatting from those user settings are applied.
Saving OptionsWhen saving formatting settings, you can save all formatting, Save All, or just save the changes you have made, Save Changes Only.
Note: Split level/dimension settings and the sort order without attributes setting are not saved in the formatting database.
Note: When a new workbook is created, the user’s default group is used for the group availability level check.
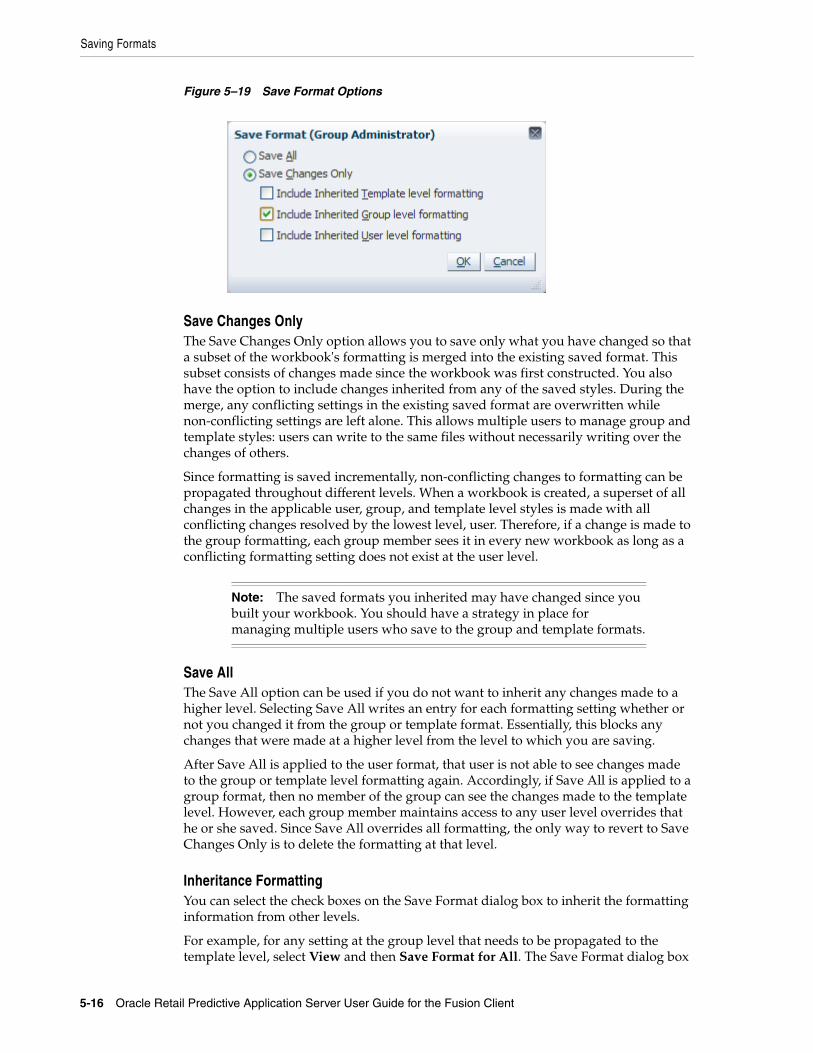
Saving Formats
5-16 Oracle Retail Predictive Application Server User Guide for the Fusion Client
Figure 5–19 Save Format Options
Save Changes OnlyThe Save Changes Only option allows you to save only what you have changed so that a subset of the workbook's formatting is merged into the existing saved format. This subset consists of changes made since the workbook was first constructed. You also have the option to include changes inherited from any of the saved styles. During the merge, any conflicting settings in the existing saved format are overwritten while non-conflicting settings are left alone. This allows multiple users to manage group and template styles: users can write to the same files without necessarily writing over the changes of others.
Since formatting is saved incrementally, non-conflicting changes to formatting can be propagated throughout different levels. When a workbook is created, a superset of all changes in the applicable user, group, and template level styles is made with all conflicting changes resolved by the lowest level, user. Therefore, if a change is made to the group formatting, each group member sees it in every new workbook as long as a conflicting formatting setting does not exist at the user level.
Save AllThe Save All option can be used if you do not want to inherit any changes made to a higher level. Selecting Save All writes an entry for each formatting setting whether or not you changed it from the group or template format. Essentially, this blocks any changes that were made at a higher level from the level to which you are saving.
After Save All is applied to the user format, that user is not able to see changes made to the group or template level formatting again. Accordingly, if Save All is applied to a group format, then no member of the group can see the changes made to the template level. However, each group member maintains access to any user level overrides that he or she saved. Since Save All overrides all formatting, the only way to revert to Save Changes Only is to delete the formatting at that level.
Inheritance FormattingYou can select the check boxes on the Save Format dialog box to inherit the formatting information from other levels.
For example, for any setting at the group level that needs to be propagated to the template level, select View and then Save Format for All. The Save Format dialog box
Note: The saved formats you inherited may have changed since you built your workbook. You should have a strategy in place for managing multiple users who save to the group and template formats.
Deleting Formats
Formatting 5-17
appears. Click Save Changes Only, and then select Include Inherited Group Formatting.
For any setting at the template level that needs to be propagated to the user level, select View and then Save Format for User. The Save Format dialog box appears. Click Save Changes Only, and then select Include Inherited Template Formatting.
Deleting FormatsYou can delete formats that you created. To delete a format, perform the following steps.
1. Open the workbook that has the formatting you want to delete.
2. From the View menu, click Delete Format.
3. Choose the level you want to delete it from.
■ For Just Me: The workbook format is deleted only for the user who created it.
■ For My Group: The workbook format is deleted for all members of the user’s group.
■ For Everyone: The workbook format is deleted for all users in the organization. Only administrators can save for everyone.
Note: Chart format data is not merged into the existing saved format as other data is. It is saved as Save All (overwriting existing formatting), even if Save Changes Only is selected.

Deleting Formats
5-18 Oracle Retail Predictive Application Server User Guide for the Fusion Client
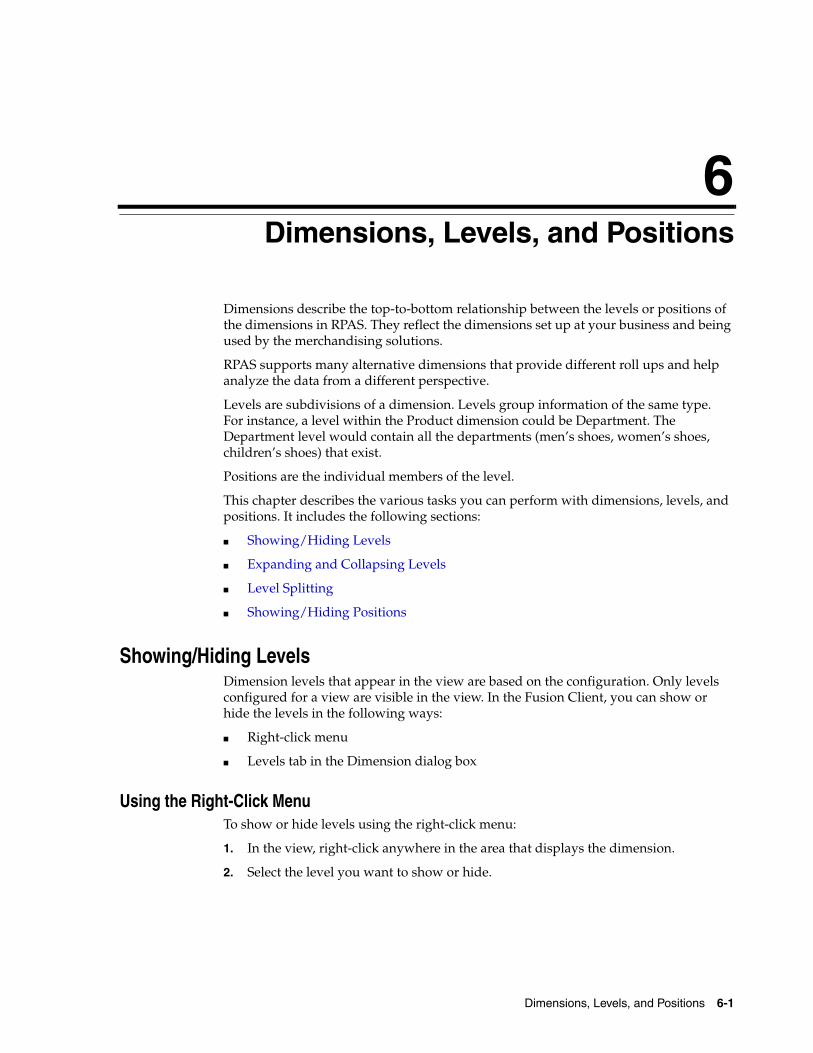
Dimensions, Levels, and Positions 6-1
6Dimensions, Levels, and Positions
Dimensions describe the top-to-bottom relationship between the levels or positions of the dimensions in RPAS. They reflect the dimensions set up at your business and being used by the merchandising solutions.
RPAS supports many alternative dimensions that provide different roll ups and help analyze the data from a different perspective.
Levels are subdivisions of a dimension. Levels group information of the same type. For instance, a level within the Product dimension could be Department. The Department level would contain all the departments (men’s shoes, women’s shoes, children’s shoes) that exist.
Positions are the individual members of the level.
This chapter describes the various tasks you can perform with dimensions, levels, and positions. It includes the following sections:
■ Showing/Hiding Levels
■ Expanding and Collapsing Levels
■ Level Splitting
■ Showing/Hiding Positions
Showing/Hiding LevelsDimension levels that appear in the view are based on the configuration. Only levels configured for a view are visible in the view. In the Fusion Client, you can show or hide the levels in the following ways:
■ Right-click menu
■ Levels tab in the Dimension dialog box
Using the Right-Click MenuTo show or hide levels using the right-click menu:
1. In the view, right-click anywhere in the area that displays the dimension.
2. Select the level you want to show or hide.
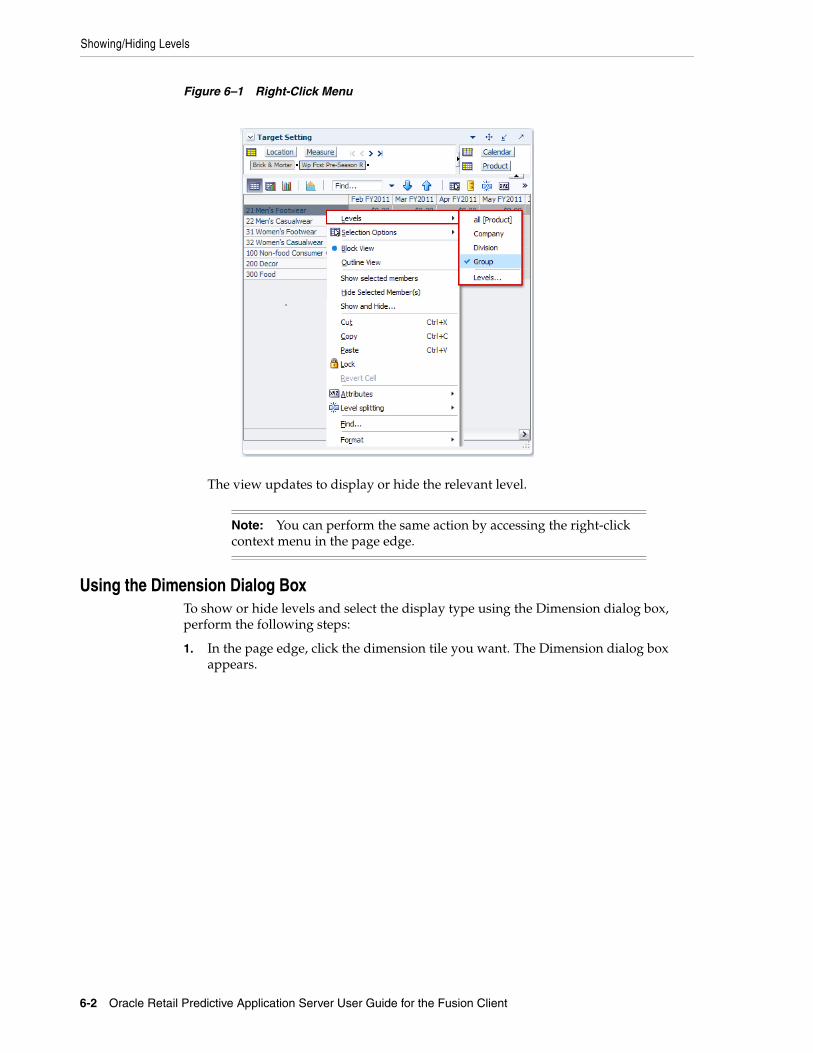
Showing/Hiding Levels
6-2 Oracle Retail Predictive Application Server User Guide for the Fusion Client
Figure 6–1 Right-Click Menu
The view updates to display or hide the relevant level.
Using the Dimension Dialog Box To show or hide levels and select the display type using the Dimension dialog box, perform the following steps:
1. In the page edge, click the dimension tile you want. The Dimension dialog box appears.
Note: You can perform the same action by accessing the right-click context menu in the page edge.
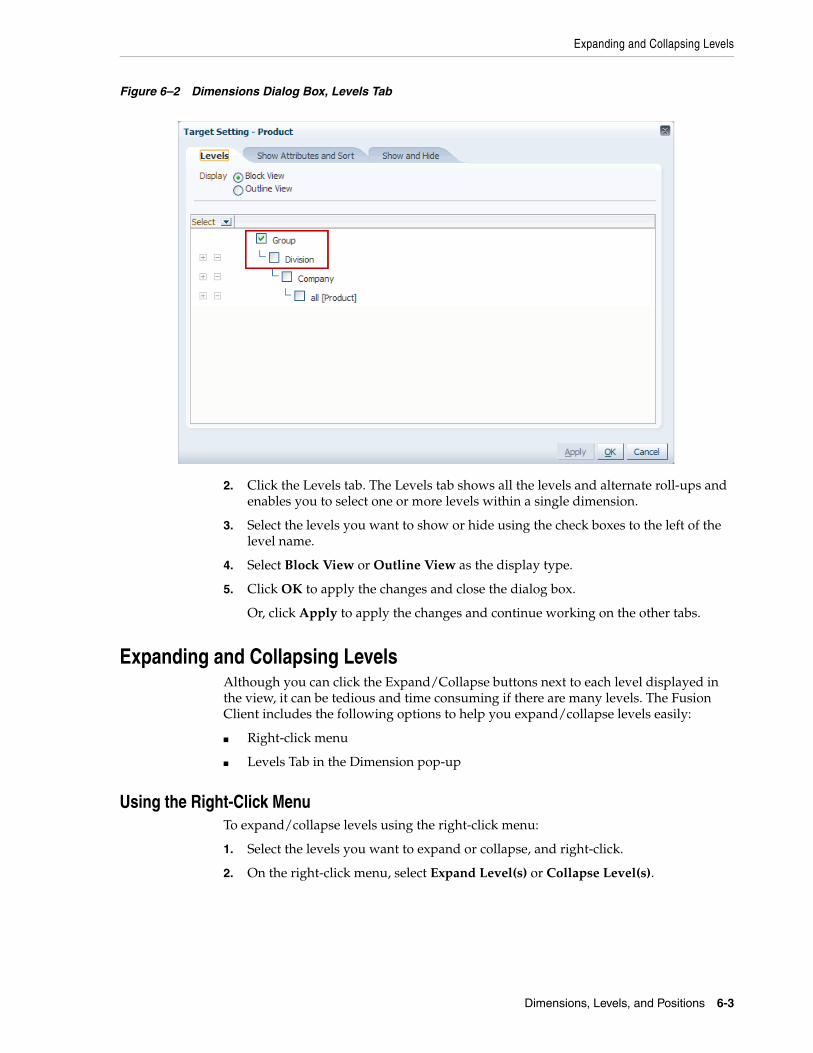
Expanding and Collapsing Levels
Dimensions, Levels, and Positions 6-3
Figure 6–2 Dimensions Dialog Box, Levels Tab
2. Click the Levels tab. The Levels tab shows all the levels and alternate roll-ups and enables you to select one or more levels within a single dimension.
3. Select the levels you want to show or hide using the check boxes to the left of the level name.
4. Select Block View or Outline View as the display type.
5. Click OK to apply the changes and close the dialog box.
Or, click Apply to apply the changes and continue working on the other tabs.
Expanding and Collapsing LevelsAlthough you can click the Expand/Collapse buttons next to each level displayed in the view, it can be tedious and time consuming if there are many levels. The Fusion Client includes the following options to help you expand/collapse levels easily:
■ Right-click menu
■ Levels Tab in the Dimension pop-up
Using the Right-Click MenuTo expand/collapse levels using the right-click menu:
1. Select the levels you want to expand or collapse, and right-click.
2. On the right-click menu, select Expand Level(s) or Collapse Level(s).

Expanding and Collapsing Levels
6-4 Oracle Retail Predictive Application Server User Guide for the Fusion Client
Figure 6–3 Expand Level and Collapse Level Options in the Right-click Menu
Using the Dimension Dialog BoxTo expand or collapse levels using the Dimension dialog box:
1. In the page edge, click the dimension tile of the dimension you want to collapse or expand. The Dimension dialog box appears.
Figure 6–4 Dimensions Dialog Box, Levels Tab
2. On the Levels tab, select the relevant check box to expand or collapse all the positions at the level. To expand or collapse all positions at all the visible levels, click the Expand/Collapse shortcut menu on the top.
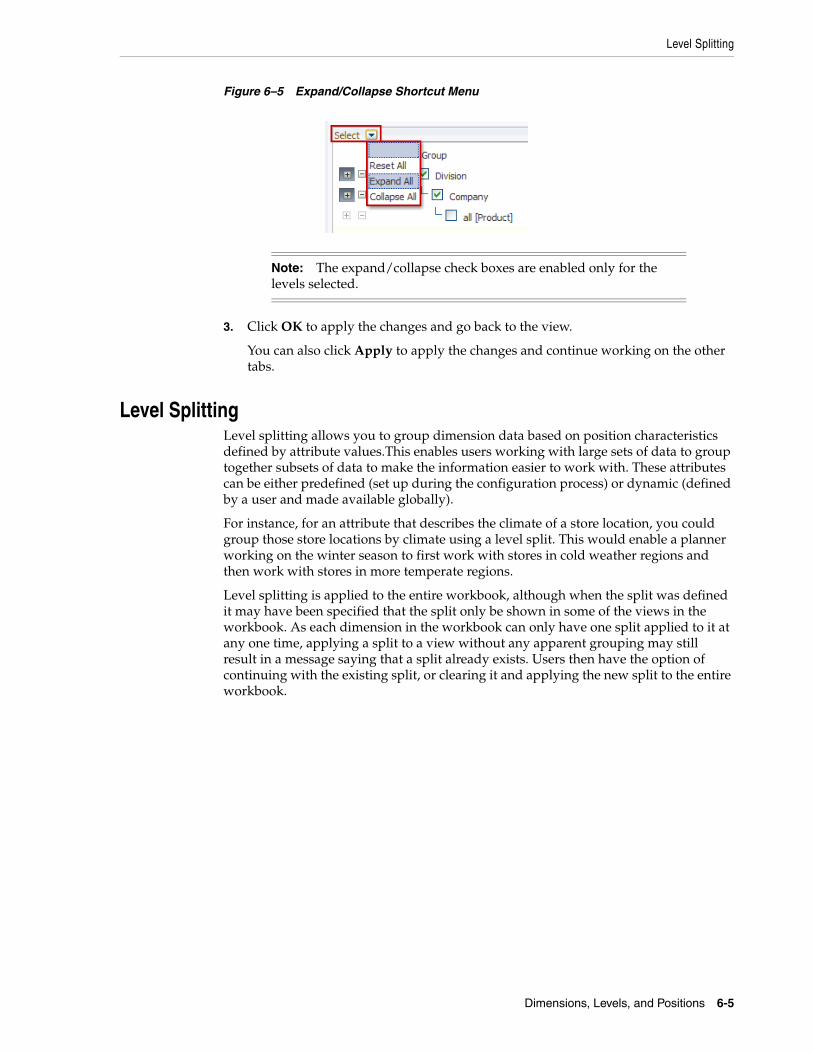
Level Splitting
Dimensions, Levels, and Positions 6-5
Figure 6–5 Expand/Collapse Shortcut Menu
3. Click OK to apply the changes and go back to the view.
You can also click Apply to apply the changes and continue working on the other tabs.
Level SplittingLevel splitting allows you to group dimension data based on position characteristics defined by attribute values.This enables users working with large sets of data to group together subsets of data to make the information easier to work with. These attributes can be either predefined (set up during the configuration process) or dynamic (defined by a user and made available globally).
For instance, for an attribute that describes the climate of a store location, you could group those store locations by climate using a level split. This would enable a planner working on the winter season to first work with stores in cold weather regions and then work with stores in more temperate regions.
Level splitting is applied to the entire workbook, although when the split was defined it may have been specified that the split only be shown in some of the views in the workbook. As each dimension in the workbook can only have one split applied to it at any one time, applying a split to a view without any apparent grouping may still result in a message saying that a split already exists. Users then have the option of continuing with the existing split, or clearing it and applying the new split to the entire workbook.
Note: The expand/collapse check boxes are enabled only for the levels selected.
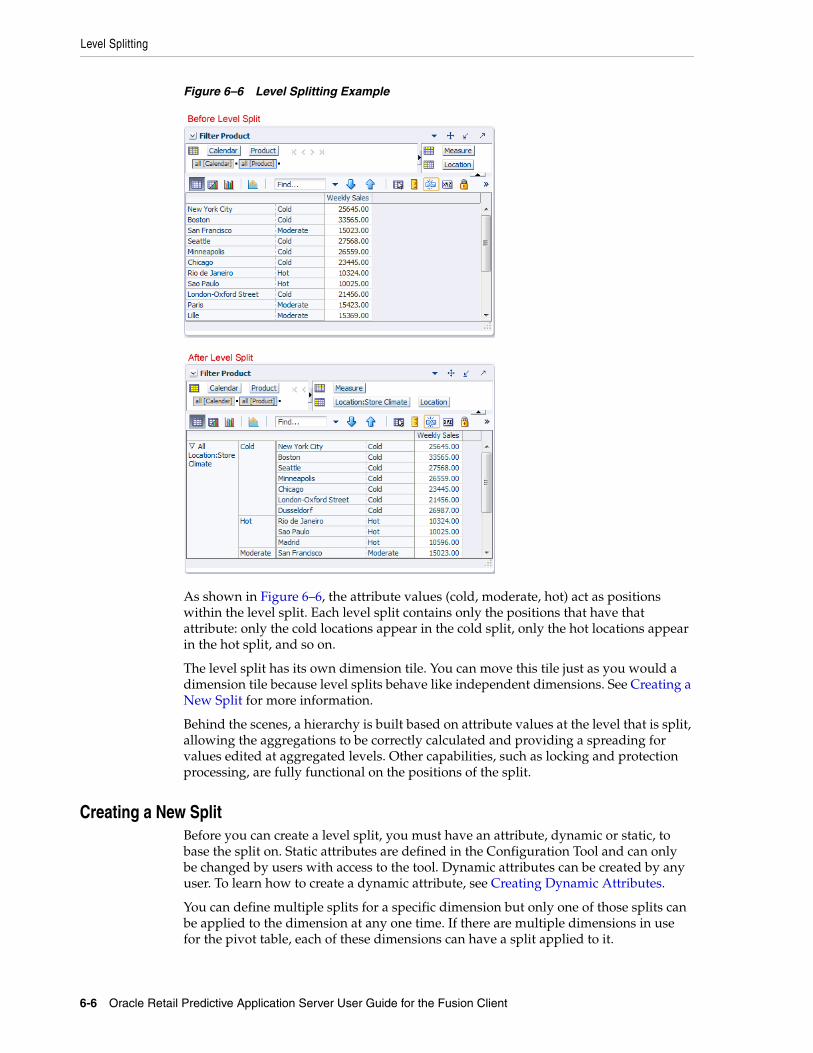
Level Splitting
6-6 Oracle Retail Predictive Application Server User Guide for the Fusion Client
Figure 6–6 Level Splitting Example
As shown in Figure 6–6, the attribute values (cold, moderate, hot) act as positions within the level split. Each level split contains only the positions that have that attribute: only the cold locations appear in the cold split, only the hot locations appear in the hot split, and so on.
The level split has its own dimension tile. You can move this tile just as you would a dimension tile because level splits behave like independent dimensions. See Creating a New Split for more information.
Behind the scenes, a hierarchy is built based on attribute values at the level that is split, allowing the aggregations to be correctly calculated and providing a spreading for values edited at aggregated levels. Other capabilities, such as locking and protection processing, are fully functional on the positions of the split.
Creating a New SplitBefore you can create a level split, you must have an attribute, dynamic or static, to base the split on. Static attributes are defined in the Configuration Tool and can only be changed by users with access to the tool. Dynamic attributes can be created by any user. To learn how to create a dynamic attribute, see Creating Dynamic Attributes.
You can define multiple splits for a specific dimension but only one of those splits can be applied to the dimension at any one time. If there are multiple dimensions in use for the pivot table, each of these dimensions can have a split applied to it.
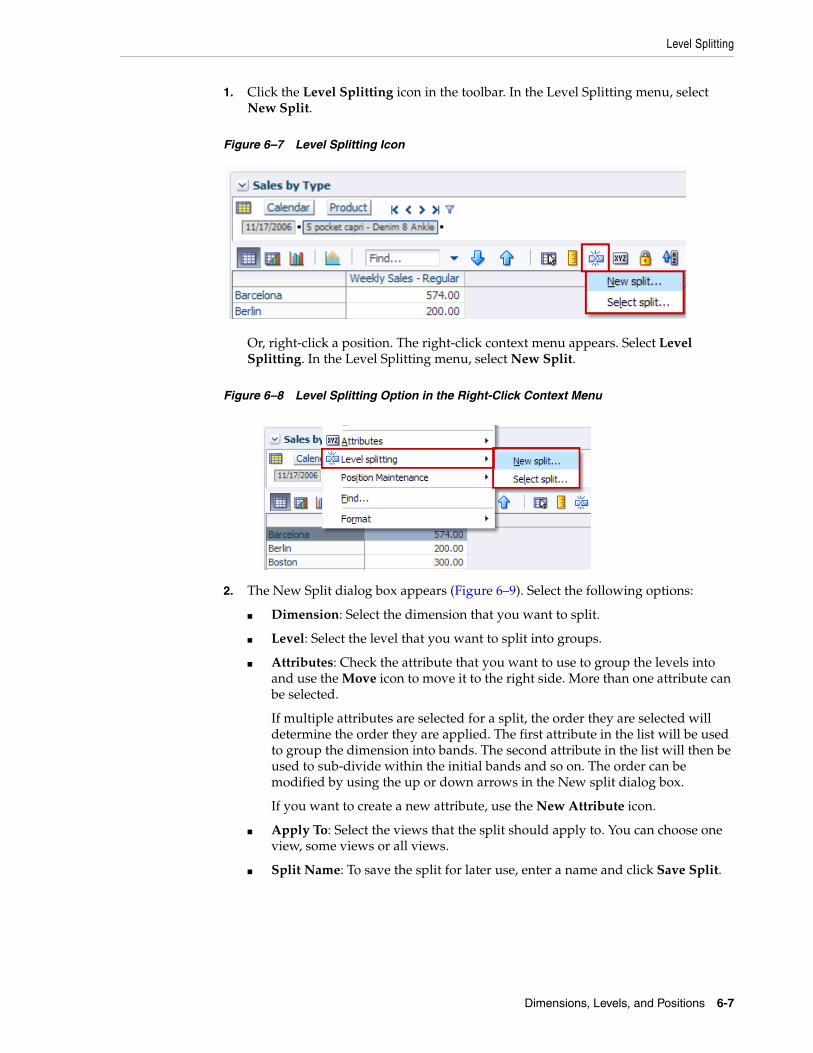
Level Splitting
Dimensions, Levels, and Positions 6-7
1. Click the Level Splitting icon in the toolbar. In the Level Splitting menu, select New Split.
Figure 6–7 Level Splitting Icon
Or, right-click a position. The right-click context menu appears. Select Level Splitting. In the Level Splitting menu, select New Split.
Figure 6–8 Level Splitting Option in the Right-Click Context Menu
2. The New Split dialog box appears (Figure 6–9). Select the following options:
■ Dimension: Select the dimension that you want to split.
■ Level: Select the level that you want to split into groups.
■ Attributes: Check the attribute that you want to use to group the levels into and use the Move icon to move it to the right side. More than one attribute can be selected.
If multiple attributes are selected for a split, the order they are selected will determine the order they are applied. The first attribute in the list will be used to group the dimension into bands. The second attribute in the list will then be used to sub-divide within the initial bands and so on. The order can be modified by using the up or down arrows in the New split dialog box.
If you want to create a new attribute, use the New Attribute icon.
■ Apply To: Select the views that the split should apply to. You can choose one view, some views or all views.
■ Split Name: To save the split for later use, enter a name and click Save Split.
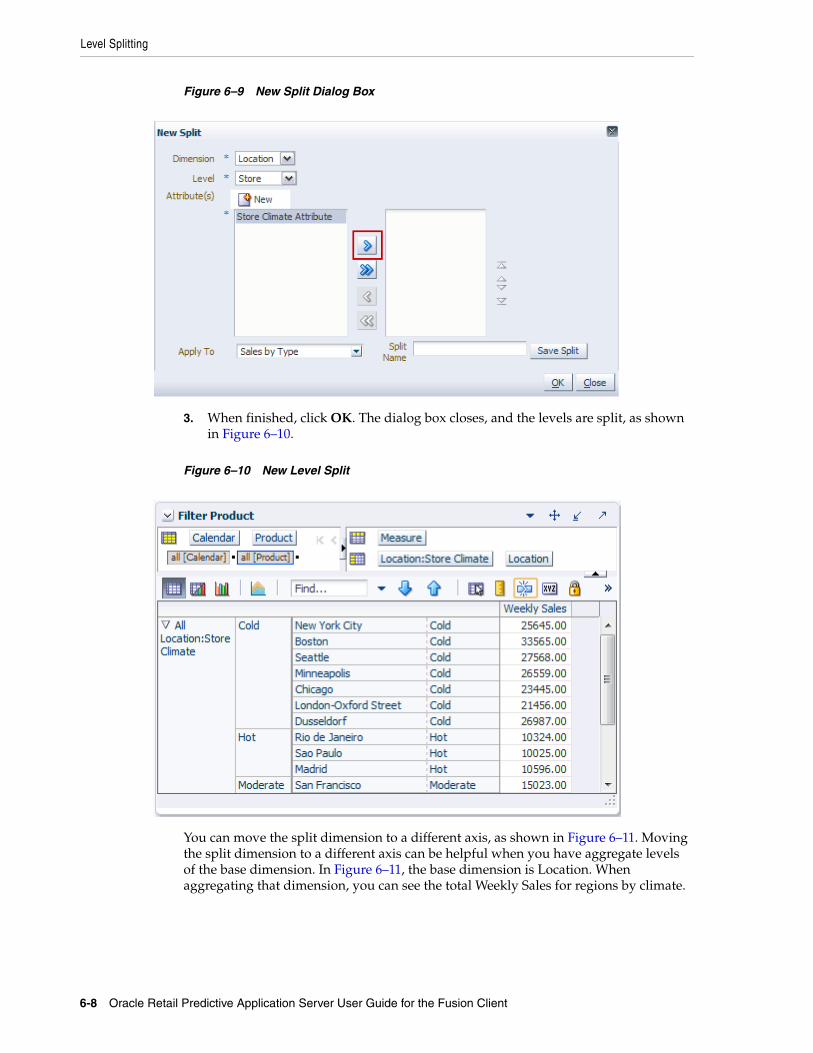
Level Splitting
6-8 Oracle Retail Predictive Application Server User Guide for the Fusion Client
Figure 6–9 New Split Dialog Box
3. When finished, click OK. The dialog box closes, and the levels are split, as shown in Figure 6–10.
Figure 6–10 New Level Split
You can move the split dimension to a different axis, as shown in Figure 6–11. Moving the split dimension to a different axis can be helpful when you have aggregate levels of the base dimension. In Figure 6–11, the base dimension is Location. When aggregating that dimension, you can see the total Weekly Sales for regions by climate.
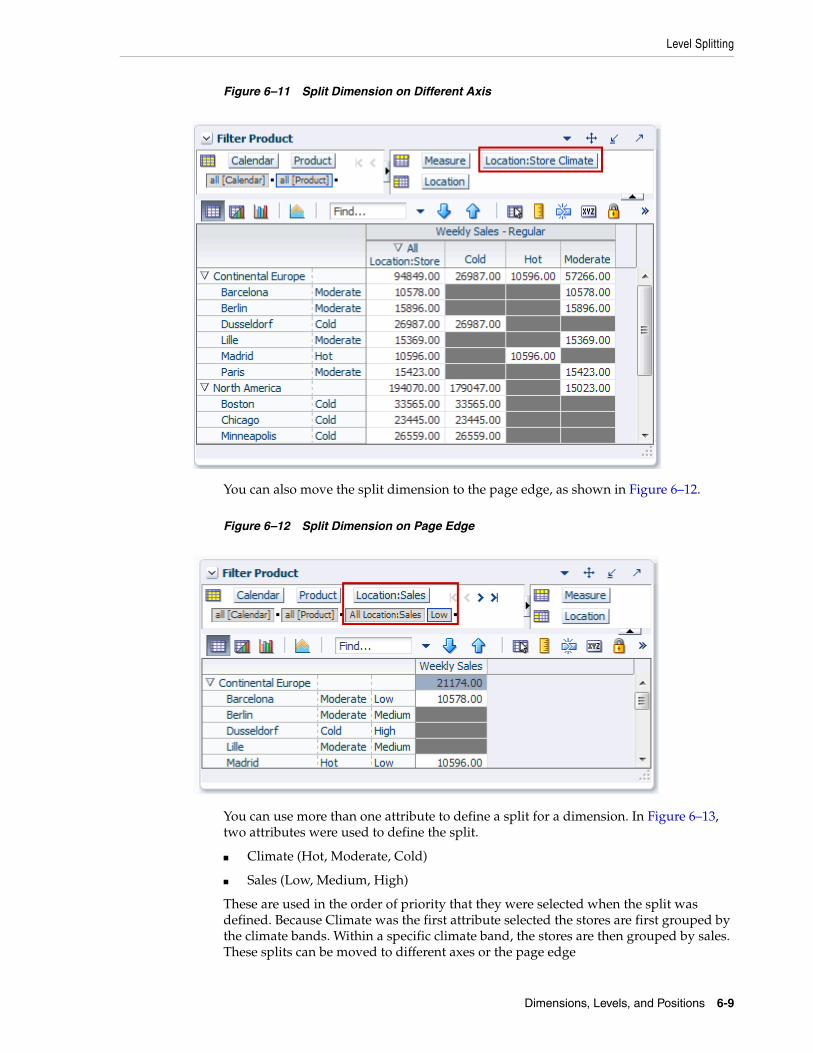
Level Splitting
Dimensions, Levels, and Positions 6-9
Figure 6–11 Split Dimension on Different Axis
You can also move the split dimension to the page edge, as shown in Figure 6–12.
Figure 6–12 Split Dimension on Page Edge
You can use more than one attribute to define a split for a dimension. In Figure 6–13, two attributes were used to define the split.
■ Climate (Hot, Moderate, Cold)
■ Sales (Low, Medium, High)
These are used in the order of priority that they were selected when the split was defined. Because Climate was the first attribute selected the stores are first grouped by the climate bands. Within a specific climate band, the stores are then grouped by sales. These splits can be moved to different axes or the page edge
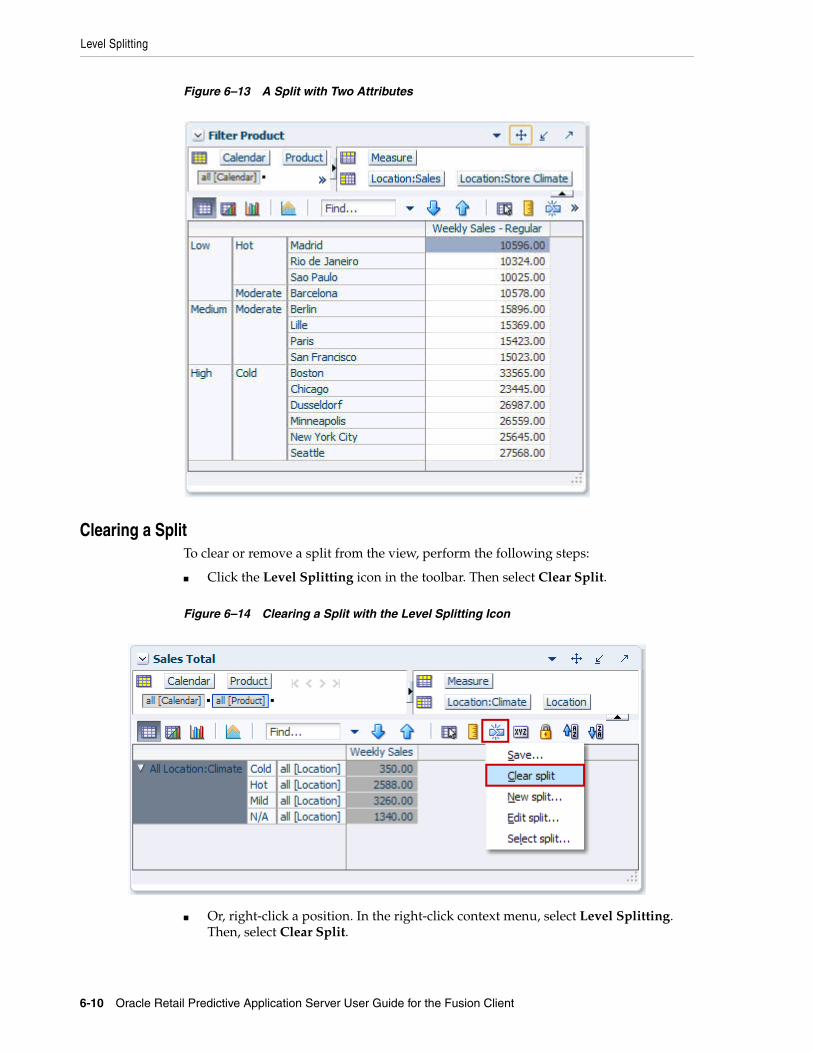
Level Splitting
6-10 Oracle Retail Predictive Application Server User Guide for the Fusion Client
Figure 6–13 A Split with Two Attributes
Clearing a SplitTo clear or remove a split from the view, perform the following steps:
■ Click the Level Splitting icon in the toolbar. Then select Clear Split.
Figure 6–14 Clearing a Split with the Level Splitting Icon
■ Or, right-click a position. In the right-click context menu, select Level Splitting. Then, select Clear Split.
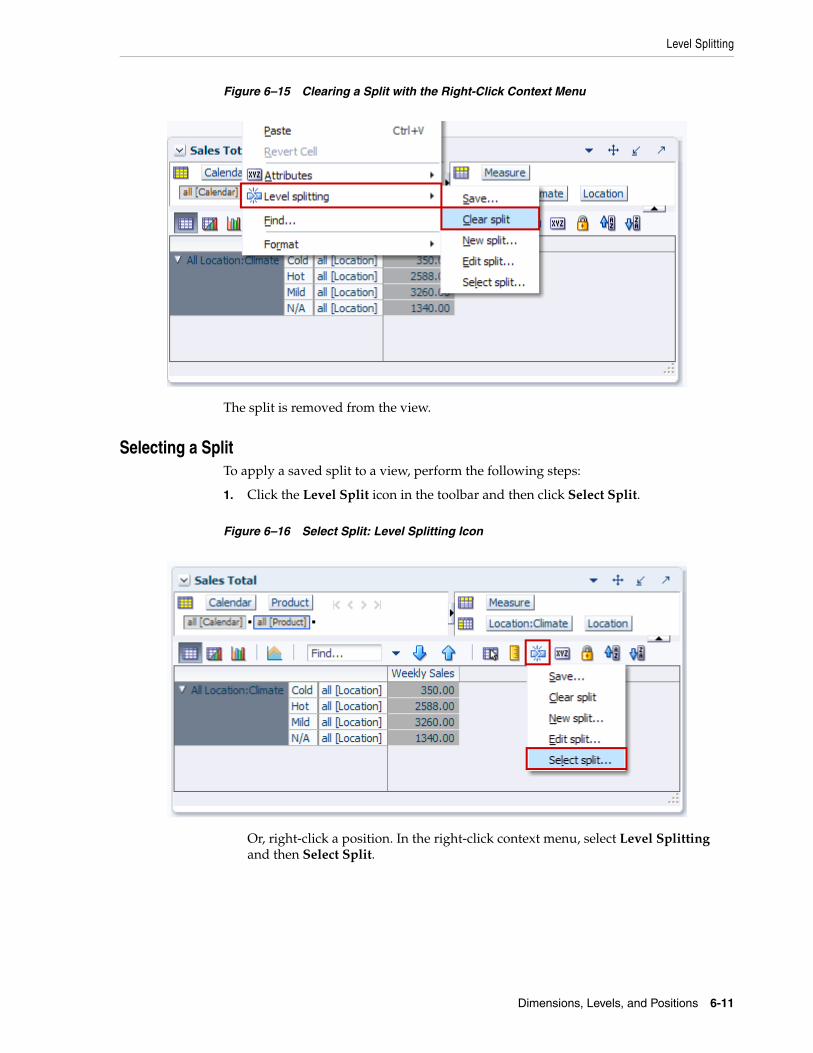
Level Splitting
Dimensions, Levels, and Positions 6-11
Figure 6–15 Clearing a Split with the Right-Click Context Menu
The split is removed from the view.
Selecting a SplitTo apply a saved split to a view, perform the following steps:
1. Click the Level Split icon in the toolbar and then click Select Split.
Figure 6–16 Select Split: Level Splitting Icon
Or, right-click a position. In the right-click context menu, select Level Splitting and then Select Split.
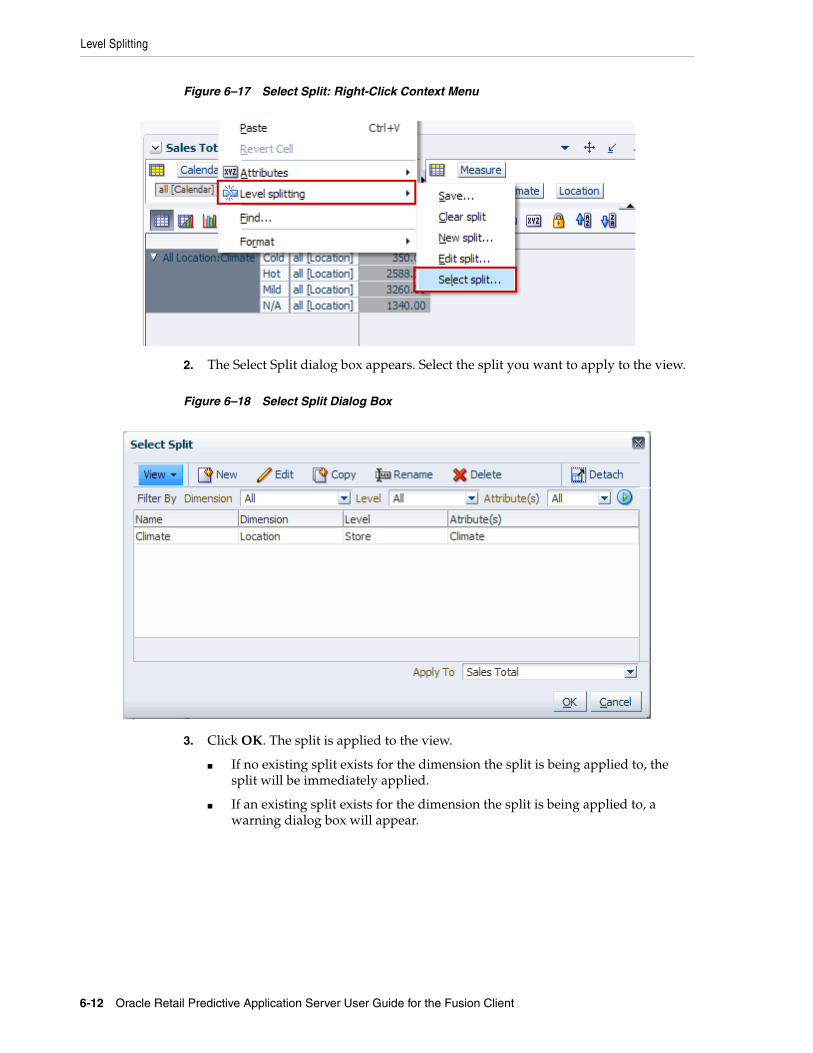
Level Splitting
6-12 Oracle Retail Predictive Application Server User Guide for the Fusion Client
Figure 6–17 Select Split: Right-Click Context Menu
2. The Select Split dialog box appears. Select the split you want to apply to the view.
Figure 6–18 Select Split Dialog Box
3. Click OK. The split is applied to the view.
■ If no existing split exists for the dimension the split is being applied to, the split will be immediately applied.
■ If an existing split exists for the dimension the split is being applied to, a warning dialog box will appear.
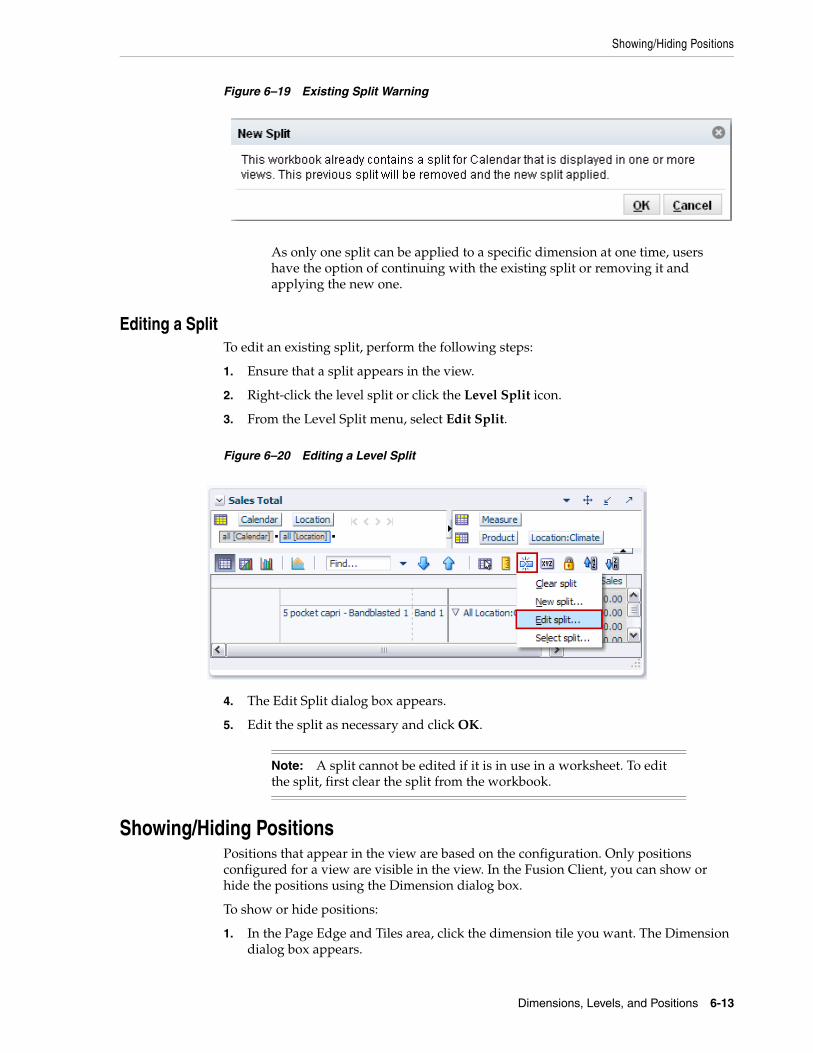
Showing/Hiding Positions
Dimensions, Levels, and Positions 6-13
Figure 6–19 Existing Split Warning
As only one split can be applied to a specific dimension at one time, users have the option of continuing with the existing split or removing it and applying the new one.
Editing a SplitTo edit an existing split, perform the following steps:
1. Ensure that a split appears in the view.
2. Right-click the level split or click the Level Split icon.
3. From the Level Split menu, select Edit Split.
Figure 6–20 Editing a Level Split
4. The Edit Split dialog box appears.
5. Edit the split as necessary and click OK.
Showing/Hiding PositionsPositions that appear in the view are based on the configuration. Only positions configured for a view are visible in the view. In the Fusion Client, you can show or hide the positions using the Dimension dialog box.
To show or hide positions:
1. In the Page Edge and Tiles area, click the dimension tile you want. The Dimension dialog box appears.
Note: A split cannot be edited if it is in use in a worksheet. To edit the split, first clear the split from the workbook.
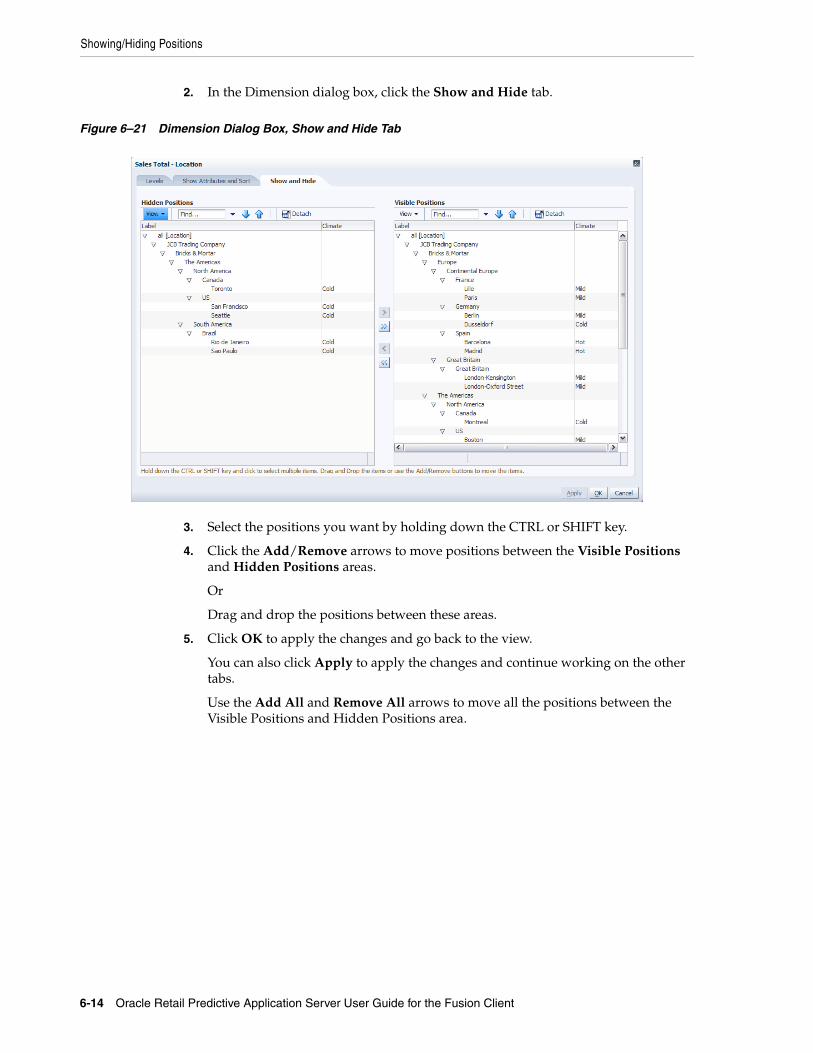
Showing/Hiding Positions
6-14 Oracle Retail Predictive Application Server User Guide for the Fusion Client
2. In the Dimension dialog box, click the Show and Hide tab.
Figure 6–21 Dimension Dialog Box, Show and Hide Tab
3. Select the positions you want by holding down the CTRL or SHIFT key.
4. Click the Add/Remove arrows to move positions between the Visible Positions and Hidden Positions areas.
Or
Drag and drop the positions between these areas.
5. Click OK to apply the changes and go back to the view.
You can also click Apply to apply the changes and continue working on the other tabs.
Use the Add All and Remove All arrows to move all the positions between the Visible Positions and Hidden Positions area.
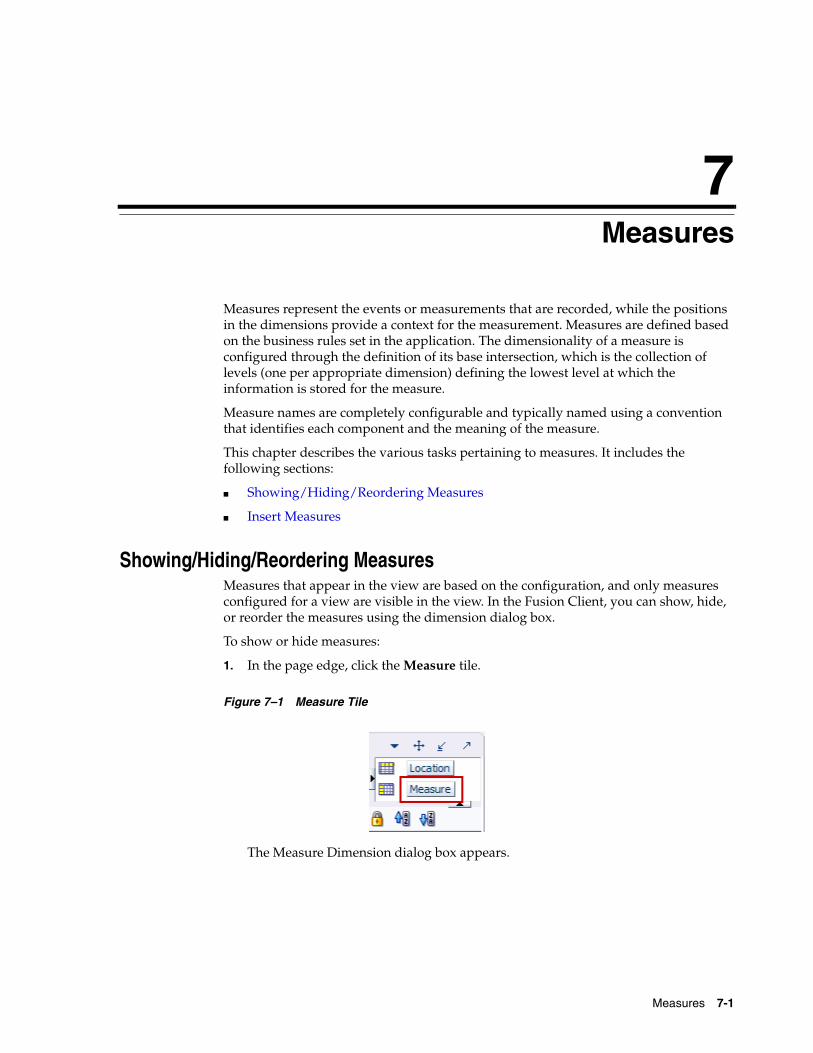
Measures 7-1
7Measures
Measures represent the events or measurements that are recorded, while the positions in the dimensions provide a context for the measurement. Measures are defined based on the business rules set in the application. The dimensionality of a measure is configured through the definition of its base intersection, which is the collection of levels (one per appropriate dimension) defining the lowest level at which the information is stored for the measure.
Measure names are completely configurable and typically named using a convention that identifies each component and the meaning of the measure.
This chapter describes the various tasks pertaining to measures. It includes the following sections:
■ Showing/Hiding/Reordering Measures
■ Insert Measures
Showing/Hiding/Reordering MeasuresMeasures that appear in the view are based on the configuration, and only measures configured for a view are visible in the view. In the Fusion Client, you can show, hide, or reorder the measures using the dimension dialog box.
To show or hide measures:
1. In the page edge, click the Measure tile.
Figure 7–1 Measure Tile
The Measure Dimension dialog box appears.

Showing/Hiding/Reordering Measures
7-2 Oracle Retail Predictive Application Server User Guide for the Fusion Client
Figure 7–2 Measure Dimension Dialog Box, Show and Hide Tab
2. On the Show and Hide tab, select the measures you want by holding down the Ctrl or Shift key.
3. Click the Add/Remove arrows to move measures between the Visible Measures and Hidden Measures areas.
Or, drag and drop the measures between these areas.
4. Click OK to apply the changes and go back to the view.
You can also click Apply to apply the changes and continue working on the other tabs. Use the Add All and Remove All arrows to move all the measures between the Visible Measures and Hidden Measures area.
To reorder measures:
■ On the Show and Hide tab, select the measures you want to reorder, and click the First, Up, Down, or Last arrows until you get the order you want.
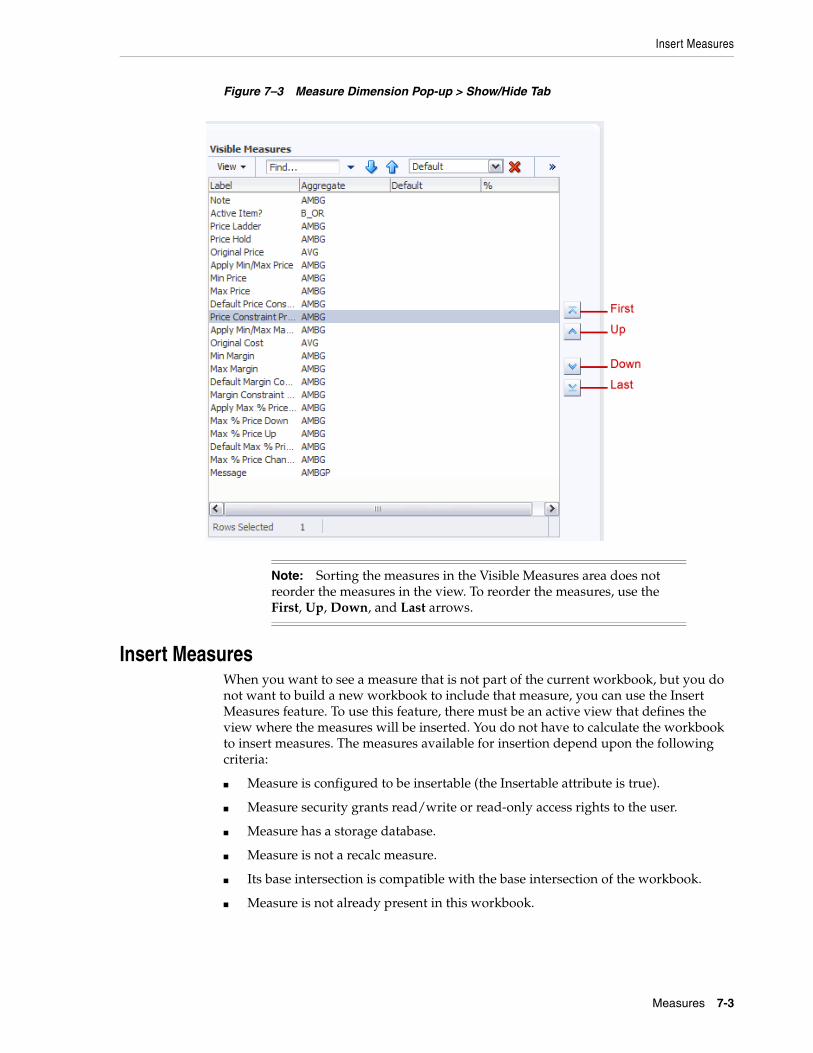
Insert Measures
Measures 7-3
Figure 7–3 Measure Dimension Pop-up > Show/Hide Tab
Insert MeasuresWhen you want to see a measure that is not part of the current workbook, but you do not want to build a new workbook to include that measure, you can use the Insert Measures feature. To use this feature, there must be an active view that defines the view where the measures will be inserted. You do not have to calculate the workbook to insert measures. The measures available for insertion depend upon the following criteria:
■ Measure is configured to be insertable (the Insertable attribute is true).
■ Measure security grants read/write or read-only access rights to the user.
■ Measure has a storage database.
■ Measure is not a recalc measure.
■ Its base intersection is compatible with the base intersection of the workbook.
■ Measure is not already present in this workbook.
Note: Sorting the measures in the Visible Measures area does not reorder the measures in the view. To reorder the measures, use the First, Up, Down, and Last arrows.
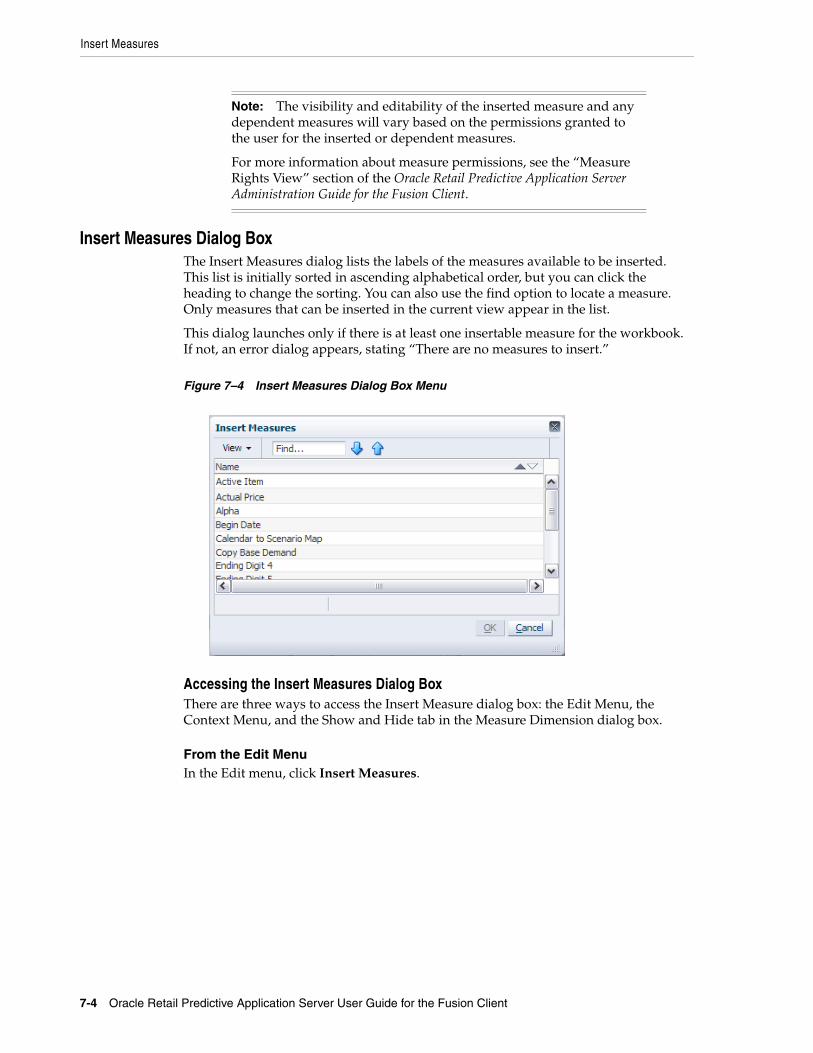
Insert Measures
7-4 Oracle Retail Predictive Application Server User Guide for the Fusion Client
Insert Measures Dialog BoxThe Insert Measures dialog lists the labels of the measures available to be inserted. This list is initially sorted in ascending alphabetical order, but you can click the heading to change the sorting. You can also use the find option to locate a measure. Only measures that can be inserted in the current view appear in the list.
This dialog launches only if there is at least one insertable measure for the workbook. If not, an error dialog appears, stating “There are no measures to insert.”
Figure 7–4 Insert Measures Dialog Box Menu
Accessing the Insert Measures Dialog BoxThere are three ways to access the Insert Measure dialog box: the Edit Menu, the Context Menu, and the Show and Hide tab in the Measure Dimension dialog box.
From the Edit MenuIn the Edit menu, click Insert Measures.
Note: The visibility and editability of the inserted measure and any dependent measures will vary based on the permissions granted to the user for the inserted or dependent measures.
For more information about measure permissions, see the “Measure Rights View” section of the Oracle Retail Predictive Application Server Administration Guide for the Fusion Client.
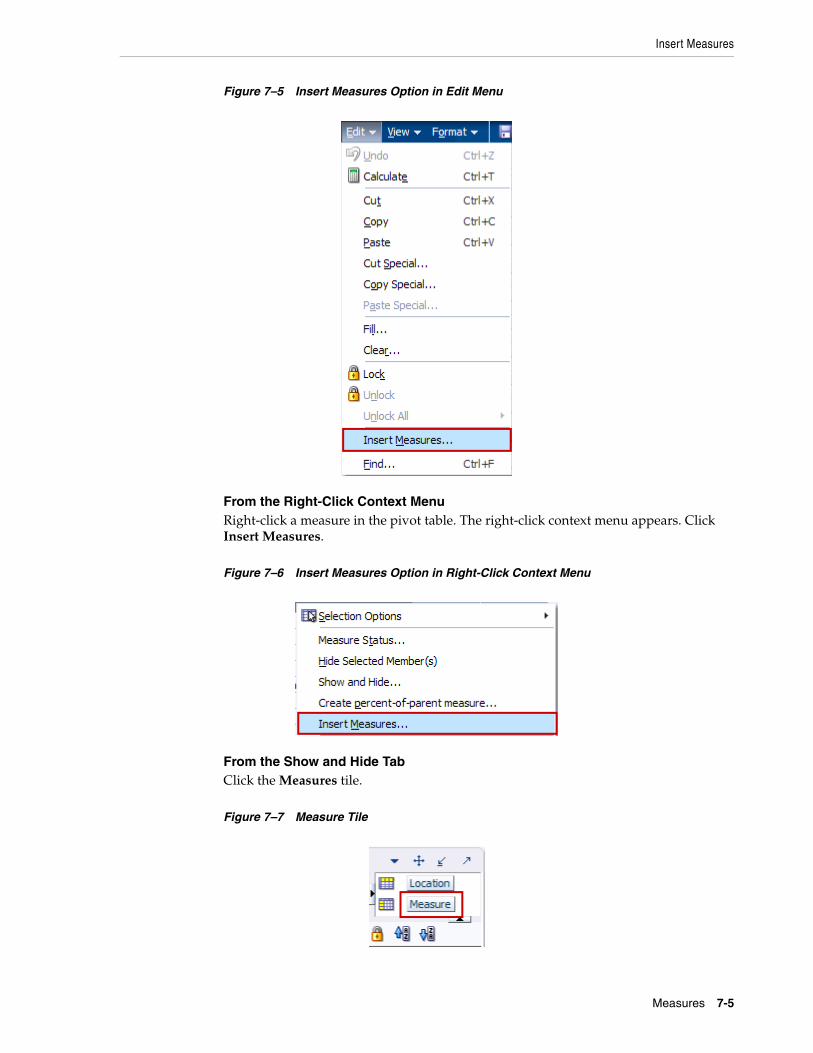
Insert Measures
Measures 7-5
Figure 7–5 Insert Measures Option in Edit Menu
From the Right-Click Context MenuRight-click a measure in the pivot table. The right-click context menu appears. Click Insert Measures.
Figure 7–6 Insert Measures Option in Right-Click Context Menu
From the Show and Hide TabClick the Measures tile.
Figure 7–7 Measure Tile

Insert Measures
7-6 Oracle Retail Predictive Application Server User Guide for the Fusion Client
The Measure Dimension dialog box appears. On the Show and Hide tab, click the Insert Measures icon.
Figure 7–8 Insert Measures Option on Show/Hide Tab
Inserting a MeasureTo insert a measure, perform the following steps:
1. Open the Insert Measures dialog box from the Edit menu, Context menu, or Show and Hide tab, as described in Accessing the Insert Measures Dialog Box.
2. In the Insert Measures dialog box, select the measure you want to insert.
To select more than one measure, hold the Ctrl key and click the measures. As the measures are selected, they become shaded.
3. Click OK.
The dialog box closes, and the selected measures are inserted in the workbook for the current view.
When inserting measures from the Show and Hide tab, you have the additional option of specifying where you want the measures to be inserted.
1. Click the Measure dimension tile. The Measure Dimension dialog box appears.
Figure 7–9 Measure Dimension Tile
2. On the Show and Hide tab, in the Visible Measures section, select the measure that you want the inserted measure to appear under.
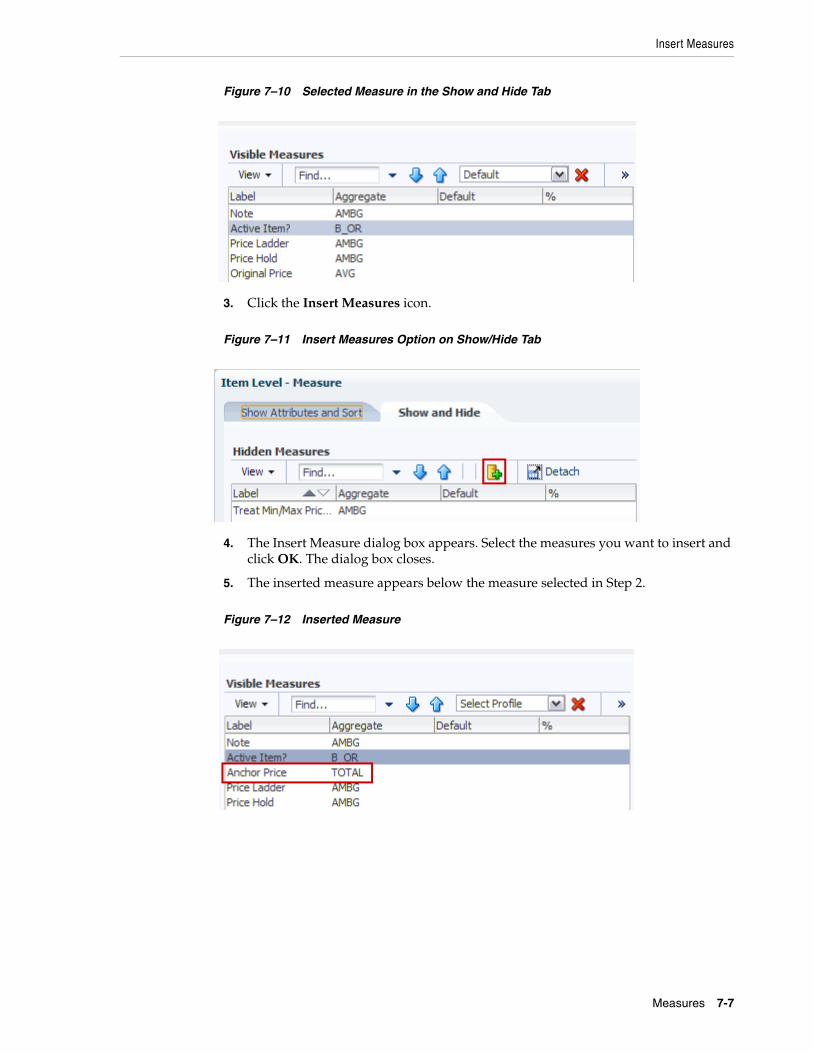
Insert Measures
Measures 7-7
Figure 7–10 Selected Measure in the Show and Hide Tab
3. Click the Insert Measures icon.
Figure 7–11 Insert Measures Option on Show/Hide Tab
4. The Insert Measure dialog box appears. Select the measures you want to insert and click OK. The dialog box closes.
5. The inserted measure appears below the measure selected in Step 2.
Figure 7–12 Inserted Measure
Insert Measures
7-8 Oracle Retail Predictive Application Server User Guide for the Fusion Client
About Inserted MeasuresHere are a few things you should know about inserted measures.
■ After measures are added to a particular view, they cannot be added to other views in the workbook. They do not appear in subsequent Insert Measures dialogs.
■ After a measure is added to a workbook, it cannot be deleted. The only way to revert the workbook is to close it without saving and open a previously saved version.
■ Each measure selected for insertion is added to the view and made visible.
■ If the inserted measure has dependent measures, those are inserted as well. Dependent measures are measures configured to act as upper or lower bounds of the inserted measure. If the dependent measures have dependent measures themselves, those measures are also inserted.
Dependent measures are inserted in the view but are not automatically made visible in the views. You can make them visible by moving them from the Hidden Measures section to the Visible Measures section in the Show and Hide tab of the Measure Dimension dialog box.
■ Inserted measures have only a load rule. Inserted measures with writable access can be edited within the workbook, but because they have no commit rule, the edits cannot be committed to the domain.
■ Inserted measures can be formatted, and that formatting can be saved to a template. However, the inserted measures are not added to the template and are not present when new workbooks are built. If measures are inserted later, they can still use the formatting saved in the template.
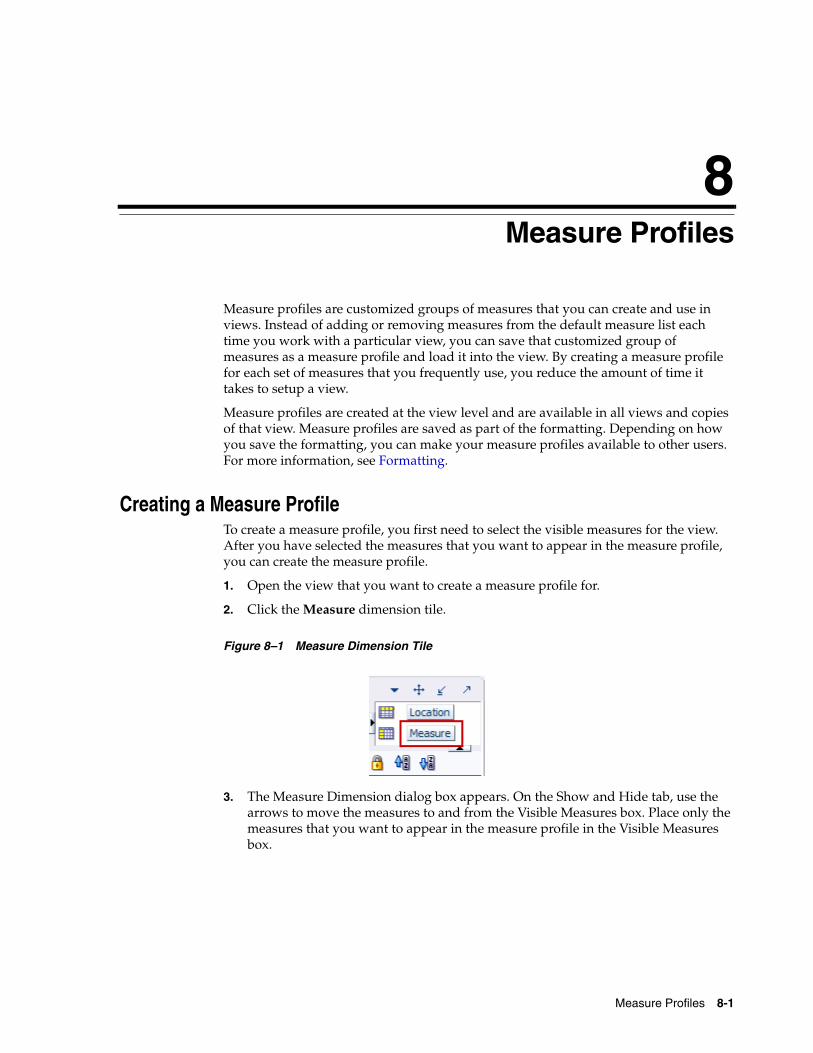
Measure Profiles 8-1
8Measure Profiles
Measure profiles are customized groups of measures that you can create and use in views. Instead of adding or removing measures from the default measure list each time you work with a particular view, you can save that customized group of measures as a measure profile and load it into the view. By creating a measure profile for each set of measures that you frequently use, you reduce the amount of time it takes to setup a view.
Measure profiles are created at the view level and are available in all views and copies of that view. Measure profiles are saved as part of the formatting. Depending on how you save the formatting, you can make your measure profiles available to other users. For more information, see Formatting.
Creating a Measure ProfileTo create a measure profile, you first need to select the visible measures for the view. After you have selected the measures that you want to appear in the measure profile, you can create the measure profile.
1. Open the view that you want to create a measure profile for.
2. Click the Measure dimension tile.
Figure 8–1 Measure Dimension Tile
3. The Measure Dimension dialog box appears. On the Show and Hide tab, use the arrows to move the measures to and from the Visible Measures box. Place only the measures that you want to appear in the measure profile in the Visible Measures box.
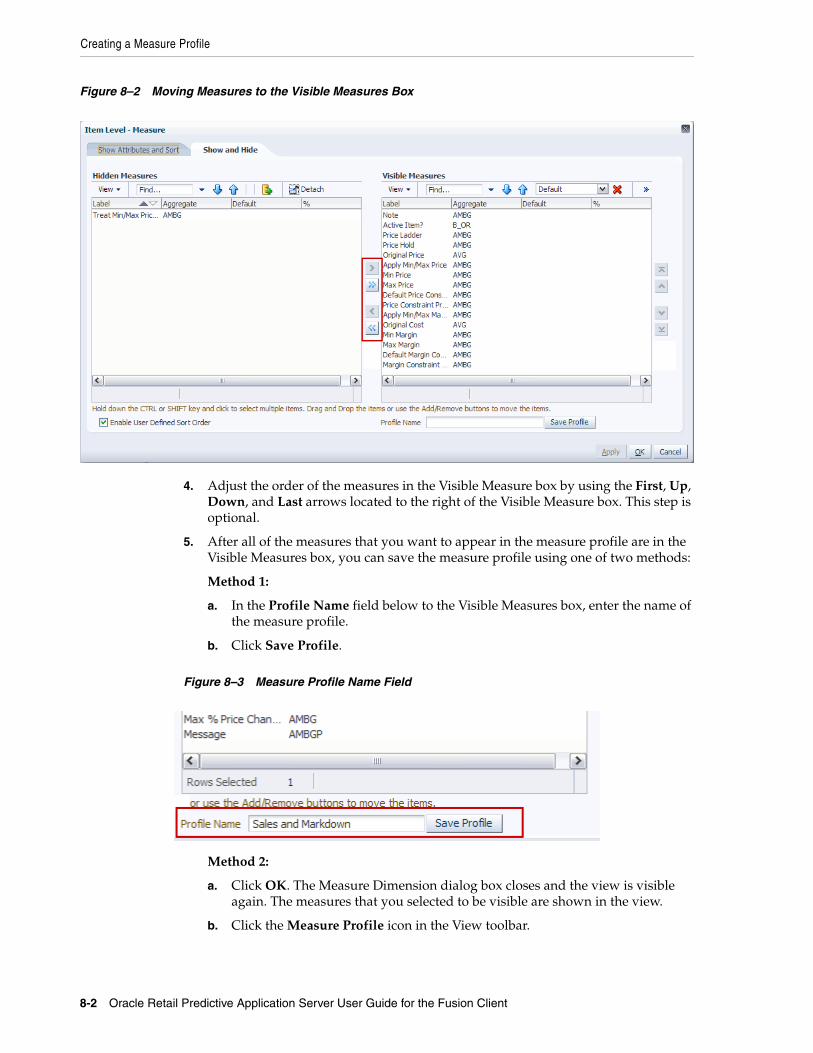
Creating a Measure Profile
8-2 Oracle Retail Predictive Application Server User Guide for the Fusion Client
Figure 8–2 Moving Measures to the Visible Measures Box
4. Adjust the order of the measures in the Visible Measure box by using the First, Up, Down, and Last arrows located to the right of the Visible Measure box. This step is optional.
5. After all of the measures that you want to appear in the measure profile are in the Visible Measures box, you can save the measure profile using one of two methods:
Method 1:
a. In the Profile Name field below to the Visible Measures box, enter the name of the measure profile.
b. Click Save Profile.
Figure 8–3 Measure Profile Name Field
Method 2:
a. Click OK. The Measure Dimension dialog box closes and the view is visible again. The measures that you selected to be visible are shown in the view.
b. Click the Measure Profile icon in the View toolbar.
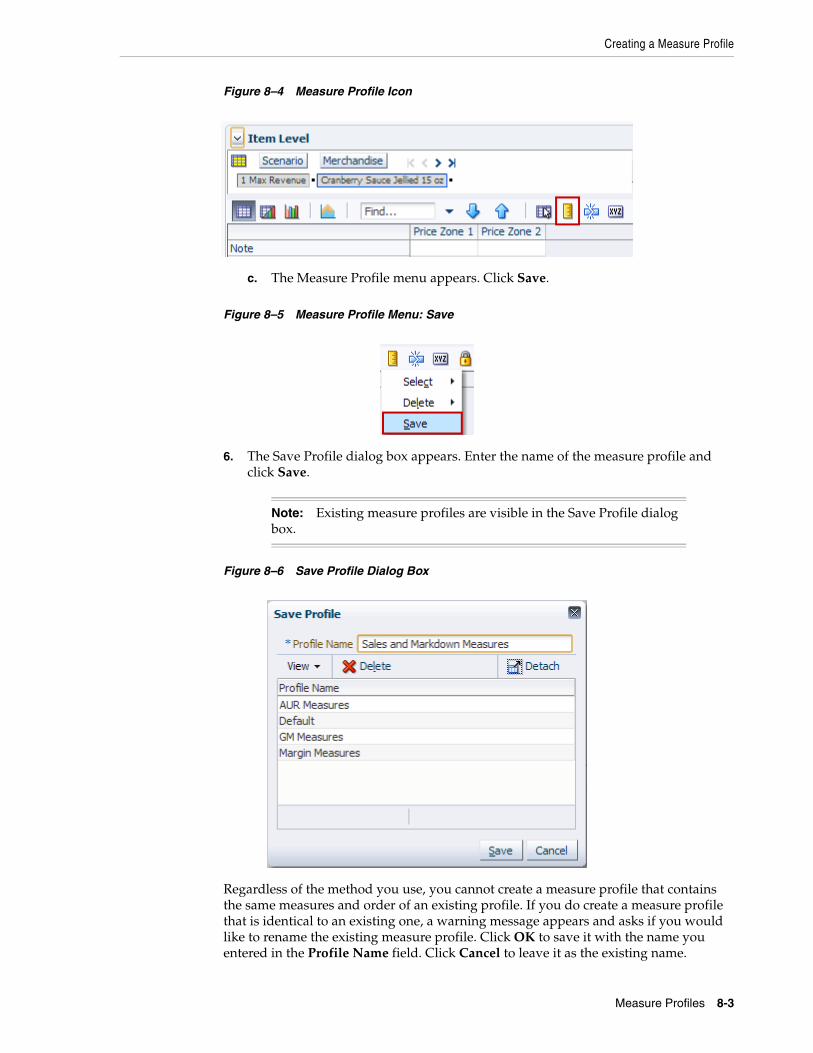
Creating a Measure Profile
Measure Profiles 8-3
Figure 8–4 Measure Profile Icon
c. The Measure Profile menu appears. Click Save.
Figure 8–5 Measure Profile Menu: Save
6. The Save Profile dialog box appears. Enter the name of the measure profile and click Save.
Figure 8–6 Save Profile Dialog Box
Regardless of the method you use, you cannot create a measure profile that contains the same measures and order of an existing profile. If you do create a measure profile that is identical to an existing one, a warning message appears and asks if you would like to rename the existing measure profile. Click OK to save it with the name you entered in the Profile Name field. Click Cancel to leave it as the existing name.
Note: Existing measure profiles are visible in the Save Profile dialog box.
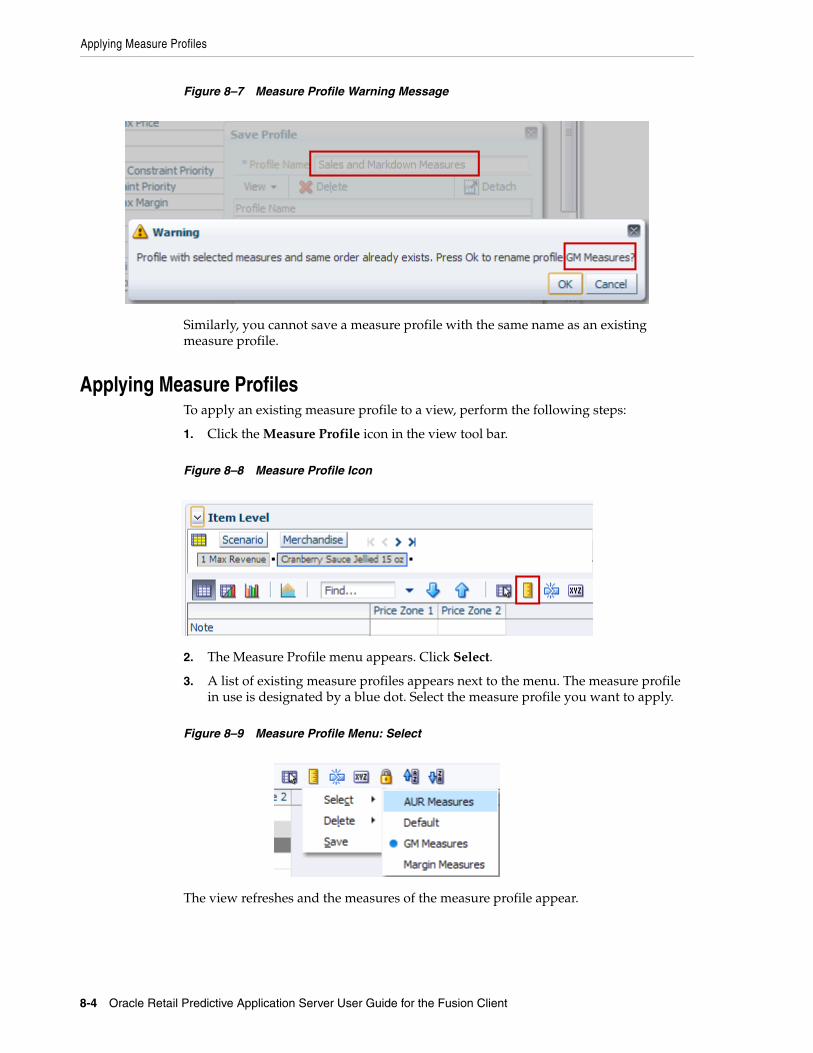
Applying Measure Profiles
8-4 Oracle Retail Predictive Application Server User Guide for the Fusion Client
Figure 8–7 Measure Profile Warning Message
Similarly, you cannot save a measure profile with the same name as an existing measure profile.
Applying Measure ProfilesTo apply an existing measure profile to a view, perform the following steps:
1. Click the Measure Profile icon in the view tool bar.
Figure 8–8 Measure Profile Icon
2. The Measure Profile menu appears. Click Select.
3. A list of existing measure profiles appears next to the menu. The measure profile in use is designated by a blue dot. Select the measure profile you want to apply.
Figure 8–9 Measure Profile Menu: Select
The view refreshes and the measures of the measure profile appear.
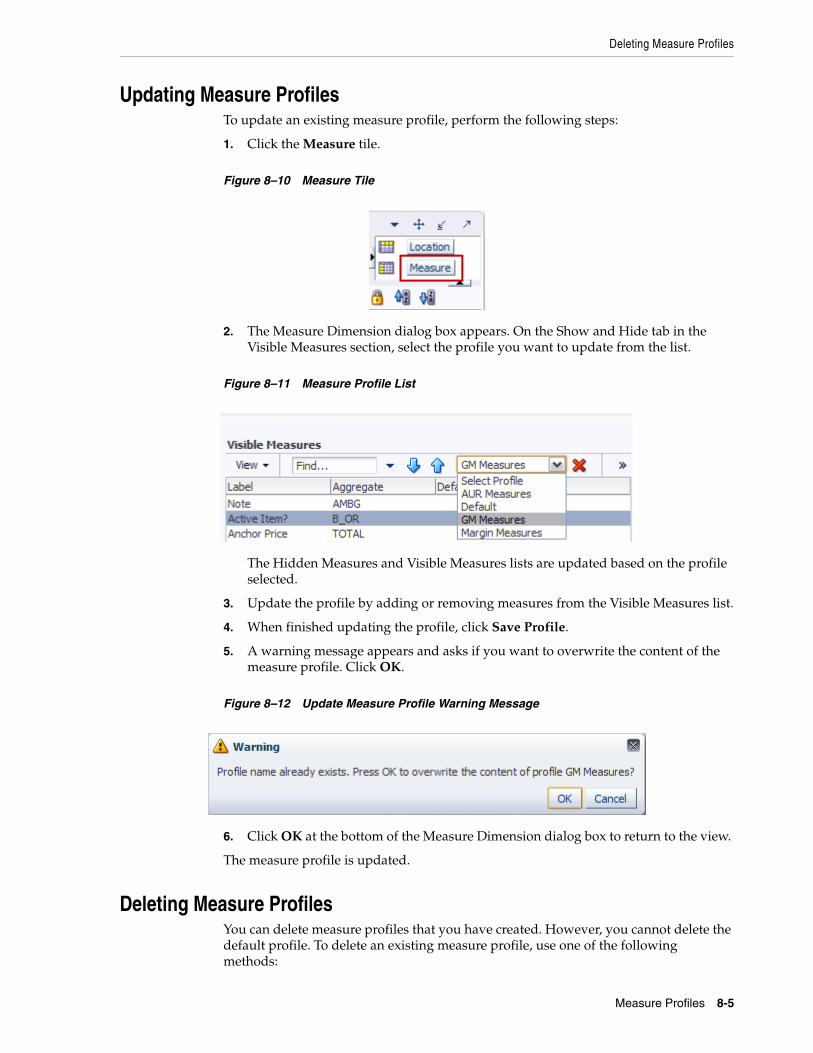
Deleting Measure Profiles
Measure Profiles 8-5
Updating Measure ProfilesTo update an existing measure profile, perform the following steps:
1. Click the Measure tile.
Figure 8–10 Measure Tile
2. The Measure Dimension dialog box appears. On the Show and Hide tab in the Visible Measures section, select the profile you want to update from the list.
Figure 8–11 Measure Profile List
The Hidden Measures and Visible Measures lists are updated based on the profile selected.
3. Update the profile by adding or removing measures from the Visible Measures list.
4. When finished updating the profile, click Save Profile.
5. A warning message appears and asks if you want to overwrite the content of the measure profile. Click OK.
Figure 8–12 Update Measure Profile Warning Message
6. Click OK at the bottom of the Measure Dimension dialog box to return to the view.
The measure profile is updated.
Deleting Measure ProfilesYou can delete measure profiles that you have created. However, you cannot delete the default profile. To delete an existing measure profile, use one of the following methods:
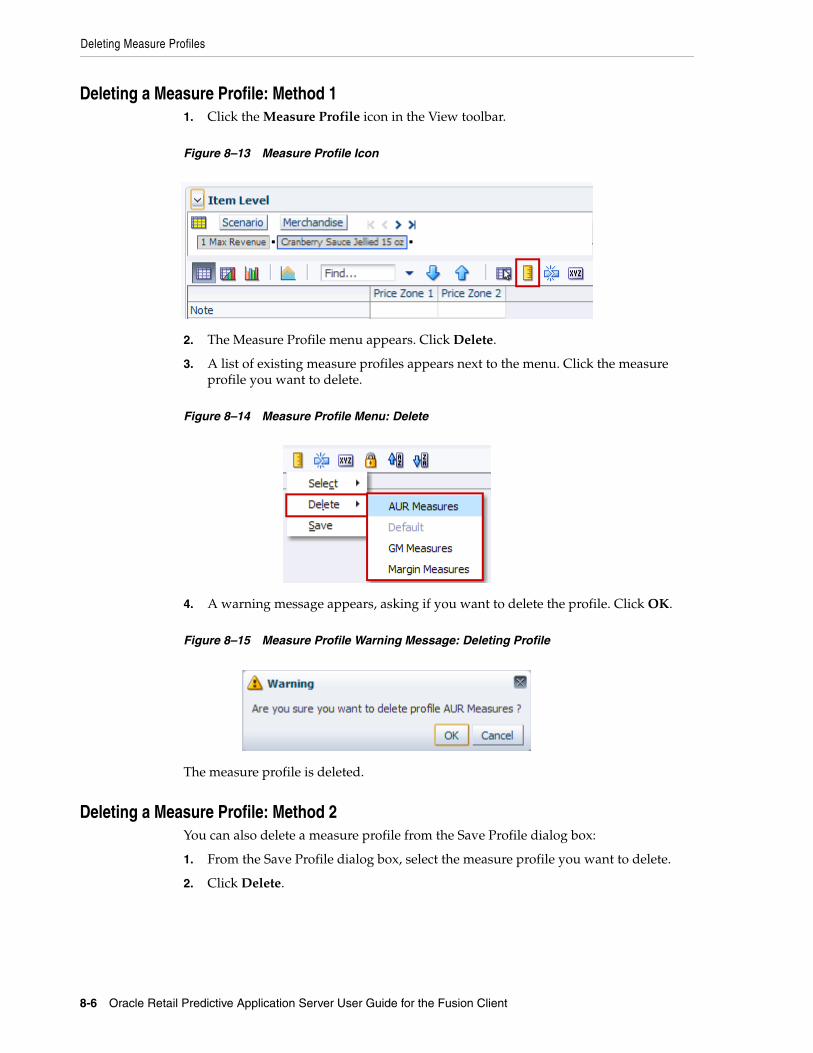
Deleting Measure Profiles
8-6 Oracle Retail Predictive Application Server User Guide for the Fusion Client
Deleting a Measure Profile: Method 11. Click the Measure Profile icon in the View toolbar.
Figure 8–13 Measure Profile Icon
2. The Measure Profile menu appears. Click Delete.
3. A list of existing measure profiles appears next to the menu. Click the measure profile you want to delete.
Figure 8–14 Measure Profile Menu: Delete
4. A warning message appears, asking if you want to delete the profile. Click OK.
Figure 8–15 Measure Profile Warning Message: Deleting Profile
The measure profile is deleted.
Deleting a Measure Profile: Method 2You can also delete a measure profile from the Save Profile dialog box:
1. From the Save Profile dialog box, select the measure profile you want to delete.
2. Click Delete.

Deleting Measure Profiles
Measure Profiles 8-7
Figure 8–16 Deleting from the Save Profile Dialog Box
3. A warning message appears, asking if you are sure you want to delete the profile. Click OK.
The measure profile is removed from the list.

Deleting Measure Profiles
8-8 Oracle Retail Predictive Application Server User Guide for the Fusion Client
Dynamic Position Maintenance 9-1
9Dynamic Position Maintenance
Dynamic Position Maintenance (DPM) enables users to dynamically add, edit, or remove positions to a non-calendar position while working in a workbook. These user-defined or informal positions are updated in both the domain and workbook dimensions. Positions added by the user are referred to as informal positions. Positions added during the load process are referred to as formal positions.
When an informal position is to be made formal, the position's name (label is not necessary for the update to occur) must first be updated to reflect the correct position name that will be loaded during the load process. Prior to the load, an administrative utility is run against the environment to change the status of a position from informal to formal (see the Oracle Retail Predictive Application Server Administration Guide for the Fusion Client for more information on the updateDpmPositionStatus utility). This process enables the loading and purging of that position through the hierarchy load process and disables further DPM activities on the position.
DPM Restrictions The following limitations for DPM exist:
■ You cannot add a dynamic position to the calendar dimension. Due to the rolling nature of calculations for measures, were you to add a position to the calendar dimension, data for those measures and other measures that depend on them would be inconsistent.
■ In a global domain environment, the DPM process cannot be used for maintaining positions at or above the partition level. For example, if a global domain is partitioned by department that rolls up to division, you cannot use DPM functionality to add informal departments or divisions.
■ In a global domain environment, the DPM process cannot be initiated from workbooks in the master domain.
When you creating a workbook for this purpose, pay attention to the “master domain” warning in the Select Domain dialog. When opening, look at the “Domain Type” column in the open dialog. This can steer you clear of master domains.
Note: Access to the DPM menus and dimensions that DPM functionality can be applied is determined in the solution and workbook configuration (see the Oracle Retail Predictive Application Server Configuration Tools User Guide for more information on enabling DPM functionality).

Add New Positions to a Dimension
9-2 Oracle Retail Predictive Application Server User Guide for the Fusion Client
■ Positions from alternate dimensions that are not already in the workbook cannot be imported into the workbook to be used as parents for new DPM positions.
■ DPM cannot be performed in a master domain.
Add New Positions to a DimensionTo add new positions to a dimension, perform the following steps:
1. From the Edit menu, select Position Maintenance and then the dimension to which you want to add a dynamic position.
Figure 9–1 Position Maintenance Option in Edit Menu
Or, right-click the position level to which you want to add a new position. The right-click context menu appears. Select Position Maintenance and then select Add Position.
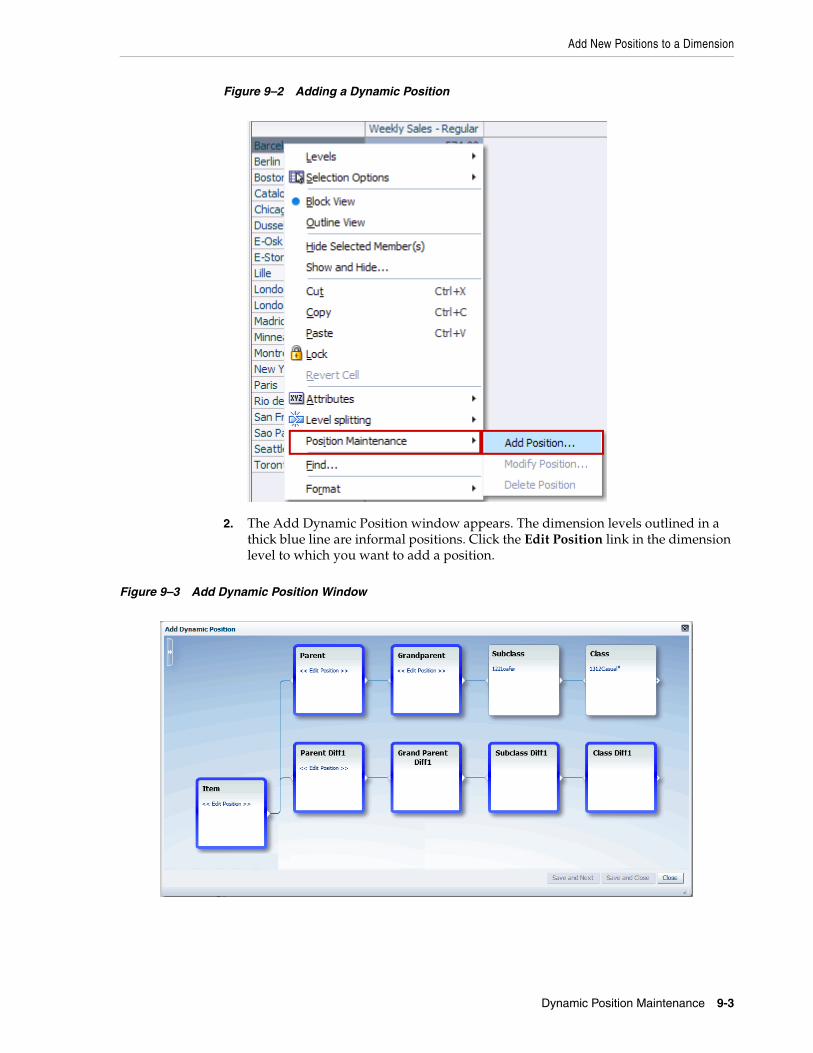
Add New Positions to a Dimension
Dynamic Position Maintenance 9-3
Figure 9–2 Adding a Dynamic Position
2. The Add Dynamic Position window appears. The dimension levels outlined in a thick blue line are informal positions. Click the Edit Position link in the dimension level to which you want to add a position.
Figure 9–3 Add Dynamic Position Window
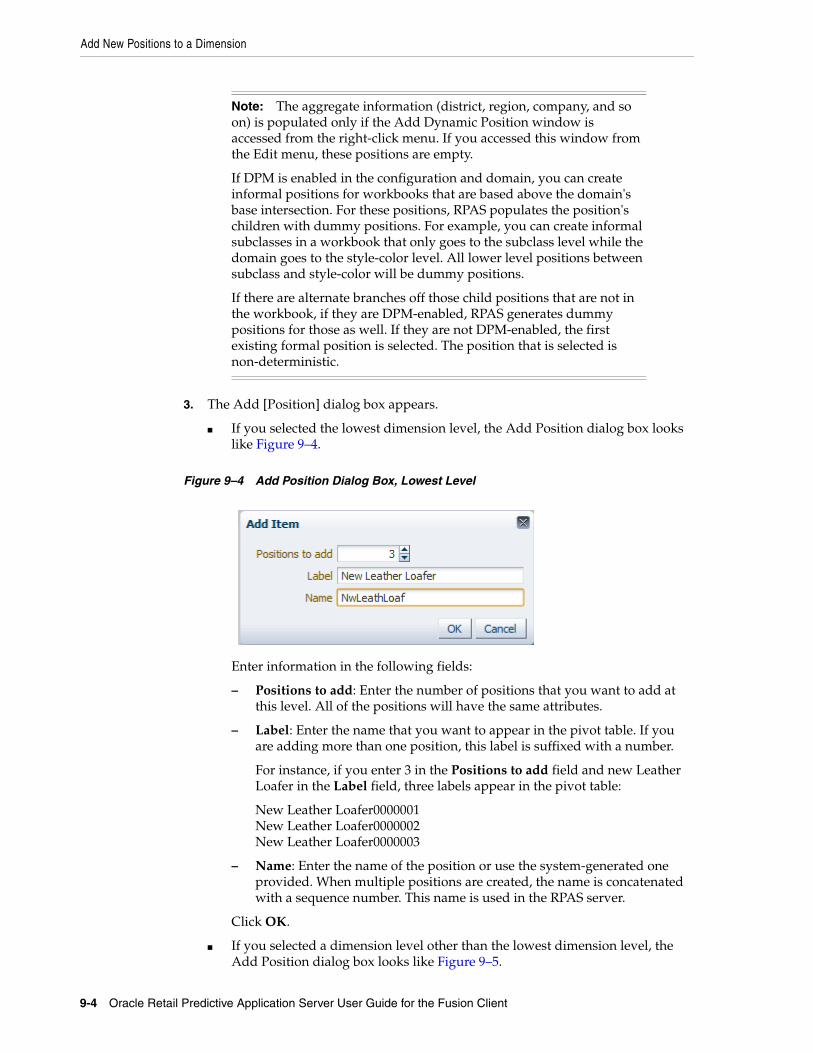
Add New Positions to a Dimension
9-4 Oracle Retail Predictive Application Server User Guide for the Fusion Client
3. The Add [Position] dialog box appears.
■ If you selected the lowest dimension level, the Add Position dialog box looks like Figure 9–4.
Figure 9–4 Add Position Dialog Box, Lowest Level
Enter information in the following fields:
– Positions to add: Enter the number of positions that you want to add at this level. All of the positions will have the same attributes.
– Label: Enter the name that you want to appear in the pivot table. If you are adding more than one position, this label is suffixed with a number.
For instance, if you enter 3 in the Positions to add field and new Leather Loafer in the Label field, three labels appear in the pivot table:
New Leather Loafer0000001New Leather Loafer0000002New Leather Loafer0000003
– Name: Enter the name of the position or use the system-generated one provided. When multiple positions are created, the name is concatenated with a sequence number. This name is used in the RPAS server.
Click OK.
■ If you selected a dimension level other than the lowest dimension level, the Add Position dialog box looks like Figure 9–5.
Note: The aggregate information (district, region, company, and so on) is populated only if the Add Dynamic Position window is accessed from the right-click menu. If you accessed this window from the Edit menu, these positions are empty.
If DPM is enabled in the configuration and domain, you can create informal positions for workbooks that are based above the domain's base intersection. For these positions, RPAS populates the position's children with dummy positions. For example, you can create informal subclasses in a workbook that only goes to the subclass level while the domain goes to the style-color level. All lower level positions between subclass and style-color will be dummy positions.
If there are alternate branches off those child positions that are not in the workbook, if they are DPM-enabled, RPAS generates dummy positions for those as well. If they are not DPM-enabled, the first existing formal position is selected. The position that is selected is non-deterministic.
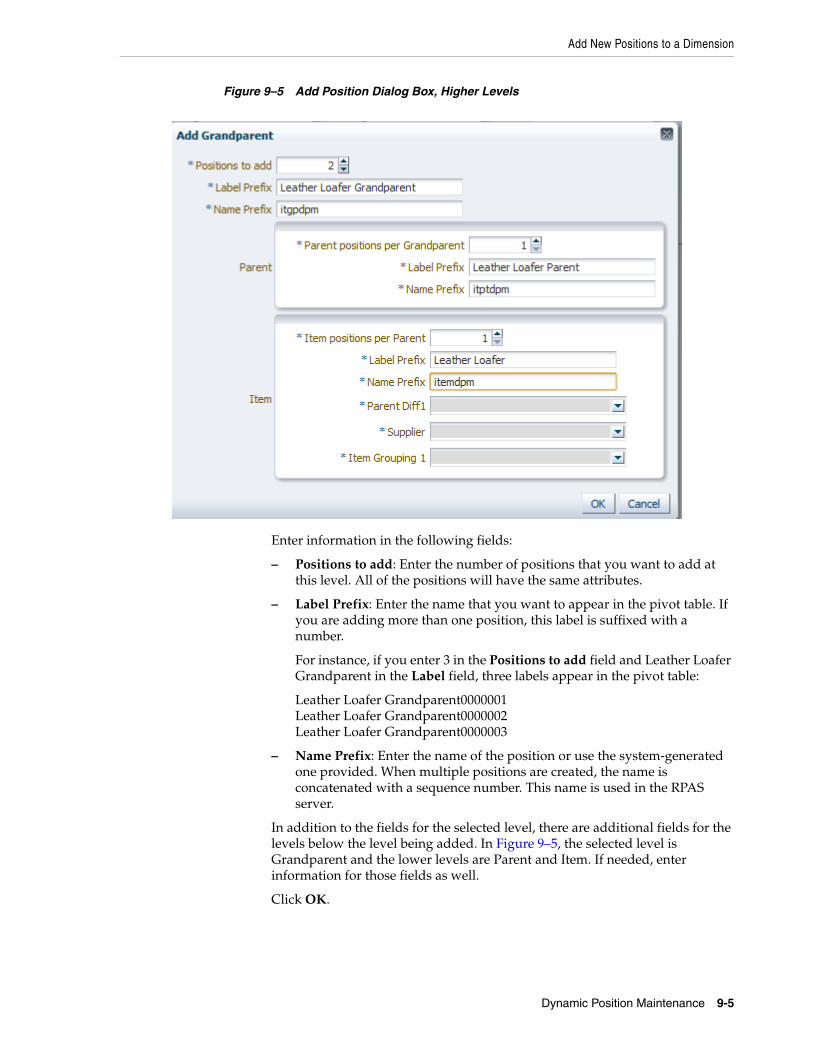
Add New Positions to a Dimension
Dynamic Position Maintenance 9-5
Figure 9–5 Add Position Dialog Box, Higher Levels
Enter information in the following fields:
– Positions to add: Enter the number of positions that you want to add at this level. All of the positions will have the same attributes.
– Label Prefix: Enter the name that you want to appear in the pivot table. If you are adding more than one position, this label is suffixed with a number.
For instance, if you enter 3 in the Positions to add field and Leather Loafer Grandparent in the Label field, three labels appear in the pivot table:
Leather Loafer Grandparent0000001Leather Loafer Grandparent0000002Leather Loafer Grandparent0000003
– Name Prefix: Enter the name of the position or use the system-generated one provided. When multiple positions are created, the name is concatenated with a sequence number. This name is used in the RPAS server.
In addition to the fields for the selected level, there are additional fields for the levels below the level being added. In Figure 9–5, the selected level is Grandparent and the lower levels are Parent and Item. If needed, enter information for those fields as well.
Click OK.

Add New Positions to a Dimension
9-6 Oracle Retail Predictive Application Server User Guide for the Fusion Client
4. The Add Dynamic Position window refreshes with the new positions shown in the selected dimension level.
Figure 9–6 Added Dynamic Position
5. Modify the parent levels of the new positions. You can select an existing parent level or create a new (dynamic) one. To do either, click the link in a level above the new position.
Figure 9–7 Modifying the Parent Level
Notes: If there are alternate hierarchies, the value can either be selected or added as new if the alternate hierarchy supports dynamic positions.
After multiple positions are added for a level in the position tree, the levels above that level can only support single position add or edit.
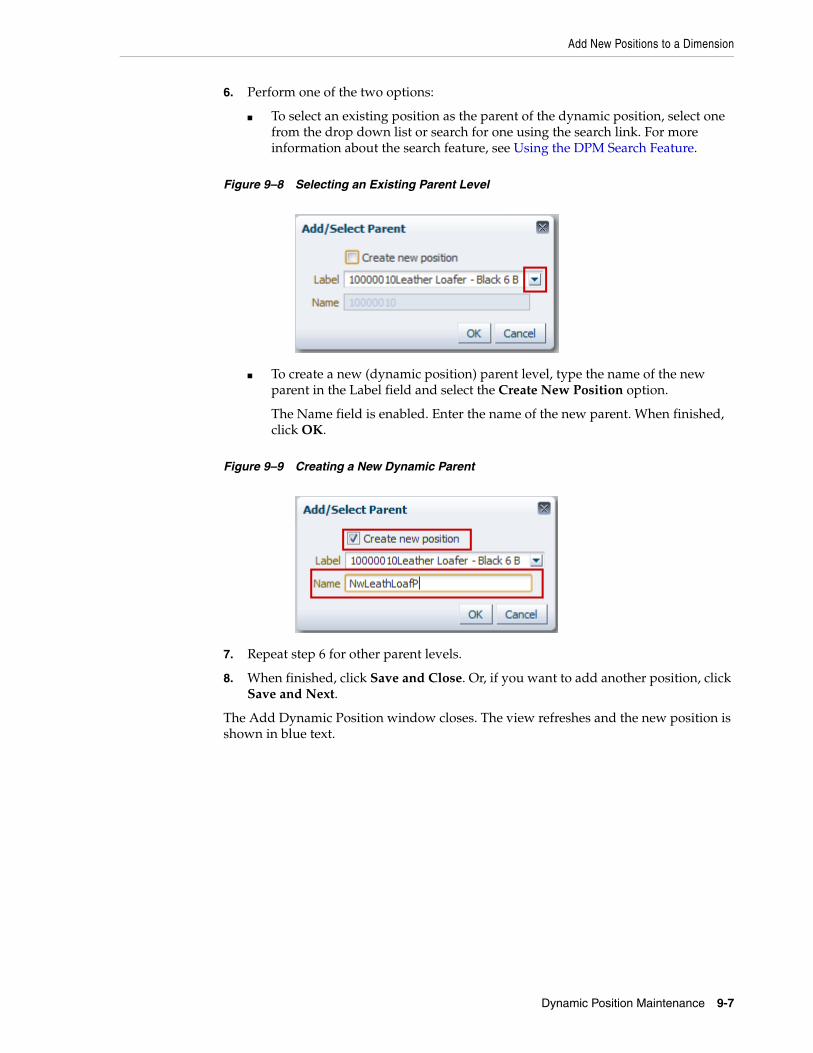
Add New Positions to a Dimension
Dynamic Position Maintenance 9-7
6. Perform one of the two options:
■ To select an existing position as the parent of the dynamic position, select one from the drop down list or search for one using the search link. For more information about the search feature, see Using the DPM Search Feature.
Figure 9–8 Selecting an Existing Parent Level
■ To create a new (dynamic position) parent level, type the name of the new parent in the Label field and select the Create New Position option.
The Name field is enabled. Enter the name of the new parent. When finished, click OK.
Figure 9–9 Creating a New Dynamic Parent
7. Repeat step 6 for other parent levels.
8. When finished, click Save and Close. Or, if you want to add another position, click Save and Next.
The Add Dynamic Position window closes. The view refreshes and the new position is shown in blue text.

Modify an Informal Position
9-8 Oracle Retail Predictive Application Server User Guide for the Fusion Client
Figure 9–10 New Dynamic Position in View
Modify an Informal Position After dynamic positions are added to the hierarchy, the DPM process allows you to:
■ Change the parent of a dynamic position to a different formal or dynamic parent.
■ Update the position name and position label.
1. Right-click the dynamic position you want to modify.
2. From the right-click menu, select Position Maintenance, then Modify Position.
Note: If the active view has a PQD and the Automatically Evaluate Position Queries option is enabled, the newly created position may not appear in the view if its default value is set to false.
Note: Only dynamic positions can be modified using the DPM feature. The Modify menu is not visible if there are no dynamic positions in the workbook.
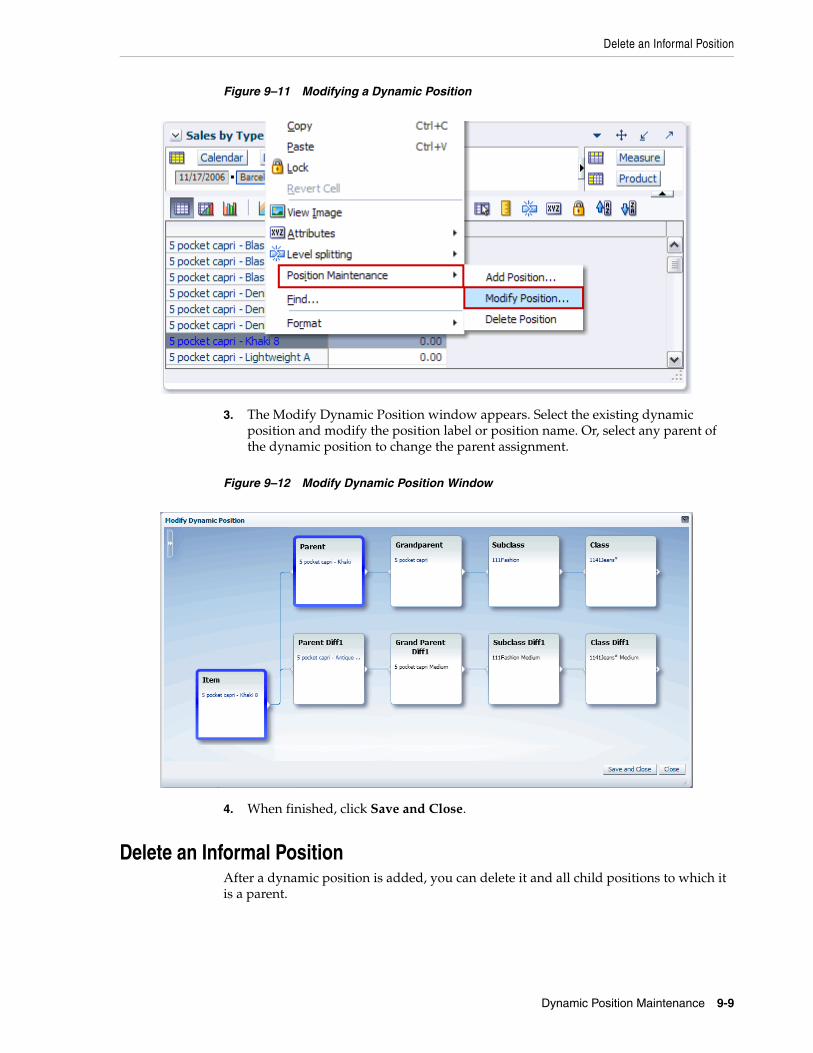
Delete an Informal Position
Dynamic Position Maintenance 9-9
Figure 9–11 Modifying a Dynamic Position
3. The Modify Dynamic Position window appears. Select the existing dynamic position and modify the position label or position name. Or, select any parent of the dynamic position to change the parent assignment.
Figure 9–12 Modify Dynamic Position Window
4. When finished, click Save and Close.
Delete an Informal PositionAfter a dynamic position is added, you can delete it and all child positions to which it is a parent.
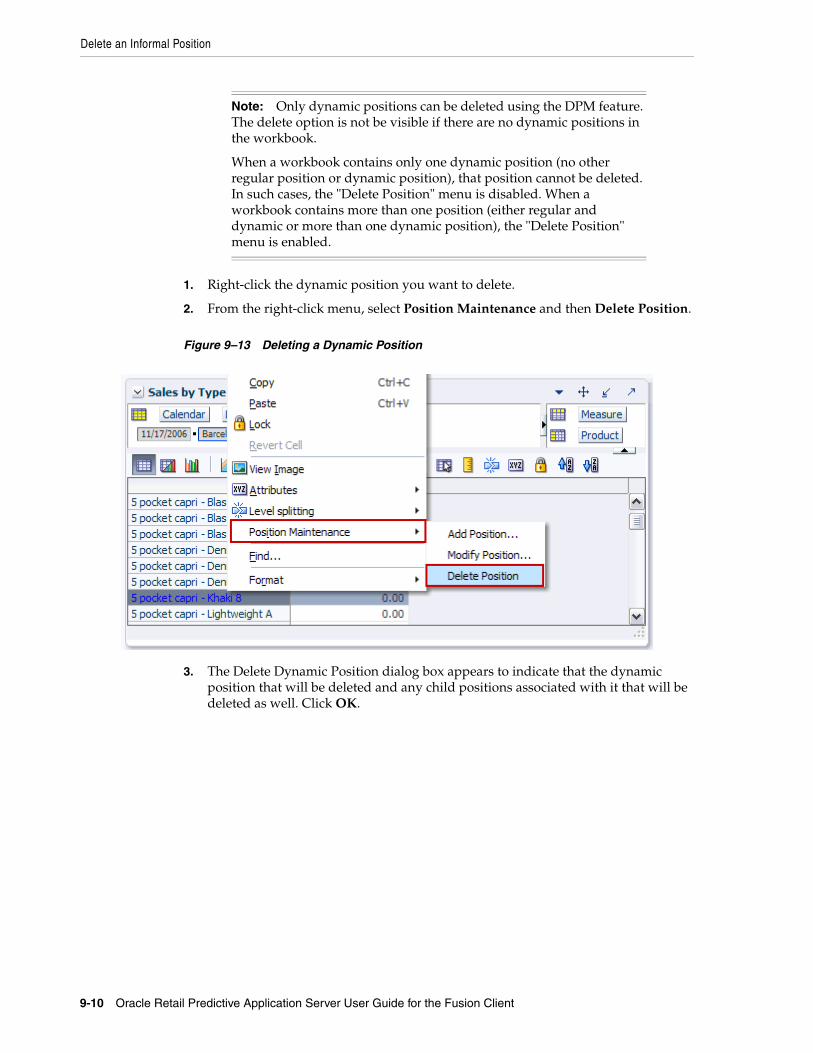
Delete an Informal Position
9-10 Oracle Retail Predictive Application Server User Guide for the Fusion Client
1. Right-click the dynamic position you want to delete.
2. From the right-click menu, select Position Maintenance and then Delete Position.
Figure 9–13 Deleting a Dynamic Position
3. The Delete Dynamic Position dialog box appears to indicate that the dynamic position that will be deleted and any child positions associated with it that will be deleted as well. Click OK.
Note: Only dynamic positions can be deleted using the DPM feature. The delete option is not be visible if there are no dynamic positions in the workbook.
When a workbook contains only one dynamic position (no other regular position or dynamic position), that position cannot be deleted. In such cases, the "Delete Position" menu is disabled. When a workbook contains more than one position (either regular and dynamic or more than one dynamic position), the "Delete Position" menu is enabled.
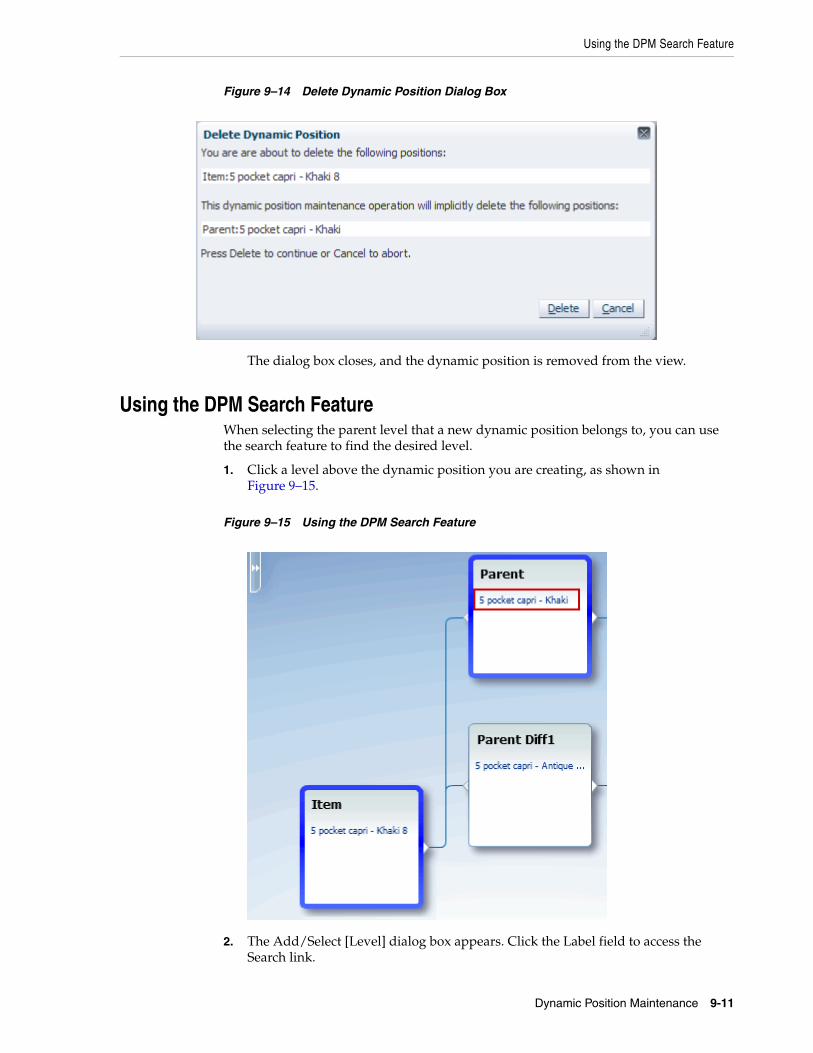
Using the DPM Search Feature
Dynamic Position Maintenance 9-11
Figure 9–14 Delete Dynamic Position Dialog Box
The dialog box closes, and the dynamic position is removed from the view.
Using the DPM Search FeatureWhen selecting the parent level that a new dynamic position belongs to, you can use the search feature to find the desired level.
1. Click a level above the dynamic position you are creating, as shown in Figure 9–15.
Figure 9–15 Using the DPM Search Feature
2. The Add/Select [Level] dialog box appears. Click the Label field to access the Search link.
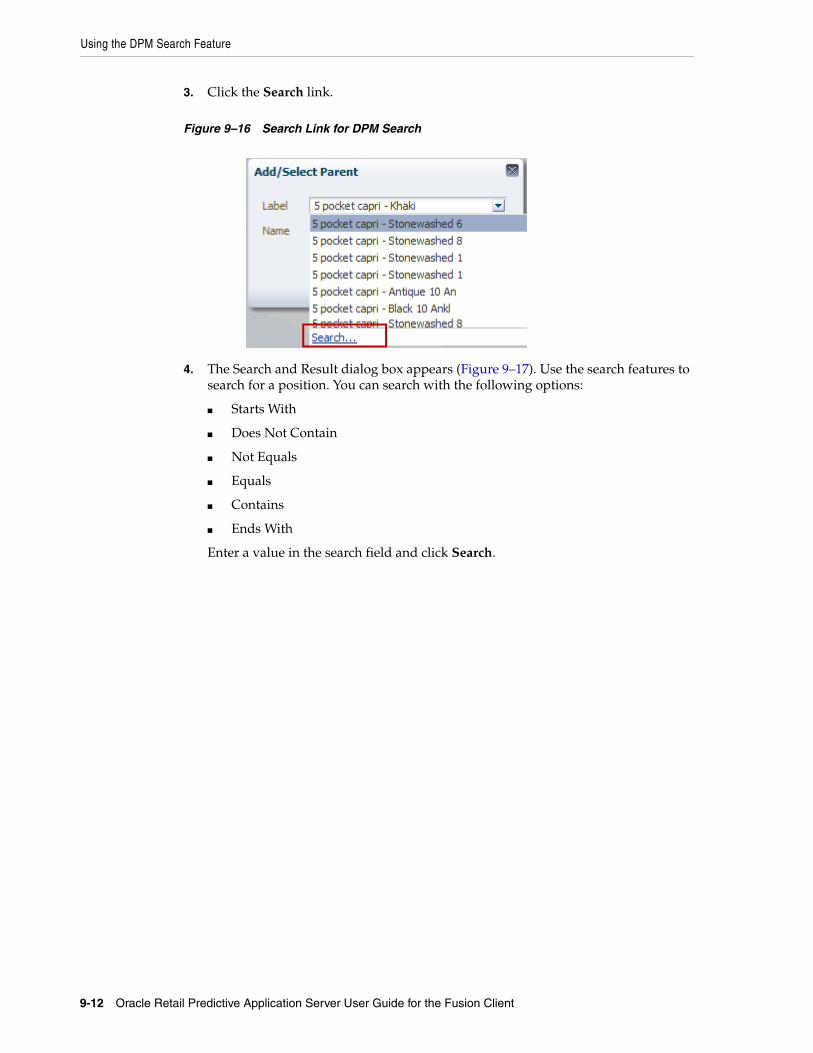
Using the DPM Search Feature
9-12 Oracle Retail Predictive Application Server User Guide for the Fusion Client
3. Click the Search link.
Figure 9–16 Search Link for DPM Search
4. The Search and Result dialog box appears (Figure 9–17). Use the search features to search for a position. You can search with the following options:
■ Starts With
■ Does Not Contain
■ Not Equals
■ Equals
■ Contains
■ Ends With
Enter a value in the search field and click Search.
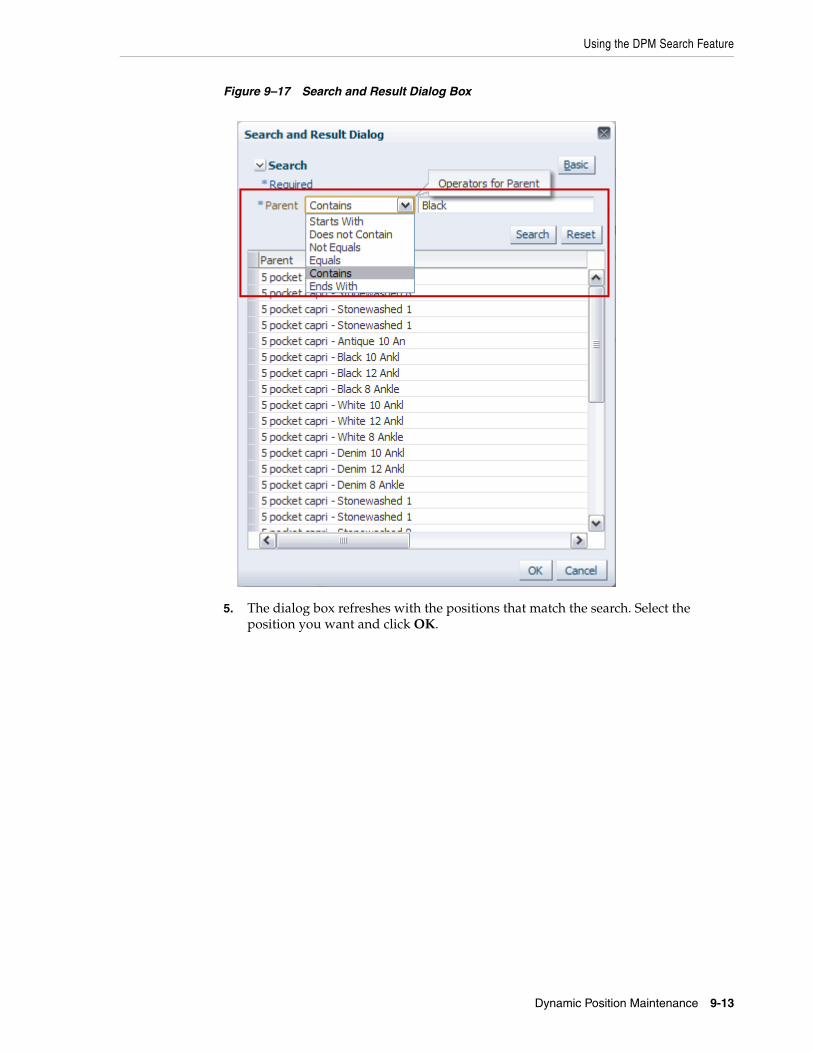
Using the DPM Search Feature
Dynamic Position Maintenance 9-13
Figure 9–17 Search and Result Dialog Box
5. The dialog box refreshes with the positions that match the search. Select the position you want and click OK.
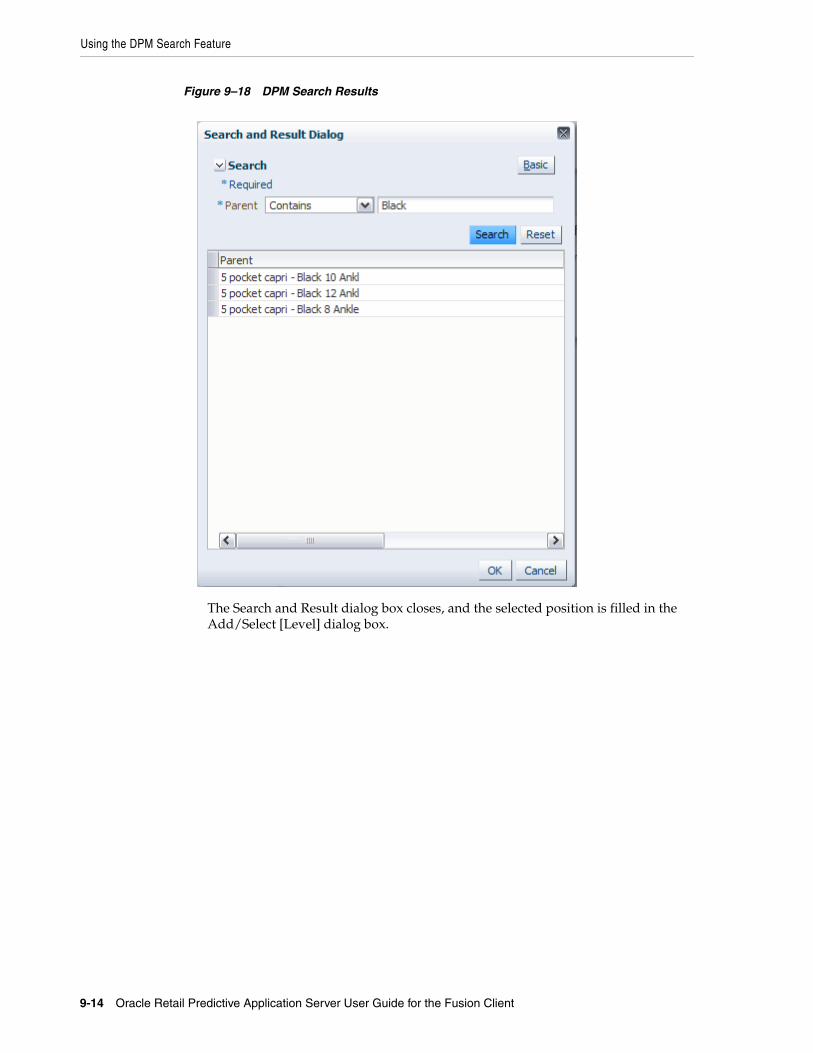
Using the DPM Search Feature
9-14 Oracle Retail Predictive Application Server User Guide for the Fusion Client
Figure 9–18 DPM Search Results
The Search and Result dialog box closes, and the selected position is filled in the Add/Select [Level] dialog box.
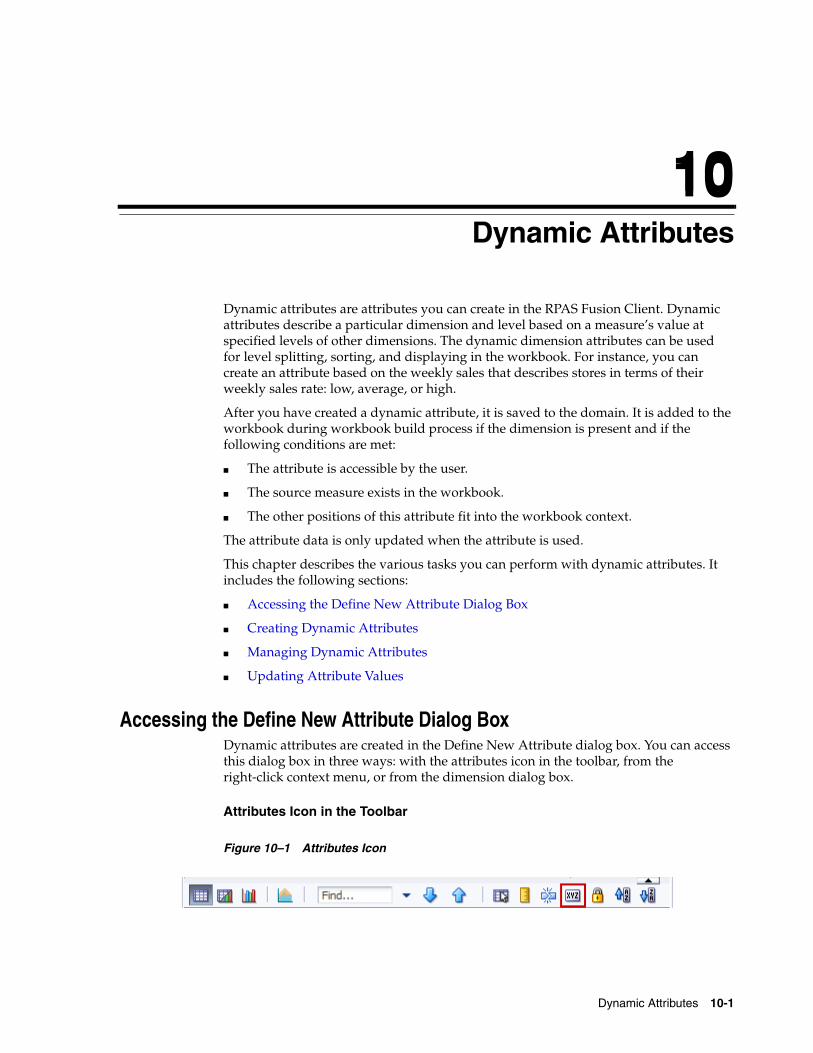
10
Dynamic Attributes 10-1
10Dynamic Attributes
Dynamic attributes are attributes you can create in the RPAS Fusion Client. Dynamic attributes describe a particular dimension and level based on a measure’s value at specified levels of other dimensions. The dynamic dimension attributes can be used for level splitting, sorting, and displaying in the workbook. For instance, you can create an attribute based on the weekly sales that describes stores in terms of their weekly sales rate: low, average, or high.
After you have created a dynamic attribute, it is saved to the domain. It is added to the workbook during workbook build process if the dimension is present and if the following conditions are met:
■ The attribute is accessible by the user.
■ The source measure exists in the workbook.
■ The other positions of this attribute fit into the workbook context.
The attribute data is only updated when the attribute is used.
This chapter describes the various tasks you can perform with dynamic attributes. It includes the following sections:
■ Accessing the Define New Attribute Dialog Box
■ Creating Dynamic Attributes
■ Managing Dynamic Attributes
■ Updating Attribute Values
Accessing the Define New Attribute Dialog BoxDynamic attributes are created in the Define New Attribute dialog box. You can access this dialog box in three ways: with the attributes icon in the toolbar, from the right-click context menu, or from the dimension dialog box.
Attributes Icon in the Toolbar
Figure 10–1 Attributes Icon
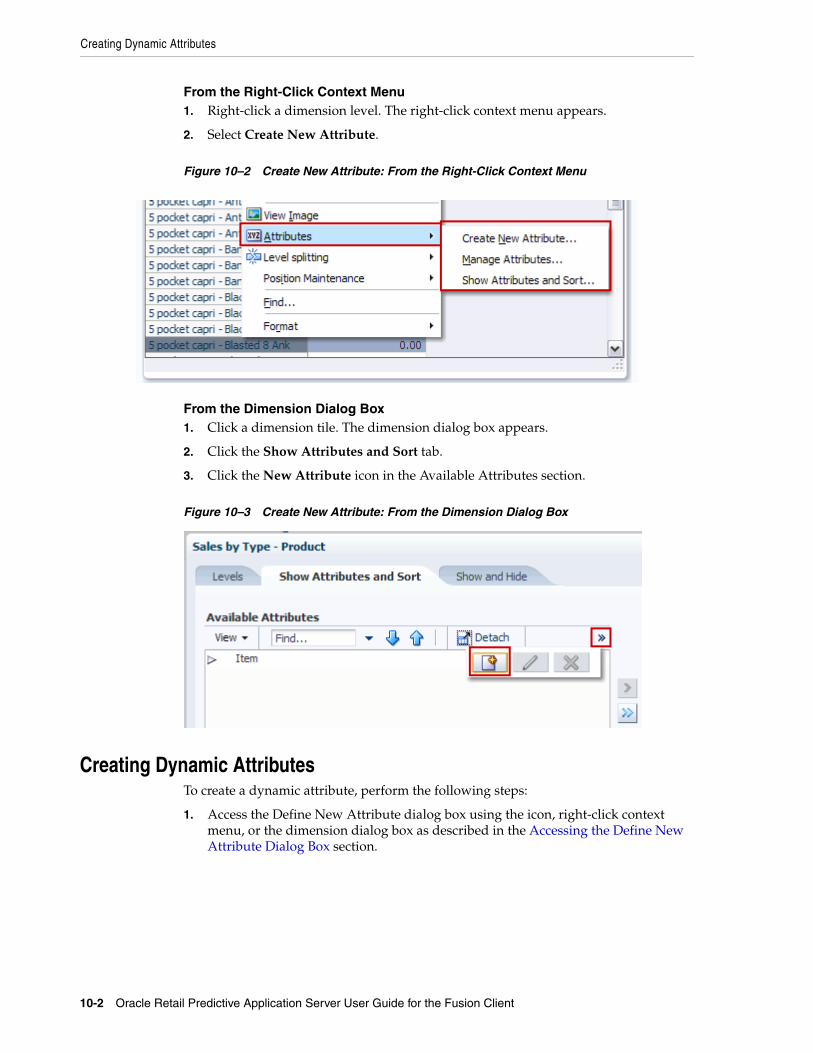
Creating Dynamic Attributes
10-2 Oracle Retail Predictive Application Server User Guide for the Fusion Client
From the Right-Click Context Menu1. Right-click a dimension level. The right-click context menu appears.
2. Select Create New Attribute.
Figure 10–2 Create New Attribute: From the Right-Click Context Menu
From the Dimension Dialog Box1. Click a dimension tile. The dimension dialog box appears.
2. Click the Show Attributes and Sort tab.
3. Click the New Attribute icon in the Available Attributes section.
Figure 10–3 Create New Attribute: From the Dimension Dialog Box
Creating Dynamic AttributesTo create a dynamic attribute, perform the following steps:
1. Access the Define New Attribute dialog box using the icon, right-click context menu, or the dimension dialog box as described in the Accessing the Define New Attribute Dialog Box section.
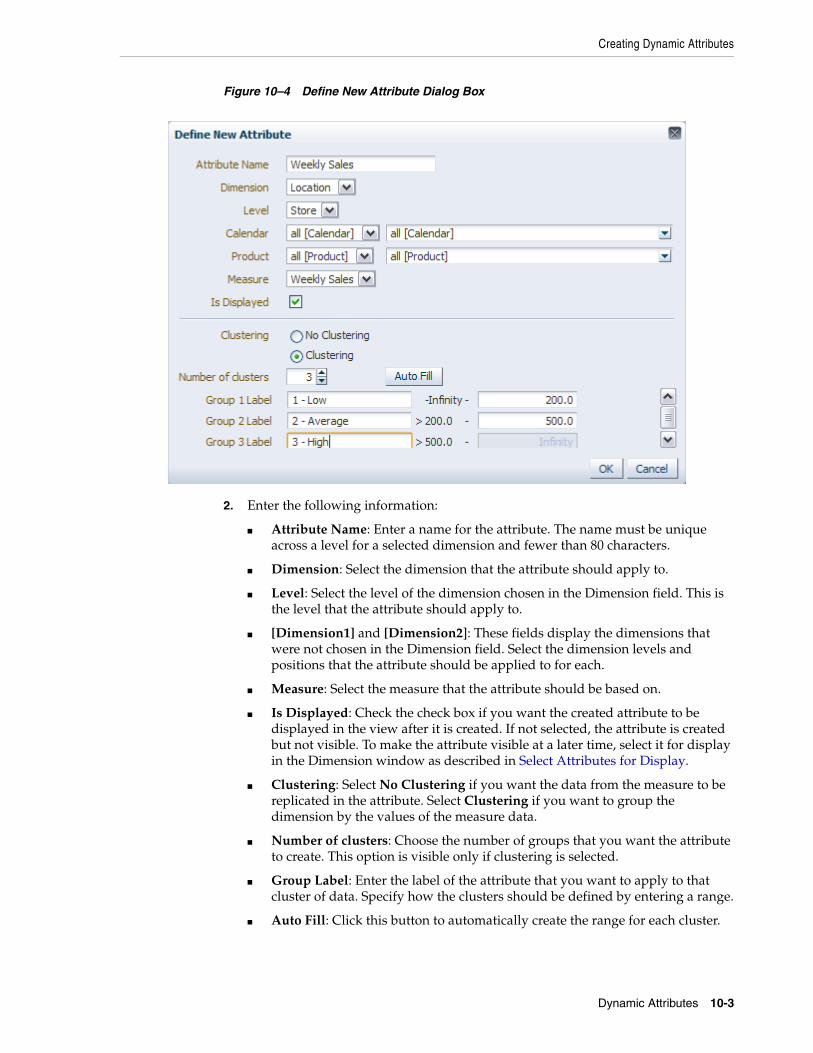
Creating Dynamic Attributes
Dynamic Attributes 10-3
Figure 10–4 Define New Attribute Dialog Box
2. Enter the following information:
■ Attribute Name: Enter a name for the attribute. The name must be unique across a level for a selected dimension and fewer than 80 characters.
■ Dimension: Select the dimension that the attribute should apply to.
■ Level: Select the level of the dimension chosen in the Dimension field. This is the level that the attribute should apply to.
■ [Dimension1] and [Dimension2]: These fields display the dimensions that were not chosen in the Dimension field. Select the dimension levels and positions that the attribute should be applied to for each.
■ Measure: Select the measure that the attribute should be based on.
■ Is Displayed: Check the check box if you want the created attribute to be displayed in the view after it is created. If not selected, the attribute is created but not visible. To make the attribute visible at a later time, select it for display in the Dimension window as described in Select Attributes for Display.
■ Clustering: Select No Clustering if you want the data from the measure to be replicated in the attribute. Select Clustering if you want to group the dimension by the values of the measure data.
■ Number of clusters: Choose the number of groups that you want the attribute to create. This option is visible only if clustering is selected.
■ Group Label: Enter the label of the attribute that you want to apply to that cluster of data. Specify how the clusters should be defined by entering a range.
■ Auto Fill: Click this button to automatically create the range for each cluster.

Creating Dynamic Attributes
10-4 Oracle Retail Predictive Application Server User Guide for the Fusion Client
3. Click OK.
The attribute is added to the pivot table.
After you have created the attribute, you can sort the positions by attribute. For more about sorting, see Attribute Sorting.
Figure 10–5 Dynamic Attribute: Clustering Example
Another way to use dynamic attributes is to duplicate measure data in the attribute. For instance, if you had a Climate measure that describes the climate of a location, you could create an attribute based on that measure and select No Clustering, as shown in Figure 10–6 and Figure 10–7.
Note: The cluster options are only available for real and integer measures.

Managing Dynamic Attributes
Dynamic Attributes 10-5
Figure 10–6 Define New Attribute: No Clustering
Figure 10–7 Dynamic Attribute: Non-Clustering Example
Managing Dynamic AttributesAfter you have created a dynamic dimension attribute, you can edit, copy, rename, or delete it using the Manage Dynamic Attributes dialog box.
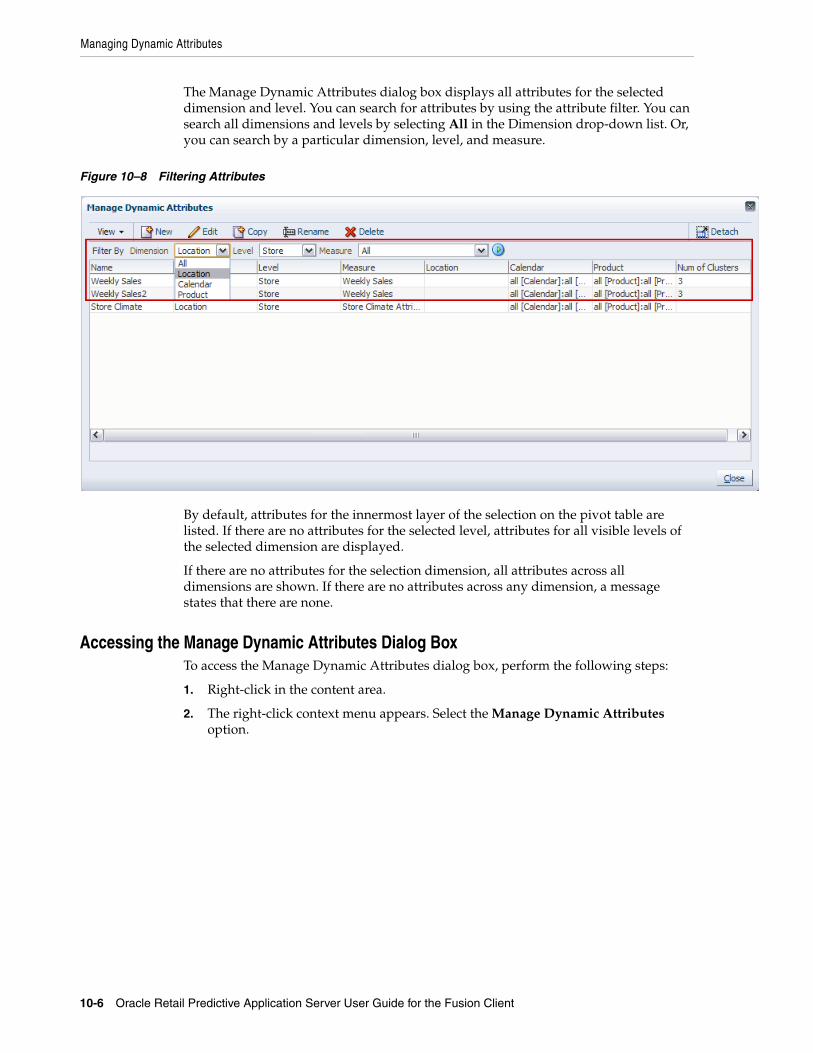
Managing Dynamic Attributes
10-6 Oracle Retail Predictive Application Server User Guide for the Fusion Client
The Manage Dynamic Attributes dialog box displays all attributes for the selected dimension and level. You can search for attributes by using the attribute filter. You can search all dimensions and levels by selecting All in the Dimension drop-down list. Or, you can search by a particular dimension, level, and measure.
Figure 10–8 Filtering Attributes
By default, attributes for the innermost layer of the selection on the pivot table are listed. If there are no attributes for the selected level, attributes for all visible levels of the selected dimension are displayed.
If there are no attributes for the selection dimension, all attributes across all dimensions are shown. If there are no attributes across any dimension, a message states that there are none.
Accessing the Manage Dynamic Attributes Dialog BoxTo access the Manage Dynamic Attributes dialog box, perform the following steps:
1. Right-click in the content area.
2. The right-click context menu appears. Select the Manage Dynamic Attributes option.
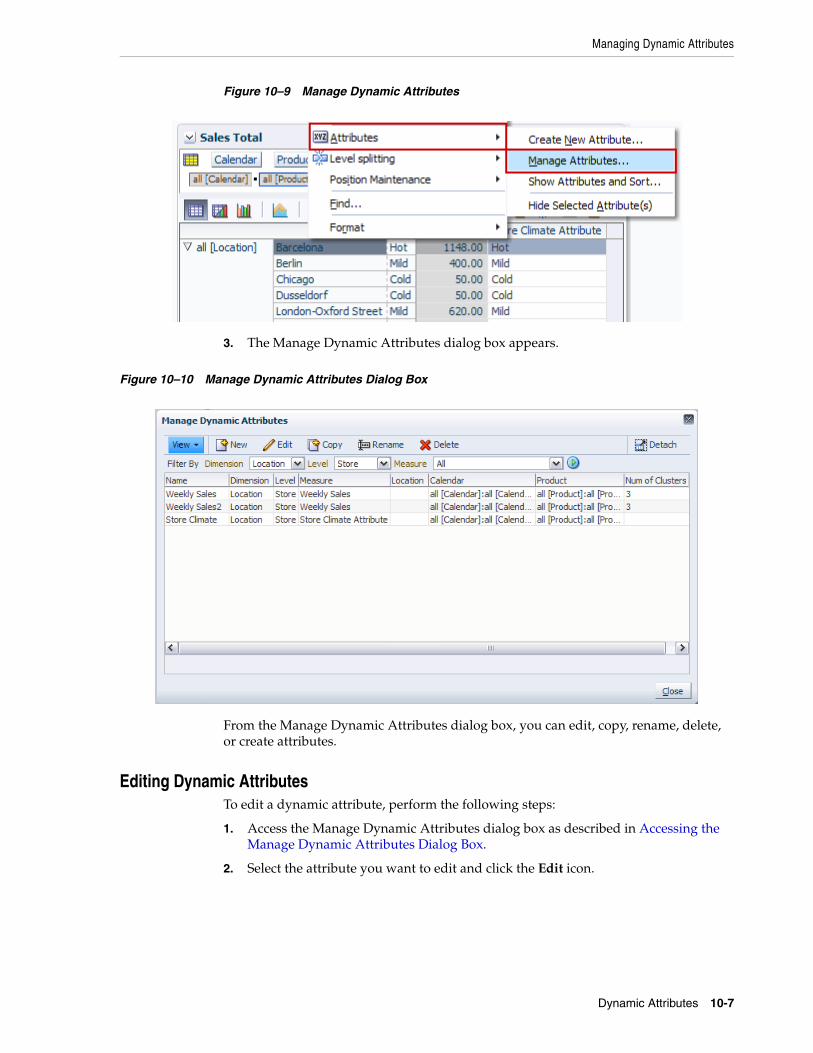
Managing Dynamic Attributes
Dynamic Attributes 10-7
Figure 10–9 Manage Dynamic Attributes
3. The Manage Dynamic Attributes dialog box appears.
Figure 10–10 Manage Dynamic Attributes Dialog Box
From the Manage Dynamic Attributes dialog box, you can edit, copy, rename, delete, or create attributes.
Editing Dynamic AttributesTo edit a dynamic attribute, perform the following steps:
1. Access the Manage Dynamic Attributes dialog box as described in Accessing the Manage Dynamic Attributes Dialog Box.
2. Select the attribute you want to edit and click the Edit icon.
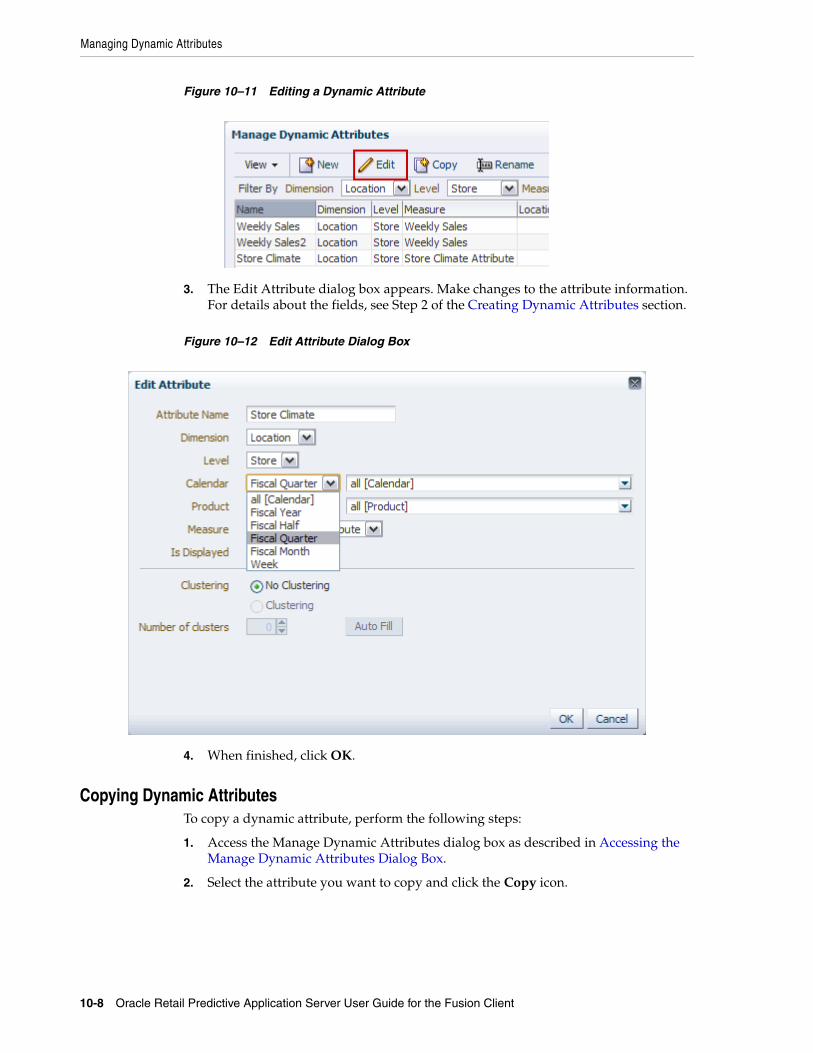
Managing Dynamic Attributes
10-8 Oracle Retail Predictive Application Server User Guide for the Fusion Client
Figure 10–11 Editing a Dynamic Attribute
3. The Edit Attribute dialog box appears. Make changes to the attribute information. For details about the fields, see Step 2 of the Creating Dynamic Attributes section.
Figure 10–12 Edit Attribute Dialog Box
4. When finished, click OK.
Copying Dynamic AttributesTo copy a dynamic attribute, perform the following steps:
1. Access the Manage Dynamic Attributes dialog box as described in Accessing the Manage Dynamic Attributes Dialog Box.
2. Select the attribute you want to copy and click the Copy icon.
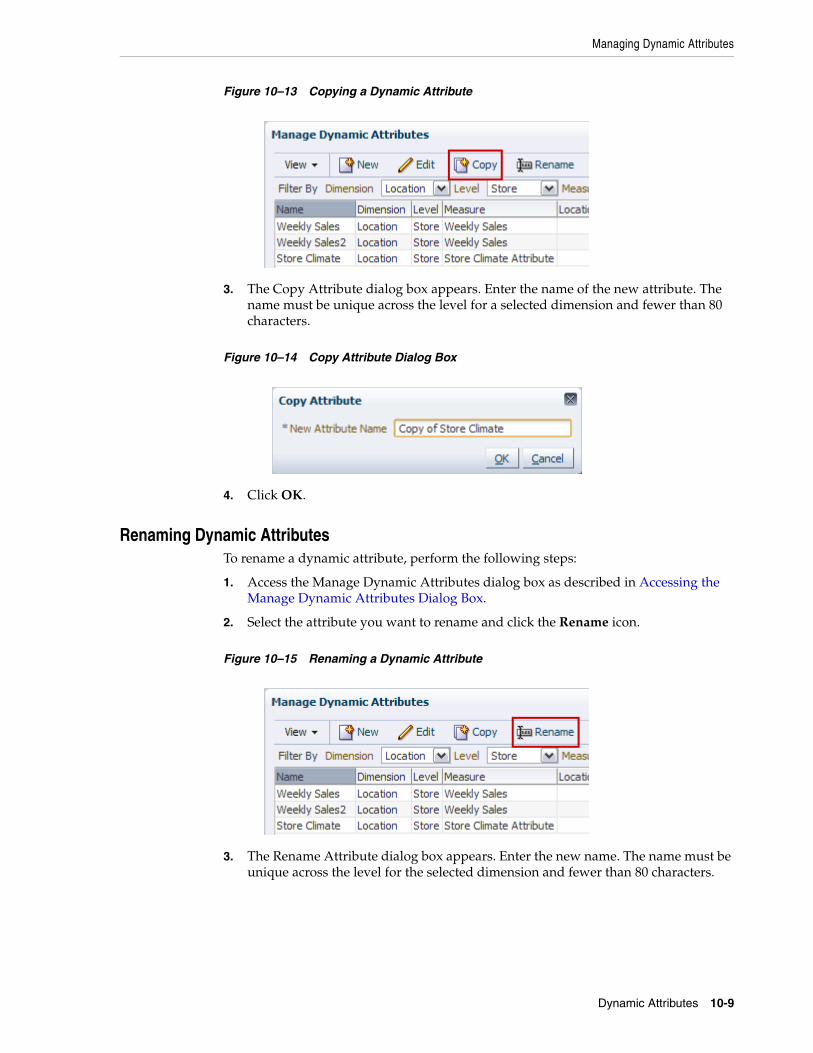
Managing Dynamic Attributes
Dynamic Attributes 10-9
Figure 10–13 Copying a Dynamic Attribute
3. The Copy Attribute dialog box appears. Enter the name of the new attribute. The name must be unique across the level for a selected dimension and fewer than 80 characters.
Figure 10–14 Copy Attribute Dialog Box
4. Click OK.
Renaming Dynamic AttributesTo rename a dynamic attribute, perform the following steps:
1. Access the Manage Dynamic Attributes dialog box as described in Accessing the Manage Dynamic Attributes Dialog Box.
2. Select the attribute you want to rename and click the Rename icon.
Figure 10–15 Renaming a Dynamic Attribute
3. The Rename Attribute dialog box appears. Enter the new name. The name must be unique across the level for the selected dimension and fewer than 80 characters.
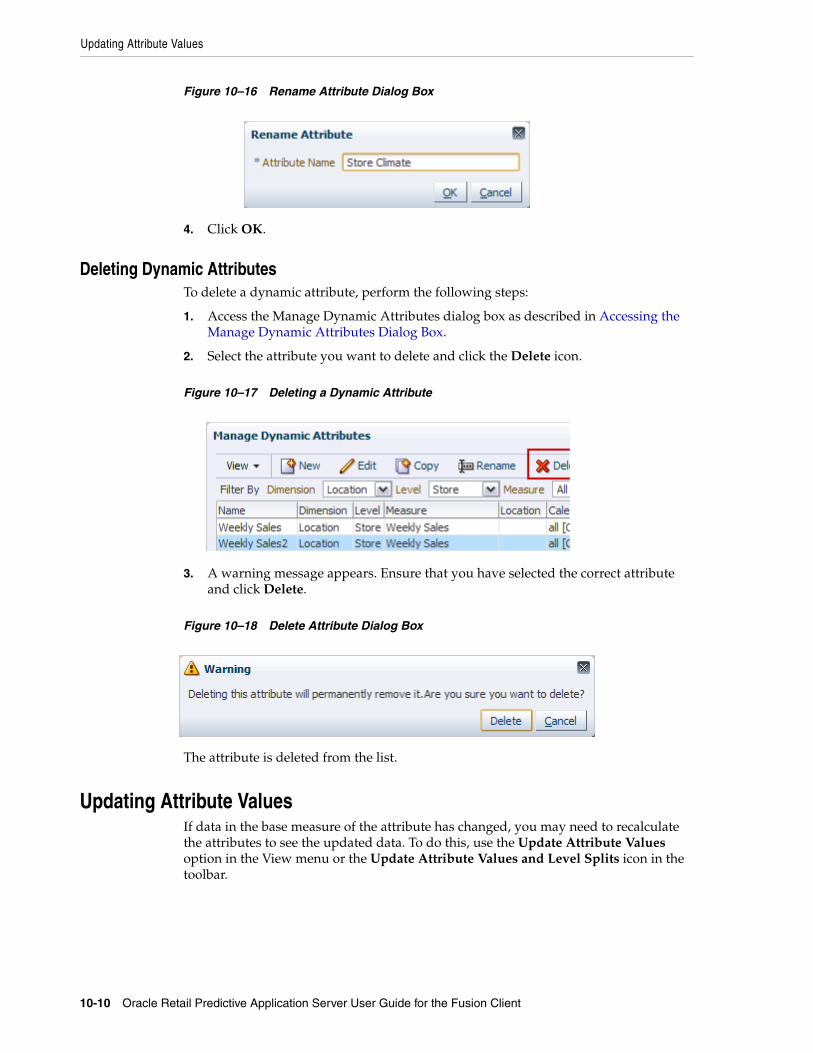
Updating Attribute Values
10-10 Oracle Retail Predictive Application Server User Guide for the Fusion Client
Figure 10–16 Rename Attribute Dialog Box
4. Click OK.
Deleting Dynamic AttributesTo delete a dynamic attribute, perform the following steps:
1. Access the Manage Dynamic Attributes dialog box as described in Accessing the Manage Dynamic Attributes Dialog Box.
2. Select the attribute you want to delete and click the Delete icon.
Figure 10–17 Deleting a Dynamic Attribute
3. A warning message appears. Ensure that you have selected the correct attribute and click Delete.
Figure 10–18 Delete Attribute Dialog Box
The attribute is deleted from the list.
Updating Attribute ValuesIf data in the base measure of the attribute has changed, you may need to recalculate the attributes to see the updated data. To do this, use the Update Attribute Values option in the View menu or the Update Attribute Values and Level Splits icon in the toolbar.
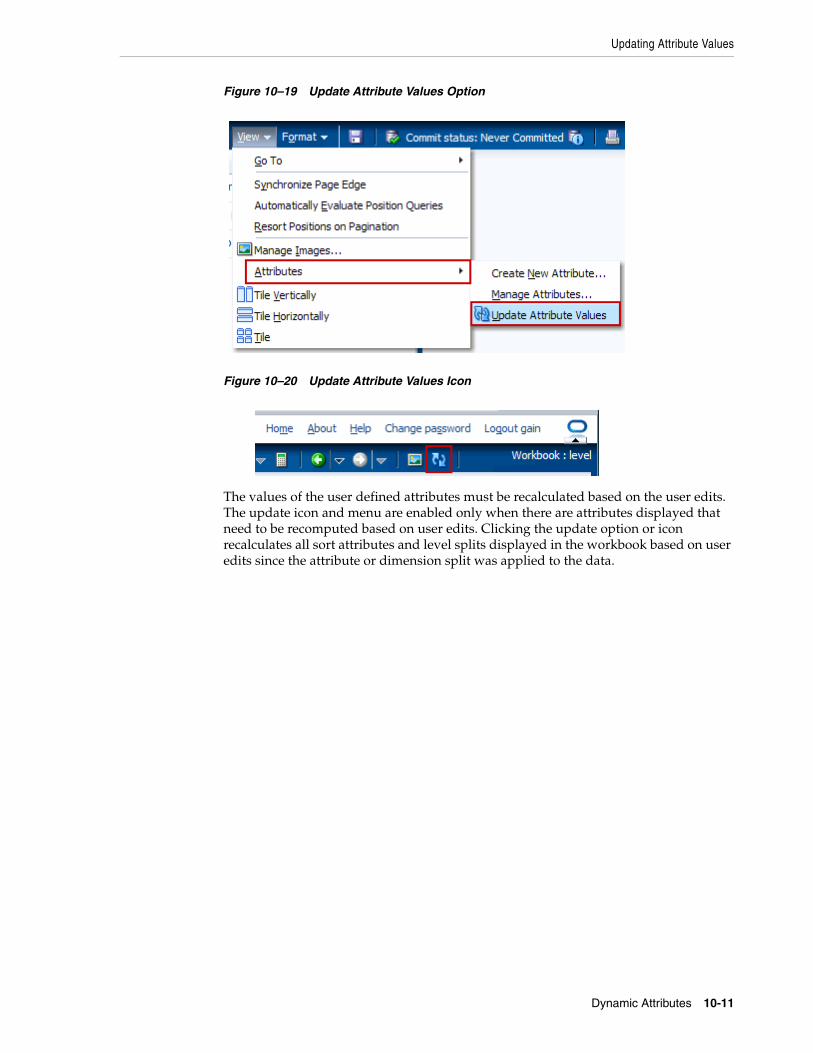
Updating Attribute Values
Dynamic Attributes 10-11
Figure 10–19 Update Attribute Values Option
Figure 10–20 Update Attribute Values Icon
The values of the user defined attributes must be recalculated based on the user edits. The update icon and menu are enabled only when there are attributes displayed that need to be recomputed based on user edits. Clicking the update option or icon recalculates all sort attributes and level splits displayed in the workbook based on user edits since the attribute or dimension split was applied to the data.

Updating Attribute Values
10-12 Oracle Retail Predictive Application Server User Guide for the Fusion Client
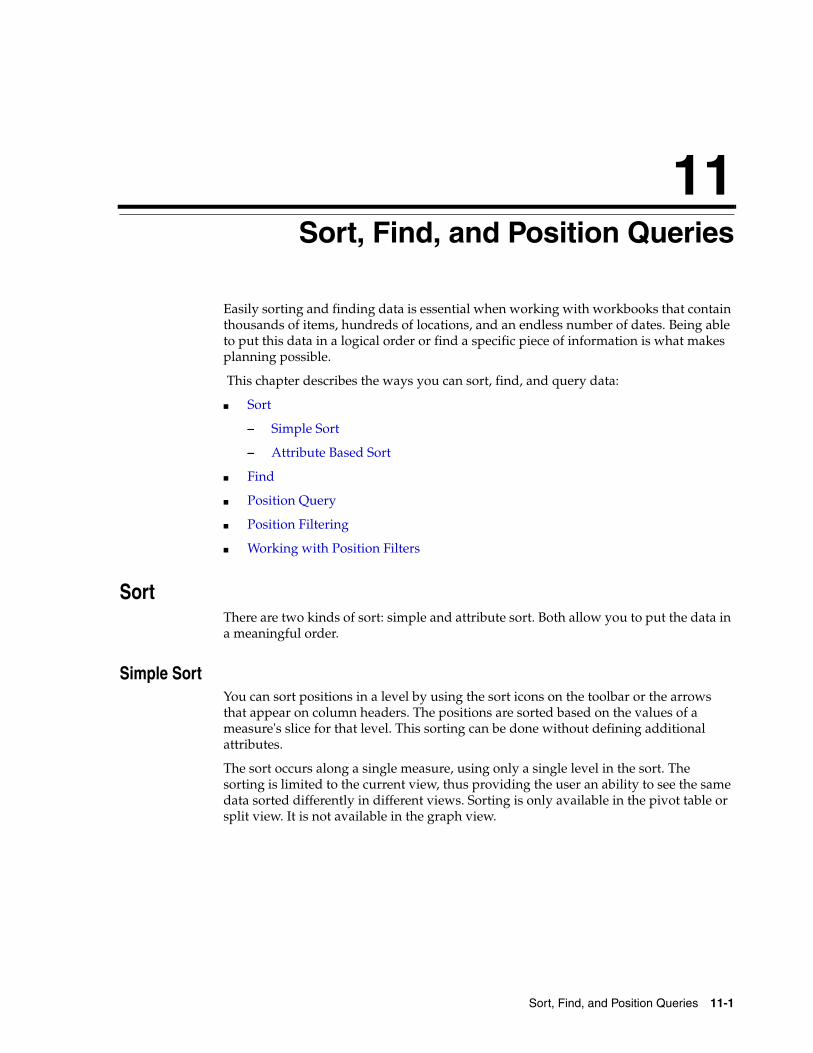
Sort, Find, and Position Queries 11-1
11Sort, Find, and Position Queries
Easily sorting and finding data is essential when working with workbooks that contain thousands of items, hundreds of locations, and an endless number of dates. Being able to put this data in a logical order or find a specific piece of information is what makes planning possible.
This chapter describes the ways you can sort, find, and query data:
■ Sort
– Simple Sort
– Attribute Based Sort
■ Find
■ Position Query
■ Position Filtering
■ Working with Position Filters
SortThere are two kinds of sort: simple and attribute sort. Both allow you to put the data in a meaningful order.
Simple SortYou can sort positions in a level by using the sort icons on the toolbar or the arrows that appear on column headers. The positions are sorted based on the values of a measure's slice for that level. This sorting can be done without defining additional attributes.
The sort occurs along a single measure, using only a single level in the sort. The sorting is limited to the current view, thus providing the user an ability to see the same data sorted differently in different views. Sorting is only available in the pivot table or split view. It is not available in the graph view.

Sort
11-2 Oracle Retail Predictive Application Server User Guide for the Fusion Client
After you have selected the desired valid slice of measure data that you want to sort, the sorting arrows are enabled on the toolbar and in the columns, as shown in Figure 11–1.
Figure 11–1 Sort Arrows
After you click one of the sort arrows, the selected positions are sorted according to the measure's values in the selected slice.
The Sort Ascending icons in the toolbar and columns order the data so that the lowest number appears at the top of the list and the highest at the bottom. After the data is sorted, the column header is shaded gray and the Sort Ascending arrow is shaded dark gray, as shown in Figure 11–2.
Notes: A slice is valid if it involves only one measure and if it has a unique value for each position along the level being sorted (meaning that one position along all other dimensions in the measure's intersection has been selected).
Simple sort cannot be applied to positions in a dimension along the page axis. However, you can pivot the desired dimension to either row or column axes, execute the sort along the desired slice, and then pivot the sorted dimension back to the page axis.
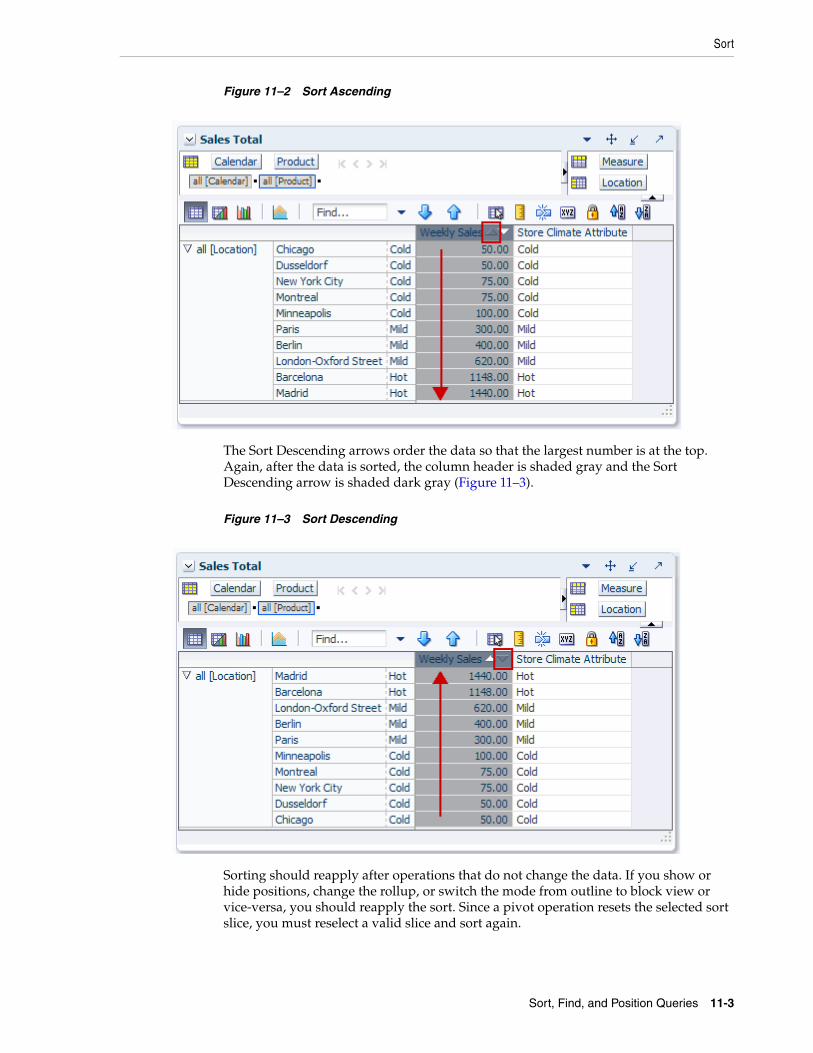
Sort
Sort, Find, and Position Queries 11-3
Figure 11–2 Sort Ascending
The Sort Descending arrows order the data so that the largest number is at the top. Again, after the data is sorted, the column header is shaded gray and the Sort Descending arrow is shaded dark gray (Figure 11–3).
Figure 11–3 Sort Descending
Sorting should reapply after operations that do not change the data. If you show or hide positions, change the rollup, or switch the mode from outline to block view or vice-versa, you should reapply the sort. Since a pivot operation resets the selected sort slice, you must reselect a valid slice and sort again.
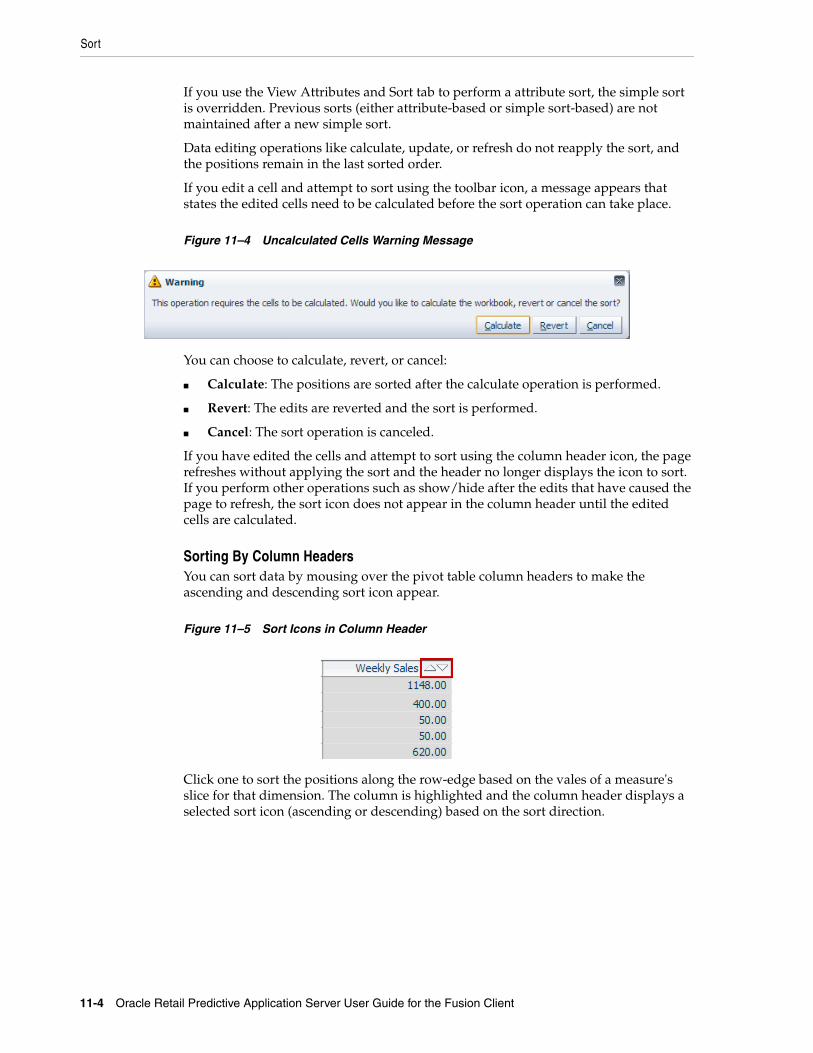
Sort
11-4 Oracle Retail Predictive Application Server User Guide for the Fusion Client
If you use the View Attributes and Sort tab to perform a attribute sort, the simple sort is overridden. Previous sorts (either attribute-based or simple sort-based) are not maintained after a new simple sort.
Data editing operations like calculate, update, or refresh do not reapply the sort, and the positions remain in the last sorted order.
If you edit a cell and attempt to sort using the toolbar icon, a message appears that states the edited cells need to be calculated before the sort operation can take place.
Figure 11–4 Uncalculated Cells Warning Message
You can choose to calculate, revert, or cancel:
■ Calculate: The positions are sorted after the calculate operation is performed.
■ Revert: The edits are reverted and the sort is performed.
■ Cancel: The sort operation is canceled.
If you have edited the cells and attempt to sort using the column header icon, the page refreshes without applying the sort and the header no longer displays the icon to sort. If you perform other operations such as show/hide after the edits that have caused the page to refresh, the sort icon does not appear in the column header until the edited cells are calculated.
Sorting By Column HeadersYou can sort data by mousing over the pivot table column headers to make the ascending and descending sort icon appear.
Figure 11–5 Sort Icons in Column Header
Click one to sort the positions along the row-edge based on the vales of a measure's slice for that dimension. The column is highlighted and the column header displays a selected sort icon (ascending or descending) based on the sort direction.
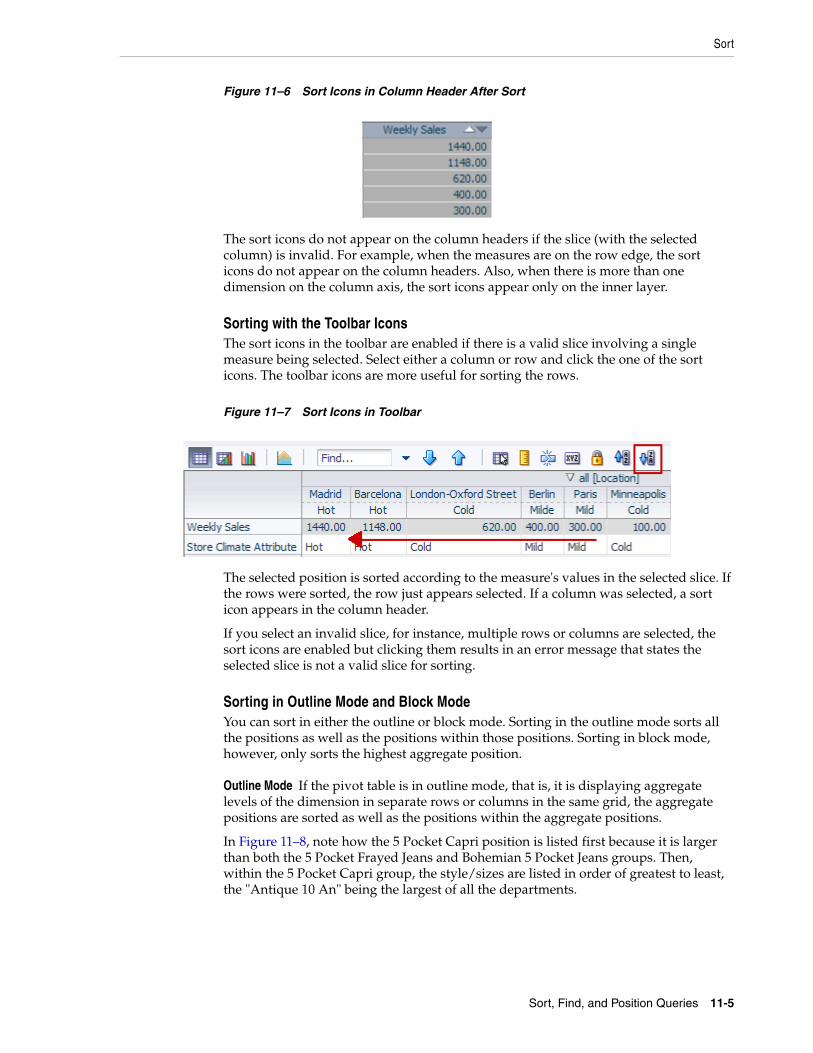
Sort
Sort, Find, and Position Queries 11-5
Figure 11–6 Sort Icons in Column Header After Sort
The sort icons do not appear on the column headers if the slice (with the selected column) is invalid. For example, when the measures are on the row edge, the sort icons do not appear on the column headers. Also, when there is more than one dimension on the column axis, the sort icons appear only on the inner layer.
Sorting with the Toolbar IconsThe sort icons in the toolbar are enabled if there is a valid slice involving a single measure being selected. Select either a column or row and click the one of the sort icons. The toolbar icons are more useful for sorting the rows.
Figure 11–7 Sort Icons in Toolbar
The selected position is sorted according to the measure's values in the selected slice. If the rows were sorted, the row just appears selected. If a column was selected, a sort icon appears in the column header.
If you select an invalid slice, for instance, multiple rows or columns are selected, the sort icons are enabled but clicking them results in an error message that states the selected slice is not a valid slice for sorting.
Sorting in Outline Mode and Block ModeYou can sort in either the outline or block mode. Sorting in the outline mode sorts all the positions as well as the positions within those positions. Sorting in block mode, however, only sorts the highest aggregate position.
Outline Mode If the pivot table is in outline mode, that is, it is displaying aggregate levels of the dimension in separate rows or columns in the same grid, the aggregate positions are sorted as well as the positions within the aggregate positions.
In Figure 11–8, note how the 5 Pocket Capri position is listed first because it is larger than both the 5 Pocket Frayed Jeans and Bohemian 5 Pocket Jeans groups. Then, within the 5 Pocket Capri group, the style/sizes are listed in order of greatest to least, the "Antique 10 An" being the largest of all the departments.
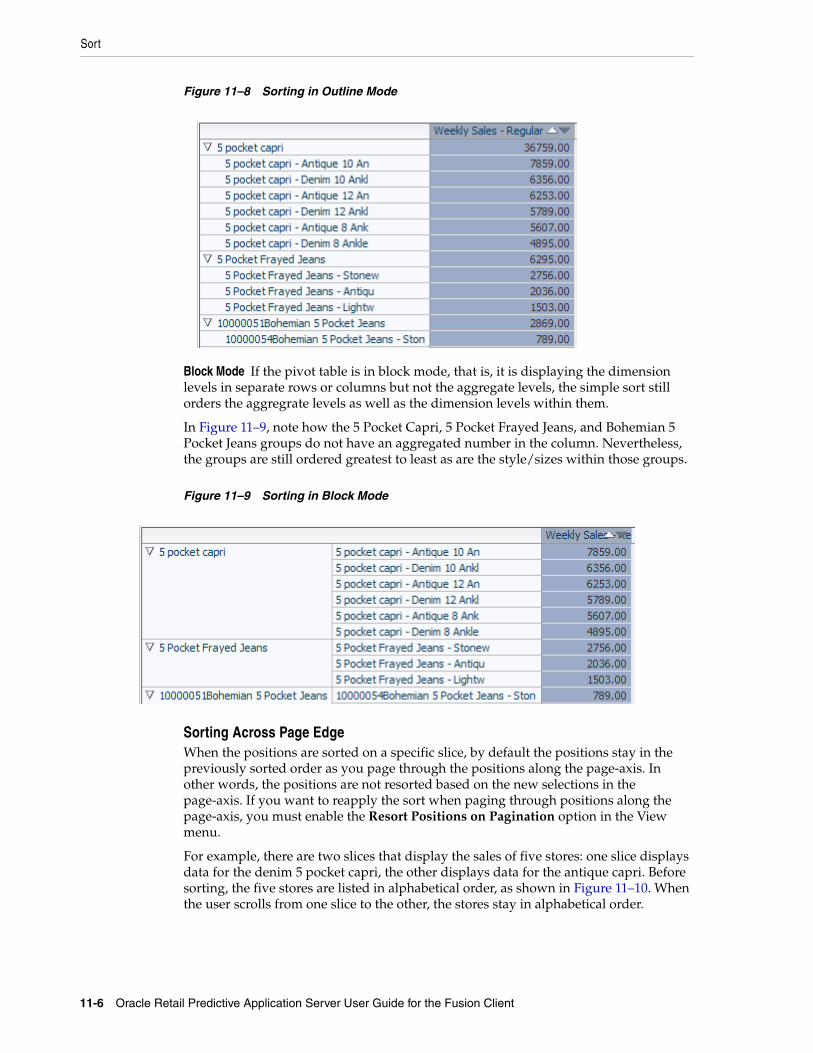
Sort
11-6 Oracle Retail Predictive Application Server User Guide for the Fusion Client
Figure 11–8 Sorting in Outline Mode
Block Mode If the pivot table is in block mode, that is, it is displaying the dimension levels in separate rows or columns but not the aggregate levels, the simple sort still orders the aggregrate levels as well as the dimension levels within them.
In Figure 11–9, note how the 5 Pocket Capri, 5 Pocket Frayed Jeans, and Bohemian 5 Pocket Jeans groups do not have an aggregated number in the column. Nevertheless, the groups are still ordered greatest to least as are the style/sizes within those groups.
Figure 11–9 Sorting in Block Mode
Sorting Across Page EdgeWhen the positions are sorted on a specific slice, by default the positions stay in the previously sorted order as you page through the positions along the page-axis. In other words, the positions are not resorted based on the new selections in the page-axis. If you want to reapply the sort when paging through positions along the page-axis, you must enable the Resort Positions on Pagination option in the View menu.
For example, there are two slices that display the sales of five stores: one slice displays data for the denim 5 pocket capri, the other displays data for the antique capri. Before sorting, the five stores are listed in alphabetical order, as shown in Figure 11–10. When the user scrolls from one slice to the other, the stores stay in alphabetical order.
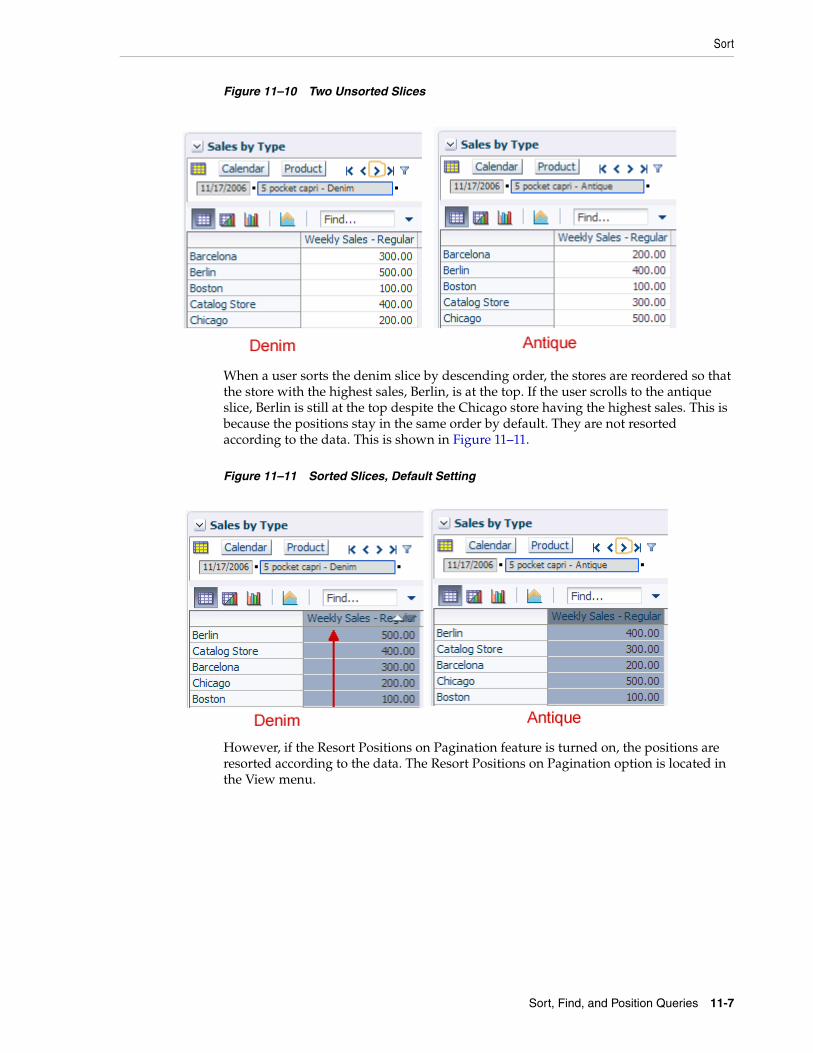
Sort
Sort, Find, and Position Queries 11-7
Figure 11–10 Two Unsorted Slices
When a user sorts the denim slice by descending order, the stores are reordered so that the store with the highest sales, Berlin, is at the top. If the user scrolls to the antique slice, Berlin is still at the top despite the Chicago store having the highest sales. This is because the positions stay in the same order by default. They are not resorted according to the data. This is shown in Figure 11–11.
Figure 11–11 Sorted Slices, Default Setting
However, if the Resort Positions on Pagination feature is turned on, the positions are resorted according to the data. The Resort Positions on Pagination option is located in the View menu.
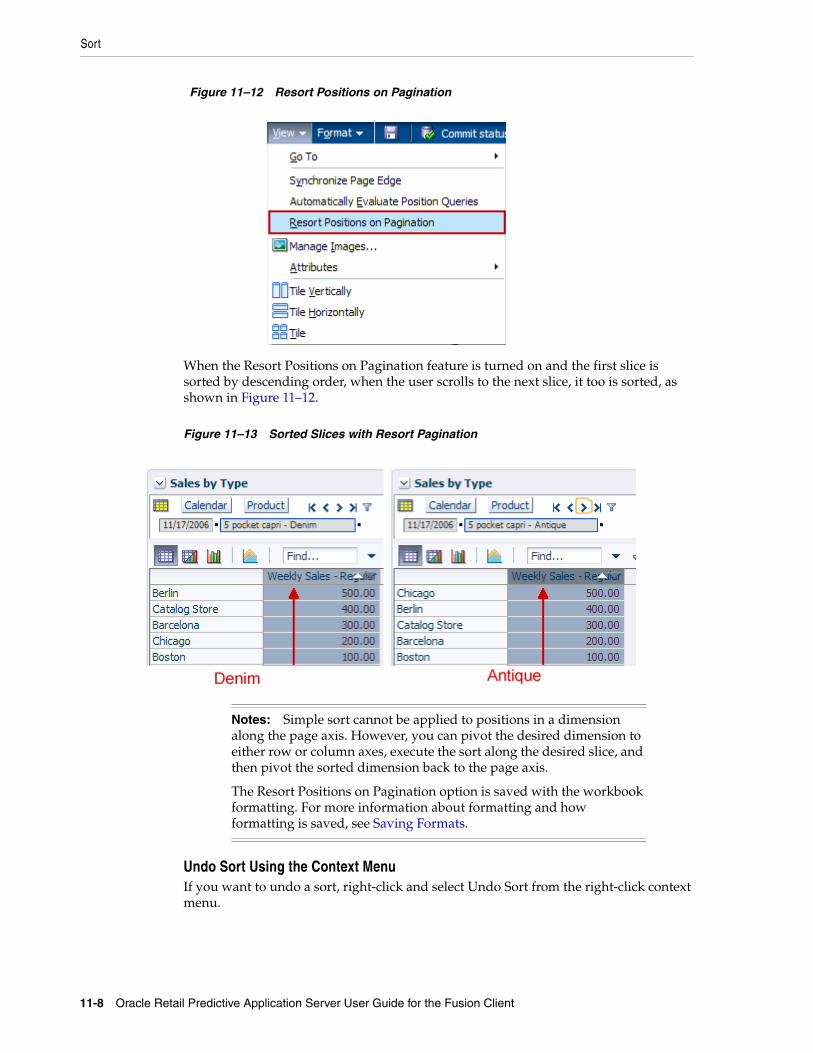
Sort
11-8 Oracle Retail Predictive Application Server User Guide for the Fusion Client
Figure 11–12 Resort Positions on Pagination
When the Resort Positions on Pagination feature is turned on and the first slice is sorted by descending order, when the user scrolls to the next slice, it too is sorted, as shown in Figure 11–12.
Figure 11–13 Sorted Slices with Resort Pagination
Undo Sort Using the Context MenuIf you want to undo a sort, right-click and select Undo Sort from the right-click context menu.
Notes: Simple sort cannot be applied to positions in a dimension along the page axis. However, you can pivot the desired dimension to either row or column axes, execute the sort along the desired slice, and then pivot the sorted dimension back to the page axis.
The Resort Positions on Pagination option is saved with the workbook formatting. For more information about formatting and how formatting is saved, see Saving Formats.
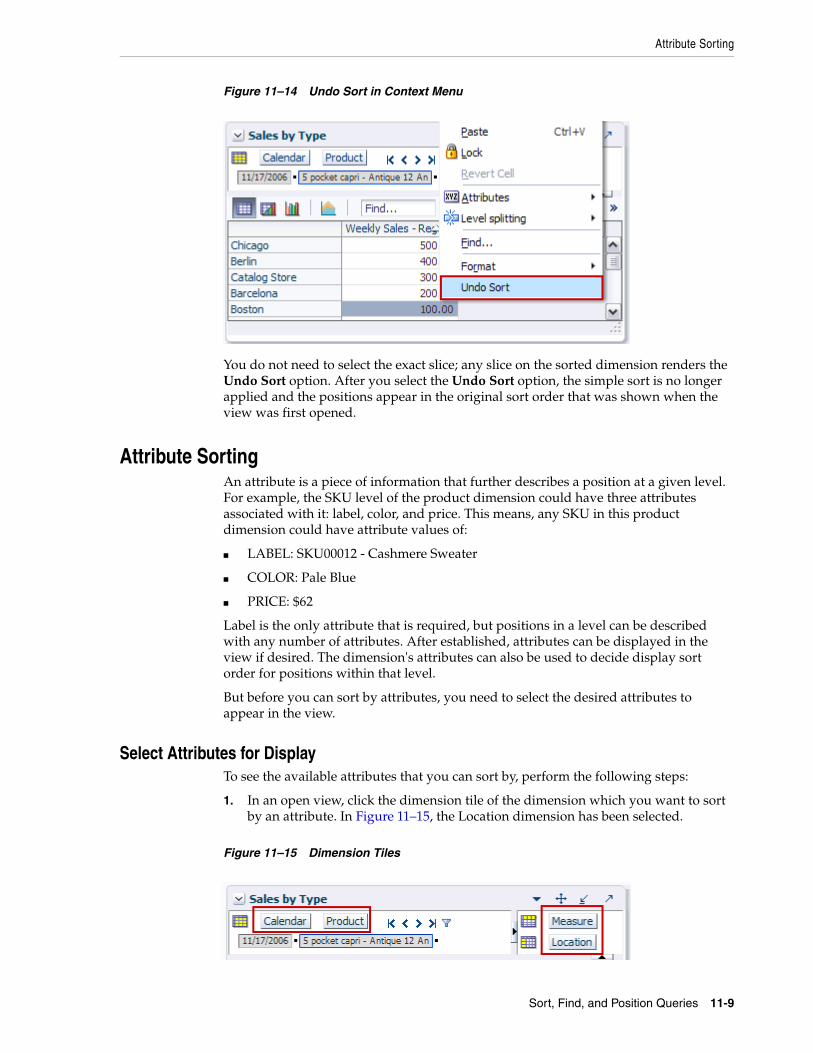
Attribute Sorting
Sort, Find, and Position Queries 11-9
Figure 11–14 Undo Sort in Context Menu
You do not need to select the exact slice; any slice on the sorted dimension renders the Undo Sort option. After you select the Undo Sort option, the simple sort is no longer applied and the positions appear in the original sort order that was shown when the view was first opened.
Attribute SortingAn attribute is a piece of information that further describes a position at a given level. For example, the SKU level of the product dimension could have three attributes associated with it: label, color, and price. This means, any SKU in this product dimension could have attribute values of:
■ LABEL: SKU00012 - Cashmere Sweater
■ COLOR: Pale Blue
■ PRICE: $62
Label is the only attribute that is required, but positions in a level can be described with any number of attributes. After established, attributes can be displayed in the view if desired. The dimension's attributes can also be used to decide display sort order for positions within that level.
But before you can sort by attributes, you need to select the desired attributes to appear in the view.
Select Attributes for DisplayTo see the available attributes that you can sort by, perform the following steps:
1. In an open view, click the dimension tile of the dimension which you want to sort by an attribute. In Figure 11–15, the Location dimension has been selected.
Figure 11–15 Dimension Tiles

Attribute Sorting
11-10 Oracle Retail Predictive Application Server User Guide for the Fusion Client
2. The Dimension window appears. Click the Show Attributes and Sort tab.
3. In the Show Attributes and Sort tab, the available attributes for the dimension are listed in both the Available Attributes and Sort Attributes sections on the left. The attributes currently shown in the view are listed on the right. Those shown attributes have a check mark beside them.
Figure 11–16 Show Attributes and Sort Tab
a. Select the attributes that you want to appear in the view from the Available Attributes section at the top.
b. Either click the right arrow to move the attribute to the Visible Attributes box on the right side, or drag the attribute to the right side.
c. Repeat the same process for the attributes you want to sort by moving them to the Sort Attributes section at the bottom.
d. When finished, click OK. This saves your changes and closes the window.
If you want to make additional changes on other tabs in the Dimension window, click Apply instead. This saves your changes but leaves the Dimension window open so you can go to other tabs.
The attributes now appear in the workbook as shown in Figure 11–17.
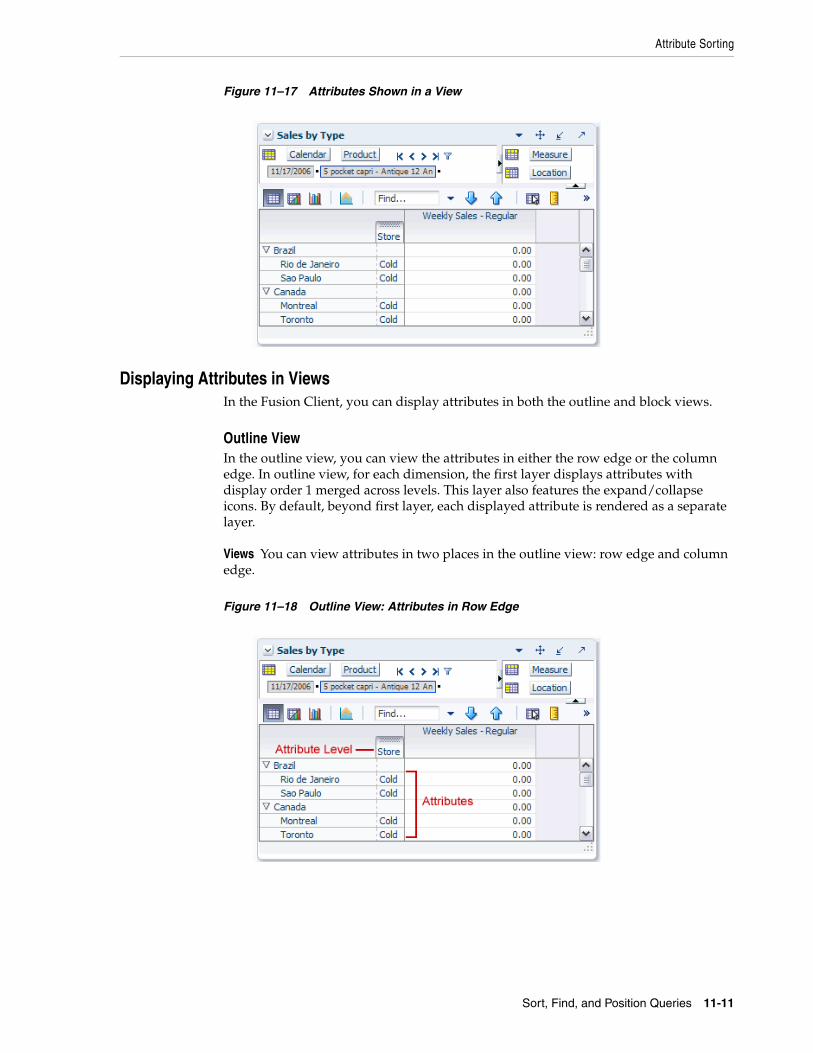
Attribute Sorting
Sort, Find, and Position Queries 11-11
Figure 11–17 Attributes Shown in a View
Displaying Attributes in ViewsIn the Fusion Client, you can display attributes in both the outline and block views.
Outline ViewIn the outline view, you can view the attributes in either the row edge or the column edge. In outline view, for each dimension, the first layer displays attributes with display order 1 merged across levels. This layer also features the expand/collapse icons. By default, beyond first layer, each displayed attribute is rendered as a separate layer.
Views You can view attributes in two places in the outline view: row edge and column edge.
Figure 11–18 Outline View: Attributes in Row Edge
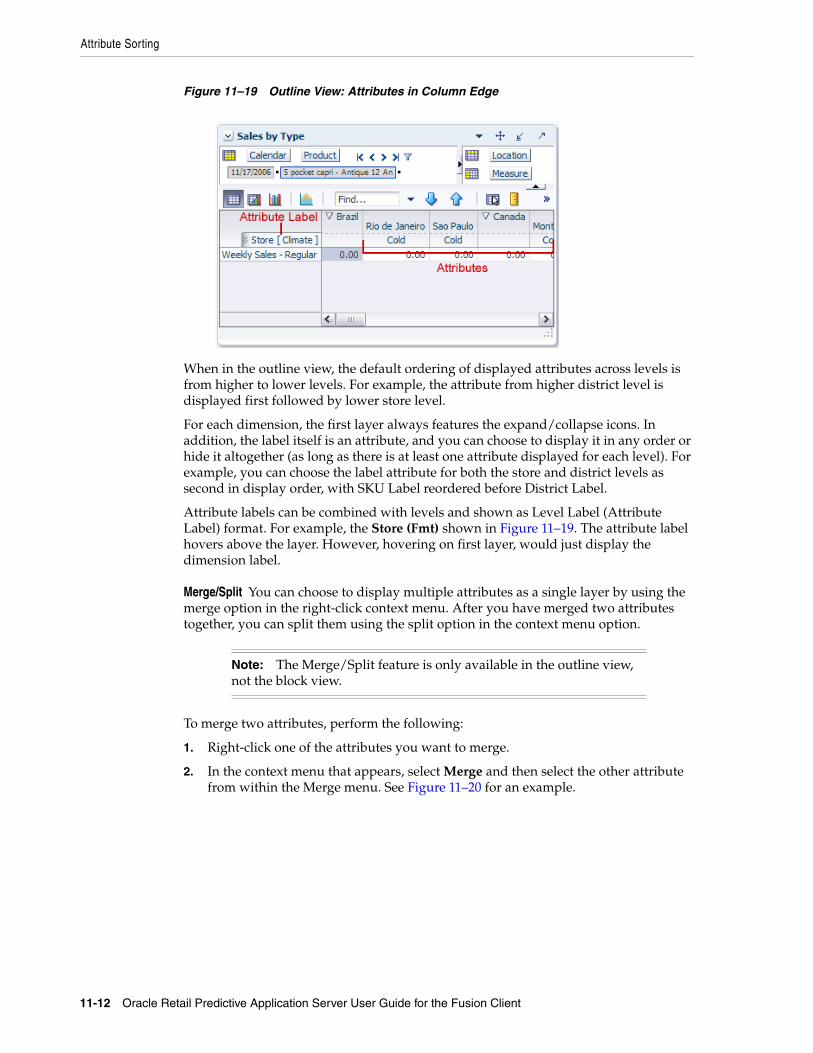
Attribute Sorting
11-12 Oracle Retail Predictive Application Server User Guide for the Fusion Client
Figure 11–19 Outline View: Attributes in Column Edge
When in the outline view, the default ordering of displayed attributes across levels is from higher to lower levels. For example, the attribute from higher district level is displayed first followed by lower store level.
For each dimension, the first layer always features the expand/collapse icons. In addition, the label itself is an attribute, and you can choose to display it in any order or hide it altogether (as long as there is at least one attribute displayed for each level). For example, you can choose the label attribute for both the store and district levels as second in display order, with SKU Label reordered before District Label.
Attribute labels can be combined with levels and shown as Level Label (Attribute Label) format. For example, the Store (Fmt) shown in Figure 11–19. The attribute label hovers above the layer. However, hovering on first layer, would just display the dimension label.
Merge/Split You can choose to display multiple attributes as a single layer by using the merge option in the right-click context menu. After you have merged two attributes together, you can split them using the split option in the context menu option.
To merge two attributes, perform the following:
1. Right-click one of the attributes you want to merge.
2. In the context menu that appears, select Merge and then select the other attribute from within the Merge menu. See Figure 11–20 for an example.
Note: The Merge/Split feature is only available in the outline view, not the block view.
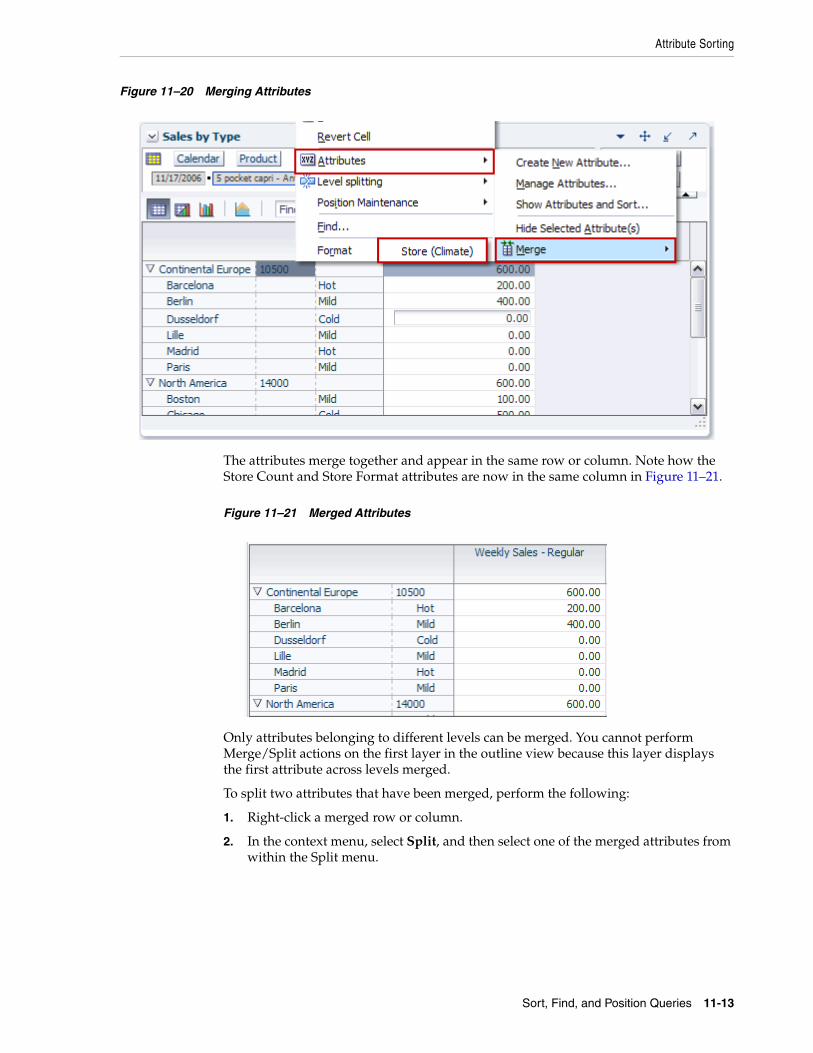
Attribute Sorting
Sort, Find, and Position Queries 11-13
Figure 11–20 Merging Attributes
The attributes merge together and appear in the same row or column. Note how the Store Count and Store Format attributes are now in the same column in Figure 11–21.
Figure 11–21 Merged Attributes
Only attributes belonging to different levels can be merged. You cannot perform Merge/Split actions on the first layer in the outline view because this layer displays the first attribute across levels merged.
To split two attributes that have been merged, perform the following:
1. Right-click a merged row or column.
2. In the context menu, select Split, and then select one of the merged attributes from within the Split menu.
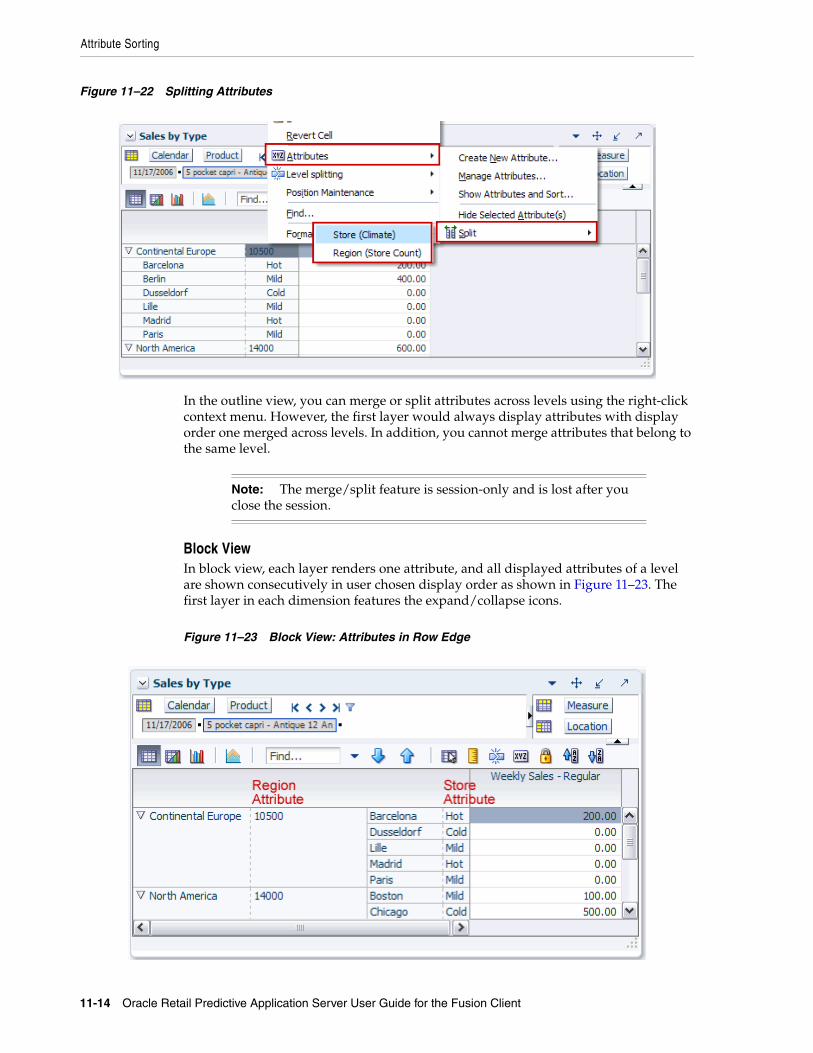
Attribute Sorting
11-14 Oracle Retail Predictive Application Server User Guide for the Fusion Client
Figure 11–22 Splitting Attributes
In the outline view, you can merge or split attributes across levels using the right-click context menu. However, the first layer would always display attributes with display order one merged across levels. In addition, you cannot merge attributes that belong to the same level.
Block ViewIn block view, each layer renders one attribute, and all displayed attributes of a level are shown consecutively in user chosen display order as shown in Figure 11–23. The first layer in each dimension features the expand/collapse icons.
Figure 11–23 Block View: Attributes in Row Edge
Note: The merge/split feature is session-only and is lost after you close the session.
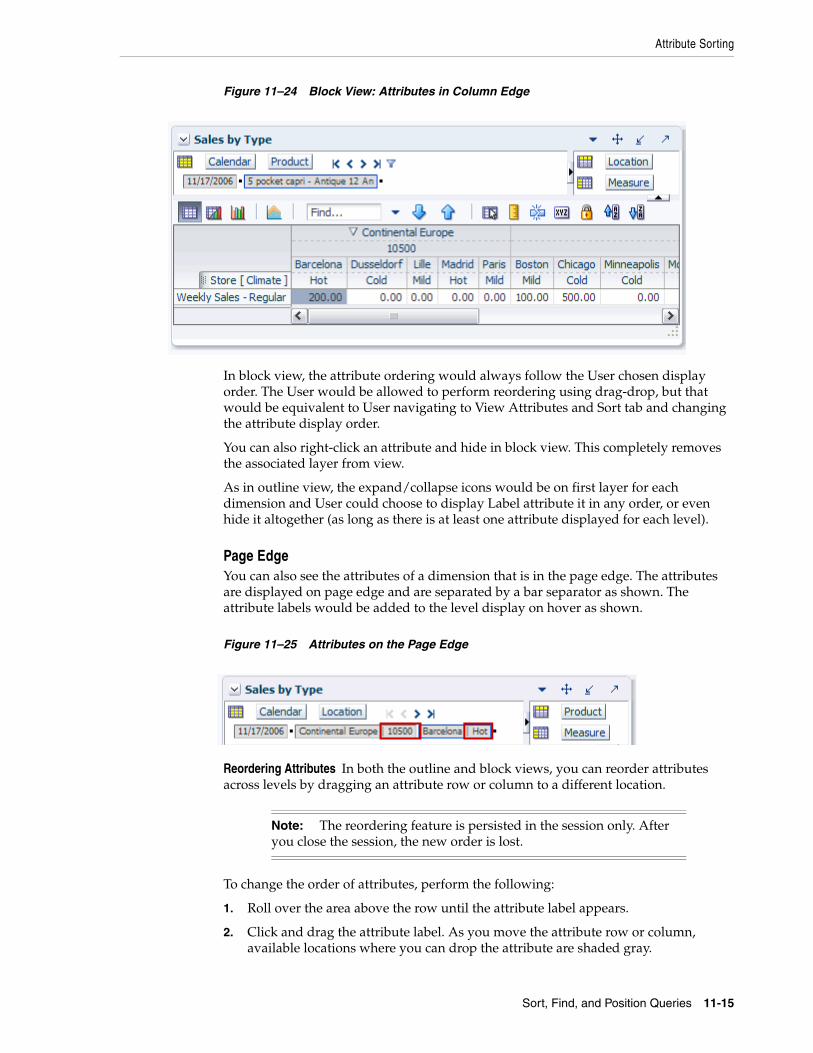
Attribute Sorting
Sort, Find, and Position Queries 11-15
Figure 11–24 Block View: Attributes in Column Edge
In block view, the attribute ordering would always follow the User chosen display order. The User would be allowed to perform reordering using drag-drop, but that would be equivalent to User navigating to View Attributes and Sort tab and changing the attribute display order.
You can also right-click an attribute and hide in block view. This completely removes the associated layer from view.
As in outline view, the expand/collapse icons would be on first layer for each dimension and User could choose to display Label attribute it in any order, or even hide it altogether (as long as there is at least one attribute displayed for each level).
Page EdgeYou can also see the attributes of a dimension that is in the page edge. The attributes are displayed on page edge and are separated by a bar separator as shown. The attribute labels would be added to the level display on hover as shown.
Figure 11–25 Attributes on the Page Edge
Reordering Attributes In both the outline and block views, you can reorder attributes across levels by dragging an attribute row or column to a different location.
To change the order of attributes, perform the following:
1. Roll over the area above the row until the attribute label appears.
2. Click and drag the attribute label. As you move the attribute row or column, available locations where you can drop the attribute are shaded gray.
Note: The reordering feature is persisted in the session only. After you close the session, the new order is lost.

Attribute Sorting
11-16 Oracle Retail Predictive Application Server User Guide for the Fusion Client
Figure 11–26 Reordering Attributes
3. When the location where you would like to move the attribute is shaded gray, drop the attribute.
Figure 11–27 Reordered Attributes
Hiding Attributes You can hide an attribute in a view by right-clicking a cell within that attribute’s row or column. In the context menu, select Attributes and then select Hide Selected Attribute(s).
Note: The hiding feature is session-only and is lost after you close the session.
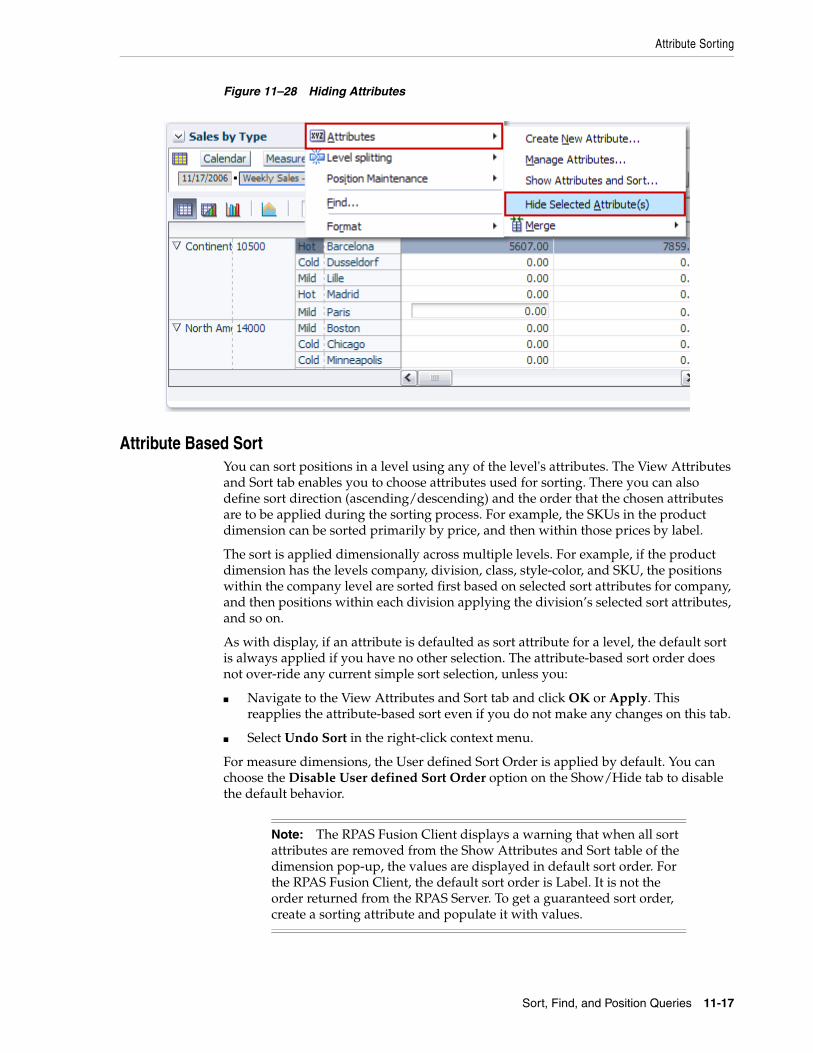
Attribute Sorting
Sort, Find, and Position Queries 11-17
Figure 11–28 Hiding Attributes
Attribute Based SortYou can sort positions in a level using any of the level's attributes. The View Attributes and Sort tab enables you to choose attributes used for sorting. There you can also define sort direction (ascending/descending) and the order that the chosen attributes are to be applied during the sorting process. For example, the SKUs in the product dimension can be sorted primarily by price, and then within those prices by label.
The sort is applied dimensionally across multiple levels. For example, if the product dimension has the levels company, division, class, style-color, and SKU, the positions within the company level are sorted first based on selected sort attributes for company, and then positions within each division applying the division’s selected sort attributes, and so on.
As with display, if an attribute is defaulted as sort attribute for a level, the default sort is always applied if you have no other selection. The attribute-based sort order does not over-ride any current simple sort selection, unless you:
■ Navigate to the View Attributes and Sort tab and click OK or Apply. This reapplies the attribute-based sort even if you do not make any changes on this tab.
■ Select Undo Sort in the right-click context menu.
For measure dimensions, the User defined Sort Order is applied by default. You can choose the Disable User defined Sort Order option on the Show/Hide tab to disable the default behavior.
Note: The RPAS Fusion Client displays a warning that when all sort attributes are removed from the Show Attributes and Sort table of the dimension pop-up, the values are displayed in default sort order. For the RPAS Fusion Client, the default sort order is Label. It is not the order returned from the RPAS Server. To get a guaranteed sort order, create a sorting attribute and populate it with values.
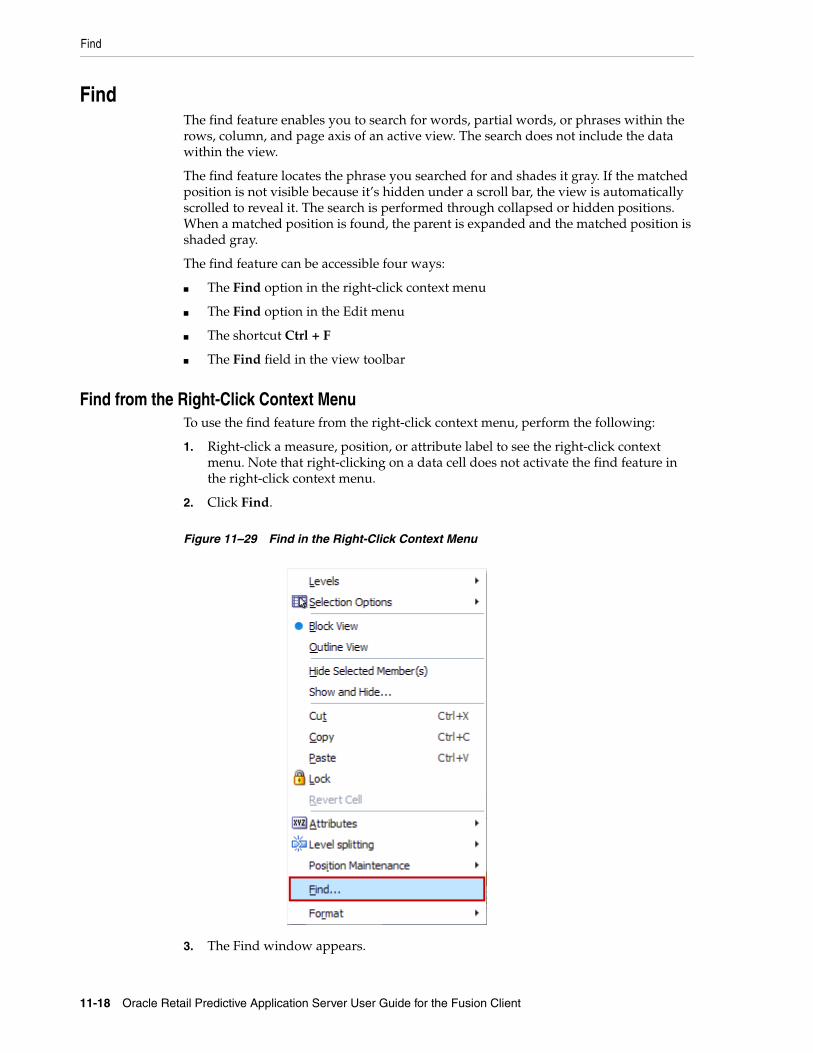
Find
11-18 Oracle Retail Predictive Application Server User Guide for the Fusion Client
FindThe find feature enables you to search for words, partial words, or phrases within the rows, column, and page axis of an active view. The search does not include the data within the view.
The find feature locates the phrase you searched for and shades it gray. If the matched position is not visible because it’s hidden under a scroll bar, the view is automatically scrolled to reveal it. The search is performed through collapsed or hidden positions. When a matched position is found, the parent is expanded and the matched position is shaded gray.
The find feature can be accessible four ways:
■ The Find option in the right-click context menu
■ The Find option in the Edit menu
■ The shortcut Ctrl + F
■ The Find field in the view toolbar
Find from the Right-Click Context MenuTo use the find feature from the right-click context menu, perform the following:
1. Right-click a measure, position, or attribute label to see the right-click context menu. Note that right-clicking on a data cell does not activate the find feature in the right-click context menu.
2. Click Find.
Figure 11–29 Find in the Right-Click Context Menu
3. The Find window appears.
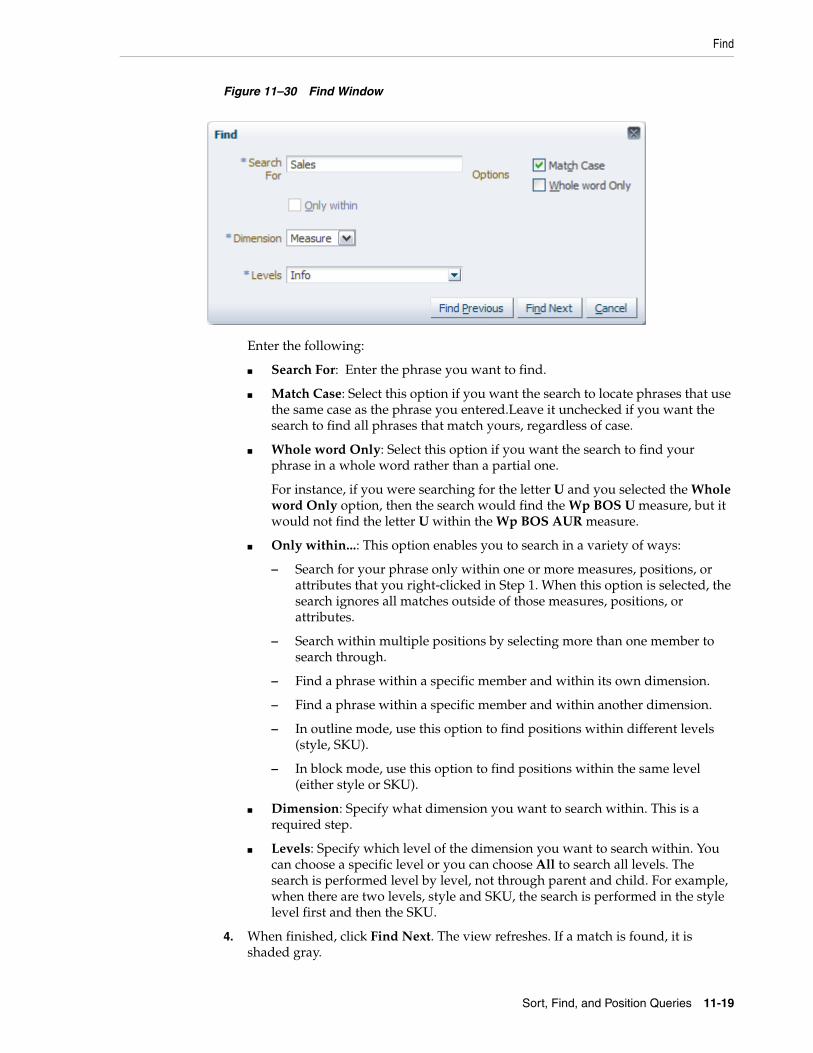
Find
Sort, Find, and Position Queries 11-19
Figure 11–30 Find Window
Enter the following:
■ Search For: Enter the phrase you want to find.
■ Match Case: Select this option if you want the search to locate phrases that use the same case as the phrase you entered.Leave it unchecked if you want the search to find all phrases that match yours, regardless of case.
■ Whole word Only: Select this option if you want the search to find your phrase in a whole word rather than a partial one.
For instance, if you were searching for the letter U and you selected the Whole word Only option, then the search would find the Wp BOS U measure, but it would not find the letter U within the Wp BOS AUR measure.
■ Only within...: This option enables you to search in a variety of ways:
– Search for your phrase only within one or more measures, positions, or attributes that you right-clicked in Step 1. When this option is selected, the search ignores all matches outside of those measures, positions, or attributes.
– Search within multiple positions by selecting more than one member to search through.
– Find a phrase within a specific member and within its own dimension.
– Find a phrase within a specific member and within another dimension.
– In outline mode, use this option to find positions within different levels (style, SKU).
– In block mode, use this option to find positions within the same level (either style or SKU).
■ Dimension: Specify what dimension you want to search within. This is a required step.
■ Levels: Specify which level of the dimension you want to search within. You can choose a specific level or you can choose All to search all levels. The search is performed level by level, not through parent and child. For example, when there are two levels, style and SKU, the search is performed in the style level first and then the SKU.
4. When finished, click Find Next. The view refreshes. If a match is found, it is shaded gray.
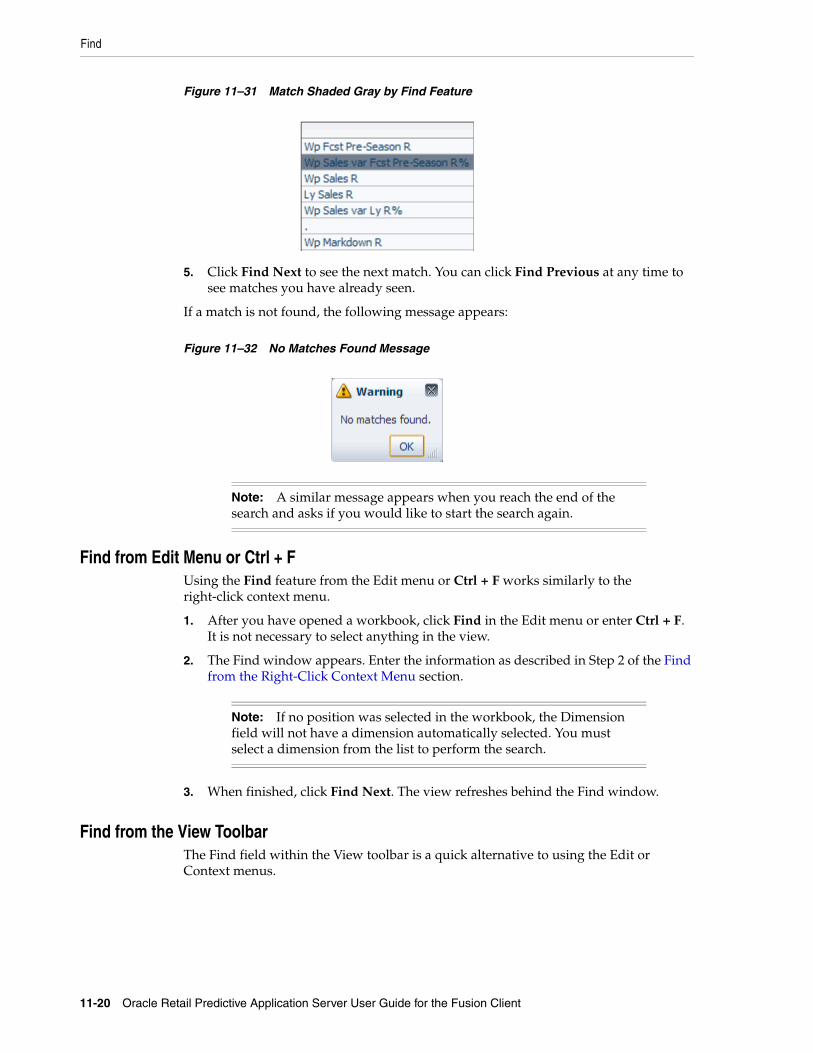
Find
11-20 Oracle Retail Predictive Application Server User Guide for the Fusion Client
Figure 11–31 Match Shaded Gray by Find Feature
5. Click Find Next to see the next match. You can click Find Previous at any time to see matches you have already seen.
If a match is not found, the following message appears:
Figure 11–32 No Matches Found Message
Find from Edit Menu or Ctrl + FUsing the Find feature from the Edit menu or Ctrl + F works similarly to the right-click context menu.
1. After you have opened a workbook, click Find in the Edit menu or enter Ctrl + F. It is not necessary to select anything in the view.
2. The Find window appears. Enter the information as described in Step 2 of the Find from the Right-Click Context Menu section.
3. When finished, click Find Next. The view refreshes behind the Find window.
Find from the View ToolbarThe Find field within the View toolbar is a quick alternative to using the Edit or Context menus.
Note: A similar message appears when you reach the end of the search and asks if you would like to start the search again.
Note: If no position was selected in the workbook, the Dimension field will not have a dimension automatically selected. You must select a dimension from the list to perform the search.
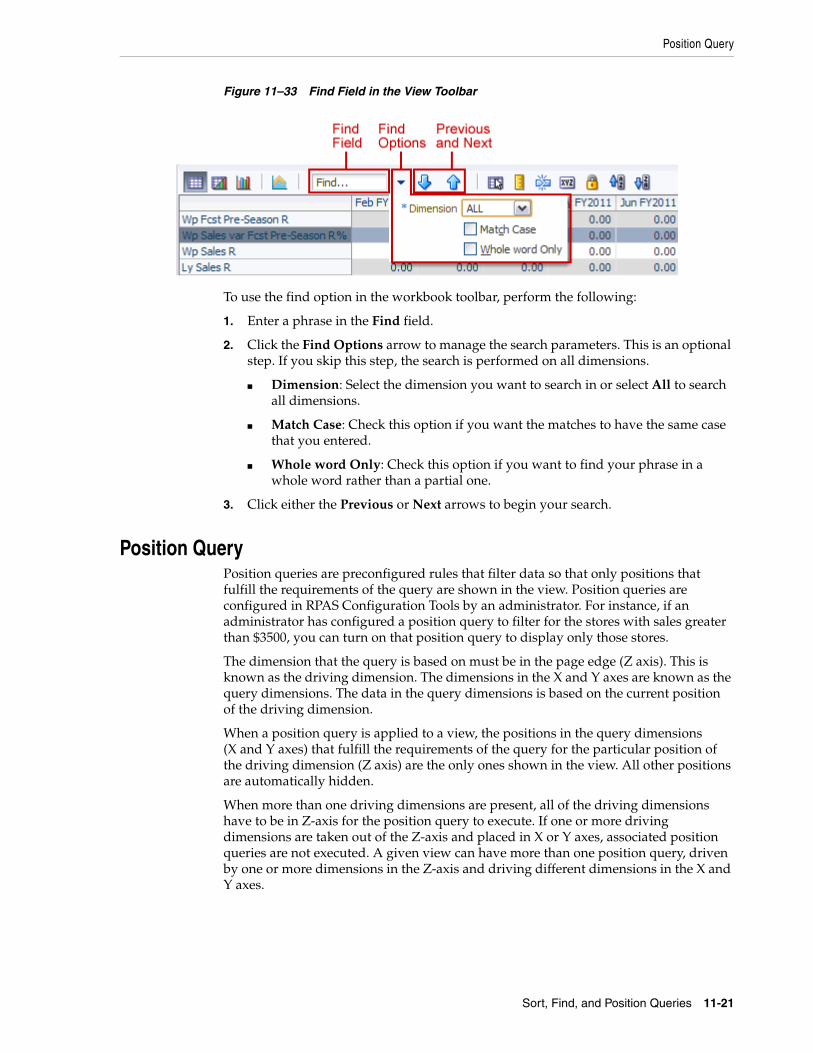
Position Query
Sort, Find, and Position Queries 11-21
Figure 11–33 Find Field in the View Toolbar
To use the find option in the workbook toolbar, perform the following:
1. Enter a phrase in the Find field.
2. Click the Find Options arrow to manage the search parameters. This is an optional step. If you skip this step, the search is performed on all dimensions.
■ Dimension: Select the dimension you want to search in or select All to search all dimensions.
■ Match Case: Check this option if you want the matches to have the same case that you entered.
■ Whole word Only: Check this option if you want to find your phrase in a whole word rather than a partial one.
3. Click either the Previous or Next arrows to begin your search.
Position QueryPosition queries are preconfigured rules that filter data so that only positions that fulfill the requirements of the query are shown in the view. Position queries are configured in RPAS Configuration Tools by an administrator. For instance, if an administrator has configured a position query to filter for the stores with sales greater than $3500, you can turn on that position query to display only those stores.
The dimension that the query is based on must be in the page edge (Z axis). This is known as the driving dimension. The dimensions in the X and Y axes are known as the query dimensions. The data in the query dimensions is based on the current position of the driving dimension.
When a position query is applied to a view, the positions in the query dimensions (X and Y axes) that fulfill the requirements of the query for the particular position of the driving dimension (Z axis) are the only ones shown in the view. All other positions are automatically hidden.
When more than one driving dimensions are present, all of the driving dimensions have to be in Z-axis for the position query to execute. If one or more driving dimensions are taken out of the Z-axis and placed in X or Y axes, associated position queries are not executed. A given view can have more than one position query, driven by one or more dimensions in the Z-axis and driving different dimensions in the X and Y axes.
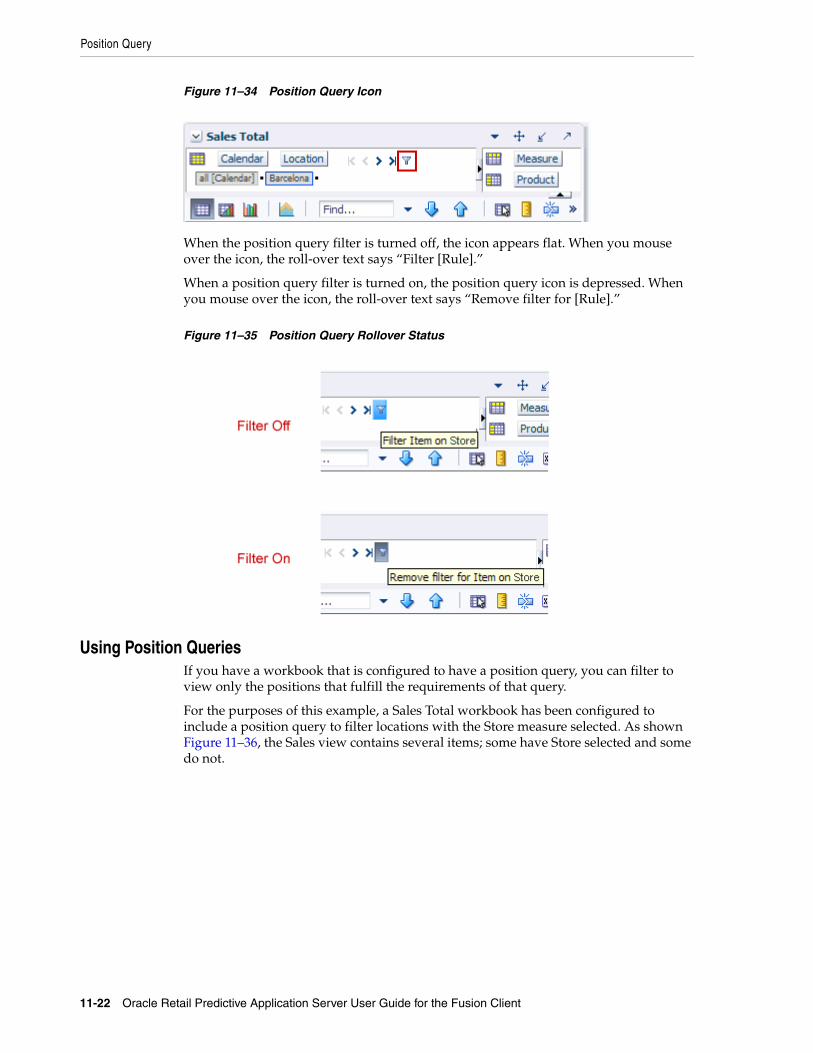
Position Query
11-22 Oracle Retail Predictive Application Server User Guide for the Fusion Client
Figure 11–34 Position Query Icon
When the position query filter is turned off, the icon appears flat. When you mouse over the icon, the roll-over text says “Filter [Rule].”
When a position query filter is turned on, the position query icon is depressed. When you mouse over the icon, the roll-over text says “Remove filter for [Rule].”
Figure 11–35 Position Query Rollover Status
Using Position QueriesIf you have a workbook that is configured to have a position query, you can filter to view only the positions that fulfill the requirements of that query.
For the purposes of this example, a Sales Total workbook has been configured to include a position query to filter locations with the Store measure selected. As shown Figure 11–36, the Sales view contains several items; some have Store selected and some do not.
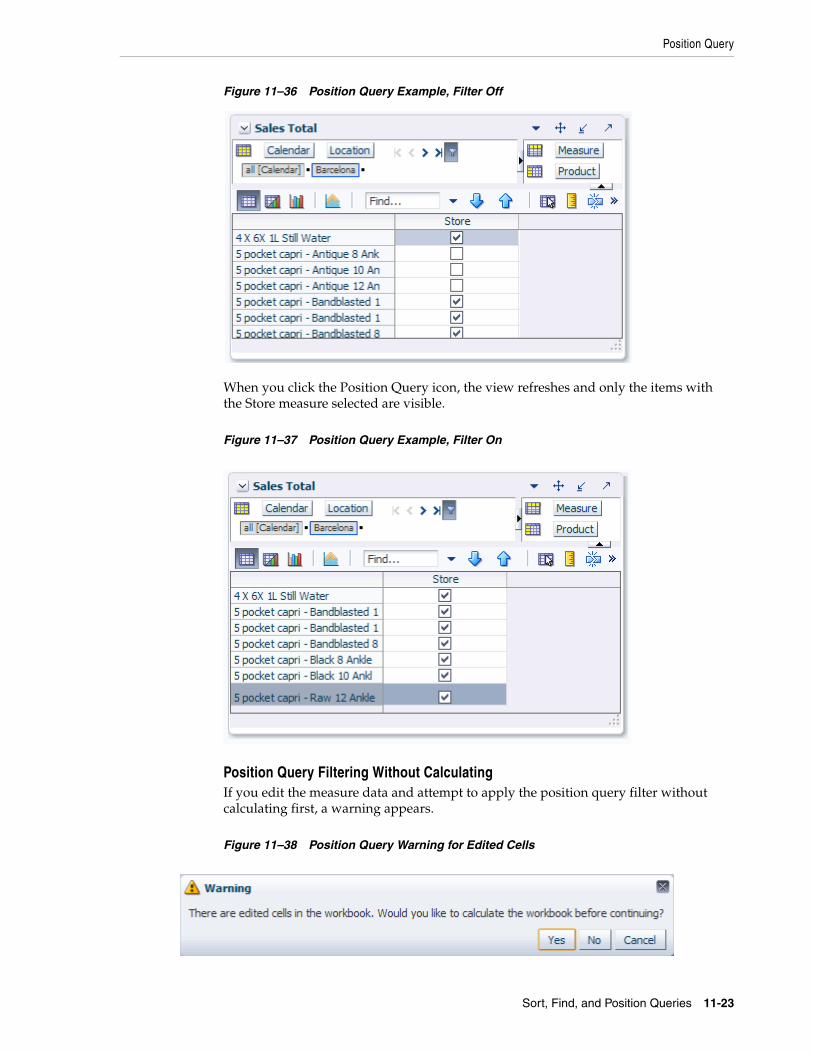
Position Query
Sort, Find, and Position Queries 11-23
Figure 11–36 Position Query Example, Filter Off
When you click the Position Query icon, the view refreshes and only the items with the Store measure selected are visible.
Figure 11–37 Position Query Example, Filter On
Position Query Filtering Without CalculatingIf you edit the measure data and attempt to apply the position query filter without calculating first, a warning appears.
Figure 11–38 Position Query Warning for Edited Cells

Position Query
11-24 Oracle Retail Predictive Application Server User Guide for the Fusion Client
To calculate the data and then apply the position query filter, click Yes. To apply the filter without considering the edited data, click No. To cancel the action, click Cancel.
Updating Measure Data in Position QueriesAfter you have applied a position query filter to the data, if you edit the data and calculate, the position query filter does not automatically refilter according to the new values. When this happens, the filter icon changes to a warning icon. The warning icon means that the position query may have stale data in it.
For instance, if you deselect the Store measure for the Still Water product and click Calculate while the filter is on, Still Water remains visible in the view and the filter icon changes to a warning icon.
Figure 11–39 Updating Measure Data in a Position Query
If you want the position query to automatically refilter the edited data, use the Auto Evaluate feature. For more information about this feature, see Using Position Queries with Auto Evaluate.
Scrolling in Position QueriesAfter you have filtered the slice, if you scroll to the next position, the position query filter is not reapplied to the new position and only the positions that were shown in the previous slice are shown in the current slice.
For example, click the Next icon to scroll to the next location.
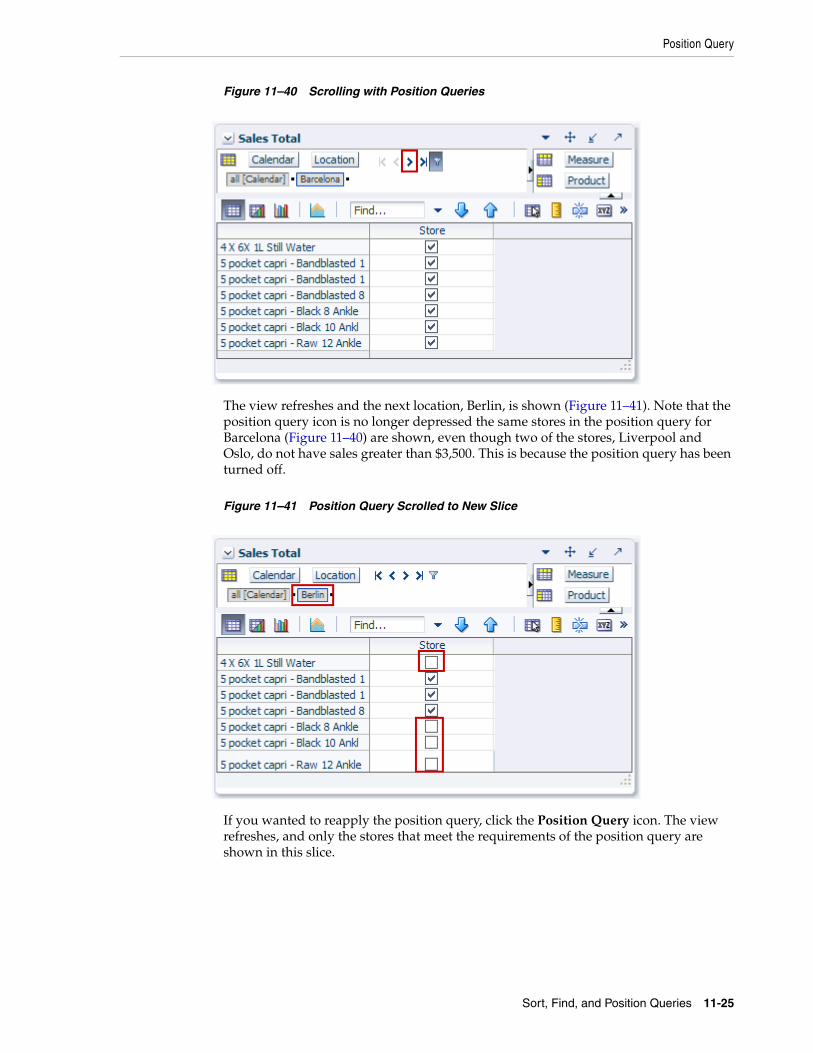
Position Query
Sort, Find, and Position Queries 11-25
Figure 11–40 Scrolling with Position Queries
The view refreshes and the next location, Berlin, is shown (Figure 11–41). Note that the position query icon is no longer depressed the same stores in the position query for Barcelona (Figure 11–40) are shown, even though two of the stores, Liverpool and Oslo, do not have sales greater than $3,500. This is because the position query has been turned off.
Figure 11–41 Position Query Scrolled to New Slice
If you wanted to reapply the position query, click the Position Query icon. The view refreshes, and only the stores that meet the requirements of the position query are shown in this slice.
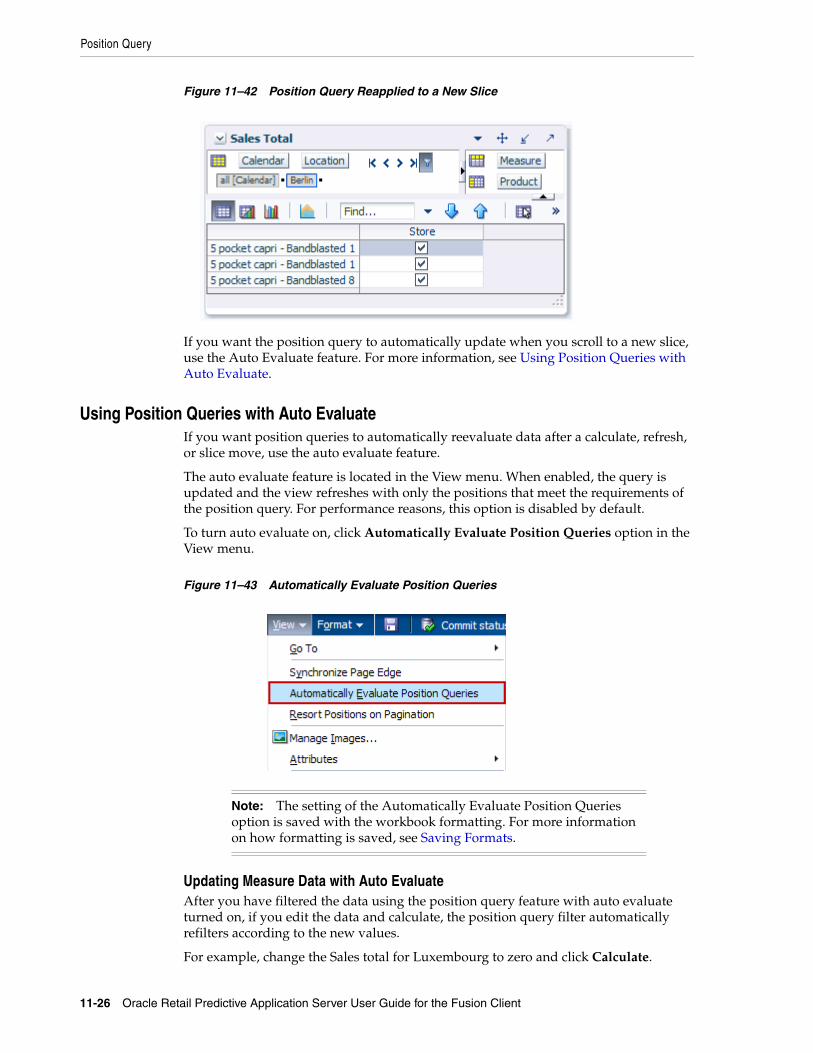
Position Query
11-26 Oracle Retail Predictive Application Server User Guide for the Fusion Client
Figure 11–42 Position Query Reapplied to a New Slice
If you want the position query to automatically update when you scroll to a new slice, use the Auto Evaluate feature. For more information, see Using Position Queries with Auto Evaluate.
Using Position Queries with Auto EvaluateIf you want position queries to automatically reevaluate data after a calculate, refresh, or slice move, use the auto evaluate feature.
The auto evaluate feature is located in the View menu. When enabled, the query is updated and the view refreshes with only the positions that meet the requirements of the position query. For performance reasons, this option is disabled by default.
To turn auto evaluate on, click Automatically Evaluate Position Queries option in the View menu.
Figure 11–43 Automatically Evaluate Position Queries
Updating Measure Data with Auto EvaluateAfter you have filtered the data using the position query feature with auto evaluate turned on, if you edit the data and calculate, the position query filter automatically refilters according to the new values.
For example, change the Sales total for Luxembourg to zero and click Calculate.
Note: The setting of the Automatically Evaluate Position Queries option is saved with the workbook formatting. For more information on how formatting is saved, see Saving Formats.

Position Query
Sort, Find, and Position Queries 11-27
Figure 11–44 Updating Measure Data with Auto Evaluate
The view refreshes and Luxembourg is no longer shown in the filter results.
Figure 11–45 Measure Data Updated with Auto Evaluate
Scrolling with Auto EvaluateAfter the slice is filtered, if auto evaluate is enabled and you scroll to the next position, the position query filter is reapplied to the new position. As a result, only the positions that meet the requirements of the position query are shown in the current slice.
For example, click the Next icon to scroll to the next location.

Position Query
11-28 Oracle Retail Predictive Application Server User Guide for the Fusion Client
Figure 11–46 Scrolling with Auto Evaluate
The view refreshes and the next location, Berlin, is shown (Figure 11–47). Note how the position query icon remains depressed and how different stores are shown compared to the previous slice (Figure 11–46). Because auto evaluate is enabled, the position query remains on, and only the stores that meet the position query requirements are shown.
Figure 11–47 Position Query Scrolled to New Slice with Auto Evaluate
No Position Query MatchesIf you scroll to a new slice where no position meets the requirements of the position query, all positions in the view are displayed and a warning appears.
Figure 11–48 Scrolling with No Position Query Matches

Position Filtering
Sort, Find, and Position Queries 11-29
Position FilteringPosition filtering allows a user to use the set of selected data cells in one worksheet view to filter another worksheet view. For example, a user selects one or more cells in a pivot table which are associated with a group of items, locations, and measures. The intersection of selected cells can be used to filter another worksheet view.
This provides the user with a convenient way of filtering a large worksheet with one or more views down to the subset of data they are interested on working with.
Figure 11–49 Position Filtering in a Single View
In the example above a set of positions is selected in a single view. When position filtering is applied, the cells visible in the view are reduced to those specified by the selected positions.
Figure 11–50 Position Filtering in Two Views
In the above example, a set of positions is selected in the first view. When the position filter is applied, a second view is selected. The positions in the second view are filtered to match those selected in the position filter in the first view.
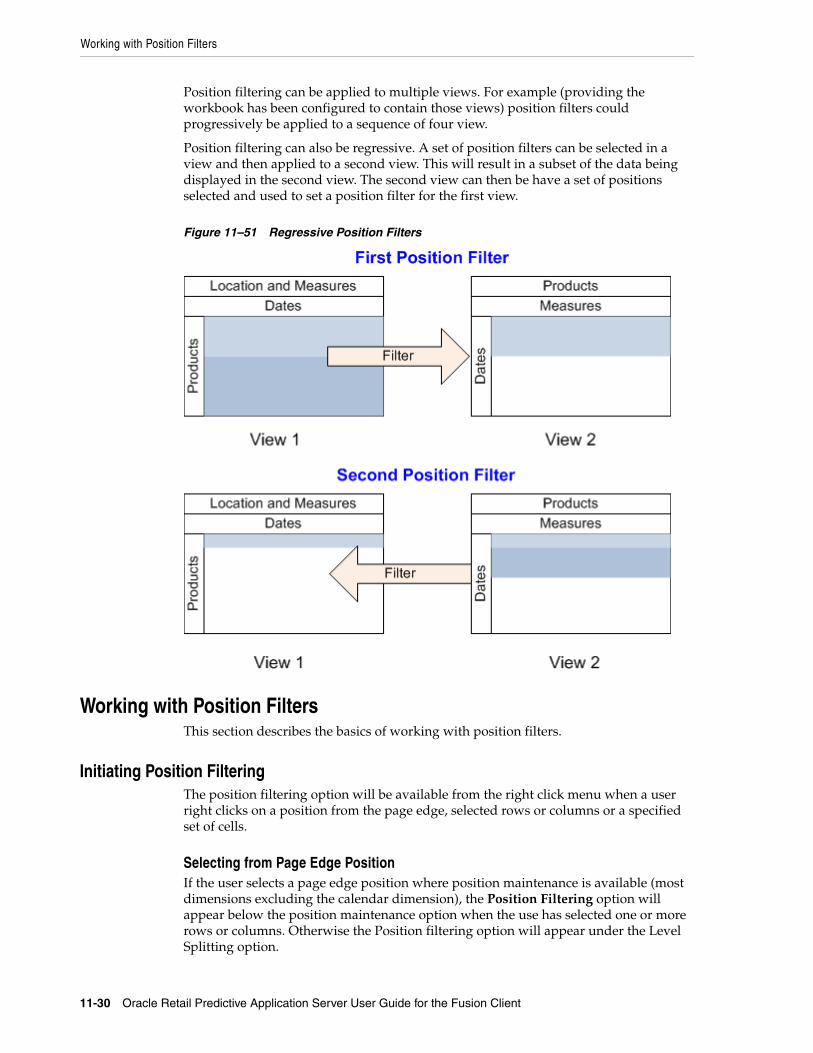
Working with Position Filters
11-30 Oracle Retail Predictive Application Server User Guide for the Fusion Client
Position filtering can be applied to multiple views. For example (providing the workbook has been configured to contain those views) position filters could progressively be applied to a sequence of four view.
Position filtering can also be regressive. A set of position filters can be selected in a view and then applied to a second view. This will result in a subset of the data being displayed in the second view. The second view can then be have a set of positions selected and used to set a position filter for the first view.
Figure 11–51 Regressive Position Filters
Working with Position FiltersThis section describes the basics of working with position filters.
Initiating Position FilteringThe position filtering option will be available from the right click menu when a user right clicks on a position from the page edge, selected rows or columns or a specified set of cells.
Selecting from Page Edge PositionIf the user selects a page edge position where position maintenance is available (most dimensions excluding the calendar dimension), the Position Filtering option will appear below the position maintenance option when the use has selected one or more rows or columns. Otherwise the Position filtering option will appear under the Level Splitting option.
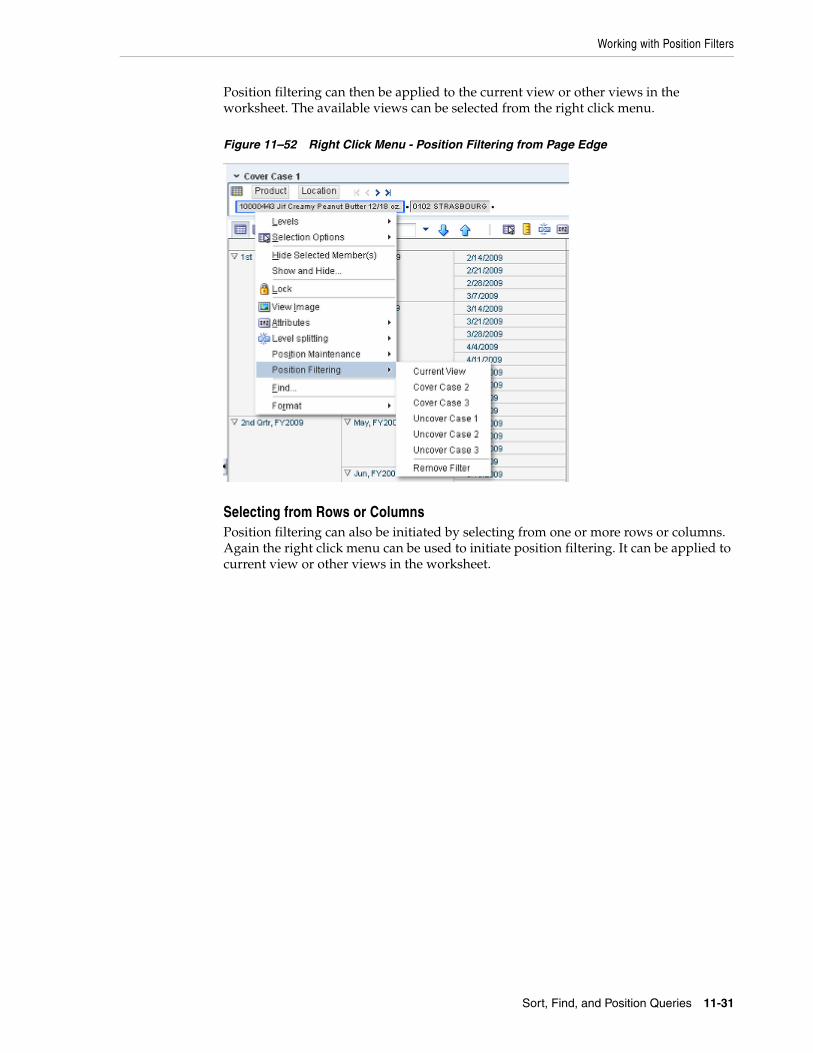
Working with Position Filters
Sort, Find, and Position Queries 11-31
Position filtering can then be applied to the current view or other views in the worksheet. The available views can be selected from the right click menu.
Figure 11–52 Right Click Menu - Position Filtering from Page Edge
Selecting from Rows or ColumnsPosition filtering can also be initiated by selecting from one or more rows or columns. Again the right click menu can be used to initiate position filtering. It can be applied to current view or other views in the worksheet.
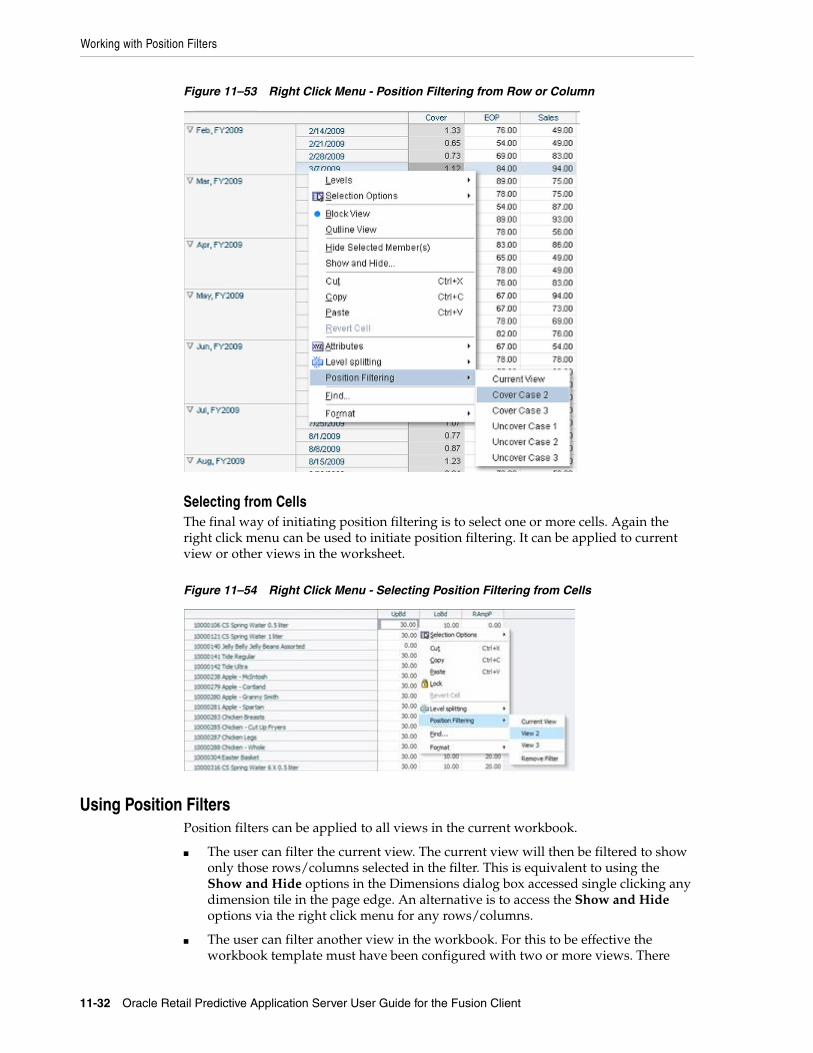
Working with Position Filters
11-32 Oracle Retail Predictive Application Server User Guide for the Fusion Client
Figure 11–53 Right Click Menu - Position Filtering from Row or Column
Selecting from CellsThe final way of initiating position filtering is to select one or more cells. Again the right click menu can be used to initiate position filtering. It can be applied to current view or other views in the worksheet.
Figure 11–54 Right Click Menu - Selecting Position Filtering from Cells
Using Position FiltersPosition filters can be applied to all views in the current workbook.
■ The user can filter the current view. The current view will then be filtered to show only those rows/columns selected in the filter. This is equivalent to using the Show and Hide options in the Dimensions dialog box accessed single clicking any dimension tile in the page edge. An alternative is to access the Show and Hide options via the right click menu for any rows/columns.
■ The user can filter another view in the workbook. For this to be effective the workbook template must have been configured with two or more views. There
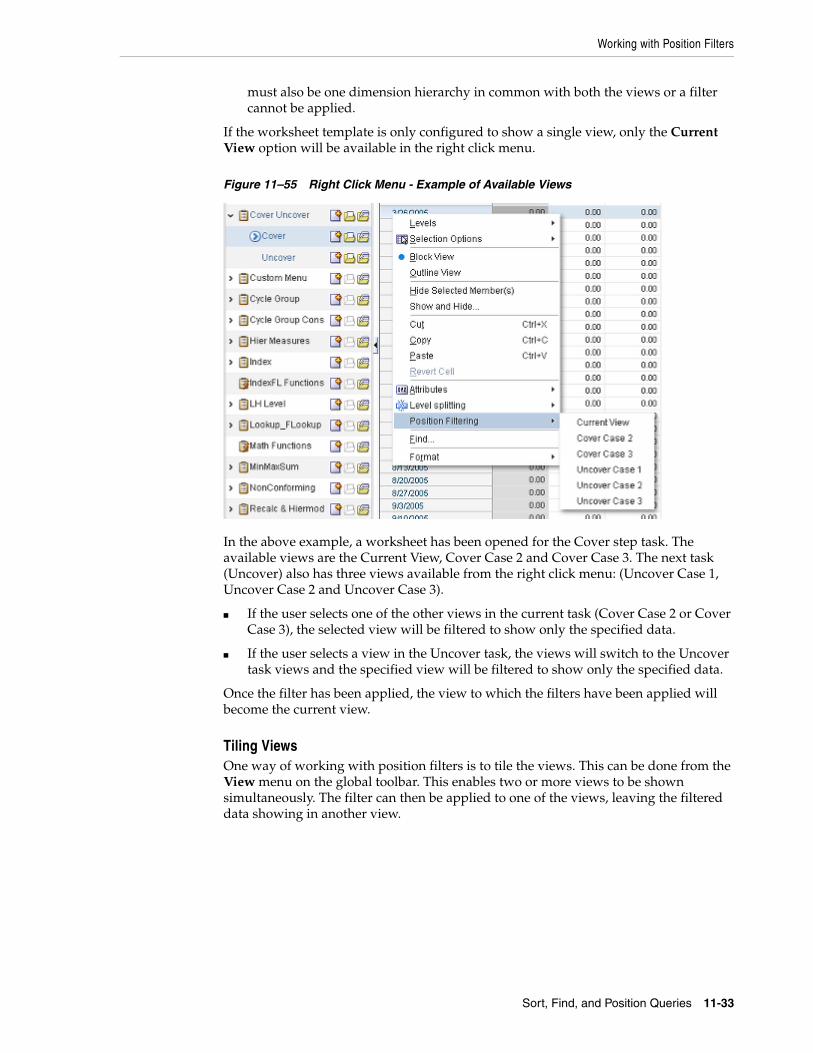
Working with Position Filters
Sort, Find, and Position Queries 11-33
must also be one dimension hierarchy in common with both the views or a filter cannot be applied.
If the worksheet template is only configured to show a single view, only the Current View option will be available in the right click menu.
Figure 11–55 Right Click Menu - Example of Available Views
In the above example, a worksheet has been opened for the Cover step task. The available views are the Current View, Cover Case 2 and Cover Case 3. The next task (Uncover) also has three views available from the right click menu: (Uncover Case 1, Uncover Case 2 and Uncover Case 3).
■ If the user selects one of the other views in the current task (Cover Case 2 or Cover Case 3), the selected view will be filtered to show only the specified data.
■ If the user selects a view in the Uncover task, the views will switch to the Uncover task views and the specified view will be filtered to show only the specified data.
Once the filter has been applied, the view to which the filters have been applied will become the current view.
Tiling ViewsOne way of working with position filters is to tile the views. This can be done from the View menu on the global toolbar. This enables two or more views to be shown simultaneously. The filter can then be applied to one of the views, leaving the filtered data showing in another view.
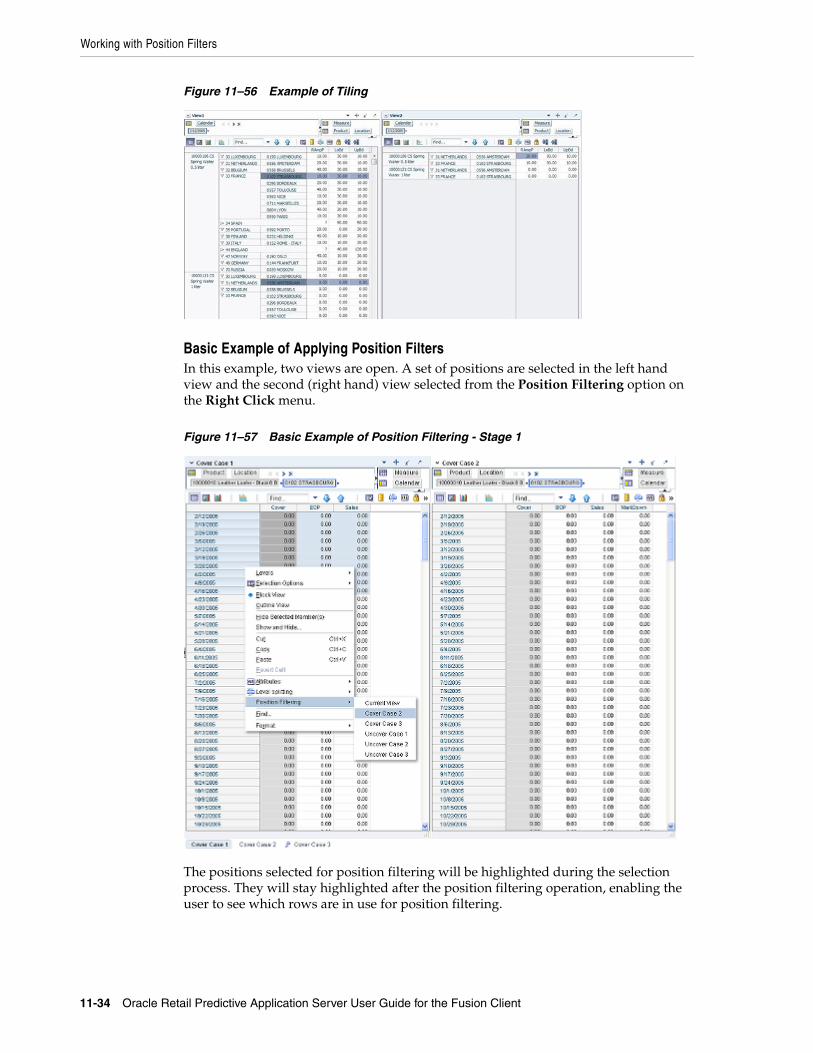
Working with Position Filters
11-34 Oracle Retail Predictive Application Server User Guide for the Fusion Client
Figure 11–56 Example of Tiling
Basic Example of Applying Position FiltersIn this example, two views are open. A set of positions are selected in the left hand view and the second (right hand) view selected from the Position Filtering option on the Right Click menu.
Figure 11–57 Basic Example of Position Filtering - Stage 1
The positions selected for position filtering will be highlighted during the selection process. They will stay highlighted after the position filtering operation, enabling the user to see which rows are in use for position filtering.
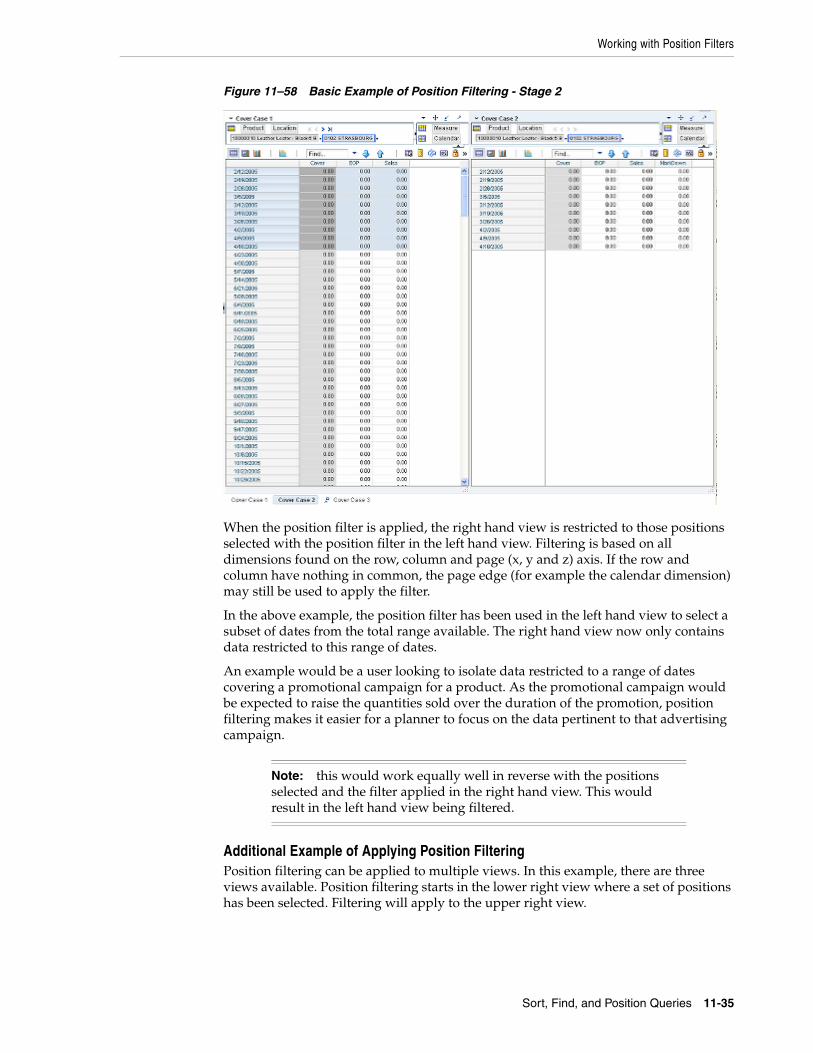
Working with Position Filters
Sort, Find, and Position Queries 11-35
Figure 11–58 Basic Example of Position Filtering - Stage 2
When the position filter is applied, the right hand view is restricted to those positions selected with the position filter in the left hand view. Filtering is based on all dimensions found on the row, column and page (x, y and z) axis. If the row and column have nothing in common, the page edge (for example the calendar dimension) may still be used to apply the filter.
In the above example, the position filter has been used in the left hand view to select a subset of dates from the total range available. The right hand view now only contains data restricted to this range of dates.
An example would be a user looking to isolate data restricted to a range of dates covering a promotional campaign for a product. As the promotional campaign would be expected to raise the quantities sold over the duration of the promotion, position filtering makes it easier for a planner to focus on the data pertinent to that advertising campaign.
Additional Example of Applying Position FilteringPosition filtering can be applied to multiple views. In this example, there are three views available. Position filtering starts in the lower right view where a set of positions has been selected. Filtering will apply to the upper right view.
Note: this would work equally well in reverse with the positions selected and the filter applied in the right hand view. This would result in the left hand view being filtered.
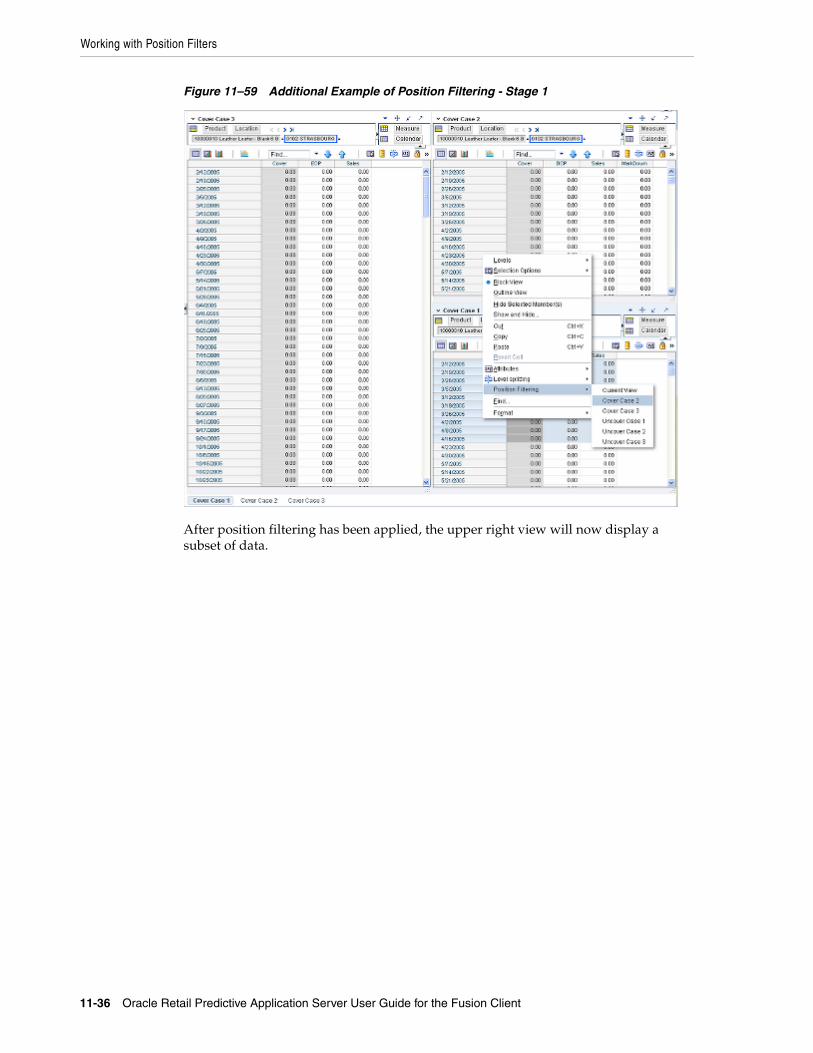
Working with Position Filters
11-36 Oracle Retail Predictive Application Server User Guide for the Fusion Client
Figure 11–59 Additional Example of Position Filtering - Stage 1
After position filtering has been applied, the upper right view will now display a subset of data.
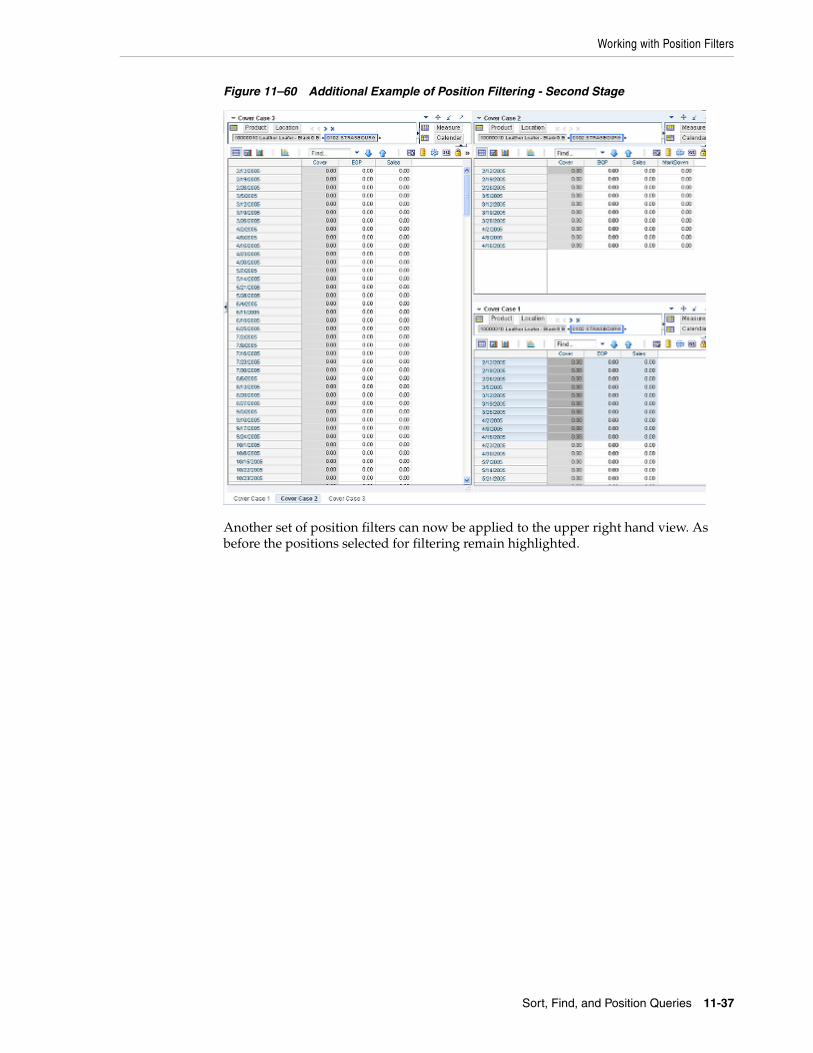
Working with Position Filters
Sort, Find, and Position Queries 11-37
Figure 11–60 Additional Example of Position Filtering - Second Stage
Another set of position filters can now be applied to the upper right hand view. As before the positions selected for filtering remain highlighted.

Working with Position Filters
11-38 Oracle Retail Predictive Application Server User Guide for the Fusion Client
Figure 11–61 Additional Example of Position Filtering - Third Stage
When the position filter is applied, the third (left hand) view is filtered.
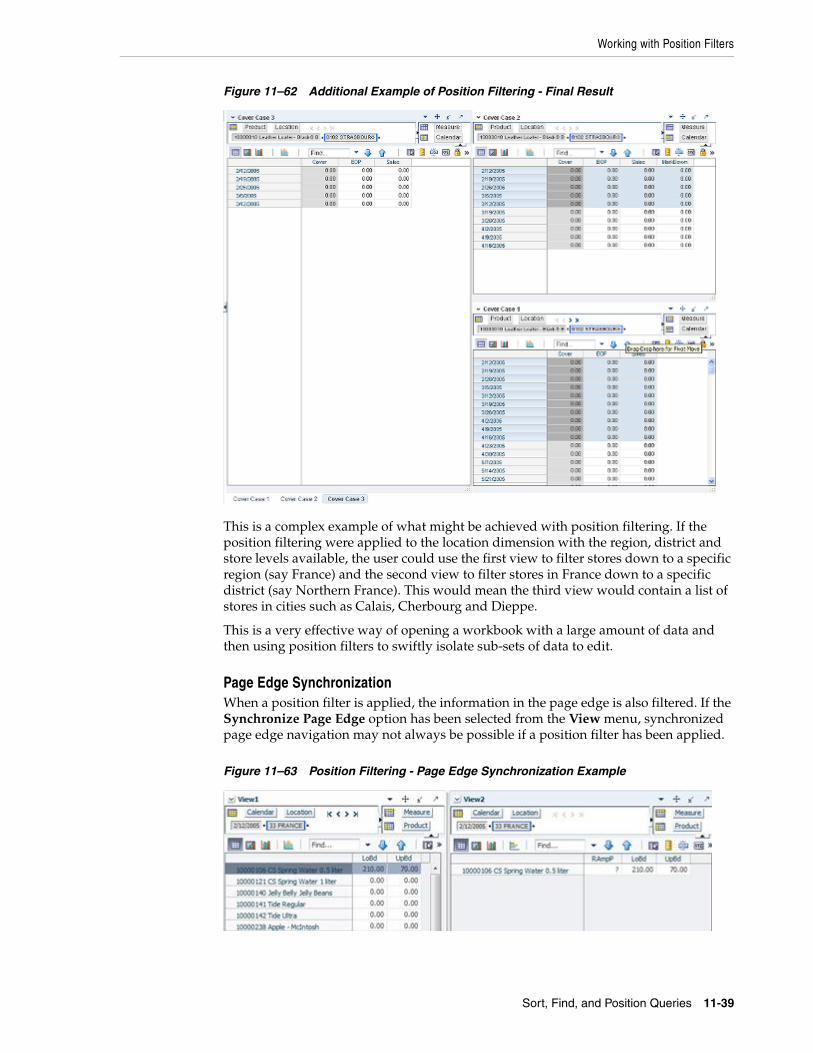
Working with Position Filters
Sort, Find, and Position Queries 11-39
Figure 11–62 Additional Example of Position Filtering - Final Result
This is a complex example of what might be achieved with position filtering. If the position filtering were applied to the location dimension with the region, district and store levels available, the user could use the first view to filter stores down to a specific region (say France) and the second view to filter stores in France down to a specific district (say Northern France). This would mean the third view would contain a list of stores in cities such as Calais, Cherbourg and Dieppe.
This is a very effective way of opening a workbook with a large amount of data and then using position filters to swiftly isolate sub-sets of data to edit.
Page Edge SynchronizationWhen a position filter is applied, the information in the page edge is also filtered. If the Synchronize Page Edge option has been selected from the View menu, synchronized page edge navigation may not always be possible if a position filter has been applied.
Figure 11–63 Position Filtering - Page Edge Synchronization Example
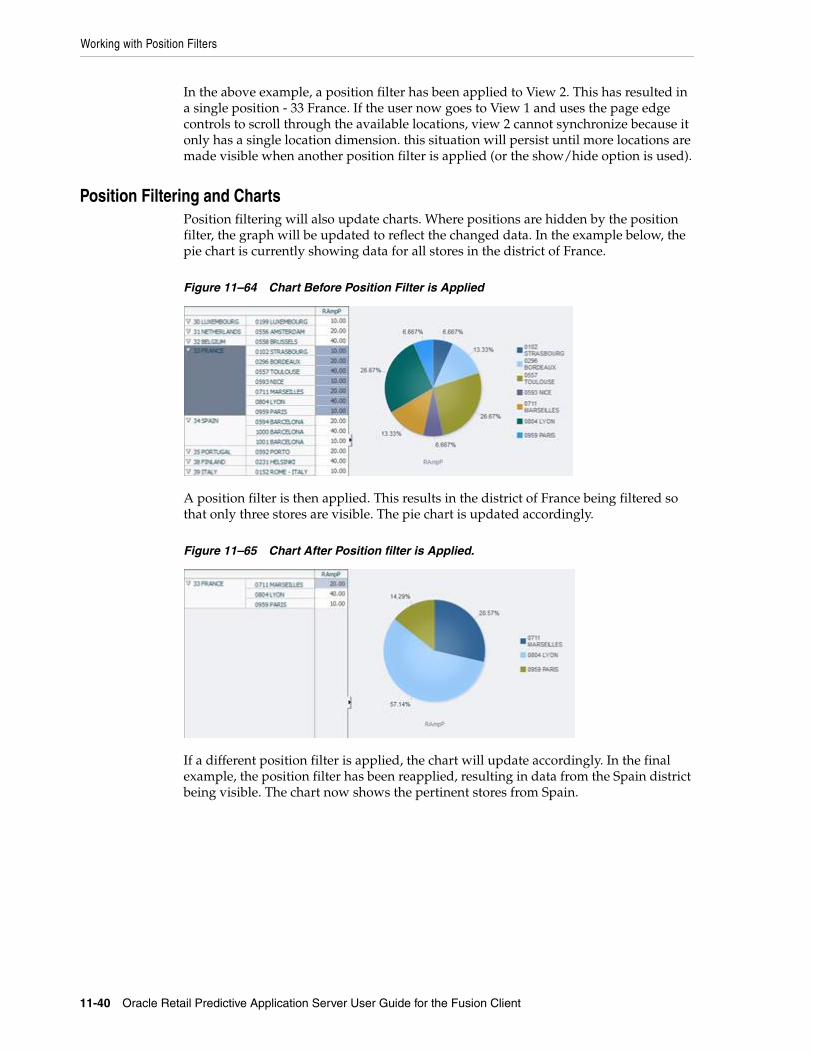
Working with Position Filters
11-40 Oracle Retail Predictive Application Server User Guide for the Fusion Client
In the above example, a position filter has been applied to View 2. This has resulted in a single position - 33 France. If the user now goes to View 1 and uses the page edge controls to scroll through the available locations, view 2 cannot synchronize because it only has a single location dimension. this situation will persist until more locations are made visible when another position filter is applied (or the show/hide option is used).
Position Filtering and ChartsPosition filtering will also update charts. Where positions are hidden by the position filter, the graph will be updated to reflect the changed data. In the example below, the pie chart is currently showing data for all stores in the district of France.
Figure 11–64 Chart Before Position Filter is Applied
A position filter is then applied. This results in the district of France being filtered so that only three stores are visible. The pie chart is updated accordingly.
Figure 11–65 Chart After Position filter is Applied.
If a different position filter is applied, the chart will update accordingly. In the final example, the position filter has been reapplied, resulting in data from the Spain district being visible. The chart now shows the pertinent stores from Spain.
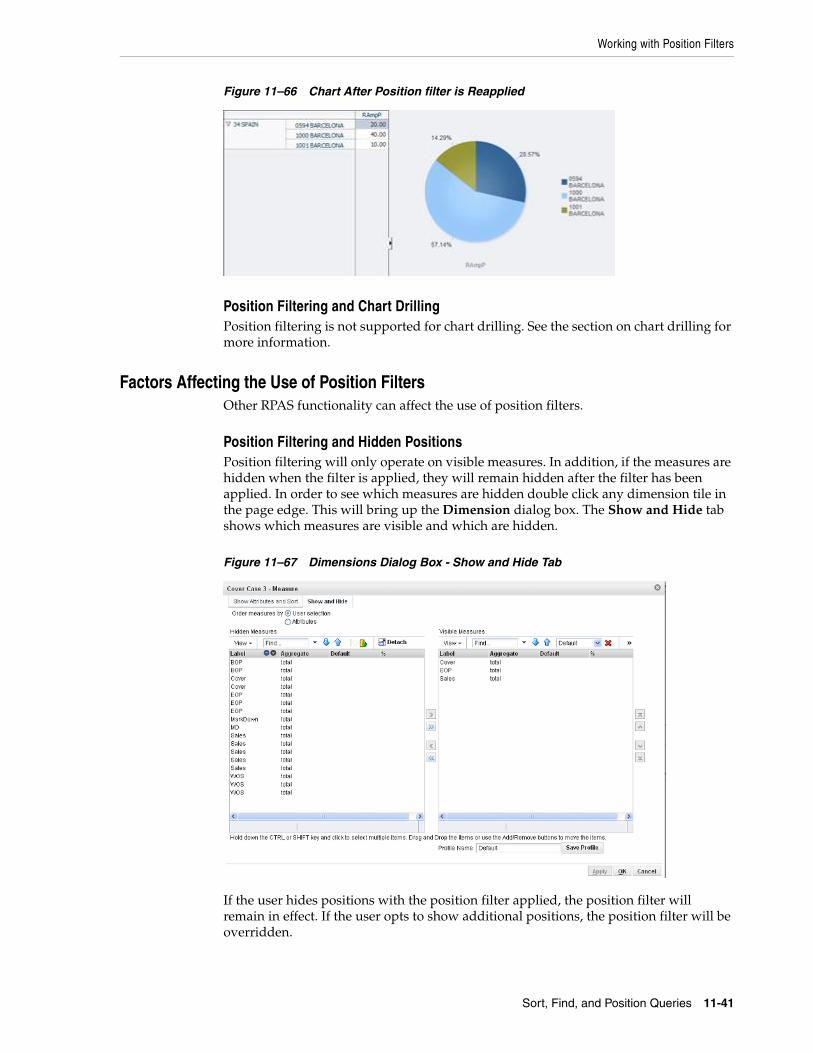
Working with Position Filters
Sort, Find, and Position Queries 11-41
Figure 11–66 Chart After Position filter is Reapplied
Position Filtering and Chart DrillingPosition filtering is not supported for chart drilling. See the section on chart drilling for more information.
Factors Affecting the Use of Position FiltersOther RPAS functionality can affect the use of position filters.
Position Filtering and Hidden PositionsPosition filtering will only operate on visible measures. In addition, if the measures are hidden when the filter is applied, they will remain hidden after the filter has been applied. In order to see which measures are hidden double click any dimension tile in the page edge. This will bring up the Dimension dialog box. The Show and Hide tab shows which measures are visible and which are hidden.
Figure 11–67 Dimensions Dialog Box - Show and Hide Tab
If the user hides positions with the position filter applied, the position filter will remain in effect. If the user opts to show additional positions, the position filter will be overridden.
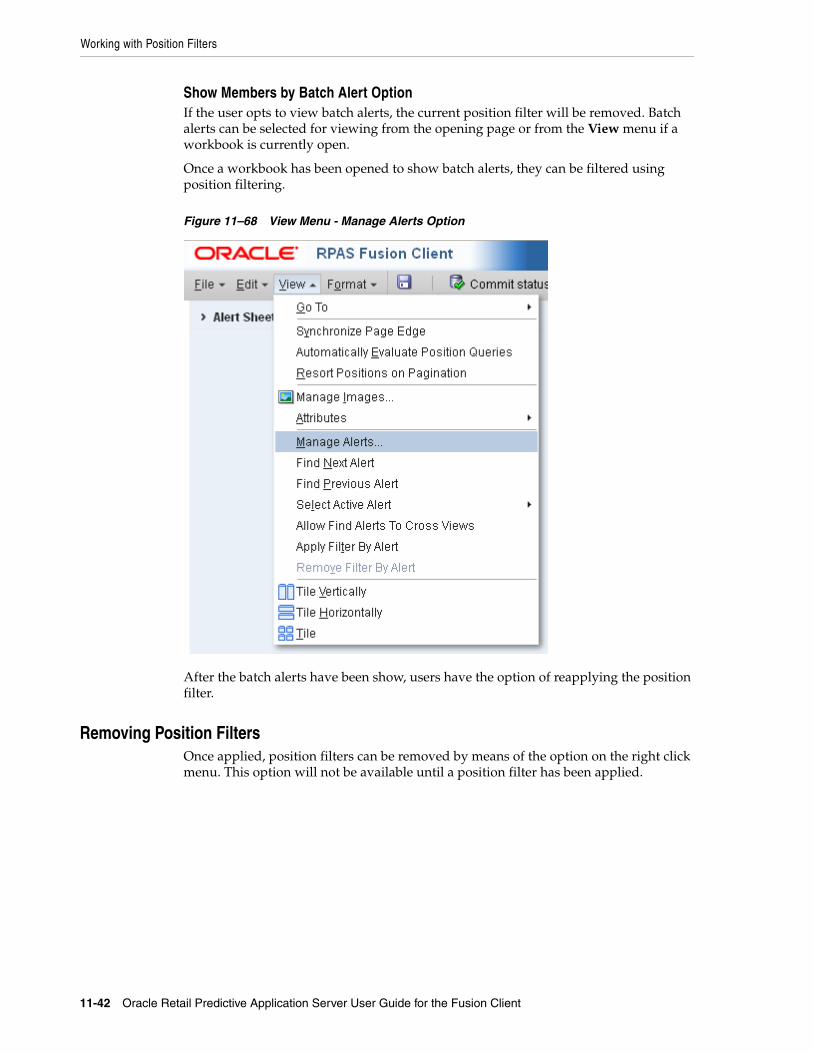
Working with Position Filters
11-42 Oracle Retail Predictive Application Server User Guide for the Fusion Client
Show Members by Batch Alert OptionIf the user opts to view batch alerts, the current position filter will be removed. Batch alerts can be selected for viewing from the opening page or from the View menu if a workbook is currently open.
Once a workbook has been opened to show batch alerts, they can be filtered using position filtering.
Figure 11–68 View Menu - Manage Alerts Option
After the batch alerts have been show, users have the option of reapplying the position filter.
Removing Position FiltersOnce applied, position filters can be removed by means of the option on the right click menu. This option will not be available until a position filter has been applied.
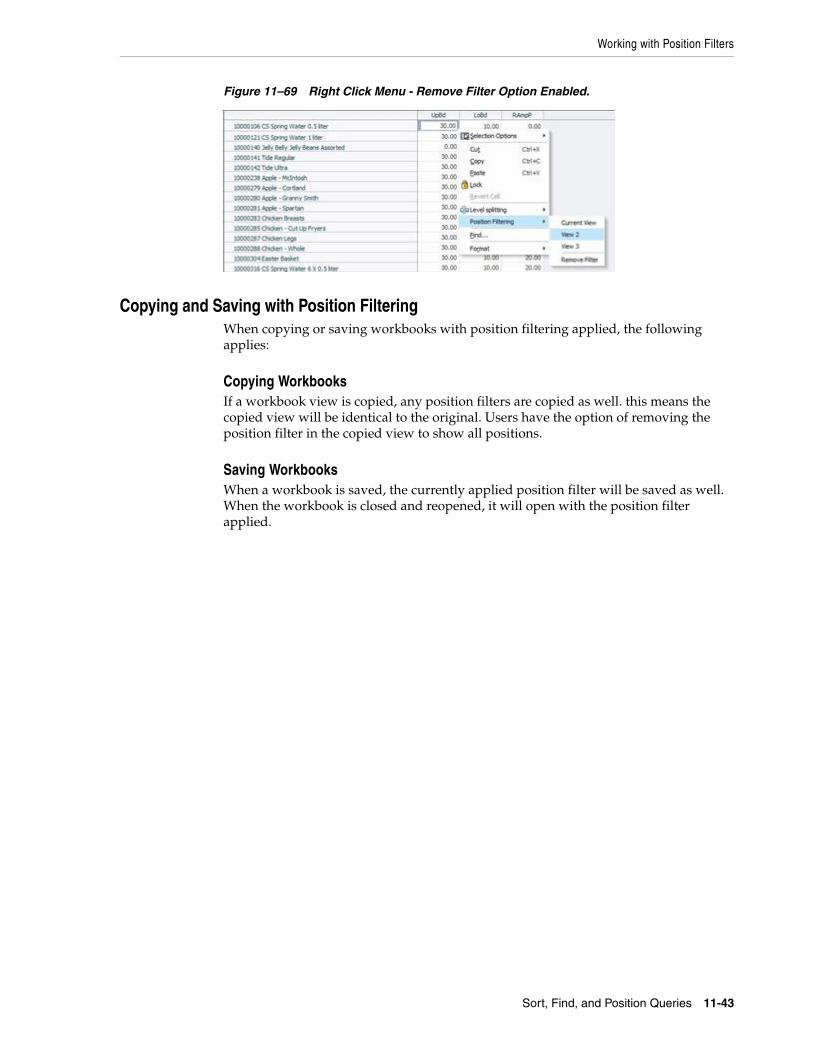
Working with Position Filters
Sort, Find, and Position Queries 11-43
Figure 11–69 Right Click Menu - Remove Filter Option Enabled.
Copying and Saving with Position FilteringWhen copying or saving workbooks with position filtering applied, the following applies:
Copying WorkbooksIf a workbook view is copied, any position filters are copied as well. this means the copied view will be identical to the original. Users have the option of removing the position filter in the copied view to show all positions.
Saving WorkbooksWhen a workbook is saved, the currently applied position filter will be saved as well. When the workbook is closed and reopened, it will open with the position filter applied.

Working with Position Filters
11-44 Oracle Retail Predictive Application Server User Guide for the Fusion Client
Working With Charts 12-1
12Working With Charts
You can use the charting feature to generate a visual representation of the data in the form of charts. This section describes the available chart types and provides instructions on the various tasks you can perform with charts. It includes the following sections:
■ Viewing Charts
■ Charts View User Interface
■ Available Chart Types
■ Editing Data Through a Chart
■ Customizing a Chart
■ Saving a Chart as an Image
Viewing ChartsYou can view charts using the following views:
■ Chart View - In this view, the chart displays in the complete view area.
■ Split View - In this view, the chart and data display together in two vertical panels.
To view a chart:
1. Select the data you want for the chart.
2. From the View toolbar, click the Select Chart Type icon, and then select the chart type.
Note: Due to some limitations of Flash, chart axes and labels may not be visible at times and chart sizes may not adjust as expected.

Viewing Charts
12-2 Oracle Retail Predictive Application Server User Guide for the Fusion Client
Figure 12–1 Select Chart Type Icon on the View Toolbar
3. After you select the chart type, click one of the following icons:
■ Switch to Chart View – Select this icon to switch the view to charts.
Figure 12–2 Switch to Chart View Icon on the View Toolbar
■ Switch to Split View – Select this icon to see the pivot table and chart split in two vertical panels.
Figure 12–3 Switch to Split View Icon on the View Toolbar
To switch back to the pivot table, click the Switch to Pivot Table View icon.
Figure 12–4 Switch to Pivot Table View Icon on the View Toolbar
Cell Selection ConsiderationsWhen you choose to view a chart, only the cells that you select are represented in a chart. Each available graph type requires that a specific amount of data or cells are

Viewing Charts
Working With Charts 12-3
selected for a graph to appear. Although you may select a subset, the cells must contain enough data to support the desired graph for the graph to be displayed. For more information on the information required for each graph type, see Available Chart Types.
Squaring the SelectionWhen the chart is rendered on screen, the cell selections in the view are automatically squared. In this operation, additional cells are added to your selection to represent a squared selection area. This ensures that the data is analyzed in a consistent manner.
If you choose to select some cells before viewing a chart, as shown in Figure 12–5:
Figure 12–5 Example of Cells Selected Before Viewing a Chart
After the chart appears, your selection in the view is squared, as shown in Figure 12–6:
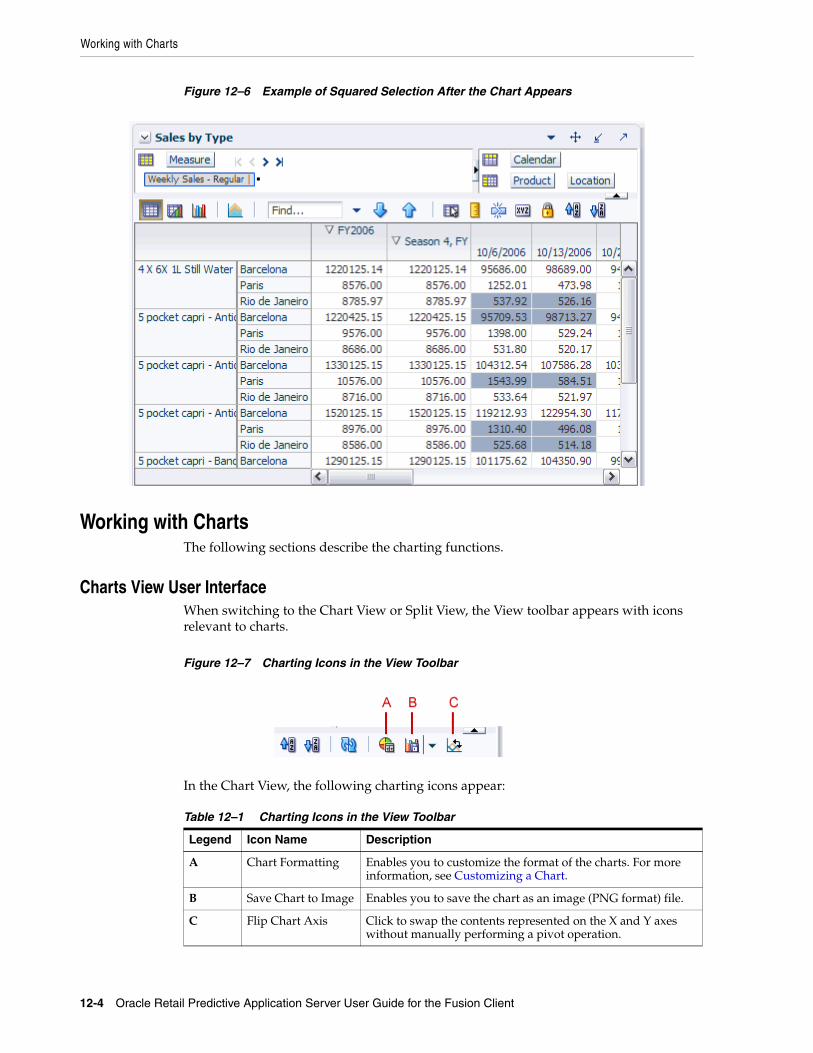
Working with Charts
12-4 Oracle Retail Predictive Application Server User Guide for the Fusion Client
Figure 12–6 Example of Squared Selection After the Chart Appears
Working with ChartsThe following sections describe the charting functions.
Charts View User InterfaceWhen switching to the Chart View or Split View, the View toolbar appears with icons relevant to charts.
Figure 12–7 Charting Icons in the View Toolbar
In the Chart View, the following charting icons appear:
Table 12–1 Charting Icons in the View Toolbar
Legend Icon Name Description
A Chart Formatting Enables you to customize the format of the charts. For more information, see Customizing a Chart.
B Save Chart to Image Enables you to save the chart as an image (PNG format) file.
C Flip Chart Axis Click to swap the contents represented on the X and Y axes without manually performing a pivot operation.
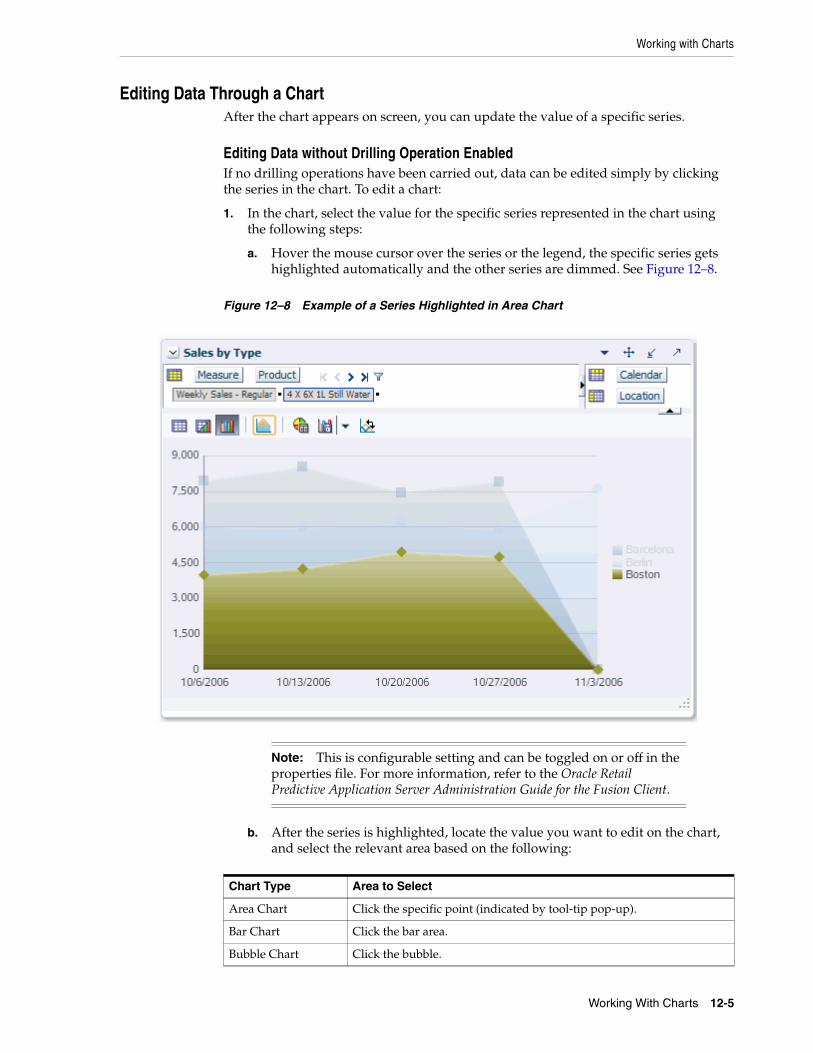
Working with Charts
Working With Charts 12-5
Editing Data Through a ChartAfter the chart appears on screen, you can update the value of a specific series.
Editing Data without Drilling Operation EnabledIf no drilling operations have been carried out, data can be edited simply by clicking the series in the chart. To edit a chart:
1. In the chart, select the value for the specific series represented in the chart using the following steps:
a. Hover the mouse cursor over the series or the legend, the specific series gets highlighted automatically and the other series are dimmed. See Figure 12–8.
Figure 12–8 Example of a Series Highlighted in Area Chart
b. After the series is highlighted, locate the value you want to edit on the chart, and select the relevant area based on the following:
Note: This is configurable setting and can be toggled on or off in the properties file. For more information, refer to the Oracle Retail Predictive Application Server Administration Guide for the Fusion Client.
Chart Type Area to Select
Area Chart Click the specific point (indicated by tool-tip pop-up).
Bar Chart Click the bar area.
Bubble Chart Click the bubble.
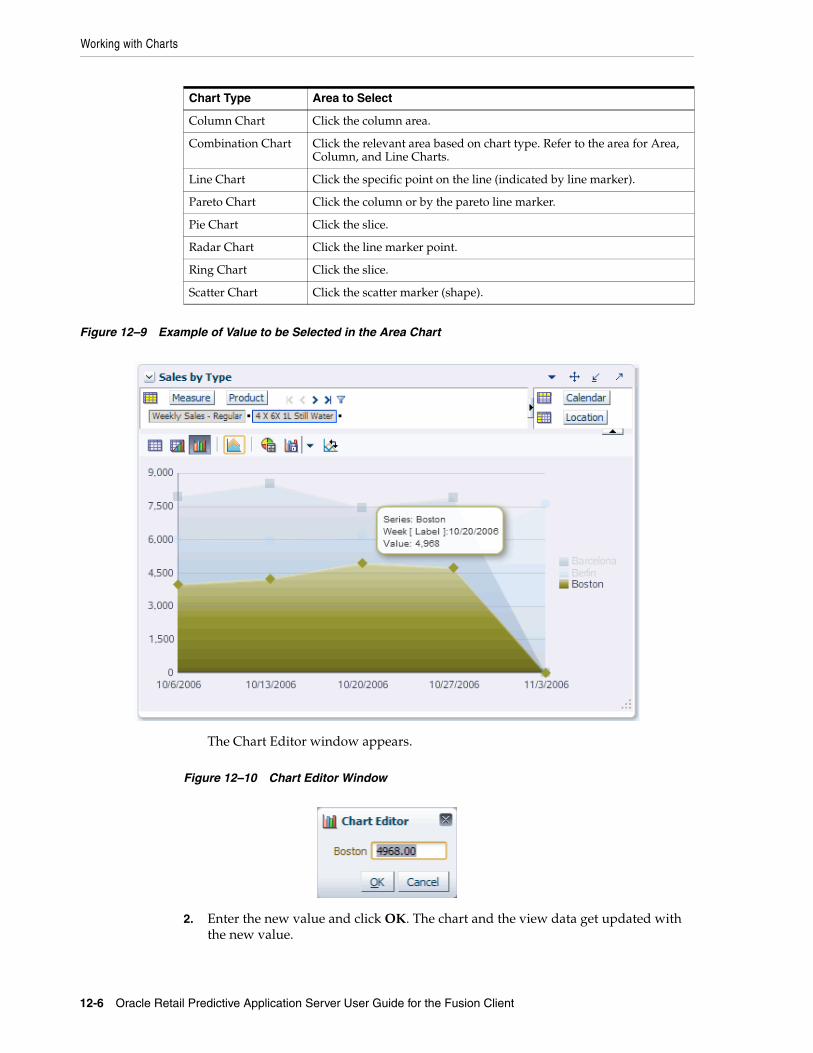
Working with Charts
12-6 Oracle Retail Predictive Application Server User Guide for the Fusion Client
Figure 12–9 Example of Value to be Selected in the Area Chart
The Chart Editor window appears.
Figure 12–10 Chart Editor Window
2. Enter the new value and click OK. The chart and the view data get updated with the new value.
Column Chart Click the column area.
Combination Chart Click the relevant area based on chart type. Refer to the area for Area, Column, and Line Charts.
Line Chart Click the specific point on the line (indicated by line marker).
Pareto Chart Click the column or by the pareto line marker.
Pie Chart Click the slice.
Radar Chart Click the line marker point.
Ring Chart Click the slice.
Scatter Chart Click the scatter marker (shape).
Chart Type Area to Select
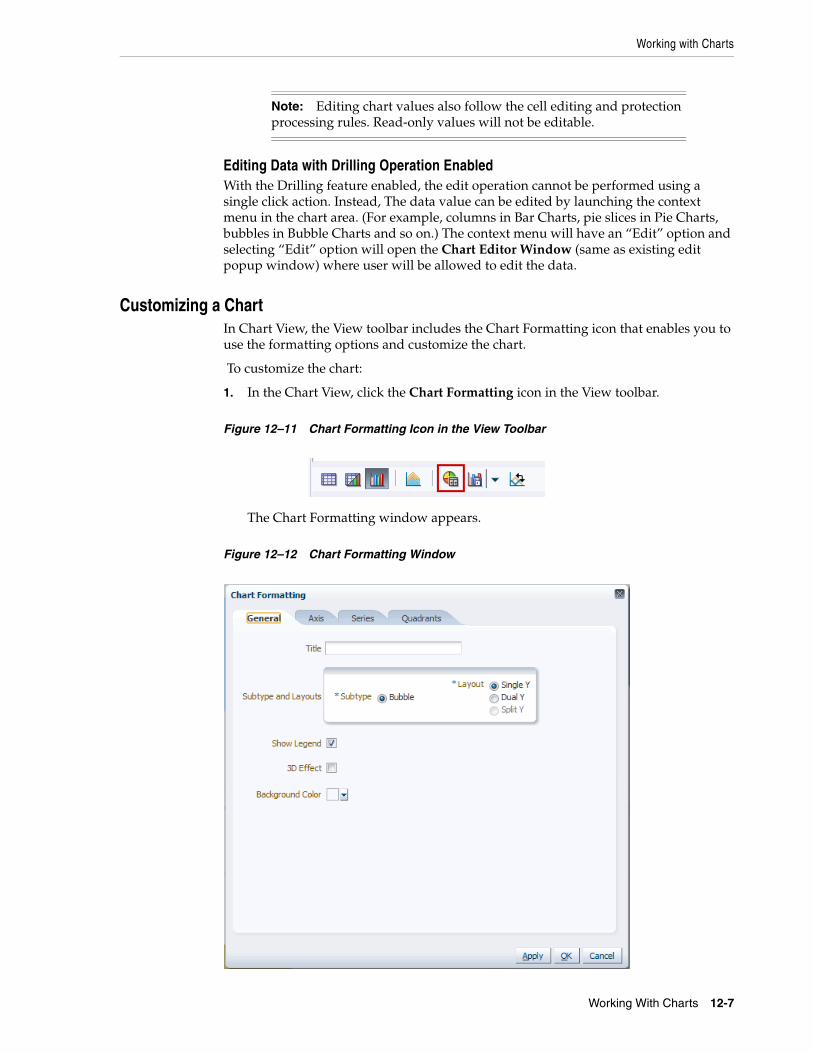
Working with Charts
Working With Charts 12-7
Editing Data with Drilling Operation EnabledWith the Drilling feature enabled, the edit operation cannot be performed using a single click action. Instead, The data value can be edited by launching the context menu in the chart area. (For example, columns in Bar Charts, pie slices in Pie Charts, bubbles in Bubble Charts and so on.) The context menu will have an “Edit” option and selecting “Edit” option will open the Chart Editor Window (same as existing edit popup window) where user will be allowed to edit the data.
Customizing a ChartIn Chart View, the View toolbar includes the Chart Formatting icon that enables you to use the formatting options and customize the chart.
To customize the chart:
1. In the Chart View, click the Chart Formatting icon in the View toolbar.
Figure 12–11 Chart Formatting Icon in the View Toolbar
The Chart Formatting window appears.
Figure 12–12 Chart Formatting Window
Note: Editing chart values also follow the cell editing and protection processing rules. Read-only values will not be editable.
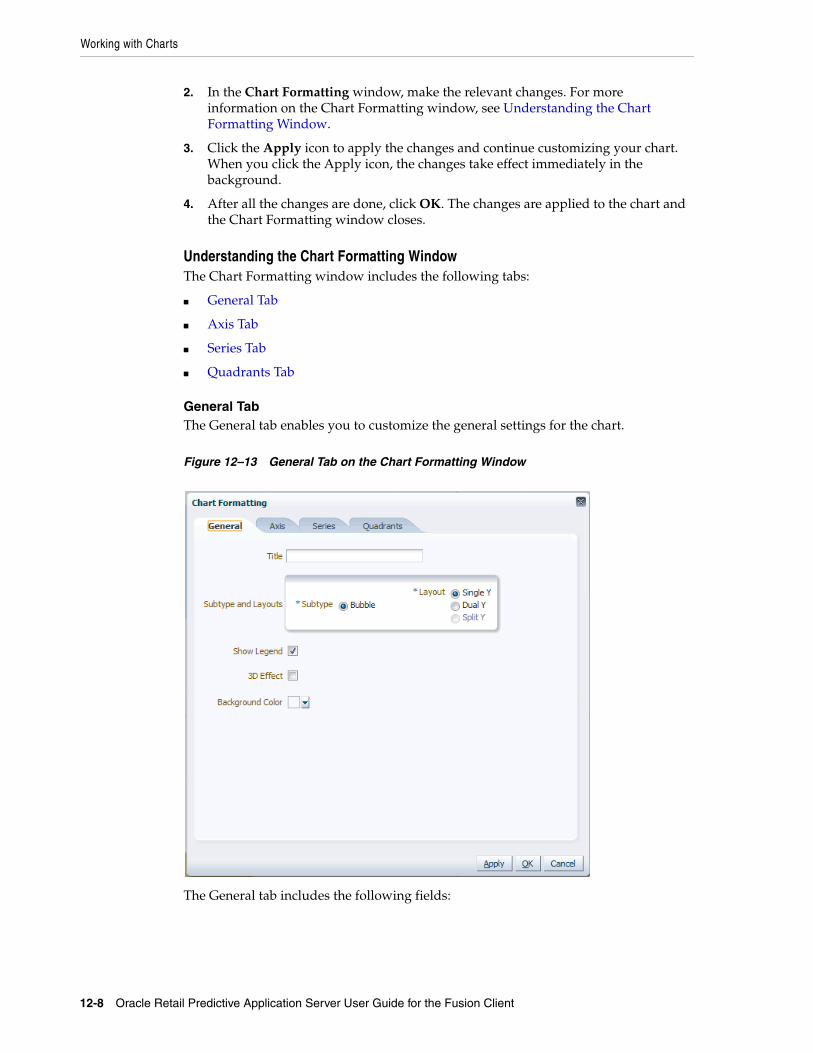
Working with Charts
12-8 Oracle Retail Predictive Application Server User Guide for the Fusion Client
2. In the Chart Formatting window, make the relevant changes. For more information on the Chart Formatting window, see Understanding the Chart Formatting Window.
3. Click the Apply icon to apply the changes and continue customizing your chart. When you click the Apply icon, the changes take effect immediately in the background.
4. After all the changes are done, click OK. The changes are applied to the chart and the Chart Formatting window closes.
Understanding the Chart Formatting WindowThe Chart Formatting window includes the following tabs:
■ General Tab
■ Axis Tab
■ Series Tab
■ Quadrants Tab
General TabThe General tab enables you to customize the general settings for the chart.
Figure 12–13 General Tab on the Chart Formatting Window
The General tab includes the following fields:
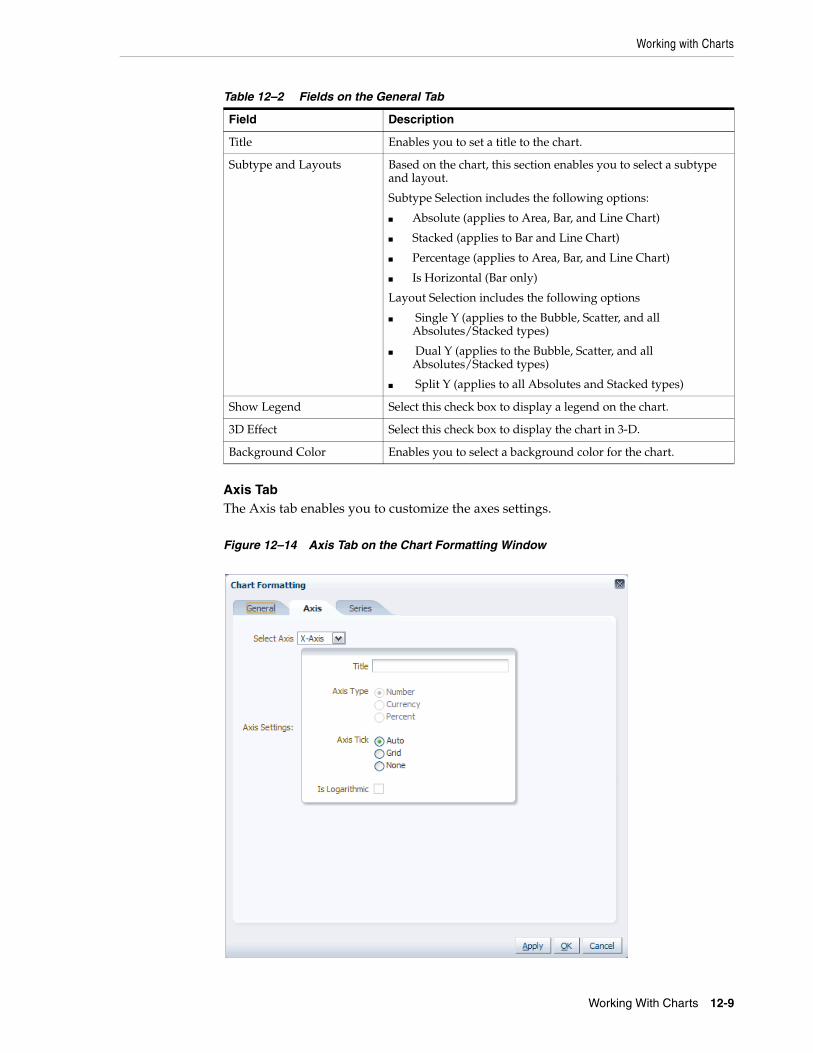
Working with Charts
Working With Charts 12-9
Axis TabThe Axis tab enables you to customize the axes settings.
Figure 12–14 Axis Tab on the Chart Formatting Window
Table 12–2 Fields on the General Tab
Field Description
Title Enables you to set a title to the chart.
Subtype and Layouts Based on the chart, this section enables you to select a subtype and layout.
Subtype Selection includes the following options:
■ Absolute (applies to Area, Bar, and Line Chart)
■ Stacked (applies to Bar and Line Chart)
■ Percentage (applies to Area, Bar, and Line Chart)
■ Is Horizontal (Bar only)
Layout Selection includes the following options
■ Single Y (applies to the Bubble, Scatter, and all Absolutes/Stacked types)
■ Dual Y (applies to the Bubble, Scatter, and all Absolutes/Stacked types)
■ Split Y (applies to all Absolutes and Stacked types)
Show Legend Select this check box to display a legend on the chart.
3D Effect Select this check box to display the chart in 3-D.
Background Color Enables you to select a background color for the chart.
Working with Charts
12-10 Oracle Retail Predictive Application Server User Guide for the Fusion Client
The Axis tab includes the following fields:
Series TabThe Series tab enables you to set the series color and Y-Axis assignment.
Table 12–3 Fields on the Axis Tab
Field Description
Select Axis Based on the type of chart, displays the axes for the chart. You can select each axes and set the parameters in the Axis Settings section.
Title Enables you to set a title for the axis.
Axis Type These options are available for only bubble and scatter charts. They enable you to set the data type for the axis. You can choose from the following options:
■ Number (does not apply for percentage type graphs).
■ Currency (does not apply for percentage type graphs).
■ Percentage (automatic on percentage type graphs).
Axis Tick Enables you to show or hide grid lines within the chart. Select from the following options:
■ Auto
■ Grid
■ None
Is Logarithmic Changes the axis to use a logarithmic scale when plotting data. This is useful to display data with large range differences. For example, you may have the values 99999, 5002, and 250. Normally, the value 250 would not appear due to its small value. Checking the Is Logarithmic box enables that value to be displayed properly in the bar chart.
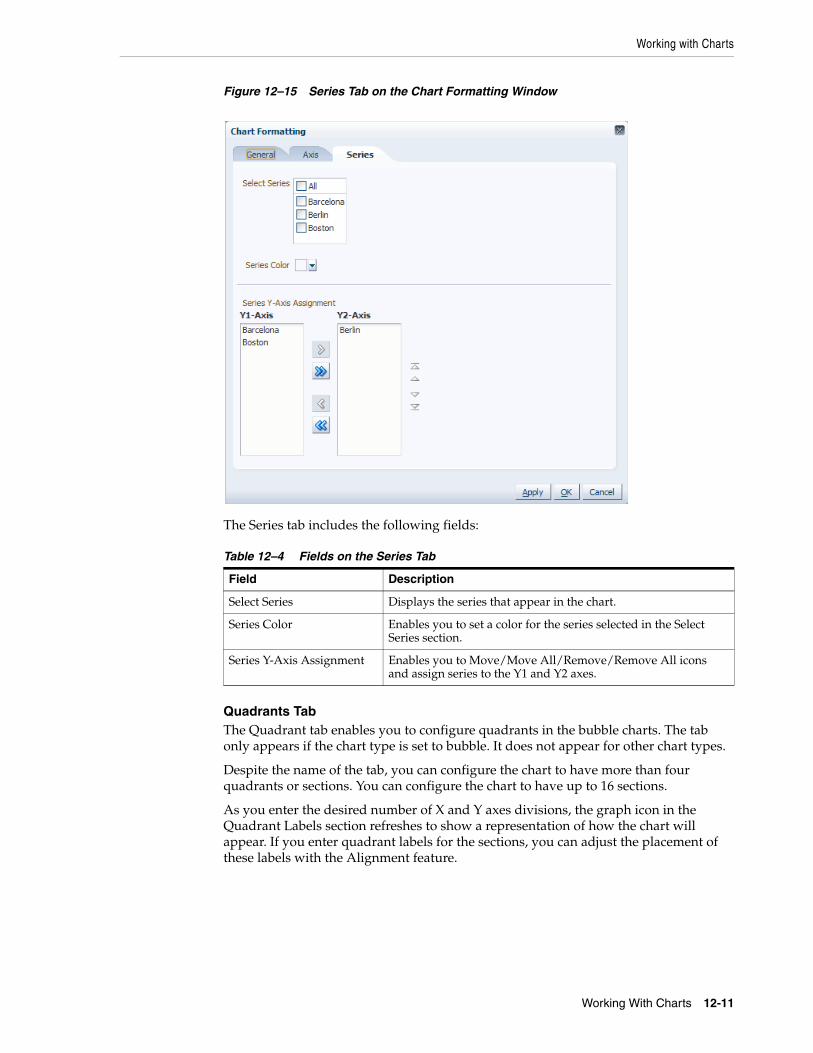
Working with Charts
Working With Charts 12-11
Figure 12–15 Series Tab on the Chart Formatting Window
The Series tab includes the following fields:
Quadrants TabThe Quadrant tab enables you to configure quadrants in the bubble charts. The tab only appears if the chart type is set to bubble. It does not appear for other chart types.
Despite the name of the tab, you can configure the chart to have more than four quadrants or sections. You can configure the chart to have up to 16 sections.
As you enter the desired number of X and Y axes divisions, the graph icon in the Quadrant Labels section refreshes to show a representation of how the chart will appear. If you enter quadrant labels for the sections, you can adjust the placement of these labels with the Alignment feature.
Table 12–4 Fields on the Series Tab
Field Description
Select Series Displays the series that appear in the chart.
Series Color Enables you to set a color for the series selected in the Select Series section.
Series Y-Axis Assignment Enables you to Move/Move All/Remove/Remove All icons and assign series to the Y1 and Y2 axes.
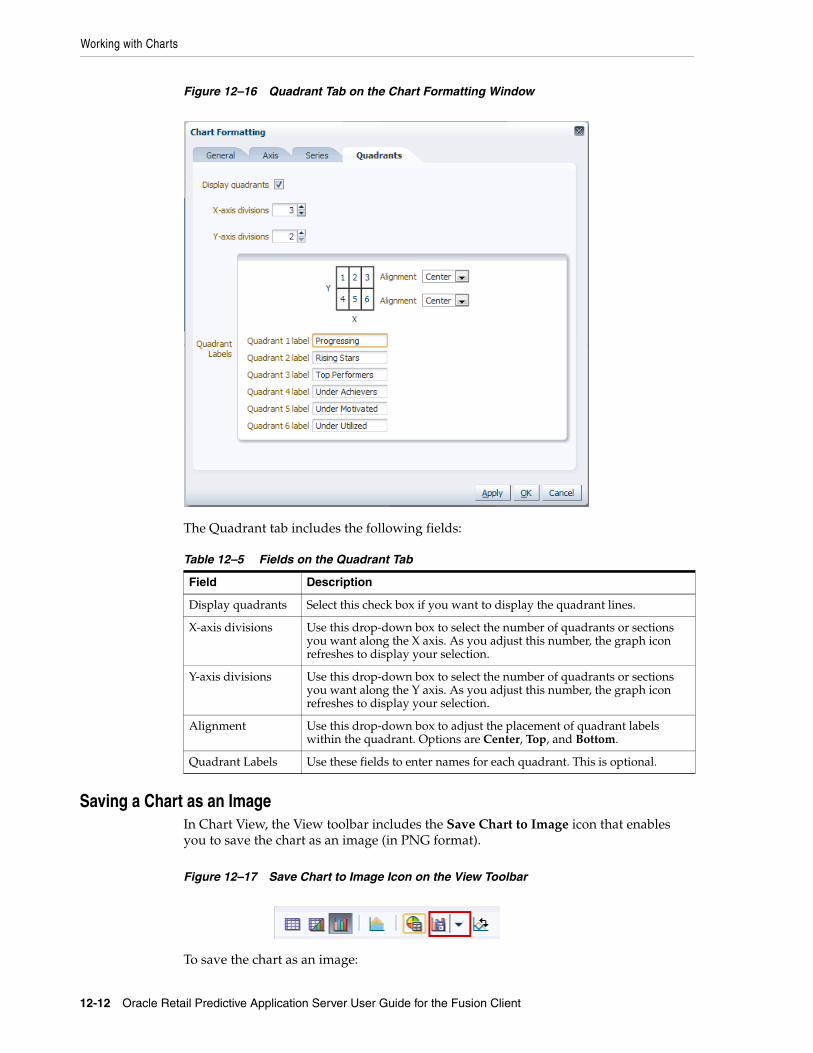
Working with Charts
12-12 Oracle Retail Predictive Application Server User Guide for the Fusion Client
Figure 12–16 Quadrant Tab on the Chart Formatting Window
The Quadrant tab includes the following fields:
Saving a Chart as an ImageIn Chart View, the View toolbar includes the Save Chart to Image icon that enables you to save the chart as an image (in PNG format).
Figure 12–17 Save Chart to Image Icon on the View Toolbar
To save the chart as an image:
Table 12–5 Fields on the Quadrant Tab
Field Description
Display quadrants Select this check box if you want to display the quadrant lines.
X-axis divisions Use this drop-down box to select the number of quadrants or sections you want along the X axis. As you adjust this number, the graph icon refreshes to display your selection.
Y-axis divisions Use this drop-down box to select the number of quadrants or sections you want along the Y axis. As you adjust this number, the graph icon refreshes to display your selection.
Alignment Use this drop-down box to adjust the placement of quadrant labels within the quadrant. Options are Center, Top, and Bottom.
Quadrant Labels Use these fields to enter names for each quadrant. This is optional.

Working with Charts
Working With Charts 12-13
1. In the Chart View, click the drop-down arrow on the Save Chart to Image icon, and select the image resolution.
Figure 12–18 Drop-down Menu on the Save Chart to Image Icon
2. Click the Save Chart to Image icon to save the image.
3. The File Download dialog box appears. Click Open or Save as shown in Figure 12–19.
Clicking Open opens the chart as a PNG file. Clicking Save allows you to select a location to save the file.
Figure 12–19 File Download Dialog Box
Available Chart TypesThe following chart types are available with the charting feature:
■ Area Chart
■ Column Chart
■ Bubble Chart
■ Bar Chart
■ Combination Chart
■ Line Chart
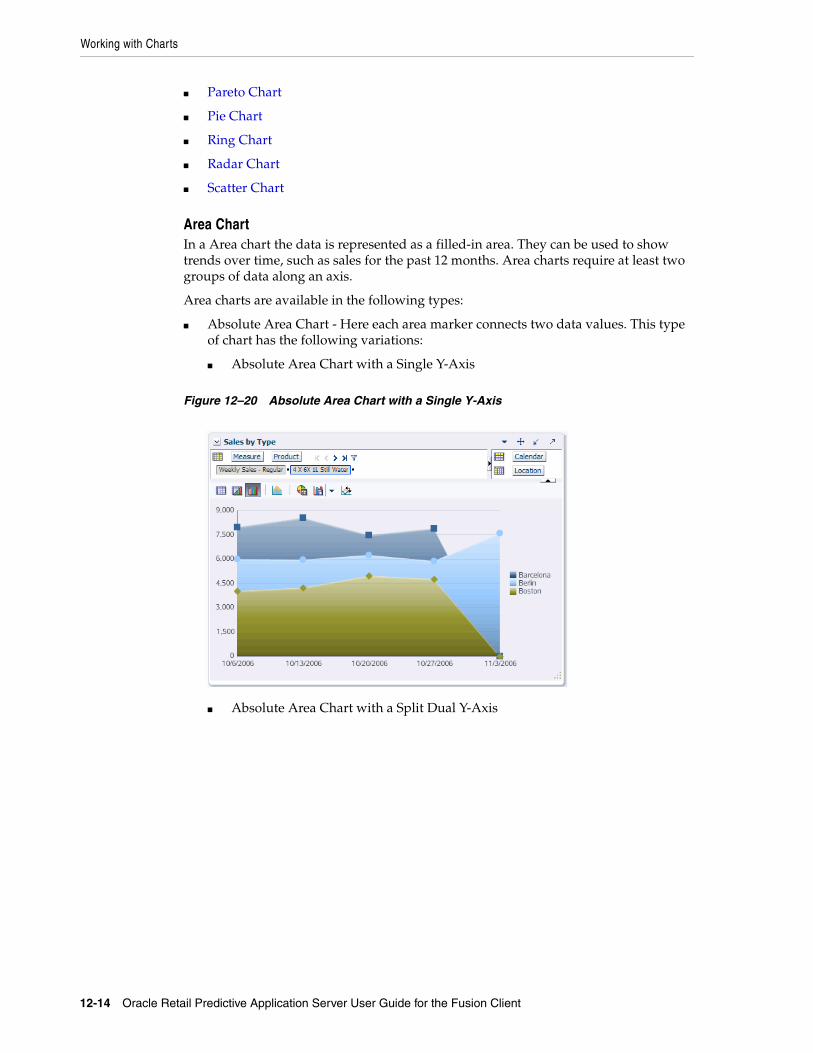
Working with Charts
12-14 Oracle Retail Predictive Application Server User Guide for the Fusion Client
■ Pareto Chart
■ Pie Chart
■ Ring Chart
■ Radar Chart
■ Scatter Chart
Area ChartIn a Area chart the data is represented as a filled-in area. They can be used to show trends over time, such as sales for the past 12 months. Area charts require at least two groups of data along an axis.
Area charts are available in the following types:
■ Absolute Area Chart - Here each area marker connects two data values. This type of chart has the following variations:
■ Absolute Area Chart with a Single Y-Axis
Figure 12–20 Absolute Area Chart with a Single Y-Axis
■ Absolute Area Chart with a Split Dual Y-Axis
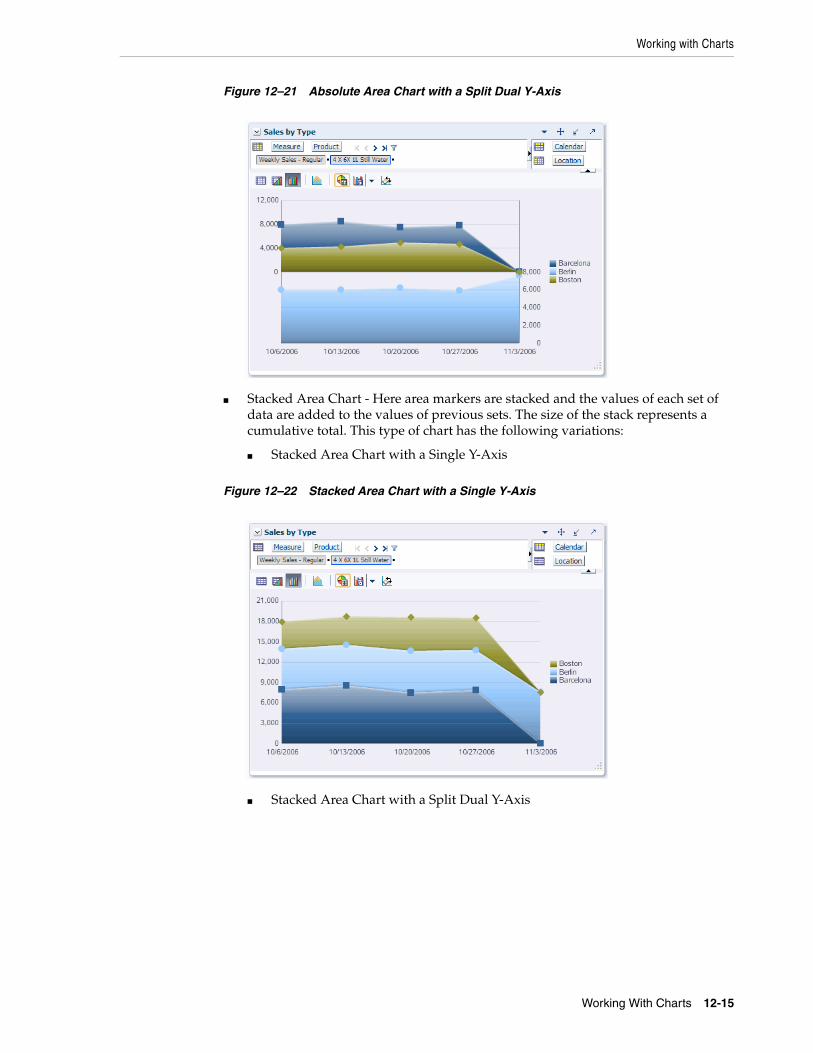
Working with Charts
Working With Charts 12-15
Figure 12–21 Absolute Area Chart with a Split Dual Y-Axis
■ Stacked Area Chart - Here area markers are stacked and the values of each set of data are added to the values of previous sets. The size of the stack represents a cumulative total. This type of chart has the following variations:
■ Stacked Area Chart with a Single Y-Axis
Figure 12–22 Stacked Area Chart with a Single Y-Axis
■ Stacked Area Chart with a Split Dual Y-Axis
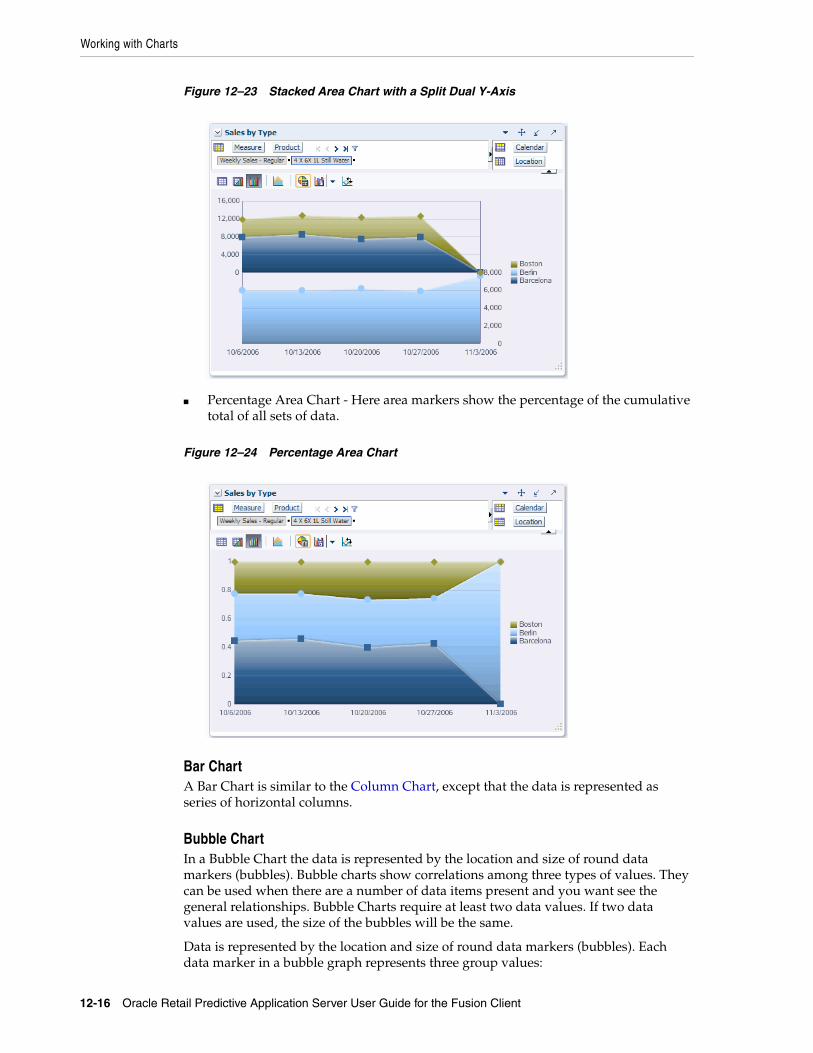
Working with Charts
12-16 Oracle Retail Predictive Application Server User Guide for the Fusion Client
Figure 12–23 Stacked Area Chart with a Split Dual Y-Axis
■ Percentage Area Chart - Here area markers show the percentage of the cumulative total of all sets of data.
Figure 12–24 Percentage Area Chart
Bar ChartA Bar Chart is similar to the Column Chart, except that the data is represented as series of horizontal columns.
Bubble ChartIn a Bubble Chart the data is represented by the location and size of round data markers (bubbles). Bubble charts show correlations among three types of values. They can be used when there are a number of data items present and you want see the general relationships. Bubble Charts require at least two data values. If two data values are used, the size of the bubbles will be the same.
Data is represented by the location and size of round data markers (bubbles). Each data marker in a bubble graph represents three group values:
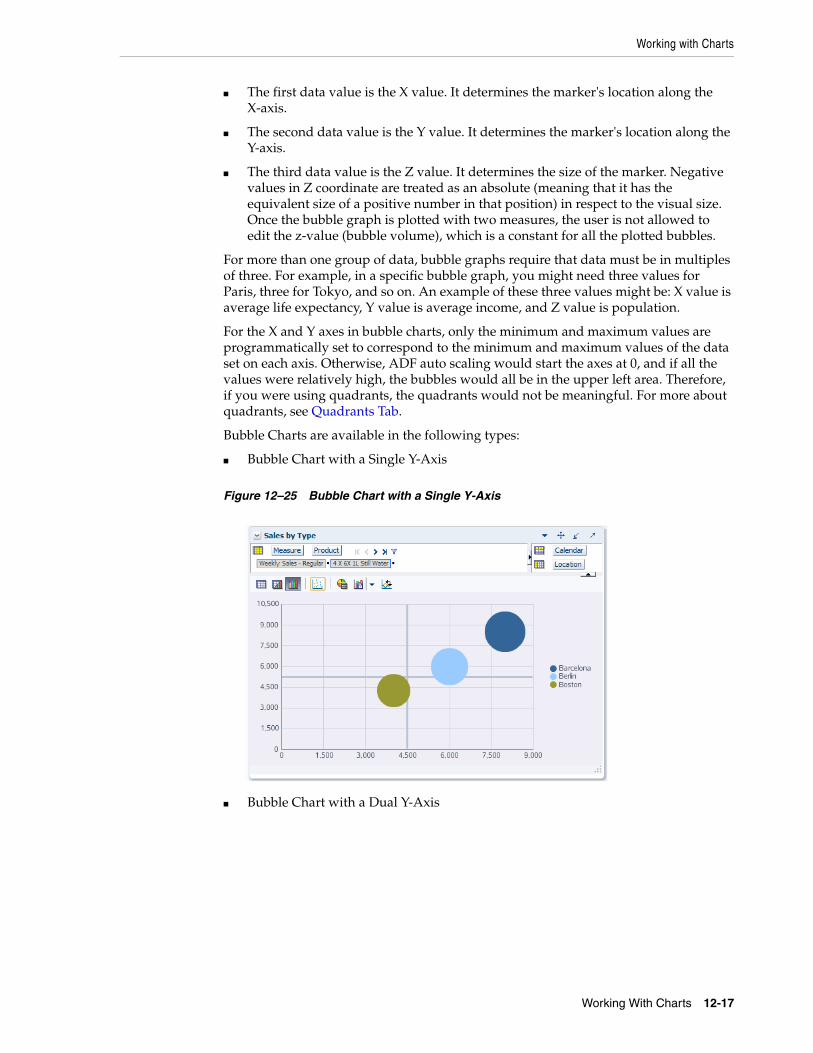
Working with Charts
Working With Charts 12-17
■ The first data value is the X value. It determines the marker's location along the X-axis.
■ The second data value is the Y value. It determines the marker's location along the Y-axis.
■ The third data value is the Z value. It determines the size of the marker. Negative values in Z coordinate are treated as an absolute (meaning that it has the equivalent size of a positive number in that position) in respect to the visual size. Once the bubble graph is plotted with two measures, the user is not allowed to edit the z-value (bubble volume), which is a constant for all the plotted bubbles.
For more than one group of data, bubble graphs require that data must be in multiples of three. For example, in a specific bubble graph, you might need three values for Paris, three for Tokyo, and so on. An example of these three values might be: X value is average life expectancy, Y value is average income, and Z value is population.
For the X and Y axes in bubble charts, only the minimum and maximum values are programmatically set to correspond to the minimum and maximum values of the data set on each axis. Otherwise, ADF auto scaling would start the axes at 0, and if all the values were relatively high, the bubbles would all be in the upper left area. Therefore, if you were using quadrants, the quadrants would not be meaningful. For more about quadrants, see Quadrants Tab.
Bubble Charts are available in the following types:
■ Bubble Chart with a Single Y-Axis
Figure 12–25 Bubble Chart with a Single Y-Axis
■ Bubble Chart with a Dual Y-Axis
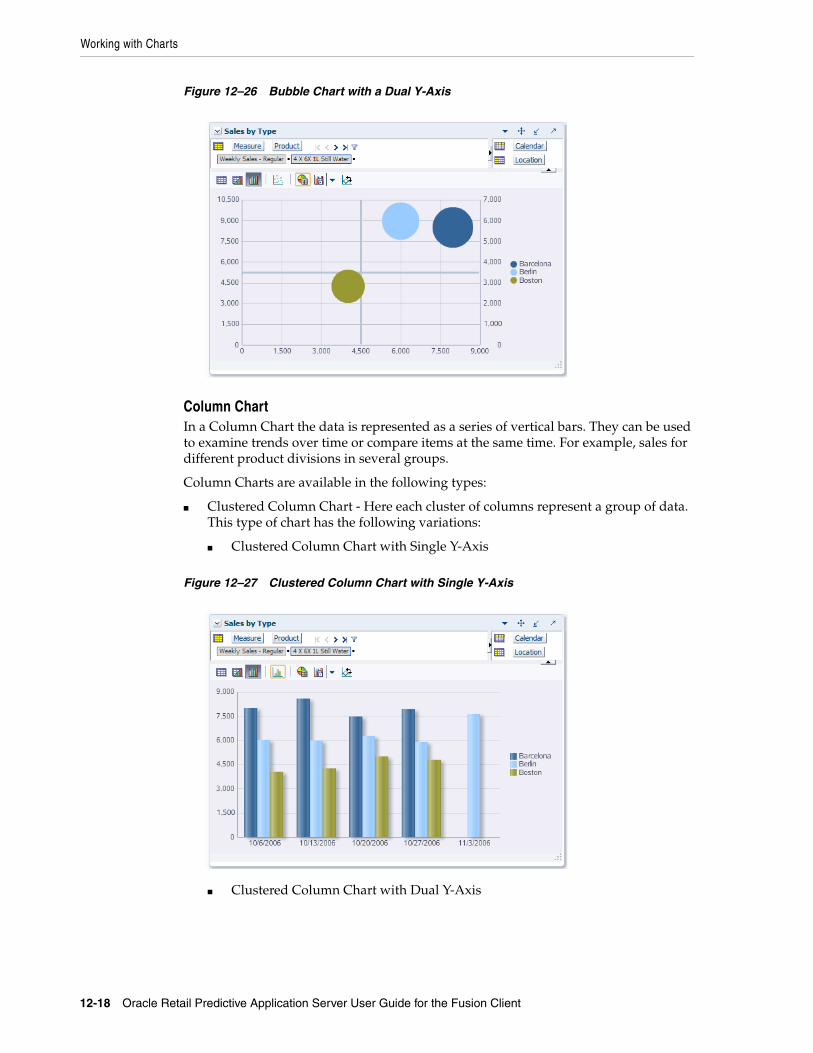
Working with Charts
12-18 Oracle Retail Predictive Application Server User Guide for the Fusion Client
Figure 12–26 Bubble Chart with a Dual Y-Axis
Column ChartIn a Column Chart the data is represented as a series of vertical bars. They can be used to examine trends over time or compare items at the same time. For example, sales for different product divisions in several groups.
Column Charts are available in the following types:
■ Clustered Column Chart - Here each cluster of columns represent a group of data. This type of chart has the following variations:
■ Clustered Column Chart with Single Y-Axis
Figure 12–27 Clustered Column Chart with Single Y-Axis
■ Clustered Column Chart with Dual Y-Axis

Working with Charts
Working With Charts 12-19
Figure 12–28 Clustered Column Chart with Dual Y-Axis
■ Clustered Column Chart with Split Dual Y-Axis
Figure 12–29 Clustered Column Chart with Split Dual Y-Axis
■ Stacked Column Chart - Here bars of each set of data are appended to the previous sets of data. The size of the stack represents a cumulative data total. This type of chart has the following variations:
■ Stacked Column Chart with a Single Y-Axis
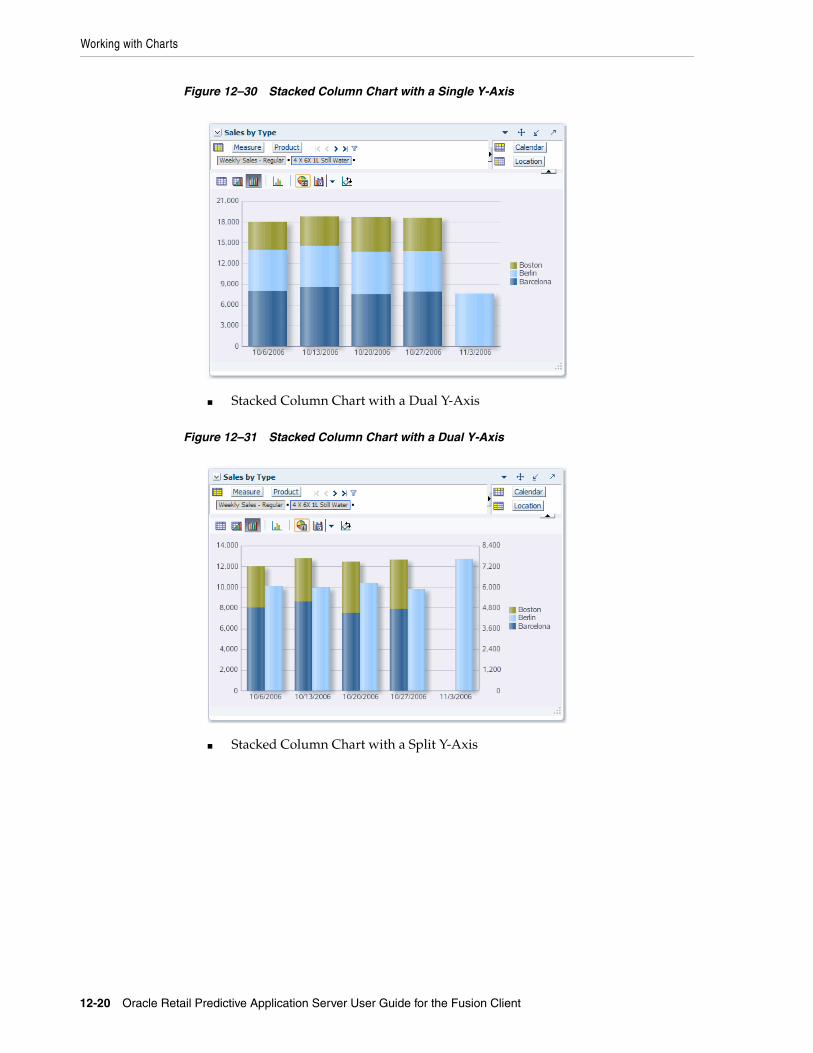
Working with Charts
12-20 Oracle Retail Predictive Application Server User Guide for the Fusion Client
Figure 12–30 Stacked Column Chart with a Single Y-Axis
■ Stacked Column Chart with a Dual Y-Axis
Figure 12–31 Stacked Column Chart with a Dual Y-Axis
■ Stacked Column Chart with a Split Y-Axis
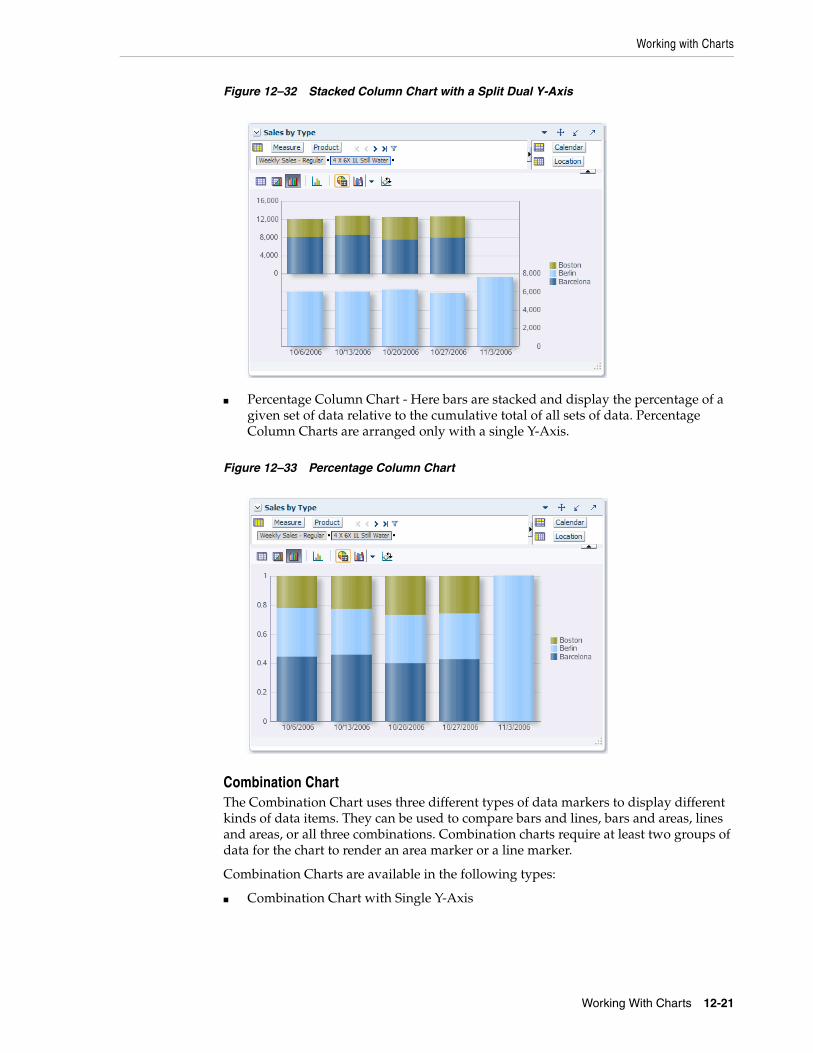
Working with Charts
Working With Charts 12-21
Figure 12–32 Stacked Column Chart with a Split Dual Y-Axis
■ Percentage Column Chart - Here bars are stacked and display the percentage of a given set of data relative to the cumulative total of all sets of data. Percentage Column Charts are arranged only with a single Y-Axis.
Figure 12–33 Percentage Column Chart
Combination ChartThe Combination Chart uses three different types of data markers to display different kinds of data items. They can be used to compare bars and lines, bars and areas, lines and areas, or all three combinations. Combination charts require at least two groups of data for the chart to render an area marker or a line marker.
Combination Charts are available in the following types:
■ Combination Chart with Single Y-Axis
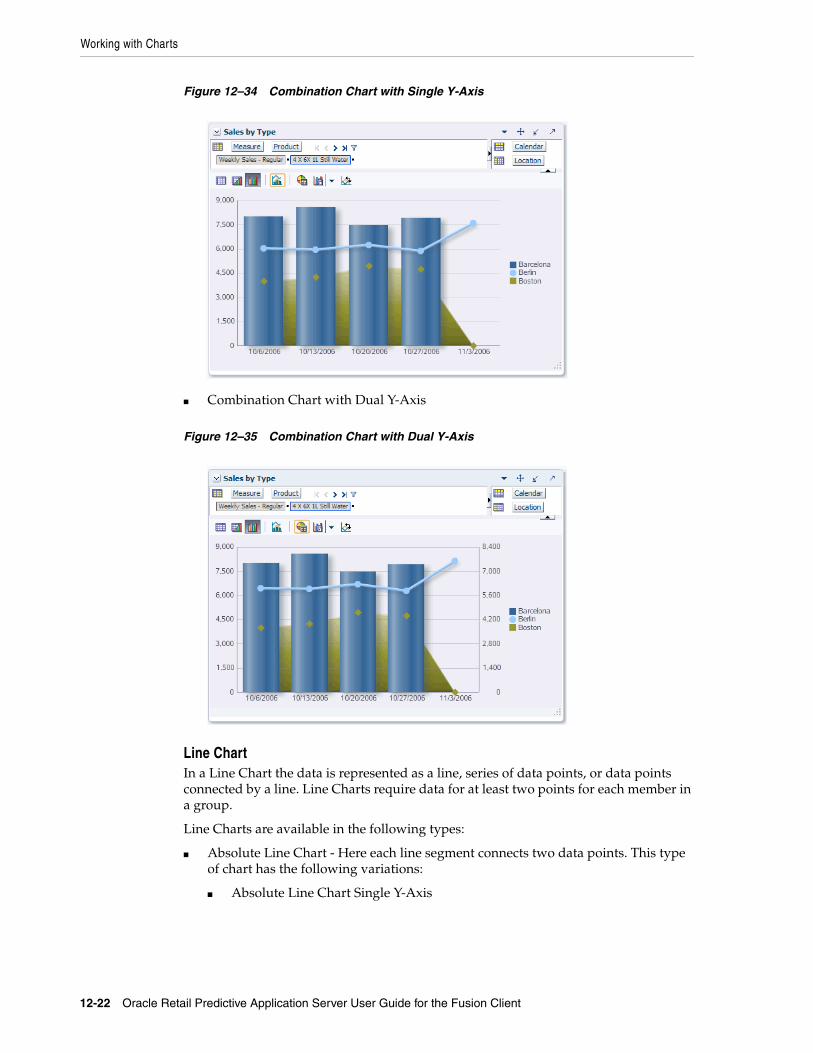
Working with Charts
12-22 Oracle Retail Predictive Application Server User Guide for the Fusion Client
Figure 12–34 Combination Chart with Single Y-Axis
■ Combination Chart with Dual Y-Axis
Figure 12–35 Combination Chart with Dual Y-Axis
Line ChartIn a Line Chart the data is represented as a line, series of data points, or data points connected by a line. Line Charts require data for at least two points for each member in a group.
Line Charts are available in the following types:
■ Absolute Line Chart - Here each line segment connects two data points. This type of chart has the following variations:
■ Absolute Line Chart Single Y-Axis
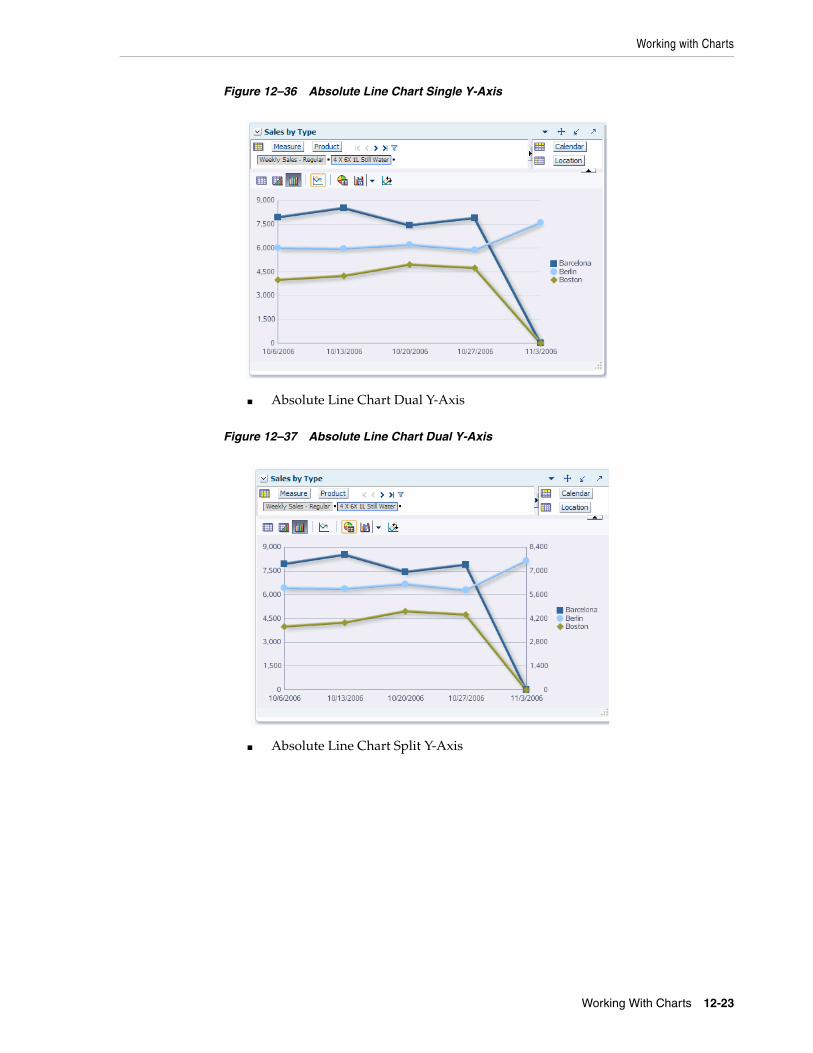
Working with Charts
Working With Charts 12-23
Figure 12–36 Absolute Line Chart Single Y-Axis
■ Absolute Line Chart Dual Y-Axis
Figure 12–37 Absolute Line Chart Dual Y-Axis
■ Absolute Line Chart Split Y-Axis
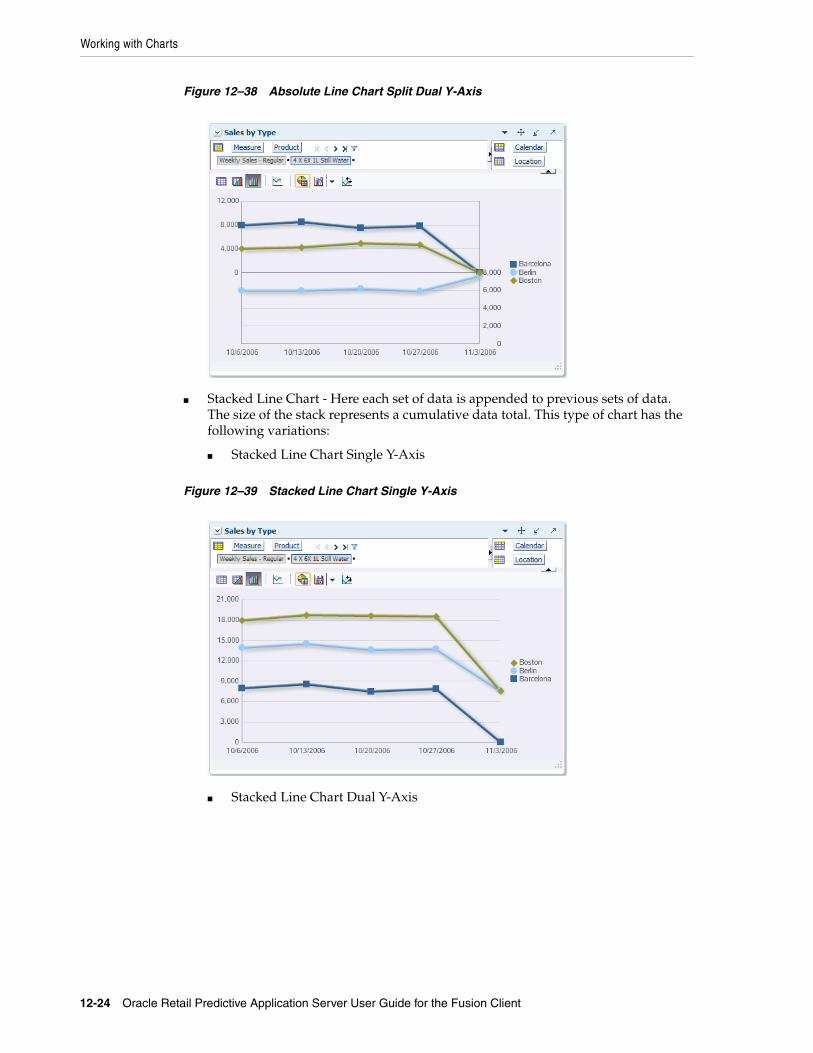
Working with Charts
12-24 Oracle Retail Predictive Application Server User Guide for the Fusion Client
Figure 12–38 Absolute Line Chart Split Dual Y-Axis
■ Stacked Line Chart - Here each set of data is appended to previous sets of data. The size of the stack represents a cumulative data total. This type of chart has the following variations:
■ Stacked Line Chart Single Y-Axis
Figure 12–39 Stacked Line Chart Single Y-Axis
■ Stacked Line Chart Dual Y-Axis
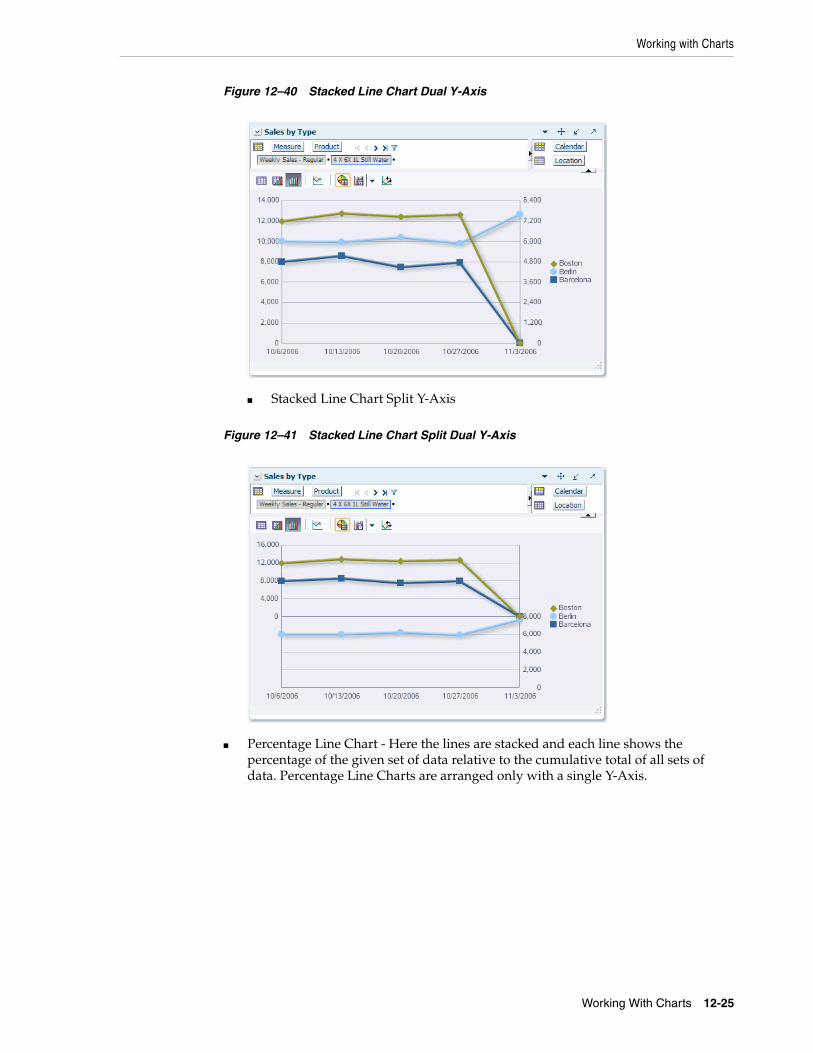
Working with Charts
Working With Charts 12-25
Figure 12–40 Stacked Line Chart Dual Y-Axis
■ Stacked Line Chart Split Y-Axis
Figure 12–41 Stacked Line Chart Split Dual Y-Axis
■ Percentage Line Chart - Here the lines are stacked and each line shows the percentage of the given set of data relative to the cumulative total of all sets of data. Percentage Line Charts are arranged only with a single Y-Axis.

Working with Charts
12-26 Oracle Retail Predictive Application Server User Guide for the Fusion Client
Figure 12–42 Percentage Line Chart
Pareto ChartIn a Pareto Chart the data is represented by bars and a percentage line that indicates the cumulative percentage of bars. Bars are arranged by value from left to right, from the largest to the lowest. A Pareto Chart is always a Dual Y-Axis chart. The first Y-Axis corresponds to values that the bars represent and the second Y-Axis runs from 0-100% and represents the cumulative percentage values.
Figure 12–43 Pareto Chart
Pie ChartIn a Pie Chart the data is represented as sections of a circle. Pie charts can be used to show the relationship of parts to a whole.

Working with Charts
Working With Charts 12-27
Figure 12–44 Pie Chart
Ring ChartRing Charts are similar to the Pie Chart, except that the center of each circle displays the total pie value.
Figure 12–45 Ring Chart
Radar ChartIn a Radar Chart the data is represented in a polygon layout. They are used to show patterns that occur in cycles, such as monthly sales for last three years.
The data structure of a Radar Chart is:
■ Number of sides on the polygon is equal to the number of groups of data. Each corner of the polygon represents a group.
■ A series or set of data is represented by a line, markers of the same color, or both (labeled by legend text).

Working with Charts
12-28 Oracle Retail Predictive Application Server User Guide for the Fusion Client
Figure 12–46 Radar Chart
Scatter ChartIn a Scatter Chart the data is represented by the location of data markers. Scatter Charts can be used to show the correlation between two different kinds of data values.
Scatter Charts are available in the following types:
■ Scatter Chart with a Single Y-Axis
Figure 12–47 Scatter Chart with a Single Y-Axis
■ Scatter Chart with a Dual Y-Axis
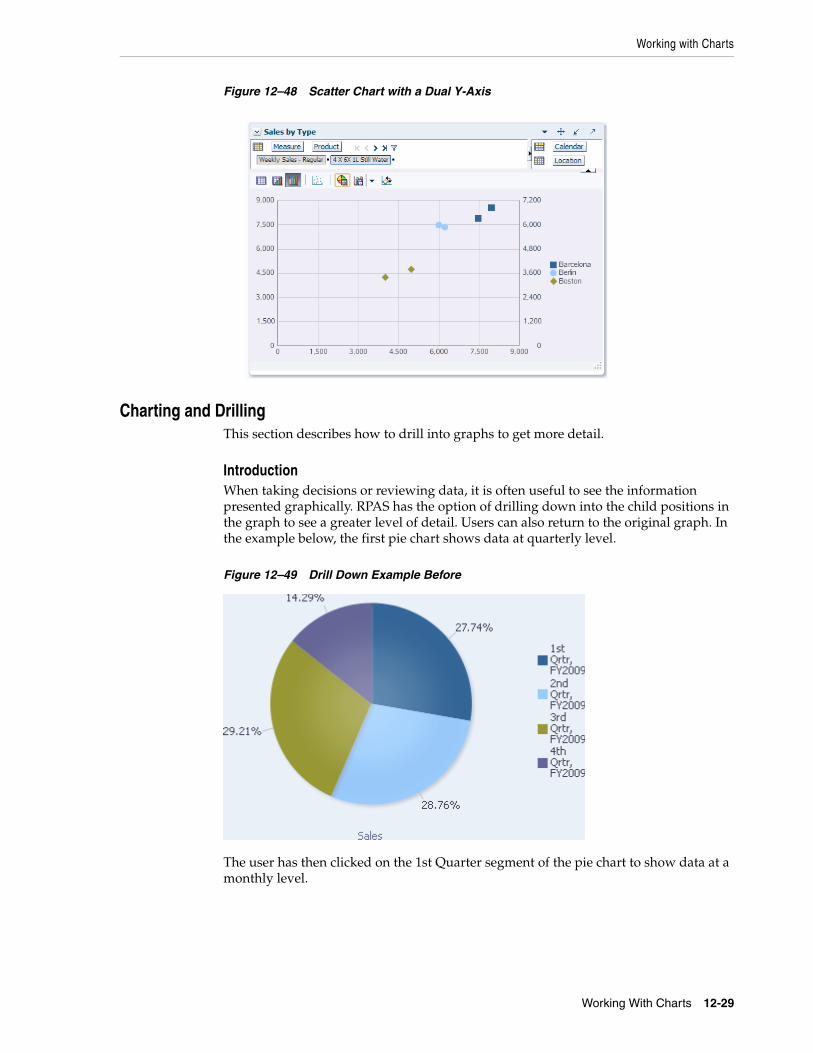
Working with Charts
Working With Charts 12-29
Figure 12–48 Scatter Chart with a Dual Y-Axis
Charting and DrillingThis section describes how to drill into graphs to get more detail.
IntroductionWhen taking decisions or reviewing data, it is often useful to see the information presented graphically. RPAS has the option of drilling down into the child positions in the graph to see a greater level of detail. Users can also return to the original graph. In the example below, the first pie chart shows data at quarterly level.
Figure 12–49 Drill Down Example Before
The user has then clicked on the 1st Quarter segment of the pie chart to show data at a monthly level.

Working with Charts
12-30 Oracle Retail Predictive Application Server User Guide for the Fusion Client
Figure 12–50 Drill Down Example After
Users can return to the previous level in the drill down by clicking on the provided link in the legend. If the user has drilled down more than one level they can select any prior level from a drop down list. [Not shown in above screen shot].
Users can drill down to the lowest level in the hierarchy and then drill back (go back) to the original chart. To see data at a higher level than that originally selected for the chart, users must make a fresh selection in the pivot table view.
Unless the user makes a fresh selection, the data selected in the pivot table will remain unaffected by the drilling operation.
Restrictions on DrillingThe drilling functionality has some restrictions:
Types of ChartThe following chart types cannot be drilled into:
■ Pareto Chart
■ Radar Chart
Drilling into Groups is not supported for the following types of charts:
■ Bubble Chart
■ Scatter Chart
Disabling Chart LegendWhen configuring charts, users have the option to hide the legend. If the legend is not visible, users cannot use it for drilling down, nor for returning to the previous level. They can still drill down by clicking any chart segment, or return by selecting previous levels in the drop down list.
DimensionsUsers can drill into any dimension other than measures. This is because a measure consists of a fact (numerical value of some item of information) plus a formula used to manipulate that information. This formula may vary at different points along a dimension, meaning that drilling down into a measure is not meaningful.
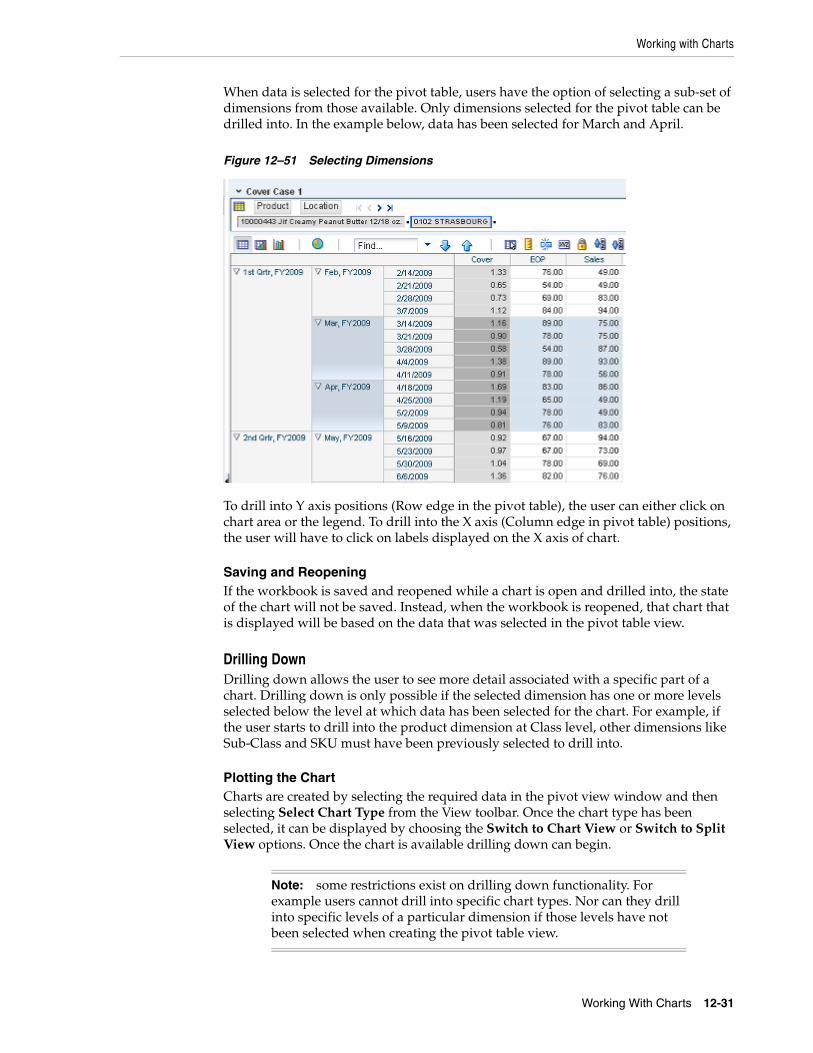
Working with Charts
Working With Charts 12-31
When data is selected for the pivot table, users have the option of selecting a sub-set of dimensions from those available. Only dimensions selected for the pivot table can be drilled into. In the example below, data has been selected for March and April.
Figure 12–51 Selecting Dimensions
To drill into Y axis positions (Row edge in the pivot table), the user can either click on chart area or the legend. To drill into the X axis (Column edge in pivot table) positions, the user will have to click on labels displayed on the X axis of chart.
Saving and ReopeningIf the workbook is saved and reopened while a chart is open and drilled into, the state of the chart will not be saved. Instead, when the workbook is reopened, that chart that is displayed will be based on the data that was selected in the pivot table view.
Drilling Down Drilling down allows the user to see more detail associated with a specific part of a chart. Drilling down is only possible if the selected dimension has one or more levels selected below the level at which data has been selected for the chart. For example, if the user starts to drill into the product dimension at Class level, other dimensions like Sub-Class and SKU must have been previously selected to drill into.
Plotting the ChartCharts are created by selecting the required data in the pivot view window and then selecting Select Chart Type from the View toolbar. Once the chart type has been selected, it can be displayed by choosing the Switch to Chart View or Switch to Split View options. Once the chart is available drilling down can begin.
Note: some restrictions exist on drilling down functionality. For example users cannot drill into specific chart types. Nor can they drill into specific levels of a particular dimension if those levels have not been selected when creating the pivot table view.

Working with Charts
12-32 Oracle Retail Predictive Application Server User Guide for the Fusion Client
Methods of Drilling DownOne way of drilling down is to click on the required part of the legend. Another is to click in the appropriate section of the chart. If there are no further levels to drill into the chart legend becomes un-clickable.
To drill into Y axis positions (Row edge in the pivot table), the user can either click on chart area or the legend. To drill into the X axis (Column edge in pivot table) positions, the user will have to click on labels displayed on the X axis of chart.
Figure 12–52 Drilling Down Methods
On clicking the legend or chart section, the chart will redraw showing the information at the lower level.
Reaching Lowest LevelWhen the lowest available level for drilling down has been reached, clicking on the legend or chart area will have no further effect.
Drilling Back (Reversing Drilling Operation)Once the chart has been drilled down at least one level, the user has the option of reverting to previous levels. There are two options for doing that:

Working with Charts
Working With Charts 12-33
Figure 12–53 Drilling Back Methods
■ Clicking on the link in the legend
The legend will have the link used to drill down highlighted. This link will show the immediate parent position level. Clicking this will take the user back one level. If drilling has been through multiple levels, each click on the legend will take the user back one level.
■ Using the drop down list
The user can also got back to previous levels using the drop down list. If the user has drilled down multiple levels, any previous level can be selected.
Page Edge NavigationUsers have the option of selecting alternative positions on the page edge.
Figure 12–54 Page Edge Position
If the user selects another position; for example another product or another location the chart will be refreshed with that information at the currently selected drill down level. For example, if the user selects another store and they have drilled down two
Working with Charts
12-34 Oracle Retail Predictive Application Server User Guide for the Fusion Client
levels from the information selected in the pivot table, the chart will refresh showing information for the new store two levels down from that selected in the pivot table.
Formatting OptionsThe standard chart formatting options work in the drilled state:
■ Refreshing Chart
The chart can be refreshed with pivot table selections while in the drilled state.
■ Changing Chart Type
Chart types can be changed while in the drilled state. The new chart type will be drawn with the same positions and data values as the one it is replacing.
■ Toggling Between Views
Toggling between pivot table view to graph view or toggling between graph view to pivot table view will retain the same positions and data values at the current drilled state.
■ Copying Views
Using the Copy View option when the chart is in the drilled state will also copy the state of the drilled graph.
■ Drilling into Split Levels
If the user has drilled into split levels:
– The charts drilled state will be preserved when the workbook is recalculated.
– The drilled state of the chart will be preserved when the workbook is saved and refreshed. However, the drilled state will be lost if the user closes and reopens the workbook.
■ Flipping Charts
If the axes of the chart are reversed, the drilled state of the chart will be preserved and it will remain at the current drilled level.
■ Pivot Swap from Row or Column to Axis
If a pivot swap from row to column axis (or vice versa) is carried out - either by using tiles or directly in the pivot table, the chart will revert to its original, un-drilled state. This initial state is determined by the selected data in the pivot table.
■ Pivot Swap between Page Edge to Column or Row
A pivot swap between column edge to column or row (or vice versa) will also result in the chart reverting back to its original state.
Editing Data ValuesIn both normal and drilled chart view, data can be edited by right clicking in the chart area and opening the Right Click menu.

Working with Charts
Working With Charts 12-35
Figure 12–55 Editing Data - Right Click Menu
Selecting the Edit option will then open a pop-up window which will allow the user to edit the data.
Figure 12–56 Pop-up Menu for Editing Data
Refreshing the ChartThe refresh button can be used to update the chart with the current data in pivot view.
Figure 12–57 Toolbar - Refresh Option
■ If the data selected in the pivot table is unchanged, the chart will be restored to its undrilled state.
■ If the data selected in the pivot table has changes, the chart will be redrawn to an undrilled state and display the new data.

Working with Charts
12-36 Oracle Retail Predictive Application Server User Guide for the Fusion Client

Images 13-1
13Images
The ability to view images associated with positions on a non-calendar dimension is useful in many aspects of the retail world such as assortment planning, item planning, story boarding, and so on.
For instance, you can associate an item with a image of what it should look like displayed on the shelf. You can associate stores with images of the store front or interior. You can use images to storyboard themes by creating a collection of looks and colors for a particular buying period, floor set, or flow. Some retailers choose to associate multiple types images with multiple levels of the Product dimension. For instance, you could associate images for the following Product levels:
■ Department: Image of a generic sweater
■ Class: Image of a wool sweater
■ Subclass: Image of a L/S V-Neck Solid sweater
■ Style: Image of Chunky Shrunken Style, Washable Wool, L/S V-Neck Solid sweater
■ Style/Color: Image of Chunky Shrunken Style, Color Pumpkin, Washable Wool, L/S V-Neck Solid sweater
The Fusion Client gives you the ability to associate an image for any dimension other than Calendar. These images can be stored on a website or in a repository located in the same network as the application server.
After images are associated with a position, you can view and compare them within the Fusion Client.
Associating Images with a PositionTo associate an image with a position, perform the following steps:
1. Click the Manage Images icon in the toolbar or select Manage Images from the View menu.
Figure 13–1 Manage Images Icon

Associating Images with a Position
13-2 Oracle Retail Predictive Application Server User Guide for the Fusion Client
Figure 13–2 Manage Images Option
2. The View/Manage Images dialog box appears. Enter the following information:
■ Dimension and Level: Select the dimension and level into which you want to load the image. In Figure 13–3, the Product dimension and Item level were chosen.
■ Find image for: Select the position for which you want to load the image. You can select the position from the drop-down list or you can scroll through the positions in the carousel view.
■ Show Children: This option appears when you have selected a dimension level other than the lowest dimension level. Select this option to display images of the children instead of the parent.
■ At Level: This option is enabled when the Show Children option is selected. Use this field to select which child level to display images for.
■ Image Source: Select either URL or Repository as the location of the image. Select URL if the image is located on the internet. Select Repository if the image has already been loaded into the repository on a shared network location.
■ File path: Enter the file path for the image. You can type or paste the file path for either a Repository or URL image source. For Repository images, you can also use Browse to locate the file within the repository. After you have entered the file path, click Go.
Note: The repository is configured during installation process. Contact your administrator for assistance. See the Oracle Retail Predictive Application Server Installation Guide for more information.

Deleting Images
Images 13-3
Figure 13–3 Loading Images
The image appears in the image carousel and is now associated with the position.
Deleting ImagesYou can disassociate an image with a position by using Delete in the View/Manage Images dialog box.
To delete an image, perform the following steps:
1. Click the Manage Images icon in the toolbar or select Mange Images from the View menu.
Or, right-click the position within the view and select View Image from the right-click context menu.
Note: Using the Delete function does not delete an image from the repository. It only disassociates the image with the position.

Viewing Image from a View
13-4 Oracle Retail Predictive Application Server User Guide for the Fusion Client
Figure 13–4 View Image Option in the Right-Click Context Menu
2. The View/Manage Images dialog box appears. Select the position for which you want to delete the image. You can select the position from the Find image for drop-down box or from the image carousel.
3. After you have selected the position, click Delete located to the right of the File Path field.
Figure 13–5 Delete Button
The image disappears from the image carousel.
Viewing Image from a ViewTo view the image associated with a position, use one of the following methods:
Viewing Images - Method 11. Right-click the position within the view or page edge.
2. The right-click context menu appears. Select View Image.
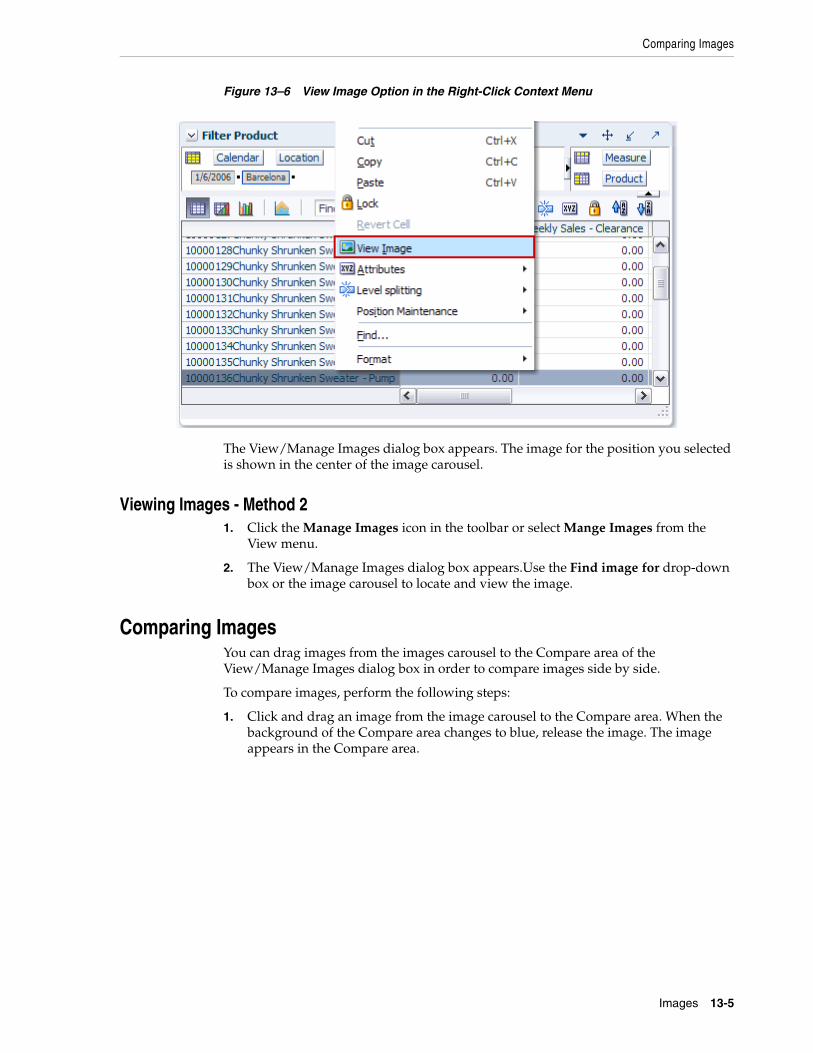
Comparing Images
Images 13-5
Figure 13–6 View Image Option in the Right-Click Context Menu
The View/Manage Images dialog box appears. The image for the position you selected is shown in the center of the image carousel.
Viewing Images - Method 21. Click the Manage Images icon in the toolbar or select Mange Images from the
View menu.
2. The View/Manage Images dialog box appears.Use the Find image for drop-down box or the image carousel to locate and view the image.
Comparing ImagesYou can drag images from the images carousel to the Compare area of the View/Manage Images dialog box in order to compare images side by side.
To compare images, perform the following steps:
1. Click and drag an image from the image carousel to the Compare area. When the background of the Compare area changes to blue, release the image. The image appears in the Compare area.
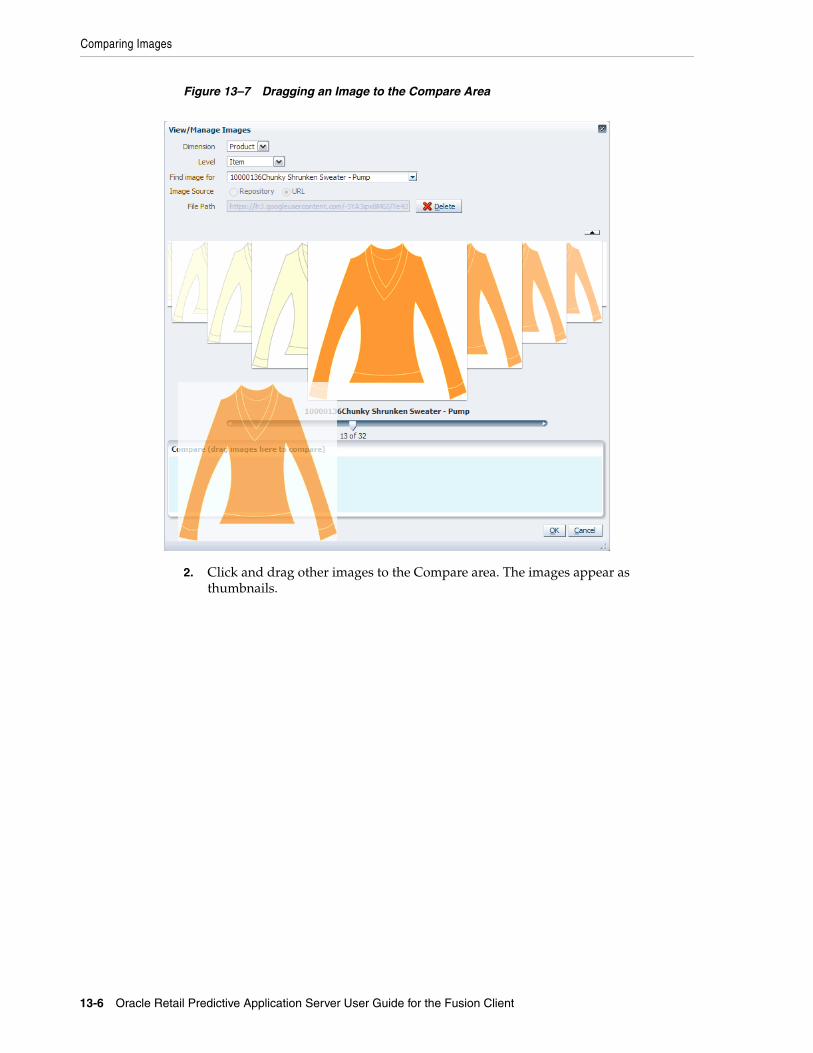
Comparing Images
13-6 Oracle Retail Predictive Application Server User Guide for the Fusion Client
Figure 13–7 Dragging an Image to the Compare Area
2. Click and drag other images to the Compare area. The images appear as thumbnails.
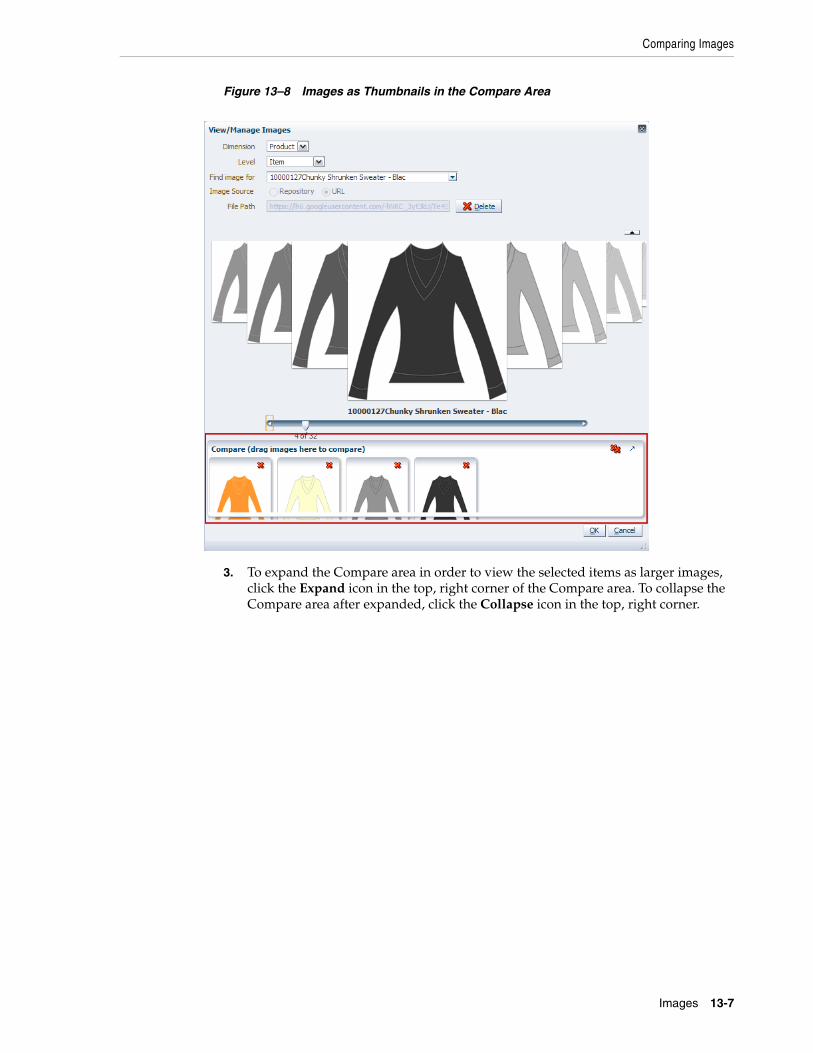
Comparing Images
Images 13-7
Figure 13–8 Images as Thumbnails in the Compare Area
3. To expand the Compare area in order to view the selected items as larger images, click the Expand icon in the top, right corner of the Compare area. To collapse the Compare area after expanded, click the Collapse icon in the top, right corner.

Comparing Images
13-8 Oracle Retail Predictive Application Server User Guide for the Fusion Client
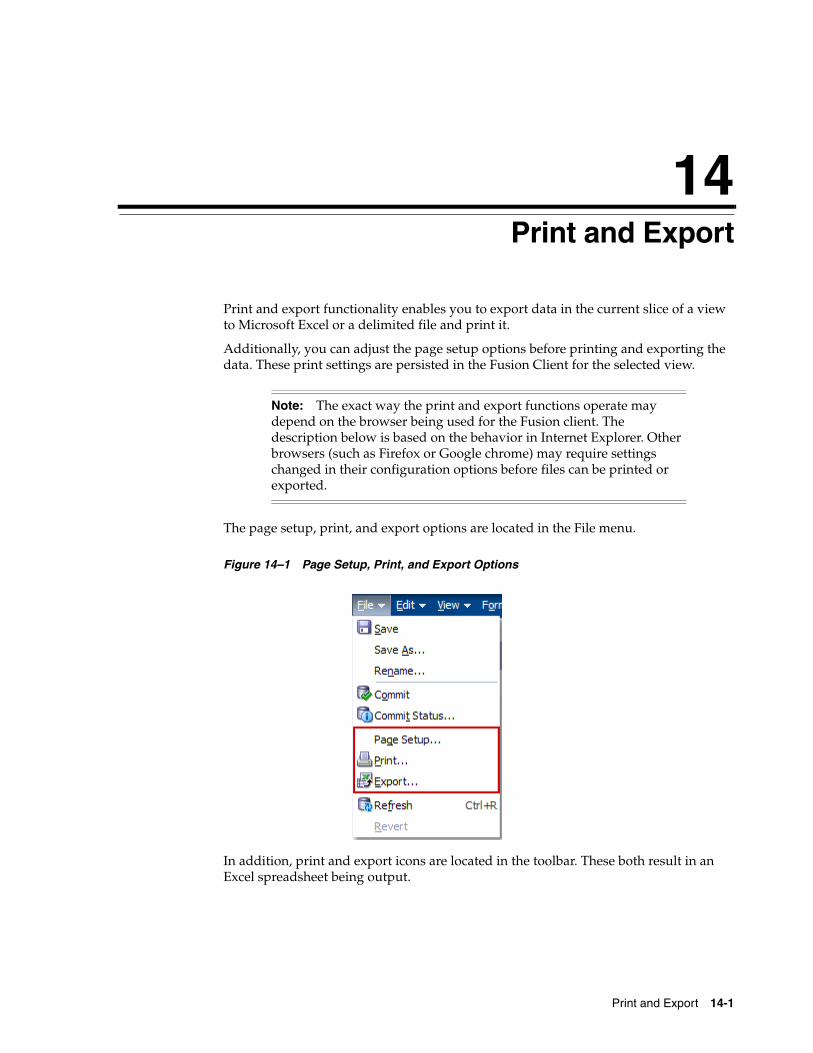
Print and Export 14-1
14Print and Export
Print and export functionality enables you to export data in the current slice of a view to Microsoft Excel or a delimited file and print it.
Additionally, you can adjust the page setup options before printing and exporting the data. These print settings are persisted in the Fusion Client for the selected view.
The page setup, print, and export options are located in the File menu.
Figure 14–1 Page Setup, Print, and Export Options
In addition, print and export icons are located in the toolbar. These both result in an Excel spreadsheet being output.
Note: The exact way the print and export functions operate may depend on the browser being used for the Fusion client. The description below is based on the behavior in Internet Explorer. Other browsers (such as Firefox or Google chrome) may require settings changed in their configuration options before files can be printed or exported.
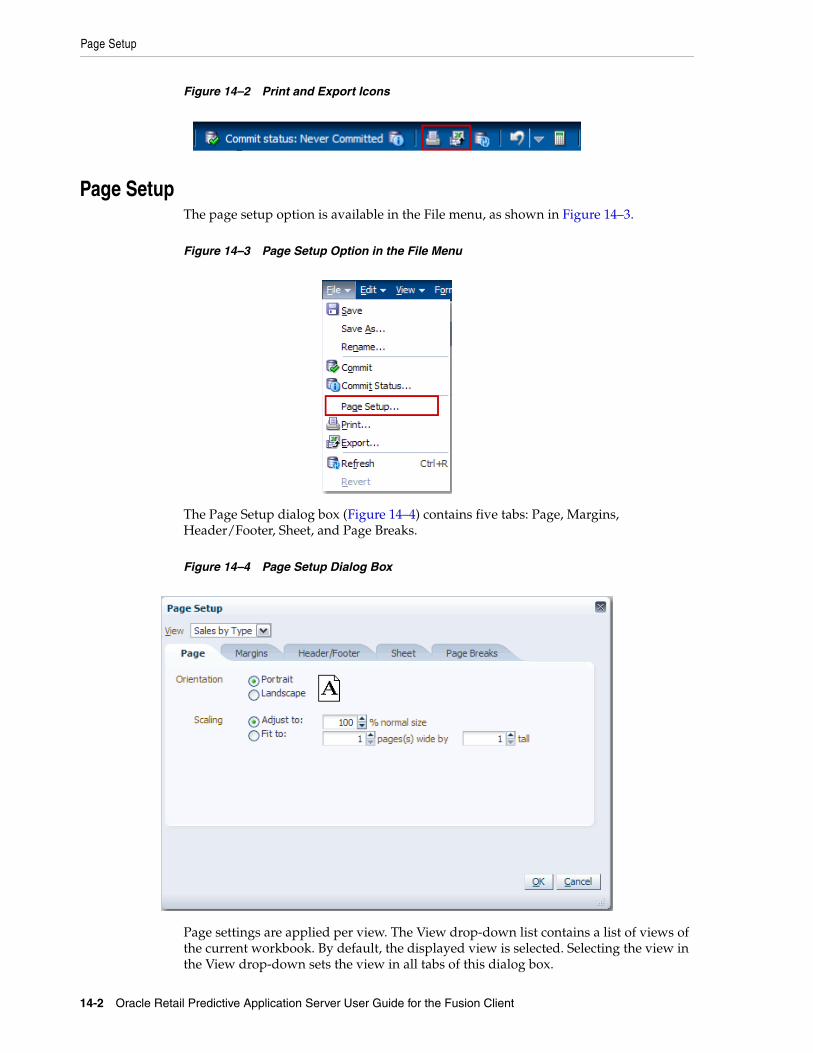
Page Setup
14-2 Oracle Retail Predictive Application Server User Guide for the Fusion Client
Figure 14–2 Print and Export Icons
Page SetupThe page setup option is available in the File menu, as shown in Figure 14–3.
Figure 14–3 Page Setup Option in the File Menu
The Page Setup dialog box (Figure 14–4) contains five tabs: Page, Margins, Header/Footer, Sheet, and Page Breaks.
Figure 14–4 Page Setup Dialog Box
Page settings are applied per view. The View drop-down list contains a list of views of the current workbook. By default, the displayed view is selected. Selecting the view in the View drop-down sets the view in all tabs of this dialog box.
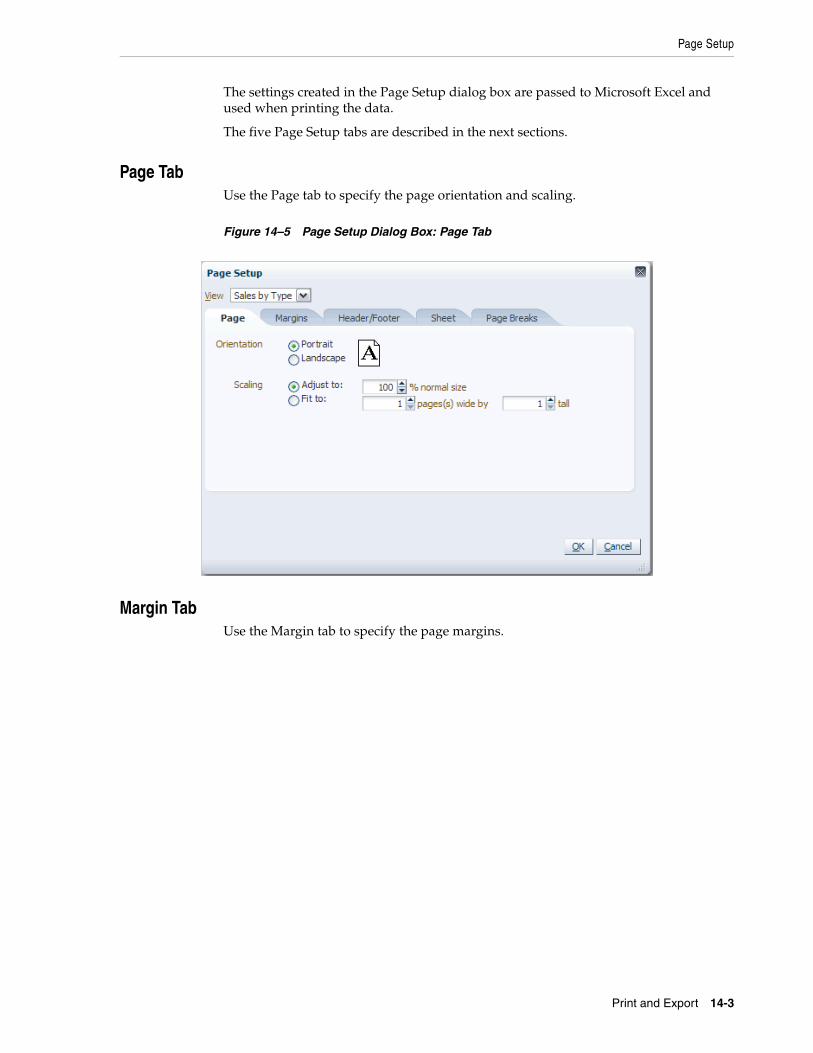
Page Setup
Print and Export 14-3
The settings created in the Page Setup dialog box are passed to Microsoft Excel and used when printing the data.
The five Page Setup tabs are described in the next sections.
Page TabUse the Page tab to specify the page orientation and scaling.
Figure 14–5 Page Setup Dialog Box: Page Tab
Margin TabUse the Margin tab to specify the page margins.
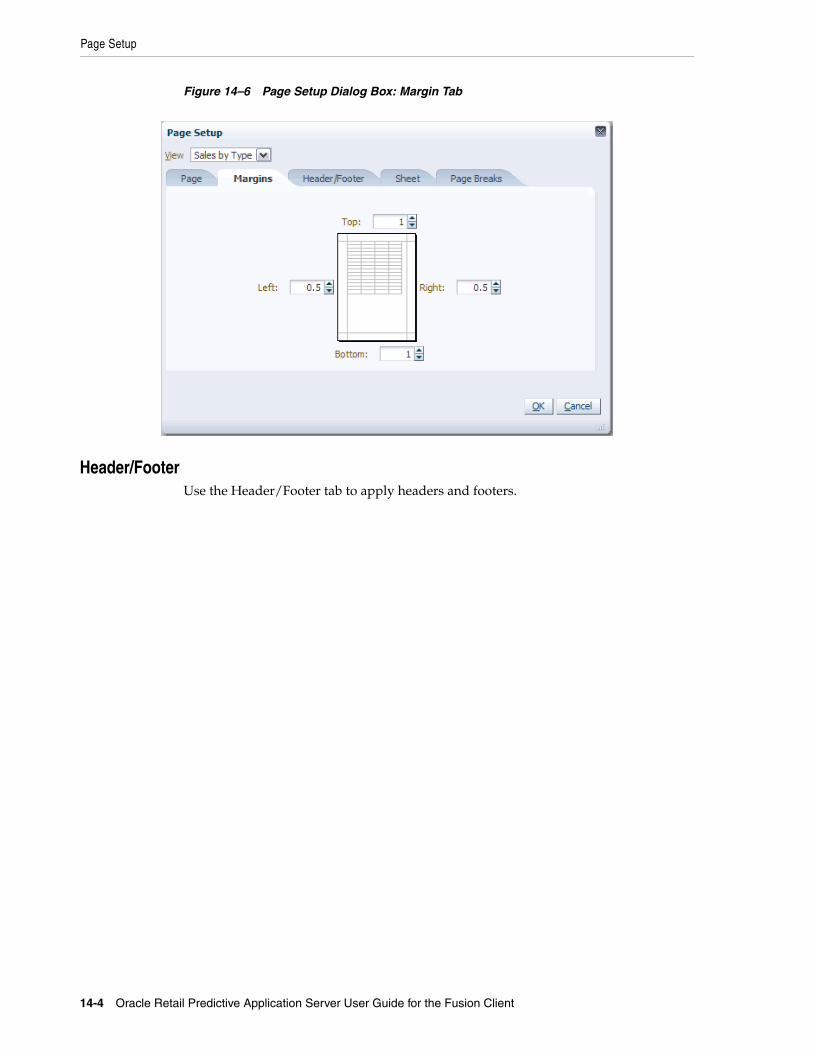
Page Setup
14-4 Oracle Retail Predictive Application Server User Guide for the Fusion Client
Figure 14–6 Page Setup Dialog Box: Margin Tab
Header/FooterUse the Header/Footer tab to apply headers and footers.
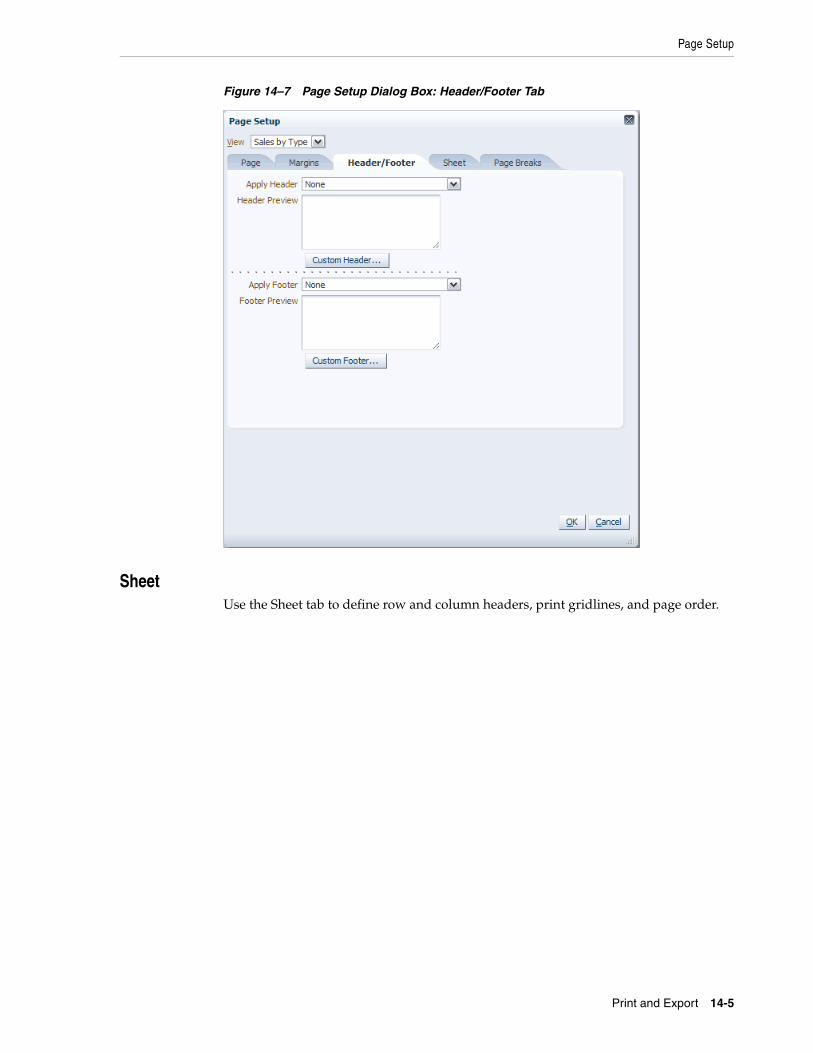
Page Setup
Print and Export 14-5
Figure 14–7 Page Setup Dialog Box: Header/Footer Tab
SheetUse the Sheet tab to define row and column headers, print gridlines, and page order.

Page Setup
14-6 Oracle Retail Predictive Application Server User Guide for the Fusion Client
Figure 14–8 Page Setup Dialog Box: Sheet Tab
Page BreaksUse the Page Breaks tab to specify how the rows and columns break across pages.
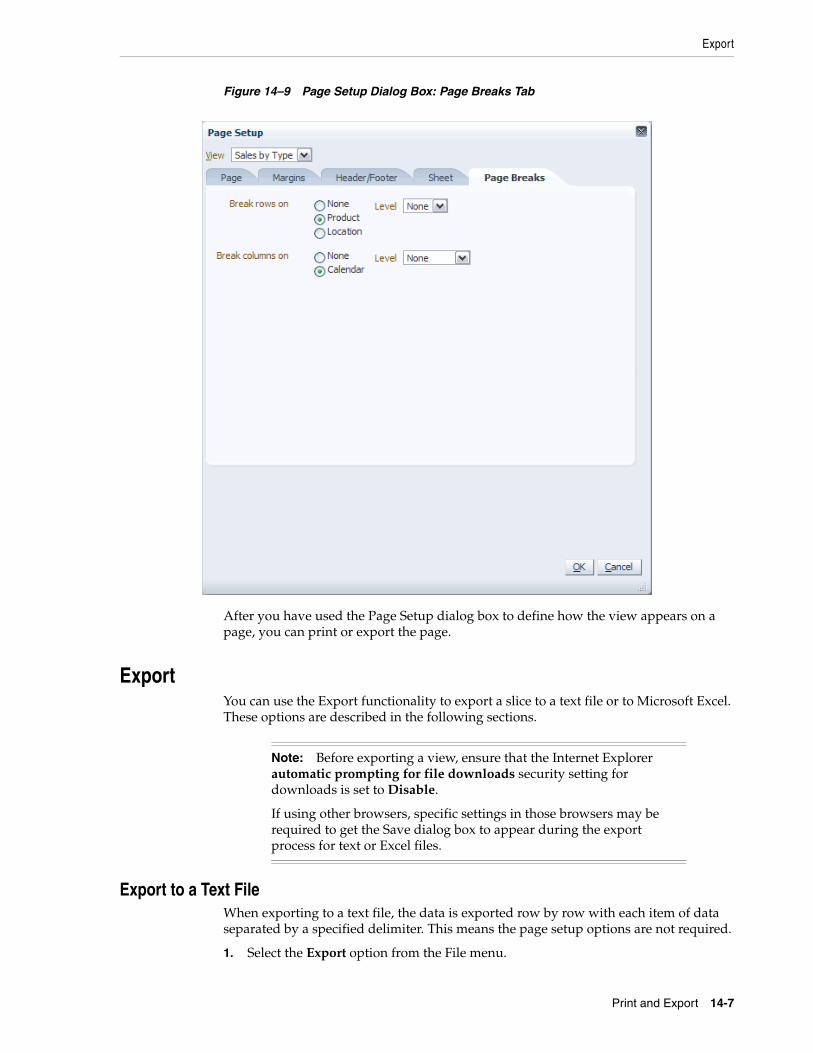
Export
Print and Export 14-7
Figure 14–9 Page Setup Dialog Box: Page Breaks Tab
After you have used the Page Setup dialog box to define how the view appears on a page, you can print or export the page.
ExportYou can use the Export functionality to export a slice to a text file or to Microsoft Excel. These options are described in the following sections.
Export to a Text FileWhen exporting to a text file, the data is exported row by row with each item of data separated by a specified delimiter. This means the page setup options are not required.
1. Select the Export option from the File menu.
Note: Before exporting a view, ensure that the Internet Explorer automatic prompting for file downloads security setting for downloads is set to Disable.
If using other browsers, specific settings in those browsers may be required to get the Save dialog box to appear during the export process for text or Excel files.
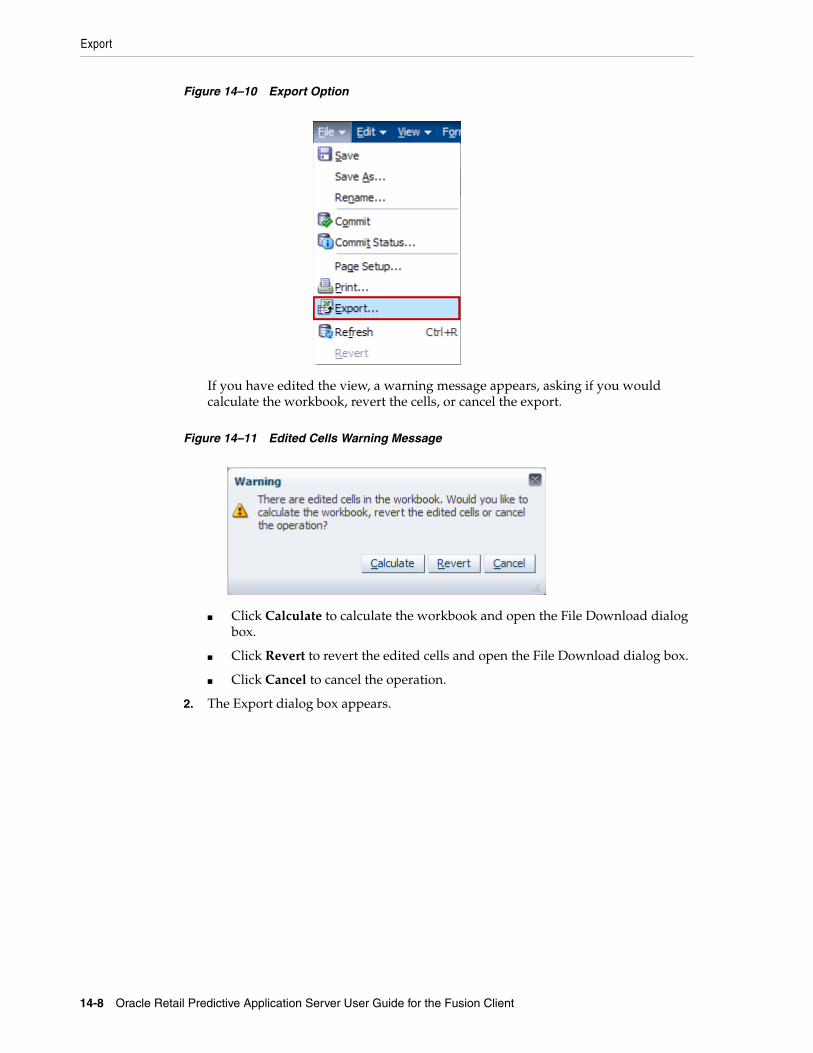
Export
14-8 Oracle Retail Predictive Application Server User Guide for the Fusion Client
Figure 14–10 Export Option
If you have edited the view, a warning message appears, asking if you would calculate the workbook, revert the cells, or cancel the export.
Figure 14–11 Edited Cells Warning Message
■ Click Calculate to calculate the workbook and open the File Download dialog box.
■ Click Revert to revert the edited cells and open the File Download dialog box.
■ Click Cancel to cancel the operation.
2. The Export dialog box appears.

Export
Print and Export 14-9
Figure 14–12 Export Dialog Box: Text
Set the Export To radio button to Text. This specifies that the output is to be in text format. It also ensures that options such as Separator and Descriptions are available for selection and not grayed out. The lower part of the dialog box (used for exporting to Excel spreadsheets) will be grayed out and unavailable).
Select the following options:
■ View: Choose the view that you want to export.
■ Export Format Type: Choose As Seen, or Raw Data. (The Formatted option is not available when exporting to a text file.)
– Choose As Seen if you want the data to be exported as it appears in the Fusion Client.
– Choose Raw Data if you want the exported data in the text file to appear with no number formatting.
For instance, if you have entered 12588.687 and the number formatting is configured to have a scale of 1, a precision of 2, the separator turned on, and a prefix of $, the number appears as $12,588.69 in the pivot table. This number appears in the text file in the following ways, depending on the exported format type:
– As Seen: $12588.69
– Raw: 12588.687
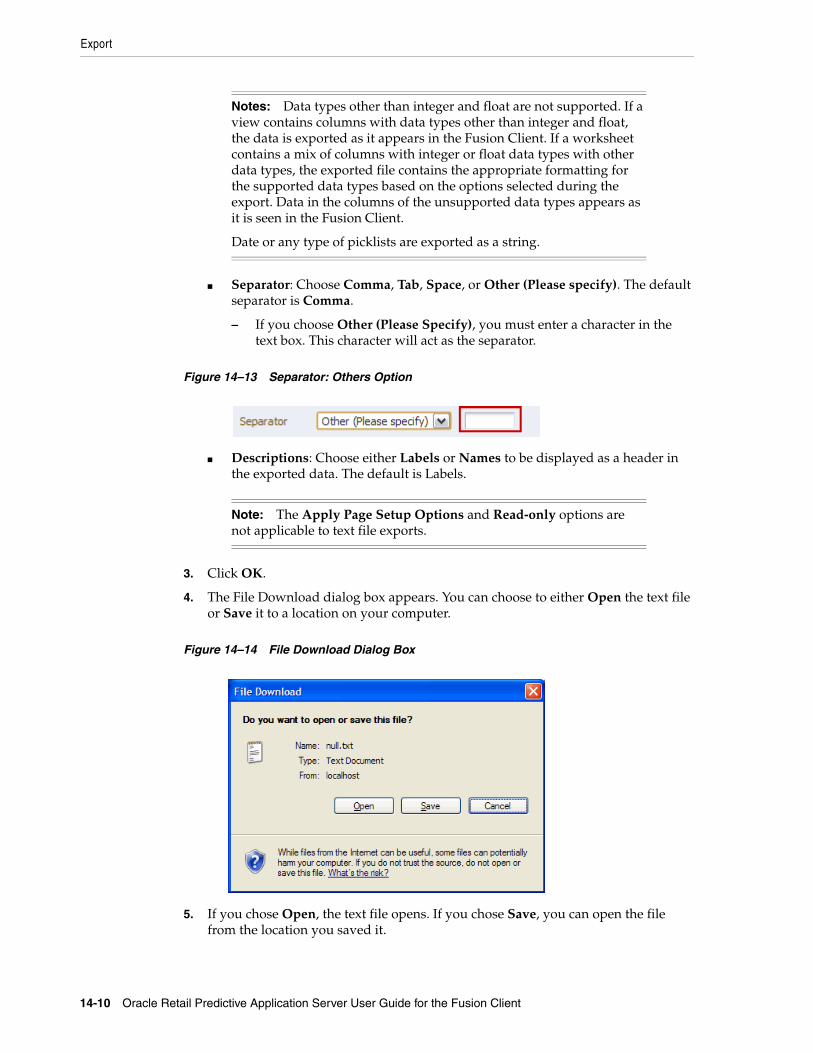
Export
14-10 Oracle Retail Predictive Application Server User Guide for the Fusion Client
■ Separator: Choose Comma, Tab, Space, or Other (Please specify). The default separator is Comma.
– If you choose Other (Please Specify), you must enter a character in the text box. This character will act as the separator.
Figure 14–13 Separator: Others Option
■ Descriptions: Choose either Labels or Names to be displayed as a header in the exported data. The default is Labels.
3. Click OK.
4. The File Download dialog box appears. You can choose to either Open the text file or Save it to a location on your computer.
Figure 14–14 File Download Dialog Box
5. If you chose Open, the text file opens. If you chose Save, you can open the file from the location you saved it.
Notes: Data types other than integer and float are not supported. If a view contains columns with data types other than integer and float, the data is exported as it appears in the Fusion Client. If a worksheet contains a mix of columns with integer or float data types with other data types, the exported file contains the appropriate formatting for the supported data types based on the options selected during the export. Data in the columns of the unsupported data types appears as it is seen in the Fusion Client.
Date or any type of picklists are exported as a string.
Note: The Apply Page Setup Options and Read-only options are not applicable to text file exports.
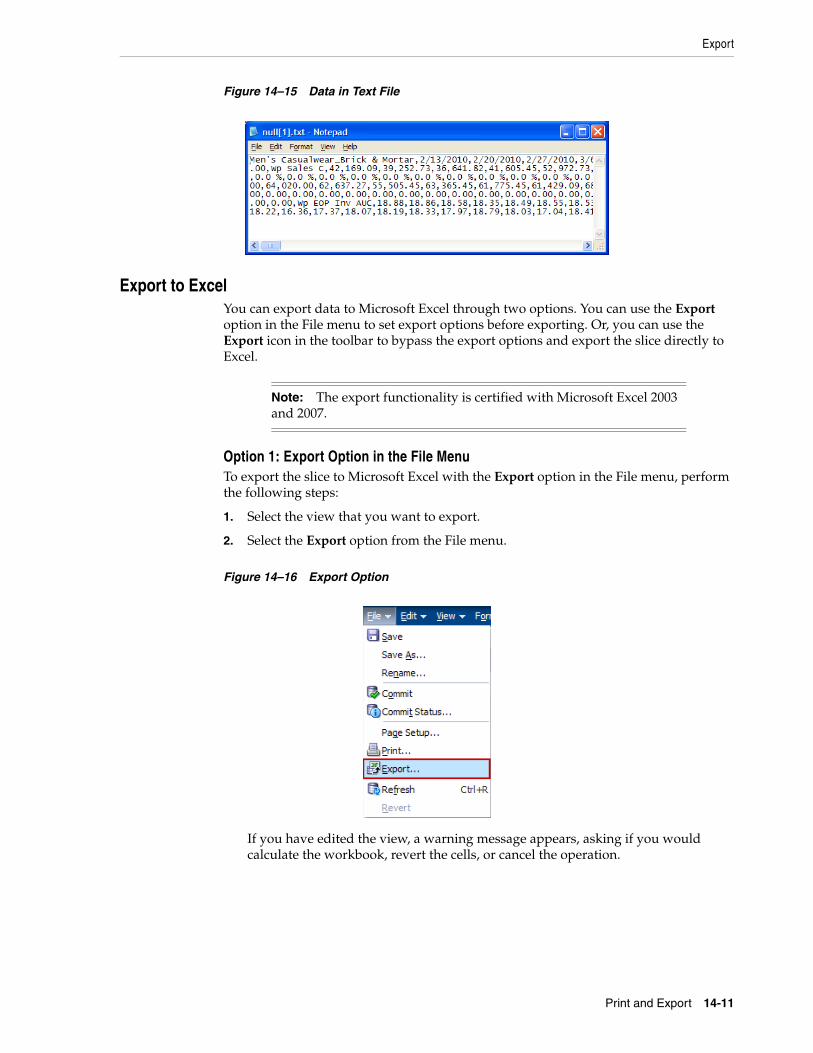
Export
Print and Export 14-11
Figure 14–15 Data in Text File
Export to ExcelYou can export data to Microsoft Excel through two options. You can use the Export option in the File menu to set export options before exporting. Or, you can use the Export icon in the toolbar to bypass the export options and export the slice directly to Excel.
Option 1: Export Option in the File MenuTo export the slice to Microsoft Excel with the Export option in the File menu, perform the following steps:
1. Select the view that you want to export.
2. Select the Export option from the File menu.
Figure 14–16 Export Option
If you have edited the view, a warning message appears, asking if you would calculate the workbook, revert the cells, or cancel the operation.
Note: The export functionality is certified with Microsoft Excel 2003 and 2007.
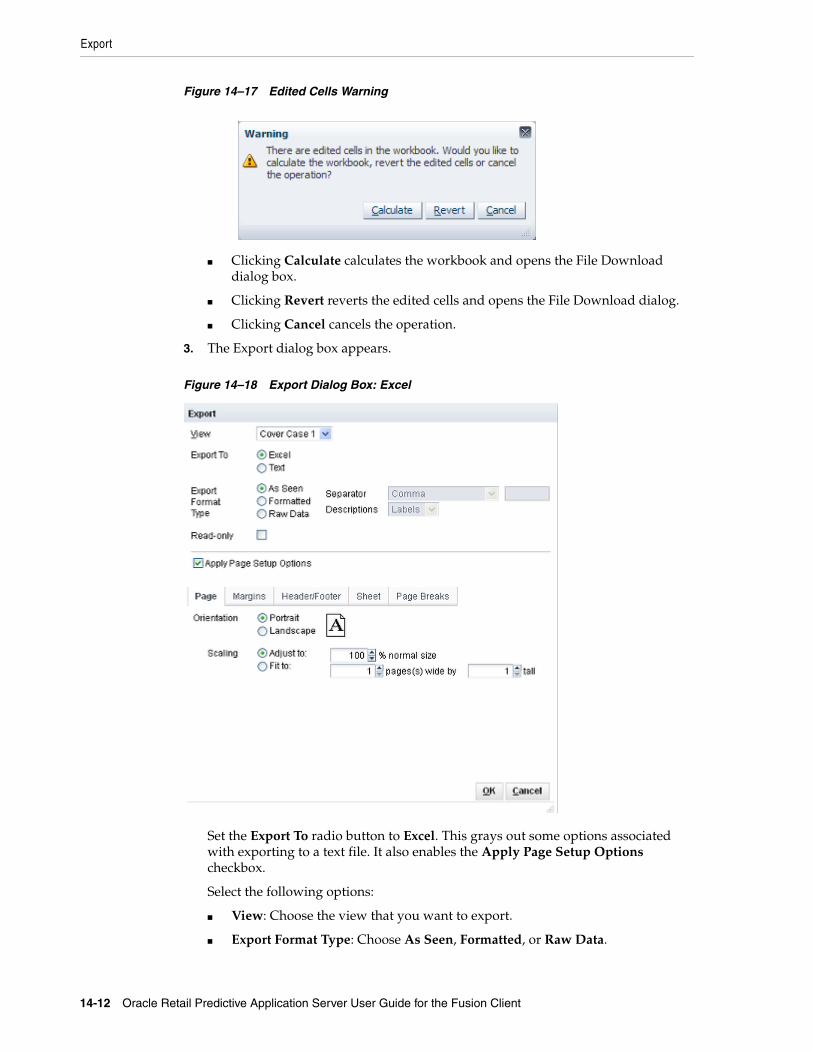
Export
14-12 Oracle Retail Predictive Application Server User Guide for the Fusion Client
Figure 14–17 Edited Cells Warning
■ Clicking Calculate calculates the workbook and opens the File Download dialog box.
■ Clicking Revert reverts the edited cells and opens the File Download dialog.
■ Clicking Cancel cancels the operation.
3. The Export dialog box appears.
Figure 14–18 Export Dialog Box: Excel
Set the Export To radio button to Excel. This grays out some options associated with exporting to a text file. It also enables the Apply Page Setup Options checkbox.
Select the following options:
■ View: Choose the view that you want to export.
■ Export Format Type: Choose As Seen, Formatted, or Raw Data.
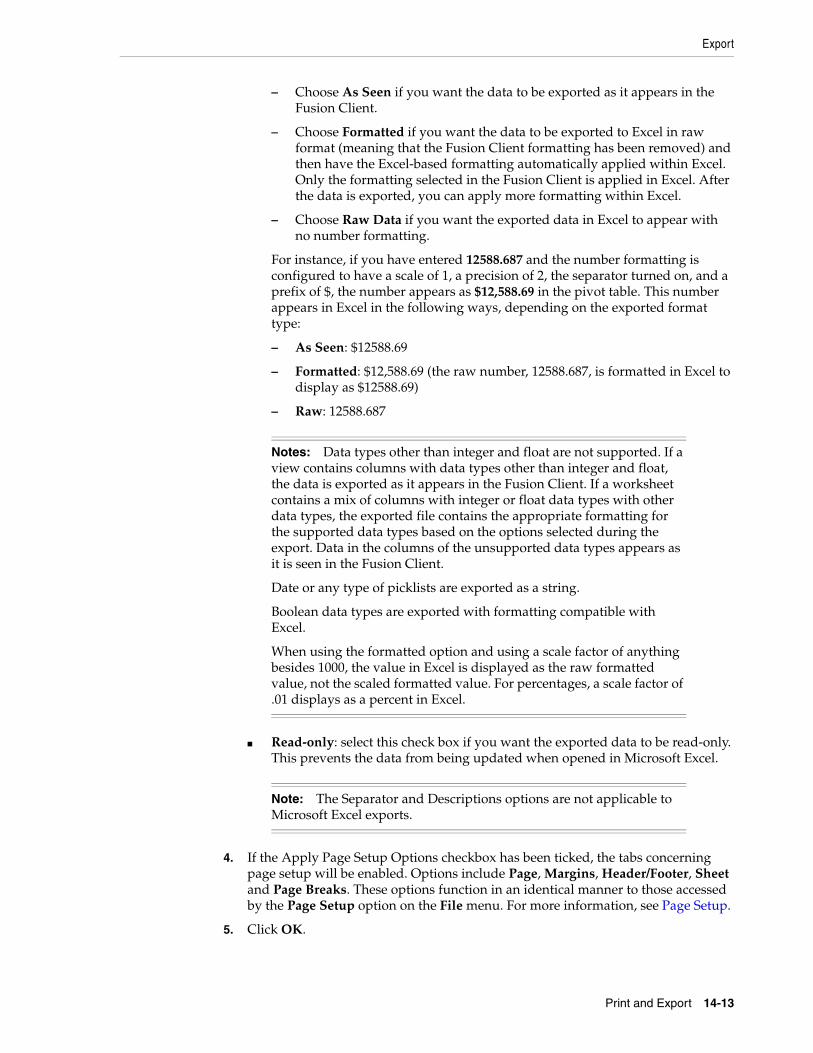
Export
Print and Export 14-13
– Choose As Seen if you want the data to be exported as it appears in the Fusion Client.
– Choose Formatted if you want the data to be exported to Excel in raw format (meaning that the Fusion Client formatting has been removed) and then have the Excel-based formatting automatically applied within Excel. Only the formatting selected in the Fusion Client is applied in Excel. After the data is exported, you can apply more formatting within Excel.
– Choose Raw Data if you want the exported data in Excel to appear with no number formatting.
For instance, if you have entered 12588.687 and the number formatting is configured to have a scale of 1, a precision of 2, the separator turned on, and a prefix of $, the number appears as $12,588.69 in the pivot table. This number appears in Excel in the following ways, depending on the exported format type:
– As Seen: $12588.69
– Formatted: $12,588.69 (the raw number, 12588.687, is formatted in Excel to display as $12588.69)
– Raw: 12588.687
■ Read-only: select this check box if you want the exported data to be read-only. This prevents the data from being updated when opened in Microsoft Excel.
4. If the Apply Page Setup Options checkbox has been ticked, the tabs concerning page setup will be enabled. Options include Page, Margins, Header/Footer, Sheet and Page Breaks. These options function in an identical manner to those accessed by the Page Setup option on the File menu. For more information, see Page Setup.
5. Click OK.
Notes: Data types other than integer and float are not supported. If a view contains columns with data types other than integer and float, the data is exported as it appears in the Fusion Client. If a worksheet contains a mix of columns with integer or float data types with other data types, the exported file contains the appropriate formatting for the supported data types based on the options selected during the export. Data in the columns of the unsupported data types appears as it is seen in the Fusion Client.
Date or any type of picklists are exported as a string.
Boolean data types are exported with formatting compatible with Excel.
When using the formatted option and using a scale factor of anything besides 1000, the value in Excel is displayed as the raw formatted value, not the scaled formatted value. For percentages, a scale factor of .01 displays as a percent in Excel.
Note: The Separator and Descriptions options are not applicable to Microsoft Excel exports.

Export
14-14 Oracle Retail Predictive Application Server User Guide for the Fusion Client
6. The File Download dialog box appears. You can choose to either Open the Microsoft Excel file or Save it to a location on your computer.
Figure 14–19 Export Dialog Box
7. If you chose Open, Microsoft Excel opens and the slice appears in a spreadsheet. If you chose Save, you can open the file from the location you saved it.
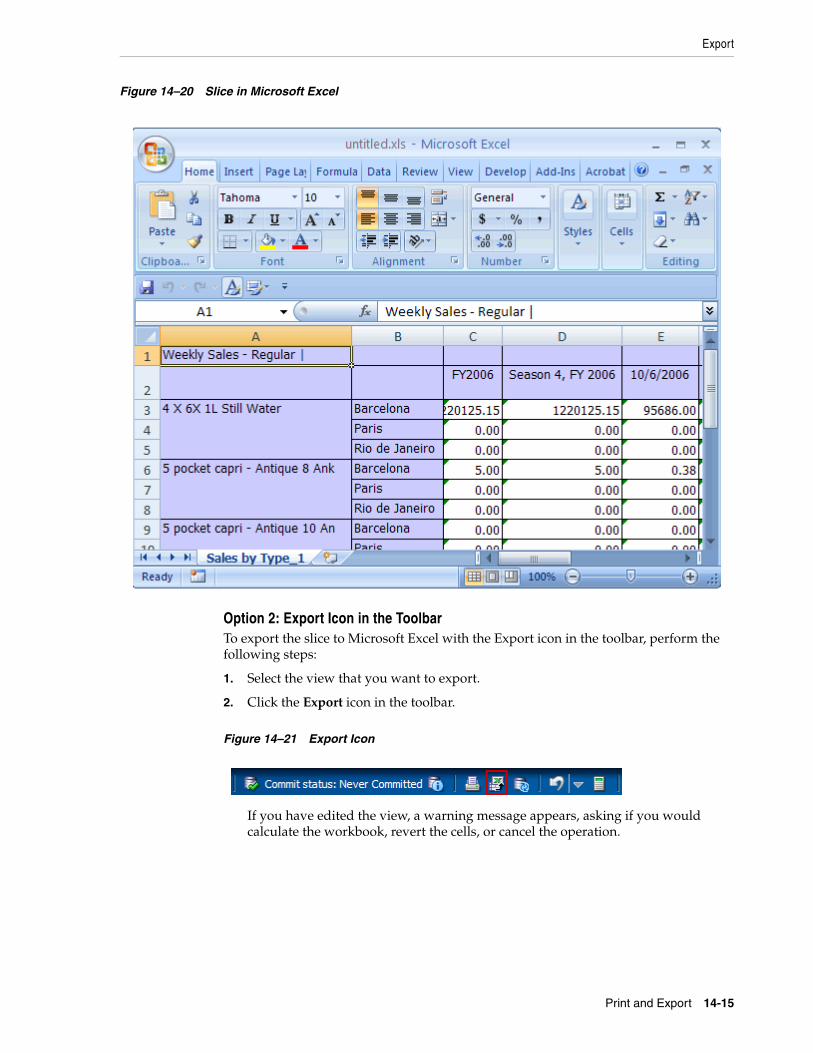
Export
Print and Export 14-15
Figure 14–20 Slice in Microsoft Excel
Option 2: Export Icon in the ToolbarTo export the slice to Microsoft Excel with the Export icon in the toolbar, perform the following steps:
1. Select the view that you want to export.
2. Click the Export icon in the toolbar.
Figure 14–21 Export Icon
If you have edited the view, a warning message appears, asking if you would calculate the workbook, revert the cells, or cancel the operation.
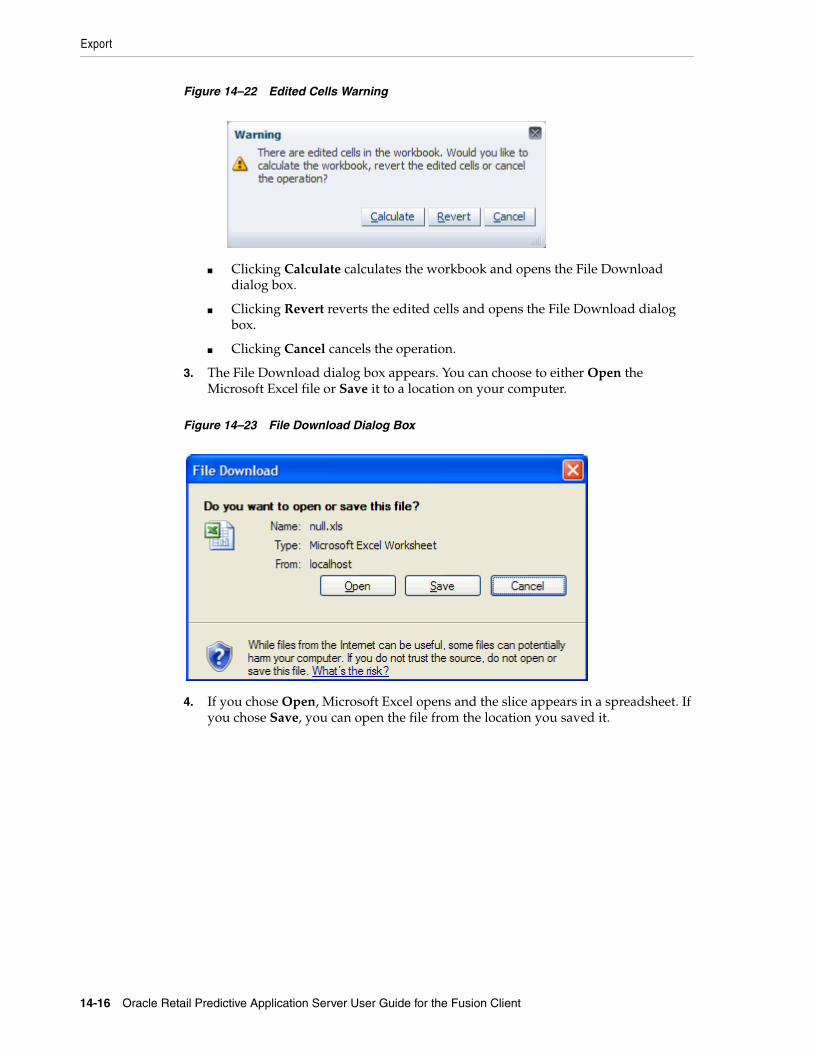
Export
14-16 Oracle Retail Predictive Application Server User Guide for the Fusion Client
Figure 14–22 Edited Cells Warning
■ Clicking Calculate calculates the workbook and opens the File Download dialog box.
■ Clicking Revert reverts the edited cells and opens the File Download dialog box.
■ Clicking Cancel cancels the operation.
3. The File Download dialog box appears. You can choose to either Open the Microsoft Excel file or Save it to a location on your computer.
Figure 14–23 File Download Dialog Box
4. If you chose Open, Microsoft Excel opens and the slice appears in a spreadsheet. If you chose Save, you can open the file from the location you saved it.
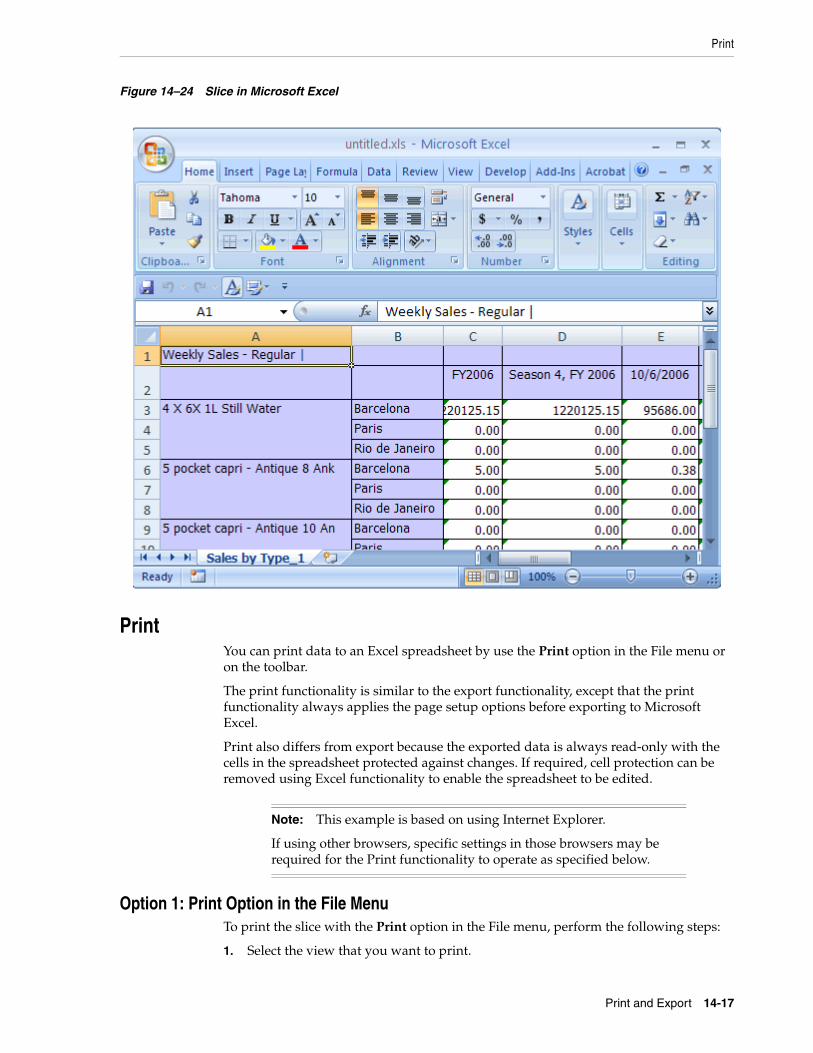
Print and Export 14-17
Figure 14–24 Slice in Microsoft Excel
PrintYou can print data to an Excel spreadsheet by use the Print option in the File menu or on the toolbar.
The print functionality is similar to the export functionality, except that the print functionality always applies the page setup options before exporting to Microsoft Excel.
Print also differs from export because the exported data is always read-only with the cells in the spreadsheet protected against changes. If required, cell protection can be removed using Excel functionality to enable the spreadsheet to be edited.
Option 1: Print Option in the File MenuTo print the slice with the Print option in the File menu, perform the following steps:
1. Select the view that you want to print.
Note: This example is based on using Internet Explorer.
If using other browsers, specific settings in those browsers may be required for the Print functionality to operate as specified below.
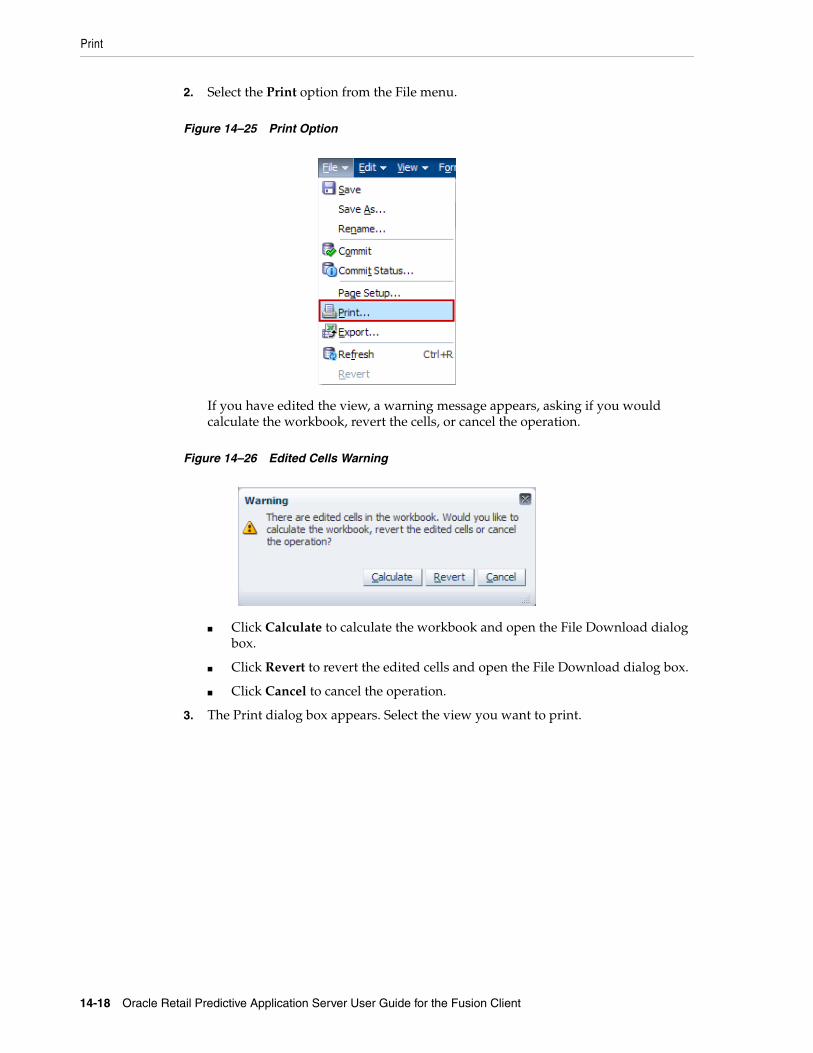
14-18 Oracle Retail Predictive Application Server User Guide for the Fusion Client
2. Select the Print option from the File menu.
Figure 14–25 Print Option
If you have edited the view, a warning message appears, asking if you would calculate the workbook, revert the cells, or cancel the operation.
Figure 14–26 Edited Cells Warning
■ Click Calculate to calculate the workbook and open the File Download dialog box.
■ Click Revert to revert the edited cells and open the File Download dialog box.
■ Click Cancel to cancel the operation.
3. The Print dialog box appears. Select the view you want to print.
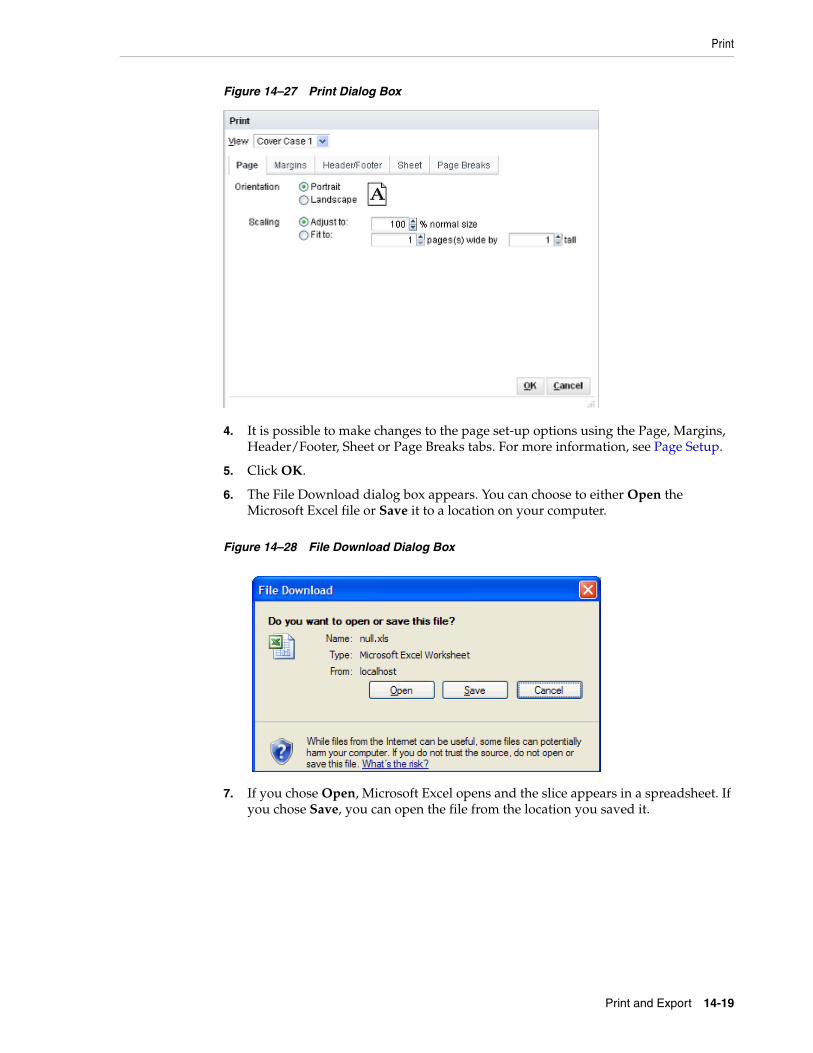
Print and Export 14-19
Figure 14–27 Print Dialog Box
4. It is possible to make changes to the page set-up options using the Page, Margins, Header/Footer, Sheet or Page Breaks tabs. For more information, see Page Setup.
5. Click OK.
6. The File Download dialog box appears. You can choose to either Open the Microsoft Excel file or Save it to a location on your computer.
Figure 14–28 File Download Dialog Box
7. If you chose Open, Microsoft Excel opens and the slice appears in a spreadsheet. If you chose Save, you can open the file from the location you saved it.

14-20 Oracle Retail Predictive Application Server User Guide for the Fusion Client
Figure 14–29 Slice in Microsoft Excel
From Microsoft Excel, click the Print option in the main menu.
Figure 14–30 Print Icon in Microsoft Excel
Option 2: Print Icon in the ToolbarTo print the slice with the Print icon in the toolbar, perform the following steps:
1. Select the view that you want to export.
2. Click the Print icon in the toolbar.
Figure 14–31 Print Icon
If you have edited the view, a warning message appears, asking if you would calculate the workbook, revert the cells, or cancel the operation.
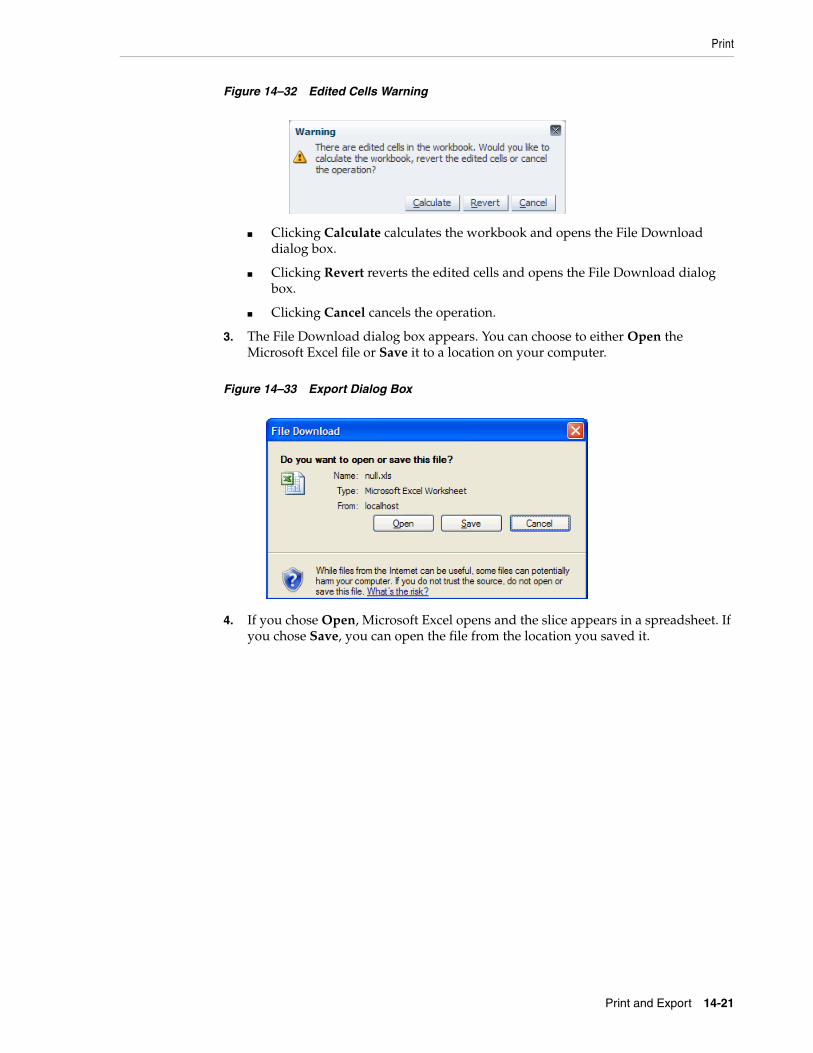
Print and Export 14-21
Figure 14–32 Edited Cells Warning
■ Clicking Calculate calculates the workbook and opens the File Download dialog box.
■ Clicking Revert reverts the edited cells and opens the File Download dialog box.
■ Clicking Cancel cancels the operation.
3. The File Download dialog box appears. You can choose to either Open the Microsoft Excel file or Save it to a location on your computer.
Figure 14–33 Export Dialog Box
4. If you chose Open, Microsoft Excel opens and the slice appears in a spreadsheet. If you chose Save, you can open the file from the location you saved it.
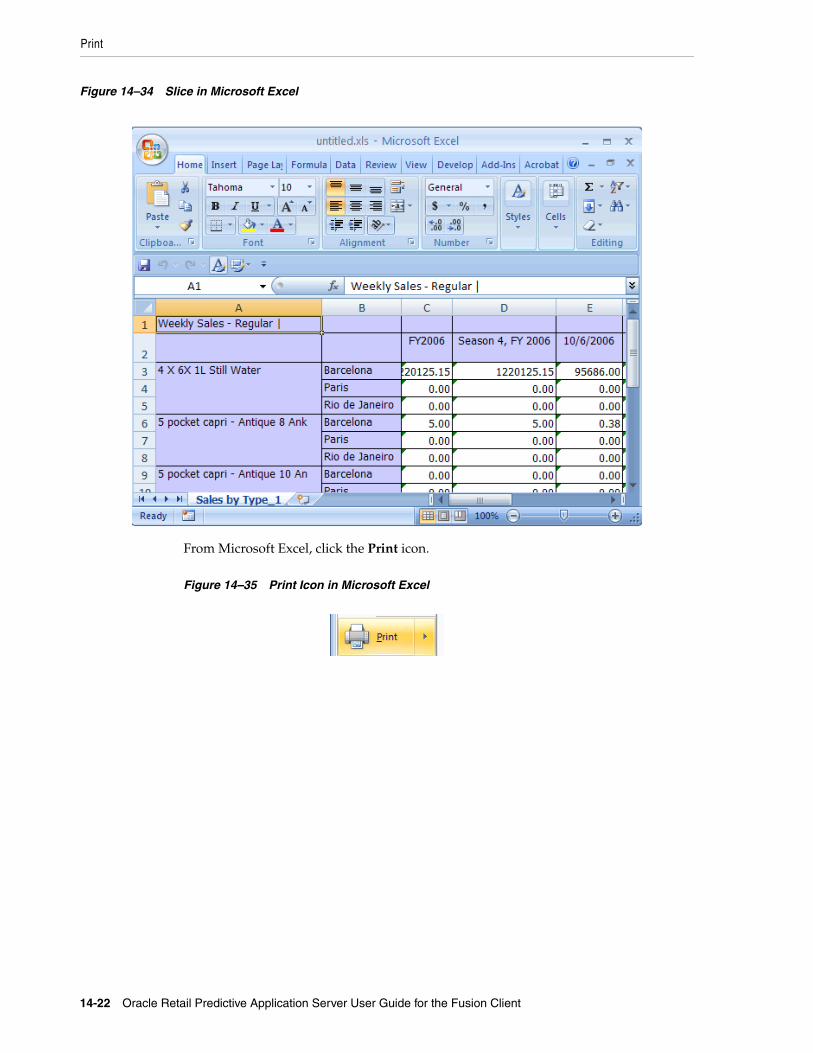
14-22 Oracle Retail Predictive Application Server User Guide for the Fusion Client
Figure 14–34 Slice in Microsoft Excel
From Microsoft Excel, click the Print icon.
Figure 14–35 Print Icon in Microsoft Excel
Special RPAS Fusion Client Features 15-1
15Special RPAS Fusion Client Features
This chapter describes special RPAS Fusion Client features that you can use. The following sections are included:
■ Batch Alerts
■ Real Time Alerts
■ Extended Measures
■ Replicate Selections
■ Creating a Consumer Decision Tree
Overview of AlertsRetailers routinely deal with very large volumes of data. In order to manage the inevitable problems that will occur, two forms of alerts are provided. These enable users to focus directly on the areas of the plan that need corrective action.
Batch AlertsBatch alerts are run at a regular time interval by a scheduling tool - for example on a daily basis. They provide a method for a retailer to set up a systematic framework to identify data that falls outside of specific parameters.
Real Time AlertsReal time alerts are calculated and updated when the workbook is opened. They can then be manually updated by users. Data outside of specified parameters is highlighted. After the data has been modified to a suitable value, clicking Calculate will clear the alert. This allows the user to systematically work through and clear a particular set of problems.
Configuring Batch and Real Time AlertsThe defaults for both batch and real time alerts are configured in the RPAS Configuration Module. This is done by users with access to the configuration tools and alertmgr utility. They are not accessible by standard users. Standard users have the option of modifying the visual appearance and priorities of real time alerts for workbooks or workbook templates to suit their personal preferences.
Batch AlertsBatch alerts are based on business rules that notify users about retail events such as open to buy opportunities, stock outages, sales performance against plan, margin
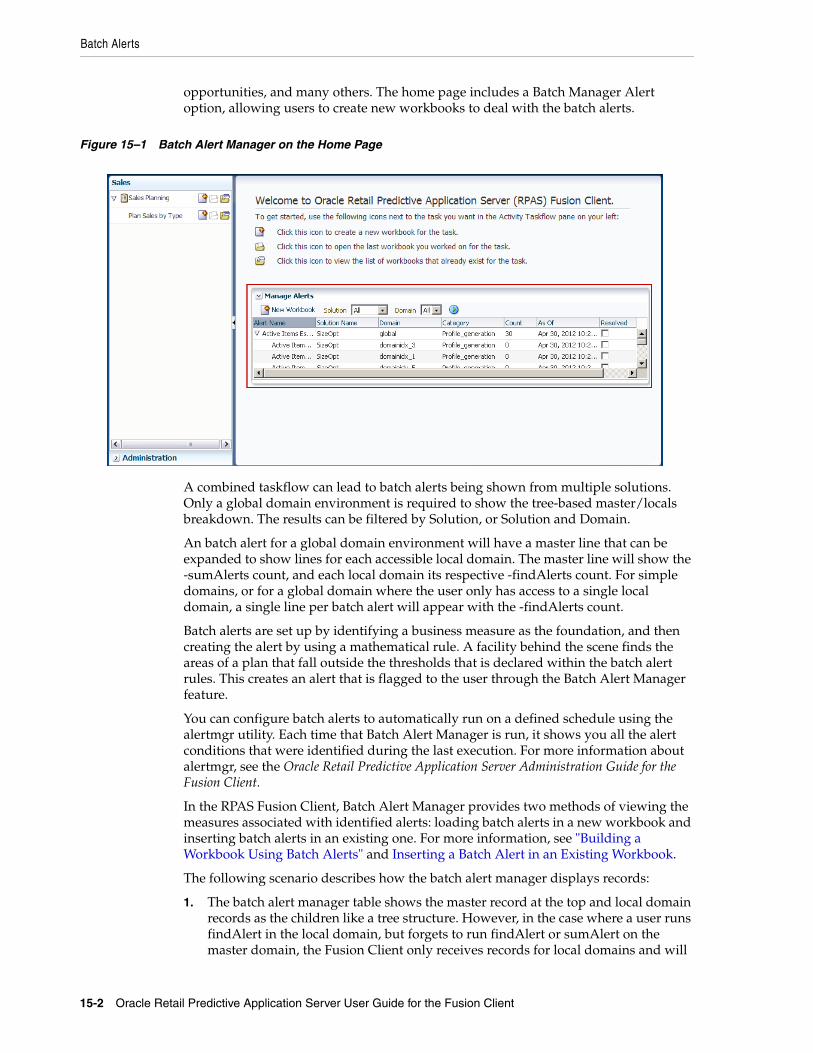
Batch Alerts
15-2 Oracle Retail Predictive Application Server User Guide for the Fusion Client
opportunities, and many others. The home page includes a Batch Manager Alert option, allowing users to create new workbooks to deal with the batch alerts.
Figure 15–1 Batch Alert Manager on the Home Page
A combined taskflow can lead to batch alerts being shown from multiple solutions. Only a global domain environment is required to show the tree-based master/locals breakdown. The results can be filtered by Solution, or Solution and Domain.
An batch alert for a global domain environment will have a master line that can be expanded to show lines for each accessible local domain. The master line will show the -sumAlerts count, and each local domain its respective -findAlerts count. For simple domains, or for a global domain where the user only has access to a single local domain, a single line per batch alert will appear with the -findAlerts count.
Batch alerts are set up by identifying a business measure as the foundation, and then creating the alert by using a mathematical rule. A facility behind the scene finds the areas of a plan that fall outside the thresholds that is declared within the batch alert rules. This creates an alert that is flagged to the user through the Batch Alert Manager feature.
You can configure batch alerts to automatically run on a defined schedule using the alertmgr utility. Each time that Batch Alert Manager is run, it shows you all the alert conditions that were identified during the last execution. For more information about alertmgr, see the Oracle Retail Predictive Application Server Administration Guide for the Fusion Client.
In the RPAS Fusion Client, Batch Alert Manager provides two methods of viewing the measures associated with identified alerts: loading batch alerts in a new workbook and inserting batch alerts in an existing one. For more information, see "Building a Workbook Using Batch Alerts" and Inserting a Batch Alert in an Existing Workbook.
The following scenario describes how the batch alert manager displays records:
1. The batch alert manager table shows the master record at the top and local domain records as the children like a tree structure. However, in the case where a user runs findAlert in the local domain, but forgets to run findAlert or sumAlert on the master domain, the Fusion Client only receives records for local domains and will
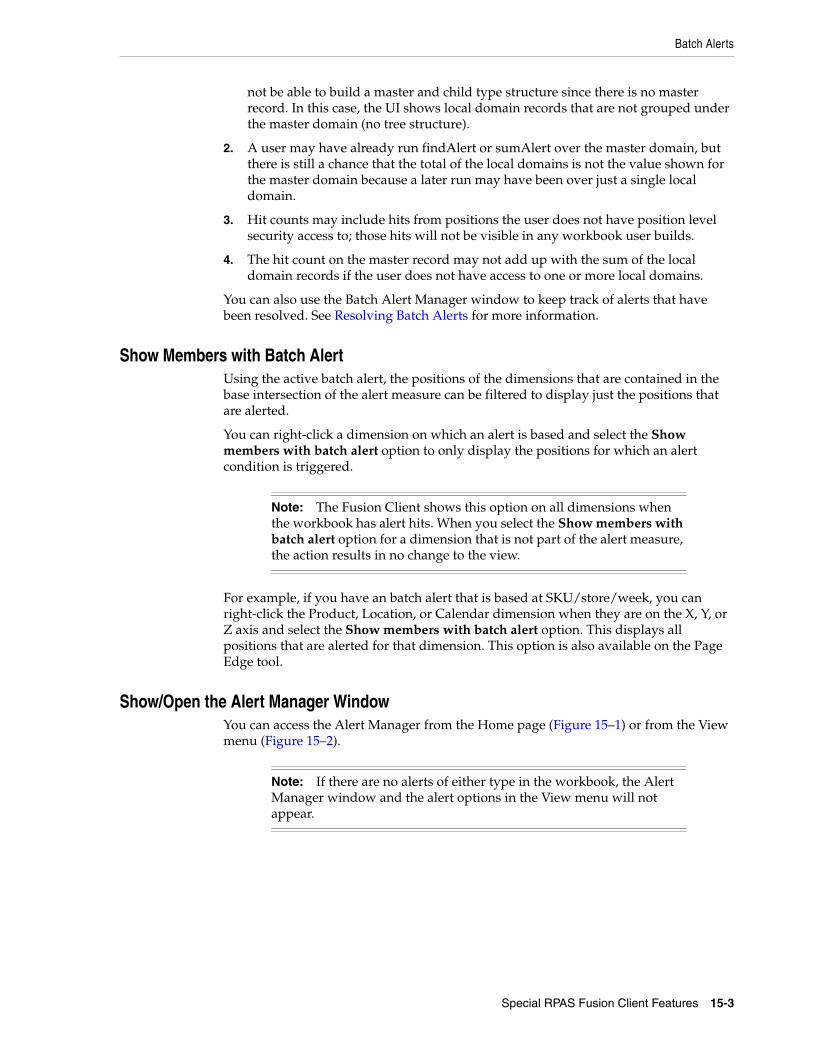
Batch Alerts
Special RPAS Fusion Client Features 15-3
not be able to build a master and child type structure since there is no master record. In this case, the UI shows local domain records that are not grouped under the master domain (no tree structure).
2. A user may have already run findAlert or sumAlert over the master domain, but there is still a chance that the total of the local domains is not the value shown for the master domain because a later run may have been over just a single local domain.
3. Hit counts may include hits from positions the user does not have position level security access to; those hits will not be visible in any workbook user builds.
4. The hit count on the master record may not add up with the sum of the local domain records if the user does not have access to one or more local domains.
You can also use the Batch Alert Manager window to keep track of alerts that have been resolved. See Resolving Batch Alerts for more information.
Show Members with Batch AlertUsing the active batch alert, the positions of the dimensions that are contained in the base intersection of the alert measure can be filtered to display just the positions that are alerted.
You can right-click a dimension on which an alert is based and select the Show members with batch alert option to only display the positions for which an alert condition is triggered.
For example, if you have an batch alert that is based at SKU/store/week, you can right-click the Product, Location, or Calendar dimension when they are on the X, Y, or Z axis and select the Show members with batch alert option. This displays all positions that are alerted for that dimension. This option is also available on the Page Edge tool.
Show/Open the Alert Manager WindowYou can access the Alert Manager from the Home page (Figure 15–1) or from the View menu (Figure 15–2).
Note: The Fusion Client shows this option on all dimensions when the workbook has alert hits. When you select the Show members with batch alert option for a dimension that is not part of the alert measure, the action results in no change to the view.
Note: If there are no alerts of either type in the workbook, the Alert Manager window and the alert options in the View menu will not appear.
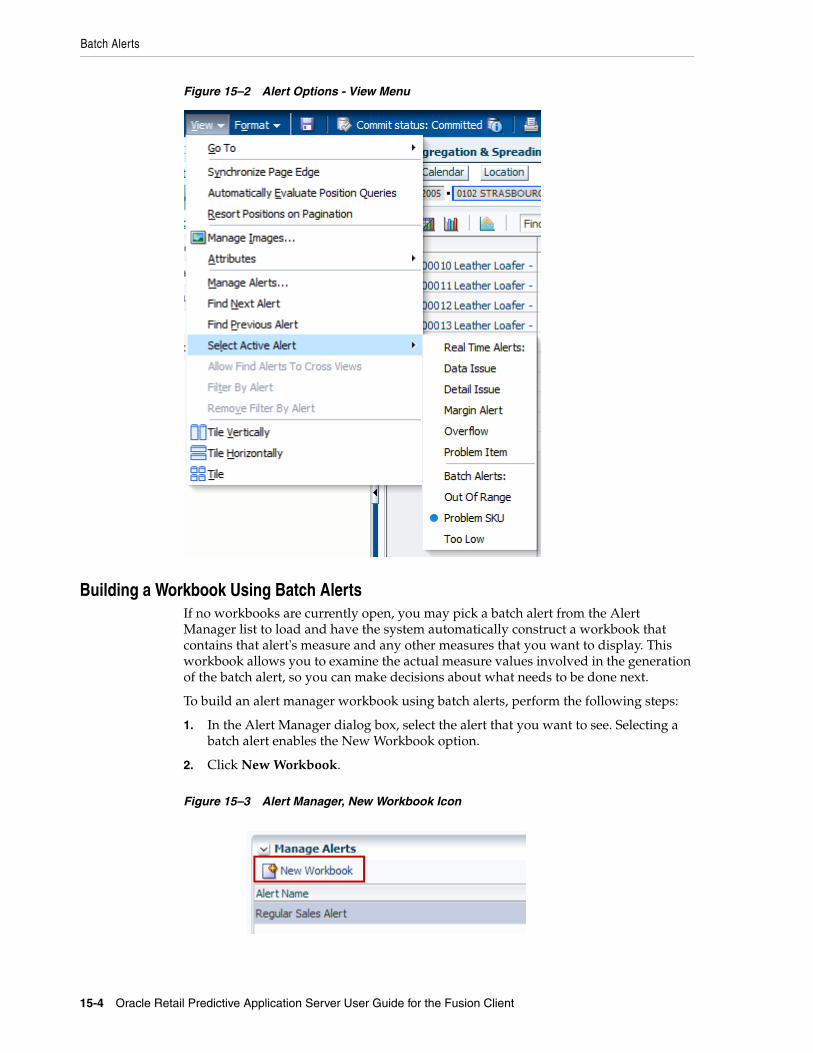
Batch Alerts
15-4 Oracle Retail Predictive Application Server User Guide for the Fusion Client
Figure 15–2 Alert Options - View Menu
Building a Workbook Using Batch AlertsIf no workbooks are currently open, you may pick a batch alert from the Alert Manager list to load and have the system automatically construct a workbook that contains that alert's measure and any other measures that you want to display. This workbook allows you to examine the actual measure values involved in the generation of the batch alert, so you can make decisions about what needs to be done next.
To build an alert manager workbook using batch alerts, perform the following steps:
1. In the Alert Manager dialog box, select the alert that you want to see. Selecting a batch alert enables the New Workbook option.
2. Click New Workbook.
Figure 15–3 Alert Manager, New Workbook Icon
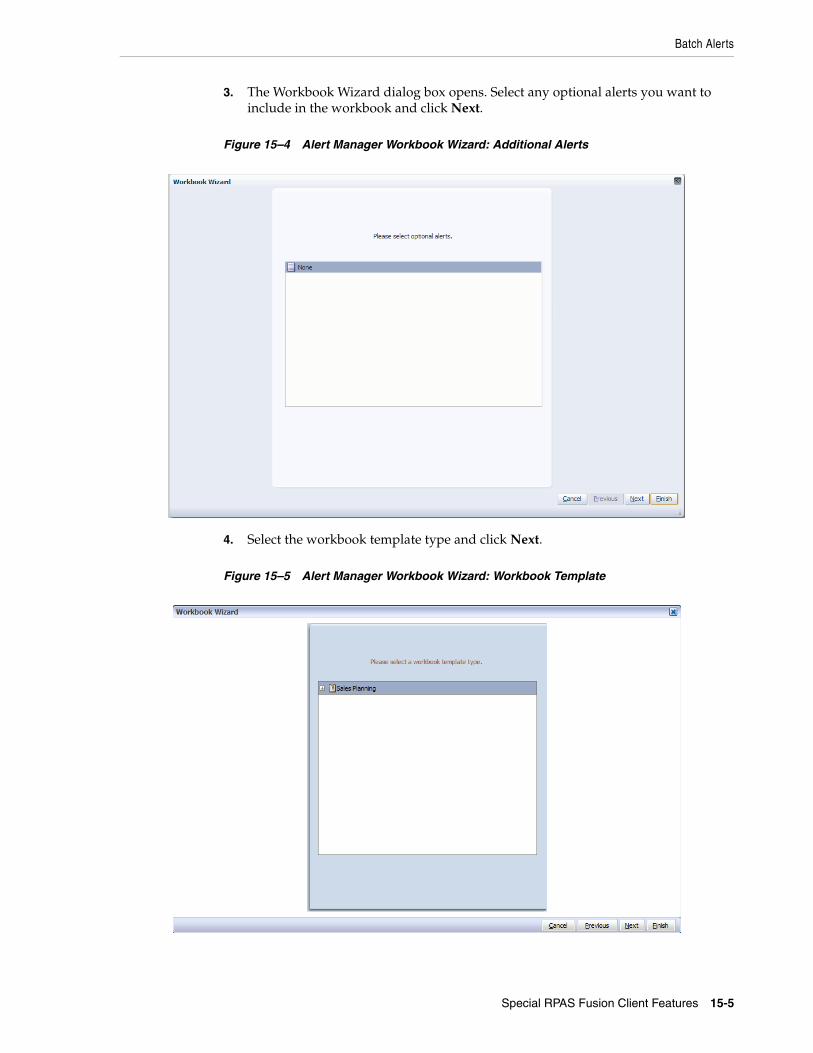
Batch Alerts
Special RPAS Fusion Client Features 15-5
3. The Workbook Wizard dialog box opens. Select any optional alerts you want to include in the workbook and click Next.
Figure 15–4 Alert Manager Workbook Wizard: Additional Alerts
4. Select the workbook template type and click Next.
Figure 15–5 Alert Manager Workbook Wizard: Workbook Template
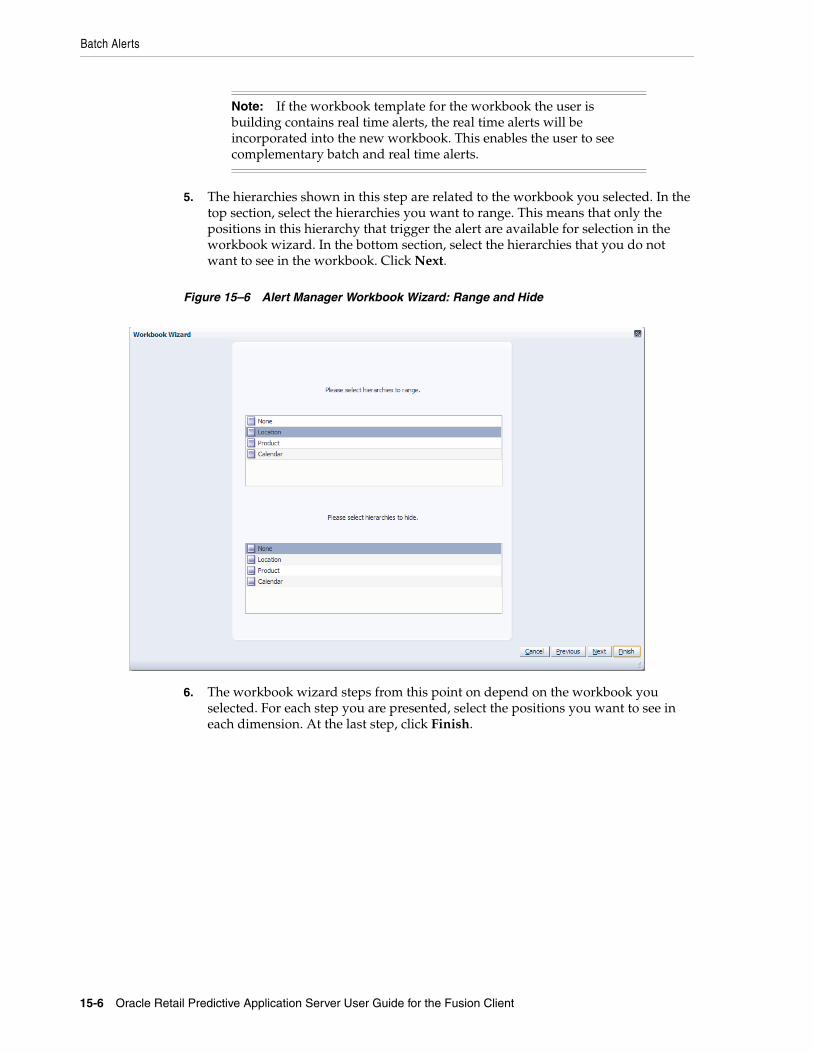
Batch Alerts
15-6 Oracle Retail Predictive Application Server User Guide for the Fusion Client
5. The hierarchies shown in this step are related to the workbook you selected. In the top section, select the hierarchies you want to range. This means that only the positions in this hierarchy that trigger the alert are available for selection in the workbook wizard. In the bottom section, select the hierarchies that you do not want to see in the workbook. Click Next.
Figure 15–6 Alert Manager Workbook Wizard: Range and Hide
6. The workbook wizard steps from this point on depend on the workbook you selected. For each step you are presented, select the positions you want to see in each dimension. At the last step, click Finish.
Note: If the workbook template for the workbook the user is building contains real time alerts, the real time alerts will be incorporated into the new workbook. This enables the user to see complementary batch and real time alerts.
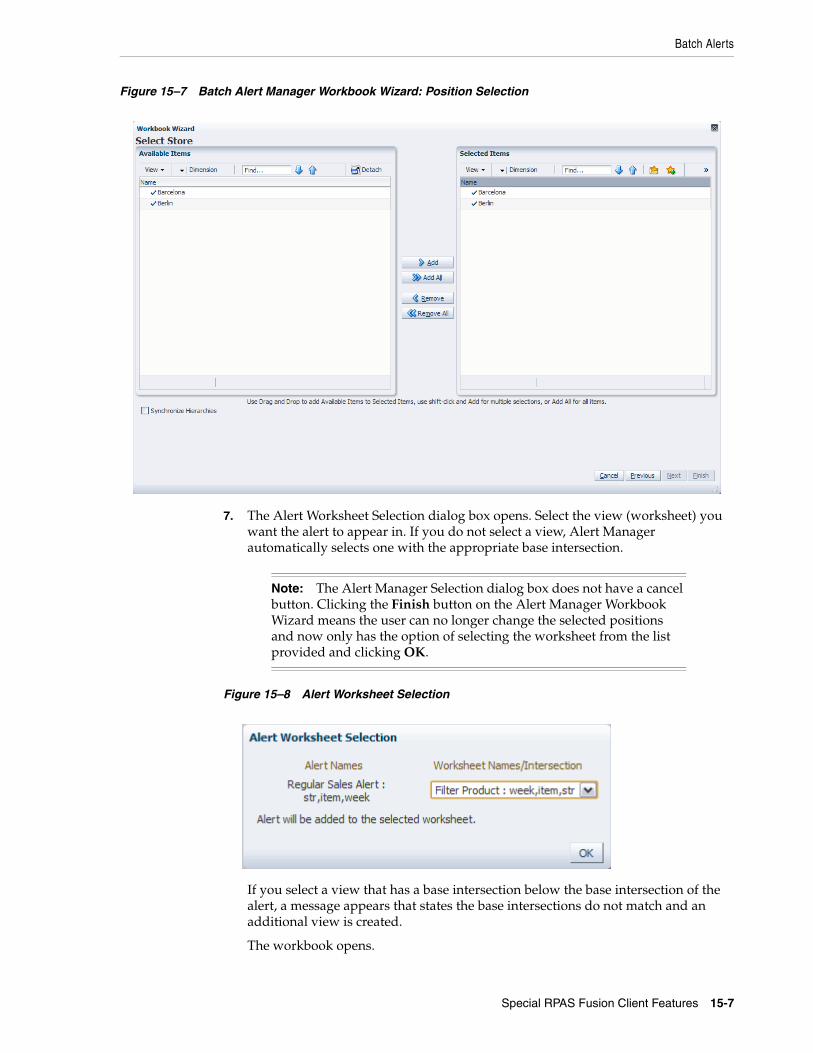
Batch Alerts
Special RPAS Fusion Client Features 15-7
Figure 15–7 Batch Alert Manager Workbook Wizard: Position Selection
7. The Alert Worksheet Selection dialog box opens. Select the view (worksheet) you want the alert to appear in. If you do not select a view, Alert Manager automatically selects one with the appropriate base intersection.
Figure 15–8 Alert Worksheet Selection
If you select a view that has a base intersection below the base intersection of the alert, a message appears that states the base intersections do not match and an additional view is created.
The workbook opens.
Note: The Alert Manager Selection dialog box does not have a cancel button. Clicking the Finish button on the Alert Manager Workbook Wizard means the user can no longer change the selected positions and now only has the option of selecting the worksheet from the list provided and clicking OK.
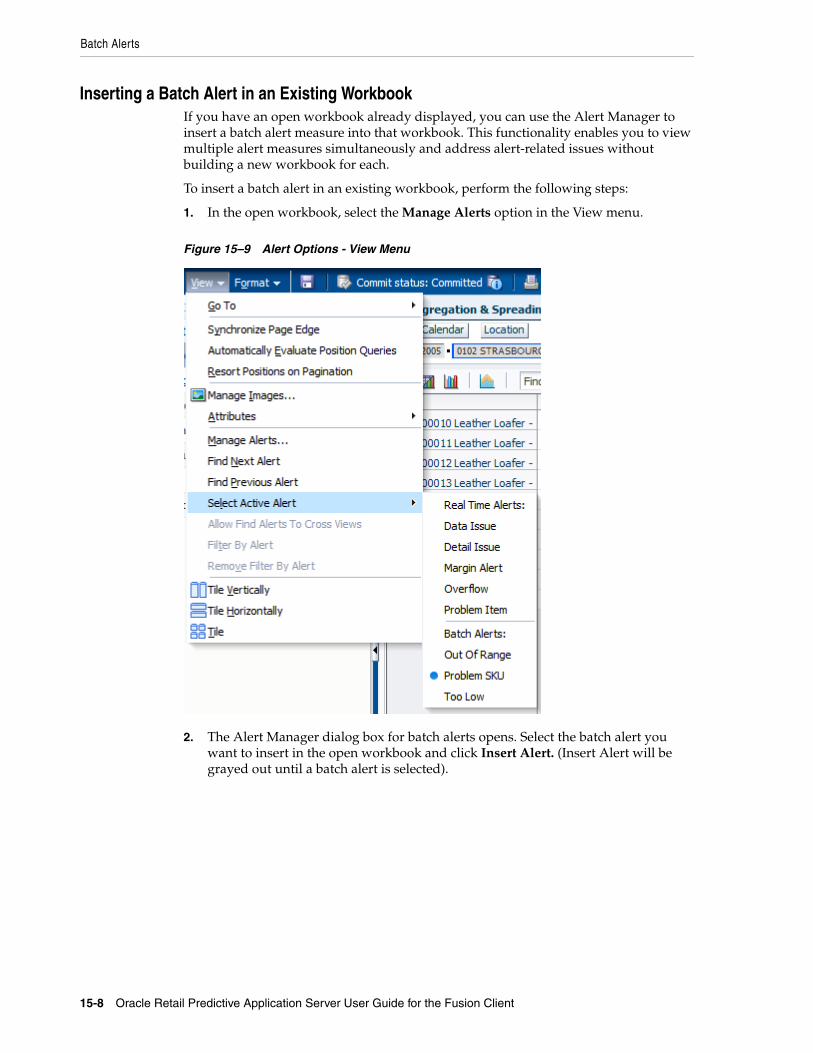
Batch Alerts
15-8 Oracle Retail Predictive Application Server User Guide for the Fusion Client
Inserting a Batch Alert in an Existing WorkbookIf you have an open workbook already displayed, you can use the Alert Manager to insert a batch alert measure into that workbook. This functionality enables you to view multiple alert measures simultaneously and address alert-related issues without building a new workbook for each.
To insert a batch alert in an existing workbook, perform the following steps:
1. In the open workbook, select the Manage Alerts option in the View menu.
Figure 15–9 Alert Options - View Menu
2. The Alert Manager dialog box for batch alerts opens. Select the batch alert you want to insert in the open workbook and click Insert Alert. (Insert Alert will be grayed out until a batch alert is selected).

Batch Alerts
Special RPAS Fusion Client Features 15-9
Figure 15–10 Alert Manager Dialog Box for Batch Alerts
The workbook refreshes and the alert measure is inserted.
3. Close the dialog box using the Close icon or Cancel.
The Alert Manager dialog box closes, and the alert measure is visible in the workbook.
Finding Batch AlertsIn the view, the batch alert appears and behaves like a read-only boolean measure. Positions that have triggered the alert have selected check boxes.
If you have more than one batch alert (or a combination of batch and real time alerts) in the workbook, use the Select Alert icon to choose the alert type that you want to work with. Use the Find Next and Find Previous alert icons (Figure 15–11) to scroll through all instances of that alert in the workbook. If the next or previous alert is not visible in the view, the view refreshes or scrolls to make it visible.
Figure 15–11 Select Batch Alert and Find Next and Previous Batch Alerts Icons
Resolving Batch AlertsAfter you have reviewed the alert instances and made any necessary changes to the data, you can mark the batch alert as resolved in the Alert Manager dialog box.
To resolve a batch alert, check the Resolved check box for that alert (Figure 15–12). Checking the resolved check box does not change the data in the workbook or clear
Note: The user can use the alert controls to determine whether they want to work with batch alerts or real time alerts. If the user has opted to work with batch alerts, the controls will enable them to step forward or back through those alerts. If the user has opted to work with real time alerts, the controls will operate on those.

Real Time Alerts
15-10 Oracle Retail Predictive Application Server User Guide for the Fusion Client
the instances of that alert. It serves only as a visual cue to users that they have addressed the alert.
Real time alerts can be considered resolved when their hit count falls to zero in the workbook.
Figure 15–12 Resolving a Batch Alert
Real Time AlertsReal time alerts are interactive alerts that are displayed on opening a workbook or view. The alerts are then updated each time the user edits data and clicks Calculate.
Configuring Real Time Alerts
Real Time Alerts are configured in the RPAS Configuration Module. This module is normally only accessible by Administrators. This section gives a brief overview of how these alerts are configured. It is intended to give some background information to users with access to the Fusion Client only.
Alert DefinitionReal Time Alerts are configured on workbook templates, and appear in workbooks built using those templates. An alert definition specifies a number of conditions, each with styles and a message, that the alert can detect and display. Alerts hits are determined by a designated alert measure, which uses a rule to calculate a condition identifier representing each hit at a designated alert intersection. These hits are then displayed on the cells of a designated target measure at that same intersection. The alert definition also contains a priority that is used when multiple alerts are raised on the same target measure cells.
Alert MeasureThe alert measure is calculated by a rule that detects the conditions for the alert. For example, an alert measure FcstAlert may be computed by the following rule:
FcstAlert = if(FcstQty <300, "tooLow", if(FcstQty >600, "tooHigh",""))
Note: For a detailed explanation of how to configure Real Time Alerts, see the RPAS Configuration Tools User Guide.
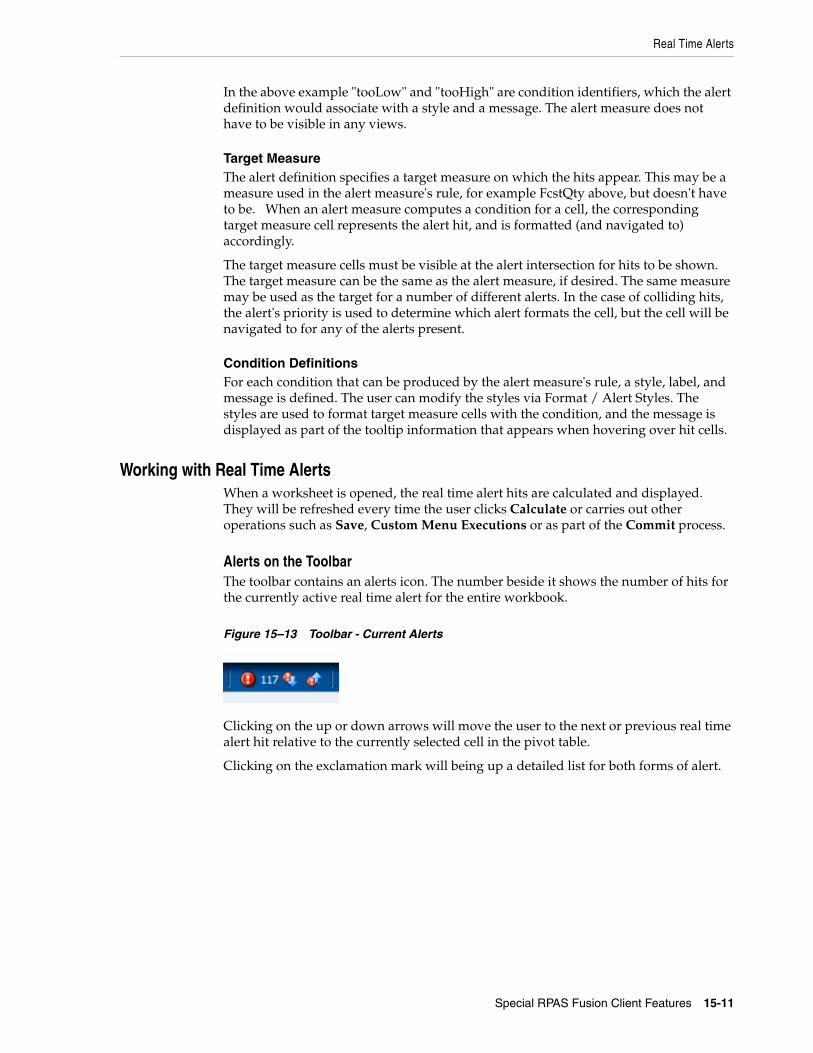
Real Time Alerts
Special RPAS Fusion Client Features 15-11
In the above example "tooLow" and "tooHigh" are condition identifiers, which the alert definition would associate with a style and a message. The alert measure does not have to be visible in any views.
Target MeasureThe alert definition specifies a target measure on which the hits appear. This may be a measure used in the alert measure's rule, for example FcstQty above, but doesn't have to be. When an alert measure computes a condition for a cell, the corresponding target measure cell represents the alert hit, and is formatted (and navigated to) accordingly.
The target measure cells must be visible at the alert intersection for hits to be shown. The target measure can be the same as the alert measure, if desired. The same measure may be used as the target for a number of different alerts. In the case of colliding hits, the alert's priority is used to determine which alert formats the cell, but the cell will be navigated to for any of the alerts present.
Condition DefinitionsFor each condition that can be produced by the alert measure's rule, a style, label, and message is defined. The user can modify the styles via Format / Alert Styles. The styles are used to format target measure cells with the condition, and the message is displayed as part of the tooltip information that appears when hovering over hit cells.
Working with Real Time AlertsWhen a worksheet is opened, the real time alert hits are calculated and displayed. They will be refreshed every time the user clicks Calculate or carries out other operations such as Save, Custom Menu Executions or as part of the Commit process.
Alerts on the ToolbarThe toolbar contains an alerts icon. The number beside it shows the number of hits for the currently active real time alert for the entire workbook.
Figure 15–13 Toolbar - Current Alerts
Clicking on the up or down arrows will move the user to the next or previous real time alert hit relative to the currently selected cell in the pivot table.
Clicking on the exclamation mark will being up a detailed list for both forms of alert.
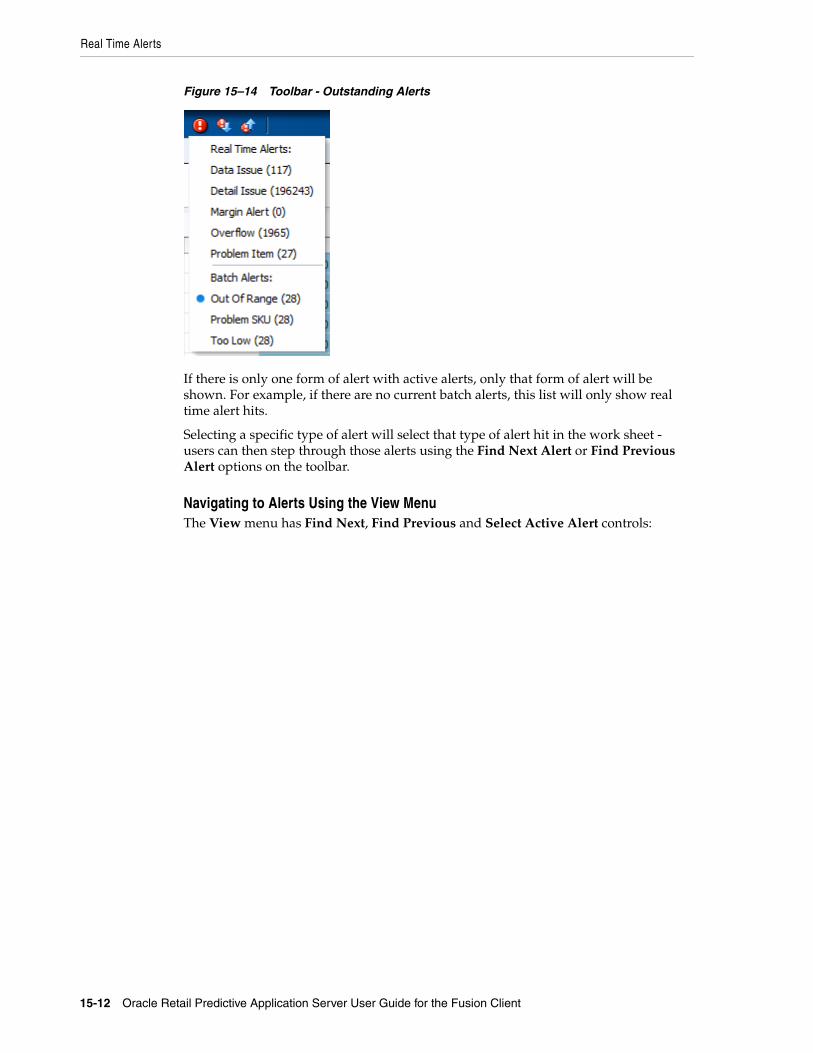
Real Time Alerts
15-12 Oracle Retail Predictive Application Server User Guide for the Fusion Client
Figure 15–14 Toolbar - Outstanding Alerts
If there is only one form of alert with active alerts, only that form of alert will be shown. For example, if there are no current batch alerts, this list will only show real time alert hits.
Selecting a specific type of alert will select that type of alert hit in the work sheet - users can then step through those alerts using the Find Next Alert or Find Previous Alert options on the toolbar.
Navigating to Alerts Using the View MenuThe View menu has Find Next, Find Previous and Select Active Alert controls:
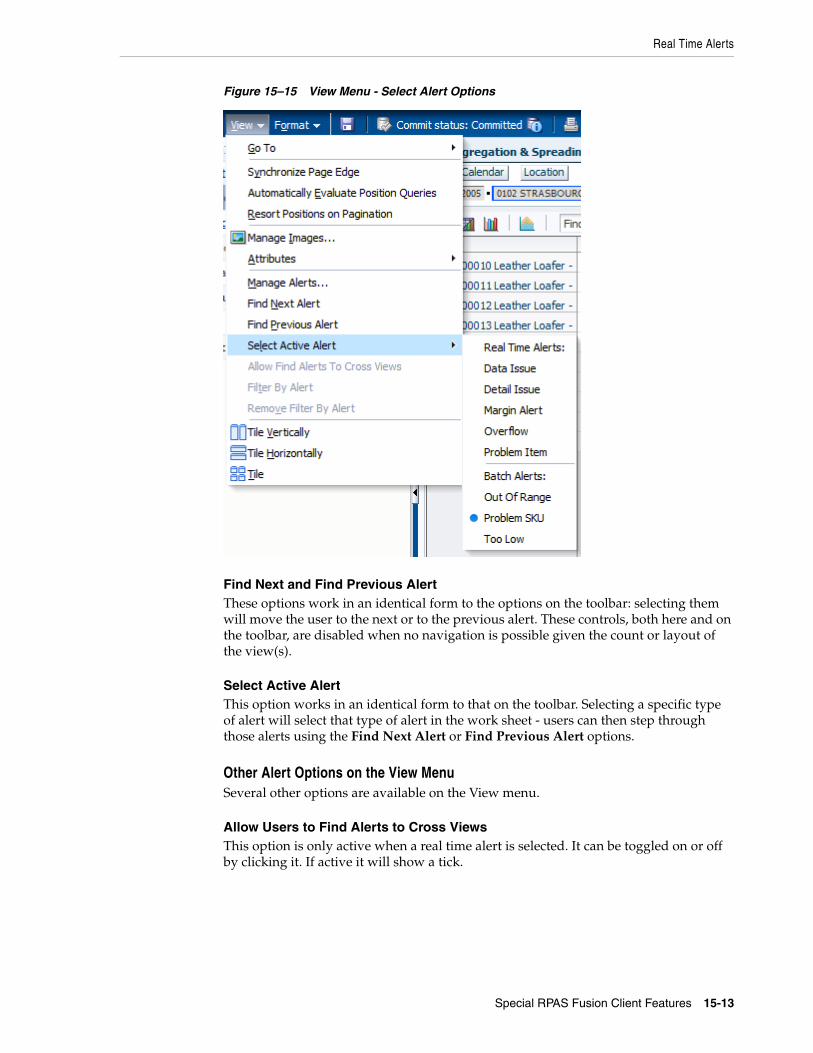
Real Time Alerts
Special RPAS Fusion Client Features 15-13
Figure 15–15 View Menu - Select Alert Options
Find Next and Find Previous AlertThese options work in an identical form to the options on the toolbar: selecting them will move the user to the next or to the previous alert. These controls, both here and on the toolbar, are disabled when no navigation is possible given the count or layout of the view(s).
Select Active AlertThis option works in an identical form to that on the toolbar. Selecting a specific type of alert will select that type of alert in the work sheet - users can then step through those alerts using the Find Next Alert or Find Previous Alert options.
Other Alert Options on the View MenuSeveral other options are available on the View menu.
Allow Users to Find Alerts to Cross ViewsThis option is only active when a real time alert is selected. It can be toggled on or off by clicking it. If active it will show a tick.
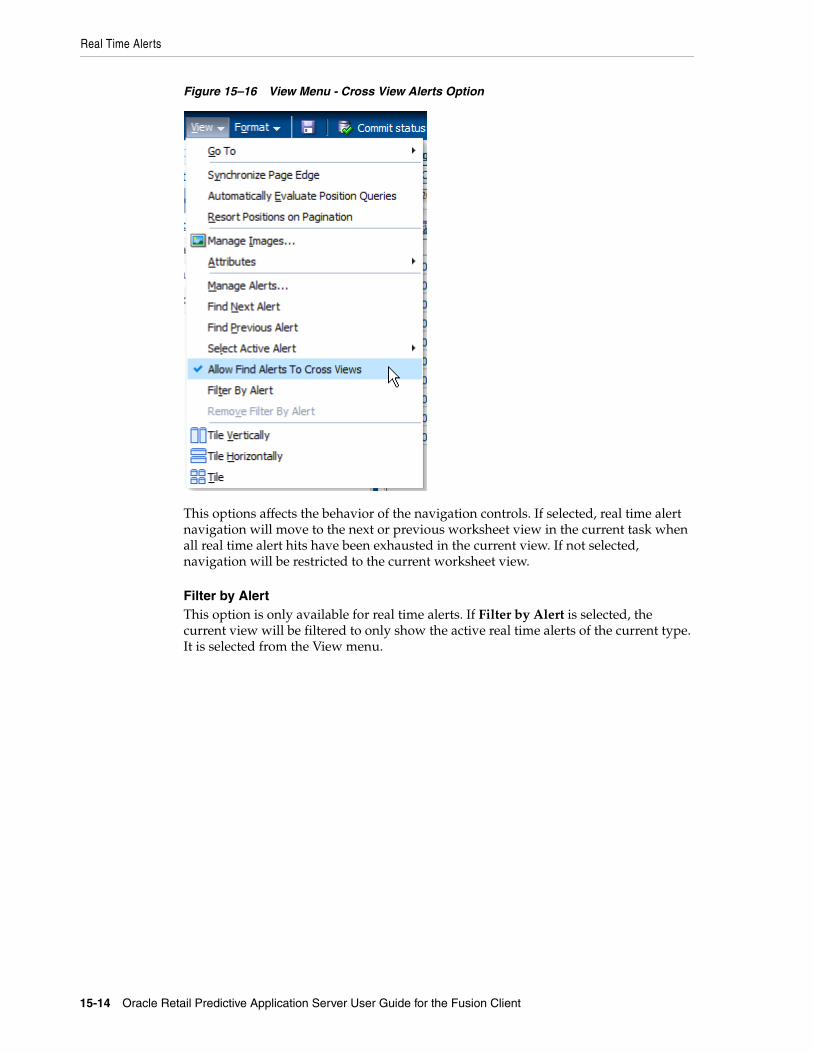
Real Time Alerts
15-14 Oracle Retail Predictive Application Server User Guide for the Fusion Client
Figure 15–16 View Menu - Cross View Alerts Option
This options affects the behavior of the navigation controls. If selected, real time alert navigation will move to the next or previous worksheet view in the current task when all real time alert hits have been exhausted in the current view. If not selected, navigation will be restricted to the current worksheet view.
Filter by AlertThis option is only available for real time alerts. If Filter by Alert is selected, the current view will be filtered to only show the active real time alerts of the current type. It is selected from the View menu.
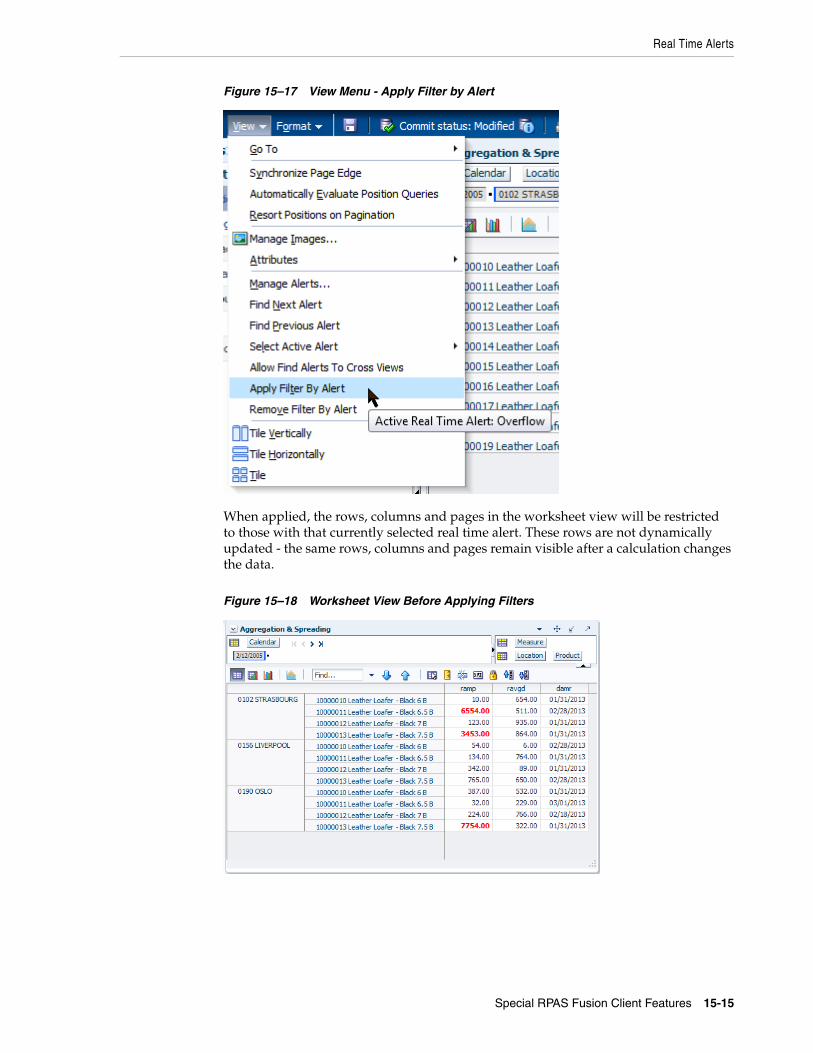
Real Time Alerts
Special RPAS Fusion Client Features 15-15
Figure 15–17 View Menu - Apply Filter by Alert
When applied, the rows, columns and pages in the worksheet view will be restricted to those with that currently selected real time alert. These rows are not dynamically updated - the same rows, columns and pages remain visible after a calculation changes the data.
Figure 15–18 Worksheet View Before Applying Filters
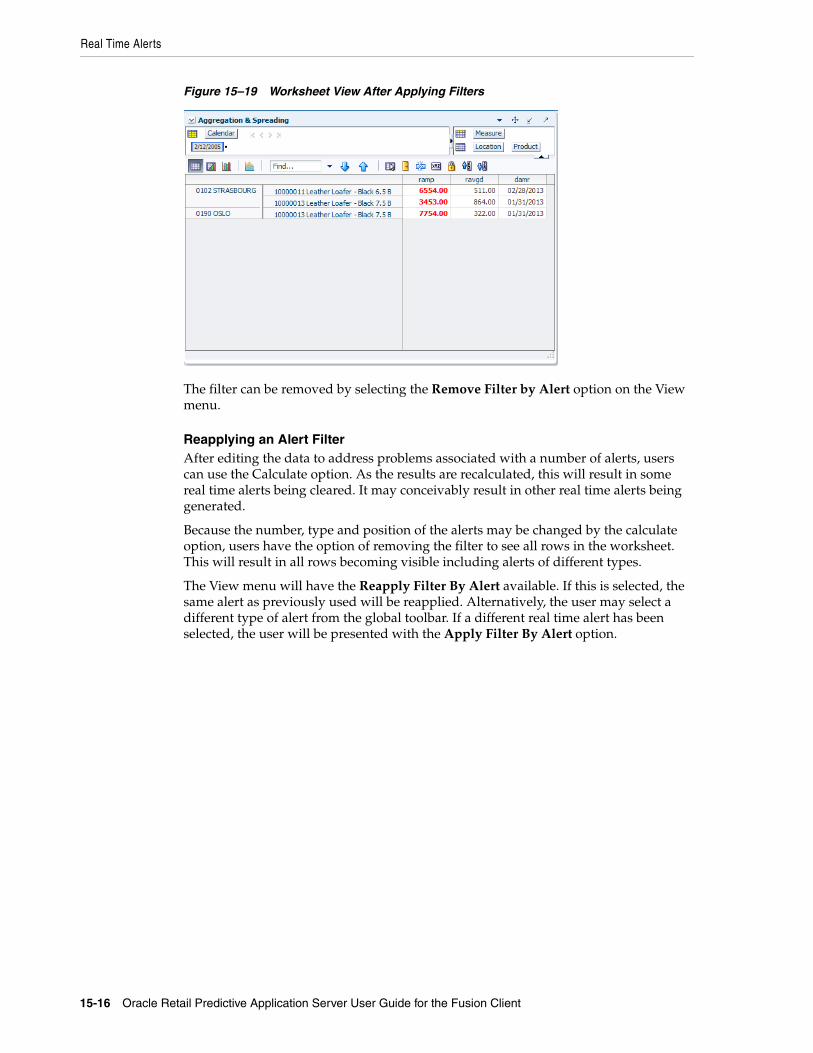
Real Time Alerts
15-16 Oracle Retail Predictive Application Server User Guide for the Fusion Client
Figure 15–19 Worksheet View After Applying Filters
The filter can be removed by selecting the Remove Filter by Alert option on the View menu.
Reapplying an Alert FilterAfter editing the data to address problems associated with a number of alerts, users can use the Calculate option. As the results are recalculated, this will result in some real time alerts being cleared. It may conceivably result in other real time alerts being generated.
Because the number, type and position of the alerts may be changed by the calculate option, users have the option of removing the filter to see all rows in the worksheet. This will result in all rows becoming visible including alerts of different types.
The View menu will have the Reapply Filter By Alert available. If this is selected, the same alert as previously used will be reapplied. Alternatively, the user may select a different type of alert from the global toolbar. If a different real time alert has been selected, the user will be presented with the Apply Filter By Alert option.
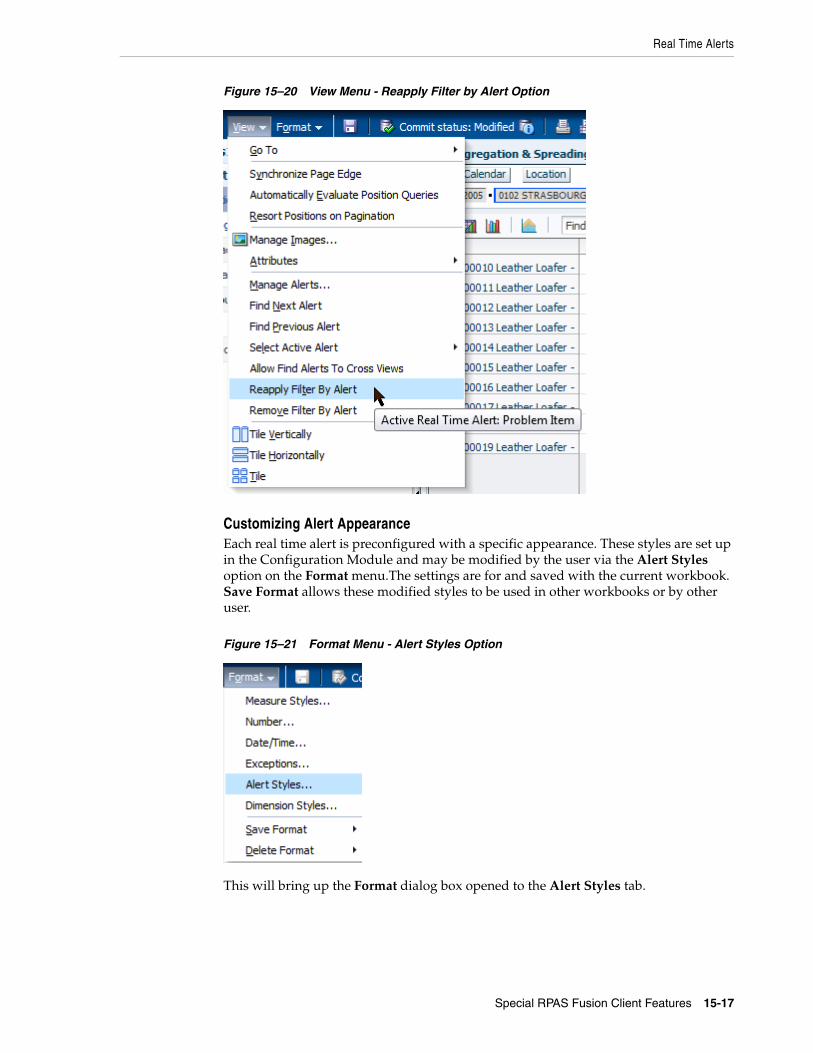
Real Time Alerts
Special RPAS Fusion Client Features 15-17
Figure 15–20 View Menu - Reapply Filter by Alert Option
Customizing Alert AppearanceEach real time alert is preconfigured with a specific appearance. These styles are set up in the Configuration Module and may be modified by the user via the Alert Styles option on the Format menu.The settings are for and saved with the current workbook. Save Format allows these modified styles to be used in other workbooks or by other user.
Figure 15–21 Format Menu - Alert Styles Option
This will bring up the Format dialog box opened to the Alert Styles tab.

Real Time Alerts
15-18 Oracle Retail Predictive Application Server User Guide for the Fusion Client
Figure 15–22 Format Dialog Box - Alert Styles Tab
Users may then customize the appearance of their alerts.
■ The Real Time Alert may be selected from the drop down list. Selecting this will automatically set the options visible in the Condition drop down list.
■ The Condition to customise the appearance for can be selected from the Condition drop down list. All conditions may be set to the same appearance, or individual conditions may be set to different appearances.
■ The visual appearance can be specified from a combination of text color, background color and font style. The result is shown as an example.
The user has three buttons available to them:
■ Apply will save the current settings.
■ Clear will remove the settings so the real time alert reverts to an un-formatted style.
■ Close will close the dialog box.
Saving the Alert StylesThe user has the option of saving the modified real time alert appearances in three forms: For Just Me, For My Group or For Everyone. The save option can be specified using the Save Format option on the Format menu. These will take effect the next time a user creates a new workbook from the workbook template the modified real time alert appearances have been saved back to.
Setting the Alert PrioritiesA specific measure (such as Gross Margins or Forecast Quantities) may be the subject of more than one real time alert. The order of precedence can be set for cases where multiple alerts occur. This is done by selecting the Manage Alerts option from the View menu.
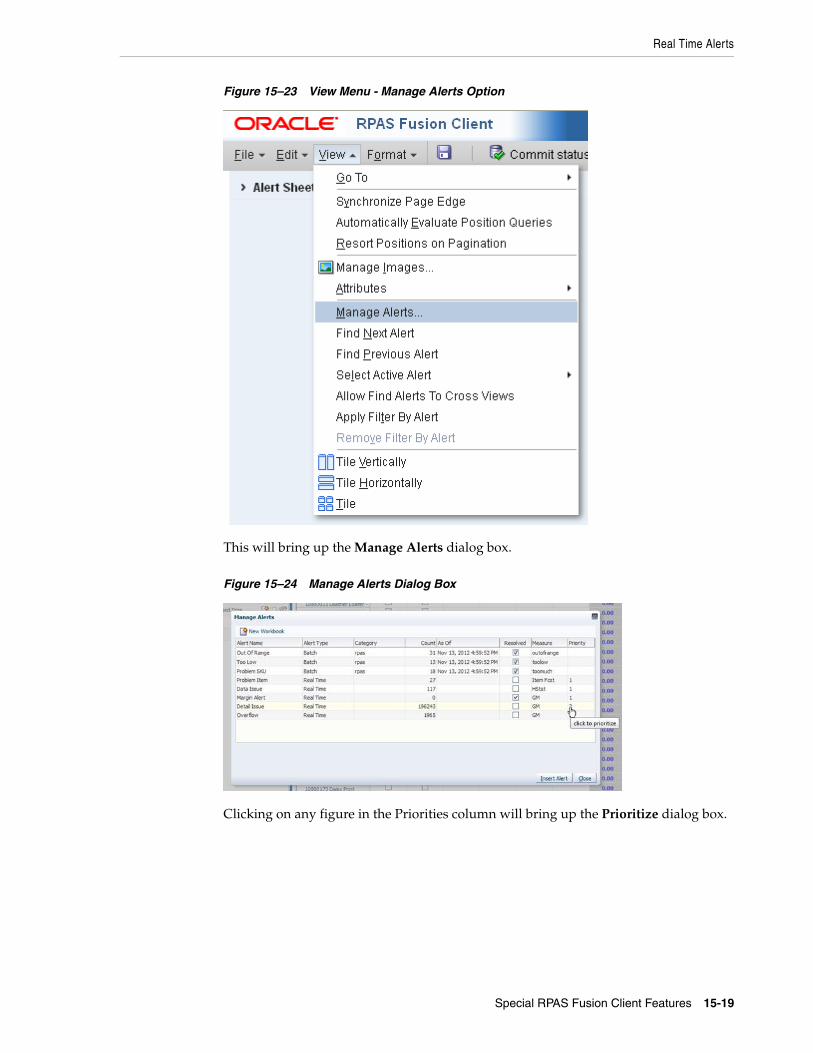
Real Time Alerts
Special RPAS Fusion Client Features 15-19
Figure 15–23 View Menu - Manage Alerts Option
This will bring up the Manage Alerts dialog box.
Figure 15–24 Manage Alerts Dialog Box
Clicking on any figure in the Priorities column will bring up the Prioritize dialog box.
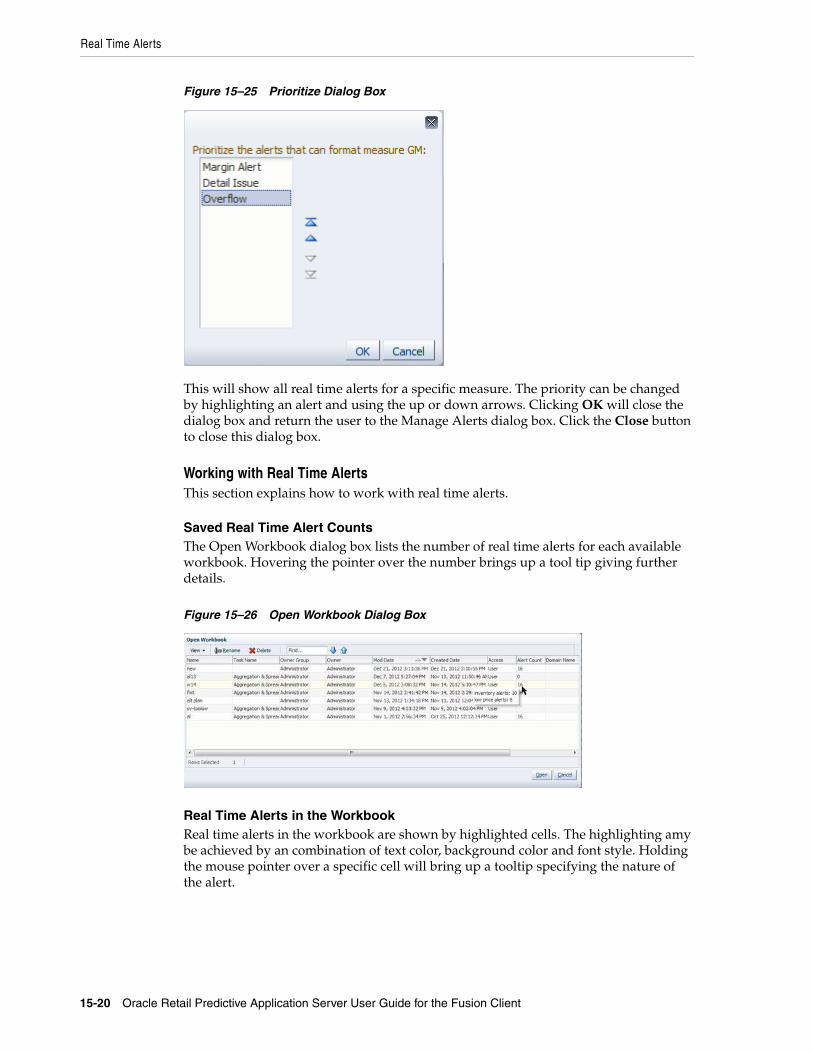
Real Time Alerts
15-20 Oracle Retail Predictive Application Server User Guide for the Fusion Client
Figure 15–25 Prioritize Dialog Box
This will show all real time alerts for a specific measure. The priority can be changed by highlighting an alert and using the up or down arrows. Clicking OK will close the dialog box and return the user to the Manage Alerts dialog box. Click the Close button to close this dialog box.
Working with Real Time AlertsThis section explains how to work with real time alerts.
Saved Real Time Alert CountsThe Open Workbook dialog box lists the number of real time alerts for each available workbook. Hovering the pointer over the number brings up a tool tip giving further details.
Figure 15–26 Open Workbook Dialog Box
Real Time Alerts in the WorkbookReal time alerts in the workbook are shown by highlighted cells. The highlighting amy be achieved by an combination of text color, background color and font style. Holding the mouse pointer over a specific cell will bring up a tooltip specifying the nature of the alert.

Extended Measures
Special RPAS Fusion Client Features 15-21
Figure 15–27 Example of Color Coded Cells and Tooltip
The appearance of the cells are set to default values in the configuration module, but can be customized by the user: Customizing Alert Appearance. If there are multiple real time alerts for a cell, the order in which they appear is set in the configuration Module - only the first alert being visible. The order can be customized by the user: Setting the Alert Priorities.
Where a view has large numbers of rows, users can filter the view so that only rows, columns and pages with alerts show: Other Alert Options on the View Menu.
Users can then systematically work to clear the real time alerts in the view by:
■ Navigating to a specific real time alert and identifying its nature from its appearance or from the tool tip.
■ Editing the value of any cell referenced by the rule to calculate the alert.
■ Clicking Calculate to update the view.
■ On clicking calculate, if an appropriate value has been entered into the cell, the alert should clear.
The user can then periodically commit the changes to save them back to the multidimensional database.
Extended MeasuresAn extended measure allows you to define, view, and edit a measure as a proportion or percentage of another measure for a parent that is up one or more levels. These measure relationships are also referred to as participation measures. These measures can be defined in the RPAS Fusion Client in a view or preconfigured in the RPAS Configuration Tools. For more information about preconfigured measures, see the Oracle Retail Predictive Application Server Configuration Tools User Guide.
A common use of this functionality is to define measures that are percentage participations of sales measures. Typically, these measures are defined as:
■ Absolute Percent of Parent: A percentage of a fixed level (such as class) so that the participation of each item to the class can be viewed and manipulated.
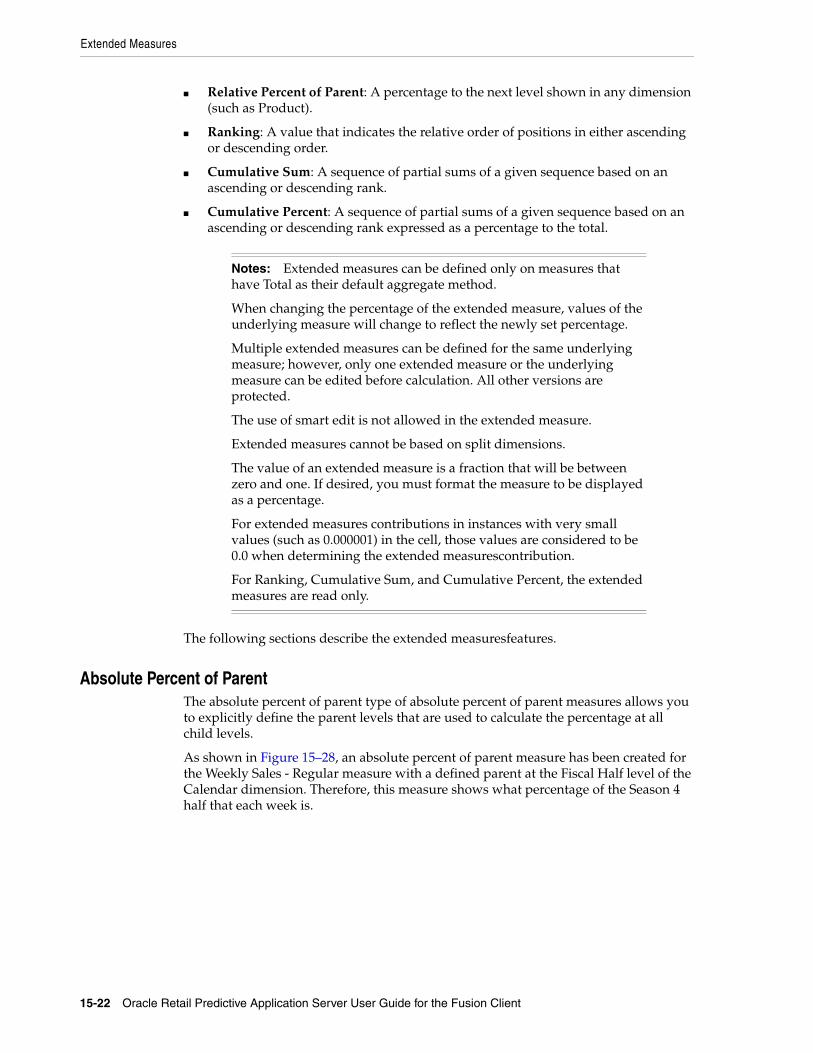
Extended Measures
15-22 Oracle Retail Predictive Application Server User Guide for the Fusion Client
■ Relative Percent of Parent: A percentage to the next level shown in any dimension (such as Product).
■ Ranking: A value that indicates the relative order of positions in either ascending or descending order.
■ Cumulative Sum: A sequence of partial sums of a given sequence based on an ascending or descending rank.
■ Cumulative Percent: A sequence of partial sums of a given sequence based on an ascending or descending rank expressed as a percentage to the total.
The following sections describe the extended measuresfeatures.
Absolute Percent of ParentThe absolute percent of parent type of absolute percent of parent measures allows you to explicitly define the parent levels that are used to calculate the percentage at all child levels.
As shown in Figure 15–28, an absolute percent of parent measure has been created for the Weekly Sales - Regular measure with a defined parent at the Fiscal Half level of the Calendar dimension. Therefore, this measure shows what percentage of the Season 4 half that each week is.
Notes: Extended measures can be defined only on measures that have Total as their default aggregate method.
When changing the percentage of the extended measure, values of the underlying measure will change to reflect the newly set percentage.
Multiple extended measures can be defined for the same underlying measure; however, only one extended measure or the underlying measure can be edited before calculation. All other versions are protected.
The use of smart edit is not allowed in the extended measure.
Extended measures cannot be based on split dimensions.
The value of an extended measure is a fraction that will be between zero and one. If desired, you must format the measure to be displayed as a percentage.
For extended measures contributions in instances with very small values (such as 0.000001) in the cell, those values are considered to be 0.0 when determining the extended measurescontribution.
For Ranking, Cumulative Sum, and Cumulative Percent, the extended measures are read only.
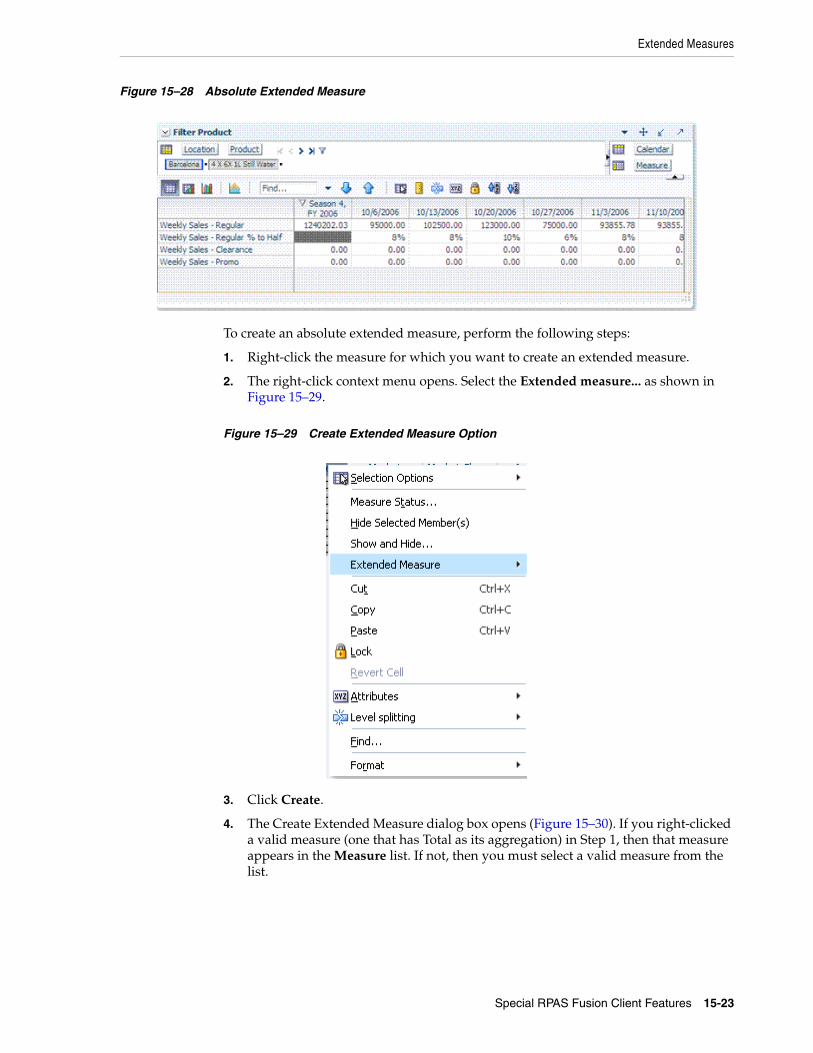
Extended Measures
Special RPAS Fusion Client Features 15-23
Figure 15–28 Absolute Extended Measure
To create an absolute extended measure, perform the following steps:
1. Right-click the measure for which you want to create an extended measure.
2. The right-click context menu opens. Select the Extended measure... as shown in Figure 15–29.
Figure 15–29 Create Extended Measure Option
3. Click Create.
4. The Create Extended Measure dialog box opens (Figure 15–30). If you right-clicked a valid measure (one that has Total as its aggregation) in Step 1, then that measure appears in the Measure list. If not, then you must select a valid measure from the list.
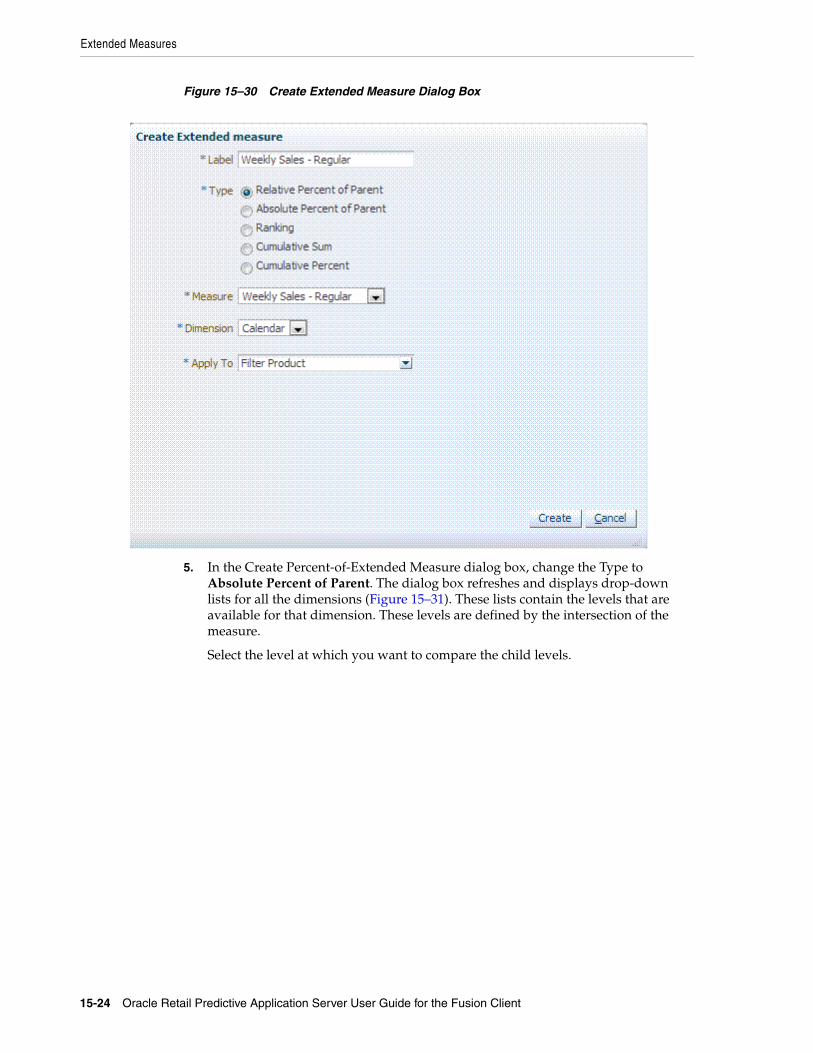
Extended Measures
15-24 Oracle Retail Predictive Application Server User Guide for the Fusion Client
Figure 15–30 Create Extended Measure Dialog Box
5. In the Create Percent-of-Extended Measure dialog box, change the Type to Absolute Percent of Parent. The dialog box refreshes and displays drop-down lists for all the dimensions (Figure 15–31). These lists contain the levels that are available for that dimension. These levels are defined by the intersection of the measure.
Select the level at which you want to compare the child levels.

Extended Measures
Special RPAS Fusion Client Features 15-25
Figure 15–31 Create Extended Measure - Absolute
6. When finished defining the parent levels, click Create. The view refreshes and the new extended measure appears (Figure 15–32).
Figure 15–32 Absolute Extended Measure
As shown in Figure 15–32, a new extended measure has been created for the Weekly Sales - Regular measure with a defined parent at the Fiscal Half level of the Calendar dimension. The measure shows what percentage of the Season 4 half that each week is. For example, the Weekly Sales - Regular for week 10/6/2006 are 8% of the entire Season 4 half of the 2006 fiscal year.
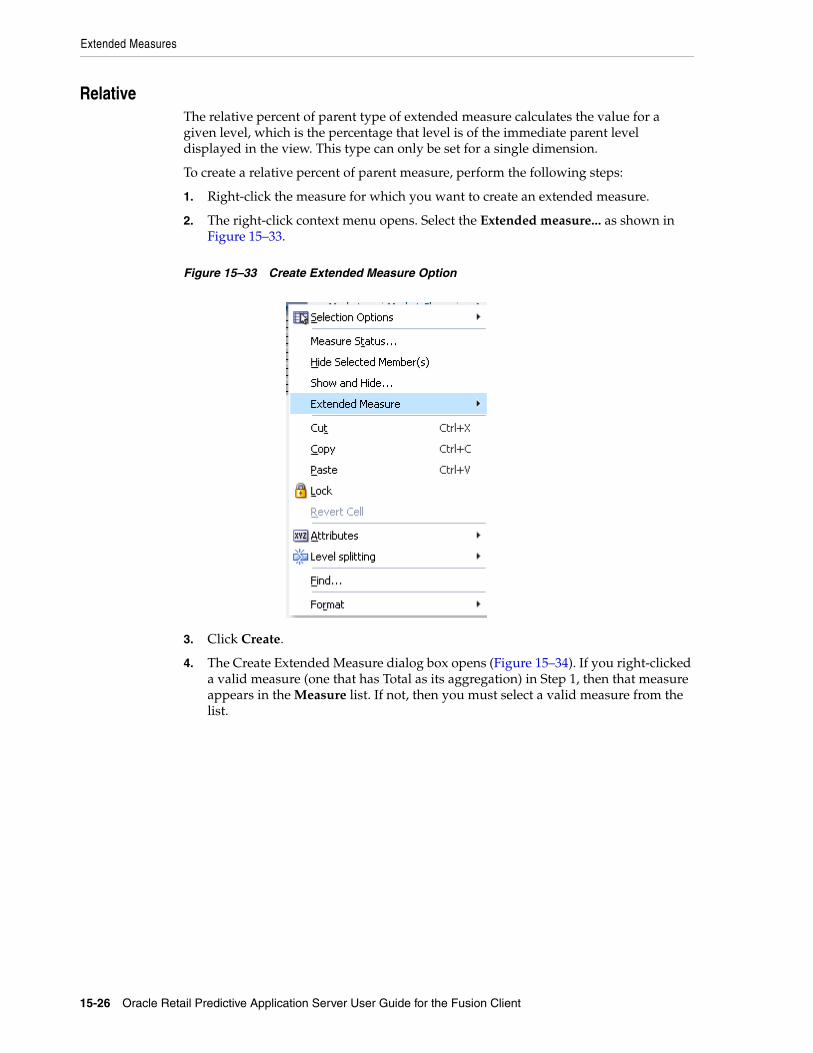
Extended Measures
15-26 Oracle Retail Predictive Application Server User Guide for the Fusion Client
RelativeThe relative percent of parent type of extended measure calculates the value for a given level, which is the percentage that level is of the immediate parent level displayed in the view. This type can only be set for a single dimension.
To create a relative percent of parent measure, perform the following steps:
1. Right-click the measure for which you want to create an extended measure.
2. The right-click context menu opens. Select the Extended measure... as shown in Figure 15–33.
Figure 15–33 Create Extended Measure Option
3. Click Create.
4. The Create Extended Measure dialog box opens (Figure 15–34). If you right-clicked a valid measure (one that has Total as its aggregation) in Step 1, then that measure appears in the Measure list. If not, then you must select a valid measure from the list.

Extended Measures
Special RPAS Fusion Client Features 15-27
Figure 15–34 Create Extended Measure Dialog Box
5. In the Create Extended Measure dialog box, select the dimension for which you want to set the parent level.
6. Click Create. The view refreshes and the new extended measure appears.
Figure 15–35 Relative Extended Measure
As shown in Figure 15–35, a new extended measure has been created for the Weekly Sales - Regular measure with a defined dimension of Calendar. Because a dimension is defined and not a specific level of a dimension, the extended measure data shown is relative. This means that the percentage shown is compared to the next level shown in the view.
For example, the Weekly Sales - Regular % of Calendar measure for week 10/6/2006 makes up 24% of the next level shown, which is October, FY 2006. Accordingly, October makes up 32% of all [Quarter 4, FY 2006]. There is no percentage shown for all [Calendar] because it is the highest level in the workbook.

Extended Measures
15-28 Oracle Retail Predictive Application Server User Guide for the Fusion Client
Comparing Absolute and Relative Percent of Parent MeasuresThe difference between an absolute percent of parent measure and a relative one is that the parent level for absolute is specified by the user. The parent level for relative is not specified—it is the next parent level shown in the view.
Figure 15–36 Comparing Absolute and Relative Percent of Parent Measures
As shown in Figure 15–36, there is an Absolute and Relative Percent of Parent measure created on the source measure of Weekly Sales - Regular. The absolute measure (Weekly Sales - Regular % to Half) compares the children levels to the static level of Fiscal Half.
The relative extended measure (Weekly Sales - Regular % of Calendar) displays the percent of the children position to the next higher position displayed in the view.
Since the absolute extended measure specifies Fiscal Half as the parent level, the other level shown in the view, Month, is compared to Half. For instance, week 10/6/2006 is 8% of the Season 4. October is 32% of the Season 4. Because Fiscal Half is the specified parent, it does not show what percentage of FY2006 it is.
However, the relative extended measure only specifies the Calendar dimension as the parent. This means that any parent level shown in the view can act as the parent. Therefore, week 10/6/2006 is 24% of its immediate parent level, which is month October. October is 32% of its immediately displayed parent level, which is Season 4. Finally, Season 4 is 100% of its immediately displayed parent level, FY2006. The relationship of month to quarter (the configured parent of the month level) is not displayed since quarter is not displayed in the view.
If the month level of the Calendar dimension were hidden in this view, then the relative extended measure would look more like the absolute one since the immediately displayed parent level for week would be Fiscal Half, which is the specified absolute parent. This is illustrated in Figure 15–37.
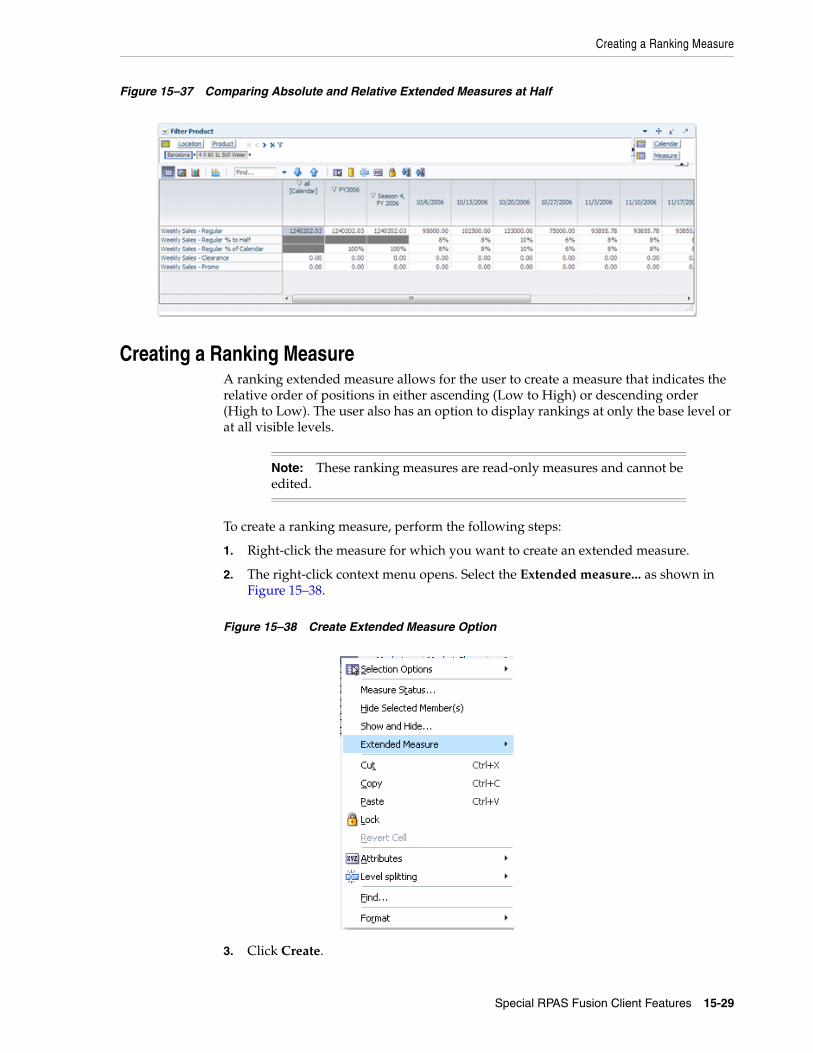
Creating a Ranking Measure
Special RPAS Fusion Client Features 15-29
Figure 15–37 Comparing Absolute and Relative Extended Measures at Half
Creating a Ranking MeasureA ranking extended measure allows for the user to create a measure that indicates the relative order of positions in either ascending (Low to High) or descending order (High to Low). The user also has an option to display rankings at only the base level or at all visible levels.
To create a ranking measure, perform the following steps:
1. Right-click the measure for which you want to create an extended measure.
2. The right-click context menu opens. Select the Extended measure... as shown in Figure 15–38.
Figure 15–38 Create Extended Measure Option
3. Click Create.
Note: These ranking measures are read-only measures and cannot be edited.
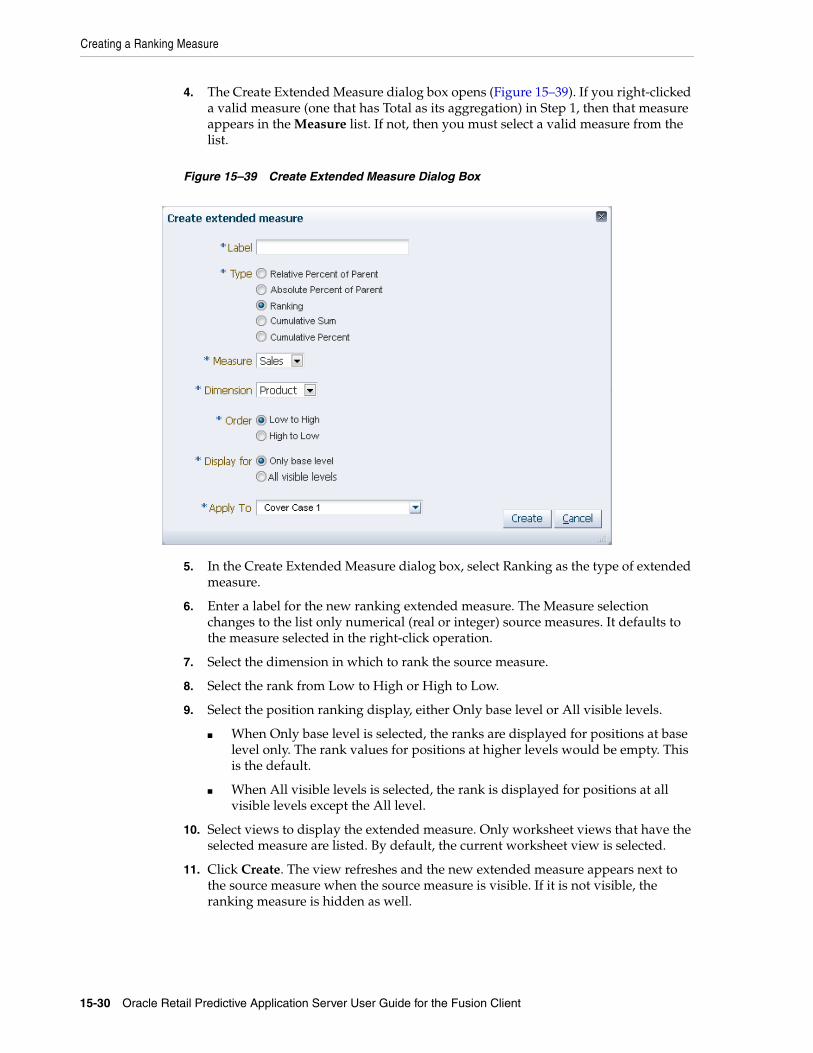
Creating a Ranking Measure
15-30 Oracle Retail Predictive Application Server User Guide for the Fusion Client
4. The Create Extended Measure dialog box opens (Figure 15–39). If you right-clicked a valid measure (one that has Total as its aggregation) in Step 1, then that measure appears in the Measure list. If not, then you must select a valid measure from the list.
Figure 15–39 Create Extended Measure Dialog Box
5. In the Create Extended Measure dialog box, select Ranking as the type of extended measure.
6. Enter a label for the new ranking extended measure. The Measure selection changes to the list only numerical (real or integer) source measures. It defaults to the measure selected in the right-click operation.
7. Select the dimension in which to rank the source measure.
8. Select the rank from Low to High or High to Low.
9. Select the position ranking display, either Only base level or All visible levels.
■ When Only base level is selected, the ranks are displayed for positions at base level only. The rank values for positions at higher levels would be empty. This is the default.
■ When All visible levels is selected, the rank is displayed for positions at all visible levels except the All level.
10. Select views to display the extended measure. Only worksheet views that have the selected measure are listed. By default, the current worksheet view is selected.
11. Click Create. The view refreshes and the new extended measure appears next to the source measure when the source measure is visible. If it is not visible, the ranking measure is hidden as well.
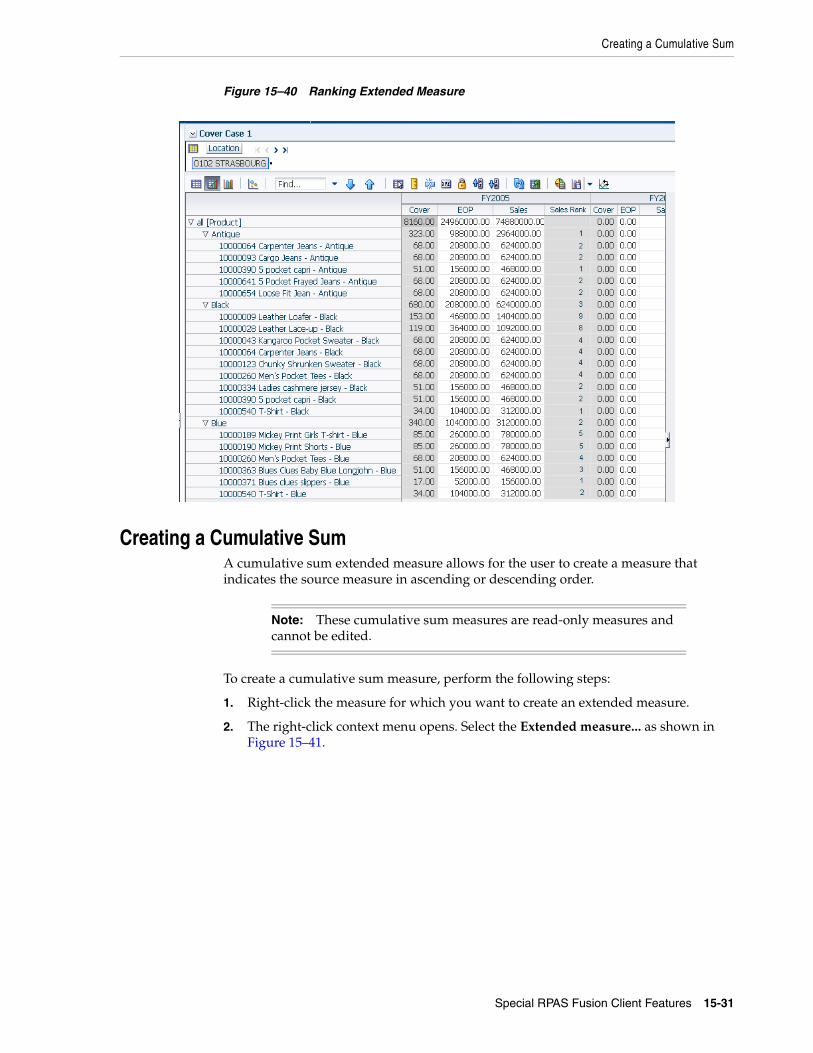
Creating a Cumulative Sum
Special RPAS Fusion Client Features 15-31
Figure 15–40 Ranking Extended Measure
Creating a Cumulative SumA cumulative sum extended measure allows for the user to create a measure that indicates the source measure in ascending or descending order.
To create a cumulative sum measure, perform the following steps:
1. Right-click the measure for which you want to create an extended measure.
2. The right-click context menu opens. Select the Extended measure... as shown in Figure 15–41.
Note: These cumulative sum measures are read-only measures and cannot be edited.
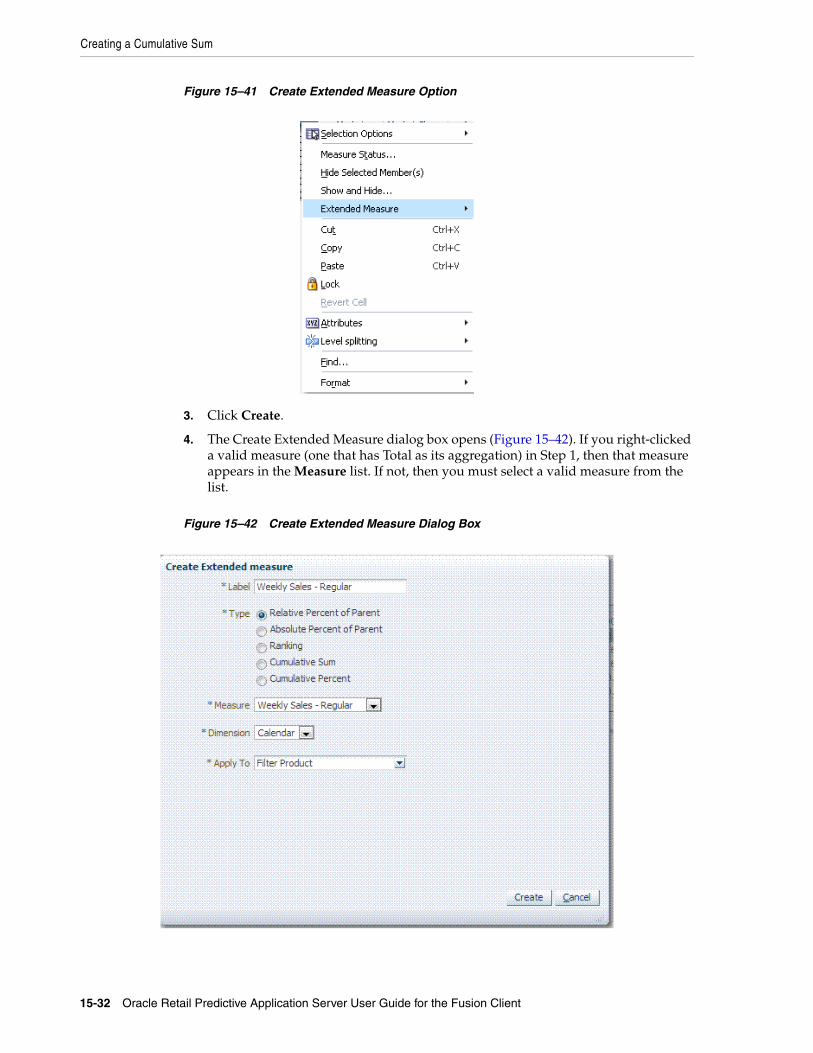
Creating a Cumulative Sum
15-32 Oracle Retail Predictive Application Server User Guide for the Fusion Client
Figure 15–41 Create Extended Measure Option
3. Click Create.
4. The Create Extended Measure dialog box opens (Figure 15–42). If you right-clicked a valid measure (one that has Total as its aggregation) in Step 1, then that measure appears in the Measure list. If not, then you must select a valid measure from the list.
Figure 15–42 Create Extended Measure Dialog Box
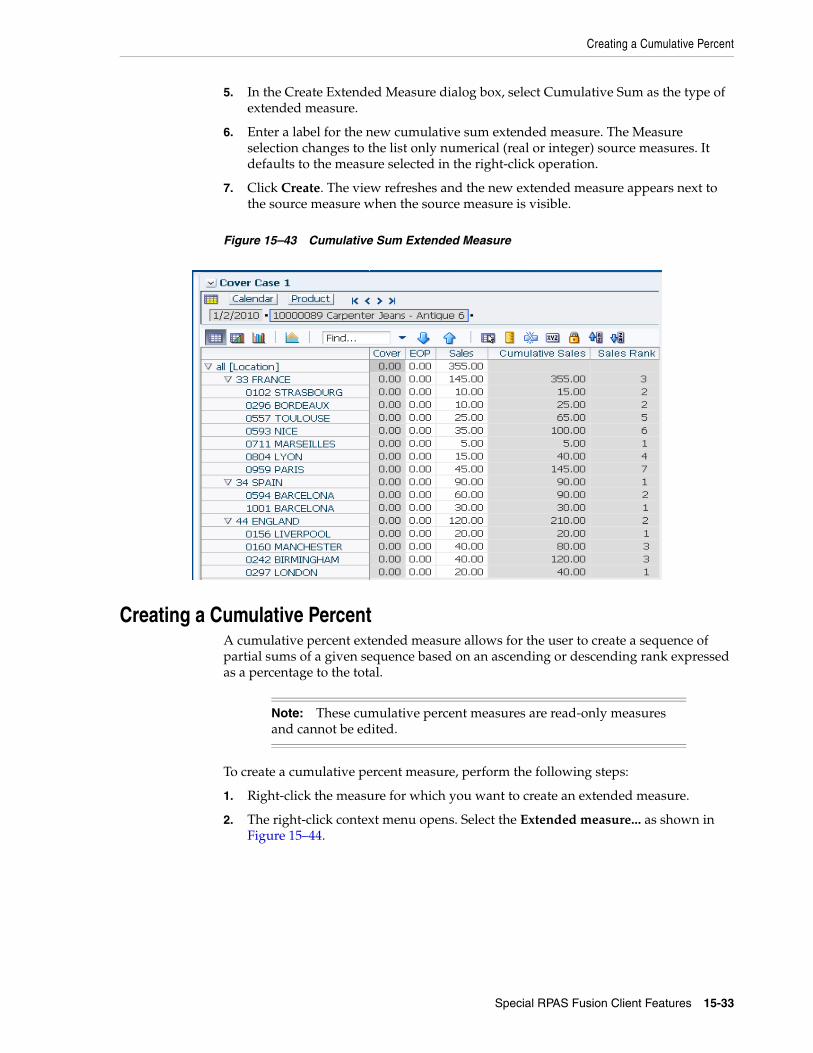
Creating a Cumulative Percent
Special RPAS Fusion Client Features 15-33
5. In the Create Extended Measure dialog box, select Cumulative Sum as the type of extended measure.
6. Enter a label for the new cumulative sum extended measure. The Measure selection changes to the list only numerical (real or integer) source measures. It defaults to the measure selected in the right-click operation.
7. Click Create. The view refreshes and the new extended measure appears next to the source measure when the source measure is visible.
Figure 15–43 Cumulative Sum Extended Measure
Creating a Cumulative PercentA cumulative percent extended measure allows for the user to create a sequence of partial sums of a given sequence based on an ascending or descending rank expressed as a percentage to the total.
To create a cumulative percent measure, perform the following steps:
1. Right-click the measure for which you want to create an extended measure.
2. The right-click context menu opens. Select the Extended measure... as shown in Figure 15–44.
Note: These cumulative percent measures are read-only measures and cannot be edited.

Creating a Cumulative Percent
15-34 Oracle Retail Predictive Application Server User Guide for the Fusion Client
Figure 15–44 Create Extended Measure Option
3. Click Create.
4. The Create Extended Measure dialog box opens (Figure 15–34). If you right-clicked a valid measure (one that has Total as its aggregation) in Step 1, then that measure appears in the Measure list. If not, then you must select a valid measure from the list.
Figure 15–45 Create Extended Measure Dialog Box
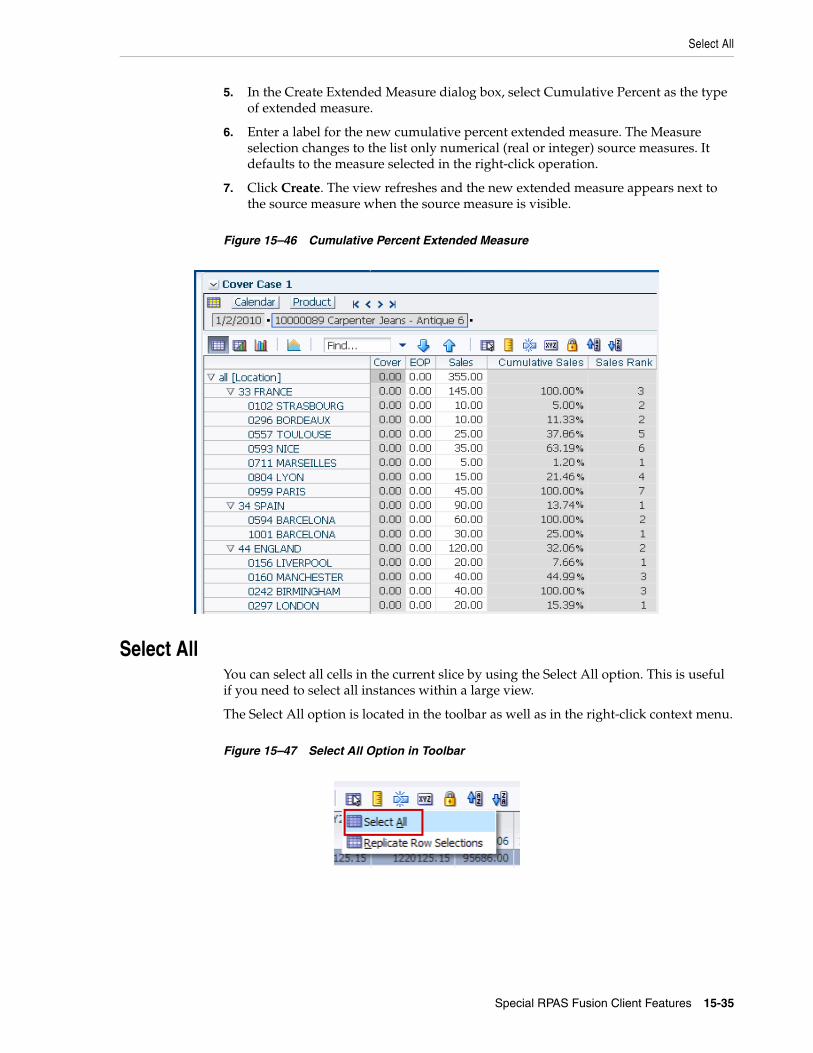
Select All
Special RPAS Fusion Client Features 15-35
5. In the Create Extended Measure dialog box, select Cumulative Percent as the type of extended measure.
6. Enter a label for the new cumulative percent extended measure. The Measure selection changes to the list only numerical (real or integer) source measures. It defaults to the measure selected in the right-click operation.
7. Click Create. The view refreshes and the new extended measure appears next to the source measure when the source measure is visible.
Figure 15–46 Cumulative Percent Extended Measure
Select AllYou can select all cells in the current slice by using the Select All option. This is useful if you need to select all instances within a large view.
The Select All option is located in the toolbar as well as in the right-click context menu.
Figure 15–47 Select All Option in Toolbar
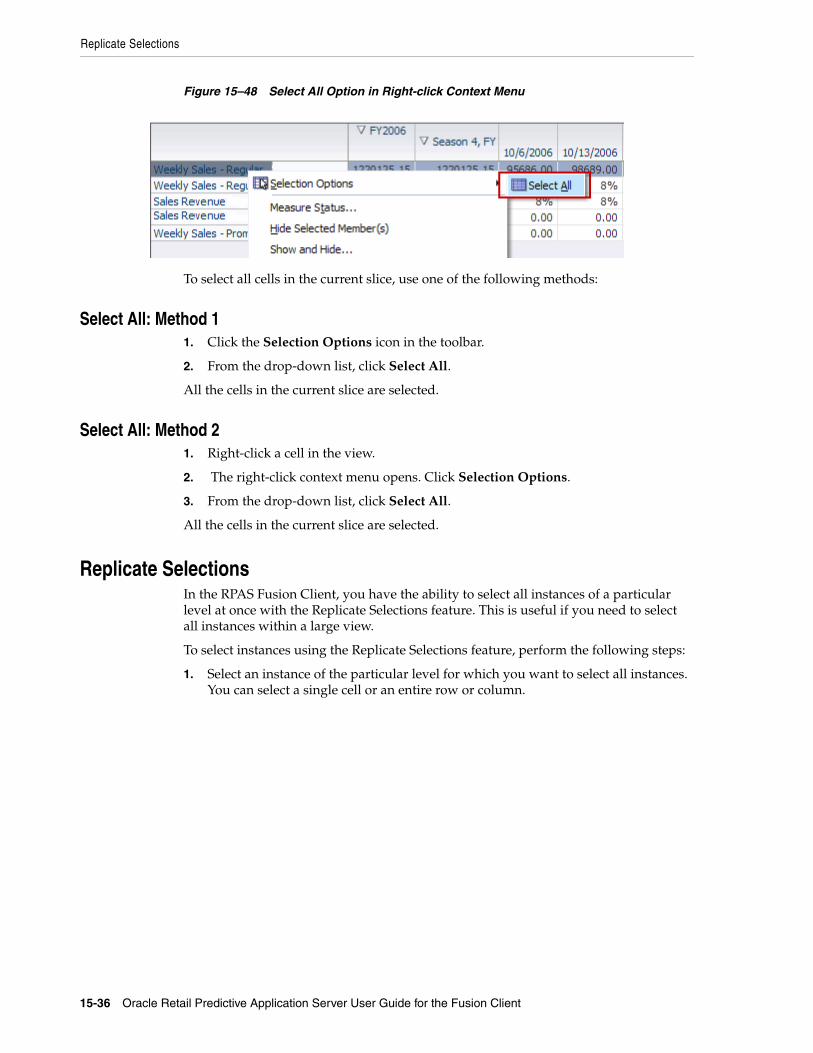
Replicate Selections
15-36 Oracle Retail Predictive Application Server User Guide for the Fusion Client
Figure 15–48 Select All Option in Right-click Context Menu
To select all cells in the current slice, use one of the following methods:
Select All: Method 11. Click the Selection Options icon in the toolbar.
2. From the drop-down list, click Select All.
All the cells in the current slice are selected.
Select All: Method 21. Right-click a cell in the view.
2. The right-click context menu opens. Click Selection Options.
3. From the drop-down list, click Select All.
All the cells in the current slice are selected.
Replicate SelectionsIn the RPAS Fusion Client, you have the ability to select all instances of a particular level at once with the Replicate Selections feature. This is useful if you need to select all instances within a large view.
To select instances using the Replicate Selections feature, perform the following steps:
1. Select an instance of the particular level for which you want to select all instances. You can select a single cell or an entire row or column.
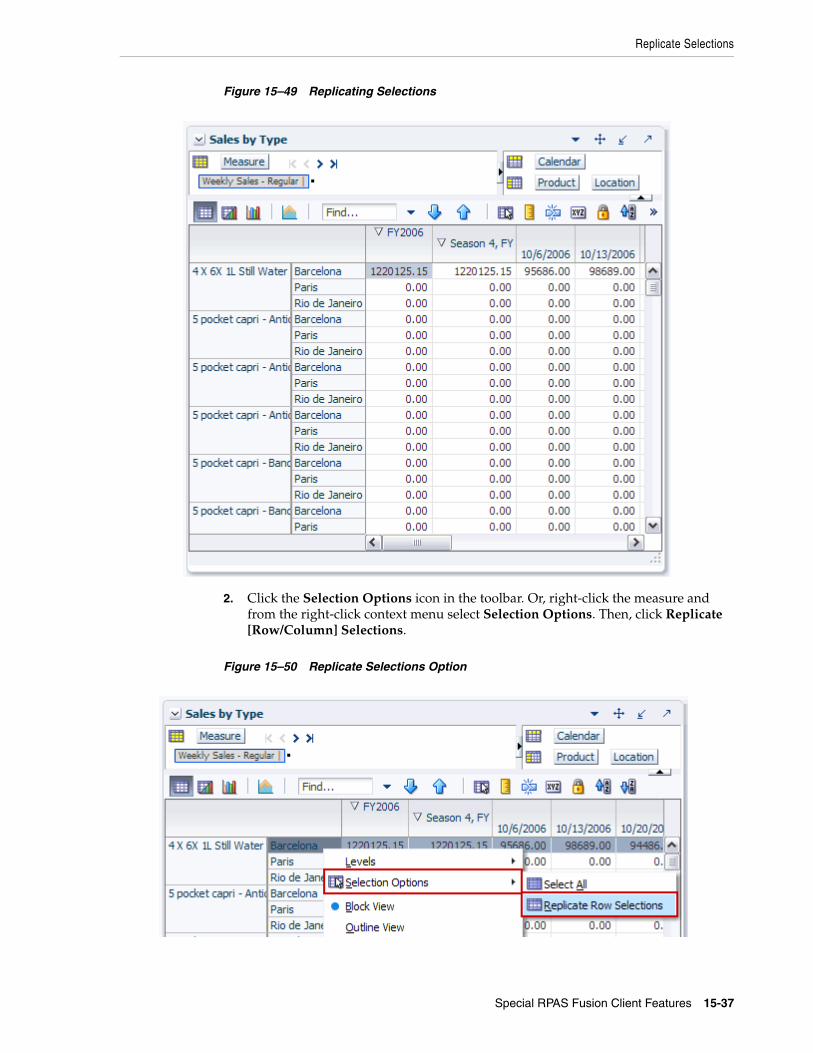
Replicate Selections
Special RPAS Fusion Client Features 15-37
Figure 15–49 Replicating Selections
2. Click the Selection Options icon in the toolbar. Or, right-click the measure and from the right-click context menu select Selection Options. Then, click Replicate [Row/Column] Selections.
Figure 15–50 Replicate Selections Option
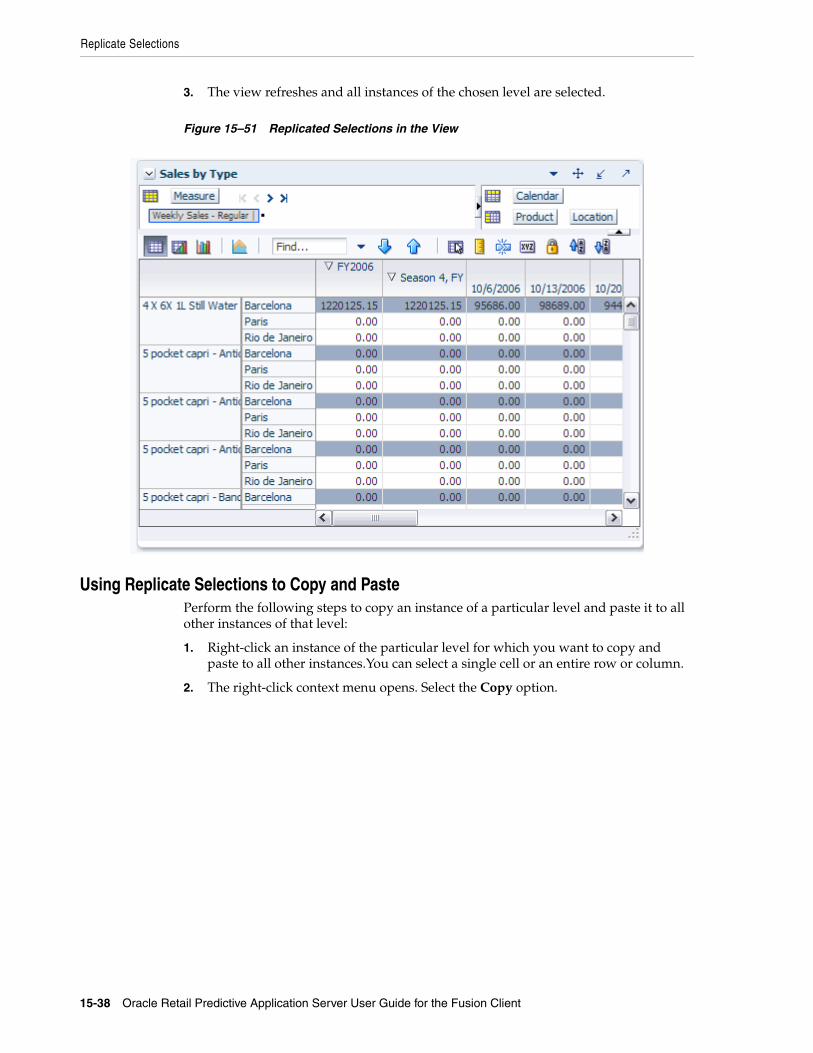
Replicate Selections
15-38 Oracle Retail Predictive Application Server User Guide for the Fusion Client
3. The view refreshes and all instances of the chosen level are selected.
Figure 15–51 Replicated Selections in the View
Using Replicate Selections to Copy and PastePerform the following steps to copy an instance of a particular level and paste it to all other instances of that level:
1. Right-click an instance of the particular level for which you want to copy and paste to all other instances.You can select a single cell or an entire row or column.
2. The right-click context menu opens. Select the Copy option.
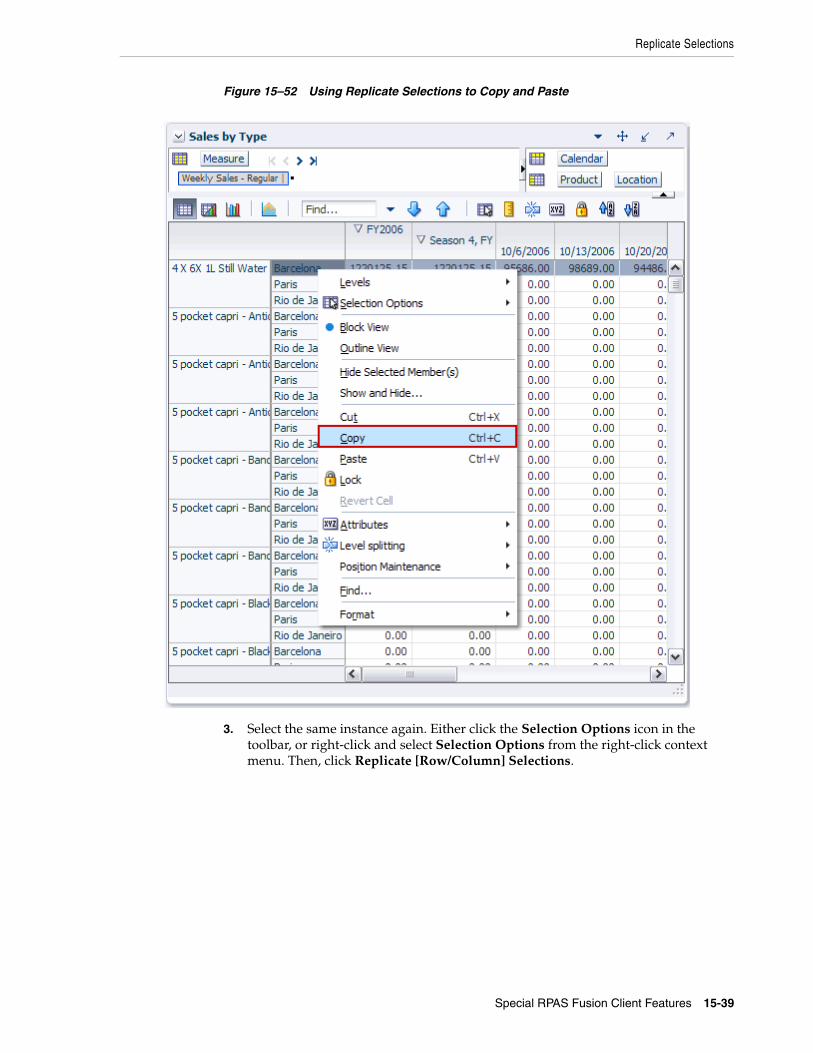
Replicate Selections
Special RPAS Fusion Client Features 15-39
Figure 15–52 Using Replicate Selections to Copy and Paste
3. Select the same instance again. Either click the Selection Options icon in the toolbar, or right-click and select Selection Options from the right-click context menu. Then, click Replicate [Row/Column] Selections.
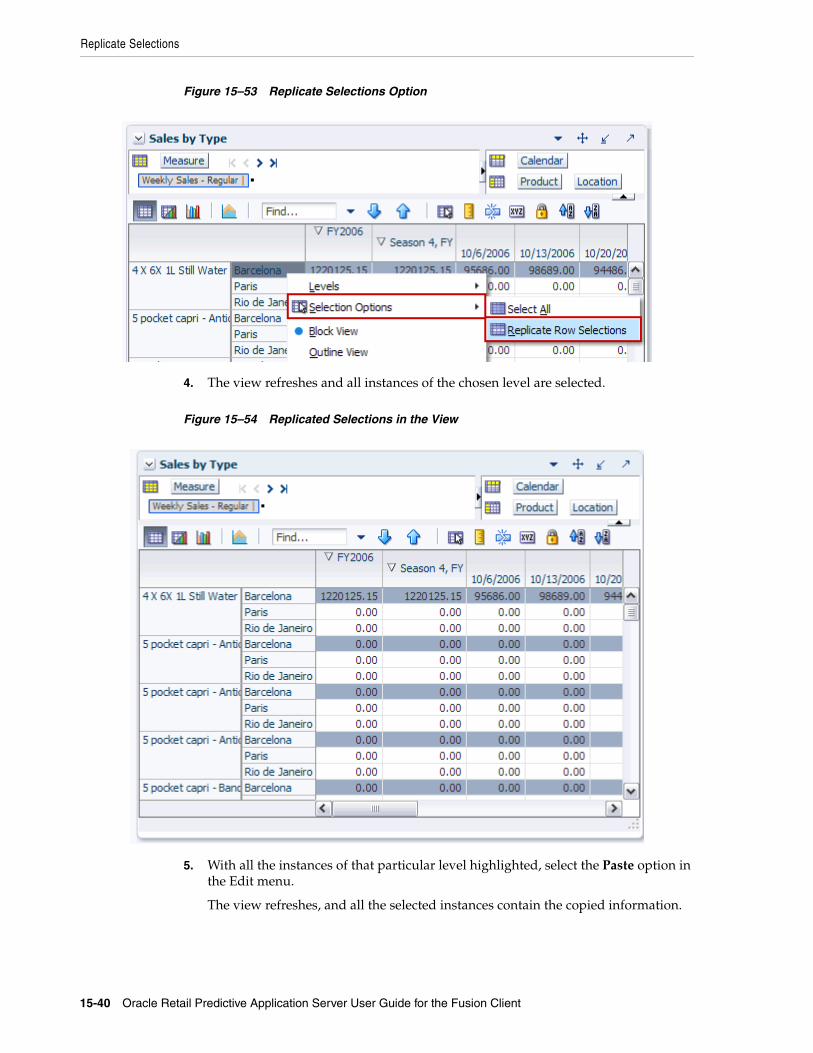
Replicate Selections
15-40 Oracle Retail Predictive Application Server User Guide for the Fusion Client
Figure 15–53 Replicate Selections Option
4. The view refreshes and all instances of the chosen level are selected.
Figure 15–54 Replicated Selections in the View
5. With all the instances of that particular level highlighted, select the Paste option in the Edit menu.
The view refreshes, and all the selected instances contain the copied information.
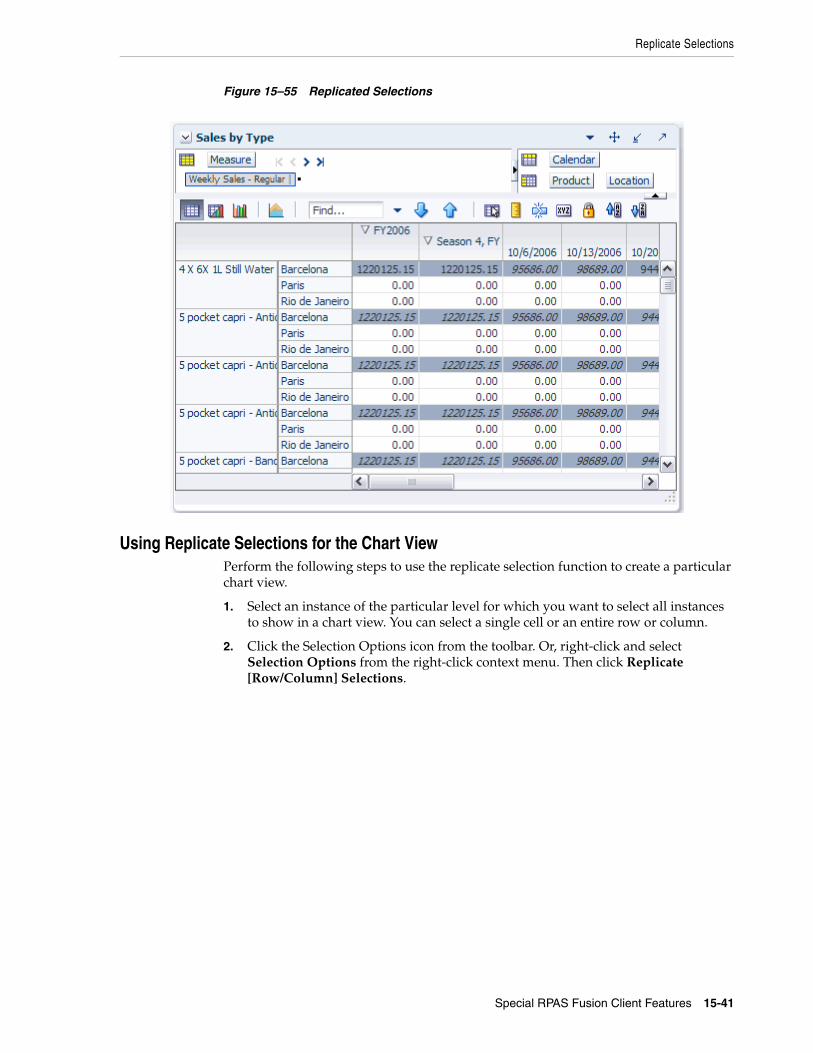
Replicate Selections
Special RPAS Fusion Client Features 15-41
Figure 15–55 Replicated Selections
Using Replicate Selections for the Chart ViewPerform the following steps to use the replicate selection function to create a particular chart view.
1. Select an instance of the particular level for which you want to select all instances to show in a chart view. You can select a single cell or an entire row or column.
2. Click the Selection Options icon from the toolbar. Or, right-click and select Selection Options from the right-click context menu. Then click Replicate [Row/Column] Selections.
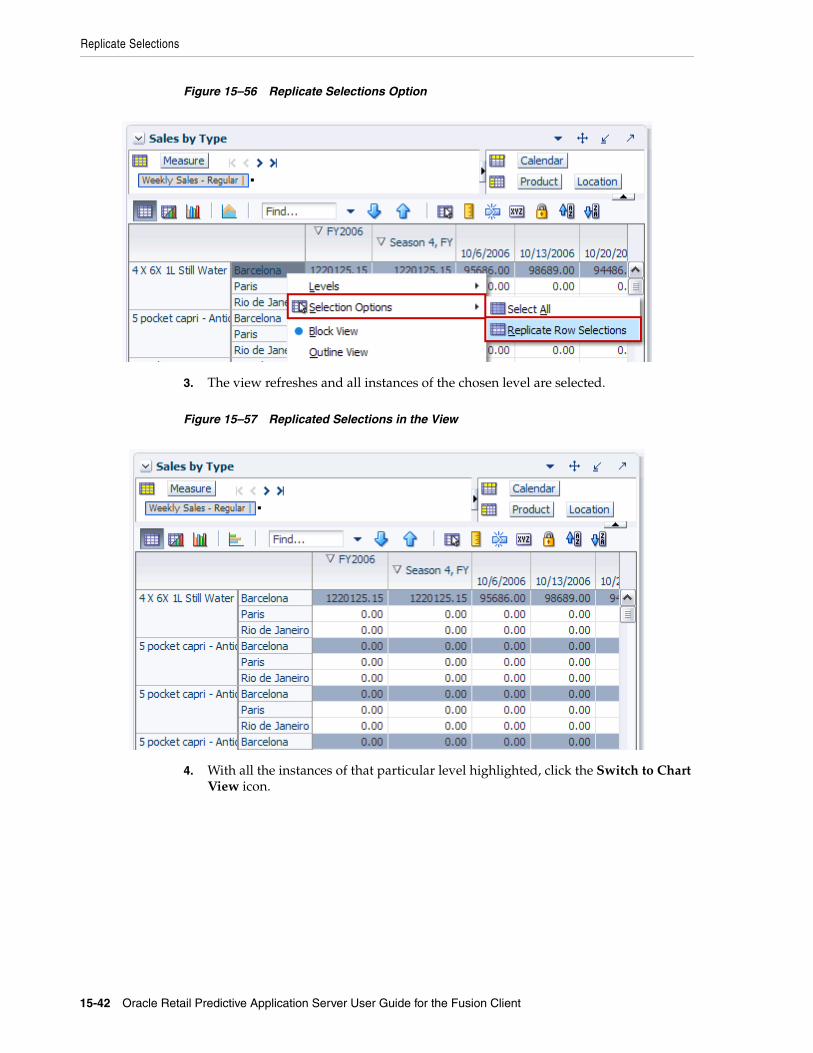
Replicate Selections
15-42 Oracle Retail Predictive Application Server User Guide for the Fusion Client
Figure 15–56 Replicate Selections Option
3. The view refreshes and all instances of the chosen level are selected.
Figure 15–57 Replicated Selections in the View
4. With all the instances of that particular level highlighted, click the Switch to Chart View icon.

Replicate Selections
Special RPAS Fusion Client Features 15-43
Figure 15–58 Switch to Chart View Icon
The chart view opens. Only the selected instances are shown in the chart. In Figure 15–59, the chart only shows data for the Brick & Mortar because those were the selected instances.
Figure 15–59 Replicated Selections in Chart View
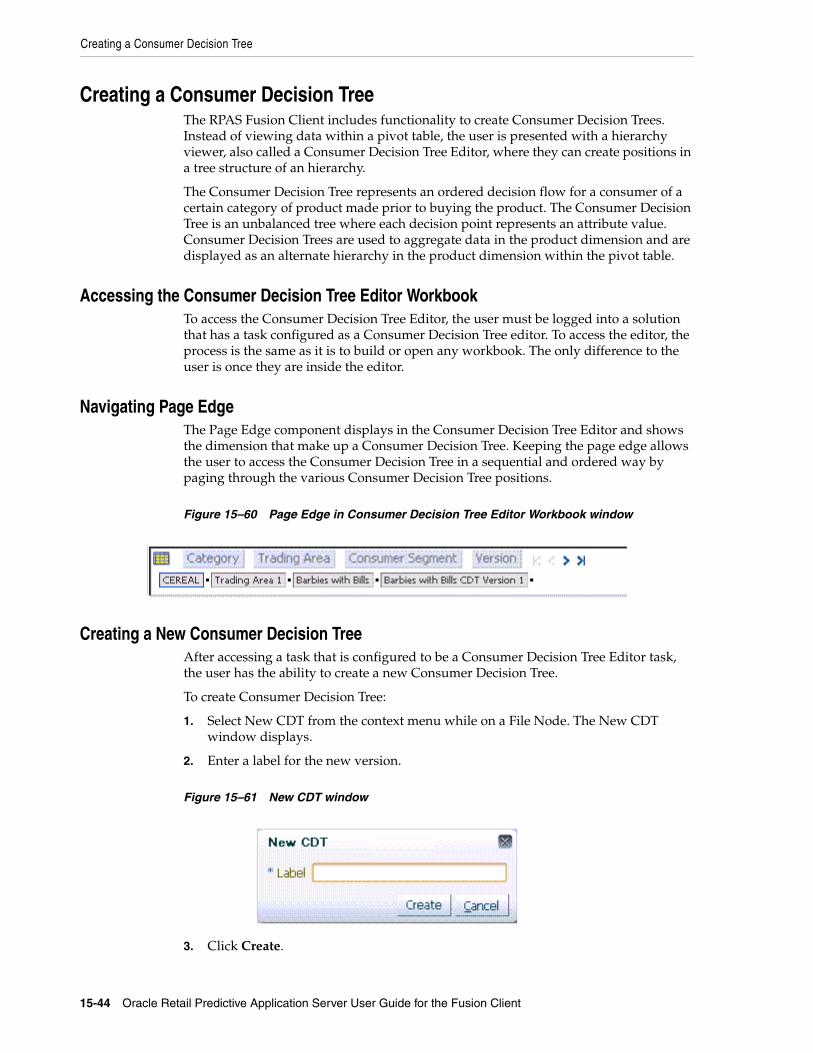
Creating a Consumer Decision Tree
15-44 Oracle Retail Predictive Application Server User Guide for the Fusion Client
Creating a Consumer Decision TreeThe RPAS Fusion Client includes functionality to create Consumer Decision Trees. Instead of viewing data within a pivot table, the user is presented with a hierarchy viewer, also called a Consumer Decision Tree Editor, where they can create positions in a tree structure of an hierarchy.
The Consumer Decision Tree represents an ordered decision flow for a consumer of a certain category of product made prior to buying the product. The Consumer Decision Tree is an unbalanced tree where each decision point represents an attribute value. Consumer Decision Trees are used to aggregate data in the product dimension and are displayed as an alternate hierarchy in the product dimension within the pivot table.
Accessing the Consumer Decision Tree Editor WorkbookTo access the Consumer Decision Tree Editor, the user must be logged into a solution that has a task configured as a Consumer Decision Tree editor. To access the editor, the process is the same as it is to build or open any workbook. The only difference to the user is once they are inside the editor.
Navigating Page EdgeThe Page Edge component displays in the Consumer Decision Tree Editor and shows the dimension that make up a Consumer Decision Tree. Keeping the page edge allows the user to access the Consumer Decision Tree in a sequential and ordered way by paging through the various Consumer Decision Tree positions.
Figure 15–60 Page Edge in Consumer Decision Tree Editor Workbook window
Creating a New Consumer Decision TreeAfter accessing a task that is configured to be a Consumer Decision Tree Editor task, the user has the ability to create a new Consumer Decision Tree.
To create Consumer Decision Tree:
1. Select New CDT from the context menu while on a File Node. The New CDT window displays.
2. Enter a label for the new version.
Figure 15–61 New CDT window
3. Click Create.

Creating a Consumer Decision Tree
Special RPAS Fusion Client Features 15-45
4. Continue to edit/build the Consumer Decision Tree.
Consumer Decision Tree Editor ViewThe Consumer Decision Tree editor is within the framework of the Fusion Client workbook page, but many of the workbook functions do not apply to the Consumer Decision Tree. The available commands from the Consumer Decision Tree editor view are shown in Figure 15–62 and Table 15–1:
Figure 15–62 Consumer Decision Tree Editor Layout Window
Adding Nodes to the TreeThe Consumer Decision Tree tree displays the root node representing the pre-selected highest node of the Consumer Decision Tree.
Table 15–1 Consumer Decision Tree Commands
File Menu Edit Menu View Menu Global Toolbar
Save Add Child Go To Save
Save As Edit Commit
Rename Copy Branch Commit Status
Commit Paste Branch Taskflow Navigation-Previous and Next Step
Revert Delete
Delete Branch
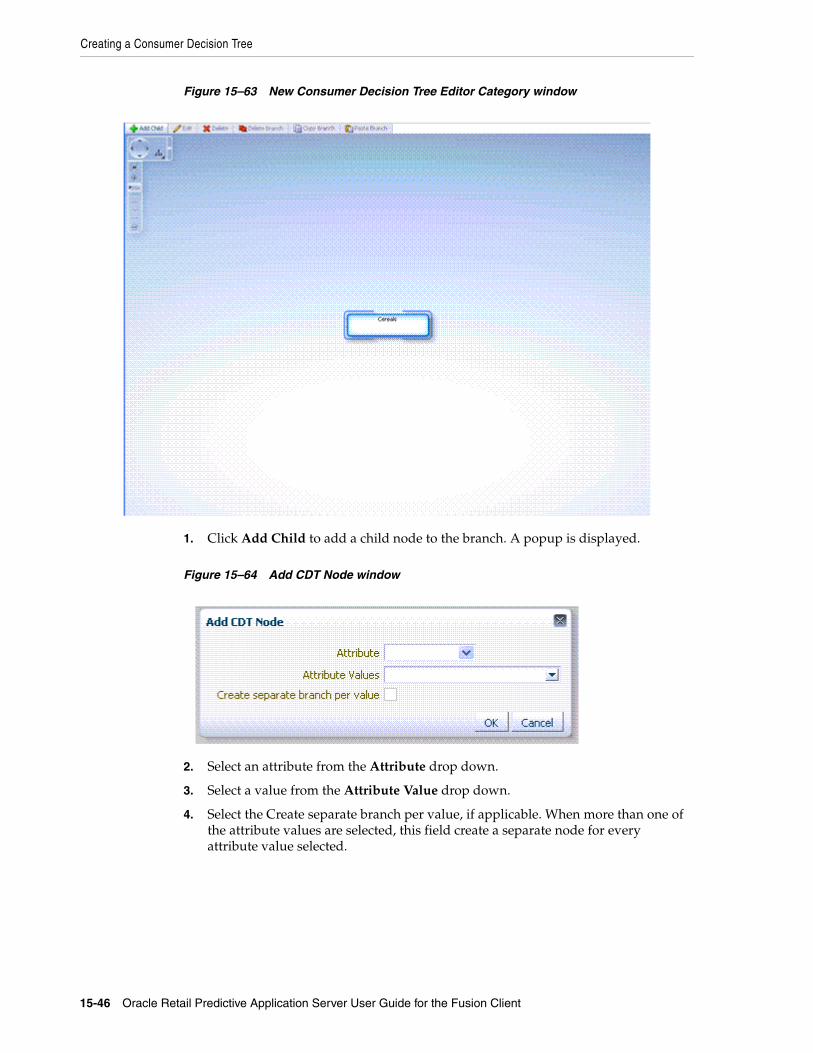
Creating a Consumer Decision Tree
15-46 Oracle Retail Predictive Application Server User Guide for the Fusion Client
Figure 15–63 New Consumer Decision Tree Editor Category window
1. Click Add Child to add a child node to the branch. A popup is displayed.
Figure 15–64 Add CDT Node window
2. Select an attribute from the Attribute drop down.
3. Select a value from the Attribute Value drop down.
4. Select the Create separate branch per value, if applicable. When more than one of the attribute values are selected, this field create a separate node for every attribute value selected.

Creating a Consumer Decision Tree
Special RPAS Fusion Client Features 15-47
5. Click OK.
Editing NodesEditing is allowed on all nodes as long as there are additional attribute values available. The selections from the node being edited are preselected in the dialog. The attribute cannot be changed, so the attribute drop-down will be disabled. Any attribute values that are in use by other siblings will not be displayed in the list.
Deleting NodesNodes can be deleted from the tree. There are two options for deleting: Delete and Delete Branch.
Selecting Delete will delete the selected node. Delete is available for any leaf node (a node without any children). It is also available for a non-leaf node that represents all the attributes for an attribute value: the children under this node move under the parent.
Selecting Delete Branch will delete the entire branch of nodes under the selected node, but not the selected node itself.
Copying/Pasting in Consumer Decision Tree Editor Copy and Paste functionality is provided to copy nodes from one branch to another. Copy Branch is enabled when a node is selected that has children. The Copy Branch function copies the full branch of children of the selected node, but not the selected node itself. Paste Branch is enabled when a branch has been copied and the selected node is a leaf node.
Viewing a Consumer Decision TreeThe Consumer Decision Trees have the potential to get large and occupy more space than the screen real estate allows for. The hierarchy viewer component used to display the Consumer Decision Tree provides several features to assist in viewing the Consumer Decision Tree effectively.
Expanding and Collapsing of Nodes or BranchesOne way to limit the amount of space taken up by the Consumer Decision Tree is to collapse branches of the tree. For any node that has children, a small triangle appears at the bottom of the box for that node. Hovering over the triangle enlarges it and
Note: A node can be created by selecting one or more attribute values. If multiple attribute values are chosen, and the check box to create a separate branch is not selected, one node that represents multiple attribute values is created.
If one branch is created for all values of an attribute, select all attribute values and only one node will appear with the attribute value of ALL.
If all the attribute values for an attribute are used, either by creating one node or separate nodes, a child cannot be added to the node, and the Add Child is disabled. Creating a node with ALL does not associate the specific attribute values with the node. Instead, it encompasses any attribute value.
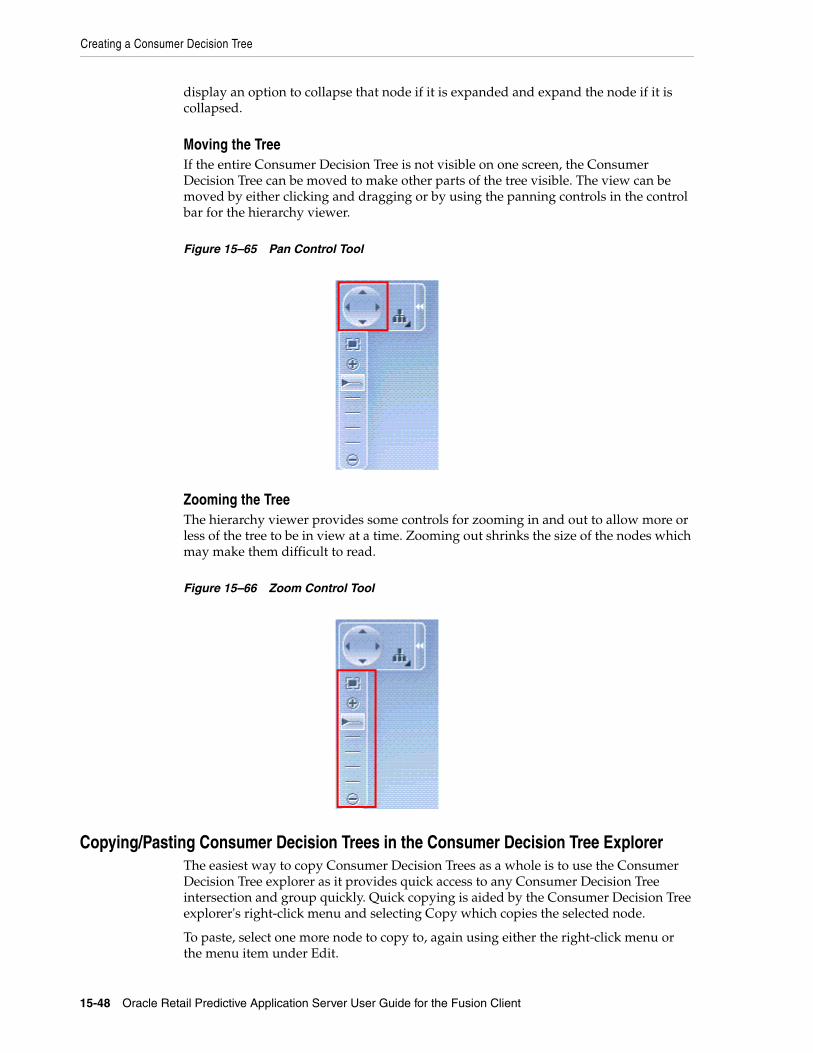
Creating a Consumer Decision Tree
15-48 Oracle Retail Predictive Application Server User Guide for the Fusion Client
display an option to collapse that node if it is expanded and expand the node if it is collapsed.
Moving the TreeIf the entire Consumer Decision Tree is not visible on one screen, the Consumer Decision Tree can be moved to make other parts of the tree visible. The view can be moved by either clicking and dragging or by using the panning controls in the control bar for the hierarchy viewer.
Figure 15–65 Pan Control Tool
Zooming the TreeThe hierarchy viewer provides some controls for zooming in and out to allow more or less of the tree to be in view at a time. Zooming out shrinks the size of the nodes which may make them difficult to read.
Figure 15–66 Zoom Control Tool
Copying/Pasting Consumer Decision Trees in the Consumer Decision Tree ExplorerThe easiest way to copy Consumer Decision Trees as a whole is to use the Consumer Decision Tree explorer as it provides quick access to any Consumer Decision Tree intersection and group quickly. Quick copying is aided by the Consumer Decision Tree explorer's right-click menu and selecting Copy which copies the selected node.
To paste, select one more node to copy to, again using either the right-click menu or the menu item under Edit.
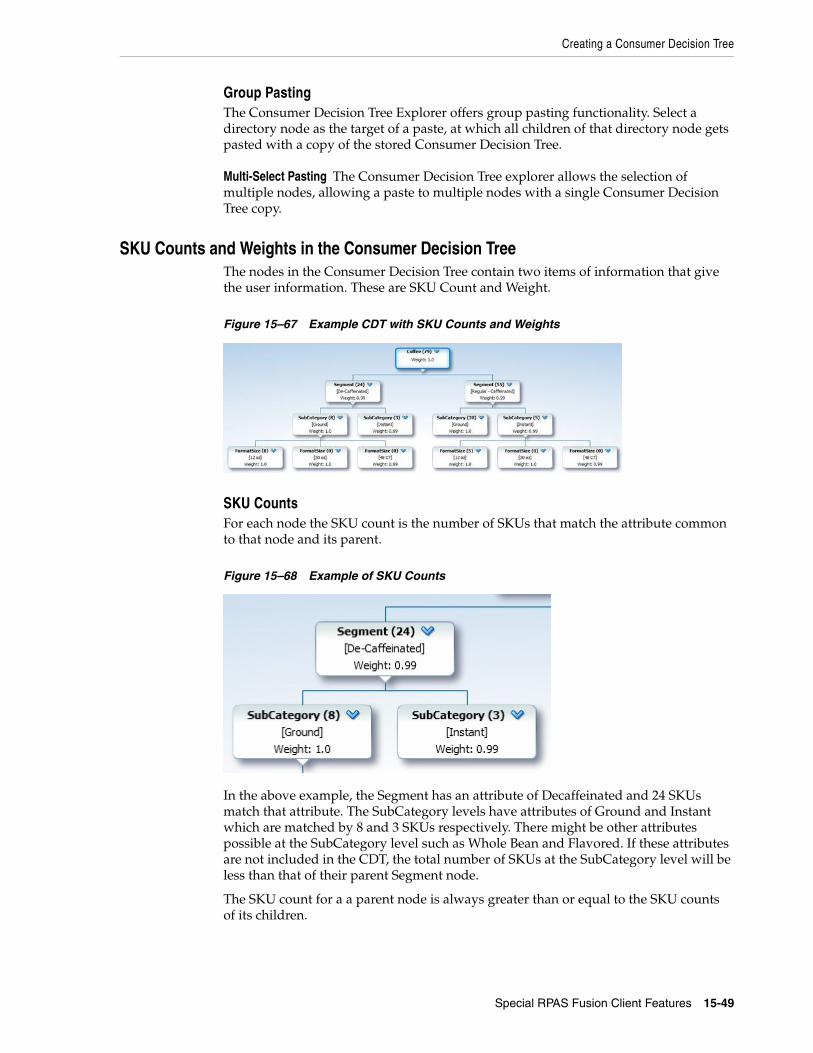
Creating a Consumer Decision Tree
Special RPAS Fusion Client Features 15-49
Group PastingThe Consumer Decision Tree Explorer offers group pasting functionality. Select a directory node as the target of a paste, at which all children of that directory node gets pasted with a copy of the stored Consumer Decision Tree.
Multi-Select Pasting The Consumer Decision Tree explorer allows the selection of multiple nodes, allowing a paste to multiple nodes with a single Consumer Decision Tree copy.
SKU Counts and Weights in the Consumer Decision TreeThe nodes in the Consumer Decision Tree contain two items of information that give the user information. These are SKU Count and Weight.
Figure 15–67 Example CDT with SKU Counts and Weights
SKU CountsFor each node the SKU count is the number of SKUs that match the attribute common to that node and its parent.
Figure 15–68 Example of SKU Counts
In the above example, the Segment has an attribute of Decaffeinated and 24 SKUs match that attribute. The SubCategory levels have attributes of Ground and Instant which are matched by 8 and 3 SKUs respectively. There might be other attributes possible at the SubCategory level such as Whole Bean and Flavored. If these attributes are not included in the CDT, the total number of SKUs at the SubCategory level will be less than that of their parent Segment node.
The SKU count for a a parent node is always greater than or equal to the SKU counts of its children.
Creating a Consumer Decision Tree
15-50 Oracle Retail Predictive Application Server User Guide for the Fusion Client
SKU WeightsSKU weights area measure of the relative importance of each node. They are normally calculated in another application and imported into the CDT. A typical way of calculating the weight is as the total sales of items represented in the node as a percentage of the total sales of items in the category. this value may change depending on the time period, trade area and customer segment for which the CDT has been defined.
As an example, if a specific node had 10,247 sales from a total of 93,284 sales in the category, it would be assigned a weight of 0.11.
The XML ButtonThe XML button enables a CDT to be imported in the form of an XML file. The XML file has an attribute that enables the imported CDT to be set to Read Only. This can be used to ensure that externally generated CDTs are not edited after import.
However, copying from one CDT to another is allowed in some circumstances. In that case, imported values will be cleared.
Effect of Editing on CDTIf the CDT is edited, for example by deleting or cutting and pasting nodes, the SKU count for each node will be recalculated and re-displayed. However, cutting and pasting a note will invalidate any calculations as to the weights associated with each node. As these calculations cannot be carried out by the CDT editor, the weights will be removed from the entire tree.
Saving a Consumer Decision TreeSave and Save As functions are available for both any Consumer Decision Tree Editor Workbook. Overall, the Consumer Decision Tree workbook save process behaves exactly the same way as any other workbook would, despite the difference in appearance.
Committing a Consumer Decision TreeEditing and saving a Consumer Decision Tree can occur before making it official and committing the work. When a Consumer Decision Tree is finalized and ready to publish, click Commit.
Printing a Consumer Decision TreePrinting is not supported from the Consumer Decision Tree, but printing the tree does work in Internet Explorer 8, as long as the tree is visible in one page view by using the browser's print function.

A
Available Menu Shortcuts A-1
AAvailable Menu Shortcuts
Some of the commonly used menu items can have shortcut keys assigned. The shortcuts will appear in the menu alongside the command they have been associated with. The user can then use those shortcut keys as an alternative to manually selecting items from the menu.
The list of menu items that have shortcuts is pre-configured. Additional shortcuts cannot be created for menu items outside of this list. Neither should entries be deleted as they are referenced by the software. The only thing that can be modified is the combination of keystrokes assigned to each menu item.
The default settings are defined in rpasBundle.properties as follows:
■ Copy
menu.edit.copy.accelerator=control C
■ Cut
menu.edit.cut.accelerator=control X
■ Find
Setting = menu.edit.find.accelerator=control F
■ Paste
menu.edit.paste.accelerator=control V
■ Undo
Setting = menu.edit.undo.accelerator=control Z
■ New Tab???
menu.edit.calculate.accelerator=control T
■ Search Backwards???
menu.edit.refresh.accelerator=control R
Note: The browser also has shortcuts. Care must be taken that the key combinations used for the menu do not duplicate the key combinations used for the browser.

A-2 User Guide for the Fusion Client


![[2] Cara Instalasi Client](https://img.dokumen.tips/doc/110x75/634b78b59fa0ab3f6b08824c/2-cara-instalasi-client.jpg)


