Embed Size (px)
Citation preview

Use of Rayleigh imaging and ray tracing to correctfor beam-steering effects in turbulent flames
Sebastian A. Kaiser, Jonathan H. Frank, and Marshall B. Long
Laser Rayleigh imaging has been applied in a number of flow and flame studies to measure concen-tration or temperature distributions. Rayleigh cross sections are dependent on the index of refractionof the scattering medium. The same index of refraction changes that provide contrast in Rayleighimages can also deflect the illuminating laser sheet. By applying a ray-tracing algorithm to thedetected image, it is possible to correct for some of these beam-steering effects and thereby improvethe accuracy of the measured field. Additionally, the quantification of the degree of beam steeringthrough the flow provides information on the degradation of spatial resolution in the measurement.Application of the technique in a well-studied laboratory flame is presented, along with analysis of theeffects of image noise and spatial resolution on the effectiveness of the algorithm. © 2005 OpticalSociety of America
OCIS codes: 120.1740, 100.2000, 290.5870.
1. Introduction
Planar laser imaging has become one of the mostwidely used laser diagnostic techniques applied to thestudy of combustion and gas dynamic flow fields. Theability to record the spatial distribution of quantitiesof interest provides true insight into these complexsystems. The work of R. K. Hanson’s group over morethan 25 years has been instrumental in pushing theboundaries of laser imaging techniques.1–3 Planarlaser-induced fluorescence (PLIF) techniques are par-ticularly useful for their ability to measure trace spe-cies, temperature, pressure, and even velocities in awide variety of environments.
Laser Rayleigh scattering is among the most eas-ily implemented laser imaging techniques for mea-surements in reacting and nonreacting flows. SinceRayleigh scattering is an elastic process, it does notrequire a specific laser wavelength for its implemen-tation but simply requires enough laser energy for asufficient signal. A broad range of commercially avail-
able laser sources is suitable for Rayleigh measure-ments. Depending on the particular flow beingstudied, Rayleigh scattering has been used to studynonreactive mixing,4,5 as well as temperature6–9 andfuel concentration10 in flames. Because the signalsare relatively strong and their interpretationstraightforward, Rayleigh scattering has been usedextensively for quantitative imaging measurements.
The Rayleigh signal from a volume of gas dependson the scattered intensity at the detector and can beexpressed as follows:
SRay � KI0 NV �i xi�i � KI0 NV�eff, (1)
where K is a constant dependent on the experimentalconfiguration, I0 is the intensity of incident laserlight, and N is the number density of molecules in theprobe volume, V. The summation is over all species,with xi the mole fraction and �i the Rayleigh crosssection of the ith gas in the mixture. The summationterm is often collected into a single, effective Rayleighscattering cross section, �eff.
The Rayleigh cross section is related to the localindex of refraction, n, by the expression11
� �24�3
�4N2 �n2 � 1
n2 � 2�2
, (2)
with � the wavelength of light and, as before, N the
S. A. Kaiser and M. B. Long ([email protected]) are withthe Department of Mechanical Engineering, Yale University, P.O.Box 208284, New Haven, Connecticut 06520. J. H. Frank is withthe Combustion Research Facility, Sandia National Laboratories,P.O. Box 969, Livermore, California 94551.
Received 2 February 2005; revised manuscript received 19 May2005; accepted 20 May 2005.
0003-6935/05/316557-08$15.00/0© 2005 Optical Society of America
1 November 2005 � Vol. 44, No. 31 � APPLIED OPTICS 6557

number density of scatterers (neglecting depolariza-tion effects). It should be noted that both N and n arefor the local conditions of temperature and pressureand that � represents the total (rather than differ-ential) cross section. For gases the index of refractionis very close to one, and the approximation
�n2 � 1��n2 � 2�
�23 �n � 1� (3)
is often made. Combining relations (1)–(3) gives anexpression for the Rayleigh signal in terms of theindex of refraction:
SRay � KI0 V32�3
3�4
�n � 1�2
N . (4)
This formulation makes it clear that the Rayleighsignal carries information on the local index of refrac-tion of the gas mixture. The same variations in thelocal index of refraction that generate contrast in theRayleigh image of a flow or flame can also cause beamsteering of the illuminating laser sheet. The beamsteering of the laser sheet is a specific case of themore general problem of the distortion of wavefrontspropagating in turbulent media. There has been con-siderable work done on this topic by the aero-opticscommunity. Dimotakis et al.12 provide useful refer-ences to this work and demonstrate the use of aFourier transform filter approach to correct for beam-steering effects. If the Rayleigh image can be used toinfer the local index of refraction, then it may bepossible to use this information to characterize thebeam steering caused by the flow and perhaps evencorrect for its effects.
For a given experiment with a fixed laser intensityand wavelength, the index of refraction will dependon the Rayleigh signal and local number density ac-cording to
n � 1��SRay N . (5)
As mentioned previously, Rayleigh scattering can beused to study flows in several different circum-stances. In an isothermal flow, Rayleigh scatteringcan be used to measure the mixing of two gases withdifferent Rayleigh cross sections.4,5 In this case, thenumber density, N, will be constant and the localindex of refraction will simply be proportional to thesquare root of the Rayleigh signal:
n � 1��SRay (6)
Rayleigh scattering can also be used to monitor tem-perature variations (i.e., variations in N) in a gas orgas mixture in which the Rayleigh cross section isconstant. Examples of this type of application wouldbe that of a heated jet mixing with ambient-temperature gas of the same composition, or a flame
in which the fuel, oxidizer, and products are speciallychosen to have a constant Rayleigh cross section.6 Forthis case of constant Rayleigh cross section and vary-ing number density, the Rayleigh signal depends onlyon the number density, so, from Eq. (1) and relation(5), the local index of refraction varies linearly withthe Rayleigh signal:
n � 1 � SRay. (7)
In the general combustion case, both N (inver-sely proportional to temperature) and the effectiveRayleigh cross section of the gas mixture, �eff canvary. For these cases, additional information on thelocal value of N or �eff would, in principle, be neces-sary to determine the value of the local refractiveindex. As will be seen below, however, a reasonableestimate of the index of refraction field in a turbulentpartially premixed hydrocarbon flame can be ob-tained from the Rayleigh signal alone.
2. Ray-Tracing Algorithm
If a discrete image representing the index of refrac-tion in a flow field is available, it should be possible tosimulate the path of the laser beam as it traverses theflow. Snell’s law describes the refraction of a ray prop-agating from a medium with index of refraction n1 toanother medium with n2 across a planar interface atan angle �1 relative to the normal of the interface:
n1 sin �1 � n2 sin �2. (8)
Rays are traced across the entire image by using thestencil shown in Fig. 1 to propagate across a pixel�i, j�. The refractive index n1 is determined by thevalue of pixel �i, j�. The two-dimensional index gradi-
Fig. 1. Pixel stencil used in the ray-tracing implementation.
6558 APPLIED OPTICS � Vol. 44, No. 31 � 1 November 2005
ent, n, is calculated by using the surrounding pixelsfor central differencing �nx and ny� and is utilizedto obtain the angle � of the interface and therighthand-side index n2:
� ��
2 � tan�1nx
ny,
n2 � n1 � r̂ · n, (9)
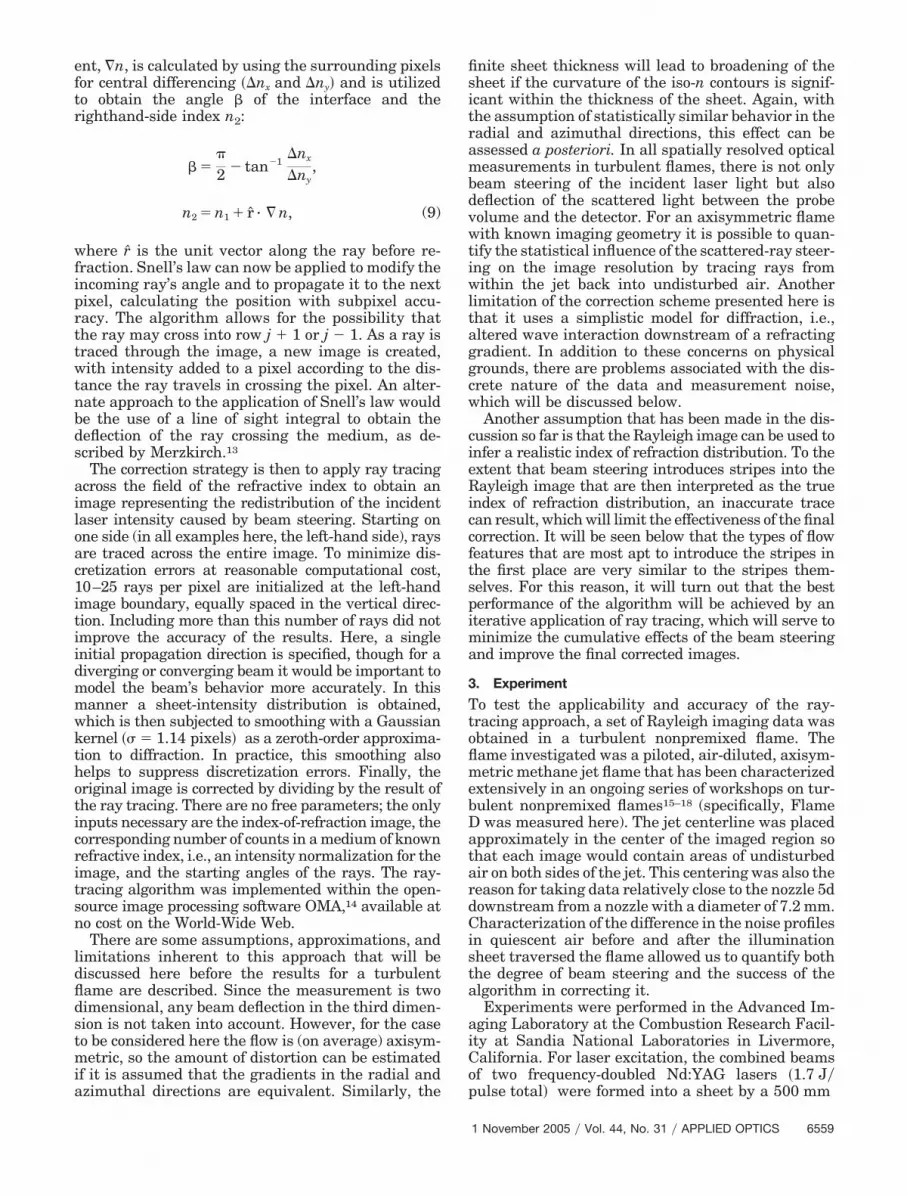
where r̂ is the unit vector along the ray before re-fraction. Snell’s law can now be applied to modify theincoming ray’s angle and to propagate it to the nextpixel, calculating the position with subpixel accu-racy. The algorithm allows for the possibility thatthe ray may cross into row j � 1 or j � 1. As a ray istraced through the image, a new image is created,with intensity added to a pixel according to the dis-tance the ray travels in crossing the pixel. An alter-nate approach to the application of Snell’s law wouldbe the use of a line of sight integral to obtain thedeflection of the ray crossing the medium, as de-scribed by Merzkirch.13
The correction strategy is then to apply ray tracingacross the field of the refractive index to obtain animage representing the redistribution of the incidentlaser intensity caused by beam steering. Starting onone side (in all examples here, the left-hand side), raysare traced across the entire image. To minimize dis-cretization errors at reasonable computational cost,10–25 rays per pixel are initialized at the left-handimage boundary, equally spaced in the vertical direc-tion. Including more than this number of rays did notimprove the accuracy of the results. Here, a singleinitial propagation direction is specified, though for adiverging or converging beam it would be important tomodel the beam’s behavior more accurately. In thismanner a sheet-intensity distribution is obtained,which is then subjected to smoothing with a Gaussiankernel �� � 1.14 pixels� as a zeroth-order approxima-tion to diffraction. In practice, this smoothing alsohelps to suppress discretization errors. Finally, theoriginal image is corrected by dividing by the result ofthe ray tracing. There are no free parameters; the onlyinputs necessary are the index-of-refraction image, thecorresponding number of counts in a medium of knownrefractive index, i.e., an intensity normalization for theimage, and the starting angles of the rays. The ray-tracing algorithm was implemented within the open-source image processing software OMA,14 available atno cost on the World-Wide Web.
There are some assumptions, approximations, andlimitations inherent to this approach that will bediscussed here before the results for a turbulentflame are described. Since the measurement is twodimensional, any beam deflection in the third dimen-sion is not taken into account. However, for the caseto be considered here the flow is (on average) axisym-metric, so the amount of distortion can be estimatedif it is assumed that the gradients in the radial andazimuthal directions are equivalent. Similarly, the
finite sheet thickness will lead to broadening of thesheet if the curvature of the iso-n contours is signif-icant within the thickness of the sheet. Again, withthe assumption of statistically similar behavior in theradial and azimuthal directions, this effect can beassessed a posteriori. In all spatially resolved opticalmeasurements in turbulent flames, there is not onlybeam steering of the incident laser light but alsodeflection of the scattered light between the probevolume and the detector. For an axisymmetric flamewith known imaging geometry it is possible to quan-tify the statistical influence of the scattered-ray steer-ing on the image resolution by tracing rays fromwithin the jet back into undisturbed air. Anotherlimitation of the correction scheme presented here isthat it uses a simplistic model for diffraction, i.e.,altered wave interaction downstream of a refractinggradient. In addition to these concerns on physicalgrounds, there are problems associated with the dis-crete nature of the data and measurement noise,which will be discussed below.
Another assumption that has been made in the dis-cussion so far is that the Rayleigh image can be used toinfer a realistic index of refraction distribution. To theextent that beam steering introduces stripes into theRayleigh image that are then interpreted as the trueindex of refraction distribution, an inaccurate tracecan result, which will limit the effectiveness of the finalcorrection. It will be seen below that the types of flowfeatures that are most apt to introduce the stripes inthe first place are very similar to the stripes them-selves. For this reason, it will turn out that the bestperformance of the algorithm will be achieved by aniterative application of ray tracing, which will serve tominimize the cumulative effects of the beam steeringand improve the final corrected images.
3. Experiment
To test the applicability and accuracy of the ray-tracing approach, a set of Rayleigh imaging data wasobtained in a turbulent nonpremixed flame. Theflame investigated was a piloted, air-diluted, axisym-metric methane jet flame that has been characterizedextensively in an ongoing series of workshops on tur-bulent nonpremixed flames15–18 (specifically, FlameD was measured here). The jet centerline was placedapproximately in the center of the imaged region sothat each image would contain areas of undisturbedair on both sides of the jet. This centering was also thereason for taking data relatively close to the nozzle 5ddownstream from a nozzle with a diameter of 7.2 mm.Characterization of the difference in the noise profilesin quiescent air before and after the illuminationsheet traversed the flame allowed us to quantify boththe degree of beam steering and the success of thealgorithm in correcting it.
Experiments were performed in the Advanced Im-aging Laboratory at the Combustion Research Facil-ity at Sandia National Laboratories in Livermore,California. For laser excitation, the combined beamsof two frequency-doubled Nd:YAG lasers �1.7 J�pulse total� were formed into a sheet by a 500 mm
1 November 2005 � Vol. 44, No. 31 � APPLIED OPTICS 6559

focal length cylindrical lens. Rayleigh scattering wasimaged onto the chip of an interline transfer camera,gated at 600 ns to suppress flame luminosity. After 2� 2 on-chip binning, the resulting useable portion ofthe images as shown consists of 640 � 166 pixelswith a pixel volume projection of 58 �m 58 �m 200 �m. Here, the largest dimension represents anestimate of the average sheet thickness (in quiescentair), which was obtained by inserting a partially re-flecting wedge into the beam path to create an imageof the sheet cross section on another CCD camera.
Before applying the ray-tracing correction, all stan-dard image corrections were performed. These in-cluded (1) subtraction of background and a smallaverage luminosity component that was not gated outby the detector, (2) correction for variations in theaverage laser-intensity profile as well as nonunifor-mities in the detector response and optical through-put, and (3) a shot-to-shot laser-intensity profilecorrection obtained from the portion of the imagecorresponding to quiescent air before the beam haspropagated into the flame (on the left-hand side in theimages shown below).
For the air-diluted methane flame considered here,the effective Rayleigh cross section is not constant butvaries as the composition changes throughout theflame. Based on tabulated Rayleigh cross sections andspecies compositions obtained from strained laminarflame calculations, the Rayleigh cross section is ex-pected to vary by 30% in this flame, with the great-est deviation coming from the unreacted fuel (methanehas a cross section 2.2 times larger than air). Sinceneither the number density nor the effective cross sec-tion is fixed, the index of refraction will in generaldepend on both parameters [see relation (5)]. However,variations in the number density are considerablygreater than those for the cross section (the tempera-ture varies by nearly a factor of 7). Consequently, theformulation in relation (7), in which n � 1 is taken tobe directly proportional to the Rayleigh signal, is ex-pected to yield the best results if a separate measure-ment of the Rayleigh cross section is not available.
4. Results and Discussion
Figure 2(a) shows one of the images from the data setbefore any beam-steering corrections have been per-formed. As the illumination sheet crosses the image,stripes are created by the varying index-of-refractionfield. The flow features that contain steep gradientsat a shallow angle with respect to the beam propaga-tion direction are particularly likely to mark thestart of the sheet nonuniformities that subsequentlycontinue across the image [marked by arrows inFig. 2(a)].
In order to quantitatively measure the success ofthe ray-tracing correction, it is useful to define a met-ric for the success of the technique. In the absence ofbeam steering, the imaged areas containing quies-cent air on the left-hand (L) and right-hand (R) side ofthe images would have the same noise levels �NR
� NL�. Beam steering introduces additional structureon the right-hand side, increasing the noise on that
side. A metric for success of the correction is thereforethe reduction �r of this left-to-right degradation,which was normalized here by the left-to-right deg-radation of the original image according to
�r ��NR � NL�Orig � �NR � NL�Corr
�NR � NL�Orig. (10)
Total reversal of the beam-steering-induced left-to-right image degradation would correspond to �r �100%, no effect at all to �r � 0%.
Using this metric, the average improvement in the50-shot image set that was obtained using the ray-tracing algorithm outlined above was �r � 21%. Thereason for this relatively modest improvement can beunderstood by noting the similarity of the imagestripes to the flow features that created them. Bytreating these beam-steering-induced-stripes as partof the actual index-of-refraction distribution, theirinfluence is overestimated—an effect that increasesas the distance the beam propagates along the stripesincreases.
A more satisfactory result was obtained by modify-
Fig. 2. Single-shot Rayleigh image from a turbulent methane–airjet flame (Flame D) at 5 jet diameters downstream. (a) originalimage, (b) corrected image using columnwise ray tracing, (c) cal-culated sheet-intensity deviation based on the columnwise ray-tracing approach, (d) intensity deviation along the vertical line atthe right of the images in (a) and (c). Images are 37 mm � 9.6 mm,corresponding to 5.2 d � 1.3 d.
6560 APPLIED OPTICS � Vol. 44, No. 31 � 1 November 2005

ing the basic ray-tracing algorithm to account for theredistribution of the sheet intensity as the rays werepropagated. In the initial implementation, each raywas propagated all the way across the image, and thesheet intensity was determined after 10 to 25 rays perpixel had been traced across the image and their in-tensities summed. In a modified version, all rays werepropagated across a single column of pixels and theresulting intensity distribution in that column was cal-culated. This distribution was smoothed with a Gauss-ian kernel �� � 1.14 pixels� to remove single-pixelartifacts, propagated one pixel forward, and used tomodify the index of refraction distribution that deter-mined subsequent beam-steering effects. This proce-dure tends to correct for the beam steering as the rayspropagate and minimizes the overestimation of thebeam steering. Using this columnwise ray-tracingtechnique, the average value of �r for the 50-imagedata set was increased to 78%. Figure 2(b) shows acorrected image obtained using this scheme, and Fig.2(c) shows the calculated sheet-intensity distribution.Figure 2(d) shows a comparison of the measured andthe calculated intensities in air on the right-hand sideof the image. The maximum modulation of the sheetintensity in both cases is seen to be just over �10%,with the agreement between the measured and thecalculated distribution quite satisfactory.
An iterative approach to removing the stripescaused by the index gradients yielded a further mod-est improvement in the performance of the ray-tracing technique. In this method, the rays were onceagain propagated across the image without a forwardcorrection. However, in this implementation thesheet-intensity fluctuations calculated by the raytrace were scaled down to a fraction of their originalmagnitude in order to eliminate the overcorrection ofthe stripes caused by beam steering. The scaled-downsheet-intensity image was then used to correct theimage. The remaining fluctuations on the right-handside of the corrected image were then calculated, andif they were lower than in the previous iteration, theprocess was repeated. When application of the stripecorrection caused an increase in the noise on theright-hand side of the image in ambient air, the finalcorrection was discarded, the process was termi-nated, and the previous iteration taken as the result.Different values of the multiplicative reduction factorwere investigated. A value of 0.1 resulted in an opti-mum sheet correction in 7–9 iterations and resultedin an average �r � 80% for the 50-image data set. Forthe data taken here, the improvement in the cor-rected image probably does not warrant the increasedcomputational time required by the iterative ap-proach. However, it will be shown below that for datawith less favorable signal-to-noise ratio (SNR) orpoorer spatial resolution the iterative technique maybe useful. It should also be noted that the success ofthe ray-tracing techniques is quite sensitive to theproper angle of propagation of the initial beams. De-viations of 0.1° on either side of the optimum valueresulted in a decrease of �r by 10%.
Most experiments employing Rayleigh imaging do
not record quiescent air on both sides of the image,since doing so tends to reduce the spatial resolution ofthe measurement and the signal collection efficiency.This was done in this study to provide known referenceconditions in order to more easily evaluate the successof the algorithm. It should be noted that neither of thealgorithms discussed here require the measurement ofconstant conditions after the beam passes through theflow to be effective. Application of the columnwise ray-tracing method is the most straightforward—the solu-tion is reached when all columns have been traced. Forthe iterative algorithm, a test is needed to determinewhen the optimum correction has been achieved. Itwas found that the application of a relatively simplehigh-pass filter operation in a region of the image cor-responding to the longest beam path through the flow(on the right-hand side of the image in our case) re-sulted in an image region representative of the stripescaused by the beam steering. This filtered image re-gion was used to provide a test for stopping the itera-tions. Figure 3 shows an example of the application ofthe iterative ray-tracing algorithm to a turbulentflame in which quiescent air was not recorded on bothsides of the image.
5. Effects of Noise and Spatial Resolution
It is not always possible to obtain images with such arelatively high SNR as in the Rayleigh images pre-sented here (the single-shot SNR on the left side is66). Therefore the robustness of the beam-steeringcorrection to noise was investigated by artificiallyincreasing the noise. The uncorrected image wasmultiplied with a Gaussian-noise image and then cor-rected by using both the columnwise single-pass anditerative processes described above. Although thenoise generated in this way does not yield exactly thescaling of noise to signal that would correspond toincreased shot noise, this type of artificial degrada-tion should suffice for the present purposes. For eachnoise level, the SNRs of the original and the corrected
Fig. 3. (a) Rayleigh image from a turbulent flame. (b) Rayleighimage corrected for beam steering by using the iterative ray-tracing algorithm. Images are 37 mm � 9.6 mm.
1 November 2005 � Vol. 44, No. 31 � APPLIED OPTICS 6561

images were evaluated in the undisturbed air on theleft- and right-hand side of the images.
Figure 4 shows the behavior of �r as a function ofthe SNR for both ray-tracing algorithms. Initially,both correction methods prove to be resistant to in-creasing the noise in the original image, with theeffectiveness �r remaining roughly constant down toan SNR of about 40. A further increase of the noiseaffects the performance at first moderately, thenmore drastically. The performance of the single-passalgorithm falls off more rapidly, with SNR levels of15 representing the lower limit of effective correc-tion for beam steering. The iterative approach showssome useful improvement down to a SNR of 5. It isconcluded that for high-resolution Rayleigh images aSNR above 10 is sufficient to be able to achievesignificant improvement through ray-tracing-basedbeam-steering correction, particularly using the iter-ative approach. However, it should be noted that thenoise considered here has no pixel-to-pixel spatialcorrelation. Noise with a larger spatial structure war-rants further investigation of the effectiveness of thecorrection. In particular, photon shot noise originat-ing from the photocathode of an image-intensifieddetector is often spread over several pixels and couldhave a more pronounced effect.
In the same way that the SNR of the images in thecurrent data set can be artificially degraded to assessthe performance of the correction techniques, the abil-ity of the algorithms to cope with decreased spatialresolution can also be evaluated. From the flame im-ages and sheet-intensity plots of Fig. 2, it is clear thatthe spatial scale of the stripes approaches the pixelresolution of the image data (the area projected ontoeach pixel is 58 �m 58 �m; images are 640 � 166pixels). By subsampling the images at every 2, 3, or 4pixels, it is possible to obtain images with increasinglylower spatial resolution while maintaining the sameoverall SNR. Results are shown in Fig. 5 for both thecolumnwise and the iterative algorithms. The effec-
tiveness of the correction drops quickly as the spatialresolution of the measurement decreases, emphasizingthe importance of resolving the stripes and the gradi-ents of the flow structures to adequately correct for thebeam steering. For the flow considered here, the spa-tial resolution of the original measurement appears tobe nearly adequate, though it is not clear how muchbetter the correction would be if higher-resolution datawere available. Once again, the iterative algorithmmaintains an advantage over the columnwise tech-nique for the range of resolutions investigated. Resultsobtained by binning the pixels (rather than subsam-pling) do not change significantly from those shown inFig. 5, even though there is an increase in the SNR ofthe binned images. The results summarized in Figs. 4and 5 suggest that the technique is relatively noisetolerant but suffers considerably from lack of sufficientresolution, a consideration in setting up an experimentutilizing the technique.
6. Simulations
With the validity of the ray-tracing algorithms dem-onstrated by their ability to adequately predict andcorrect image stripes, the algorithm and data set canbe used to simulate a number of situations relevant toimaging diagnostics. For example, the effect of theindex gradients in the flame on the detection of laserlight scattered in the probe volume can now be as-sessed. Figure 6(a) shows the virtual experimentalarrangement used. Note that, as in a typical imagingexperiment, the orientation of detection and there-fore that of the plane displayed in the figure is or-thogonal to the laser sheet (the plane the previousfigures were in). Rays originating from a point sourcein the center of the jet are traced through the flame toan ideal collection lens corresponding to an f�5 lensimaging at 1:1 magnification onto the plane of detec-tion (this solid angle approximately corresponded tothat used in the experiment). The distance of the lensfrom the probe volume and the lens size could bechosen to be greater, but this would not alter the
Fig. 4. Performance of the beam-steering correction for differentnoise levels in the original image. Solid curve, iterative ray-tracingalgorithm; dashed curve, columnwise technique. See text for de-tails on the performance measure.
Fig. 5. Performance of the beam-steering correction for differentpixel spacings. Solid curve, iterative ray-tracing algorithm; dashedcurve, columnwise technique.
6562 APPLIED OPTICS � Vol. 44, No. 31 � 1 November 2005

results, since once the rays travel in undisturbed air,their angular distribution will remain unchanged. Atypical result is shown in Fig. 6(b) as a ray-densityimage equivalent to Fig. 2(c), but on a logarithmiccolor scale to account for the large intensity variationin this point-to-point imaging arrangement. At thisresolution, there is no effect of the flame on thespread of the focal point, which remains one pixel tall.In fact, the index gradient in the flame has to beincreased by more than an order of magnitude toyield spreading beyond one pixel. Thus, for flames ofradial dimensions comparable with the ones of thisjet flame, beam steering should not be a significantlimitation for data collection. However, detection-sidebeam steering may become non-negligible in high-pressure flames or in geometries with much longerdistances between probe volume and flame front.
From Eq. (1) and relation (5) it is seen that n � 1is directly proportional to the number density, N.This suggests that, by scaling the index of refractioncalibration constant used in the ray tracing, the im-ages can be used to simulate the beam-steering be-havior that would occur at different pressures. Thisscaling does not take into account changes in spatialscale of the flow that would occur with changes inpressure but does provide some insight into the dif-ficulties that could be expected when going to higherpressure. To investigate pressure effects, the distri-bution of ray deviations encountered in traversingthe turbulent flames was calculated for all of the raystraced in the 50-image data set, first by using thecalibration for air and then with a value ten times aslarge, which would correspond to flames with thesame spatial structure at 1 and 10 atm (760 and7600 Torr). The images used for the simulation werecorrected by using the iterative ray-tracing algorithm��r � 80%�, so the effects of stripes should be mini-mal. The results are shown as a probability densityfunction (pdf) in Fig. 7. The pixel deviation is normal-ized by the pressure, and it is seen that to within thenoise of the pdf, the distributions are the same. Thesimilarity of the pdfs is perhaps not surprising inlight of the fact that even at 10 atm, the deflection
angles are quite small, as is n � 1. For the 1 atm caseit is seen that essentially all deviations are less than0.5 pixel. However, in propagating across the flow fieldwith a pressure of 10 atm, a significant fraction of therays would undergo deviations of several pixels, which,neglecting diffraction, could lead to gaps in the illumi-nation sheet. The deviations calculated here occur inthe plane of the sheet. However, it is expected thatsimilar out-of-plane deviations will occur in these flowsas well. If the radial and azimuthal components of thegradient are assumed to be similar, then the pdfsshown could be used to estimate the thickening of thelaser sheet caused by out-of-plane gradients.
The ray-tracing algorithm and corrected image dataset can also be used to simulate Rayleigh images ob-tained at high pressure. The atmospheric Rayleigh im-ages [corrected for beam steering as in Fig. 2(b)] areused as a starting point, and the sheet-intensity dis-tribution is calculated by using a calibration factor forn � 1 that is ten times that of air (to simulate 10 atm).The calculated sheet-intensity distribution is multi-plied by the original image to obtain a predicted, high-pressure Rayleigh image as shown in Fig. 8(a). Thesame columnwise or iterative ray-tracing algorithmscan now be applied to this new image. The result of theapplication of the columnwise algorithm to the imageshown in Fig 8(a) is shown in Fig. 8(b). While thepresence of residual stripes in the image is evident,their magnitude has been decreased considerably. Atthis simulated higher pressure, beam steering causessignificantly more structure in the sheet as it traversesthe flow, as is made clear from the plot of the sheet-intensity modulation shown in Fig. 8(c). The sheet-intensity fluctuations are now approximately �80%.In the figure, the simulated intensity modulation in airis shown in blue, while the modulation calculated dur-ing the ray trace is in red. The average improvementover the 50-shot image set was 59% for the iterativemethod, while the columnwise technique gave an im-provement of �r � 64%.
Fig. 6. Ray tracing of scattered light from the probe volume tothe detector. (a) Extended Rayleigh image with flame, lens, anddetector, (b) corresponding intensity distribution, is displayedin an arbitrary logarithmic color scale corresponding to log(rays�pixel). The Spatial coverage of the images is 61 mm�12 mm. Fig. 7. Deviation of rays propagating across a turbulent flame.
Two curves are shown. One for the actual data taken at 1 atm; thesecond is the simulated behavior at 10 atm. To within the noise ofthe pdf, the curves are the same.
1 November 2005 � Vol. 44, No. 31 � APPLIED OPTICS 6563

7. Conclusions
In turbulent flames, ray tracing is concluded to be auseful tool for correcting beam-steering effectsbased on Rayleigh images. In general, Rayleigh im-ages allow for an approximate calculation of theindex field necessary for ray tracing. For the givenimage series from a nonpremixed methane–airflame, correction efficiencies of 80% were achievedwith an iterative correction scheme. The correctionwas found to have significant noise tolerance, but amore detailed analysis that would include the ef-fects of spatial scales, both in the flame as well asintroduced through the detection process, is desir-able. Since the ray-tracing correction is very sensi-tive to the initial angle, it is important to properlyaccount for the angle of the incoming beam as wellas any possible divergence. Rayleigh images of aturbulent flow field can be used with the ray-tracingalgorithm to characterize the beam steering be-tween the probe volume and the detector. For theturbulent flame considered here, the effect wasfound to be negligible. The image data and ray-tracing algorithms presented here were also used tosimulate the beam-steering behavior at 10 atm.Since Rayleigh scattering will be generated in anylaser imaging experiment, (e.g., PLIF measure-ments), it may be possible to combine this techniquewith others to correct for the effects of beam steer-ing on the image.
This research was supported by the Division ofChemical Sciences, Geosciences, and Biosciences, Of-fice of Basic Energy Sciences, U.S. Department of
Energy. The authors thank R. Sigurdsson for assis-tance during the experiments. Sandia National Lab-oratories is a multiprogram laboratory operated bySandia Corporation, a Lockheed Martin Company,for the United States Department of Energy undercontract DE-AC04-94-AL85000. The software usedand developed in this work is available for free down-load from the World-Wide Web.14
References1. G. Kychakoff, R. Howe, R. K. Hanson, and J. McDaniel, “Quan-
titative visualization of combustion species in a plane,” Appl.Opt. 21, 3225–3227 (1982).
2. G. Kychakoff, R. Howe, R. K. Hanson, M. Drake, R. Pitz, M.Lapp, and C. Penney, “Visualization of turbulent flame frontswith planar laser-induced fluorescence,” Science 224, 382–384(1984).
3. R. K. Hanson, “Combustion diagnostics: planar imaging tech-niques,” Proc. Combust. Inst. 21, 1677–1691 (1986).
4. M. C. Escoda and M. B. Long, “Rayleigh scattering measure-ments of the gas concentration field in turbulent jets,” AIAA J.21, 81–84 (1983).
5. D. R. Dowling and P. E. Dimotakis, “Similarity of the concen-tration field of gas-phase turbulent jets,” J. Fluid Mech. 218,109–141 (1990).
6. R. W. Dibble and R. E. Hollenbach, “Laser Rayleigh thermom-etry in turbulent flames,” Proc. Combust. Inst. 18, 1489–1499(1981).
7. D. C. Fourguette, R. M. Zurn, and M. B. Long, “Two-dimensional Rayleigh thermometry in a turbulent nonpre-mixed methane hydrogen flame,” Combust. Sci. Tech. 44,307–317 (1986).
8. V. Bergmann, W. Meier, D. Wolff, and W. Stricker, “Applica-tion of spontaneous Raman and Rayleigh scattering and 2DLIF for the characterization of a turbulent CH4/H2/N2 jet dif-fusion flame,” Appl. Phys. B 66, 489–502 (1998).
9. Y.-C. Chen and M. S. Mansour, “Topology of turbulent pre-mixed flame fronts resolved by simultaneous planar imaging ofLIPF of OH radical and Rayleigh scattering,” Exp. Fluids. 26,277–287 (1999).
10. J. Fielding, J. H. Frank, S. A. Kaiser, and M. B. Long,“Polarized/depolarized Rayleigh scattering for determiningfuel concentrations in flames,” Proc. Combust. Inst. 29, 2703–2709 (2002).
11. R. B. Miles, W. R. Lempert, and J. N. Forkey, “Laser Rayleighscattering,” Meas. Sci. Technol. 12, R33–R51 (2001).
12. P. E. Dimotakis, H. J. Catrakis, and D. C. Fourguette, “Flowstructure and optical beam propagation in high-Reynolds-number gas-phase shear layers and jets,” J. Fluid Mech. 433,105–134 (2001).
13. W. Merzkirch, Flow visualization (Academic, 1974).14. P. A. Kalt and M. B. Long, “OMA—image processing for Mac
OS X,” www.oma-x.org (accessed May 2005; includes the ray-tracing algorithms used here).
15. R. S. Barlow, ed., “International workshop on measurementand computation of turbulent nonpremixed flames,” www.ca.sandia.gov/TNF/ (accessed May 2005).
16. R. S. Barlow and J. H. Frank, “Effects of turbulence on speciesmass fractions in methane/air jet flames,” Proc. Combust. Inst.27, 1087–1095 (1998).
17. A. N. Karpetis and R. S. Barlow, “Measurements of scalardissipation in a turbulent piloted methane�air jet flame,” Proc.Combust. Inst. 29, 1929–1936 (2002).
18. J. H. Frank, S. A. Kaiser, and M. B. Long, “Reaction-rate, mixture-fraction, and temperature imaging in turbulent methane/air jetflames,” Proc. Combust. Inst. 29, 2687–2694 (2002).
Fig. 8. (a) Simulated Rayleigh image from a 10 atm flame;(b) image corrected by using the columnwise ray-tracing algorithm;(c) blue, sheet-intensity modulation from the right side of the un-corrected image; red, sheet intensity modulation calculated by theray-tracing algorithm. Images are 37 mm � 9.6 mm.
6564 APPLIED OPTICS � Vol. 44, No. 31 � 1 November 2005


