Embed Size (px)
Citation preview
Fourier transform infrared Hadamard tomography of sooting flames Stephen C Bates Robert Carangelo Kim Knight and Michael Serio Advanced Fuel Research 87 Church Street East Hartford Connecticut 06108
(Received 10 August 1992 accepted for publication 22 December 1992)
An experimental technique is described that combines tomography Hadamard signal encodement and a patented Fourier transform infrared (Ff-IR) emissiontransmission (EIT) technique to perform simultaneous spatially resolved gas species and soot measurements during combustion Tomographic analysis of line-of-sight Ff-IR data allows spatially resolved measurements to be made Hadamard encodement of the tomographic sections increases the overall signal throughput improving the signal to noise (SIN) ratio for each measurement The Hadamard technique leads to a major simplification in the tomographic apparatus in that the scanning apparatus that would normally be required is eliminated and focusing of the infrared light is much easier An experiment demonstrating Hadamard data processing as applied to FT-IR tomography is described Deconvolution of the encoded data is shown to be accurate and gives the predicted improvement in SIN ratio The FT-IR Hadamard tomography is performed to measure soot in a fuel-rich diffusion flame Spatially resolved concentration measurements agree well with previous data and clearly show striking three-dimensional features that could not normally be measured by simple line-of-sight techniques
I INTRODUCTION
There are a wide variety of techniques currently availshyable as combustion diagnostics Laser spectroscopic and scattering techniques as well as other optical diagnostics have been developed to measure gas species concentration and gas temperature as well as soot particle size and conshycentration Many of these techniques were reviewed by Penner et a 12 and Hardesty3 and some have been applied to study soot formation in gaseous flames4--13 Several new two-dimensional (2-D) flow visualization techniques have been developed using lasers I 4--20 These and other new 2-D techniques were recently reviewed by Hanson21 The comshypleteness of a simultaneous data set of the temperature composition and physical properties of the different gas species and soot is critical for exact process control and research into understanding the complex reaction system of a combustor Fourier transform infrared (Ff-IR) specshytroicOPY provides a means for obtaining this data set using a single instrument Competing diagnostic techniques utishylize lasers in different ways but these diagnostics are typshyically difficult to use and expensive
One of the most important processes within a hydroshycarbon combustion environment is the formation and evoshylution of soot Soot measurement provides a direct monitor of combustion inefficiency radiation heat losses and parshyticulate pollution Also since soot is such a strong radiator in flames and soot and gas temperatures are often signifishycantly different both of these temperatures must be meashysured separately Most studies of soot formation have been performed in flames Extensive measurements in diffusion flames show that soot is formed primarily in the fuel-rich regions where pyrolysis is occurring4--1O122223 A substanshytial amount of work (especially on surface growth) has also been performed in atmospheric pressure twoshydimensional premixed flames using compounds beginning with ethylene and progressing through a series of more
aromatic compounds24--26 Advances in the understanding and measurement of the formation and destruction of soot must be made before improved combustion devices can be designed and operated Detailed simultaneous measureshyments of the concentration and temperature of soot and gas species are needed especially of soot precursors and soot combustion products
II FT-IR EMISSIONTRANSMISSION (ET) TOMOGRAPHY
A FT-IR emissiontransmission (ET) spectroscopic technique for diagnosing gas concentration and temperashyture was recently developed and patented (US No 4653766) by Advanced Fuel Research (AFR)27-34 The Ff-IR soot diagnostic is built around a Bomem Michelson spectrometer This instrumentation has a resolution of 4 cm- 1 using a corner cube mirror system and a Ge-KBr beam splitter that allows data acquisition from 6500 cm- (15 Lm) to 400 cm -I (25 Lm) The spectrometer has been modified for sequential emissiontransmission FT-IR to be able to perform simultaneous measurement of the temperature composition and physical properties of the different gas species and soot A similar Ff-IR spectromshyeter system together with IR collection optics and detecshytors was developed and used to perform process measureshyments during hazardous waste incineration at the SERI High Flux Solar Furnace in Golden CO in a recovery boiler for paper waste recycling at the Weyerhauser facility in Longview W A and in a flue gas stream from a coalshyfired power plant in Beverly OH
A Emissiontransmission spectroscopy
The background for the Ff-IR EIT tomography is described by work performed on line-of-sight EIT specshytroscopy27-34 For multiphase reacting systems measureshyments are made of the transmittance and the radiance and from these a normalized radiance is calculated For nonshy
1213 Rev Sci Instrum 64 (5) May 1993 0034-674893051213-09$0600 1993 American Institute of Physics 1213
scattering optically thin samples such as gas and soot the quantity 1-transmittance is proportional to the total exshytinction from each absorbing component The radiance is proportional to the extinction times the Planck black body function as a function of wavelength The normalized rashydiance which is the radiance divided by ( 1 - transmittance) is then proportional to the Planck black body function at the temperature of the component This proportionality applies across the spectra of black and gray bodies such as soot as well as at the specific absorption wavelengths of a particular gas The complete analysis for nonthin samples and for particles follows Siegel and Howshye1l35 and has been presented previously31
B Transmission tomography
An integrating line path measurement can be used to tomographically reconstruct a fully three-dimensional imshyage of a partially absorbing object The three-dimensional images are formed by combining a closely spaced parallel set of spatially resolved two-dimensional image slices through the object These two-dimensional images are in turn mathematically reconstructed using tomography from integral line-of-sight measurements that span a plane through the object where the beam must pass through each area element from two different directions A beam measurement that is scanned in a plane perpendicular to the beam (up and down left and right) to cover an entire measurement volume can be used to reconstruct a 3-D image of an axially symmetric object For the creation of 3-D images both the required absorption measurements and the reconstruction itself are greatly simplified for obshyjects with this axial symmetry The most common reconshystruction techniques in these cases use a radial inversion based on Abels equations36-39 More recent reconstruction techniques can produce two-dimensional slices of an image for objects of arbitrary shape40-43
For transmission tomographythe basic measurements are line-of-sight absorbances The spatial dependencies of both gas concentrations and temperatures have been obshytained previously from tomography applied to monochroshymatic measurements of a steady-state flame44 These results apply to gas samples without a condensed phase The sishymultaneous presence of a condensed phase (eg soot) and other gas band features reduces the accuracy of the monoshychromatic measurements The effects of soot can only be separated when the image reconstruction techniques deshyscribed above are based on local measurements and include IR absorbance spectra over an extended wave~number range Accurate local concentrations can then be detershymined for soot and all of the gases present in the flame At this time only the case of a low absorbance sample (transshymittance gt 80) has been studied in this manner22
C Emission tomography
A straightforward application of reconstruction techshyniques to scans of radiance is not possible where there is self-absorption in the sample There are a number of cases for which the self-absorbance has been corrected to obtain
1214 Rev Sci Instrum Vol 64 No5 May 1993
local species concentrations and temperatures from line-ofshysight emission and transmission measurements In the case of small absorbance (transmission gt 80 ) an emission measurement can be corrected by an absorption measureshyment made along the same path A radial inversion can be applied directly to the emission thus corrected to obtain local radiances 45
For samples with larger absorbance (80 gtpercent transmission gt 20) an iterative procedure in conjunction with radial inversion has been used to give local radishyances44 In addition in those cases for which there is not a linear relationship between absorbance and concentration (BeerS Law does not apply) a band model in conjunction with radial inversion has led to the determination of local gas species concentrations and temperatures4647
In the work described below the flame had high transshymission so that the radiance could be corrected for selfshyabsorption using the direct method45 The Fourier reconshystruction technique was applied to these corrected radiance spectra to give local radiances These reconstruction proshycedures were applied to each 16-cm- 1wave-number intershyval from 500-6500 cm -I to build up local emission and transmission IR spectra The analysis of these local spectra was performed in the same manner as for thin homogenous samples
D Standard tomography results
Spectral tomography for an ethylene diffusion flame has been described previously27 In these measurements 21 parallel scans were made at each of ten different heights in the flame The beam diameter in these cases was 1 mm For each height the transmission scans were converted to abshysorbance (-loglo T where T is the transmittance) since it is the projections of this quantity across the flame which are the appropriate inputs to image reconstruction algoshyrithms A Fourier reconstruction of the two-dimensional images from the projections was performed using the proshygram published by Shepp and Logan44
Local spectra were obtained for transmittance radishyance and normalized radiance From these data concenshytrations and temperatures were obtained for the soot as well as for CO2 H20 alkanes alkenes and alkynes The results of the local soot concentrations were obtained from the percent transmittance at 6500 cm -I using the optical constants for soot measured by Dalzell and Sarofim48 These values are compared with laser extinction and scatshytering data obtained by Santoro et aL 49 for a flame formed by the same burner under nominally identical conditions with very good agreement between the results obtained from the two different techniques Temperature comparishysons were made with the thermocouple measurement of gas temperatures (lumped) by Santoro et al 49 and the nonintrusive CARS temperature measurement for CO2 by Boedeker and Dobbs13 The temperatures from the FT-IR tomography were about 1OOmiddotC higher than those from thermocouple measurement with an additional 1OOmiddotC inshycrement in the soot zone On the other hand there is exshycellent agreement between FT-IR and CARS It is most
Tomography of sooting flames 1214
probable that radiation heat loss from soot-covered thershymocouples is the cause of low temperatures in the thermoshycouple measurements
Reconstructed images of organics soot CO2 and H20 concentrations were obtained as well as the temperashyture profiles for the same species One conclusion from this data is that average soot and gas temperatures in the same local pixel (1 mm3) can have significantly differing values The differences cross several pixel boundaries in a region of slowly varying temperatures and so cannot be an artifact of the measurement While contrary to previous comments on the matter 50 these observations are the first experimenshytal evidence on the relative local soot and gas temperatures The FT-IR tomography has demonstrated the unique cashypability of measuring local species concentrations and temshyperatures in mixed phase systems
III HADAMARD PROCESSING
Hadamard processing was originally developed as a means of increasing the optical throughput of a dispersive spectrometer In front of the detector is placed a mask that has a specific combination of open and closed slots Light impinges on the detector through all of the open slots A data set is formed by using a series of masks that have slot combinations that change in a pattern determined by the Hadamard encodement The traditional spectral data for each slot is derived from this data set by postprocessing using the Hadamard deconvolution formulas The advanshytage of this procedure is that because each measurement taken through the mask passes through multiple slots it has an improved signal to noise (SIN) ratio which leads to an improved SIN ratio of the deconvolved data relative to single slot measurements The Hadamard encoding mask replaces the spectrometer exit slit with an aperture that is either reflective (or opaque) or transmissive to chosen spectral elements the spectral elements allowed to impinge upon the detector are determined by the Hadamard encoshydement The Hadamard encodement is also cyclic so that the series of masks can be replaced by a linearly translating mask Once this mask has gone through its complete cycle and all patterns of the Hadamard encodement matrix have been in front of the aperture the detector responses as a function of the Hadamard encodement number are conshyverted by the Hadamard transform into a conventional spectrum
Hadamard transform spectroscopy (HTS) has been described in depth by several authors 51-57 For a stationary Hadamard encoding mask in single detector HTS the number of slots is N for N spectral elements The Hadashymard encodement matrix is cyclic such that a moving Hadamard encoding mask is made with 2N- 1 slots for N spectral elements and translated across the N-wide opening to give the proper N different slot combinations The cyclic arrangement of open and closed elements in an array of size N is determined by a cyclic matrix of order N A total of N individual Hadamard encodements are required for N data acquisitions before the Hadamard transform can be performed to obtain spectral data Each of the N Hadashymard encodements has (N+1)2 slots that transmit their
1215 Rev Sci Instrum Vol 64 No5 May 1993
spectral element and (N-1 )2 slots that reject their specshytral element The number of spectral elements incident on the single detector is thus as close to half of those present as is possible for an odd number of spectral elements
In this case the multiplexing advantage in HTS is achieved by allowing approximately half of the spectral elements to impinge upon a single detector for each meashysurement A general treatment of the multiplexing advanshytage has been presented elsewhere5859 and shows that the improvement in signal-to-noise ratio (SIN) is given by the expression (NS + 1)(2 ~) where NS=the number of scans for Fourier transform spectroscopy (FTS) or the number of spectral elements for HTS The factor for imshyprovement in SIN approaches ~2 as NS increases for HTS compared to the corresponding factor of ~ for FTS Thus the factors for both FTS and HTS increase in proportion in ~ In HTS the SIN for NS= 7 spectral resolution elements increases by a factor of 151 and for NS= 127 the SIN increases by a factor of 568 compared to dispersive spectrometry
Hadamard transform spectrometers have been successshyfully developed for use in a variety of applications These include photothermal deflection imaging60 infrared specshytroscopy61 two-dimensional Hadamard transform infrared imaging51 Fourier transform infrared imaging52 and other spectroscopic instrumentation 53-55 The utility of Hadashymard processing is usually based on the multiplex advanshytage found in the data acquisition and the simplicity of the application of the technique Optical spectrometric methshyods and thermal detection have probably been the main focus as a result of the substantial improvement in the SIN afforded by the multiplex capability Consequently a sigshynificant effort has been devoted toward the development of these optical Hadamard transform instruments
IV ADVANTAGES OF FT-IR HADAMARD TOMOGRAPHY
Hadamard processing improves the SIN ratio of FT-IR tomography measurements through the multiplexshying advantage discussed above The greater SIN of added signals is combined with the noise averaging of multiple measurements to give deconvolved measurements that have greater SIN than each measurement taken singly A Hadamard measurement also greatly reduces focusing losses because the beam covers the entire mask rather than having to be focused down to the area of a single slit Focusing on a single slit would otherwise be necessary to achieve the same spatial resolution The large illuminated area is important for FT-IR applications because a typical FT-IR spectrometer beam is large and poorly collimated Although half of the infrared probe beam is thrown away on the closed Hadamard mask elements this loss can be recovered using fiberoptics to perform the encoding as disshycussed below
The other major advantage of Hadamard tomography is the simplification of the tomographic measurements This occurs because normally to build up the tomographic sections the infrared beam would have to be moved across
Tomography of sooting flames 1215
HADAMARD PROCESSING M OVING MASK
~IIII 1111 12345671234567
N=7 Indjyjdual MAA1sn
1111 till III II I III ltil 3 ~~ ~
Mask 2 3 4PositiOll
Mask PosiuOll 6 7
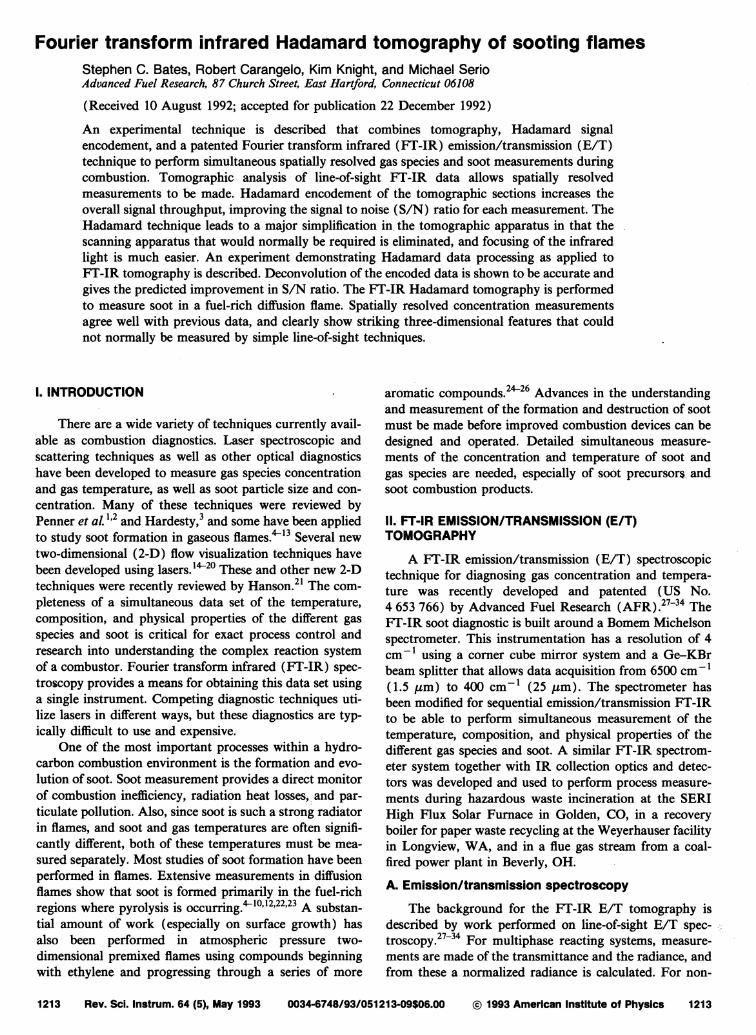
FIG 1 Hadamard masking single moving mask and individual encodeshyment masks
the flame with a scanning apparatus In Hadamard tomogshyraphy the complex scanning equipment is replaced with Hadamard masks whose elements provide the appropriate slices through the flame Furthermore the cyclic character of the Hadamard encoding permits a single translating 2N-I-element-wide mask moving across an N-wide openshying to be used instead of separate masks for each encodeshyment The FT-IR beam is sized optically to fill the N-wide opening which in turn is sized to include all or part of the flame as desired A set of Hadamard measurements are made and the tomographic slices are deconvolved using the Hadamard inverse matrix Given the computational power already associated with the FT-IR measurements Hadashymard deconvolution processing is a minor additional reshyquirement
v HADAMARD MEASUREMENT DEMONSTRATION
Feasibility experiments were done to demonstrate the process of Hadamard manipulation in the context of toshymo~raphy using transparent plastic to simulate an infrared spectrum Shown in Fig 1 is the overall Hadamard mask and the encoding masks designed with seven elements Seven was chosen as the minimum number of elements that could resolve the flame profile with minimum processing complexity (the next largest permissible number of Hadashymard elements is 14) The moving mask is 13 (2N - 1 ) elements wide and sized vertically to give the appropriate tomographic resolution in that direction
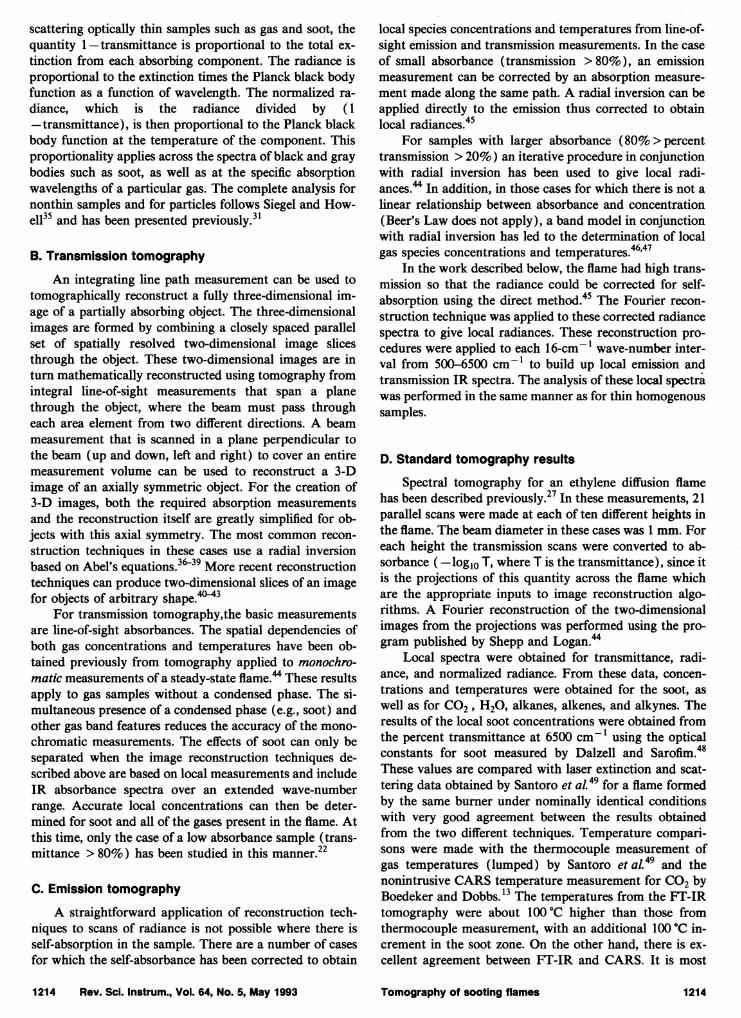
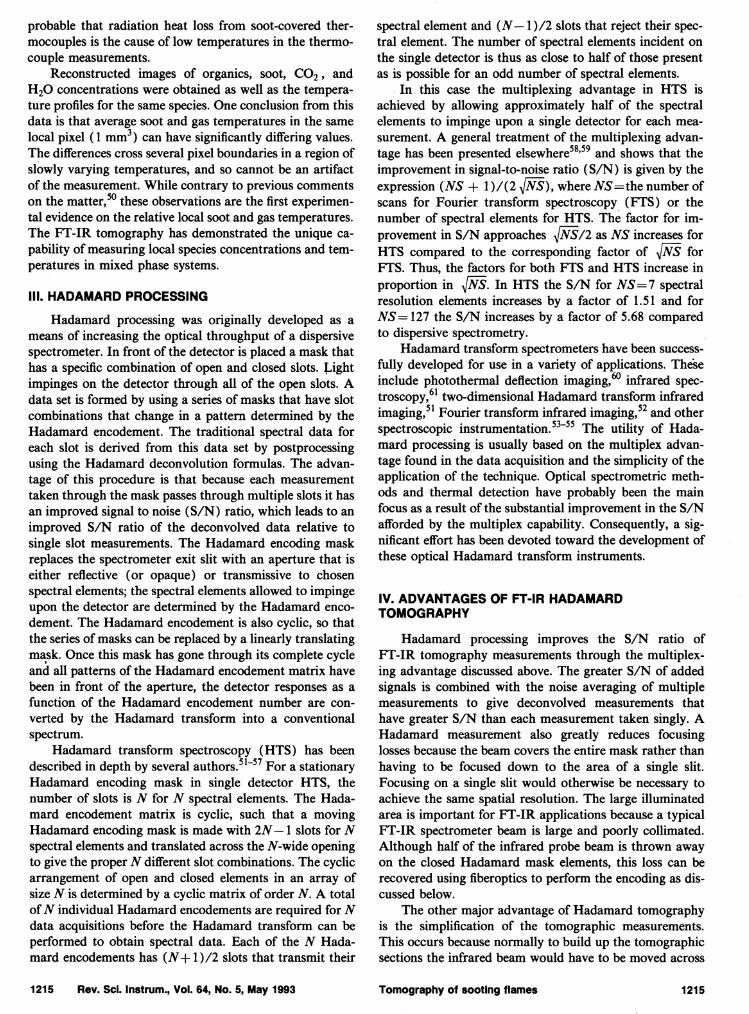
A uniformly thick visually transparent plastic was placed in front of the mask and sized so that it covered the entire area of element 4 in the seven element wide mask The plastic remained fixed as the mask and the encodeshyment changed generating an artificial spectra in element 4 The seven FT-IR Hadamard spectra are shown in Fig 2 and they appear to differ in only minor ways In spite of this the seven measurements are deconvolved using the inverse Hadamard matrix to give the single slot spectra of Fig 3 which clearly show the distinctive spectrum of the transparency isolated at position 4 Figure 4 shows a comshy
1216 Rev ScI Instrum Vol 64 No5 May 1993
2
3Q) V) I o 4Q V) Q)
n 5 o L
6U -Q) Q
Vl 7
5000 4000 3000 2000 1000
Wavenumber (cm-1)
FIG 2 Spectra measurements for each Hadamard mask encodement
parison of the deconvolved position 4 spectrum with a dishyrect spectrum of the transparency the match is excellent The spectrum of the plastic sheet was taken over the open seven-wide aperture so that it has much higher SIN acshycounting for the difference in the intensity of the spectra
To verify the improved SIN of the Hadamard process regions of the spectra where absorption was not significant were isolated and the spectral noise was computed as a square root of the value squared at each wave number The results are shown in Figs 5(a) and 5(b) The improveshyment in signal-to-noise is expected to be 15 based on the formula (NS + 1)2 $S and this is confirmed visually although a numerical calculation is difficult as a result of the spectral variations The SIN improvement increases approximately in proportion to $S12 for large NS
The SIN improvements of the Hadamard process can be increased by using fiber optics Although the Hadamard process increases SIN by increasing the light throughput for each measurement the blocking elements of the mask
0 D 2 L
~ 3Q)
V)
I 0 4Q V) Q)
n 5 0 L
u 6-Q) Q Vl 7
5000 4000 3000 2000 1000
Wavenumber (cm-1)
FIG 3 Deconvolved spectra for each ofthe seven single slots of the mask encodement
Tomography of sooting flames 1216
Thin Film Spectrum
Q L
0 -
II) til c 0 0 a til II)
0
e o -II) a
()
O~-----~~----~~~~
5000 4000 3000 2000 1000
Wavenumber (cm-1)
FIG 4 Comparison of the thin film spectral response through a sevenshywide opening with the deconvolved spectrum of the fourth single slot position covered by the film
necessarily limit the usage of the beam to slightly over half the beam area This is not an inherent limitation because fiber optics can be used to transform the entire beam area to the desired Hadamard encodement by distributing the output fibers in the pattern required for each encoding position In this case the SIN increases by another factor of 2 to become (NS + 1)~ a very significant imshyprovement especially for a smaller number of elements Such a fiber optic encodement could be done by translating slot-width bundles back and forth within the overall mask to form the appropriate Hadamard combinations
VI FT-IR HADAMARD TOMOGRAPHY MEASUREMENTS IN AXISYMMETRIC FLAMES
The FI-IR EIT Hadamard tomography was validated in a coannular laminar ethylene diffusion flame of the type studied at the National Institute of Science and Technolshyogy (NIST)4581O and elsewhere6bull7bull13 Extensive data on soot formation and species concentration has been obshytained in these flames by other methods Tomography on this flame has been performed previously in a project at AFR39 and has been described above as Standard Tomogshyraphy Results For the work described here a flame of similar height and flows (here 365 cm3Is fuel) was used The diffusion flame was stabilized with a lexan tube with slots for FT-IR beam access A restriction was also placed at the top of the enclosure beneath the exhaust duct Within this enclosure the flame was stable to within a few tenths of a millimeter and axisymmetric
The primary emphasis was on concentration measureshyments which were derived from transmission spectra through the flame A FI-IR absorbance spectrum of the fuel-rich part of the flame is shown in Fig 6 to show all of the readily identifiable species in the system Absorption features characteristic of ethylene (C2H4) carbon dioxide (C02) carbon monoxide (CO) and acetylene (C2H2) are shown in the figure An absorbance spectrum through the sooting part of the flame is shown in Fig 7 The signature
1217 Rev Sci Instrum Vol 64 No5 May 1993
Single Slot RMS Noise
Q L
~ gt-iii c II)-EO
0 L
0 -II) a ()
20
15
10
(a)
Q
L
0 -
gt-iii c II)
c -0 L
0 -II) a
()
5000 4500 4000 3500 3000 2500
Wavenumber (cm-1)
Deconvolved Hadamard RMS Noise
20 r-------
15
10
05
5000 4500 4000 3500 3000 2500
fbI Wavenumber (cm-1)
FIG 5 The Ff-IR spectral root-mean-squared (rms) noise (a) meashysured through a single slot and (b) measured as a single-slot Hadamard deconvolution
of the soot presence is -seen from the sloping baseline Conshycentration measurements were determined for CO2 using the peak at 668 cm- I for acetylene using its primary peak at 730 cm-I for CO using an integral under the curve of the upper branch of the absorption centered at 2145 cm- I
and for soot by measuring the absorbance value at 4000 cm - I as described in previous work23 Gas concentration calibrations were performed at AFR using commercial calshyibration gases and a similar FI-IR 4 cm- i resolution specshytrometer Care must be taken in comparing the room temshyperature calibration spectra with those taken through the flame The wings of the absorption bands spread out and decrease as more states are occupied as a result of the higher energy at higher temperature
The FT-IR beam was focused (condensed) through the mask and flame with parabolic mirrors leading to much improved SIN compared with a full-sized but
masked spectrometer beam A moving Hadamard mask based on seven elements was made out of strips of alumishynum foil attached to a stainless steel sheet Each element
Tomography of sooting flames 1217
N= N t)
0 t)
3 N 0 t)
N 0
CIl =~ 2 N
~
~ t)til c NM 0 =
N c t) III 0
1 t)
-lt
Soot o ~-----------r------- 4000 3000 2000 1000500
Wavenumber (em-I)
FIG 6 The Ff-IR transmission spectrum through an ethylene--oxygen diffusion flame
was 10 mm wide and 70 mm high the mask coding was checked with a reticle to be accurate to 01 mm or better in element positioning The mask was placed 15 cm from the flame center to minimize IR beam divergence effects in the distance between the mask and the flame Making the mask with 1-mm wide elements was difficult but necessary to be the appropriate size to span the ethylene diffusion flame A typical industrial application will use larger masks Moving the mask with precision was also difficult to do by hand but will be simple in an actual instrument which will use a stepper motor
The tomography on the flame was performed with the seventh (end) mask element centered at the center of the flame diving the flame into seven radial segments Five adjacent vertical positions were scanned starting from a position where the mask was centered 11 mm above the fuel inlet so that only the base of the flame is measured Background measurements were alternated with flame measurements for each mask position to minimize thermal
0 t)
N 0 N3 t) =
N t)
CIl ~ ~ 2 til c M 0 III
c 1 -lt
0
6000 5000 4000 3000 2000 1000
Wavenumber (em-1)
FIG 7 The Ff-IR transmission spectrum through the sooting region of the ethylene--oxygen flame
distortion effects After a set of Hadamard measurements were completed at one vertical position transmission specshytra were computed using the background spectrum for each appropriate mask position The seven Hadamard mask measurements were then deconvolved using the Hadshyamard inverse matrix to give single slot data The single slot data was then deconvolved tomographically to give relative concentration as a function of radius
Species measured were the ethylene fuel acetylene (a soot precursor) soot and CO2 the data are presented in Figs 8(a)-8(d) The line-of-sight measurements are reshyconstructed radially and information about the central value arises only from one cord measurement passing through the center For this reason the SIN is very low at the center and the data are presented showing the central value extrapolated based on the data trends This makes the data easier to understand visually These data are not intended to be precise only to demonstrate the power of Hadamard FT-IR tomography Each data point represents an average concentration value over the 1 X7-mm slot
Figures 8(a)-8(d) show a great amount of detail in the flame structure The data is comparable to the lower half of the flame images presented from earlier work Figshyure 8(a) shows the ethylene fuel fed into the base of the flame and being consumed Figure 8 (b) shows the soot precursor acetylene being formed from the hot ethylene and being consumed by the soot formation process Figure 8 (c) shows the soot being formed in an outer shell and at the center as the ethylene pyrolyses Figure 8(d) shows the CO2 being formed as the soot burns The sections do not include all ofthe flame as is shown by the soot peaks at the greatest radius in Fig 8(c)
The concentration data shows a major feature that does not appear in the previous data The ethylene acetyshylene and soot data indicate that there is a toroidal region in the flame with accentuated soot production Since this was not expected the literature was consulted to determine if this was a real effect In fact Santoro et al 4 have found this region in their research describing the soot formation process that causes it in detail Our data confirms his reshysults The soot data presented in Fig 8(c) is somewhat misleading as a result of an artifact of the graphics that draws descending contours in a different manner than asshycending contours This accounts for the asymmetry in the figure even though the data is symmetric (by definition) but obscures the toroidal region in the soot data The spashytially resolved concentration results agree well with previshyous data and clearly show striking 3-D features that could not normally be measured by simple line-of-sight techshyniques J
Tomographically deconvolved temperature measureshyments were also made at one height in the flame by taking emission data and calibrating with a blackbody source Figure 9 shows the results giving the soot and CO2 temshyperatures across the flame at an average height of 25 mm in the flame Once again the central measurements are unreshyliable so they have been omitted It can be seen that the CO2 temperature is considerably higher that the soot temshy
1218 Rev Sci Instrum Vol 64 No5 May 1993 Tomography of sooting flames 1218
1
50
3Q
1
20 20
14 1814
16 12
12 14 ~ c 12 Ig1 10 ~
101 ~
g j
10 ~ 0 amp
Q)
~ ~
~ ~ g
(e)
I I
I
(a)
50 14
4S
40 12
as ~ 8 10 10 ~ g g ~ltsA
~ I 1 ~
4 ()~ B-
FIG 8 Ethylene-air diffusion flame spatially resolved relative concentration measurements reconstructed from Hadamard tomography data (a) ethylene (b) acetylene (e) soot and (d) CO2
perature as expected since the soot radiates so much enshyergy
Finally experiments were done to determine if soot concentration changes dependent on fuel doping could be
~ ------------------------
CO~
2500
g2000 ~ -
- --- - - shy
soo~
500
o ~~~~~~~~~~~~-w -a -4 -2 o 2 4 6
Radius (mm)
FIG 9 Ethylene-air diffusion flame soot and CO2 temperature profiles derived from Hadamard tomography measurements
followed Figure 10 shows the variation in soot concentrashytion with the fraction of acetylene in the ethylene fuel feed The increased slope of the spectrum is directly proporshytional to concentration and shows a global increase in soot in the flame averaged across the entire flame as the fraction of ethylene is increased Both oxygen and hydrogen were also added but the change in soot production was much less
VII APPLICATIONS
Since FT-IR Hadamard tomography can provide spashytially resolved volume measurements of both concentration and temperatures of gas species and soot simultaneously it is expected to have broad applicability to the study of comshyplex combustion problems The method will be especially valuable to sooting systems since it can also detect the concentration and temperature of species important to soot formation such as acetylene and polyaromatic hydrocarshybons
Potential applications in combustion process control include furnaces boilers and incinerators which would all
1219 Rev Sci Instrum Vol 64 No5 May 1993 Tomography of sooting flames 1219
O 0 +---~-------+t____JIj
C2H4 Fuel
Oltr---+------~I_--_Itt
~O C2H2
~OO~~------------~~~r-~
ltII= -e ~ 0 laquo
6000 5000 4000 3000 2000 1000
Wavenumber (em-I)
FIG 10 Ethylene-air diffusion flame soot variation with acetylene reshyplacing ethylene fuel
benefit from the application of this monitoring system to achieve increased operating efficiency Applications in polshylution monitoring are widespread ranging from measuring the output of soot itself as particles that are dangerous to breathe to the optimization of combustion processes for minimizing pollutant production In research the system has many applications as a pure measurement device and other applications where by being able to measure soot and soot precursor gases simultaneously it can greatly enhance soot science In all these applications the FT-IR system has the advantage of making the same measurements with a single instrument that previously required a number of sepshyarate devices
ACKNOWLEDGMENTS
This work was supported by the National Science Foundation under Small Business Innovative Research (SBIR) Grant No ISI-9060897 and the authors wish to express their thanks to the agency and the program that made this work possible
IS S Penner c P Wang and M Y Bahadori Prog Energy Comb Sci 10209 (1984)
2S S Penner C P Wang and M Y Bahadori 20th Symp (Int) Comb (The Combustion Institute Pittsburgh PA 1984) p 1149
3D R Hardesty Report No SAND84-8724 Sandia National Laborashytories (1984)
4R J Santoro and H G Semerjian and R A Dobbins Combust Flame 51 203 (1983)
5R J Santoro and H G Semerjian The 20th Symp (Int) on Comb (The Combustion Institute Pittsburgh PA 1984) p 997
6J H Kent and H Gg Wagner The 20th Symp (Int) Comb (The Combustion Institute Pittsburgh PA 1984) p 1007
7 G H Markstein and J deRis The 20th Sym (Int) Comb (The Comshybustion Institute Pittsburgh PA 1984) p 1637
8R J Santoro T T Yeh and H G Semerjian in Heat Transfer in Fire and Combustion Systems edited by C K Law Y Jaluria W W Yuen and K Miyasaka (American Society of Mechanical Engineering New York 1985) p 57
9K C Smyth J H Miller R C Dorfman W G MaJlard and R J Santoro Combust Flame 62 157 (1985)
lOR J Santoro T T Yeh J J Horvath and H G Semerjian The 1985
1220 Rev Sci Instrum Vol 64 No5 May 1993
Fall Technical Meeting Eastern Section of the Combustion Institute Nov 4-6 1985 Philadelphia PA
11 A C Eckbreth and R J Hall Combust Flame 36 87 (1979) 12W L Flower C T Bowman 20th Symp (Int) on Comb (The Comshy
bustion Institute Pittsburgh PA 1984) p 1035 13L R Boedeker and G M Dobbs Combust Sci and Tech 363-6301
(1986) 14L D Chen W M Roquemore Combust Flame 66 81 (1986) 15W M Roquemore R S Tankin H H Chui and S A Lottes Exp
Fluids 4 205 (1986) 16M B Long B T Chu and R K Cheng AIAAA J 19 1151 (1981) 17M C Escoda and M B Long AIAA J 21 81 (1983) bull18M B Long P S Levin and D C Fourguette Opt Lett 10 267
(1985) 19T Utami and T Ueno Exp Fluids 225 (1984) 20M G Allen R D Howe and R K Hanson Opt Lett 11 (3) 126
(1986) 21 R K Hanson 21st Symposium (Int) on Combustion Invited Paper 22p E Best P L Chien R M Carangelo and P R Solomon Combust
Flame 85 309 (1991) 23K C Smyth and J H Miller Science 236 1540 (1987) 24S J Harris and A M Weiner 20th Symp (Int) on Comb (The Comshy
bustion Institute Pittsburgh P A 1984) p 969 25S J Harris A M Weiner R J Blint and J E M Goldsmith 21st
Symp (Int) on Comb (The Combustion Institute Pittsburgh P A 1986) p 1033
26L Baumgartner D Hesse H Jander and H G G Wagner 20th Symp (Int) on Comb (The Combustion Institute Pittsburgh PA 1984) p 959
27p R Solomon P E Best R M Carangelo J R Markham P L Chien R J Santoro and H G Semerjian 21st Symp (Int) Comb (The Combustion Institute Pittsburgh PA 1986) p 1763
28p R Solomon M A Serio R M Carangelo and J R Markham Fuel 65 182 (1986)
29p R Solomon R M Carangelo D G Hamblen and P E Best Appl Spectrosc 40 6 746 (1986)
30p R Solomon R M Carangelo P E Best J R Markham and D G Hamblen Fuel 66 897 (1987)
31 P E Best R M Carangelo J R Markham and P R Solomon Combust and Flame 66 47 (1986)
32p R Solomon R M Carangelo P E Best J R Markham and D G Hamblen 21st Symp (Int) on Comb (The Combustion Institute Pittsshyburgh PA 1986) p 437
33p R Solomon R M Carangelo P E Best J R Markham D G Hamblen and P L Chien in Fundamentals of Physical-Chemistry of Pulverized Coal Combustion edited by J Lahaye and G Prado (Klushywer New York 1987) p 347
34p R Solomon P L Chien R M Carangelo P E Best J R Markham 22nd Symp (Int) on Comb (The Combustion Institute Pittsburgh PA 1988) p 211
35R Siegel and J R Howell Thermal Radiation Heat Transfer (McGraw-Hill New York 1972)
36R H Tourin Spectroscopic Gas Temperature Measurement (Elsevier New York 1966)
37W J Pearce Conference on Extremely High Temperatures (Wiley New York 1958) pp 123-135
38B J Hughey and D A Santavicca Combust Sci Tech 29 167 ( 1982)
39C B Ludwig W Malkums J R Reardon and J A L Thomson in Handbook of Infrared Radiation from Combustion Gases edited by R Goulard and J A L Thomson NASA SP-3080 (NASA Scientific and Technical Information Office Washington DC 1973)
4OS Ray and H G Semerjian Laser Tomography for Simultaneous Concentration and Temperature Measurements in Reacting Flows AlAA 18th Thermophysics Conference Montreal Canada (1983)
41 R J Santoro H G Semerjian P J Emmerman and R Gouland Int J Heat Mass Transfer 24 (7) 1139 (1981)
42H G Semerjian R J Santoro R Goulard and P J Emmerman in Fluid Mechanics of Combustion Systems edited by T Morel R P Lohmann and J M Rackley (The American Society of Mechanical Engineers New York 1981) p 119
43L A Shepp and B F Logan IEEE Trans Nucl Sci NSmiddot21 21 (1974)
44p Elder T Jerrick and J W Birkeland Appl Opt 4 (5) 589 (1965)
Tomography of sooting flames 1220
41M P Freeman and S J Katz J Opt Soc Am 50 (8) 826 (1960) 46C C Limbaugh in Infrared Methodsfor Gaseous Measurement Theory
and Practice edited by J Wormhoudt (Marcel Dekker New York 1985) Chap 5 p 197
47L E Brewer and C C Limbaugh Appl Opt 11 1200 (1972) 48W H Dalzell and A J Sarofim Heat Transfer 92 100 (1969) 49R J Santoro T T Yeh and H G Semerjian Conference on Lasers
bull
and Electro-Optics Baltimore MD 21 May 1985 (Optical Society of America 1985) p 300
lOR C Millikan in Temperature Its Measurement and Control in Scishyence and Industry Vol 3 Part 2 edited by A I Dahl (Reinhold New York 1962) p 497
51 H Coufal U Moller and S Schneider Appl Opt 21 116 (1982) 52M E Kraenz and D Kunath J Molec Struct 79 47 (1982) 5lN Sugimoto Appl Opt 25 863 (1986)
bull
54F W Plankey T H Glenn L P Hart and J D Winefordner Ana Chern 46 1000 (1974)
SSM Harwit App Opt 10 1415 (1971) 56R M Hammaker J A Graham D C Tilotta and W G Fateley
Vibrational Spectra and Structure Vo 15 edited by J R Durig (Elsevier Amsterdam 1986) pp 401-485
57R D Swift R B Wattson J A Decker Jr R Paganetti and M Harwit Appl Opt 15 1595 (1976)
58 A P Bohlke J D Tate J S White J V Paukstelis R M Hamshymaker and W G Fate1ey J Molec Struct(Theochem) 200 471 (1989)
59S A Dyer and J B Park App Spectrosc 43 278 (1989) 6OF K Fotiou and M D Morris Appl Spectrosc 40 704 (1986) 61 J A Decker Jr App Opt 21 116 (1982)
1221 Rev Sci Instrum Vol- 64 No5 May 1993 Tomography of sooting flames 1221
scattering optically thin samples such as gas and soot the quantity 1-transmittance is proportional to the total exshytinction from each absorbing component The radiance is proportional to the extinction times the Planck black body function as a function of wavelength The normalized rashydiance which is the radiance divided by ( 1 - transmittance) is then proportional to the Planck black body function at the temperature of the component This proportionality applies across the spectra of black and gray bodies such as soot as well as at the specific absorption wavelengths of a particular gas The complete analysis for nonthin samples and for particles follows Siegel and Howshye1l35 and has been presented previously31
B Transmission tomography
An integrating line path measurement can be used to tomographically reconstruct a fully three-dimensional imshyage of a partially absorbing object The three-dimensional images are formed by combining a closely spaced parallel set of spatially resolved two-dimensional image slices through the object These two-dimensional images are in turn mathematically reconstructed using tomography from integral line-of-sight measurements that span a plane through the object where the beam must pass through each area element from two different directions A beam measurement that is scanned in a plane perpendicular to the beam (up and down left and right) to cover an entire measurement volume can be used to reconstruct a 3-D image of an axially symmetric object For the creation of 3-D images both the required absorption measurements and the reconstruction itself are greatly simplified for obshyjects with this axial symmetry The most common reconshystruction techniques in these cases use a radial inversion based on Abels equations36-39 More recent reconstruction techniques can produce two-dimensional slices of an image for objects of arbitrary shape40-43
For transmission tomographythe basic measurements are line-of-sight absorbances The spatial dependencies of both gas concentrations and temperatures have been obshytained previously from tomography applied to monochroshymatic measurements of a steady-state flame44 These results apply to gas samples without a condensed phase The sishymultaneous presence of a condensed phase (eg soot) and other gas band features reduces the accuracy of the monoshychromatic measurements The effects of soot can only be separated when the image reconstruction techniques deshyscribed above are based on local measurements and include IR absorbance spectra over an extended wave~number range Accurate local concentrations can then be detershymined for soot and all of the gases present in the flame At this time only the case of a low absorbance sample (transshymittance gt 80) has been studied in this manner22
C Emission tomography
A straightforward application of reconstruction techshyniques to scans of radiance is not possible where there is self-absorption in the sample There are a number of cases for which the self-absorbance has been corrected to obtain
1214 Rev Sci Instrum Vol 64 No5 May 1993
local species concentrations and temperatures from line-ofshysight emission and transmission measurements In the case of small absorbance (transmission gt 80 ) an emission measurement can be corrected by an absorption measureshyment made along the same path A radial inversion can be applied directly to the emission thus corrected to obtain local radiances 45
For samples with larger absorbance (80 gtpercent transmission gt 20) an iterative procedure in conjunction with radial inversion has been used to give local radishyances44 In addition in those cases for which there is not a linear relationship between absorbance and concentration (BeerS Law does not apply) a band model in conjunction with radial inversion has led to the determination of local gas species concentrations and temperatures4647
In the work described below the flame had high transshymission so that the radiance could be corrected for selfshyabsorption using the direct method45 The Fourier reconshystruction technique was applied to these corrected radiance spectra to give local radiances These reconstruction proshycedures were applied to each 16-cm- 1wave-number intershyval from 500-6500 cm -I to build up local emission and transmission IR spectra The analysis of these local spectra was performed in the same manner as for thin homogenous samples
D Standard tomography results
Spectral tomography for an ethylene diffusion flame has been described previously27 In these measurements 21 parallel scans were made at each of ten different heights in the flame The beam diameter in these cases was 1 mm For each height the transmission scans were converted to abshysorbance (-loglo T where T is the transmittance) since it is the projections of this quantity across the flame which are the appropriate inputs to image reconstruction algoshyrithms A Fourier reconstruction of the two-dimensional images from the projections was performed using the proshygram published by Shepp and Logan44
Local spectra were obtained for transmittance radishyance and normalized radiance From these data concenshytrations and temperatures were obtained for the soot as well as for CO2 H20 alkanes alkenes and alkynes The results of the local soot concentrations were obtained from the percent transmittance at 6500 cm -I using the optical constants for soot measured by Dalzell and Sarofim48 These values are compared with laser extinction and scatshytering data obtained by Santoro et aL 49 for a flame formed by the same burner under nominally identical conditions with very good agreement between the results obtained from the two different techniques Temperature comparishysons were made with the thermocouple measurement of gas temperatures (lumped) by Santoro et al 49 and the nonintrusive CARS temperature measurement for CO2 by Boedeker and Dobbs13 The temperatures from the FT-IR tomography were about 1OOmiddotC higher than those from thermocouple measurement with an additional 1OOmiddotC inshycrement in the soot zone On the other hand there is exshycellent agreement between FT-IR and CARS It is most
Tomography of sooting flames 1214
probable that radiation heat loss from soot-covered thershymocouples is the cause of low temperatures in the thermoshycouple measurements
Reconstructed images of organics soot CO2 and H20 concentrations were obtained as well as the temperashyture profiles for the same species One conclusion from this data is that average soot and gas temperatures in the same local pixel (1 mm3) can have significantly differing values The differences cross several pixel boundaries in a region of slowly varying temperatures and so cannot be an artifact of the measurement While contrary to previous comments on the matter 50 these observations are the first experimenshytal evidence on the relative local soot and gas temperatures The FT-IR tomography has demonstrated the unique cashypability of measuring local species concentrations and temshyperatures in mixed phase systems
III HADAMARD PROCESSING
Hadamard processing was originally developed as a means of increasing the optical throughput of a dispersive spectrometer In front of the detector is placed a mask that has a specific combination of open and closed slots Light impinges on the detector through all of the open slots A data set is formed by using a series of masks that have slot combinations that change in a pattern determined by the Hadamard encodement The traditional spectral data for each slot is derived from this data set by postprocessing using the Hadamard deconvolution formulas The advanshytage of this procedure is that because each measurement taken through the mask passes through multiple slots it has an improved signal to noise (SIN) ratio which leads to an improved SIN ratio of the deconvolved data relative to single slot measurements The Hadamard encoding mask replaces the spectrometer exit slit with an aperture that is either reflective (or opaque) or transmissive to chosen spectral elements the spectral elements allowed to impinge upon the detector are determined by the Hadamard encoshydement The Hadamard encodement is also cyclic so that the series of masks can be replaced by a linearly translating mask Once this mask has gone through its complete cycle and all patterns of the Hadamard encodement matrix have been in front of the aperture the detector responses as a function of the Hadamard encodement number are conshyverted by the Hadamard transform into a conventional spectrum
Hadamard transform spectroscopy (HTS) has been described in depth by several authors 51-57 For a stationary Hadamard encoding mask in single detector HTS the number of slots is N for N spectral elements The Hadashymard encodement matrix is cyclic such that a moving Hadamard encoding mask is made with 2N- 1 slots for N spectral elements and translated across the N-wide opening to give the proper N different slot combinations The cyclic arrangement of open and closed elements in an array of size N is determined by a cyclic matrix of order N A total of N individual Hadamard encodements are required for N data acquisitions before the Hadamard transform can be performed to obtain spectral data Each of the N Hadashymard encodements has (N+1)2 slots that transmit their
1215 Rev Sci Instrum Vol 64 No5 May 1993
spectral element and (N-1 )2 slots that reject their specshytral element The number of spectral elements incident on the single detector is thus as close to half of those present as is possible for an odd number of spectral elements
In this case the multiplexing advantage in HTS is achieved by allowing approximately half of the spectral elements to impinge upon a single detector for each meashysurement A general treatment of the multiplexing advanshytage has been presented elsewhere5859 and shows that the improvement in signal-to-noise ratio (SIN) is given by the expression (NS + 1)(2 ~) where NS=the number of scans for Fourier transform spectroscopy (FTS) or the number of spectral elements for HTS The factor for imshyprovement in SIN approaches ~2 as NS increases for HTS compared to the corresponding factor of ~ for FTS Thus the factors for both FTS and HTS increase in proportion in ~ In HTS the SIN for NS= 7 spectral resolution elements increases by a factor of 151 and for NS= 127 the SIN increases by a factor of 568 compared to dispersive spectrometry
Hadamard transform spectrometers have been successshyfully developed for use in a variety of applications These include photothermal deflection imaging60 infrared specshytroscopy61 two-dimensional Hadamard transform infrared imaging51 Fourier transform infrared imaging52 and other spectroscopic instrumentation 53-55 The utility of Hadashymard processing is usually based on the multiplex advanshytage found in the data acquisition and the simplicity of the application of the technique Optical spectrometric methshyods and thermal detection have probably been the main focus as a result of the substantial improvement in the SIN afforded by the multiplex capability Consequently a sigshynificant effort has been devoted toward the development of these optical Hadamard transform instruments
IV ADVANTAGES OF FT-IR HADAMARD TOMOGRAPHY
Hadamard processing improves the SIN ratio of FT-IR tomography measurements through the multiplexshying advantage discussed above The greater SIN of added signals is combined with the noise averaging of multiple measurements to give deconvolved measurements that have greater SIN than each measurement taken singly A Hadamard measurement also greatly reduces focusing losses because the beam covers the entire mask rather than having to be focused down to the area of a single slit Focusing on a single slit would otherwise be necessary to achieve the same spatial resolution The large illuminated area is important for FT-IR applications because a typical FT-IR spectrometer beam is large and poorly collimated Although half of the infrared probe beam is thrown away on the closed Hadamard mask elements this loss can be recovered using fiberoptics to perform the encoding as disshycussed below
The other major advantage of Hadamard tomography is the simplification of the tomographic measurements This occurs because normally to build up the tomographic sections the infrared beam would have to be moved across
Tomography of sooting flames 1215
HADAMARD PROCESSING M OVING MASK
~IIII 1111 12345671234567
N=7 Indjyjdual MAA1sn
1111 till III II I III ltil 3 ~~ ~
Mask 2 3 4PositiOll
Mask PosiuOll 6 7
FIG 1 Hadamard masking single moving mask and individual encodeshyment masks
the flame with a scanning apparatus In Hadamard tomogshyraphy the complex scanning equipment is replaced with Hadamard masks whose elements provide the appropriate slices through the flame Furthermore the cyclic character of the Hadamard encoding permits a single translating 2N-I-element-wide mask moving across an N-wide openshying to be used instead of separate masks for each encodeshyment The FT-IR beam is sized optically to fill the N-wide opening which in turn is sized to include all or part of the flame as desired A set of Hadamard measurements are made and the tomographic slices are deconvolved using the Hadamard inverse matrix Given the computational power already associated with the FT-IR measurements Hadashymard deconvolution processing is a minor additional reshyquirement
v HADAMARD MEASUREMENT DEMONSTRATION
Feasibility experiments were done to demonstrate the process of Hadamard manipulation in the context of toshymo~raphy using transparent plastic to simulate an infrared spectrum Shown in Fig 1 is the overall Hadamard mask and the encoding masks designed with seven elements Seven was chosen as the minimum number of elements that could resolve the flame profile with minimum processing complexity (the next largest permissible number of Hadashymard elements is 14) The moving mask is 13 (2N - 1 ) elements wide and sized vertically to give the appropriate tomographic resolution in that direction
A uniformly thick visually transparent plastic was placed in front of the mask and sized so that it covered the entire area of element 4 in the seven element wide mask The plastic remained fixed as the mask and the encodeshyment changed generating an artificial spectra in element 4 The seven FT-IR Hadamard spectra are shown in Fig 2 and they appear to differ in only minor ways In spite of this the seven measurements are deconvolved using the inverse Hadamard matrix to give the single slot spectra of Fig 3 which clearly show the distinctive spectrum of the transparency isolated at position 4 Figure 4 shows a comshy
1216 Rev ScI Instrum Vol 64 No5 May 1993
2
3Q) V) I o 4Q V) Q)
n 5 o L
6U -Q) Q
Vl 7
5000 4000 3000 2000 1000
Wavenumber (cm-1)
FIG 2 Spectra measurements for each Hadamard mask encodement
parison of the deconvolved position 4 spectrum with a dishyrect spectrum of the transparency the match is excellent The spectrum of the plastic sheet was taken over the open seven-wide aperture so that it has much higher SIN acshycounting for the difference in the intensity of the spectra
To verify the improved SIN of the Hadamard process regions of the spectra where absorption was not significant were isolated and the spectral noise was computed as a square root of the value squared at each wave number The results are shown in Figs 5(a) and 5(b) The improveshyment in signal-to-noise is expected to be 15 based on the formula (NS + 1)2 $S and this is confirmed visually although a numerical calculation is difficult as a result of the spectral variations The SIN improvement increases approximately in proportion to $S12 for large NS
The SIN improvements of the Hadamard process can be increased by using fiber optics Although the Hadamard process increases SIN by increasing the light throughput for each measurement the blocking elements of the mask
0 D 2 L
~ 3Q)
V)
I 0 4Q V) Q)
n 5 0 L
u 6-Q) Q Vl 7
5000 4000 3000 2000 1000
Wavenumber (cm-1)
FIG 3 Deconvolved spectra for each ofthe seven single slots of the mask encodement
Tomography of sooting flames 1216
Thin Film Spectrum
Q L
0 -
II) til c 0 0 a til II)
0
e o -II) a
()
O~-----~~----~~~~
5000 4000 3000 2000 1000
Wavenumber (cm-1)
FIG 4 Comparison of the thin film spectral response through a sevenshywide opening with the deconvolved spectrum of the fourth single slot position covered by the film
necessarily limit the usage of the beam to slightly over half the beam area This is not an inherent limitation because fiber optics can be used to transform the entire beam area to the desired Hadamard encodement by distributing the output fibers in the pattern required for each encoding position In this case the SIN increases by another factor of 2 to become (NS + 1)~ a very significant imshyprovement especially for a smaller number of elements Such a fiber optic encodement could be done by translating slot-width bundles back and forth within the overall mask to form the appropriate Hadamard combinations
VI FT-IR HADAMARD TOMOGRAPHY MEASUREMENTS IN AXISYMMETRIC FLAMES
The FI-IR EIT Hadamard tomography was validated in a coannular laminar ethylene diffusion flame of the type studied at the National Institute of Science and Technolshyogy (NIST)4581O and elsewhere6bull7bull13 Extensive data on soot formation and species concentration has been obshytained in these flames by other methods Tomography on this flame has been performed previously in a project at AFR39 and has been described above as Standard Tomogshyraphy Results For the work described here a flame of similar height and flows (here 365 cm3Is fuel) was used The diffusion flame was stabilized with a lexan tube with slots for FT-IR beam access A restriction was also placed at the top of the enclosure beneath the exhaust duct Within this enclosure the flame was stable to within a few tenths of a millimeter and axisymmetric
The primary emphasis was on concentration measureshyments which were derived from transmission spectra through the flame A FI-IR absorbance spectrum of the fuel-rich part of the flame is shown in Fig 6 to show all of the readily identifiable species in the system Absorption features characteristic of ethylene (C2H4) carbon dioxide (C02) carbon monoxide (CO) and acetylene (C2H2) are shown in the figure An absorbance spectrum through the sooting part of the flame is shown in Fig 7 The signature
1217 Rev Sci Instrum Vol 64 No5 May 1993
Single Slot RMS Noise
Q L
~ gt-iii c II)-EO
0 L
0 -II) a ()
20
15
10
(a)
Q
L
0 -
gt-iii c II)
c -0 L
0 -II) a
()
5000 4500 4000 3500 3000 2500
Wavenumber (cm-1)
Deconvolved Hadamard RMS Noise
20 r-------
15
10
05
5000 4500 4000 3500 3000 2500
fbI Wavenumber (cm-1)
FIG 5 The Ff-IR spectral root-mean-squared (rms) noise (a) meashysured through a single slot and (b) measured as a single-slot Hadamard deconvolution
of the soot presence is -seen from the sloping baseline Conshycentration measurements were determined for CO2 using the peak at 668 cm- I for acetylene using its primary peak at 730 cm-I for CO using an integral under the curve of the upper branch of the absorption centered at 2145 cm- I
and for soot by measuring the absorbance value at 4000 cm - I as described in previous work23 Gas concentration calibrations were performed at AFR using commercial calshyibration gases and a similar FI-IR 4 cm- i resolution specshytrometer Care must be taken in comparing the room temshyperature calibration spectra with those taken through the flame The wings of the absorption bands spread out and decrease as more states are occupied as a result of the higher energy at higher temperature
The FT-IR beam was focused (condensed) through the mask and flame with parabolic mirrors leading to much improved SIN compared with a full-sized but
masked spectrometer beam A moving Hadamard mask based on seven elements was made out of strips of alumishynum foil attached to a stainless steel sheet Each element
Tomography of sooting flames 1217
N= N t)
0 t)
3 N 0 t)
N 0
CIl =~ 2 N
~
~ t)til c NM 0 =
N c t) III 0
1 t)
-lt
Soot o ~-----------r------- 4000 3000 2000 1000500
Wavenumber (em-I)
FIG 6 The Ff-IR transmission spectrum through an ethylene--oxygen diffusion flame
was 10 mm wide and 70 mm high the mask coding was checked with a reticle to be accurate to 01 mm or better in element positioning The mask was placed 15 cm from the flame center to minimize IR beam divergence effects in the distance between the mask and the flame Making the mask with 1-mm wide elements was difficult but necessary to be the appropriate size to span the ethylene diffusion flame A typical industrial application will use larger masks Moving the mask with precision was also difficult to do by hand but will be simple in an actual instrument which will use a stepper motor
The tomography on the flame was performed with the seventh (end) mask element centered at the center of the flame diving the flame into seven radial segments Five adjacent vertical positions were scanned starting from a position where the mask was centered 11 mm above the fuel inlet so that only the base of the flame is measured Background measurements were alternated with flame measurements for each mask position to minimize thermal
0 t)
N 0 N3 t) =
N t)
CIl ~ ~ 2 til c M 0 III
c 1 -lt
0
6000 5000 4000 3000 2000 1000
Wavenumber (em-1)
FIG 7 The Ff-IR transmission spectrum through the sooting region of the ethylene--oxygen flame
distortion effects After a set of Hadamard measurements were completed at one vertical position transmission specshytra were computed using the background spectrum for each appropriate mask position The seven Hadamard mask measurements were then deconvolved using the Hadshyamard inverse matrix to give single slot data The single slot data was then deconvolved tomographically to give relative concentration as a function of radius
Species measured were the ethylene fuel acetylene (a soot precursor) soot and CO2 the data are presented in Figs 8(a)-8(d) The line-of-sight measurements are reshyconstructed radially and information about the central value arises only from one cord measurement passing through the center For this reason the SIN is very low at the center and the data are presented showing the central value extrapolated based on the data trends This makes the data easier to understand visually These data are not intended to be precise only to demonstrate the power of Hadamard FT-IR tomography Each data point represents an average concentration value over the 1 X7-mm slot
Figures 8(a)-8(d) show a great amount of detail in the flame structure The data is comparable to the lower half of the flame images presented from earlier work Figshyure 8(a) shows the ethylene fuel fed into the base of the flame and being consumed Figure 8 (b) shows the soot precursor acetylene being formed from the hot ethylene and being consumed by the soot formation process Figure 8 (c) shows the soot being formed in an outer shell and at the center as the ethylene pyrolyses Figure 8(d) shows the CO2 being formed as the soot burns The sections do not include all ofthe flame as is shown by the soot peaks at the greatest radius in Fig 8(c)
The concentration data shows a major feature that does not appear in the previous data The ethylene acetyshylene and soot data indicate that there is a toroidal region in the flame with accentuated soot production Since this was not expected the literature was consulted to determine if this was a real effect In fact Santoro et al 4 have found this region in their research describing the soot formation process that causes it in detail Our data confirms his reshysults The soot data presented in Fig 8(c) is somewhat misleading as a result of an artifact of the graphics that draws descending contours in a different manner than asshycending contours This accounts for the asymmetry in the figure even though the data is symmetric (by definition) but obscures the toroidal region in the soot data The spashytially resolved concentration results agree well with previshyous data and clearly show striking 3-D features that could not normally be measured by simple line-of-sight techshyniques J
Tomographically deconvolved temperature measureshyments were also made at one height in the flame by taking emission data and calibrating with a blackbody source Figure 9 shows the results giving the soot and CO2 temshyperatures across the flame at an average height of 25 mm in the flame Once again the central measurements are unreshyliable so they have been omitted It can be seen that the CO2 temperature is considerably higher that the soot temshy
1218 Rev Sci Instrum Vol 64 No5 May 1993 Tomography of sooting flames 1218
1
50
3Q
1
20 20
14 1814
16 12
12 14 ~ c 12 Ig1 10 ~
101 ~
g j
10 ~ 0 amp
Q)
~ ~
~ ~ g
(e)
I I
I
(a)
50 14
4S
40 12
as ~ 8 10 10 ~ g g ~ltsA
~ I 1 ~
4 ()~ B-
FIG 8 Ethylene-air diffusion flame spatially resolved relative concentration measurements reconstructed from Hadamard tomography data (a) ethylene (b) acetylene (e) soot and (d) CO2
perature as expected since the soot radiates so much enshyergy
Finally experiments were done to determine if soot concentration changes dependent on fuel doping could be
~ ------------------------
CO~
2500
g2000 ~ -
- --- - - shy
soo~
500
o ~~~~~~~~~~~~-w -a -4 -2 o 2 4 6
Radius (mm)
FIG 9 Ethylene-air diffusion flame soot and CO2 temperature profiles derived from Hadamard tomography measurements
followed Figure 10 shows the variation in soot concentrashytion with the fraction of acetylene in the ethylene fuel feed The increased slope of the spectrum is directly proporshytional to concentration and shows a global increase in soot in the flame averaged across the entire flame as the fraction of ethylene is increased Both oxygen and hydrogen were also added but the change in soot production was much less
VII APPLICATIONS
Since FT-IR Hadamard tomography can provide spashytially resolved volume measurements of both concentration and temperatures of gas species and soot simultaneously it is expected to have broad applicability to the study of comshyplex combustion problems The method will be especially valuable to sooting systems since it can also detect the concentration and temperature of species important to soot formation such as acetylene and polyaromatic hydrocarshybons
Potential applications in combustion process control include furnaces boilers and incinerators which would all
1219 Rev Sci Instrum Vol 64 No5 May 1993 Tomography of sooting flames 1219
O 0 +---~-------+t____JIj
C2H4 Fuel
Oltr---+------~I_--_Itt
~O C2H2
~OO~~------------~~~r-~
ltII= -e ~ 0 laquo
6000 5000 4000 3000 2000 1000
Wavenumber (em-I)
FIG 10 Ethylene-air diffusion flame soot variation with acetylene reshyplacing ethylene fuel
benefit from the application of this monitoring system to achieve increased operating efficiency Applications in polshylution monitoring are widespread ranging from measuring the output of soot itself as particles that are dangerous to breathe to the optimization of combustion processes for minimizing pollutant production In research the system has many applications as a pure measurement device and other applications where by being able to measure soot and soot precursor gases simultaneously it can greatly enhance soot science In all these applications the FT-IR system has the advantage of making the same measurements with a single instrument that previously required a number of sepshyarate devices
ACKNOWLEDGMENTS
This work was supported by the National Science Foundation under Small Business Innovative Research (SBIR) Grant No ISI-9060897 and the authors wish to express their thanks to the agency and the program that made this work possible
IS S Penner c P Wang and M Y Bahadori Prog Energy Comb Sci 10209 (1984)
2S S Penner C P Wang and M Y Bahadori 20th Symp (Int) Comb (The Combustion Institute Pittsburgh PA 1984) p 1149
3D R Hardesty Report No SAND84-8724 Sandia National Laborashytories (1984)
4R J Santoro and H G Semerjian and R A Dobbins Combust Flame 51 203 (1983)
5R J Santoro and H G Semerjian The 20th Symp (Int) on Comb (The Combustion Institute Pittsburgh PA 1984) p 997
6J H Kent and H Gg Wagner The 20th Symp (Int) Comb (The Combustion Institute Pittsburgh PA 1984) p 1007
7 G H Markstein and J deRis The 20th Sym (Int) Comb (The Comshybustion Institute Pittsburgh PA 1984) p 1637
8R J Santoro T T Yeh and H G Semerjian in Heat Transfer in Fire and Combustion Systems edited by C K Law Y Jaluria W W Yuen and K Miyasaka (American Society of Mechanical Engineering New York 1985) p 57
9K C Smyth J H Miller R C Dorfman W G MaJlard and R J Santoro Combust Flame 62 157 (1985)
lOR J Santoro T T Yeh J J Horvath and H G Semerjian The 1985
1220 Rev Sci Instrum Vol 64 No5 May 1993
Fall Technical Meeting Eastern Section of the Combustion Institute Nov 4-6 1985 Philadelphia PA
11 A C Eckbreth and R J Hall Combust Flame 36 87 (1979) 12W L Flower C T Bowman 20th Symp (Int) on Comb (The Comshy
bustion Institute Pittsburgh PA 1984) p 1035 13L R Boedeker and G M Dobbs Combust Sci and Tech 363-6301
(1986) 14L D Chen W M Roquemore Combust Flame 66 81 (1986) 15W M Roquemore R S Tankin H H Chui and S A Lottes Exp
Fluids 4 205 (1986) 16M B Long B T Chu and R K Cheng AIAAA J 19 1151 (1981) 17M C Escoda and M B Long AIAA J 21 81 (1983) bull18M B Long P S Levin and D C Fourguette Opt Lett 10 267
(1985) 19T Utami and T Ueno Exp Fluids 225 (1984) 20M G Allen R D Howe and R K Hanson Opt Lett 11 (3) 126
(1986) 21 R K Hanson 21st Symposium (Int) on Combustion Invited Paper 22p E Best P L Chien R M Carangelo and P R Solomon Combust
Flame 85 309 (1991) 23K C Smyth and J H Miller Science 236 1540 (1987) 24S J Harris and A M Weiner 20th Symp (Int) on Comb (The Comshy
bustion Institute Pittsburgh P A 1984) p 969 25S J Harris A M Weiner R J Blint and J E M Goldsmith 21st
Symp (Int) on Comb (The Combustion Institute Pittsburgh P A 1986) p 1033
26L Baumgartner D Hesse H Jander and H G G Wagner 20th Symp (Int) on Comb (The Combustion Institute Pittsburgh PA 1984) p 959
27p R Solomon P E Best R M Carangelo J R Markham P L Chien R J Santoro and H G Semerjian 21st Symp (Int) Comb (The Combustion Institute Pittsburgh PA 1986) p 1763
28p R Solomon M A Serio R M Carangelo and J R Markham Fuel 65 182 (1986)
29p R Solomon R M Carangelo D G Hamblen and P E Best Appl Spectrosc 40 6 746 (1986)
30p R Solomon R M Carangelo P E Best J R Markham and D G Hamblen Fuel 66 897 (1987)
31 P E Best R M Carangelo J R Markham and P R Solomon Combust and Flame 66 47 (1986)
32p R Solomon R M Carangelo P E Best J R Markham and D G Hamblen 21st Symp (Int) on Comb (The Combustion Institute Pittsshyburgh PA 1986) p 437
33p R Solomon R M Carangelo P E Best J R Markham D G Hamblen and P L Chien in Fundamentals of Physical-Chemistry of Pulverized Coal Combustion edited by J Lahaye and G Prado (Klushywer New York 1987) p 347
34p R Solomon P L Chien R M Carangelo P E Best J R Markham 22nd Symp (Int) on Comb (The Combustion Institute Pittsburgh PA 1988) p 211
35R Siegel and J R Howell Thermal Radiation Heat Transfer (McGraw-Hill New York 1972)
36R H Tourin Spectroscopic Gas Temperature Measurement (Elsevier New York 1966)
37W J Pearce Conference on Extremely High Temperatures (Wiley New York 1958) pp 123-135
38B J Hughey and D A Santavicca Combust Sci Tech 29 167 ( 1982)
39C B Ludwig W Malkums J R Reardon and J A L Thomson in Handbook of Infrared Radiation from Combustion Gases edited by R Goulard and J A L Thomson NASA SP-3080 (NASA Scientific and Technical Information Office Washington DC 1973)
4OS Ray and H G Semerjian Laser Tomography for Simultaneous Concentration and Temperature Measurements in Reacting Flows AlAA 18th Thermophysics Conference Montreal Canada (1983)
41 R J Santoro H G Semerjian P J Emmerman and R Gouland Int J Heat Mass Transfer 24 (7) 1139 (1981)
42H G Semerjian R J Santoro R Goulard and P J Emmerman in Fluid Mechanics of Combustion Systems edited by T Morel R P Lohmann and J M Rackley (The American Society of Mechanical Engineers New York 1981) p 119
43L A Shepp and B F Logan IEEE Trans Nucl Sci NSmiddot21 21 (1974)
44p Elder T Jerrick and J W Birkeland Appl Opt 4 (5) 589 (1965)
Tomography of sooting flames 1220
41M P Freeman and S J Katz J Opt Soc Am 50 (8) 826 (1960) 46C C Limbaugh in Infrared Methodsfor Gaseous Measurement Theory
and Practice edited by J Wormhoudt (Marcel Dekker New York 1985) Chap 5 p 197
47L E Brewer and C C Limbaugh Appl Opt 11 1200 (1972) 48W H Dalzell and A J Sarofim Heat Transfer 92 100 (1969) 49R J Santoro T T Yeh and H G Semerjian Conference on Lasers
bull
and Electro-Optics Baltimore MD 21 May 1985 (Optical Society of America 1985) p 300
lOR C Millikan in Temperature Its Measurement and Control in Scishyence and Industry Vol 3 Part 2 edited by A I Dahl (Reinhold New York 1962) p 497
51 H Coufal U Moller and S Schneider Appl Opt 21 116 (1982) 52M E Kraenz and D Kunath J Molec Struct 79 47 (1982) 5lN Sugimoto Appl Opt 25 863 (1986)
bull
54F W Plankey T H Glenn L P Hart and J D Winefordner Ana Chern 46 1000 (1974)
SSM Harwit App Opt 10 1415 (1971) 56R M Hammaker J A Graham D C Tilotta and W G Fateley
Vibrational Spectra and Structure Vo 15 edited by J R Durig (Elsevier Amsterdam 1986) pp 401-485
57R D Swift R B Wattson J A Decker Jr R Paganetti and M Harwit Appl Opt 15 1595 (1976)
58 A P Bohlke J D Tate J S White J V Paukstelis R M Hamshymaker and W G Fate1ey J Molec Struct(Theochem) 200 471 (1989)
59S A Dyer and J B Park App Spectrosc 43 278 (1989) 6OF K Fotiou and M D Morris Appl Spectrosc 40 704 (1986) 61 J A Decker Jr App Opt 21 116 (1982)
1221 Rev Sci Instrum Vol- 64 No5 May 1993 Tomography of sooting flames 1221
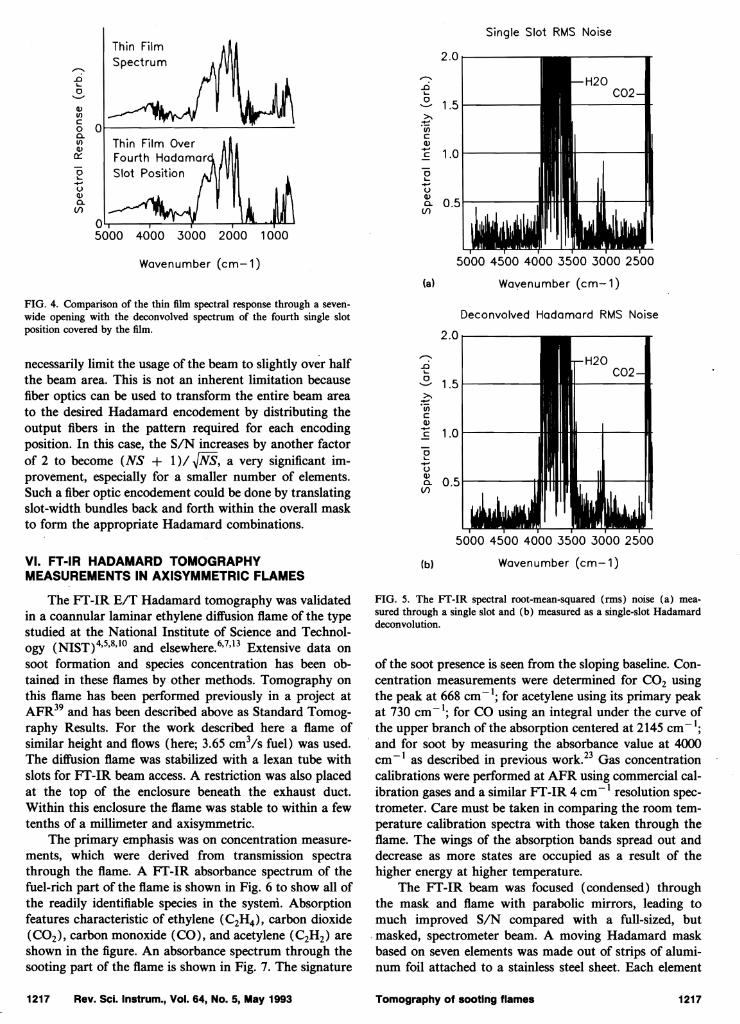
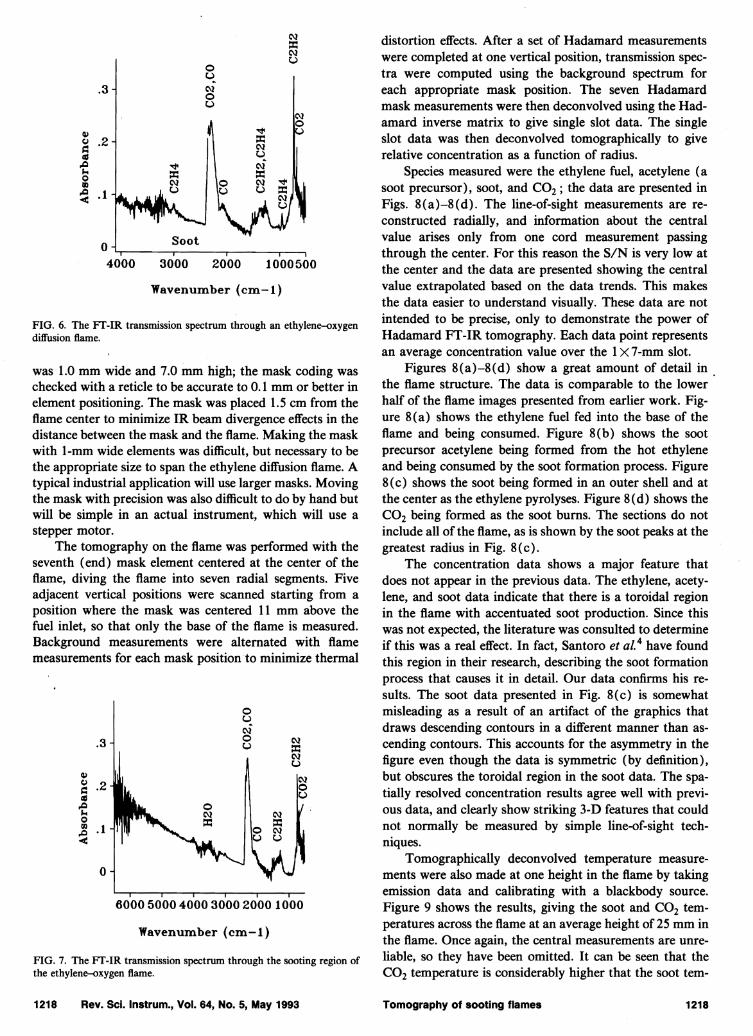
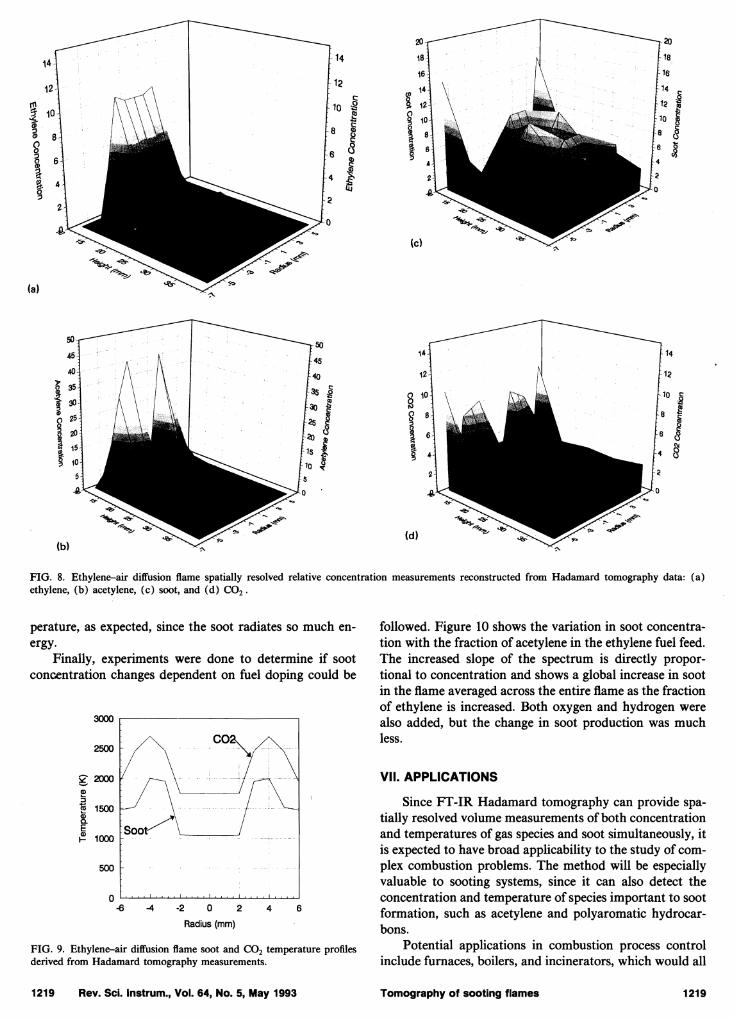
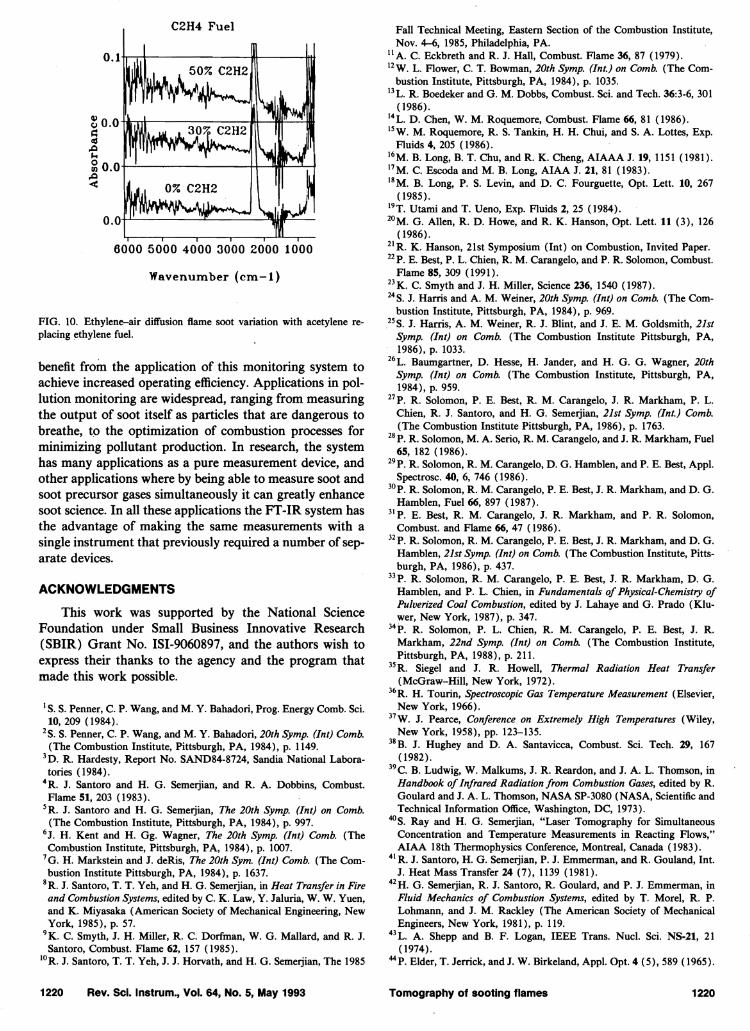


