Embed Size (px)
Citation preview
Use of Airborne Hyper-Spectral Remote Sensing (HSRS) to Focus Remediation and Monitor Vegetation Processes on Gold Mining Landscapes in South Africa
I.M. Weiersbye School of Animal, Plant and Environmental Sciences, University of the Witwatersrand, South Africa
N. Margalit Bar-Kal Systems Engineering, Israel
T. Feingersh Bar-Kal Systems Engineering, Israel
G. Revivo Bar-Kal Systems Engineering, Israel
R. Stark Bar-Kal Systems Engineering, Israel
Y. Zur Bar-Kal Systems Engineering, Israel
D. Heller Bar-Kal Systems Engineering, Israel
O. Braun Bar-Kal Systems Engineering, Israel
E.M. Cukrowska School of Chemistry, University of the Witwatersrand, South Africa
1 ABSTRACT Gold has been mined from the Witwatersrand Basin for over a century at depths ranging from surface to over 4 km deep. Uranium has been similarly mined for over 50 years. Waste-rock and milled tailings are stored in unlined and mountainous tailings storage facilities (TSFs), most of which experience wall failures, erosion and seepage. Further transport of contaminants occurs via wind and water-borne pathways, and efflorescence of minerals from acid mine drainage (AMD) may be visible on soils many kilometres distant from the original source (Naiker et al., 2003). However, most contamination cannot be detected without detailed chemical investigations. Cost-effective methods for mapping contamination over large areas would assist in identifying potential risks, and help focus financial resources for strategic remediation. Accurate mapping of contaminant baselines before, and after, remediation would also allow environmental improvements to be visualized. Demonstrating environmental compliance is crucial for mines in South Africa, as lack thereof can lead to the loss of the mining permit, as well as failure to achieve mine closure.
Earth observation systems on board satellites are widely used to map land-use, vegetation and some minerals. For example, the multi-spectral ASTER sensor on NASA’s TERRA satellite was used to map contamination around Johannesburg (Sutton et al., 2006). However, the spectral and spatial resolution of ASTER is too low for the detailed mapping that we require in our research program, which focuses on the use of vegetation to reclaim contaminated soils and groundwater. In contrast, airborne HSRS is characterised by high spectral and spatial resolution. We were especially interested in whether airborne HSRS could detect landscape processes associated with trees, and in whether HSRS would be suitable for monitoring the performance of different tree species planted to control acid mine drainage (AMD; Weiersbye et al., 2002).
We tested the capacity of airborne HSRS at two altitudes for the mapping of vegetation, seepage and minerals on a range of semi-arid landscapes. Ground-truthing comprised geo-referenced and hand-held spectral readings of vegetation, soils, tailings, mineral efflorescence and other representative surfaces, followed by chemical and mineralogical analyses of samples. Airborne HSRS proved to be a consistent tool for the mapping of minerals, seepage and vegetation across a range of landscapes, provided that ground-truthing was adequate. This paper comprises an overview of the HSRS applications found to be achievable.
Mine Closure 2006 ― Andy Fourie and Mark Tibbett (eds)© 2006 Australian Centre for Geomechanics, Perth, ISBN 0-9756756-6-4
Mine Closure 2006, Perth, Australia 601
2 INTRODUCTION The Witwatersrand Basin is historically the world’s richest deposit of gold and low-grade uranium. The reef consists of gold-bearing conglomerates, with a high pyrite (+3%, mostly iron sulphides) and uranium content. Since the concentrations of gold are less than 10 g/t4, large volumes of tailings have been generated and form mountainous TSFs, locally known as sand dumps, rock dumps and slimes dams.
Since TSFs are elevated, they are particularly susceptible to erosion and seepage. Contamination of soils occurs via four main routes: (i) from windblown tailings material; (ii) through the deposition of spilled tailings; (iii) from seepage due to water percolating through tailings; and (iv), via precipitation of mineral efflorescence (`salts’) on the soil from seepage or shallow groundwater. The last is driven by evaporation greatly exceeding precipitation during winter, and includes secondary minerals such as jarosite, copiapite, melanterite, gypsum and uranyl sulphates (Naiker et al., 2003; Tutu et al., 2003; Winde et al., 2004).
Less well-recognized routes of pollutant transfer can be facilitated by plants (Weiersbye et al., 2006a): the trapping of mineral dust on plant canopies and run-off onto soil; high evapotranspiration rates during the dry season contributing to the capillary rise of pollutants from groundwater; and direct uptake of pollutants into plants, with subsequent deposition of contaminated leaves on topsoils. Phreatophytes are deep-rooted plants, such as shrubs and trees, which obtain most of their water requirements from ground water. Contaminants in shallow groundwater can thus become accumulated in the rooting-zone, or even translocated above-ground into leaves and wood. There is great interest in this plant-mediated process (loosely termed `phytoremediation’), as it presents a mechanism for abstraction of pollutants, or at least for their immobilization in the rooting zone (Meagher, 2000). However, depending on the speciation chemistry of the abstracted pollutants, there could also be a secondary pollutant risk to vegetation and soils (Dickinson, 2000; Ebbs et al., 2001). An ecological engineering and phytoremediation approach to gold mine closure is being tested under South African semi-arid conditions (Weiersbye et al., 2006b). This includes woodland planting for AMD control and reclamation of polluted soils and TSFs, in order to foster a post-mining economy that is based on renewable natural resources (Weiersbye et al., 2002).
The different routes of contaminant transfer from TSFs and AMD to water, soils and vegetation can be differentiated on the basis of chemical signatures, although this is complex due to the presence of natural ore-bodies as well as contamination from numerous industries over the last century. We therefore wanted to determine if HSRS, of a combination of vegetation and mineral signatures, would allow discrimination between the different processes at a landscape scale.
This aim is of value in developing reliable protocols for the mapping of contamination and mineral recovery, for assessing the role of vegetation in contaminant attenuation, objective assessment of clean-up technologies, and for demonstrating environmental improvements in order to achieve closure.
3 METHODOLOGY To achieve the above objectives, airborne HSRS data was acquired at high altitude from 425 km2 of polygons, and at low altitude from 115 km of 900 m-wide transects, along a bioclimatic gradient from cold steppe (average rainfall 470 mm) to savanna woodland and grassland (average rainfall 625 to 750 mm). Study sites were situated around gold mines near the towns of Welkom, Klerksdorp and Carletonville, and along the historic mining belt across Greater Johannesburg. We acquired data during winter (the dry season) in order to minimize masking of soils by seasonal vegetation, and detect mineral efflorescence.
3.1 Data Collection There are three main stages: data collection, data interpretation and production of thematic maps. Data collection is divided into ground and airborne data collection. Two types of ground-based data were collected: spectral and chemical. Ground-based spectral data were collected with a hand-held spectroradiometer, the FieldSpec-Pro Analytical Spectral Device (ASD, with a spectral range of 350-2500 nm) and used to correct atmospheric data and for airborne spectral validation. The ASD spectra for atmospheric calibration were collected from homogenous targets at each study location (open areas with contrasting spectral characteristics), whereas spectra for airborne validation were collected from targets of interest replicated across the study areas: the canopies of evergreen trees, dead winter grasses, soils, tailings
Use of Airborne Hyper-Spectral Remote Sensing (HSRS) to Focus Remediation and Monitor Vegetation Processes on Gold Mining Landscapes in South Africa
I.M. Weiersbye, et al.
602 Mine Closure 2006, Perth, Australia
and a range of primary and secondary minerals. ASD measurements comprise the mean of 40 measurements from each individual target, and were done in situ and in vivo on the same days as the airborne data collection. ASD measurements were followed by chemical and mineralogical analyses of the targets in order to confirm composition and provide valid values for the final maps. Because the dust-load present on vegetation during winter was significant, we analyzed the elemental content of both dust and cleaned leaves.
The airborne data was collected with a hyper-spectral imager, flown on a Piper PA-31T Cheyenne aircraft. The AISA-ES is a push broom sensor composed of 2 scanners that together make up the hyper-spectral imager. The first covers the Very Near Infra Red (VNIR, 400-963 nm) and the second the Short Wave Infra Red (SWIR, 968-2372 nm) spectral ranges, with 180 spectral bands and average spectral resolution of 10 nm ± 3 nm. The field of view is 294 pixels cross track, each with 0.528 mrad IFOV. Airborne data-gathering was carried out at two altitudes in order to determine whether certain minerals and vegetation features would only be detectable at lower altitude: at 21000 feet above ground level (fagl) with 3.3 m spatial resolution and at 10000 fagl with 1.6 m spatial resolution.
3.2 Data processing Processing of the acquired spectral data was performed in three steps: (a) pre-processing (corrections and calibrations, including radiometric and geometric corrections of the airborne data); (b) processing (interpretation of spatial patterns); and (c) post-processing (image and index-mosaicing of interpreted data from all flight lines to larger area maps, construction of Red-Green-Blue (RGB) mosaics and thematic maps of mineral and vegetation features).
For radiometric correction, raw digital numbers at each image pixel were converted to physical (radiance) values, using pre-defined gain. Gain was measured and updated, per wavelength, under laboratory conditions, whereas offset was measured during flight. Radiometric correction brings all image pixels to a common calibrated radiometric basis. Images were atmospherically corrected using the "empirical line method" which crosses each flight strip, and compares values of electromagnetic radiance from the surface to reflectance values measured on the ground with the calibrated ASD. Atmospheric correction was performed on calibration strips in order to generate gain and offset. The gain and offset were then applied to the image.
3.2.1 Mapping of vegetation reflectance indices We mapped nine indicators of plant productivity and stress, as well as plant water content (an indicator of water availability in the environment) (Table 1). In addition to four chlorophyll indices, we mapped photosynthetically active radiation (PAR)–absorbing compounds (which includes chlorophyll and carotenoids), carotenoids specifically, anthocyanins and blue-absorbing compounds. Pigments in plants are genetically determined, and are therefore an indicator of vegetation class - grass, trees, photosynthetic pathway and so forth. Carotenoids, anthocyanins and blue-absorbing compounds are produced in response to normal seasonal influences, such as winter, but also in response to other stressors and therefore are indicators of underlying environmental conditions. Plant water content was determined from the normalized difference water index (NDWI), with a minor modification; we used the 980 nm band instead of the 857 nm wavelength. The validity of using 980 nm was confirmed from a regression (R2=0.98) of NDWI857 against NDWI980, collected with the ASD from sample tree leaves in each region.
We masked all dormant vegetation in the images, in order to only map pigments in the evergreen trees, bushes, winter crops and perennial wetland plants, based on the normalized difference vegetation index (NDVI). The vegetation threshold value (the minimum value used to discriminate between the presence and absence of vegetation in imagery) is based on the NDVI. This threshold value is determined by the interpreter and can be affected by vegetation condition, the ratio between soil and vegetation per pixel (mixing) and the quality of atmospheric correction. Ground-truthing of leaf water and pigment content was carried out by in situ and in vivo field ASD measurements on plants, followed by determination of water content and pigments in the collected samples.
3.2.2 Mapping of minerals and free surface water (seepage) Identification of minerals is based on their unique spectral properties (Clark, 1999; Mueller and Kaufman, 2002):
Contaminant Risks and Off-Site Impacts
Mine Closure 2006, Perth, Australia 603
• Goethite, hematite, jarosite and copiapite - these iron-bearing minerals have unique spectral features in the VNIR range (400-1100 nm). Goethite and hematite are primary minerals typical of rocks and soils, whereas jarosite and copiapite are secondary minerals associated with weathering of sulphides and AMD.
• Gypsum is a secondary mineral typical of efflorescence from AMD in the presence of calcium; spectral features are in the SWIR-I range (1400-1800 nm).
• Kaolinite, chlorite and pyrophyllite are primary silicaceous minerals common in tailings; relevant spectral features are in the SWIR II region (2100-2300 nm) (Vaughan and Calvin, 2004).
• Uranium bearing minerals – since no published spectra are available, reference ground-truth data was taken from a chemically-defined mine evaporation pan containing a range of uranium-bearing mineral precipitates as well as tailings. Spectral features that were used for interpretation were in the SWIR II region (2100-2300 nm). Although this spectral signature was repeatable in the Welkom and Klerksdorp regions, it resulted in under-detection of known uranium-bearing anomalies in the Johannesburg transect, leading us to conclude that there are local differences in the dominant uranium-bearing precipitates. This finding emphasizes the importance of adequate ground-truthing that includes chemical and mineralogical characterization of a large range of samples against certified standards.
• For mapping of surface seepage, we used the water band at 851nm. Interpretation of water salinity is possible, but was not attempted in this study.
Table 1 Vegetation reflectance indices
Index Formula
Leaf water content (Gao, 1995) )()(
1241980
1241980RR
RRNDWI +−=
Leaf anthocyanin content (Gitelson et al., 2001) )/1()/1(1 550700 RRARTI −=
Chlorophyll content (Tucker, 1979) )()(
676750
676750RR
RRNDVI +−=
Chlorophyll content (Gitelson and Merzlyak, 1997) )()(
550750
550750RR
RRGNDVI +−=
Chlorophyll content (Carter, 1994) 670
695R
R
Chlorophyll content (Datt, 1999) )()(
680850
710850RR
RR−
−
Carotenoid content (Merzlyak et al., 1999) 750
500680 )(R
RRPSRI −=
Leaf Total Blue Absorbing Compounds ( )∑
=
−=450
4001
iiRA
Leaf Total PAR Absorbing Compounds ( )∑
=
−=750
4001
iiRA
Vegetation fraction (Carlson, et al., 1997) )/()( minmaxmin RRRRVF ref −−=
3.2.2.1 Spectral validation of minerals
With the exception of uranium-bearing minerals, reference spectra for mineral mapping were obtained from the United States Geological Survey (USGS) spectral library. Spectral validation was based on comparison of air-borne spectra, ASD ground-based spectra, and spectra from the USGS spectral library. Good agreement was obtained between all source spectra (Figure 1).
Use of Airborne Hyper-Spectral Remote Sensing (HSRS) to Focus Remediation and Monitor Vegetation Processes on Gold Mining Landscapes in South Africa
I.M. Weiersbye, et al.
604 Mine Closure 2006, Perth, Australia
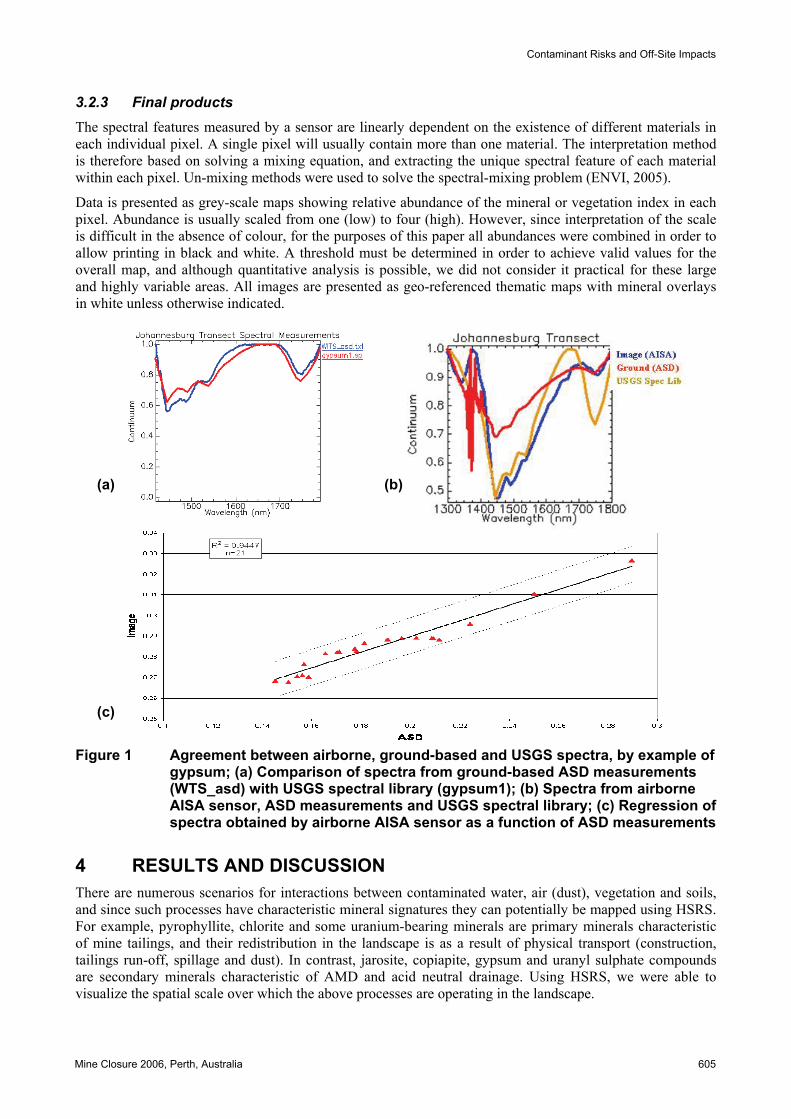
3.2.3 Final products The spectral features measured by a sensor are linearly dependent on the existence of different materials in each individual pixel. A single pixel will usually contain more than one material. The interpretation method is therefore based on solving a mixing equation, and extracting the unique spectral feature of each material within each pixel. Un-mixing methods were used to solve the spectral-mixing problem (ENVI, 2005).
Data is presented as grey-scale maps showing relative abundance of the mineral or vegetation index in each pixel. Abundance is usually scaled from one (low) to four (high). However, since interpretation of the scale is difficult in the absence of colour, for the purposes of this paper all abundances were combined in order to allow printing in black and white. A threshold must be determined in order to achieve valid values for the overall map, and although quantitative analysis is possible, we did not consider it practical for these large and highly variable areas. All images are presented as geo-referenced thematic maps with mineral overlays in white unless otherwise indicated.
(b)
(a)
(c)
Figure 1 Agreement between airborne, ground-based and USGS spectra, by example of gypsum; (a) Comparison of spectra from ground-based ASD measurements (WTS_asd) with USGS spectral library (gypsum1); (b) Spectra from airborne AISA sensor, ASD measurements and USGS spectral library; (c) Regression of spectra obtained by airborne AISA sensor as a function of ASD measurements
4 RESULTS AND DISCUSSION There are numerous scenarios for interactions between contaminated water, air (dust), vegetation and soils, and since such processes have characteristic mineral signatures they can potentially be mapped using HSRS. For example, pyrophyllite, chlorite and some uranium-bearing minerals are primary minerals characteristic of mine tailings, and their redistribution in the landscape is as a result of physical transport (construction, tailings run-off, spillage and dust). In contrast, jarosite, copiapite, gypsum and uranyl sulphate compounds are secondary minerals characteristic of AMD and acid neutral drainage. Using HSRS, we were able to visualize the spatial scale over which the above processes are operating in the landscape.
Contaminant Risks and Off-Site Impacts
Mine Closure 2006, Perth, Australia 605
4.1 Mapping of Seepage, Soil, Ore bodies, Tailings and Acid Mine Drainage
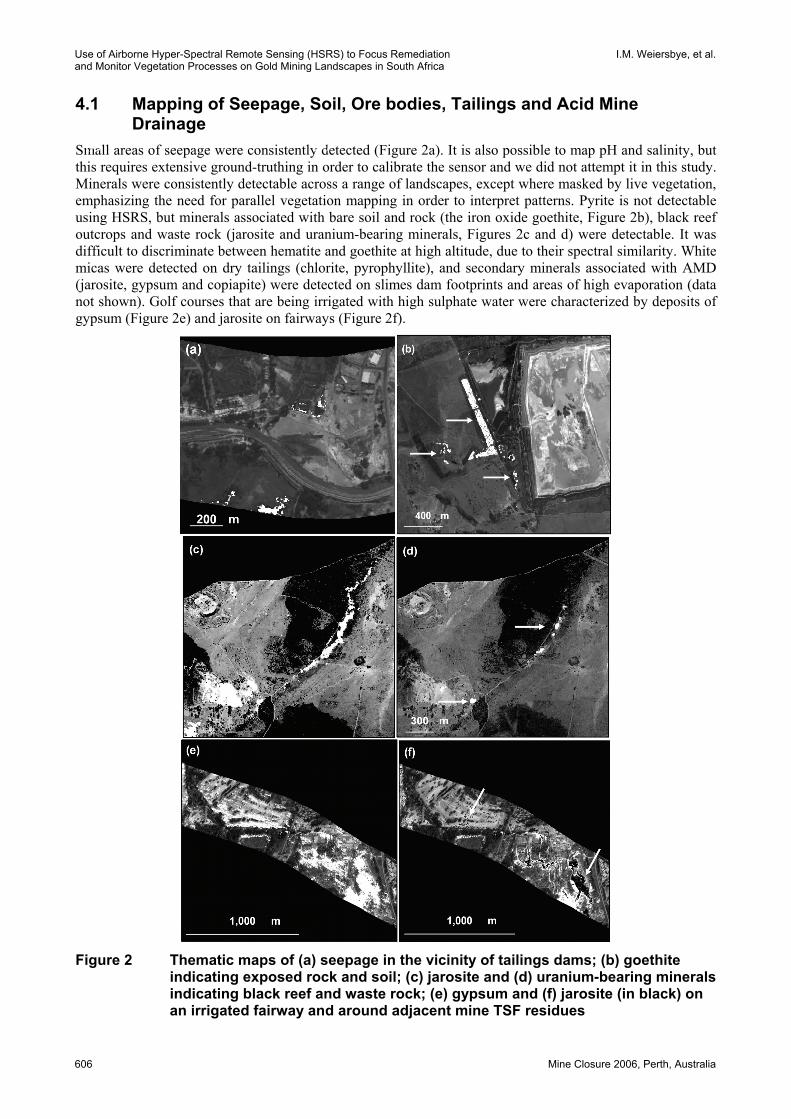
Small areas of seepage were consistently detected (Figure 2a). It is also possible to map pH and salinity, but this requires extensive ground-truthing in order to calibrate the sensor and we did not attempt it in this study. Minerals were consistently detectable across a range of landscapes, except where masked by live vegetation, emphasizing the need for parallel vegetation mapping in order to interpret patterns. Pyrite is not detectable using HSRS, but minerals associated with bare soil and rock (the iron oxide goethite, Figure 2b), black reef outcrops and waste rock (jarosite and uranium-bearing minerals, Figures 2c and d) were detectable. It was difficult to discriminate between hematite and goethite at high altitude, due to their spectral similarity. White micas were detected on dry tailings (chlorite, pyrophyllite), and secondary minerals associated with AMD (jarosite, gypsum and copiapite) were detected on slimes dam footprints and areas of high evaporation (data not shown). Golf courses that are being irrigated with high sulphate water were characterized by deposits of gypsum (Figure 2e) and jarosite on fairways (Figure 2f).
(a) (b)
Figure 2 Thematic maps of (a) seepage in the vicinity of tailings dams; (b) goethite
indicating exposed rock and soil; (c) jarosite and (d) uranium-bearing minerals indicating black reef and waste rock; (e) gypsum and (f) jarosite (in black) on an irrigated fairway and around adjacent mine TSF residues
Use of Airborne Hyper-Spectral Remote Sensing (HSRS) to Focus Remediation and Monitor Vegetation Processes on Gold Mining Landscapes in South Africa
I.M. Weiersbye, et al.
606 Mine Closure 2006, Perth, Australia
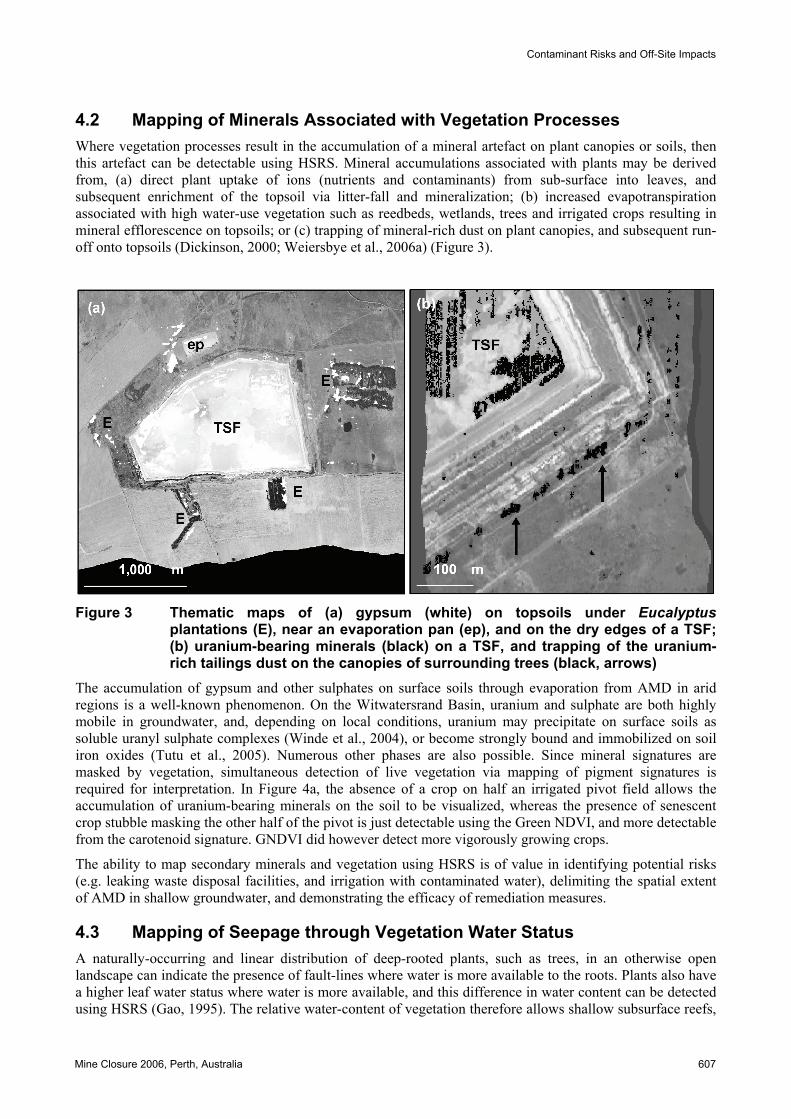
4.2 Mapping of Minerals Associated with Vegetation Processes Where vegetation processes result in the accumulation of a mineral artefact on plant canopies or soils, then this artefact can be detectable using HSRS. Mineral accumulations associated with plants may be derived from, (a) direct plant uptake of ions (nutrients and contaminants) from sub-surface into leaves, and subsequent enrichment of the topsoil via litter-fall and mineralization; (b) increased evapotranspiration associated with high water-use vegetation such as reedbeds, wetlands, trees and irrigated crops resulting in mineral efflorescence on topsoils; or (c) trapping of mineral-rich dust on plant canopies, and subsequent run-off onto topsoils (Dickinson, 2000; Weiersbye et al., 2006a) (Figure 3).
Figure 3 Thematic maps of (a) gypsum (white) on topsoils under Eucalyptus
plantations (E), near an evaporation pan (ep), and on the dry edges of a TSF; (b) uranium-bearing minerals (black) on a TSF, and trapping of the uranium-rich tailings dust on the canopies of surrounding trees (black, arrows)
The accumulation of gypsum and other sulphates on surface soils through evaporation from AMD in arid regions is a well-known phenomenon. On the Witwatersrand Basin, uranium and sulphate are both highly mobile in groundwater, and, depending on local conditions, uranium may precipitate on surface soils as soluble uranyl sulphate complexes (Winde et al., 2004), or become strongly bound and immobilized on soil iron oxides (Tutu et al., 2005). Numerous other phases are also possible. Since mineral signatures are masked by vegetation, simultaneous detection of live vegetation via mapping of pigment signatures is required for interpretation. In Figure 4a, the absence of a crop on half an irrigated pivot field allows the accumulation of uranium-bearing minerals on the soil to be visualized, whereas the presence of senescent crop stubble masking the other half of the pivot is just detectable using the Green NDVI, and more detectable from the carotenoid signature. GNDVI did however detect more vigorously growing crops.
The ability to map secondary minerals and vegetation using HSRS is of value in identifying potential risks (e.g. leaking waste disposal facilities, and irrigation with contaminated water), delimiting the spatial extent of AMD in shallow groundwater, and demonstrating the efficacy of remediation measures.
4.3 Mapping of Seepage through Vegetation Water Status A naturally-occurring and linear distribution of deep-rooted plants, such as trees, in an otherwise open landscape can indicate the presence of fault-lines where water is more available to the roots. Plants also have a higher leaf water status where water is more available, and this difference in water content can be detected using HSRS (Gao, 1995). The relative water-content of vegetation therefore allows shallow subsurface reefs,
Contaminant Risks and Off-Site Impacts
Mine Closure 2006, Perth, Australia 607
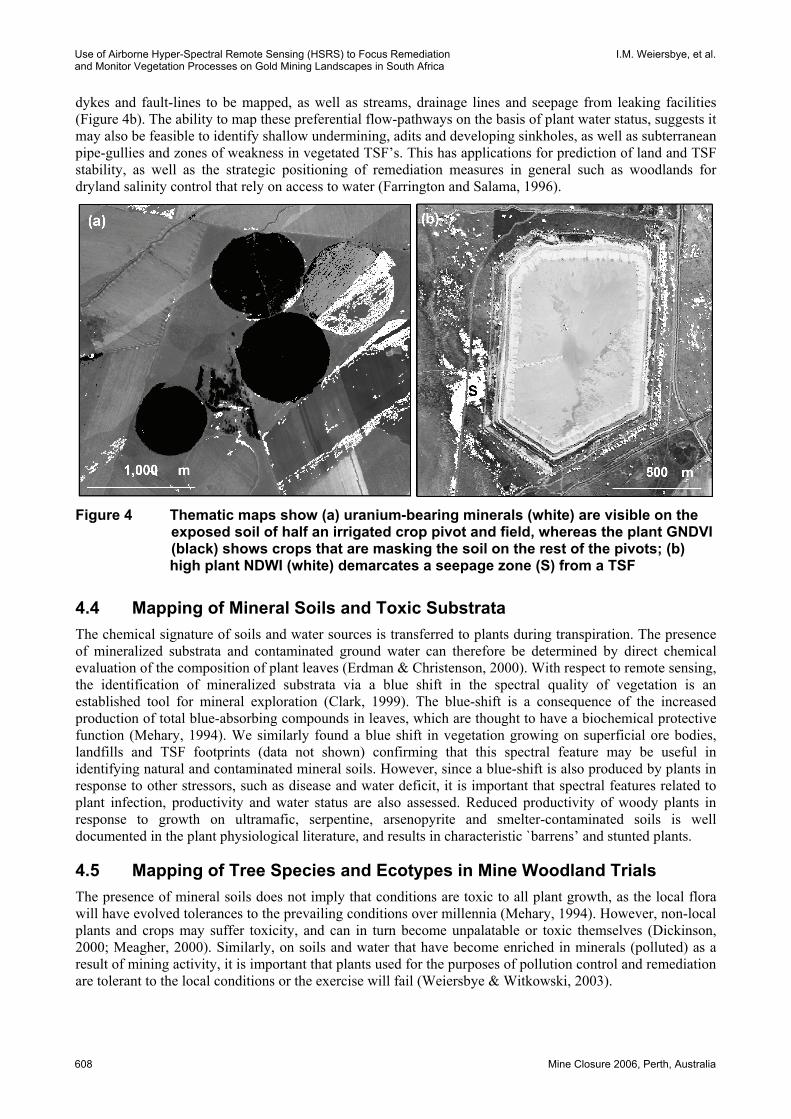
dykes and fault-lines to be mapped, as well as streams, drainage lines and seepage from leaking facilities (Figure 4b). The ability to map these preferential flow-pathways on the basis of plant water status, suggests it may also be feasible to identify shallow undermining, adits and developing sinkholes, as well as subterranean pipe-gullies and zones of weakness in vegetated TSF’s. This has applications for prediction of land and TSF stability, as well as the strategic positioning of remediation measures in general such as woodlands for dryland salinity control that rely on access to water (Farrington and Salama, 1996).
Figure 4 Thematic maps show (a) uranium-bearing minerals (white) are visible on the
exposed soil of half an irrigated crop pivot and field, whereas the plant GNDVI (black) shows crops that are masking the soil on the rest of the pivots; (b) high plant NDWI (white) demarcates a seepage zone (S) from a TSF
4.4 Mapping of Mineral Soils and Toxic Substrata The chemical signature of soils and water sources is transferred to plants during transpiration. The presence of mineralized substrata and contaminated ground water can therefore be determined by direct chemical evaluation of the composition of plant leaves (Erdman & Christenson, 2000). With respect to remote sensing, the identification of mineralized substrata via a blue shift in the spectral quality of vegetation is an established tool for mineral exploration (Clark, 1999). The blue-shift is a consequence of the increased production of total blue-absorbing compounds in leaves, which are thought to have a biochemical protective function (Mehary, 1994). We similarly found a blue shift in vegetation growing on superficial ore bodies, landfills and TSF footprints (data not shown) confirming that this spectral feature may be useful in identifying natural and contaminated mineral soils. However, since a blue-shift is also produced by plants in response to other stressors, such as disease and water deficit, it is important that spectral features related to plant infection, productivity and water status are also assessed. Reduced productivity of woody plants in response to growth on ultramafic, serpentine, arsenopyrite and smelter-contaminated soils is well documented in the plant physiological literature, and results in characteristic `barrens’ and stunted plants.
4.5 Mapping of Tree Species and Ecotypes in Mine Woodland Trials The presence of mineral soils does not imply that conditions are toxic to all plant growth, as the local flora will have evolved tolerances to the prevailing conditions over millennia (Mehary, 1994). However, non-local plants and crops may suffer toxicity, and can in turn become unpalatable or toxic themselves (Dickinson, 2000; Meagher, 2000). Similarly, on soils and water that have become enriched in minerals (polluted) as a result of mining activity, it is important that plants used for the purposes of pollution control and remediation are tolerant to the local conditions or the exercise will fail (Weiersbye & Witkowski, 2003).
Use of Airborne Hyper-Spectral Remote Sensing (HSRS) to Focus Remediation and Monitor Vegetation Processes on Gold Mining Landscapes in South Africa
I.M. Weiersbye, et al.
608 Mine Closure 2006, Perth, Australia
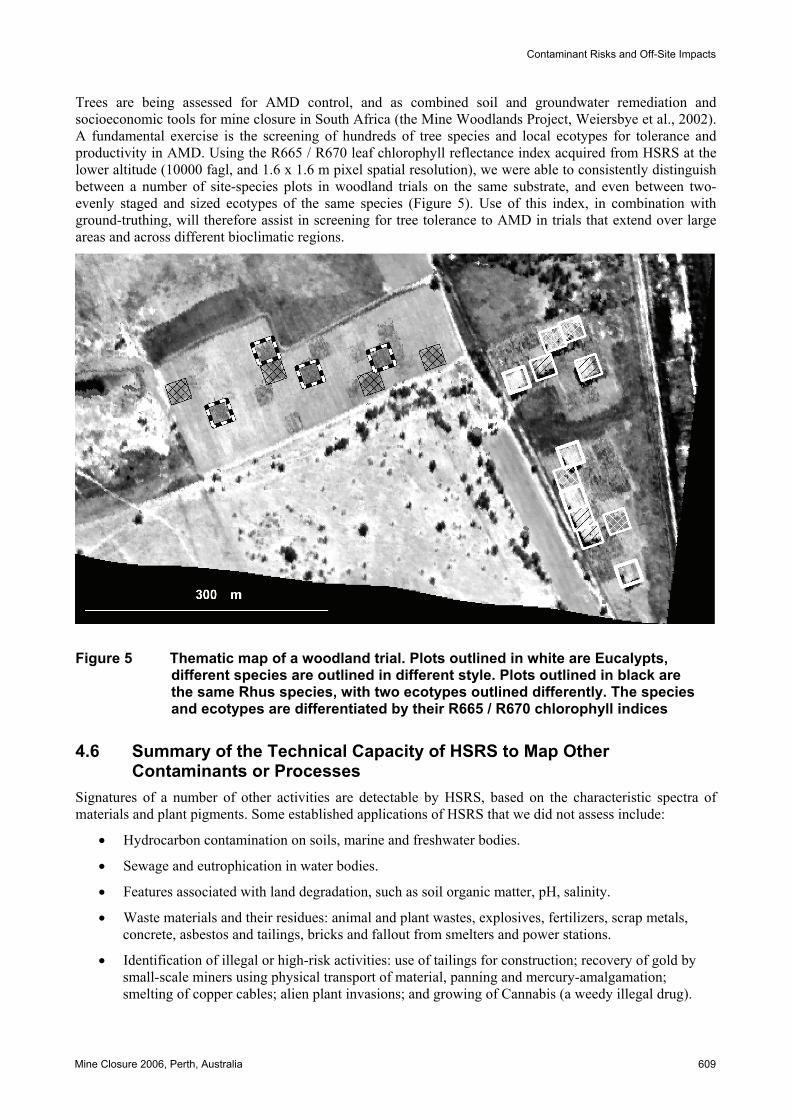
Trees are being assessed for AMD control, and as combined soil and groundwater remediation and socioeconomic tools for mine closure in South Africa (the Mine Woodlands Project, Weiersbye et al., 2002). A fundamental exercise is the screening of hundreds of tree species and local ecotypes for tolerance and productivity in AMD. Using the R665 / R670 leaf chlorophyll reflectance index acquired from HSRS at the lower altitude (10000 fagl, and 1.6 x 1.6 m pixel spatial resolution), we were able to consistently distinguish between a number of site-species plots in woodland trials on the same substrate, and even between two-evenly staged and sized ecotypes of the same species (Figure 5). Use of this index, in combination with ground-truthing, will therefore assist in screening for tree tolerance to AMD in trials that extend over large areas and across different bioclimatic regions.
Figure 5 Thematic map of a woodland trial. Plots outlined in white are Eucalypts, different species are outlined in different style. Plots outlined in black are the same Rhus species, with two ecotypes outlined differently. The species and ecotypes are differentiated by their R665 / R670 chlorophyll indices
4.6 Summary of the Technical Capacity of HSRS to Map Other Contaminants or Processes
Signatures of a number of other activities are detectable by HSRS, based on the characteristic spectra of materials and plant pigments. Some established applications of HSRS that we did not assess include:
• Hydrocarbon contamination on soils, marine and freshwater bodies.
• Sewage and eutrophication in water bodies.
• Features associated with land degradation, such as soil organic matter, pH, salinity.
• Waste materials and their residues: animal and plant wastes, explosives, fertilizers, scrap metals, concrete, asbestos and tailings, bricks and fallout from smelters and power stations.
• Identification of illegal or high-risk activities: use of tailings for construction; recovery of gold by small-scale miners using physical transport of material, panning and mercury-amalgamation; smelting of copper cables; alien plant invasions; and growing of Cannabis (a weedy illegal drug).
Contaminant Risks and Off-Site Impacts
Mine Closure 2006, Perth, Australia 609
5 CONCLUSIONS This study illustrates the potential of airborne hyper-spectral remote sensing for environmental monitoring ranging from safety and compliance, to mineral recovery, remediation and rehabilitation performance. The most important attributes are the broad spectral range, high spectral resolution and high spatial resolution that is achievable in comparison to other remote sensing techniques; the identification of living, dead and abiotic materials according to their spectra, and the ability to map these materials over a large area. In order to achieve valid maps, it is important to demonstrate agreement between material chemical and/or mineralogical composition, the "real spectra", and the airborne spectra for a well-replicated suite of samples across the entire mapped region (i.e. “ground-truthing”). The maps presented in this paper are "semi-quantitative"; they provide information on the relative amount of each material in every pixel. Accurate quantitative maps are theoretically possible and rely on the development of models that link analytical chemical data with the spectral features of each material.
Primary and secondary minerals associated with gold and uranium mining and AMD, as well as vegetation processes, were detectable across a range of landscapes. For most features, similar results were obtained at both altitudes. Mapping can therefore be carried out at higher altitudes (lower pixel resolution), which saves time and overall cost. However, in our study, only the low altitude mapping permitted discrimination between closely-related oxide minerals, and between the spectral characteristics of some tree species. We therefore recommend that high altitude mapping is complemented by selected low altitude transects. Simultaneous mapping of vegetation is essential in order to understand the processes underlying mineral distribution, as plants can both mask and facilitate mineral accumulation.
Accurate mapping of contaminants in relation to natural backgrounds will determine whether levels are elevated above environmental norms, and enable focused mineral recovery, clean-up and rehabilitation exercises. The technique is also useful for demonstrating environmental improvements and compliance over large areas during the mine closure process.
ACKNOWLEDGEMENTS This study is part of the Ecological Engineering and Phytoremediation program (the Mine Woodlands Project) being conducted by the University of the Witwatersrand and AngloGold Ashanti Ltd. We are also grateful to the Department of Trade & Industry and the National Research Foundation of South Africa for THRIP funding, and to the Elbitt Systems Group for additional sponsorship and technical support. Two anonymous referees are thanked for their contributions to this paper.
REFERENCES Carter, G.A. (1994) Ratios of leaf reflectances in narrow wavebands as indicators of plant stress. International Journal
of Remote Sensing 15, pp. 697-703.
Carlson, T.N. and Ripley, D.A. (1997) On the relation between NDVI, fractional vegetation cover, and leaf area index. Remote Sensing of Environment 62(3), pp. 241-252.
Clark, R.N. (1999) Spectroscopy of Rocks and Minerals and Principles of Spectroscopy. Manual of Remote Sensing, Remote Sensing for the Earth Sciences. Rencz and Ryerson (eds), John Wiley and Sons, 699 p.
Datt, B. (1999) Visible/near infrared reflectance and chlorophyll content in Eucalyptus leaves. International Journal of Remote Sensing 20(14), pp. 2741-2759.
Dickinson, N.M. (2000) Strategies for sustainable woodland on contaminated soils. Chemosphere 41, 259-263.
Ebbs, S., Brady, D., Norvell, W. and Kochian, L. (2001) Uranium speciation, plant uptake and phytoremediation. Practice Periodical of Hazardous, Toxic & Radioactive Waste Management July, pp. 130-135.
ENVI 4.2 Reference Guides (2005).
Erdman, J.A. and Christenson, S. (2000) Elements in cottonwood trees as an indicator of ground water contaminated by landfill leachate. Groundwater monitoring & Remediation 20(1), pp. 120-126.
Farrington, P. and Salama, R.B. (1996) Controlling dryland salinity by planting trees in the best possible hydrogeological setting. Land Degradation & Development Vol. 7, pp. 183-204.
Use of Airborne Hyper-Spectral Remote Sensing (HSRS) to Focus Remediation and Monitor Vegetation Processes on Gold Mining Landscapes in South Africa
I.M. Weiersbye, et al.
610 Mine Closure 2006, Perth, Australia
Gao, B.C. (1995) Normalized Difference Water Index for Remote Sensing of Vegetation Liquid Water from Space. Proceedings of SPIE 2480, pp. 225-236.
Gitelson, A.A. and Merzlyak, M.N. (1997) Remote Estimation of Chlorophyll Content in higher Plant Leaves. International Journal of Remote Sensing 18(12), pp. 291-298.
Gitelson, A.A., Merzlyak, M.N. and Chivkunova, O.B. (2001) Optical Properties and Nondestructive Estimation of Anthocyanin Content in Plant Leaves. Photochemistry and Photobiology 71, pp. 38-45.
Meagher, R.B. (2000) Phytoremdiation of toxic elemental and organic pollutants. Current Opinion in Plant Biology 3, pp. 153-162.
Mehary, A.A. (1994) Integrated tolerance mechanisms: constitutive and adaptive plant responses to elevated metal concentrations in the environment. Plant, Cell & Environment 7, pp. 989-993.
Merzlyak, J.R., Gitelson, A.A., Chivkunova, O.B. and Rakitin, V.Y. (1999) Non-destructive Optical Detection of Pigment Changes During Leaf Senescence and Fruit Ripening. Physiologia Plantarum 106, pp. 135-141.
Mueller, A. and Kaufman, H. (2002) Imaging Spectroscopy in Mining Environments, the Experience of DLR. 2nd MINEO Workshop.
Naicker, K., Cukrowska, E. and McCarthy, T.S. (2003) Acid mine drainage arising from gold mining activity in Johannesburg, South Africa and environs. Journal of Environmental Pollution 122, pp. 29-40.
Sutton, M.W., Weiersbye, I.M., Galpin, J. and Heller, D. (2006) GIS-based history of gold mining and risk assessment of land-uses on the Witwatersrand Basin of South Africa. 1st International Seminar on Mine Closure, Perth, Australia, September 2006.
Tucker, C.J. (1979) Red and Photographic Infrared Linear Combinations for Monitoring Vegetation. Remote Sensing. of the Environment 8, pp. 127-150.
Tutu, H., Cukrowska, E.M., McCarthy, T.S., Mphephu, N.F. and Hart, R. (2003) Determination and modelling of geochemical speciation of uranium in gold mine polluted land in South Africa. Mine Water and the Environment, Armstrong, D, A.B. de Villiers, R.L.P. Kleinmann, T.S. McCarthy & P.J. Norton (eds). Proceedings of the 8th International Mine Water Association Congress, Johannesburg, South Africa, pp. 137-149.
Tutu, H., Cukrowska, E. M., Dohnal, V. and Havel, J. (2005) Application of artificial neural networks for classification of uranium distribution in the central Rand goldfield, South Africa. Environmental Modelling and Assessment, 10, pp. 143-152.
USGS Spectral Library (2005) United States Geological Services.
Vaughan, R.G. and Calvin, W.M. (2004) Mapping Weathering and Alteration Minerals in Virginia City, Nevada with AVIRIS and HyperSpecTIR. Proceedings of the 13th Airborne Geoscience Workshop, JPL, Pasadena, California.
Weiersbye, I.M. and Witkowski, E.T.F. (2003) Acid rock drainage from gold tailings dams on the Witwatersrand basin impacts on tree seed fate, inorganic content and seedling morphology. Mine Water and the Environment, D. Armstrong, A.B. de Villiers, R.L.P. Kleinmann, T.S. McCarthy & P.J. Norton (eds). Proceedings of the 8th International Congress on Mine Water & the Environment, Johannesburg, South Africa, pp. 311-328.
Weiersbye, I.M., Witkowski, E.T.F., Dye, P., Vivier, J.J.K., Van Rensburg, H.J., Herbert, M., Amis, E.J., Parsons, S.J., Reichardt, M., Fourie, L., Holmwood, R. and Van Wyk, A. (2002) The Containment of Pollution from Tailings Dams. Invited Report to the Directorate of Community Forestry, Dept. Water Affairs & Forestry, and the Directorate of Mine Rehabilitation, Dept. Minerals & Energy, WITS_GOVT_20/07/02V2, 71 p.
Weiersbye, I.M., Margalit, N., Cukrowska, E.M., Feingersh, T., Revivo, G., Braun, O., Stark, R. and Zur, Y. (2006a) Acid mine drainage and cycling of contaminants by phreatophyte vegetation: implications for land-use planning. Multiple Use Management of Natural forests and Woodlands: Policy Refinements and Scientific Progress. Proceedings of the Natural Forests & Savanna Woodlands Symposium IV, Bester, J. (ed). Department of Water Affairs & Forestry of South Africa. Submitted.
Weiersbye, I.M., Witkowski, E.T.F. and Reichardt, M. (2006b) The flora of gold and uranium tailings dams, and contaminated soils, on South Africa’s deep-level mines. Bothalia 36(1), pp. 101-127.
Winde, F., Wade, P. and Van der Walt, I.J. (2004) Gold tailings as a source of waterborne uranium contamination of streams – The Koekemoerspruit (Klerksdorp goldfield, South Africa) as a case study. Part I of III: Uranium migration along the aqueous pathway. Water SA 30(2), pp. 219-225.
Contaminant Risks and Off-Site Impacts
Mine Closure 2006, Perth, Australia 611


