Embed Size (px)
Citation preview
Urban Climate AdaptationFROM RISK BARRIERS TO RESULTS
Managing the Social, Political, Environmental, & Financial Risks of Urban Infrastructure
A Resource Guide for Local Leaders
CLIMATE LEADERSHIP ACADEMY
CityLinks Pilot Partnership Between US and ASEAN Member States
Produced by
CLIMATE LEADERSHIP ACADEMYCityLinks Pilot Partnership Between US and ASEAN Member States
A Resource Guide for Local Leaders
Urban Climate AdaptationFROM RISK BARRIERS TO RESULTS
Managing the Social, Political, Environmental, & Financial Risks of Urban Infrastructure
Produced by
Acknowledgements
This Resource Guide was developed for the Climate Leadership Academy on Urban Climate Adaptation held August 13-15, 2013, Jakarta, Indonesia. The Guide was made possible with generous funding from the ICMA CityLinksTM program. This Climate Leadership Academy is presented as part of the CityLinks Pilot Partnership between US and ASEAN Member StatesIn researching and producing the Resource Guide, ISC consulted with the eight participating city teams, as well as Resource Team members, and a wide range of leading experts and practitioners. CityLinks wishes to thank the many individuals and organizations that contributed their knowledge and expertise, including IGES, The Institute for Global Environmental Strategies; ASEC – The ASEAN Secretariat; and the AWGESC: ASEAN Working Group on Environmentally Sustainable Cities.
This Resource Guide is made possible by the generous support of the American people through the United States Agency for International Development (USAID) in support of ICMA’s CityLinks™ Program under Leader with Associates Cooperative Agreement AID-OAA-L-11-00008. The contents are the responsibility of the CityLinks program and do not necessarily reflect the views of USAID or the United States Government.
ABOUT ICMA ICMA, the International City/County Management Association, develops and advances professional local government management to create sustainable communities that improve lives worldwide. ICMA provides member support; publications; data and information; peer and results-oriented assistance; and training and professional development to nearly 9,000 city, town, and county experts and other individuals and organizations throughout the world. The management decisions made by ICMA’s members affect millions of individuals living in thousands of communities, from small villages and towns to large metropolitan areas. Please visit www.icma.org/CityLinks.
ABOUT THE INSTITUTE FOR SUSTAINABLE COMMUNITIESSince its founding in 1991 by former Vermont Governor Madeleine Kunin, ISC has led 91 transformative, community-driven projects in 25 countries. ISC specializes in developing and delivering training and technical assistance programs that improve the effectiveness of communities, their leaders, and the institutions that support them. In 2012, ISC launched the Sustainable Communities Leadership Academy website (www.sustainablecommunitiesleadershipacademy.org) to make the valuable, high-caliber information from our first-class peer-learning and training workshops available to practitioners in any community. www.iscvt.org
WE WELCOME YOUR FEEDBACK!This Resource Guide is a work-in-progress. It will be maintained as a web-based resource and updated to provide valuable resources to public, private and nonprofit sector leaders working to promote resilience-building activities across North America. If you have comments on the guide, or ideas for how to improve it, please send them to Anna Casey at the Institute for Sustainable Communities at [email protected].
This Resource Guide was printed on 100% recycled paper.
CityLinks | http://icma.org/en/international/citylinks/icma_citylinks | Twitter: @ICMACityLinks
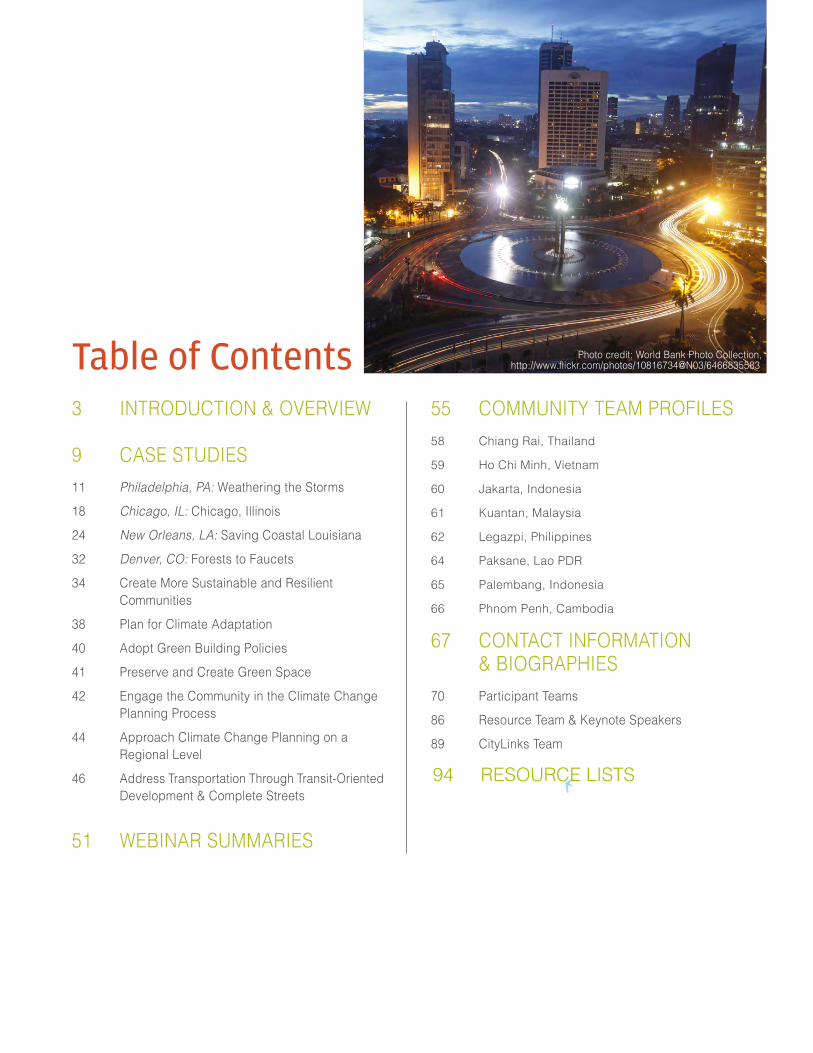
Table of Contents3 INTRODUCTION & OVERVIEW
9 CASE STUDIES11 Philadelphia, PA: Weathering the Storms
18 Chicago, IL: Chicago, Illinois
24 New Orleans, LA: Saving Coastal Louisiana
32 Denver, CO: Forests to Faucets
34 Create More Sustainable and Resilient Communities
38 Plan for Climate Adaptation
40 Adopt Green Building Policies
41 Preserve and Create Green Space
42 Engage the Community in the Climate Change Planning Process
44 Approach Climate Change Planning on a Regional Level
46 Address Transportation Through Transit-Oriented Development & Complete Streets
51 WEBINAR SUMMARIES
55 COMMUNITY TEAM PROFILES58 Chiang Rai, Thailand
59 Ho Chi Minh, Vietnam
60 Jakarta, Indonesia
61 Kuantan, Malaysia
62 Legazpi, Philippines
64 Paksane, Lao PDR
65 Palembang, Indonesia
66 Phnom Penh, Cambodia
67 CONTACT INFORMATION & BIOGRAPHIES
70 Participant Teams
86 Resource Team & Keynote Speakers
89 CityLinks Team
Photo credit: World Bank Photo Collection, http://www.flickr.com/photos/10816734@N03/6466835583
94 RESOURCE LISTS

Introduction & Overview | 3
Introduction and Overview
THE CHALLENGE
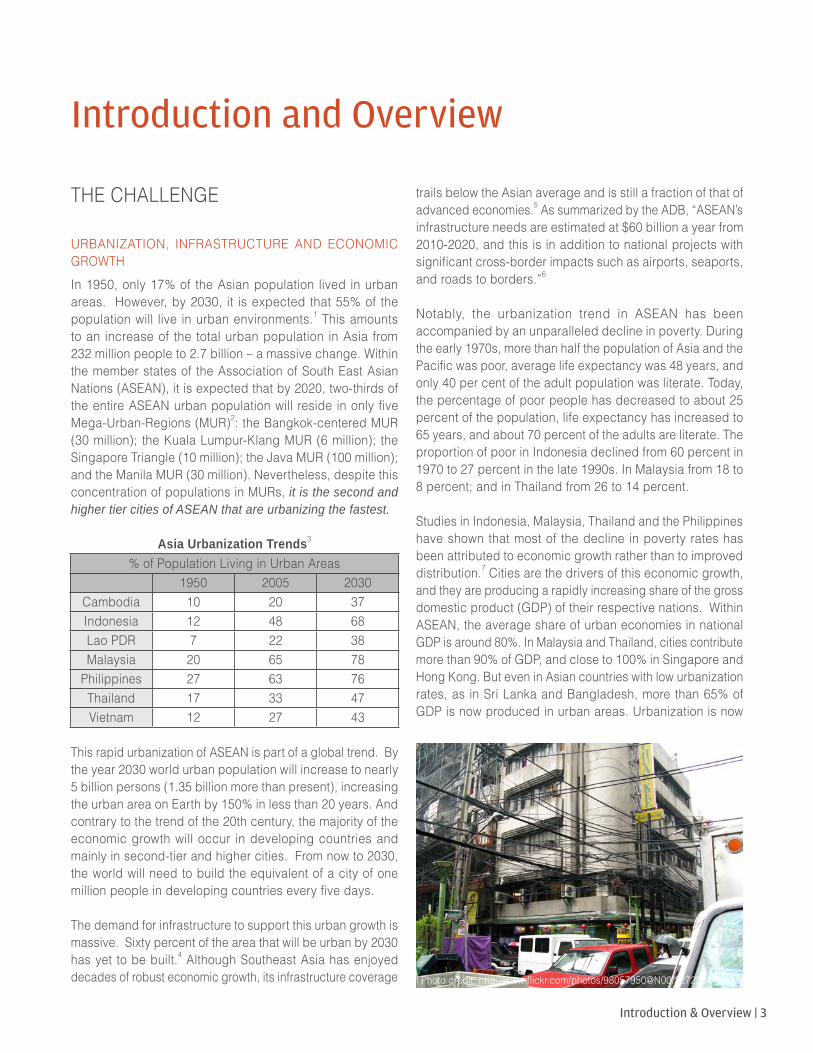
URBANIZATION, INFRASTRUCTURE AND ECONOMIC GROWTHIn 1950, only 17% of the Asian population lived in urban areas. However, by 2030, it is expected that 55% of the population will live in urban environments.1 This amounts to an increase of the total urban population in Asia from 232 million people to 2.7 billion – a massive change. Within the member states of the Association of South East Asian Nations (ASEAN), it is expected that by 2020, two-thirds of the entire ASEAN urban population will reside in only five Mega-Urban-Regions (MUR)2: the Bangkok-centered MUR (30 million); the Kuala Lumpur-Klang MUR (6 million); the Singapore Triangle (10 million); the Java MUR (100 million); and the Manila MUR (30 million). Nevertheless, despite this concentration of populations in MURs, it is the second and higher tier cities of ASEAN that are urbanizing the fastest.
Asia Urbanization Trends3
% of Population Living in Urban Areas1950 2005 2030
Cambodia 10 20 37Indonesia 12 48 68Lao PDR 7 22 38Malaysia 20 65 78
Philippines 27 63 76Thailand 17 33 47Vietnam 12 27 43
This rapid urbanization of ASEAN is part of a global trend. By the year 2030 world urban population will increase to nearly 5 billion persons (1.35 billion more than present), increasing the urban area on Earth by 150% in less than 20 years. And contrary to the trend of the 20th century, the majority of the economic growth will occur in developing countries and mainly in second-tier and higher cities. From now to 2030, the world will need to build the equivalent of a city of one million people in developing countries every five days.
The demand for infrastructure to support this urban growth is massive. Sixty percent of the area that will be urban by 2030 has yet to be built.4 Although Southeast Asia has enjoyed decades of robust economic growth, its infrastructure coverage
trails below the Asian average and is still a fraction of that of advanced economies.5 As summarized by the ADB, “ASEAN’s infrastructure needs are estimated at $60 billion a year from 2010-2020, and this is in addition to national projects with significant cross-border impacts such as airports, seaports, and roads to borders.”6
Notably, the urbanization trend in ASEAN has been accompanied by an unparalleled decline in poverty. During the early 1970s, more than half the population of Asia and the Pacific was poor, average life expectancy was 48 years, and only 40 per cent of the adult population was literate. Today, the percentage of poor people has decreased to about 25 percent of the population, life expectancy has increased to 65 years, and about 70 percent of the adults are literate. The proportion of poor in Indonesia declined from 60 percent in 1970 to 27 percent in the late 1990s. In Malaysia from 18 to 8 percent; and in Thailand from 26 to 14 percent.
Studies in Indonesia, Malaysia, Thailand and the Philippines have shown that most of the decline in poverty rates has been attributed to economic growth rather than to improved distribution.7 Cities are the drivers of this economic growth, and they are producing a rapidly increasing share of the gross domestic product (GDP) of their respective nations. Within ASEAN, the average share of urban economies in national GDP is around 80%. In Malaysia and Thailand, cities contribute more than 90% of GDP, and close to 100% in Singapore and Hong Kong. But even in Asian countries with low urbanization rates, as in Sri Lanka and Bangladesh, more than 65% of GDP is now produced in urban areas. Urbanization is now
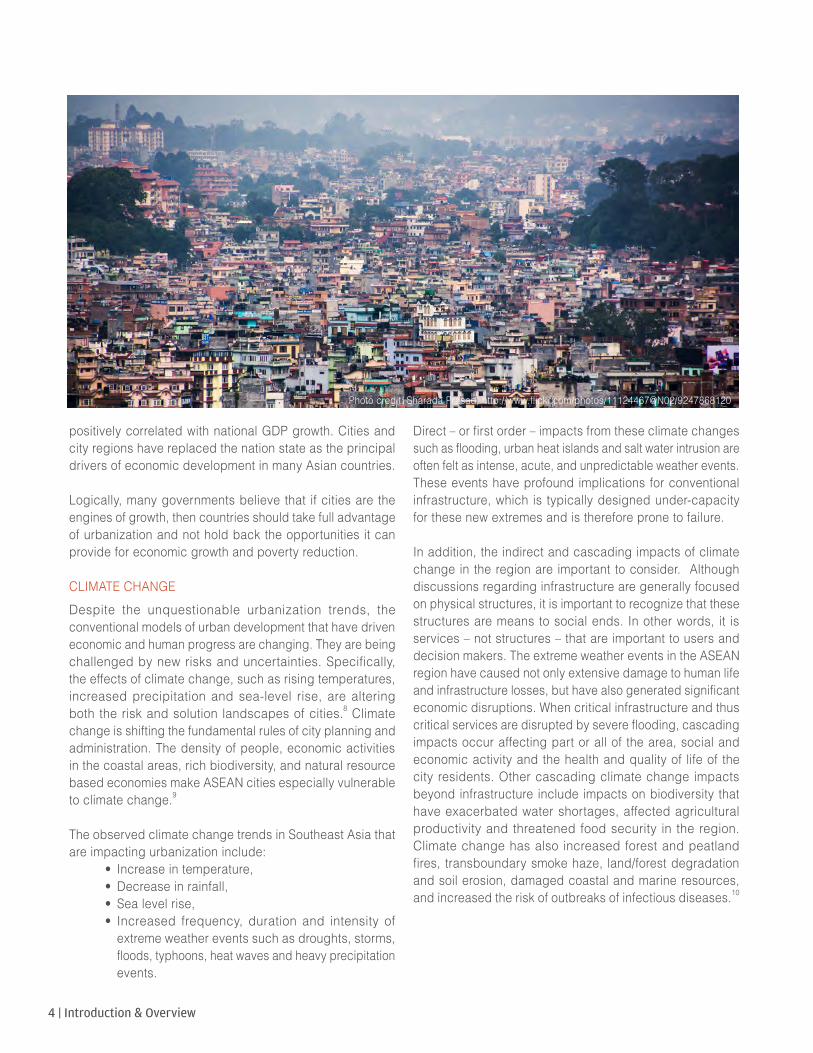
Photo credit: http://www.flickr.com/photos/98057950@N00/2272291132
4 | Introduction & Overview
positively correlated with national GDP growth. Cities and city regions have replaced the nation state as the principal drivers of economic development in many Asian countries.
Logically, many governments believe that if cities are the engines of growth, then countries should take full advantage of urbanization and not hold back the opportunities it can provide for economic growth and poverty reduction. CLIMATE CHANGE Despite the unquestionable urbanization trends, the conventional models of urban development that have driven economic and human progress are changing. They are being challenged by new risks and uncertainties. Specifically, the effects of climate change, such as rising temperatures, increased precipitation and sea-level rise, are altering both the risk and solution landscapes of cities.8 Climate change is shifting the fundamental rules of city planning and administration. The density of people, economic activities in the coastal areas, rich biodiversity, and natural resource based economies make ASEAN cities especially vulnerable to climate change.9
The observed climate change trends in Southeast Asia that are impacting urbanization include:
• Increase in temperature, • Decrease in rainfall, • Sea level rise, • Increased frequency, duration and intensity of
extreme weather events such as droughts, storms, floods, typhoons, heat waves and heavy precipitation events.
Direct – or first order – impacts from these climate changes such as flooding, urban heat islands and salt water intrusion are often felt as intense, acute, and unpredictable weather events. These events have profound implications for conventional infrastructure, which is typically designed under-capacity for these new extremes and is therefore prone to failure.
In addition, the indirect and cascading impacts of climate change in the region are important to consider. Although discussions regarding infrastructure are generally focused on physical structures, it is important to recognize that these structures are means to social ends. In other words, it is services – not structures – that are important to users and decision makers. The extreme weather events in the ASEAN region have caused not only extensive damage to human life and infrastructure losses, but have also generated significant economic disruptions. When critical infrastructure and thus critical services are disrupted by severe flooding, cascading impacts occur affecting part or all of the area, social and economic activity and the health and quality of life of the city residents. Other cascading climate change impacts beyond infrastructure include impacts on biodiversity that have exacerbated water shortages, affected agricultural productivity and threatened food security in the region. Climate change has also increased forest and peatland fires, transboundary smoke haze, land/forest degradation and soil erosion, damaged coastal and marine resources, and increased the risk of outbreaks of infectious diseases.10
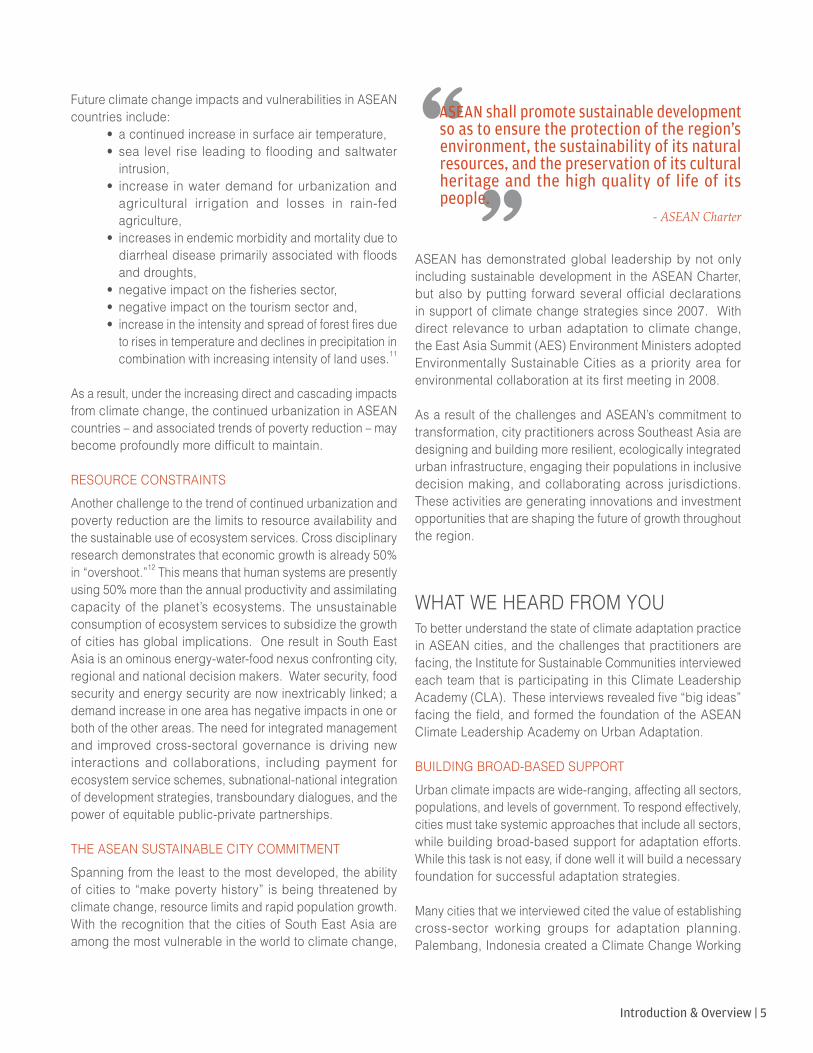
Photo credit: Sharada Prasad, http://www.flickr.com/photos/11124467@N02/9247868120
Introduction & Overview | 5
Future climate change impacts and vulnerabilities in ASEAN countries include:
• a continued increase in surface air temperature, • sea level rise leading to flooding and saltwater
intrusion, • increase in water demand for urbanization and
agricultural irrigation and losses in rain-fed agriculture,
• increases in endemic morbidity and mortality due to diarrheal disease primarily associated with floods and droughts,
• negative impact on the fisheries sector, • negative impact on the tourism sector and,• increase in the intensity and spread of forest fires due
to rises in temperature and declines in precipitation in combination with increasing intensity of land uses.11
As a result, under the increasing direct and cascading impacts from climate change, the continued urbanization in ASEAN countries – and associated trends of poverty reduction – may become profoundly more difficult to maintain.
RESOURCE CONSTRAINTS Another challenge to the trend of continued urbanization and poverty reduction are the limits to resource availability and the sustainable use of ecosystem services. Cross disciplinary research demonstrates that economic growth is already 50% in “overshoot.”12 This means that human systems are presently using 50% more than the annual productivity and assimilating capacity of the planet’s ecosystems. The unsustainable consumption of ecosystem services to subsidize the growth of cities has global implications. One result in South East Asia is an ominous energy-water-food nexus confronting city, regional and national decision makers. Water security, food security and energy security are now inextricably linked; a demand increase in one area has negative impacts in one or both of the other areas. The need for integrated management and improved cross-sectoral governance is driving new interactions and collaborations, including payment for ecosystem service schemes, subnational-national integration of development strategies, transboundary dialogues, and the power of equitable public-private partnerships.
THE ASEAN SUSTAINABLE CITY COMMITMENTSpanning from the least to the most developed, the ability of cities to “make poverty history” is being threatened by climate change, resource limits and rapid population growth. With the recognition that the cities of South East Asia are among the most vulnerable in the world to climate change,
ASEAN has demonstrated global leadership by not only including sustainable development in the ASEAN Charter, but also by putting forward several official declarations in support of climate change strategies since 2007. With direct relevance to urban adaptation to climate change, the East Asia Summit (AES) Environment Ministers adopted Environmentally Sustainable Cities as a priority area for environmental collaboration at its first meeting in 2008.
As a result of the challenges and ASEAN’s commitment to transformation, city practitioners across Southeast Asia are designing and building more resilient, ecologically integrated urban infrastructure, engaging their populations in inclusive decision making, and collaborating across jurisdictions. These activities are generating innovations and investment opportunities that are shaping the future of growth throughout the region.
WHAT WE HEARD FROM YOUTo better understand the state of climate adaptation practice in ASEAN cities, and the challenges that practitioners are facing, the Institute for Sustainable Communities interviewed each team that is participating in this Climate Leadership Academy (CLA). These interviews revealed five “big ideas” facing the field, and formed the foundation of the ASEAN Climate Leadership Academy on Urban Adaptation.
BUILDING BROAD-BASED SUPPORTUrban climate impacts are wide-ranging, affecting all sectors, populations, and levels of government. To respond effectively, cities must take systemic approaches that include all sectors, while building broad-based support for adaptation efforts. While this task is not easy, if done well it will build a necessary foundation for successful adaptation strategies.
Many cities that we interviewed cited the value of establishing cross-sector working groups for adaptation planning. Palembang, Indonesia created a Climate Change Working
““ASEAN shall promote sustainable development so as to ensure the protection of the region's environment, the sustainability of its natural resources, and the preservation of its cultural heritage and the high quality of life of its people.
- ASEAN Charter
6 | Introduction & Overview
Group consisting of the Environment Ministry and Public Works departments, academic institutions, and community groups. This group is creating a Climate Strategy that strives to be inclusive and widely endorsed.
Ho Chi Minh City, Vietnam established a Climate Change Bureau, which coordinates a Climate Change Network consisting of a Steering Board, and several working groups in government departments. The Network successfully created a draft Adaptation Action Plan that includes commitments from all government departments. Ho Chi Minh has also participated in several international adaptation networks, including the C40 Cities Climate Leadership Group, the Connecting Delta Cities Network, and the Green Growth Network. These networks have greatly increased their community of practice and allowed for a rich exchange of best practices and lessons learned across borders.
In June 2012, Jakarta, Indonesia launched their Planning for Integrated Coastal Adaptation Strategy (PICAS). A major initiative of the program is focused on community-based adaptation planning: researchers from the University of Indonesia consulted communities living in Jakarta’s urban Kampung (neighborhoods of 10,000 or fewer people) to better understand traditional strategies for living with flooding, such as stilt construction. These strategies are now being incorporated into the city’s zoning regulations for floodplains.
RESTORING URBAN ECOSYSTEM SERVICESASEAN countries enjoy rich ecosystems and strong biodiversity. On a national level, countries have committed to ecosystem preservation, protecting forests, rivers and lakes, and the quality of life they afford. This important work is now being applied on the urban-scale with significant efforts to identify, restore and sustainably use the provisioning, regulating, supporting and cultural services – i.e. clean air and water, flood control, food security, fuel, soil formation, nutrient cycling, reduced heat islands, recreation, etc. – that healthy ecosystems provide to urban systems.
Since 2008, Chiang Rai, Thailand has worked with the Asian Cities Climate Change Resilience Network (ACCCRN) to adapt to new flooding and landslide threats from increased precipitation. They began work to restore the Kok River, a main waterway through the city that suffers from unsanitary conditions and that is prone to flooding. Restoring the river is expected to simultaneously control flooding, improve water quality, reduce disease vectors, and potentially serve urban agriculture projects.
Kuantan, Malaysia committed to maintaining 80 percent land use dedicated to green space: they have a plan for preserving key urban ecosystems, including mangroves, wetlands, and forests, while any future infrastructure development must include at least 10 percent green space. In addition, the city has been working with local communities to plant 10,000 trees annually, which help clean the air, provide shade, and support healthy nutrient cycling.
Legazpi, Philippines has actively planted new mangrove forests along the coast to help mitigate the effects of sea-level rise. They’re also implementing an Urban Drainage Master Plan to reduce flooding risk. The plan includes the deepening and widening of drainage canals restoration of river dikes, and the elevation of roads.
RE-THINKING URBANIZATIONAll cities that we interviewed saw themselves at crossroads. Conventional development pathways, while effective at reducing poverty, are not adequately addressing new risks from population growth, resource constraints, pollution, public health, and other urban challenges. And the effects of climate change exacerbate these risks substantially. Increased precipitation, temperature, drought, sea-level rise, and extreme weather affect cities on every level and have the potential to push urban systems to the brink. Yet with any change, there is opportunity. Cities better understand their climate vulnerabilities and are investing in alternative, adaptive infrastructure, that integrates urban systems with natural and social systems.
Chiang Rai, Thailand undertook a systemic analysis of land use and climate vulnerability in the city. They began making fundamental changes to the design of the city, including removing buildings that blocked watercourses to the Kok River, and increasing “natural buffer zones” around the city. They made fundamental changes to their land use plan that define more adaptive approaches to development. Most importantly, they revamped their systems to enforce this plan, and worked closely with stakeholders to achieve buy-in. They participate actively in the Urban & Environmental Learning Network in Thailand to share lessons learned with five other cities Thailand.
Legazpi, Philippines, together with other cities in the Province of Albay, has been working with the Center for Initiatives and Research on Climate Adaptation (CIRCA) to integrate adaptation into its spatial plan. They are using sophisticated software program called SimCLIM, which examines the effects of climate variability over time and space. The software was
Introduction & Overview | 7
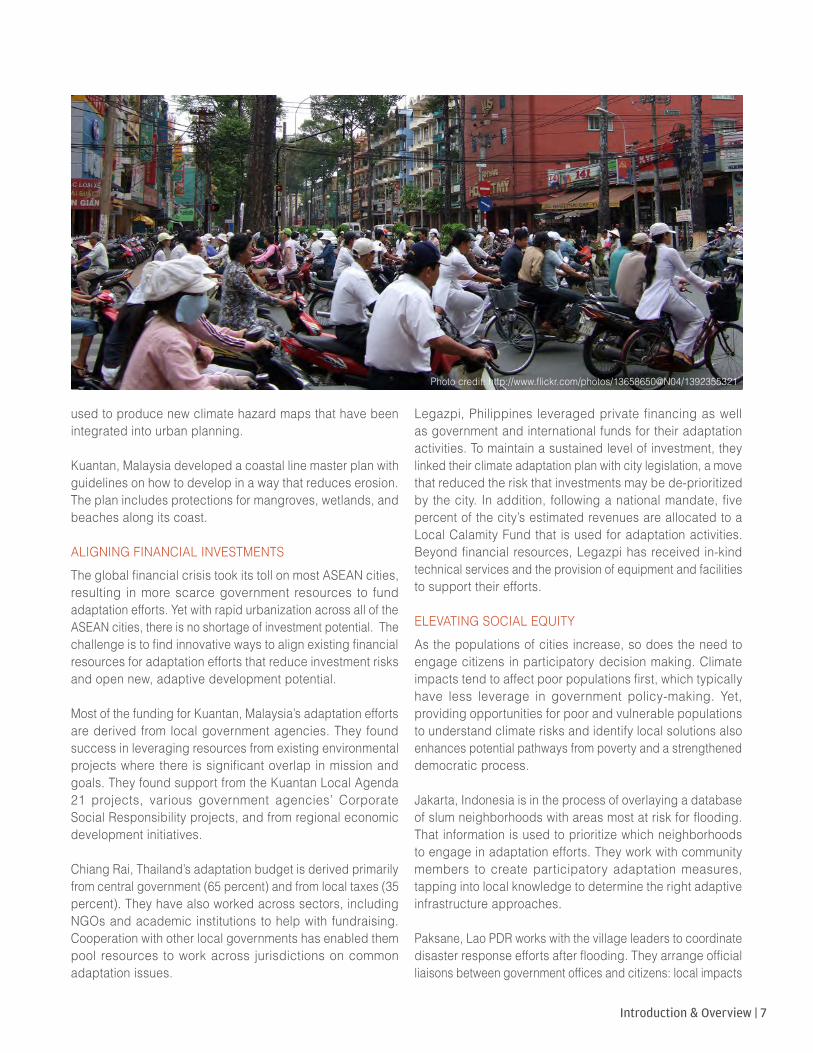
used to produce new climate hazard maps that have been integrated into urban planning.
Kuantan, Malaysia developed a coastal line master plan with guidelines on how to develop in a way that reduces erosion. The plan includes protections for mangroves, wetlands, and beaches along its coast.
ALIGNING FINANCIAL INVESTMENTSThe global financial crisis took its toll on most ASEAN cities, resulting in more scarce government resources to fund adaptation efforts. Yet with rapid urbanization across all of the ASEAN cities, there is no shortage of investment potential. The challenge is to find innovative ways to align existing financial resources for adaptation efforts that reduce investment risks and open new, adaptive development potential.
Most of the funding for Kuantan, Malaysia’s adaptation efforts are derived from local government agencies. They found success in leveraging resources from existing environmental projects where there is significant overlap in mission and goals. They found support from the Kuantan Local Agenda 21 projects, various government agencies’ Corporate Social Responsibility projects, and from regional economic development initiatives.
Chiang Rai, Thailand’s adaptation budget is derived primarily from central government (65 percent) and from local taxes (35 percent). They have also worked across sectors, including NGOs and academic institutions to help with fundraising. Cooperation with other local governments has enabled them pool resources to work across jurisdictions on common adaptation issues.
Legazpi, Philippines leveraged private financing as well as government and international funds for their adaptation activities. To maintain a sustained level of investment, they linked their climate adaptation plan with city legislation, a move that reduced the risk that investments may be de-prioritized by the city. In addition, following a national mandate, five percent of the city’s estimated revenues are allocated to a Local Calamity Fund that is used for adaptation activities. Beyond financial resources, Legazpi has received in-kind technical services and the provision of equipment and facilities to support their efforts. ELEVATING SOCIAL EQUITYAs the populations of cities increase, so does the need to engage citizens in participatory decision making. Climate impacts tend to affect poor populations first, which typically have less leverage in government policy-making. Yet, providing opportunities for poor and vulnerable populations to understand climate risks and identify local solutions also enhances potential pathways from poverty and a strengthened democratic process.
Jakarta, Indonesia is in the process of overlaying a database of slum neighborhoods with areas most at risk for flooding. That information is used to prioritize which neighborhoods to engage in adaptation efforts. They work with community members to create participatory adaptation measures, tapping into local knowledge to determine the right adaptive infrastructure approaches.
Paksane, Lao PDR works with the village leaders to coordinate disaster response efforts after flooding. They arrange official liaisons between government offices and citizens: local impacts
Photo credit: http://www.flickr.com/photos/13658650@N04/1392355321
8 | Introduction & Overview
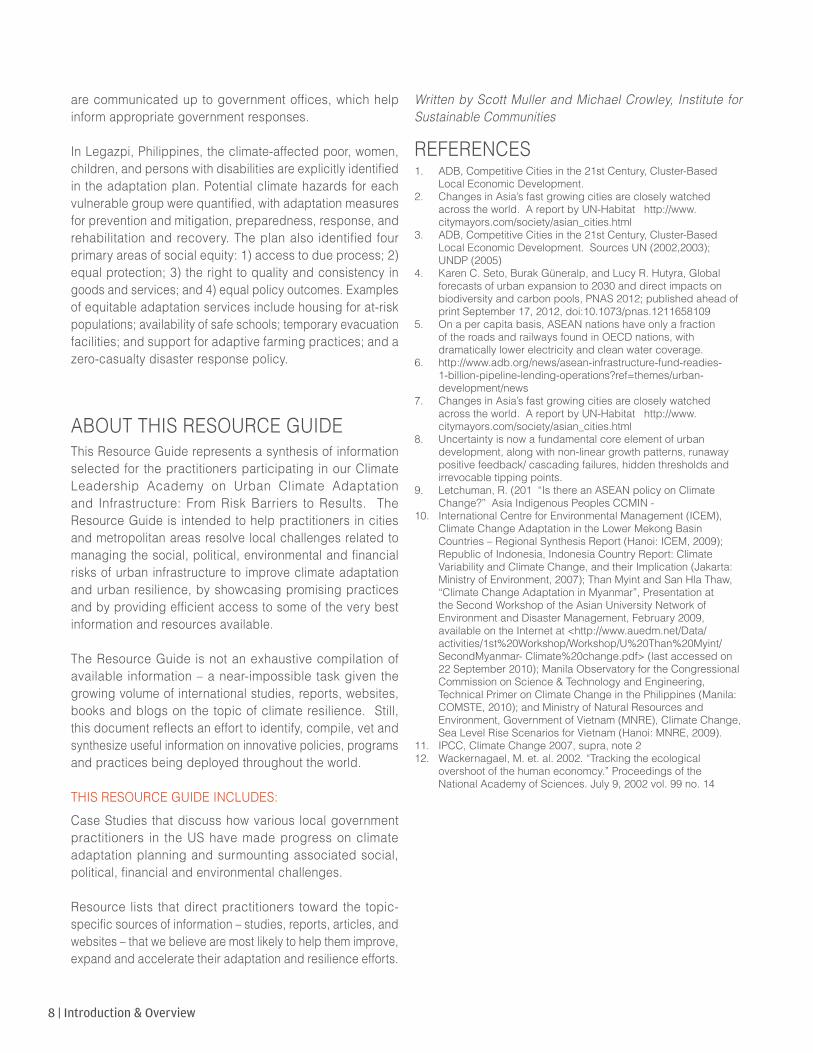
are communicated up to government offices, which help inform appropriate government responses.
In Legazpi, Philippines, the climate-affected poor, women, children, and persons with disabilities are explicitly identified in the adaptation plan. Potential climate hazards for each vulnerable group were quantified, with adaptation measures for prevention and mitigation, preparedness, response, and rehabilitation and recovery. The plan also identified four primary areas of social equity: 1) access to due process; 2) equal protection; 3) the right to quality and consistency in goods and services; and 4) equal policy outcomes. Examples of equitable adaptation services include housing for at-risk populations; availability of safe schools; temporary evacuation facilities; and support for adaptive farming practices; and a zero-casualty disaster response policy.
ABOUT THIS RESOURCE GUIDEThis Resource Guide represents a synthesis of information selected for the practitioners participating in our Climate Leadership Academy on Urban Climate Adaptation and Infrastructure: From Risk Barriers to Results. The Resource Guide is intended to help practitioners in cities and metropolitan areas resolve local challenges related to managing the social, political, environmental and financial risks of urban infrastructure to improve climate adaptation and urban resilience, by showcasing promising practices and by providing efficient access to some of the very best information and resources available.
The Resource Guide is not an exhaustive compilation of available information – a near-impossible task given the growing volume of international studies, reports, websites, books and blogs on the topic of climate resilience. Still, this document reflects an effort to identify, compile, vet and synthesize useful information on innovative policies, programs and practices being deployed throughout the world.
THIS RESOURCE GUIDE INCLUDES:Case Studies that discuss how various local government practitioners in the US have made progress on climate adaptation planning and surmounting associated social, political, financial and environmental challenges.
Resource lists that direct practitioners toward the topic-specific sources of information – studies, reports, articles, and websites – that we believe are most likely to help them improve, expand and accelerate their adaptation and resilience efforts.
Written by Scott Muller and Michael Crowley, Institute for Sustainable Communities
REFERENCES1. ADB, Competitive Cities in the 21st Century, Cluster-Based
Local Economic Development.2. Changes in Asia’s fast growing cities are closely watched
across the world. A report by UN-Habitat http://www.citymayors.com/society/asian_cities.html
3. ADB, Competitive Cities in the 21st Century, Cluster-Based Local Economic Development. Sources UN (2002,2003); UNDP (2005)
4. Karen C. Seto, Burak Güneralp, and Lucy R. Hutyra, Global forecasts of urban expansion to 2030 and direct impacts on biodiversity and carbon pools, PNAS 2012; published ahead of print September 17, 2012, doi:10.1073/pnas.1211658109
5. On a per capita basis, ASEAN nations have only a fraction of the roads and railways found in OECD nations, with dramatically lower electricity and clean water coverage.
6. http://www.adb.org/news/asean-infrastructure-fund-readies-1-billion-pipeline-lending-operations?ref=themes/urban-development/news
7. Changes in Asia’s fast growing cities are closely watched across the world. A report by UN-Habitat http://www.citymayors.com/society/asian_cities.html
8. Uncertainty is now a fundamental core element of urban development, along with non-linear growth patterns, runaway positive feedback/ cascading failures, hidden thresholds and irrevocable tipping points.
9. Letchuman, R. (201 “Is there an ASEAN policy on Climate Change?” Asia Indigenous Peoples CCMIN -
10. International Centre for Environmental Management (ICEM), Climate Change Adaptation in the Lower Mekong Basin Countries – Regional Synthesis Report (Hanoi: ICEM, 2009); Republic of Indonesia, Indonesia Country Report: Climate Variability and Climate Change, and their Implication (Jakarta: Ministry of Environment, 2007); Than Myint and San Hla Thaw, “Climate Change Adaptation in Myanmar”, Presentation at the Second Workshop of the Asian University Network of Environment and Disaster Management, February 2009, available on the Internet at <http://www.auedm.net/Data/activities/1st%20Workshop/Workshop/U%20Than%20Myint/SecondMyanmar- Climate%20change.pdf> (last accessed on 22 September 2010); Manila Observatory for the Congressional Commission on Science & Technology and Engineering, Technical Primer on Climate Change in the Philippines (Manila: COMSTE, 2010); and Ministry of Natural Resources and Environment, Government of Vietnam (MNRE), Climate Change, Sea Level Rise Scenarios for Vietnam (Hanoi: MNRE, 2009).
11. IPCC, Climate Change 2007, supra, note 212. Wackernagael, M. et. al. 2002. “Tracking the ecological
overshoot of the human economcy.” Proceedings of the National Academy of Sciences. July 9, 2002 vol. 99 no. 14
Case Studies
10 | Case Studies
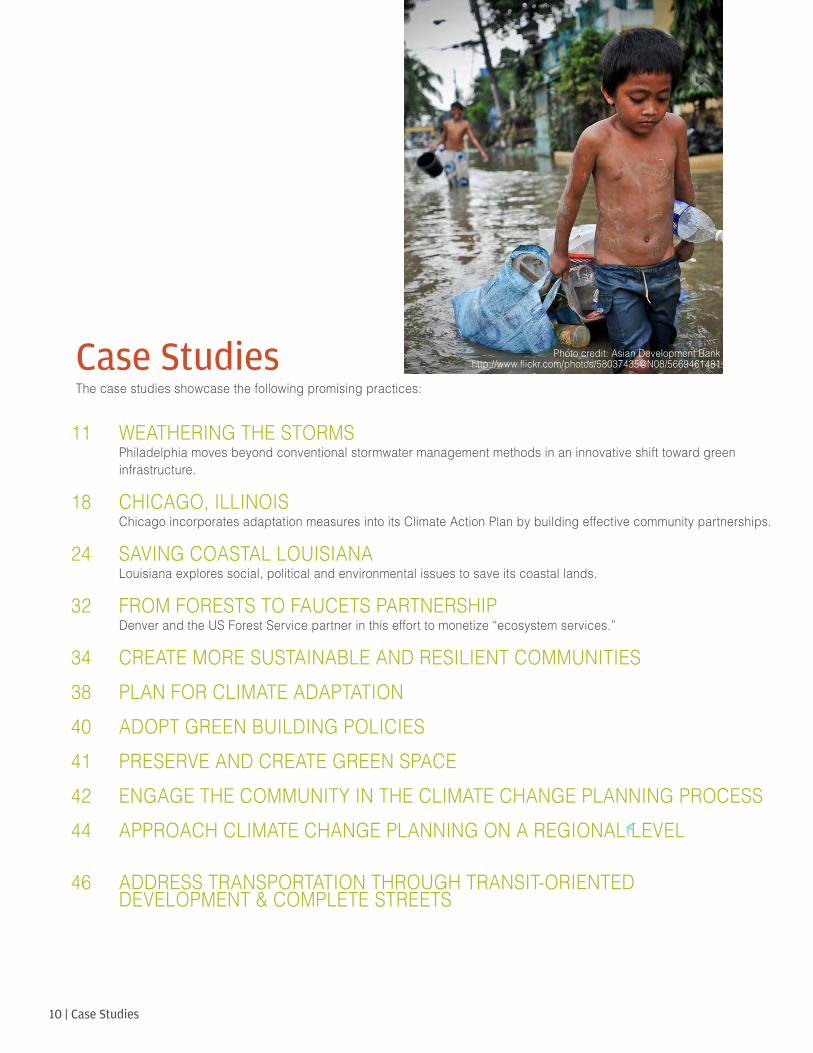
Case StudiesThe case studies showcase the following promising practices:
11 WEATHERING THE STORMS Philadelphia moves beyond conventional stormwater management methods in an innovative shift toward green infrastructure.
18 CHICAGO, ILLINOIS Chicago incorporates adaptation measures into its Climate Action Plan by building effective community partnerships.
24 SAVING COASTAL LOUISIANA Louisiana explores social, political and environmental issues to save its coastal lands.
32 FROM FORESTS TO FAUCETS PARTNERSHIP Denver and the US Forest Service partner in this effort to monetize “ecosystem services.”
34 CREATE MORE SUSTAINABLE AND RESILIENT COMMUNITIES 38 PLAN FOR CLIMATE ADAPTATION40 ADOPT GREEN BUILDING POLICIES41 PRESERVE AND CREATE GREEN SPACE 42 ENGAGE THE COMMUNITY IN THE CLIMATE CHANGE PLANNING PROCESS44 APPROACH CLIMATE CHANGE PLANNING ON A REGIONAL LEVEL
46 ADDRESS TRANSPORTATION THROUGH TRANSIT-ORIENTED DEVELOPMENT & COMPLETE STREETS
Photo credit: Asian Development Bankhttp://www.flickr.com/photos/58037435@N08/5669461481
| 11Case Study: Philadelphia, PA
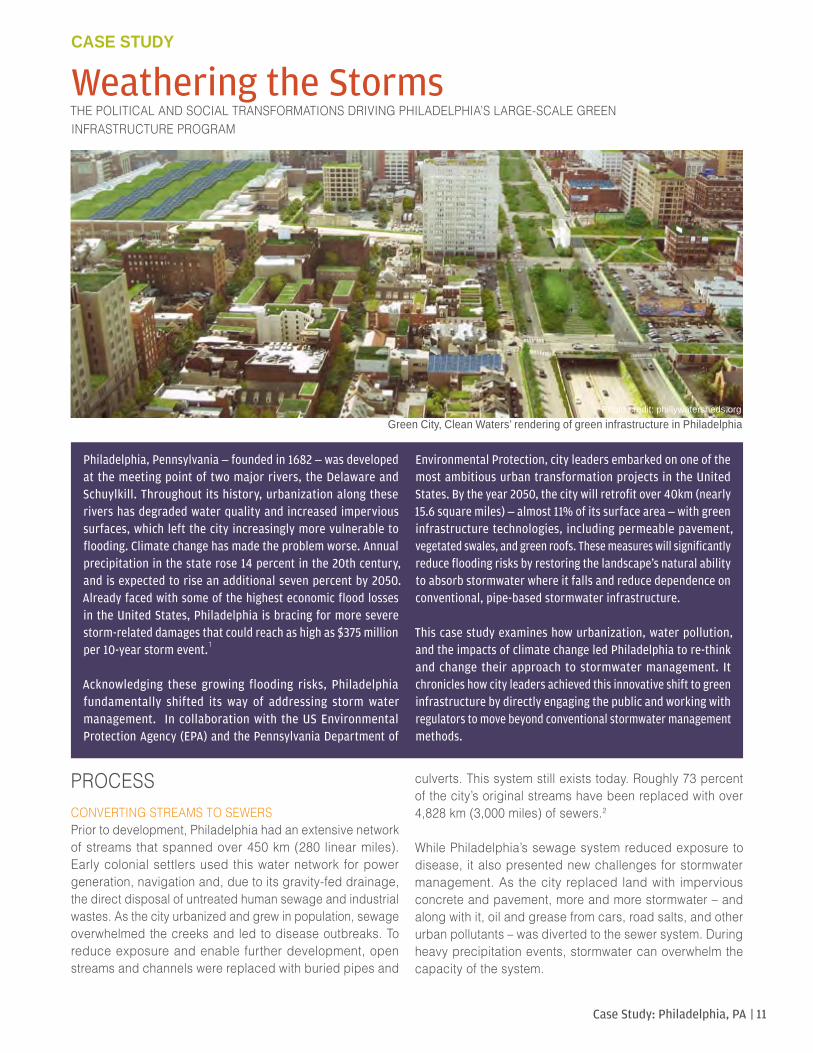
Photo credit: phillywatersheds.org
Green City, Clean Waters’ rendering of green infrastructure in Philadelphia
PROCESSCONVERTING STREAMS TO SEWERSPrior to development, Philadelphia had an extensive network of streams that spanned over 450 km (280 linear miles). Early colonial settlers used this water network for power generation, navigation and, due to its gravity-fed drainage, the direct disposal of untreated human sewage and industrial wastes. As the city urbanized and grew in population, sewage overwhelmed the creeks and led to disease outbreaks. To reduce exposure and enable further development, open streams and channels were replaced with buried pipes and
culverts. This system still exists today. Roughly 73 percent of the city’s original streams have been replaced with over 4,828 km (3,000 miles) of sewers.2
While Philadelphia’s sewage system reduced exposure to disease, it also presented new challenges for stormwater management. As the city replaced land with impervious concrete and pavement, more and more stormwater – and along with it, oil and grease from cars, road salts, and other urban pollutants – was diverted to the sewer system. During heavy precipitation events, stormwater can overwhelm the capacity of the system.
Weathering the StormsCASE STUDY
THE POLITICAL AND SOCIAL TRANSFORMATIONS DRIVING PHILADELPHIA’S LARGE-SCALE GREEN INFRASTRUCTURE PROGRAM
Philadelphia, Pennsylvania – founded in 1682 – was developed at the meeting point of two major rivers, the Delaware and Schuylkill. Throughout its history, urbanization along these rivers has degraded water quality and increased impervious surfaces, which left the city increasingly more vulnerable to flooding. Climate change has made the problem worse. Annual precipitation in the state rose 14 percent in the 20th century, and is expected to rise an additional seven percent by 2050. Already faced with some of the highest economic flood losses in the United States, Philadelphia is bracing for more severe storm-related damages that could reach as high as $375 million per 10-year storm event.1
Acknowledging these growing flooding risks, Philadelphia fundamentally shifted its way of addressing storm water management. In collaboration with the US Environmental Protection Agency (EPA) and the Pennsylvania Department of
Environmental Protection, city leaders embarked on one of the most ambitious urban transformation projects in the United States. By the year 2050, the city will retrofit over 40km (nearly 15.6 square miles) – almost 11% of its surface area – with green infrastructure technologies, including permeable pavement, vegetated swales, and green roofs. These measures will significantly reduce flooding risks by restoring the landscape's natural ability to absorb stormwater where it falls and reduce dependence on conventional, pipe-based stormwater infrastructure.
This case study examines how urbanization, water pollution, and the impacts of climate change led Philadelphia to re-think and change their approach to stormwater management. It chronicles how city leaders achieved this innovative shift to green infrastructure by directly engaging the public and working with regulators to move beyond conventional stormwater management methods.
12 | Case Study: Philadelphia, PA
Like many US cities, most of Philadelphia’s sewer systems are “combined systems” carrying human sewage and stormwater through a single pipe to water treatment plants before being discharged to waterways. Philadelphia’s network of 164 combined sewer overflows (CSO) are designed to discharge sewage and stormwater to local waterways during heavy storm events: a feature that prevents neighborhood streets and treatment facilities from flooding. Yet CSOs can result in devastating effects on local water quality. CSO discharge events in Philadelphia occur up to 85 times per year, and result in high levels of fecal coliform bacteria, elevated water temperatures, and dissolved oxygen levels below minimum standards. This has a severe negative impact on the health of aquatic ecosystems. About 60 percent of Philadelphia’s sewer system consists of combined sewer systems, representing a 166 square km (64 square mile) drainage area.3
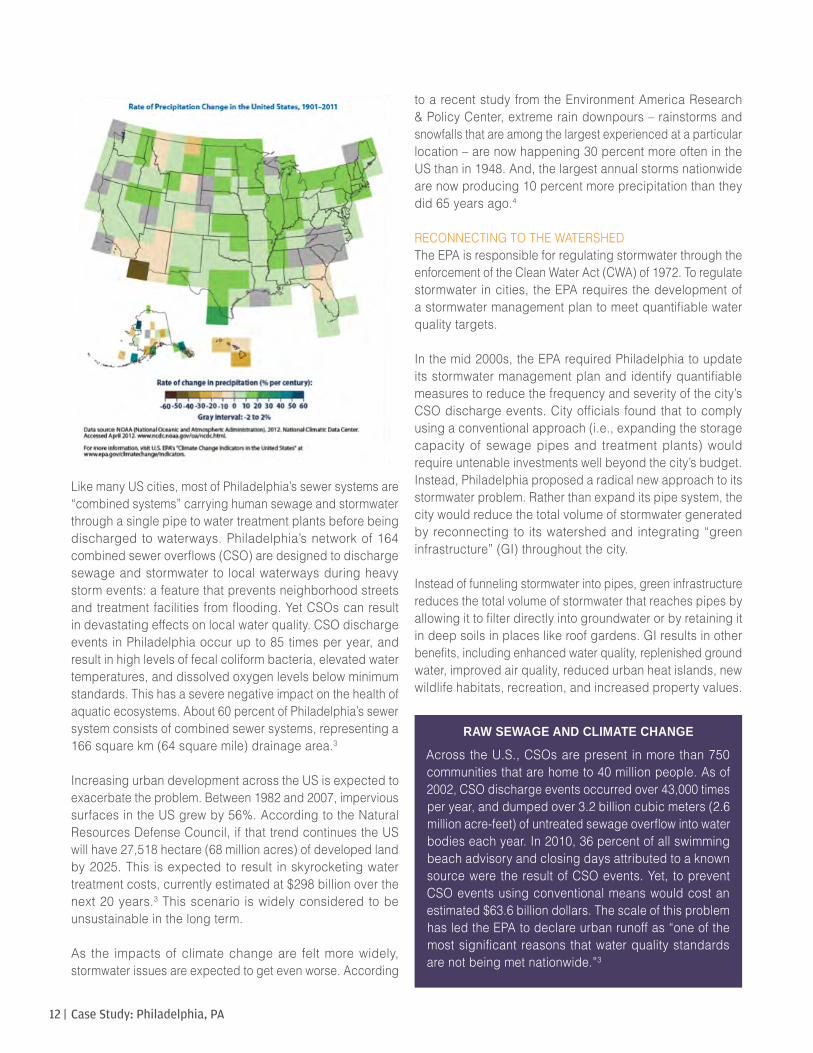
Increasing urban development across the US is expected to exacerbate the problem. Between 1982 and 2007, impervious surfaces in the US grew by 56%. According to the Natural Resources Defense Council, if that trend continues the US will have 27,518 hectare (68 million acres) of developed land by 2025. This is expected to result in skyrocketing water treatment costs, currently estimated at $298 billion over the next 20 years.3 This scenario is widely considered to be unsustainable in the long term.
As the impacts of climate change are felt more widely, stormwater issues are expected to get even worse. According
to a recent study from the Environment America Research & Policy Center, extreme rain downpours – rainstorms and snowfalls that are among the largest experienced at a particular location – are now happening 30 percent more often in the US than in 1948. And, the largest annual storms nationwide are now producing 10 percent more precipitation than they did 65 years ago.4
RECONNECTING TO THE WATERSHEDThe EPA is responsible for regulating stormwater through the enforcement of the Clean Water Act (CWA) of 1972. To regulate stormwater in cities, the EPA requires the development of a stormwater management plan to meet quantifiable water quality targets.
In the mid 2000s, the EPA required Philadelphia to update its stormwater management plan and identify quantifiable measures to reduce the frequency and severity of the city’s CSO discharge events. City officials found that to comply using a conventional approach (i.e., expanding the storage capacity of sewage pipes and treatment plants) would require untenable investments well beyond the city’s budget. Instead, Philadelphia proposed a radical new approach to its stormwater problem. Rather than expand its pipe system, the city would reduce the total volume of stormwater generated by reconnecting to its watershed and integrating “green infrastructure” (GI) throughout the city.
Instead of funneling stormwater into pipes, green infrastructure reduces the total volume of stormwater that reaches pipes by allowing it to filter directly into groundwater or by retaining it in deep soils in places like roof gardens. GI results in other benefits, including enhanced water quality, replenished ground water, improved air quality, reduced urban heat islands, new wildlife habitats, recreation, and increased property values.
RAW SEWAGE AND CLIMATE CHANGE Across the U.S., CSOs are present in more than 750 communities that are home to 40 million people. As of 2002, CSO discharge events occurred over 43,000 times per year, and dumped over 3.2 billion cubic meters (2.6 million acre-feet) of untreated sewage overflow into water bodies each year. In 2010, 36 percent of all swimming beach advisory and closing days attributed to a known source were the result of CSO events. Yet, to prevent CSO events using conventional means would cost an estimated $63.6 billion dollars. The scale of this problem has led the EPA to declare urban runoff as “one of the most significant reasons that water quality standards are not being met nationwide.”3
| 13Case Study: Philadelphia, PA
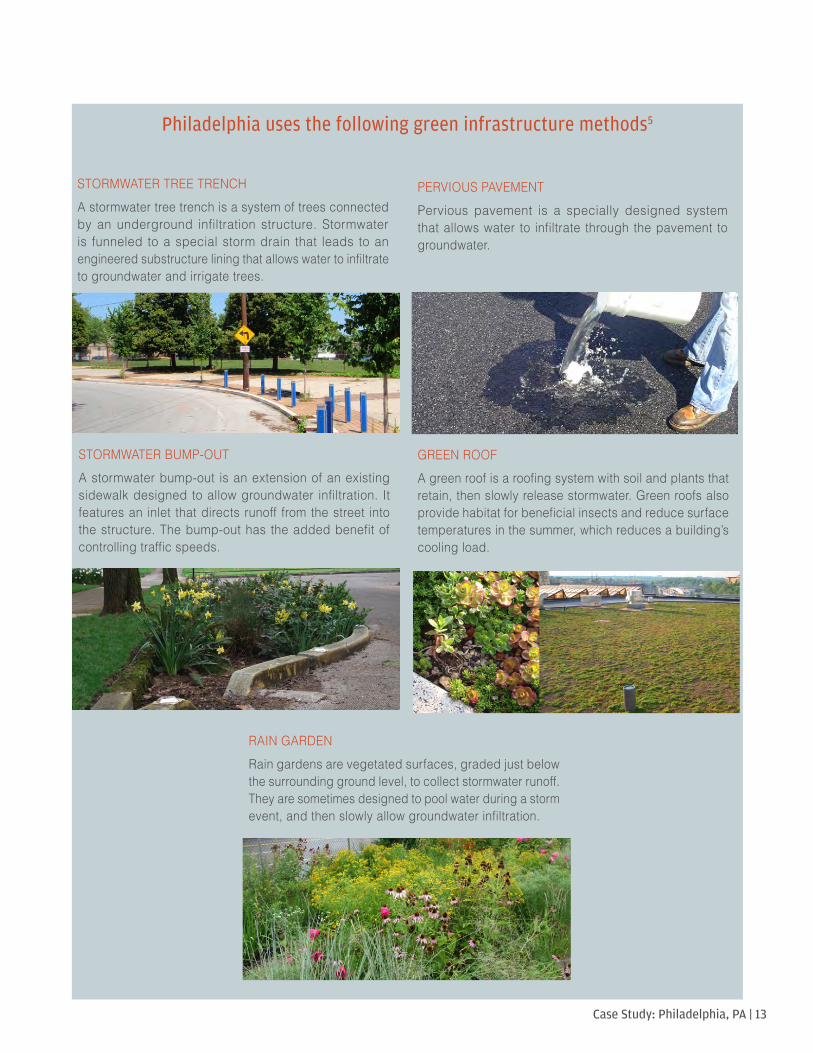
Philadelphia uses the following green infrastructure methods5
STORMWATER TREE TRENCHA stormwater tree trench is a system of trees connected by an underground infiltration structure. Stormwater is funneled to a special storm drain that leads to an engineered substructure lining that allows water to infiltrate to groundwater and irrigate trees.
STORMWATER BUMP-OUT A stormwater bump-out is an extension of an existing sidewalk designed to allow groundwater infiltration. It features an inlet that directs runoff from the street into the structure. The bump-out has the added benefit of controlling traffic speeds.
PERVIOUS PAVEMENT Pervious pavement is a specially designed system that allows water to infiltrate through the pavement to groundwater.
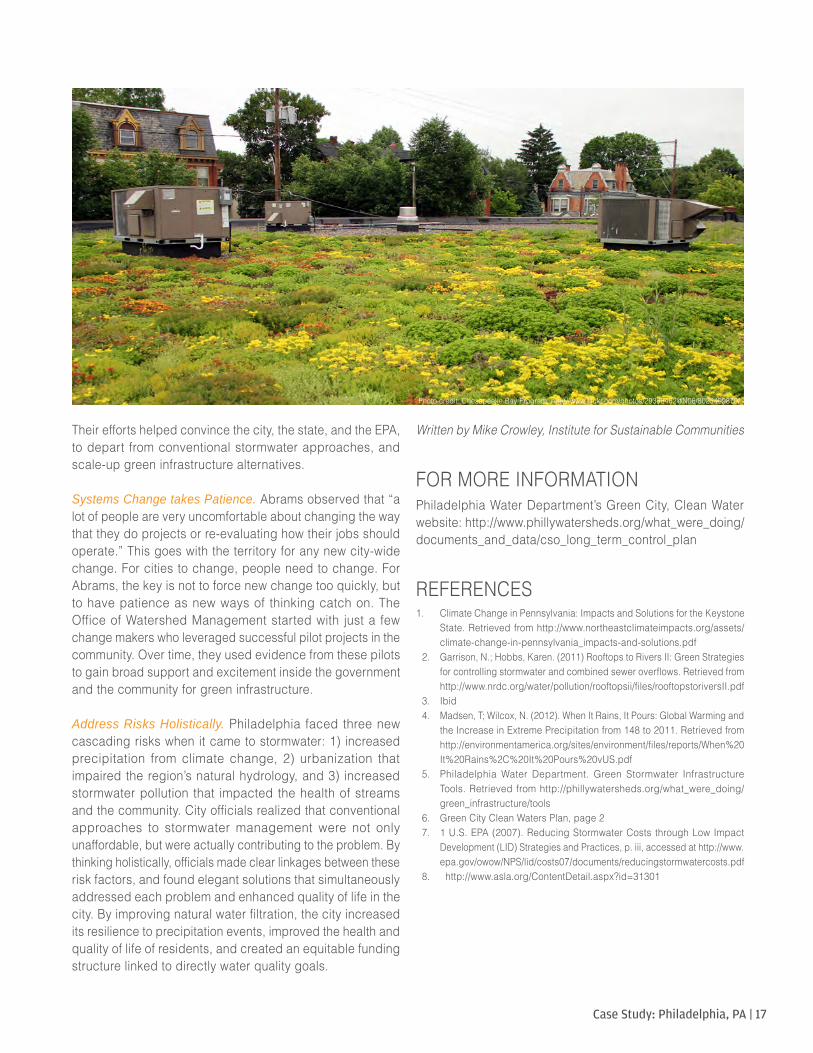
GREEN ROOF A green roof is a roofing system with soil and plants that retain, then slowly release stormwater. Green roofs also provide habitat for beneficial insects and reduce surface temperatures in the summer, which reduces a building’s cooling load.
RAIN GARDEN Rain gardens are vegetated surfaces, graded just below the surrounding ground level, to collect stormwater runoff. They are sometimes designed to pool water during a storm event, and then slowly allow groundwater infiltration.
14 | Case Study: Philadelphia, PA
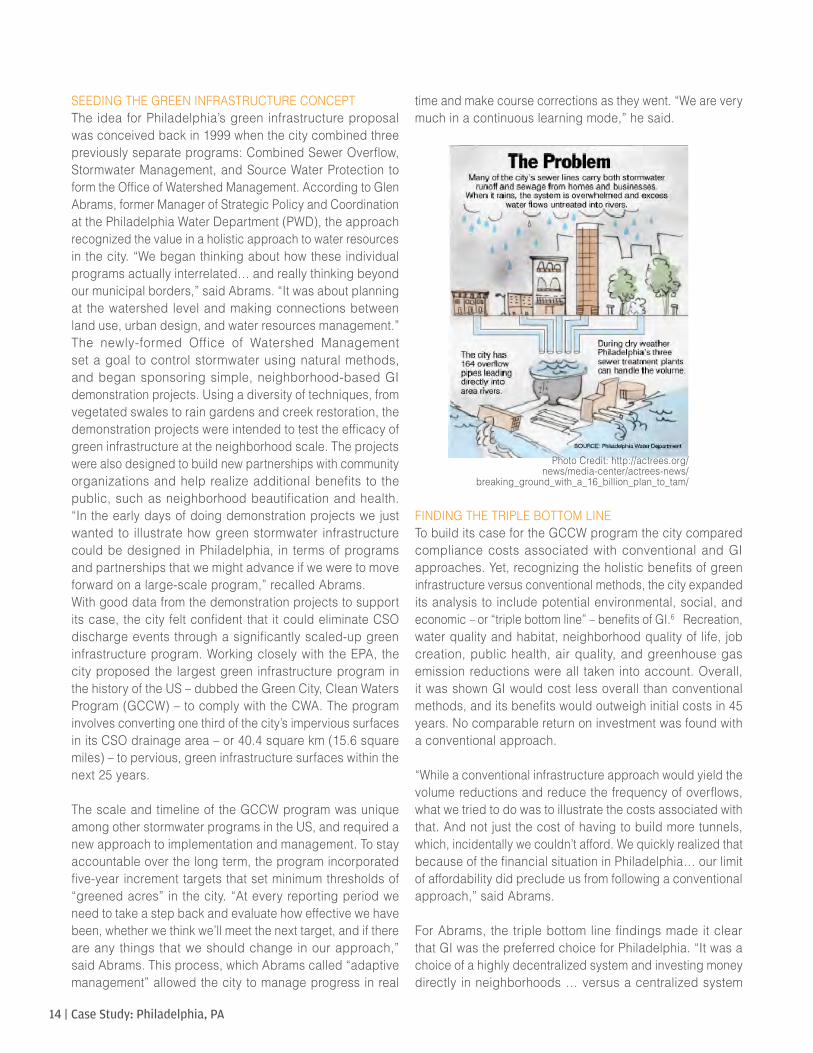
SEEDING THE GREEN INFRASTRUCTURE CONCEPTThe idea for Philadelphia’s green infrastructure proposal was conceived back in 1999 when the city combined three previously separate programs: Combined Sewer Overflow, Stormwater Management, and Source Water Protection to form the Office of Watershed Management. According to Glen Abrams, former Manager of Strategic Policy and Coordination at the Philadelphia Water Department (PWD), the approach recognized the value in a holistic approach to water resources in the city. “We began thinking about how these individual programs actually interrelated… and really thinking beyond our municipal borders,” said Abrams. “It was about planning at the watershed level and making connections between land use, urban design, and water resources management.” The newly-formed Office of Watershed Management set a goal to control stormwater using natural methods, and began sponsoring simple, neighborhood-based GI demonstration projects. Using a diversity of techniques, from vegetated swales to rain gardens and creek restoration, the demonstration projects were intended to test the efficacy of green infrastructure at the neighborhood scale. The projects were also designed to build new partnerships with community organizations and help realize additional benefits to the public, such as neighborhood beautification and health. “In the early days of doing demonstration projects we just wanted to illustrate how green stormwater infrastructure could be designed in Philadelphia, in terms of programs and partnerships that we might advance if we were to move forward on a large-scale program,” recalled Abrams. With good data from the demonstration projects to support its case, the city felt confident that it could eliminate CSO discharge events through a significantly scaled-up green infrastructure program. Working closely with the EPA, the city proposed the largest green infrastructure program in the history of the US – dubbed the Green City, Clean Waters Program (GCCW) – to comply with the CWA. The program involves converting one third of the city’s impervious surfaces in its CSO drainage area – or 40.4 square km (15.6 square miles) – to pervious, green infrastructure surfaces within the next 25 years.
The scale and timeline of the GCCW program was unique among other stormwater programs in the US, and required a new approach to implementation and management. To stay accountable over the long term, the program incorporated five-year increment targets that set minimum thresholds of “greened acres” in the city. “At every reporting period we need to take a step back and evaluate how effective we have been, whether we think we’ll meet the next target, and if there are any things that we should change in our approach,” said Abrams. This process, which Abrams called “adaptive management” allowed the city to manage progress in real
time and make course corrections as they went. “We are very much in a continuous learning mode,” he said.
FINDING THE TRIPLE BOTTOM LINETo build its case for the GCCW program the city compared compliance costs associated with conventional and GI approaches. Yet, recognizing the holistic benefits of green infrastructure versus conventional methods, the city expanded its analysis to include potential environmental, social, and economic – or “triple bottom line” – benefits of GI.6 Recreation, water quality and habitat, neighborhood quality of life, job creation, public health, air quality, and greenhouse gas emission reductions were all taken into account. Overall, it was shown GI would cost less overall than conventional methods, and its benefits would outweigh initial costs in 45 years. No comparable return on investment was found with a conventional approach.
“While a conventional infrastructure approach would yield the volume reductions and reduce the frequency of overflows, what we tried to do was to illustrate the costs associated with that. And not just the cost of having to build more tunnels, which, incidentally we couldn’t afford. We quickly realized that because of the financial situation in Philadelphia… our limit of affordability did preclude us from following a conventional approach,” said Abrams.
For Abrams, the triple bottom line findings made it clear that GI was the preferred choice for Philadelphia. “It was a choice of a highly decentralized system and investing money directly in neighborhoods … versus a centralized system
Photo Credit: http://actrees.org/news/media-center/actrees-news/
breaking_ground_with_a_16_billion_plan_to_tam/

| 15Case Study: Philadelphia, PA
that’s a very deep tunnel program, so once it’s constructed it’s not visible… It was clear that this was a greater return on our investment,” he said.
INNOVATING FUNDINGTo meet its goals, the GCCW program requires $1.2 billion in strategic investments over a 25 year period: $1.67 billion will go to green infrastructure; $345 million to upgrading treatment plant capacity; and $420 million will be used for “flexible spending,” to be determined as the program evolves.
While the cost is below what a traditional infrastructure plan would require, it still remains above the range recommended by the EPA (1.5% to 2% of median household income). Traditional bonds would not cover the full costs, so the city had to find creative, new and unconventional funding sources.
The city asked the developers to provide the most significant funding. In 2006, the city updated its stormwater regulations to require that every development and redevelopment project with a footprint greater than 1,394 square meters (15,000 square feet) must make arrangements to manage most stormwater runoff through GI. The city estimated that with a project development rate of 1 percent annually, more than $1 billion in present value that would have otherwise been
spent on post-construction retrofits will be leveraged in the next 25 years. That funding would have otherwise been spent on post-construction retrofits to handle the stormwater loads created by impervious surfaces from these developments.
Evidence suggests that this policy change will have little to no effect on the budgets of developers. In 2007, the EPA published a study that reviewed 17 developments that included GI, and found that all but one had lower upfront construction costs. In fact, costs were reduced anywhere between 15-80 percent.7 A similar study by the American Society of Landscape Architects found that “not only does green infrastructure cost less, but these practices can further reduce costs of treating large amounts of polluted runoff.”8
Another significant source of funding will come from changes in the way that stormwater is billed to customers. Historically, the city billed for sewage treatment based on the amount of domestic water used by its customers. This system was recognized to be inherently unfair because it did not reflect the true cost of service: some customers used comparatively little domestic water but owned large areas of impervious surfaces that had large impacts on sewer systems. In the early 2000s, to help grapple with this issue, the city assembled a rate-payers committee. The committee recommended a
Photo Credit: Philadelphia Water Department, http://phillywatersheds.org/what_were_doing/green_infrastructure/tools
16 | Case Study: Philadelphia, PA
stormwater billing structure based on the acres of impervious land that customers owned: more impervious surfaces meant more stormwater treatment, and higher bills.
The new billing system – called the “Parcel-Based Billing Initiative”— will be in effect by 2015 (implementation had to wait for new technology such as Global Positioning Software to make the system possible). The city recognized that some customers will be impacted more than others, so they created a free design assistance and site evaluation to identify potential green infrastructure opportunities. In addition, the city provides free cost-benefit analysis to help property owners weigh the cost of retrofit versus the savings in their bill.
Other costs to the program will be covered by traditional bonds as well as public and private grants.
COMMUNITY OUTREACHThe city recognized that it needed to reach beyond the development and commercial landowner communities if it was going to meet its stormwater goals. City officials began new partnerships with local community organizations such as the Pennsylvania Horticulture Society and the Tookany/Tacony-Frankford Watershed Partnership (TTF Partnership) to find the right ways to engage the community. Together, the city and nonprofit groups hosted community workshops on how to install affordable, residential green infrastructure projects, such as rain barrels and green roofs. The city offered tax credits to any resident who installed a green roof, and
free rain barrels to anyone who attended a workshop.
They also secured a $30 million loan from the Pennsylvania Infrastructure Reinvestment Authority to further develop community-scale GI demonstration projects across the city. The projects retrofitted entire blocks in each neighborhood to showcase a variety of green infrastructure practices, and they brought the community together to raise awareness about their shared watershed.
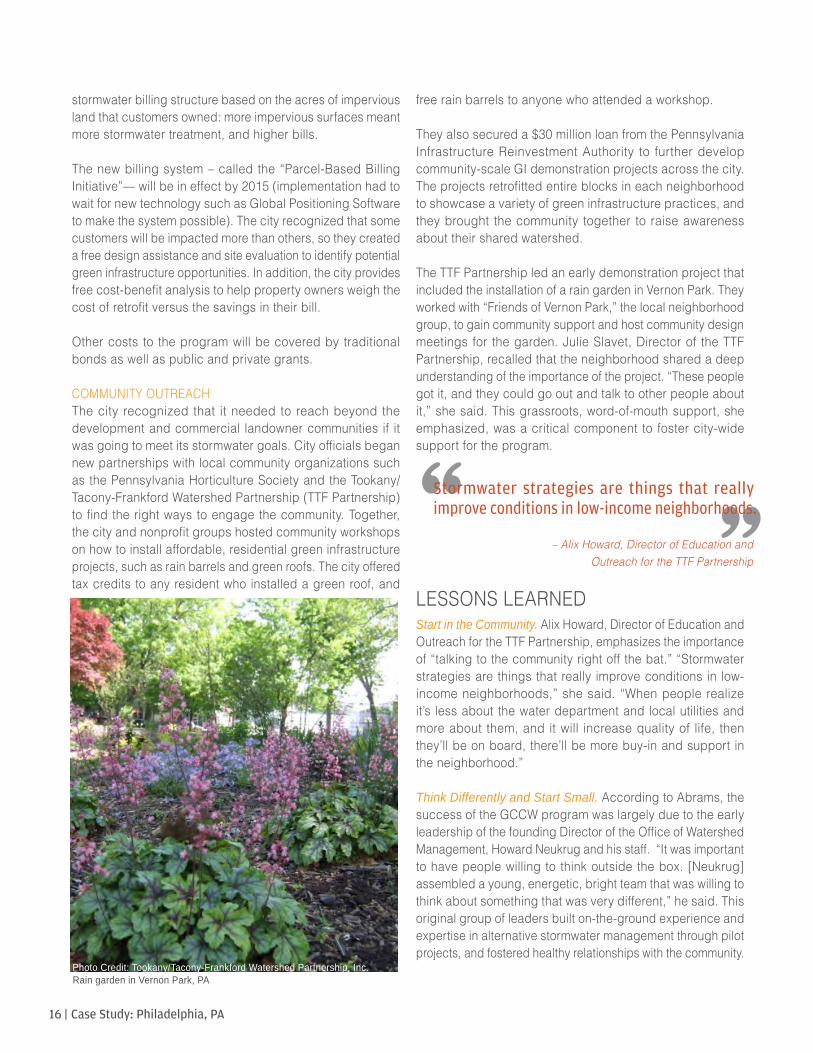
The TTF Partnership led an early demonstration project that included the installation of a rain garden in Vernon Park. They worked with “Friends of Vernon Park,” the local neighborhood group, to gain community support and host community design meetings for the garden. Julie Slavet, Director of the TTF Partnership, recalled that the neighborhood shared a deep understanding of the importance of the project. “These people got it, and they could go out and talk to other people about it,” she said. This grassroots, word-of-mouth support, she emphasized, was a critical component to foster city-wide support for the program.
LESSONS LEARNEDStart in the Community. Alix Howard, Director of Education and Outreach for the TTF Partnership, emphasizes the importance of “talking to the community right off the bat.” “Stormwater strategies are things that really improve conditions in low-income neighborhoods,” she said. “When people realize it’s less about the water department and local utilities and more about them, and it will increase quality of life, then they’ll be on board, there’ll be more buy-in and support in the neighborhood.”
Think Differently and Start Small. According to Abrams, the success of the GCCW program was largely due to the early leadership of the founding Director of the Office of Watershed Management, Howard Neukrug and his staff. “It was important to have people willing to think outside the box. [Neukrug] assembled a young, energetic, bright team that was willing to think about something that was very different,” he said. This original group of leaders built on-the-ground experience and expertise in alternative stormwater management through pilot projects, and fostered healthy relationships with the community.
Photo Credit: Tookany/Tacony-Frankford Watershed Partnership, Inc.Rain garden in Vernon Park, PA
““Stormwater strategies are things that really
improve conditions in low-income neighborhoods.
– Alix Howard, Director of Education and Outreach for the TTF Partnership
| 17Case Study: Philadelphia, PA
Photo credit: Chesapeake Bay Program, http://www.flickr.com/photos/29388462@N06/8023409870/
Their efforts helped convince the city, the state, and the EPA, to depart from conventional stormwater approaches, and scale-up green infrastructure alternatives.
Systems Change takes Patience. Abrams observed that “a lot of people are very uncomfortable about changing the way that they do projects or re-evaluating how their jobs should operate.” This goes with the territory for any new city-wide change. For cities to change, people need to change. For Abrams, the key is not to force new change too quickly, but to have patience as new ways of thinking catch on. The Office of Watershed Management started with just a few change makers who leveraged successful pilot projects in the community. Over time, they used evidence from these pilots to gain broad support and excitement inside the government and the community for green infrastructure.
Address Risks Holistically. Philadelphia faced three new cascading risks when it came to stormwater: 1) increased precipitation from climate change, 2) urbanization that impaired the region’s natural hydrology, and 3) increased stormwater pollution that impacted the health of streams and the community. City officials realized that conventional approaches to stormwater management were not only unaffordable, but were actually contributing to the problem. By thinking holistically, officials made clear linkages between these risk factors, and found elegant solutions that simultaneously addressed each problem and enhanced quality of life in the city. By improving natural water filtration, the city increased its resilience to precipitation events, improved the health and quality of life of residents, and created an equitable funding structure linked to directly water quality goals.
Written by Mike Crowley, Institute for Sustainable Communities
FOR MORE INFORMATIONPhiladelphia Water Department’s Green City, Clean Water website: http://www.phillywatersheds.org/what_were_doing/documents_and_data/cso_long_term_control_plan
REFERENCES1. Climate Change in Pennsylvania: Impacts and Solutions for the Keystone
State. Retrieved from http://www.northeastclimateimpacts.org/assets/climate-change-in-pennsylvania_impacts-and-solutions.pdf
2. Garrison, N.; Hobbs, Karen. (2011) Rooftops to Rivers II: Green Strategies for controlling stormwater and combined sewer overflows. Retrieved from http://www.nrdc.org/water/pollution/rooftopsii/files/rooftopstoriversII.pdf
3. Ibid4. Madsen, T; Wilcox, N. (2012). When It Rains, It Pours: Global Warming and
the Increase in Extreme Precipitation from 148 to 2011. Retrieved from http://environmentamerica.org/sites/environment/files/reports/When%20It%20Rains%2C%20It%20Pours%20vUS.pdf
5. Philadelphia Water Department. Green Stormwater Infrastructure Tools. Retrieved from http://phillywatersheds.org/what_were_doing/green_infrastructure/tools
6. Green City Clean Waters Plan, page 27. 1 U.S. EPA (2007). Reducing Stormwater Costs through Low Impact
Development (LID) Strategies and Practices, p. iii, accessed at http://www.epa.gov/owow/NPS/lid/costs07/documents/reducingstormwatercosts.pdf
8. http://www.asla.org/ContentDetail.aspx?id=31301
18 | Case Study: Chicago, IL
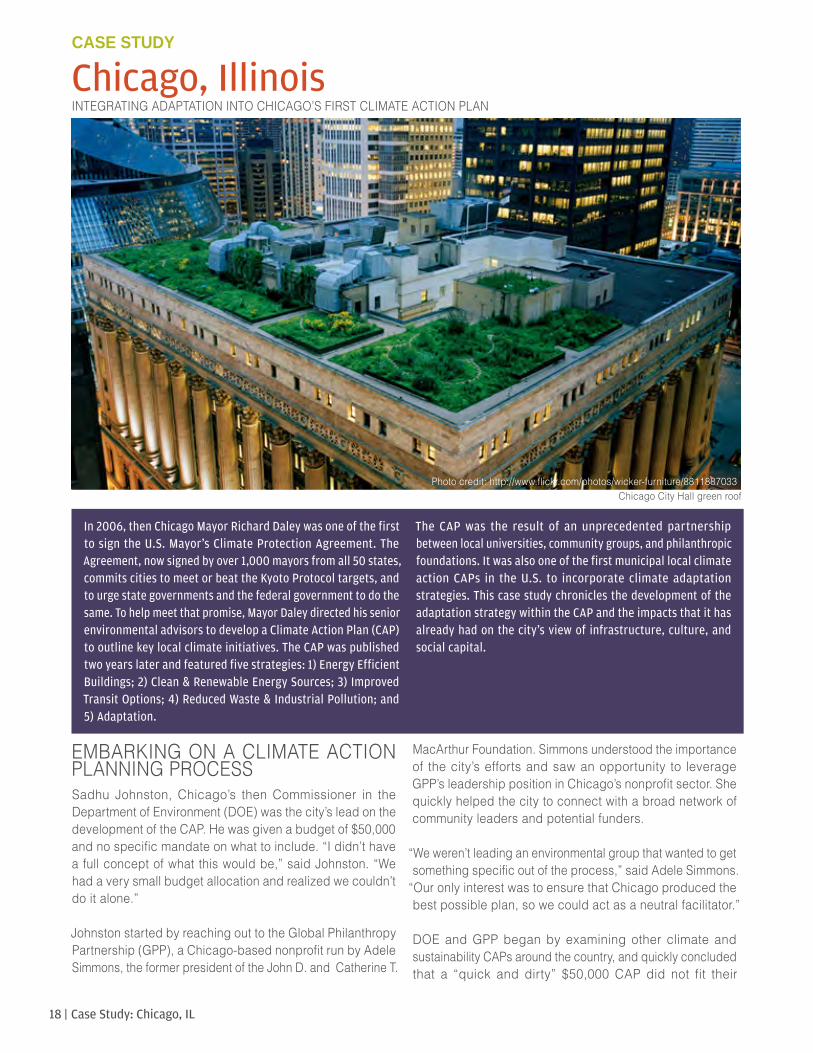
Chicago, Illinois CASE STUDY
Photo credit: http://www.flickr.com/photos/wicker-furniture/8811887033
In 2006, then Chicago Mayor Richard Daley was one of the first to sign the U.S. Mayor's Climate Protection Agreement. The Agreement, now signed by over 1,000 mayors from all 50 states, commits cities to meet or beat the Kyoto Protocol targets, and to urge state governments and the federal government to do the same. To help meet that promise, Mayor Daley directed his senior environmental advisors to develop a Climate Action Plan (CAP) to outline key local climate initiatives. The CAP was published two years later and featured five strategies: 1) Energy Efficient Buildings; 2) Clean & Renewable Energy Sources; 3) Improved Transit Options; 4) Reduced Waste & Industrial Pollution; and 5) Adaptation.
The CAP was the result of an unprecedented partnership between local universities, community groups, and philanthropic foundations. It was also one of the first municipal local climate action CAPs in the U.S. to incorporate climate adaptation strategies. This case study chronicles the development of the adaptation strategy within the CAP and the impacts that it has already had on the city's view of infrastructure, culture, and social capital.
EMBARKING ON A CLIMATE ACTION PLANNING PROCESSSadhu Johnston, Chicago’s then Commissioner in the Department of Environment (DOE) was the city’s lead on the development of the CAP. He was given a budget of $50,000 and no specific mandate on what to include. “I didn’t have a full concept of what this would be,” said Johnston. “We had a very small budget allocation and realized we couldn’t do it alone.”
Johnston started by reaching out to the Global Philanthropy Partnership (GPP), a Chicago-based nonprofit run by Adele Simmons, the former president of the John D. and Catherine T.
MacArthur Foundation. Simmons understood the importance of the city’s efforts and saw an opportunity to leverage GPP’s leadership position in Chicago’s nonprofit sector. She quickly helped the city to connect with a broad network of community leaders and potential funders.
“We weren’t leading an environmental group that wanted to get something specific out of the process,” said Adele Simmons.
“Our only interest was to ensure that Chicago produced the best possible plan, so we could act as a neutral facilitator.”
DOE and GPP began by examining other climate and sustainability CAPs around the country, and quickly concluded that a “quick and dirty” $50,000 CAP did not fit their
Chicago City Hall green roof
INTEGRATING ADAPTATION INTO CHICAGO’S FIRST CLIMATE ACTION PLAN
| 19Case Study: Chicago, IL
evolving vision. Acknowledging the critical role that Chicago organizations and communities would play in responding to the challenges created by climate change, the DOE and GPP wanted to make a plan for all of Chicago, not just the city agencies. With that vision in mind, they started reaching out to community partners and funders whose missions aligned with their own. “It evolved somewhat organically as we got outside resources and partnerships,” said Johnston.
GPP helped the city identify local nonprofit organizations that could expand city resources while building a broad sense of ownership in the final product. The Chicago Civic Alliance, a nonprofit consulting firm, for example, helped the city secure pro-bono consulting services, valued at more than $1 million. Once the CAP was complete, the Chicago Community Trust, the metro area’s community foundation, helped convene a special funders group, where the city regularly presents its funding needs for implementation, and foundation partnership can coordinate their giving.
With help from Simmons, Johnston convened the Chicago Climate Task Force, a group of 19 leaders from business, civic, environmental, foundation and nonprofit organizations throughout the city. Adele Simmons served as chair.
During its eight formal meetings between December 2006 and February 2008, the Task Force provided input on the CAP’s emissions reductions goals, helped shape the approach to studying climate impacts, connected the city to new resources and partners and helped forge a list of possible mitigation and adaptation actions for further research and refinement.
“What struck me during the whole process is that we were really all collaborating together,” recounted Simmons. “You didn’t have the sense that there were silos or competing organizations. You had the sense that this was a group of people from different sectors of the city all working together to produce a very strong CAP that was grounded in science.”
In addition to the extensive work with the Climate Task Force, GPP and DOE also organized larger forums—four
“Climate Summits” and one “Big Ideas” Forum – where invited community and business leaders could hear briefings of the scientific work and provide their own ideas for climate action. DOE also formed sector groups to provide ideas and feedback on implementation challenges in certain areas of climate action such as existing buildings, waste, water and information infrastructure, and green urban design. These sector groups were comprised of a mix of city staff and stakeholders. Input from these meetings was drawn upon heavily in the final CAP.
INCORPORATING ADAPTATION From the start, Johnston wanted to include climate adaptation in the CAP alongside mitigation measures. Chicago had already seen an increased frequency and severity of weather disturbances, including a heat wave in 1995 when more than 750 people were killed over a period of five days. Johnston saw the need to be better prepared for these climate extremes, and thought the CAP could help make a stronger link between climate impacts to the need for mitigation.
“We said wait a second, before we look at what we should do to mitigate our emissions, we first need to understand what is going to happen in our city on the ground in terms of climate impacts,” explained Johnson. “Then we can look at our baseline emissions, and with those two pieces in place, we’ll be ready to develop our strategies – both for reducing our carbon footprint, and for getting our city prepared. From there it evolved further to a focus on those strategies that would have a dual benefit.”
Those foundational ideas – that the CAP should spring from a close look at local impacts, and recommend both mitigation and adaptation strategies – shaped everything about Chicago’s process. It created a vision that inspired outside funders and partners. It also prompted the city to engage scientists and economists from universities, non-profits like the Center for Neighborhood Technology, and a small cadre of consultants to develop a data-driven picture of what climate change would mean for Chicago.
To better understand how climate change was impacting Chicago, Johnston reached out to Dr. Don Wuebbles, a climate researcher at the University of Illinois. The two had met previously when Wuebbles presented findings from a climate impacts assessment for the Great Lakes region to the city. Wuebbles had a history of producing science that impacted policy: he developed the concept of Ozone Depletion Potentials, used in the Montreal Protocol and the U.S. Clean Air Act, and contributed to the concept of Global
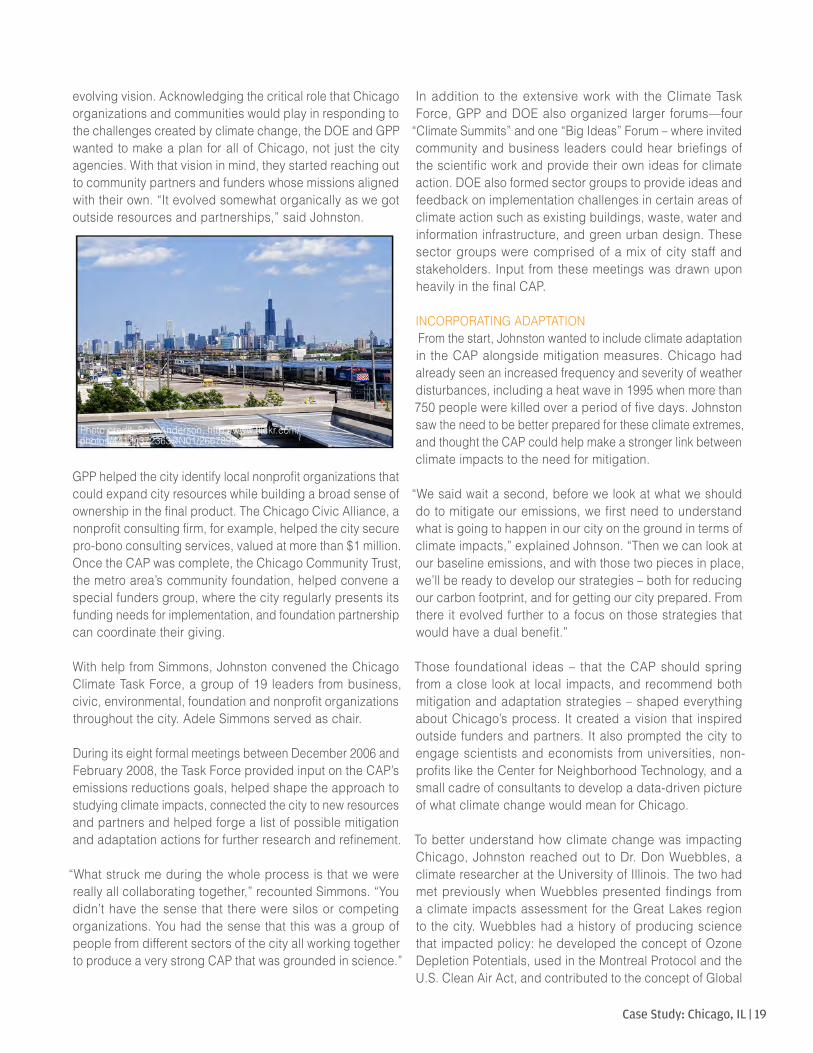
Photo credit: Seth Anderson, http://www.flickr.com/photos/44124372363@N01/2667899459
20 | Case Study: Chicago, IL
Warming Potentials used in the Kyoto Protocol and most carbon trading programs. Recognizing Wuebbles’ unique expertise, Johnston asked Wuebbles to conduct a climate impact assessment for the Chicago. Wuebbles jumped at the opportunity. “Other cities are often reluctant to bring in
scientists, or they simply don’t know how to find us,” he said. “Chicago’s willingness to work closely with scientists on the CAP really strengthened it.”
Weubbles and his team began their assessment by “downscaling” global climate models to the Chicago region using advanced statistical techniques. The result was a custom climate model specific to Chicago that was used to predict changes in climate over the next century and help policy-makers be better prepared.1
Wuebbles and co-author Katharine Hayhoe from Texas Tech University published their findings in a report, “Climate Change and Chicago: Projections and Potential Impacts.” The report listed two impact scenarios for this century: low emissions (up to 550 parts per million (ppm) of atmospheric carbon dioxide (CO2)), and high emissions (up to 1,000 ppm). It detailed changes to temperature, precipitation, and ecosystems, and predicted subsequent impacts on public health, the economy, and infrastructure. (See box at right).
The city then hired consultants to specify how predicted climate impacts would affect city operations – from snow plowing to operating buildings to maintaining parks – and to calculate the economic costs of preparing versus holding to the status quo. This extensive work produced a detailed set of reports painting a comprehensive picture of what change would mean locally. The various experts were then invited to present their results at internal meetings, as well as during meetings of the Climate Task Force.
“This kind of analysis doesn’t have to be perfect,” explained Aaron Durnbaugh, Deputy Commissioner of the Department of Environment, and the city’s current lead on climate adaptation efforts. “For example, there were gaps in our analysis of the costs of adapting to climate change. But it gave a rough estimate of the total cost – up to $700 billion – and those numbers got people’s attention.”
According to Johnston, looking at climate impacts and adaptation challenges ultimately compelled city staff and community leaders to take the mitigation side more seriously.
“For the naysayers, the description of a future with climate change helped them make sense of changes they were already seeing. That helped them realize that the wisest course of action was to adapt our operations and infrastructure, and it helped them understand the importance of reducing our carbon emissions in the first place.”
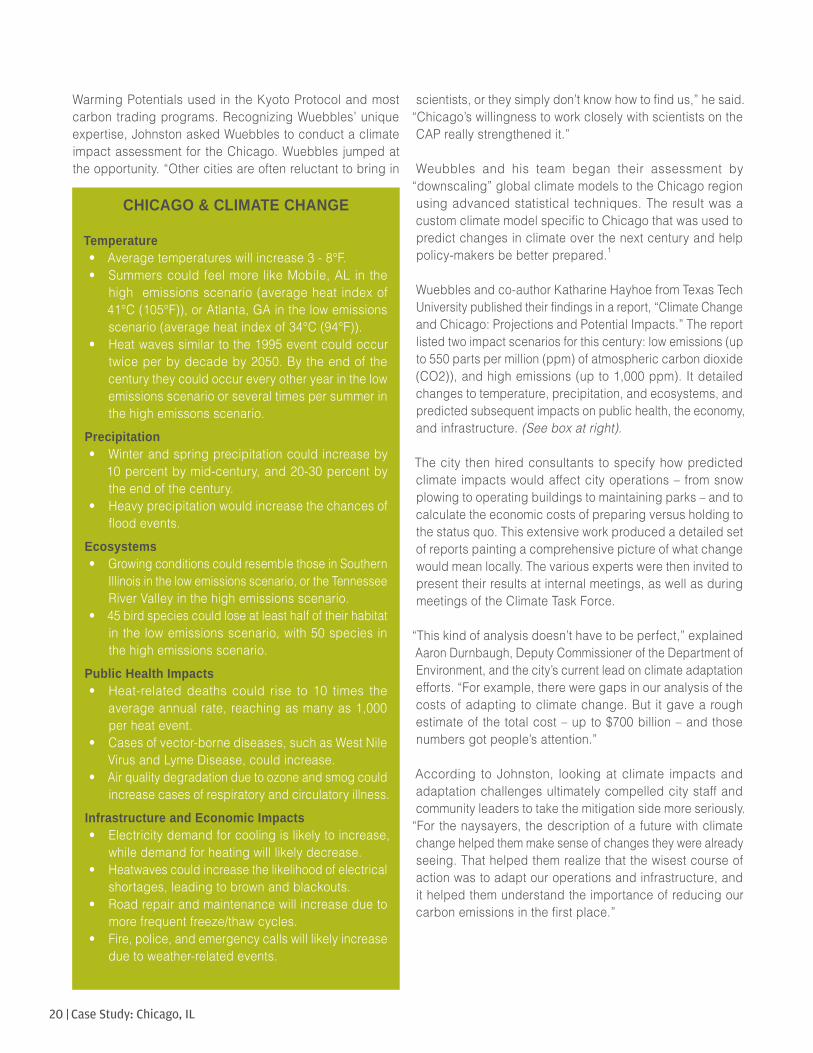
CHICAGO & CLIMATE CHANGE
Temperature• Average temperatures will increase 3 - 8°F. • Summers could feel more like Mobile, AL in the
high emissions scenario (average heat index of 41°C (105°F)), or Atlanta, GA in the low emissions scenario (average heat index of 34°C (94°F)).
• Heat waves similar to the 1995 event could occur twice per by decade by 2050. By the end of the century they could occur every other year in the low emissions scenario or several times per summer in the high emissons scenario.
Precipitation• Winter and spring precipitation could increase by
10 percent by mid-century, and 20-30 percent by the end of the century.
• Heavy precipitation would increase the chances of flood events.
Ecosystems• Growing conditions could resemble those in Southern
Illinois in the low emissions scenario, or the Tennessee River Valley in the high emissions scenario.
• 45 bird species could lose at least half of their habitat in the low emissions scenario, with 50 species in the high emissions scenario.
Public Health Impacts• Heat-related deaths could rise to 10 times the
average annual rate, reaching as many as 1,000 per heat event.
• Cases of vector-borne diseases, such as West Nile Virus and Lyme Disease, could increase.
• Air quality degradation due to ozone and smog could increase cases of respiratory and circulatory illness.
Infrastructure and Economic Impacts• Electricity demand for cooling is likely to increase,
while demand for heating will likely decrease.• Heatwaves could increase the likelihood of electrical
shortages, leading to brown and blackouts.• Road repair and maintenance will increase due to
more frequent freeze/thaw cycles.• Fire, police, and emergency calls will likely increase
due to weather-related events.
| 21Case Study: Chicago, IL
ENGAGING CITY DEPARTMENTSThe huge investment in engaging leaders outside of city government was a key strategy that helped forge broad-based public support for the CAP. In retrospect, Johnston wishes that he and other leaders of the process had invested as much in engaging the upper echelons of agency management within government. He offers an example of a missed opportunity: As part of the work to quantify the costs of adapting city infrastructure and operations to changing climate patterns, the city’s consultants requested meetings with all the key departments. Mid-level staffers were usually sent to those meetings. Often, they found it difficult to provide informed feedback about what their department would likely do to respond to climate impacts, and the questions that those meetings raised did not percolate up to senior management.
School Board staff, for example, were briefed on the number of days of extreme heat that might occur during late spring and early fall months. Since they lacked the understanding and authority to anticipate the policy changes that would be triggered by such extreme heat and its risks for school-aged children, they suggested that the School Board was unlikely to add air conditioning to its schools. This resulted in what Johnston understands to be a major underestimation of the costs of adapting to extreme heat in Chicago’s city facilities.
Johnston believes more dialogue with the School Board itself, and senior managers across the city, would have resulted in better analysis of what climate impacts would mean for city operations. “We did so much work with our external partners, and we had very high-level people from the unions and businesses and other organizations,” he said. “With our commissioners, we mostly updated them once in a while. In retrospect, it would have been helpful to have a high-level internal steering committee, or at least embed some of our Commissioners in the Task Force, to get them more deeply engaged in shaping the work.”
GETTING TO A FINAL CAPWhen Johnston thought the CAP was ready, he took it to the city’s press office and to senior departmental leaders to get a sign-off on the document’s key recommendations. But instead of getting approval, Johnston encountered resistance. DOE worked through multiple re-writes, but nothing seemed to be working. “I was banging my head against the wall,” recounted Johnston. “There were subtle things happening that I just didn’t pick up on.”
It took a full six months for Johnston to get all the approvals he needed. He attributes his success to two things. First, his position within city government had changed. He was
now the Chicago’s Chief Environmental Officer, reporting directly to Mayor Daley. Occupying a high-level position in the Mayor’s office gave Johnston an ability to move the document through a complex city bureaucracy.
Johnston also realized that the resistance he was encountering was less about the CAP’s content, and more about its overall framing and tone. At the foundation of the document was a vivid picture of how Chicago could be affected by shifting climate patterns. Summers would be much hotter, approximating the current weather patterns in Mobile, Alabama. There would be more intense storms, droughts, and larger snow events. What Johnson finally realized was that the stark description of risks facing the city was “scaring” city managers, and the only way to build positive support for the CAP within the city was to the change the tone.
“Many of us folks that are passionate about the environment have a tendency to want to jump on a soapbox and scream and shout about everything we need to be worried about,” explained Johnson. “But we had to tone down that ‘city is going to hell in a hand basket’ approach, and start talking about what going green represents for the city. We had to talk about the jobs pieces of it, and the money we would save from implementing the strategies, and the ways in which acting would protect our residents and improve their quality of life.”
LEADING BY EXAMPLEChicago’s Climate Action CAP is only four years old, but major initiatives recommended in the CAP are already completed or well underway, including a large scale building retrofit program, an update to the city’s energy code, a new strategy for increasing the use of renewable energy sources and a nationally known green jobs training program. Daley’s mantra that the city must “lead by example” helped create this forward momentum.
“Whether it is building more energy efficient facilities, or greening a fleet, or putting green roofs on buildings, Daley always said that if the city doesn’t do it, no one else will,” said Durnbaugh. “He insisted that we needed to clean up
““Many of us folks who are passionate about the environment have a tendency to want to jump
on a soapbox. But we had to start talking about what going green represents for the City. We had to talk about jobs... and the money we
would save from implementing the strategies.
– Sadhu Johnston, Former Commissioner, Chicago Department of Environment
22 | Case Study: Chicago, IL
our own house before asking others to clean up theirs.” Leading by example creates moral authority that the city can draw on when it asks its leading nonprofit organizations, businesses and civic organizations to get directly involved in implementation. It also can help to drive the transformation of markets.
Durnbaugh offers Chicago’s work to promote green infrastructure as an example. The CAP recommended the expansion of green roofs and other green infrastructure throughout the city. “We knew we couldn’t go out and change our policies immediately,” explained Durnbaugh. “We had to build the market up, and grow the number of vendors. So we found some money and announced that we were going to build our first green roof.”
Once the city had demonstrated that green roofs could work – both to ameliorate the urban heat island affect, and to reduce the energy needed to run cooling systems and pump water – it began offering incentives for private developers to do the same (for example, increases in the allowable “floor area” in a new development in exchange for the installation of green infrastructure).
When the city convened a Green Ribbon Committee of national and local leaders (many of whom had served on the Climate Task Force) to help monitor and guide the implementation of the new climate CAP, it signaled accountability for its commitments. Simmons points out that the group has no formal authority, but because it includes many powerful and respected community leaders, it can push effectively for acceleration of effort in areas of the CAP that are languishing.
“Someone working for the Mayor would have a hard time going to him and saying things are not going well,” she said.
“But having this group is good for the Mayor. Some of the people who are valued most by political leaders are those who are willing to offer constructive criticism.”
LESSONS LEARNEDNonprofit partnerships can be a fulcrum for effective climate planning. It may be startling to hear that Sadhu Johnston launched Chicago’s process with only $50,000 and “not much of a grand plan.” He and others in DOE saw the wisdom of inviting a philanthropic organization with deep roots in Chicago to help shape and support the process. That openness to nonprofit partnership – and the vision that emerged from it – ultimately enabled the city to leverage millions of dollars in funding from inspired foundations, as well as expert assistance from well-respected universities and firms. While the landscape of organizations varies from city to city, Chicago’s experience demonstrates what strategic partnerships with community-based organizations and business leaders can accomplish.
Start by asking: ‘How will climate change affect our city?’ The City of Chicago’s decision to ground its plan in an exploration of local climate impacts catalyzed a new way of thinking. For city managers who were skeptical about the need to invest in climate planning, it made an unassailable case for the costs and risks of inaction. For community leaders, it motivated deep involvement in the process of figuring out what Chicago residents should be asked to do. Durnbaugh urges cities to remember that looking at climate impacts is no
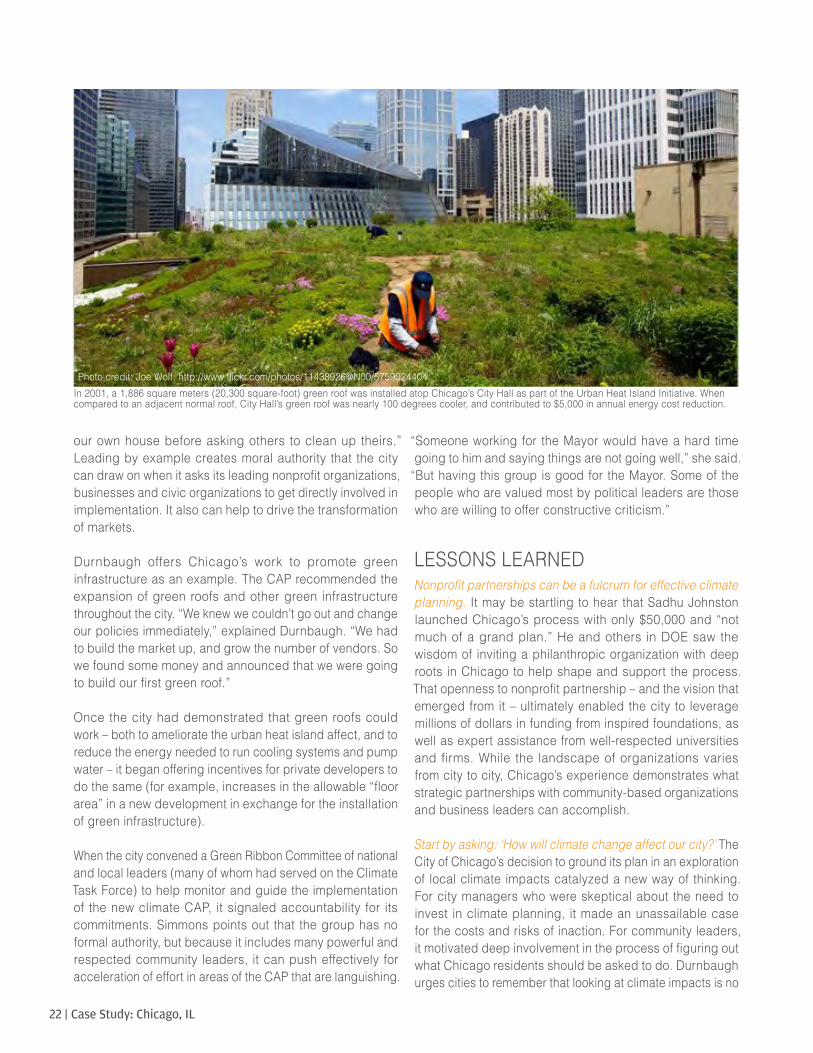
In 2001, a 1,886 square meters (20,300 square-foot) green roof was installed atop Chicago’s City Hall as part of the Urban Heat Island Initiative. When compared to an adjacent normal roof, City Hall’s green roof was nearly 100 degrees cooler, and contributed to $5,000 in annual energy cost reduction.
Photo credit: Joe Wolf, http://www.flickr.com/photos/11438926@N00/5759024404
| 23Case Study: Chicago, IL
different than looking at any other external factor that drives city planning, whether it’s fire risks or storms or population trends. Sustainability leaders can begin changing their cities’ resilience to climate change just by inviting key city managers and stakeholders to ask: how will climate change affect us here?
Credible science makes climate change real for city government and residents. Chicago completed a set of scientific and engineering studies that were ambitious and comprehensive by any standard. That pursuit of excellence was possible because generous Chicago-based foundations aspired to create a model metro-scale climate plan. The plan’s architects emphasize, however, that high quality and credible climate plans can be forged with much less investigation, by drawing on good existing data, and if necessary and possible, funding some modest investigations to fill gaps in understanding. Scientific information about impacts, especially when it is gathered or developed in close consultation with its ultimate consumers, can provide a powerful impetus to action.
Invest in internal outreach. The city convened a Task Force of business, civic and nonprofit organizations, and made integrating the group into all the steps of its climate planning one of its highest priorities. Since the plan was about what both the city government and its residents should do to address and prepare for climate change, it was essential to build the community’s understanding, and invite their input, from the beginning. However, efforts to build the understanding of city department heads and senior staff were launched much later in the process, causing a missed opportunity to engage them in specifying what the city should do and what it would cost. While challenging, it’s important to find ways of balancing internal and external outreach, so that neither is neglected. It’s also important to build buy-in at multiple levels of government – local, city, county and state.
Give people reasons for optimism. Looking at how climate change might affect day to day life in a city can tax the hopefulness of even the most optimistic sustainability practitioner. Johnston learned the hard way, after trying for months to get a sign-off on Chicago’s plan, that too much focus on the risks resulting from shifting climate patterns can erode the political motivation to commit to bold new actions. A plan can present risks honestly, and still describe the many benefits that will accrue to city residents and government agencies from being on the leading edge of climate mitigation and adaptation, including green economic development, and job growth.
Choose near and long term goals, and take early steps to model commitment. Chicago signaled its commitment to its plan when it adopted two goals for reducing greenhouse gas emissions – one for 2020, and one for 2050. Having a goal twelve years out from the release of the plan helped spur the city bureaucracy and the community at large to begin implementing the plan’s many recommendations right away, without forcing accountability for quantifiable progress too soon. Continuing a long tradition of Mayor Daley’s administration, the city has galvanized significant progress – especially in the retrofitting of old inefficient buildings and the increasing use of green roofs, street trees and other green infrastructure – by doing its own model projects.
Thanks to Sadhu Johnston, Aaron Durnbaugh, Olivia Cohn, Don Wuebbles, and Adele Simmons.
Case study written by Sarah McKearnan, Consultant to the Institute for Sustainable Communities, and updated by Michael Crowley, Senior Program Officer, Institute for Sustainable Communities.
FOR MORE INFORMATIONChicago Climate Action CAP: http://www.chicagoclimateaction.org
Global Philanthropy Partnership website: http://www.global-philanthropy.org/
“Lessons Learned: Creating the Chicago Climate Action CAP,” Julia Parzen, July 2009. http://www.chicagoclimateaction.org/filebin/pdf/LessonsLearned.pdf
REFERENCES1. Climate Change and Chicago, pg. vii
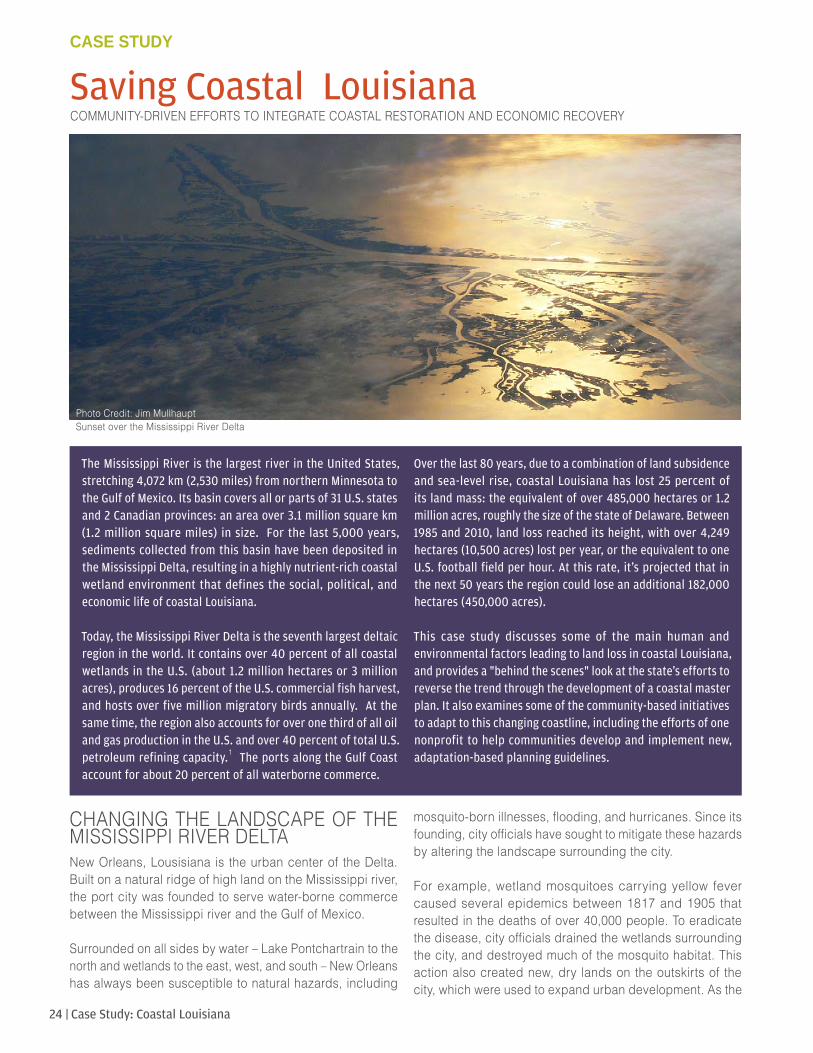
24 | Case Study: Coastal Louisiana
CHANGING THE LANDSCAPE OF THE MISSISSIPPI RIVER DELTANew Orleans, Lousisiana is the urban center of the Delta. Built on a natural ridge of high land on the Mississippi river, the port city was founded to serve water-borne commerce between the Mississippi river and the Gulf of Mexico.
Surrounded on all sides by water – Lake Pontchartrain to the north and wetlands to the east, west, and south – New Orleans has always been susceptible to natural hazards, including
mosquito-born illnesses, flooding, and hurricanes. Since its founding, city officials have sought to mitigate these hazards by altering the landscape surrounding the city.
For example, wetland mosquitoes carrying yellow fever caused several epidemics between 1817 and 1905 that resulted in the deaths of over 40,000 people. To eradicate the disease, city officials drained the wetlands surrounding the city, and destroyed much of the mosquito habitat. This action also created new, dry lands on the outskirts of the city, which were used to expand urban development. As the
Saving Coastal LouisianaCASE STUDY
COMMUNITY-DRIVEN EFFORTS TO INTEGRATE COASTAL RESTORATION AND ECONOMIC RECOVERY
The Mississippi River is the largest river in the United States, stretching 4,072 km (2,530 miles) from northern Minnesota to the Gulf of Mexico. Its basin covers all or parts of 31 U.S. states and 2 Canadian provinces: an area over 3.1 million square km (1.2 million square miles) in size. For the last 5,000 years, sediments collected from this basin have been deposited in the Mississippi Delta, resulting in a highly nutrient-rich coastal wetland environment that defines the social, political, and economic life of coastal Louisiana. Today, the Mississippi River Delta is the seventh largest deltaic region in the world. It contains over 40 percent of all coastal wetlands in the U.S. (about 1.2 million hectares or 3 million acres), produces 16 percent of the U.S. commercial fish harvest, and hosts over five million migratory birds annually. At the same time, the region also accounts for over one third of all oil and gas production in the U.S. and over 40 percent of total U.S. petroleum refining capacity.1 The ports along the Gulf Coast account for about 20 percent of all waterborne commerce.
Over the last 80 years, due to a combination of land subsidence and sea-level rise, coastal Louisiana has lost 25 percent of its land mass: the equivalent of over 485,000 hectares or 1.2 million acres, roughly the size of the state of Delaware. Between 1985 and 2010, land loss reached its height, with over 4,249 hectares (10,500 acres) lost per year, or the equivalent to one U.S. football field per hour. At this rate, it's projected that in the next 50 years the region could lose an additional 182,000 hectares (450,000 acres).
This case study discusses some of the main human and environmental factors leading to land loss in coastal Louisiana, and provides a "behind the scenes" look at the state's efforts to reverse the trend through the development of a coastal master plan. It also examines some of the community-based initiatives to adapt to this changing coastline, including the efforts of one nonprofit to help communities develop and implement new, adaptation-based planning guidelines.
Photo Credit: Jim MullhauptSunset over the Mississippi River Delta
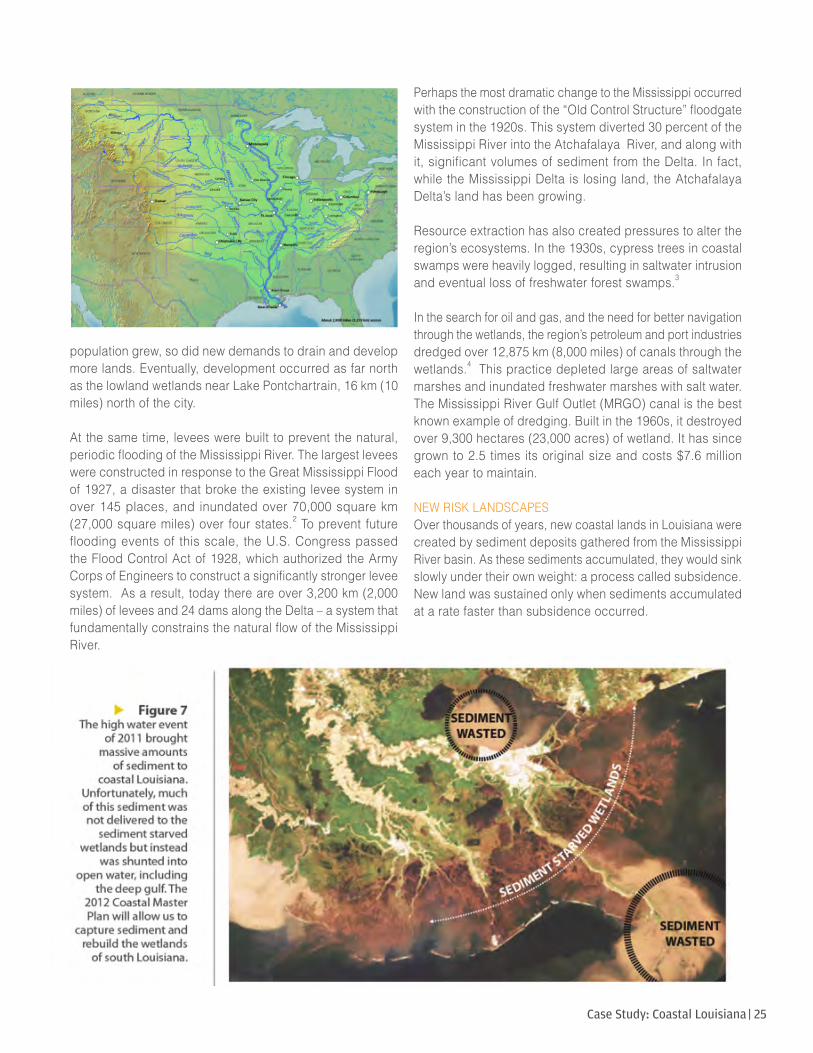
| 25Case Study: Coastal Louisiana
population grew, so did new demands to drain and develop more lands. Eventually, development occurred as far north as the lowland wetlands near Lake Pontchartrain, 16 km (10 miles) north of the city.
At the same time, levees were built to prevent the natural, periodic flooding of the Mississippi River. The largest levees were constructed in response to the Great Mississippi Flood of 1927, a disaster that broke the existing levee system in over 145 places, and inundated over 70,000 square km (27,000 square miles) over four states.2 To prevent future flooding events of this scale, the U.S. Congress passed the Flood Control Act of 1928, which authorized the Army Corps of Engineers to construct a significantly stronger levee system. As a result, today there are over 3,200 km (2,000 miles) of levees and 24 dams along the Delta – a system that fundamentally constrains the natural flow of the Mississippi River.
Perhaps the most dramatic change to the Mississippi occurred with the construction of the “Old Control Structure” floodgate system in the 1920s. This system diverted 30 percent of the Mississippi River into the Atchafalaya River, and along with it, significant volumes of sediment from the Delta. In fact, while the Mississippi Delta is losing land, the Atchafalaya Delta’s land has been growing.
Resource extraction has also created pressures to alter the region’s ecosystems. In the 1930s, cypress trees in coastal swamps were heavily logged, resulting in saltwater intrusion and eventual loss of freshwater forest swamps.3
In the search for oil and gas, and the need for better navigation through the wetlands, the region’s petroleum and port industries dredged over 12,875 km (8,000 miles) of canals through the wetlands.4 This practice depleted large areas of saltwater marshes and inundated freshwater marshes with salt water. The Mississippi River Gulf Outlet (MRGO) canal is the best known example of dredging. Built in the 1960s, it destroyed over 9,300 hectares (23,000 acres) of wetland. It has since grown to 2.5 times its original size and costs $7.6 million each year to maintain.
NEW RISK LANDSCAPESOver thousands of years, new coastal lands in Louisiana were created by sediment deposits gathered from the Mississippi River basin. As these sediments accumulated, they would sink slowly under their own weight: a process called subsidence. New land was sustained only when sediments accumulated at a rate faster than subsidence occurred.
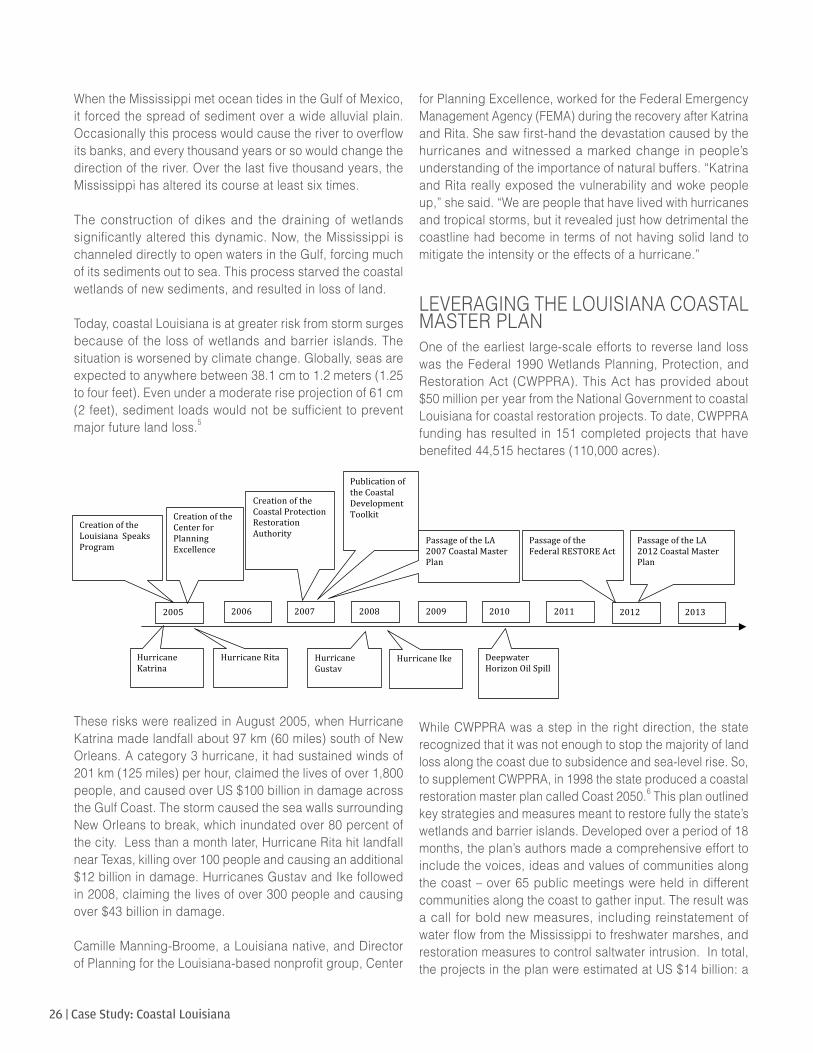
26 | Case Study: Coastal Louisiana
When the Mississippi met ocean tides in the Gulf of Mexico, it forced the spread of sediment over a wide alluvial plain. Occasionally this process would cause the river to overflow its banks, and every thousand years or so would change the direction of the river. Over the last five thousand years, the Mississippi has altered its course at least six times.
The construction of dikes and the draining of wetlands significantly altered this dynamic. Now, the Mississippi is channeled directly to open waters in the Gulf, forcing much of its sediments out to sea. This process starved the coastal wetlands of new sediments, and resulted in loss of land. Today, coastal Louisiana is at greater risk from storm surges because of the loss of wetlands and barrier islands. The situation is worsened by climate change. Globally, seas are expected to anywhere between 38.1 cm to 1.2 meters (1.25 to four feet). Even under a moderate rise projection of 61 cm (2 feet), sediment loads would not be sufficient to prevent major future land loss.5
These risks were realized in August 2005, when Hurricane Katrina made landfall about 97 km (60 miles) south of New Orleans. A category 3 hurricane, it had sustained winds of 201 km (125 miles) per hour, claimed the lives of over 1,800 people, and caused over US $100 billion in damage across the Gulf Coast. The storm caused the sea walls surrounding New Orleans to break, which inundated over 80 percent of the city. Less than a month later, Hurricane Rita hit landfall near Texas, killing over 100 people and causing an additional $12 billion in damage. Hurricanes Gustav and Ike followed in 2008, claiming the lives of over 300 people and causing over $43 billion in damage.
Camille Manning-Broome, a Louisiana native, and Director of Planning for the Louisiana-based nonprofit group, Center
for Planning Excellence, worked for the Federal Emergency Management Agency (FEMA) during the recovery after Katrina and Rita. She saw first-hand the devastation caused by the hurricanes and witnessed a marked change in people’s understanding of the importance of natural buffers. “Katrina and Rita really exposed the vulnerability and woke people up,” she said. “We are people that have lived with hurricanes and tropical storms, but it revealed just how detrimental the coastline had become in terms of not having solid land to mitigate the intensity or the effects of a hurricane.”
LEVERAGING THE LOUISIANA COASTAL MASTER PLANOne of the earliest large-scale efforts to reverse land loss was the Federal 1990 Wetlands Planning, Protection, and Restoration Act (CWPPRA). This Act has provided about $50 million per year from the National Government to coastal Louisiana for coastal restoration projects. To date, CWPPRA funding has resulted in 151 completed projects that have benefited 44,515 hectares (110,000 acres).
While CWPPRA was a step in the right direction, the state recognized that it was not enough to stop the majority of land loss along the coast due to subsidence and sea-level rise. So, to supplement CWPPRA, in 1998 the state produced a coastal restoration master plan called Coast 2050.6 This plan outlined key strategies and measures meant to restore fully the state’s wetlands and barrier islands. Developed over a period of 18 months, the plan’s authors made a comprehensive effort to include the voices, ideas and values of communities along the coast – over 65 public meetings were held in different communities along the coast to gather input. The result was a call for bold new measures, including reinstatement of water flow from the Mississippi to freshwater marshes, and restoration measures to control saltwater intrusion. In total, the projects in the plan were estimated at US $14 billion: a
Hurricane Katrina
Hurricane Rita Hurricane Gustav
Hurricane Ike
Creation of the Coastal Protection Restoration Authority
2005 2006 2013 2009 2008 2007 2012 2011 2010
Deepwater Horizon Oil Spill
Passage of the LA 2007 Coastal Master Plan
Passage of the LA 2012 Coastal Master Plan
Passage of the Federal RESTORE Act
Creation of the Louisiana Speaks Program
Creation of the Center for Planning Excellence
Publication of the Coastal Development Toolkit
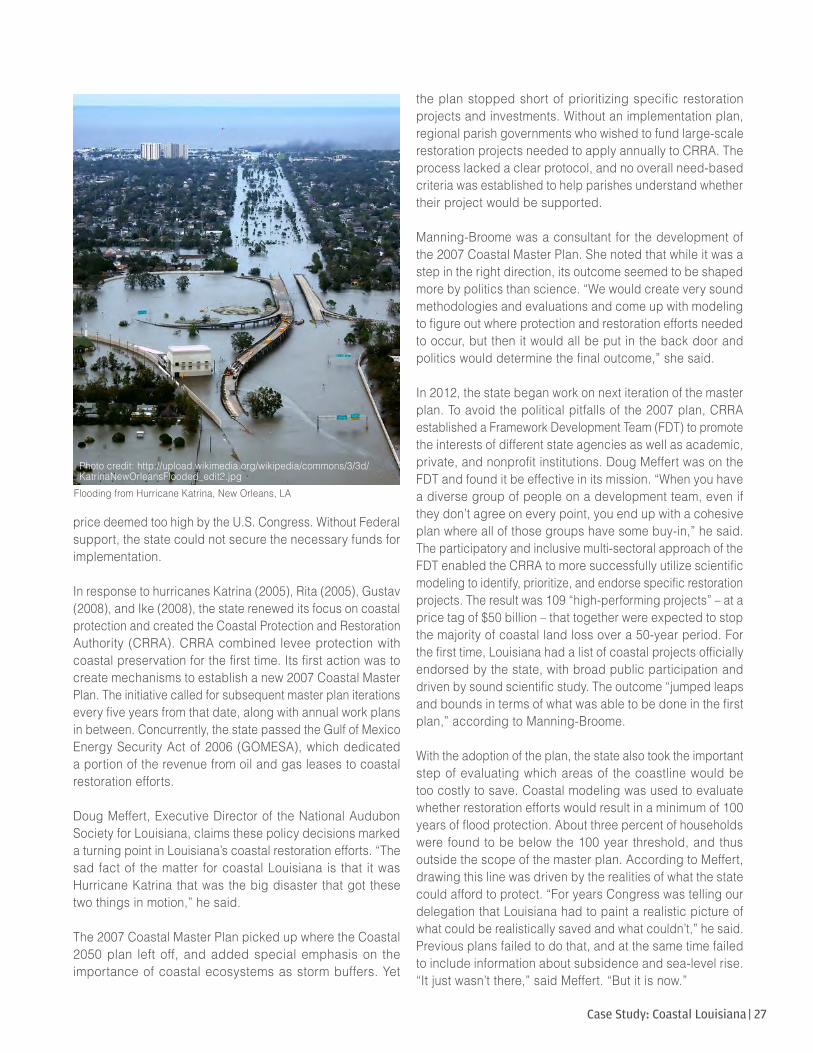
| 27Case Study: Coastal Louisiana
price deemed too high by the U.S. Congress. Without Federal support, the state could not secure the necessary funds for implementation.
In response to hurricanes Katrina (2005), Rita (2005), Gustav (2008), and Ike (2008), the state renewed its focus on coastal protection and created the Coastal Protection and Restoration Authority (CRRA). CRRA combined levee protection with coastal preservation for the first time. Its first action was to create mechanisms to establish a new 2007 Coastal Master Plan. The initiative called for subsequent master plan iterations every five years from that date, along with annual work plans in between. Concurrently, the state passed the Gulf of Mexico Energy Security Act of 2006 (GOMESA), which dedicated a portion of the revenue from oil and gas leases to coastal restoration efforts.
Doug Meffert, Executive Director of the National Audubon Society for Louisiana, claims these policy decisions marked a turning point in Louisiana’s coastal restoration efforts. “The sad fact of the matter for coastal Louisiana is that it was Hurricane Katrina that was the big disaster that got these two things in motion,” he said.
The 2007 Coastal Master Plan picked up where the Coastal 2050 plan left off, and added special emphasis on the importance of coastal ecosystems as storm buffers. Yet
the plan stopped short of prioritizing specific restoration projects and investments. Without an implementation plan, regional parish governments who wished to fund large-scale restoration projects needed to apply annually to CRRA. The process lacked a clear protocol, and no overall need-based criteria was established to help parishes understand whether their project would be supported.
Manning-Broome was a consultant for the development of the 2007 Coastal Master Plan. She noted that while it was a step in the right direction, its outcome seemed to be shaped more by politics than science. “We would create very sound methodologies and evaluations and come up with modeling to figure out where protection and restoration efforts needed to occur, but then it would all be put in the back door and politics would determine the final outcome,” she said.
In 2012, the state began work on next iteration of the master plan. To avoid the political pitfalls of the 2007 plan, CRRA established a Framework Development Team (FDT) to promote the interests of different state agencies as well as academic, private, and nonprofit institutions. Doug Meffert was on the FDT and found it be effective in its mission. “When you have a diverse group of people on a development team, even if they don’t agree on every point, you end up with a cohesive plan where all of those groups have some buy-in,” he said.The participatory and inclusive multi-sectoral approach of the FDT enabled the CRRA to more successfully utilize scientific modeling to identify, prioritize, and endorse specific restoration projects. The result was 109 “high-performing projects” – at a price tag of $50 billion – that together were expected to stop the majority of coastal land loss over a 50-year period. For the first time, Louisiana had a list of coastal projects officially endorsed by the state, with broad public participation and driven by sound scientific study. The outcome “jumped leaps and bounds in terms of what was able to be done in the first plan,” according to Manning-Broome.
With the adoption of the plan, the state also took the important step of evaluating which areas of the coastline would be too costly to save. Coastal modeling was used to evaluate whether restoration efforts would result in a minimum of 100 years of flood protection. About three percent of households were found to be below the 100 year threshold, and thus outside the scope of the master plan. According to Meffert, drawing this line was driven by the realities of what the state could afford to protect. “For years Congress was telling our delegation that Louisiana had to paint a realistic picture of what could be realistically saved and what couldn’t,” he said. Previous plans failed to do that, and at the same time failed to include information about subsidence and sea-level rise. “It just wasn’t there,” said Meffert. “But it is now.”
Photo credit: http://upload.wikimedia.org/wikipedia/commons/3/3d/KatrinaNewOrleansFlooded_edit2.jpg
Flooding from Hurricane Katrina, New Orleans, LA
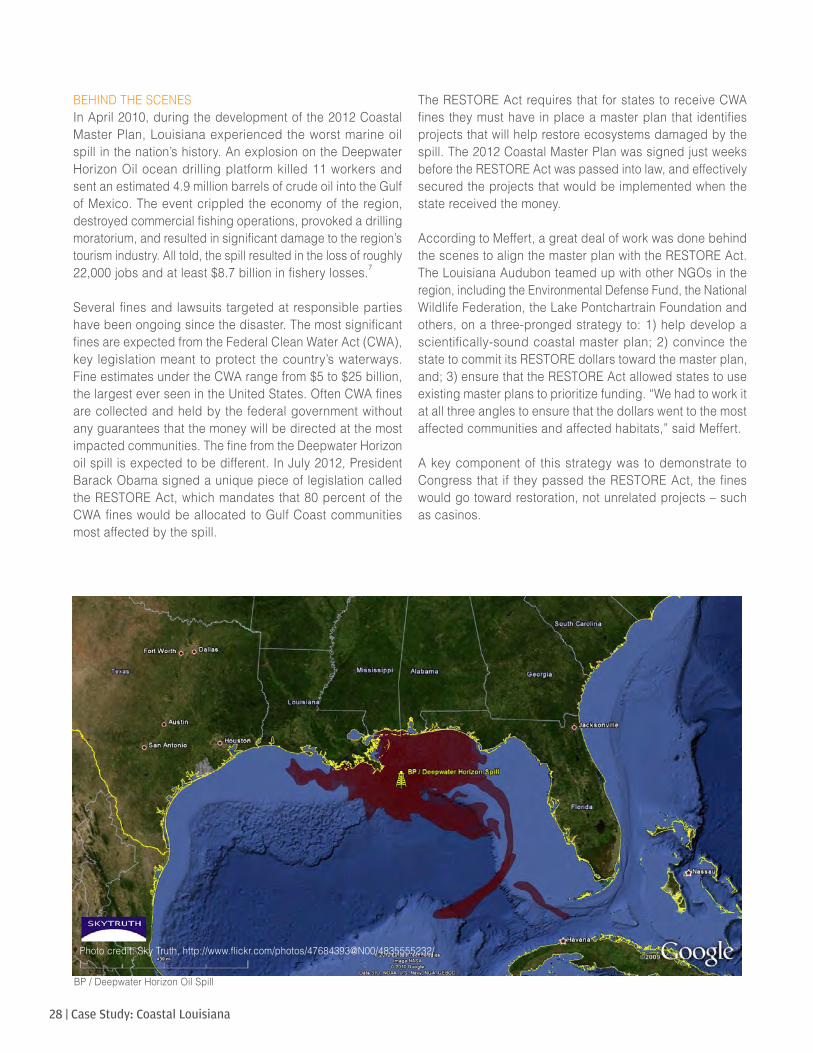
28 | Case Study: Coastal Louisiana
BEHIND THE SCENESIn April 2010, during the development of the 2012 Coastal Master Plan, Louisiana experienced the worst marine oil spill in the nation’s history. An explosion on the Deepwater Horizon Oil ocean drilling platform killed 11 workers and sent an estimated 4.9 million barrels of crude oil into the Gulf of Mexico. The event crippled the economy of the region, destroyed commercial fishing operations, provoked a drilling moratorium, and resulted in significant damage to the region’s tourism industry. All told, the spill resulted in the loss of roughly 22,000 jobs and at least $8.7 billion in fishery losses.7
Several fines and lawsuits targeted at responsible parties have been ongoing since the disaster. The most significant fines are expected from the Federal Clean Water Act (CWA), key legislation meant to protect the country’s waterways. Fine estimates under the CWA range from $5 to $25 billion, the largest ever seen in the United States. Often CWA fines are collected and held by the federal government without any guarantees that the money will be directed at the most impacted communities. The fine from the Deepwater Horizon oil spill is expected to be different. In July 2012, President Barack Obama signed a unique piece of legislation called the RESTORE Act, which mandates that 80 percent of the CWA fines would be allocated to Gulf Coast communities most affected by the spill.
The RESTORE Act requires that for states to receive CWA fines they must have in place a master plan that identifies projects that will help restore ecosystems damaged by the spill. The 2012 Coastal Master Plan was signed just weeks before the RESTORE Act was passed into law, and effectively secured the projects that would be implemented when the state received the money.
According to Meffert, a great deal of work was done behind the scenes to align the master plan with the RESTORE Act. The Louisiana Audubon teamed up with other NGOs in the region, including the Environmental Defense Fund, the National Wildlife Federation, the Lake Pontchartrain Foundation and others, on a three-pronged strategy to: 1) help develop a scientifically-sound coastal master plan; 2) convince the state to commit its RESTORE dollars toward the master plan, and; 3) ensure that the RESTORE Act allowed states to use existing master plans to prioritize funding. “We had to work it at all three angles to ensure that the dollars went to the most affected communities and affected habitats,” said Meffert.
A key component of this strategy was to demonstrate to Congress that if they passed the RESTORE Act, the fines would go toward restoration, not unrelated projects – such as casinos.
Photo credit: Sky Truth, http://www.flickr.com/photos/47684393@N00/4835555232/
BP / Deepwater Horizon Oil Spill
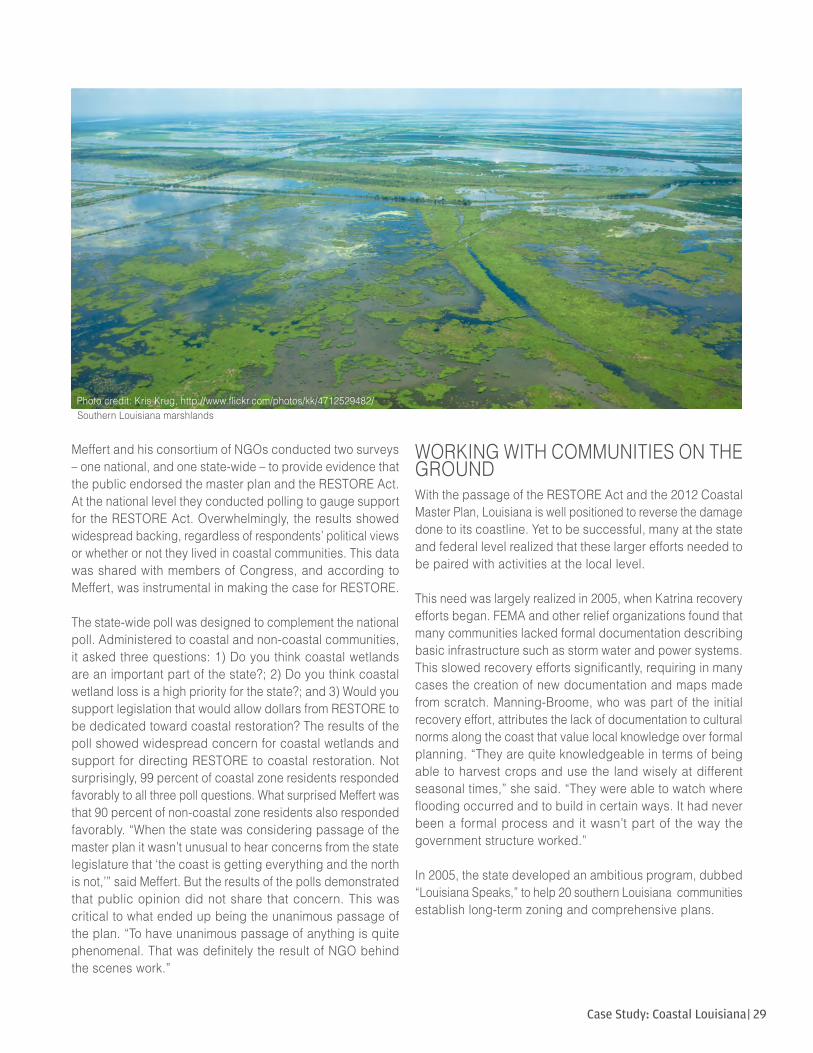
| 29Case Study: Coastal Louisiana
Meffert and his consortium of NGOs conducted two surveys – one national, and one state-wide – to provide evidence that the public endorsed the master plan and the RESTORE Act. At the national level they conducted polling to gauge support for the RESTORE Act. Overwhelmingly, the results showed widespread backing, regardless of respondents’ political views or whether or not they lived in coastal communities. This data was shared with members of Congress, and according to Meffert, was instrumental in making the case for RESTORE.
The state-wide poll was designed to complement the national poll. Administered to coastal and non-coastal communities, it asked three questions: 1) Do you think coastal wetlands are an important part of the state?; 2) Do you think coastal wetland loss is a high priority for the state?; and 3) Would you support legislation that would allow dollars from RESTORE to be dedicated toward coastal restoration? The results of the poll showed widespread concern for coastal wetlands and support for directing RESTORE to coastal restoration. Not surprisingly, 99 percent of coastal zone residents responded favorably to all three poll questions. What surprised Meffert was that 90 percent of non-coastal zone residents also responded favorably. “When the state was considering passage of the master plan it wasn’t unusual to hear concerns from the state legislature that ‘the coast is getting everything and the north is not,’” said Meffert. But the results of the polls demonstrated that public opinion did not share that concern. This was critical to what ended up being the unanimous passage of the plan. “To have unanimous passage of anything is quite phenomenal. That was definitely the result of NGO behind the scenes work.”
WORKING WITH COMMUNITIES ON THE GROUNDWith the passage of the RESTORE Act and the 2012 Coastal Master Plan, Louisiana is well positioned to reverse the damage done to its coastline. Yet to be successful, many at the state and federal level realized that these larger efforts needed to be paired with activities at the local level.
This need was largely realized in 2005, when Katrina recovery efforts began. FEMA and other relief organizations found that many communities lacked formal documentation describing basic infrastructure such as storm water and power systems. This slowed recovery efforts significantly, requiring in many cases the creation of new documentation and maps made from scratch. Manning-Broome, who was part of the initial recovery effort, attributes the lack of documentation to cultural norms along the coast that value local knowledge over formal planning. “They are quite knowledgeable in terms of being able to harvest crops and use the land wisely at different seasonal times,” she said. “They were able to watch where flooding occurred and to build in certain ways. It had never been a formal process and it wasn’t part of the way the government structure worked.”
In 2005, the state developed an ambitious program, dubbed “Louisiana Speaks,” to help 20 southern Louisiana communities establish long-term zoning and comprehensive plans.
Photo credit: Kris Krug, http://www.flickr.com/photos/kk/4712529482/Southern Louisiana marshlands
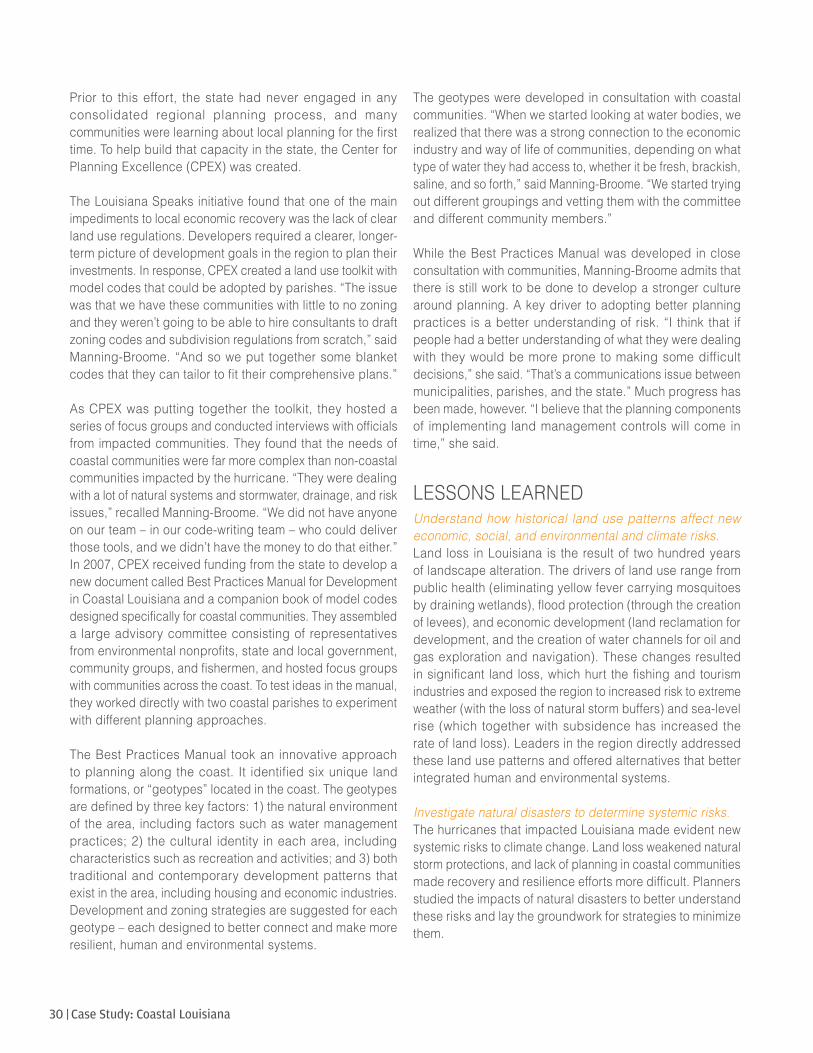
30 | Case Study: Coastal Louisiana
Prior to this effort, the state had never engaged in any consolidated regional planning process, and many communities were learning about local planning for the first time. To help build that capacity in the state, the Center for Planning Excellence (CPEX) was created.
The Louisiana Speaks initiative found that one of the main impediments to local economic recovery was the lack of clear land use regulations. Developers required a clearer, longer-term picture of development goals in the region to plan their investments. In response, CPEX created a land use toolkit with model codes that could be adopted by parishes. “The issue was that we have these communities with little to no zoning and they weren’t going to be able to hire consultants to draft zoning codes and subdivision regulations from scratch,” said Manning-Broome. “And so we put together some blanket codes that they can tailor to fit their comprehensive plans.”
As CPEX was putting together the toolkit, they hosted a series of focus groups and conducted interviews with officials from impacted communities. They found that the needs of coastal communities were far more complex than non-coastal communities impacted by the hurricane. “They were dealing with a lot of natural systems and stormwater, drainage, and risk issues,” recalled Manning-Broome. “We did not have anyone on our team – in our code-writing team – who could deliver those tools, and we didn’t have the money to do that either.”In 2007, CPEX received funding from the state to develop a new document called Best Practices Manual for Development in Coastal Louisiana and a companion book of model codes designed specifically for coastal communities. They assembled a large advisory committee consisting of representatives from environmental nonprofits, state and local government, community groups, and fishermen, and hosted focus groups with communities across the coast. To test ideas in the manual, they worked directly with two coastal parishes to experiment with different planning approaches.
The Best Practices Manual took an innovative approach to planning along the coast. It identified six unique land formations, or “geotypes” located in the coast. The geotypes are defined by three key factors: 1) the natural environment of the area, including factors such as water management practices; 2) the cultural identity in each area, including characteristics such as recreation and activities; and 3) both traditional and contemporary development patterns that exist in the area, including housing and economic industries. Development and zoning strategies are suggested for each geotype – each designed to better connect and make more resilient, human and environmental systems.
The geotypes were developed in consultation with coastal communities. “When we started looking at water bodies, we realized that there was a strong connection to the economic industry and way of life of communities, depending on what type of water they had access to, whether it be fresh, brackish, saline, and so forth,” said Manning-Broome. “We started trying out different groupings and vetting them with the committee and different community members.”
While the Best Practices Manual was developed in close consultation with communities, Manning-Broome admits that there is still work to be done to develop a stronger culture around planning. A key driver to adopting better planning practices is a better understanding of risk. “I think that if people had a better understanding of what they were dealing with they would be more prone to making some difficult decisions,” she said. “That’s a communications issue between municipalities, parishes, and the state.” Much progress has been made, however. “I believe that the planning components of implementing land management controls will come in time,” she said.
LESSONS LEARNEDUnderstand how historical land use patterns affect new economic, social, and environmental and climate risks. Land loss in Louisiana is the result of two hundred years of landscape alteration. The drivers of land use range from public health (eliminating yellow fever carrying mosquitoes by draining wetlands), flood protection (through the creation of levees), and economic development (land reclamation for development, and the creation of water channels for oil and gas exploration and navigation). These changes resulted in significant land loss, which hurt the fishing and tourism industries and exposed the region to increased risk to extreme weather (with the loss of natural storm buffers) and sea-level rise (which together with subsidence has increased the rate of land loss). Leaders in the region directly addressed these land use patterns and offered alternatives that better integrated human and environmental systems.
Investigate natural disasters to determine systemic risks. The hurricanes that impacted Louisiana made evident new systemic risks to climate change. Land loss weakened natural storm protections, and lack of planning in coastal communities made recovery and resilience efforts more difficult. Planners studied the impacts of natural disasters to better understand these risks and lay the groundwork for strategies to minimize them.
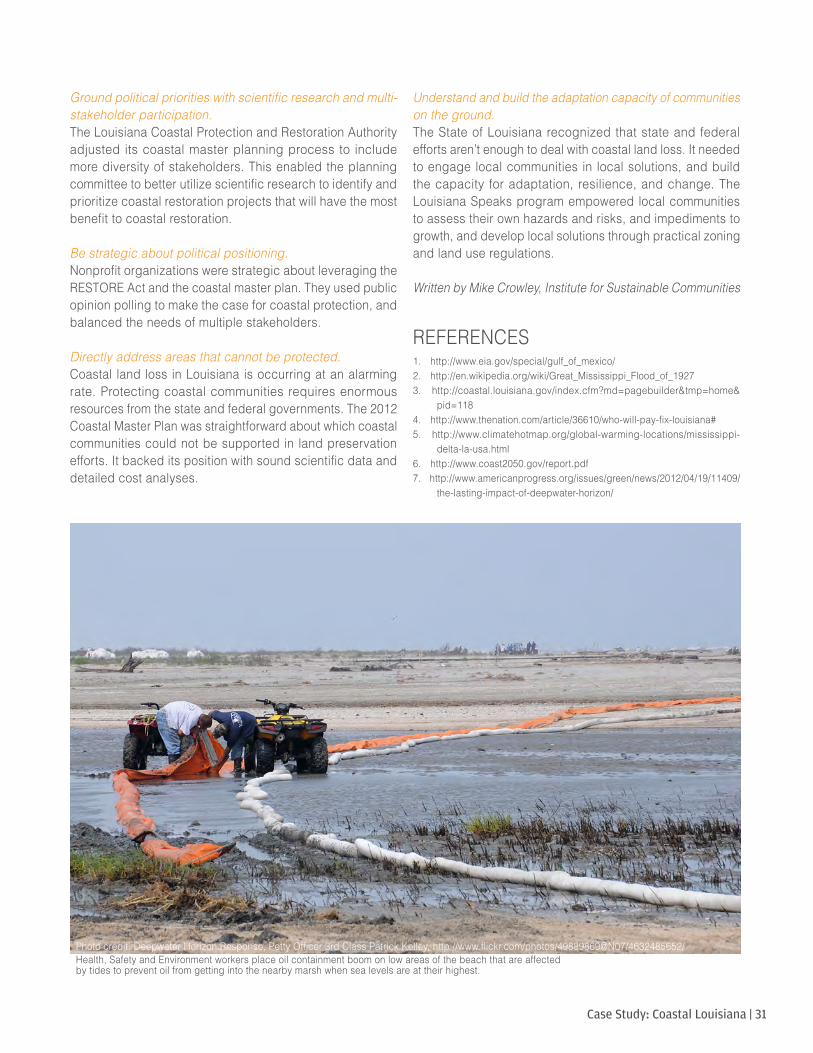
| 31Case Study: Coastal Louisiana
Ground political priorities with scientific research and multi-stakeholder participation. The Louisiana Coastal Protection and Restoration Authority adjusted its coastal master planning process to include more diversity of stakeholders. This enabled the planning committee to better utilize scientific research to identify and prioritize coastal restoration projects that will have the most benefit to coastal restoration.
Be strategic about political positioning. Nonprofit organizations were strategic about leveraging the RESTORE Act and the coastal master plan. They used public opinion polling to make the case for coastal protection, and balanced the needs of multiple stakeholders.
Directly address areas that cannot be protected. Coastal land loss in Louisiana is occurring at an alarming rate. Protecting coastal communities requires enormous resources from the state and federal governments. The 2012 Coastal Master Plan was straightforward about which coastal communities could not be supported in land preservation efforts. It backed its position with sound scientific data and detailed cost analyses.
Understand and build the adaptation capacity of communities on the ground. The State of Louisiana recognized that state and federal efforts aren’t enough to deal with coastal land loss. It needed to engage local communities in local solutions, and build the capacity for adaptation, resilience, and change. The Louisiana Speaks program empowered local communities to assess their own hazards and risks, and impediments to growth, and develop local solutions through practical zoning and land use regulations.
Written by Mike Crowley, Institute for Sustainable Communities
REFERENCES1. http://www.eia.gov/special/gulf_of_mexico/2. http://en.wikipedia.org/wiki/Great_Mississippi_Flood_of_19273. http://coastal.louisiana.gov/index.cfm?md=pagebuilder&tmp=home&
pid=1184. http://www.thenation.com/article/36610/who-will-pay-fix-louisiana#5. http://www.climatehotmap.org/global-warming-locations/mississippi-
delta-la-usa.html6. http://www.coast2050.gov/report.pdf7. http://www.americanprogress.org/issues/green/news/2012/04/19/11409/
the-lasting-impact-of-deepwater-horizon/
Photo credit: Deepwater Horizon Response, Petty Officer 3rd Class Patrick Kelley, http://www.flickr.com/photos/49889869@N07/4632485652/Health, Safety and Environment workers place oil containment boom on low areas of the beach that are affected by tides to prevent oil from getting into the nearby marsh when sea levels are at their highest.
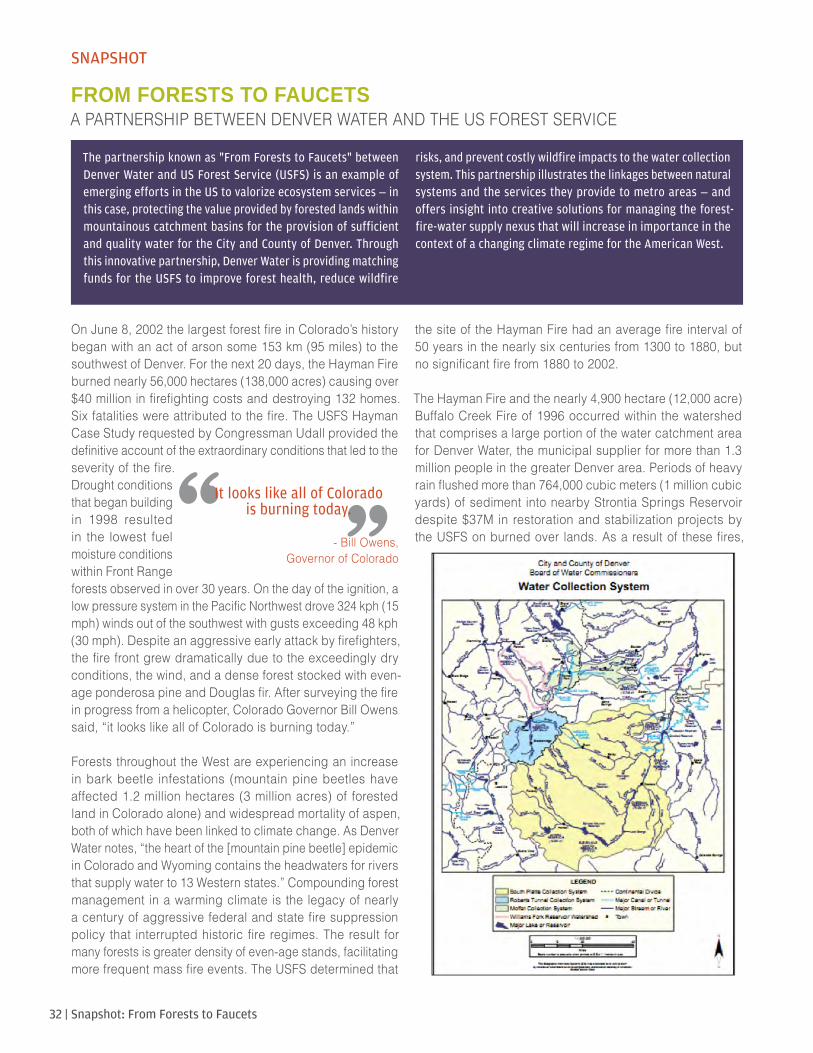
32 | Snapshot: From Forests to Faucets
SNAPSHOT
FROM FORESTS TO FAUCETSA PARTNERSHIP BETWEEN DENVER WATER AND THE US FOREST SERVICE
On June 8, 2002 the largest forest fire in Colorado’s history began with an act of arson some 153 km (95 miles) to the southwest of Denver. For the next 20 days, the Hayman Fire burned nearly 56,000 hectares (138,000 acres) causing over $40 million in firefighting costs and destroying 132 homes. Six fatalities were attributed to the fire. The USFS Hayman Case Study requested by Congressman Udall provided the definitive account of the extraordinary conditions that led to the severity of the fire. Drought conditions that began building in 1998 resulted in the lowest fuel moisture conditions within Front Range forests observed in over 30 years. On the day of the ignition, a low pressure system in the Pacific Northwest drove 324 kph (15 mph) winds out of the southwest with gusts exceeding 48 kph (30 mph). Despite an aggressive early attack by firefighters, the fire front grew dramatically due to the exceedingly dry conditions, the wind, and a dense forest stocked with even-age ponderosa pine and Douglas fir. After surveying the fire in progress from a helicopter, Colorado Governor Bill Owens said, “it looks like all of Colorado is burning today.”
Forests throughout the West are experiencing an increase in bark beetle infestations (mountain pine beetles have affected 1.2 million hectares (3 million acres) of forested land in Colorado alone) and widespread mortality of aspen, both of which have been linked to climate change. As Denver Water notes, “the heart of the [mountain pine beetle] epidemic in Colorado and Wyoming contains the headwaters for rivers that supply water to 13 Western states.” Compounding forest management in a warming climate is the legacy of nearly a century of aggressive federal and state fire suppression policy that interrupted historic fire regimes. The result for many forests is greater density of even-age stands, facilitating more frequent mass fire events. The USFS determined that
the site of the Hayman Fire had an average fire interval of 50 years in the nearly six centuries from 1300 to 1880, but no significant fire from 1880 to 2002.
The Hayman Fire and the nearly 4,900 hectare (12,000 acre) Buffalo Creek Fire of 1996 occurred within the watershed that comprises a large portion of the water catchment area for Denver Water, the municipal supplier for more than 1.3 million people in the greater Denver area. Periods of heavy rain flushed more than 764,000 cubic meters (1 million cubic yards) of sediment into nearby Strontia Springs Reservoir despite $37M in restoration and stabilization projects by the USFS on burned over lands. As a result of these fires,
““It looks like all of Colorado
is burning today.
- Bill Owens, Governor of Colorado
The partnership known as "From Forests to Faucets" between Denver Water and US Forest Service (USFS) is an example of emerging efforts in the US to valorize ecosystem services – in this case, protecting the value provided by forested lands within mountainous catchment basins for the provision of sufficient and quality water for the City and County of Denver. Through this innovative partnership, Denver Water is providing matching funds for the USFS to improve forest health, reduce wildfire
risks, and prevent costly wildfire impacts to the water collection system. This partnership illustrates the linkages between natural systems and the services they provide to metro areas – and offers insight into creative solutions for managing the forest-fire-water supply nexus that will increase in importance in the context of a changing climate regime for the American West.
| 33Snapshot: From Forests to Faucets
Denver Water has incurred over $26M in costs on water quality treatment, sediment and debris removal, reclamation techniques, and infrastructure projects to date.
In August of 2010, Denver Water and the USFS signed a contract creating “From Forests to Faucets” in which Denver Water will provide $16.5M in funding to match an equal amount provided by the USFS (totaling $33M). The forest treatment activities are considered a form of “payments for watershed protection” by USFS officials, who have been engaged in similar ecosystem services projects in federally owned forested landscapes in New England. Over the next five years, the Forest Service will administer and oversee a range of restoration activities, including forest thinning and other fuel reduction projects to reduce the risk of catastrophic wildfire on Denver Water’s collection system.
The work will be performed on land owned by the Forest Service in the Upper South Platte River, South Platte River Headwaters, St. Vrain River, Colorado River Headwaters, and Blue River watersheds, which are the primary water supply source areas for Denver Water. According to Denver Water:
“The Denver Water-funded treatments will be focused in specific ‘Zones of Concern’ within these larger watersheds identified through an assessment that analyzed and ranked wildfire hazards, flooding or debris risks, soil erodibility and water uses. This methodology was developed in 2009 in a collaborative effort by Front Range water providers, the United States Forest Service, Colorado State Forest Service, United States Geological Survey, United State Bureau of Land Management, the Colorado Department of Public Health and Environment and the United States Natural Resources Conservation Service. This has become the accepted methodology by all agencies to identify and prioritize ‘at risk’ watersheds for hazard reduction treatments and other watershed protection measures.”
As the largest “payment for watershed protection” effort in the nation, this effort to treat over 15,000 hectares (38,000 acres) of forest over five years is designed to forestall much higher future costs for Denver Water. According to Don Kennedy, Environmental Scientist at Denver Water, and the leading staffer coordinating the partnership efforts, these collection agreements were put together to get work done on the ground to reduce risk. “It’s so much cheaper to do something now as opposed to waiting for something catastrophic to occur.”
But the outcome of these efforts will also increase forest resilience to bark beetle infestations, reduce wildfire risks for communities, and improve habitat for fish and wildlife species. Similar projects are being explored elsewhere around the West, including the Four Forest Restoration Initiative in Arizona as well as early efforts in New Mexico, and other parts of Colorado.
Innovative partnerships that yield unconventional funding strategies are critical for addressing community-scale climate resilience concerns in a time of increasingly scarce public sector funds. Kennedy advises practitioners looking to replicate this partnership to seek out partners which overlap on areas of concern in the landscape to build robust collection agreements. This project also demonstrates the benefits of
“systems thinking” in addressing resilience challenges. The cost, quality and reliability of Metro Denver’s water supply is in large measure determined by the conditions of forests over 161 km (100 miles) away from the city. By considering preventative measures, Denver Water and the Forest Service are reducing the risk that Denver Water’s customers will face expensive future outlays should the perfect conditions for mass fire arise as they did on June 8, 2002.
Written by Steve Adams, Institute for Sustainable Communities; updated by Nathaly Agosto Filión, Institute for Sustainable Communities.
FOR MORE INFORMATION
Denver Water’s From Forest to Faucet website:http://www.denverwater.org/SupplyPlanning/WaterSupply/PartnershipUSFS/
Hayman Fire Case Study, Russell T. Graham, 2003. Rocky Mountain Research Station publication RMRS-GTR-114:http://www.fs.fed.us/rm/pubs/rmrs_gtr114.html
Innovative partnerships that yield unconventional
funding strategies are critical for addressing
community-scale climate resilience concerns in a time of increasingly
scarce public sector funds.
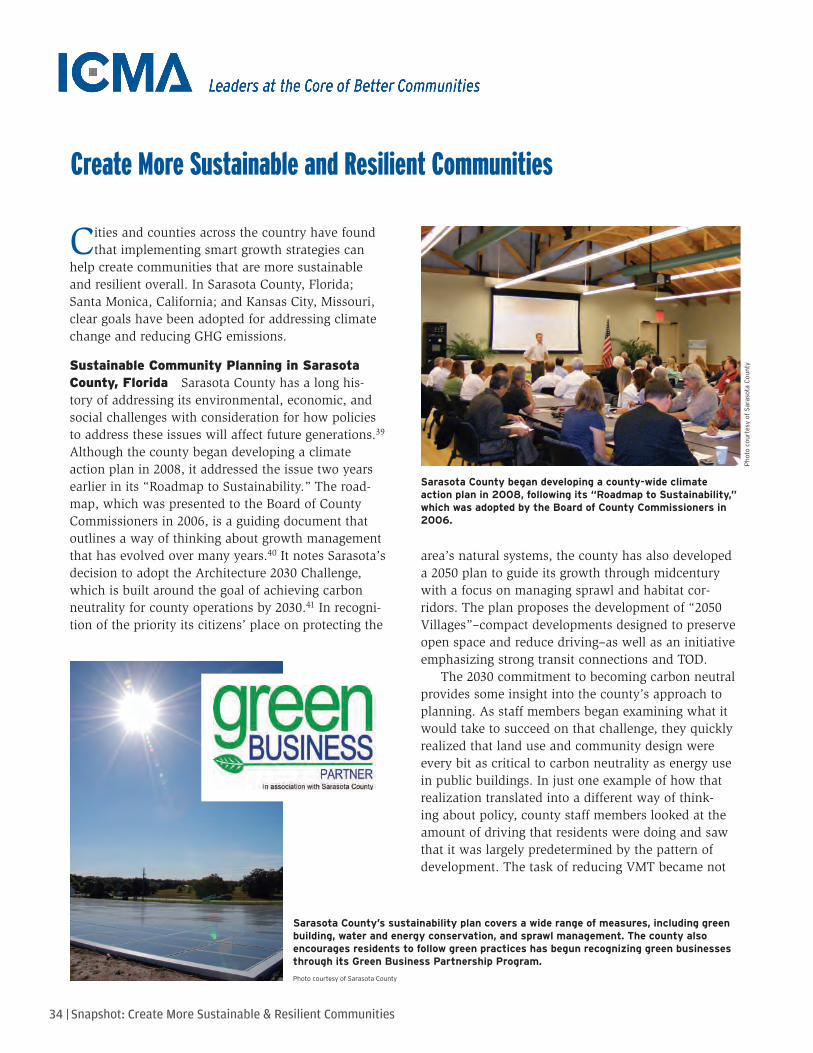
34 | Snapshot: Create More Sustainable & Resilient Communities10
1 Create More Sustainable and Resilient Communities
Cities and counties across the country have found that implementing smart growth strategies can
help create communities that are more sustainable and resilient overall. In Sarasota County, Florida; Santa Monica, California; and Kansas City, Missouri, clear goals have been adopted for addressing climate change and reducing GHG emissions.
sustainable community planning in sarasota county, florida Sarasota County has a long his-tory of addressing its environmental, economic, and social challenges with consideration for how policies to address these issues will affect future generations.39 Although the county began developing a climate action plan in 2008, it addressed the issue two years earlier in its “Roadmap to Sustainability.” The road-map, which was presented to the Board of County Commissioners in 2006, is a guiding document that outlines a way of thinking about growth management that has evolved over many years.40 It notes Sarasota’s decision to adopt the Architecture 2030 Challenge, which is built around the goal of achieving carbon neutrality for county operations by 2030.41 In recogni-tion of the priority its citizens’ place on protecting the
area’s natural systems, the county has also developed a 2050 plan to guide its growth through midcentury with a focus on managing sprawl and habitat cor-ridors. The plan proposes the development of “2050 Villages”–compact developments designed to preserve open space and reduce driving–as well as an initiative emphasizing strong transit connections and TOD.
The 2030 commitment to becoming carbon neutral provides some insight into the county’s approach to planning. As staff members began examining what it would take to succeed on that challenge, they quickly realized that land use and community design were every bit as critical to carbon neutrality as energy use in public buildings. In just one example of how that realization translated into a different way of think-ing about policy, county staff members looked at the amount of driving that residents were doing and saw that it was largely predetermined by the pattern of development. The task of reducing VMT became not
Sarasota County began developing a county-wide climate action plan in 2008, following its “Roadmap to Sustainability,” which was adopted by the Board of County Commissioners in 2006.
Photo courtesy of Sarasota County
Photo courtesy of Sarasota County
Sarasota County’s sustainability plan covers a wide range of measures, including green building, water and energy conservation, and sprawl management. The county also encourages residents to follow green practices has begun recognizing green businesses through its Green Business Partnership Program.
10
1 Create More Sustainable and Resilient Communities
Cities and counties across the country have found that implementing smart growth strategies can
help create communities that are more sustainable and resilient overall. In Sarasota County, Florida; Santa Monica, California; and Kansas City, Missouri, clear goals have been adopted for addressing climate change and reducing GHG emissions.
sustainable community planning in sarasota county, florida Sarasota County has a long his-tory of addressing its environmental, economic, and social challenges with consideration for how policies to address these issues will affect future generations.39 Although the county began developing a climate action plan in 2008, it addressed the issue two years earlier in its “Roadmap to Sustainability.” The road-map, which was presented to the Board of County Commissioners in 2006, is a guiding document that outlines a way of thinking about growth management that has evolved over many years.40 It notes Sarasota’s decision to adopt the Architecture 2030 Challenge, which is built around the goal of achieving carbon neutrality for county operations by 2030.41 In recogni-tion of the priority its citizens’ place on protecting the
area’s natural systems, the county has also developed a 2050 plan to guide its growth through midcentury with a focus on managing sprawl and habitat cor-ridors. The plan proposes the development of “2050 Villages”–compact developments designed to preserve open space and reduce driving–as well as an initiative emphasizing strong transit connections and TOD.
The 2030 commitment to becoming carbon neutral provides some insight into the county’s approach to planning. As staff members began examining what it would take to succeed on that challenge, they quickly realized that land use and community design were every bit as critical to carbon neutrality as energy use in public buildings. In just one example of how that realization translated into a different way of think-ing about policy, county staff members looked at the amount of driving that residents were doing and saw that it was largely predetermined by the pattern of development. The task of reducing VMT became not
Sarasota County began developing a county-wide climate action plan in 2008, following its “Roadmap to Sustainability,” which was adopted by the Board of County Commissioners in 2006.
Photo courtesy of Sarasota County
Photo courtesy of Sarasota County
Sarasota County’s sustainability plan covers a wide range of measures, including green building, water and energy conservation, and sprawl management. The county also encourages residents to follow green practices has begun recognizing green businesses through its Green Business Partnership Program.
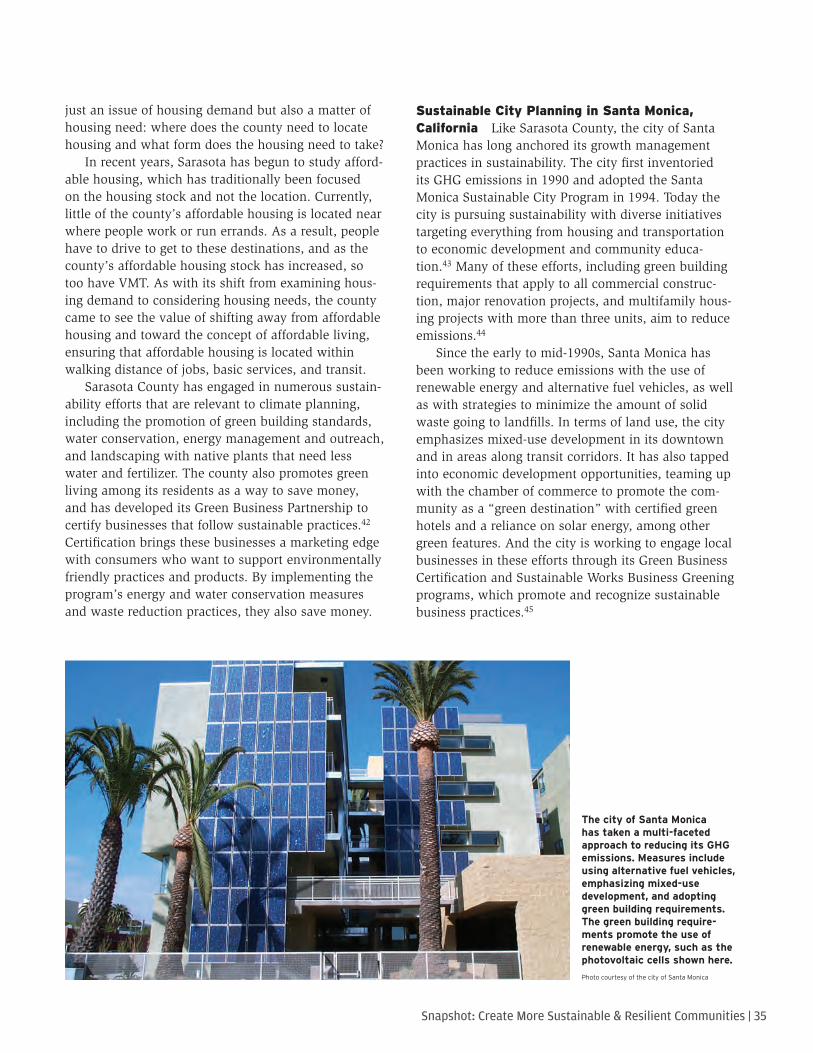
| 35Snapshot: Create More Sustainable & Resilient Communities
Getting Smart about Climate Change 11
just an issue of housing demand but also a matter of housing need: where does the county need to locate housing and what form does the housing need to take?
In recent years, Sarasota has begun to study afford-able housing, which has traditionally been focused on the housing stock and not the location. Currently, little of the county’s affordable housing is located near where people work or run errands. As a result, people have to drive to get to these destinations, and as the county’s affordable housing stock has increased, so too have VMT. As with its shift from examining hous-ing demand to considering housing needs, the county came to see the value of shifting away from affordable housing and toward the concept of affordable living, ensuring that affordable housing is located within walking distance of jobs, basic services, and transit.
Sarasota County has engaged in numerous sustain-ability efforts that are relevant to climate planning, including the promotion of green building standards, water conservation, energy management and outreach, and landscaping with native plants that need less water and fertilizer. The county also promotes green living among its residents as a way to save money, and has developed its Green Business Partnership to certify businesses that follow sustainable practices.42 Certification brings these businesses a marketing edge with consumers who want to support environmentally friendly practices and products. By implementing the program’s energy and water conservation measures and waste reduction practices, they also save money.
sustainable city planning in santa monica, california Like Sarasota County, the city of Santa Monica has long anchored its growth management practices in sustainability. The city first inventoried its GHG emissions in 1990 and adopted the Santa Monica Sustainable City Program in 1994. Today the city is pursuing sustainability with diverse initiatives targeting everything from housing and transportation to economic development and community educa-tion.43 Many of these efforts, including green building requirements that apply to all commercial construc-tion, major renovation projects, and multifamily hous-ing projects with more than three units, aim to reduce emissions.44
Since the early to mid-1990s, Santa Monica has been working to reduce emissions with the use of renewable energy and alternative fuel vehicles, as well as with strategies to minimize the amount of solid waste going to landfills. In terms of land use, the city emphasizes mixed-use development in its downtown and in areas along transit corridors. It has also tapped into economic development opportunities, teaming up with the chamber of commerce to promote the com-munity as a “green destination” with certified green hotels and a reliance on solar energy, among other green features. And the city is working to engage local businesses in these efforts through its Green Business Certification and Sustainable Works Business Greening programs, which promote and recognize sustainable business practices.45
The city of Santa Monica has taken a multi-faceted approach to reducing its GHG emissions. Measures include using alternative fuel vehicles, emphasizing mixed-use development, and adopting green building requirements. The green building require-ments promote the use of renewable energy, such as the photovoltaic cells shown here.
Photo courtesy of the city of Santa Monica
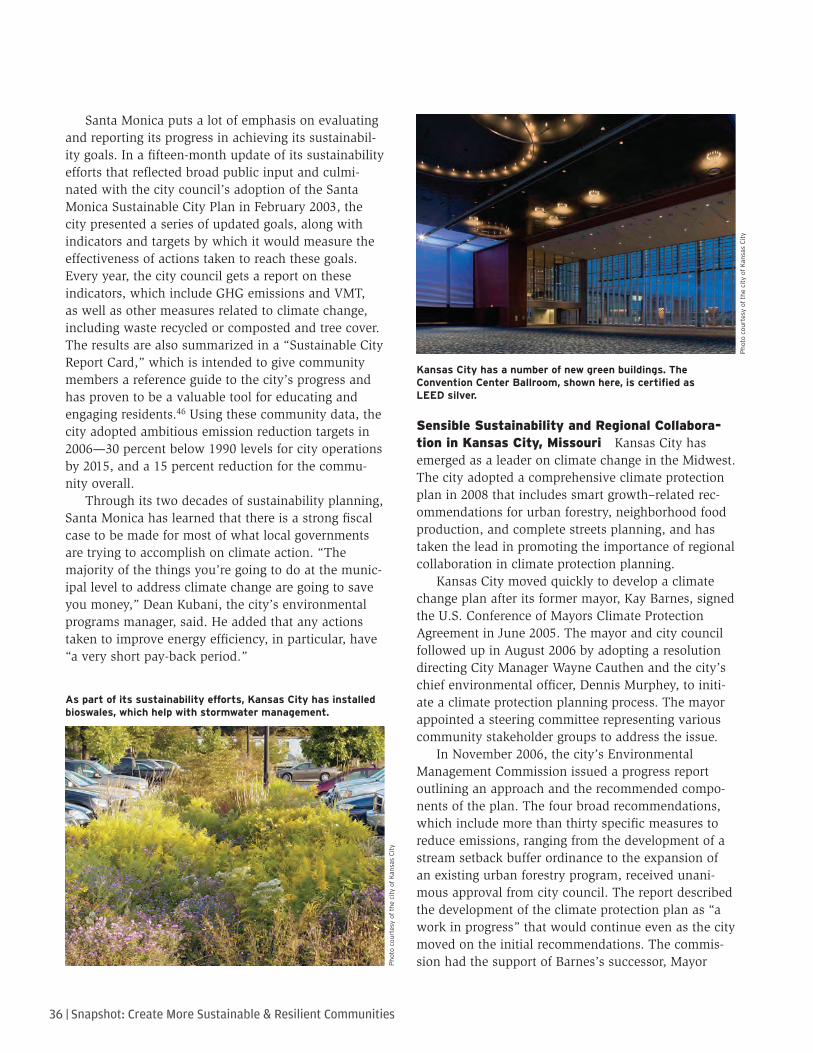
36 | Snapshot: Create More Sustainable & Resilient Communities
12 Getting Smart about Climate Change
Santa Monica puts a lot of emphasis on evaluating and reporting its progress in achieving its sustainabil-ity goals. In a fifteen-month update of its sustainability efforts that reflected broad public input and culmi-nated with the city council’s adoption of the Santa Monica Sustainable City Plan in February 2003, the city presented a series of updated goals, along with indicators and targets by which it would measure the effectiveness of actions taken to reach these goals. Every year, the city council gets a report on these indicators, which include GHG emissions and VMT, as well as other measures related to climate change, including waste recycled or composted and tree cover. The results are also summarized in a “Sustainable City Report Card,” which is intended to give community members a reference guide to the city’s progress and has proven to be a valuable tool for educating and engaging residents.46 Using these community data, the city adopted ambitious emission reduction targets in 2006—30 percent below 1990 levels for city operations by 2015, and a 15 percent reduction for the commu-nity overall.
Through its two decades of sustainability planning, Santa Monica has learned that there is a strong fiscal case to be made for most of what local governments are trying to accomplish on climate action. “The majority of the things you’re going to do at the munic-ipal level to address climate change are going to save you money,” Dean Kubani, the city’s environmental programs manager, said. He added that any actions taken to improve energy efficiency, in particular, have “a very short pay-back period.”
sensible sustainability and regional collabora-tion in kansas city, missouri Kansas City has emerged as a leader on climate change in the Midwest. The city adopted a comprehensive climate protection plan in 2008 that includes smart growth–related rec-ommendations for urban forestry, neighborhood food production, and complete streets planning, and has taken the lead in promoting the importance of regional collaboration in climate protection planning.
Kansas City moved quickly to develop a climate change plan after its former mayor, Kay Barnes, signed the U.S. Conference of Mayors Climate Protection Agreement in June 2005. The mayor and city council followed up in August 2006 by adopting a resolution directing City Manager Wayne Cauthen and the city’s chief environmental officer, Dennis Murphey, to initi-ate a climate protection planning process. The mayor appointed a steering committee representing various community stakeholder groups to address the issue.
In November 2006, the city’s Environmental Management Commission issued a progress report outlining an approach and the recommended compo-nents of the plan. The four broad recommendations, which include more than thirty specific measures to reduce emissions, ranging from the development of a stream setback buffer ordinance to the expansion of an existing urban forestry program, received unani-mous approval from city council. The report described the development of the climate protection plan as “a work in progress” that would continue even as the city moved on the initial recommendations. The commis-sion had the support of Barnes’s successor, Mayor
Kansas City has a number of new green buildings. The Convention Center Ballroom, shown here, is certified as LEED silver.
Photo courtesy of the city of Kan
sas City
As part of its sustainability efforts, Kansas City has installed bioswales, which help with stormwater management.
Photo courtesy of the city of Kan
sas City
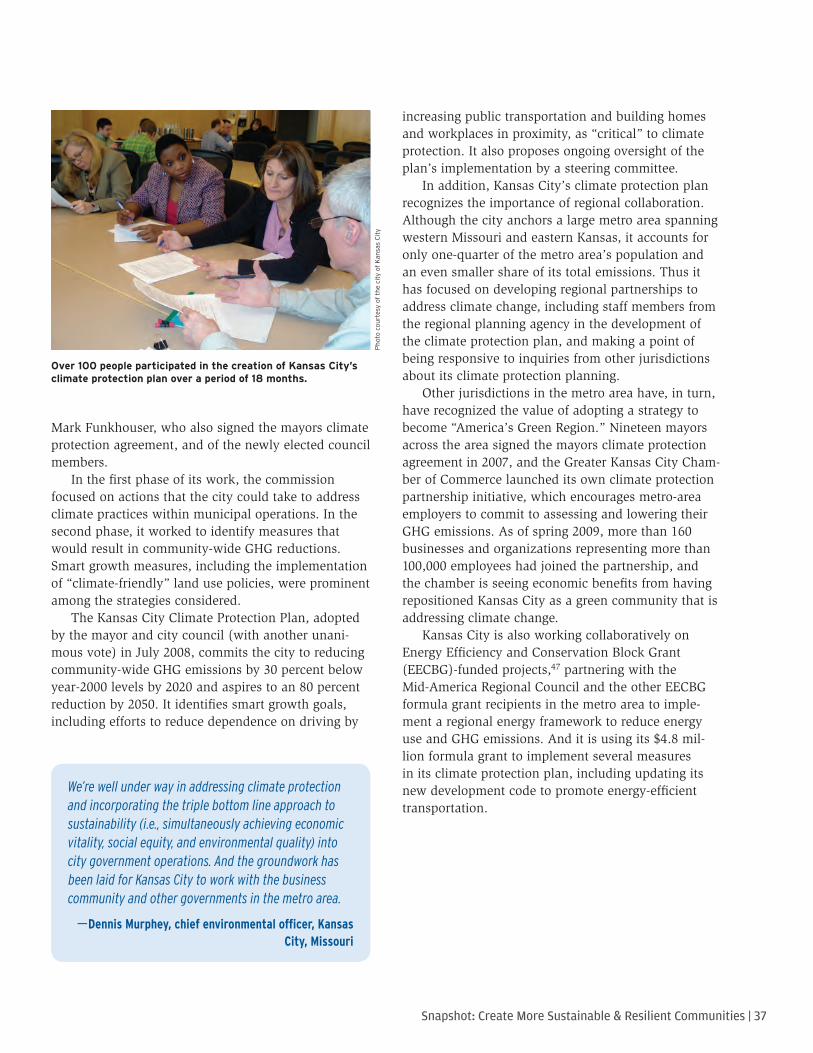
| 37Snapshot: Create More Sustainable & Resilient Communities
Getting Smart about Climate Change 13
Mark Funkhouser, who also signed the mayors climate protection agreement, and of the newly elected council members.
In the first phase of its work, the commission focused on actions that the city could take to address climate practices within municipal operations. In the second phase, it worked to identify measures that would result in community-wide GHG reductions. Smart growth measures, including the implementation of “climate-friendly” land use policies, were prominent among the strategies considered.
The Kansas City Climate Protection Plan, adopted by the mayor and city council (with another unani-mous vote) in July 2008, commits the city to reducing community-wide GHG emissions by 30 percent below year-2000 levels by 2020 and aspires to an 80 percent reduction by 2050. It identifies smart growth goals, including efforts to reduce dependence on driving by
increasing public transportation and building homes and workplaces in proximity, as “critical” to climate protection. It also proposes ongoing oversight of the plan’s implementation by a steering committee.
In addition, Kansas City’s climate protection plan recognizes the importance of regional collaboration. Although the city anchors a large metro area spanning western Missouri and eastern Kansas, it accounts for only one-quarter of the metro area’s population and an even smaller share of its total emissions. Thus it has focused on developing regional partnerships to address climate change, including staff members from the regional planning agency in the development of the climate protection plan, and making a point of being responsive to inquiries from other jurisdictions about its climate protection planning.
Other jurisdictions in the metro area have, in turn, have recognized the value of adopting a strategy to become “America’s Green Region.” Nineteen mayors across the area signed the mayors climate protection agreement in 2007, and the Greater Kansas City Cham-ber of Commerce launched its own climate protection partnership initiative, which encourages metro-area employers to commit to assessing and lowering their GHG emissions. As of spring 2009, more than 160 businesses and organizations representing more than 100,000 employees had joined the partnership, and the chamber is seeing economic benefits from having repositioned Kansas City as a green community that is addressing climate change.
Kansas City is also working collaboratively on Energy Efficiency and Conservation Block Grant (EECBG)-funded projects,47 partnering with the Mid-America Regional Council and the other EECBG formula grant recipients in the metro area to imple-ment a regional energy framework to reduce energy use and GHG emissions. And it is using its $4.8 mil-lion formula grant to implement several measures in its climate protection plan, including updating its new development code to promote energy-efficient transportation.
Over 100 people participated in the creation of Kansas City’s climate protection plan over a period of 18 months.
Photo courtesy of the city of Kan
sas City
We’re well under way in addressing climate protection and incorporating the triple bottom line approach to sustainability (i.e., simultaneously achieving economic vitality, social equity, and environmental quality) into city government operations. And the groundwork has been laid for Kansas City to work with the business community and other governments in the metro area.
—Dennis Murphey, chief environmental officer, Kansas City, Missouri
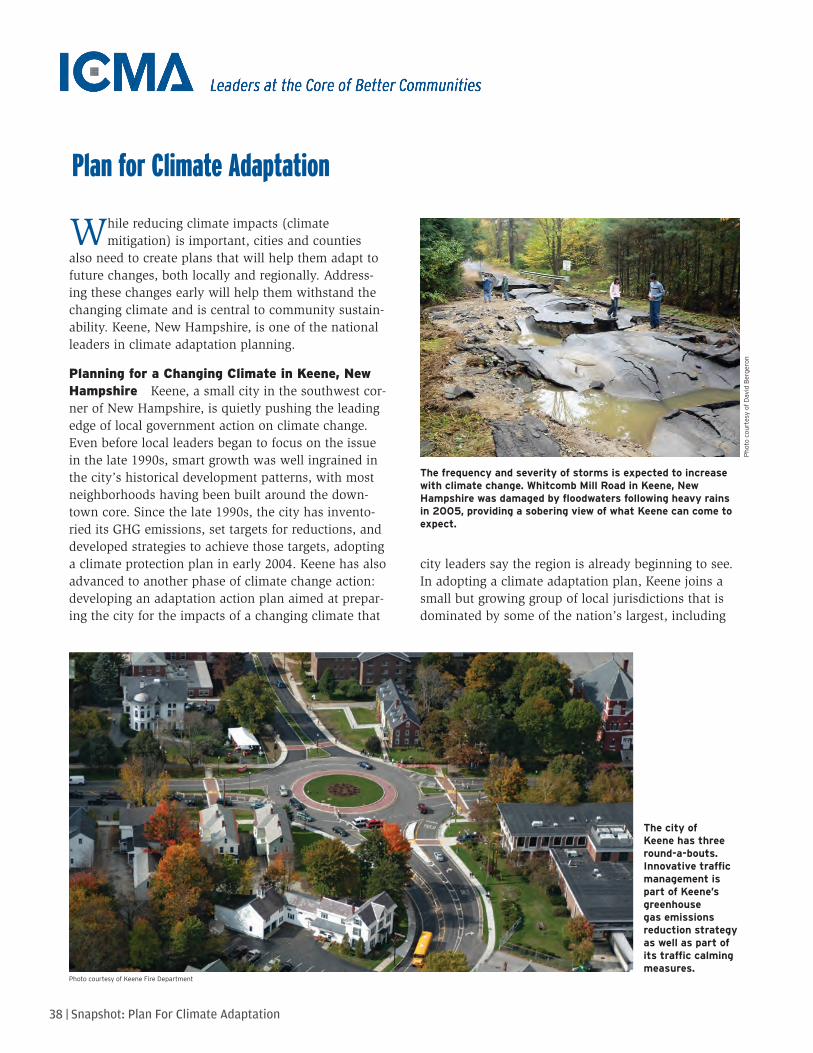
38 | Snapshot: Plan For Climate Adaptation24
Plan for Climate Adaptation9
While reducing climate impacts (climate mitigation) is important, cities and counties
also need to create plans that will help them adapt to future changes, both locally and regionally. Address-ing these changes early will help them withstand the changing climate and is central to community sustain-ability. Keene, New Hampshire, is one of the national leaders in climate adaptation planning.
planning for a changing climate in keene, new hampshire Keene, a small city in the southwest cor-ner of New Hampshire, is quietly pushing the leading edge of local government action on climate change. Even before local leaders began to focus on the issue in the late 1990s, smart growth was well ingrained in the city’s historical development patterns, with most neighborhoods having been built around the down-town core. Since the late 1990s, the city has invento-ried its GHG emissions, set targets for reductions, and developed strategies to achieve those targets, adopting a climate protection plan in early 2004. Keene has also advanced to another phase of climate change action: developing an adaptation action plan aimed at prepar-ing the city for the impacts of a changing climate that
city leaders say the region is already beginning to see. In adopting a climate adaptation plan, Keene joins a small but growing group of local jurisdictions that is dominated by some of the nation’s largest, including
The frequency and severity of storms is expected to increase with climate change. Whitcomb Mill Road in Keene, New Hampshire was damaged by floodwaters following heavy rains in 2005, providing a sobering view of what Keene can come to expect.
Photo courtesy of Dav
id Bergeron
The city of Keene has three round-a-bouts. Innovative traffic management is part of Keene’s greenhouse gas emissions reduction strategy as well as part of its traffic calming measures.
Photo courtesy of Keene Fire Department
24
Plan for Climate Adaptation9
While reducing climate impacts (climate mitigation) is important, cities and counties
also need to create plans that will help them adapt to future changes, both locally and regionally. Address-ing these changes early will help them withstand the changing climate and is central to community sustain-ability. Keene, New Hampshire, is one of the national leaders in climate adaptation planning.
planning for a changing climate in keene, new hampshire Keene, a small city in the southwest cor-ner of New Hampshire, is quietly pushing the leading edge of local government action on climate change. Even before local leaders began to focus on the issue in the late 1990s, smart growth was well ingrained in the city’s historical development patterns, with most neighborhoods having been built around the down-town core. Since the late 1990s, the city has invento-ried its GHG emissions, set targets for reductions, and developed strategies to achieve those targets, adopting a climate protection plan in early 2004. Keene has also advanced to another phase of climate change action: developing an adaptation action plan aimed at prepar-ing the city for the impacts of a changing climate that
city leaders say the region is already beginning to see. In adopting a climate adaptation plan, Keene joins a small but growing group of local jurisdictions that is dominated by some of the nation’s largest, including
The frequency and severity of storms is expected to increase with climate change. Whitcomb Mill Road in Keene, New Hampshire was damaged by floodwaters following heavy rains in 2005, providing a sobering view of what Keene can come to expect.
Photo courtesy of Dav
id Bergeron
The city of Keene has three round-a-bouts. Innovative traffic management is part of Keene’s greenhouse gas emissions reduction strategy as well as part of its traffic calming measures.
Photo courtesy of Keene Fire Department
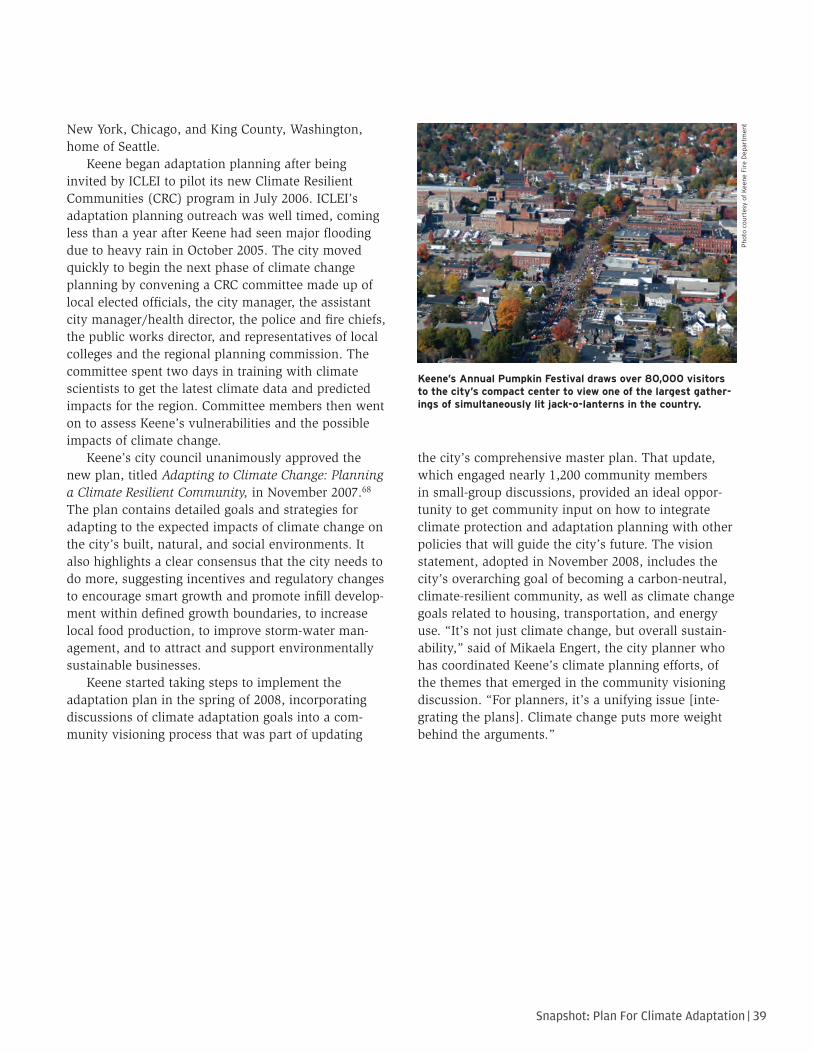
| 39Snapshot: Plan For Climate Adaptation
Getting Smart about Climate Change 25
New York, Chicago, and King County, Washington, home of Seattle.
Keene began adaptation planning after being invited by ICLEI to pilot its new Climate Resilient Communities (CRC) program in July 2006. ICLEI’s adaptation planning outreach was well timed, coming less than a year after Keene had seen major flooding due to heavy rain in October 2005. The city moved quickly to begin the next phase of climate change planning by convening a CRC committee made up of local elected officials, the city manager, the assistant city manager/health director, the police and fire chiefs, the public works director, and representatives of local colleges and the regional planning commission. The committee spent two days in training with climate scientists to get the latest climate data and predicted impacts for the region. Committee members then went on to assess Keene’s vulnerabilities and the possible impacts of climate change.
Keene’s city council unanimously approved the new plan, titled Adapting to Climate Change: Planning a Climate Resilient Community, in November 2007.68 The plan contains detailed goals and strategies for adapting to the expected impacts of climate change on the city’s built, natural, and social environments. It also highlights a clear consensus that the city needs to do more, suggesting incentives and regulatory changes to encourage smart growth and promote infill develop-ment within defined growth boundaries, to increase local food production, to improve storm-water man-agement, and to attract and support environmentally sustainable businesses.
Keene started taking steps to implement the adaptation plan in the spring of 2008, incorporating discussions of climate adaptation goals into a com-munity visioning process that was part of updating
the city’s comprehensive master plan. That update, which engaged nearly 1,200 community members in small-group discussions, provided an ideal oppor-tunity to get community input on how to integrate climate protection and adaptation planning with other policies that will guide the city’s future. The vision statement, adopted in November 2008, includes the city’s overarching goal of becoming a carbon-neutral, climate-resilient community, as well as climate change goals related to housing, transportation, and energy use. “It’s not just climate change, but overall sustain-ability,” said of Mikaela Engert, the city planner who has coordinated Keene’s climate planning efforts, of the themes that emerged in the community visioning discussion. “For planners, it’s a unifying issue [inte-grating the plans]. Climate change puts more weight behind the arguments.”
Keene’s Annual Pumpkin Festival draws over 80,000 visitors to the city’s compact center to view one of the largest gather-ings of simultaneously lit jack-o-lanterns in the country.
Photo courtesy of Kee
ne Fire Dep
artm
ent
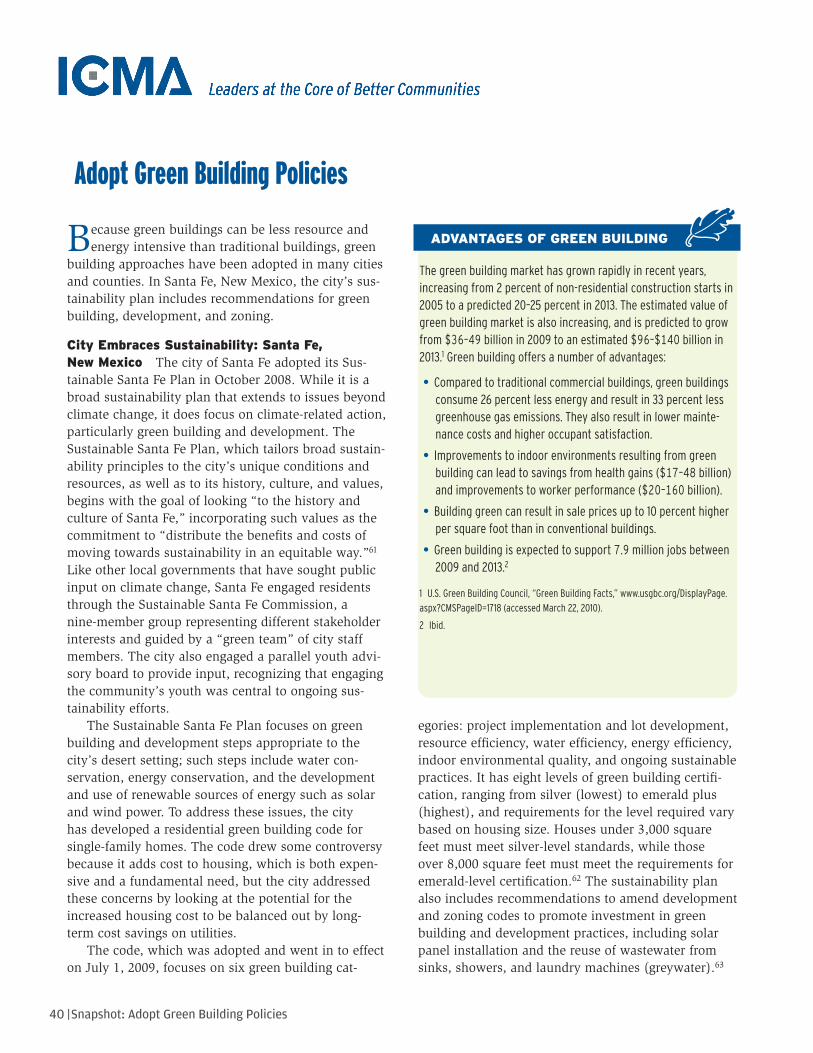
40 | Snapshot: Adopt Green Building Policies22
Adopt Green Building Policies7
Because green buildings can be less resource and energy intensive than traditional buildings, green
building approaches have been adopted in many cities and counties. In Santa Fe, New Mexico, the city’s sus-tainability plan includes recommendations for green building, development, and zoning.
city embraces sustainability: santa fe, new mexico The city of Santa Fe adopted its Sus-tainable Santa Fe Plan in October 2008. While it is a broad sustainability plan that extends to issues beyond climate change, it does focus on climate-related action, particularly green building and development. The Sustainable Santa Fe Plan, which tailors broad sustain-ability principles to the city’s unique conditions and resources, as well as to its history, culture, and values, begins with the goal of looking “to the history and culture of Santa Fe,” incorporating such values as the commitment to “distribute the benefits and costs of moving towards sustainability in an equitable way.”61 Like other local governments that have sought public input on climate change, Santa Fe engaged residents through the Sustainable Santa Fe Commission, a nine-member group representing different stakeholder interests and guided by a “green team” of city staff members. The city also engaged a parallel youth advi-sory board to provide input, recognizing that engaging the community’s youth was central to ongoing sus-tainability efforts.
The Sustainable Santa Fe Plan focuses on green building and development steps appropriate to the city’s desert setting; such steps include water con-servation, energy conservation, and the development and use of renewable sources of energy such as solar and wind power. To address these issues, the city has developed a residential green building code for single-family homes. The code drew some controversy because it adds cost to housing, which is both expen-sive and a fundamental need, but the city addressed these concerns by looking at the potential for the increased housing cost to be balanced out by long-term cost savings on utilities.
The code, which was adopted and went in to effect on July 1, 2009, focuses on six green building cat-
egories: project implementation and lot development, resource efficiency, water efficiency, energy efficiency, indoor environmental quality, and ongoing sustainable practices. It has eight levels of green building certifi-cation, ranging from silver (lowest) to emerald plus (highest), and requirements for the level required vary based on housing size. Houses under 3,000 square feet must meet silver-level standards, while those over 8,000 square feet must meet the requirements for emerald-level certification.62 The sustainability plan also includes recommendations to amend development and zoning codes to promote investment in green building and development practices, including solar panel installation and the reuse of wastewater from sinks, showers, and laundry machines (greywater).63
AdVAntAges of green buIldIng
The green building market has grown rapidly in recent years, increasing from 2 percent of nonresidential construction starts in 2005 to a predicted 20–25 percent in 2013. The estimated value of green building market is also increasing, and is predicted to grow from $36–49 billion in 2009 to an estimated $96–$140 billion in 2013.1 Green building offers a number of advantages:
Compared to traditional commercial buildings, green buildings • consume 26 percent less energy and result in 33 percent less greenhouse gas emissions. They also result in lower maintenance costs and higher occupant satisfaction.
Improvements to indoor environments resulting from green • building can lead to savings from health gains ($17–48 billion) and improvements to worker performance ($20–160 billion).
Building green can result in sale prices up to 10 percent higher • per square foot than in conventional buildings.
Green building is expected to support • 7.9 million jobs between 2009 and 2013.2
1 U.S. Green Building Council, “Green Building Facts,” www.usgbc.org/DisplayPage.aspx?CMSPageID=1718 (accessed March 22, 2010).
2 Ibid.
22
Adopt Green Building Policies7
Because green buildings can be less resource and energy intensive than traditional buildings, green
building approaches have been adopted in many cities and counties. In Santa Fe, New Mexico, the city’s sus-tainability plan includes recommendations for green building, development, and zoning.
city embraces sustainability: santa fe, new mexico The city of Santa Fe adopted its Sus-tainable Santa Fe Plan in October 2008. While it is a broad sustainability plan that extends to issues beyond climate change, it does focus on climate-related action, particularly green building and development. The Sustainable Santa Fe Plan, which tailors broad sustain-ability principles to the city’s unique conditions and resources, as well as to its history, culture, and values, begins with the goal of looking “to the history and culture of Santa Fe,” incorporating such values as the commitment to “distribute the benefits and costs of moving towards sustainability in an equitable way.”61 Like other local governments that have sought public input on climate change, Santa Fe engaged residents through the Sustainable Santa Fe Commission, a nine-member group representing different stakeholder interests and guided by a “green team” of city staff members. The city also engaged a parallel youth advi-sory board to provide input, recognizing that engaging the community’s youth was central to ongoing sus-tainability efforts.
The Sustainable Santa Fe Plan focuses on green building and development steps appropriate to the city’s desert setting; such steps include water con-servation, energy conservation, and the development and use of renewable sources of energy such as solar and wind power. To address these issues, the city has developed a residential green building code for single-family homes. The code drew some controversy because it adds cost to housing, which is both expen-sive and a fundamental need, but the city addressed these concerns by looking at the potential for the increased housing cost to be balanced out by long-term cost savings on utilities.
The code, which was adopted and went in to effect on July 1, 2009, focuses on six green building cat-
egories: project implementation and lot development, resource efficiency, water efficiency, energy efficiency, indoor environmental quality, and ongoing sustainable practices. It has eight levels of green building certifi-cation, ranging from silver (lowest) to emerald plus (highest), and requirements for the level required vary based on housing size. Houses under 3,000 square feet must meet silver-level standards, while those over 8,000 square feet must meet the requirements for emerald-level certification.62 The sustainability plan also includes recommendations to amend development and zoning codes to promote investment in green building and development practices, including solar panel installation and the reuse of wastewater from sinks, showers, and laundry machines (greywater).63
AdVAntAges of green buIldIng
The green building market has grown rapidly in recent years, increasing from 2 percent of nonresidential construction starts in 2005 to a predicted 20–25 percent in 2013. The estimated value of green building market is also increasing, and is predicted to grow from $36–49 billion in 2009 to an estimated $96–$140 billion in 2013.1 Green building offers a number of advantages:
Compared to traditional commercial buildings, green buildings • consume 26 percent less energy and result in 33 percent less greenhouse gas emissions. They also result in lower maintenance costs and higher occupant satisfaction.
Improvements to indoor environments resulting from green • building can lead to savings from health gains ($17–48 billion) and improvements to worker performance ($20–160 billion).
Building green can result in sale prices up to 10 percent higher • per square foot than in conventional buildings.
Green building is expected to support • 7.9 million jobs between 2009 and 2013.2
1 U.S. Green Building Council, “Green Building Facts,” www.usgbc.org/DisplayPage.aspx?CMSPageID=1718 (accessed March 22, 2010).
2 Ibid.
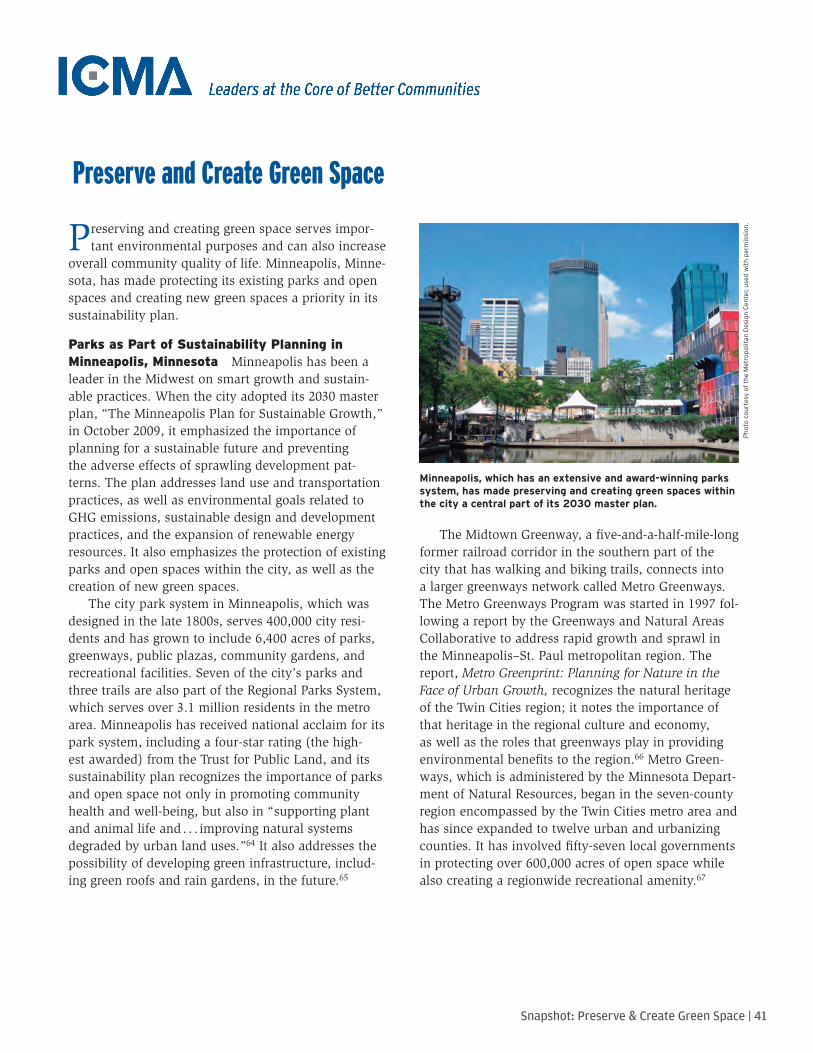
| 41Snapshot: Preserve & Create Green Space23
Preserve and Create Green Space8
Preserving and creating green space serves impor-tant environmental purposes and can also increase
overall community quality of life. Minneapolis, Minne-sota, has made protecting its existing parks and open spaces and creating new green spaces a priority in its sustainability plan.
parks as part of sustainability planning in minneapolis, minnesota Minneapolis has been a leader in the Midwest on smart growth and sustain-able practices. When the city adopted its 2030 master plan, “The Minneapolis Plan for Sustainable Growth,” in October 2009, it emphasized the importance of planning for a sustainable future and preventing the adverse effects of sprawling development pat-terns. The plan addresses land use and transportation practices, as well as environmental goals related to GHG emissions, sustainable design and development practices, and the expansion of renewable energy resources. It also emphasizes the protection of existing parks and open spaces within the city, as well as the creation of new green spaces.
The city park system in Minneapolis, which was designed in the late 1800s, serves 400,000 city resi-dents and has grown to include 6,400 acres of parks, greenways, public plazas, community gardens, and recreational facilities. Seven of the city’s parks and three trails are also part of the Regional Parks System, which serves over 3.1 million residents in the metro area. Minneapolis has received national acclaim for its park system, including a four-star rating (the high-est awarded) from the Trust for Public Land, and its sustainability plan recognizes the importance of parks and open space not only in promoting community health and well-being, but also in “supporting plant and animal life and . . . improving natural systems degraded by urban land uses.”64 It also addresses the possibility of developing green infrastructure, includ-ing green roofs and rain gardens, in the future.65
The Midtown Greenway, a five-and-a-half-mile-long former railroad corridor in the southern part of the city that has walking and biking trails, connects into a larger greenways network called Metro Greenways. The Metro Greenways Program was started in 1997 fol-lowing a report by the Greenways and Natural Areas Collaborative to address rapid growth and sprawl in the Minneapolis–St. Paul metropolitan region. The report, Metro Greenprint: Planning for Nature in the Face of Urban Growth, recognizes the natural heritage of the Twin Cities region; it notes the importance of that heritage in the regional culture and economy, as well as the roles that greenways play in providing environmental benefits to the region.66 Metro Green-ways, which is administered by the Minnesota Depart-ment of Natural Resources, began in the seven-county region encompassed by the Twin Cities metro area and has since expanded to twelve urban and urbanizing counties. It has involved fifty-seven local governments in protecting over 600,000 acres of open space while also creating a regionwide recreational amenity.67
Minneapolis, which has an extensive and award-winning parks system, has made preserving and creating green spaces within the city a central part of its 2030 master plan.
Photo courtesy of the Metropolitan
Design Cen
ter, used with permission.
23
Preserve and Create Green Space8
Preserving and creating green space serves impor-tant environmental purposes and can also increase
overall community quality of life. Minneapolis, Minne-sota, has made protecting its existing parks and open spaces and creating new green spaces a priority in its sustainability plan.
parks as part of sustainability planning in minneapolis, minnesota Minneapolis has been a leader in the Midwest on smart growth and sustain-able practices. When the city adopted its 2030 master plan, “The Minneapolis Plan for Sustainable Growth,” in October 2009, it emphasized the importance of planning for a sustainable future and preventing the adverse effects of sprawling development pat-terns. The plan addresses land use and transportation practices, as well as environmental goals related to GHG emissions, sustainable design and development practices, and the expansion of renewable energy resources. It also emphasizes the protection of existing parks and open spaces within the city, as well as the creation of new green spaces.
The city park system in Minneapolis, which was designed in the late 1800s, serves 400,000 city resi-dents and has grown to include 6,400 acres of parks, greenways, public plazas, community gardens, and recreational facilities. Seven of the city’s parks and three trails are also part of the Regional Parks System, which serves over 3.1 million residents in the metro area. Minneapolis has received national acclaim for its park system, including a four-star rating (the high-est awarded) from the Trust for Public Land, and its sustainability plan recognizes the importance of parks and open space not only in promoting community health and well-being, but also in “supporting plant and animal life and . . . improving natural systems degraded by urban land uses.”64 It also addresses the possibility of developing green infrastructure, includ-ing green roofs and rain gardens, in the future.65
The Midtown Greenway, a five-and-a-half-mile-long former railroad corridor in the southern part of the city that has walking and biking trails, connects into a larger greenways network called Metro Greenways. The Metro Greenways Program was started in 1997 fol-lowing a report by the Greenways and Natural Areas Collaborative to address rapid growth and sprawl in the Minneapolis–St. Paul metropolitan region. The report, Metro Greenprint: Planning for Nature in the Face of Urban Growth, recognizes the natural heritage of the Twin Cities region; it notes the importance of that heritage in the regional culture and economy, as well as the roles that greenways play in providing environmental benefits to the region.66 Metro Green-ways, which is administered by the Minnesota Depart-ment of Natural Resources, began in the seven-county region encompassed by the Twin Cities metro area and has since expanded to twelve urban and urbanizing counties. It has involved fifty-seven local governments in protecting over 600,000 acres of open space while also creating a regionwide recreational amenity.67
Minneapolis, which has an extensive and award-winning parks system, has made preserving and creating green spaces within the city a central part of its 2030 master plan.
Photo courtesy of the Metropolitan
Design Cen
ter, used with permission.
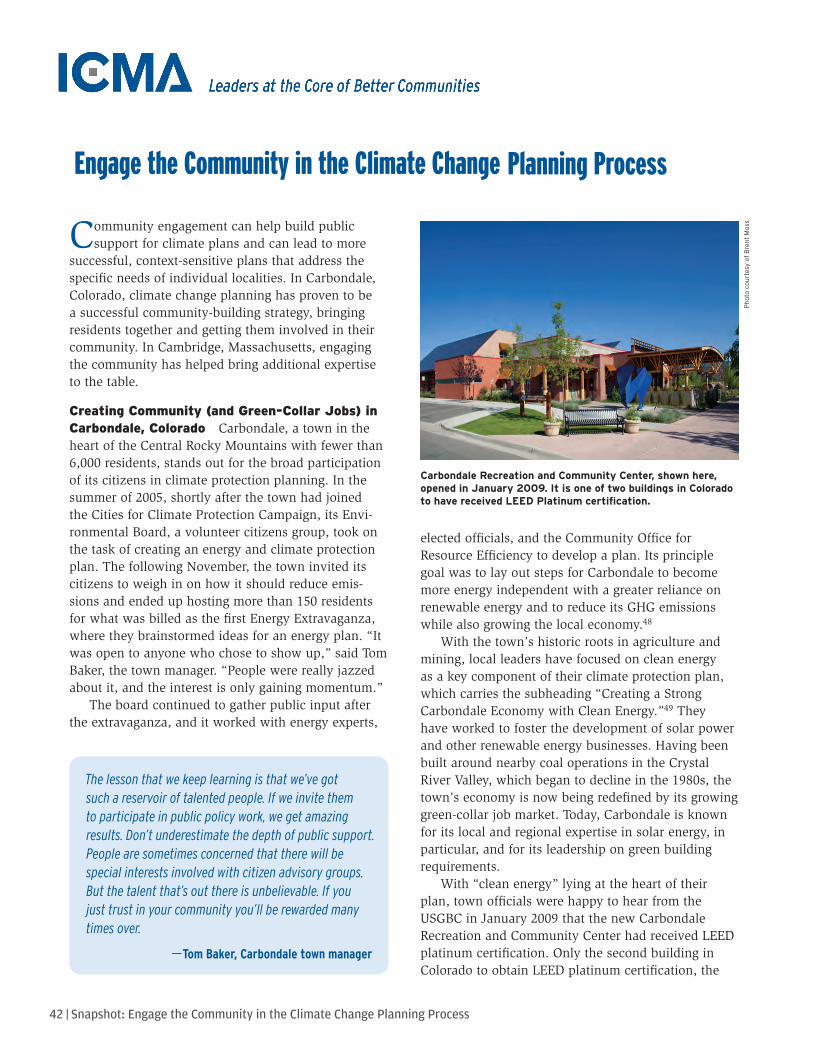
42 | Snapshot: Engage the Community in the Climate Change Planning Process 15
Engage the Community in the Climate Change Planning Process3
Community engagement can help build public support for climate plans and can lead to more
successful, context-sensitive plans that address the specific needs of individual localities. In Carbondale, Colorado, climate change planning has proven to be a successful community-building strategy, bringing residents together and getting them involved in their community. In Cambridge, Massachusetts, engaging the community has helped bring additional expertise to the table.
creating community (and green-collar Jobs) in carbondale, colorado Carbondale, a town in the heart of the Central Rocky Mountains with fewer than 6,000 residents, stands out for the broad participation of its citizens in climate protection planning. In the summer of 2005, shortly after the town had joined the Cities for Climate Protection Campaign, its Envi-ronmental Board, a volunteer citizens group, took on the task of creating an energy and climate protection plan. The following November, the town invited its citizens to weigh in on how it should reduce emis-sions and ended up hosting more than 150 residents for what was billed as the first Energy Extravaganza, where they brainstormed ideas for an energy plan. “It was open to anyone who chose to show up,” said Tom Baker, the town manager. “People were really jazzed about it, and the interest is only gaining momentum.”
The board continued to gather public input after the extravaganza, and it worked with energy experts,
elected officials, and the Community Office for Resource Efficiency to develop a plan. Its principle goal was to lay out steps for Carbondale to become more energy independent with a greater reliance on renewable energy and to reduce its GHG emissions while also growing the local economy.48
With the town’s historic roots in agriculture and mining, local leaders have focused on clean energy as a key component of their climate protection plan, which carries the subheading “Creating a Strong Carbondale Economy with Clean Energy.”49 They have worked to foster the development of solar power and other renewable energy businesses. Having been built around nearby coal operations in the Crystal River Valley, which began to decline in the 1980s, the town’s economy is now being redefined by its growing green-collar job market. Today, Carbondale is known for its local and regional expertise in solar energy, in particular, and for its leadership on green building requirements.
With “clean energy” lying at the heart of their plan, town officials were happy to hear from the USGBC in January 2009 that the new Carbondale Recreation and Community Center had received LEED platinum certification. Only the second building in Colorado to obtain LEED platinum certification, the
The lesson that we keep learning is that we’ve got such a reservoir of talented people. If we invite them to participate in public policy work, we get amazing results. Don’t underestimate the depth of public support. People are sometimes concerned that there will be special interests involved with citizen advisory groups. But the talent that’s out there is unbelievable. If you just trust in your community you’ll be rewarded many times over.
—Tom Baker, Carbondale town manager
Carbondale Recreation and Community Center, shown here, opened in January 2009. It is one of two buildings in Colorado to have received LEED Platinum certification.
Photo courtesy of Brent Moss
15
Engage the Community in the Climate Change Planning Process3
Community engagement can help build public support for climate plans and can lead to more
successful, context-sensitive plans that address the specific needs of individual localities. In Carbondale, Colorado, climate change planning has proven to be a successful community-building strategy, bringing residents together and getting them involved in their community. In Cambridge, Massachusetts, engaging the community has helped bring additional expertise to the table.
creating community (and green-collar Jobs) in carbondale, colorado Carbondale, a town in the heart of the Central Rocky Mountains with fewer than 6,000 residents, stands out for the broad participation of its citizens in climate protection planning. In the summer of 2005, shortly after the town had joined the Cities for Climate Protection Campaign, its Envi-ronmental Board, a volunteer citizens group, took on the task of creating an energy and climate protection plan. The following November, the town invited its citizens to weigh in on how it should reduce emis-sions and ended up hosting more than 150 residents for what was billed as the first Energy Extravaganza, where they brainstormed ideas for an energy plan. “It was open to anyone who chose to show up,” said Tom Baker, the town manager. “People were really jazzed about it, and the interest is only gaining momentum.”
The board continued to gather public input after the extravaganza, and it worked with energy experts,
elected officials, and the Community Office for Resource Efficiency to develop a plan. Its principle goal was to lay out steps for Carbondale to become more energy independent with a greater reliance on renewable energy and to reduce its GHG emissions while also growing the local economy.48
With the town’s historic roots in agriculture and mining, local leaders have focused on clean energy as a key component of their climate protection plan, which carries the subheading “Creating a Strong Carbondale Economy with Clean Energy.”49 They have worked to foster the development of solar power and other renewable energy businesses. Having been built around nearby coal operations in the Crystal River Valley, which began to decline in the 1980s, the town’s economy is now being redefined by its growing green-collar job market. Today, Carbondale is known for its local and regional expertise in solar energy, in particular, and for its leadership on green building requirements.
With “clean energy” lying at the heart of their plan, town officials were happy to hear from the USGBC in January 2009 that the new Carbondale Recreation and Community Center had received LEED platinum certification. Only the second building in Colorado to obtain LEED platinum certification, the
The lesson that we keep learning is that we’ve got such a reservoir of talented people. If we invite them to participate in public policy work, we get amazing results. Don’t underestimate the depth of public support. People are sometimes concerned that there will be special interests involved with citizen advisory groups. But the talent that’s out there is unbelievable. If you just trust in your community you’ll be rewarded many times over.
—Tom Baker, Carbondale town manager
Carbondale Recreation and Community Center, shown here, opened in January 2009. It is one of two buildings in Colorado to have received LEED Platinum certification.
Photo courtesy of Brent Moss
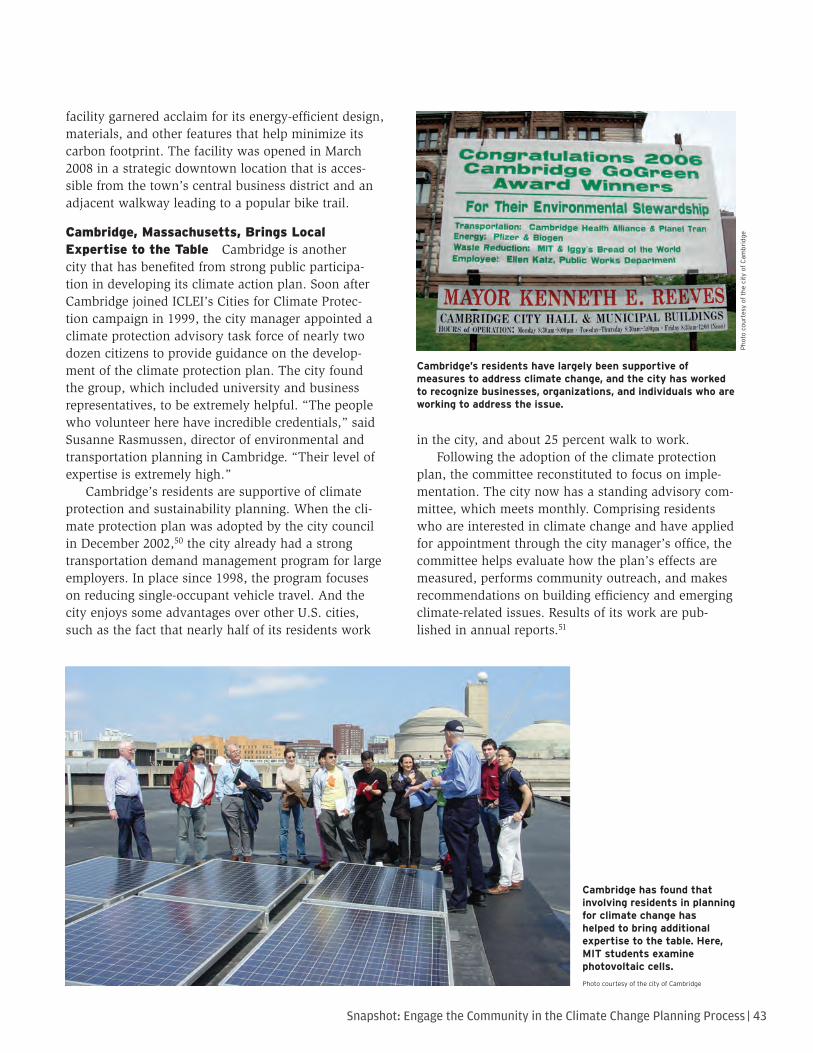
| 43Snapshot: Engage the Community in the Climate Change Planning Process
16 Getting Smart about Climate Change
facility garnered acclaim for its energy-efficient design, materials, and other features that help minimize its carbon footprint. The facility was opened in March 2008 in a strategic downtown location that is acces-sible from the town’s central business district and an adjacent walkway leading to a popular bike trail.
cambridge, massachusetts, brings local expertise to the table Cambridge is another city that has benefited from strong public participa-tion in developing its climate action plan. Soon after Cambridge joined ICLEI’s Cities for Climate Protec-tion campaign in 1999, the city manager appointed a climate protection advisory task force of nearly two dozen citizens to provide guidance on the develop-ment of the climate protection plan. The city found the group, which included university and business representatives, to be extremely helpful. “The people who volunteer here have incredible credentials,” said Susanne Rasmussen, director of environmental and transportation planning in Cambridge. “Their level of expertise is extremely high.”
Cambridge’s residents are supportive of climate protection and sustainability planning. When the cli-mate protection plan was adopted by the city council in December 2002,50 the city already had a strong transportation demand management program for large employers. In place since 1998, the program focuses on reducing single-occupant vehicle travel. And the city enjoys some advantages over other U.S. cities, such as the fact that nearly half of its residents work
in the city, and about 25 percent walk to work. Following the adoption of the climate protection
plan, the committee reconstituted to focus on imple-mentation. The city now has a standing advisory com-mittee, which meets monthly. Comprising residents who are interested in climate change and have applied for appointment through the city manager’s office, the committee helps evaluate how the plan’s effects are measured, performs community outreach, and makes recommendations on building efficiency and emerging climate-related issues. Results of its work are pub-lished in annual reports.51
Photo courtesy of the city of Cambridge
Cambridge has found that involving residents in planning for climate change has helped to bring additional expertise to the table. Here, MIT students examine photovoltaic cells.
Cambridge’s residents have largely been supportive of measures to address climate change, and the city has worked to recognize businesses, organizations, and individuals who are working to address the issue.
Photo courtesy of the city of Cam
bridge
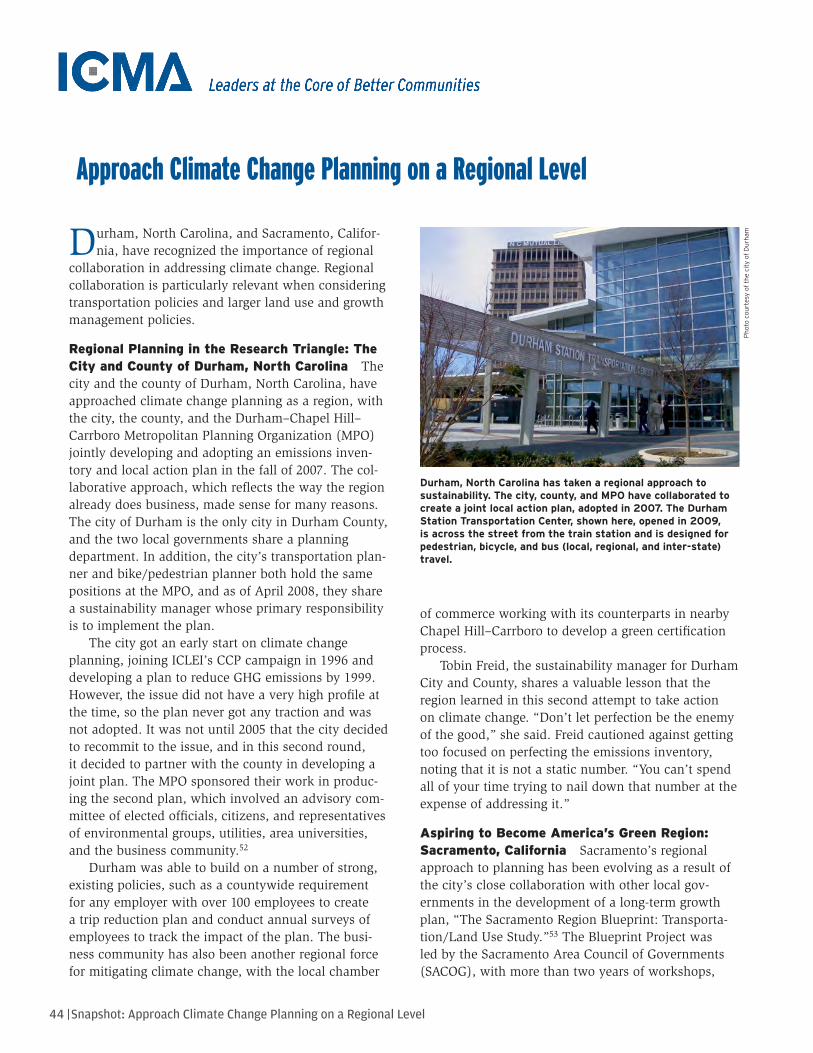
44 | Snapshot: Approach Climate Change Planning on a Regional Level 17
Approach Climate Change Planning on a Regional Level4
Durham, North Carolina, and Sacramento, Califor-nia, have recognized the importance of regional
collaboration in addressing climate change. Regional collaboration is particularly relevant when considering transportation policies and larger land use and growth management policies.
regional planning in the research triangle: the city and county of durham, north carolina The city and the county of Durham, North Carolina, have approached climate change planning as a region, with the city, the county, and the Durham–Chapel Hill–Carrboro Metropolitan Planning Organization (MPO) jointly developing and adopting an emissions inven-tory and local action plan in the fall of 2007. The col-laborative approach, which reflects the way the region already does business, made sense for many reasons. The city of Durham is the only city in Durham County, and the two local governments share a planning department. In addition, the city’s transportation plan-ner and bike/pedestrian planner both hold the same positions at the MPO, and as of April 2008, they share a sustainability manager whose primary responsibility is to implement the plan.
The city got an early start on climate change planning, joining ICLEI’s CCP campaign in 1996 and developing a plan to reduce GHG emissions by 1999. However, the issue did not have a very high profile at the time, so the plan never got any traction and was not adopted. It was not until 2005 that the city decided to recommit to the issue, and in this second round, it decided to partner with the county in developing a joint plan. The MPO sponsored their work in produc-ing the second plan, which involved an advisory com-mittee of elected officials, citizens, and representatives of environmental groups, utilities, area universities, and the business community.52
Durham was able to build on a number of strong, existing policies, such as a countywide requirement for any employer with over 100 employees to create a trip reduction plan and conduct annual surveys of employees to track the impact of the plan. The busi-ness community has also been another regional force for mitigating climate change, with the local chamber
of commerce working with its counterparts in nearby Chapel Hill–Carrboro to develop a green certification process.
Tobin Freid, the sustainability manager for Durham City and County, shares a valuable lesson that the region learned in this second attempt to take action on climate change. “Don’t let perfection be the enemy of the good,” she said. Freid cautioned against getting too focused on perfecting the emissions inventory, noting that it is not a static number. “You can’t spend all of your time trying to nail down that number at the expense of addressing it.”
Aspiring to become America’s green region: sacramento, california Sacramento’s regional approach to planning has been evolving as a result of the city’s close collaboration with other local gov-ernments in the development of a long-term growth plan, “The Sacramento Region Blueprint: Transporta-tion/Land Use Study.”53 The Blueprint Project was led by the Sacramento Area Council of Governments (SACOG), with more than two years of workshops,
Durham, North Carolina has taken a regional approach to sustainability. The city, county, and MPO have collaborated to create a joint local action plan, adopted in 2007. The Durham Station Transportation Center, shown here, opened in 2009, is across the street from the train station and is designed for pedestrian, bicycle, and bus (local, regional, and inter-state) travel.
Photo courtesy of the city of Durham
17
Approach Climate Change Planning on a Regional Level4
Durham, North Carolina, and Sacramento, Califor-nia, have recognized the importance of regional
collaboration in addressing climate change. Regional collaboration is particularly relevant when considering transportation policies and larger land use and growth management policies.
regional planning in the research triangle: the city and county of durham, north carolina The city and the county of Durham, North Carolina, have approached climate change planning as a region, with the city, the county, and the Durham–Chapel Hill–Carrboro Metropolitan Planning Organization (MPO) jointly developing and adopting an emissions inven-tory and local action plan in the fall of 2007. The col-laborative approach, which reflects the way the region already does business, made sense for many reasons. The city of Durham is the only city in Durham County, and the two local governments share a planning department. In addition, the city’s transportation plan-ner and bike/pedestrian planner both hold the same positions at the MPO, and as of April 2008, they share a sustainability manager whose primary responsibility is to implement the plan.
The city got an early start on climate change planning, joining ICLEI’s CCP campaign in 1996 and developing a plan to reduce GHG emissions by 1999. However, the issue did not have a very high profile at the time, so the plan never got any traction and was not adopted. It was not until 2005 that the city decided to recommit to the issue, and in this second round, it decided to partner with the county in developing a joint plan. The MPO sponsored their work in produc-ing the second plan, which involved an advisory com-mittee of elected officials, citizens, and representatives of environmental groups, utilities, area universities, and the business community.52
Durham was able to build on a number of strong, existing policies, such as a countywide requirement for any employer with over 100 employees to create a trip reduction plan and conduct annual surveys of employees to track the impact of the plan. The busi-ness community has also been another regional force for mitigating climate change, with the local chamber
of commerce working with its counterparts in nearby Chapel Hill–Carrboro to develop a green certification process.
Tobin Freid, the sustainability manager for Durham City and County, shares a valuable lesson that the region learned in this second attempt to take action on climate change. “Don’t let perfection be the enemy of the good,” she said. Freid cautioned against getting too focused on perfecting the emissions inventory, noting that it is not a static number. “You can’t spend all of your time trying to nail down that number at the expense of addressing it.”
Aspiring to become America’s green region: sacramento, california Sacramento’s regional approach to planning has been evolving as a result of the city’s close collaboration with other local gov-ernments in the development of a long-term growth plan, “The Sacramento Region Blueprint: Transporta-tion/Land Use Study.”53 The Blueprint Project was led by the Sacramento Area Council of Governments (SACOG), with more than two years of workshops,
Durham, North Carolina has taken a regional approach to sustainability. The city, county, and MPO have collaborated to create a joint local action plan, adopted in 2007. The Durham Station Transportation Center, shown here, opened in 2009, is across the street from the train station and is designed for pedestrian, bicycle, and bus (local, regional, and inter-state) travel.
Photo courtesy of the city of Durham
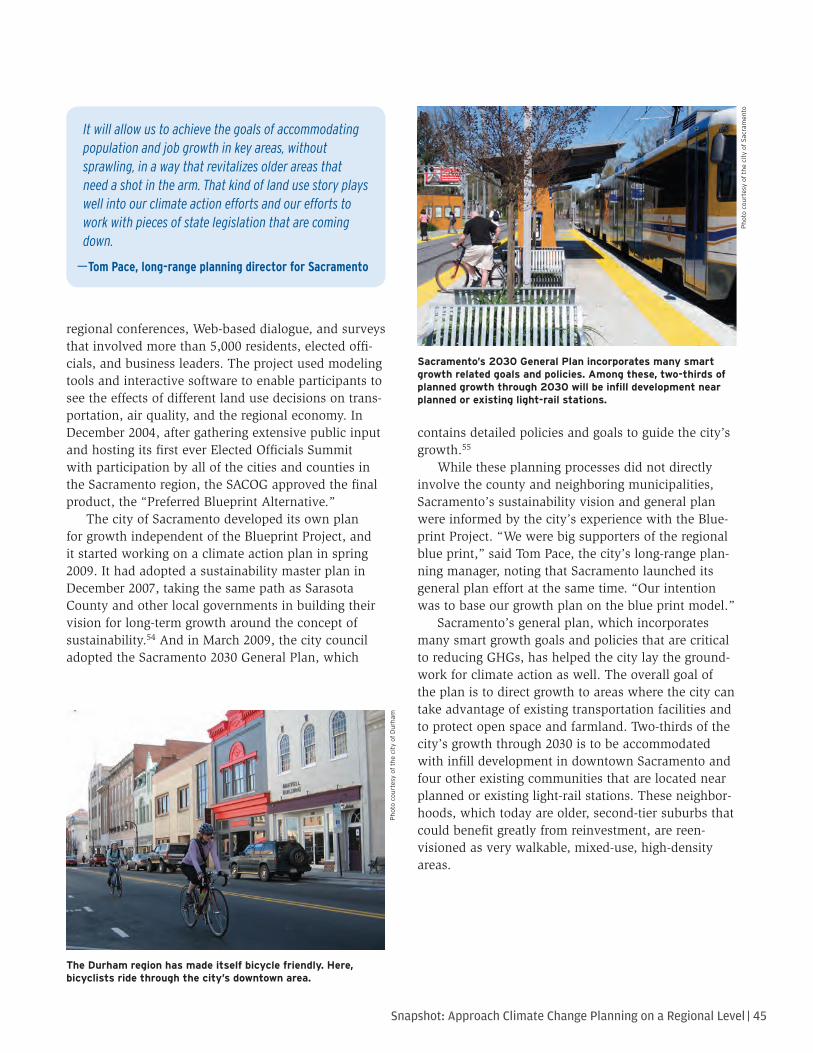
| 45Snapshot: Approach Climate Change Planning on a Regional Level
18 Getting Smart about Climate Change
regional conferences, Web-based dialogue, and surveys that involved more than 5,000 residents, elected offi-cials, and business leaders. The project used modeling tools and interactive software to enable participants to see the effects of different land use decisions on trans-portation, air quality, and the regional economy. In December 2004, after gathering extensive public input and hosting its first ever Elected Officials Summit with participation by all of the cities and counties in the Sacramento region, the SACOG approved the final product, the “Preferred Blueprint Alternative.”
The city of Sacramento developed its own plan for growth independent of the Blueprint Project, and it started working on a climate action plan in spring 2009. It had adopted a sustainability master plan in December 2007, taking the same path as Sarasota County and other local governments in building their vision for long-term growth around the concept of sustainability.54 And in March 2009, the city council adopted the Sacramento 2030 General Plan, which
contains detailed policies and goals to guide the city’s growth.55
While these planning processes did not directly involve the county and neighboring municipalities, Sacramento’s sustainability vision and general plan were informed by the city’s experience with the Blue-print Project. “We were big supporters of the regional blue print,” said Tom Pace, the city’s long-range plan-ning manager, noting that Sacramento launched its general plan effort at the same time. “Our intention was to base our growth plan on the blue print model.”
Sacramento’s general plan, which incorporates many smart growth goals and policies that are critical to reducing GHGs, has helped the city lay the ground-work for climate action as well. The overall goal of the plan is to direct growth to areas where the city can take advantage of existing transportation facilities and to protect open space and farmland. Two-thirds of the city’s growth through 2030 is to be accommodated with infill development in downtown Sacramento and four other existing communities that are located near planned or existing light-rail stations. These neighbor-hoods, which today are older, second-tier suburbs that could benefit greatly from reinvestment, are reen-visioned as very walkable, mixed-use, high-density areas.
The Durham region has made itself bicycle friendly. Here, bicyclists ride through the city’s downtown area.
Sacramento’s 2030 General Plan incorporates many smart growth related goals and policies. Among these, two-thirds of planned growth through 2030 will be infill development near planned or existing light-rail stations.
It will allow us to achieve the goals of accommodating population and job growth in key areas, without sprawling, in a way that revitalizes older areas that need a shot in the arm. That kind of land use story plays well into our climate action efforts and our efforts to work with pieces of state legislation that are coming down.
—Tom Pace, long-range planning director for Sacramento
Photo courtesy of the city of Durham
Photo courtesy of the city of Sac
ramen
to
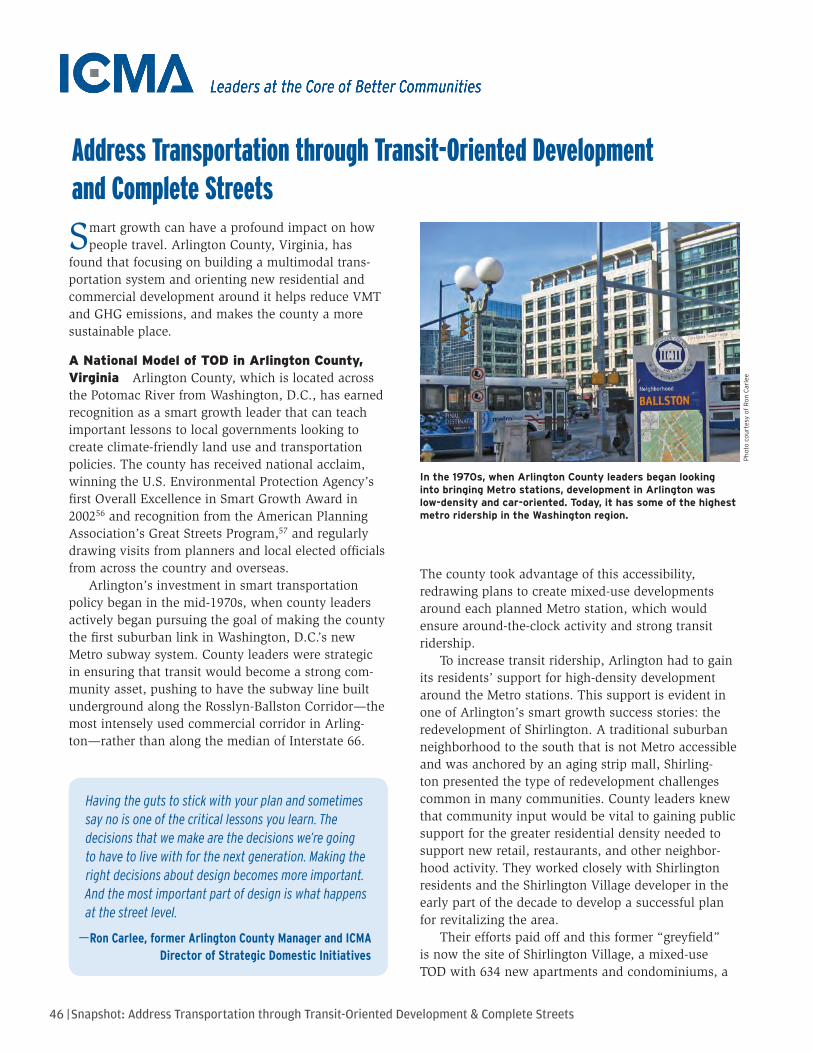
46 | Snapshot: Address Transportation through Transit-Oriented Development & Complete Streets 19
Address Transportation through Transit-Oriented Development and Complete Streets5
Smart growth can have a profound impact on how people travel. Arlington County, Virginia, has
found that focusing on building a multimodal trans-portation system and orienting new residential and commercial development around it helps reduce VMT and GHG emissions, and makes the county a more sustainable place.
A national model of tod in Arlington county, Virginia Arlington County, which is located across the Potomac River from Washington, D.C., has earned recognition as a smart growth leader that can teach important lessons to local governments looking to create climate-friendly land use and transportation policies. The county has received national acclaim, winning the U.S. Environmental Protection Agency’s first Overall Excellence in Smart Growth Award in 200256 and recognition from the American Planning Association’s Great Streets Program,57 and regularly drawing visits from planners and local elected officials from across the country and overseas.
Arlington’s investment in smart transportation policy began in the mid-1970s, when county leaders actively began pursuing the goal of making the county the first suburban link in Washington, D.C.’s new Metro subway system. County leaders were strategic in ensuring that transit would become a strong com-munity asset, pushing to have the subway line built underground along the Rosslyn-Ballston Corridor—the most intensely used commercial corridor in Arling-ton—rather than along the median of Interstate 66.
The county took advantage of this accessibility, redrawing plans to create mixed-use developments around each planned Metro station, which would ensure around-the-clock activity and strong transit ridership.
To increase transit ridership, Arlington had to gain its residents’ support for high-density development around the Metro stations. This support is evident in one of Arlington’s smart growth success stories: the redevelopment of Shirlington. A traditional suburban neighborhood to the south that is not Metro accessible and was anchored by an aging strip mall, Shirling-ton presented the type of redevelopment challenges common in many communities. County leaders knew that community input would be vital to gaining public support for the greater residential density needed to support new retail, restaurants, and other neighbor-hood activity. They worked closely with Shirlington residents and the Shirlington Village developer in the early part of the decade to develop a successful plan for revitalizing the area.
Their efforts paid off and this former “greyfield” is now the site of Shirlington Village, a mixed-use TOD with 634 new apartments and condominiums, a
In the 1970s, when Arlington County leaders began looking into bringing Metro stations, development in Arlington was low-density and car-oriented. Today, it has some of the highest metro ridership in the Washington region.
Having the guts to stick with your plan and sometimes say no is one of the critical lessons you learn. The decisions that we make are the decisions we’re going to have to live with for the next generation. Making the right decisions about design becomes more important. And the most important part of design is what happens at the street level.
—Ron Carlee, former Arlington County Manager and ICMA Director of Strategic Domestic Initiatives
Photo courtesy of Ron Carlee
19
Address Transportation through Transit-Oriented Development and Complete Streets5
Smart growth can have a profound impact on how people travel. Arlington County, Virginia, has
found that focusing on building a multimodal trans-portation system and orienting new residential and commercial development around it helps reduce VMT and GHG emissions, and makes the county a more sustainable place.
A national model of tod in Arlington county, Virginia Arlington County, which is located across the Potomac River from Washington, D.C., has earned recognition as a smart growth leader that can teach important lessons to local governments looking to create climate-friendly land use and transportation policies. The county has received national acclaim, winning the U.S. Environmental Protection Agency’s first Overall Excellence in Smart Growth Award in 200256 and recognition from the American Planning Association’s Great Streets Program,57 and regularly drawing visits from planners and local elected officials from across the country and overseas.
Arlington’s investment in smart transportation policy began in the mid-1970s, when county leaders actively began pursuing the goal of making the county the first suburban link in Washington, D.C.’s new Metro subway system. County leaders were strategic in ensuring that transit would become a strong com-munity asset, pushing to have the subway line built underground along the Rosslyn-Ballston Corridor—the most intensely used commercial corridor in Arling-ton—rather than along the median of Interstate 66.
The county took advantage of this accessibility, redrawing plans to create mixed-use developments around each planned Metro station, which would ensure around-the-clock activity and strong transit ridership.
To increase transit ridership, Arlington had to gain its residents’ support for high-density development around the Metro stations. This support is evident in one of Arlington’s smart growth success stories: the redevelopment of Shirlington. A traditional suburban neighborhood to the south that is not Metro accessible and was anchored by an aging strip mall, Shirling-ton presented the type of redevelopment challenges common in many communities. County leaders knew that community input would be vital to gaining public support for the greater residential density needed to support new retail, restaurants, and other neighbor-hood activity. They worked closely with Shirlington residents and the Shirlington Village developer in the early part of the decade to develop a successful plan for revitalizing the area.
Their efforts paid off and this former “greyfield” is now the site of Shirlington Village, a mixed-use TOD with 634 new apartments and condominiums, a
In the 1970s, when Arlington County leaders began looking into bringing Metro stations, development in Arlington was low-density and car-oriented. Today, it has some of the highest metro ridership in the Washington region.
Having the guts to stick with your plan and sometimes say no is one of the critical lessons you learn. The decisions that we make are the decisions we’re going to have to live with for the next generation. Making the right decisions about design becomes more important. And the most important part of design is what happens at the street level.
—Ron Carlee, former Arlington County Manager and ICMA Director of Strategic Domestic Initiatives
Photo courtesy of Ron Carlee
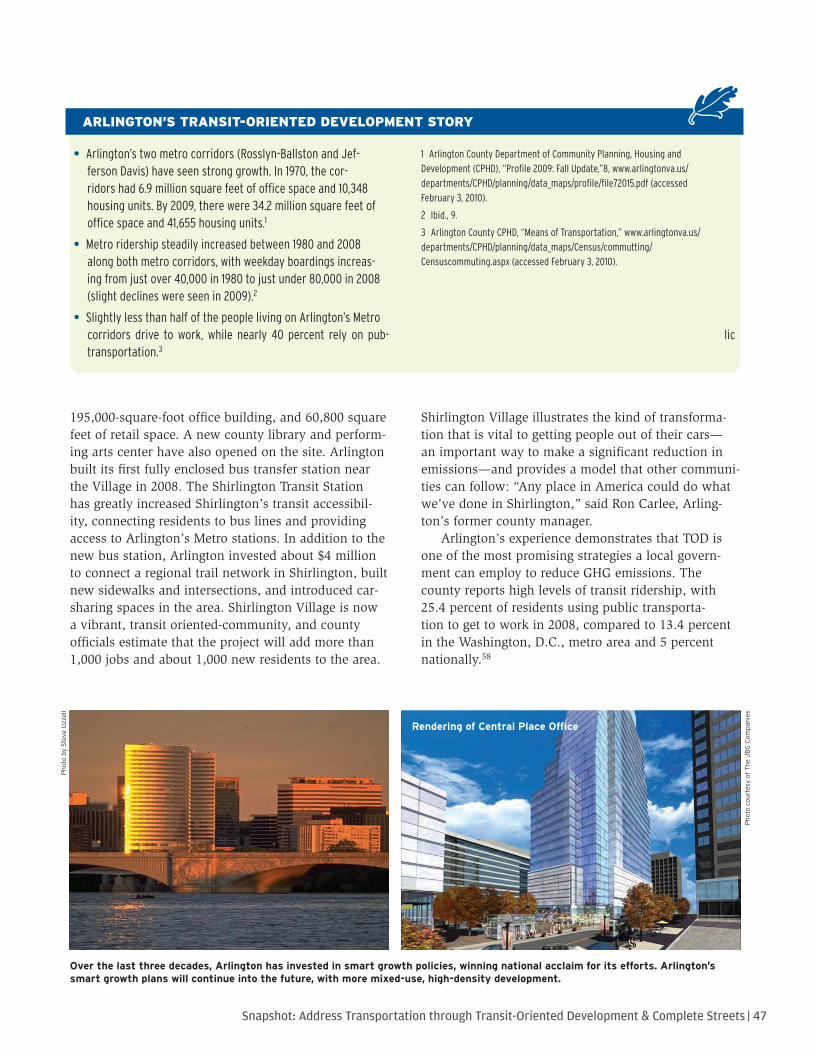
| 47Snapshot: Address Transportation through Transit-Oriented Development & Complete Streets
20 Getting Smart about Climate Change
195,000-square-foot office building, and 60,800 square feet of retail space. A new county library and perform-ing arts center have also opened on the site. Arlington built its first fully enclosed bus transfer station near the Village in 2008. The Shirlington Transit Station has greatly increased Shirlington’s transit accessibil-ity, connecting residents to bus lines and providing access to Arlington’s Metro stations. In addition to the new bus station, Arlington invested about $4 million to connect a regional trail network in Shirlington, built new sidewalks and intersections, and introduced car-sharing spaces in the area. Shirlington Village is now a vibrant, transit oriented-community, and county officials estimate that the project will add more than 1,000 jobs and about 1,000 new residents to the area.
Shirlington Village illustrates the kind of transforma-tion that is vital to getting people out of their cars—an important way to make a significant reduction in emissions—and provides a model that other communi-ties can follow: “Any place in America could do what we’ve done in Shirlington,” said Ron Carlee, Arling-ton’s former county manager.
Arlington’s experience demonstrates that TOD is one of the most promising strategies a local govern-ment can employ to reduce GHG emissions. The county reports high levels of transit ridership, with 25.4 percent of residents using public transporta-tion to get to work in 2008, compared to 13.4 percent in the Washington, D.C., metro area and 5 percent nationally.58
ArlIngton’s trAnsIt-orIented deVelopment story
Arlington’s two metro corridors (RosslynBallston and Jef• ferson Davis) have seen strong growth. In 1970, the corridors had 6.9 million square feet of office space and 10,348 housing units. By 2009, there were 34.2 million square feet of office space and 41,655 housing units.1
Metro ridership steadily increased between 1980 and 2008 • along both metro corridors, with weekday boardings increasing from just over 40,000 in 1980 to just under 80,000 in 2008 (slight declines were seen in 2009).2
Slightly less than half of the people living on Arlington’s Metro • corridors drive to work, while nearly 40 percent rely on pub lic transportation.3
1 Arlington County Department of Community Planning, Housing and Development (CPHD), “Profile 2009: Fall Update,”8, www.arlingtonva.us/departments/CPHD/planning/data_maps/profile/file72015.pdf (accessed February 3, 2010).
2 Ibid., 9.
3 Arlington County CPHD, “Means of Transportation,” www.arlingtonva.us/departments/CPHD/planning/data_maps/Census/commutting/ Censuscommuting.aspx (accessed February 3, 2010).
Over the last three decades, Arlington has invested in smart growth policies, winning national acclaim for its efforts. Arlington’s smart growth plans will continue into the future, with more mixed-use, high-density development.
Photo courtesy of The JBG Compa
nies
Photo by Steve
Uzzell
Rendering of Central Place Office
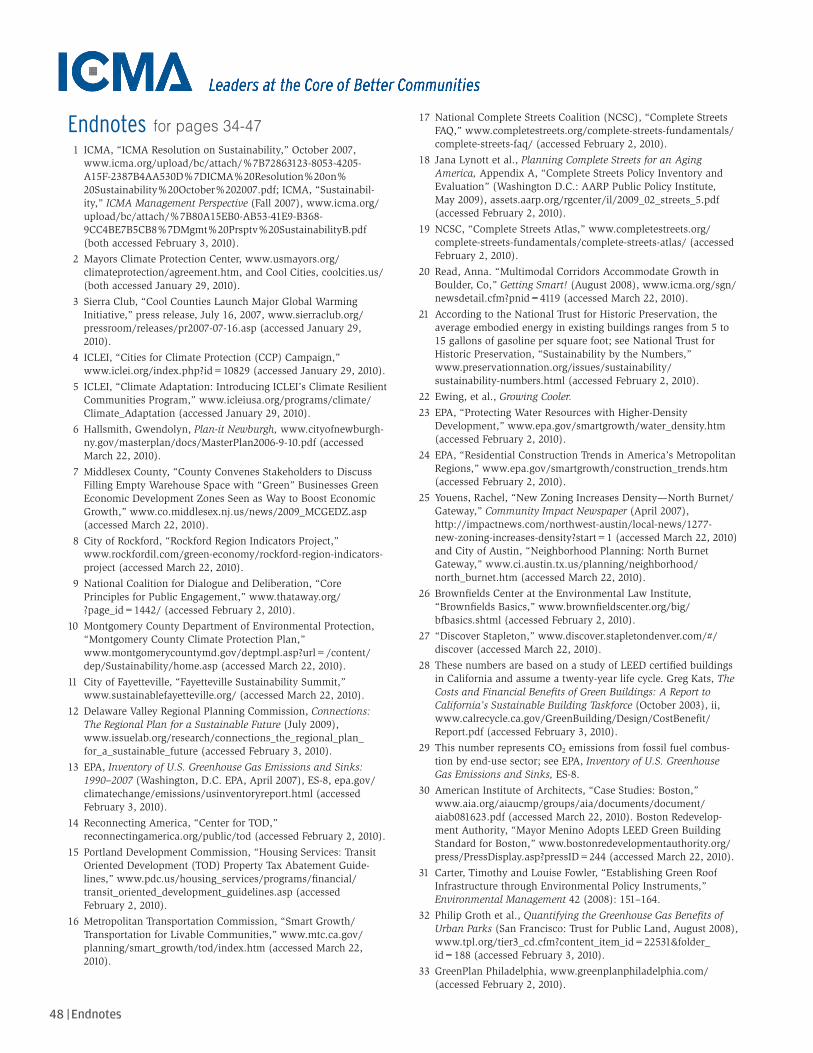
48 | Endnotes
28 Getting Smart about Climate Change
Endnotes 1 ICMA, “ICMA Resolution on Sustainability,” October 2007,
www.icma.org/upload/bc/attach/%7B72863123-8053-4205-A15F-2387B4AA530D%7DICMA%20Resolution%20on% 20Sustainability%20October%202007.pdf; ICMA, “Sustainabil-ity,” ICMA Management Perspective (Fall 2007), www.icma.org/upload/bc/attach/%7B80A15EB0-AB53-41E9-B368-9CC4BE7B5CB8%7DMgmt%20Prsptv%20SustainabilityB.pdf (both accessed February 3, 2010).
2 Mayors Climate Protection Center, www.usmayors.org/climateprotection/agreement.htm, and Cool Cities, coolcities.us/ (both accessed January 29, 2010).
3 Sierra Club, “Cool Counties Launch Major Global Warming Initiative,” press release, July 16, 2007, www.sierraclub.org/pressroom/releases/pr2007-07-16.asp (accessed January 29, 2010).
4 ICLEI, “Cities for Climate Protection (CCP) Campaign,” www.iclei.org/index.php?id=10829 (accessed January 29, 2010).
5 ICLEI, “Climate Adaptation: Introducing ICLEI’s Climate Resilient Communities Program,” www.icleiusa.org/programs/climate/Climate_Adaptation (accessed January 29, 2010).
6 Hallsmith, Gwendolyn, Plan-it Newburgh, www.cityofnewburgh-ny.gov/masterplan/docs/MasterPlan2006-9-10.pdf (accessed March 22, 2010).
7 Middlesex County, “County Convenes Stakeholders to Discuss Filling Empty Warehouse Space with “Green” Businesses Green Economic Development Zones Seen as Way to Boost Economic Growth,” www.co.middlesex.nj.us/news/2009_MCGEDZ.asp (accessed March 22, 2010).
8 City of Rockford, “Rockford Region Indicators Project,” www.rockfordil.com/green-economy/rockford-region-indicators-project (accessed March 22, 2010).
9 National Coalition for Dialogue and Deliberation, “Core Principles for Public Engagement,” www.thataway.org/ ?page_id=1442/ (accessed February 2, 2010).
10 Montgomery County Department of Environmental Protection, “Montgomery County Climate Protection Plan,” www.montgomerycountymd.gov/deptmpl.asp?url=/content/dep/Sustainability/home.asp (accessed March 22, 2010).
11 City of Fayetteville, “Fayetteville Sustainability Summit,” www.sustainablefayetteville.org/ (accessed March 22, 2010).
12 Delaware Valley Regional Planning Commission, Connections: The Regional Plan for a Sustainable Future (July 2009), www.issuelab.org/research/connections_the_regional_plan_for_a_sustainable_future (accessed February 3, 2010).
13 EPA, Inventory of U.S. Greenhouse Gas Emissions and Sinks: 1990–2007 (Washington, D.C. EPA, April 2007), ES-8, epa.gov/climatechange/emissions/usinventoryreport.html (accessed February 3, 2010).
14 Reconnecting America, “Center for TOD,” reconnectingamerica.org/public/tod (accessed February 2, 2010).
15 Portland Development Commission, “Housing Services: Transit Oriented Development (TOD) Property Tax Abatement Guide-lines,” www.pdc.us/housing_services/programs/financial/transit_oriented_development_guidelines.asp (accessed February 2, 2010).
16 Metropolitan Transportation Commission, “Smart Growth/Transportation for Livable Communities,” www.mtc.ca.gov/planning/smart_growth/tod/index.htm (accessed March 22, 2010).
17 National Complete Streets Coalition (NCSC), “Complete Streets FAQ,” www.completestreets.org/complete-streets-fundamentals/complete-streets-faq/ (accessed February 2, 2010).
18 Jana Lynott et al., Planning Complete Streets for an Aging America, Appendix A, “Complete Streets Policy Inventory and Evaluation” (Washington D.C.: AARP Public Policy Institute, May 2009), assets.aarp.org/rgcenter/il/2009_02_streets_5.pdf (accessed February 2, 2010).
19 NCSC, “Complete Streets Atlas,” www.completestreets.org/complete-streets-fundamentals/complete-streets-atlas/ (accessed February 2, 2010).
20 Read, Anna. “Multimodal Corridors Accommodate Growth in Boulder, Co,” Getting Smart! (August 2008), www.icma.org/sgn/newsdetail.cfm?pnid=4119 (accessed March 22, 2010).
21 According to the National Trust for Historic Preservation, the average embodied energy in existing buildings ranges from 5 to 15 gallons of gasoline per square foot; see National Trust for Historic Preservation, “Sustainability by the Numbers,” www.preservationnation.org/issues/sustainability/ sustainability-numbers.html (accessed February 2, 2010).
22 Ewing, et al., Growing Cooler.
23 EPA, “Protecting Water Resources with Higher-Density Development,” www.epa.gov/smartgrowth/water_density.htm (accessed February 2, 2010).
24 EPA, “Residential Construction Trends in America’s Metropolitan Regions,” www.epa.gov/smartgrowth/construction_trends.htm (accessed February 2, 2010).
25 Youens, Rachel, “New Zoning Increases Density—North Burnet/Gateway,” Community Impact Newspaper (April 2007), http://impactnews.com/northwest-austin/local-news/1277- new-zoning-increases-density?start=1 (accessed March 22, 2010) and City of Austin, “Neighborhood Planning: North Burnet Gateway,” www.ci.austin.tx.us/planning/neighborhood/ north_burnet.htm (accessed March 22, 2010).
26 Brownfields Center at the Environmental Law Institute, “Brownfields Basics,” www.brownfieldscenter.org/big/ bfbasics.shtml (accessed February 2, 2010).
27 “Discover Stapleton,” www.discover.stapletondenver.com/#/discover (accessed March 22, 2010).
28 These numbers are based on a study of LEED certified buildings in California and assume a twenty-year life cycle. Greg Kats, The Costs and Financial Benefits of Green Buildings: A Report to California’s Sustainable Building Taskforce (October 2003), ii, www.calrecycle.ca.gov/GreenBuilding/Design/CostBenefit/Report.pdf (accessed February 3, 2010).
29 This number represents CO2 emissions from fossil fuel combus-tion by end-use sector; see EPA, Inventory of U.S. Greenhouse Gas Emissions and Sinks, ES-8.
30 American Institute of Architects, “Case Studies: Boston,” www.aia.org/aiaucmp/groups/aia/documents/document/aiab081623.pdf (accessed March 22, 2010). Boston Redevelop-ment Authority, “Mayor Menino Adopts LEED Green Building Standard for Boston,” www.bostonredevelopmentauthority.org/press/PressDisplay.asp?pressID=244 (accessed March 22, 2010).
31 Carter, Timothy and Louise Fowler, “Establishing Green Roof Infrastructure through Environmental Policy Instruments,” Environmental Management 42 (2008): 151–164.
32 Philip Groth et al., Quantifying the Greenhouse Gas Benefits of Urban Parks (San Francisco: Trust for Public Land, August 2008), www.tpl.org/tier3_cd.cfm?content_item_id=22531&folder_id=188 (accessed February 3, 2010).
33 GreenPlan Philadelphia, www.greenplanphiladelphia.com/ (accessed February 2, 2010).
for pages 34-47

| 49Endnotes
Getting Smart about Climate Change 29
34 Lanks, Belinda, “Creative Shrinkage,” New York Times, Decem-ber 10, 2006, www.nytimes.com/2006/12/10/magazine/ 10section1B.t-3.html?_r=1&scp=1&sq=youngstown% 20ohio%202006&st=cse (accessed March 23, 2010).
35 Pew Center on Global Climate Change and Pew Center on the States, “Adaptation,” in Climate Change 101: Preparing for a Warming World (Arlington, Va., and Washington, D.C., February 25, 2008), www.pewtrusts.org/our_work_report_detail.aspx?id=36356&category=474 (accessed February 3, 2010).
36 Pew Center on Global Climate Change, “Adaptation Plans,” www.pewclimate.org/what_s_being_done/in_the_states/adaptation_map.cfm (accessed February 3, 2010).
37 ICLEI, “Introducing ICLEI’s Climate Resilient Communities Program,” www.icleiusa.org/programs/climate/Climate_ Adaptation (accessed February 3, 2010).
38 City of Seattle, Seattle, A Climate of Change: Meeting the Kyoto Challenge, www.cityofseattle.net/climate/docs/SeaCAP_plan .pdf, (accessed March 23, 2010).
39 Sarasota County, “Sustainability,” www.scgov.net/Sustainability/default.asp (accessed February 3, 2010).
40 Sarasota County, “Roadmap to Sustainability,” www.scgov.net/Sustainability/Roadmap.asp (accessed February 3, 2010).
41 Architecture 2030, “The 2030 Challenge,” www.architecture2030 .org/2030_challenge/index.html (accessed February 3, 2010).
42 Sarasota County, “Green Business Partnership,” www.scgov.net/greenbusiness/default.asp (accessed February 3, 2010).
43 City of Santa Monica, Office of Sustainability and the Environ-ment, www01.smgov.net/epd/scp/index.htm (accessed February 3, 2010).
44 City of Santa Monica, Office of Sustainability and the Environ-ment, “Green Building,” www.smgov.net/departments/ose/categories/buildGreen.aspx (accessed February 3, 2010).
45 City of Santa Monica, Office of Sustainability and the Environ-ment, “Green Business Programs,” www.smgov.net/ Departments/OSE/Business/Green_Business_Programs.aspx (accessed February 3, 2010).
46 City of Santa Monica, “Sustainable City Report Card,” www01.smgov.net/epd/scpr/report_card.htm (accessed February 3, 2010).
47 EECBG program formula grants are competitively funded through the Department of Energy’s Offices of Weatherization and Intergovernmental Programs and Energy Efficiency and Renewable Energy. Over $2.7 billion are available to states, territories, local governments, and Indian tribes to improve energy efficiency and implement measures to reduce fossil fuel emissions. More information on the EECBG program is available at www.eecbg.energy.gov/ (accessed February 3, 2010).
48 Town of Carbondale, Municipal Website, www.carbondalegov .org/ (accessed February 3, 2010).
49 Town of Carbondale, “Energy and Climate Protection Plan: Creating a Strong Carbondale Economy with Clean Energy,”http://www.carbondalegov.org/vertical/Sites/ %7BE239F6F5-CCA3-4F3A-8B27-95E8145FD79A%7D/uploads/ %7BB4F77F3F-9D59-483C-BBEA-B62DFA49B156%7D.PDF
50 Cambridge Community Development Department, Climate Protection Plan: Local Actions to Reduce Greenhouse Gas Emissions (December 2002), www.cambridgema.gov/cdd/et/climate/clim_plan/clim_plan_full.pdf (accessed February 3, 2010).
51 Cambridge Community Development Department, “Climate Action Plan and Climate Protection Action Committee,” www.cambridgema.gov/cdd/et/climate/clim_cte/ index.html#comm (accessed February 3, 2010).
52 City of Durham, “Durham Greenhouse Gas Emissions Inventory and Local Action Plan,” www.durhamnc.gov/ghg/ (accessed February 3, 2010).
53 Sacramento Region Blueprint Project, www.sacregionblueprint .org/sacregionblueprint/home.cfm (accessed February 3, 2010).
54 City of Sacramento, “Sustainable Sacramento,” www.cityofsacramento.org/generalservices/sustainability/ (accessed February 3, 2010).
55 City of Sacramento, Sacramento 2030 General Plan (2009), www.sacgp.org/ (accessed February 3, 2010).
56 EPA, “National Award for Smart Growth Achievement” brochure (2002), 6–7, www.epa.gov/smartgrowth/pdf/sg_awards.pdf (accessed February 3, 2010).
57 In 2008, the American Planning Association recognized the Clarendon-Wilson Corridor between the Clarendon Metro station and Courthouse square as a one of its great streets for its compact, mixed-use development; transit-oriented design; preservation of historic structures; and complete streets. www.planning.org/greatplaces/streets/2008/clarendonwilson .htm (accessed February 3, 2010).
58 The 13.4 percent includes Arlington. Excluding Arlington, according to the American Community Survey’s 2008 one-year estimates, “Table B08006: Sex of Workers by Means of Transpor-tation to Work,” 12.8 percent of residents in the metro area take transit to work.
59 “Atlantic Station: 2008 Project XL Report,” www.atlanticstation .com/concept_green_projectXL08.php (accessed February 3, 2010).
60 “Strategies for Metropolitan Atlanta’s Regional Transportation and Air Quality,” January 2007, www.act-trans.ubc.ca/smartraq/pages/about.htm (accessed February 3, 2010).
61 City of Santa Fe Green Team, “Introduction and Approach,” in Sustainable Santa Fe Plan: Building a More Sustainable Future by Looking to the Past (October 2008), www.santafenm.gov/DocumentView.aspx?DID=702 (accessed February 3, 2010).
62 City of Santa Fe, “Santa Fe Residential Green Building Code,” 2, www.santafenm.gov/DocumentView.aspx?DID=2232 (accessed February 3, 2010).
63 Santa Fe 400, “Development and Zoning Code,” www.santafenm .gov/index.aspx?NID=1363 (accessed February 3, 2010).
64 City of Minneapolis, “Open Space and Parks,” in The Minneapo-lis Plan for Sustainable Growth (October 2009), 7-5, www.ci.minneapolis.mn.us/cped/comp_plan_update_draft_ plan.asp (accessed February 3, 2010).
65 Ibid., 7-6.
66 Greenways and Natural Areas Collaborative, Metro Greenprint: Planning for Nature in the Face of Urban Growth (Minnesota Department of Natural Resources, December 1997), files.dnr.state.mn.us/assistance/nrplanning/community/greenways/greenprint.pdf (accessed February 3, 2010).
67 Green Infrastructure, “Metro Greenways Program – MN,” www.greeninfrastructure.net/content/project/ metro-greenways-program-mn (accessed February 3, 2010).
68 City of Keene, Adapting to Climate Change: Planning a Climate Resilient Community (November 2007), www.ci.keene.nh.us/sites/default/files/Keene%20Report_ICLEI_FINAL_v2_1.pdf (accessed February 3, 2010).


Webinar Summaries
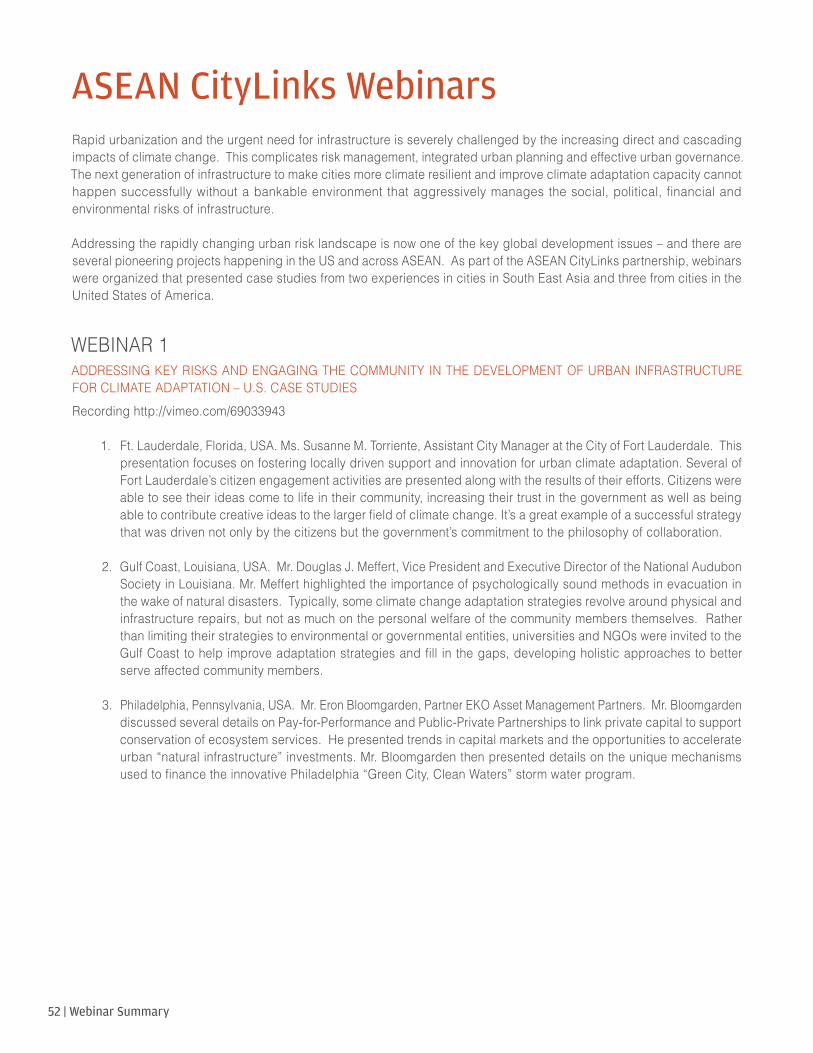
52 | Webinar Summary
ASEAN CityLinks WebinarsRapid urbanization and the urgent need for infrastructure is severely challenged by the increasing direct and cascading impacts of climate change. This complicates risk management, integrated urban planning and effective urban governance. The next generation of infrastructure to make cities more climate resilient and improve climate adaptation capacity cannot happen successfully without a bankable environment that aggressively manages the social, political, financial and environmental risks of infrastructure.
Addressing the rapidly changing urban risk landscape is now one of the key global development issues – and there are several pioneering projects happening in the US and across ASEAN. As part of the ASEAN CityLinks partnership, webinars were organized that presented case studies from two experiences in cities in South East Asia and three from cities in the United States of America.
WEBINAR 1
ADDRESSING KEY RISKS AND ENGAGING THE COMMUNITY IN THE DEVELOPMENT OF URBAN INFRASTRUCTURE FOR CLIMATE ADAPTATION – U.S. CASE STUDIESRecording http://vimeo.com/69033943
1. Ft. Lauderdale, Florida, USA. Ms. Susanne M. Torriente, Assistant City Manager at the City of Fort Lauderdale. This presentation focuses on fostering locally driven support and innovation for urban climate adaptation. Several of Fort Lauderdale’s citizen engagement activities are presented along with the results of their efforts. Citizens were able to see their ideas come to life in their community, increasing their trust in the government as well as being able to contribute creative ideas to the larger field of climate change. It’s a great example of a successful strategy that was driven not only by the citizens but the government’s commitment to the philosophy of collaboration.
2. Gulf Coast, Louisiana, USA. Mr. Douglas J. Meffert, Vice President and Executive Director of the National Audubon Society in Louisiana. Mr. Meffert highlighted the importance of psychologically sound methods in evacuation in the wake of natural disasters. Typically, some climate change adaptation strategies revolve around physical and infrastructure repairs, but not as much on the personal welfare of the community members themselves. Rather than limiting their strategies to environmental or governmental entities, universities and NGOs were invited to the Gulf Coast to help improve adaptation strategies and fill in the gaps, developing holistic approaches to better serve affected community members.
3. Philadelphia, Pennsylvania, USA. Mr. Eron Bloomgarden, Partner EKO Asset Management Partners. Mr. Bloomgarden
discussed several details on Pay-for-Performance and Public-Private Partnerships to link private capital to support conservation of ecosystem services. He presented trends in capital markets and the opportunities to accelerate urban “natural infrastructure” investments. Mr. Bloomgarden then presented details on the unique mechanisms used to finance the innovative Philadelphia “Green City, Clean Waters” storm water program.
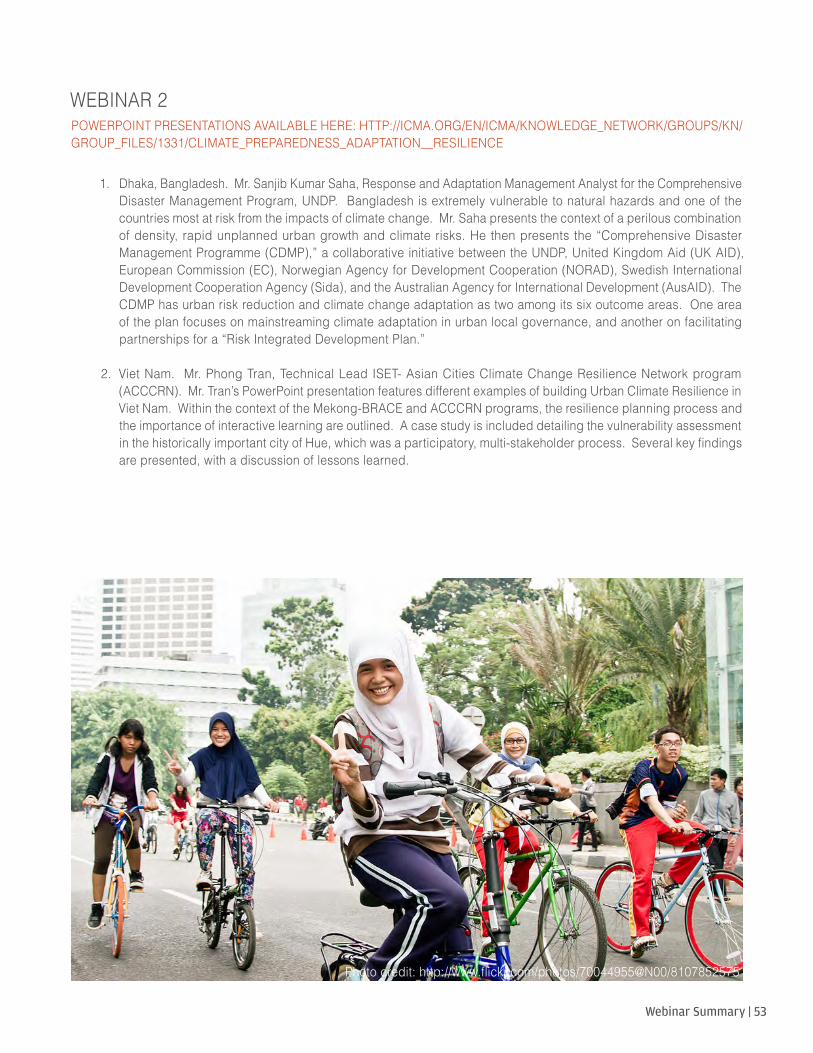
Webinar Summary | 53
WEBINAR 2 POWERPOINT PRESENTATIONS AVAILABLE HERE: HTTP://ICMA.ORG/EN/ICMA/KNOWLEDGE_NETWORK/GROUPS/KN/GROUP_FILES/1331/CLIMATE_PREPAREDNESS_ADAPTATION__RESILIENCE
1. Dhaka, Bangladesh. Mr. Sanjib Kumar Saha, Response and Adaptation Management Analyst for the Comprehensive Disaster Management Program, UNDP. Bangladesh is extremely vulnerable to natural hazards and one of the countries most at risk from the impacts of climate change. Mr. Saha presents the context of a perilous combination of density, rapid unplanned urban growth and climate risks. He then presents the “Comprehensive Disaster Management Programme (CDMP),” a collaborative initiative between the UNDP, United Kingdom Aid (UK AID), European Commission (EC), Norwegian Agency for Development Cooperation (NORAD), Swedish International Development Cooperation Agency (Sida), and the Australian Agency for International Development (AusAID). The CDMP has urban risk reduction and climate change adaptation as two among its six outcome areas. One area of the plan focuses on mainstreaming climate adaptation in urban local governance, and another on facilitating partnerships for a “Risk Integrated Development Plan.”
2. Viet Nam. Mr. Phong Tran, Technical Lead ISET- Asian Cities Climate Change Resilience Network program (ACCCRN). Mr. Tran’s PowerPoint presentation features different examples of building Urban Climate Resilience in Viet Nam. Within the context of the Mekong-BRACE and ACCCRN programs, the resilience planning process and the importance of interactive learning are outlined. A case study is included detailing the vulnerability assessment in the historically important city of Hue, which was a participatory, multi-stakeholder process. Several key findings are presented, with a discussion of lessons learned.
Photo credit: http://www.flickr.com/photos/70044955@N00/8107852575


Team Profiles
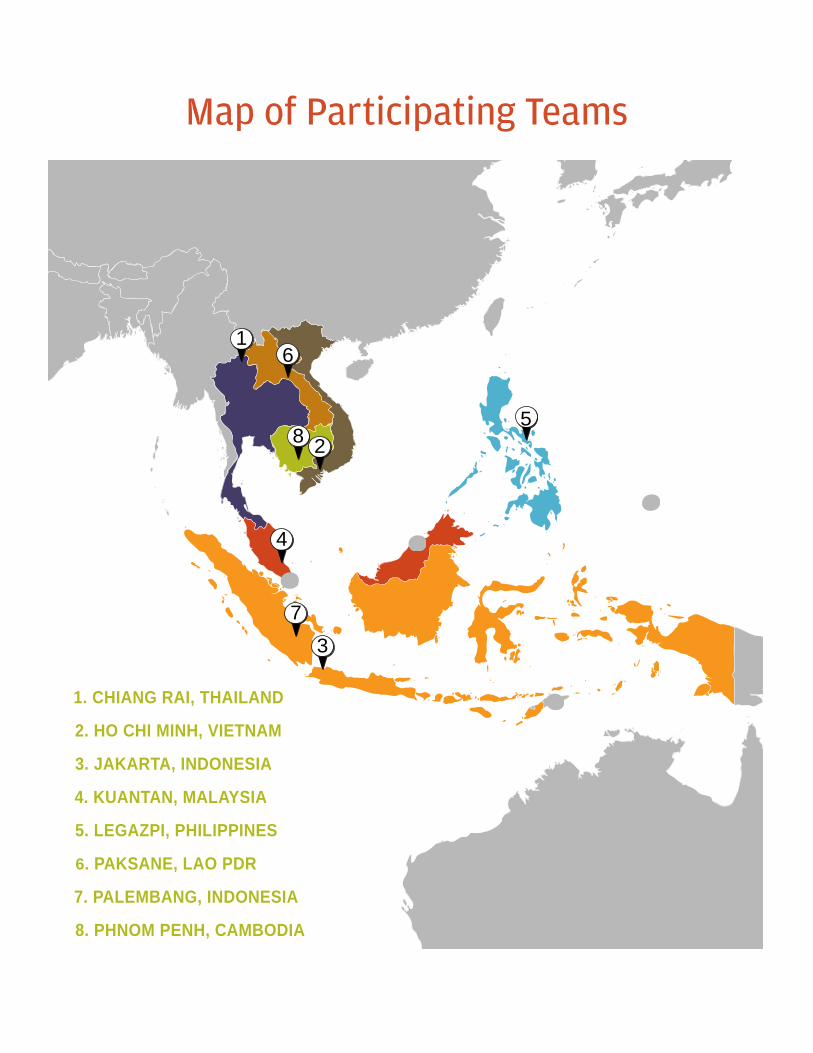
Map of Participating Teams
11
22
33
44
55
66
77
88
1. CHIANG RAI, THAILAND
2. HO CHI MINH, VIETNAM
3. JAKARTA, INDONESIA
4. KUANTAN, MALAYSIA
5. LEGAZPI, PHILIPPINES
6. PAKSANE, LAO PDR
7. PALEMBANG, INDONESIA
8. PHNOM PENH, CAMBODIA
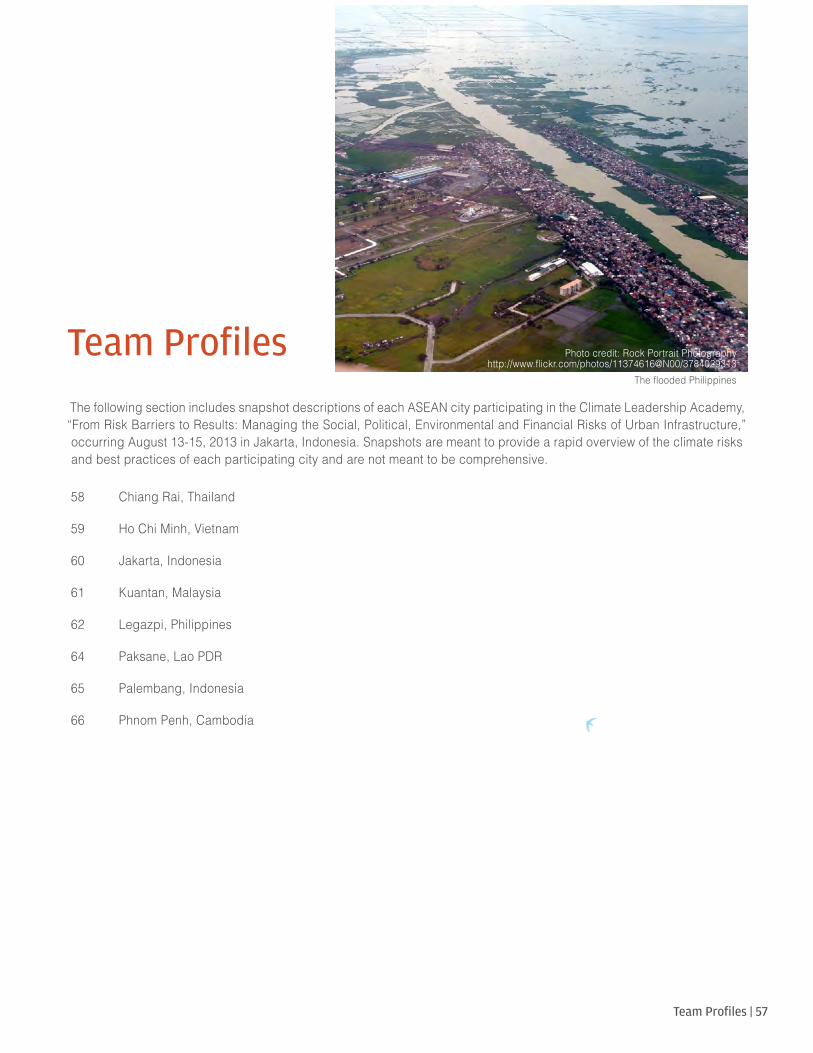
Team Profiles | 57
Team Profiles
58 Chiang Rai, Thailand
59 Ho Chi Minh, Vietnam
60 Jakarta, Indonesia
61 Kuantan, Malaysia
62 Legazpi, Philippines
64 Paksane, Lao PDR
65 Palembang, Indonesia
66 Phnom Penh, Cambodia
Photo credit: Rock Portrait Photographyhttp://www.flickr.com/photos/11374616@N00/3784029313
The flooded Philippines
The following section includes snapshot descriptions of each ASEAN city participating in the Climate Leadership Academy, “From Risk Barriers to Results: Managing the Social, Political, Environmental and Financial Risks of Urban Infrastructure,” occurring August 13-15, 2013 in Jakarta, Indonesia. Snapshots are meant to provide a rapid overview of the climate risks and best practices of each participating city and are not meant to be comprehensive.
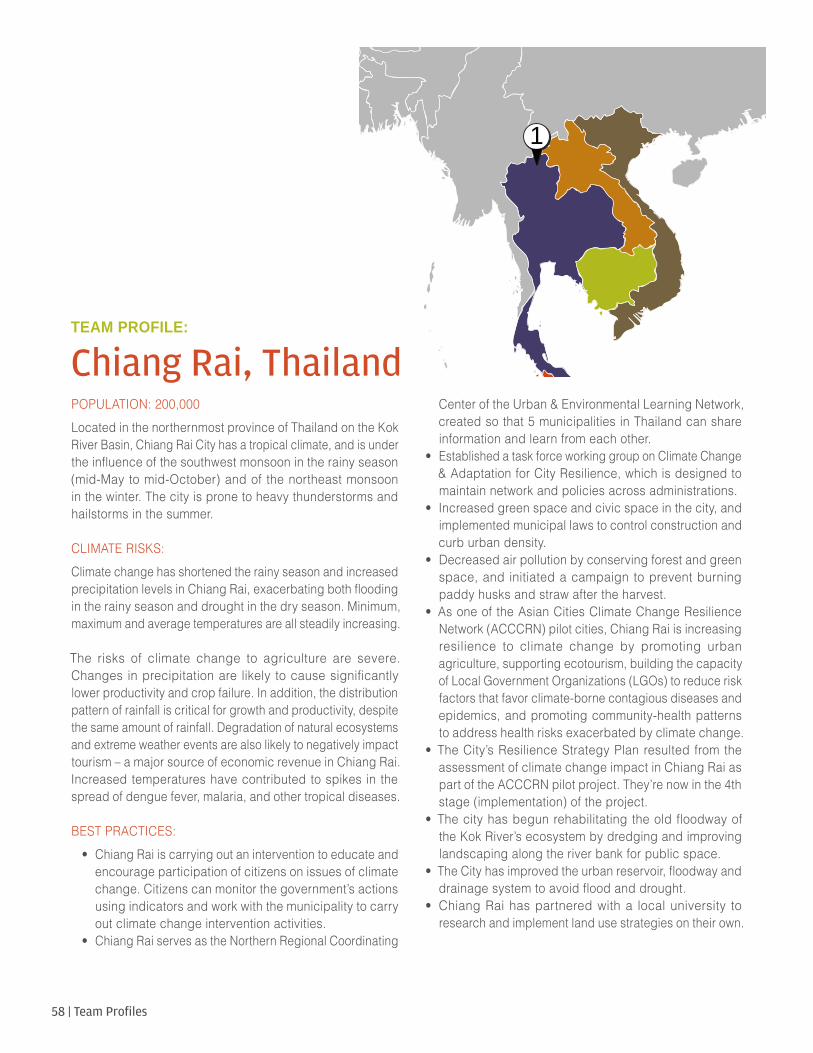
58 | Team Profiles
TEAM PROFILE:
Chiang Rai, ThailandPOPULATION: 200,000 Located in the northernmost province of Thailand on the Kok River Basin, Chiang Rai City has a tropical climate, and is under the influence of the southwest monsoon in the rainy season (mid-May to mid-October) and of the northeast monsoon in the winter. The city is prone to heavy thunderstorms and hailstorms in the summer.
CLIMATE RISKS: Climate change has shortened the rainy season and increased precipitation levels in Chiang Rai, exacerbating both flooding in the rainy season and drought in the dry season. Minimum, maximum and average temperatures are all steadily increasing.
The risks of climate change to agriculture are severe. Changes in precipitation are likely to cause significantly lower productivity and crop failure. In addition, the distribution pattern of rainfall is critical for growth and productivity, despite the same amount of rainfall. Degradation of natural ecosystems and extreme weather events are also likely to negatively impact tourism – a major source of economic revenue in Chiang Rai. Increased temperatures have contributed to spikes in the spread of dengue fever, malaria, and other tropical diseases.
BEST PRACTICES:• Chiang Rai is carrying out an intervention to educate and
encourage participation of citizens on issues of climate change. Citizens can monitor the government’s actions using indicators and work with the municipality to carry out climate change intervention activities.
• Chiang Rai serves as the Northern Regional Coordinating
Center of the Urban & Environmental Learning Network, created so that 5 municipalities in Thailand can share information and learn from each other.
• Established a task force working group on Climate Change & Adaptation for City Resilience, which is designed to maintain network and policies across administrations.
• Increased green space and civic space in the city, and implemented municipal laws to control construction and curb urban density.
• Decreased air pollution by conserving forest and green space, and initiated a campaign to prevent burning paddy husks and straw after the harvest.
• As one of the Asian Cities Climate Change Resilience Network (ACCCRN) pilot cities, Chiang Rai is increasing resilience to climate change by promoting urban agriculture, supporting ecotourism, building the capacity of Local Government Organizations (LGOs) to reduce risk factors that favor climate-borne contagious diseases and epidemics, and promoting community-health patterns to address health risks exacerbated by climate change.
• The City’s Resilience Strategy Plan resulted from the assessment of climate change impact in Chiang Rai as part of the ACCCRN pilot project. They’re now in the 4th stage (implementation) of the project.
• The city has begun rehabilitating the old floodway of the Kok River’s ecosystem by dredging and improving landscaping along the river bank for public space.
• The City has improved the urban reservoir, floodway and drainage system to avoid flood and drought.
• Chiang Rai has partnered with a local university to research and implement land use strategies on their own.
11
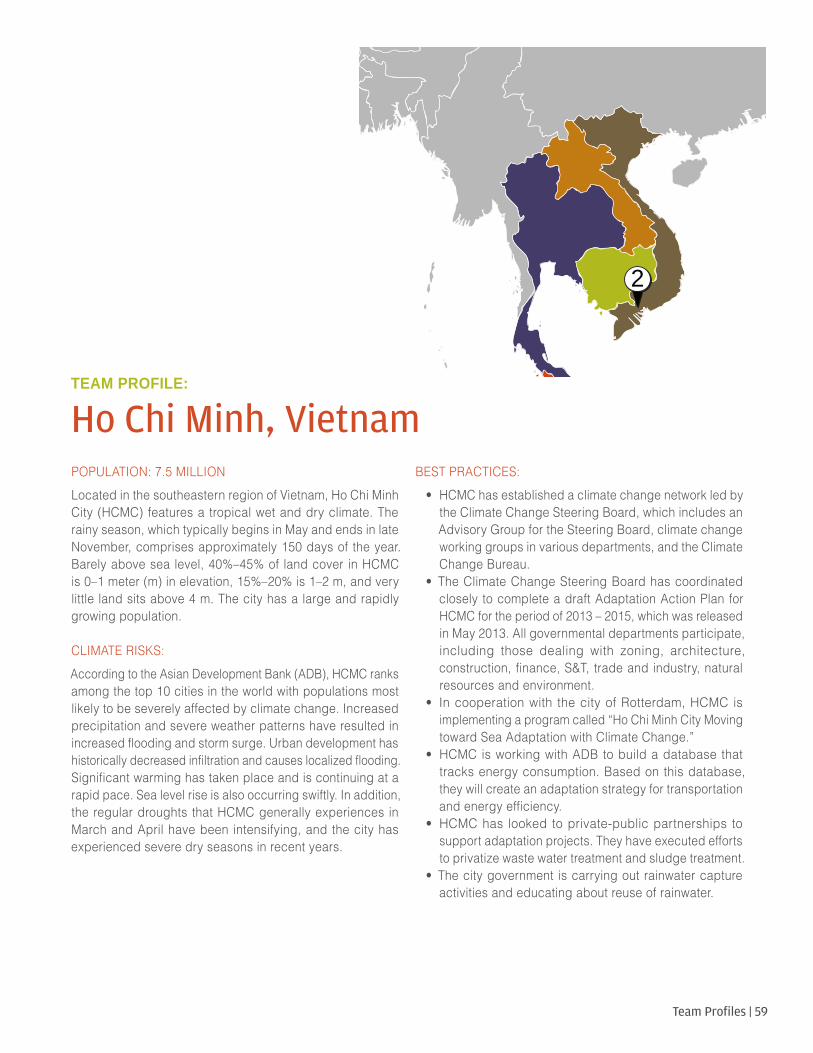
Team Profiles | 59
TEAM PROFILE:
Ho Chi Minh, VietnamPOPULATION: 7.5 MILLIONLocated in the southeastern region of Vietnam, Ho Chi Minh City (HCMC) features a tropical wet and dry climate. The rainy season, which typically begins in May and ends in late November, comprises approximately 150 days of the year. Barely above sea level, 40%–45% of land cover in HCMC is 0–1 meter (m) in elevation, 15%–20% is 1–2 m, and very little land sits above 4 m. The city has a large and rapidly growing population.
CLIMATE RISKS:According to the Asian Development Bank (ADB), HCMC ranks among the top 10 cities in the world with populations most likely to be severely affected by climate change. Increased precipitation and severe weather patterns have resulted in increased flooding and storm surge. Urban development has historically decreased infiltration and causes localized flooding. Significant warming has taken place and is continuing at a rapid pace. Sea level rise is also occurring swiftly. In addition, the regular droughts that HCMC generally experiences in March and April have been intensifying, and the city has experienced severe dry seasons in recent years.
BEST PRACTICES:• HCMC has established a climate change network led by
the Climate Change Steering Board, which includes an Advisory Group for the Steering Board, climate change working groups in various departments, and the Climate Change Bureau.
• The Climate Change Steering Board has coordinated closely to complete a draft Adaptation Action Plan for HCMC for the period of 2013 – 2015, which was released in May 2013. All governmental departments participate, including those dealing with zoning, architecture, construction, finance, S&T, trade and industry, natural resources and environment.
• In cooperation with the city of Rotterdam, HCMC is implementing a program called “Ho Chi Minh City Moving toward Sea Adaptation with Climate Change.”
• HCMC is working with ADB to build a database that tracks energy consumption. Based on this database, they will create an adaptation strategy for transportation and energy efficiency.
• HCMC has looked to private-public partnerships to support adaptation projects. They have executed efforts to privatize waste water treatment and sludge treatment.
• The city government is carrying out rainwater capture activities and educating about reuse of rainwater.
22
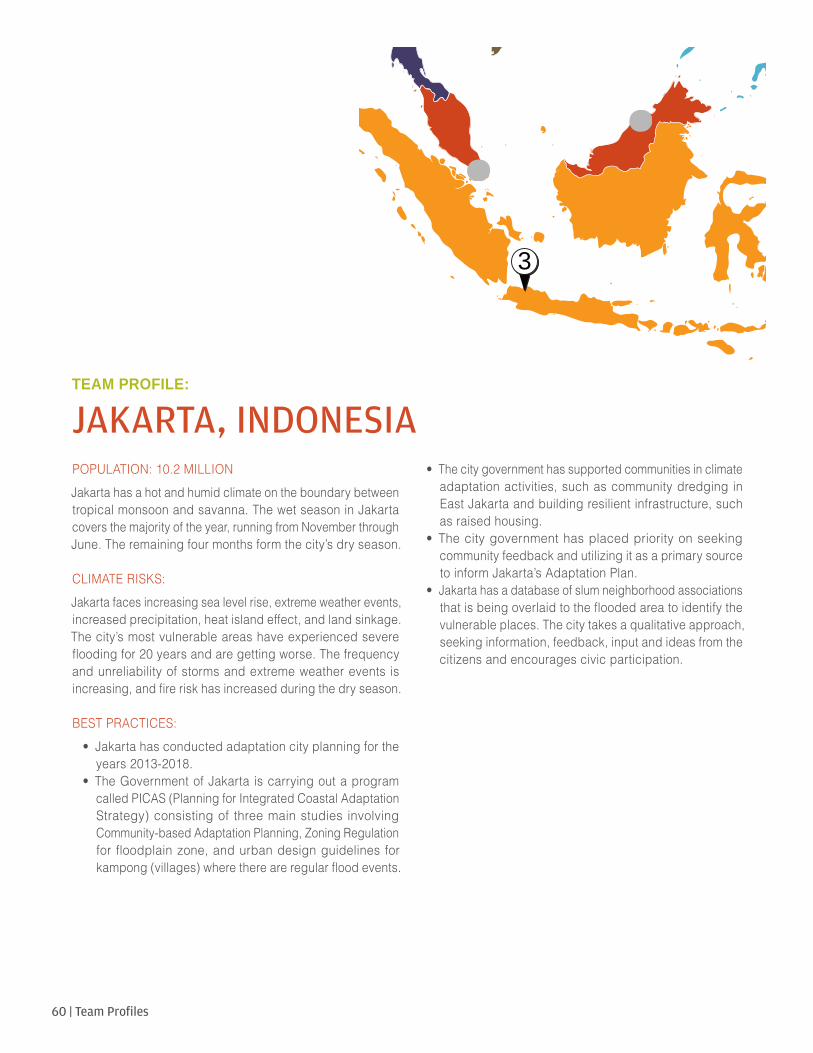
60 | Team Profiles
TEAM PROFILE:
JAKARTA, INDONESIAPOPULATION: 10.2 MILLIONJakarta has a hot and humid climate on the boundary between tropical monsoon and savanna. The wet season in Jakarta covers the majority of the year, running from November through June. The remaining four months form the city’s dry season.
CLIMATE RISKS: Jakarta faces increasing sea level rise, extreme weather events, increased precipitation, heat island effect, and land sinkage. The city’s most vulnerable areas have experienced severe flooding for 20 years and are getting worse. The frequency and unreliability of storms and extreme weather events is increasing, and fire risk has increased during the dry season.
BEST PRACTICES:• Jakarta has conducted adaptation city planning for the
years 2013-2018.• The Government of Jakarta is carrying out a program
called PICAS (Planning for Integrated Coastal Adaptation Strategy) consisting of three main studies involving Community-based Adaptation Planning, Zoning Regulation for floodplain zone, and urban design guidelines for kampong (villages) where there are regular flood events.
• The city government has supported communities in climate adaptation activities, such as community dredging in East Jakarta and building resilient infrastructure, such as raised housing.
• The city government has placed priority on seeking community feedback and utilizing it as a primary source to inform Jakarta’s Adaptation Plan.
• Jakarta has a database of slum neighborhood associations that is being overlaid to the flooded area to identify the vulnerable places. The city takes a qualitative approach, seeking information, feedback, input and ideas from the citizens and encourages civic participation.
33

Team Profiles | 61
TEAM PROFILE:
KUANTAN, MALAYSIAPOPULATION: 608,000Kuantan features a tropical rainforest climate, with a rainy season occurring from roughly October to March and a hot, dry season from April to September. Eighty percent of the city is covered by green space.
CLIMATE RISKS: Sea levels have risen by as much as 10cm along the Kuantan coast over the last century, increasing erosion and stress on infrastructure and natural resources. Rainfall has increased in recent years and extreme weather events caused by climate change occur more frequently. Kuantan is affected by severe flooding – a major flood in 2012 took the city by surprise and ravaged a great deal of infrastructure and housing. During the dry season, forest woodland fires are becoming more frequent and intense due to increased temperatures and heat waves.
BEST PRACTICES: • Kuantan has an Environmental Sustainability Plan. • They are in the process of developing their own Climate
Adaptation Committee. • Kuantan’s climate adaptation efforts pertaining to water
management has led to the city’s participation in the ASEAN Sustainable Cities for Clean Water 2010 project.
• Kuantan had an MOU with a local university through which various studies on water quality were executed and environmental indicators in one of the main industrial areas were tested.
• Kuantan has a plan for preserving and reserving natural resources including mangroves, wetlands, and also forests, as well as a large forest reserve that is protected through city laws and policies. The city works with local communities to plant 10,000 trees annually.
• City policies ensure that housing schemes and infrastructure plans must preserve 10% of green space when building.
• They have a coastal line master plan with guidelines on how to redevelop after disasters. This plan touches on coastal erosion, which is carried out through the Mitigation Department.
• Kuantan is working on a project with the United Nations to control emissions from the city’s landfill and to generate renewable energy from methane gas. The implementation of holistic approaches in air quality control has reduced carbon emissions, resulting in good standing on the Air Pollutant Index (API).
• Kuantan has a Disaster Committee that has prepared a plan for disaster preparedness and mitigation.
44
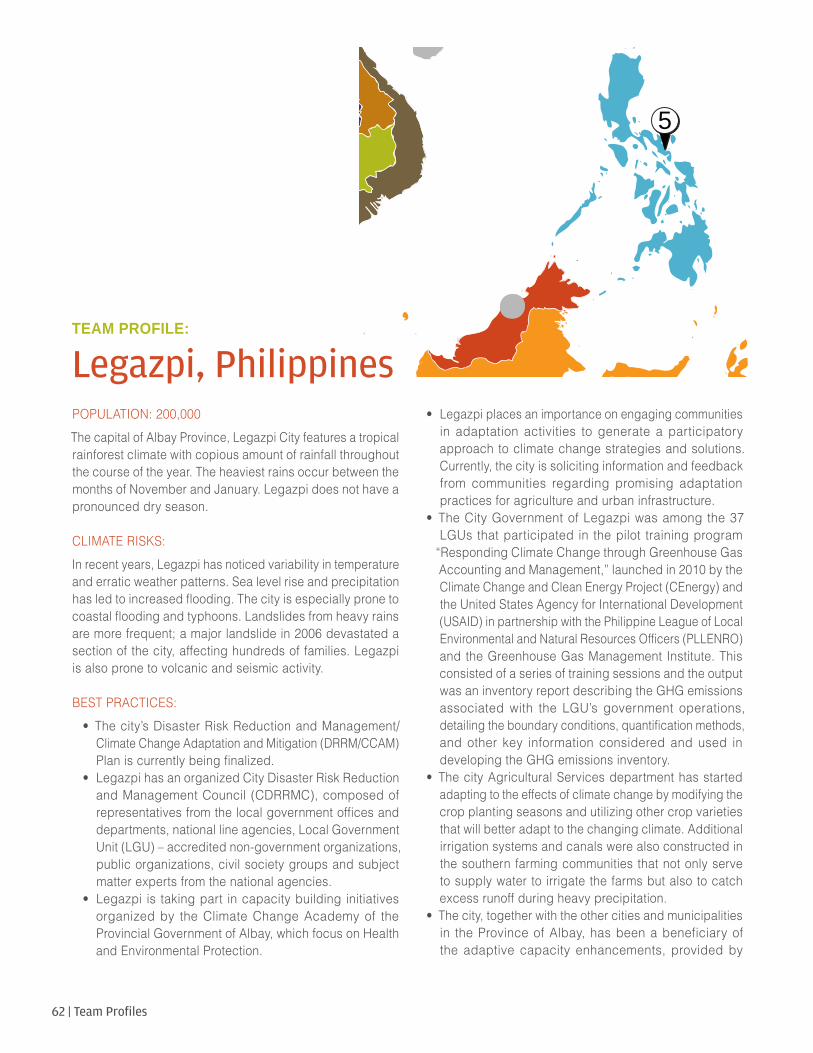
62 | Team Profiles
TEAM PROFILE:
Legazpi, PhilippinesPOPULATION: 200,000The capital of Albay Province, Legazpi City features a tropical rainforest climate with copious amount of rainfall throughout the course of the year. The heaviest rains occur between the months of November and January. Legazpi does not have a pronounced dry season.
CLIMATE RISKS:In recent years, Legazpi has noticed variability in temperature and erratic weather patterns. Sea level rise and precipitation has led to increased flooding. The city is especially prone to coastal flooding and typhoons. Landslides from heavy rains are more frequent; a major landslide in 2006 devastated a section of the city, affecting hundreds of families. Legazpi is also prone to volcanic and seismic activity.
BEST PRACTICES:• The city’s Disaster Risk Reduction and Management/
Climate Change Adaptation and Mitigation (DRRM/CCAM) Plan is currently being finalized.
• Legazpi has an organized City Disaster Risk Reduction and Management Council (CDRRMC), composed of representatives from the local government offices and departments, national line agencies, Local Government Unit (LGU) – accredited non-government organizations, public organizations, civil society groups and subject matter experts from the national agencies.
• Legazpi is taking part in capacity building initiatives organized by the Climate Change Academy of the Provincial Government of Albay, which focus on Health and Environmental Protection.
• Legazpi places an importance on engaging communities in adaptation activities to generate a participatory approach to climate change strategies and solutions. Currently, the city is soliciting information and feedback from communities regarding promising adaptation practices for agriculture and urban infrastructure.
• The City Government of Legazpi was among the 37 LGUs that participated in the pilot training program
“Responding Climate Change through Greenhouse Gas Accounting and Management,” launched in 2010 by the Climate Change and Clean Energy Project (CEnergy) and the United States Agency for International Development (USAID) in partnership with the Philippine League of Local Environmental and Natural Resources Officers (PLLENRO) and the Greenhouse Gas Management Institute. This consisted of a series of training sessions and the output was an inventory report describing the GHG emissions associated with the LGU’s government operations, detailing the boundary conditions, quantification methods, and other key information considered and used in developing the GHG emissions inventory.
• The city Agricultural Services department has started adapting to the effects of climate change by modifying the crop planting seasons and utilizing other crop varieties that will better adapt to the changing climate. Additional irrigation systems and canals were also constructed in the southern farming communities that not only serve to supply water to irrigate the farms but also to catch excess runoff during heavy precipitation.
• The city, together with the other cities and municipalities in the Province of Albay, has been a beneficiary of the adaptive capacity enhancements, provided by
55
Team Profiles | 63
the Center for Initiatives and Research on Climate Adaptation (CIRCA) of the Provincial Government, in integrating DRRM/CCAM elements to spatial planning. The city government was introduced to the utilization and application of simulation software such as the Rapid Earthquake Disaster Assessment System (REDAS,) developed by the Philippine Institute of Volcanology and Seismology, and the SimCLIM, developed by the CLIMsystems, Ltd. that examines the effects of climate variability and change over time and space. So far, the hazard maps produced by REDAS and SimCLIMwere used in the risk and vulnerability assessments for the CLUP, CDP and the DRRM/CCAM Plans.
• Legazpi has constructed a city boulevard along the urban coastal and the plantation of mangroves in the southeast coastal area of the city. Both serve as barriers to storm surge and give protection to the barangays (villages) along the shoreline.
• In the urban area, the city is currently implementing the Urban Drainage Master Plan in phases to address the issue of flooding. The project includes the deepening and widening of drainage canals, the rehabilitation of river dikes, the installation of jetties, elevation of roads, and the installation of pumping stations and water gates, to protect the city from the intrusion of sea tidal waters that are exacerbated especially during rainy season.
• After the onslaught of Super Typhoon Reming in the area, the constituents learned to “build back better” by constructing houses that can withstand the winds of a
super typhoon and elevate the structures to be safe from flooding.
• Sustainability and strengthening of the Ecological Solid Waste Management Program has been continuously undertaken with the active participation of the community which supports the segregation at source of solid waste, segregated collection, solid waste diversion, recovery/recycling system and the full operation and maintenance of the sanitary landfill facility. A law was passed that requires ecological solid waste management, which is very promising.
• The city has recently approved a Comprehensive Land Use Plan (CLUP) and Comprehensive Development Plan (CDP), which are being enforced through its implementing arm, the Zoning Ordinance. Criteria from the DRRM/CCAM Plan, which is currently being finalized, has already been integrated into the abovementioned plans.
• The Legazpi government linked the DRR/CCAM plan with legislation so city investment would be less risky.
• Following a national mandate, 5% of the city’s estimated revenues from regular sources are allocated for the Local Calamity Fund to accommodate such undertakings.
• A relocation program was also implemented to aid vulnerable communities in the face of disaster events. The program includes the construction of climate adaptive emergency evacuation centers/multi-purpose holding areas. Early warning systems and communication systems for climate/weather related disturbances are in place.
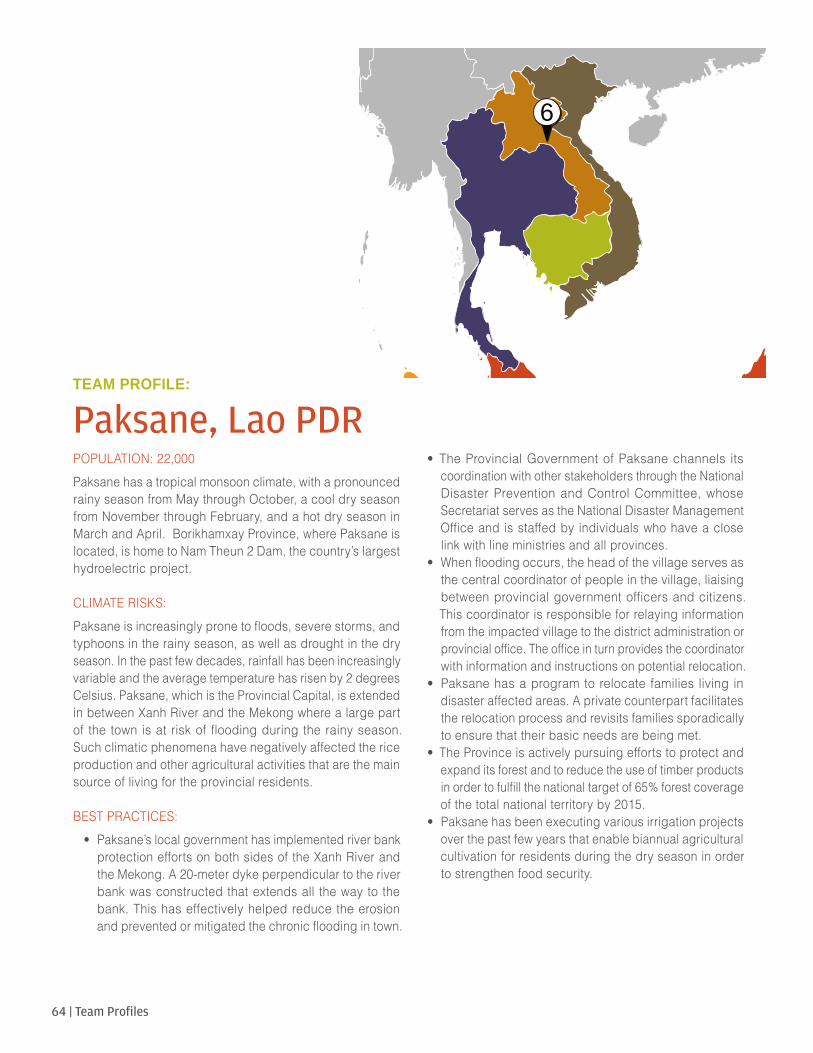
64 | Team Profiles
TEAM PROFILE:
Paksane, Lao PDRPOPULATION: 22,000Paksane has a tropical monsoon climate, with a pronounced rainy season from May through October, a cool dry season from November through February, and a hot dry season in March and April. Borikhamxay Province, where Paksane is located, is home to Nam Theun 2 Dam, the country’s largest hydroelectric project.
CLIMATE RISKS:Paksane is increasingly prone to floods, severe storms, and typhoons in the rainy season, as well as drought in the dry season. In the past few decades, rainfall has been increasingly variable and the average temperature has risen by 2 degrees Celsius. Paksane, which is the Provincial Capital, is extended in between Xanh River and the Mekong where a large part of the town is at risk of flooding during the rainy season. Such climatic phenomena have negatively affected the rice production and other agricultural activities that are the main source of living for the provincial residents.
BEST PRACTICES:• Paksane’s local government has implemented river bank
protection efforts on both sides of the Xanh River and the Mekong. A 20-meter dyke perpendicular to the river bank was constructed that extends all the way to the bank. This has effectively helped reduce the erosion and prevented or mitigated the chronic flooding in town.
• The Provincial Government of Paksane channels its coordination with other stakeholders through the National Disaster Prevention and Control Committee, whose Secretariat serves as the National Disaster Management Office and is staffed by individuals who have a close link with line ministries and all provinces.
• When flooding occurs, the head of the village serves as the central coordinator of people in the village, liaising between provincial government officers and citizens. This coordinator is responsible for relaying information from the impacted village to the district administration or provincial office. The office in turn provides the coordinator with information and instructions on potential relocation.
• Paksane has a program to relocate families living in disaster affected areas. A private counterpart facilitates the relocation process and revisits families sporadically to ensure that their basic needs are being met.
• The Province is actively pursuing efforts to protect and expand its forest and to reduce the use of timber products in order to fulfill the national target of 65% forest coverage of the total national territory by 2015.
• Paksane has been executing various irrigation projects over the past few years that enable biannual agricultural cultivation for residents during the dry season in order to strengthen food security.
66
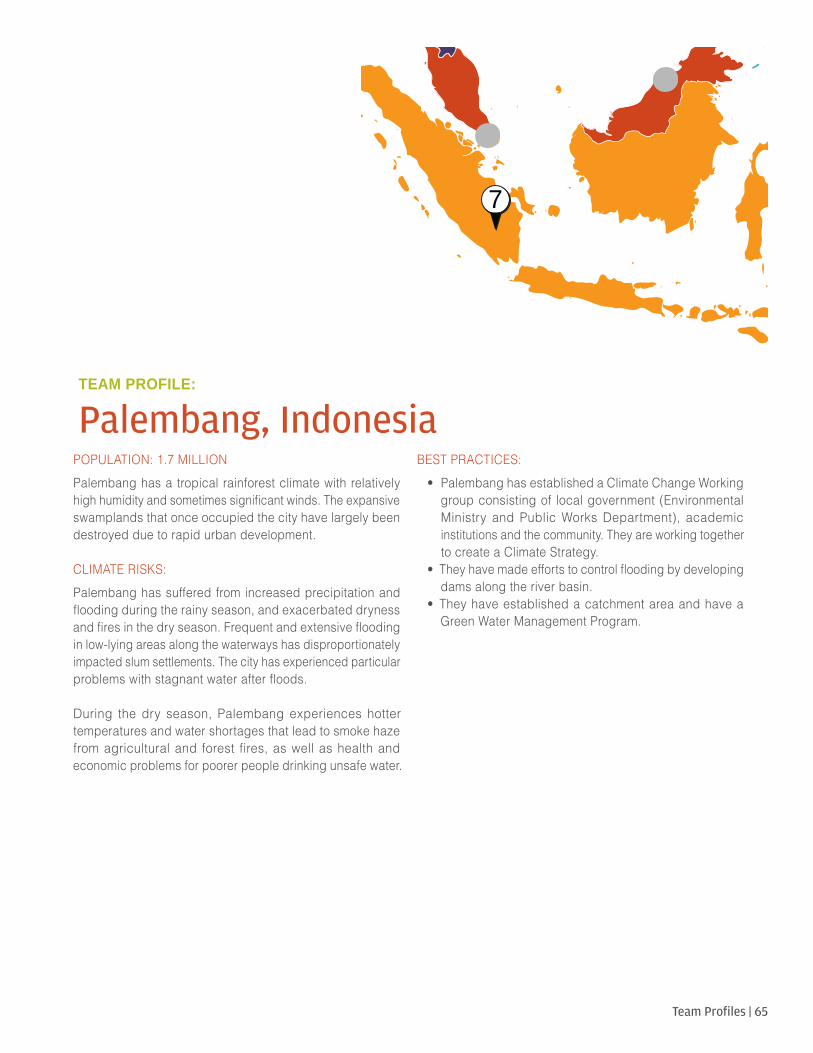
Team Profiles | 65
TEAM PROFILE:
Palembang, IndonesiaPOPULATION: 1.7 MILLIONPalembang has a tropical rainforest climate with relatively high humidity and sometimes significant winds. The expansive swamplands that once occupied the city have largely been destroyed due to rapid urban development.
CLIMATE RISKS: Palembang has suffered from increased precipitation and flooding during the rainy season, and exacerbated dryness and fires in the dry season. Frequent and extensive flooding in low-lying areas along the waterways has disproportionately impacted slum settlements. The city has experienced particular problems with stagnant water after floods.
During the dry season, Palembang experiences hotter temperatures and water shortages that lead to smoke haze from agricultural and forest fires, as well as health and economic problems for poorer people drinking unsafe water.
BEST PRACTICES:• Palembang has established a Climate Change Working
group consisting of local government (Environmental Ministry and Public Works Department), academic institutions and the community. They are working together to create a Climate Strategy.
• They have made efforts to control flooding by developing dams along the river basin.
• They have established a catchment area and have a Green Water Management Program.
77
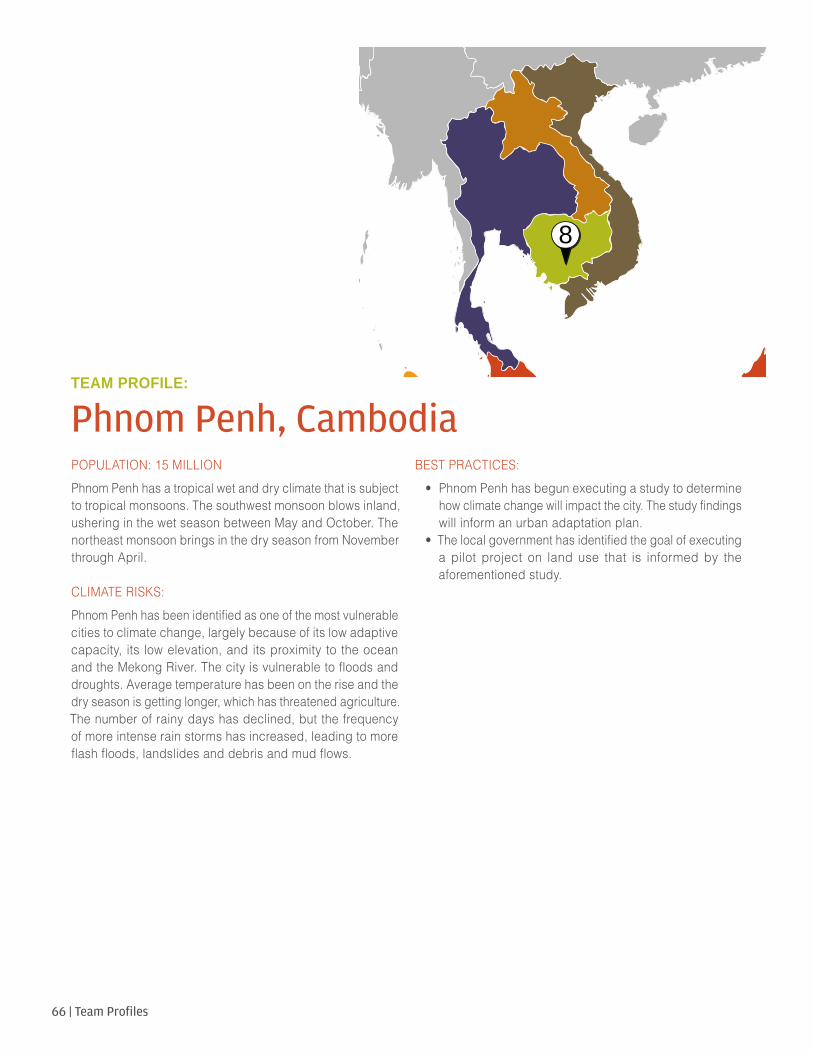
66 | Team Profiles
TEAM PROFILE:
Phnom Penh, CambodiaPOPULATION: 15 MILLIONPhnom Penh has a tropical wet and dry climate that is subject to tropical monsoons. The southwest monsoon blows inland, ushering in the wet season between May and October. The northeast monsoon brings in the dry season from November through April.
CLIMATE RISKS:Phnom Penh has been identified as one of the most vulnerable cities to climate change, largely because of its low adaptive capacity, its low elevation, and its proximity to the ocean and the Mekong River. The city is vulnerable to floods and droughts. Average temperature has been on the rise and the dry season is getting longer, which has threatened agriculture. The number of rainy days has declined, but the frequency of more intense rain storms has increased, leading to more flash floods, landslides and debris and mud flows.
BEST PRACTICES:• Phnom Penh has begun executing a study to determine
how climate change will impact the city. The study findings will inform an urban adaptation plan.
• The local government has identified the goal of executing a pilot project on land use that is informed by the aforementioned study.
88

Contact Information & Biographies

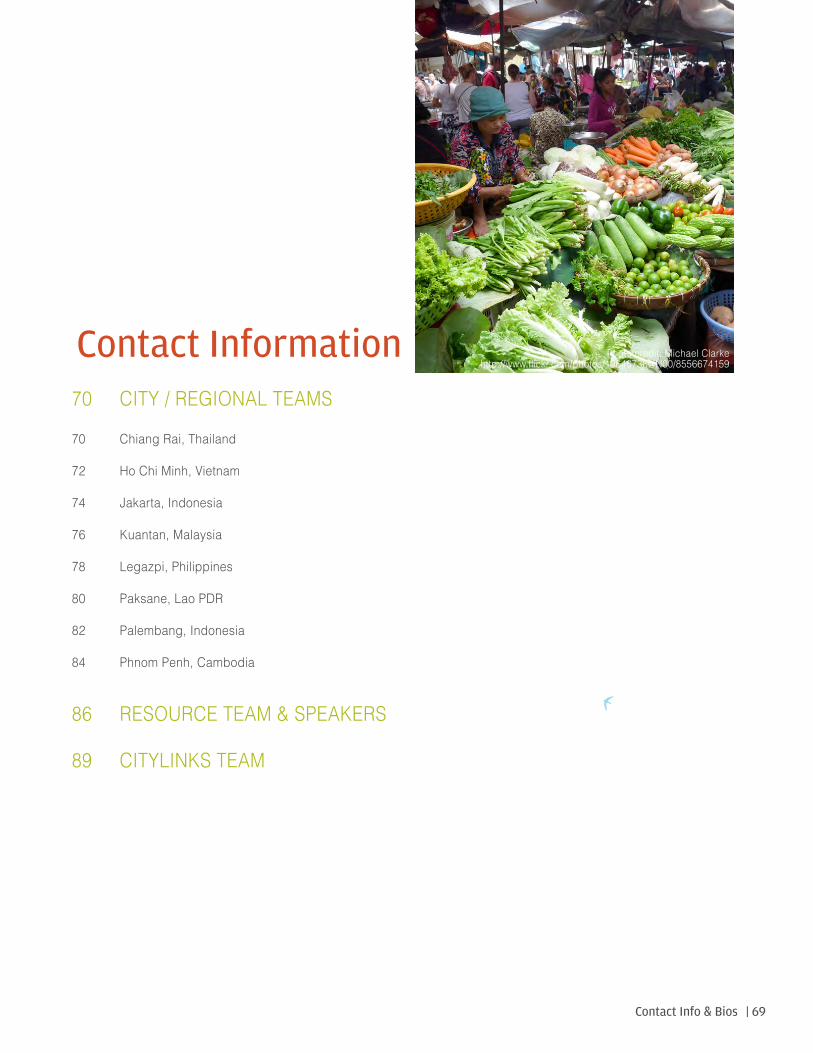
| 69Contact Info & Bios
Contact Information70 CITY / REGIONAL TEAMS
70 Chiang Rai, Thailand
72 Ho Chi Minh, Vietnam
74 Jakarta, Indonesia
76 Kuantan, Malaysia
78 Legazpi, Philippines
80 Paksane, Lao PDR
82 Palembang, Indonesia
84 Phnom Penh, Cambodia
86 RESOURCE TEAM & SPEAKERS
89 CITYLINKS TEAM
Photo credit: Michael Clarkehttp://www.flickr.com/photos/19646736@N00/8556674159
70 | Participant Teams Contact Info & Bios
CHIANG RAI, THAILAND
SURANID ONG-LA (TEAM LEADER) CHIEF EXECUTIVE OFFICER CHIANG RAI [email protected]
Suranid Ong-la is the Chief Executive Officer of the Chiang Rai Municipality where she has over 30 years of experience in the local government sector. Her work focuses on how to balance several aspects of sustainable development. Ms. Ong-la has been working with strategic partners such as government bodies, civil society and NGOs to initiate and implement projects related to climate change mitigation and adaptation.
Ms. Ong-la was the Chairperson of the Chiang Rai working group of ACCCRN and has presented at numerous conventions including “City Biodiversity Summit 2010: COP 10” in Nagoya, Japan and “City Biodiversity Summit 2012: COP 11” in Hyderabad, India. Ms. Ong-la received the “Good Practice” award at the World Habitat Day 2011 in Aguascalientes, Mexico. The city of Chiang Rai was selected out of 15 projects for the Guangzhou International Award for Urban Innovation 2012 in Guangzhou, China.
SUPITPORN BUNNAG ASEAN WORKING GROUP ON ENVIRONMENTALLY SUSTAINABLE CITIES FOCAL POINT (AWGESC), DIRECTOR OF GREEN CITY SUBDIVISION, URBAN ENVIRONMENT AND AREA PLANNING DIVISION
OFFICE OF NATURAL RESOURCES AND ENVIRONMENTAL POLICY AND PLANNING (ONEP)MINISTRY OF NATURAL RESOURCES AND [email protected] | [email protected] | [email protected]
With 33 years working in ONEP, Ms. Supitporn Bunnag has vast experience in the management of urban environments specifically focused on green and clean cities. She is responsible for setting up a framework on Environmentally Sustainable Cities (ESC) and for the formulation of a policy action plan to green the city under a mandate from ONEP. Ms. Bunnag also coordinates with different partners which include governmental agencies, private sector, NGOs and several cities in Thailand. She works on projects on the international scale as well.
Ms. Bunnag is an AWGESC Coordinator in Thailand and holds a Master’s degree in Urban Planning from Thailand University.
ANURAK CHALUMPUT SANITARY OFFICER
CHIANG RAI [email protected]
Mr. Anurak Chalumput has been working in the municipal public health sector for more than 10 years. As Sanitary Officer of the Chiang Rai municipality, his main responsibilities are to ensure the coordination and operation of public health, sanitation, and environment actions in order to implement the development plan of the municipality. Mr. Chalumput also coordinates the Urban Ecosystems and Biodiversity Conservation towards Sustainable City and Climate Change Resilience Projects. He is a member of the Task Force for the provincial environmental development plan of Chiang Rai Province and a coordinator of Northern Region Learning Network on urban and environment management promoted by Municipality League of Thailand (NMT).
In addition, Mr. Chalumput is a coach for the Low Carbon City Project and the Secretary of the working group of Chiang Rai Municipality on the Partnership for Democratic Local Governance in Southeast Asia Project (DELGOSEA).
| 71Participant Teams Contact Info & Bios
CHIANG RAI, THAILAND
THAREE KAMUANG PROJECT MANAGER
MUNICIPALITY LEAGUE OF [email protected]
As a freelance researcher for over 17 years, Ms. Kamuang has promoted low carbon and sustainable city concepts in the Thai local government. For 15 years, she worked with a leading environmental NGO in Thailand and implemented more than 30 projects in collaboration with local communities, school teachers and children, as well as with local and national government institutes.
The focus of her work is climate change mitigation and adaptation, with an emphasis on sustainable development. Specific achievements of her work are the development of a toolkit for school teachers on climate change and the promotion of urban agriculture and biodiversity for climate change adaptation in Thai cities. Currently, she is in charge of a 36-month project entitled “The Promotion of Low Carbon City Across Thai Municipalities” under the Municipality League of Thailand (NMT), funded by the European Union.
WANNOBON KHUAN-ARCH RESEARCHER/ PROJECT COORDINATOR
THAILAND ENVIRONMENT [email protected]
Wannobon Khuan-arch is a project coordinator and researcher with over four years of experience, including two years of experience in urban climate resilience projects such as the Asian Cities Climate Change Resilience Network (ACCCRN) project in Thailand. She has worked as a researcher for the ACCCRN project under the Thailand Environment Institute, where she provided significant assistance to Thai local government agencies. Her role included formulating and planning climate resilience strategies and intervention projects for cities. Ms. Khuan-Arch has also worked with the National Municipal League of Thailand (NMT) in facilitating processes of knowledge exchange to local governments and municipalities on building urban climate change resilience for their cities.
72 | Participant Teams Contact Info & Bios
HO CHI MINH, VIETNAM
TRUNG VIET NGUYEN (TEAM LEADER) MANAGER
CLIMATE CHANGE [email protected]
Dr. Nguyen Trung Viet is currently the Manager of the Ho Chi Minh City Climate Change Bureau (HCCB), and a leader of the Advisory Group for the Climate Change Steering Board. Prior to this role, Dr. Viet was the Head of the Solid Waste Management Division within the Department of Natural Resources and Environment (DoNRE). During his time at DoNRE, Dr. Viet participated in numerous projects and programs related to solid waste management and drove Ho Chi Minh City to improve its solid waste management systems. He contributed to the development of centralized solid waste treatment complexes and also helped draft the city’s Master Plan for solid waste management system, which lays out a vision and strategy through the year 2030. He also gave recommendations to the HCM People’s Committee to develop the systems for climate change issues.
Earlier in his career, Dr. Viet was a professor and Dean of Faculty of Environmental Technology at the University of Technology at Van Lang University (Ho Chi Minh City). He was also the Director of the Center for Environmental Technology and Management at Van Lang University. He received his Ph.D in Environmental Technology from Wageningen University in the Netherlands.
HUY PHUONG NGUYEN OFFICIAL
HO CHI MINH CITY CLIMATE CHANGE [email protected]
Mr. Nguyen Huy Phuong is an Official in the Climate Change Bureau of Ho Chi Minh City. Mr. Phuong was an active participant in the “Ho Chi Minh City Moving toward the Sea Adaptation with Climate Change” program in cooperation with the city of Rotterdam. The objective of this program was to enable and guide the long-term sustainable socio-economic development of Ho Chi Minh City, taking into account the effects of climate change. Before working in the Climate Change Bureau, he held a position in the Solid Waste Management Division.
Mr. Phuong attended the MRV/NAMA training course in Kitakyushu, Japan last year and is developing a GHG inventory in the MRV manner for HCM City. He received his MSc in Natural Resources and Environment Engineering from the University of Nottingham in the United Kingdom.
DO NAM THANG AWGESC, DEPUTY DIRECTOR OF THE INSTITUTE OF SCIENCE FOR ENVIRONMENTAL MANAGEMENT
VIETNAM ENVIRONMENT ADMINISTRATION [email protected]
Do Nam Thang is the Deputy Director of the Institute of Science for Environmental Management, in the Ministry of Natural Resources and Environment. He is a national focal point of the ASEAN Working Group on Environmentally Sustainable Cities and has led numerous national research projects on several topics including climate change mitigation policy. In addition, Dr. Nam has acted as a resource for the Ministry in various environmental policy issues such as water management, pollution control, climate change policy and environmentally sustainable cities.
Dr. Nam has a Bachelor’s degree in Environmental Engineering from the British Columbia Institute of Technology in Canada.He holds a Ph.D in Environmental Economics and a Master’s degree in Environmental Management and Development from the Australian National University.
| 73Participant Teams Contact Info & Bios
HO CHI MINH, VIETNAM
NGUYEN THANH TRAM SENIOR OFFICER OF INTERNATIONAL COOPERATION DEPARTMENTVIETNAM ENVIRONMENT [email protected]
As Senior Officer of the International Cooperation Department of the Vietnam Environment Administration, Ms. Nguyen Thanh Tram coordinates the international cooperation activities among ASEAN member countries, in particular, activities related to resilient cities. She holds a Master’s degree in Environmental Engineering from the Asian Institute of Technology.
LINH VU VICE MANAGER CLIMATE CHANGE [email protected]
Linh Vu is currently the Vice Manager of the Ho Chi Minh Climate Change Bureau. His key responsibilities in this role include the development of Ho Chi Minh City’s climate change action plan, management of CDM landfill and waste management projects, as well as communications and human resource development. Prior to this role, he worked for the Department of Natural Resources and Environment where he was tasked with managing hazardous waste activities as well as widening international relationships.
Mr. Vu holds a Bachelor’s degree in Environmental Management and Technologies from Van Lang University, Ho Chi Minh City, and a Master’s degree in Environmental Management from the University of East Anglia, United Kingdom.
74 | Participant Teams Contact Info & Bios
JAKARTA, INDONESIA
IZHAR CHAIDIR (TEAM LEADER) ACTING SECRETARY/ HEAD OF CITY PLANNING DIVISION
SPATIAL PLANNING DEPARTMENT, GOVERNMENT OF DKI JAKARTA [email protected] | [email protected]
Mr. Chaidir is the Head of Urban Spatial Planning division in the Department of Spatial Planning, Government of DKI Jakarta province. He was appointed to this position in 2011, after being the head of the section for 11 years in several divisions. In 2012, he became the Acting Secretary of the Department of Spatial Planning. He is responsible for formulating plans from the city level to the local level and is responsible for considering the differences between private needs and government planning proposals.
Mr. Chaidir is involved in the formulation of many projects related to the future of Jakarta, such as the Jakarta Master Plan 2030, the Detail Plan and Zoning Regulation, and the Master Plan of Heritage Area. He is also involved in formulating the IT Master Plan, GIS Master Plan, and implementing the Quality Management System of ISO 2001-2008.
Mr. Chaidir received his Bachelor’s degree in Regional and City Planning from the Institute of Technology Bandung (ITB) in Indonesia and he received his Master’s degree in International Relations (majoring in Economic Development and Infrastructure) from Waseda University, Tokyo, Japan in 2001.
BERNARDUS DJONOPUTRO SECRETARY GENERAL
INDONESIAN ASSOCIATION OF PLANNERSbernardus.djonoputro@nusantarainf | rastructure.com
Mr. Djonoputro currently serves as member of the advisory board of the ITB School of Business and Management. Prior to this appointment, he was elected as Secretary General of the Indonesia Association of Planners (Ikatan Ahli Perencana –IAP) for the period of 2007-2010.
During the peak of reform in 1997, he co-founded SPUR (Solidarity of Professionals for Reform), a loose association of young pro-reform professionals to support the student movement that pushed for reformasi. Mr. Djonoputro has more than 20 years of experience in business and the professional services industry. He served as Director of Marketing of Ernst & Young Indonesia for five years before moving to Price Waterhouse Coopers (PWC). As Director of PWC, he was responsible for business development and go-to-market strategy of the firm in Indonesia, until he co-founded HD Asia Advisory.
Mr. Djonoputro graduated from the Institute of Technology Bandung’s (ITB) School of Regional & City Planning and is an alumni of the Indonesia-Australia Intergovernmental Youth Exchange Program.
| 75Participant Teams Contact Info & Bios
JAKARTA, INDONESIA
HENDRICUS ANDY SIMARMATA LECTURER/ RESEARCHER
UNIVERSITY OF [email protected]
Mr. Simarmata is a lecturer, researcher and a certified urban and regional planner. He has written numerous papers on urban and regional planning and climate change adaptation and has been published in international journals and proceedings of international and national conferences. He has twelve years of research and consultancy experience with spatial planning, climate change adaptation and urban environmental assessments.
Mr. Simarmata has worked for UN Habitat Indonesia and received research funding from JICA-RI, START, British Council (UK-Aid), and various government agencies both on the national and local level in Indonesia. He has worked in most of Indonesia’s regions including: North Sumatra, West Sumatra, Riau, and Riau Kepulauan; East, South, and Central Kalimantan; DKI Jakarta, Central Java, and Jogjakarta; South and North Sulawesi; and Papua and Papua Barat.
He is currently a Ph.D. fellow at Zentrum fur Entwicklungsforschung (ZEF) in Bonn, Germany.
IMAN SOEDRADJAT (NATIONAL GOVERNMENT), DIRECTOR OF NATIONAL SPATIAL PLANNING DIRECTORATE
DIRECTORATE GENERAL OF SPATIAL PLANNING, MINISTRY OF PUBLIC [email protected]
Since 2006, Iman Soedradjat has been the Director of National Spatial Planning at the Directorate General of Spatial Planning within the Ministry of Public Works. He is actively involved in many organizations where he has held key roles such as Treasurer of EAROPH Indonesia between 2004 and 2010. He is also an EXCO member in EAROPH International.
Mr. Soedradjat received a Bachelor’s degree in Regional and City Planning from the Institute of Technology in Bandung and holds a Master’s of Public Administration degree from Carnegie Mellon University in Pennsylvania, USA.
76 | Participant Teams Contact Info & Bios
KUANTAN, MALAYSIA
DATO’ HAJI ZULKIFLI HAJI YAACOB (TEAM LEADER) PRESIDENT OF KUANTAN MUNICIPAL COUNCIL
KUANTAN MUNICIPAL COUNCIL [email protected]
Dato’ Haji Zulkifli bin Haji Yaacob was appointed President of Kuantan Municipal Council in August 2010. As Municipality President, he ensures the operation of the social, economic, environmental and cultural well-being of the city, in accordance with relevant laws, ordinances and administrative guidelines. He is responsible for managing, planning, controlling, liaising and supervising the administration of the council including personnel and fiscal operations. He also manages urban service delivery, city planning, public amenities development and maintenance, public health, business controls, city beautification, environmental development and community development.
Mr. Haji Yaacob has initiated efforts in environmental management and sustainable development which led Kuantan to win the ASEAN Sustainable City Awards in 2011 Category Clean Water, the Silver Award in the International Awards for Livable Communities in 2011 and the Gold Award in the same category in 2012. The awards are related to good practice in safeguarding the environment. He has initiated the 3Rs Partnership Project which was recognized as a Best Practice in the International Dubai Awards in 2012. He was also awarded the Author of the Most Outstanding Project in the 1st International Tehran Festival of Research and Innovation in Urban Management for the same project.
He holds a Master’s of Science degree in Urban Planning from University of Wales, United Kingdom.
HAMIZA HAMZAH DIRECTOR OF PLANNING DEVELOPMENT DEPARTMENT
KUANTAN MUNICIPAL [email protected]
Hamiza Hamzah is the Director of the Planning Development Department within the Kuantan Municipal Council. In this role, she has played a key part in developing the Kuantan Local Plan 2004-2015, the Kuantan Municipal Council Strategic Planning 2009-2014 and the Sungai Lembing Special Area Plan. She has also undertaken project designs on traffic and transportation management and environmental initiatives. In 2010, she led a sustainable community project called “The Largest Banner of Mind Maps” which was accredited in the Malaysia Book of Records.
Ms. Hamizah actively participates in many regional and international organizations and events, such as the UNDP, UNEP, UNHABITAT, Kuantan Traffic Planning Committee, LYNAS Environment Enforcement Committee and the Kuantan Local Agenda 21 Committee. She also provides advice to various organizations and individuals including government agencies, NGOs, CBOs, developers and professionals.
Ms. Hamizah holds an Advanced Diploma in Town and Regional Planning from the University of Technology, MARA in Selangor, Malyasia. She was certified as a Corporate Planner by the Malaysian Institute of Planning in 1994.
| 77Participant Teams Contact Info & Bios
KUANTAN, MALAYSIA
DATO’ ABU HASAN MOHD ISA (NATIONAL GOVERNMENT), DIRECTOR, STRATEGIC COMMUNICATIONS DIVISION
DEPARTMENT OF ENVIRONMENT [email protected]
Dato’ Abu Hasan bin Mohd Isa is Director of the Strategic Communications Division, Department of Environment, Putrajaya since November 2012. Prior to this role, he was Director of Department of Environment in Perak. He has served in this Department for over 30 years and has working experience in enforcement, Environment Impact Assessment, and environmental auditing.
Currently, he is responsible for monitoring, promoting, and implementing awareness through environmental education programs geared toward sustainable development for every sector of society including schools, universities and communities. He also helps to foster regional and international relationships on environmental management and promotes information exchange.
He received his Master’s degree in Environment and Pollution Control from University of Manchester, England in 1995.
ABDUL RAHIM MUDA HEAD OF ENVIRONMENTAL HEALTH DIVISION KUANTAN MUNICIPAL [email protected]
Abdul Rahim is Head of the Environmental Health Division within the Kuantan Municipal Council. In this role, he is responsible for managing the environmental health and cleanliness programs in the city. Mr. Rahim is an Environmental Health Officer and is currently the President of Environmental Health Officers of Malaysia. He is the backbone for the 3R Partnership Project which was awarded the International Tehran Awards for Research and Innovation Urban Management in 2012 and the International Dubai Awards for Improved Living Environment in 2012. He has been involved in many international events including the International Seminar on Environmental Health Malaysia in 2013, the United Nations Institute Training and Research (UNITAR) on Governance Urban Sanitation in 2011 and the City Biodiversity Index for the ASEAN Sustainable City Workshop in 2010.
Mr. Rahim graduated with a diploma from the Royal Society of Health in London and received his Bachelor’s of Science degree in Environmental and Occupational Health from the University Putra Malaysia.
MUHAMMAD AZHA ABD RANI HEAD OF INFRASTRUCTURE DIVISION
KUANTAN MUNICIPAL [email protected]
As the Head of Infrastructure Division within the Kuantan Municipal Council, Mr. Rani plays a key role in developing, controlling and implementing the infrastructure plan in Kuantan. Most recently, he completed the Stormwater Management and Drainage Master Plan Study in Kuantan. In 2008, he presented the paper ‘Infrastructure Management in Kuantan’ to the Local Government Development Foundation (LOGODEFF) Conference in the Philippines. Mr. Rani is a member of the Kuantan Environmental Impact Assessment Committee and has served in the community with numerous environmental awareness programs such as the ‘1River, 1State’ program and Kuantan Local Agenda 2.
Mr. Rani is a Civil Engineer and a member of the Institution of Engineers Malaysia (IEM). He graduated from the University Technology MARA, Malaysia, with a Bachelor’s of Science degree in Civil Engineering, specializing in Hydraulics and Hydrology.
78 | Participant Teams Contact Info & Bios
LEGAZPI, PHILIPPINES
NOEL ROSAL (TEAM LEADER) CHIEF EXECUTIVE
CITY GOVERNMENT OF LEGAZPI
As the Chief Executive of the City Government of Legazpi, Honorable Noel Ebriega Rosal is primarily tasked to promote the general welfare of the City and its inhabitants. In addition, Mayor Rosal has the lead responsibility of overseeing climate change adaptation and infrastructural initiatives in Legazpi City.
CEDRIC DAEP PROVINCIAL GOVERNMENT DEPARTMENT HEAD
PROVINCIAL GOVERNMENT OF ALBAY, ALBAY PUBLIC SAFTY AND EMERGENCY MANAGEMENT OFFICE/CLIMATE CHANGE [email protected]
Cedric Daep is the Department Head of Albay Public Safety and Emergency Management Office (APSEMO), an office that he created in 1995. Additionally, he was recently appointed as Executive Director of the Climate Change Academy. In these roles, he is responsible for local and national trainings and seminars on DRR/CCA, which aim for zero casualty in areas of high vulnerability to natural calamities. The Climate Change Academy hosts local area and hazard specific trainings that are conducted locally by APSEMO.
JOSEPH ESPLANA CITY PLANNING AND DEVELOPMENT COORDINATOR
LGU LEGAZPI [email protected]
Joseph Esplana is the City Planning and Development Coordinator at the Legazpi City Planning and Development Office. Prior to this role, he served in the Planning and Development Office as Senior Project Evaluation Officer, Urban Planner, Planning Officer III, Project Evaluation Officer IV, Assistant City Planning and Development Coordinator. At the start of his career, Mr. Esplana worked as a Development Project Analyst in the Legazpi City Planning and Development Staff/City Mayor’s Office.
He holds a Bachelor’s degree in Civil Engineering from Bicol University in Legazpi, Philippines and a Master’s of Science degree in Management Engineering.
| 79Participant Teams Contact Info & Bios
LEGAZPI, PHILIPPINES
GILBERT GONZALES (REGIONAL GOVERNMENT), REGIONAL EXECUTIVE DIRECTOR
DEPARTMENT OF ENVIRONMENT AND NATURAL RESOURCES (DENR) [email protected]
As the Regional Executive Director (RED) of the Department of Environment and Natural Resources (DENR) V, Gilbert Gonzales is responsible for directing and coordinating the implementation of all policies, regulations, programs and projects in environmental and natural resources development and conservation in the Bicol Region. The DENR provides technical support to all environmental management programs initiated by the City Government of Legazpi particularly on Environmental Pollution and Management such as Solid Waste Management (SWM), Air Quality Management and Water Quality Management.
Mr. Gonzales was a member of the SWM Board that formulated the SWM program of the City, as well as part of the Technical Working Group that established Air Quality Monitoring System and Sagumayon River Management Council in the City. He was also one of the prime movers of the Climate Change Adaptation Program of the Province of Albay and Legazpi City.
RAUL ROSAL CITY COUNCILOR
LGU LEGAZPI [email protected]
Since 2007, Raul Rosal has served as City Councilor of Legazpi City. He is an author of more than 30 notable Ordinances and more than 100 Resolutions concerning environmental protection, assistance to barangay workers, public utilities, public order, safety, and finance and appropriations. Mr. Rosal has chaired several committees including the Committee on Public Utilities, Committee on Finance and Appropriations, Committee on Education, Arts and Culture, and the Committee on Public Order and Safety.
Prior to his current appointment, Mr. Rosal was a Mining Engineer for 28 years. During this time, he worked for the Mines and Geosciences Bureau Region V as a Senior Science Research Specialist.
Mr. Rosal holds a Bachelor’s of Science degree in Mining Engineering from the MAPUA Institute of Technology in Manila, Philippines.
CARMEN GERALDINE BARRAMEDA ROSAL FORMER CITY MAYOR AND SPECIAL CONSULTANT TO THE MAYOR FOR WOMEN’S CONCERNS
Ms. Rosal was the Mayor of Legazpi City from 2010-2013 and is a Special Consultant to the Mayor for Women’s Concerns. Prior to these roles, she worked for DHL Philippines in Naga City and was an Air Philippines Traffic Customer Service Representative. In 2009, Ms. Rosal was awarded Most Outstanding Chairperson of a Gender Development Program and was recognized for developing the Most Outstanding Community Development Program by the Junior Chamber Philippines. Ms. Rosal received her Bachelor’s of Science degree in Secondary Education from Bicol University in Legazpi, Philippines. She recently completed training courses related to Strategic Management from the Asian Institute of Management and Local Governance from the Ateneo de Manila School of Government.
80 | Participant Teams Contact Info & Bios
PAKSANE, LAO PDR
NOUANSAVANH SENGMANY (TEAM LEADER) DIRECTOR GENERAL
DEPARTMENT OF PUBLIC WORKS AND TRANSPORT OF BORIKHAMXAY PROVINCE [email protected]
Since 2008, Mr. Nouansavanh Sengmany has been the Director General of the Department of Public Works and Transport of Borikhamxay Province. Prior to this position, he was Deputy Director for 12 years. He started his professional career as a public servant in the same department with the rank of Head of Transport and Urban Planning Section.
From 2002 to 2004 Mr. Sengmany attended Hanoi Transport and Communication University in Vietnam where he earned a Master’s degree in Civil Engineering as an extension of his Bachelor’s degree from the Building Construction Institute in the Lao PDR. He also holds a Master’s of Science degree in hydro-Engineering from the former USSR Leningrad Water Transport Institute.
SENGDARA DOUANGMYXAY AWGESC, URBAN DEVELOPMENT SPECIALIST
DEPARTMENT OF HOUSING AND URBAN PLANNING, MINISTRY OF PUBLIC WORKS AND TRANSPORT [email protected]
Mr. Sengdara Douangmyxay is an urban development specialist and is Lao PDR’s National Focal Point for the ASEAN Working Group on Environmentally Sustainable Cities stationed in the Department of Housing and Urban Planning, Ministry of Public Works and Transport. His major duties include supervising territorial planning, assisting the Department in policy formulation and assessing law enforcement in infrastructure and land use planning. Prior to his current position, for six years, he was involved in the management of urban development works funded by the Asian Development Bank in 12 cities.
In 1983, Mr. Douangmyxay completed Architecture and Civil Engineering College in Sofia, Bulgaria and later earned his Master’s degree in Civil Engineering from Kharkov Institute of Municipal Engineers in Ukraine. He recently attended the University of Canberra in Australia, where he specialized in urban management and public administration.
THONGLITH FONGSINOUAN HEAD OF HOUSING AND URBAN PLANNING SECTION
DEPARTMENT OF PUBLIC WORKS AND TRANSPORT OF BORIKHAMXAY [email protected]
Mr. Thonglith Pongsinouan has been employed by the Department of Public Works and Transport of Borikhamxay Province since 1990. He is currently the Head of the Housing and Urban Planning Section. Prior to this appointment, he was a Civil Engineer in the same section. His main functions include considering building applications, supervising the enforcement of site and building codes within the provincial territory and monitoring housing and urban development projects. He is also responsible for providing assistance to the Director of the Department and the local community in all aspects of urban environment management.
Mr. Fongsinouan graduated from the Building Construction Institute with a Bachelor’s degree in Architecture in 1990. In 2012, he obtained a Master’s degree in Urban Planning from the National University of Laos.
| 81Participant Teams Contact Info & Bios
PAKSANE, LAO PDR
YOUPHAS POKHASOMBATH DEPUTY SECTION HEAD
DEPARTMENT OF PUBLIC WORKS AND TRANSPORT OF BORIKHAMXAY PROVINCE [email protected]
Ms. Youphas Pokhasombath is the Deputy Head of Housing and Urban Planning Section of the Department of Public Works and Transport of Borikhamxay Province. Prior to this position, she was the Section’s Building Engineer for three years. Her current tasks include assessing building applications and ensuring the compliance of construction with site and building codes, and cost evaluation in government funded projects.
Ms. Pokhasombath holds a Bachelor’s degree in Civil Engineering from the Building Construction Institute.
KEODARA VONGSAVANTHONG CIVIL ENGINEER
DEPARTMENT OF PUBLIC WORKS AND TRANSPORT OF BORIKHAMXAY PROVINCE [email protected]
Mr. Keodara Vongsavanthong is a civil engineer in the Department of Public Works and Transport of Borikhamxay Province. His tasks include monitoring and supervising construction sites, verifying building construction, and identifying repair and maintenance needs for urban infrastructure and public amenities. Prior to his current position, Mr. Vongsavanthong worked for the Institute of Communication Design and Research Institute and was responsible for budget planning and procurement. From 2004 to 2008, he was a Quantity Surveyor and Building Engineer for the Second Mekong Bridge Construction Project, assisting the project manager in evaluation and control of payment certificates during the design and construction of immigration control facilities for both Lao PDR and Thailand.
Mr. Vongsavanthong holds a Bachelor’s degree in Civil Engineering from King Mongkut’s University of Technology in Bangkok, Thailand.
82 | Participant Teams Contact Info & Bios
PALEMBANG, INDONESIA
RENI SEFRIANY (TEAM LEADER) HEAD OF ENVIRONMENTAL RESTORATION AND DAMAGE CONTROL DIVISION
ENVIRONMETAL [email protected]
Reni Sefriany is the Head of Environmental Restoration and Damage Control within the Environment Agency of Palembang. Mr. Sefriany is responsible for coordinating, developing and formulating policies, as well as overseeing monitoring and evaluation activities related to climate change and ozone layer protection. He has recently attended several trainings including, “Establishment of Sound Material Cycle for ASEAN Countries – Formulation of Practical Measures” in Kitakyusu, Japan, and “Beyond Climate Change Impact on Water Resources and Biodiversity: Communication and the Role of Society” in Thailand.
Mr. Sefriany has a degree in Chemical Engineering from the University of Sriwijaya in Palembang and a Master’s of Management in Urban Development from the Institute of Technology.
EKA GUSTINI FLOOD CONTROL AND DRAINING SUBDIVISION
PUBLIC WORKS DEPARTMENT, PALEMBANG CITY
Eka Gustini is a staff member in the Flood Control and Draining Subdivision of the Public Works Department. Her primary responsibilities include managing flood control, sanitation and drainage infrastructure in Palembang City. She helps to formulate, monitor and implement local regulations and policies regarding flood control, water supply, drainage and sanitation in Palembang City, and she coordinates these policies with other cities and stakeholders, as well as with the national government.
Ms. Gustini holds a Master’s degree in Hydraulic Engineering, specializing in land and water development from UNESCO-IHE in Delft, Netherlands. In 2011, she attended an environmental energy course in Korea and
NYIMAS IDA APRIANI HEAD OF ENVIRONMENTAL AGENCY
LOCAL ENVIRONMENTAL AGENCY OF PALEMBANG CITY
Nyimas Ida Apriani is the Head of the Environmental Agency of Palembang City. In this role, she is responsible for formulating policy and regulations, overseeing monitoring and evaluation, as well as analysis and implementation. She also provides technical assistance on projects that include mitigation, adaptation and ozone layer protection in Palembang City.
Ms. Apriani holds a Master’s degree in City Planning and Implementation from Gajah Mada University in Yogyakarta county. She has also recently attended an Urban Management course in Japan and a Waste to Energy course in Korea.
| 83Participant Teams Contact Info & Bios
PALEMBANG, INDONESIA
TRI WIDAYATI (NATIONAL GOVERNMENT), HEAD OF CLIMATE CHANGE ADAPTATION EFFORT DIVISION
ENVIRONMENTAL [email protected]
Tri Widayati is the Head of the Climate Change Adaptation Effort Division of the Environmental Ministry. For the past 19 years, he has been responsible for climate change adaptation efforts in Indonesia which includes formulating policies and regulations as well as overseeing monitoring and implementing adaptation efforts. Mr. Widayati has climate adaptation experience working in local, regional, national and international settings.
Mr. Widayati holds a Master’s degree from Indonesia University.
MUHAMMAD YUNUS HEAD OF ENVIRONMENTAL RESTORATION SUB DIVISION
ENVIRONMENTAL AGENCY OF PALEMBANG [email protected]
Muhammad Yunus is Head of the Environmental Restoration Subdivision of Palembang City’s Environmental Agency. In this role, Mr. Yunus is responsible for formulating policies and regulations, monitoring and evaluating projects and providing technical assistance. He also gives reports on restoration waste and climate impacts. His educational background is in the biological sciences and he holds a Master’s of Public Health.
84 | Participant Teams Contact Info & Bios
PHNOM PENH, CAMBODIA
MR. CHIEK ANG (TEAM LEADER), AWGESC, DIRECTOR
PHNOM PENH ENVIRONMENTAL [email protected]
Mr. Chiek Ang has worked in the Environmental Department of Phnom Penh since 1995. Since 2007, he has served as the National Focal Point of the ASEAN Working Group on ESC. He also currently works for the Permanence Secretariat of the City Steering Committee on CDM and Climate Change.
Prior to these roles, he participated in trainings that included Capacity Building for Environmental Fields in Singapore, China, Japan, and Thailand. In 2005-2006, he participated in the Training for Trainer for Integrated Environmental Education in Yokohama and communicated his experience as a featured presenter in Hanoi. He played a key role in implementing environmental education for all of the primary schools in Phnom Penh City. In 2006, he attended the Capacity Building Program for Water Monitoring Process in New Hampshire, USA. In 2007, he led a project entitled “Establishing Policy on Dry Battery Waste in Cambodia.” More recently, he worked for the Consortium Research Project on Solid Waste Management and led a local program for changing behavior regarding waste littering and plastic bags management.
Mr. Chiek Ang holds a Master’s degree in Rural Development.
MR. THAI DARA HEAD OF SOCIAL AND ECONOMIC OFFICE OF INTER-SECTORS DIVISION
PHNOM PENH CITY [email protected]
As Head of the Social and Economic Office of Inter-Sectors Division in Phnom City, Mr. Thai Dara coordinates all of the technical Departments of Ministry lines with the workings of the City Hall and nine other local authorities (districts). Prior to this role, he worked in the Cambodia National Election Committee. In addition, for nine years, he worked with the Local Authority Unit in District of 7 Makara, Phnom Penh City and worked for seven years in the Phnom Penh City Hall.
Mr. Dara has a Bachelor’s degree in Architecture and a General Administrative Diploma. He also holds a Master’s degree in Public Administration.
DR. POEUNG RATANAK PH.D. HEAD OF LAND MANAGEMENT AND URBANIZATION OFFICE
DEPARTMENT OF PHNOM PENH LAND MANAGEMENT, URBANIZATION, CADASTRAL AND [email protected]
Prior to his current role as Head of the Land Management and Urbanization Office, Dr. Poeung Ratanak has worked for the Land Management and Urbanization Office for many years and has held several positions including the Section Chief and the Deputy Head of the Office.
Mr. Ratanak has a Bachelor’s degree in Business Administration and a Master’s of Business Administration. In 2008, he received his Ph.D. in Rural Development.
| 85Participant Teams Contact Info & Bios
PHNOM PENH, CAMBODIA
MR. CHHUN SEIHA (NATIONAL GOVERNMENT), DEPUTY HEAD OF VULNERABILITY ASSESSMENT AND ADAPTATION OFFICE
CLIMATE CHANGE DEPARTMENT, MINISTRY OF [email protected]
Since 2011, Mr. Chhun Seiha has been the Deputy Head of the Vulnerability Assessment and Adaptation office in the Climate Change Department of the Ministry of Environment. In this role, his primary responsibilities include conducting Vulnerability Assessments and promoting the implementation of climate change adaptation projects in Cambodia. Mr. Seiha oversees adaptation activities at the national and sectoral levels while helping to drive communication with national and international stakeholders working on climate change initiatives. Prior to his current position, he worked as a part-time lecturer at various Universities. In addition, from 2007 to 2011, he worked as a Technical Officer in the Pollution Control Office in the Kandal Provincial Environmental Department. During that time he attended training abroad regarding waste water treatment and water management. In addition, he has had the opportunity to present on the topic of regulation and pollution control to various stakeholders, institutions and other target audiences.
Mr. Seiha has a Bachelor’s degree in Business Administration from Norton University and a Bachelor’s degree in Education in English, which he earned from the Institute of Foreign Language in 2012. He also holds a Master’s degree in Management from the Norton University in Phnom Penh, Cambodia.
MR. NEY SONA DEPUTY DIRECTOR
PHNOM PENH DEPARTMENT OF PUBLIC WORKS AND TRANSPORTATION (DPWT)MINISTRY OF PUBLIC WORKS AND [email protected] Ney Sona has worked for the Government of Cambodia for 21 years, starting from the role of general staff of the Kampot Department of Public Works and Transportation (DPWT) in 1994 to Deputy Director of Takeo DPWT in 2000 and shifting to the Capital City in 2007. His current role is Deputy Director of Phnom Penh’s DPWT. The DPWT is responsible for building and maintaining public infrastructure including roads, sewage, bridges and dikes.
Mr. Sona holds a Bachelor’s degree in Civil Engineering from Soviet Institute of Technology and a Master’s degree in Civil Engineering from Phnom Penh International University.
86 | Resource Team & Speakers Contact Info & Bios
RESOURCE TEAM & SPEAKERS
GREG BRUCE EXECUTIVE MANAGER
INTEGRATED SUSTAINABILITY SERVICES DEPARTMENTCITY OF TOWNSVILLE, QUEENSLAND, AUSTRALIA Greg Bruce works in the “sustainability renaissance city” of Townsville in north Queensland, Australia – where he is inspired to work with and for the community as a whole, including citizens, residents, businesses, researchers, government, volunteers and students. His passion is what he calls “back to the future thinking” where we evolve the “memes (ideas, culture) of sustainability and change” from our own human interactions in our cities. Where smart cities of the future are driven not just by engineering and technology, but also by our past successes and failures; our collective experiences and knowledge; our dreams for the future and most importantly from the actual people embedded in them. He loves finding practical and proven ways to communicate, collaborate and implement on-ground practical and adaptive sustainability that foster innovation, resilience and meaningful outcomes. Where we actively create opportunities to involve citizens and businesses in ways that matter to them, not us. Thinking of cities as carbon-based systems running on sunlight or energy derived from the sun - old or new, food or fuel, because we are already “solar cities”. This type of city is fuelled by people and their interactions with each other, more than their ideas. Mr. Bruce brings this all together by leading and integrating water, energy, waste and nature through an “integrated sustainability framework for action” focused on fostering and obtaining functional behaviour change, integrating social and economic dimensions and the creation of new memes (replicable culture for sustainable behaviours).
He works with many private and public champions of “sustainability in action,” to develop cutting edge partnerships and collaborations, especially with the local energy utility (Ergon Energy); IBM Smarter Cities Team in Australia; James Cook University (JCU); The Natural Edge Project (TNEP); local companies; and Professors Sam Ham (University of Idaho, USA) and Valerie Brown A.O. (University of Western Sydney), Dr. Doug MacKenzie-Mohr and his outstanding Departmental team and fellow collaborators. Commencing with a national solar city project in 2006 and leading to adaptive and resilience building projects of energy demand management, energy efficiency, integrated renewables, thermal storage in our CBD and developing Townsville as a Smart City, Solar City. His vision is for Townsville to be a leading centre in the world for smart technology and sustainability communications enabling an array of environmental products and services and practical, affordable sustainability, supporting and involving people themselves.
Mr. Bruce has been in the Townsville City Council for 18 years and prior spent 14 years in military forces as an officer. He has a Bachelor of Applied Science in Natural Resources Management (NRM) from University of Adelaide and over past few years has regularly to and assisted the city administrators of Port Moresby in actionable sustainability. In 2011, he participated as a Professional Fellow (Climate Change and Sustainability) to the United States and undertook an exchange with City of Dubuque, Iowa.
| 87Resource Team & Speakers Contact Info & Bios
RESOURCE TEAM & SPEAKERS
JOSEPH FIKSELOHIO STATE UNIVERSITY614-688-8155 | [email protected]
Dr. Joseph Fiksel is Executive Director of the Center for Resilience at The Ohio State University, and also heads the consulting firm Eco-Nomics LLC. He is an internationally recognized authority on sustainability and resilience, with over 25 years of research and consulting experience for government agencies, multi-national companies, and industry consortia such as the World Business Council for Sustainable Development. Currently he is serving as Special Assistant for Sustainability to the U.S. Environmental Protection Agency, helping to incorporate systems thinking into their research programs.
Dr. Fiksel’s current research focuses on the challenges that communities and nations face in adapting to a complex and turbulent environment. Global achievement of sustainable and equitable economic development becomes more challenging in the face of emerging threats such as climate change, resource depletion, and natural habitat degradation. The use of advanced system modeling methods is helping decision makers to develop a more integrated understanding of these dynamic forces, and to invest wisely in assuring the security of food, energy, water, and infrastructure, as well as human rights.
A native of Montreal, Dr. Fiksel began his career at DuPont of Canada, and later served as Director of Decision & Risk Management at Arthur D. Little and Vice President for Life Cycle Management at Battelle. He has published over 80 articles and five books, has testified in Congress, and is a frequent keynote speaker at conferences. He holds a bachelor’s degree from M.I.T., a doctorate in Operations Research from Stanford University, and an advanced degree from La Sorbonne in Paris. His most recent book, Design for Environment, was published by McGraw-Hill in 2011.
ROBERT MATHER PH.D. HEAD OF THE SOUTHEAST ASIA COUNTRY GROUP
IUCN
Robert Mather earned a Ph.D. from Cambridge University in 1992, based on field work on primate ecology in Central Kalimantan, Indonesia. He joined WWF in 1993 coordinating a large project for the Huay Kha Kaeng-Thung Yai Naresuan World Heritage site, in western Thailand, and established the WWF Thailand Country Office in 1995, taking it from a start-up operation to a nationally well-known and respected organization with 60 talented staff by 2005.
Dr. Mather started working on Mekong issues in 2001 and from 2005-2008 led WWF’s Living Mekong Programme based out of Vientiane, Lao PDR. He joined IUCN in September 2008 and is now Head of the Southeast Asia Country Group. In addition to providing overall management responsibility and supervision of IUCN’s programmes in all ASEAN countries, Dr. Mather is also directly involved in a number of IUCN flagship initiatives in the region – including the Mekong Water Dialogues (MWD); Mangroves for the Future (MFF); and Building Resilience to Climate Change in Coastal Southeast Asia (BCR); as well as supporting the development of urban biodiversity initiatives in Thailand.
PHONG TRAN TECHNICAL LEAD
ISET
Phong Tran is a Technical Lead of ISET in Vietnam. He has an intensive knowledge of climate change adaptation and disaster risk reduction theories and practices, particularly in urban climate change adaptation. Dr. Tran has worked with city partners in Vietnam on the ACCCRN and USAID funded programs in building urban climate resilience and urban resilience planning.
Dr. Tran obtained his Doctoral degree in Environmental Studies from Kyoto University, Japan and his Master’s degree in Urban and Regional Planning from Hawaii University, USA.
88 | Resource Team & Speakers Contact Info & Bios
RESOURCE TEAM & SPEAKERS
LEE R. FELDMAN CITY MANAGER, CITY OF FORT LAUDERDALE, FL
ICMA-CM
Lee Feldman was appointed City Manager for the City of Fort Lauderdale, Florida, in June 2011. Prior to his appointment as Fort Lauderdale City Manager, Mr. Feldman was employed by the City of Palm Bay, Florida, where he served as City Manager from October 2002 through June 2011.
He previously served as the City Manager of North Miami, Florida, from May 1996 to October 2002, and as the Deputy City Manager beginning in 1989. Mr. Feldman’s career also includes serving as an Assistant to the City Manager and Assistant City Manager for the City of North Miami Beach.
Mr. Feldman is a graduate of Washington and Lee University, where he received a Bachelor of Arts degree in Liberal Arts. He earned a Master’s degree in Governmental Administration from the Fels Center of Government at the University of Pennsylvania. In addition, he is a graduate of the Senior Executive in State and Local Government program at Harvard University’s Kennedy School of Government.
Mr. Feldman currently serves as a Vice President (Southeast Region) of the International City and County Management Association (ICMA) and previously served as President of the Florida City and County Management Association. He is a past recipient of the Florida League of Cities’ “City Manager of the Year” Award.
His numerous professional affiliations include serving as a member of the United States Federal Emergency Management Agency National Advisory Council, and a member of the National League of Cities Steering Committee on Public Safety and Crime Prevention and Advocacy. Mr. Feldman is a past chair of the National League of Cities’ City Futures Panel on Public Finance; and a past chair of the International City and County Management Association’s (ICMA) Governmental Affairs and Policy Committee. He serves on the ICMA’s Sustainability Advisory Group and has served on the Association’s Task Force on Community Tools for Ending Racism.
Mr. Feldman teaches newly elected municipal officials the principles of finance and taxation in Florida and is frequently called upon to speak to professional groups on a variety of municipal issues.
SAENGROAJ SRISAWASKRAISORN CLIMATE CHANGE ADAPTATION SPECIALIST
USAID/RDMA
Mr. Srisawaskraisorn is currently the USAID Project Manager for WaterLinks Alliance, a water related public-private partnership, and Mekong-Building Resilient Asian Cities (M-BRACE), a climate change related project. He has more than 12 years of experience implementing and managing development projects, both as a USAID contractor and a USAID officer. His professional background includes water and sanitation, environmental governance, air quality, urban planning, and climate change adaptation and resilience. As evident in his past and present roles and experiences, he is a natural advocate for peer-to-peer learning, public-private partnerships, and environmental good governance.
Mr. Srisawaskraisorn holds a Bachelor’s degree in International Relations from Thammasat University, Thailand, and a Master’s degree in Urban and Regional Planning from the University of Hawaii, Honolulu. He is also a former grantee of the East-West Center in Honolulu.
| 89Staff Contact Info & Bios
CITYLINKS TEAM
JOSEPH LOMBARDO DIRECTOR
ICMA CITYLINKS PROGRAM [email protected]
Joseph Lombardo has more than three decades of experience in international development, including 22 years as a Foreign Service Officer with the U.S. Agency for International Development (USAID). As the CityLinks Program Director at ICMA, Mr. Lombardo oversees a USAID-funded program creating city-to-city partnerships to help build resiliency of local governments and vulnerable populations facing interrelated challenges of climate change, food security, and water and sanitation access.
He has held senior leadership positions directing USAID overseas missions, and agency strategic planning and budget in Washington; run his own consulting firm; and held senior management positions with international development NGOs and local governments in the United States. Mr. Lombardo has worked in nearly 30 countries in Asia, Europe, Africa, and Latin America and the Caribbean. His work with USAID earned him numerous honors and performance awards.
He has a B.A. degree in sociology and psychology from the State University of New York at Buffalo, a M.S. in educational psychology and statistics from the State University of New York at Albany, and a MRP (master of regional planning) with a concentration in international development policy, planning, and management from the Maxwell School for Citizenship and Public Affairs, Syracuse University. He is fluent in English and Spanish.
VIC AQUITANIA REGIONAL DIRECTOR FOR SOUTHEAST ASIA
ICLEI-LOCAL GOVERNMENTS FOR [email protected]
As Regional Director for Southeast Asia, Vic Aquitania develops, manages and evaluates strategies in optimizing local government capacities on sustainable development. Mr. Aquitania manages a team of experts to localize global and national programs covering issues on climate change mitigation and adaptation, renewable energy and energy efficiency, water and sanitation, cleaner mobility, urban biodiversity, and disaster risk reduction.
Prior to joining ICLEI in 2005, Mr. Aquitania has spent more than a decade as a Planning Officer for the City of Baguio, Philippines, where he has prepared program development plans, physical framework plans, and annual investment plans. He had likewise been involved in the implementation, budgeting and human resource management of projects funded by the local government, national agencies and international organizations.
He holds a Bachelor’s degree in Forestry, a Bachelor of Laws, a Bachelor’s degree in Forestry, a Bachelor of Laws, and has completed coursework towards a Master’s in Public Administration.
90 | Staff Contact Info & Bios
CITYLINKS TEAM
JOY BAILEY URBAN AND REGIONAL PLANNER
ICLEI-LOCAL GOVERNMENTS FOR [email protected]
Joy Bailey is a licensed Urban and Regional Planner who has worked in Southeast and South Asian countries on projects focused on climate change, disaster response, air quality, water governance, and community development. She has piloted the Walkability Survey in both Colombo, Sri Lanka and in Male, Maldives. As a Fredskorpset (Norwegian Peace Corps) exchange participant from Clean Air Initiatives for Asian Cities, she assisted in the Air Quality Scorecard for Sri Lanka. Ms. Bailey also provided technical support to local governments in Indonesia, Philippines and Thailand who were part of ICLEI’s Cities for Climate Protection (CCP) Campaign.
Her postgraduate dissertation was entitled “Do Cities Respond to the Global Call for Climate Protection: A Case Study of Yogyakarta, Indonesia” for her MSc in Environmental Change and Management at the University of Oxford.
JESSICA CHO PROGRAM MANAGER
ICMA CITYLINKS [email protected]
Jessica Cho has over five years of experience managing international development projects. She joined ICMA in early 2013 as the CityLinks program manager where she manages capacity building activities through global city-to-city partnerships. Before joining ICMA, Ms. Cho received her Master’s of Science degree in Public Policy and Management from the H. John Heinz College at Carnegie Mellon University. While at Heinz College, she was named a fellow with the Council of Women World Leaders. As a fellow, she worked in the Office of the Prime Minister of Trinidad and Tobago on gender and education issues. Prior to completing her degree, she worked in Iraq on counter insurgency and stability projects. Following her time in Iraq, she spent one year in Afghanistan working on a USAID funded nationwide food security and counterinsurgency project.
Ms. Cho’s technical competencies include the development and implementation of stability programming in post-conflict environments, monitoring and evaluation, report writing, donor compliance, and gender programming. She was also a Peace Corps volunteer in Jordan, where she learned Arabic and served as an English teacher from 2006 to 2008.
Ms. Cho has a B.A. in Peace and Conflict Studies from Chapman University in Orange, California and is originally from Denver, Colorado.
| 91Staff Contact Info & Bios
CITYLINKS TEAM
MIKE CROWLEY SENIOR PROGRAM OFFICER
INSTITUTE FOR SUSTAINABLE COMMUNITIESwww.iscvt.org | 802-225-2943 | [email protected]
Michael Crowley joined the Institute for Sustainable Communities in January 2011 as Senior Program Officer in the US Climate & Environment Program. He helps build the capacity of local practitioners in climate adaptation, transportation, energy efficiency, and sustainability leadership through peer-learning workshops and targeted on-the-ground technical assistance.
Previously he was the Sustainability Program Manager at Environmental Health & Engineering (EH&E), an environmental consulting firm in Needham, MA. In that role, he helped clients develop robust institutional sustainability programs, and provided technical support ranging from change management to climate action planning and green building programming. Prior to his position at EH&E, Mr. Crowley was the Assistant Director of the Harvard University Green Campus Initiative (now the Office for Sustainability), where he established a green building program, managed a $12 million revolving loan fund for energy conservation projects, and led the strategic planning effort to develop a greenhouse gas reduction commitment for the Faculty of Arts and Sciences.
He holds a Bachelor of Arts degree in Environmental Studies from the University of Vermont, and a M.S. in Environmental Science from Schumacher College/University of Plymouth.
LAURA J. HAGG DIRECTOR, MIDDLE EAST & NORTH AFRICA PROGRAMS
ICMA INTERNATIONAL202 962 3692 | [email protected]
Ms. Hagg is the Knowledge Management and Communications Specialist for CityLinks. She also serves as Director for the Middle East & North Africa programs for ICMA International. She also is the Program Director for a U.S. Department of State exchange program with local government professionals from China, New Zealand, Thailand and the U.S.
At ICMA, she leads efforts for the International Team to utilize the Knowledge Network, a professional networking and knowledge sharing platform launched by ICMA in May 2010. Ms. Hagg began her professional career more than 20 years earlier as a management intern for the city of Westminster, Colorado. There, she learned firsthand about budgeting, economic development, environmental and emergency management, citizen outreach and other critical services. Since then she has worked in a number of public outreach, communications, and policy capacities including work with the city of Philadelphia and Washington DC region.
In 2008, she was selected to participate in USAID’s Emerging Market Development Advisors Program (EMDAP) and worked in Amman, Jordan, as a business development officer for the Jordan Inbound Tour Operators Association, where she developed new market opportunities, managed projects, launched an internship program, and successfully wrote two grant proposals.
92 | Staff Contact Info & Bios
CITYLINKS TEAM
SCOTT A. MULLER SENIOR MANAGER, INTERNATIONAL CLIMATE PROGRAMS
INSTITUTE FOR SUSTAINABLE COMMUNITIESwww.iscvt.org | 802-229-2939 | [email protected]
Scott Muller has extensive international experience incorporating strategies for sustainability into development with specific attention to climate change, ecosystem services, urbanization, biodiversity, cultural heritage and renewable energy. At ISC, Mr. Muller works with local communities, municipal and national governments to respond to shifting “fitness landscapes” by developing and implementing actions that rapidly scale up urban sustainability and resilience.
From 2007-2012, Mr. Muller was the City Director for the William J. Clinton Foundation’s Climate Initiative (CCI) - C40 Cities Climate Leadership Group in Lima, Peru. His work involved mitigation and adaptation catalyst projects, including a major CNG fueled BRT system, decentralized wastewater treatment and water recycling, massive outdoor LED lighting retrofits, an advanced traffic management system, landfill gas to energy, massive public vehicle scrapping, non motorized transportation initiatives and energy efficiency building retrofits.
Mr. Muller has designed and implemented model programs and served as a technical expert to the Convention on Biological Diversity and UNESCO on issues of development, governance, hydrology and the sustainable use of the components of biodiversity. He received the “EuropeAid for Innovation” Award from the European Union for a project that trained locals and installed photovoltaic systems in more than 40 indigenous villages. He collaborated as a Lead Author on the UN-supported Millennium Ecosystem Assessment as well as several other major publications.
He graduated from Vanderbilt University with a focus on Environmental Engineering.

Resource Lists
Resource Lists | 95
URBAN INFRASTRUCTURE RESOURCE LISTS
The Resource Lists are organized as follows:
96 ADAPTATION PLANNING 103 GETTING A COMMITMENT TO ADAPTATION 109 RISK ASSESSMENTS 114 INFRASTRUCTURE 116 WATER RESOURCE MANAGEMENT & ADAPTATION 124 FINANCING 128 ECOSYSTEM SERVICES 130 MONITORING & EVALUATION 132 COASTAL REGIONS AND CLIMATE CHANGE 132 134 GENERAL RESOURCES
Resource Lists | 96
ADAPTATION PLANNING
10 PRINCIPLES FOR LIVEABLE HIGH–DENSITY CITIES: LESSONS FROM SINGAPORE
Author: Widness, B. UrbanLand, 2013.
Website: http://www.uli.org/wp-content/uploads/ULI-Documents/10PrinciplesSingapore.pdf
This report draws upon Singapore’s successful urbanization experience. The ten principles in the publication
were developed during two workshops hosted in 2012 by the CLC and ULI Asia Pacific, bringing together 62
thought leaders, experts, and practitioners from different disciplines related to urban planning and
development.
HO CHI MINH CITY ADAPTATION TO CLIMATE CHANGE: A SUMMARY REPORT
Website: http://www.adb.org/publications/ho-chi-minh-city-adaptation-climate-change-summary-report
Ho Chi Minh City (HCMC) ranks among the top 10 cities in the world with populations most likely to be severely
affected by climate change. By 2050, millions of its citizens will be at increased risk from regular and extreme
climatic events such as floods, droughts, and tropical storms. To help reduce the impacts of these risks, this
study provides HCMC's government and private sector with projections of HCMC's 2050 exposure in key sectors
and areas, and proposes structural and nonstructural measures to build climate resilience in the city's most
vulnerable sectors and areas.
ADAPTING TO CLIMATE CHANGE: STRATEGIES FOR LOCAL GOVERNMENT
Author: Mary L. Walsh Website: http://bookstore.icma.org/Adapting_to_Climate_Change_St_P1960C14.cfm
This report describes the ways leading-edge communities are taking a risk approach to planning and policymaking around the topic of climate change. The first section offers some of the latest scientific findings showing the urgency of the issue; the second section describes tools for adaptation; the third section discusses methods for involving the public; and the last section offers case studies and examples of local government initiatives.
THE CLIMATE RESILIENCE FRAMEWORK TRAINING MATERIALS
Website: http://training.i-s-e-t.org/
These training materials, gathered and prepared by ISET-International are an excellent tool to provide
communities with a clear approach to building resilience into sustainable city planning and implementation.
Resource Lists | 97
INTEGRATING DISASTER RISK MANAGEMENT INTO URBAN MANAGEMENT. PRACTIONER’S HANDBOOK
SERIES.
Website: http://www.adpc.net/2012/download/DRM-
Handbook/ADPC%20DRM%20Practitioners%20Handbook%20-%20Urban%20Management.pdf
Developed by the Asian Disaster Preparedness Center, Bangkok (ADPC), with funding from the Asian
Development Bank (ADB). The handbook provides DRM practitioners with advice for integrating DRM into four
key urban management tools: building regulation, urban land use planning, informal settlement upgrading and
critical facilities emergency management. It guides practitioners on how to engage municipal planning teams,
urban managers, city officials and other public and private agencies that utilize these four urban management
tools to influence or regulate urban development.
A FRAMEWORK FOR URBAN CLIMATE RESILIENCE
Author: Stephen Tyler & Marcus Moench
Website: http://www.tandfonline.com/eprint/VaVMpErdVGCNYa82jefg/full#.Ud285hb81bw
This article reviews concepts and theories in a range of diverse fields to illustrate how the general notion of urban climate resilience can be developed into an operational framework for planning practitioners.
ADAPTING TO COASTAL CLIMATE CHANGE: A GUIDEBOOK FOR DEVELOPMENT PLANNERS
Website: http://pdf.usaid.gov/pdf_docs/PNADO614.pdf
This Guidebook is both a tool in itself and a link to other resources to help with those efforts. The processes, tools, and resources that it contains are based on the inputs of numerous coastal planners, climate change experts, and other development professionals. It was prepared under the guidance of the Water Team and Global Climate Change Team of the U.S. Agency for International Development.
CALIFORNIA ADAPTATION PLANNING GUIDE: PLANNING FOR ADAPTIVE COMMUNITIES
Author: State of California
Website: http://resources.ca.gov/climate_adaptation/local_government/adaptation_
planning_guide.html
The Adaptation Planning Guide (APG) provides guidance to support regional and local communities in
proactively addressing the unavoidable consequences of climate change. The APG provides a step-by-step
process for local and regional climate vulnerability assessment and adaptation strategy development. Usage of
the APG is meant to allow for flexibility in the commitment of time, money, and effort to suit the needs of the
community.
Resource Lists | 98
PREPARING FOR CLIMATE CHANGE: A GUIDEBOOK FOR LOCAL, REGIONAL AND STATE GOVERNMENTS
Author: University of Washington’s Climate Impacts Group, King County Washington, and ICLEI, 2007,
186pp.
Website: http://cses.washington.edu/cig/fpt/guidebook.shtml
This guidebook describes a step-by-step process for achieving a set of climate change preparedness milestones
within the context of municipal planning, based on ICLEI’s five milestone process.
CENTER FOR CLIMATE STRATEGIES ADAPTATION GUIDEBOOK
Author: Center for Climate Strategies, Sept 2011, 124pp.
Website: To request a copy of the guidebook, email [email protected]
This guidebook offers a step-by-step process to help agencies develop climate change adaptation plans at the
state, local, or regional level.
OBJECTIVE SETTING FOR CLIMATE CHANGE ADAPTATION POLICY
Author: AEA Technology Environment, Stockholm Environment Institute, Metroeconomica, UK Climate
Impacts Programme. 2005, 193pp.
Website: http://www.ukcip.org.uk/wordpress/wp-content/PDFs/Objective_setting.pdf
This guide presents an iterative process for setting objectives in climate change adaptation planning and
implementation. It also describes how the model was applied by Defra (UK’s Department for Environment, Food,
and Rural Affairs) to generate ‘strawmen’ objectives and targets. This methodology can help other regions
systematically think through and prioritize their own objectives.
THE MITIGATION-ADAPTATION CONNECTION: MILESTONES, SYNERGIES AND CONTRADICTIONS
Author: ICLEI, Aug 2010, 8pp.
Website: http://www.icleiusa.org/action-center/planning/The%20Mitigation-Adaptation%20Connection.pdf
This primer briefly describes an approach for integrating adaptation into mitigation planning, and provides
several examples, by sector, of how mitigation and adaptation actions can be synergistic, and how they may be
contradictory.
IDENTIFYING ADAPTATION OPTIONS
Author: UK Climate Impacts Programme, 2009, 35pp.
Website: http://www.ukcip.org.uk/wordpress/wp-content/PDFs/ID_Adapt_options.pdf
This guide includes a framework for identifying and selecting adaptation options.
Resource Lists | 99
SHAPING CLIMATE-RESILIENT DEVELOPMENT: A FRAMEWORK FOR DECISION-MAKING
Author: Economics of Climate Adaptation, 2009, 164pp.
Website: http://www.mckinsey.com/App_Media/Images/Page_Images/Offices/SocialSector/
PDF/ECA_Shaping_Climate%20Resilent_Development.pdf
This comprehensive report provides concepts and tools for thinking about adaptation in terms of risk and how
to assess that risk: risk to life, to communities, and to economies and livelihoods. It provides guidance on
quantifying the risks of climate disruption, how to make an economic case for investing in resiliency, and how to
prioritize adaptation projects. It draws on a number of case studies around the world.
CLIMATE CHANGE HANDBOOK FOR REGIONAL WATER PLANNING
Author: State of California Department of Water Resources, EPA, Resources Legacy Fund, and the US Army
Corps of Engineers
Website: http://www.water.ca.gov/climatechange/CCHandbook.cfm
The Climate Change Handbook for Regional Water Planning provides a framework for considering climate
change in water management planning. Key decision considerations, resources, tools, and decision options are
presented that will guide resource managers and planners as they develop means of adapting their programs to
a changing climate.The handbook uses DWR’s Integrated Regional Water Management (IRWM) planning
framework as a model into which analysis of climate change impacts and planning for adaptation and mitigation
can be integrated.
CLIMATE ADAPTATION KNOWLEDGE EXCHANGE (CAKE) WEBSITE
Author: EcoAdapt and Island Press, 2010
Website: www.cakex.org
This searchable website features: profiles of adaptation project case studies (over 100), information resources
(over 300), a directory of people and organizations engaged in adaptation work, tools for decision makers,
managers, and educators (40), and a community section including an international events calendar and advice
column.
US DEPARTMENT OF TRANSPORTATION FRAMEWORK FOR CONSIDERING CLIMATE CHANGE IN
TRANSPORTATION AND LAND USE SCENARIO PLANNING
Author: US DOT RITA Volpe Center, 2011, 68pp.
Website: http://www.volpe.dot.gov/coi/ppoa/publiclands/projects/docs/cape_cod_pilot_
finalreport.pdf
This framework report from the US Department of Transportation’s Research & Innovative Technology
Administration provides an overview and lessons learned from a pilot project in Cape Cod, MA.
Resource Lists | 100
STATE AND LOCAL ADAPTATION PLANS
Author: Georgetown Climate Center, 2010
Website: http://www.georgetownclimate.org/adaptation/adaptation-plans.php
This webpage tracks state and local efforts on adaptation planning, and provides links and brief overviews.
Localities include Homer AK, Phoenix AZ, several cities in CA, Miami-Dade County FL, Alexandria VA, King County
WA, and Milwaukee WI.
ADAPTING TO CLIMATE CHANGE: A GUIDE FOR BUSINESS IN SCOTLAND
Author: Scottish Climate Change Impacts Partnership, 12pp.
Website: http://www.sccip.org.uk/3/82/0/Adapting-to-Climate-Change--A-Guide-for-Businesses-in-
Scotland.aspx
A brief, practical guide that officials can use as a model to engage their own business sectors. This guide for the
private sector gives an overview of what risk and opportunities climate change may pose for Scottish businesses
and explains how to build the adaptive capacity to deal with these risks.
UKCIP’S CLIMATE ADAPTATION RESOURCE FOR ADVISORS (CLARA)
Author: UK Climate Impacts Programme, 2010
Website: http://www.ukcip.org.uk/clara/
This tool is useful for US practitioners who want to engage their local business community. CLARA is a web-
based UK resource aimed at helping business advisors support small and medium enterprises (SMEs) in
understanding and preparing for the impacts of climate change. The factsheets are designed to be accessed
directly by the business community. The site provides background information on climate change, and advice on
how to make the business case.
BUSINESS AS USUAL
Author: London Climate Change Partnership, 2006, 28pp.
Website: http://www.london.gov.uk/lccp/publications/business-usual.jsp
Developed for London, this paper could be used by officials elsewhere looking to engage and evolve their area’s
financial industries. It poses questions for discussions held between the Mayor of London and the city’s financial
leaders in insurance, pensions, fund management, banking, infrastructure, and utilities regarding the need for
them to take account of climate impacts.
Resource Lists | 101
ADAPTING TO CLIMATE VARIABILITY AND CHANGE: A GUIDANCE MANUAL FOR DEVELOPMENT PLANNING
Author: USAID, 2007, 31pp.
Website: http://pdf.usaid.gov/pdf_docs/PNADJ990.pdf
This guidance manual provides a 6-step process for incorporating vulnerability and adaptation into project
design. Although developed for USAID’s grantees, the guidelines are readily transferable to other project
managers seeking to account for climate hazards.
UK CLIMATE IMPACTS PROGRAM ADAPTATION WIZARD
Author: UK Climate Impacts Programme, 2010
Website: http://www.ukcip.org.uk/wizard/
This web-based tool guides users through a 5-step adaptation planning process and provides relevant resources
for each step, including how to identify vulnerabilities to climate change and how to identify ways to reduce
vulnerability. It is designed for use by a wide range of audiences new to climate change adaption, and it provides
a structure for planning and awareness-raising.
PLANNING FOR CLIMATE CHANGE: CUSTOMIZABLE WORKSHOP MATERIALS
Author: Coastal Training Program, National Estuarine Reserve System, 2009
Website: http://www.nerrs.noaa.gov/CTPIndex.aspx?ID=455
The customizable workshop was developed for planners and coastal decision makers. Piloted in two locations in
2009 in Washington State, the materials, including all PowerPoints and streaming videos, are available on the
website, and can be used as a roadmap for engaging planners and decision makers. The materials are grounded
in science and focus on actions to prepare for and adapt to impacts of climate change.
LOCAL GOVERNMENT CLIMATE CHANGE ADAPTATION TOOLKIT
Author: ICLEI and Australia’s Department of Climate Change
Website: http://www.iclei.org/index.php?id=adaptation-toolkit
This toolkit includes a 68-page comprehensive manual providing a conceptual framework for adaptation and
step-by-step instructions for 14 tools geared towards different stages of adaptation planning. The tools are also
available for download from this page, including a planning workshop template, stakeholder identification
worksheet, barriers document, and risk assessment scenario worksheet. The tools were piloted with 5 Australian
communities prior to the toolkit’s release in 2008.
Resource Lists | 102
CLIMATE ADAPTATION STARTER KIT
Author: EcoAdapt
Website: http://ecoadapt.org/programs/awareness-to-action/climate-starter-kit
The toolkit includes EcoAdapt’s top resources, tools and adaptation examples. It includes resources for assessing
climate change vulnerability, risk and impact; processes to guide the development of adaptation strategies; a
sampling of climate adaptation portals, tools and resources; adaptation case studies; a guide to getting started
on adaptation planning and tips for evaluation and monitoring of adaptation programs.
CLIMATE CHANGE ACTIONS FOR LOCAL GOVERNMENTS
Author: Snowy Mountains Engineering Corporation Australia, Australia Department of the Environment and
Water Resources, 2007, 76pp.
Website: http://pandora.nla.gov.au/pan/81489/20080211-
1441/www.greenhouse.gov.au/impacts/publications/pubs/local-government.pdf
This straightforward guide provides a large sampling of possible adaptation actions related to infrastructure,
health services, natural resource management, water and sewerage services, and other areas. Descriptions, case
studies, and examples are integrated together for easy reading. The guide was developed for Australia but it
offers a useful starting point for US cities.
CHULA VISTA CLIMATE ACTION PLANNING - CLIMATE CHANGE WORKING GROUP
Author: City of Chula Vista, Department of Conservation and Environmental Services, 2010
Webpage: http://www.ci.chula-vista.ca.us/clean/conservation/Climate/ccwg1.asp
This webpage provides access to several ‘planning matrices’ – tables of detailed adaptation options by topic,
compiled by the City of Chula Vista in Southern California for its adaptation planning efforts. Impact topics
include water, energy, public health, biodiversity, business, and sea level.
HAZARD MITIGATION BEST PRACTICES SEARCH
Author: FEMA
Website: http://www.fema.gov/mitigationbp
This database of best practice in disaster mitigation is searchable by location, sector type, hazard, type of
activity, and keywords. Hazards include drought, severe storm, extreme temperatures, winter storm, and
wildfire. Activities include building codes, outreach, floodplain management, land use/planning, community
shelters, utility protective measures, vegetation management, and wetland restoration.
Resource Lists | 103
COMPILATION OF 50 PROGRAMS FOR USE IN COMMUNITY BASED ADAPTATION PROJECTS
Author: Center for Sustainable Development
Website: http://www.csd-i.org/csdi-blog/2012/6/13/compilation-of-50-programs-for-use-in-community-
based-adapta.html?SSScrollPosition=0
This compilation presents model programs for addressing challenges in community based adaptation and
participatory forest restoration projects. Programs represent the best programs being used successfully in the
field today, in categories of water use management, forest restoration, livelihoods, agriculture and building
community resilience.
ADAPTING TO CLIMATE CHANGE: A CHECKLIST FOR DEVELOPMENT
Author: Greater London Authority and London Climate Change Partnership, 2005, 72pp.
Website: http://www.ukcip.org.uk/wordpress/wp-content/PDFs/Checklist_for_development.pdf
This checklist provides guidance on designing building developments to withstand a changing climate
throughout their lifetime. The checklist covers issues such as water re-use and efficiency, reducing flood risk,
avoiding overheating and minimizing damage from subsidence and heave.
ADAPTING TO CLIMATE CHANGE: A CASE STUDY COMPANION TO THE CHECKLIST FOR DEVELOPMENT
Author: London Climate Change Partnership, 2007, 64pp.
Website: http://www.sfrpc.com/Climate%20Change/12.pdf
The companion guide applies the Checklist for Development’s guidance (above) and provides case studies of
developments or buildings that incorporate adaptation in their design and construction. This guide provides
replicable cases of buildings and developments that incorporated adaptation measures to increase resiliency to
the changing climate. The case studies address climate change impacts, such as urban heat island effect and
flooding, and they illustrate techniques relevant to key climate change adaptations issues, such as siting, site
layout, ventilation, drainage, water, outdoor spaces and connectivity.
GETTING A COMMITMENT TO ADAPTATION
MAINSTREAMING ADAPTATION INTO DEVELOPMENT PLANS: LESSONS FROM THE REGIONAL CLIMATE
CHANGE ADAPTATION KNOWLEDGE PLATFORM FOR ASIA
Author: Davis, M. Stockholm Environmental Institute, 2013.
Website: http://www.sei-
international.org/publications?pid=2276&utm_source=buffer&utm_medium=twitter&utm_campaign=Buffer:%2
BSEIclimate%2Bon%2Btwitter&buffer_share=4fcdc
The brief identifies several promising entry points for integrating adaptation at the national level, including
countries’ five- and ten-year development plans, poverty reduction strategy papers, disaster risk reduction
strategies, water resource strategies, and conservation strategies.
Resource Lists | 104
CHANGING CITIES AND CHANGING CLIMATE: INSIGHTS FROM SHARED LEARNING DIALOGUES IN THAILAND
AND VIETNAM
Author: ISET, et al. Institute for Social and Environmental Transition: Bangkok 2012.
Website: http://www.i-s-e-t.org/images/pdfs/isetinternational_changingcities
andchangingclimate_nistpassandtei_2012.pdf
This paper describes how the concept of shared learning is being applied in 4 cities in the M-BRACE program
(Mekong – Building Climate Resilient Asian Cities). It shares insights on the trends of urbanization and climate
change from the perspective of stakeholders, as discussed during the first round of “shared learning dialogues”
(SLDs) in each city.
GLOBAL INITIATIVE FOR RESOURCE EFFICIENT CITIES
Author: UNEP Division of Technology
Website: http://www.unep.org/pdf/GI-REC_4pager.pdf
This Global Initiative for Resource Efficient Cities (GIREC) seeks to connect the many different entities around
the world working on Resource Efficiency, using UNEP’s convening ability to mobilize partners and different
constituencies from governments at both the national and local levels, civil society, business and industry and
other major groups. The ultimate goal of the Global Initiative is to mainstream resource efficiency and
sustainable consumption and production into policies and tools at the city level and to change citizens’ and
business’ habits accordingly.
REGIONAL WORKSHOP ON MAINSTREAMING CLIMATE CHANGE ADAPTATION IN ENVIRONMENTAL IMPACT
ASSESSMENT IN ASIA
Website: http://www.asiapacificadapt.net/sites/default/files/resource/attach/
proceedings_0.pdf
The workshop brought together over 30 Environmental Impact Assessment practitioners and climate change
experts from Asia and outside the region. Experts from the Netherlands, Australia, the US and the ADB served as
workshop resource persons and facilitators. The workshop provided a comprehensive overview of current
progress in mainstreaming climate change in EIA globally and within individual countries in Asia.
Resource Lists | 105
GREEN INFRASTRUCTURE & ECONOMIC DEVELOPMENT: STRATEGIES TO FOSTER OPPORTUNITY FOR
MARGINALIZED COMMUNITIES
Author: MIT Community Innovators Lab (CoLab)
Website: http://web.mit.edu/colab/pdf/tools/gedi-green-infrastructure-economic-development.pdf
This report articulates local economic development opportunities associated with Green Infrastructure (GI)
investments. It is intended for economic development organizations (EDOs) and stormwater management
agencies. It suggests how practitioners within these organizations can support economic opportunity for local
and/or historically disadvantaged communities. Such opportunities include greater representation amongst the
GI labor force and contracting firm’s ownership, as well as by improving prospects for career advancement and
job quality. To identify economic development strategies that may be associated with GI investments, this
report reviews practices in two cities leading in GI planning and implementation: New York; and Portland,
Oregon. It also conducts a more cursory review of GI investments in Philadelphia.
BEST PRACTICES APPROACHES FOR CHARACTERIZING, COMMUNICATING, AND INCORPORATING SCIENTIFIC
UNCERTAINTY IN CLIMATE DECISION MAKING
Author: M. Granger Morgan, et al., US Climate Change Science Program, Jan 2009, 96pp.
Website: http://downloads.globalchange.gov/sap/sap5-2/sap5-2-final-report-all.pdf
This report is a tutorial for climate analysis and decision-making communities on current best practice in
describing and analyzing uncertainty in climate-related problems.
COMMUNITY-BASED RISK SCREENING TOOL—ADAPTATION & LIVELIHOODS (CRISTAL)
Author: International Union for Conservation of Nature, International Institute for Sustainable
Development, Stockholm Environmental Institute’s US Center.
Website: http://www.cristaltool.org/content/about.aspx
CRiSTAL is a project planning and management tool. Used at the community level to incorporate local
knowledge about climate change and resource use considerations into development projects, it helps project
planners and managers integrate risk reduction and climate change adaptation into projects. CRiSTAL uses a
series of worksheets to guide users systematically through the climate change context of their project, the
resources at risk, existing coping strategies, and possible project modifications to reduce project vulnerability to
climate change. It is designed as an Excel Workbook, but can be used in hard copy. The Workbook and User
Manual are available in French, English, and Spanish.
Resource Lists | 106
ENGAGING CHICAGO’S DIVERSE COMMUNITIES IN THE CHICAGO CLIMATE ACTION PLAN
Author: The Field Museum Division of Environment, Culture, and Conservation, City of Chicago Department
of Environment, Aug 2010.
Website: http://fieldmuseum.org/explore/department/ecco/engaging-chicago-communities-climate-action
This website provides links to the Field Museum’s Division of Environment, Culture and Conservation’s (ECCo)
reports on community engagement in Chicago regarding implementation of the Chicago Climate Action Plan.
The reports describe an inclusive approach for soliciting public perceptions of climate change issues.
LOW CARBON SCOTLAND: PUBLIC ENGAGEMENT STRATEGY
Author: The Scottish Government
Website: http://www.scotland.gov.uk/Resource/Doc/336432/0110100.pdf
This publication, part of the Scottish Government’s Climate Change Adaptation Toolkit, provides a step-by-step
guide for writing an effective communications strategy.
LEARNED LESSONS ON KEY CONSIDERATIONS FOR COMMUNICATING CLIMATE RISK
Author: weADAPT
Website: http://wikiadapt.org/index.php?title=Learned_lessons_on_key_considerations_for_
communicating_climate_risk
This webpage summarizes key considerations for communicating climate risk, based on lessons learned from
developing climate risk communication strategies and implementing them on the ground in Africa and Asia, but
applicable elsewhere. Strategies described are: two-way dialogue; knowing the local context; understanding the
local know-how on climate risk; engagement in the process; combining strategies to target different
stakeholders; strategic use of space; and innovative ways of communicating.
(Based on a synthesis report of the Advancing Capacity to Support Climate Change Adaptation project, which
can be downloaded at http://start.org/download/accca-synthesis.pdf.)
CLIMATE COMMUNICATIONS AND BEHAVIOR CHANGE
Author: Cara Pike, Bob Doppelt, Meredith Herr, Climate Leadership Initiative, University of Oregon, 2010.
54pp.
Website: http://www.theresourceinnovationgroup.org/storage/PubHealthPrepManual5-10LR.pdf
This guide illustrates the challenges with existing climate change communications efforts and provides tips on
how to frame and deliver outreach efforts in a way that motivates changes in thinking and behavior for a range
of audience segments. The focus is not on climate adaptation, though the guide does include some tips explicit
to it.

Resource Lists | 107
HOLD THAT THOUGHT! QUESTIONING FIVE COMMON ASSUMPTIONS ABOUT COMMUNICATING WITH THE
PUBLIC
Author: Joe Cone, Oregon Sea Grant: Public Science Communication Research & Practice, 16pp.
Website: http://seagrant.oregonstate.edu/sgpubs/onlinepubs/h08005.pdf
This report discusses false assumptions about communicating with the public, and provides some guidance
about designing more effective communications. The false assumptions are: We need to get the word out; We
already know how to communicate; If they only had information Z then recipients of our information will
consider it thoughtfully; and Successful communication is an art.
EXPAND YOUR VIEW: INSIGHTS FOR PUBLIC COMMUNICATORS FROM BEHAVIORAL RESEARCH
Author: Joe Cone, Oregon Sea Grant: Public Science Communication Research & Practice, 24pp.
Website: http://seagrant.oregonstate.edu/sgpubs/onlinepubs/h08006.pdf
This primer provides a research-based look at how to improve communication effectiveness. Topics include
understanding and addressing psychological barriers, embracing voluntary learning, and fomenting social
change. Not specific to climate change but useful to such public officials.
TELLING THE TALE OF DISASTER RESISTANCE: A GUIDE TO CAPTURING AND COMMUNICATING THE STORY
Author: FEMA, 2001, 65pp.
Website: http://www.fema.gov/library/viewRecord.do?id=1762
This guidebook provides some of the “best practices” of those who have promoted disaster-resistance efforts
throughout the country, which can serve as one component in an overall adaptation outreach strategy. This
publication explains what value documenting and disseminating disaster resistance provides to local
governments, and provides a step-by-step guide on how to document disaster-resistance efforts, offers
guidance for developing story leads, researching and documenting projects.
COMMUNICATING CLIMATE CHANGE: PODCASTS WITH SOCIAL SCIENTISTS
Author: Produced by Joe Cone, Sea Grant Oregon, last updated Aug 2010.
Website: http://blogs.oregonstate.edu/communicatingclimatechange
This website features extended audio interviews with leading social scientists about the human dimensions of
climate change. The podcast is aimed at professional science communicators, whose job it is to explain complex
scientific concepts and the work of scientists to the public at large.
Resource Lists | 108
SETTING THE RECORD STRAIGHT: RESPONSES TO COMMON CHALLENGES TO CLIMATE SCIENCE
Author: CLI, Jan 2009, 9pp.
Website: http://www.theresourceinnovationgroup.org/storage/Setting_record_Straight.pdf
This brief document provides credible responses to some common ‘skeptic’ arguments against climate change.
For more detailed, in-depth treatment, see Grist’s guide, “How to Talk to a Climate Skeptic”
http://www.grist.org/article/series/skeptics.
CLIMATE SOLUTIONS FOR A STRONGER AMERICA: A GUIDE FOR ENGAGING AND WINNING ON CLIMATE
CHANGE & CLEAN ENERGY
Author: Betsy Taylor, Breakthrough Strategies & Solutions, LLC, 22pp.
Website: http://www.climateaccess.org/sites/default/files/Breakthrough_Climate
%20Solutions%20for%20a%20stronger%20America.pdf
This guide provides communication strategies for candidates, business and civic leaders and others advocating
for climate and clean energy solutions in the public sphere.
INTRODUCTION TO STAKEHOLDER PARTICIPATION
Author: NOAA, 20pp.
Website: http://www.csc.noaa.gov/cms/human_dimensions/Stakeholder_Participation_
Guidance_Document.pdf
For those brand new to stakeholder participation, this document briefly examines several important aspects of
stakeholder participation, provides guidance on identifying coastal management stakeholders, describes some
of the most commonly used techniques, and discusses evaluation of stakeholder participation.
STAKEHOLDER ENGAGEMENT STRATEGIES FOR PARTICIPATORY MAPPING
Author: NOAA, 28pp.
Website: http://www.csc.noaa.gov/cms/human_dimensions/participatory_mapping.pdf
The participatory mapping tool is designed to help engage the public in land use decisions. The maps represent
society’s values, including social, cultural and economic values. The publication provides facilitators with
strategies to lead a participatory mapping process. This process is particularly useful in creating opportunities for
stakeholder participation, capturing new information, and building community understanding and knowledge of
climate risks. The mapping exercise also helps decision makers build community resilience and make better
coastal management decisions.
Resource Lists | 109
PARTICIPATORY LEARNING AND ACTION: COMMUNITY-BASED ADAPTATION TO CLIMATE CHANGE
Author: International Institute for Environment and Development, Dec 2009, 221pp.
Website: http://pubs.iied.org/pdfs/14573IIED.pdf
Through reflections, case studies and descriptions of available participatory tools, the authors give an overview
of working in communities on adaptation efforts. The first section includes reflections on participatory processes
and practice in community-based adaptation to climate change. These have a variety of entry points, including
participatory vulnerability analysis and disaster risk reduction frameworks. The second section focuses on
participatory tool-based case studies and describes a participatory process with an emphasis on the use of a
particular tool. The third section, participatory tools, includes shorter, step-by-step descriptions of how to
facilitate a particular tool in a community.
RISK ASSESSMENTS
TURN DOWN THE HEAT: CLIMATE EXTREMES, REGIONAL IMPACTS, AND THE CASE FOR RESILIENCE
Website: http://www-wds.worldbank.org/external/default/WDSContentServer/WDSP
/IB/2013/06/14/000445729_20130614145941/Rendered/PDF/784240WP0Full00D0CONF0to0June19090L.pdf
This report focuses on the risks of climate change to development in Sub-Saharan Africa, South East Asia and
South Asia. Building on the 2012 report, Turn Down the Heat: Why a 4°C Warmer World Must be Avoided, this
new scientific analysis examines the likely impacts of present day, 2°C and 4°C warming on agricultural
production, water resources, and coastal vulnerability for affected populations. It finds many significant climate
and development impacts are already being felt in some regions, and in some cases multiple threats of
increasing extreme heat waves, sea level rise, more severe storms, droughts and floods are expected to have
further severe negative implications for the poorest. Climate related extreme events could push households
below the poverty trap threshold. High temperature extremes appear likely to affect yields of rice, wheat, maize
and other important crops, adversely affecting food security. Promoting economic growth and the eradication of
poverty and inequality will thus be an increasingly challenging task under future climate change. Immediate
steps are needed to help countries adapt to the risks already locked in at current levels of 0.8°C warming, but
with ambitious global action to drastically reduce greenhouse gas emissions, many of the worst projected
climate impacts could still be avoided by holding warming below 2°C
CONSTRUCTING WEATHER DATA FOR BUILDING SIMULATION CONSIDERING URBAN HEAT ISLAND
Author: Building Services Engineering Research and Technology, 2012.
Website: http://bse.sagepub.com/content/early/2012/12/04/0143624412467194
This study proposed a method to construct urban hourly weather data by adopting the ‘morphing’ approach
considering urban heat islands. The method starts with the surrounding rural weather as the ‘baseline climate’
and an Urban Canopy Model is used to provide the differences in the monthly average values of major climate
parameters due to urban heat islands.
Resource Lists | 110
CLIMATE ADAPTATION: RISK, UNCERTAINTY AND DECISION-MAKING
Author: Robert Willows & Richenda Connell, UK Climate Impacts Programme, 2003, 166pp.
Website: http://www.ukcip.org.uk/wordpress/wp-content/PDFs/Risk.pdf
This report provides an 8-stage decision-making framework for examining and choosing among available
adaptation options. This framework is most appropriate for decision makers who have some knowledge of
climate risks, but who want to better understand them and their adaptation options.
COMMUNITY AND REGIONAL RESILIENCE: PERSPECTIVES FROM HAZARDS, DISASTERS, AND EMERGENCY
MANAGEMENT
Author: Susan Cutter et al., Community & Regional Resilience Initiative (CARRI), 2008, 33pp.
Website: http://www.resilientus.org/library/FINAL_CUTTER_9-25-08_1223482309.pdf
This research paper outlines: what makes people and places vulnerable, including location, infrastructure and
economic factors; what makes communities resilient, including recognizing and understanding hazards and
planning for disaster recovery, planning and land use and development; and barriers to planning for resilience. It
also reviews possible measurement and indicators for resilience and some frameworks for community resilience
assessment.
CLIMATE CHANGE ADAPTATION IN NEW YORK CITY: BUILDING A RISK MANAGEMENT RESPONSE
Author: New York City Panel on Climate Change, City of New York, NY; Annals of the New York Academy of
Sciences, May 2010.
Website: http://www3.interscience.wiley.com/journal/123443047/issue
This webpage provides access to New York City’s risk assessment by chapter. The information and
recommendations are relevant to other cities, and could serve as a template for other city risk assessments.
Content includes: how and why New York City might adopt a risk-based approach; infrastructure impacts and
adaptation challenges; a review of the range of current environmental laws and regulations for their applicability
to climate change adaptation efforts; the role of the insurance industry; and recommendations for a monitoring
program. The appendices include three workbooks to guide a climate change adaptation planning process:
“Climate Risk Information” related to risks to critical infrastructure, “Adaptation Assessment Guidebook” which
outlines a stakeholder process, and “Climate Protection Levels” which evaluates policies.
ADAPTING TO CLIMATE CHANGE: A RISK-BASED GUIDE FOR LOCAL GOVERNMENTS
Author: Robert A. Black, James P. Bruce, I.D. Mark Egener, Natural Resources Canada, 2010.
Website: http://www.nrcan.gc.ca/sites/www.nrcan.gc.ca.earth-sciences/files/pdf/projdb/
pdf/ris_e.pdf
This guide argues for a risk-based approach to adaptation planning and outlines the process for risk
management. It also highlights climate trends and projections in Canada and has an appendix that discusses risk
communications and perceptions and how to talk to the public about risks.

Resource Lists | 111
CLIMATE CHANGE 2007: IMPACTS, ADAPTATION, AND VULNERABILITY
Author: Martin L. Parry et al., IPCC & Cambridge University Press, Cambridge, United Kingdom, 2007,
1000pp.
Website: http://www.ipcc-wg2.gov/publications/AR4/index.html
The report available on this webpage is the Impacts, Adaptation and Vulnerability component of the Fourth
Assessment Report of the Intergovernmental Panel on Climate Change. The 16-page “Summary for
Policymakers” is available here: http://www.ipcc-wg2.gov/AR4/website/spm.pdf, and the 36-page chapter on
North America here: http://www.ipcc-wg2.gov/AR4/website/14.pdf.
CLIMATE CHANGE IMPACTS & RISK MANAGEMENT: A GUIDE FOR BUSINESS AND GOVERNMENT
Author: Australian Government Department of Environment and Heritage, 2006, 75pp.
Website: http://www.climatechange.gov.au/sites/climatechange/files/documents/
03_2013/risk-management.pdf
Although the case studies upon which it is based are Australian, this guide can be used by elected
representatives, general management, and risk managers elsewhere particularly in their beginning stages of
assessment and prioritization. This guide is designed to assist businesses and organizations adapt to climate
change and integrate climate change impacts into risk management and strategic planning activities. Case
studies about a large private company, a public utility, a government agency and a local government illustrate a
good risk management framework for managing increased risk to organizations due to climate change, and in
particular the initial assessment and prioritization of risks.
VULNERABILITY ASSESSMENT FOR CLIMATE ADAPTATION
Author: Thomas E. Downing et al., 2002, 39pp.
Website: http://www.aiaccproject.org/meetings/Trieste_02/trieste_cd/
This technical paper presents a structured approach to climate change vulnerability assessment. The paper
recommends five tasks and suggests appropriate methods suitable for different levels of analysis. The five tasks
link a conceptual framing of vulnerability to identification of vulnerable conditions, analytical tools and
stakeholders.
ASSESSING VULNERABILITY AND RISK OF CLIMATE CHANGE EFFECTS ON TRANSPORTATION INFRASTRUCTURE:
PILOT OF THE CONCEPTUAL MODEL
Author: Federal Highway Administration, 2010.
Website: http://www.fhwa.dot.gov/hep/climate/conceptual_model62410.htm
This webpage outlines a conceptual Risk Assessment Model that is being piloted by three to four State
Departments of Transportation or Metropolitan Planning Organizations selected by the Federal Highway
Administration (FHWA). The goal of the Risk Assessment Model is to help transportation decision makers
(particularly transportation planners, asset managers, and system operators) identify which assets (a) are most
exposed to the threats from climate change and/or (b) are associated with the most serious potential
consequences of those climate change threats.
Resource Lists | 112
ENGINEERING LITERATURE REVIEW: WATER RESOURCES – INFRASTRUCTURE IMPACTS, VULNERABILITIES AND
DESIGN CONSIDERATIONS FOR FUTURE CLIMATE CHANGE
Author: Slobodan P. Simonovic, PIEVC, 2008, 204pp.
Website: http://www.pievc.ca/e/Appendix_C_Literature_Reviews.pdf
This review includes information on water infrastructure and climate change resource documents, impacts of
climate change on water resources, and a summary, discussion and recommendations. Developed for a more
adaptation-focused Canadian audience, this review can be a useful starting point for US water managers seeking
to assess their risks.
BUSINESS AREAS CLIMATE IMPACTS ASSESSMENT TOOL (BACLIAT)
Author: UK Climate Impacts Programme, 2010.
Website: http://www.ukcip.org.uk/bacliat/
This tool provides a good starting point for exploring the implications of climate change for a particular business
or sector and for municipalities who would like to engage the business sector in climate adaptation efforts. It is
comprised of a simple checklist for assessing the potential impacts of climate change under generic business
areas. It encourages the consideration of both threats and opportunities and is most effective when used as part
of a group brainstorming exercise.
CLIMATESMART—CLIMATE CHANGE: DEVELOPER’S RISK MANAGEMENT GUIDE
Author: Halifax Regional Municipality, 2007, 35pp.
Website: http://ccap.org/docs/resources/394/DevelopersGuidetoRiskManagment.pdf
This can serve as a model government guide for developers. It was created for developers of Halifax’s coastal,
lowlying, urban/forest fringe, and rural areas. The guide includes an overview of climate change, describes the
predicted impacts on Halifax relevant to development projects, provides a step-by-step approach to assessing
the risk, and provides a checklist that can be used in the planning and evaluating of development proposals.
HOW TO BECOME STORMREADY®
Author: National Weather Service, last updated June 2013
Website: http://www.stormready.noaa.gov/howto.htm
This website provides guidelines and a toolkit to emergency managers to help them prepare their communities
for severe storms, and explains how to apply to become a StormReady community. As of June 2013, there were
2,080 StormReady sites, including cities, counties, and commercial properties.
Resource Lists | 113
STEMMING THE TIDE: HOW LOCAL GOVERNMENTS CAN MANAGE RISING FLOOD RISKS
Author: Andrew C. Silton and Jessica Grannis, Georgetown Climate Center, May 2010, 24pp.
Website: http://www.georgetownclimate.org/virginia-case-study-stemming-the-tide-how-local-
governments-can-manage-rising-flood-risks
This study analyzes how Virginian local governments can use existing land use powers to adapt to climate
change impacts such as flooding and coastal erosion, increased pressures on emergency response and rising
infrastructure and property damages. The study also looks at legal obstacles and specific land use tools for local
governments implementing policy identified in Virginia’s Climate Action Plan.
URBAN FLOODING
Author: Parliamentary Office of Science and Technology, Jul 2007, 4pp.
Website: http://www.parliament.uk/documents/post/postpn289.pdf
This document gives an overview of UK approaches to managing urban flooding, including dealing with an
overwhelmed sewer system, and examines ways to improve policy.
CITIES AND FLOODING: A GUIDE TO INTEGRATED URBAN FLOOD RISK MANAGEMENT FOR THE 21ST CENTURY
Author: Abhas K Jha, Robin Bloch, Jessica Lamond, International Bank for Reconstruction and Development,
2012, 638pp.
Website: http://www.seachangecop.org/sites/default/files/documents/
2012%2002%20World%20Bank%20-%20Urban%20flood%20risk%20management.pdf
This text provides guidance on managing the risk of floods in an urban environment and serves as a primer for
decision and policy makers across sectors.
U.S. ENVIRONMENTAL PROTECTION AGENCY (EPA) CLIMATE READY ESTUARIES COASTAL TOOLKIT
Author: EPA, 2009, 32pp.
Website: http://www.epa.gov/CRE/toolkit.html
This webpage compiles resources for estuaries and coastal programs that are interested in learning more about
climate change impacts and adaptation. Estuaries are highly and uniquely vulnerable to climate change.
Resource Lists | 114
INFRASTRUCTURE
CLIMATE CHANGE AND INFRASTRUCTURE, URBAN SYSTEMS, AND VULNERABILITIES (TECHNICAL REPORT FOR
THE U.S. DEPARTMENT OF ENERGY)
Author: Wilbanks, T.; Fernandez, S. et al. Oak Ridge National Laboratory, Feb 2012.
Website: http://www.esd.ornl.gov/eess/Infrastructure.pdf
A central theme of this report is that vulnerabilities and impacts are issues beyond physical infrastructure
themselves. The concern is with the value of services provided by infrastructures, where the true consequences
of impacts and disruptions involve not only the costs associated with the clean-up, repair, and/or replacement
of affected infrastructures but also economic, social, and environmental effects as supply chains are disrupted,
economic activities are suspended, and/or social well-being is threatened.
HIGH LEVEL PANEL ON INFRASTRUCTURE RECOMMENDATIONS TO G20 – FINAL REPORT
Author: The High Level Panel (HLP) on Infrastructure Investment, October 2011.
Website: http://www.boell.org/downloads/HPL_Report_on_Infrastructure_10-26-2011.pdf
The HLP recommendations are organized around three areas, each corresponding to key issues that it argues
must be tackled to produce a step-change in infrastructure investment: 1) Ensuring a strong and sustainable
supply of bankable projects; 2) Contributing to building an enabling environment; 3) Making funding available
under appropriate terms.
USAID BRIEF: ADDRESSING CLIMATE CHANGE IMPACTS ON INFRASTRUCTURE, APRIL 2013
Website: https://dec.usaid.gov/dec/GetDoc.axd?ctID=ODVhZjk4NWQ
tM2YyMi00YjRmLTkxNjktZTcxMjM2NDBmY2Uy&rID=MzM2Njkx&pID=NTYw&attchmnt=VHJ1ZQ==&uSesDM=Fal
se&rIdx=NDM2MzY4&rCFU=
Infrastructure includes a wide variety of systems that are essential to development priorities—and these assets
may be at risk due to climate change. This set of fact sheets describes the impacts climate change may have on
nine categories of infrastructure in developing countries. The document also introduces the common themes
related to infrastructure, climate change impacts, and adaptation strategies, and covers the basic terminology
and concepts that are used in the fact sheets.
THE VALUE OF GREEN INFRASTRUCTURE: A GUIDE TO RECOGNIZING ITS ECONOMIC, ENVIRONMENTAL AND
SOCIAL BENEFITS
Author: American Rivers and the Center for Neighborhood Technology
Website: http://www.americanrivers.org/assets/pdfs/reports-and-publications/natural-security-report.pdf
“The Value of Green Infrastructure” provides a framework to help communities measure and value the air
quality, energy use, and many other benefits that green infrastructure provides. It allows communities to more
accurately compare different infrastructure investments and choose the option that provides the greatest long-
term benefit.
Resource Lists | 115
REGIONAL CLIMATE CHANGE EFFECTS: USEFUL INFORMATION FOR TRANSPORTATION AGENCIES
Author: Federal Highway Administration, 2010
Website: http://www.fhwa.dot.gov/hep/climate/climate_effects/effects00.cfm
This report provides the transportation community (including highway engineers, planners, NEPA practitioners)
with digestible, transparent, regional information on projected climate change effects that are most relevant to
the US highway system. This information informs assessments of the risks and vulnerabilities facing the current
transportation system, and can inform planning and project development activities.
THE VALUE OF GREEN INFRASTRUCTURE FOR URBAN CLIMATE ADAPTATION
Author: Foster, J; Lowe, A; Winkelman, S; The Center for Clean Air Policy, Feb. 2011.
Website: http://www.cakex.org/sites/default/files/Green_Infrastructure_FINAL.pdf
Various solutions can help build adaptive capacity but the uncertainty involved in calculating their economic and
social costs and benefits is a barrier to action for local governments. This report evaluates the performance and
benefits of a selection of green infrastructure solutions, using their range of technological, managerial,
institutional, and financial innovations as a proxy for their value for climate adaptation.
PATHWAYS TO CLIMATE ADAPTED AND HEALTHY LOW INCOME HOUSING
Author: Guy Barnett, Matt Beaty, et al Website: http://www.nccarf.edu.au/sites/default/files/attached_files_publications/SI1004-Barnett-Climate-adapted-low-income-housing.pdf
This report presents the findings from the “Pathways to Climate Adapted and Healthy Low Income Housing” project undertaken by the CSIRO Climate Adaptation Flagship in partnership with two organizations responsible for providing social housing in Australia. The project was based on the premise that interactions between people, housing, and neighborhood are dynamic and best viewed as a complex, coupled social-ecological system. Using social housing as a case study, the objectives of the project were to: Model vulnerability of housing and tenants to selected climate change impacts; Identify/evaluate engineering, behavioral and institutional adaptation options; Scope co-benefits of climate adaptation for human health and well-being; and develop house typologies and climate analogues for national generalizations.
INTERNATIONAL CONFERENCE: STRATEGIES FOR ADAPTING PUBLIC AND PRIVATE INFRASTRUCTURE TO
CLIMATE CHANGE
Author: Adaptation Learning Mechanism, Jul 2010
Website: http://www.adaptationlearning.net/infrastructure-adaptation
This website presents a list of workshop materials for the international conference, “Strategies for Adapting
Public and Private Infrastructure to Climate Change,” held in El Salvador, June 30-July 1, 2010. Resources useful
to a US audience include the workshop agenda, concept note, conference presentations, and publications
related to the topic of climate proofing of infrastructure in the context of climate change adaptation and urban
and regional planning.
Resource Lists | 116
WATER RESOURCE MANAGEMENT & ADAPTATION
STRIVING FOR BALANCE IN THE NARRAGANSETT BAY WATERSHED: EPA’S TRIPLE VALUE SIMULATION (3VS)
MODEL
Website: http://www.epa.gov/research/docs/3vs-tool-nutrient-mgt-narr-bay.pdf
Brief on simulation tool that informs decisions used to achieve a balanced water resources management system
that will support environmental, economic, and social sustainability. By modeling the full nutrient cycle, the
simulation helps to identify solutions that will protect ecosystem integrity while providing the water resources
that are essential for continued economic prosperity.
STORMWATER CALCULATOR TO MANAGE RAINFALL RUNOFF
A new tool developed by EPA allows planners and property owners to assess how green infrastructure can be
used to reduce rainwater runoff from development sites http://www.epa.gov/research/gems/stormwater.htm.
The development ofEPA’s Stormwater Calculator and SWMM Climate Assessment Tool can be found here:
http://www.epa.gov/ncer/events/calendar/2013/feb26/berner.pdf
WATER USE, SANITATION AND HEALTH IN A FRAGMENTED URBAN WATER SYSTEM: CASE STUDY AND
HOUSEHOLD SURVEY IN CAN THO CITY VIETNAM
Author: Luis E. Neumanna et al., Urban Water Journal
Website: http://www.tandfonline.com/doi/abs/10.1080/1573062X.2013.768685#.
UfuzlZKfiWY
This report describes a study undertaken to identify strategies to deal with rapid urbanization and threatening
climate change, in Can Tho City, Vietnam, a survey of 1200 households was undertaken to investigate water
access and sanitation services. The survey targeted three different groups based on their access to water
services: (a) those with piped water supply, (b) without piped water, and (c) a mix of (a) and (b). Socio-economic
factors and level of urbanization significantly influenced the different water sources accessed by households and
their type of sanitation.
DESIGN AND CONSTRUCTION OF URBAN STORMWATER MANAGEMENT SYSTEMS
Author: American Public Works Association
Website: http://www2.apwa.net/bookstore/detail.asp?PC=PB.XBBL
Systems Learn about design for stormwater management systems that meets tomorrow's tough regulatory
standards. This book contains the latest in design practices and concepts. Experts in every related discipline take
you step-by-step throughout the design process.
MUNICIPAL STORMWATER MANAGEMENT - 2ND EDITION
Author: American Public Works Association
Resource Lists | 117
Website: http://www2.apwa.net/bookstore/detail.asp?PC=PB.XMSW
Known by many stormwater managers, designers, and planners as the "stormwater bible," the bestselling
Municipal Stormwater Management has been expanded and updated to be a standalone desktop reference for
the stormwater manager, designer, and planner.
WATER RIPPLES: EXPANDING RISKS FOR US WATER PROVIDERS
Author: Ceres
Website: http://www.ceres.org/resources/reports/water-ripples-expanding-risks-for-US-water-
providers/view
Citing shrinking federal funds, uncertain water demand and declining revenues to pay for the projects, the
report recommends that utilities move carefully before embarking on major pipelines, reservoirs and other new
infrastructure that will create financial risks for investors and utility customers alike. The report also
recommends that water demand projections be viewed skeptically by credit rating agencies, investors and
policymakers; that investors and credit rating agencies seek better understanding of how rate structures
influence demand and revenue streams; and that environmental and consumer groups actively work to build
public support for water rates that ensure future water security and affordability.
DECLINING WATER SALES AND UTILITY REVENUES: A FRAMEWORK FOR UNDERSTANDING AND ADAPTING
Author: Alliance for Water Efficiency and the Johnson Foundation at Wingspread
Website: http://www.allianceforwaterefficiency.org/Declining-Sales-and-Revenues.aspx
In August 2012, AWE and The Johnson Foundation at Wingspread co-hosted a summit with water utility
managers, rate experts, price regulators, economists, and advocacy groups to explore the issues surrounding
declining water sales, utility revenue losses, and the impact on conservation programs. This white paper
provides a summary of these proceedings, which addressed the following five discussion topics: 1) How and why
are water sales declining? 2) Are water utility revenues falling short of revenue requirements? 3) Do water
utilities and the conservation community have a messaging problem? 4) What methods are available to repair
revenues and improve fiscal stability? 5) What role do industry standards, practices, and policy reforms play?
WATER WORKS: REBUILDING INFRASTRUCTURE AND CREATING JOBS
Author: Green for All, American Rivers, Pacific Institute, and the Economic Policy Institute
Website: http://greenforall.org/focus/water/water-works-rebuilding-infrastructure-creating-jobs-greening-
the-environment/
The report looks at an investment of $188.4 billion in water infrastructure –the amount the EPA indicates would
be required to manage stormwater and preserve water quality. That investment would inject a quarter of a
trillion dollars into the economy, create nearly 1.3 million direct and indirect jobs and result in 568,000
additional jobs from increased spending. Further, the report notes that this is the best moment to make the
investment. With the recession creating a shortfall of 11.1 million jobs that would be needed to keep pace with
the population and 9.1% unemployment, the jobs are critically needed. Moreover, the cost of financing these
Resource Lists | 118
much-needed upgrades are at historic lows, and the still-struggling economy means much cheaper construction
costs.
CONFRONTING CLIMATE CHANGE: AN EARLY ANALYSIS OF WATER AND WASTEWATER ADAPTATION COSTS
Author: Association of Metropolitan Water Agencies
Website: http://www.amwa.net/galleries/climate-change/Confronting
ClimateChangeOct09.pdf
This report provides preliminary analyses of potential climate change impacts on drinking water and wastewater
services in the United States through 2050. Included in the analyses are initial cost assessments (ranging from
$448 billion to $944 billion) of potential adaptations to address some of the likely impacts of climate change.
The analyses in this white paper, based on potential greenhouse gas scenarios and regional projections of
climate change effects, were developed to assist policy makers and the water and wastewater sectors to
understand the challenges of ensuring that reliable water and wastewater services continue to be available in
the face of a changing climate.
URBAN FLOOD RISK MANAGEMENT: A TOOL FOR INTEGRATED FLOOD MANAGEMENT
Author: Associated Programme on Flood Management, Mar 2008, 44pp.
Website: http://www.apfm.info/pdf/ifm_tools/Tools_Urban_Flood_Risk_Management.pdf
This tool guides practitioners on flood management and includes information on various types of urban flood
hazards, impacts of flooding in cities, risk assessment and management, and a framework for flood risk
management. The tool also discusses integrating flood risks in urban planning, surface water management plans,
and participatory planning.
EMERGING CLIMATE CHANGE IMPACTS ON FRESHWATER RESOURCES: A PERSPECTIVE OF TRANSFORMED
WATERSHEDS
Author: Alan P. Covich, Resources for the Future, 2009, 45pp.
Website: http://www.rff.org/rff/documents/RFF-Rpt-Adaptation-Covich.pdf
This report discusses the effect of climate change on freshwater resources in the United States. Six case studies
illustrate regional, cost-effective adaptation efforts for climate change affecting freshwater sources: Colorado
River, Boston Metro, New York City, Flint River, Everglades, and San Joaquin River. Starting on page 24 the
report also lists adaptive responses to climatic effects.
CALIFORNIA WATER SUCCESS STORIES, EXECUTIVE SUMMARY
Author: Peter H. Gleick et al., Pacific Institute, 1999, 25pp.
Website: http://pacinst.org/reports/sustainable_california/ca_water_success_stories.pdf
This executive summary sketches 29 stories of effective water management in a variety of contexts. Though an
older resource, it helps make the case that sustainable use of water does not require extraordinary actions, but
rather a commitment to expanding existing, positive trends. It also reviews the repeating themes and success
factors across the cases.
Resource Lists | 119
SOLUTIONS: SAVING WATER FOR THE FUTURE
Author: Denver Water, 2010, 40pp.
Website: http://www.denverwater.org/docs/assets/DCC8BD7A-E2B9-A215-
2D2FDDC3D6C736E7/Solutions2010.pdf
This report includes an outline of Denver’s water utility programs and projects to conserve and recycle water,
including incentive, education, and outreach programs for the public.
SUSTAINABLE WATER JOBS: A NATIONAL ASSESSMENT OF WATER-RELATED GREEN JOB OPPORTUNITIES
Author: Pacific Institute
Website: http://www.pacinst.org/reports/sustainable_water_jobs
The report finds that proactive investments increasing efficient water use and re-use will both address growing
problems associated with drought, flooding, and contamination and create jobs in a wide range of professions.
The study identifies 136 different kinds of jobs involved in implementing sustainable water strategies, from
plumbers to landscapers, engineers to irrigation specialists. Thirty-seven of these job types are also projected to
have high growth in the overall economy, with each projected to have more than 100,000 job openings across
industries by 2020.
MANAGING STORMWATER IN REDEVELOPMENT AND GREENFIELD DEVELOPMENT PROJECTS USING GREEN
INFRASTRUCTURE
Author: American Rivers
Website: http://www.americanrivers.org/newsroom/resources/managing-stormwater-using-green-
infrastructure.html
Clean water and healthy communities go hand in hand. Urban areas are increasingly using green infrastructure
to create multiple benefits for their communities. However, there have been questions whether strong
stormwater standards could unintentionally deter urban redevelopment and shift development to
environmentally damaging sprawl. Working with Smart Growth America, the Center for Neighborhood
Technology, River Network and NRDC, American Rivers highlights several communities that are protecting clean
water and fostering redevelopment, the findings show that clean water and urban redevelopment are
compatible.
IMPLICATIONS OF CLIMATE CHANGE FOR URBAN WATER UTILITIES
Author: Association of Metropolitan Water Agencies
Website: http://www.americanrivers.org/newsroom/resources/drinking-water-infrastructure.html
This white paper provides a basic understanding of the potential impacts of climate change on urban water
utilities to help move past the initial information overload that can be a barrier to understanding the issues
involved and developing appropriate responses. Based on the potential climate impacts outlined, responses to
climate change are discussed, both in terms of “adaptation strategies” to reduce or avoid impacts of climate
change, and in terms of “mitigation strategies” that utilities may adopt to reduce the contribution of water
utility operations to the production of greenhouse gas emissions.
Resource Lists | 120
ADAPTATION STRATEGIES GUIDE FOR WATER UTILITIES
Author: EPA Climate Ready Water Utilities
Website: http://www.amwa.net/galleries/climate-change/EPA%20Climate%20
Adaptation%20Guide_Jan2012.pdf
A guide developed through EPA’s Climate Ready Water Utilities initiative is designed to help drinking water and
wastewater utilities get “a better understanding of what climate change-related impacts they may face in their
region and what adaptation strategies can be used to prepare their system for those impacts.” The guide
includes basic climate science information, adaptation case studies and planning worksheets intended to help
jump-start the adaptation planning process.
THE NEW WAVE: GREENING OUR WATER INFRASTRUCTURE
Author: Green for All
Website: http://greenforall.org/resources/educators-organizers/the-new-wave-greening-our-water-
infrastructure-aworkshop-guide/
This document provides guidance on how to conduct a highly participatory workshop designed for a diverse set
of participants to explore our relationship to water as well as the causes and consequences of the current water
crisis, and to collectively generate a comprehensive action plan to ensure fresh water is available for generations
to come.
Topics include: Climate Change and Water Scarcity; Water: The Molecule of Life; Water Waste; The Water Cycle;
Urbanization and Concrete; Water Pollution; Natural Solutions; and Green Cities.
THE CERES AQUA GAUGE: A FRAMEWORK FOR 21ST CENTURY WATER RISK MANAGEMENT
Author: Ceres
Website: http://www.ceres.org/resources/reports/aqua-gauge/view
This report introduces experts and newcomers alike to the Ceres Aqua Gauge™, a new framework for assessing
corporate management of water risk. The report provides a broad overview of how competing freshwater
demands and limits to supply are beginning to affect corporate financial performance in a range of industrial
sectors. The report also identifies trends in corporate and investor responses to emerging water issues −and
explains how investors can identify holdings in their portfolios more likely to be exposed to water-related risks.
ADDRESSING CLIMATE CHANGE IN LONG-TERM WATER RESOURCES PLANNING AND MANAGEMENT: USER
NEEDS FOR IMPROVING TOOLS AND INFORMATION
Author: US Army Corps of Engineers; US Bureau of Reclamation
Website: http://www.usbr.gov/climate/userneeds/
This report seeks to focus research and technology efforts to address information and tools needed for longer-
term water resources planning and management. It found there were gaps in the information and tools to help
water managers understand how to use climate change information to make decisions, how to assess the
responses of natural systems to climate change, and how to communicate the results and uncertainties of
climate change assessments to decision-makers.
Resource Lists | 121
SHORT-TERM WATER MANAGEMENT DECISIONS: USER NEEDS FOR IMPROVED CLIMATE, WEATHER, AND
HYDROLIC INFORMATION
Author: US Army Corps of Engineers; US Bureau of Reclamation
Website: http://www.ccawwg.us/index.php/activities/addressing-climate-change-in-long-term-water-
resourcesplanning-and-management
This report seeks to focus research and technology efforts to address information and tool gaps needed for
short-term water resources planning and management. It found there were gaps in the information and tools to
help water managers understand how to use climate change information to make decisions, how to assess the
responses of natural systems to climate change, and how to communicate the results and uncertainties of
climate change to decision-makers.
ADAPTIVE RESPONSE FRAMEWORK FOR DRINKING WATER AND WASTEWATER UTILITIES
Author: EPA Climate Ready Water Utilities
Website: http://water.epa.gov/infrastructure/watersecurity/climate/upload/epa817f12009.pdf
This Framework describes approaches for water utilities seeking to become more “climate ready.” It supports
and guides utilities as they learn about and pursue management techniques and adaptive actions that can be
implemented to build climate readiness, including 11 findings and 12 recommendations. The Adaptive Response
Framework highlights six elements of becoming more Climate Ready: Climate Impact Awareness, Adaptation
Strategies, Federal and State Policies and Programs, Mitigation Strategies, Community Interest and Support, and
Partnerships Outside of the Utility.
U.S. NATIONAL WATER PROGRAM 2012 STRATEGY: RESPONSE TO CLIMATE CHANGE
Author: EPA National Water Program
Website: http://water.epa.gov/scitech/climatechange/2012-National-Water-Program-Strategy.cfm
EPA’s National Water Program 2012 Strategy: Response to Climate Change sets out long-term goals and specific
actions that are EPA’s contributions to national efforts to prepare for, and build resilience to, the impacts of a
changing climate on water resources. The 2012 Strategy is organized around five long-term programmatic vision
areas: protecting water infrastructure; coastal and ocean waters; watersheds; and water quality. The EPA
National Water Program looks forward to working with state, tribal, and local governments, as well as other
partners to implement actions that address climate change challenges in these areas.
Resource Lists | 122
PLANNING FOR SUSTAINABILITY: A HANDBOOK FOR WATER AND WASTEWATER UTILITIES
Author: EPA
Website: http://water.epa.gov/infrastructure/sustain/upload/EPA-s-Planning-for-Sustainability-
Handbook.pdf
This Handbook describes a number of steps utilities can undertake to enhance their existing planning processes
to ensure that water infrastructure investments are cost-effective over their life-cycle, resource efficient, and
support other relevant community goals. Developed after extensive consultation and input from utilities, states,
and other stakeholders, the Handbook is organized around a series of Core Elements, including:
• Setting utility sustainability goals and objectives that also support relevant community goals;
• Analyzing a range of alternatives, including green infrastructure and other innovative approaches, based on
full life-cycle costs; and
• Implementing a financial strategy, including adequate rate structures, to ensure the alternatives selected are
sufficiently funded, operated, maintained, and replaced over time.
CLIMATE READY WATER UTILITIES FINAL REPORT OF THE NATIONAL DRINKING WATER ADVISORY COUNCIL
Author: EPA National Drinking Water Advisory Council
Website: http://water.epa.gov/drink/ndwac/climatechange/upload/CRWU-NDWAC-Final-Report-12-09-10-
2.pdf
Working Group to evaluate the concept of “climate ready water utilities.” The evaluation was to provide findings
and recommendations relating to the development of a program enabling water and wastewater utilities to
prepare longrange plans that account for climate change impacts. NDWAC specifically requested that the
Working Group’s findings and recommendations cover three topics: identify the behaviors that will characterize
a climate ready utility; identify climate change-related tools, training, and products needed to enable climate
ready utility behaviors; and explore ways to encourage broad adoption through recognition or incentives
incorporated into existing United States Environmental Protection Agency (EPA) Office of Water recognition and
awards programs or new recognition programs.
NATURAL SECURITY: HOW SUSTAINABLE WATER STRATEGIES ARE PREPARING COMMUNITIES FOR A
CHANGING CLIMATE
Author: American Rivers
Website: http://www.americanrivers.org/assets/pdfs/reports-and-publications/natural-security-report.pdf
This report highlights eight forward-looking communities that have become more resilient to the impacts of
climate change by embracing green infrastructure. They have taken steps to prepare themselves in four areas
where the effects of rising temperatures will be felt most: public health, extreme weather, water supply, and
quality of life. In each case study we demonstrate how these water management strategies build resilience to
the projected impacts of climate change in that area and how the communities that have adopted them will
continue to thrive in an uncertain future.
Resource Lists | 123
CASE STUDIES OF SUSTAINABLE WATER AND WASTEWATER PRICING
Author: EPA Office of Water
Website: http://www.epa.gov/safewater/smallsystems/pdfs/guide_smallsystems_
fullcost_pricing_case_studies.pdf
This document provides eight case studies of water utilities that provide primary funding sources for
infrastructure modernization. Each case study addresses EPA’s “Four Pillars of Sustainable Infrastructure,”
including better management; full-cost pricing; efficient water use; and watershed approaches to protection.
MUNICIPAL POLICIES FOR MANAGING STORMWATER WITH GREEN INFRASTRUCTURE
Author: EPA Office of Wetlands, Oceans and Watersheds
Website: http://www.epa.gov/owow/NPS/lid/gi_case_studies_2010.pdf
This report presents the common trends in how 12 local governments developed and implemented stormwater
policies to support green infrastructure. The local policies examined in this paper include interagency
cooperation, enforcement and management issues and integration with state and federal regulations. While a
strong motivation for these policies and programs is innovation in stormwater management, many communities
are moving past the era of single objective spending and investing in runoff reduction and stormwater
management strategies that have multiple benefits. Not only do these case studies include success stories for
building a comprehensive green infrastructure program, but they also provide insight into the barriers and
failures these communities experienced while trying to create a stormwater management system that includes
more green infrastructure approaches.
CLIMATE CHANGE AND WATER RESOURCES MANAGEMENT: A FEDERAL PERSPECTIVE
Author: US Department of the Interior; US Geological Survey
Website: http://pubs.usgs.gov/circ/1331/
The purpose of this interagency report prepared by the US Geological Survey (USGS), US Army Corps of
Engineers (USACE), Bureau of Reclamation (Reclamation), and National Oceanic and Atmospheric Administration
(NOAA) is to explore strategies to improve water management by tracking, anticipating, and responding to
climate change. This report describes the existing and still needed underpinning science crucial to addressing the
many impacts of climate change on water resources management.
Resource Lists | 124
CLIMATE CHANGE VULNERABILITY ASSESSMENTS: A REVIEW OF WATER UTILITY PRACTICES
Author: EPA Office of Water
Website: http://water.epa.gov/scitech/climatechange/upload/Climate-Change-Vulnerability-Assessments-
Sept-2010.pdf
This study examines and documents the steps taken by some of the leading utilities in an attempt to identify the
emergent characteristics of water utility climate change vulnerability assessments. By examining the approaches
taken and articulating the steps, information, and judgments needed for such decision making, it is the EPA’s
hope to contribute to the collaborative problem solving among the user and research communities who are
working to further refine and validate such procedures. The study describes the activities of eight water utilities
who have conducted climate vulnerability assessments: East Bay Municipal Utility District, City of Boulder
Utilities Division, Denver Water, Massachusetts Water Resources Authority, New York City Department of
Environmental Protection, Portland Water Bureau, Lower Colorado River Authority, and Seattle Public Utilities.
THIRSTY FOR ANSWERS
Author: Natural Resources Defense Council
Website: http://www.nrdc.org/water/thirstyforanswers.asp
Cities across the United States face significant water-related vulnerabilities due to climate change, ranging from
water shortages to more intense storms and floods to sea level rise. To help cities become more resilient to the
impacts of climate change, NRDC reviewed more than 75 scientific studies and other reports to summarize the
water-related vulnerabilities in 12 cities across the United States. Although there may still be some uncertainty
about what particular impacts threaten cities and how quickly or severely they might occur, action at the local
level is the most effective method of reducing and preventing the negative effects of climate change. NRDC
urges cities to prepare for the coming challenges relating to water resources. Fortunately, as highlighted in their
report, there are steps cities are already taking to become more resilient.
FINANCING
FINANCING THE RESILIENT CITY: A DEMAND DRIVEN APPROACH TO DEVELOPMENT, DISASTER RISK
REDUCTION AND CLIMATE ADAPTATION
Author: An ICLEI White Paper, ICLEI Global Report, 2011.
Website: http://www.cakex.org/virtual-library/financing-resilient-city-demand-driven-approach-
development-disaster-risk-reduction-
This report provides a conceptual framework for better understanding how to integrate climate and other risk
reduction measures in urban areas and systems. Here resilience is offered as an economic and performance
model with far reaching implications. The report calls for more locally responsive climate financing investment
strategies and instruments. It also sets the scene for and provides a valuable contribution to the ongoing
international discussions on climate financing for adaptation; how it can be mobilized, leveraged and innovated
for the local level.
Resource Lists | 125
RESTORING FLOWS: FINANCING THE NEXT GENERATION OF WATER SYSTEMS: A STRATEGY FOR COALITION
BUILDING
Author: Ceres, American Rivers, 2012.
Website: http://www.circleofblue.org/waternews/wp-content/uploads/2012/05/Ceres_restoring-the-
flows.pdf
This document is an attempt to distill those ideas into a set of high-priority, high-impact strategies that can be
jointly pursued by the many stakeholders who have a stake in shaping a more prosperous water future: the
utilities who provide water, the financial intermediaries who help capital flow to those water providers, the
investors who provide that capital, the NGOs who advocate for better water stewardship and job creation
through infrastructure investments, and the foundations who enable cooperation across sectors.
FAST OUT OF THE GATE: HOW DEVELOPING ASIAN COUNTRIES CAN PREPARE TO ACCESS INTERNATIONAL
GREEN GROWTH FINANCING (USAID)
Website: http://lowemissionsasia.org/resources/fast-out-gate-vol-1.pdf
The report reviews more than 200 public and private sector funds and mechanisms for financing projects,
businesses, and infrastructure in the Asia region that mitigate emissions of greenhouse gases and thereby
address climate change. The study aims to help Asian policymakers, public and private fund managers, banks,
and even local communities identify ways to fund low-carbon development. A key message from the report is
that countries that are first to develop strong measurement, reporting, and verification frameworks for
greenhouse gas emissions—a central requirement of public and private sector funds—will have the advantage in
accessing climate finance.
PLANNING, CONNECTING, AND FINANCING CITIES—NOW: PRIORITIES FOR CITY LEADERS.
Author: World Bank
Website: http://siteresources.worldbank.org/EXTSDNET/Resources/Urbanization-Planning-Connecting-
Financing-2013.pdf
This report provides Mayors and other policymakers with a policy framework and diagnostic tools to anticipate
and implement strategies that can avoid their cities from locking into irreversible physical and social structures.
To help mayors and other policy makers identify the bottlenecks they face as urbanization accelerates and to
propose policy options to tackle such challenges, the World Bank— with support from the Swiss State
Secretariat for Economic Affairs (SECO) and the Cities Alliance—has carried out diagnostics called “Urbanization
Reviews” in 12 countries across 4 continents. This program has created a bedrock of credible facts and a set of
solutions that are tailored to the fiscal, political, and administrative realities of cities. This report, Planning,
Connecting, and Financing Cities—Now distills the lessons learned from these diagnostics into a practical
framework for sustainable urbanization, which is organized around the three policy pillars of the title.
Resource Lists | 126
GUIDANCE FOR MUNICIPAL STORMWATER FUNDING
Author: Doug Harrison Scott Tucker, eds., USEPA, NAFSMA, Jan 2006, 140pp.
Website: http://www.nafsma.org/Guidance%20Manual%20Version%202X.pdf
This paper discusses the evolution of local government’s role in municipal stormwater management and serves
as a resource to local practitioners as they address stormwater program financing challenges. The guide covers
various sources of funding, legal considerations, implementation of stormwater funding programs and case
studies from US cities.
ADAPT ASIA-PACIFIC SESSION AT THE 3RD APAN FORUM 2013: "ACCESSING CLIMATE CHANGE ADAPTATION
FINANCE.” MARCH 2013
Website: http://www.adaptasiapacific.org/activities/adapt-asia-pacific-session-3rd-apan-forum-2013-
accessing-climate-change-adaptation ADAPT Asia-Pacific Funds Compendium:
http://www.adaptasiapacific.org/funds-compendium
Asia-Pacific countries share insights to accessing international climate finance for adaptation.
8 POINTS ON FINANCING CLIMATE CHANGE ADAPTATION IN URBAN AREAS
Author: David Satterthwaite, IIED. June 2013. Website: http://www.iied.org/8-points-financing-climate-change-adaptation-urban-areas
This report discusses major issues related to financing climate change adaptation in urban areas. It focuses on where the money might come from, whether governments and international agencies will act with the needed urgency and whether those who need to act get the support they require. The report describes a meeting on Financing Urban Adaptation to Climate Change held at IIED in June 2013 which highlighted eight points to guide funding.
CLEAN WATER FINANCING: WATER QUALITY COOPERATIVE AGREEMENTS
Author: EPA, last updated Jul 2010
Website: http://water.epa.gov/grants_funding/cwf/waterquality.cfm
This page links to a number of water impact-relevant funding programs, including the Clean Water State
Revolving Loan Fund (e.g. for estuary protection projects), Water Quality Cooperative Agreements, and Drinking
Water State Revolving Loan Funds.
Resource Lists | 127
GOING GREEN TO SAVE GREEN: ECONOMIC BENEFITS OF GREEN INFRASTRUCTURE PRACTICES
Author: American Rivers
Website: http://www.americanrivers.org/newsroom/resources/going-green-to-save-green.html
American Rivers’ series of new reports highlights the economic benefits of green infrastructure strategies to
better manage polluted runoff. These practices, from rain gardens to green roofs, work by capturing rainwater
where it falls. By reducing the polluted runoff that flows into rivers and streams, green infrastructure practices
play a critical role in protecting clean rivers. Unlike most traditional water infrastructure, green infrastructure
practices can help communities save money while also providing a number of economic benefits that include
reduced costs, increased energy efficiency, mitigating flooding and improving air quality.
CHARTING NEW WATERS CONVENING REPORT: FINANCING SUSTAINABLE WATER INFRASTRUCTURE
Author: American Rivers, Ceres, and the Johnson Foundation at Wingspread
Website: http://www.johnsonfdn.org/aboutus/water-infrastructure
The Financing Sustainable Water Infrastructure report is the product of a meeting convened by The Johnson
Foundation, in collaboration with American Rivers and Ceres, that brought together a group of experts to discuss
ways to drive funding toward the infrastructure needed for the 21st century. Specifically, this group focused on
the following questions:
What new financing techniques can communities use to pay for integrated and sustainable infrastructure
approaches? How can we direct private capital toward more sustainable water management projects? The
report finds that while options for more cost-effective, resilient and environmentally sustainable systems are
available, they are not the norm. In fact, investment in inflexible and expensive “siloed” water systems is still
pervasive, despite the fact that money available for financing water infrastructure is increasingly scarce.
RESTORING THE FLOWS: FINANCING THE NEXT GENERATION OF WATER SYSTEMS – A STRATEGY FOR
COALITION BUILDING
Author: American Rivers, Ceres
Website: http://www.ceres.org/resources/reports/restoring-flows-financing-the-next-generation-of-water-
systemsa-strategy-for-coalition-building/view
In this report, Ceres and American Rivers join forces to highlight the importance of bringing together
environmentalists, economists, water utilities, water users, financial institutions, foundations, investors and
labor groups to create opportunities for the creation of shared pursuits beyond the boundaries of politics,
watersheds and economic sectors that typically define our relationship to water.
This report originates from a convening of water providers, finance experts and NGOs in August 2011, as part of
The Johnson Foundation’s Charting New Waters. With support from the Russell Family Foundation, Ceres and
American Rivers were able to continue that dialogue in a series of interviews. This document is an attempt to
distill those ideas into a set of high-priority, high-impact strategies that can be jointly pursued by the many
stakeholders who have a stake in shaping a more prosperous water future.
Resource Lists | 128
ECOSYSTEM SERVICES
STATE OF WATERSHED PAYMENTS 2012
Author: Ecosystem Marketplace
Website: http://www.ecosystemmarketplace.com/pages/dynamic/
resources.library.page.php?page_id=9544§ion=our_publications&eod=1
The report, State of Watershed Payments 2012, is the second installment of the most comprehensive inventory
to date of initiatives around the world that are paying individuals and communities to revive or preserve water-
friendly features of the landscape. Such features include wetlands, streams, and forests that can capture, filter,
and store freshwater.
ENVIROATLAS
Author: U.S. EPA
Website: http://www.epa.gov/research/enviroatlas/index.htm
Currently available as a password protection beta-version, EnviroAtlas is a collection of tools and resources that
provides geospatial data, maps, research, and analysis on the relationships between nature, people, health, and
the economy. Using EnviroAtlas, you can see and explore information related to the benefits that humans
receive from nature.
WHY THE EMERGENCY MANAGEMENT COMMUNITY SHOULD BE CONCERNED ABOUT CLIMATE CHANGE: A
DISCUSSION OF THE IMPACT OF CLIMATE CHANGE ON SELECTED NATURAL HAZARDS
Author: Joel Silverman et al., CNA Analysis and Solutions, Jun 2009, 48pp.
Website: http://www.cna.org/sites/default/files/SAS%20Why%20the%20
Emergency%20Management%20Community%20Should%20be%20Concerned%20about%20Climate%20Change.
This draft report outlines key climate change issues for consideration from an emergency management
perspective and introduces potential implications for the near-, medium-, and long-term. It summarizes the
current climate change literature, focusing on the estimated impacts on the location, frequency, and occurrence
of natural hazards, such as tropical cyclones, wildfires, floods, and winter storms. It also identifies related policy
issues in the areas of disaster mitigation, preparedness, response, and recovery. Finally, it provides potential
courses of action to support future dialogue among emergency management practitioners from all levels of
government to explore policy solutions in greater depth.
Resource Lists | 129
MITIGATING NEW YORK CITY’S HEAT ISLAND WITH URBAN FORESTRY, LIVING ROOFS, AND LIGHT SURFACES
Author: New York State Energy Research and Development Authority (NYSERDA), 2006, 173pp.
Website: http://www.nyserda.ny.gov/Publications/Research-and-Development/Environmental/EMEP-
Publications/~/media/Files/Publications/Research/%20Environmental/EMEP/06-06%20Complete%20report-
web.ashx
This report includes a step-by-step cost-benefit analysis of the titular approaches to mitigating the urban heat
island effect.
FOUR FOREST RESTORATION INITIATIVE
Author: US Forest Service, accessed March 2012
Website: http://www.fs.usda.gov/4fri
The overall goal of the Four Forest Restoration Initiative (4FRI) is to restore the structure, pattern and
composition of fire-adapted ecosystems, which will provide for fuels reduction, forest health, and wildlife and
plant diversity. A key objective is doing this while creating sustainable ecosystems and industries in the long
term. Appropriately-scaled businesses will likely play a key role in the effort by harvesting, processing and selling
wood products. The restoration based work opportunities are expected to create jobs across northern Arizona.
LANDSCAPE CONSERVATION COOPERATIVES
Author: Department of Interior, accessed March 2012
Website: http://www.doi.gov/lcc/index.cfm
Landscape Conservation Cooperatives (LCCs) recognize that these challenges transcend political and
jurisdictional boundaries and require a more networked approach to conservation –holistic, collaborative,
adaptive and grounded in science to ensure the sustainability of America’s land, water, wildlife and cultural
resources. As a collaborative, LCCs seek to identify best practices, connect efforts, identify gaps, and avoid
duplication through improved conservation planning and design. Partner agencies and organizations coordinate
with each other while working within their existing authorities and jurisdictions. The 22 LCCs collectively form a
national network of land, water, wildlife, and cultural resource managers, scientists, and interested public and
private organizations –within the US and across international borders—that share a common need for scientific
information and interest in conservation.
CDC POLICY ON CLIMATE CHANGE AND PUBLIC HEALTH
Author: Center for Disease Control and Prevention, 2pp.
Website: http://www.cdc.gov/climateandhealth/policy.htm
This statement summarizes some of the main public health risks and populations at risk for specific climate
impacts. It also identifies eleven priority health responses, most of which point toward actions to be taken in the
future.
Resource Lists | 130
ENVIRONMENTAL HEALTH PRIMER
Author: National Association of Local Boards of Health, National Environmental Health Science and
Protection Accreditation Council, Center for Disease Control and Prevention, 2003.
Webpage: http://www.cdc.gov/nceh/ehs/NALBOH/NALBOH_EH_Primer.htm
This primer provides a basic understanding of environmental public health concepts and principles to help local
officials make better decisions. Geared to local boards of health but provides useful background information for
other official audiences too. Chapters of relevance to climate adaptation include air quality (in Part 2), drinking
water and wastewater (Part 3), and vector control (in Part 4).
MONITORING & EVALUATION
LEARNING TO ADAPT: MONITORING AND EVALUATION APPROACHES IN CLIMATE CHANGE ADAPTATION AND
DISASTER RISK MANAGEMENT – CHALLENGES, GAPS AND WAYS FORWARD.
Author: Villanueva, P.S. Strengthening Climate Resilience, 2011.
Website: http://community.eldis.org/.5a093c0d
This working paper is a methodological contribution to the emerging debate on monitoring and evaluation
(M&E) in the context of climate change adaptation and disaster risk reduction. Effectively managing disaster risk
is critical for adapting to the impacts of climate change, however disasters risk reduction M&E practice may be
limited in capturing progress towards adaptation.
MONITORING AND EVALUATION FRAMEWORK FOR ADAPTATION TO CLIMATE CHANGE
Author: UNDP, 2007-2008.
Website: http://www.seachangecop.org/node/1480
To fulfill the mandates of the SCCF and LDCF, the draft M&E framework for adaptation presented here is
organized according to seven “Thematic Areas” (TAs) representing key climate change-sensitive development
objectives, as well as priorities that have emerged from over 130 country assessments and the scientific
consensus of the IPCC.
EVALUATION OF ADAPTATION TO CLIMATE CHANGE FROM A DEVELOPMENT PERSPECTIVE
Author: Hedger, MM, et al. Institute of Development Studies Sussex, 2008.
Website: http://www.seachangecop.org/files/documents/2008_08_IDS_Evaluating_
CCA_from_a_development_perspective.pdf
The aim is to present an overview of approaches relevant to or used for the evaluation of interventions intended
to support adaptation to climate change and to identify main gaps in evaluation of adaptation interventions. The
report sought answers for the following questions: What types of interventions can already be considered for
evaluation with an ‘adaptation lens’? What additional questions should be asked when applying an ‘adaptation
lens’ to evaluate such interventions? What indicators of success relating to adaptation have been used in
different types of projects and programs?
Resource Lists | 131
SYNTHESIS REPORT ON EFFORTS UNDERTAKEN TO MONITOR AND EVALUATE THE IMPLEMENTATION OF
ADAPTATION PROJECTS, POLICIES AND PROGRAMS AND THE COSTS AND EFFECTIVENESS OF COMPLETED
PROJECTS, POLICIES AND PROGRAMS, AND VIEWS ON LESSONS LEARNED, GOOD PRACTICES, GAPS AND
NEEDS.
Author: UNFCCC, 2010.
Website: http://unfccc.int/resource/docs/2010/sbsta/eng/05.pdf
This document synthesizes information contained in submissions from Parties and organizations and in other
relevant sources on efforts undertaken to monitor and evaluate the implementation of adaptation measures,
including projects, policies and programs. This document synthesizes efforts in this area and also reports on the
development and use of adaptation indicators. A summary of lessons learned, good practices, gaps and needs is
provided, and the document concludes by raising issues for further consideration.
TRACKING PROGRESS FOR EFFECTIVE ACTION: A FRAMEWORK FOR MONITORING AND EVALUATING
ADAPTATION TO CLIMATE CHANGE
Author: Sanahuja, H.E., GEF Climate-Eval, 2011.
Website: http://www.climate-eval.org/www.climate-
eval.org/?q=system/files/studies/A%20Framework%20for%20Monitoring%20and%20Evaluating%20Adaptation
%20to%20Climate%20Change.pdf
This framework paper is largely about the application of sound monitoring and evaluation methodologies and
processes to initiatives of adaptation to climate change. It is intended as a practical guide to allow for more fluid
progress towards capacity development for monitoring and evaluating adaptation to climate change
interventions.
IIED CLIMATE CHANGE WORKING PAPER 1: TRACKING ADAPTATION AND MEASURING DEVELOPMENT
Author: Brooks, N; Anderson, S; Ayers, J; Burton, I; and Tellam, I. IIED, 2011.
Website: http://www.seachangecop.org/node/118
As adaptation to climate change becomes the focus of increasing attention and the target of significant
spending, there is a growing need for frameworks and tools that enable organisations to track and assess the
outcomes of adaptation interventions. This paper presents a coherent framework for climate change adaptation
programming, including potential indicators, or indicator categories/types, for tracking and evaluating the
success of adaptation support and adaptation interventions. The paper begins with a discussion of some of the
key issues related to the evaluation of adaptation, and outlines some of the main difficulties and constraints
with respect to the development of adaptation indicators. Next, an evaluation framework is proposed and
indicator categories or “domains” are identified. Lastly, key conclusions are provided and a theory of change is
outlined that shows how development and use of the framework could lead to more effective adaptation
investments for climate resilient development.
Resource Lists | 132
MAKING ADAPTATION COUNT: CONCEPTS AND OPTIONS FOR MONITORING AND EVALUATION OF CLIMATE
CHANGE ADAPTATION
Author: GIZ, WRI, 2011.
Website: http://pdf.wri.org/making_adaptation_count.pdf
This paper aims to provide adaptation and development practitioners with a practical framework for developing
M&E systems that can track the success and failure of adaptation initiatives in the development context.
ADAPTME TOOLKIT FOR MONITORING AND EVALUATION OF ADAPTATION ACTIVITIES
Author: Pringle, P.; Lonsdale, K.; Gawith, M.; Goldthorpe, M.; and Street, R. UKCIP, 2011.
Website: http://www.ukcip.org.uk/wordpress/wp-content/AdaptME/AdaptME.pdf
This toolkit will help to refine your evaluation purpose and objectives, understand how specific traits of climate
adaptation can make evaluation challenging and how you can overcome these challenges, draw out, understand
and re-evaluate your assumptions, consider how progress and performance might be best measured and
evaluated, identify examples, good practice and techniques which may help ensure your evaluation is robust in
the context of climate change, prioritise your evaluation activities, recognising that evaluations need to be
proportionate to the investment and are resource limited.
URBAN MANAGEMENT CENTER EQUITY OF SERVICE DELIVERY TO URBAN POOR
Website: http://umcasia.org/uploads/GIS_Based_Mapping_of_Living_ Heritage_of_Surat_Report_Randar_Gamtalpdf.pdf
A survey tool undertaken in almost 1200 slum pockets across all cities of Gujarat to understand the level of services they receive. This was done with a view to understand the equity of services.
COASTAL REGIONS AND CLIMATE CHANGE
SYNTHESIS OF ADAPTATION OPTIONS FOR COASTAL REGIONS
Author: EPA, 2009, 32pp.
Website: http://water.epa.gov/type/oceb/cre/upload/CRE_Synthesis_1-09
This guide provides a brief introduction to key physical impacts of climate change on estuaries and a review of
on-the-ground adaptation options available to coastal managers to reduce their systems’ vulnerability to climate
change impacts. Estuaries are highly and uniquely vulnerable to climate change.
Resource Lists | 133
RESILIENT COASTS: A BLUEPRINT FOR ACTION
Author: Heinz Center and Ceres, Apr 2009, 9pp.
Website: http://www.ceres.org/resources/reports/resilient-coasts-blueprint-for-action-2009
This blueprint was designed for federal, state and local leaders and identifies critical steps to reduce risks and
losses due to climate change. It discusses basic principles of coastal resiliency, and suggests strategies for
climate change adaptation, including financing and insurance. The blueprint is designed to help individuals,
communities and ecosystems withstand and recover from the impacts of coastal storms and rising sea levels.
COASTAL COMMUNITIES AND CLIMATE CHANGE: MAINTAINING FUTURE INSURABILITY
Author: Lloyd’s of London, 2008, 28pp.
Website: http://www.lloyds.com/~/media/Lloyds/Reports/360/360%20Climate%20reports/
360_Coastalcommunitiesandclimatechange.pdf
This report looks at the impact of climate change on flood risk at a number of coastal locations around the
world, considering sea level rise, the effect of wind speed on storm surges, and changes in land use. Although
the four case studies mentioned in the report are from outside the United States, the lessons learned are
applicable to any coastal community. That the publisher is a large insurance company may aid planners in
making the case for adaptation action.
ADAPTING TO COASTAL CLIMATE CHANGE: A GUIDEBOOK FOR DEVELOPMENT PLANNERS
Author: USAID et al., May 2009, 148pp.
Website: http://pdf.usaid.gov/pdf_docs/PNADO614.pdf
This guidebook provides a 5-step process for integrating climate change adaptation into development planning
in coastal regions. The guide goes in-depth into assessment, action selection, integration, implementation, and
evaluation. It also provides descriptions of several coastal adaptation measures.
THE RESILIENCE OF NEW ORLEANS: URBAN AND COASTAL ADAPTATION TO DISASTERS AND CLIMATE CHANGE
Author: Douglas J. Meffert, Lincoln Land Institute, 2008, 16pp.
Website: http://www.lincolninst.edu/pubs/1508_The-Resilience-of-New-OrleansStorms/Flooding
This report includes an assessment of the carrying capacity of Coastal Louisiana in terms of geography,
infrastructure costs, and land use challenges and opportunities. The methodology used can guide similar
assessments for other coastal regions.
Resource Lists | 134
GENERAL RESOURCES
SUSTAINABLE SERVICE DELIVERY IN AN INCREASINGLY URBANIZED WORLD
Author: USAID Policy Draft March 2013.
Website: http://www.usaid.gov/sites/default/files/documents/1870/USAIDSustainable
UrbanServicesPolicy_DraftforReview_March2013.pdf
This report provides tools to help countries and communities improve the delivery of services in urban areas. By
focusing on good governance, pro-poor service delivery models, and the sound financial management of water,
sanitation, energy, and urban health services, this Policy seeks to prepare the Agency for the ongoing rapid
growth of cities throughout the world.
USAID ASIA-PACIFIC REGIONAL CLIMATE CHANGE ADAPTATION ASSESSMENT (2010)
Website: http://pdf.usaid.gov/pdf_docs/PNADS197.pdf
In recognition of the region’s vulnerability to climate change, its role in mitigating greenhouse gas (GHG) emissions, and the moral responsibility of developed countries to assist the most vulnerable people to adapt to climate change as expressed by the Obama administration, this report seeks to identify opportunities for USAID to deepen its regional engagement in supporting adaptation to climate change in Asia.
MEKONG ADAPTATION AND RESILIENCE TO CLIMATE CHANGE (MEKONG ARCC)
Website: http://www.mekongarcc.net/sites/default/files/mekongarcc_draft_synthesis_
report.pdf
This document describes the Mekong ARCC project, a five- year program (2011-2016) funded by the USAID
Regional Development Mission for Asia (RDMA) in Bangkok and implemented by DAI in partnership with ICEM -
International Centre for Environmental Management and World Resources Institute (WRI). The project focuses
on identifying the environmental, economic and social effects of climate change in the Lower Mekong Basin
(LMB), and on assisting highly exposed and vulnerable rural populations in ecologically sensitive areas increase
their ability to adapt to climate change impacts on water resources, agricultural and aquatic systems, livestock,
ecosystems, and livelihood options.
USAID'S URBAN SERVICES POLICY (DRAFT)
Website: http://www.usaid.gov/sites/default/files/documents/1870/USAIDSustainable UrbanServicesPolicy_DraftforReview_March2013.pdf
Supporting the Agency’s broader development objectives, USAID’s Sustainable Urban Services Policy seeks to provide tools to USAID overseas Missions so they can help countries and communities improve the delivery of services in urban areas. This Policy, which is based on existing Agency objectives, enables Missions to empower countries to deliver urban services. By focusing on good governance, pro-poor service delivery models, and the sound financial management of water, sanitation, energy, and urban health services,
Resource Lists | 135
this Policy seeks to prepare the Agency for the ongoing rapid growth of cities throughout the world.
STAYING GREEN AND GROWING JOBS: GREEN INFRASTRUCTURE OPERATIONS AND MAINTENANCE AS CAREER
PATHWAY STEPPING STONES
Author: Green for All and American Rivers
Website: http://greenforall.org/wordpress/wp-content/uploads/2013/04/Staying-Green-and-Growing-Jobs-
April-2013.pdf.pdf
The operations and maintenance (O&M) of green infrastructure represents a significant opportunity to create
entry level jobs in the green sector for individuals from disadvantaged communities. In the coming years,
thousands of new green infrastructure (GI) projects will be installed throughout the country. They will require a
workforce trained to maintain and monitor the projects. This report reveals that water utilities investing in green
infrastructure can outsource O&M work to workforce development programs that train individuals in green
infrastructure – in fact, some already do. Operations and maintenance work gives disadvantaged community
members access to jobs and career on-ramps while performing the O&M work required by water utilities.
JOB PROJECTION AND TRACKING GUIDE
Author: Green for All
Website: http://greenforall.org/wordpress/wp-content/uploads/2012/04/Job-Projection-and-Tracking-
Guide_03.06.2012.pdf
This guide is a resource for agencies and other organizations responsible for overseeing GI projects, and it
highlights the fundamental importance of using sound and persuasive data to foster investment in green jobs. It
also calls on agencies that invest in green infrastructure to increase their efforts to track project job outcomes.
Unless they collect data on GI project outcomes, agencies and other entities cannot demonstrate the benefits
that GI projects create. By providing information in this guide about the benefits of, and challenges to, job
tracking and job projection, Green For All’s goal is to promote investment in green water infrastructure while
also creating quality jobs that provide family supporting wages.
FIREWISE COMMUNITIES
Author: National Fire Protection Association, 2012.
Website: http://www.firewise.org/
This website houses information for individuals, firefighters, developers and municipal officials on reducing
wildfire risk in communities, particularly in the rural-urban interface.
CALIFORNIA FIRE ALLIANCE
Author: California Fire Alliance, 2012.
Website: http://www.cafirealliance.org/
This website houses a wide range of information including sample community fire plans.
Resource Lists | 136
PREPARING A COMMUNITY WILDFIRE PROTECTION PLAN
Author: National Association of Counties et al, 2004, 12pp.
Website: http://www.stateforesters.org/files/cwpphandbook.pdf
This report from the National Association of Counties, National Association of State Foresters, the Society of
American Foresters and the Western Governor’s Association provides a step by step process to develop a
community level plan.
TRANSPORTATION AND CLIMATE CHANGE CLEARINGHOUSE—CLIMATE CHANGE IMPACTS
Author: Department of Transportation, 2010.
Website: http://climate.dot.gov/impacts-adaptations/forcasts.html
This annotated list of resources on the impacts of climate change on transportation infrastructure is continually
updated.
CLIMATE CHANGE INDICATORS IN THE UNITED STATES
Author: USEPA, 2010, 80pp.
Website: http://www.epa.gov/climatechange/pdfs/climateindicators-full.pdf
This report gives an overview of climate impacts and 24 climate change indicators for the United States. The
report uses visual tools to help readers interpret these indicators.
GLOBAL CLIMATE CHANGE IMPACTS IN THE UNITED STATES
Author: US Global Change Research Program, 2009, 196pp.
Website: http://www.globalchange.gov/publications/reports/scientific-assessments/us-impacts
This report summarizes, in plain language, the science and the impacts of climate change on the United States
by region, now and in the future. It provides an overview of impacts on various aspects of society and the
economy such as energy, water, agriculture, and health.
COASTAL CLIMATE ADAPTATION
Author: NOAA, 2010.
Website: http://collaborate.csc.noaa.gov/climateadaptation/default.aspx
This site includes a wide range of resources on climate change impacts and adaptation, and a forum for coastal
state and local government officials. The list of resources is organized by topic area and state, and includes
adaptation plans, action plans, case studies, strategies, guidebooks, outreach materials, risk and vulnerability
assessments, stakeholder engagement guides, and training and workshop materials.
Resource Lists | 137
ASSESSMENT OF CLIMATE CHANGE IMPACTS ON LOCAL ECONOMIES
Author: Rosalind, H. Bark, Lincoln Land Institute, Oct 2009, 58pp.
Website: http://www.lincolninst.edu/pubs/1706_Assessment-of-Climate-Change-Impacts-on-Local-
Economies
This report includes an overview of climate change impacts and actions in the Intermountain West: urban heat
island and excessive heat events, urban water resources, flooding and floodplain development, ski resorts,
national forests and parks, and ranching and farming.
CLIMATE CHANGE 101: ADAPTATION
Author: Pew Center on Global Climate Change, Jan 2011, 14pp.
Website: http://www.c2es.org/docUploads/climate101-adaptation.pdf
This report provides a summary analysis of climate change adaptation, providing an overview of the impacts
expected across the United States, an argument for adaptation planning, and a series of successful strategies.
MANAGING THE RISKS OF EXTREME EVENTS AND DISASTERS TO ADVANCE CLIMATE CHANGE ADAPTATION:
SUMMARY FOR POLICYMAKERS
Website: http://ipcc-wg2.gov/SREX/images/uploads/SREX-SPMbrocure_FINAL.pdf
This summary for policymakers presents key findings from the Special Report on Managing the Risks of Extreme
Events and Disasters to Advance Climate Change Adaptation (SREX). The SREX approaches the topic by assessing
the scientific literature on issues that range from the relationship between climate change and extreme weather
and climate events (‘climate extremes’) to the implications of these events for society and sustainable
development. The assessment concerns the interaction of climatic, environmental, and human factors that can
lead to impacts and disasters, options for managing the risks posed by impacts and disasters, and the important
role that non-climatic factors play in determining impacts.
COPING WITH GLOBAL CLIMATE CHANGE: THE ROLE OF ADAPTATION IN THE UNITED STATES
Author: William E. Easterling III et al., Pew Center on Global Climate Change, 2004, 52pp.
Website: http://www.pewclimate.org/global-warming-in-depth/all_reports/adaptation
This report provides a strong overview of proactive adaptation approaches, including infrastructure planning
and development, avoidance of “maladaptations,” and the role of public policy. It provides more detail on
approaches to agriculture, water resources, and sea level rise.
Resource Lists | 138
CITIES PREPARING FOR CLIMATE CHANGE: A STUDY OF SIX URBAN REGIONS
Author: Clean Air Partnership, 2007.
Website: http://www.cleanairpartnership.org/pdf/cities_climate_change.pdf
This report incorporates the lessons learned from six “early adopters” –London, New York, Boston region,
Halifax, Greater Vancouver, and Seattle and King County –and addresses these experiences by phase of the
adaptation planning process.
IMPLEMENTING CLIMATE CHANGE ADAPTATION: LESSONS LEARNED FROM TEN EXAMPLES
Author: Headwaters Economics, Feb 2012.
Website: http://headwaterseconomics.org/wphw/wp-
content/uploads/Climate_Adaptation_Lessons_Learned.pdf
This report provides practical examples of adaptation planning and implementation from cities and counties
across the US, including Boulder (CO), Chicago (IL), Chula Vista (CA), Eugene (OR), Keene (NH), Miami-Dade
County (FL), New York City (NY), Olympia (WA), Portland (OR) and Taos (NM) and reports on lessons learned.
EXCESSIVE HEAT EVENTS GUIDEBOOK
Author: USEPA, Jun 2006, 60pp.
Website http://www.epa.gov/heatisland/about/pdf/EHEguide_final.pdf
This guidebook provides information that local public health officials and others need to begin assessing their
vulnerability to excessive heat events and developing and implementing notification and response programs.
Cost/benefit guidelines are also included.
HEAT ISLAND EFFECT
Author: EPA, last updated Aug 2010.
Website: http://www.epa.gov/heatislands/index.htm
This website provides access to EPA’s Urban Heat Island Community Actions Database, by state & locality,
initiative type, and strategy. Initiative types include ordinances, building codes, and outreach programs;
strategies include trees and vegetation, green roofs, cool roofs, and cool pavements. It also has resources such
as outreach materials, a compendium of strategies, and a Mitigation Impact Screening Tool.
ADAPTING TO URBAN HEAT: A TOOLKIT FOR LOCAL GOVERNMENTS
Author: Sara P. Hoverter, Georgetown Climate Center, 2012, 82pp.
Website: http://www.law.georgetown.edu/academics/academic-programs/clinical-programs/our-
clinics/HIP/upload/Urban-Heat-Toolkit_RD2.pdf
This analytic tool helps policy makers to consider a combination of four built-environment changes (cool roofs,
green roofs, cool pavements, and urban forestry) and provides clear criteria for selecting among them, along
with examining the roles government can play in pursuing these changes: shaping government’s own
operations, mandating or providing incentives for private choices, and engaging in public education.