Embed Size (px)
Citation preview

Technical Assistance Consultant’s Report
This consultant’s report does not necessarily reflect the views of ADB or the Government concerned, and ADB and the Government cannot be held liable for its contents. (For project preparatory technical assistance: All the views expressed herein may not be incorporated into the proposed project’s design.
Project Number: 44429 October 2014
India: Climate Adaptation through Sub-Basin Development Program (Financed by the Technical Assistance Special Fund)
Prepared by
Mott MacDonald
Delhi, India
For Water Resources Department, Public Works Department, Government of Tamil Nadu
Climate Adaptation through Sub-Basin
Development Program
PPTA Final Report
October 2014
Asian Development Bank
Climate Adaptation through Sub-Basin Development Program PPTA Final Report
Revision Date Originator Checker Approver Descript ion
Click here to enter text.
A 14 April 2014 PPTA Team I Hogg P Ede
First Draft
B 17 September 2014 PPTA Team I Hogg P Ede Second Draft
C 10 October 2014 PPTA Team I Hogg P Ede Final
Issue and revision record
Informat ion Class: Standard
This document is issued for the party which commissioned it and for specific purposes connected with the above-captioned project only. It should not be relied upon by any other party or used for any other purpose.
We accept no responsibility for the consequences of this document being relied upon by any other party, or being used for any other purpose, or containing any error or omission which is due to an error or omission in data supplied to us by other parties.
This document contains confidential information and proprietary intellectual property. It should not be shown to other parties without consent from us and from the party which commissioned it.
324440/IDD/IDC/1/B 10 October2014 Final Report Final V1
Climate Adaptation through Sub-Basin Development Program PPTA Final Report
Chapter Tit le Page
Executive Summary i
1 Rationale for CASDP 1
2 Execution of the PPTA 3
2.1 PPTA Consultants and Contractors _____________________________________________________ 3 2.2 ToR for Program Preparation __________________________________________________________ 3 2.3 Deliverables from the Main Consultancy _________________________________________________ 4 2.4 Reporting and Review Missions ________________________________________________________ 5
3 The Project Area 8
3.1 The Cauvery River Basin _____________________________________________________________ 8 3.2 Water Development _________________________________________________________________ 9 3.2.1 The Cauvery River Basin _____________________________________________________________ 9 3.2.2 The Cauvery River Sub-Basin in Tamil Nadu _____________________________________________ 11 3.2.3 The Vennar Irrigation and Drainage System _____________________________________________ 12
4 Due Diligence 17
4.1 Water Resources Issues ____________________________________________________________ 17 4.2 Availability of Surface Water __________________________________________________________ 17 4.3 Availability of Groundwater ___________________________________________________________ 18 4.3.1 Aquifers _________________________________________________________________________ 18 4.3.2 Groundwater Quality________________________________________________________________ 21 4.3.3 Groundwater Development ___________________________________________________________ 23 4.4 Water Demand ____________________________________________________________________ 24 4.4.1 Agriculture _______________________________________________________________________ 24 4.4.2 Aquaculture ______________________________________________________________________ 24 4.4.3 Power Generation__________________________________________________________________ 25 4.4.4 Industry __________________________________________________________________________ 25 4.4.5 Drinking Water ____________________________________________________________________ 26 4.4.6 Return flow _______________________________________________________________________ 27 4.4.7 Summary of Demand _______________________________________________________________ 27 4.5 Water Balance Model _______________________________________________________________ 27 4.6 Irrigation Infrastructure ______________________________________________________________ 29 4.7 Inefficient Water Use _______________________________________________________________ 31 4.8 Flooding _________________________________________________________________________ 31 4.9 Droughts _________________________________________________________________________ 33 4.10 Climate Change ___________________________________________________________________ 33 4.11 Water Resources Management _______________________________________________________ 34 4.11.1 Institutions _______________________________________________________________________ 34 4.11.2 Policy ___________________________________________________________________________ 35 4.11.3 Legislation _______________________________________________________________________ 37 4.11.4 Government Projects _______________________________________________________________ 38 4.12 Agricultural Systems ________________________________________________________________ 40 4.12.1 Climate __________________________________________________________________________ 40
Contents
324440/IDD/IDC/1/B 10 October2014 Final Report Final V1
Climate Adaptation through Sub-Basin Development Program PPTA Final Report
4.12.2 Climate Change ___________________________________________________________________ 40 4.12.3 Soils ____________________________________________________________________________ 40 4.12.4 Tamil Nadu Agricultural Policies and Programs ___________________________________________ 40 4.12.5 Agricultural Practices and Issues ______________________________________________________ 41 4.12.6 Current Cropping Pattern, Yields and Net Returns _________________________________________ 41 4.12.7 Scope for Water Saving Technologies __________________________________________________ 42 4.12.8 Procurement Capacity Assessment ____________________________________________________ 43 4.12.9 Financial Management Assessment ____________________________________________________ 44
5 Formulation of CASDP 46
5.1 Context __________________________________________________________________________ 46 5.2 Impact and Outcome _______________________________________________________________ 46 5.3 Outputs __________________________________________________________________________ 46 5.3.1 Output 1: Integrated Programs and Infrastructure for the Management of Surface Water, Groundwater
and Salinity _______________________________________________________________________ 47 5.3.2 Output 2 - Improved Systems for Management of Water Resources, Flood Risk and Flood Events ___ 47 5.4 New Design Guidelines for Drainage Infrastructure ________________________________________ 50 5.5 Feasibility Studies for Structural Drainage Improvements ___________________________________ 52 5.6 Feasibility Studies for Upgrading Pumped Irrigation Schemes ________________________________ 53 5.7 Social Safeguards _________________________________________________________________ 54 5.8 Environmental Safeguards ___________________________________________________________ 55 5.9 Economics _______________________________________________________________________ 55 5.10 Hydrologic and Hydraulic Modelling ____________________________________________________ 56 5.10.1 Hydrologic Modelling _______________________________________________________________ 57 5.10.2 Hydraulic Model ___________________________________________________________________ 59 5.11 Groundwater Model ________________________________________________________________ 70 5.12 Conjunctive Use of Groundwater ______________________________________________________ 73 5.13 Groundwater Recharge _____________________________________________________________ 74 5.14 Coastal Processes _________________________________________________________________ 75 5.14.1 East Coast Outlets _________________________________________________________________ 75 5.14.2 South Coast Outlets ________________________________________________________________ 76 5.15 Management of Flood Risk, Events and Disasters _________________________________________ 77 5.15.1 Flood Event Management ___________________________________________________________ 77 5.15.2 Flood Risk Management _____________________________________________________________ 78 5.15.3 Flood Disaster Management _________________________________________________________ 79 5.16 Improved Management of Flood Risk, Events and Disasters _________________________________ 80 5.16.1 Structural Measures ________________________________________________________________ 80 5.16.2 Non-Structural Measures ____________________________________________________________ 81 5.17 Road Map to Integrated Water Resources Management ____________________________________ 82 5.18 Decision Support System (DSS)_______________________________________________________ 87 5.19 Detailed Project Reports and Initial Procurement Packages _________________________________ 89 5.20 CASDP Appraisal Documentation _____________________________________________________ 89 5.21 Implementation ____________________________________________________________________ 90 5.22 Program Management ______________________________________________________________ 90 5.22.1 Project Management Unit ____________________________________________________________ 90 5.22.2 Project Implementation Units _________________________________________________________ 92 5.22.3 Financial Plan _____________________________________________________________________ 93 5.22.4 Procurement Plan __________________________________________________________________ 93 5.23 Training _________________________________________________________________________ 94 5.24 Design and Monitoring Framework _____________________________________________________ 95 5.25 Safeguards ______________________________________________________________________ 102
324440/IDD/IDC/1/B 10 October2014 Final Report Final V1
Technical Assistance Consultant’s Report
This consultant’s report does not necessarily reflect the views of ADB or the Government concerned, and ADB and the Government cannot be held liable for its contents. (For project preparatory technical assistance: All the views expressed herein may not be incorporated into the proposed project’s design.
Project Number: 44429 October 2014
India: Climate Adaptation through Sub-Basin Development Program (Financed by the Technical Assistance Special Fund)
Prepared by
Mott MacDonald
Delhi, India
For Water Resources Department, Public Works Department, Government of Tamil Nadu
Climate Adaptation through Sub-Basin Development Program PPTA Final Report
5.26 Program Risks and Mitigating Measures _______________________________________________ 102
6 Conclusions 106
7 References 108
Appendices
Appendix A. Water Resources Sector Assessment _________________________________________________ 110 Appendix B. Agriculture Sector Assessment ______________________________________________________ 111 Appendix C. Aquaculture Sector Assessment _____________________________________________________ 112 Appendix D. Climate Change Assessment ________________________________________________________ 113 Appendix E. Institutions and Policies Assessment __________________________________________________ 114 Appendix F. Financial Management Assessment ___________________________________________________ 115 Appendix G. Procurement Capacity Assessment ___________________________________________________ 116 Appendix H. Detailed Project Report ____________________________________________________________ 117 Appendix I. Surface Water and Groundwater Modelling _____________________________________________ 118 Appendix J. Economic and Financial Analysis _____________________________________________________ 119 Appendix K. Social and Gender Assessment ______________________________________________________ 120 Appendix L. Resettlement Framework ___________________________________________________________ 121 Appendix M. Resettlement Plan and Gender Action Plan _____________________________________________ 122 Appendix N. Environmental Assessment and Review Framework ______________________________________ 123 Appendix O. Initial Environmental Examination_____________________________________________________ 124 Appendix P. Water Resources Management Road Map _____________________________________________ 125 Appendix Q. Flood Management________________________________________________________________ 126 Appendix R. Communication Plan ______________________________________________________________ 127 Appendix S. CASDP Risk Assessment and Risk Management Plan ____________________________________ 128 Appendix T. Climate Change Study _____________________________________________________________ 129 Appendix U. Sea Level Rise Study ______________________________________________________________ 130
Figures
Figure 3.1: The Cauvery River Basin ____________________________________________________________ 10 Figure 3.2: Anicuts and Irrigation Systems in the Cauvery Delta _______________________________________ 11 Figure 3.3: The Vennar System ________________________________________________________________ 13 Figure 3.4: Flows and Rainfall at VVR Head Regulator ______________________________________________ 14 Figure 3.5: Typical Irrigation Flows through Main Channels ___________________________________________ 14 Figure 4.1: The Vennar System Problem Tree _____________________________________________________ 19 Figure 4.2: Monthly Storage in the Stanley Reservoir _______________________________________________ 20 Figure 4.3: Annual Flow in the Vennar River at the VVR Head Regulator ________________________________ 20 Figure 4.4: NE Monsoon Rainfall over the Vennar System ___________________________________________ 21 Figure 4.5: Extent of Saline Groundwater in the Vennar System _______________________________________ 22 Figure 4.6: Extent of Saline Groundwater in the Cauvery Delta ________________________________________ 22 Figure 4.7: Groundwater Use by Block in the Vennar System _________________________________________ 24 Figure 4.8: Head, Cross and Tail-End regulators on Project 1 Rivers ___________________________________ 31 Figure 4.9: Mettur Dam Annual Maximum Daily Outflow _____________________________________________ 32 Figure 5.1: Design Process ___________________________________________________________________ 51 Figure 5.2: Rivers, Drains and Canal included in Project-1 ___________________________________________ 53 Figure 5.3: Location of Pumping Schemes ________________________________________________________ 54 Figure 5.4: Project-1 Rivers and Drains in the Vennar System_________________________________________ 57 Figure 5.5: MWSWAT Watersheds in the Vennar System ____________________________________________ 58
324440/IDD/IDC/1/B 10 October2014 Final Report Final V1
Climate Adaptation through Sub-Basin Development Program PPTA Final Report
Figure 5.6: Locations of Rainfall and Climate Stations _______________________________________________ 59 Figure 5.7: Flooded Areas in Vennar Sub Basin November 2008 ______________________________________ 60 Figure 5.8: Modelling Approach ________________________________________________________________ 60 Figure 5.9: Detailed Survey of Flood Zones _______________________________________________________ 61 Figure 5.10: Composite High Resolution DEM ______________________________________________________ 62 Figure 5.11: Phase-1 HEC-RAS Model of the Harichandra River with Uniform Lateral Inflow __________________ 63 Figure 5.12: Phase-2 HEC-RAS Model of the Harichandra River with Flood Storage Cells ____________________ 63 Figure 5.13: Observed and Modelled Peak Flows at Brinjimoolai Tail-End Regulator ________________________ 65 Figure 5.14: Modelled Peak Water Levels along the Harichandra River, November 2008 _____________________ 65 Figure 5.15: Modelled and Observed Flows at Brinjimoolai Tail End Regulator on Harichandra River ___________ 66 Figure 5.16: Comparison of Modelled and Observed Flood Zones in November 2008 _______________________ 67 Figure 5.17: Modelled Flood Areas on the Harichandra River for the 2008 Flood with Project 1 ________________ 68 Figure 5.18: Modelled Flood Areas on the Harichandra River for 25, 50 and 100-year Design Floods ___________ 69 Figure 5.19: Modelled Flood Areas in Harichandra River for 25, 50 and 100-year Design Floods _______________ 69 Figure 5.20: Conceptual Model of the Aquifers in the Vennar System ____________________________________ 70 Figure 5.21: Groundwater Model Boundary Conditions _______________________________________________ 71 Figure 5.22: Modelled and Observed Groundwater Levels in the Shallow Aquifer ___________________________ 71 Figure 5.23: Water Table Elevation - June 2012 ____________________________________________________ 72 Figure 5.24: Water Table Elevation – June 2032 ____________________________________________________ 72 Figure 5.25: Salt Concentration – June 2012 _______________________________________________________ 72 Figure 5.26: Salt Concentration – June 2032 _______________________________________________________ 72 Figure 5.27: Program Implementation Plan ________________________________________________________ 90 Figure 5.28: CASDP Management Structure _______________________________________________________ 91 Figure 5.29: Organisation of Project Management Unit _______________________________________________ 92
Tables
Table 2.1: Summary of Main Consultants Terms of Reference _________________________________________ 3 Table 3.1: Cauvery Basin Areas ________________________________________________________________ 8 Table 3.2: Cauvery Waters Dispute Tribunal Allocations _____________________________________________ 9 Table 3.3: Irrigation Systems in the Cauvery Delta __________________________________________________ 9 Table 4-1: Industrial Water Supply _____________________________________________________________ 25 Table 4-2: Domestic and industrial demand in 2025 ________________________________________________ 26 Table 4-3: Projected population of the three Vennar System Districts ___________________________________ 26 Table 4-4: Drinking water status and surface source ________________________________________________ 26 Table 4.5: Insert Table Title here_______________________________________________________________ 27 Table 4.6: Water Balance of the Vennar System___________________________________________________ 28 Table 4.7: Irrigation and Drainage Systems in the Cauvery Delta ______________________________________ 29 Table 4.8: Frequency of Extreme Rainfall ________________________________________________________ 32 Table 4.9: Climate Change Projections to 2050 for the Vennar System _________________________________ 33 Table 4.10: Tender Acceptance Authority _________________________________________________________ 43 Table 5-1: Design Criteria for Project-1 Works ____________________________________________________ 50 Table 5.2: Structure Works in Project-1 __________________________________________________________ 52 Table 5.3: Main Findings and Recommendations of Survey of 13 Project-1 Pumping Schemes ______________ 53 Table 5.4: Institutional Framework for Disaster Management _________________________________________ 79 Table 5.5: Equipment and Indicative Costs of Simplified DSS ________________________________________ 83 Table 5.6: CASDP Appraisal and Implementation Documents ________________________________________ 89 Table 5.7: Summary Financing Plan ____________________________________________________________ 93 Table 5.8: Estimated Costs of Project 1 Works Packages ___________________________________________ 93 Table 5.9: Provisional Training Program _________________________________________________________ 94 Table 5.10: CASDP Design and Monitoring Framework ______________________________________________ 95
324440/IDD/IDC/1/B 10 October2014 Final Report Final V1
Climate Adaptation through Sub-Basin Development Program PPTA Final Report
Table 5.11: Project 1 Design and Monitoring Framework _____________________________________________ 99 Table 5.12: CASDP Risk Assessment and Risk Management Plan ____________________________________ 103
324440/IDD/IDC/1/B 10 October2014 Final Report Final V1
Climate Adaptation through Sub-Basin Development Program PPTA Final Report
Abbreviat ions
ADB Asian Development Bank
CASDP Climate Adaptation through Sub-Basin Development Program
CGWB Central Ground Water Board
CMP Cauvery Modernisation Plan
CMR Cauvery Modernisation Report
CWC Central Water Commission
DDA Deputy Director of Agriculture
DEM Digital Elevation Map
DSS Decision Support System
DTM Digital Terrain Model
FAM Facility Administration Manual
FAO Food and Agriculture Organisation
GCM General Circulation Model
GUI Graphical User Interface
HRU Hydrologic Response Unit
IMTI Irrigation Management Technology Institute
IPCC Inter-governmental Panel on Climate Change
IWRM Integrated Water Resources Management
JDA Joint Director of Agriculture
KVK Krishi Vigyan Kendra
MFF Multi-tranche Finance Facility
NGO Non-governmental Organisation
O&M Operation and Maintenance
PET Potential Evapotranspiration
PMSL Prime Meridian Surveys Ltd
PPTA Project Preparatory Technical Assistance
PWD Public Works Department
RCM Regional Climate Model
RSLR Relative Sea Level Rise
SGSWDC State Ground and Surface Water Data Centre
SWaRMA State Water Resources Management Agency
SWAT Soil and Water Assessment Tool
SWMRI Soil and Water Management Research Institute
TMC Thousand Million Cubic Feet
TNAU Tamil Nadu Agriculture University
ToR Terms of Reference
TRRI Tamil Nadu Rice Research Institute
TWAD Tamil Nadu Water Supply and Drainage Board
UNESCO-IHE UNESCO Institute for Water Education
WRD Water Resources Department
324440/IDD/IDC/1/B 10 October2014 Final Report Final V1

Climate Adaptation through Sub-Basin Development Program PPTA Final Report
WTC Water Technology Center
WUA Water User Association
324440/IDD/IDC/1/B 10 October2014 Final Report Final V1
Climate Adaptation through Sub-Basin Development Program PPTA Final Report
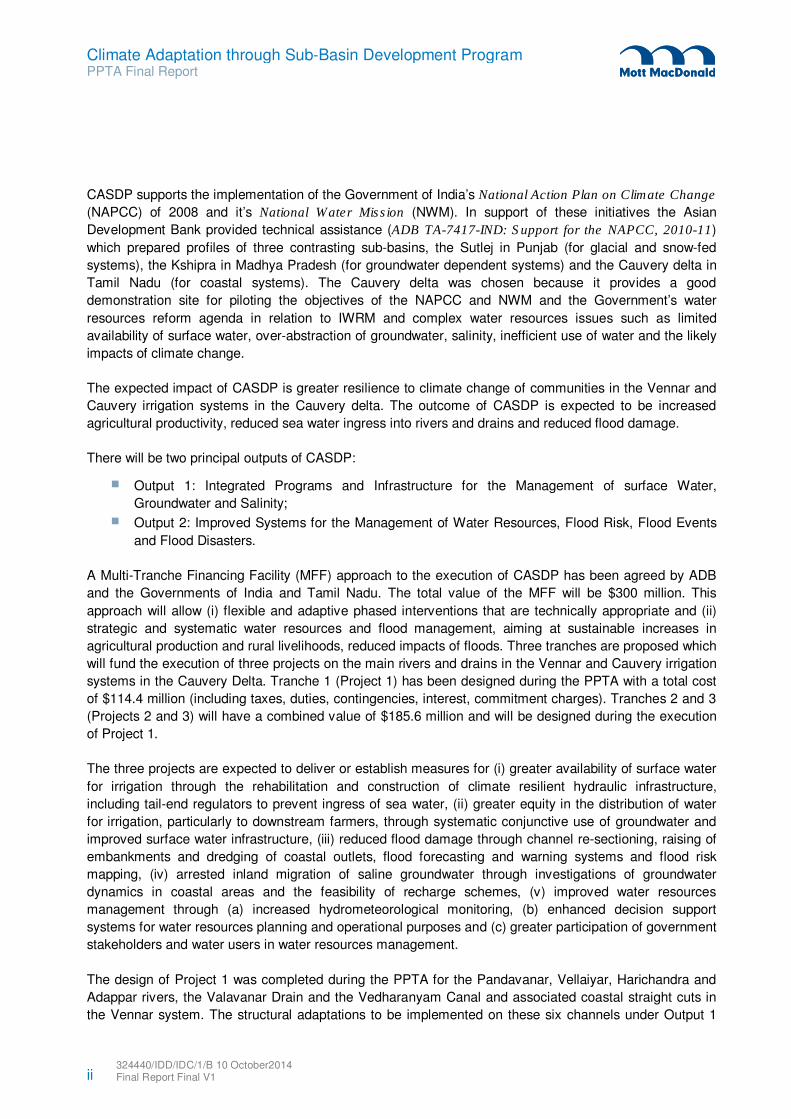
This report is the Main Report of the Project Preparation Technical Assistance (PPTA) for the Climate
Adaptation through Sub-Basin Development Program (CASDP). The technical assistance started in April
2013 with climate change and sea level studies by UNESCO-IHE and topographic surveys of channels and
structures by Prime Meridian Surveys Ltd (PMSL). The main consultancy by Mott MacDonald Ltd (MML)
started in August 2013 and was completed in October 2014.
The objective of the PPTA was to design an investment plan for climate adaptation in the Cauvery River
delta in Tamil Nadu, India that will address the following water resources issues affecting the sub-basin:
The availability of surface water is variable in space and time,
The distribution of surface water is inefficient and unequal,
The irrigation infrastructure is physically old, manually operated and much of it is in need of repair,
There is a growing dependence on groundwater for irrigation even when surface water is available,
In coastal areas groundwater is generally saline and the availability of surface water supply is limited,
Highly water consumptive and inefficient agricultural systems are in use,
A vulnerability to fluvial floods due to inadequate channel capacity in the rivers and inadequate drainage from the irrigation command areas,
A vulnerability to flooding in coastal areas, particularly when fluvial floods coincide with tidal surges,
A vulnerability to agricultural droughts when poor south-west monsoons (June to August) in the first half of the growing season are followed by poor north-east monsoons (November to December) during the second half of the growing season,
Uncoordinated water resources development and management with supply-side interventions dwarfing demand-side interventions.
The design of the CASDP investment plan includes structural investments comprising extensive channel
re-sectioning and raising of embankments along the principal rivers, drains and coastal outlets in the
Vennar and Lower Cauvery irrigation systems, using new engineering design guidelines which take
account of climate change projections. These works will reduce the frequency and impact of flooding. The
structural investments also include the repair and reconstruction of existing irrigation infrastructure and the
construction of new infrastructure to improve the reliability of irrigation water supply.
The design of CASDP also includes non-structural investments comprising greater participation of water
users, particularly women and farmers, in water resources management; increased monitoring of surface
water and groundwater resources; greater use of decision support systems for the seasonal planning and
operational control of irrigation water; flood risk assessments and maps; enhanced flood event
management procedures and support for flood disaster management planning by local government.
CASDP complies with the ADB Country Partnership Strategy which seeks to demonstrate solutions to the
challenge posed by water scarcity and climate change and promotes efficient and sustainable water
management in the agricultural, urban, and industrial sectors. CASDP also complies with the Government
of India’s 12th Five-Year Plan (2013-2017) particularly in terms of improving water management systems
and institutions.
Executive Summary
i 324440/IDD/IDC/1/B 10 October2014 Final Report Final V1
Climate Adaptation through Sub-Basin Development Program PPTA Final Report
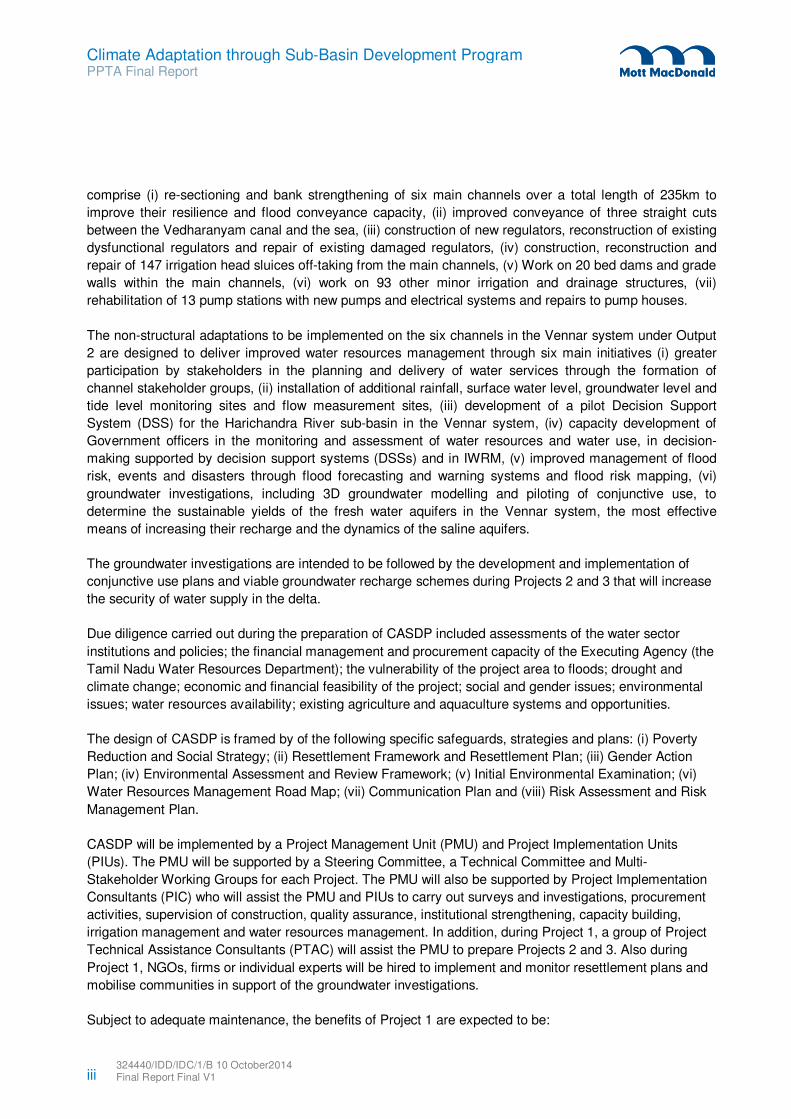
CASDP supports the implementation of the Government of India’s National Action Plan on Climate Change
(NAPCC) of 2008 and it’s National Water Mission (NWM). In support of these initiatives the Asian
Development Bank provided technical assistance (ADB TA-7417-IND: Support for the NAPCC, 2010-11)
which prepared profiles of three contrasting sub-basins, the Sutlej in Punjab (for glacial and snow-fed
systems), the Kshipra in Madhya Pradesh (for groundwater dependent systems) and the Cauvery delta in
Tamil Nadu (for coastal systems). The Cauvery delta was chosen because it provides a good
demonstration site for piloting the objectives of the NAPCC and NWM and the Government’s water
resources reform agenda in relation to IWRM and complex water resources issues such as limited
availability of surface water, over-abstraction of groundwater, salinity, inefficient use of water and the likely
impacts of climate change.
The expected impact of CASDP is greater resilience to climate change of communities in the Vennar and
Cauvery irrigation systems in the Cauvery delta. The outcome of CASDP is expected to be increased
agricultural productivity, reduced sea water ingress into rivers and drains and reduced flood damage.
There will be two principal outputs of CASDP:
Output 1: Integrated Programs and Infrastructure for the Management of surface Water,
Groundwater and Salinity;
Output 2: Improved Systems for the Management of Water Resources, Flood Risk, Flood Events
and Flood Disasters.
A Multi-Tranche Financing Facility (MFF) approach to the execution of CASDP has been agreed by ADB
and the Governments of India and Tamil Nadu. The total value of the MFF will be $300 million. This
approach will allow (i) flexible and adaptive phased interventions that are technically appropriate and (ii)
strategic and systematic water resources and flood management, aiming at sustainable increases in
agricultural production and rural livelihoods, reduced impacts of floods. Three tranches are proposed which
will fund the execution of three projects on the main rivers and drains in the Vennar and Cauvery irrigation
systems in the Cauvery Delta. Tranche 1 (Project 1) has been designed during the PPTA with a total cost
of $114.4 million (including taxes, duties, contingencies, interest, commitment charges). Tranches 2 and 3
(Projects 2 and 3) will have a combined value of $185.6 million and will be designed during the execution
of Project 1.
The three projects are expected to deliver or establish measures for (i) greater availability of surface water
for irrigation through the rehabilitation and construction of climate resilient hydraulic infrastructure,
including tail-end regulators to prevent ingress of sea water, (ii) greater equity in the distribution of water
for irrigation, particularly to downstream farmers, through systematic conjunctive use of groundwater and
improved surface water infrastructure, (iii) reduced flood damage through channel re-sectioning, raising of
embankments and dredging of coastal outlets, flood forecasting and warning systems and flood risk
mapping, (iv) arrested inland migration of saline groundwater through investigations of groundwater
dynamics in coastal areas and the feasibility of recharge schemes, (v) improved water resources
management through (a) increased hydrometeorological monitoring, (b) enhanced decision support
systems for water resources planning and operational purposes and (c) greater participation of government
stakeholders and water users in water resources management.
The design of Project 1 was completed during the PPTA for the Pandavanar, Vellaiyar, Harichandra and
Adappar rivers, the Valavanar Drain and the Vedharanyam Canal and associated coastal straight cuts in
the Vennar system. The structural adaptations to be implemented on these six channels under Output 1
ii 324440/IDD/IDC/1/B 10 October2014 Final Report Final V1
Climate Adaptation through Sub-Basin Development Program PPTA Final Report
comprise (i) re-sectioning and bank strengthening of six main channels over a total length of 235km to
improve their resilience and flood conveyance capacity, (ii) improved conveyance of three straight cuts
between the Vedharanyam canal and the sea, (iii) construction of new regulators, reconstruction of existing
dysfunctional regulators and repair of existing damaged regulators, (iv) construction, reconstruction and
repair of 147 irrigation head sluices off-taking from the main channels, (v) Work on 20 bed dams and grade
walls within the main channels, (vi) work on 93 other minor irrigation and drainage structures, (vii)
rehabilitation of 13 pump stations with new pumps and electrical systems and repairs to pump houses.
The non-structural adaptations to be implemented on the six channels in the Vennar system under Output
2 are designed to deliver improved water resources management through six main initiatives (i) greater
participation by stakeholders in the planning and delivery of water services through the formation of
channel stakeholder groups, (ii) installation of additional rainfall, surface water level, groundwater level and
tide level monitoring sites and flow measurement sites, (iii) development of a pilot Decision Support
System (DSS) for the Harichandra River sub-basin in the Vennar system, (iv) capacity development of
Government officers in the monitoring and assessment of water resources and water use, in decision-
making supported by decision support systems (DSSs) and in IWRM, (v) improved management of flood
risk, events and disasters through flood forecasting and warning systems and flood risk mapping, (vi)
groundwater investigations, including 3D groundwater modelling and piloting of conjunctive use, to
determine the sustainable yields of the fresh water aquifers in the Vennar system, the most effective
means of increasing their recharge and the dynamics of the saline aquifers.
The groundwater investigations are intended to be followed by the development and implementation of
conjunctive use plans and viable groundwater recharge schemes during Projects 2 and 3 that will increase
the security of water supply in the delta.
Due diligence carried out during the preparation of CASDP included assessments of the water sector
institutions and policies; the financial management and procurement capacity of the Executing Agency (the
Tamil Nadu Water Resources Department); the vulnerability of the project area to floods; drought and
climate change; economic and financial feasibility of the project; social and gender issues; environmental
issues; water resources availability; existing agriculture and aquaculture systems and opportunities.
The design of CASDP is framed by of the following specific safeguards, strategies and plans: (i) Poverty
Reduction and Social Strategy; (ii) Resettlement Framework and Resettlement Plan; (iii) Gender Action
Plan; (iv) Environmental Assessment and Review Framework; (v) Initial Environmental Examination; (vi)
Water Resources Management Road Map; (vii) Communication Plan and (viii) Risk Assessment and Risk
Management Plan.
CASDP will be implemented by a Project Management Unit (PMU) and Project Implementation Units
(PIUs). The PMU will be supported by a Steering Committee, a Technical Committee and Multi-
Stakeholder Working Groups for each Project. The PMU will also be supported by Project Implementation
Consultants (PIC) who will assist the PMU and PIUs to carry out surveys and investigations, procurement
activities, supervision of construction, quality assurance, institutional strengthening, capacity building,
irrigation management and water resources management. In addition, during Project 1, a group of Project
Technical Assistance Consultants (PTAC) will assist the PMU to prepare Projects 2 and 3. Also during
Project 1, NGOs, firms or individual experts will be hired to implement and monitor resettlement plans and
mobilise communities in support of the groundwater investigations.
Subject to adequate maintenance, the benefits of Project 1 are expected to be:
iii 324440/IDD/IDC/1/B 10 October2014 Final Report Final V1
Climate Adaptation through Sub-Basin Development Program PPTA Final Report
Damage due to floods up to 25-year severity will be largely eliminated except in tidal areas of the
Pandavanar, Vellaiyar, Harichandra and Adappar rivers and the Valavanar Drain,
Hydraulic infrastructure in the Pandavanar, Vellaiyar, Harichandra and Adappar rivers, the
Valavanar Drain will be in full working order,
Pumps and pump houses at 13 pumped irrigation schemes will be replaced giving potential
restoration of up to a total of 3000 ha of currently un-serviced command area,
Farmers, including women, will meet regularly with Government officials to monitor and evaluate
the progress of the project, plan seasonal and shorter-term irrigation schedules and respond to
contingencies such as flood and droughts,
The Water Resources Department will use a computerised Decision Support System (DSS), with
real-time links to telemetric rainfall, river level, river flow, tide level and groundwater level
monitoring stations, to inform seasonal and short-term operational decision making about the
availability and allocation of surface water resources, to forecast flood conditions and target flood
warnings on at-risk communities and assets identified with flood risk maps.
Improved understanding of the availability of groundwater, the effectiveness of existing recharge
schemes and the risk of further intrusion of saline groundwater into fresh water aquifers if
abstraction continues at current rates or is accelerated.
The combined financial benefit-cost ratios for the six Project-1 channels and the 13 pumping schemes
under zero, medium and high climate change scenarios are 1.23, 1.11 and 1.08 respectively. The
combined FIRR is 13.8%, 12.9% and 12.7%, while the combined EIRR is 14.2%, 13.2% and 13.1%
respectively. Although some individual components are not economically feasible, Project-1 as a whole is
financially and economically feasible now and also under medium and high climate change scenarios and
also in the case of 20% cost overruns or 20% lower than expected benefits. Only in the case of lower
benefits combined with higher costs, is the overall economic and financial feasibility somewhat
jeopardized.
iv 324440/IDD/IDC/1/B 10 October2014 Final Report Final V1
Climate Adaptation through Sub-Basin Development Program PPTA Final Report
Communities in the Cauvery delta in Tamil Nadu, India, particularly in rural areas, are vulnerable to a
number of water resources development issues that limit livelihoods and wellbeing. Water supply for
irrigation and domestic use is unreliable due to limited and variable availability. The distribution of water for
irrigation is inequitable due to the poor physical condition of irrigation infrastructure. Water use is generally
inefficient due to low priority given to water conservation, high distribution and field losses and highly
consumptive crops, notably paddy, sugar cane and bananas.
The Cauvery delta lies in a marginally semi-arid region on the east coast of southern India. Annual rainfall
is variable, ranging between 1774mm and 653mm with an average of 1192mm. The north-east monsoon
(November to December) ranges between 1331mm and 316mm with an average of 782mm, contributing
most of the annual total in many years. Normally the south-west monsoon (June to August) delivers only
light rains in Tamil Nadu due to the rain shadow effect of the Western Ghat mountains in Karnataka and
Kerala. Potential evapotranspiration is about 1599mm/year near the coast and 2227mm/year at
Tiruchirappalli near the apex of the delta.
Annual and monthly surface water inflows to the delta from upstream are limited by an inter-state water
sharing rule for the Cauvery River basin. The annual allocation (57%) to Tamil Nadu, combined with local
rainfall, is not sufficient to meet all demands in the Tamil Nadu part of the basin. Furthermore the inflows
are naturally unreliable due to highly variable monsoon rains in the upper basin. In the period 1990 to 2013
the Stanley reservoir (93.5 TMC1) at Mettur Dam, close to the Tamil Nadu-Karnataka border, filled
completely in only 10 years out of 24 years and was less than half full in 6 years (notably during the severe
drought from 2002 to 2004). Nevertheless during floods it was, and will continue to be, necessary to
release flood water to the sea because there were no additional storage facilities available and there is
insufficient potential storage capacity remaining in the Tamil Nadu part of the basin to store excess water.
Groundwater is a vital supplementary source of water without which agricultural output and rural incomes
would be significantly lower. However in the Cauvery delta there are many areas with limited groundwater
availability or with saline groundwater. Periodic assessments show signs of over-abstraction of fresh
groundwater in several areas. According to the Central Ground Water Board (CGWB), in the 35
administrative blocks in Cauvery delta, current rates of groundwater abstraction are sustainable in only 11
blocks, 16 blocks are semi-critical, fully exploited or over-exploited and 8 blocks are too saline to use.
Damaging floods and droughts are endemic. There have been three major floods in the delta since 2000
causing $70.4 million of damage in Thiravarur and Nagapattinam Districts in the Cauvery delta according
to local Government records. Climate change projections for the delta indicate significantly more storm
rainfall and therefore more flooding. There was a major drought from 2003 to 2004.
The agricultural sector accounts for almost all water use in the project area. The irrigation and drainage
systems are very old adaptations of natural drainage systems which, because of the long-standing
Cauvery River water sharing dispute with neighbouring states, have received only essential maintenance
in recent times.
The consequences of these climatic and water resources management factors include low agricultural
productivity, insecure rural livelihoods, high vulnerability to natural disasters such as floods, droughts and
tidal surges, inefficient water use, and over-abstraction of groundwater.
1 TMC = Thousand million cubic feet
1 Rationale for CASDP
324440/IDD/IDC/1/B 10 October2014 Final Report Final V1
1
Climate Adaptation through Sub-Basin Development Program PPTA Final Report
Average rural income is INR 9323/person/year in the Vennar system which is below the poverty threshold
of INR10,560/person/year set by the State Planning Commission.
The three districts in the Cauvery delta (Thanjavur, Thiruvarur, Nagapattinam) record the lowest paddy
production in Tamil Nadu, ranging from 2,182 tonnes/ha/year in Nagapattinam to 3,069 tonnes/ha/year in
Thiruvarur and 3,138 tonnes/ha/year in Thanjavur. Relatively low yields of other important crops like, black
gram, green gram, groundnut, sesame and sugarcane, are also reported.
Climate change studies during the CASDP PPTA indicate increases in rainfall during the monsoon months
(June to December) but drier conditions from January to May. Mean annual temperature is expected to rise
by 1.50C by 2050. The climate projections also show large increases in storm rainfall (19%). Therefore
more frequent and serious flooding can be expected. In coastal areas flooding will be gradually
exacerbated by rising sea levels of between 0.29m (low scenario) and 0.87m (high scenario) by 2100.
The Tamil Nadu State Agricultural Policy aims to double food production by (i) developing a scientific
approach to support the development of the rural economy and preserve the ecological balance; (ii)
increasing productivity, production and profitability; (iii) implementing farmers’ welfare schemes such as
integrated watershed development, land management, development of water resources, organic farming
especially use of green manure, bio-fertilizers, bioconversion of agricultural wastes, bio pesticides and
parasites, integrated pest management, remunerative price to agricultural produce, processing, value
addition to agricultural produce, promotion of crops with export potential, with a view to ensure economic
improvement, besides rural prosperity.
A proposal for the modernisation of the irrigation systems in the Cauvery basin prepared by the Tamil
Nadu Water Resources Department in 2013 supports the State Agricultural Policy by addressing the water
resources issues that limit agricultural production. The proposal includes major investments in the
rehabilitation of irrigation systems and the improvement of water resources management. This represents
a clear opportunity for ADB to support the Tamil Nadu Government through CASDP. Accordingly CASDP
has been designed in alignment with the WRD proposal.
324440/IDD/IDC/1/B 10 October2014 Final Report Final V1
2
Climate Adaptation through Sub-Basin Development Program PPTA Final Report
2.1 PPTA Consultants and Contractors
The concept paper for CASDP set out the terms of reference (ToR) for the PPTA required to prepare the
investment plan and design the MFF that will deliver the Program outputs. The PPTA comprised three
activities (i) climate change and sea level rise studies by UNESCO-IHE2 carried out between June 2012
and July 2013, (ii) topographic survey of channels and structures in the Vennar system by PMSL3 carried
out between April and November 2013 and (iii) preparation of the Program by Mott MacDonald Ltd (MML),
the main consultants, between August 2013 and October 2014.
The results of the climate change and sea level rise studies and the results of the topographic survey are
discussed in Appendices I, T and U respectively. This report focuses primarily on the results of the
Program preparation by MML.
2.2 ToR for Program Preparat ion
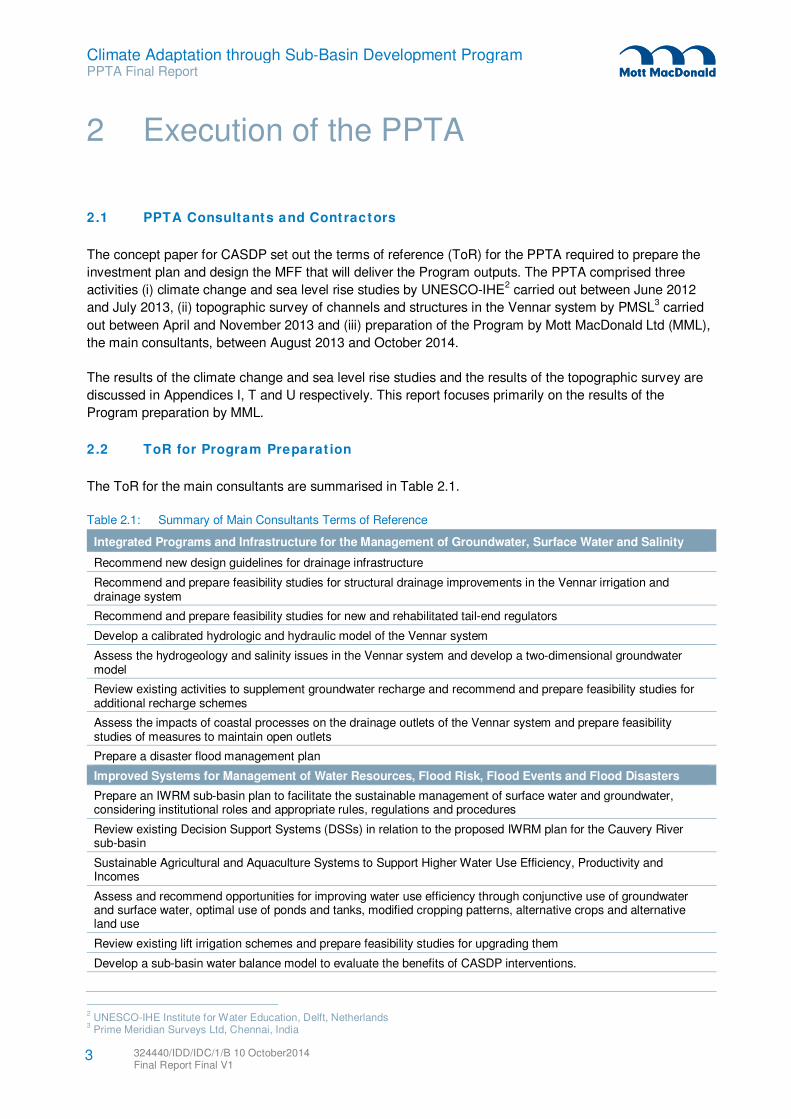
The ToR for the main consultants are summarised in Table 2.1.
Table 2.1: Summary of Main Consultants Terms of Reference
Integrated Programs and Infrastructure for the Management of Groundwater, Surface Water and Salinity
Recommend new design guidelines for drainage infrastructure
Recommend and prepare feasibility studies for structural drainage improvements in the Vennar irrigation and drainage system
Recommend and prepare feasibility studies for new and rehabilitated tail-end regulators
Develop a calibrated hydrologic and hydraulic model of the Vennar system
Assess the hydrogeology and salinity issues in the Vennar system and develop a two-dimensional groundwater model
Review existing activities to supplement groundwater recharge and recommend and prepare feasibility studies for additional recharge schemes
Assess the impacts of coastal processes on the drainage outlets of the Vennar system and prepare feasibility studies of measures to maintain open outlets
Prepare a disaster flood management plan
Improved Systems for Management of Water Resources, Flood Risk, Flood Events and Flood Disasters
Prepare an IWRM sub-basin plan to facilitate the sustainable management of surface water and groundwater, considering institutional roles and appropriate rules, regulations and procedures
Review existing Decision Support Systems (DSSs) in relation to the proposed IWRM plan for the Cauvery River sub-basin
Sustainable Agricultural and Aquaculture Systems to Support Higher Water Use Efficiency, Productivity and Incomes
Assess and recommend opportunities for improving water use efficiency through conjunctive use of groundwater and surface water, optimal use of ponds and tanks, modified cropping patterns, alternative crops and alternative land use
Review existing lift irrigation schemes and prepare feasibility studies for upgrading them
Develop a sub-basin water balance model to evaluate the benefits of CASDP interventions.
2 UNESCO-IHE Institute for Water Education, Delft, Netherlands
3 Prime Meridian Surveys Ltd, Chennai, India
2 Execution of the PPTA
324440/IDD/IDC/1/B 10 October2014 Final Report Final V1
3
Climate Adaptation through Sub-Basin Development Program PPTA Final Report
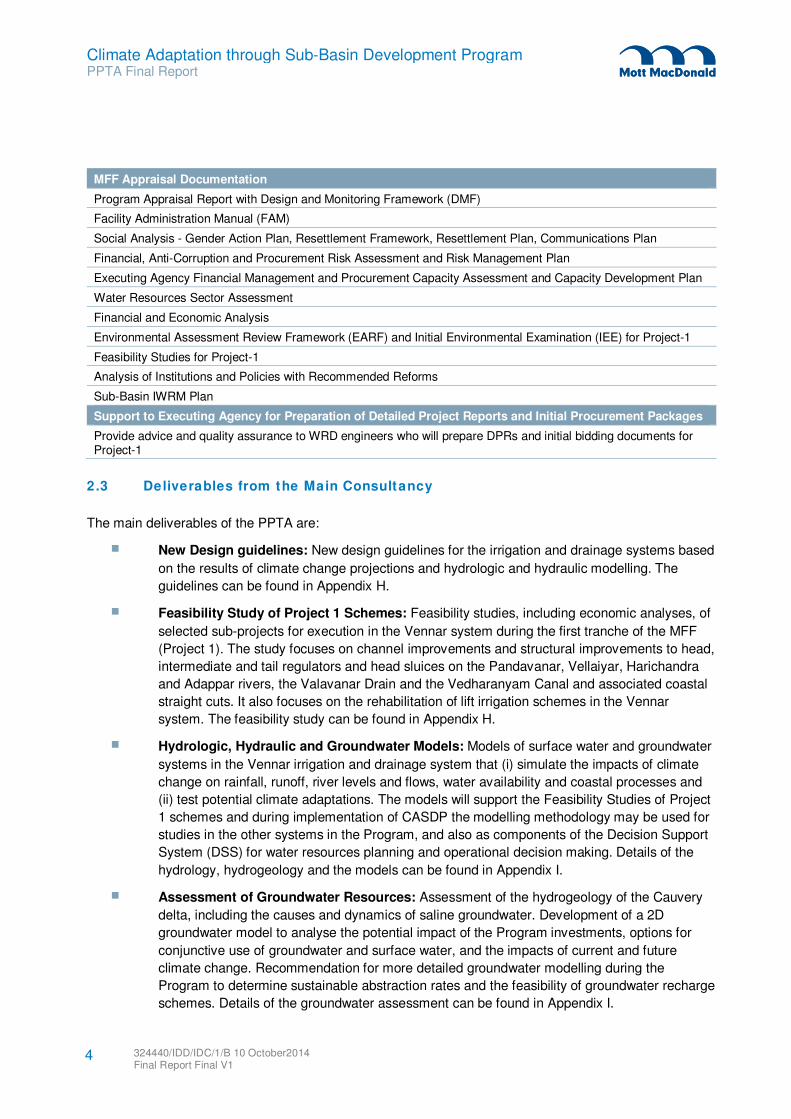
MFF Appraisal Documentation
Program Appraisal Report with Design and Monitoring Framework (DMF)
Facility Administration Manual (FAM)
Social Analysis - Gender Action Plan, Resettlement Framework, Resettlement Plan, Communications Plan
Financial, Anti-Corruption and Procurement Risk Assessment and Risk Management Plan
Executing Agency Financial Management and Procurement Capacity Assessment and Capacity Development Plan
Water Resources Sector Assessment
Financial and Economic Analysis
Environmental Assessment Review Framework (EARF) and Initial Environmental Examination (IEE) for Project-1
Feasibility Studies for Project-1
Analysis of Institutions and Policies with Recommended Reforms
Sub-Basin IWRM Plan
Support to Executing Agency for Preparation of Detailed Project Reports and Initial Procurement Packages
Provide advice and quality assurance to WRD engineers who will prepare DPRs and initial bidding documents for Project-1
2.3 Deliverables from the Main Consultancy
The main deliverables of the PPTA are:
New Design guidelines: New design guidelines for the irrigation and drainage systems based
on the results of climate change projections and hydrologic and hydraulic modelling. The
guidelines can be found in Appendix H.
Feasibility Study of Project 1 Schemes: Feasibility studies, including economic analyses, of
selected sub-projects for execution in the Vennar system during the first tranche of the MFF
(Project 1). The study focuses on channel improvements and structural improvements to head,
intermediate and tail regulators and head sluices on the Pandavanar, Vellaiyar, Harichandra
and Adappar rivers, the Valavanar Drain and the Vedharanyam Canal and associated coastal
straight cuts. It also focuses on the rehabilitation of lift irrigation schemes in the Vennar
system. The feasibility study can be found in Appendix H.
Hydrologic, Hydraulic and Groundwater Models: Models of surface water and groundwater
systems in the Vennar irrigation and drainage system that (i) simulate the impacts of climate
change on rainfall, runoff, river levels and flows, water availability and coastal processes and
(ii) test potential climate adaptations. The models will support the Feasibility Studies of Project
1 schemes and during implementation of CASDP the modelling methodology may be used for
studies in the other systems in the Program, and also as components of the Decision Support
System (DSS) for water resources planning and operational decision making. Details of the
hydrology, hydrogeology and the models can be found in Appendix I.
Assessment of Groundwater Resources: Assessment of the hydrogeology of the Cauvery
delta, including the causes and dynamics of saline groundwater. Development of a 2D
groundwater model to analyse the potential impact of the Program investments, options for
conjunctive use of groundwater and surface water, and the impacts of current and future
climate change. Recommendation for more detailed groundwater modelling during the
Program to determine sustainable abstraction rates and the feasibility of groundwater recharge
schemes. Details of the groundwater assessment can be found in Appendix I.
324440/IDD/IDC/1/B 10 October2014 Final Report Final V1
4
Climate Adaptation through Sub-Basin Development Program PPTA Final Report
Assessment of Coastal Processes: Assessment of existing and future coastal process and
their impact on the drainage of the Vennar system. Recommendation for maintaining free
discharge from the Vennar system to the sea. The assessment of coastal processes can be
found in Appendix H.
Flood Event Management Plan: Plan for enhanced management of flood events by the
Water Resources Department including the issue of flood warnings, post-flood surveys of flood
extent and depth and preparation of flood risk maps to support flood disaster risk management
measures and planning by the State and District Disaster Management Authorities. The flood
event management plan can be found in Appendix Q.
Assessment of Institutions and Policies: Assessment of water resources institutions and
policies and establishment of the institutional context for implementation of the Program. The
assessment of institutions and policies can be found in Appendix E.
Water Resources Management Road Map: A roadmap leading to improved water resources
management in the Cauvery River sub-basin in order to increase water use efficiency and
productivity in the face of climate change. The water resources road map can be found in
Appendix P.
Design of a Decision Support System: A DSS design that will support the Water Resources
Management Road Map and the Flood Event Management Plan. Details of the proposed DSS
can be found in Appendix P.
Assessment and Recommendations for the Agriculture and Aquaculture Sectors:
Assessments of the agricultural and aquaculture sectors. Recommendations for improved
water use efficiency through conjunctive use of groundwater and surface water, modified
cropping patterns and alternative crops. The assessments of the agriculture and aquaculture
sectors can be found in Appendices B and C respectively.
MFF Appraisal Documentation: Documentation recording the management, monitoring and
evaluation arrangements and the social, environmental, financial and procurement safeguards
for the Program. Details of this documentation are discussed in Section 5.20.
Support to the Executing Agency for Preparation of Detailed Project Reports (DPR) and
Initial Procurement Packages: Advice and quality assurance for WRD design engineers who
are responsible for the preparation of a DPR for Project-1 for submission to the Central Water
Commission (CWC) and to prepare associated procurement packages.
2.4 Report ing and Review Missions
During the 1-month inception period in August 2013 initial meetings with ADB and the WRD took place, the
PPTA work plan and staff schedule were developed, data requests were submitted, site visits were made
and office and domestic arrangements were established. An Inception Report was submitted on 28 August
2013. The Inception Report included an updated work plan, staff schedule and an outline of the proposed
PPTA Final Report.
From 28 August to 26 November 2013 the PPTA team concentrated on (i) obtaining data from WRD and
other institutions, (ii) stakeholder consultation, (iii) hydrologic, hydraulic and groundwater modelling, (iv)
site visits to identify and investigate irrigation, drainage, flood, salinity and coastal problems, particularly
with respect to hydraulic infrastructure.
324440/IDD/IDC/1/B 10 October2014 Final Report Final V1
5
Climate Adaptation through Sub-Basin Development Program PPTA Final Report
In the case of data collection, data held by WRD in Thanjavur was provided promptly to the PPTA team,
but some data and other items held by other institutions and contractors, including tide data and satellite
imagery requested by ADB before the PPTA began, took many weeks to be provided or were not provided
at all. Consequently the analysis of historical storm surges by UNESCO-IHE could not be delivered until
May 2104. The digital elevation model (DEM) of the project area to be prepared by WRD from satellite
imagery to be purchased from the National Remote Sensing Centre (NRSC) could not be delivered at all.
Therefore the PPTA team was asked by ADB to propose alternative methods of generating a DEM and to
manage its production. A terrestrial topographic survey of known flood zones in the Vennar system was
proposed and the PPTA consultancy contract was duly varied. However the survey could not be carried
out during the 2013-14 cropping season because of restricted access to agricultural land and therefore it
did not commence until May 2014. The results of the survey are discussed in Appendix I.
An Interim Report was submitted on 26 November 2013 giving details of progress made since 28 August
2013. It included draft new design guidelines for hydraulic structures, the scope of the proposed Water
Resources Management Road Map, preliminary findings of hydrologic, hydraulic and groundwater
modelling and an outline template for the Project 1 feasibility study.
This was followed by an ADB mission in December 2013 to review and comment on the Interim Report and
to agree the scope of the Project 1 feasibility study. During the mission it was agreed that the resources
(funds and consultants) to design Projects 2 and 3 would be included in the loan for Project-1 and that
preparation for Projects 2 and 3 would start immediately upon loan effectiveness.
WRD informed the Mission that it was preparing a project proposal for improvements and rehabilitation of
irrigation systems in the Cauvery Basin for financing under the National Government's Accelerated
Irrigation Benefits Program (AIBP). In the light of this, WRD requested that the preparation of CASDP
should focus on improved conveyance of water in the main rivers and drains in the delta while the
proposed WRD project would focus on interventions to improve water use efficiency at the irrigation canal
and farm level. These interventions were originally envisaged as CASDP Output 3 “Sustainable Agriculture
Systems to Support Higher Water Use Efficiency, Productivity, and Incomes”. Output 3 was therefore
removed from the Program and ADB and WRD agreed to continue close collaboration on the scope and
design of both projects in order to avoid overlapping or gaps. Although Output 3 will be omitted from
CASDP, it was agreed that the PPTA agriculture specialists would complete their assessment of what is
needed to improve agricultural systems and agricultural water use in the Cauvery Delta.
A further ADB review mission in February 2014 determined the scope of the PPTA Draft Final Report
(DFR) and reframed the format of the Project 1 Feasibility Study report to conform to the format of a
Detailed Project Report (DPR) for the modernisation of irrigation projects as specified in Central Water
Commission guidelines (CWC, 2010). Due to the accelerated timetable of the PPTA, caused by the
urgency for WRD to obtain CWC approval of the DPR and start execution of Project 1 during 2014, the
geographical extent of Project-1 was restricted to approximately 40% of the Vennar system. Consequently
Project 1 includes the Harichandra, Adappar, Vellaiyar and Pandavanar Rivers, the Valavanar Drain and
the Vedharanyam Canal and associated coastal outlets (straight cuts). Other rivers and drains in the
Vennar system will be included in Project 2.
The DFR and a draft DPR were submitted to ADB and WRD by MML in April 2014. After some additions by
WRD a preview of the DPR was submitted by WRD to CWC in May 2014. This was followed by a further
ADB review mission in May 2014 which determined an action plan to revise the DPR in the light of
preliminary feedback from CWC, update the DFR, and resolve issues concerning environmental
clearances for Project 1 works proposed in the Coastal Regulation Zone (CRZ). It was also determined
324440/IDD/IDC/1/B 10 October2014 Final Report Final V1
6
Climate Adaptation through Sub-Basin Development Program PPTA Final Report
that the proposed Program budget of $300 million was insufficient to cover all the necessary improvements
in the Cauvery delta and that therefore the Program area should be reduced to the Vennar and Cauvery
systems, omitting the Grand Anicut Canal system.
MML submitted a revised draft DPR to ADB and WRD in June 2014 and an updated DFR in August 2014.
Another ADB review mission in July 2014 discussed continuing issues concerning environmental
clearances, resettlement of squatters and gaps in the DPR. In order to avoid delay to the start of Project 1
due to a potentially protracted environmental clearance process for works in Coastal Regulation Zone I
(CRZ I), it was decided by WRD that these works should be excluded from Project 1. This decision
necessitated further revision of the DPR which was carried out by MML during July 2014. The final DPR
was delivered by MML to WRD and ADB in July 2104. The final DPR (as prepared by MML) is included as
Appendix H.
324440/IDD/IDC/1/B 10 October2014 Final Report Final V1
7
Climate Adaptation through Sub-Basin Development Program PPTA Final Report
3.1 The Cauvery River Basin
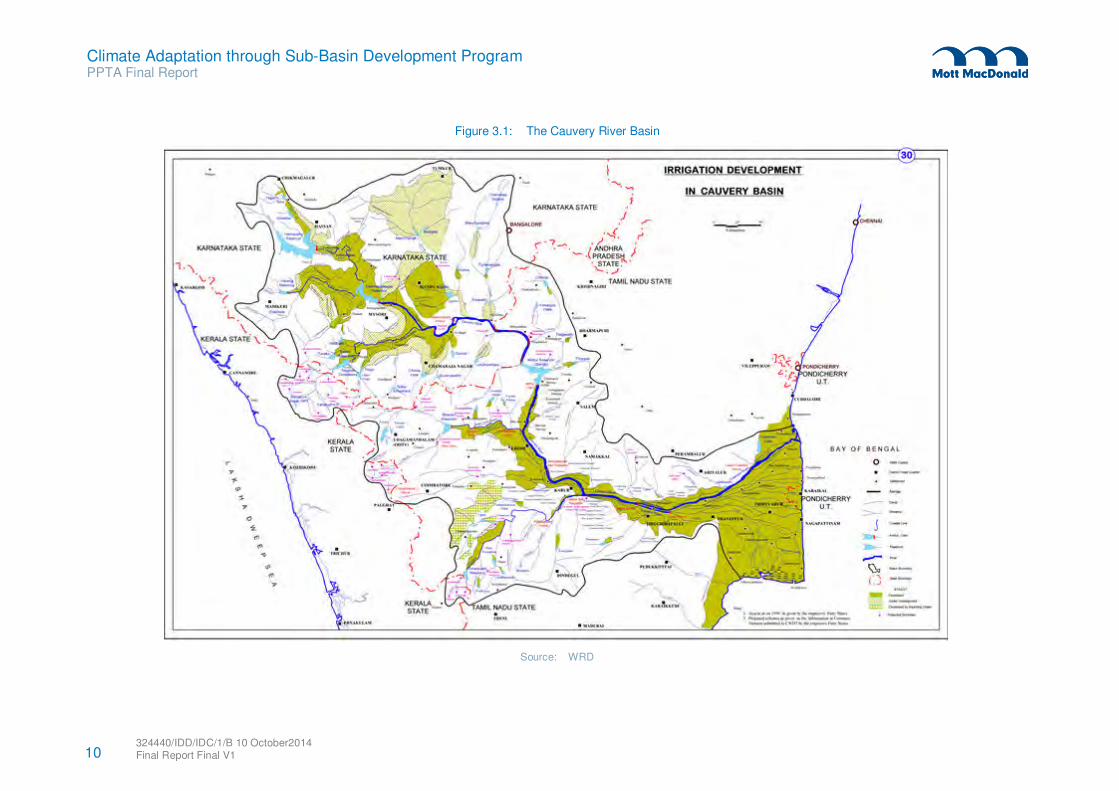
The Cauvery River is one of the major Indian rivers flowing east from the Deccan plateau to the Bay of
Bengal. It flows through the States of Karnataka, Kerala, Tamil Nadu and the Karaikkal enclave of the
Union Territory of Pondicherry and has a total catchment area of 81,155 km2 of which 44,016 km
2 lies
within Tamil Nadu. The areas of the basin lying within each of the three riparian States and the enclave of
Karraikal in the Union Territory of Pondicherry are shown in Table 3.1.
Table 3.1: Cauvery Basin Areas
State Area km2
Karnataka 34,273
Kerala 2,866
Tamil Nadu (including Karraikal) 44,016
Total 81,155
The Cauvery River is the only perennial river flowing through Tamil Nadu and its catchment covers over
34% of the area of the State. The total population of the basin within Tamil Nadu was 72.14 million in 2011
of whom 37.19 million were rural.
The Cauvery delta has a geographical area of 6,900 km2 and a gross irrigated area of 5,220 km
2 which is
about 48% of the total area irrigated by canals in Tamil Nadu. Irrigation water is supplied to the delta from
the Cauvery River at the Grand Anicut (barrage) via the Cauvery and Vennar rivers and the Grand Anicut
Canal and their 36 natural branches through a network of 29,881 distribution canals with a total length in
excess of 22,400 km. Many of these canals and their irrigation infrastructure are in a poor state of repair.
The availability of surface water resources is unreliable due to highly variable monsoon rains and a
shortage of storage sites. Without substantial abstractions of fresh groundwater in the delta, agricultural
output and rural incomes would be significantly lower. However the quantity and extent of fresh
groundwater is limited due to variable rainfall and saline aquifers in coastal areas of the delta. There are
signs of over-abstraction of groundwater (see Appendix I).
Damaging floods and droughts are endemic due to erratic monsoon conditions. There have been three
major floods and one major drought in the delta since 2000 causing $240 million of damage in Thanjavur,
Thiravarur and Nagapattinam Districts in the Cauvery delta according to local Government records.
Climate change projections for the delta (Srinivasan, 2013) indicate slightly less surface water stress
during the irrigation season but significantly more flood risk.
Sharing of the surface water resources of the Cauvery River basin between the riparian states has been a
contentious issue for many years and the subject of prolonged tribunal proceedings. The proceedings
culminated in a unanimous decision by the Cauvery Water Disputes Tribunal in 2007. After appeal this
decision was upheld by the Supreme Court in February 2013. The annual allocation to each state is shown
in Table 3.2.
3 The Project Area
324440/IDD/IDC/1/B 10 October2014 Final Report Final V1
8
Climate Adaptation through Sub-Basin Development Program PPTA Final Report
Table 3.2: Cauvery Waters Dispute Tribunal Allocations
State TMC % MCM
Tamil Nadu 419 57% 11,865
Karnataka 270 37% 7,645
Kerala 30 4% 849
Pondicherry 7 1% 198
Environment 14 1% 396
Total 740 100% 20,953
Source: Gazette of India, 19 February 2013
TMC = Thousand Million Cubic Feet
MCM = Million Cubic Metres
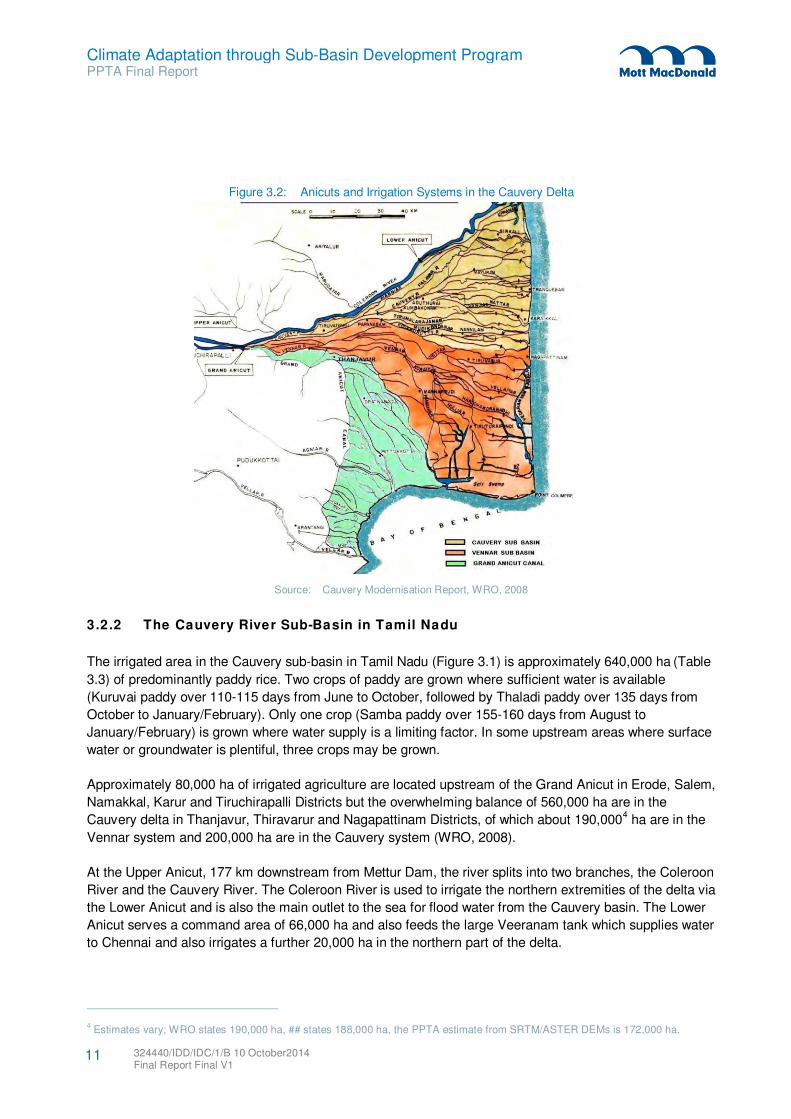
The Cauvery delta contains four irrigation and drainage systems as shown in Figure 3.2 and Table 3.3.
Table 3.3: Irrigation Systems in the Cauvery Delta
System Irrigated Area (ha) Irrigated Area (acres)
Cauvery System 200,000 494,210
Vennar System 190,000 469,500
Grand Anicut Canal System 121,000 298,997
Lower Coleroon Anicut system 49,000 121,081
Total Irrigated Area in Delta 560,000 1,383,788
Total Area of Delta 673,900 1,665,241
Systems upstream of Grand Anicut 80,000 197,600
Source: WRD
The CASDP project area comprises the Vennar (1900 km2) and Cauvery (2000 km
2) irrigation and
drainage systems although water resources management aspects of the Program extend to the entire sub-
basin that lies within Tamil Nadu (Figure 3.1).
3.2 Water Development
3.2.1 The Cauvery River Basin
Prior to the construction of major dams in the Cauvery River basin in the 1930s, farms were irrigated from
run-of-river flows generated mainly during the south-west monsoon (June to August). After the south-west
monsoon ended, river flows diminished naturally and irrigated crops, particularly in the Cauvery delta,
became dependent on rainfall from the north-east monsoon (October to December) during the latter part of
the growing season. As both monsoons are unreliable and consequently river flows are also unreliable,
agriculture was highly vulnerable to water scarcity.
After construction of the Krishna Raja Sagara dam (Figure 3.1) in Karnataka (49 TMC) in 1924, and the
Mettur dam (93.5 TMC) in Tamil Nadu in 1934, it became possible to regulate flows so that surface water
supply for irrigation was more reliable and agricultural was more sustainable. Since then a number of other
dams have been constructed and the total storage capacity of the reservoirs in the Cauvery basin has
increased to 330 TMC (WRO, 2008).
324440/IDD/IDC/1/B 10 October2014 Final Report Final V1
9
Climate Adaptation through Sub-Basin Development Program PPTA Final Report
Figure 3.1: The Cauvery River Basin
Source: WRD
10 324440/IDD/IDC/1/B 10 October2014 Final Report Final V1
Climate Adaptation through Sub-Basin Development Program PPTA Final Report
Figure 3.2: Anicuts and Irrigation Systems in the Cauvery Delta
Source: Cauvery Modernisation Report, WRO, 2008
3.2.2 The Cauvery River Sub-Basin in Tamil Nadu
The irrigated area in the Cauvery sub-basin in Tamil Nadu (Figure 3.1) is approximately 640,000 ha (Table
3.3) of predominantly paddy rice. Two crops of paddy are grown where sufficient water is available
(Kuruvai paddy over 110-115 days from June to October, followed by Thaladi paddy over 135 days from
October to January/February). Only one crop (Samba paddy over 155-160 days from August to
January/February) is grown where water supply is a limiting factor. In some upstream areas where surface
water or groundwater is plentiful, three crops may be grown.
Approximately 80,000 ha of irrigated agriculture are located upstream of the Grand Anicut in Erode, Salem,
Namakkal, Karur and Tiruchirapalli Districts but the overwhelming balance of 560,000 ha are in the
Cauvery delta in Thanjavur, Thiravarur and Nagapattinam Districts, of which about 190,0004 ha are in the
Vennar system and 200,000 ha are in the Cauvery system (WRO, 2008).
At the Upper Anicut, 177 km downstream from Mettur Dam, the river splits into two branches, the Coleroon
River and the Cauvery River. The Coleroon River is used to irrigate the northern extremities of the delta via
the Lower Anicut and is also the main outlet to the sea for flood water from the Cauvery basin. The Lower
Anicut serves a command area of 66,000 ha and also feeds the large Veeranam tank which supplies water
to Chennai and also irrigates a further 20,000 ha in the northern part of the delta.
4 Estimates vary; WRO states 190,000 ha, ## states 188,000 ha, the PPTA estimate from SRTM/ASTER DEMs is 172,000 ha.
324440/IDD/IDC/1/B 10 October2014 Final Report Final V1
11
Climate Adaptation through Sub-Basin Development Program PPTA Final Report
The Cauvery River downstream of the Upper Anicut serves the irrigation needs of the delta area south of
the Coleroon River. About 30 km downstream of the Upper Anicut on the Cauvery River lies the Grand
Anicut where head regulators distribute flows to the three main delta rivers (Cauvery, Vennar, Grand
Anicut Canal) that supply the three main irrigation systems in the delta. Surplus flows at the Grand Anicut,
including flood releases from Mettur Dam and/or flood runoff from intermediate sub-basins in Tamil Nadu,
are diverted at the Grand Anicut through the Ullar channel to the Coleroon River5.
The Cauvery and Vennar systems comprise natural deltaic ephemeral distributary rivers that are used,
when there is inflow from the Grand Anicut, to irrigate command areas (ayacuts) of 390,000 ha in total.
Some of the rivers also serve as drains which distribute already-used water to downstream command
areas and also drain excess water to the sea. The delta rivers divide and sub-divide into branches. In the
Cauvery and Vennar systems there are 36 branches from which a network of 29,881 canals, with a total
length of more than 22,400km, distribute water to the command areas. The Grand Anicut Canal is a
comparatively modern (1937), mainly man-made, system that serves a command area (ayacut) of
121,000ha located in the western delta.
In many parts of the delta the rivers are used not only to irrigate and drain the command areas but also to
discharge flood water from local storm runoff. Being natural watercourses, the rivers are generally
oversized for irrigation purposes. Being ephemeral, they are prone to congestion from vegetation and
sediment and consequently, without adequate maintenance, they have limited capacity to drain floods from
upstream watersheds and command areas following heavy rainfall. Consequently the irrigation systems
are prone to flooding due to overtopping and breaching of river embankments and drainage congestion in
the command areas.
3.2.3 The Vennar Irrigation and Drainage System
CASDP Projects 1 and 2 will be targeted at the Vennar system. The layout of the main channels and
drains of the Vennar system is shown schematically in Figure 3.3. Ten main river channels convey both
irrigation and drainage water while ten other channels are primarily drainage channels (for example, the
Valavanar and Nallar Drains).
The main channels of the Vennar System are old river channels that have been modified and adapted over
centuries to carry irrigation, drainage and flood flows. The physical characteristics of the channels are
variable. Some reaches have uniform cross sections and a straight alignments while other reaches have
varying cross sections and winding alignments. Some reaches are overgrown with vegetation while other
reaches are quite open.
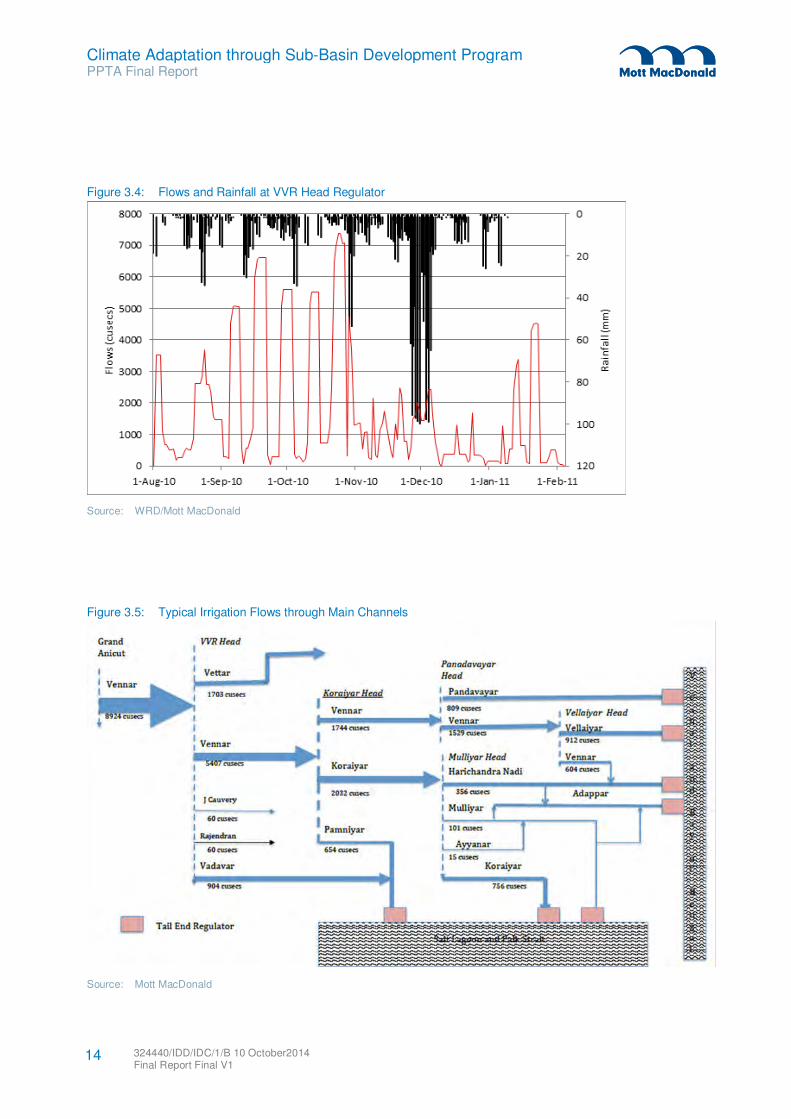
Irrigation flows into the system come from releases from the Mettur Dam via the Grand Anicut. Irrigation
water is provided for varying periods each year as shown in Figure 3.4.
5 In 2005 a large flood in the Cauvery River upstream of the Grand Anicut burst its banks and bypassed the anicut causing serious
flood damage in the delta.
324440/IDD/IDC/1/B 10 October2014 Final Report Final V1
12
Climate Adaptation through Sub-Basin Development Program PPTA Final Report
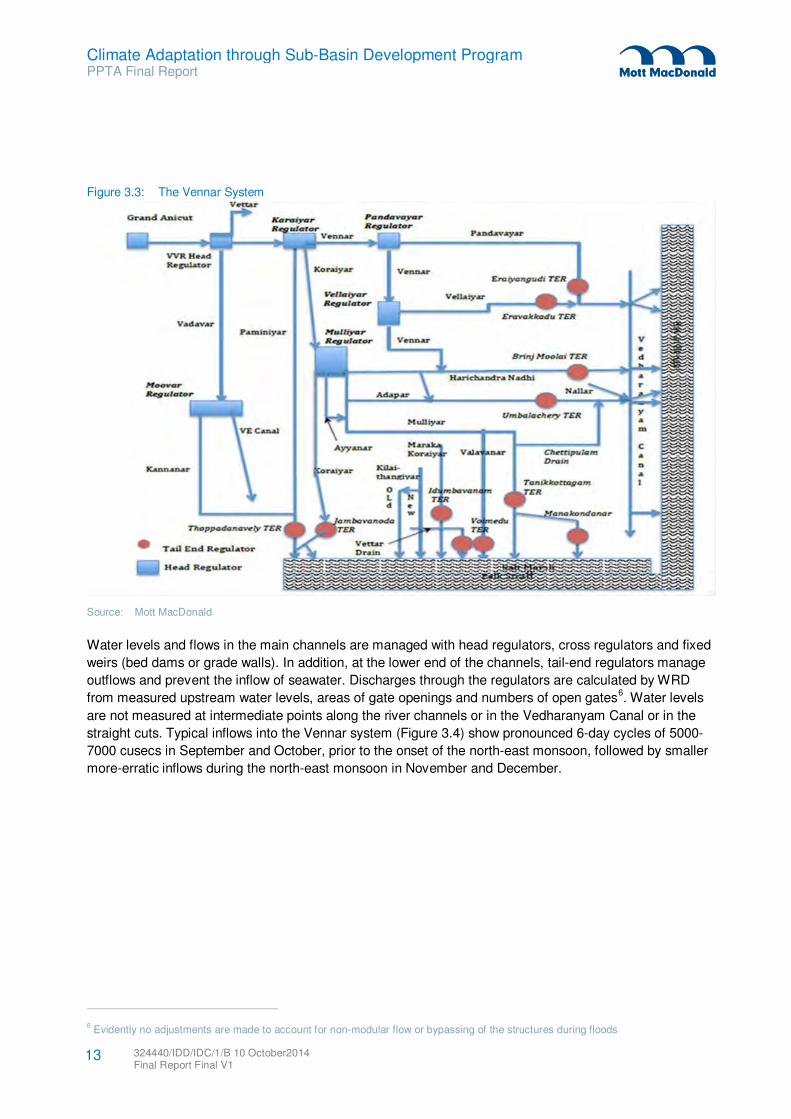
Figure 3.3: The Vennar System
Source: Mott MacDonald
Water levels and flows in the main channels are managed with head regulators, cross regulators and fixed
weirs (bed dams or grade walls). In addition, at the lower end of the channels, tail-end regulators manage
outflows and prevent the inflow of seawater. Discharges through the regulators are calculated by WRD
from measured upstream water levels, areas of gate openings and numbers of open gates6. Water levels
are not measured at intermediate points along the river channels or in the Vedharanyam Canal or in the
straight cuts. Typical inflows into the Vennar system (Figure 3.4) show pronounced 6-day cycles of 5000-
7000 cusecs in September and October, prior to the onset of the north-east monsoon, followed by smaller
more-erratic inflows during the north-east monsoon in November and December.
6 Evidently no adjustments are made to account for non-modular flow or bypassing of the structures during floods
324440/IDD/IDC/1/B 10 October2014 Final Report Final V1
13
Climate Adaptation through Sub-Basin Development Program PPTA Final Report
Figure 3.4: Flows and Rainfall at VVR Head Regulator
Source: WRD/Mott MacDonald
Figure 3.5: Typical Irrigation Flows through Main Channels
Source: Mott MacDonald
324440/IDD/IDC/1/B 10 October2014 Final Report Final V1
14
Climate Adaptation through Sub-Basin Development Program PPTA Final Report
In the Vennar system there are seven head regulators at major river bifurcation points, 188 intermediate
regulators and 11 tail-end regulators (see Section 4.6). The tail-end regulators serve the dual purpose of
increasing water levels to serve low lying command areas near the coast and preventing sea water ingress
to the system. When heavy rainfall occurs and drainage congestion takes place the tail-end regulators are
kept open to accelerate outflows to the sea, but the balancing effect of the Vedharanyam Canal and
adjacent lagoons, combined with high tides, and the storm surges that tend to accompany cyclonic rainfall,
slow outflows causing drainage congestion and flooding in coastal areas.
Irrigation water is distributed from the main channels through head sluices located on the banks of the
main channels. The head sluices are mostly located sufficiently close to cross regulators that water levels
are adequate, but some head sluices are too far upstream and are therefore sometimes subject to
inadequate water levels. From the irrigation head sluices, water is distributed through networks of canals
and field channels to the fields. Maintenance of these networks has been minimal in recent times and
consequently water distribution is inefficient due to seepage, congestion due to vegetation and sediment,
and broken sluices. In the worst cases, distant farmers do not receive any surface water at all.
Drainage is provided by a network of field and collector drains connected to the main channels. Flows from
some drains to the main channels are managed by drainage infall sluices but most drains have open
infalls. During floods, water levels in the main channels are commonly higher than water levels in the
drains thus preventing the drainage of surface runoff from the command areas.
The anicuts and principal regulators have been operated and maintained by Government departments
since the 19th century. In the modern era it is WRD that operates the infrastructure. Most of the
infrastructure is physically old and, within the Cauvery and Vennar systems, manually operated. Many of
the structures are in need of repair.
Originally the canals, many of which are natural streams, were maintained by the farmers through the self-
help (kudimaramath) system. However, in the 1930s, most of the distribution canals and their structures
were adopted by the government. In the modern era the government has had to concentrate maintenance
on critical primary infrastructure such as head, cross and tail-end regulators and arterial canals, because of
limited resources. It has not been possible to maintain secondary structures and the canal network to the
same standard
In the 20th century the WRD added 108 new intermediate regulators on the main delta rivers in order to
increase water levels in the main channels and thereby create sufficient hydraulic head at the head sluices.
However some head sluices are out of reach of the backwaters created by the intermediate regulators and
it is therefore necessary to run some main rivers at discharges in excess of normal irrigation supply in
order to ensure adequate water levels at those sluices. This is an inherent inefficiency in the operating
system and for this reason the WRD intends that more intermediate regulators will be constructed (WRO,
2008).
Minor canals and structures are nominally in the care of the farmers, but gradually the self-help system has
broken down, particularly since the advent of electrical pumps for groundwater abstraction and the
provision of free electricity. Consequently, the physical condition of the minor infrastructure has
deteriorated. Many of the smaller canals and watercourses are now silted-up, weedy and leaky and some
are no longer maintained or used.
The surface water distribution system has not kept pace with the changing distribution of landholdings in
the command areas. Land tenure has become progressively fragmented through the traditional inheritance
324440/IDD/IDC/1/B 10 October2014 Final Report Final V1
15
Climate Adaptation through Sub-Basin Development Program PPTA Final Report
system. The average size of a land holding in the delta is now 0.75 ha (WRO, 2008) whereas the canal
network was designed for 20 ha blocks. Therefore, in many locations small scale distribution infrastructure
does not exist, and field-to-field spillage is necessary in order to water distant farms.
Recognising the dilapidation of the system the WRD has proposed (WRO, 2008) (WRD, 2013) a number of
interventions to restore the irrigation and drainage systems in the delta. These include strengthening of
river embankments, lining of some rivers and canals, improvements to the alignment of canals, repairs to
and replacement of structures, additional intermediate regulators, and additional tail-end regulators.
324440/IDD/IDC/1/B 10 October2014 Final Report Final V1
16
Climate Adaptation through Sub-Basin Development Program PPTA Final Report
4.1 Water Resources Issues
The water resources issues affecting the Cauvery River delta sub-basin are presented in the ‘problem tree’
format required by ADB in Figure 4.1. It identifies the following core problems:
The availability of surface is variable in space and time,
The distribution of surface water is inefficient and unequal,
The irrigation infrastructure is physically old, manually operated and much of it is in need of repair,
There is a growing dependence on groundwater for irrigation even when surface water is available,
Groundwater is generally saline and surface water supply is least reliable in the south east of the delta,
Highly water consumptive and inefficient agricultural systems are in use,
A vulnerability to fluvial floods due to inadequate channel capacity in the rivers and inadequate drainage from the irrigation command areas,
A vulnerability to flooding in coastal areas, particularly when fluvial floods coincide with tidal surges,
A vulnerability to agricultural droughts when poor SW monsoons in the first half of the growing season are followed by poor NE monsoons during the second half of the growing season,
Uncoordinated water resources development and management with supply measures dwarfing demand management measures.
The general impacts of these issues are (i) agricultural productivity and rural incomes are less than
potential because of unreliable supplies of irrigation water and flood damage, (ii) there are early indications
of conflicts between different water users, between paddy farmers and shrimp farmers for instance, and (iii)
soils in some areas are being degraded by excessive use of unsuitable groundwater and prolonged mono-
cropping of paddy.
These water resources issues are discussed in greater detail in the following sections of this chapter.
4.2 Availability of Surface Water
The flow in the Cauvery River released from the Mettur Dam, normally from June to January, is variable
and is the major determinant of the annual cropping schedule in the sub-basin. A poor south-west
monsoon in Karnataka limits flows in the river and therefore reduces the amount of surface water available
for irrigation. Figure 4.2 indicates that the Stanley reservoir filled (93.5 TMC) completely in only 10 years
out of 24 years in the period 1990 to 2013 and was less than half filled (46.8 TMC) in 6 years (notably
during the severe drought from 2002 to 2004).
The inflow of surface water into the Vennar system is not only temporally variable, it is also spatially
variable. Distribution to the irrigation command areas is unequal between upstream and downstream
ayacuts. In years with low inflows, some tail-end ayacuts receive little, if any, surface water. In some cases
these deficiencies may be exacerbated by poorly maintained canals. Where sufficient groundwater is
available, the shortfall in surface water can often be made up. However there are many areas in the
Cauvery delta with limited groundwater availability or with saline groundwater.
4 Due Diligence
324440/IDD/IDC/1/B 10 October2014 Final Report Final V1
17
Climate Adaptation through Sub-Basin Development Program PPTA Final Report
4.3 Availability of Groundw ater
Groundwater is a vital resource in the Cauvery Delta that is widely used to compensate for unreliable
surface water supplies. However there are many areas where the availability of groundwater is limited or
where it is saline. Although the aquifers are monitored to some extent, there is insufficient data on their
lithology, storage characteristics and yields and therefore their potential as sources of water is not fully
understood.
According to the most recent estimates (CGWB, District Groundwater Brochure Thanjavur District. March
2009. (V. Dhinagaran, Scientist-D), 2009) there is an annual sustainable groundwater yield of about 1,187
MCM in the three Cauvery delta districts of Thanjavur, Thiruvarur and Nagapattinam. However annual
abstraction is estimated to be 1,450 MCM, 122% of the annual recharge. Approximately 80% is used for
irrigation and water supply.
The key issues affecting development of groundwater are:
Significant areas have saline groundwater which therefore cannot be used for irrigation or
drinking water.
Currently there is no effective regulation of groundwater development and no meaningful tariff
of charges for electricity connections to pumped borewells. Therefore there are no incentives
for farmers to conserve groundwater.
The increasing use of artificial groundwater recharge schemes could help to replenish
groundwater reserves, but the impact of these schemes is not being monitored and therefore
the benefits are unclear.
Periodic government assessments of groundwater development in administrative units (blocks)
indicate that some blocks are overexploited and that there should be no more development.
Seepage, mostly around channel regulators, causes local waterlogging.
Further details of the groundwater issues in the delta are provided in Appendix I.
4.3.1 Aquifers
The Cauvery delta has two main aquifer systems – a shallow unconfined alluvial aquifer and a deeper
confined sandstone aquifer. These are linked, with flow between the two possible through the intervening
aquitard, but this has low vertical permeability so the aquifers are able to sustain significantly different
piezometric heads.
The upper aquifer responds more than the lower aquifer to seasonal drivers (rainfall recharge, groundwater
use). Records of groundwater levels indicate that the shallow aquifer is normally fully replenished by
January each year following the north-east monsoon. The records show that seasonal variations are also
present in the lower aquifer, but much dampened. During the 1960s the lower aquifer was artesian (UNDP,
1970) but abstractions from this aquifer since then have caused piezometric levels to drop significantly
(although they may have stabilised recently) and there are now no flowing wells.
324440/IDD/IDC/1/B 10 October2014 Final Report Final V1
18
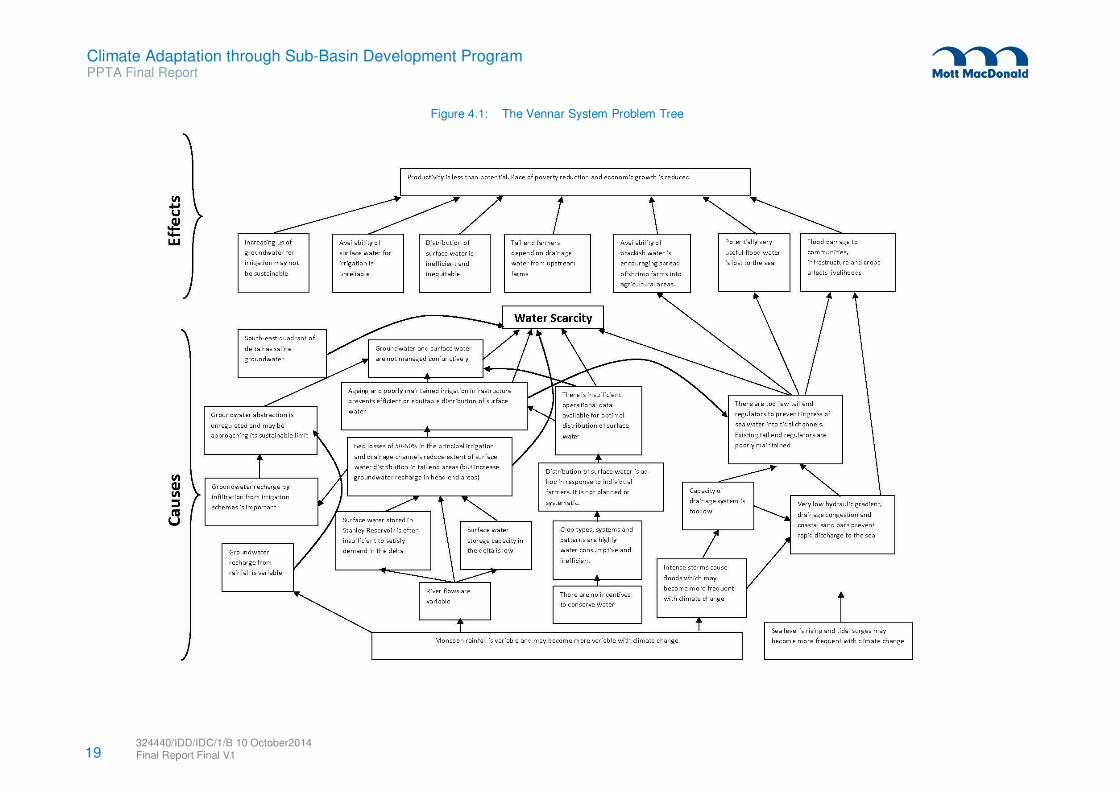
Climate Adaptation through Sub-Basin Development Program PPTA Final Report
Figure 4.1: The Vennar System Problem Tree
19 324440/IDD/IDC/1/B 10 October2014 Final Report Final V1
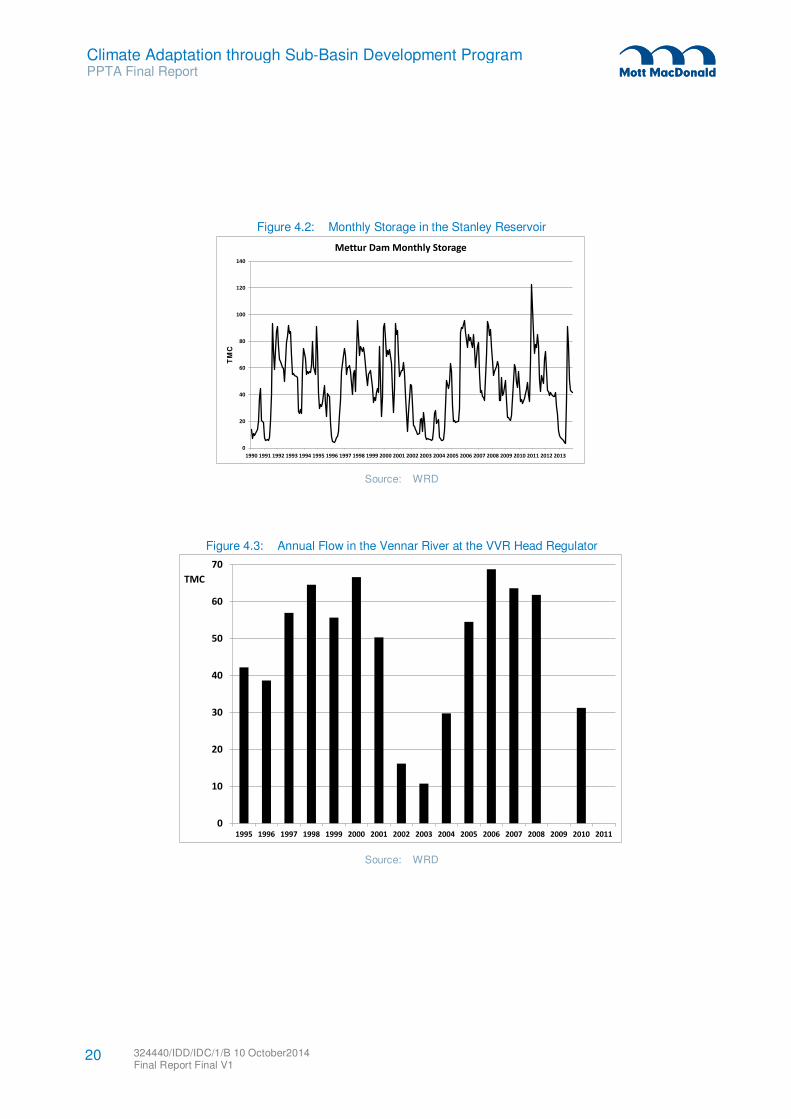
Climate Adaptation through Sub-Basin Development Program PPTA Final Report
Figure 4.2: Monthly Storage in the Stanley Reservoir
Source: WRD
Figure 4.3: Annual Flow in the Vennar River at the VVR Head Regulator
Source: WRD
0
20
40
60
80
100
120
140
1990 1991 1992 1993 1994 1995 1996 1997 1998 1999 2000 2001 2002 2003 2004 2005 2006 2007 2008 2009 2010 2011 2012 2013
TM
C
Mettur Dam Monthly Storage
0
10
20
30
40
50
60
70
1995 1996 1997 1998 1999 2000 2001 2002 2003 2004 2005 2006 2007 2008 2009 2010 2011
TMC
324440/IDD/IDC/1/B 10 October2014 Final Report Final V1
20
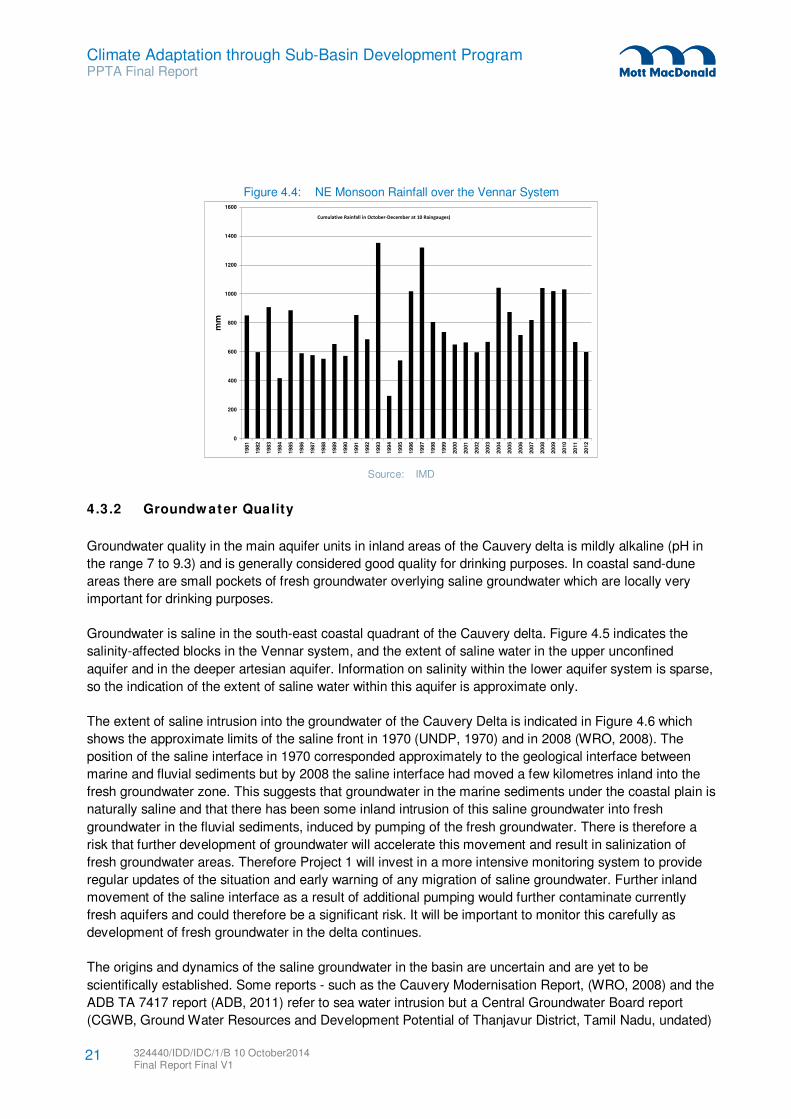
Climate Adaptation through Sub-Basin Development Program PPTA Final Report
Figure 4.4: NE Monsoon Rainfall over the Vennar System
Source: IMD
4.3.2 Groundw ater Quality
Groundwater quality in the main aquifer units in inland areas of the Cauvery delta is mildly alkaline (pH in
the range 7 to 9.3) and is generally considered good quality for drinking purposes. In coastal sand-dune
areas there are small pockets of fresh groundwater overlying saline groundwater which are locally very
important for drinking purposes.
Groundwater is saline in the south-east coastal quadrant of the Cauvery delta. Figure 4.5 indicates the
salinity-affected blocks in the Vennar system, and the extent of saline water in the upper unconfined
aquifer and in the deeper artesian aquifer. Information on salinity within the lower aquifer system is sparse,
so the indication of the extent of saline water within this aquifer is approximate only.
The extent of saline intrusion into the groundwater of the Cauvery Delta is indicated in Figure 4.6 which
shows the approximate limits of the saline front in 1970 (UNDP, 1970) and in 2008 (WRO, 2008). The
position of the saline interface in 1970 corresponded approximately to the geological interface between
marine and fluvial sediments but by 2008 the saline interface had moved a few kilometres inland into the
fresh groundwater zone. This suggests that groundwater in the marine sediments under the coastal plain is
naturally saline and that there has been some inland intrusion of this saline groundwater into fresh
groundwater in the fluvial sediments, induced by pumping of the fresh groundwater. There is therefore a
risk that further development of groundwater will accelerate this movement and result in salinization of
fresh groundwater areas. Therefore Project 1 will invest in a more intensive monitoring system to provide
regular updates of the situation and early warning of any migration of saline groundwater. Further inland
movement of the saline interface as a result of additional pumping would further contaminate currently
fresh aquifers and could therefore be a significant risk. It will be important to monitor this carefully as
development of fresh groundwater in the delta continues.
The origins and dynamics of the saline groundwater in the basin are uncertain and are yet to be
scientifically established. Some reports - such as the Cauvery Modernisation Report, (WRO, 2008) and the
ADB TA 7417 report (ADB, 2011) refer to sea water intrusion but a Central Groundwater Board report
(CGWB, Ground Water Resources and Development Potential of Thanjavur District, Tamil Nadu, undated)
0
200
400
600
800
1000
1200
1400
1600
19
81
19
82
19
83
19
84
19
85
19
86
19
87
19
88
19
89
19
90
19
91
19
92
19
93
19
94
19
95
19
96
19
97
19
98
19
99
20
00
20
01
20
02
20
03
20
04
20
05
20
06
20
07
20
08
20
09
20
10
20
11
20
12
mm
Cumulative Rainfall in October-December at 10 Raingauges)
324440/IDD/IDC/1/B 10 October2014 Final Report Final V1
21
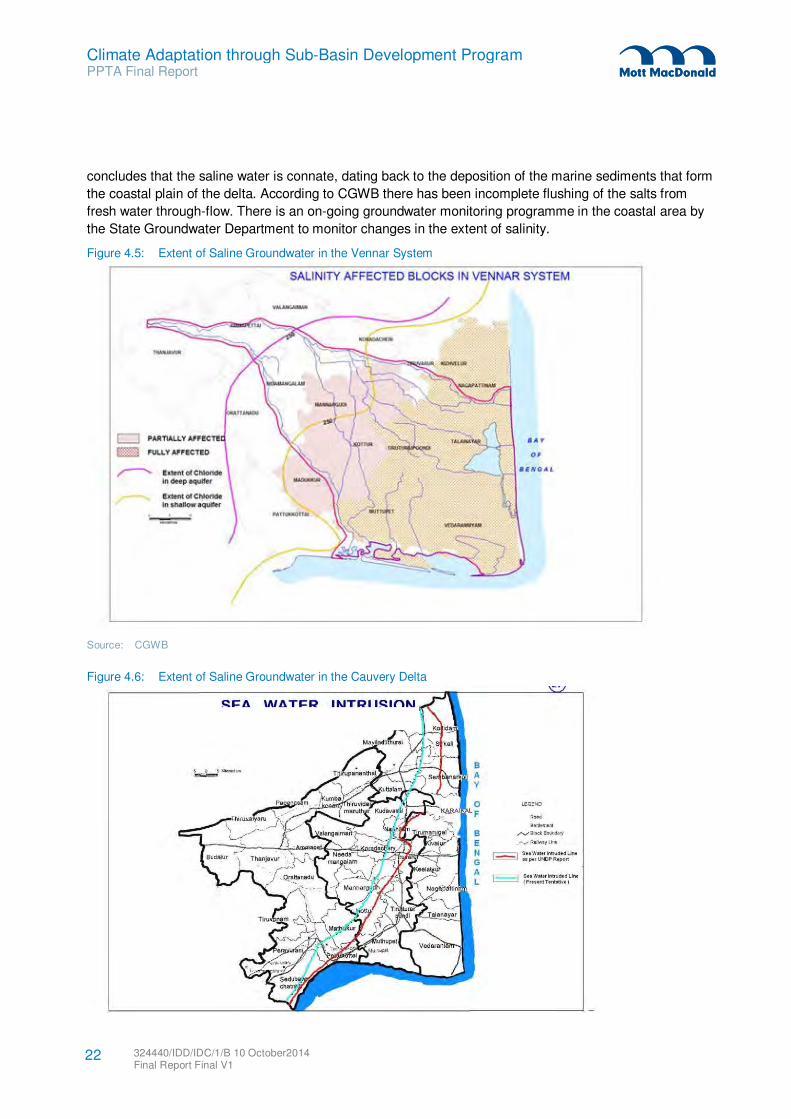
Climate Adaptation through Sub-Basin Development Program PPTA Final Report
concludes that the saline water is connate, dating back to the deposition of the marine sediments that form
the coastal plain of the delta. According to CGWB there has been incomplete flushing of the salts from
fresh water through-flow. There is an on-going groundwater monitoring programme in the coastal area by
the State Groundwater Department to monitor changes in the extent of salinity.
Figure 4.5: Extent of Saline Groundwater in the Vennar System
Source: CGWB
Figure 4.6: Extent of Saline Groundwater in the Cauvery Delta
324440/IDD/IDC/1/B 10 October2014 Final Report Final V1
22
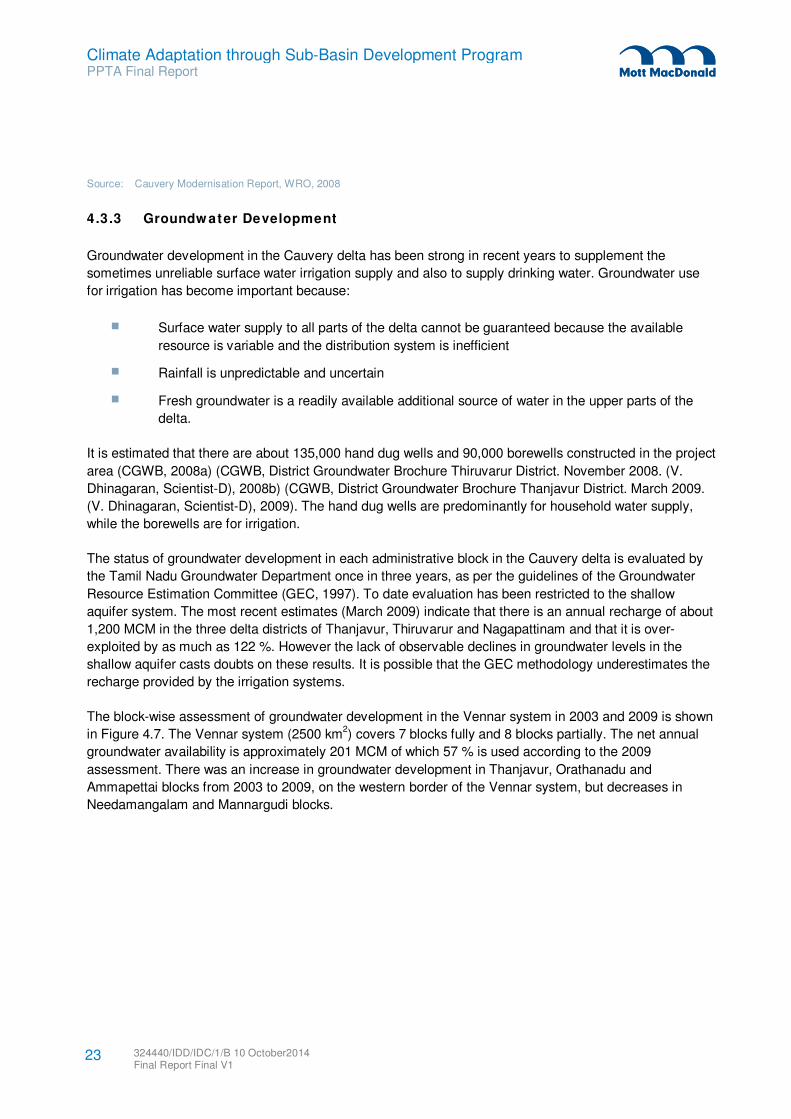
Climate Adaptation through Sub-Basin Development Program PPTA Final Report
Source: Cauvery Modernisation Report, WRO, 2008
4.3.3 Groundw ater Development
Groundwater development in the Cauvery delta has been strong in recent years to supplement the
sometimes unreliable surface water irrigation supply and also to supply drinking water. Groundwater use
for irrigation has become important because:
Surface water supply to all parts of the delta cannot be guaranteed because the available
resource is variable and the distribution system is inefficient
Rainfall is unpredictable and uncertain
Fresh groundwater is a readily available additional source of water in the upper parts of the
delta.
It is estimated that there are about 135,000 hand dug wells and 90,000 borewells constructed in the project
area (CGWB, 2008a) (CGWB, District Groundwater Brochure Thiruvarur District. November 2008. (V.
Dhinagaran, Scientist-D), 2008b) (CGWB, District Groundwater Brochure Thanjavur District. March 2009.
(V. Dhinagaran, Scientist-D), 2009). The hand dug wells are predominantly for household water supply,
while the borewells are for irrigation.
The status of groundwater development in each administrative block in the Cauvery delta is evaluated by
the Tamil Nadu Groundwater Department once in three years, as per the guidelines of the Groundwater
Resource Estimation Committee (GEC, 1997). To date evaluation has been restricted to the shallow
aquifer system. The most recent estimates (March 2009) indicate that there is an annual recharge of about
1,200 MCM in the three delta districts of Thanjavur, Thiruvarur and Nagapattinam and that it is over-
exploited by as much as 122 %. However the lack of observable declines in groundwater levels in the
shallow aquifer casts doubts on these results. It is possible that the GEC methodology underestimates the
recharge provided by the irrigation systems.
The block-wise assessment of groundwater development in the Vennar system in 2003 and 2009 is shown
in Figure 4.7. The Vennar system (2500 km2) covers 7 blocks fully and 8 blocks partially. The net annual
groundwater availability is approximately 201 MCM of which 57 % is used according to the 2009
assessment. There was an increase in groundwater development in Thanjavur, Orathanadu and
Ammapettai blocks from 2003 to 2009, on the western border of the Vennar system, but decreases in
Needamangalam and Mannargudi blocks.
324440/IDD/IDC/1/B 10 October2014 Final Report Final V1
23
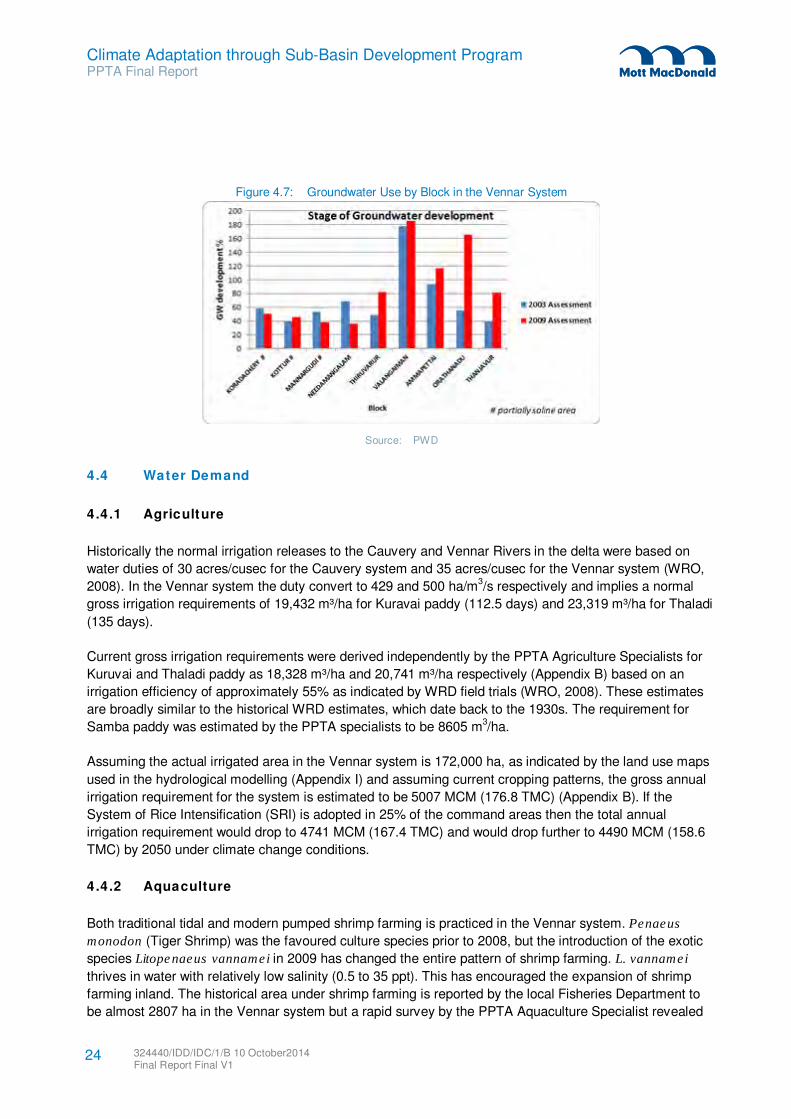
Climate Adaptation through Sub-Basin Development Program PPTA Final Report
Figure 4.7: Groundwater Use by Block in the Vennar System
Source: PWD
4.4 Water Demand
4.4.1 Agriculture
Historically the normal irrigation releases to the Cauvery and Vennar Rivers in the delta were based on
water duties of 30 acres/cusec for the Cauvery system and 35 acres/cusec for the Vennar system (WRO,
2008). In the Vennar system the duty convert to 429 and 500 ha/m3/s respectively and implies a normal
gross irrigation requirements of 19,432 m³/ha for Kuravai paddy (112.5 days) and 23,319 m³/ha for Thaladi
(135 days).
Current gross irrigation requirements were derived independently by the PPTA Agriculture Specialists for
Kuruvai and Thaladi paddy as 18,328 m³/ha and 20,741 m³/ha respectively (Appendix B) based on an
irrigation efficiency of approximately 55% as indicated by WRD field trials (WRO, 2008). These estimates
are broadly similar to the historical WRD estimates, which date back to the 1930s. The requirement for
Samba paddy was estimated by the PPTA specialists to be 8605 m3/ha.
Assuming the actual irrigated area in the Vennar system is 172,000 ha, as indicated by the land use maps
used in the hydrological modelling (Appendix I) and assuming current cropping patterns, the gross annual
irrigation requirement for the system is estimated to be 5007 MCM (176.8 TMC) (Appendix B). If the
System of Rice Intensification (SRI) is adopted in 25% of the command areas then the total annual
irrigation requirement would drop to 4741 MCM (167.4 TMC) and would drop further to 4490 MCM (158.6
TMC) by 2050 under climate change conditions.
4.4.2 Aquaculture
Both traditional tidal and modern pumped shrimp farming is practiced in the Vennar system. Penaeus
monodon (Tiger Shrimp) was the favoured culture species prior to 2008, but the introduction of the exotic
species Litopenaeus vannamei in 2009 has changed the entire pattern of shrimp farming. L. vannamei
thrives in water with relatively low salinity (0.5 to 35 ppt). This has encouraged the expansion of shrimp
farming inland. The historical area under shrimp farming is reported by the local Fisheries Department to
be almost 2807 ha in the Vennar system but a rapid survey by the PPTA Aquaculture Specialist revealed
324440/IDD/IDC/1/B 10 October2014 Final Report Final V1
24
Climate Adaptation through Sub-Basin Development Program PPTA Final Report
only about 1884 ha of active ponds including 500 ha in the fresh water inland zone and 1384 ha in the
coastal belt. Some areas of historical shrimp farming have now been abandoned due to issues such as
land ownership, procuring licenses, failure of P. monodon production due to disease, and poor site
selection, while other areas are idle. Currently the production of L. vannamei in the Vennar system is
around 11,304 metric tons per annum in two harvests.
Water use for shrimp farming in the Vennar system is 17,500 m3/ha per shrimp crop. Normally two crops
per annum are produced and therefore the total water demand is 65.9 MCM (2.3 TMC) over the 1884 ha of
active ponds. Of this 28.3 MCM (1.0 TMC) is consumed and 37.7 MCM (1.3 TMC) is returned. Typically,
12 m3 of fresh or brackish water are required to produce 1 kg of shrimps of which approximately 5 m
3 are
lost due to evaporation and infiltration.
In the coastal zone, most of the land suitable for shrimp farming has been developed. Consequently there
are few opportunities to expand. However, currently there are 923 ha of inactive shrimp farms on the coast
because of land ownership, water quality, soil texture, or social problems. The new Project-1 tail end
regulators will make more fresh water available which may reactivate about 277 ha (30 %) of the inactive
farms and increase their productivity. The area of shrimp farms in inland areas is expected to increase
sharply to over 7000 ha over the next few years as more farms are opened using fresher water. By 2020
water demand in the Vennar system for shrimp farming may rise to around 278.8 MCM (9.9 TMC).
As shrimp farming expands important safeguards and issues will be required e.g. systematic adoption and
development of bio-secure shrimp farm practices, marketing and prices, infrastructure, access to credit,
improvement of forward and backward linkages and implementation of appropriate legislation and policies
(Appendix C).
4.4.3 Pow er Generat ion
The demand for fresh water for cooling processes in power generation is small. Mostly sea water is used.
Use of water in a thermal coal-fired plant is estimated to be in the range of 1.7 to 8.0 m3 per MW of power
production (BoEF, 2006). This puts the total water demand for thermal power plants in Thiriavarur and
Nagapattinam Districts at between 17,000 and 80,000 m3 per day.
4.4.4 Industry
The TWAD Board Act 1970 has a provision to execute water supply and sewerage schemes for industries
and institutions. The schemes are executed by the Board on a commercial basis. The current industrial
water supply and the quantity allotted under the jurisdiction of the Chief Engineer (Thanjavur Circle,
TWAD) are shown in Table 4-1.
Table 4-1: Industrial Water Supply
Industry Water source Litres/day
TNEB Gas Plant CWSS to Gas Based power project and 77 habitations and Kuthalam UTP in Thanjavur and Nagapattinam Districts 225,000
LANCO (Aban) Power Plant CWSS to TNEB Gas plant and 77 habitations in Kuthalam Union 100,000
SIDCO Thuvakudi, SIDCO, Valavanthankottai and Food Craft, Thuvakudi
CWSS to Thiuverumbur UTP, Thuvakudi Municipality, Koothappar RTP and 97 other habitations in Thiruverumbur union and 17 private beneficiaries in Trichy District 1,294,000
324440/IDD/IDC/1/B 10 October2014 Final Report Final V1
25
Climate Adaptation through Sub-Basin Development Program PPTA Final Report
Industry Water source Litres/day
SIPCOT and Indian Oil Corporation
CWSS to Pudukkottai Municipality, 3 Town panchayats and 15 habitations in Pudukkottai, Trichy and Karur districts 515,000
Total 2,134,000
Source: CE-TWAD Board, Thanjavur
The projected domestic and industrial water demand for 2025 is estimated to be 82.46 MCM. The district-wise break-down is indicated in the Table 4-2.
Table 4-2: Domestic and industrial demand in 2025
District Demand in MCM
Thanjavur 43.18
Thiruvarur 19.01
Nagapattinam 20.27
Total 82.46
Source: District Estimates, Technical Report Series, CGWB, 2008
4.4.5 Drinking Water
The populations of the three project districts of Thanjavur, Thiravarur and Nagapattinam are expected to grow by 8-10% between 2011 and 2021 (Table 4-3).
Table 4-3: Projected population of the three Vennar System Districts
District Population (2011) Population (2021)
Thanjavur 2,402,781 2,425,025
Thiruvarur 1,264,277 1,390,705
Nagapattinam 1,488,839 1,637,725
Total 5,155,897 5,453,455
Source: Growth of Population Density, T. Sangeetha and R Baskaran, Department of Earth Sciences, Tamil University, Thanjavur, 2010 and other sources
Table 4-4 summarizes the settlements and towns covered by the TWAD Board in the Vennar system and
their sources of the water. The Cauvery and Coleroon Rivers are the two most important sources. In some
locations surface water is supplemented by groundwater.
Table 4-4: Drinking water status and surface source
District Villages Habitations Service Levels Towns Source
Thanjavur 589 3902 Fully served = 3748
Partly served = 154
25 Cauvery and Kollidam
Thiruvarur 430 2582 Fully served = 2521
Partly served = 61
11 Cauvery
Nagapattinam 434 2872 Fully served = 2521
Partly served = 351
13 Kollidam
Total for Vennar system
1019 9356 8790
566
49
Source: TWAD Thanjavur, 2011
324440/IDD/IDC/1/B 10 October2014 Final Report Final V1
26
Climate Adaptation through Sub-Basin Development Program PPTA Final Report
The TWAD Board sources drinking water from 8 schemes in Thanjavur and 8 schemes in Thiruvarur and
Nagapattinam at a rate of 237 million litres/day (MLD). With increasing population and increasing per
capita consumption, the situation is likely to change significantly and the estimated demand in 2021 will
increase by 15 to 20%.
4.4.6 Return flow
The return flow of domestic, commercial and industrial use is likely to be in the range of 10 to 30%. In
almost all towns grey water is discharged into the environment without any treatment, thereby polluting
surface water and groundwater bodies. Most small towns and villages do not have sewage treatment
plants; in those few that do, the capacities of the plants are insufficient to meet requirements. In Tamil
Nadu there are no major industries in the Cauvery River sub-basin that require industrial effluent treatment,
but as the industrial sector grows the State Government is making an effort to control pollution by imposing
a ban on highly polluting new industries within 5 km of the river (TNPC, 2005). Upstream of Tamil Nadu
however, a number of polluting industries such as tanneries, chemical and textiles are located in
Karnataka.
4.4.7 Summary of Demand
In Tamil Nadu, surface water supply for irrigation is provided by the Water Resources Department (WRD)
of the Public Works Department (PWD) free of charge. Groundwater abstractions are not currently
regulated by the state government, although they are discouraged in already over-abstracted areas
identified by the Central Groundwater Board (CGWB). Encouraged by free electricity and subsidised plant,
use of groundwater for irrigation by individual farmers has proliferated over the last 30-40 years. In the
Vennar system, the most important current demands are summarised in Table 4.5.
Table 4.5: Insert Table Title here
Annual Water Demand
Irrigation
(Mm3)
Aquaculture
(Mm3)
Industrial and domestic (Mm3)
Power
(Mm3)
Total
(Mm3)
Present 5007 66 75 18 5166
Future 5007* (4740**) 241 83 18 5349(5082**)
* The irrigated area is not expected to increase significantly in the future because almost all irrigable land is already in use. Therefore irrigation demand is unlikely to increase.
** If the System of Rice Intensification (SRI) is adopted then irrigation demand will fall significantly.
4.5 Water Balance Model
A water balance model for the Vennar System has been prepared based on estimates of the coverage of
land use and soils from the SWAT hydrological model (Appendix Q) and crop water requirements from the
FAO CROPWAT model.
The water balance of any closed hydrological system for a given period of time is expressed as:
I – O = ΔS
Where:
I = Inflow into the system
O = Outflow from the system
ΔS = Change in storage
324440/IDD/IDC/1/B 10 October2014 Final Report Final V1
27
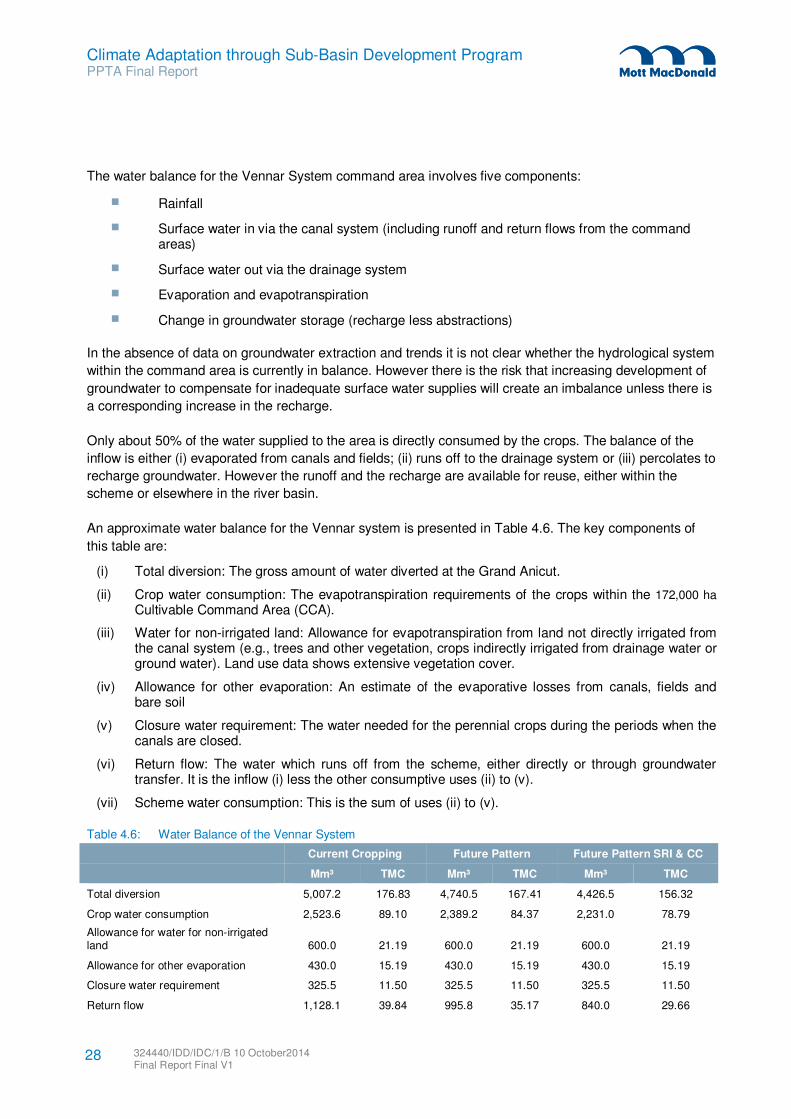
Climate Adaptation through Sub-Basin Development Program PPTA Final Report
The water balance for the Vennar System command area involves five components:
Rainfall
Surface water in via the canal system (including runoff and return flows from the command areas)
Surface water out via the drainage system
Evaporation and evapotranspiration
Change in groundwater storage (recharge less abstractions)
In the absence of data on groundwater extraction and trends it is not clear whether the hydrological system
within the command area is currently in balance. However there is the risk that increasing development of
groundwater to compensate for inadequate surface water supplies will create an imbalance unless there is
a corresponding increase in the recharge.
Only about 50% of the water supplied to the area is directly consumed by the crops. The balance of the
inflow is either (i) evaporated from canals and fields; (ii) runs off to the drainage system or (iii) percolates to
recharge groundwater. However the runoff and the recharge are available for reuse, either within the
scheme or elsewhere in the river basin.
An approximate water balance for the Vennar system is presented in Table 4.6. The key components of
this table are:
(i) Total diversion: The gross amount of water diverted at the Grand Anicut.
(ii) Crop water consumption: The evapotranspiration requirements of the crops within the 172,000 ha
Cultivable Command Area (CCA).
(iii) Water for non-irrigated land: Allowance for evapotranspiration from land not directly irrigated from the canal system (e.g., trees and other vegetation, crops indirectly irrigated from drainage water or ground water). Land use data shows extensive vegetation cover.
(iv) Allowance for other evaporation: An estimate of the evaporative losses from canals, fields and bare soil
(v) Closure water requirement: The water needed for the perennial crops during the periods when the canals are closed.
(vi) Return flow: The water which runs off from the scheme, either directly or through groundwater transfer. It is the inflow (i) less the other consumptive uses (ii) to (v).
(vii) Scheme water consumption: This is the sum of uses (ii) to (v).
Table 4.6: Water Balance of the Vennar System
Current Cropping Future Pattern Future Pattern SRI & CC
Mm³ TMC Mm³ TMC Mm³ TMC
Total diversion 5,007.2 176.83 4,740.5 167.41 4,426.5 156.32
Crop water consumption 2,523.6 89.10 2,389.2 84.37 2,231.0 78.79
Allowance for water for non-irrigated land 600.0 21.19 600.0 21.19 600.0 21.19
Allowance for other evaporation 430.0 15.19 430.0 15.19 430.0 15.19
Closure water requirement 325.5 11.50 325.5 11.50 325.5 11.50
Return flow 1,128.1 39.84 995.8 35.17 840.0 29.66
324440/IDD/IDC/1/B 10 October2014 Final Report Final V1
28
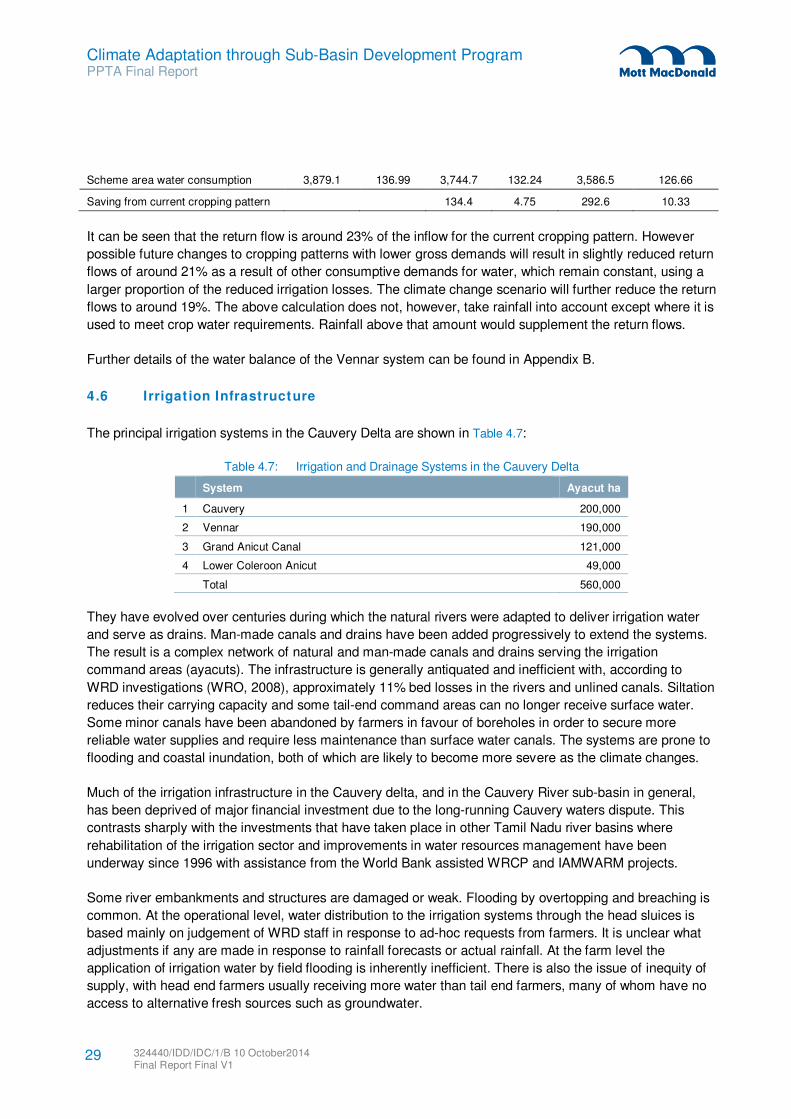
Climate Adaptation through Sub-Basin Development Program PPTA Final Report
Scheme area water consumption 3,879.1 136.99 3,744.7 132.24 3,586.5 126.66
Saving from current cropping pattern 134.4 4.75 292.6 10.33
It can be seen that the return flow is around 23% of the inflow for the current cropping pattern. However
possible future changes to cropping patterns with lower gross demands will result in slightly reduced return
flows of around 21% as a result of other consumptive demands for water, which remain constant, using a
larger proportion of the reduced irrigation losses. The climate change scenario will further reduce the return
flows to around 19%. The above calculation does not, however, take rainfall into account except where it is
used to meet crop water requirements. Rainfall above that amount would supplement the return flows.
Further details of the water balance of the Vennar system can be found in Appendix B.
4.6 I rrigat ion Infrastructure
The principal irrigation systems in the Cauvery Delta are shown in Table 4.7:
Table 4.7: Irrigation and Drainage Systems in the Cauvery Delta
System Ayacut ha
1 Cauvery 200,000
2 Vennar 190,000
3 Grand Anicut Canal 121,000
4 Lower Coleroon Anicut 49,000
Total 560,000
They have evolved over centuries during which the natural rivers were adapted to deliver irrigation water
and serve as drains. Man-made canals and drains have been added progressively to extend the systems.
The result is a complex network of natural and man-made canals and drains serving the irrigation
command areas (ayacuts). The infrastructure is generally antiquated and inefficient with, according to
WRD investigations (WRO, 2008), approximately 11% bed losses in the rivers and unlined canals. Siltation
reduces their carrying capacity and some tail-end command areas can no longer receive surface water.
Some minor canals have been abandoned by farmers in favour of boreholes in order to secure more
reliable water supplies and require less maintenance than surface water canals. The systems are prone to
flooding and coastal inundation, both of which are likely to become more severe as the climate changes.
Much of the irrigation infrastructure in the Cauvery delta, and in the Cauvery River sub-basin in general,
has been deprived of major financial investment due to the long-running Cauvery waters dispute. This
contrasts sharply with the investments that have taken place in other Tamil Nadu river basins where
rehabilitation of the irrigation sector and improvements in water resources management have been
underway since 1996 with assistance from the World Bank assisted WRCP and IAMWARM projects.
Some river embankments and structures are damaged or weak. Flooding by overtopping and breaching is
common. At the operational level, water distribution to the irrigation systems through the head sluices is
based mainly on judgement of WRD staff in response to ad-hoc requests from farmers. It is unclear what
adjustments if any are made in response to rainfall forecasts or actual rainfall. At the farm level the
application of irrigation water by field flooding is inherently inefficient. There is also the issue of inequity of
supply, with head end farmers usually receiving more water than tail end farmers, many of whom have no
access to alternative fresh sources such as groundwater.
324440/IDD/IDC/1/B 10 October2014 Final Report Final V1
29
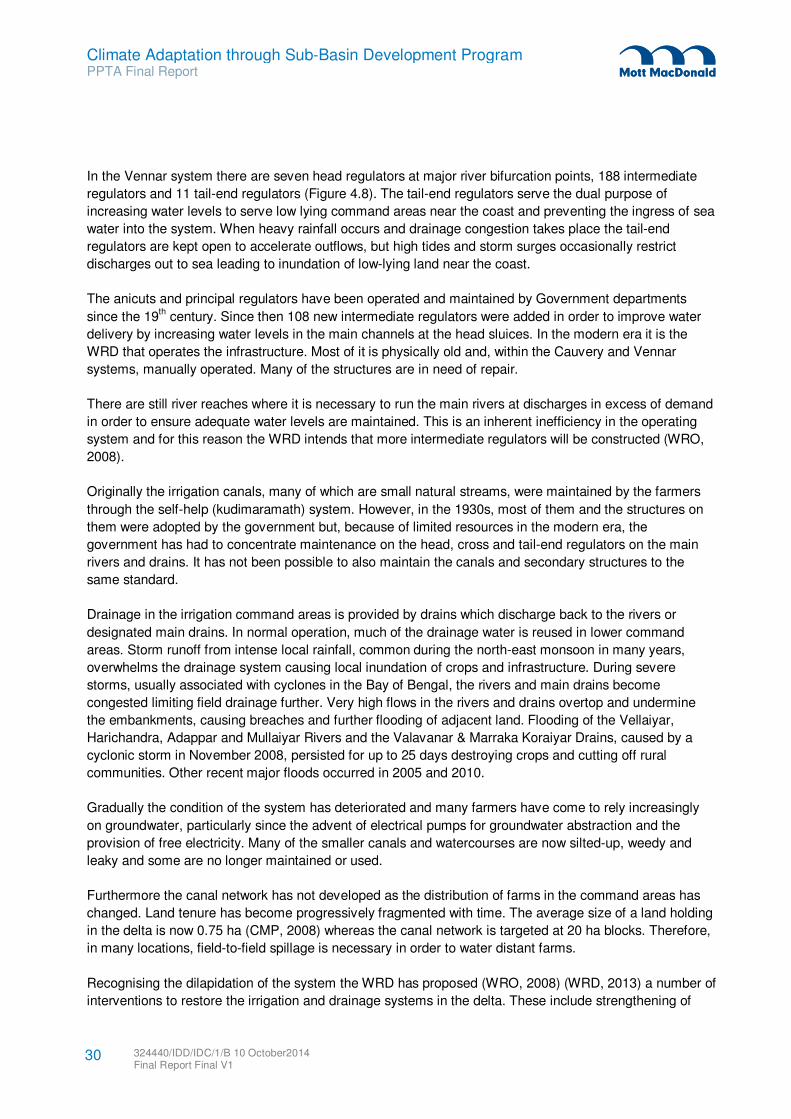
Climate Adaptation through Sub-Basin Development Program PPTA Final Report
In the Vennar system there are seven head regulators at major river bifurcation points, 188 intermediate
regulators and 11 tail-end regulators (Figure 4.8). The tail-end regulators serve the dual purpose of
increasing water levels to serve low lying command areas near the coast and preventing the ingress of sea
water into the system. When heavy rainfall occurs and drainage congestion takes place the tail-end
regulators are kept open to accelerate outflows, but high tides and storm surges occasionally restrict
discharges out to sea leading to inundation of low-lying land near the coast.
The anicuts and principal regulators have been operated and maintained by Government departments
since the 19th century. Since then 108 new intermediate regulators were added in order to improve water
delivery by increasing water levels in the main channels at the head sluices. In the modern era it is the
WRD that operates the infrastructure. Most of it is physically old and, within the Cauvery and Vennar
systems, manually operated. Many of the structures are in need of repair.
There are still river reaches where it is necessary to run the main rivers at discharges in excess of demand
in order to ensure adequate water levels are maintained. This is an inherent inefficiency in the operating
system and for this reason the WRD intends that more intermediate regulators will be constructed (WRO,
2008).
Originally the irrigation canals, many of which are small natural streams, were maintained by the farmers
through the self-help (kudimaramath) system. However, in the 1930s, most of them and the structures on
them were adopted by the government but, because of limited resources in the modern era, the
government has had to concentrate maintenance on the head, cross and tail-end regulators on the main
rivers and drains. It has not been possible to also maintain the canals and secondary structures to the
same standard.
Drainage in the irrigation command areas is provided by drains which discharge back to the rivers or
designated main drains. In normal operation, much of the drainage water is reused in lower command
areas. Storm runoff from intense local rainfall, common during the north-east monsoon in many years,
overwhelms the drainage system causing local inundation of crops and infrastructure. During severe
storms, usually associated with cyclones in the Bay of Bengal, the rivers and main drains become
congested limiting field drainage further. Very high flows in the rivers and drains overtop and undermine
the embankments, causing breaches and further flooding of adjacent land. Flooding of the Vellaiyar,
Harichandra, Adappar and Mullaiyar Rivers and the Valavanar & Marraka Koraiyar Drains, caused by a
cyclonic storm in November 2008, persisted for up to 25 days destroying crops and cutting off rural
communities. Other recent major floods occurred in 2005 and 2010.
Gradually the condition of the system has deteriorated and many farmers have come to rely increasingly
on groundwater, particularly since the advent of electrical pumps for groundwater abstraction and the
provision of free electricity. Many of the smaller canals and watercourses are now silted-up, weedy and
leaky and some are no longer maintained or used.
Furthermore the canal network has not developed as the distribution of farms in the command areas has
changed. Land tenure has become progressively fragmented with time. The average size of a land holding
in the delta is now 0.75 ha (CMP, 2008) whereas the canal network is targeted at 20 ha blocks. Therefore,
in many locations, field-to-field spillage is necessary in order to water distant farms.
Recognising the dilapidation of the system the WRD has proposed (WRO, 2008) (WRD, 2013) a number of
interventions to restore the irrigation and drainage systems in the delta. These include strengthening of
324440/IDD/IDC/1/B 10 October2014 Final Report Final V1
30
Climate Adaptation through Sub-Basin Development Program PPTA Final Report
river embankments, lining of some rivers and canals, improvements to the alignment of canals, repairs to
and replacement of structures, additional intermediate regulators, tail-end regulators etc.
Figure 4.8: Head, Cross and Tail-End regulators on Project 1 Rivers
4.7 Ineffic ient Water Use
The Cauvery delta irrigation systems are not typical. This is because they are served by numerous natural
distributaries of the Cauvery River which are operated as combined irrigation and drainage canals.
Government estimates of bed losses from the Vennar River are 10-11% (WRD, 2013). Unfortunately
interventions to reduce losses by lining such a large natural system are not feasible. Furthermore many of
the irrigation structures are old and poorly maintained due to a chronic lack of investment due to the
Government’s understandable caution caused by the water sharing dispute with upstream states.
Consequently the distribution of surface water is inefficient and incomplete due to high bed losses in the
rivers and canals, particularly in the delta. The government estimate that the overall irrigation efficiency in
the Cauvery River sub-basin is 55-60% (WRO, 2008).
4.8 Flooding
Occasional cyclonic storms during the north-east monsoon bring prolonged intense rain falling causing
flooding as rivers overtop their banks and drainage of runoff from fields is impeded by congestion in the
324440/IDD/IDC/1/B 10 October2014 Final Report Final V1
31
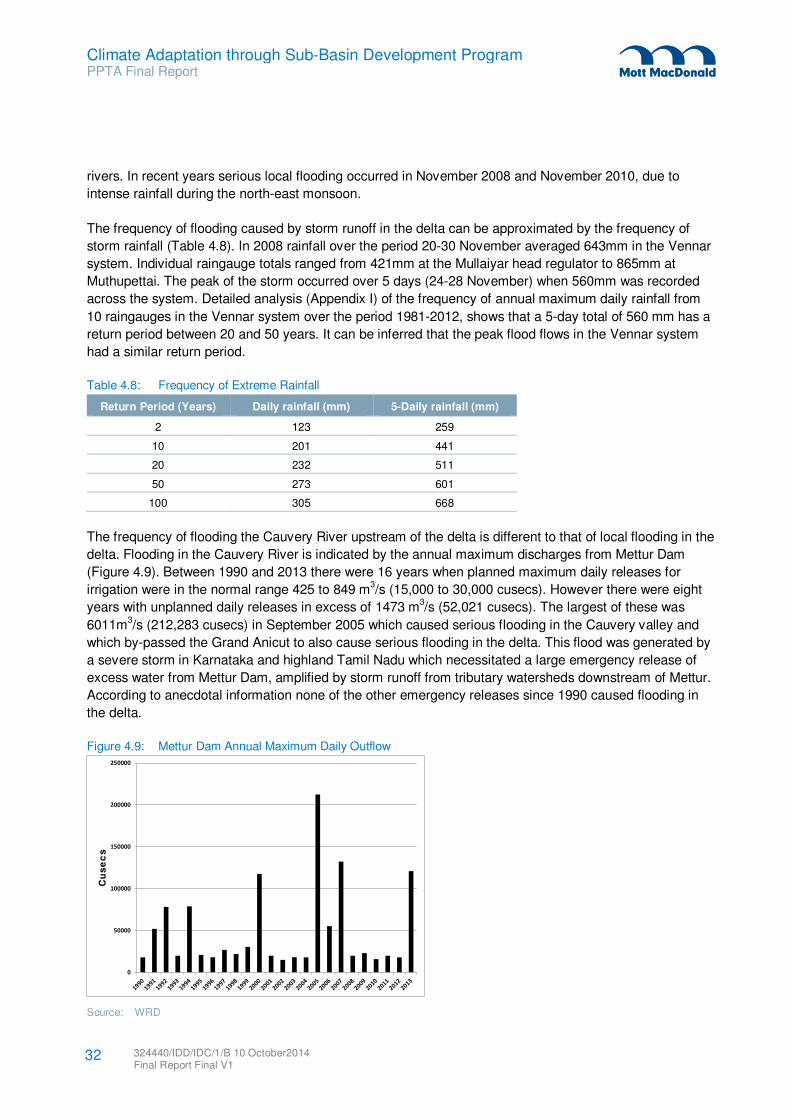
Climate Adaptation through Sub-Basin Development Program PPTA Final Report
rivers. In recent years serious local flooding occurred in November 2008 and November 2010, due to
intense rainfall during the north-east monsoon.
The frequency of flooding caused by storm runoff in the delta can be approximated by the frequency of
storm rainfall (Table 4.8). In 2008 rainfall over the period 20-30 November averaged 643mm in the Vennar
system. Individual raingauge totals ranged from 421mm at the Mullaiyar head regulator to 865mm at
Muthupettai. The peak of the storm occurred over 5 days (24-28 November) when 560mm was recorded
across the system. Detailed analysis (Appendix I) of the frequency of annual maximum daily rainfall from
10 raingauges in the Vennar system over the period 1981-2012, shows that a 5-day total of 560 mm has a
return period between 20 and 50 years. It can be inferred that the peak flood flows in the Vennar system
had a similar return period.
Table 4.8: Frequency of Extreme Rainfall
Return Period (Years) Daily rainfall (mm) 5-Daily rainfall (mm)
2 123 259
10 201 441
20 232 511
50 273 601
100 305 668
The frequency of flooding the Cauvery River upstream of the delta is different to that of local flooding in the
delta. Flooding in the Cauvery River is indicated by the annual maximum discharges from Mettur Dam
(Figure 4.9). Between 1990 and 2013 there were 16 years when planned maximum daily releases for
irrigation were in the normal range 425 to 849 m3/s (15,000 to 30,000 cusecs). However there were eight
years with unplanned daily releases in excess of 1473 m3/s (52,021 cusecs). The largest of these was
6011m3/s (212,283 cusecs) in September 2005 which caused serious flooding in the Cauvery valley and
which by-passed the Grand Anicut to also cause serious flooding in the delta. This flood was generated by
a severe storm in Karnataka and highland Tamil Nadu which necessitated a large emergency release of
excess water from Mettur Dam, amplified by storm runoff from tributary watersheds downstream of Mettur.
According to anecdotal information none of the other emergency releases since 1990 caused flooding in
the delta.
Figure 4.9: Mettur Dam Annual Maximum Daily Outflow
Source: WRD
0
50000
100000
150000
200000
250000
Cu
se
cs
324440/IDD/IDC/1/B 10 October2014 Final Report Final V1
32
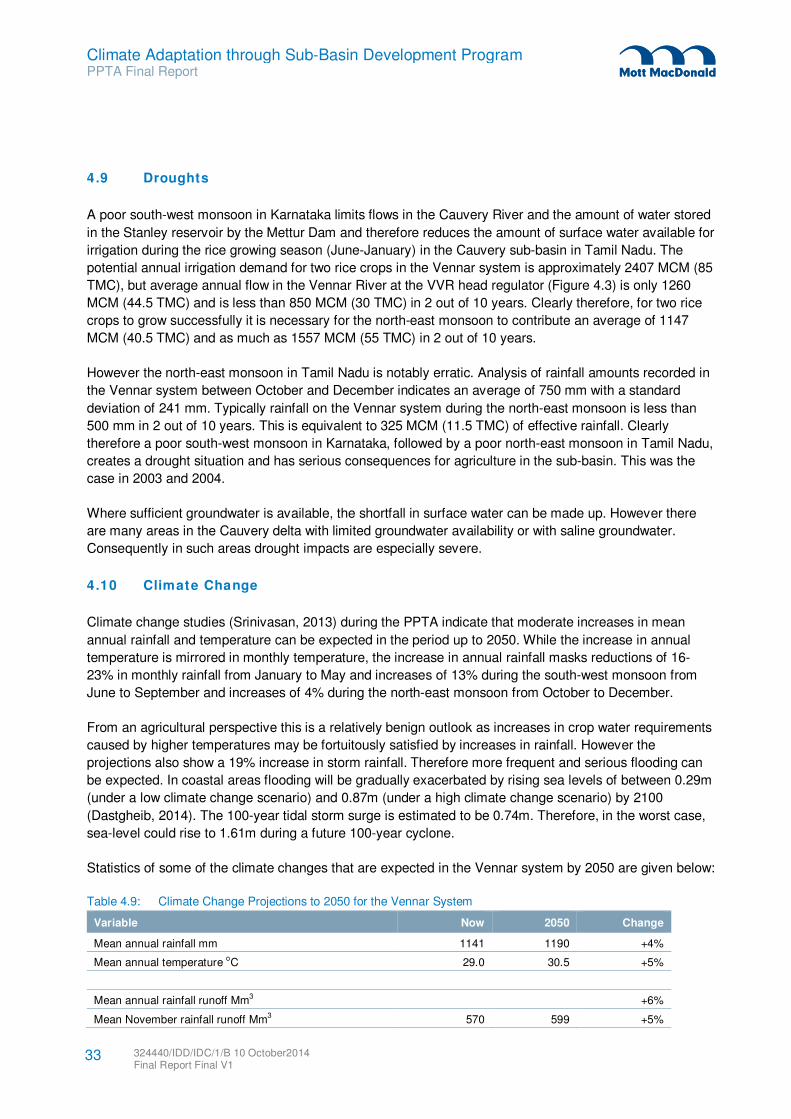
Climate Adaptation through Sub-Basin Development Program PPTA Final Report
4.9 Droughts
A poor south-west monsoon in Karnataka limits flows in the Cauvery River and the amount of water stored
in the Stanley reservoir by the Mettur Dam and therefore reduces the amount of surface water available for
irrigation during the rice growing season (June-January) in the Cauvery sub-basin in Tamil Nadu. The
potential annual irrigation demand for two rice crops in the Vennar system is approximately 2407 MCM (85
TMC), but average annual flow in the Vennar River at the VVR head regulator (Figure 4.3) is only 1260
MCM (44.5 TMC) and is less than 850 MCM (30 TMC) in 2 out of 10 years. Clearly therefore, for two rice
crops to grow successfully it is necessary for the north-east monsoon to contribute an average of 1147
MCM (40.5 TMC) and as much as 1557 MCM (55 TMC) in 2 out of 10 years.
However the north-east monsoon in Tamil Nadu is notably erratic. Analysis of rainfall amounts recorded in
the Vennar system between October and December indicates an average of 750 mm with a standard
deviation of 241 mm. Typically rainfall on the Vennar system during the north-east monsoon is less than
500 mm in 2 out of 10 years. This is equivalent to 325 MCM (11.5 TMC) of effective rainfall. Clearly
therefore a poor south-west monsoon in Karnataka, followed by a poor north-east monsoon in Tamil Nadu,
creates a drought situation and has serious consequences for agriculture in the sub-basin. This was the
case in 2003 and 2004.
Where sufficient groundwater is available, the shortfall in surface water can be made up. However there
are many areas in the Cauvery delta with limited groundwater availability or with saline groundwater.
Consequently in such areas drought impacts are especially severe.
4.10 Climate Change
Climate change studies (Srinivasan, 2013) during the PPTA indicate that moderate increases in mean
annual rainfall and temperature can be expected in the period up to 2050. While the increase in annual
temperature is mirrored in monthly temperature, the increase in annual rainfall masks reductions of 16-
23% in monthly rainfall from January to May and increases of 13% during the south-west monsoon from
June to September and increases of 4% during the north-east monsoon from October to December.
From an agricultural perspective this is a relatively benign outlook as increases in crop water requirements
caused by higher temperatures may be fortuitously satisfied by increases in rainfall. However the
projections also show a 19% increase in storm rainfall. Therefore more frequent and serious flooding can
be expected. In coastal areas flooding will be gradually exacerbated by rising sea levels of between 0.29m
(under a low climate change scenario) and 0.87m (under a high climate change scenario) by 2100
(Dastgheib, 2014). The 100-year tidal storm surge is estimated to be 0.74m. Therefore, in the worst case,
sea-level could rise to 1.61m during a future 100-year cyclone.
Statistics of some of the climate changes that are expected in the Vennar system by 2050 are given below:
Table 4.9: Climate Change Projections to 2050 for the Vennar System
Variable Now 2050 Change
Mean annual rainfall mm 1141 1190 +4%
Mean annual temperature oC 29.0 30.5 +5%
Mean annual rainfall runoff Mm3 +6%
Mean November rainfall runoff Mm3 570 599 +5%
324440/IDD/IDC/1/B 10 October2014 Final Report Final V1
33
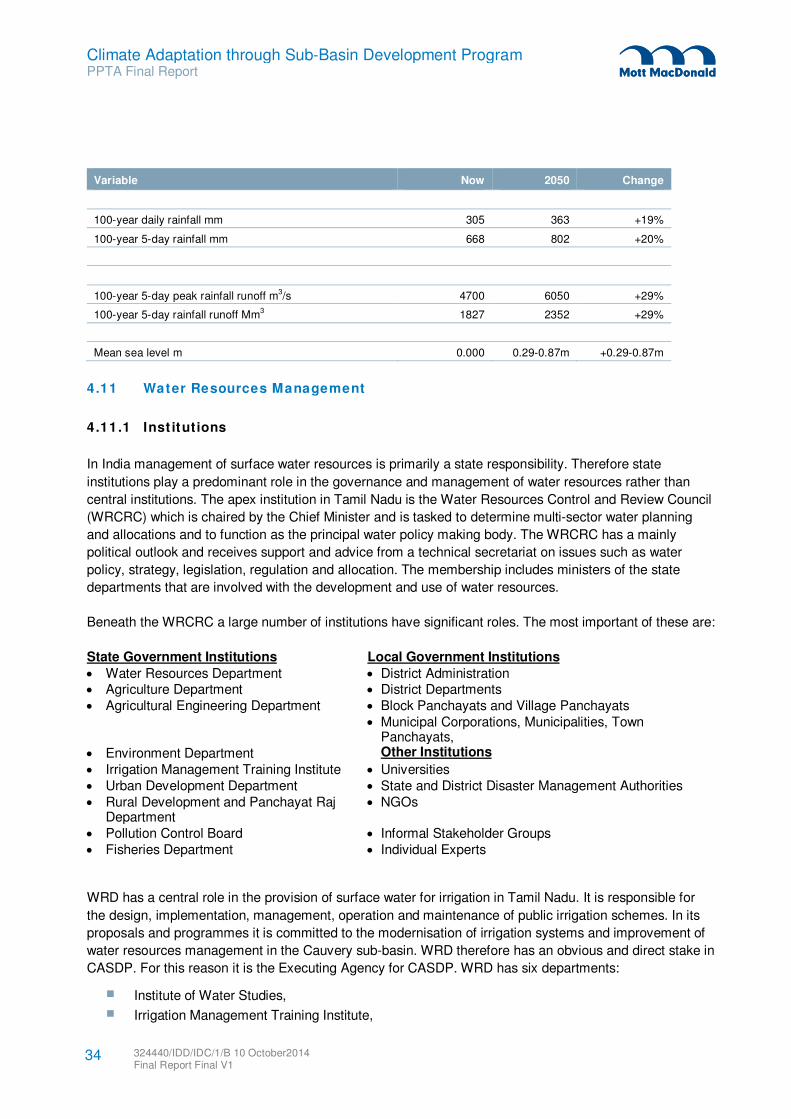
Climate Adaptation through Sub-Basin Development Program PPTA Final Report
Variable Now 2050 Change
100-year daily rainfall mm 305 363 +19%
100-year 5-day rainfall mm 668 802 +20%
100-year 5-day peak rainfall runoff m3/s 4700 6050 +29%
100-year 5-day rainfall runoff Mm3 1827 2352 +29%
Mean sea level m 0.000 0.29-0.87m +0.29-0.87m
4.11 Water Resources Management
4.11.1 Inst itutions
In India management of surface water resources is primarily a state responsibility. Therefore state
institutions play a predominant role in the governance and management of water resources rather than
central institutions. The apex institution in Tamil Nadu is the Water Resources Control and Review Council
(WRCRC) which is chaired by the Chief Minister and is tasked to determine multi-sector water planning
and allocations and to function as the principal water policy making body. The WRCRC has a mainly
political outlook and receives support and advice from a technical secretariat on issues such as water
policy, strategy, legislation, regulation and allocation. The membership includes ministers of the state
departments that are involved with the development and use of water resources.
Beneath the WRCRC a large number of institutions have significant roles. The most important of these are:
State Government Institutions Local Government Institutions
• Water Resources Department • District Administration • Agriculture Department • District Departments • Agricultural Engineering Department • Block Panchayats and Village Panchayats
• Municipal Corporations, Municipalities, Town Panchayats,
• Environment Department Other Institutions
• Irrigation Management Training Institute • Universities • Urban Development Department • State and District Disaster Management Authorities • Rural Development and Panchayat Raj
Department • NGOs
• Pollution Control Board • Informal Stakeholder Groups • Fisheries Department • Individual Experts
WRD has a central role in the provision of surface water for irrigation in Tamil Nadu. It is responsible for
the design, implementation, management, operation and maintenance of public irrigation schemes. In its
proposals and programmes it is committed to the modernisation of irrigation systems and improvement of
water resources management in the Cauvery sub-basin. WRD therefore has an obvious and direct stake in
CASDP. For this reason it is the Executing Agency for CASDP. WRD has six departments:
Institute of Water Studies,
Irrigation Management Training Institute,
324440/IDD/IDC/1/B 10 October2014 Final Report Final V1
34
Climate Adaptation through Sub-Basin Development Program PPTA Final Report
Surface Water and Groundwater Data Centre,
Operation and Maintenance,
Plan Formulation,
Design, Research and Construction Support,
In addition there is a Surface Water Resources Management Agency (SWaRMA) which is a parastatal
agency of the WRD created as a focal agency for inter-sector water management. SWaRMA’s objective is
to improve the institutional arrangements and to develop and manage water resources in an integrated
manner on river basin framework. SWaRMA operates from within the premises of Institute of Water
Studies, Chennai. As its name indicates, SWaRMA is an agency and therefore does not have any
regulatory role. Its responsibility is limited to providing advice to the Government of Tamil Nadu on the
following five aspects:
developing water policies
developing river basin management approaches
planning and development of water resources
promoting efficient water management and
improving the institutional arrangement and capacity building for sustainable water resources
management.
SWaRMA is administered by a State Water Committee (SWC) represented by nine state level secretaries
with the Chief Secretary as the Chair Person and Secretary WRD as the convenor. The SWC is supported
by a Water Advisory Committee (WAC) with the Director of SWaRMA as a member. SWaRMA is staffed by
experts seconded from other Government departments and contracted consultants/specialists.
Potentially SWaRMA has an important role to play in CASDP implementation, because it has been
empowered to review and recommend water allocation proposals and acts as ‘think tank’ for state level
policy advice.
Detailed discussion of the institutions can be found in Appendix E.
4.11.2 Policy
In India management of water resources is primarily a state responsibility. Whereas several states have
recently announced water policies modelled on the National Water Policy (2012), Tamil Nadu’s current
water resources policy is in draft. While containing several elements of the national policy, the draft state
policy emphasises the State Government’s over-riding objective to increase irrigated agricultural output
rather than the National Government’s objective to regulate water use. Therefore the state policy prioritises
water supply measures such as improved infrastructure, particularly for irrigation, over regulatory
measures such as water service charges to control demand.
In practice most water services in Tamil Nadu are free or almost free of charge to users, especially surface
water and groundwater for irrigation, with few if any incentives for efficient use of the water. Tamil Nadu
has not created a water regulatory authority as envisaged in the National Water Policy although it has
created the Surface Water Resources Management Agency (SWaRMA) to advise on water resources
matters.
The current draft state water policy originates in the 1994 Tamil Nadu State Water Policy. This emphasises
water supply to meet existing demand rather demand management to reduce pressure on supply. It
324440/IDD/IDC/1/B 10 October2014 Final Report Final V1
35
Climate Adaptation through Sub-Basin Development Program PPTA Final Report
contains no effective economic incentives for efficient conjunctive water use or recycling, or to impose
financial penalties as a measure to reduce pollution and wastage. Little or no practical allowance is made
for the likely impact of climate change on water resources availability, flood and drought frequency.
Since the issue of the 2002 National Water Policy, and then the 2012 National Water Policy, the State
Government has been reviewing the State Water Policy. The review has highlighted State concerns with
regulatory aspects of the National Policy and also the State’s need to consider specific issues such as the
acute vulnerability of Tamil Nadu to surface water scarcity compounded by the cap on the availability of
surface water resources in the Cauvery River sub-basin set by the Cauvery Waters Dispute Tribunal, the
current lack of regulation of groundwater development and a general inefficiency in water use, particularly
in the agriculture sector.
The draft state policy already has much in common with the 2012 National Water Policy. It prioritises water
allocations in the following order: (i) drinking, (ii) irrigation, (iii) hydropower, (iv) environmental needs and
(v) industry. It adopts the river basin as a planning unit and envisages a multi-sector approach involving
sustainable use of surface and ground water, incorporating quantity and quality aspects as well as
environmental considerations, watershed management through extensive soil conservation, catchment
area treatment, preservation of forest and construction of check-dams and making water available to dry
areas by transfer from wet areas including from one river basin to another (GoTN, 2006).
The IAMWARM Project (2007-2014) and its predecessor the WRCP, reflect the State Government’s
concerns with water use efficiency and water conservation. These projects (see 4.11.4) included water
resources management concepts that are similar to those in the National Water Policy. Although many of
these concepts have now been applied elsewhere in Tamil Nadu, in the Cauvery sub-basin they have not
been implemented because of the Cauvery waters sharing dispute with neighbouring states. Therefore
many of the tenets of the National Water Policy, and the principals of modern water resources
management, are still largely absent from the Cauvery sub-basin. Consequently, the planning,
development and management of water resources in the sub-basin is not integrated, there is relatively little
meaningful stakeholder participation, transparency and accountability in water resources decision making
and regulation, minimum ecological needs are not given due consideration and there is no effective use of
economic incentives and penalties to reduce pollution and wastage.
The draft state policy recognizes that Tamil Nadu’s water resources are all but fully utilised and that the
only technically and economically feasible source of additional water resources is diversion from wetter
neighbouring states. However it is also recognized that the political feasibility of inter-state water transfers
is highly doubtful in the near-to-medium term. Accordingly the 11th Tamil Nadu 5-Year Plan (2007-2012)
states:
“The total demand and supply gap of water is very high. The challenge in the current
situation is how best this gap can be bridged, either by reducing the demand or by efficient
water management.”
The 11th 5-Year Plan goes on to state that the major objective of the irrigation sector is to maximize the
productivity per unit of water so as to increase the income of farmers and promote equity and social justice
among water users. This will be achieved through preservation and stabilization of the existing water
resources and maximising agricultural production by increasing the area under irrigation and by improving
the water use efficiency through micro-irrigation and other water saving methods. Participatory Irrigation
Management (PIM) will be promoted to make water use more equitable as well as to provide flood
protection and drainage.
324440/IDD/IDC/1/B 10 October2014 Final Report Final V1
36
Climate Adaptation through Sub-Basin Development Program PPTA Final Report
The 12th 5-Year Plan (2012-2017) is less explicit about water resources policy. Nevertheless it can be seen
from the foregoing that the broad objectives of CASDP are very much in line with State Government
thinking, particularly with respect to water use efficiency, stakeholder participation and flood protection.
The Government of Tamil Nadu recognises that modernization of irrigation infrastructure is essential to
improve agricultural productivity and that this will involve improved management of water resources,
upgrading of irrigation infrastructure and control systems, strengthening of management capacity,
improvement of agricultural practices, and strengthening farm to market linkages (WRO, 2008); (WRD,
2013).
The key is to develop a strategy for the farming community so that it can cope better with water scarcity.
Crop diversification is an important option in order to increase productivity and rural income per unit of
scarce water. Accordingly the objectives for the Tamil Nadu 12th 5-Year Plan 2012-2017 (GoTN, 2012)
seek to improve farmers’ per capita income by 2 to 3 times through judicious crop diversification
comprising high value horticulture and commercial crops, further development of rainfed agriculture, mixed
farming and other farm-based interventions.
As a matter of policy Tamil Nadu does not charge directly for irrigation services. Instead it follows an
indirect system of differential land taxes distinguishing between wet land and dry land with the difference in
tax amounting to an irrigation levy. However irrigation levy receipts fall short of expenditure on irrigation
services e.g. in 2000 the levy covered only of 3.13% of capital expenditure on major and medium irrigation
schemes and only 5.01% for minor irrigation schemes (GoTN, 2005). The recovery of operational and
maintenance costs was about 16.7%. As a matter of state policy, the irrigation levy and other irrigation
related charges in Tamil Nadu have been kept low in line with the state vision of doubling agricultural
production by 2025.
Detailed discussion of policy matters can be found in Appendix E.
4.11.3 Legislat ion
The current water resources legislation in Tamil Nadu is characterized by a divergent set of individual acts
and rules adopted over many years that address numerous discrete issues such as regulation of water
supplies, irrigation and canals, rainwater harvesting, protection of riverbanks etc. None of these acts and
regulations is holistic and collectively they do not facilitate the integration of water resources management
in whole river basins or the separation of the water regulation, water delivery and water use functions that
characterises modern water resources management practices.
In addition to the 2012 National Water Resources Policy the Government of India has also proposed a
National Water Framework Law based on precepts such as: (i) water being a fundamental right to life, (ii) a
general perception of an imminent water crisis in India and the urgent need to conserve water, (iii) the
history of, and potential for further, inter-state and international water disputes, (iv) the increasing pollution
of rivers and aquifers, (v) the long-term environmental, ecological and social implications of water projects,
(vi) the socio-economic implications of the distribution, use and control of water and (vii) concerns about
the impact of climate change (Iver, 2013).
However, as stated previously, under the national constitution the management of water resources is the
responsibility of the states. Consequently the proposed National Water Framework Law has received a
mixed reception from some state governments. In Tamil Nadu one of the state government’s priorities is
food production and the necessary provision of irrigation water rather than the management of water
324440/IDD/IDC/1/B 10 October2014 Final Report Final V1
37
Climate Adaptation through Sub-Basin Development Program PPTA Final Report
resources as an end in itself. Therefore water legislation, as opposed to water policy, in Tamil Nadu is not
currently under review.
Currently use of both surface water and groundwater, especially for irrigation, is effectively unregulated in
Tamil Nadu and water resources management is demand driven. In the case of the Cauvery River sub-
basin the WRD provides as much surface water as possible for irrigation, while the municipalities and
panchayats attempt to provide as much drinking water as is needed.
4.11.4 Government Projects
The Government of Tamil Nadu’s general response to state-wide water resources availability and
management challenges includes the Irrigated Agriculture Modernization and Water-Bodies Restoration
and Management (IAMWARM) project. But in the Cauvery River sub-basin, the government’s response
has been, until recently, inhibited by the long-running water sharing dispute with Karnataka and other
riparian states.
However, following the Cauvery Waters Dispute Tribunal ruling in 2007 (GoI, 2007) which allocated 57% of
the surface water yield of the Cauvery River basin to Tamil Nadu, the Tamil Nadu Water Resources
Department (then titled the Water Resources Organisation) prepared the Cauvery Modernisation Project
(CMP 1) (WRO, 2008). Since the Supreme Court decision in 2013 to uphold the 2007 tribunal ruling the
CMP has been superseded by the Proposal for Improvements and Rehabilitation of Irrigation Systems in
the Cauvery Basin for Efficient Water Management (CMP 2) (WRD, 2013).
Separately, in support of the Government of India’s National Action Plan on Climate Change (NAPCC) of
2008 and National Water Mission (NWM), the ADB provided technical assistance (ADB, 2011) for the
preparation of a profile of the Cauvery delta in Tamil Nadu and the conception of CASDP.
Further details of these three projects are discussed in the following three sections.
4.11.4.1 IAMWARM Project
The IAMWARM project (2007-2014), and its predecessor the WRCP7, was a World Bank assisted multi-
departmental project designed to bring positive changes to irrigated agriculture in Tamil Nadu. The project
involved multiple stakeholders as follows:
Water Resources Department
Agriculture Department
Tamil Nadu Agricultural University
Horticulture Department
Agricultural Engineering Department
Agricultural Marketing Department
Animal Husbandry Department
Fisheries Department
The project involved multiple stakeholders and was implemented in 60 sub-basins in Tamil Nadu. It aimed
to expand the area under irrigated agriculture through effective and efficient water management practices
7 Water Resources Consolidation Project. http://www.worldbank.org/projects/P010476/tamil-nadu-water-resources-consolidation-
project?lang=en
324440/IDD/IDC/1/B 10 October2014 Final Report Final V1
38
Climate Adaptation through Sub-Basin Development Program PPTA Final Report
in order not only to produce more crops, meat, milk, and fish per drop of water but also to generate more
income per drop. The project was formulated with World Bank assistance with a budget of $424.5 million
(INR 2,547 crore).
The objectives of the IAMWARM project were to improve the service delivery of irrigation systems and the
productivity of irrigated agriculture with effective integrated water resources management in a sub-basin
framework. The project had four components (i) irrigation systems modernisation in a sub-basin framework
which sought to improve bulk water delivery through modernisation of irrigation over a total area of 617,000
ha, (ii) agricultural intensification and diversification to increase the productivity of agriculture-related
activities through improved agricultural intensification and diversification of crops, micro irrigation, animal
husbandry and inland aquaculture, (iii) institutional modernisation for irrigated agriculture to improve
institutional capacity and participatory irrigation management of irrigation service delivery through the WRD
and water users associations (WUAs), (iv) improved institutional arrangements and capacity for
sustainable water resources management including the creation of the State Water Resources
Management Agency (SWARMA).
4.11.4.2 Cauvery Modernisation Proposal
The WRD has prepared a Proposal for Improvements and Rehabilitation of Irrigation Systems in the
Cauvery Basin for Efficient Water Management (CMP2) (WRD, 2013) which supersedes an earlier
proposal (CMP1) prepared in 2008 (WRO, 2008). The updated proposal is for the rehabilitation of most of
the irrigation infrastructure in the Cauvery River sub-basin. The proposal lists 182 weirs, 11,213 head
sluices, 456 regulators, 223 aqueducts, 695 syphons and 679 drop structures and other allied structures in
addition to lining of channels to improve conveyance efficiency. The estimated cost of the WRD proposal is
$1.9 billion (50% from the Central Government; 50% from Tamil Nadu Government of which 45% can be
foreign funded).
The rationale of the proposal is that irrigation infrastructure in the Cauvery sub-basin has been deprived of
major financial investment for many years due to the Cauvery waters dispute. Now that the final award of
the tribunal has been legally upheld, CMP2 has been submitted for Government of India financial
assistance. During the preparation of CASDP it was noted that some of the proposed CMP2 investments
overlap with those proposed under CASDP. This therefore led to the revision of the scope of CASDP
outputs by WRD and ADB to exclude implementation of on-farm irrigation improvements.
4.11.4.3 Climate Adaptation through Sub-Basin Development Program (CASDP)
CASDP aims to increase water security and decrease flood damage in the Cauvery delta to help local
communities to adapt to climate change. It is in alignment with the WRD’s proposal for modernisation of
the irrigation systems in the Cauvery River sub-basin (CMP2). CASDP also supports the implementation of
the Government of India’s National Action Plan on Climate Change (NAPCC) of 2008 and it’s National
Water Mission (NWM).
The Cauvery delta was chosen as the CASDP project area because it provides a good demonstration site
for NWM objectives and the Government of India’s water resources reform agenda and lies within a river
sub-basin affected by a range of complex water resources issues such as limited availability of surface
water, over-abstraction of groundwater, salinity, inefficient use of water and climate change.
324440/IDD/IDC/1/B 10 October2014 Final Report Final V1
39
Climate Adaptation through Sub-Basin Development Program PPTA Final Report
4.12 Agricultural Systems
4.12.1 Climate
The Cauvery delta zone has a tropical climate, with mean annual rainfall of around 1200 mm. The
southwest and northeast monsoons are the dominant sources of precipitation providing almost 80% of the
total annual rainfall. The northeast monsoon is associated with cyclonic storms causing widespread
damage to crops and property. Inter-annual rainfall variability also causes significant damage to agriculture
as a result of flooding or drought. Intra-seasonal variability also causes frequent crop failures and loss to
major agricultural resources. The irrigation season is from June through to early January.
4.12.2 Climate Change
The Tamil Nadu agriculture sector is expected to be significantly affected by climate change impacts which
include sea level rise, increased weather variability, more droughts and floods and the spread of infectious
diseases. Research using the INFOCROP model revealed that during the south-west monsoon a 30-35%
yield reduction is projected in 2050 for paddy. In contrast to this, during the northeast monsoon, an
increase in paddy yields of up to 10% due to climate change is expected.
4.12.3 Soils
The major soil types in the Cauvery delta are Sandy Coastal Alluvium and Black Soil types which cover
about 90% of the delta. The richest soil is found in the north west of the delta; the worst land is found in the
south west of the delta where the soil is saline and drainage is poor.
The chief sources of irrigation water are rivers and wells. There are also small rainfed tanks but many of
these have been neglected or redeveloped. The tanks and wells are found mostly in upstream areas.
About 7.1% of the land in the delta is affected by water logging and 56.2% is prone to floods. About 3.5%
of the land suffers from salinity/alkalinity and 17.7% of the land is coastal sand. Thus the land affected by
soil problems constitutes about 84.5% of the total geographical area of the delta excluding forest area.
4.12.4 Tamil Nadu Agricultural Polic ies and Programs
The Tamil Nadu State Agricultural Policy is to double food production in the near future. To achieve this the
State Government has formulated an agricultural policy which aims at: (i) developing a scientific approach
to support the development of the rural economy and preservation of ecological balance based on the
requirements of agro climatic zones; (ii) increasing productivity, production and profitability; and (iii)
implementing farmers’ welfare schemes such as integrated watershed development, land management,
development of water resources, organic farming especially use of green manure, bio-fertilizers,
bioconversion of agricultural wastes, bio pesticides and parasites, integrated pest management,
remunerative price to agricultural produce, processing, value addition to agricultural produce, promotion of
crops with export potential, with a view to ensure economic improvement, besides rural prosperity.
In addition, the Government is also implementing various crop oriented subsidy schemes such as State
Sponsored Schemes, Centre-State Shared Schemes, Centrally Sponsored Schemes and Externally Aided
Projects for the holistic development of farming communities. Key areas of importance to agriculture
development in the Vennar System are the ongoing Agricultural Extension Reforms and the Agricultural
Technology Management Agency (ATMA).
324440/IDD/IDC/1/B 10 October2014 Final Report Final V1
40
Climate Adaptation through Sub-Basin Development Program PPTA Final Report
4.12.5 Agricultural Pract ices and Issues
Agriculture in Vennar system is predominantly mono-cropping and to a lesser extent double cropping of
paddy with little variation in the cropping pattern or crop rotation. Farmers are not being advised about
suitable alternatives. The land holdings in the delta are quite small with an average of around 2.0 ha, but
more than 70% are 2 ha or less. Population growth has progressively diminished the size of land holdings.
Labour intensive practices in agriculture are preferred to mechanization since mechanization in small
holdings is not economical. Livestock keeping is of relatively minor importance with farmers owning only
moderate numbers of animals.
Consultation by the PPTA team with agricultural officials and farmers in the Vennar system, revealed that
the problems faced by farmers are:
Because of overall water shortage in the basin and lack of assurance about the Mettur Dam
releases, planning of cultivation is not systematic.
Torrential rainfall during the north-east monsoon often hinders both Kuruvai harvesting and
Thaladi transplanting.
The limited number of ponds, check dams, small reservoirs and diversion structure and
facilities for storing rain water reduces capacity to control excess water at times of heavy
inundation.
Lack of drainage facilities in the delta region.
There is a labour shortage during harvesting and planting and therefore timely field operation
are not carried out.
Crop yields are low leading to low remuneration.
There is a lack of co-ordination between land owners and tenants, as well as between farmers
and fisherman, leading to social problems.
Frequent unfavourable weather conditions lead to frequent outbreaks of pests and crop
diseases.
Clear cut policies and contingency planning of cropping sequences in the events of drought
and flood have not been developed.
There is a lack of co-ordination between the Agriculture Department and the WRD on water
and crop management.
There are efforts for development of new crops suitable to the prevailing delta conditions but
few farmers are aware. Non-paddy crops, vegetables and horticulture are becoming more
popular but because of the complexity of water soil regime in delta, extensive research and
planning is needed to guide the farmers.
Most farmers have poor cash reserves; they need micro-credit facilities and insurance
services.
4.12.6 Current Cropping Pat tern, Y ields and Net Returns
Thanjavur, Thiruvarur, Nagapattinam Districts record the lowest average rice productivity in Tamil Nadu,
ranging from 2,182 tonnes/ha in Nagapattinam to 3,069 tonnes/ha in Thiruvarur and 3,138 tonnes/ha in
324440/IDD/IDC/1/B 10 October2014 Final Report Final V1
41
Climate Adaptation through Sub-Basin Development Program PPTA Final Report
Thanjavur. Low yields are also observed for other important crops like, black gram, green gram, groundnut,
sesame and sugarcane. There are three predominant rice cropping seasons (i) Samba (August-January)
with 74.7% of rainfall, (ii) Kuruvai (June-October) with 15.7% of the rainfall and (iii) Navarai (December-
April) with 9.6% of the rainfall.
In the Vennar system paddy predominates with 60.7% of land area planted to the crop. The overall
average cropping intensity is 167% - with 33% of the area planted with a double crop of Kuruvai paddy
(110-115 days duration) from June to October, followed by Thaladi paddy (135 days) from October to
January/February. On the other 66% of the land Samba paddy (155-160 days) is planted from August to
January/February.
Samba paddy is grown over the whole Vennar System but predominates in the southern part where there
is no fresh groundwater because of salinity and farmers are solely reliant on surface water. This includes
the whole of Nagapattinam district and the southern four blocks of Thiruvarur. Double cropping of paddy is
practiced in all the blocks of Thanjavur and the northern blocks of Thiruvarur that are in the Vennar system
where most farmers have access to tube wells and are able to double crop and very occasionally triple
crop paddy. However, double cropping is constrained in the mid and lower parts of the system due to poor
surface water availability and the prevalence of saline groundwater.
From January to May the main crops grown across the system are pulses of which black gram (75-80
days) is preferred as compared to green gram (65-70 days). These crops mainly rely on residual soil
moisture and are usually not irrigated unless groundwater is available. The other major crops grown
include groundnut (95-115 days), sesame (75-90 days) and small areas of maize (90-120 days), plus
minor vegetables, which collectively account for only +5.5% of gross sown area. These crops have an
average duration of 75-90 days and are planted normally in January. A biannual crop of sugar cane is
grown on 2.8% of the land particularly in Thanjavur. Long term perennial tree crops, mainly coconut but
including banana, mango and other fruit tree crops are grown on around 4.6% of the gross land area.
Thanjavur is an important producer of copra.
4.12.7 Scope for Water Saving Technologies
Several studies have indicated that irrigated rice can be easily cultivated using 8,000 to 10,000 m3/ha,
which is approximately 50% of current use in the Cauvery delta. There are several ways to reduce
consumption including:
Limiting rice cultivation to only the rainy season;
Using and developing more water efficient varieties of rice;
Promoting upland rice;
Developing drought tolerance rice;
Changing the crop planting date and making more effective use of rainfall;
Changing rice planting practices, wet seeding of rice uses about 20-25 percent less water than
in traditional transplanted rice methods and drastically reduces labour for establishing the crop
from 30-person days per ha for transplanting to 1-2 person days;
Replacing transplanting by direct seeding (dry seeded rice saves even more water, especially
during land preparation);
324440/IDD/IDC/1/B 10 October2014 Final Report Final V1
42
Climate Adaptation through Sub-Basin Development Program PPTA Final Report
Reducing water use during crop growth: Intermittent flooding, maintaining the soil in sub-
saturated condition, alternate drying and wetting can reduce water applied to the field by more
than 40 percent compared with continuous submergence methods without affecting yields;
Supplementary irrigation either for crop establishment or at critical growth stages, particularly
flowering, can improve yield;
Water recycling and conjunctive use to enable farmers to reuse seepage, percolation losses
from canals and fields as well as groundwater (to compensate for the lack of reliability,
inequities in distribution, and rigidity of canal water distribution systems);
Using alternatives to flooding techniques, e.g. use of overhead sprinklers, furrows, etc. with
newly developed aerobic varieties;
Adopting simple conservation; that is, maintaining only supersaturated soil conditions during
cultivation of the crop, significantly reducing land preparation in water (puddling) and keeping
water within the field by reducing outflow discharges;
Introduction of improved technologies – SRI – water saved can be as much as 49% (16,634
m3/ha conventional surface compared to 8,419 m
3/ha for SRI).
Farmer’s acceptance of changes in agricultural practices depends on economic and other factors. They
need technical support in upgrading irrigation systems for efficient water distribution and agricultural
support in adapting agricultural practices such as modified irrigation methods, using new varieties and new
water management practices. In order to compete with increasing demands from other water users,
improved efficiency of rice production is crucial. Improved and integrated water resources management is
also vital. There are several technical options for increasing the productivity and efficiency of water
consumption in surface irrigated rice. In addition to these, with economic incentives and adequate
production tools and irrigation services, farmers could successfully implement substantial changes in their
agricultural practices. Options for achieving this are discussed in detail in the PPTA Agriculture Systems
Report (Appendix B).
4.12.8 Procurement Capacity Assessment
The Tamil Nadu Transparency in Tenders Act, 1998 provides transparency in public procurement and
regulates tender procedures. State departments such as WRD have developed their own procurement
systems in line with the Act and other regulations. Prospective contractors are registered in various classes
based on previous experience and financial capacity. Registration is validated once in 5 years.
The scheme for tender approval by WRD engineers is summarised in Table 4.10.
Table 4.10: Tender Acceptance Authority Sl.No. Officers Acceptance Limit
1 Assistant Executive Engineer Rs.1.00 lakh (without tender excess)
2 Executive Engineer Rs.10.00 lakh (up to 5% tender excess)
Rs.10.00 lakh to Rs.30.00 lakh (without tender excess)
3 Superintending Engineer Rs.10.00 lakh (up to 10% tender excess)
Rs.10.00 lakh to Rs.30.00 lakh (up to 5% tender excess)
Rs.30.00 lakh to Rs.50.00 lakh (without tender excess)
4 Chief Engineer Rs.10.00 lakh to Rs.30.00 lakh (up to 10% tender excess)
324440/IDD/IDC/1/B 10 October2014 Final Report Final V1
43
Climate Adaptation through Sub-Basin Development Program PPTA Final Report
Sl.No. Officers Acceptance Limit
Rs.30.00 lakh to Rs.1.00 Crore (up to 5% tender excess)
5 Tender Award committee Above Rs.1.00 Crore (Full powers)
WRD procurement procedures are generally in line with ADB procedures. However there are some
weaknesses as follows:
Negotiations with lowest bidder are allowed.
Tender award notifications are not published even though the Transparency in Tenders Act 1998 requires publication.
Dissemination of information and debriefing to unsuccessful bidders is not done.
No data on the disqualified contractors is published.
Staff are not familiar with ADB procurement procedures.
Procurement is done by divisional, circle and regional technical staff who also have responsibilities for the
execution of the contracts. This may result in bias and may hamper objective evaluation of tenders.
4.12.9 Financial Management Assessment
A financial management assessment of the Executing Agency was carried out to assess the adequacy of
existing procedures relating to planning, budgeting, accounting, fund flow arrangements, reporting, internal
controls systems, auditing and asset management. The objective was to assess capacity to utilize the loan
and counterpart funds for the intended purposes and to maintain proper documentation to comply with the
fiduciary requirements of ADB.
ADB’s Financial Management and Analysis Questionnaire (FMAQ) was used to collect information during
meetings with senior WRD accountants at regional and divisional levels and also at the IAMWARM Multi-
Disciplinary Project Unit in Chennai. A sample of recent transactions and monthly accounts submitted to
the Accountant General’s Office was reviewed.
The key findings were that:
(i) WRD have well-defined processes for receipt of funds, approved expenditure on works and
procurement of goods and services, accounting, reporting, and statutory audit by the Controller
and Auditor General of India. WRD has prior experience in handling multilateral aid and loan
agencies’ projects; for instance it had a significant share of the expenditure by the IAMWARM
Multi- Project. The IAMWARM project was implemented across Tamil Nadu, except the Cauvery
basin, but some of its sub-projects were under the control of the WRD regional office at Trichy
which has been designated as the PMU for CASDP.
(ii) WRD has experienced personnel in its engineering, administrative and accounting departments.
The divisional accountants (who are likely to become the CASDP PIU accountants) report directly
to the Government of India Principal Accountant General, not directly to the WRD regional
accountant. The reporting requirements for CASDP will therefore be a departure from current
practice.
324440/IDD/IDC/1/B 10 October2014 Final Report Final V1
44
Climate Adaptation through Sub-Basin Development Program PPTA Final Report
(iii) Budgetary allocations to WRD in the past few years indicate increases in funding from central
schemes and multilateral agencies to support WRD interventions and proposals for increasing
productivity in the irrigation sector. The current main fund flows are into (i) maintenance, (ii)
projects funded by the National Bank of Agriculture and Rural Development and (iii) projects
funded by multilateral agencies e.g. the World Bank funded IAMWARM project.
(iv) Statutory audits of WRD are conducted by the Comptroller and Auditor General of India through
their offices in Chennai. WRD has no internal audit system. The most recent audit was for the
financial year ended 31 March 2012. The IAMWARM project was also audited. The process is
completed within 210 days of the financial year. This is somewhat longer than the 180 days
required by ADB.
324440/IDD/IDC/1/B 10 October2014 Final Report Final V1
45
Climate Adaptation through Sub-Basin Development Program PPTA Final Report
5.1 Context
CASDP has been formulated in alignment with the WRD’s proposals for modernising irrigation systems in
the Cauvery River sub-basin, the Government of India's 12th Five-Year Plan (2013-2017) and the ADB
Country Partnership Strategy (CPS). CASDP supports the implementation of the Government of India’s
National Action Plan on Climate Change (NAPCC) of 2008 and National Water Mission (NWM). CASDP
has been designed to deliver both structural and non-structural climate change adaptations in the water
resources sector in the Cauvery delta, particularly the irrigation and drainage sphere.
The proposed structural investments include extensive channel re-sectioning and embankment raising
along the principal rivers, drains and coastal outlets in the Vennar and Cauvery irrigation systems, using
new engineering design guidelines which take account of climate change projections. These works will
reduce the frequency and impact of flooding and improve the availability of surface water through the
repair and reconstruction of existing irrigation infrastructure, including pumped irrigation schemes, and the
construction of new infrastructure, particularly tail-end regulators.
The proposed non-structural investments include (i) greater participation of water users, particularly
farmers and women in water resources management, (ii) increased monitoring of surface water and
groundwater resources, (iii) investigations of the sustainable groundwater yield and saline intrusion, (iv)
greater use of decision support systems for the seasonal planning and operational distribution of irrigation
water, (v) flood forecasting and warning systems and assessment of flood risk and preparation of flood risk
maps and flood management plans.
A Multi-Tranche Financing Facility (MFF) approach to the execution of CASDP has been agreed by ADB
and the Governments of India and Tamil Nadu. This approach will allow (i) flexible and adaptive phased
interventions that are technically appropriate; (ii) strategic and systematic water resources management
and flood management, aiming at sustainable increases in agricultural production and rural livelihoods, and
reduced impacts of floods.
5.2 Impact and Outcome
The expected impact of CASDP is expected to be improved resilience to climate change of communities in
the Cauvery delta. The outcome of CASDP is expected to be increased agricultural productivity, reduced
sea water ingress into rivers and drains, and reduced flood damage.
5.3 Outputs
There will be two principal outputs of CASDP:
Integrated Programs and Infrastructure for the Management of surface Water, Groundwater
and Salinity;
Improved Systems for Management of Water Resources, Flood Risk and Flood Events;
5 Formulation of CASDP
324440/IDD/IDC/1/B 10 October2014 Final Report Final V1
46
Climate Adaptation through Sub-Basin Development Program PPTA Final Report
5.3.1 Output 1: Integrated Programs and Infrastructure for the Management of
Surface Water, Groundw ater and Salinity
Output 1 will deliver infrastructure adaptations that will and reduce flood damage and increase the
availability of surface water so that as many areas as possible in the Cauvery and Vennar systems are
served with irrigation water equally and efficiently. The programs required to achieve this include essential
civil works, designed according to new design guidelines, which take account of climate change, to
rehabilitate dilapidated surface water irrigation infrastructure so that it is fit for purpose to maintain normal
irrigation supply levels.
The civil works will include re-sectioning and bank strengthening of main channels and coastal outfalls to
improve their resilience and conveyance capacity, and will include new, reconstructed and repaired
regulators, head sluices, bed dams and other minor structures. The works will also include the
rehabilitation of existing pumped irrigation schemes. The structural adaptations to be implemented under
Output 1 of Project 1 comprise:
Re-sectioning and bank strengthening on the Pandavanar, Vellaiyar, Harichandra, Adappar Rivers,
the Valavanar Drain, the Vedharanyam Canal and three straight cuts to the sea, totalling 235km to
increase their resilience and flood conveyance capacity to a 25-year standard;
Construction of new regulators (including three tail-end regulators), reconstruction of existing
dysfunctional regulators and repair of existing damaged regulators
Work (new, reconstruction and repair) on 147 irrigation head sluices off-taking from the main
channels
Work on 20 bed dams and grade walls within the main channels
Work on 93 other minor irrigation and drainage structures
Rehabilitation of 13 pump stations comprising new pumps and electrical systems and repairs to
pump houses
Output 1 may also include infrastructure to accelerate groundwater recharge and facilitate planned
conjunctive use of groundwater aimed at relieving upstream pressure on surface water resources and
achieving more equitable distribution of water to downstream users and greater water use efficiency.
However the availability and dynamics of groundwater in the Cauvery Delta is not yet fully understood and
therefore Project 1 includes groundwater investigations which will establish the feasibility of further
recharge schemes and conjunctive use.
5.3.2 Output 2 - Improved Systems for Management of Water Resources, Flood Risk
and Flood Events
CASDP Output 2 will deliver non-structural adaptations designed to deliver:
Improved management of water resources
Improved management of flood risk, events and disasters.
During Project 1, Output 2 will also include groundwater investigations into sustainable yields of
the freshwater aquifers and the dynamics of the saline aquifers.
These three adaptations are discussed in the following paragraphs.
324440/IDD/IDC/1/B 10 October2014 Final Report Final V1
47
Climate Adaptation through Sub-Basin Development Program PPTA Final Report
5.3.2.1 Improved Management of Water Resources
Improved management of surface water and conjunctive use of groundwater and surface water will be
delivered through four main initiatives:
(i) Greater participation by stakeholders in the planning and delivery of water services through the
formation of Channel Stakeholder Groups (CSGs);
(ii) Installation of additional rainfall, surface water level, groundwater level and tide level monitoring
sites and flow measurement sites;
(iii) Development of a pilot Decision Support System (DSS) on the Harichandra channel in the Vennar
system;
(iv) Capacity development of Government officers in the monitoring and assessment of water
resources and water use, in decision-making supported by an appropriate Decision Support
System (DSS) and in IWRM.
Participation
During Project 1 informal Channel Stakeholder Groups (CSGs) will be established for each of the six
channels where infrastructure improvements will be made. The mandates of the CSGs will be restricted to
irrigation water supply related problems and issues and to assisting WRD with regulating the release of
water from the channels through head sluice gate control and with channel maintenance tasks. Other
activities such as on-farm development, water cess collection etc will not be in the ambit of the CSGs.
Membership will be 15-20 persons, 5 of whom will be State and District officials with the balance will be
drawn from farming communities (at least 3 of whom will be women) who own or cultivate land in the
command area adjacent to the channel. The chair of each CSG will be appointed by the District Collector.
Details of the proposed CSGs are discussed in Section 5.17.1.3.
Monitoring and Assessment of Water Resources
A network of rain gauges, river gauges and tide gauges will be installed in the Vennar and Cauvery
systems to supplement and modernize existing monitoring systems. The purpose will be to detect,
forecast, warn and monitor flood conditions and also inform normal operational decision making by WRD.
The network will have real-time links to the DSS. Possibly in future it will also have links Central and State
Government flood forecasting, warning and management services. Details of the proposed hydrometric
network are discussed in Section 5.17.1.1.
Decision Support System
During Project 1 a simple Decision Support System (DSS) comprising surface water and groundwater
databases containing hydrometeorological, hydrological and hydrogeological data and irrigation command
area (ayacut) information will be developed and piloted in the Harichandra River. This simple DSS will be
accessible to WRD decision makers through a user-friendly computer interface allowing them to inspect
up-to-date river levels, flows, water demands throughout the Harichandra sub-basin and its associated
ayacuts and to adjust surface water deliveries to actual needs considering groundwater availability and
recent rainfall.
If the pilot DSS is successful, consideration will be given to expanding the DSS to other sub-basins and to
the development of the simple DSS into a more sophisticated tool that will support the maximisation of
water use efficiency and fully reap the benefits of integrated water resources management within the
324440/IDD/IDC/1/B 10 October2014 Final Report Final V1
48
Climate Adaptation through Sub-Basin Development Program PPTA Final Report
Cauvery Delta, including the conjunctive use of groundwater if this is found to be feasible. This more
sophisticated DSS could include hydrologic and hydraulic models that would guide the operators of the
irrigation and drainage systems on a daily basis and provide comprehensive assessments of water
resources management options on a seasonal basis. Further development of the DSS could include flood
forecasting (using links to the India Meteorological Department and the CWC) and flood warning.
The formulation of the DSS is discussed in Section 5.18.
Capacity Development
The training of WRD in the installation, operation and maintenance of the field equipment will be provided
by the equipment suppliers. Training in the operation and maintenance of hydrometeorological databases
required for flood forecasting and warning, including data quality control, processing, reporting and
archiving will be provided in the course of setting up the DSS. Training in rainfall-runoff modelling,
hydraulic modelling and the development of flood warning triggers will be delivered by the Project 2 and 3
Project Technical Assistance Consultant (PTAC) modellers. Training in IWRM practices will be provided by
the Project Implementation Consultants (PIC).
Details of the proposed training plan are given in Section 5.23.
5.3.2.2 Improved Management of Flood Risk, Events and Disasters
Flood forecasting and warning systems: Flood forecasting and warning systems will be developed for
each river and drain in the Vennar and Cauvery systems using water level triggers derived from (i)
statistical correlations and travel times between monitoring sites and flood zones, (ii) hydraulic models of
the catchments that forecast water levels in the flood zones from observed or forecast rainfall, (iii) rainfall
depth, area and duration curves for the catchments etc. This will be done by the PTAC modellers who will
be appointed to do the hydrologic and hydraulic modelling for Projects 2 and 3. Water level triggers at key
regulators that correspond to incipient flood conditions in downstream flood zones will be determined from
the analysis of existing river level data and the known onset of flood conditions. These triggers can then be
used by WRD to issue flood warnings to at-risk communities and enterprises and also to inform the District
Disaster Management Authorities (DDMAs) so that emergency services can be mobilised to the most
vulnerable locations.
Details of the proposed flood forecasting and warning systems are given in Section 5.16.2.2
Flood risk mapping: Post-flood surveys of structures and embankments that are normally carried out by
WRD after floods will be expanded through the CSGs to include the mapping of flood extent and estimation
of depth, duration, velocity and direction of flow on the flood plains. This information will be used to
improve the configuration and calibration of the flood models, flood warning triggers and indicate high risk
locations where additional flood risk mitigations are required. Using the DTMs produced from the
topographic surveys of channels, structures and flood plains and stereo imagery and any existing DTMs of
the Vennar and Cauvery systems and the hydrological and hydraulic models of the systems, geo-
referenced maps of flood extent, duration and depth for a range of design floods (25, 50 and 100-year
floods with and without climate change) for the with-project scenario and the without-project scenario will
be produced. The flood maps will be used by WRD to (i) refine the flood forecasting and warning systems
by developing geographically targeted forecasts and warnings which will assist DDMAs to deploy
emergency services accurately and efficiently, (ii) identify high risk areas which require additional flood
mitigation measures and (iii) support flood disaster planning by the DDMAs.
324440/IDD/IDC/1/B 10 October2014 Final Report Final V1
49
Climate Adaptation through Sub-Basin Development Program PPTA Final Report
Details of the proposed flood risk mapping are given in Section 5.16.2.3.
5.3.2.3 Groundwater Investigations
During Project 1 groundwater investigations will aim to determine the sustainable yields of the fresh water
aquifers in the Vennar system, the most effective means of increasing their recharge and the dynamics of
the saline water aquifers. The investigations may be followed by the development and implementation of
conjunctive use plans and viable groundwater recharge schemes during Projects 2 and 3 designed to
increase the security of water supply in the delta. The investigations will be:
3D groundwater modelling of about 1000 ha in the delta to improve understanding of the
interaction between abstraction and recharge, surface and groundwater, the shallow and deeper
aquifers, and thereby refine the estimation of the potential for optimal use of groundwater.
A pilot study of conjunctive use of groundwater in a 1000 ha area where irrigation is undertaken
using both surface water and groundwater. During the study farmers will be encouraged to modify
their use of irrigation water so that the effect on groundwater can be evaluated; the outcome of this
study would, in conjunction with the 3Dmodelling, provide a basis for proposing modifications to
groundwater and surface water usage in order to achieve better overall resource utilisation and
therefore make more surface water available for downstream users.
Implementation notes for the groundwater investigations are described in detail in the Appendix H and also
in the FAM. Implementation and costs of the civil works for Project 1 are described in detail in the CASDP
Detailed Project Report (Appendix H). Costs for the whole Program (Projects 1, 2 and 3) are described in
the FAM.
5.4 New Design Guidelines for Drainage Infrastructure
New design guidelines have been developed for CASDP based on the Bureau of Indian Standards (BIS)
for planning, design, construction and operation and maintenance of various earthworks and structures. In
addition, the CASDP guidelines have drawn on the guidelines and manuals of the Central Water
Commission (CWC) and the instructions, in the form of notifications / technical circulars, prepared by the
Tamil Nadu Engineers Association (TNEA 2013). The new design guidelines take account of the asset
surveys and climate change studies conducted during the PPTA. They aim to provide robust channel
embankments that will contain future floods with 25-year return periods and irrigation infrastructure that will
withstand future 50-year floods. The complete design guidelines developed by the PPTA team are given in
Appendix H.
The main criteria adopted for the design of Project-1 works are given in Table 5-1 and the design process,
including topographic surveys, asset surveys, modelling and design, is illustrated in Figure 5.1.
Table 5-1: Design Criteria for Project-1 Works
Design Parameter Criteria
Earthworks
Freeboard 1.5 m
Side Slopes 2H to 1V
Embankment Top Width (Tw) 5 m
River Channels-Design Flow Q25
Structures-Design Flow Q50
324440/IDD/IDC/1/B 10 October2014 Final Report Final V1
50
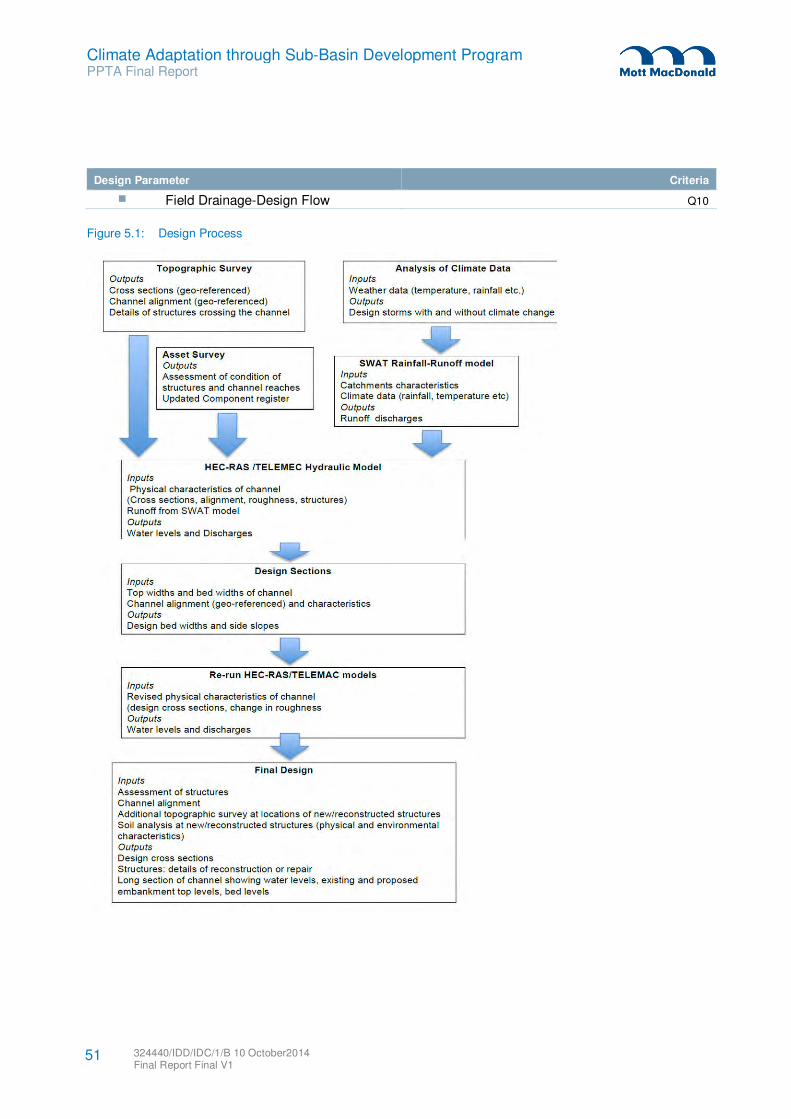
Climate Adaptation through Sub-Basin Development Program PPTA Final Report
Design Parameter Criteria
Field Drainage-Design Flow Q10
Figure 5.1: Design Process
324440/IDD/IDC/1/B 10 October2014 Final Report Final V1
51
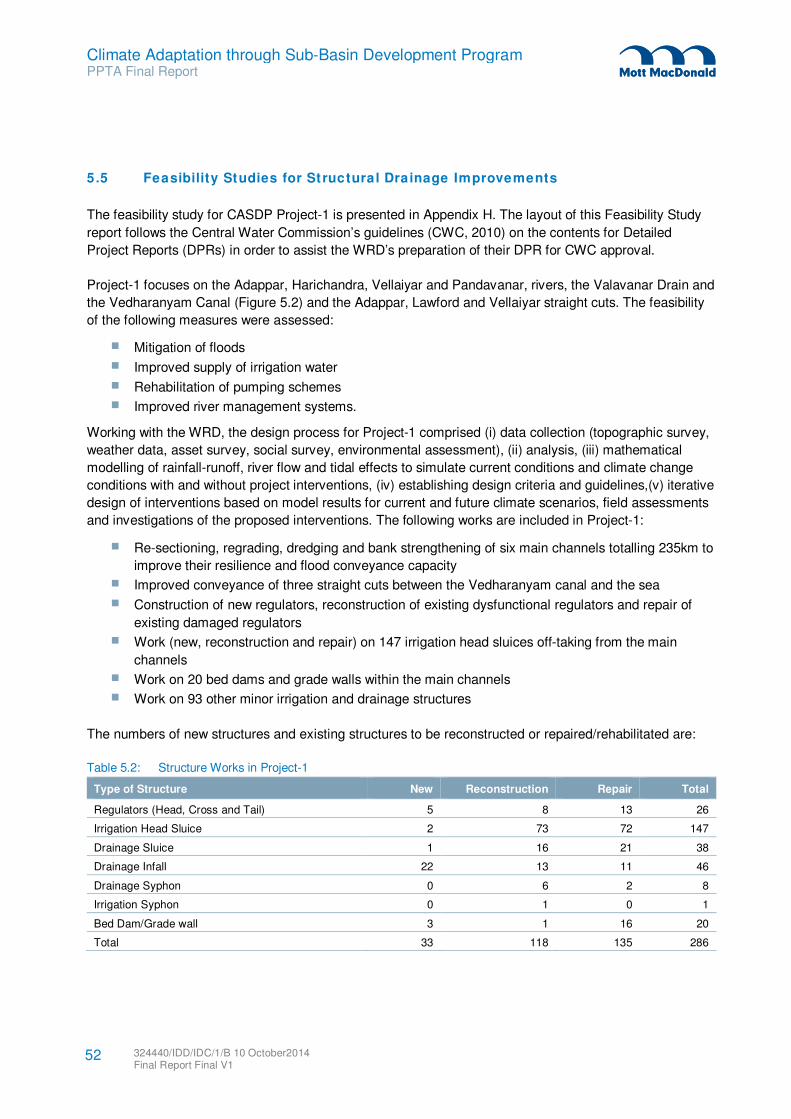
Climate Adaptation through Sub-Basin Development Program PPTA Final Report
5.5 Feasibility Studies for Structural Drainage Improvements
The feasibility study for CASDP Project-1 is presented in Appendix H. The layout of this Feasibility Study
report follows the Central Water Commission’s guidelines (CWC, 2010) on the contents for Detailed
Project Reports (DPRs) in order to assist the WRD’s preparation of their DPR for CWC approval.
Project-1 focuses on the Adappar, Harichandra, Vellaiyar and Pandavanar, rivers, the Valavanar Drain and
the Vedharanyam Canal (Figure 5.2) and the Adappar, Lawford and Vellaiyar straight cuts. The feasibility
of the following measures were assessed:
Mitigation of floods
Improved supply of irrigation water
Rehabilitation of pumping schemes
Improved river management systems.
Working with the WRD, the design process for Project-1 comprised (i) data collection (topographic survey,
weather data, asset survey, social survey, environmental assessment), (ii) analysis, (iii) mathematical
modelling of rainfall-runoff, river flow and tidal effects to simulate current conditions and climate change
conditions with and without project interventions, (iv) establishing design criteria and guidelines,(v) iterative
design of interventions based on model results for current and future climate scenarios, field assessments
and investigations of the proposed interventions. The following works are included in Project-1:
Re-sectioning, regrading, dredging and bank strengthening of six main channels totalling 235km to
improve their resilience and flood conveyance capacity
Improved conveyance of three straight cuts between the Vedharanyam canal and the sea
Construction of new regulators, reconstruction of existing dysfunctional regulators and repair of
existing damaged regulators
Work (new, reconstruction and repair) on 147 irrigation head sluices off-taking from the main
channels
Work on 20 bed dams and grade walls within the main channels
Work on 93 other minor irrigation and drainage structures
The numbers of new structures and existing structures to be reconstructed or repaired/rehabilitated are:
Table 5.2: Structure Works in Project-1
Type of Structure New Reconstruction Repair Total
Regulators (Head, Cross and Tail) 5 8 13 26
Irrigation Head Sluice 2 73 72 147
Drainage Sluice 1 16 21 38
Drainage Infall 22 13 11 46
Drainage Syphon 0 6 2 8
Irrigation Syphon 0 1 0 1
Bed Dam/Grade wall 3 1 16 20
Total 33 118 135 286
324440/IDD/IDC/1/B 10 October2014 Final Report Final V1
52
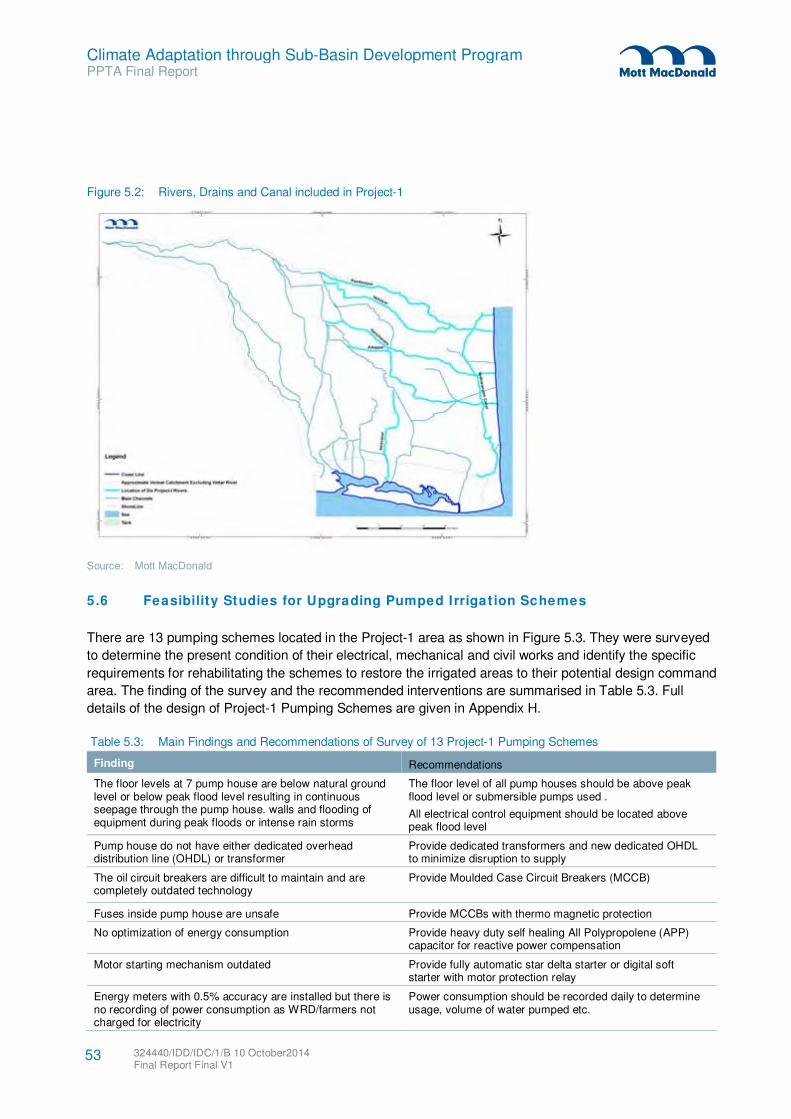
Climate Adaptation through Sub-Basin Development Program PPTA Final Report
Figure 5.2: Rivers, Drains and Canal included in Project-1
Source: Mott MacDonald
5.6 Feasibility Studies for Upgrading Pumped Irrigat ion Schemes
There are 13 pumping schemes located in the Project-1 area as shown in Figure 5.3. They were surveyed
to determine the present condition of their electrical, mechanical and civil works and identify the specific
requirements for rehabilitating the schemes to restore the irrigated areas to their potential design command
area. The finding of the survey and the recommended interventions are summarised in Table 5.3. Full
details of the design of Project-1 Pumping Schemes are given in Appendix H.
Table 5.3: Main Findings and Recommendations of Survey of 13 Project-1 Pumping Schemes
Finding Recommendations
The floor levels at 7 pump house are below natural ground level or below peak flood level resulting in continuous seepage through the pump house. walls and flooding of equipment during peak floods or intense rain storms
The floor level of all pump houses should be above peak flood level or submersible pumps used .
All electrical control equipment should be located above peak flood level
Pump house do not have either dedicated overhead distribution line (OHDL) or transformer
Provide dedicated transformers and new dedicated OHDL to minimize disruption to supply
The oil circuit breakers are difficult to maintain and are completely outdated technology
Provide Moulded Case Circuit Breakers (MCCB)
Fuses inside pump house are unsafe Provide MCCBs with thermo magnetic protection
No optimization of energy consumption Provide heavy duty self healing All Polypropolene (APP) capacitor for reactive power compensation
Motor starting mechanism outdated Provide fully automatic star delta starter or digital soft starter with motor protection relay
Energy meters with 0.5% accuracy are installed but there is no recording of power consumption as WRD/farmers not charged for electricity
Power consumption should be recorded daily to determine usage, volume of water pumped etc.
324440/IDD/IDC/1/B 10 October2014 Final Report Final V1
53
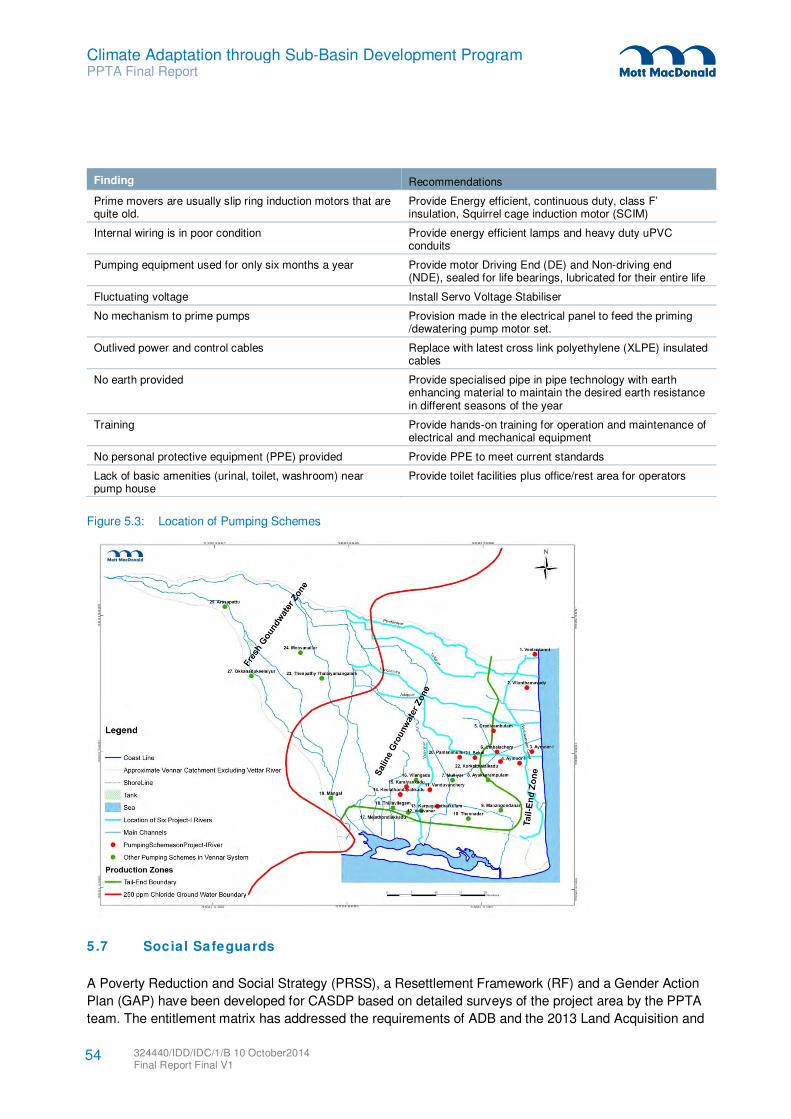
Climate Adaptation through Sub-Basin Development Program PPTA Final Report
Finding Recommendations
Prime movers are usually slip ring induction motors that are quite old.
Provide Energy efficient, continuous duty, class F’ insulation, Squirrel cage induction motor (SCIM)
Internal wiring is in poor condition Provide energy efficient lamps and heavy duty uPVC conduits
Pumping equipment used for only six months a year Provide motor Driving End (DE) and Non-driving end (NDE), sealed for life bearings, lubricated for their entire life
Fluctuating voltage Install Servo Voltage Stabiliser
No mechanism to prime pumps Provision made in the electrical panel to feed the priming /dewatering pump motor set.
Outlived power and control cables Replace with latest cross link polyethylene (XLPE) insulated cables
No earth provided Provide specialised pipe in pipe technology with earth enhancing material to maintain the desired earth resistance in different seasons of the year
Training Provide hands-on training for operation and maintenance of electrical and mechanical equipment
No personal protective equipment (PPE) provided Provide PPE to meet current standards
Lack of basic amenities (urinal, toilet, washroom) near pump house
Provide toilet facilities plus office/rest area for operators
Figure 5.3: Location of Pumping Schemes
5.7 Social Safeguards
A Poverty Reduction and Social Strategy (PRSS), a Resettlement Framework (RF) and a Gender Action
Plan (GAP) have been developed for CASDP based on detailed surveys of the project area by the PPTA
team. The entitlement matrix has addressed the requirements of ADB and the 2013 Land Acquisition and
324440/IDD/IDC/1/B 10 October2014 Final Report Final V1
54
Climate Adaptation through Sub-Basin Development Program PPTA Final Report
Resettlement and Rehabilitation Law of India, and also refers to resettlement precedents set during the
recent World Bank assisted Tamil Nadu Road Sector Project.
A resettlement plan has been prepared for Project 1. A total of 220 residential and commercial structures
will be affected by Project 1 representing 100 residential structures, 17 commercial structures, 6
commercial-cum-residential structures and 97 sheds. All the affected people are squatters or encroachers
on public land.
5.8 Environmental Safeguards
An Environment Assessment Review Framework (EARF) for CASDP and an Initial Environmental
Assessment (IEE) for Project 1 have been prepared in accordance with the ADB Safeguard Policy
Statement (2009).
The six Project-1 channels outfall to the sea and hence their downstream reaches are located in the
Coastal Regulatory Zone (CRZ). Most Project-1 works near the coast will be in regulatory zone 3 (CRZ-3)
and will require clearance at district level only. Works in CRZ-1, which are ecologically sensitive areas and
therefore require clearance from the central Government, are not included in Project-1in order to avoid
delay to the start of civil works. Works in CRZ-1 are deferred until Projects 2 and 3.
There are no archaeological, cultural or religious sites along the six Project-1 rivers except for crematoria
and an occasional graveyard. Re-sectioning of river will impact the vegetation on the embankments. The
felling of certain trees planted on the embankments will require permission from Forest Department. Re-
sectioning of the river will require the removal of silt from the riverbed and, if suitable, it will be used for the
standardisation and improvement of the embankments.
5.9 Economics
The economic and financial analysis of Project-1 (Appendix J) has been conducted in accordance with the
ADB Guidelines for the Economic Analysis of Projects. The economic analysis quantifies the incremental
economic costs and benefits at component, sub-project and project levels and assesses the economic
viability of Project 1 investments from a macro-economic point of view. This is achieved by converting
financial prices to economic prices by means of standard conversion factors. The economic analysis yields
the Economic Internal Rate of Return (EIRR), the Economic Cost-Benefit Ratio and the Economic Net
Present Value. The financial analysis does the same, but at financial prices, yielding the Financial Internal
Rate of Return (FIRR), the Financial Cost-Benefit Ratio and the Financial Net Present Value.
Project-1 is expected to maintain current levels of agricultural productivity by repairing and reconstructing
irrigation structures and pumping stations, and by making the system more resilient against flooding and
climate change. A small number of new structures are proposed especially at the tail-end of the system.
No new irrigation command areas are to be created.
Benefits have been identified for each component. Agricultural benefits are expected to result from (i)
repairs/reconstruction of irrigation structures and so maintaining the present levels of productivity, and (ii)
rehabilitation of pumping schemes by restoring water supplies to the original command areas (ayacuts).
Avoided flood damage to crops have been used to justify investments in repair or reconstruction of
drainage sluices, drainage infalls, siphons, tail-end regulators and re-sectioning of embankments and
channels. Weighted average annual avoided flood damages (loss of life, loss of livestock, and damages to
324440/IDD/IDC/1/B 10 October2014 Final Report Final V1
55
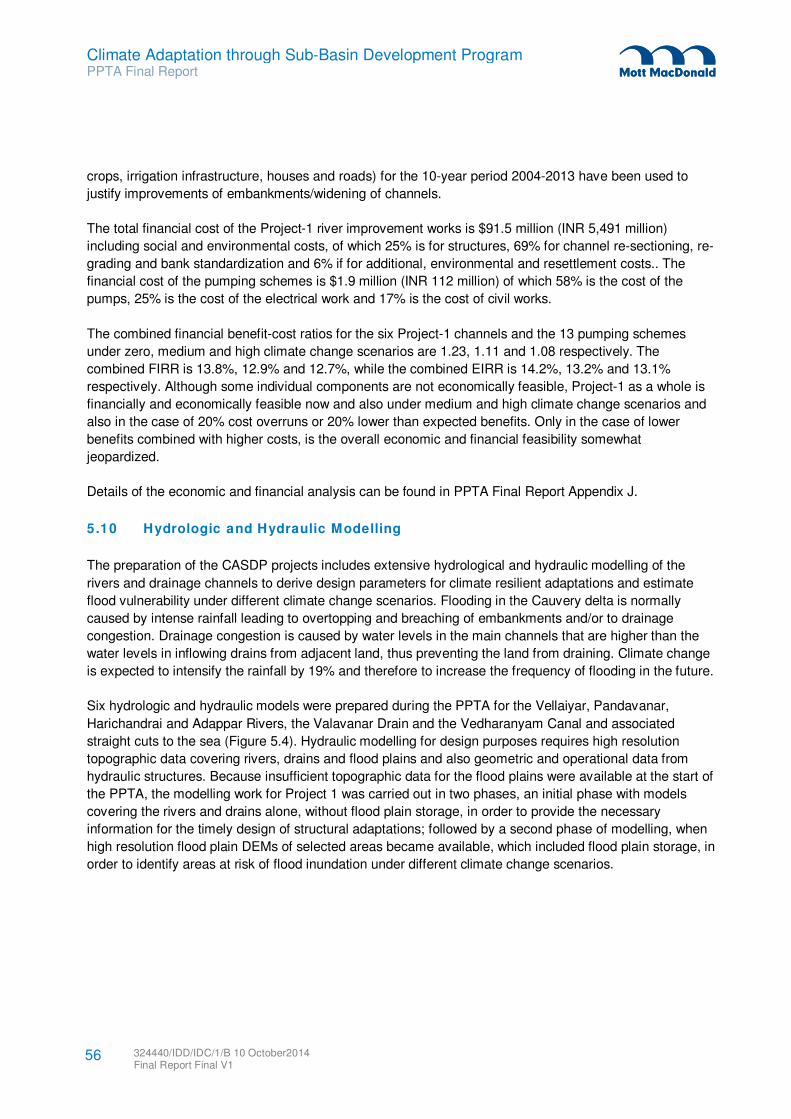
Climate Adaptation through Sub-Basin Development Program PPTA Final Report
crops, irrigation infrastructure, houses and roads) for the 10-year period 2004-2013 have been used to
justify improvements of embankments/widening of channels.
The total financial cost of the Project-1 river improvement works is $91.5 million (INR 5,491 million)
including social and environmental costs, of which 25% is for structures, 69% for channel re-sectioning, re-
grading and bank standardization and 6% if for additional, environmental and resettlement costs.. The
financial cost of the pumping schemes is $1.9 million (INR 112 million) of which 58% is the cost of the
pumps, 25% is the cost of the electrical work and 17% is the cost of civil works.
The combined financial benefit-cost ratios for the six Project-1 channels and the 13 pumping schemes
under zero, medium and high climate change scenarios are 1.23, 1.11 and 1.08 respectively. The
combined FIRR is 13.8%, 12.9% and 12.7%, while the combined EIRR is 14.2%, 13.2% and 13.1%
respectively. Although some individual components are not economically feasible, Project-1 as a whole is
financially and economically feasible now and also under medium and high climate change scenarios and
also in the case of 20% cost overruns or 20% lower than expected benefits. Only in the case of lower
benefits combined with higher costs, is the overall economic and financial feasibility somewhat
jeopardized.
Details of the economic and financial analysis can be found in PPTA Final Report Appendix J.
5.10 Hydrologic and Hydraulic Modelling
The preparation of the CASDP projects includes extensive hydrological and hydraulic modelling of the
rivers and drainage channels to derive design parameters for climate resilient adaptations and estimate
flood vulnerability under different climate change scenarios. Flooding in the Cauvery delta is normally
caused by intense rainfall leading to overtopping and breaching of embankments and/or to drainage
congestion. Drainage congestion is caused by water levels in the main channels that are higher than the
water levels in inflowing drains from adjacent land, thus preventing the land from draining. Climate change
is expected to intensify the rainfall by 19% and therefore to increase the frequency of flooding in the future.
Six hydrologic and hydraulic models were prepared during the PPTA for the Vellaiyar, Pandavanar,
Harichandrai and Adappar Rivers, the Valavanar Drain and the Vedharanyam Canal and associated
straight cuts to the sea (Figure 5.4). Hydraulic modelling for design purposes requires high resolution
topographic data covering rivers, drains and flood plains and also geometric and operational data from
hydraulic structures. Because insufficient topographic data for the flood plains were available at the start of
the PPTA, the modelling work for Project 1 was carried out in two phases, an initial phase with models
covering the rivers and drains alone, without flood plain storage, in order to provide the necessary
information for the timely design of structural adaptations; followed by a second phase of modelling, when
high resolution flood plain DEMs of selected areas became available, which included flood plain storage, in
order to identify areas at risk of flood inundation under different climate change scenarios.
324440/IDD/IDC/1/B 10 October2014 Final Report Final V1
56
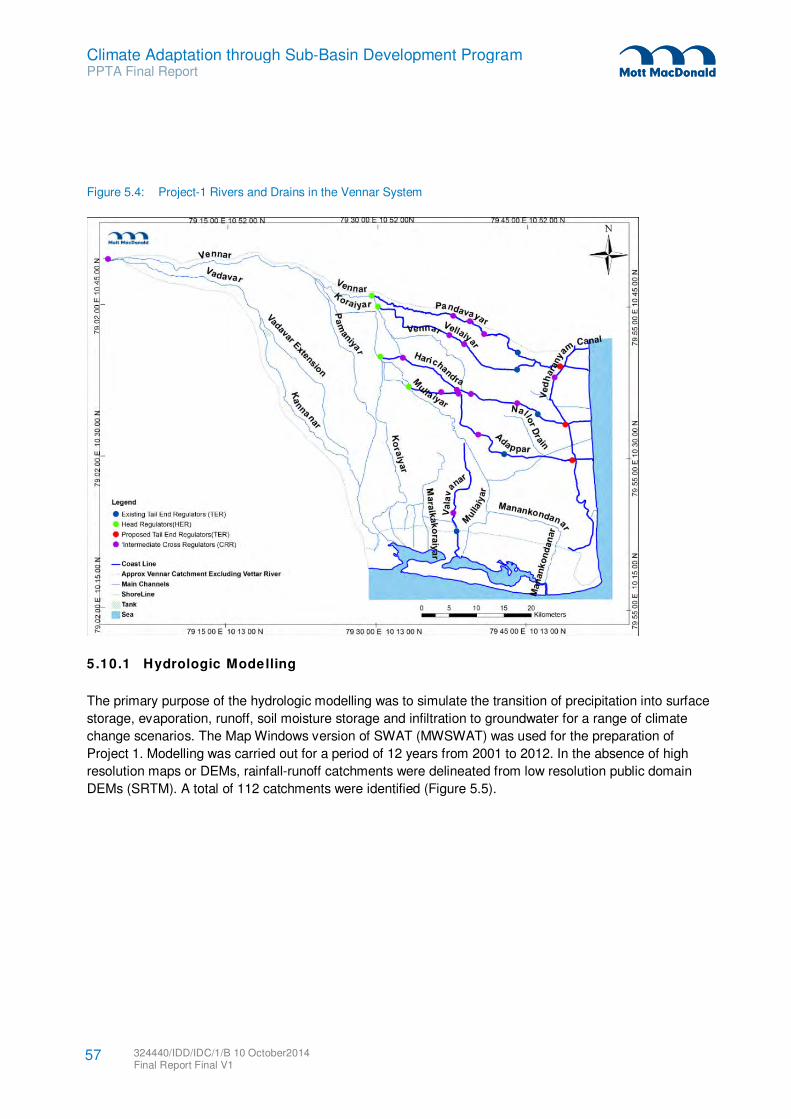
Climate Adaptation through Sub-Basin Development Program PPTA Final Report
Figure 5.4: Project-1 Rivers and Drains in the Vennar System
5.10.1 Hydrologic Modelling
The primary purpose of the hydrologic modelling was to simulate the transition of precipitation into surface
storage, evaporation, runoff, soil moisture storage and infiltration to groundwater for a range of climate
change scenarios. The Map Windows version of SWAT (MWSWAT) was used for the preparation of
Project 1. Modelling was carried out for a period of 12 years from 2001 to 2012. In the absence of high
resolution maps or DEMs, rainfall-runoff catchments were delineated from low resolution public domain
DEMs (SRTM). A total of 112 catchments were identified (Figure 5.5).
324440/IDD/IDC/1/B 10 October2014 Final Report Final V1
57
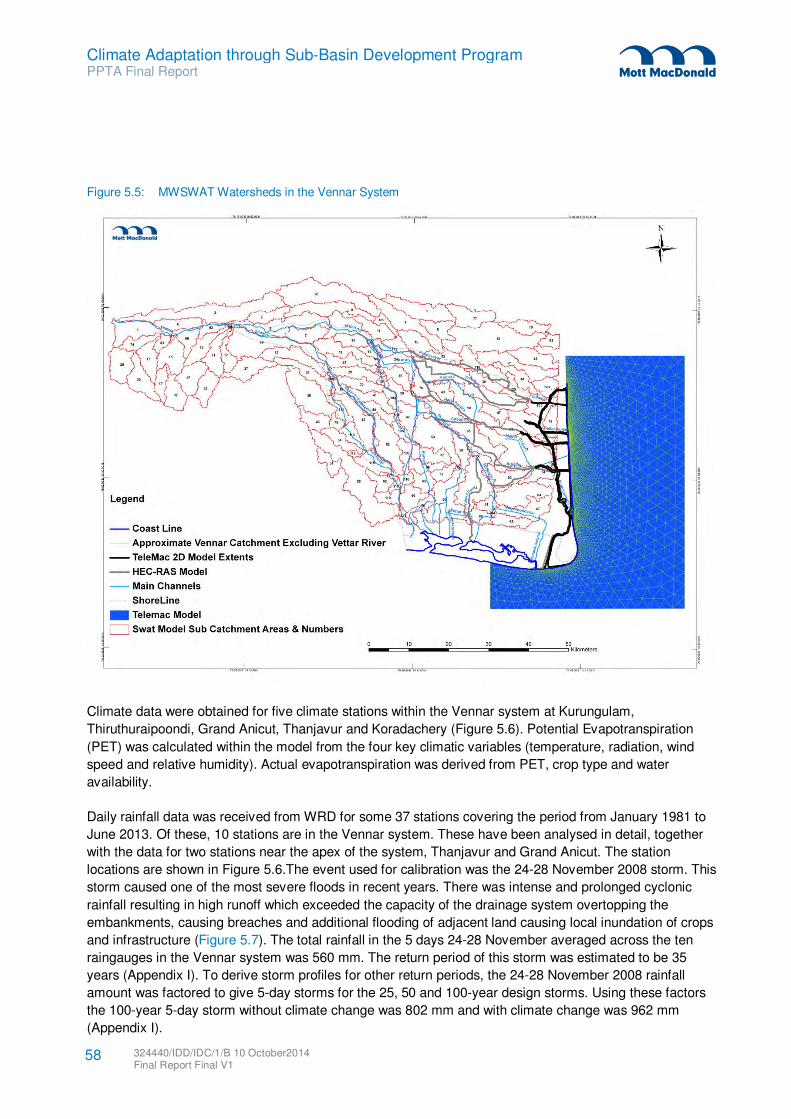
Climate Adaptation through Sub-Basin Development Program PPTA Final Report
Figure 5.5: MWSWAT Watersheds in the Vennar System
Climate data were obtained for five climate stations within the Vennar system at Kurungulam,
Thiruthuraipoondi, Grand Anicut, Thanjavur and Koradachery (Figure 5.6). Potential Evapotranspiration
(PET) was calculated within the model from the four key climatic variables (temperature, radiation, wind
speed and relative humidity). Actual evapotranspiration was derived from PET, crop type and water
availability.
Daily rainfall data was received from WRD for some 37 stations covering the period from January 1981 to
June 2013. Of these, 10 stations are in the Vennar system. These have been analysed in detail, together
with the data for two stations near the apex of the system, Thanjavur and Grand Anicut. The station
locations are shown in Figure 5.6.The event used for calibration was the 24-28 November 2008 storm. This
storm caused one of the most severe floods in recent years. There was intense and prolonged cyclonic
rainfall resulting in high runoff which exceeded the capacity of the drainage system overtopping the
embankments, causing breaches and additional flooding of adjacent land causing local inundation of crops
and infrastructure (Figure 5.7). The total rainfall in the 5 days 24-28 November averaged across the ten
raingauges in the Vennar system was 560 mm. The return period of this storm was estimated to be 35
years (Appendix I). To derive storm profiles for other return periods, the 24-28 November 2008 rainfall
amount was factored to give 5-day storms for the 25, 50 and 100-year design storms. Using these factors
the 100-year 5-day storm without climate change was 802 mm and with climate change was 962 mm
(Appendix I).
324440/IDD/IDC/1/B 10 October2014 Final Report Final V1
58
Climate Adaptation through Sub-Basin Development Program PPTA Final Report
Figure 5.6: Locations of Rainfall and Climate Stations
5.10.2 Hydraulic Model
5.10.2.1 Conceptual Models
Hydraulic modelling of the Cauvery delta was a considerable challenge due to the dense network of rivers,
canals and drains, numerous inter-linkages and structures, low hydraulic gradients, tidal influences,
merged flood plains and limited availability of detailed topographic data. A further challenge was the lack of
river level and flow data from cross regulators and head sluices and uncertainties in the river level and flow
data from the head and tail regulators, especially during severe floods when these regulators may have
been drowned or bypassed. Furthermore no observed tide data was readily available.
For Project 1 a preliminary conceptual drainage network was developed for the Vennar system and
reviewed with WRD before being finalized. Then HEC-RAS models were developed to simulate one
dimensional gravity flows in the Vellaiyar, Pandavanar, Harichandrai and Adappar Rivers and the
Valavanar Drain and the TELEMAC2D model was chosen to simulate two dimensional tidal flows in the
lower reaches of the rivers, downstream of their tail-end regulators, and also in the Vedharanyan Canal
and the straight cuts (Figure 5.8).
5.10.2.2 Model Development
Discharge data from the head regulators and tail end regulators provided by WRD for the period 2001 to
2012 were used for calibration of the HEC-RAS models. Flows at the tail-end regulators determined from
324440/IDD/IDC/1/B 10 October2014 Final Report Final V1
59
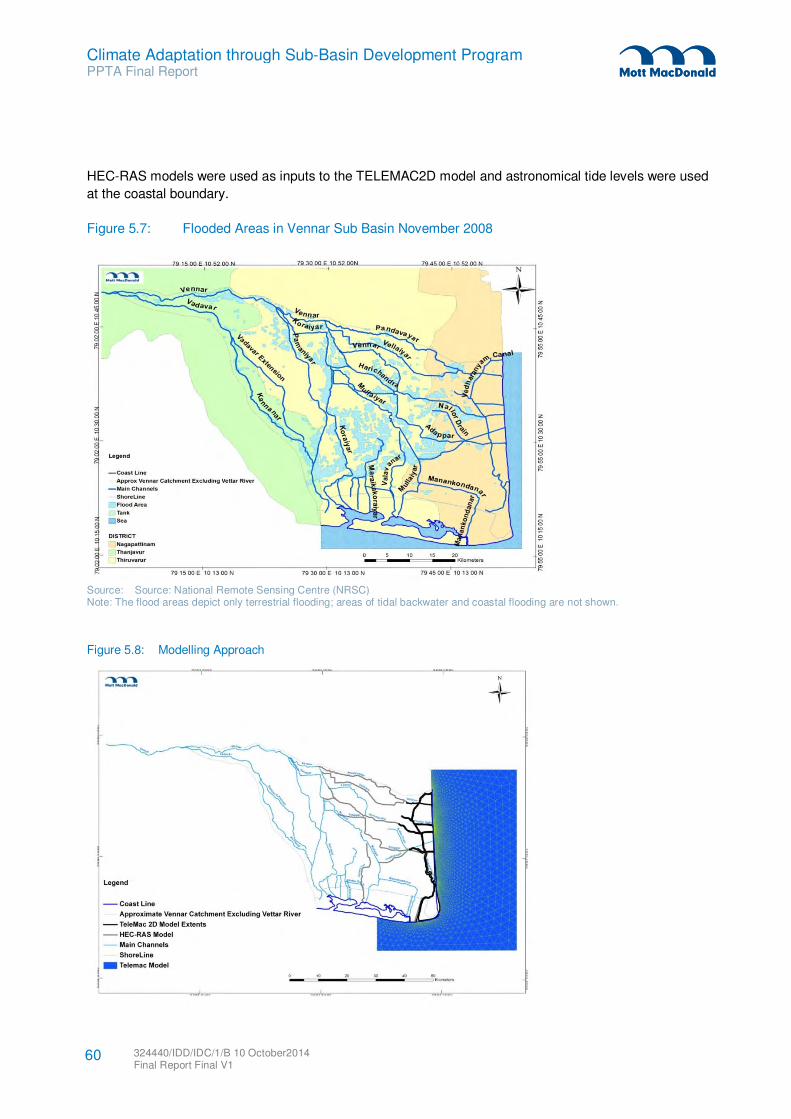
Climate Adaptation through Sub-Basin Development Program PPTA Final Report
HEC-RAS models were used as inputs to the TELEMAC2D model and astronomical tide levels were used
at the coastal boundary.
Figure 5.7: Flooded Areas in Vennar Sub Basin November 2008
Source: Source: National Remote Sensing Centre (NRSC) Note: The flood areas depict only terrestrial flooding; areas of tidal backwater and coastal flooding are not shown.
Figure 5.8: Modelling Approach
324440/IDD/IDC/1/B 10 October2014 Final Report Final V1
60
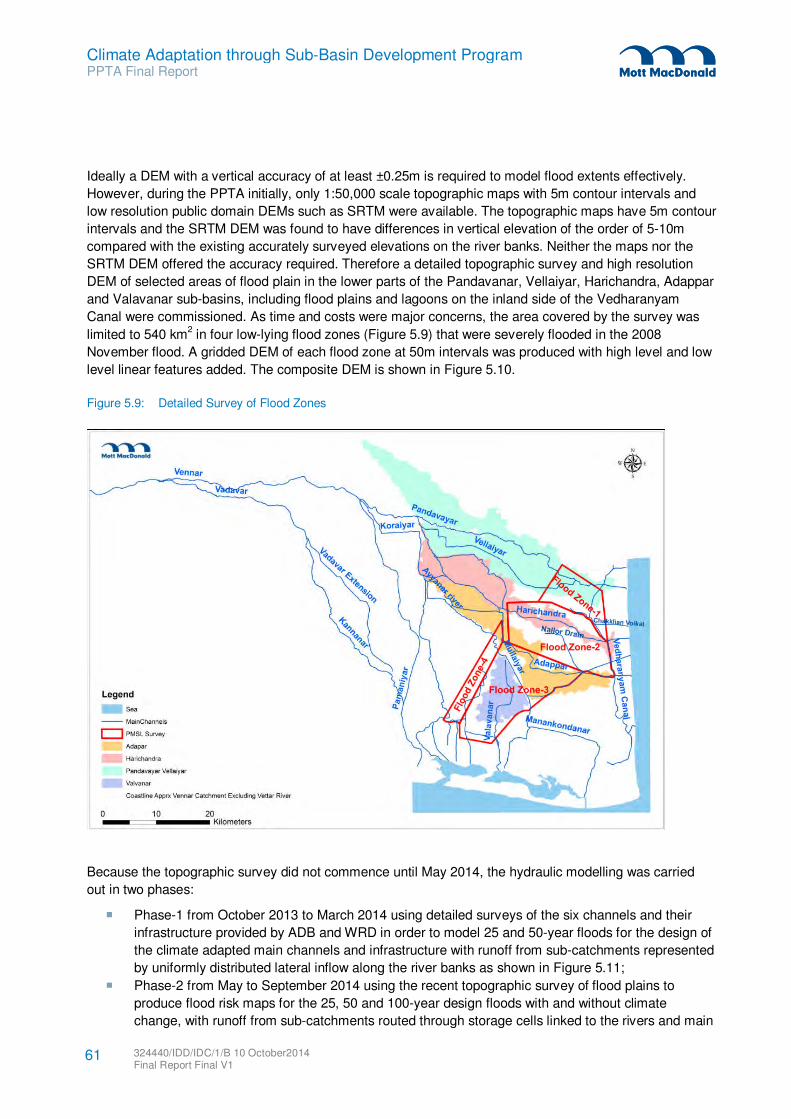
Climate Adaptation through Sub-Basin Development Program PPTA Final Report
Ideally a DEM with a vertical accuracy of at least ±0.25m is required to model flood extents effectively.
However, during the PPTA initially, only 1:50,000 scale topographic maps with 5m contour intervals and
low resolution public domain DEMs such as SRTM were available. The topographic maps have 5m contour
intervals and the SRTM DEM was found to have differences in vertical elevation of the order of 5-10m
compared with the existing accurately surveyed elevations on the river banks. Neither the maps nor the
SRTM DEM offered the accuracy required. Therefore a detailed topographic survey and high resolution
DEM of selected areas of flood plain in the lower parts of the Pandavanar, Vellaiyar, Harichandra, Adappar
and Valavanar sub-basins, including flood plains and lagoons on the inland side of the Vedharanyam
Canal were commissioned. As time and costs were major concerns, the area covered by the survey was
limited to 540 km2 in four low-lying flood zones (Figure 5.9) that were severely flooded in the 2008
November flood. A gridded DEM of each flood zone at 50m intervals was produced with high level and low
level linear features added. The composite DEM is shown in Figure 5.10.
Figure 5.9: Detailed Survey of Flood Zones
Because the topographic survey did not commence until May 2014, the hydraulic modelling was carried
out in two phases:
Phase-1 from October 2013 to March 2014 using detailed surveys of the six channels and their
infrastructure provided by ADB and WRD in order to model 25 and 50-year floods for the design of
the climate adapted main channels and infrastructure with runoff from sub-catchments represented
by uniformly distributed lateral inflow along the river banks as shown in Figure 5.11;
Phase-2 from May to September 2014 using the recent topographic survey of flood plains to
produce flood risk maps for the 25, 50 and 100-year design floods with and without climate
change, with runoff from sub-catchments routed through storage cells linked to the rivers and main
324440/IDD/IDC/1/B 10 October2014 Final Report Final V1
61
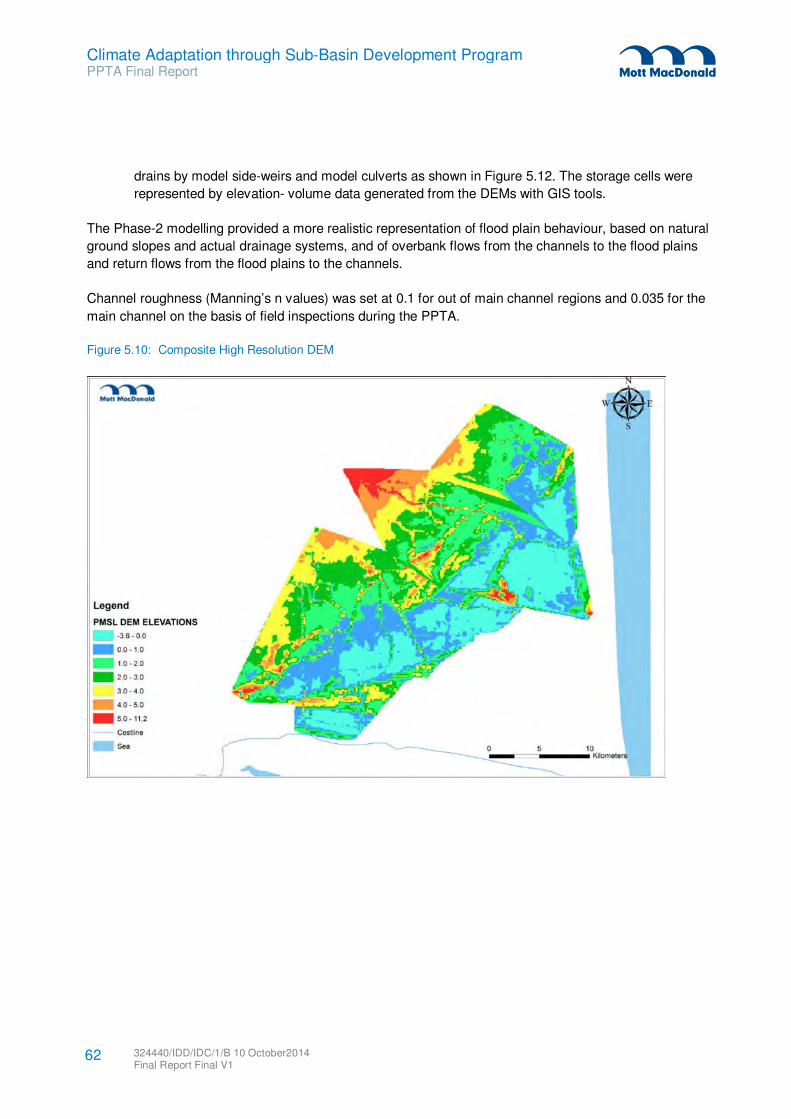
Climate Adaptation through Sub-Basin Development Program PPTA Final Report
drains by model side-weirs and model culverts as shown in Figure 5.12. The storage cells were
represented by elevation- volume data generated from the DEMs with GIS tools.
The Phase-2 modelling provided a more realistic representation of flood plain behaviour, based on natural
ground slopes and actual drainage systems, and of overbank flows from the channels to the flood plains
and return flows from the flood plains to the channels.
Channel roughness (Manning’s n values) was set at 0.1 for out of main channel regions and 0.035 for the
main channel on the basis of field inspections during the PPTA.
Figure 5.10: Composite High Resolution DEM
324440/IDD/IDC/1/B 10 October2014 Final Report Final V1
62
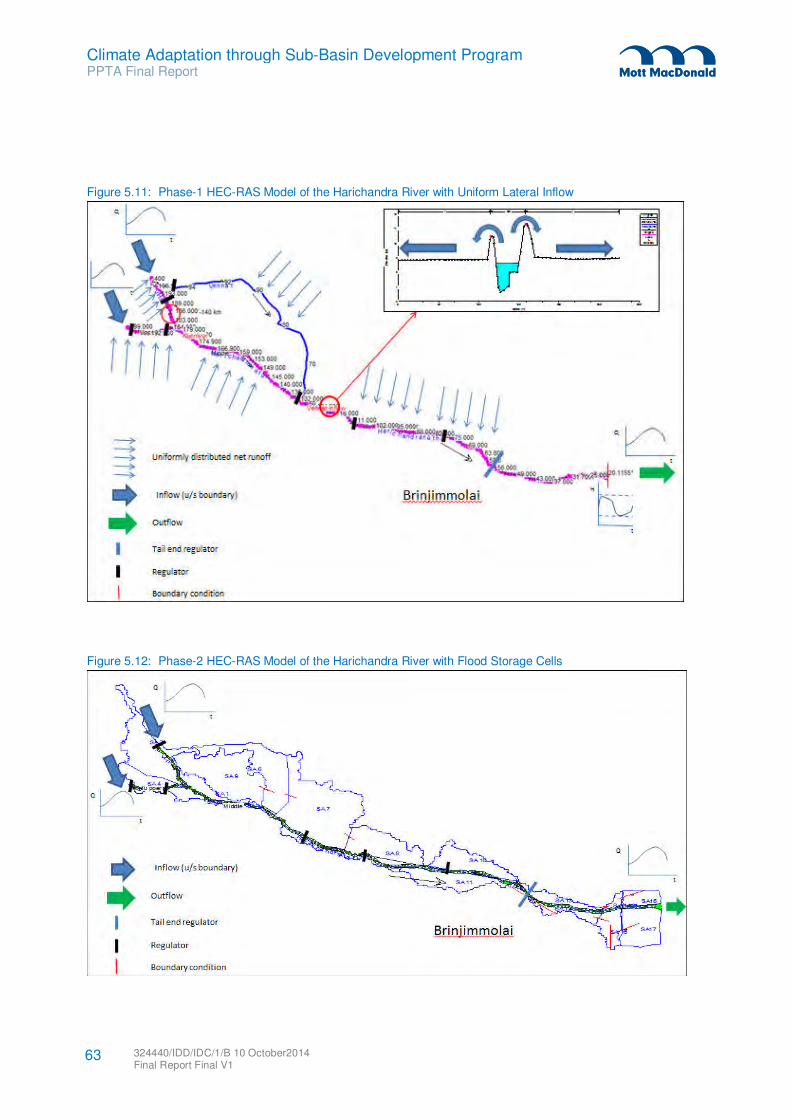
Climate Adaptation through Sub-Basin Development Program PPTA Final Report
Figure 5.11: Phase-1 HEC-RAS Model of the Harichandra River with Uniform Lateral Inflow
Figure 5.12: Phase-2 HEC-RAS Model of the Harichandra River with Flood Storage Cells
324440/IDD/IDC/1/B 10 October2014 Final Report Final V1
63
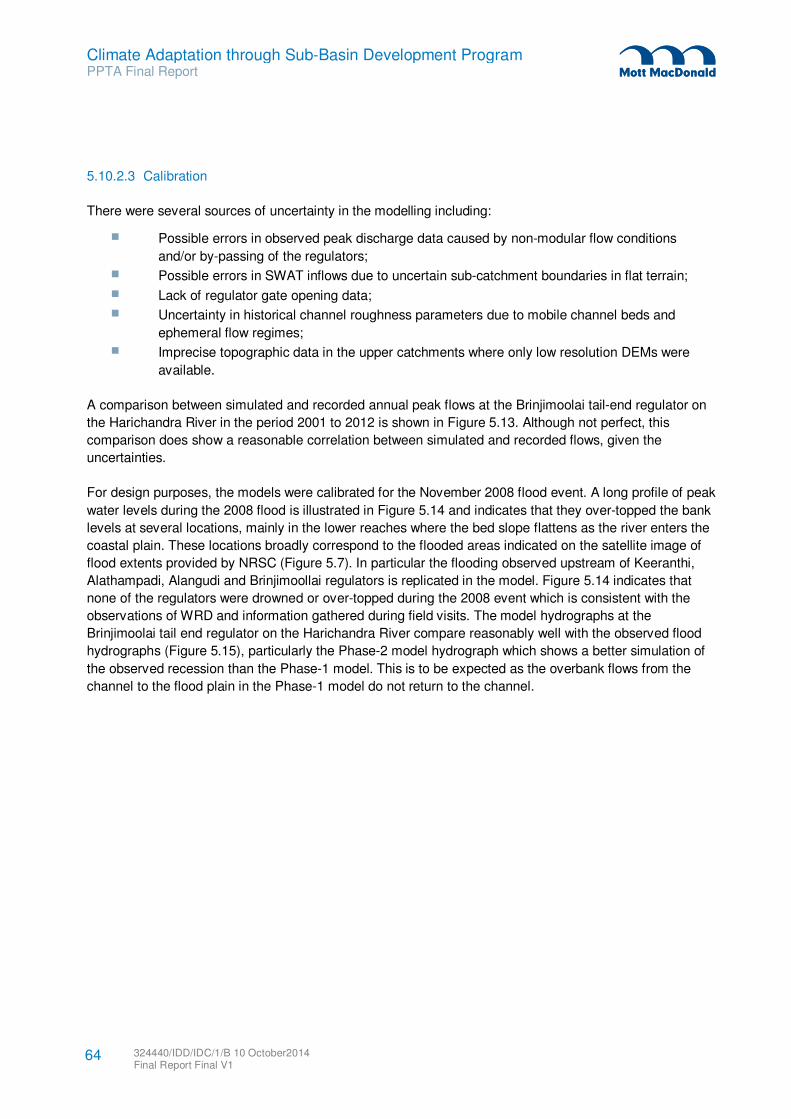
Climate Adaptation through Sub-Basin Development Program PPTA Final Report
5.10.2.3 Calibration
There were several sources of uncertainty in the modelling including:
Possible errors in observed peak discharge data caused by non-modular flow conditions
and/or by-passing of the regulators;
Possible errors in SWAT inflows due to uncertain sub-catchment boundaries in flat terrain;
Lack of regulator gate opening data;
Uncertainty in historical channel roughness parameters due to mobile channel beds and
ephemeral flow regimes;
Imprecise topographic data in the upper catchments where only low resolution DEMs were
available.
A comparison between simulated and recorded annual peak flows at the Brinjimoolai tail-end regulator on
the Harichandra River in the period 2001 to 2012 is shown in Figure 5.13. Although not perfect, this
comparison does show a reasonable correlation between simulated and recorded flows, given the
uncertainties.
For design purposes, the models were calibrated for the November 2008 flood event. A long profile of peak
water levels during the 2008 flood is illustrated in Figure 5.14 and indicates that they over-topped the bank
levels at several locations, mainly in the lower reaches where the bed slope flattens as the river enters the
coastal plain. These locations broadly correspond to the flooded areas indicated on the satellite image of
flood extents provided by NRSC (Figure 5.7). In particular the flooding observed upstream of Keeranthi,
Alathampadi, Alangudi and Brinjimoollai regulators is replicated in the model. Figure 5.14 indicates that
none of the regulators were drowned or over-topped during the 2008 event which is consistent with the
observations of WRD and information gathered during field visits. The model hydrographs at the
Brinjimoolai tail end regulator on the Harichandra River compare reasonably well with the observed flood
hydrographs (Figure 5.15), particularly the Phase-2 model hydrograph which shows a better simulation of
the observed recession than the Phase-1 model. This is to be expected as the overbank flows from the
channel to the flood plain in the Phase-1 model do not return to the channel.
324440/IDD/IDC/1/B 10 October2014 Final Report Final V1
64
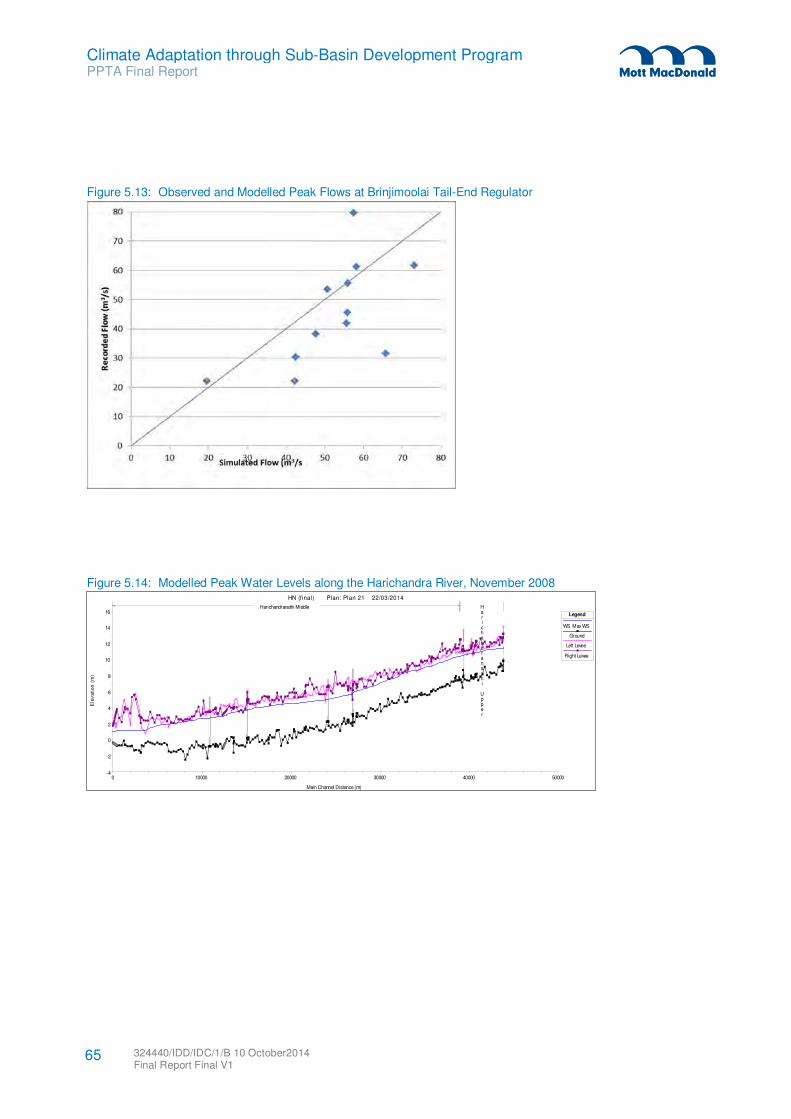
Climate Adaptation through Sub-Basin Development Program PPTA Final Report
Figure 5.13: Observed and Modelled Peak Flows at Brinjimoolai Tail-End Regulator
Figure 5.14: Modelled Peak Water Levels along the Harichandra River, November 2008
0 10000 20000 30000 40000 50000-4
-2
0
2
4
6
8
10
12
14
16
HN (final) Plan: Plan 21 22/03/2014
Main Channel Distance (m)
Ele
vation
(m
)
Legend
WS Max WS
Ground
Left Levee
Right Levee
Harichandranathi Middle Harichandranathi Upper
324440/IDD/IDC/1/B 10 October2014 Final Report Final V1
65
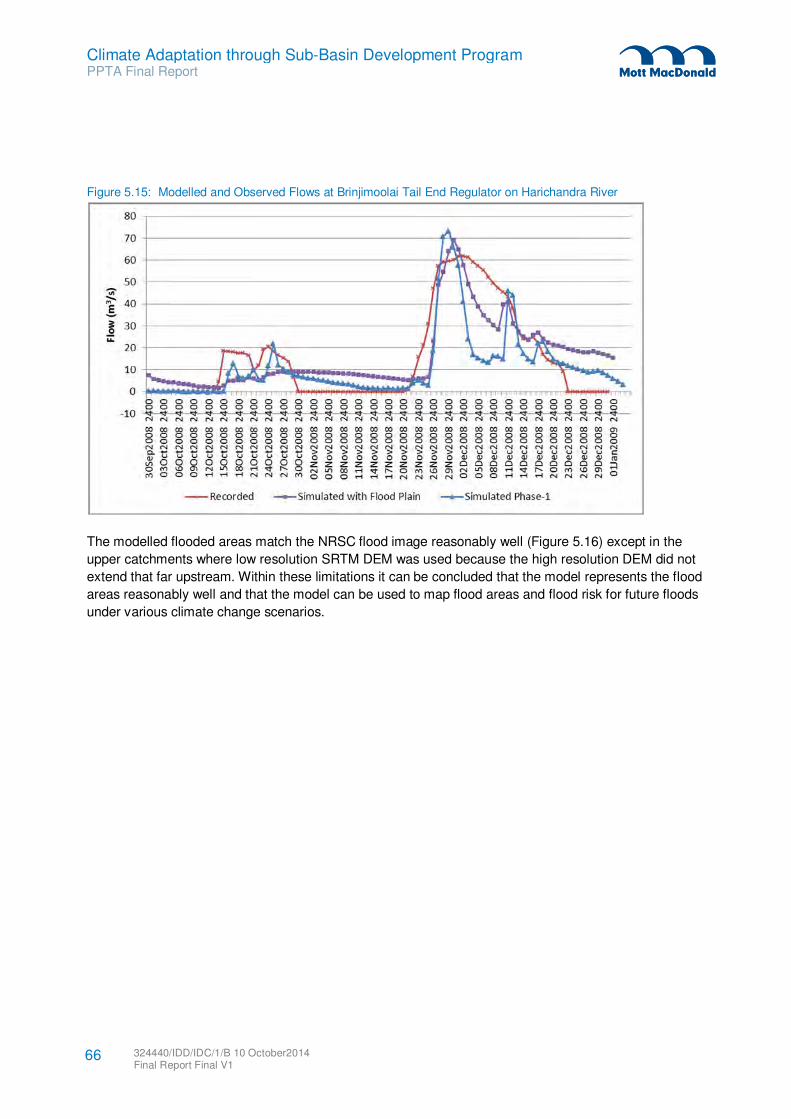
Climate Adaptation through Sub-Basin Development Program PPTA Final Report
Figure 5.15: Modelled and Observed Flows at Brinjimoolai Tail End Regulator on Harichandra River
The modelled flooded areas match the NRSC flood image reasonably well (Figure 5.16) except in the
upper catchments where low resolution SRTM DEM was used because the high resolution DEM did not
extend that far upstream. Within these limitations it can be concluded that the model represents the flood
areas reasonably well and that the model can be used to map flood areas and flood risk for future floods
under various climate change scenarios.
324440/IDD/IDC/1/B 10 October2014 Final Report Final V1
66
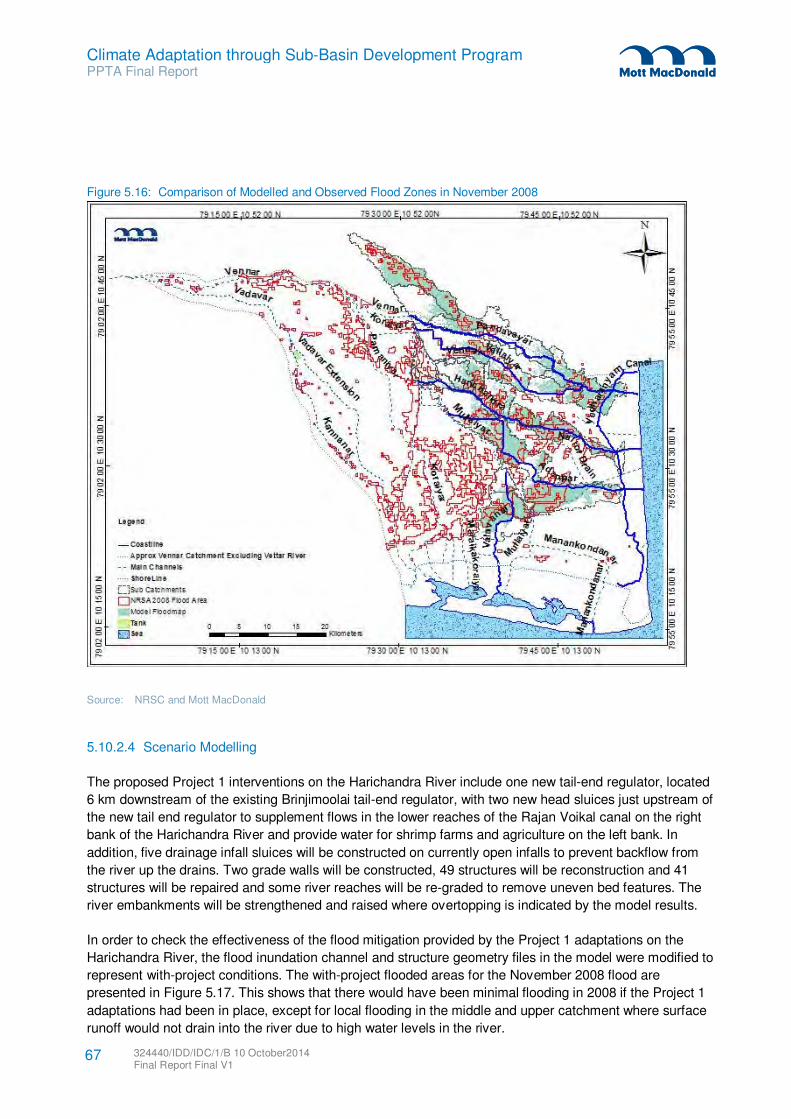
Climate Adaptation through Sub-Basin Development Program PPTA Final Report
Figure 5.16: Comparison of Modelled and Observed Flood Zones in November 2008
Source: NRSC and Mott MacDonald
5.10.2.4 Scenario Modelling
The proposed Project 1 interventions on the Harichandra River include one new tail-end regulator, located
6 km downstream of the existing Brinjimoolai tail-end regulator, with two new head sluices just upstream of
the new tail end regulator to supplement flows in the lower reaches of the Rajan Voikal canal on the right
bank of the Harichandra River and provide water for shrimp farms and agriculture on the left bank. In
addition, five drainage infall sluices will be constructed on currently open infalls to prevent backflow from
the river up the drains. Two grade walls will be constructed, 49 structures will be reconstruction and 41
structures will be repaired and some river reaches will be re-graded to remove uneven bed features. The
river embankments will be strengthened and raised where overtopping is indicated by the model results.
In order to check the effectiveness of the flood mitigation provided by the Project 1 adaptations on the
Harichandra River, the flood inundation channel and structure geometry files in the model were modified to
represent with-project conditions. The with-project flooded areas for the November 2008 flood are
presented in Figure 5.17. This shows that there would have been minimal flooding in 2008 if the Project 1
adaptations had been in place, except for local flooding in the middle and upper catchment where surface
runoff would not drain into the river due to high water levels in the river.
324440/IDD/IDC/1/B 10 October2014 Final Report Final V1
67
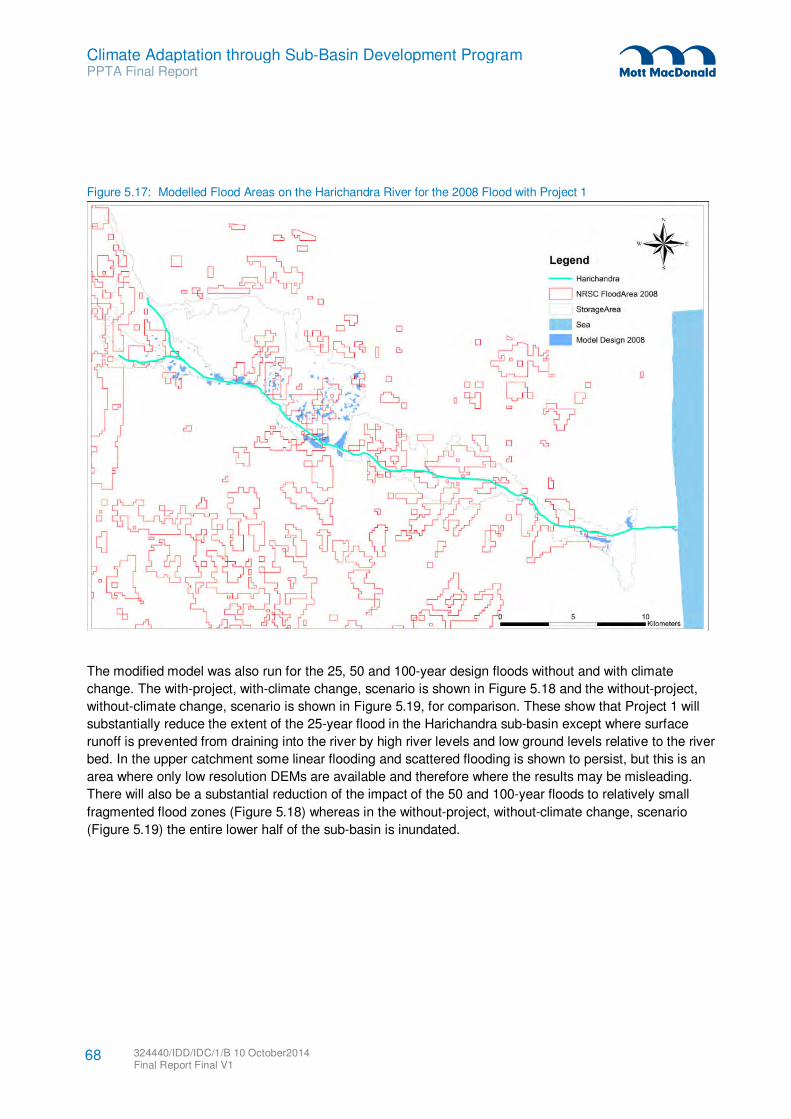
Climate Adaptation through Sub-Basin Development Program PPTA Final Report
Figure 5.17: Modelled Flood Areas on the Harichandra River for the 2008 Flood with Project 1
The modified model was also run for the 25, 50 and 100-year design floods without and with climate
change. The with-project, with-climate change, scenario is shown in Figure 5.18 and the without-project,
without-climate change, scenario is shown in Figure 5.19, for comparison. These show that Project 1 will
substantially reduce the extent of the 25-year flood in the Harichandra sub-basin except where surface
runoff is prevented from draining into the river by high river levels and low ground levels relative to the river
bed. In the upper catchment some linear flooding and scattered flooding is shown to persist, but this is an
area where only low resolution DEMs are available and therefore where the results may be misleading.
There will also be a substantial reduction of the impact of the 50 and 100-year floods to relatively small
fragmented flood zones (Figure 5.18) whereas in the without-project, without-climate change, scenario
(Figure 5.19) the entire lower half of the sub-basin is inundated.
324440/IDD/IDC/1/B 10 October2014 Final Report Final V1
68
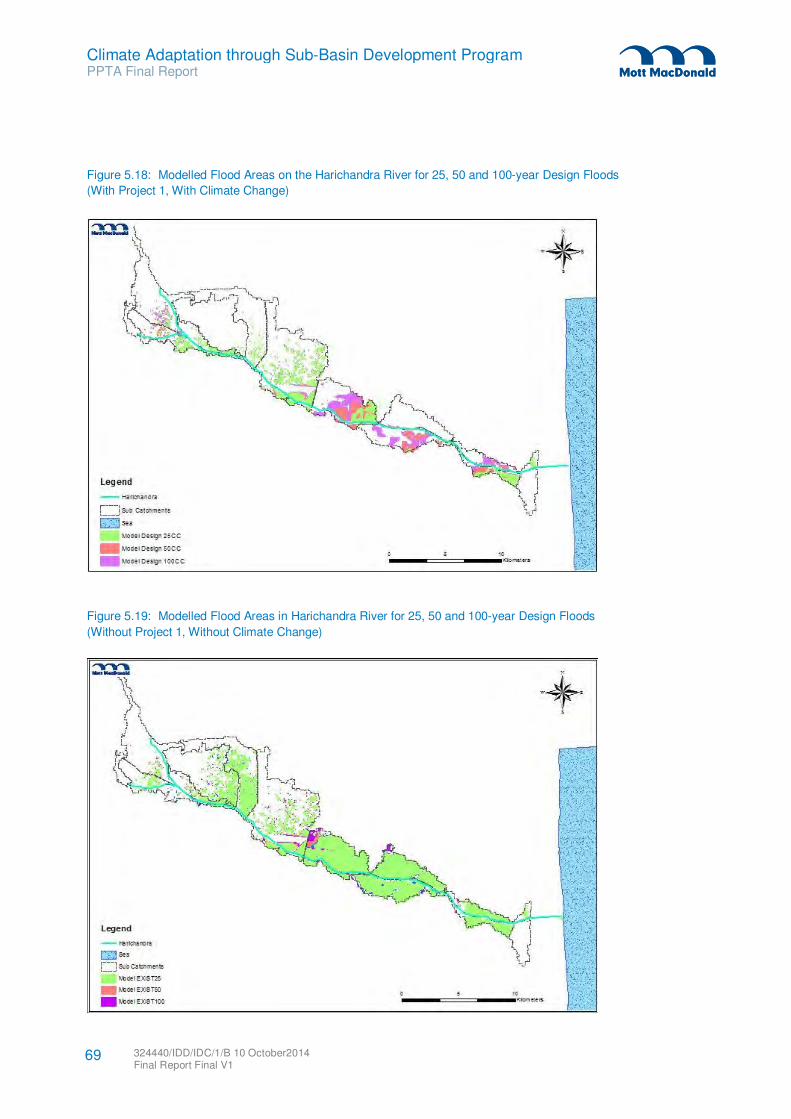
Climate Adaptation through Sub-Basin Development Program PPTA Final Report
Figure 5.18: Modelled Flood Areas on the Harichandra River for 25, 50 and 100-year Design Floods
(With Project 1, With Climate Change)
Figure 5.19: Modelled Flood Areas in Harichandra River for 25, 50 and 100-year Design Floods
(Without Project 1, Without Climate Change)
324440/IDD/IDC/1/B 10 October2014 Final Report Final V1
69
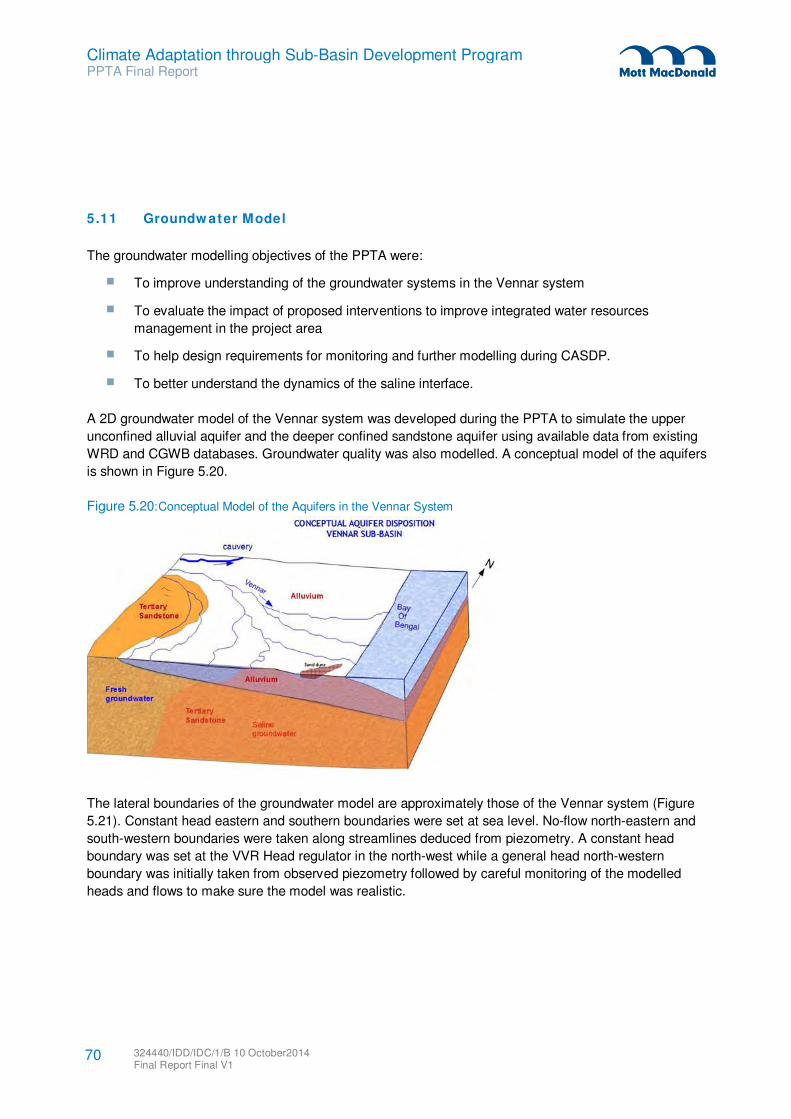
Climate Adaptation through Sub-Basin Development Program PPTA Final Report
5.11 Groundw ater Model
The groundwater modelling objectives of the PPTA were:
To improve understanding of the groundwater systems in the Vennar system
To evaluate the impact of proposed interventions to improve integrated water resources
management in the project area
To help design requirements for monitoring and further modelling during CASDP.
To better understand the dynamics of the saline interface.
A 2D groundwater model of the Vennar system was developed during the PPTA to simulate the upper
unconfined alluvial aquifer and the deeper confined sandstone aquifer using available data from existing
WRD and CGWB databases. Groundwater quality was also modelled. A conceptual model of the aquifers
is shown in Figure 5.20.
Figure 5.20: Conceptual Model of the Aquifers in the Vennar System
The lateral boundaries of the groundwater model are approximately those of the Vennar system (Figure
5.21). Constant head eastern and southern boundaries were set at sea level. No-flow north-eastern and
south-western boundaries were taken along streamlines deduced from piezometry. A constant head
boundary was set at the VVR Head regulator in the north-west while a general head north-western
boundary was initially taken from observed piezometry followed by careful monitoring of the modelled
heads and flows to make sure the model was realistic.
324440/IDD/IDC/1/B 10 October2014 Final Report Final V1
70
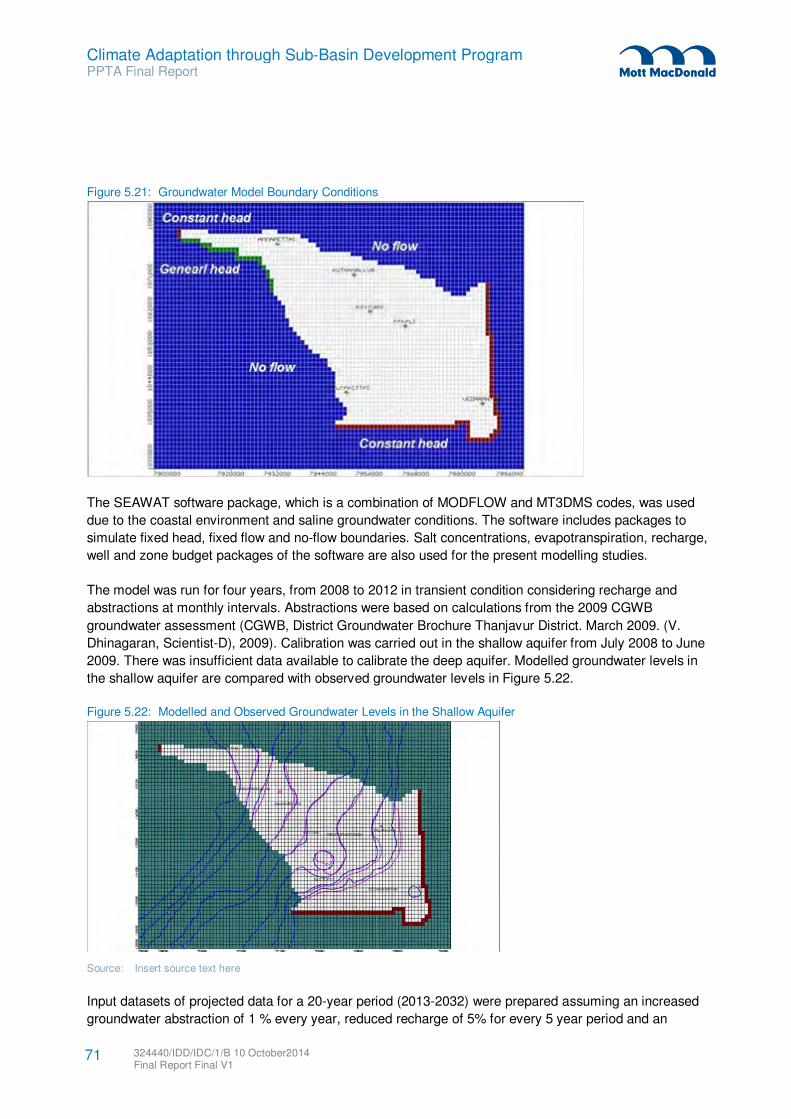
Climate Adaptation through Sub-Basin Development Program PPTA Final Report
Figure 5.21: Groundwater Model Boundary Conditions
The SEAWAT software package, which is a combination of MODFLOW and MT3DMS codes, was used
due to the coastal environment and saline groundwater conditions. The software includes packages to
simulate fixed head, fixed flow and no-flow boundaries. Salt concentrations, evapotranspiration, recharge,
well and zone budget packages of the software are also used for the present modelling studies.
The model was run for four years, from 2008 to 2012 in transient condition considering recharge and
abstractions at monthly intervals. Abstractions were based on calculations from the 2009 CGWB
groundwater assessment (CGWB, District Groundwater Brochure Thanjavur District. March 2009. (V.
Dhinagaran, Scientist-D), 2009). Calibration was carried out in the shallow aquifer from July 2008 to June
2009. There was insufficient data available to calibrate the deep aquifer. Modelled groundwater levels in
the shallow aquifer are compared with observed groundwater levels in Figure 5.22.
Figure 5.22: Modelled and Observed Groundwater Levels in the Shallow Aquifer
Source: Insert source text here
Input datasets of projected data for a 20-year period (2013-2032) were prepared assuming an increased
groundwater abstraction of 1 % every year, reduced recharge of 5% for every 5 year period and an
324440/IDD/IDC/1/B 10 October2014 Final Report Final V1
71
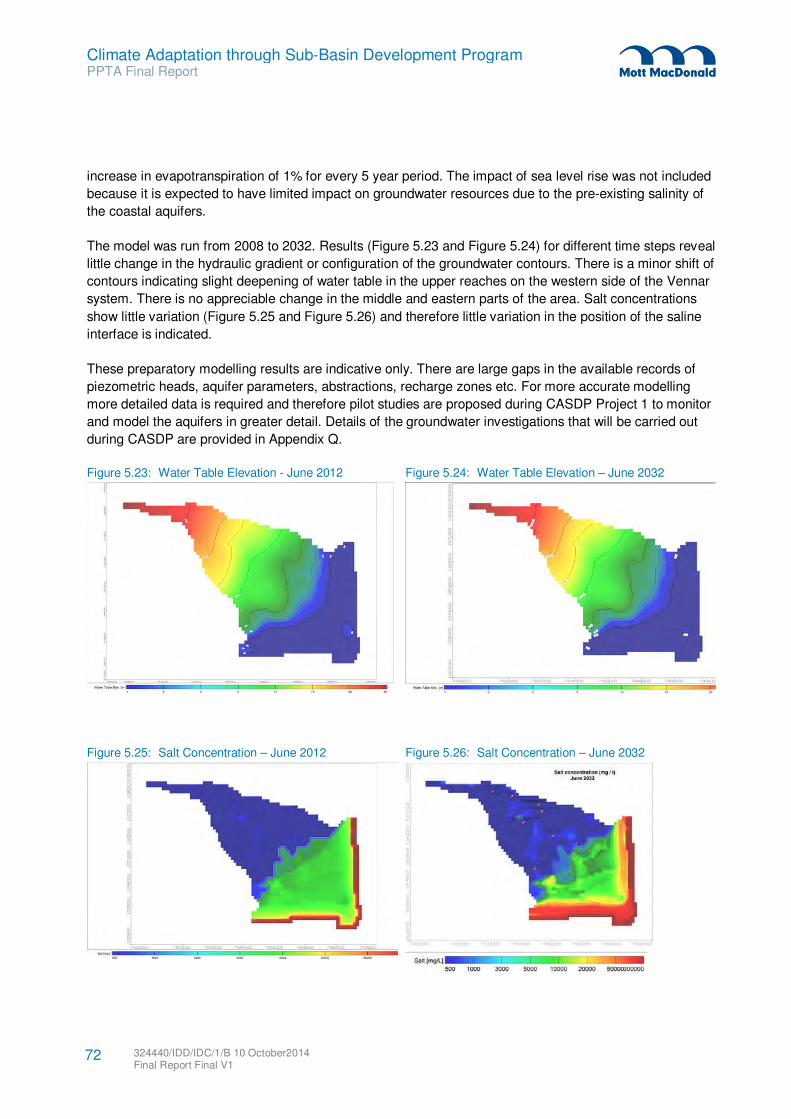
Climate Adaptation through Sub-Basin Development Program PPTA Final Report
increase in evapotranspiration of 1% for every 5 year period. The impact of sea level rise was not included
because it is expected to have limited impact on groundwater resources due to the pre-existing salinity of
the coastal aquifers.
The model was run from 2008 to 2032. Results (Figure 5.23 and Figure 5.24) for different time steps reveal
little change in the hydraulic gradient or configuration of the groundwater contours. There is a minor shift of
contours indicating slight deepening of water table in the upper reaches on the western side of the Vennar
system. There is no appreciable change in the middle and eastern parts of the area. Salt concentrations
show little variation (Figure 5.25 and Figure 5.26) and therefore little variation in the position of the saline
interface is indicated.
These preparatory modelling results are indicative only. There are large gaps in the available records of
piezometric heads, aquifer parameters, abstractions, recharge zones etc. For more accurate modelling
more detailed data is required and therefore pilot studies are proposed during CASDP Project 1 to monitor
and model the aquifers in greater detail. Details of the groundwater investigations that will be carried out
during CASDP are provided in Appendix Q.
Figure 5.23: Water Table Elevation - June 2012 Figure 5.24: Water Table Elevation – June 2032
Figure 5.25: Salt Concentration – June 2012 Figure 5.26: Salt Concentration – June 2032
324440/IDD/IDC/1/B 10 October2014 Final Report Final V1
72
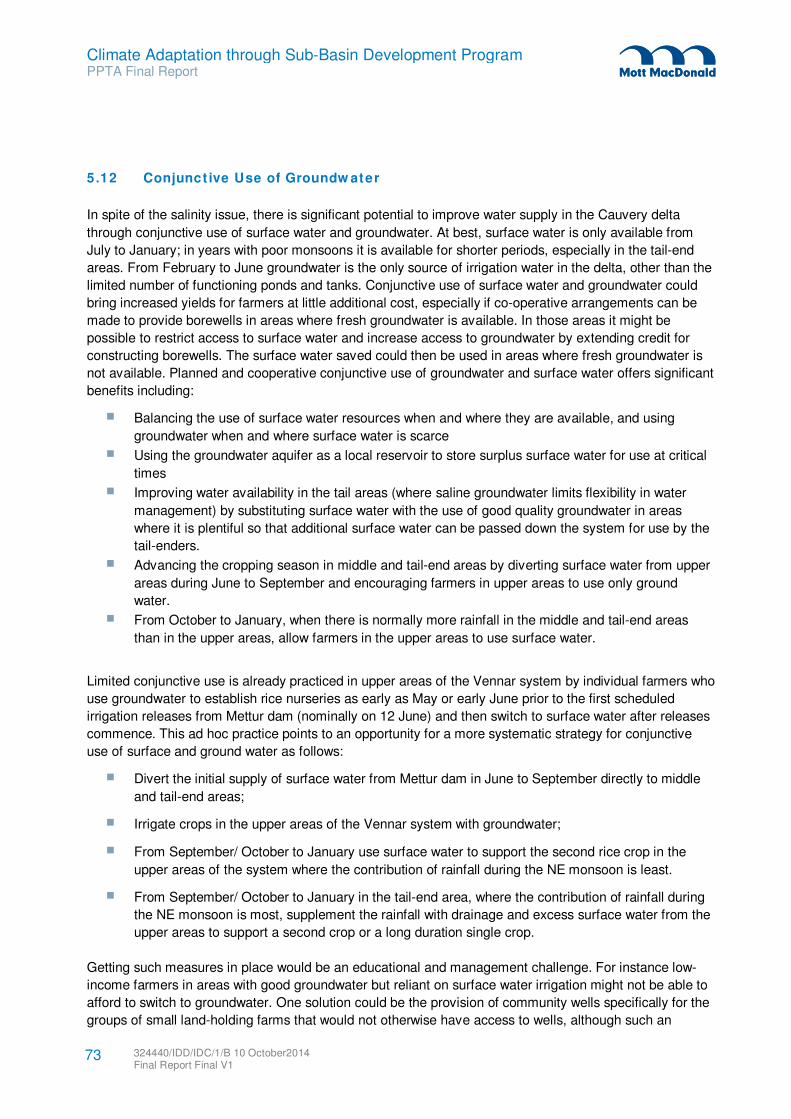
Climate Adaptation through Sub-Basin Development Program PPTA Final Report
5.12 Conjunct ive Use of Groundw ater
In spite of the salinity issue, there is significant potential to improve water supply in the Cauvery delta
through conjunctive use of surface water and groundwater. At best, surface water is only available from
July to January; in years with poor monsoons it is available for shorter periods, especially in the tail-end
areas. From February to June groundwater is the only source of irrigation water in the delta, other than the
limited number of functioning ponds and tanks. Conjunctive use of surface water and groundwater could
bring increased yields for farmers at little additional cost, especially if co-operative arrangements can be
made to provide borewells in areas where fresh groundwater is available. In those areas it might be
possible to restrict access to surface water and increase access to groundwater by extending credit for
constructing borewells. The surface water saved could then be used in areas where fresh groundwater is
not available. Planned and cooperative conjunctive use of groundwater and surface water offers significant
benefits including:
Balancing the use of surface water resources when and where they are available, and using
groundwater when and where surface water is scarce
Using the groundwater aquifer as a local reservoir to store surplus surface water for use at critical
times
Improving water availability in the tail areas (where saline groundwater limits flexibility in water
management) by substituting surface water with the use of good quality groundwater in areas
where it is plentiful so that additional surface water can be passed down the system for use by the
tail-enders.
Advancing the cropping season in middle and tail-end areas by diverting surface water from upper
areas during June to September and encouraging farmers in upper areas to use only ground
water.
From October to January, when there is normally more rainfall in the middle and tail-end areas
than in the upper areas, allow farmers in the upper areas to use surface water.
Limited conjunctive use is already practiced in upper areas of the Vennar system by individual farmers who
use groundwater to establish rice nurseries as early as May or early June prior to the first scheduled
irrigation releases from Mettur dam (nominally on 12 June) and then switch to surface water after releases
commence. This ad hoc practice points to an opportunity for a more systematic strategy for conjunctive
use of surface and ground water as follows:
Divert the initial supply of surface water from Mettur dam in June to September directly to middle
and tail-end areas;
Irrigate crops in the upper areas of the Vennar system with groundwater;
From September/ October to January use surface water to support the second rice crop in the
upper areas of the system where the contribution of rainfall during the NE monsoon is least.
From September/ October to January in the tail-end area, where the contribution of rainfall during
the NE monsoon is most, supplement the rainfall with drainage and excess surface water from the
upper areas to support a second crop or a long duration single crop.
Getting such measures in place would be an educational and management challenge. For instance low-
income farmers in areas with good groundwater but reliant on surface water irrigation might not be able to
afford to switch to groundwater. One solution could be the provision of community wells specifically for the
groups of small land-holding farms that would not otherwise have access to wells, although such an
324440/IDD/IDC/1/B 10 October2014 Final Report Final V1
73
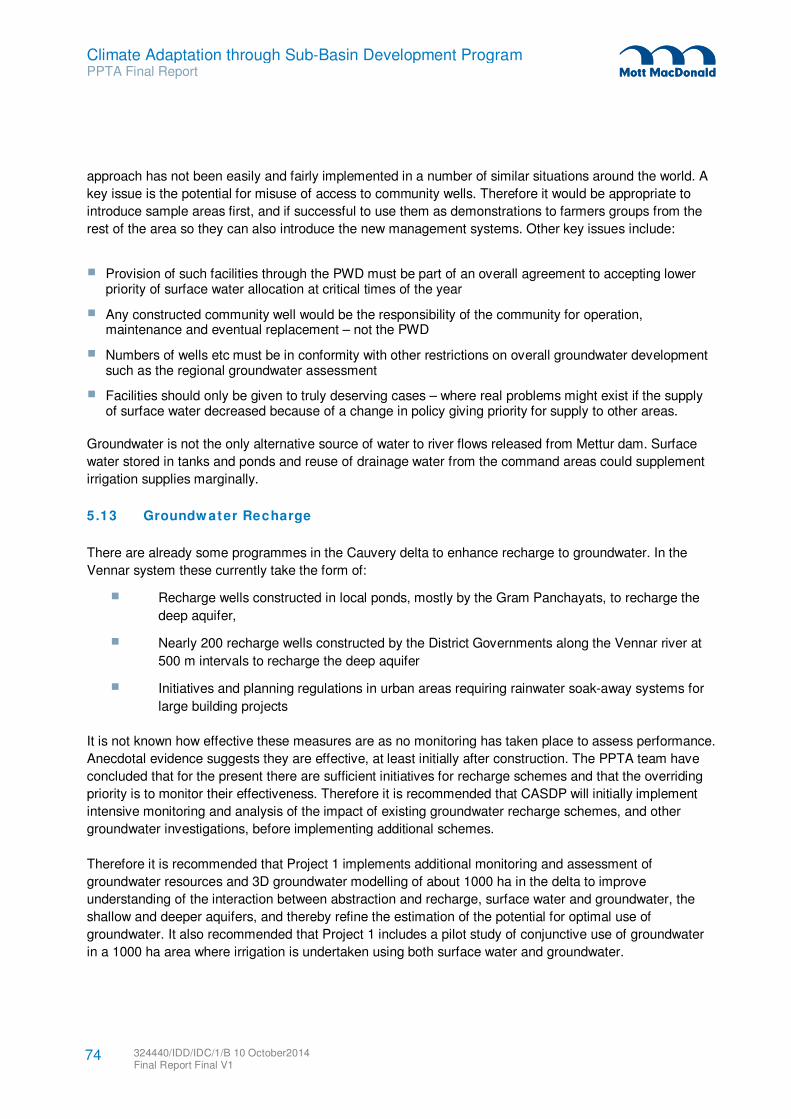
Climate Adaptation through Sub-Basin Development Program PPTA Final Report
approach has not been easily and fairly implemented in a number of similar situations around the world. A
key issue is the potential for misuse of access to community wells. Therefore it would be appropriate to
introduce sample areas first, and if successful to use them as demonstrations to farmers groups from the
rest of the area so they can also introduce the new management systems. Other key issues include:
Provision of such facilities through the PWD must be part of an overall agreement to accepting lower priority of surface water allocation at critical times of the year
Any constructed community well would be the responsibility of the community for operation, maintenance and eventual replacement – not the PWD
Numbers of wells etc must be in conformity with other restrictions on overall groundwater development such as the regional groundwater assessment
Facilities should only be given to truly deserving cases – where real problems might exist if the supply of surface water decreased because of a change in policy giving priority for supply to other areas.
Groundwater is not the only alternative source of water to river flows released from Mettur dam. Surface
water stored in tanks and ponds and reuse of drainage water from the command areas could supplement
irrigation supplies marginally.
5.13 Groundw ater Recharge
There are already some programmes in the Cauvery delta to enhance recharge to groundwater. In the
Vennar system these currently take the form of:
Recharge wells constructed in local ponds, mostly by the Gram Panchayats, to recharge the
deep aquifer,
Nearly 200 recharge wells constructed by the District Governments along the Vennar river at
500 m intervals to recharge the deep aquifer
Initiatives and planning regulations in urban areas requiring rainwater soak-away systems for
large building projects
It is not known how effective these measures are as no monitoring has taken place to assess performance.
Anecdotal evidence suggests they are effective, at least initially after construction. The PPTA team have
concluded that for the present there are sufficient initiatives for recharge schemes and that the overriding
priority is to monitor their effectiveness. Therefore it is recommended that CASDP will initially implement
intensive monitoring and analysis of the impact of existing groundwater recharge schemes, and other
groundwater investigations, before implementing additional schemes.
Therefore it is recommended that Project 1 implements additional monitoring and assessment of
groundwater resources and 3D groundwater modelling of about 1000 ha in the delta to improve
understanding of the interaction between abstraction and recharge, surface water and groundwater, the
shallow and deeper aquifers, and thereby refine the estimation of the potential for optimal use of
groundwater. It also recommended that Project 1 includes a pilot study of conjunctive use of groundwater
in a 1000 ha area where irrigation is undertaken using both surface water and groundwater.
324440/IDD/IDC/1/B 10 October2014 Final Report Final V1
74
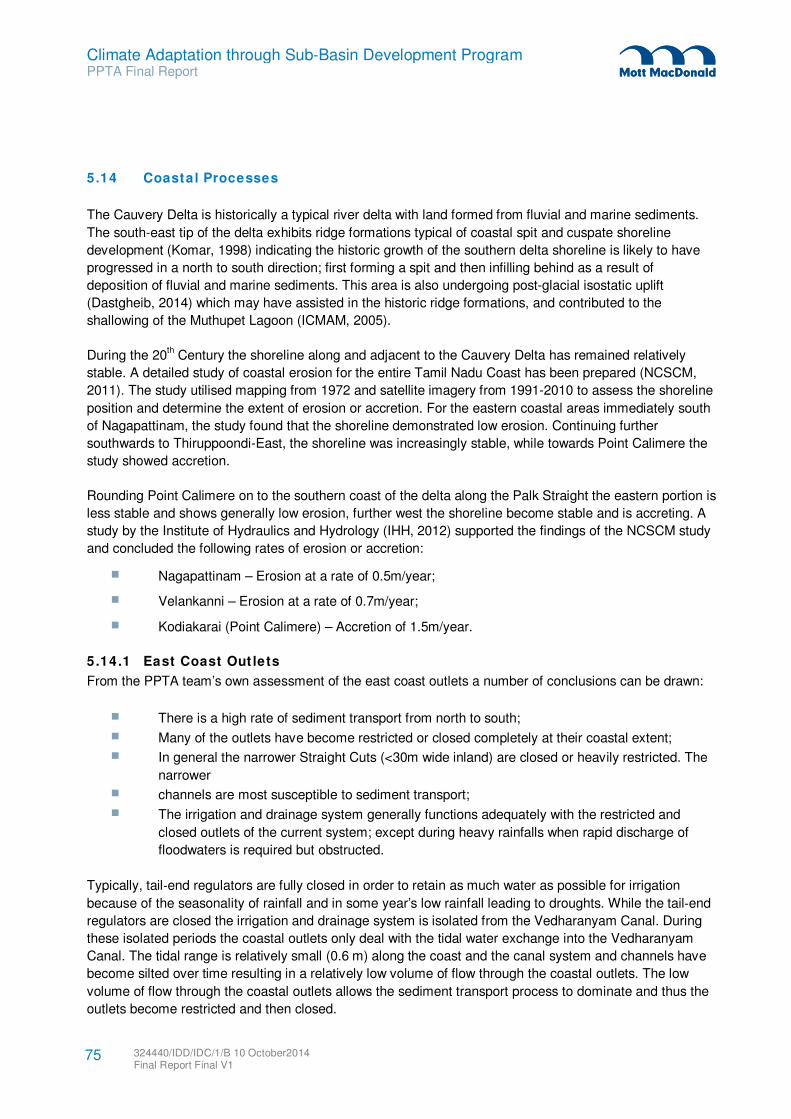
Climate Adaptation through Sub-Basin Development Program PPTA Final Report
5.14 Coastal Processes
The Cauvery Delta is historically a typical river delta with land formed from fluvial and marine sediments.
The south-east tip of the delta exhibits ridge formations typical of coastal spit and cuspate shoreline
development (Komar, 1998) indicating the historic growth of the southern delta shoreline is likely to have
progressed in a north to south direction; first forming a spit and then infilling behind as a result of
deposition of fluvial and marine sediments. This area is also undergoing post-glacial isostatic uplift
(Dastgheib, 2014) which may have assisted in the historic ridge formations, and contributed to the
shallowing of the Muthupet Lagoon (ICMAM, 2005).
During the 20th Century the shoreline along and adjacent to the Cauvery Delta has remained relatively
stable. A detailed study of coastal erosion for the entire Tamil Nadu Coast has been prepared (NCSCM,
2011). The study utilised mapping from 1972 and satellite imagery from 1991-2010 to assess the shoreline
position and determine the extent of erosion or accretion. For the eastern coastal areas immediately south
of Nagapattinam, the study found that the shoreline demonstrated low erosion. Continuing further
southwards to Thiruppoondi-East, the shoreline was increasingly stable, while towards Point Calimere the
study showed accretion.
Rounding Point Calimere on to the southern coast of the delta along the Palk Straight the eastern portion is
less stable and shows generally low erosion, further west the shoreline become stable and is accreting. A
study by the Institute of Hydraulics and Hydrology (IHH, 2012) supported the findings of the NCSCM study
and concluded the following rates of erosion or accretion:
Nagapattinam – Erosion at a rate of 0.5m/year;
Velankanni – Erosion at a rate of 0.7m/year;
Kodiakarai (Point Calimere) – Accretion of 1.5m/year.
5.14.1 East Coast Out lets
From the PPTA team’s own assessment of the east coast outlets a number of conclusions can be drawn:
There is a high rate of sediment transport from north to south;
Many of the outlets have become restricted or closed completely at their coastal extent;
In general the narrower Straight Cuts (<30m wide inland) are closed or heavily restricted. The
narrower
channels are most susceptible to sediment transport;
The irrigation and drainage system generally functions adequately with the restricted and
closed outlets of the current system; except during heavy rainfalls when rapid discharge of
floodwaters is required but obstructed.
Typically, tail‐end regulators are fully closed in order to retain as much water as possible for irrigation
because of the seasonality of rainfall and in some year’s low rainfall leading to droughts. While the tail‐end
regulators are closed the irrigation and drainage system is isolated from the Vedharanyam Canal. During
these isolated periods the coastal outlets only deal with the tidal water exchange into the Vedharanyam
Canal. The tidal range is relatively small (0.6 m) along the coast and the canal system and channels have
become silted over time resulting in a relatively low volume of flow through the coastal outlets. The low
volume of flow through the coastal outlets allows the sediment transport process to dominate and thus the
outlets become restricted and then closed.
324440/IDD/IDC/1/B 10 October2014 Final Report Final V1
75
Climate Adaptation through Sub-Basin Development Program PPTA Final Report
Once the coastal outlets become restricted they begin to constrain the flows out of the Vedharanyam
Canal. The system can cope with this constraint until severe rainfall requires the opening of the tail‐end
regulators and an increase in drainage capacity is required. When this occurs because the coastal outlets
are restricted they can cause backwater effects within the entire Vedharanyam Canal and adjacent parts of
the Vennar irrigation and drainage system. The backwater effects are relative to the amount of rainfall and
therefore more severe storms lead to increased backwater effect, this leads to flooding of the agricultural
land as the system cannot drain.
The impact of flood flows on the outlets is not currently understood in detail as there is no available data to
assess the state and condition of the outlets pre and post storm flows. It is likely that the increased water
volumes out through the outlets would, to some extent, help to scour and reduce the restrictions at the
outlets. However, the low frequency of these events means that the sediment processes will prevail,
particularly on the narrower straight cuts.
Future sea level rise will potentially increase the rate of erosion along the shoreline this will lead to
increased sediment transport and may cause more rapid closure of the existing coastal outlets. Conversely
the increase in sea level may increase the tidal flows into and out of the coastal outlets allowing them to
naturally scour and maintain their depth, although they are still likely to migrate southwards. However if
future sea level rise rates are similar to those experienced historically along this coastline then it is unlikely
to significantly affect the overall coastal processes, with the exception of worsening the frequency of
inundation.
In summary, in years without fluvial floods the sediment process will dominate causing a restriction of the
coastal outlets along the east coast. This causes a reduction in drainage capacity which is required during
periods of heavy rainfall. The results are flooding both along the Vedharanyam Canal and further upstream
within the Vennar irrigation and drainage system. The impact of sea level rise is uncertain at present given
the available data. Further numerical modelling, to be undertaken, will assist in informing this study further.
5.14.2 South Coast Outlets
Along the south coast, from Point Calimer to Adhirampattinam, water from the irrigation system runs into
the Kodiakkadu lagoon and the Muputhet lagoon and intertidal sand/mud flat areas, known as the Great
Vedharanyam Swamp (ICMAM, 2005), which subsequently discharge to the Palk Straight.
In the north and northeast of the Kodiakkadu lagoon a significant area is utilised for salt pans, an important
industry to the local economy. Within the lagoon there are significant areas which are cut with fishbone
channels for mangrove replanting. Freshwater discharges from the Vennar irrigation and drainage system
occur at the northwest corner of the lagoon and there is evidence of straight cut channels through the sand
and mud flats as well as naturally formed channels.
The Muthupet Lagoon is bordered by mangroves. Freshwater discharges from the Vennarv irrigation and
drainage system are located along the northern boundary of the lagoon area, the flows coming down
through channels below the tail‐end regulators into the lagoon which subsequently discharges to sea
through a single opening greater than 1km in width.
The southern shoreline outside of the lagoons along the Palk Straight from Point Calimere to
Adhirampattinam is shown in the NCSCM (2011) study as being generally stable with higher rates of
accretion further west. In general the lagoons and coastal processes along the southern coastal area do
not inhibit the discharges from the existing Vennar system.
324440/IDD/IDC/1/B 10 October2014 Final Report Final V1
76
Climate Adaptation through Sub-Basin Development Program PPTA Final Report
Owing to the high rates of accretion along this coast it is not recommended that straight cuts are utilised to
discharge direct to sea as they would suffer the same siltation issues as is experienced on the eastern
coast. Here discharging to the lagoon bodies protects the discharge points from becoming silted, the
lagoons are also sufficiently large water bodies that they are able to naturally maintain its seaward
opening.
Sea level rise impact to this area would include inundation of some of the mud and sand flats; this however
would not be a significant impact as the area is currently not used. Although not a focus of this study,
significant sea level rise could disrupt the operation of the salt pans.
5.15 Management of Flood Risk, Events and Disasters
Floods are endemic in the Cauvery Delta. In most years there is minor local flooding due to locally heavy
rain and drainage congestion during the north-east monsoon (November-December). In many years
cyclones and powerful weather systems develop at this time and bring widespread and very intense
prolonged rainfall and heightened tidal surges causing major inland and coastal flooding due to rivers and
main drains overtopping or breaching their embankments and/or widespread drainage congestion in the
adjacent flood plains. The largest floods in recent times were in November 2008 and November 2010.
Infrequently, floods are caused by distant storms in Karnataka, Kerala and highland Tamil Nadu during the
south-west monsoon (June to August), the runoff from which exceeds the capacity of the Grand Anicut.
This occurred in September 2005 and, according to anecdote, once more in the previous 30 years.
The current arrangements for the management of flood risk, events and disasters in the Cauvery Delta,
with particular focus on the role of the Water Resources Department (WRD), are discussed in this section.
In this context the terminology used is as follows:
Flood event management – operation of regulators and inspection of assets by WRD to route
floods through the drainage network in order to minimise impacts on communities and assets and
to advise the State and District Disaster Management Authorities of flood risks through progressive
flood forecasts and warnings;
Flood risk management – planned management by the state and district authorities of the
vulnerability of communities and assets to flooding through structural (flood defences) and non-
structural (awareness, preparedness, forecasting and warning systems, risk assessment based on
flood risk maps produced by WRD);
Flood disaster management – activation of flood disaster response plans by the of State and
District Disaster Management Authorities to implement search and rescue services, emergency
relief, evacuation plans and to assess damage and rehabilitation and compensation requirements.
5.15.1 Flood Event Management
WRD’s current role is in flood event management involving the issue of flood warnings for the Cauvery and
Coleroon Rivers and the operation and maintenance of the drainage network including inspection of the
network during and immediately after flood events.
The Indian Meteorological Department (IMD) issues weather forecasts and a hotline has been established
between the IMD and the State Emergency Operation Centre (EOC) which disseminates information to the
districts. The CWC operate a national flood forecasting service but this does not extend to the Cauvery
River basin. However a local flood warning system is operated on the lower Cauvery and Coleroon Rivers
324440/IDD/IDC/1/B 10 October2014 Final Report Final V1
77
Climate Adaptation through Sub-Basin Development Program PPTA Final Report
by WRD. Flood warnings for these rivers are issued by a WRD Flood Control Officer at Mettur Dam to
senior WRD officers in the lower reaches of the basin who in turn warn their respective local government
departments. Details of the warning system can be found in Appendix Q.
There are no flood forecasting or warning systems for the Cauvery, Vennar and Grand Anicut Rivers in the
delta. The State Disaster Management Authority (see section 5.15.3) is therefore exploring technological
options for a robust, community friendly early warning system. This opens up an avenue for CASDP to
make investments to support such flood event management initiatives. Under CASDP it is proposed that
WRD’s flood warning role should be expanded to include flood warning systems in the channels in the
Cauvery Delta, specifically the Vennar and Cauvery systems, and to prepare flood risk assessments for
these systems through the survey and mapping of flood events and also the mapping of the extent of
design floods for a range of climate change scenarios. Details of WRD’s proposed future role are
discussed in Appendix Q.
During flood conditions in the Cauvery and Coleroon Rivers, the Lower Cauvery, Vennar and Grand Anicut
Canal head regulators at the Grand Anicut are closed sufficiently to prevent flooding of the delta irrigation
and drainage systems. However, heavy rainfall on the delta itself and on neighbouring uplands, normally in
November or December, can cause widespread flooding in the delta. In these conditions it is normal
practice to fully open sufficient regulators to divert flood waters to the sea as quickly as possible. In the
Vennar system for example, flood flows from the upper system up to approximately 10,000 cusecs are
directed down the Vettar River to the east coast. Flood flows in excess of 10,000 cusecs are diverted down
the Vennar River to the east coast and down the Koraiyar and Paminiyar Rivers to the south coast.
WRD also carries out physical inspection of the embankments for slumping, breaching or overtopping and
identifies potentially high risk locations. It covers a length of 704 km (440 miles) along the Cauvery River
from its confluence with the Amaravathi River to the Grand Anicut and on down the Coleroon River to the
sea. Flood patrolling is the responsibility of WRD engineers and District, police, and panchayat officials.
According to WRD the flood event management procedures in the delta successfully managed the large
2008 flood successfully except where embankments breached. Nevertheless there was extensive flooding
in 2008 due not only to breaching but also to field drainage that was restricted by high water levels in the
rivers and main drains and also to tide locking.
5.15.2 Flood Risk Management
There are several national policy documents and laws relating to specific aspects of flood risk
management such as irrigation and drainage, land use planning, compulsory evacuation of land, acquiring
land for construction of flood works, suspension of land revenue in cases of agricultural calamity caused by
floods, and levying of betterment fee for recovering the cost of flood control work. Of these the most
notable is the National Disaster Management Act 2005, the objectives of which are:
Promoting a culture of prevention, preparedness and resilience at all levels through knowledge,
innovation and education.
Encouraging mitigation measures based on technology, traditional wisdom and environmental
sustainability.
Mainstreaming disaster management into the developmental planning process.
Establishing institutional and legal frameworks to create an enabling regulatory environment and a
compliance regime.
Ensuring efficient mechanisms for identification, assessment and monitoring of disaster risks.
324440/IDD/IDC/1/B 10 October2014 Final Report Final V1
78
Climate Adaptation through Sub-Basin Development Program PPTA Final Report
Developing contemporary forecasting and early warning systems backed by responsive and fail-
safe communication with information technology support.
Ensuring efficient response and relief with a caring approach towards the needs of the vulnerable
sections of the society.
Undertaking reconstruction as an opportunity to build disaster resilient structures and habitat for
ensuring safer living.
Promoting a productive and proactive partnership with the media for disaster management.
There are few if any Tamil Nadu state policy documents or laws relating specifically to flood risk
management other than the state’s response to the National Disaster Management Act 2005. Tamil Nadu
has a disaster management policy in place reflects the objectives of the national policy by moving away
from a purely reactive relief approach to a more proactive preparedness and quick response approach;
reducing the vulnerability of the community through risk assessment and management; putting institutions
and structures in place for efficient and effective management of disasters; ensuring disaster management
planning becomes an integral part of development planning; designing disaster prevention and mitigation
strategies for different disasters, including flood disaster; and enhancing the capacities of various
stakeholders including the community in disaster management and mitigation.
The institutional framework for disaster (including floods) risk management is relatively new and is complex
(Table 5.4). It is the establishment of effective linkages between the various layers of governance that has
been most challenging so far. For example, the function of planning, policy and funding at the national level
is strong whereas at the district level it is relatively weak due to insufficient staff, technical skills, and
funding, and also narrower local perspectives.
Table 5.4: Institutional Framework for Disaster Management
Level Policy, Planning & Funding Technical Support Implementation and Monitoring
National Ministry of Water Resources
Ministry of Home Affairs
National Disaster Management Authority
Central Water Commission
India Meteorological Department
Climate Change Cells
As required
State Revenue Department
State Disaster Management Authority
Water Resources Department
Water Resources Department
Agriculture Department
Revenue Department
District District Planning Committees
District Disaster Management Authority
None District Collector
District Disaster Management Authority
Local None None Revenue Department
Local Governments
Detailed descriptions of the roles and responsibilities of these institutions can be found in Appendix E.
5.15.3 Flood Disaster Management
Flooding was one of the major concerns raised at the CASDP PPTA government stakeholders’ workshop
in December 2013. It also figured as an important issue in the PPTA social survey conducted by the PPTA
consultants in December 2013 (Appendix K). Therefore there is a clear public awareness of and concern
about flooding in the Cauvery delta.
324440/IDD/IDC/1/B 10 October2014 Final Report Final V1
79
Climate Adaptation through Sub-Basin Development Program PPTA Final Report
However it is less clear that the stakeholders, particularly the most vulnerable (who typically are the
numerous rural poor), make any preparations prior to each flood season to mitigate the risk and impacts of
floods, or receive advice on how to do so. This is an aspect of risk flood management in the Cauvery sub-
basin that needs attention. Greater preparedness needs to be created among communities on how to
prepare for floods and what to do during floods.
In this regard, it is noteworthy that the Tamil Nadu 12th 5-Year Plan 2012-2017 (GoTN, 2012) indicates a
shift of emphasis from purely reactive to a balance of pre-emptive and reactive flood management through
the SDMA and DDMAs (Table 5.4). The primary responsibility for implementing rescue, relief and
rehabilitation measures during and after floods lies with the state governments with the central government
provides technical, physical and financial support. The Government of Tamil Nadu funds its flood
management activities from planned state allocations as well as from funds provided by centrally
sponsored schemes. Most of these activities provide short-term structural repairs and emergency
measures, whereas long-term measures to prevent or reduce future flood damage are almost absent.
At the district level the District Collector takes on the role of District Relief Officer (DRO) and has overall
charge of all relief operations in the district. The DRO chairs a District Advisory Committee (DAC) that
includes all departmental heads, divisional heads and other district level officers. The DAC coordinates the
activities of the different departments involved in the relief operations.
At the divisional level the Divisional Sub-Collector takes on the role of Divisional Relief Officer and has
overall charge of relief operations in the Revenue division. Additional Zonal Officers, in the cadre of the
Deputy Collectors are placed in-charge of each taluk. Within each taluk, the firkas are placed under the
supervision of the Zonal Officers, either a special Tahsildar or a Panchayat Union Commissioner, to assist
the taluk Tahsildar in all anti disaster operations.
In the case of municipalities and town panchayats, the Municipal Commissioners and the Panchayat
Executive Officers become the Relief Officers for their respective jurisdictions.
5.16 Improved Management of Flood Risk, Events and Disasters
The scope for WRD to contribute to improved flood management in the Cauvery sub-basin through
CASDP are can be broken down into according to CASDP Output1 (structural measures) and Output 2
(non-structural measures).
5.16.1 Structural Measures
Many possible structural measures (e.g. flood retention areas, new or enlarged drains) are excluded
because the WRD has determined that new land cannot be acquired by the government for these
purposes. Therefore the only feasible structural measure is increased conveyance of existing channels to
discharge flood flows more efficiently. This will be the responsibility of the WRD. The following structural
improvements are proposed in CASDP Project 1:
Re-sectioning and bank strengthening of six main channels totalling 235km to improve their
resilience and flood conveyance capacity
Improved conveyance of three straight cuts between the Vedharanyam canal and the sea
Five new regulator structures, reconstruction of 8 regulators and repair of 13 regulators
324440/IDD/IDC/1/B 10 October2014 Final Report Final V1
80
Climate Adaptation through Sub-Basin Development Program PPTA Final Report
These improvements are expected to reduce the probability of flooding due to overtopping and breaching
to 4% (25 years). However there will remain a risk that intense local rainfall events will continue to cause
localized flooding and crop inundation due to poor drainage. For these measures to be effective, it is
necessary that they are properly maintained according to CWC and BIS norms for inspection and
maintenance of embankments and levees. Details of the Project 1 structural measures can be found in
Appendix H.
5.16.2 Non-Structural Measures
5.16.2.1 Preparedness
Under CASDP it is proposed that WRD will have an important supporting role in flood risk management
through the maintenance of adequate defences (embankments and straight cuts) described above and the
preparation of flood risk maps for the Cauvery and Vennar systems. Analysis of flood risk on rivers and
drains and adjacent flood should be based on flood risk mapping derived from modelling of flood frequency
and impact under existing and climate change scenarios. For Project 1 this analysis has been done by the
PPTA consultants for the Pandavayar, Vellaiyar, Harichandra, Adappar and Valavanar catchments and for
the Vedharanyam Canal and associated straight cuts. For the rest of the Vennar system and the Cauvery
system this analysis will be done by the consultants who will be appointed to do the hydrologic and
hydraulic modelling for Projects 2 and 3, working with WRD modellers.
5.16.2.2 Flood forecasting and warning
Under CASDP flood forecasting and warning systems should be developed for each river and drain in the
Vennar and Cauvery systems using water level triggers derived from (i) statistical correlations and travel
times between monitoring sites and flood zones, (ii) hydraulic models of the catchments that forecast water
levels in the flood zones from observed or forecast rainfall, (iii) rainfall depth, area and duration curves for
the catchments etc. This will be done by the consultants who will be appointed to do the hydrologic and
hydraulic modelling for Projects 2 and 3 and also by WRD modellers after they have received appropriate
training (see Section 3.5.2).
For rivers in the delta, water level triggers at key regulators that correspond to incipient flood conditions in
downstream flood zones will be determined from the analysis of existing river level data and the known
onset of flood conditions. These triggers can then be used by WRD to issue flood warnings to at-risk
communities and enterprises and also to mobilise emergency services to the most vulnerable locations.
5.16.2.3 Flood Risk Assessment
Current flood disaster management practices are mainly reactive and focus on reparation more than
preparation. The resource provision for flood prevention and mitigation activities is minimal. With the
establishment of SDMAs and DDMAs this situation has witnessed some changes. However, the pace of
change is slow, both at the state and district levels.
There is scope for WRD through CASDP to support the district governments to improve their flood disaster
management planning by making flood risk assessments and flood risk maps and by issuing flood
forecasts and warnings. Furthermore, the post-flood surveys of structures and embankments that are
normally carried out by WRD after floods should be expanded to include the estimation/mapping of flood
water extent, depth and duration on the flood plains and estimates of the velocity and direction of flow on
the flood plains. It is proposed that the expanded surveys are executed through the proposed Channel
324440/IDD/IDC/1/B 10 October2014 Final Report Final V1
81
Climate Adaptation through Sub-Basin Development Program PPTA Final Report
Stakeholder Groups (CSGs) which will organise the marking out of flooded areas, maximum flood depths
and noting of flowpaths by flood victims, for later levelling by WRD or contractors.This information would be
used to improve the accuracy of the flood warning systems, the configuration and calibration of the flood
models and the accuracy of the flood risk maps.
Details of the Project 1 non-structural structural measures can be found in Appendix H.
5.17 Road Map to Integrated Water Resources Management
The National Water Policy of 2012, and the evolving Tamil Nadu state policy together with state projects
and proposals, point towards recognition by the National and State Governments that more careful
management of the scarce precious water resources in India is much needed. In the case of the Cauvery
sub-basin, the Cauvery Modernisation Proposal (WRD, 2013)states explicitly that:
“For many decades, modernization has been the prime concern of the irrigation
community. It is now well understood that modernization is not limited to the introduction
of modern hardware and software techniques, but is rather a fundamental transformation
to achieve integrated management of the available water resources. This transformation
can include changing rules and institutional structures related to water rights, water
delivery services, accountability mechanisms and incentives, in addition to the physical
structures.”
These encouraging signs point the way to the formulation of a realistic implementable programme to
improve water resources management for the Cauvery River basin in Tamil Nadu starting with small
practical pilot IWRM measures in the CASDP project area. Of the integrated water resources management
instruments listed by the Global Water Partnership, the most immediately feasible in the context of the
Cauvery delta are:
monitoring and assessment,
information management and decision making,
stakeholder participation
flood forecasting and warning.
It is proposed that these measures are piloted during CASDP Project 1.
5.17.1.1 Monitoring and Assessment
A vital foundation for effective water resources management is knowledge and understanding of the spatial
and temporal availability of water resources within a coherent hydrologic unit e.g. a river basin or sub-
basin. In the Cauvery sub-basin in Tamil Nadu this knowledge and understanding is incomplete due to
shortages of data and information of many types including:
• topographic and drainage network maps, • water quality,
• DTMs • sediment loads,
• cropped areas, • irrigation requirements,
• rainfall intensity, • groundwater abstractions,
• river, canal and drain flows and water levels • tide levels
• groundwater levels, • aquifer properties
• impact of groundwater recharge schemes
324440/IDD/IDC/1/B 10 October2014 Final Report Final V1
82
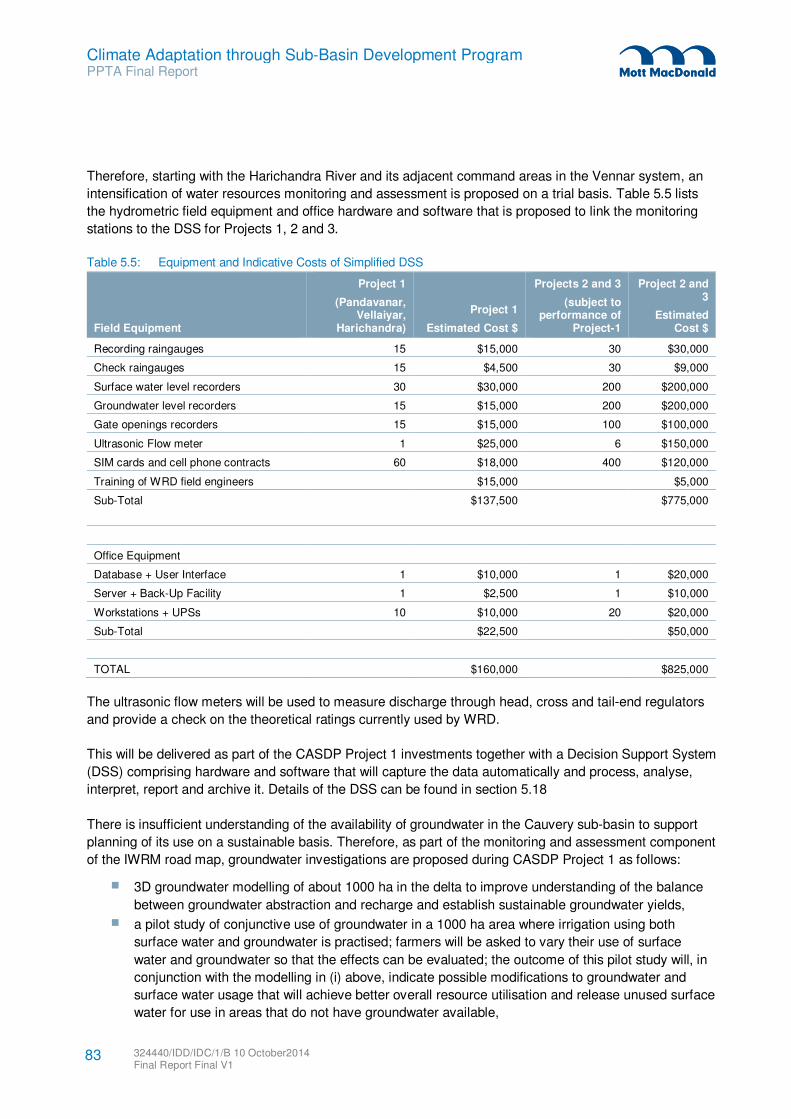
Climate Adaptation through Sub-Basin Development Program PPTA Final Report
Therefore, starting with the Harichandra River and its adjacent command areas in the Vennar system, an
intensification of water resources monitoring and assessment is proposed on a trial basis. Table 5.5 lists
the hydrometric field equipment and office hardware and software that is proposed to link the monitoring
stations to the DSS for Projects 1, 2 and 3.
Table 5.5: Equipment and Indicative Costs of Simplified DSS
Field Equipment
Project 1
(Pandavanar, Vellaiyar,
Harichandra)
Project 1
Estimated Cost $
Projects 2 and 3
(subject to performance of
Project-1
Project 2 and 3
Estimated Cost $
Recording raingauges 15 $15,000 30 $30,000
Check raingauges 15 $4,500 30 $9,000
Surface water level recorders 30 $30,000 200 $200,000
Groundwater level recorders 15 $15,000 200 $200,000
Gate openings recorders 15 $15,000 100 $100,000
Ultrasonic Flow meter 1 $25,000 6 $150,000
SIM cards and cell phone contracts 60 $18,000 400 $120,000
Training of WRD field engineers $15,000 $5,000
Sub-Total $137,500
$775,000
Office Equipment
Database + User Interface 1 $10,000 1 $20,000
Server + Back-Up Facility 1 $2,500 1 $10,000
Workstations + UPSs 10 $10,000 20 $20,000
Sub-Total $22,500 $50,000
TOTAL $160,000 $825,000
The ultrasonic flow meters will be used to measure discharge through head, cross and tail-end regulators
and provide a check on the theoretical ratings currently used by WRD.
This will be delivered as part of the CASDP Project 1 investments together with a Decision Support System
(DSS) comprising hardware and software that will capture the data automatically and process, analyse,
interpret, report and archive it. Details of the DSS can be found in section 5.18
There is insufficient understanding of the availability of groundwater in the Cauvery sub-basin to support
planning of its use on a sustainable basis. Therefore, as part of the monitoring and assessment component
of the IWRM road map, groundwater investigations are proposed during CASDP Project 1 as follows:
3D groundwater modelling of about 1000 ha in the delta to improve understanding of the balance
between groundwater abstraction and recharge and establish sustainable groundwater yields,
a pilot study of conjunctive use of groundwater in a 1000 ha area where irrigation using both
surface water and groundwater is practised; farmers will be asked to vary their use of surface
water and groundwater so that the effects can be evaluated; the outcome of this pilot study will, in
conjunction with the modelling in (i) above, indicate possible modifications to groundwater and
surface water usage that will achieve better overall resource utilisation and release unused surface
water for use in areas that do not have groundwater available,
324440/IDD/IDC/1/B 10 October2014 Final Report Final V1
83
Climate Adaptation through Sub-Basin Development Program PPTA Final Report
Depending on their outcomes and if necessary these groundwater investigations could be extended during
Projects 2 and 3.
5.17.1.2 Information Management and Decision Making
Initially a simple DSS is proposed for management of the Harichandra River and adjacent irrigation
command areas. The simple DSS will comprise surface water and groundwater databases and irrigation
command area information. Four main inputs into the DSS are proposed (i) field monitoring equipment, (ii)
computer hardware and database software, (iii) a programme of flow measurements to calibrate
discharges through regulators and (iv) a watering schedule calendar in the form of a simple spreadsheet.
The DSS will be designed to support WRD in key decision making such as (i) facilitating irrigation planning
and efficient water distribution for the irrigation systems (on seasonal and 10-day time scales) based on
actual needs, (ii) fine tuning the distribution of water to actual needs in individual command areas based on
crop state, antecedent rainfall and forecast rainfall, (iii) detecting and responding to distribution system
problems and breakdowns and (iv) coordinating the operation of head, cross and tail end regulators to
maintain appropriate flows and water levels during both normal supply and flood periods.
The DSS will be accessible to WRD decision makers through a user-friendly computer interface which will
allow them to inspect up-to-date river levels, flows, water requirements throughout an irrigation system and
to adjust surface water deliveries to actual needs considering both surface water and groundwater
availability and recent rainfall in the command areas.
The DSS will incorporate an Irrigation Water Schedule Calendar. This is a practical spreadsheet-based
approach to the management of irrigation schemes in the Vennar and Cauvery systems using a calendar
of projected crop water requirements to plan irrigation schedules well in advance.
The spreadsheet would provide a calendar of gross and net irrigation requirements for a target command
area based on planned cropped areas and crop calendars and normal rates evapotranspiration. The
spreadsheet could then be updated contingent on actual rainfall, evapotranspiration and availability of
groundwater and surface water in the rivers and local tanks in order to fine tune canal operations in order
use water efficiently and also provide early warning of emerging water supply limitations.
Details of the DSS can be found in Section 5.18.
5.17.1.3 Stakeholder Participation
Generally the primary stakeholders in the water resources arena are regulators, providers and users. Often
there are a number of secondary stakeholders such as non-government organisations (NGOs), civil society
organisations (CSOs), academic and research institutions etc. In practice not all these groupings may exist
or, if they do exist, they may not have equal weights or influence. Ideally their mandates and practices
would be integrated, but usually in practice they are not.
Regulators: In Tamil Nadu regulatory roles are defined for the Water Resources Department,
Groundwater Department, Pollution Control Board, Environment Department etc, but in practice these
roles are performed weakly, partly because in some cases, such as WRD, the regulator is also the provider
and partly because in Tamil Nadu the regulation of water resources is subordinate to the delivery of water
services.
324440/IDD/IDC/1/B 10 October2014 Final Report Final V1
84
Climate Adaptation through Sub-Basin Development Program PPTA Final Report
Providers: In Tamil Nadu the Water Resources Department (WRD) has responsibility for the bulk
provision of surface water (as well as the regulatory role) and it is local government that has responsibility
for public drinking water supply (with support from the Tamil Nadu Water and Drainage Board - TWAD).
The State Government leaves the provision of groundwater for irrigation to individual farmers. There are
few if any government groundwater irrigation schemes, although there are local government (panchayat)
drinking water schemes in rural areas that draw on groundwater.
Users: In Tamil Nadu, agricultural farmers are the dominant user group, followed by a shrimp farmers and
urban and rural domestic users.
In the case of CASDP it is proposed to increase user participation in water resources management by first
creating informal Channel Stakeholder Groups (CSGs) through which relevant government departments
and the beneficiaries (communities and farmers) of CASDP Project 1 participate in project implementation
activities that affect them.
Six stakeholder groups will be created during Project 1, one on each of the Pandavanar, Vellaiyar,
Harichandra, Adappar, Valavanar and Vedharanyam channels. The membership of each stakeholder
group will include officials from the District and State Departments (WRD, Agriculture, Fisheries,
Environment etc) and representatives of the farming communities nominated by the local Revenue
Divisional Officer (RDO).
Each stakeholder group will include 5 government officials and 15 local farmers, at least three of whom
should be women (if participation of active women land owners is not feasible, then women from farming
families will be inducted). The farmers should comprise 3 marginal farmers, 3 small farmers, 3 big farmers
and 3 Presidents from local Panchayats. The group’s Chairperson will be nominated through consensus
from amongst the member-farmers to hold office for a period of 1-year by rotation. The 5 Government
officials and the 3 Panchayat Presidents will not be involved in the Chairperson’s nomination. If the
member-farmers are unable to arrive at a consensus the RDO will nominate the Chairperson.
One-third of the non-official members will retire once in every 3-years and new members will be inducted
by the RDO to be a member for 3-years. The WRD Assistant Executive Engineer concerned will be the
secretary, responsible for convening the group at least 4 times in a year between June and January in
each growing season. The first meetings will be in June when the availability of surface water from Mettur
Dam, & therefore the likely base inflow into the channel throughout the irrigation season, is known. The
other three or more meetings will take place at 2-monthly intervals until January in order to review the
water availability situation on an on-going basis and agree any necessary adjustments to the irrigation
schedule and any remedial actions required by the Government or the farmers..
The principal objectives of the Channel Stakeholder Groups will be to (i) review progress of the CASDP
sub-projects on the channel concerned, identify issues and agree actions, (ii) agree quantities and timings
of irrigation flows in the channel that will as much as possible match crop water requirements to the water
resources available (both surface water and groundwater) while minimising, (iii) manage the use of surface
water and groundwater resources in each channel catchment during times of water shortage to minimise
crop losses, (iv) coordinate local responses during floods, including marking the maximum extents and
depths of inundation for later survey, and identify repair or maintenance works required.
At each meeting, the Agricultural Department and the farmers will advise WRD of ongoing water
requirements during the next interval and report any current water supply issues. Using the DSS, WRD will
report water supplied and rainfall amounts to date, provide an assessment of the availability of water
324440/IDD/IDC/1/B 10 October2014 Final Report Final V1
85
Climate Adaptation through Sub-Basin Development Program PPTA Final Report
resources in the next interval and agree with the Agricultural Department and the farmers any necessary
revision of the water distribution plan for the next interval.
5.17.1.4 Flood Forecasting, Warning and Flood Risk Mapping
These components of the water resources management road map were discussed in section 5.15.
5.17.1.5 Further IWRM Measures during CASDP Projects 2 and 3
Depending on the success of the initial IWRM measures introduced during Project 1, further IWRM
measures could be introduced during Projects 2 and 3. It is too early to confirm what additional measures
should be introduced but the possibilities include:
Water User Associations: Formalise the channel stakeholder groups into WUAs with mandated roles in
water resources management. It will be important to learn the lessons provided by previous attempts to set
up WUAs in Tamil Nadu, e.g. by the IAMWARM project, and to shape the mandates and aspirations of the
proposed Project 2 and 3 WUAs accordingly.
Extended Monitoring Network: Extend the surface water and groundwater monitoring network and
upgrade it to facilitate flood forecasting and warning. The hardware and software required to do this is
listed in Section 5.17.1.1.
Decision Support System: After a sufficient period of familiarization and capacity building within WRD, it
is anticipated that the geographical scope of the simple DSS introduced during Project 1 can be expanded
to the other rivers and irrigation systems in the CASDP project area and that its functionality can be
expanded to support more sophisticated WRD decision making aimed at maximising water use efficiency,
optimising conjunctive use of surface water and groundwater on a seasonal and short-term basis, and
testing water management options using computer models.
Management of Flood Risks and Flood Events: Further development of the management of flood risk
and flood events could include an extension of the Project 1 flood forecasting and warning systems and the
flood risk mapping programme to the Project 2 and 3 areas.
Additional IWRM Measures: The Cauvery sub-basin in Tamil Nadu has the largest area of agricultural
land in Tamil Nadu and is a significant contributor to total national agricultural output. However the sub-
basin lies in a marginally semi-arid region where the availability of water resources is limited and variable.
Therefore maximum efficiency of water supply and use is a clear imperative across all water using sectors.
The agricultural sector accounts for almost all water use in the sub-basin, but the irrigation and drainage
systems are very old adaptations of natural drainage systems, particularly in the delta, which for strategic
reasons have received only essential maintenance in the modern era.
The consequences of these environmental and infrastructure factors include low agricultural productivity
due to water shortages, insecure rural livelihoods, high vulnerability to natural disasters such as floods,
droughts and tidal surges due to limited and only partially maintained defences, inefficient water use, over-
abstraction of groundwater and disturbed ecosystems.
Therefore the long term aims of water resources managers in the Cauvery sub-basin must surely include
politically acceptable measures to improve:
324440/IDD/IDC/1/B 10 October2014 Final Report Final V1
86
Climate Adaptation through Sub-Basin Development Program PPTA Final Report
Water use efficiency - more productivity per drop of water through modernising water distribution
infrastructure and field irrigation technologies, more reliable water supplies through planned and
sustainable conjunctive use of groundwater, less waste through optimising consumption and
greater conservation,
social equity - fairer distribution of water so that the difference between livelihoods in the head-end
and tail-end areas are reduced or, ideally, eliminated, improved farmers livelihoods through more
formal participation in irrigation planning and management by assembling into WUAs,
environmental sustainability - identify appropriate environmental targets and manage to reach
them as measured by key performance indicators such minimum standards for river flow, river and
groundwater levels and water quality, flora and aquatic invertebrate populations and higher aquatic
fauna.
It is therefore recommended that options for achieving these important water management measures are
investigated and tested during CASDP Projects 2 and 3 and that an appropriate tailor-made sustainable
and integrated water resources management system can be evolved for the Cauvery sub-basin.
5.18 Decision Support System (DSS)
Consultation with WRD staff identified the following key irrigation decision-making processes:
(i) Surface water supply to the Cauvery Delta from June to October is determined largely by the amount
of water available in the Stanley Reservoir at Mettur Dam. Estimates of irrigation demand are
prepared by the WRD sub-divisional engineers according to irrigated farm areas and standard water
duties. The sub-divisional estimates are aggregated by the Executive Engineers and Superintending
Engineer and used to decide the necessary releases of water from Mettur Dam.
(ii) Operation of head regulators in the Cauvery delta determines the distribution of water released from
Mettur Dam. In the Vennar system the gate operators at the VVR head regulator release the
necessary discharges to maintain normal supply levels in the Vettar, Vennar and Vadavadar Rivers
simultaneously, if sufficient water is available. If insufficient water is available then a 6-day rotation
system is adopted.
(iii) Formal control rules and structure ratings, published in 1937, are still referred to by local WRD staff.
These instruct the operators how to determine appropriate gate settings. However it is not clear if
these rules and ratings are fully applicable now because there may have been changes in the
geometry of the channels and structures, and changes in the irrigated areas, since the 1930s.
(iv) WRD review gate settings on a six day cycle using information on irrigation demands and recent
rainfall to decide appropriate discharges and gate settings for the next 6 days. This procedure is
based on the experience and judgment of WRD Engineers.
(v) Actual discharges through the head regulators are considered to be less than those indicated by the
theoretical discharge tables for the regulators because of the influence of vegetation and sediment on
flow characteristics in the vicinity of the regulators. Therefore the gate operators decide to adjust gate
openings based on their judgment in order to maintain normal supply levels in the system.
(vi) WRD engineers distribute water according to farmers’ requests, many of which are received
individually by telephone or through direct lobbying. Water distribution to the command areas is
therefore largely unplanned. There appear to be no formal water distribution plans or watering
schedules for the command areas. This practice tends to favour influential farmers giving them the
324440/IDD/IDC/1/B 10 October2014 Final Report Final V1
87
Climate Adaptation through Sub-Basin Development Program PPTA Final Report
opportunity to consume more water than needed and to disadvantage less influential farmers who
consequently may receive less water than needed.
(vii) During flood conditions inflows into the delta from the Cauvery River are stopped at the Grand Anicut
and most regulators in the delta downstream of the anicut are opened fully in order to discharge local
storm runoff generated within the delta to the sea as quickly as possible. During widespread flooding,
flood waters are directed preferentially down the Vettar River, then the Vennar River and finally down
the Vadavar River.
Discussions with WRD engineers about these decision making procedures and further analysis of the
information provided led to the conclusions that (i) there is a need for greater accuracy of discharge
measurements at all regulators through updated calibrations of the gates, (ii) linking gate operation more
closely with rainfall forecasts could improve the management of the irrigation systems by reducing
irrigation requirements increasing water use efficiency and securing crop production, (iii) some irrigation
head sluices are unregulated because they are blocked or stuck partially open, or fully open, due to lack of
maintenance and therefore some farmers probably receive too much water, others too little, (iv) the use of
groundwater by farmers is not taken into account in channel operations.
To improve the management of water resources in the Cauvery Delta, and irrigation and drainage in
particular, a Decision Support System (DSS) for water distribution is proposed under CASDP. The
functions of such a DSS would be:
(i) Evaluate the volume of water available in Mettur Dam, with allowances for possible further inflows to the reservoir
(ii) Evaluate likelihood of additional inflows into the Cauvery River below Mettur
(iii) Estimate the flows that might be available at the Grand Anicut
(iv) Using information on planted areas, crop water requirements in normal and dry years, water supply efficiencies, groundwater availability, estimate water availability in the upcoming season and estimate potential shortfalls
(v) If shortages are expected, indicate likely reductions in crop yields for a range of water supply strategies e.g. (a) share deficit evenly over the entire command area and during the entire growing season, (b) reduce the cropped area and irrigate it normally, (c) reduce surface water supply to command areas with adequate fresh groundwater sources and redistribute the conserved surface water to command areas without adequate groundwater.
(vi) Provide short-term guidance on reducing irrigation demand if rain is forecast (or occurs) based on estimated soil moisture conditions following the rain. Perhaps storing excess water already in the rivers and canals in ponds and tanks within the irrigation system at the same time as reducing releases from Mettur Dam.
(vii) Assess actual water stress by location (assuming suitable monitoring systems are set up) so that irrigation water can be supplied to areas suffering more than others.
(viii) Indicate the optimum scheduling of flows in each canal what gate settings should be applied.
The DSS could help to reduce some of the flood damage by providing WRD with alternative flood
management options taking into account the spatial distribution of the rainfall and the state of the tides.
The DSS would require real-time data on water levels and flows within the Vennar system and the
expected inflows to the rivers and drains in the system from drains outside the system, e.g. drains
upstream of the VVR regulator, from the Grand Anicut (if it is likely to be by-passed) and from within the
system itself. These data would be used in a hydrodynamic model to forecast flows and water levels in the
system.
324440/IDD/IDC/1/B 10 October2014 Final Report Final V1
88
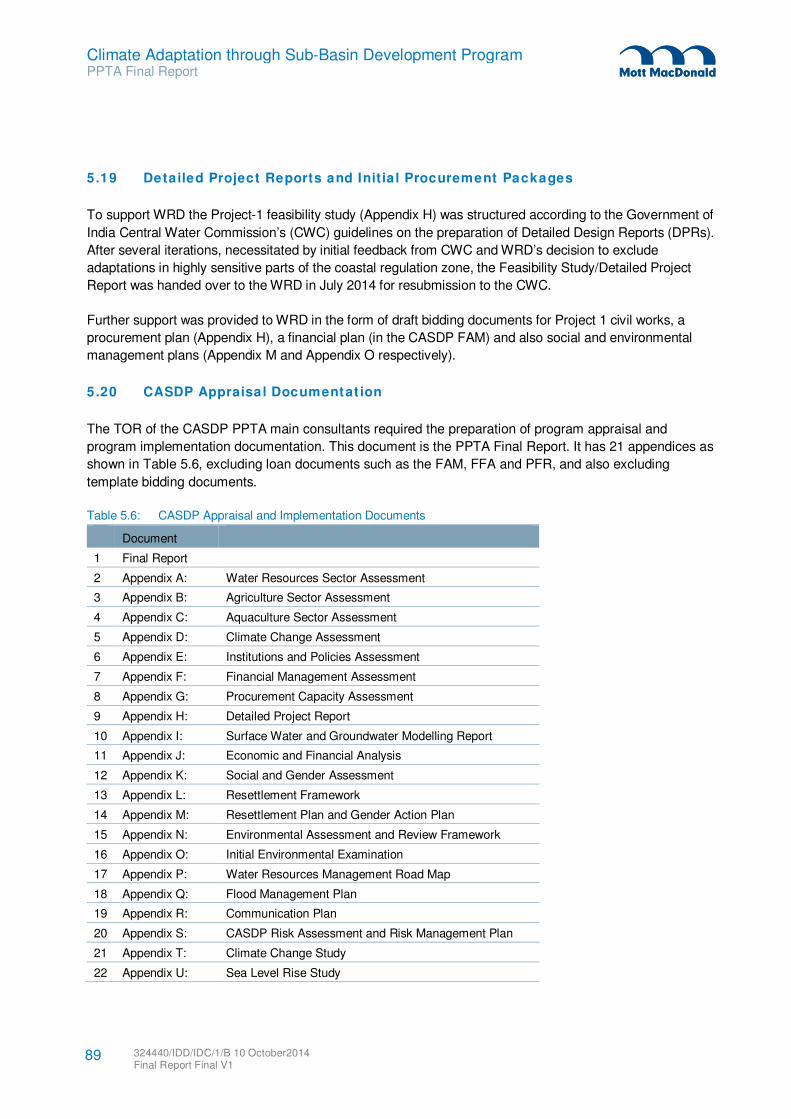
Climate Adaptation through Sub-Basin Development Program PPTA Final Report
5.19 Detailed Project Reports and Init ia l Procurement Packages
To support WRD the Project-1 feasibility study (Appendix H) was structured according to the Government of
India Central Water Commission’s (CWC) guidelines on the preparation of Detailed Design Reports (DPRs).
After several iterations, necessitated by initial feedback from CWC and WRD’s decision to exclude
adaptations in highly sensitive parts of the coastal regulation zone, the Feasibility Study/Detailed Project
Report was handed over to the WRD in July 2014 for resubmission to the CWC.
Further support was provided to WRD in the form of draft bidding documents for Project 1 civil works, a
procurement plan (Appendix H), a financial plan (in the CASDP FAM) and also social and environmental
management plans (Appendix M and Appendix O respectively).
5.20 CASDP Appraisal Documentat ion
The TOR of the CASDP PPTA main consultants required the preparation of program appraisal and
program implementation documentation. This document is the PPTA Final Report. It has 21 appendices as
shown in Table 5.6, excluding loan documents such as the FAM, FFA and PFR, and also excluding
template bidding documents.
Table 5.6: CASDP Appraisal and Implementation Documents
Document
1 Final Report
2 Appendix A: Water Resources Sector Assessment
3 Appendix B: Agriculture Sector Assessment
4 Appendix C: Aquaculture Sector Assessment
5 Appendix D: Climate Change Assessment
6 Appendix E: Institutions and Policies Assessment
7 Appendix F: Financial Management Assessment
8 Appendix G: Procurement Capacity Assessment
9 Appendix H: Detailed Project Report
10 Appendix I: Surface Water and Groundwater Modelling Report
11 Appendix J: Economic and Financial Analysis
12 Appendix K: Social and Gender Assessment
13 Appendix L: Resettlement Framework
14 Appendix M: Resettlement Plan and Gender Action Plan
15 Appendix N: Environmental Assessment and Review Framework
16 Appendix O: Initial Environmental Examination
17 Appendix P: Water Resources Management Road Map
18 Appendix Q: Flood Management Plan
19 Appendix R: Communication Plan
20 Appendix S: CASDP Risk Assessment and Risk Management Plan
21 Appendix T: Climate Change Study
22 Appendix U: Sea Level Rise Study
324440/IDD/IDC/1/B 10 October2014 Final Report Final V1
89
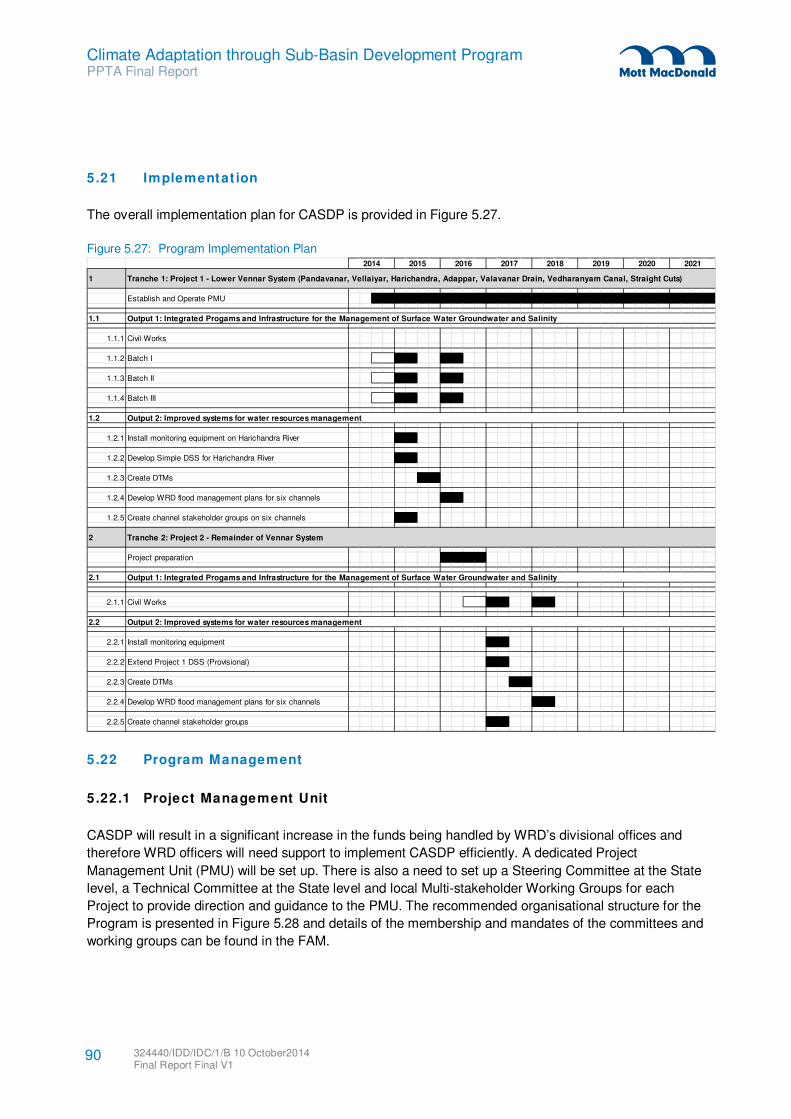
Climate Adaptation through Sub-Basin Development Program PPTA Final Report
5.21 Implementat ion
The overall implementation plan for CASDP is provided in Figure 5.27.
Figure 5.27: Program Implementation Plan
5.22 Program Management
5.22.1 Project Management Unit
CASDP will result in a significant increase in the funds being handled by WRD’s divisional offices and
therefore WRD officers will need support to implement CASDP efficiently. A dedicated Project
Management Unit (PMU) will be set up. There is also a need to set up a Steering Committee at the State
level, a Technical Committee at the State level and local Multi-stakeholder Working Groups for each
Project to provide direction and guidance to the PMU. The recommended organisational structure for the
Program is presented in Figure 5.28 and details of the membership and mandates of the committees and
working groups can be found in the FAM.
1
Establish and Operate PMU
1.1
1.1.1 Civil Works
1.1.2 Batch I
1.1.3 Batch II
1.1.4 Batch III
1.2
1.2.1 Install monitoring equipment on Harichandra River
1.2.2 Develop Simple DSS for Harichandra River
1.2.3 Create DTMs
1.2.4 Develop WRD flood management plans for six channels
1.2.5 Create channel stakeholder groups on six channels
2
Project preparation
2.1
2.1.1 Civil Works
2.2
2.2.1 Install monitoring equipment
2.2.2 Extend Project 1 DSS (Provisional)
2.2.3 Create DTMs
2.2.4 Develop WRD flood management plans for six channels
2.2.5 Create channel stakeholder groups
2020 2021
Tranche 1: Project 1 - Lower Vennar System (Pandavanar, Vellaiyar, Harichandra, Adappar, Valavanar Drain, Vedharanyam Canal, Straight Cuts)
Tranche 2: Project 2 - Remainder of Vennar System
2014 2015 2016 2017 2018 2019
Output 1: Integrated Progams and Infrastructure for the Management of Surface Water Groundwater and Salinity
Output 2: Improved systems for water resources management
Output 1: Integrated Progams and Infrastructure for the Management of Surface Water Groundwater and Salinity
Output 2: Improved systems for water resources management
324440/IDD/IDC/1/B 10 October2014 Final Report Final V1
90
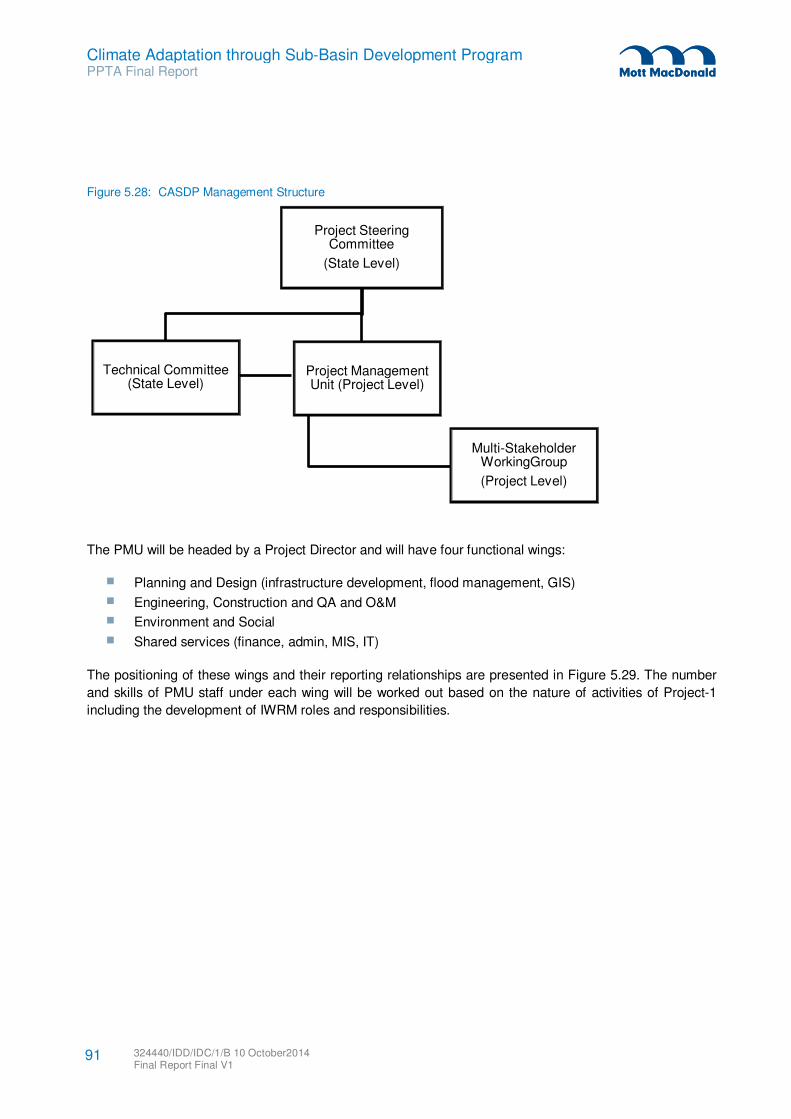
Climate Adaptation through Sub-Basin Development Program PPTA Final Report
Figure 5.28: CASDP Management Structure
The PMU will be headed by a Project Director and will have four functional wings:
Planning and Design (infrastructure development, flood management, GIS)
Engineering, Construction and QA and O&M
Environment and Social
Shared services (finance, admin, MIS, IT)
The positioning of these wings and their reporting relationships are presented in Figure 5.29. The number
and skills of PMU staff under each wing will be worked out based on the nature of activities of Project-1
including the development of IWRM roles and responsibilities.
Project Steering Committee
(State Level)
Technical Committee (State Level)
Project Management Unit (Project Level)
Multi-Stakeholder WorkingGroup
(Project Level)
324440/IDD/IDC/1/B 10 October2014 Final Report Final V1
91
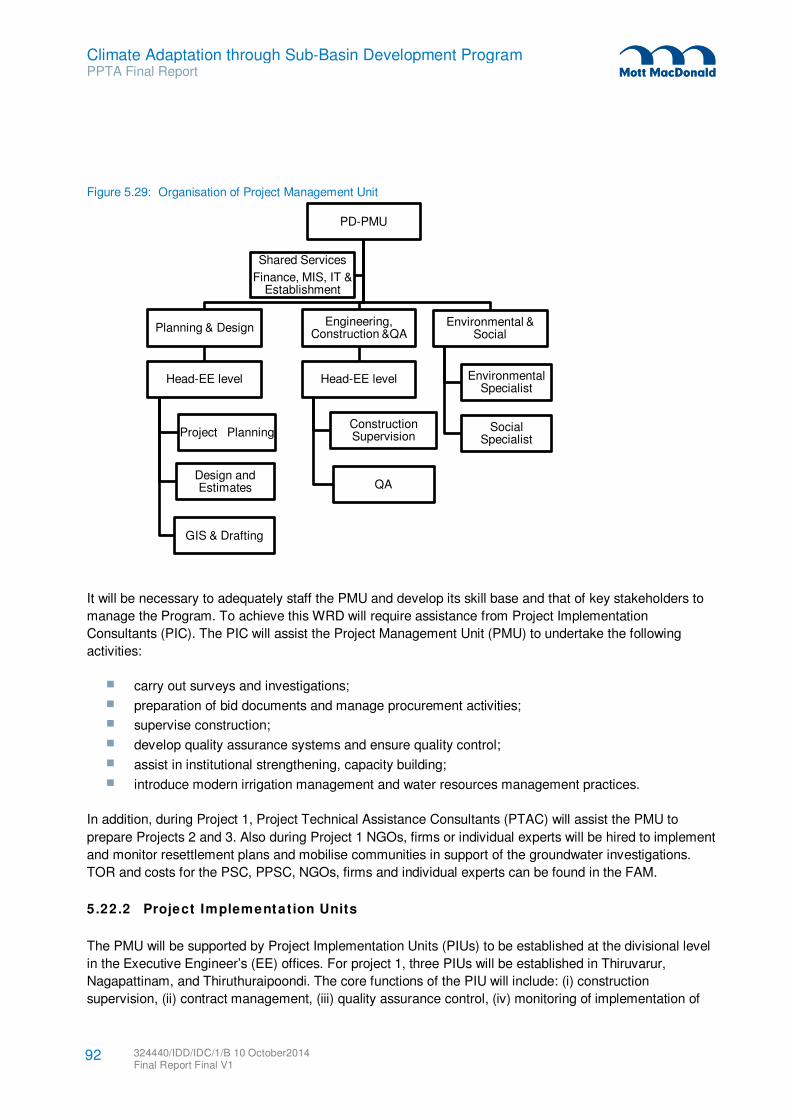
Climate Adaptation through Sub-Basin Development Program PPTA Final Report
Figure 5.29: Organisation of Project Management Unit
It will be necessary to adequately staff the PMU and develop its skill base and that of key stakeholders to
manage the Program. To achieve this WRD will require assistance from Project Implementation
Consultants (PIC). The PIC will assist the Project Management Unit (PMU) to undertake the following
activities:
carry out surveys and investigations;
preparation of bid documents and manage procurement activities;
supervise construction;
develop quality assurance systems and ensure quality control;
assist in institutional strengthening, capacity building;
introduce modern irrigation management and water resources management practices.
In addition, during Project 1, Project Technical Assistance Consultants (PTAC) will assist the PMU to
prepare Projects 2 and 3. Also during Project 1 NGOs, firms or individual experts will be hired to implement
and monitor resettlement plans and mobilise communities in support of the groundwater investigations.
TOR and costs for the PSC, PPSC, NGOs, firms and individual experts can be found in the FAM.
5.22.2 Project Implementation Units
The PMU will be supported by Project Implementation Units (PIUs) to be established at the divisional level
in the Executive Engineer’s (EE) offices. For project 1, three PIUs will be established in Thiruvarur,
Nagapattinam, and Thiruthuraipoondi. The core functions of the PIU will include: (i) construction
supervision, (ii) contract management, (iii) quality assurance control, (iv) monitoring of implementation of
PD-PMU
Planning & Design
Head-EE level
Project Planning
Design and Estimates
GIS & Drafting
Engineering, Construction &QA
Head-EE level
Construction Supervision
QA
Environmental & Social
Environmental Specialist
Social Specialist
Shared Services
Finance, MIS, IT & Establishment
324440/IDD/IDC/1/B 10 October2014 Final Report Final V1
92
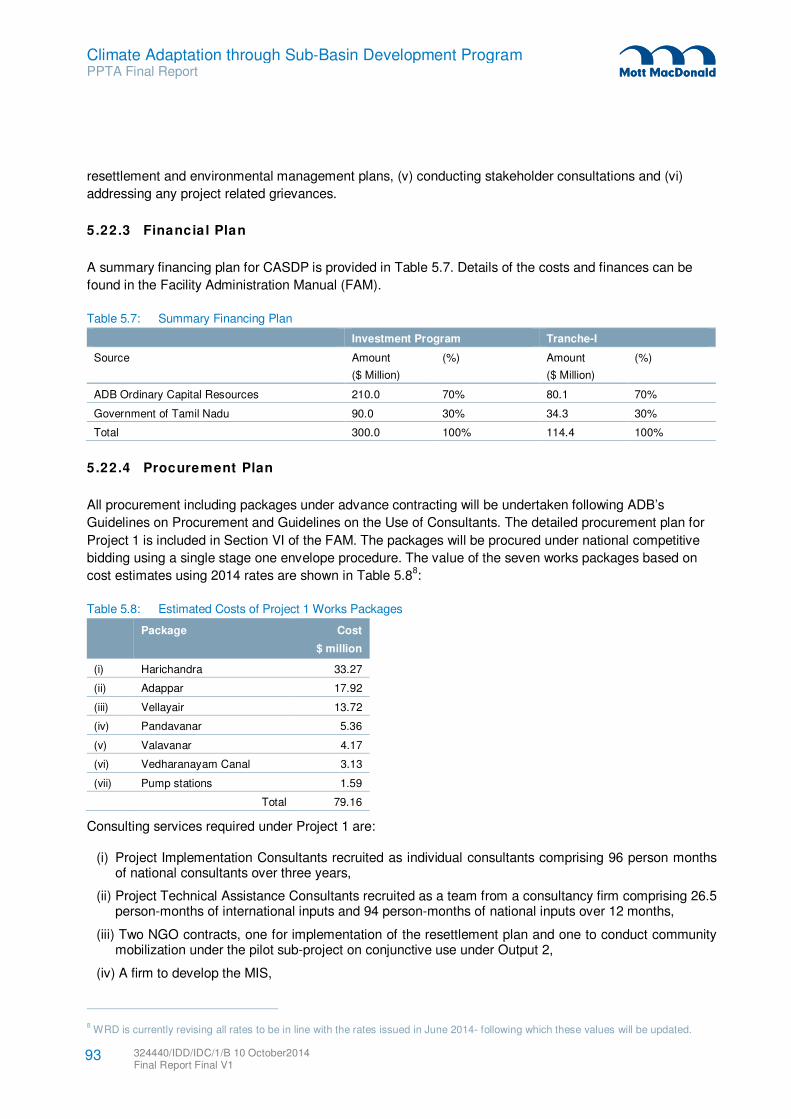
Climate Adaptation through Sub-Basin Development Program PPTA Final Report
resettlement and environmental management plans, (v) conducting stakeholder consultations and (vi)
addressing any project related grievances.
5.22.3 Financial Plan
A summary financing plan for CASDP is provided in Table 5.7. Details of the costs and finances can be
found in the Facility Administration Manual (FAM).
Table 5.7: Summary Financing Plan
Investment Program Tranche-I
Source Amount
($ Million)
(%) Amount
($ Million)
(%)
ADB Ordinary Capital Resources 210.0 70% 80.1 70%
Government of Tamil Nadu 90.0 30% 34.3 30%
Total 300.0 100% 114.4 100%
5.22.4 Procurement Plan
All procurement including packages under advance contracting will be undertaken following ADB’s
Guidelines on Procurement and Guidelines on the Use of Consultants. The detailed procurement plan for
Project 1 is included in Section VI of the FAM. The packages will be procured under national competitive
bidding using a single stage one envelope procedure. The value of the seven works packages based on
cost estimates using 2014 rates are shown in Table 5.88:
Table 5.8: Estimated Costs of Project 1 Works Packages
Package Cost
$ million
(i) Harichandra 33.27
(ii) Adappar 17.92
(iii) Vellayair 13.72
(iv) Pandavanar 5.36
(v) Valavanar 4.17
(vi) Vedharanayam Canal 3.13
(vii) Pump stations 1.59
Total 79.16
Consulting services required under Project 1 are:
(i) Project Implementation Consultants recruited as individual consultants comprising 96 person months of national consultants over three years,
(ii) Project Technical Assistance Consultants recruited as a team from a consultancy firm comprising 26.5 person-months of international inputs and 94 person-months of national inputs over 12 months,
(iii) Two NGO contracts, one for implementation of the resettlement plan and one to conduct community mobilization under the pilot sub-project on conjunctive use under Output 2,
(iv) A firm to develop the MIS,
8 WRD is currently revising all rates to be in line with the rates issued in June 2014- following which these values will be updated.
324440/IDD/IDC/1/B 10 October2014 Final Report Final V1
93
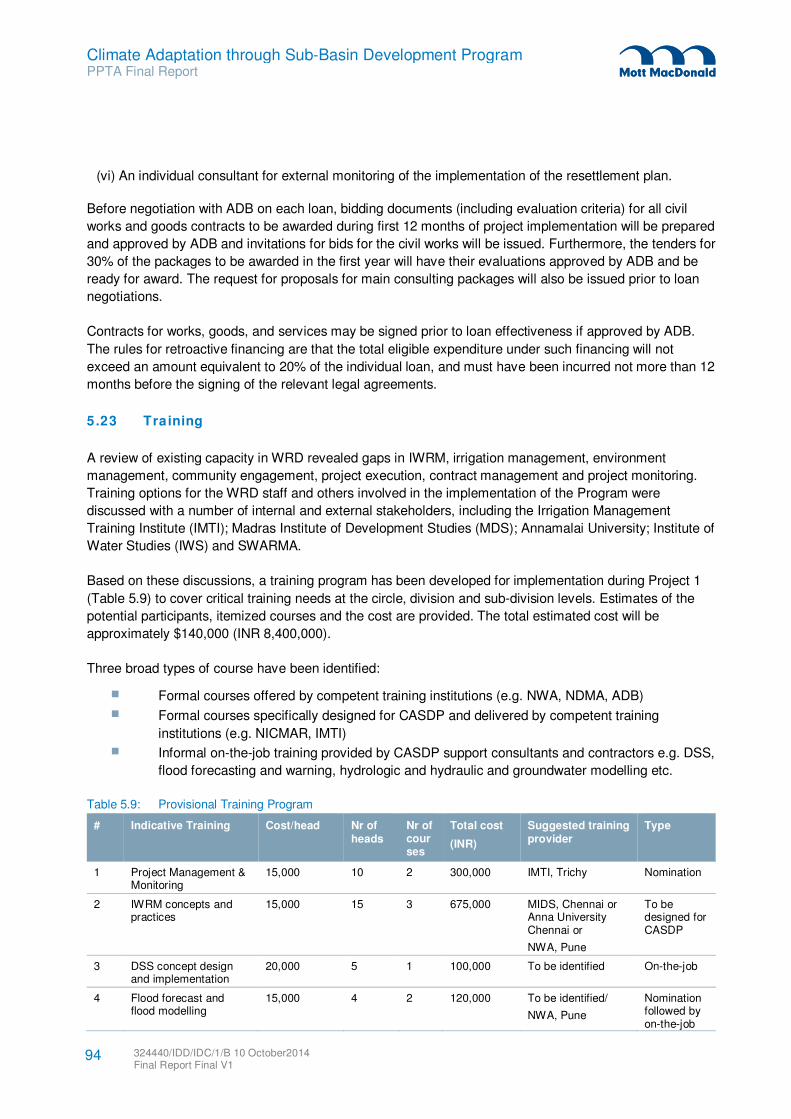
Climate Adaptation through Sub-Basin Development Program PPTA Final Report
(vi) An individual consultant for external monitoring of the implementation of the resettlement plan.
Before negotiation with ADB on each loan, bidding documents (including evaluation criteria) for all civil
works and goods contracts to be awarded during first 12 months of project implementation will be prepared
and approved by ADB and invitations for bids for the civil works will be issued. Furthermore, the tenders for
30% of the packages to be awarded in the first year will have their evaluations approved by ADB and be
ready for award. The request for proposals for main consulting packages will also be issued prior to loan
negotiations.
Contracts for works, goods, and services may be signed prior to loan effectiveness if approved by ADB.
The rules for retroactive financing are that the total eligible expenditure under such financing will not
exceed an amount equivalent to 20% of the individual loan, and must have been incurred not more than 12
months before the signing of the relevant legal agreements.
5.23 Training
A review of existing capacity in WRD revealed gaps in IWRM, irrigation management, environment
management, community engagement, project execution, contract management and project monitoring.
Training options for the WRD staff and others involved in the implementation of the Program were
discussed with a number of internal and external stakeholders, including the Irrigation Management
Training Institute (IMTI); Madras Institute of Development Studies (MDS); Annamalai University; Institute of
Water Studies (IWS) and SWARMA.
Based on these discussions, a training program has been developed for implementation during Project 1
(Table 5.9) to cover critical training needs at the circle, division and sub-division levels. Estimates of the
potential participants, itemized courses and the cost are provided. The total estimated cost will be
approximately $140,000 (INR 8,400,000).
Three broad types of course have been identified:
Formal courses offered by competent training institutions (e.g. NWA, NDMA, ADB)
Formal courses specifically designed for CASDP and delivered by competent training
institutions (e.g. NICMAR, IMTI)
Informal on-the-job training provided by CASDP support consultants and contractors e.g. DSS,
flood forecasting and warning, hydrologic and hydraulic and groundwater modelling etc.
Table 5.9: Provisional Training Program
# Indicative Training Cost/head Nr of heads
Nr of courses
Total cost
(INR)
Suggested training provider
Type
1 Project Management & Monitoring
15,000 10 2 300,000 IMTI, Trichy Nomination
2 IWRM concepts and practices
15,000 15 3 675,000 MIDS, Chennai or Anna University Chennai or
NWA, Pune
To be designed for CASDP
3 DSS concept design and implementation
20,000 5 1 100,000 To be identified On-the-job
4 Flood forecast and flood modelling
15,000 4 2 120,000 To be identified/
NWA, Pune
Nomination followed by on-the-job
324440/IDD/IDC/1/B 10 October2014 Final Report Final V1
94
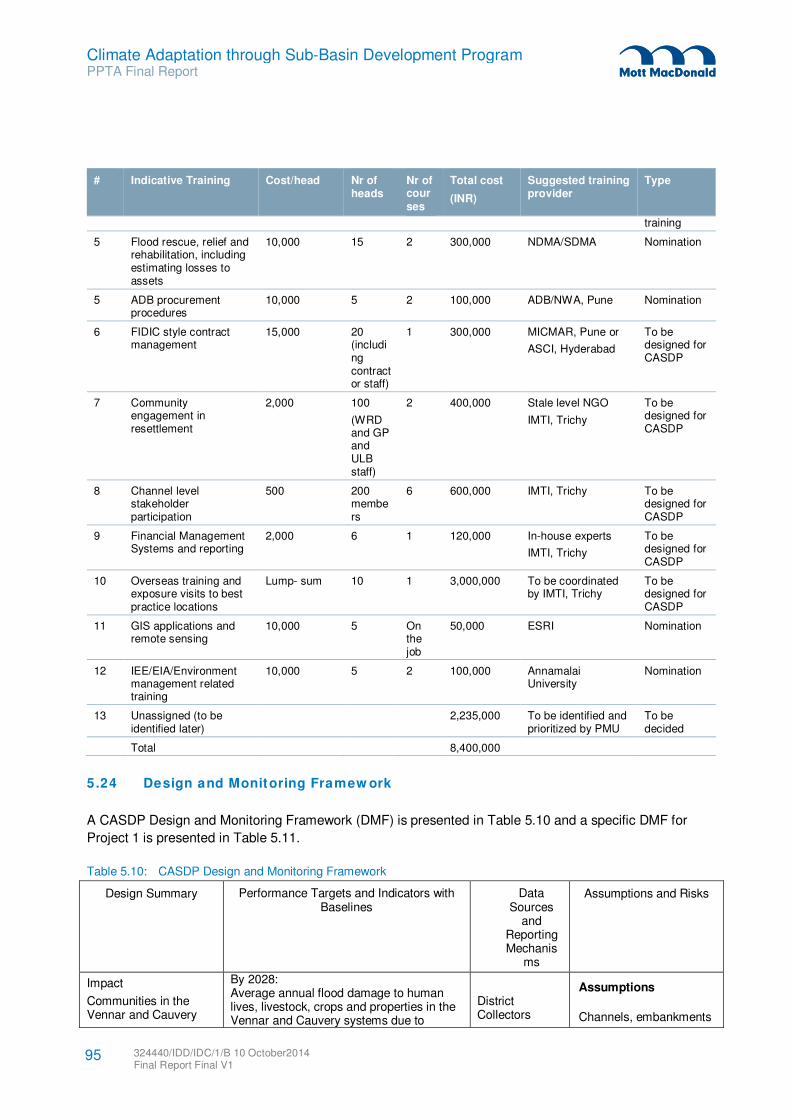
Climate Adaptation through Sub-Basin Development Program PPTA Final Report
# Indicative Training Cost/head Nr of heads
Nr of courses
Total cost
(INR)
Suggested training provider
Type
training
5 Flood rescue, relief and rehabilitation, including estimating losses to assets
10,000 15 2 300,000 NDMA/SDMA Nomination
5 ADB procurement procedures
10,000 5 2 100,000 ADB/NWA, Pune Nomination
6 FIDIC style contract management
15,000 20 (including contractor staff)
1 300,000 MICMAR, Pune or
ASCI, Hyderabad
To be designed for CASDP
7 Community engagement in resettlement
2,000 100
(WRD and GP and ULB staff)
2 400,000 Stale level NGO
IMTI, Trichy
To be designed for CASDP
8 Channel level stakeholder participation
500 200 members
6 600,000 IMTI, Trichy To be designed for CASDP
9 Financial Management Systems and reporting
2,000 6 1 120,000 In-house experts
IMTI, Trichy
To be designed for CASDP
10 Overseas training and exposure visits to best practice locations
Lump- sum 10 1 3,000,000 To be coordinated by IMTI, Trichy
To be designed for CASDP
11 GIS applications and remote sensing
10,000 5 On the job
50,000 ESRI Nomination
12 IEE/EIA/Environment management related training
10,000 5 2 100,000 Annamalai University
Nomination
13 Unassigned (to be identified later)
2,235,000 To be identified and prioritized by PMU
To be decided
Total 8,400,000
5.24 Design and Monitoring Framew ork
A CASDP Design and Monitoring Framework (DMF) is presented in Table 5.10 and a specific DMF for
Project 1 is presented in Table 5.11.
Table 5.10: CASDP Design and Monitoring Framework
Design Summary Performance Targets and Indicators with Baselines
Data Sources
and Reporting Mechanis
ms
Assumptions and Risks
Impact
Communities in the Vennar and Cauvery
By 2028: Average annual flood damage to human lives, livestock, crops and properties in the Vennar and Cauvery systems due to
District Collectors
Assumptions
Channels, embankments
324440/IDD/IDC/1/B 10 October2014 Final Report Final V1
95
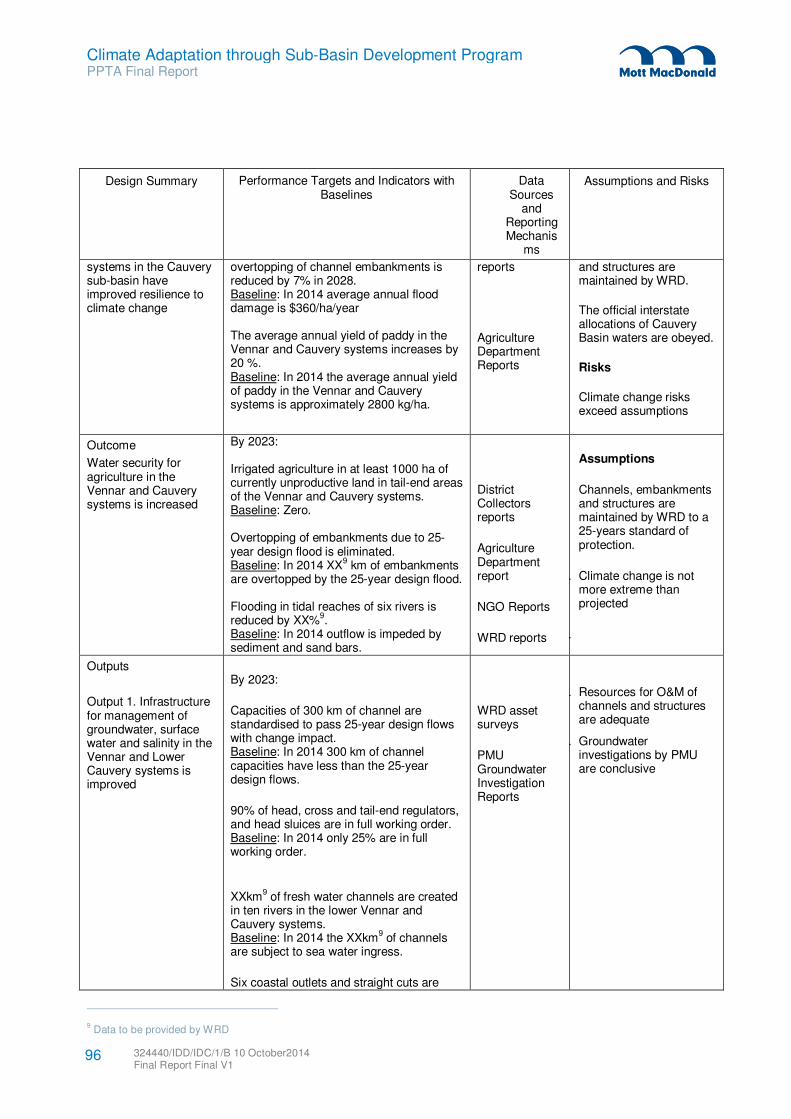
Climate Adaptation through Sub-Basin Development Program PPTA Final Report
Design Summary Performance Targets and Indicators with Baselines
Data Sources
and Reporting Mechanis
ms
Assumptions and Risks
systems in the Cauvery sub-basin have improved resilience to climate change
overtopping of channel embankments is reduced by 7% in 2028. Baseline: In 2014 average annual flood damage is $360/ha/year The average annual yield of paddy in the Vennar and Cauvery systems increases by 20 %. Baseline: In 2014 the average annual yield of paddy in the Vennar and Cauvery systems is approximately 2800 kg/ha.
reports
Agriculture Department Reports
and structures are maintained by WRD.
The official interstate allocations of Cauvery Basin waters are obeyed.
Risks
Climate change risks exceed assumptions
Outcome
Water security for agriculture in the Vennar and Cauvery systems is increased
By 2023: Irrigated agriculture in at least 1000 ha of currently unproductive land in tail-end areas of the Vennar and Cauvery systems. Baseline: Zero. Overtopping of embankments due to 25-year design flood is eliminated. Baseline: In 2014 XX
9 km of embankments
are overtopped by the 25-year design flood. Flooding in tidal reaches of six rivers is reduced by XX%
9.
Baseline: In 2014 outflow is impeded by sediment and sand bars.
District Collectors reports
Agriculture Department report
NGO Reports
WRD reports
Assumptions
Channels, embankments and structures are maintained by WRD to a 25-years standard of protection.
. Climate change is not more extreme than projected
.
Outputs
Output 1. Infrastructure for management of groundwater, surface water and salinity in the Vennar and Lower Cauvery systems is improved
By 2023:
Capacities of 300 km of channel are standardised to pass 25-year design flows with change impact. Baseline: In 2014 300 km of channel capacities have less than the 25-year design flows.
90% of head, cross and tail-end regulators, and head sluices are in full working order. Baseline: In 2014 only 25% are in full working order.
XXkm
9 of fresh water channels are created
in ten rivers in the lower Vennar and Cauvery systems. Baseline: In 2014 the XXkm
9 of channels
are subject to sea water ingress.
Six coastal outlets and straight cuts are
WRD asset surveys
PMU Groundwater Investigation Reports
. Resources for O&M of channels and structures are adequate
. Groundwater investigations by PMU are conclusive
9 Data to be provided by WRD
324440/IDD/IDC/1/B 10 October2014 Final Report Final V1
96
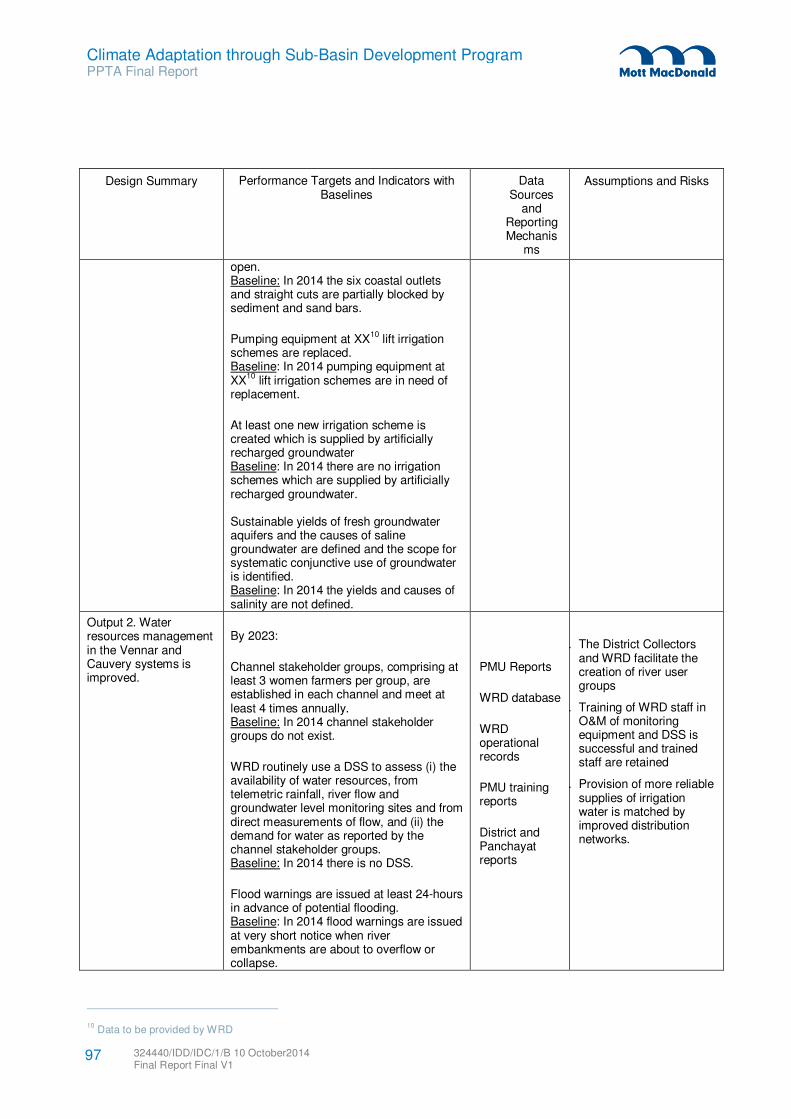
Climate Adaptation through Sub-Basin Development Program PPTA Final Report
Design Summary Performance Targets and Indicators with Baselines
Data Sources
and Reporting Mechanis
ms
Assumptions and Risks
open. Baseline: In 2014 the six coastal outlets and straight cuts are partially blocked by sediment and sand bars.
Pumping equipment at XX10
lift irrigation schemes are replaced. Baseline: In 2014 pumping equipment at XX
10 lift irrigation schemes are in need of
replacement.
At least one new irrigation scheme is created which is supplied by artificially recharged groundwater Baseline: In 2014 there are no irrigation schemes which are supplied by artificially recharged groundwater. Sustainable yields of fresh groundwater aquifers and the causes of saline groundwater are defined and the scope for systematic conjunctive use of groundwater is identified. Baseline: In 2014 the yields and causes of salinity are not defined.
Output 2. Water resources management in the Vennar and Cauvery systems is improved.
By 2023:
Channel stakeholder groups, comprising at least 3 women farmers per group, are established in each channel and meet at least 4 times annually. Baseline: In 2014 channel stakeholder groups do not exist.
WRD routinely use a DSS to assess (i) the availability of water resources, from telemetric rainfall, river flow and groundwater level monitoring sites and from direct measurements of flow, and (ii) the demand for water as reported by the channel stakeholder groups. Baseline: In 2014 there is no DSS.
Flood warnings are issued at least 24-hours in advance of potential flooding. Baseline: In 2014 flood warnings are issued at very short notice when river embankments are about to overflow or collapse.
PMU Reports
WRD database
WRD operational records
PMU training reports
District and Panchayat reports
. The District Collectors and WRD facilitate the creation of river user groups
. Training of WRD staff in O&M of monitoring equipment and DSS is successful and trained staff are retained
. Provision of more reliable supplies of irrigation water is matched by improved distribution networks.
10 Data to be provided by WRD
324440/IDD/IDC/1/B 10 October2014 Final Report Final V1
97
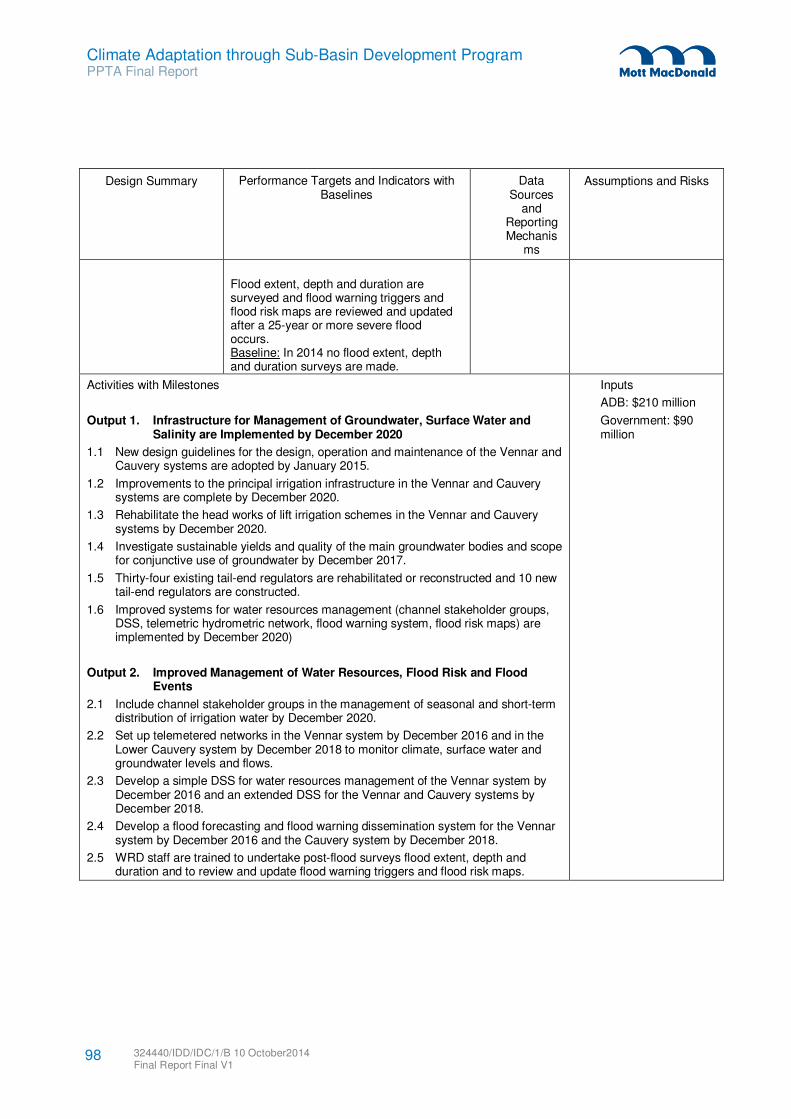
Climate Adaptation through Sub-Basin Development Program PPTA Final Report
Design Summary Performance Targets and Indicators with Baselines
Data Sources
and Reporting Mechanis
ms
Assumptions and Risks
Flood extent, depth and duration are surveyed and flood warning triggers and flood risk maps are reviewed and updated after a 25-year or more severe flood occurs. Baseline: In 2014 no flood extent, depth and duration surveys are made.
Activities with Milestones
Output 1. Infrastructure for Management of Groundwater, Surface Water and Salinity are Implemented by December 2020
1.1 New design guidelines for the design, operation and maintenance of the Vennar and Cauvery systems are adopted by January 2015.
1.2 Improvements to the principal irrigation infrastructure in the Vennar and Cauvery systems are complete by December 2020.
1.3 Rehabilitate the head works of lift irrigation schemes in the Vennar and Cauvery systems by December 2020.
1.4 Investigate sustainable yields and quality of the main groundwater bodies and scope for conjunctive use of groundwater by December 2017.
1.5 Thirty-four existing tail-end regulators are rehabilitated or reconstructed and 10 new tail-end regulators are constructed.
1.6 Improved systems for water resources management (channel stakeholder groups, DSS, telemetric hydrometric network, flood warning system, flood risk maps) are implemented by December 2020)
Output 2. Improved Management of Water Resources, Flood Risk and Flood Events
2.1 Include channel stakeholder groups in the management of seasonal and short-term distribution of irrigation water by December 2020.
2.2 Set up telemetered networks in the Vennar system by December 2016 and in the Lower Cauvery system by December 2018 to monitor climate, surface water and groundwater levels and flows.
2.3 Develop a simple DSS for water resources management of the Vennar system by December 2016 and an extended DSS for the Vennar and Cauvery systems by December 2018.
2.4 Develop a flood forecasting and flood warning dissemination system for the Vennar system by December 2016 and the Cauvery system by December 2018.
2.5 WRD staff are trained to undertake post-flood surveys flood extent, depth and duration and to review and update flood warning triggers and flood risk maps.
Inputs
ADB: $210 million
Government: $90 million
324440/IDD/IDC/1/B 10 October2014 Final Report Final V1
98
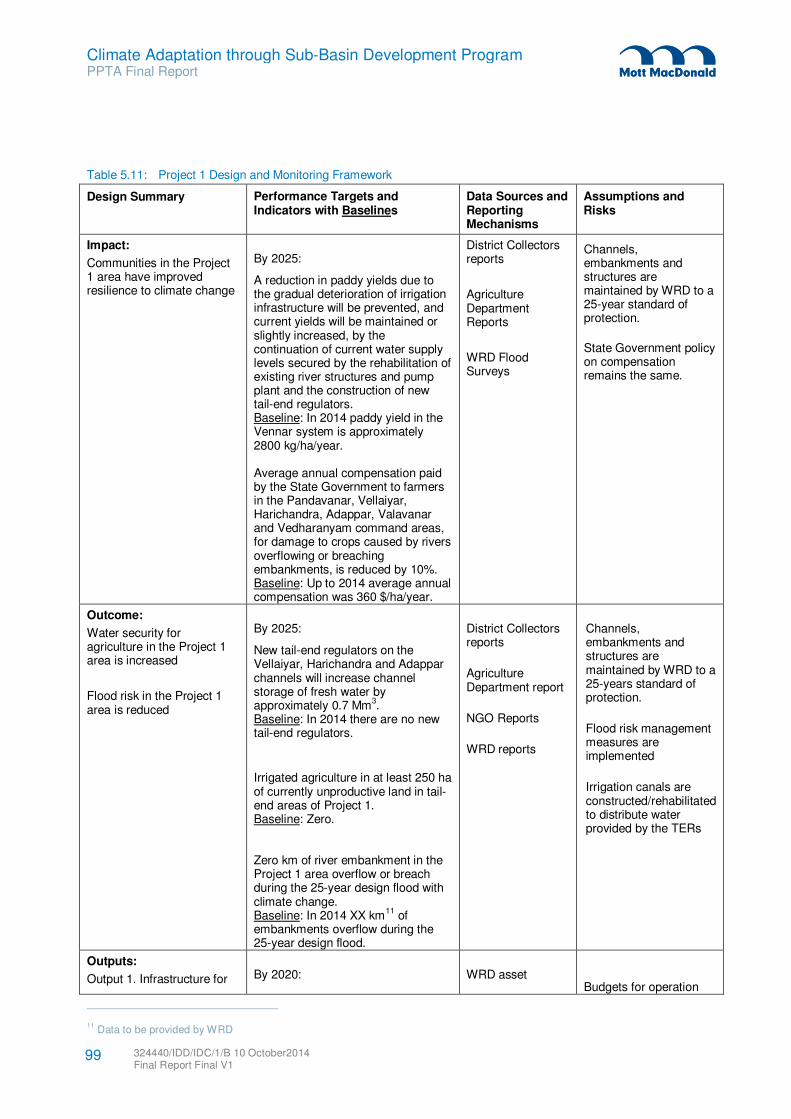
Climate Adaptation through Sub-Basin Development Program PPTA Final Report
Table 5.11: Project 1 Design and Monitoring Framework
Design Summary Performance Targets and Indicators with Baselines
Data Sources and Reporting Mechanisms
Assumptions and Risks
Impact:
Communities in the Project 1 area have improved resilience to climate change
By 2025:
A reduction in paddy yields due to the gradual deterioration of irrigation infrastructure will be prevented, and current yields will be maintained or slightly increased, by the continuation of current water supply levels secured by the rehabilitation of existing river structures and pump plant and the construction of new tail-end regulators. Baseline: In 2014 paddy yield in the Vennar system is approximately 2800 kg/ha/year. Average annual compensation paid by the State Government to farmers in the Pandavanar, Vellaiyar, Harichandra, Adappar, Valavanar and Vedharanyam command areas, for damage to crops caused by rivers overflowing or breaching embankments, is reduced by 10%. Baseline: Up to 2014 average annual compensation was 360 $/ha/year.
District Collectors reports
Agriculture Department Reports
WRD Flood Surveys
Channels, embankments and structures are maintained by WRD to a 25-year standard of protection.
State Government policy on compensation remains the same.
Outcome:
Water security for agriculture in the Project 1 area is increased
Flood risk in the Project 1 area is reduced
By 2025:
New tail-end regulators on the Vellaiyar, Harichandra and Adappar channels will increase channel storage of fresh water by approximately 0.7 Mm
3.
Baseline: In 2014 there are no new tail-end regulators.
Irrigated agriculture in at least 250 ha of currently unproductive land in tail-end areas of Project 1. Baseline: Zero. Zero km of river embankment in the Project 1 area overflow or breach during the 25-year design flood with climate change. Baseline: In 2014 XX km
11 of
embankments overflow during the 25-year design flood.
District Collectors reports
Agriculture Department report
NGO Reports
WRD reports
Channels, embankments and structures are maintained by WRD to a 25-years standard of protection.
Flood risk management measures are implemented
Irrigation canals are constructed/rehabilitated to distribute water provided by the TERs
Outputs:
Output 1. Infrastructure for By 2020: WRD asset
Budgets for operation
11 Data to be provided by WRD
324440/IDD/IDC/1/B 10 October2014 Final Report Final V1
99
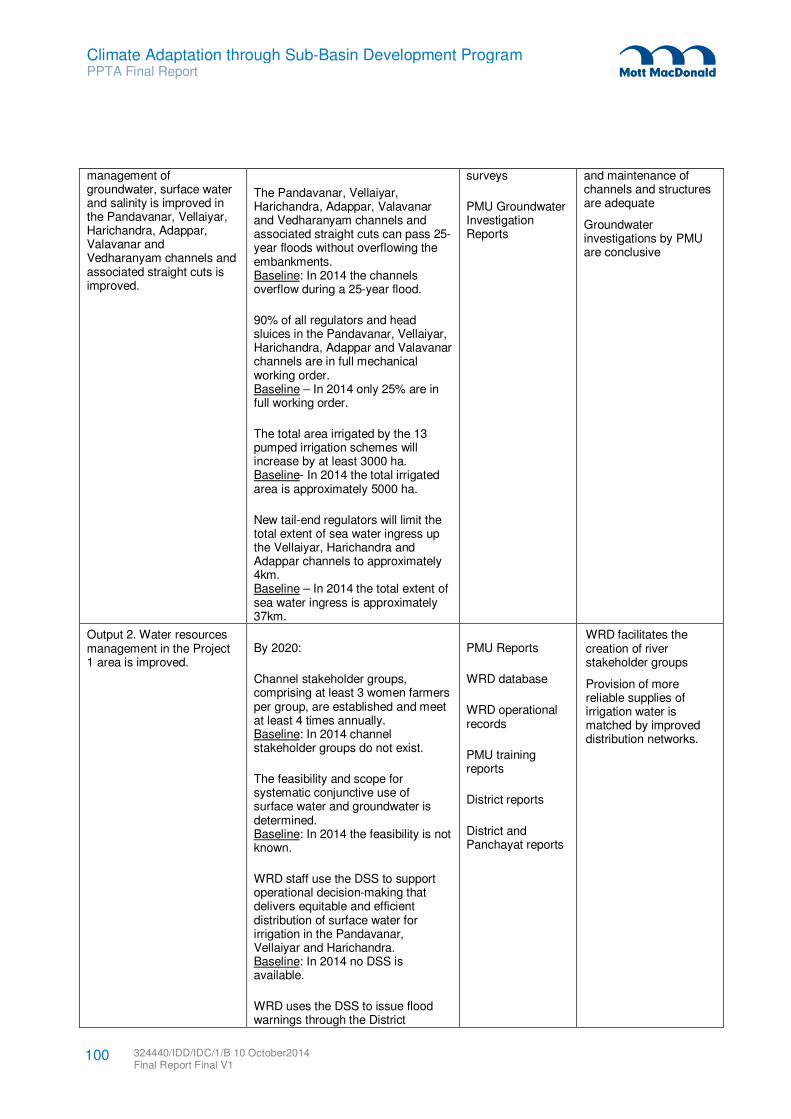
Climate Adaptation through Sub-Basin Development Program PPTA Final Report
management of groundwater, surface water and salinity is improved in the Pandavanar, Vellaiyar, Harichandra, Adappar, Valavanar and Vedharanyam channels and associated straight cuts is improved.
The Pandavanar, Vellaiyar, Harichandra, Adappar, Valavanar and Vedharanyam channels and associated straight cuts can pass 25-year floods without overflowing the embankments. Baseline: In 2014 the channels overflow during a 25-year flood.
90% of all regulators and head sluices in the Pandavanar, Vellaiyar, Harichandra, Adappar and Valavanar channels are in full mechanical working order. Baseline – In 2014 only 25% are in full working order.
The total area irrigated by the 13 pumped irrigation schemes will increase by at least 3000 ha. Baseline- In 2014 the total irrigated area is approximately 5000 ha.
New tail-end regulators will limit the total extent of sea water ingress up the Vellaiyar, Harichandra and Adappar channels to approximately 4km. Baseline – In 2014 the total extent of sea water ingress is approximately 37km.
surveys
PMU Groundwater Investigation Reports
and maintenance of channels and structures are adequate
Groundwater investigations by PMU are conclusive
Output 2. Water resources management in the Project 1 area is improved.
By 2020:
Channel stakeholder groups, comprising at least 3 women farmers per group, are established and meet at least 4 times annually. Baseline: In 2014 channel stakeholder groups do not exist.
The feasibility and scope for systematic conjunctive use of surface water and groundwater is determined. Baseline: In 2014 the feasibility is not known.
WRD staff use the DSS to support operational decision-making that delivers equitable and efficient distribution of surface water for irrigation in the Pandavanar, Vellaiyar and Harichandra. Baseline: In 2014 no DSS is available.
WRD uses the DSS to issue flood warnings through the District
PMU Reports
WRD database
WRD operational records
PMU training reports
District reports
District and Panchayat reports
WRD facilitates the creation of river stakeholder groups
Provision of more reliable supplies of irrigation water is matched by improved distribution networks.
324440/IDD/IDC/1/B 10 October2014 Final Report Final V1
100
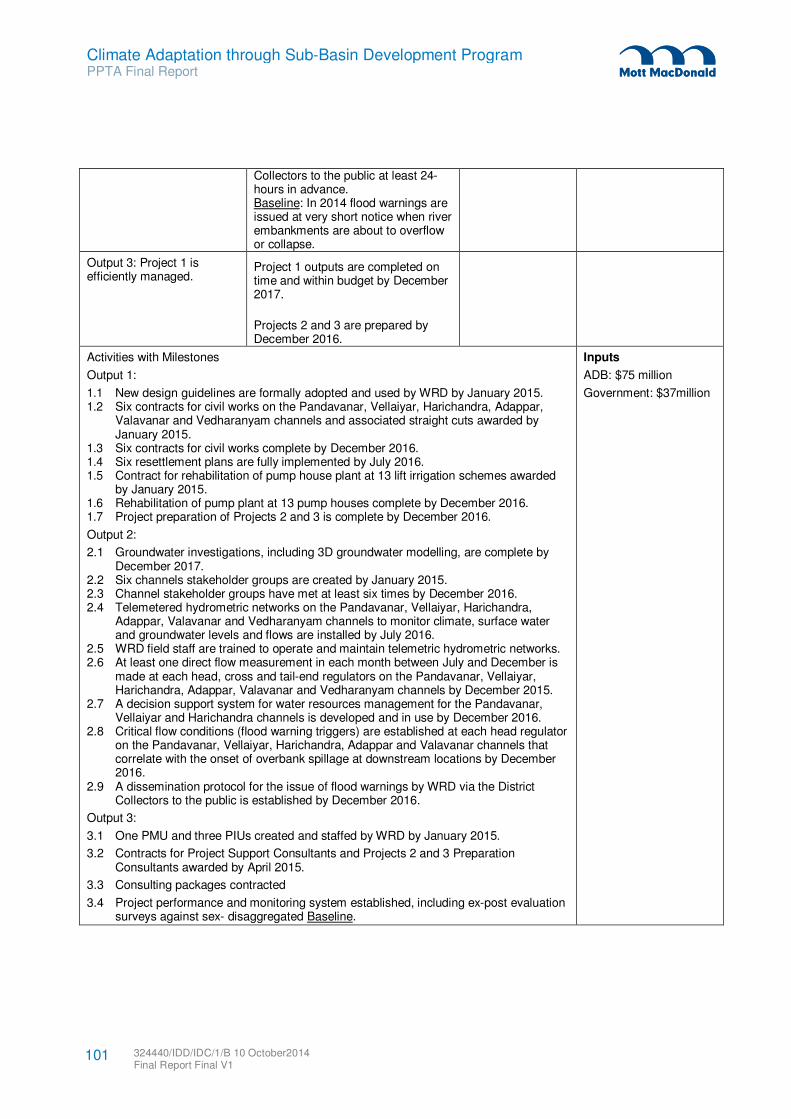
Climate Adaptation through Sub-Basin Development Program PPTA Final Report
Collectors to the public at least 24-hours in advance. Baseline: In 2014 flood warnings are issued at very short notice when river embankments are about to overflow or collapse.
Output 3: Project 1 is efficiently managed.
Project 1 outputs are completed on time and within budget by December 2017.
Projects 2 and 3 are prepared by December 2016.
Activities with Milestones
Output 1:
1.1 New design guidelines are formally adopted and used by WRD by January 2015. 1.2 Six contracts for civil works on the Pandavanar, Vellaiyar, Harichandra, Adappar,
Valavanar and Vedharanyam channels and associated straight cuts awarded by January 2015.
1.3 Six contracts for civil works complete by December 2016. 1.4 Six resettlement plans are fully implemented by July 2016. 1.5 Contract for rehabilitation of pump house plant at 13 lift irrigation schemes awarded
by January 2015. 1.6 Rehabilitation of pump plant at 13 pump houses complete by December 2016. 1.7 Project preparation of Projects 2 and 3 is complete by December 2016.
Output 2:
2.1 Groundwater investigations, including 3D groundwater modelling, are complete by December 2017.
2.2 Six channels stakeholder groups are created by January 2015. 2.3 Channel stakeholder groups have met at least six times by December 2016. 2.4 Telemetered hydrometric networks on the Pandavanar, Vellaiyar, Harichandra,
Adappar, Valavanar and Vedharanyam channels to monitor climate, surface water and groundwater levels and flows are installed by July 2016.
2.5 WRD field staff are trained to operate and maintain telemetric hydrometric networks. 2.6 At least one direct flow measurement in each month between July and December is
made at each head, cross and tail-end regulators on the Pandavanar, Vellaiyar, Harichandra, Adappar, Valavanar and Vedharanyam channels by December 2015.
2.7 A decision support system for water resources management for the Pandavanar, Vellaiyar and Harichandra channels is developed and in use by December 2016.
2.8 Critical flow conditions (flood warning triggers) are established at each head regulator on the Pandavanar, Vellaiyar, Harichandra, Adappar and Valavanar channels that correlate with the onset of overbank spillage at downstream locations by December 2016.
2.9 A dissemination protocol for the issue of flood warnings by WRD via the District Collectors to the public is established by December 2016.
Output 3:
3.1 One PMU and three PIUs created and staffed by WRD by January 2015.
3.2 Contracts for Project Support Consultants and Projects 2 and 3 Preparation Consultants awarded by April 2015.
3.3 Consulting packages contracted
3.4 Project performance and monitoring system established, including ex-post evaluation surveys against sex- disaggregated Baseline.
Inputs
ADB: $75 million
Government: $37million
324440/IDD/IDC/1/B 10 October2014 Final Report Final V1
101
Climate Adaptation through Sub-Basin Development Program PPTA Final Report
5.25 Safeguards
Details of the social and environmental safeguards for CASDP Project-1 can be found in Appendices M
and O respectively. In summary the safeguards are:
No land acquisition is anticipated in Project-1 and resettlement impacts are small. Approximately
203 squatters will be affected and may need to be relocated. Details of entitlements and type of
assistance to be extended to the project affected families have been identified as part of a
resettlement plan.
The six Project-1 channels outfall to the sea and hence their downstream reaches are located in
the Coastal Regulatory Zone (CRZ). Most Project-1 works near the coast will be in regulatory zone
3 (CRZ-3) and will require clearance at district level only. Works in CRZ-1, which are ecologically
sensitive areas, are not included in Project-1 except for the intertidal outfalls of the four straight
cuts. These will require clearance from central government.
There are no archaeological, cultural or religious sites affected by Project-1 except for crematoria
and an occasional graveyard. Re-sectioning of rivers will impact the vegetation on the
embankments. The felling of certain trees planted on the embankments will require permission
from Forest Department. Re-sectioning of the river will require the removal of silt from the riverbed
and, if suitable, it will be used for the standardisation and improvement of the embankments.
5.26 Program Risks and Mit igat ing Measures
The CASDP PPTA team carried out institutional, infrastructure, procurement and financial assessments of
the executing and the implementing agency, WRD, at State, Regional and Divisional levels. The
assessment findings and proposed risk management measures are shown in Table 5.12.
324440/IDD/IDC/1/B 10 October2014 Final Report Final V1
102
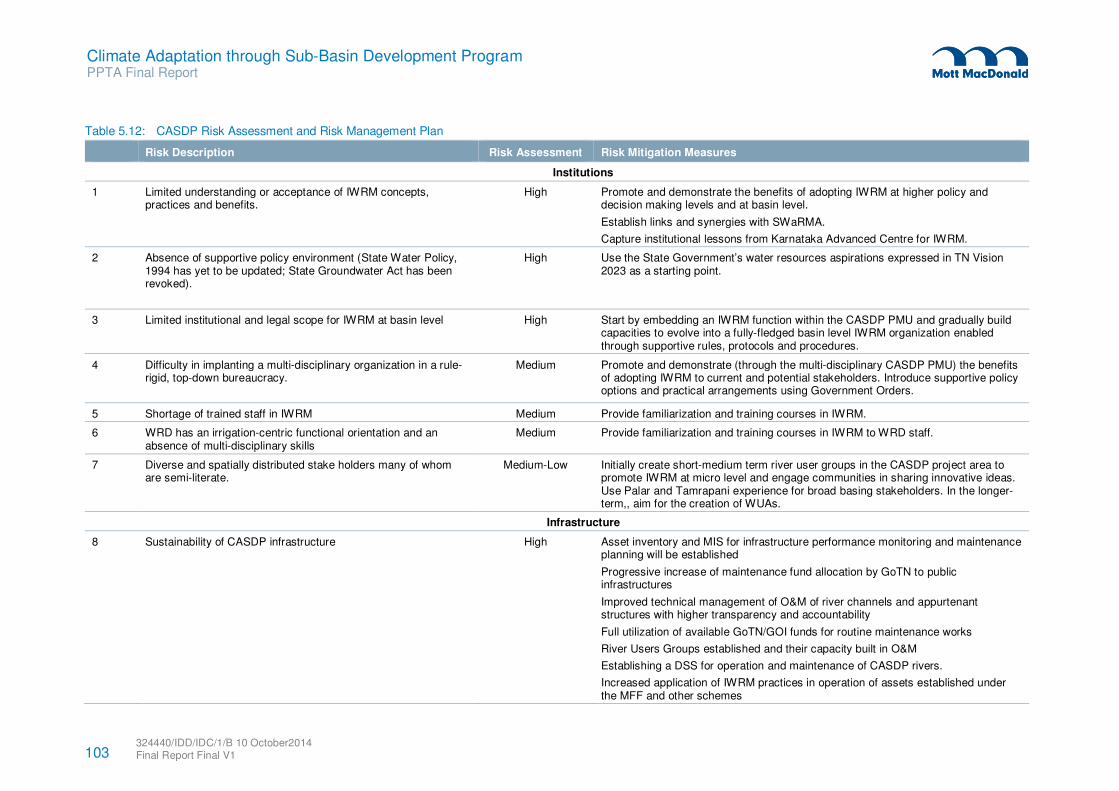
Climate Adaptation through Sub-Basin Development Program PPTA Final Report
Table 5.12: CASDP Risk Assessment and Risk Management Plan
Risk Description Risk Assessment Risk Mitigation Measures
Institutions
1 Limited understanding or acceptance of IWRM concepts, practices and benefits.
High Promote and demonstrate the benefits of adopting IWRM at higher policy and decision making levels and at basin level.
Establish links and synergies with SWaRMA.
Capture institutional lessons from Karnataka Advanced Centre for IWRM.
2 Absence of supportive policy environment (State Water Policy, 1994 has yet to be updated; State Groundwater Act has been revoked).
High Use the State Government’s water resources aspirations expressed in TN Vision 2023 as a starting point.
3 Limited institutional and legal scope for IWRM at basin level High Start by embedding an IWRM function within the CASDP PMU and gradually build capacities to evolve into a fully-fledged basin level IWRM organization enabled through supportive rules, protocols and procedures.
4 Difficulty in implanting a multi-disciplinary organization in a rule-rigid, top-down bureaucracy.
Medium Promote and demonstrate (through the multi-disciplinary CASDP PMU) the benefits of adopting IWRM to current and potential stakeholders. Introduce supportive policy options and practical arrangements using Government Orders.
5 Shortage of trained staff in IWRM Medium Provide familiarization and training courses in IWRM.
6 WRD has an irrigation-centric functional orientation and an absence of multi-disciplinary skills
Medium Provide familiarization and training courses in IWRM to WRD staff.
7 Diverse and spatially distributed stake holders many of whom are semi-literate.
Medium-Low Initially create short-medium term river user groups in the CASDP project area to promote IWRM at micro level and engage communities in sharing innovative ideas. Use Palar and Tamrapani experience for broad basing stakeholders. In the longer-term,, aim for the creation of WUAs.
Infrastructure
8 Sustainability of CASDP infrastructure High Asset inventory and MIS for infrastructure performance monitoring and maintenance planning will be established
Progressive increase of maintenance fund allocation by GoTN to public infrastructures
Improved technical management of O&M of river channels and appurtenant structures with higher transparency and accountability
Full utilization of available GoTN/GOI funds for routine maintenance works
River Users Groups established and their capacity built in O&M
Establishing a DSS for operation and maintenance of CASDP rivers.
Increased application of IWRM practices in operation of assets established under the MFF and other schemes
103 324440/IDD/IDC/1/B 10 October2014 Final Report Final V1
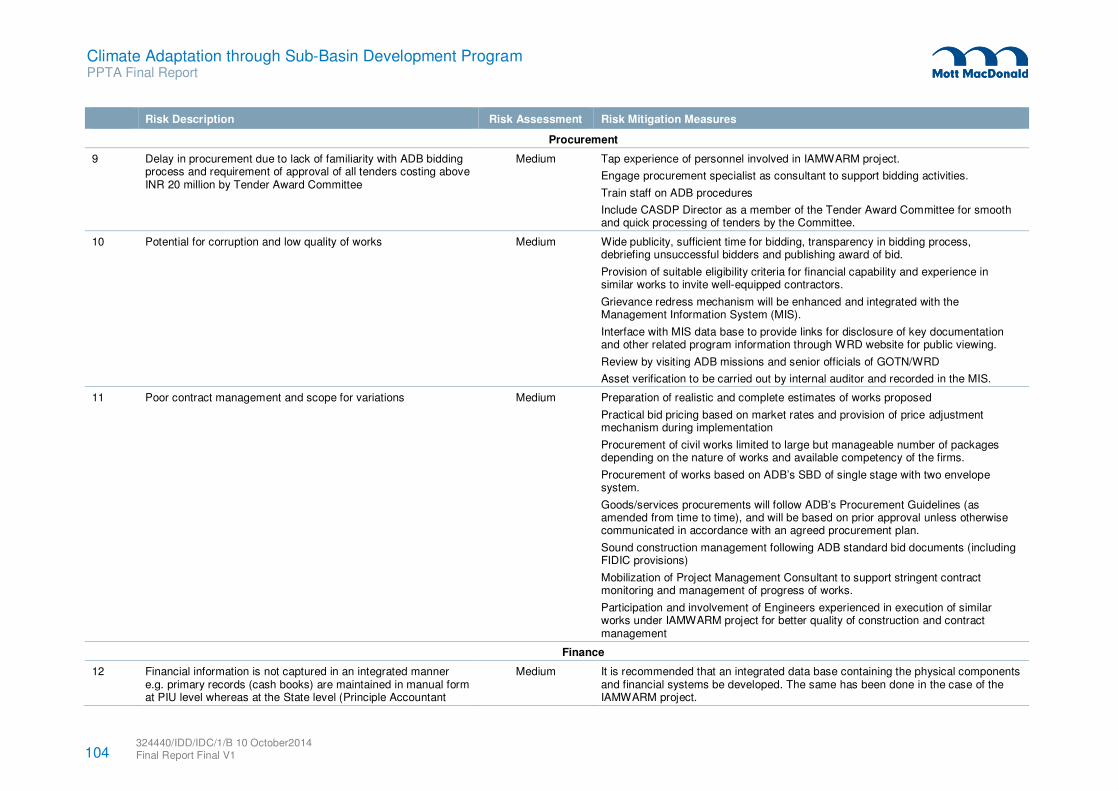
Climate Adaptation through Sub-Basin Development Program PPTA Final Report
Risk Description Risk Assessment Risk Mitigation Measures
Procurement
9 Delay in procurement due to lack of familiarity with ADB bidding process and requirement of approval of all tenders costing above INR 20 million by Tender Award Committee
Medium Tap experience of personnel involved in IAMWARM project.
Engage procurement specialist as consultant to support bidding activities.
Train staff on ADB procedures
Include CASDP Director as a member of the Tender Award Committee for smooth and quick processing of tenders by the Committee.
10 Potential for corruption and low quality of works Medium Wide publicity, sufficient time for bidding, transparency in bidding process, debriefing unsuccessful bidders and publishing award of bid.
Provision of suitable eligibility criteria for financial capability and experience in similar works to invite well-equipped contractors.
Grievance redress mechanism will be enhanced and integrated with the Management Information System (MIS).
Interface with MIS data base to provide links for disclosure of key documentation and other related program information through WRD website for public viewing.
Review by visiting ADB missions and senior officials of GOTN/WRD
Asset verification to be carried out by internal auditor and recorded in the MIS.
11 Poor contract management and scope for variations Medium Preparation of realistic and complete estimates of works proposed
Practical bid pricing based on market rates and provision of price adjustment mechanism during implementation
Procurement of civil works limited to large but manageable number of packages depending on the nature of works and available competency of the firms.
Procurement of works based on ADB’s SBD of single stage with two envelope system.
Goods/services procurements will follow ADB’s Procurement Guidelines (as amended from time to time), and will be based on prior approval unless otherwise communicated in accordance with an agreed procurement plan.
Sound construction management following ADB standard bid documents (including FIDIC provisions)
Mobilization of Project Management Consultant to support stringent contract monitoring and management of progress of works.
Participation and involvement of Engineers experienced in execution of similar works under IAMWARM project for better quality of construction and contract management
Finance
12 Financial information is not captured in an integrated manner e.g. primary records (cash books) are maintained in manual form at PIU level whereas at the State level (Principle Accountant
Medium It is recommended that an integrated data base containing the physical components and financial systems be developed. The same has been done in the case of the IAMWARM project.
104 324440/IDD/IDC/1/B 10 October2014 Final Report Final V1
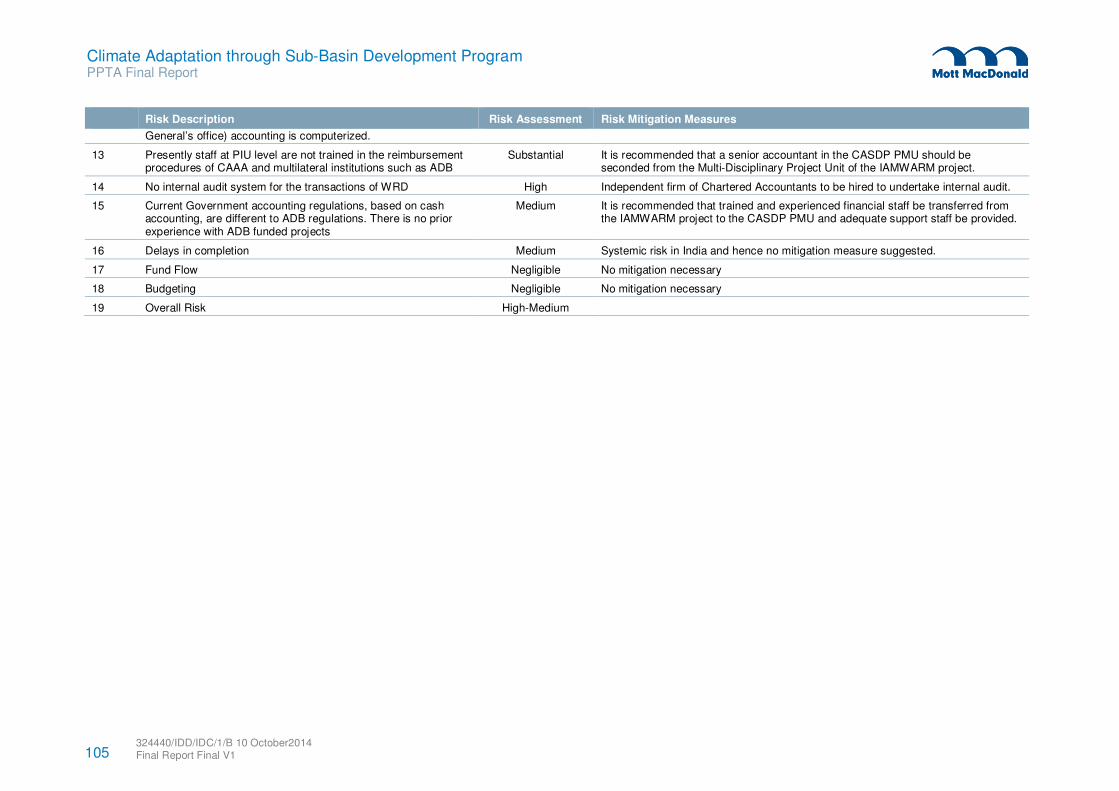
Climate Adaptation through Sub-Basin Development Program PPTA Final Report
Risk Description Risk Assessment Risk Mitigation Measures
General’s office) accounting is computerized.
13 Presently staff at PIU level are not trained in the reimbursement procedures of CAAA and multilateral institutions such as ADB
Substantial It is recommended that a senior accountant in the CASDP PMU should be seconded from the Multi-Disciplinary Project Unit of the IAMWARM project.
14 No internal audit system for the transactions of WRD High Independent firm of Chartered Accountants to be hired to undertake internal audit.
15 Current Government accounting regulations, based on cash accounting, are different to ADB regulations. There is no prior experience with ADB funded projects
Medium It is recommended that trained and experienced financial staff be transferred from the IAMWARM project to the CASDP PMU and adequate support staff be provided.
16 Delays in completion Medium Systemic risk in India and hence no mitigation measure suggested.
17 Fund Flow Negligible No mitigation necessary
18 Budgeting Negligible No mitigation necessary
19 Overall Risk High-Medium
105 324440/IDD/IDC/1/B 10 October2014 Final Report Final V1
Climate Adaptation through Sub-Basin Development Program PPTA Final Report
A Climate Adaptation through Sub-Basin Development Program (CASDP) has been prepared for irrigation
systems in the Cauvery Delta in Tamil Nadu, India. The Delta is vulnerable to water shortages, floods and
droughts. These climate impacts limit social and economic development.
Climate change studies during the CASDP PPTA indicate increases in rainfall during the monsoon months
(June to December) but drier conditions from January to May. Mean annual temperature is expected to rise
by 1.50C by 2050. The climate projections also show large increases in storm rainfall (19%). Therefore
more frequent and serious flooding can be expected. In coastal areas flooding will be gradually
exacerbated by rising sea levels of between 0.29m (low scenario) and 0.87m (high scenario) by 2100.
The climate change projections indicate only a marginal decrease in vulnerability to water scarcity during
the monsoon periods and greater vulnerability during the dry season. They also indicate a significant
increase in vulnerability to floods. The Program has therefore been designed to address two major climate
change risks (i) water scarcity and (ii) floods.
A Multi-Tranche Financing Facility (MFF) approach to the execution of CASDP has been agreed by ADB
and the Governments of India and Tamil Nadu. The total value of the MFF will be $300 million. Three
tranches are proposed to fund three projects on the main rivers and drains in the Vennar and Cauvery
irrigation systems in the Cauvery Delta which are expected to be executed sequentially over seven years
(2014 to 2021).
Project 1 (the sub-basins of the Pandavanar, Vellaiyar, Harichandra, Adappar Rivers, the Valavanar Drain,
the Vedharanyam Canal and Vellaiyar, Lawford and Adappar Straight Cuts in the Vennar System) was
designed during the PPTA for the Program and is expected to be executed from 2014 to 2016. The
estimated cost of Project 1 is $114.4 million.
Project 2 (the remaining rivers and main drains in the Vennar System) and Project 3 (the rivers and main
drains in the Cauvery System) will be designed during the execution of Project 1. However, if the range of
climate adaptations required in Projects 2 and 3 is similar to the range of Project 1, the balance ($185.6
million) of the MFF is unlikely to be sufficient to complete both Projects 2 and 3. Also it should be noted
that climate adaptations in other systems in the Cauvery Delta (Grand Anicut Canal, Lower Coleroon) are
not included in the Program. It should also be noted that the Program is designed to deliver increased
climate resilience of arterial irrigation channels and principal drains. Increased climate resilience of the
irrigation canal networks is outside the scope of the Program; it is expected to be delivered by other
proposed Government projects. Therefore the full potential benefits of CASDP will only be possible when
these other projects are executed.
In the meantime the Program is expected to deliver agricultural benefits from (i) repairs/reconstruction of
irrigation structures and maintenance of present levels of productivity and (ii) rehabilitation of pumping
schemes and restoration of water supplies to the original command areas. The Program is also expected
to deliver benefits through avoided flood damage to communities, crops and infrastructure. The financial
benefit-cost ratio for the Project-1 under a medium climate change scenario is 1.11. Although some
individual components are not economically feasible, Project-1 as a whole is financially and economically
feasible.
The impact of the Program is expected to be less vulnerability of communities in the Cauvery delta to
climate variability and climate change. The outcome is expected to be improved availability of water,
6 Conclusions
324440/IDD/IDC/1/B 10 October2014 Final Report Final V1
106
Climate Adaptation through Sub-Basin Development Program PPTA Final Report
reduced sea water ingress into rivers and drains and reduced flood damage. The outputs of the Program
are expected to be (i) greater availability of surface water for irrigation through the rehabilitation and
construction of climate resilient hydraulic infrastructure, including tail-end regulators to prevent ingress of
sea water, (ii) greater equity in the distribution of water for irrigation, particularly to downstream farmers,
through systematic conjunctive use of groundwater and improved surface water infrastructure, (iii) reduced
flood damage through channel re-sectioning, raising of embankments and dredging of coastal outlets, flood
forecasting and warning systems and flood risk mapping, (iv) arrested inland migration of saline
groundwater through investigations of groundwater dynamics in coastal areas and the feasibility of
recharge schemes, (v) improved water resources management through (a) increased hydrometeorological
monitoring, (b) enhanced decision support systems for water resources planning and operational purposes
and (c) greater participation of government stakeholders and water users in water resources management.
Acknowledgement
The PPTA Team acknowledges with thanks the guidance and support provided by ADB during the PPTA.
The PPTA Team also acknowledges with thanks the considerable assistance provided by the Tamil Nadu
Water Resources Department, specifically the Project Director/Chief Engineer in Trichy, the
Superintending Engineer of the Lower Cauvery Circle in Thanjavur, the District Executive Engineers and
their teams in Thanjavur, Thiruravur and Mayiladuthurai.
324440/IDD/IDC/1/B 10 October2014 Final Report Final V1
107
Climate Adaptation through Sub-Basin Development Program PPTA Final Report
ADB. (2011). TA-7417-IND: Support for the NAPCC, 2010-11). Manila: Asian Development Bank.
ADB. (2012). Proposed Multitranche Financing Facility; India:Climate Adaptation through Sub-Basin
Development Investment Program. Manila: Asian Development Bank.
ADB. (2013b). Climate Adaptation through Sub-Basin Development Investment Program- Aide Memoire -
PPTA Interim Review Mission 2-10 December 2013. Chennai: ADB.
BoEF. (2006, December). Water balanace and Water Conservation in Thermal Power Stations. Bulletin on
Energy Efficiency, 7(3).
CGWB. (2008a). District Groundwater Brochure Nagapattinam District. November 2008. (V. Dhinagaran,
Scientist-D). Central Groundwater Board.
CGWB. (2008b). District Groundwater Brochure Thiruvarur District. November 2008. (V. Dhinagaran,
Scientist-D). Central Groundwater Board.
CGWB. (2009). District Groundwater Brochure Thanjavur District. March 2009. (V. Dhinagaran, Scientist-
D). Central Groundwater Board.
CGWB. (undated). Ground Water Resources and Development Potential of Thanjavur District, Tamil Nadu.
Central Groundwater Board.
CWC. (2010). Guidelines for Preparation of Detailed Project Report of Irrigation and Multipurpose Projects.
Delhi: Central Water Commission.
Dastgheib. (2014). Relative Sea Level Rise Scenarios. Manila: ADB.
GEC. (1997). Method of Groundwater Resource Estimation Committee. Groundwater Estimation
Committee.
GoTN. (2005). Tamil Nadu Development Report. Chennai: Tamil Nadu Planning Commission.
GoTN. (2012). Tamil Nadu Twelfth Five Year Plan 2012-2017. Chennai: Tamil Nadu State Planning
Commission.
GoTN. (2012). Twelfth Five Year Plan 2012-2017. Chennai: Tamil Nadu Planning Commission.
Iver, R. R. (2013, January 7). Why a National Framework Law. The Hindu.
Srinivasan. (2013). Cauvery Delta Zone: Climate Data and Future Scenarios. Manila: ADB.
TNPC. (2005). Tamil Nadu Development Report. Delhi: Central Planning Commission.
7 Bibliography
324440/IDD/IDC/1/B 10 October2014 Final Report Final V1
108
Climate Adaptation through Sub-Basin Development Program PPTA Final Report
UNDP. (1970). Ground water investigation in Tamil Nadu (Phase II), Public Works Department
Groundwater Report. UNDP.
WRD. (2013). Chennai: Tamil Nadu Water Resources Department.
WRD. (2013). Preliminary Project Proposal on Improvements and Rehabilitation of Irrigation Systems in
Cauvery Basin for Efficient Water Management. Chennai: Tamil Nadu Water Resources
Department.
WRO. (2008). Cauvery Modernisation Proposal. Chennai: Water Resources Organisation.
WRO. (2008). Cauvery Modernisation Proposal. Chernnai: Tamil Nadu Water Resources Organisation.
324440/IDD/IDC/1/B 10 October2014 Final Report Final V1
109

Climate Adaptation through Sub-Basin Development Program PPTA Final Report
Appendix A. Water Resources Sector Assessment
324440/IDD/IDC/1/B 10 October2014 Final Report Final V1
110

Climate Adaptation through Sub-Basin Development Program PPTA Final Report
Appendix B. Agriculture Sector Assessment
324440/IDD/IDC/1/B 10 October2014 Final Report Final V1
111

Climate Adaptation through Sub-Basin Development Program PPTA Final Report
Appendix C. Aquaculture Sector Assessment
324440/IDD/IDC/1/B 10 October2014 Final Report Final V1
112
Climate Adaptation through Sub-Basin Development Program PPTA Final Report
Appendix D. Climate Change Assessment
324440/IDD/IDC/1/B 10 October2014 Final Report Final V1
113
Climate Adaptation through Sub-Basin Development Program PPTA Final Report
Appendix E. Institutions and Policies Assessment
324440/IDD/IDC/1/B 10 October2014 Final Report Final V1
114
Climate Adaptation through Sub-Basin Development Program PPTA Final Report
Appendix F. Financial Management Assessment
324440/IDD/IDC/1/B 10 October2014 Final Report Final V1
115
Climate Adaptation through Sub-Basin Development Program PPTA Final Report
Appendix G. Procurement Capacity Assessment
324440/IDD/IDC/1/B 10 October2014 Final Report Final V1
116
Climate Adaptation through Sub-Basin Development Program PPTA Final Report
Appendix H. Detailed Project Report
324440/IDD/IDC/1/B 10 October2014 Final Report Final V1
117
Climate Adaptation through Sub-Basin Development Program PPTA Final Report
Appendix I. Surface Water and Groundwater Modelling
324440/IDD/IDC/1/B 10 October2014 Final Report Final V1
118
Climate Adaptation through Sub-Basin Development Program PPTA Final Report
Appendix J. Economic and Financial Analysis
324440/IDD/IDC/1/B 10 October2014 Final Report Final V1
119

Climate Adaptation through Sub-Basin Development Program PPTA Final Report
Appendix K. Social and Gender Assessment
324440/IDD/IDC/1/B 10 October2014 Final Report Final V1
120
Climate Adaptation through Sub-Basin Development Program PPTA Final Report
Appendix L. Resettlement Framework
324440/IDD/IDC/1/B 10 October2014 Final Report Final V1
121
Climate Adaptation through Sub-Basin Development Program PPTA Final Report
Appendix M. Resettlement Plan and Gender Action Plan
324440/IDD/IDC/1/B 10 October2014 Final Report Final V1
122
Climate Adaptation through Sub-Basin Development Program PPTA Final Report
Appendix N. Environmental Assessment and Review Framework
324440/IDD/IDC/1/B 10 October2014 Final Report Final V1
123
Climate Adaptation through Sub-Basin Development Program PPTA Final Report
Appendix O. Initial Environmental Examination
324440/IDD/IDC/1/B 10 October2014 Final Report Final V1
124
Climate Adaptation through Sub-Basin Development Program PPTA Final Report
Appendix P. Water Resources Management Road Map
324440/IDD/IDC/1/B 10 October2014 Final Report Final V1
125
Climate Adaptation through Sub-Basin Development Program PPTA Final Report
Appendix Q. Flood Management
324440/IDD/IDC/1/B 10 October2014 Final Report Final V1
126
Climate Adaptation through Sub-Basin Development Program PPTA Final Report
Appendix R. Communication Plan
324440/IDD/IDC/1/B 10 October2014 Final Report Final V1
127
Climate Adaptation through Sub-Basin Development Program PPTA Final Report
Appendix S. CASDP Risk Assessment and Risk Management Plan
324440/IDD/IDC/1/B 10 October2014 Final Report Final V1
128
Climate Adaptation through Sub-Basin Development Program PPTA Final Report
Appendix T. Climate Change Study
324440/IDD/IDC/1/B 10 October2014 Final Report Final V1
129

Climate Adaptation through Sub-Basin Development Program PPTA Final Report
Appendix U. Sea Level Rise Study
324440/IDD/IDC/1/B 10 October2014 Final Report Final V1
130


[sub 2]-MgO, Mg[sub 2]V[sub 2]O[sub 7], and (VO)[sub 2]P[sub 2]O[sub 7](https://img.dokumen.tips/doc/110x75/631ee88f7509c0131f09539e/selectivity-patterns-in-alkane-oxidation-over-mgsub-3vosub-4sub-2-mgo-mgsub.jpg)


![Microstructure, phase transition, and electrical properties of (K[sub 0.5]Na[sub 0.5])[sub 1−x]Li[sub x](Nb[sub 1−y]Ta[sub y])O[sub 3] lead-free piezoelectric ceramics](https://img.dokumen.tips/doc/110x75/6336572db5f91cb18a0bc82e/microstructure-phase-transition-and-electrical-properties-of-ksub-05nasub.jpg)
![Nucleation of Ga[sub 2]O[sub 3] nanocrystals in the K[sub 2]O–Ga[sub 2]O[sub 3]–SiO[sub 2] glass system](https://img.dokumen.tips/doc/110x75/6337300a20d9c9602f0b2f7c/nucleation-of-gasub-2osub-3-nanocrystals-in-the-ksub-2ogasub-2osub-3siosub.jpg)


