Embed Size (px)
Citation preview
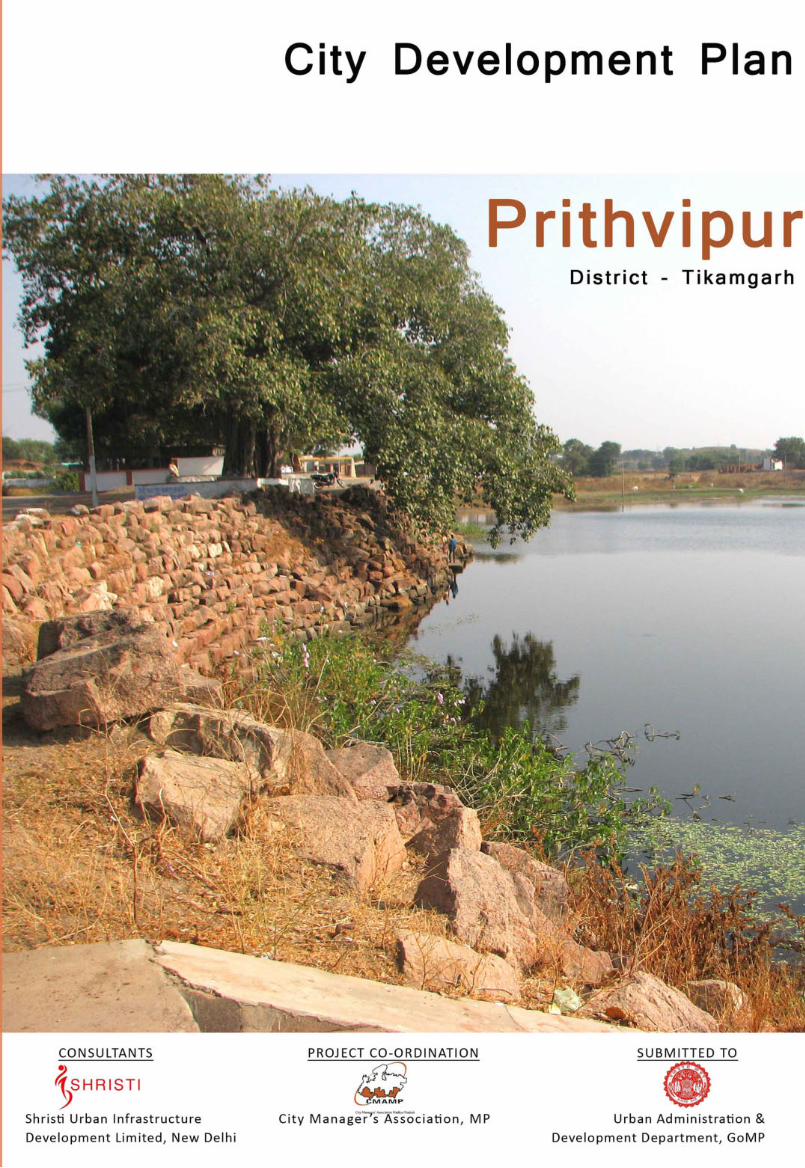
Shristi Urban Infrastructure Development Ltd. Prithvipur (Tikamgarh)
DISCLAIMER
The City Development Plan is a recommendatory report prepared by Shristi Urban Infrastructure Development
Ltd. in accordance with the Terms of Reference of the agreement with UADD, Govt. of MP. The analysis and
outcome of this report is based on stakeholder feedback and data furnished by the ULB. Based on prima facie
observation, we can assume that the facts and the data provided by the ULB are true and correct and we have
no reason to believe otherwise. However, Shristi Urban Infrastructure Development Ltd have neither verified
the data independently, nor conducted any field surveys and audits with the purpose of data verification, and
shall not be responsible for any inaccuracy or shortcomings in the data represented in the report or any errors
resulting from erroneous or incomplete data.
SWOT analysis, sector strategies & action plan and other subjective remarks and conclusions included in this
document represent only our standpoint based on the consultative process carried out with various
stakeholders. All calculations and estimates are preliminary in nature and serve to identify areas of investment
and make budgetary allocations only. They are NOT suitable for executive purposes. All projections including
the Investment Plan are subject to contingencies which may be suitably assumed while preparing detailed
project reports.
Shristi Urban Infrastructure Development Ltd assumes no liability, whatsoever, for any losses or damages
incurred by the ULB or any stakeholder. All references to this document must include this disclaimer.
Shristi Urban Infrastructure Development Ltd. Prithvipur (Tikamgarh)
City Profile
CompanyName Shristi Urban Infrastructure Development
Ltd.
ULB Name Prithvipur
Whether the Sectoral Analysis report is as per UADD requisites
Yes
Tow
n B
rief
Geographical location (Town) Latitude 25⁰11
Longitude 78⁰39
Average rainfall (annual) MM 832
Height above mean sea level Mts 290
Municipal area (1991) Sq kms 0.54
Municipal area (2001) Sq kms 0.54
Municipal area (2011) Sq kms 0.54
Date of Constitution of ULB Date 30th January 1979
Popula
tion
Population Year 1981 (under Municipal boundary only)
Town level
12163
Population Year 1991 (under Municipal boundary only)
17020
Population Year 2001 (under Municipal boundary only)
22535
Population Year 2011 (under Municipal boundary only)
26883
Name of Population projection Method
Assumed Growth Rate
Projected population adopted Year 2015
29034
Projected population adopted Year 2025
34840
Projected population adopted Year 2035
40066
Land U
se
Land Use % Standard (as
per UDPFI) Land use (Tentative
in Sq kms ) Land use (Tentative in
percentage)
Residential 40-45 1.69 44.00
Commercial 2-3 0.08 2.00
Public - semi public 6-8 0.16 4.00
Agriculture Balance 0.67 28.00
Industrial 8-10 0 0.00
Roads 10-12 0.29 8.00
Green area Balance 0 0.00
Sensitive - 0 0.00
Water bodies Balance 0.51 14.00
Total 100 3.4 100.00
Shristi Urban Infrastructure Development Ltd. Prithvipur (Tikamgarh)
City Profile (Ward Wise)
Ward # Ward 1 Ward 2
Ward 3 Ward 4
Ward 5 Ward 6
Ward 7 Ward 8 Ward 9
Ward 10
Ward 11
Ward 12
Ward 13
Ward 14
Ward 15
Total
Name of ward Chandra shakhar
Ajad
Ward
Nehru Ward
Maharani Lakshmi
Bai Ward
Hardol Ward
Ramraja Ward
Molana Abdul
Kalam
Ward
Dr. Bheemrao
Ambedkar
Ward
Subhash Ward
Indra Gandhi
Ward
Dr. Ram Manohar
Lohiya
Ward
Shivaji Ward
Amar singh
Rathor
Ward
Sanjay Gandhi
Ward
Lal Bahadur
Shashtri
Ward
Rajeev Gandhi
Ward
Ward Population (2001)
1803 1655 1734 1591 1175 1276 1306 1248 1476 2019 1548 1197 1480 1592 1435 22535
Area (Sqkm) 1.6 1.2 0.9 0.27 0.26 0.12 0.1 0.1 0.73 1.73 2.86 1.33 3.36 1.66 2.57 18.79
Density (PPSqkm) 1127 1379 1927 5893 4519 10633 13060 12480 2022 1167 541 900 440 959 558 1199.3
Male(2001) 979 878 922 833 640 655 650 665 754 1085 833 636 770 823 770 11893
Female(2001) 824 777 812 758 535 621 656 583 722 934 715 561 710 769 665 10642
SC 141 293 626 631 899 44 1062 46 197 315 120 710 100 80 239 5503
ST 42 89 50 0 0 0 0 1 10 13 43 0 30 0 16 294
BPL(2011) 120 125 96 157 235 48 145 78 143 316 254 173 247 241 261 2639
Sex ratio 842 885 881 910 836 948 1009 877 958 861 858 882 922 934 864
Literacy rate (%) 77.6 69.1 78.7 67.6 66.6 89.7 65 86.3 54.8 39.9 30.7 70.4 47.9 27.9 47.9
No. of Primary schools
1 1 1 1 0 1 1 1 1 1 1 1 1 1 1 14
No. of Primary Health Centre
0 0 1 0 0 0 0 0 0 0 0 0 0 0 0 1
No. of Households 328 301 315 289 214 232 237 227 268 367 281 218 269 289 261 4097
Primary occupation
(Majority)
Farming
Seconday occupation
Trading
Tertiary occupation
Labours
No. of SS/LS industrial units
0 0 0 0 0 0 0 0 0 0 0 0 0 0 0
No. of Commercial establishments
NA NA NA NA NA NA NA NA NA NA NA NA NA NA NA
Shristi Urban Infrastructure Development Ltd. Prithvipur (Tikamgarh)
No. of Slum pockets
0 0 0 1 1 0 0 0 0 0 0 1 1 1 1
Slum population 0 0 0 636 470 0 0 0 0 0 0 958 1184 1274 1148 5670
No. of Slum Households
0 0 0 116 85 0 0 0 0 0 0 174 215 232 209 1031
No. of Individual water connections in the ward
34 112 65 102 26 168 19 129 68 72 38 36 0 0 0 869
No. of Community water connections
4 4 4 4 4 4 4 4 4 4 4 5 6 6 6 67
No. of Commercial water connections
0 2 3 3 1 0 0 0 0 0 0 0 0 0 0 9
No. of Tubewells 0 1 0 0 0 0 0 0 1 1 1 2 0 0 2 8
No. of Handpumps 12 12 12 12 12 12 12 12 12 12 12 12 12 12 12 180
No. of OHTs 0 0 1 0 0 0 0 0 0 1 0 0 0 0 0 2
% Coverage of piped water supply
10 37 21 35 12 72 8 57 25 20 14 17 0 0 0 22
No. of Individual
Toilets 229 211 221 202 150 162 166 159 188 257 28 22 27 29 26 2077
No. of Individual Septic tanks
229 211 221 202 150 162 166 159 188 257 28 22 27 29 26 2077
No. of Community Septic tanks
0 0 0 0 0 0 0 0 0 0 0 0 0 0 0 0
No. of Community toilets
0 0 0 0 0 0 0 0 0 0 0 0 0 0 0 0
% of population - Open defecation
30 30 30 30 30 30 30 30 30 30 90 90 90 90 90 49
No. of Dust bins 2 2 2 2 2 2 2 1 2 1 2 1 1 1 1 24
Wardwise Waste generated (Kgs)
0.45 0.41 0.43 0.40 0.29 0.32 0.33 0.31 0.37 0.50 0.39 0.30 0.37 0.40 0.36 5.6
Road sweeping (1 time or 2 times)
1 1 1 1 1 1 1 1 1 1 1 1 1 1 1 15
Total no. of sanitary workers in the ward
4 4 4 4 4 4 4 4 4 4 4 3 3 3 3 56
Length of Pucca road (Mts)
2900 1300 1100 800 600 700 1400 900 700 1500 2900 2000 400 1300 1500 20000
Shristi Urban Infrastructure Development Ltd. Prithvipur (Tikamgarh)
Length of Kuccha road (Mts)
1800 1000 3000 400 300 200 300 200 500 300 700 900 3000 1000 1400 15000
Length of State Highway
0 0
Length of National Highway
3000 3000
Length of Road side drains Pucca (Mts)
2320 1040 880 640 480 560 1120 720 560 1200 2320 1600 320 1040 1200 16000
Length of Natural drains (Nallah) Pucca/Channelized (Mts)
3000 3000
Length of Natural drains (Nallah) Kuttcha (Mts)
2000 2000
No. of Streetlights 31 48 51 35 22 28 21 20 51 51 84 24 60 66 70 662
No. of Electricity connections
NA NA NA NA NA NA NA NA NA NA NA NA NA NA NA NA
Bus stop (No.) 0 0 1 0 0 0 0 0 0 0 0 0 0 0 0 1
Bus stand(No.) 0 0 1 0 0 0 0 0 0 0 0 0 0 0 0 1
Parks (No.) 0 0 0 0 0 0 0 0 0 0 0 0 0 0 0 0
Playground(No.) 0 0 0 0 0 0 0 0 1 0 0 0 0 0 0 1
Shristi Urban Infrastructure Development Ltd. Prithvipur (Tikamgarh)
Slums and Urban Poor
Ward No
Name of
Slum pocket
/ reference
name
Notified/ Un-
notified
Ward populatio
n
Slum populatio
n
Slum populatio
n hh
Individual water
connections
No. of Community taps
No. of Handpum
ps
No. of Individual toilets
No. of Community toilets
No. of Pucca house
s
No. of Semi pucca house
s
No. of Kucch
a house
s
No. of Primar
y school in the slum
No. of Primar
y Health centres in the
slum pocket
4 Notified 1591 636 116 30 4 12 35 0 35 40 40 1 0
5 Notified 1175 470 85 0 4 12 26 0 26 30 30 1 0
12 zer Notified 1197 958 174 16 5 12 17 0 26 44 104 1 0
13 Nayakeda
Notified 1480 1184 215 0 6 12 22 0 32 54 129 1 0
14 Bindpu
ra Notified 1592 1274 232 0 6 12 23 0 35 58 139 1 0
15 Kargu
a Notified 1435 1148 209 0 6 12 21 0 31 52 125 1 0
Shristi Urban Infrastructure Development Ltd. Prithvipur (Tikamgarh)
Sectoral Analysis Physic
al In
frastr
uctu
re
Wate
r Supply
Existing Source
Source Tubewell Well River/Lake
No. of Tubewell / River / Well 8 2 Radha sagar Talab, &
Jer Talab
Water Supplied by Tubewell / River / Well in MLD
0.2 0.1 0
Total water supply in the town (MLD) 0.3
Existing Supply rate (LPCD) considering distribution losses 70
Water Charges per household per month (Rs.) Flat/Metered 30 (Flat)
% Coverage under paid water supply 22
Whether any treatment plant exists (Y/N),If yes mention capacity (MLD) N
Proposed source (Surface) Jamuni River
Sew
era
ge
Total sewage generation (MLD) 0.24
Whether any treatment plant exists (Y/N),If yes mention capacity No
Total no. of individual septic tanks 2077
Total no. of community septic tanks 0
Total no. of Sewage/Mud pumps available with the ULB 0
Frequency of Cleaning Individual Septic tanks As required
Frequency of Cleaning Community Septic tanks As required
Dra
inage
Name of natural nallah (Storm water drain) no name
Length of natural nallah (Storm water drain) Kms 5
Ultimate disposal point of nallah Jamuni river
Length of road side drain (Kms) 16
Coverage of road side drainage w.r.t roads (%) 80
Ultimate disposal point of Road side drains Nallah
Any treatment plant/procedure adopted Chemical Spray
practiced
SW
M
Per capita Solid waste generation (Considering Standards) (in gms) 250
Total SW generation (in Tons) 5.60
Frequency of SW collection by the ULB (1 time per day/2 times per day) 1
Collection efficiency of the ULB (%) 55
Any initiative for DTDC (Yes /No) No
Any initiative for scientific disposal of waste No
Name of dumping/ landfill site Trenching ground
Is the existing site Dumping site or allotted site for Scientific disposal Allotted site
Area of allotted landfill site for Scientific disposal 5 he
Shristi Urban Infrastructure Development Ltd. Prithvipur (Tikamgarh)
Distance of the Dumping site/landfill site from main settlement area (Kms)
3
No. of Tractor trolleys/vehicles available with the ULB for carrying Solid waste to the LF site
2 Tractor Trolleys
If site for Scientific disposal is not allotted then whether formally
requested by the ULB
Physic
al In
frastr
uctu
re
Roads
Name of National Highway passing from or nearby from the town (NH-XYZ)
NH-12A
Distance of National Highway if nearby from the town (NH-XYZ) in Kms 0
Name of State Highway passing from or nearby from the town (SH-XYZ) SH-37
Distance of State Highway if nearby from the town (SH-XYZ) in Kms 0
Total length of Pucca roads (Kms)
CC 11
WBM 0
Total (kms) 11
Total length of Kuccha roads (kms) (kms) 15
Gap w.r.t Standards (kms) 12.5
Tra
ffic
& t
ransport
ation
Total no. of vehicles in the town
Bus stand (yes/No) 1
Any intracity mass transport mode (yes/no) NO No
Name of locations facing major traffic issues
1 Fawbara chowk
2 Jeron khalsa tigela
3 Teharka Road
Str
eet
lighting
Total no. of street lights 662
No. of Streetlights under working condition 497
No. of Streetlights having Tubes 0
No. of Streetlights having CFL 0
No. of Streetlights having Incandescent bulbs 0
No. of Streetlights having LED (SVL) 497
No. of Streetlights having LPS 0
Pow
er
Location of Substation http://www.mptransco.nic.in
400 KV Bina
220KV Tikamgarh
132KV Prithvipur
Herita
ge &
tourism
H
er
ita
ge
&
tou
ris
m
Name of Heritage site/s
Environm
ent
Name of River/Lake/Forest range/Any specific species Radha sagar Talab, &
Jer Talab
Prevailing Environmental Act/s 0
Areas facing threats 0
Socia
l
Infr
ast
ructu
re
Health
No. of Primary Health centres/Dispensary 1
Shristi Urban Infrastructure Development Ltd. Prithvipur (Tikamgarh)
No. of Hospitals
Government 1
Beds 30
Private 0
Beds 0
Multispeciality hospital if any (Y/N) no No
Name of Nearby town reffered for Treatment Name of town Tikamgarh
Distance (Kms) 57
Education No. of Primary schools 14
No. of Secondary/High schools 4
No. of Colleges 1
No. of ITI 1
Municipal Finances
Year 2005-
06
2006-
07
2007-
08
2008-
09
2009-
10
2010-
11
Revenue I
ncom
e
Tax Revenue
2.1 5.6 95.7
Non Tax Revenue
33.5 19.1 76.1
Assigned Revenue and Compensations
115.9 138.9 127.4
Revenue Grants, Contributions and
Subsidies
30.0 25.3 24.5
Extra ordinary (Advances, investment
and deposits)
5.7 10.9 10.5
Total Revenue Income
187.2 199.0 334.5
Capital In
com
e
Income from sale of asset
- - -
Loans
5.0 - -
Grants & Contributions
154.0 150.4 144.9
Public Contribution
- - -
Other Capital income
- 0.4 -
Other contributions
- - -
total capital income
159 150.8 145
Revenue E
xpenditure
Salaries/ Wages & Allowances
77.9 55.4 76.2
Administrative Expenses
10.5 4.1 4.5
Operation & Maintenance
84.3 51.0 71.3
Programme Expenses
14.0 6.1 4.6
Repayment of Loans
8.0 - 1.1
Other Miscellaneous expenditure
32.5 2.2 2.1
Deposit Works
4.0 9.6 2.5
Loans & Advances to Employees
2.5 0.2 0.6
Shristi Urban Infrastructure Development Ltd. Prithvipur (Tikamgarh)
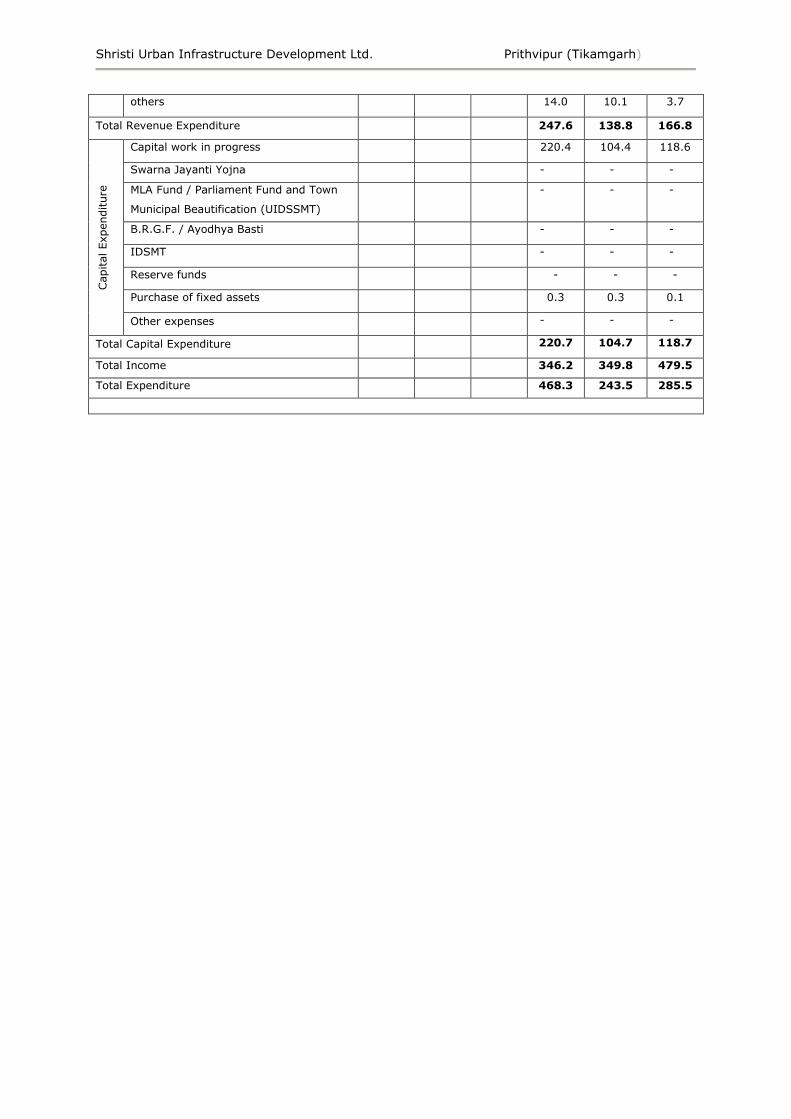
others
14.0 10.1 3.7
Total Revenue Expenditure
247.6 138.8 166.8
Capital Expenditure
Capital work in progress
220.4 104.4 118.6
Swarna Jayanti Yojna
- - -
MLA Fund / Parliament Fund and Town
Municipal Beautification (UIDSSMT)
- - -
B.R.G.F. / Ayodhya Basti
- - -
IDSMT
- - -
Reserve funds
- - -
Purchase of fixed assets
0.3 0.3 0.1
Other expenses
- - -
Total Capital Expenditure
220.7 104.7 118.7
Total Income
346.2 349.8 479.5
Total Expenditure
468.3 243.5 285.5
Shristi Urban Infrastructure Development Ltd. Prithvipur (Tikamgarh)
i
EXECUTIVE SUMMARY
THE CITY DEVELOPMENT PLAN UNDER UADD
Madhya Pradesh is urbanizing at a rapid rate and the Urban Local Bodies of the
state are facing the challenge of meeting the requirements of the growing
population with limited technical and financial resources. With the enactment of
the 74th constitutional Amendment act, major urban related tasks have been
transferred to Local Bodies. The Government of Madhya Pradesh (GoMp)
through its Urban Administration Department (UADD) is Responsible for
overseeing urban sector reforms, in terms of capital investment in basic
infrastructure for the Urban Local Bodies (ULB‘s). The UADD is also responsible
for implementation of various Public welfare Schemes sponsored by the central
and the state Government.
CITY DEVELOPMENT PLAN – THE PROCESS
The aim of this exercise is to support various Cities/Urban Local Bodies of
Madhya Pradesh in preparing the city Development Plan (CDP) for their
respective cities. The CDP Should provide a comprehensive medium strategy
(Vision 2035) as well as City Investment Plan (CIP), based on which the
concerned ULB will be able to access funds under GoI/GoMP Schemes as well
as from own and other sources based on priority actions and projects identified
in the CDP. The document should also provide Financial Operating Plan to
direct the ULB‘s for mobilising various financial resources to implement the
identified projects. The projects that qualify under this scheme include sub-
sectors of water supply, sewerage and sanitation, drainage, solid waste
management, roads, Traffic Management, Street Lighting, Urban renewal,
Tourism and Heritage Conservation, Basic services for Urban Poor, Social
Infrastructure, Environment and Municipal Governance. An important and
essential component of the CDP preparation process is stakeholder‘s
consultation. In order to effectively capture the needs and priorities of the
stakeholders, a stage wise Consultation process was adopted.
THE STATUS- CITY SWOT
A city level SWOT analysis has been done based on an assessment of the
status of various sectors of the city. These include the following
STRENGTHS
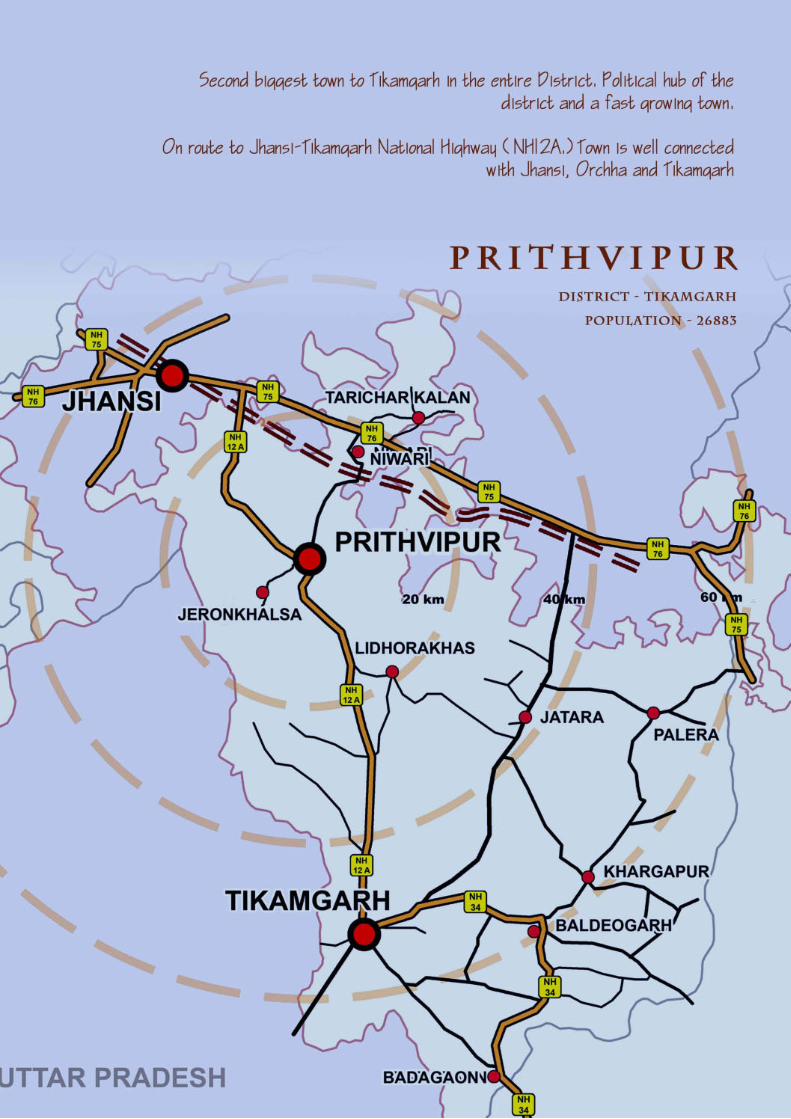
The location of Prithvipur has direct connectivity with Jhansi, Tikamgarh,
Orchha and Gwalior.
Well connected with rest of the state through road network.
One of the major centres for distribution for agricultural produce in the
region.
Presence of large number of lakes and water bodies in and around the city.
Shristi Urban Infrastructure Development Ltd. Prithvipur (Tikamgarh)
ii
Availability of large work force in the city
The city serves as a market centre for nearby small towns
Ample availability of land for development
Passionate involvement of the city residents for the betterment of their
city in many ways.
Good political will conducive for the development of the city.
Fundamental change in the mindset of people switching from traditional
family owned businesses to newer sectors reflects the eagerness to pursue
newer professions.
WEAKNESS
The major weaknesses for the city include infrastructure, Urban Growth,
Conservation, environment, Slums and institutional capacity. These include:
Absence of perennial source of water.
Lack of physical infrastructure such as street lighting, walkways, roads,
public toilets etc leads to poor quality of life in the city.
Absence of sewage disposal network and solid waste management system
in the city leads to serious health risks and environmental degradation.
Lack of socio-cultural, recreational spaces in the city.
Lack of active recreational spaces in the city for youngsters.
Poor status of traffic with narrow roads and encroachments causing
congestion.
Poor and unhygienic condition of slums
Vacant top positions in the institutional framework of Nagar Parishad,
leads to lower work efficiency of the offices.
A mismatch between post of an official and his/her responsibilities within
the Nagar Parishad also adds limited technical and administrative
capability of the municipal authorities.
Lack of jobs for graduates in the city.
OPPORTUNITIES
Promote the city as an agro based industrial centre with processing plants
since there is absence of any such large scale industry in the region.
Residents willing to pay for better services in the city, encouraging Public-
Private Partnership model for infrastructure development.
Shristi Urban Infrastructure Development Ltd. Prithvipur (Tikamgarh)
iii
Small distances within the city due to its small size, enables development
of newer, cheaper means of public transportation (eg. Solar hand
rickshaws)
Encourage innovative environment friendly measures : rainwater
harvesting, watershed development, maximize delivery and minimize
waste of water
Govt. proposed programmes such as CMUIDS, under review.
Potential for diversification of economic sector.
THREATS
Lack of sewage and solid waste management systems poses great threat
to the environment.
Lack of physical infrastructure : could hamper long term economic growth
prospects
Lack of desire of skilled workforce to stay in the city.
Competing cities for economic investments in the vicinity
Threat of loss and deterioration of natural and heritage attractions : due to
lack of awareness and proper documentation on heritage conservation
DISCUSSION/ CONS ULTATION WITH KEY STAKEHOLDERS
The objective of the stakeholder‘s consultation was to ensure that the CDP
reflects ground realities and the needs of the peoples as articulated by them
are incorporated in the CDP. For this Purpose the methodology adopted was as
follows
After identification of stakeholders, consultation was carried out to make them
aware of the cities development plan, city‘s vision and strategy. Besides
carrying out discussion with the official, discussions with the stakeholders such
as community organizations, trade associations etc were also carried out to
find their roles in the city development, know their perception about the city
vision and develop a set of mission statements during different stages of the
projects. The consultative process through stakeholder‘s consultations formed
an integral part of the City Development Plan.
Based on the outcomes of the city assessment and discussions with various
stakeholders, a city vision was developed, which provided the direction of
change with a specific timeframe, to guide the future development of the city.
FORMULATION OF CITY VISION
As the town of Prithvipur grows at a fast pace, it shall effectively plan and
manage growth, addressing its present issues and facilitating a vibrant future.
The inhabitants of the city treasures their town and look forward for the
Shristi Urban Infrastructure Development Ltd. Prithvipur (Tikamgarh)
iv
opportunities for its growth and development. The city vision brings out clearly
the need of the people to break out of the ordinary and to achieve an improved
quality of life. The vision also represents the views/issues of all the
stakeholders. This also means that the people are on the lookout for fresh
opportunities that are not far away if only some issues of the city are ironed
out effectively. While the poor were focused on their immediate issues of
access to basic services, the traders wanted the city to have a greater
economic vibrancy. Provision of sustainable infrastructure and efficient city
management came across as a vision of nearly all the stakeholders.
“To transform Prithvipur as a regional economic hub by promoting its strong agro-
economy and providing basic amenities to its citizens.”
Table Showing Sectoral Goals and their Implementation Strategies for Prithvipur Nagar Parishad
SECTOR GOAL OBJECTIVES
WA
TER
SU
PP
LY
To achieve 100%
population coverage
and ensure access to
safe, adequate and
equitable drinking
water supply for all
Preparing a regional water scheme on River Betwa which is at
a distance of about 15 Kms from the town, including
Prithvipur, Prithvipur and Jeron Khalsa.
Or
Preparing a water augmentation scheme for Prithvipur on
River Jamini which is at a distance of 3 kms from the town to
the meet the specific requirements of the town.
Revitalizing existing ponds like that of Rada Sagar, Jer Talab,
Goili Talaab and Rotela Talab present in and around the city.
These can immensely enhance the ground water recharge
system of the area.
Creation of artificial surface water bodies by following the
natural drainage pattern of the city.
Construction of 3 new OHTs of 400 Kl at Janpad Govt. School,
Near Veterinary Hospital and Bhed Farm.
Construction of new distribution network of 8.8 kms to serve
requirement till 2015.
Installation of pressure gauges and precision meters to
measure water usage
SA
NITA
TIO
N
To provide healthy
and environmental
system of sewerage
and sanitation for
entire population
Construction of Proposed 1100 individual Toilets with
Decentralized Waste water Treatment System (DEWATS)
Ensuring effective implementation of ongoing ILCS program
Provision of Public Toilets on Pay and Use basis in Market
Areas and other public places.
Ensuring effective O & M through involving Public Private
Partnership
Shristi Urban Infrastructure Development Ltd. Prithvipur (Tikamgarh)
v
SO
LID
WA
STE
MA
NA
GEM
EN
T
To ensure scientific
and environmentally
safe solid waste
management system
fora healthy and
clean city for future
Use P-P-P for collection, disposal, sorting and recycling of
waste and collection of revenue.
Upgrade existing vehicular fleet (Tractor Carrier Containers)
and personnel strength
Pass resolution to make systematic disposal mandatory for
citizens.
Prohibit the use of polythene (less than 20 microns)
Installing decentralized vermin compost for biodegradable
wastes with 3MT capacity.
EN
VIR
ON
MEN
T
To upgrade the city
environment for a
better quality of life
and safe future for
inhabitants
Initiate measures like Rain-water harvesting and ground water
recharge at macro and micro level
To envision a green city future for Prithvipur and resolve to
achieve the same
To ensure strict enforcement of pollution norms for air, water,
soil and noise levels.
Conservation of water-bodies(Up gradation of existing Nallah
for the stretch of 4 Km.), green pockets, landscape features
and natural drainage
TR
AN
SP
OR
TA
TIO
N
To ensure easy and
safe accessibility
through cost
effective public
transportation and
good quality roads
for vehicular and
pedestrian use
Construction of additional 10.4 Kms of roads by 2015
Converting 15 kms of kutcha roads in to pukka surface by
2015
Construction of a by-pass on Orchaa Road.
Installing a traffic management plan which may be revised
every year and every six months later which includes a layout
for traffic signals, one-way routes, no entry zones, etc.
Construction of parking lots near public places, market areas
etc.
EC
ON
OM
IC
GR
OW
TH
Diversification and
augmentation of
economic base of
city of Prithvipur by
creating new
avenues for
employment
Development of Agro Based Small Scale Industries.
Development of Krishi Upaj Mandi with required infrastructure
and information centre for farmers
Shristi Urban Infrastructure Development Ltd. Prithvipur (Tikamgarh)
vi
ED
UC
ATIO
N
To ensure social
equality and
economic growth by
imparting quality
education
Expansion of courses and intake capacity of vocational college
Provision of primary and secondary education facilities from
the Nagar Parishad thereby increasing the literacy rate of the
city.
Introduction of industry sponsored programs for specific
industry requirements.
Expansion of vocational training platforms, Constructing TTI in
the region.
Development of agriculture training institute
HEA
LTH
To provide better
healthcare to all
Augmentation of medical facilities Clear encroachment and
improve accessibility
Setting up of action group for disease prevention.
Employing P-P-P in hospital management to ensure better
service delivery
SO
CIA
L
IN
FR
AS
TR
UC
TU
R
E
To improve the
physical and mental
well being
Up gradation of community halls
Provision for recreation spaces.
Construction of Playground
Construction of Public Library.
Upgrading facilities for weekly market
Construction of Hawkers zone
CITY INVESTMENT PLAN
Based on the analysis carried out and the issues identified, specific projects
were conceptualised. A city investment plan provided the estimate of the level
of investment which is required at the city level to implement the City
Development Plan. The assessment of the financial status of municipal bodies
and other financial institutions were also carried out to determine their
creditworthiness to provide for identified reforms/projects/programmes.
Table showing sector wise % breakup of total investment required.
S.NO. SECTORS AMOUNT(in Lacs) Percentage
1 Water Supply 2349.03 15.94
2 Sewerage 2305.14 15.64
3 Storm Water 1462.48 9.92
4 Solid Waste Management 126.45 0.86
5 Roads 3105.97 21.08
6 Traffic Management, Streetlights And Transport
Nagar
390.13 2.65
Streetlights And Firefighting 1106.29 7.51
Shristi Urban Infrastructure Development Ltd. Prithvipur (Tikamgarh)
vii
17%
16%
10%
1%
22%
3%
8%
5%
1% 10%
1%1%3%2%
SECTORWISE % FOR REQUIRED INVESTMENTWATER SUPPLY
SEWERAGE
STORM WATER
SOLID WASTE MANAGEMENT
ROADS
TRAFFIC MANAGEMENT, STREETLIGHTS AND TRANSPORT NAGARSTREETLIGHTS AND FIREFIGHTING
HERITAGE AND TOURISM
ECONOMY
BASIC SERVICES FOR URBAN POORS
Chart showing sector wise % breakup of total investment required
CAPITAL INVESTMENT NEEDS
The summary of sector-wise investment requirement is given in the table
below. The total investment required would be around Rs. 147.37Crore for the
City Development- Prithvipur for a period of 25 years
Phase wise Investment needed.
S.No Sector of Investment Investment
by 2015
(In Crore)
Investment by
2025
(In Crore)
Investment by
2035
(In Crore)
Total
Investment
(In Crore)
1 Water Supply 12.41 7.50 3.58 23.49
2 Sewerage 9.56 12.23 1.26 23.05
3 Storm Water Drainage 2.15 7.90 4.57 14.62
4 Solid Waste Management 1.07 0.08 0.12 1.26
5 Roads 7.15 13.87 10.04 31.06
6 Traffic & Transportation 2.55 1.35 0.00 3.90
7 Fire Fighting & Street Lighting 2.10 5.20 3.77 11.06
8 Basic Services for Urban Poor 13.56 0.00 0.00 13.56
7 Heritage And Tourism 734.09 4.98
8 Economy 598.00 4.06
9 Basic Services For Urban Poor‘s 1356.19 9.20
10 Environment 104.43 0.71
11 Municipal Governance 158.23 1.07
12 Social Infrastructure 653.17 4.43
13 Urban Renewal 287.34 1.95
Total 14736.94 100.00
Shristi Urban Infrastructure Development Ltd. Prithvipur (Tikamgarh)
viii
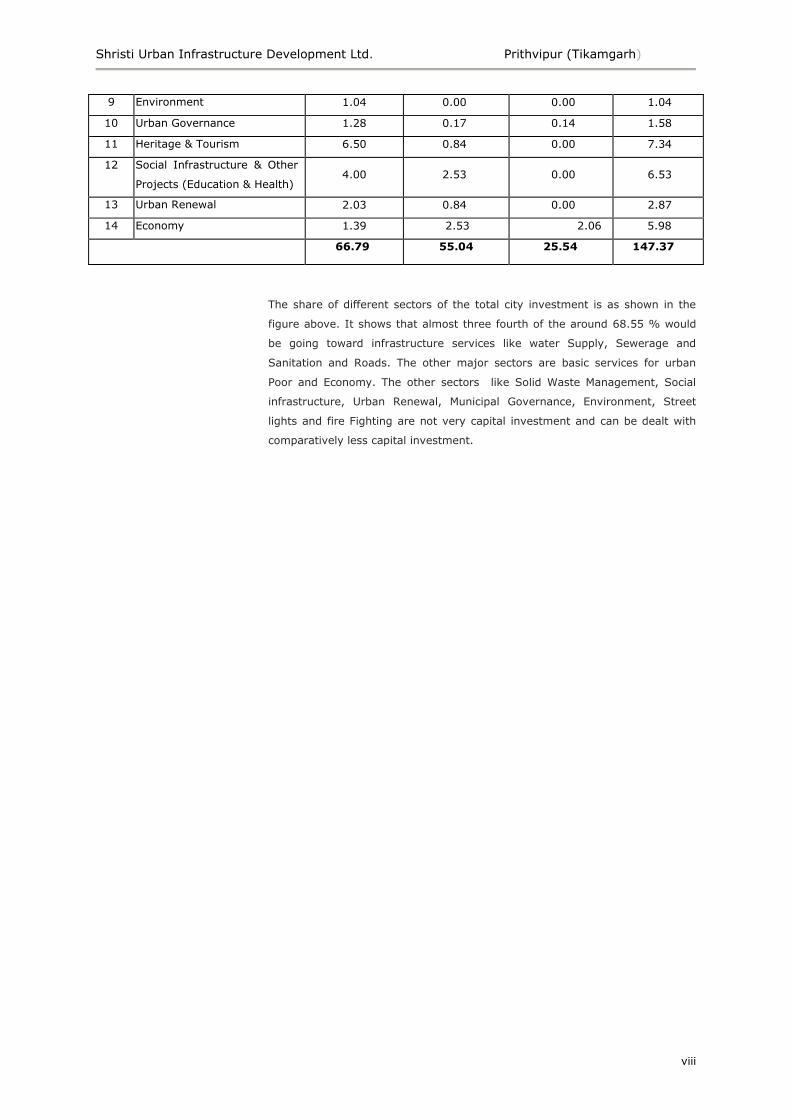
9 Environment 1.04 0.00 0.00 1.04
10 Urban Governance 1.28 0.17 0.14 1.58
11 Heritage & Tourism 6.50 0.84 0.00 7.34
12 Social Infrastructure & Other
Projects (Education & Health)
4.00 2.53 0.00 6.53
13 Urban Renewal 2.03 0.84 0.00 2.87
14 Economy 1.39 2.53 2.06 5.98
66.79 55.04 25.54 147.37
The share of different sectors of the total city investment is as shown in the
figure above. It shows that almost three fourth of the around 68.55 % would
be going toward infrastructure services like water Supply, Sewerage and
Sanitation and Roads. The other major sectors are basic services for urban
Poor and Economy. The other sectors like Solid Waste Management, Social
infrastructure, Urban Renewal, Municipal Governance, Environment, Street
lights and fire Fighting are not very capital investment and can be dealt with
comparatively less capital investment.
Shristi Urban Infrastructure Development Ltd. Prithvipur (Tikamgarh)
ix
TABLE OF CONTENTS
1 INTRODUCTION ........................................................................ 1
1.1 OVERVIEW OF URBANIZATION IN MADHYA PRADESH ................................................. 1
1.2 UADD‘S INITIATIVE FOR CDP PREPARATION .......................................................... 2
1.3 INTRODUCTION ABOUT CDP ............................................................................. 2
1.3.1 Preparation of CDP ................................................................................. 2
1.4 SCOPE OF THE WORK ..................................................................................... 3
1.5 THE PROCESS/METHODOLOGY .......................................................................... 4
1.6 KEY STEPS INVOLVED IN CDP PREPARATION .......................................................... 5
1.7 STAKEHOLDER‘S CONSULTATION ........................................................................ 6
1.7.1 Discussion / Consultations with key stakeholders ....................................... 6
1.7.2 Summary of the key issues identified and their solutions proposed by the
stakeholders ................................................................................................... 8
2 CITY LOCATION AND REGIONAL CONTEXT ............................. 10
2.1 INTRODUCTION .......................................................................................... 10
2.1.1 Bundelkhand Region ............................................................................. 10
2.2 PRITHVIPUR NAGAR PARISHAD ........................................................................ 10
2.3 REGIONAL SETTING ..................................................................................... 11
2.4 DISTRICT PROFILE TIKAMGARH........................................................................ 11
2.5 GENERAL PHYSICAL FEATURES ........................................................................ 12
2.5.1 River System ....................................................................................... 12
2.5.2 Geo-Hydrology .................................................................................... 12
2.5.3 Climate ............................................................................................... 12
2.5.4 Rainfall ............................................................................................... 12
2.5.5 Temperature &Humidity ........................................................................ 13
3 SOCIAL AND DEMOGRAPHIC PROFILE .................................... 14
3.1 INTRODUCTION .......................................................................................... 14
3.2 DEMOGRAPHIC TRENDS ................................................................................ 14
3.3 POPULATION PROJECTION .............................................................................. 15
3.3.1 Decadal population growth trend – Madhya Pradesh vs India ..................... 15
3.3.2 Population projection for Prithvipur ........................................................ 16
3.4 LITERACY ................................................................................................. 18
3.5 SOCIAL STRUCTURE ..................................................................................... 18
3.6 SEX RATIO ............................................................................................... 19
Shristi Urban Infrastructure Development Ltd. Prithvipur (Tikamgarh)
x
3.7 WORKFORCE PARTICIPATION .......................................................................... 20
3.8 OCCUPATIONAL STRUCTURE ........................................................................... 21
4 URBAN GROWTH MANAGEMENT ............................................. 26
4.1 EXISTING LANDUSE ..................................................................................... 26
4.1.1 Housing .............................................................................................. 26
4.1.2 Residential density ............................................................................... 27
4.1.3 Commercial ......................................................................................... 27
4.1.4 Public-Semi Public ................................................................................ 27
4.1.5 Traffic and Transportation ..................................................................... 27
4.2 SPATIAL GROWTH DIRECTION ......................................................................... 27
4.3 FUTURE GROWTH DIRECTIONS ........................................................................ 28
4.4 HOUSING TYPOLOGY & PATTERN ...................................................................... 29
4.4.1 Attached Mixed Use Units ...................................................................... 29
4.4.2 Attached Housing in Residential Clusters: ............................................... 29
4.4.3 Kuchha Houses: ................................................................................... 30
4.5 PROPOSED LANDUSE .................................................................................... 30
4.6 ISSUES AND STRATEGIES .............................................................................. 31
5 STAKEHOLDER CONSULTATION AND DEVELOPMENT OF CITY
VISION ........................................................................................ 33
5.1 BACKGROUND ............................................................................................ 33
5.2 ROLE OF STAKEHOLDERS IN PREPARATION OF CDP ................................................ 33
5.3 ORIENTATION OF THE KEY STAKEHOLDERS .......................................................... 34
5.3.1 Discussion / Consultations with key stakeholders ..................................... 35
5.4 SWOT ANALYSIS ....................................................................................... 36
5.5 VISION .................................................................................................... 38
5.6 SECTOR GOALS .......................................................................................... 38
6 URBAN SERVICES ................................................................... 42
6.1 WATER SUPPLY .......................................................................................... 42
6.1.1 Existing Situation ................................................................................. 42
6.1.2 Water Treatment, Storage and Distribution ............................................. 43
6.1.3 Distribution System .............................................................................. 44
6.1.4 Demand-Gap Analysis .......................................................................... 45
6.1.5 Issues/Goals and Objectives/Development Strategies ............................... 46
6.1.6 Recommendations to improve water supply services in Prithvipur .............. 47
6.2 SEWERAGE AND STORM WATER DRAINAGE .......................................................... 50
Shristi Urban Infrastructure Development Ltd. Prithvipur (Tikamgarh)
xi
6.2.1 Existing Sewerage and Sanitation .......................................................... 50
6.2.2 Existing situation for Toilets .................................................................. 51
6.2.3 CPHEEO Guidelines .............................................................................. 51
6.2.4 Demand and Gap Analysis ..................................................................... 51
6.2.5 Issues/Goals and Objectives/ Development Strategies .............................. 52
6.2.6 Recommendation to improve Sanitation services ...................................... 53
6.3 STORM WATER DRAINAGE ............................................................................. 56
6.3.1 Demand & Gap for Storm Water ............................................................ 57
6.3.2 Issues/Goals and Objectives/ Development Strategies .............................. 57
6.4 SOLID WASTE MANAGEMENT .......................................................................... 58
6.4.1 Quantity of Solid Waste ........................................................................ 58
6.4.2 Present practice of Solid Waste Management ........................................... 58
6.4.3 Demand Gap Analysis ........................................................................... 60
6.4.4 Issues/Goal/Objectives/Strategies and Action Plan ................................... 60
6.4.5 Few Recommendation for Prithvipur Nagar Parishad to improve Solid Waste
Management in the city ................................................................................. 61
6.5 ROADS AND TRAFFIC MANAGEMENT .................................................................. 63
6.5.1 Connectivity of Prithvipur ...................................................................... 63
6.5.2 Road Network ...................................................................................... 64
6.5.3 Highly congested parts of town .............................................................. 65
6.5.4 Bus Stand ........................................................................................... 65
6.5.5 Demand and Gap Analysis: ................................................................... 65
6.5.6 Issues/ Goal/Objectives/Strategies and Action Plan .................................. 66
7 SLUMS AND POVERTY ............................................................. 67
7.1 BACKGROUND ............................................................................................ 67
7.2 CONCERNED INSTITUTIONS AND THEIR ROLE IN MADHYA PRADESH .............................. 67
7.3 SLUM PROFILE OF THE CITY ............................................................................ 68
7.4 POVERTY .................................................................................................. 68
7.5 STATUS OF SERVICES SLUMS IN PRITHVIPUR ....................................................... 69
7.5.1 Density and Open Space ....................................................................... 69
7.5.2 Housing .............................................................................................. 69
7.5.3 Roads ................................................................................................. 70
7.5.4 Water ................................................................................................. 70
7.5.5 Sanitation- Toilets Drains and Sewerage ................................................. 70
7.5.6 Garbage ............................................................................................. 71
7.5.7 Land Tenure ........................................................................................ 71
7.6 ISSUES/GOAL/OBJECTIVES/STRATEGIES AND ACTION PLAN ..................................... 71
Shristi Urban Infrastructure Development Ltd. Prithvipur (Tikamgarh)
xii
8 HERITAGE CONSERVATION AND TOURISM ............................. 73
8.1 HERITAGE STRUCTURES ................................................................................ 73
8.2 EXISTING HERITAGE REGULATIONS ................................................................... 73
8.3 POTENTIAL FOR TOURISM .............................................................................. 73
8.4 ISSUES/GOAL/OBJECTIVES/STRATEGIES AND ACTION PLAN ..................................... 74
9 ENVIRONMENT ....................................................................... 76
9.1 DISTRICT AT A GLANCE ................................................................................. 76
9.1.1 Flora & Fauna ...................................................................................... 76
9.1.2 Ground Water Development .................................................................. 77
9.1.3 Land Use in Tikamgarh and rest of MP Bundelkhand Region ...................... 78
9.1.4 Soil Types in Tikamgarh District ............................................................. 79
9.1.5 Groundwater Use in Tikamgarh and rest of MP Bundelkhand Districts ......... 79
9.1.6 Irrigation Sources in Bundelkhand .......................................................... 80
9.2 GROUND WATER DEVELOPMENT ....................................................................... 80
9.3 POLLUTION ............................................................................................... 81
9.3.1 Soil Pollution ....................................................................................... 81
9.3.2 Air Pollution ........................................................................................ 81
9.3.3 WaterPollution ..................................................................................... 82
9.3.1 Noise Pollution ..................................................................................... 82
9.4 ISSUES/GOAL/OBJECTIVES/STRATEGIES AND ACTION PLAN ..................................... 82
10 SOCIAL AMENITIES .............................................................. 84
10.1 BACKGROUND ............................................................................................ 84
10.2 HEALTH FACILITIES IN TIKAMGARH ................................................................... 84
SOURCE: HTTP://WWW.MP.GOV.IN/HEALTH/INSTITUTION/HEALTH-INSTITUTIONS.PDF ................ 85
10.3 HEALTH FACILITIES IN PRITHVIPUR ................................................................... 85
10.4 EDUCATION FACILITIES ................................................................................. 86
10.4.1 Education Structure in Madhya Pradesh ............................................... 86
10.4.2 Right to Education Act-2009 ............................................................... 86
10.4.3 Existing Situation .............................................................................. 86
10.4.4 Demand Gap Analysis and Future Requirement ..................................... 87
10.5 STREETLIGHTS AND FIREFIGHTING .................................................................... 88
10.5.1 Streetlights ...................................................................................... 88
10.5.2 Firefighting ...................................................................................... 89
10.6 SOCIO-CULTURAL FACILITIES ......................................................................... 89
10.7 ISSUES/GOAL/OBJECTIVES/STRATEGIES AND ACTION PLAN ..................................... 90
Shristi Urban Infrastructure Development Ltd. Prithvipur (Tikamgarh)
xiii
11 INSTITUTIONAL SET UP AND FINANCIAL STATUS ............... 91
11.1 BACKGROUND ............................................................................................ 91
11.2 EFFECTIVE MUNICIPAL GOVERNANCE ................................................................. 91
11.3 EXISTING INSTITUTIONAL SETUP IN PRITHVIPUR ................................................... 92
11.3.1 Observations .................................................................................... 93
11.4 INSTITUTIONS AND ORGANIZATIONS ................................................................. 93
11.4.1 Urban Administration and Development Department ............................. 94
11.4.2 Town and Country Planning Department .............................................. 94
11.5 URBAN REFORMS ........................................................................................ 94
11.5.1 Mandatory Reforms ........................................................................... 94
Reforms at State Level .................................................................................. 95
11.5.2 Optional Reforms (State and ULB/ Para-statal level) .............................. 96
11.6 ISSUES/GOAL/OBJECTIVES/STRATEGIES ............................................................ 96
11.7 RECOMMENDATIONS TO IMPROVE URBAN GOVERNANCE IN PRITHVIPUR MUNICIPALITY ........ 97
11.7.1 Performance Management System ...................................................... 97
12 MUNICIPAL FINANCE ......................................................... 100
12.1 STRUCTURE OF MUNICIPAL FINANCES .............................................................. 100
12.2 FINANCIAL PROFILE OF PRITHVIPUR NAGAR PARISHAD ........................................... 101
12.3 REVENUE ACCOUNT ................................................................................... 101
12.3.1 Revenue Income ............................................................................. 101
12.3.2 Revenue Expenditure ...................................................................... 105
12.4 CAPITAL ACCOUNT .................................................................................... 107
12.4.1 CAPITAL INCOME ............................................................................ 107
12.4.2 CAPITAL EXPENDITURE ................................................................... 108
12.5 SUMMARY OF REVENUE AND CAPITAL ACCOUNTS OF PRITHVIPUR NAGAR PARISHAD ........ 109
12.6 KEY FINANCIAL INDICATORS ......................................................................... 110
12.6.1 RESOURCE MOBILIZATION INDICATORS ........................................... 110
12.6.2 FUND APPLICATION INDICATORS ..................................................... 110
12.6.3 OVERALL FINANCIAL PERFORMANCE INDICATORS .............................. 111
12.6.4 EFFICIENCY INDICATORS ................................................................ 111
13 CITY INVESTMENT PLAN AND FINANCING STRATEGIES .... 112
13.1 CITY INVESTMENT PLAN .............................................................................. 112
13.2 WATER SUPPLY ........................................................................................ 114
13.3 SEWERAGE ............................................................................................. 115
13.4 STORM WATER DRAINAGE ........................................................................... 116
13.5 SOLID WASTE MANAGEMENT ........................................................................ 116
Shristi Urban Infrastructure Development Ltd. Prithvipur (Tikamgarh)
xiv
13.6 ROADS AND TRAFFIC MANAGEMENT ................................................................ 117
13.7 URBAN RENEWAL ...................................................................................... 118
13.8 STREET LIGHT AND FIRE-FIGHTING ................................................................. 119
13.9 HERITAGE AND TOURISM ............................................................................. 120
13.10 BASIC SERVICES FOR POOR ...................................................................... 121
13.11 ENVIRONMENT ...................................................................................... 122
13.12 SOCIAL INFRASTRUCTURE ......................................................................... 122
13.13 URBAN GOVERNANCE .............................................................................. 123
14 FINANCIAL OPERATING PLAN ............................................ 124
14.1 CATEGORIES OF FOP PROJECTIONS ................................................................ 124
14.2 FINANCING STRATEGIES FOR THE CIP ............................................................. 124
14.3 FINANCE PROJECTIONS ............................................................................... 125
14.4 MUNICIPAL ACCOUNT – GROWTH PROJECTIONS AND ASSUMPTIONS........................... 125
14.5 INVESTMENT CAPACITY/ SUSTENANCE ............................................................. 126
14.6 IMPACT OF REFORMS ON INVESTMENT CAPACITY OFPRITHVIPUR NAGAR PARISHADS ........ 126
Case 1: Base Investment Capacity ................................................................ 127
Case 2: With reforms in Property Tax, Water Charges and Sewerage charges ..... 127
Case 3: Reforms and CMUIDS grants along with debt Funding .......................... 127
14.7 FUND REQUIREMENT .................................................................................. 127
14.8 PROJECTIONS FOR FINANCIAL OPERATING PLAN .................................................. 128
LIST OF TABLES
Table 1-1: Growth of urban population in M.P .......................................................................................... 1
Table 2-1 Area of Town ........................................................................................................................10
Table 2-2: Key features of Prithvipur .....................................................................................................11
Table 2-3 : Tehsil wise Area and Population ...........................................................................................12
Table 3-1 Ward wise Population of Prithvipur ..........................................................................................14
Table 3-2 Decadal growth rate MP rural and urban ..................................................................................16
Table 3-3 Population growth rate Prithvipur ............................................................................................16
Table 3-4 Population projection with different methods ............................................................................17
Table 3-5 Assumptions in population projection ......................................................................................17
Table 3-6: Status of literacy in Prithvipur ...............................................................................................18
Table 3-7: Table showing social composition ...........................................................................................19
Table 3-8: Table showing sex ratio ........................................................................................................20
Table 3-9: Table showing workers distribution ........................................................................................21
Table 3-10: Showing workers classification .............................................................................................22
Table 4-1: UDPFI standards ..................................................................................................................31
Table 6-1 Water Supply Facilities ..........................................................................................................43
Table 6-2: Table showing details of water distribution system ...................................................................44
Table 6-3: Table showing water supply requirement ................................................................................45
Table 6-4: existing and demand of water distribution lines .......................................................................45
Shristi Urban Infrastructure Development Ltd. Prithvipur (Tikamgarh)
xv
Table 6-5 Existing situation for Toilets ...................................................................................................51
Table 6-6: CPHEEO Guidelines for sewage generation in a city ..................................................................51
Table 6-7: Demand and Gap Analysis for Sewerage Network ....................................................................52
Table 6-8 nallahs in the town ................................................................................................................56
Table 6-9 Drains in the town.................................................................................................................56
Table 6-10 Demand Gap analysis ..........................................................................................................57
Table 6-11: Infrastructure details for Solid Waste Management.................................................................59
Table 6-12: Demand-Gap analysis of Solid Waste ....................................................................................60
Table 6-13: Demand for SWM in Prithvipur .............................................................................................60
Table 6-14: Details of State Highway connecting Prithvipur ......................................................................63
Table 6-15: Showing break-up of road surface area .................................................................................64
Table 6-16: Demand and Gap Analysis for required road length ................................................................66
Table 7-1: Unauthorized slums within the city.........................................................................................68
Table 7-2: Ward-wise number of persons holding various ration cards .......................................................68
Table 9-1: Land use in UP Bundelkhand (2004-05) and MP Bundelkhand (2005-06) districts ........................78
Table 9-2: Groundwater level in villages (2000-2001) ..............................................................................79
Table 9-3: Percentage of net irrigated area and sources of irrigation in MP Bundelkhand (2005-06) districts ...80
Table 10-1: Details of Health Staff in block Prithvipur ..............................................................................84
Table 10-2: Type of hospitals and number of beds ..................................................................................86
Table 10-3 Education Facilities in town ...................................................................................................87
Table 10-4 Demand Gap Analysis ..........................................................................................................88
Table 10-5: Wardwise distribution of streetlights in Prithvipur ...................................................................88
Table 10-6 Socio cultural facilities .........................................................................................................89
Table 11-1: Summary of establishment as on March 2012 ........................................................................93
Table 11-2: Department classification with number of employees and their responsibility .............................93
Table 12-1: Table showing Summary of Municipal Finances Prithvipur ...................................................... 101
Table 12-2: Table showing Revenue Income from various sources for Prithvipur Nagar Parishad ................. 103
Table 12-3: Table showing Revenue Expenditure of Prithvipur Nagar Parishad .......................................... 106
Table 12-4: Table showing Capital Income for Prithvipur Nagar Parishad(Amt. In Lacs) .............................. 107
Table 12-5: Table showing Capital Expenditure for Prithvipur Nagar Parishad ........................................... 108
Table 12-6: Table showing resource mobilization details for Prithvipur Nagar Parishad ............................... 110
Table 12-7: Table showing fund application indicator details for Prithvipur Nagar Parishad ......................... 110
Table 12-8: Table showing overall financial performance indicator for Prithvipur Nagar Parishad ................. 111
Table 13-1 Sector wise Investment ..................................................................................................... 112
Table 13-2 Phase wise Investment ...................................................................................................... 113
Table 13-3 Responsible agencies ......................................................................................................... 114
Table 14-1Important assumptions made in the projections ..................................................................... 125
Table 14-2 Final Revenue Modal .......................................................................................................... 128
LIST OF FIGURES
Figure 3-1 Decadal population growth trend ...........................................................................................15
Figure 3-2 Population and growth rate ...................................................................................................15
Figure 3-3 growth rate MP rural and urban .............................................................................................16
Figure 3-4 Literacy rate........................................................................................................................18
Figure 3-6 SC population ......................................................................................................................19
Figure 3-7 Sex Ratio ............................................................................................................................19
Figure 3-8 Types of workers .................................................................................................................20
Shristi Urban Infrastructure Development Ltd. Prithvipur (Tikamgarh)
xvi
Figure 3-9 Category of workers .............................................................................................................21
Figure 3-10 Occupational classification ...................................................................................................22
Figure 3-11 Agriculture related activities ................................................................................................23
Figure 3-12 Activities in various parts of the town ...................................................................................23
Figure 3-13 Beedi making activities .......................................................................................................24
Figure 3-14 Deserted areas of town .......................................................................................................24
Figure 3-15Activities at major junctions of town ......................................................................................25
Figure 3-16Activities on NH-12 and Fawwara chowk ................................................................................25
Figure 3-17Commercial activities around Jeron Tiraha .............................................................................25
Figure 4-1 Existing Landuse ..................................................................................................................26
Figure 4-2: Spatial arrangement of the settlement ..................................................................................28
Figure 4-3: Growth direction for Prithvipur .............................................................................................28
Figure 4-4 Inner Residential Precincts in the old city areas .......................................................................29
Figure 4-6 Inner Residential Precincts in the old city areas .......................................................................30
Figure 4-5 Inorganic development along the city periphery .......................................................................30
Figure 4-7 Proposed Landuse ................................................................................................................30
Figure 5-1: Methodology adopted for preparation of CDP .........................................................................34
Figure 6-1Water supply in Karguan is through Hand pumps and tubewells..................................................42
Figure 6-2 Water Supply Demand ..........................................................................................................45
Figure 6-3 Kuchha drains in town ..........................................................................................................50
Figure 6-4 Sewerage Generation ...........................................................................................................51
Figure 6-5 DEWATS (Basic Working) ......................................................................................................54
Figure 6-6 Road side drains ..................................................................................................................56
Figure 6-7 Solid waste being collected by the workers. ............................................................................58
Figure 6-8 Waste collection in the areas with rural background .................................................................58
Figure 6-9 Local Transport....................................................................................................................63
Figure 6-10 Situation of road due to absence of Bus Stand .......................................................................63
Figure 7-1BPL/ AAY families .................................................................................................................69
Figure 7-2 Residential pattern in slums ..................................................................................................69
Figure 7-3 Road network in slums, ward no. 12 ......................................................................................70
Figure 7-4 water supply in slums ...........................................................................................................70
Figure 7-5 Drains in slums....................................................................................................................70
Figure 7-6 Solid waste management in slums .........................................................................................71
Figure 9-1: Percentage coverage of Forests in Tikamgarh District ..............................................................76
Figure 9-2: Soil Productivity Map of Tikamgarh District ............................................................................79
Figure 9-3: Overview of Ground Water Resources ...................................................................................81
Figure 10-1: Health Facilities in District Tikamgarh ..................................................................................85
Figure 12-1 Composition of Municipal Finance ....................................................................................... 100
Figure 12-2 Figure showing Revenue Income Trend and Sources of Revenue for Prithvipur Nagar Parishad .. 102
Figure 12-3: Chart showing Revenue Income trend in Prithvipur Nagar Parishad (In Lacs) ......................... 104
Figure 12-4 Figure Showing Areas of Expenditure and Trend for Expenditure for Prithvipur Nagar Parishad .. 105
Figure 12-5: Chart showing trend in Revenue Expenditure in PrithvipurNagar Parishad (Amount in Lacs) ..... 106
Figure 12-6: Figure showing Revenue account: Income-expenditure ........................................................ 107
Figure 12-7 Figure Showing Trends in Capital Income and its Sources for Prithvipur Nagar Parishad ............ 108
Figure 12-8: Chart showing Trend of Capital Expenditure in Prithvipur Nagar Parishad ............................... 108
Figure 12-9: Chart showing Composition of Capital Expenses in Prithvipur Nagar Parishad. ........................ 108
Figure 12-10 : Figure Showing Capital Account_ Income- Expenditure ..................................................... 109
Figure 12-11: Figure showing account summary for Prithvipur Nagar Parishad .......................................... 109
Shristi Urban Infrastructure Development Ltd. Prithvipur (Tikamgarh)
1
1 Introduction
1.1 Overview of Urbanization in Madhya Pradesh
Madhya Pradesh is one of the less urbanized states of India, with 26.67% of its
population living in urban areas, as against 27.78% in the country as a whole in
2001. In 1991, its urban population was 25.27% of its total population, as against
25.71% of India. The share of Madhya Pradesh in total urban population of the
country is 5.64%. The decadal growth rate of urban population of Madhya Pradesh
has declined from 43.92% in 1991 to 31.19% in 2001 and annual compound rate of
growth has decelerated from 2.41% to 2.18% during the same period. The decadal
growth of urban population of M.P. (31.19%) in 2001 is marginally higher than the
country as a whole (31.13%).
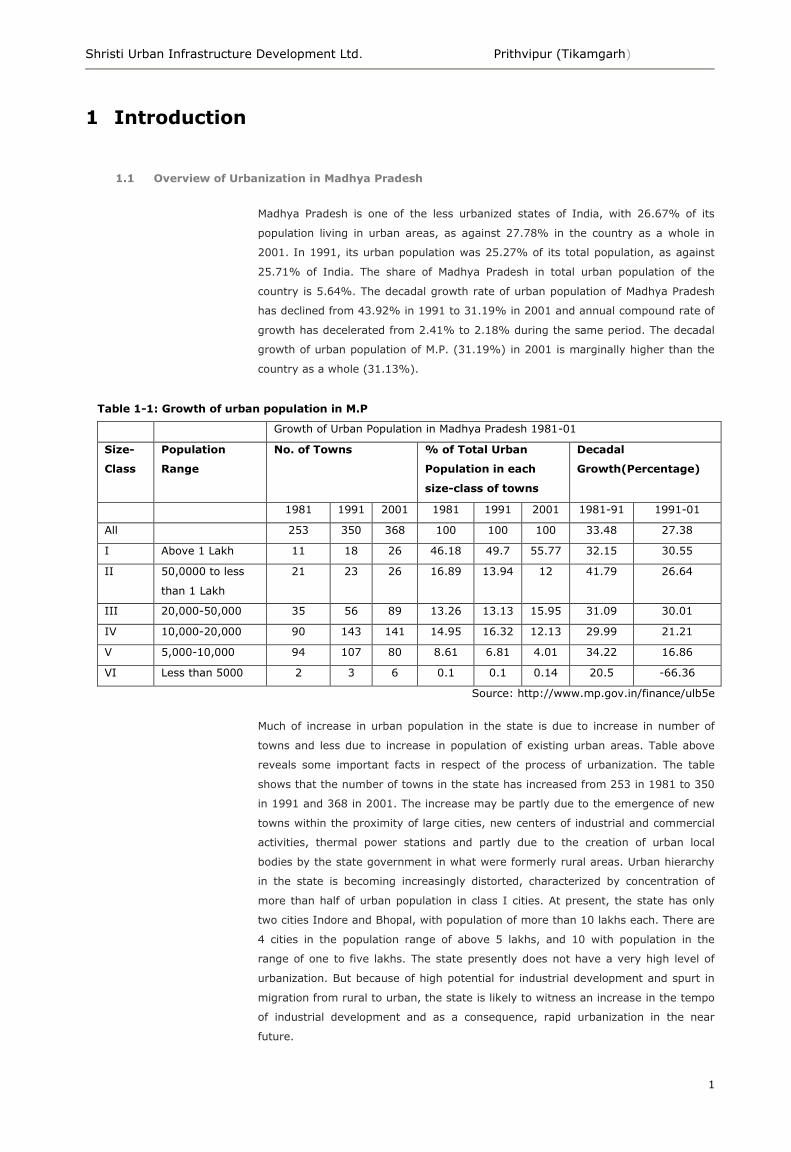
Table 1-1: Growth of urban population in M.P
Growth of Urban Population in Madhya Pradesh 1981-01
Size-
Class
Population
Range
No. of Towns % of Total Urban
Population in each
size-class of towns
Decadal
Growth(Percentage)
1981 1991 2001 1981 1991 2001 1981-91 1991-01
All 253 350 368 100 100 100 33.48 27.38
I Above 1 Lakh 11 18 26 46.18 49.7 55.77 32.15 30.55
II 50,0000 to less
than 1 Lakh
21 23 26 16.89 13.94 12 41.79 26.64
III 20,000-50,000 35 56 89 13.26 13.13 15.95 31.09 30.01
IV 10,000-20,000 90 143 141 14.95 16.32 12.13 29.99 21.21
V 5,000-10,000 94 107 80 8.61 6.81 4.01 34.22 16.86
VI Less than 5000 2 3 6 0.1 0.1 0.14 20.5 -66.36
Source: http://www.mp.gov.in/finance/ulb5e
Much of increase in urban population in the state is due to increase in number of
towns and less due to increase in population of existing urban areas. Table above
reveals some important facts in respect of the process of urbanization. The table
shows that the number of towns in the state has increased from 253 in 1981 to 350
in 1991 and 368 in 2001. The increase may be partly due to the emergence of new
towns within the proximity of large cities, new centers of industrial and commercial
activities, thermal power stations and partly due to the creation of urban local
bodies by the state government in what were formerly rural areas. Urban hierarchy
in the state is becoming increasingly distorted, characterized by concentration of
more than half of urban population in class I cities. At present, the state has only
two cities Indore and Bhopal, with population of more than 10 lakhs each. There are
4 cities in the population range of above 5 lakhs, and 10 with population in the
range of one to five lakhs. The state presently does not have a very high level of
urbanization. But because of high potential for industrial development and spurt in
migration from rural to urban, the state is likely to witness an increase in the tempo
of industrial development and as a consequence, rapid urbanization in the near
future.
Shristi Urban Infrastructure Development Ltd. Prithvipur (Tikamgarh)
2
1.2 UADD’s initiative for CDP preparation
Looking at the potential of cities in M.P. to urbanize at faster pace in coming future
and the challenge faced by ULB‘s to meet the requirements of the growing
population with limited technical and financial resources, the Government of India
and the Government of Madhya Pradesh have initiated a number of programmes to
meet the growing demands of infrastructure and service delivery— Urban
Infrastructure Development Scheme for Small and Medium Towns (UIDSSMT) and
Integrated Housing and Slum Development Programme (IHSDP) of the GoI which
links reform with investment in infrastructure for the poor etc.
With the enactment of the 74th Constitution Amendment Act, major urban related
tasks have been transferred to Local Bodies. The Government of Madhya Pradesh
(GoMP) through its Urban Administration & Development Department (UADD) is
responsible for overseeing urban sector reforms, in terms of capital investment in
basic infrastructure for the Urban Local Bodies (ULB‘s). The UADD is also responsible
for implementation of various public welfare schemes sponsored by the Central and
State Governments.
While major urban centers are being developed under the CDPs prepared by the
Jawaharlal Nehru National Urban Renewal Mission (JNNURM), Government of
Madhya Pradesh (GoMP) first completed preparation of City Development Plans
(CDP) for 254Nagar Palikas and in the second phase has now initiated CDPs of 250
Nagar Parishads in the state through the Urban Administration and Development
Department (UADD).
1.3 Introduction about CDP
City Development Plans are prepared to visualize cities and towns in the next 25
years with an objective of meeting the growth directions and service up gradation in
relation to the activity mix/growth, outline infrastructure needs based on the gap
assessment, identify reforms required in local administration and service delivery
including PPP in infrastructure development.
The City Development Plan for Prithvipur has been prepared under the initiative of
UADD, GoMP covering 254Nagar Parishad towns. This initiative has been launched
on the lines similar to that JNNURM and UIDSSMT to bring improvements in the
existing urban service levels in a financially sustainable manner. The primary
objective is to create economically productive, efficient, equitable and responsive
cities. This scheme has a horizon period of 25 years, i.e. till 2035 with clear
objective of achieving the municipal reforms as indicated in the toolkit provided by
UADD, GoMP in order to access funds for implementation of the projects. In addition
to this CDP, ULBs would develop Detailed Project Reports (DPR) for all sectors in
order to implement the same.
1.3.1 Preparation of CDP
Preparation of the CDP will consist of city development strategies that come out of a
structured consultative process. The process will enable elected representatives, key
staff of ULB departments, parastatal agencies and other institutions, policy makers
and the citizens to participate and plan for spatial, social and economic development
of the concerned cities. A City Development Plan (CDP) will present both a vision of
a desired future perspective for the city and the ULB‘s strategic framework of
Shristi Urban Infrastructure Development Ltd. Prithvipur (Tikamgarh)
3
sectoral plans translated into actions that define on how the ULB, together with
other stakeholders, intends to work towards achieving their long-term vision in the
next twenty five years.
The City development Plan must adhere with the JNNURM‘s CDP preparation toolkit.
The inadmissible components under JNNURM should also be included in the task.
The CDP should also include Broad Master planning of the town and should be
prepared keeping in view the Master Plan (wherever exists) provisions as prepared
by Town and Country Planning Department. It is also expected that the CDP would
provide Urban Reform Action Plan for the ULBs as envisaged under JNNURM.
1.4 Scope of the Work
The CDP is prepared keeping in view the tool kits, guidelines and instructions
provided by UADD, and also JnNURM guidelines for preparation of CDP. The scope of
work includes the following:
A situation analysis, focusing on demographic trends, land use pattern, economic
growth, city governance and status on access and coverage of services (i.e. water
supply, sewerage, sanitation, solid waste management, road network, urban
transport, street lighting, redevelopment of inner (old) city area, basic services to
urban poor and other social infrastructure).
Study of existing setup of departments, issues of inter departmental coordination
and review of various projects being executed or proposed
A future perspective for the city clearly showing the direction of change as well as a
vision and framework for economic growth and increased access to services
(sectoral agenda, reform agenda, quality of life, urban services, social and gender
inclusion etc.)
Formulating development strategies in the areas of economic development,
governance, land use, urban poor, core municipal infrastructure, urban environment
and cultural heritage etc., prioritization and linkage with reform agendas
City Investment Plan (CIP) with clear estimates of investments and financing
options, referring to the order of investment needed to implement the perspective
and alternative financing strategies.
To identify key institutional stakeholders, their financial status report with service
provision including an analysis of their credit worthiness and efficiency of the
institutional framework.
To prepare population forecast for next 25 for the year 2035 by standard methods
and to incorporate the proposed population with approval of the concerned Urban
Local Bodies.
To consult relevant parastatal department before preparation of CDP so that projects
concerned with them are included in the CDP for the advantage of the ULB. To
organize meetings and workshops with various stakeholders and to consider the
outcomes and issues that arises in such meetings. These outcomes and issues shall
be considered while framing the CDP.
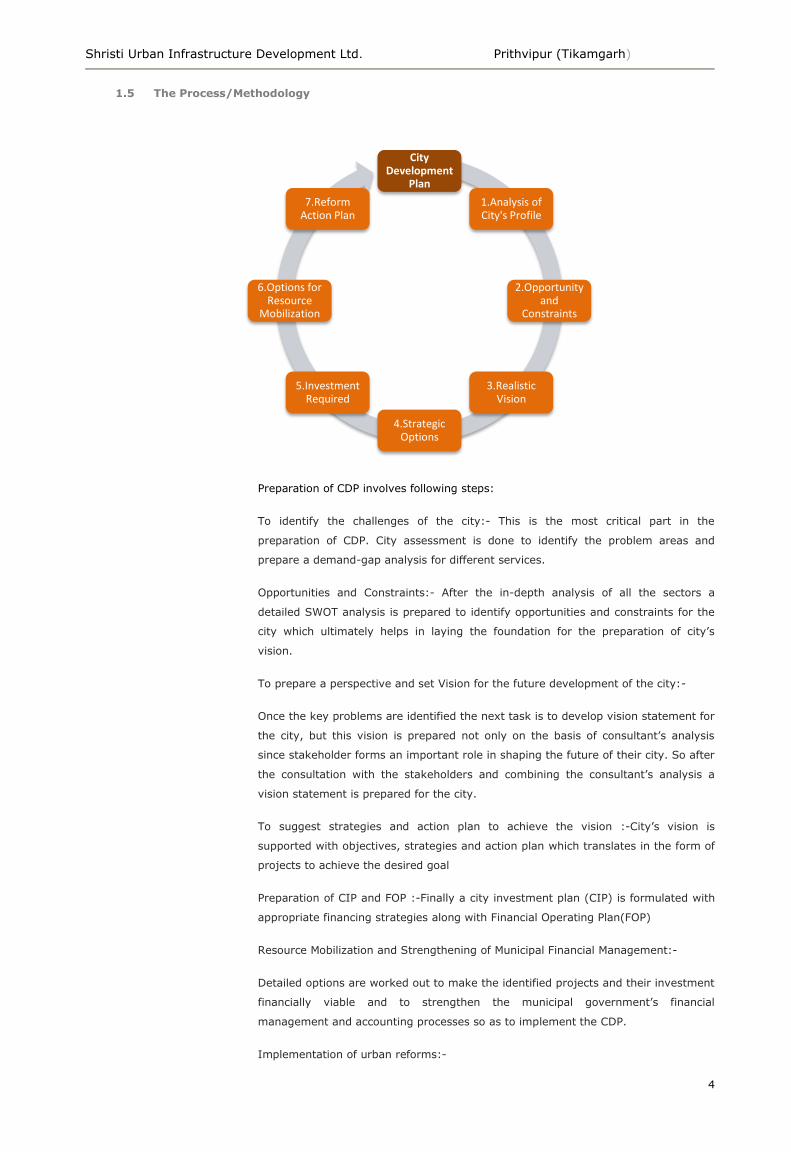
Shristi Urban Infrastructure Development Ltd. Prithvipur (Tikamgarh)
4
City Development
Plan
1.Analysis of City's Profile
2.Opportunity and
Constraints
3.Realistic Vision
4.Strategic Options
5.Investment Required
6.Options for Resource
Mobilization
7.Reform Action Plan
1.5 The Process/Methodology
Preparation of CDP involves following steps:
To identify the challenges of the city:- This is the most critical part in the
preparation of CDP. City assessment is done to identify the problem areas and
prepare a demand-gap analysis for different services.
Opportunities and Constraints:- After the in-depth analysis of all the sectors a
detailed SWOT analysis is prepared to identify opportunities and constraints for the
city which ultimately helps in laying the foundation for the preparation of city‘s
vision.
To prepare a perspective and set Vision for the future development of the city:-
Once the key problems are identified the next task is to develop vision statement for
the city, but this vision is prepared not only on the basis of consultant‘s analysis
since stakeholder forms an important role in shaping the future of their city. So after
the consultation with the stakeholders and combining the consultant‘s analysis a
vision statement is prepared for the city.
To suggest strategies and action plan to achieve the vision :-City‘s vision is
supported with objectives, strategies and action plan which translates in the form of
projects to achieve the desired goal
Preparation of CIP and FOP :-Finally a city investment plan (CIP) is formulated with
appropriate financing strategies along with Financial Operating Plan(FOP)
Resource Mobilization and Strengthening of Municipal Financial Management:-
Detailed options are worked out to make the identified projects and their investment
financially viable and to strengthen the municipal government‘s financial
management and accounting processes so as to implement the CDP.
Implementation of urban reforms:-
Shristi Urban Infrastructure Development Ltd. Prithvipur (Tikamgarh)
5
Focus on the reforms to be carried out at the State and city level in consonance with
the vision and strategic plan outlined to sustain the planned interventions.
1.6 Key steps involved in CDP Preparation
Preliminary Exercise
Resource Mobilization
Secondary Data Collection and its Analysis
Stakeholder‘s Identification
Workshops and Consultation with the stakeholders
Detailed Actions
Stage 1: City Assessment and Gap Analysis:
Data related to demography, economy, civic services, environment, physical
features, heritage, and finance was collected from the ULB and other relevant
stakeholders. A detail analysis was undertaken of the existing municipal services;
data collected was organized in formats for assessment based on the standards and
norms established by UDPFI and other relevant institutions;
• Projections: Population projections was forecasted by the consultant and through a
study of the Development Plans in order to assess the demands and gap assessment
vis a vis desired levels of services;
• A gap assessment in core municipal services was conducted for a horizon period of
25 years;
Stage 2: SWOT
SWOT analysis is the assessment of city‘s strength, weakness, opportunities and
threats which forms the basis for formulating the city‘s vision statement.
Stage 3: Formulation of city vision and implementation strategies
The results of SWOT analysis helped in formulating the vision for Prithvipur which
was the result of consultant‘s analysis and stakeholder‘s aspiration for the city.
Various objectives and action plans were prepared to achieve the city‘s vision.
Stage 4: Preparation of City Investment Plan and Financial Operating Plan
On the basis of the detail study and analysis, City Investment Plan including various
sectors will be prepared in the City Development Plan which extends over a time
frame of 25 years to attain the sustainable growth and to achieve the Mission goals.
The assessment of the financial status of municipal bodies and other financial
institutions will be carried out to determine their credit-worthiness to provide
funding for identified reforms/ projects/ Programmes which would be included in
FOP.
Stage 5: Final CDP
All information and analysis covered in the above stages would be compiled and the
final CDP report will be framed.
Shristi Urban Infrastructure Development Ltd. Prithvipur (Tikamgarh)
6
1.7 Stakeholder’s Consultation
Consultant‘s team had organized city level consultation meetings at Prithvipur
Municipality at two stages of CDP preparation to obtain the inputs of the key
stakeholders. The objective of the consultation meeting was to brief them about the
CDP initiative, obtain their inputs for the same and inform the progress of activities.
The purpose is to achieve the following:
1. Sector specific consultations
2. Inputs on identification of critical focus areas of city development
3. Discussions on key issues, concerns and challenges of the city
4. Gather suggestions and recommendations with respect to proposed exercise
1.7.1 Discussion / Consultations with key stakeholders
The objective of the stakeholder‘s consultation was to ensure that the CDP reflect
ground realities and the needs of the people as articulated by them are incorporated
in the CDP. Various stakeholder meetings and workshops were carried out at
different stages to derive a cohesive approach for the formulation of the CDP.
Table 1-2 Workshop / consultation meetings
Workshop No. Objective Date
I Kick-Off Workshop to discuss the scope, process, timeline and intentions of CDP
24th November 2011
II Stakeholder‘s Workshop to discuss sector analysis and formulate city vision, sector goals, strategies, priority actions and projects
27 th February 2012
III Stakeholder‘s Workshop on the outcomes and findings of the draft CDP
13th February 2013
The identified stakeholders comprised of people from all the walks of life including;
the president of municipal council, ward councilors, elected and ex-MLAs, chief
municipal officer, administrative & technical staff of the ULB, trade associations,
social organizations, non-governmental organizations and other responsible citizens
of the town. Consultations were carried out with the stakeholders in the form of
workshops and one-on-one discussions to make them aware of city development
plan, city‘s vision, and strategy. The process helped in gathering the general
perception about the city vision and later became the basis of project identification
and developing specific strategies.
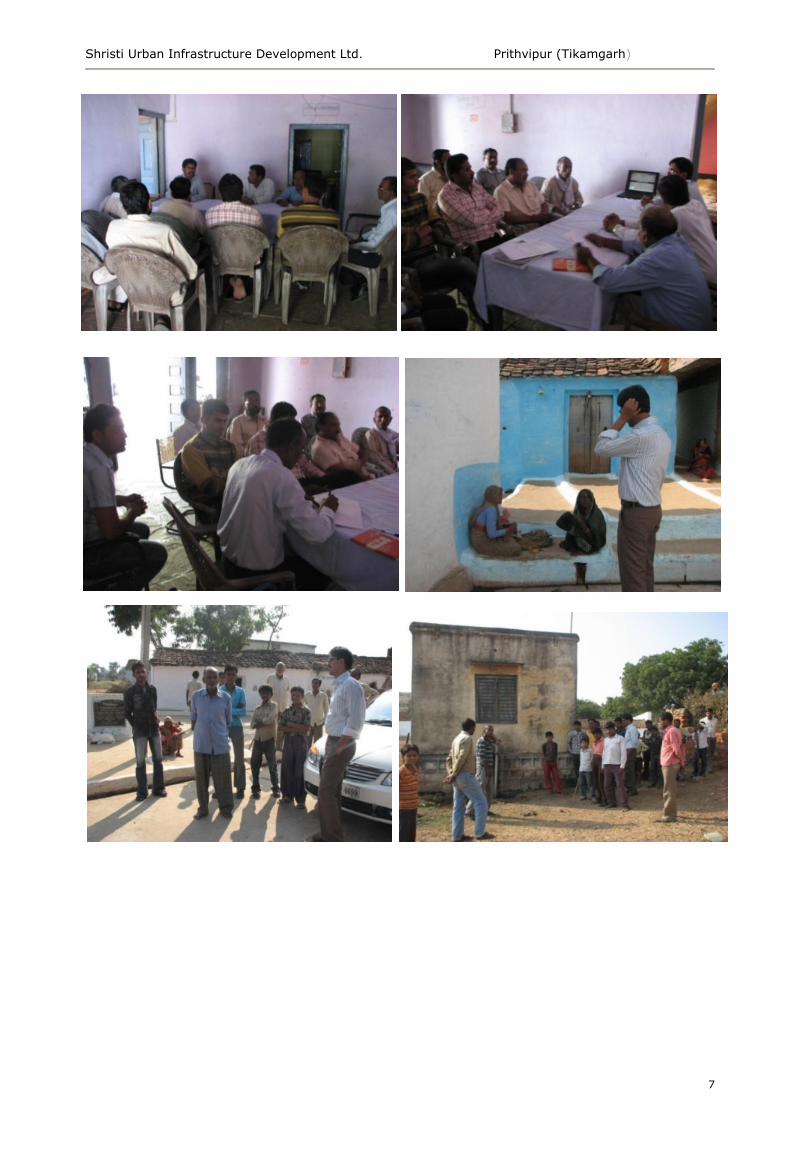
Shristi Urban Infrastructure Development Ltd. Prithvipur (Tikamgarh)
7
Shristi Urban Infrastructure Development Ltd. Prithvipur (Tikamgarh)
8
1.7.2 Summary of the key issues identified and their solutions proposed by the
stakeholders
Sector Specific Comments
Water Supply
Supplied through tubewells, no availability of surface water.
Check dams and anicuts can be built to fulfill water demand.
Distribution pipelines are due to be expanded in at least 3 wards to ensure
full coverage
The water supplied in the town is not simultaneous. Due to lack of storage
capacity the water is supplied at odd hours in the city.
Summer time observes crisis and use tanker/private suppliers to ensure
delivery.
There is no source of surface water around the town and hence water is
supplied at alternate days.
Major repairs are needed to check leakage problems.
Water supply project under Additional Central Assistance is ready but
awaiting approvals.
Treated water shall be used for irrigation purposes, gardens and fire
fighting.
Sewerage
15- 20 % household has no toilets, especially in wards 11, 12 and 13
around 90 % household doesn‘t have toilets.
No public and community toilet is available in the town.
Overflowing and choked drains are the problems because of the improper
sewerage and drainage network.
After construction of CC roads, several storm water/sewerage drains have
been rendered too deep causing safety concerns.
Nallah in the town should be embanked/ covered along appropriate
stretches of its course to ensure smooth flow of sewage.
Traffic & Transportation
The town is situated along the NH-12A. Being a highway town, the main
road faces heavy traffic congestion.
Central part of the town is facing major problem of congestion.
Bus stand needs major re-development.
Shristi Urban Infrastructure Development Ltd. Prithvipur (Tikamgarh)
9
Although there is no major public transport present in the city but for local
transportation, loading auto and magic are used.
Solid Waste Management
At present, waste is disposed off in low lying outer areas.
A trenching ground allotted for SWM but no work done on it.
No systematic manner of waste collection and disposal.
Solid waste dumped into the drain causes clogging of these drains which
ultimately lead to overflowing of waste.
The waste shall be disposed off in environmental friendly manner.
A proper mechanism right from collection to disposal shall be in practice.
Heritage & Tourism
10 days fair is being organized at Ashroo Mata Temple every year in
January which attracts a lot of tourists and pilgrimages.
Hill top of the temple can be developed as eco tourism center.Vegetable
Market
Urban Poor
6 wards have notified slum pockets.
Remote clusters are devoid of basic amenities like water supply and street
lighting.
Ward 14 has a pocket of slum dwellers, poorly connected with electricity
and other basic services.
Basic Infrastructure shall be developed in the slums area.
Provision of public toilets shall be made for all to minimize open defecation.
Places shall be identified where more public toilets are needed.
Social Infrastructure
Proper infrastructure shall be developed for the ‗108 Ambulance‘ service in
the city.
Higher education facility is absent and need to be provided soon.
More recreational activities shall be developed for the residents.
Bus stand should be developed. Proposals should be made for renewal of
roadside drains.

Shristi Urban Infrastructure Development Ltd. Prithvipur (Tikamgarh)
10
2 City Location and Regional Context
2.1 Introduction
2.1.1 Bundelkhand Region
Bundelkhand is spread over southern Uttar Pradesh (UP) and northern Madhya
Pradesh (MP). Bundelkhand comprises 13 districts: Jhansi, Lalitpur, Jalaun,
Hamirpur, Mahoba, Banda and Chitrakoot (all in UP), and Datia, Tikamgarh,
Chhatarpur, Panna, Sagar and Prithvipur (all in MP). 'Bundelkhand' comprises seven
districts of southern UP and six districts of northern MP.
The town of Prithvipur is situated in District Tikamgarh which comes under M.P.
Bundelkhand region
2.2 Prithvipur Nagar Parishad
Prithvipur is an old town, conquered by
Raja Prithvi Singh (from 1736-1752)
on whose name the town was named.
Presently, this fort is in a dilapidated
condition. Prithvipur is a class III town
which was established as Nagar
Panchayat on 30th January 1979 after
merging Jer, Bindpura, Karguwa aur
Prithvipur. Presently the town has a
population of about 26883 which in divided into 15 wards with approximate
Municipal area of 0.54 Sq Km. But according to consultant‘s analysis on satellite
images the area under Nagar Parishad comes out to be 18.79 sq Km. Thus, there is
a need to update the data.
Table 2-1 Area of Town
Area according to ULB 0.54 SqKm
Area according to Consultants Analysis 18.79 SqKm
Source : Nagar Parishad Prithvipur/ Consultants analysis
Source: Census of India
Shristi Urban Infrastructure Development Ltd. Prithvipur (Tikamgarh)
11
The prime economic activity of the people in town is agriculture and agriculture
related activities.
2.3 Regional Setting
Prithvipur is a small town and Nagar Parishad situated in the District Tikamgarh of
M.P. It is situated off Jhansi – Tikamgarh Road at 60 km from Tikamgarh and 41 km
from Jhansi.
Table 2-2: Key features of Prithvipur
S.No. Parameter Details
1 Town Prithvipur
2 District Tikamgarh
3 Latitude and Longitude 25°11′7″North 78°39′54″East
4 Elevation 290 Metre
5 Population(2011) 26883
6 Area(District) 5048 Sq Km
7 Connectivity Tikamgarh -60 Km, Jhansi-41 Km
8 Railway Station Orcha(21 Km)
9 Nearest Airport Bhopal
Source: Prithvipur Nagar Parisha
2.4 District Profile Tikamgarh
Tikamgarh District is located
in the northern part of
Madhya Pradesh. It forms
the north-western part of
Sagar District. It lies on the
Bundelkhand Plateau
between the Jamni, a
tributary of Betwa and
Dhasan rivers. The shape of
district is triangular. The
northern margin is very
irregular. The maximum
length of the district is
about 119 Km. From North
to South and width about 80
Km. Tikamgarh District is
bounded by Chhatarpur
district to east, Lalitpur district Uttar Pradesh to West, Jhansi to North and Sagar to
South. The western and Eastern boundaries are formed by two big rivers.
Tikamgarh district is divided into three sub-divisions, which are further divided into
six tehsils. The Tikamgarh sub-division comprises Tikamgarh and Baldeogarh tehsils.
Prithvipur and Prithvipur tehsils form Prithvipur sub-division while Jatara sub-
Source: Consultant Analysis
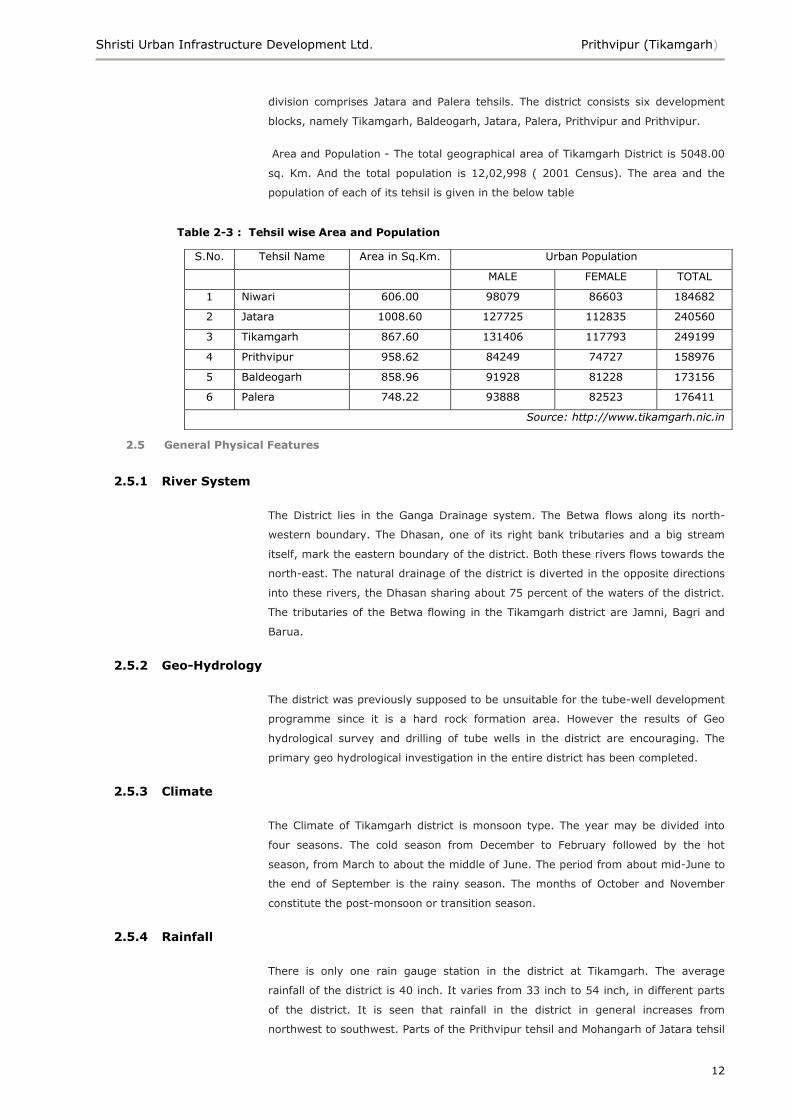
Shristi Urban Infrastructure Development Ltd. Prithvipur (Tikamgarh)
12
division comprises Jatara and Palera tehsils. The district consists six development
blocks, namely Tikamgarh, Baldeogarh, Jatara, Palera, Prithvipur and Prithvipur.
Area and Population - The total geographical area of Tikamgarh District is 5048.00
sq. Km. And the total population is 12,02,998 ( 2001 Census). The area and the
population of each of its tehsil is given in the below table
Table 2-3 : Tehsil wise Area and Population
2.5 General Physical Features
2.5.1 River System
The District lies in the Ganga Drainage system. The Betwa flows along its north-
western boundary. The Dhasan, one of its right bank tributaries and a big stream
itself, mark the eastern boundary of the district. Both these rivers flows towards the
north-east. The natural drainage of the district is diverted in the opposite directions
into these rivers, the Dhasan sharing about 75 percent of the waters of the district.
The tributaries of the Betwa flowing in the Tikamgarh district are Jamni, Bagri and
Barua.
2.5.2 Geo-Hydrology
The district was previously supposed to be unsuitable for the tube-well development
programme since it is a hard rock formation area. However the results of Geo
hydrological survey and drilling of tube wells in the district are encouraging. The
primary geo hydrological investigation in the entire district has been completed.
2.5.3 Climate
The Climate of Tikamgarh district is monsoon type. The year may be divided into
four seasons. The cold season from December to February followed by the hot
season, from March to about the middle of June. The period from about mid-June to
the end of September is the rainy season. The months of October and November
constitute the post-monsoon or transition season.
2.5.4 Rainfall
There is only one rain gauge station in the district at Tikamgarh. The average
rainfall of the district is 40 inch. It varies from 33 inch to 54 inch, in different parts
of the district. It is seen that rainfall in the district in general increases from
northwest to southwest. Parts of the Prithvipur tehsil and Mohangarh of Jatara tehsil
S.No. Tehsil Name Area in Sq.Km. Urban Population
MALE FEMALE TOTAL
1 Niwari 606.00 98079 86603 184682
2 Jatara 1008.60 127725 112835 240560
3 Tikamgarh 867.60 131406 117793 249199
4 Prithvipur 958.62 84249 74727 158976
5 Baldeogarh 858.96 91928 81228 173156
6 Palera 748.22 93888 82523 176411
Source: http://www.tikamgarh.nic.in
Shristi Urban Infrastructure Development Ltd. Prithvipur (Tikamgarh)
13
alos come in the low rainfall zone. About 90 percent of the annual rainfall in the
district is received during the south-west monsoon season - June - September, July
being the rainiest month.
2.5.5 Temperature &Humidity
There is no meteorological observation in the district. The description which follows
is based on the records of the observations in the neighbouring districts which have
similar climate. After February temperature rises progressively. May is generally the
hottest month with mean daily maximum temperature at about 43 degree Celsius
and low 29 degree Celsius. On individual day temperature may raise upto about 47
degrees Celsius. The relative humidity is high during the monsoon season, it being
generally above 70 percent. In the rest of the year the air is comparatively dry. The
driest part of the year is summer season when the relative humidity is less than 20
percent the afternoons.
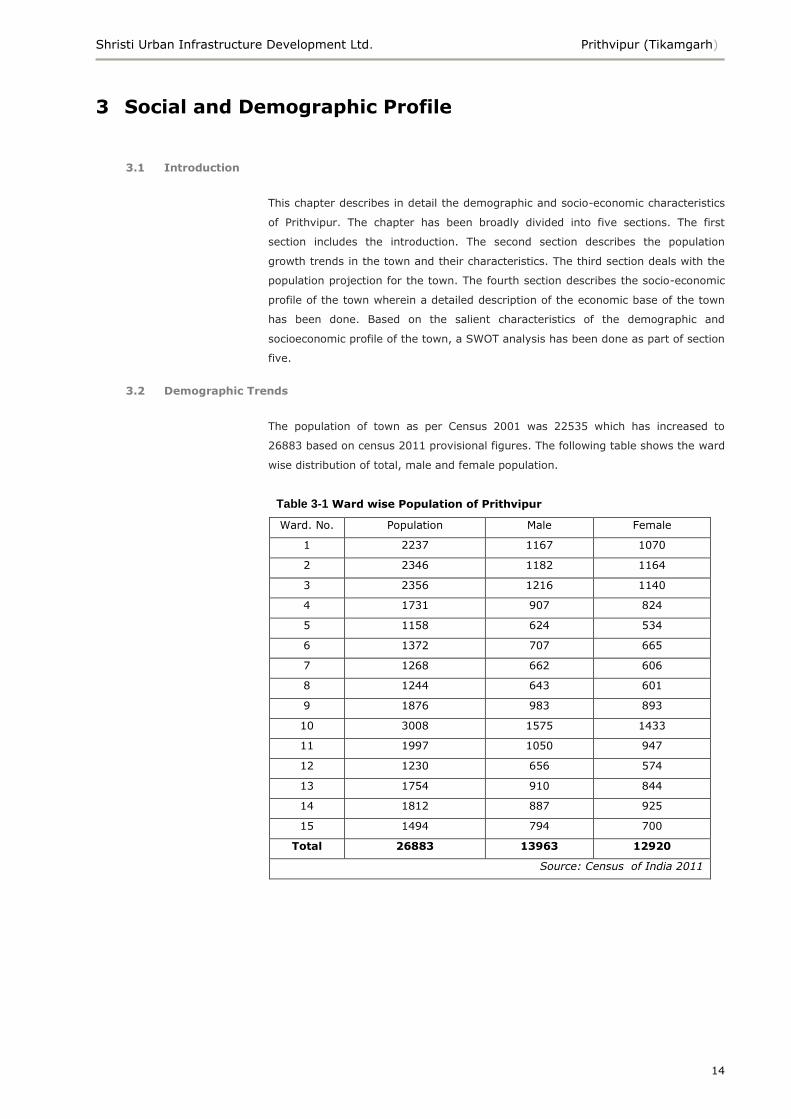
Shristi Urban Infrastructure Development Ltd. Prithvipur (Tikamgarh)
14
3 Social and Demographic Profile
3.1 Introduction
This chapter describes in detail the demographic and socio-economic characteristics
of Prithvipur. The chapter has been broadly divided into five sections. The first
section includes the introduction. The second section describes the population
growth trends in the town and their characteristics. The third section deals with the
population projection for the town. The fourth section describes the socio-economic
profile of the town wherein a detailed description of the economic base of the town
has been done. Based on the salient characteristics of the demographic and
socioeconomic profile of the town, a SWOT analysis has been done as part of section
five.
3.2 Demographic Trends
The population of town as per Census 2001 was 22535 which has increased to
26883 based on census 2011 provisional figures. The following table shows the ward
wise distribution of total, male and female population.
Table 3-1 Ward wise Population of Prithvipur
Ward. No. Population Male Female
1 2237 1167 1070
2 2346 1182 1164
3 2356 1216 1140
4 1731 907 824
5 1158 624 534
6 1372 707 665
7 1268 662 606
8 1244 643 601
9 1876 983 893
10 3008 1575 1433
11 1997 1050 947
12 1230 656 574
13 1754 910 844
14 1812 887 925
15 1494 794 700
Total 26883 13963 12920
Source: Census of India 2011
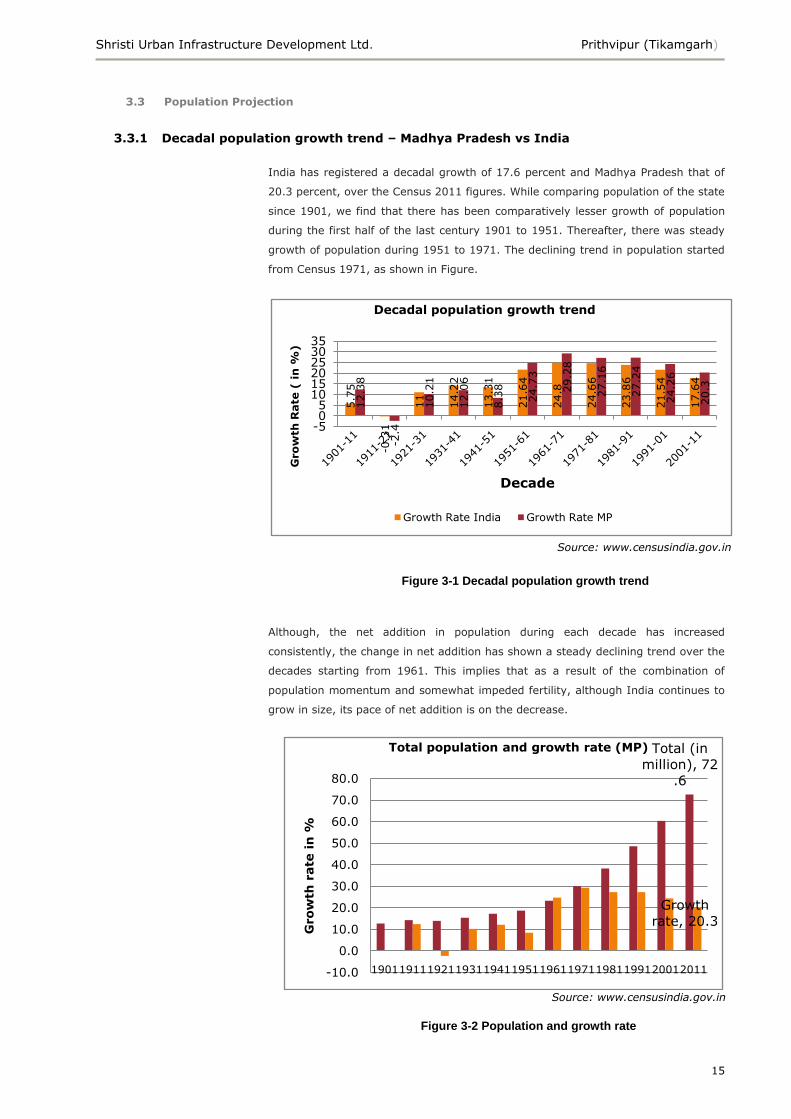
Shristi Urban Infrastructure Development Ltd. Prithvipur (Tikamgarh)
15
Total (in
million), 72
.6
Growth
rate, 20.3
-10.0
0.0
10.0
20.0
30.0
40.0
50.0
60.0
70.0
80.0
190119111921193119411951196119711981199120012011
Grow
th r
ate
in
%
Total population and growth rate (MP)
3.3 Population Projection
3.3.1 Decadal population growth trend – Madhya Pradesh vs India
India has registered a decadal growth of 17.6 percent and Madhya Pradesh that of
20.3 percent, over the Census 2011 figures. While comparing population of the state
since 1901, we find that there has been comparatively lesser growth of population
during the first half of the last century 1901 to 1951. Thereafter, there was steady
growth of population during 1951 to 1971. The declining trend in population started
from Census 1971, as shown in Figure.
Although, the net addition in population during each decade has increased
consistently, the change in net addition has shown a steady declining trend over the
decades starting from 1961. This implies that as a result of the combination of
population momentum and somewhat impeded fertility, although India continues to
grow in size, its pace of net addition is on the decrease.
5.7
5
-0.3
1
11
14.2
2
13.3
1
21.6
4
24.8
24.6
6
23.8
6
21.5
4
17.6
4
12.3
8
-2.4
10.2
1
12.0
6
8.3
8
24.7
3
29.2
8
27.1
6
27.2
4
24.2
6
20.3
-505
101520253035
Gro
wth
Rate
( in
%)
Decade
Decadal population growth trend
Growth Rate India Growth Rate MP
Figure 3-1 Decadal population growth trend
Figure 3-2 Population and growth rate
Source: www.censusindia.gov.in
Source: www.censusindia.gov.in
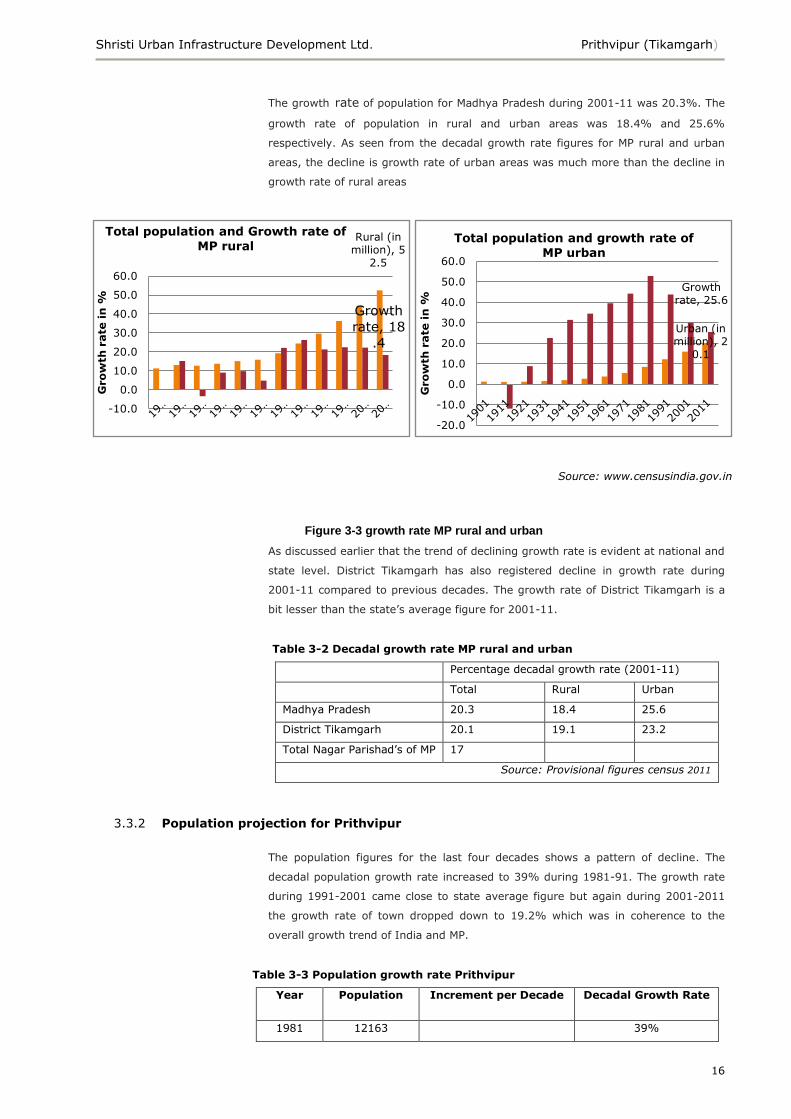
Shristi Urban Infrastructure Development Ltd. Prithvipur (Tikamgarh)
16
Rural (in million), 5
2.5
Growth
rate, 18
.4
-10.0
0.0
10.0
20.0
30.0
40.0
50.0
60.0
Gro
wth
rate
in
%
Total population and Growth rate of
MP rural
Urban (in million), 2
0.1
Growth rate, 25.6
-20.0
-10.0
0.0
10.0
20.0
30.0
40.0
50.0
60.0
Gro
wth
rate
in
%
Total population and growth rate of
MP urban
The growth rate of population for Madhya Pradesh during 2001-11 was 20.3%. The
growth rate of population in rural and urban areas was 18.4% and 25.6%
respectively. As seen from the decadal growth rate figures for MP rural and urban
areas, the decline is growth rate of urban areas was much more than the decline in
growth rate of rural areas
As discussed earlier that the trend of declining growth rate is evident at national and
state level. District Tikamgarh has also registered decline in growth rate during
2001-11 compared to previous decades. The growth rate of District Tikamgarh is a
bit lesser than the state‘s average figure for 2001-11.
Table 3-2 Decadal growth rate MP rural and urban
Percentage decadal growth rate (2001-11)
Total Rural Urban
Madhya Pradesh 20.3 18.4 25.6
District Tikamgarh 20.1 19.1 23.2
Total Nagar Parishad‘s of MP 17
Source: Provisional figures census 2011
3.3.2 Population projection for Prithvipur
The population figures for the last four decades shows a pattern of decline. The
decadal population growth rate increased to 39% during 1981-91. The growth rate
during 1991-2001 came close to state average figure but again during 2001-2011
the growth rate of town dropped down to 19.2% which was in coherence to the
overall growth trend of India and MP.
Table 3-3 Population growth rate Prithvipur
Year Population Increment per Decade Decadal Growth Rate
1981 12163 39%
Figure 3-3 growth rate MP rural and urban
Source: www.censusindia.gov.in
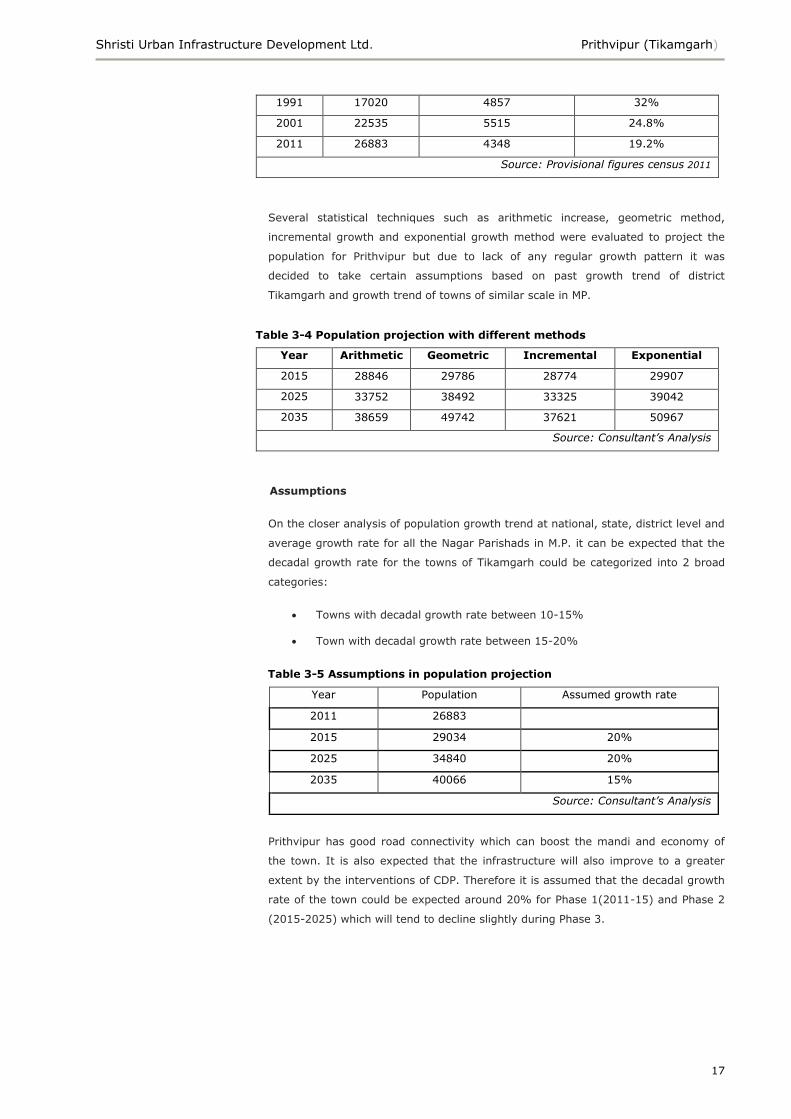
Shristi Urban Infrastructure Development Ltd. Prithvipur (Tikamgarh)
17
1991 17020 4857 32%
2001 22535 5515 24.8%
2011 26883 4348 19.2%
Source: Provisional figures census 2011
Several statistical techniques such as arithmetic increase, geometric method,
incremental growth and exponential growth method were evaluated to project the
population for Prithvipur but due to lack of any regular growth pattern it was
decided to take certain assumptions based on past growth trend of district
Tikamgarh and growth trend of towns of similar scale in MP.
Table 3-4 Population projection with different methods
Year Arithmetic Geometric Incremental Exponential
2015 28846 29786 28774 29907
2025 33752 38492 33325 39042
2035 38659 49742 37621 50967
Source: Consultant’s Analysis
Assumptions
On the closer analysis of population growth trend at national, state, district level and
average growth rate for all the Nagar Parishads in M.P. it can be expected that the
decadal growth rate for the towns of Tikamgarh could be categorized into 2 broad
categories:
Towns with decadal growth rate between 10-15%
Town with decadal growth rate between 15-20%
Table 3-5 Assumptions in population projection
Year Population Assumed growth rate
2011 26883
2015 29034 20%
2025 34840 20%
2035 40066 15%
Source: Consultant’s Analysis
Prithvipur has good road connectivity which can boost the mandi and economy of
the town. It is also expected that the infrastructure will also improve to a greater
extent by the interventions of CDP. Therefore it is assumed that the decadal growth
rate of the town could be expected around 20% for Phase 1(2011-15) and Phase 2
(2015-2025) which will tend to decline slightly during Phase 3.
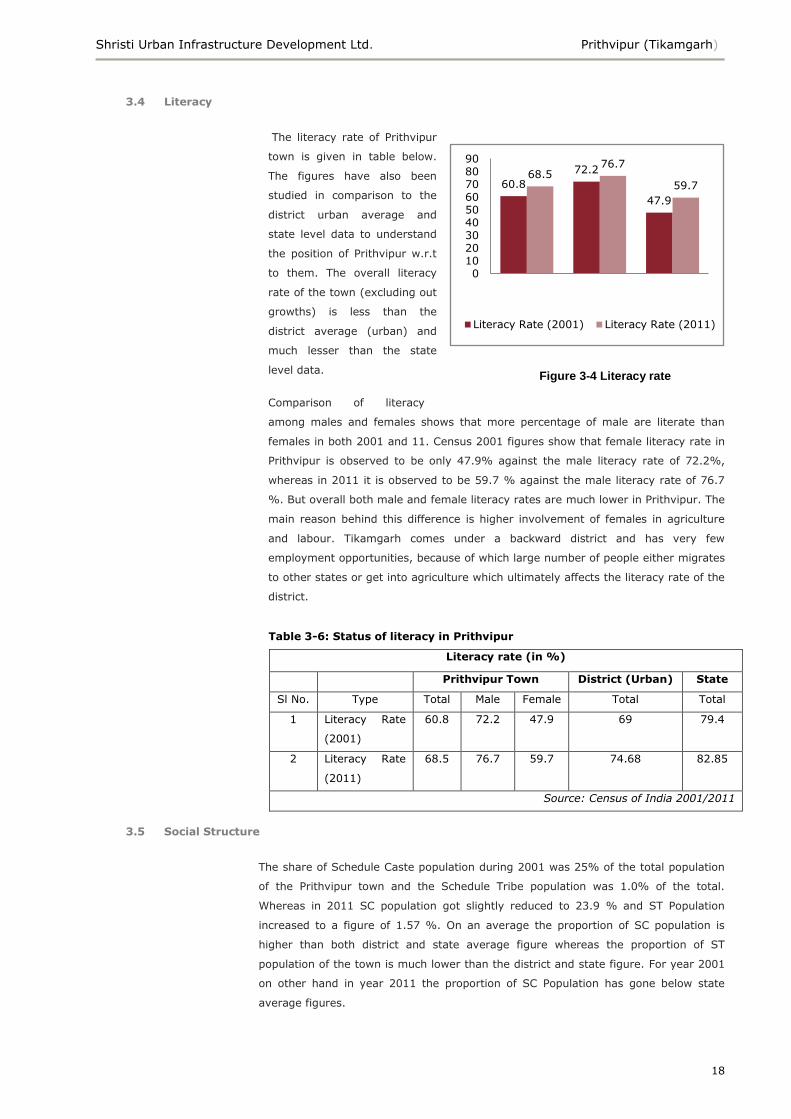
Shristi Urban Infrastructure Development Ltd. Prithvipur (Tikamgarh)
18
3.4 Literacy
The literacy rate of Prithvipur
town is given in table below.
The figures have also been
studied in comparison to the
district urban average and
state level data to understand
the position of Prithvipur w.r.t
to them. The overall literacy
rate of the town (excluding out
growths) is less than the
district average (urban) and
much lesser than the state
level data.
Comparison of literacy
among males and females shows that more percentage of male are literate than
females in both 2001 and 11. Census 2001 figures show that female literacy rate in
Prithvipur is observed to be only 47.9% against the male literacy rate of 72.2%,
whereas in 2011 it is observed to be 59.7 % against the male literacy rate of 76.7
%. But overall both male and female literacy rates are much lower in Prithvipur. The
main reason behind this difference is higher involvement of females in agriculture
and labour. Tikamgarh comes under a backward district and has very few
employment opportunities, because of which large number of people either migrates
to other states or get into agriculture which ultimately affects the literacy rate of the
district.
Table 3-6: Status of literacy in Prithvipur
Literacy rate (in %)
Prithvipur Town District (Urban) State
Sl No. Type Total Male Female Total Total
1 Literacy Rate
(2001)
60.8 72.2 47.9 69 79.4
2 Literacy Rate
(2011)
68.5 76.7 59.7 74.68 82.85
Source: Census of India 2001/2011
3.5 Social Structure
The share of Schedule Caste population during 2001 was 25% of the total population
of the Prithvipur town and the Schedule Tribe population was 1.0% of the total.
Whereas in 2011 SC population got slightly reduced to 23.9 % and ST Population
increased to a figure of 1.57 %. On an average the proportion of SC population is
higher than both district and state average figure whereas the proportion of ST
population of the town is much lower than the district and state figure. For year 2001
on other hand in year 2011 the proportion of SC Population has gone below state
average figures.
60.8
72.2
47.9
68.576.7
59.7
0102030405060708090
Literacy Rate (2001) Literacy Rate (2011)
Figure 3-4 Literacy rate
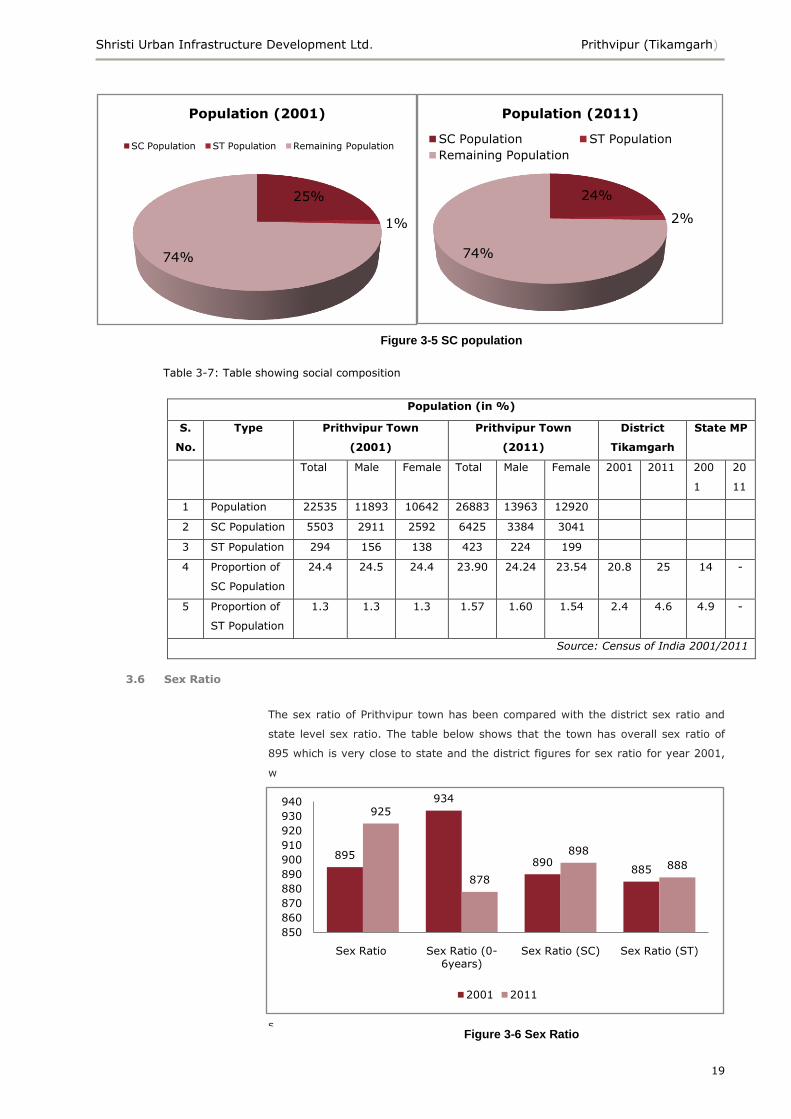
Shristi Urban Infrastructure Development Ltd. Prithvipur (Tikamgarh)
19
Table 3-7: Table showing social composition
Population (in %)
S.
No.
Type Prithvipur Town
(2001)
Prithvipur Town
(2011)
District
Tikamgarh
State MP
Total Male Female Total Male Female 2001 2011 200
1
20
11
1 Population 22535 11893 10642 26883 13963 12920
2 SC Population 5503 2911 2592 6425 3384 3041
3 ST Population 294 156 138 423 224 199
4 Proportion of
SC Population
24.4 24.5 24.4 23.90 24.24 23.54 20.8 25 14 -
5 Proportion of
ST Population
1.3 1.3 1.3 1.57 1.60 1.54 2.4 4.6 4.9 -
Source: Census of India 2001/2011
3.6 Sex Ratio
The sex ratio of Prithvipur town has been compared with the district sex ratio and
state level sex ratio. The table below shows that the town has overall sex ratio of
895 which is very close to state and the district figures for sex ratio for year 2001,
w
h
e
r
e
a
s
i
t
h
a
s
895
934
890885
925
878
898
888
850
860
870
880
890
900
910
920
930
940
Sex Ratio Sex Ratio (0-6years)
Sex Ratio (SC) Sex Ratio (ST)
2001 2011
24%
2%
74%
Population (2011)
SC Population ST Population
Remaining Population
25%
1%
74%
Population (2001)
SC Population ST Population Remaining Population
Figure 3-6 Sex Ratio
Figure 3-5 SC population
Shristi Urban Infrastructure Development Ltd. Prithvipur (Tikamgarh)
20
increased to 925 higher than state figures for year 2011.
As per the census of 2001, sex ratio of Prithvipur was quite healthy in the age group
of 0-6 years but in year 2011 it has gone down to a value of 878 lower than both
state and district figures. The reason behind lower ratio is social backwardness and
conservative attitude of people in the region.
Table 3-8: Table showing sex ratio
Sex Ratio (Females per 1000 males)
S.
No.
Category Prithvipur
Town
District
Tikamgarh
State MP
2001 2011 2001 2011 2001 2011
1 Sex Ratio 895 925 899 901 898 -
2 Sex Ratio (0-
6years)
934 878 927 892 907 -
3 Sex Ratio
(SC)
890 898 879 896 907 -
4 Sex Ratio
(ST)
885 888 964 943 912 -
Source: Census of India 2001/2011
3.7 Workforce Participation
The Workforce Participation Rate (WPR) of the town is only 27.9% which is lower
than the District WFPR of 35.9% in year 2001 whereas in year 2011 WFPR has
increased to 36.6 % as compared to 45.38% of district figure. Out of total
population main workers share 18.6%, marginal workers share 9.3% and non-
workers share 72.2% in 2001 on other hand for year 2011 out of total population
30.9 % are main workers,5.7% are marginal workers and 63.4 % are non-workers.
The overall involvement of main workers in the town is less than both district and
state average whereas involvement of marginal workers is higher than the district
and state average figures. The % of Non-Workers population in Prithvipur is 72.2%
in year 2001 and 64.1 % in year 2011 which includes students, housewives,
dependant such as infants or very elderly people, pensioners those who are drawing
pension after retirement and are not engaged in any economic activity etc.
19%9%
72%
2001
Main Marginal Non Workers
31%
6%
63%
2011
Main Marginal Non Workers
Figure 3-7 Types of workers
Shristi Urban Infrastructure Development Ltd. Prithvipur (Tikamgarh)
21
Table 3-9: Table showing workers distribution
WORKERS (in %)
S. No. Type Prithvipur Town District Tikamgarh State MP
2001 2011 2001 2011 2001 2011
1 Main
Workers
18.6 30.9 28.2 32.55 27.1 -
2 Marginal
Workers
9.3 5.7 7.7 12.8 3.6 -
3 Non Workers 72.2 63.4 64.1 54.65 69.4 -
Source: Census of India 2001/2011
The gender wise constitution of the
workers shows that, nearly 22% of
the main workers constitutes
female working category whereas
78% of the main workers are male
workers. This distribution of
workers changes significantly in
case of marginal workers where the
female participation % increases to
62.8% compared to their
participation as main workers for
2001. Whereas in year 2011 the
share of female main workers has
further reduced to 21.8 % as
compared to 82.3 % of marginal
workers. The major reason for this
character is the involvement of females in agriculture related activities and
migration of male population to large cities for better work opportunities..
3.8 Occupational Structure
The total workers in Prithvipur can be classified into 4 categories based on their
occupation as Cultivators, Agricultural Laborers, Household Industry Workers and
Other Workers.
For year 2001 Out of total workers (main + marginal) Cultivators and Agricultural
Laborers constitute 43.9% and 4.1% respectively. Quite high % of working
population is employed in HH industries (12.2%). Remaining 39.8% of people work
as other workers on other hand for year 2011 Cultivators and agricultural laborers
constitute 28.3 % and 13.8% respectively, population employed in HH industries
had reduced to 6.8 % and remaining 51.0 % belongs to other workers which include
government servants, municipal employees, teachers, factory workers, plantation
workers, those engaged in trade, commerce, business, transport banking, mining,
construction, political or social work, priests or entertainment artists etc.
Figure 3-8 Category of workers
77.8
37.2
78.2
17.7
22.2
62.8
21.8
82.3
0%
10%
20%
30%
40%
50%
60%
70%
80%
90%
100%
Main -2011
Marginal -2011
Main -2001
Marginal -2001
Male Female
Shristi Urban Infrastructure Development Ltd. Prithvipur (Tikamgarh)
22
Table 3-10: Showing workers classification
Category of workers
S. No. Type Total Male Female
2001 2011 2001 2011 2001 2011
1 Agricultural Labors (%) 4.1 13.8 2.5 11.7 7 19.2
2 Cultivators (%) 43.9 28.3 37.1 27.2 56.8 31.2
3 Household Industries
(%)
12.2 6.8 9.2 4.9 17.8 11.6
4 Other Workers (%) 39.8 51.0 51.2 56.2 18.4 38.0
Source: Census of India 2001/2011
The gender wise categorization of work force shows that in year 2001 female
participation is highest under the category of Cultivators (56.8 %) and other
workers (18.4%) which is followed by HH Industries (45.01%). Least female
participation is observed under the category of Agricultural Laborers 7%, whereas in
year 2011 female participation is highest in the category of other workers (38.0%)
and Cultivators (31.2%) which is followed by (19.2%) under agriculture laborers.
Least female participation is observed under the category of HH Industries i.e.
11.6%.
In Prithvipur, people are majorly dependent on agriculture and household industries
for income. Wheat, pulses, oil seeds, soyabean and ginger are the major agriculture
produces. Prithvipur is a sub-mandi to Niwari main mandi which only has seasonal
marketing.
4%
44%
12%
40%
2001
Agricultural Labours (%) Cultivators (%)
Household Industries (%) Other Workers (%)
14%
28%
7%
51%
2011
Agricultural Labours (%) Cultivators (%)
Household Industries (%) Other Workers (%)
Figure 3-9 Occupational classification
Shristi Urban Infrastructure Development Ltd. Prithvipur (Tikamgarh)
23
Figure 3-10 Agriculture related activities
Figure 3-11 Activities in various parts of the town
2.5
37.1
9.2
51.2
7
56.8
17.8
18.4
0
20
40
60
80
100
Agricultural
Labours (%)
Cultivators
(%)
Household
Industries
(%)
Other
Workers (%)
Male Female
11.727.2
4.9
56.219.2
31.2
11.6
38.0
0.010.020.030.040.050.060.070.080.090.0
100.0
Agricultural
Labours (%)
Cultivators
(%)
Household
Industries
(%)
Other
Workers
(%)
Male Female
Areas withsmallhouseholdindustriesand withlargerpopulation ofmigrants
Core area on NH-12 with all the major public-semi public and commercial development along
PRITHVIPUR
JER
BINDPURA
KHIRAK
Source: Consultant’s Analysis
Shristi Urban Infrastructure Development Ltd. Prithvipur (Tikamgarh)
24
Figure 3-13 Deserted areas of town
Apart from this, a large part of the population migrate to larger cities or states
especially Delhi for employment opportunities. They mostly work as construction
laborers there and come back at cropping seasons. Most of the population of Jer,
Bindpur, Karguan and ward no. 13 migrates and the areas would be found deserted
on off seasons. While in a few areas, household industries ( beedi making, clay) can
be seen.
NH-12 passes by the town and has major commercial and public semi-
pulicdevelopment along it that includes Govt offices, hotels, showrooms, bank etc
and Jeron junction has main local market near it.
Figure 3-12 Beedi making activities
NIW
AR
I
Junction of major roads coming from other towns tNiwari, Jhansi and Jeron Khalsa . All the main govt and commercial activities are located around
Road from police station to Chowkarea which has local and weekly market.
Source: Consultant’s Analysis
Shristi Urban Infrastructure Development Ltd. Prithvipur (Tikamgarh)
25
Figure 3-14Activities at major junctions of town
Figure 3-15Activities on NH-12 and Fawwara chowk
Figure 3-16Commercial activities around Jeron Tiraha
Shristi Urban Infrastructure Development Ltd. Prithvipur (Tikamgarh)
26
44%
2%4%
28%
8% 14%
Residential Commercial
Public Semipublic Agriculture
Transport Waterbody
4 Urban Growth Management
4.1 Existing Landuse
Prithvipur town
consists of four
clusters namely
Prithvipur at the
center, Jer Village on
Prithvipur Road,
Bindpura village on
Orcha Road and
Karguan village on
Jeron Khalsa road.
The residential
clusters are situated in
pockets among these
clusters leaving massive agricultural plots between them. The main public and semi-
public assemblage can be seen to be located in the heart of the town. The main
movement corridor which connects Jhansi to Tikamgarh has commercial
establishments on either side of them. The town has 44% residential, 8%
transportation, 4% public semi-public and 2% commercial land use. Agricultural land
is 28% and the rest 14% comprises of Talabs and water bodies which are present
around all the four quadrants of the town.
Prithvipur is having a good connectivity with other places around. The town is linked
to other cities and towns by road network. The town lies on the main railway
corridor that connects Jhansi and Tikamgarh. The town has its bus stand located in
the core area near the Nagar parishad office. The main water body located in the
town is Radha Sagar which is situated in the Southern-Eastern edge of the town.
The water body has a surface area of 35 acres. This plays a vital role in enhancing
the proportion of water body in the town.
4.1.1 Housing
Most of the land of the city comes under residential land use as a result it affects the
economic, social and cultural development of the city. It has been observed that the
residential development is not in accordance with the increasing population of the
city. The main reason behind emergence of slums and squatter settlements are the
non availability of proper housing facilities for the economically weaker section of
the society. Prithvipur not being an industrial and commercial city, there has not
been development of high income housing areas in the city. The residential areas of
the city can be broadly classified on economic basis into medium income and low
income housing areas.
Figure 4-1 Existing Landuse
Shristi Urban Infrastructure Development Ltd. Prithvipur (Tikamgarh)
27
4.1.2 Residential density
High residential density has been found to occur in the central areas and old
squatter settlements of the city whereas residential density is less in the outskirts of
the city. Mixed land use has been found to occur along the sides of major roads.
Most of the roads passing through the Ward no. 1, 2, 7 and 8 has commercial
activities on the ground floor and residential activities on first floor in the building
4.1.3 Commercial
In spite of being one of the important Tehsil and connected by state highways,
Prithvipur could not develop as a major commercial city. The city mostly relies on
Jhansi for commercial activities. The major commercial activities of the town are
operated from ward 1,2,4,7 and 8. Therefore need for decentralizing the commercial
activities of the city is important. Prithvipur is an up-mandi of Prithvipur and hence
the trading status of the town is moderate.
4.1.4 Public-Semi Public
Major chunk of the PSP lies at the center of the city where there are various
government offices like that of Nagar panchayat and public utilities like Community
Health Center, Police Station etc. There are also some Public-Semi Public land uses
on south-west side of the town with government rest house, schools and stadiums.
Apart from these, the other major PSPs are along the Prithvipur Road at Northern
side of the town with the presence of Up-Mandi, Tehsil office and MPEB Sub-
divisional station. Majorly the PSPs are located along the Prithvipur-Jeron road.
4.1.5 Traffic and Transportation
The major modes of transportation in the city are rickshaw, cycle and motorcycle.
Public modes of transport such as city bus, mini bus, tempo, auto rickshaw etc are
not prevalent in the city. The existing Bus stand is at the core of the city near the NP
office and is limited in area. A proposal for a bigger facility is in the pipeline.
4.2 Spatial Growth Direction
The spatial growth of the city of Prithvipur is strongly dictated by its physical setting
as well as its location in the regional context. The town is regionally linked through
movement corridors which form its vital structuring elements. NH connecting Jhansi
to Tikamgarh passing through the town forms the central movement spine, around
which the town has been shaped. Movement corridors leading to other cities have
triggered development along them. Apart from the main Prithvipur village, 3 other
villages namely Jer in the North, Bindpura in the West and Karguan in the south
comprises of the entire ULB area. Due to conglomeration of several habitable
pockets, there are a lot of areas which remain disjunct with eachother and this
affects the overall level of
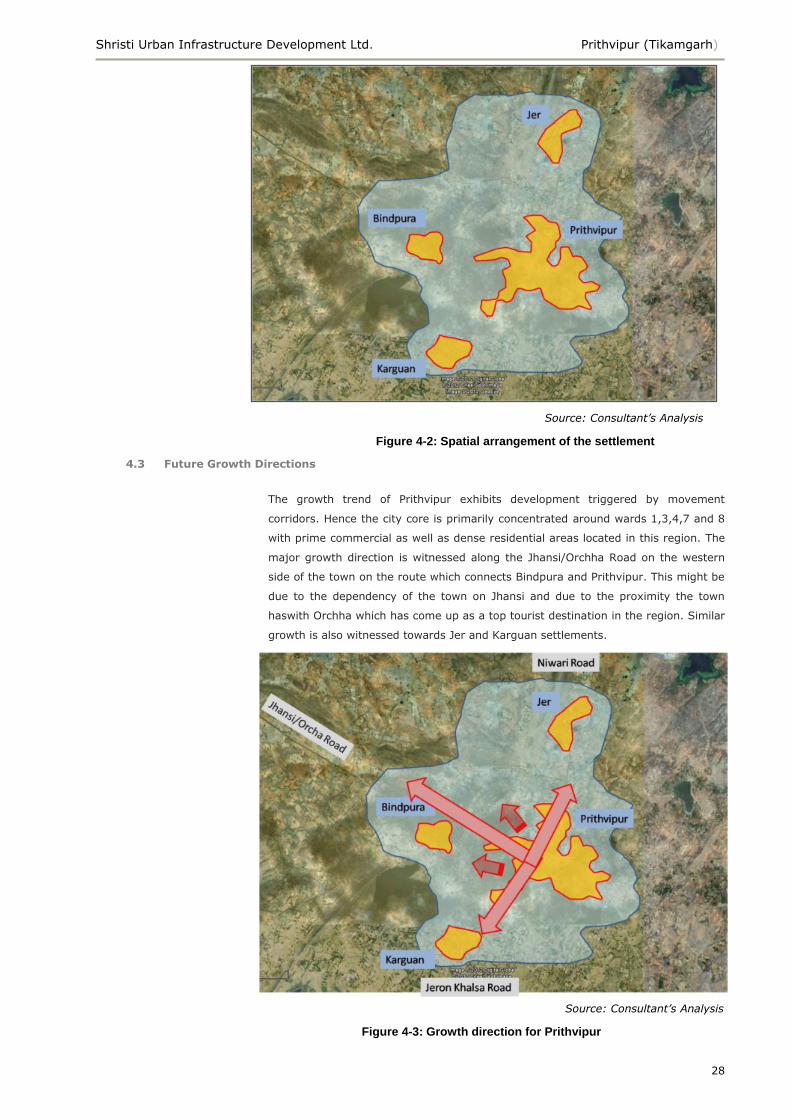
Shristi Urban Infrastructure Development Ltd. Prithvipur (Tikamgarh)
28
4.3 Future Growth Directions
The growth trend of Prithvipur exhibits development triggered by movement
corridors. Hence the city core is primarily concentrated around wards 1,3,4,7 and 8
with prime commercial as well as dense residential areas located in this region. The
major growth direction is witnessed along the Jhansi/Orchha Road on the western
side of the town on the route which connects Bindpura and Prithvipur. This might be
due to the dependency of the town on Jhansi and due to the proximity the town
haswith Orchha which has come up as a top tourist destination in the region. Similar
growth is also witnessed towards Jer and Karguan settlements.
Figure 4-2: Spatial arrangement of the settlement
Figure 4-3: Growth direction for Prithvipur
Source: Consultant’s Analysis
Source: Consultant’s Analysis
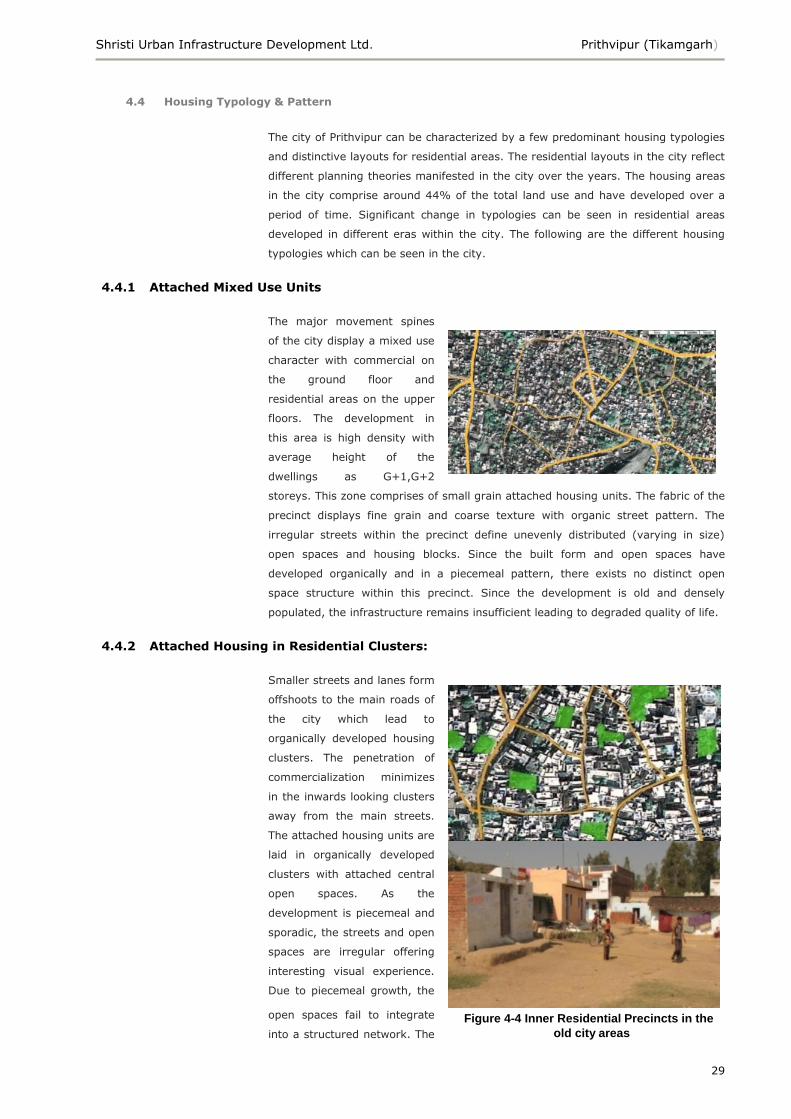
Shristi Urban Infrastructure Development Ltd. Prithvipur (Tikamgarh)
29
4.4 Housing Typology & Pattern
The city of Prithvipur can be characterized by a few predominant housing typologies
and distinctive layouts for residential areas. The residential layouts in the city reflect
different planning theories manifested in the city over the years. The housing areas
in the city comprise around 44% of the total land use and have developed over a
period of time. Significant change in typologies can be seen in residential areas
developed in different eras within the city. The following are the different housing
typologies which can be seen in the city.
4.4.1 Attached Mixed Use Units
The major movement spines
of the city display a mixed use
character with commercial on
the ground floor and
residential areas on the upper
floors. The development in
this area is high density with
average height of the
dwellings as G+1,G+2
storeys. This zone comprises of small grain attached housing units. The fabric of the
precinct displays fine grain and coarse texture with organic street pattern. The
irregular streets within the precinct define unevenly distributed (varying in size)
open spaces and housing blocks. Since the built form and open spaces have
developed organically and in a piecemeal pattern, there exists no distinct open
space structure within this precinct. Since the development is old and densely
populated, the infrastructure remains insufficient leading to degraded quality of life.
4.4.2 Attached Housing in Residential Clusters:
Smaller streets and lanes form
offshoots to the main roads of
the city which lead to
organically developed housing
clusters. The penetration of
commercialization minimizes
in the inwards looking clusters
away from the main streets.
The attached housing units are
laid in organically developed
clusters with attached central
open spaces. As the
development is piecemeal and
sporadic, the streets and open
spaces are irregular offering
interesting visual experience.
Due to piecemeal growth, the
open spaces fail to integrate
into a structured network. The
Figure 4-4 Inner Residential Precincts in the
old city areas
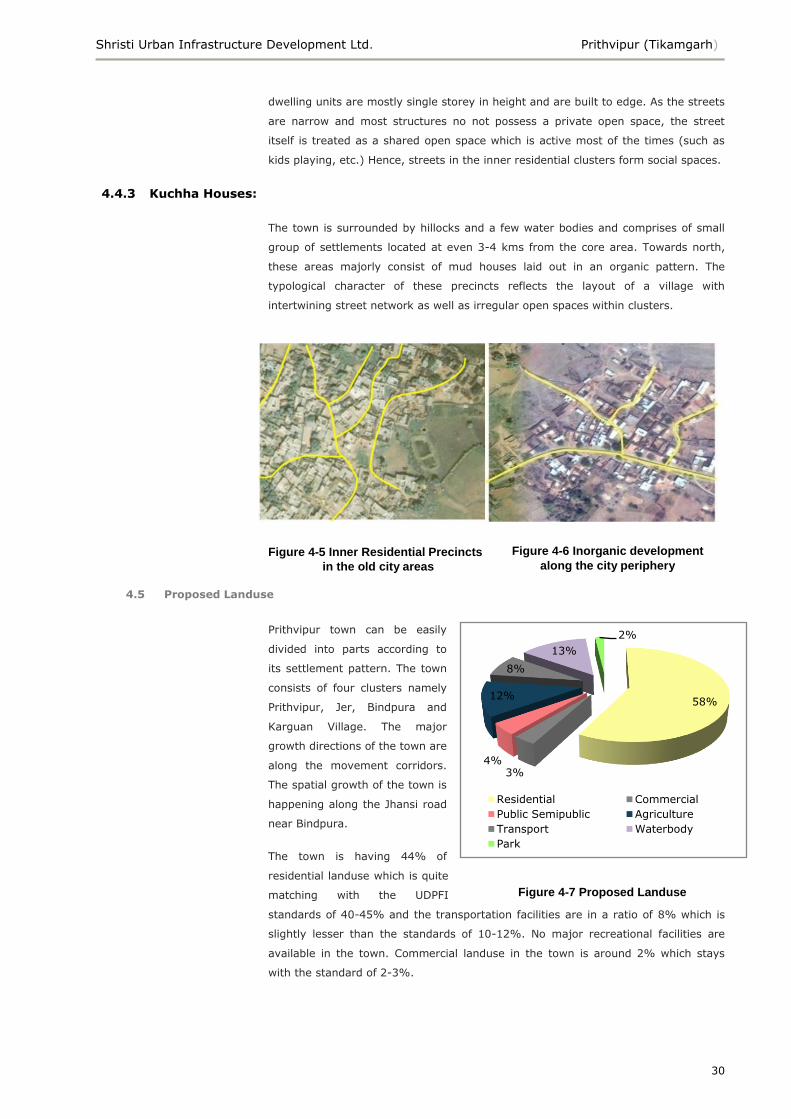
Shristi Urban Infrastructure Development Ltd. Prithvipur (Tikamgarh)
30
58%
3%4%
12%
8%
13%
2%
Residential Commercial
Public Semipublic Agriculture
Transport Waterbody
Park
dwelling units are mostly single storey in height and are built to edge. As the streets
are narrow and most structures no not possess a private open space, the street
itself is treated as a shared open space which is active most of the times (such as
kids playing, etc.) Hence, streets in the inner residential clusters form social spaces.
4.4.3 Kuchha Houses:
The town is surrounded by hillocks and a few water bodies and comprises of small
group of settlements located at even 3-4 kms from the core area. Towards north,
these areas majorly consist of mud houses laid out in an organic pattern. The
typological character of these precincts reflects the layout of a village with
intertwining street network as well as irregular open spaces within clusters.
4.5 Proposed Landuse
Prithvipur town can be easily
divided into parts according to
its settlement pattern. The town
consists of four clusters namely
Prithvipur, Jer, Bindpura and
Karguan Village. The major
growth directions of the town are
along the movement corridors.
The spatial growth of the town is
happening along the Jhansi road
near Bindpura.
The town is having 44% of
residential landuse which is quite
matching with the UDPFI
standards of 40-45% and the transportation facilities are in a ratio of 8% which is
slightly lesser than the standards of 10-12%. No major recreational facilities are
available in the town. Commercial landuse in the town is around 2% which stays
with the standard of 2-3%.
Figure 4-5 Inner Residential Precincts
in the old city areas
Figure 4-6 Inorganic development
along the city periphery
Figure 4-7 Proposed Landuse
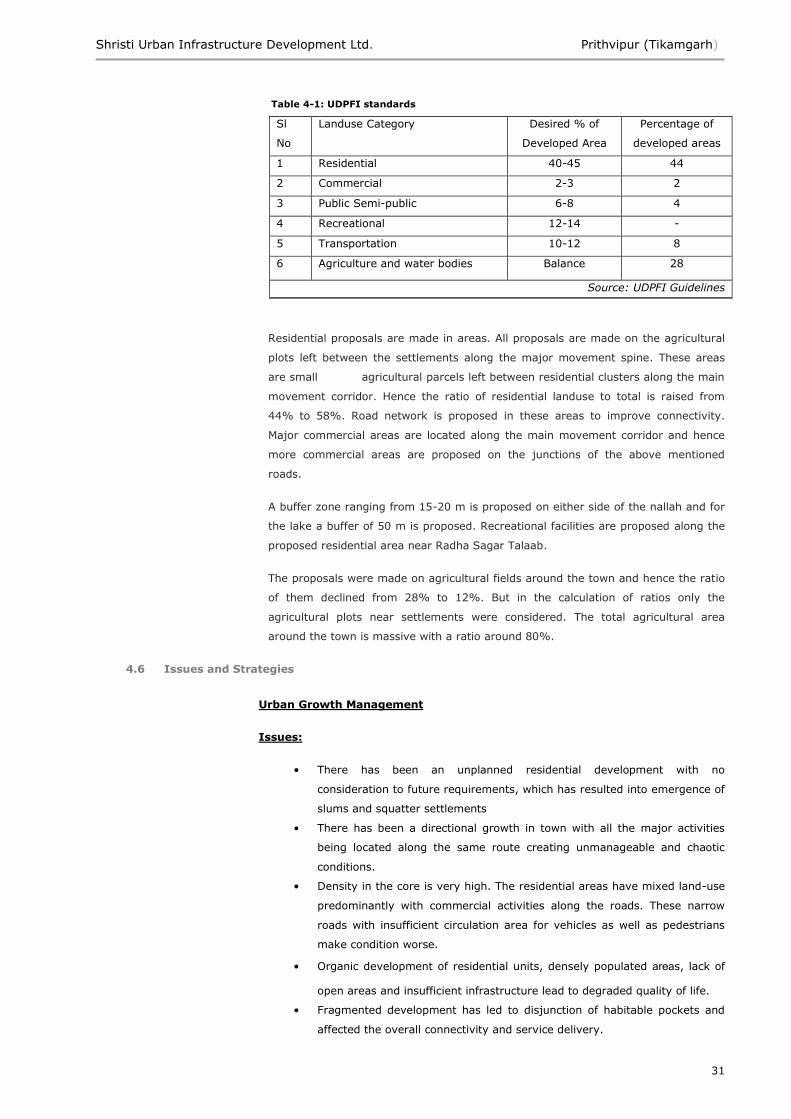
Shristi Urban Infrastructure Development Ltd. Prithvipur (Tikamgarh)
31
Table 4-1: UDPFI standards
Sl
No
Landuse Category Desired % of
Developed Area
Percentage of
developed areas
1 Residential 40-45 44
2 Commercial 2-3 2
3 Public Semi-public 6-8 4
4 Recreational 12-14 -
5 Transportation 10-12 8
6 Agriculture and water bodies Balance 28
Source: UDPFI Guidelines
Residential proposals are made in areas. All proposals are made on the agricultural
plots left between the settlements along the major movement spine. These areas
are small agricultural parcels left between residential clusters along the main
movement corridor. Hence the ratio of residential landuse to total is raised from
44% to 58%. Road network is proposed in these areas to improve connectivity.
Major commercial areas are located along the main movement corridor and hence
more commercial areas are proposed on the junctions of the above mentioned
roads.
A buffer zone ranging from 15-20 m is proposed on either side of the nallah and for
the lake a buffer of 50 m is proposed. Recreational facilities are proposed along the
proposed residential area near Radha Sagar Talaab.
The proposals were made on agricultural fields around the town and hence the ratio
of them declined from 28% to 12%. But in the calculation of ratios only the
agricultural plots near settlements were considered. The total agricultural area
around the town is massive with a ratio around 80%.
4.6 Issues and Strategies
Urban Growth Management
Issues:
• There has been an unplanned residential development with no
consideration to future requirements, which has resulted into emergence of
slums and squatter settlements
• There has been a directional growth in town with all the major activities
being located along the same route creating unmanageable and chaotic
conditions.
• Density in the core is very high. The residential areas have mixed land-use
predominantly with commercial activities along the roads. These narrow
roads with insufficient circulation area for vehicles as well as pedestrians
make condition worse.
• Organic development of residential units, densely populated areas, lack of
open areas and insufficient infrastructure lead to degraded quality of life.
• Fragmented development has led to disjunction of habitable pockets and
affected the overall connectivity and service delivery.
Shristi Urban Infrastructure Development Ltd. Prithvipur (Tikamgarh)
32
• The remote clusters in the fringe areas don‘t have strong connectivity to
the main town and lack basic infrastructural facilities.
Strategies
Efforts should be made to further develop the town in a planned manner
considering the future requirements and norms / standards.
In a small town, the growth is often triggered by the movement corridors
and all the major activities are concentrated along them. Hence, efforts
should be made to locate and manage the growth such that it does not
hinder the operation of other activities and interrupts the movement and
circulation along the corridors.
Development should be such that densities in different areas in town don‘t
have extreme variance
There should be an equitable distribution of activities and services in the
whole town so that the whole population is benefited.
Efforts should be made to rejuvenate inner precincts of the town through
various design and planning interventions and enhance the livability and
quality of life in those areas.
The connectivity of remote clusters and the main town should be
strengthened and efforts should be made to facilitate them with basic
infrastructural facilities so that they do not turn into slums and help them
becoming an integral part of the town.

Shristi Urban Infrastructure Development Ltd. Prithvipur (Tikamgarh)
33
5 Stakeholder Consultation and Development of City Vision
5.1 Background
As a part of preparation of CDP as per the guidelines of UADD, stakeholder
consultation is the key component for the purpose of understanding priority of the
local people while developing a vision for the city and identifies the projects for the
City Development Plan. For this, the project team had visited Prithvipur on several
occasions and discussed the issues with officials of government departments and the
local people. This chapter outlines the nature of consultation activities conducted by
the project team in the overall CDP process.
Consultation with local communities, local government and state government was
undertaken by the Consultants to provide an opportunity for community and
government participation in the CDP process. These activities have aimed to form an
open and cooperative communication process between the team of CDP preparation
and all stakeholders.
The overall objective of the consultation process was to get the viewpoints of the
stakeholders in the identification of issues as well as vision formulation. Specific
objectives were:
To involve local residents in the CDP process
To enable stakeholders to express their views about existing problems and
proposal;
To create a shared flow of information and
To enable local ownership of the city development plan
5.2 Role of Stakeholders in preparation of CDP
A fully consultative and participatory approach with local stakeholders and
development partners was adopted while developing a city development plan for
Prithvipur. Consultative meetings and city wide workshops were held at critical
stages of the process to arrive at consensus on key issues and to frame optional
strategies to address the service delivery and financial issues identified.
Exhaustive consultations were carried out with key stakeholders, both institutional
and individual. These stakeholders included key representatives (both elected and
administrative) of Prithvipur Nagar Parishad, the SDM and other important
departments of the state government such as DUDA, PHE, Traffic Police, Town and
Country Planning, prominent citizens of, representatives from trade and commerce,
NGOs, slum inhabitants, representatives of education institutes etc.
The CDP therefore reflects a broadly shared understanding of the city's
socioeconomic structure, constraints, and prospects and a shared "vision" for
Prithvipur city with agreed goals, priorities and requirements.
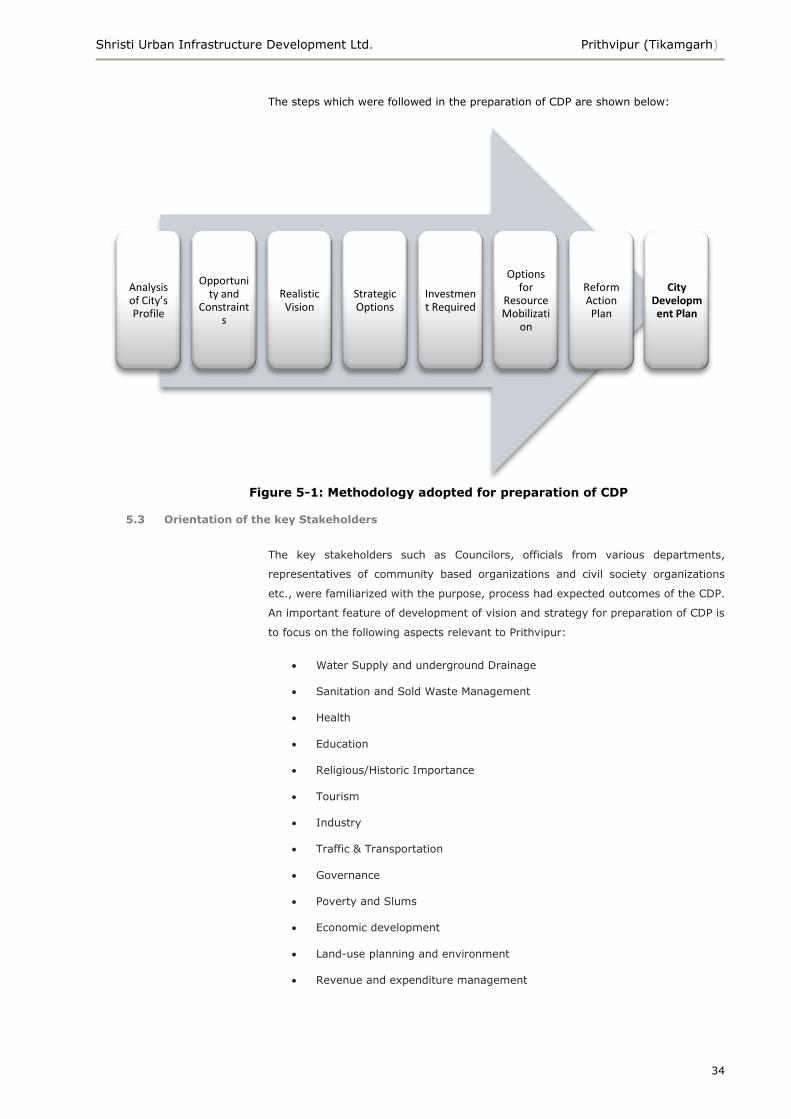
Shristi Urban Infrastructure Development Ltd. Prithvipur (Tikamgarh)
34
The steps which were followed in the preparation of CDP are shown below:
Figure 5-1: Methodology adopted for preparation of CDP
5.3 Orientation of the key Stakeholders
The key stakeholders such as Councilors, officials from various departments,
representatives of community based organizations and civil society organizations
etc., were familiarized with the purpose, process had expected outcomes of the CDP.
An important feature of development of vision and strategy for preparation of CDP is
to focus on the following aspects relevant to Prithvipur:
Water Supply and underground Drainage
Sanitation and Sold Waste Management
Health
Education
Religious/Historic Importance
Tourism
Industry
Traffic & Transportation
Governance
Poverty and Slums
Economic development
Land-use planning and environment
Revenue and expenditure management
Analysis of City’s Profile
Opportunity and
Constraints
Realistic Vision
Strategic Options
Investment Required
Options for
Resource Mobilizati
on
Reform Action Plan
City Development Plan
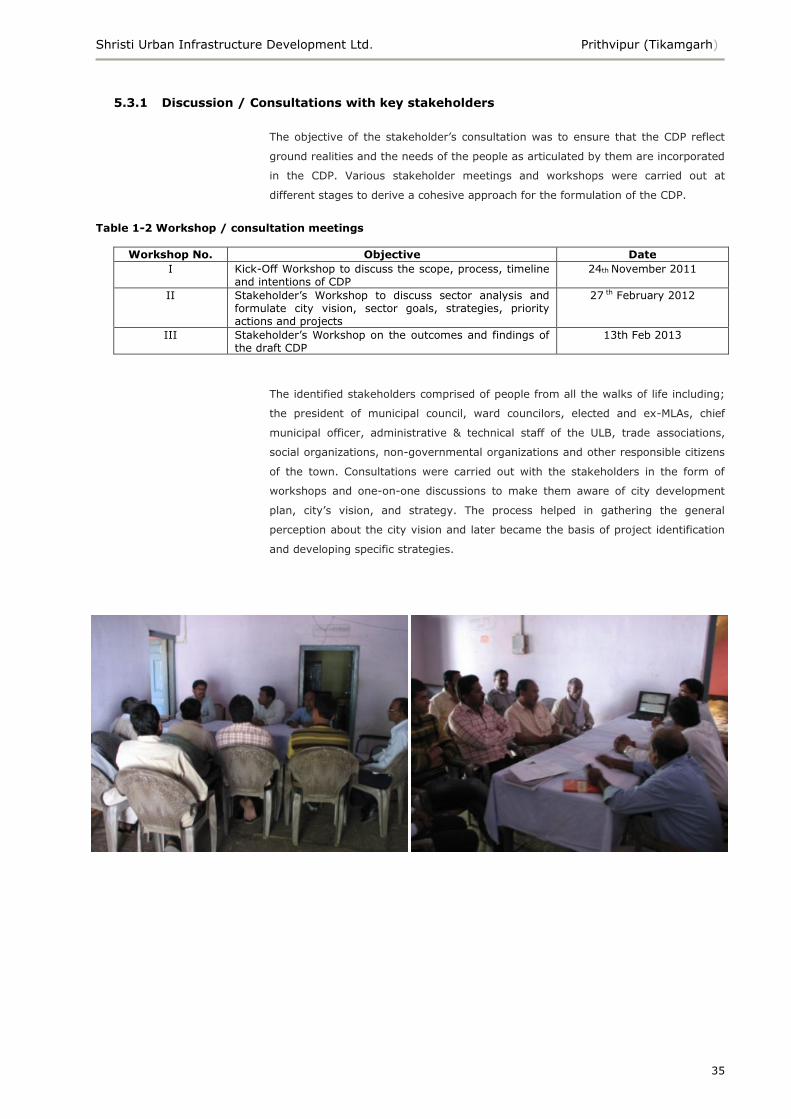
Shristi Urban Infrastructure Development Ltd. Prithvipur (Tikamgarh)
35
5.3.1 Discussion / Consultations with key stakeholders
The objective of the stakeholder‘s consultation was to ensure that the CDP reflect
ground realities and the needs of the people as articulated by them are incorporated
in the CDP. Various stakeholder meetings and workshops were carried out at
different stages to derive a cohesive approach for the formulation of the CDP.
Table 1-2 Workshop / consultation meetings
Workshop No. Objective Date
I Kick-Off Workshop to discuss the scope, process, timeline and intentions of CDP
24th November 2011
II Stakeholder‘s Workshop to discuss sector analysis and formulate city vision, sector goals, strategies, priority actions and projects
27 th February 2012
III Stakeholder‘s Workshop on the outcomes and findings of the draft CDP
13th Feb 2013
The identified stakeholders comprised of people from all the walks of life including;
the president of municipal council, ward councilors, elected and ex-MLAs, chief
municipal officer, administrative & technical staff of the ULB, trade associations,
social organizations, non-governmental organizations and other responsible citizens
of the town. Consultations were carried out with the stakeholders in the form of
workshops and one-on-one discussions to make them aware of city development
plan, city‘s vision, and strategy. The process helped in gathering the general
perception about the city vision and later became the basis of project identification
and developing specific strategies.
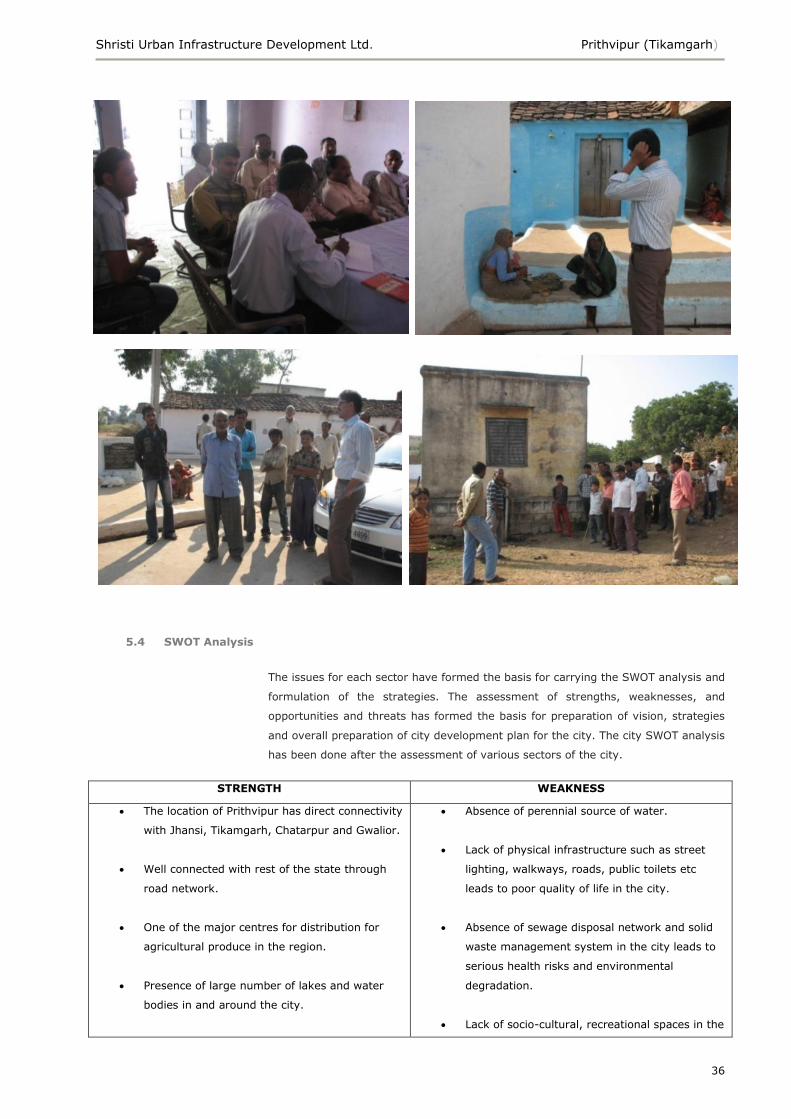
Shristi Urban Infrastructure Development Ltd. Prithvipur (Tikamgarh)
36
5.4 SWOT Analysis
The issues for each sector have formed the basis for carrying the SWOT analysis and
formulation of the strategies. The assessment of strengths, weaknesses, and
opportunities and threats has formed the basis for preparation of vision, strategies
and overall preparation of city development plan for the city. The city SWOT analysis
has been done after the assessment of various sectors of the city.
STRENGTH WEAKNESS
The location of Prithvipur has direct connectivity
with Jhansi, Tikamgarh, Chatarpur and Gwalior.
Well connected with rest of the state through
road network.
One of the major centres for distribution for
agricultural produce in the region.
Presence of large number of lakes and water
bodies in and around the city.
Absence of perennial source of water.
Lack of physical infrastructure such as street
lighting, walkways, roads, public toilets etc
leads to poor quality of life in the city.
Absence of sewage disposal network and solid
waste management system in the city leads to
serious health risks and environmental
degradation.
Lack of socio-cultural, recreational spaces in the
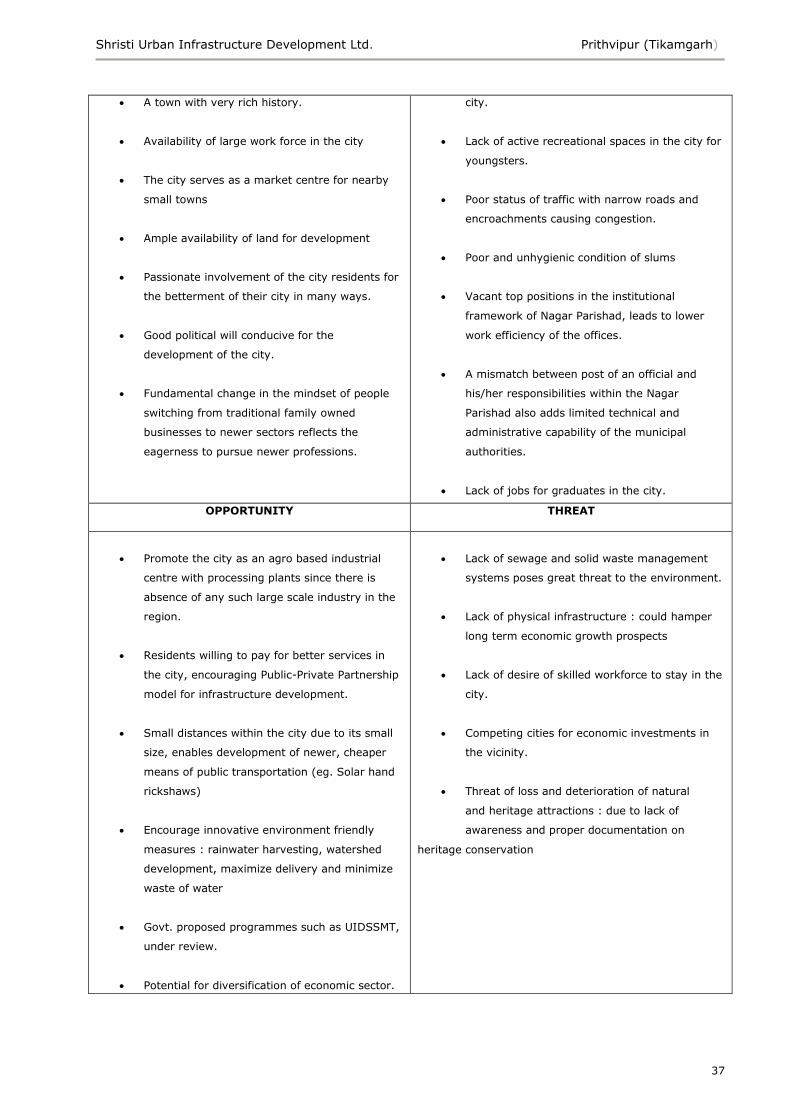
Shristi Urban Infrastructure Development Ltd. Prithvipur (Tikamgarh)
37
A town with very rich history.
Availability of large work force in the city
The city serves as a market centre for nearby
small towns
Ample availability of land for development
Passionate involvement of the city residents for
the betterment of their city in many ways.
Good political will conducive for the
development of the city.
Fundamental change in the mindset of people
switching from traditional family owned
businesses to newer sectors reflects the
eagerness to pursue newer professions.
city.
Lack of active recreational spaces in the city for
youngsters.
Poor status of traffic with narrow roads and
encroachments causing congestion.
Poor and unhygienic condition of slums
Vacant top positions in the institutional
framework of Nagar Parishad, leads to lower
work efficiency of the offices.
A mismatch between post of an official and
his/her responsibilities within the Nagar
Parishad also adds limited technical and
administrative capability of the municipal
authorities.
Lack of jobs for graduates in the city.
OPPORTUNITY THREAT
Promote the city as an agro based industrial
centre with processing plants since there is
absence of any such large scale industry in the
region.
Residents willing to pay for better services in
the city, encouraging Public-Private Partnership
model for infrastructure development.
Small distances within the city due to its small
size, enables development of newer, cheaper
means of public transportation (eg. Solar hand
rickshaws)
Encourage innovative environment friendly
measures : rainwater harvesting, watershed
development, maximize delivery and minimize
waste of water
Govt. proposed programmes such as UIDSSMT,
under review.
Potential for diversification of economic sector.
Lack of sewage and solid waste management
systems poses great threat to the environment.
Lack of physical infrastructure : could hamper
long term economic growth prospects
Lack of desire of skilled workforce to stay in the
city.
Competing cities for economic investments in
the vicinity.
Threat of loss and deterioration of natural
and heritage attractions : due to lack of
awareness and proper documentation on
heritage conservation
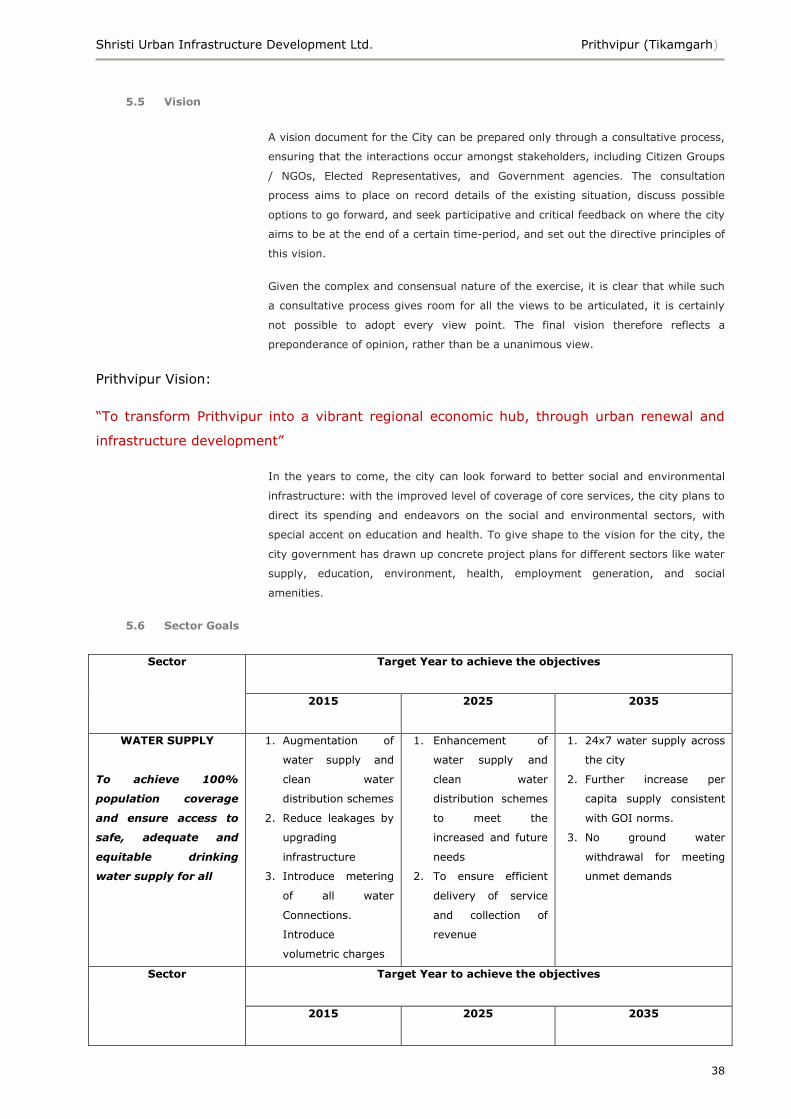
Shristi Urban Infrastructure Development Ltd. Prithvipur (Tikamgarh)
38
5.5 Vision
A vision document for the City can be prepared only through a consultative process,
ensuring that the interactions occur amongst stakeholders, including Citizen Groups
/ NGOs, Elected Representatives, and Government agencies. The consultation
process aims to place on record details of the existing situation, discuss possible
options to go forward, and seek participative and critical feedback on where the city
aims to be at the end of a certain time-period, and set out the directive principles of
this vision.
Given the complex and consensual nature of the exercise, it is clear that while such
a consultative process gives room for all the views to be articulated, it is certainly
not possible to adopt every view point. The final vision therefore reflects a
preponderance of opinion, rather than be a unanimous view.
Prithvipur Vision:
―To transform Prithvipur into a vibrant regional economic hub, through urban renewal and
infrastructure development‖
In the years to come, the city can look forward to better social and environmental
infrastructure: with the improved level of coverage of core services, the city plans to
direct its spending and endeavors on the social and environmental sectors, with
special accent on education and health. To give shape to the vision for the city, the
city government has drawn up concrete project plans for different sectors like water
supply, education, environment, health, employment generation, and social
amenities.
5.6 Sector Goals
Sector Target Year to achieve the objectives
2015
2025 2035
WATER SUPPLY
To achieve 100%
population coverage
and ensure access to
safe, adequate and
equitable drinking
water supply for all
1. Augmentation of
water supply and
clean water
distribution schemes
2. Reduce leakages by
upgrading
infrastructure
3. Introduce metering
of all water
Connections.
Introduce
volumetric charges
1. Enhancement of
water supply and
clean water
distribution schemes
to meet the
increased and future
needs
2. To ensure efficient
delivery of service
and collection of
revenue
1. 24x7 water supply across
the city
2. Further increase per
capita supply consistent
with GOI norms.
3. No ground water
withdrawal for meeting
unmet demands
Sector Target Year to achieve the objectives
2015
2025 2035
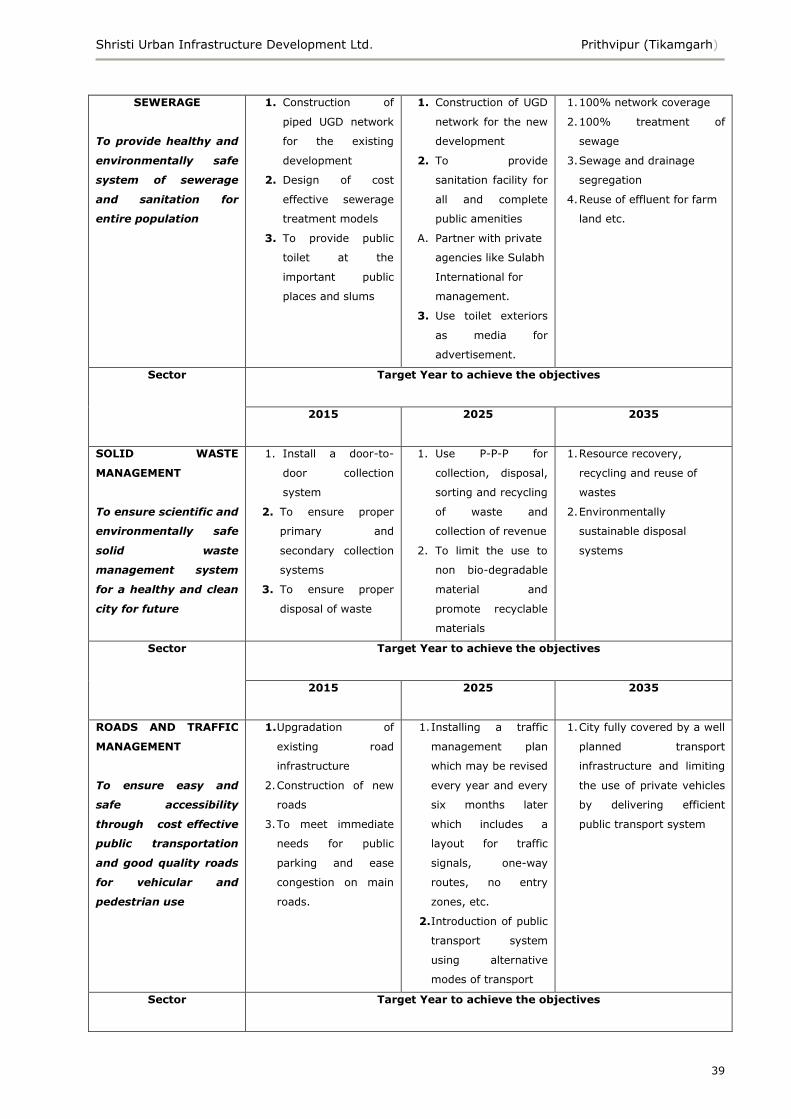
Shristi Urban Infrastructure Development Ltd. Prithvipur (Tikamgarh)
39
SEWERAGE
To provide healthy and
environmentally safe
system of sewerage
and sanitation for
entire population
1. Construction of
piped UGD network
for the existing
development
2. Design of cost
effective sewerage
treatment models
3. To provide public
toilet at the
important public
places and slums
1. Construction of UGD
network for the new
development
2. To provide
sanitation facility for
all and complete
public amenities
A. Partner with private
agencies like Sulabh
International for
management.
3. Use toilet exteriors
as media for
advertisement.
1. 100% network coverage
2. 100% treatment of
sewage
3. Sewage and drainage
segregation
4. Reuse of effluent for farm
land etc.
Sector Target Year to achieve the objectives
2015
2025 2035
SOLID WASTE
MANAGEMENT
To ensure scientific and
environmentally safe
solid waste
management system
for a healthy and clean
city for future
1. Install a door-to-
door collection
system
2. To ensure proper
primary and
secondary collection
systems
3. To ensure proper
disposal of waste
1. Use P-P-P for
collection, disposal,
sorting and recycling
of waste and
collection of revenue
2. To limit the use to
non bio-degradable
material and
promote recyclable
materials
1. Resource recovery,
recycling and reuse of
wastes
2. Environmentally
sustainable disposal
systems
Sector Target Year to achieve the objectives
2015
2025 2035
ROADS AND TRAFFIC
MANAGEMENT
To ensure easy and
safe accessibility
through cost effective
public transportation
and good quality roads
for vehicular and
pedestrian use
1. Upgradation of
existing road
infrastructure
2. Construction of new
roads
3. To meet immediate
needs for public
parking and ease
congestion on main
roads.
1. Installing a traffic
management plan
which may be revised
every year and every
six months later
which includes a
layout for traffic
signals, one-way
routes, no entry
zones, etc.
2. Introduction of public
transport system
using alternative
modes of transport
1. City fully covered by a well
planned transport
infrastructure and limiting
the use of private vehicles
by delivering efficient
public transport system
Sector Target Year to achieve the objectives
Shristi Urban Infrastructure Development Ltd. Prithvipur (Tikamgarh)
40
2015 2025 2035
TOURISM
To develop Prithvipur
as a tourist destination
1. Conservation of
existing heritage
structures
2. Development of
tourist spots
1. Sensitize citizens
towards conservation
and hospitality
2. Integrated design of
urban spaces
complete with street
furniture and signage
1. To promote Prithvipur as a
Tourist place and include
activities for local tourisim.
Sector Tar Target Year to achieve the objectives
2015
2025 2035
ECONOMIC GROWTH
To make Prithvipur a self-
propelled economy
1. Promotion of
industrial base in
Prithvipur
2. Expand trade &
commerce activities
1. Lay adequate
infrastructure
required for industrial
base
1. To mark Prithvipur
as strong self
propelled economy
Sector Target Year to achieve the objectives
2015
2025 2035
ENVIRONMENT
To upgrade the city
environment for
abetter quality of life
and safe future
forinhabitants
1. Adoption of a ―Green
Prithvipur‖ resolution
2. Conservation of
green spaces, natural
landscape and
natural drainage
3. Build parks and
promenades along
natural drain to
rejuvenate the water
body
4. Encourage tree
plantation
interspersed with
future development
1. To limit the use to
non bio-degradable
material and promote
recyclable materials
2. Water harvesting
techniques should be
promoted through
awareness
campaigns.
1. Make water-harvesting
compulsory for
households/ colonies
2. To maintain ecological
equilibrium
Sector Target Year to achieve the objectives
2015
2025 2035
HEALTH
To provide better
healthcare to all
1. Quality improvement
of existing health
facilities
2. To ensure the
delivery of
programmes for
disease prevention
1. Augmentation of
medical facilities
2. Employing P-P-P in
hospital management
to ensure better
service delivery
1. To ensure delivery of
high quality medical
facilities not only to the
people of Prithvipur but
also to the neighbouring
villages
Sector Target Year to achieve the objectives
Shristi Urban Infrastructure Development Ltd. Prithvipur (Tikamgarh)
41
2015
2025 2035
EDUCATION
To ensure social
equality and economic
growth by imparting
quality education
1. Setting up of schools
of excellence
2. Promoting avenues of
informal education
1. Expansion of
vocational training
platforms
2. Introduction of
industry sponsored
programs for specific
industry
requirements
1. To meet the workforce
requirements of local
industries and to check
out-migration of youth
Sector Target Year to achieve the objectives
2015
2025 2035
MUNICIPAL
GOVERNANCE
To make Prithvipur
with a sustainable e-
governance system for
citizen services
1. Up gradation of
administrative
toolkit and
personnel skills
1. Setting up of a
collaboration cell
2. Creating forum for
citizen involvement
3. Training modules for
ULB staff to enable e-
governance and active
update of database
4. Setting up a special
cell within the ULB
management focussed
on P-P-P
To equip ULB with the
latest technology and skill-
sets and accurate base
data of various sectors to
ensure delivery of superior
urban services
Sector Target Year to achieve the objectives
2015
2025 2035
URBAN POOR
To make Prithvipur a
city where there are no
families living below
the poverty line, and
where all residents
have access to
affordable and reliable
basic services
1. Improvement of
housing
infrastructure and
civic amenities in
slum areas
2. Business Incubation
centre for assistance
in enterprise
development and
setting up of co-
operative societies
1. To create perennial
sources of income for
the economically
weak.
2. Cross-linking the
employment schemes
with housing
improvement
programme to ensure
slum-dwellers
involvement in
development
1. Cover all slum areas with
service levels at par with
the surrounding zones i.e.
100% accessibility to basic
infrastructure services

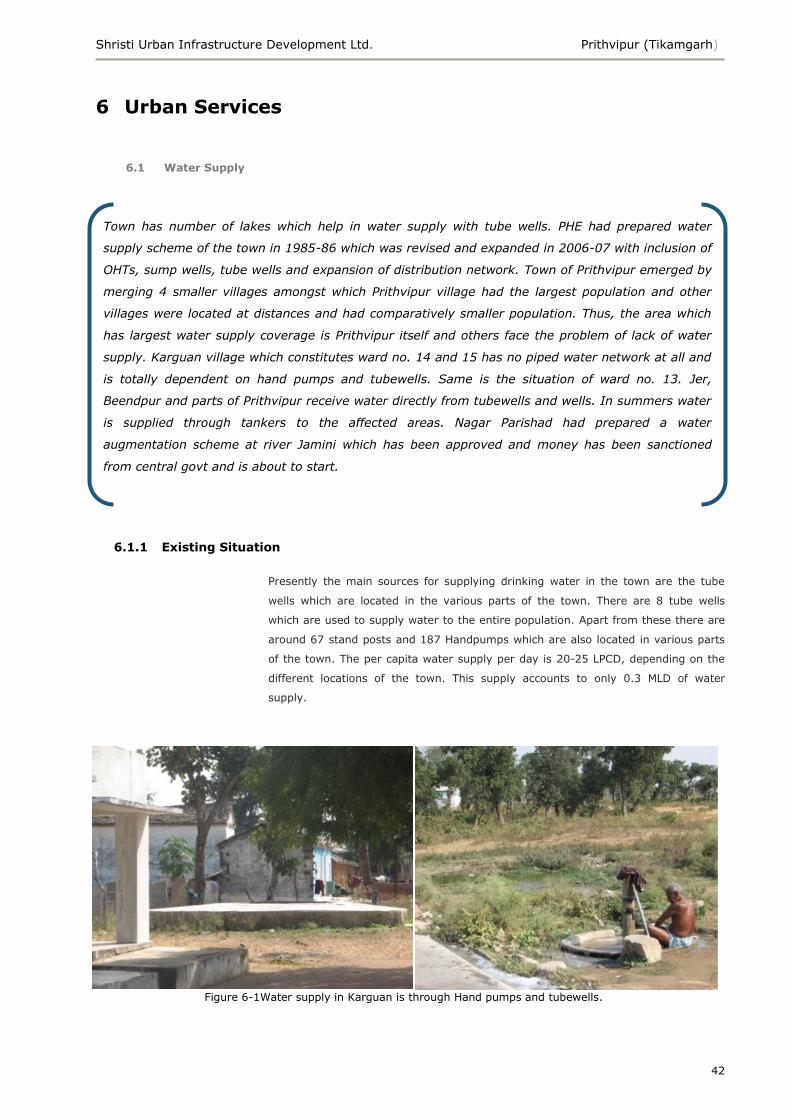
Shristi Urban Infrastructure Development Ltd. Prithvipur (Tikamgarh)
42
6 Urban Services
6.1 Water Supply
6.1.1 Existing Situation
Presently the main sources for supplying drinking water in the town are the tube
wells which are located in the various parts of the town. There are 8 tube wells
which are used to supply water to the entire population. Apart from these there are
around 67 stand posts and 187 Handpumps which are also located in various parts
of the town. The per capita water supply per day is 20-25 LPCD, depending on the
different locations of the town. This supply accounts to only 0.3 MLD of water
supply.
Figure 6-1Water supply in Karguan is through Hand pumps and tubewells.
Town has number of lakes which help in water supply with tube wells. PHE had prepared water
supply scheme of the town in 1985-86 which was revised and expanded in 2006-07 with inclusion of
OHTs, sump wells, tube wells and expansion of distribution network. Town of Prithvipur emerged by
merging 4 smaller villages amongst which Prithvipur village had the largest population and other
villages were located at distances and had comparatively smaller population. Thus, the area which
has largest water supply coverage is Prithvipur itself and others face the problem of lack of water
supply. Karguan village which constitutes ward no. 14 and 15 has no piped water network at all and
is totally dependent on hand pumps and tubewells. Same is the situation of ward no. 13. Jer,
Beendpur and parts of Prithvipur receive water directly from tubewells and wells. In summers water
is supplied through tankers to the affected areas. Nagar Parishad had prepared a water
augmentation scheme at river Jamini which has been approved and money has been sanctioned
from central govt and is about to start.
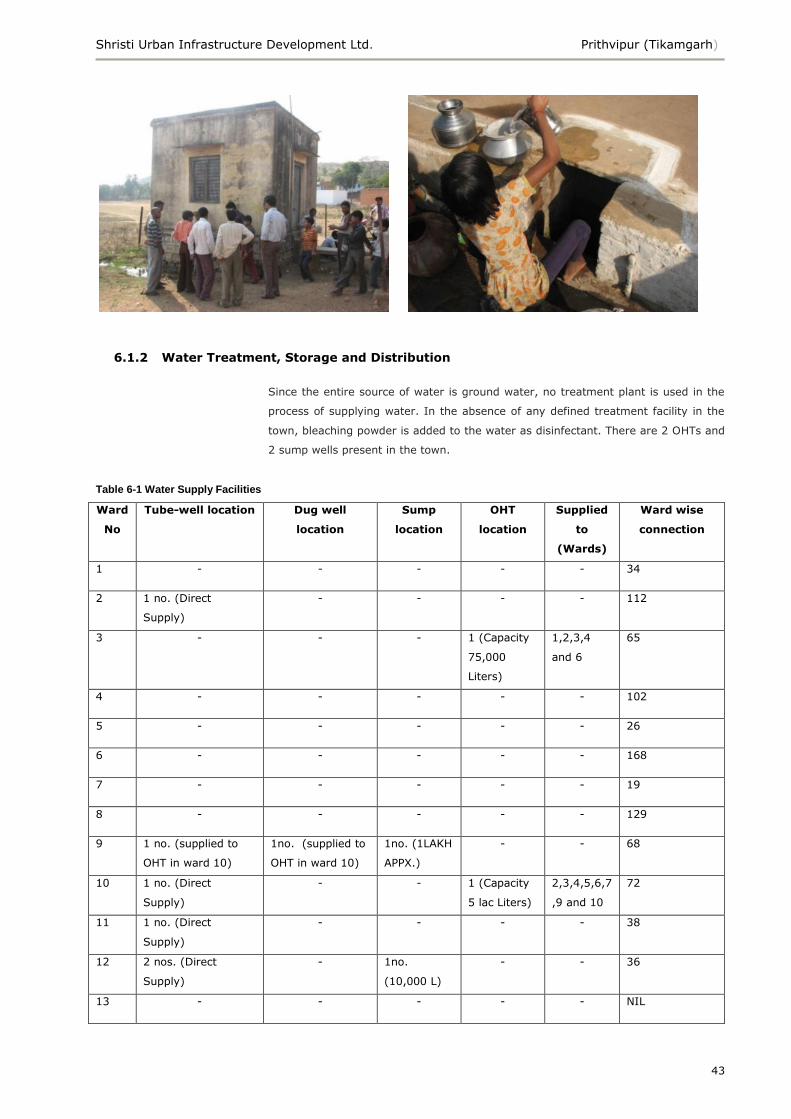
Shristi Urban Infrastructure Development Ltd. Prithvipur (Tikamgarh)
43
6.1.2 Water Treatment, Storage and Distribution
Since the entire source of water is ground water, no treatment plant is used in the
process of supplying water. In the absence of any defined treatment facility in the
town, bleaching powder is added to the water as disinfectant. There are 2 OHTs and
2 sump wells present in the town.
Table 6-1 Water Supply Facilities
Ward
No
Tube-well location Dug well
location
Sump
location
OHT
location
Supplied
to
(Wards)
Ward wise
connection
1 - - - - - 34
2 1 no. (Direct
Supply)
- - - - 112
3 - - - 1 (Capacity
75,000
Liters)
1,2,3,4
and 6
65
4 - - - - - 102
5 - - - - - 26
6 - - - - - 168
7 - - - - - 19
8 - - - - - 129
9 1 no. (supplied to
OHT in ward 10)
1no. (supplied to
OHT in ward 10)
1no. (1LAKH
APPX.)
- - 68
10 1 no. (Direct
Supply)
- - 1 (Capacity
5 lac Liters)
2,3,4,5,6,7
,9 and 10
72
11 1 no. (Direct
Supply)
- - - - 38
12 2 nos. (Direct
Supply)
- 1no.
(10,000 L)
- - 36
13 - - - - - NIL
Shristi Urban Infrastructure Development Ltd. Prithvipur (Tikamgarh)
44
14 - 1no. (supplied to
OHT in ward 10
and 3)
- - - NIL
Source: Prithvipur Nagar Parishad
6.1.3 Distribution System
Water is distributed once in two days for 40 minutes in the town. The situation is
very grim as the per capita water supply is as low as 10 LPCD which is way below
the prescribed standard of 135 LPCD. The prime reason behind inadequate supply is
inadequate and reliable source of water supply, uneven distribution of water and
very high transmission losses.The total length of the distribution network is only 2.5
kms, and the details of it are mentioned below:
Main Line
90mm PVC – from behind the petrol pump to higher sec school
90mm & 160mm PVC – Karguvan road to sump well
150mm – sump well to new OHT/ESR
Distribution pipe line
160mm PVC – new OHT to Jain temple
110mm PVC – Jain temple to old Girls School
110 & 90mm PVC – old bus stand to Jeron Road
160mm & 110mm PVC, 100mm GI –Chopra mohalla to Khisron and Shukla
mohalla
Table 6-2: Table showing details of water distribution system
Parameter Details
1.Total wards 15
2.Wards with full water supply from OHT 09 (Wards 1,2,3,4,5,6,7,9 and 10)
3.Wards with direct water supply from tube wells 03 (Wards 8,11 and 12)
4.Wards with no supply 03 (Wards 13,14 and 15)
4.Volume of water supplied at present 0.3 MLD per day
5.Duration of water supply (once in two days) 40 minutes
6.Estimated water loss per day 35-45%
Details for Water Tap Connections
Ownership No. of Connections Monthly Fees New connection charge
Domestic Approx. 869 Rs.30/- Rs 1200/-
Commercial 09 Rs.50/- Rs 1200/-
Public (Stand Post) 67 free
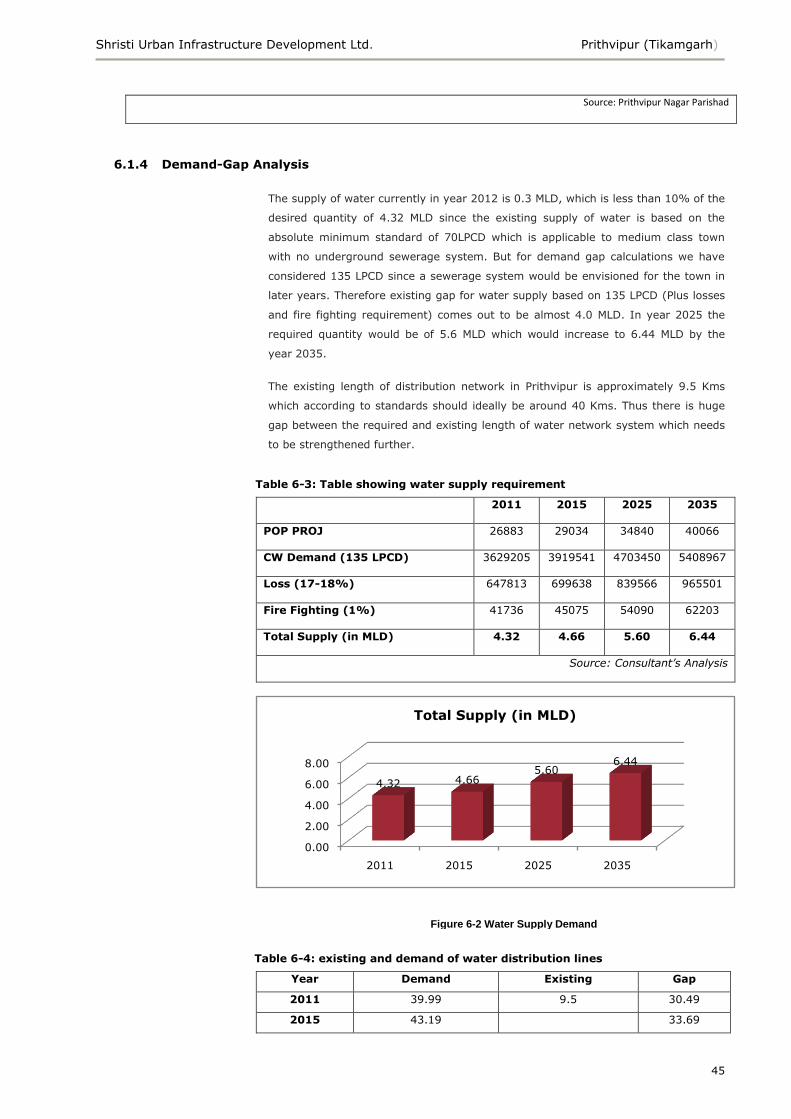
Shristi Urban Infrastructure Development Ltd. Prithvipur (Tikamgarh)
45
Source: Prithvipur Nagar Parishad
6.1.4 Demand-Gap Analysis
The supply of water currently in year 2012 is 0.3 MLD, which is less than 10% of the
desired quantity of 4.32 MLD since the existing supply of water is based on the
absolute minimum standard of 70LPCD which is applicable to medium class town
with no underground sewerage system. But for demand gap calculations we have
considered 135 LPCD since a sewerage system would be envisioned for the town in
later years. Therefore existing gap for water supply based on 135 LPCD (Plus losses
and fire fighting requirement) comes out to be almost 4.0 MLD. In year 2025 the
required quantity would be of 5.6 MLD which would increase to 6.44 MLD by the
year 2035.
The existing length of distribution network in Prithvipur is approximately 9.5 Kms
which according to standards should ideally be around 40 Kms. Thus there is huge
gap between the required and existing length of water network system which needs
to be strengthened further.
Table 6-3: Table showing water supply requirement
2011 2015 2025 2035
POP PROJ 26883 29034 34840 40066
CW Demand (135 LPCD) 3629205 3919541 4703450 5408967
Loss (17-18%) 647813 699638 839566 965501
Fire Fighting (1%) 41736 45075 54090 62203
Total Supply (in MLD) 4.32 4.66 5.60 6.44
Source: Consultant’s Analysis
Table 6-4: existing and demand of water distribution lines
Year Demand Existing Gap
2011 39.99 9.5 30.49
2015 43.19 33.69
0.00
2.00
4.00
6.00
8.00
2011 2015 2025 2035
4.32 4.665.60
6.44
Total Supply (in MLD)
Figure 6-2 Water Supply Demand
Shristi Urban Infrastructure Development Ltd. Prithvipur (Tikamgarh)
46
2025 51.83 42.33
2035 59.60 50.10
Source: Consultant’s Analysis
6.1.5 Issues/Goals and Objectives/Development Strategies
Water Supply
ISSUES:
Non usage of a surface water body as a source of water supply
Unavailability of treatment plant
Fragmented nature of town.
Each part has a different water supply source.
Lack of OHTs
Dependence on sump wells, tubewells and tankers in summers.
Areas supplied water from sump wells and tube wells faces problem of water pressure.
Contamination of water due to old service connections/ old network
Coverage needs to be increased from existing area to full extent
Reduction in the transmission and distribution from 40-45% to an efficient level of 10-
15%
The areas in the periphery does not have systematic water Supply network.
The main problems faced by the Municipality are the illegal tapping of water and
difficulty in collection of water bills from the slum people as well as others. To ensure
regular payment of bills and to detect illegal tapping of water periodical checking and
monitoring is necessary.
SECTORAL GOAL:
To achieve 100% population coverage and ensure access to safe, adequate and
equitable drinking water supply for all
SECTORAL OBJECTIVES:
1. To Protect and Secure water sources
2. To Cover 100% households with Individual tap
3. Move towards 24x7 water supply in a phased manner
4. Move towards metered water supply in a phased manner, and
5. To improve cost recovery through efficient collection and initiate reforms through
introduction of direct user charge
STRATEGIES:
Ensure Source Security
To Reduce / Eliminate use of ground water dependency and limit use of ground water
Strengthen Water Quality Monitoring System by developing laboratories monitoring
water Quality regularly
Use efficiency through introduction of water audit
Take Initiatives for ground water recharge and water recycling
Introduce water pricing to discourage its wastage
Geo-hydrological study to be conducted for sustainable withdrawal of water and regulate
ground water extraction through licenses etc.
Extension of water Supply services to uncovered areas.
Efficiency in Operation and Maintenance- Replacement of old machinery and network
systems.
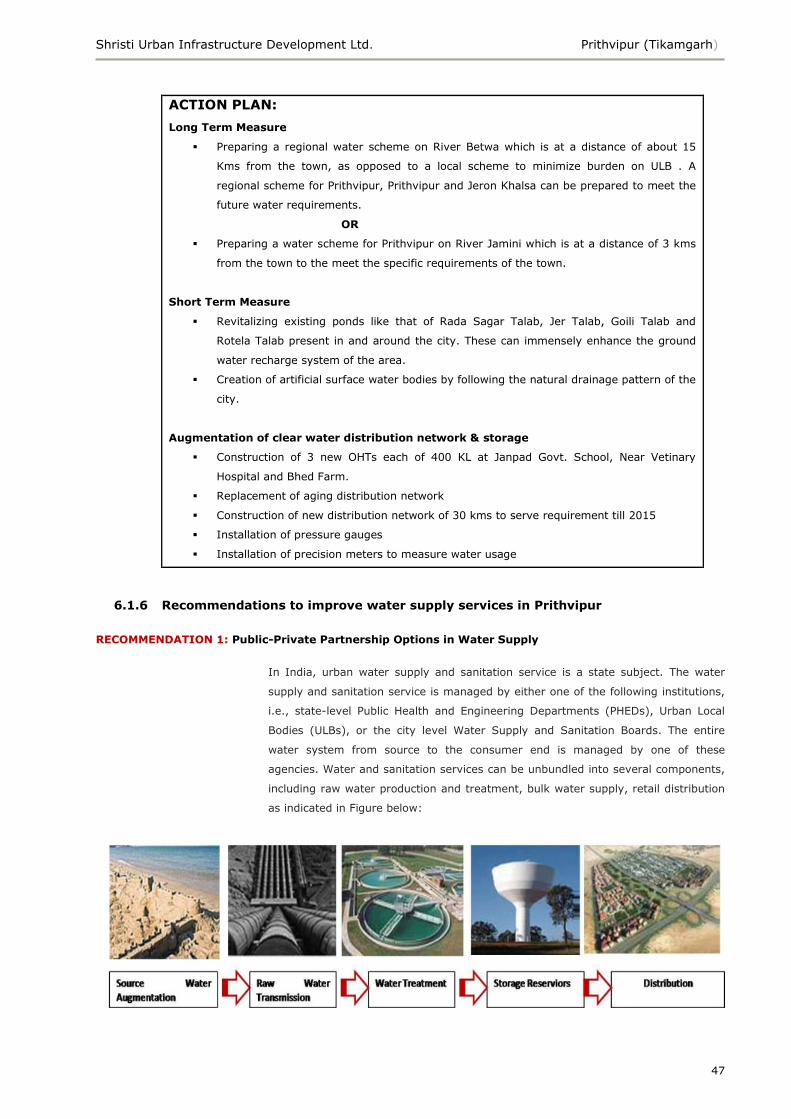
Shristi Urban Infrastructure Development Ltd. Prithvipur (Tikamgarh)
47
ACTION PLAN:
Long Term Measure
Preparing a regional water scheme on River Betwa which is at a distance of about 15
Kms from the town, as opposed to a local scheme to minimize burden on ULB . A
regional scheme for Prithvipur, Prithvipur and Jeron Khalsa can be prepared to meet the
future water requirements.
OR
Preparing a water scheme for Prithvipur on River Jamini which is at a distance of 3 kms
from the town to the meet the specific requirements of the town.
Short Term Measure
Revitalizing existing ponds like that of Rada Sagar Talab, Jer Talab, Goili Talab and
Rotela Talab present in and around the city. These can immensely enhance the ground
water recharge system of the area.
Creation of artificial surface water bodies by following the natural drainage pattern of the
city.
Augmentation of clear water distribution network & storage
Construction of 3 new OHTs each of 400 KL at Janpad Govt. School, Near Vetinary
Hospital and Bhed Farm.
Replacement of aging distribution network
Construction of new distribution network of 30 kms to serve requirement till 2015
Installation of pressure gauges
Installation of precision meters to measure water usage
6.1.6 Recommendations to improve water supply services in Prithvipur
RECOMMENDATION 1: Public-Private Partnership Options in Water Supply
In India, urban water supply and sanitation service is a state subject. The water
supply and sanitation service is managed by either one of the following institutions,
i.e., state-level Public Health and Engineering Departments (PHEDs), Urban Local
Bodies (ULBs), or the city level Water Supply and Sanitation Boards. The entire
water system from source to the consumer end is managed by one of these
agencies. Water and sanitation services can be unbundled into several components,
including raw water production and treatment, bulk water supply, retail distribution
as indicated in Figure below:
Shristi Urban Infrastructure Development Ltd. Prithvipur (Tikamgarh)
48
As a response to an insufficient provision of basic urban services and a lack of
access to finance and other resources by ULBs that aim to increase access to these
services, a number of PPP options have emerged. These include:
Service contracts;
Management contract for operations and maintenance (O&M);
Lease
Concession
Construction cum build-operate-transfer (BOT) contract
Divesture
RECOMMENDATION 3: Identification of potential sources of revenues from water supply
Water Supply
Charges
The single, largest and the most important component of revenue generated from the
provisioning of water supply services is that obtained from a levy of water supply charges.
Water supply charges may be levied in the form of flat rate tariffs, or volumetric tariffs or
telescopic tariffs. The three types of tariff structures are discussed below.
Flat rate tariff: Currently practiced in Prithvipur
Flat rate tariff refers to a pricing structure wherein the customers are charged a fixed amount
of tariff based on the size of pipe connections at certain intervals, irrespective of the quantity
of water consumed. In the case of water supply services, this implies that a fixed per monthly
charge is levied for different categories of consumers, viz., residential, commercial and
industrial. Therefore, a residential unit may be charged Rs. 120 per month for water supply
services whereas a slum unit may be charged Rs. 40 per month, and an institution may be
charged Rs. 200 per month. The rates for the commercial establishments and the industrial
units are generally much higher than the domestic rates. Typically, such a pricing structure is
found in the case of cities where no meters have been installed at the consumer end.
But in case of Prithvipur currently a flat rate of Rs 30 per HH is collected as water supply
charge irrespective of different categories such as residential, commercial, industrial etc which
ultimately results in very low water charges collection.
Volumetric tariff:
Volumetric tariff refers to a pricing structure wherein the tariff rate varies as per the quantum
of water used by the consumer. It is therefore a variable rate, where for different consumption
levels, different tariff rates are applicable. Such a tariff structure is applicable in cities/towns
where meters have been installed at the consumer end; there are separate consumption slabs
with corresponding per unit charges. The broad consumption category remains the same as
that under the flat rate tariff structure, viz., residential, commercial and industrial. Within
these categories, slabs for different consumption levels exist.
Telescopic/Increasing block tariff:
As per this tariff structure, there exist two or more prices for water used, where each price
applies to a customer‘s use within a defined block. Prices rise with each successive block.
Generally, under such a pricing structure, the first block price is deliberately set below cost. A
water user in a particular use category (e.g., residential) is charged a unit price for the first
units abstracted up to a specified amount (this defines the end of the initial or first block).
Above this amount, the user faces a higher price for additional units until a second specified
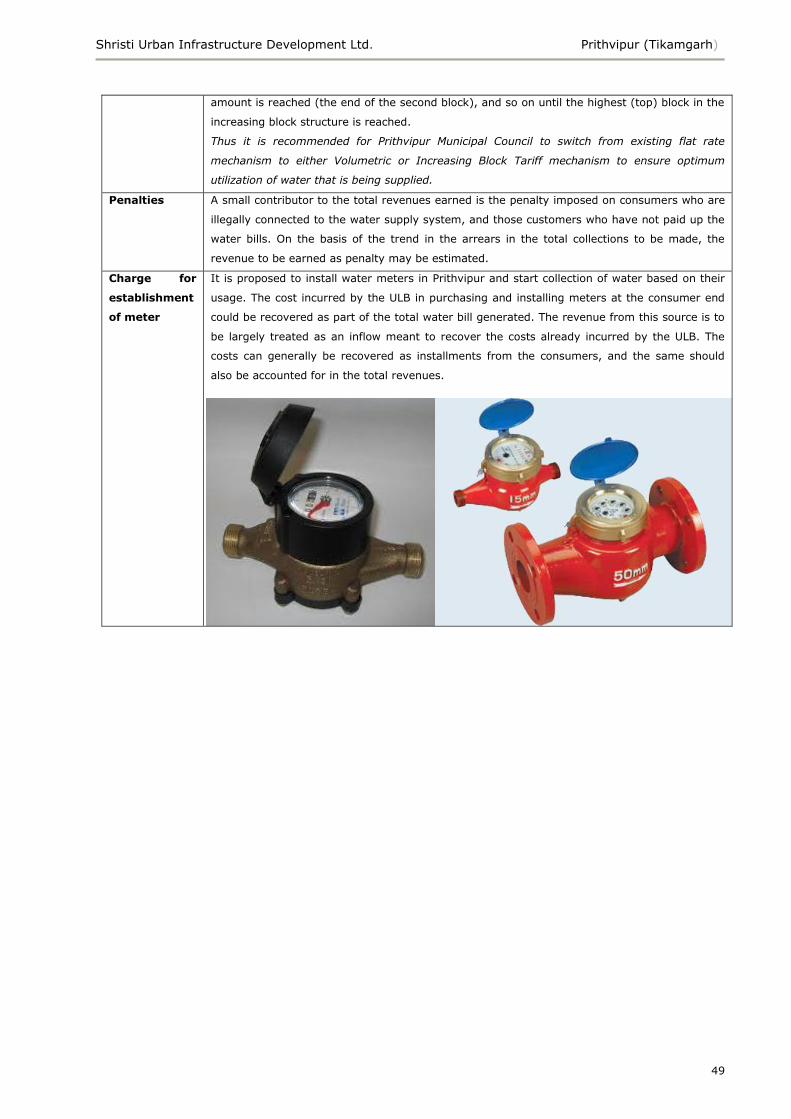
Shristi Urban Infrastructure Development Ltd. Prithvipur (Tikamgarh)
49
amount is reached (the end of the second block), and so on until the highest (top) block in the
increasing block structure is reached.
Thus it is recommended for Prithvipur Municipal Council to switch from existing flat rate
mechanism to either Volumetric or Increasing Block Tariff mechanism to ensure optimum
utilization of water that is being supplied.
Penalties
A small contributor to the total revenues earned is the penalty imposed on consumers who are
illegally connected to the water supply system, and those customers who have not paid up the
water bills. On the basis of the trend in the arrears in the total collections to be made, the
revenue to be earned as penalty may be estimated.
Charge for
establishment
of meter
It is proposed to install water meters in Prithvipur and start collection of water based on their
usage. The cost incurred by the ULB in purchasing and installing meters at the consumer end
could be recovered as part of the total water bill generated. The revenue from this source is to
be largely treated as an inflow meant to recover the costs already incurred by the ULB. The
costs can generally be recovered as installments from the consumers, and the same should
also be accounted for in the total revenues.
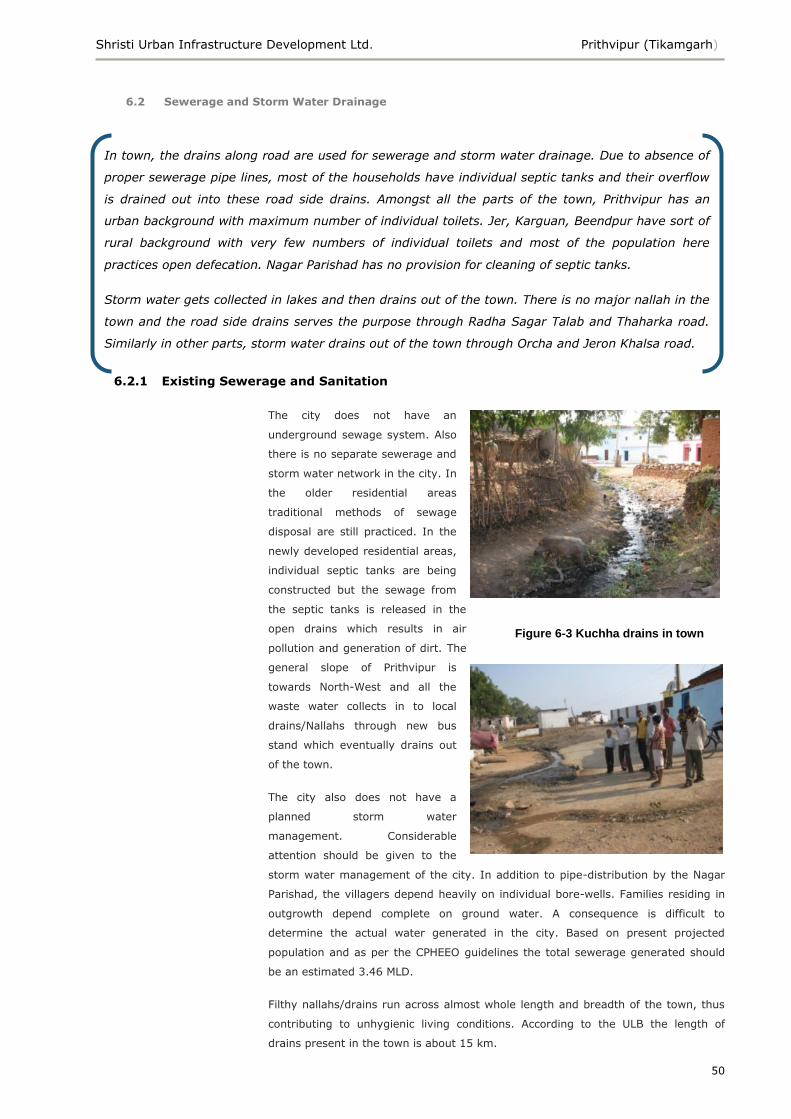
Shristi Urban Infrastructure Development Ltd. Prithvipur (Tikamgarh)
50
6.2 Sewerage and Storm Water Drainage
6.2.1 Existing Sewerage and Sanitation
The city does not have an
underground sewage system. Also
there is no separate sewerage and
storm water network in the city. In
the older residential areas
traditional methods of sewage
disposal are still practiced. In the
newly developed residential areas,
individual septic tanks are being
constructed but the sewage from
the septic tanks is released in the
open drains which results in air
pollution and generation of dirt. The
general slope of Prithvipur is
towards North-West and all the
waste water collects in to local
drains/Nallahs through new bus
stand which eventually drains out
of the town.
The city also does not have a
planned storm water
management. Considerable
attention should be given to the
storm water management of the city. In addition to pipe-distribution by the Nagar
Parishad, the villagers depend heavily on individual bore-wells. Families residing in
outgrowth depend complete on ground water. A consequence is difficult to
determine the actual water generated in the city. Based on present projected
population and as per the CPHEEO guidelines the total sewerage generated should
be an estimated 3.46 MLD.
Filthy nallahs/drains run across almost whole length and breadth of the town, thus
contributing to unhygienic living conditions. According to the ULB the length of
drains present in the town is about 15 km.
In town, the drains along road are used for sewerage and storm water drainage. Due to absence of
proper sewerage pipe lines, most of the households have individual septic tanks and their overflow
is drained out into these road side drains. Amongst all the parts of the town, Prithvipur has an
urban background with maximum number of individual toilets. Jer, Karguan, Beendpur have sort of
rural background with very few numbers of individual toilets and most of the population here
practices open defecation. Nagar Parishad has no provision for cleaning of septic tanks.
Storm water gets collected in lakes and then drains out of the town. There is no major nallah in the
town and the road side drains serves the purpose through Radha Sagar Talab and Thaharka road.
Similarly in other parts, storm water drains out of the town through Orcha and Jeron Khalsa road.
Figure 6-3 Kuchha drains in town
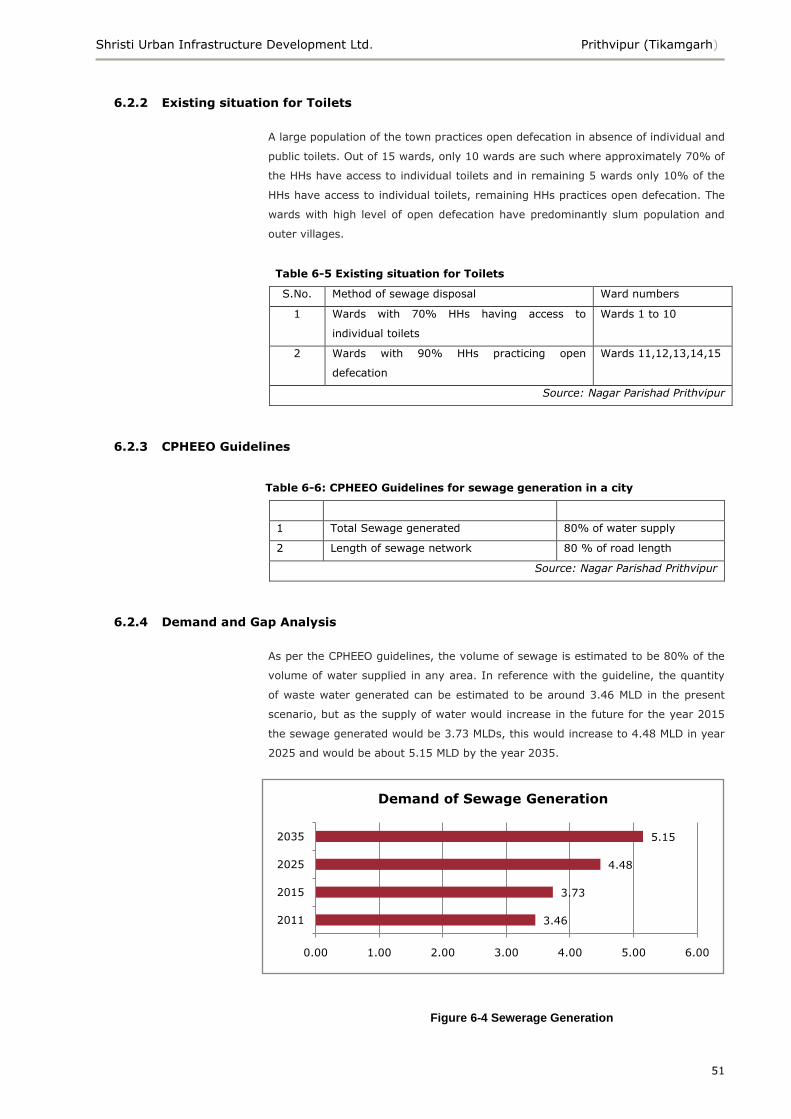
Shristi Urban Infrastructure Development Ltd. Prithvipur (Tikamgarh)
51
6.2.2 Existing situation for Toilets
A large population of the town practices open defecation in absence of individual and
public toilets. Out of 15 wards, only 10 wards are such where approximately 70% of
the HHs have access to individual toilets and in remaining 5 wards only 10% of the
HHs have access to individual toilets, remaining HHs practices open defecation. The
wards with high level of open defecation have predominantly slum population and
outer villages.
Table 6-5 Existing situation for Toilets
S.No. Method of sewage disposal Ward numbers
1 Wards with 70% HHs having access to
individual toilets
Wards 1 to 10
2 Wards with 90% HHs practicing open
defecation
Wards 11,12,13,14,15
Source: Nagar Parishad Prithvipur
6.2.3 CPHEEO Guidelines
Table 6-6: CPHEEO Guidelines for sewage generation in a city
1 Total Sewage generated 80% of water supply
2 Length of sewage network 80 % of road length
Source: Nagar Parishad Prithvipur
6.2.4 Demand and Gap Analysis
As per the CPHEEO guidelines, the volume of sewage is estimated to be 80% of the
volume of water supplied in any area. In reference with the guideline, the quantity
of waste water generated can be estimated to be around 3.46 MLD in the present
scenario, but as the supply of water would increase in the future for the year 2015
the sewage generated would be 3.73 MLDs, this would increase to 4.48 MLD in year
2025 and would be about 5.15 MLD by the year 2035.
3.46
3.73
4.48
5.15
0.00 1.00 2.00 3.00 4.00 5.00 6.00
2011
2015
2025
2035
Demand of Sewage Generation
Figure 6-4 Sewerage Generation
Shristi Urban Infrastructure Development Ltd. Prithvipur (Tikamgarh)
52
Table 6-7: Demand and Gap Analysis for Sewerage Network
Year Required Sewerage Network
@ 80% of Road Network ( in Km)
Existing Gap (in Km)
2011 37.64 0 37.64
2015 40.65 40.65
2025 48.78 8.13
2035 56.09 7.32
Source: Consultant‘s Analysis
6.2.5 Issues/Goals and Objectives/ Development Strategies
Sewage and Sanitation
ISSUES:
Absence of sewerage network in Prithvipur: Absence of sewerage system and the
conservancy system of sanitation, in other words, the rudimentary method of manual
collection and disposal of night soil in trenching grounds still prevails in the city. The
effluent, which is left out from the existing drains, is causing further deterioration of the
environment of the city.
Lack of proper drainage system: Apart from the sewerage system, the city is not having,
proper drainage system which is essential service of the city. In the absence of good
drainage system in the city the waste water comes on road at many places.
Lack of maintenance: Even though some areas are having proper drainage system, they
are enduring by the poor maintenance of the local authority. The drains are completely
obstructed with the garbage and roadside waste.
Sewerage is dumped directly without any treatment into the lake or river thereby
degrading their quality
No availability of public toilets in the town, which needs improvement.
SECTORAL GOAL:
To provide healthy and environmentally safe system of sewerage and sanitation for
entire population
SECTORAL OBJECTIVES:
Augmentation of scientific sewerage system in Prithvipur
Interception & diversion works.
Application of Sewage Treatment techniques
Disposal Quality Monitoring
To achieve sanitation for all and reduce open defecation
STRATEGIES:
Universalization of city sanitation approach
Identification of sites in slums and public places for community and individual toilet
Involve Sulabh International, interested NGOs, and CBOs for design, construction and
maintenance and affordable pricing including monthly passes extraction through licenses
etc.
Provision of underground sewerage system
Provision of household sewer connection
Provision of public toilets to prevent open defecation.
Shristi Urban Infrastructure Development Ltd. Prithvipur (Tikamgarh)
53
6.2.6 Recommendation to improve Sanitation services
RECOMMENDATION 1 – Minimizing high percentage of open defecation in
town
BY implementing the scheme of Integrated Low Cost Sanitation Scheme, the ULB
shall work in the direction of providing individual toilets and public toilets in the
town. As per the consultants estimate around 1100 individual toilets are required in
the entire city. Apart from these, 5 Public toilets are required at the location of Bus
Stand, Mandi-Tehsil Area, Jer Village, Bindpura Village and Kharguan Village.
RECOMMENDATION 2 – Proposing Decentralized Wastewater treatment
system (DEWATS)
The DEWAT is a tailored System to improve sanitation conditions in densely
populated urban areas and to provide reliable low-cost sanitation and wastewater
treatment solutions.
Decentralized Wastewater treatment system (DEWATS) is a combination of the
following treatment systems:
Sedimentation and primary treatment in settlers, Septic Tanks or Imhoff
tanks.
Secondary Anaerobic Treatment in fixed bed filters or Baffled Reactors
Secondary and tertiary aerobic/anaerobic treatment in reedbed / duckweed
ponds/ constructed wetlands or Planted Gravel Filters
The advantages of the system are
Water can be treated to CPCB discharge standards and recycled for irrigation
Operable with semi skilled/ unskilled labor
DEWAT Can be decentralized thereby reducing plumbing and pumping costs.
Adaptability to varying load conditions and to varying climatic conditions
DEWAT Can treat waste water with high fat, suspended solids and BOD.
No mechanical parts
Less expensive than comparable conventional treatment systems and
Very low operational and maintenance costs
The proposed DEWATS under this assignment consists of the following units:
Settler
Baffled Septic Tank combined with filter
Horizontal Gravity filter
In this system sewage and sludge from toilet block is directed to a settler. The
settled effluent is then transferred to subsurface baffled reactor. The effluent from
the reactor is drained into a constructed planted filter. The resulting effluent can be
used for agriculture or community garden or can be discharged into drain.
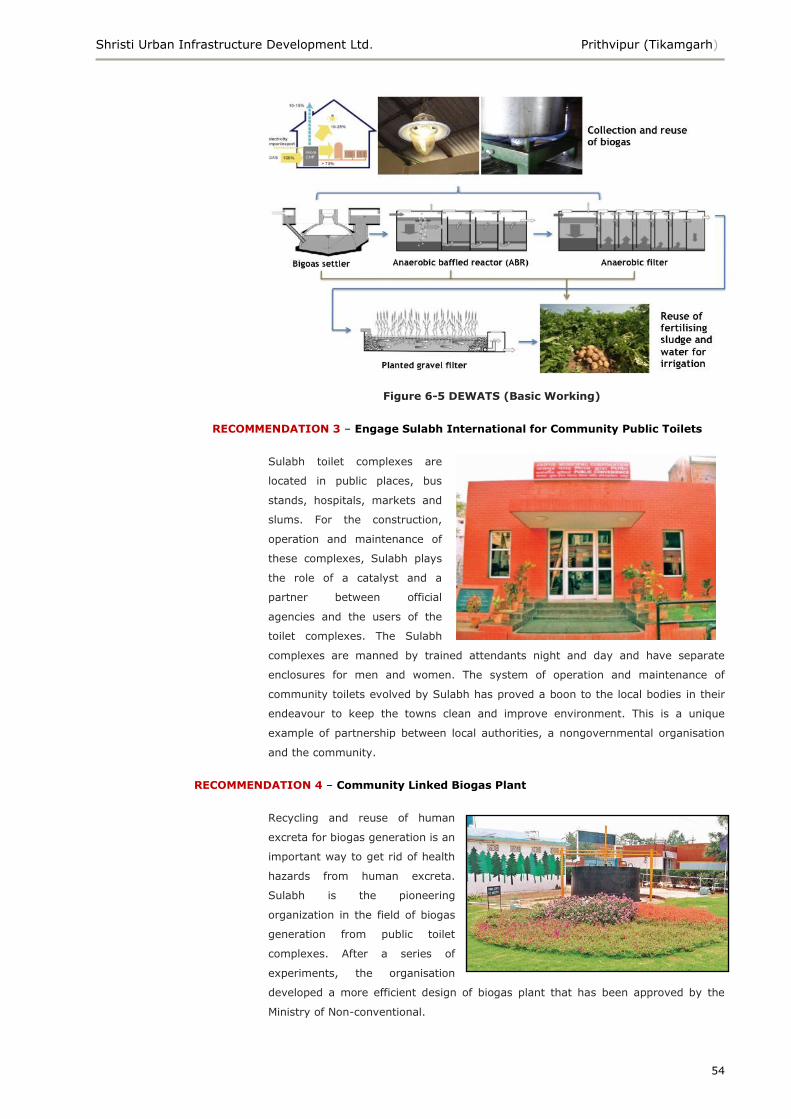
Shristi Urban Infrastructure Development Ltd. Prithvipur (Tikamgarh)
54
Figure 6-5 DEWATS (Basic Working)
RECOMMENDATION 3 – Engage Sulabh International for Community Public Toilets
Sulabh toilet complexes are
located in public places, bus
stands, hospitals, markets and
slums. For the construction,
operation and maintenance of
these complexes, Sulabh plays
the role of a catalyst and a
partner between official
agencies and the users of the
toilet complexes. The Sulabh
complexes are manned by trained attendants night and day and have separate
enclosures for men and women. The system of operation and maintenance of
community toilets evolved by Sulabh has proved a boon to the local bodies in their
endeavour to keep the towns clean and improve environment. This is a unique
example of partnership between local authorities, a nongovernmental organisation
and the community.
RECOMMENDATION 4 – Community Linked Biogas Plant
Recycling and reuse of human
excreta for biogas generation is an
important way to get rid of health
hazards from human excreta.
Sulabh is the pioneering
organization in the field of biogas
generation from public toilet
complexes. After a series of
experiments, the organisation
developed a more efficient design of biogas plant that has been approved by the
Ministry of Non-conventional.
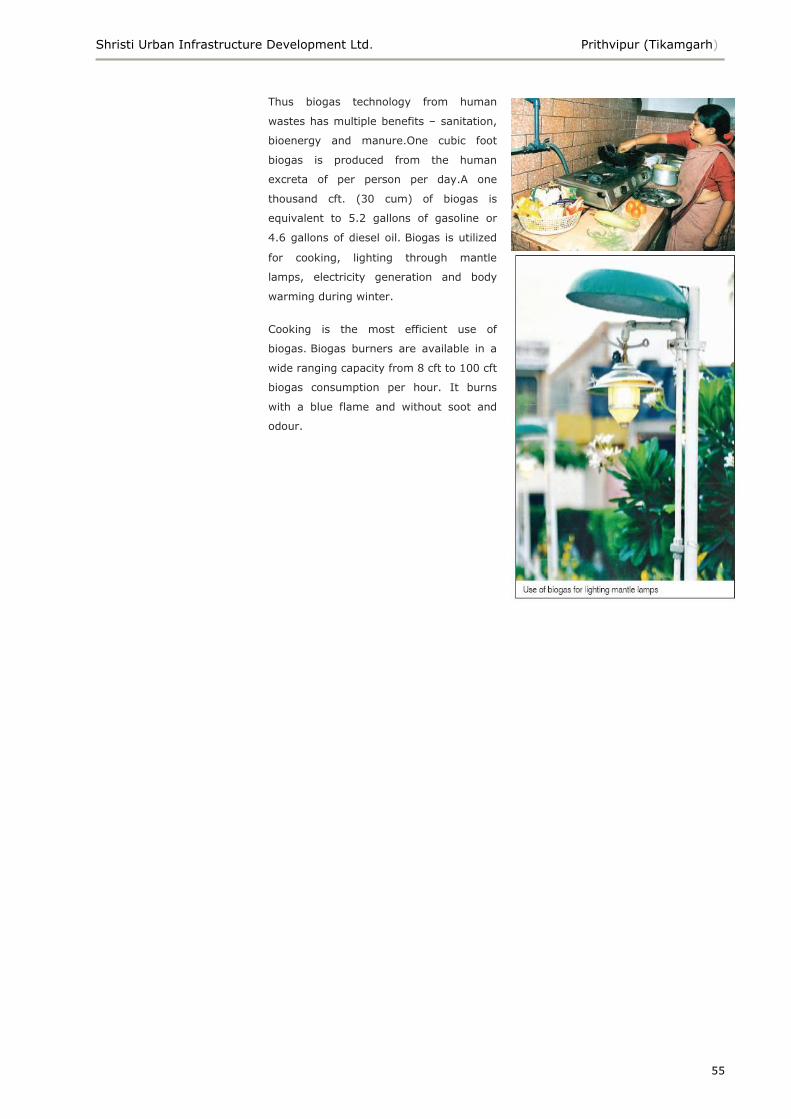
Shristi Urban Infrastructure Development Ltd. Prithvipur (Tikamgarh)
55
Thus biogas technology from human
wastes has multiple benefits – sanitation,
bioenergy and manure.One cubic foot
biogas is produced from the human
excreta of per person per day.A one
thousand cft. (30 cum) of biogas is
equivalent to 5.2 gallons of gasoline or
4.6 gallons of diesel oil. Biogas is utilized
for cooking, lighting through mantle
lamps, electricity generation and body
warming during winter.
Cooking is the most efficient use of
biogas. Biogas burners are available in a
wide ranging capacity from 8 cft to 100 cft
biogas consumption per hour. It burns
with a blue flame and without soot and
odour.
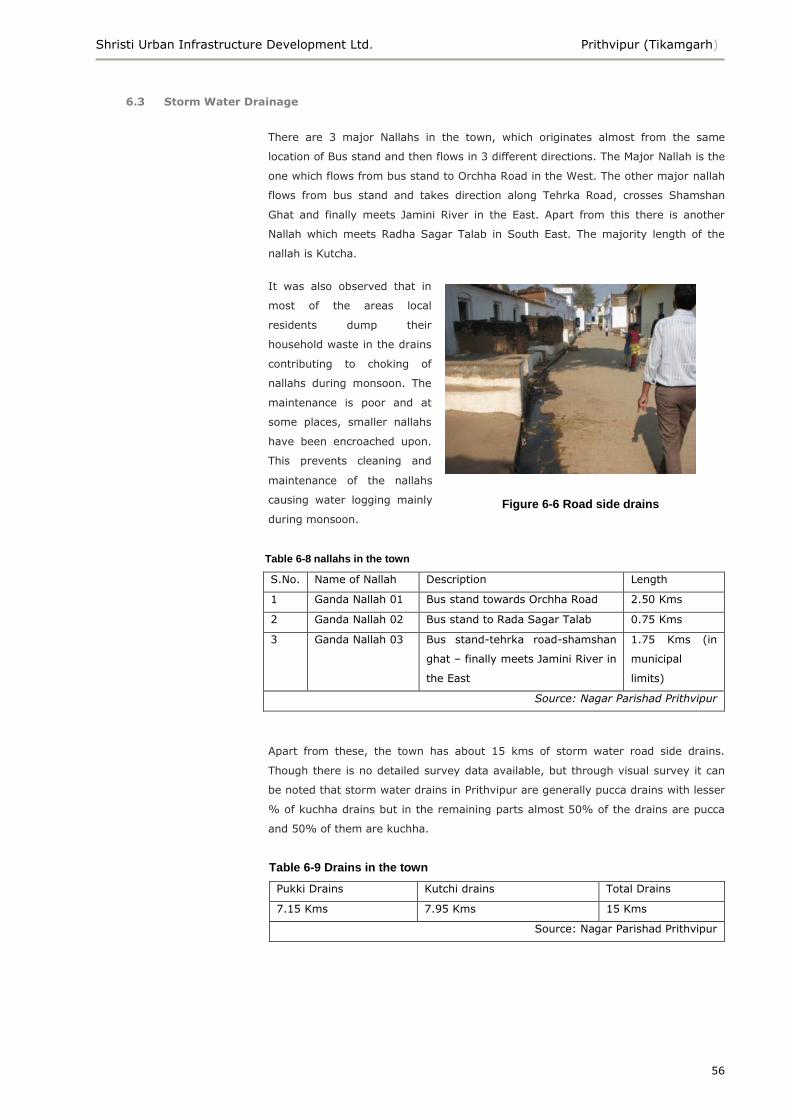
Shristi Urban Infrastructure Development Ltd. Prithvipur (Tikamgarh)
56
6.3 Storm Water Drainage
There are 3 major Nallahs in the town, which originates almost from the same
location of Bus stand and then flows in 3 different directions. The Major Nallah is the
one which flows from bus stand to Orchha Road in the West. The other major nallah
flows from bus stand and takes direction along Tehrka Road, crosses Shamshan
Ghat and finally meets Jamini River in the East. Apart from this there is another
Nallah which meets Radha Sagar Talab in South East. The majority length of the
nallah is Kutcha.
It was also observed that in
most of the areas local
residents dump their
household waste in the drains
contributing to choking of
nallahs during monsoon. The
maintenance is poor and at
some places, smaller nallahs
have been encroached upon.
This prevents cleaning and
maintenance of the nallahs
causing water logging mainly
during monsoon.
Table 6-8 nallahs in the town
S.No. Name of Nallah Description Length
1 Ganda Nallah 01 Bus stand towards Orchha Road 2.50 Kms
2 Ganda Nallah 02 Bus stand to Rada Sagar Talab 0.75 Kms
3 Ganda Nallah 03 Bus stand-tehrka road-shamshan
ghat – finally meets Jamini River in
the East
1.75 Kms (in
municipal
limits)
Source: Nagar Parishad Prithvipur
Apart from these, the town has about 15 kms of storm water road side drains.
Though there is no detailed survey data available, but through visual survey it can
be noted that storm water drains in Prithvipur are generally pucca drains with lesser
% of kuchha drains but in the remaining parts almost 50% of the drains are pucca
and 50% of them are kuchha.
Table 6-9 Drains in the town
Pukki Drains Kutchi drains Total Drains
7.15 Kms 7.95 Kms 15 Kms
Source: Nagar Parishad Prithvipur
Figure 6-6 Road side drains
Shristi Urban Infrastructure Development Ltd. Prithvipur (Tikamgarh)
57
6.3.1 Demand & Gap for Storm Water
Table 6-10 Demand Gap analysis
Year Population Served
(100%)
Desired Length of network @
130% of road length(km)
Existing Length
of Network (Km)
Gap(k
m)
2011 26883 61.16 15.1 46.06
2015 29034 66.05 50.95
2025 34840 79.26 64.16
2035 40066 91.15 76.05
Source: Consultant‘s Analysis
Due to the very vast area of the Prithvipur Municipal limits, there is a requirement of
proper storm water drainage system in the entire habitable areas so as to tackle the
problems of flooding in the urban areas. To achieve the same the ULB needs to
maintain a ratio of 1:1.3 for construction of Roads to Storm Water Drains
respectively.
6.3.2 Issues/Goals and Objectives/ Development Strategies
Storm Water
ISSUES:
Uncovered drains are subjected to disposal of solid waste resulting in clogging of drains
and spread of malaria
Water logging and flooding causes health hazards especially during monsoon
SECTORAL GOAL:
To provide healthy and environmentally safesystem of drainage for entire population
SECTORAL OBJECTIVES:
Improving coverage of drains in water logged areas
Prohibitive measures to control encroachments and illegal constructions in natural
streams/ nallas and on drains.
Developing city wide network of drains covering 100% of road length
Connecting new developments with the existing network.
Adapting Recycling and Reuse mechanism for treated wastewater
STRATEGIES:
Conversion of 7.95 Kms of kutcha drain in to pukka drain
Channelizing of the major Nallah for a length of 4 kms
Construction of about 13.5 kms of drains on both sides of the road.
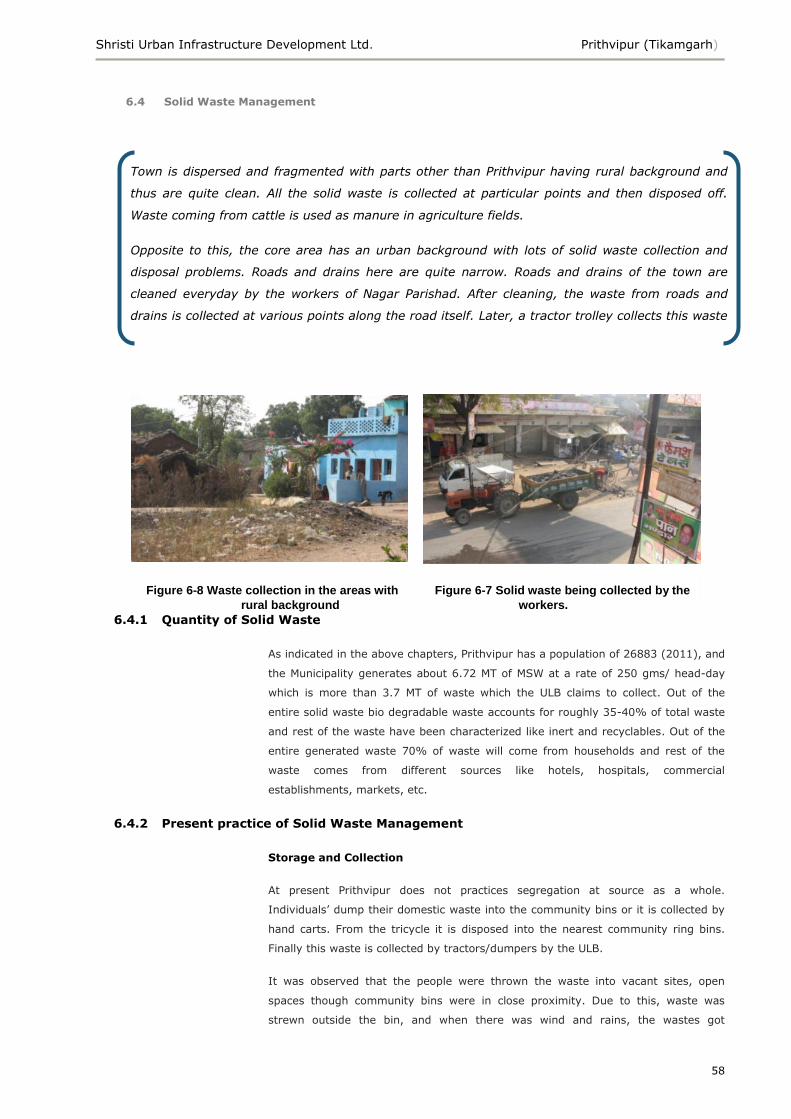
Shristi Urban Infrastructure Development Ltd. Prithvipur (Tikamgarh)
58
6.4 Solid Waste Management
6.4.1 Quantity of Solid Waste
As indicated in the above chapters, Prithvipur has a population of 26883 (2011), and
the Municipality generates about 6.72 MT of MSW at a rate of 250 gms/ head-day
which is more than 3.7 MT of waste which the ULB claims to collect. Out of the
entire solid waste bio degradable waste accounts for roughly 35-40% of total waste
and rest of the waste have been characterized like inert and recyclables. Out of the
entire generated waste 70% of waste will come from households and rest of the
waste comes from different sources like hotels, hospitals, commercial
establishments, markets, etc.
6.4.2 Present practice of Solid Waste Management
Storage and Collection
At present Prithvipur does not practices segregation at source as a whole.
Individuals‘ dump their domestic waste into the community bins or it is collected by
hand carts. From the tricycle it is disposed into the nearest community ring bins.
Finally this waste is collected by tractors/dumpers by the ULB.
It was observed that the people were thrown the waste into vacant sites, open
spaces though community bins were in close proximity. Due to this, waste was
strewn outside the bin, and when there was wind and rains, the wastes got
Town is dispersed and fragmented with parts other than Prithvipur having rural background and
thus are quite clean. All the solid waste is collected at particular points and then disposed off.
Waste coming from cattle is used as manure in agriculture fields.
Opposite to this, the core area has an urban background with lots of solid waste collection and
disposal problems. Roads and drains here are quite narrow. Roads and drains of the town are
cleaned everyday by the workers of Nagar Parishad. After cleaning, the waste from roads and
drains is collected at various points along the road itself. Later, a tractor trolley collects this waste
and dumps it near cemetery outside the town. Though, 5 hectares of land has been allotted in
ward no. 13, still it’s not being used due to lack of infrastructure.
Figure 6-8 Waste collection in the areas with
rural background
Figure 6-7 Solid waste being collected by the
workers.
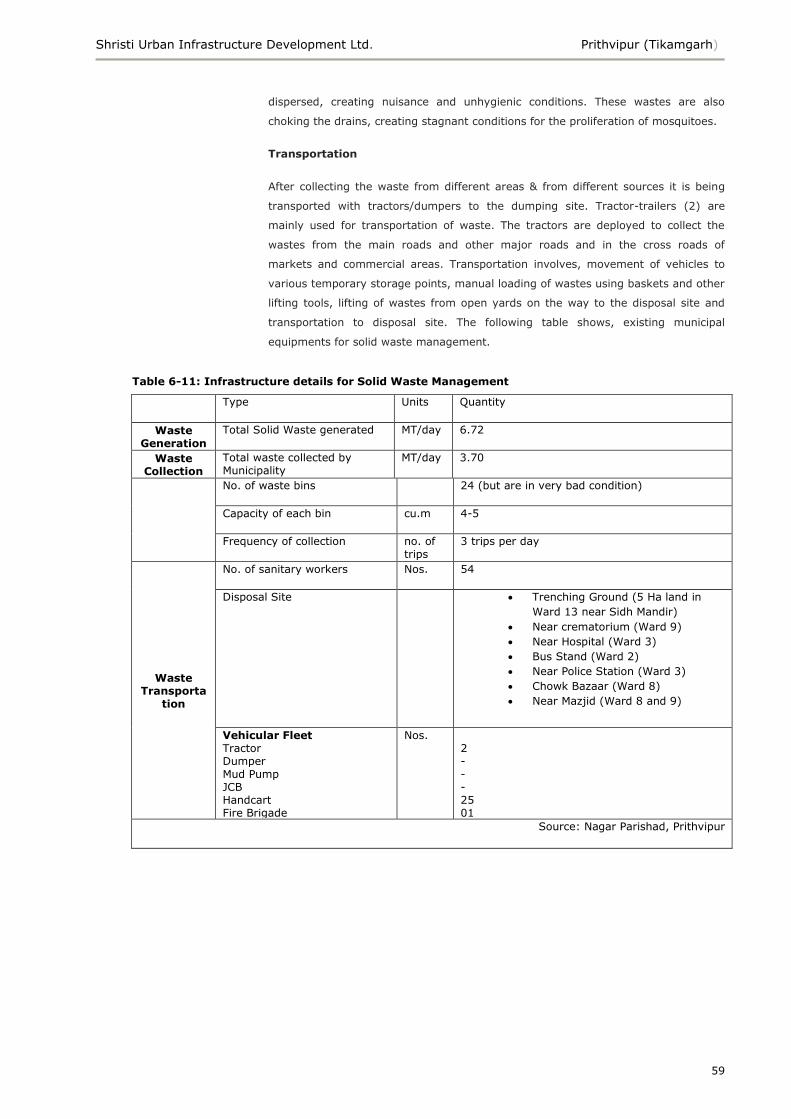
Shristi Urban Infrastructure Development Ltd. Prithvipur (Tikamgarh)
59
dispersed, creating nuisance and unhygienic conditions. These wastes are also
choking the drains, creating stagnant conditions for the proliferation of mosquitoes.
Transportation
After collecting the waste from different areas & from different sources it is being
transported with tractors/dumpers to the dumping site. Tractor-trailers (2) are
mainly used for transportation of waste. The tractors are deployed to collect the
wastes from the main roads and other major roads and in the cross roads of
markets and commercial areas. Transportation involves, movement of vehicles to
various temporary storage points, manual loading of wastes using baskets and other
lifting tools, lifting of wastes from open yards on the way to the disposal site and
transportation to disposal site. The following table shows, existing municipal
equipments for solid waste management.
Table 6-11: Infrastructure details for Solid Waste Management
Type Units Quantity
Waste Generation
Total Solid Waste generated MT/day 6.72
Waste Collection
Total waste collected by Municipality
MT/day 3.70
No. of waste bins 24 (but are in very bad condition)
Capacity of each bin cu.m 4-5
Frequency of collection no. of trips
3 trips per day
Waste Transporta
tion
No. of sanitary workers Nos. 54
Disposal Site Trenching Ground (5 Ha land in
Ward 13 near Sidh Mandir)
Near crematorium (Ward 9)
Near Hospital (Ward 3)
Bus Stand (Ward 2)
Near Police Station (Ward 3)
Chowk Bazaar (Ward 8)
Near Mazjid (Ward 8 and 9)
Vehicular Fleet Tractor Dumper Mud Pump JCB Handcart Fire Brigade
Nos. 2 - - - 25 01
Source: Nagar Parishad, Prithvipur
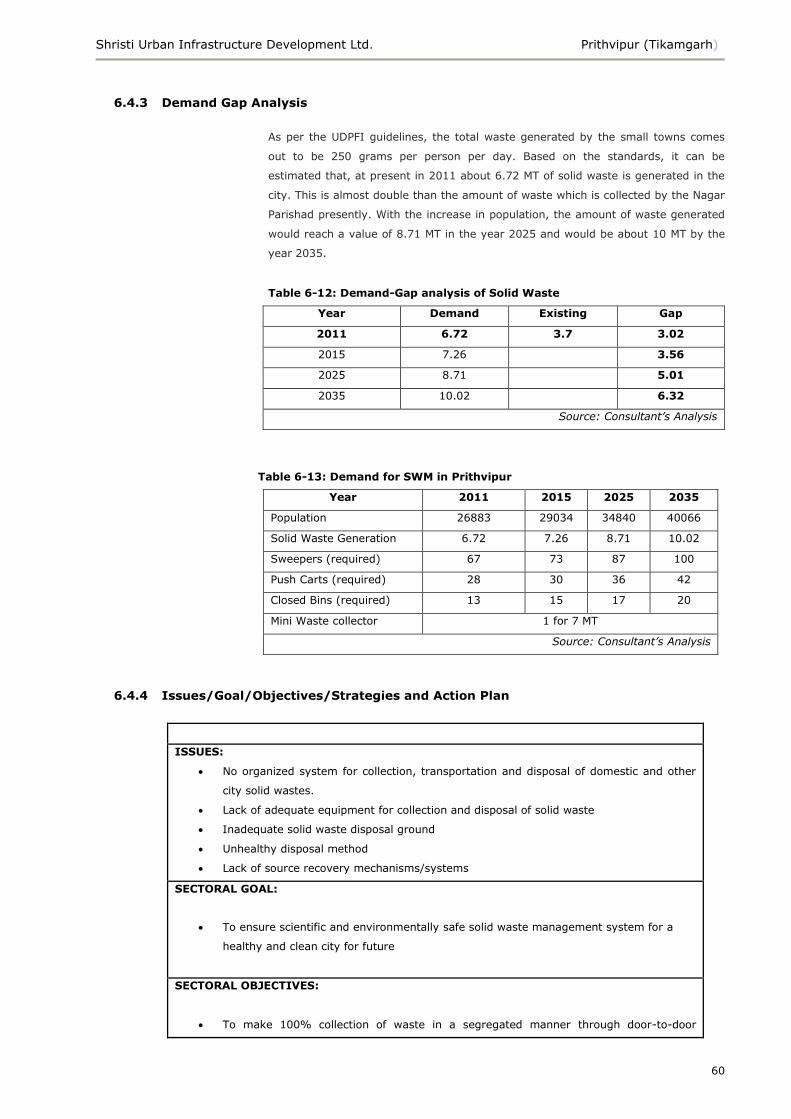
Shristi Urban Infrastructure Development Ltd. Prithvipur (Tikamgarh)
60
6.4.3 Demand Gap Analysis
As per the UDPFI guidelines, the total waste generated by the small towns comes
out to be 250 grams per person per day. Based on the standards, it can be
estimated that, at present in 2011 about 6.72 MT of solid waste is generated in the
city. This is almost double than the amount of waste which is collected by the Nagar
Parishad presently. With the increase in population, the amount of waste generated
would reach a value of 8.71 MT in the year 2025 and would be about 10 MT by the
year 2035.
Table 6-12: Demand-Gap analysis of Solid Waste
Year Demand Existing Gap
2011 6.72 3.7 3.02
2015 7.26 3.56
2025 8.71 5.01
2035 10.02 6.32
Source: Consultant’s Analysis
Table 6-13: Demand for SWM in Prithvipur
Year 2011 2015 2025 2035
Population 26883 29034 34840 40066
Solid Waste Generation 6.72 7.26 8.71 10.02
Sweepers (required) 67 73 87 100
Push Carts (required) 28 30 36 42
Closed Bins (required) 13 15 17 20
Mini Waste collector 1 for 7 MT
Source: Consultant’s Analysis
6.4.4 Issues/Goal/Objectives/Strategies and Action Plan
Solid Waste Management
ISSUES:
No organized system for collection, transportation and disposal of domestic and other
city solid wastes.
Lack of adequate equipment for collection and disposal of solid waste
Inadequate solid waste disposal ground
Unhealthy disposal method
Lack of source recovery mechanisms/systems
SECTORAL GOAL:
To ensure scientific and environmentally safe solid waste management system for a
healthy and clean city for future
SECTORAL OBJECTIVES:
To make 100% collection of waste in a segregated manner through door-to-door
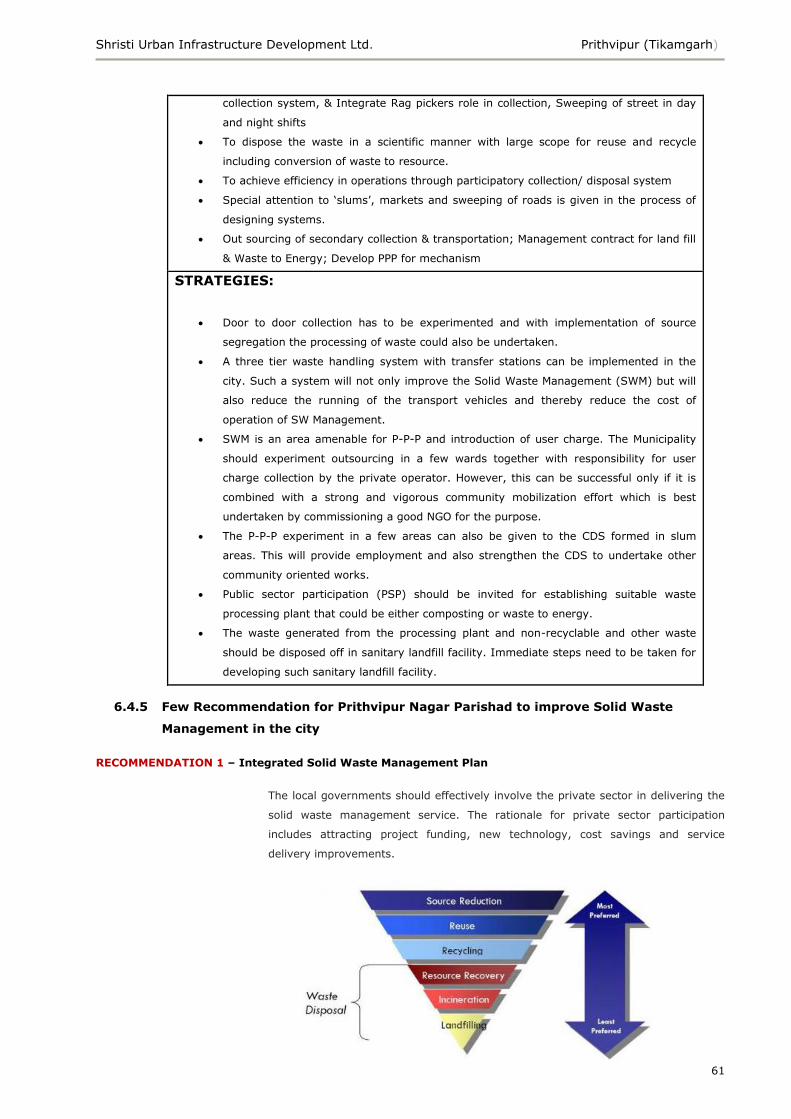
Shristi Urban Infrastructure Development Ltd. Prithvipur (Tikamgarh)
61
collection system, & Integrate Rag pickers role in collection, Sweeping of street in day
and night shifts
To dispose the waste in a scientific manner with large scope for reuse and recycle
including conversion of waste to resource.
To achieve efficiency in operations through participatory collection/ disposal system
Special attention to ‗slums‘, markets and sweeping of roads is given in the process of
designing systems.
Out sourcing of secondary collection & transportation; Management contract for land fill
& Waste to Energy; Develop PPP for mechanism
STRATEGIES:
Door to door collection has to be experimented and with implementation of source
segregation the processing of waste could also be undertaken.
A three tier waste handling system with transfer stations can be implemented in the
city. Such a system will not only improve the Solid Waste Management (SWM) but will
also reduce the running of the transport vehicles and thereby reduce the cost of
operation of SW Management.
SWM is an area amenable for P-P-P and introduction of user charge. The Municipality
should experiment outsourcing in a few wards together with responsibility for user
charge collection by the private operator. However, this can be successful only if it is
combined with a strong and vigorous community mobilization effort which is best
undertaken by commissioning a good NGO for the purpose.
The P-P-P experiment in a few areas can also be given to the CDS formed in slum
areas. This will provide employment and also strengthen the CDS to undertake other
community oriented works.
Public sector participation (PSP) should be invited for establishing suitable waste
processing plant that could be either composting or waste to energy.
The waste generated from the processing plant and non-recyclable and other waste
should be disposed off in sanitary landfill facility. Immediate steps need to be taken for
developing such sanitary landfill facility.
6.4.5 Few Recommendation for Prithvipur Nagar Parishad to improve Solid Waste
Management in the city
RECOMMENDATION 1 – Integrated Solid Waste Management Plan
The local governments should effectively involve the private sector in delivering the
solid waste management service. The rationale for private sector participation
includes attracting project funding, new technology, cost savings and service
delivery improvements.
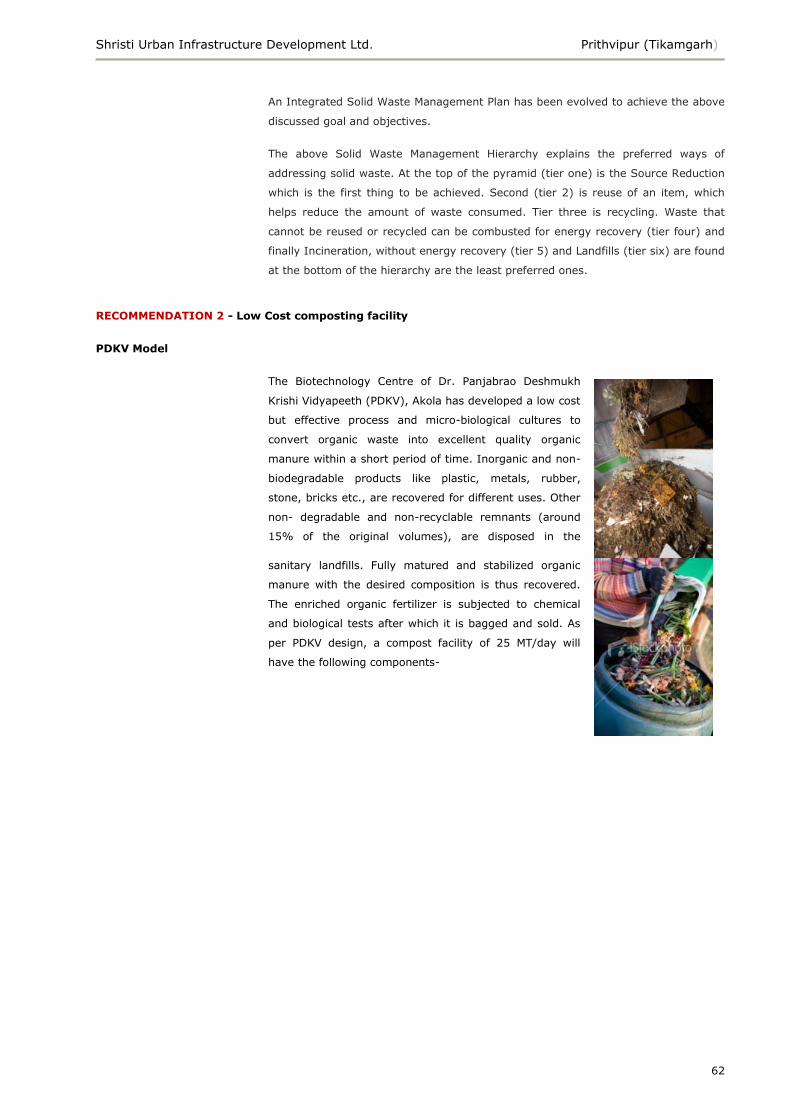
Shristi Urban Infrastructure Development Ltd. Prithvipur (Tikamgarh)
62
An Integrated Solid Waste Management Plan has been evolved to achieve the above
discussed goal and objectives.
The above Solid Waste Management Hierarchy explains the preferred ways of
addressing solid waste. At the top of the pyramid (tier one) is the Source Reduction
which is the first thing to be achieved. Second (tier 2) is reuse of an item, which
helps reduce the amount of waste consumed. Tier three is recycling. Waste that
cannot be reused or recycled can be combusted for energy recovery (tier four) and
finally Incineration, without energy recovery (tier 5) and Landfills (tier six) are found
at the bottom of the hierarchy are the least preferred ones.
RECOMMENDATION 2 - Low Cost composting facility
PDKV Model
The Biotechnology Centre of Dr. Panjabrao Deshmukh
Krishi Vidyapeeth (PDKV), Akola has developed a low cost
but effective process and micro-biological cultures to
convert organic waste into excellent quality organic
manure within a short period of time. Inorganic and non-
biodegradable products like plastic, metals, rubber,
stone, bricks etc., are recovered for different uses. Other
non- degradable and non-recyclable remnants (around
15% of the original volumes), are disposed in the
sanitary landfills. Fully matured and stabilized organic
manure with the desired composition is thus recovered.
The enriched organic fertilizer is subjected to chemical
and biological tests after which it is bagged and sold. As
per PDKV design, a compost facility of 25 MT/day will
have the following components-
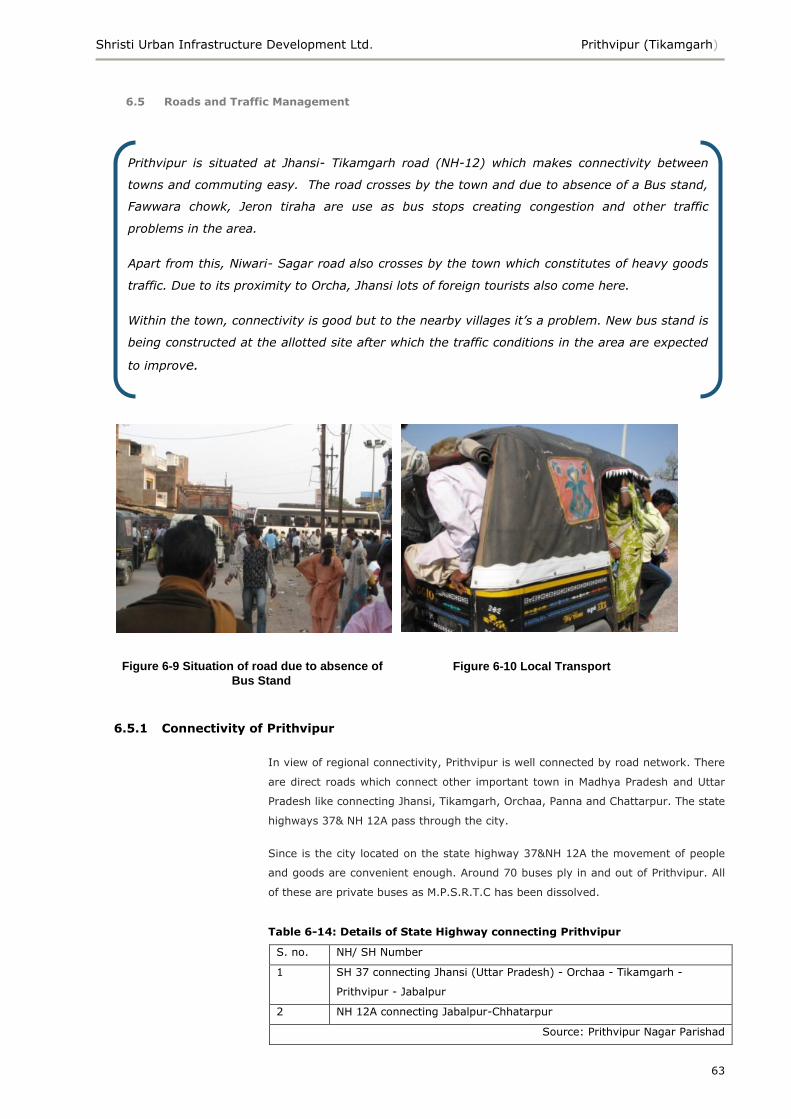
Shristi Urban Infrastructure Development Ltd. Prithvipur (Tikamgarh)
63
6.5 Roads and Traffic Management
6.5.1 Connectivity of Prithvipur
In view of regional connectivity, Prithvipur is well connected by road network. There
are direct roads which connect other important town in Madhya Pradesh and Uttar
Pradesh like connecting Jhansi, Tikamgarh, Orchaa, Panna and Chattarpur. The state
highways 37& NH 12A pass through the city.
Since is the city located on the state highway 37&NH 12A the movement of people
and goods are convenient enough. Around 70 buses ply in and out of Prithvipur. All
of these are private buses as M.P.S.R.T.C has been dissolved.
Table 6-14: Details of State Highway connecting Prithvipur
S. no. NH/ SH Number
1 SH 37 connecting Jhansi (Uttar Pradesh) - Orchaa - Tikamgarh -
Prithvipur - Jabalpur
2 NH 12A connecting Jabalpur-Chhatarpur
Source: Prithvipur Nagar Parishad
Prithvipur is situated at Jhansi- Tikamgarh road (NH-12) which makes connectivity between
towns and commuting easy. The road crosses by the town and due to absence of a Bus stand,
Fawwara chowk, Jeron tiraha are use as bus stops creating congestion and other traffic
problems in the area.
Apart from this, Niwari- Sagar road also crosses by the town which constitutes of heavy goods
traffic. Due to its proximity to Orcha, Jhansi lots of foreign tourists also come here.
Within the town, connectivity is good but to the nearby villages it’s a problem. New bus stand is
being constructed at the allotted site after which the traffic conditions in the area are expected
to improve.
Figure 6-9 Situation of road due to absence of
Bus Stand
Figure 6-10 Local Transport
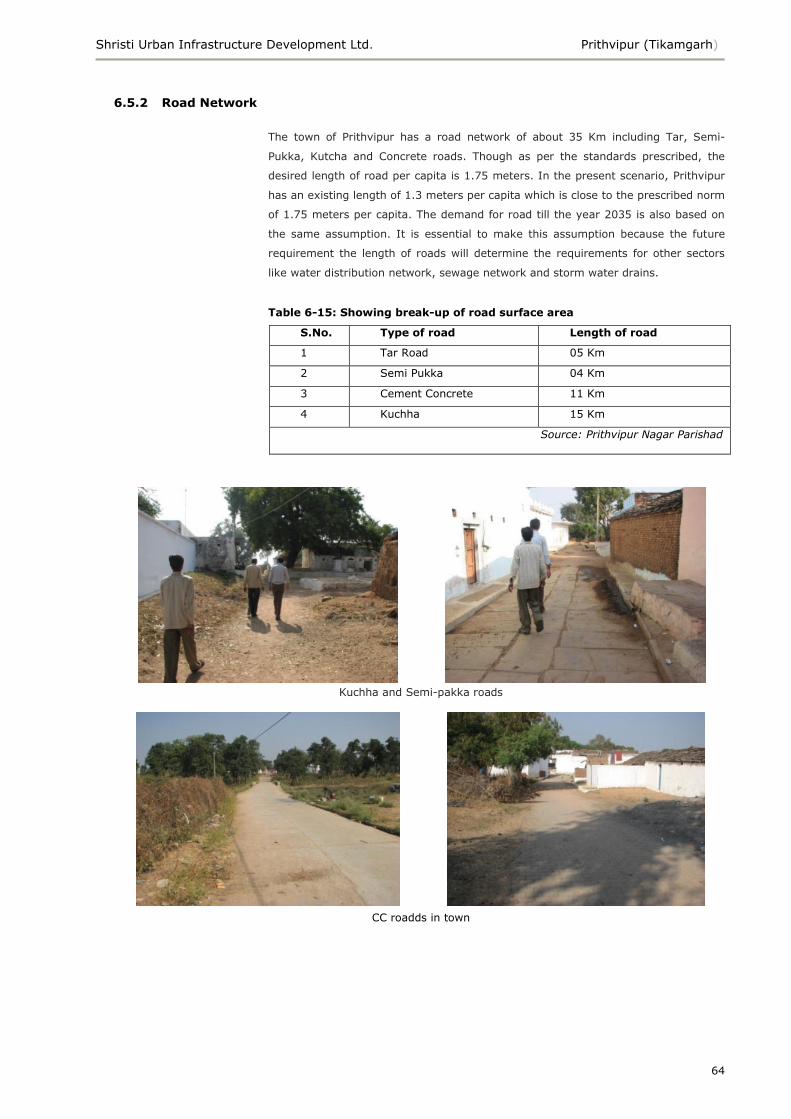
Shristi Urban Infrastructure Development Ltd. Prithvipur (Tikamgarh)
64
6.5.2 Road Network
The town of Prithvipur has a road network of about 35 Km including Tar, Semi-
Pukka, Kutcha and Concrete roads. Though as per the standards prescribed, the
desired length of road per capita is 1.75 meters. In the present scenario, Prithvipur
has an existing length of 1.3 meters per capita which is close to the prescribed norm
of 1.75 meters per capita. The demand for road till the year 2035 is also based on
the same assumption. It is essential to make this assumption because the future
requirement the length of roads will determine the requirements for other sectors
like water distribution network, sewage network and storm water drains.
Table 6-15: Showing break-up of road surface area
S.No. Type of road Length of road
1 Tar Road 05 Km
2 Semi Pukka 04 Km
3 Cement Concrete 11 Km
4 Kuchha 15 Km
Source: Prithvipur Nagar Parishad
Kuchha and Semi-pakka roads
CC roadds in town
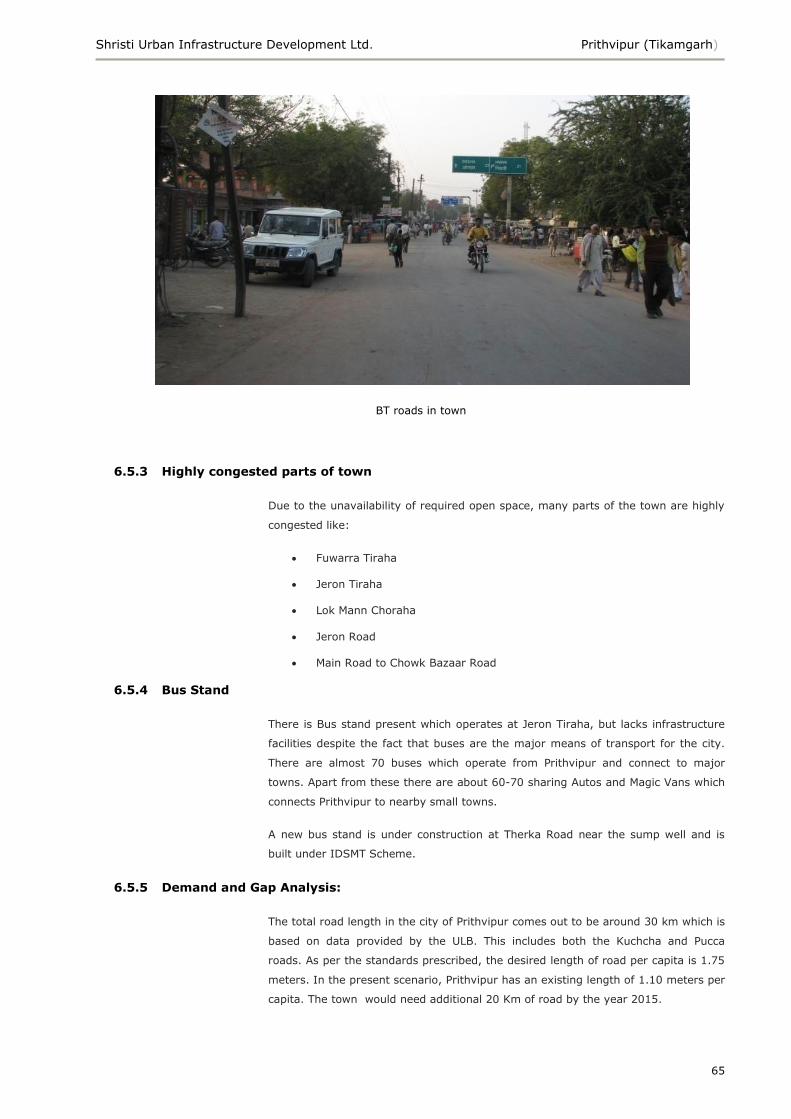
Shristi Urban Infrastructure Development Ltd. Prithvipur (Tikamgarh)
65
BT roads in town
6.5.3 Highly congested parts of town
Due to the unavailability of required open space, many parts of the town are highly
congested like:
Fuwarra Tiraha
Jeron Tiraha
Lok Mann Choraha
Jeron Road
Main Road to Chowk Bazaar Road
6.5.4 Bus Stand
There is Bus stand present which operates at Jeron Tiraha, but lacks infrastructure
facilities despite the fact that buses are the major means of transport for the city.
There are almost 70 buses which operate from Prithvipur and connect to major
towns. Apart from these there are about 60-70 sharing Autos and Magic Vans which
connects Prithvipur to nearby small towns.
A new bus stand is under construction at Therka Road near the sump well and is
built under IDSMT Scheme.
6.5.5 Demand and Gap Analysis:
The total road length in the city of Prithvipur comes out to be around 30 km which is
based on data provided by the ULB. This includes both the Kuchcha and Pucca
roads. As per the standards prescribed, the desired length of road per capita is 1.75
meters. In the present scenario, Prithvipur has an existing length of 1.10 meters per
capita. The town would need additional 20 Km of road by the year 2015.
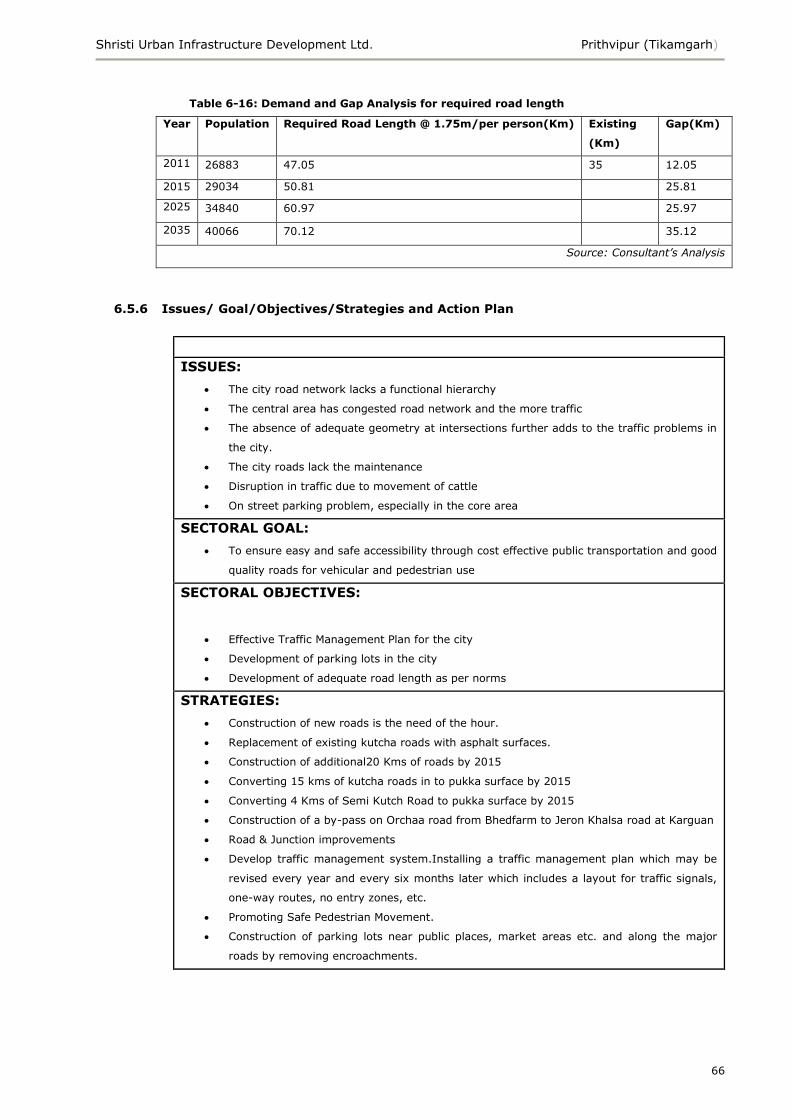
Shristi Urban Infrastructure Development Ltd. Prithvipur (Tikamgarh)
66
Table 6-16: Demand and Gap Analysis for required road length
Year Population Required Road Length @ 1.75m/per person(Km) Existing
(Km)
Gap(Km)
2011 26883 47.05 35 12.05
2015 29034 50.81 25.81
2025 34840 60.97 25.97
2035 40066 70.12 35.12
Source: Consultant’s Analysis
6.5.6 Issues/ Goal/Objectives/Strategies and Action Plan
Roads and Transportation
ISSUES:
The city road network lacks a functional hierarchy
The central area has congested road network and the more traffic
The absence of adequate geometry at intersections further adds to the traffic problems in
the city.
The city roads lack the maintenance
Disruption in traffic due to movement of cattle
On street parking problem, especially in the core area
SECTORAL GOAL:
To ensure easy and safe accessibility through cost effective public transportation and good
quality roads for vehicular and pedestrian use
SECTORAL OBJECTIVES:
Effective Traffic Management Plan for the city
Development of parking lots in the city
Development of adequate road length as per norms
STRATEGIES:
Construction of new roads is the need of the hour.
Replacement of existing kutcha roads with asphalt surfaces.
Construction of additional20 Kms of roads by 2015
Converting 15 kms of kutcha roads in to pukka surface by 2015
Converting 4 Kms of Semi Kutch Road to pukka surface by 2015
Construction of a by-pass on Orchaa road from Bhedfarm to Jeron Khalsa road at Karguan
Road & Junction improvements
Develop traffic management system.Installing a traffic management plan which may be
revised every year and every six months later which includes a layout for traffic signals,
one-way routes, no entry zones, etc.
Promoting Safe Pedestrian Movement.
Construction of parking lots near public places, market areas etc. and along the major
roads by removing encroachments.

Shristi Urban Infrastructure Development Ltd. Prithvipur (Tikamgarh)
67
7 Slums and Poverty
7.1 Background
Madhya Pradesh has consistently been progressive in terms of policy and legislation
for the poor. It was the first state in country to hold elections to Panchayti Raj
Institutions after the passing of the 73rd Amendment of the Constitution in 1991. It
commissioned the Human Development Report to identify the lacunae and the
achievements of the Constitution to make the Urban governance more accountable
and to devolve power to the grassroots. In 1984, the state govt. enacted the ―Patta
Act‖ or the M.P. Nagariya Kshetro ke Bhumihin Vyakti Adhiniyam. This act granted
leasehold of tensure to landless urban dwellers on municipal. Following on the heels
of the Patta act, in 1984 the state govt. also introduced the ―single batti‖ yojna. This
scheme gave a single point electric connection to every house at a nominal cost, to
those with 30 years patta. In 1988, the Patta act was amended to absorb the new
slums and to make functional changes with respect to scope, tenure, Mohalla samitis
and Patta rules.
7.2 Concerned Institutions and their role in Madhya Pradesh
Following departments are primarily concerned with city and slum developments:
Housing Environment Department
Department of Urban Administration and Development
Revenue Department
Local Administration
Public Health and Engineering Department
Water Resource Department
Electricity Department
Department of Social Welfare
Department of Women and Child Welfare
There is no holistic approach in which the activities of all the special bodies are
converged for a common ultimate goal. The sectoral approach leads to piecemeal
implementation of projects that may leave important gaps and inconsistencies.
Shristi Urban Infrastructure Development Ltd. Prithvipur (Tikamgarh)
68
7.3 Slum Profile of the City
Based on the survey which was conducted by the Nagar Parishad Prithvipur there
were 6 notified slum areas in Prithvipur Municipal Area. Although a detailed survey is
required to assess the situation accurately, but based on the information available it
can be observed that the slum population of the city is more than 5600. The slum
population accounts to almost 20% of the total population.
Table 7-1: Unauthorized slums within the city
Sl no Name of slum Ward Population Slum
Population
1. Part of Ward No. 4 1591 636
2. Part of Ward No. 5 1175 470
3. Ward 12 1197 957
4. Ward 13 1480 1184
5. Ward 14 1592 1273
6. Ward 15 1435 1148
Total 8470 5668
Source: Nagar Parishad Prithvipur
7.4 Poverty
Table 7-2: Ward-wise number of persons holding various ration cards
Ward Number APL BPL AAY
Ward 1 220 120 34
Ward 2 220 125 31
Ward 3 246 96 28
Ward 4 149 157 47
Ward 5 58 235 61
Ward 6 185 48 63
Ward 7 96 145 53
Ward 8 138 78 45
Ward 9 154 143 47
Ward 10 223 316 45
Ward 11 52 254 89
Ward 12 42 173 41
Ward 13 28 247 35
Ward 14 27 241 56
Ward 15 36 261 65
Total 1874 2639 740
Source: Nagar Parishad Prithvipur
A survey of BPL households in Prithvipur revealed that there are more than 2639
BPL households in Prithvipur. The present figures for ration card distribution indicate
that 740 families have been issued Antyodaya Food Scheme (AAY) ration cards. The
remaining BPL households are expected to be covered soon. The wards with a high
BPL to total household ratio combined with a high number of BPL families (higher
Shristi Urban Infrastructure Development Ltd. Prithvipur (Tikamgarh)
69
0
100
200
300
400
500
600
700
AAY
BPL
APL
than the average for each ward) may be labelled as priority areas for socio-
economic development.
There is an interesting observation which was made in the pattern of distribution of
BPL families, slum pockets and SC population in Prithvipur. It was observed that the
ward no 13,14,15 which have very high BPL population invariably have high SC
population as well and also the slum pockets are largely located in these wards
only.
7.5 Status of Services Slums in Prithvipur
7.5.1 Density and Open Space
The slums are of low to medium density. There is no uniform distribution of slums in
the entire slum area. In some pockets it is dense whereas in some pockets it is low.
Both the characteristics i.e. cluster formations and scattered habitations were
noticed during the site visit.
7.5.2 Housing
One can see mixture of housing
from pucca, semi-pucca(where
there is brick masonry with mud
plaster) to kuchha mud houses.
Most of the existing structures or
housing units are single storied,
one to two room houses
averaging an area of 300-400 sq.
feet. Few of the housing units are
pucca. As per visual observation
the ratio between the two may be
around 30:70. The quality of
housing stock depends on a
combination of factors such as the age of settlement, level of tenure security and
infrastructure provisions.
Figure 7-2 Residential pattern in slums
Figure 7-1BPL/ AAY families
Shristi Urban Infrastructure Development Ltd. Prithvipur (Tikamgarh)
70
7.5.3 Roads
It was noticed that almost 90-95%
of the area had WBM and kuchha
roads. Only 5-10% of the road was
cemented which was also not laid
properly causing stagnation of
waste water. In general it might be
said that the approach roads within
the slum areas were not good and
as such no surface drains were
observed, road gradient was also
not proper, hence causing
hindrance to the surface drainage
and is responsible for unsanitary conditions.
7.5.4 Water
The most common problem in
most of the slums is that the
water is available from hand
pumps near main road and
people have to carry water to the
internal areas in buckets through
kuchha lanes. Near to these hand
pumps dirty water gets
accumulated in pits leading to
mosquito breeding and also
polluting the ground water
indirectly affecting the human
health and putting it at risk unknowingly.
7.5.5 Sanitation- Toilets Drains and Sewerage
Toilets and drainage are clearly
problems in every slum. Less
than 20% of the households have
access to some toilet facility
within the community. More than
80% of the people go for open
defecation. In the slums
observed, although the number of
individual toilets was low, there
was space and demand for
individual toilets in most places.
Domestic waste generated in the locality flows into the open drains, due to the
improper gradient and faulty design sewage gets accumulated and leads to the
water borne and viral diseases. Choking of drains is yet another problem which can
Figure 7-3 Road network in slums,
ward no. 12
Figure 7-4 water supply in slums
Figure 7-5 Drains in slums
Shristi Urban Infrastructure Development Ltd. Prithvipur (Tikamgarh)
71
be seen clearly. Apart from the faulty design at most of the places, links of open
drains are missing which also aggravates the problem.
7.5.6 Garbage
There is little or no access to
solid waste management services
provided by the municipal
maintenance systems. Solid
waste bins shall be placed at
various points and regular
collection by the Municipality
shall be done. As such there is
very little collection of garbage
within the slums, it is generally
thrown into the nallah which the
residents recognize as one of the
reason for choking and overflowing of the drains etc.
7.5.7 Land Tenure
Majority of the slums are located either on govt. land or private land. The
percentages of people living on patta land are very less.
7.6 Issues/Goal/Objectives/Strategies and Action Plan
Slums and Poverty
ISSUES:
Lack of basic urban infrastructure within the slums.
Most of the slum population engaged in low return income generating activities.
Coverage in terms of target population and target areas of the slum upgradation and
poverty alleviation programs insufficient.
Lack of awareness among the people about poverty alleviation programmes
SECTORAL GOAL:
To make Prithvipur a city where there are no families living in slums, and where all
residents have access to affordable and reliable basic services
SECTORAL OBJECTIVES:
Improvement of housing infrastructure and civic amenities in slum areas
Business Incubation centre for assistance in enterprise development and setting up of co-
operative societies
Cover all slum areas with service levels at par with the surrounding zones i.e. 100%
accessibility to basic infrastructure services
STRATEGIES:
Internal rods or footpaths shall be provided in slums such that all houses have clean and
paved access.
At present there is no underground storm water drainage in Prithvipur. In monsoons the
rain water flows in open drains and often on to the roads and surroundings areas. In
slums, the conditions are particularly treacherous because the roads are kuchha which
Figure 7-6 Solid waste management in
slums
Shristi Urban Infrastructure Development Ltd. Prithvipur (Tikamgarh)
72
become muddy and slippery. Therefore there is need to introduce storm water drainage in
slums as a part alongside the roads to facilitate the drainage and to avoid stagnation and
water pool creation. A complete drainage network shall be introduced to collect the storm
water and release it to the nearby natural drain.
Slum free city action plan shall be prepared with socio-economic analysis for the existing
slums with GIS and MIS system.
Formulation of Notification and De-notification Policy
Relocation of slums located in non -hazardous and non-vulnerable Areas
Provision of basic infrastructure - both physical (water, roads, sanitation and sewerage)
and social infrastructure (clinics, schools, training facilities, etc).
Cross-linking the employment schemes with housing improvement programme to ensure
urban poor‘s involvement in development Connecting new developments with the existing
network.
Business Incubation centre for assistance in enterprise development and setting up of co-
operative societies
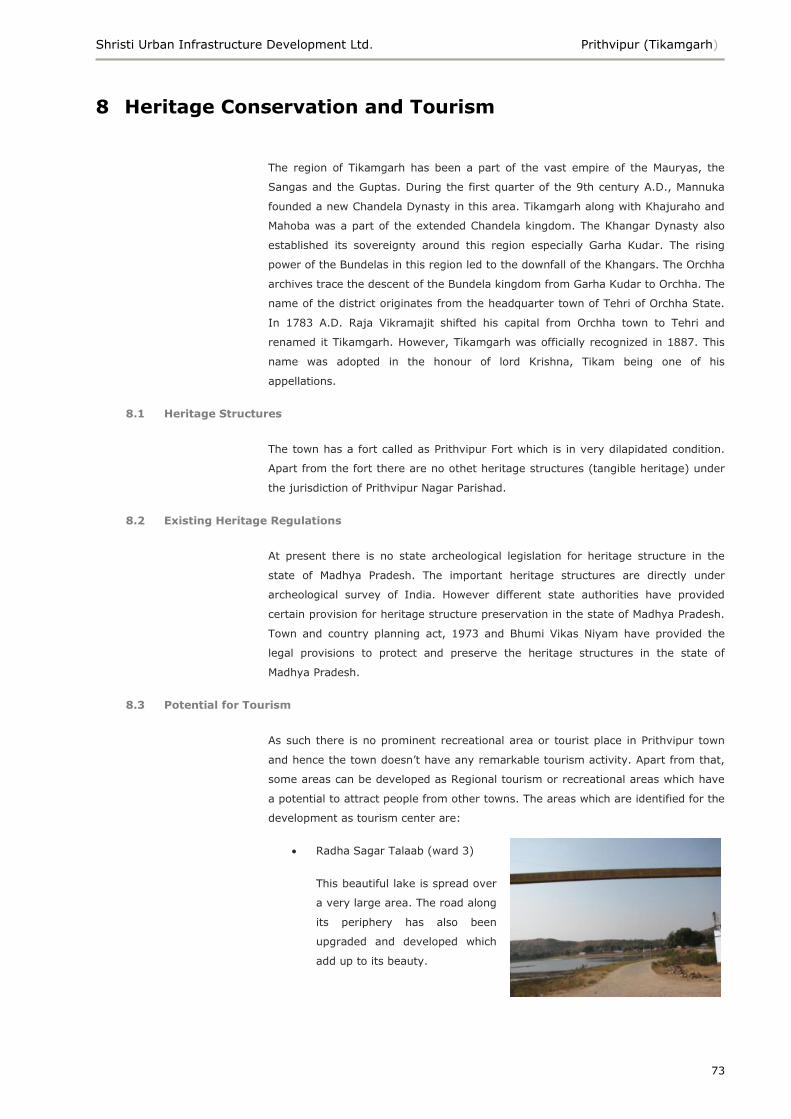
Shristi Urban Infrastructure Development Ltd. Prithvipur (Tikamgarh)
73
8 Heritage Conservation and Tourism
The region of Tikamgarh has been a part of the vast empire of the Mauryas, the
Sangas and the Guptas. During the first quarter of the 9th century A.D., Mannuka
founded a new Chandela Dynasty in this area. Tikamgarh along with Khajuraho and
Mahoba was a part of the extended Chandela kingdom. The Khangar Dynasty also
established its sovereignty around this region especially Garha Kudar. The rising
power of the Bundelas in this region led to the downfall of the Khangars. The Orchha
archives trace the descent of the Bundela kingdom from Garha Kudar to Orchha. The
name of the district originates from the headquarter town of Tehri of Orchha State.
In 1783 A.D. Raja Vikramajit shifted his capital from Orchha town to Tehri and
renamed it Tikamgarh. However, Tikamgarh was officially recognized in 1887. This
name was adopted in the honour of lord Krishna, Tikam being one of his
appellations.
8.1 Heritage Structures
The town has a fort called as Prithvipur Fort which is in very dilapidated condition.
Apart from the fort there are no othet heritage structures (tangible heritage) under
the jurisdiction of Prithvipur Nagar Parishad.
8.2 Existing Heritage Regulations
At present there is no state archeological legislation for heritage structure in the
state of Madhya Pradesh. The important heritage structures are directly under
archeological survey of India. However different state authorities have provided
certain provision for heritage structure preservation in the state of Madhya Pradesh.
Town and country planning act, 1973 and Bhumi Vikas Niyam have provided the
legal provisions to protect and preserve the heritage structures in the state of
Madhya Pradesh.
8.3 Potential for Tourism
As such there is no prominent recreational area or tourist place in Prithvipur town
and hence the town doesn‘t have any remarkable tourism activity. Apart from that,
some areas can be developed as Regional tourism or recreational areas which have
a potential to attract people from other towns. The areas which are identified for the
development as tourism center are:
Radha Sagar Talaab (ward 3)
This beautiful lake is spread over
a very large area. The road along
its periphery has also been
upgraded and developed which
add up to its beauty.
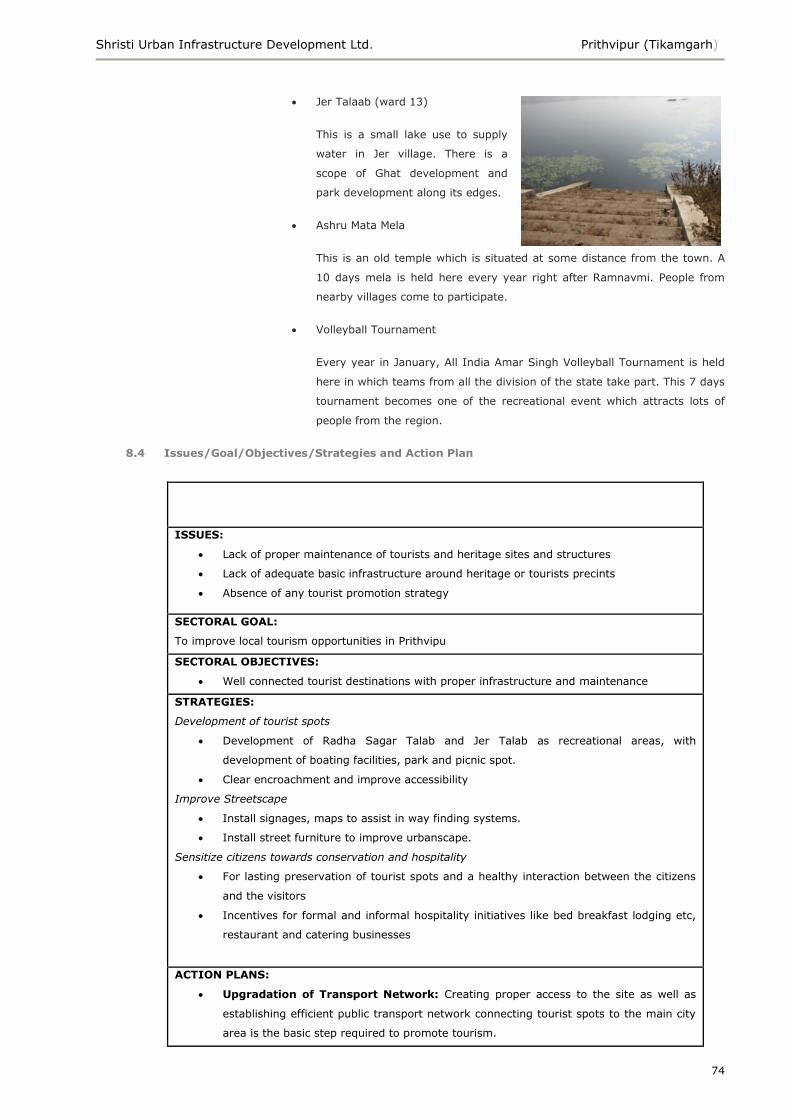
Shristi Urban Infrastructure Development Ltd. Prithvipur (Tikamgarh)
74
Jer Talaab (ward 13)
This is a small lake use to supply
water in Jer village. There is a
scope of Ghat development and
park development along its edges.
Ashru Mata Mela
This is an old temple which is situated at some distance from the town. A
10 days mela is held here every year right after Ramnavmi. People from
nearby villages come to participate.
Volleyball Tournament
Every year in January, All India Amar Singh Volleyball Tournament is held
here in which teams from all the division of the state take part. This 7 days
tournament becomes one of the recreational event which attracts lots of
people from the region.
8.4 Issues/Goal/Objectives/Strategies and Action Plan
Heritage Conservation and Tourism
ISSUES:
Lack of proper maintenance of tourists and heritage sites and structures
Lack of adequate basic infrastructure around heritage or tourists precints
Absence of any tourist promotion strategy
SECTORAL GOAL:
To improve local tourism opportunities in Prithvipu
SECTORAL OBJECTIVES:
Well connected tourist destinations with proper infrastructure and maintenance
STRATEGIES:
Development of tourist spots
Development of Radha Sagar Talab and Jer Talab as recreational areas, with
development of boating facilities, park and picnic spot.
Clear encroachment and improve accessibility
Improve Streetscape
Install signages, maps to assist in way finding systems.
Install street furniture to improve urbanscape.
Sensitize citizens towards conservation and hospitality
For lasting preservation of tourist spots and a healthy interaction between the citizens
and the visitors
Incentives for formal and informal hospitality initiatives like bed breakfast lodging etc,
restaurant and catering businesses
ACTION PLANS:
Upgradation of Transport Network: Creating proper access to the site as well as
establishing efficient public transport network connecting tourist spots to the main city
area is the basic step required to promote tourism.
Shristi Urban Infrastructure Development Ltd. Prithvipur (Tikamgarh)
75
Infrastructure Up gradation: Installation of basic services such as water supply,
sanitation, sewage disposal, power supply and waste management are basic
infrastructural inputs required to develop an area into a tourist precinct.
Provision of Basic Amenities: Installation of basic tourist amenities such as rest
areas, accommodation, restaurants, information centres etc.
Creation of Recreational Spaces around these precincts would help in attracting
people to these areas and cater to their recreational needs.
Enhancing the environmental attributes of the city—the state of pollution, traffic
chaos and disorder, cleanliness of the public domain and the legibility in a city accounts
for a city‘s environmental attributes. As the city of Prithvipur scores low in all these
domains, there is a dire need to enhance its environmental attributes by taking
measures to lower traffic congestion, chaos, disorder and ensure cleanliness.
Installation of way finding systems and appropriate signage is a must to enhance
legibility in the city and make the city tourist friendly.
Enhancing the image of SH and NH as a gateway to the city of Prithvipur would help
in improving the image ability of the city. There is also a need to render an appropriate
image to the other approach roads to the city.
Ownership and Maintenance: As the nature of ownership / ownership pattern in a
city reflects the status of maintenance of structures and places, it becomes essential to
work out a clear ownership pattern of important structures and precincts in the city.
Ownership disputes often lead to negligence in the maintenance of the areas and
structures adding to the precinct‘s illegibility.
Organization of cultural events such as light and sound shows, fares, pilgrimage
walks etc. would promote visits to such places in the city.

Shristi Urban Infrastructure Development Ltd. Prithvipur (Tikamgarh)
76
9 Environment
9.1 District at a glance
9.1.1 Flora & Fauna
Flora: The forest cover around the Jamuni River which supplies water to Tikamgarh
town is mainly classified as southern tropical dry deciduous forest. The landscape
around Timamgarh is mainly covered by shrubs, herbs and grass. The commonly
found shrubs and herbs are Adusa, Aak, Baibirang, Chhind, Charota, Dudhi,
Gokharu, Harsingar, Karonda, Nagphani and Ratanjot.
The dry deciduous forest has Teak and Kardhi as prime species growing with other
species like Haldu, Sejna, Arjun, Saja, Bija, Kasi, Reunjha, Shisham, Tendu, Palas,
Khair, Achar and Mahua. Among trees, Palash, Bel, Kewanch, Ratti, Ghunchi and
Satawar are commonly seen.
Fauna: In the dry deciduous forest the fauna comprises spotted deer, Blue bull,
Peacock, Wild pig, Monkey, Jackal etc. Besides these, bovine population is also
adequately distributed in the region.
Source: Ministry of Water Resources, Central Ground Water Board, North Central
Region, GoI,2009
Figure 9-1: Percentage coverage of Forests in Tikamgarh
District
Shristi Urban Infrastructure Development Ltd. Prithvipur (Tikamgarh)
77
9.1.2 Ground Water Development
The District of Tikamgarh has been identified as one of the poorest districts of the
country by the Planning Commission, Govt. of India. The reason is consistent
draught, high rate of desertification, water scarcity and sanitation problems. The
overall environmental degradation is evident through following environmental
assessment of the town. The assessment is based on primary, secondary resources
of data and information and field observations. The major secondary sources
identified are:
Development Alternatives Report – Bundelkhand Region
Status of Environmental Report – Tikamgarh District 2009
Tikamgarh District Ground Water Information Booklet – CGWB 2009
S.No. Parameters Statistics
1 Geomorphology
Major Physiographic units:
1. The hill ranges.
2. The intermountain fertile
valleys.
Major Drainage: 1. Betwa River.
2. Dhasan River.
2 Landuse (Sq.Km):
1. Forest area
2. Net Sown area
3. Cultivable area
294.38
2619.20
2409.51
3 Major Soil Types: Black Humus Granitic & yellowish grey colour with Kankar soils.
4 Irrigation by different sources:
Source Nos. Area Irrigated (Sq.Km)
Tube wells/Bore wells 1955 88.73
Dug wells 76215 1235.74
Canal 175 134.80
Tanks/Ponds 276 105.13
Net irrigated area - 1629.76
Gross Irrigated Area - 2067.78
5 No. Of Ground Water Monitoring Wells of CGWB(As on 31.03.2007)
No. Of Dug Wells 15
No. Of Piezometers 07
6 Predominant Geological Formations Bundelkhand Granite and
Gneisses
7 Hydrology
Major Water Bearing Formation
Granite and Gneisses Alluvium.
Pre-Monsoon Depth to water level (2007)
Post-monsoon depth to water level (2007)
6.44mbgl-16.58 mbgl
3.80 mbgl – 13.30 mbgl
8 Ground Water Exploration by CGWB( As on
Shristi Urban Infrastructure Development Ltd. Prithvipur (Tikamgarh)
78
31.03.2007)
No. of wells drilled Total
Depth range (m)
Discharge (lps)
53
60.97m – 200mbgl
<1 lps – 6.25 lps
9 Ground Water Quality:
Presence of chemical constituents more than
permissible limits (e.g. EC, F, As, Fe)
NIL
10 Dynamic Ground Water Resources (2004)
Annual Replenishable Ground Water Resources 766.14 MCM
Net Annual Ground Water Draft 393.73 MCM
Projected Demand for Domestic and Industrial uses
upto 2025
37.66 MCM
Stage of Ground Water Development 51%
Major ground water problems and issues
1. Depletion of ground water
level.
2. Drought due to ground water,
over exploitation
3. Salinity problems at places.
Source: Ministry of Water Resources, Central Ground Water Board, North Central Region, GoI,2009
9.1.3 Land Use in Tikamgarh and rest of MP Bundelkhand Region
Land use pattern in MP Bundelkhand districts is not significantly different from the
rest of MP. Net sown area in Tikamgarh district is relatively lower than rest of the
districts in MP Bundelkhand region which is shown below.
Table 9-1: Land use in UP Bundelkhand (2004-05) and MP Bundelkhand (2005-06) districts
District Total area in
hectares
Percentage of total area under different uses
Notified
forest
land
Non-
agri
use
Barren
land
Grazing
land
Under
misc
tree
crops
Cultivable
wasteland
Net
sown
Datia 2,95,874 8.4 7.3 4.9 1.5 0.9 5.2 66.7
Chhatarpur 8,63,036 24.8 5.1 0.2 7.4 0 7.5 46.8
Tikamgarh 5,04,002 13.7 4.7 14.2 4.6 0 4.2 47.8
Panna 7,02,924 42.6 5.9 3.2 1.2 NA 8 35.8
Prithvipur 7,28,583 36.8 4.4 8.1 4.6 0 1.8 42.7
Sagar 10,22,759 29.1 5.1 1.9 8 0 0.9 52.7
MP
Bundelkhand
41,17,178 28.5 5.2 4.6 5.2 4.4 47.2
MP 3,07,55,752 28.3 6.3 4.7 4.3 0 3.8 48.7
Source: www.bundelkhandinfo.com
Shristi Urban Infrastructure Development Ltd. Prithvipur (Tikamgarh)
79
9.1.4 Soil Types in Tikamgarh District
Soils derived from parent rocks are of three types i.e. black humus granitic and
yellowish grey colour with kankar soils are derived due to disintegration and
decomposition of parent rocks.
Figure 9-2: Soil Productivity Map of Tikamgarh District
9.1.5 Groundwater Use in Tikamgarh and rest of MP Bundelkhand Districts
Except in the ravine belts along the Yamuna in the northern extreme of
Bundelkhand, and in the Panna-Ajaigarh hill ranges, water is available at fairly
accessible depths in most inhabited parts of Bundelkhand.Data from the Union
government's Minor Irrigation Census (2000-01) show that in the majority of the
region's villages, groundwater is available at a depth of up to 30 metres.
Table 9-2: Groundwater level in villages (2000-2001)
Percentage of total villages in districts according to groundwater levels
<10 m 10 m-30 m 30 m-70 m >70 m
Datia 21 70 9 Neg
Chhatarpur 62 37 Neg 0
Tikamgarh 60 40 0 Neg
Panna 84 15 Neg Neg
Source: Ministry of Water Resources, Central Ground Water Board, North Central
Region, GoI,2009
Shristi Urban Infrastructure Development Ltd. Prithvipur (Tikamgarh)
80
Prithvipur 68 23 4 5
Sagar 84 15 Neg Neg
MP Bundelkhand 69 29 2 1
MP 57 40 2 Neg
9.1.6 Irrigation Sources in Bundelkhand
Groundwater, mainly extracted from open wells, is the main source of irrigation in
Bundelkhand. In Panna, Sagar and Prithvipur, water from mountain springs are a
major 'other' source of irrigation.
Table 9-3: Percentage of net irrigated area and sources of irrigation in MP Bundelkhand (2005-
06) districts
Net irrigated area as
% of net sown area
% of net irrigated area by source
Canals Tanks Tubewells Other
wells
Other
sources
Datia 68 55 Neg 1 42 Neg
Chhatarpur 56 9 2 Neg 75 12
Tikamgarh 68 8 6 5 76 4
Panna 33 12 7 7 22 52
Prithvipur 36 9 Neg 26 24 41
Sagar 44 2 1 17 50 31
MP Bundelkhand 50 14 3 9 53 21
MP 38 18 3 26 40 14
Source: www.bundelkhandinfo.com
9.2 Ground Water Development
As per ground water resource estimation of Tikamgarh district for the year 2004, the
available ground water resources and gross annual ground water drafts are 766.14
MCM and 393.73 MCM respectively, making stage of ground water development
51% as a whole for the district. Thus, there is enough scope for feature
development of ground water resources in the district.
All 6 blocks namely Tikamgarh, Palera, Prithvipur, Jatara, Prithivipur and Baldeogarh
are falling under safe categories. Decadal water trend analysis reveals falling trend
of water level during pre and post monsoon seasons. After making allocation for
future domestic and industrial water supply upto next 25 years balance available
ground water at 50%$ stage of ground water development safe limit in Tikamgarh
district would be 354.97 MCM. If 70% of balance available ground water resources is
to be developed through dug wells and 30% through tube wells, than at suitable
hydro geological location tentatively 24800 new dug wells and 2775 new tube wells
for irrigation can be constructed in the district, considering unit draft of dug wells
and tube wells 0.01 and 0.04 MCM respectively.
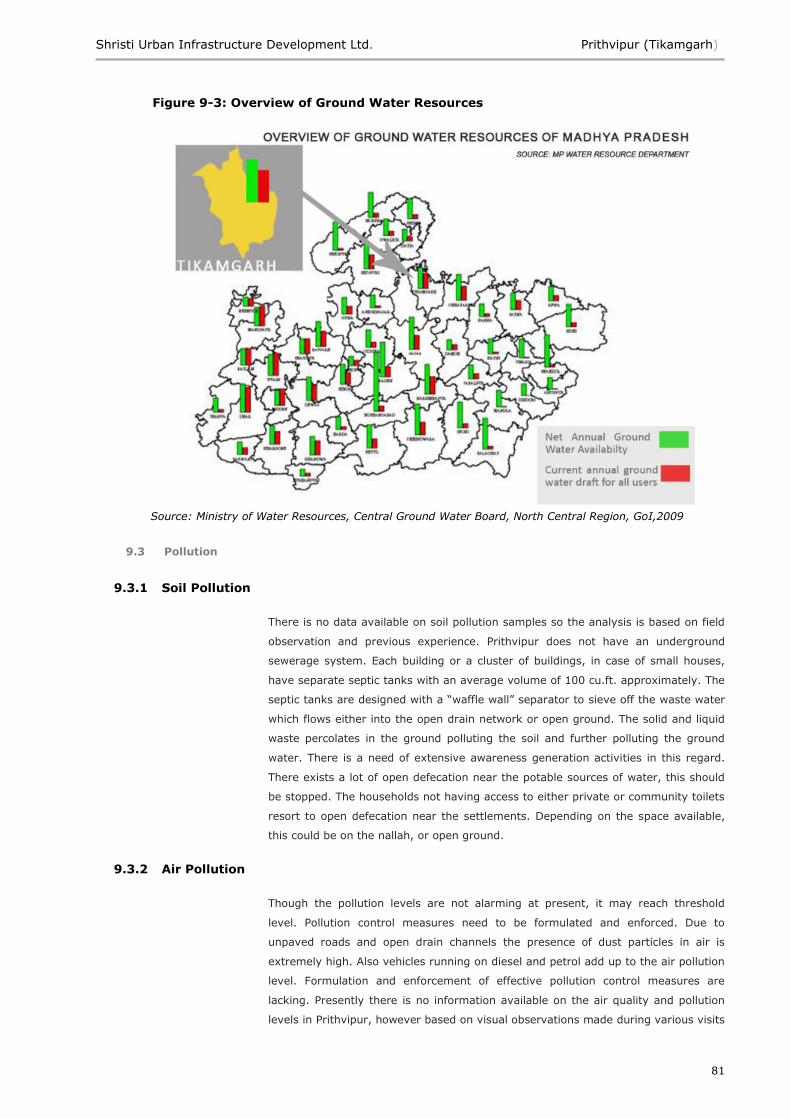
Shristi Urban Infrastructure Development Ltd. Prithvipur (Tikamgarh)
81
Figure 9-3: Overview of Ground Water Resources
9.3 Pollution
9.3.1 Soil Pollution
There is no data available on soil pollution samples so the analysis is based on field
observation and previous experience. Prithvipur does not have an underground
sewerage system. Each building or a cluster of buildings, in case of small houses,
have separate septic tanks with an average volume of 100 cu.ft. approximately. The
septic tanks are designed with a ―waffle wall‖ separator to sieve off the waste water
which flows either into the open drain network or open ground. The solid and liquid
waste percolates in the ground polluting the soil and further polluting the ground
water. There is a need of extensive awareness generation activities in this regard.
There exists a lot of open defecation near the potable sources of water, this should
be stopped. The households not having access to either private or community toilets
resort to open defecation near the settlements. Depending on the space available,
this could be on the nallah, or open ground.
9.3.2 Air Pollution
Though the pollution levels are not alarming at present, it may reach threshold
level. Pollution control measures need to be formulated and enforced. Due to
unpaved roads and open drain channels the presence of dust particles in air is
extremely high. Also vehicles running on diesel and petrol add up to the air pollution
level. Formulation and enforcement of effective pollution control measures are
lacking. Presently there is no information available on the air quality and pollution
levels in Prithvipur, however based on visual observations made during various visits
Source: Ministry of Water Resources, Central Ground Water Board, North Central Region, GoI,2009
Shristi Urban Infrastructure Development Ltd. Prithvipur (Tikamgarh)
82
it can be expected that air pollution levels are comparatively higher along Jeron
Road and Jhansi Road
9.3.3 WaterPollution
The key causes of water pollution in the town are the discharge of untreated sewage
and deposition of solid waste in the course of natural drains and nalllahs. The
nallahs flowing through the town are subjected to disposal of garbage at many
locations which obstructs their flow resulting in accumulation of water. These
locations then become grounds for mosquito breeding.
Under developed drainage network and undeveloped waste water conveyance
system leads to the stagnation of storm water and waste water at various locations
of the town leading to unhygienic conditions which pose serious threat to the health
of the citizens.
The tube wells located in close proximity to the nallahs and septic tanks located near
ground water source also pose serious threat of water contamination
9.3.1 Noise Pollution
There is no data available on the level of noise pollution. Though based on the
primary data and consultation with the stakeholders, it has been observed that the
noise level at the Bus Stand causes a lot of inconvenience for the residents and shop
keepers. This noise pollution is generated because of the continuous traffic of buses,
tractors and trucks movement along these roads.
9.4 Issues/Goal/Objectives/Strategies and Action Plan
Environment
ISSUES:
Depletion of ground water table
Water logging in the low lying areas specially during the monsoon
Absence of sewerage system in the city
Indiscriminate dumping of garbage
Pollution of water bodies and lakes
SECTORAL GOAL:
To upgrade the city environment for abetter quality of life and safe future forinhabitants
SECTORAL OBJECTIVES:
Adoption of a ―Green Prithvipur‖ resolution
Conservation of green spaces, natural landscape and natural drainage
Build parks and promenades along natural drain to rejuvenate the water body
Encourage tree plantation interspersed with future development
Make water-harvesting compulsory for households/ colonies
Conservation of lakes and Bawdi‘s and recharging the dug wells.
ACTION PLAN:
Strict norms for pollution control
The pollution norms should be strictly enforced and any violator should be penalized. The norms
Shristi Urban Infrastructure Development Ltd. Prithvipur (Tikamgarh)
83
and standards for vehicle emission, air quality should be developed and standardized. The
norms should be identified for the environmentally sensitive areas of the city. The detail action
plans should be worked out for regular pollution check of air, noise, water and ground water
table in the city.
Prevention of Pollution in the water bodies
The activities along the lake should be restricted since there are many lakes and Bawdi‘s in
Prithvipur. The polluting activities like disposal of sewage, dumping of garbage in the lake should
be prevented. The strict norms should be enforced. The proper solid waste disposal sites should
be allocated so that garbage is not dumped.
Public awareness needs to be done for action against activities related to the pollution of the
water bodies. Regular cleaning and maintenance of the lakes.
Preservation and conservation of water bodies and development of new parks
The maintenance and revitalization factors should be suggested for preservation and
conservation of water bodies in the city. The pollution levels, water quality check should be done
in the city. The water bodies can also be developed as tourist spots.
Conserve ground water resource by adopting rainwater-harvesting techniques
The rainwater harvesting techniques should be introduced in the city. Existing large government
/ institutional buildings should set an example by adopting these techniques.
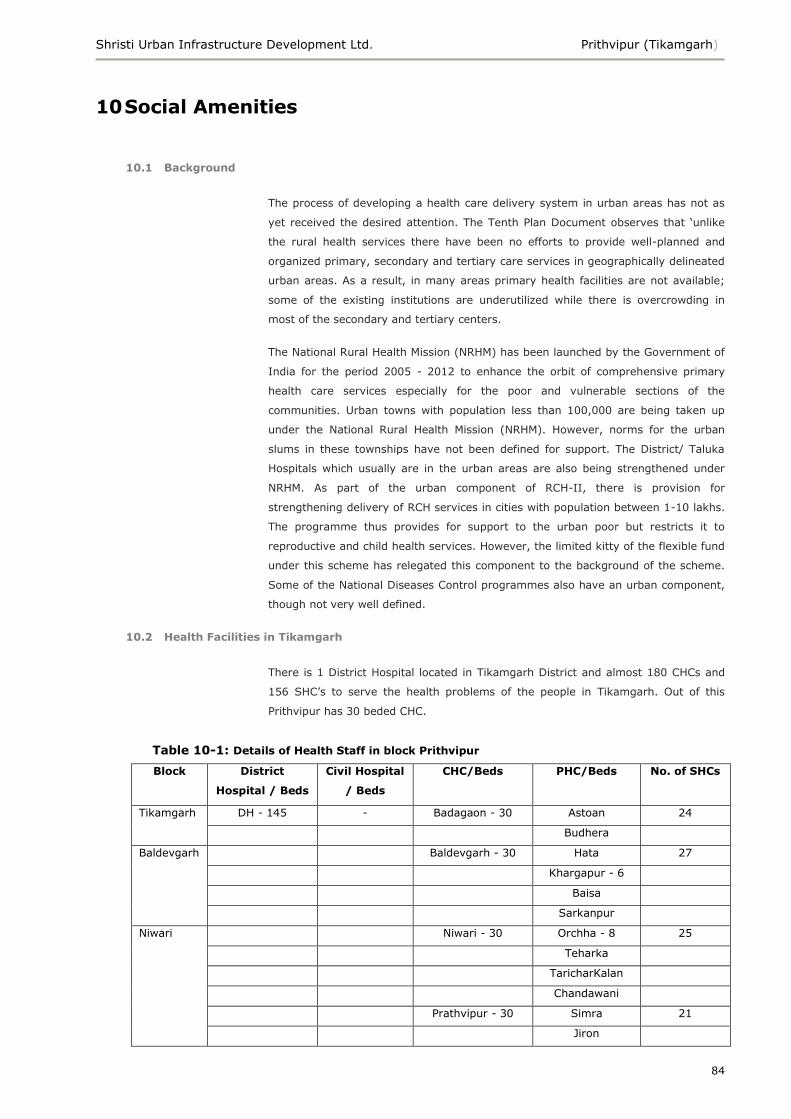
Shristi Urban Infrastructure Development Ltd. Prithvipur (Tikamgarh)
84
10 Social Amenities
10.1 Background
The process of developing a health care delivery system in urban areas has not as
yet received the desired attention. The Tenth Plan Document observes that ‗unlike
the rural health services there have been no efforts to provide well-planned and
organized primary, secondary and tertiary care services in geographically delineated
urban areas. As a result, in many areas primary health facilities are not available;
some of the existing institutions are underutilized while there is overcrowding in
most of the secondary and tertiary centers.
The National Rural Health Mission (NRHM) has been launched by the Government of
India for the period 2005 - 2012 to enhance the orbit of comprehensive primary
health care services especially for the poor and vulnerable sections of the
communities. Urban towns with population less than 100,000 are being taken up
under the National Rural Health Mission (NRHM). However, norms for the urban
slums in these townships have not been defined for support. The District/ Taluka
Hospitals which usually are in the urban areas are also being strengthened under
NRHM. As part of the urban component of RCH-II, there is provision for
strengthening delivery of RCH services in cities with population between 1-10 lakhs.
The programme thus provides for support to the urban poor but restricts it to
reproductive and child health services. However, the limited kitty of the flexible fund
under this scheme has relegated this component to the background of the scheme.
Some of the National Diseases Control programmes also have an urban component,
though not very well defined.
10.2 Health Facilities in Tikamgarh
There is 1 District Hospital located in Tikamgarh District and almost 180 CHCs and
156 SHC‘s to serve the health problems of the people in Tikamgarh. Out of this
Prithvipur has 30 beded CHC.
Table 10-1: Details of Health Staff in block Prithvipur
Block District
Hospital / Beds
Civil Hospital
/ Beds
CHC/Beds PHC/Beds No. of SHCs
Tikamgarh DH - 145 - Badagaon - 30 Astoan 24
Budhera
Baldevgarh Baldevgarh - 30 Hata 27
Khargapur - 6
Baisa
Sarkanpur
Niwari Niwari - 30 Orchha - 8 25
Teharka
TaricharKalan
Chandawani
Prathvipur - 30 Simra 21
Jiron
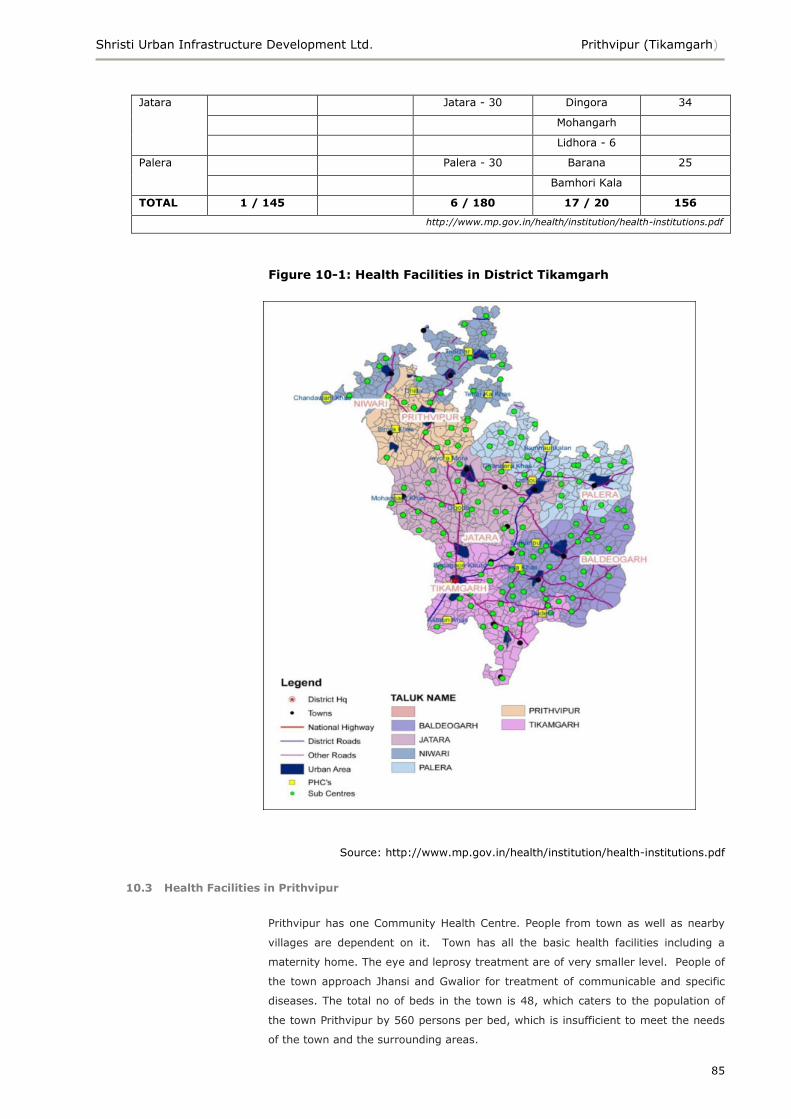
Shristi Urban Infrastructure Development Ltd. Prithvipur (Tikamgarh)
85
Jatara Jatara - 30 Dingora 34
Mohangarh
Lidhora - 6
Palera Palera - 30 Barana 25
Bamhori Kala
TOTAL 1 / 145 6 / 180 17 / 20 156
http://www.mp.gov.in/health/institution/health-institutions.pdf
Figure 10-1: Health Facilities in District Tikamgarh
Source: http://www.mp.gov.in/health/institution/health-institutions.pdf
10.3 Health Facilities in Prithvipur
Prithvipur has one Community Health Centre. People from town as well as nearby
villages are dependent on it. Town has all the basic health facilities including a
maternity home. The eye and leprosy treatment are of very smaller level. People of
the town approach Jhansi and Gwalior for treatment of communicable and specific
diseases. The total no of beds in the town is 48, which caters to the population of
the town Prithvipur by 560 persons per bed, which is insufficient to meet the needs
of the town and the surrounding areas.
Shristi Urban Infrastructure Development Ltd. Prithvipur (Tikamgarh)
86
Table 10-2: Type of hospitals and number of beds
Sl.
No.
Name of
health facility
Govt./private No of
beds
No of Doctors
1 CHC Govt. 30 6 (33 other staff)
2 3 - Dispensary Govt. 18 1 (2 post vacant)
Source: Prithvipur Nagar Parishad
10.4 Education Facilities
10.4.1 Education Structure in Madhya Pradesh
The structure of education in the state is based on the national pattern with 12
years of schooling, consisting of eight years of elementary education, that is five
years of primary and three years of middle school education for the age groups 6-11
and 11-14 years respectively, followed by high and higher secondary school
education of two years each besides three years of pre-primary education. Schooling
education is administratively managed by Directorate of Public Instruction, Madhya
Pradesh, Bhopal. At district level, office of District Education Officer and at block
level, office of Block Education Officer manages and coordinates schooling.
10.4.2 Right to Education Act-2009
The Right of children to Free and Compulsory Education Act came into from April 1,
2010. This was a historic day for the people of India as from that day the right to
education has been accorded the same legal status as the right to life as provided by
Article 21A of the Indian Constitution. Every child in the age group of 6-14 years will
be provided 8 years of elementary education in an age appropriate classroom in the
vicinity of his/her neighborhood.
Any cost that prevents a child from accessing school will be borne by the State
which shall have the responsibility of enrolling the child as well as ensuring
attendance and completion of 8 years of schooling. No child shall be denied
admission for want of documents; no child shall be turned away if the admission
cycle in the school is over and no child shall be asked to take an admission test.
Children with disabilities will also be educated in the mainstream schools.
10.4.3 Existing Situation
Comparison of literacy among males and females shows that more percentage of
male are literate than females. Census 2001 figures show that female literacy rate in
Prithvipur is observed to be only 47.9% against the male literacy rate of 72.2%. But
overall both male and female literacy rates are much lower in Prithvipur.
For primary education, the town has total 14 nos. of Govt primary schools and 9
private primary schools. There are 5 government middle schools and 05 private
middle schools. In secondary / higher secondary education, the town has 02 public
and 4 private school which is adequate for catering to present population. There is a
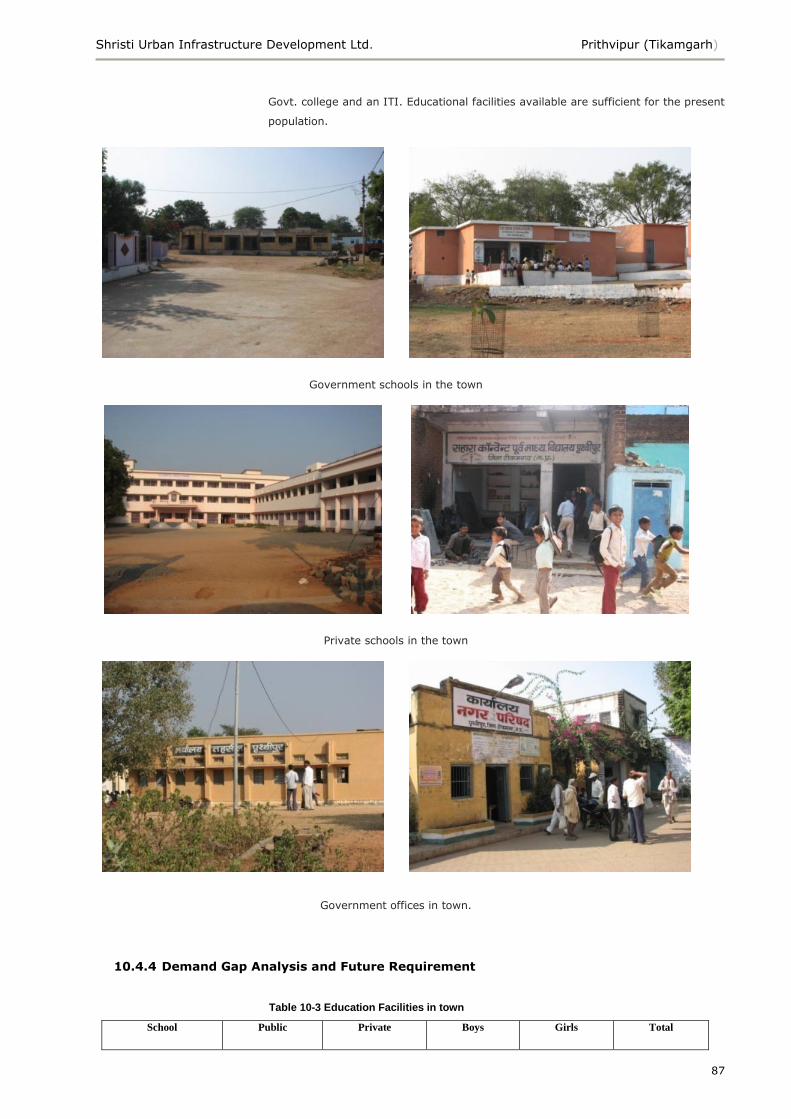
Shristi Urban Infrastructure Development Ltd. Prithvipur (Tikamgarh)
87
Govt. college and an ITI. Educational facilities available are sufficient for the present
population.
Government schools in the town
Private schools in the town
Government offices in town.
10.4.4 Demand Gap Analysis and Future Requirement
Table 10-3 Education Facilities in town
School Public Private Boys Girls Total
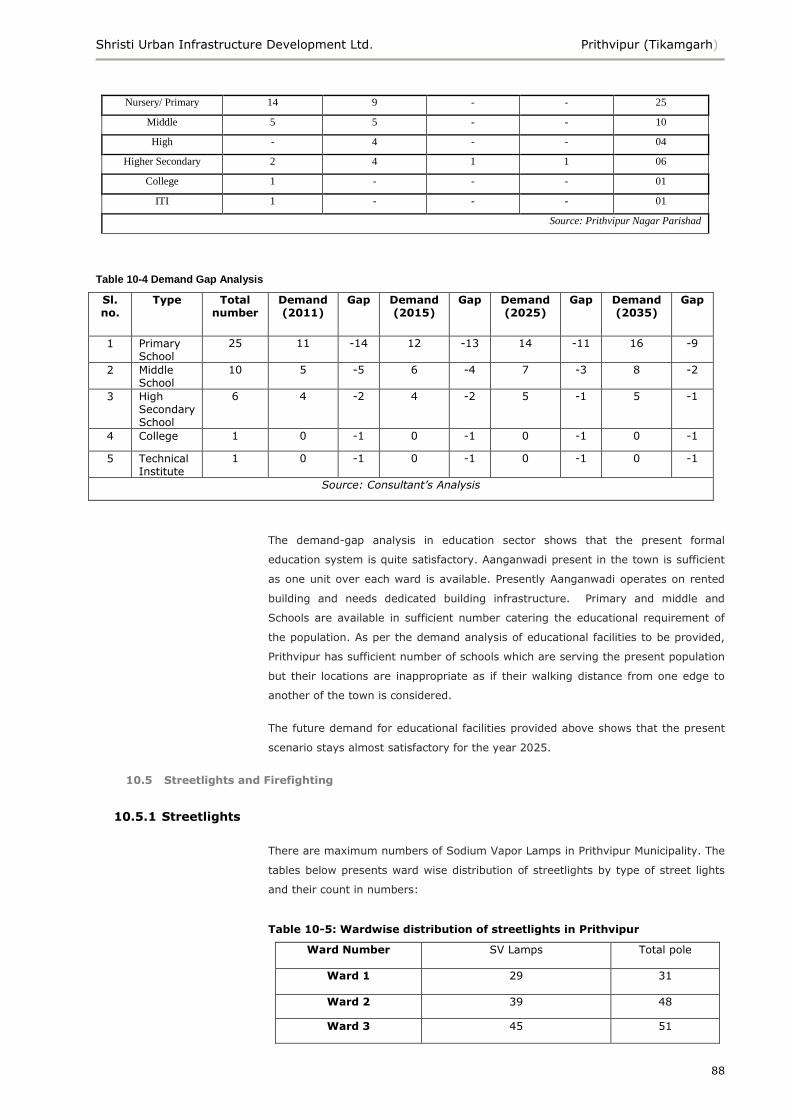
Shristi Urban Infrastructure Development Ltd. Prithvipur (Tikamgarh)
88
Nursery/ Primary 14 9 - - 25
Middle 5 5 - - 10
High - 4 - - 04
Higher Secondary 2 4 1 1 06
College 1 - - - 01
ITI 1 - - - 01
Source: Prithvipur Nagar Parishad
Table 10-4 Demand Gap Analysis
Sl. no.
Type Total number
Demand (2011)
Gap Demand (2015)
Gap Demand (2025)
Gap Demand (2035)
Gap
1 Primary School
25 11 -14 12 -13 14 -11 16 -9
2 Middle School
10 5 -5 6 -4 7 -3 8 -2
3 High Secondary School
6 4 -2 4 -2 5 -1 5 -1
4 College 1 0 -1 0 -1 0 -1 0 -1
5 Technical Institute
1 0 -1 0 -1 0 -1 0 -1
Source: Consultant’s Analysis
The demand-gap analysis in education sector shows that the present formal
education system is quite satisfactory. Aanganwadi present in the town is sufficient
as one unit over each ward is available. Presently Aanganwadi operates on rented
building and needs dedicated building infrastructure. Primary and middle and
Schools are available in sufficient number catering the educational requirement of
the population. As per the demand analysis of educational facilities to be provided,
Prithvipur has sufficient number of schools which are serving the present population
but their locations are inappropriate as if their walking distance from one edge to
another of the town is considered.
The future demand for educational facilities provided above shows that the present
scenario stays almost satisfactory for the year 2025.
10.5 Streetlights and Firefighting
10.5.1 Streetlights
There are maximum numbers of Sodium Vapor Lamps in Prithvipur Municipality. The
tables below presents ward wise distribution of streetlights by type of street lights
and their count in numbers:
Table 10-5: Wardwise distribution of streetlights in Prithvipur
Ward Number SV Lamps Total pole
Ward 1 29 31
Ward 2 39 48
Ward 3 45 51
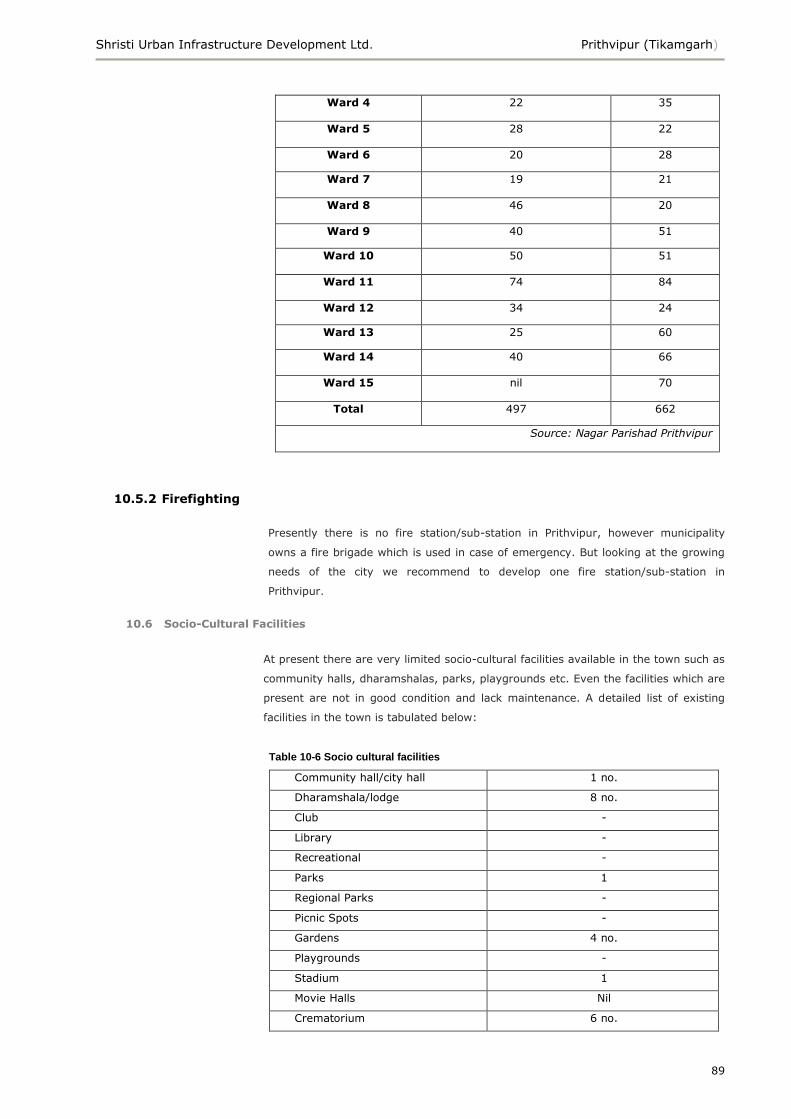
Shristi Urban Infrastructure Development Ltd. Prithvipur (Tikamgarh)
89
Ward 4 22 35
Ward 5 28 22
Ward 6 20 28
Ward 7 19 21
Ward 8 46 20
Ward 9 40 51
Ward 10 50 51
Ward 11 74 84
Ward 12 34 24
Ward 13 25 60
Ward 14 40 66
Ward 15 nil 70
Total 497 662
Source: Nagar Parishad Prithvipur
10.5.2 Firefighting
Presently there is no fire station/sub-station in Prithvipur, however municipality
owns a fire brigade which is used in case of emergency. But looking at the growing
needs of the city we recommend to develop one fire station/sub-station in
Prithvipur.
10.6 Socio-Cultural Facilities
At present there are very limited socio-cultural facilities available in the town such as
community halls, dharamshalas, parks, playgrounds etc. Even the facilities which are
present are not in good condition and lack maintenance. A detailed list of existing
facilities in the town is tabulated below:
Table 10-6 Socio cultural facilities
Community hall/city hall 1 no.
Dharamshala/lodge 8 no.
Club -
Library -
Recreational -
Parks 1
Regional Parks -
Picnic Spots -
Gardens 4 no.
Playgrounds -
Stadium 1
Movie Halls Nil
Crematorium 6 no.
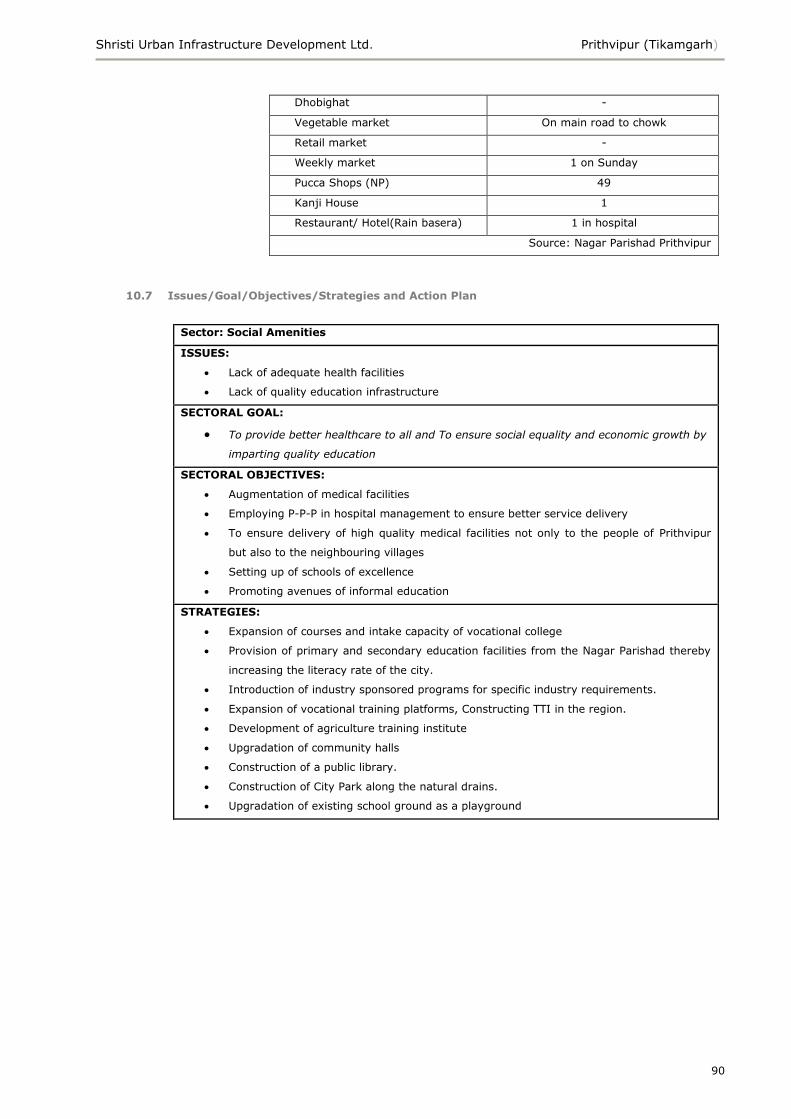
Shristi Urban Infrastructure Development Ltd. Prithvipur (Tikamgarh)
90
Dhobighat -
Vegetable market On main road to chowk
Retail market -
Weekly market 1 on Sunday
Pucca Shops (NP) 49
Kanji House 1
Restaurant/ Hotel(Rain basera) 1 in hospital
Source: Nagar Parishad Prithvipur
10.7 Issues/Goal/Objectives/Strategies and Action Plan
Sector: Social Amenities
ISSUES:
Lack of adequate health facilities
Lack of quality education infrastructure
SECTORAL GOAL:
To provide better healthcare to all and To ensure social equality and economic growth by
imparting quality education
SECTORAL OBJECTIVES:
Augmentation of medical facilities
Employing P-P-P in hospital management to ensure better service delivery
To ensure delivery of high quality medical facilities not only to the people of Prithvipur
but also to the neighbouring villages
Setting up of schools of excellence
Promoting avenues of informal education
STRATEGIES:
Expansion of courses and intake capacity of vocational college
Provision of primary and secondary education facilities from the Nagar Parishad thereby
increasing the literacy rate of the city.
Introduction of industry sponsored programs for specific industry requirements.
Expansion of vocational training platforms, Constructing TTI in the region.
Development of agriculture training institute
Upgradation of community halls
Construction of a public library.
Construction of City Park along the natural drains.
Upgradation of existing school ground as a playground

Shristi Urban Infrastructure Development Ltd. Prithvipur (Tikamgarh)
91
11 Institutional Set up and Financial Status
11.1 Background
'Good governance' is the overarching objective of public administration in the civic
arena. In virtually all sectors of public intervention and service delivery, it is now
agreed that unless and until the state of governance is 'good', service or product
delivery will not be proper. In the recent past, a large number of people and
organizations have given a variety of definitions of what governance is all about.
Governance is defined differently in terms of the context. According to one
definition, ―the ways in which stakeholders interact with each other in order to
influence the outcomes of public policies " is public governance. According to the
World Bank, ―the manner in which power is exercised in the management of a
country's economic and social resources for development " is good governance.
There are today dozens of definitions of what governance and good governance is.
However, if one has to summaries and list downs the ten characteristics of good
governance, they would be:
Citizen involvement, participation and satisfaction
Transparency in all decision making
Accountability of actions taken
Equality and social inclusion
Ethical and honest behavior
Ability to compete in a global environment
Efficiency of service delivery
Respect for democratic values
Respect for the rule of law
Use of appropriate technology and environmental sustainability
11.2 Effective Municipal Governance
The effectiveness of municipal governance depends on a wide range of factors:
political, social and economic. It also depends upon the skills and motivations of its
political leaders, officers, staff and other stakeholders. But structures, processes and
resource bases are themselves factors contributing to effectiveness. The
institutional characteristics of urban government play a part in determining its
effectiveness, along with the people who run it and the environment within which it
operates‖ [Davey (1993)]. Thus, the key factors affecting municipal performance
would include: the innate strength of municipal institutions, the relationship of
municipalities with other institutions: parastatal, State Government, civil society
organizations, etc., inter-institution operational conditions and factors and the
effectiveness of the municipal leaders and staff.
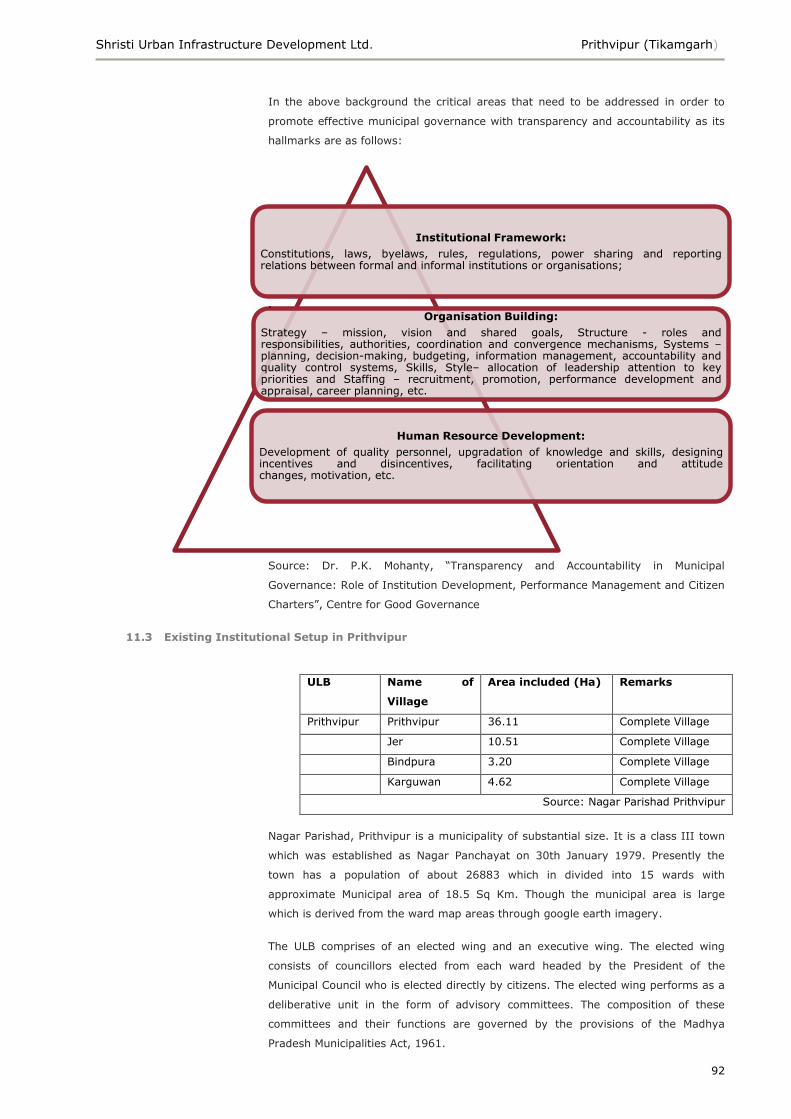
Shristi Urban Infrastructure Development Ltd. Prithvipur (Tikamgarh)
92
Institutional Framework:
Constitutions, laws, byelaws, rules, regulations, power sharing and reportingrelations between formal and informal institutions or organisations;
Organisation Building:
Strategy – mission, vision and shared goals, Structure - roles andresponsibilities, authorities, coordination and convergence mechanisms, Systems –planning, decision-making, budgeting, information management, accountability andquality control systems, Skills, Style– allocation of leadership attention to keypriorities and Staffing – recruitment, promotion, performance development andappraisal, career planning, etc.
Human Resource Development:
Development of quality personnel, upgradation of knowledge and skills, designingincentives and disincentives, facilitating orientation and attitudechanges, motivation, etc.
In the above background the critical areas that need to be addressed in order to
promote effective municipal governance with transparency and accountability as its
hallmarks are as follows:
.
Source: Dr. P.K. Mohanty, ―Transparency and Accountability in Municipal
Governance: Role of Institution Development, Performance Management and Citizen
Charters‖, Centre for Good Governance
11.3 Existing Institutional Setup in Prithvipur
Nagar Parishad, Prithvipur is a municipality of substantial size. It is a class III town
which was established as Nagar Panchayat on 30th January 1979. Presently the
town has a population of about 26883 which in divided into 15 wards with
approximate Municipal area of 18.5 Sq Km. Though the municipal area is large
which is derived from the ward map areas through google earth imagery.
The ULB comprises of an elected wing and an executive wing. The elected wing
consists of councillors elected from each ward headed by the President of the
Municipal Council who is elected directly by citizens. The elected wing performs as a
deliberative unit in the form of advisory committees. The composition of these
committees and their functions are governed by the provisions of the Madhya
Pradesh Municipalities Act, 1961.
ULB Name of
Village
Area included (Ha) Remarks
Prithvipur Prithvipur 36.11 Complete Village
Jer 10.51 Complete Village
Bindpura 3.20 Complete Village
Karguwan 4.62 Complete Village
Source: Nagar Parishad Prithvipur
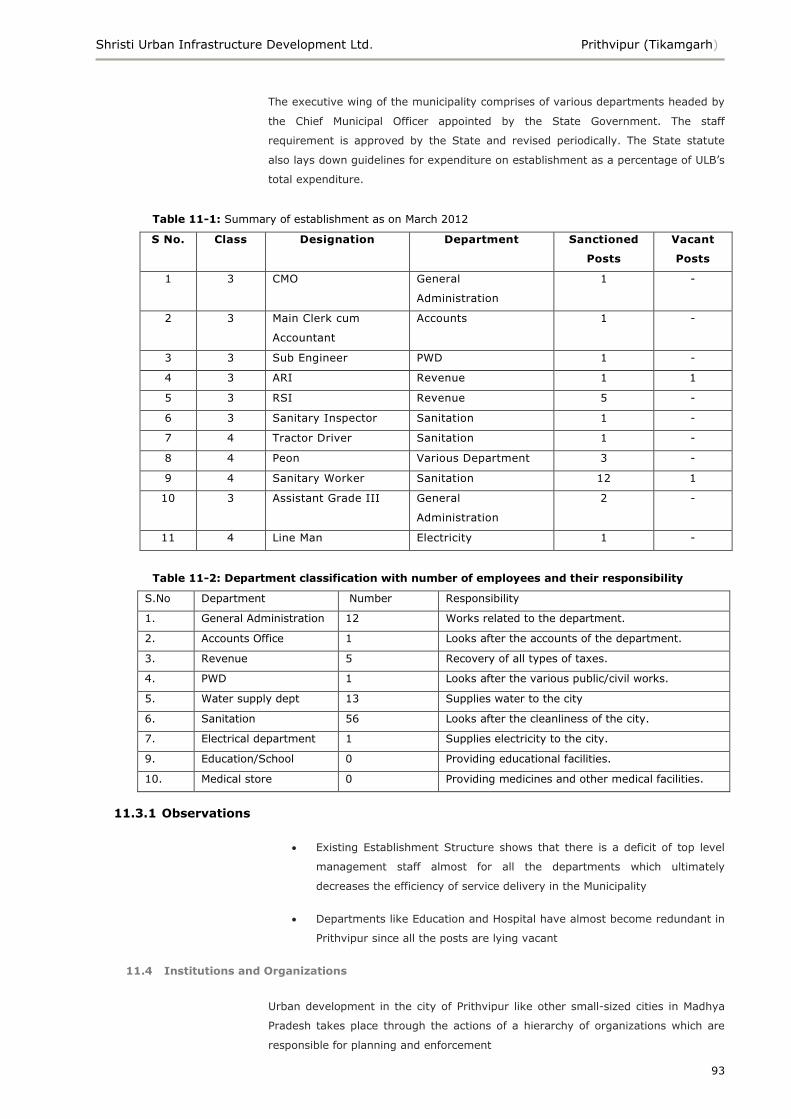
Shristi Urban Infrastructure Development Ltd. Prithvipur (Tikamgarh)
93
The executive wing of the municipality comprises of various departments headed by
the Chief Municipal Officer appointed by the State Government. The staff
requirement is approved by the State and revised periodically. The State statute
also lays down guidelines for expenditure on establishment as a percentage of ULB‘s
total expenditure.
Table 11-1: Summary of establishment as on March 2012
S No. Class Designation Department Sanctioned
Posts
Vacant
Posts
1 3 CMO General
Administration
1 -
2 3 Main Clerk cum
Accountant
Accounts 1 -
3 3 Sub Engineer PWD 1 -
4 3 ARI Revenue 1 1
5 3 RSI Revenue 5 -
6 3 Sanitary Inspector Sanitation 1 -
7 4 Tractor Driver Sanitation 1 -
8 4 Peon Various Department 3 -
9 4 Sanitary Worker Sanitation 12 1
10 3 Assistant Grade III General
Administration
2 -
11 4 Line Man Electricity 1 -
Table 11-2: Department classification with number of employees and their responsibility
S.No Department Number Responsibility
1. General Administration 12 Works related to the department.
2. Accounts Office 1 Looks after the accounts of the department.
3. Revenue 5 Recovery of all types of taxes.
4. PWD 1 Looks after the various public/civil works.
5. Water supply dept 13 Supplies water to the city
6. Sanitation 56 Looks after the cleanliness of the city.
7. Electrical department 1 Supplies electricity to the city.
9. Education/School 0 Providing educational facilities.
10. Medical store 0 Providing medicines and other medical facilities.
11.3.1 Observations
Existing Establishment Structure shows that there is a deficit of top level
management staff almost for all the departments which ultimately
decreases the efficiency of service delivery in the Municipality
Departments like Education and Hospital have almost become redundant in
Prithvipur since all the posts are lying vacant
11.4 Institutions and Organizations
Urban development in the city of Prithvipur like other small-sized cities in Madhya
Pradesh takes place through the actions of a hierarchy of organizations which are
responsible for planning and enforcement
Shristi Urban Infrastructure Development Ltd. Prithvipur (Tikamgarh)
94
11.4.1 Urban Administration and Development Department
With the enactment of the 74th Constitution Amendment Act, major urban related
tasks have been transferred to Local Bodies. The Government of Madhya Pradesh
(GoMP) through its Urban Administration & Development Department (UADD) is
responsible for overseeing urban sector reforms, in terms of capital investment in
basic infrastructure for the Urban Local Bodies (ULB‘s).
The UADD is also responsible for implementation of various public welfare schemes
sponsored by the Central and State Governments. Some such schemes include
Conversion of Dry Latrine Program, Swarna Jayanti Urban Employment Scheme,
National Slum Development Program, Social Security Group Insurance Scheme,
Janashri Insurance Scheme etc. These schemes are implemented through the
District Urban Development Agency.
Being the parent organization of Municipal Corporations, UADD monitors the
functioning of all municipal corporations and municipalities in the state.
11.4.2 Town and Country Planning Department
The activities of Town and Country Planning Department (TCPD) are guided by the
provisions of the Madhya Pradesh Nagar Tatha Gram Nivesh Niyam, 1973 (the
Rules). The State Government, as per provisions of the Rules declares a region
including major urban areas and its surrounding settlements as a planning area, and
orders the preparation of a development plan for the region.
The implementation responsibility of the development plan proposals vests with the
Prithvipur Nagar Parishad within the jurisdiction of municipal limits. Enforcement of
development control regulations and other guidelines also lies with the municipal
council.
11.5 Urban Reforms
The main thrust of the revised strategy of urban renewal is to ensure improvement
in urban governance so that the Urban Local Bodies (ULBs) and para-statal agencies
become financially sound with enhanced credit rating and ability to access market
capital for undertaking new programmes and expansion of services. In this improved
environment, public-private participation models for provision of various services
would also become feasible. To achieve this objective, the State Government, Urban
Local Bodies and para-statal agencies will be required to accept the implementation
of an agenda of reforms. The proposed reforms shall broadly fall into two categories
# Mandatory reforms
# Optional reforms
All the mandatory and optional reforms shall be implemented by the
State/ULB/Para-Statals within the stipulated time.
11.5.1 Mandatory Reforms
There will be two sets of mandatory reforms. Core reforms at ULB/Para-statal level
aimed at re-engineering the process of governance through deployment of
Shristi Urban Infrastructure Development Ltd. Prithvipur (Tikamgarh)
95
technology to enable more efficient, reliable, timely services in a transparent
manner. The other set of reforms are framework related at State level.
Reforms at Urban Local Body/Para-statal
Adoption of modern, accrual-based double entry system of accounting in Urban
Local Bodies/Para-statal.
Introduction of system of e-governance using IT application like, GIS and MIS
for various services provided by ULBs/ Para-statal.
Reform of property tax with GIS, so that is becomes major source of revenue
for Urban Local Bodies ( ULBs) and arrangements for its effective
implementation so that collection efficiency reaches at least 85% within next
seven years.
Levy of reasonable user charges by ULBs/Para-statal with the objective that full
cost of operation and maintenance or recurring cost is collected within next
seven years. However. Cities/towns in Northeast and other special category
States may recover at least 50% of operation & maintenance charges initially.
These cities/towns should graduate to full O & M cost recovery in a phased
manner.
Internal earmarking within local body, budgets for basic services to the urban
poor.
Provision of basic services to urban poor including security of tenure at
affordable prices, improved housing watersupply, sanitation and ensuing
delivery of other already existing universal services of the Government of
education, health and social security.
Reforms at State Level
Implementation of decentralization measures as envisaged in 74th constitution
Amendment Act. Stated should ensure meaningful association/engagement of
ULBs in planning function of para-statals as well as delivery of services to the
citizens.
Repeal of Urban Land Ceiling and Regulation Act.
Reform of Rent Control Laws balancing the interests of landlords and tenants.
Rationalisation of Stamp Duty to bring it down to no more than 5% within next
seven years.
Enactment of public Disclosure Law to ensure preparation of medium-term fiscal
plan of ULBs/ Parastatals and release of quarterly performance information to
all stakeholders.
Enactment of Community participation Law to institutionalise citizen
participation and introducing the concept of Area Sabha in urban areas.
Assigning or associating elected ULBs with "city planning function" Over a period
of seven years, transferring all special agencies that deliver civic services in
Shristi Urban Infrastructure Development Ltd. Prithvipur (Tikamgarh)
96
urban areas to ULBs and creating accountability platforms for all urban civic
service providers in transition.
11.5.2 Optional Reforms (State and ULB/ Para-statal level)
Revision of bye-laws to streamline the approval process for construction of
buildings, development of sites etc
Simplification of legal and procedural frameworks for conversion of
agricultural land for non-agricultural purposes
Introduction of property Title Certification System in ULBs
Earmarking at least 20-25% of developed land in all housing projects
(both public and private Agencies) for EWS/LIG category with a system of
cross subsidization
Introduction of computerized process of registration of land and property
Revision of bye-laws to make rainwater harvesting mandatory in
all buildings and adoption of water conservation measures
Bye-laws for reused of recycled water
Administrative reforms, i.e. reduction in establishment by bringing out voluntary
retirement schemes, non-filling up of posts falling vacant due to retirement etc.,
and achieving specified milestones in this regard
Structural reforms
Encouraging Public Private Partnership.
Note:
Any two optional reforms to be implemented together by State & ULBs/
Parastatals in each year
If the ULB do not undertake reforms in true spirit, It will be difficult to achieve
the vision and goal set in the city development plan
11.6 Issues/Goal/Objectives/Strategies
Urban Governance
ISSUES:
The NP is incapable of implementing the powers and functions provided under 74th
constitutional amendment.
SECTORAL GOAL:
To make Prithvipur with a sustainable e-governance system for citizen services
SECTORAL OBJECTIVES:
Up gradation of administrative toolkit and personnel skills
Shristi Urban Infrastructure Development Ltd. Prithvipur (Tikamgarh)
97
To equip ULB with the latest technology and skill-sets and accurate base data of various
sectors to ensure delivery of superior urban services
Creating forum for citizen involvement
Training modules for ULB staff to enable e-governance and active update of database
Setting up a special cell within the ULB management focused on P-P-P
STRATEGIES:
Preparation of a digital map of Prithvipur with different layers for various services and
infrastructure.
Training modules for ULB staff to enable e-governance and active update of database.
Physical surveys like OD surveys for traffic, BPL population survey etc. for latest and
most accurate findings.
Adoption of accounting reforms.
Setting up a special cell within the ULB management focussed on P-P-P
Creating forum for citizen involvement as an extension of roles for the Steering
Committee into the execution stage of CDP
11.7 Recommendations to improve urban governance in Prithvipur Municipality
11.7.1 Performance Management System
Background
Municipal governance is much broader than what municipal governments do. Cities
are increasingly becoming multi-governmental and the effective management of
cities requires multi-pronged partnerships and the involvement of many
stakeholders. The key stakeholders in the urban context include: municipal elected
officials and non-officials, Council and Committees, employees and their trade
unions, para-statals, Government departments, ratepayers‘ associations, resident
welfare groups, Chamber of Commerce, business associations, NGOs, CBOs,
neighbourhood committees, self-help groups, professional organisations, the media
and the like. Thus effectiveness of municipal governance depends on how the
interactions between various stakeholders are managed to produce the desired goals
of providing civic infrastructure and services to the citizens in a transparent and
accountable manner.
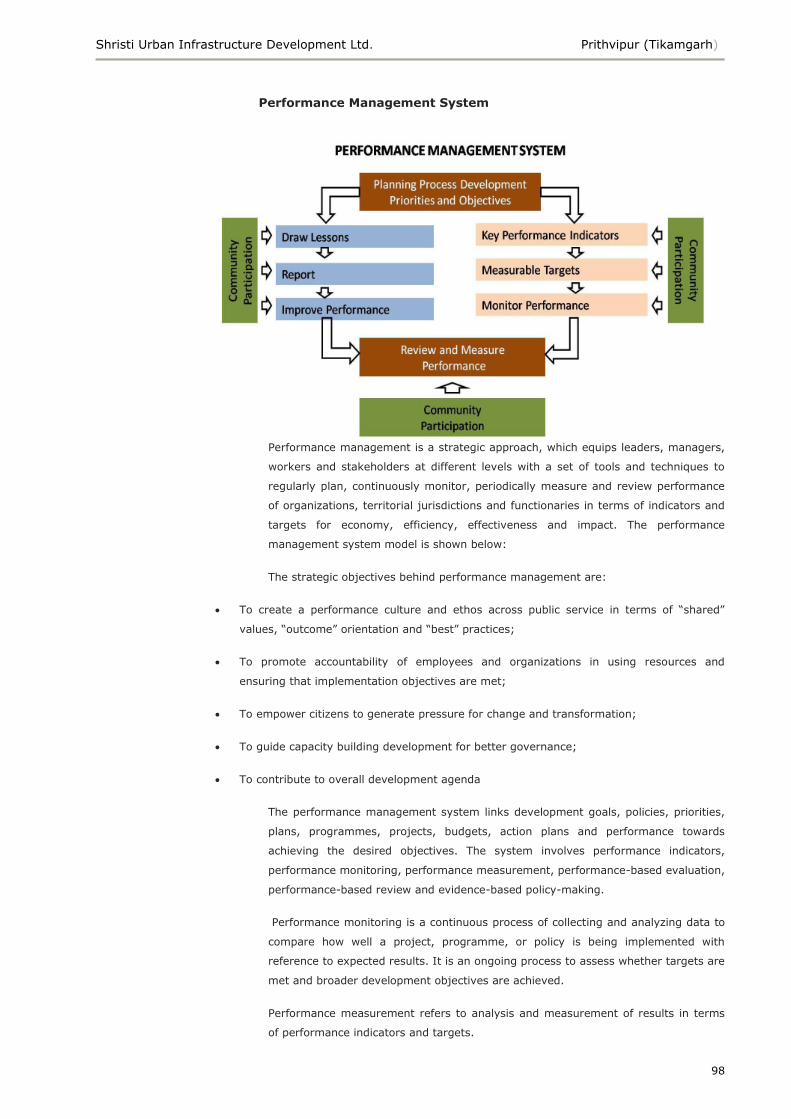
Shristi Urban Infrastructure Development Ltd. Prithvipur (Tikamgarh)
98
Performance Management System
Performance management is a strategic approach, which equips leaders, managers,
workers and stakeholders at different levels with a set of tools and techniques to
regularly plan, continuously monitor, periodically measure and review performance
of organizations, territorial jurisdictions and functionaries in terms of indicators and
targets for economy, efficiency, effectiveness and impact. The performance
management system model is shown below:
The strategic objectives behind performance management are:
To create a performance culture and ethos across public service in terms of ―shared‖
values, ―outcome‖ orientation and ―best‖ practices;
To promote accountability of employees and organizations in using resources and
ensuring that implementation objectives are met;
To empower citizens to generate pressure for change and transformation;
To guide capacity building development for better governance;
To contribute to overall development agenda
The performance management system links development goals, policies, priorities,
plans, programmes, projects, budgets, action plans and performance towards
achieving the desired objectives. The system involves performance indicators,
performance monitoring, performance measurement, performance-based evaluation,
performance-based review and evidence-based policy-making.
Performance monitoring is a continuous process of collecting and analyzing data to
compare how well a project, programme, or policy is being implemented with
reference to expected results. It is an ongoing process to assess whether targets are
met and broader development objectives are achieved.
Performance measurement refers to analysis and measurement of results in terms
of performance indicators and targets.
Shristi Urban Infrastructure Development Ltd. Prithvipur (Tikamgarh)
99
1. Key Performance Indicators
Key Performance indicators are measurable factors of extreme importance to any
organization in achieving its strategic goals, objectives, vision and values. These
indicators are required to be designed carefully so as to be in a position to:
Indicate the progress made towards the goal
Provide a common framework for gathering data for measurement and
reporting
Capture complex concepts in simple terms
Enable review of goals, objectives and policies
Focus the organization on strategic areas
Provide feedback to organization and staff
Performance-based evaluation is an assessment, as systematic and objective as
possible, of a planned, ongoing, or competed intervention. The aim of
evaluation is to determine the relevance of objectives, economy (minimising
cost of obtaining resources), efficiency (using resources efficiently),
effectiveness (achieving the desired socio-economic impacts), and sustainability
so as to incorporate lessons learnt into the decision-making process.
Performance-based review involves periodic review to identify broad trends and
assess the likelihood of outcomes being achieved – whether the programmers or
projects are ―on track‖. It aims at effecting correction mechanisms to ensure that
programmes or projects do not deviate from the central goals and objectives for
which they were created.
The performance management cycle involves policy-making, planning and budgeting
leading to programme implementation followed by assessment and feedback and
then going to the policy-making.

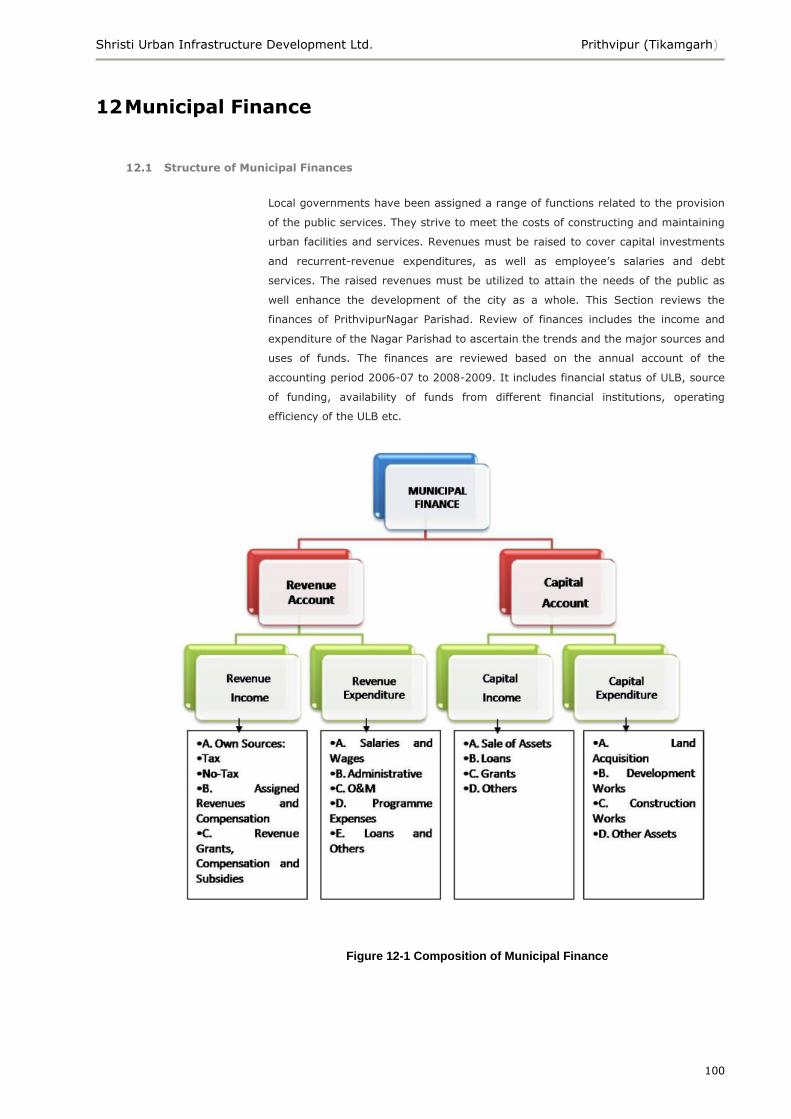
Shristi Urban Infrastructure Development Ltd. Prithvipur (Tikamgarh)
100
12 Municipal Finance
12.1 Structure of Municipal Finances
Local governments have been assigned a range of functions related to the provision
of the public services. They strive to meet the costs of constructing and maintaining
urban facilities and services. Revenues must be raised to cover capital investments
and recurrent-revenue expenditures, as well as employee‘s salaries and debt
services. The raised revenues must be utilized to attain the needs of the public as
well enhance the development of the city as a whole. This Section reviews the
finances of PrithvipurNagar Parishad. Review of finances includes the income and
expenditure of the Nagar Parishad to ascertain the trends and the major sources and
uses of funds. The finances are reviewed based on the annual account of the
accounting period 2006-07 to 2008-2009. It includes financial status of ULB, source
of funding, availability of funds from different financial institutions, operating
efficiency of the ULB etc.
Figure 12-1 Composition of Municipal Finance
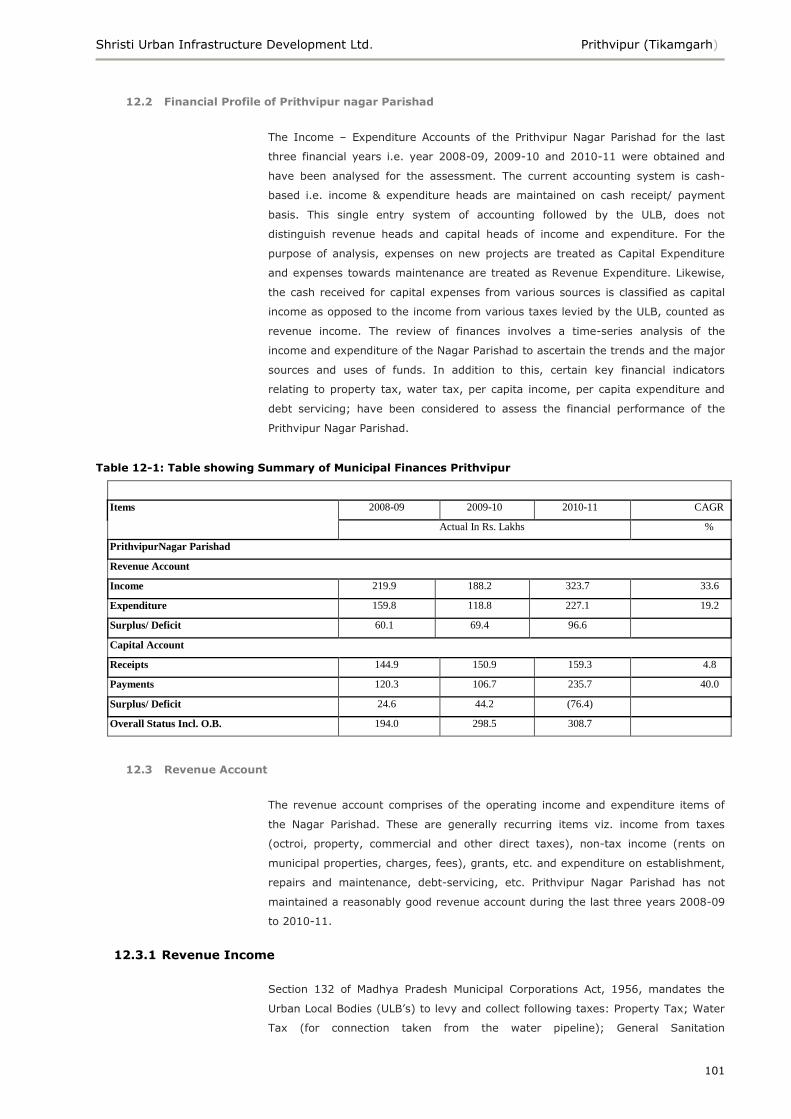
Shristi Urban Infrastructure Development Ltd. Prithvipur (Tikamgarh)
101
12.2 Financial Profile of Prithvipur nagar Parishad
The Income – Expenditure Accounts of the Prithvipur Nagar Parishad for the last
three financial years i.e. year 2008-09, 2009-10 and 2010-11 were obtained and
have been analysed for the assessment. The current accounting system is cash-
based i.e. income & expenditure heads are maintained on cash receipt/ payment
basis. This single entry system of accounting followed by the ULB, does not
distinguish revenue heads and capital heads of income and expenditure. For the
purpose of analysis, expenses on new projects are treated as Capital Expenditure
and expenses towards maintenance are treated as Revenue Expenditure. Likewise,
the cash received for capital expenses from various sources is classified as capital
income as opposed to the income from various taxes levied by the ULB, counted as
revenue income. The review of finances involves a time-series analysis of the
income and expenditure of the Nagar Parishad to ascertain the trends and the major
sources and uses of funds. In addition to this, certain key financial indicators
relating to property tax, water tax, per capita income, per capita expenditure and
debt servicing; have been considered to assess the financial performance of the
Prithvipur Nagar Parishad.
Table 12-1: Table showing Summary of Municipal Finances Prithvipur
Financial Status At A Glance
Items 2008-09 2009-10 2010-11 CAGR
Actual In Rs. Lakhs %
PrithvipurNagar Parishad
Revenue Account
Income 219.9 188.2 323.7 33.6
Expenditure 159.8 118.8 227.1 19.2
Surplus/ Deficit 60.1 69.4 96.6
Capital Account
Receipts 144.9 150.9 159.3 4.8
Payments 120.3 106.7 235.7 40.0
Surplus/ Deficit 24.6 44.2 (76.4)
Overall Status Incl. O.B. 194.0 298.5 308.7
12.3 Revenue Account
The revenue account comprises of the operating income and expenditure items of
the Nagar Parishad. These are generally recurring items viz. income from taxes
(octroi, property, commercial and other direct taxes), non-tax income (rents on
municipal properties, charges, fees), grants, etc. and expenditure on establishment,
repairs and maintenance, debt-servicing, etc. Prithvipur Nagar Parishad has not
maintained a reasonably good revenue account during the last three years 2008-09
to 2010-11.
12.3.1 Revenue Income
Section 132 of Madhya Pradesh Municipal Corporations Act, 1956, mandates the
Urban Local Bodies (ULB‘s) to levy and collect following taxes: Property Tax; Water
Tax (for connection taken from the water pipeline); General Sanitation
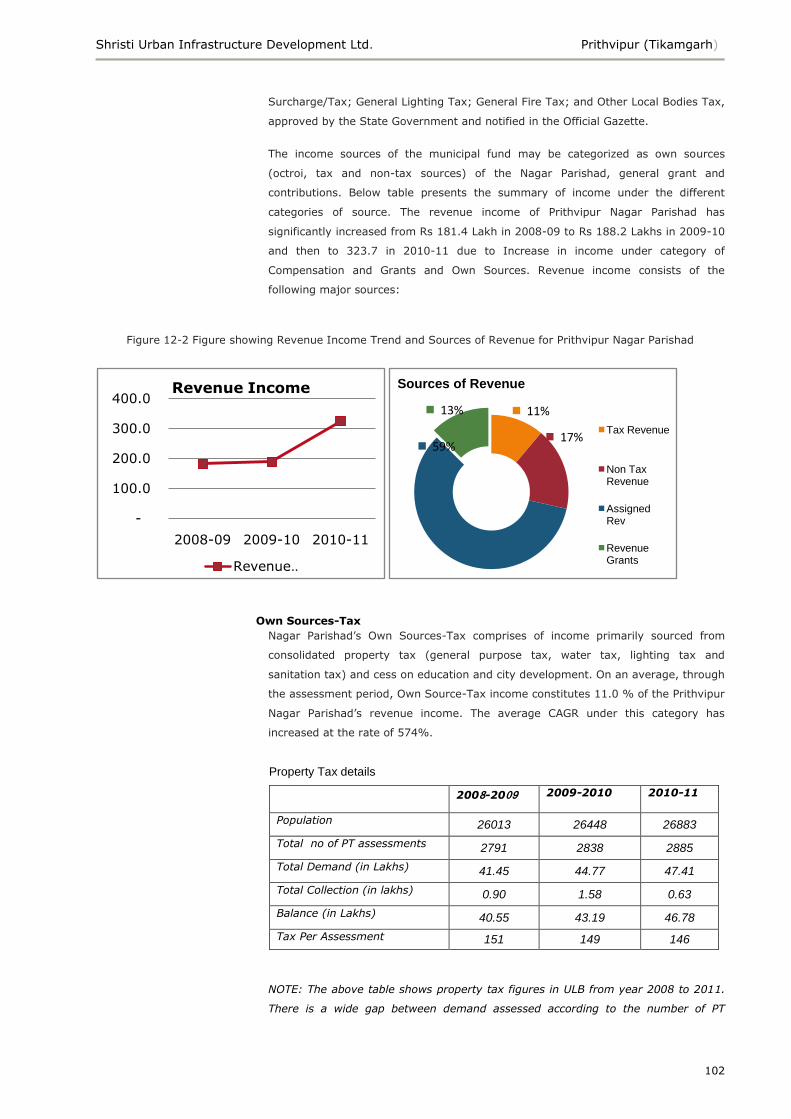
Shristi Urban Infrastructure Development Ltd. Prithvipur (Tikamgarh)
102
Surcharge/Tax; General Lighting Tax; General Fire Tax; and Other Local Bodies Tax,
approved by the State Government and notified in the Official Gazette.
The income sources of the municipal fund may be categorized as own sources
(octroi, tax and non-tax sources) of the Nagar Parishad, general grant and
contributions. Below table presents the summary of income under the different
categories of source. The revenue income of Prithvipur Nagar Parishad has
significantly increased from Rs 181.4 Lakh in 2008-09 to Rs 188.2 Lakhs in 2009-10
and then to 323.7 in 2010-11 due to Increase in income under category of
Compensation and Grants and Own Sources. Revenue income consists of the
following major sources:
Figure 12-2 Figure showing Revenue Income Trend and Sources of Revenue for Prithvipur Nagar Parishad
Own Sources-Tax
Nagar Parishad‘s Own Sources-Tax comprises of income primarily sourced from
consolidated property tax (general purpose tax, water tax, lighting tax and
sanitation tax) and cess on education and city development. On an average, through
the assessment period, Own Source-Tax income constitutes 11.0 % of the Prithvipur
Nagar Parishad‘s revenue income. The average CAGR under this category has
increased at the rate of 574%.
Property Tax details
2008-2009 2009-2010 2010-11
Population 26013 26448 26883
Total no of PT assessments 2791 2838 2885
Total Demand (in Lakhs) 41.45 44.77 47.41
Total Collection (in lakhs) 0.90 1.58 0.63
Balance (in Lakhs) 40.55 43.19 46.78
Tax Per Assessment 151 149 146
NOTE: The above table shows property tax figures in ULB from year 2008 to 2011.
There is a wide gap between demand assessed according to the number of PT
-
100.0
200.0
300.0
400.0
2008-09 2009-10 2010-11
Revenue Income
Revenue …
11%
17%59%
13%
Sources of Revenue
Tax Revenue
Non Tax Revenue
Assigned Rev
Revenue Grants
Shristi Urban Infrastructure Development Ltd. Prithvipur (Tikamgarh)
103
assessments and actual amount collected which is due to inefficient collection
mechanism in the town.
There are various discrepancies in property tax amount in detail account sheets and
total collection figure which can be corrected by adapting double counting system
Own Sources- Non Tax
This category comprises of income from municipal properties, fees on municipal
services (building permission, etc.), user charges (water and sewerage tariffs) and
income from special services (educational and medical). On an average, through the
assessment period, Own Source-Non tax income constitutes 17 % of the total
revenue income. The CAGR for income through non-tax (own sources) of the
Prithvipur Nagar Parishad has grown at the rate of 51 % over the 3 assessment
years.
Assigned Revenues
This category comprises of income from Government of Madhya Pradesh
(GoMP)/State transfers of municipal income collected by the state line department.
The income items include surcharge on stamp duty, octroi compensation, motor
vehicle tax, and other transfers. Octroi was levied on the goods entering within the
municipal limits for use, consumption or sale. But octroi has been removed now and
whatsoever is received is in the form of arrears In order to compensate for the loss
of the removal of octroi, the State government has made an assessment of octroi
compensation to be sanctioned to the urban civic bodies on the basis of 2001 census
and instituted a grant with an annual growth of 59 %. Assigned revenue constitutes
about 55.0 % of the Nagar Parishad‘s total revenue income of which only octroi
compensation is 80-85% and has declined at a CAGR of about 5 % over the
assessment period.
Revenue Grants and Contribution
This category comprises of SFC grants, special establishment grants and other
special grants that the State Government may transfer from time-to- time to the
Nagar Parishad. In case of Prithvipur, Grant component accounts for an average of
about 13 % of the total revenue income over the assessment period. Income under
this head has declined at a CAGR of about (10) % over the assessment period.
Table 12-2: Table showing Revenue Income from various sources for Prithvipur Nagar Parishad
Revenue Income
A Own Sources 2008-09 2009-10 2010-11
Tax Revenue
1 Property Tax 0.9 1.7 43.2
2 Integrated tax 1.2 2.3 50.2
3 Export Tax - 0.9 1.0
4 Other Taxes - 0.2 0.8
Sub-Total (Tax Revenue) 2.1 5.6 95.7
Non- Tax Revenue
1 Rental Income 2.1 2.3 28.3
2 Water Charges 2.5 3.0 8.0
3 License Fees 9.2 11.9 11.0
4 Development Charges - - -
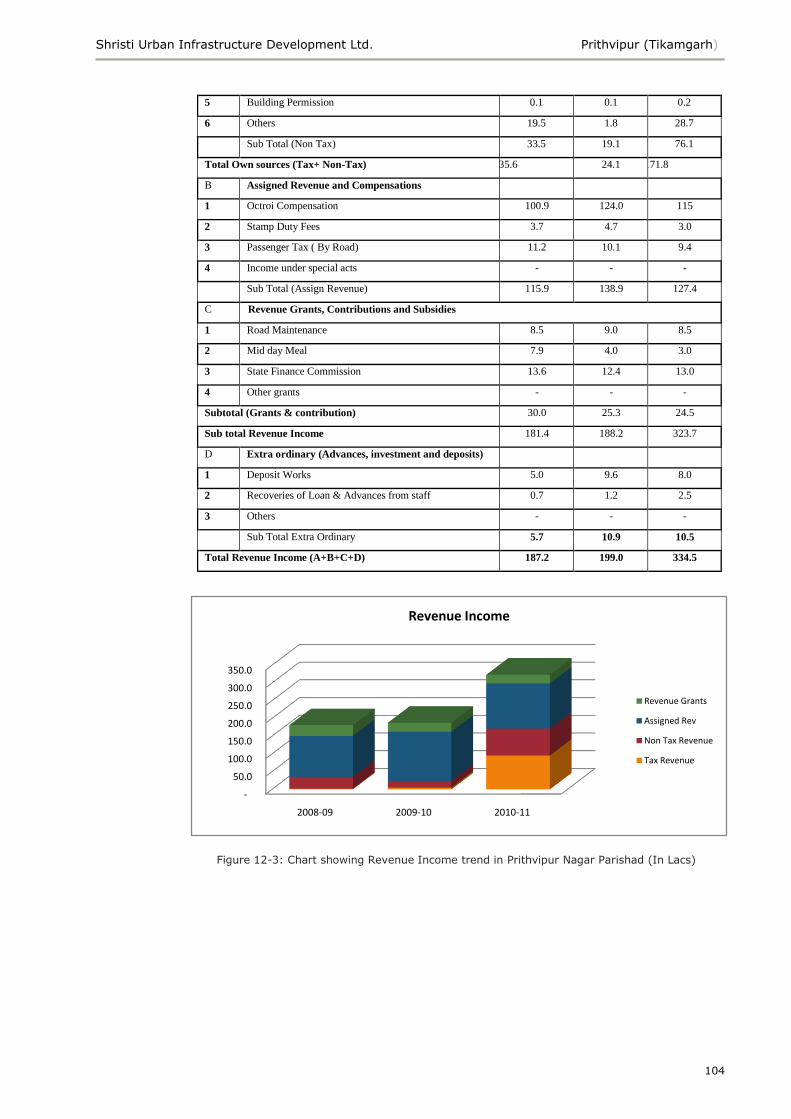
Shristi Urban Infrastructure Development Ltd. Prithvipur (Tikamgarh)
104
5 Building Permission 0.1 0.1 0.2
6 Others 19.5 1.8 28.7
Sub Total (Non Tax) 33.5 19.1 76.1
Total Own sources (Tax+ Non-Tax) 35.6 24.1 171.8
B Assigned Revenue and Compensations
1 Octroi Compensation 100.9 124.0 115
2 Stamp Duty Fees 3.7 4.7 3.0
3 Passenger Tax ( By Road) 11.2 10.1 9.4
4 Income under special acts - - -
Sub Total (Assign Revenue) 115.9 138.9 127.4
C Revenue Grants, Contributions and Subsidies
1 Road Maintenance 8.5 9.0 8.5
2 Mid day Meal 7.9 4.0 3.0
3 State Finance Commission 13.6 12.4 13.0
4 Other grants - - -
Subtotal (Grants & contribution) 30.0 25.3 24.5
Sub total Revenue Income 181.4 188.2 323.7
D Extra ordinary (Advances, investment and deposits)
1 Deposit Works 5.0 9.6 8.0
2 Recoveries of Loan & Advances from staff 0.7 1.2 2.5
3 Others - - -
Sub Total Extra Ordinary 5.7 10.9 10.5
Total Revenue Income (A+B+C+D) 187.2 199.0 334.5
Figure 12-3: Chart showing Revenue Income trend in Prithvipur Nagar Parishad (In Lacs)
-
50.0
100.0
150.0
200.0
250.0
300.0
350.0
2008-09 2009-10 2010-11
Revenue Income
Revenue Grants
Assigned Rev
Non Tax Revenue
Tax Revenue
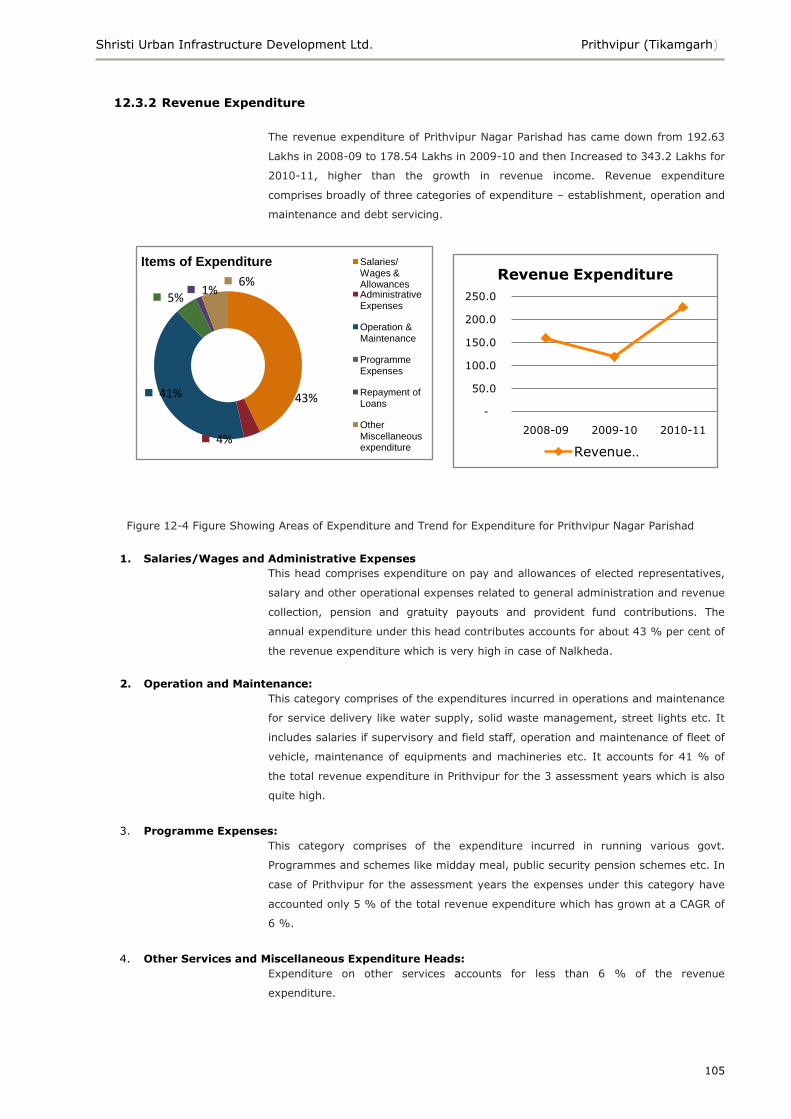
Shristi Urban Infrastructure Development Ltd. Prithvipur (Tikamgarh)
105
12.3.2 Revenue Expenditure
The revenue expenditure of Prithvipur Nagar Parishad has came down from 192.63
Lakhs in 2008-09 to 178.54 Lakhs in 2009-10 and then Increased to 343.2 Lakhs for
2010-11, higher than the growth in revenue income. Revenue expenditure
comprises broadly of three categories of expenditure – establishment, operation and
maintenance and debt servicing.
Figure 12-4 Figure Showing Areas of Expenditure and Trend for Expenditure for Prithvipur Nagar Parishad
1. Salaries/Wages and Administrative Expenses
This head comprises expenditure on pay and allowances of elected representatives,
salary and other operational expenses related to general administration and revenue
collection, pension and gratuity payouts and provident fund contributions. The
annual expenditure under this head contributes accounts for about 43 % per cent of
the revenue expenditure which is very high in case of Nalkheda.
2. Operation and Maintenance:
This category comprises of the expenditures incurred in operations and maintenance
for service delivery like water supply, solid waste management, street lights etc. It
includes salaries if supervisory and field staff, operation and maintenance of fleet of
vehicle, maintenance of equipments and machineries etc. It accounts for 41 % of
the total revenue expenditure in Prithvipur for the 3 assessment years which is also
quite high.
3. Programme Expenses:
This category comprises of the expenditure incurred in running various govt.
Programmes and schemes like midday meal, public security pension schemes etc. In
case of Prithvipur for the assessment years the expenses under this category have
accounted only 5 % of the total revenue expenditure which has grown at a CAGR of
6 %.
4. Other Services and Miscellaneous Expenditure Heads:
Expenditure on other services accounts for less than 6 % of the revenue
expenditure.
43%
4%
41%
5%1%
6%
Items of Expenditure Salaries/ Wages & AllowancesAdministrative Expenses
Operation & Maintenance
Programme Expenses
Repayment of Loans
Other Miscellaneous expenditure
-
50.0
100.0
150.0
200.0
250.0
2008-09 2009-10 2010-11
Revenue Expenditure
Revenue …
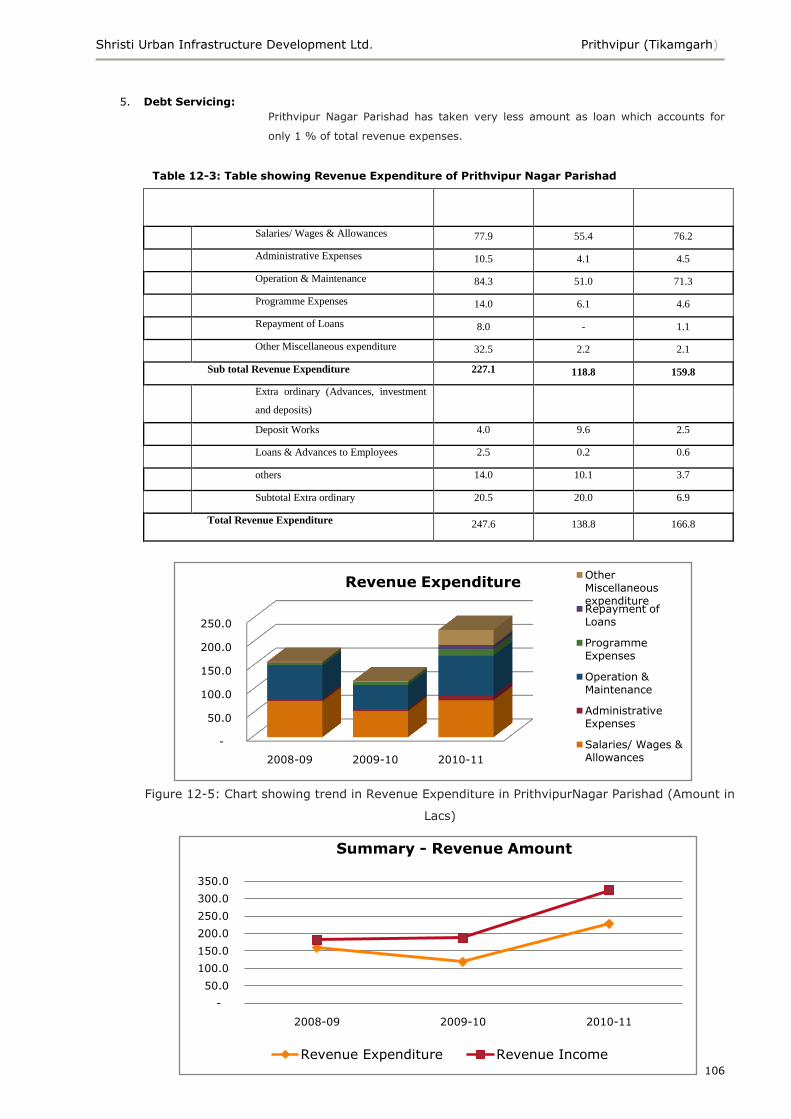
Shristi Urban Infrastructure Development Ltd. Prithvipur (Tikamgarh)
106
Figure 12-5: Chart showing trend in Revenue Expenditure in PrithvipurNagar Parishad (Amount in
Lacs)
5. Debt Servicing:
Prithvipur Nagar Parishad has taken very less amount as loan which accounts for
only 1 % of total revenue expenses.
Table 12-3: Table showing Revenue Expenditure of Prithvipur Nagar Parishad
Revenue Expenditure 2006-
07
2007-
08
2008-
09
A Salaries/ Wages & Allowances 77.9 55.4 76.2
B Administrative Expenses 10.5 4.1 4.5
C Operation & Maintenance 84.3 51.0 71.3
D Programme Expenses 14.0 6.1 4.6
E Repayment of Loans 8.0 - 1.1
F Other Miscellaneous expenditure 32.5 2.2 2.1
Sub total Revenue Expenditure 227.1 118.8 159.8
G Extra ordinary (Advances, investment
and deposits)
1 Deposit Works 4.0 9.6 2.5
2 Loans & Advances to Employees 2.5 0.2 0.6
4 others 14.0 10.1 3.7
Subtotal Extra ordinary 20.5 20.0 6.9
Total Revenue Expenditure 247.6 138.8 166.8
-
50.0
100.0
150.0
200.0
250.0
300.0
350.0
2008-09 2009-10 2010-11
Summary - Revenue Amount
Revenue Expenditure Revenue Income
-
50.0
100.0
150.0
200.0
250.0
2008-09 2009-10 2010-11
Revenue ExpenditureOther Miscellaneous expenditureRepayment of Loans
Programme Expenses
Operation & Maintenance
Administrative Expenses
Salaries/ Wages & Allowances
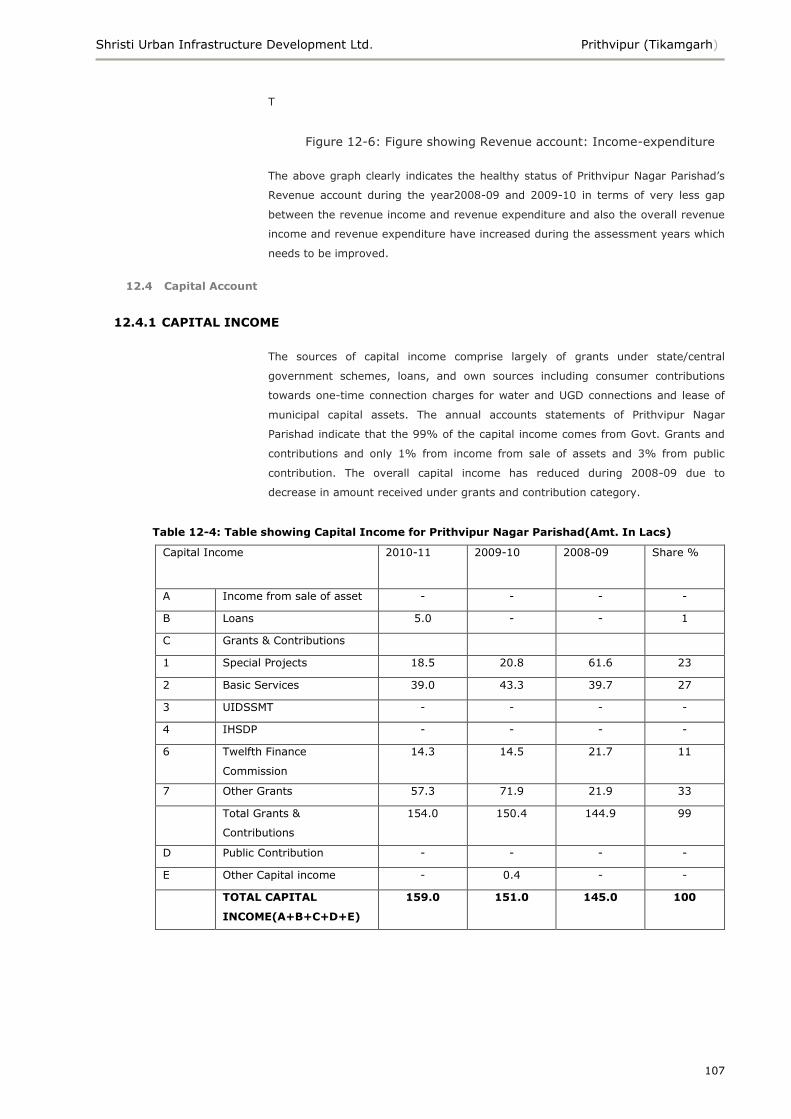
Shristi Urban Infrastructure Development Ltd. Prithvipur (Tikamgarh)
107
T
The above graph clearly indicates the healthy status of Prithvipur Nagar Parishad‘s
Revenue account during the year2008-09 and 2009-10 in terms of very less gap
between the revenue income and revenue expenditure and also the overall revenue
income and revenue expenditure have increased during the assessment years which
needs to be improved.
12.4 Capital Account
12.4.1 CAPITAL INCOME
The sources of capital income comprise largely of grants under state/central
government schemes, loans, and own sources including consumer contributions
towards one-time connection charges for water and UGD connections and lease of
municipal capital assets. The annual accounts statements of Prithvipur Nagar
Parishad indicate that the 99% of the capital income comes from Govt. Grants and
contributions and only 1% from income from sale of assets and 3% from public
contribution. The overall capital income has reduced during 2008-09 due to
decrease in amount received under grants and contribution category.
Table 12-4: Table showing Capital Income for Prithvipur Nagar Parishad(Amt. In Lacs)
Capital Income 2010-11 2009-10 2008-09 Share %
A Income from sale of asset - - - -
B Loans 5.0 - - 1
C Grants & Contributions
1 Special Projects 18.5 20.8 61.6 23
2 Basic Services 39.0 43.3 39.7 27
3 UIDSSMT - - - -
4 IHSDP - - - -
6 Twelfth Finance
Commission
14.3 14.5 21.7 11
7 Other Grants 57.3 71.9 21.9 33
Total Grants &
Contributions
154.0 150.4 144.9 99
D Public Contribution - - - -
E Other Capital income - 0.4 - -
TOTAL CAPITAL
INCOME(A+B+C+D+E)
159.0 151.0 145.0 100
Figure 12-6: Figure showing Revenue account: Income-expenditure
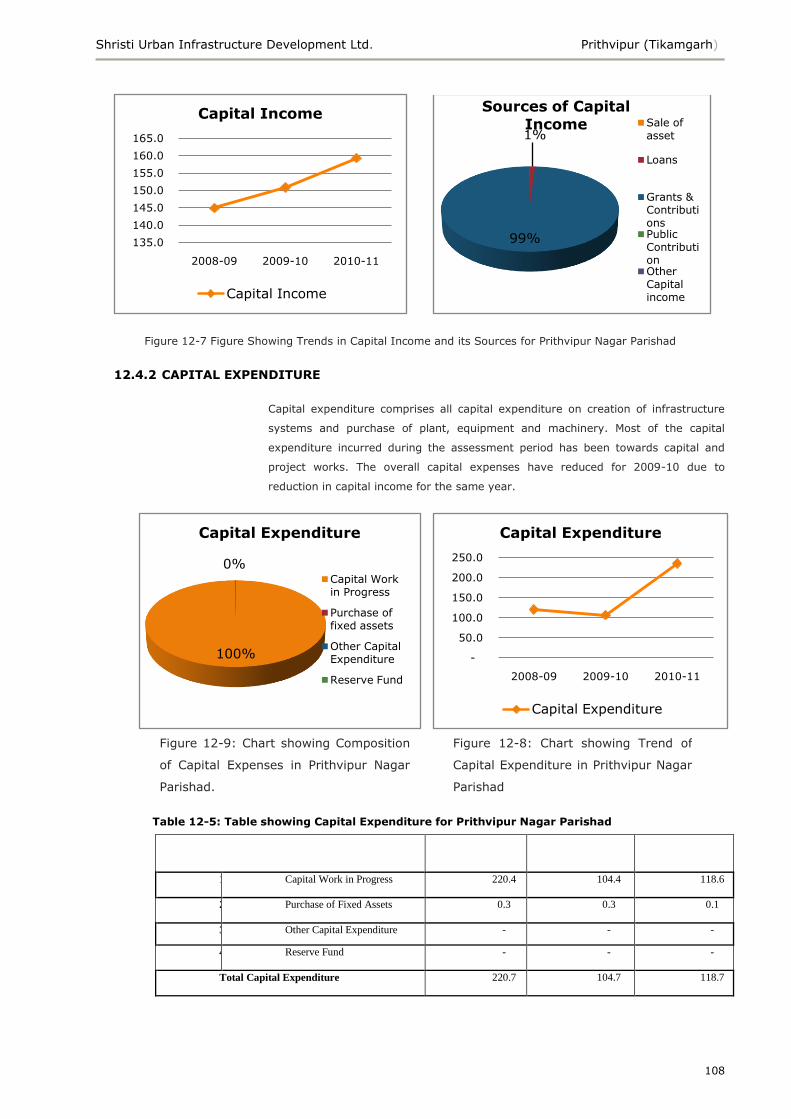
Shristi Urban Infrastructure Development Ltd. Prithvipur (Tikamgarh)
108
Figure 12-7 Figure Showing Trends in Capital Income and its Sources for Prithvipur Nagar Parishad
12.4.2 CAPITAL EXPENDITURE
Capital expenditure comprises all capital expenditure on creation of infrastructure
systems and purchase of plant, equipment and machinery. Most of the capital
expenditure incurred during the assessment period has been towards capital and
project works. The overall capital expenses have reduced for 2009-10 due to
reduction in capital income for the same year.
Table 12-5: Table showing Capital Expenditure for Prithvipur Nagar Parishad
Capital Expenditure 2006-
07
2007-08 2008-
09
1 Capital Work in Progress 220.4 104.4 118.6
2 Purchase of Fixed Assets 0.3 0.3 0.1
3 Other Capital Expenditure - - -
4 Reserve Fund - - -
Total Capital Expenditure 220.7 104.7 118.7
1%
99%
Sources of Capital
Income Sale of asset
Loans
Grants & ContributionsPublic ContributionOther Capital income
Figure 12-8: Chart showing Trend of
Capital Expenditure in Prithvipur Nagar
Parishad
Figure 12-9: Chart showing Composition
of Capital Expenses in Prithvipur Nagar
Parishad.
135.0
140.0
145.0
150.0
155.0
160.0
165.0
2008-09 2009-10 2010-11
Capital Income
Capital Income
-
50.0
100.0
150.0
200.0
250.0
2008-09 2009-10 2010-11
Capital Expenditure
Capital Expenditure
100%
0%
Capital Expenditure
Capital Work in Progress
Purchase of fixed assets
Other Capital Expenditure
Reserve Fund
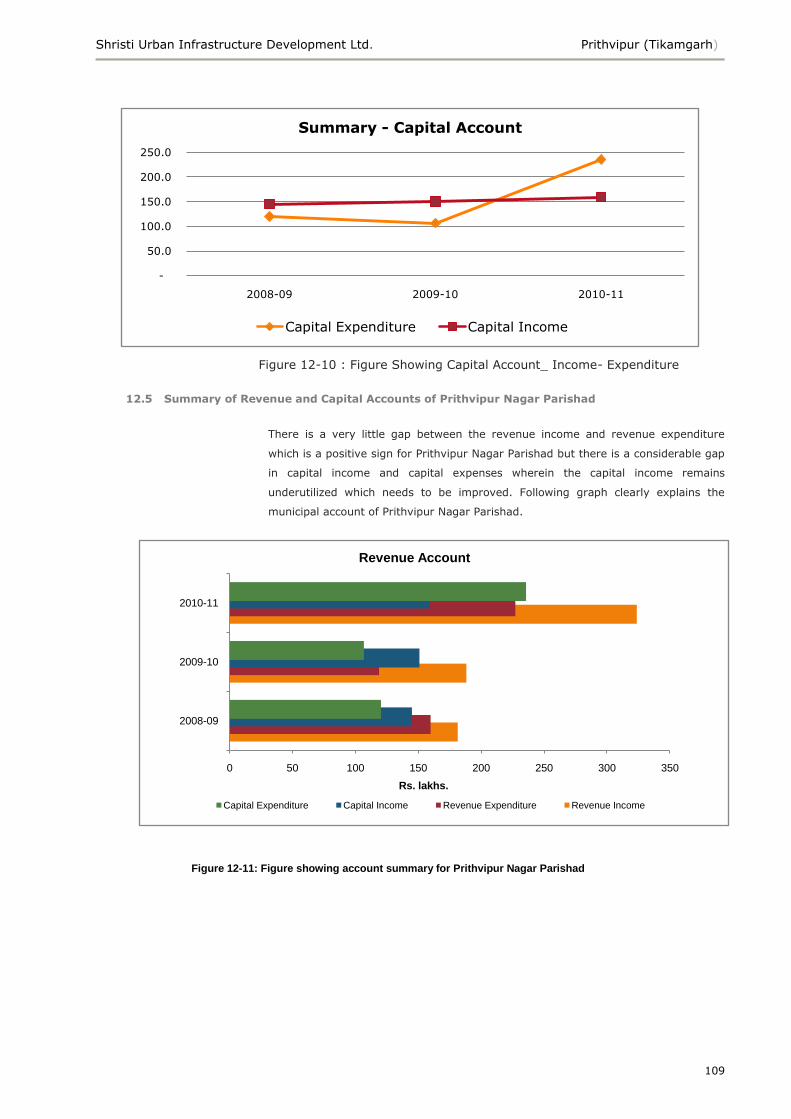
Shristi Urban Infrastructure Development Ltd. Prithvipur (Tikamgarh)
109
Figure 12-10 : Figure Showing Capital Account_ Income- Expenditure
12.5 Summary of Revenue and Capital Accounts of Prithvipur Nagar Parishad
There is a very little gap between the revenue income and revenue expenditure
which is a positive sign for Prithvipur Nagar Parishad but there is a considerable gap
in capital income and capital expenses wherein the capital income remains
underutilized which needs to be improved. Following graph clearly explains the
municipal account of Prithvipur Nagar Parishad.
-
50.0
100.0
150.0
200.0
250.0
2008-09 2009-10 2010-11
Summary - Capital Account
Capital Expenditure Capital Income
Figure 12-11: Figure showing account summary for Prithvipur Nagar Parishad
0 50 100 150 200 250 300 350
2008-09
2009-10
2010-11
Rs. lakhs.
Revenue Account
Capital Expenditure Capital Income Revenue Expenditure Revenue Income
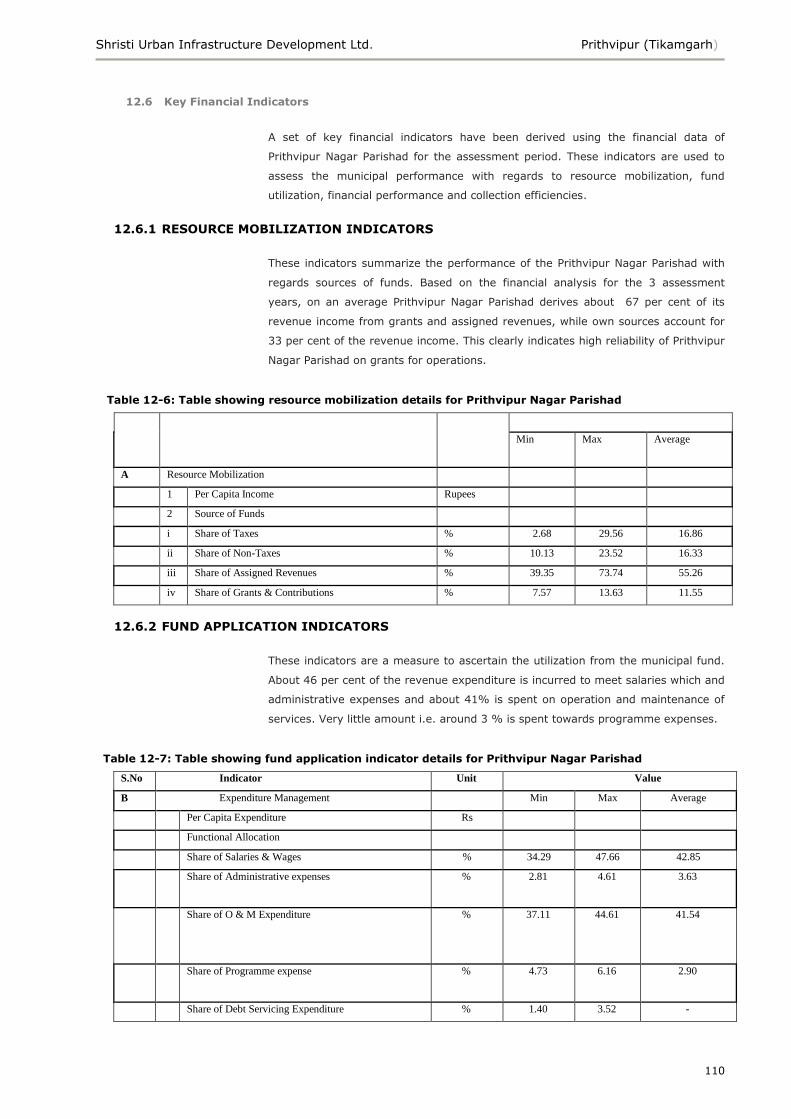
Shristi Urban Infrastructure Development Ltd. Prithvipur (Tikamgarh)
110
12.6 Key Financial Indicators
A set of key financial indicators have been derived using the financial data of
Prithvipur Nagar Parishad for the assessment period. These indicators are used to
assess the municipal performance with regards to resource mobilization, fund
utilization, financial performance and collection efficiencies.
12.6.1 RESOURCE MOBILIZATION INDICATORS
These indicators summarize the performance of the Prithvipur Nagar Parishad with
regards sources of funds. Based on the financial analysis for the 3 assessment
years, on an average Prithvipur Nagar Parishad derives about 67 per cent of its
revenue income from grants and assigned revenues, while own sources account for
33 per cent of the revenue income. This clearly indicates high reliability of Prithvipur
Nagar Parishad on grants for operations.
Table 12-6: Table showing resource mobilization details for Prithvipur Nagar Parishad
S. No INDICATOR Unit Value
Min Max Average
A Resource Mobilization
1 Per Capita Income Rupees
2 Source of Funds
i Share of Taxes % 2.68 29.56 16.86
ii Share of Non-Taxes % 10.13 23.52 16.33
iii Share of Assigned Revenues % 39.35 73.74 55.26
iv Share of Grants & Contributions % 7.57 13.63 11.55
12.6.2 FUND APPLICATION INDICATORS
These indicators are a measure to ascertain the utilization from the municipal fund.
About 46 per cent of the revenue expenditure is incurred to meet salaries which and
administrative expenses and about 41% is spent on operation and maintenance of
services. Very little amount i.e. around 3 % is spent towards programme expenses.
Table 12-7: Table showing fund application indicator details for Prithvipur Nagar Parishad
S.No Indicator Unit Value
B Expenditure Management Min Max Average
1 Per Capita Expenditure Rs
2 Functional Allocation
i Share of Salaries & Wages % 34.29 47.66 42.85
i
i
Share of Administrative expenses % 2.81 4.61 3.63
i
i
i
Share of O & M Expenditure % 37.11 44.61 41.54
i
v
Share of Programme expense % 4.73 6.16 2.90
v Share of Debt Servicing Expenditure % 1.40 3.52 -
Shristi Urban Infrastructure Development Ltd. Prithvipur (Tikamgarh)
111
12.6.3 OVERALL FINANCIAL PERFORMANCE INDICATORS
These indicators are a measure to assess the overall financial performance of the
Nagar Parishad with regards operational performance and effective growth in
revenue income and expenditure. The average operating ratio during the
assessment period was a healthy 0.69 and the capital utilization ratio was 0.97
indicating that the capital is underutilized. The overall summary of revenue and
capital account for Prithvipur Nagar Parishad shows an average surplus of Rs 313.5
Lakhs only which is a very small amount.
Table 12-8: Table showing overall financial performance indicator for Prithvipur Nagar
Parishad
Performance 2010-11 2009-10 2008-09 Average
Operating Ratio 0.70 0.63 0.73 0.69
Capital Utilisation Ratio 1.39 0.69 0.72 0.97
Overall status of incl. O.B. 365.8 340.6 234.1 313.5
12.6.4 EFFICIENCY INDICATORS
These indicators are essentially measured to assess municipal efficiency with
regards revenue base coverage and realization. The collection performance for
property tax in Prithvipur is around 1-2% for the assessment period which needs to
be increased which in turn will be reflected in increased tax collection.
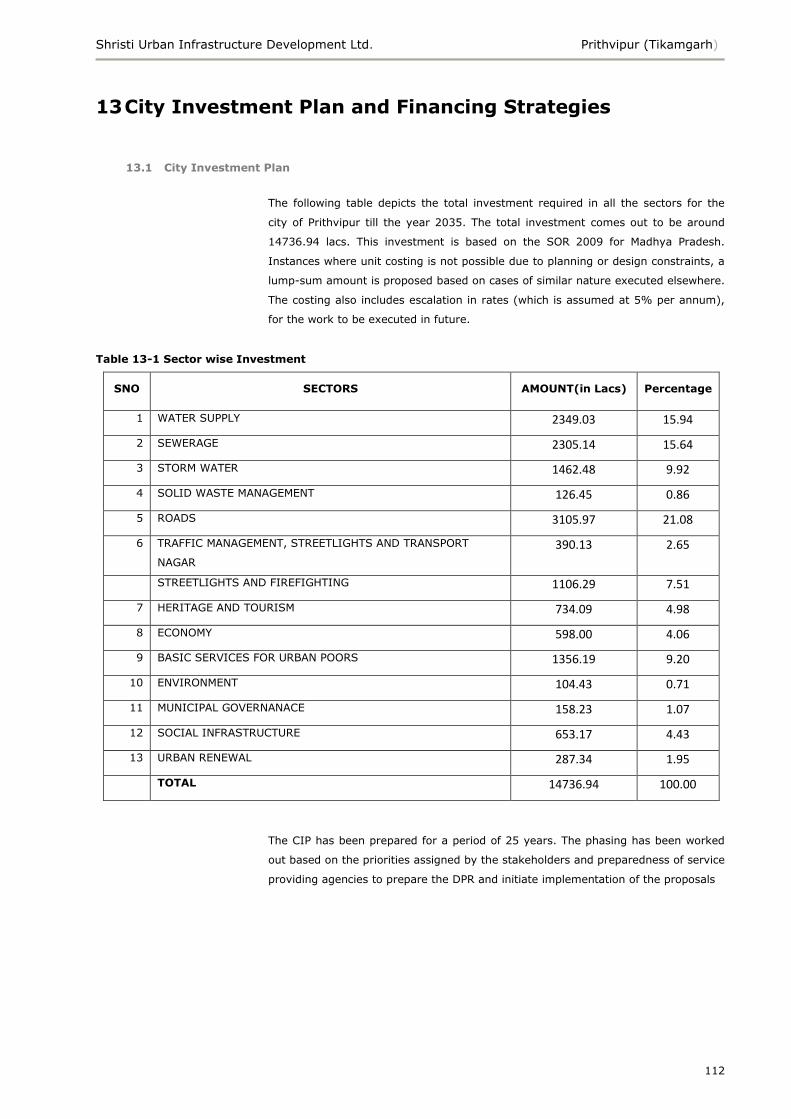
Shristi Urban Infrastructure Development Ltd. Prithvipur (Tikamgarh)
112
13 City Investment Plan and Financing Strategies
13.1 City Investment Plan
The following table depicts the total investment required in all the sectors for the
city of Prithvipur till the year 2035. The total investment comes out to be around
14736.94 lacs. This investment is based on the SOR 2009 for Madhya Pradesh.
Instances where unit costing is not possible due to planning or design constraints, a
lump-sum amount is proposed based on cases of similar nature executed elsewhere.
The costing also includes escalation in rates (which is assumed at 5% per annum),
for the work to be executed in future.
Table 13-1 Sector wise Investment
SNO SECTORS AMOUNT(in Lacs) Percentage
1 WATER SUPPLY 2349.03 15.94
2 SEWERAGE 2305.14 15.64
3 STORM WATER 1462.48 9.92
4 SOLID WASTE MANAGEMENT 126.45 0.86
5 ROADS 3105.97 21.08
6 TRAFFIC MANAGEMENT, STREETLIGHTS AND TRANSPORT
NAGAR
390.13 2.65
STREETLIGHTS AND FIREFIGHTING 1106.29 7.51
7 HERITAGE AND TOURISM 734.09 4.98
8 ECONOMY 598.00 4.06
9 BASIC SERVICES FOR URBAN POORS 1356.19 9.20
10 ENVIRONMENT 104.43 0.71
11 MUNICIPAL GOVERNANACE 158.23 1.07
12 SOCIAL INFRASTRUCTURE 653.17 4.43
13 URBAN RENEWAL 287.34 1.95
TOTAL 14736.94 100.00
The CIP has been prepared for a period of 25 years. The phasing has been worked
out based on the priorities assigned by the stakeholders and preparedness of service
providing agencies to prepare the DPR and initiate implementation of the proposals
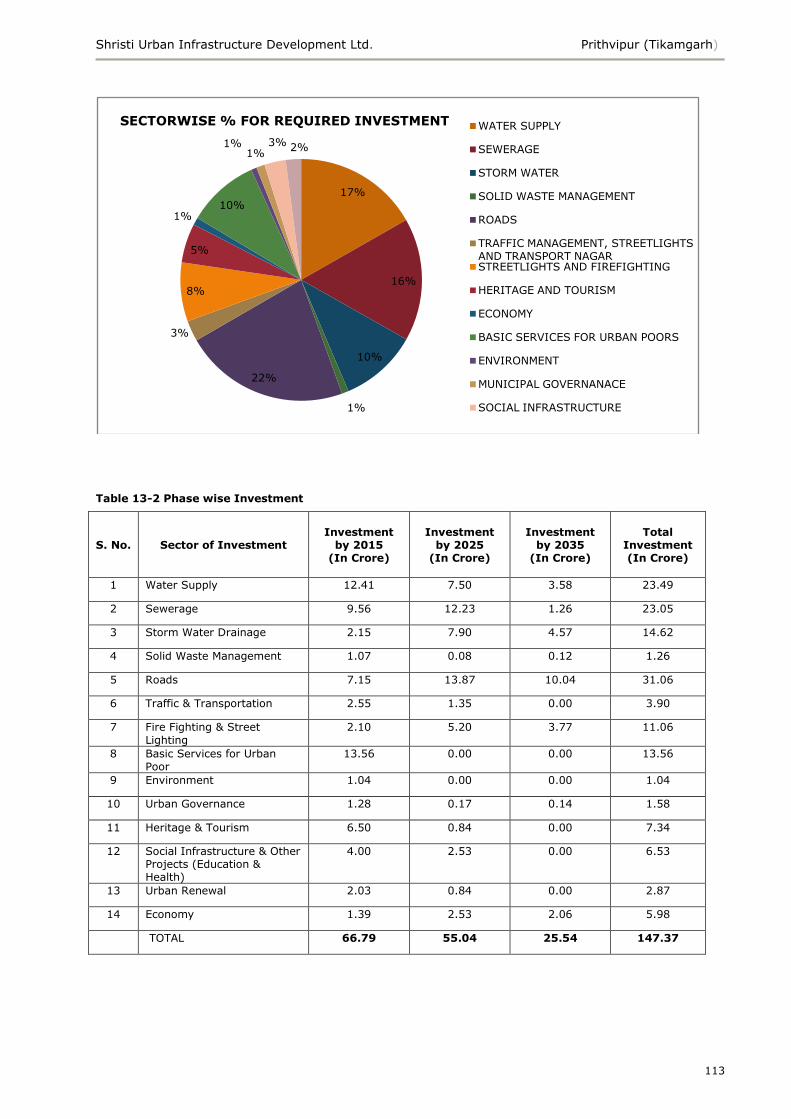
Shristi Urban Infrastructure Development Ltd. Prithvipur (Tikamgarh)
113
Table 13-2 Phase wise Investment
S. No. Sector of Investment Investment
by 2015 (In Crore)
Investment by 2025
(In Crore)
Investment by 2035
(In Crore)
Total Investment (In Crore)
1 Water Supply 12.41 7.50 3.58 23.49
2 Sewerage 9.56 12.23 1.26 23.05
3 Storm Water Drainage 2.15 7.90 4.57 14.62
4 Solid Waste Management 1.07 0.08 0.12 1.26
5 Roads 7.15 13.87 10.04 31.06
6 Traffic & Transportation 2.55 1.35 0.00 3.90
7 Fire Fighting & Street
Lighting
2.10 5.20 3.77 11.06
8 Basic Services for Urban Poor
13.56 0.00 0.00 13.56
9 Environment 1.04 0.00 0.00 1.04
10 Urban Governance 1.28 0.17 0.14 1.58
11 Heritage & Tourism 6.50 0.84 0.00 7.34
12 Social Infrastructure & Other Projects (Education & Health)
4.00 2.53 0.00 6.53
13 Urban Renewal 2.03 0.84 0.00 2.87
14 Economy 1.39 2.53 2.06 5.98
TOTAL 66.79 55.04 25.54 147.37
17%
16%
10%
1%
22%
3%
8%
5%
1%10%
1%1%
3% 2%
SECTORWISE % FOR REQUIRED INVESTMENT WATER SUPPLY
SEWERAGE
STORM WATER
SOLID WASTE MANAGEMENT
ROADS
TRAFFIC MANAGEMENT, STREETLIGHTS AND TRANSPORT NAGARSTREETLIGHTS AND FIREFIGHTING
HERITAGE AND TOURISM
ECONOMY
BASIC SERVICES FOR URBAN POORS
ENVIRONMENT
MUNICIPAL GOVERNANACE
SOCIAL INFRASTRUCTURE
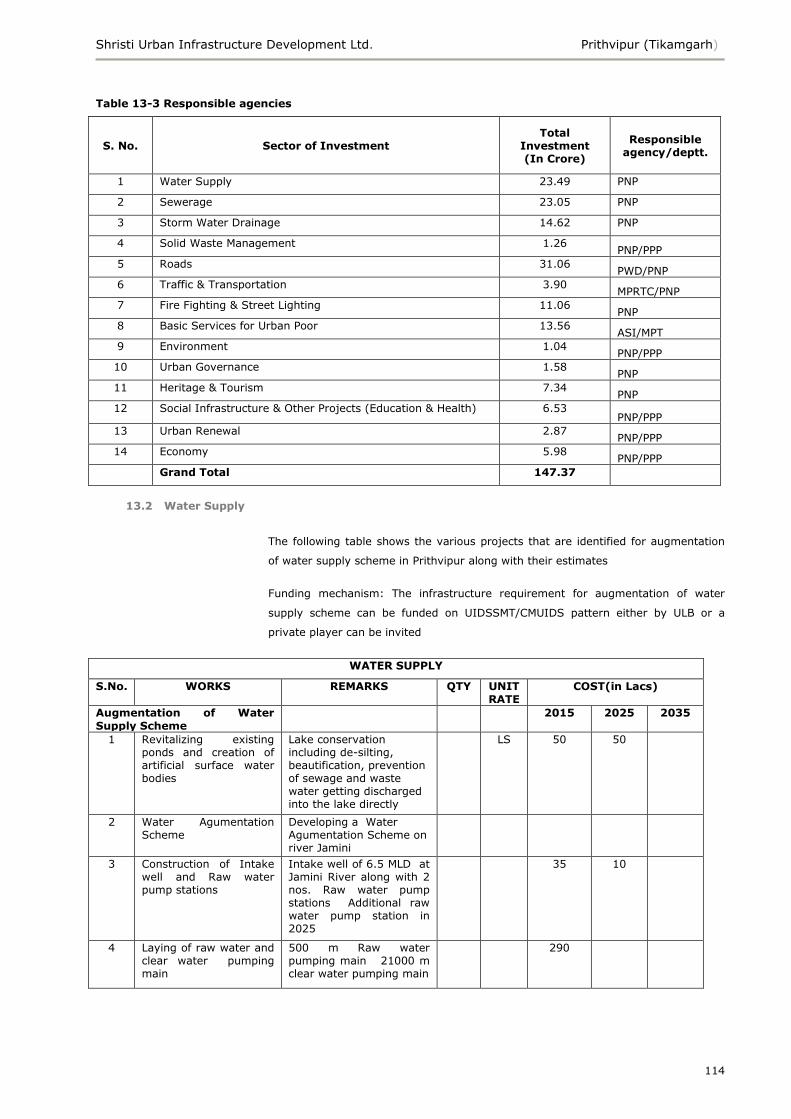
Shristi Urban Infrastructure Development Ltd. Prithvipur (Tikamgarh)
114
Table 13-3 Responsible agencies
S. No. Sector of Investment Total
Investment (In Crore)
Responsible agency/deptt.
1 Water Supply 23.49 PNP
2 Sewerage 23.05 PNP
3 Storm Water Drainage 14.62 PNP
4 Solid Waste Management 1.26 PNP/PPP
5 Roads 31.06 PWD/PNP
6 Traffic & Transportation 3.90 MPRTC/PNP
7 Fire Fighting & Street Lighting 11.06 PNP
8 Basic Services for Urban Poor 13.56 ASI/MPT
9 Environment 1.04 PNP/PPP
10 Urban Governance 1.58 PNP
11 Heritage & Tourism 7.34 PNP
12 Social Infrastructure & Other Projects (Education & Health) 6.53 PNP/PPP
13 Urban Renewal 2.87 PNP/PPP
14 Economy 5.98 PNP/PPP
Grand Total 147.37
13.2 Water Supply
The following table shows the various projects that are identified for augmentation
of water supply scheme in Prithvipur along with their estimates
Funding mechanism: The infrastructure requirement for augmentation of water
supply scheme can be funded on UIDSSMT/CMUIDS pattern either by ULB or a
private player can be invited
WATER SUPPLY
S.No. WORKS REMARKS QTY UNIT RATE
COST(in Lacs)
Augmentation of Water
Supply Scheme
2015 2025 2035
1 Revitalizing existing ponds and creation of artificial surface water bodies
Lake conservation including de-silting, beautification, prevention of sewage and waste water getting discharged into the lake directly
LS 50 50
2 Water Agumentation Scheme
Developing a Water Agumentation Scheme on river Jamini
3 Construction of Intake well and Raw water pump stations
Intake well of 6.5 MLD at Jamini River along with 2 nos. Raw water pump stations Additional raw water pump station in 2025
35 10
4 Laying of raw water and clear water pumping main
500 m Raw water pumping main 21000 m clear water pumping main
290
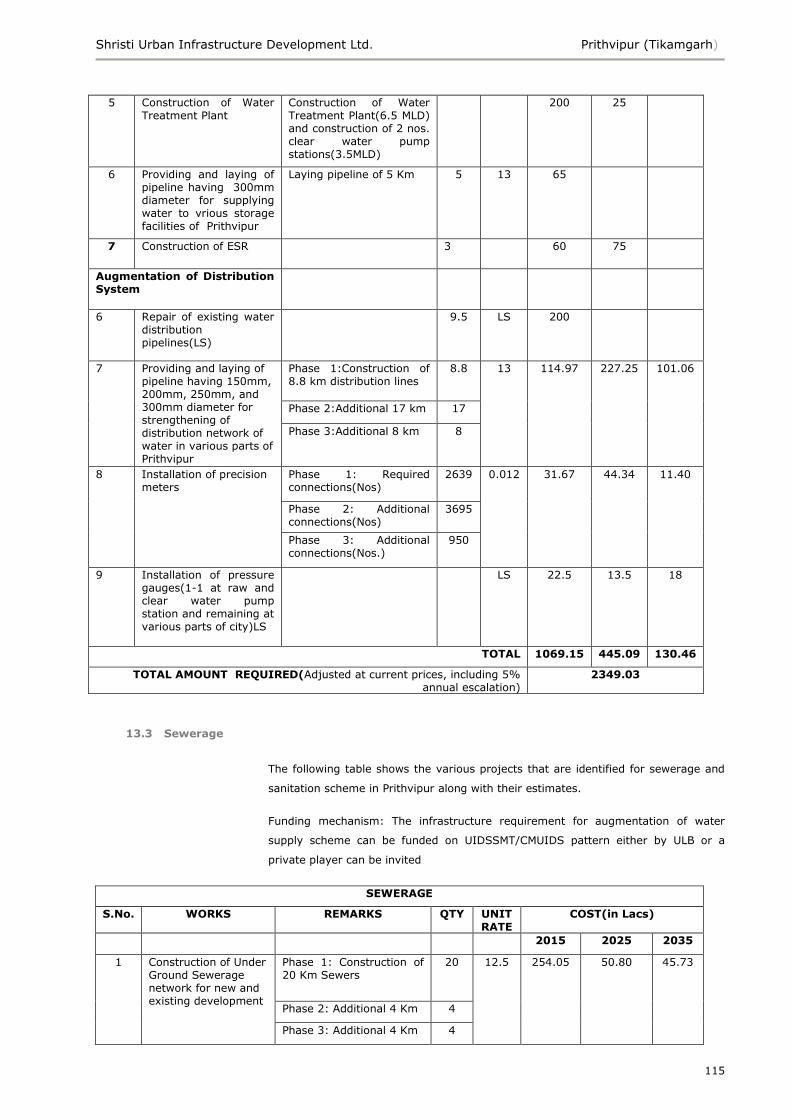
Shristi Urban Infrastructure Development Ltd. Prithvipur (Tikamgarh)
115
5 Construction of Water Treatment Plant
Construction of Water Treatment Plant(6.5 MLD) and construction of 2 nos. clear water pump stations(3.5MLD)
200 25
6 Providing and laying of pipeline having 300mm diameter for supplying water to vrious storage facilities of Prithvipur
Laying pipeline of 5 Km 5 13 65
7 Construction of ESR 3 60 75
Augmentation of Distribution System
6 Repair of existing water distribution pipelines(LS)
9.5 LS 200
7 Providing and laying of pipeline having 150mm, 200mm, 250mm, and 300mm diameter for strengthening of distribution network of water in various parts of Prithvipur
Phase 1:Construction of 8.8 km distribution lines
8.8 13 114.97 227.25 101.06
Phase 2:Additional 17 km 17
Phase 3:Additional 8 km 8
8 Installation of precision meters
Phase 1: Required connections(Nos)
2639 0.012 31.67 44.34 11.40
Phase 2: Additional connections(Nos)
3695
Phase 3: Additional connections(Nos.)
950
9 Installation of pressure gauges(1-1 at raw and clear water pump station and remaining at various parts of city)LS
LS 22.5 13.5 18
TOTAL 1069.15 445.09 130.46
TOTAL AMOUNT REQUIRED(Adjusted at current prices, including 5% annual escalation)
2349.03
13.3 Sewerage
The following table shows the various projects that are identified for sewerage and
sanitation scheme in Prithvipur along with their estimates.
Funding mechanism: The infrastructure requirement for augmentation of water
supply scheme can be funded on UIDSSMT/CMUIDS pattern either by ULB or a
private player can be invited
SEWERAGE
S.No. WORKS REMARKS QTY UNIT RATE
COST(in Lacs)
2015 2025 2035
1 Construction of Under Ground Sewerage network for new and existing development
Phase 1: Construction of 20 Km Sewers
20 12.5 254.05 50.80 45.73
Phase 2: Additional 4 Km 4
Phase 3: Additional 4 Km 4
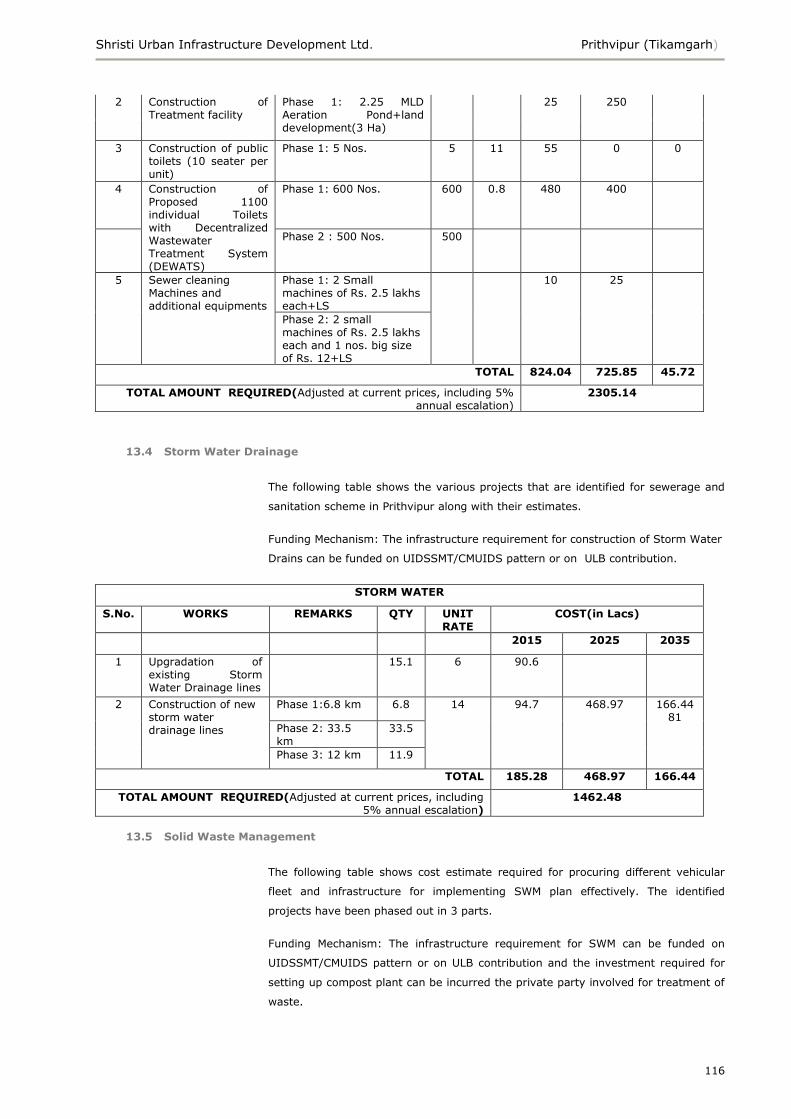
Shristi Urban Infrastructure Development Ltd. Prithvipur (Tikamgarh)
116
2 Construction of Treatment facility
Phase 1: 2.25 MLD Aeration Pond+land development(3 Ha)
25 250
3 Construction of public toilets (10 seater per unit)
Phase 1: 5 Nos. 5 11 55 0 0
4 Construction of Proposed 1100 individual Toilets with Decentralized Wastewater Treatment System (DEWATS)
Phase 1: 600 Nos. 600 0.8 480 400
Phase 2 : 500 Nos. 500
5 Sewer cleaning Machines and additional equipments
Phase 1: 2 Small machines of Rs. 2.5 lakhs each+LS
10 25
Phase 2: 2 small machines of Rs. 2.5 lakhs each and 1 nos. big size of Rs. 12+LS
TOTAL 824.04 725.85 45.72
TOTAL AMOUNT REQUIRED(Adjusted at current prices, including 5% annual escalation)
2305.14
13.4 Storm Water Drainage
The following table shows the various projects that are identified for sewerage and
sanitation scheme in Prithvipur along with their estimates.
Funding Mechanism: The infrastructure requirement for construction of Storm Water
Drains can be funded on UIDSSMT/CMUIDS pattern or on ULB contribution.
STORM WATER
S.No. WORKS REMARKS QTY UNIT RATE
COST(in Lacs)
2015 2025 2035
1 Upgradation of existing Storm Water Drainage lines
15.1 6 90.6
2 Construction of new storm water drainage lines
Phase 1:6.8 km 6.8 14 94.7 468.97 166.4481
Phase 2: 33.5 km
33.5
Phase 3: 12 km 11.9
TOTAL 185.28 468.97 166.44
TOTAL AMOUNT REQUIRED(Adjusted at current prices, including 5% annual escalation)
1462.48
13.5 Solid Waste Management
The following table shows cost estimate required for procuring different vehicular
fleet and infrastructure for implementing SWM plan effectively. The identified
projects have been phased out in 3 parts.
Funding Mechanism: The infrastructure requirement for SWM can be funded on
UIDSSMT/CMUIDS pattern or on ULB contribution and the investment required for
setting up compost plant can be incurred the private party involved for treatment of
waste.
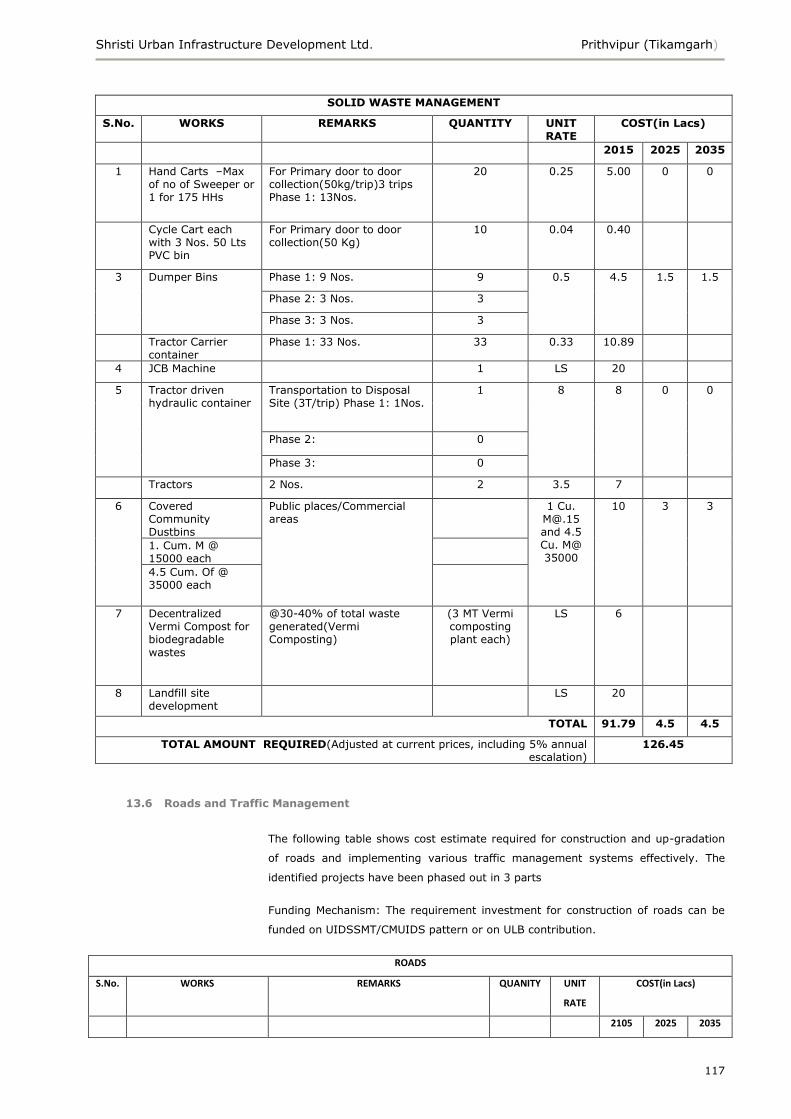
Shristi Urban Infrastructure Development Ltd. Prithvipur (Tikamgarh)
117
SOLID WASTE MANAGEMENT
S.No. WORKS REMARKS QUANTITY UNIT RATE
COST(in Lacs)
2015 2025 2035
1 Hand Carts –Max of no of Sweeper or 1 for 175 HHs
For Primary door to door collection(50kg/trip)3 trips Phase 1: 13Nos.
20 0.25 5.00 0 0
Cycle Cart each with 3 Nos. 50 Lts PVC bin
For Primary door to door collection(50 Kg)
10 0.04 0.40
3 Dumper Bins Phase 1: 9 Nos. 9 0.5 4.5 1.5 1.5
Phase 2: 3 Nos. 3
Phase 3: 3 Nos. 3
Tractor Carrier container
Phase 1: 33 Nos. 33 0.33 10.89
4 JCB Machine
1 LS 20
5 Tractor driven hydraulic container
Transportation to Disposal Site (3T/trip) Phase 1: 1Nos.
1 8 8 0 0
Phase 2: 0
Phase 3: 0
Tractors 2 Nos. 2 3.5 7
6 Covered Community Dustbins
Public places/Commercial areas
1 Cu. [email protected] and 4.5 Cu. M@ 35000
10 3 3
1. Cum. M @ 15000 each
4.5 Cum. Of @ 35000 each
7 Decentralized Vermi Compost for biodegradable
wastes
@30-40% of total waste generated(Vermi Composting)
(3 MT Vermi composting plant each)
LS 6
8 Landfill site development
LS 20
TOTAL 91.79 4.5 4.5
TOTAL AMOUNT REQUIRED(Adjusted at current prices, including 5% annual escalation)
126.45
13.6 Roads and Traffic Management
The following table shows cost estimate required for construction and up-gradation
of roads and implementing various traffic management systems effectively. The
identified projects have been phased out in 3 parts
Funding Mechanism: The requirement investment for construction of roads can be
funded on UIDSSMT/CMUIDS pattern or on ULB contribution.
ROADS
S.No. WORKS REMARKS QUANITY UNIT
RATE
COST(in Lacs)
2105 2025 2035
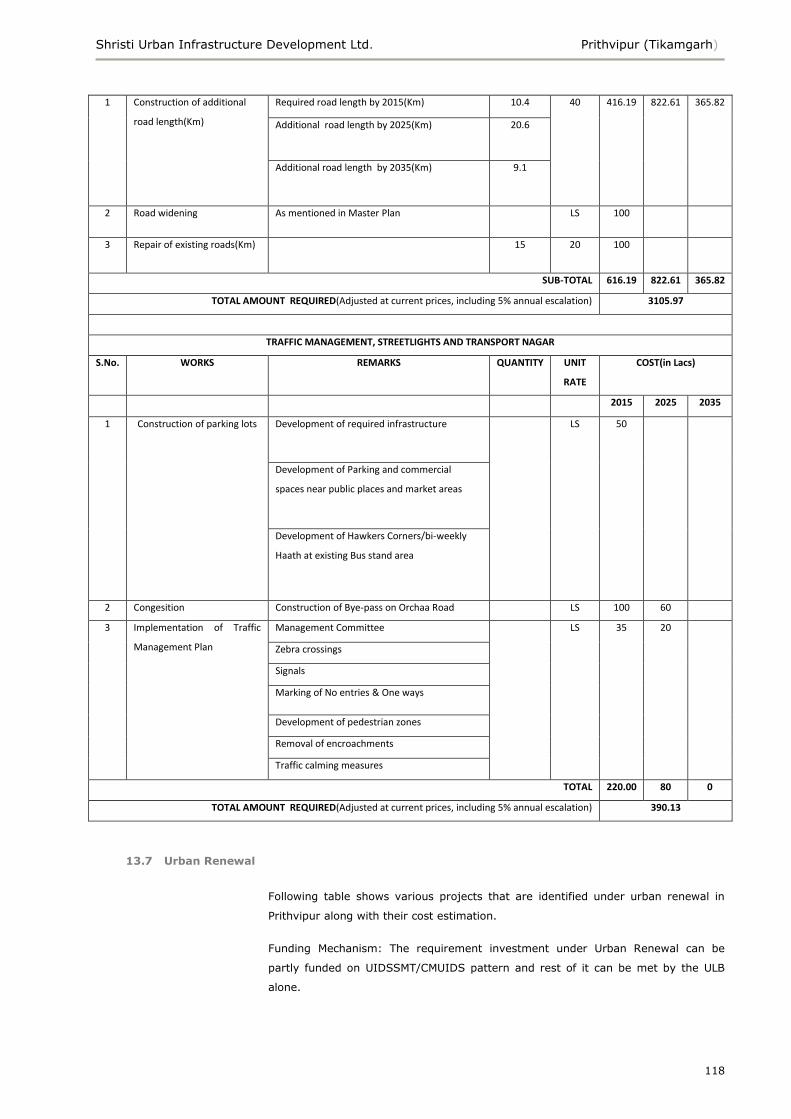
Shristi Urban Infrastructure Development Ltd. Prithvipur (Tikamgarh)
118
1 Construction of additional
road length(Km)
Required road length by 2015(Km) 10.4 40 416.19 822.61 365.82
Additional road length by 2025(Km) 20.6
Additional road length by 2035(Km) 9.1
2 Road widening As mentioned in Master Plan LS 100
3 Repair of existing roads(Km) 15 20 100
SUB-TOTAL 616.19 822.61 365.82
TOTAL AMOUNT REQUIRED(Adjusted at current prices, including 5% annual escalation) 3105.97
TRAFFIC MANAGEMENT, STREETLIGHTS AND TRANSPORT NAGAR
S.No. WORKS REMARKS QUANTITY UNIT
RATE
COST(in Lacs)
2015 2025 2035
1 Construction of parking lots Development of required infrastructure LS 50
Development of Parking and commercial
spaces near public places and market areas
Development of Hawkers Corners/bi-weekly
Haath at existing Bus stand area
2 Congesition Construction of Bye-pass on Orchaa Road LS 100 60
3 Implementation of Traffic
Management Plan
Management Committee LS 35 20
Zebra crossings
Signals
Marking of No entries & One ways
Development of pedestrian zones
Removal of encroachments
Traffic calming measures
TOTAL 220.00 80 0
TOTAL AMOUNT REQUIRED(Adjusted at current prices, including 5% annual escalation) 390.13
13.7 Urban Renewal
Following table shows various projects that are identified under urban renewal in
Prithvipur along with their cost estimation.
Funding Mechanism: The requirement investment under Urban Renewal can be
partly funded on UIDSSMT/CMUIDS pattern and rest of it can be met by the ULB
alone.
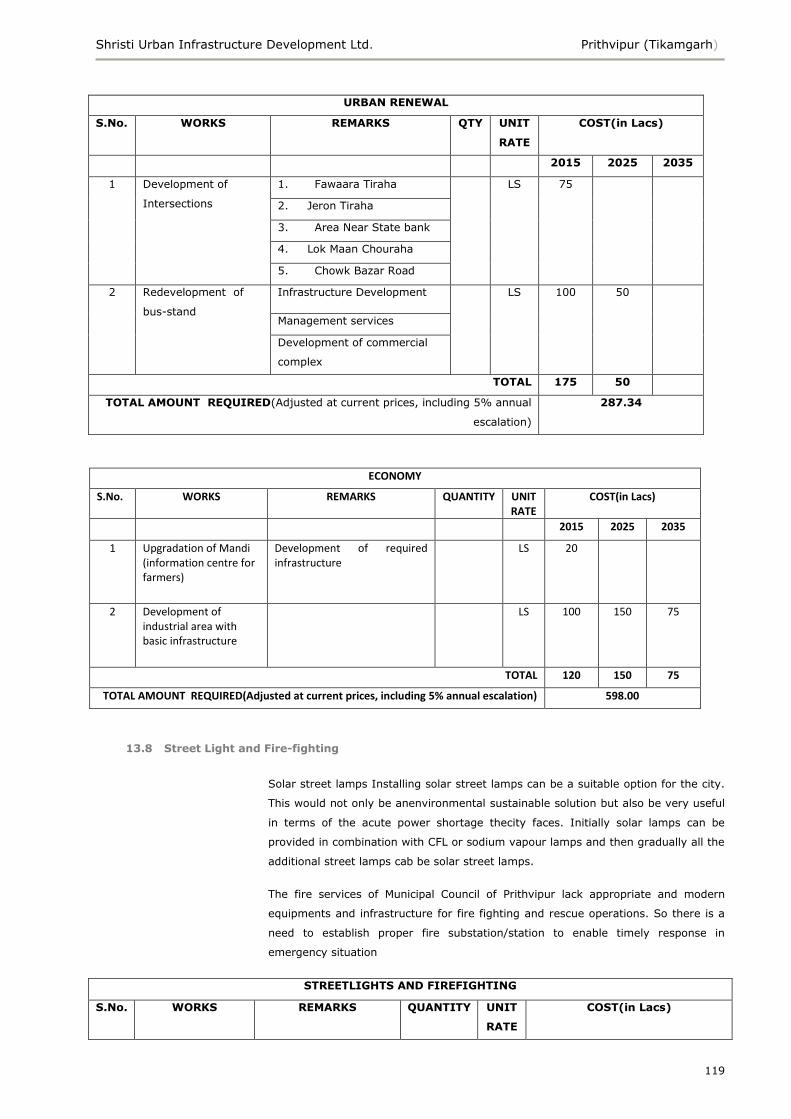
Shristi Urban Infrastructure Development Ltd. Prithvipur (Tikamgarh)
119
URBAN RENEWAL
S.No. WORKS REMARKS QTY UNIT
RATE
COST(in Lacs)
2015 2025 2035
1
Development of
Intersections
1. Fawaara Tiraha
LS
75
2. Jeron Tiraha
3. Area Near State bank
4. Lok Maan Chouraha
5. Chowk Bazar Road
2 Redevelopment of
bus-stand
Infrastructure Development LS 100 50
Management services
Development of commercial
complex
TOTAL 175 50
TOTAL AMOUNT REQUIRED(Adjusted at current prices, including 5% annual
escalation)
287.34
ECONOMY
S.No. WORKS REMARKS QUANTITY UNIT RATE
COST(in Lacs)
2015 2025 2035
1 Upgradation of Mandi (information centre for farmers)
Development of required infrastructure
LS 20
2 Development of industrial area with basic infrastructure
LS 100 150 75
TOTAL 120 150 75
TOTAL AMOUNT REQUIRED(Adjusted at current prices, including 5% annual escalation) 598.00
13.8 Street Light and Fire-fighting
Solar street lamps Installing solar street lamps can be a suitable option for the city.
This would not only be anenvironmental sustainable solution but also be very useful
in terms of the acute power shortage thecity faces. Initially solar lamps can be
provided in combination with CFL or sodium vapour lamps and then gradually all the
additional street lamps cab be solar street lamps.
The fire services of Municipal Council of Prithvipur lack appropriate and modern
equipments and infrastructure for fire fighting and rescue operations. So there is a
need to establish proper fire substation/station to enable timely response in
emergency situation
STREETLIGHTS AND FIREFIGHTING
S.No. WORKS REMARKS QUANTITY UNIT
RATE
COST(in Lacs)
Shristi Urban Infrastructure Development Ltd. Prithvipur (Tikamgarh)
120
2015 2025 2035
1 Streetlights (50%
tubelights, 30%
Solar tubelights
and 15% SV Lamp
and High Mast)
Requirement till 2015 -
Additional 346
346 0.45 155.70 308.48 137.18
2025 – Additional 100%
Solar
686
2035 – Additional 100%
Solar
305
2 Establishment of
Fire Station/Sub
Station
Procurement of rescue
van and fire brigades
LS 25
Advanced fire
equipments(Hose pipes,
search lights, gas
cutters, generators, life
jackets, wireless sets
etc)
Installation of fire
hydrants at different
locations
TOTAL 180.70 308.47875 137.1825
TOTAL AMOUNT REQUIRED(Adjusted at current prices, including 5%
annual escalation)
1106.29
13.9 Heritage and Tourism
There are many important religious/historical structures in Prithvipur which either
needs conservation or development for which following projects are identified. The
detailed cost estimates under this sector are discussed below. The funding of
projects based on conservation of historical or heritage structure can be done by
Dept. Of ASI and tourist places can be developed by M.P. Tourism deptt. The
development of local recreational places, public gardens, parks can be funded from
ULB‘s account.
Funding Mechanism: The funding of projects based on conservation of historical or
heritage structure can be done by Dept. Of ASI and tourist places can be developed
by M.P. Tourism deptt. The development of local recreational places, public gardens,
parks can be funded from ULB‘s account.
HERITAGE AND TOURISM
S.No WORKS REMARKS QTY UNIT
RATE
COST(in Lacs)
2015 2025 2035
1 Infrastructure
development of places
of tourist interests
Development of view point LS 150 50
Restoration of Remaining
Fort Areas
Development of
Information centres
2 Improvement of Street Furniture LS 150
Shristi Urban Infrastructure Development Ltd. Prithvipur (Tikamgarh)
121
Streetscape Way finding systems
Signages
Entry Gate
3 Development of Radha
Talaab and Jer Talaab
Development of
recreational areas, with
boating facilities, park and
picnic spot
4 Procurement of tourist
buses and vehicles
1 LS 20
5 Improvement of access
roads and connection
between tourist
destinations and areas
within a city
Enhancing the image of
Nh-12A as a gateway to
the city
LS 180
6 Funds for Branding and
Advertisements
LS 50
7 Public Awareness and
Training
LS 10
TOTAL 560 50
TOTAL AMOUNT REQUIRED(Adjusted at current prices, including 5% annual
escalation)
734.09
13.10 Basic Services for Poor
With the focussed attention to integrated development of basic services to the urban
poor in the city, provision of basic services to urban poor including security of
tenure at affordable prices, improved housing, water supply, sanitation and enduring
delivery through convergence of other already existing universal services of the
govt. for education, health and social security. The projects identified below have
intended to ensure adequate investment of funds to fulfil deficiencies in the basic
services to the urban poor created in the cities, are not only maintained efficiently
but also become self sustaining over time. Table below shows the capital investment
required for the basic services to urban poor
BASIC SERVICES FOR URBAN POOR
S.No. WORKS REMARKS QTY UNIT
RATE
COST(in Lacs)
2015 2025 2035
1 Construction of LIG/EWS qtrs Nos. 570 1.77 1008.9
2 Upgradation of houses Nos. 280 0.25 70
3 Cement Concrete Road(Km) Km 0.56 13.5 7.56
4 RCC Drain(Km) Km 0.56 8.8 4.928
5 Community Hall(No) Nos. 1 6.5 6.5
6 School Building(No) Nos. 2.3 0
7 Primary Health Centre(No) Nos. 1 2.7 2.7
Shristi Urban Infrastructure Development Ltd. Prithvipur (Tikamgarh)
122
8 Sewer Line(Km) Km 6 4.82 28.92
9 Water Supply Pipeline(Km) Km 0 3.6 0
10 Electric pole with essential LT
line(No)
Nos. 39 0.16 6.24
11 Sulabh Complex(No) Nos. 3 11 33
TOTAL 1168.74
8
TOTAL AMOUNT REQUIRED(Adjusted at current prices, including 5% annual
escalation)
1356.19
13.11 Environment
The environmental conservation and protection projects can be funded by EPCO or
some grants can also be availed under UIDSSMT/CMUIDS pattern or ULB‘s
contribution.
Funding Mechanism:The environmental conservation and protection projects can be
funded by EPCO or some grants can also be availed under UIDSSMT/CMUIDS
pattern or on ULB‘s contribution. The flood protection scheme is Prithvipur could be
financed by Disaster Management Institute.
ENVIRONMENT
S.No. WORKS REMARKS QTY UNIT
RATE
COST(in Lacs)
2015 2025 2035
1 Upgradation of nallaha in the
town
Ganda Nallaha - 4 Km
1. Bus stand to
Orchha road
2. Bus stand to
Radha Sagar road 3.
Bus stand to Samshan
LS 45
Chanelizing major nallaha
Resectioning of nallah
2 Trees plantation along roads
and nallah
LS 20
3 Ground water recharge(LS) LS 25
TOTAL 90 0 0
TOTAL AMOUNT REQUIRED(Adjusted at current prices, including 5% annual
escalation)
104.43
13.12 Social Infrastructure
Along with basic infrastructure development, development of social infrastructure is
also very important to deliver better quality of life to the people. After analyzing the
status of present social amenities, following projects have been identified
Funding Mechanism: The requirement of investment for construction of social
infrastructure is primarily dependent on ULB‘s funds and partly the involvement of
private party
Shristi Urban Infrastructure Development Ltd. Prithvipur (Tikamgarh)
123
SOCIAL INFRASTRUCTURE
S.No
.
WORKS REMARKS QTY UNIT
RATE
COST(in Lacs)
2015 2025 2035
1 Development of Hospital facilities on PPP LS 10
2 Upgradation of Community Hall LS 25
3 Construction of City Park Along the
Natural Drain
LS 85
4 Construction of Playground LS 50 50
5 Construction of Public Library LS 25
6 Upgrading educational facilities LS 100 100
7 Construction of Hawkers Zone LS
8 Development of Facilities For weekly
market
LS 50
Total 345 150
TOTAL AMOUNT REQUIRED(Adjusted at current prices, including 5% annual
escalation)
653.17
13.13 Urban Governance
Following projects are proposed under Governance sector which would upgrade the
service standards of Prithvipur Municipality. Majority of these investments are for e-
governance, capacity building etc.
URBAN GOVERNANCE
S.No. WORKS REMARKS QTY UNIT RATE
COST(in Lacs)
2015 2025 2035
1 Procurement of computers, printers, Xerox machines etc for preparation of a digital map of Prithvipur with different layers for various services and infrastructure
LS 10 10 5
2 Training modules for ULB staff
and enabling of e-governance and active update of database
LS 15
3 Physical surveys like OD surveys for traffic, BPL population survey etc
LS 20
4 Creation of Geographic Information System for the city
LS 50
6 Setting up of a collaboration cell for managing PPP Projects in Prithvipur
LS 15
TOTAL 110 10 5
TOTAL AMOUNT REQUIRED(Adjusted at current prices, including 5% annual escalation)
158.23
Shristi Urban Infrastructure Development Ltd. Prithvipur (Tikamgarh)
124
14 Financial Operating Plan
The sustainable investment capacity of Prithvipur Nagar Parishads is assessed
through a Financial Operating Plan (FOP), which gives a yearly forecast of finances
for the short term i.e. year 2011-12 to year 2015-16. A salient feature of the FOP is
that all outstanding dues, including debt and non-debt liabilities if any, have been
taken into account.
The accounts data ofPrithvipur Nagar Parishads between the years 2009-10 and
2011-12 are used as the basis for determining past trends in revenue and
expenditure and arriving at appropriate growth assumptions for each of the income
and expense items. After forecasting the revenue account, the capital investments
proposed under the CIP are added to the forecast. The FOP is generated to assess
the investment-sustaining capacity of Prithvipur Nagar Parishads.
The project funding structure comprises grants under the CMUIDS framework
(accounting for 90 per cent of the funding); internal resources and loans accounting
for the rest. The level of investment that Prithvipur Nagar Parishads can sustain is
determined by studying the overall surpluses/ year-to-year opening balance and
debt service coverage ratio. If the debt service coverage ratio - DSCR (amount of
surplus available to pay interest and to repay principal that is due) falls below 1,
then the investments are reduced gradually till the DSCR exceeds 1 in all the years
in the forecast period.
The main items of income and expenditure, classified into the revenue account and
the capital account, are projected in the FOP under the following categories.
14.1 Categories of FOP Projections
Revenue Account Receipts:
- Taxes, Non Tax Sources, Assigned Revenue and
- Grants, Contribution and Subsidies
Revenue Account Expenditure:
- Establishment
- Operation and Maintenance
- Debt Servicing- Existing and New Loans
- Phasing of non debt liabilities, and
- Additional O&M
Capital Income and
Capital Expenditure
14.2 Financing Strategies for the CIP
In determining a long-term financial strategy, Prithvipur Nagar Parishads plans to
raise resources and fund the CIP through:
Shristi Urban Infrastructure Development Ltd. Prithvipur (Tikamgarh)
125
Grants available under the CMUIDS Framework (as percent of investment proposed
for funding by 2015 in Urban governance and infrastructure sectors - 80 percent
Central Govt. Grants and 10 percent State Govt. Grants). In this CMUIDS grant is
not considered for capital cost towards projects identified for Economic development
and Urban Governance.
Available internal resources and improving upon the same through
Revision of the Unit Area Value at certain levels, which would lead to revision in
Annual letting Value (applicable for Prithvipur Nagar Parishads )
Revision of Water charges at specific intervals
Introduction of Sewerage Charges in 2015-16, after implementing the Sewerage
Project
Maintenance of the collection performance of taxes and charges at certain
minimum levels for current and for arrears
Borrowings from market or financial institutions
14.3 Finance Projections
Current revenue sources are projected under built-in growth assumptions for income
and expenditure items, to assess the impact of each such revenue enhancement
measure being suggested. The projections also aim at estimating the surplus that
will be available for servicing new debt. Part of the surplus, after meeting the
additional O&M expenses on newly created assets and infrastructure, is translated
into debt size and project size (grant component plus debt component) based on
certain assumptions regarding interest rate, repayment method and loan-grant mix.
A spreadsheet FOP model has been customised to depict the financial position of
Prithvipur Nagar Parishads; the investment sustaining capacity of Nagar Parishads is
assessed based on the FOP assumptions. The model was used to calculate future
surpluses under various scenarios involving combinations of internal revenue
improvement, state support, financing terms, etc.
14.4 Municipal Account – Growth Projections and Assumptions
The standard assumptions under which the projections are carried out and certain
expenditure control and revenue augmentation measures proposed in line with the
mandatory and optional reforms under the CMUIDS framework are presented below
in table 49
Table 14-1Important assumptions made in the projections
Head Assumptions
Guiding Factor for Assessing the Sustaining Capacity
Surplus Positive surplus - year on year basis
DSCR Greater than 1
Project Financing – for admissible Components under JNNURM
Project Costing Unit Cost, with 5 % Cost escalation factor and 10%
Physical contingency
New/Additional O & M and from second year of
investment 5% growth is considered for the
Shristi Urban Infrastructure Development Ltd. Prithvipur (Tikamgarh)
126
Head Assumptions
additional O & M 5% of Capital cost
Grant from GoI 80% of Proposed Projects
Grant from GoMP 10% of Proposed Projects
If Loan for Balance funding Repayment in 12 years, with 3 year principal
moratorium @ 8 % interest rate
Old Outstanding loans As per existing terms and conditions
Revenue Expenditure
Growth in Expenditure Actual average growth with a minimum 8% and
maximum of 12% (based on last five years trend)
Pay Commission Revision Pay Commission revision- additional 10% from 2013-
14 every five years
Assumption for assessment of Prithvipur Nagar Parishads ‘s sustainability
Income Items
Growth in revenue income Actual average growth with a minimum 8% and
maximum of 12% (based on last five years trend)
Property Tax: Propose to introduce from FY 2008-09
Annual growth in Assessment 2.30% per annum
Initial Revision in 2011-12 100% of the existing
Revision of Tax 20% every four years
Collection Performance 85% or current average whichever is higher by 2015
Assumption for assessment of PHED sustainability
Income Items- Water Supply
Annual growth in Water Connection 2.27% per annum
Initial revision in water tariffs by 100% in FY 20011
Next Revisions in water tariffs by 25% every four years
Initial revision - new Connection fee by 100% in FY 20011
Future revision - new Connection fee by 10% every four years
Collection Performance 85% by 2015
Income Items- Sewerage
Sewerage Charge 50% of water charges
Initial revision - new Connection fee Rs. 1000 per connections
Future revision - new Connection fee by 25% every four years
Collection Performance 85% by 2015
14.5 Investment Capacity/ Sustenance
Given the existing financial position ofPrithvipur Nagar Parishads, the revenue and
capital accounts are projected against the growth scenario and assumptions
presented above. The FOP is generated from the sustainable investment point of
view in line with current growth trends against the identified investment for Nagar
Parishadsof Rs. 66.79 crores at till 2015
14.6 Impact of Reforms on Investment Capacity ofPrithvipur Nagar Parishads
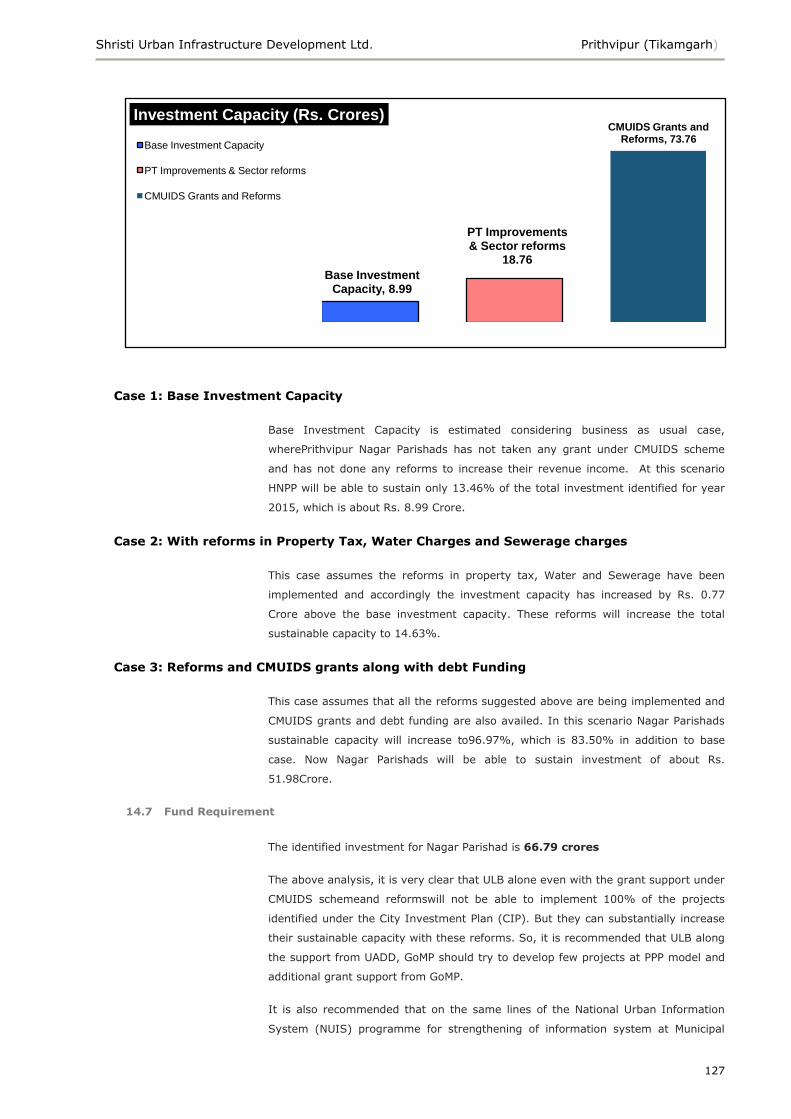
Shristi Urban Infrastructure Development Ltd. Prithvipur (Tikamgarh)
127
Case 1: Base Investment Capacity
Base Investment Capacity is estimated considering business as usual case,
wherePrithvipur Nagar Parishads has not taken any grant under CMUIDS scheme
and has not done any reforms to increase their revenue income. At this scenario
HNPP will be able to sustain only 13.46% of the total investment identified for year
2015, which is about Rs. 8.99 Crore.
Case 2: With reforms in Property Tax, Water Charges and Sewerage charges
This case assumes the reforms in property tax, Water and Sewerage have been
implemented and accordingly the investment capacity has increased by Rs. 0.77
Crore above the base investment capacity. These reforms will increase the total
sustainable capacity to 14.63%.
Case 3: Reforms and CMUIDS grants along with debt Funding
This case assumes that all the reforms suggested above are being implemented and
CMUIDS grants and debt funding are also availed. In this scenario Nagar Parishads
sustainable capacity will increase to96.97%, which is 83.50% in addition to base
case. Now Nagar Parishads will be able to sustain investment of about Rs.
51.98Crore.
14.7 Fund Requirement
The identified investment for Nagar Parishad is 66.79 crores
The above analysis, it is very clear that ULB alone even with the grant support under
CMUIDS schemeand reformswill not be able to implement 100% of the projects
identified under the City Investment Plan (CIP). But they can substantially increase
their sustainable capacity with these reforms. So, it is recommended that ULB along
the support from UADD, GoMP should try to develop few projects at PPP model and
additional grant support from GoMP.
It is also recommended that on the same lines of the National Urban Information
System (NUIS) programme for strengthening of information system at Municipal
Base Investment Capacity, 8.99
PT Improvements & Sector reforms
18.76
CMUIDS Grants and Reforms, 73.76
Investment Capacity (Rs. Crores)
Base Investment Capacity
PT Improvements & Sector reforms
CMUIDS Grants and Reforms
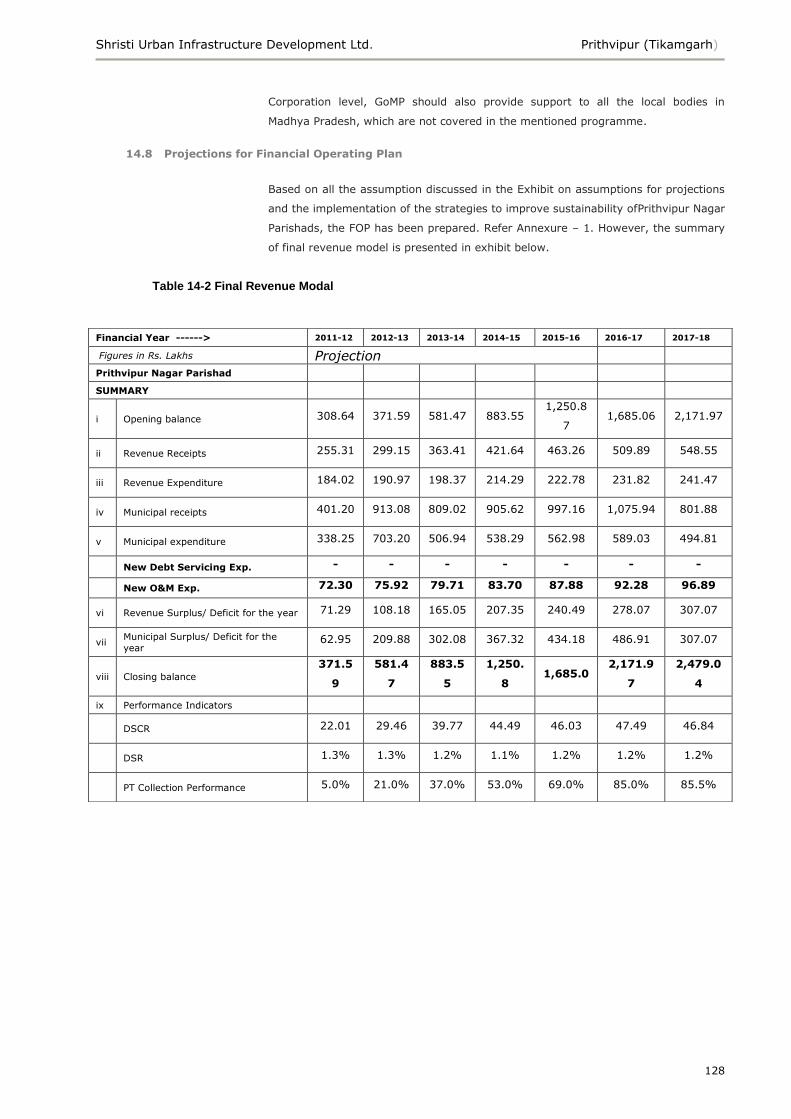
Shristi Urban Infrastructure Development Ltd. Prithvipur (Tikamgarh)
128
Corporation level, GoMP should also provide support to all the local bodies in
Madhya Pradesh, which are not covered in the mentioned programme.
14.8 Projections for Financial Operating Plan
Based on all the assumption discussed in the Exhibit on assumptions for projections
and the implementation of the strategies to improve sustainability ofPrithvipur Nagar
Parishads, the FOP has been prepared. Refer Annexure – 1. However, the summary
of final revenue model is presented in exhibit below.
Table 14-2 Final Revenue Modal
Financial Year ------> 2011-12 2012-13 2013-14 2014-15 2015-16 2016-17 2017-18
Figures in Rs. Lakhs Projection
Prithvipur Nagar Parishad
SUMMARY
i Opening balance 308.64 371.59 581.47 883.55 1,250.8
7 1,685.06 2,171.97
ii Revenue Receipts 255.31 299.15 363.41 421.64 463.26 509.89 548.55
iii Revenue Expenditure 184.02 190.97 198.37 214.29 222.78 231.82 241.47
iv Municipal receipts 401.20 913.08 809.02 905.62 997.16 1,075.94 801.88
v Municipal expenditure 338.25 703.20 506.94 538.29 562.98 589.03 494.81
New Debt Servicing Exp. - - - - - - -
New O&M Exp. 72.30 75.92 79.71 83.70 87.88 92.28 96.89
vi Revenue Surplus/ Deficit for the year 71.29 108.18 165.05 207.35 240.49 278.07 307.07
vii Municipal Surplus/ Deficit for the
year 62.95 209.88 302.08 367.32 434.18 486.91 307.07
viii Closing balance
371.5
9
581.4
7
883.5
5
1,250.
8 1,685.0
2,171.9
7
2,479.0
4
ix Performance Indicators
DSCR 22.01 29.46 39.77 44.49 46.03 47.49 46.84
DSR 1.3% 1.3% 1.2% 1.1% 1.2% 1.2% 1.2%
PT Collection Performance 5.0% 21.0% 37.0% 53.0% 69.0% 85.0% 85.5%
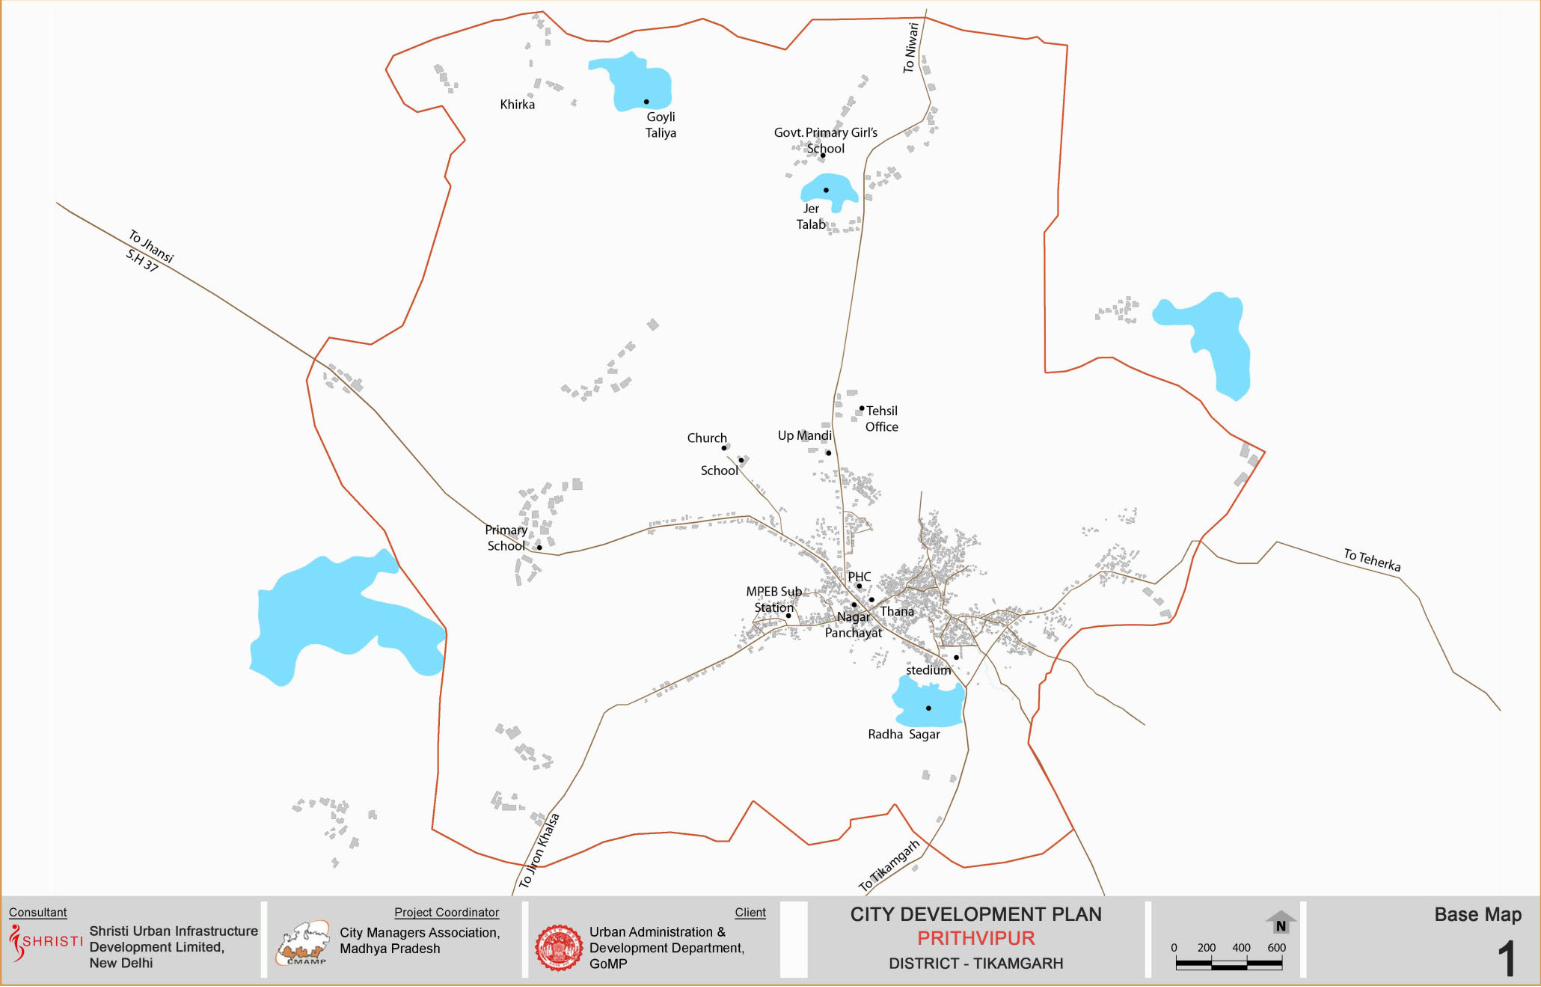
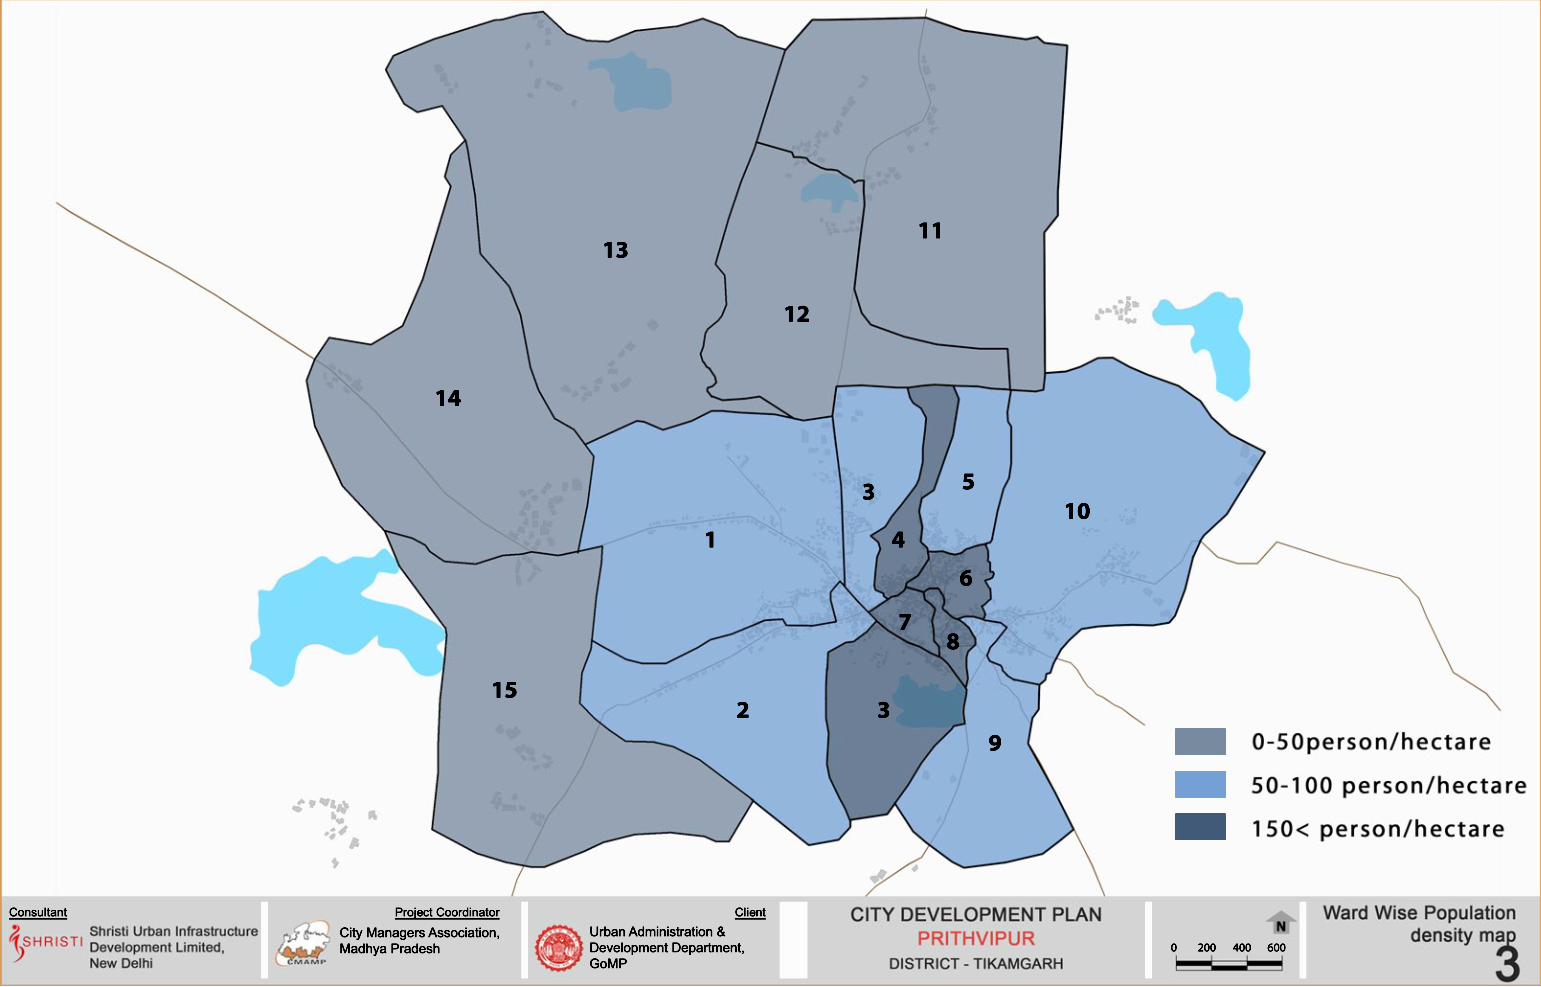
0 200 400 600Urban Administration &Development Department, GoMP
City Managers Association,Madhya Pradesh
1
2
3
3
4
5
6
78
9
11
10
12
13
14
15
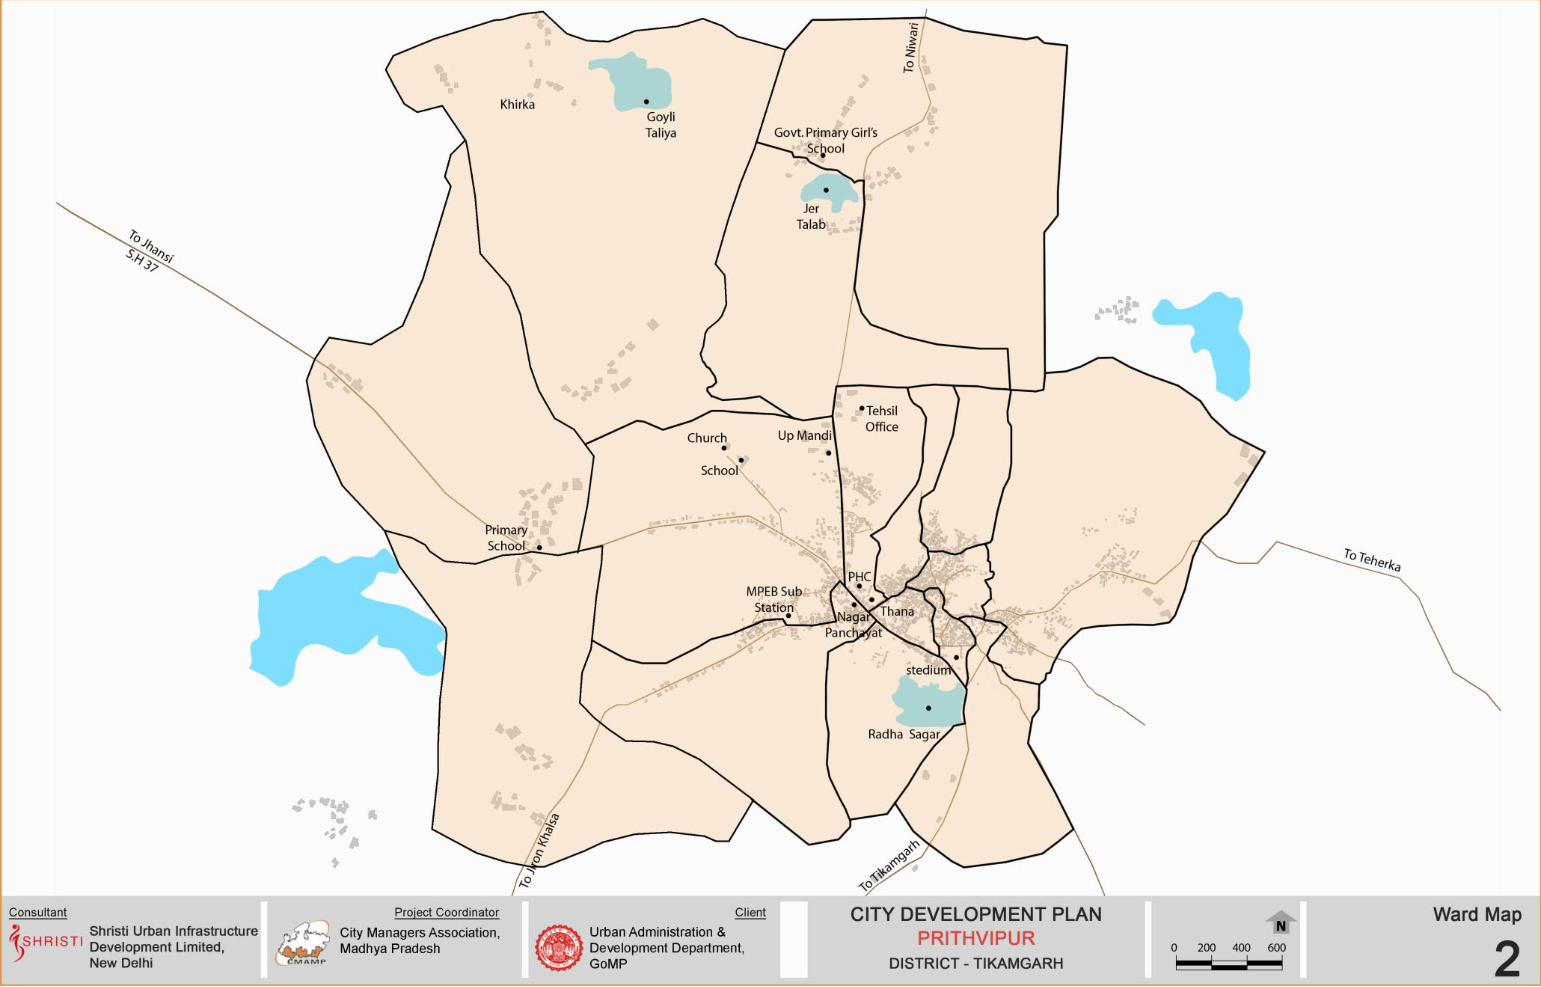
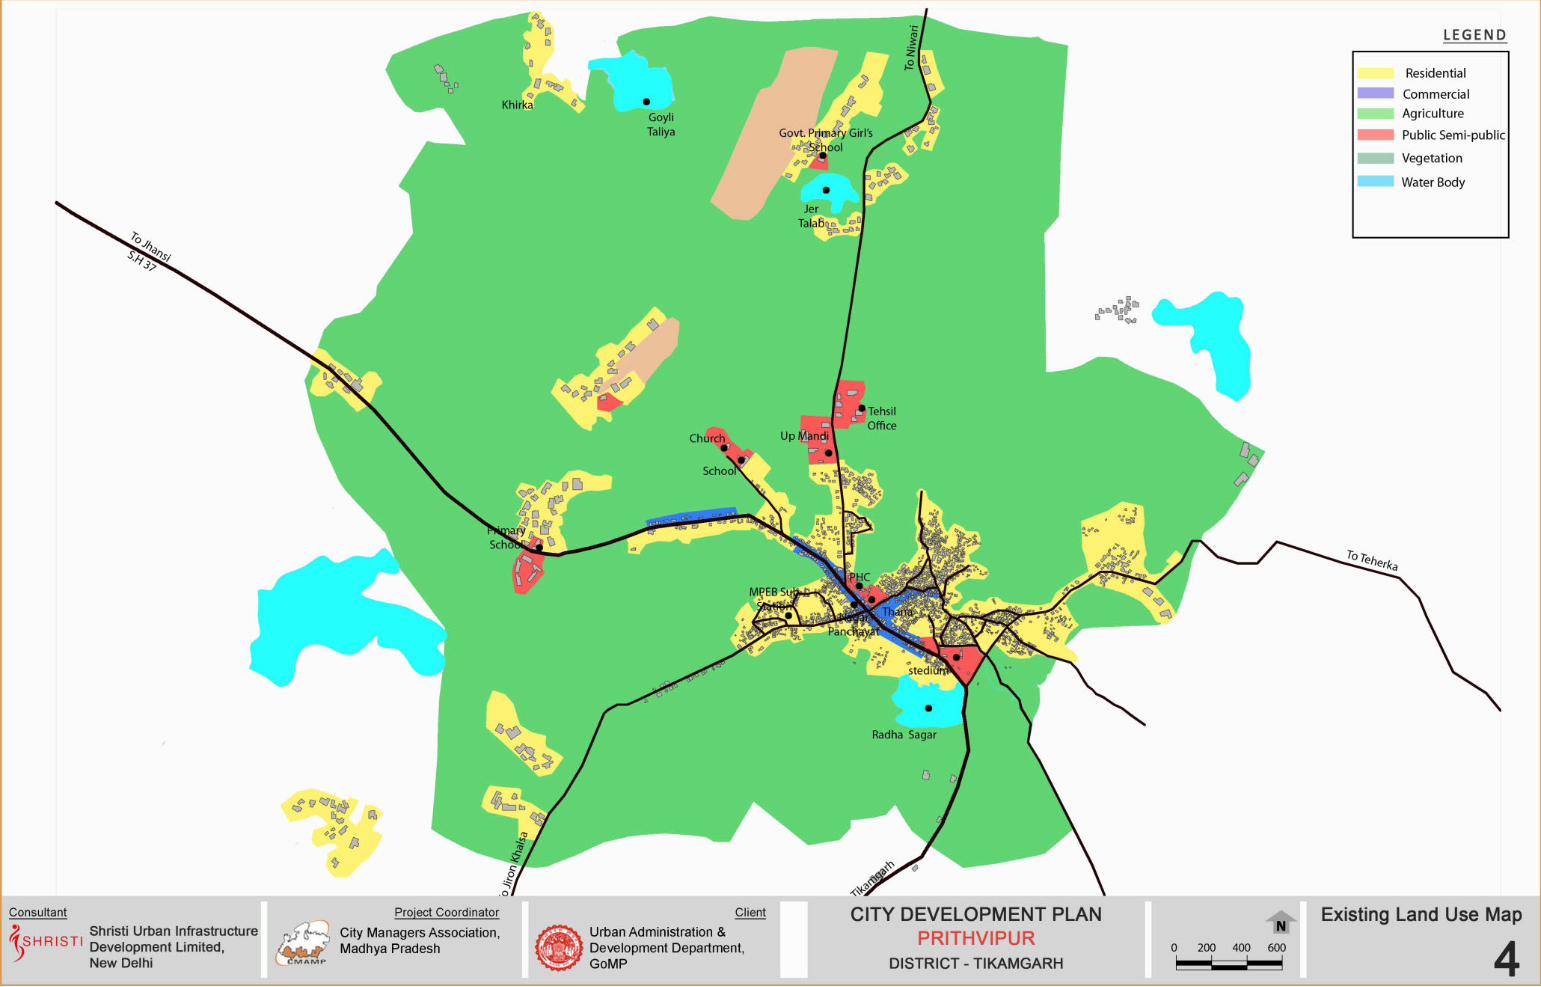
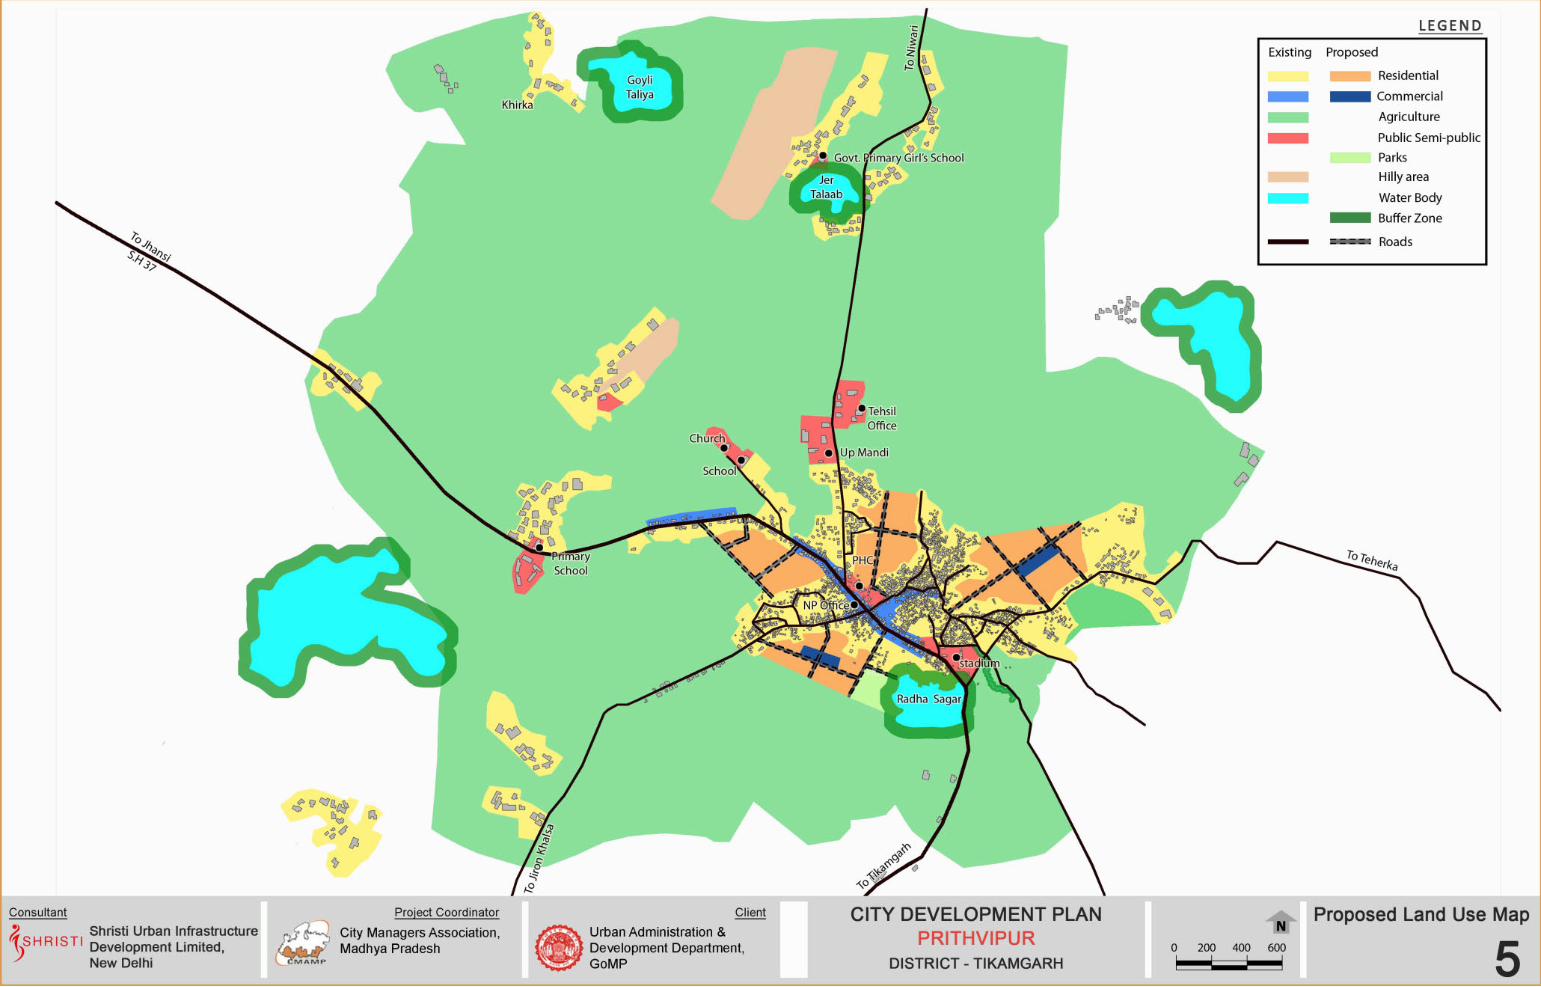
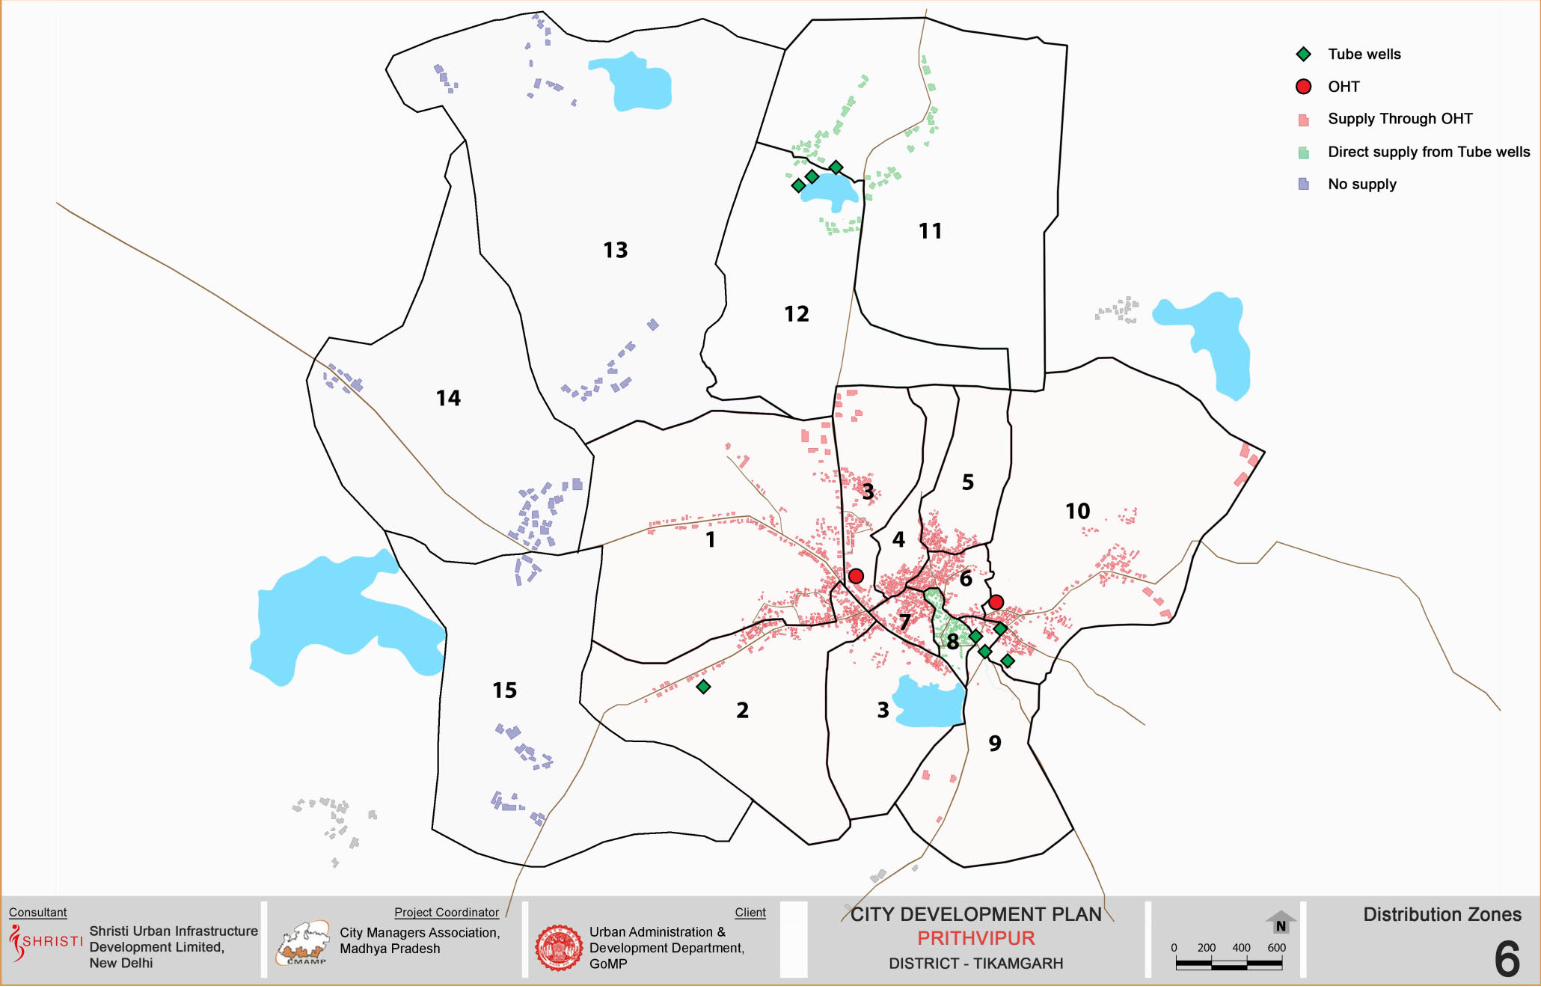
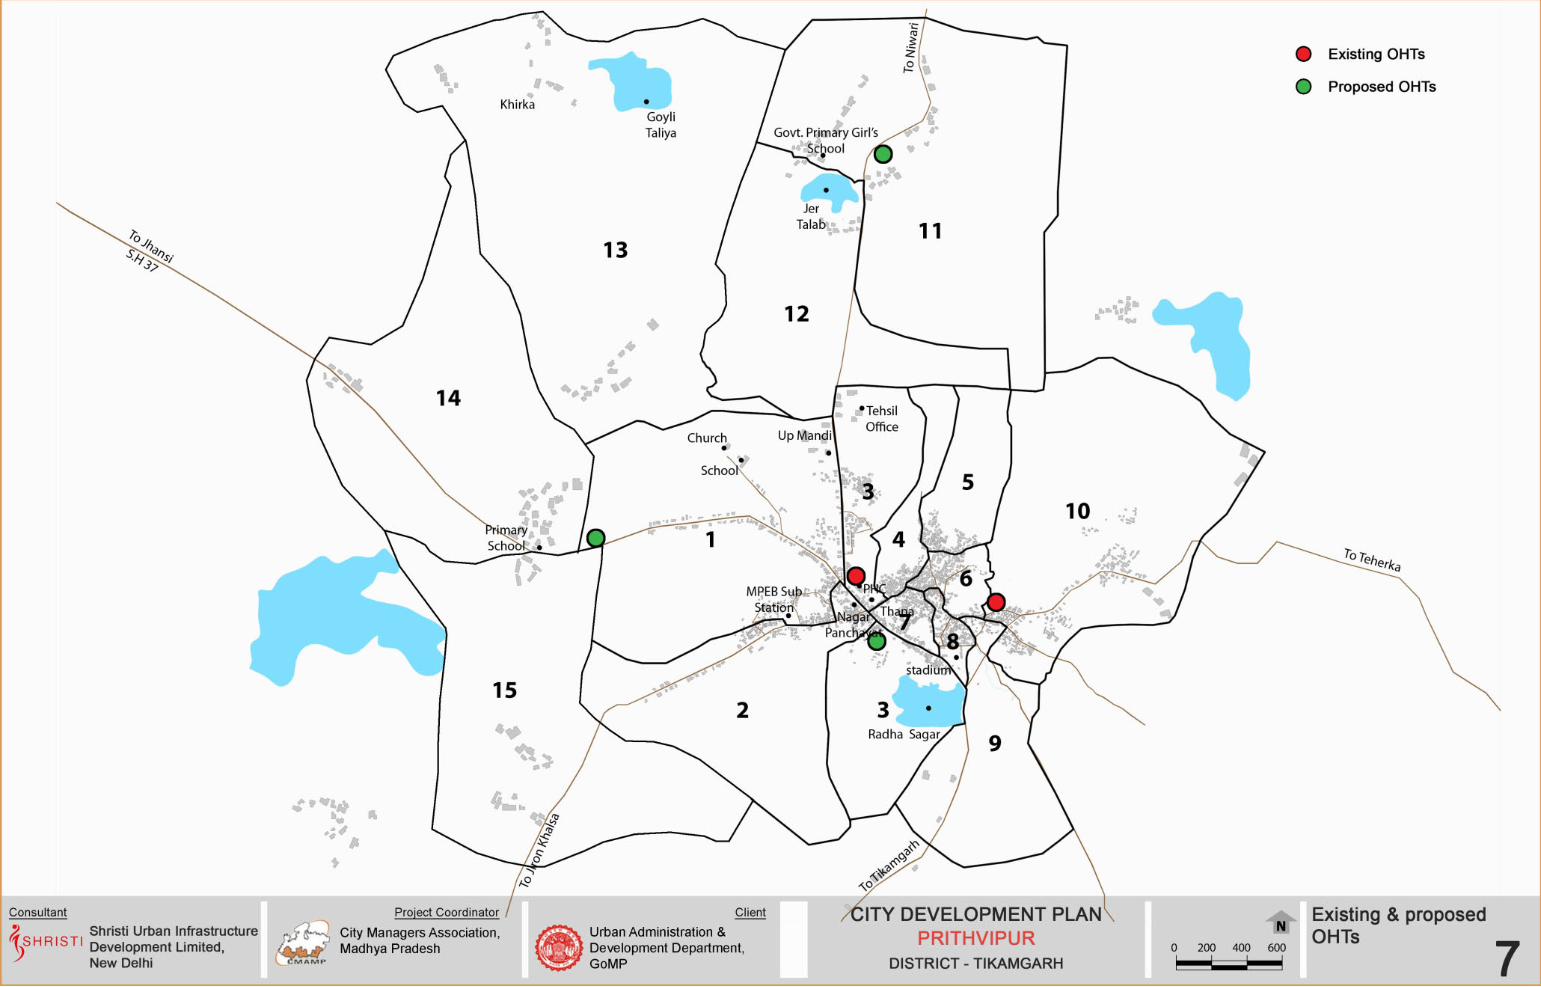
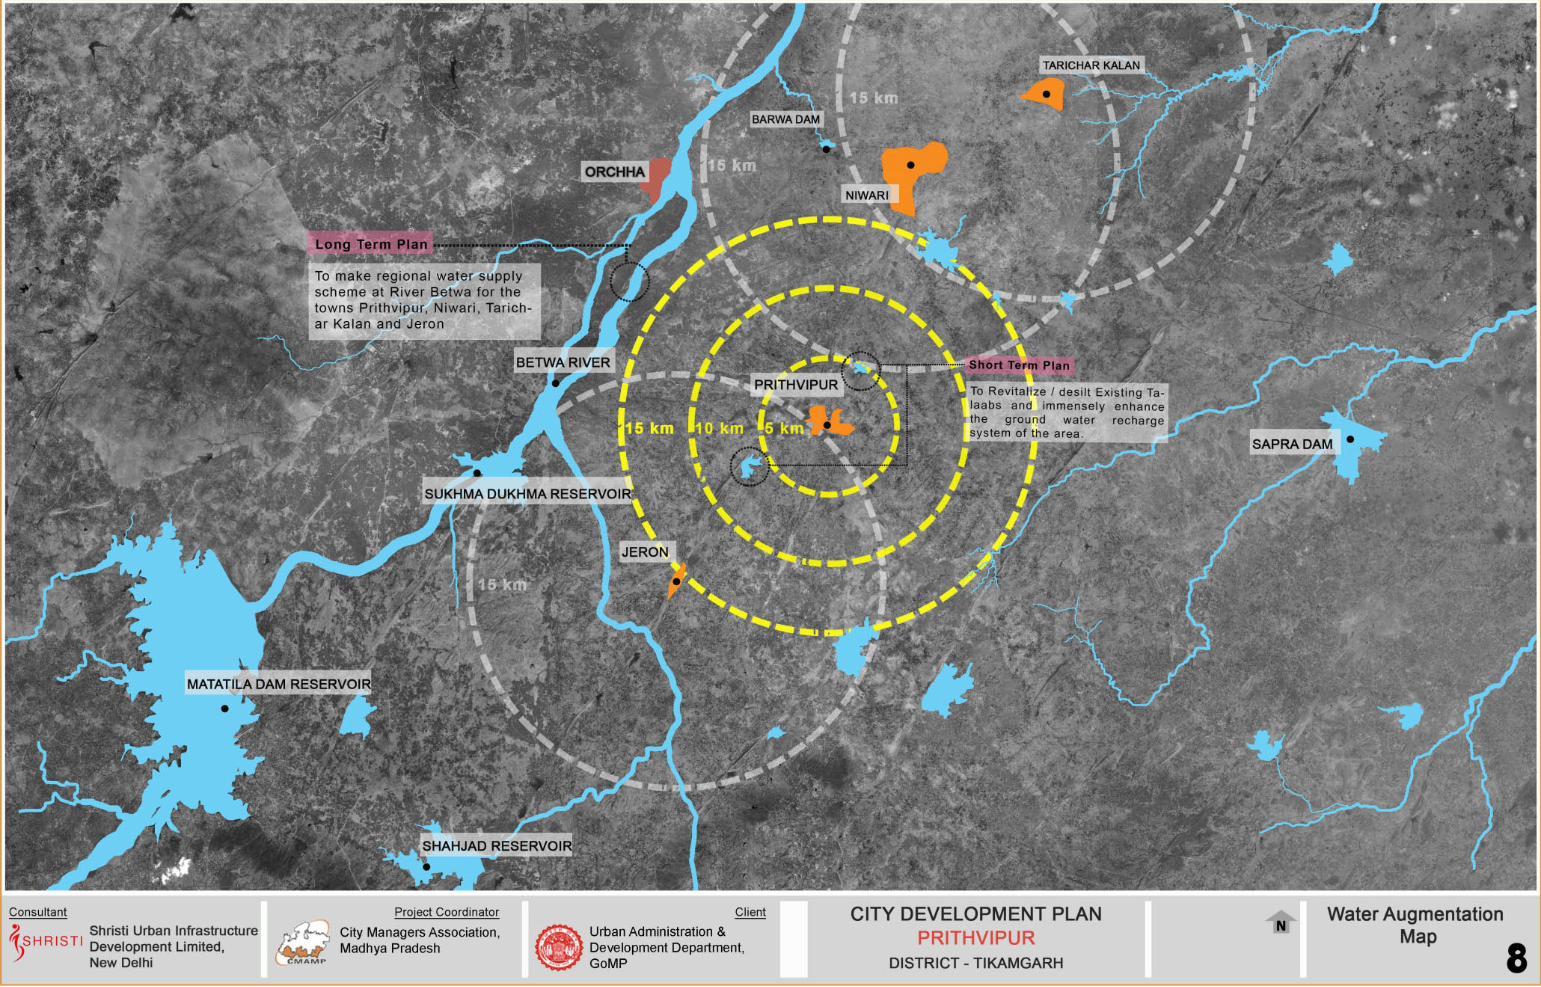
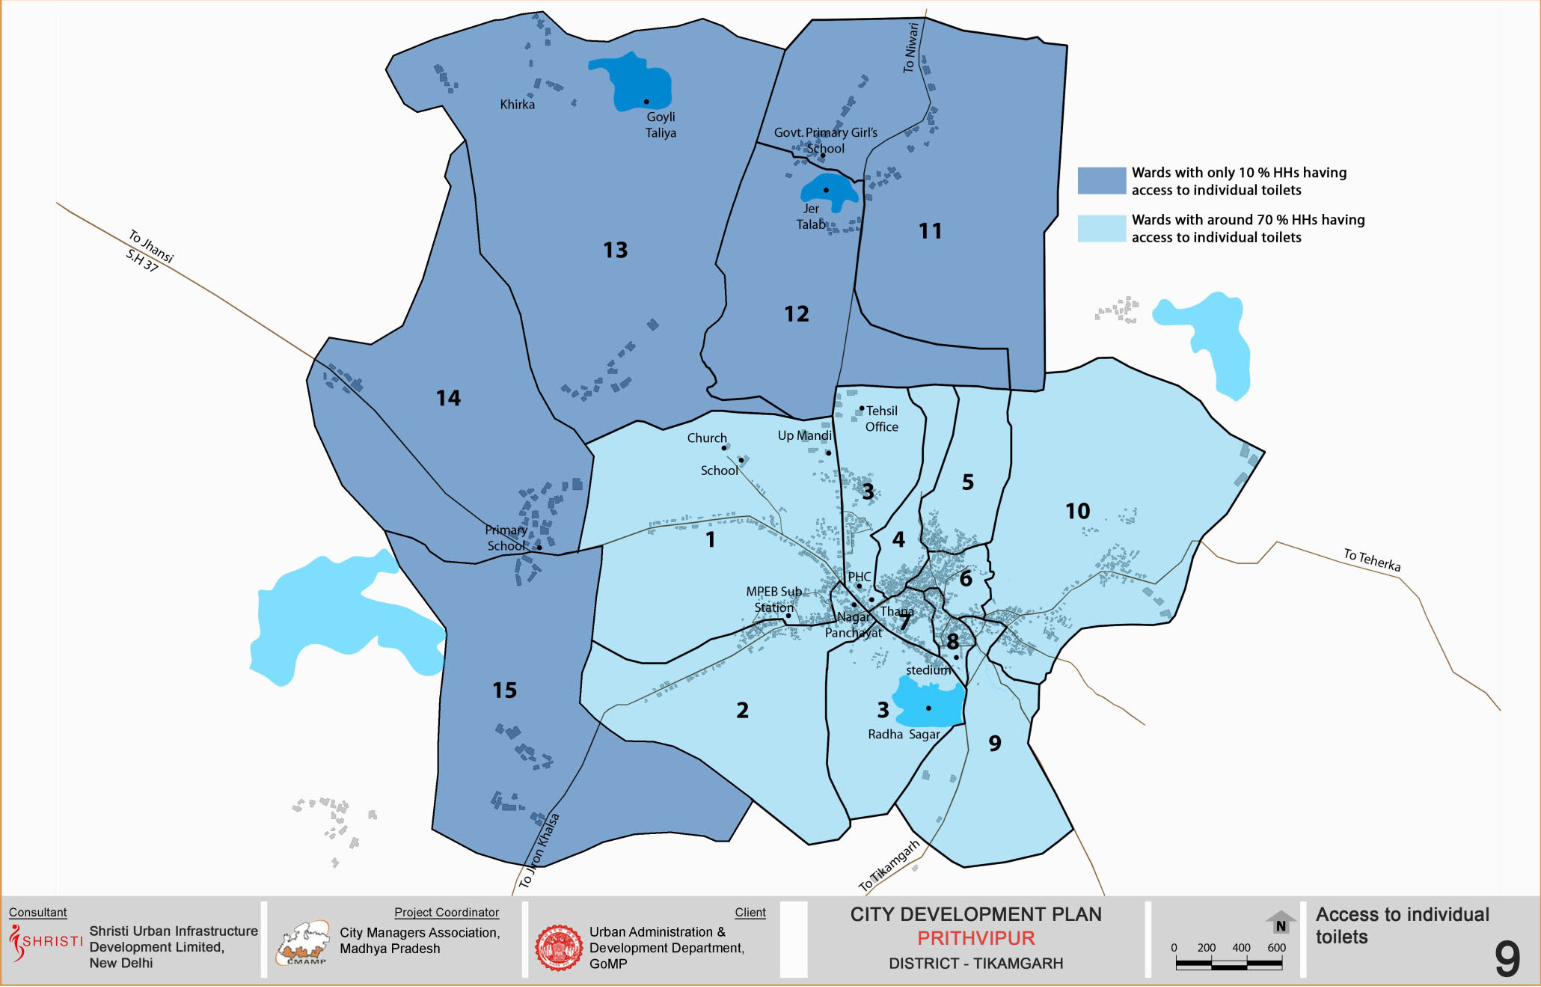
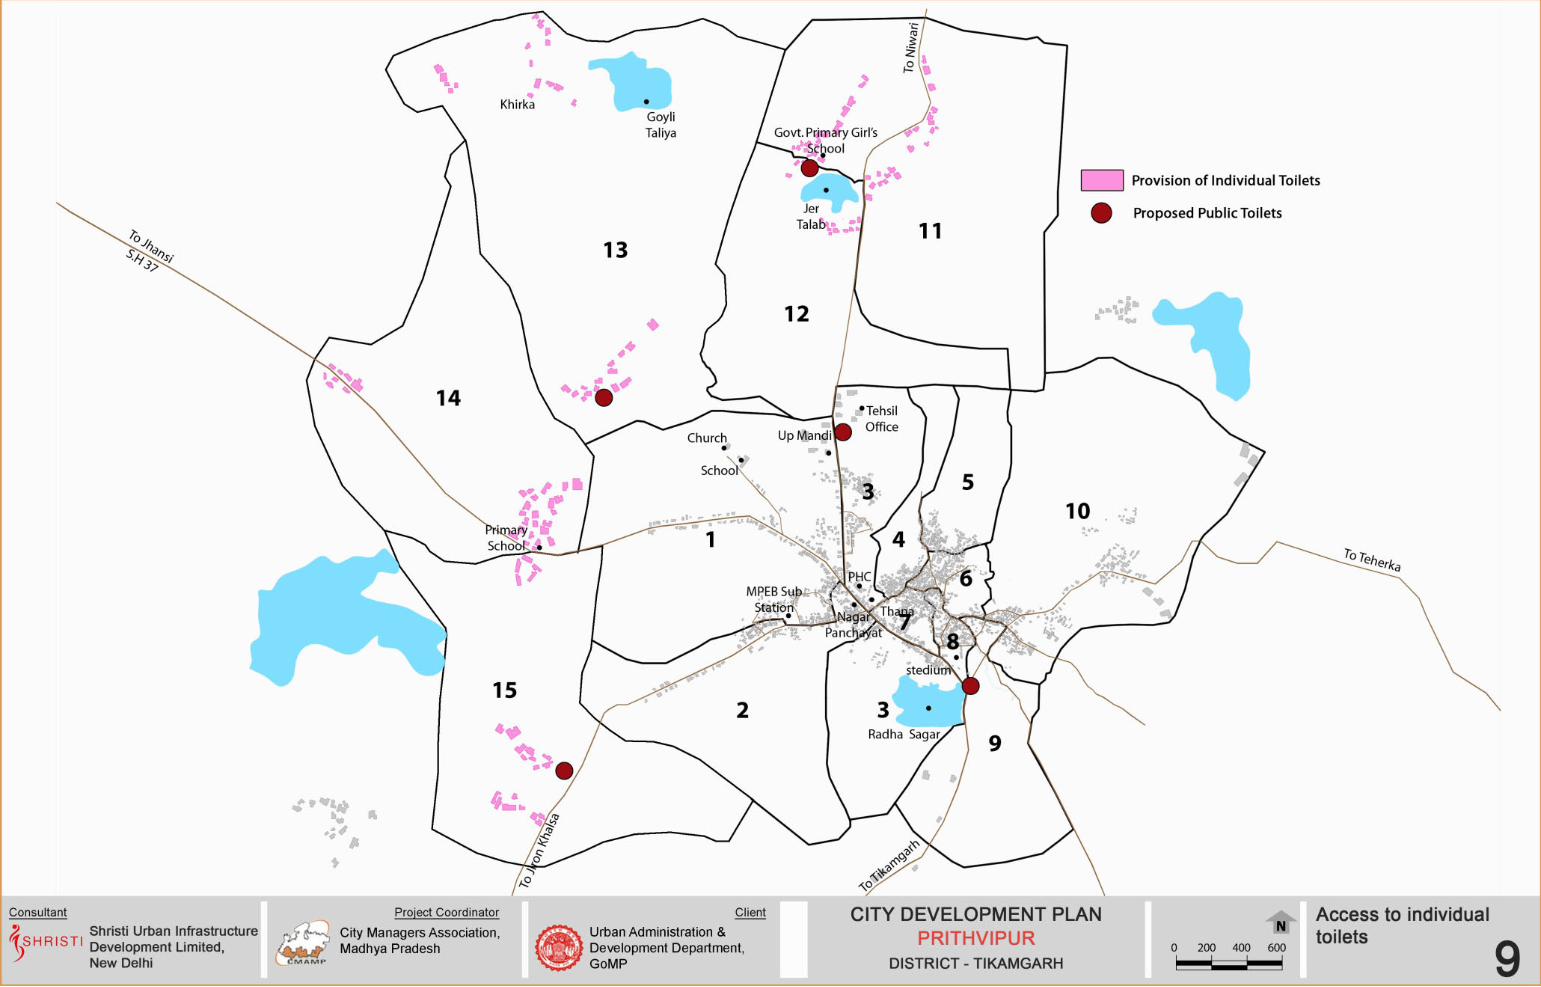
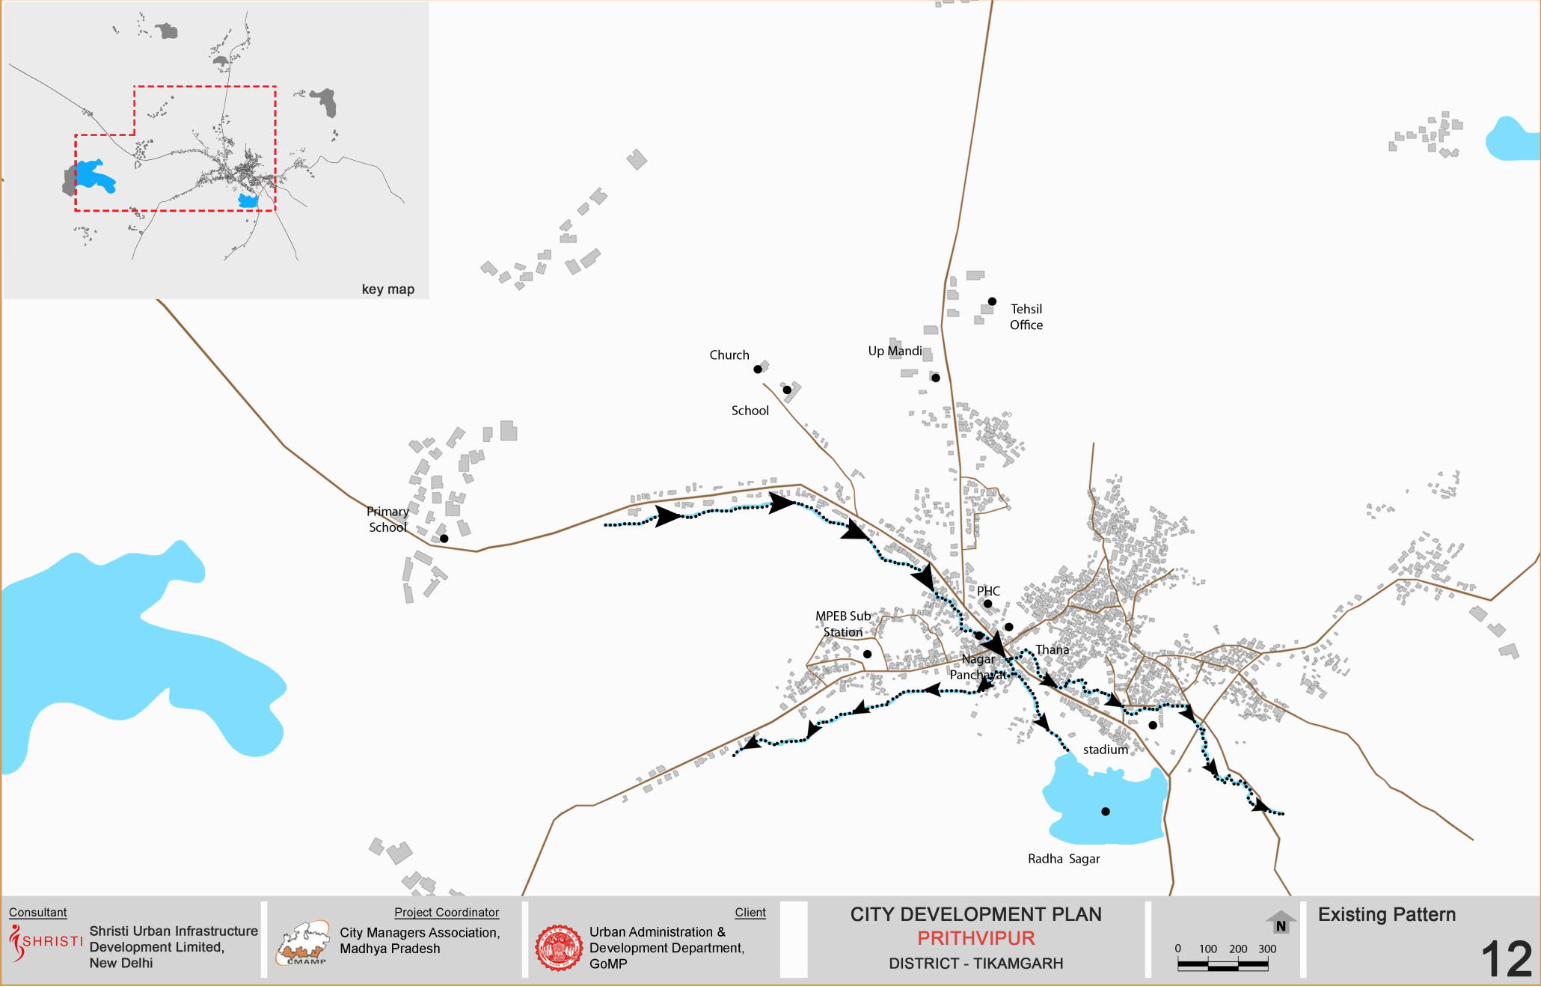

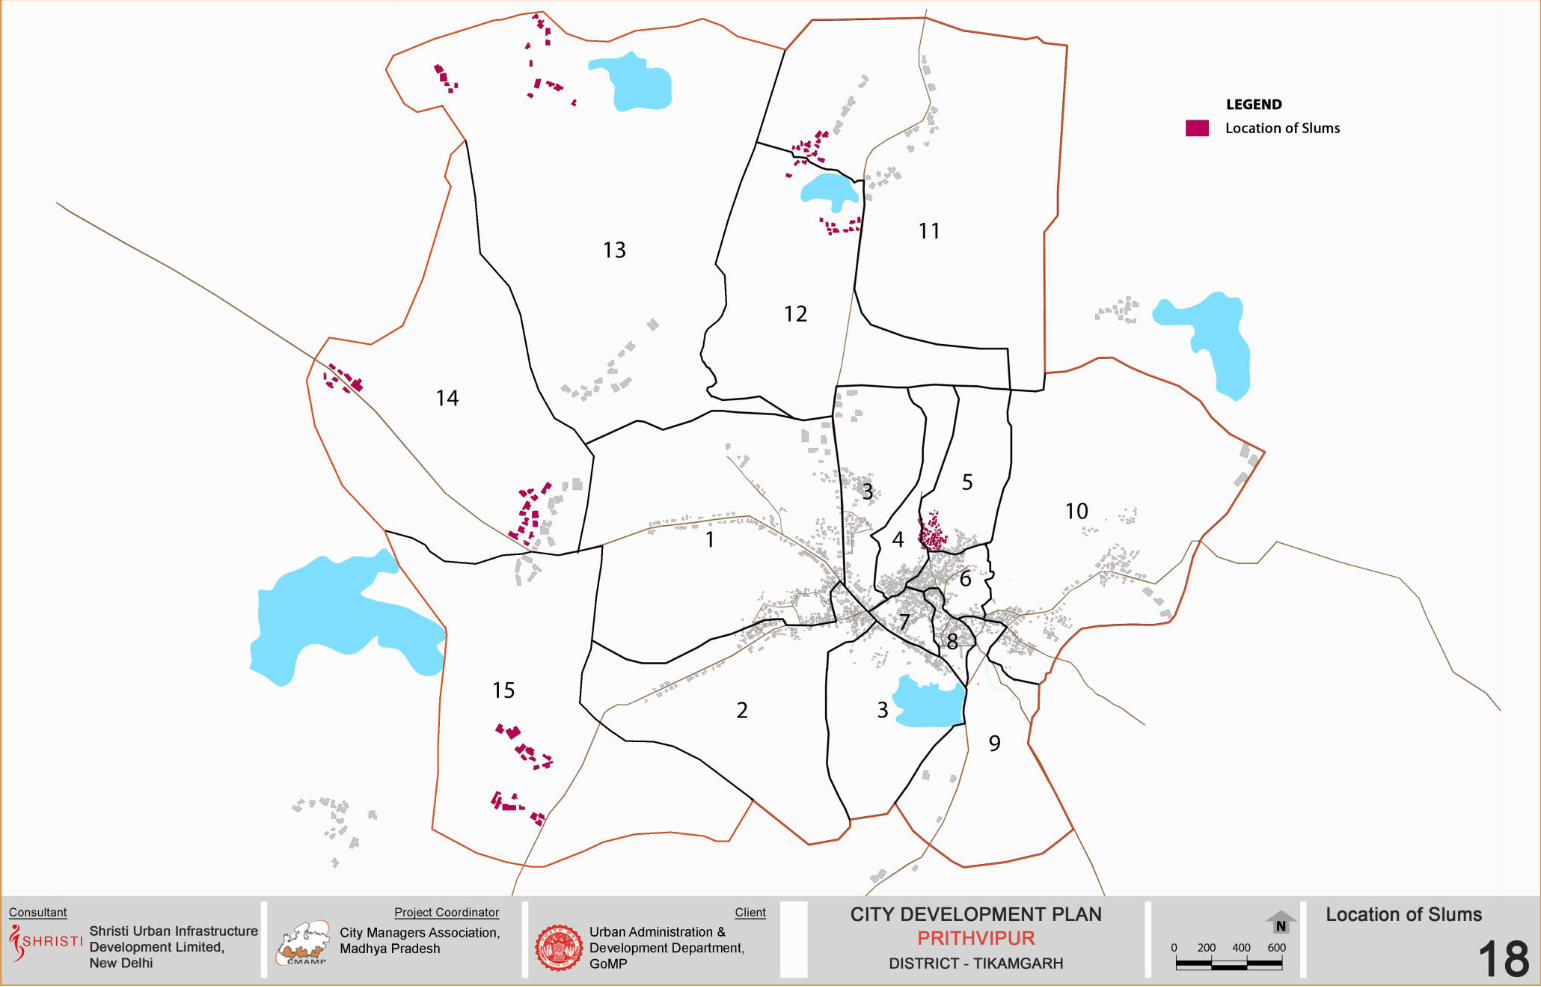
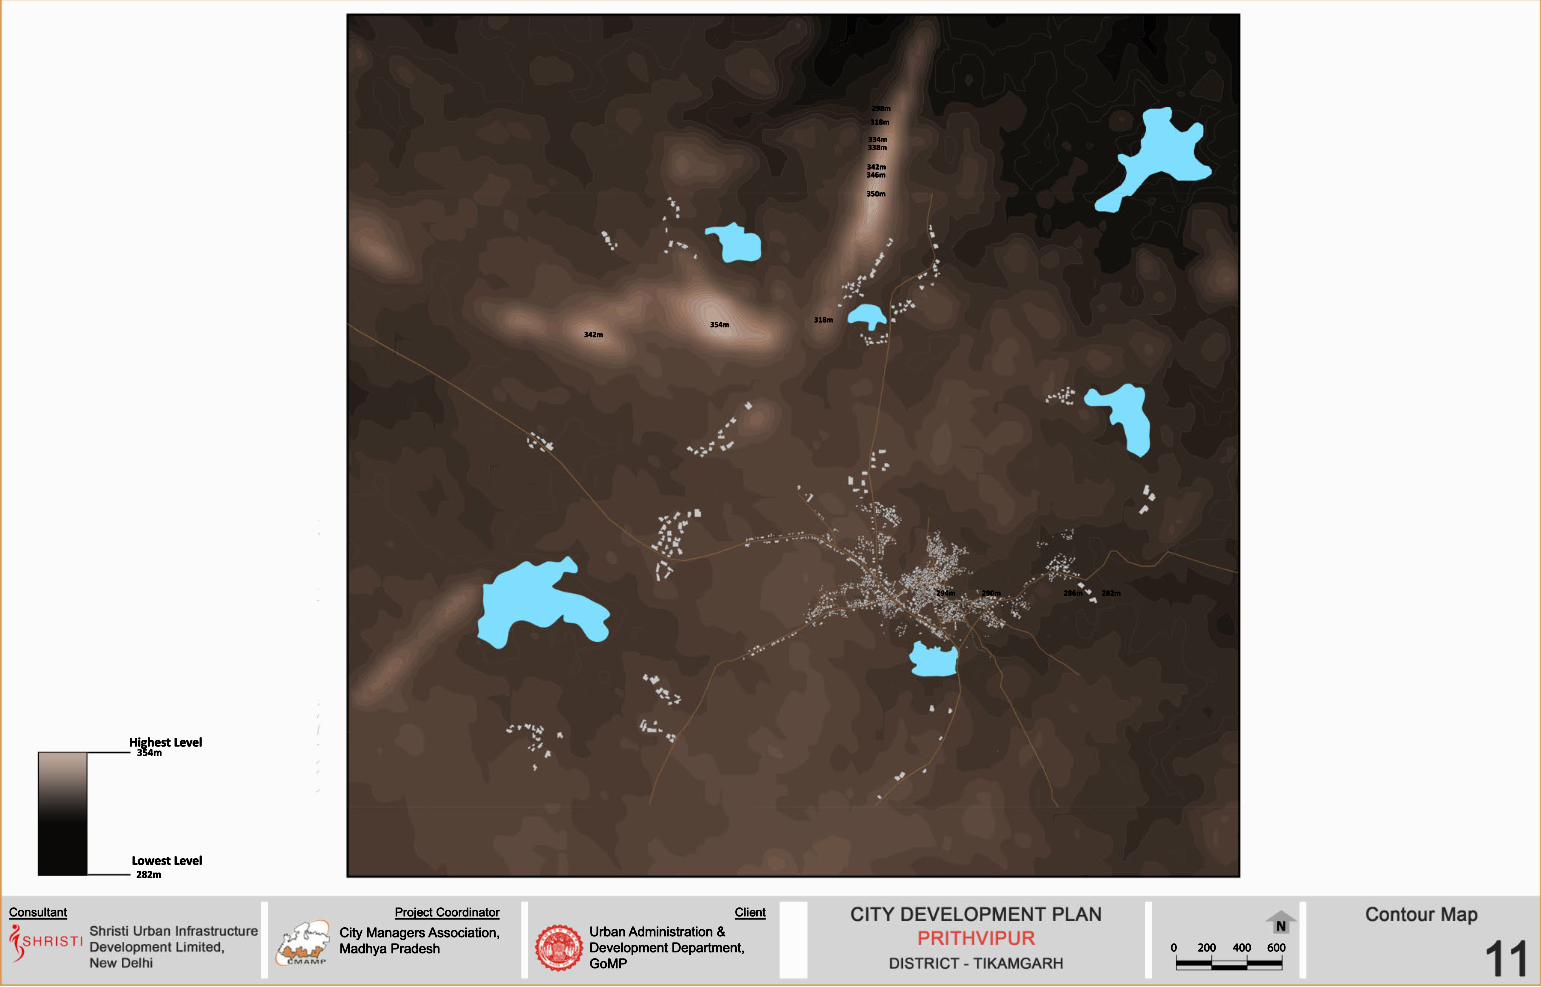
Highest Level354m
282mLowest Level
350m
354m342m
346m342m
338m334m
318m
318m
294m 290m 286m 282m
298m
0 200 400 600Urban Administration &Development Department, GoMP
City Managers Association,Madhya Pradesh


