Embed Size (px)
Citation preview

Appendix to
The Rice Economy of Asia:
Rice Statistics by Country,
Tables with Notes
Beth Rose
NOTE
This appendix is a companion volume to The RiceEconomy of Asia by Randolph Barker, Robert W. Herdt, with Beth Rose.

Copyright © 1985 by Resources for the Future. Inc. All rights reserved Manufactured in the United States of America Published by Resources for the Future, Inc.. 1616 p Street. NW., Washington, D.C. 20036 Resources for the Future books are distributed worldwide by The Johns Hopkins University Press Library of Congress Cataloging in Publication Data (for the book) Barker. Randolph. The rice economy of Asia. Bibliography: p. Includes index. I. Rice trade-Asia. I. Herds; Robert W. II. Rose. Beth. III. Title. HD9066.A7B37 1985 338.173 18'095 85-2382 ISBN 0-915707-14-4 ISBN 0-9157t)7-15-2 (pbk.)

R e S O U R C e S
FOR THe FUTURe
1616 P Street. N.W.. Washington. D.C. 20036
DIRECTORS M. Gordon Wolman, Chairman Kenneth L. Lay Charles E. Bishop Franklin A. Lindsay Anne P. Carter Vincent E. McKelvey Emery N. Castle Richard W, Manderbach William I. Creson Laurence I. Moss Henry L. Diamond Leopoldo Soils James R. Ellis Carl H. Stoltenberg Jerry D. Geist Russell E. Train John H. Gibbons Barbara S. Uehling Bohdan Hawrylyshyn Robert M. White Thomas J. Klutznick Franklin H. Williams
HONORARY DIRECTORS Horace M. Albright Edward S. Mason Hugh L. Keenleyside William S. Paley
John W Vanderwilt
OFFICERS
Emery N- Castle. President John F. Ahearne. Vice President
Edward F. Hand, Secretary-Treasurer Resources for the Future is a nonprofit organization for research and education in the development, conservation, and use of natural resources, including the quality of the environment. It was established in 1952 with the cooperation of the Ford Foundation. Grants for research are accepted from government and private sources only on the condi- tion that RFF shall be solely responsible for the conduct of the research and free to make its results available to the public. Most of the work of Resources for the Future is carried out by its resident staff; part is supported by grants to universities and other nonprofit organizations. Unless otherwise stated, interpretations and conclusions in RFF publica- tions arc those of the authors; the organization takes responsibility for the selection of significant subjects for study. the competence of the researchers. and their freedom of inquiry.

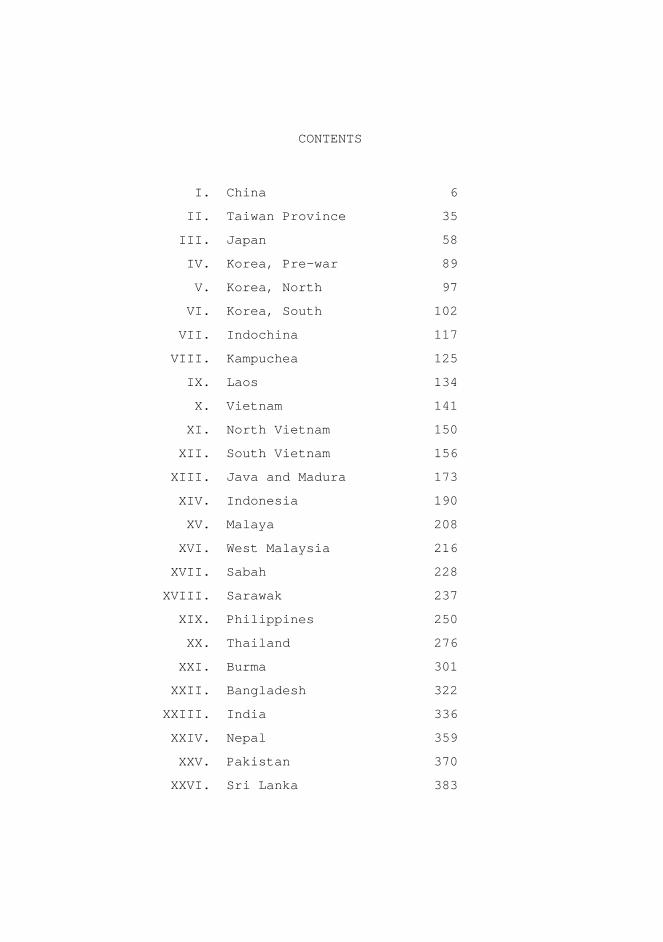
CONTENTS
I. China 6
II. Taiwan Province 35
III. Japan 58
IV. Korea, Pre-war 89
V. Korea, North 97
VI. Korea, South 102
VII. Indochina 117
VIII. Kampuchea 125
IX. Laos 134
X. Vietnam 141
XI. North Vietnam 150
XII. South Vietnam 156
XIII. Java and Madura 173
XIV. Indonesia 190
XV. Malaya 208
XVI. West Malaysia 216
XVII. Sabah 228
XVIII. Sarawak 237
XIX. Philippines 250
XX. Thailand 276
XXI. Burma 301
XXII. Bangladesh 322
XXIII. India 336
XXIV. Nepal 359
XXV. Pakistan 370
XXVI. Sri Lanka 383

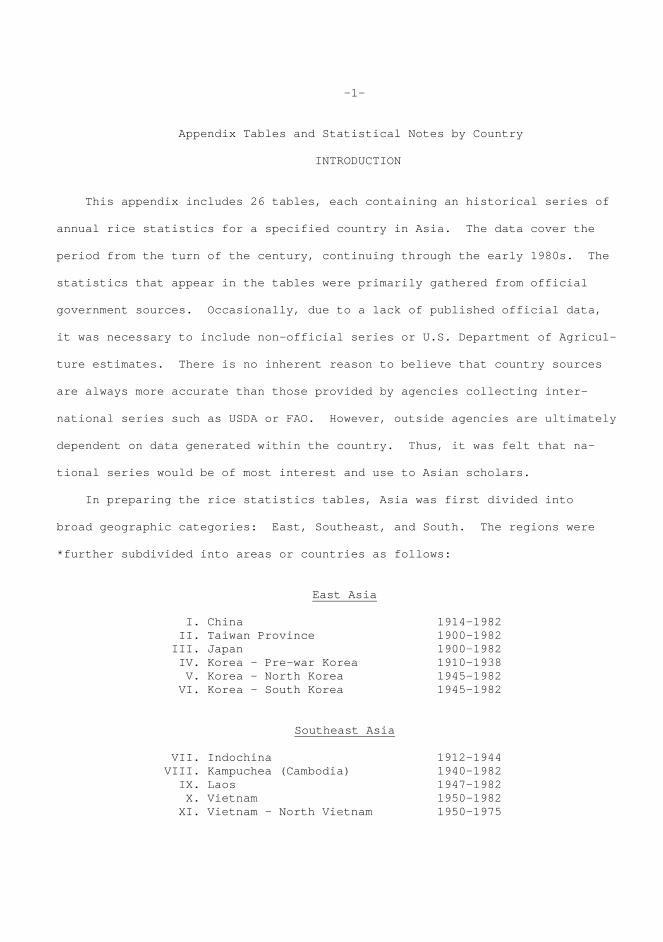
-1- Appendix Tables and Statistical Notes by Country INTRODUCTION This appendix includes 26 tables, each containing an historical series of annual rice statistics for a specified country in Asia. The data cover the period from the turn of the century, continuing through the early 1980s. The statistics that appear in the tables were primarily gathered from official government sources. Occasionally, due to a lack of published official data, it was necessary to include non-official series or U.S. Department of Agricul- ture estimates. There is no inherent reason to believe that country sources are always more accurate than those provided by agencies collecting inter- national series such as USDA or FAO. However, outside agencies are ultimately dependent on data generated within the country. Thus, it was felt that na- tional series would be of most interest and use to Asian scholars. In preparing the rice statistics tables, Asia was first divided into broad geographic categories: East, Southeast, and South. The regions were *further subdivided into areas or countries as follows:
East Asia I. China 1914-1982 II. Taiwan Province 1900-1982 III. Japan 1900-1982 IV. Korea - Pre-war Korea 1910-1938 V. Korea - North Korea 1945-1982 VI. Korea - South Korea 1945-1982
Southeast Asia VII. Indochina 1912-1944 VIII. Kampuchea (Cambodia) 1940-1982 IX. Laos 1947-1982 X. Vietnam 1950-1982 XI. Vietnam - North Vietnam 1950-1975
-2-
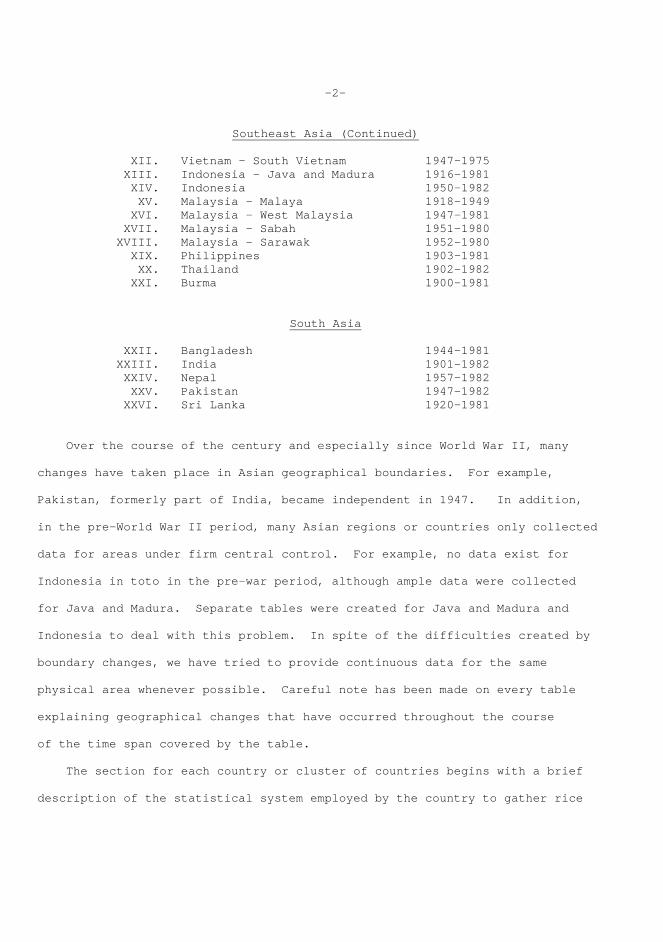
Southeast Asia (Continued) XII. Vietnam - South Vietnam 1947-1975 XIII. Indonesia - Java and Madura 1916-1981 XIV. Indonesia 1950-1982 XV. Malaysia - Malaya 1918-1949 XVI. Malaysia - West Malaysia 1947-1981 XVII. Malaysia - Sabah 1951-1980 XVIII. Malaysia - Sarawak 1952-1980 XIX. Philippines 1903-1981 XX. Thailand 1902-1982 XXI. Burma 1900-1981
South Asia XXII. Bangladesh 1944-1981 XXIII. India 1901-1982 XXIV. Nepal 1957-1982 XXV. Pakistan 1947-1982 XXVI. Sri Lanka 1920-1981 Over the course of the century and especially since World War II, many changes have taken place in Asian geographical boundaries. For example, Pakistan, formerly part of India, became independent in 1947. In addition, in the pre-World War II period, many Asian regions or countries only collected data for areas under firm central control. For example, no data exist for Indonesia in toto in the pre-war period, although ample data were collected for Java and Madura. Separate tables were created for Java and Madura and Indonesia to deal with this problem. In spite of the difficulties created by boundary changes, we have tried to provide continuous data for the same physical area whenever possible. Careful note has been made on every table explaining geographical changes that have occurred throughout the course of the time span covered by the table. The section for each country or cluster of countries begins with a brief description of the statistical system employed by the country to gather rice
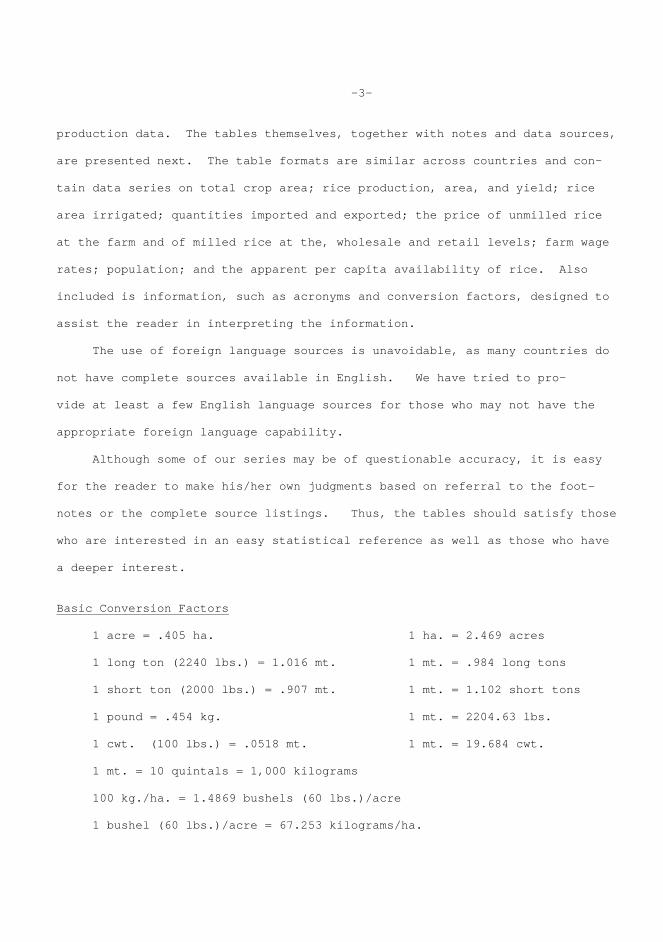
-3- production data. The tables themselves, together with notes and data sources, are presented next. The table formats are similar across countries and con- tain data series on total crop area; rice production, area, and yield; rice area irrigated; quantities imported and exported; the price of unmilled rice at the farm and of milled rice at the, wholesale and retail levels; farm wage rates; population; and the apparent per capita availability of rice. Also included is information, such as acronyms and conversion factors, designed to assist the reader in interpreting the information. The use of foreign language sources is unavoidable, as many countries do not have complete sources available in English. We have tried to pro- vide at least a few English language sources for those who may not have the appropriate foreign language capability. Although some of our series may be of questionable accuracy, it is easy for the reader to make his/her own judgments based on referral to the foot- notes or the complete source listings. Thus, the tables should satisfy those who are interested in an easy statistical reference as well as those who have a deeper interest. Basic Conversion Factors 1 acre = .405 ha. 1 ha. = 2.469 acres 1 long ton (2240 lbs.) = 1.016 mt. 1 mt. = .984 long tons 1 short ton (2000 lbs.) = .907 mt. 1 mt. = 1.102 short tons 1 pound = .454 kg. 1 mt. = 2204.63 lbs. 1 cwt. (100 lbs.) = .0518 mt. 1 mt. = 19.684 cwt. 1 mt. = 10 quintals = 1,000 kilograms 100 kg./ha. = 1.4869 bushels (60 lbs.)/acre 1 bushel (60 lbs.)/acre = 67.253 kilograms/ha.
-4- Basic Conversion Factors (Continued) 1 square mile = 2.590 sq. kilometers 1 square mile = 640 acres = 259 ha. 1 square kilometer = 100 ha. Interpretation of Tables 1. Unless otherwise stated, assume all years to be in crop years, that is, for example, 1979 = fall 1979, spring 1980 for rice production and area, but calendar years (January-December) for rice prices and rice imports and exports. 2. A blank space means no data are available at present. 3. A dash (-) means no or negligible value. 4. NA means data not available and ~re unlikely to appear in the future. 5. Rice area includes double and triple-cropped area unless otherwise indicated. 6. Rice area is assumed to be harvested area unless otherwise stated. 7. All arable land is counted on a calendar-year basis when FA0 is the stated source. 8. USDA 1982 rice area, production, and yield figures are provisional and may be subject to revision. 9. Irrigated area figures refer to man-made irrigated cultivated area unless otherwise stated and do-not include rainfed area. 10. All wholesale and retail prices are free-market prices unless otherwise indicated. 11. When numbers are rounded, all numbers five and greater were rounded up; all numbers four and smaller were rounded down. 12. Data on cultivated land per person are calculated by dividing cultivated land (1) by population (8) on an annual basis.
-5- EAST ASIA I. China 6 II. Taiwan Province 35 III. Japan 58 IV. Korea - Pre-war Korea 89 V. Korea - North Korea 97 VI. Korea - South Korea 102
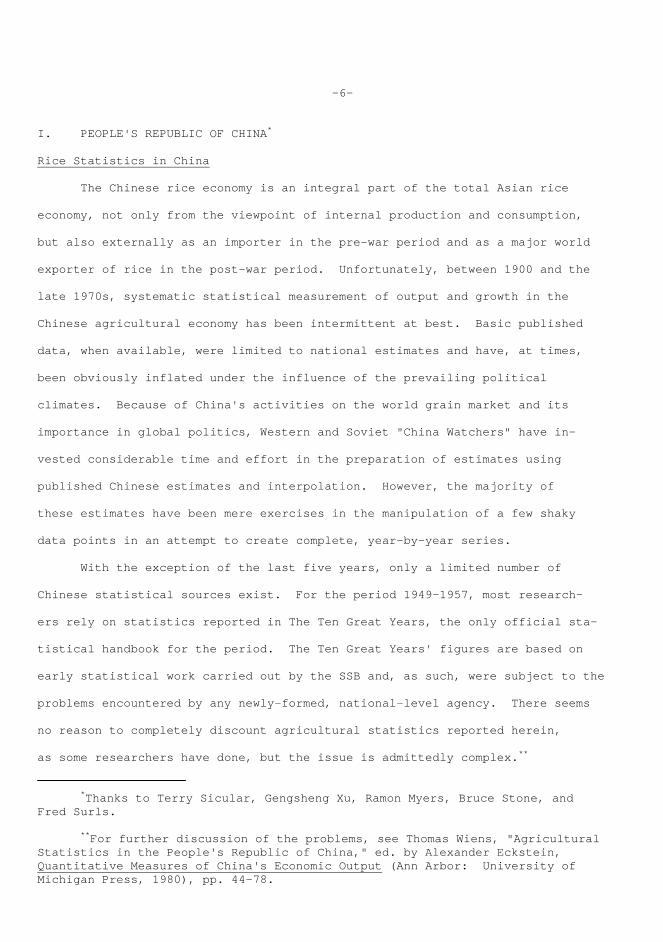
-6- I. PEOPLE'S REPUBLIC OF CHINA*
Rice Statistics in China The Chinese rice economy is an integral part of the total Asian rice economy, not only from the viewpoint of internal production and consumption, but also externally as an importer in the pre-war period and as a major world exporter of rice in the post-war period. Unfortunately, between 1900 and the late 1970s, systematic statistical measurement of output and growth in the Chinese agricultural economy has been intermittent at best. Basic published data, when available, were limited to national estimates and have, at times, been obviously inflated under the influence of the prevailing political climates. Because of China's activities on the world grain market and its importance in global politics, Western and Soviet "China Watchers" have in- vested considerable time and effort in the preparation of estimates using published Chinese estimates and interpolation. However, the majority of these estimates have been mere exercises in the manipulation of a few shaky data points in an attempt to create complete, year-by-year series. With the exception of the last five years, only a limited number of Chinese statistical sources exist. For the period 1949-1957, most research- ers rely on statistics reported in The Ten Great Years, the only official sta- tistical handbook for the period. The Ten Great Years' figures are based on early statistical work carried out by the SSB and, as such, were subject to the problems encountered by any newly-formed, national-level agency. There seems no reason to completely discount agricultural statistics reported herein, as some researchers have done, but the issue is admittedly complex.**
*Thanks to Terry Sicular, Gengsheng Xu, Ramon Myers, Bruce Stone, and Fred Surls. **For further discussion of the problems, see Thomas Wiens, "Agricultural Statistics in the People's Republic of China," ed. by Alexander Eckstein, Quantitative Measures of China's Economic Output (Ann Arbor: University of Michigan Press, 1980), pp. 44-78.
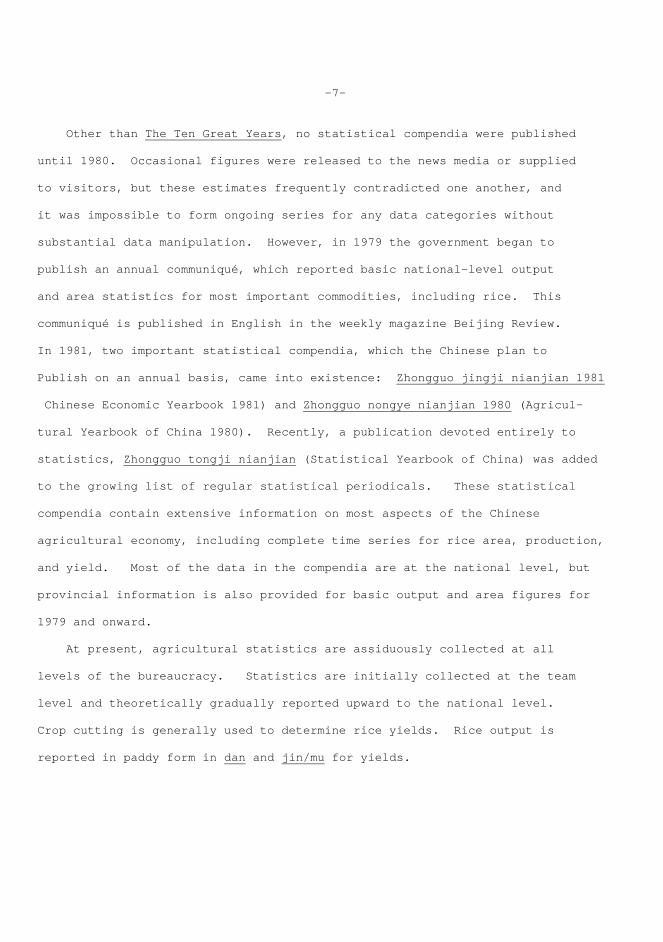
-7- Other than The Ten Great Years, no statistical compendia were published until 1980. Occasional figures were released to the news media or supplied to visitors, but these estimates frequently contradicted one another, and it was impossible to form ongoing series for any data categories without substantial data manipulation. However, in 1979 the government began to publish an annual communiqué, which reported basic national-level output and area statistics for most important commodities, including rice. This communiqué is published in English in the weekly magazine Beijing Review. In 1981, two important statistical compendia, which the Chinese plan to Publish on an annual basis, came into existence: Zhongguo jingji nianjian 1981 Chinese Economic Yearbook 1981) and Zhongguo nongye nianjian 1980 (Agricul- tural Yearbook of China 1980). Recently, a publication devoted entirely to statistics, Zhongguo tongji nianjian (Statistical Yearbook of China) was added to the growing list of regular statistical periodicals. These statistical compendia contain extensive information on most aspects of the Chinese agricultural economy, including complete time series for rice area, production, and yield. Most of the data in the compendia are at the national level, but provincial information is also provided for basic output and area figures for 1979 and onward. At present, agricultural statistics are assiduously collected at all levels of the bureaucracy. Statistics are initially collected at the team level and theoretically gradually reported upward to the national level. Crop cutting is generally used to determine rice yields. Rice output is reported in paddy form in dan and jin/mu for yields.
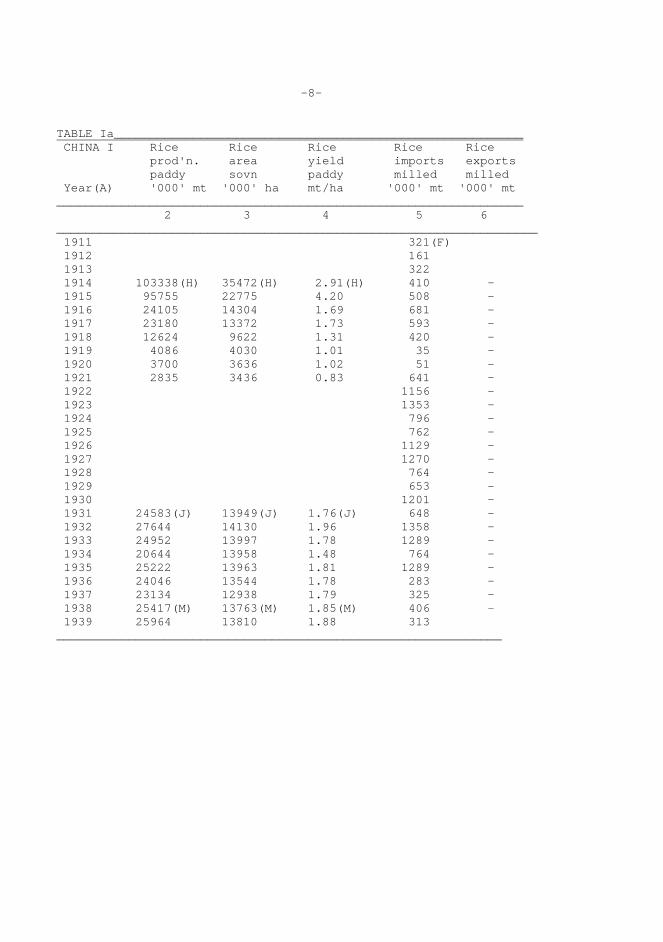
-8- TABLE Ia_________________________________________________________ CHINA I Rice Rice Rice Rice Rice prod'n. area yield imports exports paddy sovn paddy milled milled Year(A) '000' mt '000' ha mt/ha '000' mt '000' mt _________________________________________________________________ 2 3 4 5 6 ___________________________________________________________________ 1911 321(F) 1912 161 1913 322 1914 103338(H) 35472(H) 2.91(H) 410 - 1915 95755 22775 4.20 508 - 1916 24105 14304 1.69 681 - 1917 23180 13372 1.73 593 - 1918 12624 9622 1.31 420 - 1919 4086 4030 1.01 35 - 1920 3700 3636 1.02 51 - 1921 2835 3436 0.83 641 - 1922 1156 - 1923 1353 - 1924 796 - 1925 762 - 1926 1129 - 1927 1270 - 1928 764 - 1929 653 - 1930 1201 - 1931 24583(J) 13949(J) 1.76(J) 648 - 1932 27644 14130 1.96 1358 - 1933 24952 13997 1.78 1289 - 1934 20644 13958 1.48 764 - 1935 25222 13963 1.81 1289 - 1936 24046 13544 1.78 283 - 1937 23134 12938 1.79 325 - 1938 25417(M) 13763(M) 1.85(M) 406 - 1939 25964 13810 1.88 313 ______________________________________________________________
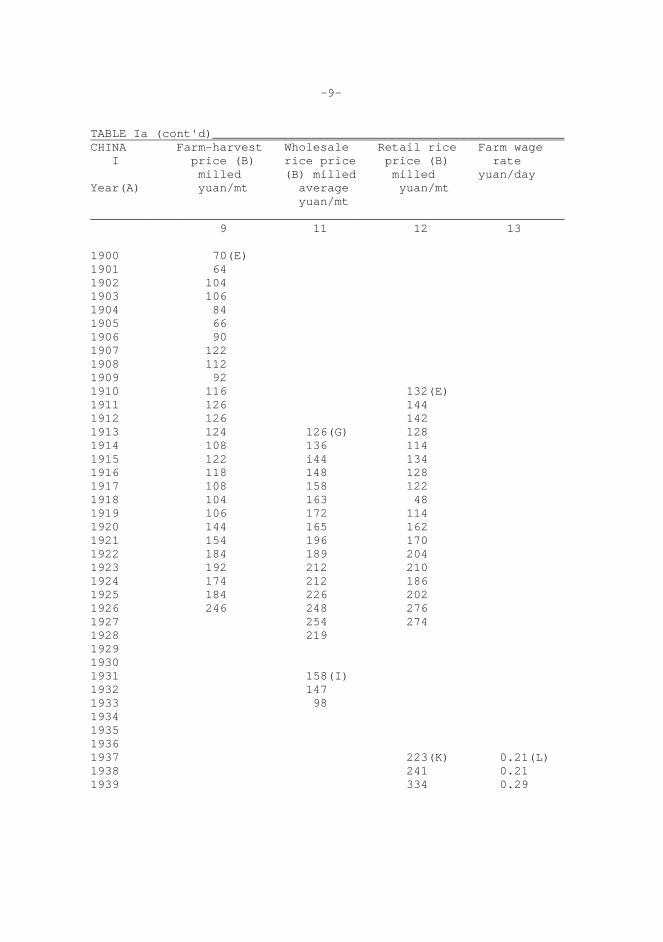
-9- TABLE Ia (cont'd)_________________________________________________ CHINA Farm-harvest Wholesale Retail rice Farm wage I price (B) rice price price (B) rate milled (B) milled milled yuan/day Year(A) yuan/mt average yuan/mt yuan/mt __________________________________________________________________ 9 11 12 13 1900 70(E) 1901 64 1902 104 1903 106 1904 84 1905 66 1906 90 1907 122 1908 112 1909 92 1910 116 132(E) 1911 126 144 1912 126 142 1913 124 126(G) 128 1914 108 136 114 1915 122 i44 134 1916 118 148 128 1917 108 158 122 1918 104 163 48 1919 106 172 114 1920 144 165 162 1921 154 196 170 1922 184 189 204 1923 192 212 210 1924 174 212 186 1925 184 226 202 1926 246 248 276 1927 254 274 1928 219 1929 1930 1931 158(I) 1932 147 1933 98 1934 1935 1936 1937 223(K) 0.21(L) 1938 241 0.21 1939 334 0.29
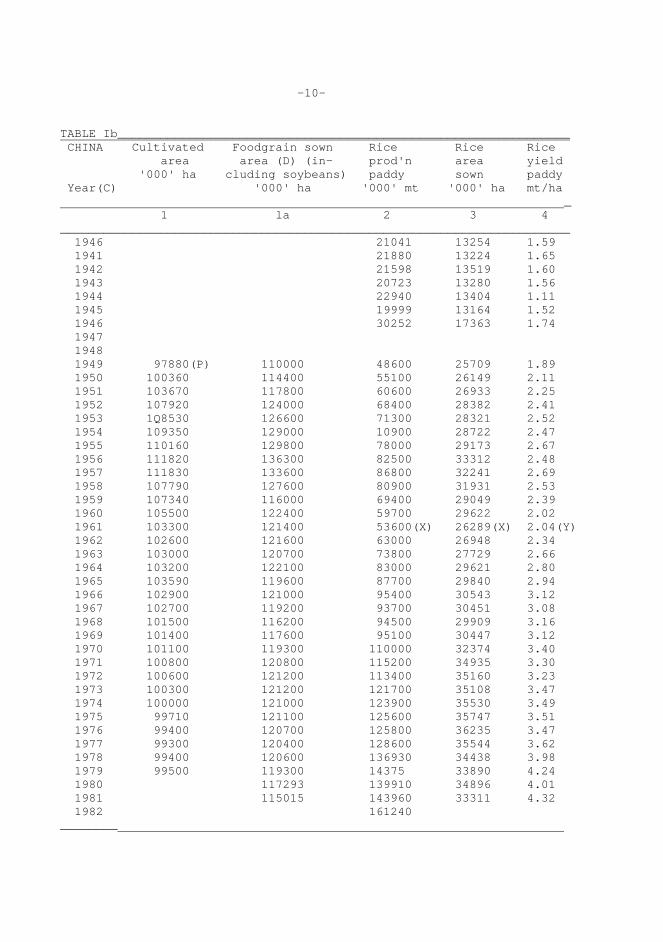
-10- TABLE Ib_______________________________________________________________ CHINA Cultivated Foodgrain sown Rice Rice Rice area area (D) (in- prod'n area yield '000' ha cluding soybeans) paddy sown paddy Year(C) '000' ha '000' mt '000' ha mt/ha _ 1 la 2 3 4 _______________________________________________________________________ 1946 21041 13254 1.59 1941 21880 13224 1.65 1942 21598 13519 1.60 1943 20723 13280 1.56 1944 22940 13404 1.11 1945 19999 13164 1.52 1946 30252 17363 1.74 1947 1948 1949 97880(P) 110000 48600 25709 1.89 1950 100360 114400 55100 26149 2.11 1951 103670 117800 60600 26933 2.25 1952 107920 124000 68400 28382 2.41 1953 1Q8530 126600 71300 28321 2.52 1954 109350 129000 10900 28722 2.47 1955 110160 129800 78000 29173 2.67 1956 111820 136300 82500 33312 2.48 1957 111830 133600 86800 32241 2.69 1958 107790 127600 80900 31931 2.53 1959 107340 116000 69400 29049 2.39 1960 105500 122400 59700 29622 2.02 1961 103300 121400 53600(X) 26289(X) 2.04(Y) 1962 102600 121600 63000 26948 2.34 1963 103000 120700 73800 27729 2.66 1964 103200 122100 83000 29621 2.80 1965 103590 119600 87700 29840 2.94 1966 102900 121000 95400 30543 3.12 1967 102700 119200 93700 30451 3.08 1968 101500 116200 94500 29909 3.16 1969 101400 117600 95100 30447 3.12 1970 101100 119300 110000 32374 3.40 1971 100800 120800 115200 34935 3.30 1972 100600 121200 113400 35160 3.23 1973 100300 121200 121700 35108 3.47 1974 100000 121000 123900 35530 3.49 1975 99710 121100 125600 35747 3.51 1976 99400 120700 125800 36235 3.47 1977 99300 120400 128600 35544 3.62 1978 99400 120600 136930 34438 3.98 1979 99500 119300 14375 33890 4.24 1980 117293 139910 34896 4.01 1981 115015 143960 33311 4.32 1982 161240 ________
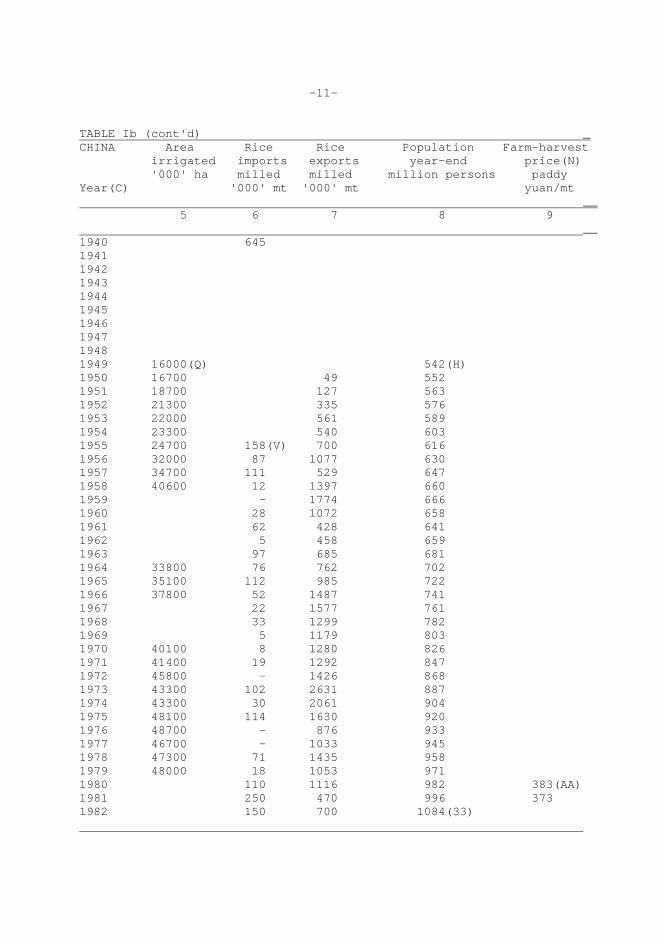
-11- TABLE Ib (cont'd) _ CHINA Area Rice Rice Population Farm-harvest irrigated imports exports year-end price(N) '000' ha milled milled million persons paddy Year(C) '000' mt '000' mt yuan/mt __ 5 6 7 8 9 __ 1940 645 1941 1942 1943 1944 1945 1946 1947 1948 1949 16000(Q) 542(H) 1950 16700 49 552 1951 18700 127 563 1952 21300 335 576 1953 22000 561 589 1954 23300 540 603 1955 24700 158(V) 700 616 1956 32000 87 1077 630 1957 34700 111 529 647 1958 40600 12 1397 660 1959 - 1774 666 1960 28 1072 658 1961 62 428 641 1962 5 458 659 1963 97 685 681 1964 33800 76 762 702 1965 35100 112 985 722 1966 37800 52 1487 741 1967 22 1577 761 1968 33 1299 782 1969 5 1179 803 1970 40100 8 1280 826 1971 41400 19 1292 847 1972 45800 - 1426 868 1973 43300 102 2631 887 1974 43300 30 2061 904 1975 48100 114 1630 920 1976 48700 - 876 933 1977 46700 - 1033 945 1978 47300 71 1435 958 1979 48000 18 1053 971 1980 110 1116 982 383(AA) 1981 250 470 996 373 1982 150 700 1084(33)
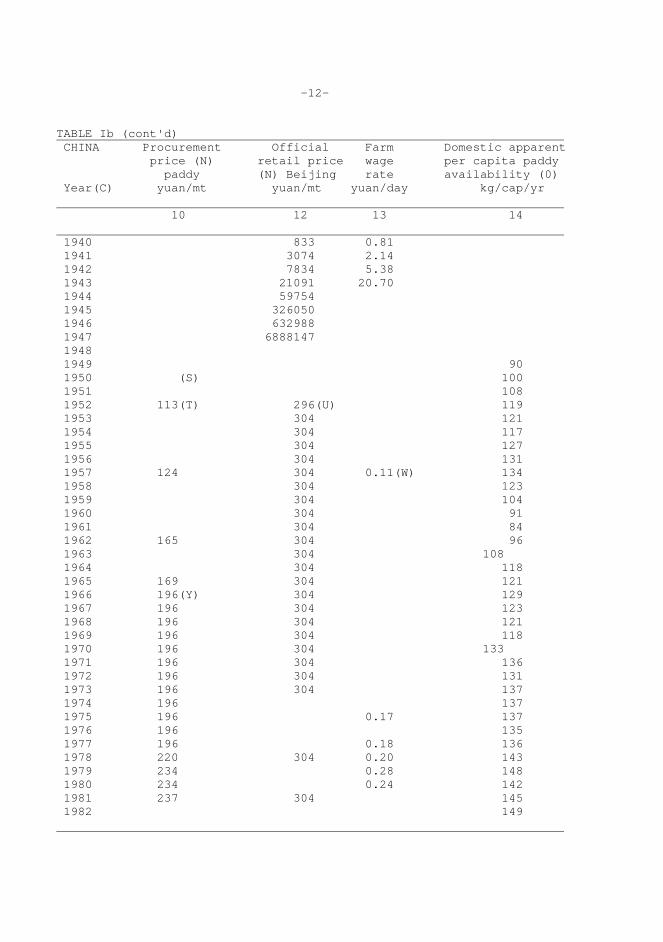
-12- TABLE Ib (cont'd) CHINA Procurement Official Farm Domestic apparent price (N) retail price wage per capita paddy paddy (N) Beijing rate availability (0) Year(C) yuan/mt yuan/mt yuan/day kg/cap/yr 10 12 13 14 1940 833 0.81 1941 3074 2.14 1942 7834 5.38 1943 21091 20.70 1944 59754 1945 326050 1946 632988 1947 6888147 1948 1949 90 1950 (S) 100 1951 108 1952 113(T) 296(U) 119 1953 304 121 1954 304 117 1955 304 127 1956 304 131 1957 124 304 0.11(W) 134 1958 304 123 1959 304 104 1960 304 91 1961 304 84 1962 165 304 96 1963 304 108 1964 304 118 1965 169 304 121 1966 196(Y) 304 129 1967 196 304 123 1968 196 304 121 1969 196 304 118 1970 196 304 133 1971 196 304 136 1972 196 304 131 1973 196 304 137 1974 196 137 1975 196 0.17 137 1976 196 135 1977 196 0.18 136 1978 220 304 0.20 143 1979 234 0.28 148 1980 234 0.24 142 1981 237 304 145 1982 149
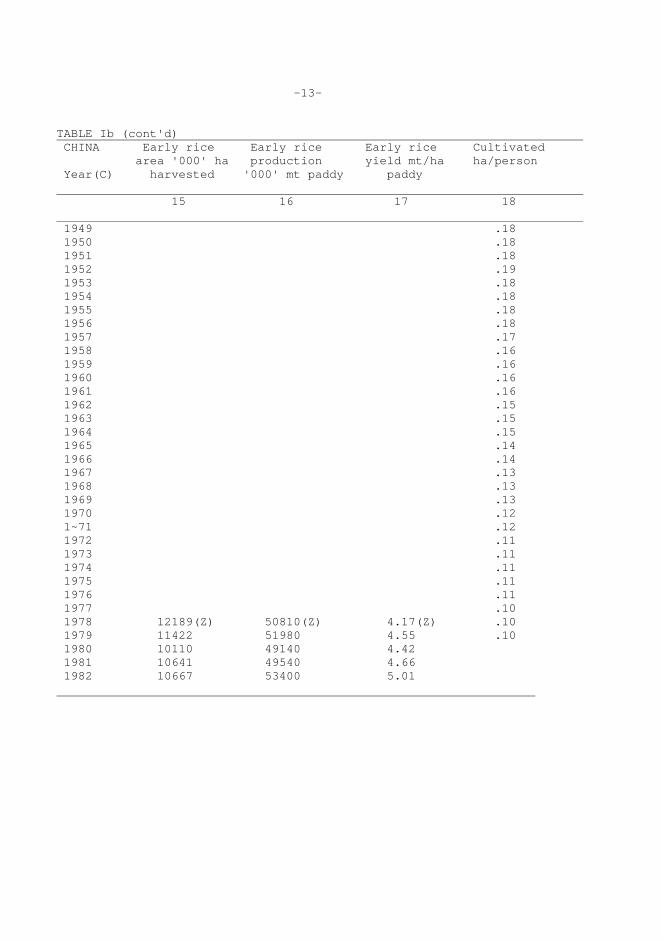
-13- TABLE Ib (cont'd) CHINA Early rice Early rice Early rice Cultivated area '000' ha production yield mt/ha ha/person Year(C) harvested '000' mt paddy paddy 15 16 17 18 1949 .18 1950 .18 1951 .18 1952 .19 1953 .18 1954 .18 1955 .18 1956 .18 1957 .17 1958 .16 1959 .16 1960 .16 1961 .16 1962 .15 1963 .15 1964 .15 1965 .14 1966 .14 1967 .13 1968 .13 1969 .13 1970 .12 1~71 .12 1972 .11 1973 .11 1974 .11 1975 .11 1976 .11 1977 .10 1978 12189(Z) 50810(Z) 4.17(Z) .10 1979 11422 51980 4.55 .10 1980 10110 49140 4.42 1981 10641 49540 4.66 1982 10667 53400 5.01
-14-
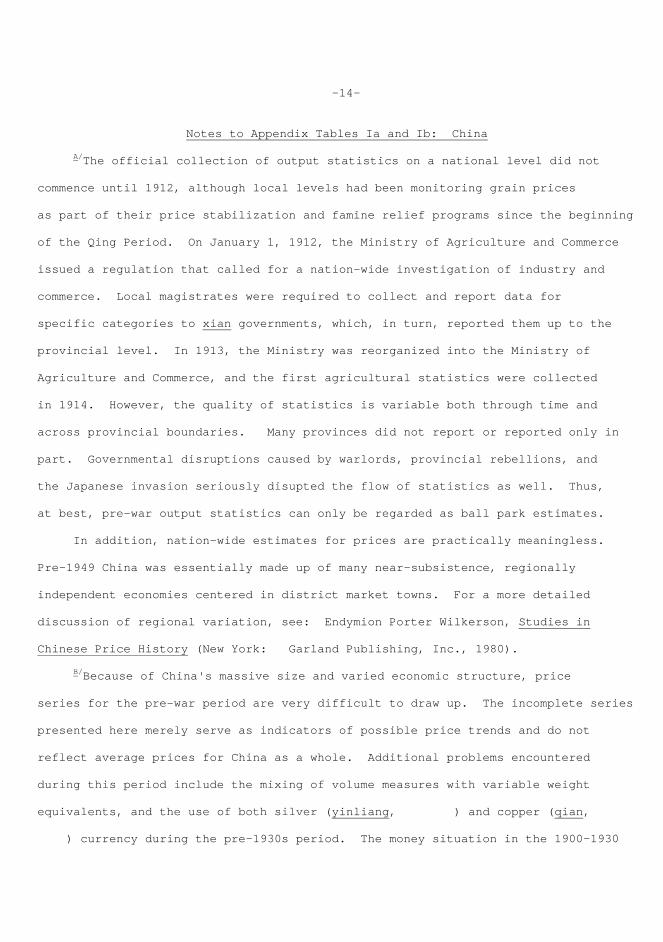
Notes to Appendix Tables Ia and Ib: China A/The official collection of output statistics on a national level did not commence until 1912, although local levels had been monitoring grain prices as part of their price stabilization and famine relief programs since the beginning of the Qing Period. On January 1, 1912, the Ministry of Agriculture and Commerce issued a regulation that called for a nation-wide investigation of industry and commerce. Local magistrates were required to collect and report data for specific categories to xian governments, which, in turn, reported them up to the provincial level. In 1913, the Ministry was reorganized into the Ministry of Agriculture and Commerce, and the first agricultural statistics were collected in 1914. However, the quality of statistics is variable both through time and across provincial boundaries. Many provinces did not report or reported only in part. Governmental disruptions caused by warlords, provincial rebellions, and the Japanese invasion seriously disupted the flow of statistics as well. Thus, at best, pre-war output statistics can only be regarded as ball park estimates. In addition, nation-wide estimates for prices are practically meaningless. Pre-1949 China was essentially made up of many near-subsistence, regionally independent economies centered in district market towns. For a more detailed discussion of regional variation, see: Endymion Porter Wilkerson, Studies in Chinese Price History (New York: Garland Publishing, Inc., 1980). B/Because of China's massive size and varied economic structure, price series for the pre-war period are very difficult to draw up. The incomplete series presented here merely serve as indicators of possible price trends and do not reflect average prices for China as a whole. Additional problems encountered during this period include the mixing of volume measures with variable weight equivalents, and the use of both silver (yinliang, ) and copper (qian, ) currency during the pre-1930s period. The money situation in the 1900-1930
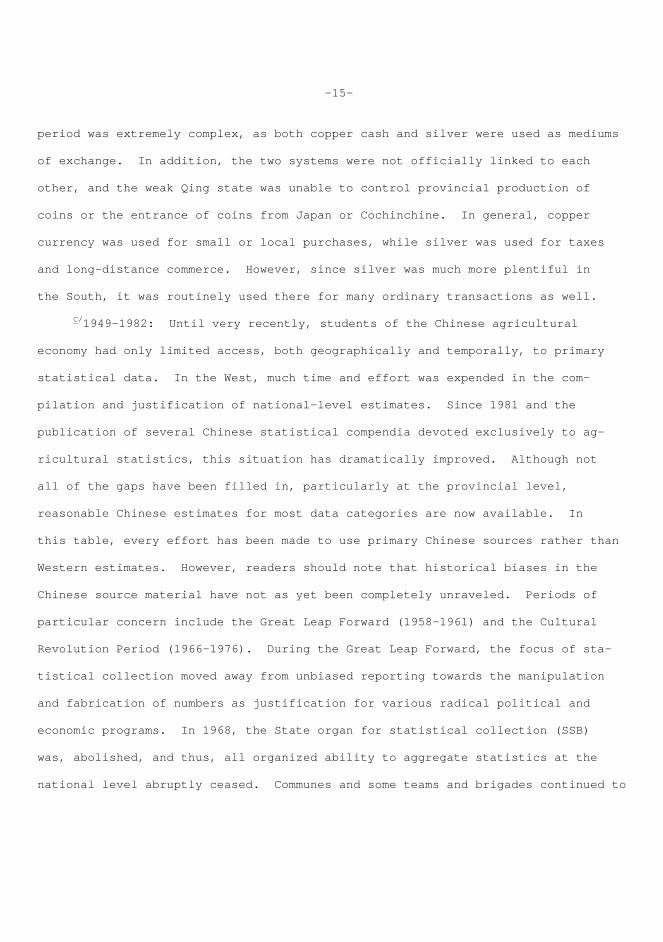
-15- period was extremely complex, as both copper cash and silver were used as mediums of exchange. In addition, the two systems were not officially linked to each other, and the weak Qing state was unable to control provincial production of coins or the entrance of coins from Japan or Cochinchine. In general, copper currency was used for small or local purchases, while silver was used for taxes and long-distance commerce. However, since silver was much more plentiful in the South, it was routinely used there for many ordinary transactions as well. C/1949-1982: Until very recently, students of the Chinese agricultural economy had only limited access, both geographically and temporally, to primary statistical data. In the West, much time and effort was expended in the com- pilation and justification of national-level estimates. Since 1981 and the publication of several Chinese statistical compendia devoted exclusively to ag- ricultural statistics, this situation has dramatically improved. Although not all of the gaps have been filled in, particularly at the provincial level, reasonable Chinese estimates for most data categories are now available. In this table, every effort has been made to use primary Chinese sources rather than Western estimates. However, readers should note that historical biases in the Chinese source material have not as yet been completely unraveled. Periods of particular concern include the Great Leap Forward (1958-1961) and the Cultural Revolution Period (1966-1976). During the Great Leap Forward, the focus of sta- tistical collection moved away from unbiased reporting towards the manipulation and fabrication of numbers as justification for various radical political and economic programs. In 1968, the State organ for statistical collection (SSB) was, abolished, and thus, all organized ability to aggregate statistics at the national level abruptly ceased. Communes and some teams and brigades continued to
-16- keep records, but these were not always passed on to higher levels. By 1971 and the conclusion of the phase of popular participation in the Cultural Revolution, the SSB was reorganized. Since then, the Chinese have made concerted efforts to improve and systematize statistical collection. D/1949 1981: This series has been included due to the rough and approximate nature of the "Cultivated Area" series. It should be noted that the Chinese definition of foodgrain includes rice, wheat, corn, millet, sorghum, and other grains as well as soybeans and tubers valued at one-fifth their wet weight. E/1900-1940: Farm-harvest and retail prices are for white polished rice. Data were collected from six market towns in Wuchin Xian in Jiangsu Province. Prices are recorded in silver currency. Gradual devaluation of silver (due to the abandonment of the silver standard in many countries) primarily accounts for the increases in prices between 1900 and 1927. Jiangsu Province is an important rice-growing province in China. F/1911-1940: Rice imports are for net imports, with the exception of the 1911 figure, which is for gross imports. G/1913-1928: Data is an average of Shanghai and Xiaozhan. H/1914-1921: Prior to 1916, 21 provinces reported data. Only Mongolia, Tibet, and Qinghai were not included. After 1916, regular reporting in certain provinces, mostly in south and southwest China (including Yunnan, Guizhou, Sichuan, Guangdong, Guangxi, and Hunan) was curtailed due to the disruptions caused by internal rebellion. By 1921, only six provinces (Henan, Shanxi, Jiangsu, Anhui, Shensi, and Chahar) were still regularly reporting. This accounts for the drop in rice area and production throughout the period.
-17- I/1931-1933: Average of nine urban centers throughout China for medium quality rice. J/1931-1937: Data is for Ningxia, Gansu, Shaanxi, Henan, Hubei, Sichuan, Yunnan, Guizhou, Hunan, Jiangxi, Zhejiang, Fujian, and Guangdong Provinces only. K/l937-1947: Data are average prices for grade one rice in Henan Province. L/1937-1943: Farm wage rate represents an average of both busy and off- season wage rates for male and female laborers. M/1938-1946: Data is for Ningxia, Gansu, Shaanxi, Henan, Hubei, Sichuan, Yunnan, Guizhou, Hunan, Jiangxi, Zhejiang, Fujian, Guangdong, Guangxi, and Qinghai Provinces only. N/Since China is a centrally planned economy, the pricing structure differs considerably from most other Asian rice economies, where free market conditions prevail. The Chinese government divides agricultural products, into categories according to their strategic importance. Crucial products in the major cate- gory, including cereals, cotton, and edible vegetable oils, are subject to strict state control and are part of a regular procurement program. Until very recently, these products could not legally he sold or exchanged on the tree market. Although peasants may now legally sell surplus crucial products (except cotton) privately, this accounts for only a small percentage of the total commodities marketed and procured. Thus, the publication of farm-gate prices for rice is a recent Chinese phenomenon. Distinct prices for rice are available at approximately seven stages in the Chinese marketing and procurement system. The basic price is the fixed procurement price (shougou jiage) for quota sales of rice. With the exception
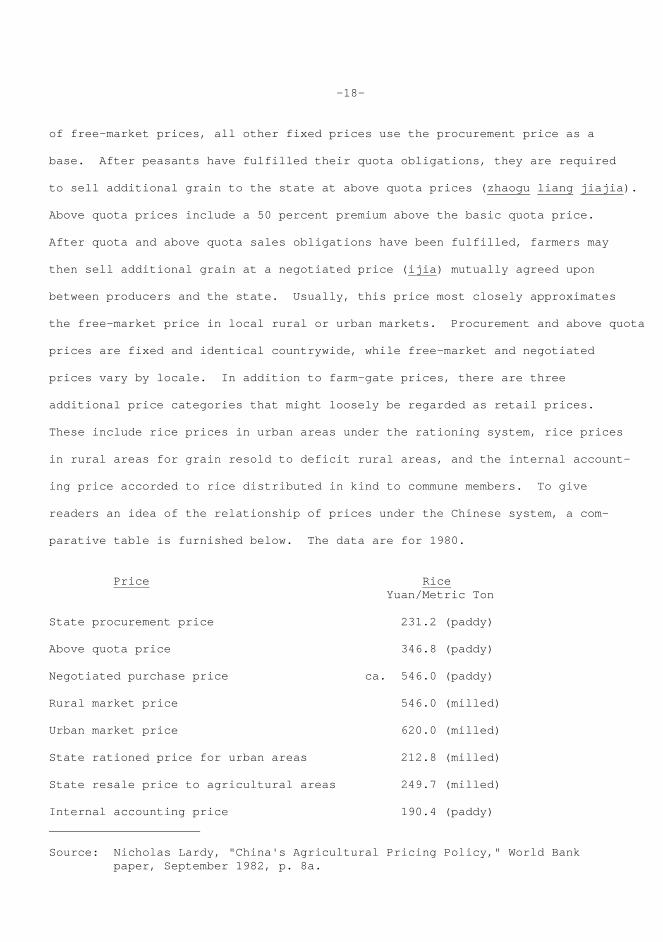
-18- of free-market prices, all other fixed prices use the procurement price as a base. After peasants have fulfilled their quota obligations, they are required to sell additional grain to the state at above quota prices (zhaogu liang jiajia). Above quota prices include a 50 percent premium above the basic quota price. After quota and above quota sales obligations have been fulfilled, farmers may then sell additional grain at a negotiated price (ijia) mutually agreed upon between producers and the state. Usually, this price most closely approximates the free-market price in local rural or urban markets. Procurement and above quota prices are fixed and identical countrywide, while free-market and negotiated prices vary by locale. In addition to farm-gate prices, there are three additional price categories that might loosely be regarded as retail prices. These include rice prices in urban areas under the rationing system, rice prices in rural areas for grain resold to deficit rural areas, and the internal account- ing price accorded to rice distributed in kind to commune members. To give readers an idea of the relationship of prices under the Chinese system, a com- parative table is furnished below. The data are for 1980. Price Rice Yuan/Metric Ton State procurement price 231.2 (paddy) Above quota price 346.8 (paddy) Negotiated purchase price ca. 546.0 (paddy) Rural market price 546.0 (milled) Urban market price 620.0 (milled) State rationed price for urban areas 212.8 (milled) State resale price to agricultural areas 249.7 (milled) Internal accounting price 190.4 (paddy) Source: Nicholas Lardy, "China's Agricultural Pricing Policy," World Bank paper, September 1982, p. 8a.
-19- O/Although rice is the primary foodgrain in China, wheat and corn are also extremely important. Thus, low apparent availability is in no way an indication of total average foodgrain availability, which in most years would probably be close to triple the rice availability. P/1949-1979: Cultivated area refers to area sown to annual crops. Permanent tree crops and pasture land are not included. The "Cultivated Area" series is obviously a very rough attempt at the estimation of cultivated area. The "Food Grain Sown Area," series (1a), provides a much more realistic appraisal of total area actually in use, although it does not include commercial craps (e.g., oilseeds, cotton) and denotes sown rather than cultivated area. (The multiple cropping index is approximately 150.) Q/l949-l979: Data are for total cultivated area that is irrigated. Although most rice area in China is irrigated, many other crops, such as wheat or cotton. are also frequently irrigated. The 1949-1957 figures are from SSB, Ten Great Years and are still used by the SSB and the Ministry of Water Conservancy. Bruce Stone (IFPRI constructed the remainder of this series on the basis of five absolute figures (1949, 1973, 1977, 1978 and 1979) issued by the Ministry of Water Conservancy. Other figures were calculated from published percentage increments. R/l949-l980: Data are year-end figures. This series is drawn from official State Statistical Bureau estimates (1949-1951) and from an approximation of an official series created by John Aird of the Foreign Demographic Analysis Division of the U.S. Department of Commerce. A full census of the Chinese population was carried out in midyear1982 (see Footnote bb). S/1950-1953: Procurement prices reportedly rose by more than one-third between 1950 and the instigation of widespread procurement in 1953. These changes were made to raise the value of agricultural products relative to industrial
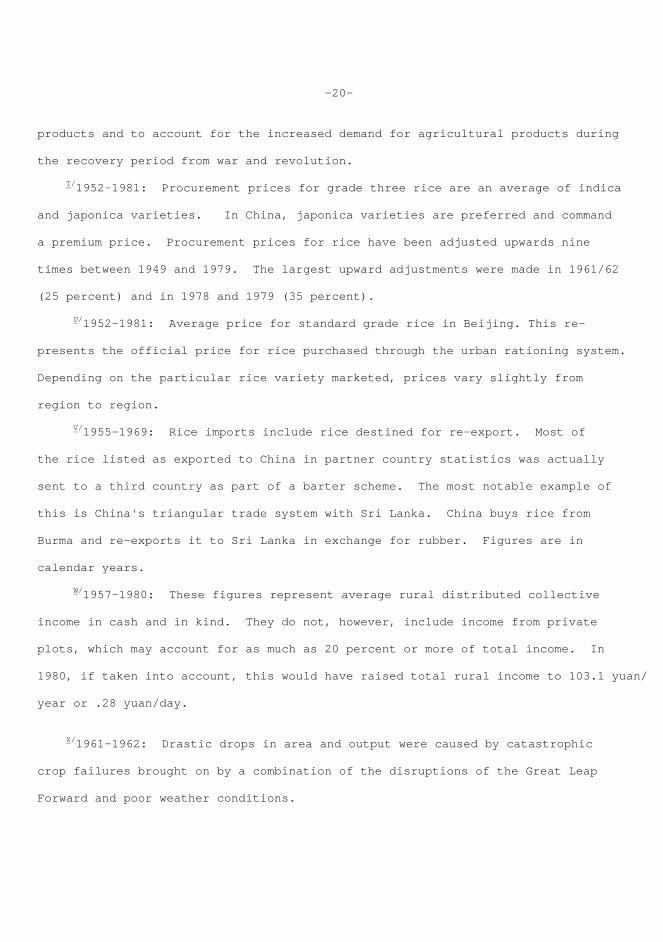
-20- products and to account for the increased demand for agricultural products during the recovery period from war and revolution. T/1952-1981: Procurement prices for grade three rice are an average of indica and japonica varieties. In China, japonica varieties are preferred and command a premium price. Procurement prices for rice have been adjusted upwards nine times between 1949 and 1979. The largest upward adjustments were made in 1961/62 (25 percent) and in 1978 and 1979 (35 percent). U/1952-1981: Average price for standard grade rice in Beijing. This re- presents the official price for rice purchased through the urban rationing system. Depending on the particular rice variety marketed, prices vary slightly from region to region. V/1955-1969: Rice imports include rice destined for re-export. Most of the rice listed as exported to China in partner country statistics was actually sent to a third country as part of a barter scheme. The most notable example of this is China's triangular trade system with Sri Lanka. China buys rice from Burma and re-exports it to Sri Lanka in exchange for rubber. Figures are in calendar years. W/1957-1980: These figures represent average rural distributed collective income in cash and in kind. They do not, however, include income from private plots, which may account for as much as 20 percent or more of total income. In 1980, if taken into account, this would have raised total rural income to 103.1 yuan/ year or .28 yuan/day. X/1961-1962: Drastic drops in area and output were caused by catastrophic crop failures brought on by a combination of the disruptions of the Great Leap Forward and poor weather conditions.
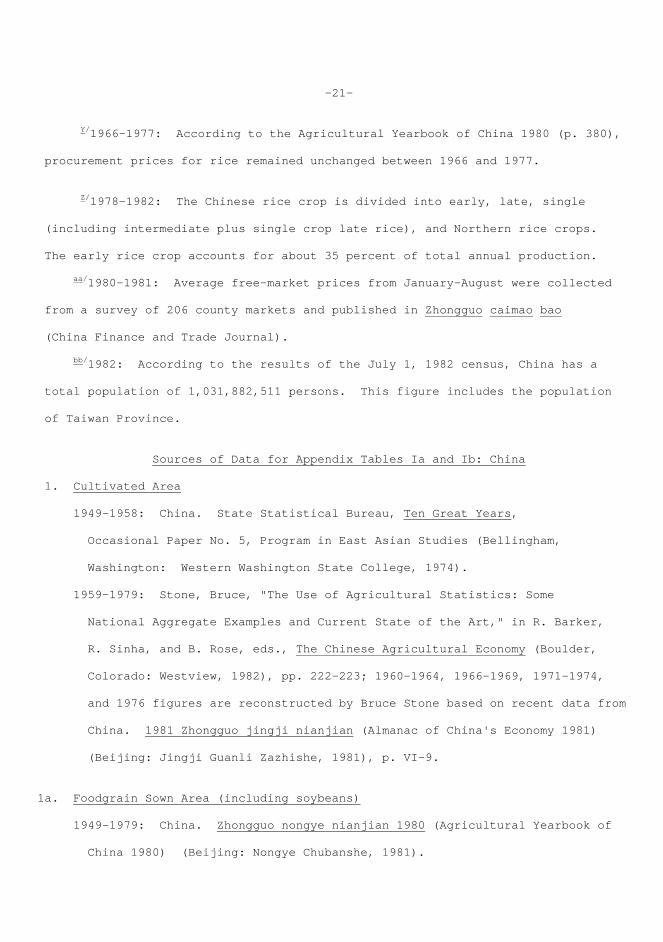
-21- Y/1966-1977: According to the Agricultural Yearbook of China 1980 (p. 380), procurement prices for rice remained unchanged between 1966 and 1977. Z/1978-1982: The Chinese rice crop is divided into early, late, single (including intermediate plus single crop late rice), and Northern rice crops. The early rice crop accounts for about 35 percent of total annual production. aa/1980-1981: Average free-market prices from January-August were collected from a survey of 206 county markets and published in Zhongguo caimao bao (China Finance and Trade Journal). bb/1982: According to the results of the July 1, 1982 census, China has a total population of 1,031,882,511 persons. This figure includes the population of Taiwan Province. Sources of Data for Appendix Tables Ia and Ib: China 1. Cultivated Area 1949-1958: China. State Statistical Bureau, Ten Great Years, Occasional Paper No. 5, Program in East Asian Studies (Bellingham, Washington: Western Washington State College, 1974). 1959-1979: Stone, Bruce, "The Use of Agricultural Statistics: Some National Aggregate Examples and Current State of the Art," in R. Barker, R. Sinha, and B. Rose, eds., The Chinese Agricultural Economy (Boulder, Colorado: Westview, 1982), pp. 222-223; 1960-1964, 1966-1969, 1971-1974, and 1976 figures are reconstructed by Bruce Stone based on recent data from China. 1981 Zhongguo jingji nianjian (Almanac of China's Economy 1981) (Beijing: Jingji Guanli Zazhishe, 1981), p. VI-9. 1a. Foodgrain Sown Area (including soybeans) 1949-1979: China. Zhongguo nongye nianjian 1980 (Agricultural Yearbook of China 1980) (Beijing: Nongye Chubanshe, 1981).
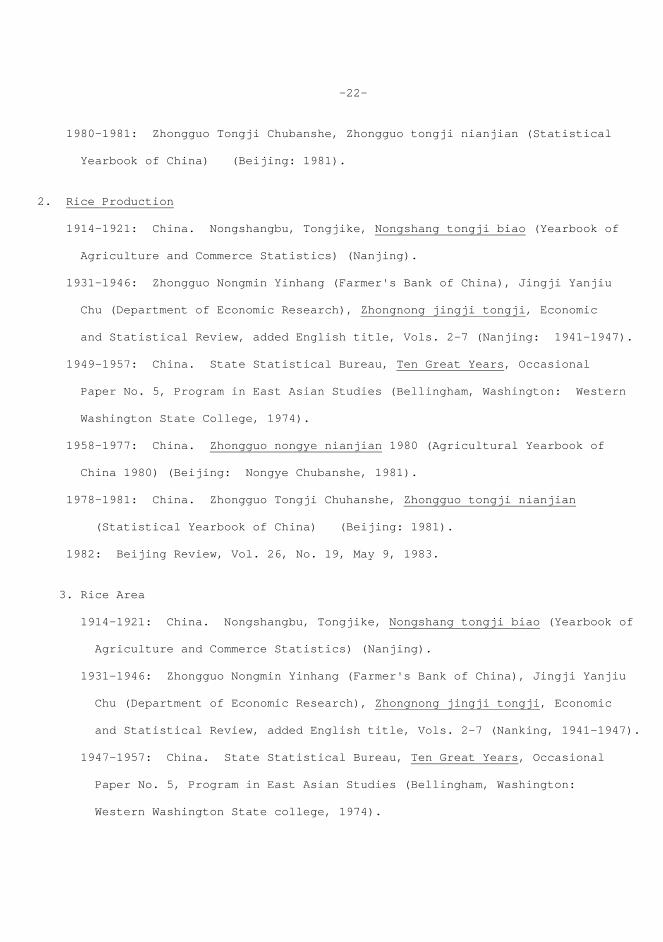
-22- 1980-1981: Zhongguo Tongji Chubanshe, Zhongguo tongji nianjian (Statistical Yearbook of China) (Beijing: 1981). 2. Rice Production 1914-1921: China. Nongshangbu, Tongjike, Nongshang tongji biao (Yearbook of Agriculture and Commerce Statistics) (Nanjing). 1931-1946: Zhongguo Nongmin Yinhang (Farmer's Bank of China), Jingji Yanjiu Chu (Department of Economic Research), Zhongnong jingji tongji, Economic and Statistical Review, added English title, Vols. 2-7 (Nanjing: 1941-1947). 1949-1957: China. State Statistical Bureau, Ten Great Years, Occasional Paper No. 5, Program in East Asian Studies (Bellingham, Washington: Western Washington State College, 1974). 1958-1977: China. Zhongguo nongye nianjian 1980 (Agricultural Yearbook of China 1980) (Beijing: Nongye Chubanshe, 1981). 1978-1981: China. Zhongguo Tongji Chuhanshe, Zhongguo tongji nianjian (Statistical Yearbook of China) (Beijing: 1981). 1982: Beijing Review, Vol. 26, No. 19, May 9, 1983. 3. Rice Area 1914-1921: China. Nongshangbu, Tongjike, Nongshang tongji biao (Yearbook of Agriculture and Commerce Statistics) (Nanjing). 1931-1946: Zhongguo Nongmin Yinhang (Farmer's Bank of China), Jingji Yanjiu Chu (Department of Economic Research), Zhongnong jingji tongji, Economic and Statistical Review, added English title, Vols. 2-7 (Nanking, 1941-1947). 1947-1957: China. State Statistical Bureau, Ten Great Years, Occasional Paper No. 5, Program in East Asian Studies (Bellingham, Washington: Western Washington State college, 1974).
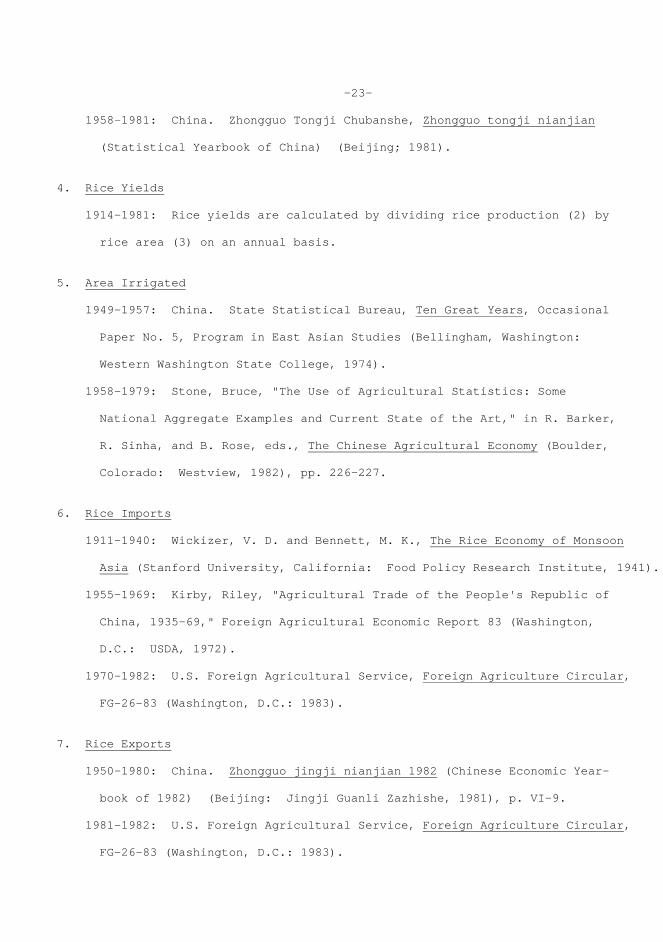
-23- 1958-1981: China. Zhongguo Tongji Chubanshe, Zhongguo tongji nianjian (Statistical Yearbook of China) (Beijing; 1981). 4. Rice Yields 1914-1981: Rice yields are calculated by dividing rice production (2) by rice area (3) on an annual basis. 5. Area Irrigated 1949-1957: China. State Statistical Bureau, Ten Great Years, Occasional Paper No. 5, Program in East Asian Studies (Bellingham, Washington: Western Washington State College, 1974). 1958-1979: Stone, Bruce, "The Use of Agricultural Statistics: Some National Aggregate Examples and Current State of the Art," in R. Barker, R. Sinha, and B. Rose, eds., The Chinese Agricultural Economy (Boulder, Colorado: Westview, 1982), pp. 226-227. 6. Rice Imports 1911-1940: Wickizer, V. D. and Bennett, M. K., The Rice Economy of Monsoon Asia (Stanford University, California: Food Policy Research Institute, 1941). 1955-1969: Kirby, Riley, "Agricultural Trade of the People's Republic of China, 1935-69," Foreign Agricultural Economic Report 83 (Washington, D.C.: USDA, 1972). 1970-1982: U.S. Foreign Agricultural Service, Foreign Agriculture Circular, FG-26-83 (Washington, D.C.: 1983). 7. Rice Exports 1950-1980: China. Zhongguo jingji nianjian 1982 (Chinese Economic Year- book of 1982) (Beijing: Jingji Guanli Zazhishe, 1981), p. VI-9. 1981-1982: U.S. Foreign Agricultural Service, Foreign Agriculture Circular, FG-26-83 (Washington, D.C.: 1983).
-24- 8. Population 1949-1980: Stone, Bruce, "The Use of Agricultural Statistics: Some National Aggregate Examples and Current State of the Art," in R. Barker, R. Sinha, and B. Rose, eds., The Chinese Agricultural Economy (Boulder, Colorado: Westview Press, 1982), pp. 210-211. 1981: China. Zhongguo Tongji Chubanshe, Zhongguo tongji nianjian (Statistical Yearbook of China) (Beijing: 1981). 1982: Beijing Review, Vol. 25, No. 45, November, 1982, p. 5. 9. Farm-Harvest Price 1900-1926: Chang, L. L., "Farm Prices in Wuchin, Kiangsu, China," Booklet Series No. 19 (Shanghai: Bureau of Foreign Trade, 1932). 1980-1981: Data collected and aggregated from Chinese journal Zhongguo caimao bao (Chinese Finance and Trade Journal) by Dr. Terry Sicular, University of Wisconsin. 1O. Procurement Price 1952-1979: China. Zhongguo nongye nianjian 1980 (Agricultural Yearbook of China 1980) (Beijing: Nongye Chubanshe, 1980), pp. 380-382. 1980-1981: Lardy, Nicholas, "China's Agricultural Pricing Policy," World Bank, September 1982, p. 38. 11. Average Wholesale Rice Price 1913-1928: Nankai University, Nankai University Committee on Social and Economic Research, Wholesale Prices and Price Index Numbers in North China 1913-1929, Price Series Bulletin No. 1 (Tientsin, China: China Press, Ltd., 1929).
-25- 1931-1933: China. Ministry of Industries, Bureau of Statistics, Monthly Price Statistics (Nanjing: 1934-1935). 12. Official Retail Rice Price 1910-1927: Chang,. L. L., "Farm Prices In Wuchin, Kiangsu, China," Booklet Series No. 19 (Shanghai: Bureau of Foreign Trade, 1932). 1937-1947: Zhongguo Nongmin Yinhang (Farmer's Bank of China), Jingji Yanjiu Chu (Department of Economic Research), Zhongnong jingji tongji, Economic and Statistical Review, added English title, Vols. 2-7 (Nanking: 1941-1947). 1953-1973: Wang, Tong-eng, Economic Policies and Price Stability in China, Institute of East Asian Studies, China Research Monograph No. 16 (Berkeley: University of California, 1980), p. 13. 1952, 1979, 1981: Lardy, Nicholas, "China's Agricultural Pricing Policy," World Bank, September 1982, p. 38. 13. Farm Wage Rate 1937-1943: Zhongguo Nongmin Yinhang (Farmer's Bank of China), Jingji Yanjiu Chu (Department of Economic Research), Zhongnong jingji tongji, Economic and Statistical Review, added English title, Vole. 2-7 (Nanking: 1941-1947). 1957-1979: State Statistical Bureau. 1980: Beijing Review, No. 20, May 18, 1981, p. 19. 14. Domestic Apparent Per Capita Paddy Availability 1949-1982: Paddy availability is calculated by dividing paddy production (2) by population (8) on an annual basis. 15. Early Rice Area 1978-1982: U.S. Foreign Agricultural Service, Foreign Agriculture Circular, Grains, FG-4-84 (Washington, D.C.: Jan. 17, 1984), p. 12.
-26- 16. Early Rice Production 1978-1982: U.S. Foreign Agricultural Service, Foreign Agriculture Circular, Grains, FG-4-84 (Washington, D.C.: Jan. 17. 1984), p. 12. 17. Early Rice Yields 1978-1982: Early rice yields are calculated by dividing early rice production (16) by early rice area (15) on an annual basis. Country Sources of Basic Data*: China 1. China. State Statistical Bureau, Ten Great Years, Occasional Paper No. 5, Program in East Asian Studies (Bellingham, Washington: Western Washington State College, 1974). This is a translation of the original Chinese text. 2. U.S. Department of Agriculture, Economics, Statistics and Cooperative Service, Agricultural Situation - Review of 1979 and Outlook for 1980 - People's Republic of China, Supplement 6 to WAS-21 (Washington, D.C.: 1979). This is a yearly publication. This particular year is recommended because long-term output and area series are included. 3. Buck, John Lossing, Land Utilization in China, Vol. 1, a classic for pre- communist China, describes the topography, climate, soils, population. crops, labor, prices, marketing, and consumption' in China. Volume 2 is an atlas of the areas covered in Buck's study. Volume 3 contains the sta- tistics collected during this study and some statistical analysis. __________________________ *Several Western sources in English have been included because of the lack of translated material and because many important Chinese sources are not easily available overseas.
-27- 4. Zhongguo Nongmin Yinhang (Farmer's Bank of China), Jingji Yanjiu Chu (De- partment of Economic Research), Zhonghong jingli tongji, Economic and Statistical Review added English title (Nanking). 5. Ministry of Industries, The National Agricultural Research Bureau, Division of Agricultural Economics, Nongqing baogao (Crop Reports) (Nanjing: 1930s). (Monthly). 6. Ministry of Agriculture and Commerce, Nongshang tongji biao (Yearbook of Agriculture and Commerce Statistics (Nanjing: 1916-1924). An important early Republican period source. 7. Zhongguo Kexue Yuan, Dili Yanjiu Suo, Jingji Dili Yanjiushi, Zhongguo nongye dili zonglun (General Treatise on the Agricultural Geography of China) (Beijing: Kexue Chubanshe, 1980). 8. Zhongguo caimao bao (Chinese Finance and Trade Journal). A recent journal published three times a week. 9. Shi chang (Marketing). Published weekly since 1979 by People's Daily. 10. Zhongguo jingji nianjian 1982 (Chinese Economic Yearbook of 1982) (Beijing: Jingji Guanli Zazhishe, 1982). (Annual). 11. Zhongguo nongye nianjian 1980 (Agricultural Yearbook of China 1980) (Beijing: Nongye Chubanshe, 1981). (Annual). 12. Zhongguo tongji nianjian 1981 (Statistical Yearbook of China) (Beijing: Zhongguo Tongji Chubanshe, 1981). Some Important Translation Sources in English 1. Beijing Review (Beijing). A Chinese weekly of general news and political outlooks in English. Quite frequently, articles containing official figures on the Chinese agricultural economy are published.
-28- 2. Foreign Broadcast Information Service, Daily Report: China (FBIS). A U.S. daily translation service for Chinese radio and news broadcasts. Available in paper and on microfiche in most libraries. 3. U.S. Joint Publications Research Service (JPRS) China. A translation service for important Chinese magazines, books, newspapers, and periodicals. Formerly published as a single series, it is now divided according to topic. Pertinent areas include: China Report - Agriculture; China Report - Economic Affairs; and China Report - Political, Sociological and Military Affairs. 4. Summary of World Broadcasts (SWB). A British daily translation service with material somewhat similar to that of FBIS. 5. China Reconstructs, A monthly Chinese magazine containing articles of general interest. 6. Far Eastern Economic Review. A weekly news magazine for all of Asia. Contains many important articles on China. Useful Secondary Sources 1. Sinha, Radha, "Chinese Agriculture: A Quantitative Look," The Journal of Development Studies, Volume 2, No. 3, April 1975, pp. 201-223. 2. Chander, R., "China: Statistical System and Basic Data," February 1981, World Bank Mimeo. 3. Li. Choh-ming, The Statistical System of Communist China (Berkeley: University of California Press, 1962). 4. Barker, R., Sinha, R., and Rose, B., eds., The Chinese Agricultural Economy (Boulder, Colorado: Westview, 1982). See especially Chapter 11, Barker, R., Sisler, U., and Rose, B., "Prospects for Growth in Grain Production in China," and Stone, B., "Appendix A: The Use of Agricultural Statistics: Some National Aggregate Examples and Current State of the Art."
-29-
An Annotated Bibliography of Western Compilations of
Chinese Agricultural Statistics with Special Reference to
Province-Level Statistics
1. Walker, Kenneth, "Provincial Grain Output in China 1952-57: A Statistical Compilation," Research Notes and Studies No. 3 (London: Contemporary China Institute, School of Oriental and African Studies, University of London, 1977). Provides, a well documented series for grain and soybean output by province between 1952-1957. Walker has made an attempt to reconcile different Chinese sources and systematize data definition and coverage. 2. Liu, Twanmo, Yeh, Production of Food Crops on the Chinese Mainland: Prewar and Postwar (Santa Monica: Rand Corporation, 1964). Although this monograph provides some interesting estimates for food- grain output based on the authors' research, especially for the pre-1949 period based on Buck's data, it is somewhat politically slanted. The stated intent of the monograph is to disprove Chinese claims of sub- stantial foodgrain output increases between the 1930s and the 1949-1959 period. 3. Buck, John Lossing, Land Utilization in China (Nanking: University of Nanking, 1937). This book, a classic in the field, is the result of an extensive survey carried out in the 1930s by Buck. The book includes not only detailed statistical output for food crops, but also extensive documentation and analysis of climate, soils, livestock, crops, labor, markets, population, and nutrition for pre-communist China. The data are frequently used as a benchmark against which scholars compare post-liberation progress. Buck
-30- breaks China down into broad agricultural regions according to climate and crops. 4. Chen, Nai-ruenn, Chinese Economic Statistics (Chicago: Aldine Publishing Company, 1967). Chen's book is not strictly limited to agricultural data. It contains sub- stantial sections on industry, transport, population, and other critical sectors. Although the book is somewhat dated and rather disorganized, it does, however, contain many useful sections. 5. Office of Economic Research, Directorate of Intelligence, CIA, Agricultural Acreage in Communist China, 1949-1968: A Statistical Compilation (l969). This small publication `is a rich source of extensive agricultural area figures for the period pre-1949-1968 gleaned from official reports. Some area data are reported for all grain and commercial crops and green manure area, as well as cropping indexes, and total cultivated area nationally and by province. Unfortunately, the sources are not acknowledged, although the authors have obviously made an extensive review of available official sources. 6. Provincial Agricultural Statistics for Communist China (Ithaca, New York: Committee on the Economy of China, Social Science Research Council, 1969). Authors of this monograph combed many Chinese journals, newspapers, and other sources to draw up tables by province for the 1949-1959 period. No attempt is made to estimate missing cells, and all numbers are clearly documented. Data include cultivated and irrigated area, sown area, output, and yield by crop for foodgrains, rice, wheat, tubers, coarse grains, soy- beans, and cotton. The authors make no attempt to assess the relative quality of the data. Useful for the pre-Great Leap Period.
-31- 7. Stone, Bruce, "The Use of Agricultural Statistics: Some National Aggre- gate Examples and Current State of the Art," in Barker, R., Sinha, R., and Rose, B.., eds., The Chinese Agricultural Economy (Boulder, Colorado: Westview, 1982), pp. 205-246. Stone's chapter includes national-level statistical series for many aspects of agriculture, including grains, livestock, population, fertilizers, agricultural machinery, and irrigated area. The author has collected major statistical series for each area of interest, including official statistics. A critique of each series and a description of how the official system functions, including its pitfalls, accompanies the discussion of each area. 8. Wiens, Thomas, "Agricultural Statistics in the People's Republic of China," in Alexander Eckstein, ed., Quantitative Measure of China's Economic Output (Ann Arbor: University of Michigan Press, 1980); pp. 44-107. Wiens' chapter, in a larger volume dealing with all of China's economic output, is yet another attempt to assess the relative quality of Chinese agricultural statistics during 1949-1957 and 1958-1975. The author also critiques some of the other important Western series and presents some adjusted and improved series of his own. 9. CIA, National Foreign Assessment Center (NFAC). The NFAC issues periodic research reports on various aspects of the Chinese economy. Like the USDA, the NFAC collects yearly production, area, and yield figures. NFAC has access to raw data similar to that used by USDA researchers so that the estimates from these two sources seldom differ markedly. 10. USDA, Economics and Statistics Service, Agricultural Statistics: People's Republic of China Review of 1981 and Outlook for 1982, Supplement 6 to
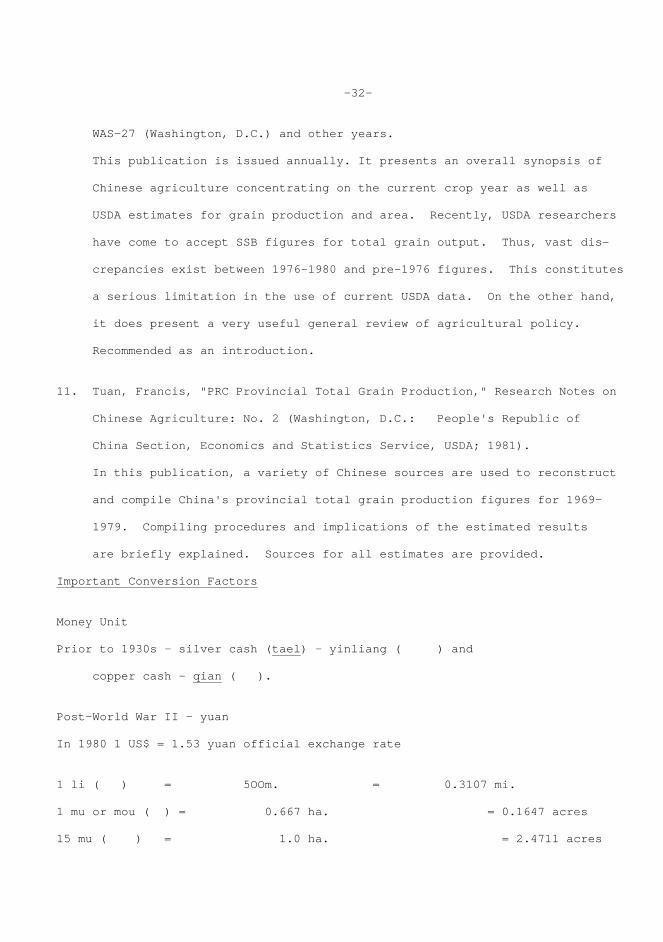
-32- WAS-27 (Washington, D.C.) and other years. This publication is issued annually. It presents an overall synopsis of Chinese agriculture concentrating on the current crop year as well as USDA estimates for grain production and area. Recently, USDA researchers have come to accept SSB figures for total grain output. Thus, vast dis- crepancies exist between 1976-1980 and pre-1976 figures. This constitutes a serious limitation in the use of current USDA data. On the other hand, it does present a very useful general review of agricultural policy. Recommended as an introduction. 11. Tuan, Francis, "PRC Provincial Total Grain Production," Research Notes on Chinese Agriculture: No. 2 (Washington, D.C.: People's Republic of China Section, Economics and Statistics Service, USDA; 1981). In this publication, a variety of Chinese sources are used to reconstruct and compile China's provincial total grain production figures for 1969- 1979. Compiling procedures and implications of the estimated results are briefly explained. Sources for all estimates are provided. Important Conversion Factors Money Unit Prior to 1930s - silver cash (tael) - yinliang ( ) and copper cash - qian ( ). Post-World War II - yuan In 1980 1 US$ = 1.53 yuan official exchange rate 1 li ( ) = 5OOm. = 0.3107 mi. 1 mu or mou ( ) = 0.667 ha. = 0.1647 acres 15 mu ( ) = 1.0 ha. = 2.4711 acres
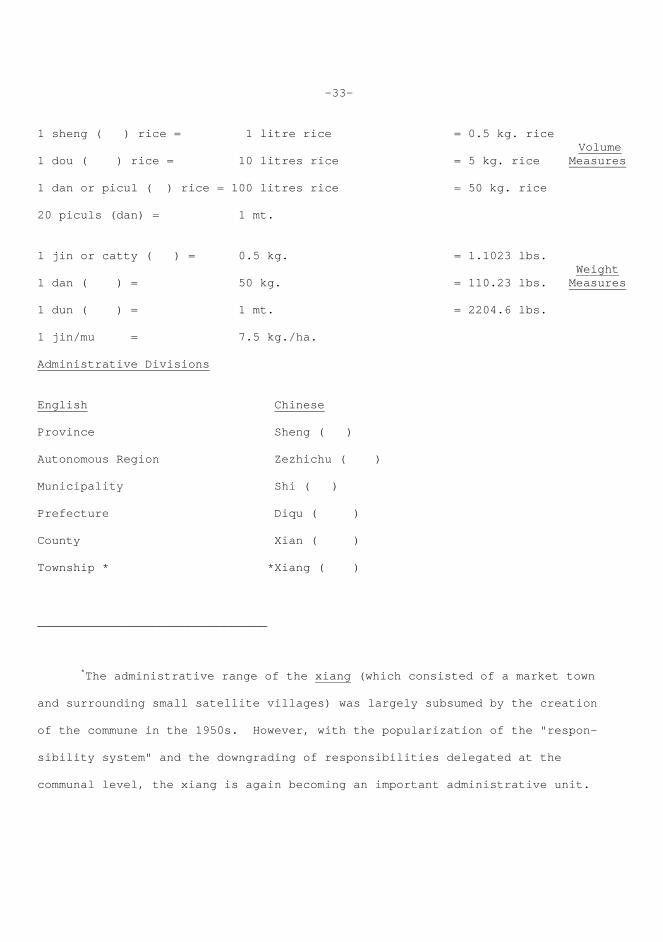
-33- 1 sheng ( ) rice = 1 litre rice = 0.5 kg. rice Volume 1 dou ( ) rice = 10 litres rice = 5 kg. rice Measures 1 dan or picul ( ) rice = 100 litres rice = 50 kg. rice 20 piculs (dan) = 1 mt. 1 jin or catty ( ) = 0.5 kg. = 1.1023 lbs. Weight 1 dan ( ) = 50 kg. = 110.23 lbs. Measures 1 dun ( ) = 1 mt. = 2204.6 lbs. 1 jin/mu = 7.5 kg./ha. Administrative Divisions English Chinese Province Sheng ( ) Autonomous Region Zezhichu ( ) Municipality Shi ( ) Prefecture Diqu ( ) County Xian ( ) Township * *Xiang ( ) ________________________________ *The administrative range of the xiang (which consisted of a market town and surrounding small satellite villages) was largely subsumed by the creation of the commune in the 1950s. However, with the popularization of the "respon- sibility system" and the downgrading of responsibilities delegated at the communal level, the xiang is again becoming an important administrative unit.
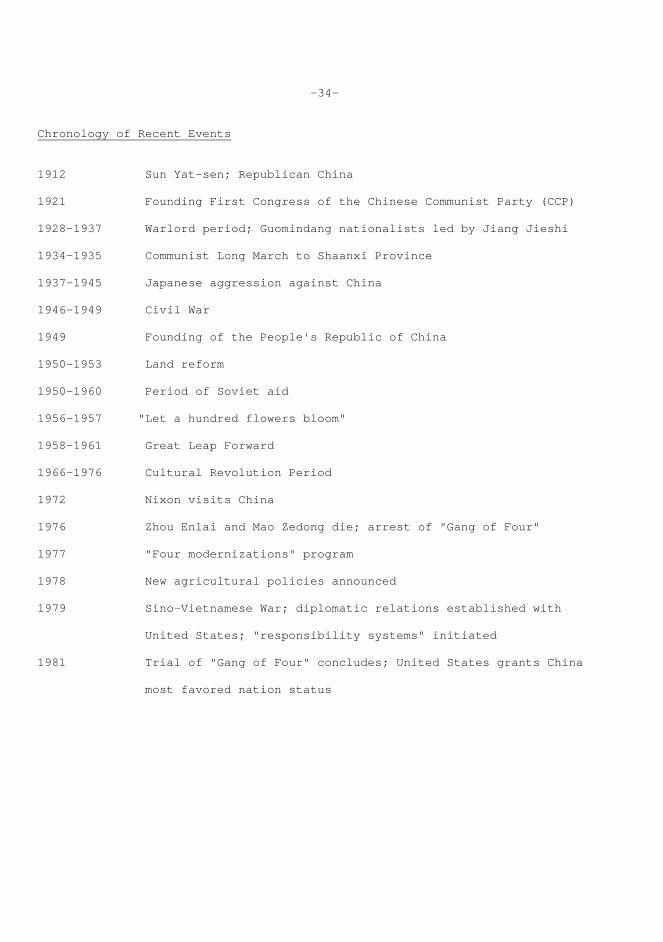
-34- Chronology of Recent Events 1912 Sun Yat-sen; Republican China 1921 Founding First Congress of the Chinese Communist Party (CCP) 1928-1937 Warlord period; Guomindang nationalists led by Jiang Jieshi 1934-1935 Communist Long March to Shaanxi Province 1937-1945 Japanese aggression against China 1946-1949 Civil War 1949 Founding of the People's Republic of China 1950-1953 Land reform 1950-1960 Period of Soviet aid 1956-1957 "Let a hundred flowers bloom" 1958-1961 Great Leap Forward 1966-1976 Cultural Revolution Period 1972 Nixon visits China 1976 Zhou Enlai and Mao Zedong die; arrest of "Gang of Four" 1977 "Four modernizations" program 1978 New agricultural policies announced 1979 Sino-Vietnamese War; diplomatic relations established with United States; "responsibility systems" initiated 1981 Trial of "Gang of Four" concludes; United States grants China most favored nation status
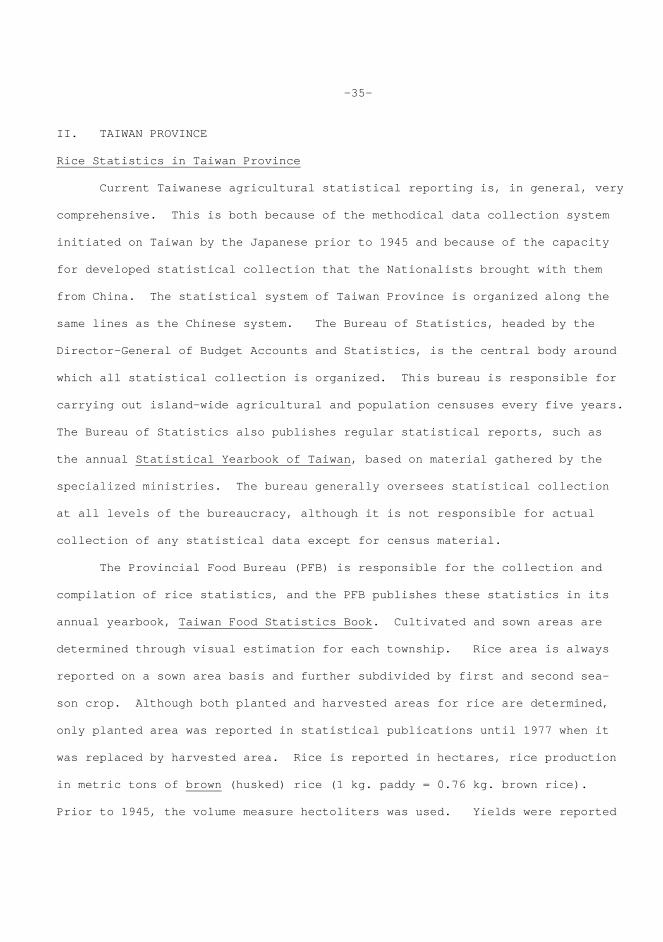
-35- II. TAIWAN PROVINCE Rice Statistics in Taiwan Province Current Taiwanese agricultural statistical reporting is, in general, very comprehensive. This is both because of the methodical data collection system initiated on Taiwan by the Japanese prior to 1945 and because of the capacity for developed statistical collection that the Nationalists brought with them from China. The statistical system of Taiwan Province is organized along the same lines as the Chinese system. The Bureau of Statistics, headed by the Director-General of Budget Accounts and Statistics, is the central body around which all statistical collection is organized. This bureau is responsible for carrying out island-wide agricultural and population censuses every five years. The Bureau of Statistics also publishes regular statistical reports, such as the annual Statistical Yearbook of Taiwan, based on material gathered by the specialized ministries. The bureau generally oversees statistical collection at all levels of the bureaucracy, although it is not responsible for actual collection of any statistical data except for census material. The Provincial Food Bureau (PFB) is responsible for the collection and compilation of rice statistics, and the PFB publishes these statistics in its annual yearbook, Taiwan Food Statistics Book. Cultivated and sown areas are determined through visual estimation for each township. Rice area is always reported on a sown area basis and further subdivided by first and second sea- son crop. Although both planted and harvested areas for rice are determined, only planted area was reported in statistical publications until 1977 when it was replaced by harvested area. Rice is reported in hectares, rice production in metric tons of brown (husked) rice (1 kg. paddy = 0.76 kg. brown rice). Prior to 1945, the volume measure hectoliters was used. Yields were reported
-36- in kilograms of brown rice per hectare. Crop cutting is used to determine total output and average yields. Fields are chosen at random and samples are har- vested from five points in each field. Rice area, production,and yield statistics are available at hsien and township levels as well as for all of Taiwan Province. Data are subdivided into wet or upland area. However, less than one percent of the total rice crop is grown under upland conditions. Paddy rice statistics are further sub- divided by rice type. These include ponlai rice ( ), non-glutinous chailai rice ( ), long grain indica rice ( ), round glutinous rice ( ), and oval glutinous rice ( ). In 1978, almost 80 percent of the total rice crop was of the ponlai type, although Taiwan is also an important world producer of glutinous rice used in the brewing industry and in the preparation of sweets and specialty foods.
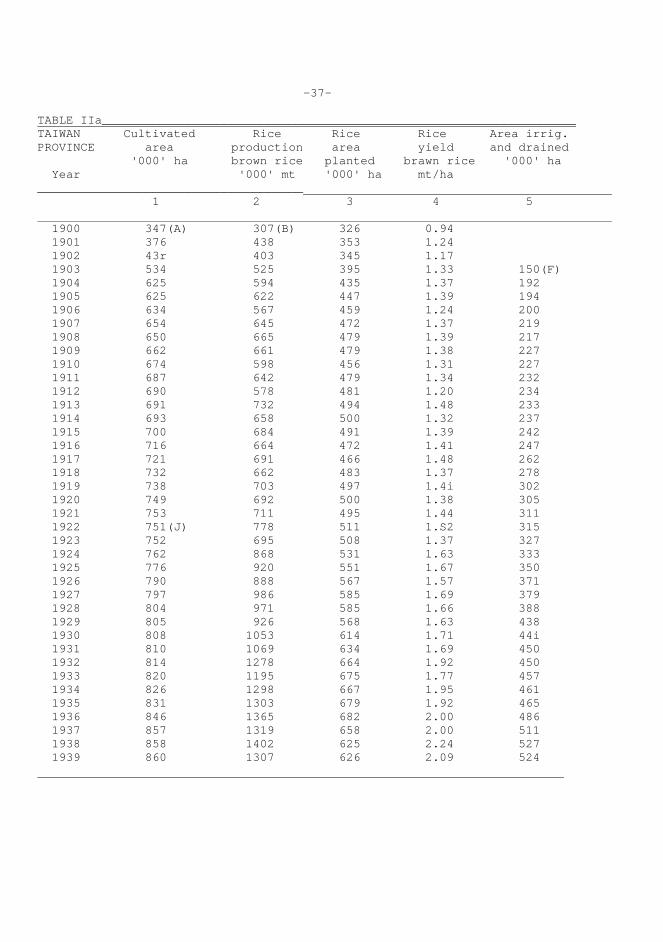
-37- TABLE IIa__________________________________________________________________ TAIWAN Cultivated Rice Rice Rice Area irrig. PROVINCE area production area yield and drained '000' ha brown rice planted brawn rice '000' ha Year '000' mt '000' ha mt/ha _____________________________________ 1 2 3 4 5 1900 347(A) 307(B) 326 0.94 1901 376 438 353 1.24 1902 43r 403 345 1.17 1903 534 525 395 1.33 150(F) 1904 625 594 435 1.37 192 1905 625 622 447 1.39 194 1906 634 567 459 1.24 200 1907 654 645 472 1.37 219 1908 650 665 479 1.39 217 1909 662 661 479 1.38 227 1910 674 598 456 1.31 227 1911 687 642 479 1.34 232 1912 690 578 481 1.20 234 1913 691 732 494 1.48 233 1914 693 658 500 1.32 237 1915 700 684 491 1.39 242 1916 716 664 472 1.41 247 1917 721 691 466 1.48 262 1918 732 662 483 1.37 278 1919 738 703 497 1.4i 302 1920 749 692 500 1.38 305 1921 753 711 495 1.44 311 1922 751(J) 778 511 1.S2 315 1923 752 695 508 1.37 327 1924 762 868 531 1.63 333 1925 776 920 551 1.67 350 1926 790 888 567 1.57 371 1927 797 986 585 1.69 379 1928 804 971 585 1.66 388 1929 805 926 568 1.63 438 1930 808 1053 614 1.71 44i 1931 810 1069 634 1.69 450 1932 814 1278 664 1.92 450 1933 820 1195 675 1.77 457 1934 826 1298 667 1.95 461 1935 831 1303 679 1.92 465 1936 846 1365 682 2.00 486 1937 857 1319 658 2.00 511 1938 858 1402 625 2.24 527 1939 860 1307 626 2.09 524
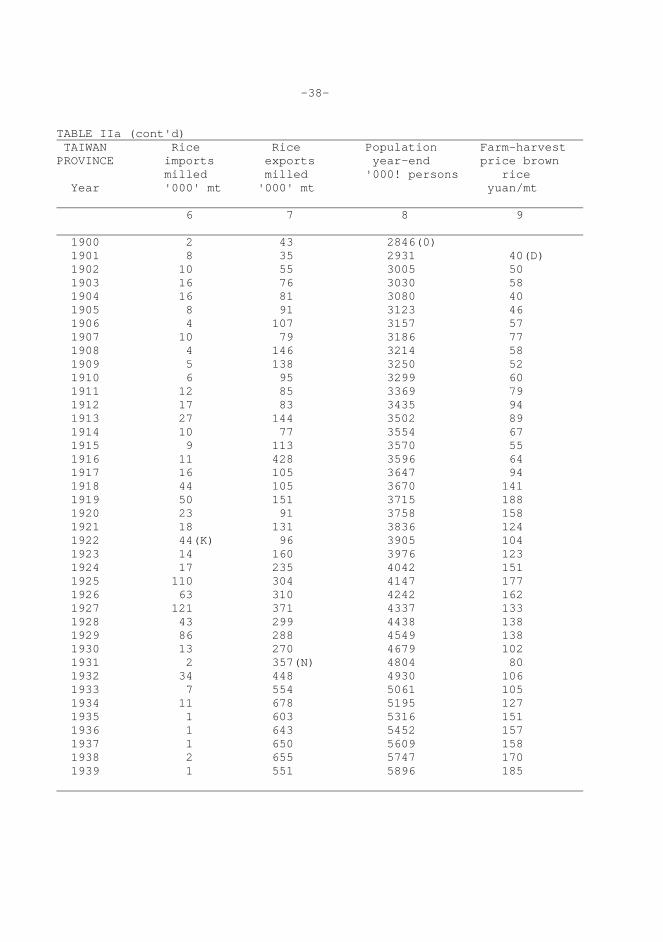
-38- TABLE IIa (cont'd) TAIWAN Rice Rice Population Farm-harvest PROVINCE imports exports year-end price brown milled milled '000! persons rice Year '000' mt '000' mt yuan/mt 6 7 8 9 1900 2 43 2846(0) 1901 8 35 2931 40(D) 1902 10 55 3005 50 1903 16 76 3030 58 1904 16 81 3080 40 1905 8 91 3123 46 1906 4 107 3157 57 1907 10 79 3186 77 1908 4 146 3214 58 1909 5 138 3250 52 1910 6 95 3299 60 1911 12 85 3369 79 1912 17 83 3435 94 1913 27 144 3502 89 1914 10 77 3554 67 1915 9 113 3570 55 1916 11 428 3596 64 1917 16 105 3647 94 1918 44 105 3670 141 1919 50 151 3715 188 1920 23 91 3758 158 1921 18 131 3836 124 1922 44(K) 96 3905 104 1923 14 160 3976 123 1924 17 235 4042 151 1925 110 304 4147 177 1926 63 310 4242 162 1927 121 371 4337 133 1928 43 299 4438 138 1929 86 288 4549 138 1930 13 270 4679 102 1931 2 357(N) 4804 80 1932 34 448 4930 106 1933 7 554 5061 105 1934 11 678 5195 127 1935 1 603 5316 151 1936 1 643 5452 157 1937 1 650 5609 158 1938 2 655 5747 170 1939 1 551 5896 185
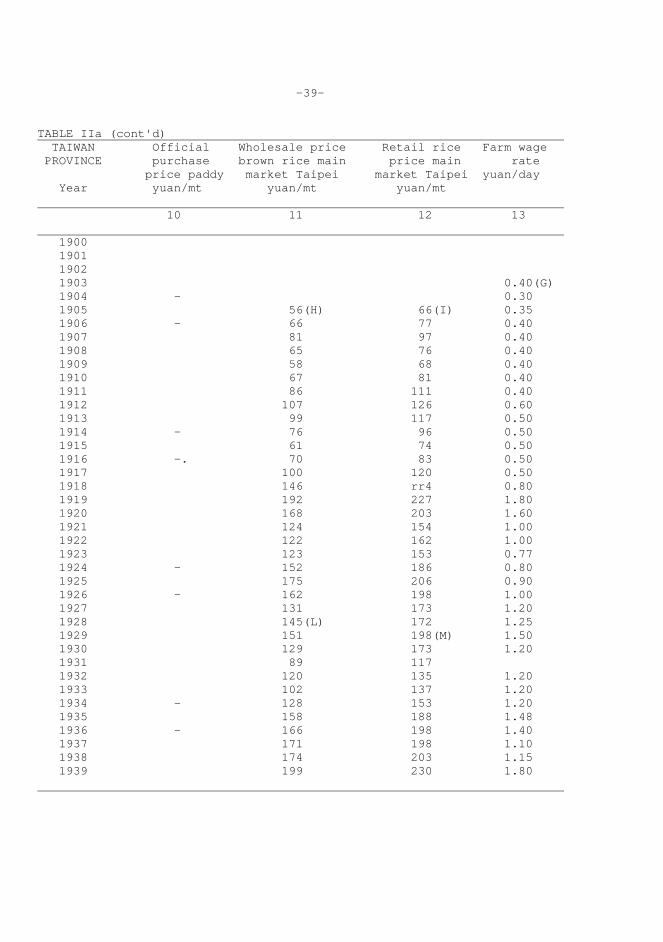
-39- TABLE IIa (cont'd) TAIWAN Official Wholesale price Retail rice Farm wage PROVINCE purchase brown rice main price main rate price paddy market Taipei market Taipei yuan/day Year yuan/mt yuan/mt yuan/mt 10 11 12 13 1900 1901 1902 1903 0.40(G) 1904 - 0.30 1905 56(H) 66(I) 0.35 1906 - 66 77 0.40 1907 81 97 0.40 1908 65 76 0.40 1909 58 68 0.40 1910 67 81 0.40 1911 86 111 0.40 1912 107 126 0.60 1913 99 117 0.50 1914 - 76 96 0.50 1915 61 74 0.50 1916 -. 70 83 0.50 1917 100 120 0.50 1918 146 rr4 0.80 1919 192 227 1.80 1920 168 203 1.60 1921 124 154 1.00 1922 122 162 1.00 1923 123 153 0.77 1924 - 152 186 0.80 1925 175 206 0.90 1926 - 162 198 1.00 1927 131 173 1.20 1928 145(L) 172 1.25 1929 151 198(M) 1.50 1930 129 173 1.20 1931 89 117 1932 120 135 1.20 1933 102 137 1.20 1934 - 128 153 1.20 1935 158 188 1.48 1936 - 166 198 1.40 1937 171 198 1.10 1938 174 203 1.15 1939 199 230 1.80
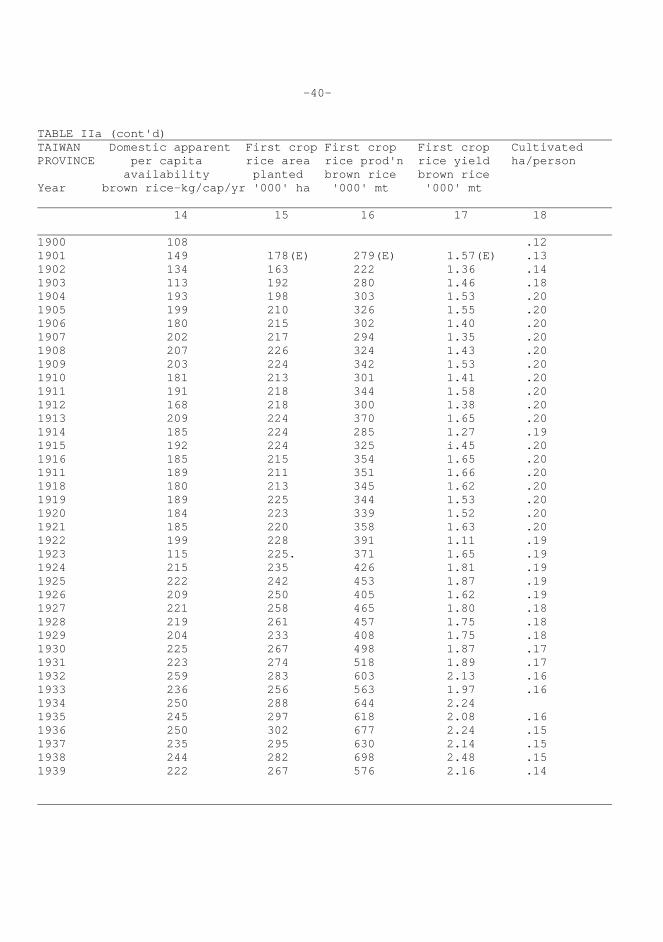
-40- TABLE IIa (cont'd) TAIWAN Domestic apparent First crop First crop First crop Cultivated PROVINCE per capita rice area rice prod'n rice yield ha/person availability planted brown rice brown rice Year brown rice-kg/cap/yr '000' ha '000' mt '000' mt 14 15 16 17 18 1900 108 .12 1901 149 178(E) 279(E) 1.57(E) .13 1902 134 163 222 1.36 .14 1903 113 192 280 1.46 .18 1904 193 198 303 1.53 .20 1905 199 210 326 1.55 .20 1906 180 215 302 1.40 .20 1907 202 217 294 1.35 .20 1908 207 226 324 1.43 .20 1909 203 224 342 1.53 .20 1910 181 213 301 1.41 .20 1911 191 218 344 1.58 .20 1912 168 218 300 1.38 .20 1913 209 224 370 1.65 .20 1914 185 224 285 1.27 .19 1915 192 224 325 i.45 .20 1916 185 215 354 1.65 .20 1911 189 211 351 1.66 .20 1918 180 213 345 1.62 .20 1919 189 225 344 1.53 .20 1920 184 223 339 1.52 .20 1921 185 220 358 1.63 .20 1922 199 228 391 1.11 .19 1923 115 225. 371 1.65 .19 1924 215 235 426 1.81 .19 1925 222 242 453 1.87 .19 1926 209 250 405 1.62 .19 1927 221 258 465 1.80 .18 1928 219 261 457 1.75 .18 1929 204 233 408 1.75 .18 1930 225 267 498 1.87 .17 1931 223 274 518 1.89 .17 1932 259 283 603 2.13 .16 1933 236 256 563 1.97 .16 1934 250 288 644 2.24 1935 245 297 618 2.08 .16 1936 250 302 677 2.24 .15 1937 235 295 630 2.14 .15 1938 244 282 698 2.48 .15 1939 222 267 576 2.16 .14
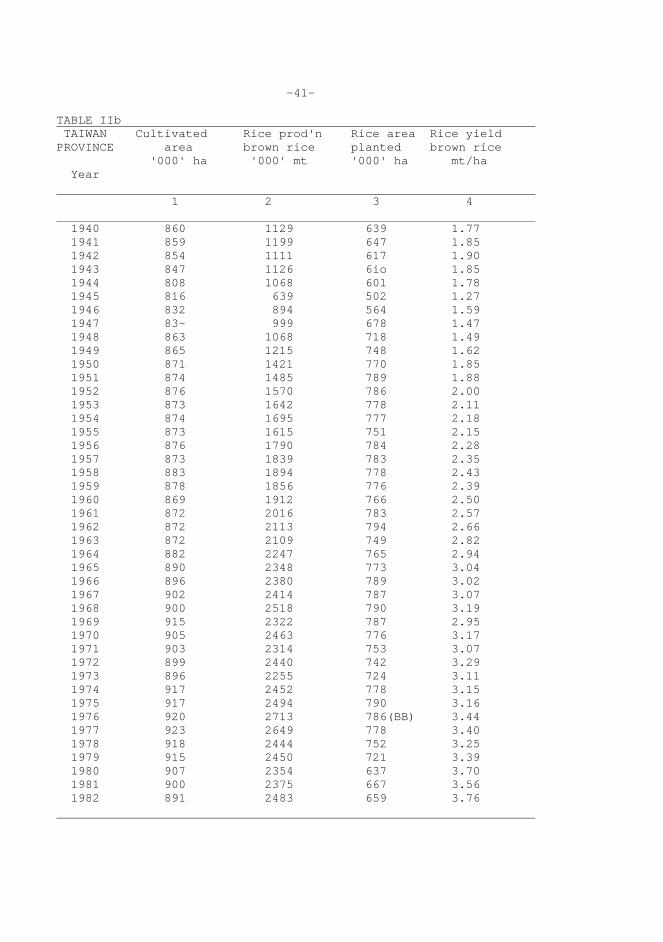
-41- TABLE IIb TAIWAN Cultivated Rice prod'n Rice area Rice yield PROVINCE area brown rice planted brown rice '000' ha '000' mt '000' ha mt/ha Year 1 2 3 4 1940 860 1129 639 1.77 1941 859 1199 647 1.85 1942 854 1111 617 1.90 1943 847 1126 6io 1.85 1944 808 1068 601 1.78 1945 816 639 502 1.27 1946 832 894 564 1.59 1947 83~ 999 678 1.47 1948 863 1068 718 1.49 1949 865 1215 748 1.62 1950 871 1421 770 1.85 1951 874 1485 789 1.88 1952 876 1570 786 2.00 1953 873 1642 778 2.11 1954 874 1695 777 2.18 1955 873 1615 751 2.15 1956 876 1790 784 2.28 1957 873 1839 783 2.35 1958 883 1894 778 2.43 1959 878 1856 776 2.39 1960 869 1912 766 2.50 1961 872 2016 783 2.57 1962 872 2113 794 2.66 1963 872 2109 749 2.82 1964 882 2247 765 2.94 1965 890 2348 773 3.04 1966 896 2380 789 3.02 1967 902 2414 787 3.07 1968 900 2518 790 3.19 1969 915 2322 787 2.95 1970 905 2463 776 3.17 1971 903 2314 753 3.07 1972 899 2440 742 3.29 1973 896 2255 724 3.11 1974 917 2452 778 3.15 1975 917 2494 790 3.16 1976 920 2713 786(BB) 3.44 1977 923 2649 778 3.40 1978 918 2444 752 3.25 1979 915 2450 721 3.39 1980 907 2354 637 3.70 1981 900 2375 667 3.56 1982 891 2483 659 3.76
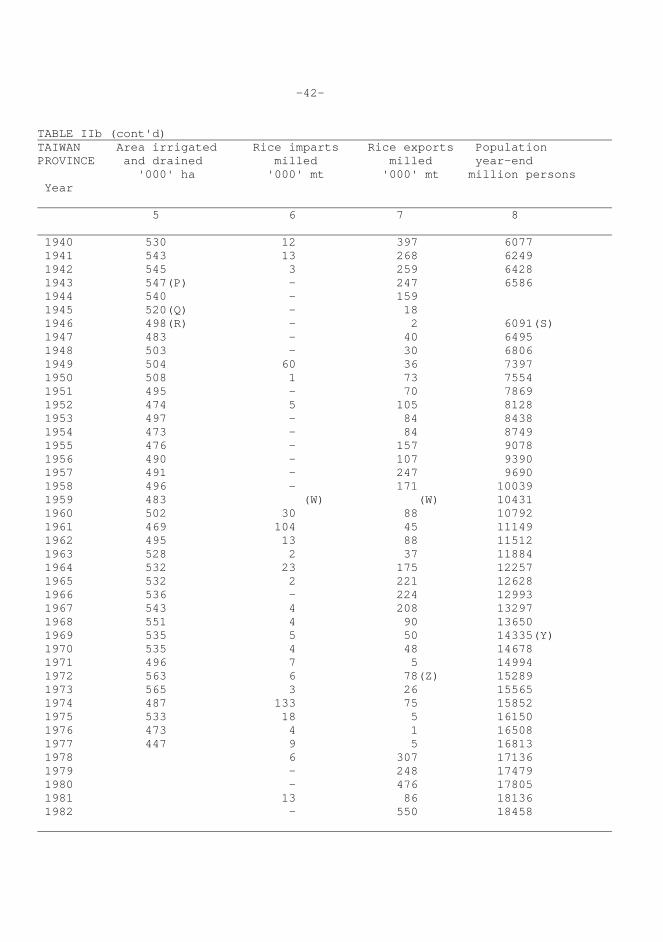
-42- TABLE IIb (cont'd) TAIWAN Area irrigated Rice imparts Rice exports Population PROVINCE and drained milled milled year-end '000' ha '000' mt '000' mt million persons Year 5 6 7 8 1940 530 12 397 6077 1941 543 13 268 6249 1942 545 3 259 6428 1943 547(P) - 247 6586 1944 540 - 159 1945 520(Q) - 18 1946 498(R) - 2 6091(S) 1947 483 - 40 6495 1948 503 - 30 6806 1949 504 60 36 7397 1950 508 1 73 7554 1951 495 - 70 7869 1952 474 5 105 8128 1953 497 - 84 8438 1954 473 - 84 8749 1955 476 - 157 9078 1956 490 - 107 9390 1957 491 - 247 9690 1958 496 - 171 10039 1959 483 (W) (W) 10431 1960 502 30 88 10792 1961 469 104 45 11149 1962 495 13 88 11512 1963 528 2 37 11884 1964 532 23 175 12257 1965 532 2 221 12628 1966 536 - 224 12993 1967 543 4 208 13297 1968 551 4 90 13650 1969 535 5 50 14335(Y) 1970 535 4 48 14678 1971 496 7 5 14994 1972 563 6 78(Z) 15289 1973 565 3 26 15565 1974 487 133 75 15852 1975 533 18 5 16150 1976 473 4 1 16508 1977 447 9 5 16813 1978 6 307 17136 1979 - 248 17479 1980 - 476 17805 1981 13 86 18136 1982 - 550 18458
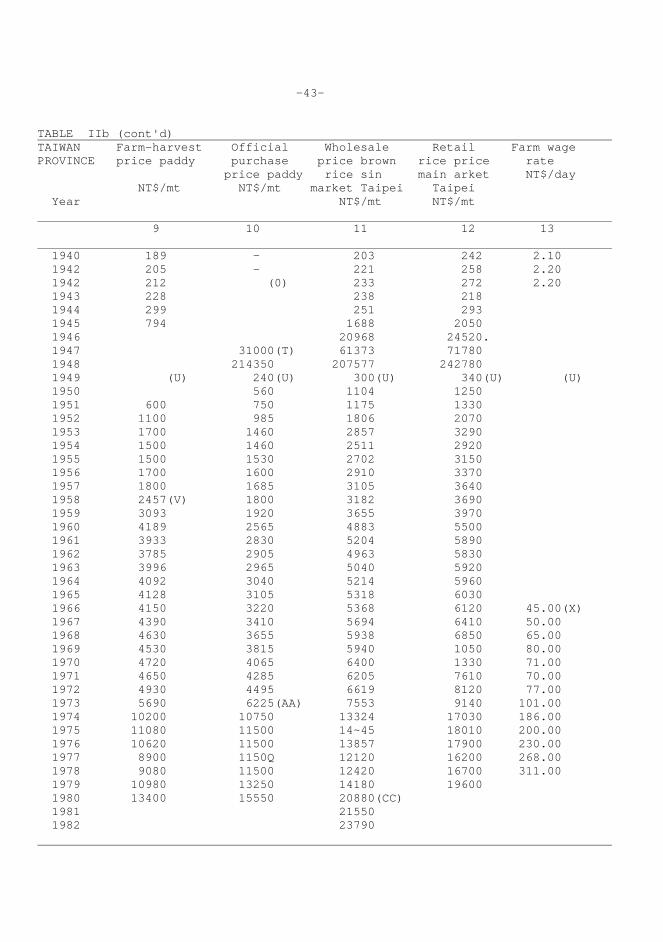
-43- TABLE IIb (cont'd) TAIWAN Farm-harvest Official Wholesale Retail Farm wage PROVINCE price paddy purchase price brown rice price rate price paddy rice sin main arket NT$/day NT$/mt NT$/mt market Taipei Taipei Year NT$/mt NT$/mt 9 10 11 12 13 1940 189 - 203 242 2.10 1942 205 - 221 258 2.20 1942 212 (0) 233 272 2.20 1943 228 238 218 1944 299 251 293 1945 794 1688 2050 1946 20968 24520. 1947 31000(T) 61373 71780 1948 214350 207577 242780 1949 (U) 240(U) 300(U) 340(U) (U) 1950 560 1104 1250 1951 600 750 1175 1330 1952 1100 985 1806 2070 1953 1700 1460 2857 3290 1954 1500 1460 2511 2920 1955 1500 1530 2702 3150 1956 1700 1600 2910 3370 1957 1800 1685 3105 3640 1958 2457(V) 1800 3182 3690 1959 3093 1920 3655 3970 1960 4189 2565 4883 5500 1961 3933 2830 5204 5890 1962 3785 2905 4963 5830 1963 3996 2965 5040 5920 1964 4092 3040 5214 5960 1965 4128 3105 5318 6030 1966 4150 3220 5368 6120 45.00(X) 1967 4390 3410 5694 6410 50.00 1968 4630 3655 5938 6850 65.00 1969 4530 3815 5940 1050 80.00 1970 4720 4065 6400 1330 71.00 1971 4650 4285 6205 7610 70.00 1972 4930 4495 6619 8120 77.00 1973 5690 6225(AA) 7553 9140 101.00 1974 10200 10750 13324 17030 186.00 1975 11080 11500 14~45 18010 200.00 1976 10620 11500 13857 17900 230.00 1977 8900 1150Q 12120 16200 268.00 1978 9080 11500 12420 16700 311.00 1979 10980 13250 14180 19600 1980 13400 15550 20880(CC) 1981 21550 1982 23790
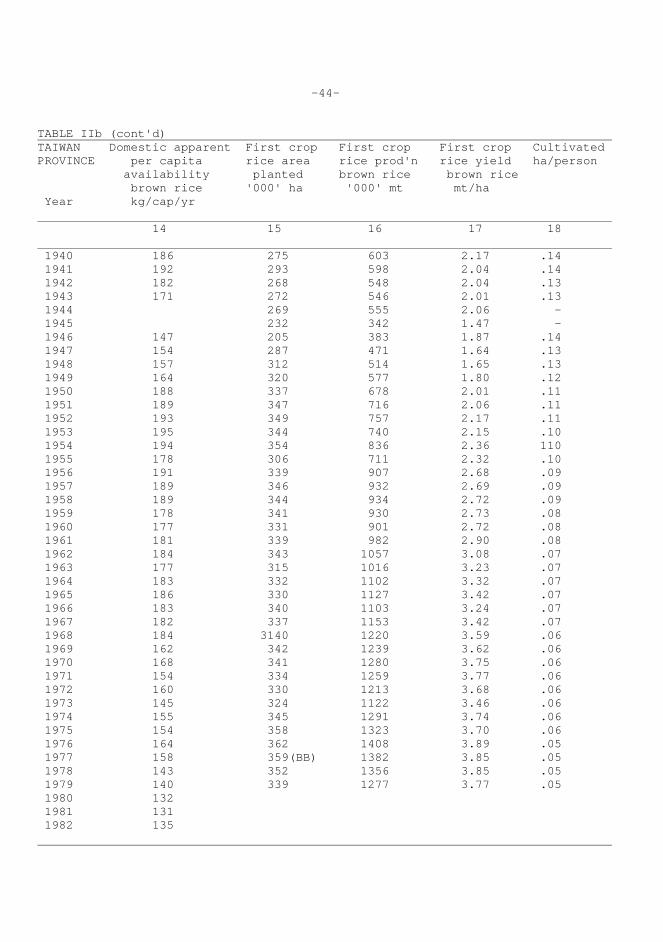
-44- TABLE IIb (cont'd) TAIWAN Domestic apparent First crop First crop First crop Cultivated PROVINCE per capita rice area rice prod'n rice yield ha/person availability planted brown rice brown rice brown rice '000' ha '000' mt mt/ha Year kg/cap/yr 14 15 16 17 18 1940 186 275 603 2.17 .14 1941 192 293 598 2.04 .14 1942 182 268 548 2.04 .13 1943 171 272 546 2.01 .13 1944 269 555 2.06 - 1945 232 342 1.47 - 1946 147 205 383 1.87 .14 1947 154 287 471 1.64 .13 1948 157 312 514 1.65 .13 1949 164 320 577 1.80 .12 1950 188 337 678 2.01 .11 1951 189 347 716 2.06 .11 1952 193 349 757 2.17 .11 1953 195 344 740 2.15 .10 1954 194 354 836 2.36 110 1955 178 306 711 2.32 .10 1956 191 339 907 2.68 .09 1957 189 346 932 2.69 .09 1958 189 344 934 2.72 .09 1959 178 341 930 2.73 .08 1960 177 331 901 2.72 .08 1961 181 339 982 2.90 .08 1962 184 343 1057 3.08 .07 1963 177 315 1016 3.23 .07 1964 183 332 1102 3.32 .07 1965 186 330 1127 3.42 .07 1966 183 340 1103 3.24 .07 1967 182 337 1153 3.42 .07 1968 184 3140 1220 3.59 .06 1969 162 342 1239 3.62 .06 1970 168 341 1280 3.75 .06 1971 154 334 1259 3.77 .06 1972 160 330 1213 3.68 .06 1973 145 324 1122 3.46 .06 1974 155 345 1291 3.74 .06 1975 154 358 1323 3.70 .06 1976 164 362 1408 3.89 .05 1977 158 359(BB) 1382 3.85 .05 1978 143 352 1356 3.85 .05 1979 140 339 1277 3.77 .05 1980 132 1981 131 1982 135
-45-
Notes to Appendix Tables IIa and IIb: Taiwan Province A/1900- 1982: Figures refer to cultivated land area, which include; dry land and all types of paddy land. B/1900-1982: Production figures recorded in brown rice. C/l900~l982: Population is for Dec. 31 of each calendar year. In the pre-war period, population includes Japanese, Taiwanese, aborigines,and foreigners. D/l901~l945: Farm-harvest price is calculated on a metric ton basis from the total gross value of the rice crop in yuan, including first and second crop, in brown rice. The column in the original source, labeled value" (chia chih ) is taken to man value of the rice crop for farmers, and thus is used to calculate an average farm-harvest price. How- ever, it is unclear how the "value" column was tabulated in the original source, so that "value" may indicate a wholesale, rather than fan-gate value. E/1901-1979: Data obtained from Provincial Food Bureau. "First crop" refers to rice planted between January 1 and April 30 and harvested within that calendar year. "Second crop" refers to rice planted between Hay 1 and September 30 and harvested within that calendar year. The second crop occupies a larger area than the first crop but yields are, on average, much lower. First and second crop include wet and dry land rice culture although wet land, or paddy rice culture, accounts for the majority of total rice area. Production figures recorded in brown rice. F/1903-1945: Irrigated area numbers refer to total cultivated area irrigated and drained by man-made means for all crops. Rice was grown- on
-46- most of the irrigated area, but same sugar cane was also irrigated. Irri- gated area figures include all cultivated areas with irrigation and drainage facilities controlled by the irrigation associations, and all cultivated area under small-scale private irrigation systems. Although total irrigated area has risen steadily, with the clear exception of the period 1943-1945, the relative portion of land devoted to public and private irrigation systems has changed drastically. In 1903, 26 percent of total irrigated area was under public control, while 74 percent was under private systems. Area under public control rose rapidly and steadily while area under private control declined, both as a percent of total, and numerically. By 1945, private irrigated area had shrunk to only one percent of total irrigated area. Figures supplied by the Water Conservancy Bureau. G/1903-1942: Male paddy worker wage rate for Taipei. Female wage rates are available for selected years. The disparity between male and female wage rates is large--usually, on average, women made half or less than their male counterparts. For example, in 1932 the average male wage rate was 1.2 yuan per day, while the average female wage rate was 0.5 yuan. Paddy worker wage rate series are also available for Taichung and Tainan. Wage rates for Taichung and Tainan tend to be lower than those f or Taipei, with less disparity between male and female wage rates. H/l905-l927: Wholesale main market (Taipei City) brown rice price for chailai rice ( ). Chailai rice includes an amalgam of all the indigenous indica rice varieties grown in Taiwan until the introduction of "ponlai rice" ( ) in 1926. I/19051928: Retail main-market (Taipei City) polished rice price is for chailai rice, the predominant native varieties used until the introduction
-47- and popularization of japonica X native crosses (ponlai rice) by the Japanese in the late 1920s. J/1922-1982: Based on data supplied by the Provincial Department of Agriculture and Forestry. K/1922-1980: Rice imports recorded in brown rice and changed to milled rice at the ponlai rate of .94. L/1928-1979: Wholesale main market (Taipei City) brown rice price for ponlai rice ( ) is continuous with the preceding chailai series. In 1926, the Japanese introduced ponlai rice, which is a cross between native varieties and Japanese japonica varieties. Ponlai rice, inherently much more productive than native varieties, although it requires increased use of inputs, rapidly came to dominate rice area in Taiwan. This was both because of Japanese consumer preference for this type, and because of the relative profitability of ponlai types. Today, almost all rice area is planted to ponlai varieties. In the marketplace, ponlai rice costs a little more than chailai rice. For example, in 1939 in Taipei, ponlai rice cost 199 yuan/mt. while chailai rice cost 185 yuan/mt. M/1929'1979: Retail main market (Taipei City) polished rice price is for ponlai rice, the most predominant variety. N/1931-1980: Recorded in brown rice--changed to milled rice at the ponlai rate of .94. O/1942: Government interference in the rice market began in 1942 when the Japanese tried to ration rice supplies and made compulsory collections of rice to aid food-short Japan.
-48- P/ 1945-1977: Since 1943, irrigated area under Public Irrigation System ( ) has been included under Water Conservancy Association area ( ). Q/ 1945-1977: Since 1945, the government has not collected figures for irrigation systems without official recognition or for irrigated area under private control not connected to the association area. Thus, the area of irrigation and drainage presented here appears proportionately smaller. The question as to what percentage private area may make up of the total is moot, although by the 1940s private area was probably less than five percent of total irrigated and drained area. A Ph.D. thesis by Teng-hui Lee, "Inter- sectoral Capital Flows in the Economic Development of Taiwan, 1895-1960," Cornell University, 1968, suggests that privately irrigated land makes up 15 percent of the total irrigated area (p. 94), but no documentation is presented. Undoubtedly, irrigated area may not have increased in the post-war period as much as one might suspect because effort has been concentrated on more rational and timely use of existing facilities rather than on the construc- tion of new facilities. Figures supplied by the Water Conservancy Ministry. R/ 1946-1977: By 1946, irrigated and drained area was subdivided by types of area irrigated (double-cropping fields, sin4e-cropping fields, etc.) and.types of area drained (paddy fields and dry-farmed fields). From this breakdown, it is obvious that area of drained land makes up a substantial portion of total area irrigated and drained, ranging from 6 percent to over 20 percent depending on the year under consideration. S/ 1946-1968: Population figures exclude servicemen and foreign nationals.
-49- T/ 1947-1972: Procurement price refers to the official purchase price of paddy rice, first and second crop prices averaged. The purchase price for second crop paddy rice is set a little higher than the first crop paddy rice price. U/ 1949: Since June 15, 1949, New Taiwan Dollar in use (NT$). V/ 1958-1980: Farm-harvest price is for ponlai paddy rice. W/ 1959: No number listed for 1959 in the source used. X/ 1966-1978: Represents the average wage paid to unskilled laborers for construction work in Taipei. Y/ 1969-1982: Population figures include servicemen. Z/ From 1972, rice processed products not included. aa/ 1973-1980: Procurement price refers to the official purchase price for first and second crop ponlai rice averaged. bb/ From 1976, rice area refers to harvested area, not planted area. cc/ l980-l982: Wholesale rice price is an average Taiwan price for white ponlai rice. Because this price is in milled form, it is about 10 percent greater than comparable brown rice prices.
-50- Sources of Data for Appendix Tables IIa and IIb: Taiwan Province 1. Cultivated Area 1900-1921: Taiwan Province, Governor-General Directorate of Statistics, Taiwansheng wushiyinianlai tongli tiyao (Summary of Statistics for 51 Years) (Taipei: 1946). 1922-1979: Taiwan Province. Food Bureau, Taiwan Food Statistics Book (1980) 1980-1982: Taiwan Province. Council for Economic Planning and Development, Executive Yuan, Taiwan Statistical Data Book (Taipei: 1983). 2. Rice Production 1900: Hsieh, S. C., and Lee, T. H., "Agricultural Development and Its Contributions to Economic Growth in Taiwan," Economic Digest Series: No. 17 (Taipei: Joint Commission on Rural Reconstruction, 1966), p. 15. 1901-1921: JCER, Rural Economics Division, Taiwan Agricultural Statistics 1901-1965, Economic Digest Series: No. 18 (Taipei: 1966). 1922-1979: Taiwan Province. Food Bureau, Taiwan Food Statistics Book (1980). 1980-1982: Taiwan Province. Council for Economic Planning and Development, Executive Yuan, Taiwan Statistical Data Book (Taipei: 1983). 3. Rice Area 1900: Hsieh, S. C. and Lee, T. H., "Agricultural Development and Its Contributions to Economic Growth in Taiwan," Economic Digest Series: No. 17 (Taipei: Joint Commission on Rural Reconstruction, 1966), p. 15. 1901-1921: JCRR, Rural Economics Division, Taiwan Agricultural Statistics 1901-1965, Economic Digest Series: No. 18 (Taipei: 1966). 1922-1979: Taiwan Province. Food Bureau, Taiwan Food Statistics Book (1980).
-51- 1980-1982: Taiwan Province. Council for Economic Planning and Development, Executive Yuan, Taiwan Statistical Data Book (Taipei: 1983). 4. Rice Yield 1900-1982: Rice yields are calculated by dividing rice production (2) by rice area (3) on an annual basis. 5. Area Irrigated and Drained 1903-1945: Bank of Taiwan. Taiwan shuili wenti (Questions of Water Manage- ment in Taiwan), Economic Series No. 4 (Taipei: 1950). 1946-1968: Taiwan Province. Department of Budget, Accounting and Statistics, Statistical Yearbook of Taiwan (Taipei). 1969-1977: Taiwan Province. Department of Agriculture and Forestry, Taiwan Agricultural Yearbook (1947-1978). 6. Rice Imports 1900-1933: Ishibashi, Tanzan, ed., Foreign Trade of Japan: A Statistical Survey (Nihon böki yöran) (Tokyo: Toyo Keizai Shimposha, 1975). 1934-1980: Taiwan Province. Food Bureau, Taiwan Food Statistics Book (1980). 1981-1982: U.S. Foreign Agricultural Service, Foreign Agriculture Circular, FG-26-83 (Washington, D.C., 1983). 7. Rice Exports 1900-1933: Ishibashi, Tanzan, ed., Foreign Trade of Japan: A Statistical Survey (Nihon b5eki y5ran) (Tokyo: Toyo Keizai Shimposha, 1975). 1934-1980: Taiwan Province. Food Bureau, Taiwan Food Statistics Book (1980). 1981-1982: U.S. Foreign Agricultural Service, Foreign Agriculture Circular, FG-26-83 (Washington, D.C., 1983). 8. Population 1900-1904: Taiwan Province. Governor-General of Taiwan, The Statistical Summary of Taiwan (Tokyo: Japan Times Press, 1912).
-52- 1905-1910: Taiwan Province. Governor-General, Directorate of Statistics, Taiwansheng wushiyinianlai tongji tiyao (Summary of Statistics for 51 Years) (Taipei: 1946). 1911-1965: JCRR, Rural Economics Division, Taiwan Agricultural Statistics 1901-1965, Economic Digest Series: No. 18 (Taipei: 1966). 1966-1982: Taiwan Province. Council for Economic Planning and Development, Executive Yuan, Taiwan Statistical Data Book (Taipei: 1982). Source: The Statistical Report of Household Registration, MOI. 9. Farm-Harvest Price 1901-1945: Taiwan Province. Governor-General, Directorate of Statistics Taiwansheng wushiyinianlai tongji tiyao (Summary of Statistics for 51 Years) (Taipei: 1946). 1951-1957: FAO, World Rice Economy in Figures, 1965 as quoted in Palacpac, Adelita, World Rice Statistics (Los Baños, Philippines: International Rice Research Institute, 1980), pp. 85-86. 1958-1980: Taiwan Province. Department of Agriculture and Forestry, Taiwan Agricultural Prices Monthly (Taipei). 10. Official Purchase Price 1947-1979: Taiwan Province. Food Bureau, Taiwan Food Statistics Book (1980). 1980: Taiwan Province. Department of Agriculture and Forestry, Taiwan Agrjcultural Prices Monthly (Taipei). 11. Wholesale Brown Rice Price (Main Market, Taipei City) 1905-1927: Taiwan Province. Governor-General, Directorate of Statistics, Taiwansheng wushiyinianlai tongji tiyao (Summary of Statistics for 51 Years) (Taipei: 1946).
-53- 1928-1979: Taiwan Province. Food Bureau, Taiwan Food Statistics Book (1980). 1980-4982: Taiwan Province. Council for Economic Planning and Development, Executive Yuan, Taiwan Statistical Data Book (Taipei: 1982). 12. Retail Rice Price (Main Market, Taipei City) 1905-1929: Taiwan Province. Governor-General, Directorate of Statistics, Taiwansheng wushirinianlai tongji tiyao (Summary of Statistics for 51 Years) (Taipei: 1946). 1930-1979: Taiwan Province. Food Bureau, Taiwan Food Statistics Book (1980). 13. Farm Wage Rate 1911-1942: Mush, S. C. end Lee, T. B., "Agricultural Development and Its Contributions to Economic Growth in Taiwan," Economic Digest Series: No. 17 (Taipei: Joint Commission on Rural Reconstruction, 1966), p. 97. 1966-1978: Taiwan Province, Bureau of Budget, Accounting and Statistics, Commodity-Price Statistics Monthly Taipei City (Taipei). 14. Domestic Apparent Per Capita Brown Rice Availability 1900-1982: Calculated by dividing brown rice production (2) by population (8) on an annual basis. 15. First Crop Rice Area 1901-1921: Taiwan Province. Governor-General, Directorate of Statistics, Taiwansheng wushiyinianlai tongji tiyao (Summary of Statistics for 51 Years) (Taipei: 1946). 1922-1979: Taiwan Province. Food Bureau, Taiwan Food Statistics Book (1980). 16. First Crop Brown Rice Production 1901-1921: Taiwan Province. Governor-General, Directorate of Statistics,
-54- Taiwansheng wushiyinianlai tongji tiyao (Summary of Statistics for 51 Years) (Taipei: 1946). 1922-1979: Taiwan Province. Food Bureau, Taiwan Food Statistics Book (1980). 17. First Crop Brown Rice Yield 1901-1979: Calculated by dividing brown rice production (16) by rice area (15) on an annual basis.
Country Sources of Basic Data: Taiwan Province Data sources published prior to World War II are in Japanese, while those dating from after the war are in Chinese, or Chinese and English. In addition to regular annual or monthly statisti~a1 journals, Taiwan has also published several compendiums of agricultural statistics. Only a sampling of the most important statistical material is listed here. Compendiums 1. The Governor-General of Taiwan, The Statistical Summary of Taiwan (Tokyo: Japan Times Press, 1912). 2. Taiwan Province. Governor-General, Directorate of Statistics, Taiwansheng wushiyinianlai tongji tiyao (Summary of Statistics for 51 Years) (Taipei: 1946). 3. Joint Commission on Rural Reconstruction, Rural Economics Division, Taiwan Agricultural Statistics 1901-1965, Economic Digest Series: No. 18 (Taipei: 1966). 4. Joint Commission on Rural Reconstruction, Rural Economics Division, Taiwan Agricultural Statistics 1961-1975, Economic Digest Series: No. 22 (Taipei: 1977).
-55- Regular Statistical Journals 1. Taiwan Province. Department of Budget, Accounting and Statistics, Statistical Abstract of Taiwan (Taipei). 2. Taiwan Province. Department of Budget, Accounting and Statistics, Statistical Yearbook of Taiwan (Taipei). 3. Taiwan Province. Department of Agriculture and Forestry, Taiwan Agricultural Prices Monthly (Taipei). 4. Taiwan Province. Department of Budget, Accounting and Statistics, Commodity- Price Statistics Monthly Taipei City (Taipei). 5. Taiwan Province. Department of Agriculture and Forestry, Taiwan Agricultural Yearbook (Taipei). 6. Taiwan Province. Food Bureau, Taiwan Food Statistics Book (Taipei). 7. Taiwan Province. Economic Planning Council, Executive Yuan, Taiwan Statistical Data Book (Taipei). Useful Secondary Sources 1. Taiwan Province. Governor-General, Taiwan beikoku yoran (Summary of Taiwan Rice Production) (Taipei: 1939). 2. Kawano, Shigeto, Taiwan beikoku keizai ron (Treatise on the Rice Economy of Taiwan) (Tokyo: Yuhikaku, 1941). 3. Shen, T. H., Agricultural Development on Taiwan Since World War II (Ithaca, New York: Comstock Publishing Associates - A Division of Cornell University Press, 1964). 4. Hsieh, S. C. and Lee, T. H., "Agricultural Development and Its Contribution to Economic Growth in Taiwan--Input-Output and Productivity Analysis of Taiwan's Agricultural Development," Economic Digest Series: No. 17 (Taipei: JCRR, April 1966).
-56- 5. Chen, Hsu and Mao, "Rice Policies of Taiwan," mimeo of paper presented at the workshop on the "Political Economy of Rice," sponsored by the Food Research Institute, Stanford University, at IRRI, Los Baños, Philippines, July 1974. 6. Mizoguchi, Toshiyuki, Taiwan Chosen no keizai seicho: bukka tokei o chushin toshite (Economic Growth in Taiwan and Korea with Special Reference to Price Statistics) (Tokyo: Iwanami, 1975). 7. Kikuchi, Masao, "Irrigation and Rice Technology in Agricultural Development A Comparative History of Taiwan, Korea and the Philippines," Ph.D. thesis, University of Hokkaido, 1975. Important Chinese Terms Brown Rice Wholesale Price Paddy Land Dry Land Retail Price Chailai Rice Ponlai Rice Acronyms/Conversion Factors JCRR: Joint Commission on Rural Reconstruction. Name changed to Council for Agricultural Planning and Development (CAPD) in 1979. PFB: Provincial Food Board
-57- Money Unit Prior to June 14, 1949 Taiwan dollar (yuan) used. Since June 15, 1949 New Taiwan dollar (NT$) in use. In 1980 1 US$ = 36.01 NT$ official exchange rate In 1980 1 US$ = 38.40 NT$ free-market exchange rate 1 kg. paddy rice = 0.76 kg. brown rice 1 kg. ponlai brown rice = 0.93 kg. polished rice (domestic) 1 kg. chailai brown rice = 0.94 kg. polished rice (domestic) 1 hectare = 1.03 chia ( ) 1 chia = 0.9699 ha. 1 old catty ( ) = 0.5968 kg. 1 shih catty ( ) = 0.5 kg. 1 koku brown rice = 150 kg. 1 koku paddy = 187.5 kg. 1 koku rice = 136.5 kg.
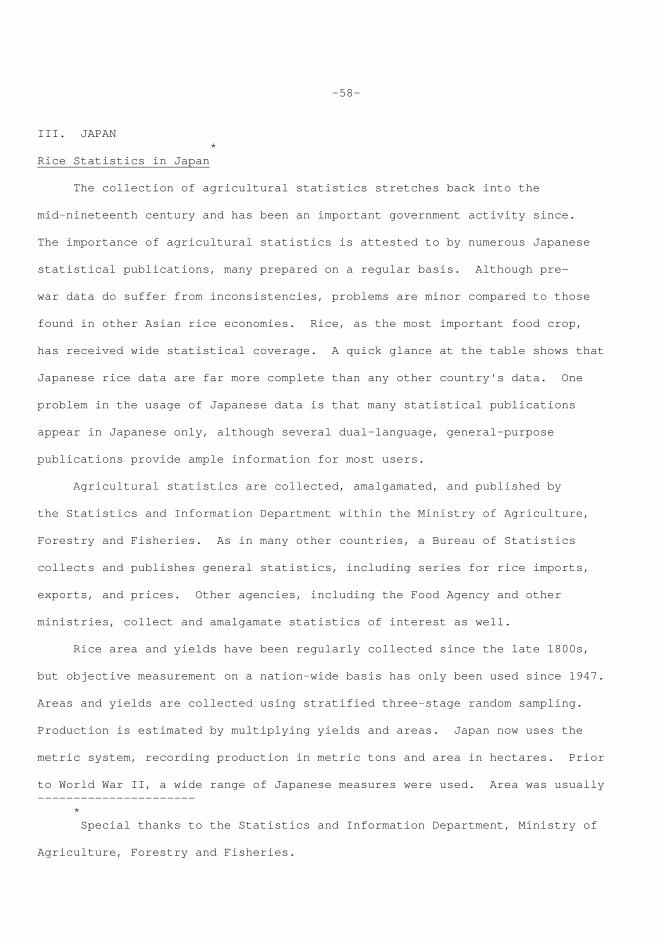
-58- III. JAPAN * Rice Statistics in Japan The collection of agricultural statistics stretches back into the mid-nineteenth century and has been an important government activity since. The importance of agricultural statistics is attested to by numerous Japanese statistical publications, many prepared on a regular basis. Although pre- war data do suffer from inconsistencies, problems are minor compared to those found in other Asian rice economies. Rice, as the most important food crop, has received wide statistical coverage. A quick glance at the table shows that Japanese rice data are far more complete than any other country's data. One problem in the usage of Japanese data is that many statistical publications appear in Japanese only, although several dual-language, general-purpose publications provide ample information for most users. Agricultural statistics are collected, amalgamated, and published by the Statistics and Information Department within the Ministry of Agriculture, Forestry and Fisheries. As in many other countries, a Bureau of Statistics collects and publishes general statistics, including series for rice imports, exports, and prices. Other agencies, including the Food Agency and other ministries, collect and amalgamate statistics of interest as well. Rice area and yields have been regularly collected since the late 1800s, but objective measurement on a nation-wide basis has only been used since 1947. Areas and yields are collected using stratified three-stage random sampling. Production is estimated by multiplying yields and areas. Japan now uses the metric system, recording production in metric tons and area in hectares. Prior to World War II, a wide range of Japanese measures were used. Area was usually —————————————————————— * Special thanks to the Statistics and Information Department, Ministry of Agriculture, Forestry and Fisheries.
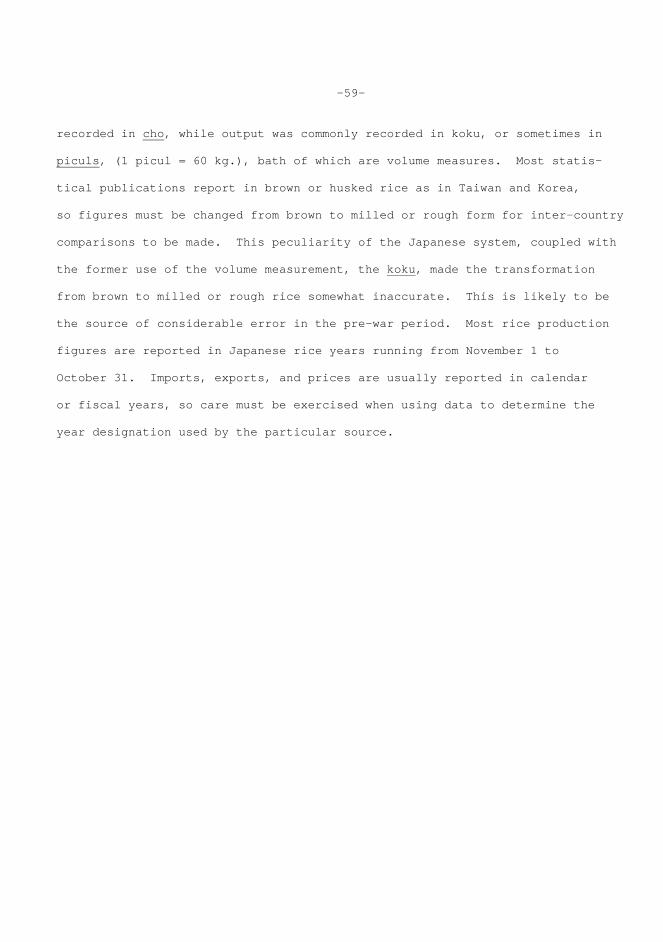
-59- recorded in cho, while output was commonly recorded in koku, or sometimes in piculs, (1 picul = 60 kg.), bath of which are volume measures. Most statis- tical publications report in brown or husked rice as in Taiwan and Korea, so figures must be changed from brown to milled or rough form for inter-country comparisons to be made. This peculiarity of the Japanese system, coupled with the former use of the volume measurement, the koku, made the transformation from brown to milled or rough rice somewhat inaccurate. This is likely to be the source of considerable error in the pre-war period. Most rice production figures are reported in Japanese rice years running from November 1 to October 31. Imports, exports, and prices are usually reported in calendar or fiscal years, so care must be exercised when using data to determine the year designation used by the particular source.
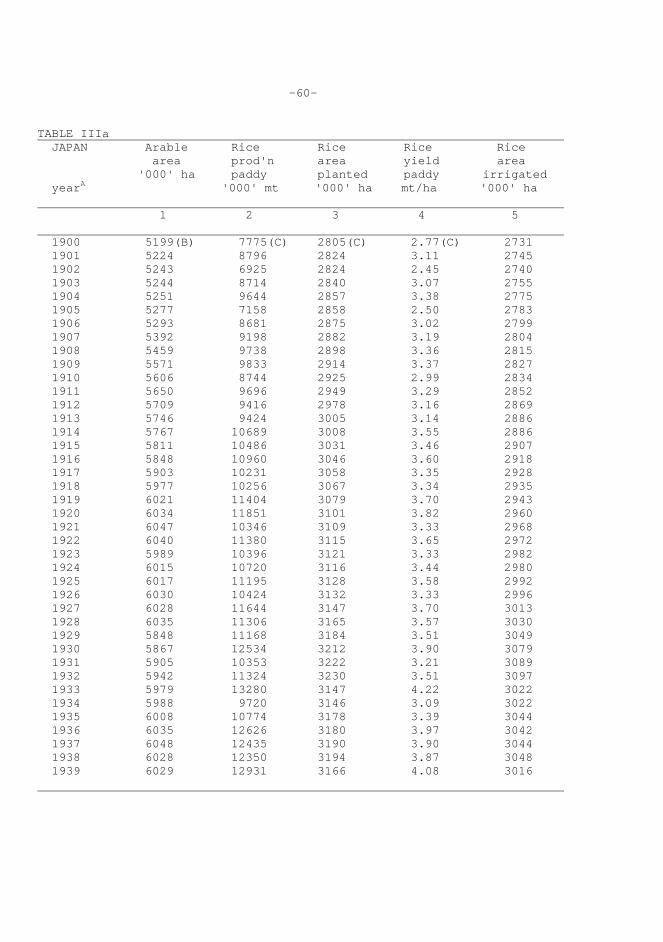
-60- TABLE IIIa JAPAN Arable Rice Rice Rice Rice area prod'n area yield area '000' ha paddy planted paddy irrigated yearA '000' mt '000' ha mt/ha '000' ha 1 2 3 4 5 1900 5199(B) 7775(C) 2805(C) 2.77(C) 2731 1901 5224 8796 2824 3.11 2745 1902 5243 6925 2824 2.45 2740 1903 5244 8714 2840 3.07 2755 1904 5251 9644 2857 3.38 2775 1905 5277 7158 2858 2.50 2783 1906 5293 8681 2875 3.02 2799 1907 5392 9198 2882 3.19 2804 1908 5459 9738 2898 3.36 2815 1909 5571 9833 2914 3.37 2827 1910 5606 8744 2925 2.99 2834 1911 5650 9696 2949 3.29 2852 1912 5709 9416 2978 3.16 2869 1913 5746 9424 3005 3.14 2886 1914 5767 10689 3008 3.55 2886 1915 5811 10486 3031 3.46 2907 1916 5848 10960 3046 3.60 2918 1917 5903 10231 3058 3.35 2928 1918 5977 10256 3067 3.34 2935 1919 6021 11404 3079 3.70 2943 1920 6034 11851 3101 3.82 2960 1921 6047 10346 3109 3.33 2968 1922 6040 11380 3115 3.65 2972 1923 5989 10396 3121 3.33 2982 1924 6015 10720 3116 3.44 2980 1925 6017 11195 3128 3.58 2992 1926 6030 10424 3132 3.33 2996 1927 6028 11644 3147 3.70 3013 1928 6035 11306 3165 3.57 3030 1929 5848 11168 3184 3.51 3049 1930 5867 12534 3212 3.90 3079 1931 5905 10353 3222 3.21 3089 1932 5942 11324 3230 3.51 3097 1933 5979 13280 3147 4.22 3022 1934 5988 9720 3146 3.09 3022 1935 6008 10774 3178 3.39 3044 1936 6035 12626 3180 3.97 3042 1937 6048 12435 3190 3.90 3044 1938 6028 12350 3194 3.87 3048 1939 6029 12931 3166 4.08 3016
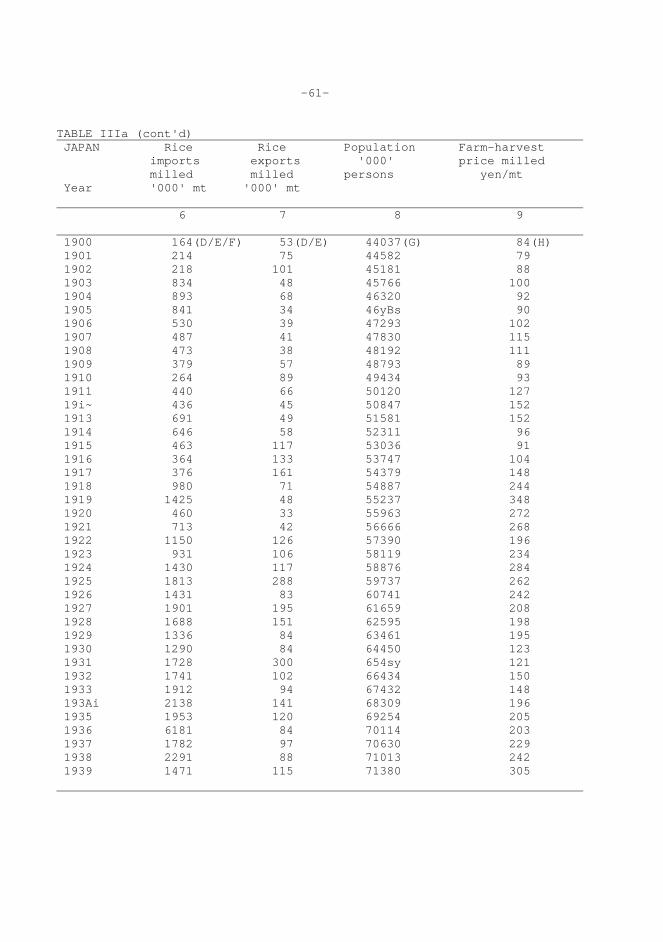
-61- TABLE IIIa (cont'd) JAPAN Rice Rice Population Farm-harvest imports exports '000' price milled milled milled persons yen/mt Year '000' mt '000' mt 6 7 8 9 1900 164(D/E/F) 53(D/E) 44037(G) 84(H) 1901 214 75 44582 79 1902 218 101 45181 88 1903 834 48 45766 100 1904 893 68 46320 92 1905 841 34 46yBs 90 1906 530 39 47293 102 1907 487 41 47830 115 1908 473 38 48192 111 1909 379 57 48793 89 1910 264 89 49434 93 1911 440 66 50120 127 19i~ 436 45 50847 152 1913 691 49 51581 152 1914 646 58 52311 96 1915 463 117 53036 91 1916 364 133 53747 104 1917 376 161 54379 148 1918 980 71 54887 244 1919 1425 48 55237 348 1920 460 33 55963 272 1921 713 42 56666 268 1922 1150 126 57390 196 1923 931 106 58119 234 1924 1430 117 58876 284 1925 1813 288 59737 262 1926 1431 83 60741 242 1927 1901 195 61659 208 1928 1688 151 62595 198 1929 1336 84 63461 195 1930 1290 84 64450 123 1931 1728 300 654sy 121 1932 1741 102 66434 150 1933 1912 94 67432 148 193Ai 2138 141 68309 196 1935 1953 120 69254 205 1936 6181 84 70114 203 1937 1782 97 70630 229 1938 2291 88 71013 242 1939 1471 115 71380 305
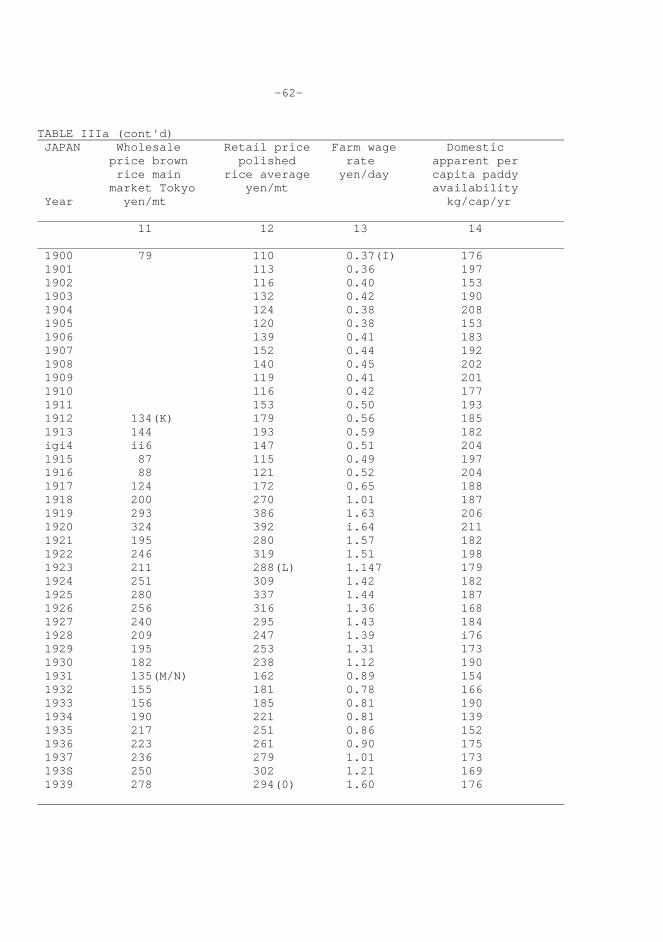
-62- TABLE IIIa (cont'd) JAPAN Wholesale Retail price Farm wage Domestic price brown polished rate apparent per rice main rice average yen/day capita paddy market Tokyo yen/mt availability Year yen/mt kg/cap/yr 11 12 13 14 1900 79 110 0.37(I) 176 1901 113 0.36 197 1902 116 0.40 153 1903 132 0.42 190 1904 124 0.38 208 1905 120 0.38 153 1906 139 0.41 183 1907 152 0.44 192 1908 140 0.45 202 1909 119 0.41 201 1910 116 0.42 177 1911 153 0.50 193 1912 134(K) 179 0.56 185 1913 144 193 0.59 182 igi4 ii6 147 0.51 204 1915 87 115 0.49 197 1916 88 121 0.52 204 1917 124 172 0.65 188 1918 200 270 1.01 187 1919 293 386 1.63 206 1920 324 392 i.64 211 1921 195 280 1.57 182 1922 246 319 1.51 198 1923 211 288(L) 1.147 179 1924 251 309 1.42 182 1925 280 337 1.44 187 1926 256 316 1.36 168 1927 240 295 1.43 184 1928 209 247 1.39 i76 1929 195 253 1.31 173 1930 182 238 1.12 190 1931 135(M/N) 162 0.89 154 1932 155 181 0.78 166 1933 156 185 0.81 190 1934 190 221 0.81 139 1935 217 251 0.86 152 1936 223 261 0.90 175 1937 236 279 1.01 173 193S 250 302 1.21 169 1939 278 294(0) 1.60 176
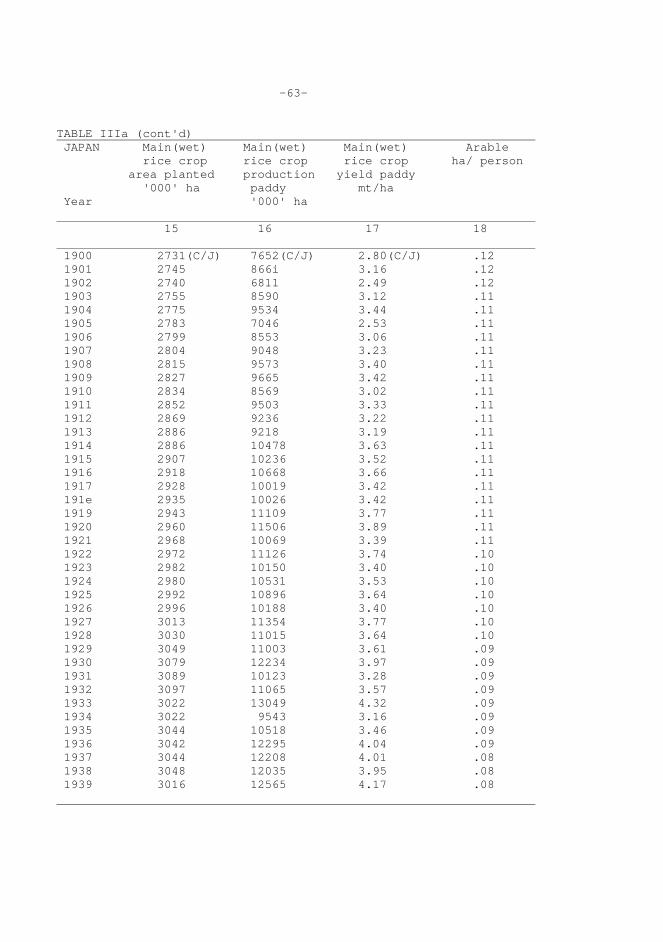
-63- TABLE IIIa (cont'd) JAPAN Main(wet) Main(wet) Main(wet) Arable rice crop rice crop rice crop ha/ person area planted production yield paddy '000' ha paddy mt/ha Year '000' ha 15 16 17 18 1900 2731(C/J) 7652(C/J) 2.80(C/J) .12 1901 2745 866i 3.16 .12 1902 2740 6811 2.49 .12 1903 2755 8590 3.12 .11 1904 2775 9534 3.44 .11 1905 2783 7046 2.53 .11 1906 2799 8553 3.06 .11 1907 2804 9048 3.23 .11 1908 2815 9573 3.40 .11 1909 2827 9665 3.42 .11 1910 2834 8569 3.02 .11 1911 2852 9503 3.33 .11 1912 2869 9236 3.22 .11 1913 2886 9218 3.19 .11 1914 2886 10478 3.63 .11 1915 2907 10236 3.52 .11 1916 2918 10668 3.66 .11 1917 2928 10019 3.42 .11 191e 2935 10026 3.42 .11 1919 2943 11109 3.77 .11 1920 2960 11506 3.89 .11 1921 2968 10069 3.39 .11 1922 2972 11126 3.74 .10 1923 2982 10150 3.40 .10 1924 2980 10531 3.53 .10 1925 2992 10896 3.64 .10 1926 2996 10188 3.40 .10 1927 3013 11354 3.77 .10 1928 3030 11015 3.64 .10 1929 3049 11003 3.61 .09 1930 3079 12234 3.97 .09 1931 3089 10123 3.28 .09 1932 3097 11065 3.57 .09 1933 3022 13049 4.32 .09 1934 3022 9543 3.16 .09 1935 3044 10518 3.46 .09 1936 3042 12295 4.04 .09 1937 3044 12208 4.01 .08 1938 3048 12035 3.95 .08 1939 3016 12565 4.17 .08
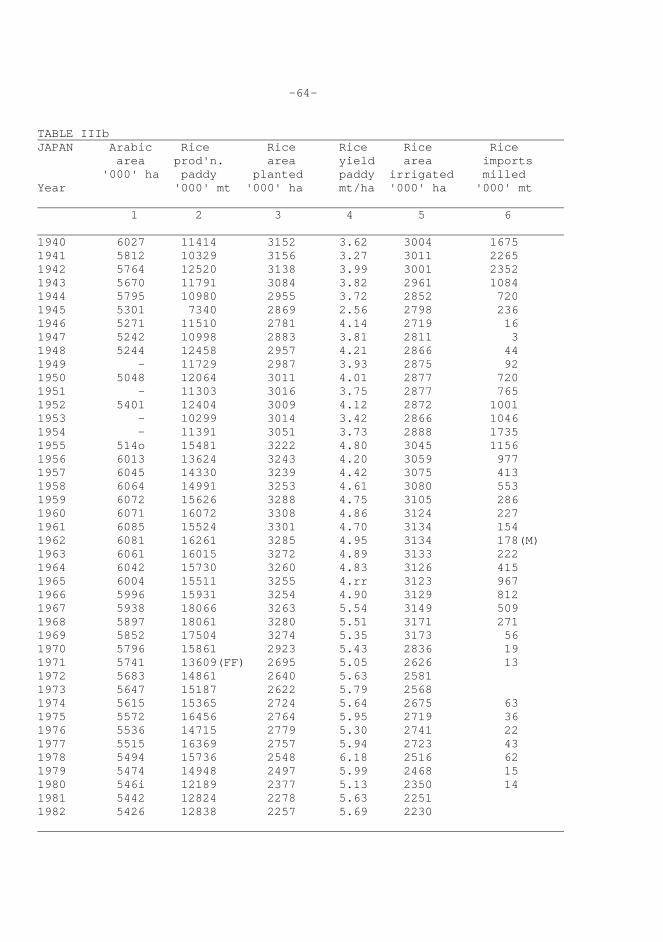
-64- TABLE IIIb JAPAN Arabic Rice Rice Rice Rice Rice area prod'n. area yield area imports '000' ha paddy planted paddy irrigated milled Year '000' mt '000' ha mt/ha '000' ha '000' mt 1 2 3 4 5 6 1940 6027 11414 3152 3.62 3004 1675 1941 5812 10329 3156 3.27 3011 2265 1942 5764 12520 3138 3.99 3001 2352 1943 5670 11791 3084 3.82 2961 1084 1944 5795 10980 2955 3.72 2852 720 1945 5301 7340 2869 2.56 2798 236 1946 5271 11510 2781 4.14 2719 16 1947 5242 10998 2883 3.81 2811 3 1948 5244 12458 2957 4.21 2866 44 1949 - 11729 2987 3.93 2875 92 1950 5048 12064 3011 4.01 2877 720 1951 - 11303 3016 3.75 2877 765 1952 5401 12404 3009 4.12 2872 1001 1953 - 10299 3014 3.42 2866 1046 1954 - 11391 3051 3.73 2888 1735 1955 514o 15481 3222 4.80 3045 1156 1956 6013 13624 3243 4.20 3059 977 1957 6045 14330 3239 4.42 3075 413 1958 6064 14991 3253 4.61 3080 553 1959 6072 15626 3288 4.75 3105 286 1960 6071 16072 3308 4.86 3124 227 1961 6085 15524 3301 4.70 3134 154 1962 6081 16261 3285 4.95 3134 178(M) 1963 6061 16015 3272 4.89 3133 222 1964 6042 15730 3260 4.83 3126 415 1965 6004 15511 3255 4.rr 3123 967 1966 5996 15931 3254 4.90 3129 812 1967 5938 18066 3263 5.54 3149 509 1968 5897 18061 3280 5.51 3171 271 1969 5852 17504 3274 5.35 3173 56 1970 5796 15861 2923 5.43 2836 19 1971 5741 13609(FF) 2695 5.05 2626 13 1972 5683 14861 2640 5.63 2581 1973 5647 15187 2622 5.79 2568 1974 5615 15365 2724 5.64 2675 63 1975 5572 16456 2764 5.95 2719 36 1976 5536 14715 2779 5.30 2741 22 1977 5515 16369 2757 5.94 2723 43 1978 5494 15736 2548 6.18 2516 62 1979 5474 14948 2497 5.99 2468 15 1980 546i 12189 2377 5.13 2350 14 1981 5442 12824 2278 5.63 2251 1982 5426 12838 2257 5.69 2230
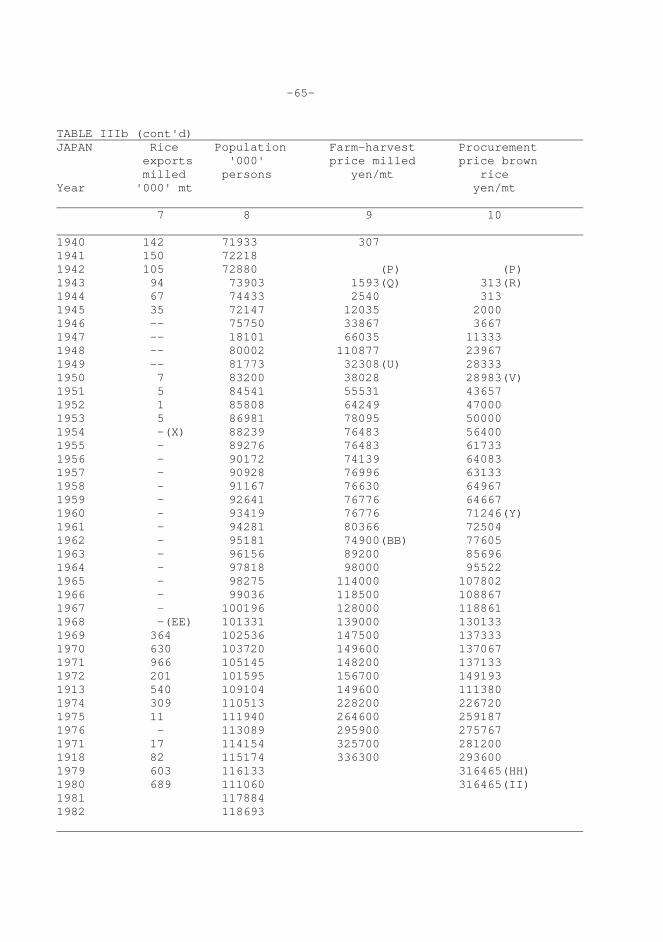
-65- TABLE IIIb (cont'd) JAPAN Rice Population Farm-harvest Procurement exports '000' price milled price brown milled persons yen/mt rice Year '000' mt yen/mt 7 8 9 10 1940 142 71933 307 1941 150 72218 1942 105 72880 (P) (P) 1943 94 73903 1593(Q) 313(R) 1944 67 74433 2540 313 1945 35 72147 12035 2000 1946 -- 75750 33867 3667 1947 -- 18101 66035 11333 1948 -- 80002 110877 23967 1949 -- 81773 32308(U) 28333 1950 7 83200 38028 28983(V) 1951 5 84541 55531 43657 1952 1 85808 64249 47000 1953 5 86981 78095 50000 1954 -(X) 88239 76483 56400 1955 - 89276 76483 61733 1956 - 90172 74139 64083 1957 - 90928 76996 63133 1958 - 91167 76630 64967 1959 - 92641 76776 64667 1960 - 93419 76776 71246(Y) 1961 - 94281 80366 72504 1962 - 95181 74900(BB) 77605 1963 - 96156 89200 85696 1964 - 97818 98000 95522 1965 - 98275 114000 107802 1966 - 99036 118500 108867 1967 - 100196 128000 118861 1968 -(EE) 101331 139000 130133 1969 364 102536 147500 137333 1970 630 103720 149600 137067 1971 966 105145 148200 137133 1972 201 101595 156700 149193 1913 540 109104 149600 111380 1974 309 110513 228200 226720 1975 11 111940 264600 259187 1976 - 113089 295900 275767 1971 17 114154 325700 281200 1918 82 115174 336300 293600 1979 603 116133 316465(HH) 1980 689 111060 316465(II) 1981 117884 1982 118693
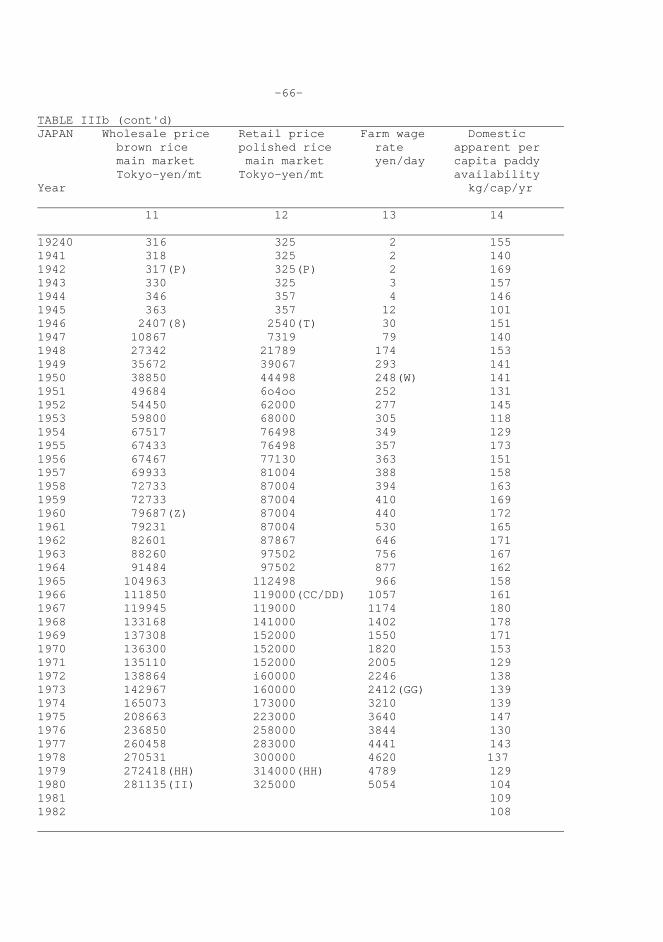
-66- TABLE IIIb (cont'd) JAPAN Wholesale price Retail price Farm wage Domestic brown rice polished rice rate apparent per main market main market yen/day capita paddy Tokyo-yen/mt Tokyo-yen/mt availability Year kg/cap/yr 11 12 13 14 19240 316 325 2 155 1941 318 325 2 140 1942 317(P) 325(P) 2 169 1943 330 325 3 157 1944 346 357 4 146 1945 363 357 12 101 1946 2407(8) 2540(T) 30 151 1947 10867 7319 79 140 1948 27342 21789 174 153 1949 35672 39067 293 141 1950 38850 44498 248(W) 141 1951 49684 6o4oo 252 131 1952 54450 62000 277 145 1953 59800 68000 305 118 1954 67517 76498 349 129 1955 67433 76498 357 173 1956 67467 77130 363 151 1957 69933 81004 388 158 1958 72733 87004 394 163 1959 72733 87004 410 169 1960 79687(Z) 87004 440 172 1961 79231 87004 530 165 1962 82601 87867 646 171 1963 88260 97502 756 167 1964 91484 97502 877 162 1965 104963 112498 966 158 1966 111850 119000(CC/DD) 1057 161 1967 119945 119000 1174 180 1968 133168 141000 1402 178 1969 137308 152000 1550 171 1970 136300 152000 1820 153 1971 135110 152000 2005 129 1972 138864 i60000 2246 138 1973 142967 160000 2412(GG) 139 1974 165073 173000 3210 139 1975 208663 223000 3640 147 1976 236850 258000 3844 130 1977 260458 283000 4441 143 1978 270531 300000 4620 137 1979 272418(HH) 314000(HH) 4789 129 1980 281135(II) 325000 5054 104 1981 109 1982 108
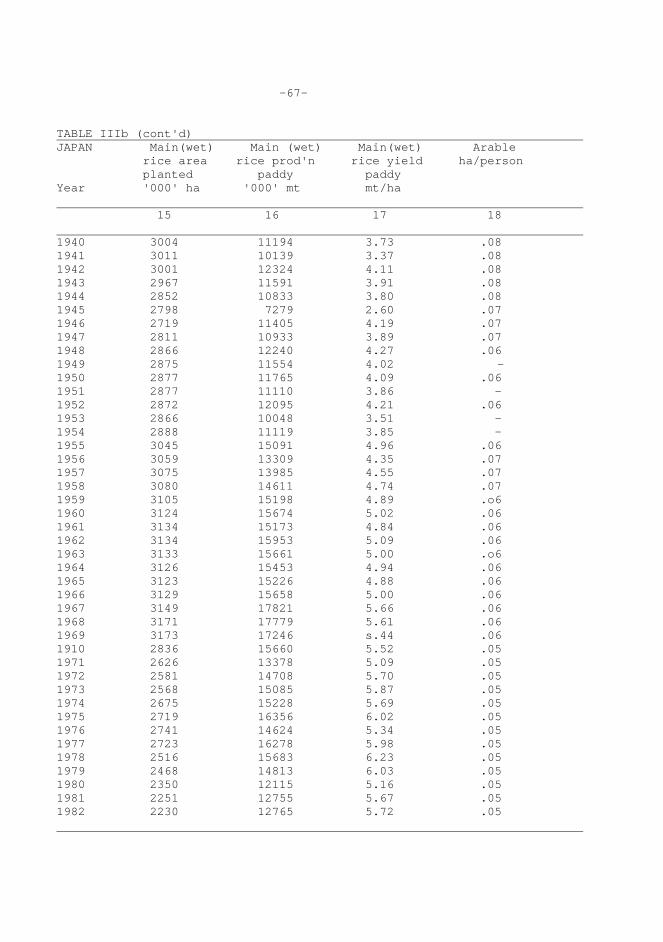
-67- TABLE IIIb (cont'd) JAPAN Main(wet) Main (wet) Main(wet) Arable rice area rice prod'n rice yield ha/person planted paddy paddy Year '000' ha '000' mt mt/ha 15 16 17 18 1940 3004 11194 3.73 .08 1941 3011 10139 3.37 .08 1942 3001 12324 4.11 .08 1943 2967 11591 3.91 .08 1944 2852 10833 3.80 .08 1945 2798 7279 2.60 .07 1946 2719 11405 4.19 .07 1947 2811 10933 3.89 .07 1948 2866 12240 4.27 .06 1949 2875 11554 4.02 - 1950 2877 11765 4.09 .06 1951 2877 11110 3.86 - 1952 2872 12095 4.21 .06 1953 2866 10048 3.51 - 1954 2888 11119 3.85 - 1955 3045 15091 4.96 .06 1956 3059 13309 4.35 .07 1957 3075 13985 4.55 .07 1958 3080 14611 4.74 .07 1959 3105 15198 4.89 .o6 1960 3124 15674 5.02 .06 1961 3134 15173 4.84 .06 1962 3134 15953 5.09 .06 1963 3133 15661 5.00 .o6 1964 3126 15453 4.94 .06 1965 3123 15226 4.88 .06 1966 3129 15658 5.00 .06 1967 3149 17821 5.66 .06 1968 3171 17779 5.61 .06 1969 3173 17246 s.44 .06 1910 2836 15660 5.52 .05 1971 2626 13378 5.09 .05 1972 2581 14708 5.70 .05 1973 2568 15085 5.87 .05 1974 2675 15228 5.69 .05 1975 2719 16356 6.02 .05 1976 2741 14624 5.34 .05 1977 2723 16278 5.98 .05 1978 2516 15683 6.23 .05 1979 2468 14813 6.03 .05 1980 2350 12115 5.16 .05 1981 2251 12755 5.67 .05 1982 2230 12765 5.72 .05
-68-
Notes to Appendix Tables IIIa and IIIb: Japan
A/Rice data presented in Appendix Table III are for Japan Proper including Okinawa through 1944 but excluding it from 1945. In 1972, Okinawa was re- turned to Japan. From 1974 it is included. B/1900-1982: Arable land area refers to total cultivated area ( ) including paddy and upland area as well as land planted to trees, vines, and shrubs on an annual basis. Arable area figures for the period 1900-1940 were collected by local agricultural associations (nokai) and local governments for the central government. Figures for 1941-1948 are interpolations based on past trends. 1950-1955 figures are taken from the 1950 World Agricultural Census, the 1952 Annual Basic Survey, and the 1955 Temporary Basic Survey on Agriculture, respectively. The 1956-1982 series are taken from the "Sample Re-measurement Survey for Arable Land." For further information see: Japan. Ministry of Agriculture, Forestry and Fisheries, Sakumotsu tokei (Crop Statistics) (Tokyo: 1981), Table ~ or Ohkawa, Shinohara, Umemura, eds., Estimates of Long-Term Economic Statistics of Japan Since 1868, "Agriculture and Forestry" (Tokyo: Toyo Keizai Shinposha, 1966), pp. 139-41 or pp. 75-90. Area data exclude Okinawa prior to 1923 and from 1945-1973, and include it from 1924-1943 and from 1974-1982. C/1900-1982: Rice area, output, and yield are recorded on a calendar-vein basis. In the original sources, rice production is recorded in brown rice. To simplify matters and encourage comparison between Japan and other Asian countries, rice production was changed to paddy form using a constant conversion factor of 1.25. D/1900-1980: Rice imports and exports are the simple totals of rough rice
-69- ( ), white rice ( ). and other ( ). E/1900-1961: Rice imports and exports are in rice years, Nov. 1-Oct. 31. F/l900-1945: Rice imports include rice imported from Korea, Taiwan, and other Japanese possessions. This is a very important distinction as many official import series do not count rice imports from Japanese colonies as true imports. Figures for such series are much smaller than those recorded here. From 1945 and the collapse of the Japanese empire, imports from former colonies are simply counted as import. G/1900-1978: Population reported on a Nov. 1-Oct. 31 basis. H/1900-1940 and 1949-1961: Farm-harvest price is for paddy and upland field rice ( ). For the 1900-1940 period, weighted averages of various descriptions and grades of rice were utilized in an effort to form a coherent price series. For some years, appropriate data were unavailable and interpolations were used. 1902-1908 and 1912-1914 figures are interpo- lations. Ministry of Agriculture and Forestry data, published in Commodities Statistics of Farm Household Economy Survey, were used for the 1949-1961 period. For a more detailed description of sources and methods, see Ohkawa, Shinohara, and Umemura, eds., Estimates of Long-Term Economic Statistics of Japan Since 1868, Vol. 8, "Prices" (Tokyo: Toyo Keizai Shinposha, 1967), pp. 74-77 and 124-126. I/1900-1980: Farm wage rate is for male workers. 1900-1963 farm wage rate is for daily contract workers in agriculture ( ) (hiyatoi). Daily workers,who commute to work, receive regular wages with some meals and are frequently part time are to be distinguished from nenko ( ), who are
-70- permanently employed, live on the farm, and receive additional compensation (food, clothing) as well as cash wages. J/Unlike in most other rice-growing countries, in Japan rice area is subdivided into wet and dry land, although at present about 99 percent of the rice crop is planted on paddy land. Paddy or wet land is defined as area having facilities for irrigation and storing water. Upland area does not have these facilities. K/l912-1930: Wholesale rice price is the average price of medium grade indigenous brown rice at the Fukagawa Rice Exchange in Tokyo. Original ma- terial was published in the Annual Report of Food Control Statistics. L/1923-1938: Retail rice price is for domestic, ordinary variety, third-grade rice ( ). M/1931: The fall in the wholesale brown rice price is an actual market drop brought about by the serious 1930s world-wide depression. N/l93l-l945: Wholesale brown rice price is for native, home-grown rice ( ). Data were amassed by the Bank of Japan and are on a calendar-year basis. O/1939-1945: Retail rice price is an average Tokyo (main market) price for medium quality rice. Beginning on Nov. 6, 1939, rice prices were fixed as part of the war effort. In 1942, the Food Control Law (Shokuryo kanri ho) placed the production and marketing activities of all major food items under central control. The Food Control Law established compulsory procurement and rationing and was executed by the Ministry of Agriculture and Forestry. Although control over other foods was gradually returned to the private sector, rice remained
-71-
under centrals control. The retail rice price continued to be strictly fixed
until 1972, when pricing was liberalized. Retail rice prices shown here are
official government prices. A free market with much higher prices also existed,
but data for these prices are not easily available. P/In 1942, the Japanese government took strict measures to control the
marketing and pricing of rice under the Food Control Law (Shokuryo kanri ho).
Under war-time conditions, this allowed the government to procure all of the
rice crop and to ration its consumption in urban areas. After the war, control
was gradually relaxed until only rice still remained under the jurisdiction
of the Food Agency. The procurement price is fixed by the government and is
set very high, helping to ensure farmers an adequate income. The Food Agency
sells rice to wholesalers at a fixed "resale" price (this is the price recorded
under "Wholesale Rice Price" in the table), who in turn sell the rice to
retailers. Retailers and wholesalers are allowed a certain margin of profit
by law. Prior to 1972, retail prices were controlled by the government, but
under the present surplus conditions, control has been relaxed, and a guided
or suggested price substituted.
In the early days of food control when rice was scarce and government
prices low, the black-market, farm-harvest price was considerably higher than
fixed procurement prices. A substantial portion, perhaps 30-40 percent of
production, was marketed clandestinely. However, as the supply situation im-
proved and government procurement prices rose, the black market share declined
drastically. In 1969, with mounting surpluses, the government began to
encourage legal marketing of rice through cooperatives.
It should be clear from the price tables that the government has been
accumulating large deficits while financing the rice program. As the tables
-72- show, it sells rice to wholesalers for a smaller sum than it pays farmers. This has caused considerable problems in the government and has been addressed through the instigation of acreage substitution plans, large, subsidized ex- ports, diversion of surplus rice to other industries (for example, feed, confectionary, or alcohol), and cut backs in rises in the procurement price. Q/1943-1948: Farm-harvest price is for polished rice and is the price at which producers sold rice (to special collectors) after prefectural quota amounts were met. It can be considered an above-quota price. R/1943...1949: Procurement price i8 for third-grade brown rice. S/l946-l959: Wholesale rice price for domestic brown rice is the govern- ment resale price. The resale price is the price the government receives when it markets procured rice to wholesalers. Prices are on a calendar-year basis. T/1946-1965: Retail rice price is the average price for domestic rationed rice (hai naichi haku mai). As mentioned in Footnote P, a flourishing black market existed until the late 1950s. Prices on the black market were considerably higher than fixed rationed prices. For example, in 1952, polished rice sold for an average price of 100760 yen/mt. on the Tokyo black market while rationed polished rice cost 62000 yen/mt. (Rice Statistical Compilation, p. 61). U/1949-1961: Farm-harvest price is the "price of agricultural products" and refers to prices received by farmers. V/1950-1959: Procurement price is for domestic, brown, nonglutinous rice and is in calendar years. W/l950-l972: Farm wage rate is for male workers on a daily basis.
-73- X/1954-1967: No or negligible rice exports made. Y/l960-l980: Procurement price is for milled rice and is recorded in Japanese fiscal years (April-March). Z/1960-1980: Wholesale rice price for standard quality rice is the government resale price for milled rice. The resale price is the price the government receives when it markets procured rice to wholesalers. aa/1962-1980: Rice imports are in calendar years. bb/1962-1978: Farm-harvest price is on a fiscal year basis (April-March) and is for milled rice. cc/1966-1980: Retail rice price is the official retail price for medium- grade domestic polished rice. dd/1966-1980: Retail rice price is in Japanese fiscal years (April-March). ee/1968-1980: Rice exports are in calendar years. ff/1971-1982: The rapid drop in rice area registered since 1971 is partly a function of an overall decline in cultivated area due to urbanization. The government also began to actively encourage tanners to plant paddy land to other crops, as unmanageable surpluses accumulated at great cost to the taxpayers. The Food Agency, responsible for the procurement of rice at high fixed prices, began to limit its procurement activities. The government also instigated a set-aside program that paid farmers for idling rice land or switching it to other crops. gg/Farm wage rate is for temporary male employees in agricul- tore and is on a fiscal year basis.
-74- hh/1979: Differential pricing scheme initiated. ii/1980: Preliminary.
Sources of Data for Appendix Tables IIIa and IIIb: Japan 1. Arable Area 1900-1903: Ohkawa, Kazushi; Shinohara, Miyohei; and Umemura, Mataji, eds., Estimates of Long-Term Economic Statistics of Japan Since 1868, Vol. 9 "Agriculture and Forestry" (Tokyo: Toyo Keizai Shinposha, 1965). 1904-1963: Japan. Statistics and Information Department, Ministry of Agriculture, Forestry and Fisheries, Sakumotsu tokei (Crop Statistics) (Tokyo). 1964-1978: Japan. Bureau of Statistics, Office of the Prime Minister, Nihon tokei nenkan (Japan Statistical Yearbook) (Tokyo: 1980). 1979-1981: Japan. Statistics and Information Department, Ministry of Agriculture, Forestry and Fisheries, Abstract of Statistics on Agriculture, Forestry and Fisheries (Tokyo: Association of Agriculture Forestry Statistics, 1982). 1982: Japan. Statistics and Information Department, Ministry of Agricul- ture, Forestry and Fisheries. 2. Rice Production 1900-1959: Japan. Statistics and Information Department, Ministry of Agriculture, Forestry and Fisheries, Sakumotsu tokei (Crop Statistics) (Tokyo). 1960-1978: Japan. Bureau of Statistics, Office of the Prime Minister, Nihon tokei nenkan (Japan Statistical Yearbook) (Tokyo: 1980).
-75- 1979-1981: Japan. Statistics and Information Department, Ministry of Agriculture, Forestry and Fisheries, Abstract of Statistics on Agriculture, Forestry and Fisheries (Tokyo: Association of Agriculture Forestry Statistics, 1982). 1982: Japan. Statistics and Information Department, Ministry of Agricul- ture, Forestry and Fisheries. 3. Rice Area 1900-1959: Japan. Statistics and Information Department, Ministry of Agriculture, Forestry and Fisheries, Sakumotsu tokei (Crop Statistics) (Tokyo). 1960-1978: Japan. Bureau of Statistics, Office of the Prime Minister, Nihon tokei nenkan (Japan Statistical Yearbook) (Tokyo: 1980). 1979-1981: Japan. Statistics and Information Department, Ministry of Agriculture, Forestry and Fisheries, Abstract of Statistics on Agricul- ture, Forestry and Fisheries (Tokyo: Association of Agriculture Forestry Statistics, 1982). 1982: Japan. Statistics and Information Department, Ministry of Agriculture, Forestry and Fisheries. 4. Rice Yield 1900-1982: Rice yields are calculated by dividing rice production (2) by rice area (3) on an annual basis. 5. Rice Area Irrigated 1900-1982: Although data for rice area irrigated as a specific category are not collected, it is generally assumed that paddy or wet-land rice area may be used as a proxy for irrigated area. Sources for the data presented here nay be found under Number 15 - Main (wet) Rice Area.
-76- 6. Rice Imports 1900-1961: Institute of Developing Economies, One Hundred Years of Agricultural Statistics in Japan (Tokyo: Kabushiki Kaisha Sangyo Tokei Kenkyusha, 1969). 1962-1980: Japan External Trade Organization (JETRO), White Paper on International Trade, English Summary ( ) (Tokyo). Annual. 7. Rice Exports 1900-1949: Institute of Developing Economies, One Hundred Years of Agri- cultural Statistics in Japan (Tokyo: Kabushiki Kaisha Sangyo Tokei Kenkyusha, 1969). 1950-1954: Japan. Ministry of Finance, Nippon gaikoku boeki nenpyo yushutsu- hen (The Annual Report of Japanese Foreign Trade in the Area of Exports) (Tokyo). 1955-1960: Japan. Ministry of Finance, Nippon gaikoku boeki nenpyo, shinabetsu-kunibetsu-hen (The Annual Report of Japanese Foreign Trade by Commodity and by Country) (Tokyo). 1961-1967: Kikuchi, Masao; Mochida, Keizo; and Hayami, Yujiro, Rice Statistics in Japan (Los Baños, Philippines: International Rice Research Institute, 1975). 1968-1980: Japan External Trade Organization.(JETRO), White Paper on International Trade, English Summary ( )(Tokyo). Annual. 8. Population 1900-1919: Institute of Developing Economies, One Hundred Years of Agri- cultural Statistics in Japan (Tokyo: Kabushiki Kaisha Sangyo Yokei Kenkyusha, 1969).
-77- 1920-1978: Japan. Bureau of Statistics, Office of the Prime Minister, Nihon tokei nenkan (Japan Statistical Yearbook) (Tokyo: 1980). 1979-1982: Japan. Statistics Bureau, Prime Minister's Office, Statistical Handbook of Japan 1982 (Tokyo: Prime Minister's Office, 1982). 9. Farm-Harvest Price 1900-1940: Ohkawa, Kazushi; Shinohara, Miyohei; and Umemura, Mataji, eds., Estimates of Long-Term Economic Statistics of Japan Since 1868, Vol. 8, "Prices" ( ) (Tokyo: Toyo Keizai Shinposha, 1967). 1943-1958: Japan. Ministry of Finance, Statistical Abstract of Japanese Economy (Tokyo: 1950). 1959-1961: Ohkawa, Kazushi; Shinohara, Miyohei; and Umemura, Mataji, eds., Estimates of Long-Term Economic Statistics of Japan Since 1868, vol. 8, "Prices" (Tokyo: Toyo Keizai Shinposha, 1967). 1962-1978: Japan. Bureau of Statistics, Office of the Prime Minister, Nihon tokei nenkan (Japan Statistical Yearbook) (Tokyo: 1980). 10. Procurement Price 1943-1949: Japan. Statistics and Survey Division, Ministry of Agriculture and Forestry, Rice Statistical Compilation (Tokyo: 1954). 1950-1959: Kikuchi, Masao; Mochida, Keizo; and Hayami, Yujiro, Rice Statistics in Japan (Los Baños, Philippines: International Rice Research Institute, 1975). 1960-1980: Ministry of Agriculture, Forestry and Fisheries, Norinsuisansho tokei kyo (Statistical Yearbook of the Ministry of Agriculture, Forestry and Fisheries) (Tokyo).
-78- 11. Wholesale Brown Rice Price 1912-1930: Japan. Statistics and Survey Division, Ministry of Agriculture and Forestry, Rice Statistical Compilation (Tokyo: 1954). 1931-1945: Japan. Bureau of Statistics, Office of the Prime Minister, Nihon tokei nenkan (Japan Statistical Yearbook) (Tokyo: 1980). 1946-1949: Japan. Statistics and Survey Division, Ministry of Agricul- ture and Forestry, Rice Statistical Compilation (Tokyo: 1954). 1950-1959: Kikuchi, Masao; Mochida, Keizo; and Hayami, Yujiro, Rice Statistics in Japan (Los Baños, Philippines: International Rice Research Institute, 1975). 1960-1978: Japan. Ministry of Agriculture and Forestry, Norinsho tokei hyo (Statistical Yearbook of the Ministry of Agriculture and Forestry) (Tokyo). 1979-1980: Japan. Ministry of Agriculture, Forestry and Fisheries, Norinsuisansho tokei hyo (Statistical Yearbook of the Ministry of Agriculture, Forestry and Fisheries) (Tokyo). 12. Retail Rice Price 1900-1938: Ohkawa, Kazushi; Shinohara, Miyohei; and Umemura, Mataji, eds., Estimates of Long-Term Economic Statistics of Japan Since 1868, Vol. 8, "Prices" (Tokyo: Toyo Keizai Shinposha, 1967). 1939-1945: General Headquarters, Supreme Commander for the Allied Powers, Economic and Scientific Section, Staple Food Prices in Japan 1930-1948 (1949). 1946-1965: Ohkawa, Kazushi; Shinohara, Miyobei; and Umemura, Mataji, eds., Estimates of Long-Tern Economic Statistics of Japan Since 1868, Vol. 8, "Prices" (Tokyo: Toyo Keizai Shinposha, 1967).
-79- 1966-1980: The Tsuneta Yano Memorial Society (Yano-Tsuneta Kinekai) under supervision of Ichiro Yano, ed., Nippon: A Charted survey of Japan (Tokyo: Kokuseisha). Original source: Bureau of Statistics, Office of the Prime Minister. 13. Farm Wage Rate 1900-1963: Ohkawa, Kazushi; Shinohara, Miyohei; and Umemura, Mataji, eds., Estimates of Long-Term Economic Statistics of Japan Since 1868, Vol. 9, "Agriculture and Forestry" (Tokyo: Toyo Keizai Shinposha, 1967). 1964-1972: Kikuchi, Masso; Mochida, Keizo; and Hayami, Yujiro, Rice Statistics in Japan (Los Baños, Philippines: International Rice Research Institute, 1975), Table 25. 1973-1980: Japan. Ministry of Agriculture, Forestry and Fisheries, Abstract of Statistics on Agriculture, Forestry and Fisheries (Tokyo: 1971-1982). 14. Domestic Apparent Per Capita Paddy Availability 1900-1982: Domestic apparent per capita paddy availability is calculated by dividing paddy production (2) by total population (8) on an annual basis. 15. Main (wet) Rice Area 1900-1959: Japan. Statistics and Information Department, Ministry of Agriculture, Forestry and Fisheries, Sakumotsu tokei (Crop Statistics) (Tokyo). 1960-1978: Japan. Bureau of Statistics, Office of the Prime Minister, Nihon tokei nenkan (Japan Statistical Yearbook) (Tokyo: 1980). 1979-1981: Japan. Statistics and Information Department, Ministry of Agri- culture, Forestry and Fisheries, Abstract of Statistics on Agriculture,
-80- Forestry and Fisheries (Tokyo: Association of Agriculture Forestry Statistics, 1982). 1982: Japan. Statistics and Information Department, Ministry of Agri- culture, Forestry and Fisheries. 16. Main (wet) Rice Production 1900-1959: Japan. Statistics and Information Department, Ministry of Agriculture, Forestry and Fisheries, Sakumotsu tokei (Crop Statistics) (Tokyo). 1960-1978: Japan. Bureau of Statistics, Office of the Prime Minister, Nihon tokei nenkan (Japan Statistical Yearbook) (Tokyo: 1980). 1979-1981: Japan. Statistics and Information Department, Ministry of Agriculture, Forestry and Fisheries, Abstract of Statistics on Agricul- ture, Forestry and Fisheries (Tokyo: Association of Agriculture Forestry Statistics, 1982). 1982: Japan. Statistics and Information Department, Ministry of Agricul- ture, Forestry and Fisheries. 17. Main (wet) Rice Yield 1900-1982: Main (wet) rice yield is calculated by dividing wet rice production (16) by wet rice area (15) on an annual basis.
Country Sources of Basic Data: Japan In the case of Japan, we are very fortunate in having many primary statistical sources to turn to for both the post- and pre-war period. Some of the most common sources, with a heavy emphasis on those with dual language or English language text, are listed below.
-81-
Pre-War Primary Sources*
1. Japan. Cabinet Imperial, Bureau de la Statistique Generale (Naikaku Tokei
Kyoku), Résumé statistique de l'empire du Japon (Tokio). Dual language
French and Japanese text. Also includes statistical information for
Taiwan and Korea.
2. Japan. Section of Statistics, The Department of Agriculture and Commerce,
The Agricultural and Commercial Statistics for ————— (Tokyo). This
series was published on an annual basis for the years 1919-19.23. In
1923, The Department of Agriculture and Commerce was replaced by the De-
partment of Agriculture and Forestry. Agricultural and Commercial Sta-
tistics was replaced by The Statistical Abstract of the Department of
Agriculture and Forestry with the 1924 edition (see post-war sources).
3. Japan. Bureau of Statistics, Dai Nihon teikoku tokei nenkan (Statistical
Yearbook of the Japanese Empire) (Tokyo). After World War II, replaced
by the dual language Japan Statistical Yearbook.
Post-War Primary Sources - General
1. Japan. Bureau of Statistics, Office of the Prime Minister, Nihon tokei
nenkan (Japan Statistical Yearbook) (Tokyo: 1949- ).
2. Japan. Bureau of Statistics, Monthly Statistics of Japan (Tokyo).
3. The Tsuneta Yano Memorial Society (Yano-Tsuneta Kinenkai) under supervision
of Ichiro Yano, ed., Nippon: A Charted Survey of Japan (Tokyo: Kokuseisha).
4. Japan. Statistics Bureau, Office of the Prime Minister, Statistical
Handbook of Japan (Tokyo).
—————————————————————
*Other important sources that continued to be issued after World War II
are listed under "Post-War Primary Sources."
-82- 5. Statistics Department, Bank of Japan, Keizai tokei nenpo (Economic Statistics Yearbook) (Tokyo). 6. Japan External Trade Organization (JETRO), White Paper on International Trade (Tokyo). Post-War Primary Sources - Agriculture 1. Japan. Ministry of Agriculture, Forestry and Fisheries, The Statistical Abstract of the Department of Agriculture and Forestry (Tokyo). 2. Japan. Food Agency, Shokuryo kanri tokei nenpo (Statistical Yearbook of Food Control) (Tokyo). 3. Japan. Ministry of Agriculture, Forestry and Fisheries, Norinsuisansho tokei hyo (Statistical Yearbook of the Ministry of Agriculture, Forestry and Fisheries) (Tokyo). 4. Japan. Statistics and Information Department, Ministry of Agriculture, Forestry and Fisheries, Sakumotsu tokei (Crop Statistics) (Tokyo). Statistical Compendia 1. Masao Kikuchi, Keizo Mochida, and Yujiro Hayami, Rice Statistics in Japan (Los Baños. Philippines! International Rice Research Institute, 1975). 2. Institute of Developing Economies, One Hundred Years of Agricultural Statistics in Japan (Tokyo: Kabushiki Kaisha Sangyo Tokei Kenkyusha, 1969). 3. Kazushi Ohkawa, Miyohei Shinohara, and Mataji Umemura, eds., Estimates of Long-Term Economic Statistics of Japan Since 1868 (Tokyo: Toyo Keizai Shinposha, .1965). Thirteen volumes on different subjects, although some are not yet published. No. 8, "Prices" and No. 9, "Agriculture and Forestry" are useful.
-83- 4. Tokyo Association of Agriculture-Forestry Statistics, Rice Statistical Compilation (Tokyo: 1954). 5. Nihon Ginko Tokeikyoku (Statistics Department, The Bank of Japan), Hundred- Year Statistics of the Japanese Economy (Tokyo: 1966).
Useful Secondary Sources 1. William T. Coyle, Japan's Rice Policy, Foreign Agricultural Economic Report, No. 164 (Washington, D.C.: USDA, Economics and Statistics Service, July 1981). 2. Yujiro Hayami, "Japan's Rice Policy in Historical Perspective," Stanford University, Calif., Food Research Institute Studies, Vol. 14, No. 4 (1975), pp. 359-380. 3. Takekazu Ogura, Can Japanese Agriculture Survive? A Historical and Com- parative Approach (Tokyo: Agricultural Policy Research Center, 1980). 4. Kayo Nobufumi, Nihon nogyo kiso tokei (Basic Statistics of Japanese Agriculture) (Tokyo: Norm Suisangyo Seisansei Kojo Kaigi, 1968). 5. G. C. Allen, A Short Economic History of Modern Japan (New York: St. Martin's Press, 1981). 6. T. J. Pempel, Policy and Politics in Japan (Philadelphia: Temple University Press, 1982). 7. Takekazu Ogura, ed., Agricultural Development in Modern Japan (Tokyo: Fuji Publishing Co., Ltd., 1963).
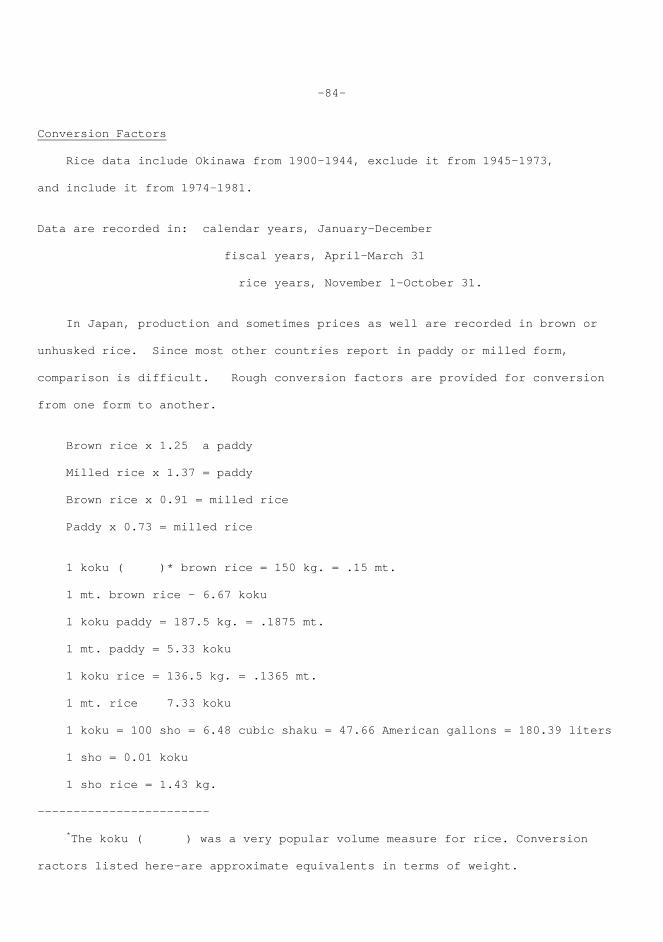
-84- Conversion Factors Rice data include Okinawa from 1900-1944, exclude it from 1945-1973, and include it from 1974-1981. Data are recorded in: calendar years, January-December fiscal years, April-March 31 rice years, November 1-October 31. In Japan, production and sometimes prices as well are recorded in brown or unhusked rice. Since most other countries report in paddy or milled form, comparison is difficult. Rough conversion factors are provided for conversion from one form to another. Brown rice x 1.25 a paddy Milled rice x 1.37 = paddy Brown rice x 0.91 = milled rice Paddy x 0.73 = milled rice 1 koku ( )* brown rice = 150 kg. = .15 mt. 1 mt. brown rice - 6.67 koku 1 koku paddy = 187.5 kg. = .1875 mt. 1 mt. paddy = 5.33 koku 1 koku rice = 136.5 kg. = .1365 mt. 1 mt. rice 7.33 koku 1 koku = 100 sho = 6.48 cubic shaku = 47.66 American gallons = 180.39 liters 1 sho = 0.01 koku 1 sho rice = 1.43 kg. ———————————————————————— *The koku ( ) was a very popular volume measure for rice. Conversion ractors listed here-are approximate equivalents in terms of weight.
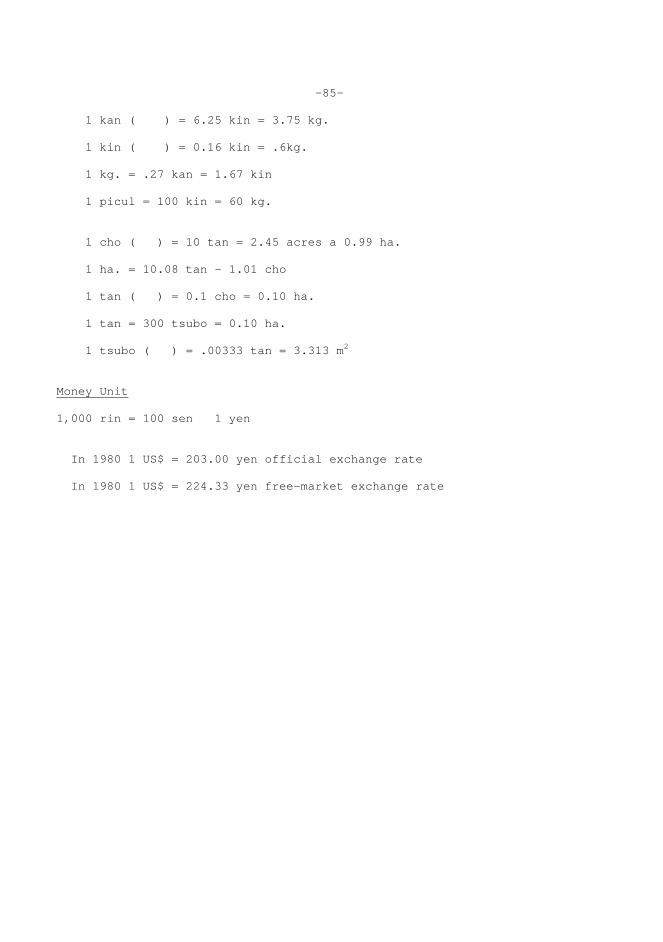
-85- 1 kan ( ) = 6.25 kin = 3.75 kg. 1 kin ( ) = 0.16 kin = .6kg. 1 kg. = .27 kan = 1.67 kin 1 picul = 100 kin = 60 kg. 1 cho ( ) = 10 tan = 2.45 acres a 0.99 ha. 1 ha. = 10.08 tan - 1.01 cho 1 tan ( ) = 0.1 cho = 0.10 ha. 1 tan = 300 tsubo = 0.10 ha. 1 tsubo ( ) = .00333 tan = 3.313 m2
Money Unit 1,000 rin = 100 sen 1 yen In 1980 1 US$ = 203.00 yen official exchange rate In 1980 1 US$ = 224.33 yen free-market exchange rate
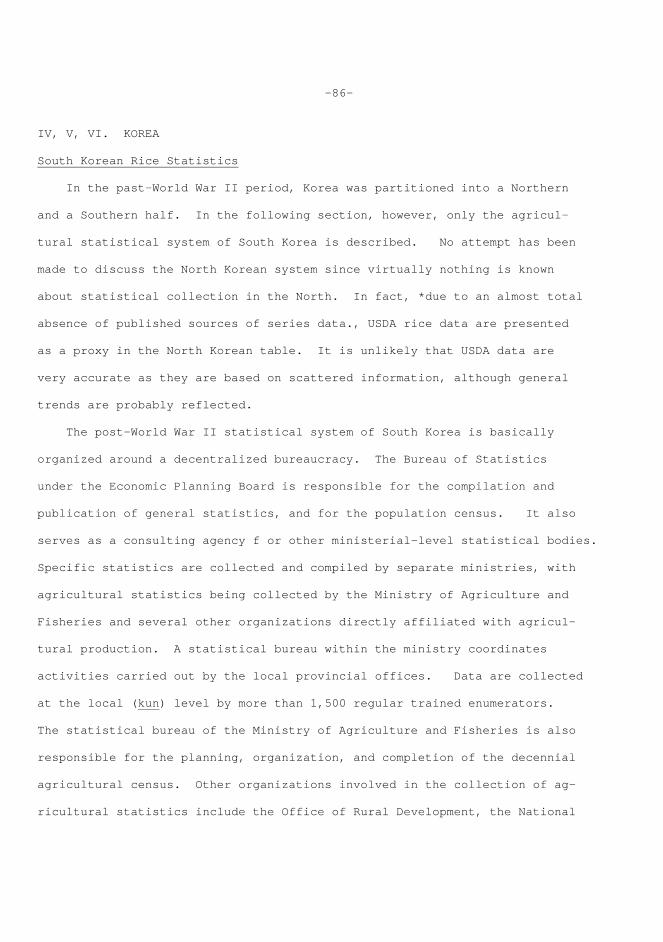
-86- IV, V, VI. KOREA South Korean Rice Statistics In the past-World War II period, Korea was partitioned into a Northern and a Southern half. In the following section, however, only the agricul- tural statistical system of South Korea is described. No attempt has been made to discuss the North Korean system since virtually nothing is known about statistical collection in the North. In fact, *due to an almost total absence of published sources of series data., USDA rice data are presented as a proxy in the North Korean table. It is unlikely that USDA data are very accurate as they are based on scattered information, although general trends are probably reflected. The post-World War II statistical system of South Korea is basically organized around a decentralized bureaucracy. The Bureau of Statistics under the Economic Planning Board is responsible for the compilation and publication of general statistics, and for the population census. It also serves as a consulting agency f or other ministerial-level statistical bodies. Specific statistics are collected and compiled by separate ministries, with agricultural statistics being collected by the Ministry of Agriculture and Fisheries and several other organizations directly affiliated with agricul- tural production. A statistical bureau within the ministry coordinates activities carried out by the local provincial offices. Data are collected at the local (kun) level by more than 1,500 regular trained enumerators. The statistical bureau of the Ministry of Agriculture and Fisheries is also responsible for the planning, organization, and completion of the decennial agricultural census. Other organizations involved in the collection of ag- ricultural statistics include the Office of Rural Development, the National
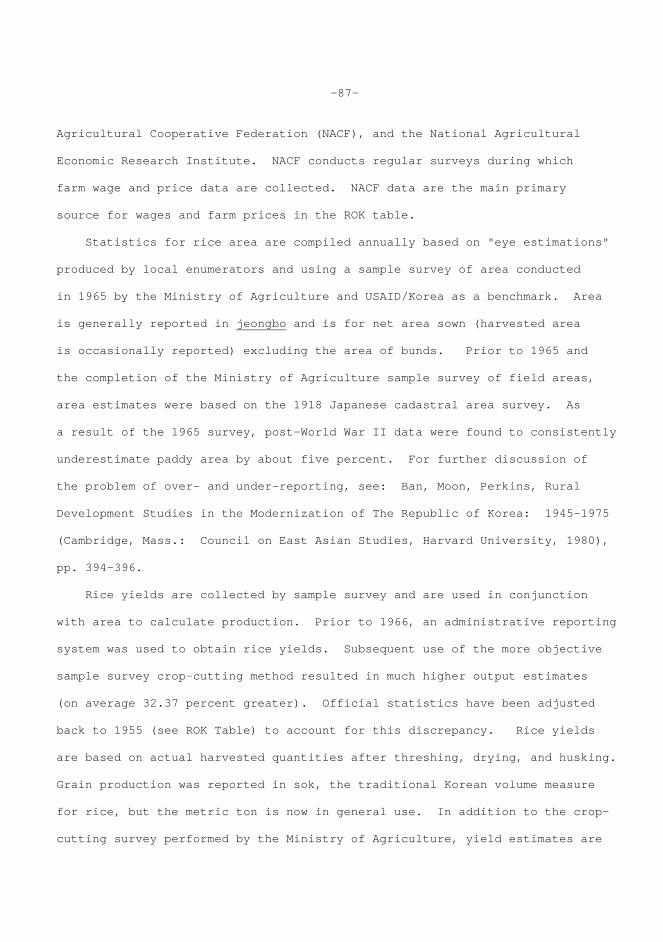
-87- Agricultural Cooperative Federation (NACF), and the National Agricultural Economic Research Institute. NACF conducts regular surveys during which farm wage and price data are collected. NACF data are the main primary source for wages and farm prices in the ROK table. Statistics for rice area are compiled annually based on "eye estimations" produced by local enumerators and using a sample survey of area conducted in 1965 by the Ministry of Agriculture and USAID/Korea as a benchmark. Area is generally reported in jeongbo and is for net area sown (harvested area is occasionally reported) excluding the area of bunds. Prior to 1965 and the completion of the Ministry of Agriculture sample survey of field areas, area estimates were based on the 1918 Japanese cadastral area survey. As a result of the 1965 survey, post-World War II data were found to consistently underestimate paddy area by about five percent. For further discussion of the problem of over- and under-reporting, see: Ban, Moon, Perkins, Rural Development Studies in the Modernization of The Republic of Korea: 1945-1975 (Cambridge, Mass.: Council on East Asian Studies, Harvard University, 1980), pp. 394-396. Rice yields are collected by sample survey and are used in conjunction with area to calculate production. Prior to 1966, an administrative reporting system was used to obtain rice yields. Subsequent use of the more objective sample survey crop-cutting method resulted in much higher output estimates (on average 32.37 percent greater). Official statistics have been adjusted back to 1955 (see ROK Table) to account for this discrepancy. Rice yields are based on actual harvested quantities after threshing, drying, and husking. Grain production was reported in sok, the traditional Korean volume measure for rice, but the metric ton is now in general use. In addition to the crop- cutting survey performed by the Ministry of Agriculture, yield estimates are
-88- also produced by the Production-Cast Survey CPCS). The PCS is based on a maple of 1,200 grain farmers who keep detailed records with the help of trained enumerators. PCS numbers tend to be lower than those obtained through the random sample `survey. Host analysts use the Ministry estimates because they assume that since the Ministry closely supervises the collection of data, these data are more likely to be accurate. For more information, see: Pal Yang Moon and Byong Seo Yoo, "A Review of the Crop Production Estimates and Key Statistics Related to Grain Policy (Korea)" (Seoul: Korea Development Institute, 1974), p. 5.
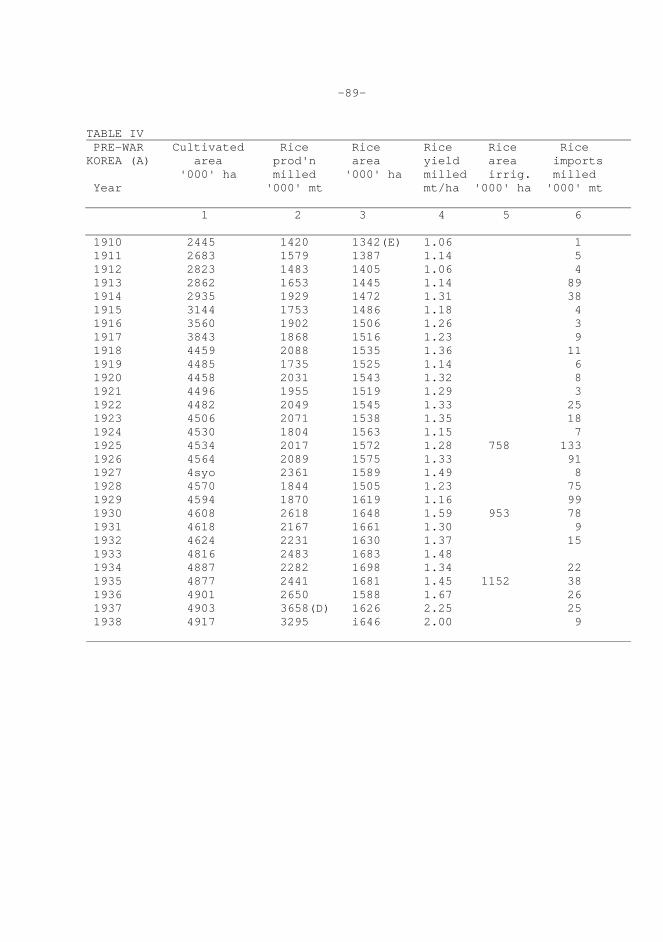
-89-
TABLE IV PRE-WAR Cultivated Rice Rice Rice Rice Rice KOREA (A) area prod'n area yield area imports '000' ha milled '000' ha milled irrig. milled Year '000' mt mt/ha '000' ha '000' mt
1 2 3 4 5 6
1910 2445 1420 1342(E) 1.06 1 1911 2683 1579 1387 1.14 5 1912 2823 1483 1405 1.06 4 1913 2862 1653 1445 1.14 89 1914 2935 1929 1472 1.31 38 1915 3144 1753 1486 1.18 4 1916 3560 1902 1506 1.26 3 1917 3843 1868 1516 1.23 9 1918 4459 2088 1535 1.36 11 1919 4485 1735 1525 1.14 6 1920 4458 2031 1543 1.32 8 1921 4496 1955 1519 1.29 3 1922 4482 2049 1545 1.33 25 1923 4506 2071 1538 1.35 18 1924 4530 1804 1563 1.15 7 1925 4534 2017 1572 1.28 758 133 1926 4564 2089 1575 1.33 91 1927 4syo 2361 1589 1.49 8 1928 4570 1844 1505 1.23 75 1929 4594 1870 1619 1.16 99 1930 4608 2618 1648 1.59 953 78 1931 4618 2167 1661 1.30 9 1932 4624 2231 1630 1.37 15 1933 4816 2483 1683 1.48 1934 4887 2282 1698 1.34 22 1935 4877 2441 1681 1.45 1152 38 1936 4901 2650 1588 1.67 26 1937 4903 3658(D) 1626 2.25 25 1938 4917 3295 i646 2.00 9
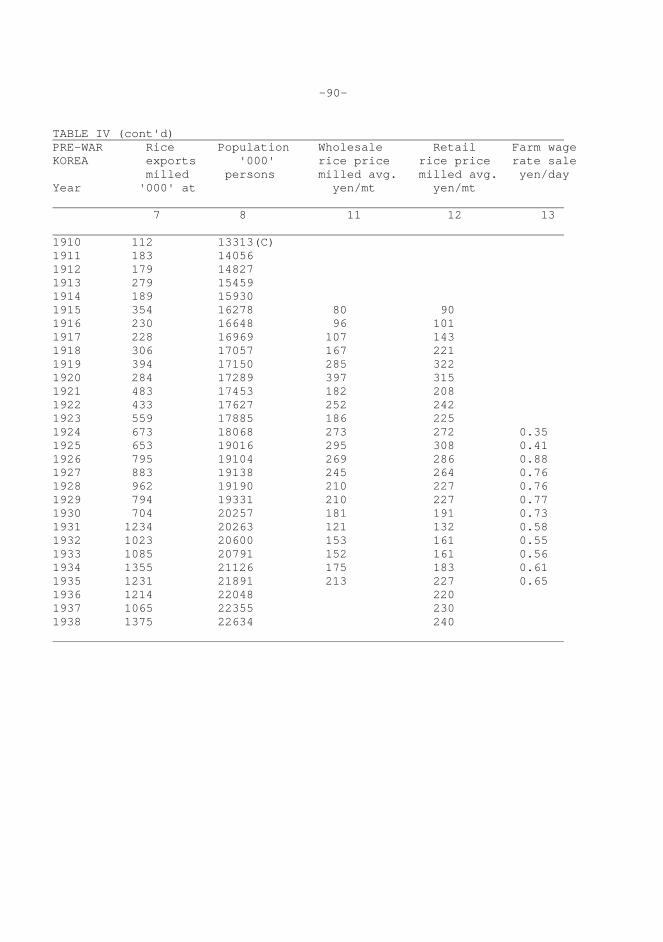
-90- TABLE IV (cont'd) PRE-WAR Rice Population Wholesale Retail Farm wage KOREA exports '000' rice price rice price rate sale milled persons milled avg. milled avg. yen/day Year '000' at yen/mt yen/mt 7 8 11 12 13 1910 112 13313(C) 1911 183 14056 1912 179 14827 1913 279 15459 1914 189 15930 1915 354 16278 80 90 1916 230 16648 96 101 1917 228 16969 107 143 1918 306 17057 167 221 1919 394 17150 285 322 1920 284 17289 397 315 1921 483 17453 182 208 1922 433 17627 252 242 1923 559 17885 186 225 1924 673 18068 273 272 0.35 1925 653 19016 295 308 0.41 1926 795 19104 269 286 0.88 1927 883 19138 245 264 0.76 1928 962 19190 210 227 0.76 1929 794 19331 210 227 0.77 1930 704 20257 181 191 0.73 1931 1234 20263 121 132 0.58 1932 1023 20600 153 161 0.55 1933 1085 20791 152 161 0.56 1934 1355 21126 175 183 0.61 1935 1231 21891 213 227 0.65 1936 1214 22048 220 1937 1065 22355 230 1938 1375 22634 240
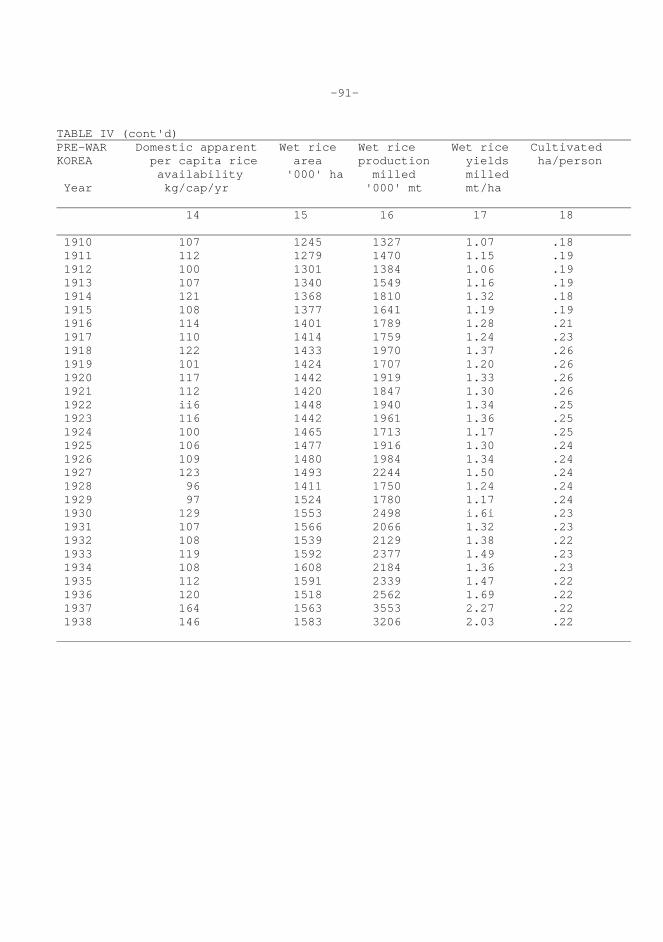
-91- TABLE IV (cont'd) PRE-WAR Domestic apparent Wet rice Wet rice Wet rice Cultivated KOREA per capita rice area production yields ha/person availability '000' ha milled milled Year kg/cap/yr '000' mt mt/ha 14 15 16 17 18 1910 107 1245 1327 1.07 .18 1911 112 1279 1470 1.15 .19 1912 100 1301 1384 1.06 .19 1913 107 1340 1549 1.16 .19 1914 121 1368 1810 1.32 .18 1915 108 1377 1641 1.19 .19 1916 114 1401 1789 1.28 .21 1917 110 1414 1759 1.24 .23 1918 122 1433 1970 1.37 .26 1919 101 1424 1707 1.20 .26 1920 117 1442 1919 1.33 .26 1921 112 1420 1847 1.30 .26 1922 ii6 1448 1940 1.34 .25 1923 116 1442 1961 1.36 .25 1924 100 1465 1713 1.17 .25 1925 106 1477 1916 1.30 .24 1926 109 1480 1984 1.34 .24 1927 123 1493 2244 1.50 .24 1928 96 1411 1750 1.24 .24 1929 97 1524 1780 1.17 .24 1930 129 1553 2498 i.6i .23 1931 107 1566 2066 1.32 .23 1932 108 1539 2129 1.38 .22 1933 119 1592 2377 1.49 .23 1934 108 1608 2184 1.36 .23 1935 112 1591 2339 1.47 .22 1936 120 1518 2562 1.69 .22 1937 164 1563 3553 2.27 .22 1938 146 1583 3206 2.03 .22
-92-
Notes to Appendix Table IV: Pre-War Korea A/Pre-war rice data in this table include both North and South Korea. Data were collected under the direction of the Japanese Governor General's office, as Korea was a Japanese colony from 1910 through the conclusion of World War II. It should be noted, however, that more than 70 percent of rice area was located in the South, although the North had a larger population. The North did pro- duce large amounts of foodgrains (about 50 percent of total output) including millets, sorghum, corn, buckwheat, and beans, which were more adapted to the North's harsher, cooler climate. The Japanese made a deliberate attempt to shift food consumption patterns away from rice to millets and other lesser grains. Although the South produced large amounts of rice, much of the crop was exported to Japan. Northern foodgrain output was an important and primary domestic food source. B/In 1918, the colonial government completed an extensive land survey of Korea. Using 1918 as a benchmark, 1910-1917 area statistics were revised by the government. The revised statistics are recorded here. C/Population figures include Koreans and "foreigners" residing in Korea in addition to Japanese. Pre-war Korean population data are based on two sources: quinquennial censuses and annual registrations of household members. After the Japanese formally annexed Korea in 1910, they introduced registration. In 1925, the first census was held, and this was repeated every five years on a regular basis until the last census in 1944. Census data are generally believed to be more accurate than registration figures. Population estimates for the pre-war period have been recalculated using census figures as benchmarks. For further discussion, see sung-chul Suh, Growth and Structural Changes in the Korean Economy, 1910-1940 (Cambridge, Mass.: Council on East Asian Studies, Harvard
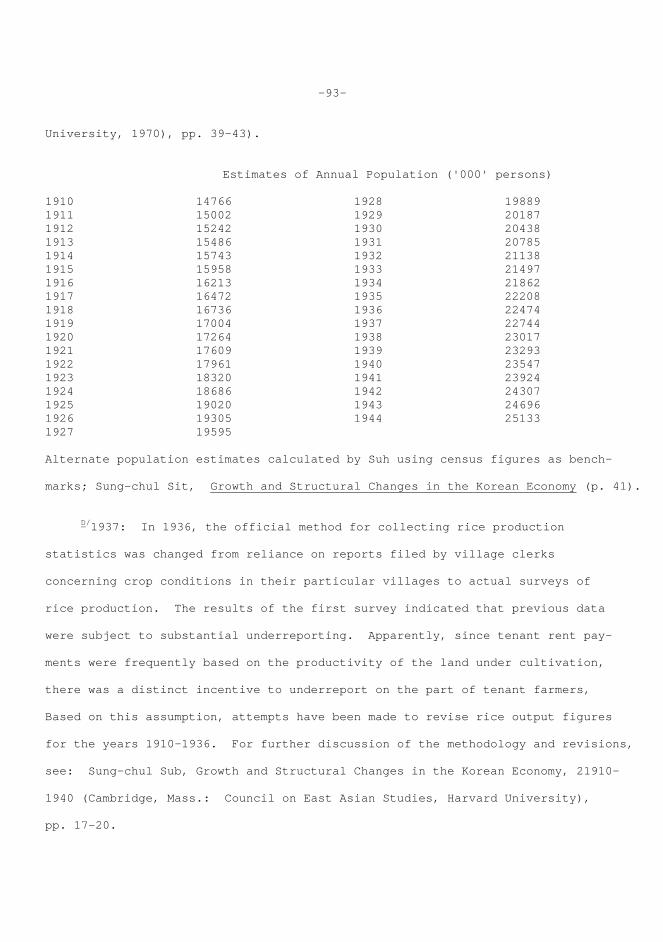
-93- University, 1970), pp. 39-43).
Estimates of Annual Population ('000' persons) 1910 14766 1928 19889 1911 15002 1929 20187 1912 15242 1930 20438 1913 15486 1931 20785 1914 15743 1932 21138 1915 15958 1933 21497 1916 16213 1934 21862 1917 16472 1935 22208 1918 16736 1936 22474 1919 17004 1937 22744 1920 17264 1938 23017 1921 17609 1939 23293 1922 17961 1940 23547 1923 18320 1941 23924 1924 18686 1942 24307 1925 19020 1943 24696 1926 19305 1944 25133 1927 19595 Alternate population estimates calculated by Suh using census figures as bench- marks; Sung-chul Sit, Growth and Structural Changes in the Korean Economy (p. 41). D/1937: In 1936, the official method for collecting rice production statistics was changed from reliance on reports filed by village clerks concerning crop conditions in their particular villages to actual surveys of rice production. The results of the first survey indicated that previous data were subject to substantial underreporting. Apparently, since tenant rent pay- ments were frequently based on the productivity of the land under cultivation, there was a distinct incentive to underreport on the part of tenant farmers, Based on this assumption, attempts have been made to revise rice output figures for the years 1910-1936. For further discussion of the methodology and revisions, see: Sung-chul Sub, Growth and Structural Changes in the Korean Economy, 21910- 1940 (Cambridge, Mass.: Council on East Asian Studies, Harvard University), pp. 17-20.
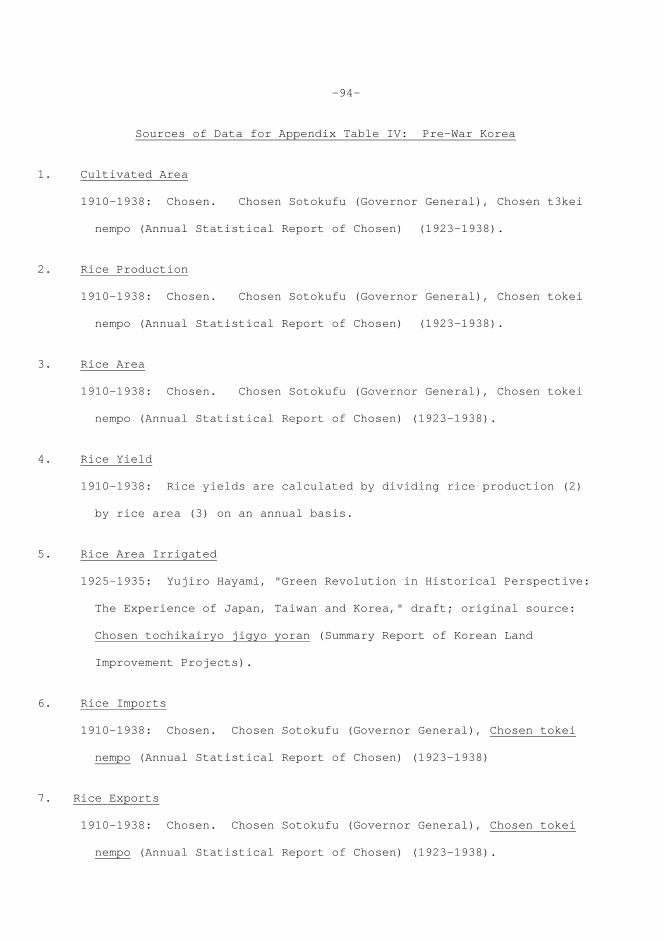
-94-
Sources of Data for Appendix Table IV: Pre-War Korea 1. Cultivated Area 1910-1938: Chosen. Chosen Sotokufu (Governor General), Chosen t3kei nempo (Annual Statistical Report of Chosen) (1923-1938). 2. Rice Production 1910-1938: Chosen. Chosen Sotokufu (Governor General), Chosen tokei nempo (Annual Statistical Report of Chosen) (1923-1938). 3. Rice Area 1910-1938: Chosen. Chosen Sotokufu (Governor General), Chosen tokei nempo (Annual Statistical Report of Chosen) (1923-1938). 4. Rice Yield 1910-1938: Rice yields are calculated by dividing rice production (2) by rice area (3) on an annual basis. 5. Rice Area Irrigated 1925-1935: Yujiro Hayami, "Green Revolution in Historical Perspective: The Experience of Japan, Taiwan and Korea," draft; original source: Chosen tochikairyo jigyo yoran (Summary Report of Korean Land Improvement Projects). 6. Rice Imports 1910-1938: Chosen. Chosen Sotokufu (Governor General), Chosen tokei nempo (Annual Statistical Report of Chosen) (1923-1938) 7. Rice Exports 1910-1938: Chosen. Chosen Sotokufu (Governor General), Chosen tokei nempo (Annual Statistical Report of Chosen) (1923-1938).
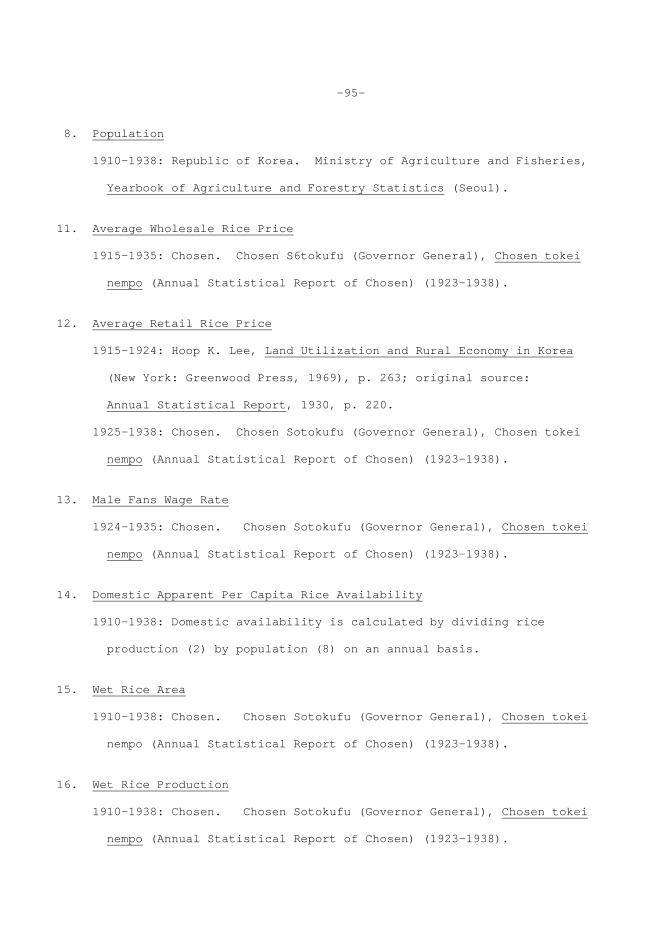
-95- 8. Population 1910-1938: Republic of Korea. Ministry of Agriculture and Fisheries, Yearbook of Agriculture and Forestry Statistics (Seoul). 11. Average Wholesale Rice Price 1915-1935: Chosen. Chosen S6tokufu (Governor General), Chosen tokei nempo (Annual Statistical Report of Chosen) (1923-1938). 12. Average Retail Rice Price 1915-1924: Hoop K. Lee, Land Utilization and Rural Economy in Korea (New York: Greenwood Press, 1969), p. 263; original source: Annual Statistical Report, 1930, p. 220. 1925-1938: Chosen. Chosen Sotokufu (Governor General), Chosen tokei nempo (Annual Statistical Report of Chosen) (1923-1938). 13. Male Fans Wage Rate 1924-1935: Chosen. Chosen Sotokufu (Governor General), Chosen tokei nempo (Annual Statistical Report of Chosen) (1923-1938). 14. Domestic Apparent Per Capita Rice Availability 1910-1938: Domestic availability is calculated by dividing rice production (2) by population (8) on an annual basis. 15. Wet Rice Area 1910-1938: Chosen. Chosen Sotokufu (Governor General), Chosen tokei nempo (Annual Statistical Report of Chosen) (1923-1938). 16. Wet Rice Production 1910-1938: Chosen. Chosen Sotokufu (Governor General), Chosen tokei nempo (Annual Statistical Report of Chosen) (1923-1938).
-96- 17. Wet Rice Yields 1910-1938: Wet rice yields are calculated by dividing wet rice production (16) by wet rice area (15) on an annual basis.
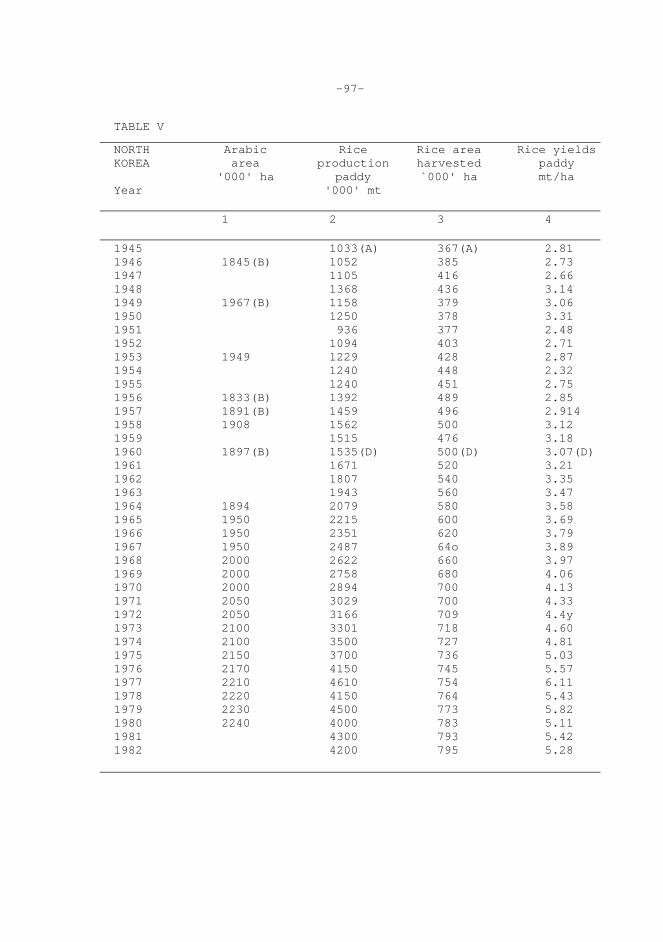
-97-
TABLE V
NORTH Arabic Rice Rice area Rice yields KOREA area production harvested paddy '000' ha paddy `000' ha mt/ha Year '000' mt 1 2 3 4 1945 1033(A) 367(A) 2.81 1946 1845(B) 1052 385 2.73 1947 1105 416 2.66 1948 1368 436 3.14 1949 1967(B) 1158 379 3.06 1950 1250 378 3.31 1951 936 377 2.48 1952 1094 403 2.71 1953 1949 1229 428 2.87 1954 1240 448 2.32 1955 1240 451 2.75 1956 1833(B) 1392 489 2.85 1957 1891(B) 1459 496 2.914 1958 1908 1562 500 3.12 1959 1515 476 3.18 1960 1897(B) 1535(D) 500(D) 3.07(D) 1961 1671 520 3.21 1962 1807 540 3.35 1963 1943 560 3.47 1964 1894 2079 580 3.58 1965 1950 2215 600 3.69 1966 1950 2351 620 3.79 1967 1950 2487 64o 3.89 1968 2000 2622 660 3.97 1969 2000 2758 680 4.06 1970 2000 2894 700 4.13 1971 2050 3029 700 4.33 1972 2050 3166 709 4.4y 1973 2100 3301 718 4.60 1974 2100 3500 727 4.81 1975 2150 3700 736 5.03 1976 2170 4150 745 5.57 1977 2210 4610 754 6.11 1978 2220 4150 764 5.43 1979 2230 4500 773 5.82 1980 2240 4000 783 5.11 1981 4300 793 5.42 1982 4200 795 5.28
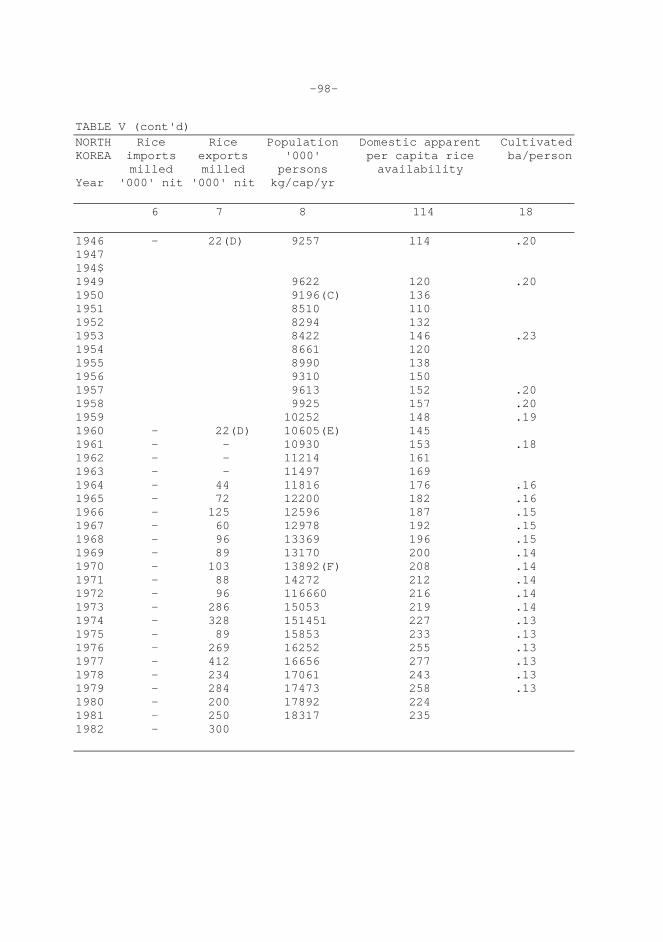
-98-
TABLE V (cont'd) NORTH Rice Rice Population Domestic apparent Cultivated KOREA imports exports '000' per capita rice ba/person milled milled persons availability Year '000' nit '000' nit kg/cap/yr 6 7 8 114 18 1946 - 22(D) 9257 l14 .20 1947 194$ 1949 9622 120 .20 1950 9196(C) 136 1951 8510 110 1952 8294 132 1953 8422 146 .23 1954 8661 120 1955 8990 138 1956 9310 150 1957 9613 152 .20 1958 9925 157 .20 1959 10252 148 .19 1960 - 22(D) 10605(E) 145 1961 - - 10930 153 .18 1962 - - 11214 161 1963 - - 11497 169 1964 - 44 11816 176 .16 1965 - 72 12200 182 .16 1966 - 125 12596 187 .15 1967 - 60 12978 192 .15 1968 - 96 13369 196 .15 1969 - 89 13170 200 .14 1970 - 103 13892(F) 208 .14 1971 - 88 14272 212 .14 1972 - 96 116660 216 .14 1973 - 286 15053 219 .14 1974 - 328 151451 227 .13 1975 - 89 15853 233 .13 1976 - 269 16252 255 .13 1977 - 412 16656 277 .13 1978 - 234 17061 243 .13 1979 - 284 17473 258 .13 1980 - 200 17892 224 1981 - 250 18317 235 1982 - 300
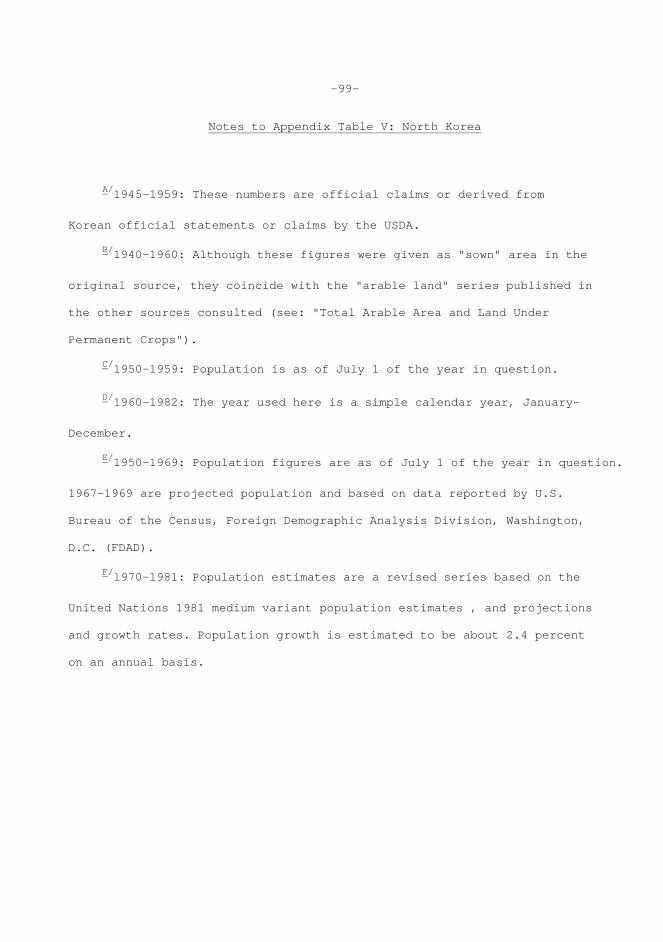
-99-
Notes to Appendix Table V: North Korea
A/1945-1959: These numbers are official claims or derived from
Korean official statements or claims by the USDA.
B/1940-1960: Although these figures were given as "sown" area in the
original source, they coincide with the "arable land" series published in
the other sources consulted (see: "Total Arable Area and Land Under
Permanent Crops").
C/1950-1959: Population is as of July 1 of the year in question.
D/1960-1982: The year used here is a simple calendar year, January-
December.
E/1950-1969: Population figures are as of July 1 of the year in question.
1967-1969 are projected population and based on data reported by U.S.
Bureau of the Census, Foreign Demographic Analysis Division, Washington,
D.C. (FDAD).
F/l970-l981: Population estimates are a revised series based on the
United Nations 1981 medium variant population estimates , and projections
and growth rates. Population growth is estimated to be about 2.4 percent
on an annual basis.
-100-
Sources of Data for Appendix Table V: North Korea
A quick glance at the accompanying table will show that official Korean
rice data are not readily available. This problem is, however, not limited
to rice alone, but to all other facets of the economy of the DFRK as well.
In fact, it is not even: known for sure whether rice production is reported
in milled or paddy form Thus, the statistics used here are, for the most
part, estimates derived by staff at USDA.
1. Total Arable Area
1946-1960: Statistical Compilation of the Economic Development of
the Democratic People's Republic of Korea (P'yongyang: 1961).
1957: Razvitie narodnogo khoziaistva i kultury koreiskoi narodno-
demokraticheskoi respubliki (Moscow: 1959).
1953, 1958: JPRS 2691 May 1960 microfilm. "Information from the 1959
North Korean Yearbook."
1964-1980: Food and Agriculture Organization of the United Nations,
FAO Production Yearbook (Rome: 1947-1981).
2. Rice Production
1945-1959: Personal communication from Marion R. Larsen, Asia Branch,
International Economics Division, Economics, Statistics and Cooperatives
Service, U.S.D.A., Washington, D.C., July, 1980.
1960-1982: U.S. Foreign Agricultural Service, Foreign Agriculture
Circular, FG-26-83 (Washington, D.C.: 1983).
3. Rice Area
1945-1959: Personal communication from Marion R. Larsen, Asia Branch,
International Economics Division, Economics, Statistics and Cooperatives
-101-
Service, U.S.D.A., Washington, D.C., July, 1980. 1960-1982: U.S. Foreign Agricultural Service, Foreign Agriculture Circular, FG-26-83 (Washington, D.C.: 1983). 4. Rice Yields 1945-1982: Rice yields are calculated by dividing rice production (2) by rice area (3) on an annual basis. 6. Rice Imports 1960-1982: U.S. Foreign Agricultural Service, Foreign Agriculture Circular, FG-26-83 (Washington, D.C.: 1983). 7. Rice Exports 1960-1982: U.S. Foreign Agricultural Service, Foreign Agriculture Circular, FG-26-83 (Washington, D.C.: 1983). 8. Population 1946-1949: Joseph Sang-Moan Chung, The North Korean Economy (Stanford: Hoover Institution Press, 1974). 1950-1959: U.S. Department of Commerce, Bureau of the Census, World Population 1977 (Washington,: D.C.: 1978). 1960-1969: U.S. Department of Commerce, Bureau of the Census, Inter- national Population Dynamics, 1950-79 (Washington, D.C.: 1980). 1970-1981: U.S. Department of Commerce, Bureau of the Census, Demo- graphic Estimates for Countries with a Population of 10 Million or More: 1981 (Washington, D.C.: 1981). 14. Domestic Apparent Per Capita Paddy Availability 1946-1981: Domestic apparent per capita paddy availability is calculated by dividing rice production (2).by population (8) on an annual basis.
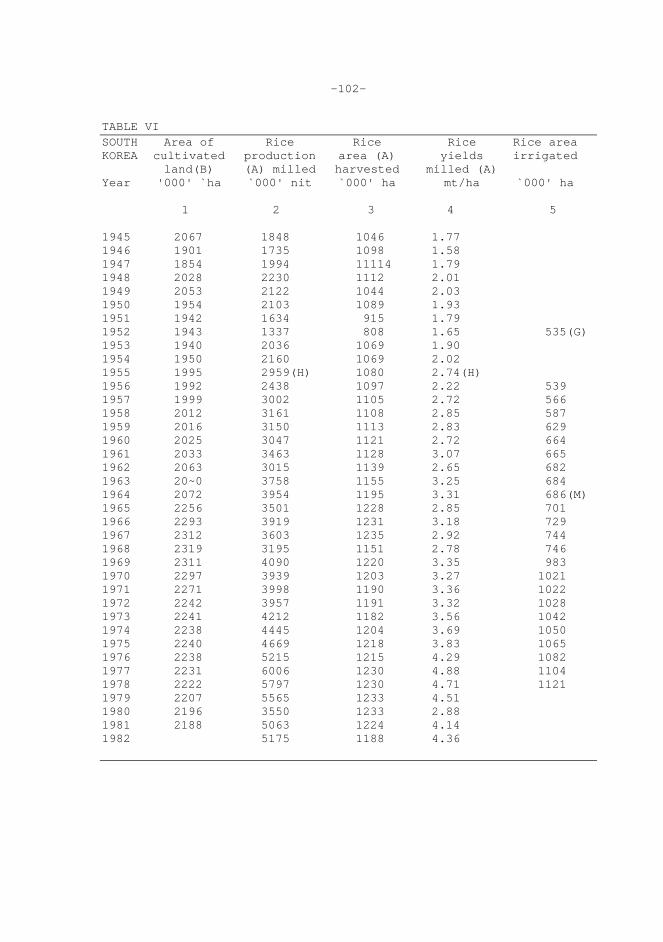
-102-
TABLE VI SOUTH Area of Rice Rice Rice Rice area KOREA cultivated production area (A) yields irrigated land(B) (A) milled harvested milled (A) Year '000' `ha `000' nit `000' ha mt/ha `000' ha 1 2 3 4 5 1945 2067 1848 1046 1.77 1946 1901 1735 1098 1.58 1947 1854 1994 11114 1.79 1948 2028 2230 1112 2.01 1949 2053 2122 1044 2.03 1950 1954 2103 1089 1.93 1951 1942 1634 915 1.79 1952 1943 1337 808 1.65 535(G) 1953 1940 2036 1069 1.90 1954 1950 2160 1069 2.02 1955 1995 2959(H) 1080 2.74(H) 1956 1992 2438 1097 2.22 539 1957 1999 3002 1105 2.72 566 1958 2012 3161 1108 2.85 587 1959 2016 3150 1113 2.83 629 1960 2025 3047 1121 2.72 664 1961 2033 3463 1128 3.07 665 1962 2063 3015 1139 2.65 682 1963 20~0 3758 1155 3.25 684 1964 2072 3954 1195 3.31 686(M) 1965 2256 3501 1228 2.85 701 1966 2293 3919 1231 3.18 729 1967 2312 3603 1235 2.92 744 1968 2319 3195 1151 2.78 746 1969 2311 4090 1220 3.35 983 1970 2297 3939 1203 3.27 1021 1971 2271 3998 1190 3.36 1022 1972 2242 3957 1191 3.32 1028 1973 2241 4212 1182 3.56 1042 1974 2238 4445 1204 3.69 1050 1975 2240 4669 1218 3.83 1065 1976 2238 5215 1215 4.29 1082 1977 2231 6006 1230 4.88 1104 1978 2222 5797 1230 4.71 1121 1979 2207 5565 1233 4.51 1980 2196 3550 1233 2.88 1981 2188 5063 1224 4.14 1982 5175 1188 4.36
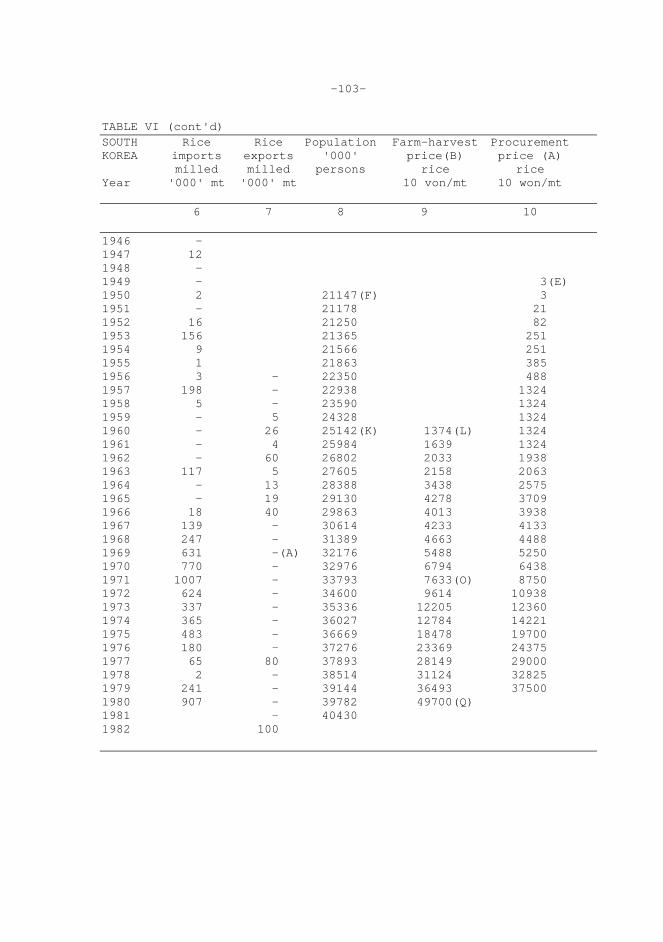
-103-
TABLE VI (cont'd) SOUTH Rice Rice Population Farm-harvest Procurement KOREA imports exports '000' price(B) price (A) milled milled persons rice rice Year '000' mt '000' mt 10 von/mt 10 won/mt 6 7 8 9 10 1946 - 1947 12 1948 - 1949 - 3(E) 1950 2 21147(F) 3 1951 - 21178 21 1952 16 21250 82 1953 156 21365 251 1954 9 21566 251 1955 1 21863 385 1956 3 - 22350 488 1957 198 - 22938 1324 1958 5 - 23590 1324 1959 - 5 24328 1324 1960 - 26 25142(K) 1374(L) 1324 1961 - 4 25984 1639 1324 1962 - 60 26802 2033 1938 1963 117 5 27605 2158 2063 1964 - 13 28388 3438 2575 1965 - 19 29130 4278 3709 1966 18 40 29863 4013 3938 1967 139 - 30614 4233 4133 1968 247 - 31389 4663 4488 1969 631 -(A) 32176 5488 5250 1970 770 - 32976 6794 6438 1971 1007 - 33793 7633(O) 8750 1972 624 - 34600 9614 10938 1973 337 - 35336 12205 12360 1974 365 - 36027 12784 14221 1975 483 - 36669 18478 19700 1976 180 - 37276 23369 24375 1977 65 80 37893 28149 29000 1978 2 - 38514 31124 32825 1979 241 - 39144 36493 37500 1980 907 - 39782 49700(Q) 1981 - 40430 1982 100
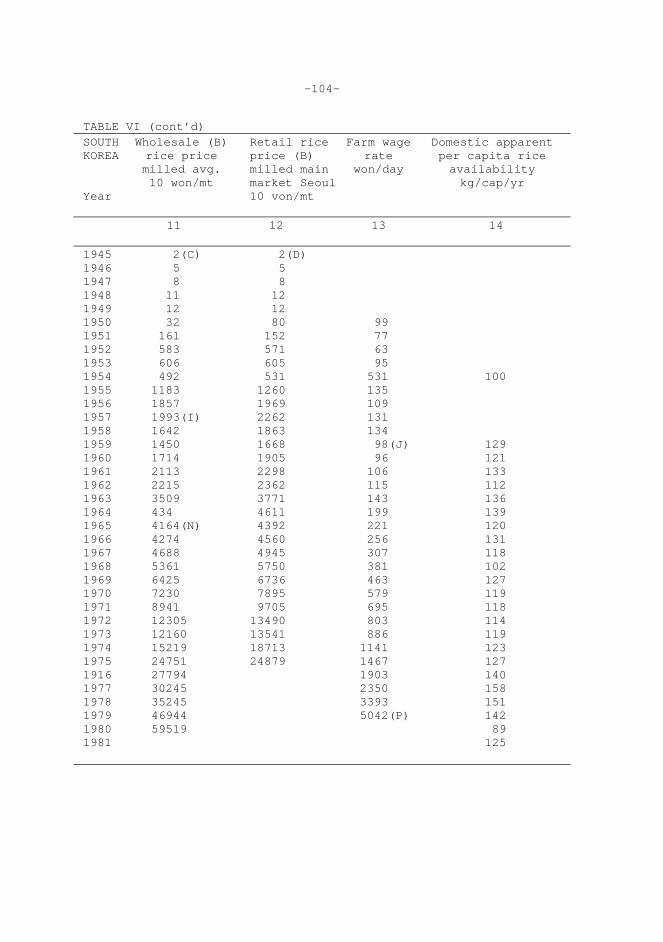
-104-
TABLE VI (cont’d) SOUTH Wholesale (B) Retail rice Farm wage Domestic apparent KOREA rice price price (B) rate per capita rice milled avg. milled main won/day availability 10 won/mt market Seoul kg/cap/yr Year 10 von/mt 11 12 13 14 1945 2(C) 2(D) 1946 5 5 1947 8 8 1948 11 12 1949 12 12 1950 32 80 99 1951 161 152 77 1952 583 571 63 1953 606 605 95 1954 492 531 531 100 1955 1183 1260 135 1956 1857 1969 109 1957 1993(I) 2262 131 1958 1642 1863 134 1959 1450 1668 98(J) 129 1960 1714 1905 96 121 1961 2113 2298 106 133 1962 2215 2362 115 112 1963 3509 3771 143 136 1964 434 4611 199 139 1965 4164(N) 4392 221 120 1966 4274 4560 256 131 1967 4688 4945 307 118 1968 5361 5750 381 102 1969 6425 6736 463 127 1970 7230 7895 579 119 1971 8941 9705 695 118 1972 12305 13490 803 114 1973 12160 13541 886 119 1974 15219 18713 1141 123 1975 24751 24879 1467 127 1916 27794 1903 140 1977 30245 2350 158 1978 35245 3393 151 1979 46944 5042(P) 142 1980 59519 89 1981 125
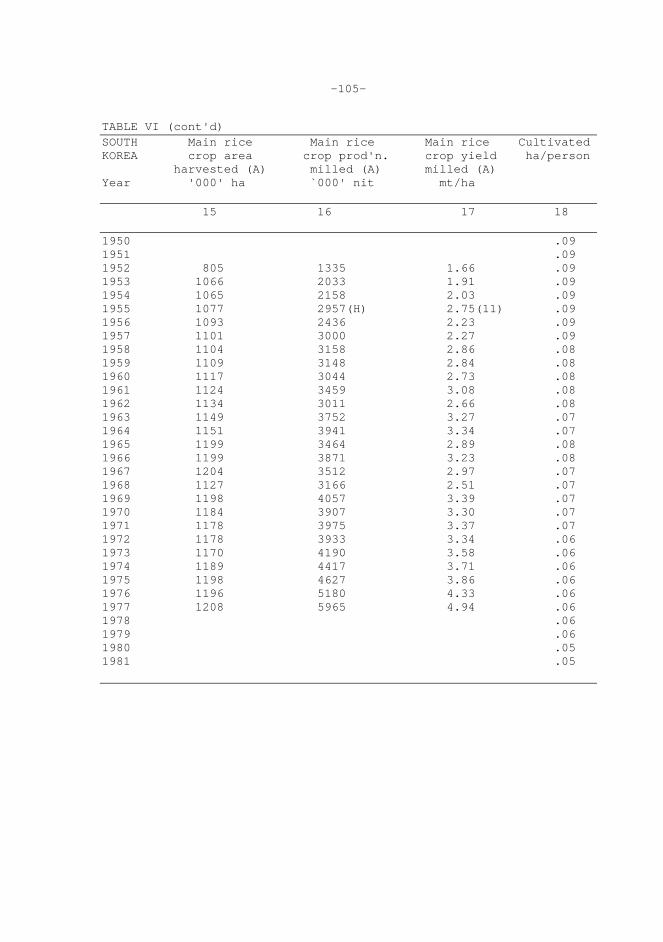
-105-
TABLE VI (cont'd) SOUTH Main rice Main rice Main rice Cultivated KOREA crop area crop prod'n. crop yield ha/person harvested (A) milled (A) milled (A) Year '000' ha `000' nit mt/ha 15 16 17 18 1950 .09 1951 .09 1952 805 1335 1.66 .09 1953 1066 2033 1.91 .09 1954 1065 2158 2.03 .09 1955 1077 2957(H) 2.75(11) .09 1956 1093 2436 2.23 .09 1957 1101 3000 2.27 .09 1958 1104 3158 2.86 .08 1959 1109 3148 2.84 .08 1960 1117 3044 2.73 .08 1961 1124 3459 3.08 .08 1962 1134 3011 2.66 .08 1963 1149 3752 3.27 .07 1964 1151 3941 3.34 .07 1965 1199 3464 2.89 .08 1966 1199 3871 3.23 .08 1967 1204 3512 2.97 .07 1968 1127 3166 2.51 .07 1969 1198 4057 3.39 .07 1970 1184 3907 3.30 .07 1971 1178 3975 3.37 .07 1972 1178 3933 3.34 .06 1973 1170 4190 3.58 .06 1974 1189 4417 3.71 .06 1975 1198 4627 3.86 .06 1976 1196 5180 4.33 .06 1977 1208 5965 4.94 .06 1978 .06 1979 .06 1980 .05 1981 .05
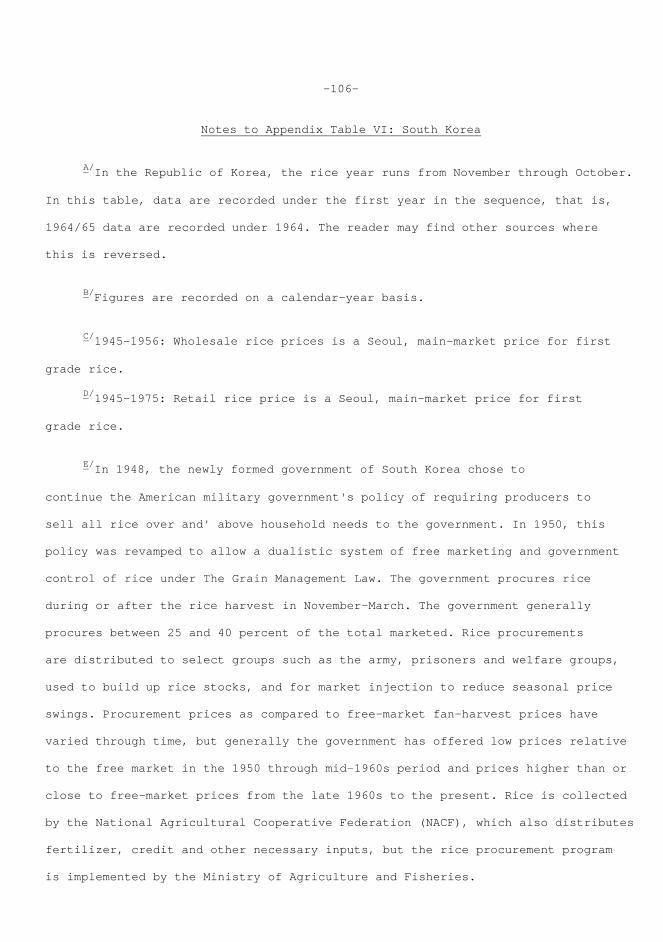
-106-
Notes to Appendix Table VI: South Korea
A/In the Republic of Korea, the rice year runs from November through October. In this table, data are recorded under the first year in the sequence, that is, 1964/65 data are recorded under 1964. The reader may find other sources where this is reversed. B/Figures are recorded on a calendar-year basis. C/1945-1956: Wholesale rice prices is a Seoul, main-market price for first grade rice. D/1945-1975: Retail rice price is a Seoul, main-market price for first grade rice. E/In 1948, the newly formed government of South Korea chose to continue the American military government's policy of requiring producers to sell all rice over and' above household needs to the government. In 1950, this policy was revamped to allow a dualistic system of free marketing and government control of rice under The Grain Management Law. The government procures rice during or after the rice harvest in November-March. The government generally procures between 25 and 40 percent of the total marketed. Rice procurements are distributed to select groups such as the army, prisoners and welfare groups, used to build up rice stocks, and for market injection to reduce seasonal price swings. Procurement prices as compared to free-market fan-harvest prices have varied through time, but generally the government has offered low prices relative to the free market in the 1950 through mid-1960s period and prices higher than or close to free-market prices from the late 1960s to the present. Rice is collected by the National Agricultural Cooperative Federation (NACF), which also distributes fertilizer, credit and other necessary inputs, but the rice procurement program is implemented by the Ministry of Agriculture and Fisheries.
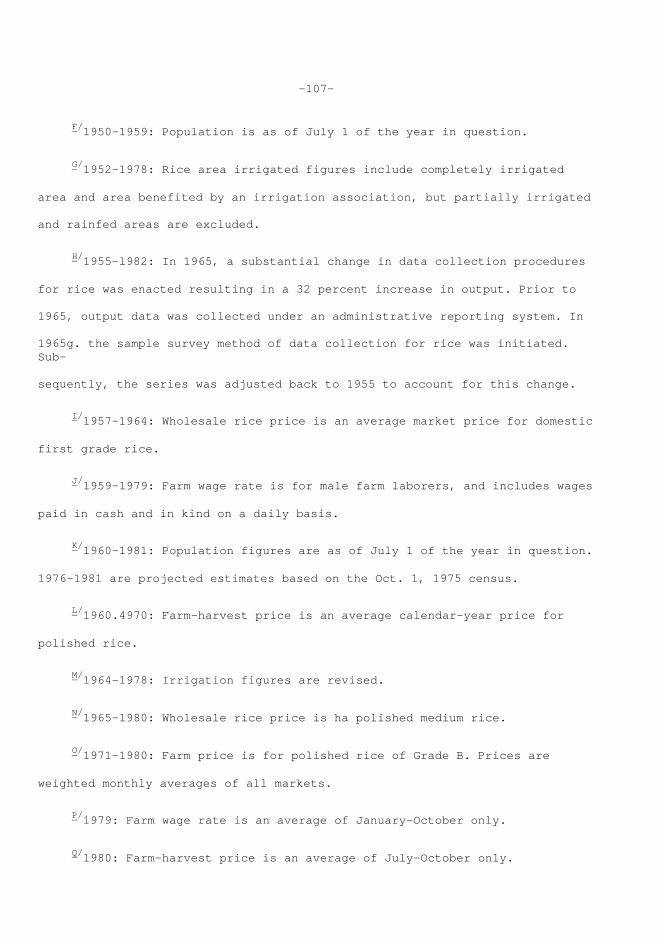
-107-
F/1950-1959: Population is as of July 1 of the year in question.
G/1952-1978: Rice area irrigated figures include completely irrigated area and area benefited by an irrigation association, but partially irrigated and rainfed areas are excluded.
H/1955-l982: In 1965, a substantial change in data collection procedures for rice was enacted resulting in a 32 percent increase in output. Prior to 1965, output data was collected under an administrative reporting system. In 1965g. the sample survey method of data collection for rice was initiated. Sub- sequently, the series was adjusted back to 1955 to account for this change.
I/1957-1964: Wholesale rice price is an average market price for domestic first grade rice.
J/1959-1979: Farm wage rate is for male farm laborers, and includes wages paid in cash and in kind on a daily basis.
K/1960-1981: Population figures are as of July 1 of the year in question. 1976-1981 are projected estimates based on the Oct. 1, 1975 census.
L/1960.4970: Farm-harvest price is an average calendar-year price for polished rice.
M/1964-1978: Irrigation figures are revised.
N/1965-1980: Wholesale rice price is ha polished medium rice.
O/1971-1980: Farm price is for polished rice of Grade B. Prices are weighted monthly averages of all markets.
P/1979: Farm wage rate is an average of January-October only.
Q/1980: Farm-harvest price is an average of July-October only.
-108-
Sources of Data for Appendix Table VI: South Korea 1. Area of Cultivated Land 1945-1948: Sung Hwan Ban, Pal Yang Moon, and Dwight H. Perkins, Rural Development: Studies in the Modernization of the Republic of Korea: 1945-1975 (Cambridge, Mass.: Council of East Asian Studies, Harvard University, l98O), p. 417. 1949-1951: Bank ot Korea, Economic Statistics Yearbook (Seoul). 1952-1959: Republic of Korea. Ministry of Agriculture and Forestry, Yearbook of Agriculture and Forestry Statistics (Seoul). 1960-1979: Bank of Korea, Economic Statistics Yearbook (Seoul). 1980-1981: Yonhap News Agency, Korea Annual 1983 (Seoul: Chung Chong-shik, 1983). 2. Rice Production 1945-1976: Republic of Korea. Ministry of Agriculture and Forestry, Yearbook of Agriculture and Forest Statistics (Seoul). 1977-1980: Bank of Korea, Economic Statistic's Yearbook (Seoul). 1981: Yonhap News Agency, Korea Annual 1983 (Seoul: Chung Chong-shik, 1983). 1982: U.S. Foreign: Agricultural Service, Foreign Agriculture Circular, FG-26-83 (Washington, D.C.: 1983). 3. Rice Area 1945-1951: Republic of Korea. Ministry of Agriculture and Forestry, Food Crop Statistics (Seoul). 1952-1976: Republic of Korea. Ministry of Agriculture and Forestry, Yearbook of Agriculture and Forestry Statistics (Seoul). 1977-1980: Bank of Korea, Economic Statistics Yearbook (Seoul). 1981: Yonhap News Agency, Korea Annual 1983 (Seoul: Chung Chong-shik, 1983). 1982: U.S. Foreign: Agricultural Service, Foreign Agriculture Circular, FG-26-83 (Washington, D.C.: 1983).
-109-
4. Rice Yields 1945-1982: Rice yields are calculated by dividing rice production (2) by rice area (3) on an annual basis. 5. Rice Area Irrigated 1952-1978: Republic of Korea. Ministry of Agriculture and Forestry, Yearbook of Agriculture and Forestry Statistics (Seoul). *Name later changed to Ministry of Agriculture and Fisheries. 6. Rice Imports 1946-1980: Bank of Korea, Economic Statistics Yearbook (Seoul). 7. Rice Exports 1955-1968: Bank of Korea, Economic Statistics Yearbook (Seoul). 1969-1982: U.S. Foreign Agricultural Service, Foreign Agriculture Circular, FG-26-83 (Washington, D.C.: 1983). 8. Population 1950-1959: U.S. Department of Commerce, Bureau of the Census, World Population 1977 (Washington, D.C.; 1978). 1960-1969: U.S. Department of Commerce, Bureau of the Census, International Population Dynamics 1950-79 (Washington, D.C.: 1980). 1970-1981: U.S. Department of Commerce, Bureau of the Census, Demographic Estimates for Countries with a Population of 10 Million or More: 1981 (Washington, D.C.: 1981). 9. Farm-Harvest Price 1959-1970: National Agricultural Cooperative Federation, Farm Price Statistics Summary 1959-1970 (Seoul).
-110-
1971-1977: Republic of Korea. Ministry of Agriculture and Fisheries, Yearbook of Agriculture and Forestry Statistics (Seoul). 1978-1980: The National Agricultural Cooperative Federation, The Agricultural Cooperatives Survey (Seoul). 10. Procurement Price 1949-1967: Republic of Korea. Ministry of Agriculture and Forestry, Grain Statistics Yearbook and Cost of Production Survey, 1962-1975 (Seoul). 1968-1979: Republic of Korea. Ministry, of Agriculture and Fisheries, Yearbook of Agriculture and Forestry statistics (Seoul). 11. Average Wholesale Price 1945-1980: Bank of Korea, Economic Statistics Yearbook (Seoul). 12. Retail Rice Price (Main Market) 1945-1964: Bank of Korea, Economic Statistics Yearbook (Seoul). 1965-1973: Republic of Korea. Economic Planning Board, Monthly Statistics of Korea (Seoul). 1974-1975: Sung Ryan Ban, Pal Yong Moon, and Dwight Perkins, Rural Development Studies in the Modernization of the Republic of Korea: 1945-1975 (Cambridge, Mass.: Council on East Asian Studies, Harvard University, 1980), p. 249; original source:, BOK: Price Survey. 13. Farm Wage Rate 1959-1979: The National Agricultural Cooperative Federation, The Agricultural cooperatives Survey (Seoul). 14. Domestic Apparent Per Capita Rice Availability 1950-1981. Domestic rice availability is calculated by dividing rice production (2) by population (8) on an annual basis.
-111-
15. Main Rico Crop Area 1952-1977: Republic of Korea. Ministry of Agriculture and Forestry, Yearbook of Agriculture and Forestry Statistics (Seoul). 16. Main Rice Crop Production 1952-1977: Republic of Korea. Ministry of Agriculture and Forestry, Yearbook of Agriculture and Forestry Statistics (Seoul). 17. Main Rice Crop Yield 1952-1977: Main rice crop yield is calculated by dividing main rice crop production (16) by main rice crop area (15) on an annual basis.
Country Sources of Basic Data: Korea
Pre-War Korea Primary statistical data for pre-war Korea were collected by the Japanese. Thus, original source material is printed in Japanese only. 1. Chosen Sotokufu (Governor General of Korea), Chósen tókei nempó (Statistical Yearbook of Korea). 2. Chósen Ginkó (Bank of Korea), Tokai geppó (Bulletin of Honthly Statistics). 3. Chósen Sótokufu (Governor General of Korea), Chósen bóeki nempyó (Trade Yearbook of Korea). North Korea Primary statistical data for North Korea are not available except for occasional translations into English of Korean materials by U.S. government translation services such as JPRS.
-112-
1. Pyóngyang Korean Central News Agency, Choson chungang yongam (Korean Central Yearbook)--excerpts .occasionally available in English translation. South Korea 1. Republic of Korea. Ministry of Agriculture and Forestry, Yearbook of Agriculture and Fishery Statistics (Seoul). Formerly Yearbook of Agriculture and Forestry Statistics. 2. Republic of Korea. The National Agricultural Cooperative Federation, The Agricultural Cooperatives Survey. 3. Republic of Korea.: Ministry of Agriculture and Forestry, Food Crop Statistics (Seoul). 4. Republic of Korea. Ministry of Agriculture and Forestry, Report on the Results of Farm and Household Economy Survey and Production Cost Survey of Agricultural Products (Seoul). 5. Bank of Korea, Economic Statistics Yearbook (Seoul). 6. Bank of Korea, Monthly Economic Statistics (Seoul).
Useful Secondary Sources
Pre-War Korea 1. Seizo Kató, Kankoku nógyó ron (A Discussion on Korean Agriculture) (Tokyo: 1904). A history of the land tenure system in Korea. 2. Sung-chul Suh, Growth and Structural Changes in the Korean Economy, 1910- 1940 (Cambridge, Mass.: Council on East Asian Studies, Harvard University, 1978).
-113-
North Korea 1. Joseph Sang-Moon Chung, The North Korean Economy (Stanford: Hoover Institution Press, Stanford University, 1974). 2. Ellen Brun and Jacques Hersh, Socialist Korea: A Case Study in the Strategy of Economic Development (New York: Monthly Review Press, 1976). 3. Frederica H. Bunge, ed., Area Handbook Series) North Korea: A Country Study (Washington, D.C.: U.S. Sup't of Documents, 1981). South Korea 1. Pal Yong Moon, "A Brief Review of the Evolution of Rice Policy in Korea" (Seoul: Korea Development Institute, 1974). 2. Pal Yong Moon and Byong Seo Yoo, "A Review of the Crop Production Estimates and the Key Statistics Related to Grain Policy" (Seoul: Korea Development Institute, 1974). 3. Hoon, K. Lee, Land Utilization and Rural Economy in Korea (New York: Greenwood Press, Publishers, 1969). 4. Sung Hwan Ban, Pal Yang Moon, and Dwight H. Perkins, Rural Development, in the book series Studies in the Modernization of the Republic of Korea: 1945-1975, edited by Edward S. Mason and Hahn Je Kim (Cambridge, Mass.: Council on East Asian Studies, Harvard University, 1980). Money Unit South Korea = won In 1980 1 US$ = 659.90 won official exchange rate In 1980 1 US$ = 625.00 won free-market exchange rate
-114-
Conversion Factors Pre-1945 Korea Area 1 cho = .99174 ha. 1 danbo (tanbo) = .099174 ha. Volume 1 liter = .005543 seok (attIc) 1 picul = 60.47867 kg. 100 liters = .5543 seok 1 koku = .1365 kg. 100 liters = 79.8192 kg. rice 1 koku = .1875 at. rice 1 at. = 16.53 piculs 1 koku - .150 at. brown rice Area 1 danbo (tanbo) 0.3. jeonabo (chungba) = 0.099174 ha. 1 jeongbo = 10 danbo = 0.99174 ha. 1 hectare = 10.083 danbo = 1.0083 jeongbo Volume 1 seok (suk) polished rice 144 kg. = .144 mt. 1 seok foreign rice 144 kg. = .144 mt. 1 seok unpolished (brown) rice = 155 kg. = 155 mt. 1 seok paddy = 100 kg. = .100 mt. 1 mt. = 6.9444 seok polished rice 100 liters = 79.8264 kg. rice 100 liters = .55435 seok rice 200 liters = 1.087 seok rice 20 liters = .11087 seok rice
-115-
20 liters = 15.96528 kg. = .01596258 mt. rice 100 liters = 79.8264 kg. = .0798264 mt. rice 200 liters = 159.6528 kg. = .1596528 mt. rice Weight 1 mt. = 266.666 gwan 1 gwan (bean) = .00375 mt. Glossary of Jap~anese Terms Used in the Pre-1945 Period - picul - maui = unhulled rice, paddy - uruchi = ordinary, non-glutinous rice - machigome = glutinous rice - upland, dry rice - gen,mai = brown rice - kilogram - sho -white rice - wholesale rice - average retail price - cultivated surface area Administrative Units in South Korea Province (9) - to County (138) - lain Town, formerly the county seat (138) - up Township - myon Subcounties (group of villages - about 1O/myon) - tong village (about 27/tong) - ri. There are about 36,405 villages in South Korea. hamlet - purak
-116-
SOUTHEAST ASIA
VII. Indochina 117 VIII. Icampuchea 125 IX. Laos 134 X. Vietnam 141 XI. North Vietnam 150 XII. South Vietnam 156 XIII. Java and Madura 173 XIV. Indonesia 190 XV. Malaya 208 XVI. West Malaysia 216 XVII. Sabah 228 XVIII. Sarawak 237 XIX. Philippines 250 XX. Thailand 276 XXI. Burma 301
-117-
VII. INDOCHINA Rice Statistics in Indochina After the French established nominal control over most of Indochina, they organized official agencies to collect statistics. Service de 1a Statistique Générale was the main body responsibl, for the collection and aggregation of general statistics. Specific statistical coverage varied widely from region to region, but probably the most reliable statistics were collected for Cochinchine because of direct French rule. Anna, Tonkin, and Cambodge, as French protectarates, had less direct and more erratic statistical coverage. Statistics foi Laos are unavailable or are of poor quality. Generally, statistics are available in a disaggregated form for each region and for Indochina as a whole. Statistics pertaining to rice area and production were collected by local governments and aggregated by l' Of tics Indochinois du Ri: and l' Inspection Generale de 1'Agriculture, de l' Elevage et des Fo4ts. L' Office du RI: van an administrative body drawn from persons involved in the growing, processing, and export of rice and as such was oriented toward the export of rice. The central office was located in Saigon in Cochinchine, the major port through which rice exports passed, with lesser offices scattered throughout Indochina. The quality of rice statistics is generally poor, with great year-to- year variability in reporting.. In addition, no statistics for outlying regions such as Laos were collected. Estimates for rice area and production were irregularly released in quintals of paddy for first and second crop rice area, production and yield by province, by region, and for Indochina as a whole. Production and area statistics were reported in June-Hay crop years. Because of the commercial interest of the French in rice, long-term export price series are available for several cities and for three varieties of

-118-
export rice an a monthly basis. Prices were collected from the Chambers of Commerce of Saigon and the syndicate of exporters of Saigon and Haiphong by government officials. These statistics were published in annual statistical journals such as the Annuaire Statisrigue de 1'Thdochine.
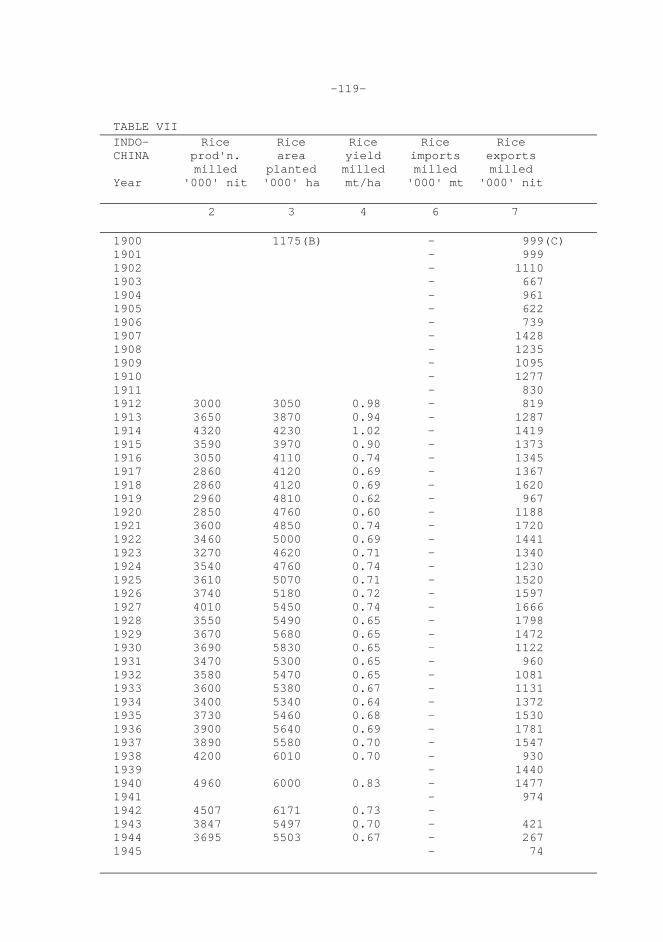
-119-
TABLE VII INDO- Rice Rice Rice Rice Rice CHINA prod'n. area yield imports exports milled planted milled milled milled Year '000' nit '000' ha mt/ha '000' mt '000' nit 2 3 4 6 7 1900 1175(B) - 999(C) 1901 - 999 1902 - 1110 1903 - 667 1904 - 961 1905 - 622 1906 - 739 1907 - 1428 1908 - 1235 1909 - 1095 1910 - 1277 1911 - 830 1912 3000 3050 0.98 - 819 1913 3650 3870 0.94 - 1287 1914 4320 4230 1.02 - 1419 1915 3590 3970 0.90 - 1373 1916 3050 4110 0.74 - 1345 1917 2860 4120 0.69 - 1367 1918 2860 4120 0.69 - 1620 1919 2960 4810 0.62 - 967 1920 2850 4760 0.60 - 1188 1921 3600 4850 0.74 - 1720 1922 3460 5000 0.69 - 1441 1923 3270 4620 0.71 - 1340 1924 3540 4760 0.74 - 1230 1925 3610 5070 0.71 - 1520 1926 3740 5180 0.72 - 1597 1927 4010 5450 0.74 - 1666 1928 3550 5490 0.65 - 1798 1929 3670 5680 0.65 - 1472 1930 3690 5830 0.65 - 1122 1931 3470 5300 0.65 - 960 1932 3580 5470 0.65 - 1081 1933 3600 5380 0.67 - 1131 1934 3400 5340 0.64 - 1372 1935 3730 5460 0.68 - 1530 1936 3900 5640 0.69 - 1781 1937 3890 5580 0.70 - 1547 1938 4200 6010 0.70 - 930 1939 - 1440 1940 4960 6000 0.83 - 1477 1941 - 974 1942 4507 6171 0.73 - 1943 3847 5497 0.70 - 421 1944 3695 5503 0.67 - 267 1945 - 74
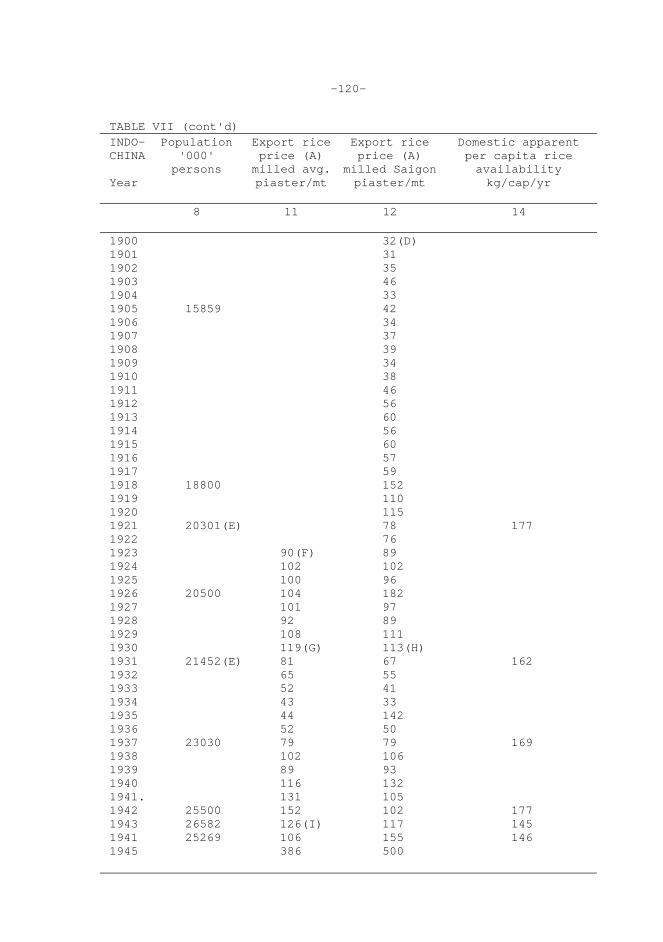
-120-
TABLE VII (cont'd) INDO- Population Export rice Export rice Domestic apparent CHINA '000' price (A) price (A) per capita rice persons milled avg. milled Saigon availability Year piaster/mt piaster/mt kg/cap/yr 8 11 12 14 1900 32(D) 1901 31 1902 35 1903 46 1904 33 1905 15859 42 1906 34 1907 37 1908 39 1909 34 1910 38 1911 46 1912 56 1913 60 1914 56 1915 60 1916 57 1917 59 1918 18800 152 1919 110 1920 115 1921 20301(E) 78 177 1922 76 1923 90(F) 89 1924 102 102 1925 100 96 1926 20500 104 182 1927 101 97 1928 92 89 1929 108 111 1930 119(G) 113(H) 1931 21452(E) 81 67 162 1932 65 55 1933 52 41 1934 43 33 1935 44 142 1936 52 50 1937 23030 79 79 169 1938 102 106 1939 89 93 1940 116 132 1941. 131 105 1942 25500 152 102 177 1943 26582 126(I) 117 145 1941 25269 106 155 146 1945 386 500
-121-
Notes to Appendix Table VII: Indochina
A/Numbers under columns 11 and 12 are prices in the respective markets for rice destined for export, except for 1930-1945 main-market (Saigon) rice price, which is a prix de gras mensuels (monthly wholesale price). B/1900: This is rice area cultivated for Cochinchine only. Cochinchine was the major rice exporting region of French Indochina and th. area over which French control was most complete. In 1937, 2,200,000 ha. of rice area were cultivated in Cochinchine. C/1900-1945: Rice exports cover rice in all forms, including rough rice, cargo rice, white rice, rice meal, and brisures. D/1929: Saigon market (Cochinchine) price is an export price for white No. 2 rice. E/Census figure. F/Average rice price is for white No. 2 rice and is an average of Saigon and Hanoi prices. G/1930-1942: Average rice price is for Saigon white No. 1, 25 percent brokens and Haiphong No. 1 rices. H/1930-1945: Main-market (Saigon) wholesale rice price is for 25 percent brokens. I/l943-1945: Average rice price ii for white 25 percent brokens rice and is an average of Phnom-penh and Saigon prices.
-122-
Sources of Data for Appendix Table VII: Indochina
1. Arable Area No yearly statistics are available, however, rice occupied about four- fifths of total cultivated area excluding permanent tree crops, thus, total cultivated-area was probably about 6,000,000 ha. 2. Rice Production 1912-1938: Wickizer, V. D. and Bennett, M. K., Rice Economy of Monsoon Asia (Stanford University, Calif.: Food Research Institute, 1941). 1940-1944: Indochdina. Service de la Statistique Générale, Annuaire statistique de 1’Indochine (Hanoi: Imprimerie d' Extrême-Orient, 1940-1944). 3. Rice Area 1900: Robequain, Charles, The Economic Development of French Indochina (New York: Oxford University Press, 1944). 1912-1938: Wickizer, V. D. and Bennett, M. K., Rice Economy of Monsoon Asia (Stanford University, Calif.: Food Research Institute, 1941). 1940-1944: Indochina. Service de la Statistique Générale, Annuaire statistigue de l'Indochine (Hanoi: Imprimerie d'Extrême-Orient, 1940-1944). 4. Rice Yield 1912-1944: Rice yields are calculated by dividing rice production (2) by rice area (3) on an annual basis. 6. Rice Imports No net imports made. 7. Rice Exports 1900-1912: Brenier, Henri, Essai d'atlas statisrique de l'Indochine francaise
-123-
(Hanoi-Haiphong: Imprimerie d'Extrême-Orient, 1914). 1913-1929: Indochina. Inspection Généra1e des Mines et de 1'Industrie, Statistigue générale do 1'Indochine résumé rétrospectif 1913-1929 (Hanoi: Imprimerie d'Extréme-orient, 1931). 1930-1945: Indochina. Service de la Statistique Générale, Annuaire statistigue de 1'Indochine (Hanoi: Imprimerie d'Extreme-0rient, 1930-1945). 8. Population 1905-1945: Indochina. Service do is Statistique Générale, Annuaire statistigue do 1'Indochine (Hanoi: Isprimerie d'Extrême-Orient, 1918-1945). 1921-1926: Indochina. Inspection Générale des Mines at de 1'Industrie, Statistigue générale do 1'Indochine resume rétrospectif 1913-1929 (Hanoi: Imprimerie d'Extrême-Orient, 1931). 11. Average Export Rice Price 1923-1945: Indochina. Service de la Statistique Générale, Annuaire statistigue de 1'Indochine (Hanoi: Imprimerie d'Extreme-Orient, 1923-1946). 12. Export Rice Price 1900-1912: Brenier, Henri, Essai d'atlas statistigue de 1'Indochine française (Hanoi-Haiphong: Imprimerie d’Extrême-Orient, 1914). 1913-1929: Indochina. Service de la Statistique Generale, Résumé statistique relatif aux années, 1913-1940 (Hanoi: Imprimerie d'Extreme-Orient, 1941). 14. Domestic Apparent Per Capita Rice Availability 1918-1944: Domestic rice availability is calculated by dividing rice pro- duction (2) by population (8) on a yearly basis.
-124-
Country Sources of Basic Data: Indochina
1. Indochina. Service de la Statistique Générale, Bulletin économique de l'Indochine (Saigon~: begins publication in 1898). 2. Indochina. Service~ de la Statistique Générale, Annuaire statistique de 1'Indochine (Hanoi: Imprimerie d'Extreme-Orient). 3. Brenier, Henri, Essai d'atlas statistique do l'Indochine francaise (Hanoi- Haiphong: Imprimerie d'Extreme-Orient, 1914). 4. Indochina. Inspection Genera1e des Mines et de 1'Industrie, Statistique générale do 1'Indochine resume retrospectif 1913-1929 (Hanoi: Imprimerie d'Extrême-Orient, 1931). 5. Indochina. Service de la Statistique Générale, Résumé statistique relatif aux annés, 1913-1940 (Hanoi: Imprimerie d'Extreme-Orient, 1941).
Useful Secondary Sources 1. Teston, Eugene and Percheron, Maurice, L'Indochine historique: Encyclopedie administrative, touristique, artistique et économigue (Paris: Librarie de France, 1931). 2. Wickizer, V. D. and~ Bennett, M. K., The Rice Economy of Monsoon Asia (Stanford University, Calif.: Food Research Institute, 1941). 3. Gourou; Pierre, L'Utilisation dii sol en Indochine francaise (Paris: Centre d'Etudes de Politique, Etrangère, Travaux des Croupes d'Etudes No. 14, 1947). 4. Robequain, Charles, Economic Development of French Indochina (New York: Oxford University Press, 1944). Important Conversion Factors 1 picul paddy = 68 kg. paddy money unit = piastre milling rate = .62 white rice .78 cargo rice
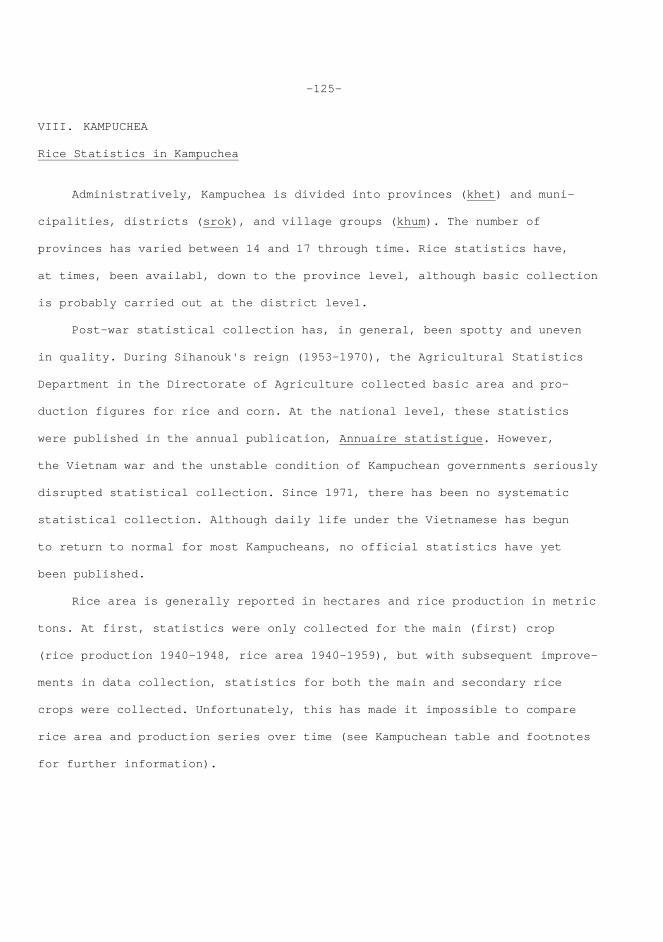
-125-
VIII. KAMPUCHEA Rice Statistics in Kampuchea Administratively, Kampuchea is divided into provinces (khet) and muni- cipalities, districts (srok), and village groups (khum). The number of provinces has varied between 14 and 17 through time. Rice statistics have, at times, been availabl, down to the province level, although basic collection is probably carried out at the district level. Post-war statistical collection has, in general, been spotty and uneven in quality. During Sihanouk's reign (1953-1970), the Agricultural Statistics Department in the Directorate of Agriculture collected basic area and pro- duction figures for rice and corn. At the national level, these statistics were published in the annual publication, Annuaire statistigue. However, the Vietnam war and the unstable condition of Kampuchean governments seriously disrupted statistical collection. Since 1971, there has been no systematic statistical collection. Although daily life under the Vietnamese has begun to return to normal for most Kampucheans, no official statistics have yet been published. Rice area is generally reported in hectares and rice production in metric tons. At first, statistics were only collected for the main (first) crop (rice production 1940-1948, rice area 1940-1959), but with subsequent improve- ments in data collection, statistics for both the main and secondary rice crops were collected. Unfortunately, this has made it impossible to compare rice area and production series over time (see Kampuchean table and footnotes for further information).
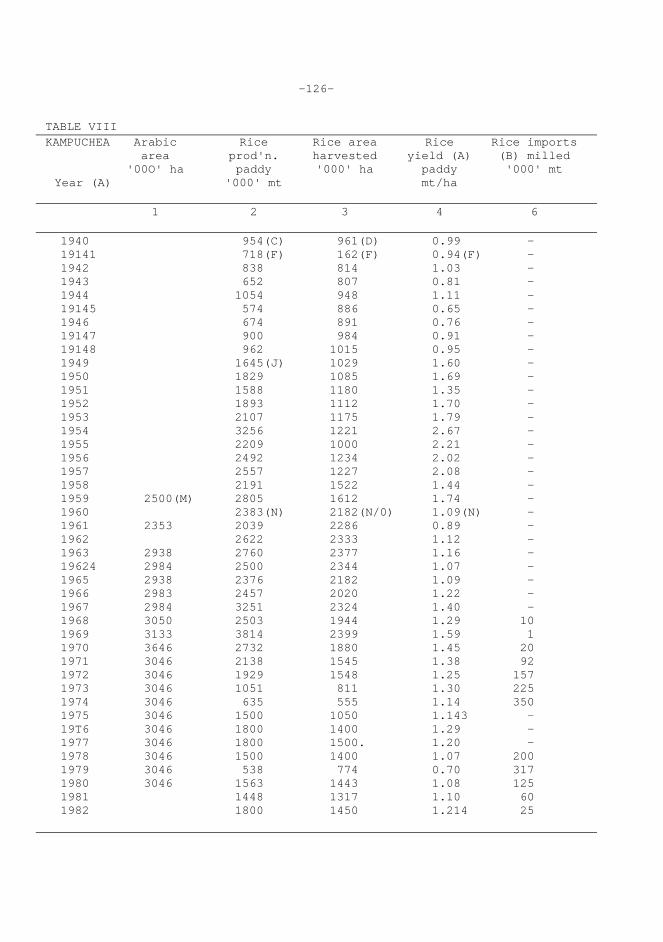
-126-
TABLE VIII KAMPUCHEA Arabic Rice Rice area Rice Rice imports area prod'n. harvested yield (A) (B) milled '00O' ha paddy '000' ha paddy '000' mt Year (A) '000' mt mt/ha 1 2 3 4 6
1940 954(C) 961(D) 0.99 - 19141 718(F) 162(F) 0.94(F) - 1942 838 814 1.03 - 1943 652 807 0.81 - 1944 1054 948 1.11 - 19145 574 886 0.65 - 1946 674 891 0.76 - 19147 900 984 0.91 - 19148 962 1015 0.95 - 1949 1645(J) 1029 1.60 - 1950 1829 1085 1.69 - 1951 1588 1180 1.35 - 1952 1893 1112 1.70 - 1953 2107 1175 1.79 - 1954 3256 1221 2.67 - 1955 2209 1000 2.21 - 1956 2492 1234 2.02 - 1957 2557 1227 2.08 - 1958 2191 1522 1.44 - 1959 2500(M) 2805 1612 1.74 - 1960 2383(N) 2182(N/0) 1.09(N) - 1961 2353 2039 2286 0.89 - 1962 2622 2333 1.12 - 1963 2938 2760 2377 1.16 - 19624 2984 2500 2344 1.07 - 1965 2938 2376 2182 1.09 - 1966 2983 2457 2020 1.22 - 1967 2984 3251 2324 1.40 - 1968 3050 2503 1944 1.29 10 1969 3133 3814 2399 1.59 1 1970 3646 2732 1880 1.45 20 1971 3046 2138 1545 1.38 92 1972 3046 1929 1548 1.25 157 1973 3046 1051 811 1.30 225 1974 3046 635 555 1.14 350 1975 3046 1500 1050 1.143 - 19T6 3046 1800 1400 1.29 - 1977 3046 1800 1500. 1.20 - 1978 3046 1500 1400 1.07 200 1979 3046 538 774 0.70 317 1980 3046 1563 1443 1.08 125 1981 1448 1317 1.10 60 1982 1800 1450 1.214 25
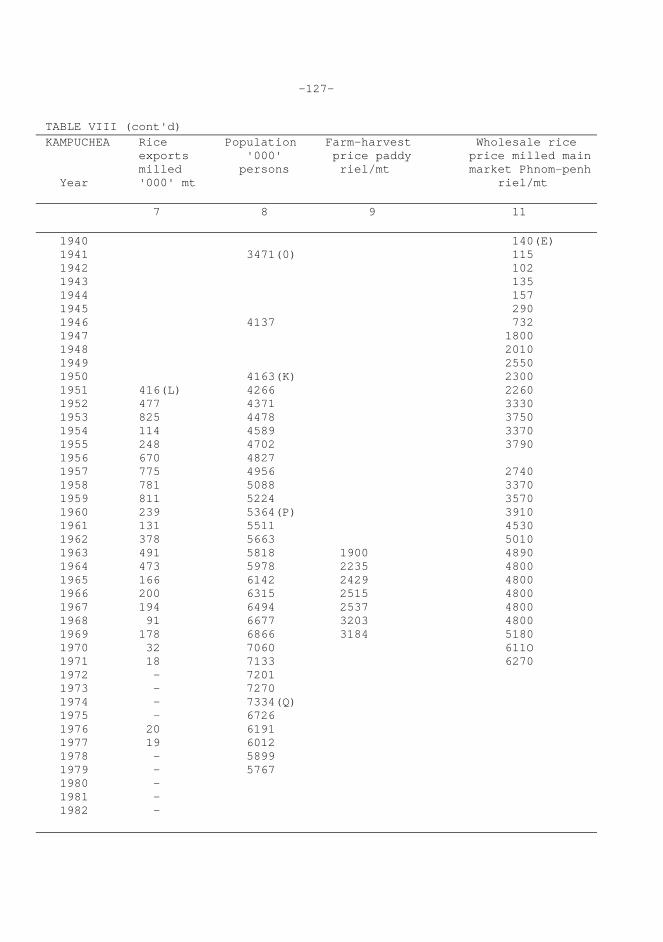
-127-
TABLE VIII (cont'd) KAMPUCHEA Rice Population Farm-harvest Wholesale rice exports '000' price paddy price milled main milled persons riel/mt market Phnom-penh Year '000' mt riel/mt 7 8 9 11 1940 140(E) 1941 3471(0) 115 1942 102 1943 135 1944 157 1945 290 1946 4137 732 1947 1800 1948 2010 1949 2550 1950 4163(K) 2300 1951 416(L) 4266 2260 1952 477 4371 3330 1953 825 4478 3750 1954 114 4589 3370 1955 248 4702 3790 1956 670 4827 1957 775 4956 2740 1958 781 5088 3370 1959 811 5224 3570 1960 239 5364(P) 3910 1961 131 5511 4530 1962 378 5663 5010 1963 491 5818 1900 4890 1964 473 5978 2235 4800 1965 166 6142 2429 4800 1966 200 6315 2515 4800 1967 194 6494 2537 4800 1968 91 6677 3203 4800 1969 178 6866 3184 5180 1970 32 7060 611O 1971 18 7133 6270 1972 - 7201 1973 - 7270 1974 - 7334(Q) 1975 - 6726 1976 20 6191 1977 19 6012 1978 - 5899 1979 - 5767 1980 - 1981 - 1982 -
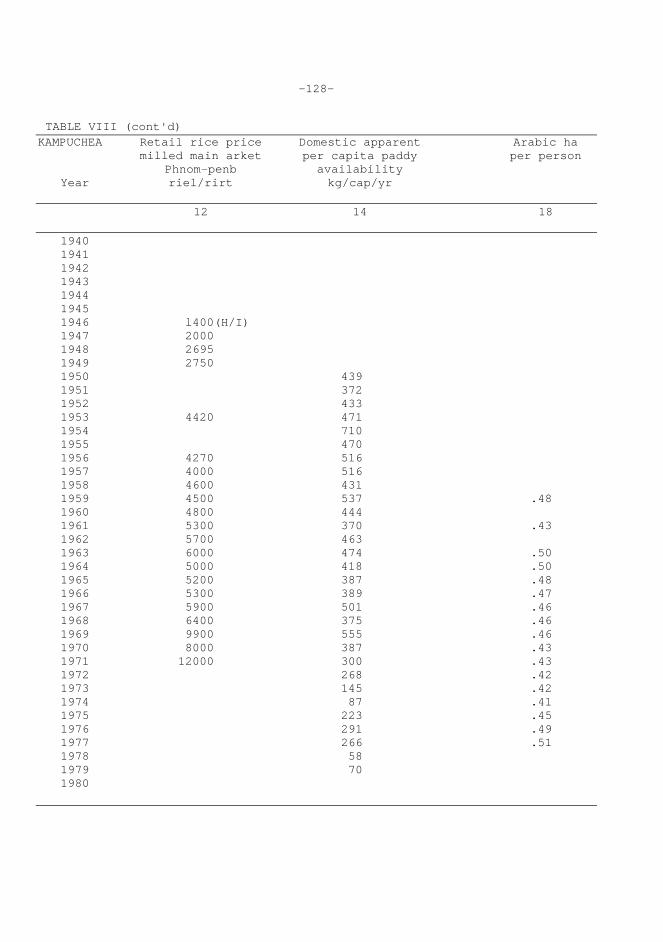
-128-
TABLE VIII (cont'd) KAMPUCHEA Retail rice price Domestic apparent Arabic ha milled main arket per capita paddy per person Phnom-penb availability
Year riel/rirt kg/cap/yr 12 14 18 1940 1941 1942 1943 1944 1945 1946 l400(H/I) 1947 2000 1948 2695 1949 2750 1950 439 1951 372 1952 433 1953 4420 471 1954 710 1955 470 1956 4270 516 1957 4000 516 1958 4600 431 1959 4500 537 .48 1960 4800 444 1961 5300 370 .43 1962 5700 463 1963 6000 474 .50 1964 5000 418 .50 1965 5200 387 .48 1966 5300 389 .47 1967 5900 501 .46 1968 6400 375 .46 1969 9900 555 .46 1970 8000 387 .43 1971 12000 300 .43 1972 268 .42 1973 145 .42 1974 87 .41 1975 223 .45 1976 291 .49 1977 266 .51 1978 58 1979 70 1980
-129-
Notes to Appendix Table VIII: Kampuchea
A/1940-1982: Rice yields reported here are not comparable across time because different data were used for the periods 1940-1948 and 1960-1982. 1940-1948 yields are for main (first) crop only. 1949-1959 yields cannot be computed because rice production statistics are for total production whereas area statistics are for first crop area only. 1960-1982 yields are computed from total rice production and total rice, area. B/Kampuchea is traditionally a net exporter of rice. Rice imports did not begin until constant war disrupted the production of rice. C/1940-1948: First crop rice production only reported. D/1940-1959: Area for first crop only reported. E/Wholesale rice price is for white No. 1, 25 percent broken rice. F/Production figures do not include Battambang. G/1941: The total population was estimated at 2803 thousand in 1931, 2403 thousand In 1921, and 1102 thousand in 1900. H/1946-1947: Retail rice price is for December only. I/1946-1971: Retail rice price is for white No. 1 rice. J/From 1949, production for both crops reported. This is why paddy production increases dramatically in 1949. K/1950-1959: Population is as of July 1 of the year in question. L/1951-1971: Rice exports are for rice and rice products.
-130-
M/1959-1980: Arable area is reported in calendar years. FAO numbers used in this table are obvious guesstimates. N/1960-1982: Rice area, production, and yield are reported in calendar years. O/1960-1982: From 1960, area for both first and second crops reported. This is why rice area jumps so drastically in 1960. P/1960-1979: Population figures are as of July 1 of the year in question. All years are projected estimates. A census taken in 1962 counted 5,728,771 persons (unadjusted). Q/l974~l979: Since 1974, the Kampuchean population has actually had a negative growth rate because of harsh living conditions produced by constant war. Population estimates for 1980 will likely show a small increase from the 1979 estimate as living conditions have probably improved.
-131-
Sources of Data for Appendix Table VIII: Kampuchea 1. Arabia Land 1959-1980: Economic and Social Commission for Asia and the Pacific, Statistical Yearbook for Asia and the Pacific (Bangkok: United Nations).* 2. Rice Production 1940-1971: République Khmère. Institut National de la Statistique et des Recherches Economiques, Commissariat au Plan, Annuaire statistique (Phnom-penh). 1972-1982: U.S. Foreign Agricultural Service, Foreign Agriculture Circular, FG-26-83 (Washington, D.C.: 1983). 3. Rice Area 1940-1971: Republique Khemer. Institut National de la Statistique et des Recherches Economiques, Commissariat au Plan, Annuaire statistigue (Phnom-penh). 1972-1982: U.S. Foreign Agricultural Service, Foreign Agriculture Circular, FC-26-83 (Washington, D.C.: 1983). 4. Rice Yields 1940-1982: Rice yields are calculated by dividing rice production (2) by rice area (3) on an annual basis. 5. Rice Area Irrigated Although all Kampuchean rice is grown under wet-land (paddy) conditions, technically irrigated area is very small, probably no more than a few thousand hectares. _____________________ *Statistical Yearbook for Asia and the Pacific replaces Statistical Yearbook for Asia and the Far East in 1972.
-132-
6. Rice Imports 1940-1959: République Khmère. Institut National de la Statistique et des Recherches Economiques, Coimnissariat au Plan, Annuaire statistique (Phnom-penh). 1960-1982: U.S. Foreign Agricultural Service, Foreign Agriculture Circular, FC-26-83 (Washington, D.C.: 1983). 7. Rice Exports 1951-1959: Republique Khm~re. Institut National de la Statistique et des Recherches Economiques, Commissariat au Plan, Annuaire statistique (Pbonm-penh). 1960-1982: U.S. Foreign Agricultural Service, Foreign Agriculture Circular, FC-26-83 (Washington, D.C.: 1983). 8. Population 1941, 1946: Tan Kim-Huon, Géographie du Cambodge de l'Asie des moussons et des principales puissances (Phnom-penh: 1963). 1950-1959: U.S. Department of Commerce, Bureau of the Census, World Population 1977 (Washington: 1978). 1960-1979: U.S. Department of Commerce, Bureau of the Census, Inter- national Population Dynamics 1950-79 (Washington, D.C.: 1980). 9. Farm-Harvest Price 1963-1969: République Khmare. ILnstitut National de la Statistique et des Recherches Economiques, Commissariat au Plan, Annuaire statistique (Phonmn-penh). 11. Wholesale Rice Price Main Market (Phnom-penh) 1940-1971: République Khmère. Institut National de la Statistique et des
-133-
Recherches Economiques, Commissariat au Plan, Annuaire statistique (Phonm-penh). 12. Retail Rice Price Main Market (Phonm-penh) 1946-1971: République Khm&e. Institut National de la Statistique et des Recherches Economiques, Commissariat au Plan, Annuaire statistique (Phonm-penh). 14. Domestic Apparent Per Capita Paddy Availability 1950-1979: Domestic apparent rice availability is calculated by dividing rice production (2) by total population (8) on an annual basis.
Country Sources of Basic Data: Kampuchea 1. République Khmère. Institut National de la Staristique et des Recherches Economiques, Commissariat au Plan, Annuaire statistique (Phnom-penh).
Useful Secondary Sources 1. D. Whitaker et al., Area Handbook for the Khmer Republic (Washington, D.C.: Foreign Area Studies, American University, 1973). 2. D. Steinberg, Cambodia (New Haven: HRAF Pres~, 1957). Important Conversion Factors Money Unit 1 riel* = 100 sen 1 picul = 68 kg. 14.7059 piculs = 1 mt. ___________________________ *The riel was created in the 1950s with the establishment of an indepen- dent Kampuchean banking and currency system. Prior to World War II, the Indochinese plaster was in circulation. It was issued by the private Banque de 1' Indochine and was linked to the French franc.
-134-
X. LAOS Rice Statistics in Laos Administratively, Laos is divided into provinces (khoueng), districts (muong), cantons (tassèng), and villages (ban). The statistical system in Laos, which is structured around these divisions, is very undeveloped. Even figures f or glutinous rice output, Laos' most important and major crop, are scarce and available only at the national level. Little is known about the current organization of' statistical collection, but a Vietnamese-style system is probably in use. Formerly a statistical section, Service de la Statistique du Laos under the Ministere du Plan was responsible for the collection of all statistics, including those pertaining to agriculture. Unfortunately, repeated disruptions prevented the regular collection and publication of statistics. Bulletin de statistigues du Laos was published for a ten-year period (1959- 1969) on a quarterly basis, and a few issues of the annual Statistique essentielles were published in the late 1960s and early 1970s. However, data in these pub- lications are sketchy and incomplete on a year-to-year basis. The USDA and FAO provide regular estimates of rice output and area in Laos, which many people prefer to use, but these numbers must be viewed as rough estimates only. In addition, US/AID reports from the 1960s provide some useful statistics. Rice output and area statistics are reported in metric tons and hectares on a national basis only in the official statistics. There is no breakdown between glutinous and ordinary rice, but most rice, perhaps 90 percent, is of the glutinous variety. Official irrigated rice area statistics are not available, but most guesses range in the 2 to 8 percent range. Rice price statistics are not generally available except in index form, although researchers and ob- servers have recorded scattered prices in urban areas. Laos does not export rice. Import figures were available from the Lao Customs Service, but currently are rarely made public.
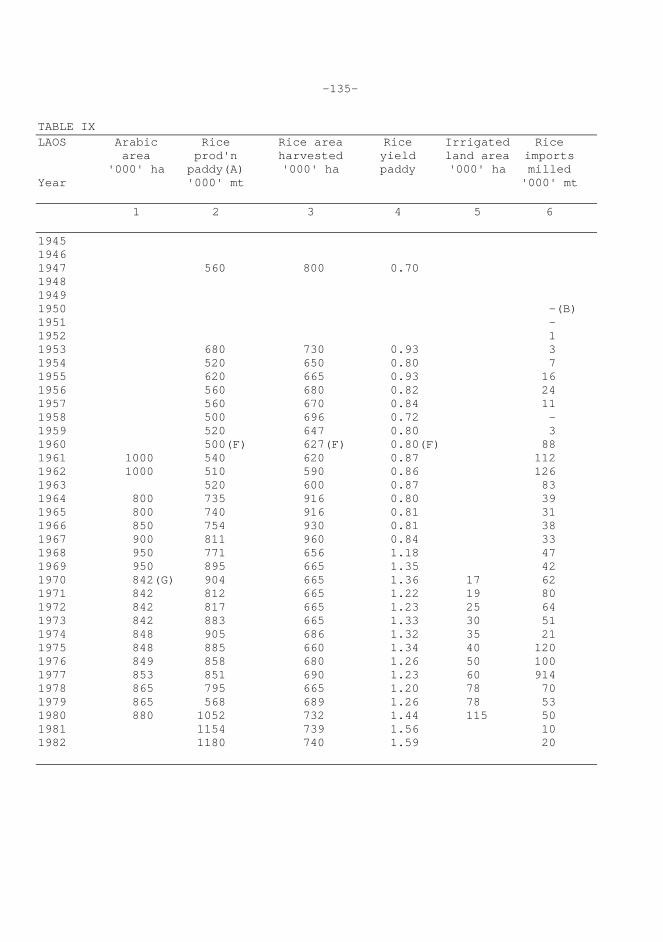
-135-
TABLE IX LAOS Arabic Rice Rice area Rice Irrigated Rice area prod'n harvested yield land area imports '000' ha paddy(A) '000' ha paddy '000' ha milled Year '000' mt '000' mt 1 2 3 4 5 6 1945 1946 1947 560 800 0.70 1948 1949 1950 -(B) 1951 - 1952 1 1953 680 730 0.93 3 1954 520 650 0.80 7 1955 620 665 0.93 16 1956 560 680 0.82 24 1957 560 670 0.84 11 1958 500 696 0.72 - 1959 520 647 0.80 3 1960 500(F) 627(F) 0.80(F) 88 1961 1000 540 620 0.87 112 1962 1000 510 590 0.86 126 1963 520 600 0.87 83 1964 800 735 916 0.80 39 1965 800 740 916 0.81 31 1966 850 754 930 0.81 38 1967 900 811 960 0.84 33 1968 950 771 656 1.18 47 1969 950 895 665 1.35 42 1970 842(G) 904 665 1.36 17 62 1971 842 812 665 1.22 19 80 1972 842 817 665 1.23 25 64 1973 842 883 665 1.33 30 51 1974 848 905 686 1.32 35 21 1975 848 885 660 1.34 40 120 1976 849 858 680 1.26 50 100 1977 853 851 690 1.23 60 914 1978 865 795 665 1.20 78 70 1979 865 568 689 1.26 78 53 1980 880 1052 732 1.44 115 50 1981 1154 739 1.56 10 1982 1180 740 1.59 20
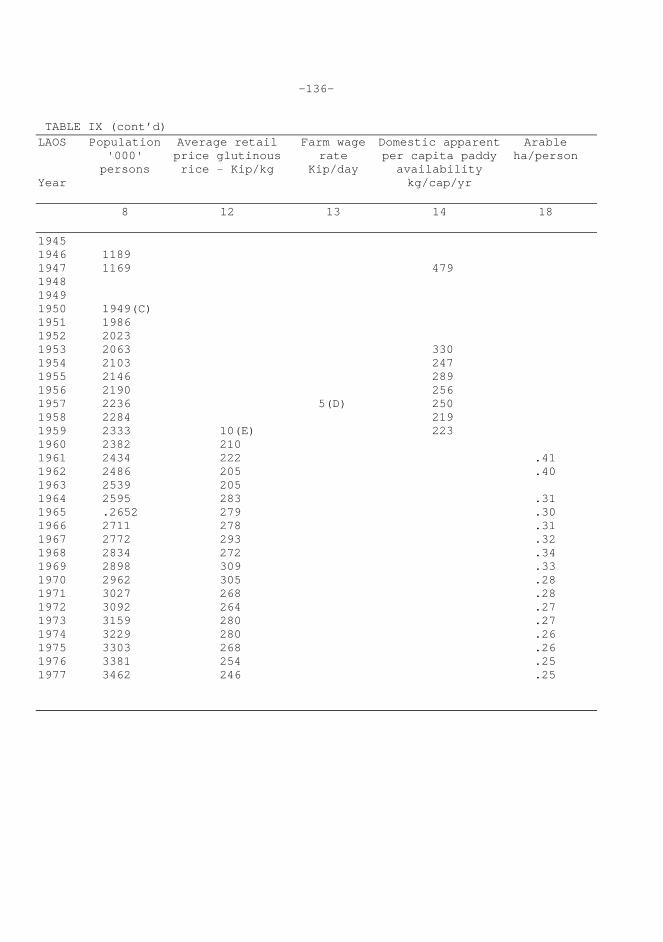
-136-
TABLE IX (cont’d) LAOS Population Average retail Farm wage Domestic apparent Arable '000' price glutinous rate per capita paddy ha/person persons rice - Kip/kg Kip/day availability Year kg/cap/yr 8 12 13 14 18 1945 1946 1189 1947 1169 479 1948 1949 1950 1949(C) 1951 1986 1952 2023 1953 2063 330 1954 2103 247 1955 2146 289 1956 2190 256 1957 2236 5(D) 250 1958 2284 219 1959 2333 10(E) 223 1960 2382 210 1961 2434 222 .41 1962 2486 205 .40 1963 2539 205 1964 2595 283 .31 1965 .2652 279 .30 1966 2711 278 .31 1967 2772 293 .32 1968 2834 272 .34 1969 2898 309 .33 1970 2962 305 .28 1971 3027 268 .28 1972 3092 264 .27 1973 3159 280 .27 1974 3229 280 .26 1975 3303 268 .26 1976 3381 254 .25 1977 3462 246 .25
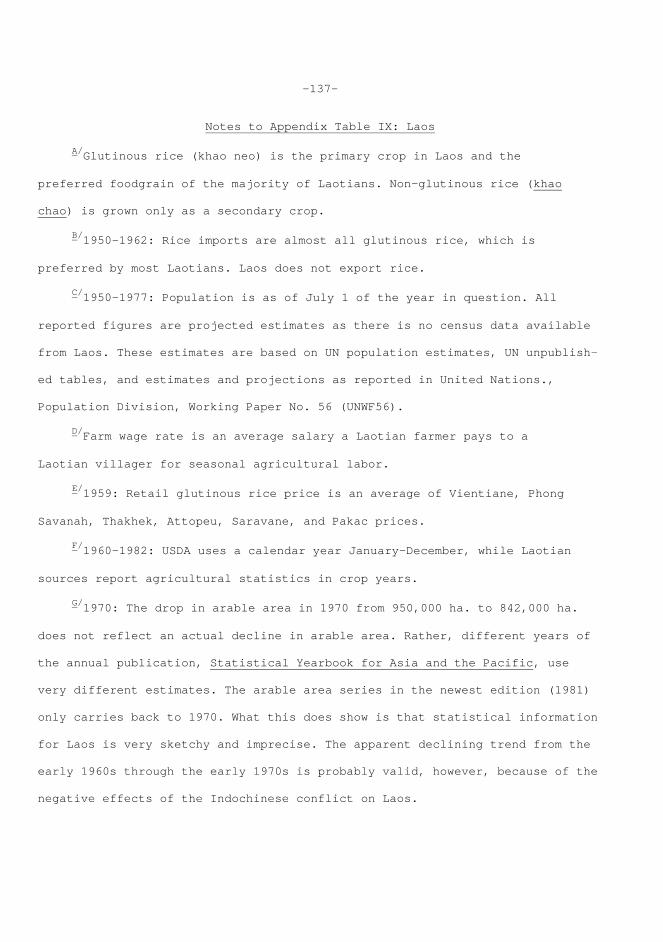
-137-
Notes to Appendix Table IX: Laos A/Glutinous rice (khao neo) is the primary crop in Laos and the preferred foodgrain of the majority of Laotians. Non-glutinous rice (khao chao) is grown only as a secondary crop. B/1950-1962: Rice imports are almost all glutinous rice, which is preferred by most Laotians. Laos does not export rice. C/1950-1977: Population is as of July 1 of the year in question. All reported figures are projected estimates as there is no census data available from Laos. These estimates are based on UN population estimates, UN unpublish- ed tables, and estimates and projections as reported in United Nations., Population Division, Working Paper No. 56 (UNWF56). D/Farm wage rate is an average salary a Laotian farmer pays to a Laotian villager for seasonal agricultural labor. E/1959: Retail glutinous rice price is an average of Vientiane, Phong Savanah, Thakhek, Attopeu, Saravane, and Pakac prices. F/1960-1982: USDA uses a calendar year January-December, while Laotian sources report agricultural statistics in crop years. G/1970: The drop in arable area in 1970 from 950,000 ha. to 842,000 ha. does not reflect an actual decline in arable area. Rather, different years of the annual publication, Statistical Yearbook for Asia and the Pacific, use very different estimates. The arable area series in the newest edition (1981) only carries back to 1970. What this does show is that statistical information for Laos is very sketchy and imprecise. The apparent declining trend from the early 1960s through the early 1970s is probably valid, however, because of the negative effects of the Indochinese conflict on Laos.
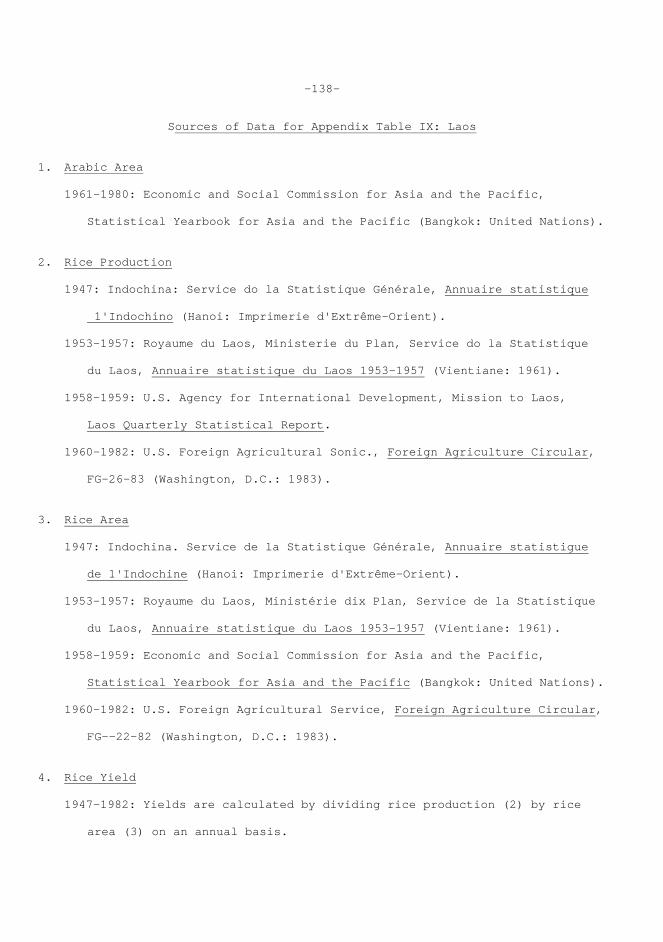
-138-
Sources of Data for Appendix Table IX: Laos 1. Arabic Area 1961-1980: Economic and Social Commission for Asia and the Pacific, Statistical Yearbook for Asia and the Pacific (Bangkok: United Nations). 2. Rice Production 1947: Indochina: Service do la Statistique Générale, Annuaire statistique 1'Indochino (Hanoi: Imprimerie d'Extrême-Orient). 1953-1957: Royaume du Laos, Ministerie du Plan, Service do la Statistique du Laos, Annuaire statistique du Laos 1953-1957 (Vientiane: 1961). 1958-1959: U.S. Agency for International Development, Mission to Laos, Laos Quarterly Statistical Report. 1960-1982: U.S. Foreign Agricultural Sonic., Foreign Agriculture Circular, FG-26-83 (Washington, D.C.: 1983). 3. Rice Area 1947: Indochina. Service de la Statistique Générale, Annuaire statistigue de 1'Indochine (Hanoi: Imprimerie d'Extrême-Orient). 1953-1957: Royaume du Laos, Ministérie dix Plan, Service de la Statistique du Laos, Annuaire statistique du Laos 1953-1957 (Vientiane: 1961). 1958-1959: Economic and Social Commission for Asia and the Pacific, Statistical Yearbook for Asia and the Pacific (Bangkok: United Nations). 1960-1982: U.S. Foreign Agricultural Service, Foreign Agriculture Circular, FG--22-82 (Washington, D.C.: 1983). 4. Rice Yield 1947-1982: Yields are calculated by dividing rice production (2) by rice area (3) on an annual basis.
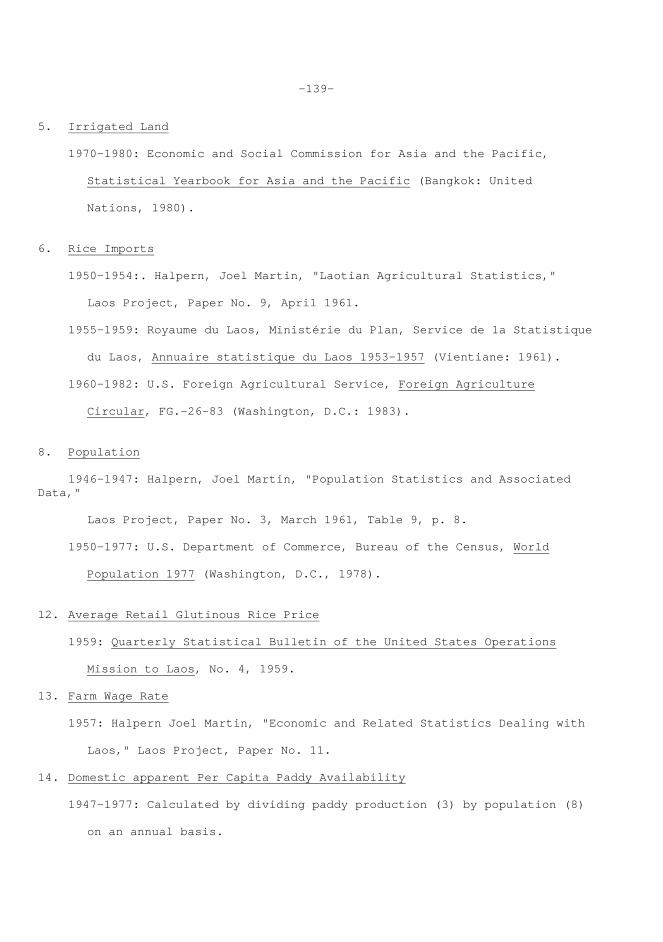
-139-
5. Irrigated Land 1970-1980: Economic and Social Commission for Asia and the Pacific, Statistical Yearbook for Asia and the Pacific (Bangkok: United Nations, 1980). 6. Rice Imports 1950-1954:. Halpern, Joel Martin, "Laotian Agricultural Statistics," Laos Project, Paper No. 9, April 1961. 1955-1959: Royaume du Laos, Ministérie du Plan, Service de la Statistique du Laos, Annuaire statistique du Laos 1953-1957 (Vientiane: 1961). 1960-1982: U.S. Foreign Agricultural Service, Foreign Agricu1ture Circular, FG.-26-83 (Washington, D.C.: 1983). 8. Population 1946-1947: Halpern, Joel Martin, "Population Statistics and Associated Data," Laos Project, Paper No. 3, March 1961, Table 9, p. 8. 1950-1977: U.S. Department of Commerce, Bureau of the Census, World Population 1977 (Washington, D.C., 1978). 12. Average Retail Glutinous Rice Price 1959: Quarterly Statistical Bulletin of the United States Operations Mission to Laos, No. 4, 1959. 13. Farm Wage Rate 1957: Halpern Joel Martin, "Economic and Related Statistics Dealing with Laos," Laos Project, Paper No. 11. 14. Domestic apparent Per Capita Paddy Availability 1947-1977: Calculated by dividing paddy production (3) by population (8) on an annual basis.
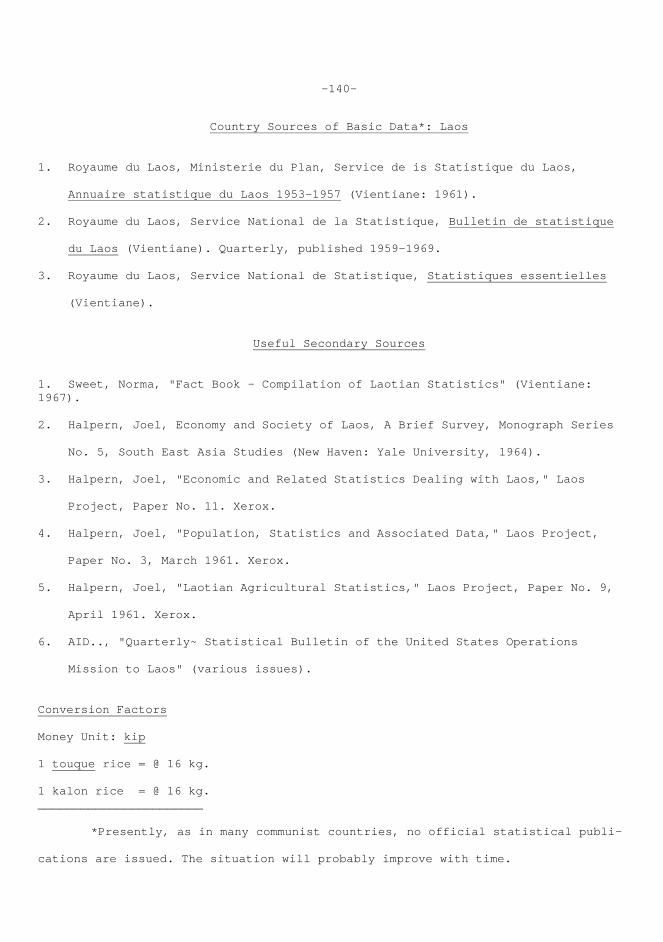
-140-
Country Sources of Basic Data*: Laos 1. Royaume du Laos, Ministerie du Plan, Service de is Statistique du Laos, Annuaire statistique du Laos 1953-1957 (Vientiane: 1961). 2. Royaume du Laos, Service National de la Statistique, Bulletin de statistique du Laos (Vientiane). Quarterly, published 1959-1969. 3. Royaume du Laos, Service National de Statistique, Statistiques essentielles (Vientiane).
Useful Secondary Sources 1. Sweet, Norma, "Fact Book - Compilation of Laotian Statistics" (Vientiane: 1967). 2. Halpern, Joel, Economy and Society of Laos, A Brief Survey, Monograph Series No. 5, South East Asia Studies (New Haven: Yale University, 1964). 3. Halpern, Joel, "Economic and Related Statistics Dealing with Laos," Laos Project, Paper No. 11. Xerox. 4. Halpern, Joel, "Population, Statistics and Associated Data," Laos Project, Paper No. 3, March 1961. Xerox. 5. Halpern, Joel, "Laotian Agricultural Statistics," Laos Project, Paper No. 9, April 1961. Xerox. 6. AID.., "Quarterly~ Statistical Bulletin of the United States Operations Mission to Laos" (various issues). Conversion Factors Money Unit: kip 1 touque rice = @ 16 kg. 1 kalon rice = @ 16 kg. _______________________ *Presently, as in many communist countries, no official statistical publi- cations are issued. The situation will probably improve with time.
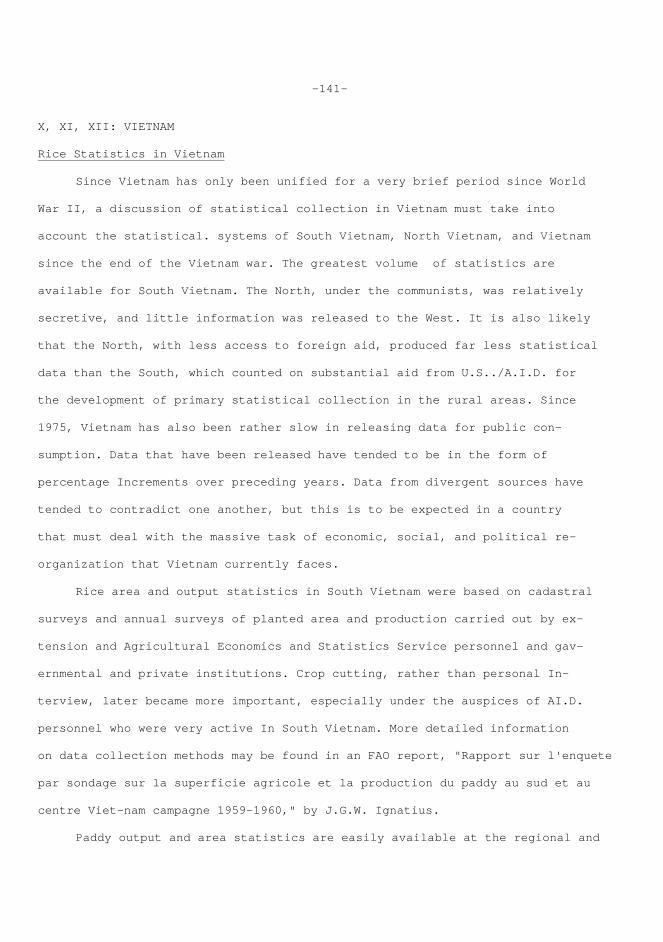
-141-
X, XI, XII: VIETNAM Rice Statistics in Vietnam Since Vietnam has only been unified for a very brief period since World War II, a discussion of statistical collection in Vietnam must take into account the statistical. systems of South Vietnam, North Vietnam, and Vietnam since the end of the Vietnam war. The greatest volume of statistics are available for South Vietnam. The North, under the communists, was relatively secretive, and little information was released to the West. It is also likely that the North, with less access to foreign aid, produced far less statistical data than the South, which counted on substantial aid from U.S../A.I.D. for the development of primary statistical collection in the rural areas. Since 1975, Vietnam has also been rather slow in releasing data for public con- sumption. Data that have been released have tended to be in the form of percentage Increments over preceding years. Data from divergent sources have tended to contradict one another, but this is to be expected in a country that must deal with the massive task of economic, social, and political re- organization that Vietnam currently faces. Rice area and output statistics in South Vietnam were based on cadastral surveys and annual surveys of planted area and production carried out by ex- tension and Agricultural Economics and Statistics Service personnel and gav- ernmental and private institutions. Crop cutting, rather than personal In- terview, later became more important, especially under the auspices of AI.D. personnel who were very active In South Vietnam. More detailed information on data collection methods may be found in an FAO report, "Rapport sur l'enquete par sondage sur la superficie agricole et la production du paddy au sud et au centre Viet-nam campagne 1959-1960," by J.G.W. Ignatius. Paddy output and area statistics are easily available at the regional and
-142-
provincial levels. Since double cropping is quite prevalent, some information is also available on area and output attributed to first and second crops. Due to French influence, metric units were used, and paddy production is re- ported in rough form. Agricultural statistics are reported in split, agricul- tural years while the calendar year is commonly used for prices and trade data. The availability of statistics for Vietnam since 1975 is, if anything, worse than that for North Vietnam. Almost no statistics are made public, except those leaked to visitors. Statistical collection is going on under the control of the General Statistical Office, but apparently is as yet in a nascent stage. More statistics viii eventually be made public, and hopefully the Vietnamese will begin the publication of regular statistical materials. However, for flaw, mast, researchers must depend on USDA or FAO estimates and on the release of occasional information.
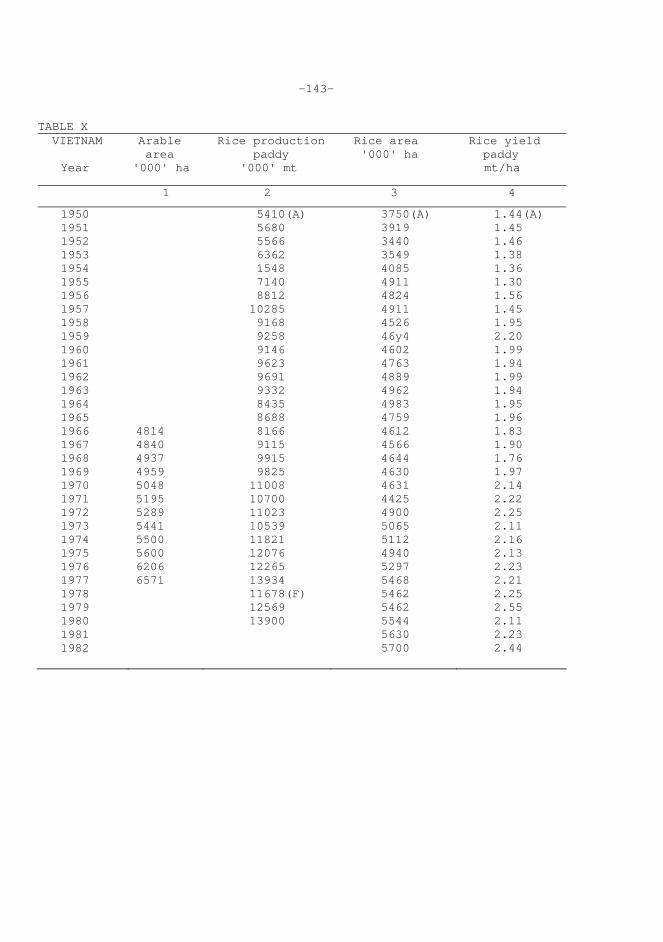
-143-
TABLE X VIETNAM Arable Rice production Rice area Rice yield area paddy '000' ha paddy
Year '000' ha '000' mt mt/ha
1 2 3 4
1950 1951 1952 1953 1954 1955 1956 1957 1958 1959 1960 1961 1962 1963 1964 1965 1966 1967 1968 1969 1970 1971 1972 1973 1974 1975 1976 1977 1978 1979 1980 1981 1982
4814 4840 4937 4959 5048 5195 5289 5441 5500 5600 6206 6571
5410(A) 5680 5566 6362 1548 7140 8812 10285 9168 9258 9146 9623 9691 9332 8435 8688 8166 9115 9915 9825 11008 10700 11023 10539 11821 12076 12265 13934 11678(F) 12569 13900
3750(A) 3919 3440 3549 4085 4911 4824 4911 4526 46y4 4602 4763 4889 4962 4983 4759 4612 4566 4644 4630 4631 4425 4900 5065 5112 4940 5297 5468 5462 5462 5544 5630 5700
1.44(A) 1.45 1.46 1.38 1.36 1.30 1.56 1.45 1.95 2.20 1.99 1.94 1.99 1.94 1.95 1.96 1.83 1.90 1.76 1.97 2.14 2.22 2.25 2.11 2.16 2.13 2.23 2.21 2.25 2.55 2.11 2.23 2.44
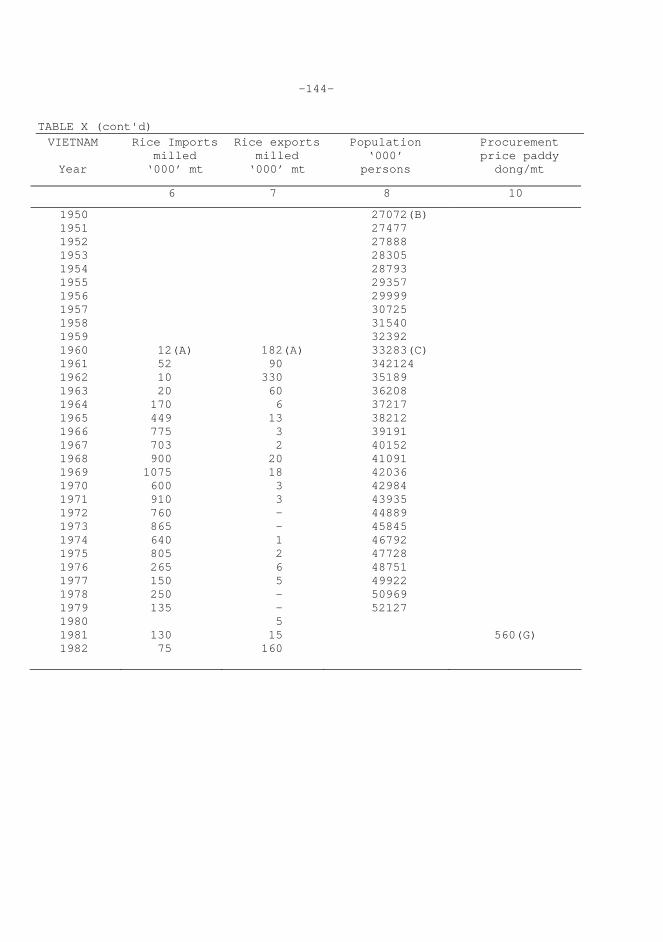
-144-
TABLE X (cont'd) VIETNAM Rice Imports Rice exports Population Procurement milled milled ‘000’ price paddy Year ‘000’ mt ‘000’ mt persons dong/mt
6 7 8 10
27072(B) 1950 1951 1952 1953 1954 1955 1956 1957 1958 1959 1960 1961 1962 1963 1964 1965 1966 1967 1968 1969 1970 1971 1972 1973 1974 1975 1976 1977 1978 1979 1980 1981 1982
12(A) 52 10 20 170 449 775 703 900 1075 600 910 760 865 640 805 265 150 250 135 130 75
182(A) 90 330 60 6 13 3 2 20 18 3 3 - - 1 2 6 5 - - 5 15 160
27477 27888 28305 28793 29357 29999 30725 31540 32392 33283(C) 342124 35189 36208 37217 38212 39191 40152 41091 42036 42984 43935 44889 45845 46792 47728 48751 49922 50969 52127
560(G)
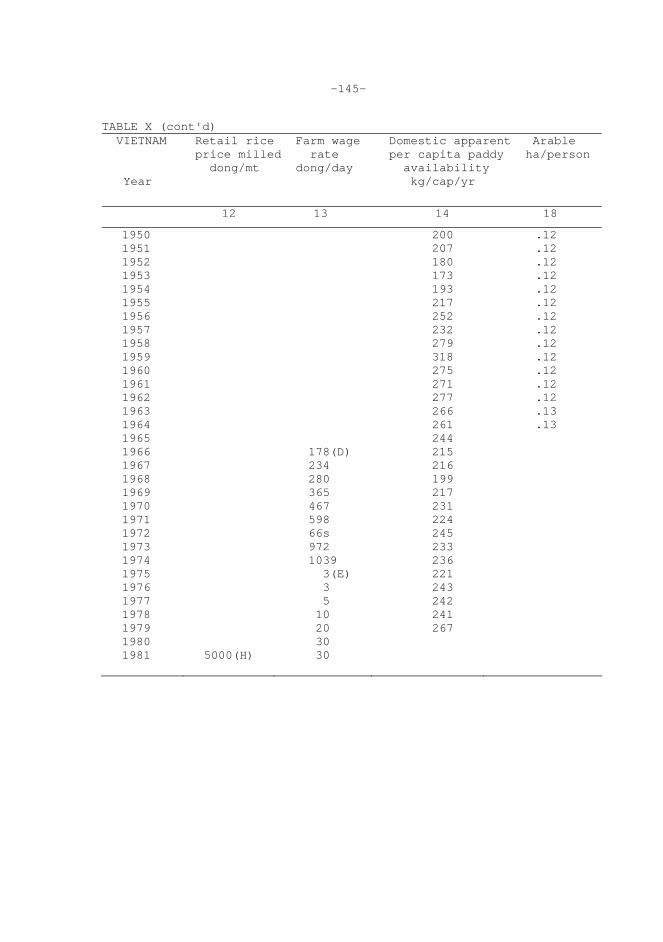
-145-
TABLE X (cont'd) VIETNAM Retail rice Farm wage Domestic apparent Arable price milled rate per capita paddy ha/person dong/mt dong/day availability Year kg/cap/yr
12 13 14 18
1950 1951 1952 1953 1954 1955 1956 1957 1958 1959 1960 1961 1962 1963 1964 1965 1966 1967 1968 1969 1970 1971 1972 1973 1974 1975 1976 1977 1978 1979 1980 1981
5000(H)
178(D) 234 280 365 467 598 66s 972 1039 3(E) 3 5 10 20 30 30
200 207 180 173 193 217 252 232 279 318 275 271 277 266 261 244 215 216 199 217 231 224 245 233 236 221 243 242 241 267
.12
.12
.12
.12
.12
.12
.12
.12
.12
.12
.12
.12
.12
.13
.13
-146-
Notes to Appendix Table X: Vietnam
A/1950-1982: Year runs from January-December.
B/1950-1959: Population is as of July 1 of the year in question.
C/1960-1979: Population is as of July of the year in question. 1976-1979
population figures are projected estimates based on April 1, 1974 census of North Vietnam and February 6, 1976 census of South Vietnam.
D/1966-1974: Farm Wage rate is for unskilled male fan labor only.
E/1975-1981: In 1975, a new currency, the dong, was released. One dong
was set equal to 500 old piasters.
F/1980-1982: Rice production estimates of USDA differ considerably from
official Vietnamese estimates.
G/1981: Vietnam, a communist society, is currently in the process of
collectivizing agricultural production. Host land in North Vietnam is under collective control while only about 25 percent has been successfully collectivized in the South. Farmers are offered fixed procurement prices for their rice, with special above quota prices available to those who produce more than their quota share. However, a black market in rice continues to thrive, where peasants might receive as much as ten times the price the government is paying for quota rice. Production remained stagnant and actually declined in some parts of the south, the rice bowl of Vietnam. In 1980, a piecework or contract system much like that currently in use in China was initiated to encourage individuals to increase rice output. Under this system, peasants were allowed to dispose of a portion of their harvest on the free market. The contract system was en- thusiastically accepted in the North, where record harvests were reaped in 1982.
-147-
Procurement price is the quota price paid by the government to farmers for ordinary grade (coarse) paddy. The above quota price for ordinary rice is 2750 doing/mt., considerably higher than the quota price. The quota price for good quality (fine) paddy is 670 dong/mt.,and the above quota price is 3000 doug/mt.
H/Retail rice price is the free "black" market price for ordinary
grade rice. The government also supports the price of rice in urban areas for select groups, including employees of the government. The support price is set at 450 doug/mt. However, only limited amounts of rice (13 kg./month) may be bought at the subsidized price.
Sources of Data for Appendix Table X: Vietnam 1. Arable Area 1966-1974: Economic and Social Commission for Asia and the Pacific, Statistical Yearbook for Asia and the Pacific (Bangkok:United Nations). 1975-1977: General Statistical Office, Hanoi, Vietnam, 1979. 2. Rice Production 1950-1959: Personal communication from Marion R. Larsen, Asia Branch, International Economics Division, U.S. Department of Agriculture, Economics, Statistics and Cooperatives Service. 1960-1974 and 1980-1982: U.S. Foreign Agricultural Service, Foreign Agriculture Circular, FG-26-83 (Washington, D.C.: 1983). 1975-1979: General Statistical Office, Hanoi, Vietnam, 1979. 3. Rice Area 1950-1959: Personal communication from Marion R. Larsen, Asia Branch, International Economics Division, U.S. Department of Agriculture,
-148-
Economics, Statistics and Cooperative Service. 1960-1974 and 1980-3982: U.S. Foreign Agricultural Service, Foreign Agriculture Circular, P0-26-83 (Washington, D.C.: 1983). 1975-1979: General Statistical Office, Hanoi, Vietnam, 1979. 4. Rice Yield 1950-1982: Rice yields are calculated by dividing rice production (2) by rice area (3) an an annual basis. 6. Rice Imports 1960-1982: U.S. Foreign Agricultural Service, Foreign Agriculture Circular, P0-26-83 (Washington, D.C.:. 1983). 7. Rice Export 1960-1982: U.S. Foreign Agricultural Service, Foreign Agriculture Circular, FG-26-83 (Washington, D.C.: 1983). 8. Population 1950-1959: U.S. Department of Commerce, Bureau of the Census, World Population 1977 (Washington, D.C.: 1978). 1960-1979: U.S. Department of Commerce, Bureau of the Census, Inter- national Population Dynamics 1900-1979 (Washington, D.C.: 1980). 10. Procurement Price 1981: General Statistical Office, Hanoi, Vietnam. 12. Retail Rice Price 1981: General Statistical Office, Hanoi, Vietnam. 13. Farm Wage Rate 1966-1974: Economic and Social Commission for Asia and the Pacific,
-149-
Statistical Yearbook for Asia and the Pacific (Bangkok:United Nations). 1975-1981: General Statistical Office, Hanoi, Vietnam. 14. Domestic Apparent Per Capita Paddy Availability 1950-1979: Paddy availability is calculated by dividing rice production (2) by population (8) on an annual basis.
-149-
Statistical Yearbook for Asia and the Pacific (Bangkok: United Nations). 1975-1981: General Statistical Office, Hanoi, Vietnam. 14. Domestic Apparent Per Capita Paddy Availability 1950-1979: Paddy availability is calculated by dividing rice production (2) by population (8) on an annual basis.
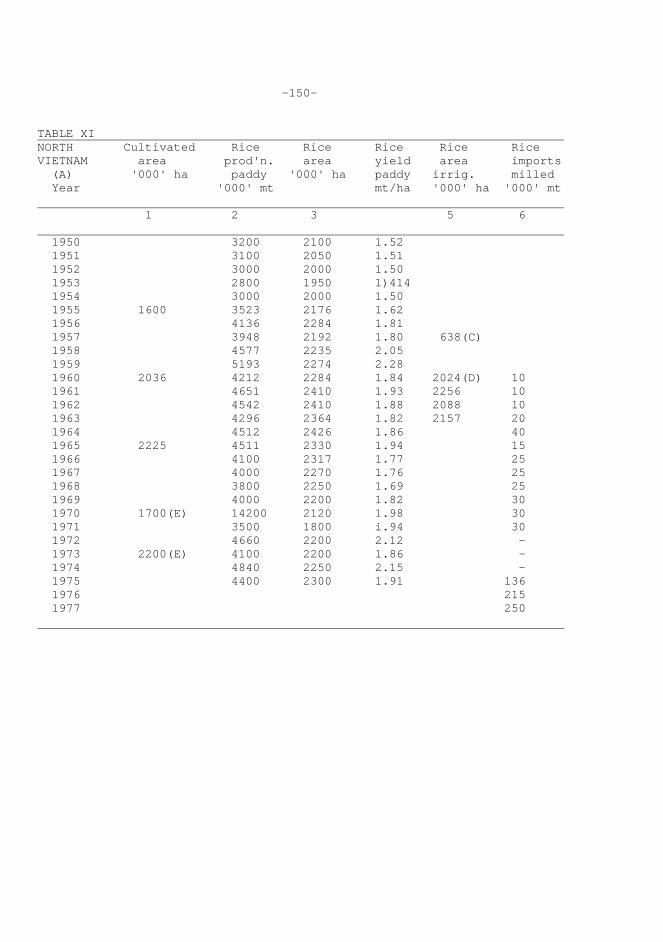
-150- TABLE XI NORTH Cultivated Rice Rice Rice Rice Rice VIETNAM area prod'n. area yield area imports (A) '000' ha paddy '000' ha paddy irrig. milled Year '000' mt mt/ha '000' ha '000' mt 1 2 3 5 6 1950 3200 2100 1.52 1951 3100 2050 1.51 1952 3000 2000 1.50 1953 2800 1950 1)414 1954 3000 2000 1.50 1955 1600 3523 2176 1.62 1956 4136 2284 1.81 1957 3948 2192 1.80 638(C) 1958 4577 2235 2.05 1959 5193 2274 2.28 1960 2036 4212 2284 1.84 2024(D) 10 1961 4651 2410 1.93 2256 10 1962 4542 2410 1.88 2088 10 1963 4296 2364 1.82 2157 20 1964 4512 2426 1.86 40 1965 2225 4511 2330 1.94 15 1966 4100 2317 1.77 25 1967 4000 2270 1.76 25 1968 3800 2250 1.69 25 1969 4000 2200 1.82 30 1970 1700(E) 14200 2120 1.98 30 1971 3500 1800 i.94 30 1972 4660 2200 2.12 - 1973 2200(E) 4100 2200 1.86 - 1974 4840 2250 2.15 - 1975 4400 2300 1.91 136 1976 215 1977 250
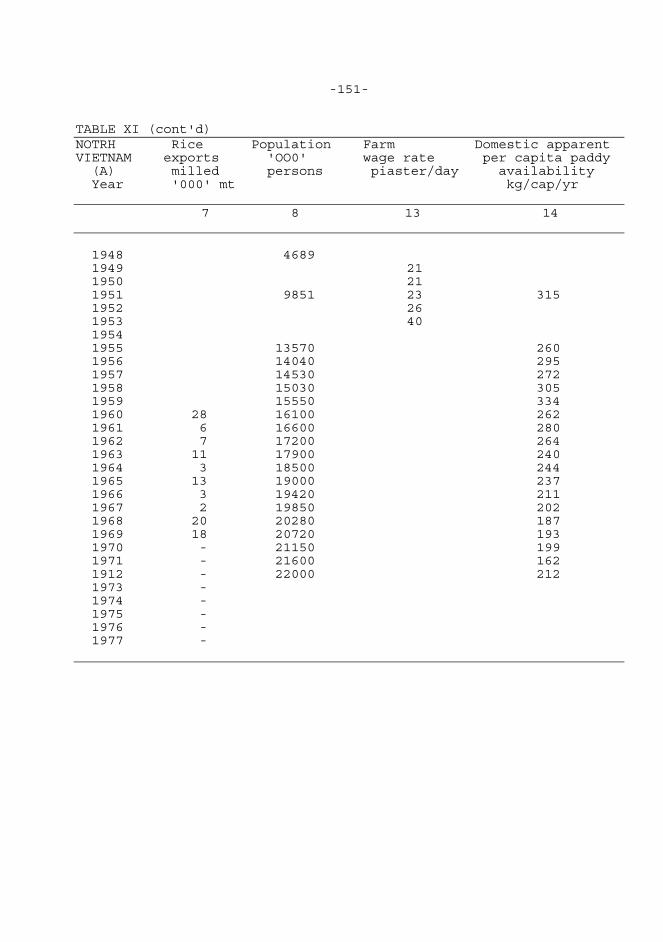
-151- TABLE XI (cont'd) NOTRH Rice Population Farm Domestic apparent VIETNAM exports 'OO0' wage rate per capita paddy (A) milled persons piaster/day availability Year '000' mt kg/cap/yr 7 8 13 14 1948 4689 1949 21 1950 21 1951 9851 23 315 1952 26 1953 40 1954 1955 13570 260 1956 14040 295 1957 14530 272 1958 15030 305 1959 15550 334 1960 28 16100 262 1961 6 16600 280 1962 7 17200 264 1963 11 17900 240 1964 3 18500 244 1965 13 19000 237 1966 3 19420 211 1967 2 19850 202 1968 20 20280 187 1969 18 20720 193 1970 - 21150 199 1971 - 21600 162 1912 - 22000 212 1973 - 1974 - 1975 - 1976 - 1977 -
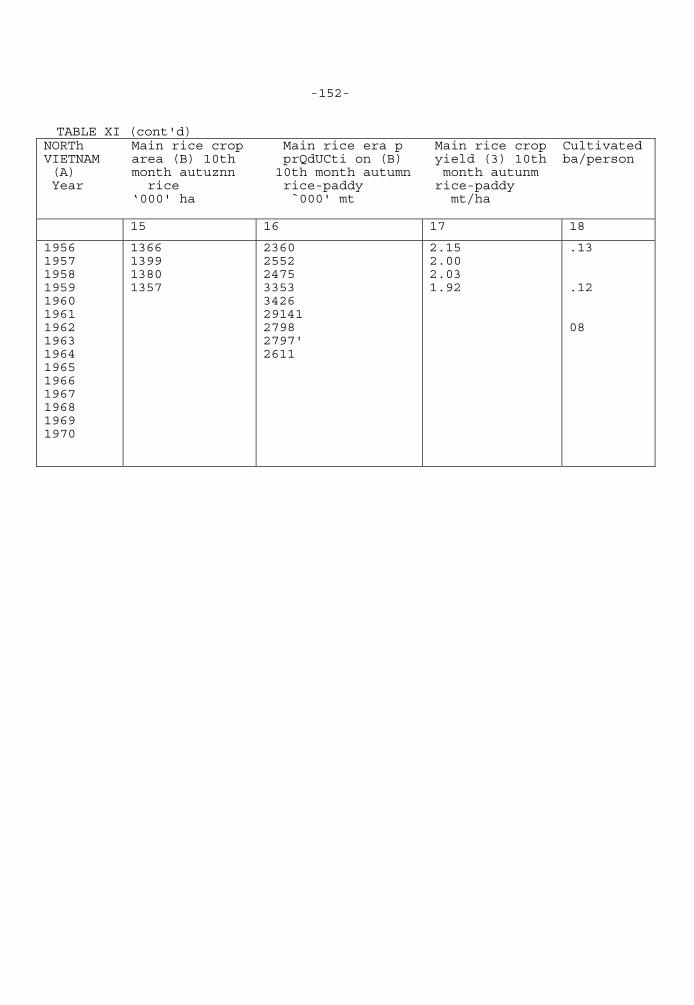
-152- TABLE XI (cont'd)
NORTh Main rice crop Main rice era p Main rice crop Cultivated VIETNAM area (B) 10th prQdUCti on (B) yield (3) 10th ba/person (A) month autuznn 10th month autumn month autunm Year rice rice-paddy rice-paddy ‘000' ha `000' mt mt/ha 15 16 17 18
1956 1957 1958 1959 1960 1961 1962 1963 1964 1965 1966 1967 1968 1969 1970
1366 1399 1380 1357
2360 2552 2475 3353 3426 29141 2798 2797' 2611
2.15 2.00 2.03 1.92
.13 .12 08
-153-
Notes to Appendix Table XI: North Vietnam
A/The Democratic Republic of Vietnam did not, apparently, have the extensive
statistical system that the South did. Statistics that were collected were seldom made public and are practically unavailable in the West. Price statis- tics are especially lacking. In 1975, with the end of the war, North and South were joined together.
B/Traditionally two rice crops are grown each year, the main 10th month
or autumn crop (va mna) planted in May-June and harvested in October-November, and the secondary fifth month or winter crop (vu chiem) planted in October- November and harvested in May-June. The North, in an attempt to increase output per hectare (as there is very little new land that can be reclaimed), introduced an additional spring and summer crop, but these are relatively unimportant.
C/1957: Rice area irrigated includes 270,000 ha. command area under
large projects and 368,000 ha. irrigated by smaller works.
D/1960-1964 Irrigated area figures are probably inflated.
E/1970 and 1973: Cultivated area figures estimated by G. Nguyen lien Hung.
Sources of Data for Appendix Table XI: North Vietnam
1. Cultivated Area
1955-1973: C. Nguyen lien Hung, Economic Development of Socialist Vietnam 1955-1980 (New York: Praeger Publishers, 1977)., pp. 4-5. 2. Rice Production 1950-1975: Personal communication from Marion L. Larsen, Asia Branch, International Economics Division, U.S., Department of Agriculture, Economics, Statistics, and Cooperatives Service. Data are based on
-154-
official data released by DRYN and on estimates derived by the USDA. 1955, 1957, 1960-1963, and 1972-1973: Democratic Republic of Vietnam. Vietnamese Studies (Hanoi: Xunhasaba), No. 13 (1967) and No. 44 (1976). 3. Rice Area 1950-1975: Personal communication from Marion P.. Larsen, Asia Branch, International Economics Division, U.S., Department of Agriculture, Economics, Statistics, and Cooperatives Service. Data are based on official data released by DRVN and on estimates derived by the USDA. 1955, 1957, 1960-1963, and 1972-1973: Democratic Republic of Vietnam. Vietnamese Studies (Hanoi: Xunhasaba), No. 13 (1967) and No. 44 (1976). 4. Rice Yield 1950-1975: Rice yields are calculated by dividing rice production (2) by rice area (3) on an annual basis. 5. Rice Area Irrigated 1957: G. Nguyen lien Hung, Economic Development of Socialist Vietnam, 1955-1980 (New York: Praeger Publishers, 1977), p. 45. 1960-1963: Democratic Republic of Vietnam, So lien thông-kê 1963 (Sta- tistical Data 19~3) (Hanoi: Su That Publishing House, 1964). 6. Rice Imports 1960-1977: U.S. Foreign Agricultural Service, Foreign Agriculture Circular, FG-4-78 (Washington, D.C.: 1978). 7. Rice Exports 1960-1977: U.S. Foreign Agricultural Service, Foreign Agriculture Circular, FC-4- 78 (Washington, D.C.: 1978).
-155-
8. Population 1948-1972: Republic of Vietnam. Vien Quoc-gia Thong-ke, Viet-nam nien-
giam thong-ke (Statistical Yearbook of Vietnam) (Saigon). In Vietnamese and French. 13. Farm Wage Rate 1949-1953: Republic of Vietnam. Vien Quoc-gia Thong-k6,Viet-nam nien-giam thong-ke (Statistical Yearbook of Vietnam) (Saigon). In Vietnamese and French. 14. Domestic Apparent Per Capita Paddy Availability 1955-1972: Domestic apparent per capita paddy availability is calculated by dividing rice production (2) by total population (8) on an annual basis. 15. Main (Autumn) l0th Month Rice Area 1960-1963: Democratic Republic of Vietnam. So lien thông-kê 1963 (Statis- tical Data 1963) (Hanoi: Su That Publishing House, 1964). 16. Main (Autumn) lath Month Rice Production 1955-1959: G. Nguyen lien Hung, Economic Development of Socialist Vietnam, 1955-1980 (New York: Praeger Publishers, 1977). 1960-1963: Democratic Republic of Vietnam. So lien thông-kê 1963 (Statis- tical Data 1963) (Hanoi: Su That Publishing House, 1964). 17. Main (Autumn) lath Month Rice Yield 1960-1963: Main rice crop yield is calculated by dividing main crop production (16) by area (15).
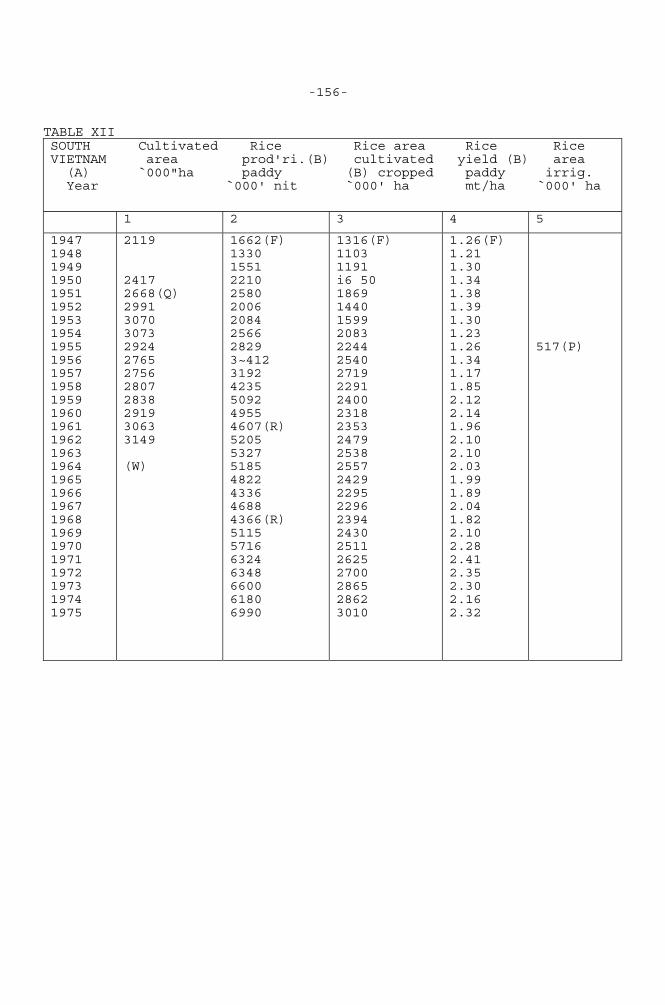
-156- TABLE XII SOUTH Cultivated Rice Rice area Rice Rice VIETNAM area prod'ri.(B) cultivated yield (B) area (A) `000"ha paddy (B) cropped paddy irrig. Year `000' nit `000' ha mt/ha `000' ha
1 2 3 4 5
1947 1948 1949 1950 1951 1952 1953 1954 1955 1956 1957 1958 1959 1960 1961 1962 1963 1964 1965 1966 1967 1968 1969 1970 1971 1972 1973 1974 1975
2119 2417 2668(Q) 2991 3070 3073 2924 2765 2756 2807 2838 2919 3063 3149 (W)
1662(F) 1330 1551 2210 2580 2006 2084 2566 2829 3~412 3192 4235 5092 4955 4607(R) 5205 5327 5185 4822 4336 4688 4366(R) 5115 5716 6324 6348 6600 6180 6990
1316(F) 1103 1191 i6 50 1869 1440 1599 2083 2244 2540 2719 2291 2400 2318 2353 2479 2538 2557 2429 2295 2296 2394 2430 2511 2625 2700 2865 2862 3010
1.26(F) 1.21 1.30 1.34 1.38 1.39 1.30 1.23 1.26 1.34 1.17 1.85 2.12 2.14 1.96 2.10 2.10 2.03 1.99 1.89 2.04 1.82 2.10 2.28 2.41 2.35 2.30 2.16 2.32
517(P)
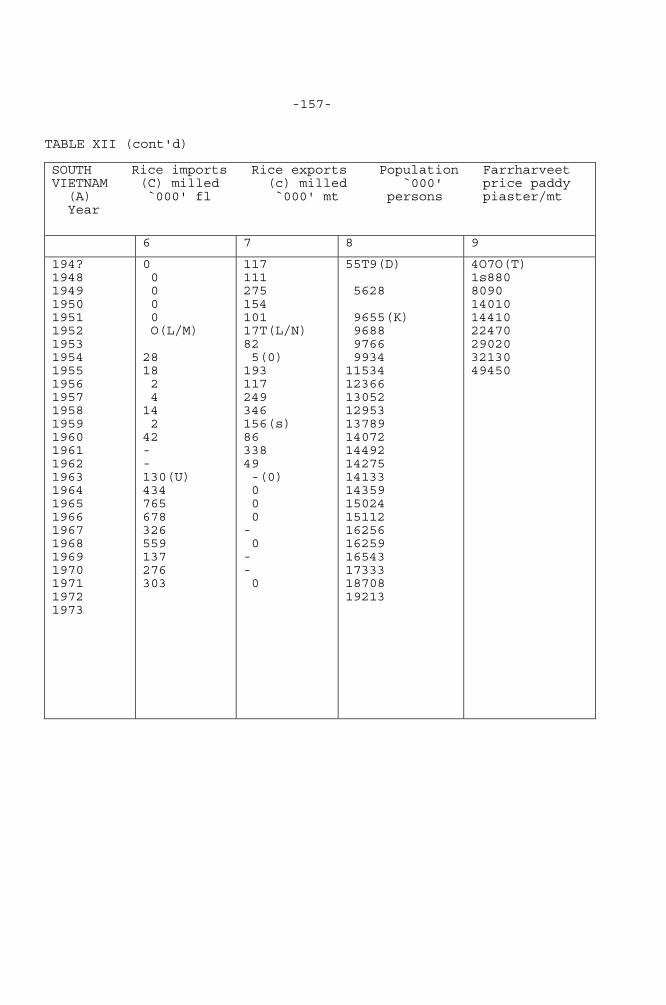
-157- TABLE XII (cont'd) SOUTH Rice imports Rice exports Population Farrharveet VIETNAM (C) milled (c) milled `000' price paddy (A) `000' fl `000' mt persons piaster/mt Year
6 7 8 9
194? 1948 1949 1950 1951 1952 1953 1954 1955 1956 1957 1958 1959 1960 1961 1962 1963 1964 1965 1966 1967 1968 1969 1970 1971 1972 1973
0 0 0 0 0 O(L/M) 28 18 2 4 14 2 42 - - 130(U) 434 765 678 326 559 137 276 303
117 111 275 154 101 17T(L/N) 82 5(0) 193 117 249 346 156(s) 86 338 49 -(0) 0 0 0 - 0 - - 0
55T9(D) 5628 9655(K) 9688 9766 9934 11534 12366 13052 12953 13789 14072 14492 14275 14133 14359 15024 15112 16256 16259 16543 17333 18708 19213
4O7O(T) 1s880 8090 14010 14410 22470 29020 32130 49450
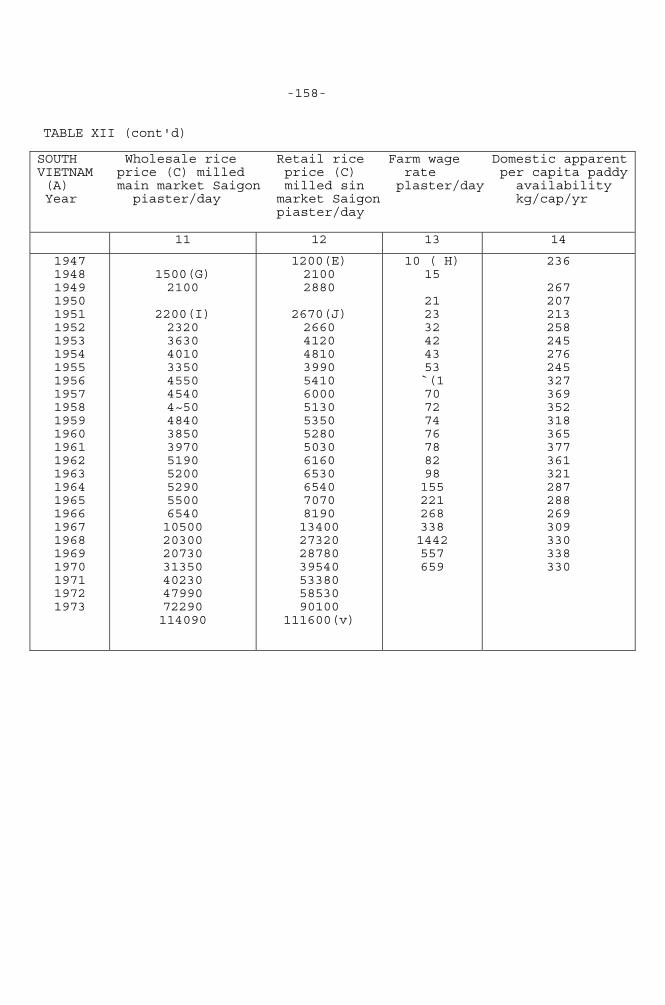
-158- TABLE XII (cont'd) SOUTH Wholesale rice Retail rice Farm wage Domestic apparent VIETNAM price (C) milled price (C) rate per capita paddy (A) main market Saigon milled sin plaster/day availability Year piaster/day market Saigon kg/cap/yr piaster/day
11 12 13 14
1947 1948 1949 1950 1951 1952 1953 1954 1955 1956 1957 1958 1959 1960 1961 1962 1963 1964 1965 1966 1967 1968 1969 1970 1971 1972 1973
1500(G) 2100
2200(I) 2320 3630 4010 3350 4550 4540 4~50 4840 3850 3970 5190 5200 5290 5500 6540 10500 20300 20730 31350 40230 47990 72290 114090
1200(E) 2100 2880
2670(J) 2660 4120 4810 3990 5410 6000 5130 5350 5280 5030 6160 6530 6540 7070 8190 13400 27320 28780 39540 53380 58530 90100
111600(v)
10 ( H) 15 21 23 32 42 43 53 `(1 70 72 74 76 78 82 98 155 221 268 338 1442 557 659
236
267 207 213 258 245 276 245 327 369 352 318 365 377 361 321 287 288 269 309 330 338 330
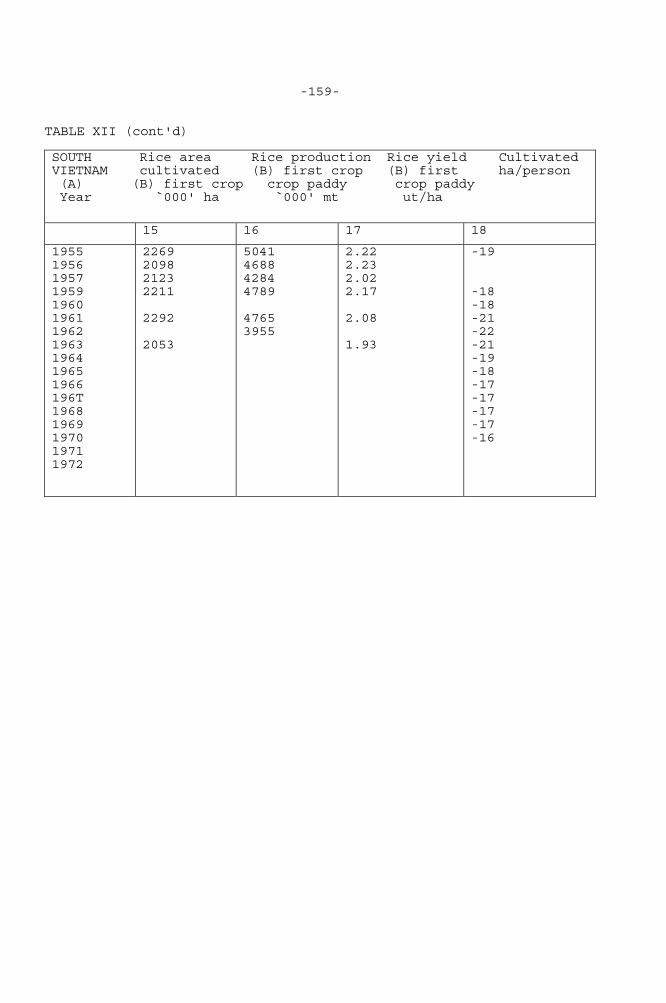
-159- TABLE XII (cont'd) SOUTH Rice area Rice production Rice yield Cultivated VIETNAM cultivated (B) first crop (B) first ha/person (A) (B) first crop crop paddy crop paddy Year `000' ha `000' mt ut/ha
15 16 17 18
1955 1956 1957 1959 1960 1961 1962 1963 1964 1965 1966 196T 1968 1969 1970 1971 1972
2269 2098 2123 2211 2292 2053
5041 4688 4284 4789 4765 3955
2.22 2.23 2.02 2.17 2.08 1.93
-19 -18 -18 -21 -22 -21 -19 -18 -17 -17 -17 -17 -16
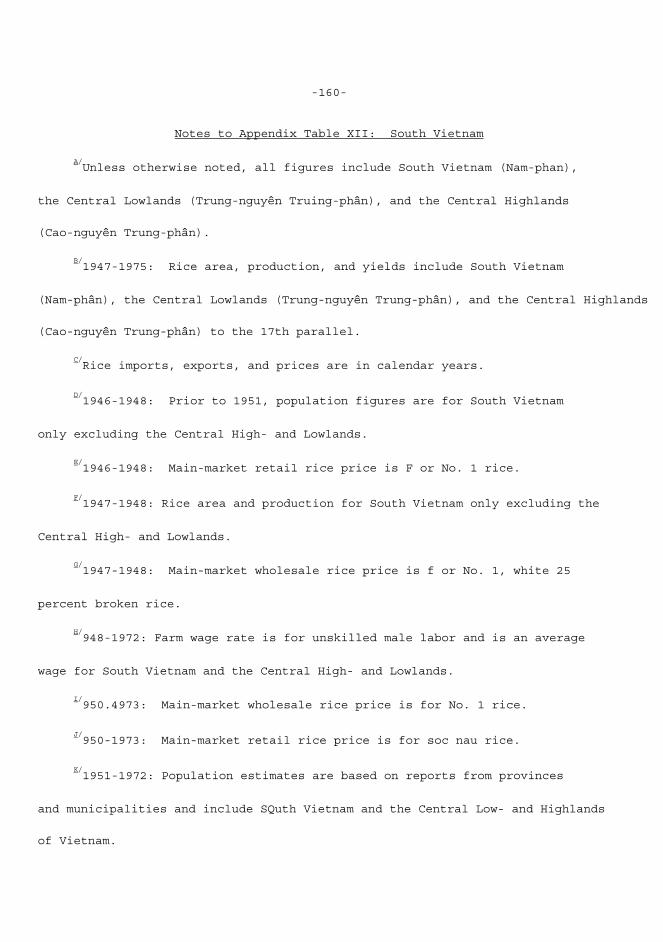
-160-
Notes to Appendix Table XII: South Vietnam
A/Unless otherwise noted, all figures include South Vietnam (Nam-phan),
the Central Lowlands (Trung-nguyên Truing-phân), and the Central Highlands
(Cao-nguyên Trung-phân).
B/1947-1975: Rice area, production, and yields include South Vietnam
(Nam-phân), the Central Lowlands (Trung-nguyên Trung-phân), and the Central Highlands
(Cao-nguyên Trung-phân) to the 17th parallel.
C/Rice imports, exports, and prices are in calendar years.
D/1946-1948: Prior to 1951, population figures are for South Vietnam
only excluding the Central High- and Lowlands.
E/1946-1948: Main-market retail rice price is F or No. 1 rice.
F/1947-1948: Rice area and production for South Vietnam only excluding the
Central High- and Lowlands.
G/1947-1948: Main-market wholesale rice price is f or No. 1, white 25
percent broken rice.
H/948-1972: Farm wage rate is for unskilled male labor and is an average
wage for South Vietnam and the Central High- and Lowlands.
I/950.4973: Main-market wholesale rice price is for No. 1 rice.
J/950-1973: Main-market retail rice price is for soc nau rice.
K/1951-1972: Population estimates are based on reports from provinces
and municipalities and include SQuth Vietnam and the Central Low- and Highlands
of Vietnam.
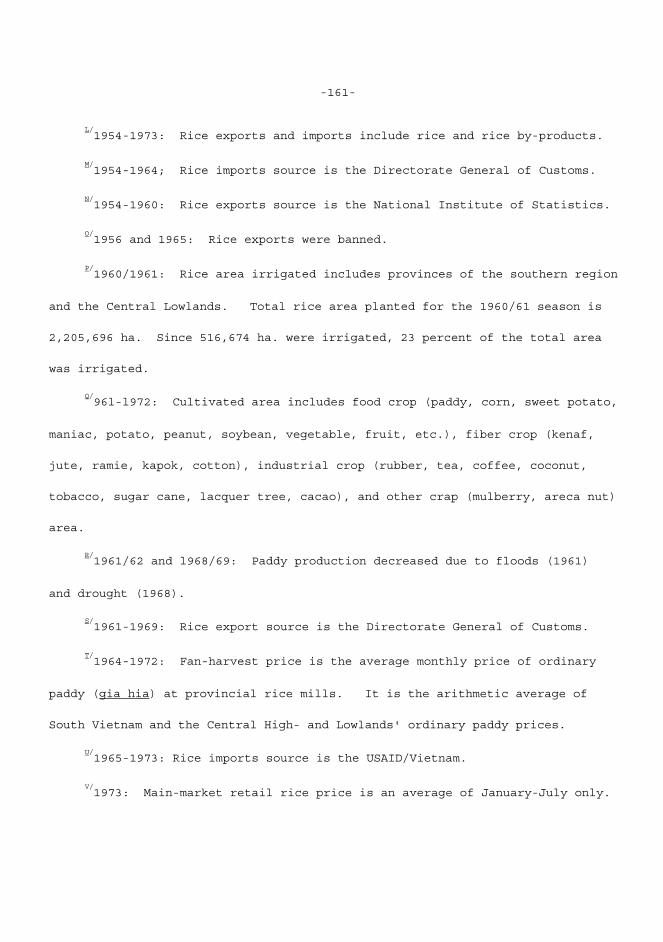
-161-
L/1954-1973: Rice exports and imports include rice and rice by-products.
M/1954-1964; Rice imports source is the Directorate General of Customs.
N/1954-1960: Rice exports source is the National Institute of Statistics.
O/1956 and 1965: Rice exports were banned.
P/1960/1961: Rice area irrigated includes provinces of the southern region
and the Central Lowlands. Total rice area planted for the 1960/61 season is 2,205,696 ha. Since 516,674 ha. were irrigated, 23 percent of the total area was irrigated.
Q/96l-l972: Cultivated area includes food crop (paddy, corn, sweet potato,
maniac, potato, peanut, soybean, vegetable, fruit, etc.), fiber crop (kenaf, jute, ramie, kapok, cotton), industrial crop (rubber, tea, coffee, coconut, tobacco, sugar cane, lacquer tree, cacao), and other crap (mulberry, areca nut) area.
R/1961/62 and l968/69: Paddy production decreased due to floods (1961)
and drought (1968).
S/1961-1969: Rice export source is the Directorate General of Customs.
T/1964-1972: Fan-harvest price is the average monthly price of ordinary
paddy (gia hia) at provincial rice mills. It is the arithmetic average of South Vietnam and the Central High- and Lowlands' ordinary paddy prices.
U/1965-1973: Rice imports source is the USAID/Vietnam.
V/1973: Main-market retail rice price is an average of January-July only.
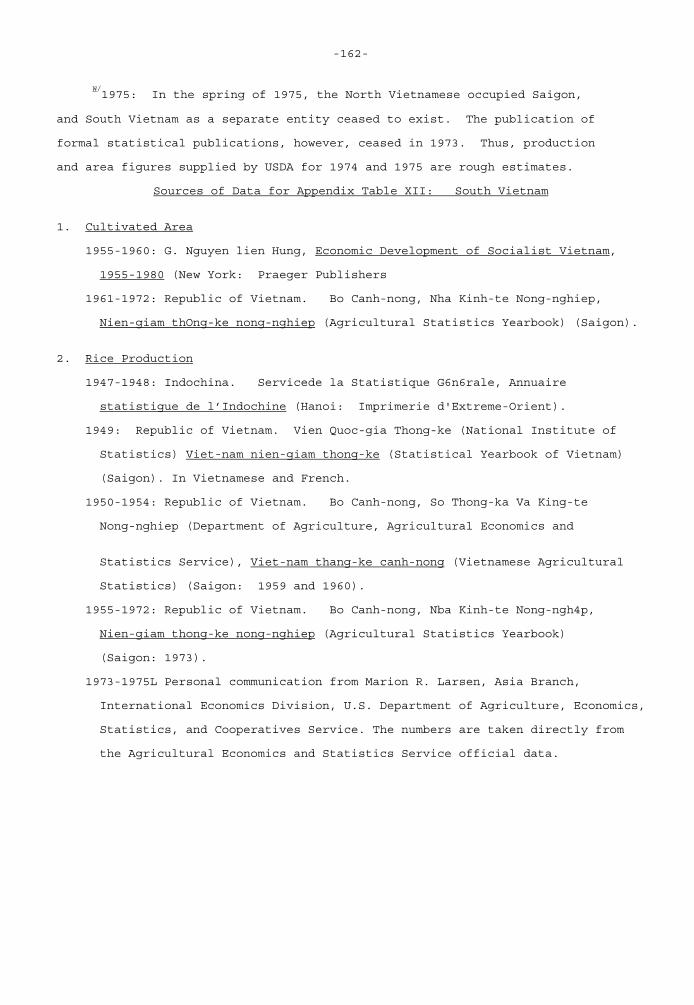
-162-
W/1975: In the spring of 1975, the North Vietnamese occupied Saigon,
and South Vietnam as a separate entity ceased to exist. The publication of formal statistical publications, however, ceased in 1973. Thus, production and area figures supplied by USDA for 1974 and 1975 are rough estimates.
Sources of Data for Appendix Table XII: South Vietnam 1. Cultivated Area 1955-1960: G. Nguyen lien Hung, Economic Development of Socialist Vietnam, 1955-1980 (New York: Praeger Publishers 1961-1972: Republic of Vietnam. Bo Canh-nong, Nha Kinh-te Nong-nghiep, Nien-giam thOng-ke nong-nghiep (Agricultural Statistics Yearbook) (Saigon). 2. Rice Production 1947-1948: Indochina. Servicede la Statistique G6n6rale, Annuaire statistigue de l’Indochine (Hanoi: Imprimerie d'Extreme-Orient). 1949: Republic of Vietnam. Vien Quoc-gia Thong-ke (National Institute of Statistics) Viet-nam nien-giam thong-ke (Statistical Yearbook of Vietnam) (Saigon). In Vietnamese and French. 1950-1954: Republic of Vietnam. Bo Canh-nong, So Thong-ka Va King-te Nong-nghiep (Department of Agriculture, Agricultural Economics and Statistics Service), Viet-nam thang-ke canh-nong (Vietnamese Agricultural Statistics) (Saigon: 1959 and 1960). 1955-1972: Republic of Vietnam. Bo Canh-nong, Nba Kinh-te Nong-ngh4p, Nien-giam thong-ke nong-nghiep (Agricultural Statistics Yearbook) (Saigon: 1973). 1973-1975L Personal communication from Marion R. Larsen, Asia Branch, International Economics Division, U.S. Department of Agriculture, Economics, Statistics, and Cooperatives Service. The numbers are taken directly from the Agricultural Economics and Statistics Service official data.
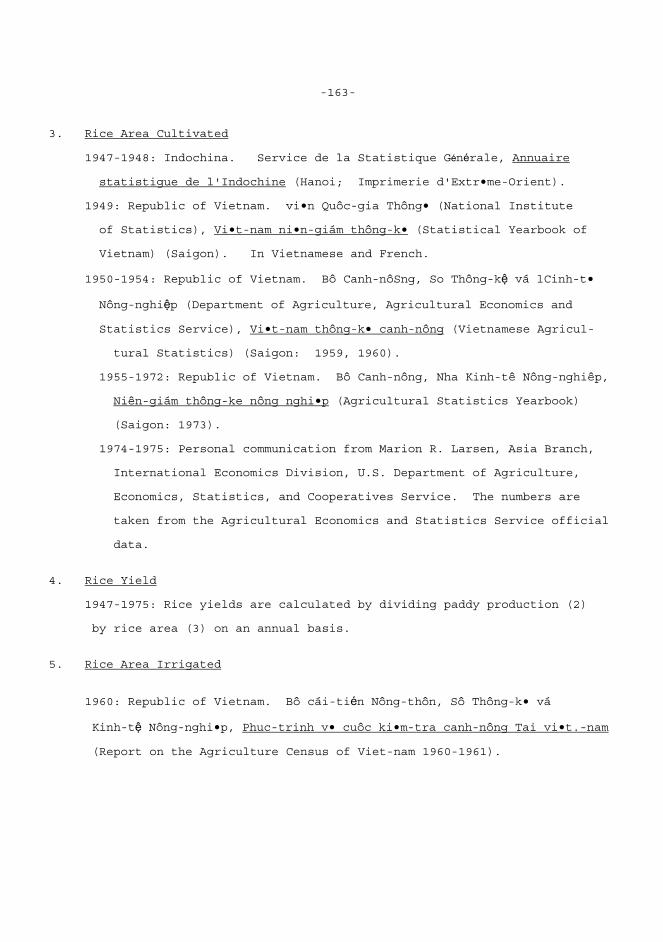
-163-
3. Rice Area Cultivated 1947-1948: Indochina. Service de la Statistique Générale, Annuaire statistigue de l'Indochine (Hanoi; Imprimerie d'Extr•me-Orient). 1949: Republic of Vietnam. vi•n Quôc-gia Thông• (National Institute of Statistics), Vi•t-nam ni•n-giám thông-k• (Statistical Yearbook of Vietnam) (Saigon). In Vietnamese and French. 1950-1954: Republic of Vietnam. Bô Canh-nôSng, So Thông-kệ vá lCinh-t• Nông-nghiệp (Department of Agriculture, Agricultural Economics and Statistics Service), Vi•t-nam thông-k• canh-nông (Vietnamese Agricul- tural Statistics) (Saigon: 1959, 1960). 1955-1972: Republic of Vietnam. Bô Canh-nông, Nha Kinh-tê Nông-nghiêp, Niên-giám thông-ke nông nghi•p (Agricultural Statistics Yearbook) (Saigon: 1973). 1974-1975: Personal communication from Marion R. Larsen, Asia Branch, International Economics Division, U.S. Department of Agriculture, Economics, Statistics, and Cooperatives Service. The numbers are taken from the Agricultural Economics and Statistics Service official data. 4. Rice Yield 1947-1975: Rice yields are calculated by dividing paddy production (2) by rice area (3) on an annual basis. 5. Rice Area Irrigated 1960: Republic of Vietnam. Bô cái-tién Nông-thôn, Sô Thông-k• vá Kinh-tệ Nông-nghi•p, Phuc-trinh v• cuôc ki•m-tra canh-nông Tai vi•t.-nam (Report on the Agriculture Census of Viet-nam 1960-1961).
-164-
6. Rice Imports 1949-1953 and 1973: Republic of Vietnam. Viên Quôc-gia Thông-kê (National Institute of Statistics), Vi•t-nam ni•n~giám thông-k• (Statistical Yearbook of Vietnam) (Saigon). En Vietnamese and French. 1954-1972: Republic of Vietnam. Bô Canh-nông, Nha Kinh-t• Nông-nghi•p, Ni•n-giám thôhg-k• nông-nghi•p, (Agricultural Statistics Yearbook) (Saigon: 1973). 7. Rice Exports 1949-1953 and 1973: Republic of Vietnam. Vi•n Quôc-gia Thông-k• (National Institute of Statliotics), Vi•t-nam ni•n-giám thông-k• (Statistical Year- book of Vietnam) (Saigon). In Vietnamese and French. 1954-1972: Republic of Vietnam. Bô Canh-nông, Nha kinh-t• Nông-nghi•p, Ni•n-giám thông-k• nông-nghi•p (Agricultural Statistics Yearbook) (Saigon: 1973). 8. Population 1946-1948: Indochina. Service de la Statistique Générale, Annuaire statistigue de l'Indochine (Hanoi: Imprimerie d'Extr•me-Orient). 1950-1955: J. P. Gittinger and Da-Uyen, Vietnamese Agricultural Statistics (Saigon: United Stares Operations Mission to Viet-nam, 1959); original source: National' Institute of Statistics. 1956-1972: Republic of Vietnam. Vi•n Quôc-gia Thông-k• (National Institute of Statistics), Vi•t-nam ni•n-giam thông-k• (Statistical Yearbook of Vietnam) (Saigon):. 9. Farm-Harvest Price 1964-1972: Republic of Vietnam. Ba Canh-nông, Nha Kinh-t• Nông-nghi•p, Ni•n-giám thông-kệ nông-nghiep (Agricultural Statistics Yearbook) (Saigon).
-165-
11. Main-Market Wholesale Price 1947-1948: Indochina. Service de la Statistique Générale, Annuaire statistigue de 1'Imdochine (Hanoi: Imprimerie d'Extr•me-Orienc). 1950-1973: Republic of Vietnam. Vi•n Quôc-gia Thông-k• (National Institute of Statistics), Vi•t-nam ni•n-giám thông-k• (Statistical Yearbook of Vietnam) (Saigon). In Vietnamese and French. 12. Retail Main-Market Price 1946-1948: Indochina. Service do la Statistique Générale, Annuaire statistigue de 1'Indochine (Hanoi: Imprimerie d'Extême-Orient). 1950-1973: Republic of Vietnam. Vi•n Quôe-gia Thông-k• (National Institute of Statistics), Vi•t-nam ni•n-giám thông-k• (Statistical Yearbook of Vietnam) (Saigon). In Vietnamese and French. 13. Farm Wage Rate 1948: Indochina. Service de la Statistique Générale, Annuaire statistique de l'Indochine (Hanoi: Imprimerie d'Extr•me-Orient). 1949-1972: Republic of Vietnam. Vi•n Quôc-gia Thông-k• (National Institute of Statistics), Vi•t-nam ni•n-giám thông-k• (Statistical Yearbook of Vietnam) (Saigon). In Vietnamese and French. 14. Domestiq Apparent Per Capita Paddy Availability 1948-1972: Rice availability is calculated by dividing rice production (2) by total population (8) on an annual basis. 15. Rice Area First Crop 1959-1960: Republic of Vietnam. Bô Canh-nông, So Thông-k• vá Kinh-t• Nông- nghi•p (Department of Agriculture, Agricultural Economics and Statistics
-166-
Service), Vi•t-nam thông-k• canh.nông nám 1960 (vietnamese Agricultural Statistics) (Saigon). 1961-1966: Republic of Vietnam. Bô Canh-nông, So Thông-k• và Kinh-t• Nông-nghi•p, Ni•n-gim thông-k• nông- nghi•p (Agricultural Statistics Yearbook) (Saigon). 16. Rice Production, First Crop 1959-1960: Republic of Vietnam. Bô Canh-nông, So Thông-k• vá Kinh-t• Nông-nghi•p (Department of Agriculture, Agricultural Economics and Statistics Service), Vi•t-nam thông-k• canh-nông nám 1960 (Vietnamese Agricultural Statistics) (Saigon). 1961-1966: Republic of Vietnam. Bô Canh-nông, So Thông-k• vá Kinh-t• Nông- nghi•p, Ni•n-giám thông-k• nông-nghi•p (Agricultural Statistics Yearbook) (Saigon). 17. Rice Yield, First Crop 1959-1966: Rice yields are calculated by dividing first crop rice pro- duction (16) by first crop rice area (15) on an annual basis. _______________________________ Note: The major agricultural statistics yearbook changed its name from Vi•t-nam thông-k• canh-nông (Vietnamese Agricultural Statistics) to Nien-giám thông-k• nông-nghi•p (Agricultural Statistics Yearbook) in 1961. Also, the So Thông-k• vá Kinh-t• Nông-nghi•p (Agricultural Economics and Statistics Service) was reorganized into Nba Kinh-t• Nông-nghi•p (Directorate of Agricultural Economics) `in June 1972.
-167-
Country Sources of Basic Data: Vietnam* North Vietnam: 1. DRVN. So lien thong-kê 1963 (Statistical Data 1963) (Hanoi: Su That Publishing House, 1964). English translation also available. 2. DRVN. Etudes Vietnamiennes (Hanoi). Selected issues that pertain to agriculture. 3. DRVN. Central Statistical Office, Nam nam xay dung kinh te va van hòa (Five Years of Economic and Cultural Building) (Hanoi: Central Statistical Office, 1960) South Vietnam: 1. vi•t-nam Công-Hôa. Bô k•-hoach và Phát-tri•n Quôc-gia (Ministry of National Planning and Development), Vi•n Quôc-gia Thông-k• (National Institute of Statistics), Vi•t-nam ni•n-giám thông-k• (Statistical Yearbook of Vietnam) (Saigon: 1949/50-1972/73). In Vietnamese and French. 2. Vi•t-nn Công-hôa. So Thông-k• vá Kinh-t• Nông-nghi•p (Agricultural Economics and Statistics Service), Vi•t-nam thong k• canh-nông nám 1959, 1960 (Vietnairese Agricultural Statistics 1959, 1960) (Saigon: 1959, 1960). 3. Vi•t-nam Công-hôa. So Thông-k• vá Kinh-tệ Nông-nghi•p, Nien-giam thông- k• nông-nghi•p (Agricultural Statistics Yearbook) (Saigon: 1949/50-1972/73). 4. Vi•t-nam công-hôa. So Thông-k• vá Kinh-t• Nông-nghi•p, Canh-nông thông-k• nguyr•t-san (Monthly Bulletin of Statistics) (Saigon).
Useful Secondary Sources** North Vietnam: ___________________
*There is currently no published material available for Vietnam.
**There is currently no material available for Vietnam with the exception of
magazine and journal articles. The Far Eastern Economic Review is particularly recommended.
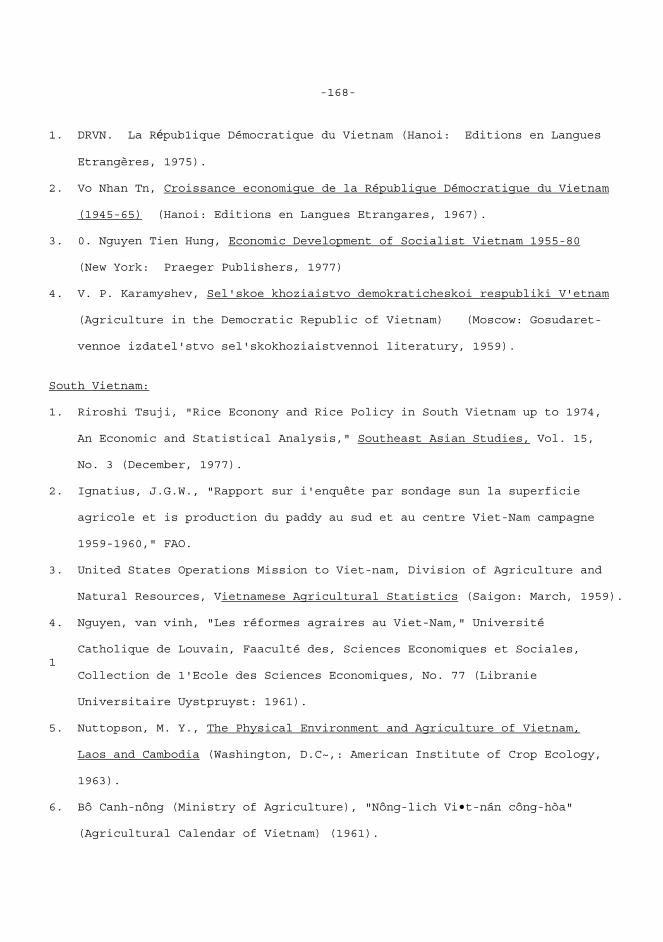
-168-
1. DRVN. La Répub1ique Démocratique du Vietnam (Hanoi: Editions en Langues Etrangères, 1975). 2. Vo Nhan Tn, Croissance economigue de la Républigue Démocratigue du Vietnam (1945-65) (Hanoi: Editions en Langues Etrangares, 1967). 3. 0. Nguyen Tien Hung, Economic Development of Socialist Vietnam 1955-80 (New York: Praeger Publishers, 1977) 4. V. P. Karamyshev, Sel'skoe khoziaistvo demokraticheskoi respubliki V'etnam (Agriculture in the Democratic Republic of Vietnam) (Moscow: Gosudaret- vennoe izdatel'stvo sel'skokhoziaistvennoi literatury, 1959). South Vietnam: 1. Riroshi Tsuji, "Rice Econony and Rice Policy in South Vietnam up to 1974, An Economic and Statistical Analysis," Southeast Asian Studies, Vol. 15, No. 3 (December, 1977). 2. Ignatius, J.G.W., "Rapport sur i'enquête par sondage sun la superficie agricole et is production du paddy au sud et au centre Viet-Nam campagne 1959-1960," FAO. 3. United States Operations Mission to Viet-nam, Division of Agriculture and Natural Resources, Vietnamese Agricultural Statistics (Saigon: March, 1959). 4. Nguyen, van vinh, "Les réformes agraires au Viet-Nam," Université Catholique de Louvain, Faaculté des, Sciences Economiques et Sociales, 1 Collection de 1'Ecole des Sciences Economiques, No. 77 (Libranie Universitaire Uystpruyst: 1961). 5. Nuttopson, M. Y., The Physical Environment and Agriculture of Vietnam, Laos and Cambodia (Washington, D.C~,: American Institute of Crop Ecology, 1963). 6. Bô Canh-nông (Ministry of Agriculture), "Nông-lich Vi•t-nán công-hòa" (Agricultural Calendar of Vietnam) (1961).

-169-
Conversion Factors Metric Units are in standard usage South Vietnamese money unit - piaster (dong) North Vietnamese money unit - dong (plaster) Vietnamese money unit - dong. One dong set equal to 500 old piasters in 1975.
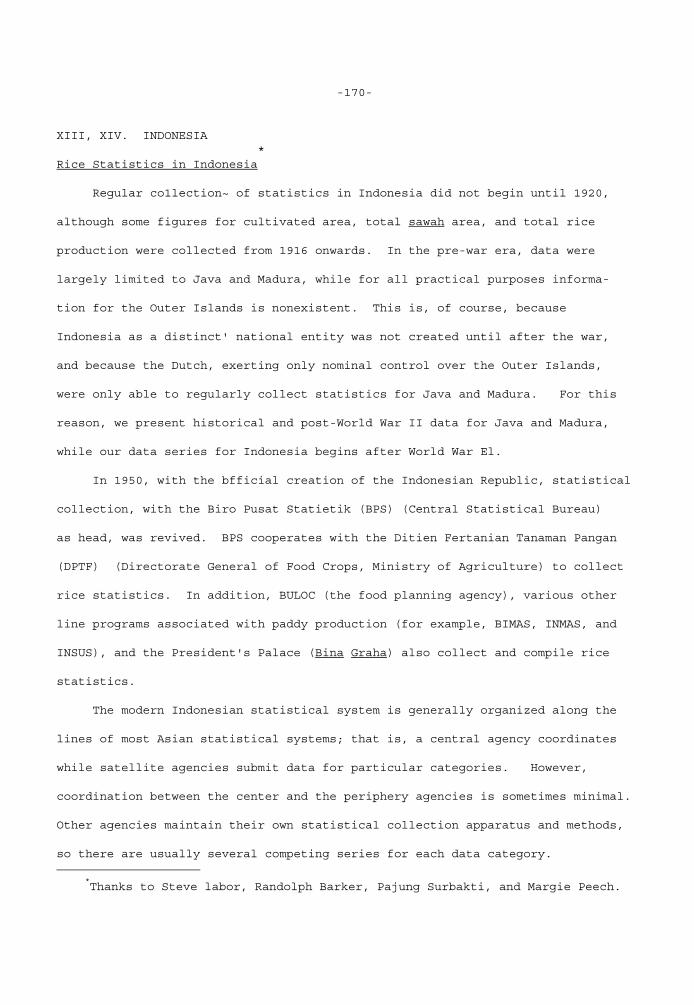
-170- XIII, XIV. INDONESIA * Rice Statistics in Indonesia Regular co1lection~ of statistics in Indonesia did not begin until 1920, although some figures for cultivated area, total sawah area, and total rice production were collected from 1916 onwards. In the pre-war era, data were largely limited to Java and Madura, while for all practical purposes informa- tion for the Outer Islands is nonexistent. This is, of course, because Indonesia as a distinct' national entity was not created until after the war, and because the Dutch, exerting only nominal control over the Outer Islands, were only able to regularly collect statistics for Java and Madura. For this reason, we present historical and post-World War II data for Java and Madura, while our data series for Indonesia begins after World War El. In 1950, with the bfficial creation of the Indonesian Republic, statistical collection, with the Biro Pusat Statietik (BPS) (Central Statistical Bureau) as head, was revived. BPS cooperates with the Ditien Fertanian Tanaman Pangan (DPTF) (Directorate General of Food Crops, Ministry of Agriculture) to collect rice statistics. In addition, BULOC (the food planning agency), various other line programs associated with paddy production (for example, BIMAS, INMAS, and INSUS), and the President's Palace (Bina Graha) also collect and compile rice statistics. The modern Indonesian statistical system is generally organized along the lines of most Asian statistical systems; that is, a central agency coordinates while satellite agencies submit data for particular categories. However, coordination between the center and the periphery agencies is sometimes minimal. Other agencies maintain their own statistical collection apparatus and methods, so there are usually several competing series for each data category. ————————————
*Thanks to Steve labor, Randolph Barker, Pajung Surbakti, and Margie Peech.
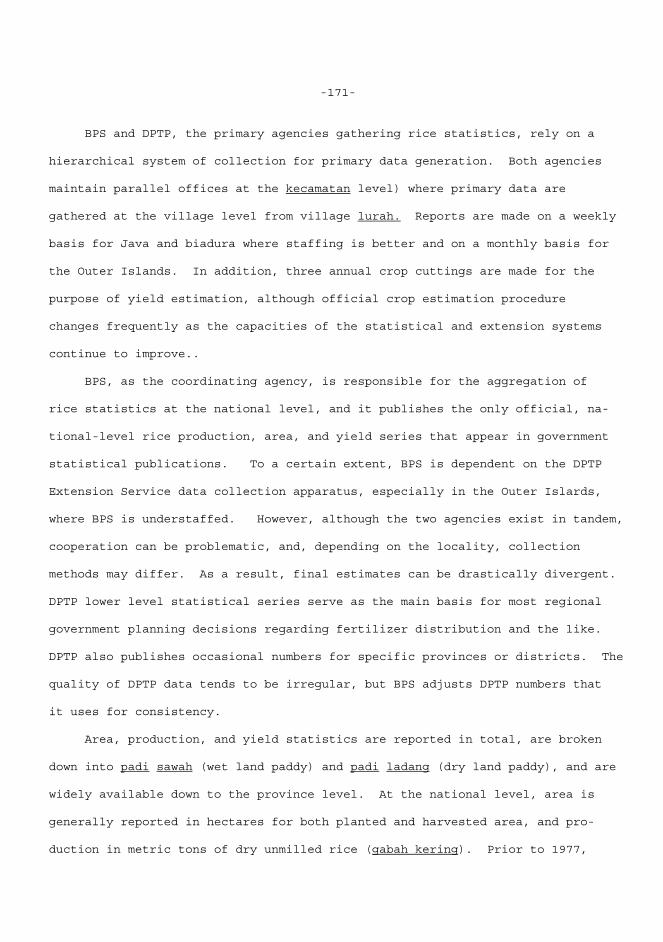
-171-
BPS and DPTP, the primary agencies gathering rice statistics, rely on a hierarchical system of collection for primary data generation. Both agencies maintain parallel offices at the kecamatan level) where primary data are gathered at the village level from village lurah. Reports are made on a weekly basis for Java and biadura where staffing is better and on a monthly basis for the Outer Islands. In addition, three annual crop cuttings are made for the purpose of yield estimation, although official crop estimation procedure changes frequently as the capacities of the statistical and extension systems continue to improve.. BPS, as the coordinating agency, is responsible for the aggregation of rice statistics at the national level, and it publishes the only official, na- tional-level rice production, area, and yield series that appear in government statistical publications. To a certain extent, BPS is dependent on the DPTP Extension Service data collection apparatus, especially in the Outer Islards, where BPS is understaffed. However, although the two agencies exist in tandem, cooperation can be problematic, and, depending on the locality, collection methods may differ. As a result, final estimates can be drastically divergent. DPTP lower level statistical series serve as the main basis for most regional government planning decisions regarding fertilizer distribution and the like. DPTP also publishes occasional numbers for specific provinces or districts. The quality of DPTP data tends to be irregular, but BPS adjusts DPTP numbers that it uses for consistency. Area, production, and yield statistics are reported in total, are broken down into padi sawah (wet land paddy) and padi ladang (dry land paddy), and are widely available down to the province level. At the national level, area is generally reported in hectares for both planted and harvested area, and pro- duction in metric tons of dry unmilled rice (gabah kering). Prior to 1977,
-172-
at the lower levels, rice production was reported in dry stalk paddy (padi kering), the traditional form far unprocessed rice in Indonesia. Currently, with the introduction and popularization of the sickle in place of the ani-ani knife for rice harvest, production is reported in dry gabah (rough rice). Indonesia is peculiar throughout Asia for measuring rice production in stalk paddy form (the panicle' of unhusked rice, with a short piece of straw attached: This problem is compounded by the fact that the Indonesian term padi is fre- quently translated into' English as paddy, a common term for unmilled rice.
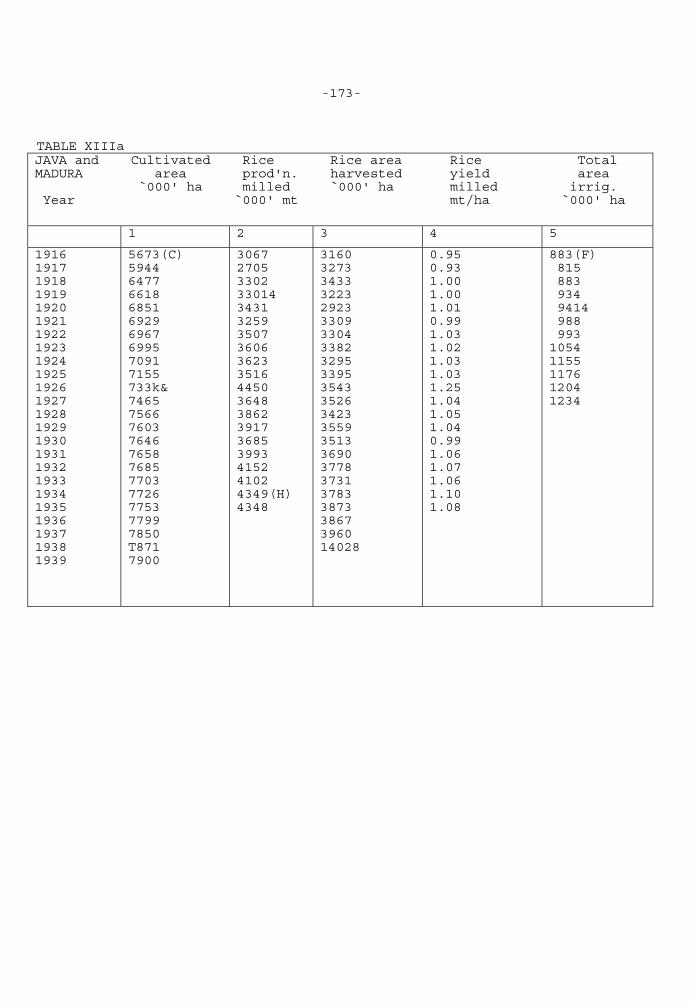
-173- TABLE XIIIa JAVA and Cultivated Rice Rice area Rice Total MADURA area prod'n. harvested yield area `000' ha milled `000' ha milled irrig. Year `000' mt mt/ha `000' ha
1 2 3 4 5
1916 1917 1918 1919 1920 1921 1922 1923 1924 1925 1926 1927 1928 1929 1930 1931 1932 1933 1934 1935 1936 1937 1938 1939
5673(C) 5944 6477 6618 6851 6929 6967 6995 7091 7155 733k& 7465 7566 7603 7646 7658 7685 7703 7726 7753 7799 7850 T871 7900
3067 2705 3302 33014 3431 3259 3507 3606 3623 3516 4450 3648 3862 3917 3685 3993 4152 4102 4349(H) 4348
3160 3273 3433 3223 2923 3309 3304 3382 3295 3395 3543 3526 3423 3559 3513 3690 3778 3731 3783 3873 3867 3960 14028
0.95 0.93 1.00 1.00 1.01 0.99 1.03 1.02 1.03 1.03 1.25 1.04 1.05 1.04 0.99 1.06 1.07 1.06 1.10 1.08
883(F) 815 883 934 9414 988 993 1054 1155 1176 1204 1234
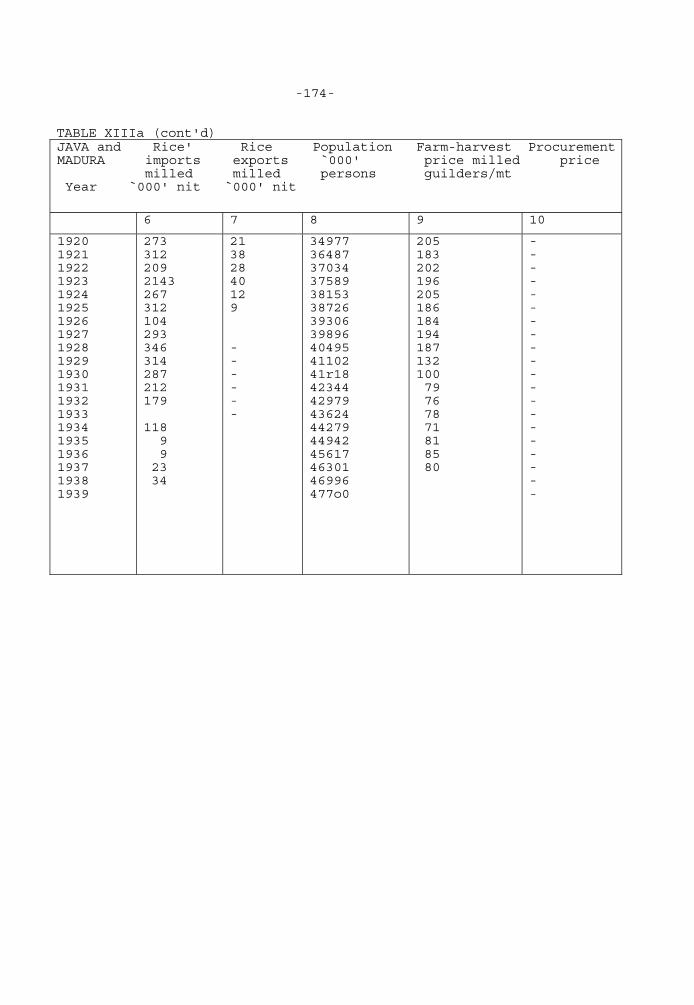
-174- TABLE XIIIa (cont'd) JAVA and Rice' Rice Population Farm-harvest Procurement MADURA imports exports `000' price milled price milled milled persons guilders/mt Year `000' nit `000' nit
6 7 8 9 10
1920 1921 1922 1923 1924 1925 1926 1927 1928 1929 1930 1931 1932 1933 1934 1935 1936 1937 1938 1939
273 312 209 2143 267 312 104 293 346 314 287 212 179 118 9 9 23 34
21 38 28 40 12 9 - - - - - -
34977 36487 37034 37589 38153 38726 39306 39896 40495 41102 41r18 42344 42979 43624 44279 44942 45617 46301 46996 477o0
205 183 202 196 205 186 184 194 187 132 100 79 76 78 71 81 85 80
- - - - - - - - - - - - - - - - - - - -
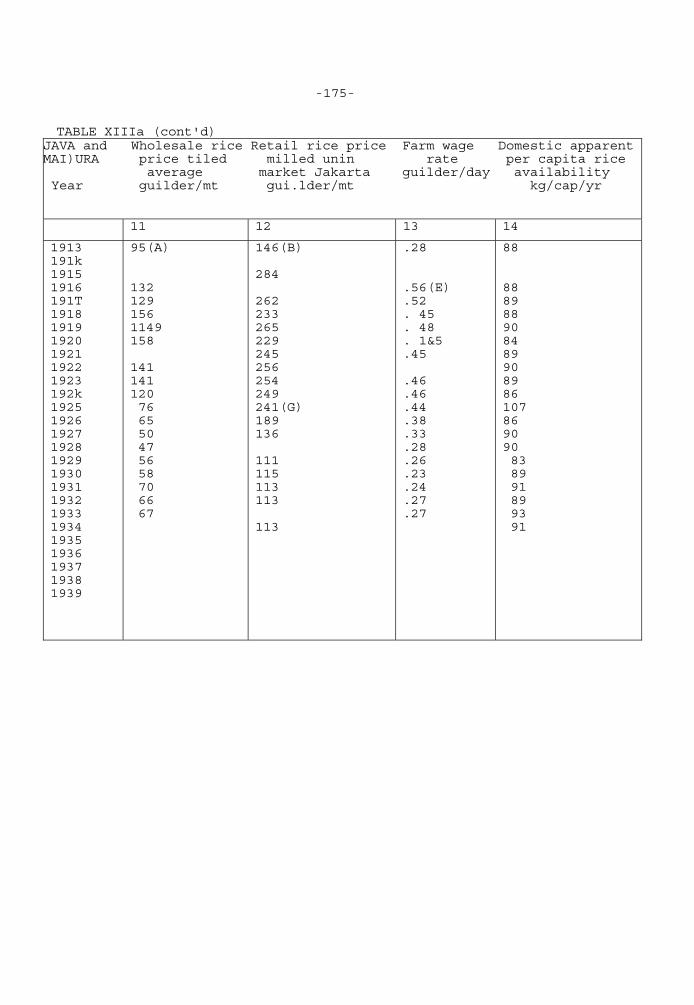
-175- TABLE XIIIa (cont'd)
JAVA and Wholesale rice Retail rice price Farm wage Domestic apparent MAI)URA price tiled milled unin rate per capita rice average market Jakarta guilder/day availability Year guilder/mt gui.lder/mt kg/cap/yr 11 12 13 14
1913 191k 1915 1916 191T 1918 1919 1920 1921 1922 1923 192k 1925 1926 1927 1928 1929 1930 1931 1932 1933 1934 1935 1936 1937 1938 1939
95(A) 132 129 156 1149 158 141 141 120 76 65 50 47 56 58 70 66 67
146(B) 284 262 233 265 229 245 256 254 249 241(G) 189 136 111 115 113 113 113
.28 .56(E) .52 . 45 . 48 . 1&5 .45 .46 .46 .44 .38 .33 .28 .26 .23 .24 .27 .27
88 88 89 88 90 84 89 90 89 86 107 86 90 90 83 89 91 89 93 91
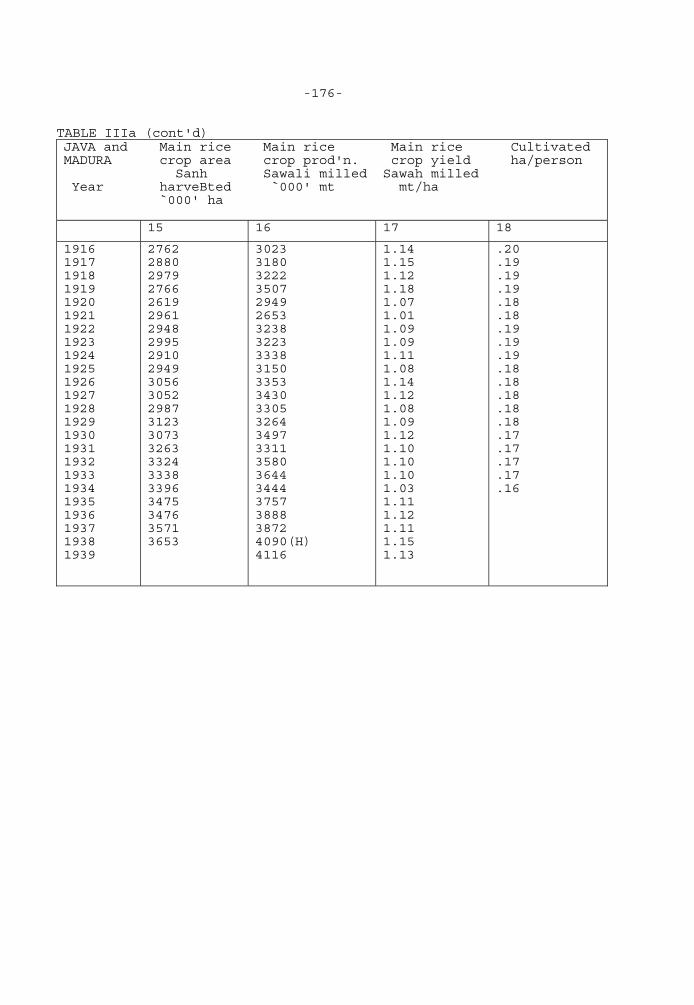
-176- TABLE IIIa (cont'd) JAVA and Main rice Main rice Main rice Cultivated MADURA crop area crop prod'n. crop yield ha/person Sanh Sawali milled Sawah milled Year harveBted `000' mt mt/ha `000' ha 15 16 17 18
1916 1917 1918 1919 1920 1921 1922 1923 1924 1925 1926 1927 1928 1929 1930 1931 1932 1933 1934 1935 1936 1937 1938 1939
2762 2880 2979 2766 2619 2961 2948 2995 2910 2949 3056 3052 2987 3123 3073 3263 3324 3338 3396 3475 3476 3571 3653
3023 3180 3222 3507 2949 2653 3238 3223 3338 3150 3353 3430 3305 3264 3497 3311 3580 3644 3444 3757 3888 3872 4090(H) 4116
1.14 1.15 1.12 1.18 1.07 1.01 1.09 1.09 1.11 1.08 1.14 1.12 1.08 1.09 1.12 1.10 1.10 1.10 1.03 1.11 1.12 1.11 1.15 1.13
.20
.19
.19
.19
.18
.18
.19
.19
.19
.18
.18
.18
.18
.18
.17
.17
.17
.17
.16
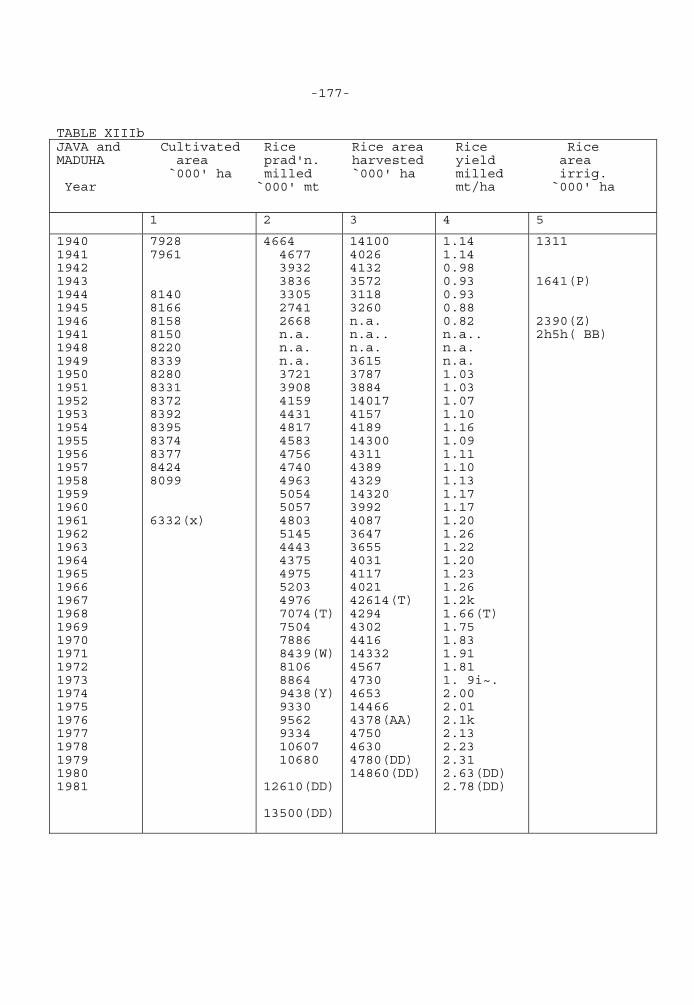
-177- TABLE XIIIb JAVA and Cultivated Rice Rice area Rice Rice MADUHA area prad'n. harvested yield area `000' ha milled `000' ha milled irrig. Year `000' mt mt/ha `000' ha
1 2 3 4 5
1940 1941 1942 1943 1944 1945 1946 1941 1948 1949 1950 1951 1952 1953 1954 1955 1956 1957 1958 1959 1960 1961 1962 1963 1964 1965 1966 1967 1968 1969 1970 1971 1972 1973 1974 1975 1976 1977 1978 1979 1980 1981
7928 7961 8140 8166 8158 8150 8220 8339 8280 8331 8372 8392 8395 8374 8377 8424 8099 6332(x)
4664 4677 3932 3836 3305 2741 2668 n.a. n.a. n.a. 3721 3908 4159 4431 4817 4583 4756 4740 4963 5054 5057 4803 5145 4443 4375 4975 5203 4976 7074(T) 7504 7886 8439(W) 8106 8864 9438(Y) 9330 9562 9334 10607 10680 12610(DD) 13500(DD)
14100 4026 4132 3572 3118 3260 n.a. n.a.. n.a. 3615 3787 3884 14017 4157 4189 14300 4311 4389 4329 14320 3992 4087 3647 3655 4031 4117 4021 42614(T) 4294 4302 4416 14332 4567 4730 4653 14466 4378(AA) 4750 4630 4780(DD) 14860(DD)
1.14 1.14 0.98 0.93 0.93 0.88 0.82 n.a.. n.a. n.a. 1.03 1.03 1.07 1.10 1.16 1.09 1.11 1.10 1.13 1.17 1.17 1.20 1.26 1.22 1.20 1.23 1.26 1.2k 1.66(T) 1.75 1.83 1.91 1.81 1. 9i~. 2.00 2.01 2.1k 2.13 2.23 2.31 2.63(DD) 2.78(DD)
1311 1641(P) 2390(Z) 2h5h( BB)
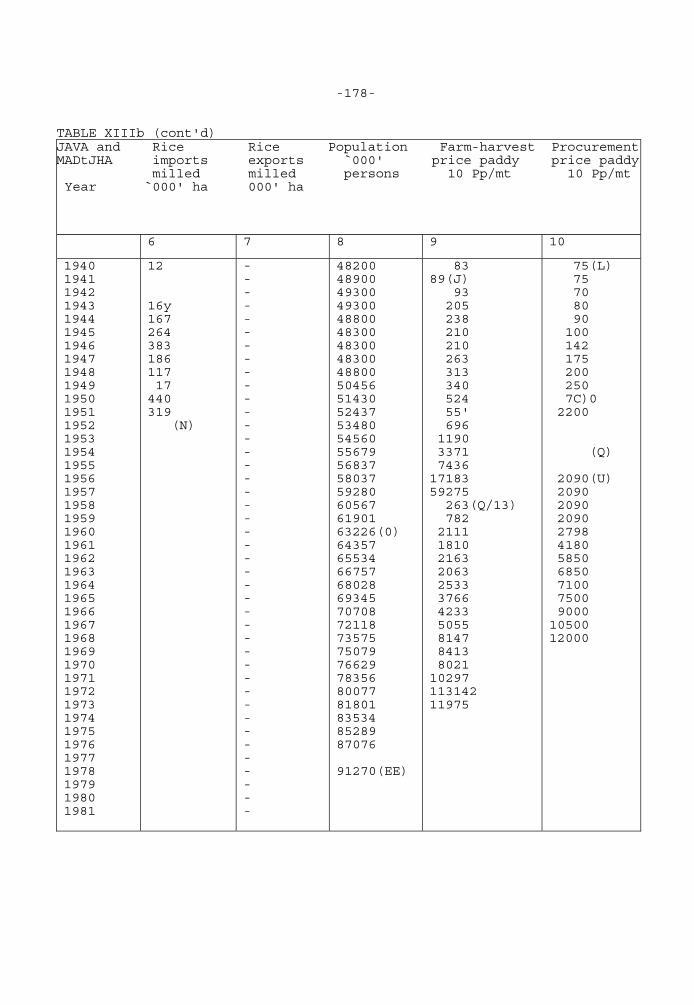
-178- TABLE XIIIb (cont'd) JAVA and Rice Rice Population Farm-harvest Procurement MADtJHA imports exports `000' price paddy price paddy milled milled persons 10 Pp/mt 10 Pp/mt Year `000' ha 000' ha
6 7 8 9 10
1940 1941 1942 1943 1944 1945 1946 1947 1948 1949 1950 1951 1952 1953 1954 1955 1956 1957 1958 1959 1960 1961 1962 1963 1964 1965 1966 1967 1968 1969 1970 1971 1972 1973 1974 1975 1976 1977 1978 1979 1980 1981
12 16y 167 264 383 186 117 17 440 319 (N)
- - - - - - - - - - - - - - - - - - - - - - - - - - - - - - - - - - - - - - - - - -
48200 48900 49300 49300 48800 48300 48300 48300 48800 50456 51430 52437 53480 54560 55679 56837 58037 59280 60567 61901 63226(0) 64357 65534 66757 68028 69345 70708 72118 73575 75079 76629 78356 80077 81801 83534 85289 87076 91270(EE)
83 89(J) 93 205 238 210 210 263 313 340 524 55' 696 1190 3371 7436 17183 59275 263(Q/13) 782 2111 1810 2163 2063 2533 3766 4233 5055 8147 8413 8021 10297 113142 11975
75(L) 75 70 80 90 100 142 175 200 250 7C)0 2200 (Q) 2090(U) 2090 2090 2090 2798 4180 5850 6850 7100 7500 9000 10500 12000
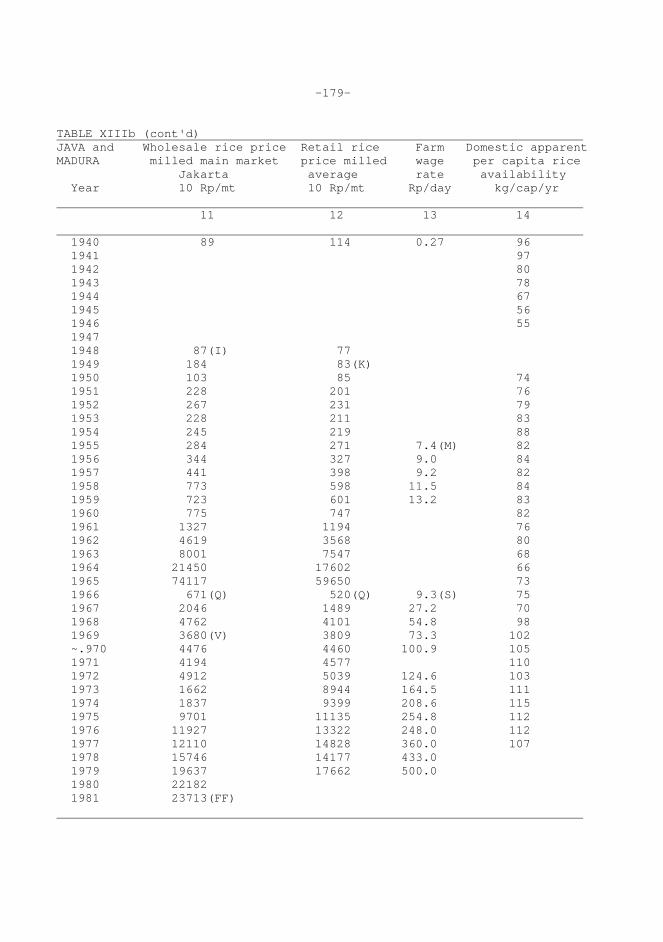
-179- TABLE XIIIb (cont'd) JAVA and Wholesale rice price Retail rice Farm Domestic apparent MADURA milled main market price milled wage per capita rice Jakarta average rate availability Year 10 Rp/mt 10 Rp/mt Rp/day kg/cap/yr 11 12 13 14 1940 89 114 0.27 96 1941 97 1942 80 1943 78 1944 67 1945 56 1946 55 1947 1948 87(I) 77 1949 184 83(K) 1950 103 85 74 1951 228 201 76 1952 267 231 79 1953 228 211 83 1954 245 219 88 1955 284 271 7.4(M) 82 1956 344 327 9.0 84 1957 441 398 9.2 82 1958 773 598 11.5 84 1959 723 601 13.2 83 1960 775 747 82 1961 1327 1194 76 1962 4619 3568 80 1963 8001 7547 68 1964 21450 17602 66 1965 74117 59650 73 1966 671(Q) 520(Q) 9.3(S) 75 1967 2046 1489 27.2 70 1968 4762 4101 54.8 98 1969 3680(V) 3809 73.3 102 ~.970 4476 4460 100.9 105 1971 4194 4577 110 1972 4912 5039 124.6 103 1973 1662 8944 164.5 111 1974 1837 9399 208.6 115 1975 9701 11135 254.8 112 1976 11927 13322 248.0 112 1977 12110 14828 360.0 107 1978 15746 14177 433.0 1979 19637 17662 500.0 1980 22182 1981 23713(FF)
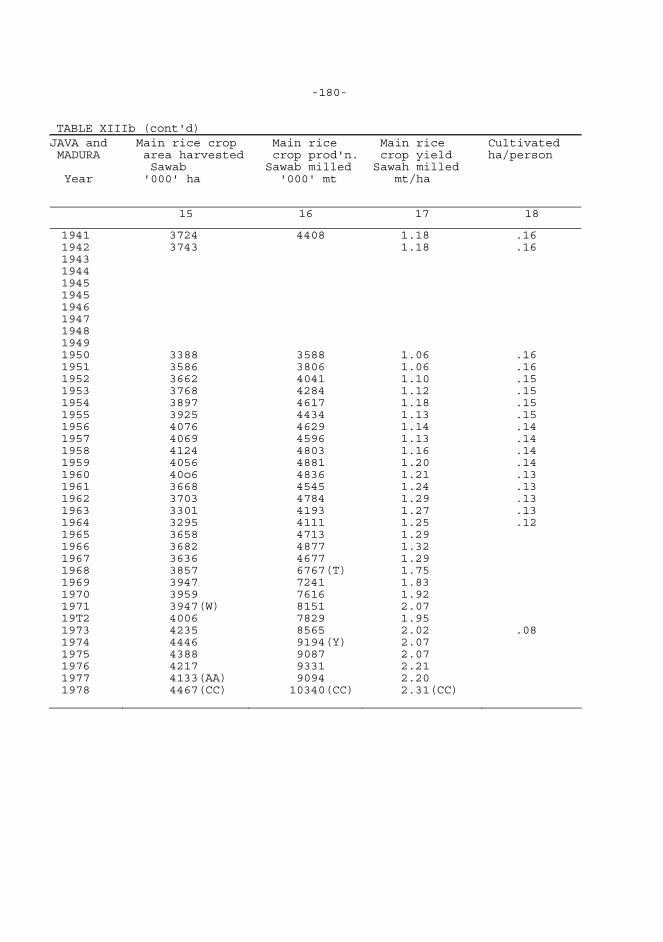
-180- TABLE XIIIb (cont'd) JAVA and Main rice crop Main rice Main rice Cultivated MADURA area harvested crop prod'n. crop yield ha/person Sawab Sawab milled Sawah milled Year '000' ha '000' mt mt/ha
15 16 17 18
1941 1942 1943 1944 1945 1945 1946 1947 1948 1949 1950 1951 1952 1953 1954 1955 1956 1957 1958 1959 1960 1961 1962 1963 1964 1965 1966 1967 1968 1969 1970 1971 19T2 1973 1974 1975 1976 1977 1978
3724 3743 3388 3586 3662 3768 3897 3925 4076 4069 4124 4056 40o6 3668 3703 3301 3295 3658 3682 3636 3857 3947 3959 3947(W) 4006 4235 4446 4388 4217 4133(AA) 4467(CC)
4408 3588 3806 4041 4284 4617 4434 4629 4596 4803 4881 4836 4545 4784 4193 4111 4713 4877 4677 6767(T) 7241 7616 8151 7829 8565 9194(Y) 9087 9331 9094 10340(CC)
1.18 1.18
1.06 1.06 1.10 1.12 1.18 1.13 1.14 1.13 1.16 1.20 1.21 1.24 1.29 1.27 1.25 1.29 1.32 1.29 1.75 1.83 1.92 2.07 1.95 2.02 2.07 2.07 2.21 2.20
2.31(CC)
.16
.16 .16 .16 .15 .15 .15 .15 .14 .14 .14 .14 .13 .13 .13 .13 .12 .08
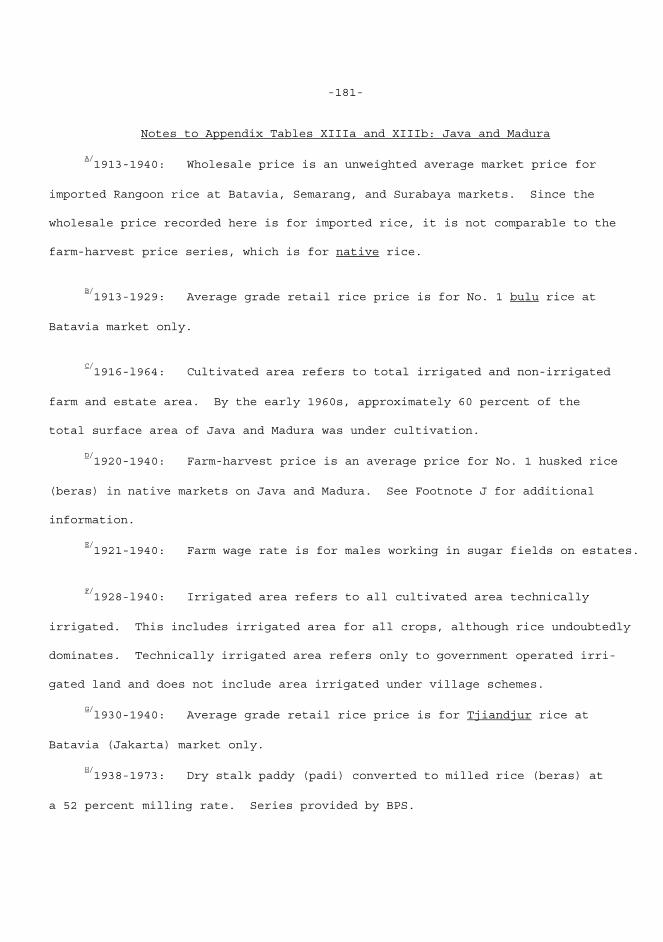
-181-
Notes to Appendix Tables XIIIa and XIIIb: Java and Madura
A/1913-1940: Wholesale price is an unweighted average market price for
imported Rangoon rice at Batavia, Semarang, and Surabaya markets. Since the wholesale price recorded here is for imported rice, it is not comparable to the farm-harvest price series, which is for native rice.
B/1913-1929: Average grade retail rice price is for No. 1 bulu rice at
Batavia market only.
C/1916-l964: Cultivated area refers to total irrigated and non-irrigated
farm and estate area. By the early 1960s, approximately 60 percent of the total surface area of Java and Madura was under cultivation.
D/1920-1940: Farm-harvest price is an average price for No. 1 husked rice
(beras) in native markets on Java and Madura. See Footnote J for additional information.
E/1921-1940: Farm wage rate is for males working in sugar fields on estates.
F/1928-l940: Irrigated area refers to all cultivated area technically
irrigated. This includes irrigated area for all crops, although rice undoubtedly dominates. Technically irrigated area refers only to government operated irri- gated land and does not include area irrigated under village schemes.
G/l930-1940: Average grade retail rice price is for Tjiandjur rice at
Batavia (Jakarta) market only.
H/1938-1973: Dry stalk paddy (padi) converted to milled rice (beras) at
a 52 percent milling rate. Series provided by BPS.
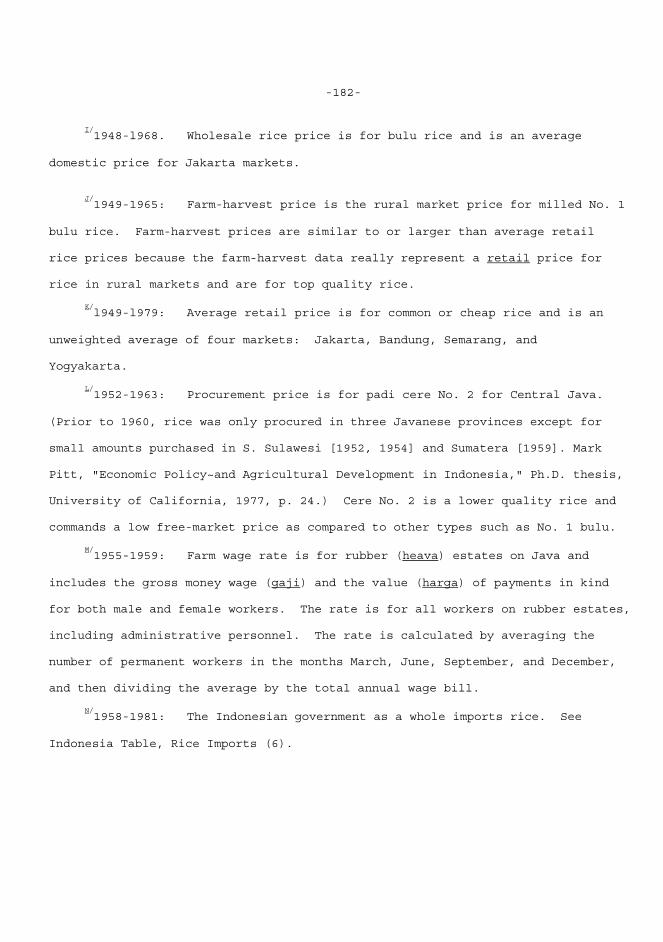
-182-
I/1948-l968. Wholesale rice price is for bulu rice and is an average
domestic price for Jakarta markets.
J/1949-1965: Farm-harvest price is the rural market price for milled No. 1
bulu rice. Farm-harvest prices are similar to or larger than average retail rice prices because the farm-harvest data really represent a retail price for rice in rural markets and are for top quality rice.
K/l949-l979: Average retail price is for common or cheap rice and is an
unweighted average of four markets: Jakarta, Bandung, Semarang, and Yogyakarta.
L/1952-1963: Procurement price is for padi cere No. 2 for Central Java.
(Prior to 1960, rice was only procured in three Javanese provinces except for small amounts purchased in S. Sulawesi [1952, 1954] and Sumatera [1959]. Mark Pitt, "Economic Policy~and Agricultural Development in Indonesia," Ph.D. thesis, University of California, 1977, p. 24.) Cere No. 2 is a lower quality rice and commands a low free-market price as compared to other types such as No. 1 bulu.
M/1955-1959: Farm wage rate is for rubber (heava) estates on Java and
includes the gross money wage (gaji) and the value (harga) of payments in kind for both male and female workers. The rate is for all workers on rubber estates, including administrative personnel. The rate is calculated by averaging the number of permanent workers in the months March, June, September, and December, and then dividing the average by the total annual wage bill.
N/1958-1981: The Indonesian government as a whole imports rice. See
Indonesia Table, Rice Imports (6).
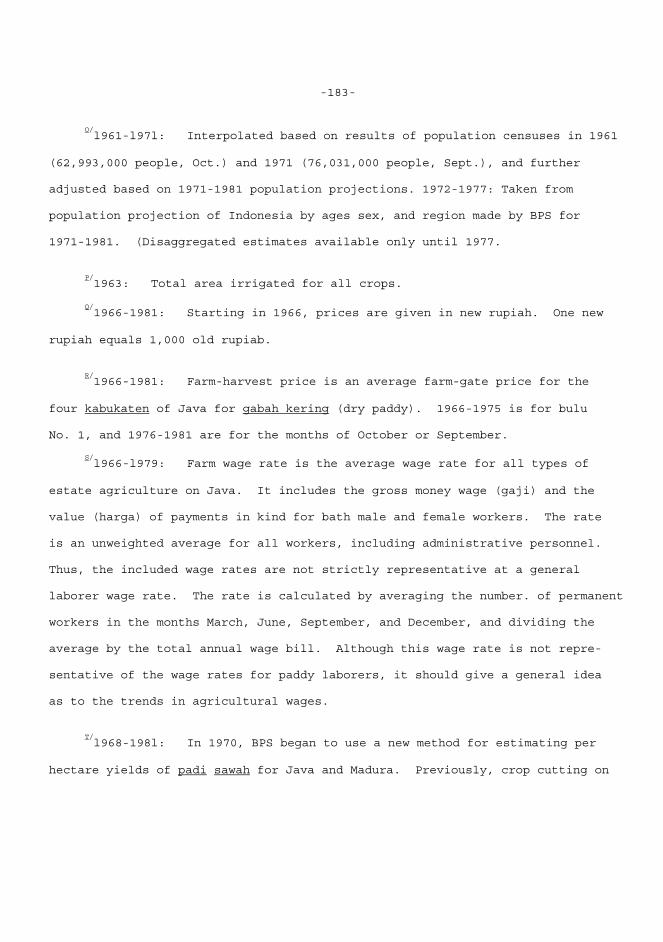
-183-
O/l961-l97l: Interpolated based on results of population censuses in 1961
(62,993,000 people, Oct.) and 1971 (76,031,000 people, Sept.), and further adjusted based on 1971-1981 population projections. 1972-1977: Taken from population projection of Indonesia by ages sex, and region made by BPS for 1971-1981. (Disaggregated estimates available only until 1977.
P/1963: Total area irrigated for all crops.
Q/1966-1981: Starting in 1966, prices are given in new rupiah. One new
rupiah equals 1,000 old rupiab.
R/1966-1981: Farm-harvest price is an average farm-gate price for the
four kabukaten of Java for gabah kering (dry paddy). 1966-1975 is for bulu No. 1, and 1976-1981 are for the months of October or September.
S/l966-l979: Farm wage rate is the average wage rate for all types of
estate agriculture on Java. It includes the gross money wage (gaji) and the value (harga) of payments in kind for bath male and female workers. The rate is an unweighted average for all workers, including administrative personnel. Thus, the included wage rates are not strictly representative at a general laborer wage rate. The rate is calculated by averaging the number. of permanent workers in the months March, June, September, and December, and dividing the average by the total annual wage bill. Although this wage rate is not repre- sentative of the wage rates for paddy laborers, it should give a general idea as to the trends in agricultural wages.
T/l968-198l: In 1970, BPS began to use a new method for estimating per
hectare yields of padi sawah for Java and Madura. Previously, crop cutting on
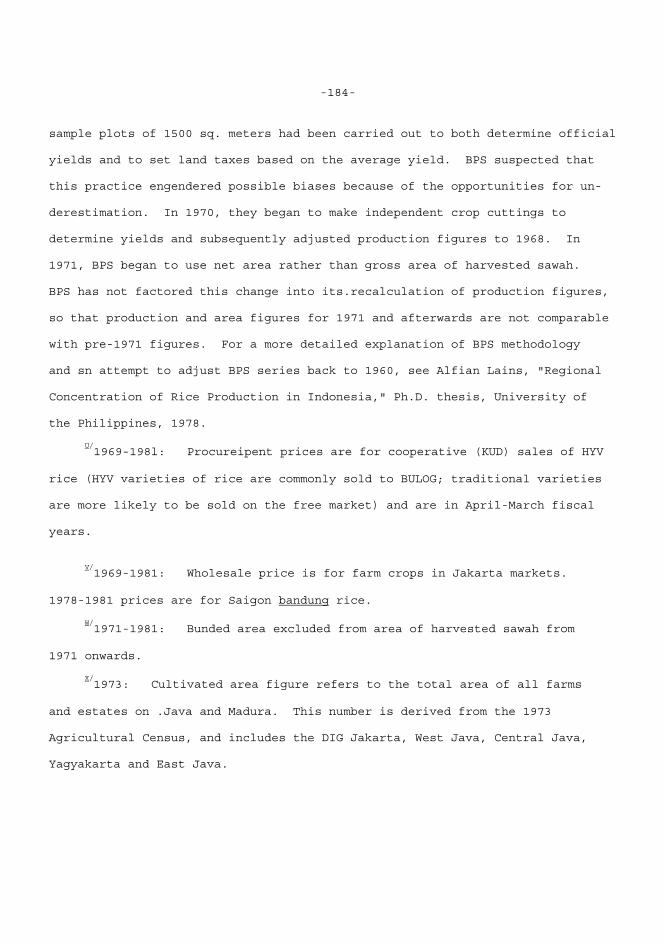
-184-
sample plots of 1500 sq. meters had been carried out to both determine official yields and to set land taxes based on the average yield. BPS suspected that this practice engendered possible biases because of the opportunities for un- derestimation. In 1970, they began to make independent crop cuttings to determine yields and subsequently adjusted production figures to 1968. In 1971, BPS began to use net area rather than gross area of harvested sawah. BPS has not factored this change into its.recalculation of production figures, so that production and area figures for 1971 and afterwards are not comparable with pre-1971 figures. For a more detailed explanation of BPS methodology and sn attempt to adjust BPS series back to 1960, see Alfian Lains, "Regional Concentration of Rice Production in Indonesia," Ph.D. thesis, University of the Philippines, 1978.
U/1969-198l: Procureipent prices are for cooperative (KUD) sales of HYV
rice (HYV varieties of rice are commonly sold to BULOG; traditional varieties are more likely to be sold on the free market) and are in April-March fiscal years.
V/1969-1981: Wholesale price is for farm crops in Jakarta markets.
1978-1981 prices are for Saigon bandung rice.
W/1971-1981: Bunded area excluded from area of harvested sawah from
1971 onwards.
X/1973: Cultivated area figure refers to the total area of all farms
and estates on .Java and Madura. This number is derived from the 1973 Agricultural Census, and includes the DIG Jakarta, West Java, Central Java, Yagyakarta and East Java.
-185-
Y/11974-1981: Dry unhusked paddy (gabah) converted to milled rice.(beraa)
at 68 percent.
Z/1976: Irrigated area figure is for rice area, including technical)
semi-technical, simple/village irrigation, and tidal/swamp land.
aa/l977-l981: Definition of sawah area changed to include bunded paddy area.
bb/1978: Irrigated area figure refers to total wet-land area planted to
paddy and irrigated using man-made means. This includes area under technical, semi-technical, and village/simple systems. Figure refers to total surface area and does not count double-cropped area twice.
cc/1978: Preliminary.
dd/1980, 1981: Preliminary.
ee/l980: Unadjusted results of 1980 population census not including East
Timor.
ff/Average of January-September only.
Sources of Data for Appendix Tables XIIIa & b: Java and Madura
1. Cultivated Area 1916-4927: Nederlandscb-Indid. Samengesteld door het Centraal Kantoor voor de Statistiek van het Departement van Econamische Zaken, Statistisch jarroverzicht van Nederlandsch-Indië (Batavia: Landsdrulckerij). 1928-1973: Nederlandsch-Indië. Departement van Economische Zaken, Centraal Kantoor voor de Statistiek, Statistisch zakboekle voor Nederlandsch-Indië (Batavia: 1934-1938). Name changed to Indonesia. Biro Pusat Statistik, Statistical Pocketbook of Indonesia (Jakarta).
-186-
2. Rice Production 1920-1937: Meats, Leon, Rice Marketing in the Republic of Indonesia (Djakarta: Djakarta School of Economics, University of Indonesia, 1961). 1938-1978: Indonesia. Biro Fusat Statistik, Statistical Pocketbook of Indonesia (Jakarta). 1979-1981: Nears, Leon, The New Rice Economy of Indonesia (Yagyakarta: Gadjah Mada University Press, 1981). 3. Rice Area 1916-1919: Nederlandsch-Indië. Samengesteld door het Centraal Kantoor voor de Statistiek van het Deparrement von Economisehe Zaken, Statistisch jarroverzicht van Neder1andsch-Indië (Batavia: Landsdrukkerij). 1920-1949: Nears, Leon, Rice Marketinz in the Republic of Indonesia (Djakarta: Djakarta School of Economics, University of Indonesia, 1961). 1950-1978: Indonesia. Biro Pusat Statistik, Statistical Pocketbook of Indonesia (Jakarta). 1979-1981: Nears, Leon, The New Rice Economy of Indonesia (Yogyakarta: Gadjah Mada University Press, 1981). 4. Rice Yields 1920-1981: Rice yields are calculated by dividing rice production (3) by rice area (2) on an annual basis. 5. Rice Area Irrigated 1928-1940: Nederlandsch-Indih. Samengesteld door het Cenrraal Kantoor voor de Statistiek vanhet Departement van Economische Zaken, Statistisch jarroverzicht van Nederlandsch-Indië (Batavia: Landsdrukkerij). 1963: 1963 Agricultural Census Final Report. 1976: Nyberg, Alberg and Prabowo, Dibyo, "Status and Performance of Irrigation as of 1976 and the Prospects to 1990 and 2000," prepared for
-187-
IFPRI/IRRI/IFDC Rice Policy Project in Southeast Asian Countries Workshop, Los Baños, Philippines, May 22-25, 1979, pp. 53-54. 1978: Indonesia. Biro Pusat Statistik, Statistical Pocketbook of Indonesia (1979/1980: Jakarta). 6. Rice Imports 1921-1956: Mears, Leon, Rice Marketing in the Republic of Indonesia (Djakarta; Djakarta School of Economics, University of Indonesia, 1961). 7. Rice Exports 1923-1928: Neder1andsch-Indië. Samengesteld door het Centraal Kantoor voor de Statistiek van het Departement van Economieche Zaken, Statistisch jarroverzicht van Nederlandsch-Indië (Batavia: Landsdrukkerij). 8. Population 1920-1950: Hears, Leon, Rice Marketing in the Republic of Indonesia (Djakarta: Djakarta School of Economics, University of Indonesia, 1961). 1951-1977: Indonesia. Biro Pusat Statistik, Statistical Pocketbook of Indonesia (Jakarta). 1980: Indonesia. Biro Pusat Statistik, Indikator ekonomi. (Jakarta: 1981). 9. Farm-Harvest Price 1920-1940: Nederlandech-Indie. Samengesteld door het Centraal Kantoor voor de Statistiek van het Departement van Economisehe Zaken, Statistisch jarroverzicht van Nederlandsch-Indië (Batavia: Landsdrukkerij). 1949-1965: Indonesia. Biro Pusat Statistik, Statistical Pocketbook of Indonesia (Jakarta). 1966-1981: Indonesia. Biro Pusat Statistik, Indikator ekonomi (Jakarta: 1970-1981).
-188-
10. Procurement Price No procurement prior to World War II. 1952-1963: Pitt, Mark, "Economic Policy and Agricultural Development in Indonesia," Ph.p. thesis, University of California, 1977, p. 21. Original data from BUL0G. 1969-1981: Indonesia. Badan Urusan Logistik. 11. Wholesale Rice Price 1913-1940: Nederlandsch-Indië. Samengesteld door bet Centraal Kantoor voor de Statistiek van het Departement van Economische Zaken, Statistisch jarroverzichr van Nederlandsch-Indië (Batavia: Landsdrukkerij). 1948-1981: Indonesia. Biro Pusat Statistik, Indikator ekonomi (Jakarta: 1970-1981). 12. Retail Rice Price 1913-1940: Nederlandsch-Indië. Samengesteld door het Centraal Rantoor voor de Statistiek van het Departement van Economische Zaken, Statistisch zakboekje voor Nederlandsch-Indië (Batavia: 1934-1938). 1948-1957: Nears, Leon, Rice Marketing in the Repub1ic of Indonesia (Djakarta: Djakarta School of Economics, University of Indonesia, 1961). 1958-1979: Indonesia. Biro Pusat Statistik, Statistical Pocketbook of Indonesia (Jakarta). 13. Farm Wage Rate 1921-1940: Nederlandsch-Indië. Samengesteld door bet Centraal Kantoor voor de Statistlek van het Departement van Economisehe Zaken, Statistisch jarroverzicht van Neder1andsch-Indië (Batavia: tandsdrukkerij). 1955-1959: Indonesia. Biro Pusat Statistik, Rata-rata upah burub perkebunan (Jakarta).
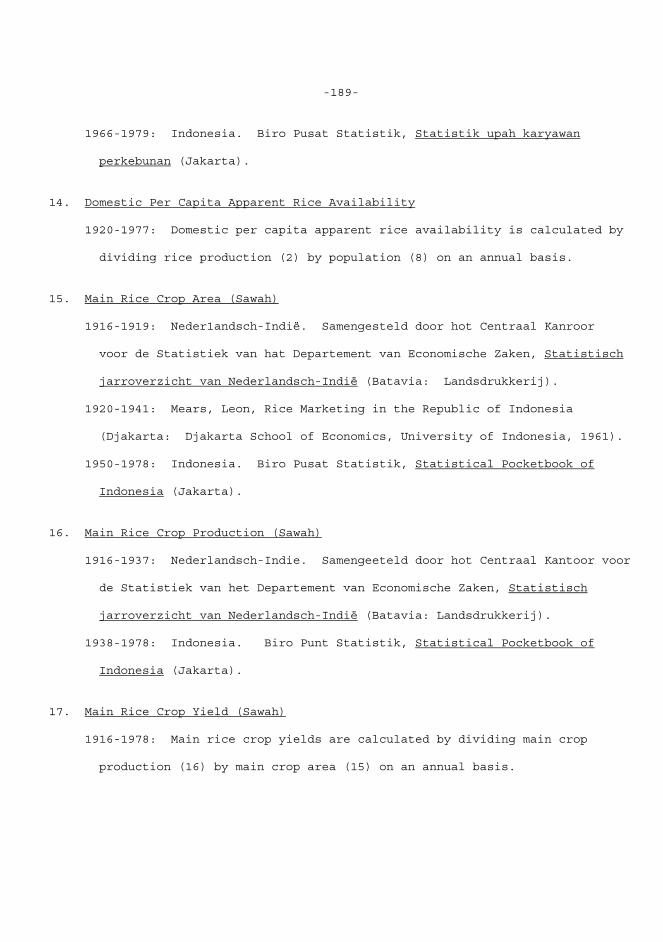
-189-
1966-1979: Indonesia. Biro Pusat Statistik, Statistik upah karyawan perkebunan (Jakarta). 14. Domestic Per Capita Apparent Rice Availability 1920-1977: Domestic per capita apparent rice availability is calculated by dividing rice production (2) by population (8) on an annual basis. 15. Main Rice Crop Area (Sawah) 1916-1919: Neder1andsch-Indië. Samengesteld door hot Centraal Kanroor voor de Statistiek van hat Departement van Economische Zaken, Statistisch jarroverzicht van Nederlandsch-Indië (Batavia: Landsdrukkerij). 1920-1941: Mears, Leon, Rice Marketing in the Republic of Indonesia (Djakarta: Djakarta School of Economics, University of Indonesia, 1961). 1950-1978: Indonesia. Biro Pusat Statistik, Statistical Pocketbook of Indonesia (Jakarta). 16. Main Rice Crop Production (Sawah) 1916-1937: Nederlandsch-Indie. Samengeeteld door hot Centraal Kantoor voor de Statistiek van het Departement van Economische Zaken, Statistisch jarroverzicht van Nederlandsch-Indië (Batavia: Landsdrukkerij). 1938-1978: Indonesia. Biro Punt Statistik, Statistical Pocketbook of Indonesia (Jakarta). 17. Main Rice Crop Yield (Sawah) 1916-1978: Main rice crop yields are calculated by dividing main crop production (16) by main crop area (15) on an annual basis.
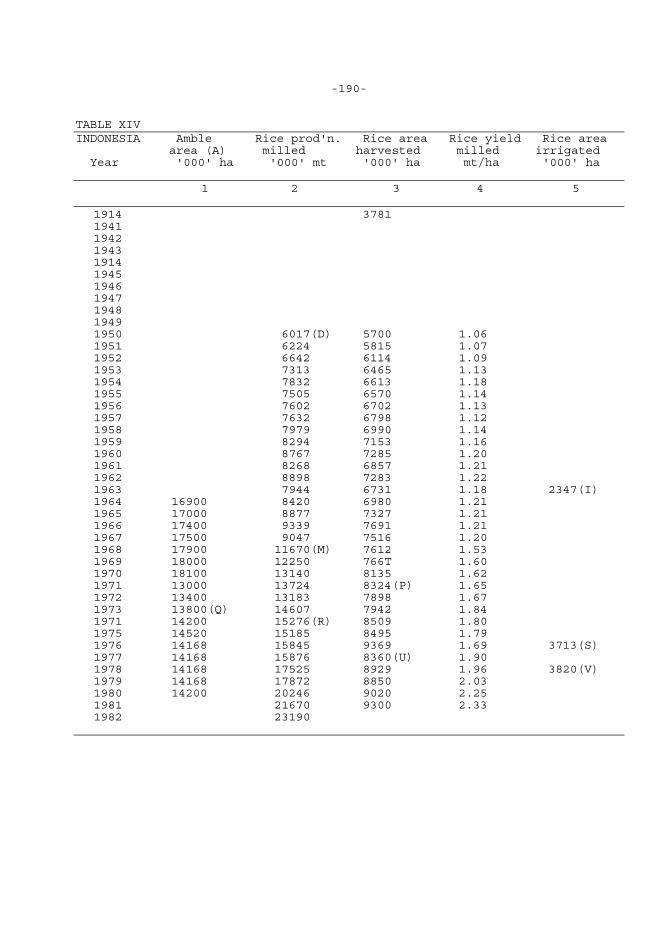
-190- TABLE XIV INDONESIA Amble Rice prod'n. Rice area Rice yield Rice area area (A) milled harvested milled irrigated Year '000' ha '000' mt '000' ha mt/ha '000' ha 1 2 3 4 5
1914 3781 1941 1942 1943 1914 1945 1946 1947 1948 1949 1950 6017(D) 5700 1.06 1951 6224 5815 1.07 1952 6642 6114 1.09 1953 7313 6465 1.13 1954 7832 6613 1.18 1955 7505 6570 1.14 1956 7602 6702 1.13 1957 7632 6798 1.12 1958 7979 6990 1.14 1959 8294 7153 1.16 1960 8767 7285 1.20 1961 8268 6857 1.21 1962 8898 7283 1.22 1963 7944 6731 1.18 2347(I) 1964 16900 8420 6980 1.21 1965 17000 8877 7327 1.21 1966 17400 9339 7691 1.21 1967 17500 9047 7516 1.20 1968 17900 11670(M) 7612 1.53 1969 18000 12250 766T 1.60 1970 18100 13140 8135 1.62 1971 13000 13724 8324(P) 1.65 1972 13400 13183 7898 1.67 1973 13800(Q) 14607 7942 1.84 1971 14200 15276(R) 8509 1.80 1975 14520 15185 8495 1.79 1976 14168 15845 9369 1.69 3713(S) 1977 14168 15876 8360(U) 1.90 1978 14168 17525 8929 1.96 3820(V) 1979 14168 17872 8850 2.03 1980 14200 20246 9020 2.25 1981 21670 9300 2.33 1982 23190
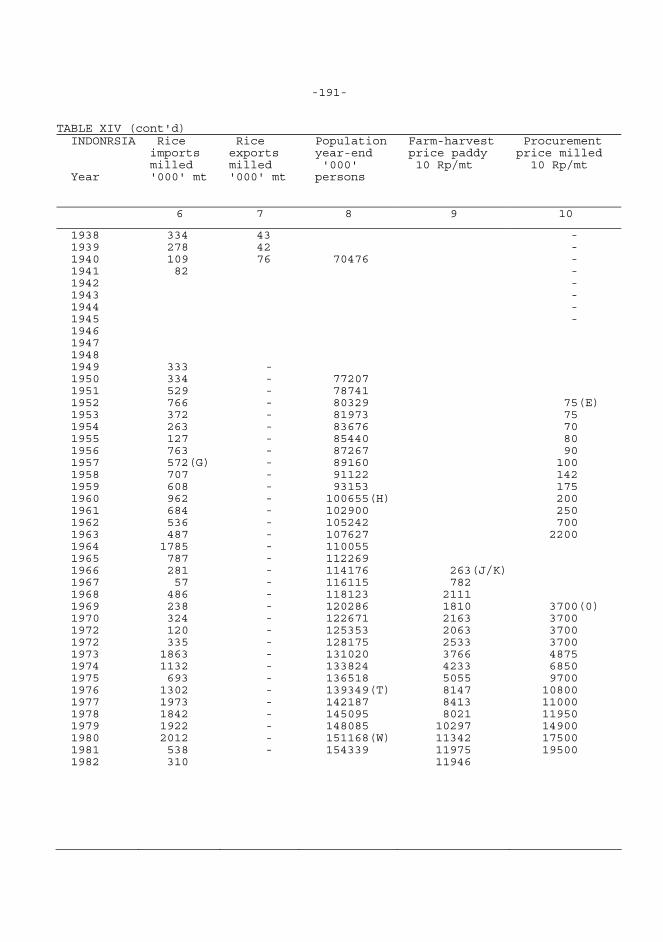
-191- TABLE XIV (cont'd) INDONRSIA Rice Rice Population Farm-harvest Procurement imports exports year-end price paddy price milled milled milled '000' 10 Rp/mt 10 Rp/mt Year '000' mt '000' mt persons
6 7 8 9 10
1938 1939 1940 1941 1942 1943 1944 1945 1946 1947 1948 1949 1950 1951 1952 1953 1954 1955 1956 1957 1958 1959 1960 1961 1962 1963 1964 1965 1966 1967 1968 1969 1970 1972 1972 1973 1974 1975 1976 1977 1978 1979 1980 1981 1982
334 278 109 82 333 334 529 766 372 263 127 763 572(G) 707 608 962 684 536 487 1785 787 281 57 486 238 324 120 335 1863 1132 693 1302 1973 1842 1922 2012 538 310
43 42 76
- - - - - - - - - - - - - - - - - - - - - - - - - - - - - - - - -
70476 77207 78741 80329 81973 83676 85440 87267 89160 91122 93153 100655(H) 102900 105242 107627 110055 112269 114176 116115 118123 120286 122671 125353 128175 131020 133824 136518 139349(T) 142187 145095 148085 151168(W) 154339
263(J/K) 782 2111 1810 2163 2063 2533 3766 4233 5055 8147 8413 8021 10297 11342 11975 11946
- - - - - - - - 75(E) 75 70 80 90 100 142 175 200 250 700 2200 3700(0) 3700 3700 3700 4875 6850 9700 10800 11000 11950 14900 17500 19500
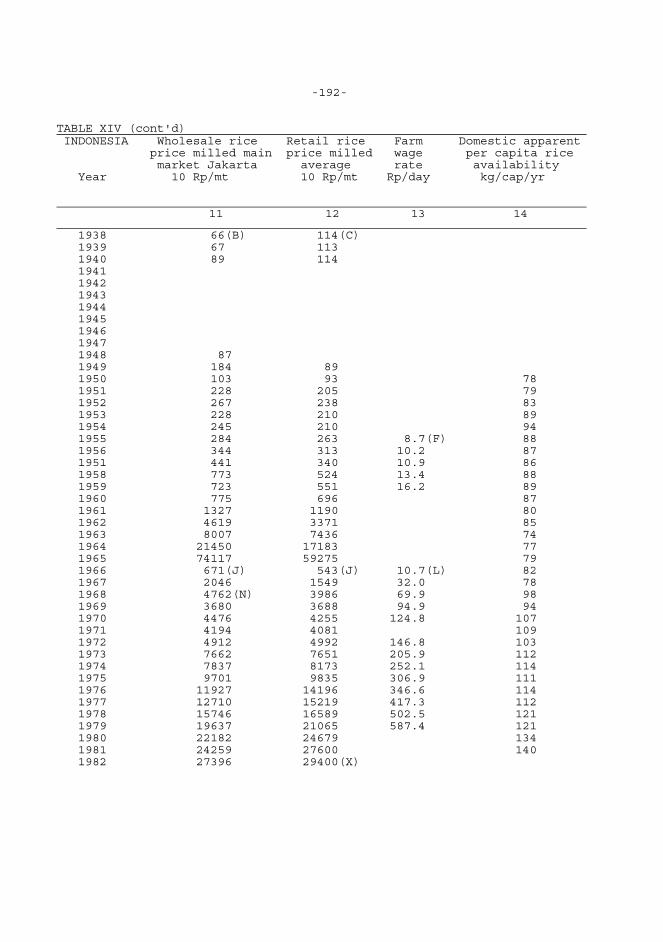
-192- TABLE XIV (cont'd) INDONESIA Wholesale rice Retail rice Farm Domestic apparent price milled main price milled wage per capita rice market Jakarta average rate availability Year 10 Rp/mt 10 Rp/mt Rp/day kg/cap/yr
11 12 13 14
1938 1939 1940 1941 1942 1943 1944 1945 1946 1947 1948 1949 1950 1951 1952 1953 1954 1955 1956 1951 1958 1959 1960 1961 1962 1963 1964 1965 1966 1967 1968 1969 1970 1971 1972 1973 1974 1975 1976 1977 1978 1979 1980 1981 1982
66(B) 67 89 87 184 103 228 267 228 245 284 344 441 773 723 775 1327 4619 8007 21450 74117 671(J) 2046 4762(N) 3680 4476 4194 4912 7662 7837 9701 11927 12710 15746 19637 22182 24259 27396
114(C) 113 114 89 93 205 238 210 210 263 313 340 524 551 696 1190 3371 7436 17183 59275 543(J) 1549 3986 3688 4255 4081 4992 7651 8173 9835 14196 15219 16589 21065 24679 27600 29400(X)
8.7(F) 10.2 10.9 13.4 16.2 10.7(L) 32.0 69.9 94.9 124.8 146.8 205.9 252.1 306.9 346.6 417.3 502.5 587.4
78 79 83 89 94 88 87 86 88 89 87 80 85 74 77 79 82 78 98 94 107 109 103 112 114 111 114 112 121 121 134 140
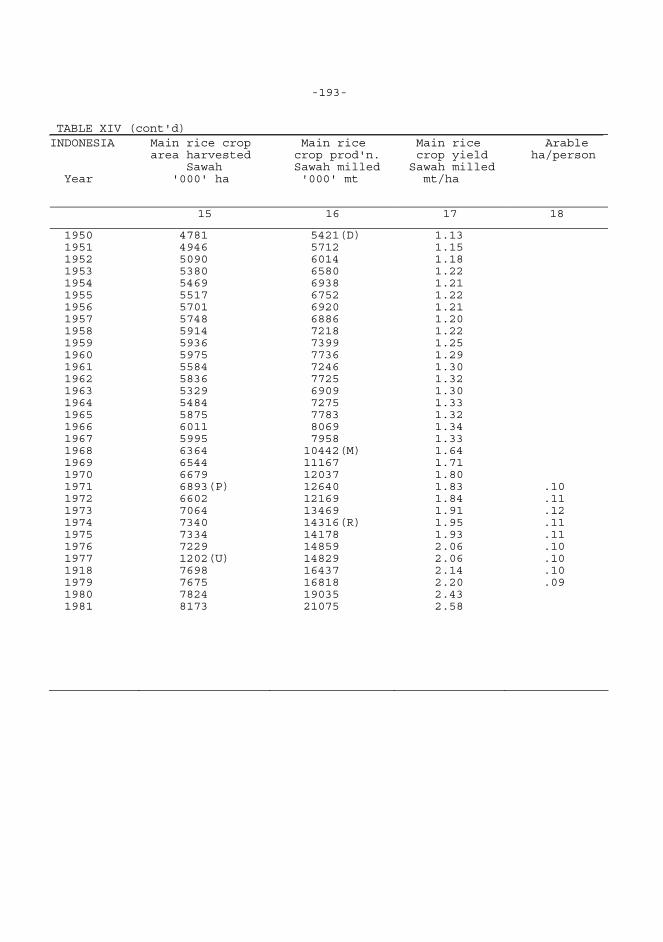
-193- TABLE XIV (cont'd) INDONESIA Main rice crop Main rice Main rice Arable area harvested crop prod'n. crop yield ha/person Sawah Sawah milled Sawah milled Year '000' ha '000' mt mt/ha
15 16 17 18
1950 1951 1952 1953 1954 1955 1956 1957 1958 1959 1960 1961 1962 1963 1964 1965 1966 1967 1968 1969 1970 1971 1972 1973 1974 1975 1976 1977 1918 1979 1980 1981
4781 4946 5090 5380 5469 5517 5701 5748 5914 5936 5975 5584 5836 5329 5484 5875 6011 5995 6364 6544 6679 6893(P) 6602 7064 7340 7334 7229 1202(U) 7698 7675 7824 8173
5421(D) 5712 6014 6580 6938 6752 6920 6886 7218 7399 7736 7246 7725 6909 7275 7783 8069 7958 10442(M) 11167 12037 12640 12169 13469 14316(R) 14178 14859 14829 16437 16818 19035 21075
1.13 1.15 1.18 1.22 1.21 1.22 1.21 1.20 1.22 1.25 1.29 1.30 1.32 1.30 1.33 1.32 1.34 1.33 1.64 1.71 1.80 1.83 1.84 1.91 1.95 1.93 2.06 2.06 2.14 2.20 2.43 2.58
.10
.11
.12
.11
.11
.10
.10
.10
.09
-194-
Notes to Appendix Table XIV: Indonesia
A/BPS does not release cultivated area statistics on an annual basis, although
an estimate for the total area of farms and estates is computed decennially as part of the agricultural census. (For the most recent estimate, see Footnote Q, 1973.) Harvested area' statistics for most important food crops are regularly released each year.
B/1938-1967: Wholesale rice price is for bulu and is an average domestic
price for Jakarta markets.
C/1939-1982: Retail price is for No. 1 ,milled bulu rice. Bulu is the best
quality and hence highest priced domestic rice. Data are taken from the BPS "Retail price of 12 food articles in rural markets of Java and Mad'-ra" series, and represent an average market price for tht islands of Java and Madura only.
D/1950-1973: Dry stalk paddy (padi) converted to milled rice (beras) at
52 percent. Series provided by BPS.
E/1952-1963: Procurement price is for padi cere No. 2 for Central Java.
(Prior to 1960, rice was only procured in three Javanese provinces except for small amounts purchased in S. Sulawesi [1952, 1954] and Sumatera [1959]. Mark Pitt, "Economic Policy and Agricultural Development in Indonesia," Ph.D. thesis, University of California, 1977, p. 24.) Cere No. 2 is lower quality than bulu.
F/1955-1959: Farm wage rate is for rubber (heava) estates, and includes
the gross money wage (gaji) and the value (harga) of payments in kind for both male and female workers. The rate is for all workers on rubber estates, including administrative personnel. The rate is calculated by averaging the number of permanent workers in the months March, June, September, and December, and dividing the average by the total annual wage bill.
-195-
G/1957-1982: Includes rice and glutinous rice imports.
H/1960: USDA estimates are used 1960-1981. USDA estimates are considerably
larger than official Indonesian figures, but probably more realistically assess population growth. 1960-1975 population estimates exclude E. Timor (annexed in 1976). An adjusted 1970 census figure for E. Timor estimates the total population as 642,000 persons.
I/1963: Total area irrigated for all crops.
J/1966-1982: Starting in 1966 prices are given in new rupiah: one new
rupiah equals 1,000 old rupiah.
K/1966-1982: Farm-harvest price is an average tan-gate price for the
four kabupaten of Java for gabah kering (dry paddy). 1966-1975 is for bulu No. 1, and 1976-1982 are for the months of October or September.
L/1966-1979: Farm wage rate is the average wage rate for all types of
estate agriculture. It includes the gross money wage (gaji) and the value (harga) of payments in kind for both male and female workers. The rate is an unweighted average for all workers including administrative personnel. Thus, the included wage rates are not strictly representative of a general laborer wage rate. The rate is calculated by averaging the number of permanent workers in the months March, June, September and December, and dividing the average by the total annual wage bill. Although this wage rate is not representative of the wage rates for paddy laborers, it should give a general idea of the trends in agricultural wage rates.
-196-
M/1968-1982: In 1970, BPS began to use a nai method for estimating per
hectare yields of padi sawah for Java and Madura. Previously, crop cutting on sample plots of 1500 sq. meters had been carried out to both determine official yields and to set land taxes based on average yields. BPS suspected that this practice engendered possible biases because of the opportunities for underestimation. in 1970, they began to make independent crop cuttings to deteymine yields, and subsequently adjusted production figures back to 1968. In 1971, BPS began to use net area rather than gross area of harvested sawah. BPS has not factored this change into its recalculation of production figures, so that produdtion and area figures for 1971 and afterwards are not comparable with pre-1971 figures. For a more detailed explanation of BPS methodology and an attempt to adjust BPS series back to 1960 see: Alfian Lains, "Regional Concentration of Rice Production in Indonesia," Ph.D. thesis, University of the Philippines, 1978. Leon Nears also provides a table in which rice production is adjusted back to 1960 (The New Rice Economy of Indonesia, 1981, p. 488).
N/1968-1982: Wholesale rice price is for farm crops in Jakarta markets.
1978-1982 prices are for Saigon Bandung rice.
0/1969-1981: Procurement prices are for cooperative (KIJD) sales of HYV
rice CUYV varieties of rice are commonly sold to BULOG; traditional varieties are more likely to be sold on the free market), and are in April-March fiscal years.
P/1971-1981: Bunded area excluded from area of harvested sawah from
1971 onwards.
-197-
Q/1973: During the 1973 Census of Agriculture, BPS found that the total
area of farms and estates was 16,394,000 ha.--a much lower figure than the FAO estimate for 1973.
R/1974-1982: Dry unhusked paddy (gabah) converted to milled rice (beras)
at 68 percent. Series provided by BPS.
S/1976: Irrigated area figure is for rice area (see Footnote V), including
technical, semi-technical, simple/village, and tidal swamp land irrigation systems.
T/1976-1981: Population estimates for Indonesia are projected based on the
midyear 1975 adjusted population census figure and on assumed trends in fertility and mortality since 1975. The population of E. Timor is included.
U/1977-1981: Definition of sawab area changed to include bunded paddy area.
V/1978: Irrigated area figure refers to total wet-land area planted to
paddy and irrigated using awn-made means. This includes area under technical, semi-technical, and village/simple systems. Figure refers to total surface area and does not count double-cropped area twice.
W/1980: Unadjusted result of Oct. 31, 1980 population census--excluding
E. Timor--is 147,490,000 persons.
X/1982: Retail rice price is an average of January-November only.
-198-
Sources of Data for Appendix Table XIV: Indonesia NOTE: For the pre.-World War ILl period, see Java and Madura table. 1. Arable Area 1964-1970: Food and Agriculture Organization of the United Nations, FAO Production Yearbook (Rome). 1971-1980: U.N. Economic and Social Commission for Asia and the Pacific, Statistical Yearbook for Asia and the Pacific (Bangkok). 2. Rice Production 1950-1979: Indonesia. Biro Pusat Statistik, Statistical Pocketbook of Indonesia (Jakarta) - 1980: Indonesia. Biro Pusat Statistik, Indikator ekonomi (Jakarta: 1981). 1981: Mears, Leon, The New Rice Economy of Indonesia (Yogyakarta: Gadjah Mada University Press, 1981). 1982: Indonesia. Biro Pusat Statistik, Indikator ekonomi (Jakarta: 1983). 3. Rice Area 1950-1979: Indonesia. Biro Pusat Statistik, Statistical Pocketbook of Indonesia (Jakarta). 1980-1981: Mears, Leon, The New Rice Economy of Indonesia (Yogyakarta: Gadjah Mada University Press, 1981). 4. Rice Yield 1950-1981: Rice yields are calculated by dividing reported rice production (2) by area (3) on an annual basis. 5. Rice Area Irrigated 1963: 1963 Agricultural Census Final Report. 1976: Nyberg, Albert and Prabowo, Dibyc, "Status and Performance of Irri- gation in Indonesia as of 1978 and the Prospects to 1990 and 2000," prepared
-199-
for the IFPRI/IRRI/IFDC Rice Policy Project for Southeast Asian Countries Workshop, Los Banos, Philippines, May 22-25, 1979, pp. 53-54. 1978: Indonesia. Biro Pusat Statiscik, Statistical Pocketbook of Indonesia (1979/1980: Jakarta). 6. Rice Imports 1938-1956: Mears, Leon, Rice Marketing in the Republic of Indonesia (Djakarta: Djakarta School of Economics, University of Indonesia, 1961). 1957-1979: Indonesia. Biro Pusat Statistik, Statistical Pocketbook of Indonesia (Jakarta). 1980-1982: Indonesia. Biro Pusat Statistik, Indikator ekonomi (Jakarta: 1982). 7. Rice Exports 1938-1940: Neder1andsch-Indië. Sainengesteld door het Centraal Kantoor voor de Statistiek van het Departement van Economische Zaken, Statistisch jarroverzicht van Neder1andsch-Indië (Batavia: Landsdrukkerij). 8. Population 1940-1959: Indonesia. Biro Pusat Statistik, Statistical Pocketbook of Indonesia (Jakarta: 1940). 1960-1969: U.S. Department of Commerce, Bureau of the Census, International Population Dynamics 1950-79 (Washington, D.C.: 1979), 1SP-WP-79(A). 1970-1981: U.S. Department of Commerce, Bureau of the Census, Demographic Estimates for Countries With a Population of 10 Million or More: 1981 (Washington, D.C.: 1981), 1SP-WP-81. 9. Farm-Harvest Price 1966-1982: Indonesia. Biro Pusat Statistik, Indikator ekonomi (Jakarta: 1970-1982).
-200-
10. Procurement Price 1952-1963: Pitt, Mark, "Economic Policy and Agricultural Development in Indonesia," Ph.D. thesis, University of California, 1977, p. 21; original source: BULOG. 1969-1981: Indonesia. Badan Urusan Logistik. 11. Wholesale Rice Price (Main Market) 1938-1967: Indonesia. Biro Pusat Statistik, Statistical Pocketbook of Indonesia (Jakarta). 1968-1982: Indonesia. Biro Pusat Statistik, Indikator ekonomi (Jakarta.: 1970-1982). 12. Average Retail Rice Price 1938-1982: Indonesia. Biro Punt Statistik, Indikator ekonomi (Jakarta: 1970-1981). 13. Farm Wage Rate 1955-1959: Indonesia. Biro Pusat Statistik, Rata-rata uyah buruh perkebunan (Jakarta). 1966-1979: Indonesia. Biro Pusat Statistik, Statistik upah karyawan perkebunan (Jakarta). 14. Domestic Apparent Per Capita Rice Availability 1950-1981: Domestic availability is calculated by dividing rice production (2) by population (8) on an annual basis. 15. Main Rice Crop Area (Sawah) 1950-1981: Indonesia. Biro Pusat Statistik, Statisttzal Pocketbook of Indonesia (Jakarta).
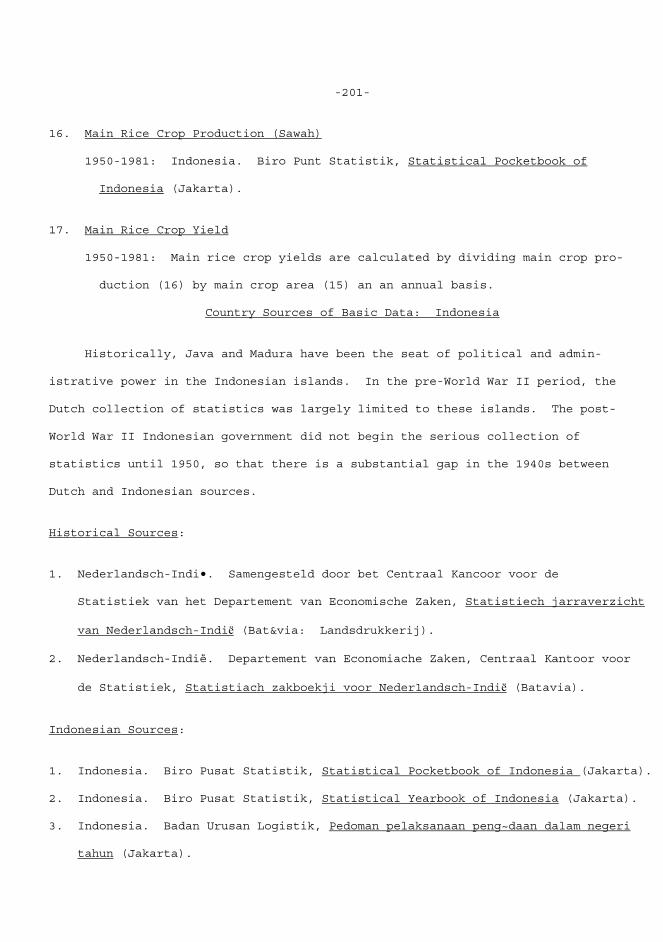
-201-
16. Main Rice Crop Production (Sawah) 1950-1981: Indonesia. Biro Punt Statistik, Statistical Pocketbook of Indonesia (Jakarta). 17. Main Rice Crop Yield 1950-1981: Main rice crop yields are calculated by dividing main crop pro- duction (16) by main crop area (15) an an annual basis.
Country Sources of Basic Data: Indonesia Historically, Java and Madura have been the seat of political and admin- istrative power in the Indonesian islands. In the pre-World War II period, the Dutch collection of statistics was largely limited to these islands. The post- World War II Indonesian government did not begin the serious collection of statistics until 1950, so that there is a substantial gap in the 1940s between Dutch and Indonesian sources. Historical Sources: 1. Nederlandsch-Indi•. Samengesteld door bet Centraal Kancoor voor de Statistiek van het Departement van Economische Zaken, Statistiech jarraverzicht van Nederlandsch-Indiё (Bat&via: Landsdrukkerij). 2. Nederlandsch-Indië. Departement van Economiache Zaken, Centraal Kantoor voor de Statistiek, Statistiach zakboekji voor Neder1andsch-Indiё (Batavia). Indonesian Sources: 1. Indonesia. Biro Pusat Statistik, Statistical Pocketbook of Indonesia (Jakarta). 2. Indonesia. Biro Pusat Statistik, Statistical Yearbook of Indonesia (Jakarta). 3. Indonesia. Badan Urusan Logistik, Pedoman pelaksanaan peng~daan dalam negeri tahun (Jakarta).
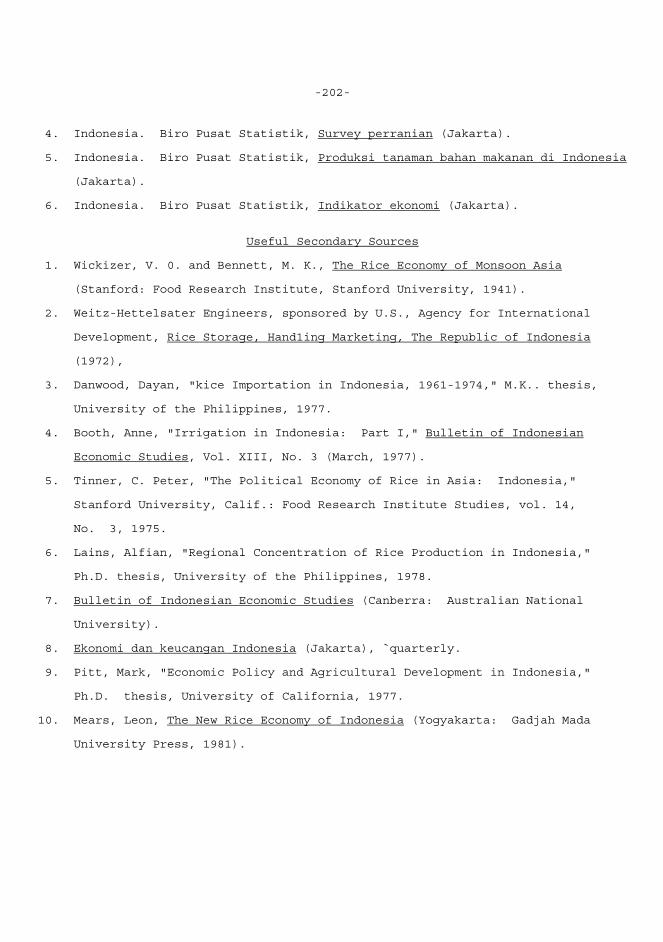
-202-
4. Indonesia. Biro Pusat Statistik, Survey perranian (Jakarta). 5. Indonesia. Biro Pusat Statistik, Produksi tanaman bahan makanan di Indonesia (Jakarta). 6. Indonesia. Biro Pusat Statistik, Indikator ekonomi (Jakarta).
Useful Secondary Sources 1. Wickizer, V. 0. and Bennett, M. K., The Rice Economy of Monsoon Asia (Stanford: Food Research Institute, Stanford University, 1941). 2. Weitz-Hettelsater Engineers, sponsored by U.S., Agency for International Development, Rice Storage, Hand1ing Marketing, The Republic of Indonesia (1972), 3. Danwood, Dayan, "kice Importation in Indonesia, 1961-1974," M.K.. thesis, University of the Philippines, 1977. 4. Booth, Anne, "Irrigation in Indonesia: Part I," Bulletin of Indonesian Economic Studies, Vol. XIII, No. 3 (March, 1977). 5. Tinner, C. Peter, "The Political Economy of Rice in Asia: Indonesia,"
Stanford University, Calif.: Food Research Institute Studies, vol. 14, No. 3, 1975. 6. Lains, Alfian, "Regional Concentration of Rice Production in Indonesia," Ph.D. thesis, University of the Philippines, 1978. 7. Bulletin of Indonesian Economic Studies (Canberra: Australian National University). 8. Ekonomi dan keucangan Indonesia (Jakarta), `quarterly. 9. Pitt, Mark, "Economic Policy and Agricultural Development in Indonesia," Ph.D. thesis, University of California, 1977. 10. Mears, Leon, The New Rice Economy of Indonesia (Yogyakarta: Gadjah Mada University Press, 1981).
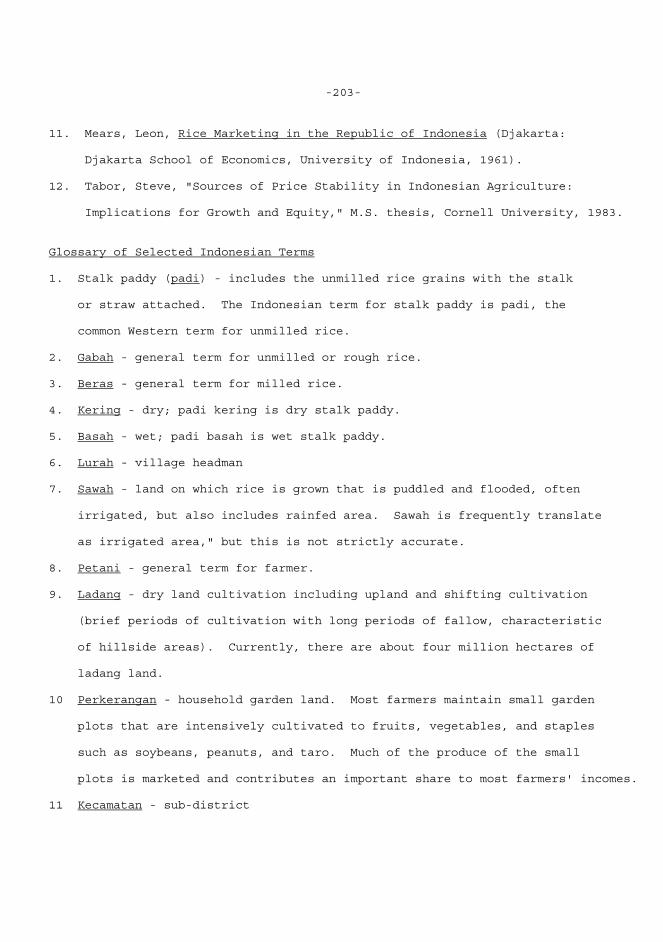
-203-
11. Mears, Leon, Rice Marketing in the Republic of Indonesia (Djakarta: Djakarta School of Economics, University of Indonesia, 1961). 12. Tabor, Steve, "Sources of Price Stability in Indonesian Agriculture: Implications for Growth and Equity," M.S. thesis, Cornell University, 1983. Glossary of Selected Indonesian Terms 1. Stalk paddy (padi) - includes the unmilled rice grains with the stalk or straw attached. The Indonesian term for stalk paddy is padi, the common Western term for unmilled rice. 2. Gabah - general term for unmilled or rough rice. 3. Beras - general term for milled rice. 4. Kering - dry; padi kering is dry stalk paddy. 5. Basah - wet; padi basah is wet stalk paddy. 6. Lurah - village headman 7. Sawah - land on which rice is grown that is puddled and flooded, often irrigated, but also includes rainfed area. Sawah is frequently translate as irrigated area," but this is not strictly accurate. 8. Petani - general term for farmer. 9. Ladang - dry land cultivation including upland and shifting cultivation (brief periods of cultivation with long periods of fallow, characteristic of hillside areas). Currently, there are about four million hectares of ladang land. 10 Perkerangan - household garden land. Most farmers maintain small garden plots that are intensively cultivated to fruits, vegetables, and staples such as soybeans, peanuts, and taro. Much of the produce of the small plots is marketed and contributes an important share to most farmers' incomes. 11 Kecamatan - sub-district
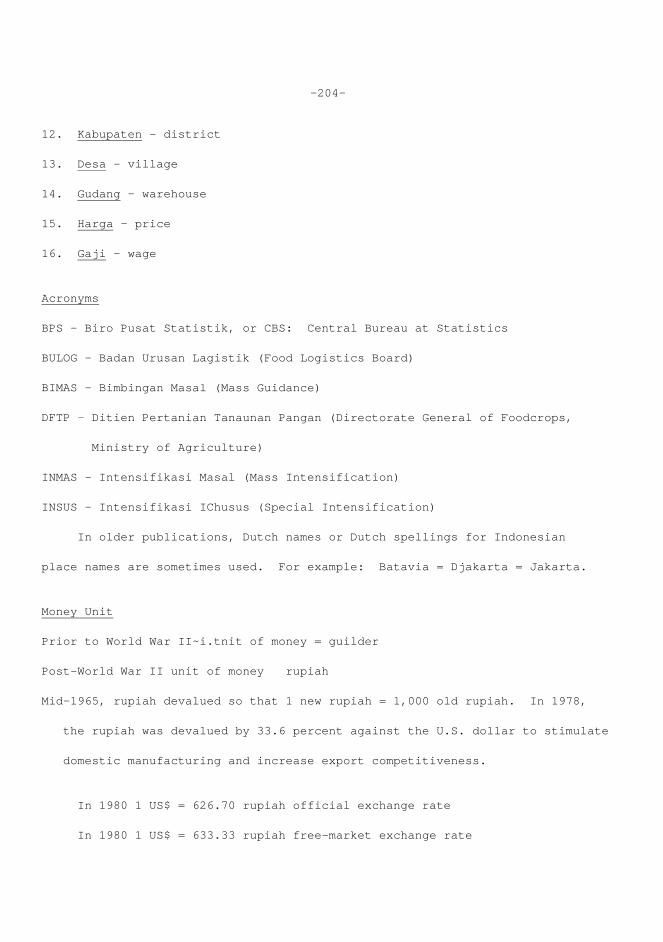
-204-
12. Kabupaten - district 13. Desa - village 14. Gudang - warehouse 15. Harga - price 16. Gaji - wage Acronyms BPS - Biro Pusat Statistik, or CBS: Central Bureau at Statistics BULOG - Badan Urusan Lagistik (Food Logistics Board) BIMAS - Bimbingan Masal (Mass Guidance) DFTP - Ditien Pertanian Tanaunan Pangan (Directorate General of Foodcrops, Ministry of Agriculture) INMAS - Intensifikasi Masal (Mass Intensification) INSUS - Intensifikasi IChusus (Special Intensification) In older publications, Dutch names or Dutch spellings for Indonesian place names are sometimes used. For example: Batavia = Djakarta = Jakarta. Money Unit Prior to World War II~i.tnit of money = guilder Post-World War II unit of money rupiah Mid-1965, rupiah devalued so that 1 new rupiah = 1,000 old rupiah. In 1978, the rupiah was devalued by 33.6 percent against the U.S. dollar to stimulate domestic manufacturing and increase export competitiveness. In 1980 1 US$ = 626.70 rupiah official exchange rate In 1980 1 US$ = 633.33 rupiah free-market exchange rate
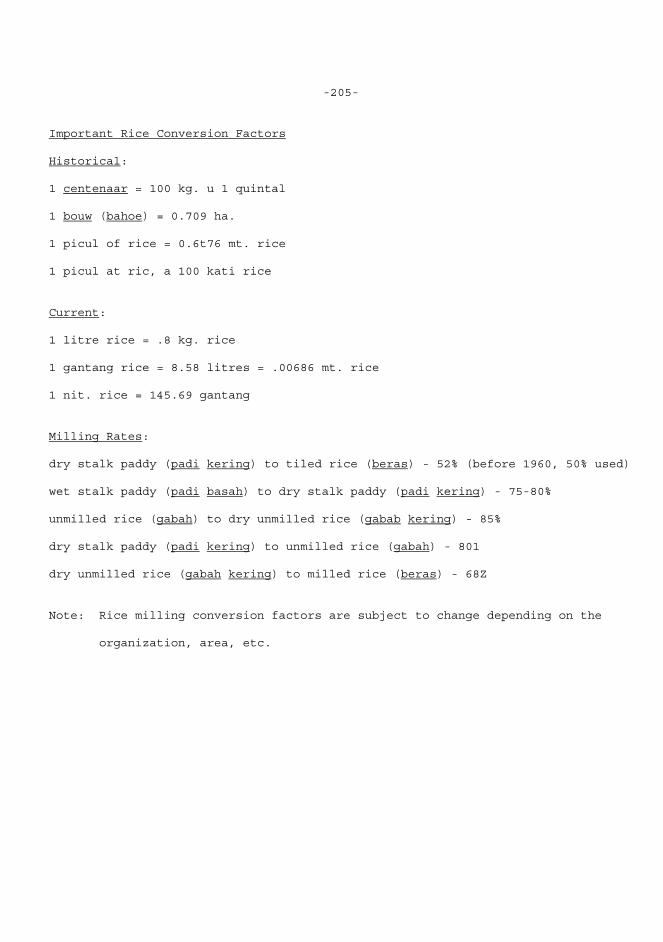
-205-
Important Rice Conversion Factors Historical: 1 centenaar = 100 kg. u 1 quintal 1 bouw (bahoe) = 0.709 ha. 1 picul of rice = 0.6t76 mt. rice 1 picul at ric, a 100 kati rice Current: 1 litre rice = .8 kg. rice 1 gantang rice = 8.58 litres = .00686 mt. rice 1 nit. rice = 145.69 gantang Milling Rates: dry stalk paddy (padi kering) to tiled rice (beras) - 52% (before 1960, 50% used) wet stalk paddy (padi basah) to dry stalk paddy (padi kering) - 75-80% unmilled rice (gabah) to dry unmilled rice (gabab kering) - 85% dry stalk paddy (padi kering) to unmilled rice (gabah) - 801 dry unmilled rice (gabah kering) to milled rice (beras) - 68Z Note: Rice milling conversion factors are subject to change depending on the organization, area, etc.
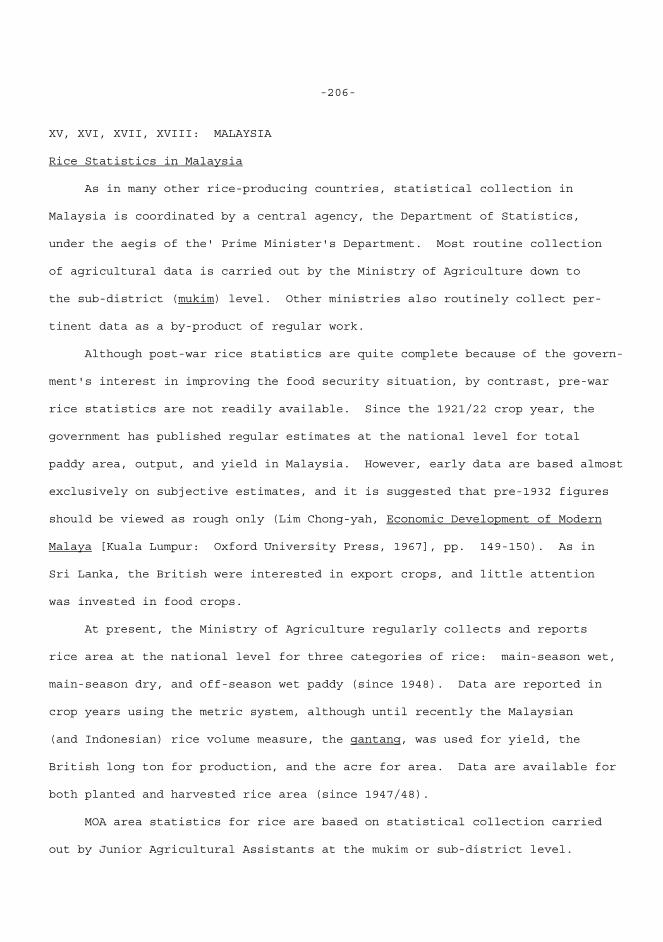
-206-
XV, XVI, XVII, XVIII: MALAYSIA Rice Statistics in Malaysia As in many other rice-producing countries, statistical collection in Malaysia is coordinated by a central agency, the Department of Statistics, under the aegis of the' Prime Minister's Department. Most routine collection of agricultural data is carried out by the Ministry of Agriculture down to the sub-district (mukim) level. Other ministries also routinely collect per- tinent data as a by-product of regular work. Although post-war rice statistics are quite complete because of the govern- ment's interest in improving the food security situation, by contrast, pre-war rice statistics are not readily available. Since the 1921/22 crop year, the government has published regular estimates at the national level for total paddy area, output, and yield in Malaysia. However, early data are based almost exclusively on subjective estimates, and it is suggested that pre-1932 figures should be viewed as rough only (Lim Chong-yah, Economic Development of Modern Malaya [Kuala Lumpur: Oxford University Press, 1967], pp. 149-150). As in Sri Lanka, the British were interested in export crops, and little attention was invested in food crops. At present, the Ministry of Agriculture regularly collects and reports rice area at the national level for three categories of rice: main-season wet, main-season dry, and off-season wet paddy (since 1948). Data are reported in crop years using the metric system, although until recently the Malaysian (and Indonesian) rice volume measure, the gantang, was used for yield, the British long ton for production, and the acre for area. Data are available for both planted and harvested rice area (since 1947/48). MOA area statistics for rice are based on statistical collection carried out by Junior Agricultural Assistants at the mukim or sub-district level.
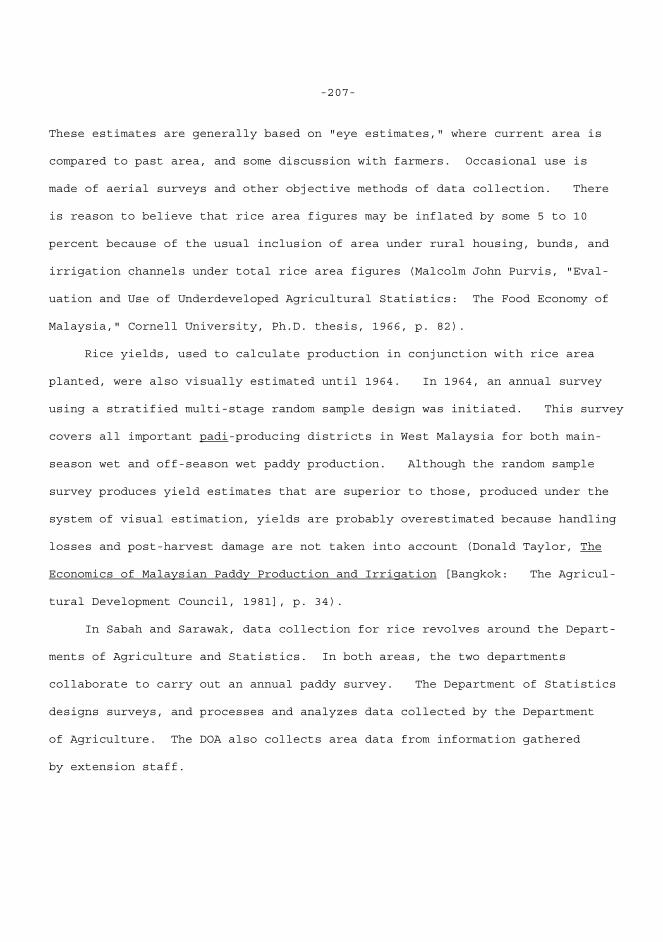
-207-
These estimates are generally based on "eye estimates," where current area is compared to past area, and some discussion with farmers. Occasional use is made of aerial surveys and other objective methods of data collection. There is reason to believe that rice area figures may be inflated by some 5 to 10 percent because of the usual inclusion of area under rural housing, bunds, and irrigation channels under total rice area figures (Malcolm John Purvis, "Eval- uation and Use of Underdeveloped Agricultural Statistics: The Food Economy of Malaysia," Cornell University, Ph.D. thesis, 1966, p. 82). Rice yields, used to calculate production in conjunction with rice area planted, were also visually estimated until 1964. In 1964, an annual survey using a stratified multi-stage random sample design was initiated. This survey covers all important padi-producing districts in West Malaysia for both main- season wet and off-season wet paddy production. Although the random sample survey produces yield estimates that are superior to those, produced under the system of visual estimation, yields are probably overestimated because handling losses and post-harvest damage are not taken into account (Donald Taylor, The Economics of Malaysian Paddy Production and Irrigation [Bangkok: The Agricul- tural Development Council, 1981], p. 34). In Sabah and Sarawak, data collection for rice revolves around the Depart- ments of Agriculture and Statistics. In both areas, the two departments collaborate to carry out an annual paddy survey. The Department of Statistics designs surveys, and processes and analyzes data collected by the Department of Agriculture. The DOA also collects area data from information gathered by extension staff.
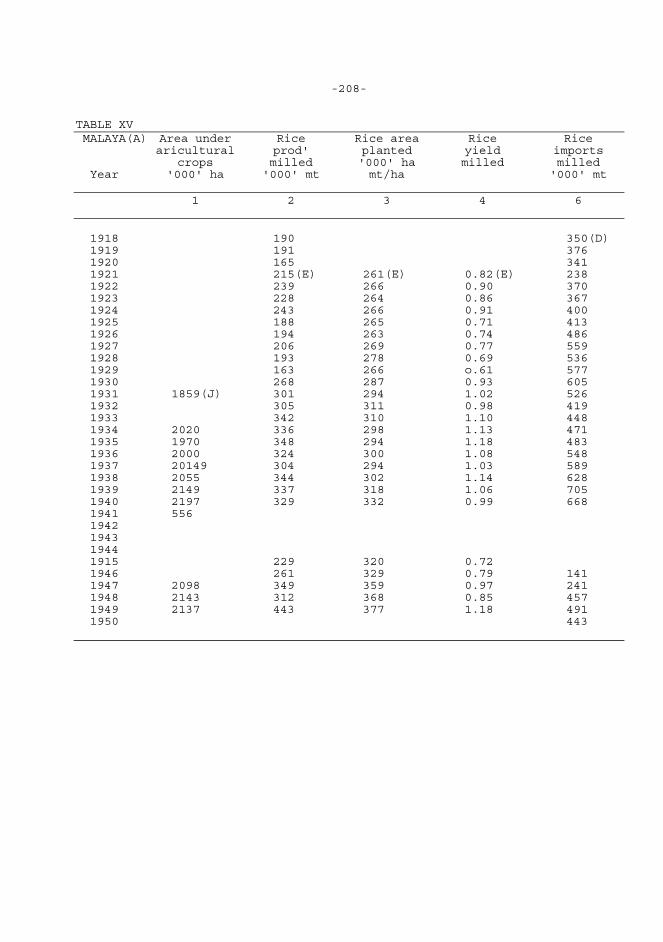
-208- TABLE XV MALAYA(A) Area under Rice Rice area Rice Rice aricultural prod' planted yield imports crops milled '000' ha milled milled Year '000' ha '000' mt mt/ha '000' mt 1 2 3 4 6 1918 190 350(D) 1919 191 376 1920 165 341 1921 215(E) 261(E) 0.82(E) 238 1922 239 266 0.90 370 1923 228 264 0.86 367 1924 243 266 0.91 400 1925 188 265 0.71 413 1926 194 263 0.74 486 1927 206 269 0.77 559 1928 193 278 0.69 536 1929 163 266 o.61 577 1930 268 287 0.93 605 1931 1859(J) 301 294 1.02 526 1932 305 311 0.98 419 1933 342 310 1.10 448 1934 2020 336 298 1.13 471 1935 1970 348 294 1.18 483 1936 2000 324 300 1.08 548 1937 20149 304 294 1.03 589 1938 2055 344 302 1.14 628 1939 2149 337 318 1.06 705 1940 2197 329 332 0.99 668 1941 556 1942 1943 1944 1915 229 320 0.72 1946 261 329 0.79 141 1947 2098 349 359 0.97 241 1948 2143 312 368 0.85 457 1949 2137 443 377 1.18 491 1950 443
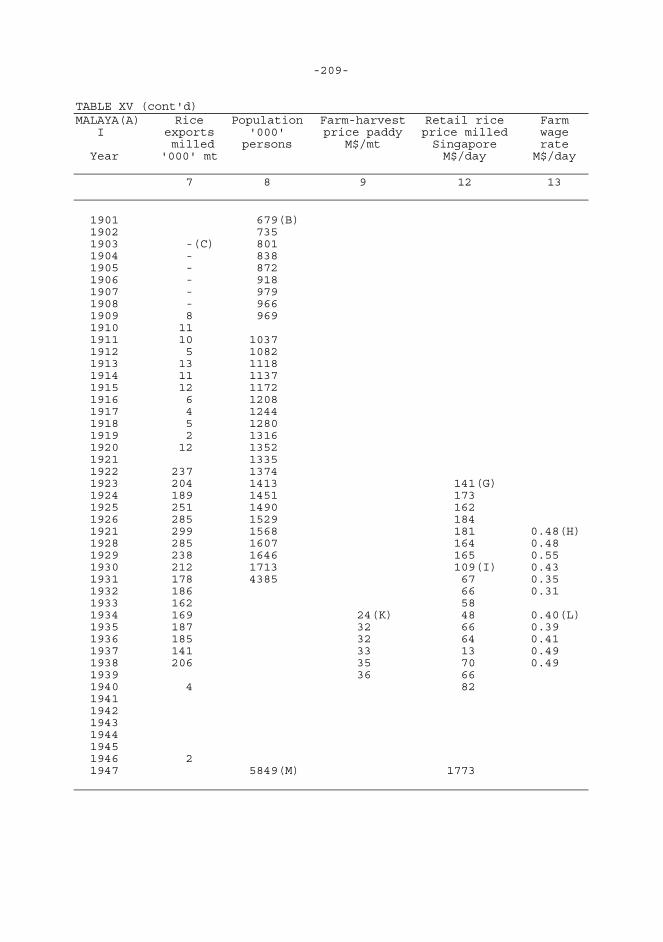
-209- TABLE XV (cont'd) MALAYA(A) Rice Population Farm-harvest Retail rice Farm I exports '000' price paddy price milled wage milled persons M$/mt Singapore rate Year '000' mt M$/day M$/day 7 8 9 12 13 1901 679(B) 1902 735 1903 -(C) 801 1904 - 838 1905 - 872 1906 - 918 1907 - 979 1908 - 966 1909 8 969 1910 11 1911 10 1037 1912 5 1082 1913 13 1118 1914 11 1137 1915 12 1172 1916 6 1208 1917 4 1244 1918 5 1280 1919 2 1316 1920 12 1352 1921 1335 1922 237 1374 1923 204 1413 141(G) 1924 189 1451 173 1925 251 1490 162 1926 285 1529 184 1921 299 1568 181 0.48(H) 1928 285 1607 164 0.48 1929 238 1646 165 0.55 1930 212 1713 109(I) 0.43 1931 178 4385 67 0.35 1932 186 66 0.31 1933 162 58 1934 169 24(K) 48 0.40(L) 1935 187 32 66 0.39 1936 185 32 64 0.41 1937 141 33 13 0.49 1938 206 35 70 0.49 1939 36 66 1940 4 82 1941 1942 1943 1944 1945 1946 2 1947 5849(M) 1773
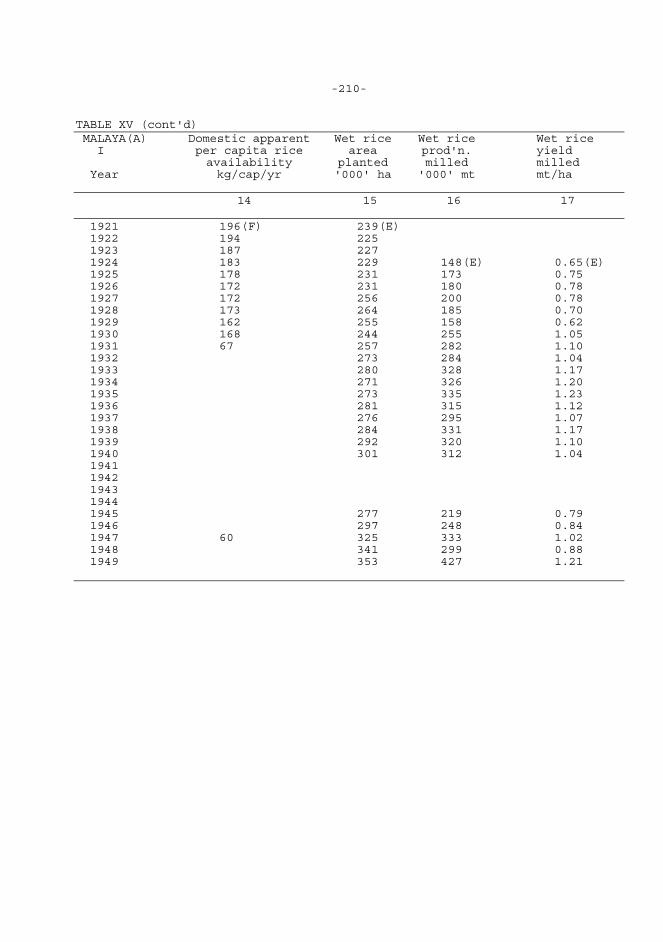
-210- TABLE XV (cont'd) MALAYA(A) Domestic apparent Wet rice Wet rice Wet rice I per capita rice area prod'n. yield availability planted milled milled Year kg/cap/yr '000' ha '000' mt mt/ha 14 15 16 17 1921 196(F) 239(E) 1922 194 225 1923 187 227 1924 183 229 148(E) 0.65(E) 1925 178 231 173 0.75 1926 172 231 180 0.78 1927 172 256 200 0.78 1928 173 264 185 0.70 1929 162 255 158 0.62 1930 168 244 255 1.05 1931 67 257 282 1.10 1932 273 284 1.04 1933 280 328 1.17 1934 271 326 1.20 1935 273 335 1.23 1936 281 315 1.12 1937 276 295 1.07 1938 284 331 1.17 1939 292 320 1.10 1940 301 312 1.04 1941 1942 1943 1944 1945 277 219 0.79 1946 297 248 0.84 1947 60 325 333 1.02 1948 341 299 0.88 1949 353 427 1.21
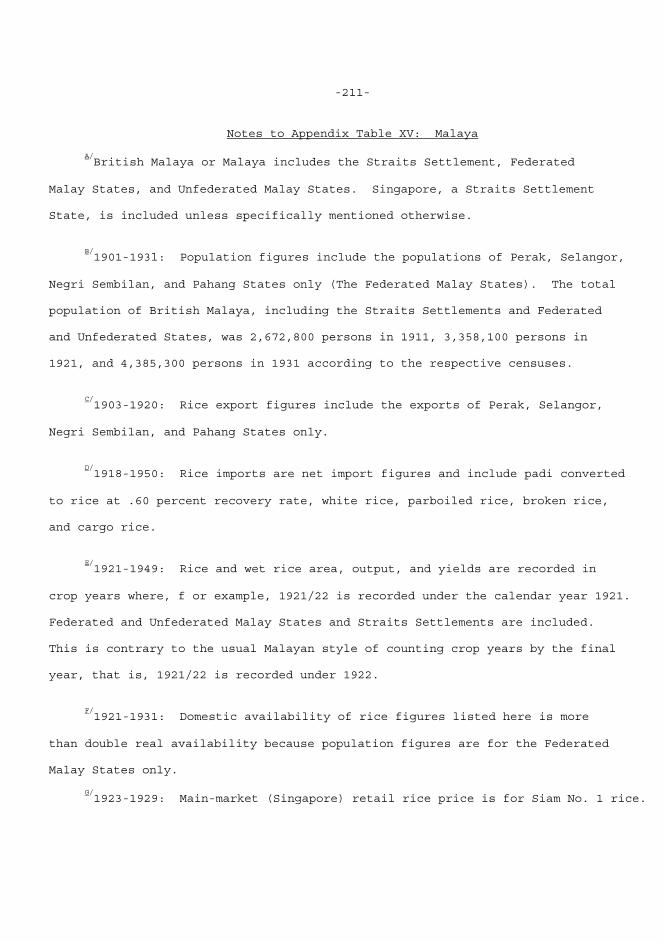
-211-
Notes to Appendix Table XV: Malaya
A/British Malaya or Malaya includes the Straits Settlement, Federated
Malay States, and Unfederated Malay States. Singapore, a Straits Settlement State, is included unless specifically mentioned otherwise.
B/1901-193l: Population figures include the populations of Perak, Selangor,
Negri Sembilan, and Pahang States only (The Federated Malay States). The total population of British Malaya, including the Straits Settlements and Federated and Unfederated States, was 2,672,800 persons in 1911, 3,358,100 persons in 1921, and 4,385,300 persons in 1931 according to the respective censuses.
C/1903-1920: Rice export figures include the exports of Perak, Selangor,
Negri Sembilan, and Pahang States only.
D/1918-1950: Rice imports are net import figures and include padi converted
to rice at .60 percent recovery rate, white rice, parboiled rice, broken rice, and cargo rice.
E/1921-1949: Rice and wet rice area, output, and yields are recorded in
crop years where, f or example, 1921/22 is recorded under the calendar year 1921. Federated and Unfederated Malay States and Straits Settlements are included. This is contrary to the usual Malayan style of counting crop years by the final year, that is, 1921/22 is recorded under 1922.
F/1921-1931: Domestic availability of rice figures listed here is more
than double real availability because population figures are for the Federated Malay States only.
G/1923-1929: Main-market (Singapore) retail rice price is for Siam No. 1 rice.
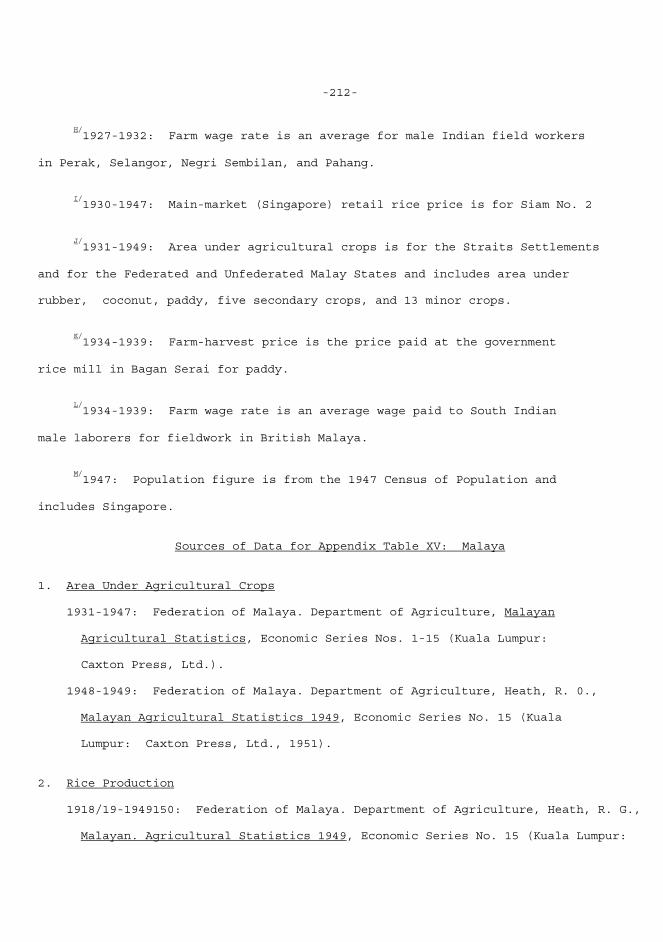
-212-
H/1927-1932: Farm wage rate is an average for male Indian field workers
in Perak, Selangor, Negri Sembilan, and Pahang.
I/1930-1947: Main-market (Singapore) retail rice price is for Siam No. 2
J/1931-1949: Area under agricultural crops is for the Straits Settlements
and for the Federated and Unfederated Malay States and includes area under rubber, coconut, paddy, five secondary crops, and 13 minor crops.
K/1934-1939: Farm-harvest price is the price paid at the government
rice mill in Bagan Serai for paddy.
L/1934-1939: Farm wage rate is an average wage paid to South Indian
male laborers for fieldwork in British Malaya.
M/1947: Population figure is from the 1947 Census of Population and
includes Singapore.
Sources of Data for Appendix Table XV: Malaya 1. Area Under Agricultural Crops 1931-1947: Federation of Malaya. Department of Agriculture, Malayan Agricultural Statistics, Economic Series Nos. 1-15 (Kuala Lumpur: Caxton Press, Ltd.). 1948-1949: Federation of Malaya. Department of Agriculture, Heath, R. 0., Malayan Agricultural Statistics 1949, Economic Series No. 15 (Kuala Lumpur: Caxton Press, Ltd., 1951). 2. Rice Production 1918/19-1949150: Federation of Malaya. Department of Agriculture, Heath, R. G., Malayan. Agricultural Statistics 1949, Economic Series No. 15 (Kuala Lumpur:
-213-
Cayton Press, Ltd., 1951). 3. Rice Area 1921/22-1949/50: Federation of Malaya. Department of Agriculture, Heath, R. C., Malayan Agricultural Statistics 1949, Economic Series No. 15 (Kuala Lumpur: Canon Press, Ltd., 1951). 4. Rice Yield 1921/22-1949/50: Rice yields are calculated by dividing rice production (2) by rice area (3) on an annual basis. 6. Rice Imports 1918-1950: Federated Malay States. Federated Malay States Government Press, Manual of Statistics Relating to the Federated Malay States (Kuala Lumpur: 1921). 7. Rice Exports 1903-1920: Federated Malay States. Federated Malay States Government Press, Manual of Statistics Relating to the Federated Malay States (Kuala Lumpur: 1921). 1922-1940: Cheng, Siok-hwa, The Rice Trade of Malaya (Singapore: University Education Press, 1973). 1946: Malaya. Malayan Statistics (London: The Malayan Information Agency). 8. Population 1901-1920: Federated Malay States. Federated Malay States Government Press, Manual of Statistics Relating the Federated Malay States (Kuala Lumpur 1921). 1921-1931: Alexander, C. S., Malayan Statistics (London: Malayan Information Agency, 1933).
-214-
1947: Federation of Malaya. Department of Agriculture, Heath, R. G., Malayan Agricultural Statistics 1949, Economic Series No. 15 (Kuala Lumpur: Gaston Press, Ltd., 1951). 9. Farm-Harvest Price 1934-1939: Federation of Malaya. Department of Agriculture, Malayan Agricultural Statistics (Kuala Lumpur: Caxton Press, Ltd.). 12. Retail Price 1923-1947: Federation of Malaya. Department of Agriculture, Malayan Agricultural Statistics (Kuala Lumpur: Caxton Press, Ltd., 1951 and 1939). 13. Farm Wage Rate 1927-1932: Alexander. C. S., Malayan Statistics (London: Malayan Information Agency, 1933). 1934-1938: Straits Settlement and Federated Malay States. Statistics Department, Malayan Yearbook (Singapore: Government Printing Office). 14. Domestic Apparent Per Capita Rice Avai1ability 1921-1947: Domestic apparent per capita rice availability is calculated by dividing total rice production (2) by population (8) on an annual basis. 15. Wet Rice Area Planted 1921122-1949/50: Federation of Malaya. Department of Agriculture, Heath, R. C., Malayan Agricultural Statistics 1949, Economic Series No. 15 (Kuala Lumpur: Caxton Press, Ltd., 1951). 16. Wet Rice Production 1924/25-1949/50: Federation of Malaya. Department of Agriculture, Heath, R. G.,
-215-
Malayan Agricultural Statistics 1949, Economic Series No. 15 (Kuala Lumpur: Canon Press, Ltd., 1951). 17. Wet Rice Yields 1924/25-1949/50: Wet rice yields are calculated by dividing wet rice pro- duction (16) by wet rice area (15) on an annual basis.
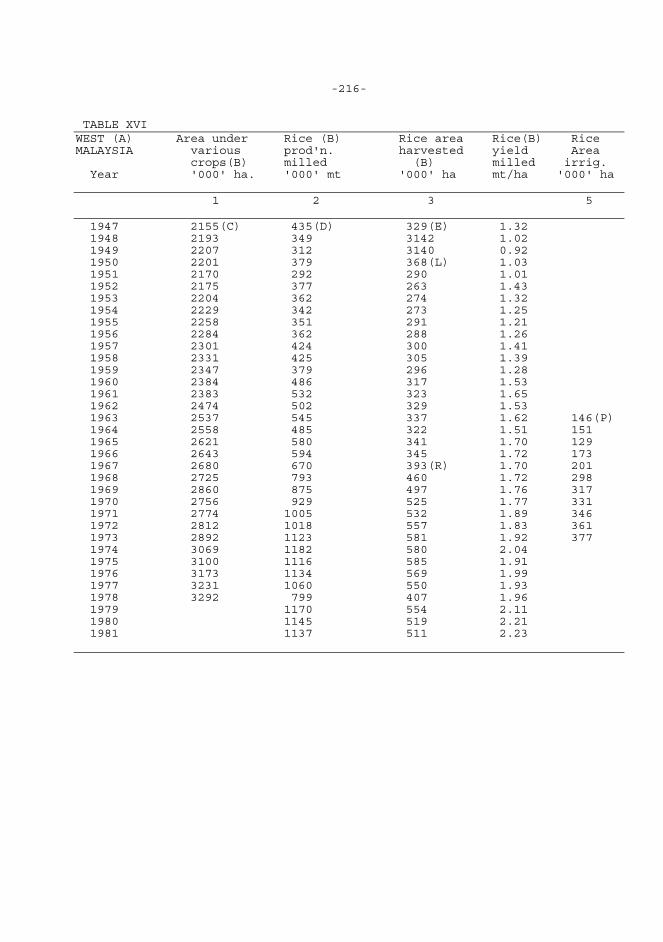
-216- TABLE XVI WEST (A) Area under Rice (B) Rice area Rice(B) Rice MALAYSIA various prod'n. harvested yield Area crops(B) milled (B) milled irrig. Year '000' ha. '000' mt '000' ha mt/ha '000' ha 1 2 3 5 1947 2155(C) 435(D) 329(E) 1.32 1948 2193 349 3142 1.02 1949 2207 312 3140 0.92 1950 2201 379 368(L) 1.03 1951 2170 292 290 1.01 1952 2175 377 263 1.43 1953 2204 362 274 1.32 1954 2229 342 273 1.25 1955 2258 351 291 1.21 1956 2284 362 288 1.26 1957 2301 424 300 1.41 1958 2331 425 305 1.39 1959 2347 379 296 1.28 1960 2384 486 317 1.53 1961 2383 532 323 1.65 1962 2474 502 329 1.53 1963 2537 545 337 1.62 146(P) 1964 2558 485 322 1.51 151 1965 2621 580 341 1.70 129 1966 2643 594 345 1.72 173 1967 2680 670 393(R) 1.70 201 1968 2725 793 460 1.72 298 1969 2860 875 497 1.76 317 1970 2756 929 525 1.77 331 1971 2774 1005 532 1.89 346 1972 2812 1018 557 1.83 361 1973 2892 1123 581 1.92 377 1974 3069 1182 580 2.04 1975 3100 1116 585 1.91 1976 3173 1134 569 1.99 1977 3231 1060 550 1.93 1978 3292 799 407 1.96 1979 1170 554 2.11 1980 1145 519 2.21 1981 1137 511 2.23
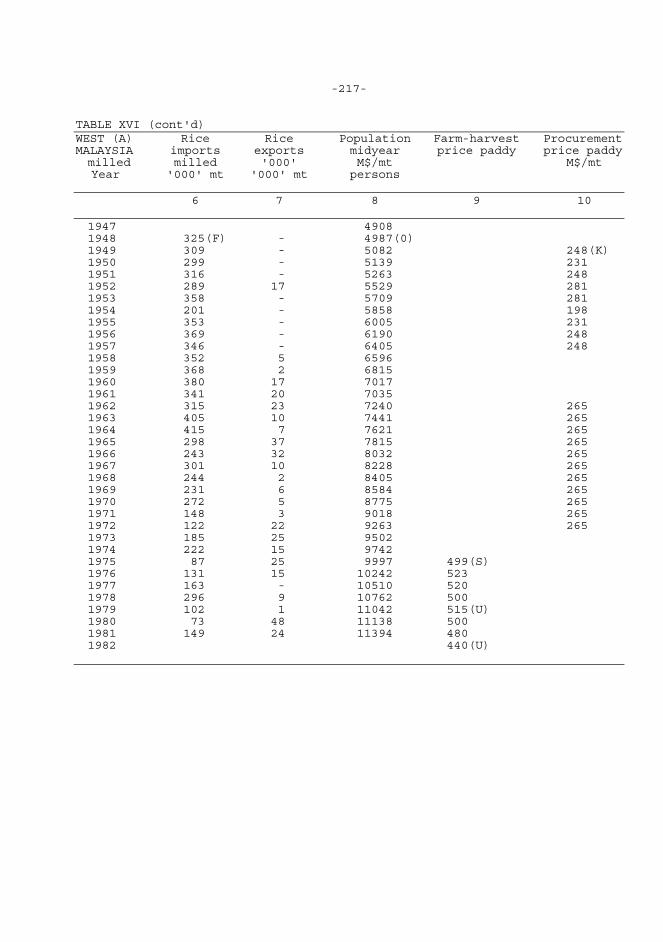
-217- TABLE XVI (cont'd) WEST (A) Rice Rice Population Farm-harvest Procurement MALAYSIA imports exports midyear price paddy price paddy milled milled '000' M$/mt M$/mt Year '000' mt '000' mt persons 6 7 8 9 10 1947 4908 1948 325(F) - 4987(0) 1949 309 - 5082 248(K) 1950 299 - 5139 231 1951 316 - 5263 248 1952 289 17 5529 281 1953 358 - 5709 281 1954 201 - 5858 198 1955 353 - 6005 231 1956 369 - 6190 248 1957 346 - 6405 248 1958 352 5 6596 1959 368 2 6815 1960 380 17 7017 1961 341 20 7035 1962 315 23 7240 265 1963 405 10 7441 265 1964 415 7 7621 265 1965 298 37 7815 265 1966 243 32 8032 265 1967 301 10 8228 265 1968 244 2 8405 265 1969 231 6 8584 265 1970 272 5 8775 265 1971 148 3 9018 265 1972 122 22 9263 265 1973 185 25 9502 1974 222 15 9742 1975 87 25 9997 499(S) 1976 131 15 10242 523 1977 163 - 10510 520 1978 296 9 10762 500 1979 102 1 11042 515(U) 1980 73 48 11138 500 1981 149 24 11394 480 1982 440(U)
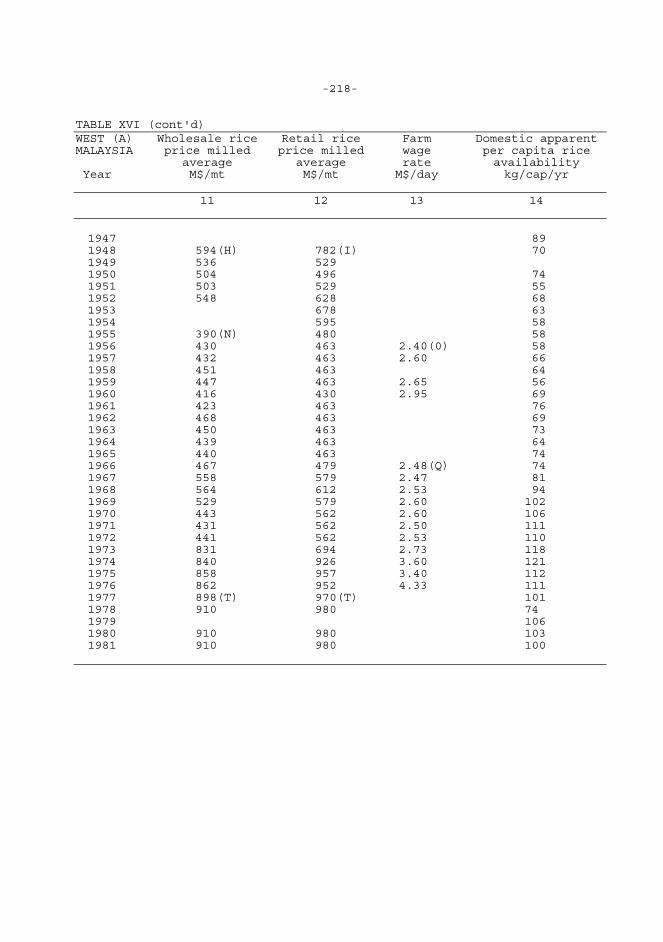
-218- TABLE XVI (cont'd) WEST (A) Wholesale rice Retail rice Farm Domestic apparent MALAYSIA price milled price milled wage per capita rice average average rate availability Year M$/mt M$/mt M$/day kg/cap/yr 11 12 13 14 1947 89 1948 594(H) 782(I) 70 1949 536 529 1950 504 496 74 1951 503 529 55 1952 548 628 68 1953 678 63 1954 595 58 1955 390(N) 480 58 1956 430 463 2.40(0) 58 1957 432 463 2.60 66 1958 451 463 64 1959 447 463 2.65 56 1960 416 430 2.95 69 1961 423 463 76 1962 468 463 69 1963 450 463 73 1964 439 463 64 1965 440 463 74 1966 467 479 2.48(Q) 74 1967 558 579 2.47 81 1968 564 612 2.53 94 1969 529 579 2.60 102 1970 443 562 2.60 106 1971 431 562 2.50 111 1972 441 562 2.53 110 1973 831 694 2.73 118 1974 840 926 3.60 121 1975 858 957 3.40 112 1976 862 952 4.33 111 1977 898(T) 970(T) 101 1978 910 980 74 1979 106 1980 910 980 103 1981 910 980 100
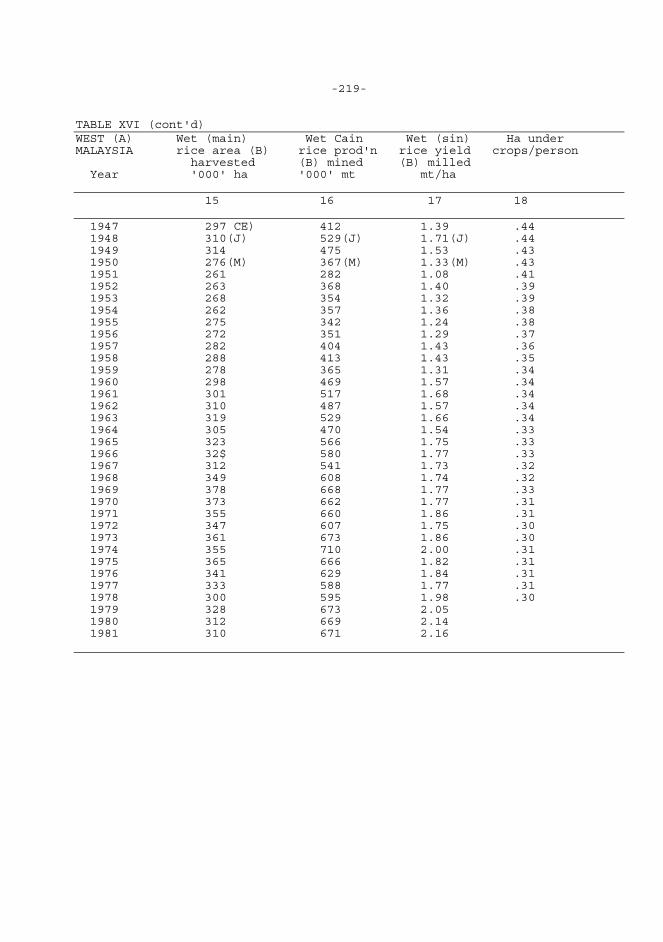
-219- TABLE XVI (cont'd) WEST (A) Wet (main) Wet Cain Wet (sin) Ha under MALAYSIA rice area (B) rice prod'n rice yield crops/person harvested (B) mined (B) milled Year '000' ha '000' mt mt/ha 15 16 17 18 1947 297 CE) 412 1.39 .44 1948 310(J) 529(J) 1.71(J) .44 1949 314 475 1.53 .43 1950 276(M) 367(M) 1.33(M) .43 1951 261 282 1.08 .41 1952 263 368 1.40 .39 1953 268 354 1.32 .39 1954 262 357 1.36 .38 1955 275 342 1.24 .38 1956 272 351 1.29 .37 1957 282 404 1.43 .36 1958 288 413 1.43 .35 1959 278 365 1.31 .34 1960 298 469 1.57 .34 1961 301 517 1.68 .34 1962 310 487 1.57 .34 1963 319 529 1.66 .34 1964 305 470 1.54 .33 1965 323 566 1.75 .33 1966 32$ 580 1.77 .33 1967 312 541 1.73 .32 1968 349 608 1.74 .32 1969 378 668 1.77 .33 1970 373 662 1.77 .31 1971 355 660 1.86 .31 1972 347 607 1.75 .30 1973 361 673 1.86 .30 1974 355 710 2.00 .31 1975 365 666 1.82 .31 1976 341 629 1.84 .31 1977 333 588 1.77 .31 1978 300 595 1.98 .30 1979 328 673 2.05 1980 312 669 2.14 1981 310 671 2.16
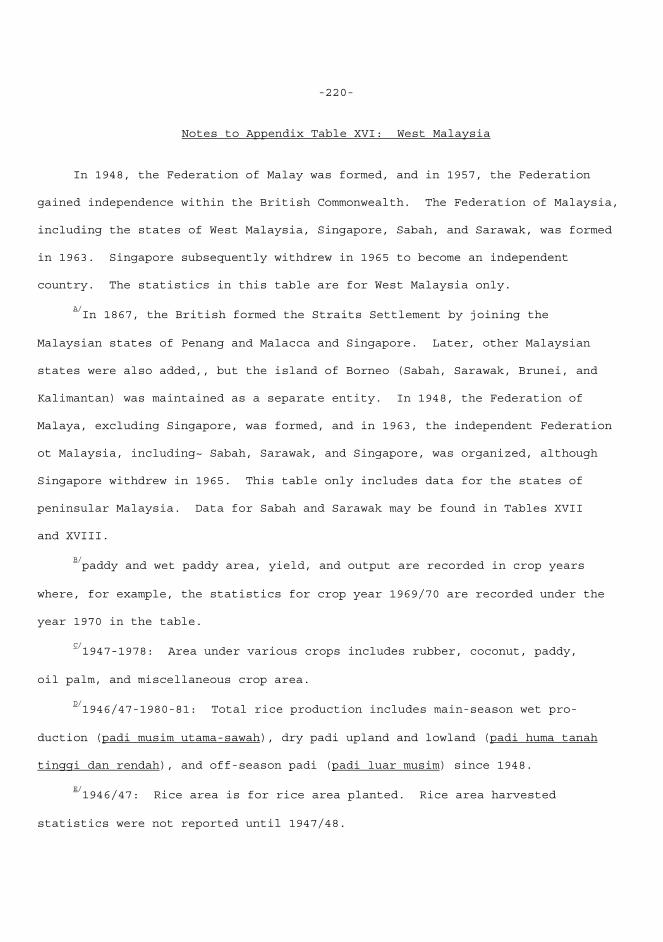
-220-
Notes to Appendix Table XVI: West Malaysia In 1948, the Federation of Malay was formed, and in 1957, the Federation gained independence within the British Commonwealth. The Federation of Malaysia, including the states of West Malaysia, Singapore, Sabah, and Sarawak, was formed in 1963. Singapore subsequently withdrew in 1965 to become an independent country. The statistics in this table are for West Malaysia only.
A/In 1867, the British formed the Straits Settlement by joining the
Malaysian states of Penang and Malacca and Singapore. Later, other Malaysian states were also added,, but the island of Borneo (Sabah, Sarawak, Brunei, and Kalimantan) was maintained as a separate entity. In 1948, the Federation of Malaya, excluding Singapore, was formed, and in 1963, the independent Federation ot Malaysia, including~ Sabah, Sarawak, and Singapore, was organized, although Singapore withdrew in 1965. This table only includes data for the states of peninsular Malaysia. Data for Sabah and Sarawak may be found in Tables XVII and XVIII.
B/paddy and wet paddy area, yield, and output are recorded in crop years
where, for example, the statistics for crop year 1969/70 are recorded under the year 1970 in the table.
C/1947-1978: Area under various crops includes rubber, coconut, paddy,
oil palm, and miscellaneous crop area.
D/1946/47-1980-81: Total rice production includes main-season wet pro-
duction (padi musim utama-sawah), dry padi upland and lowland (padi huma tanah tinggi dan rendah), and off-season padi (padi luar musim) since 1948.
E/1946/47: Rice area is for rice area planted. Rice area harvested
statistics were not reported until 1947/48.
-221-
F/1948-1981: Rice imports are for gross imports.
G/1948-1981: Population estimates are midyear estimates as of June 30th.
H/1948-1952: Wholesale rice price is for the main market of Penang only
and is for No. 1 (import) Rangoon rice.
I/l948-1976: Retail rice price is for local kedah No. 1 rice.
J/1947/48-1948/49: Wet rice area and output also include the off-season crop.
K/1949-1972: Procurement price is the Guaranteed Minimum Price (GMP) for
dry paddy (not more than 13 percent moisture content) delivered to the mill door. The GMP program was' introduced in 1949 by the government with the idea of en- couraging increased paddy output while bolstering the incomes of paddy farmers. The GMP, while nominally tied to domestic and world free-market prices, in practice is fixed and maintained at the same level for many years. Prices re- ported here are on a varying midyear basis, usually July to June.
L/1950-1981: Rice area harvested includes main-season (wet) padi (padi musim
utama-sawah), dry padi upland and lowland (padi huma tanah tinggi dan rendah), and off-season padi (padi liar muslin) since 1948.
M/1950-1981: Main-season (wet) padi (padi muslin utama-sawah) does not
include off-season production. It should be noted that main season padi output accounts for about 35 percent of total production and off-season for about 64 percent of total production. This attests to the importance of double cropping of padi land in the production of rice.
N/1955-1976: Wholesale rice price is for white No. 1, kedah rice and is
from the new crop.
-222-
0/1956-1960: Farm wage rate is for tea estate weeders.
P/1963-1973: Rice area irrigated includes main season and oft-season
irrigated area. Figures for 1970-1973 are interpolated based on a 4.429 percent annual growth. The original source for 1963-1969 is the Ministry of Agriculture and Lands, adapted from Lai Kok Chew, "On Prospects of Self-Sufficiency in Rice for West Malaysia," Malaysian Agricultural Research and Development Institute, Jalan, Swettenham, Kuala Lumpur.
Q/1966-1976: Farm wage rate is for male workers only.
R/1966/67: Paddy ,area statistics revised.
S/1975-1978 and 1980-1981: Farm-harvest price is an average padi price
for kedah long.
T/1977-1981: Average wholesale and retail rice prices are for Malaysian
long, super 10 percent~ (A2) rice.
U/l979 and 1982: Farm-harvest price is for Selangor market.
Sources of Data for Appendix Table XVI: West Malaysia 1. Area Under Various Crops 1947-1960: Federation of Malaya. Department of Statistics, Monthly Sta- tistical Bulletin of West Malaysia (Kuala Lumpur). 1961-1964: Malaysia. Jabatan Perangkaan (Department of Statistics) Buku kecil perangkaan bagi semenanjung Malaysia (Statistical Handbook of Peninsular Malaysia) (Kuala Lumpur. 1965-1978: Peninsular Malaysia. Kementerian Pertanian (Ministry of Agriculture), Rumusan perangkaan (Statistical Digest) (Kuala Lumpur).
-223-
2. Rice Production 1946/47: Federation of Malaya. Department of Statistics, Monthly Statistical Bulletin of the Federation of Malaya - Agricultural Supplement 1953 (Kuala Lumpur). 1947/48-1952/53: Malaysia. Ministry of Agriculture and Cooperatives, Revised Padi Statistics (Kuala Lumpur). 1953/54-1965/66: Malaysia. Jabatan Perangkaan (Department of Statistics), Perangkaan beras bagi Malaysia barat (Rice Statistics for West Malaysia) (Kuala Lumpur: 1967). 1966/67-1980/81: Peninsular Malaysia. Planning and Development Division, Kementerian Pertanian (Ministry of Agriculture), Perangkaan padi (Paddy Statistics) (Kuala Lumpur). 3. Rice Area 1946/47-1948/49: Federation of Malaya. Department of Statistics, Monthly Statistical Bulletin of the Federation of Malaya - Rice Supplement (Kuala Lumpur). 1949/50-1952/53: Malaysia. Ministry .of Agriculture and Cooperatives, Revised Padi Statistics (Kuala Lumpur). 1953/54-1965/66: Malaysia. Jabatan Perangkaan (Department of Statistics), Perangkaan beras bagi Malaysia barat (Rice Statistics for West Malaysia) (Kuala Lumpur: 1967). 1966/67-1980/81: Peninsular Malaysia. Planning and Development Division, Kementarian Pertanian (Ministry of Agriculture), Perangkaan padi (Paddy statistics) (Kuala Lumpur). 4. Rice Yield 1946:47-1980181: Rice yields are calculated by dividing rice production (2)
-224-
by rice area (23) on an annual basis. 5. Rice Area Irrigated 1963-1973: Palacpac, Adelita, World Rice Statistics (Los Banos, Philippines: International Rice Research Institute, 1980). 6. Rice Imports 1948-1958: Cheng, Siok-hwa The Rice Trade of Malaya (Singapore: University Education Press, 1973). 1959-1967: Malaysia. Jabatan Perangkaan (Department of Statistics), Perangkaan beras bagi Malaysia barat (Rice Statistics for West Malaysia) (Kuala Lumpur). 1968-1981: Peninsular Malaysia. Planning and Development Division, Kementerian Pertanian (Ministry of Agriculture), Perangkaan padi (Paddy Statistics) (Kuala Lumpur). 7. Rice Exports 1948-1953: Federation of Malaya. Department of Statistics, Monthly Statistical Bulletin of the Federation of Malaya - Agricultural Supplement 1953 (Kuala Lumpur). 1954-1958: Malaysia. Ministry of Agriculture and Cooperatives, "Import and Export Trade in Food and Agricultural Products" (Kuala Lumpur). 1959-1967: Malaysia. Jabatan Perangkaan (Department of Statistics), Perangkaan beras bagi Malaysia barat (Rice Statistics for West Malaysia) (Kuala Lumpur). 1968-1981: Peninsular Malaysia. Kementerian Pertanian (Ministry of Agriculture), Rumusan perangkaan (Statistical Digest) (Kuala Lumpur). 8. Population 1947: Federation of Malaya. Department of Statistics, Monthly Statis-
-225-
tical Bulletin of the Federation of Malaya - Agricultural Supplement 1953 (Kuala Lumpur). 1948-1949: Malaya. Registrar of Malayan Statistics at Singapore, Malayan Statistics Monthly Digest of Economic and Social Statistics Relating to the Colony of Singapore and the Federation of Malaya (Singapore). 1950-1960: Malaya (Federation). Department of Statistics, Monthly Statistical Bulletin of West Malaysia (Kuala Lumpur). 1961-1975: Peninsular Malaysia. Jabatan Perangkaan (Department of Statistics), Buku kecil perangkaan bagi semenanjung Malaysia (Statis- tical Handbook of Peninsular Malaysia) (Kuala Lumpur). 1976-1981: Peninsular Malaysia. Planning and Development Division, Kementerian Pertanian (Ministry of Agriculture), Perangkaan padi (Paddy Statistics) (Kuala Lumpur: 1980). 9. Farm-Harvest Price 1979 and 1982: Palacpac, Adelita, World Rice Statistics (Los Baños, Philippines: International Rice Research Institute, 1982). 1975-1981: Peninsular Malaysia. Planning and Development Division, Kementerian Pertanian (Ministry of Agriculture), Perangkaan padi (Padi Statistics) (Kuala Lumpur). 10. Procurement Price 1949-1957: ECAFE/FAC Agriculture Division, Economic Connission for Asia and the Far East, Food and Agricultural Price Policies in Asia and the Far East (Bangkok; United Nations, 1958). 1962-1972: Selvadurai, S., "Padi Farming in West Malaysia" (Kuala
-226-
Lumpur: Ministry of Agriculture and Fisheries, 1972), p. 41. 11. Average Wholesale Price 1948-1952: Federation of Malaya. Department of Statistics, Monthly Statistical Bulletin (Kuala Lumpur). 1955-1958: Federation of Malaya. Department of Statistics, Monthly Statistical Bulletin (Kuala Lumpur). 1959-1967: Malaysia. Jabatan Perangkaan (Department of Statistics), Perangkaan beras. bagi Malaysia barat (Rice Statistics for West Malaysia) (Kuala Lumpur). 1968-1981: Peninsular Malaysia. Planning and Development Division, Kementarian Pertanian (Ministry of Agriculture), Perangkaan padi (Paddy Statistics) (Kuala Lumpur). 12. Average Retail Rice Price 1948-1967: Federation of Malaya. Department of Statistics, Monthly Statistical Bulletin (Kuala Lumpur). 1968-1981: Peninsular Malaysia. Planning and Development Division, Kementarian Pertanian (Ministry of Agriculture), Perangkaan padi (Paddy Statistics) (Kuala Lumpur). 13. Farm Wage Rate 1956-1960: Federation of Malaya. Department of Statistics, Monthly Statistical Bulletin (Kuala Lumpur). 1966-1976: International Labour Organization, various issues. 14. Domestic Apparent. Per Capita Rice Availability 1947-1981: Domestic apparent per capita rice availability is calculated. by dividing rice production (2) by population (8) on an annual basis
-227-
15. Wet Rice Area 1946/47-1952/53: Federation of Malaya. Department of Statistics, Monthly Statistical Bulletin of the Federation of Malaya - Rice Sup- plement (Kuala Lumpur). 1953/54-1965/66: Malaysia. Jabatan Perangkaan (Department of Statistics), Perangkaan beras bagi Malaysia barat (Rice Statistics far West Malaysia) (Kuala Lumpur: 1967). 1966/67-1980/81: Peninsular Malaysia. Planning and Development Division, Kementarian Pertanian (Ministry of Agriculture), Perangkaan padi (Paddy Statistics) (Kuala Lumpur). 16. Wet Rice Production 1946/47-1952/53: Federation of Malaya. Department of Statistics, Monthly Statistical Bulletin of the Federation at Malaya - Rice Supplement (Kuala Lumpur). 1953/54-1965/66: Malaysia. Jabatan Perangkaan (Department of Statistics), Perangkaan beras bagi Malaysia barat (Rice Statistics for West Malaysia) Kuala Lumpur: 1967). 1966/67-1980/81: Peninsular Malaysia. Planning and Development Division, Kementarian Pertanian (Ministry of Agriculture), Perangkaan padi (Paddy Statistics) (Kuala Lumpur). 17. Wet Rica Yields 1946/47-1980/81: Wet rice yields are calculated by dividing wet rice production (16) by vet rice area (15) on an annual basis.
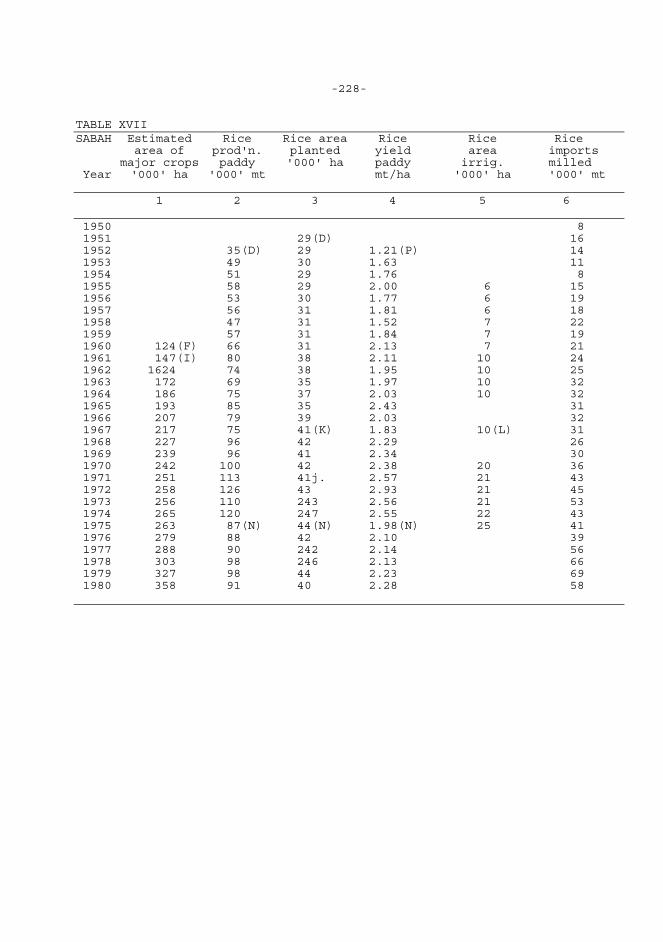
-228- TABLE XVII SABAH Estimated Rice Rice area Rice Rice Rice area of prod'n. planted yield area imports major crops paddy '000' ha paddy irrig. milled Year '000' ha '000' mt mt/ha '000' ha '000' mt 1 2 3 4 5 6 1950 8 1951 29(D) 16 1952 35(D) 29 1.21(P) 14 1953 49 30 1.63 11 1954 51 29 1.76 8 1955 58 29 2.00 6 15 1956 53 30 1.77 6 19 1957 56 31 1.81 6 18 1958 47 31 1.52 7 22 1959 57 31 1.84 7 19 1960 124(F) 66 31 2.13 7 21 1961 147(I) 80 38 2.11 10 24 1962 1624 74 38 1.95 10 25 1963 172 69 35 1.97 10 32 1964 186 75 37 2.03 10 32 1965 193 85 35 2.43 31 1966 207 79 39 2.03 32 1967 217 75 41(K) 1.83 10(L) 31 1968 227 96 42 2.29 26 1969 239 96 41 2.34 30 1970 242 100 42 2.38 20 36 1971 251 113 41j. 2.57 21 43 1972 258 126 43 2.93 21 45 1973 256 110 243 2.56 21 53 1974 265 120 247 2.55 22 43 1975 263 87(N) 44(N) 1.98(N) 25 41 1976 279 88 42 2.10 39 1977 288 90 242 2.14 56 1978 303 98 246 2.13 66 1979 327 98 44 2.23 69 1980 358 91 40 2.28 58
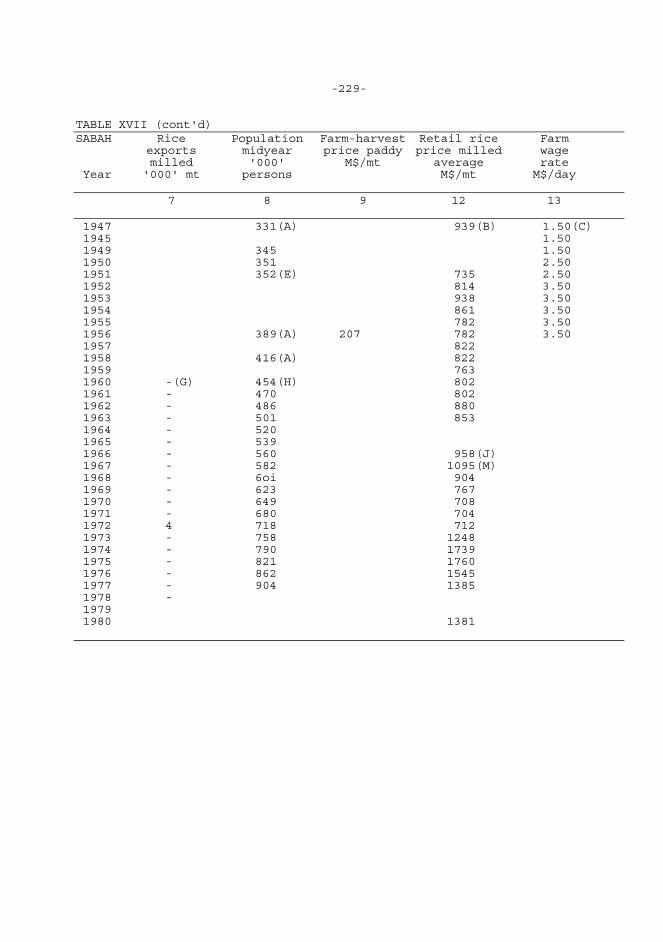
-229- TABLE XVII (cont'd) SABAH Rice Population Farm-harvest Retail rice Farm exports midyear price paddy price milled wage milled '000' M$/mt average rate Year '000' mt persons M$/mt M$/day 7 8 9 12 13 1947 331(A) 939(B) 1.50(C) 1945 1.50 1949 345 1.50 1950 351 2.50 1951 352(E) 735 2.50 1952 814 3.50 1953 938 3.50 1954 861 3.50 1955 782 3.50 1956 389(A) 207 782 3.50 1957 822 1958 416(A) 822 1959 763 1960 -(G) 454(H) 802 1961 - 470 802 1962 - 486 880 1963 - 501 853 1964 - 520 1965 - 539 1966 - 560 958(J) 1967 - 582 1095(M) 1968 - 6oi 904 1969 - 623 767 1970 - 649 708 1971 - 680 704 1972 4 718 712 1973 - 758 1248 1974 - 790 1739 1975 - 821 1760 1976 - 862 1545 1977 - 904 1385 1978 - 1979 1980 1381
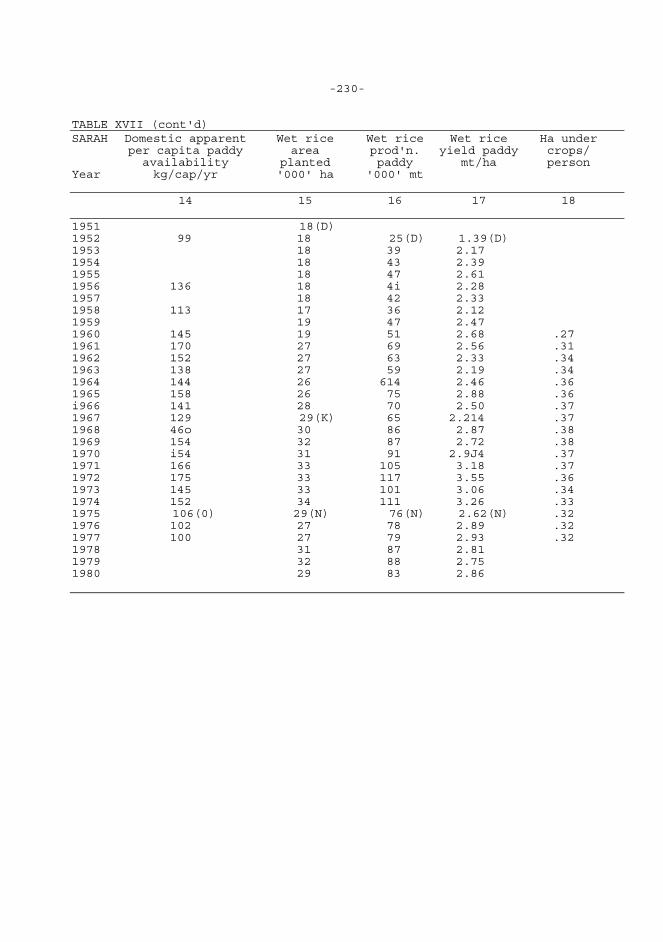
-230- TABLE XVII (cont'd) SARAH Domestic apparent Wet rice Wet rice Wet rice Ha under per capita paddy area prod'n. yield paddy crops/ availability planted paddy mt/ha person Year kg/cap/yr '000' ha '000' mt 14 15 16 17 18 1951 18(D) 1952 99 18 25(D) 1.39(D) 1953 18 39 2.17 1954 18 43 2.39 1955 18 47 2.61 1956 136 18 4i 2.28 1957 18 42 2.33 1958 113 17 36 2.12 1959 19 47 2.47 1960 145 19 51 2.68 .27 1961 170 27 69 2.56 .31 1962 152 27 63 2.33 .34 1963 138 27 59 2.19 .34 1964 144 26 614 2.46 .36 1965 158 26 75 2.88 .36 i966 141 28 70 2.50 .37 1967 129 29(K) 65 2.214 .37 1968 46o 30 86 2.87 .38 1969 154 32 87 2.72 .38 1970 i54 31 91 2.9J4 .37 1971 166 33 105 3.18 .37 1972 175 33 117 3.55 .36 1973 145 33 101 3.06 .34 1974 152 34 111 3.26 .33 1975 106(0) 29(N) 76(N) 2.62(N) .32 1976 102 27 78 2.89 .32 1977 100 27 79 2.93 .32 1978 31 87 2.81 1979 32 88 2.75 1980 29 83 2.86
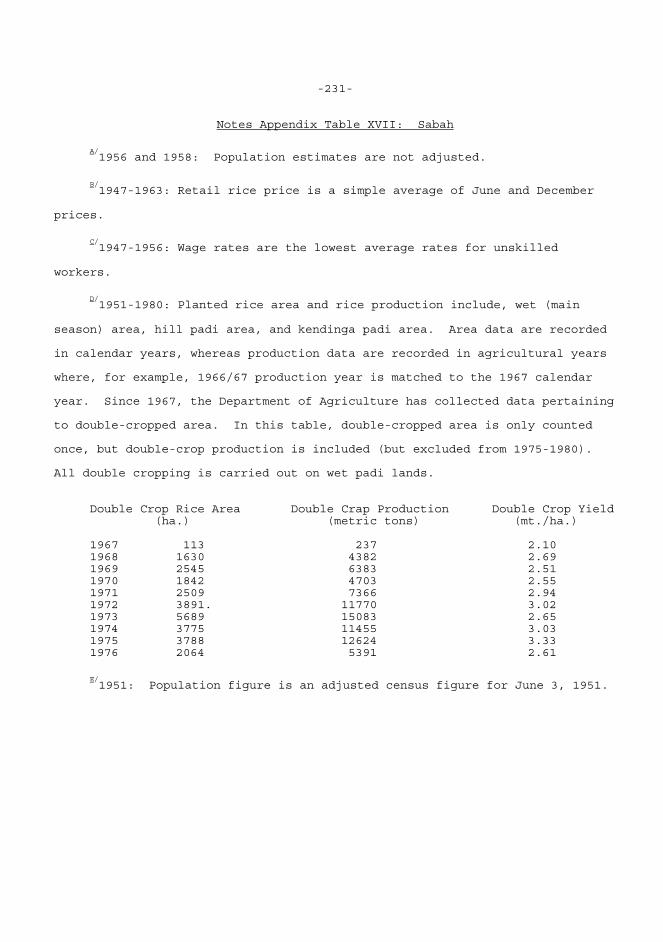
-231-
Notes Appendix Table XVII: Sabah
A/1956 and 1958: Population estimates are not adjusted.
B/1947-1963: Retail rice price is a simple average of June and December
prices.
C/1947-1956: Wage rates are the lowest average rates for unskilled
workers.
D/1951-1980: Planted rice area and rice production include, wet (main
season) area, hill padi area, and kendinga padi area. Area data are recorded in calendar years, whereas production data are recorded in agricultural years where, for example, 1966/67 production year is matched to the 1967 calendar year. Since 1967, the Department of Agriculture has collected data pertaining to double-cropped area. In this table, double-cropped area is only counted once, but double-crop production is included (but excluded from 1975-1980). All double cropping is carried out on wet padi lands. Double Crop Rice Area Double Crap Production Double Crop Yield (ha.) (metric tons) (mt./ha.) 1967 113 237 2.10 1968 1630 4382 2.69 1969 2545 6383 2.51 1970 1842 4703 2.55 1971 2509 7366 2.94 1972 3891. 11770 3.02 1973 5689 15083 2.65 1974 3775 11455 3.03 1975 3788 12624 3.33 1976 2064 5391 2.61
E/1951: Population figure is an adjusted census figure for June 3, 1951.
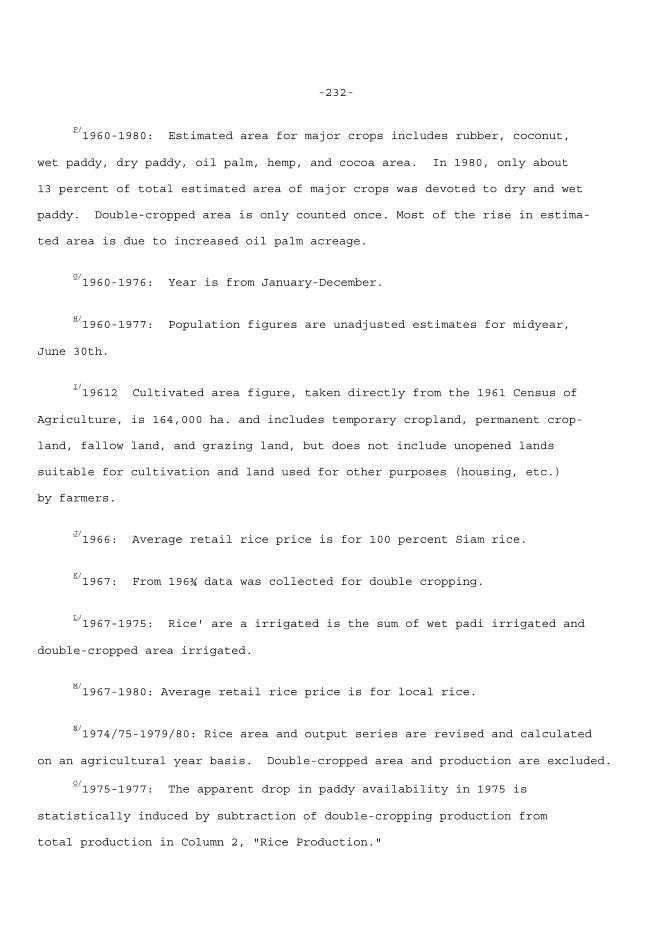
-232-
F/1960-1980: Estimated area for major crops includes rubber, coconut,
wet paddy, dry paddy, oil palm, hemp, and cocoa area. In 1980, only about 13 percent of total estimated area of major crops was devoted to dry and wet paddy. Double-cropped area is only counted once. Most of the rise in estima- ted area is due to increased oil palm acreage.
G/1960-1976: Year is from January-December.
H/1960-1977: Population figures are unadjusted estimates for midyear,
June 30th.
I/19612 Cultivated area figure, taken directly from the 1961 Census of
Agriculture, is 164,000 ha. and includes temporary cropland, permanent crop- land, fallow land, and grazing land, but does not include unopened lands suitable for cultivation and land used for other purposes (housing, etc.) by farmers.
J/1966: Average retail rice price is for 100 percent Siam rice.
K/1967: From 196¾ data was collected for double cropping.
L/1967-1975: Rice' are a irrigated is the sum of wet padi irrigated and
double-cropped area irrigated.
M/1967-1980: Average retail rice price is for local rice.
N/1974/75-1979/80: Rice area and output series are revised and calculated
on an agricultural year basis. Double-cropped area and production are excluded.
O/1975-1977: The apparent drop in paddy availability in 1975 is
statistically induced by subtraction of double-cropping production from total production in Column 2, "Rice Production."
-233-
Sources of Data for Appendix Table XVII: Sabah 1. Estimated Area of Major Crops 1960-1980: Malaysia. Jabatan Perangkaan (Department of Statistics), Siaran perangkaan tahunan (Annual Bulletin of Statistics, Sabah) (Kora Kinabalu). 2. Rice Production 1951/52-1959/60: Sabah. Department of Agriculture, Annual Report of the Department of Agriculture (Annual). 1960161-1961162: Malaysia. Department of Agriculture, Agricultural Sta- tistics of Sabah (Kota Kinabalu: Agricultural Information Division). 1962/63-1973174: Malaysia. Jabatan Perangkaan (Department of Statistics), Buku makiumat perangkaan (Statistical Handbook of Sabah) (Kota Kinabalu). 1974/75-1979/80: Malaysia. Jabatan Perangkaan (Department of Statistics), Siaran peranzkaan tahunan (Annual Bulletin of Statistics, Sabah) (Kota Kinabalu: 1980). 3. Rice Area 1951: Great Britain: Colonial Reports, North Borneo (London: His Majesty's Stationery Office). 1952-1960: Sabah. Department of Agriculture, Annual Report of the De- partment of Agriculture (Annual). 1961-1963:. Malaysia. Department of Agriculture. Sabah. Agricultural Statistics of Sabah (Kota Kinabalu: Agricultural Information Division). 1964-1974: Malaysia. Jabatan Perangkaan (Department of Statistics), Buku maklumat perangkaan (Statistical Handbook of Sabah) (Kota Kinabalu). 1974/75-1979/80: Malaysia. Jabatan Perangkaan (Department of Statistics), Siaran perangkaan tahunan (Annual Bulletin of Statistics, Sabah) (Rota Kinabalu: 1980).
-234-
4. Rice Yield 1952-1980: Rice yields are calculated by dividing rice production (2) by rice area (3) on an annual basis. 5. Rice Area Irrigated 1955-1963: Sabah. Department of Agriculture, Annual Report of the De- partment of Agriculture (Annual). 1967-1976: Sabah. Federal Department of Information, Sabah Annual Report (Singapore: Eurasia cress). 6. Rice Imports 1950-1951: Great Britain. Colonial Reports. North Borneo (London: His Majesty's Stationery Office). 1952-1960:. Sabab. Department of Agriculture, Annual Report of the. De- partment of Agriculture (Annual). 1961-1980: Malaysia. Jabatan Perangkaan (Department of Statistics), Siaran perangkaan tahunan (Annual Bulletin of Statistics, Sabah) (Rota Kinabalu: 1980).: 7. Rice Exports 1960-1976: U.S. Foreign Agricultural Service, Foreign Agriculture Circular, FG-20-79 (Washington, D.C.: 1979). 8. Population 1947-1950 and 1956, 1958: Great Britain~ Colonial Reports, North Borneo (London: His Majesty's Stationery Office). 1951: U.S. Department of Commerce, Bureau of the Census, Demographic Estimates for Countries With a Population of 10 Million or More: 1981, 1SP-WP-81 (Washington, D.C.: 1981).
-235-
1960-1977: Malaysia. Jabatan Perangkaan (Department of Statistics), Siaran perangkaan tahunan (Annual Bulletin of Statistics, Sabah) (Kota Kinabalu: 1980). 9. Farm-Harvest Price 1956: Sabali. Department of Agriculture, Annual Report of the Depart- ment of Agriculture (Annual). 12. Average Retail Price 1947-1963: Great Britain. Colonial Reports. North Borneo (London: His Majesty's Stationery Office). 1966-1980: Malaysia. Jabatan Perangkaan (Department of Statistics), Siaran perangkaan tahunan (Annual Bulletin of Statistics, Sabah) (Kota Kinabalu). 13. Farm Wage Rate 1947-1956: Great Britain. Colonial Reports, North Borneo (London: His Majesty's Stationery Office). 14. Domestic Apparent Per Capita Paddy Availability 1956-1977: Domestic apparent per capita paddy. availability is calculated by dividing rice production (2) by population (8) on an annual basis. 15. Wet Rice Area 1951: Great Britain. Colonial Reports, North Borneo (London: His Majesty's Stationery Office). 1952-1963: Sabah. Department of Agriculture, Annual Report of the Department of Agriculture (Annual). 1964-1974: Malaysia. Jabatan Perangkaan (Department of Statistics), Buku maklumat perangkaan (Statistical Handbook of Sabah) (Kota Kinabalu).
-236-
1975-1980: Malaysia. Jabatan Perangkaan (Department of Statistics), Siaran perangkaan tahunan (Annual Bulletin of Statistics, Sabah) (Rota Kinabalu). 16. Wet Rice Production 1952-1963: Sabah. Department of Agriculture, Annual Report of the Department of Agriculture (Annual). 1964-1974: Malaysia. Jabatan Perangkaan (Departmert of Statistics), Buku maklumat perangkaan (Statistical Handbook of Sabah) (Rota Kinabalu). 1975-1980: Malaysia. Jabatan Perangkaan (Department of Statistics), Siaran perangkaan tahunan (Annual Bulletin of Statistics, Sabah) (Kota Kinabalu: 1980). 17. Wet Rice Yields 1952-1980: Rice yields are calculated `by dividing wet rice production (16) by wet rice area (15) on an annual basis.
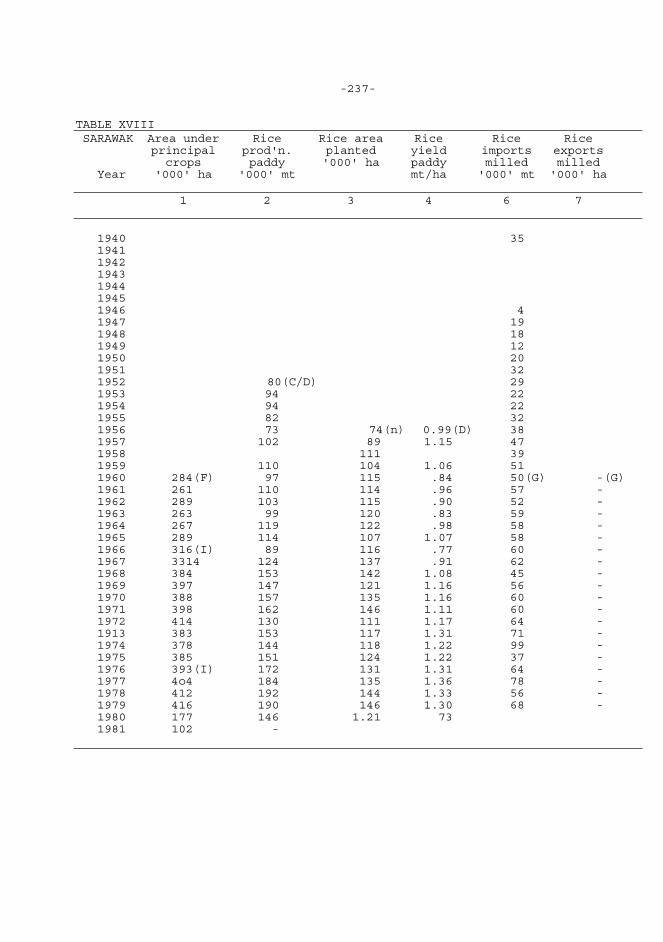
-237- TABLE XVIII SARAWAK Area under Rice Rice area Rice Rice Rice principal prod'n. planted yield imports exports crops paddy '000' ha paddy milled milled Year '000' ha '000' mt mt/ha '000' mt '000' ha 1 2 3 4 6 7 1940 35 1941 1942 1943 1944 1945 1946 4 1947 19 1948 18 1949 12 1950 20 1951 32 1952 80(C/D) 29 1953 94 22 1954 94 22 1955 82 32 1956 73 74(n) 0.99(D) 38 1957 102 89 1.15 47 1958 111 39 1959 110 104 1.06 51 1960 284(F) 97 115 .84 50(G) -(G) 1961 261 110 114 .96 57 - 1962 289 103 115 .90 52 - 1963 263 99 120 .83 59 - 1964 267 119 122 .98 58 - 1965 289 114 107 1.07 58 - 1966 316(I) 89 116 .77 60 - 1967 3314 124 137 .91 62 - 1968 384 153 142 1.08 45 - 1969 397 147 121 1.16 56 - 1970 388 157 135 1.16 60 - 1971 398 162 146 1.11 60 - 1972 414 130 111 1.17 64 - 1913 383 153 117 1.31 71 - 1974 378 144 118 1.22 99 - 1975 385 151 124 1.22 37 - 1976 393(I) 172 131 1.31 64 - 1977 4o4 184 135 1.36 78 - 1978 412 192 144 1.33 56 - 1979 416 190 146 1.30 68 - 1980 177 146 1.21 73 1981 102 -
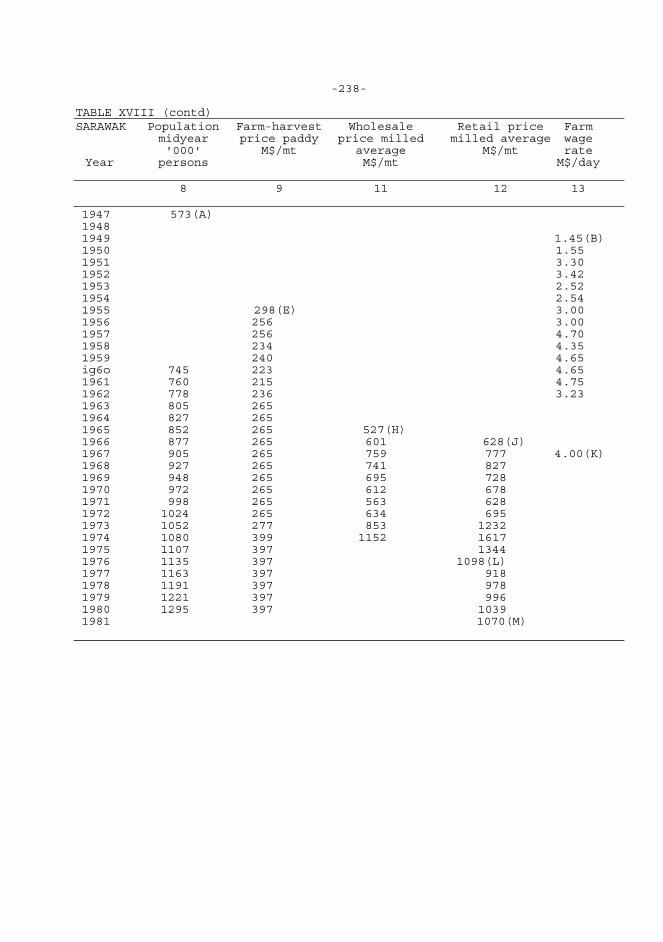
-238-
TABLE XVIII (contd) SARAWAK Population Farm-harvest Wholesale Retail price Farm midyear price paddy price milled milled average wage '000' M$/mt average M$/mt rate Year persons M$/mt M$/day 8 9 11 12 13 1947 573(A) 1948 1949 1.45(B) 1950 1.55 1951 3.30 1952 3.42 1953 2.52 1954 2.54 1955 298(E) 3.00 1956 256 3.00 1957 256 4.70 1958 234 4.35 1959 240 4.65 ig6o 745 223 4.65 1961 760 215 4.75 1962 778 236 3.23 1963 805 265 1964 827 265 1965 852 265 527(H) 1966 877 265 601 628(J) 1967 905 265 759 777 4.00(K) 1968 927 265 741 827 1969 948 265 695 728 1970 972 265 612 678 1971 998 265 563 628 1972 1024 265 634 695 1973 1052 277 853 1232 1974 1080 399 1152 1617 1975 1107 397 1344 1976 1135 397 1098(L) 1977 1163 397 918 1978 1191 397 978 1979 1221 397 996 1980 1295 397 1039 1981 1070(M)
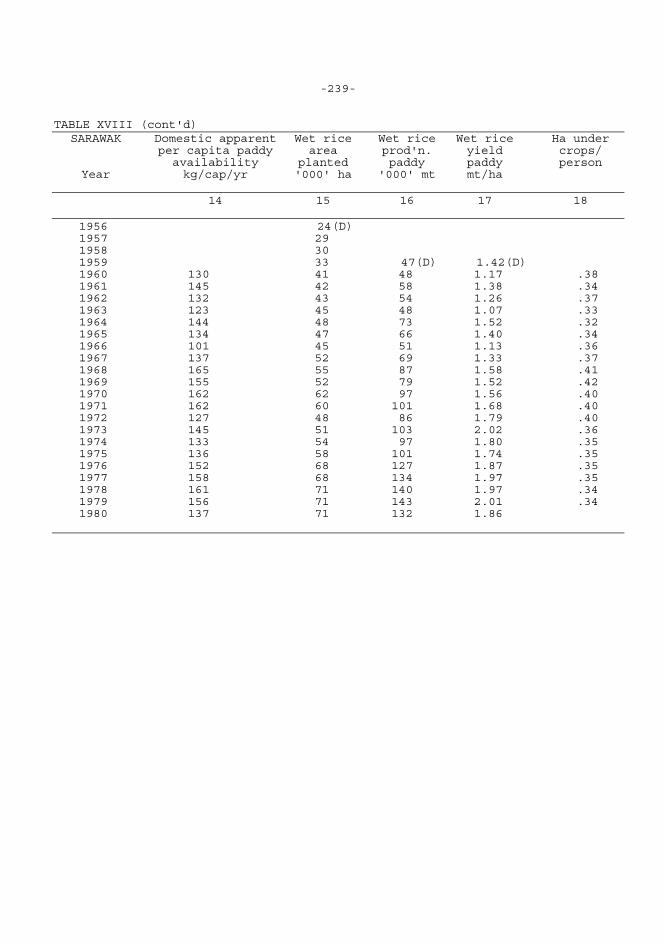
-239- TABLE XVIII (cont'd) SARAWAK Domestic apparent Wet rice Wet rice Wet rice Ha under per capita paddy area prod'n. yield crops/ availability planted paddy paddy person Year kg/cap/yr '000' ha '000' mt mt/ha 14 15 16 17 18 1956 24(D) 1957 29 1958 30 1959 33 47(D) 1.42(D) 1960 130 41 48 1.17 .38 1961 145 42 58 1.38 .34 1962 132 43 54 1.26 .37 1963 123 45 48 1.07 .33 1964 144 48 73 1.52 .32 1965 134 47 66 1.40 .34 1966 101 45 51 1.13 .36 1967 137 52 69 1.33 .37 1968 165 55 87 1.58 .41 1969 155 52 79 1.52 .42 1970 162 62 97 1.56 .40 1971 162 60 101 1.68 .40 1972 127 48 86 1.79 .40 1973 145 51 103 2.02 .36 1974 133 54 97 1.80 .35 1975 136 58 101 1.74 .35 1976 152 68 127 1.87 .35 1977 158 68 134 1.97 .35 1978 161 71 140 1.97 .34 1979 156 71 143 2.01 .34 1980 137 71 132 1.86
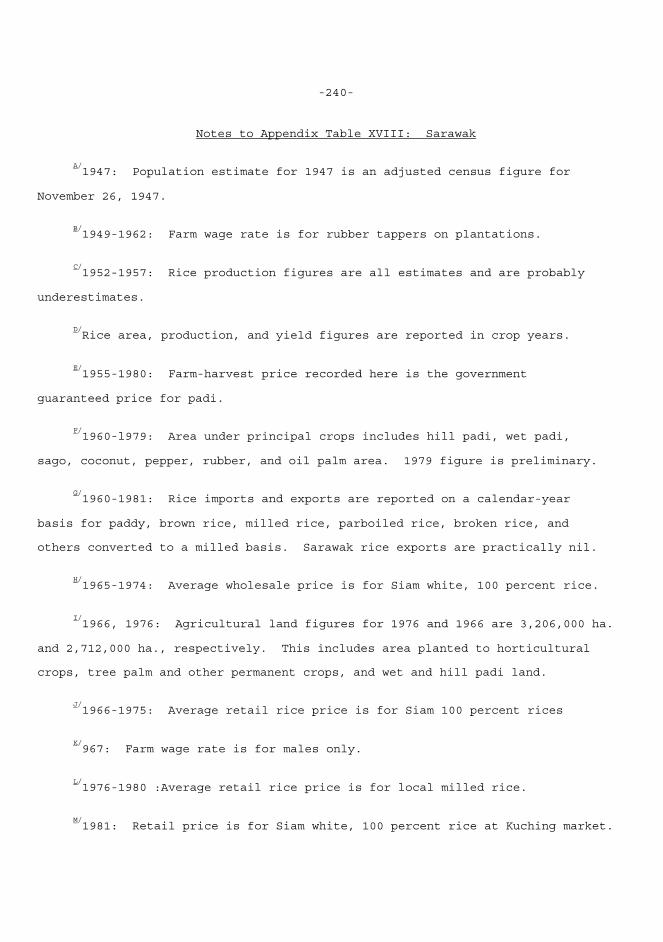
-240-
Notes to Appendix Table XVIII: Sarawak
A/1947: Population estimate for 1947 is an adjusted census figure for
November 26, 1947.
B/1949-1962: Farm wage rate is for rubber tappers on plantations.
C/1952-1957: Rice production figures are all estimates and are probably
underestimates.
D/Rice area, production, and yield figures are reported in crop years.
E/1955-1980: Farm-harvest price recorded here is the government
guaranteed price for padi.
F/1960-l979: Area under principal crops includes hill padi, wet padi,
sago, coconut, pepper, rubber, and oil palm area. 1979 figure is preliminary.
G/1960-1981: Rice imports and exports are reported on a calendar-year
basis for paddy, brown rice, milled rice, parboiled rice, broken rice, and others converted to a milled basis. Sarawak rice exports are practically nil.
H/1965-1974: Average wholesale price is for Siam white, 100 percent rice.
I/1966, 1976: Agricultural land figures for 1976 and 1966 are 3,206,000 ha.
and 2,712,000 ha., respectively. This includes area planted to horticultural crops, tree palm and other permanent crops, and wet and hill padi land.
J/1966-1975: Average retail rice price is for Siam 100 percent rices
K/967: Farm wage rate is for males only.
L/1976-1980 :Average retail rice price is for local milled rice.
M/1981: Retail price is for Siam white, 100 percent rice at Kuching market.
-241-
Sources of Data for Appendix Table XVIII: Sarawak 1. Area Under Principal Crops 1960-1979: Malaysia, Sarawak. Jabatan Perangkaan (Department of Statistics), Buku maklumat perangkaan (Statistical Handbook, Sarawak) (Kuching). 2. Rice Production 1952/53-1957/58: Great Britain. Colonial Reports, Sarawak (London: His Majestys Stationery Office). 1959/60-1980/81: Malaysia, Sarawak. Jabatan Pertanian (Department of Agriculture), Perangkaan pertanian Sarawak (Agricultural Statistics of Sarawak) (Kuching). 3. Rice Area 1956/57-1958159: Malaysia, Sarawak. Department of Agriculture, Digest of Agricultural Statistics (Kuching). 1959/60-1980/81: Malaysia, Sarawak. Jabatan Pertanian (Department Of Agriculture), Perangkaan pertanian Sarawak (Agricultural Statistics of Sarawak) (Kuching). 4. Rice Yields 1956/57-1980/81: Rice yields are calculated by dividing rice production (2) by rice area (3) on an annual basis. 6. Rice Imports l94O-l953: Great Britain. Colonial Reports, Sarawak (London: His Majestys a Stationery Office, 1962), p. 76. 1954-1959: Federation of Malaysia. Department of Statistics, Annual Bulletin of Statistics, State of Sarawak 1964 (Kuching).
-242-
1960-1981: Malaysia1 Sarawak. Jabatan Pertanian (Department of Agri- culture), Perangkaan pertanian Sarawak (Agricultural Statistics of Sarawak) (Kuching). 7. Rice Exports 1960-1981: Malaysia, Sarawak. Jabatan Pertanian (Department of Agri- culture), Perangkaan pertanian Sarawak (Agricultural Statistics of Sarawak) (Kuching). 8. Population 1947: U.S. Department of Commerce, Bureau of the Census, Demographic Estimates for Countries With a Population of 10 Million or More: 1981, iSP-WP-8l (Washington, D.C.: 1981). 1960-1980: Malaysia, Sarawak. Jabatan Pertanian (Department of Agri- culture), Perangkaan pertanian Sarawak (Agricultural Statistics of Sarawak) (Kuching: 1981). * 9. Farm-Harvest Price 1955-1959: Great Britain. Colonial Reports, Sarawak (London; His Majesty's Stationery Office). 1960-1981: Malaysia, Sarawak. Jabatan Pertanian (Department of Agri- culture), Perangkaan pertanian Sarawak (Agricultural Statistics of Sarawak) (Kuching) - 11. Wholesale Rice Price 1965-1974: Malaysia, Sarawak. Jabatan Perangkaan (Department of Statistics), __________________________
*The farm-harvest price used here is the government guaranteed price
for paddy.
-243-
Buku maklumat perangkaan (Statistical Handbook of Sarawak) (Kuching). 12. Retail Rice Price 1966-1972: Malaysia, Sarawak. Jabatan Perangkaan (Department of Statistics), Siaran perangkaan tahunan (Annual Statistical Bulletin, Sarawak) (Kuching). 1973-1979: Malaysia, Sarawak. Jabatan Perangkaan (Department of Statistics), Buku maklumat perangkaan (Statistical Handbook, Sarawak) (Kuching). 1980: Malaysia, Sarawak. Jabaran Perangkaan (Department of Statistics), Siaran peranpkaan suku pertama 1981 (Bulletin of Statistics 1st Quarter 1981) (Kuching). 1981: Malaysia, Sarawak. Jabatan Pertanian (Department of Agriculture), Peranjkaan pertanian Sarawak (Agricultural Statistics of Sarawak) (Kuching). 13. Farm Wage Rate 1949-1962: Great Britain. Colonial Reports, Sarawak (London: His Majesty's Stationery Office). 1967: Malaysia, Sarawak. Department of Agriculture, Digest of Agricul- tural Statistics (Kuching). 14. Domestic Apparent Per Capita Paddy Availability 1960-1980: Domestic apparent per capita paddy availability is calcu- lated by dividing total production (2) by population (8) on an annual basis. 15. Wet Rice Area 1956/57-1958/59: Malaysia, Sarawak. Department of Agriculture, Digest of Agricultural Statistics (Kuching).
-244-
1959/60-1980/81: Malaysia, Saravak. Jabatan Pertanian (Department of Agriculture), Perangkaan pertanian Sarawak (Agricultural Statistics of Sarawak) (Kuching). 16. Wet Rice Production 1959/60-1980/81: Malaysia, Sarawak. Jabatan Pertanian (Department of Agriculture), Perangkaan pertanian Sarawak (Agricultural Statistics of Sarawak) (Kuching). lb Wet Rice Yield 1959160-1980181: Yields of wet padi are calculated by dividing wet rice production (16) by wet rice area (15) on an annual basis.
Country Sources of Basic Data: Malaysia Malaya and West Malaysia 1. Federation of Malay. Department of Agriculture, Malayan Agricultural Statistics, Economic Series Nos. 1-15 (Kuala Lumpur: Caxton Press, Ltd.). See Nos. 7, 10, and 15. 2. Federated Malay~ States. Federated Malay States Government Press, Manual of Statistics Relating to the Federated Malay States (Kuala Lumpur: 1921). 3. Federation of Malay. Department of Statistics, Monthly Statistical Bulletin of the Federation of Malaya - Rice Supplement (Kuala Lumpur). 4. Federation of Malaya. Department of Statistics, Monthly Statistical Bulletin of the Federation of Malaya - Agricultural Supplement 1953 (Kuala Lumpur). 5. Federation of Malay. Department of Statistics, Monthly Statistical Bulletin (Kuala Lumpur).
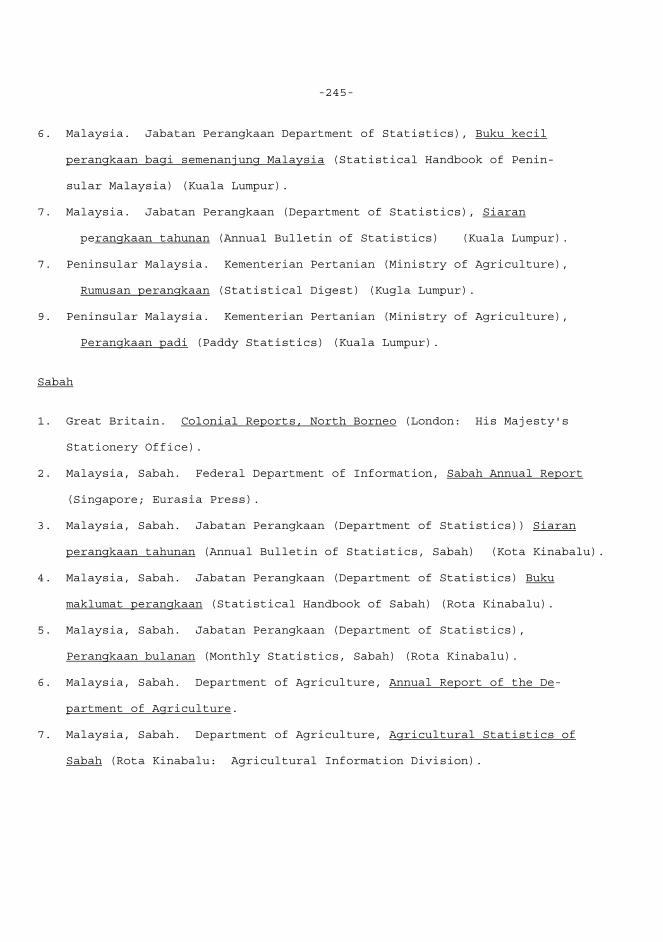
-245-
6. Malaysia. Jabatan Perangkaan Department of Statistics), Buku kecil perangkaan bagi semenanjung Malaysia (Statistical Handbook of Penin- sular Malaysia) (Kuala Lumpur). 7. Malaysia. Jabatan Perangkaan (Department of Statistics), Siaran perangkaan tahunan (Annual Bulletin of Statistics) (Kuala Lumpur). 7. Peninsular Malaysia. Kementerian Pertanian (Ministry of Agriculture), Rumusan perangkaan (Statistical Digest) (Kugla Lumpur). 9. Peninsular Malaysia. Kementerian Pertanian (Ministry of Agriculture), Perangkaan padi (Paddy Statistics) (Kuala Lumpur). Sabah 1. Great Britain. Colonial Reports, North Borneo (London: His Majesty's Stationery Office). 2. Malaysia, Sabah. Federal Department of Information, Sabah Annual Report (Singapore; Eurasia Press). 3. Malaysia, Sabah. Jabatan Perangkaan (Department of Statistics)) Siaran perangkaan tahunan (Annual Bulletin of Statistics, Sabah) (Kota Kinabalu). 4. Malaysia, Sabah. Jabatan Perangkaan (Department of Statistics) Buku maklumat perangkaan (Statistical Handbook of Sabah) (Rota Kinabalu). 5. Malaysia, Sabah. Jabatan Perangkaan (Department of Statistics), Perangkaan bulanan (Monthly Statistics, Sabah) (Rota Kinabalu). 6. Malaysia, Sabah. Department of Agriculture, Annual Report of the De- partment of Agriculture. 7. Malaysia, Sabah. Department of Agriculture, Agricultural Statistics of Sabah (Rota Kinabalu: Agricultural Information Division).
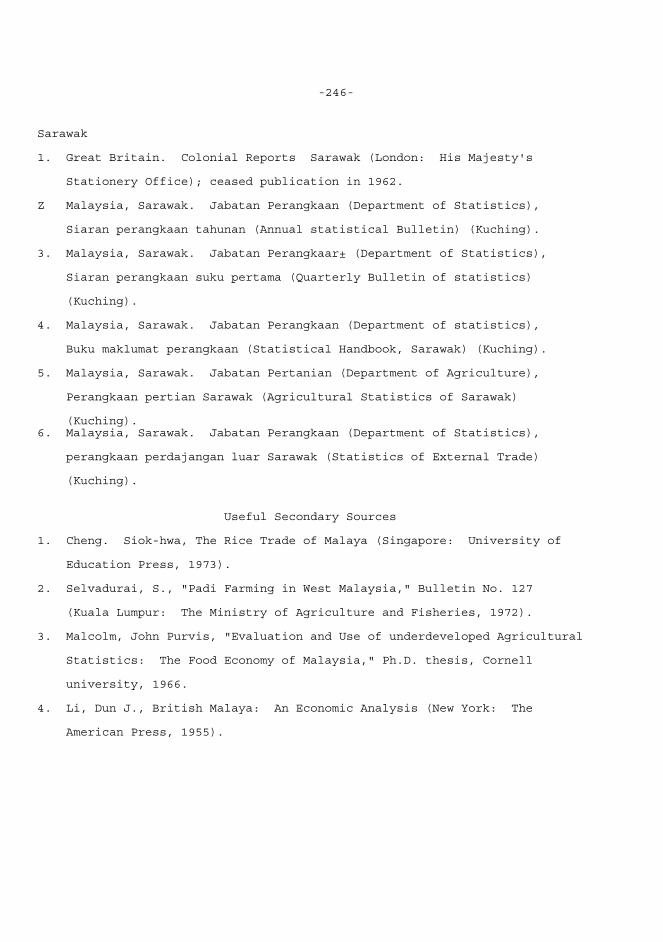
-246-
Sarawak 1. Great Britain. Colonial Reports Sarawak (London: His Majesty's Stationery Office); ceased publication in 1962. Z Malaysia, Sarawak. Jabatan Perangkaan (Department of Statistics), Siaran perangkaan tahunan (Annual statistical Bulletin) (Kuching). 3. Malaysia, Sarawak. Jabatan Perangkaar± (Department of Statistics), Siaran perangkaan suku pertama (Quarterly Bulletin of statistics) (Kuching). 4. Malaysia, Sarawak. Jabatan Perangkaan (Department of statistics), Buku maklumat perangkaan (Statistical Handbook, Sarawak) (Kuching). 5. Malaysia, Sarawak. Jabatan Pertanian (Department of Agriculture), Perangkaan pertian Sarawak (Agricultural Statistics of Sarawak) (Kuching). 6. Malaysia, Sarawak. Jabatan Perangkaan (Department of Statistics), perangkaan perdajangan luar Sarawak (Statistics of External Trade) (Kuching). Useful Secondary Sources 1. Cheng. Siok-hwa, The Rice Trade of Malaya (Singapore: University of Education Press, 1973). 2. Selvadurai, S., "Padi Farming in West Malaysia," Bulletin No. 127 (Kuala Lumpur: The Ministry of Agriculture and Fisheries, 1972). 3. Malcolm, John Purvis, "Evaluation and Use of underdeveloped Agricultural Statistics: The Food Economy of Malaysia," Ph.D. thesis, Cornell university, 1966. 4. Li, Dun J., British Malaya: An Economic Analysis (New York: The American Press, 1955).
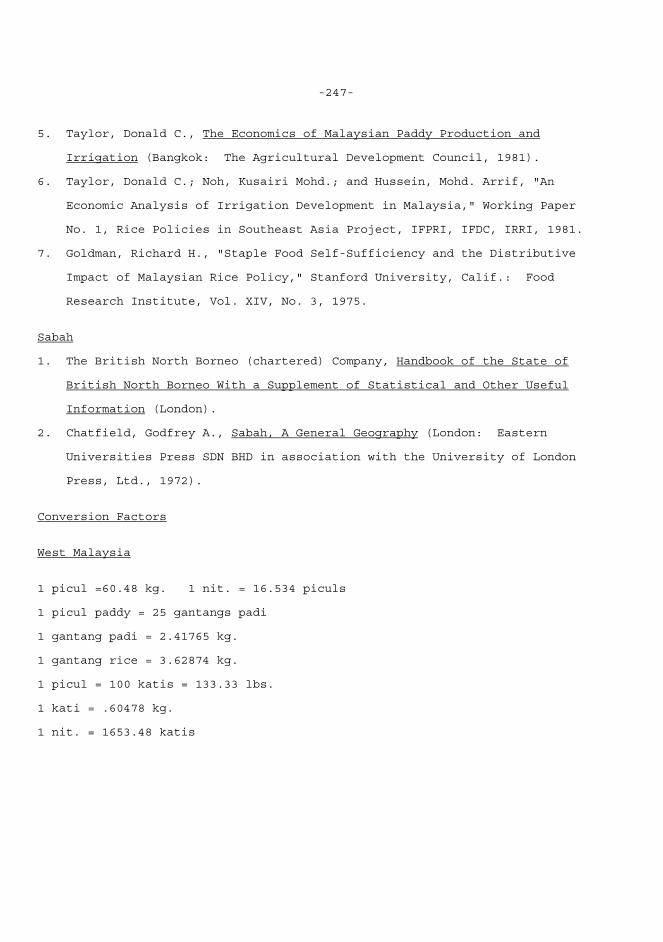
-247-
5. Taylor, Donald C., The Economics of Malaysian Paddy Production and Irrigation (Bangkok: The Agricultural Development Council, 1981). 6. Taylor, Donald C.; Noh, Kusairi Mohd.; and Hussein, Mohd. Arrif, "An Economic Analysis of Irrigation Development in Malaysia," Working Paper No. 1, Rice Policies in Southeast Asia Project, IFPRI, IFDC, IRRI, 1981. 7. Goldman, Richard H., "Staple Food Self-Sufficiency and the Distributive Impact of Malaysian Rice Policy," Stanford University, Calif.: Food Research Institute, Vol. XIV, No. 3, 1975. Sabah 1. The British North Borneo (chartered) Company, Handbook of the State of British North Borneo With a Supplement of Statistical and Other Useful Information (London). 2. Chatfield, Godfrey A., Sabah, A General Geography (London: Eastern Universities Press SDN BHD in association with the University of London Press, Ltd., 1972). Conversion Factors West Malaysia 1 picul =60.48 kg. 1 nit. = 16.534 piculs 1 picul paddy = 25 gantangs padi 1 gantang padi = 2.41765 kg. 1 gantang rice = 3.62874 kg. 1 picul = 100 katis = 133.33 lbs. 1 kati = .60478 kg. 1 nit. = 1653.48 katis
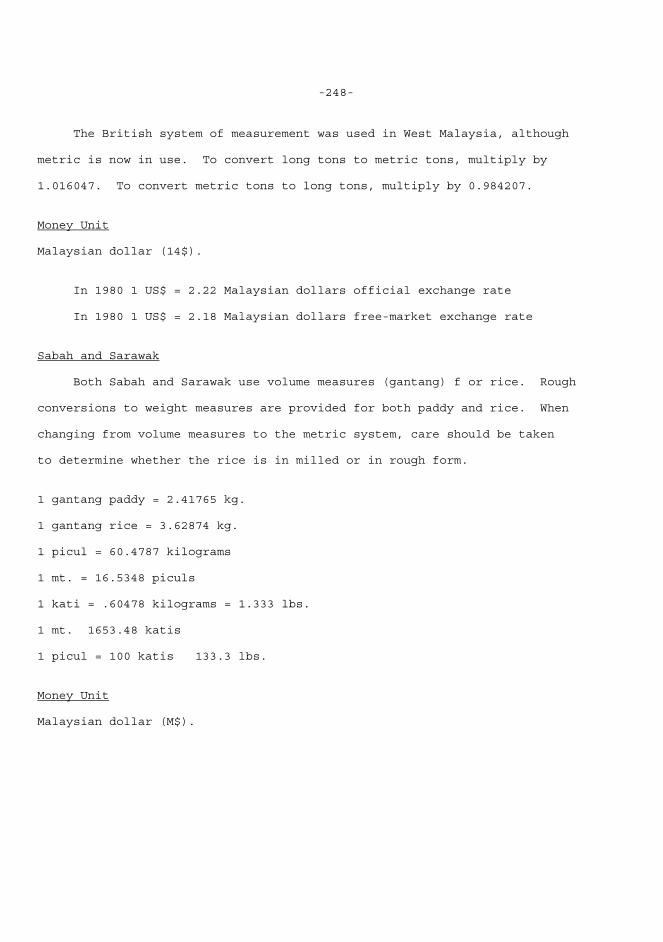
-248-
The British system of measurement was used in West Malaysia, although metric is now in use. To convert long tons to metric tons, multiply by 1.016047. To convert metric tons to long tons, multiply by 0.984207. Money Unit Malaysian dollar (14$). In 1980 1 US$ = 2.22 Malaysian dollars official exchange rate In 1980 1 US$ = 2.18 Malaysian dollars free-market exchange rate Sabah and Sarawak Both Sabah and Sarawak use volume measures (gantang) f or rice. Rough conversions to weight measures are provided for both paddy and rice. When changing from volume measures to the metric system, care should be taken to determine whether the rice is in milled or in rough form. 1 gantang paddy = 2.41765 kg. 1 gantang rice = 3.62874 kg. 1 picul = 60.4787 kilograms 1 mt. = 16.5348 piculs 1 kati = .60478 kilograms = 1.333 lbs. 1 mt. 1653.48 katis 1 picul = 100 katis 133.3 lbs. Money Unit Malaysian dollar (M$).
-249-
Glossary Padi - Term used for paddy in Malaysia. Mukim - Sub-district, the lowest administrative level in the collection of agricultural statistics. Kendinga padi - A term used in Sabah and Sarawak to' denote short-season padi produced under dry conditions in rotation with other crops. Acronyms DID: Drainage and Irrigation Department (1931) DOA: Department, of Agriculture FAMA: Federal Agricultural Marketing Authority (1965) EQA: Farmers' Organization Authority (1973) GMP: Guaranteed Minimum Price for Paddy (1949) MADA: Muda Agricultural Development Authority MARDI: Malaysian Agricultural Research and Development Institute MAB: Malaysian Agricultural Rank (1969) MAF: Ministry of Agriculture and Fisheries NPRA: National Padi and Rice Authority (1971) PRMB: Padi and Rice Marketing Board (1967)
-250- XIX: THE PHILIPPINES Rice Statistics in The Philippines Administratively, the Philippines are divided into 12 important regions, including Ilocos ; Cagayan Valley; Central Luzon; Southern Tagalog; Bicol; Central, Western and Eastern Visayas; and Eastern, Western, Northern and Southern Mindanao; and one metropolitan area, Manila. The Philippines are further subdivided into 75 provinces, 1,433 municipalities and municipal districts, and 33,776 barrios (villages). When using Philippine statistical data, the reader should be careful to note that Philippine regional boundaries have changed through time. The number of regions has varied between 9 and 12, and province have been moved from one region to another. In most cases, statistical data have not been adjusted to account for these changes. A brief summary of important changes made since 1960 is presented below.
CHANGE DATES 1. Province of Pangasinan moved from Central Luzon to Ilocos. 1973-1978 2. Province of Romblom moved from Western Visayas to Southern Tagalog. 1973-1978 3. Creation of Central Visayas. All provinces previously included in Eastern Visayas except Negros Oriental, which was previously included in Western Visayas. 1973-1978 4. Creation of Western Mindanao. All provinces previously included in Southern Mindanao. 1973-1978 5. Creation of Central Mindanao. All provinces previously included in Southern Mindanao, except Lanao del Norte and —————————————————— *Thanks to Carol Ferguson, Robert Herdt, and Randolph Barker for comments.
-251- (cont.,) CHANGE DATE Lanao del Sur, which were previously included in Northern Mindanao. 1977-1978 6. Province of Surigao del Sur moved from Northern Mindanao to Southern Mindanao. 1977-1978 Source: Howard Bouts, "Rice Policy in the Philippines," Ph.D. thesis, Stanford University, 1982. The statistical collection system in the Philippines is organized around a centralized coordinating core that oversees disparate units, much as in the United States. The Statistical Coordination office of the National Economic and Development Authority (NEDA) (formerly the National Economic Commission, NEC) is responsible for the development and enforcement of statistical procedure on a nationwide basis, as well as the formulation of classification systems and standards. Actual collection procedures are carried out by topic-specialized arms of the government bureaucracy in con- junction with other aspects of their respective work. The Philippine system is unusual in that the collection of agricultural statistics is confined almost exclusively to a single agency, the Bureau of Agricultural Economics (BAEcon). This removes the problem of interagency comparison that users must face in many other Asian countries. * BAEcon, in the Ministry of Agriculture and Natural Resources, is re- sponsible for the collection and compilation of agricultural statistics and
*Formerly The Department of Agriculture and Natural Resources, renamed
The Ministry of Agriculture and Natural Resources in 1979 when the national government was reorganized under a parliamentary system.
252-
other related functions, including specific research into and assessment of agricultural problems, and the operation of an agricultural marketing news service. BAEcon data collection is heavily oriented toward the survey of rice and corn crops at' the expense of other "lesser" food and commercial crops. The Bureau has a long and continuous history under several different names, beginning in 1919 with the establishment of the Division of Farm Economics in the Bureau of Agriculture. It was subsequently shifted to the Bureau of Plant Industries, and finally to the Division of Statistics in the Department of Agriculture and Commerce in 1933. In 1940, the Statistics Division was joined with the Bureau of Census and Statistics. During this period, statistics were usually collected through farmer interviews or mar- ket surveys by field personnel of the provincial agricultural extension ser- vice as part of their normal duties. There was little or no standardization of collection procedures, so that interspatial or inter-year comparisons are of dubious value. In 1953, an Agricultural Economics Division was formed and in 1963 raised to the status of "Bureau." BAEcon has a central office in Quezon, where planning of surveys and the collating and processing of data take place. Since 1963, BAEcon has been headed by a director with two assistant directors. One assistant manages Agricultural Estimates and Statistics, one Agricultural Economics Research. A field service staff at the regional and provincial levels serves directly under the director. The first Crop and Livestock Survey (CLS) was initiated in 1954, with heavy emphasis on palay and corn, the two major Philippine food sources. Since that time, survey procedures have been modified considerably, but BAEcon says that the results are roughly comparable across time. Since 1958,
-253-
two-stage sampling has been used, with the barrio (village) as the primary stage and the farm household as the secondary stage. Barrios are further stratified by cropping pattern and farm area. The survey was an annual activity, covering 2,300-2,500 barrios and 10,000-14,000 farm households. Most field work was carried out during May-June. Data collection was done by field staff, who interviewed heads of faming households chosen by random selection from barrios divided according to prevalent cropping systems (pure palay, pure maize, etc.). The field staff filled out standardized survey questionnaires that were turned into provincial offices for collation. In 1968, the CLS was fused with other surveys of rural labor, wages, and prices to form the quarterly Integrated Agricultural Survey (LAS). In 1973, the results of the LAS were published two times each year, which allowed calendar-year estimates in addition to the traditional crop-year estimates usually used. There is a wide variety of rice statistics reported at many levels. All rice statistics, except retail and wholesale prices and imports and exports, are recorded in crop years, July 1-June 30. Data collected include rice area harvested (planted prior to 1954/55) in hectares, palsy (rough rice) production in metric tons or cavans, and yield per hectare of palay in cavans. Data is available on a national and regional basis and for 14 important rice-producing provinces. A cavan of palay was officially set equal to 44 kg. until 1961, 45 kg. from 1961-1965, 46 kg. from 1966-1972, and 50 kg. from 1973. A cavan of rice was equal to 57 kg. until 1941, when it was reduced, to 56 kg. Rice area is subdivided by cropping patterns, including lowland first and second crop, and upland. Since 1966/67, lowland first crop refers to that area harvested July-December and lowland second
-254-
crop to that area harvested January-June. Prior to this time, lowland rice was divided into lowland planted during the rainy season and included upland plantings and lowland planted during the dry season. However, some areas of the Philippines have evenly distributed rainfall. In that case, the larger area was regarded as lowland rainy season crop. Production statistics include double-cropped area. Statistics for high-yielding varieties of rice-- area, production, yield, and type--are available since 1968. In addition to annual estimates of rice area, yield, and production, crop forecasts are regularly made to aid `policy makers in making short-term decisions, and crop damage reports are made after natural disasters.
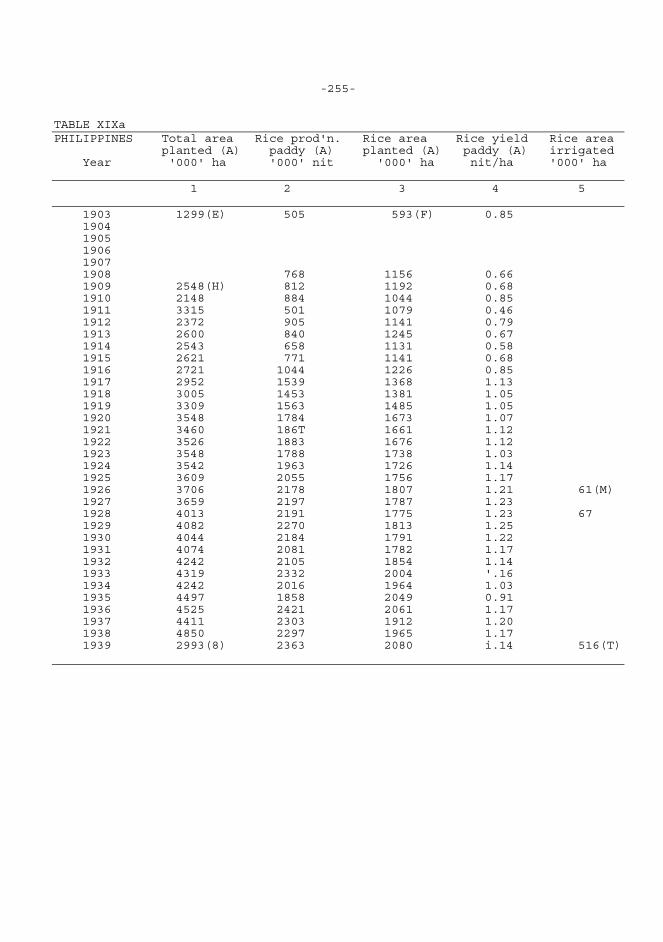
-255- TABLE XIXa PHILIPPINES Total area Rice prod'n. Rice area Rice yield Rice area planted (A) paddy (A) planted (A) paddy (A) irrigated Year '000' ha '000' nit '000' ha nit/ha '000' ha 1 2 3 4 5 1903 1299(E) 505 593(F) 0.85 1904 1905 1906 1907 1908 768 1156 0.66 1909 2548(H) 812 1192 0.68 1910 2148 884 1044 0.85 1911 3315 501 1079 0.46 1912 2372 905 1141 0.79 1913 2600 840 1245 0.67 1914 2543 658 1131 0.58 1915 2621 771 1141 0.68 1916 2721 1044 1226 0.85 1917 2952 1539 1368 1.13 1918 3005 1453 1381 1.05 1919 3309 1563 1485 1.05 1920 3548 1784 1673 1.07 1921 3460 186T 1661 1.12 1922 3526 1883 1676 1.12 1923 3548 1788 1738 1.03 1924 3542 1963 1726 1.14 1925 3609 2055 1756 1.17 1926 3706 2178 1807 1.21 61(M) 1927 3659 2197 1787 1.23 1928 4013 2191 1775 1.23 67 1929 4082 2270 1813 1.25 1930 4044 2184 1791 1.22 1931 4074 2081 1782 1.17 1932 4242 2105 1854 1.14 1933 4319 2332 2004 '.16 1934 4242 2016 1964 1.03 1935 4497 1858 2049 0.91 1936 4525 2421 2061 1.17 1937 4411 2303 1912 1.20 1938 4850 2297 1965 1.17 1939 2993(8) 2363 2080 i.14 516(T)
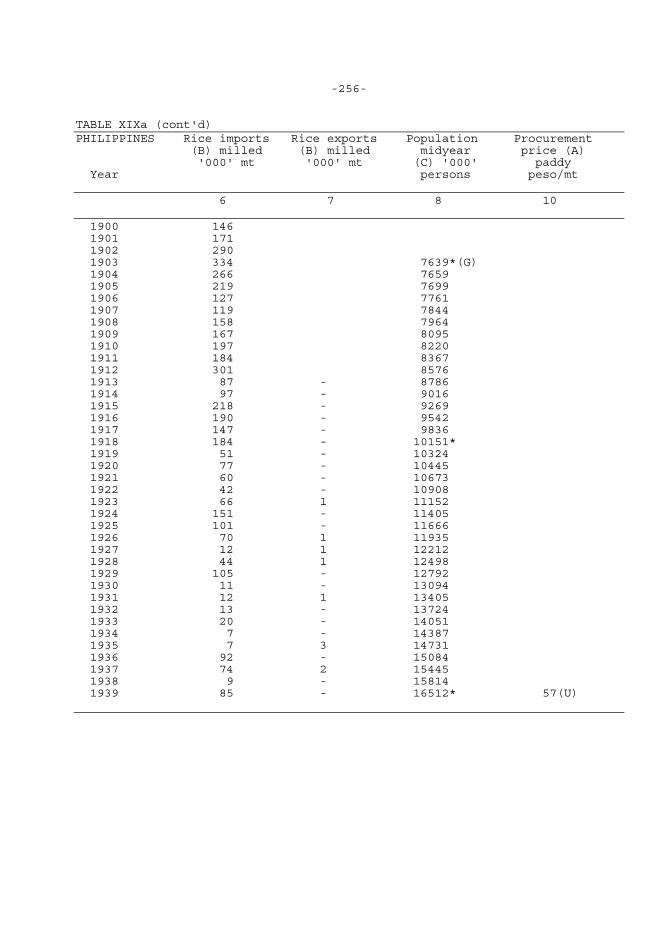
-256- TABLE XIXa (cont'd) PHILIPPINES Rice imports Rice exports Population Procurement (B) milled (B) milled midyear price (A) '000' mt '000' mt (C) '000' paddy Year persons peso/mt 6 7 8 10 1900 146 1901 171 1902 290 1903 334 7639*(G) 1904 266 7659 1905 219 7699 1906 127 7761 1907 119 7844 1908 158 7964 1909 167 8095 1910 197 8220 1911 184 8367 1912 301 8576 1913 87 - 8786 1914 97 - 9016 1915 218 - 9269 1916 190 - 9542 1917 147 - 9836 1918 184 - 10151* 1919 51 - 10324 1920 77 - 10445 1921 60 - 10673 1922 42 - 10908 1923 66 1 11152 1924 151 - 11405 1925 101 - 11666 1926 70 1 11935 1927 12 1 12212 1928 44 1 12498 1929 105 - 12792 1930 11 - 13094 1931 12 1 13405 1932 13 - 13724 1933 20 - 14051 1934 7 - 14387 1935 7 3 14731 1936 92 - 15084 1937 74 2 15445 1938 9 - 15814 1939 85 - 16512* 57(U)
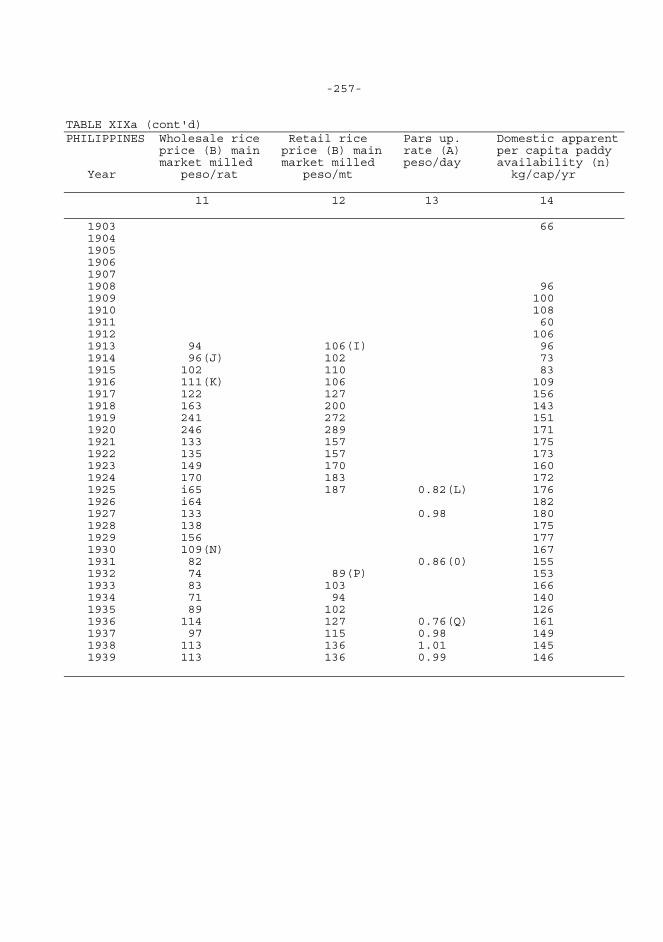
-257- TABLE XIXa (cont'd) PHILIPPINES Wholesale rice Retail rice Pars up. Domestic apparent price (B) main price (B) main rate (A) per capita paddy market milled market milled peso/day availability (n) Year peso/rat peso/mt kg/cap/yr 11 12 13 14 1903 66 1904 1905 1906 1907 1908 96 1909 100 1910 108 1911 60 1912 106 1913 94 106(I) 96 1914 96(J) 102 73 1915 102 110 83 1916 111(K) 106 109 1917 122 127 156 1918 163 200 143 1919 241 272 151 1920 246 289 171 1921 133 157 175 1922 135 157 173 1923 149 170 160 1924 170 183 172 1925 i65 187 0.82(L) 176 1926 i64 182 1927 133 0.98 180 1928 138 175 1929 156 177 1930 109(N) 167 1931 82 0.86(0) 155 1932 74 89(P) 153 1933 83 103 166 1934 71 94 140 1935 89 102 126 1936 114 127 0.76(Q) 161 1937 97 115 0.98 149 1938 113 136 1.01 145 1939 113 136 0.99 146
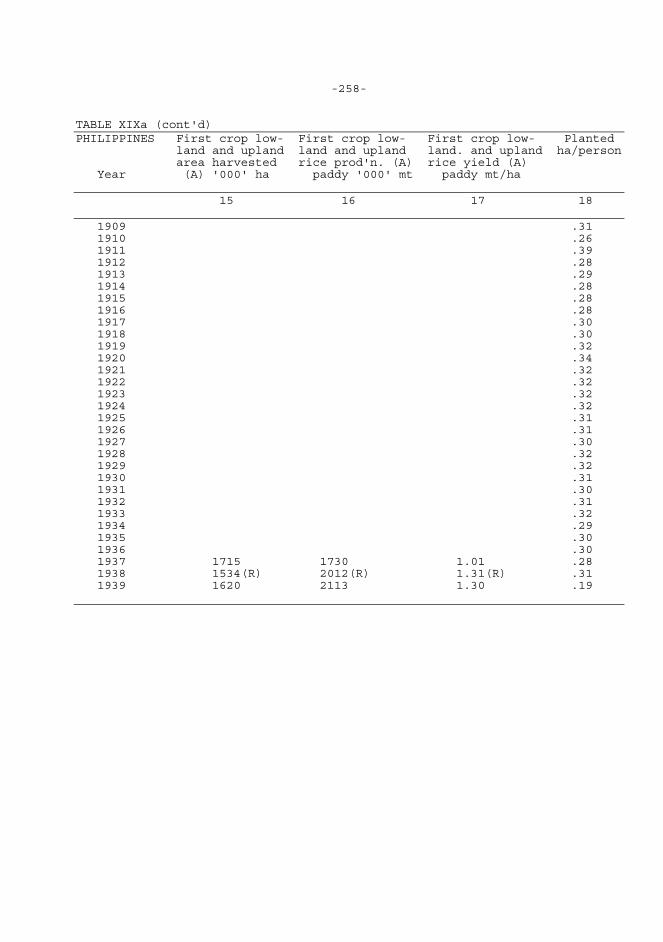
-258- TABLE XIXa (cont'd) PHILIPPINES First crop low- First crop low- First crop low- Planted land and upland land and upland land. and upland ha/person area harvested rice prod'n. (A) rice yield (A) Year (A) '000' ha paddy '000' mt paddy mt/ha 15 16 17 18 1909 .31 1910 .26 1911 .39 1912 .28 1913 .29 1914 .28 1915 .28 1916 .28 1917 .30 1918 .30 1919 .32 1920 .34 1921 .32 1922 .32 1923 .32 1924 .32 1925 .31 1926 .31 1927 .30 1928 .32 1929 .32 1930 .31 1931 .30 1932 .31 1933 .32 1934 .29 1935 .30 1936 .30 1937 1715 1730 1.01 .28 1938 1534(R) 2012(R) 1.31(R) .31 1939 1620 2113 1.30 .19
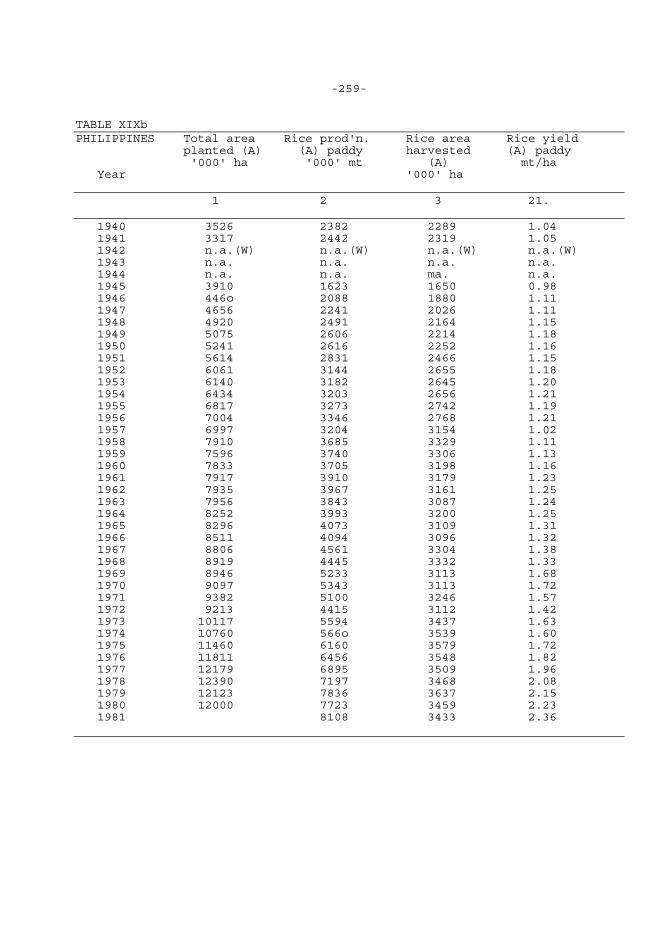
-259- TABLE XIXb PHILIPPINES Total area Rice prod'n. Rice area Rice yield planted (A) (A) paddy harvested (A) paddy '000' ha '000' mt (A) mt/ha Year '000' ha 1 2 3 21. 1940 3526 2382 2289 1.04 1941 3317 2442 2319 1.05 1942 n.a.(W) n.a.(W) n.a.(W) n.a.(W) 1943 n.a. n.a. n.a. n.a. 1944 n.a. n.a. ma. n.a. 1945 3910 1623 1650 0.98 1946 446o 2088 1880 1.11 1947 4656 2241 2026 1.11 1948 4920 2491 2164 1.15 1949 5075 2606 2214 1.18 1950 5241 2616 2252 1.16 1951 5614 2831 2466 1.15 1952 6061 3144 2655 1.18 1953 6140 3182 2645 1.20 1954 6434 3203 2656 1.21 1955 6817 3273 2742 1.19 1956 7004 3346 2768 1.21 1957 6997 3204 3154 1.02 1958 7910 3685 3329 1.11 1959 7596 3740 3306 1.13 1960 7833 3705 3198 1.16 1961 7917 3910 3179 1.23 1962 7935 3967 3161 1.25 1963 7956 3843 3087 1.24 1964 8252 3993 3200 1.25 1965 8296 4073 3109 1.31 1966 8511 4094 3096 1.32 1967 8806 4561 3304 1.38 1968 8919 4445 3332 1.33 1969 8946 5233 3113 1.68 1970 9097 5343 3113 1.72 1971 9382 5100 3246 1.57 1972 9213 4415 3112 1.42 1973 10117 5594 3437 1.63 1974 10760 566o 3539 1.60 1975 11460 6160 3579 1.72 1976 11811 6456 3548 1.82 1977 12179 6895 3509 1.96 1978 12390 7197 3468 2.08 1979 12123 7836 3637 2.15 1980 12000 7723 3459 2.23 1981 8108 3433 2.36
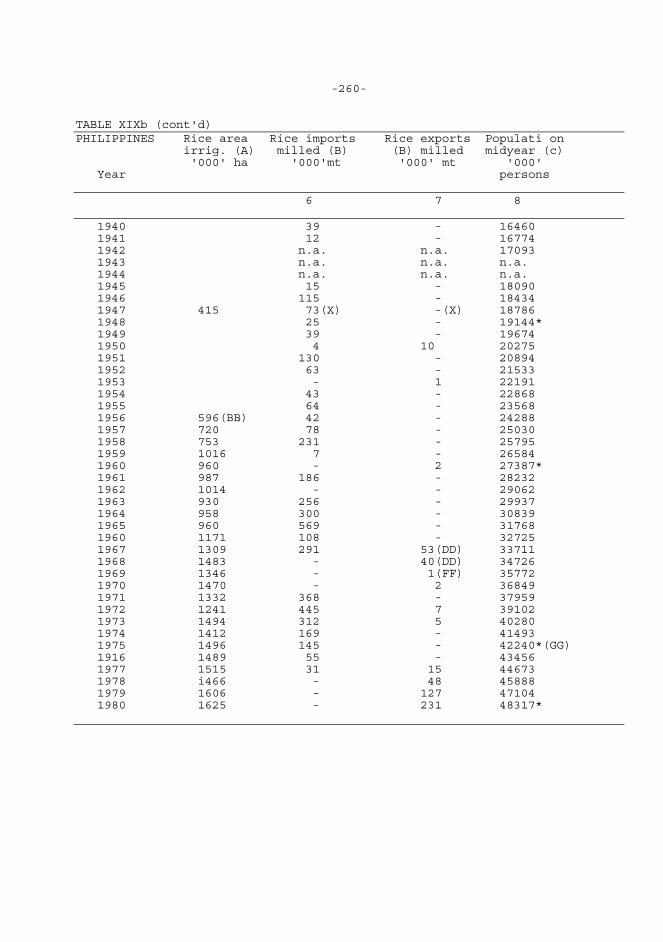
-260- TABLE XIXb (cont'd) PHILIPPINES Rice area Rice imports Rice exports Populati on irrig. (A) milled (B) (B) milled midyear (c) '000' ha '000'mt '000' mt '000' Year persons 6 7 8 1940 39 - 16460 1941 12 - 16774 1942 n.a. n.a. 17093 1943 n.a. n.a. n.a. 1944 n.a. n.a. n.a. 1945 15 - 18090 1946 115 - 18434 1947 415 73(X) -(X) 18786 1948 25 - 19144* 1949 39 - 19674 1950 4 10 20275 1951 130 - 20894 1952 63 - 21533 1953 - 1 22191 1954 43 - 22868 1955 64 - 23568 1956 596(BB) 42 - 24288 1957 720 78 - 25030 1958 753 231 - 25795 1959 1016 7 - 26584 1960 960 - 2 27387* 1961 987 186 - 28232 1962 1014 - - 29062 1963 930 256 - 29937 1964 958 300 - 30839 1965 960 569 - 31768 1960 1171 108 - 32725 1967 1309 291 53(DD) 33711 1968 1483 - 40(DD) 34726 1969 1346 - 1(FF) 35772 1970 1470 - 2 36849 1971 1332 368 - 37959 1972 1241 445 7 39102 1973 1494 312 5 40280 1974 1412 169 - 41493 1975 1496 145 - 42240*(GG) 1916 1489 55 - 43456 1977 1515 31 15 44673 1978 i466 - 48 45888 1979 1606 - 127 47104 1980 1625 - 231 48317*
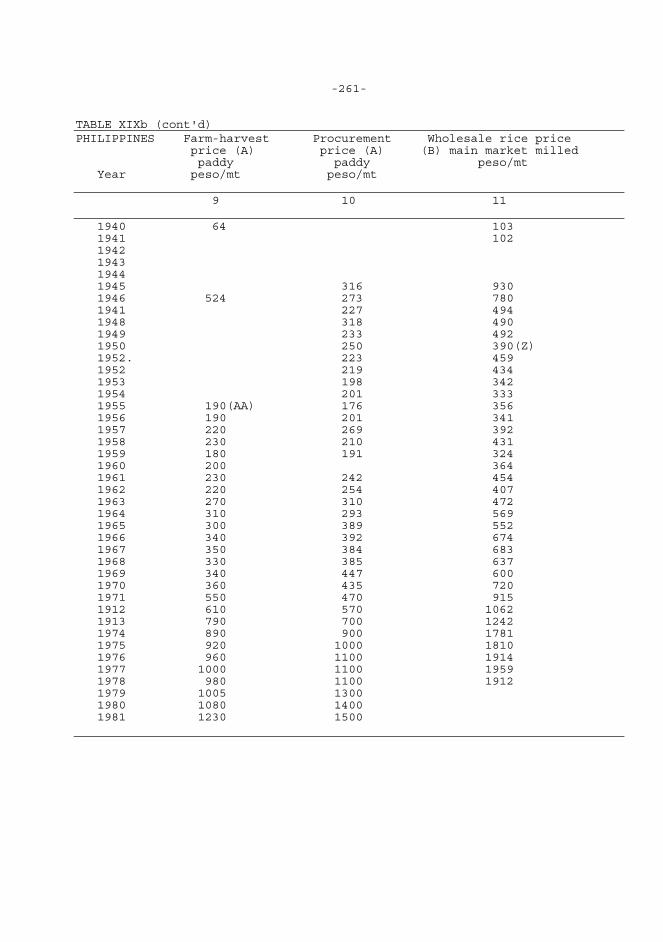
-261- TABLE XIXb (cont'd) PHILIPPINES Farm-harvest Procurement Wholesale rice price price (A) price (A) (B) main market milled paddy paddy peso/mt Year peso/mt peso/mt 9 10 11 1940 64 103 1941 102 1942 1943 1944 1945 316 930 1946 524 273 780 1941 227 494 1948 318 490 1949 233 492 1950 250 390(Z) 1952. 223 459 1952 219 434 1953 198 342 1954 201 333 1955 190(AA) 176 356 1956 190 201 341 1957 220 269 392 1958 230 210 431 1959 180 191 324 1960 200 364 1961 230 242 454 1962 220 254 407 1963 270 310 472 1964 310 293 569 1965 300 389 552 1966 340 392 674 1967 350 384 683 1968 330 385 637 1969 340 447 600 1970 360 435 720 1971 550 470 915 1912 610 570 1062 1913 790 700 1242 1974 890 900 1781 1975 920 1000 1810 1976 960 1100 1914 1977 1000 1100 1959 1978 980 1100 1912 1979 1005 1300 1980 1080 1400 1981 1230 1500
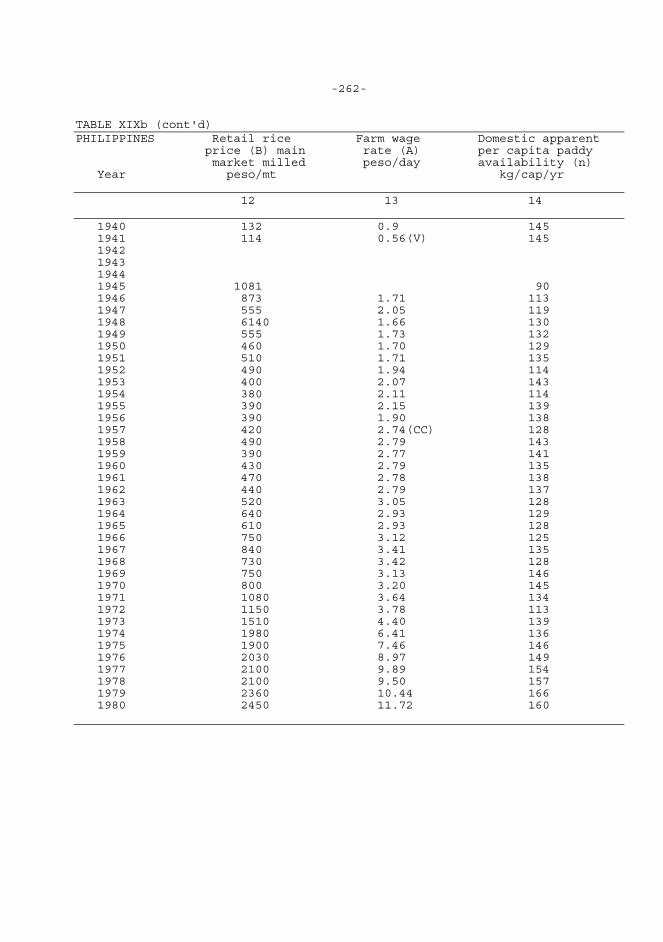
-262- TABLE XIXb (cont'd) PHILIPPINES Retail rice Farm wage Domestic apparent price (B) main rate (A) per capita paddy market milled peso/day availability (n) Year peso/mt kg/cap/yr 12 13 14 1940 132 0.9 145 1941 114 0.56(V) 145 1942 1943 1944 1945 1081 90 1946 873 1.71 113 1947 555 2.05 119 1948 6140 1.66 130 1949 555 1.73 132 1950 460 1.70 129 1951 510 1.71 135 1952 490 1.94 114 1953 400 2.07 143 1954 380 2.11 114 1955 390 2.15 139 1956 390 1.90 138 1957 420 2.74(CC) 128 1958 490 2.79 143 1959 390 2.77 141 1960 430 2.79 135 1961 470 2.78 138 1962 440 2.79 137 1963 520 3.05 128 1964 640 2.93 129 1965 610 2.93 128 1966 750 3.12 125 1967 840 3.41 135 1968 730 3.42 128 1969 750 3.13 146 1970 800 3.20 145 1971 1080 3.64 134 1972 1150 3.78 113 1973 1510 4.40 139 1974 1980 6.41 136 1975 1900 7.46 146 1976 2030 8.97 149 1977 2100 9.89 154 1978 2100 9.50 157 1979 2360 10.44 166 1980 2450 11.72 160
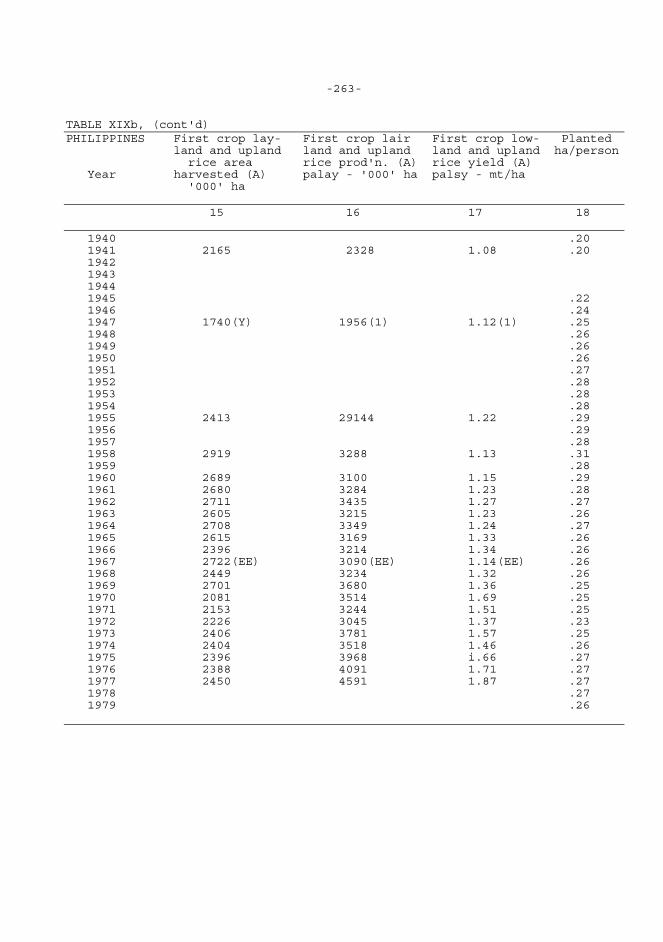
-263- TABLE XIXb, (cont'd) PHILIPPINES First crop lay- First crop lair First crop low- Planted land and upland land and upland land and upland ha/person rice area rice prod'n. (A) rice yield (A) Year harvested (A) palay - '000' ha palsy - mt/ha '000' ha 15 16 17 18 1940 .20 1941 2165 2328 1.08 .20 1942 1943 1944 1945 .22 1946 .24 1947 1740(Y) 1956(1) 1.12(1) .25 1948 .26 1949 .26 1950 .26 1951 .27 1952 .28 1953 .28 1954 .28 1955 2413 29144 1.22 .29 1956 .29 1957 .28 1958 2919 3288 1.13 .31 1959 .28 1960 2689 3100 1.15 .29 1961 2680 3284 1.23 .28 1962 2711 3435 1.27 .27 1963 2605 3215 1.23 .26 1964 2708 3349 1.24 .27 1965 2615 3169 1.33 .26 1966 2396 3214 1.34 .26 1967 2722(EE) 3090(EE) 1.14(EE) .26 1968 2449 3234 1.32 .26 1969 2701 3680 1.36 .25 1970 2081 3514 1.69 .25 1971 2153 3244 1.51 .25 1972 2226 3045 1.37 .23 1973 2406 3781 1.57 .25 1974 2404 3518 1.46 .26 1975 2396 3968 i.66 .27 1976 2388 4091 1.71 .27 1977 2450 4591 1.87 .27 1978 .27 1979 .26
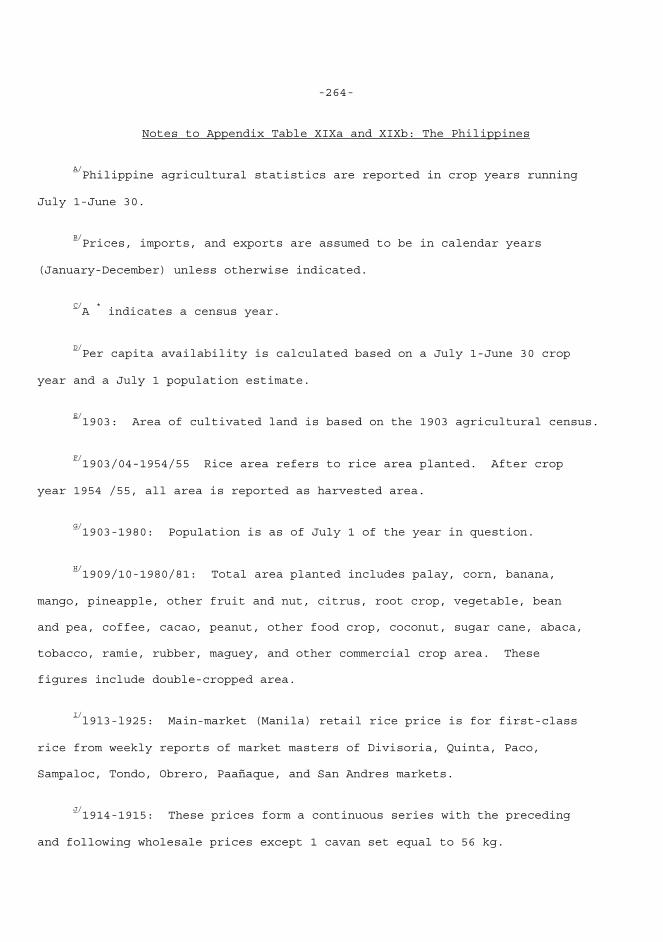
-264-
Notes to Appendix Table XIXa and XIXb: The Philippines
A/Philippine agricultural statistics are reported in crop years running
July 1-June 30.
B/Prices, imports, and exports are assumed to be in calendar years
(January-December) unless otherwise indicated.
C/A
* indicates a census year.
D/Per capita availability is calculated based on a July 1-June 30 crop
year and a July 1 population estimate.
E/1903: Area of cultivated land is based on the 1903 agricultural census.
F/1903/04-1954/55 Rice area refers to rice area planted. After crop
year 1954 /55, all area is reported as harvested area.
G/1903-1980: Population is as of July 1 of the year in question.
H/1909/10-1980/81: Total area planted includes palay, corn, banana,
mango, pineapple, other fruit and nut, citrus, root crop, vegetable, bean and pea, coffee, cacao, peanut, other food crop, coconut, sugar cane, abaca, tobacco, ramie, rubber, maguey, and other commercial crop area. These figures include double-cropped area.
I/l9l3-l925: Main-market (Manila) retail rice price is for first-class
rice from weekly reports of market masters of Divisoria, Quinta, Paco, Sampaloc, Tondo, Obrero, Paañaque, and San Andres markets.
J/1914-1915: These prices form a continuous series with the preceding
and following wholesale prices except 1 cavan set equal to 56 kg.
-265-
K/1916-1929: Main-market wholesale rice price is for native second-class
white rice. Figures collected by the Bureau of Agriculture.
L/19254/26-1940/41: Farm wage rates are for male laborers.
M/1926/27-1938/39: Includes all area irrigated by "irrigation systems."
We may assume that most of this area is rice area. Data from the Bureau of Public Works.
N/1930-1949: Average of Macan first- and second-class white rice price.
O/1931/1932: Farm wage rate is for cannon laborers.
P/1932-1980:Retail rice price is. for Macan (or equivalent) first-class
milled rice.
Q/l936/37-l940/4l: Farm wage rate is for unskilled labor.
R/1938139-1941142: Lowland area only.
S/1939: Based on the 1939 Census of Agriculture, the net area cultivated
was 3954 thousand hectares. Total gross area cultivated was 4,771,638 hectares, yielding a multiple cropping index of 121.
T/1939: Refers to total area irrigated from the 1939 census.
U/1939/40-1981/82: Procurement price is the average value per metric
ton of palay purchased by the government throughout the Philippines at the support price from farmers or through the guedan system. Quedan is a re- ceipt issued by bonded warehouses to producers who have placed a portion of their palay harvest in such warehouses. Quedan may be redeemed by farmers at named banks.
-266-
V/1941/42-1956/57: Average farm wage rates for male and female laborers
includes two meals.
W/1942/43-l944/45~: No official estimates for area, yield, or production
were prepared during the Japanese occupation.
X/1947-1980: Includes all varieties of rice and broken rice.
Y/1947/48-1966/67: We have chosen to combine lowland first crop and
upland because these crops are, in general, grown during the wet season. However, in some areas where rainfall is quite evenly distributed, it is impossible to distinguish between a "wet" and "dry" season. In those cases, the largest crop is deemed the first crop, the smaller the second. All lowland crops require constant standing water supplies.
Z/1950-1978: Main-market wholesale rice price is for Macan first-class
rice.
aa/1955/56-1981/82: Farm-harvest price is for Macan (or equivalent)
ordinary rice.
bb/l956/57-l980/81: Irrigated area refers to all rice area irrigated by
man-made means, including mechanical and gravity-fed systems. Prior to 1953/54, area irrigated is planted area; from 1953/54 area irrigated is harvested area.
cc/1957/58-1980181: Average farm wage rate is for male and female
laborers and does not include meals.
dd/-1967-1968: Rice exports include reexports.
-267-
ee/1967168-1977/78: From 1967/68, lowland first crop refers to that
area harvested July-December and lowland second crap to that area harvested January-June. Thus, the data for 1966 and before do not form a continuous series with those for 1967 to the present.
ff/1969-1973: Rice exports were mainly made for seed purposes.
gg/-l975-l980: Population estimates based on 1975 and 1980 censuses
and constructed by NCSO, Population Studies Division.
Sources of Data for Appendix Tables XIXa and XIXb: The Philippines 1. Total Area Planted 1903/04: Philippines. Bureau of the Census and Statistics, Yearbook of Philippine Statistics (Manila: Bureau of Printing, 1947). 1909/10-1927/28: Philippines. Bureau of Commerce and Industry, Statistical Bulletin of the Philippine Islands (Manila: 1922-29). 1928/29-1978/79: Philippines. National Economic and Development Authority, Philippine Statistical Yearbook (Manila: 1980). 1979/80-1980/81: Philippines. Bureau of Agricultural Economics (mimeo). 2. Rice Production 1903/04: Venegas, Ernesto and Ruttan, Vernon, "An Analysis of Rice ________________________________________________ NOTE: In Philippine source material, agricultural statistics are frequently labeled by the year in which the crop period ends, i.e., crop year 1915/1916 is labeled 1916, rather than 1915, which is standard for most other countries. Agricultural data in this table are labeled in standard format, crop year 1915/16 is called 1915.
-268-
Production in the Philippines," Economic Research Journal 11 (December 1964), pp. 159-180. 1908/09: Bouis, Howarth, "Rice Policy in the Philippines," Ph.D. thesis, Stanford University, 1982. 1909/10-1926/27: Philippines. Bureau of Commerce and Industry, Statistical Bulletin of the Philippine Islands (Manila: Bureau of Printing, 1918-1930). 1927/28-1946/47: Philippines. Bureau of the Census and Statistics, Year- book of Philippine Statistics (Manila: Bureau of Printing, 1941, 1947). 1947/48-1978/79: Philippines. National Economic and Development Authority, Philippine Statistical Yearbook (Manila: 1980). 1979/80-1981/82: Philippines. Bureau of Agricultural Economics (mimeo). 3. Rice Area 1903/04: Venegas, Ernesta and Ruttan, Vernon, "An Analysis of Rice Production in the Philippines," Economic Research Journal 11 (December 1964), pp. 159-180. 1908/09: Bouis, Howarth, "Rice Policy in the Philippines," Ph.D. thesis, Stanford University, 1982. 1909/10-1926/27: Philippines. Bureau of Commerce and Industry, Statistical Bulletin of the Philippine Islands (Manila: Bureau of Printing, 1918-1930). 1927/28-1946/47: Philippines. Bureau of the Census and Statistics, Year- book of Philippine Statistics (Manila: Bureau of Printing, 1941, 1947). 1947/48-1978/79: Philippines. National Economic and Development Authority, Philippine Statistical Yearbook (Manila: 1980). 1979/80-1981/82: Philippines. Bureau of Agricultural Economics (mimeo). 4. Rice Yields 1903-1981: Rice yields are computed by dividing rice production (2) by rice area (3) on an annual basis.
-269-
5. Rice Area Irrigated 1926/27-1928/29: Philippines. Bureau of Commerce and Industry, Statistical Bulletin of the Philippine Islands (Manila: Bureau of Printing, 1930). 1939, 1947: Philippines. Bureau of the Census and Statistics, Yearbook of Philippine Statistics (Manila: Bureau of Printing, 1947). 1956/57"-1978179: Ongkingco, P. S.; Galvez, 3.; and Rosegrant, N., "Irri- gation and Rice Production in the Philippines: Statue and Projection," Rice Policies in Southeast Asia Project, Working Paper No. 3. Data supplied by BAEcon. 1979/80-1980/8l: Philippines. Bureau of Agricultural Economics (mimeo). 6. Rice Imports 1900-1927: Philippines. Bureau of Commerce and Industry, Statistical Bulletin of the Philippine Islands (Manila: Bureau of Printing, 1930). 1928-1946: Philippines. Bureau of the Census and Statistics, Yearbook of Philippine Statistics (Manila: Bureau of Printing, 1947). 1947-1954: Philippines. Bureau of the Census and Statistics, Foreign Trade Statistics of the Philippines (Manila). 1955-1973: Apiraksirikul, Sumalee, "Rice Trade Policy as it Relates to National Objectives in the Philippines," Master's thesis, School of Economics, University of the Philippines, n.d. 1974-1977: Philippine Council for Agricultural and Resources Research, Data Series on Rice Statistics in the Philippines (Los Banos, Philippines: 1981). 1978-1980: Philippines. National Food Authority, "Rice Imports by Country of Origin," unpublished data. 7. Rice Exports 1913-1927: Philippines. Bureau of Commerce and Industry, Statistical
-270-
Bulletin of the Philippine Islands (Manila: Bureau of Printing, 1918-30). 1928-1946: Philippines. Bureau of the Census and Statistics, Yearbook of Philippine Statistics (Manila: Bureau of Printing, 1947). 1947-1978: Philippines. Bureau of the Census and Statistics, Foreign Trade Statistics of the Philippines (Manila: 1947-1979). 1979-1980: Bureau of the Census and Statistics. 8. Population 1903-1974: Anden, Teresa and Palacpac, Adelita, Data Series on Rice Statistics in the Philippines (Los Baños, Philippines: International Rice Research Institute, 1976). 1975-1980: Philippines. National Economic and Development Authority, 1981 Philippine Statistical Yearbook (Manila: 1981). 9. Farm-Harvest Price 1940/41-1946/47: Philippines. Bureau of the Census and Statistics, Yearbook of Philippine Statistics (Manila: Bureau of Printing, 1947). 1955/56-1981/82: Philippines. Bureau of Agricultural Economics, "Prices Received and Paid by Farmers." 10. Procurement Price 1939/40-1970/71: Hears, Leon et al., Rice Economy of the Philippines (Quezon City: University of the Philippines Press, 1974),. pp. 290-291. 1971-1981: Bureau of the Census and Statistics. 11. Wholesale Rice Price (Main Market) 1913-1929: Philippines. Bureau of Commerce and Industry, Statistical Bulletin of the' Philippine Islands (Manila: Bureau of Printing, 1918-1930).
-271-
1914, 1915, and 1930-1949: Mears, Leon et al., Rice Economy of the Philippines (Quezon City: University of the Philippines Press, 1974), pp. 338-339. 1950-1978: Central Bank of the Philippines, unpublished data. 12. Retail Rice Price (Main Market) 1913-1925: Philippines. Bureau of Commerce and Industry, Statistical Bulletin of the Philippine Islands (Manila: Bureau of Printing, 1918-1929). 1932-1934: FAO, World Rice Economy in Figures, 1909-1963 (Rome: 1965). 1935-1940: Philippines. Bureau of the Census and Statistics, Yearbook of Philippine Statistics (Manila: Bureau of Printing, 1941, 1947). 1941-1948: Philippines. Division of Agricultural Economics, Philippine Agricultural Statistics, Vol. 1 (1954) (Manila: 1955). 1949-1980: Central Bank of the Philippines, unpublished data. 13. Farm Wage Rate 1925-4927: Philippines. Bureau of Commerce and Industry, Statistical Bulletin of the Philippine Islands (Manila: Bureau of Printing, 1926, 1930). 1931/32-1946/47: Philippines. Bureau of the Census and Statistics, Yearbook of Philippine Statistics (Manila: Bureau of Printing, 1947). 1947/48-1950/51: Philippines. Bureau of the Census and Statistics, Journal of Philippine Statistics (Manila). 1951/52-1956/57: Philippines. Bureau of the Census and Statistics, Hand- book of Philippine Statistics, 1903-1959 (Manila: Bureau of Printing, 1960). 1957/58-1980/81: Philippines. Bureau of Agricultural Economics, Farm Wages (Manila).
-272-
14. Domestic Apparent Per Capita Rice Availability 1909-1980: Availability calculated by dividing palay production (2) by midyear population estimate (8) on an annual basis. 15. First Crap Lowland and Upland Rice Area 1937/38-1941/42: Philippines. Bureau of the Census and Statistics, Yearbook of Philippine Statistics (Manila: Bureau of Printing, 1941, 1947). 1947/48-1976/77: Philippine Council for Agricultural and Resources Research, Data Series on Rice Statistics in the Philippines (Los Baños, Philippines: 1981). 1977/78: Philippines. Bureau ~f Agricultural Economics, unpublished data. 16. First Crop. Lowland and Upland Rice Production 1937/38-1941/42: Philippines. Bureau of the Census and Statistics, Yearbook of Philippine Statistics (Manila: Bureau of Printing, 1941, 1947). 1947/48-1976/77: Philippine Council for Agricultural and Resources Research, Data Series on Rice Statistics in the Philippines (Los Baños, Philippines: 1981). 1977/78: Philippines. Bureau of Agricultural Economics, unpublished data. 17. First Crop Lowland and Upland Rice Yield 1937/38-1977/78: Rice yields are computed by dividing lowland rice pro- duction (16) by lowland rice area (15) on an annual basis.
-273-
Country Sources of Basic Data: The Philippines 1. Philippines. Bureau of Commerce and Industry, Statistical Bulletin of the Philippine Islands (Manila: 1918-1930), historical. (Annual). 2. Philippines. Bureau of the Census and Statistics, Yearbook of Philippine Statistics (Manila: Bureau of Printing). (historical). Republished on a regular basis as Philippine Statistical Yearbook from 1966. 3. Anden, Teresa and Palacpac, Adelita, Data Series on Rice Statistics in the Philippines (Los Baños, Philippines: Philippine Council for Agriculture and Resources Research, 1981). 4. Philippines. Bureau of Agricultural Economics, Crop, Livestock and Natural Resources Statistics (Manila). (Annual). 5. Philippines. Bureau of the Census and Statistics, Foreign Trade Statistics of the Philippines (Manila). (Annual). 6. Philippines. National Economic and Development Authority, Philippine Statistical Yearbook (Manila). (Annual). 7. Philippines. Bureau of Agricultural Economics, Farm Wages (Manila). (Annual). 8. Philippines. Bureau of Agricultural Economics, "Prices Received and Paid by Farmers." (mimeos).
Useful Secondary Sources 1. Apiraksirikul, Sumalee, "Rice Trade Policy as it Relates to National Objectives in the Philippines," Master's thesis, School of Economics, University of the Philippines, n.d. 2. Mears, Leon et al., Rice Economy of the Philippines (Quezon City: University of the Philippines Press, 1974).
-274-
3. Huke, Robert, Shadows on the Land: An Economic Geography of the Philippines (Manila: Bookmark~ Inc., 1963). 4. World Bank, " Phi1ippines Sector Study: Grain Production Policy Review," Report No. 2192a-PU, January 22, 1979. 5. Encarnacion, Jose Jr., Philippine Economic Problems in Perspective (Manila; Institute of Economic Development and Research, School of Economics, University of the Philippines, 1976). 6. Philippines. Department of Agriculture and Natural Resources, The Philippine Journal of Agriculture (Manila: Bureau of Printing). 7. Bouis, Howarth, "Rice Policy in the Philippines," Ph.D. thesis, Stanford University, February 1982. Acronyms BAEcon: Bureau of Agritcultural Economics BCS: Bureau of Census and Statistics (changed to NCSO) BPI: Bureau of Plant Industry CB: Central Bank `of the Philippines CLS: Crop and Livestock Survey (replaced by IAS in 1968) DANK: Department of Agriculture and Natural Resources IAS: Integrated Agricultural Survey IRRI: International Rice Research Institute NARIC: National Rica and Corn Corporation (replaced by RCA in 1962 and by NGA in 1972) NCSO: National Census and Statistics Office (formerly BCS) NEDA: National Economic and Development Authority NFA: National Food Authority (formerly NGA, became NFA in 1981)
-275-
NGA: National Grain Authority (formerly RCA) NIA: National Irrigation Authority RCA: Rice and Corn Administration (formerly NARIC) RCS: Rice and Con. Survey (formerly LAS) Conversion. Factors 1 cavan palay = 50 kg. palay* 1 cavan rice = 56 kg. rice 1 ganta rice = 2.38 kg. 1 cavan rice = 24.99 gantas rice 1 mt. palay = 20 cavans palsy 1 mt. rice = 17.86 cavans rice Official Rice Milling Rates: 1902/03 - 1966/67 67.91 percent 1967/68 - 1969/69 66.18 percent 1969/70 - Present 67.45 percent Money Unit money unit peso In 1980 1 US$ = 7.60 peso official exchange rate In 1980 1 US$ = 7.98 peso free-market exchange rate ———————————————— *The cavan and ganta (retail) are volume measures. Each has been assigned a specific official kg. weight, which has varied through time. This has ob- viously been a source of error, especially before World War II when volume measures were not adequately standardized.
-276-
*
xx. THAILAND Rice Statistics in Thailand Thailand can be divided into four primary regions on the basis of geography--the Central Plain, the North, the Northeast, and the South. Administratively, Thailand is subdivided into 72 changwats (provinces). Changwats are administered by governors who are civil servants appointed by the Ministry of the Interior. Beneath the changwat are 578 amphoes (district). Beneath th~ amphoes are 5,138 tambons (a group of villages). Tambons are administered by chiefs elected by the village headmen. Below the tambon is the muban~ (village) headed by an elected puyaiban (village headman). Most agricultural statistical collection is carried out at the village level under the' supervision of the puyaiban. Until recently, like most other Asian countries, Thailand collected rice production and area statistics through more than one agency. The two most important agencies were the National Statistics Office (NSO) and the Ministry of Agriculture (Krasuang Kaset). Since 1975, NSO no longer has any responsibility or agricultural statistics. The Royal Irrigation Department and the National Income Accounts Division of the National Economic and Social Development Board also occasionally release statistical estimates. Although the Ministry of Agriculture rice series predates NSO collection of rice statistics, we will consider NSO first. NSO regularly reported rice area, production, and yield. Figures that are available are on a calendar-year basis since 1940, and crop-year basis prior to 1940. In 1966, ————————————————————
*
Thanks to Robert Tetro and Robert Ralston for comments.
-277-
NSO began a program at yearly crop cutting at the village and changwat (pro- vince) level, Survey teams used stratified multi-stage probability sampling in sample villages to determine yields. Area was determined via a combina- tion of subjective interviews and survey measurement. Five to 10 percent of all villages were surveyed. The Ministry of Agriculture (MOAC) is responsible f or all aspects of rice production, including the collection of statistics, until the rice passes through the farm gate. The MOAC has reported rice production since at least 1937 down to the changwat level. In 1955, the MOAC issued a series of three standardized forms to be filled out individually in the village for each farmer by the village headman (puyaiban). This system is commonly referred to as the village headman reporting system., The completed forms, bearing information regarding area planted, by what method, crop damage, area harvested and total production, are sent upward to the MOAC. Agri- cultural extension agents help the process run smoothly. This system has some obvious problems in that many persons are involved in the collection process, multiplying the chance for errors, especially during tabulation. The MOAC uses the crop year (April 1-March 31) to report agricultural statistics. Statistics reported include rice area harvested, planted, transplanted and broadcast, paddy production, and, more recently, main crop area and production. Although Thai statistical series are usually labeled rice" production, the rice is actually in rough (paddy) form. Ministry of Agriculture planted and harvested rice areas are available back to 1937 and broadcasted and transplanted area back to 1955. Rice area is reported in rai, the Thai land measurement equivalent to 0.16 ha. Paddy production
-278-
is reported in metric tons or, in older sources, in piculs. Figures are easily available down to the changwat level. There are, of course, pros and cons for both the NSO and MOAC rice area and production series. `Prior to 1966 and the inception of the NSO crop- cutting surveys, the Ministry of Agriculture series is our only choice for rice production as NSO used Ministry of Agriculture estimates. After 1966 and up to 1975, we have chosen to use the NSO series for several reasons. First, the NSO obtains its numbers from objective surveys. This should help remove the possible blab introduced by local underreporting and staff errors. In fact, NSO found that its production figures were about 16 percent larger than the comparable MOA numbers, except in 1962-63 when the MOA and NSO jointly collaborated during the Agricultural Census. Thus, in Table XX we find a large jump between the 1965 MOA estimate and the 1966 NSO estimate for paddy production. Both series show similar rice area so we use Ministry of Agriculture numbers ~prior to 1966 and NSO numbers from 1966 to 1975. (For further discussion, see: Gaesuwan; Siamwalla; and Welsch, Thai Rice Production and Consumption Data 1947-1970, Thailand Rice Project, Working Paper No. 2 [Bangkok: Kasetsart University, 19741.)
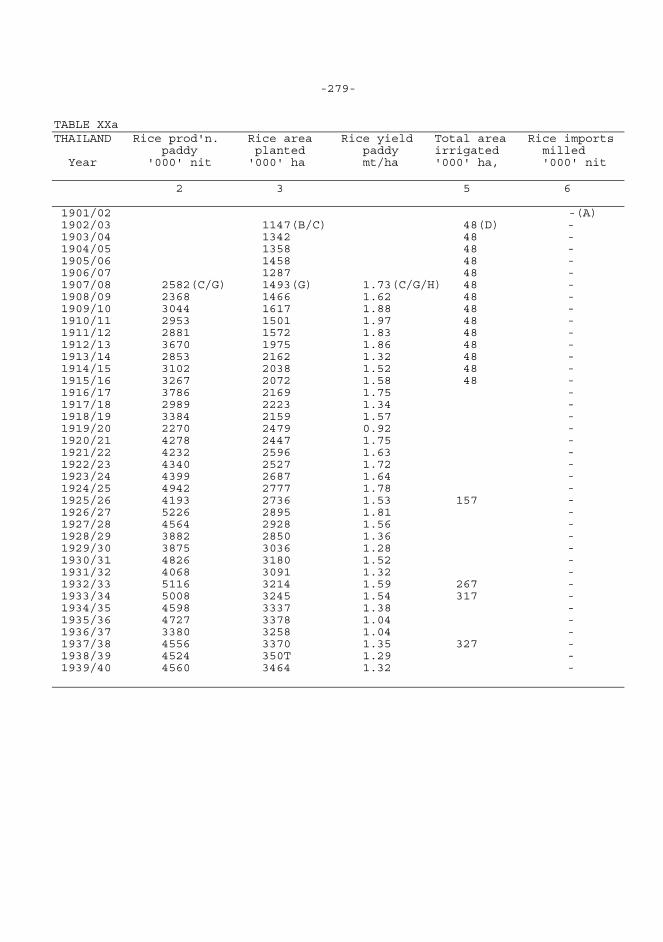
-279- TABLE XXa THAILAND Rice prod'n. Rice area Rice yield Total area Rice imports paddy planted paddy irrigated milled Year '000' nit '000' ha mt/ha '000' ha, '000' nit 2 3 5 6 1901/02 -(A) 1902/03 1147(B/C) 48(D) - 1903/04 1342 48 - 1904/05 1358 48 - 1905/06 1458 48 - 1906/07 1287 48 - 1907/08 2582(C/G) 1493(G) 1.73(C/G/H) 48 - 1908/09 2368 1466 1.62 48 - 1909/10 3044 1617 1.88 48 - 1910/11 2953 1501 1.97 48 - 1911/12 2881 1572 1.83 48 - 1912/13 3670 1975 1.86 48 - 1913/14 2853 2162 1.32 48 - 1914/15 3102 2038 1.52 48 - 1915/16 3267 2072 1.58 48 - 1916/17 3786 2169 1.75 - 1917/18 2989 2223 1.34 - 1918/19 3384 2159 1.57 - 1919/20 2270 2479 0.92 - 1920/21 4278 2447 1.75 - 1921/22 4232 2596 1.63 - 1922/23 4340 2527 1.72 - 1923/24 4399 2687 1.64 - 1924/25 4942 2777 1.78 - 1925/26 4193 2736 1.53 157 - 1926/27 5226 2895 1.81 - 1927/28 4564 2928 1.56 - 1928/29 3882 2850 1.36 - 1929/30 3875 3036 1.28 - 1930/31 4826 3180 1.52 - 1931/32 4068 3091 1.32 - 1932/33 5116 3214 1.59 267 - 1933/34 5008 3245 1.54 317 - 1934/35 4598 3337 1.38 - 1935/36 4727 3378 1.04 - 1936/37 3380 3258 1.04 - 1937/38 4556 3370 1.35 327 - 1938/39 4524 350T 1.29 - 1939/40 4560 3464 1.32 -
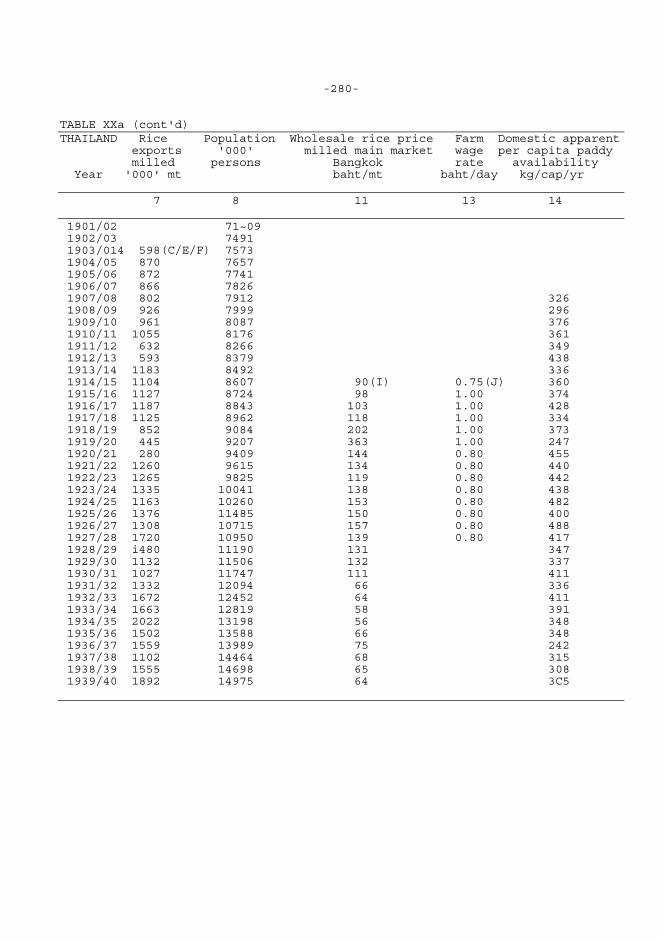
-280- TABLE XXa (cont'd) THAILAND Rice Population Wholesale rice price Farm Domestic apparent exports '000' milled main market wage per capita paddy milled persons Bangkok rate availability Year '000' mt baht/mt baht/day kg/cap/yr 7 8 11 13 14 1901/02 71~09 1902/03 7491 1903/014 598(C/E/F) 7573 1904/05 870 7657 1905/06 872 7741 1906/07 866 7826 1907/08 802 7912 326 1908/09 926 7999 296 1909/10 961 8087 376 1910/11 1055 8176 361 1911/12 632 8266 349 1912/13 593 8379 438 1913/14 1183 8492 336 1914/15 1104 8607 90(I) 0.75(J) 360 1915/16 1127 8724 98 1.00 374 1916/17 1187 8843 103 1.00 428 1917/18 1125 8962 118 1.00 334 1918/19 852 9084 202 1.00 373 1919/20 445 9207 363 1.00 247 1920/21 280 9409 144 0.80 455 1921/22 1260 9615 134 0.80 440 1922/23 1265 9825 119 0.80 442 1923/24 1335 10041 138 0.80 438 1924/25 1163 10260 153 0.80 482 1925/26 1376 11485 150 0.80 400 1926/27 1308 10715 157 0.80 488 1927/28 1720 10950 139 0.80 417 1928/29 i480 11190 131 347 1929/30 1132 11506 132 337 1930/31 1027 11747 111 411 1931/32 1332 12094 66 336 1932/33 1672 12452 64 411 1933/34 1663 12819 58 391 1934/35 2022 13198 56 348 1935/36 1502 13588 66 348 1936/37 1559 13989 75 242 1937/38 1102 14464 68 315 1938/39 1555 14698 65 308 1939/40 1892 14975 64 3C5
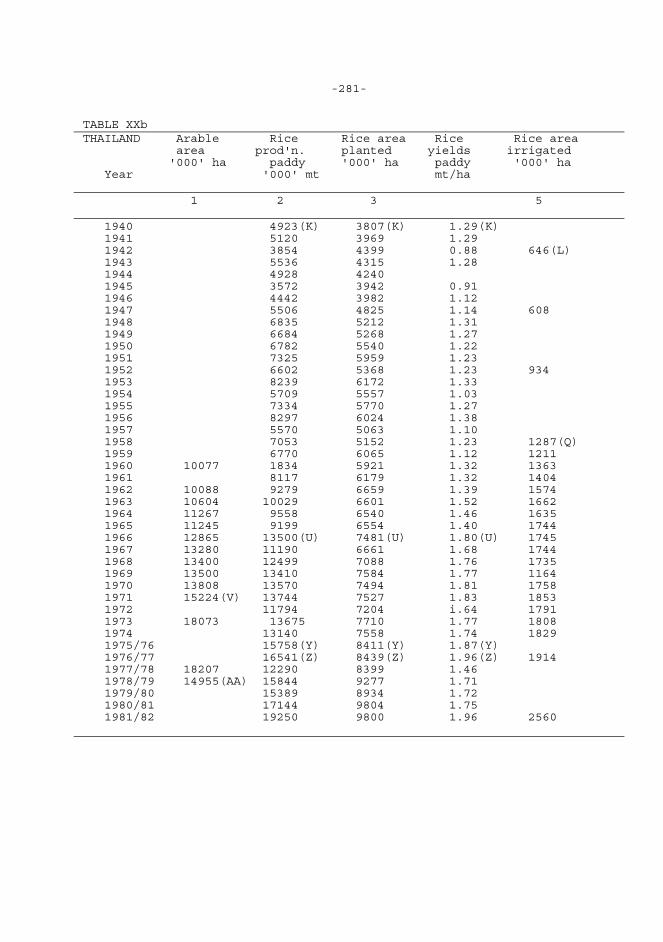
-281- TABLE XXb THAILAND Arable Rice Rice area Rice Rice area area prod'n. planted yields irrigated '000' ha paddy '000' ha paddy '000' ha Year '000' mt mt/ha 1 2 3 5 1940 4923(K) 3807(K) 1.29(K) 1941 5120 3969 1.29 1942 3854 4399 0.88 646(L) 1943 5536 4315 1.28 1944 4928 4240 1945 3572 3942 0.91 1946 4442 3982 1.12 1947 5506 4825 1.14 608 1948 6835 5212 1.31 1949 6684 5268 1.27 1950 6782 5540 1.22 1951 7325 5959 1.23 1952 6602 5368 1.23 934 1953 8239 6172 1.33 1954 5709 5557 1.03 1955 7334 5770 1.27 1956 8297 6024 1.38 1957 5570 5063 1.10 1958 7053 5152 1.23 1287(Q) 1959 6770 6065 1.12 1211 1960 10077 1834 5921 1.32 1363 1961 8117 6179 1.32 1404 1962 10088 9279 6659 1.39 1574 1963 10604 10029 6601 1.52 1662 1964 11267 9558 6540 1.46 1635 1965 11245 9199 6554 1.40 1744 1966 12865 13500(U) 7481(U) 1.80(U) 1745 1967 13280 11190 6661 1.68 1744 1968 13400 12499 7088 1.76 1735 1969 13500 13410 7584 1.77 1164 1970 13808 13570 7494 1.81 1758 1971 15224(V) 13744 7527 1.83 1853 1972 11794 7204 i.64 1791 1973 18073 13675 7710 1.77 1808 1974 13140 7558 1.74 1829 1975/76 15758(Y) 8411(Y) 1.87(Y) 1976/77 16541(Z) 8439(Z) 1.96(Z) 1914 1977/78 18207 12290 8399 1.46 1978/79 14955(AA) 15844 9277 1.71 1979/80 15389 8934 1.72 1980/81 17144 9804 1.75 1981/82 19250 9800 1.96 2560
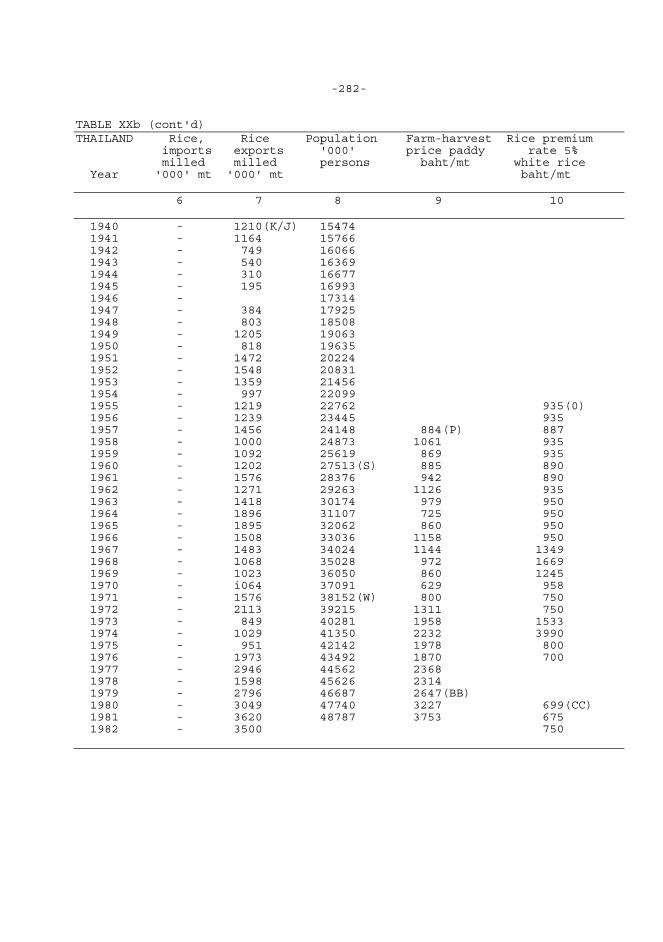
-282- TABLE XXb (cont'd) THAILAND Rice, Rice Population Farm-harvest Rice premium imports exports '000' price paddy rate 5% milled milled persons baht/mt white rice Year '000' mt '000' mt baht/mt 6 7 8 9 10 1940 - 1210(K/J) 15474 1941 - 1164 15766 1942 - 749 16066 1943 - 540 16369 1944 - 310 16677 1945 - 195 16993 1946 - 17314 1947 - 384 17925 1948 - 803 18508 1949 - 1205 19063 1950 - 818 19635 1951 - 1472 20224 1952 - 1548 20831 1953 - 1359 21456 1954 - 997 22099 1955 - 1219 22762 935(0) 1956 - 1239 23445 935 1957 - 1456 24148 884(P) 887 1958 - 1000 24873 1061 935 1959 - 1092 25619 869 935 1960 - 1202 27513(S) 885 890 1961 - 1576 28376 942 890 1962 - 1271 29263 1126 935 1963 - 1418 30174 979 950 1964 - 1896 31107 725 950 1965 - 1895 32062 860 950 1966 - 1508 33036 1158 950 1967 - 1483 34024 1144 1349 1968 - 1068 35028 972 1669 1969 - 1023 36050 860 1245 1970 - i064 37091 629 958 1971 - 1576 38152(W) 800 750 1972 - 2113 39215 1311 750 1973 - 849 40281 1958 1533 1974 - 1029 41350 2232 3990 1975 - 951 42142 1978 800 1976 - 1973 43492 1870 700 1977 - 2946 44562 2368 1978 - 1598 45626 2314 1979 - 2796 46687 2647(BB) 1980 - 3049 47740 3227 699(CC) 1981 - 3620 48787 3753 675 1982 - 3500 750
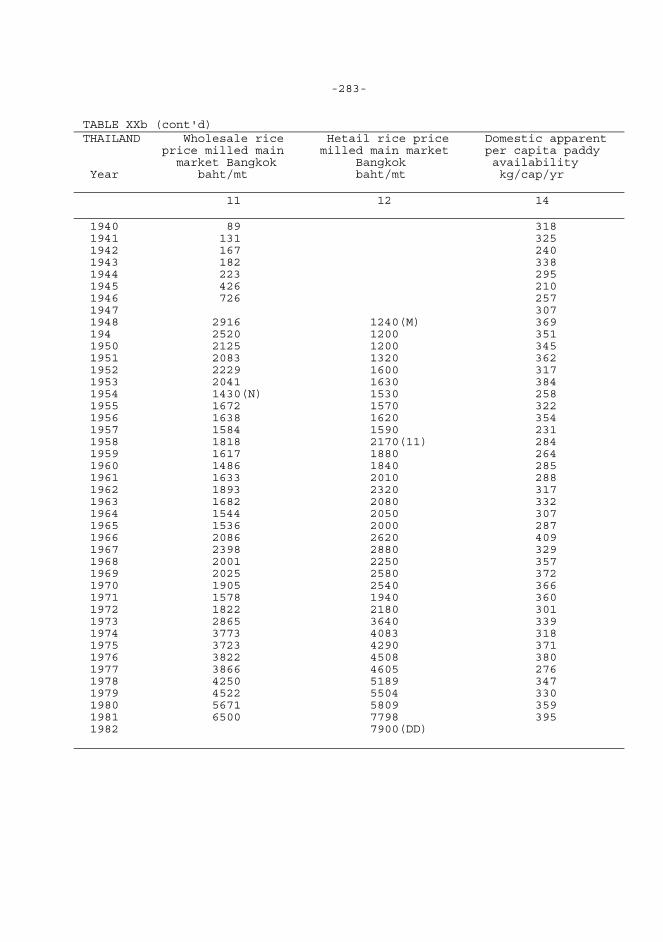
-283- TABLE XXb (cont'd) THAILAND Wholesale rice Hetail rice price Domestic apparent price milled main milled main market per capita paddy market Bangkok Bangkok availability Year baht/mt baht/mt kg/cap/yr 11 12 14 1940 89 318 1941 131 325 1942 167 240 1943 182 338 1944 223 295 1945 426 210 1946 726 257 1947 307 1948 2916 1240(M) 369 194 2520 1200 351 1950 2125 1200 345 1951 2083 1320 362 1952 2229 1600 317 1953 2041 1630 384 1954 1430(N) 1530 258 1955 1672 1570 322 1956 1638 1620 354 1957 1584 1590 231 1958 1818 2170(11) 284 1959 1617 1880 264 1960 1486 1840 285 1961 1633 2010 288 1962 1893 2320 317 1963 1682 2080 332 1964 1544 2050 307 1965 1536 2000 287 1966 2086 2620 409 1967 2398 2880 329 1968 2001 2250 357 1969 2025 2580 372 1970 1905 2540 366 1971 1578 1940 360 1972 1822 2180 301 1973 2865 3640 339 1974 3773 4083 318 1975 3723 4290 371 1976 3822 4508 380 1977 3866 4605 276 1978 4250 5189 347 1979 4522 5504 330 1980 5671 5809 359 1981 6500 7798 395 1982 7900(DD)
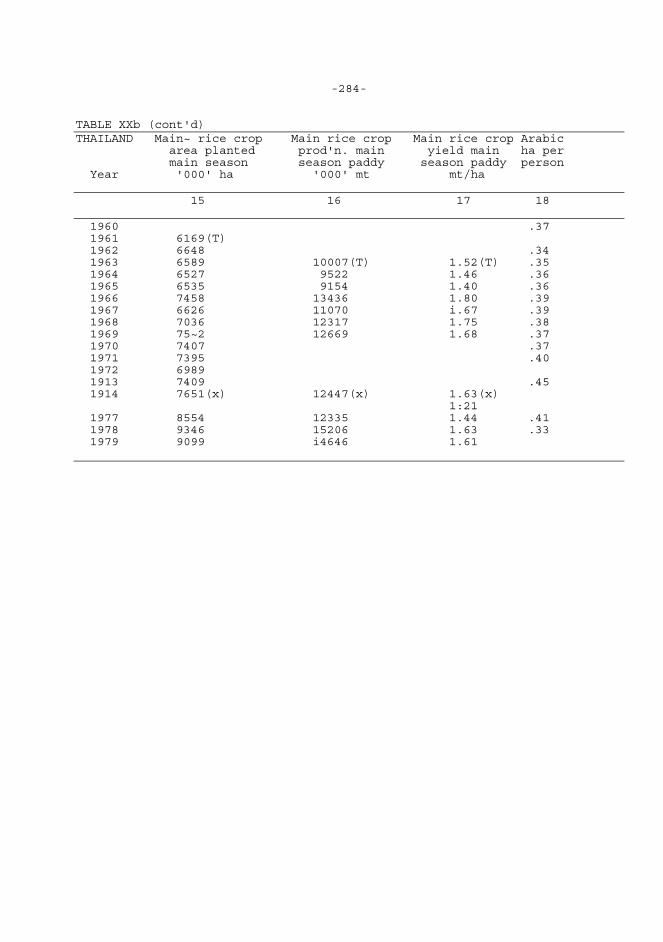
-284- TABLE XXb (cont'd) THAILAND Main~ rice crop Main rice crop Main rice crop Arabic area planted prod'n. main yield main ha per main season season paddy season paddy person Year '000' ha '000' mt mt/ha 15 16 17 18 1960 .37 1961 6169(T) 1962 6648 .34 1963 6589 10007(T) 1.52(T) .35 1964 6527 9522 1.46 .36 1965 6535 9154 1.40 .36 1966 7458 13436 1.80 .39 1967 6626 11070 i.67 .39 1968 7036 12317 1.75 .38 1969 75~2 12669 1.68 .37 1970 7407 .37 1971 7395 .40 1972 6989 1913 7409 .45 1914 7651(x) 12447(x) 1.63(x) 1:21 1977 8554 12335 1.44 .41 1978 9346 15206 1.63 .33 1979 9099 i4646 1.61
-285-
Notes to Appendix Tables XXa and XXb: Thailand
A/1901-1982: No rice imports made.
B/1902/03-1906/07: Area cultivated in rice annually as graded for tax
purposes. Rice lands were classified according to a system of five grades based on average annual yields. The grades ran from Grade 1, with a yield of 7 piculs of paddy/rai (2.6 mt. paddy/ha.) to Grade 5, with 4.75 piculs of paddy/rai (1.79 mt. paddy/ha.). Cultivated rice area figures are smaller than planted area figures used from 1907/08 because allowances were made for damage from natural or other causes. Rice land taxes'! estimated to be about one-tenth of gross production (Vella, 1957, p. 25), were paid in kind to the royal granaries.
C/1902/03-1939/40: Rice area, production, yields, and exports reported
in crop years of April-March. Rice yields appear to be rather high in the pre- war period, especially in the earlier half, relative to post-war yields. This is probably due to the fact that taxes were determined on the basis of rice area. Thus, reported rice area figures are probably too low, helping to arti- ficially raise yields. Another possible explanation, as Robert Ralston suggests, is that less productive lands, including upland areas where rainfall was barely adequate, were brought under cultivation from about 1938 onwards. The output from these marginal lands was very low, decreasing yields. There is some credence to this suggestion, because Thailand has adopted modern technology very slowly, and still suffers from the results of low investment in infrastructure.
D/l902/031937/38: Irrigated area refers to total area irrigated under
government schemes.
-286-
E/1903-1981: Rice exports include white rice, broken rice, glutinous
rice, cargo rice, and other.
F/1903: As a corollary to the data recorded here, mention should be made
of James Ingram's work, Economic Change in Thailand Since 1850. Ingram has made the most extensive review of pre-war data available. The study concen- trates on trade and finance, but there are also sections on population and rice production. The rice export series are perhaps most pertinent to this table, with series for volume, value, and average price from 1857-1950. On rice export statistics Ingram says, "Like all the statistics . . the figures for rice exports are of questionable accuracy. One useful rule to tallow in considering any of the statistical material in this study, includ- ing rice exports, is never to place much weight on close year-to-year corn- parisons . . . . The rice export series is probably one of the most accurate . . . . Customs figures before 1920/21 included the trade of Bangkok only, but very little rice has been exported overland or through any other port. The Bangkok shipments probably accounted for 95-99 percent of the total rice exports" (Ingram, p. 40).
G/1907/08-1965: Ministry of Agriculture estimates used.
H/1907/08-1981: Since planted rice area is used rather than harvested
rice area, yields are artificially depressed. Generally, approximately 4-10 percent of rice area planted is not harvested. Thus, yields for most years are about 7 percent larger than what is shown. However, for some years there are gross differences between planted and harvested areas, notably 1919, 1928, 1931, 1936, 1942, 1945, and 1977, when as much as 32 percent of
-287-
rice area planted was not harvested.
I/1914-1953: Average wholesale rice price is for No. 1, white rice,
approximately 25 percent brokens.
J/1914-4927: Farm wage rate is an average of January-March wage rates only.
K/1940-1974: Rice area, production, yields, and exports are reported in
calendar years of January-December.
L/1942-1952: Irrigated area refers to total area irrigated under govern-
ment and private schemes.
M/1948-1957: Main-market retail rice price is for 20 percent brokens.
N/1954-1981: Average wholesale rice price is for 5 percent brokens.
0/1955-1982: The rice premium was made official in 1955, although private
exporters had been paying a duty to the Rice Office for several years prior to this date. Premium rate is for 5 percent white rice (except 1980/1981 100Z) and is a weighted average of premium rates released throughout the year.
P/1957-1973: Farm-harvest price is in calendar years; 1974-1978 are in
crop years of April-March.
Q/1958-1982 Refers to rice area irrigated under government and private
schemes. Approximately 95 percent of total irrigated area is planted to rice.
R/1958-1982: Main-market retail rice price is for 5 percent brokens
(except 1974, which is for 10 percent brokens).
S/1960-1981: Population is as of July 1 of the year in question. USDA
-288-
estimates are used because country estimates tend to consistently undercount the population. T/1961-1973: Main rice crop area, yield, and production are calculated by subtracting off-season (dry) planted area and production from total planted area and production. These estimates are not strictly comparable with those published in Agricu1tura1 Statistics of Thailand. Thus, the large jump between 1973 and 1974 planted wet season areas is statistically induced.Unfortunately, the Agricultural Statistics series is not available prior to 1974. U/1966-1974: Since 1966, the National Statistical Office (NSO) has pro- duced rice area and production estimates independently of the Ministry of Agriculture. Although the series are similar for rice area, rice production estimates are widely divergent. NSO, using crop cutting, found that the Ministry of Agriculture was underreporting production by about 16 percent. For this reason, NSO estimates are used for the period 1966-1974. Thus, the large in- crease in production and yields in 1966 is statistically induced. V/1971-1977: Arabic area figures are estimates of farm-holding land, including housing area, paddy land, field-crop area, fruit tree, vegetable, and flower area, fallow land, grassland, and other. 1971 estimate is for the calendar year. 1973 and 1977 estimates are for crop years 1973/74 and 1977/78. In 1965, total farm-hol ding area was estimated at 12,595 thousand hectares (Thailand. Land Utilization of Thailand, 1965 [1968J). Ministry of Agriculture estimates are considerably larger than FAO estimates for the same years. For example, in 1977, FAO estimates that 17,650 thousand hectares were arable, almost 560 thousand hectares less than the Ministry estimate for the same year.
-289-
W/1971-1981: Population projections are based on an adjusted 1970 midyear population (36,825,000), and assumed trends in fertility and mortality are drawn from the 1974-76 "Survey of Population Change" (NSO, 197]); "The Survey of Fertility in Thailand," Institute of Population Studies, Chulalongkorn University and NSO 1977; National Projection Series (NSO, 1976); an "Analysis of the Current Demographic Situation by the Committee on Population on Demography," National Academy of Science (1980); and "1978 Thailand Contraceptive Prevalence Survey" (NIDA, Ministry of Public Health and Westinghouse Health Systems, 1979). X/1974/75-1979/80: Main rice crop area, production, and yields are in crop years (April-March) and refer to planted area. Estimates produced by the Ministry of Agriculture. Y/l975/76-1981/82: Ministry of Agriculture and Cooperatives1 estimates used (in crop years). Z/Brief mention should be made of agricultural regions in Thailand in conjunction with rice area and output statistics because the production of rice is regionally dispersed. Usually, Thailand is divided into Central, North, Northeast, and South regions. The Central region, a large well-watered plateau through which the Chao Phraya, Thailand's primary water system, meanders, is the most important rice-producing region. Yields are comparatively high, and most non-glutinous export rice is produced in this region. The North, border- ing on Burma, is mountainous. Rice production, and agriculture in general, are practiced on a subsistence basis in river valleys, where population pressure is rather intense. The Northeast, or Khorat Plateau, borders Laos and Kampuhea. The climate tends to be more variable and output is quite unstable on a year- to-year basis.The South, a narrow peninsula binding Thailand to Malaysia proper,
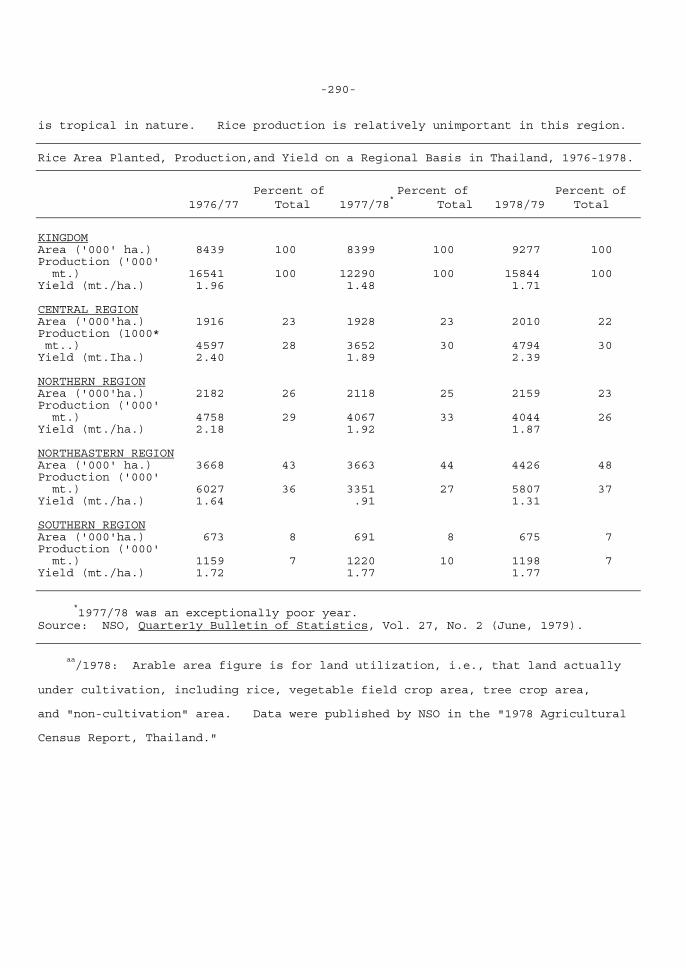
-290- is tropical in nature. Rice production is relatively unimportant in this region.
Rice Area Planted, Production,and Yield on a Regional Basis in Thailand, 1976-1978.
Percent of Percent of Percent of 1976/77 Total 1977/78
* Total 1978/79 Total
KINGDOM Area ('000' ha.) 8439 100 8399 100 9277 100 Production ('000' mt.) 16541 100 12290 100 15844 100 Yield (mt./ha.) 1.96 1.48 1.71 CENTRAL REGION Area ('000'ha.) 1916 23 1928 23 2010 22 Production (1000* mt..) 4597 28 3652 30 4794 30 Yield (mt.Iha.) 2.40 1.89 2.39 NORTHERN REGION Area ('000'ha.) 2182 26 2118 25 2159 23 Production ('000' mt.) 4758 29 4067 33 4044 26 Yield (mt./ha.) 2.18 1.92 1.87 NORTHEASTERN REGION Area ('000' ha.) 3668 43 3663 44 4426 48 Production ('000' mt.) 6027 36 3351 27 5807 37 Yield (mt./ha.) 1.64 .91 1.31 SOUTHERN REGION Area ('000'ha.) 673 8 691 8 675 7 Production ('000' mt.) 1159 7 1220 10 1198 7 Yield (mt./ha.) 1.72 1.77 1.77
*1977/78 was an exceptional1y poor year.
Source: NSO, Quarter1y Bulletin of Statistics, Vol. 27, No. 2 (June, 1979).
aa/1978: Arable area figure is for land utilization, i.e., that land actually
under cultivation, including rice, vegetable field crop area, tree crop area, and "non-cultivation" area. Data were published by NSO in the "1978 Agricultural Census Report, Thailand."
-291- bb/1979/1981: Farm-harvest price is for paddy, special grade on a calendar-year basis. The 1981 farm price is an average of January-April only. cc/1980-1982: Export premium is for 100 percent, Grade A white rice. dd/l982: Retail rice price is an average of March-June prices only.
Sources of Data for Appendix Tables XXa and XXb: Thailand 1. Arable Area 1960-1966: Economic and Social Commission for Asia and the Pacific, Statistical Yearbook for Asia and the Far East (Bangkok: United Nations). 1967-1970: Food and Agriculture Organization of the United Nations, FAO Production Yearbook (Rome). 1971-1977/78: Thailand. Center for Agricultural Statistics, Krasuang Kaset (Ministry of Agriculture), Agricultural Statistics of Thailand (Bangkok). 1978: Thailand. National Statistical Office, Office of the Prime Minister, Statistical Yearbook of Thailand (Bangkok: 1980). 2. Rice Production 1907/08-1917/18: Association of Japanese Agricultural Scientific Societies, eds., Rice in Asia (Tokyo: University of Tokyo Press, 1975), p. 133; original source: Isrankura, Vanrob. A Study on Rice Production and Con- sumption in Thailand (Division of Agricultural Economics, Ministry of Agriculture, 1966). 1918/19-1980/81: Thailand. National Statistical Office) Samut sathiti rai pi khong prathet Thai (Statistical Yearbook Thailand) (Bangkok). Prior to 1937, see: Siam. Department of Commerce and Statistics, Ministry of Finance, Statistical Yearbook of the Kingdom of Siam (Bangkok: 1916-1936).
-292-
1981/82: Thailand. Ministry of Agriculture and Cooperatives (attaché report No. 1H2025, March 2, 1982). 3. Rice Area 1902/03-1906/07: Siam. Department of Commerce and Statistics, Ministry of Finance, Statistical Yearbook of the Kingdom of Siam (Bangkok: 1923). 1907/08-1910/11: Association of Japanese Agricultural Scientific Societies, eds., Rice in Asia (Tokyo: University of Tokyo Press, 1975;, original source: Isrankura, Vanrob, A Study on Rice Production and Consumption in in Thailand (Division of Agricultural Economics, Ministry of Agriculture, 1966). 1911/12-1980/81: Thailand. National Statistical Office, Samut sathiti rai pi khong prathet Thai (Statistical Yearbook Thailand) (Bangkok). Prior to 1937, see: Siam. Department of Conmerce and Statistics, Ministry of Finance, Statistical Yearbook of the Kingdom of Siam (Bangkok). 1981/82: Thailand. Ministry of Agriculture and Cooperatives (attaché report No. TH2025, March 2, 1982). 4. Rice Yields 1907/08-1981/82: Rice yields are calculated by dividing rice production (2) by rice area (3) on an annual basis. 5. Rice Area Irrigated 1902/03-1952: Thailand. National Statistical Office, Samut sathiti rai pi khong. prathet Thai. (Statistical Yearbook Thailand) (Bangkok). Prior to 1937, see: Siam. Department of Commerce and Statistics, Ministry of Finance, Statistical Yearbook of the Kingdom of Siam (Bangkok). 1958-1974: Thailand. Royal Irrigation Department, Ministry of Agriculture and Cooperative~, from Palacpac, Adelita, World Rice Statistics (Los
-293-
Banos, Philippines: International Rice Research Institute, 1980), Table 24. 1976: Thailand. Royal Irrigation Department, Ministry of Agriculture and Cooperatives. 1981/82: American Embassy, Bangkok, "Thailand: Agricultural Situation and Policy Report," March 1982. 6. Rice Imports No imports made. 7. Rice Exports 1903-1979: Thailand. National Statistical Office, Samut sathiti rai pi khong prathet Thai (Statistical Yearbook of Thailand) (Bangkok). Prior to 1937, see: Siam. Department of Commerce and Statistics, Ministry of Finance, Statistical Yearbook of the Kingdom of Siam (Bangkok). 1980-1982: U.S. Foreign Agricultural Service, Foreign Agriculture Circular, FG-26-83 (Washington, D.C.: 1983). 8. Population 1901-1946: Thailand. National Statistical Office, Samut sathiti rai pi khong prathet Thai (Statistical Yearbook of Thailand) (Bangkok). Prior to 1937, see: Statistical Yearbook of the Kingdom of Siam. 1947-1959: Thailand. Center for Agricultural Statistics, Krasuang Kaset (Ministry of Agriculture), Agricultural Statistics of Thailand (Bangkok). 1960-1970: U.S. Department of Commerce, Bureau of the Census, International Population Dynamics 1950-1979 (Washington, D.C.: 1980). 1971-1981: U.S. Department of Commerce, Bureau of the Census, Demographic Estimates of Countries With A Population of 10 Million or More: 1981 (Washington, D.C.: 1982).
-294-
9. Farm-Harvest Price 1957-1978: Thailand. Center for Agricultural Statistics, Krasūang Kasět, (Ministry of Agriculture), Agricultural Statistics of Thailand (Bangkok). 1979-1981: Thailand. Agricultural Economics Research Division, Ministry of Agriculture and Cooperatives. 10. Rice Premium 1955-1972: Bank of Thailand. Manyanondh, Ruangrai, "Effect of Trade Taxes on Rice Farmers Real Income," Master of Economics Thesis, Thammasat University, 197t pp. 116-118. 1973-1976: The Rice Exporters Association, Production and Marketing Rice (June 1977), p. 73. 1980-1982. U.S. Agricu1tural Attach• Report No. 1145, December 4, 1981. 11. Wholesale Rice Pride (Main Market) 1914-1953: Thailahd. National Statistical Office, Samut sathiti rai p• khǒng prathet Thai (Statistical Yearbook of Thailand) (Bangkok). Prior to 1937, see: Statistical Yearbook of the Kingdom of Siam. 1954-1955; PookkachatikuL, Tongpan and Welach, delane,"Thai Rice Price Data" (Bangkok: Department of Agricultural Economics, Kasetsart University, 1974), Appendix Table No. 3. 1956-1977: Bank of Thailand. Bank of Thailand Statistical Bulletin (Bangkok). 1978-1981: Thailand. National Statistical Office. Office of the Prime Minister, Statistical Handbook of Thailand (Bangkok: 1981). 12. Retail Rice Price (Main Market) 1948-1953: Thailand. National Statistical Office, Samut sathiti rai pi khǒng prathet Thai (Statistical Yearbook of Thailand) (Bangkok). 1954-1957: Bank of' Thailand, Bank of Thailand Current Statistics (Bangkok).
-295-
1958-1973: Pookkachatikul, Tongpan and Welsch, Delane,"Thai Rice Price Data" (Bangkok: Department of Agricultural Economics, Kasetsart University, 1974). 1974-1982: Thailand. National Statistical Office, Quarterly Bulletin of Statistics (Bangkok). 13. Farm Wage Rate 1914-1927: Siam. Department of Commerce and Statistics, Ministry of Finance, Statistical Yearbook of the Kingdom of Siam (Bangkok). 14. Domestic Apparent Per Capita Rice Availability 1907-1981: Domestic availability is calculated by dividing paddy production (2) by population (8) on an annual basis. 15. Main Rice Crop Area 1961-1973: Mongkolsmai, Dow, "Status, Performance and Prospects for Irrigation in Thailand," Workshop on Rice Policies in Southeast Asia, IRRI, Los Banos, Philippines, May 21-25, 1979, p. 70. 1974-1978: Thailand. Center for Agricultural Statistics, Ministry of Agriculture, Agricultural Statistics of Thailand (Bangkok). 1979. Ministry of Agriculture, American Agricultural Attach• Report No. TH2025, Narch 2, 1982. 16. Main Rice Crop Production 1963-1969. Gaesuwan, Yuavores; Siamwalla, Ammar; and Welseb, Delane, "Thai Rice Production and Consumption Data 1947-1970," Thailand Rice Project Working Paper No. 2 (Bangkok. Department of Agricultural Economics, Kasetsart University, 1974), Appendix No. 6. 1974-1978. Thailand. Center for Agricultural Statistics, Ministry of Agriculture, Agricultural Statistics of Thailand (Bangkok).
-296-
1979: Ministry of Agriculture. American Agricultural Attaché Report No. TH2025, March 2, 1982. 17. Main Rice Crop Yield 1963-1979: Main rice crop yield is calculated by dividing main rice production (16) by area (15) on an annual basis.
*
Country Sources of Basic Data: Thailand 1. Thailand. National Statistical Office, Samut sathiti rǐ pǐ. kh•ng prathet Thai (Statistical Yearbook of Thailand) (Bangkok: 1916- ). (Formerly Siam Statistical Yearbook.) 2. Thailand. National Statistical Office, Quarterly Bulletin of Statistics (Bangkok: 1952- ). 3. Thailand. Center for Agricultural Statistics, Krasūlang Kasět (Ministry of Agriculture), Agricultural Statistics of Thailand (Bangkok: 1954- ). 4 Thailand. Krom K•n Kh•o (Department of Rice ), Kras•ang Kasět (Ministry of Agriculture), R•ing•n sarup phon k•ntham n• (Annual Report of Rice Production in Thailand) (Bangkok); in Thai. 5. Thana Khan Haeng Piath~t Thai (Bank of Thailand), Bank of Thailand Monthly Bulletin (Bangkok:: 1953- ). Formerly Bank of Thailand Current Statistics. 6. Thailand. Department of Customs, Foreign Statistics of Thailand (Bangkok: 1954- ). _________________________
*Most statistical sources are in both Thai and English. To facilitate
easy access to primary statistical sources, Thai roinanization for ministries and journal titles has~ been supplied when the main entry is in Thai.
-297-
7. Thailand. National Statistical Office, Office of the Prime Minister, Statistical Handbook of Thailand (Bangkok: 1975- ).
Useful Secondary Sources 1. Gaesuwan, Yuavores; Siamwalla, Ammar; and Welsch, Delane, "Thai Rice Production and Consumption Data 1947-1970," Thailand Rice Project Working Paper No. 2 (Bangkok: Department ot Agricultural Economics, Kasetsart University, 1974). 2. Fookkachatikul, J.; Tongpan, S.; and We2Lsch, D., "Thai Rice Price Data," Staff Paper No. 14 (Bangkok: Department of Agricultural Economics, Kasetsart University, 1974). 3. Somboonsup, Sri-on, "The Pattern of Thai Rice Exports, 1955-1972," 11.5. thesis, Graduate School of Kasetsart University, 1975. 4. World Bank, Thailand Toward a Develqpment Strategy of Full Participation (Washington, D.C.: East Asia and Pacific Regional Office, World Bank, 1980). 5. Ingram, James C., Economic Change in Thailand 1850-1970 (Stanford: Stanford University Press, 1971). 6. Silcock, T. H., The Economic Development of Thai Agriculture (Ithaca, N.Y.. Cornell University Press, 1970). 7. Siamwalla, Aunar, "A History of Rice Policies in Thailand," Stanford University, Calif., Food Research Institute Studies, Vol. 14, No. 3, 1975, pp. 233-249. 8. Mongkoitsmai, Dow, status, Performance and Prospects for Irrigation in Thailand," Workshop on Rice Policies in Southeast Asia at the International Rice Research Institute, Los Banos, Philippines, May 21-25, 1979. 9. Girling, John L. S., Thailand Society and Politics (Ithaca, N.Y.: Cornell University Press, 1981).
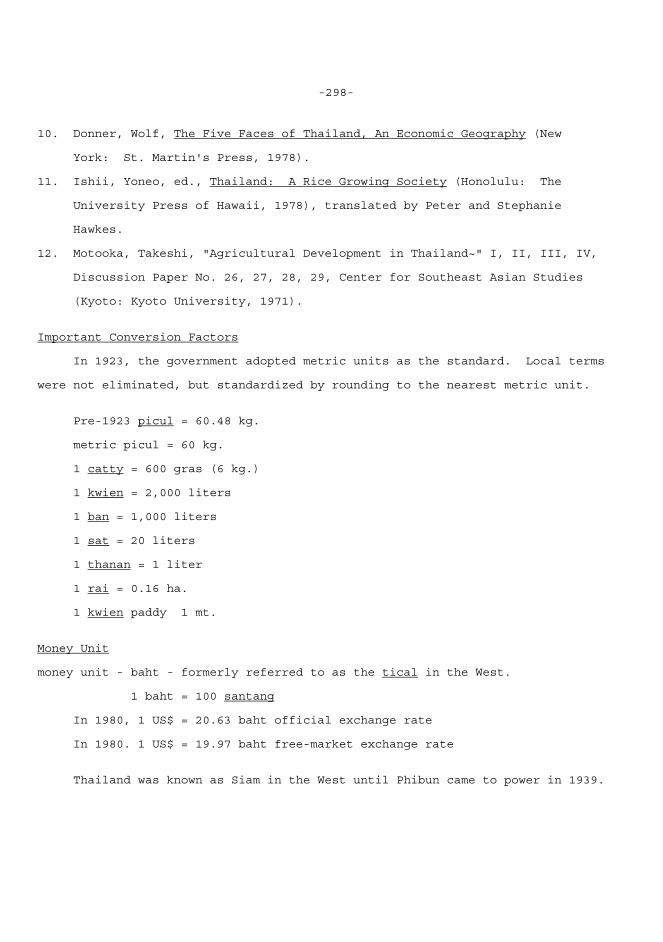
-298-
10. Donner, Wolf, The Five Faces of Thailand, An Economic Geography (New York: St. Martin's Press, 1978). 11. Ishii, Yoneo, ed., Thailand: A Rice Growing Society (Honolulu: The University Press of Hawaii, 1978), translated by Peter and Stephanie Hawkes. 12. Motooka, Takeshi, "Agricultural Development in Thailand~" I, II, III, IV, Discussion Paper No. 26, 27, 28, 29, Center for Southeast Asian Studies (Kyoto: Kyoto University, 1971). Important Conversion Factors In 1923, the government adopted metric units as the standard. Local terms were not eliminated, but standardized by rounding to the nearest metric unit. Pre-1923 picul = 60.48 kg. metric picul = 60 kg. 1 catty = 600 gras (6 kg.) 1 kwien = 2,000 liters 1 ban = 1,000 liters 1 sat = 20 liters 1 thanan = 1 liter 1 rai = 0.16 ha. 1 kwien paddy 1 mt. Money Unit money unit - baht - formerly referred to as the tical in the West. 1 baht = 100 santang In 1980, 1 US$ = 20.63 baht official exchange rate In 1980. 1 US$ = 19.97 baht free-market exchange rate Thailand was known as Siam in the West until Phibun came to power in 1939.
-299-
Phibun changed the official name at the country to Thailand. Thailand briefly became Siam again after Pribun's ouster at the end at World War II, but became Thailand again when he returned to power in 1947. Prior to 1940, the Thai calendar year began April 1 and ended March 31. This coincided with the Thai rice harvest. A calendar year, January-December, was used post-1940. The Thais also frequently count years according to Buddhist time. To change from Western years to thai years, add 543, e.g., Thai 2026 = 1983. Rice Grades in Thailand Thailand first officially began exporting rice in 1851 in response to Western demands for free trade. Because of fertile soils, ample water supplies, and a favorable climate, Thailand has been able to produce large rice surpluses on a regular basis without significant investment in infrastructure. Bur- geoning rice exports once were a significant source of income for the govern- ment, and Thailand still accounts for approximately 25 percent of total world rice trade each year. However, Thailand has diversified production into other more lucrative areas such as corn, sorghum, sugar, pineapples, and cassava. In 1979, the value of cassava exports exceeded that of rice. Thailand's primary customers are Indonesia,, Singapore, Hong Kong, Malaysia, Saudi Arabia, U.S.S.R., Nigeria, Iraq, Iran, and the Ivory Coast. As a result of the importance of rice in Thailand's export economy and the varied requests of customers, the Thais have developed a very complex system for grading rice. First, rice is classified at the mill by the degree of milling and by the average size of the grains within the type. At a later stage, rice within each type is further subdivided by the percent brokens and according to the length of the rice grains. The fine tunings of the grad- ing system allow Thailand to meet the wide spectrum of specifications demanded by the international market. The following simplified table should help clarify the rice grading system in graphic form.
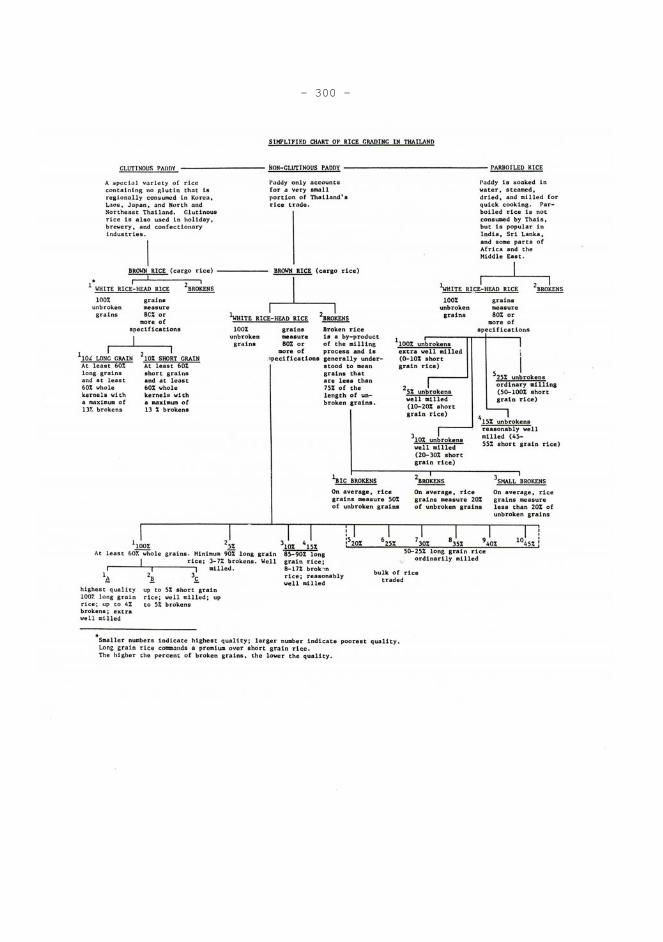
- 300 -
-301-
XXI: BURMA*
Rice Statistics in Burma In the pre-war period, Burma, under. British colonial tutelage, developed an extensive system by world standards for the collection of agricultural sta- tistics. A wide range of data is available in statistical publications for the 1900-1930s period for Burma Proper (Upper and Lower Burma), which was directly administered by the British. Conversely, statistical coverage for the surrounding hill states of Burma does not appear to have been complete, but this had only a negligible long-tern effect on rice series because little rice was produced in these areas. The post-World War II governments appear to have made few changes in colonial collecting and reporting procedures, which are similar to those used in India. However, little statistical material is available in the West for the post-war period. Burma is one of the few cases where pre-war statistics are mare plentiful than post-war statistics. During colonial times, Burma was loosely divided into Upper and Lower halves, which were subdivided into districts. Lower Burma, a malarial swamp land that later became Burma's primary source for surplus export rice, in- cluded Irrawaddy, Pegu, Arakan, and Tenasserim Districts. Upper Burma, which has a dry climate less suitable for wet-land rice production, included Mandalay, Magwe, and Sagaing Districts. These areas were collectively referred to as Divisional Burma or Burma Proper. In the post-war period, statistical coverage expanded to include the hilt states, which were gradually added to Burmese territory. These changes included the addition of a special division, the __________________________
*Thanks to John Ambler for comments.
-302-
Arakan Hill tracts, now called Chin Hills, in 1947/48; the addition of the Kachin State in the earily 1950s; and the addition of Kawathoolie (Karen State) in the mid-1950s. Burma's statistical system, like that in most other Asian countries, is organized around a central bureau, the Central Statistical Organization (CSO), which oversees statistical collection in general, as well as managing periodic population censuses. Ministries are individually responsible for data pertain- ing to their area of specialty. The Ministry of Agriculture and Forests (MAP) collects and issues ride statistics through its constituent departments. Four departments carry out data collection and analysis and make agricultural plan- ning decisions based on' statistical information. These are the Planning and Statistics Department, the Irrigation Department, the Agricultural Corporation, and the Land Record andi Settlement Department. The Land Record and Settlement Department (LRSD) carries out most data collection for rice statistics at the village and proceeding upward to the national level. Data are compiled and publicly issued in Agricultural Statistics and/or Season and Crop Report (both currently unavailable in the U.S.). This system is basically identical to that used prior to World War II. In the pre- war period, the Land Record and Settlement Department collected data and issued them through the~ annual journal, Season and Crop Report. Data were collected by district assessment officers from the LRSD. The officers used land records based on colonial cadastral surveys to obtain rice area. Yields were calculated by making a visual estimation of the current condition of the crop and comparing this to expected normal yields determined by settlement records. Today, crop cutting is frequently used to determine yields or to check eye estimations. Presently, LRSD initiates data collection at the village
-303-
level by sending a surveyor clerk to carry out initial crop cuttings with the assistance of a village manager from the Agricultural Corporation and two local farmers from the village. This process is very important to both the govern- ment and farmers because paddy procurement responsibilities are partially fixed based on expected output.
*
Area is reported in acres, production in long tons of paddy. Paddy yields are still reported using the traditional volume measure, the basket, which has been set equal to 46 lbs. of paddy. Burmese agricultural statistics are usually reported on a crop-year basis (July 1-June 30). ________________________________
*Paddy is directly procured from individual tanners or through cooperatives
by representatives of the Agricultural and Farm Produce Trade Corporation, an arm of the Ministry of Trade. The procurement price for paddy is fixed by paddy variety for Burma as a whole and frequently remains unchanged for long periods of time in spite of internal and external free-market fluctuations. Paddy is procured at a varying rate depending on local weather conditions, the size of the farm and its average yield, and the fixed needs of the govern- ment each year for exports, storage, and distribution. (Procurement rates behave like graduated taxes. Farmers with larger farms and better yields must turn over a higher portion of their paddy crop. Rates range from 7 percent to more than 60 percent of total output.)
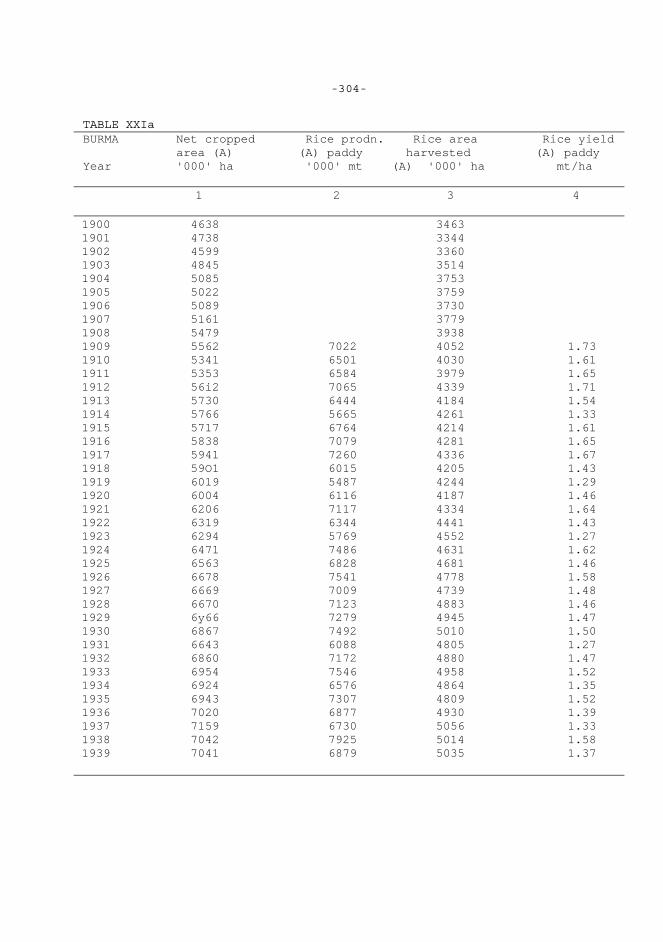
-304- TABLE XXIa BURMA Net cropped Rice prodn. Rice area Rice yield area (A) (A) paddy harvested (A) paddy Year '000' ha '000' mt (A) '000' ha mt/ha 1 2 3 4 1900 4638 3463 1901 4738 3344 1902 4599 3360 1903 4845 3514 1904 5085 3753 1905 5022 3759 1906 5089 3730 1907 5161 3779 1908 5479 3938 1909 5562 7022 4052 1.73 1910 5341 6501 4030 1.61 1911 5353 6584 3979 1.65 1912 56i2 7065 4339 1.71 1913 5730 6444 4184 1.54 1914 5766 5665 4261 1.33 1915 5717 6764 4214 1.61 1916 5838 7079 4281 1.65 1917 5941 7260 4336 1.67 1918 59O1 6015 4205 1.43 1919 6019 5487 4244 1.29 1920 6004 6116 4187 1.46 1921 6206 7117 4334 1.64 1922 6319 6344 4441 1.43 1923 6294 5769 4552 1.27 1924 6471 7486 4631 1.62 1925 6563 6828 4681 1.46 1926 6678 7541 4778 1.58 1927 6669 7009 4739 1.48 1928 6670 7123 4883 1.46 1929 6y66 7279 4945 1.47 1930 6867 7492 5010 1.50 1931 6643 6088 4805 1.27 1932 6860 7172 4880 1.47 1933 6954 7546 4958 1.52 1934 6924 6576 4864 1.35 1935 6943 7307 4809 1.52 1936 7020 6877 4930 1.39 1937 7159 6730 5056 1.33 1938 7042 7925 5014 1.58 1939 7041 6879 5035 1.37
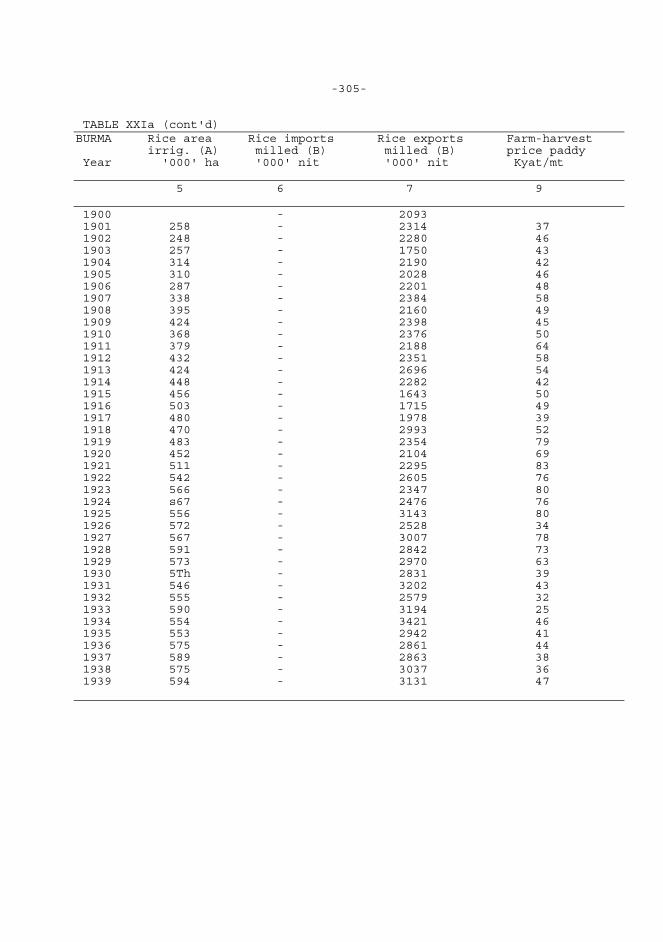
-305- TABLE XXIa (cont'd) BURMA Rice area Rice imports Rice exports Farm-harvest irrig. (A) milled (B) milled (B) price paddy Year '000' ha '000' nit '000' nit Kyat/mt 5 6 7 9 1900 - 2093 1901 258 - 2314 37 1902 248 - 2280 46 1903 257 - 1750 43 1904 314 - 2190 42 1905 310 - 2028 46 1906 287 - 2201 48 1907 338 - 2384 58 1908 395 - 2160 49 1909 424 - 2398 45 1910 368 - 2376 50 1911 379 - 2188 64 1912 432 - 2351 58 1913 424 - 2696 54 1914 448 - 2282 42 1915 456 - 1643 50 1916 503 - 1715 49 1917 480 - 1978 39 1918 470 - 2993 52 1919 483 - 2354 79 1920 452 - 2104 69 1921 511 - 2295 83 1922 542 - 2605 76 1923 566 - 2347 80 1924 s67 - 2476 76 1925 556 - 3143 80 1926 572 - 2528 34 1927 567 - 3007 78 1928 591 - 2842 73 1929 573 - 2970 63 1930 5Th - 2831 39 1931 546 - 3202 43 1932 555 - 2579 32 1933 590 - 3194 25 1934 554 - 3421 46 1935 553 - 2942 41 1936 575 - 2861 44 1937 589 - 2863 38 1938 575 - 3037 36 1939 594 - 3131 47
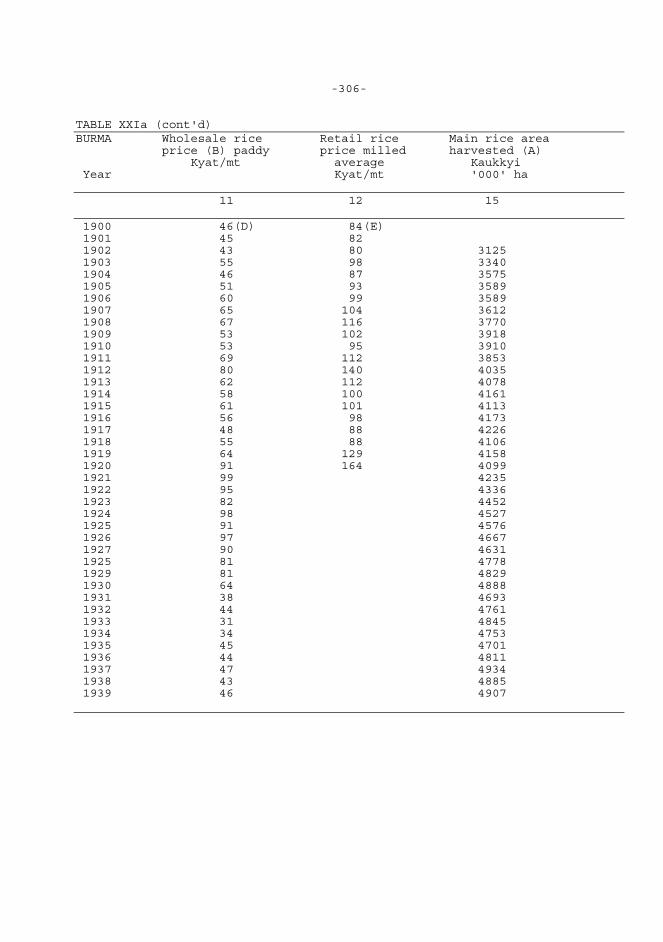
-306- TABLE XXIa (cont'd) BURMA Wholesale rice Retail rice Main rice area price (B) paddy price milled harvested (A) Kyat/mt average Kaukkyi Year Kyat/mt '000' ha 11 12 15 1900 46(D) 84(E) 1901 45 82 1902 43 80 3125 1903 55 98 3340 1904 46 87 3575 1905 51 93 3589 1906 60 99 3589 1907 65 104 3612 1908 67 116 3770 1909 53 102 3918 1910 53 95 3910 1911 69 112 3853 1912 80 140 4035 1913 62 112 4078 1914 58 100 4161 1915 61 101 4113 1916 56 98 4173 1917 48 88 4226 1918 55 88 4106 1919 64 129 4158 1920 91 164 4099 1921 99 4235 1922 95 4336 1923 82 4452 1924 98 4527 1925 91 4576 1926 97 4667 1927 90 4631 1925 81 4778 1929 81 4829 1930 64 4888 1931 38 4693 1932 44 4761 1933 31 4845 1934 34 4753 1935 45 4701 1936 44 4811 1937 47 4934 1938 43 4885 1939 46 4907
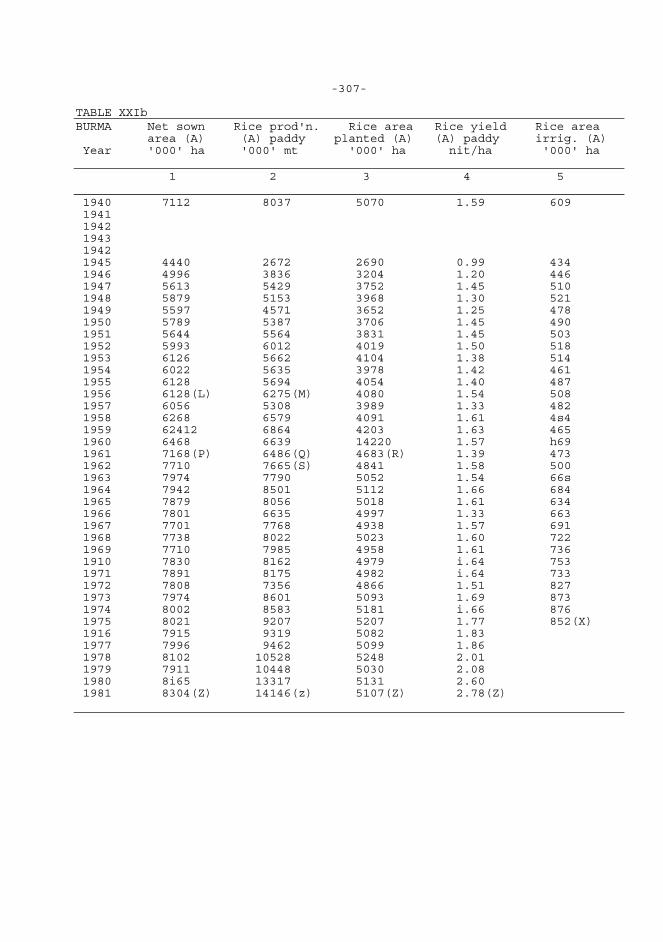
-307- TABLE XXIb BURMA Net sown Rice prod'n. Rice area Rice yield Rice area area (A) (A) paddy planted (A) (A) paddy irrig. (A) Year '000' ha '000' mt '000' ha nit/ha '000' ha 1 2 3 4 5 1940 7112 8037 5070 1.59 609 1941 1942 1943 1942 1945 4440 2672 2690 0.99 434 1946 4996 3836 3204 1.20 446 1947 5613 5429 3752 1.45 510 1948 5879 5153 3968 1.30 521 1949 5597 4571 3652 1.25 478 1950 5789 5387 3706 1.45 490 1951 5644 5564 3831 1.45 503 1952 5993 6012 4019 1.50 518 1953 6126 5662 4104 1.38 514 1954 6022 5635 3978 1.42 461 1955 6128 5694 4054 1.40 487 1956 6128(L) 6275(M) 4080 1.54 508 1957 6056 5308 3989 1.33 482 1958 6268 6579 4091 1.61 4s4 1959 62412 6864 4203 1.63 465 1960 6468 6639 14220 1.57 h69 1961 7168(P) 6486(Q) 4683(R) 1.39 473 1962 7710 7665(S) 4841 1.58 500 1963 7974 7790 5052 1.54 66s 1964 7942 8501 5112 1.66 684 1965 7879 8056 5018 1.61 634 1966 7801 6635 4997 1.33 663 1967 7701 7768 4938 1.57 691 1968 7738 8022 5023 1.60 722 1969 7710 7985 4958 1.61 736 1910 7830 8162 4979 i.64 753 1971 7891 8175 4982 i.64 733 1972 7808 7356 4866 1.51 827 1973 7974 8601 5093 1.69 873 1974 8002 8583 5181 i.66 876 1975 8021 9207 5207 1.77 852(X) 1916 7915 9319 5082 1.83 1977 7996 9462 5099 1.86 1978 8102 10528 5248 2.01 1979 7911 10448 5030 2.08 1980 8i65 13317 5131 2.60 1981 8304(Z) 14146(z) 5107(Z) 2.78(Z)
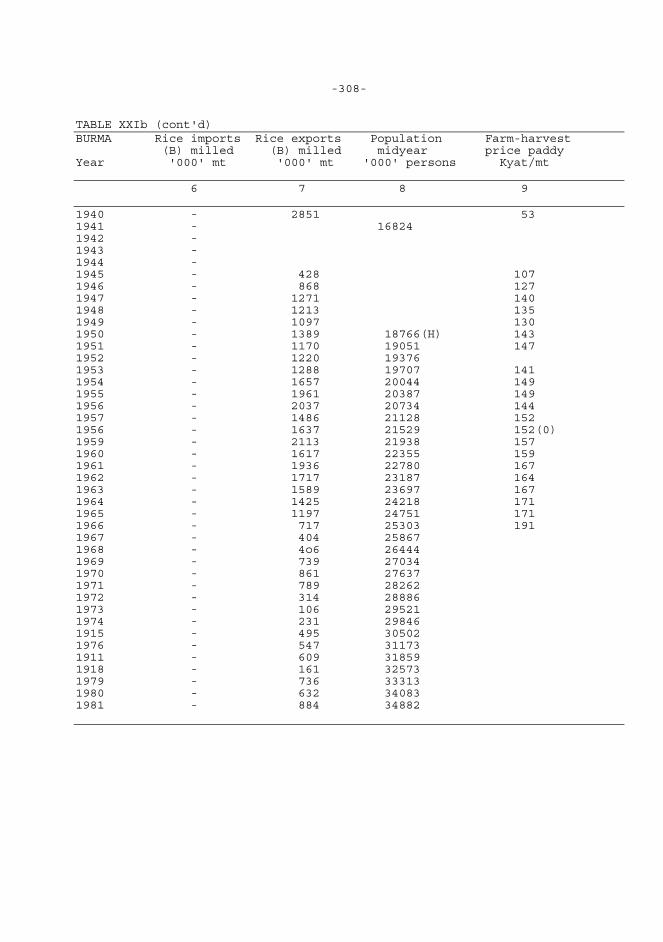
-308- TABLE XXIb (cont'd) BURMA Rice imports Rice exports Population Farm-harvest (B) milled (B) milled midyear price paddy Year '000' mt '000' mt '000' persons Kyat/mt 6 7 8 9 1940 - 2851 53 1941 - 16824 1942 - 1943 - 1944 - 1945 - 428 107 1946 - 868 127 1947 - 1271 140 1948 - 1213 135 1949 - 1097 130 1950 - 1389 18766(H) 143 1951 - 1170 19051 147 1952 - 1220 19376 1953 - 1288 19707 141 1954 - 1657 20044 149 1955 - 1961 20387 149 1956 - 2037 20734 144 1957 - 1486 21128 152 1956 - 1637 21529 152(0) 1959 - 2113 21938 157 1960 - 1617 22355 159 1961 - 1936 22780 167 1962 - 1717 23187 164 1963 - 1589 23697 167 1964 - 1425 24218 171 1965 - 1197 24751 171 1966 - 717 25303 191 1967 - 404 25867 1968 - 4o6 26444 1969 - 739 27034 1970 - 861 27637 1971 - 789 28262 1972 - 314 28886 1973 - 106 29521 1974 - 231 29846 1915 - 495 30502 1976 - 547 31173 1911 - 609 31859 1918 - 161 32573 1979 - 736 33313 1980 - 632 34083 1981 - 884 34882
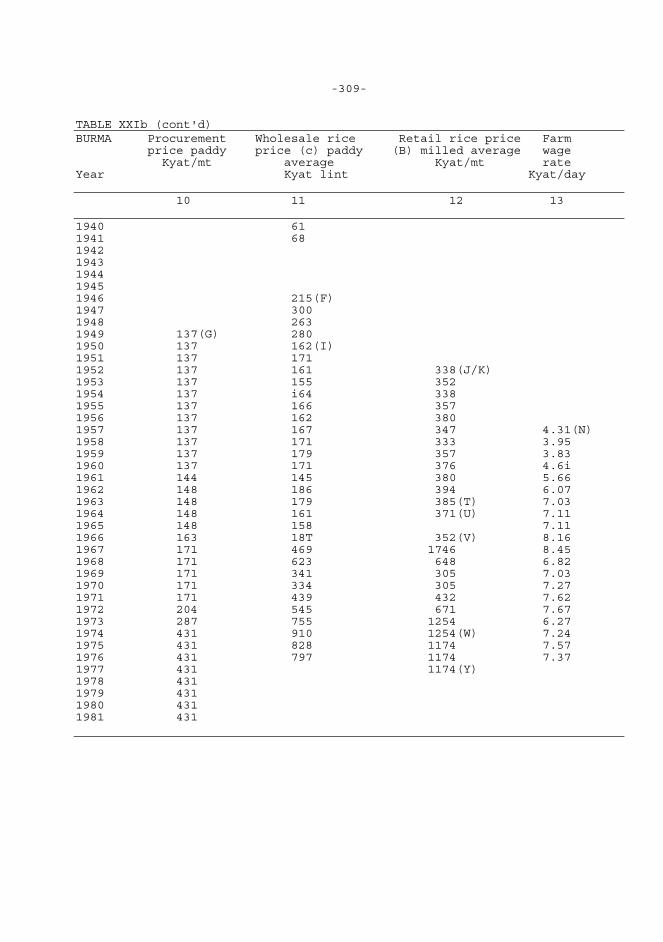
-309- TABLE XXIb (cont'd) BURMA Procurement Wholesale rice Retail rice price Farm price paddy price (c) paddy (B) milled average wage Kyat/mt average Kyat/mt rate Year Kyat lint Kyat/day 10 11 12 13 1940 61 1941 68 1942 1943 1944 1945 1946 215(F) 1947 300 1948 263 1949 137(G) 280 1950 137 162(I) 1951 137 171 1952 137 161 338(J/K) 1953 137 155 352 1954 137 i64 338 1955 137 166 357 1956 137 162 380 1957 137 167 347 4.31(N) 1958 137 171 333 3.95 1959 137 179 357 3.83 1960 137 171 376 4.6i 1961 144 145 380 5.66 1962 148 186 394 6.07 1963 148 179 385(T) 7.03 1964 148 161 371(U) 7.11 1965 148 158 7.11 1966 163 18T 352(V) 8.16 1967 171 469 1746 8.45 1968 171 623 648 6.82 1969 171 341 305 7.03 1970 171 334 305 7.27 1971 171 439 432 7.62 1972 204 545 671 7.67 1973 287 755 1254 6.27 1974 431 910 1254(W) 7.24 1975 431 828 1174 7.57 1976 431 797 1174 7.37 1977 431 1174(Y) 1978 431 1979 431 1980 431 1981 431
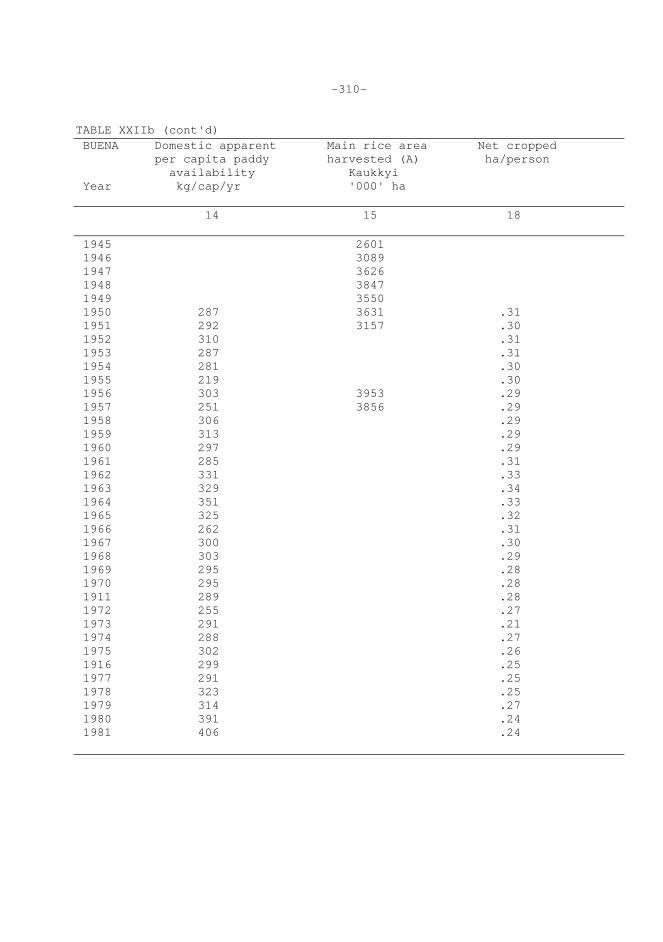
-310- TABLE XXIIb (cont'd) BUENA Domestic apparent Main rice area Net cropped per capita paddy harvested (A) ha/person availability Kaukkyi Year kg/cap/yr '000' ha 14 15 18 1945 2601 1946 3089 1947 3626 1948 3847 1949 3550 1950 287 3631 .31 1951 292 3157 .30 1952 310 .31 1953 287 .31 1954 281 .30 1955 219 .30 1956 303 3953 .29 1957 251 3856 .29 1958 306 .29 1959 313 .29 1960 297 .29 1961 285 .31 1962 331 .33 1963 329 .34 1964 351 .33 1965 325 .32 1966 262 .31 1967 300 .30 1968 303 .29 1969 295 .28 1970 295 .28 1911 289 .28 1972 255 .27 1973 291 .21 1974 288 .27 1975 302 .26 1916 299 .25 1977 291 .25 1978 323 .25 1979 314 .27 1980 391 .24 1981 406 .24
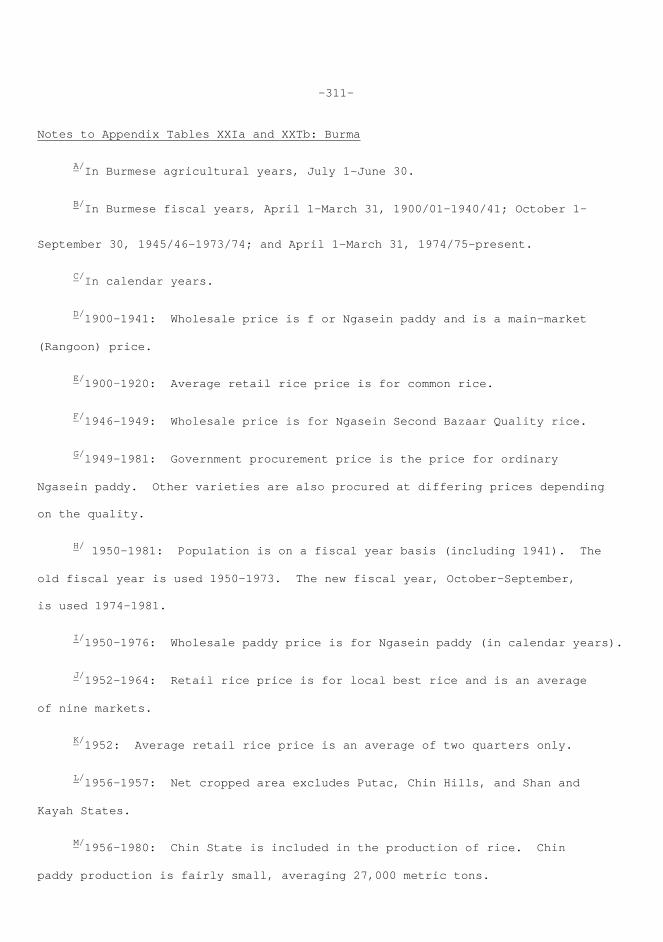
-311-
Notes to Appendix Tables XXIa and XXTb: Burma
A/In Burmese agricultural years, July 1-June 30.
B/In Burmese fiscal years, April 1-March 31, 1900/01-1940/41; October 1-
September 30, 1945/46-1973/74; and April 1-March 31, 1974/75-present.
C/In calendar years.
D/1900-1941: Wholesale price is f or Ngasein paddy and is a main-market (Rangoon) price.
E/1900-1920: Average retail rice price is for common rice.
F/1946-1949: Wholesale price is for Ngasein Second Bazaar Quality rice.
G/l949-198l: Government procurement price is the price for ordinary Ngasein paddy. Other varieties are also procured at differing prices depending on the quality.
H/ 1950-1981: Population is on a fiscal year basis (including 1941). The old fiscal year is used 1950-1973. The new fiscal year, October-September, is used 1974-1981.
I/1950-1976: Wholesale paddy price is for Ngasein paddy (in calendar years).
J/1952-1964: Retail rice price is for local best rice and is an average of nine markets.
K/1952: Average retail rice price is an average of two quarters only.
L/1956-1957: Net cropped area excludes Putac, Chin Hills, and Shan and Kayah States.
M/1956-1980: Chin State is included in the production of rice. Chin paddy production is fairly small, averaging 27,000 metric tons.
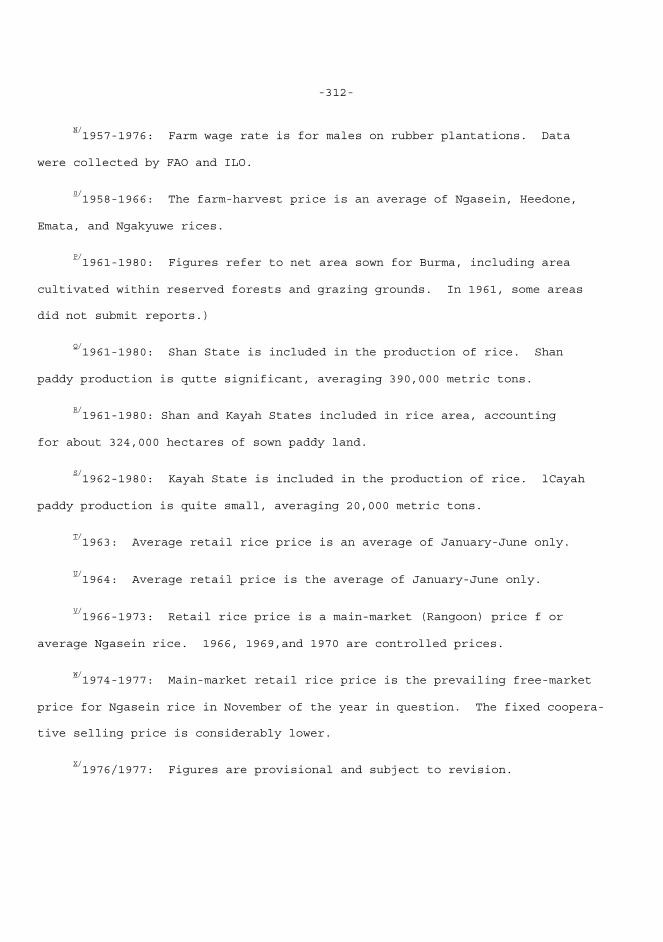
-312-
N/1957-1976: Farm wage rate is for males on rubber plantations. Data
were collected by FAO and ILO.
0/1958-1966: The farm-harvest price is an average of Ngasein, Heedone,
Emata, and Ngakyuwe rices.
P/1961-1980: Figures refer to net area sown for Burma, including area
cultivated within reserved forests and grazing grounds. In 1961, some areas did not submit reports.)
Q/1961-1980: Shan State is included in the production of rice. Shan
paddy production is qutte significant, averaging 390,000 metric tons.
R/1961-1980: Shan and Kayah States included in rice area, accounting
for about 324,000 hectares of sown paddy land.
S/1962-1980: Kayah State is included in the production of rice. lCayah
paddy production is quite small, averaging 20,000 metric tons.
T/1963: Average retail rice price is an average of January-June only.
U/1964: Average retail price is the average of January-June only.
V/1966-1973: Retail rice price is a main-market (Rangoon) price f or
average Ngasein rice. 1966, 1969,and 1970 are controlled prices.
W/1974-1977: Main-market retail rice price is the prevailing free-market
price for Ngasein rice in November of the year in question. The fixed coopera- tive selling price is considerably lower.
X/1976/1977: Figures are provisional and subject to revision.
-313- Y/1977: Main-market retail rice price is for January and is provisional. Z/1981/82: Net sown area, and rice area, production, and yield figures are provisional and subject to revision.
Sources of Data for Appendix Tables XXIa and XXIb: Burma 1. Net Cropped Area 1900/01-1957/58: Burma. Department of Land Records and Agriculture, Season and Crop Report of the Union of Burma (Rangoon). 1959/60-1981/82: Burma. Ministry of Planning and Finance, Report to the Pyithu Hluttaw on the Financial. Economic and Social Conditions of the Socialist Republic of the Union of Burma (various issues). 2. Rice Production 1909/10-1949/50: Burma. Department of Land Records and Agriculture, Season and Crop Report of the Union of Burma (Rangoon). 1950/51-1973/74: Soe, Myint, "Economics of Production and Procurement of Paddy in Burma," M.S. thesis, University of the Philippines, 1978; original source: Planning and Statistics Department. 1974/75-1981/82: Burma. Ministry of Planning and Finance, Report to the Pyithu Hluttaw on the Financial, Economic and Social Conditions of the Socialist Republic of the Union of Burma (various issues). 3. Rice Area 1900/01-1949/50: Burma. Department of Land Records and Agriculture, Season and Crop Report of the Union of Burma (Rangoon). 1950/51-1974/75: Soe, Myint, "Economics of Production and Procurement of Paddy in Burma," M.S. thesis, University of the Philippines, 1978;
-314-
original source: Planning and Statistics Department. 1975/76-1981/82: Burma. Ministry of Planning and Finance, Report to the Pyithu Hluttaw on the Financial, Economic and Social Conditions of the Socialist Republic of the Union of Burma (various issues). 4. Rice Yield 1909/10-1981/82: Rice yields are calculated by dividing rice production (2) by rice area (3). 5. Rice Area Irrigated 1900/01-1949/50: Burma. Department of Land Records and Agriculture, Season and Crop Report of the Union of Burma (Rangoon). 1950/51-1972/73: Soe, Myint, "Economics of Production and Procurement of Paddy in Burma," M.S. thesis, University of the Philippines, 1978; original source: Settlement and Land Records Department, Ministry of Agriculture and Forests. 1973/74-4976/77: Burma. Ministry of Planning and Finance, Report to the Pyithu Hluttaw on the Financial, Economic and Social Conditions of the Socialist Repub1ic of the Union of Burma (various issues). 6. Rice Imports No rice imports made. 7. Rice Exports 1900/01-1928/29: Grant, 3. W., The Rice Cro in Burma: Its History, Cultivation, Marketing and Improvement, Agricultural Survey No. 17 of 1932 (1956 reprint) (Agricultural Department, 1932). 1929/30-1934135: Economic Research Project, Economic Paper No. 5 (Rangoon: Department of Economics, Statistics and Commerce, University
-315-
of Rangoon, 1959). 1935/36-1946/47: Burma (Union). Office of the Collector of Customs, Annual Statement of the Seaborne Trade and Navigation of Burma (Rangoon: Sup't., Government Prints and Stationery). 1947/48-1949/50: Burma (Union). Central Statistical and Economic Department, Quarterly Bulletin of Statistics (Rangoon). 1950/51-1975/76: Soe, Myint, "Economics of Production and Procurement of Paddy in Burma," 11.5. thesis, University of the Philippines, 1978; original source: Agricultural Statistics Department. 1976/77-1981/82: Burma. Ministry of Planning and Finance, Report to the Pyithu Hiuttaw on the Financial, Economic and Social Conditions of the Socialist Republic of the Union of Burma (various issues). 8. Population 1941/42-1961/62: Burma. Central Statistical and economics Department, Statistical Yearbook of Burma (Rangoon: 1961). 1962 /63-1981/82: Burma. Ministry of Planning and Finance, Report to the Pyithu Hiuttaw on the Financial, Economic and Social Conditions of the Socialist Republic of the Union of Burma (1982/83 volume). 9. Farm-Harvest Price 1901-1957: Buns. Department of Land Records and Agriculture, Season and Crop Resort of the Union of Burma (Rangoon). 1958-1966: Burma. Central Statistical and Economics Department, Statistical Yearbook of Burma (Rangoon: 1961, 1963, 1967). 10. Procurement Price 1949/50-1961/62: Richter, H. V., "Burma's Rice Surpluses: Accounting for the Decline," Working Paper No. 3, Development Studies Centre, The
-316-
Australian National University. 1962/63-1981/82: Burma. Ministry of Planning and Finance, Report to the Pyithu Hiuttaw on the Finance, Economic and Social Conditions of the Socialist Republic of the Union of Burma (various, issues). 11. Average Wholesale Paddy Price 1900-1949: Burma (Union). Central Statistics and Economics Department, Quarterly Bulletin of Statistics (Rangoon). 1950-1976: Soe, Myint, "Economics of Production and Procurement of Paddy in Burma," M.S. thesis, University of the Philippines, 1978; original source: Central Statistical Organization. l2. Average Retail Rice Price 1900-1920: India. Department of Statistics, Prices and Wages in India (Calcutta: Sup't, Government Printing, 1922). 1952/53-1964/65: Burma (Union). Central Statistical and Economics Department, Quarterly Bulletin of Statistics (Rangoon). 1966/67-1973/74: Burma. Central Statistical and Economics Department, Statistical Yearbook of Burma (Rangoon: 1975). 1974/75-1977/78: Burma. Ministry of Planning and Finance, Report to the Pyithu Hiuttaw on the Financial, Economic and Social Conditions of the Socialist Republic of the Union of Burma for 1977-1978 (1977). 13. Farm Wage Rate 1957-1976: Palacpac, Adelita, World Rice Statistics (Los Banos, Philippines: International Rice Research Institute, 1981). 14. Domestic Apparent Per Capita Rice Availability 1950-1981; Domestic apparent per capita rice availability is calculated by dividing paddy production (2) by population (8) on an annual basis.
-317-
15. Main Paddy Crop Area - Kaukkyi 1902/03-1957/58: Burma. Department of. Land Records and Agriculture, Season and Crop Report of the Union of Burma (Rangoon).
Country Sources of Basic Data: Burma*
1. Burma. Department of Land Records and Agriculture, Season and Crap Report of the Union of Burma (Rangoon). 2. Burma. Office of the Collector of Customs, Annual Statement of the Seaborne Trade and Navigation of Burma (Rangoon: Sup't, Government Prints and Stationery). 3. Burma. Central Statistical and Economics Department, Quarterly Bulletin of Statistics (Rangoon). 4. Burma. Central Statistical and Economics Department, Statistical Yearbook of Burma (Rangoon). 5. Burma. Ministry of Planning and Finance, Report to the Pyithu Hluttaw on the Financial, Economic and Social Conditions of the Socialist Republic of the Union of Burma (Beginning 1974/75). —————————————————
*Available in the U.S.
Useful Secondary Sources 1. Cheng, Siok-hwa, The Rice Industry of Burma 1852-1940 (Kuala Lumpur: University of Malaya Press, 1968). 2. Government of Burma, Notes on Agricu1ture in Burma (Rangoon: Sup't., Union Government Printing and Stationery, 1955). 3. Henderson, John et al., Area Handbook of Burma (Washington, D.C.: Foreign
-318-
Area Studies, American University, 1971). 4. Richter, H. V., Burma's Rice Surpluses: Accounting for the Decline, Working Paper No. 3~ (Canberra: Development Studies Centre, Australian university Press, 1976). 5. Soe, Myint, "Economics of Production and Procurement of Paddy in Burma," M.S. thesis, University of the Philippines, June 1978. 6. Steinberg, D. I., Burma's Road to Development: Growth and Ideology (Boulder: West view Press, 1981). Important Conversion Factors 100 measures paddy = 1 basket
* paddy = 9 gallons paddy
1 basket
* paddy = 46 lbs. Paddy = 20.86 kg. paddy
1 basket
* milled rice = 75 lbs. rice = 34.02 kg. milled rice
100 baskets paddy = 2086 kg. rice 1 nit. paddy = 47.927 baskets paddy 1 bag milled rice = 225 lbs. rice = 102.06 kg. rice 1 bag milled rice = 3 baskets milled rice 1 mt. milled rice = 9.798 bags rice * ————————————————————————— Since World War II, English weight measures (pound, long ton) have usually been used in the Burmese rice economy (except for rice, yields), but prior to World War II, a volume measure, the basket, was in widespread use. Plaited bamboo baskets were used to buy, sell, and trade paddy or rice. The volume capacity of the standard basket of paddy was supposed to be nine gallons or 46 pounds, but varied between 44 and 54 pounds depending on the basket. The standard basket
-319-
1 pyi milled rice = 4.69 lbs. rice = 2.13 kg. rice 1 basket milled rice = 16 pyi rice = 1.125 bushels rice 1 mt. milled rice = 469.484 pyi rice 1 maund = 0.037 mt. 1 viss = 100 ticals = 3.60 lbs. = 1.63 kg. 1 nit. = 26.792 maunds Rice Mil1ing Rates
*
Pre-war: 60-65 percent 1946-1959: 63.1 percent 1960-1972 62.5 percent Glossary of Paddy Varieties Kaukkyi - Winter or late rices, with a long growing period of 170-200 days. Kaukkyi is the most important paddy variety, accounting for over 80 percent of Burma's rice area and is grown in low-lying rainfed or irrigated paddy fields. Kaukiat - Autumn rices with a medium growing period of 150-170 days. These varieties were widely grown in the rainf ad soils of Upper Burma. Kaukyin - Early rices with a 140-150 day maturation period. These varieties are highly drought resistant, but productivity is low. They are relatively unimportant, but grown in some areas with marginal rice growing conditions, chief lee Upper Burma. ——————————————————————————————— capacity was fixed by empty milkmaid brand condensed milk cans, called nozibu. Each condensed milk can held 14 oz., and each standard basket held 128 nozibu.
*Milling rates have continued to decline in the post-war period because of
the use of antiquated and failing milling machinery.
-320-
Mayin - Relatively unimportant spring rices, with a 140-150 day growing season. Money unit Pre-war: 1 rupee = 16 anna; 1 anna = 0.625 rupees 1953 on: rupee renamed kyat. 1 kyat = 100 pyas In 1980 1 US$ = 6.76 kyat official exchange rate In 1980 1 US$ = 47.33 kyat free-market exchange rate Rice and Paddy Classification Paddy is roughly classified into five main types according to die physical characteristics, primarily length and width, of the grain. These are: Emata, Letywezin, Ngasein, Meedone, and Byat. Emata and Letywezin rices are long and thin. They were grown primarily for the quality export marker. Ngasein, Meedone, and Byat rices are short and wide. Ngasein is the major export rice of Burn, while Heedone rices are popular for home consumption because of their taste and texture. In the pre-war period, after paddy was milled and ready to be marketed, it was regraded according to the original quality of the paddy1 the percent brokens, and the degree of milling. The extensive Burmese rice grading system was developed in response to the burgeoning export market directed towards Europe and later to the rest of Asia. The highest grades, the Europes, used Ngasein paddy and ranged from 5 percent to 27 percent brokens. Small Mills Specials and Big Mills Specials were the poorest grades milled from inferior grades of paddy, with 42-45 percent brokens. These rices were directed towards the low quality Asian export market. Straits Quality and Bazaar Quality were intermediate rices ranging from 35-38 percent brokens. Bazaar Quality, milled chiefly from Meedane paddy, was the most popular rice far home consumption. Sugandhi rices, milled from Emata paddy, were destined for export on the specialty market to India. In addition to the above, parboiled rice and
-321-
SOUTH ASIA
XXII. Bangladesh 322 XXIII. India 336 XXIV. Nepal 359 XXV. Pakistan 370 XXVI. Sri Lanka 383
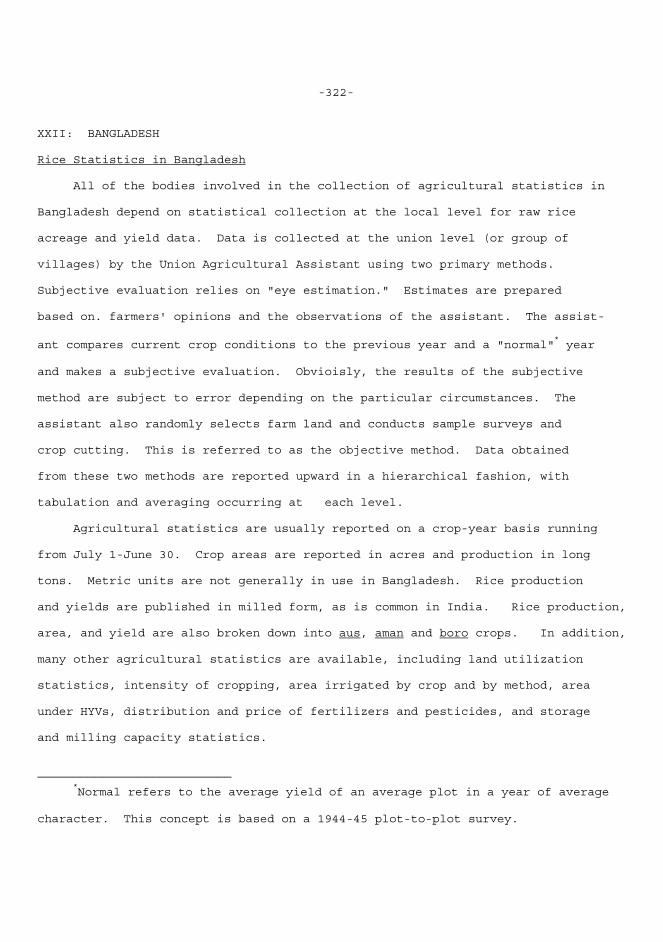
-322-
XXII: BANGLADESH Rice Statistics in Bangladesh All of the bodies involved in the collection of agricultural statistics in Bangladesh depend on statistical collection at the local level for raw rice acreage and yield data. Data is collected at the union level (or group of villages) by the Union Agricultural Assistant using two primary methods. Subjective evaluation relies on "eye estimation." Estimates are prepared based on. farmers' opinions and the observations of the assistant. The assist- ant compares current crop conditions to the previous year and a "normal"
* year
and makes a subjective evaluation. Obvioisly, the results of the subjective method are subject to error depending on the particular circumstances. The assistant also randomly selects farm land and conducts sample surveys and crop cutting. This is referred to as the objective method. Data obtained from these two methods are reported upward in a hierarchical fashion, with tabulation and averaging occurring at each level. Agricultural statistics are usually reported on a crop-year basis running from July 1-June 30. Crop areas are reported in acres and production in long tons. Metric units are not generally in use in Bangladesh. Rice production and yields are published in milled form, as is common in India. Rice production, area, and yield are also broken down into aus, aman and boro crops. In addition, many other agricultural statistics are available, including land utilization statistics, intensity of cropping, area irrigated by crop and by method, area under HYVs, distribution and price of fertilizers and pesticides, and storage and milling capacity statistics. ———————————————————————————
*Normal refers to the average yield of an average plot in a year of average
character. This concept is based on a 1944-45 plot-to-plot survey.
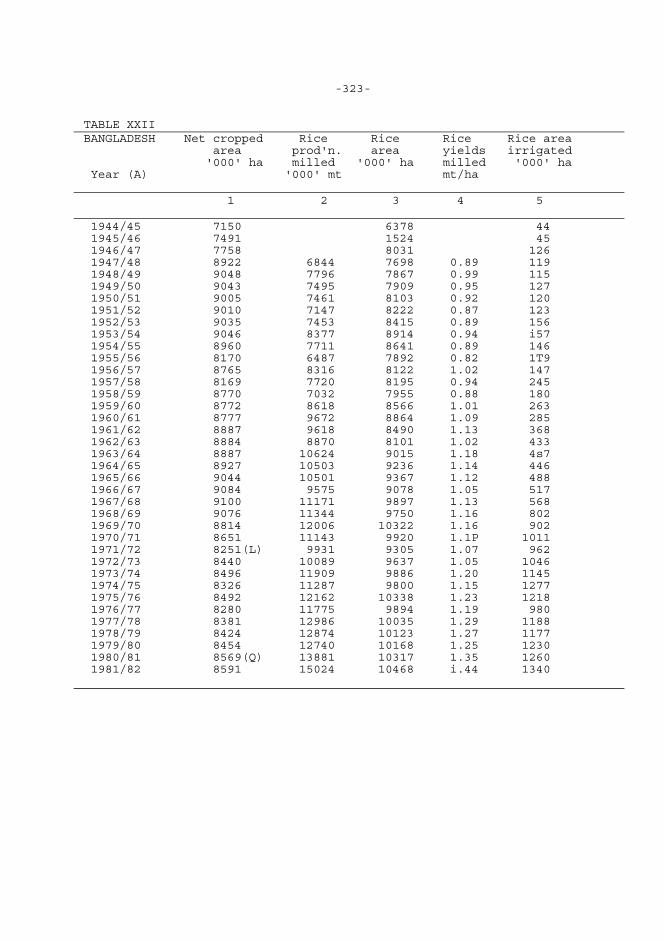
-323- TABLE XXII BANGLADESH Net cropped Rice Rice Rice Rice area area prod'n. area yields irrigated '000' ha milled '000' ha milled '000' ha Year (A) '000' mt mt/ha 1 2 3 4 5 1944/45 7150 6378 44 1945/46 7491 1524 45 1946/47 7758 8031 126 1947/48 8922 6844 7698 0.89 119 1948/49 9048 7796 7867 0.99 115 1949/50 9043 7495 7909 0.95 127 1950/51 9005 7461 8103 0.92 120 1951/52 9010 7147 8222 0.87 123 1952/53 9035 7453 8415 0.89 156 1953/54 9046 8377 8914 0.94 i57 1954/55 8960 7711 8641 0.89 146 1955/56 8170 6487 7892 0.82 1T9 1956/57 8765 8316 8122 1.02 147 1957/58 8169 7720 8195 0.94 245 1958/59 8770 7032 7955 0.88 180 1959/60 8772 8618 8566 1.01 263 1960/61 8777 9672 8864 1.09 285 1961/62 8887 9618 8490 1.13 368 1962/63 8884 8870 8101 1.02 433 1963/64 8887 10624 9015 1.18 4s7 1964/65 8927 10503 9236 1.14 446 1965/66 9044 10501 9367 1.12 488 1966/67 9084 9575 9078 1.05 517 1967/68 9100 11171 9897 1.13 568 1968/69 9076 11344 9750 1.16 802 1969/70 8814 12006 10322 1.16 902 1970/71 8651 11143 9920 1.1P 1011 1971/72 8251(L) 9931 9305 1.07 962 1972/73 8440 10089 9637 1.05 1046 1973/74 8496 11909 9886 1.20 1145 1974/75 8326 11287 9800 1.15 1277 1975/76 8492 12162 10338 1.23 1218 1976/77 8280 11775 9894 1.19 980 1977/78 8381 12986 10035 1.29 1188 1978/79 8424 12874 10123 1.27 1177 1979/80 8454 12740 10168 1.25 1230 1980/81 8569(Q) 13881 10317 1.35 1260 1981/82 8591 15024 10468 i.44 1340
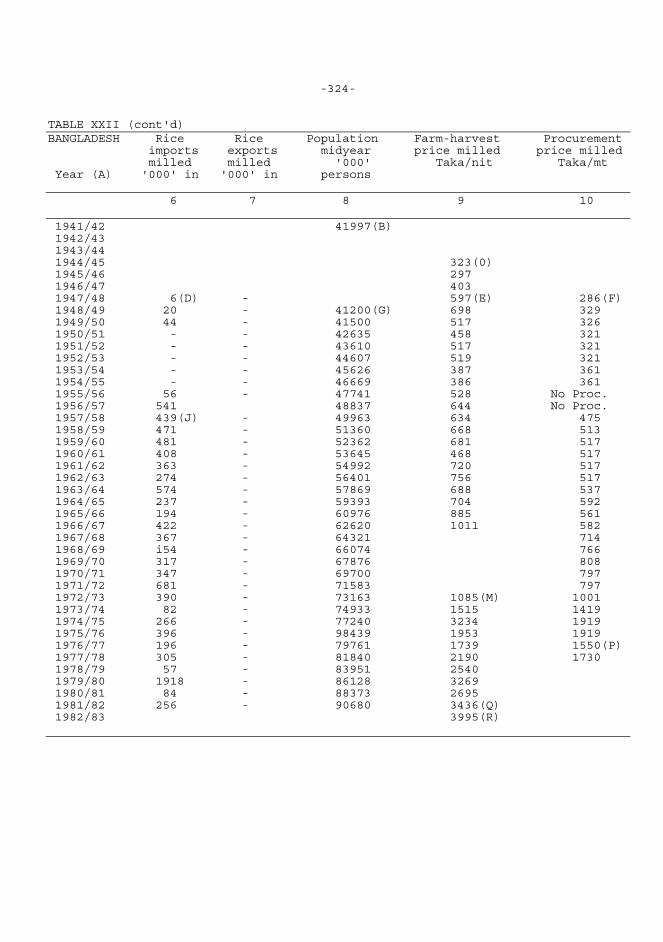
-324- TABLE XXII (cont'd) BANGLADESH Rice Rice Population Farm-harvest Procurement imports exports midyear price milled price milled milled milled '000' Taka/nit Taka/mt Year (A) '000' in '000' in persons 6 7 8 9 10 1941/42 41997(B) 1942/43 1943/44 1944/45 323(0) 1945/46 297 1946/47 403 1947/48 6(D) - 597(E) 286(F) 1948/49 20 - 41200(G) 698 329 1949/50 44 - 41500 517 326 1950/51 - - 42635 458 321 1951/52 - - 43610 517 321 1952/53 - - 44607 519 321 1953/54 - - 45626 387 361 1954/55 - - 46669 386 361 1955/56 56 - 47741 528 No Proc. 1956/57 541 48837 644 No Proc. 1957/58 439(J) - 49963 634 475 1958/59 471 - 51360 668 513 1959/60 481 - 52362 681 517 1960/61 408 - 53645 468 517 1961/62 363 - 54992 720 517 1962/63 274 - 56401 756 517 1963/64 574 - 57869 688 537 1964/65 237 - 59393 704 592 1965/66 194 - 60976 885 561 1966/67 422 - 62620 1011 582 1967/68 367 - 64321 714 1968/69 i54 - 66074 766 1969/70 317 - 67876 808 1970/71 347 - 69700 797 1971/72 681 - 71583 797 1972/73 390 - 73163 1085(M) 1001 1973/74 82 - 74933 1515 1419 1974/75 266 - 77240 3234 1919 1975/76 396 - 98439 1953 1919 1976/77 196 - 79761 1739 1550(P) 1977/78 305 - 81840 2190 1730 1978/79 57 - 83951 2540 1979/80 1918 - 86128 3269 1980/81 84 - 88373 2695 1981/82 256 - 90680 3436(Q) 1982/83 3995(R)
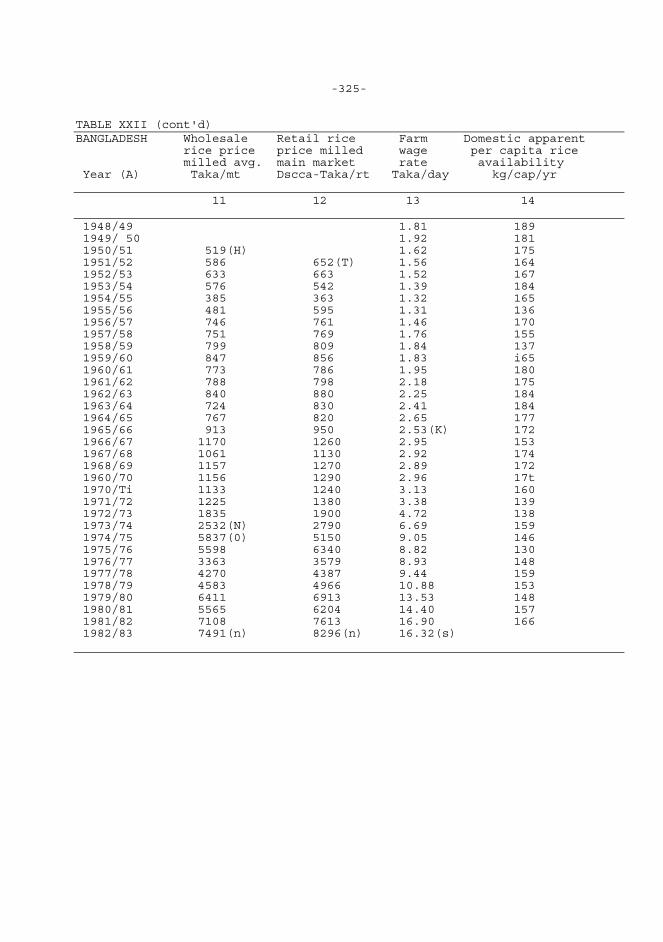
-325- TABLE XXII (cont'd) BANGLADESH Wholesale Retail rice Farm Domestic apparent rice price price milled wage per capita rice milled avg. main market rate availability Year (A) Taka/mt Dscca-Taka/rt Taka/day kg/cap/yr 11 12 13 14 1948/49 1.81 189 1949/ 50 1.92 181 1950/51 519(H) 1.62 175 1951/52 586 652(T) 1.56 164 1952/53 633 663 1.52 167 1953/54 576 542 1.39 184 1954/55 385 363 1.32 165 1955/56 481 595 1.31 136 1956/57 746 761 1.46 170 1957/58 751 769 1.76 155 1958/59 799 809 1.84 137 1959/60 847 856 1.83 i65 1960/61 773 786 1.95 180 1961/62 788 798 2.18 175 1962/63 840 880 2.25 184 1963/64 724 830 2.41 184 1964/65 767 820 2.65 177 1965/66 913 950 2.53(K) 172 1966/67 1170 1260 2.95 153 1967/68 1061 1130 2.92 174 1968/69 1157 1270 2.89 172 1960/70 1156 1290 2.96 17t 1970/Ti 1133 1240 3.13 160 1971/72 1225 1380 3.38 139 1972/73 1835 1900 4.72 138 1973/74 2532(N) 2790 6.69 159 1974/75 5837(0) 5150 9.05 146 1975/76 5598 6340 8.82 130 1976/77 3363 3579 8.93 148 1977/78 4270 4387 9.44 159 1978/79 4583 4966 10.88 153 1979/80 6411 6913 13.53 148 1980/81 5565 6204 14.40 157 1981/82 7108 7613 16.90 166 1982/83 7491(n) 8296(n) 16.32(s)
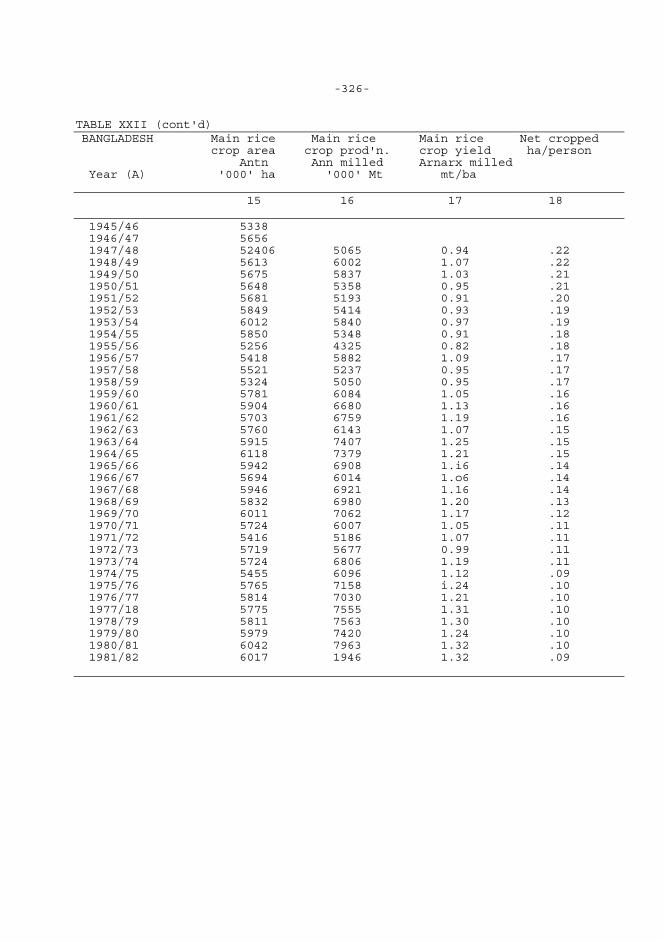
-326- TABLE XXII (cont'd) BANGLADESH Main rice Main rice Main rice Net cropped crop area crop prod'n. crop yield ha/person Antn Ann milled Arnarx milled Year (A) '000' ha '000' Mt mt/ba 15 16 17 18 1945/46 5338 1946/47 5656 1947/48 52406 5065 0.94 .22 1948/49 5613 6002 1.07 .22 1949/50 5675 5837 1.03 .21 1950/51 5648 5358 0.95 .21 1951/52 5681 5193 0.91 .20 1952/53 5849 5414 0.93 .19 1953/54 6012 5840 0.97 .19 1954/55 5850 5348 0.91 .18 1955/56 5256 4325 0.82 .18 1956/57 5418 5882 1.09 .17 1957/58 5521 5237 0.95 .17 1958/59 5324 5050 0.95 .17 1959/60 5781 6084 1.05 .16 1960/61 5904 6680 1.13 .16 1961/62 5703 6759 1.19 .16 1962/63 5760 6143 1.07 .15 1963/64 5915 7407 1.25 .15 1964/65 6118 7379 1.21 .15 1965/66 5942 6908 1.i6 .14 1966/67 5694 6014 1.o6 .14 1967/68 5946 6921 1.16 .14 1968/69 5832 6980 1.20 .13 1969/70 6011 7062 1.17 .12 1970/71 5724 6007 1.05 .11 1971/72 5416 5186 1.07 .11 1972/73 5719 5677 0.99 .11 1973/74 5724 6806 1.19 .11 1974/75 5455 6096 1.12 .09 1975/76 5765 7158 i.24 .10 1976/77 5814 7030 1.21 .10 1977/18 5775 7555 1.31 .10 1978/79 5811 7563 1.30 .10 1979/80 5979 7420 1.24 .10 1980/81 6042 7963 1.32 .10 1981/82 6017 1946 1.32 .09
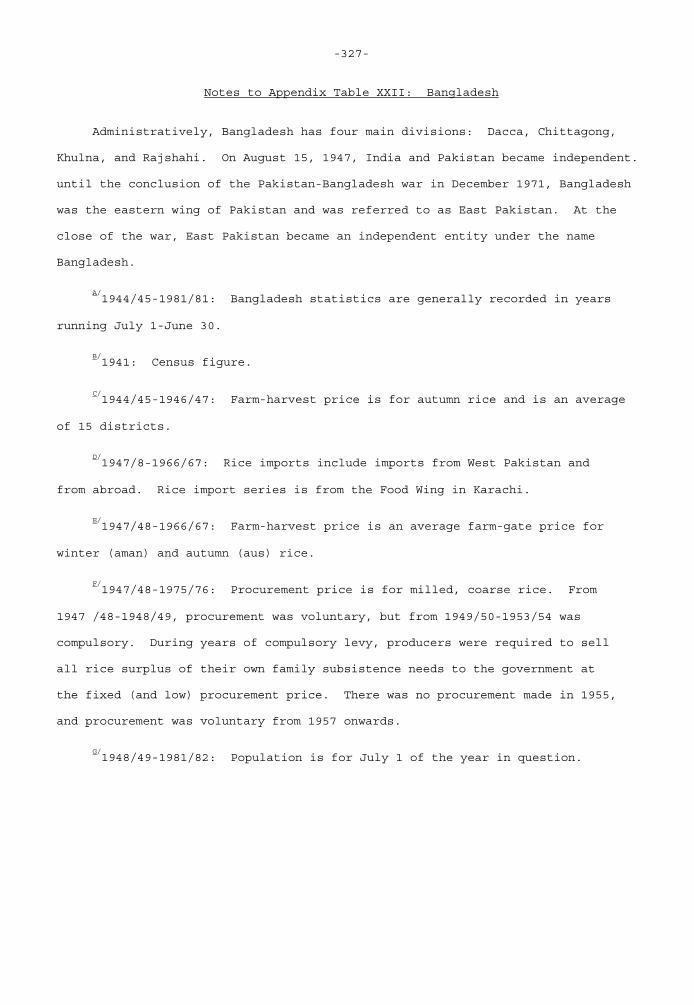
-327-
Notes to Appendix Table XXII: Bangladesh Administratively, Bangladesh has four main divisions: Dacca, Chittagong, Khulna, and Rajshahi. On August 15, 1947, India and Pakistan became independent. until the conclusion of the Pakistan-Bangladesh war in December 1971, Bangladesh was the eastern wing of Pakistan and was referred to as East Pakistan. At the close of the war, East Pakistan became an independent entity under the name Bangladesh.
A/1944/45-1981/81: Bangladesh statistics are generally recorded in years
running July 1-June 30.
B/1941: Census figure.
C/1944/45-1946/47: Farm-harvest price is for autumn rice and is an average
of 15 districts.
D/1947/8-1966/67: Rice imports include imports from West Pakistan and
from abroad. Rice import series is from the Food Wing in Karachi.
E/1947/48-1966/67: Farm-harvest price is an average farm-gate price for
winter (aman) and autumn (aus) rice.
F/1947/48-1975/76: Procurement price is for milled, coarse rice. From
1947 /48-1948/49, procurement was voluntary, but from 1949/50-1953/54 was compulsory. During years of compulsory levy, producers were required to sell all rice surplus of their own family subsistence needs to the government at the fixed (and low) procurement price. There was no procurement made in 1955, and procurement was voluntary from 1957 onwards.
G/1948/49-1981/82: Population is for July 1 of the year in question.
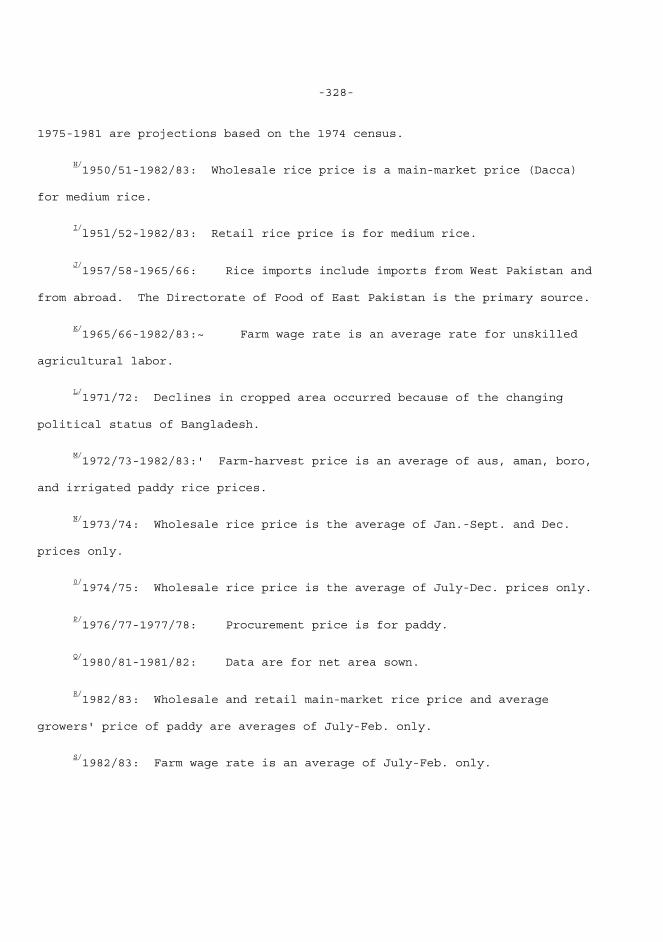
-328-
1975-1981 are projections based on the 1974 census.
H/1950/51-1982/83: Wholesale rice price is a main-market price (Dacca)
for medium rice.
I/l95l/52-l982/83: Retail rice price is for medium rice.
J/1957/58-1965/66: Rice imports include imports from West Pakistan and
from abroad. The Directorate of Food of East Pakistan is the primary source.
K/1965/66-1982/83:~ Farm wage rate is an average rate for unskilled
agricultural labor.
L/1971/72: Declines in cropped area occurred because of the changing
political status of Bangladesh.
M/1972/73-1982/83:' Farm-harvest price is an average of aus, aman, boro,
and irrigated paddy rice prices.
N/1973/74: Wholesale rice price is the average of Jan.-Sept. and Dec.
prices only.
0/1974/75: Wholesale rice price is the average of July-Dec. prices only.
P/1976/77-1977/78: Procurement price is for paddy.
Q/1980/81-1981/82: Data are for net area sown.
R/1982/83: Wholesale and retail main-market rice price and average
growers' price of paddy are averages of July-Feb. only.
S/1982/83: Farm wage rate is an average of July-Feb. only.
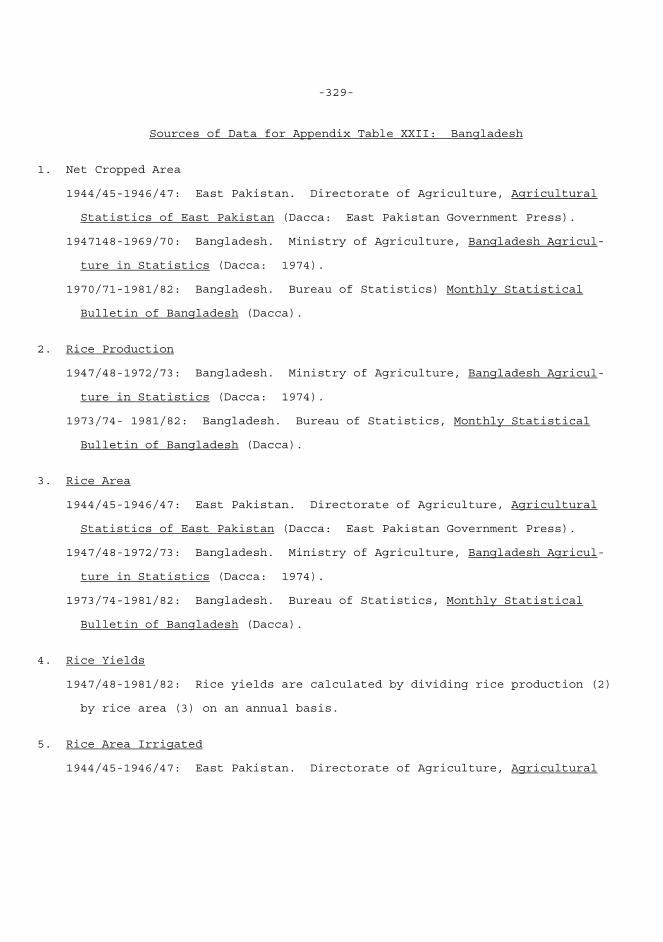
-329-
Sources of Data for Appendix Table XXII: Bangladesh 1. Net Cropped Area 1944/45-1946/47: East Pakistan. Directorate of Agriculture, Agricultural Statistics of East Pakistan (Dacca: East Pakistan Government Press). 1947148-1969/70: Bangladesh. Ministry of Agriculture, Bangladesh Agricul- ture in Statistics (Dacca: 1974). 1970/71-1981/82: Bangladesh. Bureau of Statistics) Monthly Statistical Bulletin of Bangladesh (Dacca). 2. Rice Production 1947/48-1972/73: Bangladesh. Ministry of Agriculture, Bangladesh Agricul- ture in Statistics (Dacca: 1974). 1973/74- 1981/82: Bangladesh. Bureau of Statistics, Monthly Statistical Bulletin of Bangladesh (Dacca). 3. Rice Area 1944/45-1946/47: East Pakistan. Directorate of Agriculture, Agricultural Statistics of East Pakistan (Dacca: East Pakistan Government Press). 1947/48-1972/73: Bangladesh. Ministry of Agriculture, Bangladesh Agricul- ture in Statistics (Dacca: 1974). 1973/74-1981/82: Bangladesh. Bureau of Statistics, Monthly Statistical Bulletin of Bangladesh (Dacca). 4. Rice Yields 1947/48-1981/82: Rice yields are calculated by dividing rice production (2) by rice area (3) on an annual basis. 5. Rice Area Irrigated 1944/45-1946/47: East Pakistan. Directorate of Agriculture, Agricultural
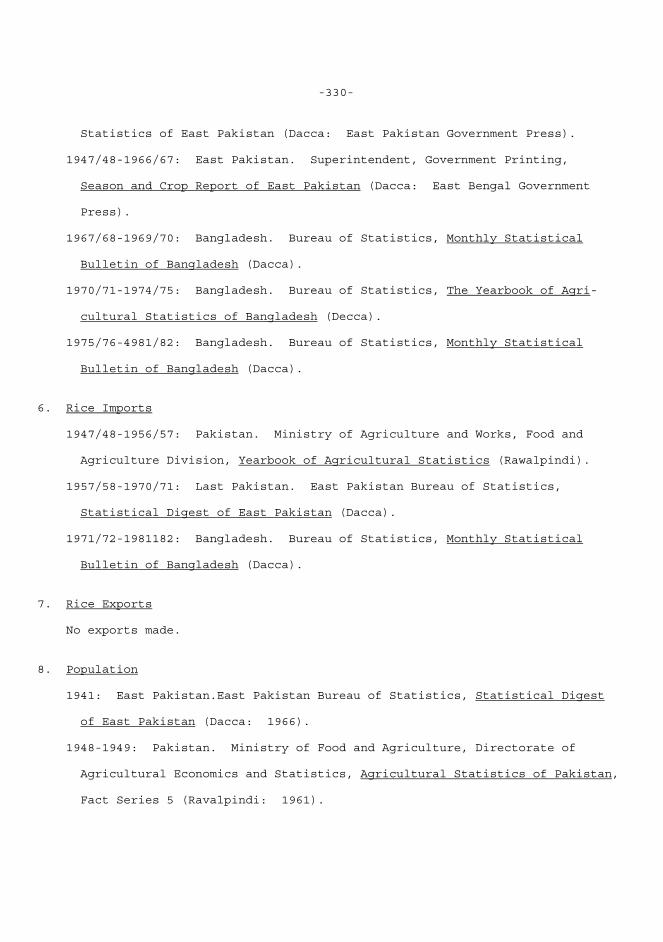
-330-
Statistics of East Pakistan (Dacca: East Pakistan Government Press). 1947/48-1966/67: East Pakistan. Superintendent, Government Printing, Season and Crop Report of East Pakistan (Dacca: East Bengal Government Press). 1967/68-1969/70: Bangladesh. Bureau of Statistics, Monthly Statistical Bulletin of Bangladesh (Dacca). 1970/71-1974/75: Bangladesh. Bureau of Statistics, The Yearbook of Agri- cultural Statistics of Bangladesh (Decca). 1975/76-4981/82: Bangladesh. Bureau of Statistics, Monthly Statistical Bulletin of Bangladesh (Dacca). 6. Rice Imports 1947/48-1956/57: Pakistan. Ministry of Agriculture and Works, Food and Agriculture Division, Yearbook of Agricultural Statistics (Rawalpindi). 1957/58-1970/71: Last Pakistan. East Pakistan Bureau of Statistics, Statistical Digest of East Pakistan (Dacca). 1971/72-1981182: Bangladesh. Bureau of Statistics, Monthly Statistical Bulletin of Bangladesh (Dacca). 7. Rice Exports No exports made. 8. Population 1941: East Pakistan.East Pakistan Bureau of Statistics, Statistical Digest of East Pakistan (Dacca: 1966). 1948-1949: Pakistan. Ministry of Food and Agriculture, Directorate of Agricultural Economics and Statistics, Agricultural Statistics of Pakistan, Fact Series 5 (Ravalpindi: 1961).
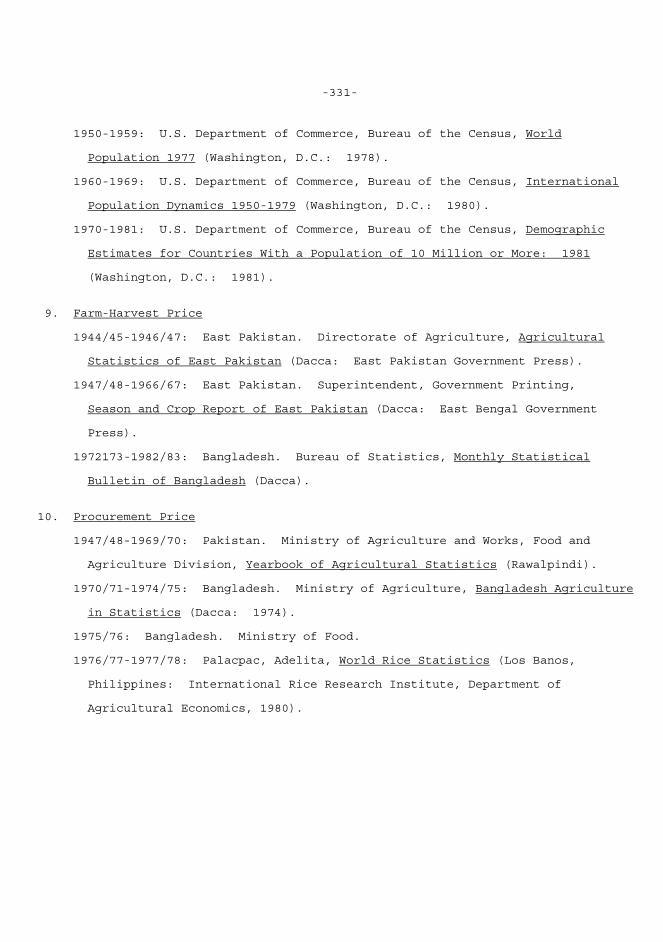
-331-
1950-1959: U.S. Department of Commerce, Bureau of the Census, World Population 1977 (Washington, D.C.: 1978). 1960-1969: U.S. Department of Commerce, Bureau of the Census, International Population Dynamics 1950-1979 (Washington, D.C.: 1980). 1970-1981: U.S. Department of Commerce, Bureau of the Census, Demographic Estimates for Countries With a Population of 10 Million or More: 1981 (Washington, D.C.: 1981). 9. Farm-Harvest Price 1944/45-1946/47: East Pakistan. Directorate of Agriculture, Agricultural Statistics of East Pakistan (Dacca: East Pakistan Government Press). 1947/48-1966/67: East Pakistan. Superintendent, Government Printing, Season and Crop Report of East Pakistan (Dacca: East Bengal Government Press). 1972173-1982/83: Bangladesh. Bureau of Statistics, Monthly Statistical Bulletin of Bangladesh (Dacca). 10. Procurement Price 1947/48-1969/70: Pakistan. Ministry of Agriculture and Works, Food and Agriculture Division, Yearbook of Agricultural Statistics (Rawalpindi). 1970/71-1974/75: Bangladesh. Ministry of Agriculture, Bangladesh Agriculture in Statistics (Dacca: 1974). 1975/76: Bangladesh. Ministry of Food. 1976/77-1977/78: Palacpac, Adelita, World Rice Statistics (Los Banos, Philippines: International Rice Research Institute, Department of Agricultural Economics, 1980).
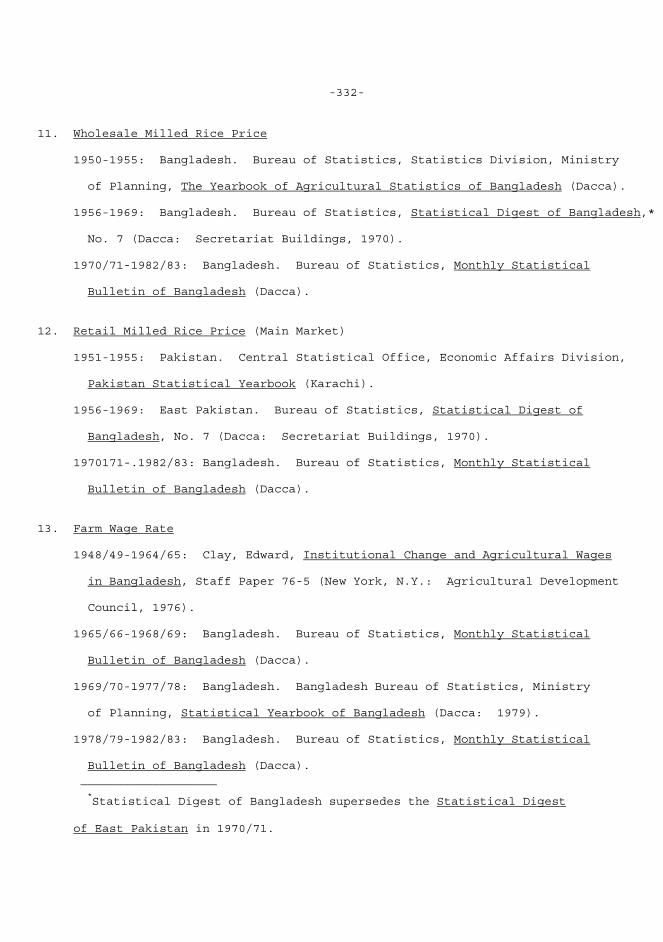
-332-
11. Wholesale Milled Rice Price 1950-1955: Bangladesh. Bureau of Statistics, Statistics Division, Ministry of Planning, The Yearbook of Agricultural Statistics of Bangladesh (Dacca). 1956-1969: Bangladesh. Bureau of Statistics, Statistical Digest of Bangladesh,* No. 7 (Dacca: Secretariat Buildings, 1970). 1970/71-1982/83: Bangladesh. Bureau of Statistics, Monthly Statistical Bulletin of Bangladesh (Dacca). 12. Retail Milled Rice Price (Main Market) 1951-1955: Pakistan. Central Statistical Office, Economic Affairs Division, Pakistan Statistical Yearbook (Karachi). 1956-1969: East Pakistan. Bureau of Statistics, Statistical Digest of Bangladesh, No. 7 (Dacca: Secretariat Buildings, 1970). 1970171-.1982/83: Bangladesh. Bureau of Statistics, Monthly Statistical Bulletin of Bangladesh (Dacca). 13. Farm Wage Rate 1948/49-1964/65: Clay, Edward, Institutional Change and Agricultural Wages in Bangladesh, Staff Paper 76-5 (New York, N.Y.: Agricultural Development Council, 1976). 1965/66-1968/69: Bangladesh. Bureau of Statistics, Monthly Statistical Bulletin of Bangladesh (Dacca). 1969/70-1977/78: Bangladesh. Bangladesh Bureau of Statistics, Ministry of Planning, Statistical Yearbook of Bangladesh (Dacca: 1979). 1978/79-1982/83: Bangladesh. Bureau of Statistics, Monthly Statistical Bulletin of Bangladesh (Dacca). ___________________
*Statistical Digest of Bangladesh supersedes the Statistical Digest
of East Pakistan in 1970/71.
-333-
14. Domestic Apparent Per Capita Rice Availability 1948/49-1980/81: Domestic apparent per capita rice availability is calcu- lated by dividing milled production (2) by population (8) on an annual basis. 15. Main Rice Crop Area (Aman) 1945/46-1946/47: East Pakistan. Directorate of Agriculture, Agricultural Statistics of East Pakistan (Dacca: East Pakistan Government Press). 1947-1972: Bangladesh. Ministry of Agriculture, Bangladesh Agriculture in Statistics (Dacca: 1974). 1973/74-1981/82: Bangladesh. Bureau of Statistics, Monthly Statistical Bulletin of Bangladesh (Dacca). 16. Main Rice Crop Production (Aman) 1947/48-1972/73: Bangladesh. Ministry of Agriculture, Bangladesh Agriculture in Statistics (Dacca: 1974). 1973/74-1981182: Bangladesh. Bureau of Statistics, Monthly Statistical Bulletin of Bangladesh (flacca). 17. Main Rice Crop Yield (Aman) 1947/48-1981/82: Main rice crop yields are calculated by dividing aman production (16) by aman area (15) on an annual basis.
-334-
Country Sources of Basic Data: Bangladesh 1. Bangladesh. Ministry of Agriculture, Bangladesh Agriculture in Statistics (Dacca: 1974). 2. Bangladesh. Bureau of Statistics, Monthly Statistical Bulletin of Bangladesh (Dacca: 1972- ). 3. Bangladesh. Bureau of Statistics, Statistics Division, The Yearbook of Agricultural Statistics of Bangladesh (Dacca). Formerly The Yearbook of Agricultural Statistics. 4. Bangladesh.Bureau of Statistics, Statistical Digest of Bangladesh (Dacca: Sec- retariat Buildings). Formerly Statistical Digest of East Pakistan. 5. East Pakistan. Season and Crop Report of East Pakistan (Dacca: East Bengal Government Press). 6. East Pakistan. East Pakistan Bureau of Statistics, Abstract of Agricultural Statistics of East Pakistan (Dacca). 7. Pakistan. Ministry of Agriculture and Works, Department of Agricultural Economics and Statistics, Land and Crop Statistics of Pakistan, Fact Series III (Karachi: Government of Pakistan Press, June 1962).
Useful Secondary Sources 1. Ahmad, Naf is, A New Economic Geography of Bangladesh (New Delhi: Vikas Publishing House PVT Ltd., 1976). 2. Alim, A., An Introduction to Bangladesh Agriculture (Dacca: N. Aiim, 1974). 3. Nyrop, R. et al., Area Handbook for Bangladesh (Washington, D.C.: Foreign Area Studies, The American University, 1975). 4. Abmed, Kalimuddin, Agriculture in East Pakistan (Dacca: N/s. Ahmed Brothers Publications, 1965).
-335-
Important Conversion Factors The Bangladesh crop year runs from July 1-June 30. 1 maund (md.) = 82.29 lbs. 37.36 kg. 1 seer (Sr.) = 2.05 lbs. = .93 kg. lakh = 1,000,000 crore = 1,000,000,000 1 long ton = 1.06605 metric tons The milling rate for rice is about 62 percent. Glossary of Seasons in Bangladesh aghani - (haimantic) winter dry season running from November through February. rabi - summer season running from March through May. kharif - (bhadai) monsoon season running from June through October. aus - summer paddy crop harvested July-August. aman - main rice crop harvested November-December and occupying 41 percent of total cropped area. boro - dry season, irrigated paddy crop harvested March-June. Money Unit Beginning in 1971, a new currency unit called "yaks" replaced the rupee. The values are identical. In 1980, 1 US$ = 16.25 taka official exchange rate In 1980, 1 US$ - 237.33 taka free-market exchange rate
-336-
XXIII: INDIA Rice Statistics in India In general, Indian statistics are very complete for all major data categories and are widely available in many different sources. In addition, changes in reporting methods are usually carefully documented, and time series data since 1900 are quite complete. Relatively speaking, India has one of the most extensive and intensive statistical collection systems in Asia. In 1868, the first published collection of Indian statistics, Statistical
*
Abstract for British India, appeared. In 1875, a Department of Agriculture and Commerce was organized, and later provincial directors of agriculture and statistical officer were appointed. The Office of Director-General of Commercial Intelligence and Statistics (CIS) was created in 1905. In 1933, a Statistical Research Bureau was established to aid official analysis and in- terpretation of economic statistics. Finally, in 1950, the Central Statistical Organization (CSO) was' created to coordinate all statistical activities in India. Currently, responsibility for agricultural statistics, is in the hands of the Directorate of Economics and Statistics (DES) in the Ministry of Agr culture, although CSO oversees the Directorate's work. In the pre-World War II period, crop acreage data were based on field-to- field enumerations carried out by village officials under the supervision of district officials. Crop area data are considered to be quite accurate, partly because most land was professionally surveyed. Crop area always re- furred to the actual area sown, regardless of whether the crop reached maturity ________________________
*The territory of British India is somewhat different from present day
India. It included parts of Burma, Nepal, Pakistan, and Bangladesh and ex- clouded some sections of India.
-337-
Yields were estimated using the standard formula: output = crop acreage x standard yield per acre x seasonal condition of the crop. Standard yield was supposed to represent the yield as a constant on land of average quality in a year of average weather conditions. Standard yields were maintained for at least a five-year period. Seasonal condition represented the proportion of current yields to the standard yield, and was based on village reports and the assessment of the district official. Production figures are considered to be somewhat less reliable than area figures. For further, in depth discussion of pre-war agricultural statistics collection methods and adjusted time series for area, production, and yield of most economically important crops including rice, readers may wish to refer to Agricultural Trends in India, 1891-1947: Output, Availability, and Productivity by George Blyn. Since World War II, Indian statistical collection has been further expanded and improved. Unlike many other Asian countries that reorganized the statis- tical collection apparatus in the post-war period, the British-style system was retained in India, and pre- and post-war statistics are very comparable. This makes long-term trend analysis a possibility. Boundary changes present a small problem, but most statistics are also available in a disaggregated form, eliminating or reducing this difficulty. In the period prior to 1937, parts of present day Burma and Pakistan were included in Indian statistics. However, in the tables accompanying this text, Burma is excluded. Since World War II, Indian borders have remained essentially the same, with the exception of the addition of Sikkim in April, 1975. Statistics for Sikkim are not available, but this makes little difference for national-level rice statistics because Sikkim rice production is not very large.
-338-
At the national level, DES is responsible for the collection and aggre- gation of agricultural area and production statistics. DES relies on the states for the collection of raw data. State statistical apparatus varies from area to area. In some states, a statistical bureau collects statistics, in others an agricultural department or a land records department. Actually, primary data is collected at the village level by village accountants (patwari) under the supervision of district officials using the same basic methods as those employed in the pre-war period. However, random sample crop-cutting surveys are now extensively used in the estimation of yields, although the traditional method, i.e., calculating yield as a percent of "normal" or stand- ard yield and condition factor, is still in use in some areas. In the case of rice area and production statistics, there are two separate series available. The official series, collected and compiled by DES, is favored by most analysts and is the one used in the accompanying table, but the National Sample Survey Organization also produces a series based on crop cutting and other activities carried out during National Sample Surveys. The two series are not consistent because of the use of different data bases, seasons, etc. In addition, official rice area and production series suffer from problems of internal inconsistency. As in most countries, as improvements are made through time, it is impossible to adjust data very far back for consistency. Indian statistical analysts have overcome this problem to a partial extent through the use of indexes. Indexes regularly accompany sta- titical compilations of this type. Rice area is reported in thousand hectares, rice production in thousand metric tons, and rice yields in quintals/hectare. Rice statistics are further subdivided by season into autumn, winter, and summer rice. The winter crop
-339-
(rainy season) is the largest, closely followed by the autumn crop, and the summer crop is much smaller. In addition, rice statistics can be found by variety. Indian rice statistics are unusual in that all data, including pro- duction and farm-harvest prices, are recorded in milled form. India also maintains an extensive pre-harvest monitoring system. Two to three formal forecasts for rice area and production are made each year prior to final estimates. These forecasts help policy makers formulate decisions on exports, stocks, procurements, and rationing. Rice production and acreage are reported on a May-June crop year.
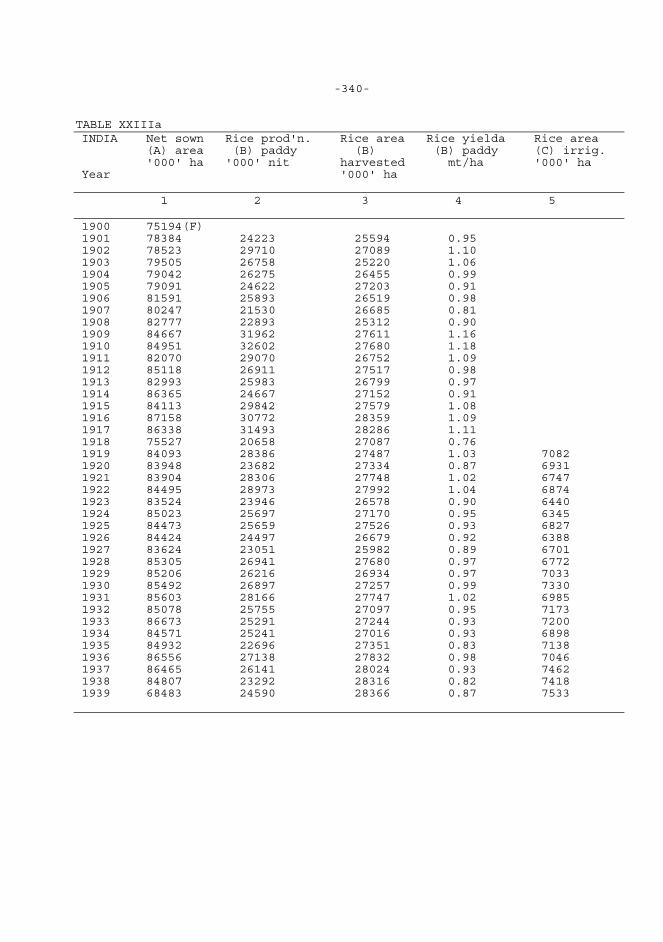
-340- TABLE XXIIIa INDIA Net sown Rice prod'n. Rice area Rice yielda Rice area (A) area (B) paddy (B) (B) paddy (C) irrig. '000' ha '000' nit harvested mt/ha '000' ha Year '000' ha 1 2 3 4 5 1900 75194(F) 1901 78384 24223 25594 0.95 1902 78523 29710 27089 1.10 1903 79505 26758 25220 1.06 1904 79042 26275 26455 0.99 1905 79091 24622 27203 0.91 1906 81591 25893 26519 0.98 1907 80247 21530 26685 0.81 1908 82777 22893 25312 0.90 1909 84667 31962 27611 1.16 1910 84951 32602 27680 1.18 1911 82070 29070 26752 1.09 1912 85118 26911 27517 0.98 1913 82993 25983 26799 0.97 1914 86365 24667 27152 0.91 1915 84113 29842 27579 1.08 1916 87158 30772 28359 1.09 1917 86338 31493 28286 1.11 1918 75527 20658 27087 0.76 1919 84093 28386 27487 1.03 7082 1920 83948 23682 27334 0.87 6931 1921 83904 28306 27748 1.02 6747 1922 84495 28973 27992 1.04 6874 1923 83524 23946 26578 0.90 6440 1924 85023 25697 27170 0.95 6345 1925 84473 25659 27526 0.93 6827 1926 84424 24497 26679 0.92 6388 1927 83624 23051 25982 0.89 6701 1928 85305 26941 27680 0.97 6772 1929 85206 26216 26934 0.97 7033 1930 85492 26897 27257 0.99 7330 1931 85603 28166 27747 1.02 6985 1932 85078 25755 27097 0.95 7173 1933 86673 25291 27244 0.93 7200 1934 84571 25241 27016 0.93 6898 1935 84932 22696 27351 0.83 7138 1936 86556 27138 27832 0.98 7046 1937 86465 26141 28024 0.93 7462 1938 84807 23292 28316 0.82 7418 1939 68483 24590 28366 0.87 7533
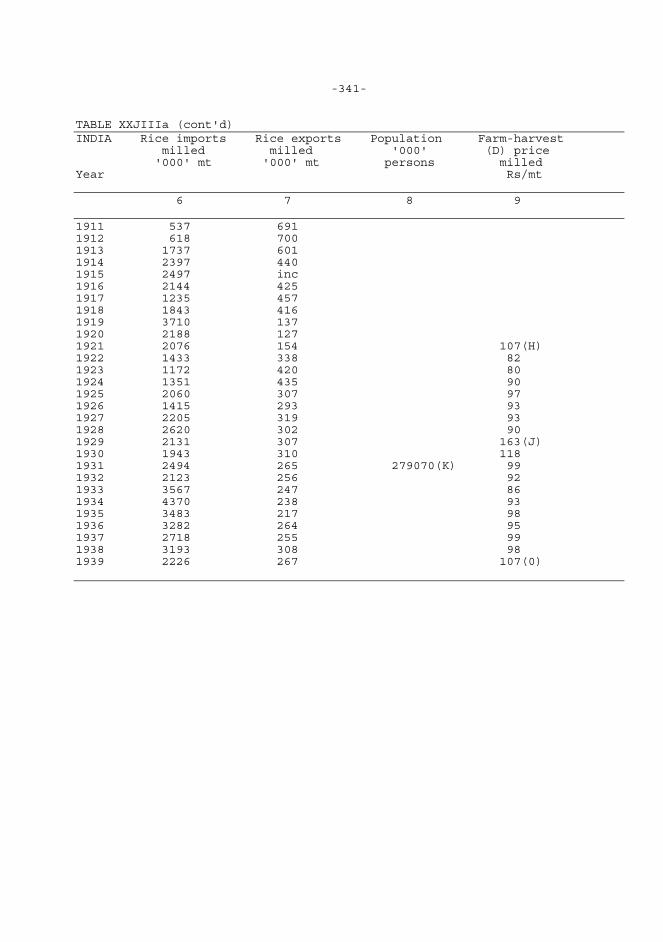
-341- TABLE XXJIIIa (cont'd) INDIA Rice imports Rice exports Population Farm-harvest milled milled '000' (D) price '000' mt '000' mt persons milled Year Rs/mt 6 7 8 9 1911 537 691 1912 618 700 1913 1737 601 1914 2397 440 1915 2497 inc 1916 2144 425 1917 1235 457 1918 1843 416 1919 3710 137 1920 2188 127 1921 2076 154 107(H) 1922 1433 338 82 1923 1172 420 80 1924 1351 435 90 1925 2060 307 97 1926 1415 293 93 1927 2205 319 93 1928 2620 302 90 1929 2131 307 163(J) 1930 1943 310 118 1931 2494 265 279070(K) 99 1932 2123 256 92 1933 3567 247 86 1934 4370 238 93 1935 3483 217 98 1936 3282 264 95 1937 2718 255 99 1938 3193 308 98 1939 2226 267 107(0)
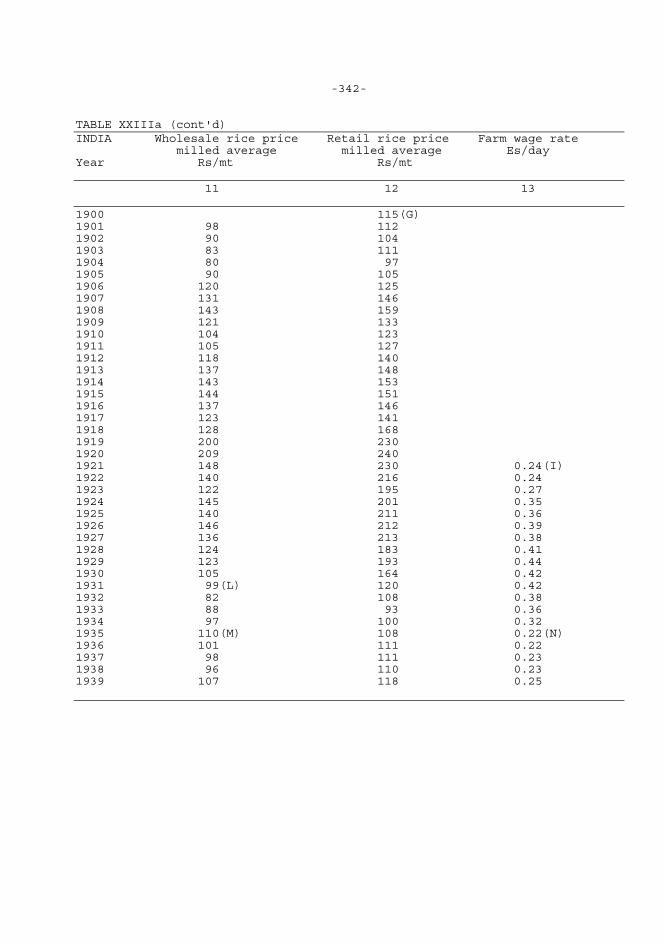
-342- TABLE XXIIIa (cont'd) INDIA Wholesale rice price Retail rice price Farm wage rate milled average milled average Es/day Year Rs/mt Rs/mt 11 12 13 1900 115(G) 1901 98 112 1902 90 104 1903 83 111 1904 80 97 1905 90 105 1906 120 125 1907 131 146 1908 143 159 1909 121 133 1910 104 123 1911 105 127 1912 118 140 1913 137 148 1914 143 153 1915 144 151 1916 137 146 1917 123 141 1918 128 168 1919 200 230 1920 209 240 1921 148 230 0.24(I) 1922 140 216 0.24 1923 122 195 0.27 1924 145 201 0.35 1925 140 211 0.36 1926 146 212 0.39 1927 136 213 0.38 1928 124 183 0.41 1929 123 193 0.44 1930 105 164 0.42 1931 99(L) 120 0.42 1932 82 108 0.38 1933 88 93 0.36 1934 97 100 0.32 1935 110(M) 108 0.22(N) 1936 101 111 0.22 1937 98 111 0.23 1938 96 110 0.23 1939 107 118 0.25
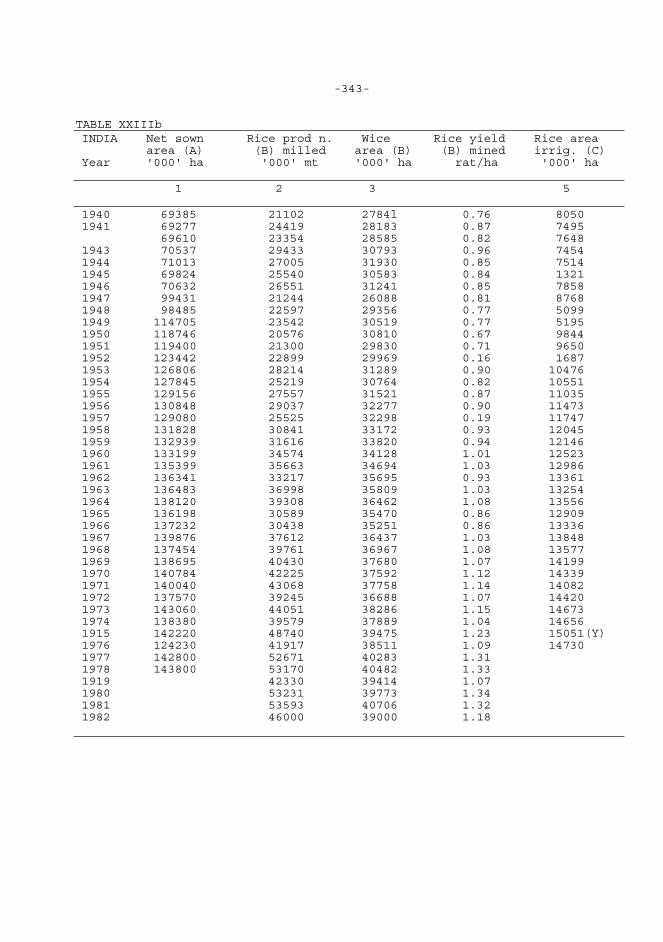
-343- TABLE XXIIIb INDIA Net sown Rice prod n. Wice Rice yield Rice area area (A) (B) milled area (B) (B) mined irrig. (C) Year '000' ha '000' mt '000' ha rat/ha '000' ha 1 2 3 5 1940 69385 21102 2784l 0.76 8050 1941 69277 24419 28183 0.87 7495 69610 23354 28585 0.82 7648 1943 70537 29433 30793 0.96 7454 1944 71013 27005 31930 0.85 7514 1945 69824 25540 30583 0.84 1321 1946 70632 26551 31241 0.85 7858 1947 99431 21244 26088 0.81 8768 1948 98485 22597 29356 0.77 5099 1949 114705 23542 30519 0.77 5195 1950 118746 20576 30810 0.67 9844 1951 119400 21300 29830 0.71 9650 1952 123442 22899 29969 0.16 1687 1953 126806 28214 31289 0.90 10476 1954 127845 25219 30764 0.82 10551 1955 129156 27557 31521 0.87 11035 1956 130848 29037 32277 0.90 11473 1957 129080 25525 32298 0.19 11747 1958 131828 30841 33172 0.93 12045 1959 132939 31616 33820 0.94 12146 1960 133199 34574 34128 1.01 12523 1961 135399 35663 34694 1.03 12986 1962 136341 33217 35695 0.93 13361 1963 136483 36998 35809 1.03 13254 1964 138120 39308 36462 1.08 13556 1965 136198 30589 35470 0.86 12909 1966 137232 30438 35251 0.86 13336 1967 139876 37612 36437 1.03 13848 1968 137454 39761 36967 1.08 13577 1969 138695 40430 37680 1.07 14199 1970 140784 42225 37592 1.12 14339 1971 140040 43068 37758 1.14 14082 1972 137570 39245 36688 1.07 14420 1973 143060 44051 38286 1.15 14673 1974 138380 39579 37889 1.04 14656 1915 142220 48740 39475 1.23 15051(Y) 1976 124230 41917 38511 1.09 14730 1977 142800 52671 40283 1.31 1978 143800 53170 40482 1.33 1919 42330 39414 1.07 1980 53231 39773 1.34 1981 53593 40706 1.32 1982 46000 39000 1.18
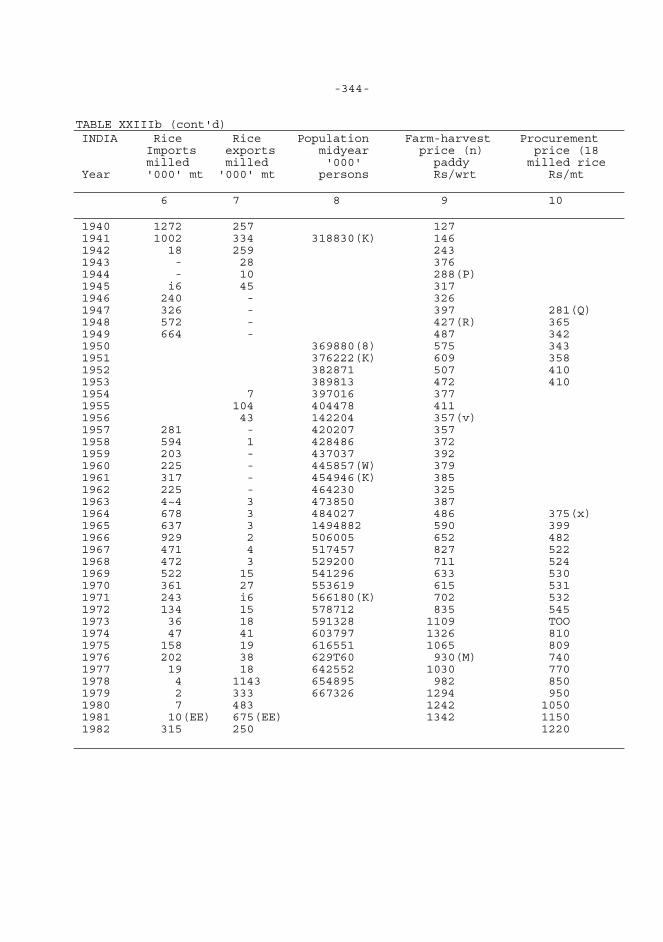
-344- TABLE XXIIIb (cont'd) INDIA Rice Rice Population Farm-harvest Procurement Imports exports midyear price (n) price (18 milled milled '000' paddy milled rice Year '000' mt '000' mt persons Rs/wrt Rs/mt 6 7 8 9 10 1940 1272 257 127 1941 1002 334 318830(K) 146 1942 18 259 243 1943 - 28 376 1944 - 10 288(P) 1945 i6 45 317 1946 240 - 326 1947 326 - 397 281(Q) 1948 572 - 427(R) 365 1949 664 - 487 342 1950 369880(8) 575 343 1951 376222(K) 609 358 1952 382871 507 410 1953 389813 472 410 1954 7 397016 377 1955 104 404478 411 1956 43 142204 357(v) 1957 281 - 420207 357 1958 594 1 428486 372 1959 203 - 437037 392 1960 225 - 445857(W) 379 1961 317 - 454946(K) 385 1962 225 - 464230 325 1963 4~4 3 473850 387 1964 678 3 484027 486 375(x) 1965 637 3 1494882 590 399 1966 929 2 506005 652 482 1967 471 4 517457 827 522 1968 472 3 529200 711 524 1969 522 15 541296 633 530 1970 361 27 553619 615 531 1971 243 i6 566180(K) 702 532 1972 134 15 578712 835 545 1973 36 18 591328 1109 TOO 1974 47 41 603797 1326 810 1975 158 19 616551 1065 809 1976 202 38 629T60 930(M) 740 1977 19 18 642552 1030 770 1978 4 1143 654895 982 850 1979 2 333 667326 1294 950 1980 7 483 1242 1050 1981 10(EE) 675(EE) 1342 1150 1982 315 250 1220
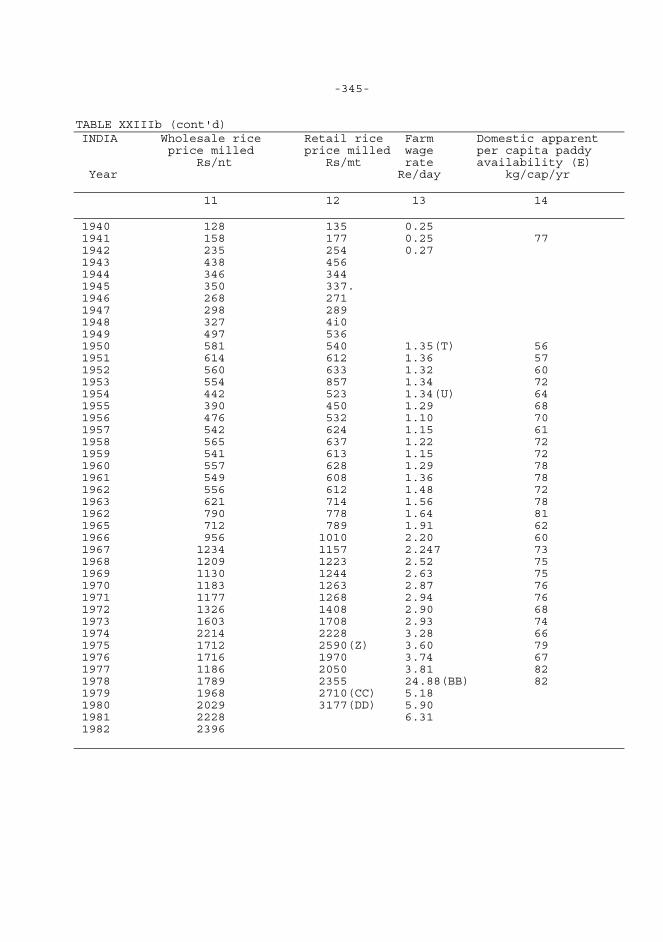
-345- TABLE XXIIIb (cont'd) INDIA Wholesale rice Retail rice Farm Domestic apparent price milled price milled wage per capita paddy Rs/nt Rs/mt rate availability (E) Year Re/day kg/cap/yr 11 12 13 14 1940 128 135 0.25 1941 158 177 0.25 77 1942 235 254 0.27 1943 438 456 1944 346 344 1945 350 337. 1946 268 271 1947 298 289 1948 327 4i0 1949 497 536 1950 581 540 1.35(T) 56 1951 614 612 1.36 57 1952 560 633 1.32 60 1953 554 857 1.34 72 1954 442 523 1.34(U) 64 1955 390 450 1.29 68 1956 476 532 1.10 70 1957 542 624 1.15 61 1958 565 637 1.22 72 1959 541 613 1.15 72 1960 557 628 1.29 78 1961 549 608 1.36 78 1962 556 612 1.48 72 1963 621 714 1.56 78 1962 790 778 1.64 81 1965 712 789 1.91 62 1966 956 1010 2.20 60 1967 1234 1157 2.247 73 1968 1209 1223 2.52 75 1969 1130 1244 2.63 75 1970 1183 1263 2.87 76 1971 1177 1268 2.94 76 1972 1326 1408 2.90 68 1973 1603 1708 2.93 74 1974 2214 2228 3.28 66 1975 1712 2590(Z) 3.60 79 1976 1716 1970 3.74 67 1977 1186 2050 3.81 82 1978 1789 2355 24.88(BB) 82 1979 1968 2710(CC) 5.18 1980 2029 3177(DD) 5.90 1981 2228 6.31 1982 2396
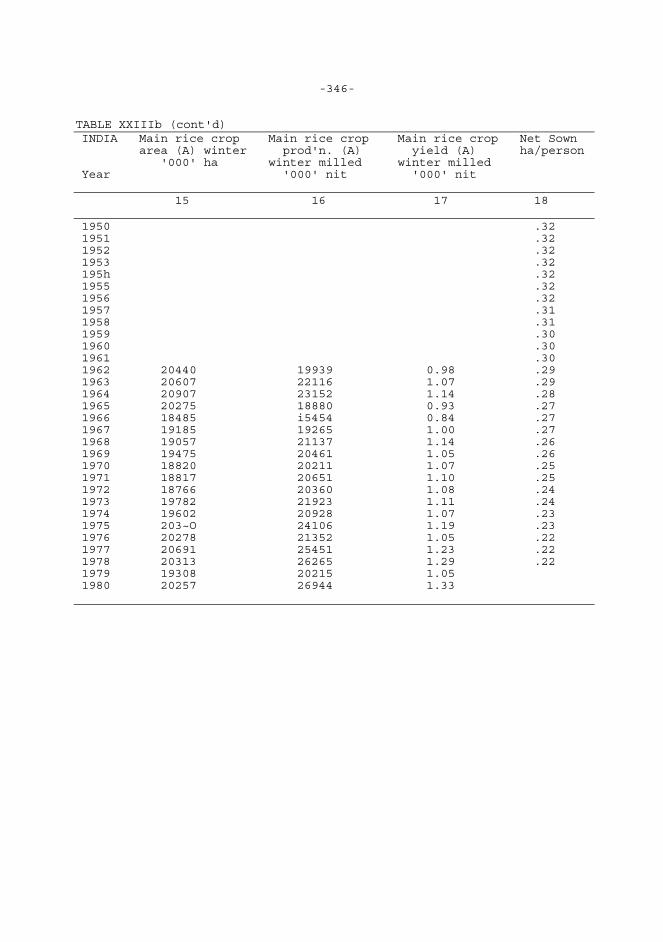
-346- TABLE XXIIIb (cont'd) INDIA Main rice crop Main rice crop Main rice crop Net Sown area (A) winter prod'n. (A) yield (A) ha/person '000' ha winter milled winter milled Year '000' nit '000' nit 15 16 17 18 1950 .32 1951 .32 1952 .32 1953 .32 195h .32 1955 .32 1956 .32 1957 .31 1958 .31 1959 .30 1960 .30 1961 .30 1962 20440 19939 0.98 .29 1963 20607 22116 1.07 .29 1964 20907 23152 1.14 .28 1965 20275 18880 0.93 .27 1966 18485 i5454 0.84 .27 1967 19185 19265 1.00 .27 1968 19057 21137 1.14 .26 1969 19475 20461 1.05 .26 1970 18820 20211 1.07 .25 1971 18817 20651 1.10 .25 1972 18766 20360 1.08 .24 1973 19782 21923 1.11 .24 1974 19602 20928 1.07 .23 1975 203~O 24106 1.19 .23 1976 20278 21352 1.05 .22 1977 20691 25451 1.23 .22 1978 20313 26265 1.29 .22 1979 19308 20215 1.05 1980 20257 26944 1.33
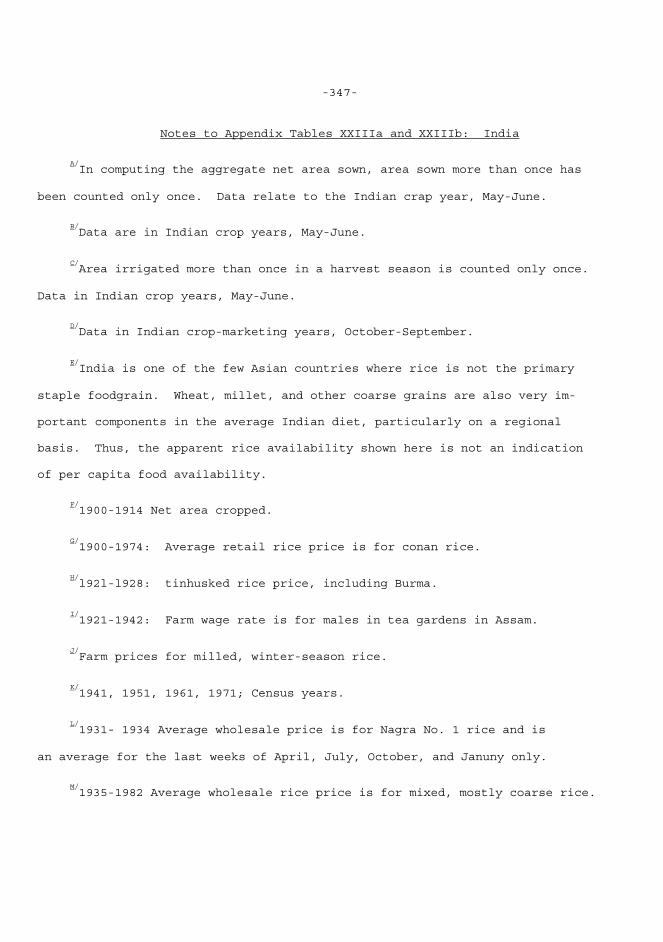
-347-
Notes to Appendix Tables XXIIIa and XXIIIb: India
A/In computing the aggregate net area sown, area sown more than once has
been counted only once. Data relate to the Indian crap year, May-June.
B/Data are in Indian crop years, May-June.
C/Area irrigated more than once in a harvest season is counted only once.
Data in Indian crop years, May-June.
D/Data in Indian crop-marketing years, October-September.
E/India is one of the few Asian countries where rice is not the primary
staple foodgrain. Wheat, millet, and other coarse grains are also very im- portant components in the average Indian diet, particularly on a regional basis. Thus, the apparent rice availability shown here is not an indication of per capita food availability.
F/1900-1914 Net area cropped.
G/1900-1974: Average retail rice price is for conan rice.
H/l92l-l928: tinhusked rice price, including Burma.
I/1921-1942: Farm wage rate is for males in tea gardens in Assam.
J/Farm prices for milled, winter-season rice.
K/1941, 1951, 1961, 1971; Census years.
L/1931- 1934 Average wholesale price is for Nagra No. 1 rice and is
an average for the last weeks of April, July, October, and Januny only.
M/1935-1982 Average wholesale rice price is for mixed, mostly coarse rice.
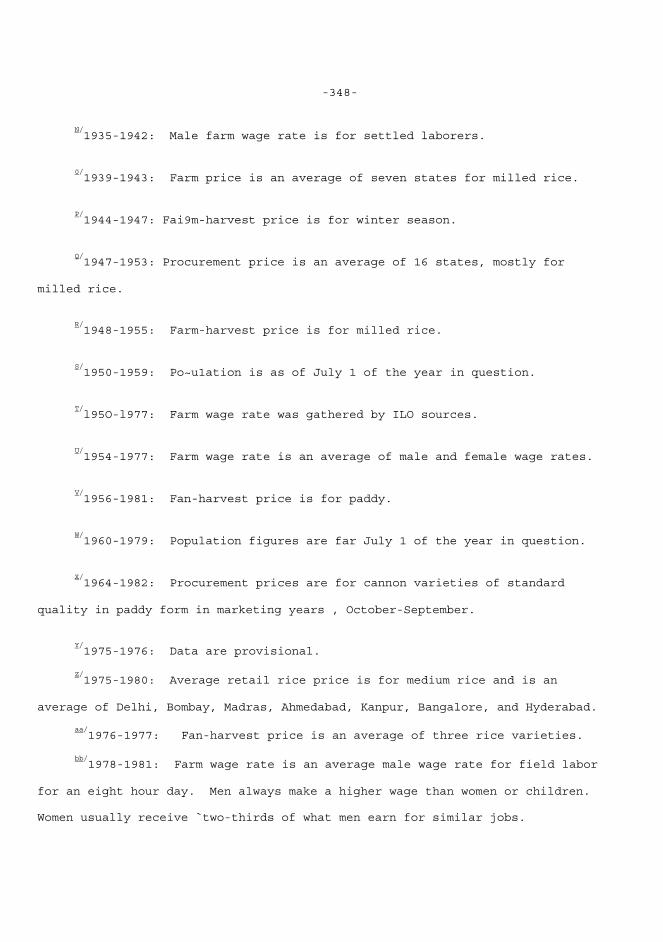
-348-
N/1935-1942: Male farm wage rate is for settled laborers.
0/1939-1943: Farm price is an average of seven states for milled rice.
P/1944-1947: Fai9m-harvest price is for winter season.
Q/1947-1953: Procurement price is an average of 16 states, mostly for
milled rice.
R/1948-1955: Farm-harvest price is for milled rice.
S/1950-1959: Po~u1ation is as of July 1 of the year in question.
T/l95O-l977: Farm wage rate was gathered by ILO sources.
U/1954-1977: Farm wage rate is an average of male and female wage rates.
V/1956-1981: Fan-harvest price is for paddy.
W/1960-1979: Population figures are far July 1 of the year in question.
X/1964-1982: Procurement prices are for cannon varieties of standard
quality in paddy form in marketing years , October-September.
Y/1975-1976: Data are provisional.
Z/1975-1980: Average retail rice price is for medium rice and is an
average of Delhi, Bombay, Madras, Ahmedabad, Kanpur, Bangalore, and Hyderabad.
aa/1976-1977: Fan-harvest price is an average of three rice varieties.
bb/1978-1981: Farm wage rate is an average male wage rate for field labor
for an eight hour day. Men always make a higher wage than women or children.
Women usually receive `two-thirds of what men earn for similar jobs.
-349-
cc/l979: Average retail price is an average of January and April-September only. dd/1980: Average retail rice price is an average of March-September only. ee/1981-1982: USDA reports rice imports and exports on a November-October marketing year basis.
Sources of Data for Appendix Tables XXIIIa and b: India*
1. Net Sown Area 1900-1938: India. Department of Statistics, Agricultural Statistics of India (name changed to Indian Agricultural Statistics in 1950) (Calcutta: Superintendent Government Printing). 1939-1943: India. Directorate of Economics and Statistics, Ministry of Agriculture, Abstract of Agricultural Statistics of India, 1936-37 to 1945-46 (Delhi: Manager of Publications, 1949). 1944-1949: India. Directorate of Economics and Statistics, Ministry of Food and Agriculture, Indian Agricultural Statistics (Delhi). 1950-1970: India. Directorate of Economics and Statistics, Estimates of Area and Production of Principal Crops in India (New Delhi: Controller of Publications). 1971-1978: India. Directorate of Economics and Statistics, Agricultural Situation in India (Delhi: Controller of Publications). _____________________ *Although British India included parts of present-day Burma prior to 1937, statistics recorded here do not include Burma unless noted. Pakistan is also included in the Indian data through 1946.
-350-
2. Rice Production 1901-1935: India. Department of Commercial Intelligence and Statistics, Statistical Abstract for British India (Delhi: Manager of Publications). 1936-1942: India. Directorate of Economics and Statistics, Ministry of Agriculture, Abstract of Agricultural Statistics of India, 1936-37 to 1945-46 (Delhi: Manager of Publications, 1949). 1943-194$: India. Directorate of Economics and Statistics, Ministry of Food and Agriculture, Abstract of Agricultural Statistics of India, 1950 (Delhi: Manager of Publications, 1952). 1949-1977: India. Directorate of Economics and Statistics, Ministry of Agriculture and Irrigation, Estimates of Area and Production of Principal Crops in India (New Delhi: Controller of Publications). 1978-1980: India. Directorate of Economics and Statistics, Agricultural Situation in India (Delhi: Controller of Publications). 1981-1982: U.S. Foreign Agricultural Service, Foreign Agriculture Circular, FG-26--83 (Washington, D.C.: 1983). 3. Rice Area 1901-1935: India. Department of Commercial Intelligence and Statistics, Statistical Abstract for British India (Delhi: Manager of Publications). 1936-1942: India. Directorate of Economics and Statistics, Ministry of Agriculture, Abstract of Agricultural Statistics of India, 1936-37 to 1945-46 (Delhi: Manager of Publications, 1949). 1943-1948: India. Directorate of Economics and Statistics, Ministry of Food and Agriculture, Abstract of Agricultural Statistics of India, 1950 (Delhi: Management of Publications, 1952). 1949-1977: India. Directorate of Economics and Statistics, Ministry of
-351-
Agriculture and Irrigation, Estimates of Area and Production of Principal Crops in India (New Delhi: Controller of Publications). 1978-1980: India. Directorate of Economics and Statistics, Agricultural Situation in India (Delhi: Controller of Publications). 1981-1982: U.S. Foreign Agricultural Service, Foreign Agriculture Circular, P0-26-83 (Washington, D.C.: 1983). 4. Rice Yields 1901-1982: Rice yields are calculated by dividing rice production (2) by rice area (3) on an annual basis. 5. Rice Area Irrigated 1919-1935: India. Department of Commercial Intelligence and Statistics, Statistical Abstract for British India (Delhi: Manager of Publications). 1936-1942: India. Directorate of Economics and Statistics, Ministry of Agriculture, Abstract of ~agricultural Statistics of India, 1936-37 to 1945-46 (Delhi: Manager of Publications, 1949). 1943-1949: India. Directorate of Economics and Statistics, Ministry of Food and Agriculture, Abstract of Agricultural Statistics of India (Delhi: Manager of Publications, 1952). 1950-1961: India. Central Statistical Organization, Department of Statistics, Basic Statistics Relating to the Indian Economy (New Delhi: 1974). 1962-1976: India. Directorate of Economics and Statistics, Ministry of Agriculture and Irrigation, Estimates of Area and Production of Principal Crops in India (New Delhi: Controller of Publications). 6. Rice Imports 1911-1939: Wickizer, V. D. and Bennett, M. K., The Rice Economy of Monsoon Asia (Stanford: Stanford University Press, 1941).
-352-
1940-1941: India. Directorate of Economics and Statistics, Ministry of Agriculture, Abstract of Agricultural Statistics of India, 1936-37 to 1945-46 (Delhi: Manage; of Publications, 1949). 1942-1973: India. Department of Statistics, Central Statistical Organization, Statistical Abstract India (New Delhi). 1974-1980: India., Directorate of Economics and Statistics, Ministry of Agriculture, Bulletin on Food Statistics (New Delhi: 1980). 1981-1982: U.S. Foreign Agricultural Service, Foreign Agriculture Circular, P0-26-83 (Washington, D.C.: 1983). 7. Rice Exports 1911-1939: Wickizer, V. TX and Bennett, H. K., The Rice Economy of Monsoon Asia (Stanford: Stanford University Press, 1941). 1940-1941: India. Directorate of Economics and Statistics, Ministry of Agriculture, Abstract of Agricultural Statistics of India, 1936-37 to 1945-46 (Delhi: Manager of Publications, 1949). 1942-1973: India. Department of Statistics, Central Statistical Organization, Statistical Abstract India (New Delhi) 1974-1980: India. Directorate of Economics and Statistics, Ministry of Agriculture, Bulletin on Food Statistics (New Delhi: 1980). 1981-1982: U.S. Foreign Agricultural Service, Foreign Agriculture Circular, FG-26-83 (Washington, D.C.: 1983). 8. Population 1931, 1941: India. Directorate of Economics and Statistics, Ministry of Food and Agriculture, Abstract of Agricultural Statistics, 1950 (Delhi: Manager of Publications, 1952). 1950-1959: U.S. Department of Commerce, Bureau of the Census, World Popu-
-353-
lation 1977 (Washington, D.C.: 1978). 1960-1979: U.S. Department of Commerce, Bureau of the Census, International Population Dynamics 1950-79 (Washington, D.C.: 1980). 9. Farm-Harvest Price 1921-1938: India. Department of Commercial Intelligence and Statistics, Agricultural Statistics of India (Delhi: Manager of Publications). 1939-1942: India. Directorate of Economics and Statistics, Ministry of Agriculture, Abstract of Agricultural Statistics of India, 1936-37 to 1945-46 (Delhi: Manager of Publications, 1949). 1943: India. Directorate of Economics and Statistics, Ministry of Food and Agriculture, Abstract of Agricultural Statistics of India, 1950 (Delhi: Manager of Publications, 1952). 1944-1947: India. Department of Statistics, Central Statistical Organization, Statistical Abstract India (New Delhi). 1948-1973: India. Directorate of Economics and Statistics, Ministry of Food and Agriculture, Agricultural Prices in India (New Delhi). 1974-1975: India. Directorate of Economics and Statistics, Ministry of Food and Agriculture, Farm Harvest Prices of Principal Crops (New Delhi). 1976-1977: Palacpac, Adelita, World Rice Statistics (Los Baños, Philippines: International Rice Research Institute, Department of Agricultural Economics, 1980). 1978-1981: India. Directorate of Economics and Statistics, Agricultural Situation in India (Delhi: Controller of Publications). 10. Procurement Price 1947-1953: India. Directorate of Economics and Statistics, Ministry of Food and Agriculture, Abstract of Agricultural Statistics (Delhi:
-354-
Manager of Publications). 1964-1982: India. Directorate of Economics and Statistics, Ministry of Agriculture, Bulletin on Food Statistics (New Delhi). 11. Wholesale Rice Price 1901-1920: India. Department of Statistics, Prices and Wages in India (Calcutta: Superintendent Government Printing, 1922). 1921-1935: India. Department of Commercial Intelligence and Statistics, Statistical Abstract for British India (Delhi: Manager of Publications). 1936-1942: India. Directorate of Economics and Statistics, Ministry of Agriculture, Abstract of Agricultural Statistics in India, 1936-37 to 1945-46 (Delhi: Manager of Publications, 1949). 1943-1948: India. Directorate of Economics and Statistics, Ministry of Food and Agriculture, Abstract of Agricultural Statistics of India, 1950 (Delhi: Manager of Publications, 1952). 1949-1974: India. Directorate of Economics and Statistics, Ministry of Food and Agriculture, Agricultural Prices in India (New Delhi). 1975: India. Directorate of Economics and Statistics, Ministry of Agriculture and Irrigation, Indian Agriculture in Brief (New Delhi: Controller of Publications). 1976-1979: India. Directorate of Economics and Statistics, Ministry of Agriculture, Bulletin on Food Statistics (New Delhi: 1978-1980). 1980-1982: India. Directorate of Economics and Statistics, Agricultural Situation in India (Delhi: Controller of Publications). 12. Retail Rice Price 1900-1920: India. Department of Statistics, Prices and Wages in India (Calcutta: Superintendent Government. Printing, 1922).
-355-
1921-1935: India. Department of Commercial Intelligence and Statistics, Statistical Abstract for British India (Delhi: Manager of Publications). 1936-1942: India. Directorate of Economics and Statistics, Ministry of Agriculture, Abstract of Agricultural Statistics of India, 1936-37 to 1945-46 (Delhi: Manager of Publications, 1949). 1943-1945: India. Directorate of Economics and Statistics, Ministry of Food and Agriculture, Abstract of Agricultural Statistics of India, 1950 (Delhi: Manager of Publications, 1952). 1946-1948: India. Department of Statistics, Central Statistical Organization, Statistical Abstract India (New Delhi). 1949-1974: India. Directorate of Economics and Statistics, Ministry of Food and Agriculture, Agricultural Prices in India (New Delhi). 1975-1980: India. Department of Statistics, Ministry of Planning, Monthly Abstract of Statistics (New Delhi). 13. Farm Wage Rate 1921-1942: India. Office of the Economic Adviser. Subramanian and Homfray, Recent Social and Economic Trends in India (Delhi: Manager of Publications). 1950-1977: Palacpac, Adelita, World Rice Statistics (Los Baños, Philippines: International Rice Research Institute, Department of Agricultural Economics) 1980), p. 40. 1978-1981: India. Directorate of Economics and Statistics, Agricultural Situation in India (Delhi: Controller of Publications). 14. Domestic Per Capita Apparent Rice Availability 1941-1979: Domestic rice availability was calculated by dividing rice production (2) by population (8) on an annual basis.
-356-
15. Main Rice Crop Area (Winter) 1962-1976: India. Directorate of Economics and Statistics Ministry of Agriculture and Irrigation, Estimates of Area and Production of Principal Crops in India (New Delhi: Controller of Publications). 1977-1980: India. Directorate of Economics and Statistics, Agricultural Situation in India (Delhi: Controller of Publications). 16. Main Rice Crop Production (Winter) 1962-1976: India. Directorate of Economics and Statistics, Ministry of Agriculture and Irrigation, Estimates of Area and Production of Principal Crops in India (New Delhi: Controller of Publications). 1977-1980: India. Directorate of Economics and Statistics, Agricultural Situation in India (Delhi: Controller of Publications). 17. Main Rice Crop Yield (Winter) 1962-1980: Main rice crop yields were calculated by dividing main rice production (16) by main rice crop area (15) on an annual basis.
Country Sources of Basic Data: India Only some of the most useful agricultural statistical sources are listed on the following page. There are many other journals and occasional publica- tions that also contain useful information. Journal titles and the names of government agencies have frequently changed through time, but only current names and titles are listed. 1. India. Directorate, of Economics and Statistics, Abstract of Agricultural Statistics (Delhi: Manager of Publications). 2. India. Directorate of Economics and Statistics, Agricultural Prices in
-357-
India (New Delhi). 3. India. Directorate of Economics and Statistics, Bulletin of Food Statistics (New Delhi). 4. India. Directorate of Economics and Statistics, Estimates of Area and Production of Principal Crops in India (New Delhi: Controller of Publica- tions). 5. India. Central Statistical Organization, Statistical Abstract of India (New Delhi). 6. India. Directorate of Economics and Statistics, Agricultural Situation in India (New Delhi: Controller of Publications).
Useful Secondary Sources 1. India. Directorate of Economics and Statistics and the Statistical Adviser, Institute of Agricultural Research Statistics, Indian Council of Agricultural Research, Handbook on Methods of Collection of Agricultural Statistics in India (New Delhi: 1959). 2. India. Directorate of Economics and Statistics, Ministry of Agriculture, Agricultural Situation in India (Delhi: Controller of Publications). 3. Dagli, Vadilal, ed., A Regional Profile of Indian Agriculture (Bombay: Voral and Co., Publishers, 1974). 4. Sharma, D. F. and Desai, V. V., Rural Economy of India (New Delhi: Vikas Publishing House, 1980). 5. Blyn, George, Agricultural Trends in India 1891-1947 (Philadelphia: Uni- versity of Philadelphia Press, 1966). 6. Gupta, A. P., Marketing of Agricultural Produce in India (Bombay: Vora and Co., Publishers PVT Ltd., 1975).
-358-
7. Elhance, D. N., Economic Statistics of India Since Independence (Delhi: Kitab Hahal Private,~ Ltd., 1962). Important Conversion Factors 1 long ton = 1.016 mt. 1 maund (ad.) a .037 at. Honey Unit money unit - rupee In 1980, 1 US$ = 27.93 rupees official exchange rate In 1980, 1 US$ = 8.38 rupees free-market exchange rate Glossary kharif = wet season rabi = dry season
-359-
XXIV: NEPAL Rice Statistics in Nepal Administratively/politically, Nepal is divided into 14 zones, 15 districts, and 3,914 panchayats (basic political units) or villages. Villages are further subdivided into nine wards. The panchayat system of political organization proposes to simplify and streamline the process of the choice of leaders at all levels of society. At the lowest level of wards, or village divisions, peasants democratically choose a representative. This representative, along with those from the other wards, chooses a village representative and so on up through the highest levels of government. Theoretically, this allows every citizen democratic representation at all levels without the existence of political patties of any kind. Nepal operates under a statistical system similar to that of India. Ul- timate control of statistical collection and aggregation is vested in the hands of the Central Bureau of Statistics (CBS) operating at the national level and located in Kathniandu, the capital. CBS is responsible for the collection, compilation, analysis, interpretation, and publication of all statistics. In addition, and as a separate entity, an Agriculture Statistics Division operates under the Department of Food and Agricultural Marketing Services (Ministry of Food, Agriculture and Irrigation) to specifically collect agricultural statis- tics. The Agriculture Statistics Division is further subdivided by crop sta- tistics, animal statistics, and methodology and statistical analysis. CBS and the Agriculture Statistics Division sometimes cooperate and at other times make independent estimates. CBS maintains district level offices, usually staffed by three to four enumerators. District offices collect statistics down to the district level.
-360-
The Ministry of Food, Agriculture and Irrigation, the main source for agri- cultural statistics, pro vides farmers with extension services at the district level and concurrently `collects agricultural statistics. Statistics are collected via crop-cutting experiments on representative fields chosen by random selection and by' enquiry. Crop reporting is carried out on 10 percent of the cultivated land of each district for primary crops. The territorial coverage of the agricultural statistics system is quite complete. Forty districts, representing 84 percent of the total cultivated land, submit statistical reports. Five of the remaining 35 districts are selected on the basis o~ agroclimatic data as representative for reporting and are visited on a monthly basis to monitor cereal crops for possible failures. Crop statistics are reported in crop years, running from June 1-May 31 or in fiscal years, running from July-July. Area is reported in matomuris or hectares; production 14 thousand metric tons of paddy. Cropped areas are split by types of crops' grown, area intercropped according to approximate pro- portions, and by wet and dry land. Sown area relates to gross area including bunds of terraces.
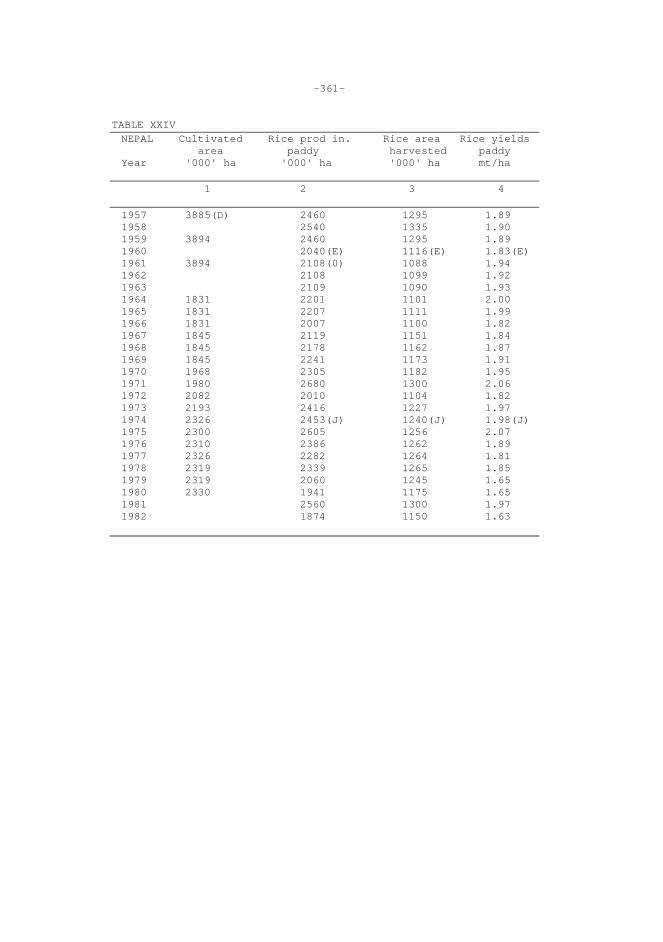
-361-
TABLE XXIV NEPAL Cultivated Rice prod in. Rice area Rice yields area paddy harvested paddy Year '000' ha '000' ha '000' ha mt/ha 1 2 3 4 1957 3885(D) 2460 1295 1.89 1958 2540 1335 1.90 1959 3894 2460 1295 1.89 1960 2040(E) 1116(E) 1.83(E) 1961 3894 2108(0) 1088 1.94 1962 2108 1099 1.92 1963 2109 1090 1.93 1964 1831 2201 1101 2.00 1965 1831 2207 1111 1.99 1966 1831 2007 1100 1.82 1967 1845 2119 1151 1.84 1968 1845 2178 1162 1.87 1969 1845 2241 1173 1.91 1970 1968 2305 1182 1.95 1971 1980 2680 1300 2.06 1972 2082 2010 1104 1.82 1973 2193 2416 1227 1.97 1974 2326 2453(J) 1240(J) 1.98(J) 1975 2300 2605 1256 2.07 1976 2310 2386 1262 1.89 1977 2326 2282 1264 1.81 1978 2319 2339 1265 1.85 1979 2319 2060 1245 1.65 1980 2330 1941 1175 1.65 1981 2560 1300 1.97 1982 1874 1150 1.63
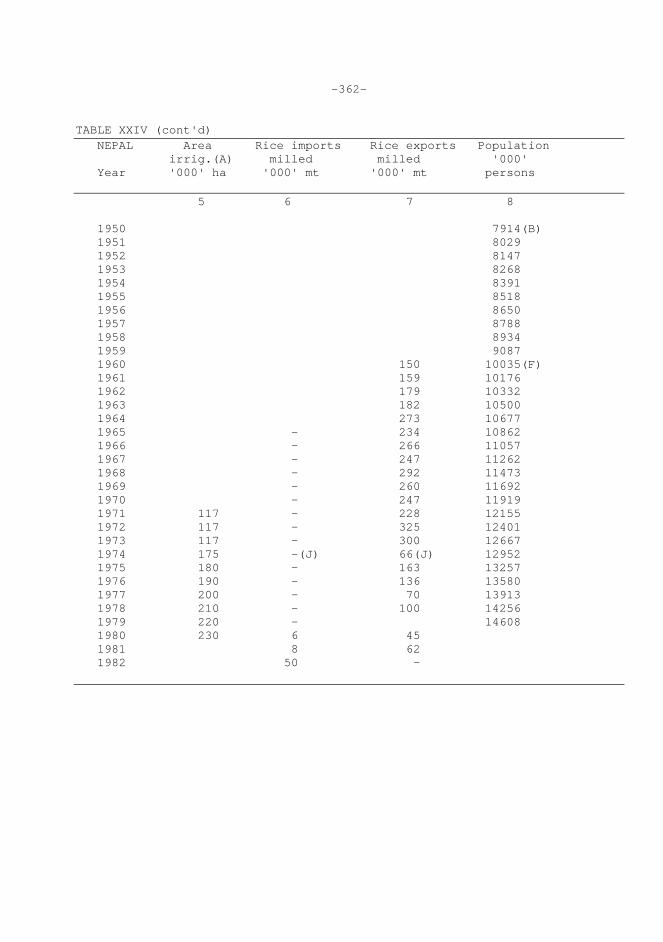
-362- TABLE XXIV (cont'd) NEPAL Area Rice imports Rice exports Population irrig.(A) milled milled '000' Year '000' ha '000' mt '000' mt persons 5 6 7 8 1950 7914(B) 1951 8029 1952 8147 1953 8268 1954 8391 1955 8518 1956 8650 1957 8788 1958 8934 1959 9087 1960 150 10035(F) 1961 159 10176 1962 179 10332 1963 182 10500 1964 273 10677 1965 - 234 10862 1966 - 266 11057 1967 - 247 11262 1968 - 292 11473 1969 - 260 11692 1970 - 247 11919 1971 117 - 228 12155 1972 117 - 325 12401 1973 117 - 300 12667 1974 175 -(J) 66(J) 12952 1975 180 - 163 13257 1976 190 - 136 13580 1977 200 - 70 13913 1978 210 - 100 14256 1979 220 - 14608 1980 230 6 45 1981 8 62 1982 50 -
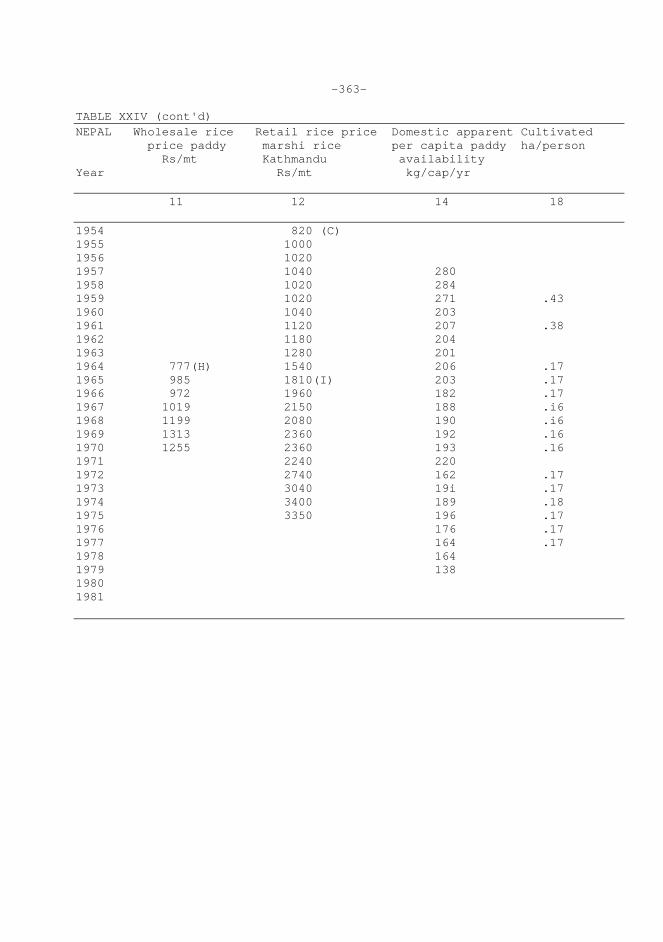
-363- TABLE XXIV (cont'd) NEPAL Wholesale rice Retail rice price Domestic apparent Cultivated price paddy marshi rice per capita paddy ha/person Rs/mt Kathmandu availability Year Rs/mt kg/cap/yr 11 12 14 18 1954 820 (C) 1955 1000 1956 1020 1957 1040 280 1958 1020 284 1959 1020 271 .43 1960 1040 203 1961 1120 207 .38 1962 1180 204 1963 1280 201 1964 777(H) 1540 206 .17 1965 985 1810(I) 203 .17 1966 972 1960 182 .17 1967 1019 2150 188 .i6 1968 1199 2080 190 .i6 1969 1313 2360 192 .16 1970 1255 2360 193 .16 1971 2240 220 1972 2740 162 .17 1973 3040 19i .17 1974 3400 189 .18 1975 3350 196 .17 1976 176 .17 1977 164 .17 1978 164 1979 138 1980 1981
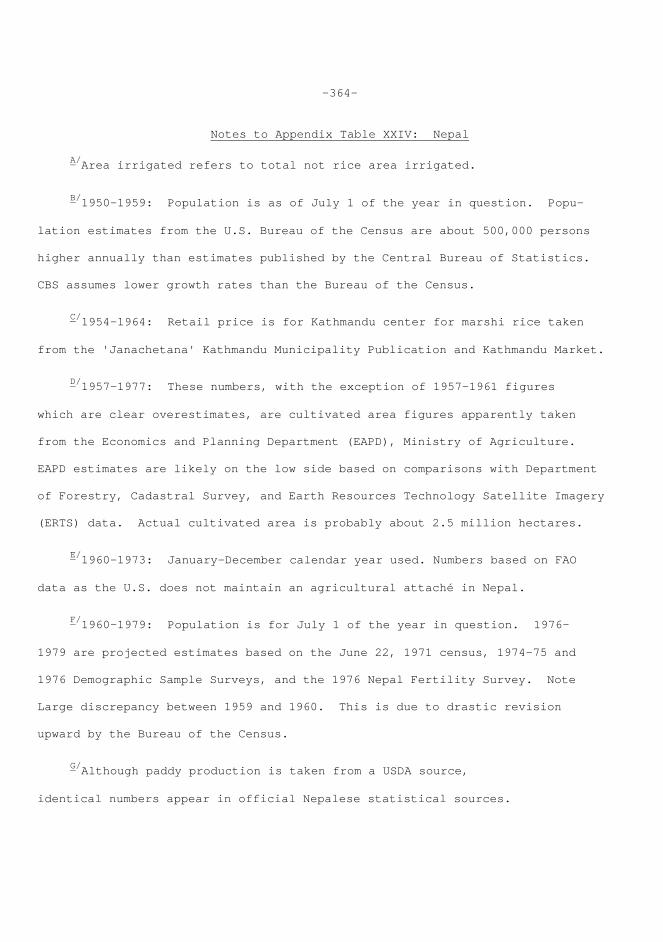
-364-
Notes to Appendix Table XXIV: Nepal
A/Area irrigated refers to total not rice area irrigated.
B/1950-1959: Population is as of July 1 of the year in question. Popu- lation estimates from the U.S. Bureau of the Census are about 500,000 persons higher annually than estimates published by the Central Bureau of Statistics. CBS assumes lower growth rates than the Bureau of the Census.
C/1954-1964: Retail price is for Kathmandu center for marshi rice taken from the 'Janachetana' Kathmandu Municipality Publication and Kathmandu Market.
D/1957-1977: These numbers, with the exception of 1957-1961 figures which are clear overestimates, are cultivated area figures apparently taken from the Economics and Planning Department (EAPD), Ministry of Agriculture. EAPD estimates are likely on the low side based on comparisons with Department of Forestry, Cadastral Survey, and Earth Resources Technology Satellite Imagery (ERTS) data. Actual cultivated area is probably about 2.5 million hectares.
E/1960-1973: January-December calendar year used. Numbers based on FAO data as the U.S. does not maintain an agricultural attaché in Nepal.
F/1960-1979: Population is for July 1 of the year in question. 1976- 1979 are projected estimates based on the June 22, 1971 census, 1974-75 and 1976 Demographic Sample Surveys, and the 1976 Nepal Fertility Survey. Note Large discrepancy between 1959 and 1960. This is due to drastic revision upward by the Bureau of the Census.
G/Although paddy production is taken from a USDA source, identical numbers appear in official Nepalese statistical sources.
-365-
H/1964-1970: Wholesale paddy price in crop years (June-July) probably is a farm-harvest price.
I/1965-1975; Retail coarse rice price is a national average price recorded in fiscal years.
J/1947-198l: July-June fiscal year used.
Sources of Data for Appendix Table XXIV: Nepal
1. Cultivated Area 1957-1980: Economic and Social Commission for Asia and the Pacific, Statistical Yearbook for Asia and the Pacific (Bangkok, Thailand: United Nations). Replaces Statistical Yearbook for Asia and the Far East in 1972. 2. Rice Production 1957-1959: Economic and Social Commission for Asia and the Pacific, Statistical Yearbook for Asia and the Pacific (Bangkok, Thailand: United Nations). 1960-1982: U.s. Foreign Agricultural Service, Foreign Agriculture Circular, FG-26--83 (Washington, D.C.: 1983). 3. Rice Area 1957-1959: Economic and Social Commission for Asia and the Pacific, Statistical Yearbook for Asia and the Pacific (Bangkok, Thailand: United Nations). l960-l982: U.S. Foreign Agricultural Service, Foreign Agriculture Circular, FG-26-83 (Washington, D.C.: 1983).
-366-
4. Rice Yields 1957-1982: Paddy yields are calculated by dividing rice production (2) by rice area (3) on an annual basis. 5. Area Irrigated 1971-1980: Economic and Social Commission for Asia and the Pacific, Statistical Yearbook for Asia and the Pacific (Bangkok, Thailand: United Nations).~ 6. Rice Imports 1960-1982: U.S. Foreign Agricultural Service, Foreign Agriculture Circular, FC-26-83 (Washington, D.C.: 1983). 7. Rice Exports 1960-1982: U.S. Foreign Agricultural Service, Foreign Agriculture Circular, FG-26-83 (Washington, D.C.: 1983). 8. Population 1950-1959: U.S. Department of Commerce, Bureau of the Census,. World Population 1977 (Washington, D.C.: 1978). 1960-1979: U.S. Department of Commerce, Bureau of the Census, International Population Dynamics, 1950-79 (Washington, D.C.: 1980). 11. Wholesale Rice Price 1964-1970: Nepal. National Planning Commission, Central Bureau of Statistics, Statistical Pocketbook of Nepal (Kathmandu: 1974). 12. Retail Rice Price (Main Market) 1954-1964: Economic Statistics Research Branch GM and ID Division, USAID/Nepal Economic Data Papers, Vol. 7, No. 1, March, 1965.
-367-
1965-1975: Nepal. EAPD, Agricultural Statistics of Nepal (Kathmandu: 1972). Other figures from World Bank, Nepal Agricultural Sector Review, Report No. 2205-NEP, April 27, 1979. 14. Domestic Apparent Per Capita Paddy Availability 1957-1979: Domestic per capita paddy availability is calculated by dividing paddy production (2) by population (8) on an annual basis.
Country Sources of Basic Data: Nepal Since the systematic collection of statistics in Nepal began recently, no long-term series are currently available. Regular publication of official statistics is also a recent phenomenon. Statistical publications are not readily available in most libraries. 1. Nepal. National Planning Commission, Central Bureau of Statistics, Statistical Pocketbook of Nepal (Kathmandu: l974, more recent years?). 2. Nepal. Central Bureau of Statistics, Monthly Statistical Bulletin (Kathmandu). 3. Nepal. Central Bureau of Statistics, Yield Data for Principal Cro$'s (Kathmandu, annually). 4. Nepal. Central Bureau of Statistics, Foreign Trade Statistics (Kathmandu).
Useful Secondary Sources 1. Bhooshan, The Development Experience of Nepal (New Delhi: Concept Publishing Co., 1979). 2. F.A.O., Asia and the Far East Commission on Agricultural Statistics, periodic reports.
-368-
3. Centre for Economic Development and Administration, Planning for Basic Needs and Mobilization of Resources, Report of a National Seminar Held in Kathmandu (Nov. 12-14, 1979) (Bangkok: ILO, 1980). 4. Regmi, Mahesh, Landownership in Nepal (Berkeley: University of California Press, 1976). Important Conversion Factors Nepalese units of volume and land measurement, as with climate and terrain, differ markedly from the tent to the hills. Listed below are some of the more common Nepalese measures. Land Measurements: I 1 khet = 1.3 ha. 1 bigha = 0.67 ha (rerai) 1 matomuri 0.13 ha. 0.25 ropani 1 ropani = 0.05 ha. (hills) = 4 muris 1 muri 0.013 ha. Weight and Volume Measurements: 1 seer ~ 0.80 Chills) weight 1 seer = 0~.93 kg. (terai) weight 1 mana = 0.3 kg. paddy weight 1 maund = 37.32 kg. paddy (terai) volume The milling rate for rice is about 60 percent.
-369-
Money unit money unit = rupees, pice 100 pisa = 1 Nepalese Rupee (NR) In 198Q 1 US$ 12.00 rupees official exchange rate In 1980,1 US$ - 14.00 rupees free-market exchange rate
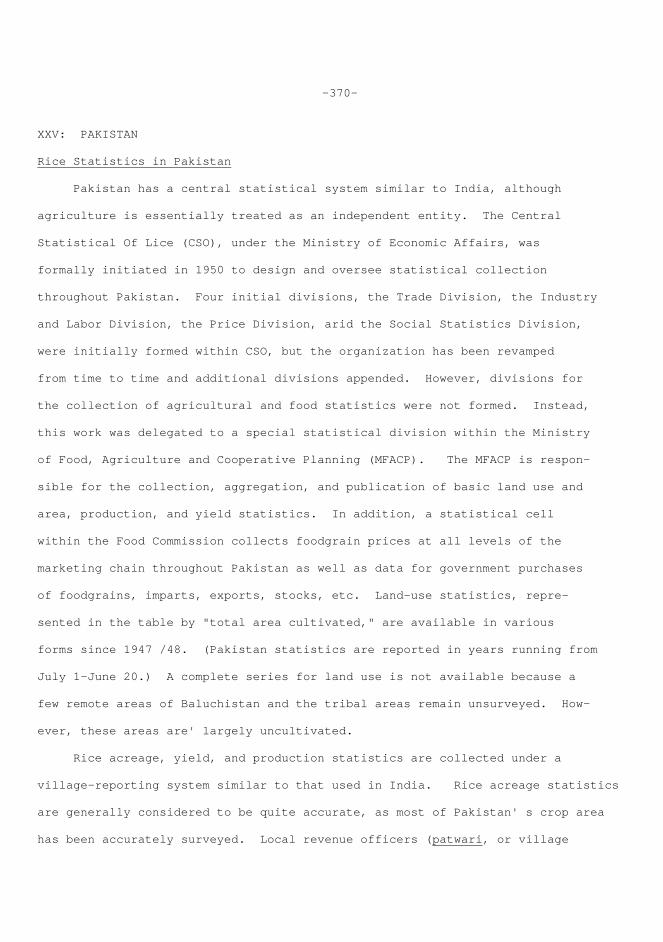
-370-
XXV: PAKISTAN Rice Statistics in Pakistan Pakistan has a central statistical system similar to India, although agriculture is essentially treated as an independent entity. The Central Statistical Of Lice (CSO), under the Ministry of Economic Affairs, was formally initiated in 1950 to design and oversee statistical collection throughout Pakistan. Four initial divisions, the Trade Division, the Industry and Labor Division, the Price Division, arid the Social Statistics Division, were initially formed within CSO, but the organization has been revamped from time to time and additional divisions appended. However, divisions for the collection of agricultural and food statistics were not formed. Instead, this work was delegated to a special statistical division within the Ministry of Food, Agriculture and Cooperative Planning (MFACP). The MFACP is respon- sible for the collection, aggregation, and publication of basic land use and area, production, and yield statistics. In addition, a statistical cell within the Food Commission collects foodgrain prices at all levels of the marketing chain throughout Pakistan as well as data for government purchases of foodgrains, imparts, exports, stocks, etc. Land-use statistics, repre- sented in the table by "total area cultivated," are available in various forms since 1947 /48. (Pakistan statistics are reported in years running from July 1-June 20.) A complete series for land use is not available because a few remote areas of Baluchistan and the tribal areas remain unsurveyed. How- ever, these areas are' largely uncultivated. Rice acreage, yield, and production statistics are collected under a village-reporting system similar to that used in India. Rice acreage statistics are generally considered to be quite accurate, as most of Pakistan' s crop area has been accurately surveyed. Local revenue officers (patwari, or village
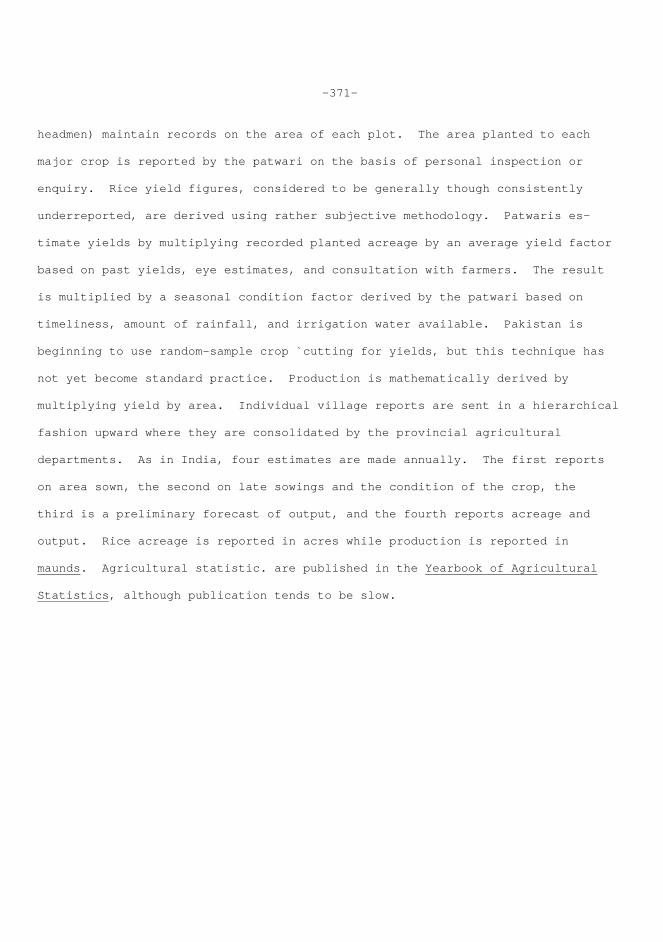
-371-
headmen) maintain records on the area of each plot. The area planted to each major crop is reported by the patwari on the basis of personal inspection or enquiry. Rice yield figures, considered to be generally though consistently underreported, are derived using rather subjective methodology. Patwaris es- timate yields by multiplying recorded planted acreage by an average yield factor based on past yields, eye estimates, and consultation with farmers. The result is multiplied by a seasonal condition factor derived by the patwari based on timeliness, amount of rainfall, and irrigation water available. Pakistan is beginning to use random-sample crop `cutting for yields, but this technique has not yet become standard practice. Production is mathematically derived by multiplying yield by area. Individual village reports are sent in a hierarchical fashion upward where they are consolidated by the provincial agricultural departments. As in India, four estimates are made annually. The first reports on area sown, the second on late sowings and the condition of the crop, the third is a preliminary forecast of output, and the fourth reports acreage and output. Rice acreage is reported in acres while production is reported in maunds. Agricultural statistic. are published in the Yearbook of Agricultural Statistics, although publication tends to be slow.
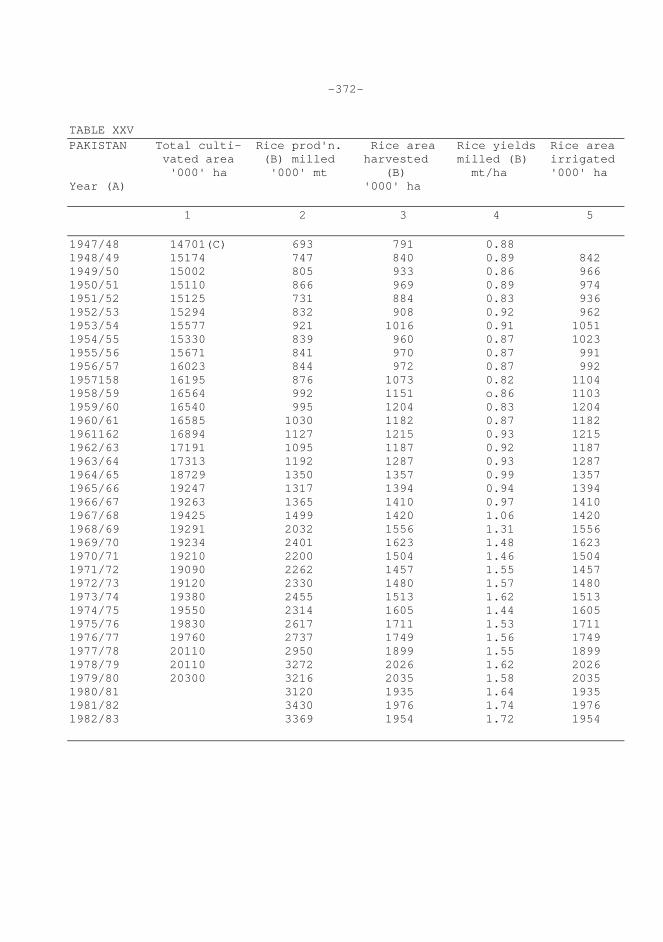
-372- TABLE XXV PAKISTAN Total culti- Rice prod'n. Rice area Rice yields Rice area vated area (B) milled harvested milled (B) irrigated '000' ha '000' mt (B) mt/ha '000' ha Year (A) '000' ha 1 2 3 4 5 1947/48 14701(C) 693 791 0.88 1948/49 15174 747 840 0.89 842 1949/50 15002 805 933 0.86 966 1950/51 15110 866 969 0.89 974 1951/52 15125 731 884 0.83 936 1952/53 15294 832 908 0.92 962 1953/54 15577 921 1016 0.91 1051 1954/55 15330 839 960 0.87 1023 1955/56 15671 841 970 0.87 991 1956/57 16023 844 972 0.87 992 1957158 16195 876 1073 0.82 1104 1958/59 16564 992 1151 o.86 1103 1959/60 16540 995 1204 0.83 1204 1960/61 16585 1030 1182 0.87 1182 1961162 16894 1127 1215 0.93 1215 1962/63 17191 1095 1187 0.92 1187 1963/64 17313 1192 1287 0.93 1287 1964/65 18729 1350 1357 0.99 1357 1965/66 19247 1317 1394 0.94 1394 1966/67 19263 1365 1410 0.97 1410 1967/68 19425 1499 1420 1.06 1420 1968/69 19291 2032 1556 1.31 1556 1969/70 19234 2401 1623 1.48 1623 1970/71 19210 2200 1504 1.46 1504 1971/72 19090 2262 1457 1.55 1457 1972/73 19120 2330 1480 1.57 1480 1973/74 19380 2455 1513 1.62 1513 1974/75 19550 2314 1605 1.44 1605 1975/76 19830 2617 1711 1.53 1711 1976/77 19760 2737 1749 1.56 1749 1977/78 20110 2950 1899 1.55 1899 1978/79 20110 3272 2026 1.62 2026 1979/80 20300 3216 2035 1.58 2035 1980/81 3120 1935 1.64 1935 1981/82 3430 1976 1.74 1976 1982/83 3369 1954 1.72 1954
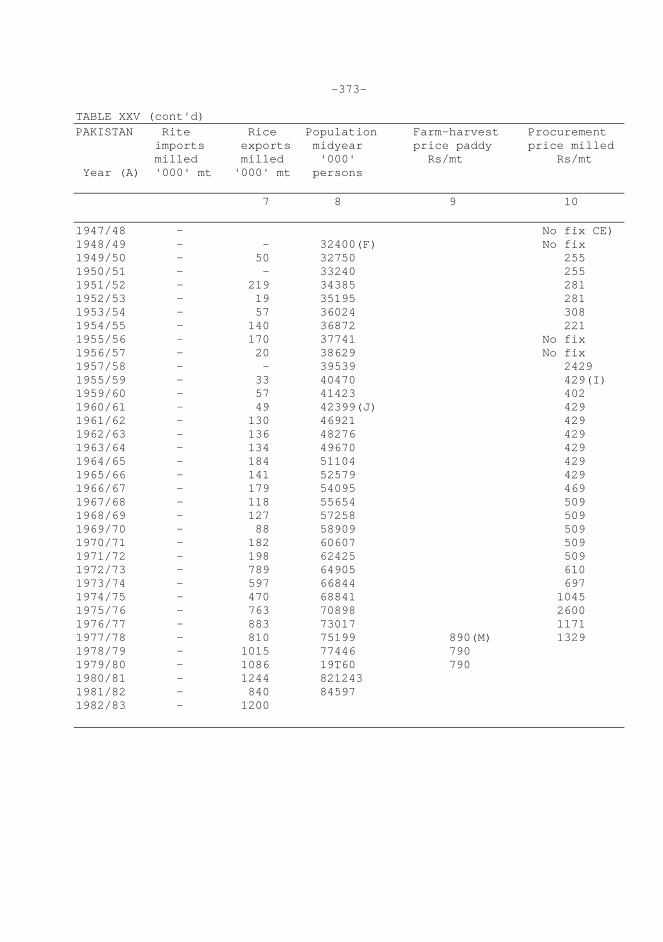
-373- TABLE XXV (cont'd) PAKISTAN Rite Rice Population Farm-harvest Procurement imports exports midyear price paddy price milled milled milled '000' Rs/mt Rs/mt Year (A) '000' mt '000' mt persons 7 8 9 10 1947/48 - No fix CE) 1948/49 - - 32400(F) No fix 1949/50 - 50 32750 255 1950/51 - - 33240 255 1951/52 - 219 34385 281 1952/53 - 19 35195 281 1953/54 - 57 36024 308 1954/55 - 140 36872 221 1955/56 - 170 37741 No fix 1956/57 - 20 38629 No fix 1957/58 - - 39539 2429 1955/59 - 33 40470 429(I) 1959/60 - 57 41423 402 1960/61 - 49 42399(J) 429 1961/62 - 130 46921 429 1962/63 - 136 48276 429 1963/64 - 134 49670 429 1964/65 - 184 51104 429 1965/66 - 141 52579 429 1966/67 - 179 54095 469 1967/68 - 118 55654 509 1968/69 - 127 57258 509 1969/70 - 88 58909 509 1970/71 - 182 60607 509 1971/72 - 198 62425 509 1972/73 - 789 64905 610 1973/74 - 597 66844 697 1974/75 - 470 68841 1045 1975/76 - 763 70898 2600 1976/77 - 883 73017 1171 1977/78 - 810 75199 890(M) 1329 1978/79 - 1015 77446 790 1979/80 - 1086 19T60 790 1980/81 - 1244 821243 1981/82 - 840 84597 1982/83 - 1200
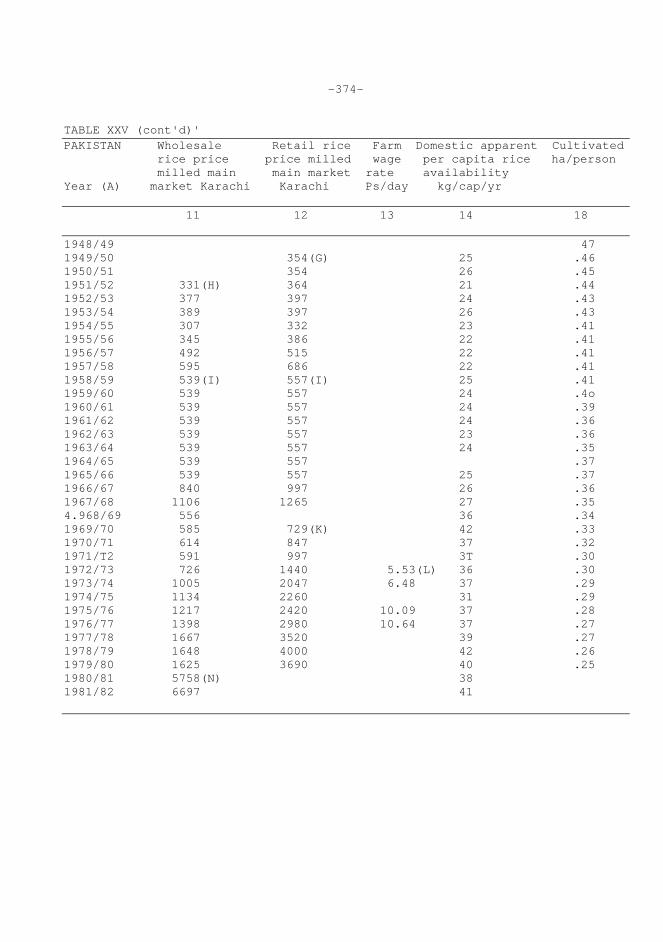
-374- TABLE XXV (cont'd)' PAKISTAN Wholesale Retail rice Farm Domestic apparent Cultivated rice price price milled wage per capita rice ha/person milled main main market rate availability Year (A) market Karachi Karachi Ps/day kg/cap/yr 11 12 13 14 18 1948/49 47 1949/50 354(G) 25 .46 1950/51 354 26 .45 1951/52 331(H) 364 21 .44 1952/53 377 397 24 .43 1953/54 389 397 26 .43 1954/55 307 332 23 .41 1955/56 345 386 22 .41 1956/57 492 515 22 .41 1957/58 595 686 22 .41 1958/59 539(I) 557(I) 25 .41 1959/60 539 557 24 .4o 1960/61 539 557 24 .39 1961/62 539 557 24 .36 1962/63 539 557 23 .36 1963/64 539 557 24 .35 1964/65 539 557 .37 1965/66 539 557 25 .37 1966/67 840 997 26 .36 1967/68 1106 1265 27 .35 4.968/69 556 36 .34 1969/70 585 729(K) 42 .33 1970/71 614 847 37 .32 1971/T2 591 997 3T .30 1972/73 726 1440 5.53(L) 36 .30 1973/74 1005 2047 6.48 37 .29 1974/75 1134 2260 31 .29 1975/76 1217 2420 10.09 37 .28 1976/77 1398 2980 10.64 37 .27 1977/78 1667 3520 39 .27 1978/79 1648 4000 42 .26 1979/80 1625 3690 40 .25 1980/81 5758(N) 38 1981/82 6697 41
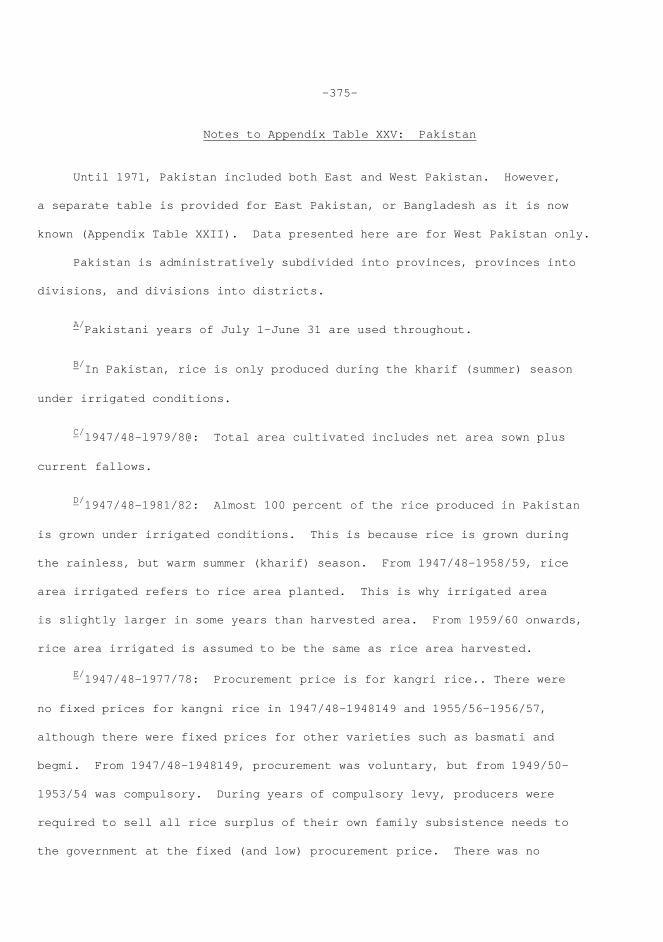
-375-
Notes to Appendix Table XXV: Pakistan Until 1971, Pakistan included both East and West Pakistan. However, a separate table is provided for East Pakistan, or Bangladesh as it is now known (Appendix Table XXII). Data presented here are for West Pakistan only. Pakistan is administratively subdivided into provinces, provinces into divisions, and divisions into districts.
A/Pakistani years of July 1-June 31 are used throughout.
B/In Pakistan, rice is only produced during the kharif (summer) season under irrigated conditions.
C/l947/48-l979/8@: Total area cultivated includes net area sown plus current fallows.
D/1947/48-1981/82: Almost 100 percent of the rice produced in Pakistan is grown under irrigated conditions. This is because rice is grown during the rainless, but warm summer (kharif) season. From 1947/48-1958/59, rice area irrigated refers to rice area planted. This is why irrigated area is slightly larger in some years than harvested area. From 1959/60 onwards, rice area irrigated is assumed to be the same as rice area harvested. E/1947/48-1977/78: Procurement price is for kangri rice.. There were no fixed prices for kangni rice in 1947/48-1948149 and 1955/56-1956/57, although there were fixed prices for other varieties such as basmati and begmi. From 1947/48-1948149, procurement was voluntary, but from 1949/50- 1953/54 was compulsory. During years of compulsory levy, producers were required to sell all rice surplus of their own family subsistence needs to the government at the fixed (and low) procurement price. There was no
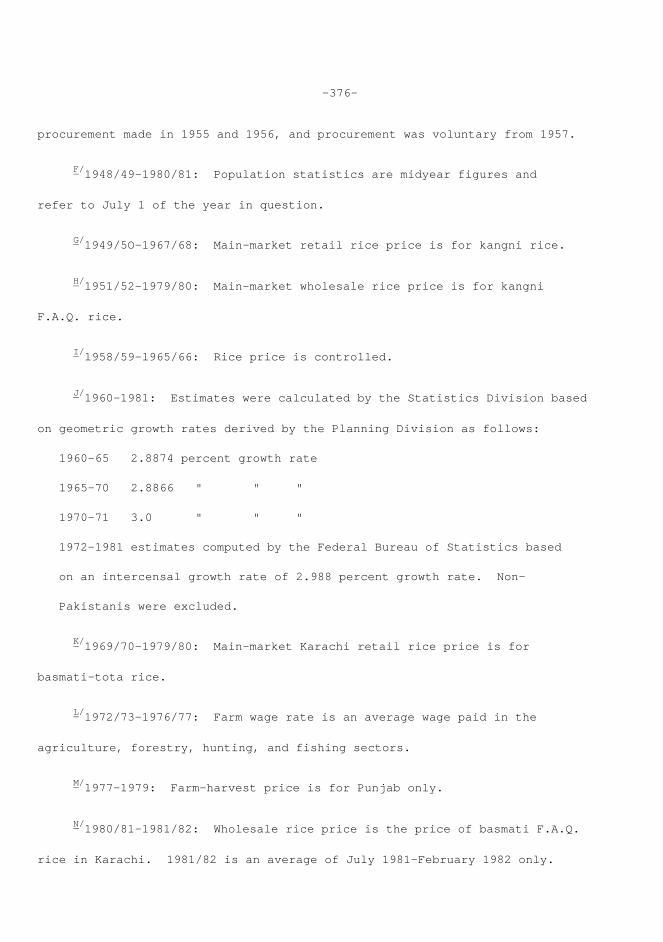
-376-
procurement made in 1955 and 1956, and procurement was voluntary from 1957.
F/1948/49-1980/81: Population statistics are midyear figures and refer to July 1 of the year in question.
G/1949/5O-1967/68: Main-market retail rice price is for kangni rice.
H/1951/52-1979/80: Main-market wholesale rice price is for kangni F.A.Q. rice.
I/l958/59-l965/66: Rice price is controlled.
J/1960-1981: Estimates were calculated by the Statistics Division based on geometric growth rates derived by the Planning Division as follows: 1960-65 2.8874 percent growth rate 1965-70 2.8866 " " " 1970-71 3.0 " " " 1972-1981 estimates computed by the Federal Bureau of Statistics based on an intercensal growth rate of 2.988 percent growth rate. Non- Pakistanis were excluded.
K/1969/70-1979/80: Main-market Karachi retail rice price is for basmati-tota rice.
L/1972/73-1976/77: Farm wage rate is an average wage paid in the agriculture, forestry, hunting, and fishing sectors.
M/1977-1979: Farm-harvest price is for Punjab only.
N/1980/81-1981/82: Wholesale rice price is the price of basmati F.A.Q. rice in Karachi. 1981/82 is an average of July 1981-February 1982 only.
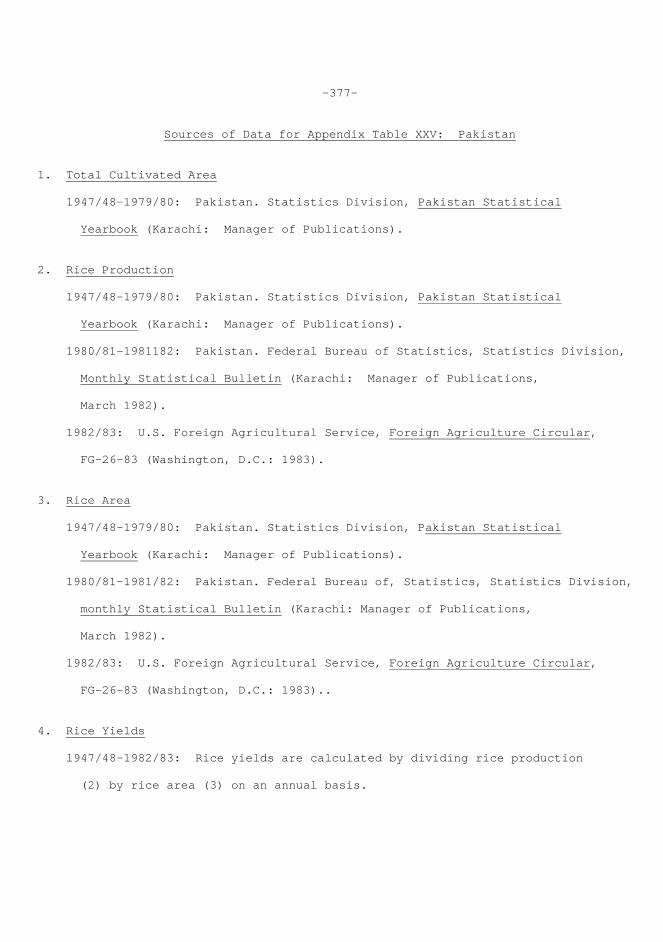
-377-
Sources of Data for Appendix Table XXV: Pakistan 1. Total Cultivated Area 1947/48-1979/80: Pakistan. Statistics Division, Pakistan Statistical Yearbook (Karachi: Manager of Publications). 2. Rice Production 1947/48-1979/80: Pakistan. Statistics Division, Pakistan Statistical Yearbook (Karachi: Manager of Publications). 1980/81-1981182: Pakistan. Federal Bureau of Statistics, Statistics Division, Monthly Statistical Bulletin (Karachi: Manager of Publications, March 1982). 1982/83: U.S. Foreign Agricultural Service, Foreign Agriculture Circular, FG-26-83 (Washington, D.C.: 1983). 3. Rice Area 1947/48-1979/80: Pakistan. Statistics Division, Pakistan Statistical Yearbook (Karachi: Manager of Publications). 1980/81-1981/82: Pakistan. Federal Bureau of, Statistics, Statistics Division, monthly Statistical Bulletin (Karachi: Manager of Publications, March 1982). 1982/83: U.S. Foreign Agricultural Service, Foreign Agriculture Circular, FG-26-83 (Washington, D.C.: 1983).. 4. Rice Yields l947/48-1982/83: Rice yields are calculated by dividing rice production (2) by rice area (3) on an annual basis.

-378-
5. Rice Area Irrigated 1947/48-1958/59: Pakistan. Ministry of Agriculture and Works, Department of Agricultural Economics and Statistics, Land and Crop Statistics of Pakistan (Karachi: Government of Pakistan Press, 1962). 1959/60-1966167: Pakistan. Ministry of Food, Agriculture and Development, Agriculture Wing, Yearbook of Agricultural Statistics (Islamabad). 1968/69-1982/83: Pakistan. Statistics Division, Pakistan Statistical * Yearbook (Karachi:. Manager of Publications). 6. Rice Imports No imports made. 7: Rice Exports 1947/48-1973/74: Pakistan. Ministry of Food, Agriculture and Development, Agriculture Wing, Yearbook of Agricultural Statistics (Islamabad). 1974/75-1982/83: U.S. Foreign Agricultural Service, Foreign Agriculture Circular, FG-26-83 (Washington ,DC.: 1983). 8. Population 1948/49-1950/51: Pakistan. Ministry of Food, Agriculture and Development, Agriculture Wing, Yearbook of Agricultural Statistics (Islamabad). 1951/52-1981/82: Pakistan. Statistics Division, Pakistan Statistical Yearbook (Karachi: Manager of Publications). 9. Farm-Harvest Price 1977-1979: Palacpac, Adelita, World Rice Statistics (Los Baños, Philippines: International Rice Research Institute, 1982).
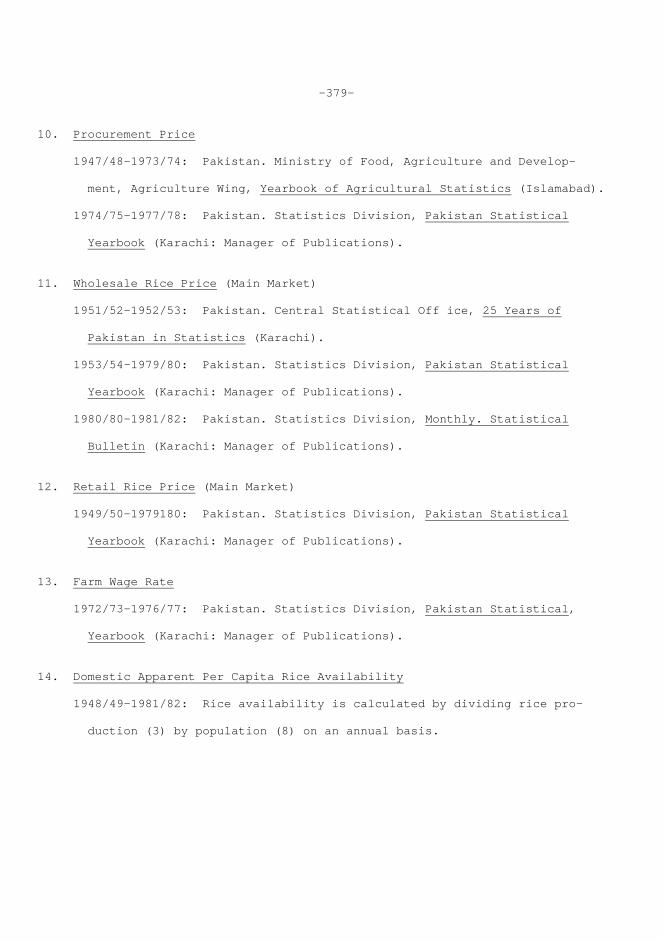
-379-
10. Procurement Price 1947/48-1973/74: Pakistan. Ministry of Food, Agriculture and Develop- ment, Agriculture Wing, Yearbook of Agricultural Statistics (Islamabad). 1974/75-1977/78: Pakistan. Statistics Division, Pakistan Statistical Yearbook (Karachi: Manager of Publications). 11. Wholesale Rice Price (Main Market) 1951/52-1952/53: Pakistan. Central Statistical Off ice, 25 Years of Pakistan in Statistics (Karachi). 1953/54-1979/80: Pakistan. Statistics Division, Pakistan Statistical Yearbook (Karachi: Manager of Publications). 1980/80-1981/82: Pakistan. Statistics Division, Monthly. Statistical Bulletin (Karachi: Manager of Publications). 12. Retail Rice Price (Main Market) 1949/50-1979180: Pakistan. Statistics Division, Pakistan Statistical Yearbook (Karachi: Manager of Publications). 13. Farm Wage Rate 1972/73-1976/77: Pakistan. Statistics Division, Pakistan Statistical, Yearbook (Karachi: Manager of Publications). 14. Domestic Apparent Per Capita Rice Availability 1948/49-1981/82: Rice availability is calculated by dividing rice pro- duction (3) by population (8) on an annual basis.
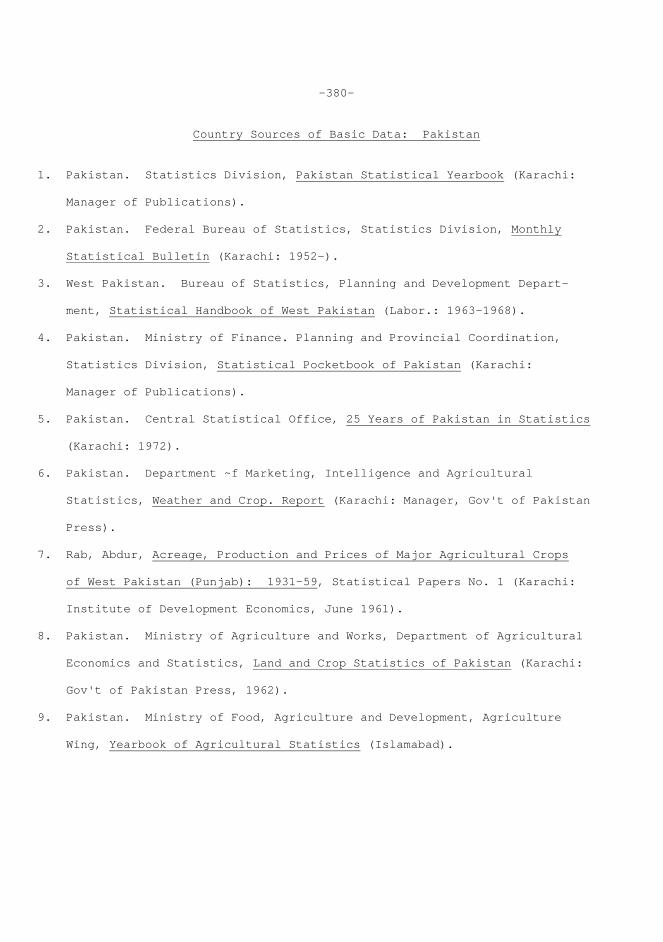
-380-
Country Sources of Basic Data: Pakistan 1. Pakistan. Statistics Division, Pakistan Statistical Yearbook (Karachi: Manager of Publications). 2. Pakistan. Federal Bureau of Statistics, Statistics Division, Monthly Statistical Bulletin (Karachi: 1952-). 3. West Pakistan. Bureau of Statistics, Planning and Development Depart- ment, Statistical Handbook of West Pakistan (Labor.: 1963-1968). 4. Pakistan. Ministry of Finance. Planning and Provincial Coordination, Statistics Division, Statistical Pocketbook of Pakistan (Karachi: Manager of Publications). 5. Pakistan. Central Statistical Office, 25 Years of Pakistan in Statistics (Karachi: 1972). 6. Pakistan. Department ~f Marketing, Intelligence and Agricultural Statistics, Weather and Crop. Report (Karachi: Manager, Gov't of Pakistan Press). 7. Rab, Abdur, Acreage, Production and Prices of Major Agricultural Crops of West Pakistan (Punjab): 1931-59, Statistical Papers No. 1 (Karachi: Institute of Development Economics, June 1961). 8. Pakistan. Ministry of Agriculture and Works, Department of Agricultural Economics and Statistics, Land and Crop Statistics of Pakistan (Karachi: Gov't of Pakistan Press, 1962). 9. Pakistan. Ministry of Food, Agriculture and Development, Agriculture Wing, Yearbook of Agricultural Statistics (Islamabad).
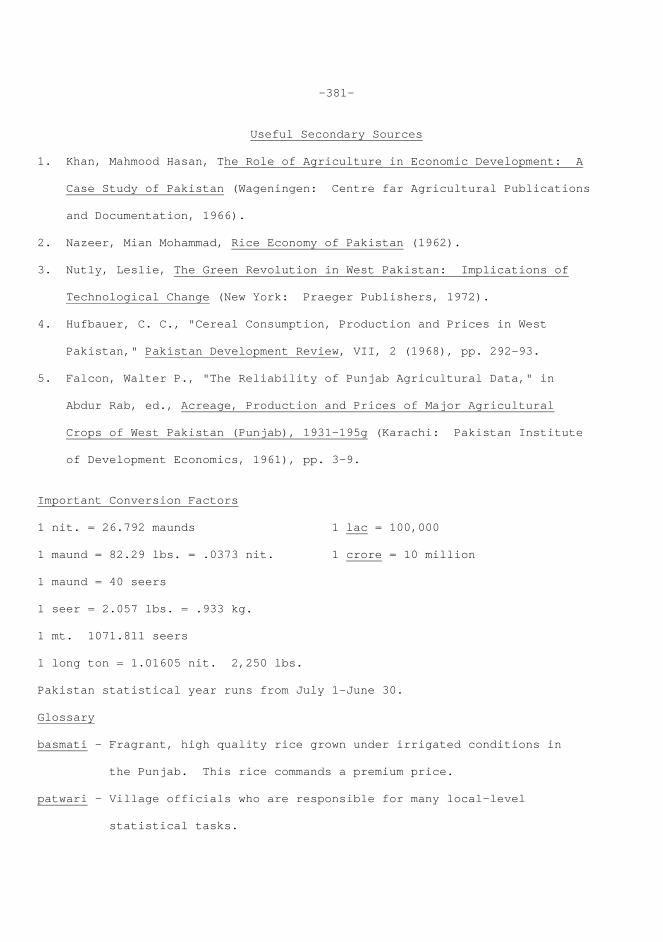
-381-
Useful Secondary Sources 1. Khan, Mahmood Hasan, The Role of Agriculture in Economic Development: A Case Study of Pakistan (Wageningen: Centre far Agricultural Publications and Documentation, 1966). 2. Nazeer, Mian Mohammad, Rice Economy of Pakistan (1962). 3. Nutly, Leslie, The Green Revolution in West Pakistan: Implications of Technological Change (New York: Praeger Publishers, 1972). 4. Hufbauer, C. C., "Cereal Consumption, Production and Prices in West Pakistan," Pakistan Development Review, VII, 2 (1968), pp. 292-93. 5. Falcon, Walter P., "The Reliability of Punjab Agricultural Data," in Abdur Rab, ed., Acreage, Production and Prices of Major Agricultural Crops of West Pakistan (Punjab), 1931-195g (Karachi: Pakistan Institute of Development Economics, 1961), pp. 3-9. Important Conversion Factors 1 nit. = 26.792 maunds 1 lac = 100,000 1 maund = 82.29 lbs. = .0373 nit. 1 crore = 10 million 1 maund = 40 seers 1 seer = 2.057 lbs. = .933 kg. 1 mt. 1071.811 seers 1 long ton = 1.01605 nit. 2,250 lbs. Pakistan statistical year runs from July 1-June 30. Glossary basmati - Fragrant, high quality rice grown under irrigated conditions in the Punjab. This rice commands a premium price. patwari - Village officials who are responsible for many local-level statistical tasks.
-382-
kharif - Summer season~ during which rice is grown under irrigated conditions in Pakistan. rabi - Winter season during which cool-weather crops such as wheat are grown in Pakistan. Money Unit money unit - rupee In 1980, 1 US$ = 9.90 rupees official exchange rate In 1980, 1 US$ = 10.95 rupees free-market exchange rate
-383-
XXVI: SRI LANKA Rice Statistics in Sri Lanka Pre-war rice statistics in Sri Lanka are very poor in quality or non- existent. This is largely because of the British emphasis on plantation export crops at the expense at paddy production. Until the maha 1947/48 season there is no continuous yearly series. Periodic agricultural census figures and independent estimates prepared by ministries provide us with benchmark figures, but do not relate to one another and can only be considered to be very rough estimates. The 1946 Census of Agriculture marks the beginning of data collection based on plotwise enumeration, and during the maha 1947/48 season, the Department of Census and Statistics began the regular collection of paddy area and yield statistics using village headmen and Divisional Revenue Officers (DRO) as data collectors. Although these early statistics were based on eye estimates only, they set a precedent for future, improved data cob- lection procedures. Rice yield statistics, in particular, were found to be underreported. Prior to 1949, most village headmen routinely reported paddy yields of 14 bushels/acre (0.72 mt./ha.). In 1949, the Department of Agri- culture ran crop-cutting experiments that showed mean yields of 27 bushels/ acre (1.39 mt./ha.). At present, the Sri Lankan statistical system is organized around a sole body, the Department of Census and Statistics, within the Ministry of Planning and Economic Affairs, which is responsible for the collection of all statistics as well as periodic censuses (including agricultural censuses). Key paddy statistics, including sown and harvested area by maha and yala seasons, asweddumized area, paddy yield and production, area irrigated subdivided by major and minor irrigation schemes and rainfed area, area under different cul- tivation practices, and spoiled area, are regularly collected down to the
-384-
village level. (Asweddumized area, a special category in Sri Lanka, refers to paddy area that is potentially cultivable; sown area to area that is physically planted; and harvested area to area harvested.) Paddy statistics are promptly published in the Annual Statistical Abstract of Sri Lanka and in various Central Bank of Ceylon reports. Although the Department of Census and Statistics is responsible for the sampling design, the selection of sample units, and the amalgamation of results, actual work at the local level is carried out by extension agents and other field officers within the district administration. Paddy statistics are recorded in split crop years where the maha season begins in one year and finishes in the following year. The yala season for the following year is counted as part of the preceding maha season. For example, the 1980/81 season refers to maha 1980/81 and yala 1981. In Sri Lanka, as in India, paddy yields are used to mathematically cal- culate paddy production. Yields are obtained from crop estimation surveys using multi-stage random sampling with the DRO divisions as strata. Within DRO, where sufficient acreage exists, the strata are substratified by type of ir- rigation scheme-major, minor, and rainfed. Major schemes are defined as irrigation works controlled and maintained under the authority of the Depart- ment of Irrigation with government funds. Minor schemes include all other irrigation schemes such as irrigation tanks. Rainfed refers to area naturally fed by direct rain, seepage, or marshy water. In each stratum, villages are selected with a probability proportional to the area under paddy. Each maha season (main), about 4,000 villages are selected, and each yala season about 2,500 are selected. Within each village, two parcels (liyadde) of paddy land are chosen in which a `standard 33 ft. by 16 1/2 ft. plot is randomly mapped
-385-
out. The grain from these plots is harvested, threshed, winnowed, and weighed to obtain an average yield per harvested area. Yields are reported in bushels (46 lbs.) of paddy per acre. Paddy production is calculated as the product of area harvested and yield data. The reported area harvested is taken as a gross area, and an island- wide correction factor is applied to obtain net area harvested. Net area is assumed to be 85 percent of gross area. It is accepted that about 15- percent of area harvested is actually devoted to non-productive purposes such as bunds, ridges, walkways, etc. The application of a blanket 15 percent loss to har- vested area has been criticized, and the Department of Census and Statistics is presently working on developing district-specific correction factors. How- ever, any bias that may be present will at least be consistent through time. Production is reported in bushels of paddy. Paddy area is collected each season on a parcel basis by DRO statistical staff. (A parcel is defined as a piece of land cultivated by one or more per- sons and surrounded by land not under paddy or cultivated by other persons.) Ancillary information, such as crop damage, cultivation practices used, and asweddumized area, are also collected. Paddy area figures are supplied by the cultivators and are adjusted based on sown seed rates per acre. Sri Lanka has not been completely cadastrally surveyed so no accurate area figures exist. Rice area figures are reported in acres and are available for aswedduznized, sown, and harvested areas.
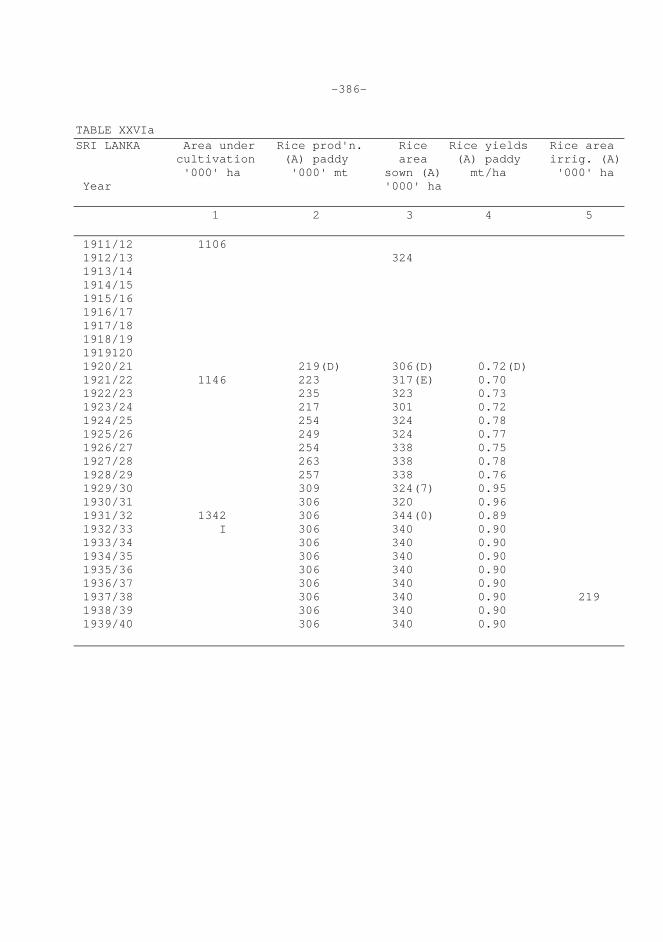
-386- TABLE XXVIa SRI LANKA Area under Rice prod'n. Rice Rice yields Rice area cultivation (A) paddy area (A) paddy irrig. (A) '000' ha '000' mt sown (A) mt/ha '000' ha Year '000' ha 1 2 3 4 5 1911/12 1106 1912/13 324 1913/14 1914/15 1915/16 1916/17 1917/18 1918/19 1919120 1920/21 219(D) 306(D) 0.72(D) 1921/22 1146 223 317(E) 0.70 1922/23 235 323 0.73 1923/24 217 301 0.72 1924/25 254 324 0.78 1925/26 249 324 0.77 1926/27 254 338 0.75 1927/28 263 338 0.78 1928/29 257 338 0.76 1929/30 309 324(7) 0.95 1930/31 306 320 0.96 1931/32 1342 306 344(0) 0.89 1932/33 I 306 340 0.90 1933/34 306 340 0.90 1934/35 306 340 0.90 1935/36 306 340 0.90 1936/37 306 340 0.90 1937/38 306 340 0.90 219 1938/39 306 340 0.90 1939/40 306 340 0.90
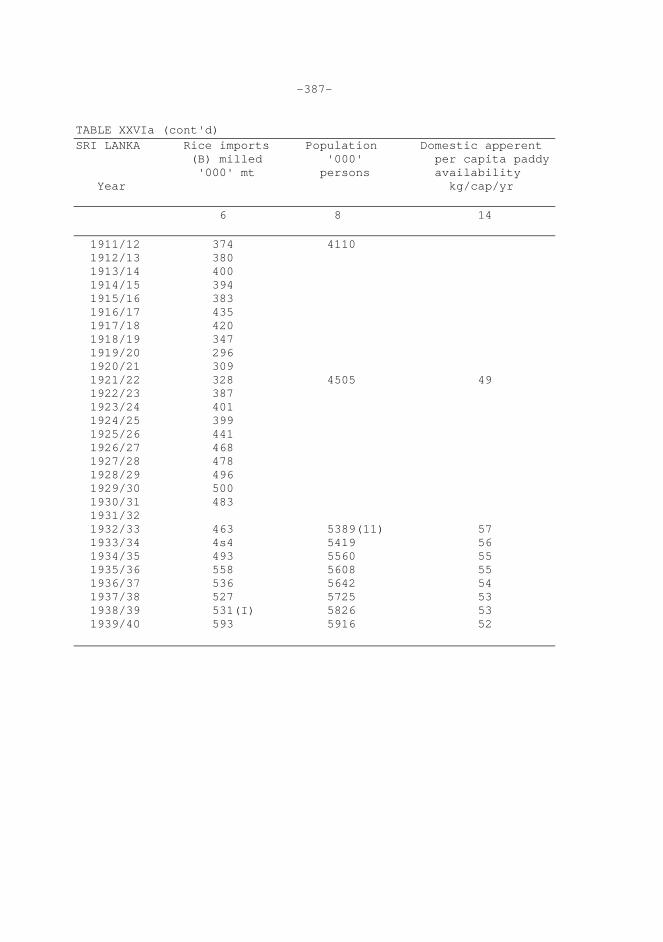
-387- TABLE XXVIa (cont'd) SRI LANKA Rice imports Population Domestic apperent (B) milled '000' per capita paddy '000' mt persons availability Year kg/cap/yr 6 8 14 1911/12 374 4110 1912/13 380 1913/14 400 1914/15 394 1915/16 383 1916/17 435 1917/18 420 1918/19 347 1919/20 296 1920/21 309 1921/22 328 4505 49 1922/23 387 1923/24 401 1924/25 399 1925/26 441 1926/27 468 1927/28 478 1928/29 496 1929/30 500 1930/31 483 1931/32 1932/33 463 5389(11) 57 1933/34 4s4 5419 56 1934/35 493 5560 55 1935/36 558 5608 55 1936/37 536 5642 54 1937/38 527 5725 53 1938/39 531(I) 5826 53 1939/40 593 5916 52
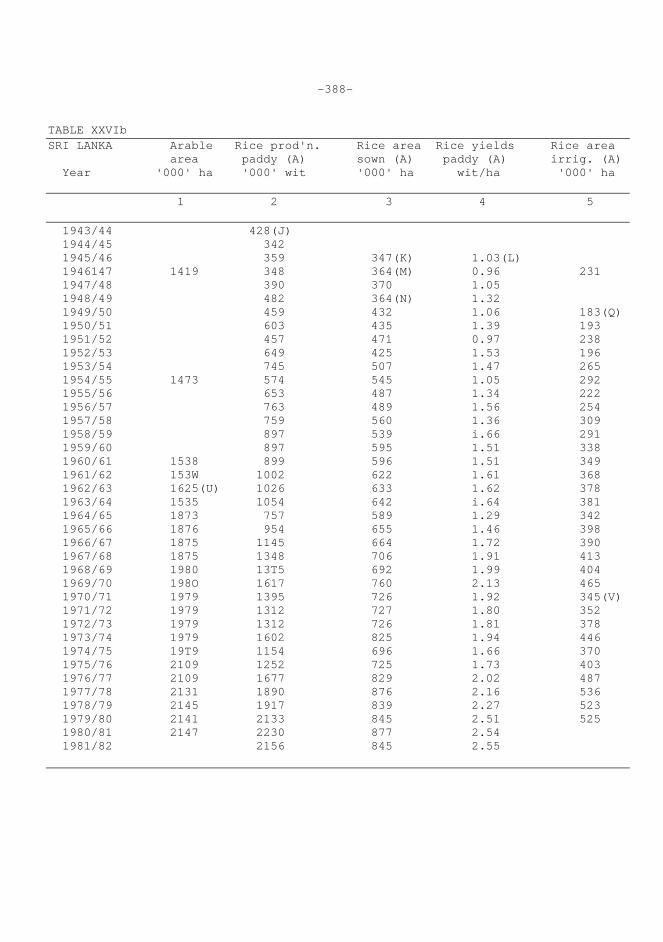
-388- TABLE XXVIb SRI LANKA Arable Rice prod'n. Rice area Rice yields Rice area area paddy (A) sown (A) paddy (A) irrig. (A) Year '000' ha '000' wit '000' ha wit/ha '000' ha 1 2 3 4 5 1943/44 428(J) 1944/45 342 1945/46 359 347(K) 1.03(L) 1946147 1419 348 364(M) 0.96 231 1947/48 390 370 1.05 1948/49 482 364(N) 1.32 1949/50 459 432 1.06 183(Q) 1950/51 603 435 1.39 193 1951/52 457 471 0.97 238 1952/53 649 425 1.53 196 1953/54 745 507 1.47 265 1954/55 1473 574 545 1.05 292 1955/56 653 487 1.34 222 1956/57 763 489 1.56 254 1957/58 759 560 1.36 309 1958/59 897 539 i.66 291 1959/60 897 595 1.51 338 1960/61 1538 899 596 1.51 349 1961/62 153W 1002 622 1.61 368 1962/63 1625(U) 1026 633 1.62 378 1963/64 1535 1054 642 i.64 381 1964/65 1873 757 589 1.29 342 1965/66 1876 954 655 1.46 398 1966/67 1875 1145 664 1.72 390 1967/68 1875 1348 706 1.91 413 1968/69 1980 13T5 692 1.99 404 1969/70 198O 1617 760 2.13 465 1970/71 1979 1395 726 1.92 345(V) 1971/72 1979 1312 727 1.80 352 1972/73 1979 1312 726 1.81 378 1973/74 1979 1602 825 1.94 446 1974/75 19T9 1154 696 1.66 370 1975/76 2109 1252 725 1.73 403 1976/77 2109 1677 829 2.02 487 1977/78 2131 1890 876 2.16 536 1978/79 2145 1917 839 2.27 523 1979/80 2141 2133 845 2.51 525 1980/81 2147 2230 877 2.54 1981/82 2156 845 2.55
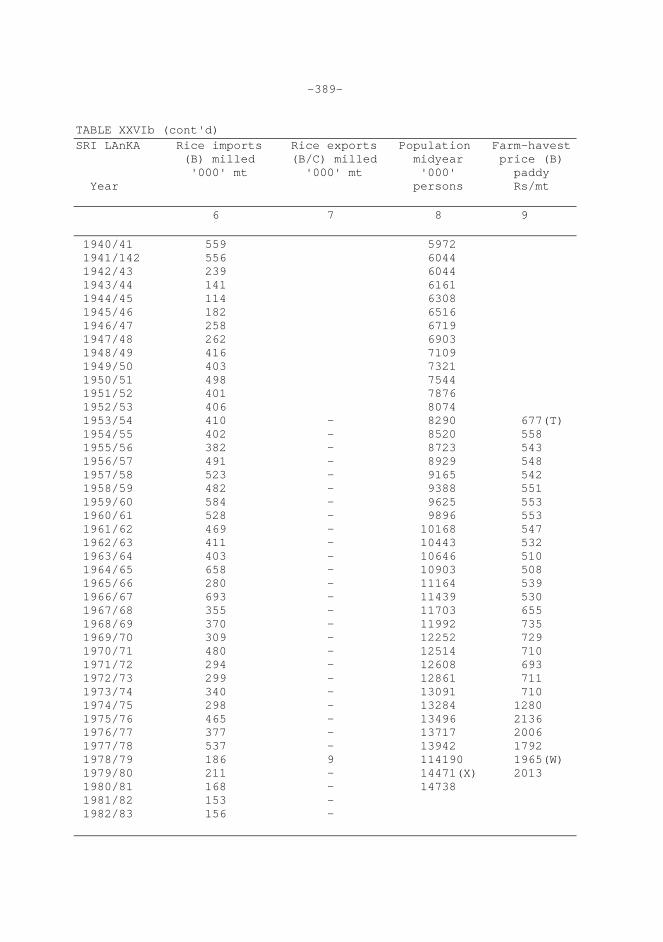
-389- TABLE XXVIb (cont'd) SRI LAnKA Rice imports Rice exports Population Farm-havest (B) milled (B/C) milled midyear price (B) '000' mt '000' mt '000' paddy Year persons Rs/mt 6 7 8 9 1940/41 559 5972 1941/142 556 6044 1942/43 239 6044 1943/44 141 6161 1944/45 114 6308 1945/46 182 6516 1946/47 258 6719 1947/48 262 6903 1948/49 416 7109 1949/50 403 7321 1950/51 498 7544 1951/52 401 7876 1952/53 406 8074 1953/54 410 - 8290 677(T) 1954/55 402 - 8520 558 1955/56 382 - 8723 543 1956/57 491 - 8929 548 1957/58 523 - 9165 542 1958/59 482 - 9388 551 1959/60 584 - 9625 553 1960/61 528 - 9896 553 1961/62 469 - 10168 547 1962/63 411 - 10443 532 1963/64 403 - 10646 510 1964/65 658 - 10903 508 1965/66 280 - 11164 539 1966/67 693 - 1l439 530 1967/68 355 - 11703 655 1968/69 370 - 11992 735 1969/70 309 - 12252 729 1970/71 480 - 12514 710 1971/72 294 - 12608 693 1972/73 299 - 12861 711 1973/74 340 - 13091 710 1974/75 298 - 13284 1280 1975/76 465 - 13496 2136 1976/77 377 - 13717 2006 1977/78 537 - 13942 1792 1978/79 186 9 114190 1965(W) 1979/80 211 - 14471(X) 2013 1980/81 168 - 14738 1981/82 153 - 1982/83 156 -
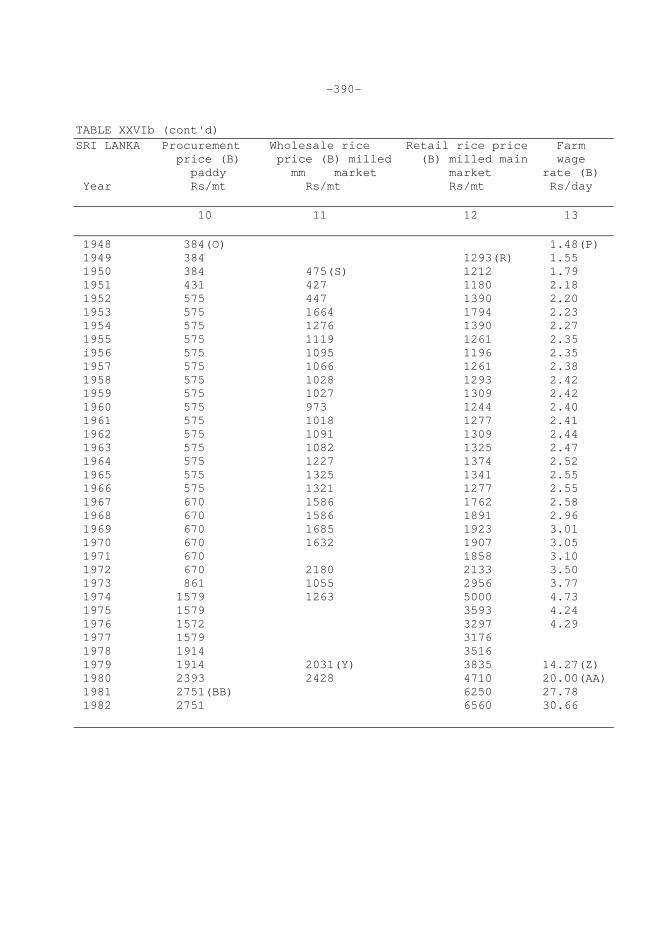
-390- TABLE XXVIb (cont'd) SRI LANKA Procurement Wholesale rice Retail rice price Farm price (B) price (B) milled (B) milled main wage paddy mm market market rate (B) Year Rs/mt Rs/mt Rs/mt Rs/day 10 11 12 13 1948 384(O) 1.48(P) 1949 384 1293(R) 1.55 1950 384 475(S) 1212 1.79 1951 431 427 1180 2.18 1952 575 447 1390 2.20 1953 575 1664 1794 2.23 1954 575 1276 1390 2.27 1955 575 1119 1261 2.35 i956 575 1095 1196 2.35 1957 575 1066 1261 2.38 1958 575 1028 1293 2.42 1959 575 1027 1309 2.42 1960 575 973 1244 2.40 1961 575 1018 1277 2.41 1962 575 1091 1309 2.44 1963 575 1082 1325 2.47 1964 575 1227 1374 2.52 1965 575 1325 1341 2.55 1966 575 1321 1277 2.55 1967 670 1586 1762 2.58 1968 670 1586 1891 2.96 1969 670 1685 1923 3.01 1970 670 1632 1907 3.05 1971 670 1858 3.10 1972 670 2180 2133 3.50 1973 861 1055 2956 3.77 1974 1579 1263 5000 4.73 1975 1579 3593 4.24 1976 1572 3297 4.29 1977 1579 3176 1978 1914 3516 1979 1914 2031(Y) 3835 14.27(Z) 1980 2393 2428 4710 20.00(AA) 1981 2751(BB) 6250 27.78 1982 2751 6560 30.66
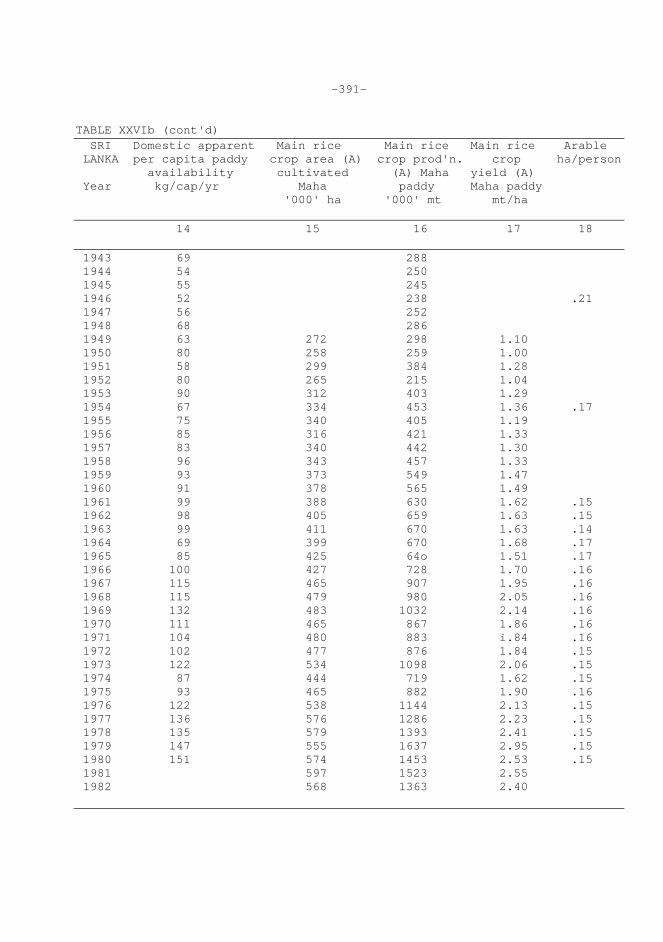
-391- TABLE XXVIb (cont'd) SRI Domestic apparent Main rice Main rice Main rice Arable LANKA per capita paddy crop area (A) crop prod'n. crop ha/person availability cultivated (A) Maha yield (A) Year kg/cap/yr Maha paddy Maha paddy '000' ha '000' mt mt/ha 14 15 16 17 18 1943 69 288 1944 54 250 1945 55 245 1946 52 238 .21 1947 56 252 1948 68 286 1949 63 272 298 1.10 1950 80 258 259 1.00 1951 58 299 384 1.28 1952 80 265 215 1.04 1953 90 312 403 1.29 1954 67 334 453 1.36 .17 1955 75 340 405 1.19 1956 85 316 421 1.33 1957 83 340 442 1.30 1958 96 343 457 1.33 1959 93 373 549 1.47 1960 91 378 565 1.49 1961 99 388 630 1.62 .15 1962 98 405 659 1.63 .15 1963 99 411 670 1.63 .14 1964 69 399 670 1.68 .17 1965 85 425 64o 1.51 .17 1966 100 427 728 1.70 .16 1967 115 465 907 1.95 .16 1968 115 479 980 2.05 .16 1969 132 483 1032 2.14 .16 1970 111 465 867 1.86 .16 1971 104 480 883 i.84 .16 1972 102 477 876 1.84 .15 1973 122 534 1098 2.06 .15 1974 87 444 719 1.62 .15 1975 93 465 882 1.90 .16 1976 122 538 1144 2.13 .15 1977 136 576 1286 2.23 .15 1978 135 579 1393 2.41 .15 1979 147 555 1637 2.95 .15 1980 151 574 1453 2.53 .15 1981 597 1523 2.55 1982 568 1363 2.40
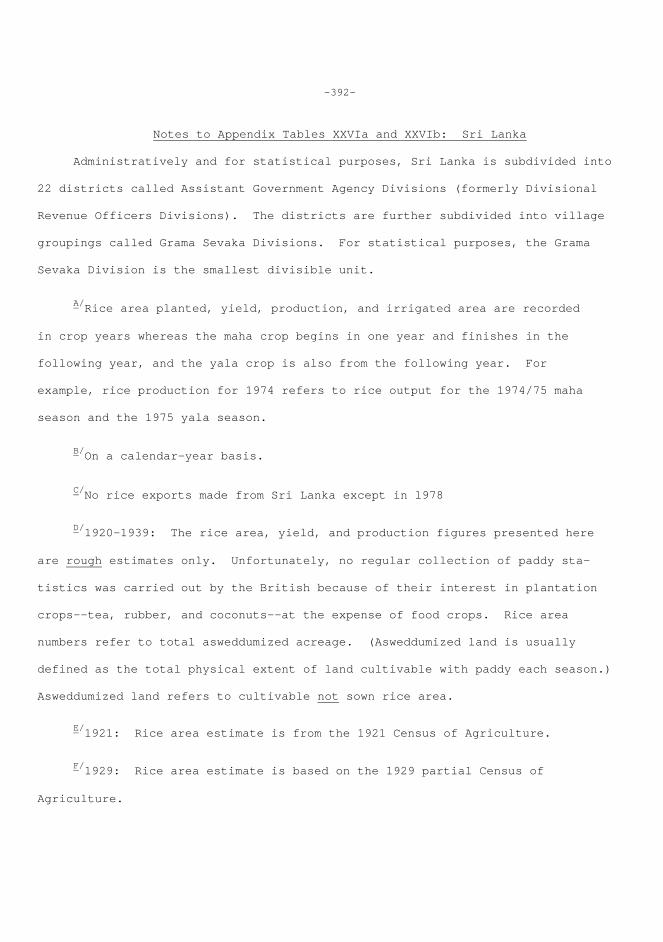
-392-
Notes to Appendix Tables XXVIa and XXVIb: Sri Lanka Administratively and for statistical purposes, Sri Lanka is subdivided into 22 districts called Assistant Government Agency Divisions (formerly Divisional Revenue Officers Divisions). The districts are further subdivided into village groupings called Grama Sevaka Divisions. For statistical purposes, the Grama Sevaka Division is the smallest divisible unit.
A/Rice area planted, yield, production, and irrigated area are recorded in crop years whereas the maha crop begins in one year and finishes in the following year, and the yala crop is also from the following year. For example, rice production for 1974 refers to rice output for the 1974/75 maha season and the 1975 yala season.
B/On a calendar-year basis.
C/No rice exports made from Sri Lanka except in l978
D/1920-1939: The rice area, yield, and production figures presented here are rough estimates only. Unfortunately, no regular collection of paddy sta- tistics was carried out by the British because of their interest in plantation crops--tea, rubber, and coconuts--at the expense of food crops. Rice area numbers refer to total asweddumized acreage. (Asweddumized land is usually defined as the total physical extent of land cultivable with paddy each season.) Asweddumized land refers to cultivable not sown rice area.
E/1921: Rice area estimate is from the 1921 Census of Agriculture.
F/1929: Rice area estimate is based on the 1929 partial Census of Agriculture.
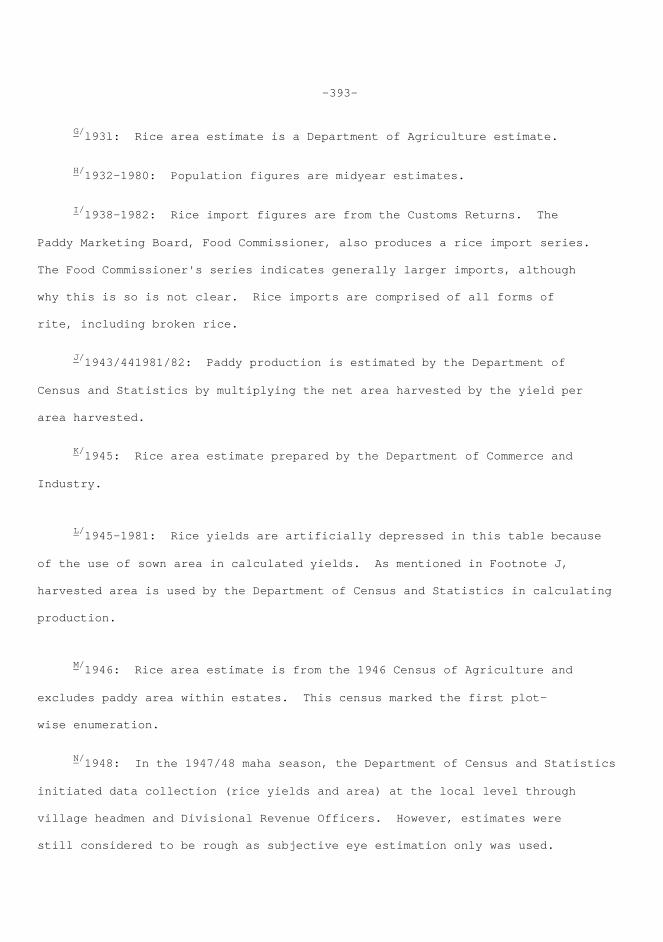
-393-
G/l93l: Rice area estimate is a Department of Agriculture estimate.
H/1932-1980: Population figures are midyear estimates.
I/1938-1982: Rice import figures are from the Customs Returns. The Paddy Marketing Board, Food Commissioner, also produces a rice import series. The Food Commissioner's series indicates generally larger imports, although why this is so is not clear. Rice imports are comprised of all forms of rite, including broken rice.
J/1943/441981/82: Paddy production is estimated by the Department of Census and Statistics by multiplying the net area harvested by the yield per area harvested.
K/1945: Rice area estimate prepared by the Department of Commerce and Industry.
L/1945-1981: Rice yields are artificially depressed in this table because of the use of sown area in calculated yields. As mentioned in Footnote J, harvested area is used by the Department of Census and Statistics in calculating production.
M/1946: Rice area estimate is from the 1946 Census of Agriculture and excludes paddy area within estates. This census marked the first plot- wise enumeration.
N/1948: In the 1947/48 maha season, the Department of Census and Statistics initiated data collection (rice yields and area) at the local level through village headmen and Divisional Revenue Officers. However, estimates were still considered to be rough as subjective eye estimation only was used.
-394-
O/1948-1982: The procurement price is the government guaranteed price for paddy. In 1948, the government introduced the Guaranteed Price Scheme (GPS). The plan, which offered a guaranteed price to producers for paddy, was implemented with the hope that the substantial subsidy built into the GPS would encourage farmers to increase output. The scheme was carried out at the village level through cooperatives that were charged with the buying and storage of paddy. Initially, the guaranteed price was set at 12 Rs/bushel (575 Re/mt.), a price well above prevailing free-market prices. During this period (1950-1966), a `large portion of marketed paddy was bought up through the GPS. Later, the guaranteed price briefly dropped below free-market prices. However, since then, the government has been careful to maintain the guaranteed price at a level slightly above prevailing free-market prices.
P/1948-1976: Farm wage rate is for males only and applies to tea growing including special allowances.
Q/1949/50-1979/80: Rice area irrigated refers to all area planted under major and minor irrigation schemes for the maha and yala seasons.
R/1949-1979: Main-market Colombo retail rice price is for raw local rice.
S/1950-1974: Main-market wholesale rice price is for raw local rice.
T/1953-1979: Fan-harvest price is the simple average market price of paddy in various districts throughout Sri Lanka.
U/1962:Cultivated area refers to distribution of area under crops within agricultural holdings, including asweddumized paddy lands, temporary crops, grassland, plantation' crops, and other crops as collected in the 1962 Census of Agriculture.
-395-
V/1970-1977: Apparently, different data were used by the two sources.
W/1978-1979: Farm-harvest price is an average producer price for paddy for Sri Lanka's 22 districts.
X/1979-1980:Provisional.
Y/ 1979-1980: The wholesale rice price is in paddy form.
Z/1979: Farm wage rate is the average daily male wage rate for trans- planting between January and June. Wages on tea plantations are considerably lower. For instance, for the same time period, the average daily male wage rate for weeding tea plants (the best paid job) was only 13.70 Rs. Additional wage ratesfor hired labor for paddy cultivation are provided in a study of the Minipe Colonization scheme by N- Amerasinghe (N. D. Abdul hinged et al., Rice Revolution in Sri Lanka (Geneva: United Nations Research Institute for Social Development, 1977), p. 105. The wage rates were as follows: in 1960, men received 2 Ra/day with meals, 2.5 Rs/day without meals; in 1966, 2.5 Ru/day with meals, 3 RS/day without meals; and in 1971, 3.5 Ks/day with meals, 4.5 Rs/day without meals. In Sri Lanka, casual laborers generally receive meals in addition to a cash wage.
aa/l98O-l9B2: An average daily wage rate for male paddy workers.
bb/1981: The guaranteed price of paddy was raised to 52.5 Rs/bushel in February 1981. It was subsequently raised again to 57.5 R8/bushel in September 1981. This is the September price.
-396-
Sources of Data for Appendix Tables XXVIa and b: Sri Lanka 1. Area Under Cultivation 1911-1946: Ceylon. Department of Census and Statistics, Census of Agri- culture, 1952, Part IV - Agriculture (Colombo: Government Press, 1956). 1962: Ceylon. Department of Census and Statistics, Census of Agriculture, 1962, Vol. II, Land Utilization (Colombo: Government Press, 1966). 1960-1980: Economic and Social Commission for Asia and the Pacific, Statistical Yearbook for Asia and the~ Pacific (Bangkok: United Nations). 2. Rice Production 1920-1939: Wickizer, V. D. and Bennett, H. K., The Rice Economy of Monsoon Asia (Stanford: Food Research Institute, Stanford University, 1941). 1943/44-1972/73: Sri Lanka. Department of Census and Statistics, Statistical Abstract of the Democratic Socialist Republic of Sri Lanka (Colombo: Department of Government Printing). 1973/74-1981/82: Sri Lanka. Central Bank of Ceylon, Central Bank of Ceylon Annual Report (Colombo: W.R.B.K. Godakumbura, 1981 and 1982). 3. Rice Area 1912, 1922: Ceylon. Department of Census and Statistics, Census of Agri- culture, 1962, Vol. III, Asweddumized Paddy Lands (Colombo: Government Press, 1966). 1920-1939: Wickizer, V. D. and Bennett, M. K., The Rice Economy of Monsoon Asia (Stanford: Food Research Institute, Stanford University, 1941). 1921, 1926, 1929, 1931, 1945, 1946, 1948: Ceylon. Department of Census and Statistics, A Report on Paddy Statistics, Monograph No. 9, 1956.
-397-
1947: Jones, Gavin W. and Selvaratnam, S., Population Growth and Economic Development in Ceylon (Colombo: Hansa Publishers Limited in Association with Marga Institute, 1972). 1949/50-1972/73: Sri Lanka. Department of Census and Statistics, Statistical Abstract of the Democratic Republic of Sri Lanka (Colombo: Department of Government Printing). 1973174-1981/82: Sri Lanka. `Central Bank of Ceylon. Central Bank of Ceylon Annual Report (Colombo: W.R.B.K. Godakumbura, 1982)'. 4. Rice Yields 1920-1981/82: Rice yields are calculated by dividing rice production (2) by rice area cultivated (3) on an annual basis. 5. Rice Area Irrigated 1937-1946: Bansil, P. C., Ceylon Agriculture, A Perspective (Delhi: Dhanpat Rat and Sons, 1971). l949/50-l969-~O: Sri Lanka. Department of Census and Statistics, Statistical Abstract of the Democratic Republic of' Sri Lanka (Colombo: Department of Government Printing). 1970/71-1977/78: Sri Lanka. Central Bank of Ceylon, Statistics Department, Economic and Social Statistics of Sri Lanka, Vol. 2, No. 1, June, 1979. 1978/79-1979/80: Sri Lanka. Ministry of Agricultural Development and Research, Agrilcultural Statistics of Sri Lanka 1951/52-1980/81 (Colombo: 1981). 6. Rice Imports 1911-1937: Wickizer, V. D. and Bennett, H. K., The Rice Economy of Monsoon Asia (Stanford: Food Research Institute, Stanford University, 1941).
-398-
1938-1968: Sri Lanka. Department of Census and Statistics, Statistical Abstract of the Democratic Socialist Republic of Sri Lanka (Colombo: Department of Government Printing) 1969-1975: Sri Lanka. Agricultural Statistical Unit, Division of Agri- cultural Economics, Agricultural Statistical Information, Agricultural Economics Publication, No. 4 (Peradeniya: Department of Agriculture, 1976). 1976-1978: Sri Lanka. Ministry of Agricultural Development and Research, Agricultural Statistics of Sri Lanka 1951/52-1980/81 (Colombo: 1981). 1979-1982: Sri Lanka. Central Bank of Ceylon, Central Bank of Ceylon Annual Report (Colombo: W.R.B.K. Godakumbura, 1982). 7. Rice Exports 1949-1982: U.S. Foreign Agricultural `Service, Foreign Agriculture Circular, FG-26-83 (Washington, D.C.: 1983). 8. Population 1911 and 1921: Ceylon. Department of Census and Statistics, Census of Agriculture, 1952, Part IV - Agriculture (Colombo: Government Press, 1956). 1932-1975: Sri Lanka. Department of Census and Statistics, Statistical Abstract of the Democratic Republic of Sri Lanka (Colombo: Department of Government Printing). 1976-1980: Sri Lanka. Ministry of Agricultural Development and Research, Agricultural Statistics of Sri Lanka 1951/52-1980/81 (Colombo: 1981).
-399-
9. Farm-Harvest Price 1953-1977: Sri Lanka. Department of Census and Statistics, Statistical Abstract of the Democratic Socialist Republic of Sri Lanka (Colombo: Department of Government Printing). 1978-1979: Sri Lanka. Department of Census and Statistics, Ministry of Plan Implementation, Bulletin of Selected Retail Prices, 1978-1980 (Colombo: 1980). 10. Procurement Price 1948-1949: Bansil, P. C., Ceylon Agriculture, A Perspective (Delhi: Dhanpat Rai and Sons, 1971). 1950-1971: Sri Lanka. Department of Census and Statistics, Statistical Abstract of the Democratic Socialist Republic of Sri Lanka (Colombo: Department of Government Printing). 1972: Sri Lanka. Central Bank of Ceylon, Central Bank of Ceylon Review of the Economy (Colombo: C. L. Senanayake, 1980). 1973-1982: Sri Lanka. Central Bank of Ceylon, Central Bank of Ceylon Annual Report (Colombo: W.R.B.K. Godakumbura, 1981 and 1982). 11. Wholesale Rice Price (Main Market) 1950-1974: Sri Lanka. Department of Census and Statistics, Statistical Abstract of the Democratic Socialist Republic of Sri Lanka (Colombo: Department of Government Printing). 1979-1980: Sri Lanka. Central flank of Ceylon, Central Bank of Ceylon Review of the Economy (Colombo: C. L. Senanayake, 1980). 12. Retail Rice Price (Main Market) 1949-1976: Sri Lanka. Department of Census and, Statistics, Statistical Abstract of the Democratic Socialist Republic of Sri Lanka (Colombo:
-400-
Department of Government Printing). 1977-1979: Sri Lanka. Department of Census and Statistics, Ministry of Plan Implementation, Bulletin of Selected Retail Prices, 1978-1980 (Colombo: 1980). 1980-1982: Sri Lanka, Central Bank of Ceylon, Central Bank of Ceylon Annual Report (Colombo: C. L.. Senanayake, 1982). 13. Farm Wage Rate 1948-1976: Sri Lanka. Department of Census and Statistics, Statistical Abstract of the Democratic Socialist Republic of Sri Lanka (Colombo: Department of Government Printing). 1979: Sri Lanka. Central Bank of Ceylon, Statistics Department, Economic and Social Statistics of Sri Lanka, Vol. 2, No. 1, June, 1979 1980-1982:. Sri Lanka. Central Bank of Ceylon, Central Bank of Ceylon Annual Report (Colombo: C. L. Senanayake, 1982). 14. Domestic Apparent Per Capita Paddy Availability 1932-1980: Domestic per capita paddy availability is calculated by dividing paddy production (2) by population (8) on an annual basis. 15. Main Rice Crop Area - Maha 1949-1975: Sri Lanka. Department of Census and Statistics, Statistical Abstract of the Democratic Republic of Sri Lanka (Colombo: Department of Government Printing). 1976-1978: Sri Lanka. Central Bank of Ceylon, Statistics Department, Economic and Social Statistics of Sri Lanka, Vol. 2, No. 1, June, 1979 1979-1980: Sri Lanka. Central Bank of Ceylon, Central Bank of Ceylon Review of the Economy (Colombo: C. L. Senanayake, 1981). 1981-1982: Sri Lanka: Central Bank of Ceylon, Central Bank of Ceylon Annual
-401-
16. Main Rice Crop Production - Maha 1943-1975: Sri Lanka. Department of Census and Statistics, Statistical Abstract of the Democratic Republic of Sri Lanka (Colombo: C. .L. Senanayake, 1980). 1976-1978: Sri Lanka. Central Bank of Ceylon, Statistics Department, Economic and Social Statistics, Vol. 2, No. 1, June, 1979. 1979-1980: Sri Lanka. Central Bank of Ceylon, Central Bank of Ceylon Review of the Economy (Colombo:. C. L. Senanayake, 1980). 1981-1982: Sri Lanka. Central Bank of Ceylon, Central Bank bf Ceylon Annual Report (Colombo: W.R.B.K. Godakumbura, 1982). 17. Main Rice Crop Yield 1949-1982: Main rice crop yields are calculated by dividing maha production (16) by maha area (15) on an annual basis.
Country Sources of Basic Data: Sri Lanka*
1. Sri Lanka. Department of Census and Statistics, Statistical Abstract of Sri Lanka (Colombo: Department of Government Printing, 1954- ). 2. Ceylon. Department of Census and Statistics, Quarterly Bulletin of Statistics (Colombo: Government Publications Bureau, 1955- ). 3. Sri Lanka. Department of Census and Statistics, Sri Lanka Yearbook (Colombo: Department of Government Printing). 4. Sri Lanka. Central Bank of Ceylon, Statistics Department, Economic and Social Statistics of Sri Lanka (Colombo). ——————————————————— *Under the British, Sri Lanka was referred to as Ceylon.
-402-
5. Sri Lanka. Central Bank of Ceylon, Central Bank of Ceylon Annual Report (Colombo: W.R.B.K. Godakumbura, 1982). 6. Sri Lanka. Central Bank of Ceylon, Central Bank of Ceylon Review of the Economy (Colombo: C. L. Senanayke, 1980). 7. Ceylon. Department of Census and Statistics, "A Report on Paddy Statistics," Monograph No. 9 (l9~6). 8. Sri Lanka. Department of Agriculture, Agricultural Statistical Unit, Agricultural Statistical Information, Agricultural Economics Publication No. 4 (1976). 9. Ceylon. Department of Census and Statistics, Ceylon, Census of Agriculture, 1952 (Colombo: Government Press, 1956). 10. Ceylon. Department of Census and Statistics, Census of Agriculture, 1962 (Colombo: Government Press, 1965).
Useful Secondary Sources 1. Endirisinghe, Neville and Poleman, Thomas, "Implications of Government Intervention in the Rice Economy of Sri Lanka," Cornell International Agriculture Mimeograph No. 48 (Ithaca. N.Y.: 1976). 2. Desilva, K. N., A History of Sri Lanka (Berkeley: University of California Press, 1981). 3. Bansil, P. C., Ceylon Agriculture, A Perspective (Delhi: Dhanpat Rai and Sons, 1971). 4. Ranasinghe, W.; Mileham,, S.M.K.; and Gunatunga, C., A Bibliography of Socio Economic Studies in the Agrarian Sector of Sri Lanka (Colombo: Agrarian Research and Training Institute, 1977). 5. Ceylon. Ministry of Finance, Economic and Social Development of Ceylon 1926-1950, A Survey (Colombo: Government Press, 1951).
-403-
6. Attanayake, D. C., "Changing Patterns of Rice Production in Ceylon, 1945- 1964," M.A. thesis, University of Wisconsin) 1969. 7. Chambers, Robert, "Water Management and Paddy Production in the Dry Zone of Sri Lanka," Occasional Publication No. B (Colombo: Agrarian Research and Training Institute, 1975). 8. Ceylon. Department of Agriculture, The Tropical Agriculturist (various issues). Important Conversion Factors 1 cwt. rice = .050802 mt. rice 1 mt. rice = 19.68246 cwt. 1 bushel paddy (volume) = 46 lbs. = 0.2086 mt. paddy 1 bushel paddy = 0.48 bushels of rice 1 bushel paddy ~ 14 kg. of rice 1 bushel paddy = 20.9 kg. paddy 1 bushel rice = 64 lbs. rice = 29.0299 kg. rice 1 bushel rice = 2.0853 bushels of paddy 1 bushel rice = 32 measures of rice 1 mt. paddy = 47.938638 bushels (volume) paddy 1 measure milled rice (volume) = 0.91 kg. 1 kg. rice = 1.1023 measures rice 1 acre = .405 ha. 1 long ton = 2240 lbs. = 1.01605 nit. Paddy to rice milling rate: 68 percent Glossary of Sri Lankan Terms With Reference to Rice Asweddunrized land - refers to the total physical extent of land that is cultivable with paddy each season. Chena - is used to refer to upland or highland cultivation. Liyadde - are the smallest paddy field units and refer to bunded paddy area.
-404-
This unit is used as the basis for the collection of paddy statistics. maha (munmari or kalapokam) - refers to the main growing Reason during which the bulk of Sri Lanka's rice crop is produced.. The maha season is dependent on the northeast monsoon. Rice is commonly sown between July and November and harvested between February and May of the following year. Yala (pinmari or sirupokam) - refers to the secondary rice growing season, accounting for only about 25 percent of Sri Lanka’s total rice output. The yala rice crop, dependent on the southwest monsoon, is commonly sown between February and June and is harvested between July and October. Money Unit money unit - Sri Lankan rupee In 1980, 1 US$ = 18.00 rupees official exchange rate In 1980, 1 US$ = 18.67 rupees free-market exchange rate


