Embed Size (px)
Citation preview

www.elsevier.com/locate/phytochem
Phytochemistry 68 (2007) 237–250
PHYTOCHEMISTRY
Unrevealed structural requirements for auxin-like moleculesby theoretical and experimental evidences
Noel Ferro a,b, Patrick Bultinck d, Ana Gallegos c, Hans-Jorg Jacobsen a,Ramon Carbo-Dorca c,d, Thomas Reinard a,*
a Institute for Plant Genetics, University of Hannover, Herrenhauser Str. 2, D-30419 Hannover, Germanyb Department of Agronomy, Forestry and Agronomy Faculty, University of Pinar del Rıo, Marti 270 Final, 20100 Pinar del Rıo, Cuba
c Institute of Computational Chemistry, University of Girona, Facultat de Ciencies, despat 164, Campus de Montilivi, Girona, Catalonia, Spaind Department of Inorganic and Physical Chemistry, Ghent University, Krijgslaan 281(S3), 9000 Ghent, Belgium
Received 1 May 2006; received in revised form 8 September 2006Available online 27 November 2006
Abstract
An computational-biostatistical approach, supported by ab initio optimizations of auxin-like molecules, was used to find biologicallymeaningful relationships between quantum chemical variables and fresh bioassay’s data. It is proven that the auxin-like recognitionrequires different molecular assembling states. We suggest that the carboxyl group is not the determining factor in explaining the bio-logical auxin-like conduct. The biological effects depends essentially on the chemical condition of the ring system. The aim to find activemolecules (quantum objects) via statistical grouping-analysis of molecular quantum similarity measures was verified by bioactivityassays. Next, this approach led to the discovery of a non-carboxylated active auxin-like molecule (2,6-dibromo-phenol). This is the firstpublication on structure activity relationship of auxin-like molecules, which relies on highly standardized bioassays of different auxinsscreened in parallel as well as analysed by multi-dimensional scaling.� 2006 Elsevier Ltd. All rights reserved.
Keywords: Auxin; Structure–activity relationship; Molecular quantum similarity measures; Plant growth regulation
1. Introduction
The analysis of chemical messengers is still one of the hotspots in plant physiology, biochemistry and molecular biol-ogy (Kulaeva and Prokoptseva, 2004), although phytohor-mones like auxin have been described decades ago (Went,1935, 1945). Indole-3-acetic acid (IAA) and its analogs werefound to be the typical auxin, mainly evaluated by cell elon-gation tests (Went and Thimann, 1937; Koepfli et al., 1938;Thimann and Schneider, 1938, 1939; Thimann, 1958; Porter
0031-9422/$ - see front matter � 2006 Elsevier Ltd. All rights reserved.
doi:10.1016/j.phytochem.2006.10.006
Abbreviations: PCA, principal component analysis; wt, wild type;MQSM, molecular quantum similarity measure; QSM, quantum simi-larity measure; DF, density function; DFT, density functional theory;HF, Hartree–Fock.
* Corresponding author. Tel.: +49 511 762 4032; fax: +49 511 762 4088.E-mail address: [email protected] (T. Reinard).
and Thimann, 1965). However, the chemical space, whichencompasses the term ‘‘auxin’’, is actually not easilyachieved, since hundreds of substances were found to exhibitan auxin-like activity in several different bioassays. The anal-ysis about structural requirements of auxins was hypothe-sized before by chemical intuition, but without convincingresults (Went and Thimann, 1937; Koepfli et al., 1938; Jons-son, 1961; Porter and Thimann, 1965; Katekar, 1979). Dif-ferent reasons can be found for the inadequacy:
� Most structure analysis was performed between 1930and 1970, a technological scenery unable to provide sub-stances sufficiently purified.� All attempts to elucidate this relationship based on bio-
logical assays were performed in different labs, underdifferent conditions, know how, and insufficient compari-son of the different results obtained.

238 N. Ferro et al. / Phytochemistry 68 (2007) 237–250
� The existence of different auxin binding proteins, thewide diversity of the auxin molecules and its pleiotropiceffects prevented the establishment of a convincing cor-relation between structure and biological activity up tonow.
The term ‘‘auxin’’ is still available as a physiological defi-nition and a well-defined molecular structure does notexist. The biochemical mechanisms of auxin-like moleculesrepresent the result of an evolutionary process in plantkingdom (Dibbfuller and Morris, 1992; Cooke et al.,2002) and are thought to be in charge of particular specific-ities on their structure – activity relationships. IAA is stillknown to be an active molecule in all bioassays (Wood-ward and Bartel, 2005), and is reliant on its plasticity prop-erties and metabolic interactions.
In a previous work, we were able to present a computa-tional approach dealing with semi-empirical optimizationsof the auxin molecules themselves. Our approach usedmolecular quantum similarity measures for the analysisof more than 240 auxin-like molecules (Ferro et al.,2006b). The finding of similarities in these molecules byfocusing basically on intermolecular interaction descriptor,enabled us to cluster the auxins into different groups (Table1). It was postulated that the auxin-like molecular recogni-tion depends more on specific molecular assembling statesthan on a specific ring system or side chain.
Here, we present the significance of the similarity groupspublished before (Ferro et al., 2006b) in the context of theircloser comparable biological activities. Furthermore, this isthe first publication on structure activity relationship analy-sis of auxins, which relays on highly standardized bioassays,performed for all tested auxins in parallel. By this integralapproach we were able to detect both nominal and continu-ous cause – effect relationships from quantitative analysis,which are objects to explain biological attributes such as:
� pleiotropic activity,� the high number of active molecules,� differentiated specificity exposed by auxin-like
molecules.
Data obtained from bioassays and biostatistical analysisenabled us to further refine the structure–activity relation-ships of auxin-like molecules.
2. Results and discussion
2.1. Analysis and clustering of biological activities
Auxins are defined mainly by a set of physiologicalactions, but the structure–effect relationship is still basedon chemical intuition. Recently, we presented a computa-tional approach dealing with semi-empirical optimizationsof the auxin molecules themselves (Ferro et al., 2006b)using Molecular Quantum Similarity Measures and addi-
tional quantum variables for the analysis of about 250 dif-ferent auxin-like molecules. Additional statistical analysisidentified relationships between eleven structural similaritygroups. These groups could be assigned to five distinctgroups according to their biological activity. However,the high variance especially of bioassay data prevented aclear discrimination. This is caused by limitations of thebioactivity data, which are available from literature. Dueto different background, those data might not be compara-ble at all. Nevertheless, the clustering of auxins accordingtheir molecule structures revealed convincing congruenceswith known biological functions. For instance, the natu-rally occurring indole-3-acetic acid (IAA) and its syntheticanalogs 1-naphthalene-acetic acid (NAA) and 2,4-dichlo-rophenoxyacetic acid (2,4-D) belonged to a group sharingthe same quantum spatial regions. Furthermore, neigh-bouring compounds within a group share similar biologicalactivities as well (Ferro et al., 2006b).
To obtain a better correlation of structural propertieswith their biological activities, we decided to choose repre-sentative substances out of each group for bioactivity anal-ysis in defined and standardized bioassay systems. A list ofthe substances, which are the subject of this analysis isshown in Table 1.
An ideal bioassay offers information from the primaryreaction (Veldstra, 1944) but due to their pleiotropiceffects, many factors in the plant may influence the biolog-ical activity of auxin, e.g. the interactions with carriersinfluences membrane-permeability (Benkova et al., 2003;Paponov et al., 2005), the effect of auxin on endocytosis(Paciorek et al., 2005), or the rapid auxin conjugation(Cooke et al., 2003). It is difficult to distinguish betweenthe primary reactions or even between primary effects.
The coleoptile test – widely used for measurements ofelongation effects – is one of the less sensitive assay. Onlycertain kinds of active auxins can be detected while othersare ineffective (Bandurski and Nonhebel, 1985). An addi-tional disadvantage is the unspecific elongation responsewith other substances like gibberellin (Roesel and Haber,1963), ethylene (Marinos, 1960) and brassinosteroids (Heet al., 1991). Usually growth measurement in coleoptiletests are limited to growth of coleoptile’s length only, mis-obey the increase in volume of the plant (Erickson, 1976).The individual cell length profiles within the overall lengthof the hypocotyl cannot readily be substituted by assump-tions of uniform cell length or growth distribution withinthe hypocotyl (Barley, 2004). Therefore, differences in theresponses of different cell types may influence each others.Biological activities must be tested in the intact organism, atest with isolated tissue limits the integration of pharmaco-kinetics/pharmacodynamic phenomena and provides anincomplete picture of the biological relevance (Abdel-Rah-man and Kauffman, 2004).
Here, we are interested in the comparison between vari-ous hormones in paralell using a standarized environment.The intention of our work is the relative activity of thedifferent substances by a multidimentional analysis of

Table 1Substances for the biological and chemical analysis
Name Structure CAS pKd ABP1 logP Class1 Che. class. induction2 Outlier
Indole-3-acetic acid (IAA)
N
OH
O
87-51-4 5.4 1.41 3abc Root/call x
Indole-3-butyric acid (IBA)
N
OH 133-32-4 5 2.30 5abc Root/call x
DL-Indole-3-lactic acid (ILA)
N
OH
OH
O832-97-3 - 1.22 1bc Root/call
Indole-3-acetamide (IAM)
N
O
NH2 879-37-8 2.1 0.53 3abc Root/call
3-Methyl-1H-indole (Skatole)
N
83-34-1 - 2.29 5abc –
1-Naphthalene acetic acid (NAA) OH
O
86-87-3 6.1 2.24 3abc Root/call x
2-Naphthaleneacetic acid(2-NAA)
HOOC 581-96-4 5.9 2.81 7ab Inactive
1-Naphthoic acid COOH 86-55-5 - 3.10 9a Inactive x
2-Naphthoic acid HOOC 93-09-4 - 3.28 2abc –
2,3,5-Triiodo benzoic acid(TIBA)
I
I
COOH
I
I
I
COOH
I
88-82-4 5,1 5.03 4abc Callus
Picloran
NCl
NH2
Cl
Cl
COOH 1918021 - 0.30 - Callus
TrysbenCl
COOH
Cl
Cl50317 - 2.71 9a Callus x
2-Fluorobenzoic acid (2-F-BA)F
COOH 445-29-4 - 1.70 2abc – x
DicambaO
Cl
COOH
Cl1918-00-9 - 2.21 - Callus
3-Fluor phenylacetic acid HOOC
F
331-25-9 - 1.65 11c Callus
2,4-Dichlorophenylacetic acid(2,4-Cl-PAA)
HOOC
Cl
Cl
19719-28-9 - 1.75 2abc Callus
(continued on next page)
N. Ferro et al. / Phytochemistry 68 (2007) 237–250 239

Table 1 (continued)
Name Structure CAS pKd ABP1 logP Class1 Che. class. induction2 Outlier
2,6-Dichlorophenylacetic acid(2,6 Cl-PAA)
HOOC
ClCl
6575-24-2 - 2.47 4abc Callus
Phenoxy acetic acid (PHAA) OOH
O
122-59-8 3.8 1.34 11c Inactive x
2,4,5-Trichlorphenoxyacetic acid(2,4,5-T)
OOH
O
Cl
Cl
Cl
93-76-5 - 3.31 7ab Callus
2,4-Dichlorphenoxyacetic acid(2,4-D)
OOH
O Cl
Cl
94-75-7 - 2.81 4abc -(Callus)
2-Nitro phenoxyacetic acid(2NO2-PHAA)
OOH
O NO2
1878-87-1 - 1.13 4abc Inactive
2,4-Dibromophenoxyacetic acid(2,4 Br-PHAA)
OOH
O Br
Br
10129-78-9 - 1.86 3abc Callus
3-Methyl phenoxy acetic acid(3Me-PHAA)
OOH
O
Me
1643-15-8 - 1.78 4abc Inactive x
2,6-Dibromophenol (2,6-Br-Phe) OHBr Br
608-33-3 - 3.36 5abc Root/call
2-Chloro-6-nitrophenol(2Cl-6NO2-Phe)
OHCl NO2
603-86-1 - 2.55 6abc Root/call
2,6-Dinitrophenol (2,6-NO2-Phe) OHO2N NO2
573-56-8 - 1.37 7ab Inactive
Chemicals are from: Duchefa, Fluka and ABCR GmbH & Co KG, and Sigma-Aldrich. 4-Amino-3,5,6-tricloro picolinic acid (Picloram), 2,3,6-trichlorobenzoic acid (Trysben); 3,6-dichloro-2-methoxybenzoic acid (Dicamba); (1) Classification due to Duncan multiple range test (Ferro et al., 2006b), in short:compounds have tendancy to maximal activity (a), be active (b), or be inactive (c); (2) Quantitative information, Table 2.
240 N. Ferro et al. / Phytochemistry 68 (2007) 237–250
different tests, taking into account the response of eachsubstance in the whole background of concentrations(Fig. 1). Dose response isotherma and its implications arenot part of the scope of this work.
As expected, the biological activity depends even quali-tatively on the structure differences and concentration ofthe substances, as it can be seen by the different responsesof NAA and 2, 6-Br-Phe (Fig. 1). However, IAA did notinduce callus significantly in any concentration, but rootsonly. The low activities of the compounds ILA and IAMare likely linked to the metabolic pathways of IAA (Car-reno-Lopez et al., 2000) and not with their self activity.Some substances, like IAA and NAA applied to maizeseedlings at lower concentrations showed significant inhibi-tory effects on root growth (Fig. 1).
Due to the multi-receptor and/or signal system of auxin,it is assumed more than one way of action (Niklas, 2003;Campanoni and Nick, 2005). Therefore various parameters
were used for the evaluation of the biological activity.These parameters derived from the standardized experi-ments (Fig. 1 and Table 2) and are defined as follows(Fig. 2):
� Elongation of etiolated maize seedlings and tobaccoexplants were analysed in different concentrationranges (10�9–10�7 M, 10�9–10�4 M, and 10�7–10�4 M) using Eq. (5) (Table 2). Root and mesoco-tyl-coleoptile lengths in maize as well as callus induc-tion (C-ind) and root induction (R-ind) were analysedin tobacco. Yes/no-responses for C-ind and R-indwere recorded as well.� The value ED50 represents the dose at which 50% of the
sample units (explants) has a response, that represents acritical dose-effect. e.g. ED50 = corresponds to 5 out of10 explants showed an response to the substanceapplied.

Fig. 1. Effects of auxin-like molecules on maize root inhibition (left panel). Concentrations of substances applied are indicated at the top of the panel.Control was done without any hormone added. One representative out of 10 seedlings is shown. Roots grown in 2Cl, 6NO2-Phe (A), and 2,6NO2-Phe (B)have been measured again two days later. These later analyses are shown at the right corner (A and B, respectively). Right panels show the influence of thedifferent substances on tobacco leaves, either on root induction (upper right panel) or on callus induction (lower right panel). The concentrations appliedare indicated at the left. Only those substance, which exhibited any effect, are shown but not those substances without any influence on the tobaccoexplants. The detailed values are summarized in Table 2. PRL (primary root length); MCL (mesocotyl–coleoptil length); R-ind (root induction), C-ind(callus induction).
N. Ferro et al. / Phytochemistry 68 (2007) 237–250 241
� Furthermore, we used the logP (Table 2), analysed byVeldstra (1944), as a variable based on lipophilicity eval-uated with the QSAR method. The lipophilicity logP
correlates with membrane permeability and receptorbinding of sample auxin molecules (Bertosa et al., 2003).� Many putative auxin receptors have been described
(overview: Napier et al., 2002), but best characterizedone is the so-called auxin-binding-protein 1 (ABP1).Definitively being an auxin-binding protein, its physio-logical role is debated and it is not involved in all the dif-ferent physiological auxin effects. Nevertheless, severalauxin-like substance have been analysed for their bind-ing behaviour to ABP1. Therefore, dissociation con-stants (Table 1) are valuable parameter, representingthe fast auxin effects. We did not considered bindingdata on other, recently described ABPs (e.g. TIR1),since the amount of binding data obtained with differentauxin analogs is not sufficient for our analysis.
In order to minimize biological variation and to focuson the analysis of the influence of the molecular structure,the values calculated by the different measurements aresummarized in Table 2. All resulting variables were submit-ted to a cluster analysis (Fig. 2) as described in Sections 4
and 4.3 below. Interestingly, two separate clusteredbranches emerged from this analysis, representing the twoprominent auxin responses: the effect of auxin on (elonga-tion) growth in the upper branches and the effect of auxinon morphogenesis in the lower branches.
It is noteworthy that the response of auxin on the auxinbinding protein ABP1 is located in the upper branch ofFig. 2, indicating a physiological role of ABP1 in elonga-tion growth only, but not in morphogenesis. ABP1 bindsa series of auxins with affinities that usually correlate withthe efficiency of the compound to stimulate cell elongation(Jones, 1994; Jones et al., 1998; Chen et al., 2001). Thisbehaviour could be predicted from the cluster analysis ofFig. 2.
2.2. Principle component analysis
The principle component analysis (PCA) allows thereduction of both the dimensionality of the problem andthe redundancies of information in our dataset, keepingthe ‘‘most important’’ aspects of the data. The PCA(Fig. 3) provides the chance to explore the individual con-tribution of the auxin like substances and distinguishingindependent biological effects. Three principal components

Table 2Quantitative bioassay results
Substance Root length (cm) Hypo length (cm) Root induction Callus induction
�9, �7 �9, �4 �7,�4 �9, �7 �9, �4 �7, �4 �9, �4 �7, �4 �9, �4 �7, �4
IAA 6.096 4.772 2.788 5.362 5.045 4.567 0.38 0.47 0.17 0.18IBA 8.924 7.054 4.523 5.155 4.944 4.830 0.24 0.42 0.19 0.34NAA 6.558 5.092 3.003 5.175 4.976 4.806 0.06 0.11 0.56 1.00TIBA 13.161 12.533 12.227 5.529 5.325 5.209 0.04 0.06 0.00 0.00Picloran 11.595 9.103 6.338 5.403 5.109 4.899 0.00 0.00 0.46 0.82Dicamba 11.642 8.894 5.730 5.350 5.173 5.065 0.13 0.23 0.44 0.79DL-ILA 11.974 11.764 11.861 5.280 5.175 5.083 0.08 0.15 0.12 0.13245-T 9.290 7.394 5.233 4.394 4.511 4.467 0.12 0.03 0.75 0.642-NAA 12.923 12.503 12.716 5.714 5.714 5.820 0.00 0.00 0.03 0.052,6 Cl-PAA 9.600 7.407 4.367 4.999 5.011 4.985 0.03 0.00 0.25 0.39Trysben 13.927 12.697 11.769 5.534 5.509 5.493 0.00 0.00 0.16 0.292NO2-PHAA 10.348 9.622 9.107 5.332 5.159 4.965 0.00 0.00 0.00 0.003Me-PHAA 10.945 10.250 9.746 5.045 5.091 5.092 0.00 0.00 0.00 0.003-F-PAA 7.317 6.961 6.349 4.779 4.922 5.151 0.00 0.00 0.36 0.64PHAA 8.904 8.896 8.792 5.015 4.932 4.720 0.00 0.00 0.00 0.00Naphthoic acid 10.515 9.367 7.731 5.012 4.938 4.920 0.00 0.00 0.00 0.002,4 Br-PHAA 8.835 6.955 4.375 4.903 4.792 4.635 0.01 0.02 0.30 0.542,6-Br-Phe 9.127 7.820 3.906 5.152 5.185 3.572 0.12 0.21 0.19 0.342Cl-6NO2-Phe 12.905 12.258 12.297 5.573 5.419 5.308 0.00 0.00 0.13 0.232.6-NO2-Phe 12.698 11.575 10.751 5.703 5.648 5.549 0.00 0.00 0.03 0.05I-3-Acetamide 12.132 11.662 11.470 5.379 5.282 5.083 0.19 0.34 0.04 0.002.4-Cl-PAA 9.230 7.911 6.441 4.918 4.901 4.794 0.00 0.00 0.09 0.16Skatol 11.954 11.481 11.014 5.650 5.554 5.344 – – – –2.4-D 10.839 8.035 3.946 5.517 5.127 4.650 – – – –2-F-BA 12.226 12.710 13.799 5.094 5.155 5.228 – – – –2-Naphthoic acid 14.107 12.232 10.848 5.902 5.638 5.497 – – – –
Each number was calculated by the equation: Y i ¼ðP
yicjÞP
cj
Root and hypocotyl length were clustered in cm at different concentration ranges: 10�9–10�7 M (=�9, �7). 10�9–10�4 M (=�9, �4). and 10�7–10�4 M(=�7, �4). Data for root and callus induction bases on a yes-no answer, calculated by the equation above.
Fig. 2. The matrix (right panel) represents the relationship among the different variables. The variables are plotted in rows and columns as indicated.Colors scheme proceeds from red! yellow! blue with increasing relationship of the variables. The corresponding dendrogram at the right is amultiscaling representation of the analyzed variables in all molecules tested by the different bioassays. It clearly can be seen that the dendrogram falls intwo main branches. In the upper group auxin effects, related to elongation growth can be found. The lower group consists of morphogenetic effects. Thetwo separated groups are also represented by the blue areas in the matrix. (For interpretation of the references to colour in this figure legend, the reader isreferred to the web version of this article.)
242 N. Ferro et al. / Phytochemistry 68 (2007) 237–250
were found to be informative with a percentage of varianceof 49.88% (growth factor), 24.94% (root induction factor),and 13.99% (callus induction factor). An assessment of the
relative biological activity (Fig. 3) shows a relation betweenchemical structure and biological activity by means of amultidimensional approach of the auxin effects.

Fig. 3. Graphical representation of the PCA coefficients for the informa-tive PCAs callus induction, root induction, and elongation growth. Thecoordinate system lists the coefficients against the various substancestested. This graph correlates the relative biological activity of eachsubstance tested for with the physiological event, respectively.
N. Ferro et al. / Phytochemistry 68 (2007) 237–250 243
2.3. Structure–function relationships
On basis of these results, we were able to consider:
� the relativity of the physiological effects;� the formation of two groups of clustered variables
(Fig. 2); and� the existence of independent principal components able
to characterize the structural influence of the moleculeson basis of the biological activity (Fig. 3).
Auxin induction of root and callus are qualitativeevents, which depend on structure and concentration. Rootinduction is hardly linked to callus induction and itdepends more on the properties of the molecule than onits concentration (Fig. 2).
The molecular discrimination based on molecular vari-ables (analysis of discriminants, Fig. 4) according to theclustered morphogenetics effects (previous analysis ofeffects) revealed the structural causes for their different bio-logical behaviour:
� one group is able to produce root and callus (�),� a second group produces callus only (m), and� a third group is inactive (,).
These groups could be discriminated in two ways by theuse of chemical descriptors in a first approach(morphogenesis):
1. The following variables were able to discriminate differ-ent biological activities: molecular volume, HOMOenergy, hardness (g = 1/2(HOMO � LUMO)) calcu-lated by density functional theory (DFT), (g(DFT)) andone factor of overlap self - similarity matrix not relatedto IAA (Fig. 4A). The overlap-self similarity matrix wasprocessed by factorial analysis and shows similarity fac-tors not related to the IAA molecule.
D1 ¼ 36:10þ 66:49gðDFTÞ � 0:01Vol þ 65:34eHOMO
þ 0:27F 3� Sim OVER ð1aÞ
D2 ¼ �0:92þ 67:19gðDFTÞ þ 0:01Vol � 1:24eHOMO
� 1:49F 3� Sim OVER ð1bÞ
2. The influence of the indol-N-atom on the HOMO orbi-tal, positions 10 and 11 on HOMO and HOMO � 1 andthe hardness calculated by Hartree–Fock (g(HF)) wereconsidered (Fig. 4B)
D1 ¼ 10:32þ 56:75gðHFÞ � 2:25N8HOMO
þ 1:86C10HOMO þ 2:36P11 ð2aÞD2 ¼ 1:23� 6:27gðHFÞ � 3:17N8HOMO
þ 1:66C10HOMO � 1:30P11 ð2bÞ
The 72.7% and 77.3% grouped cases, respectively, werecorrectly classified by cross-validation. The use of both,descriptors of electronic molecular structures and intermo-lecular interaction descriptors facilitated the explanation ofthe biological behaviour (Ferro et al., 2006a). The impor-tant role of the N-indole region for auxin action was docu-mented long before. Correlation between biological activityand the existence of the N-indole was found by Porter andThimann (1965), independent of the charge separation the-ory as explanation. Porter and Thimann (1965) as well asKaethner (1977) created an special region for this N-indolein their binding site proposals. We proved statistically theimportance of this region due to its significance to the outermolecular orbitals (HOMO and HOMO � 1). The indole-N-atom is the most negative atom in the molecule, and thisvariable has been used as a molecular descriptor before(Vaes et al., 1996). The indole compounds analysed
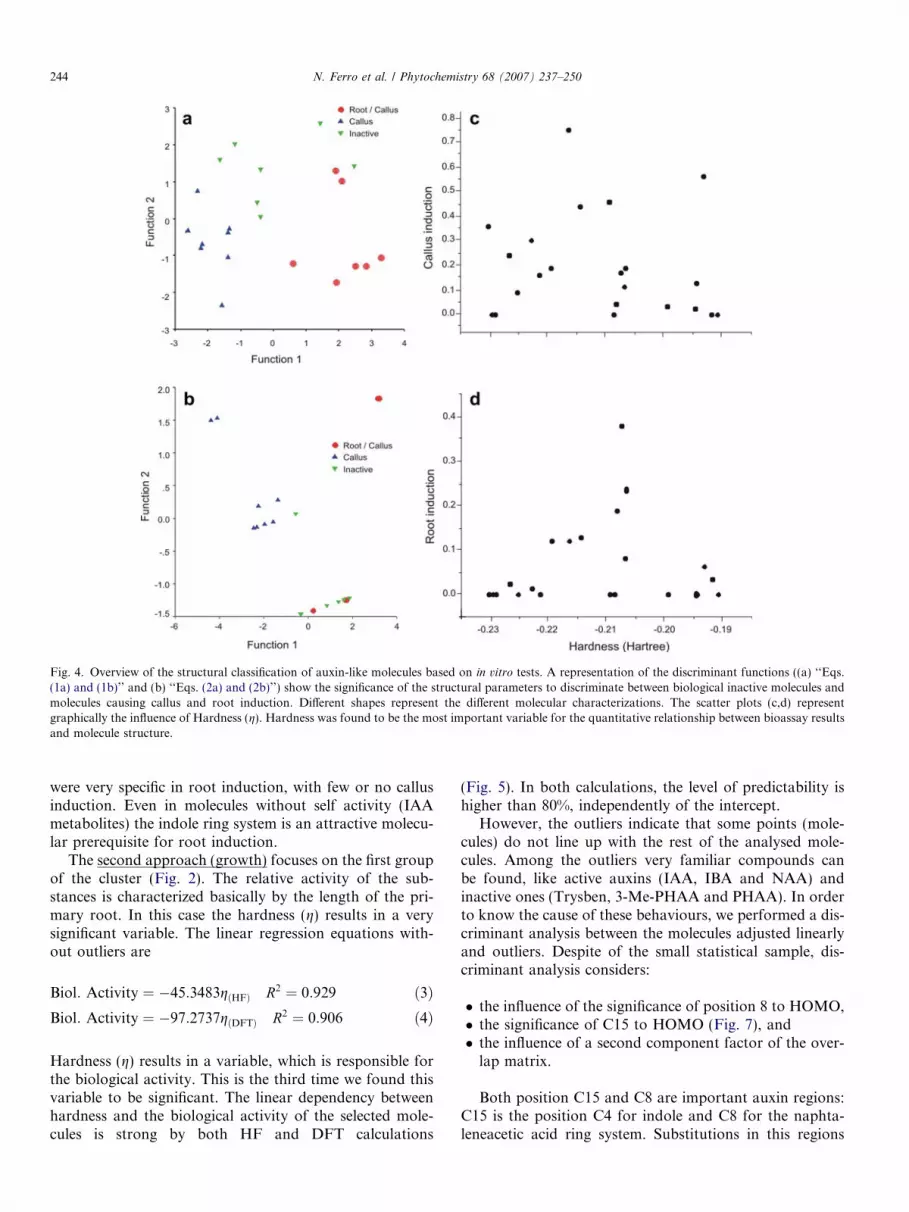
Fig. 4. Overview of the structural classification of auxin-like molecules based on in vitro tests. A representation of the discriminant functions ((a) ‘‘Eqs.(1a) and (1b)’’ and (b) ‘‘Eqs. (2a) and (2b)’’) show the significance of the structural parameters to discriminate between biological inactive molecules andmolecules causing callus and root induction. Different shapes represent the different molecular characterizations. The scatter plots (c,d) representgraphically the influence of Hardness (g). Hardness was found to be the most important variable for the quantitative relationship between bioassay resultsand molecule structure.
244 N. Ferro et al. / Phytochemistry 68 (2007) 237–250
were very specific in root induction, with few or no callusinduction. Even in molecules without self activity (IAAmetabolites) the indole ring system is an attractive molecu-lar prerequisite for root induction.
The second approach (growth) focuses on the first groupof the cluster (Fig. 2). The relative activity of the sub-stances is characterized basically by the length of the pri-mary root. In this case the hardness (g) results in a verysignificant variable. The linear regression equations with-out outliers are
Biol: Activity ¼ �45:3483gðHFÞ R2 ¼ 0:929 ð3ÞBiol: Activity ¼ �97:2737gðDFTÞ R2 ¼ 0:906 ð4Þ
Hardness (g) results in a variable, which is responsible forthe biological activity. This is the third time we found thisvariable to be significant. The linear dependency betweenhardness and the biological activity of the selected mole-cules is strong by both HF and DFT calculations
(Fig. 5). In both calculations, the level of predictability ishigher than 80%, independently of the intercept.
However, the outliers indicate that some points (mole-cules) do not line up with the rest of the analysed mole-cules. Among the outliers very familiar compounds canbe found, like active auxins (IAA, IBA and NAA) andinactive ones (Trysben, 3-Me-PHAA and PHAA). In orderto know the cause of these behaviours, we performed a dis-criminant analysis between the molecules adjusted linearlyand outliers. Despite of the small statistical sample, dis-criminant analysis considers:
� the influence of the significance of position 8 to HOMO,� the significance of C15 to HOMO (Fig. 7), and� the influence of a second component factor of the over-
lap matrix.
Both position C15 and C8 are important auxin regions:C15 is the position C4 for indole and C8 for the naphta-leneacetic acid ring system. Substitutions in this regions

Fig. 5. The scatterplots represent the relationship between root inhibitionand hardness g. Hardness was calculated with both methods HF (Hartree–Fock) and DFT (density functional theory). Bioassay data are also shownin Table 2. Each dot represents a molecule tested. A linear dependence(triangles) was found. Some outliers above and below are most interestingfrom the biological point of view (see text). The predictability of bothlineal model is shown as well.
N. Ferro et al. / Phytochemistry 68 (2007) 237–250 245
cause dramatical changes in the activities, being able to seein compounds like 4-Cl-IAA or 8-Cl-NAA. The region 8corresponds to the position of the N–H of the indole sys-tem. In case of auxin molecules the discriminant factors(principal component) of the overlap matrices representless than 10% of the information of the whole overlapself-similarity matrix. A further analysis of the moleculessignificantly included in the component revealed that mol-ecules like NAA, 2,6-Br-Phe, Naphthoic acid and Picloramare not sharing the same charge localization of indole
derivatives, TIBA, Dicamba and 2,4-D. This could explainsome differences in activity between IAA and NAA.
2.4. 2,6-Dibromo-phenol
Attractive and fully surprising results of the presentwork are represented by the positive biological activity ofa non-carboxylated compound (2,6-dibromo-phenol). Thiswas expected by a previous classification (Ferro et al.,2006b) (Figs. 1 and 4). It is the first time that, in practicalterms, a new active compound is found via quantum simi-larity measures (Carbo-Dorca, pers. com.).
The auxin-like activity of this substance support ourresults, that statistically the distances between the COOHgroup and the ring system are not significant. Biologicalactivity and metabolism of phenol derivates have alreadybeen identified to be active disubstituted phenols at posi-tions 2 and 6. But the issue was focused on the mimic ofconformational geometries and charge separation of theCOOH and NO2 groups in respect to the ring (Harperand Wain, 1969, 1971 ; Farrimond et al., 1980). NO2 is awithdrawing substituent, while for unpolarized p-systemsthe dominant interaction is p-repulsion (Hunter et al.,2001). Electron availability (Katekar, 1979) and the soft-ness as measure of the chemical polarisability influencesthe degree of auxin-like activity. The ring system and itssubstitutions generate the decisive factors.
Of the nearly 3200 known naturally occurring organo-halogen compounds, more than 1600 contain bromine(Gribble, 1999). 2,6-Br-Phenol is a versatile moleculeknown as pheromone and in marine algae (Whitfieldet al., 1999; Leonovich, 2004). As a biological remark wewant to mention recent experiments on gene silencingactivities of siRNAs with a ribo-difluorotoluyl nucleotide.These experiments demonstrated the importance of stack-ing interactions rather than hydrogen bonding in the fidel-ity of DNA replication (Xia et al., 2006).
2.5. Common analysis of both approach
The chemical space, which encompasses the auxin defini-tion, suggests a multi-dimensional molecular space charac-terized by the plasticity of its biological interactions. Beingthe hardness (g) gap between anti-bonding and bondingmolecular orbitals, a reflection of the molecular stability(Gilman, 1997), was commonly implied in every statisticalresult of this paper. The ionization potential (I) and electronaffinity (A) of a molecule should be achieved easily by a cal-culation of the ground state-geometry of the neutral mole-cule and similar calculations for its positive and negativeions. This approach is rarely performed, in its essence, thecorrelation energy errors depend on the number of electronpairs in the molecule, in our practice, a descriptor for nextworks with hundreds of molecules is being needed. But,the Koopmans’ theorem assume �eHOMO = I and�eLUMO = A without the necessity to take into accountrelaxations in the ionized sates (Pearson, 1986).

246 N. Ferro et al. / Phytochemistry 68 (2007) 237–250
The necessity of electron transfer or rearrangement forthe reaction in auxin-like molecules has been statisticallysuggested by the analysis of self-similarity Coulombmatrix of almost 250 molecules (Ferro et al., 2006b).Now it is confirmed that soft auxin-like molecules aremore active than the hard ones (Pearson, 1986) by meanof calculus of hardness using HF and DFT algorithms.Density functional theory (DFT) has been found to pro-vide a rigorous theoretical background for hardness andrelated concepts (Chattadaj et al., 2004). However theDFT method can be seen as a generalization of theHF method (Zevallos and Toro-Labbe, 2003). Both canbe used to analyse hardness by means of the Koopman’stheorem. In our study both methods produced the sameoutliers and only molecules with NO2 groups and bothvariants of naphthoxyacetic acid had different hardness,but without significance statistical differences in thepredictability.
The existence of a large number of auxin-like moleculesand their pleiotropic effect implies the principle of ‘‘a sepa-rate key to a back door’’ to the enzyme-substrate correla-tions in auxins (Veldstra, 1944). The physiologicalactivity is a result of the interaction of its effector chemicalfragments with a receptor to form the given character(quality) (Gafurov and Zefirov, 2004).
Different abilities of the substituents to bind to theaccessory binding areas (Katekar and Geissler, 1983)can be the reasons for the statistical outliers in the struc-ture–activity. Another possibility for the outliers inFig. 5 may – at least in part – be explained by otherphysiological influences. NAA and IAA are transportedby the auxin efflux carrier, while other substances like2,4-D are not. At least IAA is relatively fast metabolisedcompared to many synthetic auxins. Since some otheroutliers do not fit into these schemes, it can be proposedthat there is another variable needed to fully explain thestructure–activity relationship for these molecules. Never-theless, data presented in Fig. 5 show that hardness is
Fig. 6. Graphical view of spatial representation of the outer molecular orbitashows the energetic isolation of the HOMO and HOMO � 1 orbitals from th
the most important variable for the majority of the ana-lyzed molecules.
Hardness is a global reactivity descriptor and appears tobe inadequate to explain site selectivity (Chattadaj et al.,2004), of a phytoregulator as well. Other variables reportedfor the discriminant analysis could be helpful: like the prin-cipal components of the overlap matrix and punctualatomic significances on the outer molecular orbitals. Thephysical meaning of the overlap operator has a large setof possible applications: the volume of the molecules isdeterminant in the analysed system (Carbo-Dorca and Gir-ones, 2004) or as an estimation of charge localization (elec-tronic charge) (Sola et al., 1996).
A statistical overview of the occupied outer molecularorbital elucidates the energetic closeness of HOMO andHOMO � 1 orbitals, to which COOH, does not contributesignificantly (Fig. 6). These two orbitals are energeticallyfar away from the rest of the occupied molecular orbitals.In contrast to bigger molecules such as ecdysteroids (Ferroet al., 2006a), in auxin-like molecules the most probableorbitals to produce a reaction are HOMO and HOMO � 1.The contributions of atoms at positions 10 and 11 tomolecular orbitals (HOMO, HOMO � 1) infer a statisticalresemblance between different ring systems depending ontheir substitutions. TIBA orbital localizations are quite dif-ferent from the other molecules due to the influence of thetwo iodine atoms in ortho-position (Fig. 6).
Other variables not commented before, because of thelow percentages of the cross-validation of the multivariableanalysis, were found statistically significant in specific situ-ations. First, the number of Br and F is critical as well. Hal-ogen substitutions in organic molecules will affect theirmetabolic degradations but also their intrinsic activityand they are very decisive for auxin activity (Katekar,1979; Sexton, 1963). Second, the existence of position 4(the methylene carbon sp2 hybrids) was determinant formolecules with activity at lower concentrations (between10�9 and 10�7). It was claimed (Katekar, 1979; Katekar
ls, HOMO and HOMO � 1 in auxin-like molecules. Dendrogram (right)e rest of the outer molecular orbitals.

Fig. 7. Representation of the atom distributions to homogenize the analysis of auxin-like molecules by fix positions.
N. Ferro et al. / Phytochemistry 68 (2007) 237–250 247
and Geissler, 1982, 1983) that C4 (Fig. 7) acts as a bufferarea between the COOH group and the ring system.
The carboxyl group has been considered as the vitalmolecular site in auxins. Paradoxically, it is chemicallyand physically identical in all compounds, of which acidityis separated from the ring electronic effects by the bufferingeffect of the intervening methylene group (Katekar andGeissler, 1982, 1983). In contrast, tryptophan (indole) isthe only heterocyclic aminoacid ring system, whose elec-tronic structure has been preserved throughout all auxinanalogs (Fig. 6). The COOH group does not influenceany outer molecular orbital related to the activity(Fig. 6). However, fluoride substitutions in the first carbonof the side-chain changes the electronic structure of theindole ring and modify the biological activity totally(Fig. 6) (Zhang and Hasenstein, 2000). We suggest that dif-ferences in the activity are due to differences in the abilityto bind to the electron acceptor.
The structure–activity findings are consistent with bothunspecific reactions like callus induction and very specificreactions like root induction. An analysis of the packingbehaviour depending on size and chemical nature of thearomatic rings in the Protein Data Bank showed that thetryptophan (indole) prefers edge-to-face interactions(Samanta et al., 1999). Additional molecular interactionsanalysis confirms an obvious way to effect binding to atryptophan by hydrogen bond to the indole NH proton.One way of edge-to-face interactions of the indole ring isthe formation of a NH . . . p bond (Taylor, 2002). Trypto-phan could be the only heterocyclic amino acid, whichmay confer to the specificity of indolic auxins in root induc-tion and particularly is responsible for the high activity ofindole-3-butyric acid (IBA), whose distance between ringsystem and COOH is uncommon for active auxins (Jons-son, 1955).
Indolic compounds can induce roots at different concen-trations without any influence on other tissues. Other mol-ecules like NAA or 2,6-Br-Phe provoked root inductions ora mass of undifferentiated plant cells (callus) at highest con-centrations, which can be regarded to stress response. Oth-ers are able to produce solely callus. This suggestsunspecific non-bonding interactions of non-indolic rings.Successful biological auxin-like activity requires both thepreferred geometries of non-bonded contact and the likeli-hood of their occurrence.
3. Conclusions
An assessment of structure–property relationship ofauxin-like molecules was performed. Our strategy baseson a multi-dimensional scale of the biological activityand a dynamic view of the structural requirements. It wasdemonstrated that the mixture of both electronic structureand intermolecular interaction descriptors was able to dis-criminate this multi-dimensional biological view. Our find-ings can open the spectrum of new structural relationshipsemerging from new molecules. For the first time, QMSMmethod has been useful to detect a new active moleculewith unexpected characteristics showing empirical andexperimental evidence. A compound without COOH (2,6-Br-phenol) in the side chain was able to induce root, callusand inhibit root elongation.
Hardness (g = 1/2(HOMO � LUMO)) represents a var-iable, statistically related to auxin activity. The molecularregions 8, 9 and 15 are statistically detected as significantdepending on their influence on the outer MolecularOrbitals.
4. Experimental
4.1. Bioassays
Maize seeds from KWS SAAT AG (Einbeck, Germany)and tobacco leaf explants (Nicotiana tabacum cv. samsun)were used to perform assays of growth and morphogenesis.
The maize seeds were soaked in sterile water to stimulatethe germination. After 8 hours they were placed on soakedcotton wool for 14 h in the dark. After a negative selectionof non-germinated and extreme seedling size, the maizeseeds were rolled (10 seeds per roll) in filter paper. Eachof them were placed vertically in a plastic flask, which con-tained 50 ml of the particular auxin-like substance (Table1). The whole procedure was done under dark conditionsat 20 �C and the evaluations were accomplished four dayslater.
The sterile tobacco leaf explants were placed in a MSmedium (Murashige and Skoog, 1962) supplemented withvitamins. The whole experiment was performed under a12 h photoperiod at 20 �C. The different substances werealways tested in parallel to achieve full comparability.

248 N. Ferro et al. / Phytochemistry 68 (2007) 237–250
The evaluation of data was performed after six weeks ofgrowing.
4.2. Outputs and design of biological variables
The main goal of this work is the comparison of the dif-ferent behaviour of compounds tested. Different outputvariables, referring to the diverse physiological effects weremeasured. For the maize experiment the variables were:primary root length (PRL), mesocotyl–coleoptil length(MCL) and number of secondary roots. For the tobaccoexperiments the variables were: root induction (R-ind), cal-lus induction (C-ind) and lethality.
Dealing with the output variables we developed othervariables able to perform a structure–activity analysis:ED50, minimal active concentration, maximal active con-centration, lethal concentration, variances. LogP wasobtained from SRC Physical Properties Database (http://www.syrres.com/esc/datalog.htm). Additionally, we resumean average value in respect to all the concentrations ana-lysed for each output variable, in an attempt to focus onthe molecular influence:
Y i ¼P yi
cj
� �P
cjð5Þ
where Yi the resume value, yi the mean per treatment and cj
is the concentration Three sets of concentrations were con-sidered for each variable: 10�9 M – 10�4 M, 10�9 M–10�7 M, and 10�7 M–10�4 M. Therefore we obtained threesets of concentrations for the different effects: PRL-94,PRL-97, PRL-74. The same type of classification was usedfor the other variables: mesocotyl-coleoptile length (MCL-94, MCL-97 and MCL-74); root induction (R-ind-94,R-ind-97 and R-ind-74), callus induction (C-ind-94,C-ind-97 and C-ind-74). Finally, the relative biological ef-fects of the molecules were statistically analysed by princi-pal component analysis to remove collinearity andrepetitive information among the predictor variables andto focus on causal effects.
4.3. Statistical assessment
First of all, a molecular representation, based on napht-oxyacetic acid, was carried out. This represents schemati-cally the atom positions of any kind of auxin - likemolecule, and it was able to be treated statistically (Fig. 7).
A statistical featuring of biological variables was doneusing a classification of the range standardized (�1 to 1)by different methods of cluster analysis. This yielded in aconsistent dendrogram with two groups of related vari-ables. Based on that, two different classifications of themolecules for each case were achieved.
The repetitive information of the similarity matrixes waseliminated by principal component analysis (Ferro et al.,2006b). These components can be considered to be a dis-creet distribution of the quantum objects within a three-
dimensional similarity space. Therefore, all molecules arenot exactly related from the quantum point of view andthe components are used to find relations with effects.
Next, discriminant analysis were performed to find rela-tionships between the biological classifications and molec-ular properties by means of both descriptors ofintermolecular interaction and quantum-chemical descrip-tors related to intramolecular electronic properties (Raev-sky, 1999; Ferro et al., 2006a). Lineal regression analysiswas carried out in particular cases, which were found tobe consistent with the phenomenological facts.
4.4. Molecular modelling and quantum molecular similarity
measures
The first molecular conformations were optimized usingthe MM+ force field (in the Hyperchem program), no cut-offs for non-bonded interactions and electrostatic interac-tion bond dipoles (Allinger, 1977) and additionally semi-empirical PM3 calculus (MOPAC v. 6, March 1997, Stew-art, 1991). Subsequently, the final geometry was performedwith quantum chemical optimizations at the ab initio level,with Hartree–Fock (HF) algorithm or density functionaltheory (DFT), using Gaussian 03W, Version 6. The basisset defined for most molecules was 6-31G* (Petersson andAl-Laham, 1991). In case of the remaining molecules,which includes iodine atoms the base CEP-31G was used(Stevens et al., 1984).
Next, an analysis of molecular quantum similarity mea-sure (MQSM) was applied to the molecules applied in thebiological tests. The quantum similarity methods used inthe present paper are essentially the same than thoseexposed in the previous work on auxins by the sameauthors (Ferro et al., 2006b). A molecular quantum simi-larity measure (MQSM) (Carbo et al., 1980) can be definedas the scalar product between the first-order molecular den-sity functions (DF) of two compared molecules, weightedby a non-differential positive definite operator (X):
ZABðXÞ ¼Z Z
qAðr1ÞXðr1; r2ÞqBðr2Þdr1 dr2 ð6Þ
where A and B are the two molecules being compared, r1
and r2 are the electron coordinates, and qA and qB the cor-responding first-order density functions.
According to the form of the weighting operator, differ-ent types of MQSM can be defined. As described previ-ously (Ferro et al., 2006b), two kinds of MQSM havebeen used in the present study: the so-called OverlapQSM (Carbo et al., 1980), and the Coulomb QSM (Carboand Domingo, 1987). The molecular DF has been adjustedusing the Promolecular Atomic Shell Approximation(ASA) (Girones et al., 1998; Amat and Carbo-Dorca,2000). This electron density fitting algorithm adjusts thefirst-order molecular electronic density functions to linearcombinations of spherically symmetric functions. In thepresent study, the presence of bromine and iodine atomsforced the selection of the Huzinaga basis set, which pro-

N. Ferro et al. / Phytochemistry 68 (2007) 237–250 249
vides fitted functions from H to Rn (Amat and Carbo-Dorca, 1999). The number of terms in the expansion ofthe atomic basis set for each atom can be found athttp://iqc.udg.es/cat/similarity/ASA/table432.html, whilstthe ASA exponents and coefficients for each atom can bedownloaded from the web site (http://iqc.udg.es/cat/simi-larity/ASA/Huzinaga432/).
Similarity measures also depend on the relative orienta-tion of the molecules being compared. In this study thefield–based maximum similarity superposition algorithm(Constans et al., 1997) was used to superimpose molecularstructures. Once calculated, the whole set of pairwiseMQSM are stored in the similarity matrix (SM):Z = {ZAB}, where Z is a squared matrix of dimension N,i.e. the number of molecules.
Acknowledgements
This work was supported by a grant from the DeutscheAkademischer Austauschdienst (DAAD) to N.F. and alsoby continuous support from the National Fund for Scien-tific Research in Flanders (FWO-Vlaanderen).
References
Abdel-Rahman, S.M., Kauffman, R.E., 2004. The integration of phar-macokinetics and pharmacodynamics: understanding dose–response.Ann. Rev. Pharm. Tox. 44, 111–136.
Allinger, N.L., 1977. Conformational-analysis.130. Mm2 - hydrocarbonforce-field utilizing V1 and V2 torsional terms. J. Am. Chem. Soc. 99,8127–8134.
Amat, L., Carbo-Dorca, R., 1999. Fitted electronic density functions fromH to Rn for use in quantum similarity measures: cis-diammine-dichloroplatinum(II) complex as an application example. J. Comp.Chem. 20, 911–920.
Amat, L., Carbo-Dorca, R., 2000. Molecular electronic density fittingusing elementary Jacobi rotations under atomic shell approximation. J.Chem. Inform. Mod. 40, 1188–1198.
Bandurski, R.S., Nonhebel, H., 1985. Auxins. In: Wilkins, M. (Ed.),Advanced Plant Physiology. Pitman, London, pp. 1–20.
Barley, K., 2004. Why hypocotyl extension mutants need to be charac-terized at the cell level: a case study of axr3-1. J. Exp. Bot. 55, 1071–1078.
Benkova, E., Michniewicz, M., Sauer, M., Teichmann, T., Seifertova, D.,Jurgens, G., Friml, J., 2003. Local, efflux-dependent auxin gradients asa common module for plant organ formation. Cell 115, 591–602.
Bertosa, B., Kojic-Prodic, B., Wade, R.C., Ramek, M., Piperaki, S.,Tsantili-Kakoulidou, A., Tomic, S., 2003. A new approach to predictthe biological activity of molecules based on similarity of theirinteraction fields and the logP and logD values: application to auxins.J. Chem. Inform. Mod. 43, 1532–1541.
Campanoni, P., Nick, P., 2005. Auxin-dependent cell division and cellelongation. 1-Naphthaleneacetic acid and 2,4-dichlorophenoxyaceticacid activate different pathways. Plant Physiol. 137, 939–948.
Carbo, R., Domingo, L., 1987. LCAO-MO similarity measures andtaxonomy. Int. J. Quantum Chem. 32, 517–545.
Carbo-Dorca, R., Girones, X., 2004. Quantum similarity and quantumstructure–activity relationships. In: Bultinck, P., De Winter, H.,Langenaeker, W., Tollenaere, J.P. (Eds.), Computational MedicinalChemistry for Drug Discovery. Marcel Dekker, Inc., New York, pp.365–385.
Carbo, R., Leyda, L., Arnau, M., 1980. How similar is a molecule toanother? – An electron-density measure of similarity between twomolecular-structures. Int. J. Quantum Chem. 17, 1185–1189.
Carreno-Lopez, R., Campos-Reales, N., Elmerich, C., Baca, B.E., 2000.Physiological evidence for differently regulated tryptophan-dependentpathways for indole-3-acetic acid synthesis in Azospirillum brasilense.Mol. Gen. Genet. 264, 521–530.
Chattadaj, P.K., Nath, S., Maiti, B., 2004. Reactivity descriptors. In:Bultinck, P., De Winter, H., Langenaeker, W., Tollenaere, J.P. (Eds.),Computational Medicinal Chemistry for Drug Discovery. MarcelDekker, Inc., New York, pp. 365–385.
Chen, J.G., Shimomura, S., Sitbon, F., Sandberg, G., Jones, A.M., 2001.The role of auxin-binding protein 1 in the expansion of tobacco leafcells. Plant J. 28, 607–617.
Constans, P., Amat, L., Carbo-Dorca, R., 1997. Toward a globalmaximization of the molecular similarity function: Superposition oftwo molecules. J. Comp. Chem. 18, 826–846.
Cooke, T.J., Poli, D., Cohen, J.D., 2003. Did auxin play a crucial role inthe evolution of novel body plans during the Late Silurian–EarlyDevonian radiation of land plants? In: Hemsley, A.R., Poole, I. (Eds.),The Evolution of Plant Physiology. Elsevier Ltd, San Diego, CA, pp.85–107.
Cooke, T.J., Poli, D., Sztein, A.E., Cohen, J.D., 2002. Evolutionarypatterns in auxin action. Plant Mol. Biol. 49, 319–338.
Dibbfuller, J.E., Morris, D.A., 1992. Studies on the evolution of auxincarriers and phytotropin receptors – transmembrane auxin transport inunicellular and multicellular chlorophyta. Planta 186, 219–226.
Erickson, R.O., 1976. Modeling of plant growth. Ann. Rev. Plant Physiol.Plant Mol. Biol. 27, 407–434.
Farrimond, J.A., Elliott, M.C., Clack, D.W., 1980. Auxin structure–activity-relationships – benzoic-acids and phenols. Phytochemistry 19,367–371.
Ferro, N., Tacoronte, J.E., Reinard, T., Bultinck, P., Montero, L.A.,2006a. Structure–activity analysis on ecdysteroids: a structural andquantum chemical approach based on two biological systems.THEOCHEM 758, 263–274.
Ferro, N., Gallegos, A., Bultinck, P., Jacobsen, H.-J., Carbo-Dorca, R.,Reinard, T., 2006b. Coulomb and overlap self-similarities: a compar-ative selectivity analysis of structure–function relationships for auxin-like molecules. J. Chem. Inf. Model. 46, 1751–1762.
Gafurov, R.G., Zefirov, N.S., 2004. Strategy of chemical design ofphytoregulators and stress protectors with the given properties. Dokl.Biol. Sci. 399, 481–483.
Gilman, J.J., 1997. Chemical and physical hardness. Mater. Res. Innov. 1,71–76.
Girones, X., Amat, L., Carbo-Dorca, R., 1998. A comparative study ofisodensity surfaces using ab initio and ASA density functions. J. Mol.Graphics Modelling 16, 190–196.
Gribble, G.W., 1999. The diversity of naturally occurring organobrominecompounds. Chem. Soc. Rev. 28, 335–346.
Harper, D.B., Wain, R.L., 1969. Studies on plant growth-regulatingsubstances. XXX. The plant growth-regulating activity of substitutedphenols. Ann. Appl. Biol. 64, 395–407.
Harper, D.B., Wain, R.L., 1971. Studies on plant growth-regulatingsubstances. XXXI. The metabolism of certain 2,6-disubstituted phe-nols within plant tissue. Ann. Appl. Biol. 67, 395–408.
He, R.-Y., Wang, G.-J., Wang, X.-S., 1991. Effects of brassinolide ongrowth and chilling resistance of maize seedlings. In: Cutler, H.G.C.,Yokota, T., Adam, G. (Eds.), Brassinosteroids – Chemistry, Bioactiv-ity and Applications, ACS Symposium Series, vol. 474. AmericanChemical Society, Washington, DC, pp. 220–230.
Hunter, C.A., Lawson, K.R., Perkins, J., Urch, C.J., 2001. Aromaticinteractions. J. Chem. Soc. Perkin Trans. 2, 651–669.
Jones, A.M., 1994. Auxin-binding proteins. Ann. Rev. Plant Physiol. 45,393–420.
Jones, A.M., Im, K.H., Savka, M.A., Wu, M.J., DeWitt, N.G., Shillito,R., Binns, A.N., 1998. Auxin-dependent cell expansion mediated byoverexpressed auxin-binding protein 1. Science 282, 1114–1117.

250 N. Ferro et al. / Phytochemistry 68 (2007) 237–250
Jonsson, A., 1955. Synthetic plant hormones. VIII. Relationship betweenchemical structure and plant growth activity in the arylalkyl-,aryloxyalkyl- and indole-alkylcarboxylic acid series. Svensk Kem.Tidskr. 67, 166–187.
Jonsson, A., 1961. Chemical structure and growth activity of auxins andantiauxins. In: Ruhland, W. (Ed.), Encyclopedy of Plant Physiology,vol. 14. Springer, Berlin, pp. 959–1006.
Kaethner, T.M., 1977. Conformational change theory for auxin structure–activity-relationships. Nature 267, 19–23.
Katekar, G.F., 1979. Auxins – nature of the receptor-site and molecularrequirements for auxin activity. Phytochemistry 18, 223–233.
Katekar, G.F., Geissler, A.E., 1982. Auxins II: the effect of chlorinatedindolylacetic acids on pea stems. Phytochemistry 21, 257–260.
Katekar, G.F., Geissler, A.E., 1983. Structure–activity differences betweenindoleacetic acid auxins on pea and wheat. Phytochemistry 22, 27–31.
Koepfli, J.B., Thimann, K.V.a., Went, F.W., 1938. Phytohormones:structure and physiological activity. J. Biol. Chem. 122, 763–780.
Kulaeva, O.N., Prokoptseva, O.S., 2004. Recent advances in the study ofmechanisms of action of phytohormones. Biochemistry-Moscow 69,233–247.
Leonovich, S.A., 2004. Phenol and lactone receptors in the distal sensillaof the Haller’s organ in Ixodes ricinus ticks and their possible role inhost perception. Exp. Appl. Acarol. 32, 89–102.
Marinos, N.G., 1960. Some responses of avena coleoptiles to ethylene. J.Exp. Bot. 11, 227–235.
Murashige, T., Skoog, F., 1962. A revised medium for rapid growth andbioassays with tobacco tissue cultures. Physiol. Plant. 15, 473–497.
Napier, R.M., David, K.M., Perrot-Rechenmann, C., 2002. A shorthistory of auxin-binding proteins. Plant Mol. Biol. 49, 339–348.
Niklas, K.J., 2003. The bio-logic and machinery of plant morphogenesis.Am. J. Bot. 90, 515–525.
Paciorek, T., Zazimalova, E., Ruthardt, N., Petrasek, J., Stierhof, Y.D.,Kleine-Vehn, J., Morris, D.A., Emans, N., Jurgens, G., Geldner, N.,Friml, J., 2005. Auxin inhibits endocytosis and promotes its own effluxfrom cells. Nature 435, 1251–1256.
Paponov, I.A., Teale, W.D., Trebar, M., Blilou, K., Palme, K., 2005. ThePIN auxin efflux facilitators: evolutionary and functional perspectives.Trends Plant Sci. 10, 170–177.
Pearson, R.G., 1986. Absolute electronegativity and hardness correlatedwith molecular-orbital theory. Proc. Nat. Acad. Sci. USA 83, 8440–8441.
Petersson, G.A., Al-Laham, M.A., 1991. A complete basis set modelchemistry. II. Open-shell systems and the total energies of the first-rowatoms. J. Chem. Phys. 94, 6081–6090.
Porter, W.L., Thimann, K.V., 1965. Molecular requeriments for auxinaction I. Halogenated indoles and indoleacetic acid. Phytochemistry 4,229–243.
Raevsky, O.A., 1999. Descriptors of molecular structure in computer-aided design of biologically active compounds. Uspekhi Khimii 68,555–576.
Roesel, H.A., Haber, A.H., 1963. Studies of effects of light on growthpattern and of gibberellin sensitivity in relation to age, growth rate,and illumination in intact wheat coleoptiles. Plant Physiol. 38, 523.
Samanta, U., Pal, D., Chakrabarti, P., 1999. Packing of aromatic ringsagainst tryptophan residues in proteins. Acta Crystallogr. D 55, 1421–1427.
Sexton, W.A., 1963. Chemical Constitution and Biological Activity. E. &F.N. Spon Ltd., London.
Sola, M., Mestres, J., Oliva, J.M., Duran, M., Carbo, R., 1996. The use ofab initio quantum molecular self-similarity measures to analyzeelectronic charge density distributions. Int. J. Quantum Chem. 58,361–372.
Stevens, W.J., Basch, H., Krauss, M., 1984. Compact effective potentialsand efficient shared-exponent basis sets for the first- and second-rowatoms. J. Chem. Phys. 81, 6026.
Stewart, J.J.P., 1991. Optimization of parameters for semiempiricalmethods. 3. Extension of Pm3 to Be, Mg, Zn, Ga, Ge, as, Se,Cd, in, Sn, Sb, Te, Hg, Tl, Pb, and Bi. J. Comp. Chem. 12, 320–341.
Taylor, R., 2002. Life-science applications of the Cambridge StructuralDatabase. Acta Crystallogr. D 58, 879–888.
Thimann, K.V., Schneider, L.C., 1938. Differential growth in plant tissues.Am. J. Bot. 25, 627–641.
Thimann, K.V., Schneider, L.C., 1939. Differential growth in plant tissues.II. a modified auxin test of high sensitivity. Am. J. Bot. 26, 792–797.
Thimann, K.V., 1958. Auxin activity of some indole derivatives. PlantPhysiol. 33, 311–321.
Vaes, W.H.J., Hamwijk, C., Ramos, E.U., Verhaar, H.J.M., Hermens,J.L.M., 1996. Partitioning of organic chemicals to polyacrylate-coated solid phase microextraction fibers: kinetic behavior andquantitative structure–property relationships. Anal. Chem. 68, 4458–4462.
Veldstra, H., 1944. Researches on plant growth substances IV. Relationbetween chemical structure and physiological activity I. Enzymologia11, 97–136.
Went, F.W., 1935. Auxin, the plant-growth hormone. Bot. Rev. 1, 162–181.
Went, F.W., Thimann, K.V., 1937. Phytohormones. Macmillan Com-pany, New York.
Went, F.W., 1945. Auxin, the plant-growth hormone 2. Bot. Rev. 11, 487–496.
Whitfield, F.B., Helidoniotis, F., Shaw, K.J., Svoronos, D., 1999.Distribution of bromophenols in species of marine algae from easternAustralia. J. Agric. Food Chem. 47, 2367–2373.
Woodward, A.W., Bartel, B., 2005. Auxin: regulation, action, andinteraction. Ann. Bot. London 95, 707–735.
Xia, J., Noronha, A., Toudjarska, I., Li, F., Akinc, A., Braich, R., Frank-Kamenetsky, M., Rajeev, K.G., Egli, M., Manoharan, M., 2006. Genesilencing activity of siRNAs with a ribo-difluorotoluyl nucleotide. ACSChem. Biol. 1, 176–183.
Zevallos, J., Toro-Labbe, A., 2003. A theoretical analysis of the Kohn–Sham and Hartree–Fock orbitals and their use in the determination ofelectronic properties. J. Chil. Cem. Soc. 48, 1–22.
Zhang, N.G., Hasenstein, K.H., 2000. Halogenated auxins affect micro-tubules and root elongation in Lactuca sativa. J. Plant Growth Regul.19, 397–405.