Embed Size (px)
Citation preview
22nd National Children’s Science Congress 2014
ACTIVITY GUIDE
Focal Theme:
Understanding Weather and Climate
State Co-ordinator : Shri M.N. MustoorappaState Academic Co-ordinator : Shri T.G. Krishnamurthy Raj Urs
Shri Pandit K. Balure
State Co-ordinating Agency
Karnataka Rajya Vijnana ParishatVijnana Bhavan, No. 24/2, 21st Main, BSK II Stage, Bangalore-560 070
Telephone: 080-26718939, Telefax: 080-26718959 Email: [email protected], Web: www.krvp.org
22nd National Children’s Science Congress 2014 2ACTIVITY GUIDE
22nd NCSC Activity Guide-2014This resource material compiled in this publication was developed during the Brainstorming workshop held at Chennai, Many suggestions given at the National Orientation workshop conducted by RVPSP-DST Government of India and NCSTC-Network, New Delhi.
The softcopy of the NCSC 2014 Activity Guide is available at www.ncstc-network.org & www.krvp.org
Size : 1/4 Demi
Pages : 112
Karnataka Rajya Vijnana Parishat, Bangalore
Copies : 1000
Cover Page Photos by Prabhu S. Math
Published by Hon. Secretary Karnataka Rajya Vijnana Parishat ‘Vijnana Bhavan’, 24/2, 21st Main, BSK II Stage, Bangalore-560 070E-mail: [email protected]: www.krvp.org
Catalysed and supported by National Council for Science and Technology Communication (NCSTC) Department of Science and Technology Technology Bhavan New Mehrauli Road New Delhi – 110016Email ID – [email protected] – 01126535564/26590251
Printed atM/s Sri Guru Printers, Bangalore
22nd National Children’s Science Congress 20143 ACTIVITY GUIDE
Contents
NCSTC-Network 4
Rashtriya Vigyan Evam Prodyogiki Sanchar Parishad 5
Karnataka Rajya Vijnana Parishat 6
Forword 7
The Secretary’s Desk 8
About Children’s Science Congress (CSC)-2014 9-23
Focal Theme : Understanding Weather and Climate
Sub-Theme: I - Weather and Climate around you 24-31
Sub-Theme: II - Impact of Human Activities on Weather and Climate 32-36
Sub-Theme: III - Weather, Climate and Ecosystems 37-42
Sub-Theme: IV - Weather, Climate – Society and Culture 43-59
Sub-Theme: V - Weather,Climate and Agriculture 60-72
Sub-Theme: VI - Weather, Climate, and Health 73-85
ANNEXURES
Annexure-1: Tips for Writing CSC Project 86
Annexure-2: Project Report Format 87
Annexure-3: Guidelines for Evaluators 88-92
Annexure-4: List of Dist Coordinators and Academic Coordinators 93-98
Annexure-5: Education Department Govt. Order 99
Annexure-6: O.O.D. Facility for Government Employees 100
Annexure-7: List of Executive Committee Members of KRVP 101-103
Annexure-8: NCSC Proforma Details 104-112
22nd National Children’s Science Congress 2014 4ACTIVITY GUIDE
NCSTC-Network The NCSTC-Network, a voluntary network of over 70 voluntary and government organizations, is a unique organization for science popularization and for stimulation of scientific temperament among the people. It was registered in 1991 under Societies Registration Act-1860 of Delhi as an autonomous society.
The NCSTC-Network was formed through the effort of the National Council for Science and Technology Communication (NCSTC) under the Department of Science and Technology, Government of India to give a common platform to like minded organizations in science communication, with an objective to strengthen the science communication movement in the country.
What followed has watched by all. The Network remains a unique and successful experiment in science popularization, bringing the government and non-government sectors together in nation building exercise. It publishes books, co-ordinates and organises National Children’s Science Congress (NCSC), arranges science programmes, organizes trainings / workshops and in short, bridges science and the common person.
Major Activities:1. The most visible activity of the Network is the National Children’s Science Congress (NCSC) which is
being catalysed and supported by NCSTC. It is a unque programme for children in the age group 10 - 17. NCSC gives a common platform for the children of the country to present their scientific realization through small research project on given focal theme. It records participation of around five lakh children every year.
2. National Teachers’ Science Conference (NTSC): It is a nationwide activity. Network has been entrusted to organize this activity since the year 2005 by NCSTC. It organized the 3rd NTSC at Mysore during 27-30 January 2006 and would continue to provide this platform for the teaching community for sharing their experience of innovation in teaching - learning process.
3. Appreciating Physics in Everyday Life: the year 2005 was celebrated as the International Year of Physics. During the celebration the necessity of a nation wide campaign was felt to take applications and concepts of physics to a large number of young people through some intensive science communication activities. Network has taken up the challenge, which is being catalysed and supported by NCSTC, and has already organised a series of activities through its membeer organizations throughout the country.
4. Apart from all these activities Network was an active component in the Bharat Jan Gyan Vigyan Jatha 1992 and the Year of Scientific Awareness (YSA) 2004. In both these activities most of the Network members took active part at state and regional level. In YSA-2004 the network played a crucial role in printing and dissemination of the software.
The NCSTC-Network is now ready to take some more challenges like popularizing the concept of donation of body after death, science communication programme for girl child, etc.
To know more about the NCSTC Network you may visit its website www.ncstc-network.org
Address for communication:NCSTC-Network, E-56, Ist Floor, Samaspur RoadPandav Nagar, Delhi - 110 091, Telefax: 011-22799236E-mail: [email protected]
22nd National Children’s Science Congress 20145 ACTIVITY GUIDE
Rashtriya Vigyan Evam Prodyogiki Sanchar Parishad
Rastriya Vigyan Evam Prodyogiki Sanchar Parishad (RVPSP), New Delhi, Department of Science and Technology, is an apex body set up with the objectives of communication of science and technology (S&T) and stimulation of scientific and technological temper among the people. Among other things RVPSP:
• Catalyzes and supports research and development in the area of S&T communication and devising more effective communication methods, tools and technologies;
• develops software in different languages in the form of films, websites, radio and television programmes and magazines in different languages;
• helps prepare competent science communicators, through short and long-term courses in selected S&T based voluntary organizations, Universities, etc.
• encourages and recognizes outstanding, communicators and institutions involved in S&T communication through national awards.
• Organizes state / country wide field projects for fulfilling its objectives by involving other agencies and network of science based voluntary organizations, etc. These can be in the form of Jathas, melas, science exhibitions, science conferences, seminars, etc.
• It also orchestrates and coordinates S&T communication programmes and activities nationally. RVPSP is initiating process to encourage creativity among youth and invites suggestions and inputs for this.
For further details, please contact:
Head, Rastriya Vigyan Evam Prodyogiki Sanchar Parishad (RVPSP),Department of Science and Technology, Technology Bhawan,New Mehrauli Road, New Delhi - 110016Phone: 011-26567373, Telefax : 011-26960207
22nd National Children’s Science Congress 2014 6ACTIVITY GUIDE
KARNATAKA RAJYA VIJNANA PARISHAT
Karnataka Rajya Vijnana Parishat (KRVP) was established as a voluntary organization in the year 1980 with a few units at various places in Karnataka. Committed to the task of popularizing S & T through various channels of activities and communications, KRVP today is a federal structure of a network of more than 300 units spread all over Karnataka. The Head office is located at the Vijnana Bhavana, Banashankari 2nd Stage , Bangalore. Karnataka Rajya Vijnana Parishat is a member of All India People’s Science Network and NCSTC- Network.
OBJECTIVES
* Advancement of science, scientific attitude and science education (both formal and non-formal) in Karnataka, especially in rural areas.
* Propagation of scientific knowledge among the people of the state by organizing lectures, seminars, symposia, forums, excursions, exhibitions, publication and distribution of books and journals on science, especially in Kannada.
* Publication of science periodicals, books in Kannada, production of scientific films and audio visual aids, science kits and toys, organizing environment camps, seminars, workshops, training for science teachers in science communication and camps regarding health and hygiene are some of the major programmes. Organizing Children’s Science Congress at State level and participating at National level Congress is another important event coordinated by KRVP. The National Children’s Science Congress - 2002 was organized by KRVP at Mysore.
The Parishat organizes a science conference at the State level once in every three years. Science writer’s workshops, telescope making, balotsavas, environment awareness programmes, birth centenaries of scientists, exploring myths of blind beliefs, helping the State to set up eco-clubs, Student and Scientist Interaction Programme, science centres in schools and special environment projects are many of the programmes handled by KRVP.
22nd National Children’s Science Congress 20147 ACTIVITY GUIDE
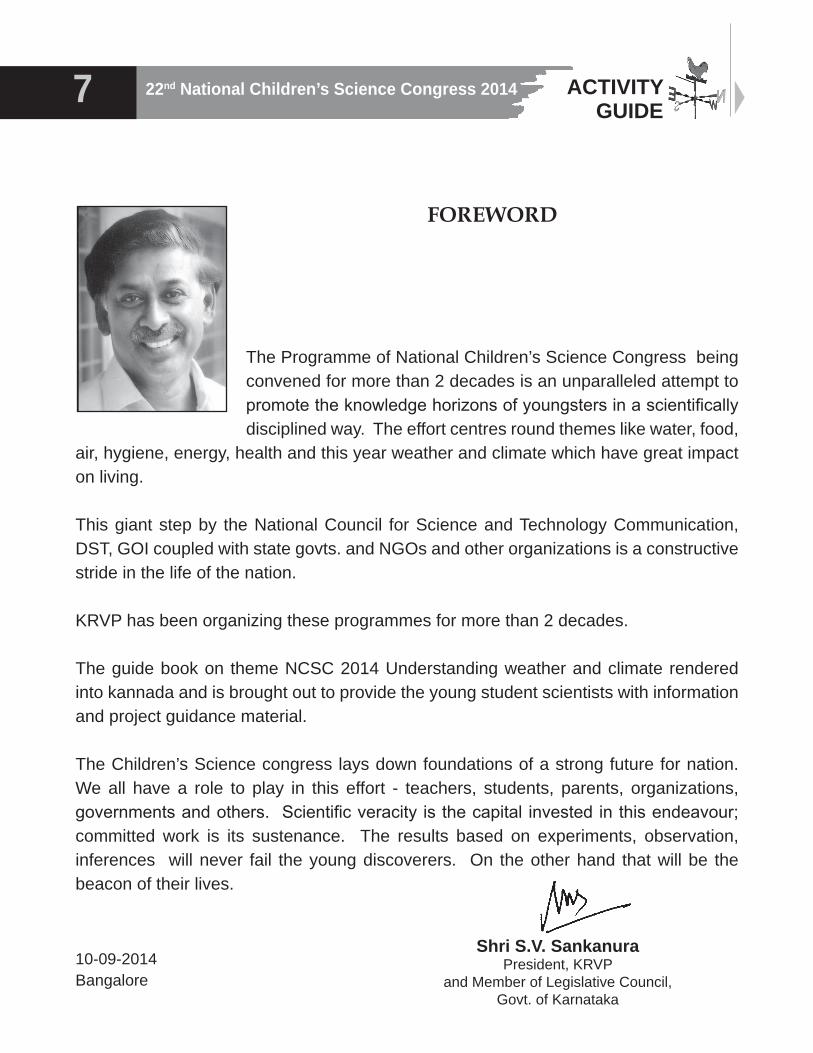
The Programme of National Children’s Science Congress being convened for more than 2 decades is an unparalleled attempt to promote the knowledge horizons of youngsters in a scientifically disciplined way. The effort centres round themes like water, food,
air, hygiene, energy, health and this year weather and climate which have great impact on living.
This giant step by the National Council for Science and Technology Communication, DST, GOI coupled with state govts. and NGOs and other organizations is a constructive stride in the life of the nation.
KRVP has been organizing these programmes for more than 2 decades.
The guide book on theme NCSC 2014 Understanding weather and climate rendered into kannada and is brought out to provide the young student scientists with information and project guidance material.
The Children’s Science congress lays down foundations of a strong future for nation. We all have a role to play in this effort - teachers, students, parents, organizations, governments and others. Scientific veracity is the capital invested in this endeavour; committed work is its sustenance. The results based on experiments, observation, inferences will never fail the young discoverers. On the other hand that will be the beacon of their lives.
Shri S.V. SankanuraPresident, KRVP
and Member of Legislative Council, Govt. of Karnataka
FOREWORD
10-09-2014 Bangalore
22nd National Children’s Science Congress 2014 8ACTIVITY GUIDE
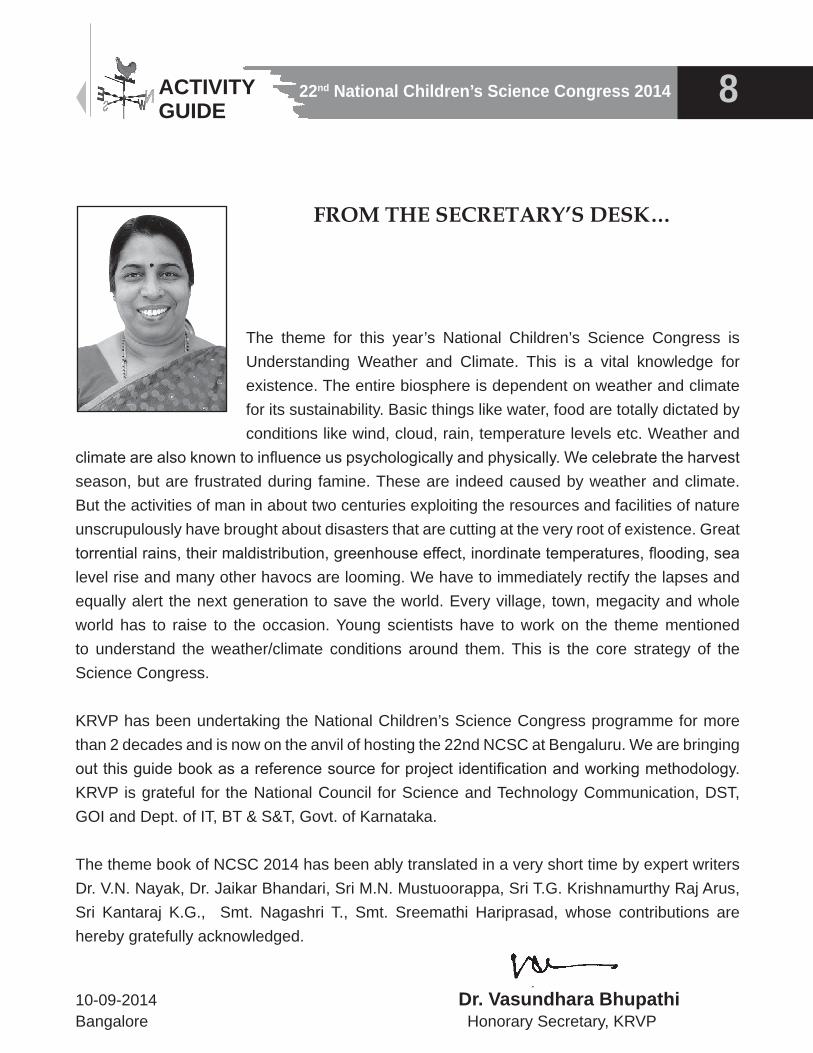
The theme for this year’s National Children’s Science Congress is Understanding Weather and Climate. This is a vital knowledge for existence. The entire biosphere is dependent on weather and climate for its sustainability. Basic things like water, food are totally dictated by conditions like wind, cloud, rain, temperature levels etc. Weather and
climate are also known to influence us psychologically and physically. We celebrate the harvest season, but are frustrated during famine. These are indeed caused by weather and climate. But the activities of man in about two centuries exploiting the resources and facilities of nature unscrupulously have brought about disasters that are cutting at the very root of existence. Great torrential rains, their maldistribution, greenhouse effect, inordinate temperatures, flooding, sea level rise and many other havocs are looming. We have to immediately rectify the lapses and equally alert the next generation to save the world. Every village, town, megacity and whole world has to raise to the occasion. Young scientists have to work on the theme mentioned to understand the weather/climate conditions around them. This is the core strategy of the Science Congress.
KRVP has been undertaking the National Children’s Science Congress programme for more than 2 decades and is now on the anvil of hosting the 22nd NCSC at Bengaluru. We are bringing out this guide book as a reference source for project identification and working methodology. KRVP is grateful for the National Council for Science and Technology Communication, DST, GOI and Dept. of IT, BT & S&T, Govt. of Karnataka.
The theme book of NCSC 2014 has been ably translated in a very short time by expert writers Dr. V.N. Nayak, Dr. Jaikar Bhandari, Sri M.N. Mustuoorappa, Sri T.G. Krishnamurthy Raj Arus, Sri Kantaraj K.G., Smt. Nagashri T., Smt. Sreemathi Hariprasad, whose contributions are hereby gratefully acknowledged.
10-09-2014 Dr. Vasundhara BhupathiBangalore Honorary Secretary, KRVP
FROM THE SECRETARY’S DESK…
22nd National Children’s Science Congress 20149 ACTIVITY GUIDE
Part-I1.0. About Children’s Science Congress (CSC)
1.1. CSC – the beginning
The seeds of the programme of children’s science congress (CSC), in the way of an exercise to carry out small research activities at micro-level were planted in Madhya Pradesh by an NGO called Gwalior Science Center. It was later adopted by National Council for Science and Technology Communication (NCSTC), Department of Science and Technology (DST), Government of India for carrying out national level activities through NCSTC-Network (a network of Non-Government and Government organizations working in the field of science popularization) as national organiser. It was a time when many of the country’s crusaders of science communication were experienced with massive science communication exercise of Bharat Jana Bigyan Jatha and Bharat Jana Gyan Bigyan Jatha. It was felt that the large scale activities for developing scientific awareness among the masses are to be continued as regular activity, so, this programme was launched nationwide in 1993, under the nomenclature of National Children’s Science Congress (NCSC), with an expectation that it would generate scientific temperament among the teachers and students, and spread among various stakeholders of the society. The programme of NCSC has been fruitfully conducted for the last 21 years.
1.2. CSC – an overview
Children’s Science Congress is targeted to spread the concept of the method of science among the children through their project activities adopting the principle of ‘Learning through doing’. The mandate of participation is that, the children will carry out a project on a particular topic in relation to theme and sub-theme decided for the year. The study is to be carried out in the neighbourhood of the children where they live in. For this, the students form a group with their like-minded friends/classmates and the study is carried out under the supervision of a guide. It is noteworthy that, CSC programme is not only for the school going children but is also open for the children outside the formal boundary of schools, in the age group of 10 to 17 years (where 10 to 14 years is considered as junior group and 14 to 17 years as senior group). Further, it is not mandatory that a guide must be a school teacher; any person with fair knowledge of dealing with children and method of science is considered eligible to guide the children.
The exercises of project activities, as a thumb rule, encourage the children to explore, think, serve and wonder. It is capable to imbibe the following temperament/quality/skill of the children:
• Observation,• Making measurement, • Making comparison and contrasts, • Classification,• Estimation, • Prediction,
22nd National Children’s Science Congress 2014 10ACTIVITY GUIDE
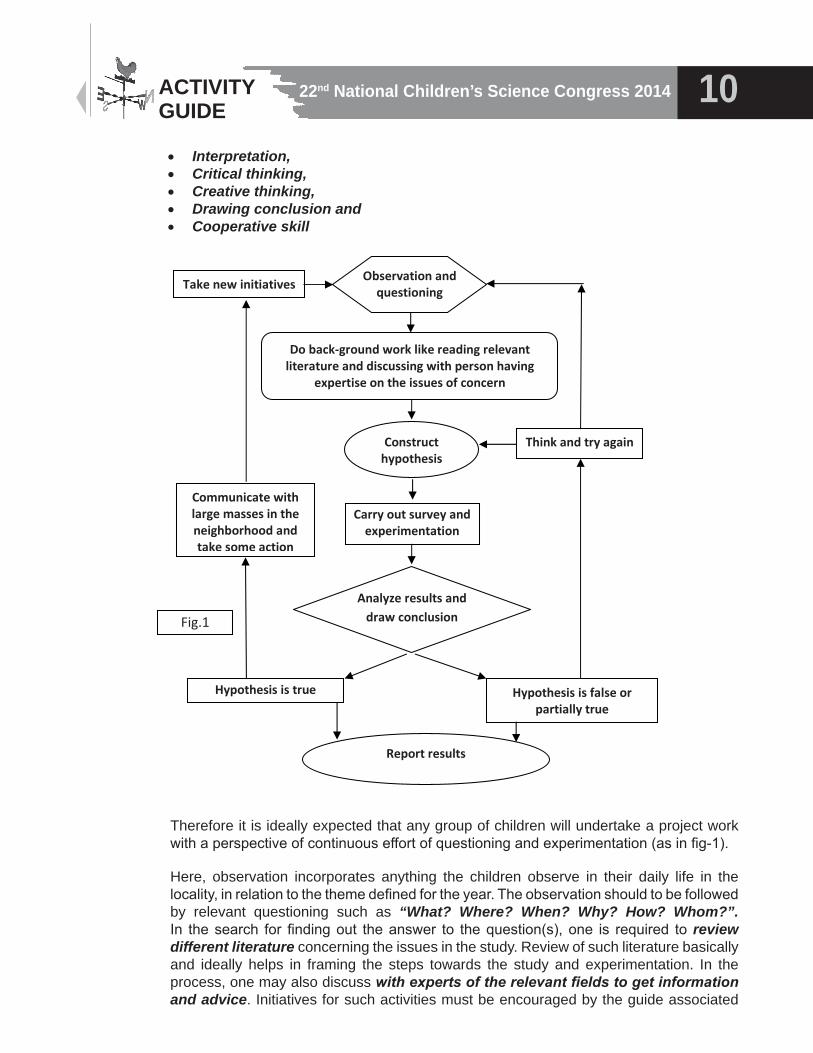
Therefore it is ideally expected that any group of children will undertake a project work with a perspective of continuous effort of questioning and experimentation (as in fig-1).
Here, observation incorporates anything the children observe in their daily life in the locality, in relation to the theme defined for the year. The observation should to be followed by relevant questioning such as “What? Where? When? Why? How? Whom?”. In the search for finding out the answer to the question(s), one is required to review different literature concerning the issues in the study. Review of such literature basically and ideally helps in framing the steps towards the study and experimentation. In the process, one may also discuss with experts of the relevant fields to get information and advice. Initiatives for such activities must be encouraged by the guide associated
3
Think and try again
Observation and questioning
Do back‐ground work like reading relevant literature and discussing with person having
expertise on the issues of concern
Construct hypothesis
Carry out survey and experimentation
Analyze results and draw conclusion
Hypothesis is true Hypothesis is false or partially true
Report results
Communicate with large masses in the neighborhood and take some action
Take new initiatives
Fig.1
• Interpretation, • Critical thinking, • Creative thinking, • Drawing conclusion and • Cooperative skill
22nd National Children’s Science Congress 201411 ACTIVITY GUIDE
with the project. These steps will help to frame assumption/hypothesis. Hypothesis is an assumption of some causes and its impact on the basis of observation, information collected from different literature and emerged from discussion with experts. After these phases, actual study through survey or experimentation or survey followed by experimentation would start. In the case of survey-based work, identification of respondent, their unit of observation, sample coverage, design of survey in relation to designing of interview schedule or questionnaire is supposed to be the most critical steps. Such decisions may vary with the issues of study. On the other hand, in case of experimentation, setting the objective of experimentation, defining different parameters, identification of ideal instruments, framing of procedures/steps and control along with repetitive observation of the experiments are critical decisions, which will determine the path towards the result. Again in relation to issues of study, such experiment may be either laboratory experiments or field experiments.
It is expected that in course of time, the children’s project will bring in lots of new information about problems and prospects of their locality along with innovative ideas to address these issues. Moreover, in the course of project work, the children may develop different new approaches of study along with the development of different instruments for their experiments. Such tools/instruments may be developed with the material in their access / available to them nearby. Another expectation was that the outcome of different studies will be communicated among the local populace, which in turn, helps in generating scientific temperament among the general mass.
In a nutshell, the CSC projects are simple, innovative, concerned with local issues related with day to day life, carried out in very nominal cost, where the focus is more on logical interpretation and analysis of issues, and finding out pragmatic solutions of generic nature to the possible extent, and not merely confined to the study topic and corresponding model making.
1.3. Objectives
The primary objectives of the Children’s Science Congress is to make a forum available to children of the age-group of 10-17 years, both from formal school system as well as from out of school, to exhibit their creativity and innovativeness and more particularly their ability to solve a societal problem experienced locally using the method of-science.
By implication, the CSC prompts children to think of some significant societal problem, ponder over its causes and subsequently try and solve the same using the scientific process. This involves close and keen observation, raising pertinent questions, building models, predicting solutions on the basis of a model, trying out various possible alternatives and arriving at an optimum solution using experimentation, field work, research and innovative ideas. The Children’s Science Congress encourages a sense of discovery. It emboldens the participants to question many aspects of our progress and development and express their findings in vernacular.
1.4. Relevance of CSC in the light of contemporary educational initiatives
The basic approach of CSC on the principle of learning through doing on the issues of children’s immediate environment significantly caries the sprit and mandate of
22nd National Children’s Science Congress 2014 12ACTIVITY GUIDE
Education for Sustainable Development (ESD) of UNESCO, National Curriculum Framework (NCF,2005) and Right to Education(RTE,2009).
The modalities and approaches of CSC cater to the five pillars of learning of Education for Sustainable Development vividly, viz. learning to know, learning to do, learning to live together, and learning to be, learning to transform one self and society (Declaration of ESD in the 57th meeting of the United Nations General Assembly in December 2002, which proclaimed the UN Decade of Education for Sustainable Development, 2005- 2014, refer – www.desd.org and www.unesco.org)
The mandate of CSC which encourage Children’s to observe, explore, experiments and wonder through a project activities and its associated ways of participation and evaluation rightly take care of the guiding principles of the NCF,2005. Therefore, example of Children’s Science Congress is rightly cited in the NCF documents under executive summery section, page ix (http://www.teindia.nic.in/Files/NCF-2005.pdf) .
Similarly CSC activities also helps in materializing the approach of learning as framed in the Right of Children of Free and Compulsory Education (RTE) Act, 2005 (particularly in relation to article 6.1, section C (ii, iii, iv and v)).
More over the CSC activities, since 1993, has catered to many of the approaches and priorities of science education visualized in the National Programme of Sarba Siksha Abhijan (SSA) (refer SSA framework, htp//ssakarnataka.gov.in/pdfs/aboutus/ ssa_framework%20.pdf) and Rastriya Madhamik Siskha Abhijan (RMSA) ( refer - http://www.educationforallinindia.com/rastriya-madhymic-shiksha-mission-RMSM.pdf).
1.5. Eligibility of participants
• It is open for children in the age of 10 to 14 years (lower age group) and from 14+ to 17 years (upper age group) as on December 31 of the calendar year.
• A group of children not exceeding five, can do the project –study under a teacher guide.
• A child scientist, who had already presented as a Group Leader at the National Level in one age-group, can act as a co-worker in the subsequent year, in the same age group (lower / upper).
• Parents, whose child would participate in the Children’s Science Congress in the ensuing year, should not hold any portfolio in the organizing committee of the CSC conducted at any level.
1.6. Modalities of participation
Following are major steps involved for participation in the CSC
“A social movement along the lines of Children’s Science Congress should be visualised in order to promote discovery learning across the nation, and eventually throughout South Asia.” - National Curriculum Framework 2005, Executive Summary, Page (ix)
22nd National Children’s Science Congress 201413 ACTIVITY GUIDE
1.7. Nature of CSC Project
The CSC projects are:
• Innovative, simple and practical;• Representing teamwork;• Based on exploration of everyday life-situations;• Involving Experimentation and/or field based data collection;• Having definite outputs, arrived through scientific methodology;• Related directly to community work in the local geographical area;• Having follow-up plans.
1.8. Criteria of Good Projects
As per past experience it has been found that projects which were rated very good had the following elements while implementing and documenting the project:• Proper understanding and definition of the problem undertaken.• Quality and quantity of work, including team work, learning process, subject
understanding and efforts to validate the data collected.• Relevance of the proposal to the community/school problem and impact of project on
schoolmates, neighbourhood community.
5
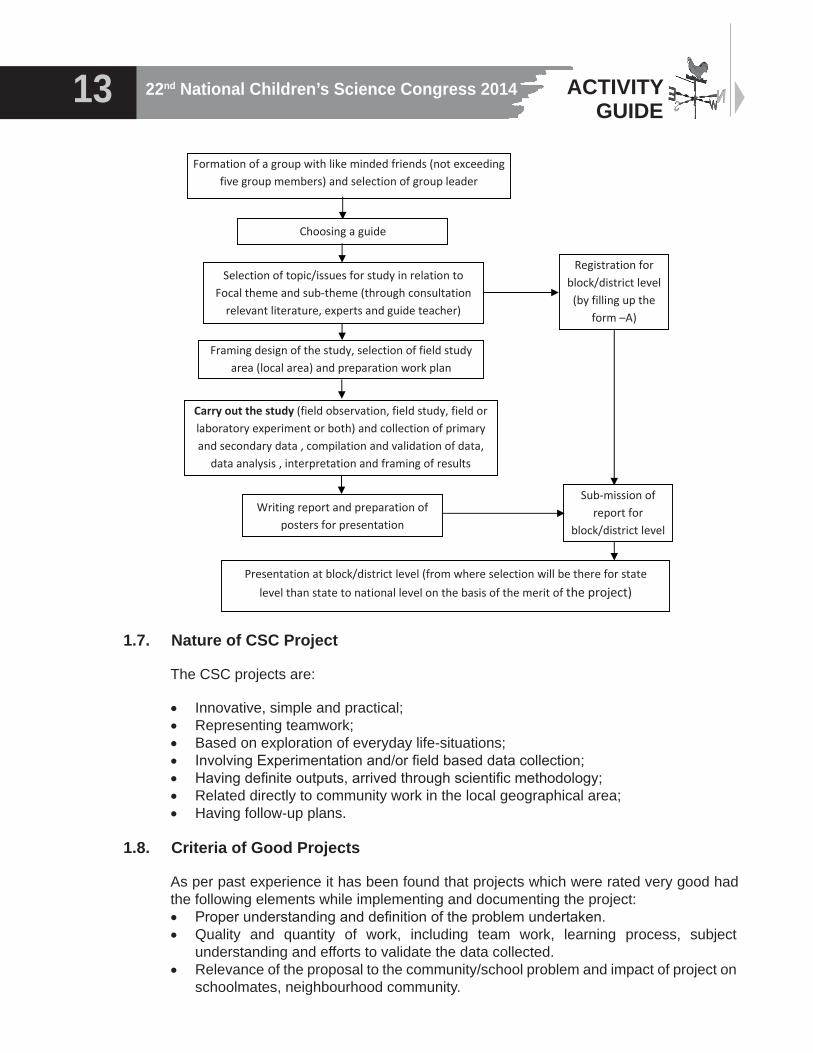
1.6. Modalities of participation
Following are major steps involved for participation in the CSC
Formation of a group with like minded friends (not exceeding five group members) and selection of group leader
Choosing a guide
Selection of topic/issues for study in relation to Focal theme and sub‐theme (through consultation relevant literature, experts and guide teacher)
Framing design of the study, selection of field study area (local area) and preparation work plan
Carry out the study (field observation, field study, field or laboratory experiment or both) and collection of primary and secondary data , compilation and validation of data,
data analysis , interpretation and framing of results
Registration for block/district level (by filling up the
form –A)
Writing report and preparation of posters for presentation
Sub‐mission of report for
block/district level
Presentation at block/district level (from where selection will be there for state
level than state to national level on the basis of the merit of the project)
22nd National Children’s Science Congress 2014 14ACTIVITY GUIDE
• Originality, innovation and creativity shown to understand the problem and find solution i.e. in methodology and experiment design.
1.9. Points to remember
The project work of CSC must be carried out in a systematic way so that it can rightly reflect the method of science in the works. The issue of the study may demand experimental or survey works or both. In case of experimental works design and principle of the experiments are very important factor which may help to get a better result in a rational way. In such case parameters of observation and verification through the experiment and its logical selection must be reflected vividly along with sets of control and approaches of data validation. Similarly, in case of survey based project universe of the study, criteria of sample selection, sample coverage, design of questionnaire or interview schedule are very important along with approaches of data compilation, validation, analysis and interpretation. Prototype model or functional models are only encouraged to use in project presentation if issues and methods of study really demands for it.
Log-Book- Proper work diary has to be maintained while carrying out the project work. The day-to-day activity has to be neatly noted in the form of a log-book, and should be submitted with the project report at the time of submission. All the details, such as Project title, name of the group leader etc should be written clearly on the cover.
1.10. Structure of the project report
The structure project report of CSC is as follow i. Cover page – must incorporate
• Title of the project• Name and address of Group leader and co-workers• Name and address of guide
ii. Form – A ( Registration form) iii. Abstract – in 250 words for lower age group and 300 words upper age group (one
copy in English)iv. Contents- list of chapter with detail heading and sub-heading, list of table, chart,
maps, etc. along with references against page numbers
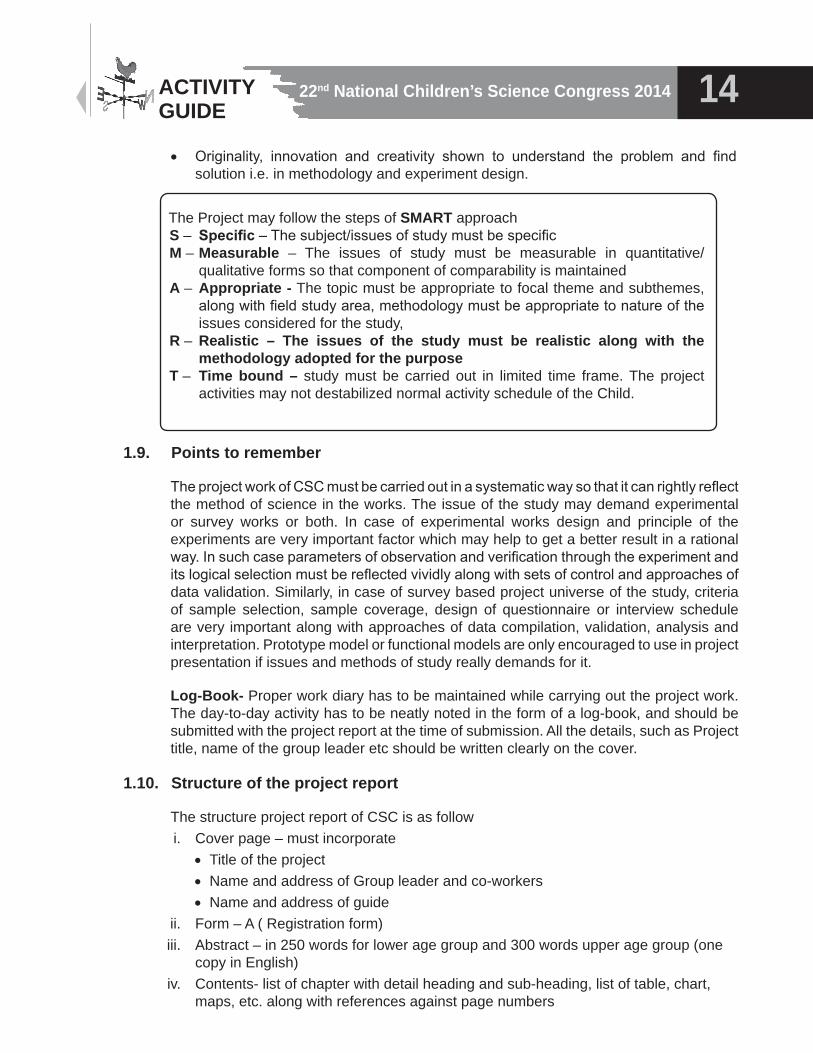
The Project may follow the steps of SMART approach S – Specific – The subject/issues of study must be specific M – Measurable – The issues of study must be measurable in quantitative/
qualitative forms so that component of comparability is maintainedA – Appropriate - The topic must be appropriate to focal theme and subthemes,
along with field study area, methodology must be appropriate to nature of the issues considered for the study,
R – Realistic – The issues of the study must be realistic along with the methodology adopted for the purpose
T – Time bound – study must be carried out in limited time frame. The project activities may not destabilized normal activity schedule of the Child.
22nd National Children’s Science Congress 201415 ACTIVITY GUIDE
v. Introduction- description on background of the study vi. Aims and objectives of the studyvii. Hypothesisviii. Need statementix. Work plan x. Methodologyxi. Observationsxii. Data analysis and interpretationxiii. Results xiv. Conclusionsxv. Solution to the problem
xvi. Future planxvii. Acknowledgementxviii. References
The word limit for the written report for the lower age group is 2500 and that for the upper age group is 3500. The written report can be substantiated by including limited number of photographs, sketches, illustrations and / or drawings, etc.
1.11. Oral presentation:
Oral presentation at the technical sessions of the congress is a very important component of the entire process. Effective communication during briefing the issues of study, its objectives, and methodology adopted for the study, important observation and findings, vital aspects on the way and approach to solve the problem or address problems is a very critical part of the exercise. Because only 8 minutes time is allotted for the purpose. Therefore, one has to plan pragmatically for the purpose. Children can use 4 different posters (which is mandatory). Poster must be prepared on 55 cm x 70 cm (21.6” x 27.5”) drawing sheets (i.e. chart papers). If needed power point presentation may be used.
Your posters should contain information on (1) The project title, (2) Names of the group members, (3) Objectives, (4) Map of the area, (5) Methodology, (6) Results, (7) Conclusion, (8) Solution to the problem. Depending upon the nature of the project the poster may or may not have a map and/or results.
1.12. Different level of Congress
Children’s Science Congress is organised in three levels where the child scientists and their project works are screened under common evaluation criteria. The evaluation of the project is done for its innovativeness, simplicity and practicality. On the basis of the merit of the project is selected for the next level. The three levels are as follows:
• Block /district level• State level• National level.
Plagiarism would lead to disqualification
22nd National Children’s Science Congress 2014 16ACTIVITY GUIDE
The District/Block level Congress is the first level in which projects compete with one another and are screened for presentation at the State level Congress, the second level. Projects as per State-wise quota indicated at Annexure- are selected from the State level for the Grand Finale – the National Children’s Science Congress. Seven to eight lakh child scientists participate at various levels from the States and the Union Territories.
1.13. Screening
(i) The selection ratio at District/State Level and at State/National Level should be as follows:
State: District = 1: 15
(Out of 15 projects presented at District 1 will be screened for State Level.)
(ii) State/National = As per State quota indicated at Annexure -
(iii) The selection ratio of Lower age group (10 to 14 years of age) to Upper age group (14+ to 17 years) should be 40:60.
1.14. Tentative Activity Schedule
• Selection of subjects and activity for registration of teams : June-July
• Working on the project: Minimum two months
• District level Congress: By September -October
• State level Congress: By November
• National level Congress: 27-31 December
• ‘Kishore Vigyani Sanmmelan’ ( at Indian Science Congress ) from 3-7 January
1.15. Approaches of Evaluation
The innovative ideas and scientific methodology are the basis of a good project but one has to prove his communication skills also to make others listen and understand his findings. For doing this, a total cooperation in the group is a must. Accept positive criticism within the group or even from outside and improve the work plan. This will bring award and recognition.
1.15.1. Evaluation Criteria
i) Originality of idea and concept: A unique or novel project idea which attempts to answer a specific question - (a hypothesis driven by curiosity to understand any concept related to focal theme). The idea should not be an exact replication of the model projects as in this Activity Guide. A proper explanation of origin of the idea may be demanded by the evaluator.
ii) Relevance of the project to the theme: This section focuses on how the project is relevant to the focal theme/sub-theme.
22nd National Children’s Science Congress 201417 ACTIVITY GUIDE
iii) Scientific understanding of the issue: Refers to the extent of knowledge the child scientist has in relation to the project idea.
iv) Data collection: Systematic collection of information using relevant tools/interviews/questionnaire. Sample size should be sufficient to support the issues under study.
v) Analysis: This includes tabulation, categorization/classification, and simple statistics as applicable to the study.
vi) Experimentation/Scientific study/validation: Conducting of experiments/field study and validation applying simple methods of science. Experiment need not be every sophisticated or lab based, they could be simple, self developed and inexpensive too.
vii) Interpretation and Problem solving attempt: To what extent the team has addressed the proposed hypothesis and the issue of the locality through the project.
viii) Team work: It refers to work division, cooperation and sharing among and beyond the team members (the child scientists).
ix) Background correction (Only for District level): In this case the background of the children is verified like geographical location of their school, village, town etc. in relation to infrastructure, information and other input related facilities available with them. The logic is that children from difficult geographical situation must get some weightage in comparison to the children from advantageous geographical location. Non-school going children should also get some weightage in this criterion.
x) Report and Presentation: Written Report and Oral Presentation are evaluated separately. Reports are evaluated for its systematic presentation, tabulation of data in support of the project idea and the clarity with which the study is documented and explained. A Log Book (actually a Daily Diary) is mandatory and should be authenticated over the signature of the guide teacher daily. The cover page of the Log Book should carry the names of the child scientists, the district and the Sate, in English. Marks awarded for the presentation covers question and answer with evaluators, presentation of charts/posters, illustrations and other visuals.
xi) Follow up Action Plan (Only for State and National levels): The child scientists should try to find out scientific solution to the bothering problem. Has the team conveyed the message to the community? How it was communicated? Will effort continue to involve more people till the problem is solved? Was any action plan suggested? Credit shall be given for similar efforts.
xii) Improvement from the previous level (Only for State and National levels): This is to encourage the child scientists towards their continuous involvement with the project for its improvement. Improvements on the work from District to state level and then from State level to the national level will be given marks separately. The evaluators shall specify the areas of improvement on a separate sheet of paper.
xiii) Additional page(s): These must be there in the Project Report with detail description of works of improvement done after the previous level (particularly on the basis of the evaluators’ suggestion in the previous level).
22nd National Children’s Science Congress 2014 18ACTIVITY GUIDE
1.15.2. Evaluators
i) Evaluators may please note that the participating children are budding scientists from the age group of 10 to 17 years with limited access to knowledge centres and therefore require encouragement. Having understood their capabilities and capacities, the evaluators should provide them with constructive inputs and positive feed-back.
ii) Evaluators should appreciate and value the efforts, innovativeness and confidence of the participating child scientists and ensure that their honest assessment work as a guiding light for future endeavours of the child scientists and each one goes back motivated, intellectually rich and more confident.
iii) Evaluators should evaluate the projects on the basis of subject matter and scientific content and are not influenced by the gadgetry used or oratory skills of the participants. They should avoid unwarranted comments and also avoid comparing the works of the child scientists with those carried out by senior members or scientists.
iv) Evaluators should avoid being any source of distraction to the child scientists while presentation is going on and do not take the interactions with the participants as a test what the participating child does not know, rather, they make efforts to know what the child scientist know about the subject area.
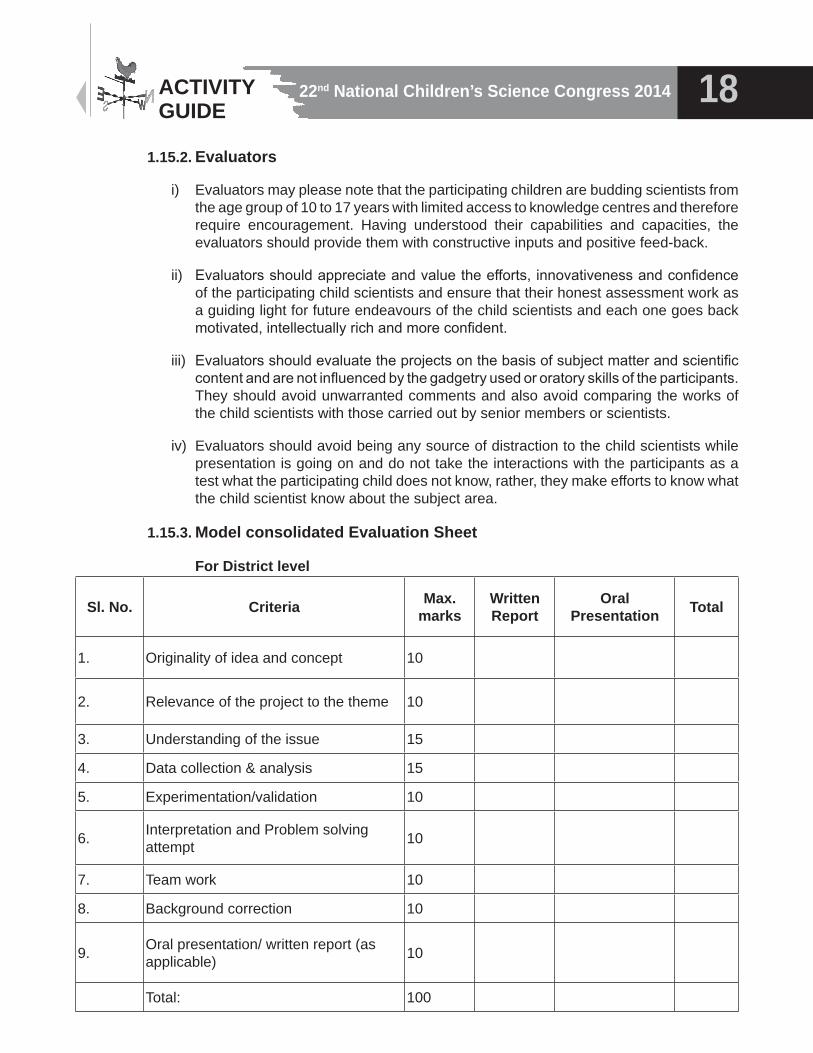
1.15.3. Model consolidated Evaluation Sheet
For District level
Sl. No. Criteria Max. marks
Written Report
Oral Presentation Total
1. Originality of idea and concept 10
2. Relevance of the project to the theme 10
3. Understanding of the issue 15
4. Data collection & analysis 15
5. Experimentation/validation 10
6. Interpretation and Problem solving attempt 10
7. Team work 10
8. Background correction 10
9. Oral presentation/ written report (as applicable) 10
Total: 100
22nd National Children’s Science Congress 201419 ACTIVITY GUIDE
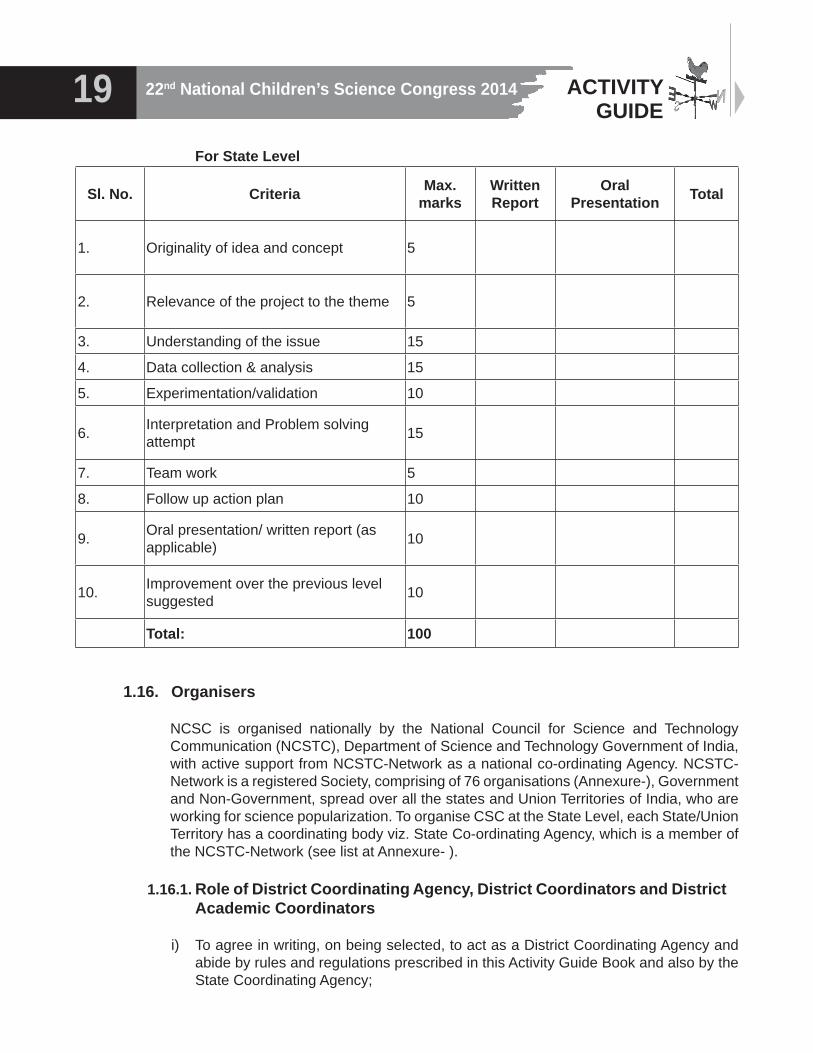
For State Level
Sl. No. Criteria Max. marks
Written Report
Oral Presentation Total
1. Originality of idea and concept 5
2. Relevance of the project to the theme 5
3. Understanding of the issue 15
4. Data collection & analysis 15
5. Experimentation/validation 10
6. Interpretation and Problem solving attempt 15
7. Team work 5
8. Follow up action plan 10
9. Oral presentation/ written report (as applicable) 10
10. Improvement over the previous level suggested 10
Total: 100
1.16. Organisers
NCSC is organised nationally by the National Council for Science and Technology Communication (NCSTC), Department of Science and Technology Government of India, with active support from NCSTC-Network as a national co-ordinating Agency. NCSTC-Network is a registered Society, comprising of 76 organisations (Annexure-), Government and Non-Government, spread over all the states and Union Territories of India, who are working for science popularization. To organise CSC at the State Level, each State/Union Territory has a coordinating body viz. State Co-ordinating Agency, which is a member of the NCSTC-Network (see list at Annexure- ).
1.16.1. Role of District Coordinating Agency, District Coordinators and District Academic Coordinators
i) To agree in writing, on being selected, to act as a District Coordinating Agency and abide by rules and regulations prescribed in this Activity Guide Book and also by the State Coordinating Agency;
22nd National Children’s Science Congress 2014 20ACTIVITY GUIDE
ii) To constitute a District Organizing Committee (DOC) and a District Academic Committee (DAC) , minimum 7 (seven) members can be selected from teachers, activists, ex-child scientists, government officials, officials of the local bodies etc. and send the lists to the State Coordinator by the date specified. The District Coordinators shall act as the Member-Secretary of both the Committees;
iii) To register groups of children (2 to 5 in one group) in Form A and provide them with necessary reference materials, kits and guidance. Number of groups registered to be intimated to the State Coordinator by the date specified;
iv) While registering the District Co-ordinator should be assured that, the age of the child scientist falls within the age as on 31st December of the calendar year. If need be a copy of the age-certificate may be retained by the District Co-ordinator, to avoid any confusion at later stages. Even while participating at the National Congress, the State Co-ordinator may also keep a copy of the certificate.
v) To select schools from rural and urban area in an equal ratio;
vi) To organise District level Teachers’ Orientation Workshops with the help of the State Coordinators;
vii) To interact with local scientist and arrange for their periodic interaction with the registered group of children, if required;
viii) Try to involve at least 50 schools and 250 numbers of project in the district including those from informal education system
ix) Organize District level Congress, Orientation of Evaluators in consultation with the State Coordinators;
x) To submit Feed-back Reports on all activities, containing names of schools and number of projects at district level and follow up action taken on projects likely to become part of community action, photocopies of all Registration/Attendance Sheets for all Workshops/Meetings, Evaluation Sheets in original, samples of certificates issued, mementos presented to child scientists, photo-documentation etc. related to CSC at the District level to the State Coordinator in the manner and by the date specified;
xi) To maintain a Bank Account and maintain Accounts at the District level and submit an audited Receipts & Payment Account to the State Coordinators by the date and in the manner specified;
xii) To maintain infrastructural facilities, including electronic communication facility such as internet connectivity, fax etc.
xiii) To arrange review and mentoring of the projects selected for presentation at the State Level NCSC.
22nd National Children’s Science Congress 201421 ACTIVITY GUIDE
1.16.2. Role of State Coordinating Agency, State Coordinators and State Academic Coordinators
The State Coordinating Agency shall have the overall responsibility for the implementation of NCSC at the State level. The specific responsibilities shall be –
i) Constitute a State Organizing Committee (SOC) and a State Academic Committee (SAC) where minimum 7 (seven) members to be selected from teachers, activists, ex-child scientists, government officials, officials of the local bodies, Network members in the State and other non-Network organizations specifically active in a region in the State, where the State Coordinating Agency does not have a reach). Submit the list of SOC, SAC, DOC and DAC along with project proposal for districts and state. The State Coordinators shall act as the Member-Secretary of both the Committees;
ii) To constitute Regional Coordinators, if found necessary in case of big States and to involve SCERT, DIET, IRIS and organizations working with handicapped children/elder citizens and media representatives. Distribution of geographical area for organizational purposes etc. will be the prerogative of the State Coordinators;
iii) To locate individuals, schools specially interested in other curricular activities;
iv) To select District Coordinating Agencies and obtain consent letter from the respective organization, where they have to agree to abide by the guideline of CSC and willing to follow the guideline of NCSTC,DST; NCSTC – Network and respective State Coordinating agency of the state.
v) Organise Orientation Workshops of District Coordinators and teachers with the help of subject experts;
vi) To coordinate translation of the Activity Guide Book to be used by the children, in local language and make them available to the District Coordinators;
vii) To maintain a Bank Account and maintain Accounts at the State level and submit an audited Receipts & Payment Account to the funding agencies within three months of the date of event with a Project Completion Report and a Utilization Certificate in the manner prescribed;
viii) To submit Feed-back Reports on all activities, samples of certificates issued, mementos presented to child scientists, photo-documentation etc. related to CSC at the State level to the funding agency in the manner and by the date specified;
ix) To remit funds to District Coordinating Agencies by account payee cheques;
x) To form linkages with Testing and Monitoring facilities available in the State (with NGOs as well as Government), Municipal Corporations and other local bodies etc. to help children in better implementation (information collection/sample testing) of their activities( Identity Cards may be issued to children registered for activities) through District Coordinators/State Coordinator;
22nd National Children’s Science Congress 2014 22ACTIVITY GUIDE
xi) To arrange review and mentoring of the projects selected for presentation at the NCSC.
xii) To ensure that Evaluation sheets, both written and oral are forwarded to the next higher level, i.e. from district to State and from State to National level, else the district / State contingent might not be registered during State/National level CSC.
xiii) State Academic Coordinators should work in close association with the district/State Coordinators for arranging evaluation process and shall make an effort to send one member from State Academic Committee as an Observer to the district level CSC. His/her signature on the selection list is mandatory. The entire process of evaluation is to be supervised by the Observer. Decision of the State Academic Committee shall be final word on the selection.
1.16.3. Note for State Coordinators and District Coordinators
i) The age limits for participation must not be less than 10 years and more than 17 years on December 31 of the year.
ii) Relatives of District Coordinators, District Academic Coordinators, State Coordinators and State Academic Coordinators will not be selected for National CSC. They may leave the post for the year if participation of the ward is desired.
iii) Any child will not participate more than twice in national CSC as Group Leader – once from each age group.
iv) Two selected projects (one from lower age group and one from upper age group) from each state to ‘Kishor Vigyani Sanmelayan’ of Indian Science Congress held every year during January 3-7.
v) Technology Entrepreneurship Promotion Program selected CSC projects meeting the following criteria may apply for support under this program –
• The idea should be new/novel,
• The idea should have potentiality for translating it into working model/ prototype/process,
• The idea should be based on known scientific principle,
• The idea should have commercial feasibility/ technical viability.
vi) Proposals from individual innovators to convert an original idea / invention / know-how into working prototype / processes. These proposals can be made by individuals or jointly with any sponsoring organizations.
22nd National Children’s Science Congress 201423 ACTIVITY GUIDE
Selected projects will be provided by financial support to undertake the above developments, patent support and guidance, scientific / technical consultancy, fabrication assistance, market information and networking with related research lab/ institutes as required.
For detailed information you may contact:
Techno-entrepreneur Promotion Programme Ministry of Science & Technology Post Bag No. 66, Hauz Khas, New Delhi -10016.
Dr B.P. SinghHead, NCSTC
Dr D. K. PandeyScientist E and National Programme Coordinator of NCSC
National Council for Science and Technology Communication (NCSC)Department of Science and TechnologyTechnology Bhavan, New Mehrauli Road, New Delhi – 110016,Telephone : 01126535564/26590251; Email : [email protected]
Mr R.S. RaghuvanshiGeneral Secretary, NCSTC Network
NCSTC-Network E-56, Pandav Nagar, New Delhi - 110091Email: [email protected]; [email protected]: 011-22799236, Mobile: 09868404002
Karnataka State details: State Co- ordinator : Shri M.N. MustoorappaNo.2009/2, Dr. Modi Road, M.C. Colony, “A” Block, Davangere – 577 004Mobile : 9448857122, Email : [email protected]
State Academic Co-ordinator : Shri T.G. Krishnamurthy Raj UrsGovt. High School, Anur PostChikmagaluru Taluk & Dist.Mobile : 9448555608; Email : [email protected]
Shri Pandit K.Balure‘Aditya Nilaya’, Basaveshwara Colony, Humanabad, Bidar – 585 330Mobile : 9731089623; Email : [email protected]
22nd National Children’s Science Congress 2014 24ACTIVITY GUIDE
Sub Theme-1
BackgroundWeather is ubiquitous. You cannot ignore it. We live “inside”. We may feel it. We complain against it. But we often take it for granted and not care about it. This could be dangerous. We need to understand the weather, measure its parameters and see if we can predict for us to even survive. It is a historical fact that we created calendars to predict weather. How can we understand the details about our local weather? How do we make observations on the weather? Do we follow the same steps our distant forefathers did? Can we find new ways? Can we learn from modern scientific methods for our local use?
Why is weather important?Weather affects all things around us. Whether it is crop production, insects biting us, diseases crippling us, fruits we eat, flowers we smell all respond to weather.
So, we think you will all agree we need to learn more about the wather that is everywhere around us.
Weather is what we feel today. Now if you can imagine yourself living for a hundred years and you remember all the days of your life and how the weather was on each of those days, then you would tell your great-grandchild that “in my days in July it was like this”—You have talked about the “climate”. Climate is an “averaged” view of weather over a long time – typically from few years to millennia.
Weather is made up of several interlinked parameters – such as, temperature, humidity, wind speed/direction at different atmospheric levels. Of course, these are all influenced by geography(latitude, longitude), distance from the sun, solar activity, sunrise, sunset,(day length) sun’s position etc.
So what can all of us do to learn more?
UNDERSTANDING WEATHER AROUND YOUOBSERVING, MEASURING, UNDERSTANDING AND PREDICTING IT
FrameworkOur objective is to be able to
(i) decide what aspect/parameter of weather or its manifestation(s) we want to observe/measure/understand/predict;
(ii) decide what methods we should adopt for this purpose
(iii) decide on instruments we could use/build for the above purpose
(iv) report/record our observations/measurements
(v) analyse the data we gather
(vi) predict what might happen in the future
ImporatanceAs already stated in the background above, it is important that we are able to predict weather as ignorance of it may be costly.
Knowledge is power. Those who know survive and prosper. Simple extrapolation would be dangerously unsuccessful. To
predict we need to know what it is now and what it was earlier so we can develop methodology. As all of us have felt at one time or another weather can really make our life difficult – whether it is cyclones, tides or tornadoes. Only knowledge will let us know what the probability we may be wrong is!
How to Proceed?We propose a series of simple-to-do experiments exemplifying each/some of the parameters that you children can do and learn from. The experiments should be of such a nature that you can think it through and come up with innovative ways of doing it. The experiments would be so designed that they bring out information on the quantity, magnitude of the factor/parameter, changes in its values over time, and how it links to other
22nd National Children’s Science Congress 201425 ACTIVITY GUIDE
parameters. Ultimately, this would allow the child to understand and describe the parameter and its role in defining the weather and its implicaitons for us.
ComponentsThe experiments would involve, inter alia, observations, measurements of different parameters of interest. The observations would push the child to integrate and synthesis the data into a set of linked proposals(hypotheses). The child would, ideally, at the end of the experiment, come up with a conclusion based on evidence which will be of some consequence. The components/ parameters/ aspects that could be studied are:• Temperature [maximum, minimum, average]• Atmospheric pressure• Wind Speed and wind directions• Relative Humidity• Clouds• Quantum, Intensity and Frequency of Rain• Lightning, thunder, rainbow• Tides [in coastal regions]• Water level [in wells, ponds]• Evaporation from surface water• Fog, mists and smog and dew• Response of Plants and insects to weather• Predicting weather from plants and animal
behavior• Emergence of diseases
Weather and climate influence many socio-economic and development patterns of a region and thus has become one of the most important environmental parameters. Weather and climate decide almost everything about our way of life including our occupational and recreational practices and this critical role is often not taken into account by planners while siting industries and power stations and making decisions on transport and other infra-structure for a region.
There is hardly any human activity that is not in one form or another influenced by weather and climate. In a country like India where rainfall is highly seasonal and agriculture is largely
dependent on the rainfall of the summer monsoon months, viz., June to September, the national economy has become crucially dependent on the behaviour of monsoon. Vagaries in the monsoon rainfall resulting in large scale floods and droughts seriously affect the annual food production of the country besides causing loss of lives and damage to property. Heavy rainfall and strong winds associated with cyclonic disturbance cause disruption and dislocation of transport and communications and loss of life and property.
The siting of industries, thermal power stations, oil refineries etc., which emit gaseous and other particulate pollutants into the atmosphere has to take due consideration of the prevailing wind and atmospheric stability conditions during the course of the year to minimise the harmful effects of the atmospheric pollution and contamination. With large scale establishment and expansion of industries throughout the country especially in the coastal belt, the protection of the environment (land, sea and air) from the harmful chemicals into the environment by man-made factors has become a matter of concern. There is apprehension that unless preventive measures are taken, this may lead to irreversible ecological imbalances and climatic changes.
The local weather and climate of a station are of interest to the residents in general since it concerns their day-to-day lives. Besides, it also influences their clothing, food habits, working styles and recreational practices. Dislocation of transport, communication, power and water distribution is a common occurrence in most states during during heavy spells of monsoon. Little can be done about gusty strong winds during pre-monsoon which uproot trees and fell electric poles year after year.
Planners require weather information for design, execution, management and control of major industrial, commercial, and other activities in and around their chosen sites. Information about local weather parameters and their seasonal variations is needed for siting of runways, railways and road network.
Structure and composition of the Atmosphere:• Meteorology is the study of the atmosphere
and all processes and phenomena that results in our particular weather.
22nd National Children’s Science Congress 2014 26ACTIVITY GUIDE
• Different branches of Meteorology are• Climatology• Synoptic Meteorology• Dynamic Meteorology
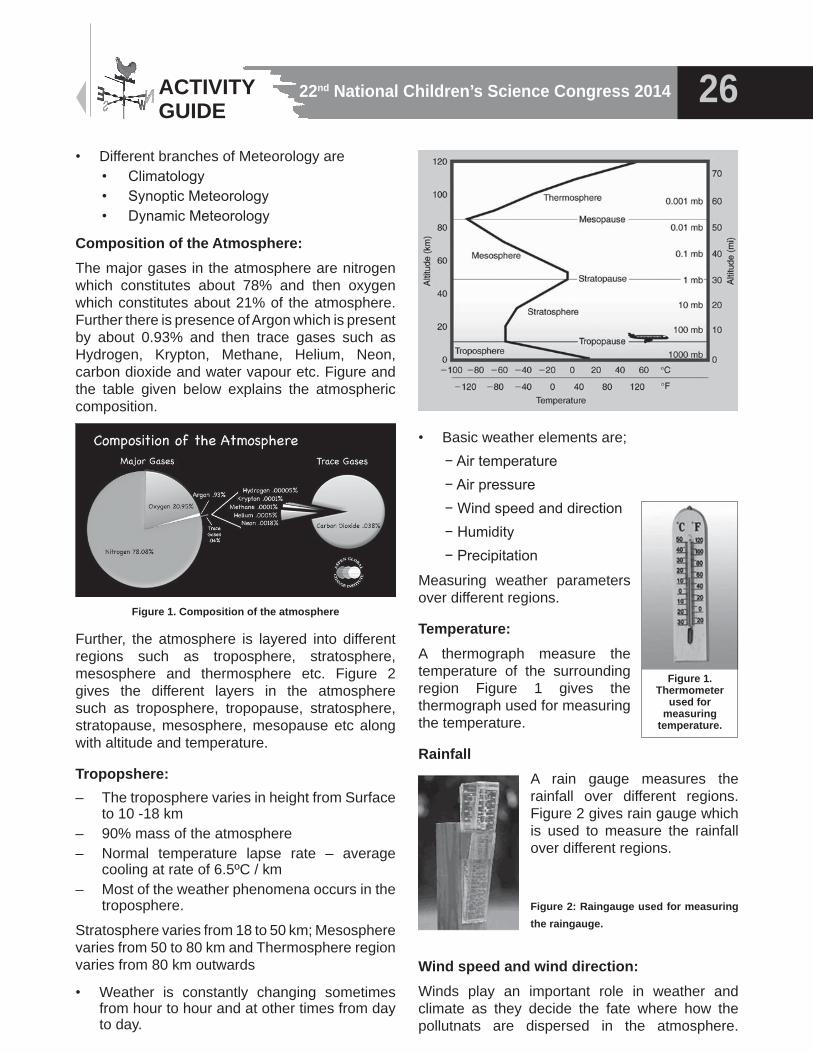
Composition of the Atmosphere:The major gases in the atmosphere are nitrogen which constitutes about 78% and then oxygen which constitutes about 21% of the atmosphere. Further there is presence of Argon which is present by about 0.93% and then trace gases such as Hydrogen, Krypton, Methane, Helium, Neon, carbon dioxide and water vapour etc. Figure and the table given below explains the atmospheric composition.
Figure 1. Composition of the atmosphere
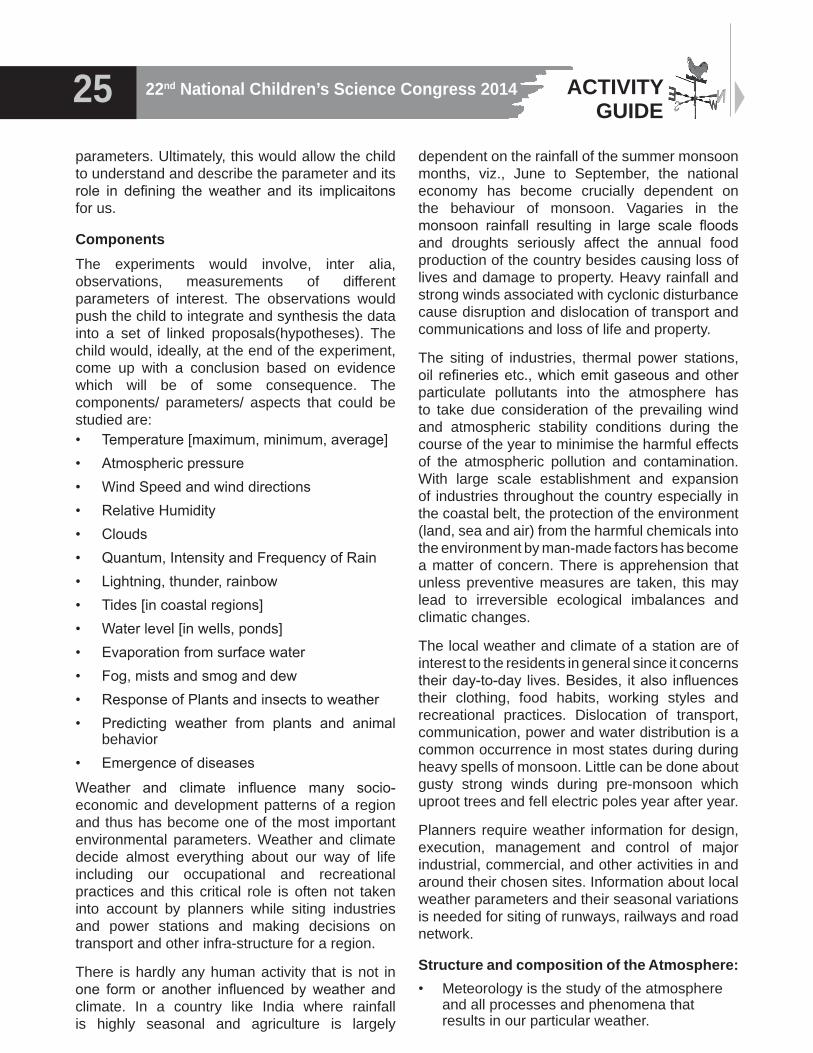
Further, the atmosphere is layered into different regions such as troposphere, stratosphere, mesosphere and thermosphere etc. Figure 2 gives the different layers in the atmosphere such as troposphere, tropopause, stratosphere, stratopause, mesosphere, mesopause etc along with altitude and temperature.
Tropopshere:– The troposphere varies in height from Surface
to 10 -18 km– 90% mass of the atmosphere– Normal temperature lapse rate – average
cooling at rate of 6.5ºC / km– Most of the weather phenomena occurs in the
troposphere.
Stratosphere varies from 18 to 50 km; Mesosphere varies from 50 to 80 km and Thermosphere region varies from 80 km outwards
• Weather is constantly changing sometimes from hour to hour and at other times from day to day.
• Basic weather elements are; − Air temperature − Air pressure − Wind speed and direction − Humidity − Precipitation
Measuring weather parameters over different regions.
Temperature:A thermograph measure the temperature of the surrounding region Figure 1 gives the thermograph used for measuring the temperature.
RainfallA rain gauge measures the rainfall over different regions. Figure 2 gives rain gauge which is used to measure the rainfall over different regions.
Figure 2: Raingauge used for measuring the raingauge.
Wind speed and wind direction:Winds play an important role in weather and climate as they decide the fate where how the pollutnats are dispersed in the atmosphere.
Figure 1. Thermometer
used for measuring
temperature.
22nd National Children’s Science Congress 201427 ACTIVITY GUIDE
Further the land and sea breeze phenomena an important role in the land and sea circulation in coastal areas. Further they also decide how the mixing takes in the low troposphere.
An Anemometer measures the wind speed and a wind vane gives the direction from which the wind comes from. Figure 3 gives the anemometer and wind vane used for measuring the wind direction.
Clouds:• Typically, temperature
decreases with altitude, so the lighter stuff (warmer air) is below the heavier stuff (colder air). This typically supports some overturning, especially in the boundary layer. This in turn generates clouds.
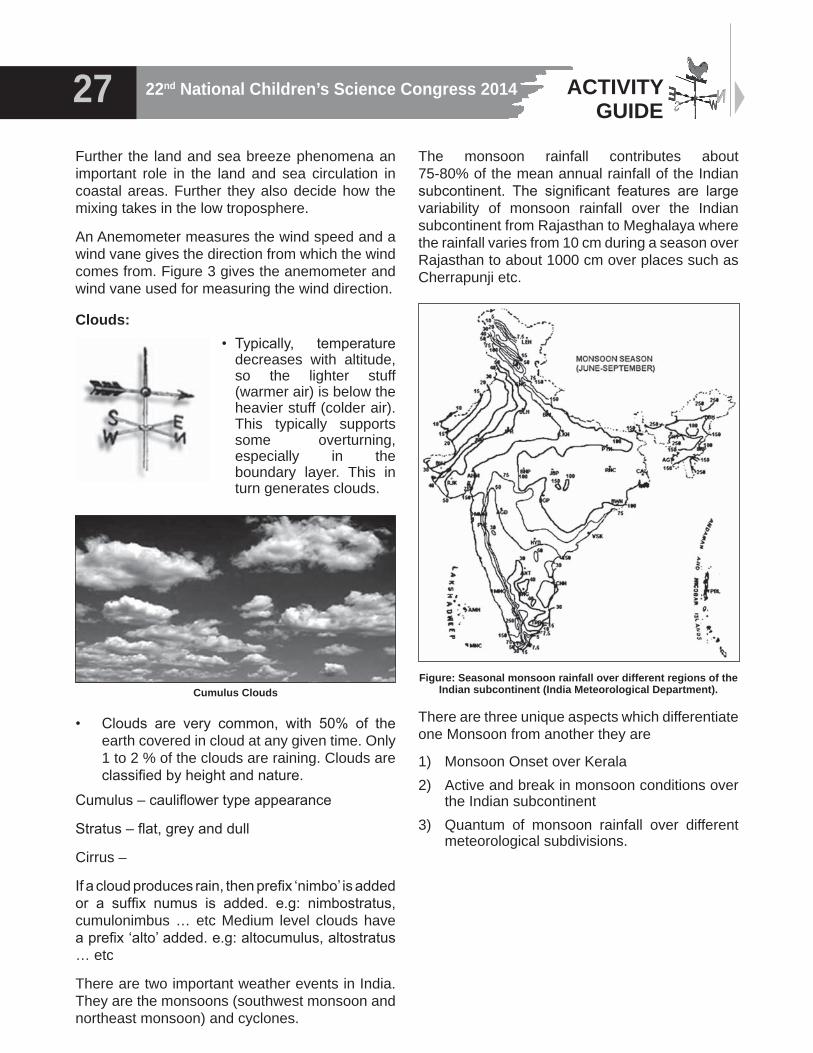
• Clouds are very common, with 50% of the earth covered in cloud at any given time. Only 1 to 2 % of the clouds are raining. Clouds are classified by height and nature.
Cumulus – cauliflower type appearance
Stratus – flat, grey and dull
Cirrus –
If a cloud produces rain, then prefix ‘nimbo’ is added or a suffix numus is added. e.g: nimbostratus, cumulonimbus … etc Medium level clouds have a prefix ‘alto’ added. e.g: altocumulus, altostratus … etc
There are two important weather events in India. They are the monsoons (southwest monsoon and northeast monsoon) and cyclones.
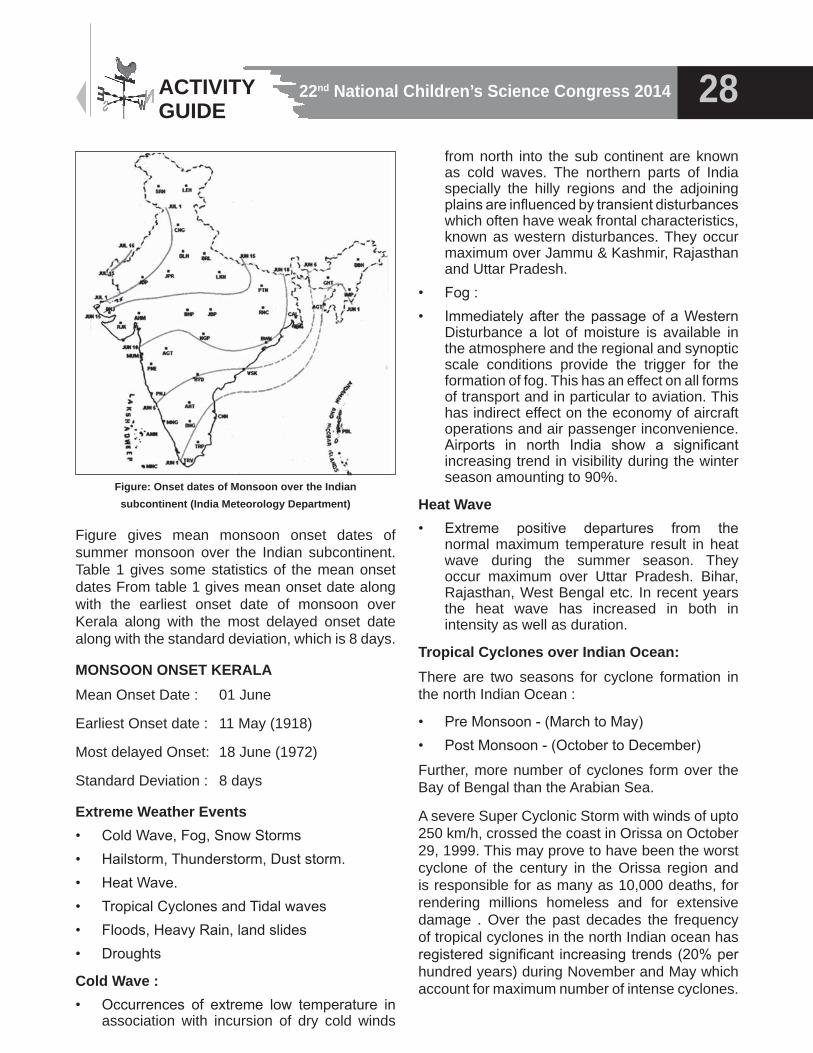
The monsoon rainfall contributes about 75-80% of the mean annual rainfall of the Indian subcontinent. The significant features are large variability of monsoon rainfall over the Indian subcontinent from Rajasthan to Meghalaya where the rainfall varies from 10 cm during a season over Rajasthan to about 1000 cm over places such as Cherrapunji etc.
Figure: Seasonal monsoon rainfall over different regions of the Indian subcontinent (India Meteorological Department).
There are three unique aspects which differentiate one Monsoon from another they are
1) Monsoon Onset over Kerala2) Active and break in monsoon conditions over
the Indian subcontinent3) Quantum of monsoon rainfall over different
meteorological subdivisions.
Cumulus Clouds
22nd National Children’s Science Congress 2014 28ACTIVITY GUIDE
Figure: Onset dates of Monsoon over the Indian subcontinent (India Meteorology Department)
Figure gives mean monsoon onset dates of summer monsoon over the Indian subcontinent. Table 1 gives some statistics of the mean onset dates From table 1 gives mean onset date along with the earliest onset date of monsoon over Kerala along with the most delayed onset date along with the standard deviation, which is 8 days.
MONSOON ONSET KERALAMean Onset Date : 01 June
Earliest Onset date : 11 May (1918)
Most delayed Onset: 18 June (1972)
Standard Deviation : 8 days
Extreme Weather Events• Cold Wave, Fog, Snow Storms• Hailstorm, Thunderstorm, Dust storm.• Heat Wave.• Tropical Cyclones and Tidal waves• Floods, Heavy Rain, land slides• Droughts
Cold Wave :• Occurrences of extreme low temperature in
association with incursion of dry cold winds
from north into the sub continent are known as cold waves. The northern parts of India specially the hilly regions and the adjoining plains are influenced by transient disturbances which often have weak frontal characteristics, known as western disturbances. They occur maximum over Jammu & Kashmir, Rajasthan and Uttar Pradesh.
• Fog :• Immediately after the passage of a Western
Disturbance a lot of moisture is available in the atmosphere and the regional and synoptic scale conditions provide the trigger for the formation of fog. This has an effect on all forms of transport and in particular to aviation. This has indirect effect on the economy of aircraft operations and air passenger inconvenience. Airports in north India show a significant increasing trend in visibility during the winter season amounting to 90%.
Heat Wave• Extreme positive departures from the
normal maximum temperature result in heat wave during the summer season. They occur maximum over Uttar Pradesh. Bihar, Rajasthan, West Bengal etc. In recent years the heat wave has increased in both in intensity as well as duration.
Tropical Cyclones over Indian Ocean:There are two seasons for cyclone formation in the north Indian Ocean :
• Pre Monsoon - (March to May)• Post Monsoon - (October to December)
Further, more number of cyclones form over the Bay of Bengal than the Arabian Sea.
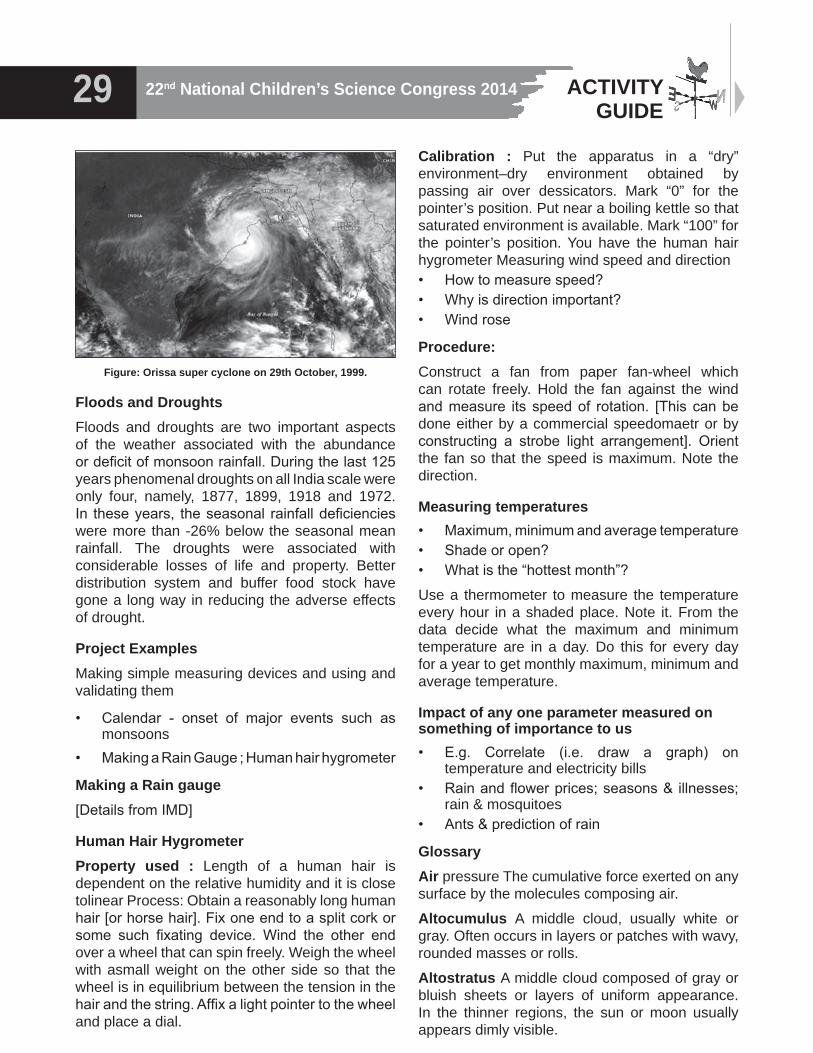
A severe Super Cyclonic Storm with winds of upto 250 km/h, crossed the coast in Orissa on October 29, 1999. This may prove to have been the worst cyclone of the century in the Orissa region and is responsible for as many as 10,000 deaths, for rendering millions homeless and for extensive damage . Over the past decades the frequency of tropical cyclones in the north Indian ocean has registered significant increasing trends (20% per hundred years) during November and May which account for maximum number of intense cyclones.
22nd National Children’s Science Congress 201429 ACTIVITY GUIDE
Figure: Orissa super cyclone on 29th October, 1999.
Floods and DroughtsFloods and droughts are two important aspects of the weather associated with the abundance or deficit of monsoon rainfall. During the last 125 years phenomenal droughts on all India scale were only four, namely, 1877, 1899, 1918 and 1972. In these years, the seasonal rainfall deficiencies were more than -26% below the seasonal mean rainfall. The droughts were associated with considerable losses of life and property. Better distribution system and buffer food stock have gone a long way in reducing the adverse effects of drought.
Project ExamplesMaking simple measuring devices and using and validating them
• Calendar - onset of major events such as monsoons
• Making a Rain Gauge ; Human hair hygrometer
Making a Rain gauge[Details from IMD]
Human Hair HygrometerProperty used : Length of a human hair is dependent on the relative humidity and it is close tolinear Process: Obtain a reasonably long human hair [or horse hair]. Fix one end to a split cork or some such fixating device. Wind the other end over a wheel that can spin freely. Weigh the wheel with asmall weight on the other side so that the wheel is in equilibrium between the tension in the hair and the string. Affix a light pointer to the wheel and place a dial.
Calibration : Put the apparatus in a “dry” environment–dry environment obtained by passing air over dessicators. Mark “0” for the pointer’s position. Put near a boiling kettle so that saturated environment is available. Mark “100” for the pointer’s position. You have the human hair hygrometer Measuring wind speed and direction• How to measure speed?• Why is direction important?• Wind rose
Procedure:Construct a fan from paper fan-wheel which can rotate freely. Hold the fan against the wind and measure its speed of rotation. [This can be done either by a commercial speedomaetr or by constructing a strobe light arrangement]. Orient the fan so that the speed is maximum. Note the direction.
Measuring temperatures• Maximum, minimum and average temperature• Shade or open?• What is the “hottest month”?
Use a thermometer to measure the temperature every hour in a shaded place. Note it. From the data decide what the maximum and minimum temperature are in a day. Do this for every day for a year to get monthly maximum, minimum and average temperature.
Impact of any one parameter measured on something of importance to us• E.g. Correlate (i.e. draw a graph) on
temperature and electricity bills• Rain and flower prices; seasons & illnesses;
rain & mosquitoes• Ants & prediction of rain
GlossaryAir pressure The cumulative force exerted on any surface by the molecules composing air.
Altocumulus A middle cloud, usually white or gray. Often occurs in layers or patches with wavy, rounded masses or rolls.
Altostratus A middle cloud composed of gray or bluish sheets or layers of uniform appearance. In the thinner regions, the sun or moon usually appears dimly visible.
22nd National Children’s Science Congress 2014 30ACTIVITY GUIDE
Anemometer An instrument designed to measure wind speed.
Aneroid barometer An instrument designed to measure atmospheric pressure. It contains no liquid.
Barograph A recording instrument that provides a continuous trace of air pressure variation with time.
Barometer An instrument that measures atmospheric pressure. The two most common barometers are the mercury barometer and the aneroid barometer.
Blizzard A severe weather condition characterized by low temperatures and strong winds (greater than 32 mi/hr) bearing a great amount of snow. When these conditions continue after the falling snow has ended, it is termed a ground blizzard.
Ceilometer An instrument that automatically records cloud height.
Climate The accumulation of daily and seasonal weather events over a long period of time. A description of aggregate weather conditions; the sum of all statistical weather information that helps describe a place or region.
Cloud base The lowest portion of a cloud.
Cloud cover The amount of the sky obscured by clouds when observed at a particular location.
Cumulonimbus An exceptionally dense and vertically developed cloud, often with a top in the shape of an anvil. The cloud is frequently accompanied by heavy showers, lightning, thunder, and sometimes hail. It is also known as a thunderstorm cloud.
Cumulus A cloud in the form of individual, detached domes or towers that are usually dense and well defined. It has a flat base with a bulging upper part that often resembles cauliflower. Cumulus clouds of fair weather are called cumulus humilis. Those that exhibit much vertical growth are called cumulus congestur or towering cumulus.
Daily range of temperature The difference between the maximum and minimum temperatures for any given day.
Desert One of two types of dry climate-the driest of the dry climates.
Dew Water that has condensed onto objects near the ground when their temperatures have fallen below the dew point of the surface air.
Drizzle Small drops between 0.2 and 0.5 mm in diameter that fall slowly and reduce visibility more than light rain
Evaporation The process by which a liquid changes into a gas.
Fog A cloud with its base at the earth’s surface. It reduces visibility to below 1 km.
Hail Solid precipitation in the form of chunks or balls of ice with diameters greater than 5 mm. The stones fall from cumulonimbus clouds.
Hailstones Transparent or partially opaque particles of ice that range in size from that of a pea to that of golf balls.
Hurricane A severe tropical cyclone having winds in excess of 64 knots (74 mi/hr).
Hygrometer An instrument designed to measure the air’s water vapor content. The sensing part of the instrument can be hair (hair hygrometer), a plate coated with carbon (electrical hygrometer), or an infrared sensor (infrared hygrometer).
Inversion An increase in air temperature with height.
Isobar A line connecting points of equal pressure
Isotach A line connecting points of equal wind speed.
Isotherm A line connecting points of equal wind temperature.
Lightning A visible electrical discharge produced by thunderstorms.
Meteorology The study of the atmosphere and atmospheric phenomena as well as the atmosphere’s interaction with the earth’s surface, oceans, and life in general.
Mist Very thin fog in which visibility is greater than 1.0 km (0.62 mi).
Nimbostratus A dark, gray cloud characterized by more or less continuously falling precipitation. It is not accompanied by lightning, thunder, or hail.
Precipitation Any form of water particles-liquid or solid-that falls from the atmosphere and reaches the ground.
22nd National Children’s Science Congress 201431 ACTIVITY GUIDE
Psychrometer An instrument used to measure the water vapor content of the air. It consists of two thermometers (dry bulb and wet bulb). After whirling the instrument, the dew point and relative humidity can be obtained with the aid of tables.
Rain Precipitation in the form of liquid water drops that have diameters greater than that of drizzle.
Rain gage A device-usually a cylindrical container-for measuring rain-fall.
Sea breeze A coastal local wind that blows from the ocean onto the land. The leading edge of the breeze is termed a sea breeze front.
Sea level pressure The atmospheric pressure at mean sea level.
Shower Intermittent precipitation from a cumuliform cloud, usually of short duration but often heavy.
Sleet A type of precipitation consisting of transparent pellets of ice 5 mm or less in diameter. Same as ice pellets.
Smog Originally smog meant a mixture of smoke and fog. Today, smog means air that has restricted visibility due to pollution, or pollution formed in the presence of sunlight-photochemical smog.
Snow Solid precipitation in the form of minute ice flakes that occur below 0ºC.
Snowflake An aggregate of ice crystals that falls from a cloud.
Stratocumulus A low cloud, predominantly stratiform with low, lumpy, rounded masses, often with blue sky between them.
Stratus A low, gray cloud layer with a rather uniform base whose precipitation is most commonly drizzle.
Temperature The degree of hotness or coldness of a substance as measured by a thermometer. It is also a measure of the average speed or kinetic energy of the atoms and molecules in a substance.
Thermograph A recording instrument that gives a continuous trace of temperature with time.
Thermometer An instrument used to measure temperature.
Thunder The sound due to rapidly expanding gases along the channel of a lightning discharge.
Tipping bucket rain gage A device that accumulates rainfall in increments of 0.01 in. by containers that alternately fill and empty (tip).
Tornado An intense, rotating column of air that protrudes from a cumulonimbus cloud in the shape of a funnel or a rope and touches the ground. (See Funnel cloud.)
Trade winds The winds that occupy most of the tropics and blow from the subtropical highs to the equatorial low.
Weather The state of the atmosphere in terms of such variables as temperature, cloudiness, precipitation, and radiation.
Wind Vane An instrument used to determine wind direction.
References:C. Donald Ahrens, 1985. Meteorology Today. West Publishing Company, 497-509.
Frederick K. Lutgens, and Edward J. Tarbuck, 1995. The Atmosphere. Prentice-Hall Inc., 443-456.
Joe R. Eagleman, 1980. Meteorology The Atmosphere in Action. Litton Educational Publishing Inc., 353-364.
Joseph M. Moran, and Michael D. Morgan, 1986. Meteorology. Burgess Publishing, 486-496.
Some websites where you can get Ocean and Atmosphere related phenomena :National Institute of Oceanography: www.nio.org
India Meteorological Department: www.imd.gov.in
Indian Institute of Tropical Meteorology : www.tropmet.res.in
Some Books on Monsoonsa. Southwest Monsoon – Y.P. Raob. The Monsoons – P.K.Dasc. Monsoon Dynamics – T.N.Krishnamurtid. Monsoon Meteorology – C.S. Ramagee. Monographs of India Meteorological Department, New Delhi available from their
website as e copies..
22nd National Children’s Science Congress 2014 32ACTIVITY GUIDE
BackgroundIt took about 60000 years for the human population to grow to one billion. It took a little more than two centuries only to grow from one billion to eight billion. Growing population requires environmental resources (life support systems like air, water and soil) for its survival and sustenance. Accordingly the pressure on environmental resources has grown many folds during last two centuries. This pressure has also impacted the climate as well as weather condition. When ever we undertake any activity we always utilise energy in some form or other. As a result the carbon stored in the energy source is released to the atmosphere in the form of carbon dioxide.
That indicates our carbon footprint. The more severe is the footprint, the more impact will be there on weather and climate. Direct and indirect impacts of such activities listed below have resulted in change of weather and climate locally and globally.
1. Agriculture: The practices were at the expense of forest lands and other ecosystems. Chemical fertilizers, pesticides, irrigation, soil salinity, ground water contamination, methane generation NOx generation etc impacted weather and climate in one or the other way.
2. Animal husbandry: Demand for meat, diary products, manure, draught animals and easy transport led to animal rearing in large scale resulting in soil compaction, over grazing energy wastage, methane generation, deforestation and water depletion.
3. Fisheries: Fertilizing the natural water bodies, eutrophication and ground water contamination results in generation of green house gases.
4. Human settlement and Urbanization: deforestation, conversion of agricultural lands to urban areas, more utilisation of energy, infra red radiation, depletion of natural resources
IMPACT OF HUMAN ACTIVITIES ON WEATHER AND CLIMATE
etc created heat islands adding to the already aggravating global warming problems.
5. Industrialisation: the fast changing scenario in natural resource utilisation and industrialisation in the 19th century resulted in rampant deforestation, further conversion of agricultural lands, increased mining, quarrying, energy utilisation, heat islands, industrial effluents, solid waste generation, air and water pollution.
6. Transportation: The development of transportation facilities vehicle explosion cause increased fossil fuel utilisation, land use changes, heat generation and air pollution
7. Communication (paper and electronic):the communication revolution in the 20th century increased the demand for paer and other resources in a tremendous proportion. This led to changes in land use pattern, energy utilisation, depletion of water and deforestation.
8. Energy production: The progress of modernisation resulted in more energy input in all the realms of development. Energy from hydel, thermal and nuclear sources led to greater ecological imbalance on land, water and atmosphere directly or indirectly impacting on weather and climate. Increase in GHG, deforestation, mining generating heat, increased water consumption, dumping of fly ash etc had direct impact. Even certain sectors of renewable sources of energy like wind and solar ha d its impact on ecosystems.
9. Waste generation:the life style changes and throw away culture led to generating huge quantity of muncipal, biomedical,industrial and agricultural waste which is cumbersome for nature to take care in its course. The GHG, open burning , dumping yards and burning of rubber, plastic etc added more problems.
10. Tourism and entertainment: globalisation, increased transport and communication facilities enhanced a sudden disproportional
Sub Theme-2
22nd National Children’s Science Congress 201433 ACTIVITY GUIDE
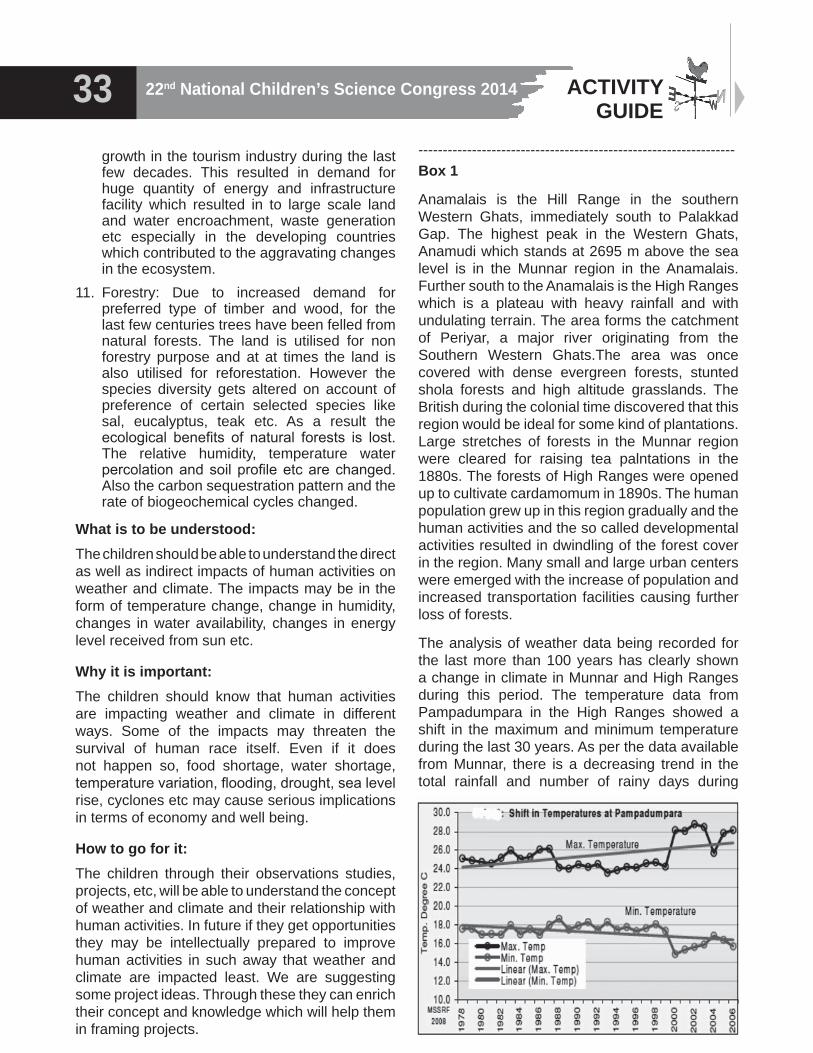
growth in the tourism industry during the last few decades. This resulted in demand for huge quantity of energy and infrastructure facility which resulted in to large scale land and water encroachment, waste generation etc especially in the developing countries which contributed to the aggravating changes in the ecosystem.
11. Forestry: Due to increased demand for preferred type of timber and wood, for the last few centuries trees have been felled from natural forests. The land is utilised for non forestry purpose and at at times the land is also utilised for reforestation. However the species diversity gets altered on account of preference of certain selected species like sal, eucalyptus, teak etc. As a result the ecological benefits of natural forests is lost. The relative humidity, temperature water percolation and soil profile etc are changed. Also the carbon sequestration pattern and the rate of biogeochemical cycles changed.
What is to be understood:The children should be able to understand the direct as well as indirect impacts of human activities on weather and climate. The impacts may be in the form of temperature change, change in humidity, changes in water availability, changes in energy level received from sun etc.
Why it is important:The children should know that human activities are impacting weather and climate in different ways. Some of the impacts may threaten the survival of human race itself. Even if it does not happen so, food shortage, water shortage, temperature variation, flooding, drought, sea level rise, cyclones etc may cause serious implications in terms of economy and well being.
How to go for it:The children through their observations studies, projects, etc, will be able to understand the concept of weather and climate and their relationship with human activities. In future if they get opportunities they may be intellectually prepared to improve human activities in such away that weather and climate are impacted least. We are suggesting some project ideas. Through these they can enrich their concept and knowledge which will help them in framing projects.
-----------------------------------------------------------------Box 1
Anamalais is the Hill Range in the southern Western Ghats, immediately south to Palakkad Gap. The highest peak in the Western Ghats, Anamudi which stands at 2695 m above the sea level is in the Munnar region in the Anamalais. Further south to the Anamalais is the High Ranges which is a plateau with heavy rainfall and with undulating terrain. The area forms the catchment of Periyar, a major river originating from the Southern Western Ghats.The area was once covered with dense evergreen forests, stunted shola forests and high altitude grasslands. The British during the colonial time discovered that this region would be ideal for some kind of plantations. Large stretches of forests in the Munnar region were cleared for raising tea palntations in the 1880s. The forests of High Ranges were opened up to cultivate cardamomum in 1890s. The human population grew up in this region gradually and the human activities and the so called developmental activities resulted in dwindling of the forest cover in the region. Many small and large urban centers were emerged with the increase of population and increased transportation facilities causing further loss of forests.
The analysis of weather data being recorded for the last more than 100 years has clearly shown a change in climate in Munnar and High Ranges during this period. The temperature data from Pampadumpara in the High Ranges showed a shift in the maximum and minimum temperature during the last 30 years. As per the data available from Munnar, there is a decreasing trend in the total rainfall and number of rainy days during
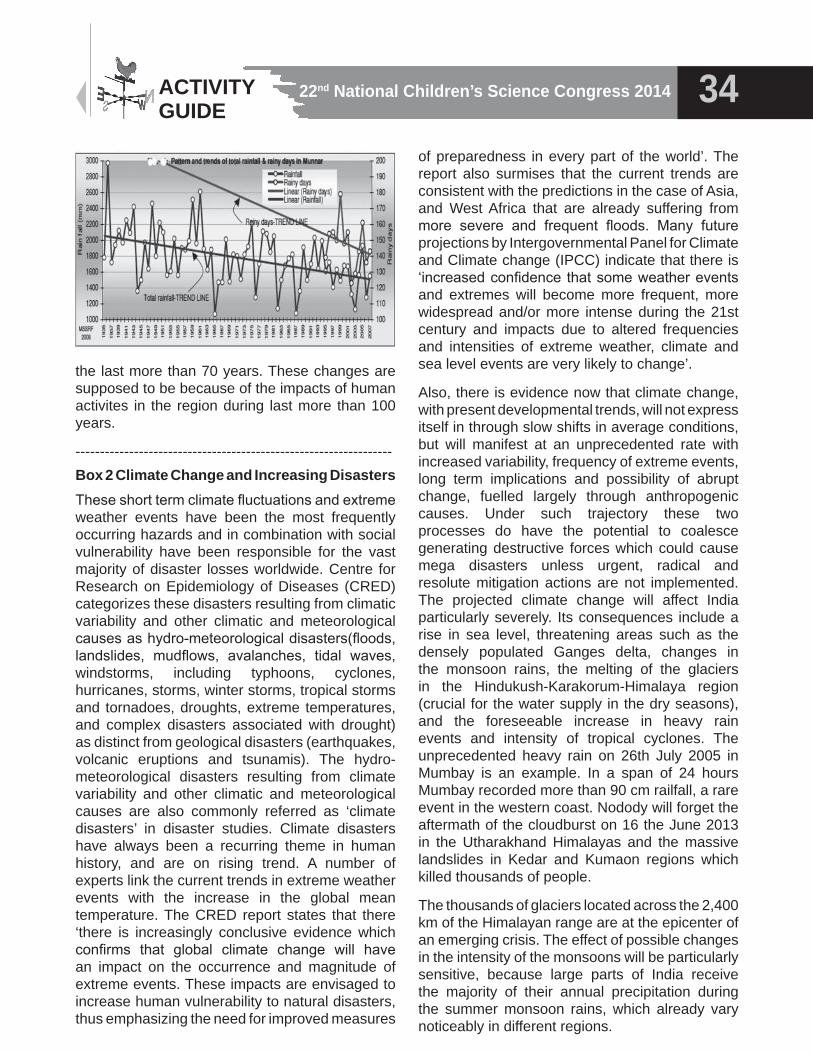
22nd National Children’s Science Congress 2014 34ACTIVITY GUIDE
the last more than 70 years. These changes are supposed to be because of the impacts of human activites in the region during last more than 100 years.
-----------------------------------------------------------------Box 2 Climate Change and Increasing DisastersThese short term climate fluctuations and extreme weather events have been the most frequently occurring hazards and in combination with social vulnerability have been responsible for the vast majority of disaster losses worldwide. Centre for Research on Epidemiology of Diseases (CRED)categorizes these disasters resulting from climatic variability and other climatic and meteorological causes as hydro-meteorological disasters(floods, landslides, mudflows, avalanches, tidal waves, windstorms, including typhoons, cyclones, hurricanes, storms, winter storms, tropical storms and tornadoes, droughts, extreme temperatures, and complex disasters associated with drought) as distinct from geological disasters (earthquakes, volcanic eruptions and tsunamis). The hydro-meteorological disasters resulting from climate variability and other climatic and meteorological causes are also commonly referred as ‘climate disasters’ in disaster studies. Climate disasters have always been a recurring theme in human history, and are on rising trend. A number of experts link the current trends in extreme weather events with the increase in the global mean temperature. The CRED report states that there ‘there is increasingly conclusive evidence which confirms that global climate change will have an impact on the occurrence and magnitude of extreme events. These impacts are envisaged to increase human vulnerability to natural disasters, thus emphasizing the need for improved measures
of preparedness in every part of the world’. The report also surmises that the current trends are consistent with the predictions in the case of Asia, and West Africa that are already suffering from more severe and frequent floods. Many future projections by Intergovernmental Panel for Climate and Climate change (IPCC) indicate that there is ‘increased confidence that some weather events and extremes will become more frequent, more widespread and/or more intense during the 21st century and impacts due to altered frequencies and intensities of extreme weather, climate and sea level events are very likely to change’.
Also, there is evidence now that climate change, with present developmental trends, will not express itself in through slow shifts in average conditions, but will manifest at an unprecedented rate with increased variability, frequency of extreme events, long term implications and possibility of abrupt change, fuelled largely through anthropogenic causes. Under such trajectory these two processes do have the potential to coalesce generating destructive forces which could cause mega disasters unless urgent, radical and resolute mitigation actions are not implemented. The projected climate change will affect India particularly severely. Its consequences include a rise in sea level, threatening areas such as the densely populated Ganges delta, changes in the monsoon rains, the melting of the glaciers in the Hindukush-Karakorum-Himalaya region (crucial for the water supply in the dry seasons), and the foreseeable increase in heavy rain events and intensity of tropical cyclones. The unprecedented heavy rain on 26th July 2005 in Mumbay is an example. In a span of 24 hours Mumbay recorded more than 90 cm railfall, a rare event in the western coast. Nodody will forget the aftermath of the cloudburst on 16 the June 2013 in the Utharakhand Himalayas and the massive landslides in Kedar and Kumaon regions which killed thousands of people.
The thousands of glaciers located across the 2,400 km of the Himalayan range are at the epicenter of an emerging crisis. The effect of possible changes in the intensity of the monsoons will be particularly sensitive, because large parts of India receive the majority of their annual precipitation during the summer monsoon rains, which already vary noticeably in different regions.
22nd National Children’s Science Congress 201435 ACTIVITY GUIDE
The summer monsoon is crucial to the annual precipitation total of the Indian subcontinent. Over 40 million hectares (12 % of land), is prone to floods, close to 5700 kms of its 7516 km coast line (about 8%), is cyclone prone and exposed to tsunamis and storm surges, 2% of land is landslide prone, and 68% of India’s arable land is affected by droughts. Of the 35 States and Union Territories, as many as 27 are disaster prone. Most disasters in India are water related the east coast of India, which lies in the path of tropical hurricanes from the Gulf of Bengal, is particularly at risk of being damaged by storms and floods.The projections by the National Institute of Oceanography (NIO), under the Council of Scientific and Industrial Research (CSIR), Government of India on the impacts of climate change on sea level, to assess the degree to which mean sea level and the occurrence of extreme events may change, showed an increased occurrence of cyclones in the Bay of Bengal, particularly in the post-monsoon period, along with increased maximum wind speeds associated with cyclones and a greater number of high surges under climate change. In addition, the strength of tropical cyclones, which represent a threat to the eastern coast of India and to Bangladesh, could increase. The risk to these areas will be aggravated by the rising sea level.
Vast stretches of land in India suffers acute water shortage. Of the net area sown in the country, 68 percent is prone to drought, and of this 33 percent is chronically drought-prone, receiving rainfall of less than 750 mm per annum, while 35 percent receives rainfall between 750-1,125 mm per annum. The steady shrinking of the Himalayan Glacier ranges will drastically cut down water availability in downstream plains of Uttar Pradesh and Bihar. India’s initial National Communication to the United Nations Framework Convention (UNFCCC) on Climate Change projects that Luni, the west flowing rivers of Kutchh and Saurashtra occupying about one fourth of the area of Gujarat and 60 % of Rajasthan are likely to experience acute physical water scarcity.
The river basins of Mahi, Pennar, Sabarmati and Tapi are also likely to experience constant water scarcities and shortages .
Landslides The areas that suffer from landslide hazards are located in the hilly tracts of the
Himalayas, Northeast India, Nilgiris, Eastern Ghats and Western Ghats. With the melting of the glaciers in the Hindukush-Karakorum- Himalaya region, and the foreseeable increase in heavy rain events and intensity of ropical cyclones, the incidences of landslides are likely to increase.
Coastal zone India has an 8000 km-long coastline with two cyclone seasons, during the southwest and northeast monsoons. Cyclones have been observed to be more frequent in the Bay of Bengal than the Arabian Sea. Future climate change in the coastal zones is likely to be manifested through worsening of some of the existing coastal zonal problems. Some of the main climate related concerns in the context of the Indian coastal zones are erosions, flooding, submergence and deterioration of coastal ecosystems, such as mangroves and salinization. In many case these are caused by, or, exacerbated by, sea level rise and tropical cyclones.
-----------------------------------------------------------------
Ideas for projects1. long term changes in weather condition of the locality : rainfall(total and pattern), temperature, relative humidity, number of rainy days, wind speed and direction data are to be obtained on long term basis (for mare than 30 years) from sources already available and plot the data to indicate any obvious changes in the parameters. If possible discuss and correlate the changes with certain observable parameters in the environment of the area. The changes may be correlated with the impact on agricultural production, drought, flood etc.
2. Urbanisation: Changes in land use in the area due to human habitation and urbanisation: Children will interact with senior persons in their locality to obtain information about changes in land use in the form of conversion of agricultural land, orchards,grass land, wilderness areas in to human habitation.The toposheets of different periods and google earth images may be used(students should get a chance to know toposheets and other sources of knowledge on earth surface, past and present) They will quantify diversions for various purposes. Compare temperature regime and humidity level in the surrounding area and in the habitation.
22nd National Children’s Science Congress 2014 36ACTIVITY GUIDE
3. Analysis of waste generation and collection and disposal in a locality and its impact on weather and climate: children will sample waste generated in few premises and classify them under biodegradable and non biodegradable. They will observe the approximate percentage of waste collected by the local authority and their disposal methods. They will make rough estimations of carbon dioxide and methane emissions from the waste. These two gases directly impact the climate and weather, as these are GHGs.
4. Evaporation from man made reservoirs and its impact on local weather: Children can plan experiments with containers of different diameters. They cn put same quantity of water in all the container and leave them. Every second day they can measure the loss of water by measuring the quantity left in each container. They should correlate evaporation rate with diameter of the container which is indicative of exposed surface area. They can correlate the findings with field observations. Ponds, ditches, lakes etc which are shallow dry up fast as compared to the deeper ones. Water vapour is a green house component and also loss of water will reflect on availability of water in the locality
Suggested projects1. Loss of forest/wilderness areas in the locality
2. Loss of water bodies with time
3. Changes in cropping pattern in the locality
4. loss of mangrove forest in coastal area and possible impact in terms of coastal erosion
5. The effect of mangrove loss on the impact of cyclone in the coastal area.
6. Food wastage and carbon footprint
7. Life style and carbon foot print
8. Afforestation and carbon footprint
9. Use of fuel in industry and impact on weather and climate.
10. Artificial fish culture, fertilizing water and GHG emission
11. Use of biowaste as compost and reduction in carbon footprint
12. Replacement of non biodegradable plates, cups etc with biodegradable to reduce carbon footprint
13. Use of bicycle in the place of motorised vehicle and reduction in carbon footprint
14. Energy saving devises to reduce GHG emission
15. Use of natural light in place of artificial light.
22nd National Children’s Science Congress 201437 ACTIVITY GUIDE
WEATHER, CLIMATE AND ECOSYSTEMS
Sub Theme-3
IntroductionWeather and climate are important physical environmental factors which influences the ecosystems. The term Ecosystem deals with the biotic (living) and abiotic (nonliving) components within the environment along with the factors interacting each other. An ecosystem can be as large as an ocean or as small as a local pond. Ecosystems provide people with food, goods, medicines, and many other products. They also play a vital role in nutrient cycling, water purification, and climate moderation.All weather and climatic paramerters affect the ecosystem elements in various ways. In turn, biotic elements influence the development of microclimate in an ecosystem. Human activities also affect weather and climate which now has come to reality leading us to the perceived global climate change.
Weather and Climate have profound effects on ecosystems and the habitats that support life on earth. The variation of temperature, humidity and precipitation the quality of water, soil forming process directly will influence the floral growth and faunal composition. Even though smaller changes are taking place in weather conditions a fairly high impact may be observed on natural resources. Changes are expected to alter the makeup and functioning of ecosystems, as well as some of the critical benefits that ecosystems provide to people. Fast changes in the climate can threaten ecosystems that have already been weakened by other human activities such as pollution, development, and overharvest etc.
Biodiversity is the living component of any ecosystem. Although species have adapted to environmental change for millions of years, a quickly changing climate could require adaptation on larger and faster scales than in the past. Those species that cannot adapt are at risk of extinction. Even the loss of a single species can have cascading effects because organisms are connected through food webs and other interactions.
The timing of many natural events, such as flower blooms and animal migrations, is linked to climate factors such as temperature, moisture availability, and amount of daylight. Changes in weather patterns and extreme events associated with climate change can disrupt these natural patterns. These isruptions, in turn, can affect seasonal behavior and interactions among species. For example, if birds migrate and lay eggs too early, hatchlings might not have an adequate food supply. While some animals and plants will successfully adjust life-cycle patterns to changing weather pattern cues, others might not be so successful. Climate change can alter where species live and how they interact, which could fundamentally transform current ecosystems. Impacts on one species can ripple through the food web and affect many organisms in an ecosystem.
India’s weather and climatic conditions are naturally controlled by its geographical locations and hence the parameters of weather vary from place to place. Due to such variations the vegetation type, soil quality and water quality also vary from place to place.
Weather and Climate variability have various significant parameters such as Rain, Temperature, Wind and Humidity that inflict impact on the abiotic and biotic nature on earth. These parameters have effect on the occurrence, abundance, seasonality and behavior of living organisms as well as quality of air, water and soil. It has direct or indirect effect on the various ecosystems. When some of these ecosystems are available every where in India some will be restricted to very specialized locations.
Types of ecosystems
Terrestrial ecosystemsForest ecosystem – Various types of forests across the country Agricultural ecosystem – various crop systems across the countryGrassland – Secondary, rarely the primary
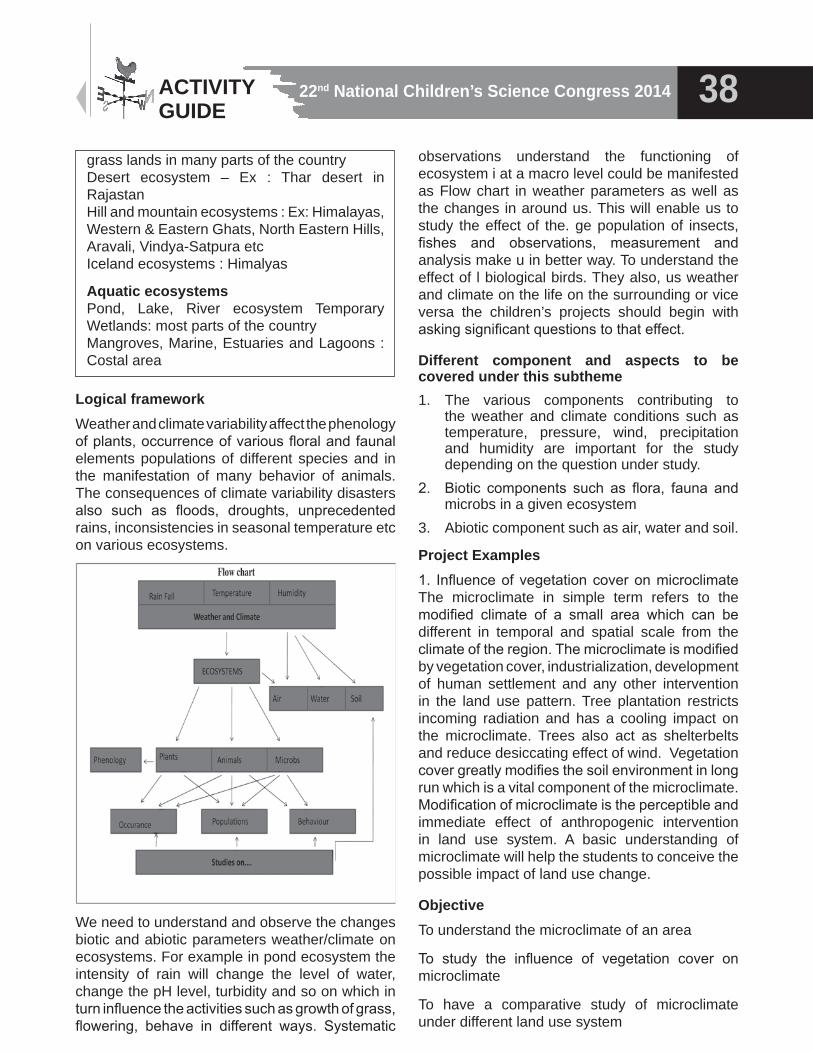
22nd National Children’s Science Congress 2014 38ACTIVITY GUIDE
grass lands in many parts of the countryDesert ecosystem – Ex : Thar desert in RajastanHill and mountain ecosystems : Ex: Himalayas, Western & Eastern Ghats, North Eastern Hills, Aravali, Vindya-Satpura etc Iceland ecosystems : Himalyas
Aquatic ecosystemsPond, Lake, River ecosystem Temporary Wetlands: most parts of the countryMangroves, Marine, Estuaries and Lagoons : Costal area
Logical frameworkWeather and climate variability affect the phenology of plants, occurrence of various floral and faunal elements populations of different species and in the manifestation of many behavior of animals. The consequences of climate variability disasters also such as floods, droughts, unprecedented rains, inconsistencies in seasonal temperature etc on various ecosystems.
observations understand the functioning of ecosystem i at a macro level could be manifested as Flow chart in weather parameters as well as the changes in around us. This will enable us to study the effect of the. ge population of insects, fishes and observations, measurement and analysis make u in better way. To understand the effect of l biological birds. They also, us weather and climate on the life on the surrounding or vice versa the children’s projects should begin with asking significant questions to that effect.
Different component and aspects to be covered under this subtheme1. The various components contributing to
the weather and climate conditions such as temperature, pressure, wind, precipitation and humidity are important for the study depending on the question under study.
2. Biotic components such as flora, fauna and microbs in a given ecosystem
3. Abiotic component such as air, water and soil.
Project Examples1. Influence of vegetation cover on microclimate The microclimate in simple term refers to the modified climate of a small area which can be different in temporal and spatial scale from the climate of the region. The microclimate is modified by vegetation cover, industrialization, development of human settlement and any other intervention in the land use pattern. Tree plantation restricts incoming radiation and has a cooling impact on the microclimate. Trees also act as shelterbelts and reduce desiccating effect of wind. Vegetation cover greatly modifies the soil environment in long run which is a vital component of the microclimate. Modification of microclimate is the perceptible and immediate effect of anthropogenic intervention in land use system. A basic understanding of microclimate will help the students to conceive the possible impact of land use change.
ObjectiveTo understand the microclimate of an area
To study the influence of vegetation cover on microclimate
To have a comparative study of microclimate under different land use system
We need to understand and observe the changes biotic and abiotic parameters weather/climate on ecosystems. For example in pond ecosystem the intensity of rain will change the level of water, change the pH level, turbidity and so on which in turn influence the activities such as growth of grass, flowering, behave in different ways. Systematic
22nd National Children’s Science Congress 201439 ACTIVITY GUIDE
The experiment may be divided in two components(A) Field study - monitoring microclimate of
different land use system(B) Development of workable model to understand
the concept of microclimate
Part A: Field study - monitoring microclimate of different land use systems
MethodologySelect different land use systems in the surrounding locality
a) Crop landb) Barren landc) Forest land/Orchardd) Settlement areas and any other typical land
use system.
Two simply measurable parameters: temperature and evaporation are selected. This can be improvised by incorporating additional indicators.
• Keep circular leak proof open pan of ½ m diameter and 50 cm depth at the representative place of each land use system. Fill with water up to 30 cm depth. Cover it with wire net.
• Keep the thermometers in suitable places to measure soil temperature, water temperature (of the pan) and air temperature in these sites. Care should be taken to avoid direct radiation on the bulb of the thermometer.
• Record the temperature observations three times daily at early morning (say, 7 am), mid day (say at 12 to 2 pm) and during evening (say, 6 pm) over a period of 4 months at weekly interval.
• Record the depth of water from these pans at weekly interval and add water as per requirement during the period of study
• Collect the soil samples from each site at 10 cm depth 3 days after each rain event. Take the fresh weight (immediately after collection) and again by drying the same sample at 105 0C for 24 hours in an oven. Calculate the moisture content as below -
Soil moisture content = (Fresh soil weight – Dry soil weight) / Dry soil weight
The impact on soil evaporation can only be perceptible if soil types are same because the
soil type (textural class) is a major driving factor for water release from soil for evaporation
Important note: It is a group activity. Time synchrony has to be maintained for observations at different field sites. Each student may be assigned one site for diurnal observation.
Relevance:Note the difference in temperature and evaporation rate from each observation site. These parameters are easily perceptible but important indicators to define a microclimate of a place. Mark, how human intervention changes the microclimate. This will give help the students to understand the microclimate and in broad sense demonstrate how anthropogenic intervention is responsible for modification of the climate on the earth surface.
Part B: Understanding the concept of microclimatic
Materials required• Earthen pot (6 Nos)• Seedlings (Fast growing plant depending
local suitability)• Card board & Ply board• Thermometer (2 Nos)• Open pan of 20 cm diameter and 5 cm depth
Methodology:• Take 6 earthen pots. Make a whole at the
bottom of each pot.• Fill the pots with one thin layer of small stones
at the bottom and the rest with soil• Plant one seedling in each pot and water
regularly.• Make two model houses using card board /
ply board• Place one model house in the middle of 6 pots
and one house in open area• Measure the temperature of the roof top of
each house (using thermometer) at 15 days interval starting from the date of planting.
• Place the open pan near each model house and keep 2 cm depth of water in each pan. Add water to each pan after drying.
• Note the temperature difference between the two situations
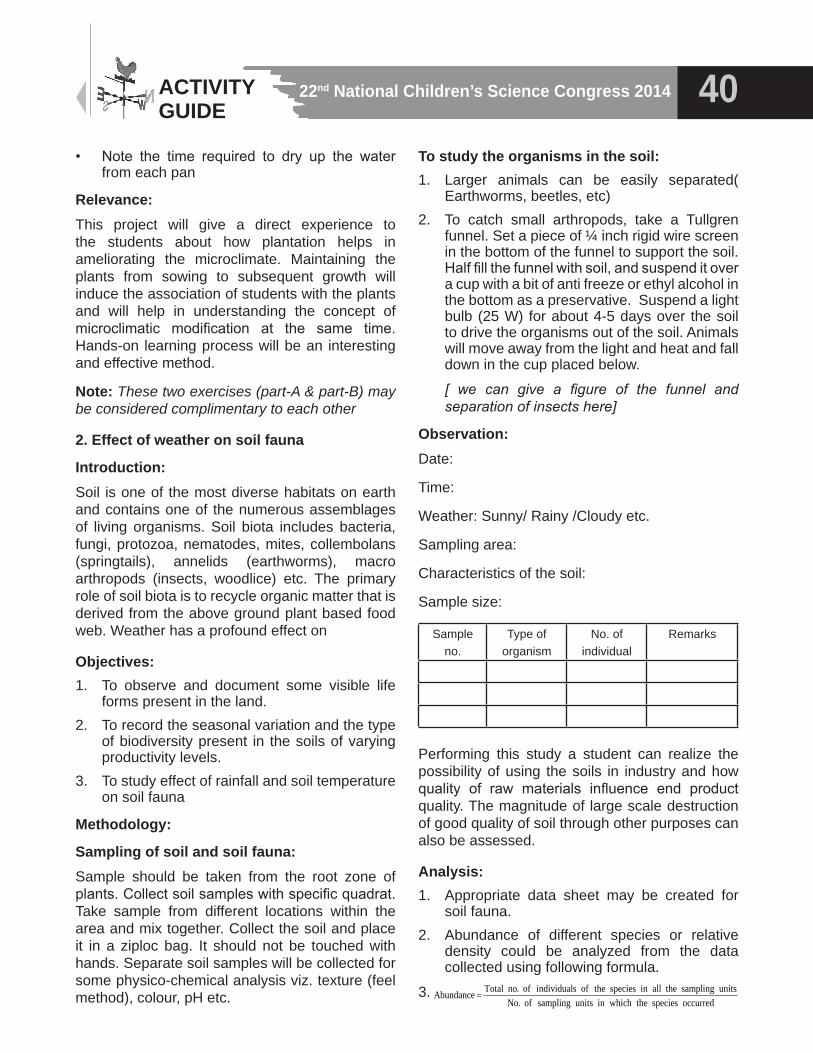
22nd National Children’s Science Congress 2014 40ACTIVITY GUIDE
• Note the time required to dry up the water from each pan
Relevance:This project will give a direct experience to the students about how plantation helps in ameliorating the microclimate. Maintaining the plants from sowing to subsequent growth will induce the association of students with the plants and will help in understanding the concept of microclimatic modification at the same time. Hands-on learning process will be an interesting and effective method.
Note: These two exercises (part-A & part-B) may be considered complimentary to each other
2. Effect of weather on soil fauna
Introduction:Soil is one of the most diverse habitats on earth and contains one of the numerous assemblages of living organisms. Soil biota includes bacteria, fungi, protozoa, nematodes, mites, collembolans (springtails), annelids (earthworms), macro arthropods (insects, woodlice) etc. The primary role of soil biota is to recycle organic matter that is derived from the above ground plant based food web. Weather has a profound effect on
Objectives:1. To observe and document some visible life
forms present in the land.2. To record the seasonal variation and the type
of biodiversity present in the soils of varying productivity levels.
3. To study effect of rainfall and soil temperature on soil fauna
Methodology:
Sampling of soil and soil fauna:Sample should be taken from the root zone of plants. Collect soil samples with specific quadrat. Take sample from different locations within the area and mix together. Collect the soil and place it in a ziploc bag. It should not be touched with hands. Separate soil samples will be collected for some physico-chemical analysis viz. texture (feel method), colour, pH etc.
To study the organisms in the soil:1. Larger animals can be easily separated(
Earthworms, beetles, etc)2. To catch small arthropods, take a Tullgren
funnel. Set a piece of ¼ inch rigid wire screen in the bottom of the funnel to support the soil. Half fill the funnel with soil, and suspend it over a cup with a bit of anti freeze or ethyl alcohol in the bottom as a preservative. Suspend a light bulb (25 W) for about 4-5 days over the soil to drive the organisms out of the soil. Animals will move away from the light and heat and fall down in the cup placed below.
[ we can give a figure of the funnel and separation of insects here]
Observation:Date:
Time:
Weather: Sunny/ Rainy /Cloudy etc.
Sampling area:
Characteristics of the soil:
Sample size:
Sample no.
Type of organism
No. of individual
Remarks
Performing this study a student can realize the possibility of using the soils in industry and how quality of raw materials influence end product quality. The magnitude of large scale destruction of good quality of soil through other purposes can also be assessed.
Analysis:1. Appropriate data sheet may be created for
soil fauna.2. Abundance of different species or relative
density could be analyzed from the data collected using following formula.
3. Total no. of individuals of the species in all the sampling unitsAbundanceNo. of sampling units in which the species occurred
=
22nd National Children’s Science Congress 201441 ACTIVITY GUIDE
4.
5. Seasonal variation of the animals could be noted under different soil conditions.
Conclusion:1. Significance of habitat choice by the organism
can be studied.2. Dominant species and rare species can be
shown.3. Compare the result between or among the
soils.
Relevance of the project:A comparison of soil macro fauna in different types of soil like, forest, agricultural land, and urban, eroded, etc can be shown. The analysis of results may suggest remedies for ecorestoration of the degraded land.
3. Effect of rainfall on phenology of plants
Objectives:1. To study the phenology of plants in relation to
the rainfall in an area.2. To analyse the relation between temperature/
rainfall and various pheno-phases of plants
Methodology• Select a set of common plants species
available in your locality.• Then collect information about these species
from elderly people and observation about their period of flowering, fruiting and other charateristics
• Start observations on each of these plants and record the phenology (budding, leaf flushing, flowering, fruiting, seed dispersal etc) of the plant systematically
• The data gathered thus should be tabulated analysed and compared to understanding the change in phenology of the different species.
Observation sheet:Date: Time:
Weather: Sunny/ Rainy /Cloudy etc. Location:
Species Number of Individuals
Phenological stage
Remarks
4. To study the impact of climate on sacred grove biodiversitySacred grooves are the ecosystems conserved through traditional belief systems in particular localities. They have played significant role in conservation and preservation of biological resources. Students can document the changes in sacred groves through questionnaire survey and collect the climatic information from secondary sources and study the relationships.
Objectives1. To understand the component of the sacred
groves and the changes in sacred grove in last 2 decades
2. Study the changes in sacred grows with respect to the weather and climate
Methodology• At the very outset we need to collect
information from the village headman/priest and elderly people regarding existence of sacred groves in the vicinity of the study area.
• The sacred grove needs to be visited for the pilot survey along with teacher.
• During the pilot visit the main features of the grove such as the deity, belief system, use of resources and biodiversity have to be recorded.
• Then the main questions regarding sacred groves to be prepared for documentation of biodiversity and degradation.
• The historical data can be compared with the current data to make us understand the changes taking place in the sacred groves.
• Meantime the information regarding weather and climate can be collected from secondary sources and can be correlated with change in sacred grove.
Total no. of individual speciesRelative density x 100Total no. of individual in all species
=
22nd National Children’s Science Congress 2014 42ACTIVITY GUIDE
List of Projects suggested
Effects of weather and claimate on Biotic Components• Effect of the pattern of weather parameters
such as Rain, Temperature, Wind and Humidity on
• Abundance of various Insects• Changes of Behaviour of insects with respect
to weather parameters• Relationship between Dragon fly population
changes and and rainfall• Relationship of movement of social insects
and weather parameters• Behaviour of birds in relation to the weather
parameters• Behavior and movement of spider in relation
to the weather parameters• Abundance and breeding of frogs in relation
to the weather parameters• Variation in weather and climate Vs presence
and absence/ abundance of plants such as weeds
• Behavior of domestic animals in relation to the weather parameters
• Seasonality of occurrence of plants
• Weather pattern and flowering of plants
• Soil Organisms and weather pattern
• Fish migration and weather pattern/ tide pattern
• Fish catch and weather pattern
• Seasonality in fish catch
• Seasonality of behavior of costal animals / tide pattern
• Weather parameters and abundance of mushroom
Effects of weather and climate on Abiotic Components• Variable weather conditions can affect quality
of air, water and soil. Some of the changes are measurable such as measuring pH amount of dissolved salts in water, organic matter in soil etc.
• Quality of air in terms of air pollutants such as Carbon dioxide, methane, NOX content in different seasons
• Soil pH in different places/ different time.
• Water pH in different places/ different time / rain water
• Determination of dissolved minerals in different water samples in your locality
• Comparing water quality before and after rain
• Determination of organic matter present in soil in different periods of time.
• Weather and soil erosion
• Effect of light period, light intensity, atm. temperature, humidity and soil moisture on growth of plants
• Stomatal count for as surrogate for the production of Oxygen – comparison of different plants
• Calculation of Carbon sequestration in different urban and rural gardens
• Relation between Wind pattern and seed production in wind dispersed seeds.
• Relation between wind pattern and flowering of anemophilic plants.
22nd National Children’s Science Congress 201443 ACTIVITY GUIDE
WEATHER, CLIMATE – SOCIETY AND CULTURE
Sub Theme-4
AbstractWeather and climate are key environmental factors which determine the state of natural environment, which influences the human being in to a large extent. In brief, weather and climatic condition determines the state of natural environment in relation to land, soil, water, flora and fauna, etc. Natural state of environment creates foundation for human livelihood practices. The natural environment and associated livelihood practices leads to formation of different social groups and traits of belief, values, norms and knowledge system. These together structure the society and form the cultural system at large and mould human way of life in terms of life style. When this life style is less energy and material intensive its impact on natural state of environment is minimum; so pressure of human activities on weather and climate are less. On the other hand, when it is more energy and material intensive its negative impact on natural state of environment is more and have more pressure on weather and climate through its activities. In many cases the social and cultural practices develop specific knowledge system through which people of this societal group try to assess the weather and predicting its nature traditionally to plan their day to day activities. In this sub-theme, it is planned to review, assess, and validate such social and cultural practices to know about the inter-woven relationship among weather-climate-society and culture, and impact of socio-culturally defined lifestyle on weather & climate. However instead of mere survey and documentation based work, it is desired that the activities would validate the practices through appropriate analysis and experimentation.
Background:Weather is the condition of the atmosphere at particular place and time1; with respect to the variables like temperature, air pressure, wind, precipitation, etc.2
On the other hand climate is the regular pattern of weather conditions of a particular place1; a region of Earth having particular meteorological condition3. It can also be defined as the conditions of the atmosphere near the Earth’s surface at certain location on Earth. But there are distinct differences with weather. Weather changes from day to day or season to season and also change in a regular cycle during the year. Climate is broadly a long term condition of weather pattern taken over a period of at least thirty years of a region.4
Society is a group of people with common territory, interaction, and culture. Society evolved through formation of groups from family to occupation based to interest based groups, etc. It may vary from region to region on the basis of natural environmental situation over different time scales. time. Because with the variation of space and time human interface with natural environment changes and human beings acquire different information and knowledge. Based on such practical experience and knowledge human beings designed their way of life, which is linked to formation of different social groups and with its elements of similarities, differences, cooperation, interdependence, social relationship, organization, etc.
Culture is everything made, learnt, or shared by the members of a society, including values, beliefs, behaviours, and material objects. Culture is learnt, and it varies tremendously from society to society.5 “A culture is the totally acquired way of life or life style for a group of people. It consists of the patterned, repetitive ways of thinking, feeling and acting that are characteristics of members of a particular society or segment of a society”.6
Weather and climatic condition of an area exerts impact on available natural resources and these natural resources provides opportunities and hurdles for human beins for designing their livelihood practices leading to formation of social groups and sub-groups and their cultural practices.
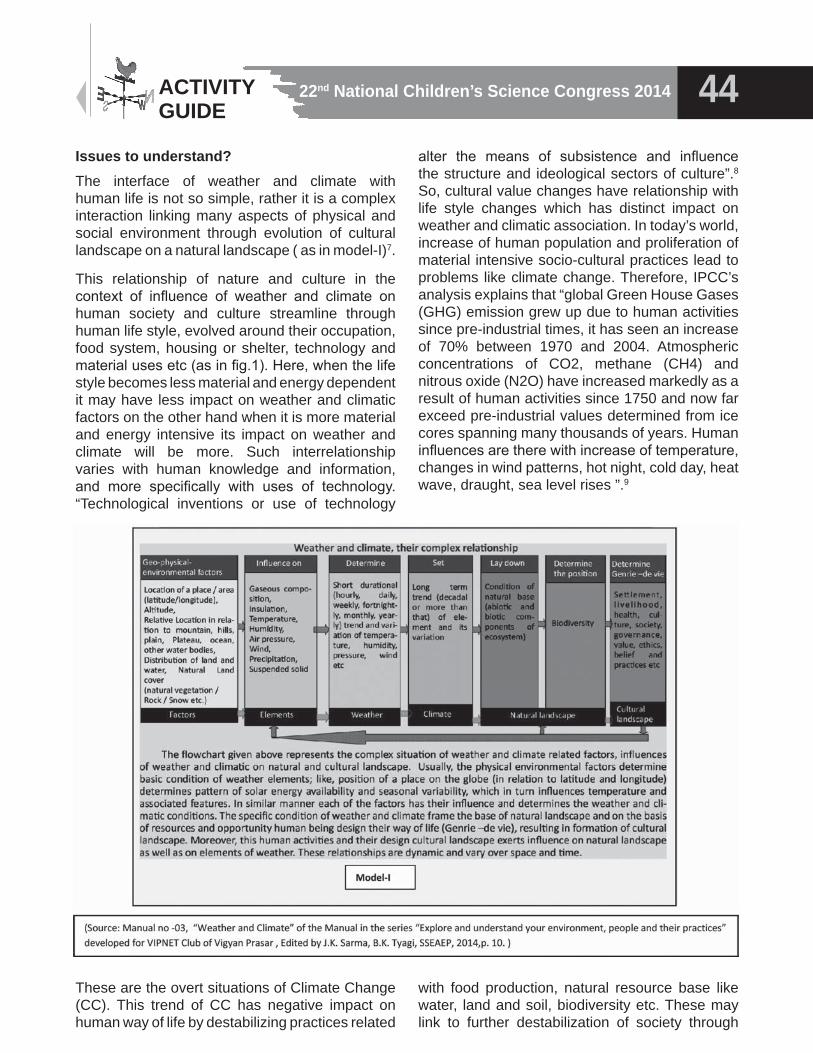
22nd National Children’s Science Congress 2014 44ACTIVITY GUIDE
Issues to understand?The interface of weather and climate with human life is not so simple, rather it is a complex interaction linking many aspects of physical and social environment through evolution of cultural landscape on a natural landscape ( as in model-I)7.
This relationship of nature and culture in the context of influence of weather and climate on human society and culture streamline through human life style, evolved around their occupation, food system, housing or shelter, technology and material uses etc (as in fig.1). Here, when the life style becomes less material and energy dependent it may have less impact on weather and climatic factors on the other hand when it is more material and energy intensive its impact on weather and climate will be more. Such interrelationship varies with human knowledge and information, and more specifically with uses of technology. “Technological inventions or use of technology
alter the means of subsistence and influence the structure and ideological sectors of culture”.8 So, cultural value changes have relationship with life style changes which has distinct impact on weather and climatic association. In today’s world, increase of human population and proliferation of material intensive socio-cultural practices lead to problems like climate change. Therefore, IPCC’s analysis explains that “global Green House Gases (GHG) emission grew up due to human activities since pre-industrial times, it has seen an increase of 70% between 1970 and 2004. Atmospheric concentrations of CO2, methane (CH4) and nitrous oxide (N2O) have increased markedly as a result of human activities since 1750 and now far exceed pre-industrial values determined from ice cores spanning many thousands of years. Human influences are there with increase of temperature, changes in wind patterns, hot night, cold day, heat wave, draught, sea level rises ”.9
These are the overt situations of Climate Change (CC). This trend of CC has negative impact on human way of life by destabilizing practices related
with food production, natural resource base like water, land and soil, biodiversity etc. These may link to further destabilization of society through
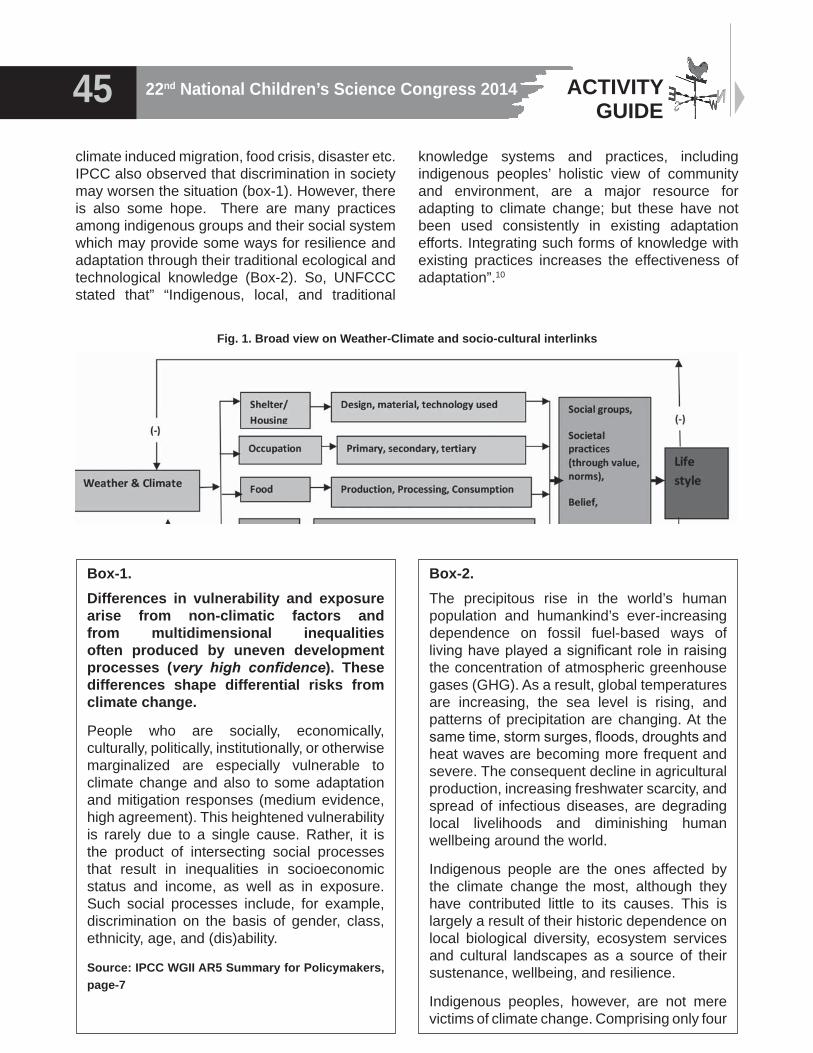
22nd National Children’s Science Congress 201445 ACTIVITY GUIDE
climate induced migration, food crisis, disaster etc. IPCC also observed that discrimination in society may worsen the situation (box-1). However, there is also some hope. There are many practices among indigenous groups and their social system which may provide some ways for resilience and adaptation through their traditional ecological and technological knowledge (Box-2). So, UNFCCC stated that” “Indigenous, local, and traditional
knowledge systems and practices, including indigenous peoples’ holistic view of community and environment, are a major resource for adapting to climate change; but these have not been used consistently in existing adaptation efforts. Integrating such forms of knowledge with existing practices increases the effectiveness of adaptation”.10
Fig. 1. Broad view on Weather-Climate and socio-cultural interlinks
Box-1.Differences in vulnerability and exposure arise from non-climatic factors and from multidimensional inequalities often produced by uneven development processes (very high confidence). These differences shape differential risks from climate change.
People who are socially, economically, culturally, politically, institutionally, or otherwise marginalized are especially vulnerable to climate change and also to some adaptation and mitigation responses (medium evidence, high agreement). This heightened vulnerability is rarely due to a single cause. Rather, it is the product of intersecting social processes that result in inequalities in socioeconomic status and income, as well as in exposure. Such social processes include, for example, discrimination on the basis of gender, class, ethnicity, age, and (dis)ability.
Source: IPCC WGII AR5 Summary for Policymakers, page-7
Box-2.The precipitous rise in the world’s human population and humankind’s ever-increasing dependence on fossil fuel-based ways of living have played a significant role in raising the concentration of atmospheric greenhouse gases (GHG). As a result, global temperatures are increasing, the sea level is rising, and patterns of precipitation are changing. At the same time, storm surges, floods, droughts and heat waves are becoming more frequent and severe. The consequent decline in agricultural production, increasing freshwater scarcity, and spread of infectious diseases, are degrading local livelihoods and diminishing human wellbeing around the world.
Indigenous people are the ones affected by the climate change the most, although they have contributed little to its causes. This is largely a result of their historic dependence on local biological diversity, ecosystem services and cultural landscapes as a source of their sustenance, wellbeing, and resilience.
Indigenous peoples, however, are not mere victims of climate change. Comprising only four
22nd National Children’s Science Congress 2014 46ACTIVITY GUIDE
administrative units have been considered in such a manner that there are fewer variations on the parameters within a zone. Now in this context if we look into people, their livelihood practices, socio-cultural practices in relation to food, shelter, clothing; uses of water, energy and technology, we may able to identify wide variation. In each climatic and agro-climatic zone, its practices are influenced by respective weather and climatic attributes along with condition of topography, land, water, soil and biodiversity. There are many to encouraging practices related to natural resource management and biodiversity conservation based on traditional knowledge systems12, like water harvesting13,14, land use management15, conservation practices16,17,18, settlement and housing practices19,20 etc having different components that can strengthen climate change resilience and adaptation system. However, there are some practices which have negative impact on natural assets in general and weather influencing factors in particular21, 22, and 23. Relook to in these situations from the perspective of understanding and following ‘what, where, why and how’ question; these may reveal new know-how, skills and techniques to face the challenges of climate change. It may also strengthen our capability to develop a “climate smart” life style.
Focused research question:• What type of influences exerted by weather
and climate related factors impact human social and cultural practices?
• What are the negative factors of human practices of a particular social and cultural framework which impinge on weather and climatic condition or its associated factors?
• Where are such influences prominent?• Why such influences do exist or existed?• How does weather and climatic factors
influence human social and cultural practices?• How socio-culturally defined human practices
affect the weather and climatic situation or its associated factors?
• How do human beings try to get accustomed with such situations and re-design their life style?
• How the knowledge and technology help in strengthening their resilience and adaptation system?
per cent of the world’s population (between 250 to 300 million people), they utilize 22 per cent of the world’s land surface. In doing so, they maintain 80% of the planet’s biodiversity in, or adjacent to,85% of the world’s protected areas. Indigenous lands also hold hundreds of gigatons of carbon — a recognition that is gradually dawning on industrialized countries that seek to secure significant carbon stocks in an effort to mitigate climate change.
Indigenous peoples are excellent observers and interpreters of change on the land, sea, and sky. Their communitybased and collectively held traditional knowledge accumulated and maintained through practice over countless generations, offers valuable insights into the state of the environment. Indigenous knowledge possesses chronological and landscape-specific precision and detail that is often lacking from scientific models developed by scientists at much broader spatial and temporal scale, including those used to understand the magnitude of climate change.
India’s weather and climate are mainly governed by her geographical location, surrounding boundary conditions (the Himalayas, the Indian Ocean, Arabian Sea and Bay of Bengal). Further, the variations in land and water distribution within the country, altitudinal differences, vegetation type and cover along with the variations of sunshine hours within the country due to its latitudinal and longitudinal extension formed different climatic and agro-climatic zones. There are six climatic zones derived recently based on 0.5◦ X 0.5◦ grid level rainfall data and average potential evapotranspiration for 144 stations located across India to compute moisture index needed for delineation of different climatic zones based on datasets refer to the period 1971–2005.These areas are –arid, semi-arid, dry sub-humid, moist sub-humid, humid, per humid (as in map1)11. Similarly A total of 127 agro-climatic zones (table-1) have been identified in India under National Agricultural Research Project (NARP) based on a comprehensive research review of each state. While delineating zonal boundaries the physiographic divisions of each of the state, its rainfall pattern, soil type, availability of irrigation water, existing cropping pattern and
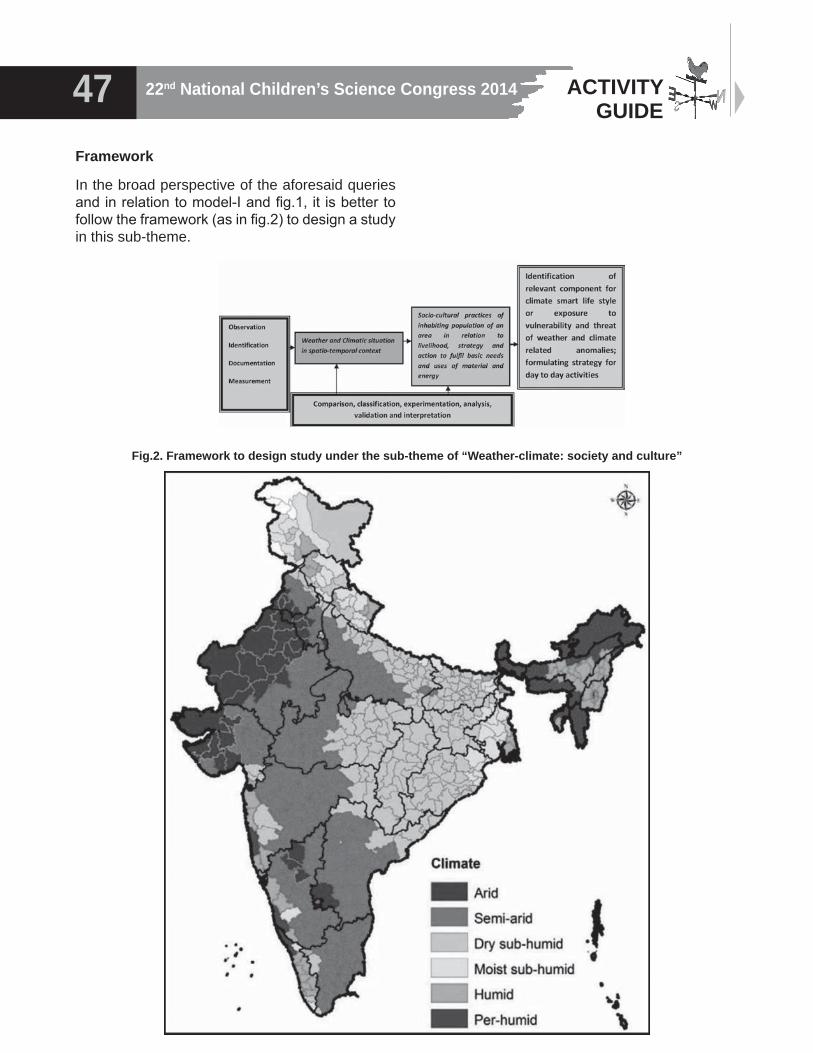
22nd National Children’s Science Congress 201447 ACTIVITY GUIDE
Fig.2. Framework to design study under the sub-theme of “Weather-climate: society and culture”
Framework
In the broad perspective of the aforesaid queries and in relation to model-I and fig.1, it is better to follow the framework (as in fig.2) to design a study in this sub-theme.
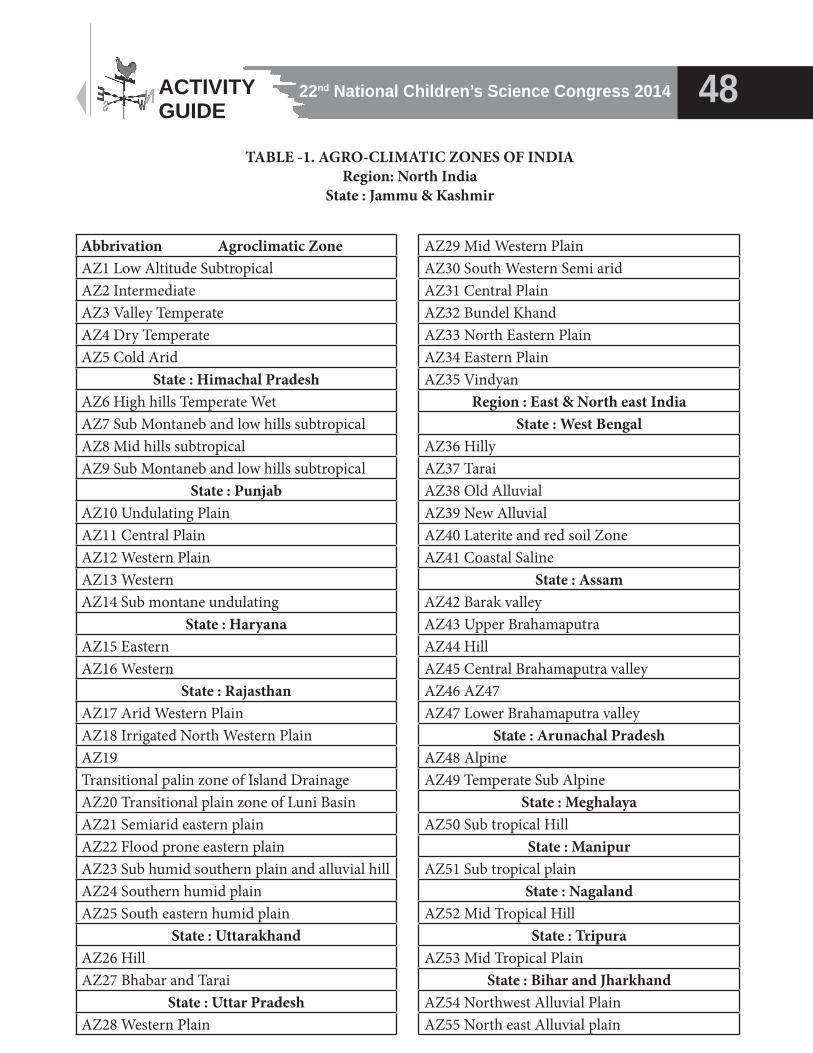
22nd National Children’s Science Congress 2014 48ACTIVITY GUIDE
TABLE -1. AGRO-CLIMATIC ZONES OF INDIARegion: North India
State : Jammu & Kashmir
Abbrivation Agroclimatic ZoneAZ1 Low Altitude SubtropicalAZ2 IntermediateAZ3 Valley TemperateAZ4 Dry TemperateAZ5 Cold Arid
State : Himachal PradeshAZ6 High hills Temperate WetAZ7 Sub Montaneb and low hills subtropicalAZ8 Mid hills subtropicalAZ9 Sub Montaneb and low hills subtropical
State : PunjabAZ10 Undulating PlainAZ11 Central PlainAZ12 Western PlainAZ13 WesternAZ14 Sub montane undulating
State : HaryanaAZ15 EasternAZ16 Western
State : RajasthanAZ17 Arid Western PlainAZ18 Irrigated North Western PlainAZ19Transitional palin zone of Island DrainageAZ20 Transitional plain zone of Luni BasinAZ21 Semiarid eastern plainAZ22 Flood prone eastern plainAZ23 Sub humid southern plain and alluvial hillAZ24 Southern humid plainAZ25 South eastern humid plain
State : UttarakhandAZ26 HillAZ27 Bhabar and Tarai
State : Uttar PradeshAZ28 Western Plain
AZ29 Mid Western PlainAZ30 South Western Semi aridAZ31 Central PlainAZ32 Bundel KhandAZ33 North Eastern PlainAZ34 Eastern PlainAZ35 Vindyan
Region : East & North east IndiaState : West Bengal
AZ36 HillyAZ37 TaraiAZ38 Old AlluvialAZ39 New AlluvialAZ40 Laterite and red soil ZoneAZ41 Coastal Saline
State : AssamAZ42 Barak valleyAZ43 Upper BrahamaputraAZ44 HillAZ45 Central Brahamaputra valleyAZ46 AZ47AZ47 Lower Brahamaputra valley
State : Arunachal PradeshAZ48 AlpineAZ49 Temperate Sub Alpine
State : MeghalayaAZ50 Sub tropical Hill
State : ManipurAZ51 Sub tropical plain
State : NagalandAZ52 Mid Tropical Hill
State : TripuraAZ53 Mid Tropical Plain
State : Bihar and JharkhandAZ54 Northwest Alluvial PlainAZ55 North east Alluvial plain
22nd National Children’s Science Congress 201449 ACTIVITY GUIDE
AZ56 South Bihar Alluvial PlainAZ57 Central and northeastern plateauAZ58 Western PlateauAZ59 South eastern plateau
State : OdishaAZ60 North western plateauAZ61 North Central plateauAZ62 North eastern Coastal plainAZ63 East & southeastern coastal plainAZ64 North eastern ghatAZ65 Eastern gaht highlandAZ66 Southeastern ghatAZ67 Western undulatingAZ68 West central tableAZ69 Mid Central table land
Peninsular IndiaState:Madhya Pradesh and Chattisgarh
AZ 70Chattigarh plain zone including
Chattisgarh districtsAZ71 Bastar PlateauAZ72 North hill zone of ChattisgarhAZ73 Kymora plateau and Satpara hillAZ74 Vindya PlateauAZ75 Central Narmada ValleyAZ76 GirdAZ77 BundelkhandAZ78 Satpura plateauAZ79 Malwa PlateauAZ80 Nimar ValleyAZ81 Jhabua hills
State: GujaratAZ82 East Gujarat heavy rainfallAZ83 South GujaratAZ84 Middle GujaratAZ85 North GujaratAZ86 North Western GujaratAZ87 South SaurashtraAZ88 North Saurashtra
AZ89 Ghat and CoastalState : Maharashtra
AZ90 South Konkan CoastalAZ91 North Konkan CoastalAZ92 Western GhatAZ93 SubmontaneAZ94 Western Maharashtra PlainAZ95 ScarcityAZ96 Central Maharashtra plateauAZ97 Central VidarbhaAZ98 Eastern Vidarbha
State : KarnatakaAZ99 North East transitionAZ100 North east dryAZ101 Northern dryAZ102 Central dryAZ103 Eastern dryAZ104 Southern dryAZ105 Southern transitionAZ106 WesternAZ107 HillAZ108 Coastal
State : KeralaAZ109 NorthernAZ110 SouthernAZ111 CentralAZ112 High AltitudeAZ113 Problem area
State : Andhra PradeshAZ114 North CoastalAZ115 SouthernAZ116 Northern TelenganaAZ117 Scarce rainfall zone of RayalseemaAZ118 Southern TelenganaAZ119 High altitude and tribalAZ120 Krishna Godavari
State : Tamil NaduAZ121 North easternAZ122 North western
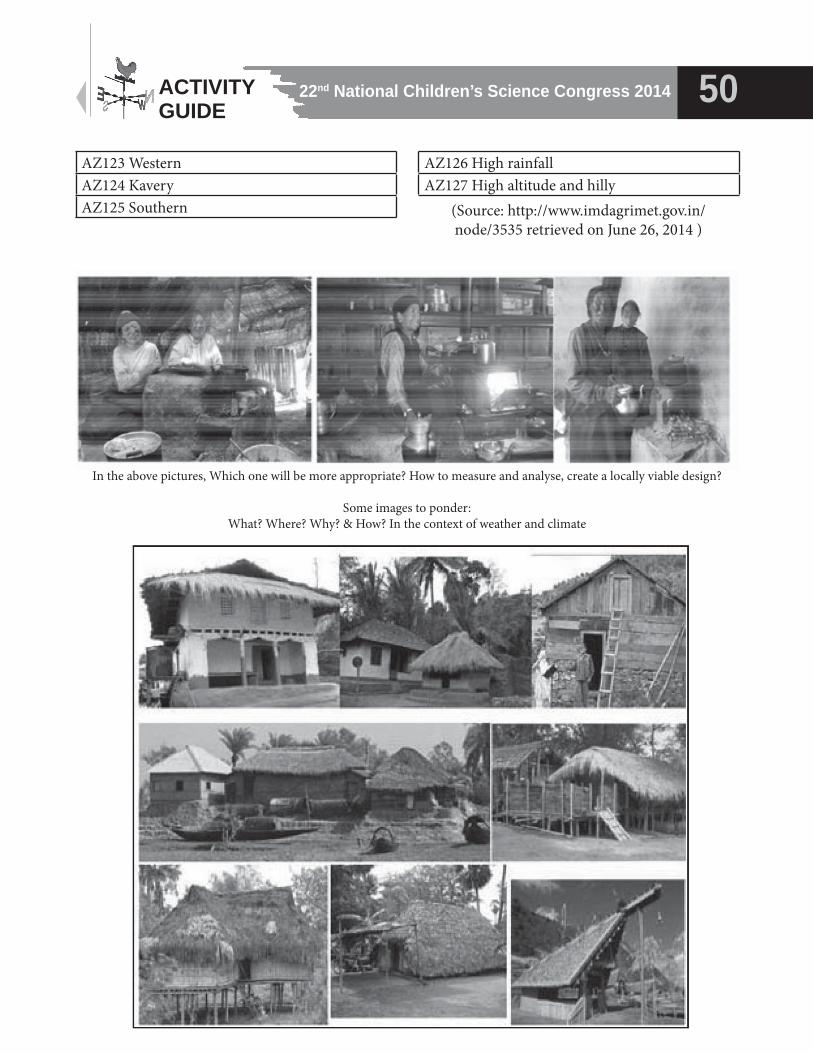
22nd National Children’s Science Congress 2014 50ACTIVITY GUIDE
AZ123 WesternAZ124 KaveryAZ125 Southern
In the above pictures, Which one will be more appropriate? How to measure and analyse, create a locally viable design?
Some images to ponder:What? Where? Why? & How? In the context of weather and climate
AZ126 High rainfallAZ127 High altitude and hilly
(Source: http://www.imdagrimet.gov.in/node/3535 retrieved on June 26, 2014 )
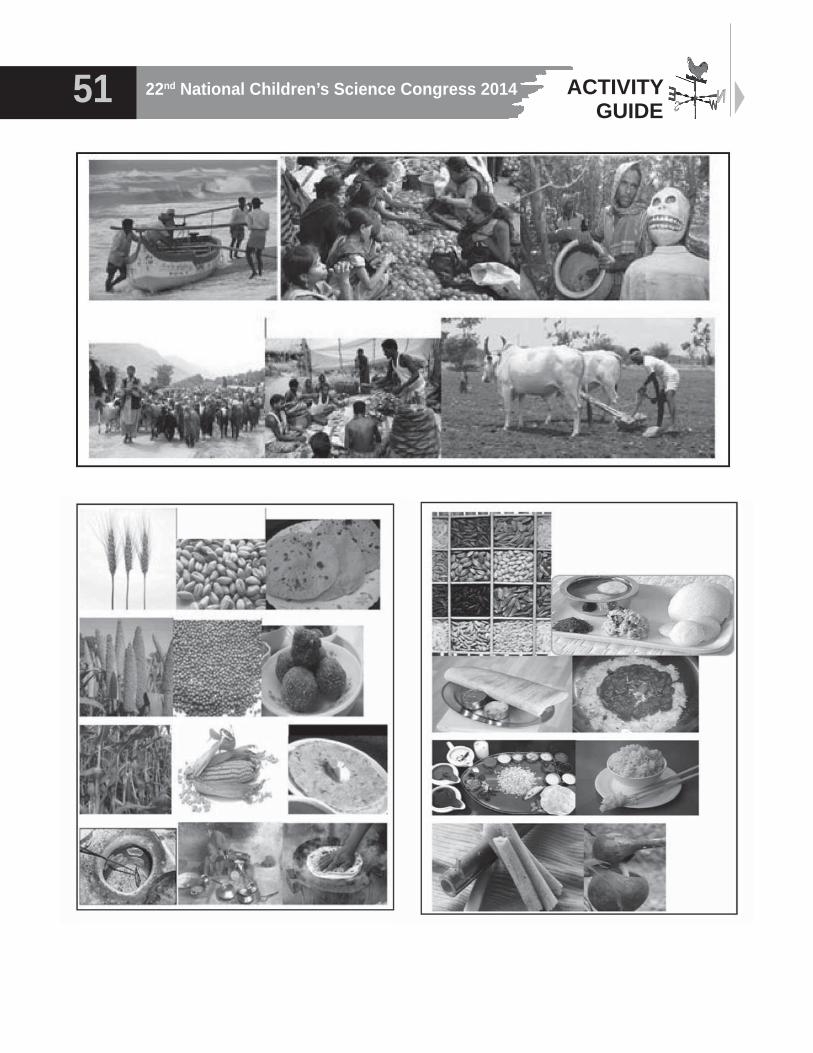
22nd National Children’s Science Congress 201451 ACTIVITY GUIDE
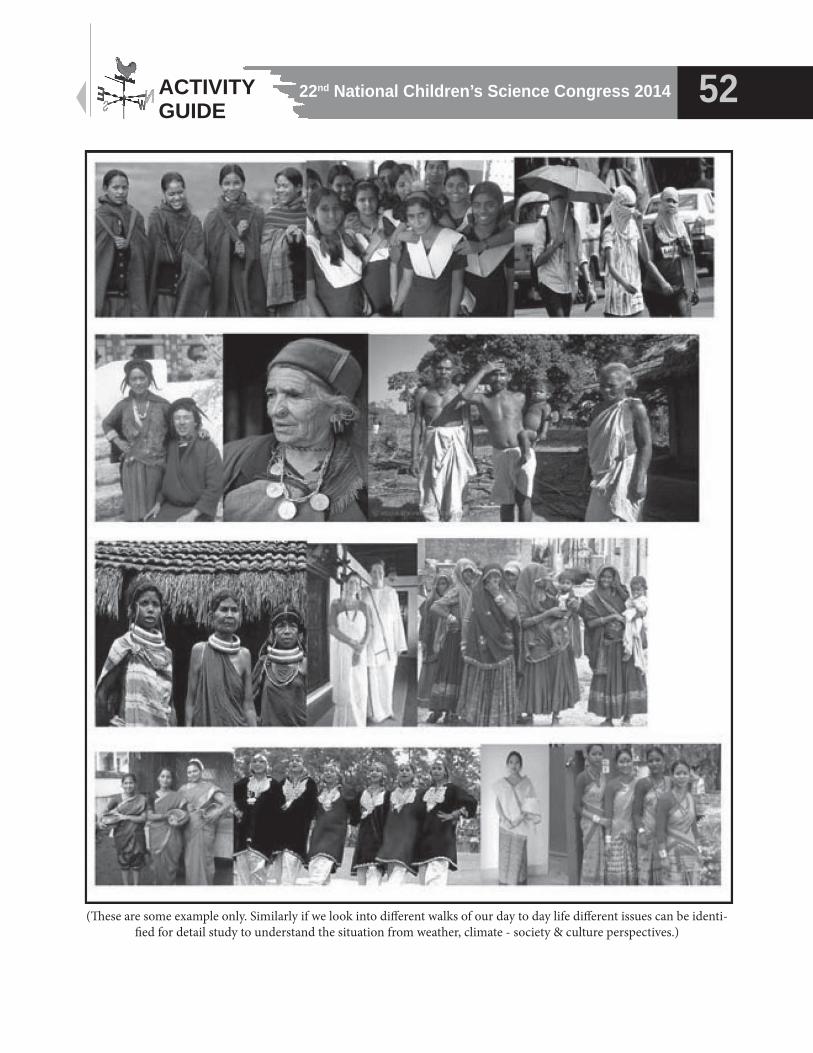
22nd National Children’s Science Congress 2014 52ACTIVITY GUIDE
(These are some example only. Similarly if we look into different walks of our day to day life different issues can be identi-fied for detail study to understand the situation from weather, climate - society & culture perspectives.)
22nd National Children’s Science Congress 201453 ACTIVITY GUIDE
Probable Project Outlines:
1. Project title: Assessing Climate resilient components in the seasonal food behaviour and practices among the community of an area.
Background: Food is one of the basic needs of human
being. Food selection, preparation, nature of food serving and consumption are postulated socio-culturally in majority of the cases. Such food practices have some seasonal variation; it may vary from summer to winter. Usually it is determined by the production system which assures the supply condition. As the production is related with weather condition, consumption pattern may be seasonal in nature. Some time specific food value or benefit from food may be able to fulfil the seasonal health requirements too.
But how people are rigid or flexible to a particular food; how particular food’s production and processing systems are favourable to different conditions of weather are important components of its potentiality to face the challenges of weather related anomalies. For example, if a particular food product is grown in less rainfall and drought like condition or in high rainfall and waterlogged/flood or in both situations, that will determine its ability to copes up in vulnerable condition. When it is grown in both the situations, it has more resilience in case of production. Similarly, if processing of that particular food requires less energy, time and human labour, it has some quality which may help to reduce energy consumption, save time and labour (which are some requirements of climate smart system). Food like this may provide better reliability in all condition.
So, analysis of such aspects through a systematic study can help us develop an inventory of local food to develop a climate smart food system.
Objectives:• To know about seasonal variation of food
practices among the community residing in an area.
• To identify potentiality of this food in production, processing and consummation in relation to weather condition and weather related anomalies.
• To identify potential food items ideal to different seasons and resistant to seasonal weather related anomalies.
Methodology:• Select a particular human settlement/
residential area and identify the communities/cultural groups living in the area;
• Conduct a survey taking household as the basic unit of observation and collect information on their food practices in different seasons (in this case following information are very much essential)
= Type of food use against season;
= Source of production, growing season, essential condition or requirement for production (if such information are unable to provide by the specific household, collect it from local farmers or agricultural experts);
= Involved system of processing (like debarking, grinding, etc) and energy and material uses for the purpose along with amount of requirement;
= System of cooking (boiling, steaming, frying, etc) and requirement of energy, additional material, labour and time;
= Reasons of taking a particular food in certain season;
• Set up some experiments to validates the collected information related to production, processing and cooking, through comparing data of experiments with the data collected from the households;
• Compiles the collected and experimental data, compare, analyses, classify the same to identify suitable food item, processing and cooking system which can help in developing a climate smart life style.
2. Project title: Study on prediction of weather through phenology of tree or insect behaviour
Background: There are many weather
22nd National Children’s Science Congress 2014 54ACTIVITY GUIDE
prediction practices among the indigenous people based on their traditional knowledge system. Traditional weather forecaster relies on observation of phenology of certain plants and behaviour of certain animals as indicator of wet or dry years or onset of rainy season or dry years or adverse weather condition.24 For example, many tribal people predict rainfall variation based on the flowering phenology of night flowering Jasmine (Nyctanthes arbortristis L.; verbenaceae).25 Similarly in the arid zone of Rajasthan and Gujarat people consider phenology of ‘Kair’ (Caparis deciduas) as an indicator of drought or normal monsoon. “Kair will be fully laden with flowers and fruits if there are drought and high temperature, where as in case of good monsoon, it bears only average flowers and fruits”. 26 In Mizoram Hmar people consider insect like Cricket and Termite as indicators of weather. According to them “if a Cricket (Grylua pensylva nicus) brings new soil particles out of its hole during the dry season, rain will be coming. When winged Termite (Phingpuihup) come out of the soil in a group after a rainfall, rain will not come again for some time”.27 So, there may be similar practices in other places, among other communities too. Identification, documentation and validation of such information can provide us new set of indicators for weather prediction.
Objectives:• To Observe, identify and document the
indigenous weather forecasting practices based on phenology of plant or behaviour of animal.
• To validate the collected information of the practices in view of scientific principles.
• Developing some sets of bio-indicators for weather forecasting.
Methodology:• Select an area for the study;
• Interact with local people and conduct survey to know about people’s beliefs and practices on weather forecasting;
• Identify actual practitioner, collect information from them through face to face interview. Collect information about bio-indicator used
by the particular person, documentation of information of last two/ three forecasting with month and year (if possible date also);
• Collect the information about particular species used for weather prediction, habitat detail, weather and climatic requirement, phenology (in case of flora), food and reproduction behaviour (in case of fauna);
• Collect weather related information of those days, months of the year for which gave the practitioner given his/her observation information from a weather station nearby;
• Compare the information given by the practitioner with the collected information of weather station; assess the variation and consistency of observational facts’
• Repeat the observation through self initiation, verify again with station data;
• Through comparative analysis identify the consistency and find out appropriate prediction practices.
3. Project Title: Study on thermal comfort of traditional housing assessing indoor temperature.
Background: Traditional housing designs have evolved through time as an adjustment process to local weather and climatic condition of the area to enhance the level of safety and security and assure the level of comfort. In the process focus on utilization of locally available building materials which are specific to that area also get highlighted. Usually uses of building materials for floor, wall, roof, etc are selected on the basis of their specific requirements. The orientation and ventilation of houses are also determined by the local condition of weather and climate, particularly temperature, wind, precipitation, sun shine hours, humidity etc. Therefore, there is significant variation of traditional housing design from high Himalayas to plains, desert and coastal region. There are significant observations in certain research; a study in Jharkhand on mud houses indicates that “mud house provides an insight for designing an energy efficient rural house that provides thermally comfortable conditions, as well as leaving behind a very low environmental
22nd National Children’s Science Congress 201455 ACTIVITY GUIDE
footprint. The various parameters which were considered in the study of the existing mud house are – orientation, plan-form, building exposure to sun, surface-volume ratio, openings, shading, building envelope material, roofing materials and ventilation. The study observed insulating property of thatches is more than mud tiles in case of roof materials. So, thatch roofing houses are cooler than the mud tile roofing houses”.28 Similarly one can carry out some studies to identify ideal thermally comfortable houses among the traditional houses, where available energy is utilized efficiently for heating, cooling, lighting etc.
Objectives:• To study the thermal comfort of traditional
housing in relation to indoor temperature;
• To assess how it is linked with energy consumption for cooling, heating and lighting;
• To identify ideal housing design for the locality.
Methodology:• Identify a locality where traditional houses are
there;
• Observe and identify different traditional houses in terms of design and material used;
• At the same time identify some modern houses with different designs and materials used;
• Observe, identify and assess the building materials used in the building, its facing and ventilation, etc for both categories of houses;
• Measures the room temperature using suitable thermometer, at different period of time both in day and night. For this purpose fixed two or three room (if available) in each of the houses considered for observation. These measurement need to be taken both in traditional and modern houses. Keep the records separately for each of the houses of observation.
• Assess the humidity level in each of the houses (in each room of observation separately). For this purpose use wet bulb thermometer or design/adopt a separate way of alternative measurement.
• Now, compare the temperature of traditional houses with modern ones and find out the differences and also find out where it is lowest and where it is highest. Try to correlate humidity level with the temperature.
• Now find out best housing design and material use for thermal comfort in particular area.
SOME MORE PROJECT IDEAS:• Study the relationship between traditional/
indigenous pest management practices and weather condition;
• Study the practices of traditional land use and land cover management and impact on weather and climate;
• Assess the impact of traditional water harvesting and management practices (like Johad, Vap, Kul, Longsor, Dong, etc) in developing sustainability of water resources in climate stress period and developing resilience system;
• Study the traditional practices of animal rearing and their health management, their relationship with weather condition and seasonality; identify components of adaptation and resilience;
• Study cultural priority on selection of food crop for cultivation in the locality and its relationship with local weather and climate induced disaster;
• Study on the efficiency of traditional utensil used for cooking and their contribution in reduction of energy and carbon emission;
• Comparative study of distribution of rainy days against month in traditional calendar system and English calendar system and find out the reliability aspects for agricultural planning;
• Study on fuel wood based cremation practices, assessment of carbon emission and developing alternative system for cremation;
• Assessment of energy requirement in traditional cooking and modern way of cooking, identify carbon emission factors and impact on weather and climate;
• Study on the alternative food sources of different cultural groups in disaster prone situation (like flood, drought, etc) and
22nd National Children’s Science Congress 2014 56ACTIVITY GUIDE
assessing its potentiality for building resilience and adaptation to climate change;
• Assess the energy consumption and pollution of air, water, noise during festival (like Diwali, Pongal, Magh Bihu, Durga Puja, etc) and impact on developing resilience and adaptation to climate change;
• Study on the traditional food storage practices among the community and its relation to weather and climate;
• Prepare community based culturally adaptable Disaster Management Plan with proper assessment of risk and vulnerability for climate induced disaster of your locality.
References:1. Oxford advanced learner’s dictionary, 2010;
2. http://www.thefreedictionary.com/weather, retrieved on June 20,2014
3. http://www.thefreedictionary.com/climate, retrieved on June 20,2014
4. Basu Biman “Earth’s Changing Climate”, Vigyan Prasar, 2012, p.2.
5. ht tp: / /www.sparknotes.com/sociology/society-and-culture/section5.rhtml, retrieved June 22,2014
6. Harris Marvin (1971) “Culture, people, nature”, Thomas Y Crowell,p.144.
7. Sarma JK and Tyagi B K ( edited ) “Weather and Climate” (Manual no -03) of the series on “Explore and understand your environment, people and their practices” developed for VIPNET Club of Vigyan Prasar, SSEAEP, 2014,p. 10
8. Harris Marvin (1971) “Culture, people, nature”, Thomas Y Crowell,p.229.
9. IPCC “Climate Change 2007: Synthesis Report” http://www.ipcc.ch/publications_and_data/ar4/syr/en/spms2.html, retrieved June 24,2014
10. FCCC/SBSTA/2014/INF.11, 8 May 2014, (Reissued for technical reasons on 16 May 2014), http://unfccc.int/resource/docs/2014/sbsta/eng/inf11.pdf (retrieved on June 25,2014) also available in http://ipccwg2. gov/AR5/images/uploads/ IPCC_WG2AR5_
SPM_Approved.pdf>. as mentioned in the previous cited document
11. Raju B.M.K. et al (2013), “Revisiting climatic classification in India: a district-level analysis”, CURRENT SCIENCE, VOL. 105, NO. 4, p. 492-495
12. Agarwal Anil and Narain Sunita “Fourth Citizens’ Report [SOE-4]: Dying Wisdom “Centre for Science and Environment(CSE),New Delhi-110003
13. Sarma J.K. and Tyagi B.K. (edited) “Traditional Knowledge System” (Manual no -07) of the series on “Explore and understand your environment, people and their practices” developed for VIPNET Club of Vigyan Prasar, SSEAEP, 2014
14. Sarma J.K. and Tyagi B.K. (edited) “Water Resources” (Manual no -02) of the series on “Explore and understand your environment, people and their practices” developed for VIPNET Club of Vigyan Prasar , SSEAEP, 2014
15. Sarma J.K., Saikia R. (2013) “ IEKS and sustainable land resource management- a surveillance on the practices among the Tangsa Naga and Tangkhul Naga of North East India” Indian Journal of Traditional Knowledge,Vol, 12(2),pp 252-258
16. Kothari A. And Pathak N. “Protected areas, community based conservation and decentralisation: lesson from India” a report under EPP, IUCN, (http://www.kalpavriksh.org/images/CCA/Consultat ion/Report_AsEcosystemsProtectedAreasPeopleProject %20(EPP)IUCNWorldCommission_April2006 .pdf) retrieved on June 20, 2014.
17. Chatterji S, Ghosh S, Sarma JK, et al (2011) “Community conserved area in North East India: some observation in Assam, Meghalaya and Arunachal Pradesh” in The Indian Forester, Vol.137,Issue.8a,
18. Sarma J.K. and Tyagi B.K. (edited) “Biodiversity” (Manual no -04) of the series on “Explore and understand your environment, people and their practices” developed for VIPNET Club of Vigyan Prasar , SSEAEP, 2014
22nd National Children’s Science Congress 201457 ACTIVITY GUIDE
19. BEST PRACTICES IN RURAL HOUSING http:/ /rural.nic. in/sites/downloads/our-schemes-glance/BestPractices.pdf , retrieved on April 20,2014
20. Sarma J.K. and Tyagi B.K. (edited) “Our Settlement” (Manual no -05) of the series on “Explore and understand your environment, people and their practices” developed for VIPNET Club of Vigyan Prasar , SSEAEP, 2014
21. Khongsa C. “Jhum Cultivation and its impact on ecology, need for viable alternatives” h t tp : / /epao.net /epSubPageExt rac tor.a s p ? s r c = e d u c a t i o n . S c i e n c e _ a n d _Technology.Jhum_Cultivation_and_its_impact_on_Ecology, retrived on 18 June,2014
22. Mandal P, et al (2012) “Impact of Diwali celebrations on urban air and noise quality in Delhi City, India”, Environ Monit Assess. 2012 Jan;184(1):209-15.
23. Singh D.P. et al (2009) “ Study of temporal variation in ambient air quality during Diwali festival in India” Environ Monit Assess., DOI 10.1007 /s10661-009-1145-9
24. Galacgae E S and Balisacan C M “ Traditional weather forecasting for sustainable agroforestrty practices in Ilocos Norte Province, Philippines” Forest Ecol. Manage. 257 (2009), 2044-2053
25. Acharya S (2011) “Prediction of rainfall variation through flowering phenology of night –flowering jasmine (Nyctanthes arbortristis L.; verbenaceae) in Tripura” in Indian Journal of Traditional Knowledge, Vol.10(1),pp.96-101.
26. Singh D and Singh R K ( 2011) “ Kair (Caparis deciduas): a potential ethno-botanical weather predictor and livelihood security shrub of Arid Zone of Rajasthan and Gujrat” in Indian Journal of Traditional Knowledge, Vol.10(1),pp. 146-155
27. Chinlampinga M (2011) “Traditional knowledge, weather prediction and bio-indicators – a case study of Mizoram, Northeastern India” in Indian Journal of Traditional Knowledge, Vol.10(1),pp 207-211
28. Gupta J “Sustainability of rural mud houses in Jharkhand: analysis related to thermal
comfort” (http://www.academia.edu/3887802/SUSTAINABILITY_OF_RURAL_MUD_HOUSES_IN_JHARKHAND_ANALYSIS_RELATED_TO_THER MAL_COMFORT, retrieve on June 25,2014)
Glossary of some important words mentioned in this document:Adaptation: Adjustment or preparation of natural or human systems to a new or changing environment which moderates harm or exploits beneficial opportunities.
Adaptive capacity: The ability of a system to adjust to climate change (including climate variability and extremes) to moderate potential damages, to take advantage of opportunities, or to cope with the consequences.
Anthropogenic: Made by people or resulting from human activities. Usually used in the context of emissions that are produced as a result of human activities.
Carbon Footprint: The total amount of greenhouse gases that are emitted into the atmosphere each year by a person, family, building, organization, or company. A persons carbon footprint includes greenhouse gas emissions from fuel that an individual burns directly, such as by heating a home or riding in a car. It also includes greenhouse gases that come from producing the goods or services that the individual uses, including emissions from power plants that make electricity, factories that make products, and landfills where trash gets dumped.
Climate: Climate in a narrow sense is usually defined as the “average weather,” or more rigorously, as the statistical description in terms of the mean and variability of relevant quantities over a period of time ranging from months to thousands of years. The classical period is 3 decades, as defined by the World Meteorological Organization (WMO). These quantities are most often surface variables such as temperature, precipitation, and wind. Climate in a wider sense is the state, including a statistical description, of the climate system.
Climate change: Climate change refers to any significant change in the measures of climate lasting for an extended period of time. In other
22nd National Children’s Science Congress 2014 58ACTIVITY GUIDE
words, climate change includes major changes in temperature, precipitation, or wind patterns, among others, that occur over several decades or longer.
Climate Smart: Concept of Climate Smart has evolved with designing and execution of responsible human activities in all walks of life, which can promote sustainable development, adapting and building resilience to climate change, reducing and/or removing green house emission. So, efficient uses of material and energy with maximization of benefit from little input along with responsible choice of material and energy for use are same of the best ways to step forward for such condition.
Culture: Culture is the totally acquired life way of life or life style for a group of people. It consists of the patterned, repetitive ways of thinking, feeling and acting that are characteristics of members of a particular society or segment of a society.
Disaster management plan: It is a planning to manage disaster. Such plans cover aspects of prevention, preparedness, relief and recovery. Disaster prevention is activities designed to provide permanent protection from disasters. Disaster preparedness is activities designed to minimise loss of life and damage – for example by removing people and property from a threatened location and by facilitating timely and effective rescue, relief and rehabilitation. Preparedness is the main way of reducing the impact of disasters. Disaster relief is a coordinated multi-agency response to reduce the impact of a disaster and its long-term results. Relief activities include rescue, relocation, providing food and water, preventing disease and disability, repairing vital services such as telecommunications and transport, providing temporary shelter and emergency health care. Disaster recovery means once emergency needs have been met and the initial crisis is over, the people affected and the communities that support them are still vulnerable. Recovery activities include rebuilding infrastructure, health care and rehabilitation.
Emissions: The release of a substance (usually a gas when referring to the subject of climate change) into the atmosphere.
Mitigation: A human intervention to reduce the human impact on the climate system; it includes strategies to reduce greenhouse gas sources and emissions and enhancing greenhouse gas sinks.
Phenology : The timing of natural events, such as flower blooms and animal migration, which is influenced by changes in climate. Phenology is the study of such important seasonal events. Phenological events are influenced by a combination of climate factors, including light, temperature, rainfall, and humidity.
Resilience: A capability to anticipate, prepare for, respond to, and recover from significant multi-hazard threats with minimum damage to social well-being, the economy, and the environment.
Risk: It is a situation involving exposure to danger. Society is a group of people with common territory, interaction, and culture. Society evolved through formation of groups from family to occupation based to interest based group, etc.
Social control: Refer to social process by which behaviour and act of individuals or groups is regulated.
Social engineering: Planned social change and social development.
Sensitivity: The degree to which a system is affected, either adversely or beneficially, by climate variability or change. The effect may be direct (e.g., a change in crop yield in response to a change in the mean, range or variability of temperature) or indirect (e.g., damages caused by an increase in the frequency of coastal flooding due to sea level rise).
Traditional Knowledge System: A cumulative body of knowledge, practices and beliefs evolved by adaptive processes and handed down through generations by cultural transmission. This knowledge system incorporates a complex combination of belief, values and norms along with practices.
United Nations Framework Convention on Climate Change (UNFCCC): The Convention on Climate Change sets an overall framework for intergovernmental efforts to tackle the challenges posed by climate change. It recognizes that
22nd National Children’s Science Congress 201459 ACTIVITY GUIDE
the climate system is a shared resource whose stability can be affected by industrial and other emissions of carbon dioxide and other greenhouse gases. The Convention enjoys near universal membership, with 189 countries having ratified.
Vulnerability: The degree to which a system is susceptible to, or unable to cope with, adverse effects of climate change, including climate variability and extremes. Vulnerability is a function of the character, magnitude, and rate of climate variation to which a system is exposed; its sensitivity; and its adaptive capacity.
Weather: Atmospheric condition at any given time or place. It is measured in terms of such things
as wind, temperature, humidity, atmospheric pressure, cloudiness, and precipitation. In most places, weather can change from hour-to-hour, day-to-day, and season-to season. Climate in a narrow sense is usually defined as the “average weather”, or more rigorously, as the statistical description in terms of the mean and variability of relevant quantities over a period of time.
(Special note: The images use in the note can be drawn with the help of illustrator in line drawing or pencil sketch for mono colour printing. For the map help can be taken from a cartographer to draw a mono colour map for the same purpose.)
22nd National Children’s Science Congress 2014 60ACTIVITY GUIDE
WEATHER, CLIMATE AND AGRICULTURE
Sub Theme-5
Agriculture, which is the backbone of our country, deals in the cultivation of plants, fungi, animalsand other life forms for food, fodder,fiber,fuel wood, medicinal plants and other products used to sustain and enhance human life. Pre-industrial agriculture was typically subsistence agriculture in which farmers raised most of their crops for their own consumption instead of cash crops for trade. A remarkable shift in agricultural practices has occurred over the past century in response to new technologies, and the development of world markets.
Agriculture is closely dependent on the endowment of natural resources and environmental conditions of soil and climate. India is a land of many climates and varieties of soils, affording scope for much diversity in agriculture. In our country, more than 50 per cent of variation of crops is determined by climate.It is climate vis-à-vis weather plays an important role, probably more so in India where aberrant weather such as drought, flood, etc., is a rule rather than an exception.
With a geographic area of 328.76 million hectares, stretching between 8oN and 36oN latitude and between 68oE and 98oE longitude, its altitude varying from the mean sea-level to the highest mountain ranges of the world, India presents a range and diversity of climate, flora and fauna, with a few parallels in the world. The country presents a paradox of having highest mean annual rainfall in the world (Cherapunji in Meghalaya) and also dry, semi-desert area in Rajasthan. The variability of rainfall is most important in all the states, but especially where it is low. In parts of Rajasthan and the Deccan,such variability is more than 100 per cent of the mean. Years of drought account for a frequent history of crop failures, whereas the years of flood also cause very considerable loss of agricultural production. Temperatures also vary greatly, both geographically and seasonally. In northern and central parts of India during pre-monsoon months the maximum temperatures reaches over 40oC over a large area. Further frost
may occur in winter in the plains, as far south as a line drawn through Madhya Pradesh and may be heavier in Kashmir and areas north of Punjab including various other parts of the Eastern Himalayan range.
Considering the fact that weather plays an important role in India efficient crop planning and growth, proper understanding of agro-climatic conditions is essential for all concerned. With the 328.76 million hectares of the geographical area the country presents a large number of complex agro-climatic situations. For the sake of scientific management of regional and local resources to meet the demand of food, fiber, fodder and fuel wood without adversely affecting the status of natural resources andenvironment, Planning Commission, Govt. of India in its 8th Plan has delineated 15 agro-climatic regions or zones foragricultural planning in country (Table-1), primarily on the basis of rainfall and evaporation which is the resultant effect of sunshine, temperature, wind and land use.
SCENARIO OF RAINFED AGRICULTUREIn agriculture, water is an important climatic factor that affects or determines plant growth and development. Its availability or scarcity determines a successful harvest, or diminution in yield, or even total failure of a crop. Rainfall is the primary source of water for crop cultivation and allied agricultural practices. As agriculture in India depends on the vagaries of rainfall, its amount and nature of distribution are very important, which vary with location and climate types and thereby affecting growth and yield of crop. In fact, it is an absolute requirement for all living organisms. The importance of water is essential for efficient functions in both plant and animal life. But plant responses differ with the type of plant species. Most plants are mesophytes, that is, they are adapted to conditions with moderate supply of water. But some, called hydrophytes, require watery or water-logged habitats, while others called xerophytes, are more tolerant to
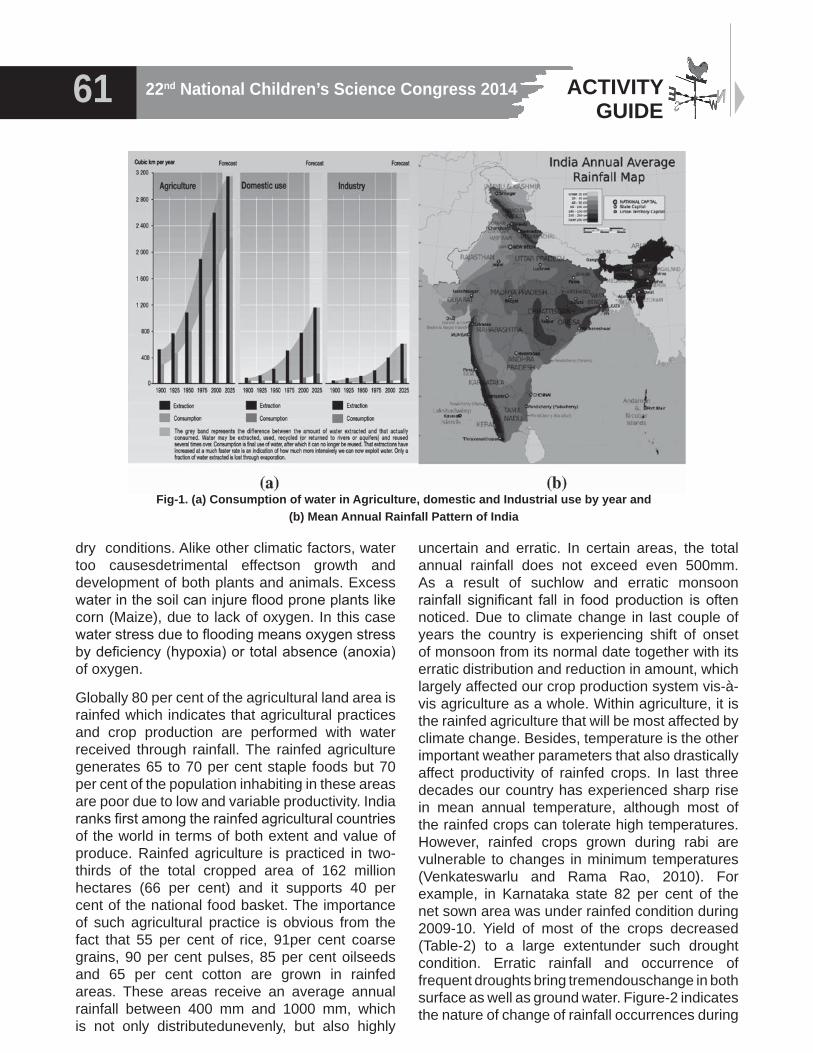
22nd National Children’s Science Congress 201461 ACTIVITY GUIDE
dry conditions. Alike other climatic factors, water too causesdetrimental effectson growth and development of both plants and animals. Excess water in the soil can injure flood prone plants like corn (Maize), due to lack of oxygen. In this case water stress due to flooding means oxygen stress by deficiency (hypoxia) or total absence (anoxia) of oxygen.
Globally 80 per cent of the agricultural land area is rainfed which indicates that agricultural practices and crop production are performed with water received through rainfall. The rainfed agriculture generates 65 to 70 per cent staple foods but 70 per cent of the population inhabiting in these areas are poor due to low and variable productivity. India ranks first among the rainfed agricultural countries of the world in terms of both extent and value of produce. Rainfed agriculture is practiced in two-thirds of the total cropped area of 162 million hectares (66 per cent) and it supports 40 per cent of the national food basket. The importance of such agricultural practice is obvious from the fact that 55 per cent of rice, 91per cent coarse grains, 90 per cent pulses, 85 per cent oilseeds and 65 per cent cotton are grown in rainfed areas. These areas receive an average annual rainfall between 400 mm and 1000 mm, which is not only distributedunevenly, but also highly
uncertain and erratic. In certain areas, the total annual rainfall does not exceed even 500mm. As a result of suchlow and erratic monsoon rainfall significant fall in food production is often noticed. Due to climate change in last couple of years the country is experiencing shift of onset of monsoon from its normal date together with its erratic distribution and reduction in amount, which largely affected our crop production system vis-à-vis agriculture as a whole. Within agriculture, it is the rainfed agriculture that will be most affected by climate change. Besides, temperature is the other important weather parameters that also drastically affect productivity of rainfed crops. In last three decades our country has experienced sharp rise in mean annual temperature, although most of the rainfed crops can tolerate high temperatures. However, rainfed crops grown during rabi are vulnerable to changes in minimum temperatures (Venkateswarlu and Rama Rao, 2010). For example, in Karnataka state 82 per cent of the net sown area was under rainfed condition during 2009-10. Yield of most of the crops decreased (Table-2) to a large extentunder such drought condition. Erratic rainfall and occurrence of frequent droughts bring tremendouschange in both surface as well as ground water. Figure-2 indicates the nature of change of rainfall occurrences during
Fig-1. (a) Consumption of water in Agriculture, domestic and Industrial use by year and (b) Mean Annual Rainfall Pattern of India
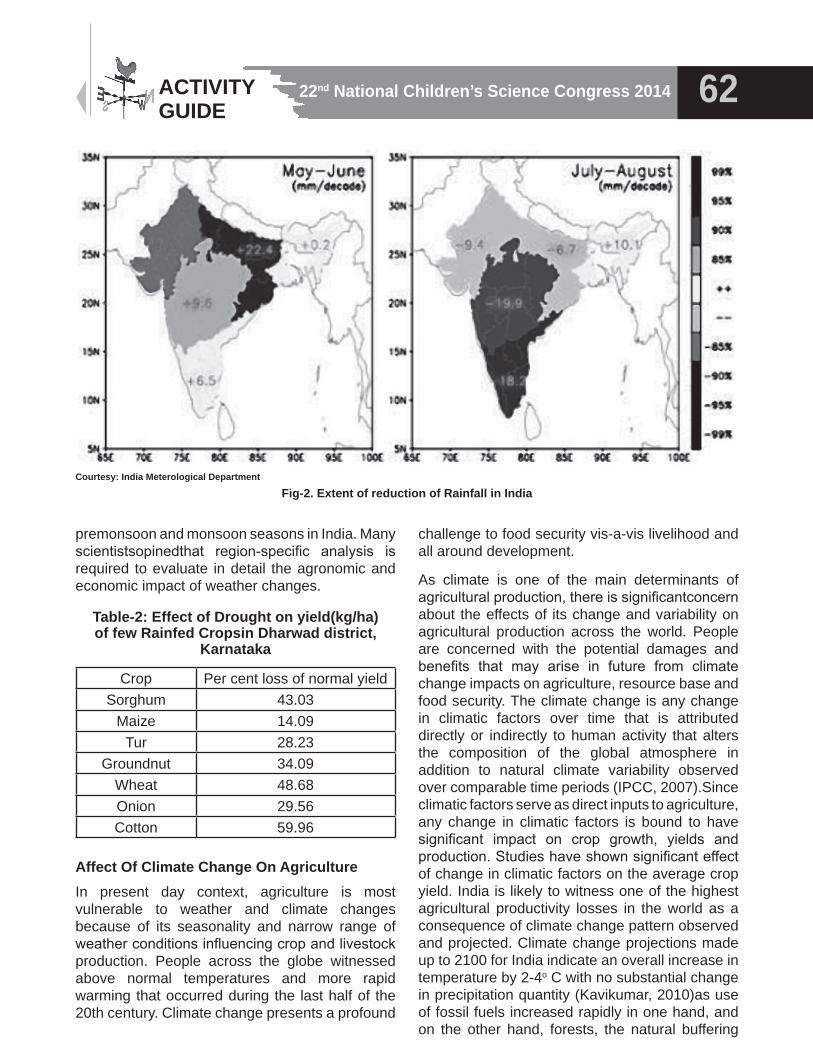
22nd National Children’s Science Congress 2014 62ACTIVITY GUIDE
premonsoon and monsoon seasons in India. Many scientistsopinedthat region-specific analysis is required to evaluate in detail the agronomic and economic impact of weather changes.
Table-2: Effect of Drought on yield(kg/ha) of few Rainfed Cropsin Dharwad district,
Karnataka
Crop Per cent loss of normal yieldSorghum 43.03
Maize 14.09Tur 28.23
Groundnut 34.09Wheat 48.68Onion 29.56Cotton 59.96
Affect Of Climate Change On AgricultureIn present day context, agriculture is most vulnerable to weather and climate changes because of its seasonality and narrow range of weather conditions influencing crop and livestock production. People across the globe witnessed above normal temperatures and more rapid warming that occurred during the last half of the 20th century. Climate change presents a profound
challenge to food security vis-a-vis livelihood and all around development.
As climate is one of the main determinants of agricultural production, there is significantconcern about the effects of its change and variability on agricultural production across the world. People are concerned with the potential damages and benefits that may arise in future from climate change impacts on agriculture, resource base and food security. The climate change is any change in climatic factors over time that is attributed directly or indirectly to human activity that alters the composition of the global atmosphere in addition to natural climate variability observed over comparable time periods (IPCC, 2007).Since climatic factors serve as direct inputs to agriculture, any change in climatic factors is bound to have significant impact on crop growth, yields and production. Studies have shown significant effect of change in climatic factors on the average crop yield. India is likely to witness one of the highest agricultural productivity losses in the world as a consequence of climate change pattern observed and projected. Climate change projections made up to 2100 for India indicate an overall increase in temperature by 2-4o C with no substantial change in precipitation quantity (Kavikumar, 2010)as use of fossil fuels increased rapidly in one hand, and on the other hand, forests, the natural buffering
Courtesy: India Meterological Department
Fig-2. Extent of reduction of Rainfall in India
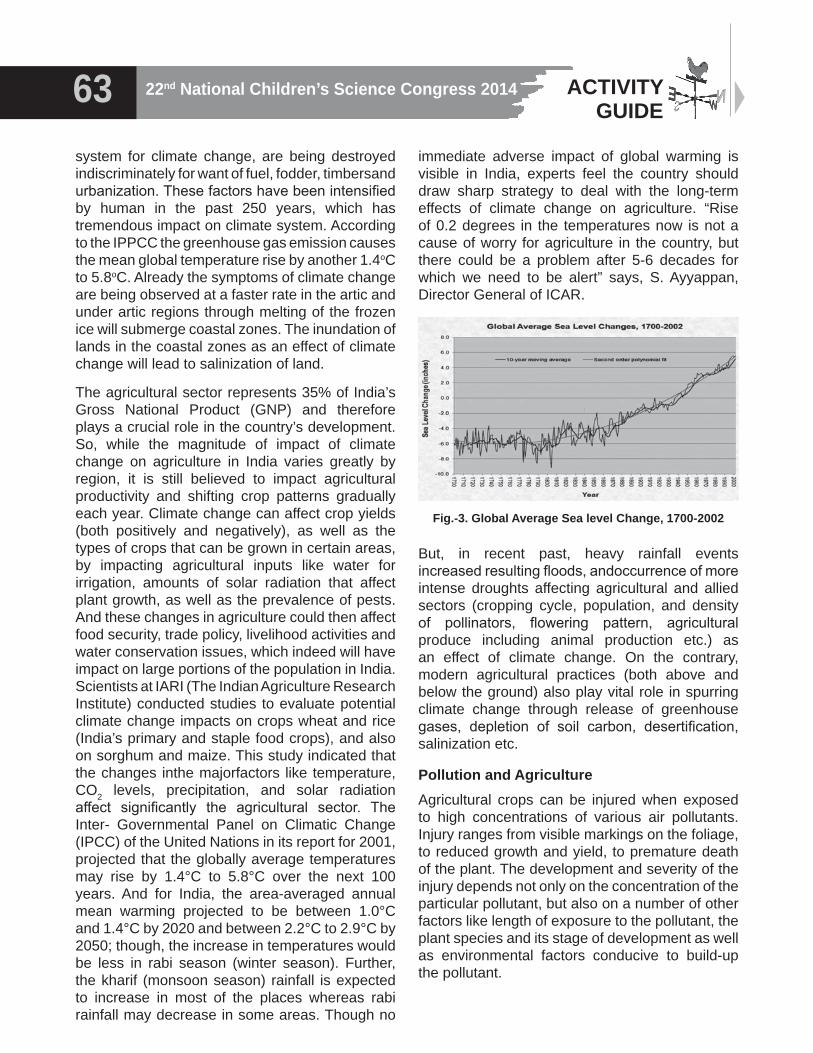
22nd National Children’s Science Congress 201463 ACTIVITY GUIDE
system for climate change, are being destroyed indiscriminately for want of fuel, fodder, timbersand urbanization. These factors have been intensified by human in the past 250 years, which has tremendous impact on climate system. According to the IPPCC the greenhouse gas emission causes the mean global temperature rise by another 1.4oC to 5.8oC. Already the symptoms of climate change are being observed at a faster rate in the artic and under artic regions through melting of the frozen ice will submerge coastal zones. The inundation of lands in the coastal zones as an effect of climate change will lead to salinization of land.
The agricultural sector represents 35% of India’s Gross National Product (GNP) and therefore plays a crucial role in the country’s development. So, while the magnitude of impact of climate change on agriculture in India varies greatly by region, it is still believed to impact agricultural productivity and shifting crop patterns gradually each year. Climate change can affect crop yields (both positively and negatively), as well as the types of crops that can be grown in certain areas, by impacting agricultural inputs like water for irrigation, amounts of solar radiation that affect plant growth, as well as the prevalence of pests. And these changes in agriculture could then affect food security, trade policy, livelihood activities and water conservation issues, which indeed will have impact on large portions of the population in India. Scientists at IARI (The Indian Agriculture Research Institute) conducted studies to evaluate potential climate change impacts on crops wheat and rice (India’s primary and staple food crops), and also on sorghum and maize. This study indicated that the changes inthe majorfactors like temperature, CO2 levels, precipitation, and solar radiation affect significantly the agricultural sector. The Inter- Governmental Panel on Climatic Change (IPCC) of the United Nations in its report for 2001, projected that the globally average temperatures may rise by 1.4°C to 5.8°C over the next 100 years. And for India, the area-averaged annual mean warming projected to be between 1.0°C and 1.4°C by 2020 and between 2.2°C to 2.9°C by 2050; though, the increase in temperatures would be less in rabi season (winter season). Further, the kharif (monsoon season) rainfall is expected to increase in most of the places whereas rabi rainfall may decrease in some areas. Though no
immediate adverse impact of global warming is visible in India, experts feel the country should draw sharp strategy to deal with the long-term effects of climate change on agriculture. “Rise of 0.2 degrees in the temperatures now is not a cause of worry for agriculture in the country, but there could be a problem after 5-6 decades for which we need to be alert” says, S. Ayyappan, Director General of ICAR.
Fig.-3. Global Average Sea level Change, 1700-2002
But, in recent past, heavy rainfall events increased resulting floods, andoccurrence of more intense droughts affecting agricultural and allied sectors (cropping cycle, population, and density of pollinators, flowering pattern, agricultural produce including animal production etc.) as an effect of climate change. On the contrary, modern agricultural practices (both above and below the ground) also play vital role in spurring climate change through release of greenhouse gases, depletion of soil carbon, desertification, salinization etc.
Pollution and AgricultureAgricultural crops can be injured when exposed to high concentrations of various air pollutants. Injury ranges from visible markings on the foliage, to reduced growth and yield, to premature death of the plant. The development and severity of the injury depends not only on the concentration of the particular pollutant, but also on a number of other factors like length of exposure to the pollutant, the plant species and its stage of development as well as environmental factors conducive to build-up the pollutant.
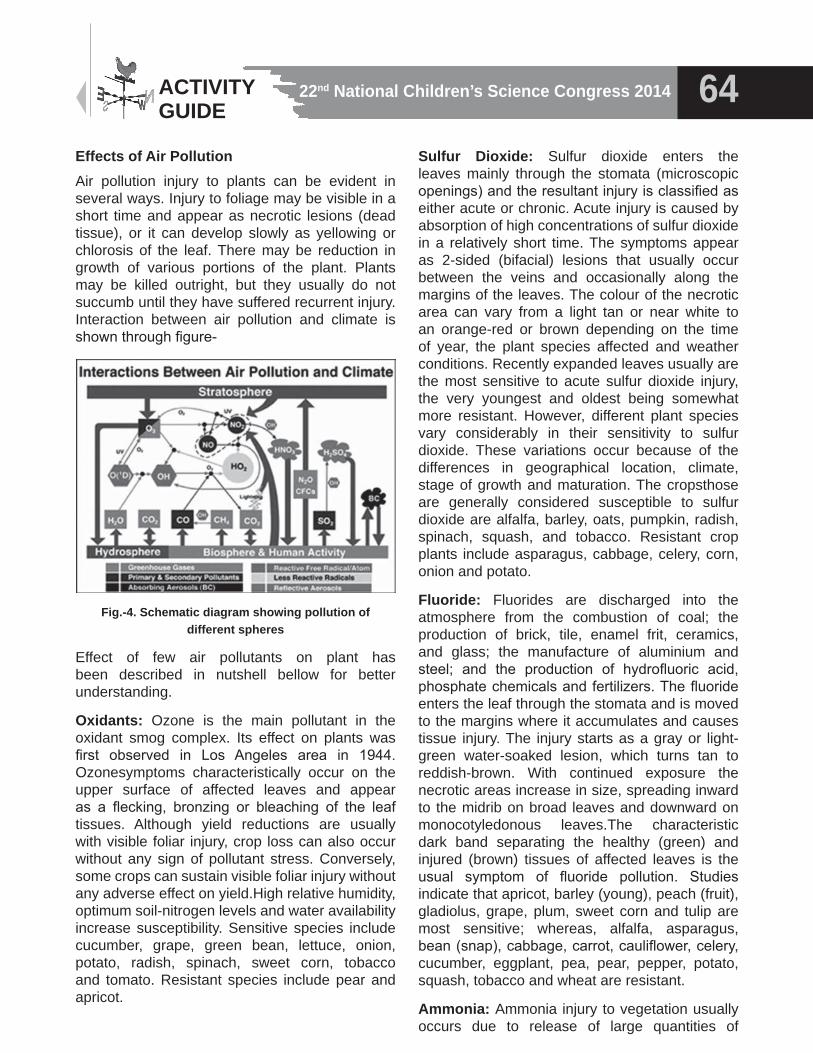
22nd National Children’s Science Congress 2014 64ACTIVITY GUIDE
Effects of Air PollutionAir pollution injury to plants can be evident in several ways. Injury to foliage may be visible in a short time and appear as necrotic lesions (dead tissue), or it can develop slowly as yellowing or chlorosis of the leaf. There may be reduction in growth of various portions of the plant. Plants may be killed outright, but they usually do not succumb until they have suffered recurrent injury. Interaction between air pollution and climate is shown through figure-
Fig.-4. Schematic diagram showing pollution of different spheres
Effect of few air pollutants on plant has been described in nutshell bellow for better understanding.
Oxidants: Ozone is the main pollutant in the oxidant smog complex. Its effect on plants was first observed in Los Angeles area in 1944. Ozonesymptoms characteristically occur on the upper surface of affected leaves and appear as a flecking, bronzing or bleaching of the leaf tissues. Although yield reductions are usually with visible foliar injury, crop loss can also occur without any sign of pollutant stress. Conversely, some crops can sustain visible foliar injury without any adverse effect on yield.High relative humidity, optimum soil-nitrogen levels and water availability increase susceptibility. Sensitive species include cucumber, grape, green bean, lettuce, onion, potato, radish, spinach, sweet corn, tobacco and tomato. Resistant species include pear and apricot.
Sulfur Dioxide: Sulfur dioxide enters the leaves mainly through the stomata (microscopic openings) and the resultant injury is classified as either acute or chronic. Acute injury is caused by absorption of high concentrations of sulfur dioxide in a relatively short time. The symptoms appear as 2-sided (bifacial) lesions that usually occur between the veins and occasionally along the margins of the leaves. The colour of the necrotic area can vary from a light tan or near white to an orange-red or brown depending on the time of year, the plant species affected and weather conditions. Recently expanded leaves usually are the most sensitive to acute sulfur dioxide injury, the very youngest and oldest being somewhat more resistant. However, different plant species vary considerably in their sensitivity to sulfur dioxide. These variations occur because of the differences in geographical location, climate, stage of growth and maturation. The cropsthose are generally considered susceptible to sulfur dioxide are alfalfa, barley, oats, pumpkin, radish, spinach, squash, and tobacco. Resistant crop plants include asparagus, cabbage, celery, corn, onion and potato.
Fluoride: Fluorides are discharged into the atmosphere from the combustion of coal; the production of brick, tile, enamel frit, ceramics, and glass; the manufacture of aluminium and steel; and the production of hydrofluoric acid, phosphate chemicals and fertilizers. The fluoride enters the leaf through the stomata and is moved to the margins where it accumulates and causes tissue injury. The injury starts as a gray or light-green water-soaked lesion, which turns tan to reddish-brown. With continued exposure the necrotic areas increase in size, spreading inward to the midrib on broad leaves and downward on monocotyledonous leaves.The characteristic dark band separating the healthy (green) and injured (brown) tissues of affected leaves is the usual symptom of fluoride pollution. Studies indicate that apricot, barley (young), peach (fruit), gladiolus, grape, plum, sweet corn and tulip are most sensitive; whereas, alfalfa, asparagus, bean (snap), cabbage, carrot, cauliflower, celery, cucumber, eggplant, pea, pear, pepper, potato, squash, tobacco and wheat are resistant.
Ammonia: Ammonia injury to vegetation usually occurs due to release of large quantities of
22nd National Children’s Science Congress 201465 ACTIVITY GUIDE
ammonia into the atmosphere for brief periods of time and cause severe injury to vegetation in the immediate vicinity. Complete system expression on affected vegetation usually takes several days to develop, and appears as irregular, bleached, bifacial, necrotic lesions. Grasses often show reddish, interveinal necrotic streaking or dark upper surface discolouration. Flowers, fruit and woody tissues usually are not affected, and in the case of severe injury to fruit trees, recovery through the production of new leaves can occur. Sensitive species include apple, barley, beans, radish and soybean. Resistant species include alfalfa, beet, carrot, corn, cucumber, eggplant, onion, peach, and tomato.
Particulate Matter: Particulate matter such as cement dust, magnesium-lime dust and carbon soot deposited on vegetation can inhibit the normal respiration and photosynthesis mechanisms within the leaf. Cement dust may cause chlorosis and death of leaf tissue by the combination of a thick crust and alkaline toxicity produced in wet weather. Accumulation of alkaline dusts in the soil can increase soil pH to levels adverse to crop growth.
Methane: The Scientists observed that any further rises in temperature are likely to accelerate the release of methane from rivers, lakes, deltas, bogs, swamps, marshlands and rice paddy fields. Most of the methane in freshwater systems is produced by an important microbescalled Archaea that live in waterlogged, oxygen-free sediments. Methane or natural gas is a greenhouse gas. It is 20 times more potent than carbon dioxide (CO2) over a century, and researchers have repeatedly examined the contribution of natural gas emitted by ruminant cattle to global warming.
Microbes, algae, freshwater plants and animals are all part of an active ecosystem and take their nourishment from and return waste to the atmosphere. Healthy plants take CO2 from the atmosphere with photosynthesis. Plant uptake of CO2 is affected by temperature, and so is microbial methane production. Scientists are in viewthat the ratio of methane to CO2 also goes up with temperature, which is the same whether it is for the microbes or for the whole ecosystem. Methane fluxes are much more responsive to temperature than the processes that produce
and consume carbon dioxide highlights another mechanism by which the global carbon cycle may serve to accelerate rather than mitigate future climate change.
Effect of Water and LandPollutionWater Pollution is the contamination of streams, lakes, underground water, bays, or oceans by substances harmful to living things. Water is one of the most essential things that pertain to life for all living things. Impure water kills plants and animals. It also causes humans to fall sick and acquire other illnesses like child-birth defects and cancer.
Land pollution is similar to that of water. It is the contamination of land with hazardous waste like garbage and other waste materials that do not belong to the land. These are consumed by plants and animals and then when the next consumer feeds on either the plant or the animal, it plies up and contaminates the body.
Usually land water bodies get polluted by deposition of pollutant in the sir. In addition the pollutants added in the land and/or soil through fertilizers, pesticides, herbicides, garbage and oil spills are deposited in the surface water bodies through run off and ground water through vertical movement of water inside the land mass, known as percolation. These pollutants affect soil directly changing its pH, structure, salinity and many more functions. Most of these found detrimental to plant and aquatic animals and finally affect us through food chain.
SUSTAINABLE AGRICULTUREAs defined by FAO, sustainable development is the management and conservation of the natural resource base and the orientation of technological and institutional change in such a manner as to ensure the attainment and continued satisfaction of human needs for the present and future generations. Such Sustainable development (in the agriculture, forestry and fisheries sectors) conserves land, water, plant and animal genetic resources, is environmentally non-degrading, technically appropriate, economically viable and socially acceptable.
It is well known that agriculture is the single largest user of freshwater resources, using a global
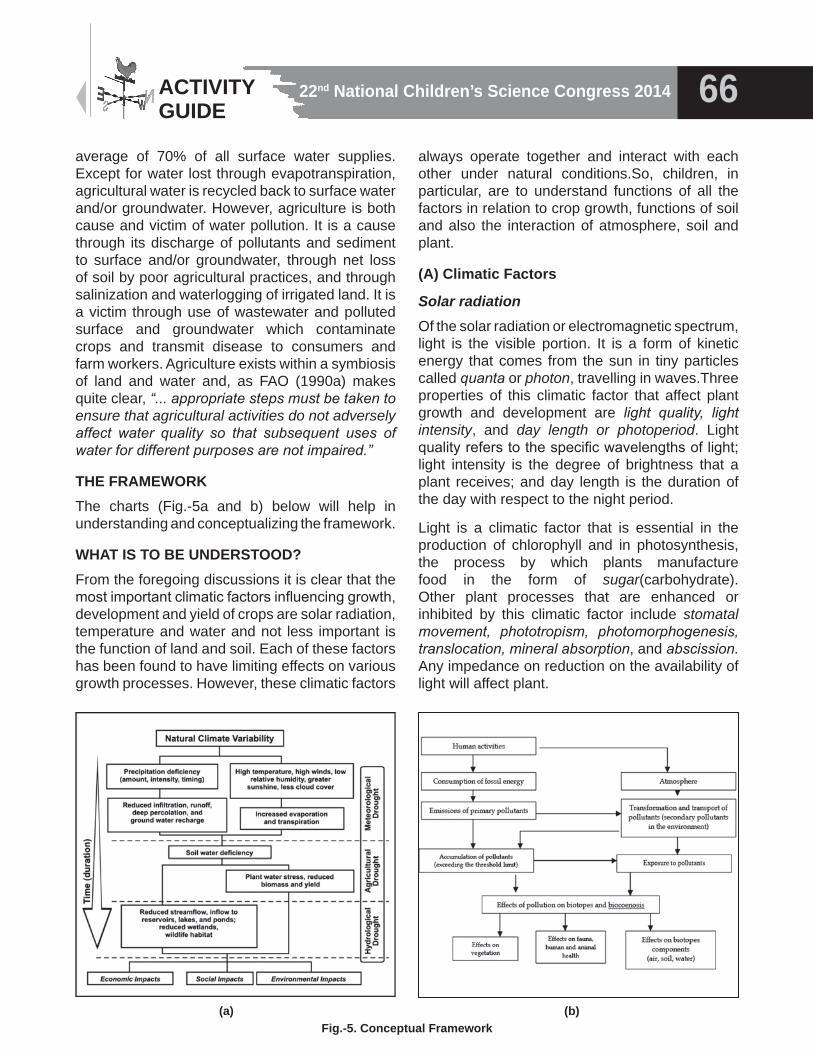
22nd National Children’s Science Congress 2014 66ACTIVITY GUIDE
average of 70% of all surface water supplies. Except for water lost through evapotranspiration, agricultural water is recycled back to surface water and/or groundwater. However, agriculture is both cause and victim of water pollution. It is a cause through its discharge of pollutants and sediment to surface and/or groundwater, through net loss of soil by poor agricultural practices, and through salinization and waterlogging of irrigated land. It is a victim through use of wastewater and polluted surface and groundwater which contaminate crops and transmit disease to consumers and farm workers. Agriculture exists within a symbiosis of land and water and, as FAO (1990a) makes quite clear, “... appropriate steps must be taken to ensure that agricultural activities do not adversely affect water quality so that subsequent uses of water for different purposes are not impaired.”
THE FRAMEWORKThe charts (Fig.-5a and b) below will help in understanding and conceptualizing the framework.
WHAT IS TO BE UNDERSTOOD?From the foregoing discussions it is clear that the most important climatic factors influencing growth, development and yield of crops are solar radiation, temperature and water and not less important is the function of land and soil. Each of these factors has been found to have limiting effects on various growth processes. However, these climatic factors
always operate together and interact with each other under natural conditions.So, children, in particular, are to understand functions of all the factors in relation to crop growth, functions of soil and also the interaction of atmosphere, soil and plant.
(A) Climatic Factors
Solar radiationOf the solar radiation or electromagnetic spectrum, light is the visible portion. It is a form of kinetic energy that comes from the sun in tiny particles called quanta or photon, travelling in waves.Three properties of this climatic factor that affect plant growth and development are light quality, light intensity, and day length or photoperiod. Light quality refers to the specific wavelengths of light; light intensity is the degree of brightness that a plant receives; and day length is the duration of the day with respect to the night period.
Light is a climatic factor that is essential in the production of chlorophyll and in photosynthesis, the process by which plants manufacture food in the form of sugar(carbohydrate). Other plant processes that are enhanced or inhibited by this climatic factor include stomatal movement, phototropism, photomorphogenesis, translocation, mineral absorption, and abscission. Any impedance on reduction on the availability of light will affect plant.
(a) (b)Fig.-5. Conceptual Framework
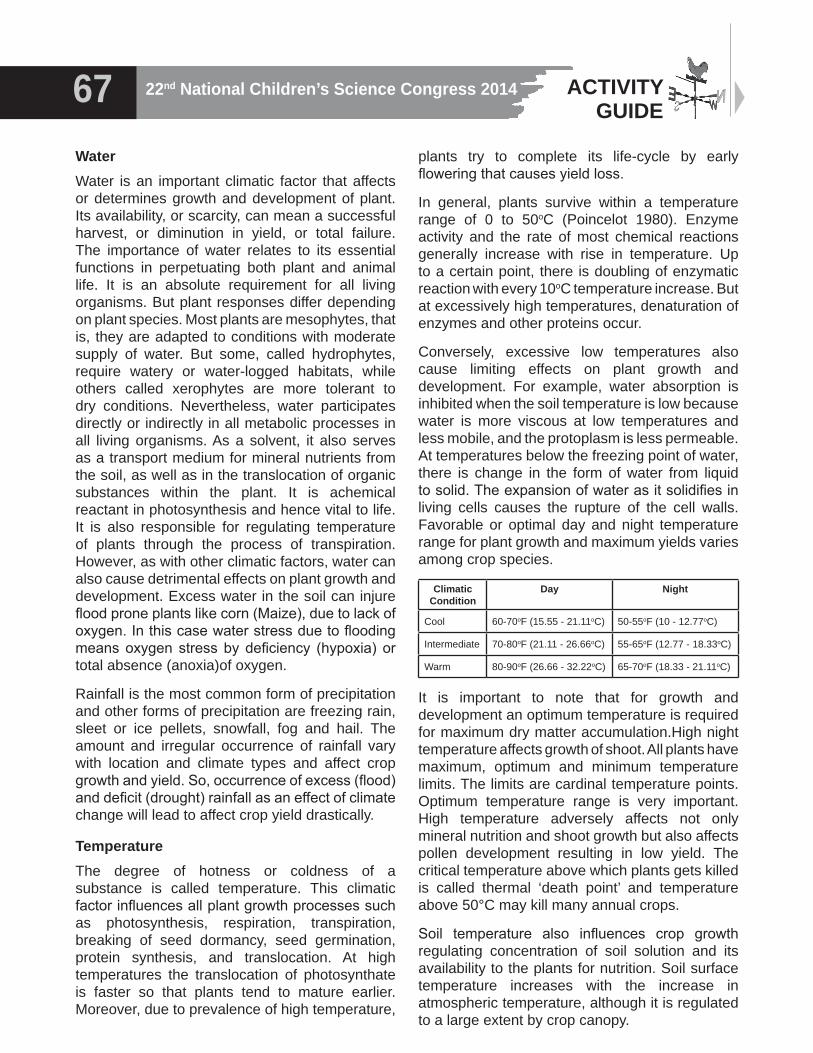
22nd National Children’s Science Congress 201467 ACTIVITY GUIDE
WaterWater is an important climatic factor that affects or determines growth and development of plant. Its availability, or scarcity, can mean a successful harvest, or diminution in yield, or total failure. The importance of water relates to its essential functions in perpetuating both plant and animal life. It is an absolute requirement for all living organisms. But plant responses differ depending on plant species. Most plants are mesophytes, that is, they are adapted to conditions with moderate supply of water. But some, called hydrophytes, require watery or water-logged habitats, while others called xerophytes are more tolerant to dry conditions. Nevertheless, water participates directly or indirectly in all metabolic processes in all living organisms. As a solvent, it also serves as a transport medium for mineral nutrients from the soil, as well as in the translocation of organic substances within the plant. It is achemical reactant in photosynthesis and hence vital to life. It is also responsible for regulating temperature of plants through the process of transpiration.However, as with other climatic factors, water can also cause detrimental effects on plant growth and development. Excess water in the soil can injure flood prone plants like corn (Maize), due to lack of oxygen. In this case water stress due to flooding means oxygen stress by deficiency (hypoxia) or total absence (anoxia)of oxygen.
Rainfall is the most common form of precipitation and other forms of precipitation are freezing rain, sleet or ice pellets, snowfall, fog and hail. The amount and irregular occurrence of rainfall vary with location and climate types and affect crop growth and yield. So, occurrence of excess (flood) and deficit (drought) rainfall as an effect of climate change will lead to affect crop yield drastically.
TemperatureThe degree of hotness or coldness of a substance is called temperature. This climatic factor influences all plant growth processes such as photosynthesis, respiration, transpiration, breaking of seed dormancy, seed germination, protein synthesis, and translocation. At high temperatures the translocation of photosynthate is faster so that plants tend to mature earlier. Moreover, due to prevalence of high temperature,
plants try to complete its life-cycle by early flowering that causes yield loss.
In general, plants survive within a temperature range of 0 to 50oC (Poincelot 1980). Enzyme activity and the rate of most chemical reactions generally increase with rise in temperature. Up to a certain point, there is doubling of enzymatic reaction with every 10oC temperature increase. But at excessively high temperatures, denaturation of enzymes and other proteins occur.
Conversely, excessive low temperatures also cause limiting effects on plant growth and development. For example, water absorption is inhibited when the soil temperature is low because water is more viscous at low temperatures and less mobile, and the protoplasm is less permeable. At temperatures below the freezing point of water, there is change in the form of water from liquid to solid. The expansion of water as it solidifies in living cells causes the rupture of the cell walls. Favorable or optimal day and night temperature range for plant growth and maximum yields varies among crop species.
It is important to note that for growth and development an optimum temperature is required for maximum dry matter accumulation.High night temperature affects growth of shoot. All plants have maximum, optimum and minimum temperature limits. The limits are cardinal temperature points. Optimum temperature range is very important. High temperature adversely affects not only mineral nutrition and shoot growth but also affects pollen development resulting in low yield. The critical temperature above which plants gets killed is called thermal ‘death point’ and temperature above 50°C may kill many annual crops.
Soil temperature also influences crop growth regulating concentration of soil solution and its availability to the plants for nutrition. Soil surface temperature increases with the increase in atmospheric temperature, although it is regulated to a large extent by crop canopy.
Climatic Condition
Day Night
Cool 60-70oF (15.55 - 21.11oC) 50-55oF (10 - 12.77oC)
Intermediate 70-80oF (21.11 - 26.66oC) 55-65oF (12.77 - 18.33oC)
Warm 80-90oF (26.66 - 32.22oC) 65-70oF (18.33 - 21.11oC)
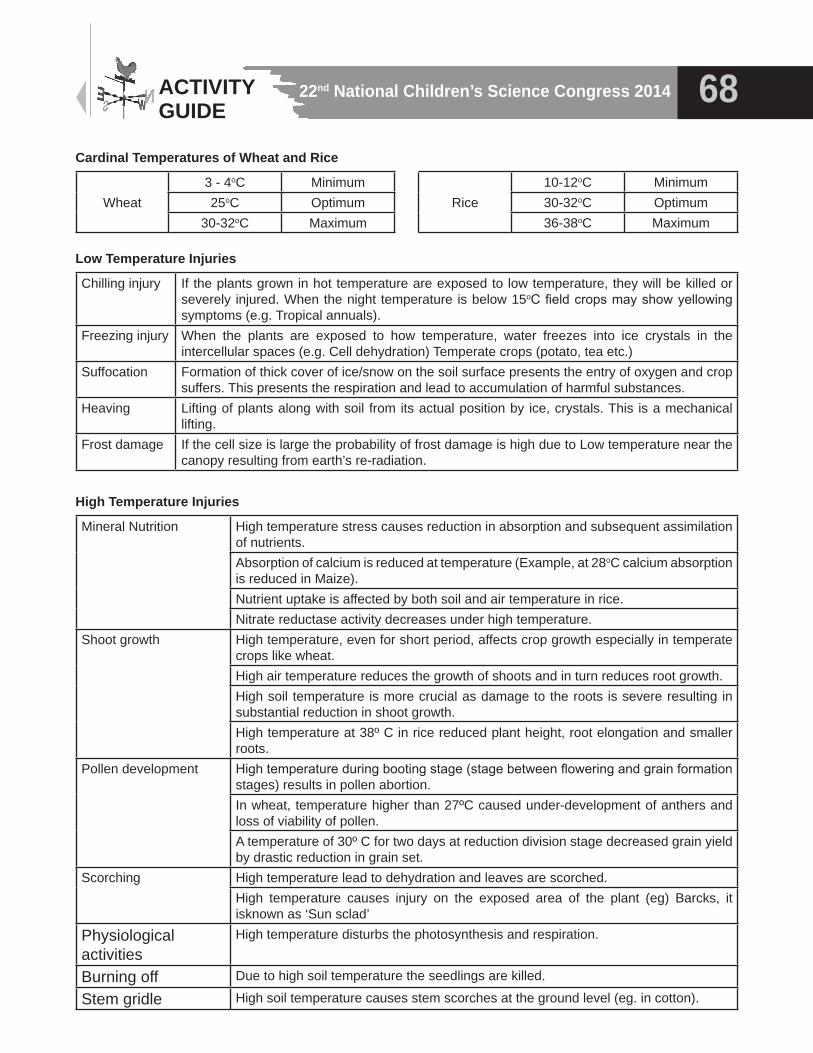
22nd National Children’s Science Congress 2014 68ACTIVITY GUIDE
Cardinal Temperatures of Wheat and Rice
Wheat3 - 4oC Minimum25oC Optimum
30-32oC Maximum
Low Temperature Injuries
Chilling injury If the plants grown in hot temperature are exposed to low temperature, they will be killed or severely injured. When the night temperature is below 15oC field crops may show yellowing symptoms (e.g. Tropical annuals).
Freezing injury When the plants are exposed to how temperature, water freezes into ice crystals in the intercellular spaces (e.g. Cell dehydration) Temperate crops (potato, tea etc.)
Suffocation Formation of thick cover of ice/snow on the soil surface presents the entry of oxygen and crop suffers. This presents the respiration and lead to accumulation of harmful substances.
Heaving Lifting of plants along with soil from its actual position by ice, crystals. This is a mechanical lifting.
Frost damage If the cell size is large the probability of frost damage is high due to Low temperature near the canopy resulting from earth’s re-radiation.
High Temperature Injuries
Mineral Nutrition High temperature stress causes reduction in absorption and subsequent assimilation of nutrients.Absorption of calcium is reduced at temperature (Example, at 28oC calcium absorption is reduced in Maize).Nutrient uptake is affected by both soil and air temperature in rice.Nitrate reductase activity decreases under high temperature.
Shoot growth High temperature, even for short period, affects crop growth especially in temperate crops like wheat.High air temperature reduces the growth of shoots and in turn reduces root growth.High soil temperature is more crucial as damage to the roots is severe resulting in substantial reduction in shoot growth.High temperature at 38º C in rice reduced plant height, root elongation and smaller roots.
Pollen development High temperature during booting stage (stage between flowering and grain formation stages) results in pollen abortion.In wheat, temperature higher than 27ºC caused under-development of anthers and loss of viability of pollen.A temperature of 30º C for two days at reduction division stage decreased grain yield by drastic reduction in grain set.
Scorching High temperature lead to dehydration and leaves are scorched.High temperature causes injury on the exposed area of the plant (eg) Barcks, it isknown as ‘Sun sclad’
Physiological activities
High temperature disturbs the photosynthesis and respiration.
Burning off Due to high soil temperature the seedlings are killed.
Stem gridle High soil temperature causes stem scorches at the ground level (eg. in cotton).
Rice10-12oC Minimum30-32oC Optimum36-38oC Maximum
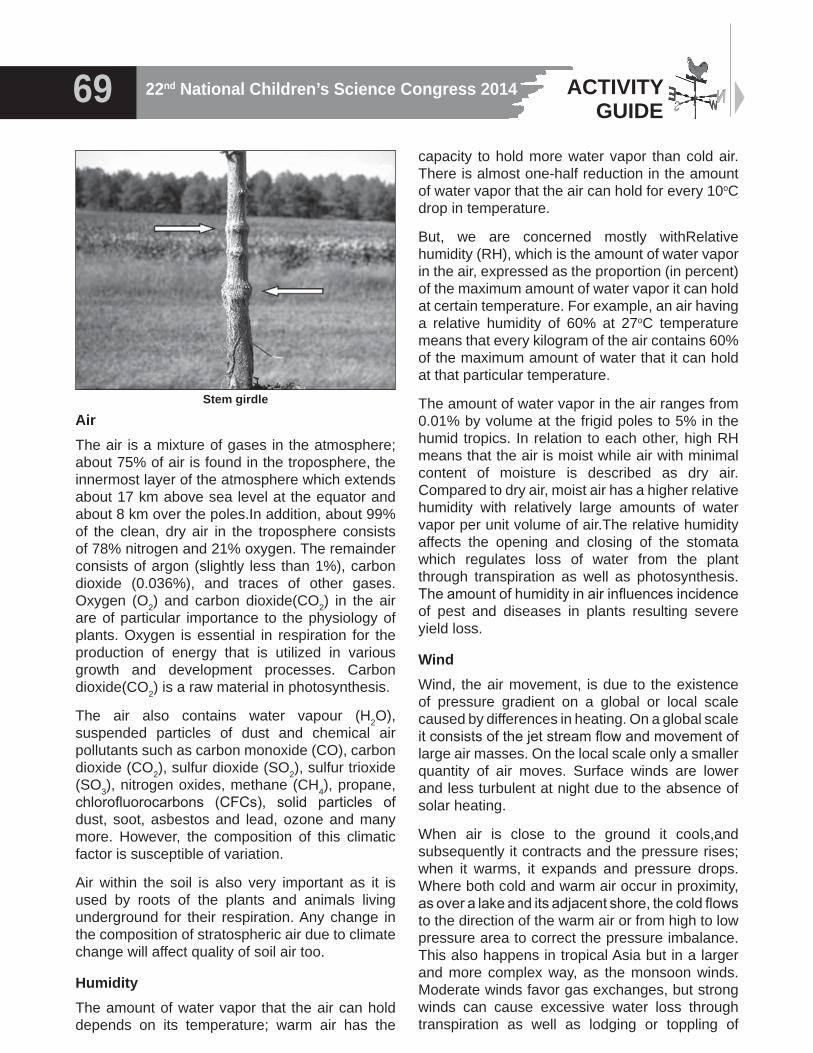
22nd National Children’s Science Congress 201469 ACTIVITY GUIDE
AirThe air is a mixture of gases in the atmosphere; about 75% of air is found in the troposphere, the innermost layer of the atmosphere which extends about 17 km above sea level at the equator and about 8 km over the poles.In addition, about 99% of the clean, dry air in the troposphere consists of 78% nitrogen and 21% oxygen. The remainder consists of argon (slightly less than 1%), carbon dioxide (0.036%), and traces of other gases. Oxygen (O2) and carbon dioxide(CO2) in the air are of particular importance to the physiology of plants. Oxygen is essential in respiration for the production of energy that is utilized in various growth and development processes. Carbon dioxide(CO2) is a raw material in photosynthesis.
The air also contains water vapour (H2O), suspended particles of dust and chemical air pollutants such as carbon monoxide (CO), carbon dioxide (CO2), sulfur dioxide (SO2), sulfur trioxide (SO3), nitrogen oxides, methane (CH4), propane, chlorofluorocarbons (CFCs), solid particles of dust, soot, asbestos and lead, ozone and many more. However, the composition of this climatic factor is susceptible of variation.
Air within the soil is also very important as it is used by roots of the plants and animals living underground for their respiration. Any change in the composition of stratospheric air due to climate change will affect quality of soil air too.
HumidityThe amount of water vapor that the air can hold depends on its temperature; warm air has the
capacity to hold more water vapor than cold air. There is almost one-half reduction in the amount of water vapor that the air can hold for every 10oC drop in temperature.
But, we are concerned mostly withRelative humidity (RH), which is the amount of water vapor in the air, expressed as the proportion (in percent) of the maximum amount of water vapor it can hold at certain temperature. For example, an air having a relative humidity of 60% at 27oC temperature means that every kilogram of the air contains 60% of the maximum amount of water that it can hold at that particular temperature.
The amount of water vapor in the air ranges from 0.01% by volume at the frigid poles to 5% in the humid tropics. In relation to each other, high RH means that the air is moist while air with minimal content of moisture is described as dry air. Compared to dry air, moist air has a higher relative humidity with relatively large amounts of water vapor per unit volume of air.The relative humidity affects the opening and closing of the stomata which regulates loss of water from the plant through transpiration as well as photosynthesis. The amount of humidity in air influences incidence of pest and diseases in plants resulting severe yield loss.
WindWind, the air movement, is due to the existence of pressure gradient on a global or local scale caused by differences in heating. On a global scale it consists of the jet stream flow and movement of large air masses. On the local scale only a smaller quantity of air moves. Surface winds are lower and less turbulent at night due to the absence of solar heating.
When air is close to the ground it cools,and subsequently it contracts and the pressure rises; when it warms, it expands and pressure drops. Where both cold and warm air occur in proximity, as over a lake and its adjacent shore, the cold flows to the direction of the warm air or from high to low pressure area to correct the pressure imbalance. This also happens in tropical Asia but in a larger and more complex way, as the monsoon winds. Moderate winds favor gas exchanges, but strong winds can cause excessive water loss through transpiration as well as lodging or toppling of
Stem girdle
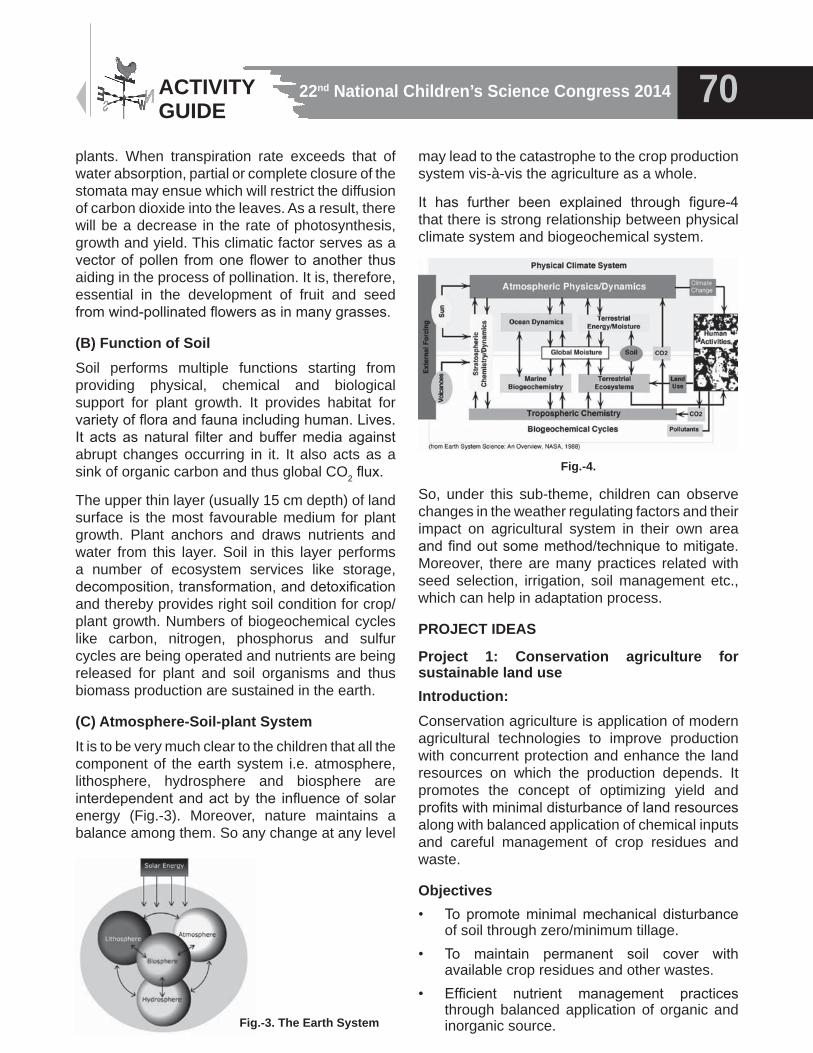
22nd National Children’s Science Congress 2014 70ACTIVITY GUIDE
plants. When transpiration rate exceeds that of water absorption, partial or complete closure of the stomata may ensue which will restrict the diffusion of carbon dioxide into the leaves. As a result, there will be a decrease in the rate of photosynthesis, growth and yield. This climatic factor serves as a vector of pollen from one flower to another thus aiding in the process of pollination. It is, therefore, essential in the development of fruit and seed from wind-pollinated flowers as in many grasses.
(B) Function of SoilSoil performs multiple functions starting from providing physical, chemical and biological support for plant growth. It provides habitat for variety of flora and fauna including human. Lives. It acts as natural filter and buffer media against abrupt changes occurring in it. It also acts as a sink of organic carbon and thus global CO2 flux.
The upper thin layer (usually 15 cm depth) of land surface is the most favourable medium for plant growth. Plant anchors and draws nutrients and water from this layer. Soil in this layer performs a number of ecosystem services like storage, decomposition, transformation, and detoxification and thereby provides right soil condition for crop/plant growth. Numbers of biogeochemical cycles like carbon, nitrogen, phosphorus and sulfur cycles are being operated and nutrients are being released for plant and soil organisms and thus biomass production are sustained in the earth.
(C) Atmosphere-Soil-plant SystemIt is to be very much clear to the children that all the component of the earth system i.e. atmosphere, lithosphere, hydrosphere and biosphere are interdependent and act by the influence of solar energy (Fig.-3). Moreover, nature maintains a balance among them. So any change at any level
may lead to the catastrophe to the crop production system vis-à-vis the agriculture as a whole.
It has further been explained through figure-4 that there is strong relationship between physical climate system and biogeochemical system.
Fig.-4.
So, under this sub-theme, children can observe changes in the weather regulating factors and their impact on agricultural system in their own area and find out some method/technique to mitigate. Moreover, there are many practices related with seed selection, irrigation, soil management etc., which can help in adaptation process.
PROJECT IDEAS
Project 1: Conservation agriculture for sustainable land useIntroduction:Conservation agriculture is application of modern agricultural technologies to improve production with concurrent protection and enhance the land resources on which the production depends. It promotes the concept of optimizing yield and profits with minimal disturbance of land resources along with balanced application of chemical inputs and careful management of crop residues and waste.
Objectives• To promote minimal mechanical disturbance
of soil through zero/minimum tillage.• To maintain permanent soil cover with
available crop residues and other wastes.• Efficient nutrient management practices
through balanced application of organic and inorganic source.Fig.-3. The Earth System
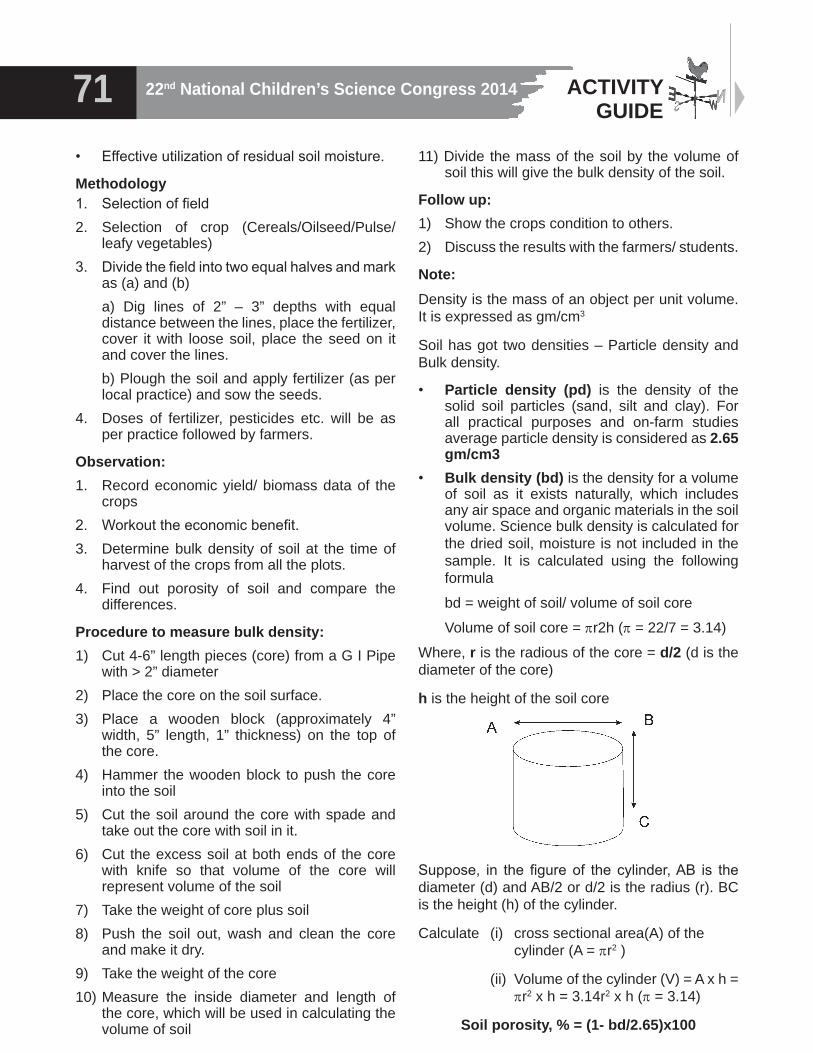
22nd National Children’s Science Congress 201471 ACTIVITY GUIDE
• Effective utilization of residual soil moisture.
Methodology1. Selection of field2. Selection of crop (Cereals/Oilseed/Pulse/
leafy vegetables)3. Divide the field into two equal halves and mark
as (a) and (b) a) Dig lines of 2” – 3” depths with equal
distance between the lines, place the fertilizer, cover it with loose soil, place the seed on it and cover the lines.
b) Plough the soil and apply fertilizer (as per local practice) and sow the seeds.
4. Doses of fertilizer, pesticides etc. will be as per practice followed by farmers.
Observation:1. Record economic yield/ biomass data of the
crops2. Workout the economic benefit.3. Determine bulk density of soil at the time of
harvest of the crops from all the plots.4. Find out porosity of soil and compare the
differences.
Procedure to measure bulk density:1) Cut 4-6” length pieces (core) from a G I Pipe
with > 2” diameter2) Place the core on the soil surface.3) Place a wooden block (approximately 4”
width, 5” length, 1” thickness) on the top of the core.
4) Hammer the wooden block to push the core into the soil
5) Cut the soil around the core with spade and take out the core with soil in it.
6) Cut the excess soil at both ends of the core with knife so that volume of the core will represent volume of the soil
7) Take the weight of core plus soil8) Push the soil out, wash and clean the core
and make it dry.9) Take the weight of the core10) Measure the inside diameter and length of
the core, which will be used in calculating the volume of soil
11) Divide the mass of the soil by the volume of soil this will give the bulk density of the soil.
Follow up:1) Show the crops condition to others.2) Discuss the results with the farmers/ students.
Note:Density is the mass of an object per unit volume. It is expressed as gm/cm3
Soil has got two densities – Particle density and Bulk density.
• Particle density (pd) is the density of the solid soil particles (sand, silt and clay). For all practical purposes and on-farm studies average particle density is considered as 2.65 gm/cm3
• Bulk density (bd) is the density for a volume of soil as it exists naturally, which includes any air space and organic materials in the soil volume. Science bulk density is calculated for the dried soil, moisture is not included in the sample. It is calculated using the following formula
bd = weight of soil/ volume of soil core
Volume of soil core = pr2h (p = 22/7 = 3.14)
Where, r is the radious of the core = d/2 (d is the diameter of the core)
h is the height of the soil core
Suppose, in the figure of the cylinder, AB is the diameter (d) and AB/2 or d/2 is the radius (r). BC is the height (h) of the cylinder.
Calculate (i) cross sectional area(A) of the cylinder (A = pr2 )
(ii) Volume of the cylinder (V) = A x h = pr2 x h = 3.14r2 x h (p = 3.14)
Soil porosity, % = (1- bd/2.65)x100
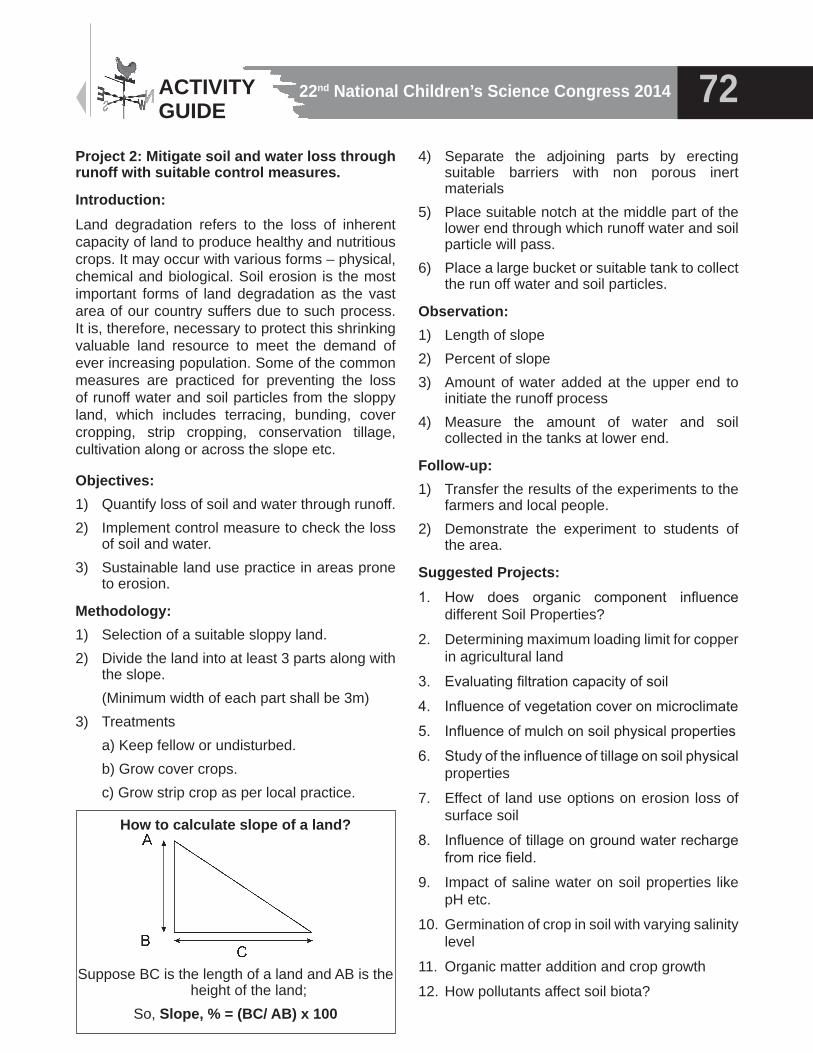
22nd National Children’s Science Congress 2014 72ACTIVITY GUIDE
Project 2: Mitigate soil and water loss through runoff with suitable control measures.
Introduction:Land degradation refers to the loss of inherent capacity of land to produce healthy and nutritious crops. It may occur with various forms – physical, chemical and biological. Soil erosion is the most important forms of land degradation as the vast area of our country suffers due to such process. It is, therefore, necessary to protect this shrinking valuable land resource to meet the demand of ever increasing population. Some of the common measures are practiced for preventing the loss of runoff water and soil particles from the sloppy land, which includes terracing, bunding, cover cropping, strip cropping, conservation tillage, cultivation along or across the slope etc.
Objectives:1) Quantify loss of soil and water through runoff.2) Implement control measure to check the loss
of soil and water.3) Sustainable land use practice in areas prone
to erosion.
Methodology:1) Selection of a suitable sloppy land.2) Divide the land into at least 3 parts along with
the slope. (Minimum width of each part shall be 3m)3) Treatments a) Keep fellow or undisturbed. b) Grow cover crops. c) Grow strip crop as per local practice.
4) Separate the adjoining parts by erecting suitable barriers with non porous inert materials
5) Place suitable notch at the middle part of the lower end through which runoff water and soil particle will pass.
6) Place a large bucket or suitable tank to collect the run off water and soil particles.
Observation:1) Length of slope2) Percent of slope3) Amount of water added at the upper end to
initiate the runoff process4) Measure the amount of water and soil
collected in the tanks at lower end.
Follow-up:1) Transfer the results of the experiments to the
farmers and local people.2) Demonstrate the experiment to students of
the area.
Suggested Projects:1. How does organic component influence
different Soil Properties?
2. Determining maximum loading limit for copper in agricultural land
3. Evaluating filtration capacity of soil
4. Influence of vegetation cover on microclimate
5. Influence of mulch on soil physical properties
6. Study of the influence of tillage on soil physical properties
7. Effect of land use options on erosion loss of surface soil
8. Influence of tillage on ground water recharge from rice field.
9. Impact of saline water on soil properties like pH etc.
10. Germination of crop in soil with varying salinity level
11. Organic matter addition and crop growth
12. How pollutants affect soil biota?
How to calculate slope of a land?
Suppose BC is the length of a land and AB is the height of the land;
So, Slope, % = (BC/ AB) x 100
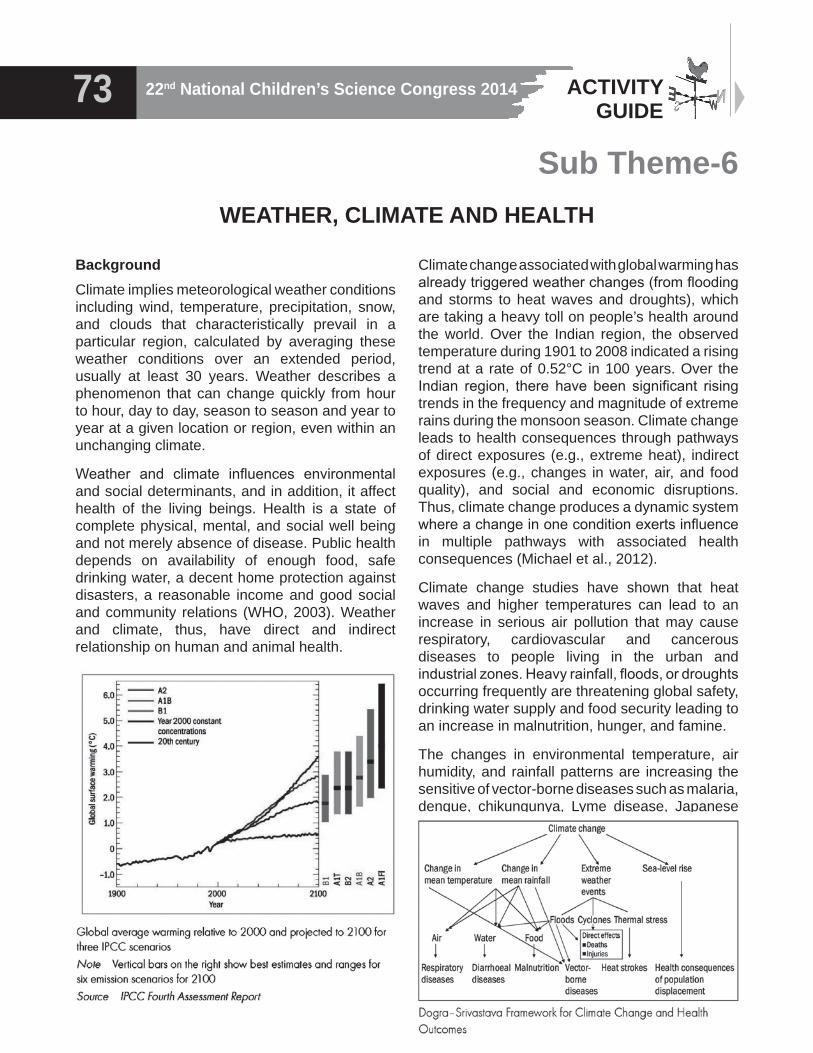
22nd National Children’s Science Congress 201473 ACTIVITY GUIDE
WEATHER, CLIMATE AND HEALTH
Sub Theme-6
BackgroundClimate implies meteorological weather conditions including wind, temperature, precipitation, snow, and clouds that characteristically prevail in a particular region, calculated by averaging these weather conditions over an extended period, usually at least 30 years. Weather describes a phenomenon that can change quickly from hour to hour, day to day, season to season and year to year at a given location or region, even within an unchanging climate.
Weather and climate influences environmental and social determinants, and in addition, it affect health of the living beings. Health is a state of complete physical, mental, and social well being and not merely absence of disease. Public health depends on availability of enough food, safe drinking water, a decent home protection against disasters, a reasonable income and good social and community relations (WHO, 2003). Weather and climate, thus, have direct and indirect relationship on human and animal health.
Climate change associated with global warming has already triggered weather changes (from flooding and storms to heat waves and droughts), which are taking a heavy toll on people’s health around the world. Over the Indian region, the observed temperature during 1901 to 2008 indicated a rising trend at a rate of 0.52°C in 100 years. Over the Indian region, there have been significant rising trends in the frequency and magnitude of extreme rains during the monsoon season. Climate change leads to health consequences through pathways of direct exposures (e.g., extreme heat), indirect exposures (e.g., changes in water, air, and food quality), and social and economic disruptions. Thus, climate change produces a dynamic system where a change in one condition exerts influence in multiple pathways with associated health consequences (Michael et al., 2012).
Climate change studies have shown that heat waves and higher temperatures can lead to an increase in serious air pollution that may cause respiratory, cardiovascular and cancerous diseases to people living in the urban and industrial zones. Heavy rainfall, floods, or droughts occurring frequently are threatening global safety, drinking water supply and food security leading to an increase in malnutrition, hunger, and famine.
The changes in environmental temperature, air humidity, and rainfall patterns are increasing the sensitive of vector-borne diseases such as malaria, dengue, chikungunya, Lyme disease, Japanese
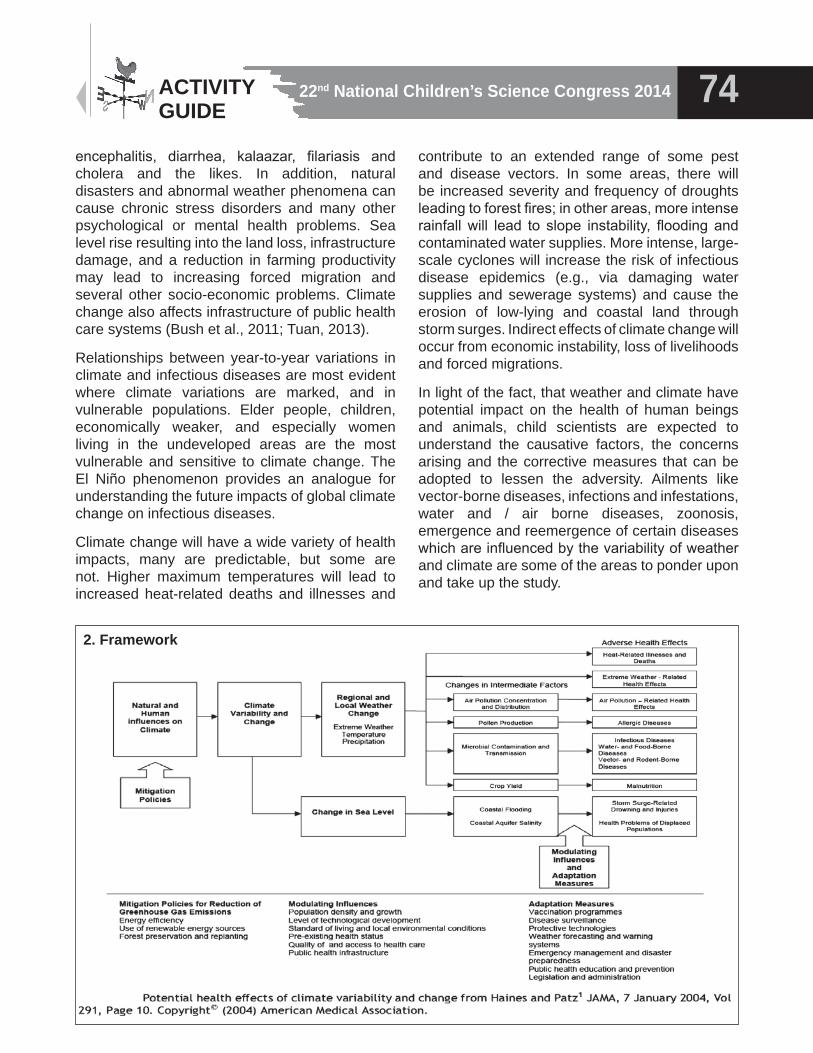
22nd National Children’s Science Congress 2014 74ACTIVITY GUIDE
encephalitis, diarrhea, kalaazar, filariasis and cholera and the likes. In addition, natural disasters and abnormal weather phenomena can cause chronic stress disorders and many other psychological or mental health problems. Sea level rise resulting into the land loss, infrastructure damage, and a reduction in farming productivity may lead to increasing forced migration and several other socio-economic problems. Climate change also affects infrastructure of public health care systems (Bush et al., 2011; Tuan, 2013).
Relationships between year-to-year variations in climate and infectious diseases are most evident where climate variations are marked, and in vulnerable populations. Elder people, children, economically weaker, and especially women living in the undeveloped areas are the most vulnerable and sensitive to climate change. The El Niño phenomenon provides an analogue for understanding the future impacts of global climate change on infectious diseases.
Climate change will have a wide variety of health impacts, many are predictable, but some are not. Higher maximum temperatures will lead to increased heat-related deaths and illnesses and
contribute to an extended range of some pest and disease vectors. In some areas, there will be increased severity and frequency of droughts leading to forest fires; in other areas, more intense rainfall will lead to slope instability, flooding and contaminated water supplies. More intense, large-scale cyclones will increase the risk of infectious disease epidemics (e.g., via damaging water supplies and sewerage systems) and cause the erosion of low-lying and coastal land through storm surges. Indirect effects of climate change will occur from economic instability, loss of livelihoods and forced migrations.
In light of the fact, that weather and climate have potential impact on the health of human beings and animals, child scientists are expected to understand the causative factors, the concerns arising and the corrective measures that can be adopted to lessen the adversity. Ailments like vector-borne diseases, infections and infestations, water and / air borne diseases, zoonosis, emergence and reemergence of certain diseases which are influenced by the variability of weather and climate are some of the areas to ponder upon and take up the study.
2. Framework
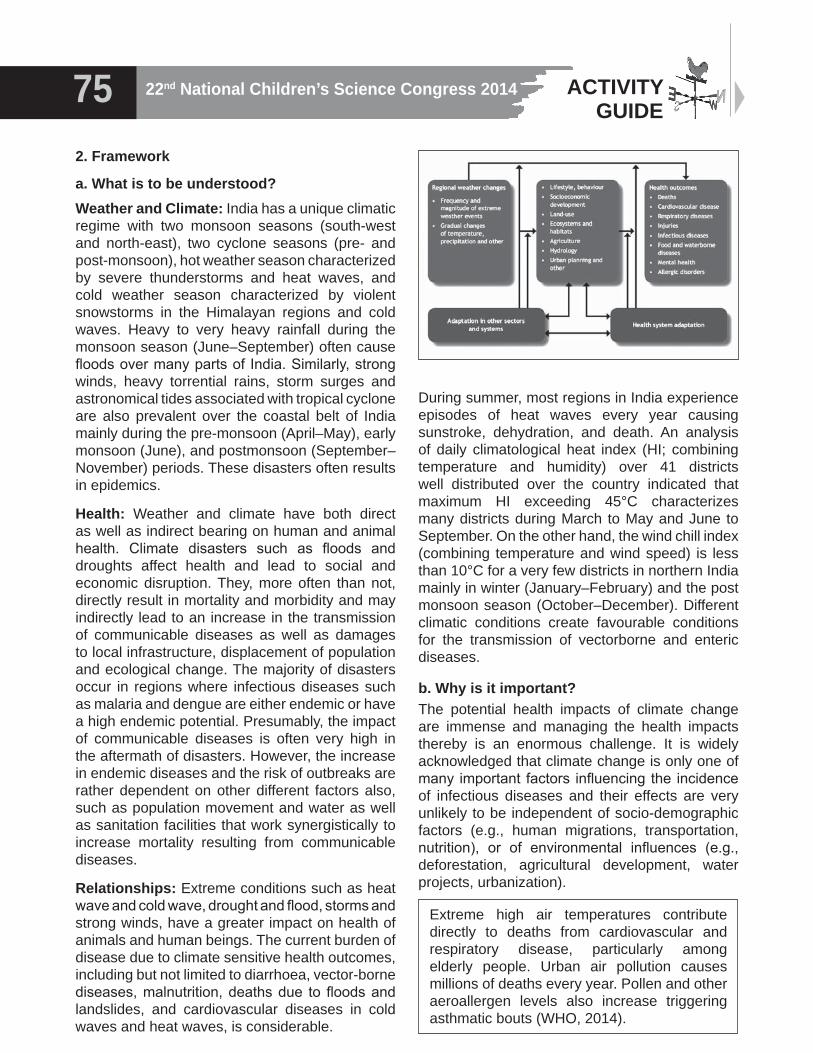
22nd National Children’s Science Congress 201475 ACTIVITY GUIDE
2. Framework
a. What is to be understood?Weather and Climate: India has a unique climatic regime with two monsoon seasons (south-west and north-east), two cyclone seasons (pre- and post-monsoon), hot weather season characterized by severe thunderstorms and heat waves, and cold weather season characterized by violent snowstorms in the Himalayan regions and cold waves. Heavy to very heavy rainfall during the monsoon season (June–September) often cause floods over many parts of India. Similarly, strong winds, heavy torrential rains, storm surges and astronomical tides associated with tropical cyclone are also prevalent over the coastal belt of India mainly during the pre-monsoon (April–May), early monsoon (June), and postmonsoon (September– November) periods. These disasters often results in epidemics.
Health: Weather and climate have both direct as well as indirect bearing on human and animal health. Climate disasters such as floods and droughts affect health and lead to social and economic disruption. They, more often than not, directly result in mortality and morbidity and may indirectly lead to an increase in the transmission of communicable diseases as well as damages to local infrastructure, displacement of population and ecological change. The majority of disasters occur in regions where infectious diseases such as malaria and dengue are either endemic or have a high endemic potential. Presumably, the impact of communicable diseases is often very high in the aftermath of disasters. However, the increase in endemic diseases and the risk of outbreaks are rather dependent on other different factors also, such as population movement and water as well as sanitation facilities that work synergistically to increase mortality resulting from communicable diseases.
Relationships: Extreme conditions such as heat wave and cold wave, drought and flood, storms and strong winds, have a greater impact on health of animals and human beings. The current burden of disease due to climate sensitive health outcomes, including but not limited to diarrhoea, vector-borne diseases, malnutrition, deaths due to floods and landslides, and cardiovascular diseases in cold waves and heat waves, is considerable.
During summer, most regions in India experience episodes of heat waves every year causing sunstroke, dehydration, and death. An analysis of daily climatological heat index (HI; combining temperature and humidity) over 41 districts well distributed over the country indicated that maximum HI exceeding 45°C characterizes many districts during March to May and June to September. On the other hand, the wind chill index (combining temperature and wind speed) is less than 10°C for a very few districts in northern India mainly in winter (January–February) and the post monsoon season (October–December). Different climatic conditions create favourable conditions for the transmission of vectorborne and enteric diseases.
b. Why is it important?The potential health impacts of climate change are immense and managing the health impacts thereby is an enormous challenge. It is widely acknowledged that climate change is only one of many important factors influencing the incidence of infectious diseases and their effects are very unlikely to be independent of socio-demographic factors (e.g., human migrations, transportation, nutrition), or of environmental influences (e.g., deforestation, agricultural development, water projects, urbanization).
Extreme high air temperatures contribute directly to deaths from cardiovascular and respiratory disease, particularly among elderly people. Urban air pollution causes millions of deaths every year. Pollen and other aeroallergen levels also increase triggering asthmatic bouts (WHO, 2014).
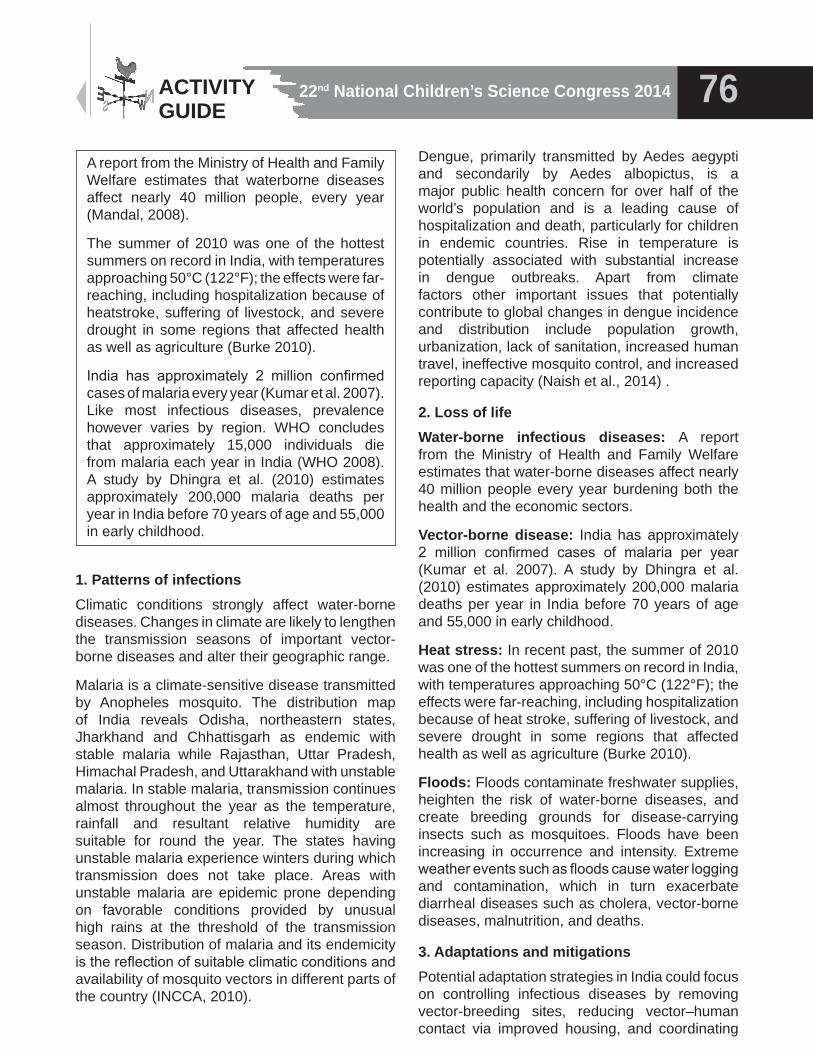
22nd National Children’s Science Congress 2014 76ACTIVITY GUIDE
A report from the Ministry of Health and Family Welfare estimates that waterborne diseases affect nearly 40 million people, every year (Mandal, 2008).
The summer of 2010 was one of the hottest summers on record in India, with temperatures approaching 50°C (122°F); the effects were far-reaching, including hospitalization because of heatstroke, suffering of livestock, and severe drought in some regions that affected health as well as agriculture (Burke 2010).
India has approximately 2 million confirmed cases of malaria every year (Kumar et al. 2007). Like most infectious diseases, prevalence however varies by region. WHO concludes that approximately 15,000 individuals die from malaria each year in India (WHO 2008). A study by Dhingra et al. (2010) estimates approximately 200,000 malaria deaths per year in India before 70 years of age and 55,000 in early childhood.
1. Patterns of infectionsClimatic conditions strongly affect water-borne diseases. Changes in climate are likely to lengthen the transmission seasons of important vector-borne diseases and alter their geographic range.
Malaria is a climate-sensitive disease transmitted by Anopheles mosquito. The distribution map of India reveals Odisha, northeastern states, Jharkhand and Chhattisgarh as endemic with stable malaria while Rajasthan, Uttar Pradesh, Himachal Pradesh, and Uttarakhand with unstable malaria. In stable malaria, transmission continues almost throughout the year as the temperature, rainfall and resultant relative humidity are suitable for round the year. The states having unstable malaria experience winters during which transmission does not take place. Areas with unstable malaria are epidemic prone depending on favorable conditions provided by unusual high rains at the threshold of the transmission season. Distribution of malaria and its endemicity is the reflection of suitable climatic conditions and availability of mosquito vectors in different parts of the country (INCCA, 2010).
Dengue, primarily transmitted by Aedes aegypti and secondarily by Aedes albopictus, is a major public health concern for over half of the world’s population and is a leading cause of hospitalization and death, particularly for children in endemic countries. Rise in temperature is potentially associated with substantial increase in dengue outbreaks. Apart from climate factors other important issues that potentially contribute to global changes in dengue incidence and distribution include population growth, urbanization, lack of sanitation, increased human travel, ineffective mosquito control, and increased reporting capacity (Naish et al., 2014) .
2. Loss of lifeWater-borne infectious diseases: A report from the Ministry of Health and Family Welfare estimates that water-borne diseases affect nearly 40 million people every year burdening both the health and the economic sectors.
Vector-borne disease: India has approximately 2 million confirmed cases of malaria per year (Kumar et al. 2007). A study by Dhingra et al. (2010) estimates approximately 200,000 malaria deaths per year in India before 70 years of age and 55,000 in early childhood.
Heat stress: In recent past, the summer of 2010 was one of the hottest summers on record in India, with temperatures approaching 50°C (122°F); the effects were far-reaching, including hospitalization because of heat stroke, suffering of livestock, and severe drought in some regions that affected health as well as agriculture (Burke 2010).
Floods: Floods contaminate freshwater supplies, heighten the risk of water-borne diseases, and create breeding grounds for disease-carrying insects such as mosquitoes. Floods have been increasing in occurrence and intensity. Extreme weather events such as floods cause water logging and contamination, which in turn exacerbate diarrheal diseases such as cholera, vector-borne diseases, malnutrition, and deaths.
3. Adaptations and mitigationsPotential adaptation strategies in India could focus on controlling infectious diseases by removing vector-breeding sites, reducing vector–human contact via improved housing, and coordinating
22nd National Children’s Science Congress 201477 ACTIVITY GUIDE
monitoring of mosquitoes, pathogens, and disease burden. In addition, improving sanitation and drinking water by supporting inexpensive and effective water treatment and increasing rainwater harvesting, safe storage, and gray-water reuse could be other means. In some areas, the focus may shift to flood, heat wave, and emergency preparedness, including strategies to address the additional risks placed on displaced populations from these and other climate-sensitive hazards. Developing an integrated early warning system, emergency response plans, and refugee management plans, along with increased capacity to provide shelter, drinking water, sanitation, and sustainable agricultural products to the most vulnerable populations could be the outcome (Bush et al., 2011).
Environmental monitoring and surveillance: There is a great need to improve environmental monitoring and surveillance systems in countries such as India. New research initiatives should focus on collecting high quality, long-term data on climate-related health outcomes with the dual purpose of understanding current climate–health associations and predicting future scenarios. Health outcomes of interest, for which such data should be collected, include total morbidity and mortality and non-communicable diseases such as cardiovascular and respiratory diseases including asthma, as well as infectious diseases such as cholera, malaria, tuberculosis, typhoid, hepatitis, dysentery, tick-borne encephalitis, and other vector-borne and water-borne diseases. Such monitoring also requires the collection of appropriate climatic (e.g., temperature and precipitation) and non-climatic data (e.g., ozone). Surveillance of extreme weather conditions and risk indicators such as mosquito abundance or pathogen load is also necessary. Such data gathering should occur in conjunction with already existing public health programs and health centers. Where the necessary public health infrastructure does not exist, the anticipated risks associated with climate change should motivate international action to build such infrastructure. The collection of such diverse data necessitates the creation of linkable and documented repositories for meteorological, air pollution, and health data (Bush et al., 2011).
c. How to go about?i. Identify vulnerable areas and groups: All
populations will be affected by climate change, but some are more vulnerable than others. People living in small islands, developing states and other coastal regions, megacities, mountainous regions are particularly vulnerable. Vulnerability of a population depends on factors such as population density, level of economic development, food availability, income level and distribution, local environmental conditions, pre-existing health status, and the quality and availability of public health care.
ii. Identify health risks: Climate-sensitive health risks include those occurring as a direct consequence of exposure to climatic stimuli (heat stroke, drowning during flood), those mediated via climate-sensitive ecological systems (water-borne and vector-borne diseases) and those resulting from the wider social implications of climate change (malnutrition). Children in particular are among the most vulnerable groups to the resulting health risks and will be exposed longer to the health consequences. The health effects are also expected to be more severe for elderly people and people with infirmities or pre-existing medical conditions. Appropriately managed resources and infrastructure could further help tackle the health risks of climate change as well as reduce greenhouse gas emissions. Similarly, a suitable lifestyle including appropriate dietary habits could not only further reduce the risks of non-communicable diseases but also contribute to protecting the climate.
A Case Study of Malaria in India presents an assessment on health risks due to climate change in India, especially enhanced malarial incidences. All-India rainfall in October seems to be positively correlated with malaria incidences in the following year whereas the May rainfall is negatively correlated with malaria incidences. Also cold temperature anomalies over eastern Pacific south of equator March-April-May season seems to be favorable for malaria incidences over India as this is also favourable to subsequent good summer monsoon rainfall.
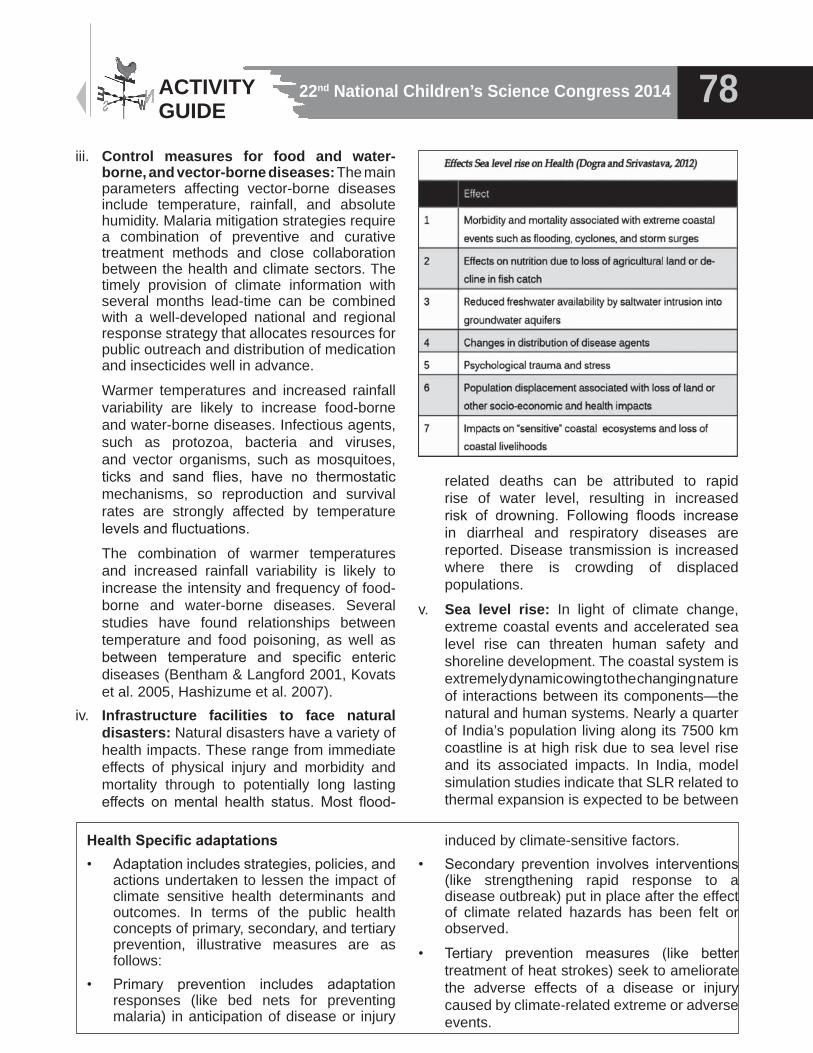
22nd National Children’s Science Congress 2014 78ACTIVITY GUIDE
iii. Control measures for food and water-borne, and vector-borne diseases: The main parameters affecting vector-borne diseases include temperature, rainfall, and absolute humidity. Malaria mitigation strategies require a combination of preventive and curative treatment methods and close collaboration between the health and climate sectors. The timely provision of climate information with several months lead-time can be combined with a well-developed national and regional response strategy that allocates resources for public outreach and distribution of medication and insecticides well in advance.
Warmer temperatures and increased rainfall variability are likely to increase food-borne and water-borne diseases. Infectious agents, such as protozoa, bacteria and viruses, and vector organisms, such as mosquitoes, ticks and sand flies, have no thermostatic mechanisms, so reproduction and survival rates are strongly affected by temperature levels and fluctuations.
The combination of warmer temperatures and increased rainfall variability is likely to increase the intensity and frequency of food-borne and water-borne diseases. Several studies have found relationships between temperature and food poisoning, as well as between temperature and specific enteric diseases (Bentham & Langford 2001, Kovats et al. 2005, Hashizume et al. 2007).
iv. Infrastructure facilities to face natural disasters: Natural disasters have a variety of health impacts. These range from immediate effects of physical injury and morbidity and mortality through to potentially long lasting effects on mental health status. Most flood-
related deaths can be attributed to rapid rise of water level, resulting in increased risk of drowning. Following floods increase in diarrheal and respiratory diseases are reported. Disease transmission is increased where there is crowding of displaced populations.
v. Sea level rise: In light of climate change, extreme coastal events and accelerated sea level rise can threaten human safety and shoreline development. The coastal system is extremely dynamic owing to the changing nature of interactions between its components—the natural and human systems. Nearly a quarter of India’s population living along its 7500 km coastline is at high risk due to sea level rise and its associated impacts. In India, model simulation studies indicate that SLR related to thermal expansion is expected to be between
Health Specific adaptations• Adaptation includes strategies, policies, and
actions undertaken to lessen the impact of climate sensitive health determinants and outcomes. In terms of the public health concepts of primary, secondary, and tertiary prevention, illustrative measures are as follows:
• Primary prevention includes adaptation responses (like bed nets for preventing malaria) in anticipation of disease or injury
induced by climate-sensitive factors.• Secondary prevention involves interventions
(like strengthening rapid response to a disease outbreak) put in place after the effect of climate related hazards has been felt or observed.
• Tertiary prevention measures (like better treatment of heat strokes) seek to ameliorate the adverse effects of a disease or injury caused by climate-related extreme or adverse events.
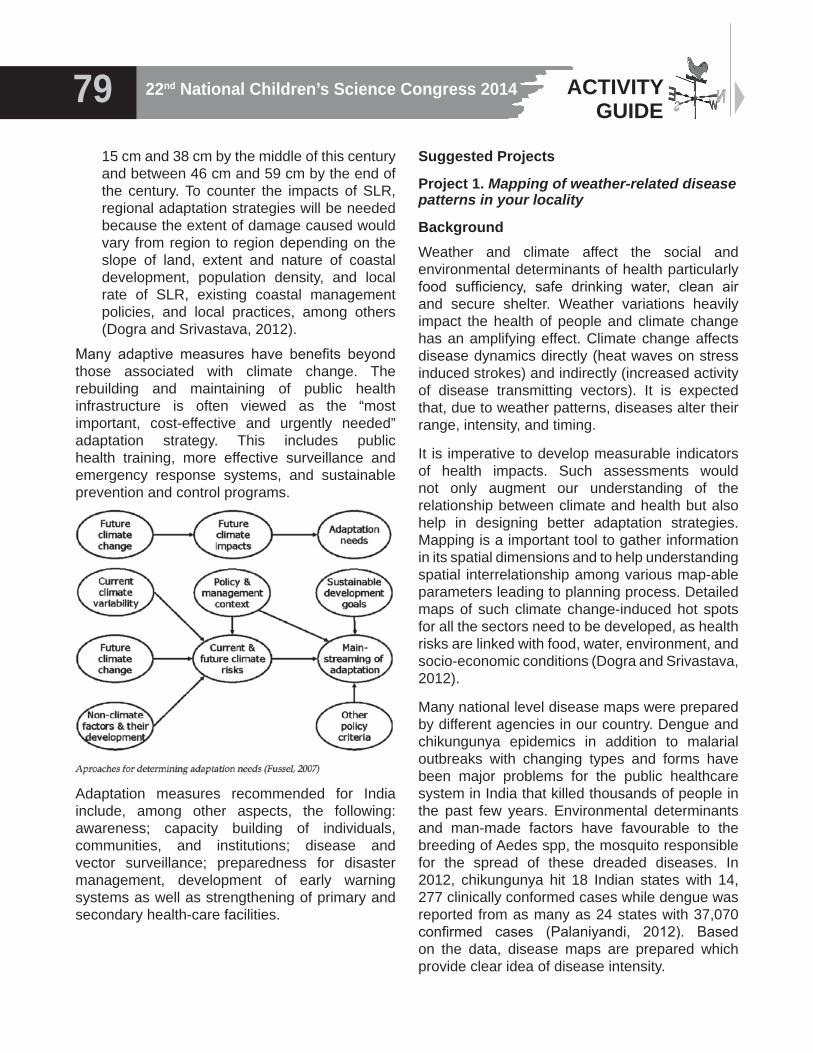
22nd National Children’s Science Congress 201479 ACTIVITY GUIDE
15 cm and 38 cm by the middle of this century and between 46 cm and 59 cm by the end of the century. To counter the impacts of SLR, regional adaptation strategies will be needed because the extent of damage caused would vary from region to region depending on the slope of land, extent and nature of coastal development, population density, and local rate of SLR, existing coastal management policies, and local practices, among others (Dogra and Srivastava, 2012).
Many adaptive measures have benefits beyond those associated with climate change. The rebuilding and maintaining of public health infrastructure is often viewed as the “most important, cost-effective and urgently needed” adaptation strategy. This includes public health training, more effective surveillance and emergency response systems, and sustainable prevention and control programs.
Suggested Projects
Project 1. Mapping of weather-related disease patterns in your locality
BackgroundWeather and climate affect the social and environmental determinants of health particularly food sufficiency, safe drinking water, clean air and secure shelter. Weather variations heavily impact the health of people and climate change has an amplifying effect. Climate change affects disease dynamics directly (heat waves on stress induced strokes) and indirectly (increased activity of disease transmitting vectors). It is expected that, due to weather patterns, diseases alter their range, intensity, and timing.
It is imperative to develop measurable indicators of health impacts. Such assessments would not only augment our understanding of the relationship between climate and health but also help in designing better adaptation strategies. Mapping is a important tool to gather information in its spatial dimensions and to help understanding spatial interrelationship among various map-able parameters leading to planning process. Detailed maps of such climate change-induced hot spots for all the sectors need to be developed, as health risks are linked with food, water, environment, and socio-economic conditions (Dogra and Srivastava, 2012).
Many national level disease maps were prepared by different agencies in our country. Dengue and chikungunya epidemics in addition to malarial outbreaks with changing types and forms have been major problems for the public healthcare system in India that killed thousands of people in the past few years. Environmental determinants and man-made factors have favourable to the breeding of Aedes spp, the mosquito responsible for the spread of these dreaded diseases. In 2012, chikungunya hit 18 Indian states with 14, 277 clinically conformed cases while dengue was reported from as many as 24 states with 37,070 confirmed cases (Palaniyandi, 2012). Based on the data, disease maps are prepared which provide clear idea of disease intensity.
Adaptation measures recommended for India include, among other aspects, the following: awareness; capacity building of individuals, communities, and institutions; disease and vector surveillance; preparedness for disaster management, development of early warning systems as well as strengthening of primary and secondary health-care facilities.
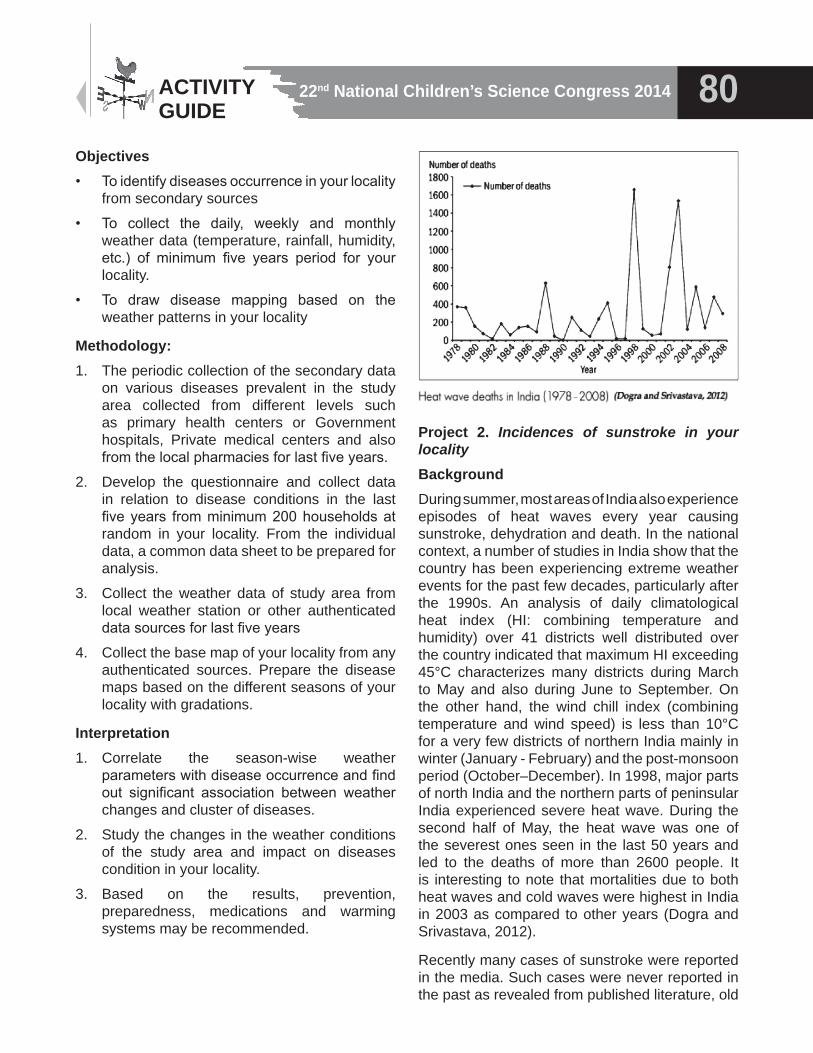
22nd National Children’s Science Congress 2014 80ACTIVITY GUIDE
Objectives• To identify diseases occurrence in your locality
from secondary sources
• To collect the daily, weekly and monthly weather data (temperature, rainfall, humidity, etc.) of minimum five years period for your locality.
• To draw disease mapping based on the weather patterns in your locality
Methodology:1. The periodic collection of the secondary data
on various diseases prevalent in the study area collected from different levels such as primary health centers or Government hospitals, Private medical centers and also from the local pharmacies for last five years.
2. Develop the questionnaire and collect data in relation to disease conditions in the last five years from minimum 200 households at random in your locality. From the individual data, a common data sheet to be prepared for analysis.
3. Collect the weather data of study area from local weather station or other authenticated data sources for last five years
4. Collect the base map of your locality from any authenticated sources. Prepare the disease maps based on the different seasons of your locality with gradations.
Interpretation1. Correlate the season-wise weather
parameters with disease occurrence and find out significant association between weather changes and cluster of diseases.
2. Study the changes in the weather conditions of the study area and impact on diseases condition in your locality.
3. Based on the results, prevention, preparedness, medications and warming systems may be recommended.
Project 2. Incidences of sunstroke in your localityBackgroundDuring summer, most areas of India also experience episodes of heat waves every year causing sunstroke, dehydration and death. In the national context, a number of studies in India show that the country has been experiencing extreme weather events for the past few decades, particularly after the 1990s. An analysis of daily climatological heat index (HI: combining temperature and humidity) over 41 districts well distributed over the country indicated that maximum HI exceeding 45°C characterizes many districts during March to May and also during June to September. On the other hand, the wind chill index (combining temperature and wind speed) is less than 10°C for a very few districts of northern India mainly in winter (January - February) and the post-monsoon period (October–December). In 1998, major parts of north India and the northern parts of peninsular India experienced severe heat wave. During the second half of May, the heat wave was one of the severest ones seen in the last 50 years and led to the deaths of more than 2600 people. It is interesting to note that mortalities due to both heat waves and cold waves were highest in India in 2003 as compared to other years (Dogra and Srivastava, 2012).
Recently many cases of sunstroke were reported in the media. Such cases were never reported in the past as revealed from published literature, old
22nd National Children’s Science Congress 201481 ACTIVITY GUIDE
hospitals records and senior citizen of the locality. So we consider it as problem to be investigated, in order to take precautions in the future to avoid such incidences.
Objectives• To understand sunstroke and it consequences
• To collect the daily weather data of summer months for last five years for that area
• To identify area from secondary sources and published data where incidences of sunstroke has been reported
• To draw relationships between weather and sunstroke and recommend precautions
Methodology1. Collect of the secondary data on incidence
of sunstroke in the study area from different levels such as primary health centers or Government hospitals, private medical centers and also from the local doctors and pharmacies of last five years
2. Develop the questionnaire and collect data in relation to sunstroke in the last five years from household survey at random in the study area. From the individual data, a common data sheet to be prepared for analysis
3. Collect the weather data of study area from local weather station or other authentic data sources of last five years
4. Compare and analyze the weather and sunstroke data
Interpretation1. To understand the indicators of sunstroke
2. Interpret the weather parameters on annual basis in relation to the occurrence of sunstroke
3. Investigate whether there is any direct relationship between nature of work, life styles, habits or place and sunstroke
4. Identify the precautions that can be taken to avoid sunstroke
5. Based on the results, recommendations may be drawn which include prevention, preparedness, first-aid and warming system
Project 3. Prevalence of dengue fever in your locality. Is it weather related?
BackgroundDengue fever is a mosquito-borne viral disease estimated to infect about 50-100 million worldwide every year, of which 25,000 are fatal. Global incidence has risen rapidly in recent decades with some 2.5 billion people, over half of the world’s population, now at risk, mainly in urban centers of the tropics and subtropics. Demographic, societal and weather changes, in particular urbanization, globalization, and increased international travel, are major contributors to the rise in incidence and geographic expansion of dengue infections. Major research gaps continue to hamper the control of dengue (Wilder-Smith et al., 2012).
The spatial distribution of the main dengue vector, Aedes aegypti, has also increased over the last 25 years. Increase in both, dengue incidence and A. aegypti distribution have also been associated to variations in the climate system, including climate change. The evidence of the effects of climate drivers on dengue incidence is still under debate (Colo´n-Gonza´lez et al., 2013). Therefore, the present work is undertaken at local level to find out the relation between weather conditions and dengue infection.
Objectives• To collect information on the occurrence of
dengue in a locality from various published or authentic secondary sources available from different levels of last five years.
• To collect the daily, weekly and monthly weather data (temperature, rainfall, humidity, etc.) of five years for the study area.
• To study weather indicators that may influence dengue transmission dynamics in a locality.
• To compare and analyze the weather data with infection pattern in the study area.
• To develop a comprehensive, early warning based on the results of data analysis.
• To determine the most useful and cost-effective predictive factors for dengue.
Methodology1. The periodic collection of the secondary
data on dengue prevalent in the study area
22nd National Children’s Science Congress 2014 82ACTIVITY GUIDE
collected from different levels such as primary health centers or Government hospitals, private medical centers and also from the local pharmacies of last five years.
2. Design and develop the questionnaire and collect data in relation to occurrence of dengue in the last five years from a minimum of 200 households at random from the study area. From the individual data sheet, a common data sheet to be prepared for analysis.
3. Collect the weather data of study area from local weather station or other authentic data sources of last five years.
4. Compare and analyze the survey data with weather conditions data. Conclude and infer on the basis of analysis.
Interpretation1. Compare weather parameters with dengue
occurrence and find out significant association between weather changes and dengue.
2. Study the changes in the weather conditions of the study area and find out impact of dengue in the same.
3. Based on the results, recommendations may be drawn which include prevention, preparedness, medications and warming systems.
List of Projects1. Mapping of weather related diseases in your
locality2. Studies on prevalence of vector-borne
diseases (malaria / dengue)3. Occurrence of communicable diseases due to
extreme weather conditions4. Effect of temperature and humidity changes
on incidences of skin diseases5. Impact of weather on production and/or health
of animals6. Effect of extreme weather on the health of
women and children7. Effect of summer, winter and monsoon on
incidence of respiratory diseases8. Effect of heat on the health of farmers /
industrial workers in your area9. Studies on weather patterns and income loss
of workers with daily wages
10. Studies on air-borne infections during variable weather conditions
Glossary of technical wordsAdaptation is adjustment in natural or human systems to a new or changing environment. Adaptation to climate change refers to adjustment in response to actual or expected climatic stimuli or their effects, which moderates harm or exploits beneficial opportunities. Various types of adaptation can be distinguished, including anticipatory and reactive adaptation, public and private adaptation, and autonomous and planned adaptation.
Adaptive capacity describes the general ability of institutions, systems and individuals to adjust to potential damages, to take advantage of opportunities or to cope with the consequences of climate change in the future.
Climate: Climate in a narrow sense is usually defined as the ‘average weather’, or more rigorously, as the statistical description in terms of the mean and variability of relevant quantities over a period of time ranging from months to thousands or millions of years. These quantities are most often surface variables such as temperature, precipitation, and wind. Climate in a wider sense is the state, including a statistical description, of the climate system. The classical period of time is 30 years, as defined by the World Meteorological Organization (WMO). In short, climate is the average state of the atmosphere and the underlying land or water in a specific region over a specific time scale.
Climate change refers to any change in climate over time, whether due to natural variability or as a result of human activity. Climate change is also defined as a statistically significant variation in either the mean state of the climate or in its variability, persisting for an extended period (typically decades or longer).
Climate model is a numerical representation of the climate system based on the physical, chemical, and biological properties of its components, their interactions and feedback processes, and accounting for all or some of its known properties. Climate models are applied, as a research tool, to study and simulate the climate, and also for
22nd National Children’s Science Congress 201483 ACTIVITY GUIDE
operational purposes, including monthly, seasonal, and inter-annual climate predictions.
Climate prediction or climate forecast is the result of an attempt to produce an estimate of the actual evolution of the climate in the future, e.g., at seasonal, inter-annual or long-term time scales.
Climate projection is the calculated response of the climate system to emissions or concentration scenarios of greenhouse gases and aerosols, or radiative forcing scenarios, often based on simulations by climate models. Climate projections are distinguished from climate predictions, in that the former critically depend on the emissions/concentration/radiative forcing scenario used, and therefore on highly uncertain assumptions of future socio-economic and technological development.
Climate-sensitive disease is a disease that is sensitive to weather or climate factors, with the current spatial distribution and seasonal transmission being affected.
Communicable disease is an infectious disease caused by transmission of an infective biological agent (virus, bacterium, protozoan, or multi-cellular macro-parasite).
Comparative risk assessment, as defined by WHO is the systematic evaluation of the changes in population health that result from modifying the population’s exposure to a risk factor or a group of risk factors. Coping capacity is the means by which people or organizations use available resources and abilities to face adverse consequences that could lead to a disaster. In general, this involves managing resources, both in normal times as well as during crises or adverse conditions. The strengthening of coping capacities usually builds resilience to withstand the effects of natural and human induced hazards.
Drought is the phenomenon that exists when precipitation is significantly below normal recorded levels, causing serious hydrological imbalances that often adversely affect land resources and production systems.
Endemic (of a disease or condition) is the one that is regularly found among particular people or in a certain area.
Environmental burden of disease is the burden of disease caused by environmental factors estimated using methods described by WHO.
Epidemic is widespread occurrence of an infectious disease in a community at a particular time.
Extreme weather event is an event that is rare within its statistical reference distribution at a particular place. By definition, the characteristics of what is called “extreme weather” may vary from place to place. An “extreme climate event” is an average of a number of weather events over a certain period of time, an average which is itself extreme (e.g., rainfall over a season).
Health is a state of complete physical, mental and social well being and not merely the absence of disease or infirmity (WHO, 1946).
Health impact assessment is a systematic process to assess the actual or potential, and direct or indirect, effects on the health of individuals, groups or communities arising from policies, objectives, programs, plans or activities.
Health risk assessment is the process of estimating the potential impact of a chemical, biological, physical or social agent on a specified human population system under a specific set of conditions and for a certain time-frame.
HVI heat vulnerability index
IPCC Intergovernmental Panel on Climate Change
Malaria is an endemic or epidemic parasitic disease caused by species of the genus Plasmodium (Protozoa) and transmitted by mosquitoes of the genus Anopheles; produces bouts of high fever and systemic disorders, affects about 300 million and kills approximately 2 million people worldwide every year.
Morbidity is the rate of occurrence of disease or other health disorders within a population, taking account of the age-specific morbidity rates. Morbidity indicators include chronic disease incidence/prevalence, rates of hospitalization, primary care consultations, disability-days (days of absence from work), and prevalence of symptoms.
22nd National Children’s Science Congress 2014 84ACTIVITY GUIDE
Mortality is the rate of occurrence of death within a population. Calculation of mortality takes account of age-specific death rates, and can thus yield measures of life expectancy and the extent of premature death.
Outbreak is a sudden occurrence of something unwelcome, such as disease.
Pandemic (of a disease) is the one that is prevalent over a whole country or the world.
Vector is a blood-sucking organism, such as an insect, that transmits a pathogen from one host to another.
Vector-borne diseases are the diseases transmitted to the hosts by a vector organism (such as a mosquito or tick); e.g., malaria, dengue and leishmaniasis.
Vulnerability is the degree to which a system is susceptible to, and unable to cope with, adverse effects of climate change, including climate variability and extremes. Vulnerability is a function of the character, magnitude, and rate of climate change and variation to which a system is exposed, its sensitivity, and its adaptive capacity.
Weather describes the day-to-day changes in atmospheric conditions in a specific place at a specific time. More simply, climate is what you expect and weather is what you get.
Zoonosis or Zoonotic diseases refer to diseases that can be passed from animals, whether wild or domesticated, to human beings.
Health Tips for summer season-
Prickly heat• Intake of fluid with salt and lesser sugar• Bathing twice or thrice• Loose fitting light coloured cotton clothes• Avoid applying prickly heat powder• Application of sandal paste• Drink butter milk and coconut water• Avoid soft drinks
Activity: Collect more information on existing traditional health tips and practices and validate
ReferencesBentham, G., Langford, I.H. 2001. Environmental temperatures and the incidence of food poisoning in England and Wales. International Journal of Biometeorology 45: 22-26.
Burke J. 2010. Hundreds Die in Indian Heatwave. The Guardian - news paper 30 May. Available: http://www.guardian.co.uk/world/2010/may/30/india-heatwave-deaths [accessed on 07 May 2014].
Bush, K.F., Luber, G., Kotha, S.R., Dhaliwal, R.S., Kapil, V., Pascual, M., Brown, D. G., Frumkin, H., Dhiman, R.C., Hess, J., Wilson, M.L., Kalpana B., Eisenberg, J., Kaur, T., Rood, R., Batterman, S., Joseph, A., Gronlund, C. J., Agrawal, A and Hu, H., 2011. Impacts of Climate Change on Public Health in India: Future Research Directions. Environmental Health Perspectives 119 (6): 765-770.
Colo´n-Gonza´lez, F.J., Fezz,i C., Lake, I.R and Hunter, P.R. 2013. The Effects of Weather and Climate Change on Dengue. PLoS Negl Trop Dis 7(11): e2503. DOI:10.1371/journal.pntd.0002503
Dhingra N, Jha P, Sharma VP, Cohen AA, Jotkar RM, Rodriguez PS, et al. 2010. Adult and child malaria mortality in India: a nationally representative mortality survey. Lancet 376: 1768–1774.
Dogra N. and Srivastava, S., 2012.Climate Change and Disease Dynamics in India [executive summary]. New Delhi: The Energy and Resources Institute (TERI), 27p.
Füssel, H.M., 2007. Adaptation planning for climate change: concepts, assessment approaches and key lessons. In: Sustainability Science. vol. 2.pp. 265–275.
Hashizume, M., Armstrong, B., Hajat, S., Wagatsuma, Y., Faruque, A.S., Hayashi, T., Sack, D.A. 2007. Association between climate variability and hospital visits for non-cholera diarrhoea in Bangladesh: effects and vulnerable groups. International Journal of Epidemiology 36: 1030-1037.
INCCA, 2010. Climate Change and India: A 4x4 Assessment- A Sectoral and Regional Analysis
22nd National Children’s Science Congress 201485 ACTIVITY GUIDE
for 2030s. INCCA: Indian Network for Climate Change Assessment, Report No.2, Ministry of Environment & Forests, Government of India, 160p.
IPCC Intergovernmental Panel on Climate Change. 2007. Climate Change 2007: Synthesis Report. Contribution of Working Groups I, II and III to the Fourth Assessment Report of the Intergovernmental Panel on Climate Change (Core Writing Team, Pachauri RK, Reisinger A, eds). Geneva:Intergovernmental Panel on Climate Change.
Kovats, R.S., Edwards, S.J., Charron, D., et al. 2005. Climate variability and campylobacter infection: an international study. International Journal of Biometeorology 49: 207-214.
Kumar A, Valecha N, Jain T, Dash AP. 2007. Burden of malaria in India: retrospective and prospective view. Am J Trop Med Hyg 77(6 suppl):69–78.
Mandal K. 2008. Drinking Water Supply vis-a-vis Technological Interventions for Social Empowerment of Rural India. Available: http://www.nistads.res.in/indiasnt2008/ [accessed on 07 May 2014].
Jerrett, Michael, Jason G. Su, Colleen E. Reid, Bill Jesdale, Alberto M. Ortega Hinojosa, Seth B.Shonkoff, Edmund Seto, Rachel Morello-Frosch (University of California, Berkeley). 2012. Mapping Climate Change Exposures, Vulnerabilities, and Adaptation to Public Health Risks in the San Francisco Bay and Fresno Regions. California Energy Commission. Publication number: CEC-500-2012-041.
Naish,S., Pat Dale, P., Mackenzie, J.S., McBride, J., Mengersen, K and Tong,S., 2014 Climate change and dengue: a critical and systematic review of quantitative modelling approaches. BMC Infectious Diseases 2014 14:167
M. Palaniyandi, M., 2012. GIS for epidemic control in India. Geospatial World Weekly 22 July 2013 at ttp://www.geospatialworld.net/Paper/Application/ArticleView.aspx aid= 30612 [Accessed on 08-05-2014]
Tuan, L., 2013. Adaptation to Climate Change for Improving Public Health in Vietnam – Commentary. Vietnam Journal of public health 1(1):9-11.
Wilder-Smith, A., Renhorn, KE., Hasitha Tissera, H., Bakar, S.A., Luke Alphey, L., Kittayapong, P., Lindsay, S., Logan, J., Hatz, C., Reiter, P., Rocklo, J., Byass, P., Louis, V.R., Yesim Tozan, Y., Massad, E., Tenorio, A., Lagneau, C., L’Ambert, G., Brooks, D., Wegerdt, J and Gubler, D., 2012. Dengue Tools: innovative tools and strategies for the surveillance and control of dengue. Glob Health Action 5: 17273 - DOI: 10.3402/gha.v5i0.17273.
WHO, (2003). Social determinants of health: the solid facts, Wilkinson R G, Marmot M G (eds), World Health Organization, Copenhagen.
WHO. (World Health Organization). 2008. World Malaria Report 2008. Geneva:WHO.
WHO, 2014. Media Centre - Climate change and health - Fact sheet N°266 – Key facts http://www.who.int/mediacentre/factsheets/fs266/en/ [Accessed on 08-05-2014]
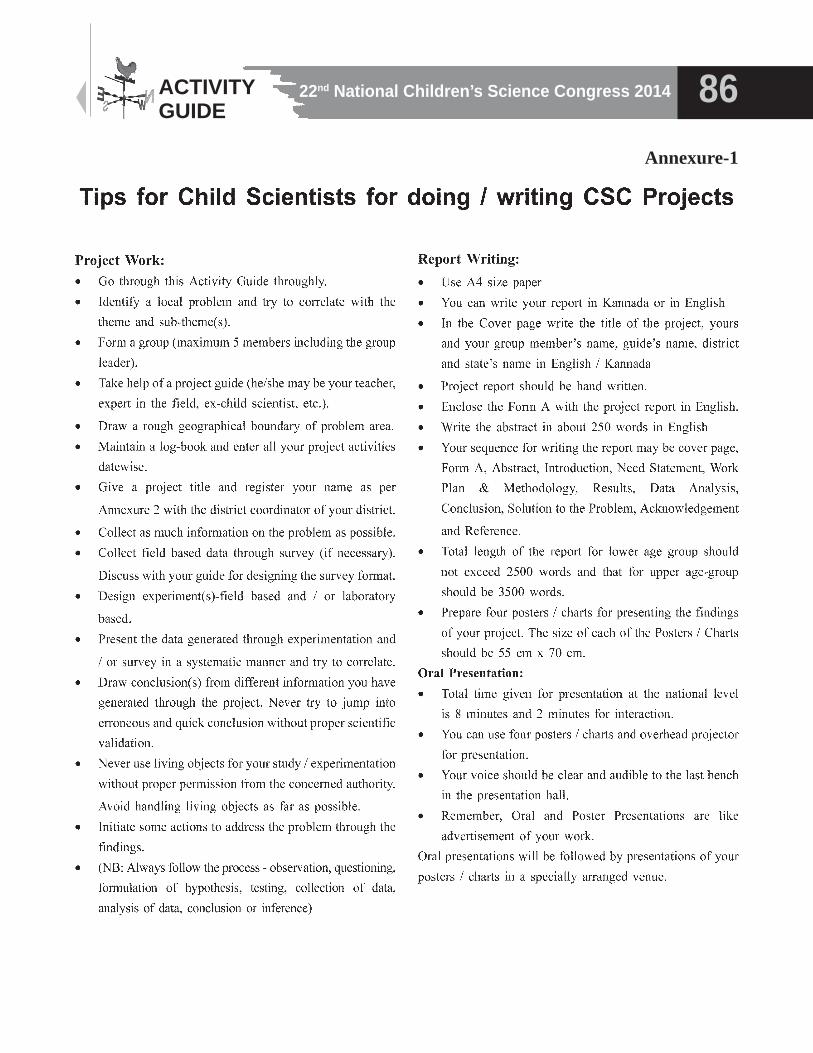
22nd National Children’s Science Congress 2014 86ACTIVITY GUIDE
Annexure-1
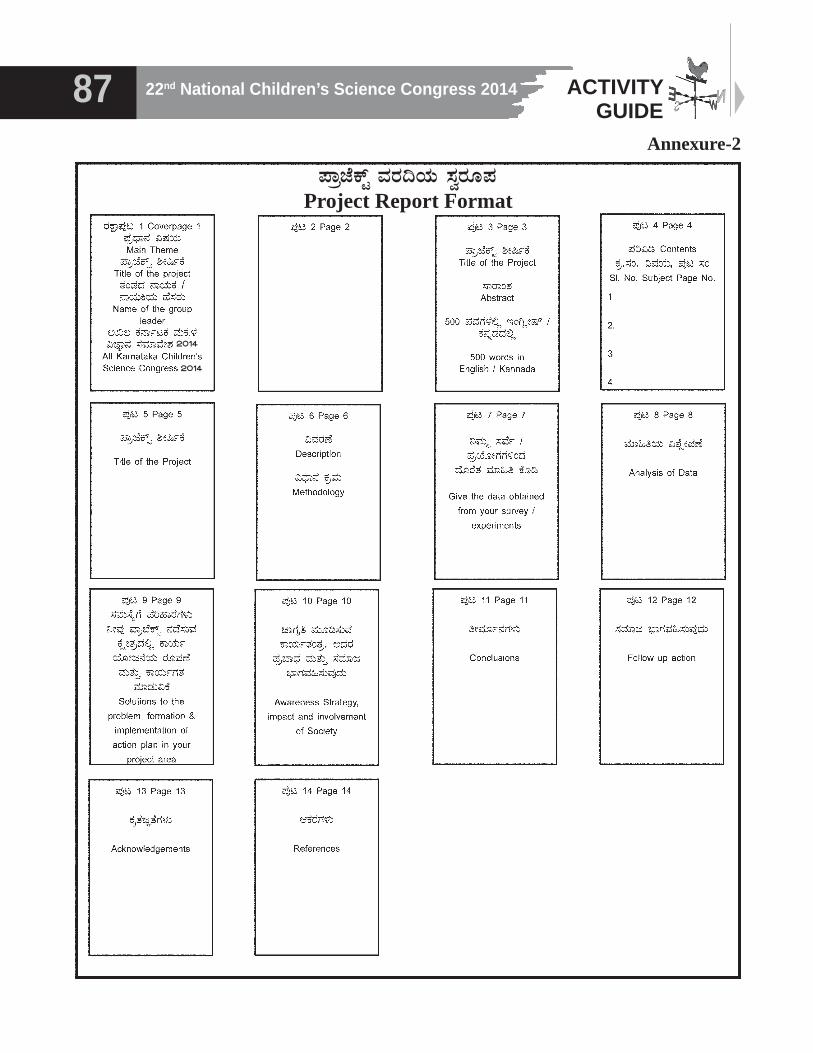
22nd National Children’s Science Congress 201487 ACTIVITY GUIDE
2014
2014
¥ÁæeÉPïÖ ªÀgÀ¢AiÀÄ ¸ÀégÀÆ¥À Project Report Format
Annexure-2
22nd National Children’s Science Congress 2014 88ACTIVITY GUIDE
GUIDELINES FOR EVALUATORS
We welcome you to the national movement to link environment to education which provides opportunities to young budding scientists to showcase their talent. To begin with we would like to tell you about this programme, initiated in 1993, for children in the age group of 10 - 17 years. It is open to all - school going or out-of-school children in this age group, belonging to rural as well as urban areas.
National Children’s Science Congress (NCSC) provides budding scientists from all over the country a unique opportunity to use their scientific temperament and knowledge to make their own ideas come true. NCSC is held annually from December 27 to 31. After a thorough scrutiny at district and state levels, about 500 children take part in this five day deliberations and fun filled science activities.
Thc basic objectivcs of this program are:• To provide a forum to the young scientists to pursue their
natural curiosity and to whet their thirst for creativity by experimenting on open-ended problems;
• To effect a change in the way science is taught and learnt by relating the learning process to the physical and social environment around of the neighbourhood;
• To encourage children throughout the country to visualise future of the nation and help building a generation of sensitive and responsible citizens;
• To stimulate scientific temperament and learning the Scientific methodology of observation, collection of data, experimentation analysis, arriving at conclusions and presenting findings.
Creativity and the internalization of the method-of- science is given, a major stress. Children learn by problem-solving/method and thus develop confidence to handle situations in real life. We have to encourage these young minds to dream and develop an urge to find solutions themselves. It is equally important to identify the talented ones and provide them opportunities to pursue their ideas further. Many of these creative participants will become active researchers. Some of them may not opt for science as a career but they will use their skills of logic and experimentation in overcoming problems that they encounter. The effort through NCSC has to continue till major parts of formal science teaching in high school convert to a discovery oriented approach.
The instructions given to children on “How to do a project’” and “How to document it” are enclosed at Annexure 1, 2 and 3 respectively.
We bank on YOU to help us realise this hope and thank you for joining hands with us.
1. Our expectations from judges:
The role of judges at District and State level congresses is very important as inputs given by you always helps children to learn more and improve their work. You are not only a subject expert but have the ability and inclination to understand the children and their capabilities and capacities.
The primary objective of this program Children’s Science Congress’ is to provide the children an opportunity to learn in a co-operative manner. This is not a competition in the usual sense though due to the screening involved at district and state level, there is bound be a comparison. Innovativeness of the idea and methodology have to be appreciated and valued. All the projects reaching national level are treated at par and the nurturing academic environment helps free exchange of ideas and results. All participants receive citations containing an honest assessment of their efforts under different headings. These are explained later in a particular section of the evaluation criteria.
The bottom line is that each participant should go back not as a dejected but as a motivated, intellectually richer and more confident child. The child may not have succeeded in his effort to find proper solution to the chosen problem but his effort to analyze the problem, formulate the hypothesis, collect data and its analysis for drawing the inference should be logical.
The expression of innovativeness and talent used, his mental and physical skills to scientifically solve an issue bothering him/her, needs proper recognition and guidance from experts working in those areas
2. For deciding the eligibility of participation in Children’s Science. Congress the following has to be kept in mind:
Annexure-3
22nd National Children’s Science Congress 201489 ACTIVITY GUIDE
• Both school-going as well as non-school-going children are eligible to participate.
• The participation ratio of 1:1 of lower age group / (10 years to 14 years to upper age group (above 14 years and up to 17 years as on 31 December, 2014) is encouraged.
• Students should not have passed class 12th.• A group can have up to 5 team members. Whether a
group is in junior (between 10 & 14 years) or senior (between 14 & 17 years) category is decided by the age of the oldest student of the group. Only one member (group leader) is eligible to represent the group and make presentation. Others can provide assistance in the presentation.
• No child scientist, as team leader, can represent more than once in the Dist., State, National level CSC.
• In case of any dispute it may be referred to the National Coordinator (Acad.) and to the Registration committee.
3. Theme and Sub themes: The activities taken up by the children should fall within the theme or subtheme defined for the year. A copy of the Activity Guide should be provided to you. In case you do not get one please ask district / state coordinator for the same.
4. Presentation: Each group will make an oral presentation and also submit a project report. The students are encouraged to submit neatly hand written project reports and present their findings in their mother tongue. The abstract can only be in English or Hindi.
4.1 Oral Presentation: The oral presentation should finish within 6 to 8 minutes to be followed by question-answer session for 2 minutes. Each panel may have 3 judges.
• The oral presentation is to basically judge the real value of the project and the child scientist’s comprehension of the work done. The attributes to be marked for are given in the annexure. Some times the contribution is more from the guide and other people. The oral presentation gives an opportunity to check that. The weight given to oratory is not much, though, obviously, the one with better communication skill conveys his ideas better.
• In the national event the child scientist is allowed to use OHP, Slide projector and Tape recorder which will be provided at the hall. No computer or Video presentation are allowed.
• Normally not more than 5 colour photographs are encouraged. You may not deduct marks if some one uses too many, while one could do with less but may
convey the undesirability of the same if you feel it was not necessary.
• They shouldn’t use expensive things in making the models, etc., unless absolutely essential. Please remember that we are not checking their material resourcefulness. We don’t prefer one over the other if shown a laser printed file and legible hand-written file.
• It will be appreciated if the child scientist is not disturbed during presentation unless absolutely essential. The question-answer session should be kept at the end. The children/young scientists present should ask questions first. The same person should not be allowed to dominate the questioning. Other adults present should not be allowed to ask questions.
• Judges should ask questions to help them evaluate the attributes specified and should in no way be intimidating. They should be friendly in manners to bring out the best in the child. Many of the child scientists may be coming from remote place with little exposure and may feel nervous.
• Immaterial of how badly (if so) the child has done, there must be something good in the project to be spoken of by the judges at the end. Then you may point out the lacunae or make suggestions. The idea is that the child should go back satisfied that he received attention which his hard work deserved and also some feedback.
4.2 About the File (Project Report):
REPORT LENGTH - The report of junior children ( 10 to 14 years) is allowed to be within 2000 words and that of the senior ones (Above 14 to 17 years) within 3500 words. They are allowed to write and speak in any language listed in the Constitution.
The group is required to prepare an account of their work and submit it. Different judges (at least 2) will evaluate each report independently. They may call the child scientist for discussion if they wish. The child may present the project orally and then proceed for discussion with the other set of judges. For this, it is essential that list of child scientists and copies of projects should have been made available in those rooms. If you do not find them please ask the evaluation committee convener or me rapporteur attached to the room for a.-ranging these. It’s the quality of work and not the paraphernalia which matters. When you assign marks for presentation it is not the quality of typing which is a function of material resources but neatness (which is also possible with neat handwriting) and style of presentation rather
22nd National Children’s Science Congress 2014 90ACTIVITY GUIDE
than the quality of paper. file cover or number of colour photographs.
5. The evaluation criteria - The projects presented by the child scientists are to be judged in 2 forms - oral presentation and file. The evaluation will be based on several considerations. At the national level there is no competition. Instead the child scientists will be provided a citation which summarises the standard of their projects under different heading (in some cases judges may like to point out if the work may be extended further if it has sufficient potential). At the district and state level selection of the best projects for the higher level congress becomes necessary. The basic elements which should be taken care of are as follows:
Quantum of Work done
a) Amount of documentation / Data Collection
b) Efforts put in testing /experimenting
c) Meaningful conclusions drawn
Quality of Data / information - originality/ innovation in
a) Approach to problem
b) Innovative element in experimenting/ testing / model or chart
c) Proper Log book
Originality shown in implementation of conclusions or popularizing the results
Oral Presentation: language, clarity of expression and ideas
File: Neatness, Clarity, quality of file, log book o Also, there may be comments on -Scope for further work and Overall grading. The points scored against in each attribute will be cumulated.
6. Special Task - We wish to have a record of any major highlights presented by the child scientists. This will be useful not only for record but for several other purposes. So please ask the organizers to provide you with one sharp person who will keep a record of such points during the session. A special orientation with judges is held usually before the CSC.
GUIDELINES FOR MARKING
Given below are the attributes which are important for evaluating a research presentation. The weightage given to them is to give an idea of their inter se importance. For example while marking for project selection, you do not have to mark for relevance to focal theme, local relevance, problem analysis etc. separately but please keep in mind that originality of idea and local relevance of the selected problem weigh more than problem selection or it’s relation to the focal theme. These guidelines are being used at national level. It will be appreciated that marking on similar lines is done at district and state level so that quality projects reach at national level and National Children’s Science Congress becomes a forum of creative, talented budding scientists.
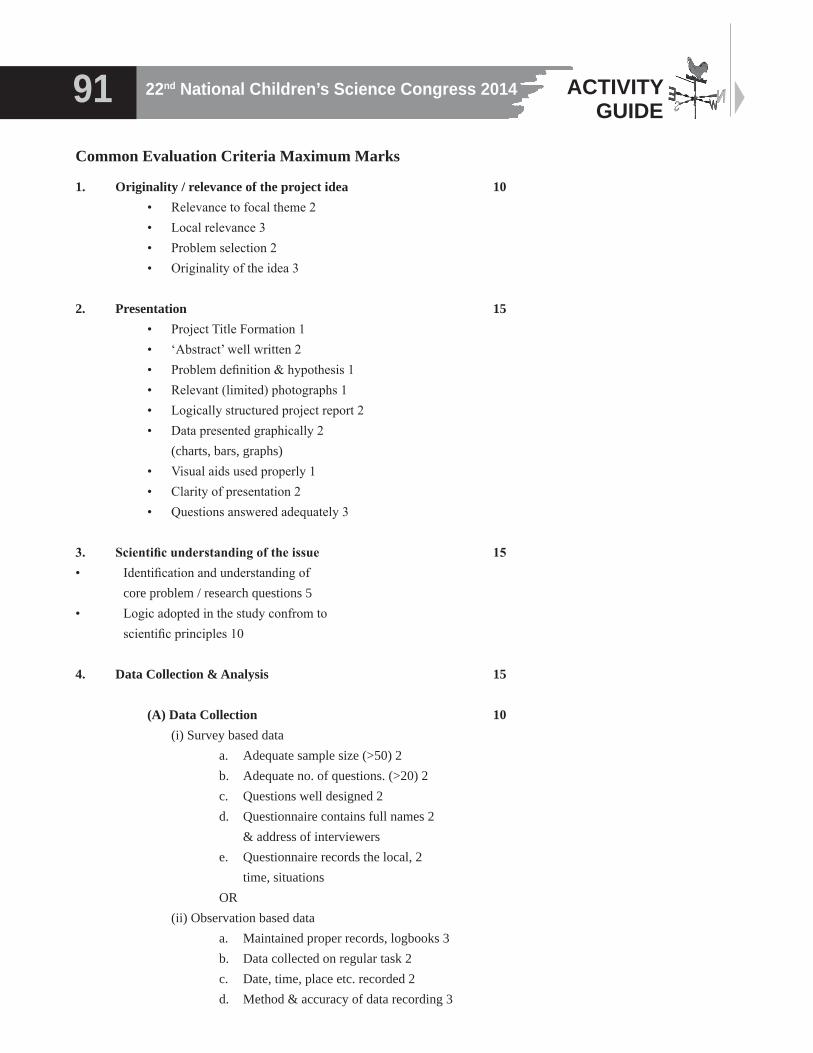
22nd National Children’s Science Congress 201491 ACTIVITY GUIDE
Common Evaluation Criteria Maximum Marks
1. Originality / relevance of the project idea 10• Relevance to focal theme 2• Local relevance 3• Problem selection 2• Originality of the idea 3
2. Presentation 15• Project Title Formation 1• ‘Abstract’ well written 2• Problem definition & hypothesis 1• Relevant (limited) photographs 1• Logically structured project report 2• Data presented graphically 2 (charts, bars, graphs)• Visual aids used properly 1• Clarity of presentation 2• Questions answered adequately 3
3. Scientificunderstandingoftheissue 15• Identification and understanding of core problem / research questions 5• Logic adopted in the study confrom to scientific principles 10
4. Data Collection & Analysis 15
(A) Data Collection 10(i) Survey based data
a. Adequate sample size (>50) 2b. Adequate no. of questions. (>20) 2c. Questions well designed 2d. Questionnaire contains full names 2 & address of interviewerse. Questionnaire records the local, 2 time, situations OR
(ii) Observation based dataa. Maintained proper records, logbooks 3b. Data collected on regular task 2c. Date, time, place etc. recorded 2d. Method & accuracy of data recording 3
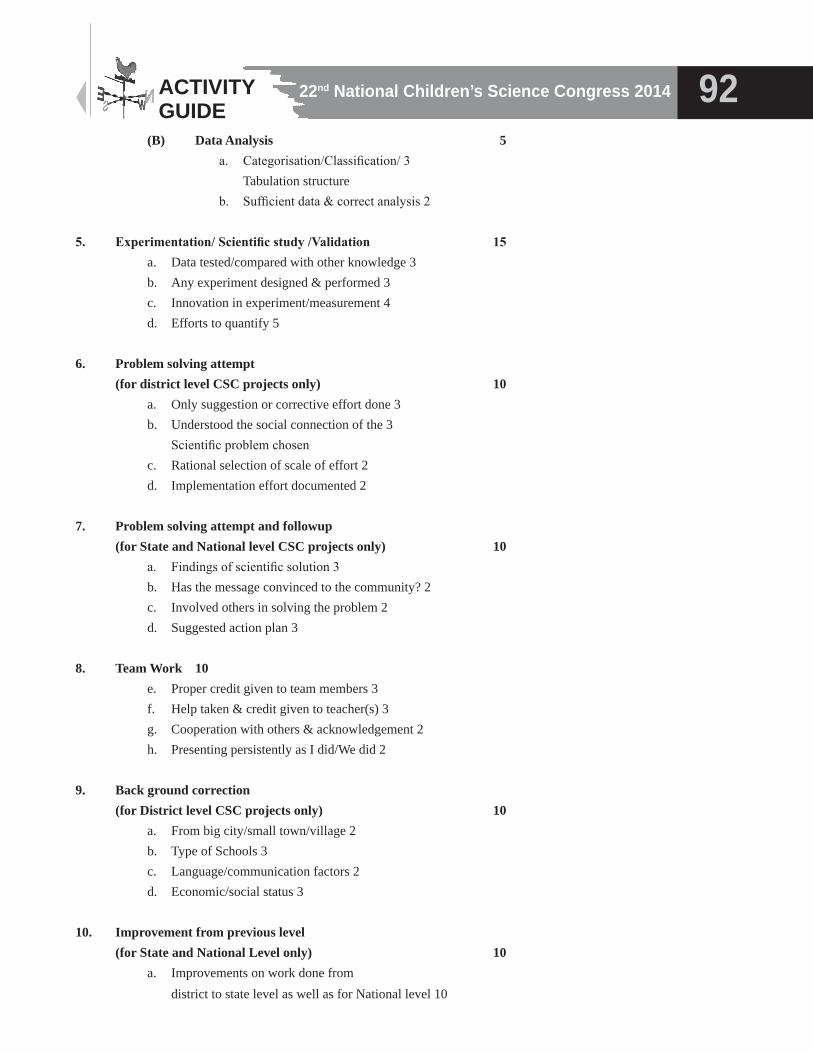
22nd National Children’s Science Congress 2014 92ACTIVITY GUIDE
(B) Data Analysis 5a. Categorisation/Classification/ 3 Tabulation structureb. Sufficient data & correct analysis 2
5. Experimentation/Scientificstudy/Validation 15a. Data tested/compared with other knowledge 3b. Any experiment designed & performed 3c. Innovation in experiment/measurement 4d. Efforts to quantify 5
6. Problem solving attempt (for district level CSC projects only) 10
a. Only suggestion or corrective effort done 3b. Understood the social connection of the 3 Scientific problem chosenc. Rational selection of scale of effort 2d. Implementation effort documented 2
7. Problem solving attempt and followup (for State and National level CSC projects only) 10
a. Findings of scientific solution 3b. Has the message convinced to the community? 2c. Involved others in solving the problem 2d. Suggested action plan 3
8. Team Work 10e. Proper credit given to team members 3f. Help taken & credit given to teacher(s) 3g. Cooperation with others & acknowledgement 2h. Presenting persistently as I did/We did 2
9. Back ground correction (for District level CSC projects only) 10
a. From big city/small town/village 2b. Type of Schools 3c. Language/communication factors 2d. Economic/social status 3
10. Improvement from previous level (for State and National Level only) 10
a. Improvements on work done from district to state level as well as for National level 10
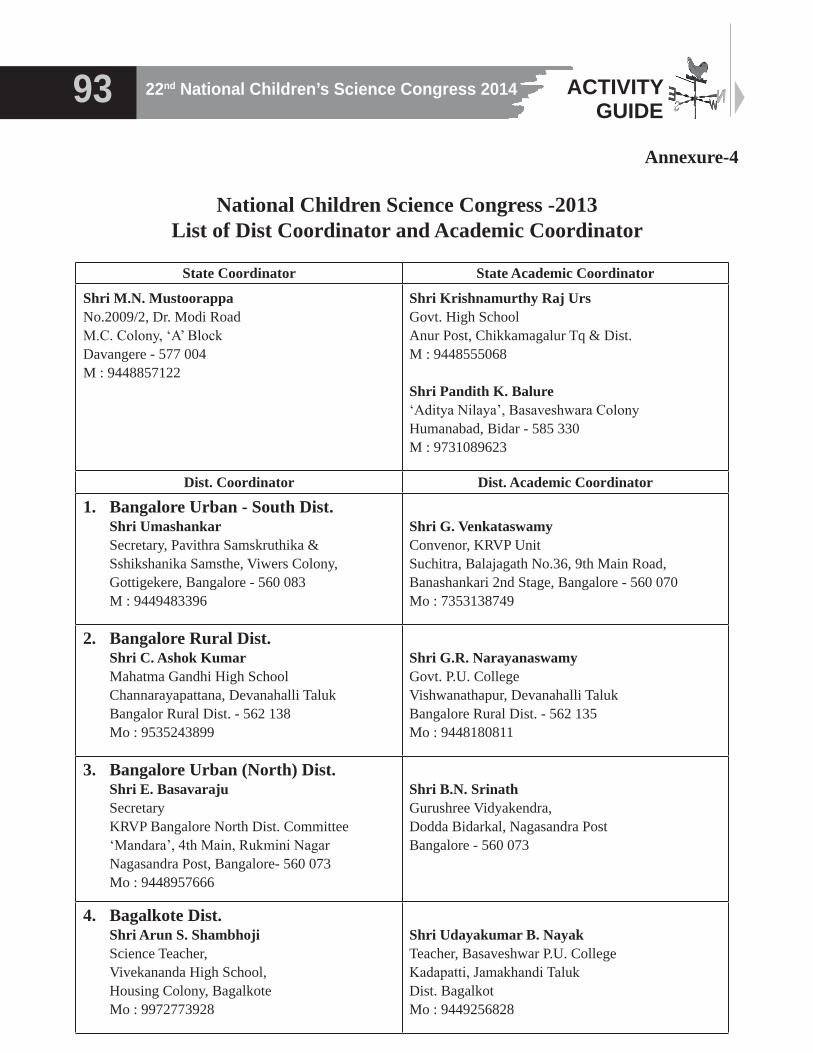
22nd National Children’s Science Congress 201493 ACTIVITY GUIDE
Annexure-4
National Children Science Congress -2013List of Dist Coordinator and Academic Coordinator
State Coordinator State Academic Coordinator
Shri M.N. MustoorappaNo.2009/2, Dr. Modi RoadM.C. Colony, ‘A’ BlockDavangere - 577 004M : 9448857122
Shri Krishnamurthy Raj UrsGovt. High SchoolAnur Post, Chikkamagalur Tq & Dist.M : 9448555068
Shri Pandith K. Balure‘Aditya Nilaya’, Basaveshwara ColonyHumanabad, Bidar - 585 330M : 9731089623
Dist. Coordinator Dist. Academic Coordinator
1. Bangalore Urban - South Dist. Shri Umashankar Secretary, Pavithra Samskruthika &
Sshikshanika Samsthe, Viwers Colony, Gottigekere, Bangalore - 560 083 M : 9449483396
Shri G. VenkataswamyConvenor, KRVP UnitSuchitra, Balajagath No.36, 9th Main Road,Banashankari 2nd Stage, Bangalore - 560 070Mo : 7353138749
2. Bangalore Rural Dist. Shri C. Ashok Kumar Mahatma Gandhi High School Channarayapattana, Devanahalli Taluk Bangalor Rural Dist. - 562 138 Mo : 9535243899
Shri G.R. NarayanaswamyGovt. P.U. CollegeVishwanathapur, Devanahalli TalukBangalore Rural Dist. - 562 135Mo : 9448180811
3. Bangalore Urban (North) Dist. Shri E. Basavaraju Secretary KRVP Bangalore North Dist. Committee ‘Mandara’, 4th Main, Rukmini Nagar Nagasandra Post, Bangalore- 560 073 Mo : 9448957666
Shri B.N. SrinathGurushree Vidyakendra, Dodda Bidarkal, Nagasandra PostBangalore - 560 073
4. Bagalkote Dist. Shri Arun S. Shambhoji Science Teacher, Vivekananda High School, Housing Colony, Bagalkote Mo : 9972773928
Shri Udayakumar B. NayakTeacher, Basaveshwar P.U. CollegeKadapatti, Jamakhandi TalukDist. BagalkotMo : 9449256828
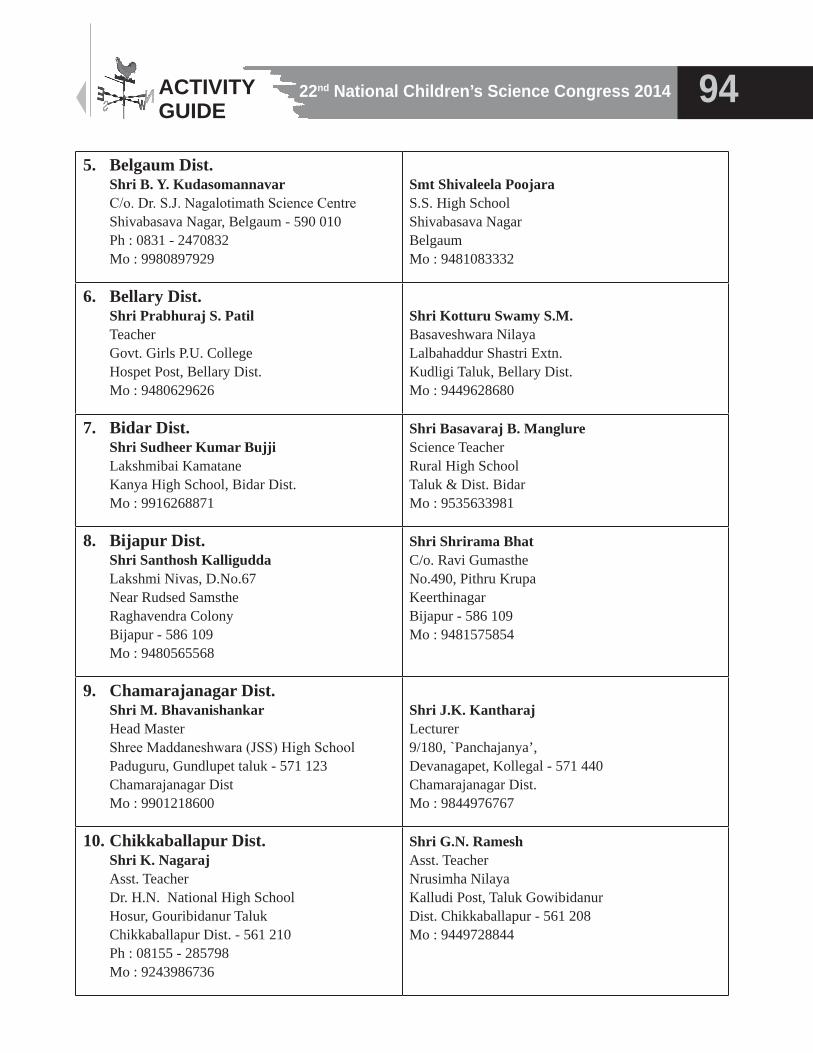
22nd National Children’s Science Congress 2014 94ACTIVITY GUIDE
5. Belgaum Dist. Shri B. Y. Kudasomannavar C/o. Dr. S.J. Nagalotimath Science Centre Shivabasava Nagar, Belgaum - 590 010 Ph : 0831 - 2470832 Mo : 9980897929
Smt Shivaleela PoojaraS.S. High SchoolShivabasava NagarBelgaumMo : 9481083332
6. Bellary Dist. Shri Prabhuraj S. Patil Teacher Govt. Girls P.U. College Hospet Post, Bellary Dist. Mo : 9480629626
Shri Kotturu Swamy S.M.Basaveshwara NilayaLalbahaddur Shastri Extn.Kudligi Taluk, Bellary Dist.Mo : 9449628680
7. Bidar Dist. Shri Sudheer Kumar Bujji Lakshmibai Kamatane Kanya High School, Bidar Dist. Mo : 9916268871
Shri Basavaraj B. ManglureScience TeacherRural High SchoolTaluk & Dist. BidarMo : 9535633981
8. Bijapur Dist. Shri Santhosh Kalligudda Lakshmi Nivas, D.No.67 Near Rudsed Samsthe Raghavendra Colony Bijapur - 586 109 Mo : 9480565568
Shri Shrirama BhatC/o. Ravi GumastheNo.490, Pithru KrupaKeerthinagarBijapur - 586 109Mo : 9481575854
9. Chamarajanagar Dist. Shri M. Bhavanishankar Head Master Shree Maddaneshwara (JSS) High School Paduguru, Gundlupet taluk - 571 123 Chamarajanagar Dist Mo : 9901218600
Shri J.K. KantharajLecturer9/180, `Panchajanya’,Devanagapet, Kollegal - 571 440Chamarajanagar Dist.Mo : 9844976767
10. Chikkaballapur Dist. Shri K. Nagaraj Asst. Teacher Dr. H.N. National High School Hosur, Gouribidanur Taluk Chikkaballapur Dist. - 561 210 Ph : 08155 - 285798 Mo : 9243986736
Shri G.N. RameshAsst. TeacherNrusimha NilayaKalludi Post, Taluk GowibidanurDist. Chikkaballapur - 561 208Mo : 9449728844
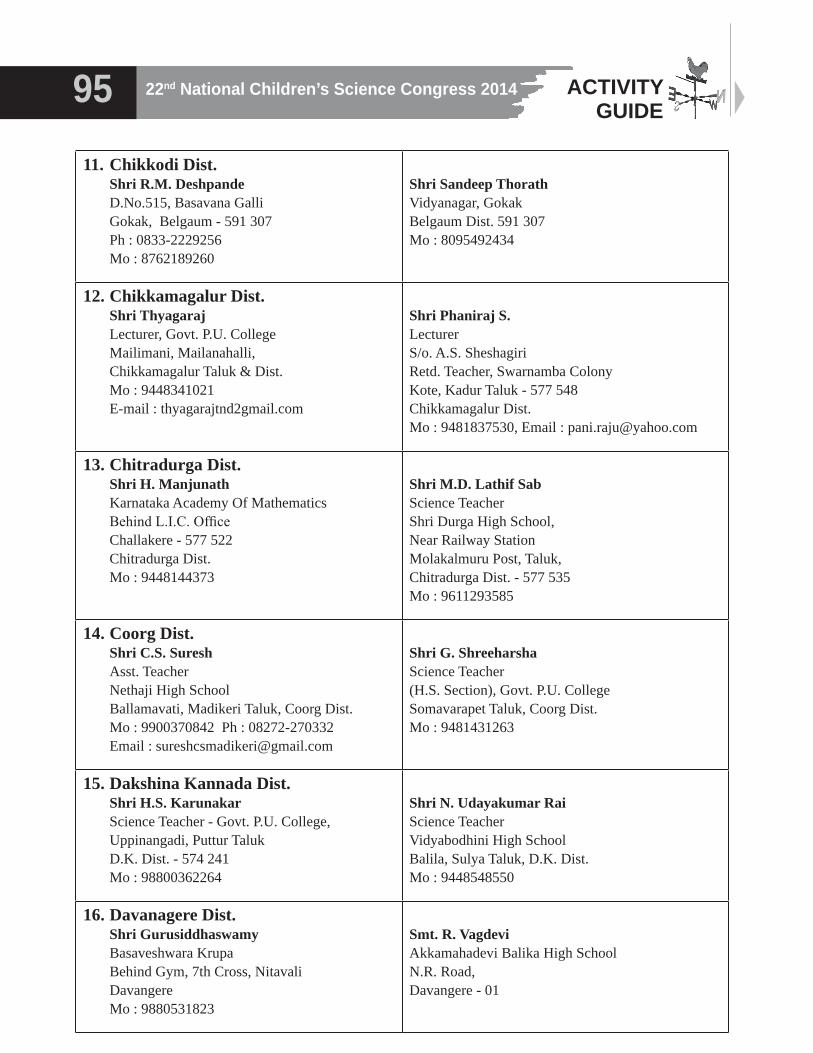
22nd National Children’s Science Congress 201495 ACTIVITY GUIDE
11. Chikkodi Dist. Shri R.M. Deshpande D.No.515, Basavana Galli Gokak, Belgaum - 591 307 Ph : 0833-2229256 Mo : 8762189260
Shri Sandeep ThorathVidyanagar, GokakBelgaum Dist. 591 307Mo : 8095492434
12. Chikkamagalur Dist. Shri Thyagaraj Lecturer, Govt. P.U. College Mailimani, Mailanahalli, Chikkamagalur Taluk & Dist. Mo : 9448341021 E-mail : thyagarajtnd2gmail.com
Shri Phaniraj S.LecturerS/o. A.S. SheshagiriRetd. Teacher, Swarnamba ColonyKote, Kadur Taluk - 577 548Chikkamagalur Dist.Mo : 9481837530, Email : [email protected]
13. Chitradurga Dist. Shri H. Manjunath Karnataka Academy Of Mathematics Behind L.I.C. Office Challakere - 577 522 Chitradurga Dist. Mo : 9448144373
Shri M.D. Lathif SabScience TeacherShri Durga High School,Near Railway StationMolakalmuru Post, Taluk,Chitradurga Dist. - 577 535Mo : 9611293585
14. Coorg Dist. Shri C.S. Suresh Asst. Teacher Nethaji High School Ballamavati, Madikeri Taluk, Coorg Dist. Mo : 9900370842 Ph : 08272-270332 Email : [email protected]
Shri G. ShreeharshaScience Teacher(H.S. Section), Govt. P.U. CollegeSomavarapet Taluk, Coorg Dist.Mo : 9481431263
15. Dakshina Kannada Dist. Shri H.S. Karunakar Science Teacher - Govt. P.U. College, Uppinangadi, Puttur Taluk D.K. Dist. - 574 241 Mo : 98800362264
Shri N. Udayakumar RaiScience TeacherVidyabodhini High SchoolBalila, Sulya Taluk, D.K. Dist.Mo : 9448548550
16. Davanagere Dist. Shri Gurusiddhaswamy Basaveshwara Krupa Behind Gym, 7th Cross, Nitavali Davangere Mo : 9880531823
Smt. R. VagdeviAkkamahadevi Balika High SchoolN.R. Road,Davangere - 01
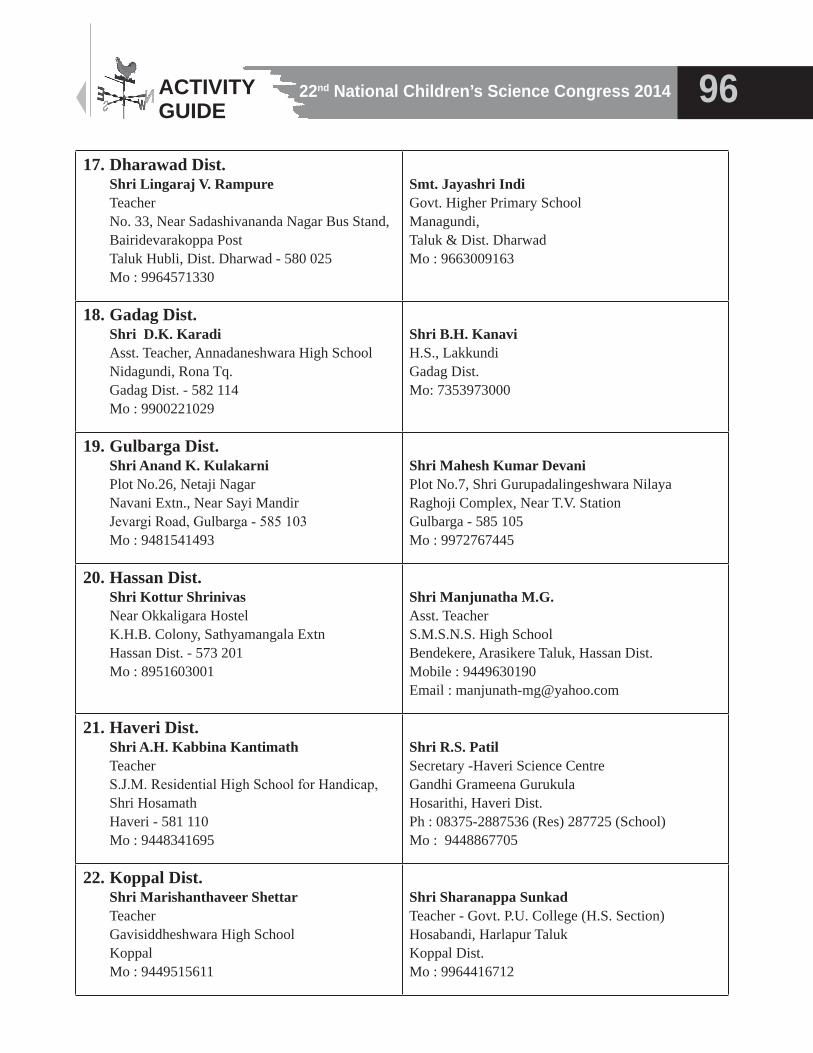
22nd National Children’s Science Congress 2014 96ACTIVITY GUIDE
17. Dharawad Dist. Shri Lingaraj V. Rampure Teacher No. 33, Near Sadashivananda Nagar Bus Stand,
Bairidevarakoppa Post Taluk Hubli, Dist. Dharwad - 580 025 Mo : 9964571330
Smt. Jayashri IndiGovt. Higher Primary SchoolManagundi,Taluk & Dist. DharwadMo : 9663009163
18. Gadag Dist. Shri D.K. Karadi Asst. Teacher, Annadaneshwara High School Nidagundi, Rona Tq. Gadag Dist. - 582 114 Mo : 9900221029
Shri B.H. KanaviH.S., LakkundiGadag Dist.Mo: 7353973000
19. Gulbarga Dist. Shri Anand K. Kulakarni Plot No.26, Netaji Nagar Navani Extn., Near Sayi Mandir Jevargi Road, Gulbarga - 585 103 Mo : 9481541493
Shri Mahesh Kumar DevaniPlot No.7, Shri Gurupadalingeshwara NilayaRaghoji Complex, Near T.V. StationGulbarga - 585 105Mo : 9972767445
20. Hassan Dist. Shri Kottur Shrinivas Near Okkaligara Hostel K.H.B. Colony, Sathyamangala Extn Hassan Dist. - 573 201 Mo : 8951603001
Shri Manjunatha M.G.Asst. TeacherS.M.S.N.S. High SchoolBendekere, Arasikere Taluk, Hassan Dist.Mobile : 9449630190Email : [email protected]
21. Haveri Dist. Shri A.H. Kabbina Kantimath Teacher
S.J.M. Residential High School for Handicap, Shri Hosamath
Haveri - 581 110 Mo : 9448341695
Shri R.S. PatilSecretary -Haveri Science CentreGandhi Grameena GurukulaHosarithi, Haveri Dist.Ph : 08375-2887536 (Res) 287725 (School)Mo : 9448867705
22. Koppal Dist. Shri Marishanthaveer Shettar Teacher Gavisiddheshwara High School Koppal Mo : 9449515611
Shri Sharanappa SunkadTeacher - Govt. P.U. College (H.S. Section)Hosabandi, Harlapur TalukKoppal Dist.Mo : 9964416712
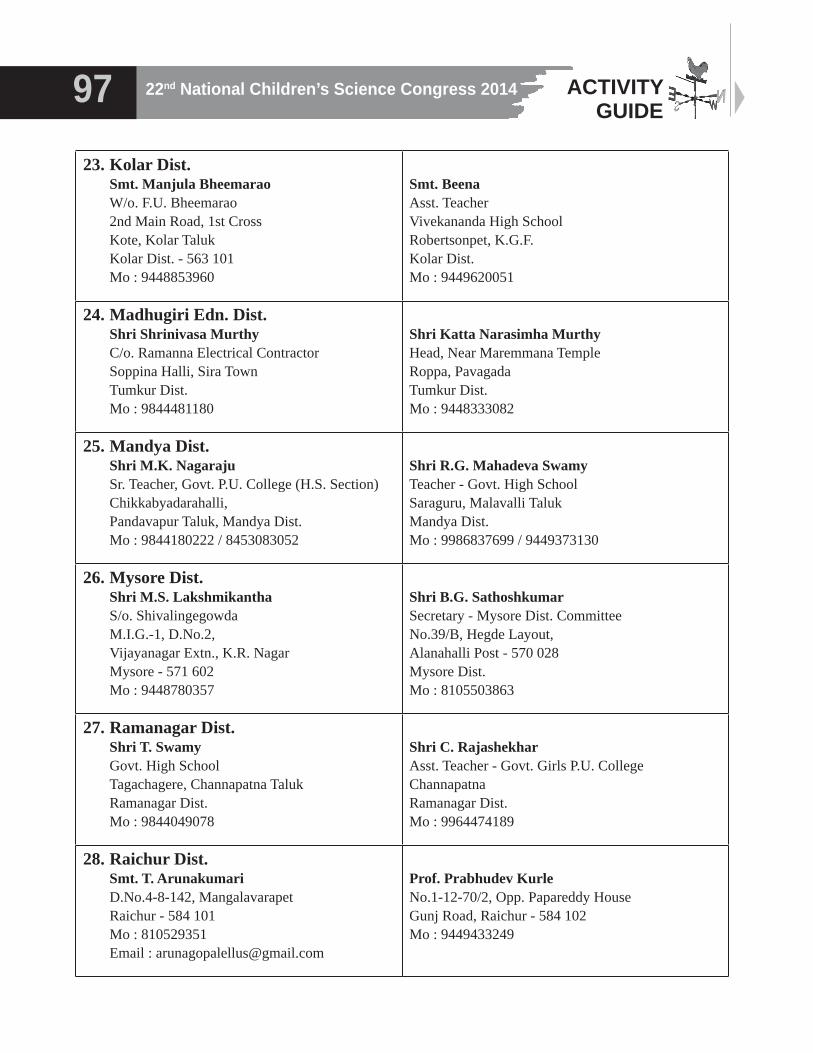
22nd National Children’s Science Congress 201497 ACTIVITY GUIDE
23. Kolar Dist. Smt. Manjula Bheemarao W/o. F.U. Bheemarao 2nd Main Road, 1st Cross Kote, Kolar Taluk Kolar Dist. - 563 101 Mo : 9448853960
Smt. BeenaAsst. TeacherVivekananda High SchoolRobertsonpet, K.G.F.Kolar Dist.Mo : 9449620051
24. Madhugiri Edn. Dist. Shri Shrinivasa Murthy C/o. Ramanna Electrical Contractor Soppina Halli, Sira Town Tumkur Dist. Mo : 9844481180
Shri Katta Narasimha MurthyHead, Near Maremmana TempleRoppa, PavagadaTumkur Dist.Mo : 9448333082
25. Mandya Dist. Shri M.K. Nagaraju Sr. Teacher, Govt. P.U. College (H.S. Section) Chikkabyadarahalli, Pandavapur Taluk, Mandya Dist. Mo : 9844180222 / 8453083052
Shri R.G. Mahadeva SwamyTeacher - Govt. High SchoolSaraguru, Malavalli TalukMandya Dist.Mo : 9986837699 / 9449373130
26. Mysore Dist. Shri M.S. Lakshmikantha S/o. Shivalingegowda M.I.G.-1, D.No.2, Vijayanagar Extn., K.R. Nagar Mysore - 571 602 Mo : 9448780357
Shri B.G. SathoshkumarSecretary - Mysore Dist. CommitteeNo.39/B, Hegde Layout,Alanahalli Post - 570 028Mysore Dist.Mo : 8105503863
27. Ramanagar Dist. Shri T. Swamy Govt. High School Tagachagere, Channapatna Taluk Ramanagar Dist. Mo : 9844049078
Shri C. RajashekharAsst. Teacher - Govt. Girls P.U. CollegeChannapatnaRamanagar Dist.Mo : 9964474189
28. Raichur Dist. Smt. T. Arunakumari D.No.4-8-142, Mangalavarapet Raichur - 584 101 Mo : 810529351 Email : [email protected]
Prof. Prabhudev KurleNo.1-12-70/2, Opp. Papareddy HouseGunj Road, Raichur - 584 102Mo : 9449433249
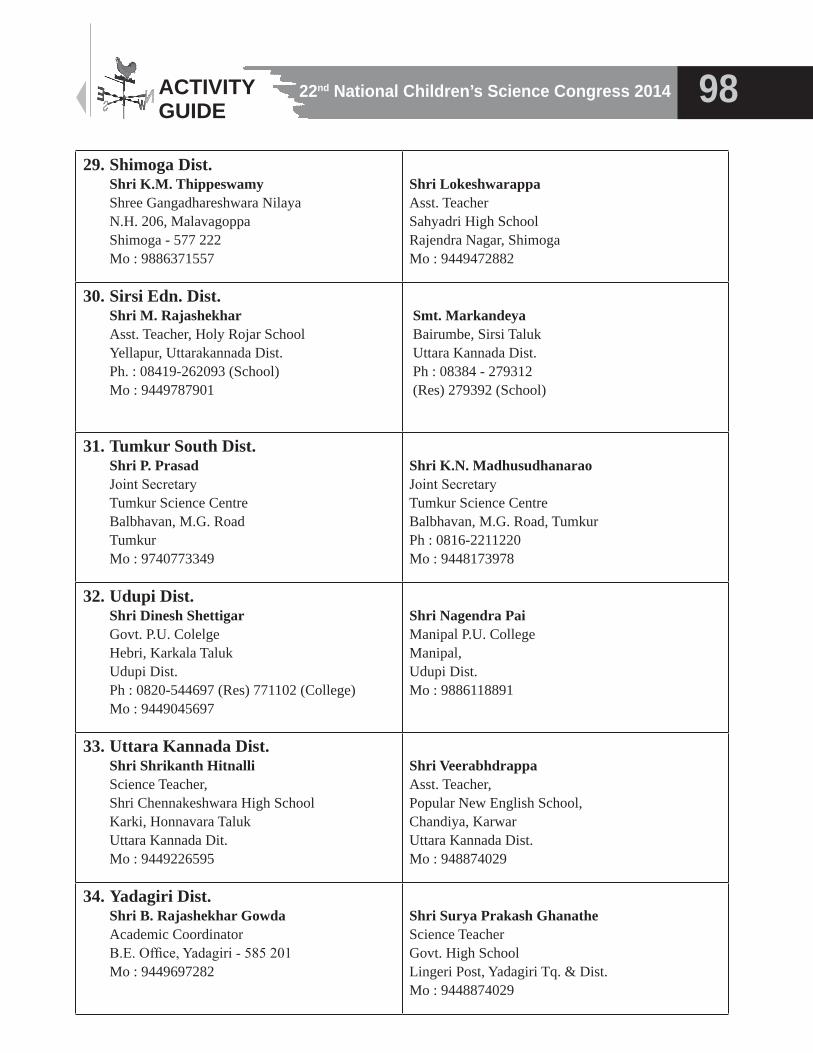
22nd National Children’s Science Congress 2014 98ACTIVITY GUIDE
29. Shimoga Dist. Shri K.M. Thippeswamy Shree Gangadhareshwara Nilaya N.H. 206, Malavagoppa Shimoga - 577 222 Mo : 9886371557
Shri LokeshwarappaAsst. TeacherSahyadri High SchoolRajendra Nagar, Shimoga Mo : 9449472882
30. Sirsi Edn. Dist. Shri M. Rajashekhar Asst. Teacher, Holy Rojar School Yellapur, Uttarakannada Dist. Ph. : 08419-262093 (School) Mo : 9449787901
Smt. MarkandeyaBairumbe, Sirsi TalukUttara Kannada Dist.Ph : 08384 - 279312 (Res) 279392 (School)
31. Tumkur South Dist. Shri P. Prasad Joint Secretary Tumkur Science Centre Balbhavan, M.G. Road Tumkur Mo : 9740773349
Shri K.N. MadhusudhanaraoJoint SecretaryTumkur Science CentreBalbhavan, M.G. Road, TumkurPh : 0816-2211220Mo : 9448173978
32. Udupi Dist. Shri Dinesh Shettigar Govt. P.U. Colelge Hebri, Karkala Taluk Udupi Dist. Ph : 0820-544697 (Res) 771102 (College) Mo : 9449045697
Shri Nagendra PaiManipal P.U. CollegeManipal,Udupi Dist.Mo : 9886118891
33. Uttara Kannada Dist. Shri Shrikanth Hitnalli Science Teacher, Shri Chennakeshwara High School Karki, Honnavara Taluk Uttara Kannada Dit. Mo : 9449226595
Shri VeerabhdrappaAsst. Teacher,Popular New English School,Chandiya, KarwarUttara Kannada Dist.Mo : 948874029
34. Yadagiri Dist. Shri B. Rajashekhar Gowda Academic Coordinator B.E. Office, Yadagiri - 585 201 Mo : 9449697282
Shri Surya Prakash GhanatheScience TeacherGovt. High SchoolLingeri Post, Yadagiri Tq. & Dist.Mo : 9448874029
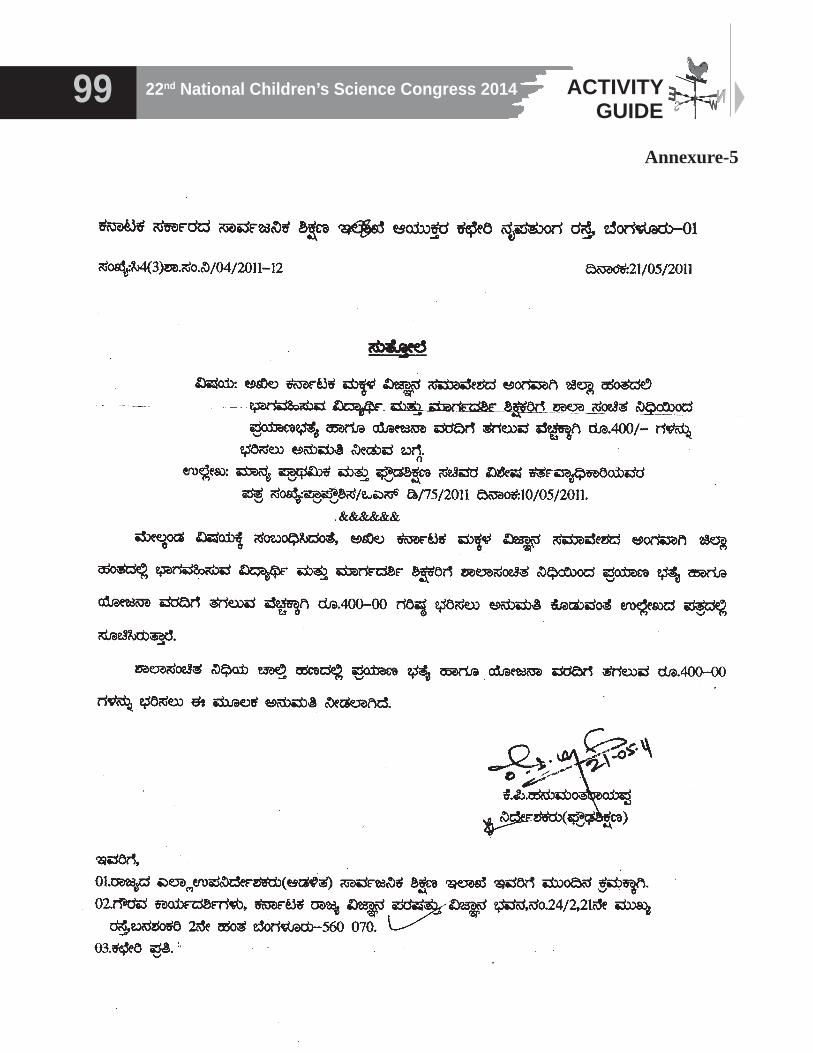
22nd National Children’s Science Congress 201499 ACTIVITY GUIDE
Annexure-5
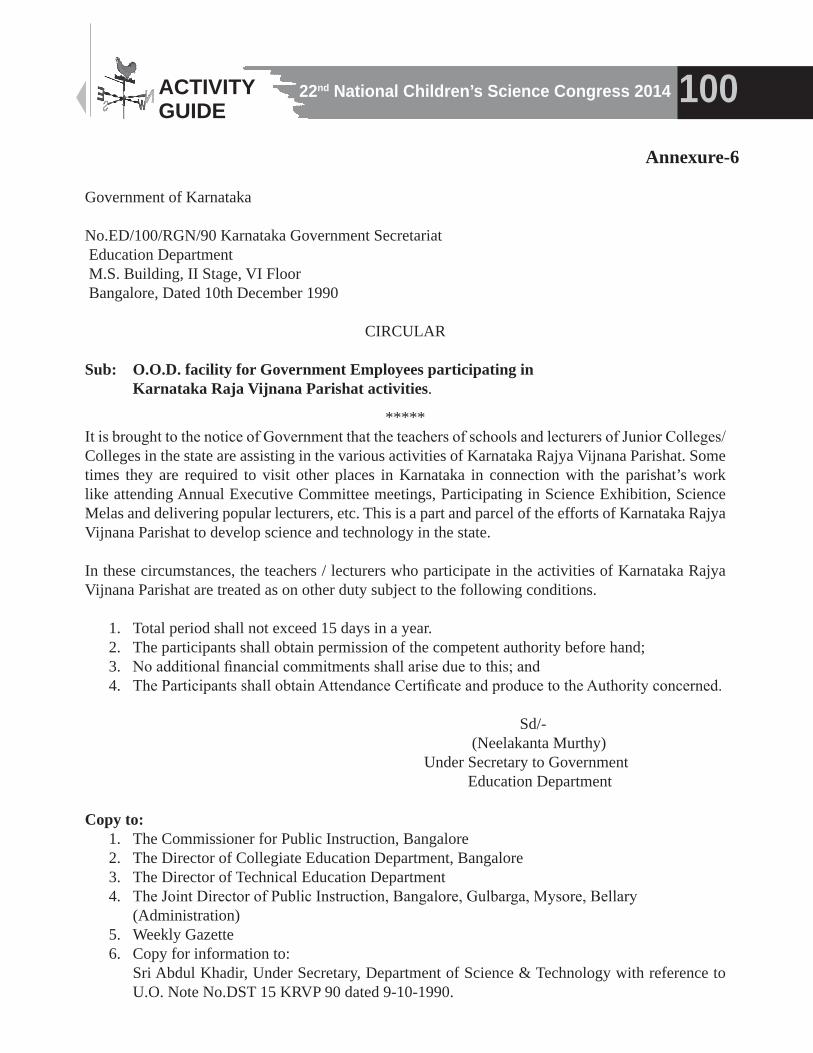
22nd National Children’s Science Congress 2014 100ACTIVITY GUIDE
Annexure-6
Government of Karnataka
No.ED/100/RGN/90 Karnataka Government Secretariat Education Department M.S. Building, II Stage, VI Floor Bangalore, Dated 10th December 1990
CIRCULAR
Sub: O.O.D. facility for Government Employees participating in Karnataka Raja Vijnana Parishat activities.
*****It is brought to the notice of Government that the teachers of schools and lecturers of Junior Colleges/Colleges in the state are assisting in the various activities of Karnataka Rajya Vijnana Parishat. Some times they are required to visit other places in Karnataka in connection with the parishat’s work like attending Annual Executive Committee meetings, Participating in Science Exhibition, Science Melas and delivering popular lecturers, etc. This is a part and parcel of the efforts of Karnataka Rajya Vijnana Parishat to develop science and technology in the state.
In these circumstances, the teachers / lecturers who participate in the activities of Karnataka Rajya Vijnana Parishat are treated as on other duty subject to the following conditions.
1. Total period shall not exceed 15 days in a year.2. The participants shall obtain permission of the competent authority before hand;3. No additional financial commitments shall arise due to this; and4. The Participants shall obtain Attendance Certificate and produce to the Authority concerned.
Sd/- (Neelakanta Murthy)
Under Secretary to GovernmentEducation Department
Copy to:1. The Commissioner for Public Instruction, Bangalore2. The Director of Collegiate Education Department, Bangalore3. The Director of Technical Education Department4. The Joint Director of Public Instruction, Bangalore, Gulbarga, Mysore, Bellary
(Administration)5. Weekly Gazette6. Copy for information to:
Sri Abdul Khadir, Under Secretary, Department of Science & Technology with reference to U.O. Note No.DST 15 KRVP 90 dated 9-10-1990.
22nd National Children’s Science Congress 2014101 ACTIVITY GUIDE
Annexure-7
Karnataka Rajya Vijnana ParishatChief Patron
Padmavibhushana Prof. C.N.R. RAO., FRSNational Reserch Professor
List of Executive Committee members
1. Prof. S.V. Sankanur President, KRVP Vakil Chala Gadag - 582 101 Mo : 9448301983
2. Shri Challakere Yerriswamy Vice President, KRVP `Nakshathra’, Opp. Police Quatress N.H. 13, Chitradurga Mo : 9448133433
3. Shri B. Doddabasappa Vice President, KRVP Mahanthanagar Hunagund - 587 118 Bagalkot Dist. Mo : 9880656200
4. Smt. Dr. Vasundhara Bhupathi Hon. Secretary, KRVP No.222, 2nd `E’ Cross, 3rd Block 3rd Stage, Basaveshwaranagar Bangalore - 560 079 Mo : 9986840477
5. Shri T.G. Premkumar Joint Secretary, KRVP Asst. Teacher, Govt. P.U. College (High School section) Suntikoppa, Somavarpet Taluk Coorg Dist. - 571 237 Mo : 9448588352
6. Shri Girish B. Kadlewad Treasurer, KRVP D.No.4-601-66/D4 Mahathma Basaveshwar Nagar Gulbarga - 585 105 Mo : 9448830454
7. Dr. Shekhar Gowler Member, KRVP Soudamini, 60 Ft. Road, 1st Cross, Vinobanagar Shimoga - 577 207 Mo : 9880162132.
8. Shri M.N. Mushtoorappa Member, KRVP D.No.2009/2, Dr. M.C. Modi Road Dr. M.C. Colony, `A’ Block, Davangere - 577 004 Mo : 9448857122
9. Shri Pandith K. Balure Member, KRVP ‘Adithya Nilaya’,
Basaveshwara Colony Humanabad Bidar - 585 330 Mo : 9731089623
10. Shri R.S. Patil Member, KRVP Gandhi Grameena Gurukula Hosarithi - 581 213 Haveri dist. Mo : 9448867705
22nd National Children’s Science Congress 2014 102ACTIVITY GUIDE
11. Dr. H.R. Swamy Member, KRVP ‘Akshara’ Maruthi Nagar Arasikere Taluk Hassan Dist. Mo : 7760040888
12. Shri Nagesh Aralukuppe Member, KRVP C/o. R. Nagesha No.27/2, 3rd Cross, Ganesha Block, Sulthan Palya Bangalore - 560 032 Mo : 9342176030 Ph : 080-23620940
13. Dr. R.S. Yeli Member, KRVP C/o. G.B. Purohith - Lawyer No. 30/16, Krishna Kunja Badi Kaman Road Behind Old Municipal Hospital Bijapur - 586 104 Mo : 9880378426
14. Shri T.G. Krishnamurthy Raj Urs Member, KRVP Govt. High School Anur Post, Chikmagalur Tq & Dist. Mo : 9448555068
15. Prof. C. Nagaraj Member, KRVP No.646, 2nd Block 3rd Stage, Basaveshwarnagar Bangalore - 560 079. Mo : 9448713461
16. Shri M. Gangadharappa Member, KRVP Shanthinagar Extn., Pavagada Post Tumkur Mo : 9449912918
17. Shri Kotruswamy S.M. Member, KRVP Basaveshwara Nilaya Lalbahadur Shastri Extn., Kottur Post, Kudligi Taluk Bellary Dist. - 585 134 Mo : 9449628680
18. Shri Anadur Maharudrappa Member, KRVP No.1-1-197, Bhaskar Nagar Chitaguppa Post, Humnabada Tq Bidar Dist. - 585412 Mo : 9008132899
19. Dr. Kunteppa Gouripur Member, KRVP Physics Lecturer No.1-4-149/1, I.B. Quarters I.B. Colony Raichur - 584 101 Mo : 9980759704
20. Dr. Sangamesh S. Hiremath Member, KRVP Regional Director KSOU Regional Centre Kannada Research Institute Gulbarga University Campus Gulbarga Mo : 9448219830
21. Shri Krishnegowda C. Member, KRVP Punya Nivasa, D.No.88,
Siddhalingeshwara Nagar Bogadi North Mysore - 570 026 Mo : 9036989384
22. Dr. Manjunath D. Member, KRVP Block 11, KIMS, G.O. Quarters Hubli, Dharwad Dist. Mo : 9900520748
22nd National Children’s Science Congress 2014103 ACTIVITY GUIDE
23. Shri H.G. Huddar Member, KRVP Postal Colony, 22nd Cross Vidyagiri, Bagalkot - 587 103 Mo : 9448624070
24. Shri R.V. Demashetty Member, KRVP Plot No.167, Shree Ganesh Nagar (Jodatti Layout), Near NAKA No.1, Gokak - 591 307, Belgaum Dist. Mo : 9035353868 / 9448908010
25. Dr. N.C. Shivaprakash Co-opted Member - KRVP Dept. of Instrumentation & Applied Physics Indian Institute of Science Bangalore - 560 012 Phone : 080 - 22932242
26. Dr. M. Pruthviraj Co-opted Member - KRVP Executive Secretary Karnataka State Council for Science & Technology Indian Institute of Science Campus Bangalore - 560 012 Phone : 080-23341652, 23348848
27. Dr. H. Honnegowda Co-opted Member - KRVP Special Director (Technical) Dept. of Information Technology, Bio Technology and Science & Technology, Govt. of Karnataka 5th Floor, 5th Stage, M.S. Building Bangalore - 560 001 Phone : 080 22032750
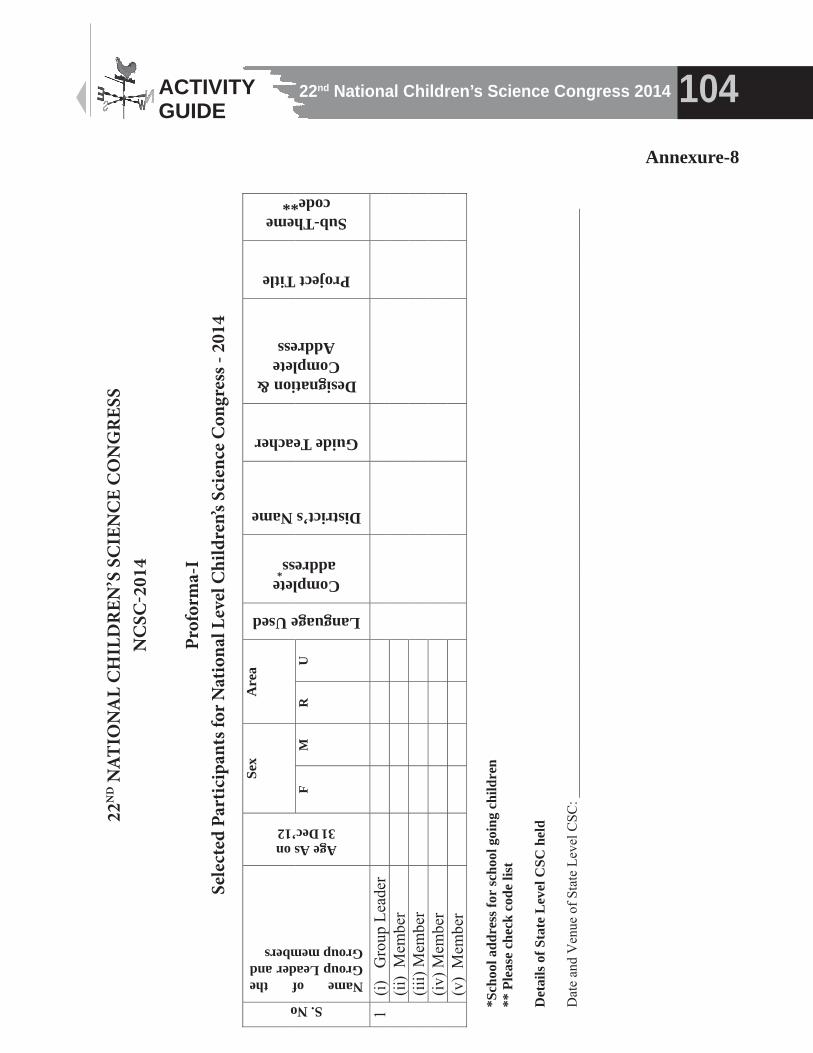
22nd National Children’s Science Congress 2014 104ACTIVITY GUIDE
Annexure-8
20th
NA
TIO
NA
L C
HIL
DR
EN’S
SC
IEN
CE
CO
NG
RES
S N
CSC
-201
2
Pr
ofor
ma-
I Se
lect
ed P
artic
ipan
ts fo
r Nat
iona
l Lev
el C
hild
ren’
s Sc
ienc
e C
ongr
ess
– 20
12
S. No
Name of the Group Leader and Group members
Age As on 31
Dec’12
Sex
Are
a
Language Used
Complete address
*
District’s Name
Guide Teacher
Designation & Complete Address
Project Title
Sub-Theme code**
F M
R
U
1 (i)
G
roup
Lea
der
(ii
) M
embe
r
(iii)
Mem
ber
(iv
) Mem
ber
(v
) M
embe
r
*S
choo
l add
ress
for
scho
ol g
oing
chi
ldre
n **
Ple
ase
chec
k co
de li
st
Det
ails
of S
tate
Lev
el C
SC h
eld
Dat
e an
d V
enue
of S
tate
Lev
el C
SC: _
____
____
____
____
____
____
____
____
____
____
____
____
____
____
____
____
____
____
____
____
___
22N
D N
ATIO
NA
L C
HIL
DR
EN’S
SC
IEN
CE
CO
NG
RES
SN
CSC
-201
4
Prof
orm
a-I
Sele
cted
Par
ticip
ants
for N
atio
nal L
evel
Chi
ldre
n’s S
cien
ce C
ongr
ess -
201
4

22nd National Children’s Science Congress 2014105 ACTIVITY GUIDE
20th
NA
TIO
NA
L C
HIL
DR
EN’S
SC
IEN
CE
CO
NG
RES
S N
CSC
-201
2
Prof
orm
a-II
St
ate
Leve
l Chi
ldre
n’s
Scie
nce
Con
gres
s - 2
012
– at
a g
lanc
e
Total No. of projects presented
Total No. of group members
Sex
Age
gr
oup
Are
a
No. of Schools represented
No. of Guide teachers
No. of evaluators
Total No. of districts
F M
U
L
R
U
22N
D N
ATIO
NA
L C
HIL
DR
EN’S
SC
IEN
CE
CO
NG
RES
SN
CSC
-201
4
Prof
orm
a-II
Stat
e Le
vel C
hild
ren’
s Sci
ence
Con
gres
s - 2
014
- at a
gla
nce
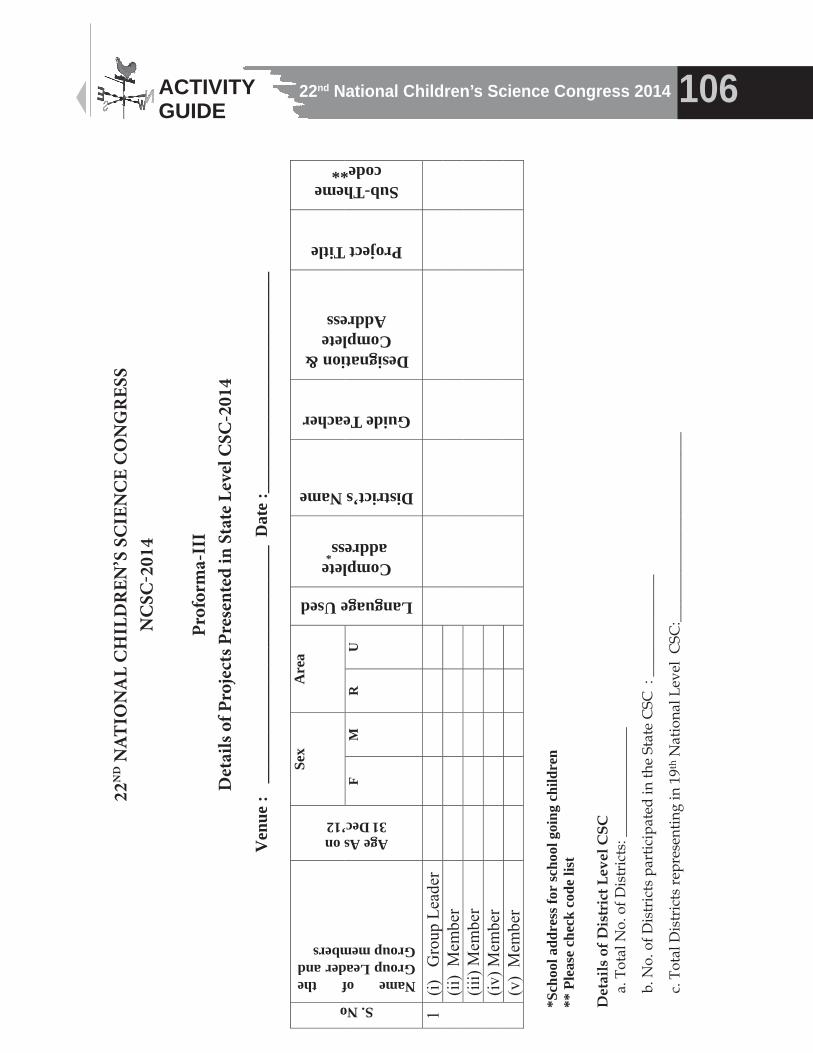
22nd National Children’s Science Congress 2014 106ACTIVITY GUIDE
20th
NA
TIO
NA
L C
HIL
DR
EN’S
SC
IEN
CE
CO
NG
RES
S N
CSC
-201
2
Pr
ofor
ma-
III
Det
ails
of P
roje
cts
Pres
ente
d in
Sta
te L
evel
CSC
-201
2
Ven
ue :
___
____
____
____
____
____
____
_ D
ate
:___
____
____
____
____
____
___
S. No
Name of the Group Leader and Group members
Age As on 31
Dec’12
Sex
Are
a
Language Used
Complete address
*
District’s Name
Guide Teacher
Designation & Complete Address
Project Title
Sub-Theme code**
F M
R
U
1 (i)
G
roup
Lea
der
(ii
) M
embe
r
(iii)
Mem
ber
(iv
) Mem
ber
(v
) M
embe
r
*Sch
ool a
ddre
ss fo
r sc
hool
goi
ng c
hild
ren
** P
leas
e ch
eck
code
list
D
etai
ls o
f Dis
tric
t Lev
el C
SC
a
. Tot
al N
o. o
f Dis
tric
ts: _
____
____
____
__
b
. No.
of D
istr
icts
par
ticip
ated
in th
e St
ate
CSC
: _
____
____
____
_
c
. Tot
al D
istr
icts
repr
esen
ting
in 1
9th N
atio
nal L
evel
CSC
:___
____
____
____
____
____
___
22N
D N
ATIO
NA
L C
HIL
DR
EN’S
SC
IEN
CE
CO
NG
RES
SN
CSC
-201
4
Prof
orm
a-II
ID
etai
ls o
f Pro
ject
s Pre
sent
ed in
Sta
te L
evel
CSC
-201
4
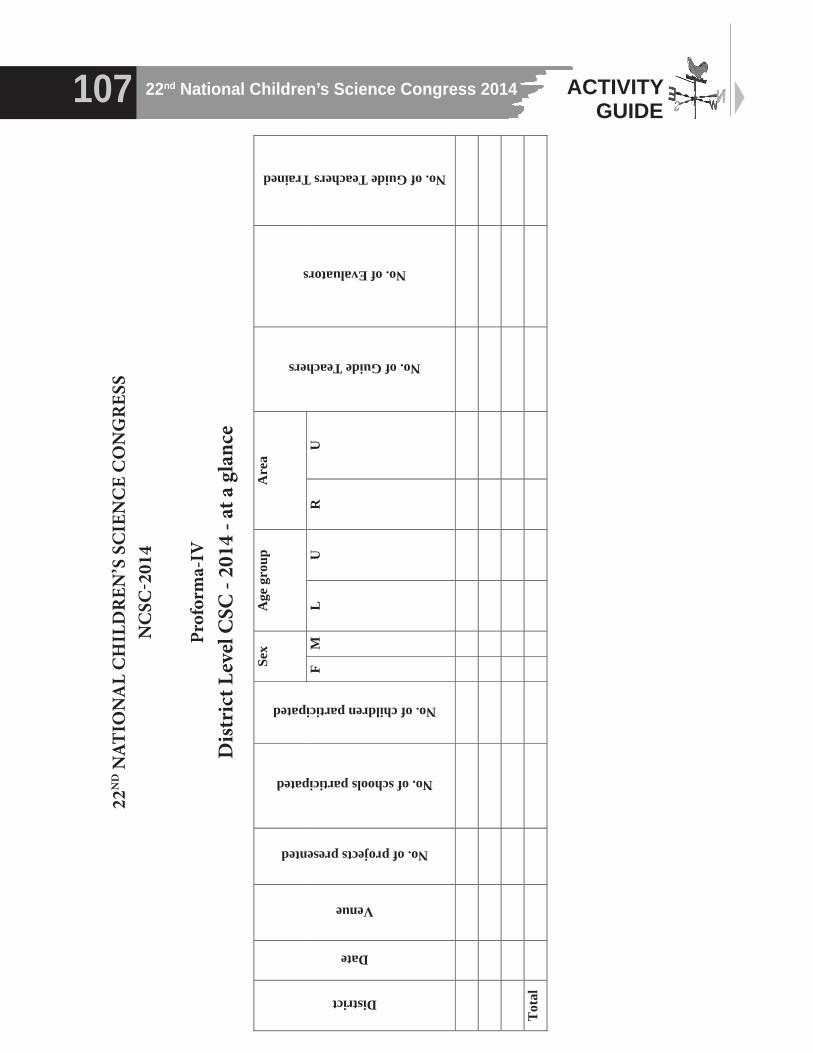
22nd National Children’s Science Congress 2014107 ACTIVITY GUIDE
20th
NA
TIO
NA
L C
HIL
DR
EN’S
SC
IEN
CE
CO
NG
RES
S N
CSC
-201
2
Pr
ofor
ma-
IV
Dis
tric
t Lev
el C
SC –
201
2 - a
t a g
lanc
e
District
Date
Venue
No. of projects presented
No. of schools participated
No. of children participated
Sex
Age
gro
up
Are
a
No. of Guide Teachers
No. of Evaluators
No. of Guide Teachers Trained
F M
L
U
R
U
Tot
al
22N
D N
ATIO
NA
L C
HIL
DR
EN’S
SC
IEN
CE
CO
NG
RES
SN
CSC
-201
4
Prof
orm
a-IV
Dis
tric
t Lev
el C
SC -
2014
- at
a g
lanc
e
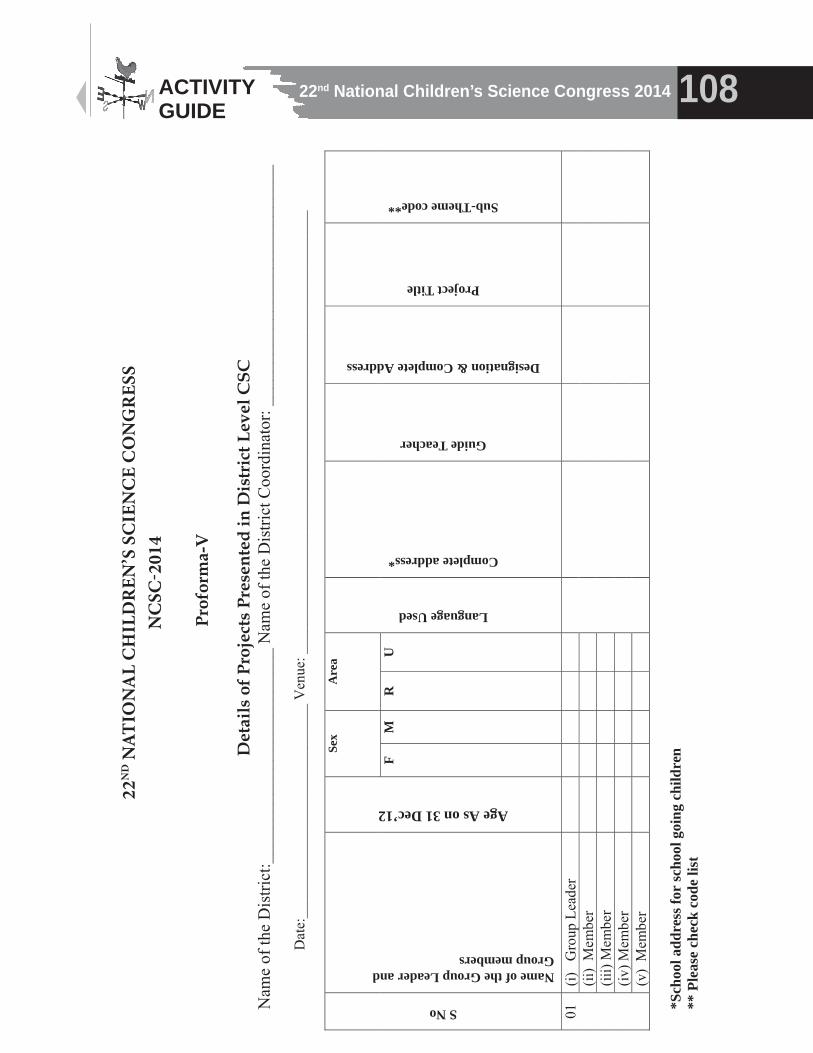
22nd National Children’s Science Congress 2014 108ACTIVITY GUIDE
20th
NA
TIO
NA
L C
HIL
DR
EN’S
SC
IEN
CE
CO
NG
RES
S N
CSC
-201
2
Pr
ofor
ma-
V
D
etai
ls o
f Pro
ject
s Pr
esen
ted
in D
istr
ict L
evel
CSC
N
ame
of th
e D
istri
ct:_
____
____
____
____
____
____
Nam
e of
the
Dis
trict
Coo
rdin
ator
: ___
____
____
____
____
____
____
_
D
ate:
____
____
____
____
____
____
____
_ V
enue
: ___
____
____
____
____
____
____
____
____
____
____
____
____
____
____
_
S No
Name of the Group Leader and Group members
Age As on 31 Dec’12
Sex
Are
a
Language Used
Complete address*
Guide Teacher
Designation & Complete Address
Project Title
Sub-Theme code**
F M
R
U
01
(i)
Gro
up L
eade
r
(ii
) M
embe
r
(ii
i) M
embe
r
(iv
) Mem
ber
(v)
Mem
ber
*S
choo
l add
ress
for
scho
ol g
oing
chi
ldre
n **
Ple
ase
chec
k co
de li
st
22N
D N
ATIO
NA
L C
HIL
DR
EN’S
SC
IEN
CE
CO
NG
RES
SN
CSC
-201
4
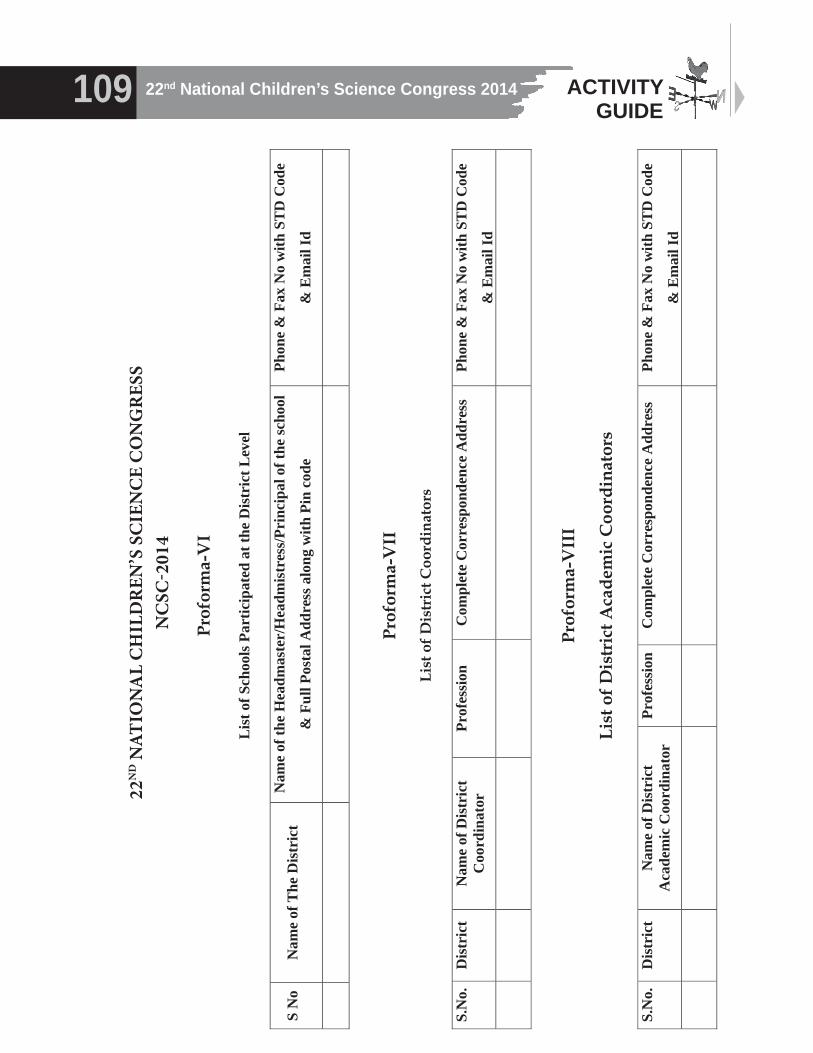
22nd National Children’s Science Congress 2014109 ACTIVITY GUIDE
20th
NA
TIO
NA
L C
HIL
DR
EN’S
SC
IEN
CE
CO
NG
RES
S N
CSC
-201
2
Pr
ofor
ma-
VI
L
ist o
f Sch
ools
Par
ticip
ated
at t
he D
istr
ict L
evel
S N
o N
ame
of T
he D
istr
ict
Nam
e of
the
Hea
dmas
ter/
Hea
dmis
tres
s/Pr
inci
pal o
f the
scho
ol
& F
ull P
osta
l Add
ress
alo
ng w
ith P
in c
ode
Phon
e &
Fax
No
with
ST
D C
ode
& E
mai
l Id
Prof
orm
a-V
II
Li
st o
f Dis
tric
t Coo
rdin
ator
s
S.
No.
D
istr
ict
Nam
e of
Dis
tric
t C
oord
inat
or
Prof
essi
on
Com
plet
e C
orre
spon
denc
e A
ddre
ss
Phon
e &
Fax
No
with
ST
D C
ode
& E
mai
l Id
Prof
orm
a-V
III
Li
st o
f Dis
tric
t Aca
dem
ic C
oord
inat
ors
S.N
o.
Dis
tric
t N
ame
of D
istri
ct
Aca
dem
ic C
oord
inat
or
Prof
essi
onC
ompl
ete
Cor
resp
onde
nce
Add
ress
Ph
one
& F
ax N
o w
ith S
TD
Cod
e
& E
mai
l Id
22N
D N
ATIO
NA
L C
HIL
DR
EN’S
SC
IEN
CE
CO
NG
RES
SN
CSC
-201
4
22nd National Children’s Science Congress 2014 110ACTIVITY GUIDE
20th
NA
TIO
NA
L C
HIL
DR
EN’S
SC
IEN
CE
CO
NG
RES
S N
CSC
-201
2
Pr
ofor
ma-
IX
D
etai
ls o
f the
Sta
te L
evel
Res
ourc
e Pe
rson
s’ T
rain
ing
Wor
ksho
p a.
Ven
ue :
____
____
____
____
____
____
____
____
____
____
____
____
____
____
____
____
__
b. D
ate
:
___
____
____
____
____
____
____
____
____
____
____
____
____
____
____
____
____
____
____
__
c. T
otal
No.
of R
esou
rce
Pers
ons a
ttend
ed :
____
____
____
____
____
____
____
____
____
____
____
____
____
Det
aile
d Li
st o
f the
Par
ticip
ants
in th
e st
ate
leve
l tra
inin
g w
orks
hop
S
No
Nam
e of
Res
ourc
e Pe
rson
s (p
artic
ipan
ts)
Dis
tric
t Pr
ofes
sion
C
ompl
ete
Add
ress
Ph
one
& F
ax N
o w
ith S
TD
Cod
e
& E
mai
l Id
Prof
orm
a-X
Det
aile
d Li
st o
f the
Par
ticip
ants
in th
e D
istr
ict L
evel
Tra
inin
g W
orks
hop
S
No
Nam
e of
the
Part
icip
ants
D
istr
ict
Prof
essi
on
Com
plet
e A
ddre
ss
Phon
e &
Fax
No
with
ST
D C
ode
& E
mai
l Id
22N
D N
ATIO
NA
L C
HIL
DR
EN’S
SC
IEN
CE
CO
NG
RES
SN
CSC
-201
4
22nd National Children’s Science Congress 2014111 ACTIVITY GUIDE
20th
NA
TIO
NA
L C
HIL
DR
EN’S
SC
IEN
CE
CO
NG
RES
S N
CSC
-201
2
Pr
ofor
ma-
XI
D
etai
ls o
f Res
ourc
e Pe
rson
s/E
valu
ator
s inv
olve
d at
Sta
te L
evel
CSC
– 2
012
S
No
Nam
e
Prof
essi
on
Are
a of
Spe
cial
isat
ion
Com
plet
e A
ddre
ss
Phon
e N
o. w
ith S
TD
Cod
e
&E
mai
l ID
Part
icip
ated
as
Res
ourc
e Pe
rson
s /
Eva
luat
ors
Pr
ofor
ma
-XII
D
etai
ls of
Res
ourc
e Pe
rson
s/E
valu
ator
s inv
olve
d at
Dis
tric
t Lev
el C
SC -2
012
S
No
Nam
e
Prof
essi
on
Are
a of
Spec
ialis
atio
n
Com
plet
e
Add
ress
Phon
e N
o. w
ith S
TD
Cod
e
&E
mai
l ID
Part
icip
ated
as
Res
ourc
e Pe
rson
s
/ Eva
luat
ors
Dis
tric
t
Su
b Th
eme
Cod
e Li
st:
Cod
e Su
b-Th
eme
1 ±ÀQ
ÛAiÀÄ
À̧A¥À£ÀÆ
ä®UÀ¼
ÀÄ 2
±ÀQÛ ª
ÀåªÀ̧ÉÜUÀ¼
ÀÄ
3 ±ÀQ
Û ªÀÄvÀÄÛ
À̧ªÀiÁd
4 ±ÀQ
Û ªÀÄvÀÄÛ ¥Àj¸
ÀgÀ 5
±ÀQÛAiÀÄ ¤ª
ÀðºÀuÉ ª
ÀÄvÀÄÛ
À̧AgÀPÀëu
É 6
±ÀQÛAiÀÄ §UÉU
É AiÉÆ
Ãf¸ÀĪÀÅzÀÄ ªÀÄvÀÄÛ ªÀiÁzÀj
vÀAiÀiÁj
¸ÀĪÀÅzÀÄ
22N
D N
ATIO
NA
L C
HIL
DR
EN’S
SC
IEN
CE
CO
NG
RES
SN
CSC
-201
4
Prof
orm
a-X
ID
etai
ls o
f Res
ourc
e pe
rson
s/Ev
alua
tors
invo
lved
at S
tate
Lev
el C
SC-2
014
Prof
orm
a-X
IID
etai
ls o
f Res
ourc
e pe
rson
s/Ev
alua
tors
invo
lved
at D
istr
ict L
evel
CSC
-201
3
20th
NA
TIO
NA
L C
HIL
DR
EN’S
SC
IEN
CE
CO
NG
RES
S N
CSC
-201
2
Pr
ofor
ma-
XI
D
etai
ls o
f Res
ourc
e Pe
rson
s/E
valu
ator
s inv
olve
d at
Sta
te L
evel
CSC
– 2
012
S
No
Nam
e
Prof
essi
on
Are
a of
Spe
cial
isat
ion
Com
plet
e A
ddre
ss
Phon
e N
o. w
ith S
TD
Cod
e
&E
mai
l ID
Part
icip
ated
as
Res
ourc
e Pe
rson
s /
Eva
luat
ors
Pr
ofor
ma
-XII
D
etai
ls of
Res
ourc
e Pe
rson
s/E
valu
ator
s inv
olve
d at
Dis
tric
t Lev
el C
SC -2
012
S
No
Nam
e
Prof
essi
on
Are
a of
Spec
ialis
atio
n
Com
plet
e
Add
ress
Phon
e N
o. w
ith S
TD
Cod
e
&E
mai
l ID
Part
icip
ated
as
Res
ourc
e Pe
rson
s
/ Eva
luat
ors
Dis
tric
t
Su
b Th
eme
Cod
e Li
st:
Cod
e Su
b-Th
eme
1 ±ÀQ
ÛAiÀÄ
À̧A¥À£ÀÆ
ä®UÀ¼
ÀÄ 2
±ÀQÛ ª
ÀåªÀ̧ÉÜUÀ¼
ÀÄ
3 ±ÀQ
Û ªÀÄvÀÄÛ
À̧ªÀiÁd
4 ±ÀQ
Û ªÀÄvÀÄÛ ¥Àj¸
ÀgÀ 5
±ÀQÛAiÀÄ ¤ª
ÀðºÀuÉ ª
ÀÄvÀÄÛ
À̧AgÀPÀëu
É 6
±ÀQÛAiÀÄ §UÉU
É AiÉÆ
Ãf¸ÀĪÀÅzÀÄ ªÀÄvÀÄÛ ªÀiÁzÀj
vÀAiÀiÁj
¸ÀĪÀÅzÀÄ
Cod
eSu
b-Th
eme
1.W
eath
er a
nd C
limat
e ar
ound
you
2.Im
pact
of H
uman
Act
iviti
es o
n W
eath
er a
nd C
limat
3.W
eath
er, C
limat
e an
d E
cosy
stem
s
4.W
eath
er, C
limat
e –
Soc
iety
and
Cul
ture
5.W
eath
er,C
limat
e an
d A
gric
ultu
re
6.W
eath
er, C
limat
e, a
nd H
ealth

22nd National Children’s Science Congress 2014 112ACTIVITY GUIDE
20th
NA
TIO
NA
L C
HIL
DR
EN’S
SC
IEN
CE
CO
NG
RES
S N
CSC
-201
2
Prof
orm
a-X
III
Pr
ojec
ts se
lect
ed fo
r In
dian
Sci
ence
Con
gres
s - 2
013
S N
o N
ame
of G
r. L
eade
r &
gro
up
mem
bers
A
ge g
roup
U
/L
Sex
(M/F
) A
rea
(U/R
) N
ame
& A
ddre
ss o
f th
e sc
hool
D
istr
ict
Gui
de
teac
her
Proj
ect
title
1
(i)
GL
(ii
)
(iii)
(iv)
(v)
2 (i)
G
L
(ii)
(ii
i)
(iv)
(v)
22N
D N
ATIO
NA
L C
HIL
DR
EN’S
SC
IEN
CE
CO
NG
RES
SN
CSC
-201
4
Prof
orm
a-X
III
Proj
ects
sele
cted
for I
ndia
n Sc
ienc
e Con
gres
s-20
14


