Embed Size (px)
Citation preview

345THE AUSTRALIAN AND NEW ZEALAND JOURNAL OF CRIMINOLOGYVOLUME 41 NUMBER 3 2008 PP. 345–363
Address for Correspondence: Anna Stewart, School of Criminology and Criminal Justice, Mt Gravatt Campus, Griffith University, Brisbane, Queensland, 4111. E-mail: [email protected]
Understanding Juvenile OffendingTrajectoriesMichael Livingston, Anna Stewart, Troy Allard and James OgilvieGriffith University, Australia
Aconsiderable amount of international research has adopted a criminalcareers framework to improve our understanding of offending
patterns across the life course. Recent innovations in statistical modellingtechniques such as Semi-Parametric Group-based Method (SPGM) haveprovided researchers with tools to model offending trajectories. Whilethis framework and these techniques may improve our understanding oflife course offending patterns, few Australian studies have adopted suchan approach. SPGM was employed in the current study to model theoffending patterns of the 1983–84 Queensland offender cohort (n =4,470) to address three research questions: (1) How many distinctoffending trajectories could be identified and what was the nature ofthese trajectories? (2) How were sex, Indigenous status, socioeconomicdisadvantage, and remoteness related to offending trajectory member-ship? and (3) Are juvenile offending trajectories predictors of adultoffending? Findings indicated that there were three distinct groups ofjuvenile offenders: Early Peaking–Moderate Offenders, Late Onset–Moderate Offenders, and Chronic Offenders. Males and Indigenousoffenders were overrepresented in the chronic offending trajectory.Support for the utility of the model was found, as Chronic Offenderswere more likely to have offended as adults. The theoretical and practicalimplications of these findings are discussed and the need for furthertrajectory research within an Australian context is emphasised.
The criminal careers framework has been extensively used in the international literature to improve our understanding of offending patterns over the developmen-tal life course (Blumstein, Cohen, Roth, & Visher, 1986; Cain, 1997; Carcach &Leverett, 1999; Chen, Matruglio, Weatherburn, & Hua, 2005; Farrington, 2003a;Lynch, Buckman, & Krenske, 2003; Marshall, 2006; Piquero, Farrington, &Blumstein, 2003a). This framework is concerned with continuity and change in thenature and pattern of criminality over time, including onset or initiation, termina-tion or desistence and duration or career length of offending (Blumstein, Cohen, &Farrington, 1988; Farrington & West, 1990). More recently, Developmental andLife-course Criminology (DLC) has extended the notion of criminal careers to

include exploration of how the dynamic nature of risk factors or changes that occurover the life course are related to particular offending pathways (Farrington, 2003b;National Crime Prevention, 1999).
DLC attempts to understand the development of offending and antisocial behav-iour, risk factors across different ages and the effects of life events on the course ofdevelopment (Farrington, 2003b). Broadly speaking, developmental approaches viewthe life course as a series of phases, a series of points of change, a series of transitions,rather than a fixed progression towards adulthood determined by factors early in life(Elder, 1994; National Crime Prevention, 1999). This approach focuses on pathwayswith a multitude of outcomes, and aspects of time and timing of life events andtransition points in order to understand developmental outcomes (Elder, 1994;National Crime Prevention, 1999). Importantly, the approach has the potential toinform research on offending behaviour, including the differences over time bothwithin and between individuals, in an effort to understand both how and when tointervene (Carcach & Leverett, 1999; Marshall, 2006).
A developmental trajectory refers to a pathway of development over the lifecourse relating to long-term patterns and sequences of behaviour (Nagin &Tremblay, 2005; Sampson & Laub, 2005). The analysis of developmental trajecto-ries in such fields as criminology and psychopathology provides researchers with theability to understand the development of normative and non-normative behaviourover the life course. It allows researchers to examine the pathways of adaptation andnonadaptation that individuals follow to arrive at particular outcomes (Chung, Hill,Hawkins, Gilchrist, & Nagin, 2002; Kokko, Tremblay, Lacourse, Nagin, & Vitaro,2006; Wiesner, Kim, & Capaldi, 2005). Recent innovations in statistical modellingtechniques, including Semi-Parametric Group-based Modelling (SPGM; Nagin,1999; Nagin & Land, 1993), and Latent Growth Mixture Modelling (LGMM;Muthén & Muthén, 2000) have provided DLC researchers with the tools to modelheterogeneity and homogeneity across offending trajectories (Kreuter & Muthén,2008; Nagin & Tremblay, 1999; Wiesner et al., 2005). Such developments are vitalto advance our knowledge of the factors associated with different offending trajecto-ries across different points in the life course.
The present study applied SPGM to model the juvenile offending trajectories ofan Australian offender cohort, as comparatively few Australian studies haveadopted criminal career or life course perspectives to examine offending patternslongitudinally (e.g., see Marshall, 2006). In Australia, understanding the offendingcareers of Indigenous young people is central to understanding juvenile offending.This study examined the relationships among Indigenous status and gender, whilecontrolling for socioeconomic status and remoteness, and juvenile offending trajec-tories. Finally, the relationship between the juvenile offending trajectories andoffending as a young adult was explored.
Theoretical DebatesWithin the DLC perspective, there exists significant diversity in theoretical modelsand debate among them in terms of how best to account for continuity and changein antisocial behaviour over the lifespan, known as the age–crime debate (Brame,Bushway, Paternoster, & Thornberry, 2005; Farrington, 2003b; Nagin &
346
MICHAEL LIVINGSTON, ANNA STEWART, TROY ALLARD AND JAMES OGILVIE
THE AUSTRALIAN AND NEW ZEALAND JOURNAL OF CRIMINOLOGY

Paternoster, 2000; Paternoster, Dean, Piquero, Mazerolle, & Brame, 1997; Sampson& Laub, 2003). This has led to debate over whether the predictors of offendinghave uniform or specific effects across different offending trajectories at differentpoints during development (Chung et al., 2002; Farrington, 2003b).
One of the most significant debates is between theories emphasising populationheterogeneity and those emphasising state dependence explanations (Brame et al.,2005; Nagin & Paternoster, 2000; Paternoster et al., 1997). Both types of theoriesattempt to explain the robust criminological finding of a moderately strong positiveassociation between past and future criminality, where individuals with prioroffences are much more likely to commit future offences when compared to thosewith no prior offences (Nagin & Paternoster, 2000).
Population heterogeneity theories conceptualise the continuity in criminality asa static process, where continuity in criminal behaviour is the result of a commontime-stable underlying propensity or proneness to commit crime that is establishedearly in life (Cernkovich & Giordano, 2001; Nagin & Paternoster, 2000;Paternoster et al., 1997). Gottfredson and Hirschi’s (1990) self-control theory,where it is argued that the propensity for criminality (low self-control) is establishedearly in life, is time-stable, differs in intensity across individuals in a population andoperates as a function of age to produce desistance from crime naturally.
In contrast, state dependence theories conceptualise continuity in criminality asa dynamic process, where continuity is a result of a process of contagion, whencriminal or non-criminal behaviour transforms life conditions and alters the proba-bility of future offending (Nagin & Paternoster, 2000). This view emphasises thevariable nature of criminality over time and the cumulative effects that variousfactors may have on offending at different points in the life course (Cernkovich &Giordano, 2001; Ezell, 2007; Nagin & Paternoster, 2000; Williams & Arnold,2002). An example of a state dependence theory is Thornberry’s (2005) interac-tional theory, which emphasises the importance of social controls in determiningantisocial behaviour. The theory argues that involvement in criminal behaviourweakens one’s attachments to prosocial individuals and institutions, which in turnsleads to an increased probability of future criminal behaviour (Thornberry, 2005).
Theoretical explanations of the continuity and change in criminal behaviourmay integrate both population heterogeneity and state dependence perspectives,where differences in continuity and change of antisocial behaviour may beexplained by both differences in antisocial propensities and the cumulative effectsof past experiences on present and future behaviour (Brame et al., 2005; Nagin &Paternoster, 2000). Sampson and Laub’s (1993, 2003, 2005) age-graded theory ofsocial control is an example of an integrated theory. They assert that crime is morelikely to occur when an individual’s bond to society is attenuated, that is, wheninformal social control is lacking. The dynamic nature of informal social controlsmeans that they exert their influences on behaviour to varying extents at differentstages of the life course and interact with individual propensities to engage in crimi-nal behaviour (Sampson & Laub, 2005).
An example of a multiple pathway theory that adopts both a static and dynamiccausal view of criminal behaviour is Moffitt’s (1993, 1997) taxonomy that proposestwo distinct theoretical explanations of the aetiological foundations of differentoffending patterns. She argues that there exist two trajectories of individuals
347
UNDERSTANDING JUVENILE OFFENDING TRAJECTORIES
THE AUSTRALIAN AND NEW ZEALAND JOURNAL OF CRIMINOLOGY

embedded within the curve of crime over age, being the Adolescent Limited (AL)Type and the Life-Course Persistent (LCP) Type (Moffitt, 1993, 1997). AL offend-ers are characterised by temporary offending patterns believed to be caused byproximal factors beginning at puberty and ending in young adulthood, where theircriminal behaviour is hypothesised to be normative and lack continuity, withdiscontinuity the hallmark of their criminal careers (Moffitt, 1993, 1997). LCPoffenders are a small group of high-rate offenders characterised by substantial conti-nuity in antisocial behaviour over time, such that their antisocial behaviour ismanifest at an early age (Moffitt, 1993, 1997). The etiological basis for LCP offend-ing is argued to be factors capable of producing differences in neuropsychologicalfunctioning of the infant nervous system, resulting in deficits in temperament,behavioural and cognitive development (Moffitt, 1993, 1997, 2006). Such deficitsare argued to set in motion a lifetime of negative reciprocal exchanges between theindividual and the social environment, consolidating their antisocial behaviour(Moffitt, 1993, 1997, 2006).
The growing body of empirical evidence examining the continuity and changein criminal behaviour over the life course indicates that the effects of both individ-ual differences in criminal propensity and individual life events and experiencesafter controlling for criminal propensity are vital factors in understanding criminalbehaviour and desistance from offending (Brame et al., 2005; Nagin & Paternoster,2000). Thus, the available evidence supports a mixed model of the development ofoffending over the life course. These theoretical developments have led to thedevelopment of statistical models for analysing longitudinal data and exploring thetheoretical issues regarding explanations of the development, continuity anddiscontinuity of crime over the life course. Currently, there are two dominantmodels in the literature: conventional growth curve models and group-based trajec-tory models (Kreuter & Muthén, 2008). Conventional growth models assumenormality of the growth factors, an assumption challenged by Nagin and Land(1993). Nagin and Land (1993) proposed a modelling technique, the Semi-Parametric Group-based Method (SPGM) that identifies different groups, each withtheir own trajectory, to capture the variation in the data (Kreuter & Muthén, 2008;Piquero, 2008). This technique has been used to examine the heterogeneity andhomogeneity among offenders and for identifying the number of groups followingdistinct developmental pathways.
Piquero (2008) reviewed over 80 studies that employed trajectory analysis.These studies varied considerably in sample characteristics, age ranges, length offollow-up measures, and analytic strategies and decisions. However, Piquero (2008)drew four main conclusions from offender-based trajectory studies. First, consistentwith Moffitt’s (1993) taxonomic theory, the empirical research does identify at leasttwo offender groups; an adolescent-peaked pattern and a chronic offender pattern.Interestingly, contrary to theoretical predictions, trajectory analyses also typicallyidentify a late-onset chronic group. This group begins offending during adolescenceand continues offending into adulthood. Second, the trajectory method consistentlyidentifies between three and five offending groups, slightly more in studies usingself-reports of offending behaviour rather than official records. Third, samples sizesgreater than 500 provide robust categorisation of groups. Finally, there tends to be alow-rate group, a high-rate group and a moderate-but-declining group.
348
MICHAEL LIVINGSTON, ANNA STEWART, TROY ALLARD AND JAMES OGILVIE
THE AUSTRALIAN AND NEW ZEALAND JOURNAL OF CRIMINOLOGY

Sex has been found to be related to trajectory group membership (Broidy et al.,2003; Chung et al., 2002; Fergusson & Horwood, 2002; Piquero et al., 2005). Whilelittle is known concerning the developmental patterns of female offending acrossthe life course (Cernkovich & Giordano, 2001; Piquero, Brame, & Moffitt, 2005)the following studies have indicated that trajectory analyses can contribute to ourunderstanding of sex difference. Fergusson and Horwood (2002) concluded thatoffending trajectories were similar for males and females; however, females weremore likely to follow low offending risk and early adolescent-limited pathways,while males were more likely to follow later adolescent-limited or chronic offendingpathways. Piquero et al. (2005) found greater variation in male conviction experi-ences when compared to females, where males were more likely to be involved in,and show greater variation in criminal activity. However, their results suggested thatthere was a high degree of similarity between males and females in terms of thestability of offending from adolescence to early adulthood.
Few trajectory analyses have been conducted using Australian cohorts (seeMarshall, 2006), with the majority of studies focusing on United Kingdom (UK) orUnited States (US) samples (Piquero, 2008). This is problematic, given that thecomposition of offenders is likely to differ considerably across countries. There havebeen a number of trajectory analyses conducted using New Zealand birth andoffender cohorts (for example see Fergusson & Horwood, 2002; Piquero, Brame, &Moffitt, 2005), although the generalisability of offending patterns identified in suchresearch must be interpreted with caution when applied to the Australian context.International findings concerning the composition and correlates of offendingtrajectories are not likely to be easily generalisable to the Australian context due tosociocultural differences, including the distribution of socioeconomic disadvantagewithin populations and the status and histories of minority groups.
Juvenile offending is a pervasive problem in Australia, with about 17 to 21% ofall young people having at least one officially recorded contact with the justicesystem (Morgan, 1993; Morgan & Gardner, 1992; Stewart, Dennison, & Hurren,2006). About two-thirds of young people who come into contact with the justicesystem have one recorded contact while those with more than one reported contactaccount for a disproportionately large amount of offending (Cain, 1997; Carcach &Leverett, 1999; Department of Families, Youth, and Community Care, 1998;Morgan, 1993).
There is a significant degree of continuity in criminal behaviour for thosejuveniles who come into contact with the justice system (Chen et al., 2005; Lynchet al., 2003). Chen et al. (2005) conducted a longitudinal investigation of recidi-vism based on an Australian juvenile offender cohort (New South Wales), andfound that 68% of youths who appeared for the first time in a Children’s Court in1995 had at least one subsequent reappearance in either a juvenile or adult criminalcourt by the end of 2003. Additionally, higher reappearance rates were found forIndigenous people, males and those who first appeared in court at a relatively youngage (Chen et al., 2005). Similar results were found for a Queensland cohort (Lynchet al., 2003) with 79% of juveniles on supervised orders during 1994–1995 progress-ing to the adult correctional system by 2002. This percentage was higher forIndigenous youths with 89% progressing to the adult correctional system by 2002,and 71% serving at least one prison term. These findings further highlight the
349
UNDERSTANDING JUVENILE OFFENDING TRAJECTORIES
THE AUSTRALIAN AND NEW ZEALAND JOURNAL OF CRIMINOLOGY

importance of Indigenous status in examining the continuity of offending trajecto-ries in the Australian context.
The overrepresentation of Indigenous Australians in the criminal justice systemis a serious concern. In 2006, 24% of the total Australian prisoner population wereIndigenous while 2.3% of the population were Indigenous (ABS, 2006). Thisconcern starts early with Indigenous young people 23 times more likely than non-Indigenous young people to spend time in juvenile detention centres (Taylor, 2006).Many social, cultural and environmental factors are proposed to explain thecomparatively high rates of Indigenous offending in Australia (Broadhurst, 1997;Tyler, 1998). Prominent among these explanations are the factors of socioeconomicdisadvantage and sociospatial isolation (Tyler, 1998). Strain explanations ofIndigenous criminality emphasise the high rates of poverty, unemployment, pooreducation and poor health that operate to constrain opportunities for Indigenouspeople to participate in mainstream activities (Broadhurst, 1997). Socioeconomicdisadvantage is likely to increase the number of developmental risk factors experi-enced by Indigenous individuals that may heighten the probability of followingcriminal trajectories. For example, socioeconomic disadvantage is likely to impacton the family environment, where it may increase the probability of child maltreat-ment and poor parenting practices, which in turn place individuals at risk for enter-ing offending pathways (Stewart et al., 2006; Weatherburn, Fitzgerald, & Hua,2003). Given the disparities between Indigenous and non-Indigenous young peoplein terms of socioeconomic disadvantage and remoteness, which are highlighted inTable 1, these factors should be taken into account in order to disentangle therelationship between race and crime in Australia.
Cross-sectional research exploring the relationship between socioeconomic statusand juvenile offending indicates that offenders are more likely to have highly disad-vantaged backgrounds (33%) and are less likely to have highly advantagedbackgrounds (5%) than the general population (18% and 15% respectively) and thatthis disparity is much greater for Indigenous offenders (Lynch et al., 2003). Whileothers have found a relationship between socioeconomic status and delinquency inearly adolescence, findings suggest that this relationship is almost entirely mediatedby parental management skills (Larzelere & Patterson, 1990; Simons, Wu, Conger, &Lorenz, 1994). Offending has also been found to be highest in ‘highly accessible or
350
MICHAEL LIVINGSTON, ANNA STEWART, TROY ALLARD AND JAMES OGILVIE
THE AUSTRALIAN AND NEW ZEALAND JOURNAL OF CRIMINOLOGY
TABLE 1
Social and Economic Indicators from 2001 Census by Indigenous Status, Queensland (ABS, 2001)
Indigenous Non-Indigenous
Median weekly income $600–$699 $800–$899
Unemployment rate 20% 8%
% completed grade 10 60% 48%
% with university qualifications 2% 10%
% households living in public housing 30% 2%
% living in very remote regions 15% 1%

very remote areas rather than those in-between’ because of factors associated withlocation such as population size and unemployment (Carcach, 2000, p. 1).
While these findings may be used to target developmental crime preventioninitiatives towards young people who are at risk of offending, the most effectivetime to intervene remains unclear because focus has been on the retrospectiveidentification of risk factors associated with entire cohorts. Developmental preven-tion aims to intervene at various life phases that are linked to negative pathwayssuch as offending (Farrington, 1994; Guerra, 1997; Johnson, 1987; Tremblay &Craig, 1995). Intervention takes place through programs that aim to divert a personfrom a negative to a positive pathway. This is achieved through addressing thecauses of crime via reducing the number of risk factors, which decreases a person’ssusceptibility to criminal behaviour and through increasing the protective factors,which enables individuals to resist criminal behaviour in difficult situations(Farrington, 1994). Given the central role that the timing of interventions has fordevelopmental crime prevention, it is remiss that few offending trajectory studieshave been conducted in Australia.
The current study will use the Semi-Parametric Group-based Method (SPGM)to model the juvenile offending patterns of the 1983–84 Queensland offendercohorts (n = 4,470) and explore three research questions: (1) How many distinctoffending trajectories could be identified and what was the nature of these trajecto-ries? (2) How were sex, Indigenous status, socioeconomic disadvantage, and remote-ness related to offending trajectory membership? and (3) Are juvenile offendingtrajectories predictors of adult offending? The findings of the research will improveour understanding of the nature of juvenile offending.
MethodSummary of the Offending CohortAn offending cohort of 4,470 Queenslanders born in 1983 and 1984 with at leastone finalised juvenile court appearance (ages 10–16 years) was used in the currentstudy. In Queensland, Australia the Juvenile Justice Act 1992 defines a juvenile as ayoung person from the age of 10 to 17 years. Sixty per cent of the cohort were non-Indigenous males. There were similar numbers of Indigenous male (17%) and non-Indigenous female (17%) offenders and Indigenous females made up the smallestoffender group (6%). In 2000, 48.5% of the population of 17-year-olds were non-Indigenous males, 2.2% were Indigenous males, 47% were non-Indigenous femalesand 2.3% were Indigenous females (ABS, 2001).
Offending data included all court appearances where there was a finalisation foran offence. In addition, for these young offenders, all formal police cautions were alsoincluded in the dataset. Under the Juvenile Justice Act 1992 police have the discre-tion to divert young people from formal processing through the courts by issuing aformal caution to young people who admit guilt. The 4,470 juvenile offenders wereresponsible for 11,713 court appearances and 3,920 police cautions. Over the 6-yearperiod, each young person had an average of 3.5 offending events, with a range from1 to 25. Indigenous males (M = 5.3, SD = 4.3) and females (M = 4.1, SD = 3.5) hadmore offending events than non-Indigenous males (M = 3.2, SD = 2.7) or females(M = 2.5, SD = 1.8).
351
UNDERSTANDING JUVENILE OFFENDING TRAJECTORIES
THE AUSTRALIAN AND NEW ZEALAND JOURNAL OF CRIMINOLOGY

Slightly more than one-tenth of juvenile offenders lived in areas of socioeco-nomic disadvantage and about 5% lived in remote areas. Nearly one-fifth ofIndigenous offenders (19%) lived in disadvantaged areas compared with 8% of non-Indigenous offenders. Likewise, Indigenous offenders were disproportionately fromremote locations (15%) when compared with non-Indigenous offenders (1%).
Dataset Linking and CleaningInformation on juvenile offending was obtained from two sources, Department ofFamilies (DoF) and Queensland Police Service (QPS). The DoF dataset recordedinformation for each separate court appearance including the matter that the childwas appearing for, whether the offence was finalised, final outcome categories andinformation relating to the child such as unique identifier, date of birth, birthplace,sex, Indigenous status and the statistical local area where the child lived includingthe suburb and postcode. Children are assigned a unique numeric identifier and4,539 unique children were identified. However, 69 children were removed becausethey died prior to the age of 17, did not reside in Queensland or were not agedbetween 10 and 17 when they appeared in court.
The QPS data included all recorded police cautions for juvenile offending foryoung people born in 1983 or 1984. For each caution issued information wasrecorded about the suburb where it was issued, who was responsible for issuing thecaution and the offence/s committed. While identifying information such as theyoung person’s name, sex, and date of birth was collected there was no uniqueidentifier. Consequently, to identify the number of police cautions any one youngperson had received, data were sorted and manually inspected to identify and linkindividual young people. These data were then similarly linked to the DoF data onname, date of birth and gender.
Adult OffendingInformation on adult offending by people born in 1983 and 1984 was obtained fromthe Department of Justice and Attorney General (DJAG) and linked to the juvenileoffending data based on personal information (name, sex and date of birth). Thislinking was carried out in 2001 when the juvenile offender cohorts were 19 or 20years old. Consequently, the young offenders had between two and four years toreoffend as adults, depending on their date of birth. The young offenders wereassigned a ‘yes’ or ‘no’ value for adult offending based on whether they had afinalised court appearance in the adult system. A comparison of the adult offendingrates of juvenile offenders born in 1983 and those born in 1984 suggested that theimpact of these differences in follow-up time was minimal. Just over one-third of the1983 (37%) and 1984 (41%) cohorts had progressed to adult offending.
Remoteness of Residence and Socioeconomic DisadvantageRemoteness of residence and socioeconomic disadvantage were based on theStatistical Local Area (SLA) where the juvenile resided at the time of theirfinalised court appearance (based on the DoF dataset) or the suburb where cautionswere issued (based on the QPS dataset). The remoteness of SLAs was based on theAccessibility and Remoteness Index of Australia (ARIA) that provides a level of
352
MICHAEL LIVINGSTON, ANNA STEWART, TROY ALLARD AND JAMES OGILVIE
THE AUSTRALIAN AND NEW ZEALAND JOURNAL OF CRIMINOLOGY

accessibility ranging from one to five (highly accessible to very remote) (ABS, 2001).Socioeconomic disadvantage was based on the Index of Relative Socio-EconomicDisadvantage (IRSED) that provides a continuous value for socioeconomic disad-vantage for suburbs (ABS, 2001). These indices have been used in a large numberof other research projects and are widely regarded as a valid measure of the socialphenomena they represent (see for example, Carcach, 2000; Lynch et al., 2003).
Assigning a single value for remoteness and socioeconomic disadvantage wasstraightforward for offenders who resided in the same SLA or had the same suburb foreach of their contacts with the justice system. However, aggregate values for thesetwo indices had to be produced for offenders who resided over time in more than oneSLA or suburb. As the IRSED is a continuous value, an average value of the indexwas created to reflect the different locations where young people resided over thecourse of their juvenile offending histories. As the ARIA only provided a categoricallevel of remoteness, offenders were assigned a remoteness level based on whicheverlevel was most common over their offending career. To simplify the analysis, thesetwo measures were transformed into binary variables so that each young person wasclassified as ‘remote’ or ‘not remote’ and ‘disadvantaged’ or ‘not disadvantaged’.
Model SelectionThe Semi-Parametric Group-based Method (SPGM) was used to develop models ofthe distinct offending trajectories for the 4,470 offenders in the cohort. The SPGManalysis was undertaken using the SAS procedure TRAJ developed by Jones, Naginand Roeder (2001). As the majority of young people in the cohort offended for onlyshort periods of time, there was an excess of data cells with zero counts for offend-ing. Because of this, the offending count data was distributed according to the Zero-Inflated Poisson distribution (ZIP; Fergusson et al., 2000; Nagin, 1999). Thisdistribution can simply be defined as a standard Poisson distribution with a greaternumber of zeros than would normally be expected.
Due to the nonparametric nature of the procedure being used, it was necessaryto specify the number of trajectory groups being modelled and the form of thesetrajectories (i.e., cubic, quadratic, linear, etc.) prior to analysis. In other words, theSPGM method does not determine the number of distinct classes of trajectories,rather this is assumed a priori. Further, it was also necessary to specify the form ofthe trajectories prior to developing the models. Thus, the development of the finalmodel was necessary iterative, with the process being repeated a number of times todetermine the parameters (i.e., the number of trajectories and their forms) thatproduced the best fit for the data.
The final number of trajectories for the model was based on both the BayesianInformation Criteria (BIC) and the average probability of assignment. The BICincreases as the model fit improves (incorporating the penalty for increases in thenumber of trajectories), while the average probability of assignment is higher formodels with more distinct trajectories. Thus, the model with the optimum numberof trajectories needed to have a high BIC (relative to other model options) and anaverage probability of group membership that was as close to one as possible.
353
UNDERSTANDING JUVENILE OFFENDING TRAJECTORIES
THE AUSTRALIAN AND NEW ZEALAND JOURNAL OF CRIMINOLOGY
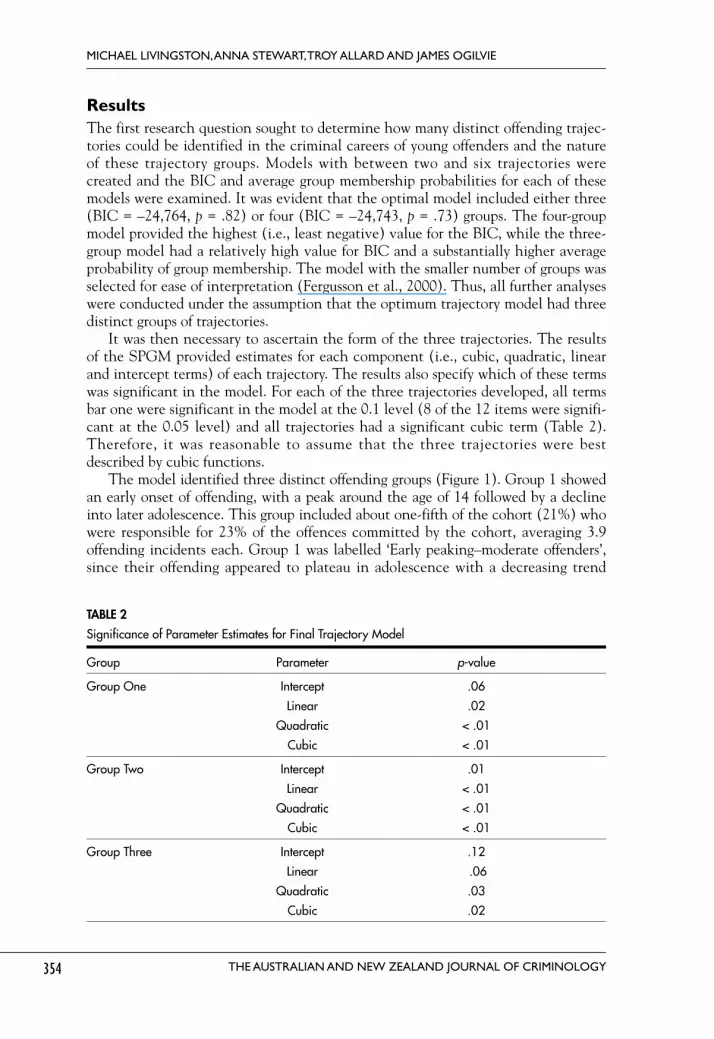
ResultsThe first research question sought to determine how many distinct offending trajec-tories could be identified in the criminal careers of young offenders and the natureof these trajectory groups. Models with between two and six trajectories werecreated and the BIC and average group membership probabilities for each of thesemodels were examined. It was evident that the optimal model included either three(BIC = –24,764, p = .82) or four (BIC = –24,743, p = .73) groups. The four-groupmodel provided the highest (i.e., least negative) value for the BIC, while the three-group model had a relatively high value for BIC and a substantially higher averageprobability of group membership. The model with the smaller number of groups wasselected for ease of interpretation (Fergusson et al., 2000). Thus, all further analyseswere conducted under the assumption that the optimum trajectory model had threedistinct groups of trajectories.
It was then necessary to ascertain the form of the three trajectories. The resultsof the SPGM provided estimates for each component (i.e., cubic, quadratic, linearand intercept terms) of each trajectory. The results also specify which of these termswas significant in the model. For each of the three trajectories developed, all termsbar one were significant in the model at the 0.1 level (8 of the 12 items were signifi-cant at the 0.05 level) and all trajectories had a significant cubic term (Table 2).Therefore, it was reasonable to assume that the three trajectories were bestdescribed by cubic functions.
The model identified three distinct offending groups (Figure 1). Group 1 showedan early onset of offending, with a peak around the age of 14 followed by a declineinto later adolescence. This group included about one-fifth of the cohort (21%) whowere responsible for 23% of the offences committed by the cohort, averaging 3.9offending incidents each. Group 1 was labelled ‘Early peaking–moderate offenders’,since their offending appeared to plateau in adolescence with a decreasing trend
354
MICHAEL LIVINGSTON, ANNA STEWART, TROY ALLARD AND JAMES OGILVIE
THE AUSTRALIAN AND NEW ZEALAND JOURNAL OF CRIMINOLOGY
TABLE 2
Significance of Parameter Estimates for Final Trajectory Model
Group Parameter p-value
Group One Intercept .06
Linear .02
Quadratic < .01
Cubic < .01
Group Two Intercept .01
Linear < .01
Quadratic < .01
Cubic < .01
Group Three Intercept .12
Linear .06
Quadratic .03
Cubic .02

towards the end of the follow-up period. Group 2 had little or no evidence of offend-ing behaviour in the early teen years with a gradual increase up until the age ofsixteen. This was the largest group of offenders and included over two-thirds of thesample (68%) who were responsible for 44% of the cohort’s offending, averaging 2.3offending incidents each. Group 2 was labelled ‘Late onset–moderate offenders’ astheir offending began at a comparatively later age and continued to increase throughlater adolescence. The third group demonstrated an early onset of offending with asharp increase throughout the time-frame. This was the smallest of the cohortsidentified by the model, containing 11% of offenders, who were responsible for abouta third (33%) of offending by the cohort, averaging 11 offending incidents each.Group 3 was labelled ‘Chronic offenders’.
The second research question explored whether sex, Indigenous status, socio -economic disadvantage and remoteness were related to offending trajectorymembership. Univariate analyses were conducted to determine whether trajec-tory group membership was independently related to each of these four factorsto determine which factors should be included in the multinominal logisticregression (Table 3). Results indicated that sex, Indigenous status, and socioeco-nomic disadvantage were related to offending trajectory group membershipwhile remoteness was not related to group membership.
One multinominal logistic regression was then performed using sex (male/female), Indigenous status (Indigenous or non-Indigenous), and socioeconomicdisadvantage (disadvantaged or not disadvantaged) as the independent variables
355
UNDERSTANDING JUVENILE OFFENDING TRAJECTORIES
THE AUSTRALIAN AND NEW ZEALAND JOURNAL OF CRIMINOLOGY
FIGURE 1
Three-group trajectory model of offending for Queensland offenders born in 1983 or 1984.
11
1
1
1
1
1
2 2 2 2
2
2
2
3
3
3
3
3
3
3
0
0.5
1
1.5
2
2.5
3
10 11 12 13 14 15 16
Age
An
nu
al o
ffen
ces
Group 1: Early peaking-moderate offenders Group 2: Late onset-moderate offenders Group 3: Chronic offenders

356
MICHAEL LIVINGSTON, ANNA STEWART, TROY ALLARD AND JAMES OGILVIE
THE AUSTRALIAN AND NEW ZEALAND JOURNAL OF CRIMINOLOGY
TABLE 3
Offending Trajectory Group Membership by Sex, Indigenous Status, Remoteness and Socioeconomic Disadvantage
Offending trajectory
Early peaking– Late peaking– Chronicmoderate moderate offendersoffenders offenders
n % n % n % χ2
Sex
Male 701 20.4 2317 67.3 425 12.3
Female 222 21.6 741 72.2 64 6.2 30.35***
Indigenous status
Indigenous 234 22.4 562 53.8 249 23.8
Non-Indigenous 689 20.1 2496 72.9 240 7.0 251.77***
Remoteness
Accessible 875 20.5 2932 68.7 459 10.8
Remote 48 23.5 126 61.8 30 14.7 5.01
SES disadvantage
Advantaged 825 20.7 2753 69.0 414 10.4
Disadvantaged 98 20.5 305 63.8 75 15.7 12.71*
Note: *p < .05; ***p < .001
and group membership (Early peaking–moderate offenders, Late onset–moderateoffenders and Chronic offenders) as the dependent variable. The proportion ofvariance in group membership accounted for using these factors was small (6%) andthe classification accuracy of the model was 68.4%. The parameter estimates for themultinominal model are displayed in Table 4, which compares group 1 (Earlypeaking–moderate offenders) and group 2 (Late onset–moderate offenders) withgroup 3 (Chronic offenders).
Indigenous status and sex were related to group membership and after these factorswere controlled for, socioeconomic disadvantage was no longer significantly related togroup membership. Indigenous offenders were 4.7 times more likely than non-Indigenous offenders to be Chronic offenders rather than Late onset–moderate offend-ers and 3.1 times more likely to be Chronic offenders than Early peaking–moderateoffenders. Male offenders were more than twice as likely as female offenders to bemembers of the Chronic offending group than either of the two other groups.
The third research question explored whether the trajectories fitted by themodel predicted adult offending. One chi-square analysis was performed thatexplored the association between group membership (independent variable) andwhether offenders had a finalised adult court appearance (dependent variable).Findings indicated that Chronic offenders were around twice as likely as offendersin either of the other two offending groups to have a finalised adult court appear-ance (χ2 = 188.13, N = 4470, df = 2, p < .001). More than two-thirds (67%) of

Chronic offenders had recorded adult offences in the follow-up period, comparedwith 33% of Early peaking-moderate offenders and 36% of Late onset-moderateoffenders (Table 5).
DiscussionThe present research is one of the few Australian studies to employ a trajectoryanalysis methodology using an offender cohort. Largely consistent with interna-tional offending trajectory studies, the present study identified three distinct offend-ing patterns within the Queensland 10- to 17-year-old offender cohort. The threetrajectories displayed key differences in the shape and rate of annual offences acrosstime. The trajectories were labelled Early peaking–moderate offending (21% of thecohort), Late onset–moderate offending’ (68% of the cohort) and Chronic offend-ing (11% of the cohort). Between-group differences were observed in offence trajec-tories and the predictive utility of the covariates of Indigenous status and sex on
357
UNDERSTANDING JUVENILE OFFENDING TRAJECTORIES
THE AUSTRALIAN AND NEW ZEALAND JOURNAL OF CRIMINOLOGY
TABLE 4
Multinomial Logistic Regression Analysis of Offending Trajectory Group Membership as a Function ofSex, Indigenous Status and Socioeconomic Disadvantage (Base Reference Group is Chronic Offenders)
Comparison β SE Wald df Odds 95% CIratio Lower Upper
Early peaking–moderate offenders
Non-Indigenous vs. Indigenous 1.114 0.12 89.8*** 1 3.13 2.47 3.96
Male vs. female –0.832 0.16 28.2*** 1 0.44 0.32 0.59
S.E. advantage vs. disadvantage 0.162 0.17 0.9*** 1 1.18 0.84 1.64
Constant 0.463 0.21 5.0*** 1
Late onset–moderate offenders
Non-Indigenous vs. Indigenous 1.554 0.10 222.7*** 1 4.73 3.86 5.80
Male vs. female –0.866 0.14 36.1*** 1 0.42 0.32 0.56
Socioeconomic advantagevs. disadvantage 0.151 0.15 1.1*** 1 1.16 0.87 1.56
Constant 1.372 0.18 55.7*** 1
Note: *p < .05; ***p < .001
TABLE 5
Offending as an Adult by Adolescent Offending Trajectory Group Membership
Adult OffendingYes No
Offending trajectory n % n %
Early peaking-moderate offenders 308 33.4 615 66.6
Late peaking-moderate offenders 1102 36.0 1956 64.0
Chronic offenders 329 67.3 160 32.7

trajectory group membership. Specifically, both Indigenous and male offenders weremore likely than non-Indigenous and female offenders to be in the ChronicOffenders group. This result highlights the importance of sex and race in under-standing the development of offending within the Australian context; it alsosupports the findings of Marshall (2006), who found Indigenous and male youths tobe highly overrepresented in trajectory groups characterised by moderate to highfrequency, early onset and serious offending.
These results are very similar to those identified in the review of trajectoryanalyses studies conducted by Piquero (2008). In support of Moffitt’s (1993) theoris-ing that there are two distinct types of offenders, this study identified a group thatappears to be adolescent limited (Early peaking–moderate offenders), in that theiroffending began in early adolescence, peaked around 14 years of age and appearedto decline in later adolescence, and comprised about one-fifth (21%) of the offend-ing cohort. Also identified was an early onset Chronic offenders group, whichcomprised one-tenth (11%) of young people who offended. As with previousresearch, this small group of habitual chronic offenders was found to be responsiblefor a considerable amount (33%) of the cohort’s offending. Given the shape of thechronic offending trajectory and the high proportion of this group (67%) whooffended as adults during the follow-up period, the findings are consistent withMoffitt’s (1993) proposition that early onset of offending is an indicator of persis-tent offending and that a small group of life course persistent offenders are responsi-ble for a large proportion of offending.
The chronic trajectory comprised 11% of the total offender cohort, or 0.44% ofall individuals born in Queensland in 1983–84. This finding does not conform withprevious offending trajectory studies using birth cohorts, which on average tend tofind chronic offending trajectories comprise between 5 to 15% of the total cohort(e.g., D’Unger et al., 1998). However, studies using official records (convictions) asthe dependent variable appear to classify lower population proportions as chronicoffenders. For example, results from analysis of the 1972 birth cohort from Dunedin,New Zealand, indicated that the highest offending frequency latent class comprisedless than 1% of the population (Piquero et al., 2005). It is likely that the proportionof individuals identified as chronic offenders in trajectory analyses depends partlyon the nature of the cohort (birth vs. offender cohort), as well as the measure ofoffending (official vs. self-report measures).
Consistent with the late onset chronic group (late onset–moderate offenders)identified by Piquero (2008) this study also identified a third offending group. Thisgroup commenced offending at the age of 15 and 33% of them continued on intoadulthood. Further trajectory analysis with data that continues past the age of 16 isrequired to confirm this group. The existence of this group is not consistent withMoffitt’s (1993) developmental taxonomy of offenders or other developmentaltheories (Chung et al., 2002; D’Unger et al., 1998; Fergusson & Horwood, 2002;Marshall, 2006; Silverthorn et al., 2001). The observation of a late onset group ofoffenders in the present study further highlights the need for criminological theoryand research to explain the developmental processes underlying the offending of theindividuals predicted to be within this trajectory.
The design of the present study did not allow for an examination of the explana-tory validity of population heterogeneity and state dependence explanations of
358
MICHAEL LIVINGSTON, ANNA STEWART, TROY ALLARD AND JAMES OGILVIE
THE AUSTRALIAN AND NEW ZEALAND JOURNAL OF CRIMINOLOGY

continuity in criminal offending. That is, time-stable and time-varying individualcharacteristics were not measured in the present study. However, the present resultsdid indicate that there was a substantial degree of continuity in criminal behaviourfrom early adolescence to late adolescence and early adulthood as measured byofficial court appearance data. It is likely that the present study would havedisplayed strong support for the population heterogeneity position if time-stable andtime-varying characteristics were measured, as Nagin and Paternoster (2000) reportthat high-risk samples based on official data are more likely to show strong evidencein support of such a position.
Consequently, the results of the present study may be interpreted as providingtentative support to the DLC assumption that different offence patterns may beexplained by unique causal processes, where offenders differ in kind as well asdegree. For example, evidence from the present study indicated that the composi-tion of the groups differed significantly according to the covariates of sex andIndigenous status. While this does not directly indicate that different etiologicalprocesses operate across different offending groups, it suggests that certain individu-als experience greater levels of risk or may be more susceptible to developmentalprocesses leading to offending behaviour.
Despite the important findings of the current study, the research should be inter-preted in light of four main limitations. First, the study used official records (caution-ing and finalised court appearances) to measure offending. Therefore, it may onlyrepresent a fraction of actual offending that comes to the attention of justice agencies,may represent more serious cases and may overrepresent those with a low socioeco-nomic status due to biases in agency activity (Brown, 1984; Widom, 1989). Second,the trajectory model developed in the current study was based on a relatively smallage range (10–16 years) when compared to other studies. While the interaction thatthese young people have had with the justice system may be accurately approximatedbased on offence histories, whether these groups will remain in the future with theaddition of adult appearance data remains a matter for speculation (D’Unger et al.,1998). Piquero (2008) emphasises that the number of latent offending groups identi-fied is likely to vary according to the time span of a study, where longer study periodsyield more trajectories. This may help explain why the current study found only threegroups, since the sample was only followed up to 17 years. Furthermore, the limitedage range likely contributed to the observation that only one group identified in thepresent study (Early peaking–moderate offending) displayed a trend towardsdesistence. Previous longitudinal research indicates that most offenders appear to beon a trajectory towards desistance from criminal activity (Piquero et al., 2002;Piquero, Farrington, & Blumstein, 2007). The current study period did not cover theearly 20s, which is where desistance processes appear to be in operation (Farrington,2003a; Piquero et al., 2007). Future research on the present cohort should attempt toexamine the processes of desistance as offenders enter early adulthood.
Third, the study could not fully take into account attrition of the sample throughdeath or population mobility. It is likely that there were a number of people in thecohort who died or moved outside of Queensland and were included in the finaltrajectory model. Evidence suggests that taking into account cohort sample attritionmay result in some variation in the final model that is identified (Eggleston et al.,2004). Finally, the current study did not control for the effects of exposure time, the
359
UNDERSTANDING JUVENILE OFFENDING TRAJECTORIES
THE AUSTRALIAN AND NEW ZEALAND JOURNAL OF CRIMINOLOGY

amount of time that an individual is restricted from engaging in criminal behaviourin public due to incapacitation, which has been argued to be essential in calculatingunbiased estimates of individual rates of offending (Piquero et al., 2001). However,in Queensland, young offenders are rarely incarcerated and are incarcerated for shortperiods of time. The average number of young people in detention at any one time is150 and the average length of time in custody is less than 3 months. Earlier investi-gation found negligible effects of incapacitation on rate of offending (Stewart,Spencer, O’Connor, Palk, Livingston, & Allard, 2004).
While further studies are required to develop tools more capable of prospectively(rather than retrospectively) identifying chronic offenders, the findings of thecurrent study highlight the crucial importance of the early years of life and the needto target crime prevention initiatives towards the chronic offending group, as this islikely to result in significant reductions in crime. This study should thereforeprovide a starting point by alerting policy makers to the existence of a small groupof offenders that pose the largest long-term concern for the justice system. Thissmall group has an early onset of delinquency, engage in criminal activity over theentirety of their teenage years, and are more likely to be Indigenous and male. Theresults of this study represent an initial step towards modelling the offence patternsof Australian offenders and identifying those individuals to which developmentalinterventions may be most effectively targeted to prevent future offending.
AcknowledgmentsThe authors would like to thank the Department of Families (renamed theDepartment of Communities), Queensland Police Service, and the Department ofJustice and Attorney General for the assistance they provided with this project.
ReferencesAustralian Bureau of Statistics. (2001). Australian census of population and housing:Indigenous community
profiles: Queensland. Canberra: Australian Bureau of Statistics.Australian Bureau of Statistics. (2006). Census of population and housing. Canberra: Australian Bureau
of Statistics.Blumstein, A., Cohen, J., Roth, J., & Visher (Eds.). (1986). Criminal careers and “career criminals”.
Report of the National Academy of Sciences Panel on research on criminal careers. Washington, DC:National Academy Press.
Blumstein, A., Cohen, J., & Farrington, D. (1988). Longitudinal and criminal career research: Furtherclarifications. Criminology, 26, 57–74.
Brame, R., Bushway, S.D., Paternoster, R., & Thornberry, T.P. (2005). Temporal linkages in violent andnonviolent criminal activity. Journal of Quantitative Criminology, 21(2), 149–174.
Broadhurst, R. (1997). Aborigines and crime in Australia. In M. Tonry (Ed.), Ethnicity, Crime, andImmigration: Comparative and Cross-National Perspectives. (Crime and Justice: A Review ofResearch, Vol. 21, pp. 407–468). Chicago: University of Chicago Press.
Broidy, L.M., Nagin, D.S., Tremblay, R.E., Bates, J.E., Brame, B., Dodge, K.A., Fergusson, D., Horwood,J.L., Loeber, R., Laird, R., Lynam, D.R., Moffitt, T.E., Pettit, G.S., & Vitaro, F. (2003).Developmental trajectories of childhood disruptive behaviors and adolescent delinquency: A six-site, cross-national study. Developmental Psychology, 39(2), 222–245.
Brown, S. (1984). Social class, child maltreatment, and delinquent behavior. Criminology, 22 (2), 259–278.
360
MICHAEL LIVINGSTON, ANNA STEWART, TROY ALLARD AND JAMES OGILVIE
THE AUSTRALIAN AND NEW ZEALAND JOURNAL OF CRIMINOLOGY

Cain, M. (1997, June). An analysis of juvenile recidivism. Paper Presented at Australian Institute ofCriminology Conference, Juvenile Crime and Juvenile Justice: Toward 2000 and Beyond,Adelaide, Australia.
Carcach, C. (2000). Size, accessibility and crime in regional Australia. Trends and Issues in Crime andCriminal Justice, No. 175. Canberra, Australia: Australian Institute of Criminology.
Carcach, C., & Leverett, S. (1999). Recidivism among juvenile offenders: An analysis of times to r eappear-ance in court. Canberra, Australia: Australian Institute of Criminology.
Cernkovich, S.A., & Giordano, P.C. (2001). Stability and change in antisocial behavior: The transition from adolescence to early adulthood. Criminology, 39(2), 371–410.
Chen, S., Matruglio, T., Weatherburn, D., & Hua, J. (2005). The transition from juvenile to adultcriminal careers. Crime and Justice Bulletin: Contemporary Issues in Crime and Justice (No. 86).Sydney, Australia: NSW Bureau of Crime Statistics and Research.
Chung, I.J., Hill, K.G., Hawkins, J.D., Gilchrist, L.D., & Nagin, D.S. (2002). Childhood predictors ofoffence trajectories. Journal of Research in Crime and Delinquency, 39(1), 60–90.
D’Unger, A., Land, K., McCall, P. & Nagin, D. (1998). How many latent classes of delinquent/criminalcareers? Results from mixed Poisson regression analyses. American Journal of Sociology, 103, 1593–1630.
Department of Families, Youth, and Community Care. (1998). Juvenile offending and recidivism inQueensland. Queensland: Juvenile Justice Branch.
Eggleston, E., Laub, J., & Sampson, R. (2004). Methodological sensitivities to latent class analysis oflong-term criminal trajectories. Journal of Quantitative Criminology, 20(1), 1–26.
Elder, G.H., Jr. (1994). Time, human agency, and social change: Perspectives on the life course. SocialPsychology Quarterly, 57(1), 4–15.
Ezell, M.E. (2007). The effect of criminal history variables on the process of desistance in adulthoodamong serious youthful offenders. Journal of Contemporary Criminal Justice, 23(1), 28–49.
Farrington, D.P. (2003a). Key results from the first forty years of the Cambridge Study in DelinquentDevelopment. In T.P. Thornberry & M. Krohn (Eds.), Taking stock of delinquency: An overview offindings from contemporary longitudinal studies (pp. 137–184). New York: Kluwer.
Farrington, D.P. (2003b). Developmental and life-course criminology: Key theoretical and empiricalissues — The 2002 Sutherland Award Address. Criminology, 41(2), 221–255.
Farrington, D. (1994). Early developmental prevention of juvenile delinquency. Criminal Behaviour andMental Health, 4, 209–226.
Farrington, D.P., & West, D.J. (1990). The Cambridge Study in Delinquent Development: A long-termfollow-up of 411 London males. In H.J. Kerner and G. Kaiser (Eds.), Criminality: Personality,Behaviour, Life History. Berlin: Springer-Verlag.
Fergusson, D., Horwood, L., & Nagan, D. (2000). Offending trajectories in a New Zealand birthcohort. Criminology, 38(2), 525–551.
Fergusson, D & Horwood, L. (2002). Male and female offending trajectories. Development andPsychopathology, 14, 159–177.
Francis, B., Soothill, K., & Fligelstone, R. (2004). Identifying patterns and pathways of behaviour: A new approach to typologies of crime. European Journal of Criminology, 1(1), 47–87.
Gottfredson, M., & Hirschi, T. (1990). A general theory of crime. Stanford, CA: Stanford UniversityPress.
Guerra, N. (1997). Intervening to prevent childhood aggression in the inner city. In J. McCord (Ed.),Violence and childhood in the inner city. Cambridge: Cambridge University Press.
Johnson, E. (1987). Handbook on crime and delinquency prevention. New York: Greenwood Press.Jones, B., Nagin, D., & Roeder, K. (2001). A SAS procedure based on mixture models for estimating
developmental trajectories. Sociological Methods and Research, 29(3), 374–393.
361
UNDERSTANDING JUVENILE OFFENDING TRAJECTORIES
THE AUSTRALIAN AND NEW ZEALAND JOURNAL OF CRIMINOLOGY
Kokko, K., Tremblay, R.E., Lacourse, E., Nagin, D.S., & Vitaro, F. (2006). Trajectories of prosocialbehavior and physical aggression in middle childhood: Links to adolescent school dropout andphysical violence. Journal of Research on Adolescence, 16(3), 403–428.
Kreuter, F., & Muthén, B. (2008). Analyzing criminal trajectory profiles: Bridging multilevel and group-based approaches using growth mixture modeling. Journal of Quantitative Criminology, 24, pp. 1–31.
Larzelere, R., & Patterson, G. (1990). Parental management: Mediator of the effect of socio-economicstatus on early delinquency. Criminology, 28(2), 301–323.
Lynch, M., Buckman, J., & Krenske, L. (2003). Youth justice: Criminal trajectories. Trends and Issues inCriminal Justice, No. 265. Canberra, Australia: Australian Institute of Criminology.
Marshall, J. (2006). Juvenile offending trajectories: A South Australian study. Adelaide, Australia: Office ofCrime Statistics and Research.
Moffitt, T.E. (1993). Life-course persistent and adolescence-limited anti-social behaviour: A develop-mental taxonomy. Psychological Review, 100, 674–701.
Moffitt, T.E. (1997). Adolescence-limited and life-course-persistent offending: A complementary pairof developmental theories. In T.P. Thornberry (Ed.), Developmental theories of crime and delinquency:Advances in criminological theory (Vol. 7, 11–54). New Jersey: Transaction Publishers.
Moffitt, T.E. (2006). Life-course-persistent versus adolescence-limited antisocial behavior. In D.Cicchetti & D.J. Cohen (Eds.), Developmental psychopathology (2nd ed., Vol. 3, pp. 570–598).Newark: John Wiley & Sons, Inc. .
Morgan, F. (1993, September). Contact with the juvenile system over the juvenile years. Paper presented atNational Conference on Juvenile Justice, Canberra, Australia.
Morgan, F., & Gardner, J. (1992). Juvenile justice. Adelaide, Australia: Office of Crime Statistics,Attorney-General’s Department.
Muthén, B.O., & Muthén, L.K. (2000). Integrating person-centered and variable-centered analyses:Growth mixture modeling with latent trajectory classes. Alcoholism: Clinical and ExperimentalResearch, 24, 882–891.
Nagin, D. (1999). Analyzing developmental trajectories: A semiparametric, group-based approach.Psychological Methods, 4(2), 139–157.
Nagin, D. & Land, L. (1993). Age, criminal careers, and population heterogeneity: Specification andestimation of a nonparametric, mixed Poisson model. Criminology, 31(3), 327–362.
Nagin, D., & Paternoster, R. (2000). Population heterogeneity and state dependence: State of theevidence and directions for future research. Journal of Quantitative Criminology, 16(2), 117–144.
Nagin, D., & Tremblay, R. (2005). What has been learned from group-based trajectory modelling?Examples from physical aggression and other problem behaviours. The Annals of the AmericanAcademy of Political and Social Sciences, 602, 82–117.
Nagin, D., & Tremblay, R.E. (1999). Trajectories of boys’ physical aggression, opposition, and hyperac-tivity on the path to physically violent and nonviolent juvenile delinquency. Child Development,70(5), 1181–1196.
National Crime Prevention. (1999). Pathways to prevention: Developmental and early interventionapproaches to crime in Australia. Canberra, Australia: Australian Government Publishing Service.Available online at http://www.ag.gov.au.
Paternoster, R., Dean, C.W., Piquero, A.R., Mazerolle, P., & Brame, R. (1997). Generality, continuity,and change in offending. Journal of Quantitative Criminology, 13(3), 231–266.
Piquero, A.R. (2008). Taking stock of developmental trajectories of criminal activity over the lifecourse. In A. Liberman (Ed.), The long view of crime: A synthesis of longitudinal research (pp. 23–78).New York: Springer.
Piquero, A.R., Blumstein, A., Brame, R., Haapanen, R., Mulvey, E.P., & Nagin, D. (2001). Assessingthe impact of exposure time and incapacitation on longitudinal trajectories of offending. Journal ofAdolescent Research, 16(1), 54–74.
Piquero, A.R., Brame, R., Mazerolle, P., & Haapanen, R. (2002). Crime in emerging adulthood.Criminology, 40(1), 137–169.
362
MICHAEL LIVINGSTON, ANNA STEWART, TROY ALLARD AND JAMES OGILVIE
THE AUSTRALIAN AND NEW ZEALAND JOURNAL OF CRIMINOLOGY

Piquero, A.R., Brame, R., & Moffitt, T.E. (2005). Extending the study of continuity and change:Gender differences in the linkage between adolescent and adult offending. Journal of QuantitativeCriminology, 21(2), 219–243.
Piquero, A., Farrington, D., & Blumstein, A. (2003a). The criminal career paradigm: background andrecent developments. Crime and Justice: A Review of Research, 30, 359–506.
Piquero, A.R., Farrington, D.P., & Blumstein, A. (2007). Key issues in criminal career research: newanalyses of the Cambridge Study in Delinquent Development. Cambridge: Cambridge University Press.
Sampson, R.J., & Laub, J.H. (1993). Crime in the making: Pathways and turning points through life.Cambridge, MA: Harvard University Press.
Sampson, R.J., & Laub, J.H. (2003). Life-course desisters? Trajectories of crime among delinquent boysfollowed to age 70. Criminology, 41(3), 301–340.
Sampson, R.J., & Laub, J.H. (2005). A life-course view of the development of crime. The Annals of theAmerican Academy, 602, 12–45.
Silverthorn, P., Frick, P.J., & Reynolds, R. (2001). Timing of onset and correlates of severe conductproblems in adjudicated girls and boys. Journal of Psychopathology and Behavioral Assessment, 23(3),171–181.
Simons, R., Wu, C., Conger, R., & Lorenz, F. (1994). Two routes to delinquency: Differences betweenearly and late starters in the impact of parenting and deviant peers. Criminology, 32(2), 247—275.
Stewart, A., Dennison, S., & Hurren, E. (2006). Juvenile offending trajectories: Pathways from childmaltreatment to juvenile offending and police cautioning in Queensland. Report to the CriminologicalResearch Council, Grant 35/03–04.
Stewart, A., Spencer, N., O’Connor, I., Palk, G., Livingston, M., & Allard, T. (2004). Juvenile justicesimulation model: A report on the Australian Research Council Strategic Partnerships with IndustryResearch and Training Grant No C00106983.
Taylor, N. (2006). Juveniles in detention in Australia, 1981–2005 (Technical and Background Paper No.22). Canberra, Australia: Australian Institute of Criminology.
Thornberry, T.P. (2005). Explaining multiple patterns of offending across the life course and acrossgenerations. The Annals of the American Academy, 602, 156–195.
Tremblay, R., & Craig, W. (1995). Developmental crime prevention. In M. Tonry & D. Farrington(Eds.), Strategic approaches to crime prevention: Building a safer society. Chicago: The University ofChicago Press.
Tyler, W. (1998). Race, crime and region: The socio-spatial dynamic of Aboriginal offending. Journal ofSociology, 34(2), 152–169.
Weatherburn, D., Fitzgerald, J., & Hua, J. (2003). Reducing Aboriginal over-representation in prison.Australian Journal of Public Administration, 67(3), 65–73.
Widom, C. S. (1989). Child abuse, neglect, and violent criminal behavior. Criminology, 27(2), 251—271.
Wiesner, M., Kim, H.K., & Capaldi, D.M. (2005). Developmental trajectories of offending: Validationand prediction to young adult alcohol use, drug use, and depressive symptoms. Development andPsychopathology, 17, 251–270.
Williams, R.K., & Arnold, B.L. (2002). Offence specialization among serious habitual juvenile offenders in a Canadian city during the early stages of criminal careers. International Criminal JusticeReview, 12, 1–21.
363
UNDERSTANDING JUVENILE OFFENDING TRAJECTORIES
THE AUSTRALIAN AND NEW ZEALAND JOURNAL OF CRIMINOLOGY
■ ■ ■