Embed Size (px)
Citation preview
1
TAKING UP UNCONVENTIONAL CHALLENGE IS A GAME CHANGER IN OIL
AND GAS INDUSTRY
Abdelaziz Khlaifat1,*
, Hani Qutob1, Naiem Barakat
2, Hocine Harhad
3, El Mahdi Yettou
3 and
Amine Mazouzi3
1Weatherford Oil Tool Middle East Ltd., Dubai, UAE
2Weatherford, Kuwait
3Sonatrach, PED, Algiers, Algeria
*Corresponding Author: [email protected]
ABSTRACT
With the increased global demands on oil and gas, operators strive to maximize
production by conducting more advanced drilling operations, such as extended reach,
horizontal and high-pressure/high-temperature (HP-HT) drilling and are expanding globally
into drilling unconventional resources. Unconventional gas resources offer significant gas
production growth potential in the coming years, currently accounting for 43% of the US gas
production. Tight Gas Sands (TGS) represents approximately 70% of the unconventional
production and significant reserves are yet to be developed.
However, economical production of TGS is very challenging as it exists in reservoirs
with micro-Darcy range permeability and low porosity but has a huge potential for
production in the future. Poor permeability results in lower gas production rates from TGS
reservoirs. In order to economically develop TGS resources an advanced technology has to be
developed and implemented. Most of the TGS reservoirs are characterized by being thick
(hundreds to thousands of feet thick) and multilayered where their gas production rates can be
enhanced by hydraulic fracturing. Although service companies have large capabilities for
conventional/unconventional reservoirs but the used technology to drill, complete and
stimulate tight gas reservoir is quite complex and the results are often unexpected and
unforeseen. The appropriate completion methods and stimulation techniques in these
reservoirs are dependent on many parameters and variables, such as depth, pressure,
temperature, capillary and overburden pressures and the number of sand layers.
This paper takes a multidisciplinary approach to better understand how gas can be
produced from tight gas sand and shale gas reservoirs. Three real case histories will be
presented; Risha gas field in eastern Jordan; Travis Peak formation in eastern Texas, USA;
and Saharan unconventional basins in Algeria.
INTRODUCTION
The International Energy Agency (IEA, 2005) predicted that oil supplies could rise as
high as 120m barrels a day by 2030. The 120m figure is debatable and can be influenced by
too many unseen factors. According to IEA there is a clear decline of „currently producing
fields‟, the clear oil peak took place right about 2004-2008, after which a massive increase in
„fields yet to be developed‟ followed by another big portion of „fields yet to be found.‟ An
increase in „non-conventional oil‟ and „natural gas liquids‟ encompasses out the supply
picture to meet the 120m figure. Based on this scenario the global oil production in total is
not expected to peak before 2030, production of conventional oil - crude oil is projected to
level off and become steady within the coming couple of years. Conventional crude oil
production alone increases only modestly over 2010-2030 – by a bit less than 5 mb/d - as
2
almost all the additional capacity from new oilfields is offset by declines in output at existing
fields.
The bulk of the net increase in total oil production comes from NGLs (driven by the
relatively rapid expansion in gas supply) and from unconventional resources and
technologies. Unconventional resources/reservoirs are defined as: tight gas; heavy oil; shale
gas; gas hydrate and coalbed methane reservoirs. These resources became a core business of
many large producers and a growing number of the majors.
A tight gas reservoir is one that cannot be produced at economic flow rates or recover
economic volumes of gas unless the well is stimulated by a large hydraulic fracture treatment
and/or produced using horizontal wellbores (Holditch, 2007, 2006). This definition also
applies to coalbed methane, shale gas, and tight carbonate reservoirs. There is no typical tight
gas reservoir, it can be: deep or shallow; high pressure or low pressure; high temperature or
low temperature; homogeneous or naturally fractured (heterogeneous); single or
multilayered; high transient decline rates; comingled production; require fracturing jobs
and/or horizontal well. In other words, tight gas is gas that is „trapped‟ in a very tight
formation underground, stored within low porosity and low permeability rock formations. A
great deal of effort has to be put into extracting this gas from a tight formation, such as
fracturing and acidizing.
In many basins, e.g. Rocky Mountain basins in the Western US, gas accumulations in
low permeability sandstones are associated with widespread gas shows while drilling and a
lack of associated water production where the productivity of wells drilled in these settings
varied dramatically (Law and Curtis, 2002). This suggested having localized areas with more
favorable rock properties, sweet spots, or the variations in drilling and completion technology
account for the productivity variability.
TGS DEVELOPMENT
The development of many tight gas sand fields that are productive today began in the
Western United States San Juan Basin. By 1970s, around 1 Tcf/year were produced
nationwide from the TGS. Then different fields were discovered including fields in East
Texas (Dew-Mimms Creek), the Piceance Basin of northwestern Colorado (Rulison, Mamm
Creek), the Green River Basin of Wyoming (Jonah, Pinedale, Wamsutter), and the Denver-
Julesberg Basin of Colorado (Wattenberg). Tight gas is predominantly a cost-effective issue.
Production is relative to technology development, well cost, stimulation cost and existing gas
price. As technology has developed, the permeability threshold in North America has
changed from less than 0.1mD in the 1970s to less than 0.01mD in the 1980s to less than
0.001mD (ultra tight) today (Holditch, 2006; Law and Curtis, 2002; Khlaifat and Qutob,
2010; Khlaifat, 1998). As a result, tight gas now makes a substantial contribution (about 30%
of produced gas) to USA gas supply. This figure was obtained based on the 70% contribution
of unconventional gas that accounts for 43% of the USA gas production. The technologies
that have allowed this are the ability to drill long horizontal wells, effective fracture
stimulation and reservoir characterization including developments in 3D seismic, special core
analysis, electric log data, and diagenetic and structural analysis.
In Europe, the higher cost base and ready access to “cheap” imported gas means that
tight gas development has been largely neglected, except in Germany where financial
incentives for tight gas exist. In Germany, tight reservoirs include reservoirs with effective
gas permeability less than 0.6 mD (DGMK, 2010). The potential resources of undiscovered
and tight gas in Germany are in the range of 50 to 150 billion cubic meters. Tight gas
developments are currently underway in Germany, offshore Holland and the UK, and efforts
are being made to develop basin centered gas accumulations in Central Europe.
3
Unconventional gas extracted from European territory is not expected to come to market for
at least a decade.
Recent developments in the gas sector caused by the application of new technology
have made unconventional gas resources available at competitive cost. A boom in
unconventional gas would also have considerable implications for different countries‟ energy
policy. Unconventional gas can play significant role in transforming any country‟s energy
supply situation, but this is accompanied by an extra cost of addressing the technological and
economic challenges unconventional gas faces as well as the questions of public acceptance.
RESOURCES
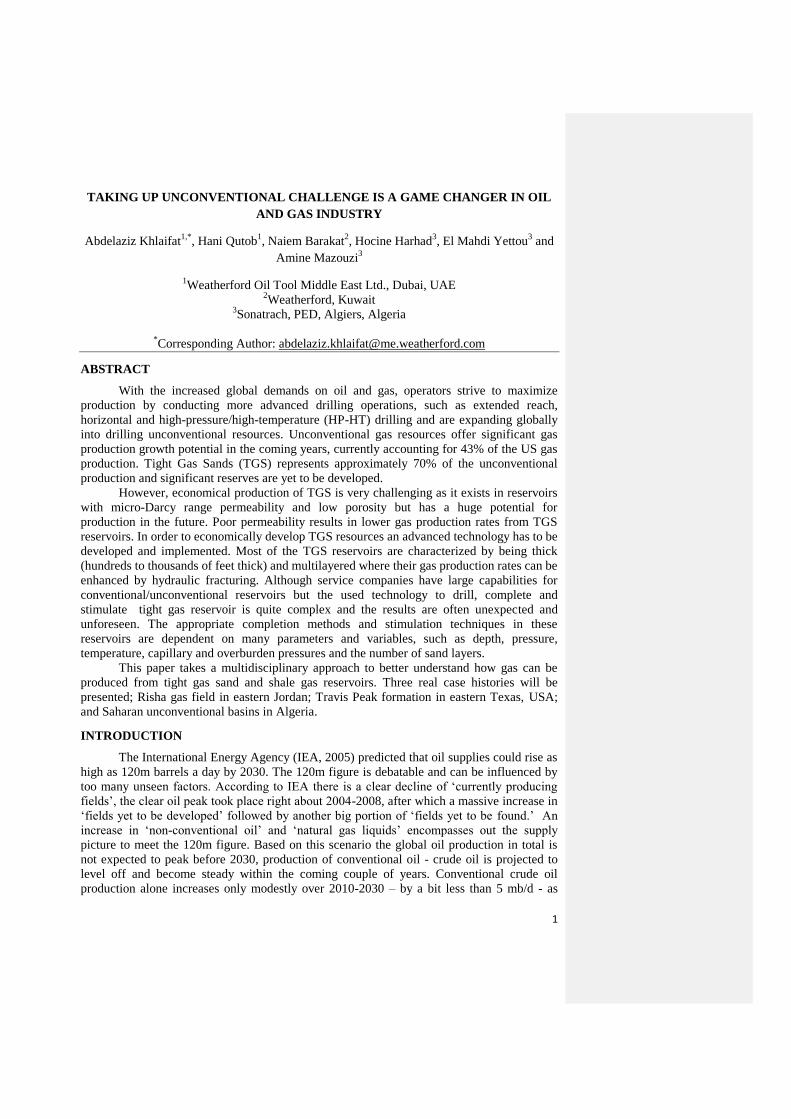
The world natural gas reserves by geographic region are shown in Figure 1
(Worldwide Look at Reserves and Production, 2008). From this figure one can see that the
largest resources of natural gas exist in the Middle East. The total volume of natural gas
reserves worldwide is 6,254 Tcf.
Figure 1: World Natural Gas Reserves by Geographic Region as of January 1, 2009 (World
Total Reserves: 6,254 Tcf)
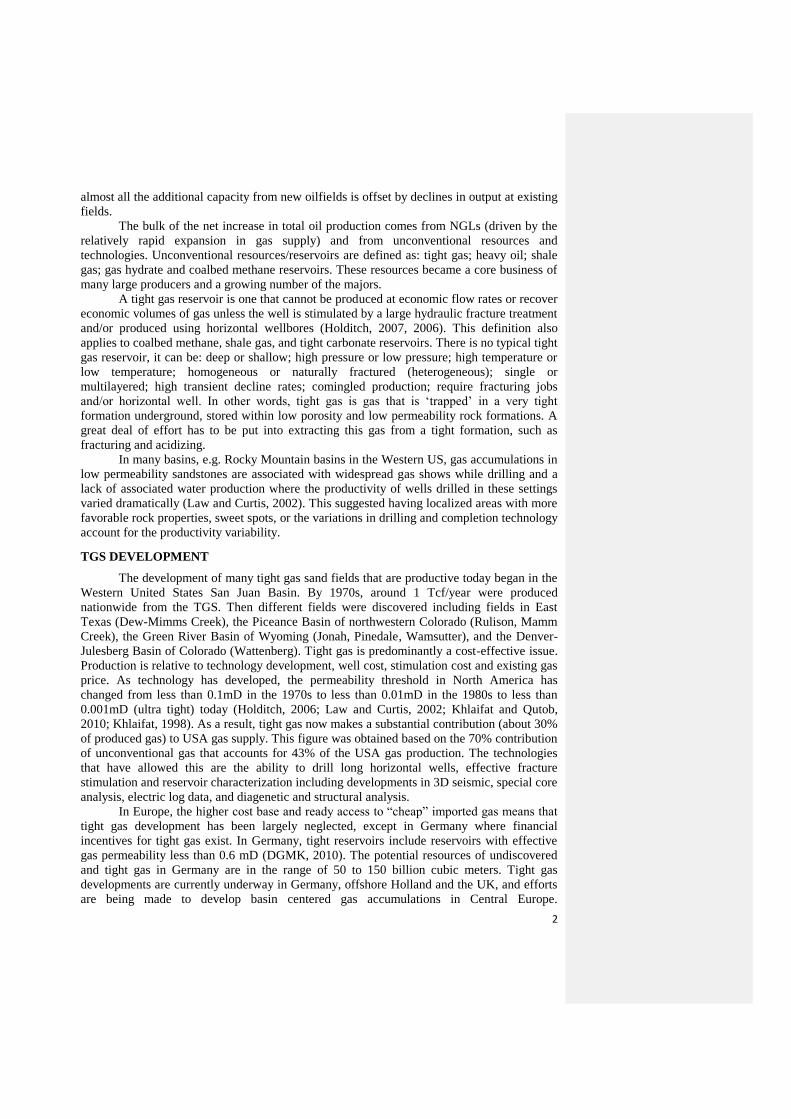
The total scope of gas resources was viewed as a triangle for the first time by Master
(1979) as shown in Figure 2. This figure shows that the natural gas resources are distributed
log-normally in nature with respect to formation permeability of tight gas sands. The triangle
peak represents the conventional gas, which is relatively easy to extract, with a small
available supply. There is much larger supply of unconventional gas, which makes up the
base of the triangle, but it is more difficult to extract. As development of gas continues, oil
and gas industries are moving down the triangle and developing more unconventional gas
resources that are difficult to be exploit but they are large in size.
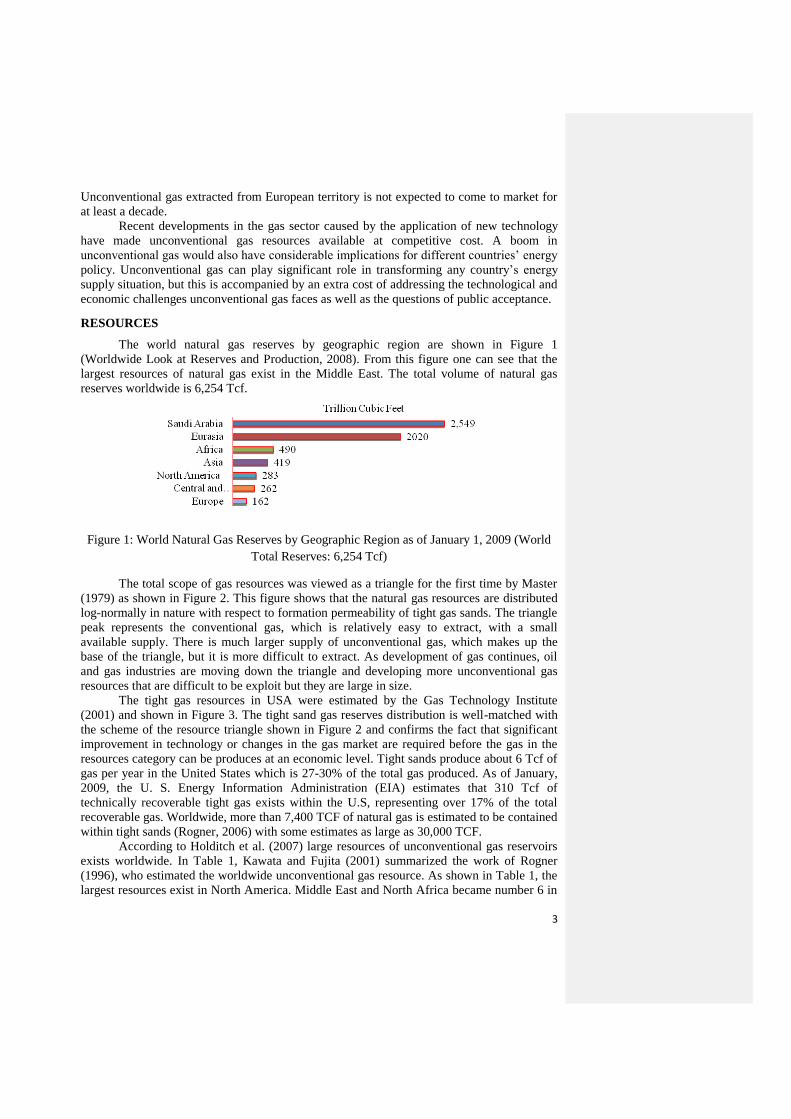
The tight gas resources in USA were estimated by the Gas Technology Institute
(2001) and shown in Figure 3. The tight sand gas reserves distribution is well-matched with
the scheme of the resource triangle shown in Figure 2 and confirms the fact that significant
improvement in technology or changes in the gas market are required before the gas in the
resources category can be produces at an economic level. Tight sands produce about 6 Tcf of
gas per year in the United States which is 27-30% of the total gas produced. As of January,
2009, the U. S. Energy Information Administration (EIA) estimates that 310 Tcf of
technically recoverable tight gas exists within the U.S, representing over 17% of the total
recoverable gas. Worldwide, more than 7,400 TCF of natural gas is estimated to be contained
within tight sands (Rogner, 2006) with some estimates as large as 30,000 TCF.
According to Holditch et al. (2007) large resources of unconventional gas reservoirs
exists worldwide. In Table 1, Kawata and Fujita (2001) summarized the work of Rogner
(1996), who estimated the worldwide unconventional gas resource. As shown in Table 1, the
largest resources exist in North America. Middle East and North Africa became number 6 in
4
the world with total unconventional resources of 32,560 Tcf, and in the fourth place in terms
of tight sand gas reserves (823 Tcf).
Figure 2: Resource Triangle
Figure 3: Tight Gas Resources in USA (GTI, 2001)
Using the United States as an analogy, there is good reason to expect that
unconventional gas production will increase significantly around the world in the coming
decades for the following reasons (Ronger, 1996; Khlaifat, 1998; Holditch et al., 2007):
• Exploitation of the estimated resources
• A large number of geologic basins around the world contain unconventional gas
reservoirs.
• Utilization of reasonable recovery efficiency to develop unconventional gas
worldwide.

5
• Tight gas sands development in the United States is critical to future U.S. gas
supply and has to be over 4 Tcf/year and is supported by ongoing technological
development.
• The related developed technology in the United States over the past 3 to 4 decades
will be available for application around the world.
• New technology is rapidly becoming a worldwide commodity through efforts of
major service companies
• The global need for energy, particularly natural gas, will continue to be an
incentive for worldwide unconventional gas resource development.
• Tight gas sands, gas shales, and coalbed methane are already critical to North
America today and will be an important energy source worldwide during the 21st
Century.
• Unconventional resources exploitation governmental incentives.
• Conventional gas is mature and declining so the future of the gas industry is
Unconventional, consequently unconventional gas production has no other choice
but to grow.
• Higher oil and gas prices are driving the development of unconventional oil and
gas resources.
Table 1: Worldwide Unconventional Gas Resources
The petrographic observation of the tight sand porous media revealed that the pore
geometry of sandstone can be broken down into three categories; (Soeder, 1984; Soeder and
Region Coalbed
Methane
Shale
Gas
TSG Total
North America 3,017 3,842 1,371 8,228
Former Soviet Union 3,957 627 901 5,485
Centrally Planned Asia and
China
1,215 3,528 353 5,094
Pacific (OECD) 470 2,313 705 3,487
Latin America 39 2,117 1,293 3,448
Middle East and North Africa 0 2,548 823 3,370
Sub-Saharan Africa 39 274 784 1,097
Western Europe 157 510 353 1,019
Other Asia Pacific 0 314 549 862
Central and Eastern Europe 118 39 78 235
South Asia 39 0 196 235
Total 9,051 16,112 7,406 32,560
6
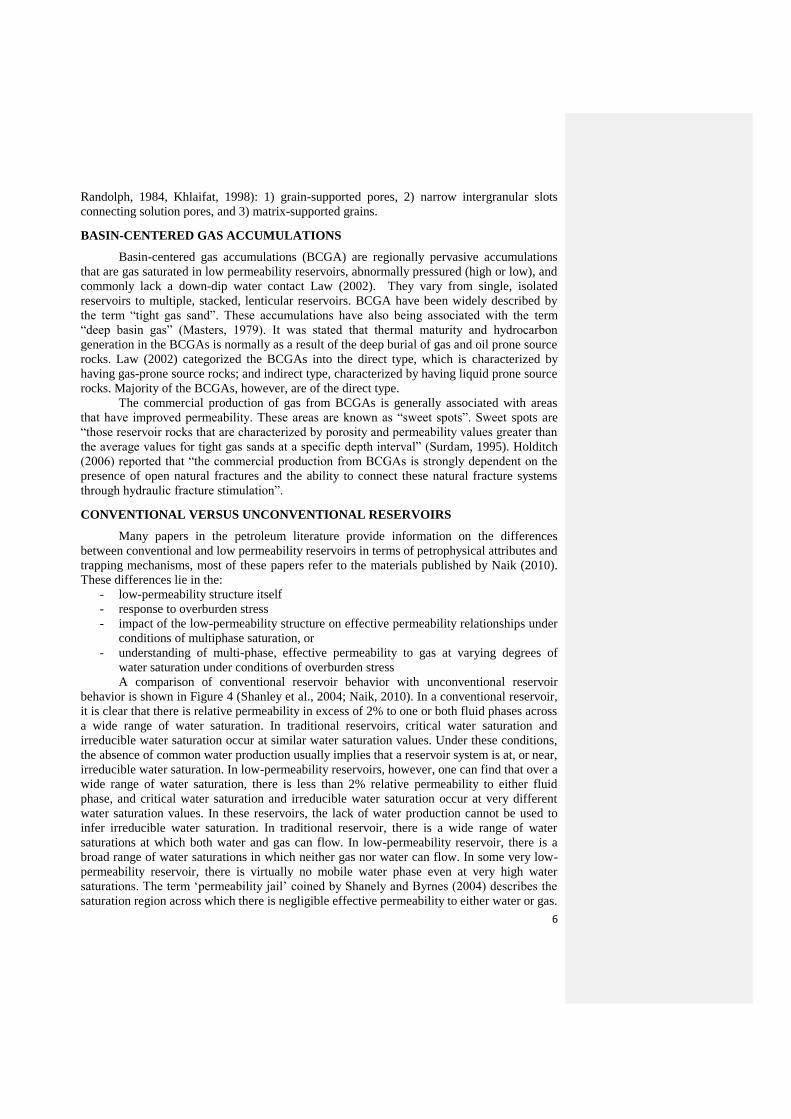
Randolph, 1984, Khlaifat, 1998): 1) grain-supported pores, 2) narrow intergranular slots
connecting solution pores, and 3) matrix-supported grains.
BASIN-CENTERED GAS ACCUMULATIONS
Basin-centered gas accumulations (BCGA) are regionally pervasive accumulations
that are gas saturated in low permeability reservoirs, abnormally pressured (high or low), and
commonly lack a down-dip water contact Law (2002). They vary from single, isolated
reservoirs to multiple, stacked, lenticular reservoirs. BCGA have been widely described by
the term “tight gas sand”. These accumulations have also being associated with the term
“deep basin gas” (Masters, 1979). It was stated that thermal maturity and hydrocarbon
generation in the BCGAs is normally as a result of the deep burial of gas and oil prone source
rocks. Law (2002) categorized the BCGAs into the direct type, which is characterized by
having gas-prone source rocks; and indirect type, characterized by having liquid prone source
rocks. Majority of the BCGAs, however, are of the direct type.
The commercial production of gas from BCGAs is generally associated with areas
that have improved permeability. These areas are known as “sweet spots”. Sweet spots are
“those reservoir rocks that are characterized by porosity and permeability values greater than
the average values for tight gas sands at a specific depth interval” (Surdam, 1995). Holditch
(2006) reported that “the commercial production from BCGAs is strongly dependent on the
presence of open natural fractures and the ability to connect these natural fracture systems
through hydraulic fracture stimulation”.
CONVENTIONAL VERSUS UNCONVENTIONAL RESERVOIRS
Many papers in the petroleum literature provide information on the differences
between conventional and low permeability reservoirs in terms of petrophysical attributes and
trapping mechanisms, most of these papers refer to the materials published by Naik (2010).
These differences lie in the:
- low-permeability structure itself
- response to overburden stress
- impact of the low-permeability structure on effective permeability relationships under
conditions of multiphase saturation, or
- understanding of multi-phase, effective permeability to gas at varying degrees of
water saturation under conditions of overburden stress
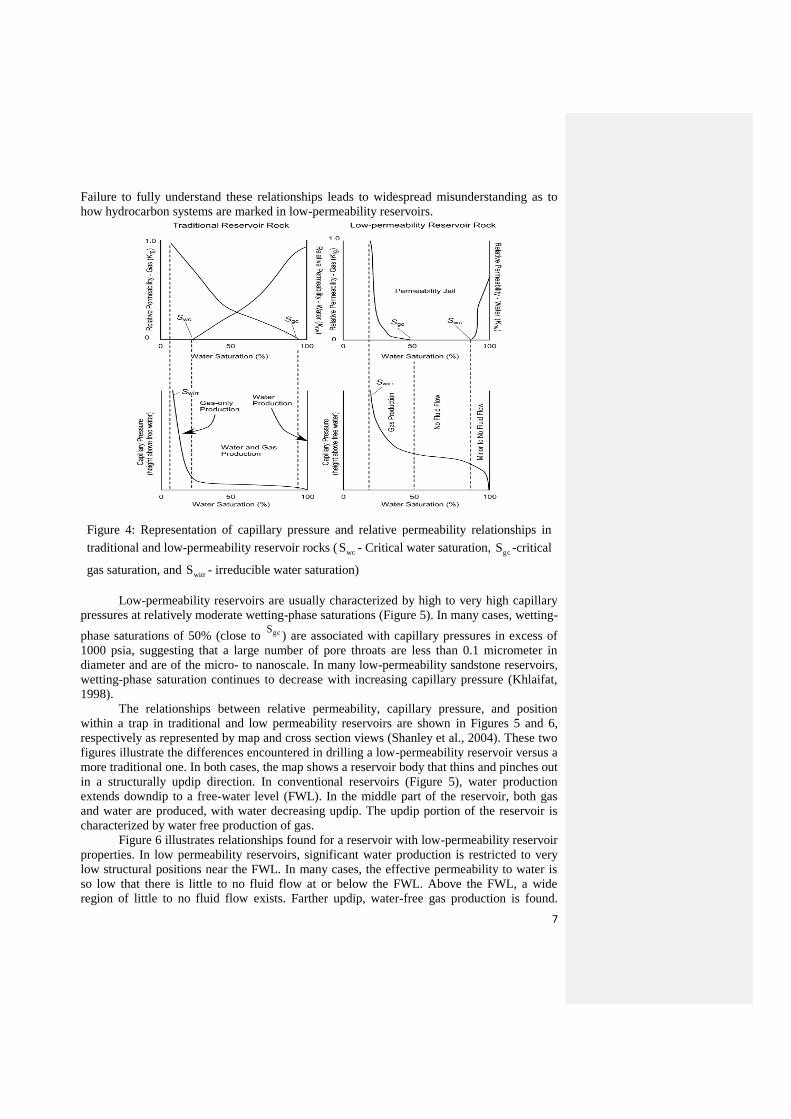
A comparison of conventional reservoir behavior with unconventional reservoir
behavior is shown in Figure 4 (Shanley et al., 2004; Naik, 2010). In a conventional reservoir,
it is clear that there is relative permeability in excess of 2% to one or both fluid phases across
a wide range of water saturation. In traditional reservoirs, critical water saturation and
irreducible water saturation occur at similar water saturation values. Under these conditions,
the absence of common water production usually implies that a reservoir system is at, or near,
irreducible water saturation. In low-permeability reservoirs, however, one can find that over a
wide range of water saturation, there is less than 2% relative permeability to either fluid
phase, and critical water saturation and irreducible water saturation occur at very different
water saturation values. In these reservoirs, the lack of water production cannot be used to
infer irreducible water saturation. In traditional reservoir, there is a wide range of water
saturations at which both water and gas can flow. In low-permeability reservoir, there is a
broad range of water saturations in which neither gas nor water can flow. In some very low-
permeability reservoir, there is virtually no mobile water phase even at very high water
saturations. The term „permeability jail‟ coined by Shanely and Byrnes (2004) describes the
saturation region across which there is negligible effective permeability to either water or gas.
7
Failure to fully understand these relationships leads to widespread misunderstanding as to
how hydrocarbon systems are marked in low-permeability reservoirs.
Low-permeability reservoirs are usually characterized by high to very high capillary
pressures at relatively moderate wetting-phase saturations (Figure 5). In many cases, wetting-
phase saturations of 50% (close to gcS) are associated with capillary pressures in excess of
1000 psia, suggesting that a large number of pore throats are less than 0.1 micrometer in
diameter and are of the micro- to nanoscale. In many low-permeability sandstone reservoirs,
wetting-phase saturation continues to decrease with increasing capillary pressure (Khlaifat,
1998).
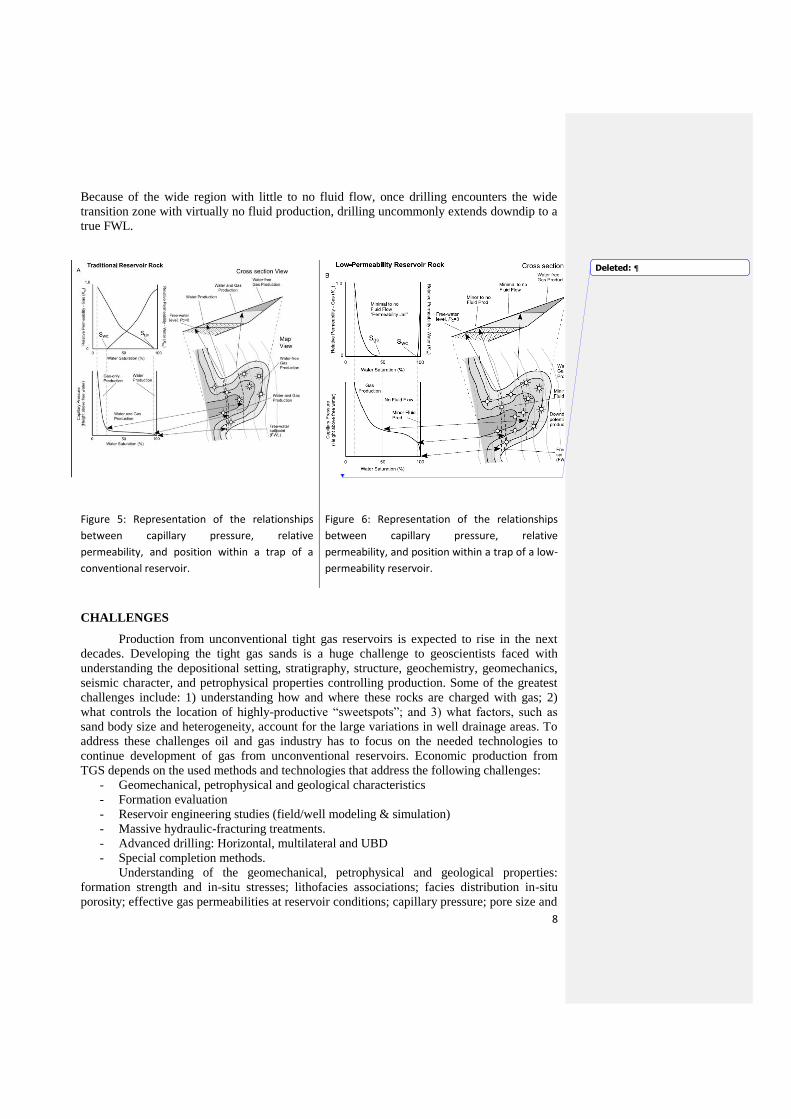
The relationships between relative permeability, capillary pressure, and position
within a trap in traditional and low permeability reservoirs are shown in Figures 5 and 6,
respectively as represented by map and cross section views (Shanley et al., 2004). These two
figures illustrate the differences encountered in drilling a low-permeability reservoir versus a
more traditional one. In both cases, the map shows a reservoir body that thins and pinches out
in a structurally updip direction. In conventional reservoirs (Figure 5), water production
extends downdip to a free-water level (FWL). In the middle part of the reservoir, both gas
and water are produced, with water decreasing updip. The updip portion of the reservoir is
characterized by water free production of gas.
Figure 6 illustrates relationships found for a reservoir with low-permeability reservoir
properties. In low permeability reservoirs, significant water production is restricted to very
low structural positions near the FWL. In many cases, the effective permeability to water is
so low that there is little to no fluid flow at or below the FWL. Above the FWL, a wide
region of little to no fluid flow exists. Farther updip, water-free gas production is found.
Figure 4: Representation of capillary pressure and relative permeability relationships in
traditional and low-permeability reservoir rocks ( wcS - Critical water saturation, gcS -critical
gas saturation, and wirrS - irreducible water saturation)
8
Because of the wide region with little to no fluid flow, once drilling encounters the wide
transition zone with virtually no fluid production, drilling uncommonly extends downdip to a
true FWL.
Figure 5: Representation of the relationships
between capillary pressure, relative
permeability, and position within a trap of a
conventional reservoir.
Figure 6: Representation of the relationships
between capillary pressure, relative
permeability, and position within a trap of a low-
permeability reservoir.
CHALLENGES
Production from unconventional tight gas reservoirs is expected to rise in the next
decades. Developing the tight gas sands is a huge challenge to geoscientists faced with
understanding the depositional setting, stratigraphy, structure, geochemistry, geomechanics,
seismic character, and petrophysical properties controlling production. Some of the greatest
challenges include: 1) understanding how and where these rocks are charged with gas; 2)
what controls the location of highly-productive “sweetspots”; and 3) what factors, such as
sand body size and heterogeneity, account for the large variations in well drainage areas. To
address these challenges oil and gas industry has to focus on the needed technologies to
continue development of gas from unconventional reservoirs. Economic production from
TGS depends on the used methods and technologies that address the following challenges:
- Geomechanical, petrophysical and geological characteristics
- Formation evaluation
- Reservoir engineering studies (field/well modeling & simulation)
- Massive hydraulic-fracturing treatments.
- Advanced drilling: Horizontal, multilateral and UBD
- Special completion methods.
Understanding of the geomechanical, petrophysical and geological properties:
formation strength and in-situ stresses; lithofacies associations; facies distribution in-situ
porosity; effective gas permeabilities at reservoir conditions; capillary pressure; pore size and
Deleted: 
9
its distribution; etc, is essential for understanding gas production from TGS reservoirs.
Because most logging tools were developed to evaluate formations with high porosity, they
often lose their sensitivity in low-permeability, low-porosity reservoirs. If technology can be
developed well enough to provide a better estimate of formation permeability, porosity and
water saturation, the development of unconventional reservoirs can be improved
substantially.
Proper formation evaluation is essential for the development of TGS reservoir. Not all
methods (volumetric, material balance, decline curves and reservoir models) used to estimate
the reserves of conventional reservoirs work to evaluate the unconventional reservoirs
reserves. Usually, volumetric methods do not work in tight gas sands because the proper
drainage area to use in the computation is hardly ever known. One of the most difficult
parameters to evaluate in tight gas reservoirs is the drainage-area size and shape. In tight
reservoirs, months or years of production normally are required before the pressure transients
are affected by reservoir boundaries or well-to-well interference. Thus, the engineer often has
to estimate the drainage-area size and shape for a typical well to estimate reserves. It is
required to know the depositional system and the effects of diagenesis (caused by increased
pressure and temperature) on the rock to estimate the drainage area size and shape for a
specific well. Egg-shaped drainage volumes are likely caused by depositional or fracture
trends and the orientation of hydraulic fractures. Also, material balance seldom works in tight
gas sands because it is almost impossible to shut in wells long enough to determine the
current average reservoir pressure. Therefore, the best method to determine reserves in tight
gas reservoirs is to analyze production data by use of either decline curves (production versus
time: hyperbolically decreasing flow rate) or reservoir simulation.
Most TGS reservoirs are not isotropic and homogeneous. Some reservoirs are
naturally fractured, layered with anisotropic permeabilities. The reservoir-engineering
analysis methods must be tailored to better analyze the processes that occur in TGS
reservoirs. A common characteristic of TGS reservoirs is that the formations can be very thin
and/or several hundreds or even thousands of feet thick. Well completion cost and recovery
maximization can be achieved if these reservoirs are produced with multizone completions,
oriented perforating, massive hydraulic fracturing, and proper logging methods.
Usually gas production from TGS reservoirs requires some form of artificial
stimulation, such as hydraulic fracturing. Wells completed in tight reservoir rocks have to be
stimulated by one or several hydraulic fracs in order to achieve an economically adequate
production rate. Compared with conventional reservoirs, TGS often show a much weaker
response to the frac treatments, resulting in low production rates and a high economic risk. It
is known that natural rock fractures are an important factor in the economic recovery of gas
from tight reservoirs. Advanced methods of gas production in these environments are taking
advantage of gas flow from natural fractures in the reservoir rock. The distribution,
orientation, and density of these fractures is key to proper planning and well scheduling in
tight gas reservoirs. In addition to these physical attributes, reservoir engineers also need
detailed analyses of the effects of interstitial clays and fluids. The nature of the natural
fractures and other characteristics of the reservoir were sufficiently well-determined that
drilling could be accurately directed.
Advancements in drilling methods reduce drilling and field development costs and
substantially improve the economics of developing TGS reservoirs. Further modern
technologies for the production of TGS reservoirs are horizontal and multilateral wells, as
well as underbalanced drilling. Application of advanced techniques like horizontal drilling
and technologies that permit efficient fracturing of multiple zones per well allow gas to
migrate a shorter distance to reach a location where it can enter a well and be produced with
10
minimum driving force. When these reservoirs extend vertically for several thousand feet,
new fracturing techniques are required. To create better solutions adapted for gas, industry
researchers will need to understand underlying flow physics in greater detail.
Gas production from a TGS well will be low on a per-well basis compared with gas
production from conventional gas reservoirs. A lot of wells have to be drilled to get most of
the gas out of the ground in TGS reservoirs. Geologists, engineers, log analysts, and other
professionals have to come to the common table with a need to better understand and predict
reservoir properties in low-permeability reservoirs and use that information in resource
evaluation, reservoir characterization and management.
CASE HISTORY
I-JORDAN
I.1- Tight Gas: Risha Gas Field in Eastern Jordan
Jordan has no conventional oil resources of its own and relies fully on imports. The
country‟s known oil reserves are only one million barrels and that of natural gas is 213 billion
cubic feet (Oil and Gas Journal, 2009). Production of gas in Jordan began in May 1989 from
the Ordovician Formation of Risha gas field that was discovered in September 1986 (see
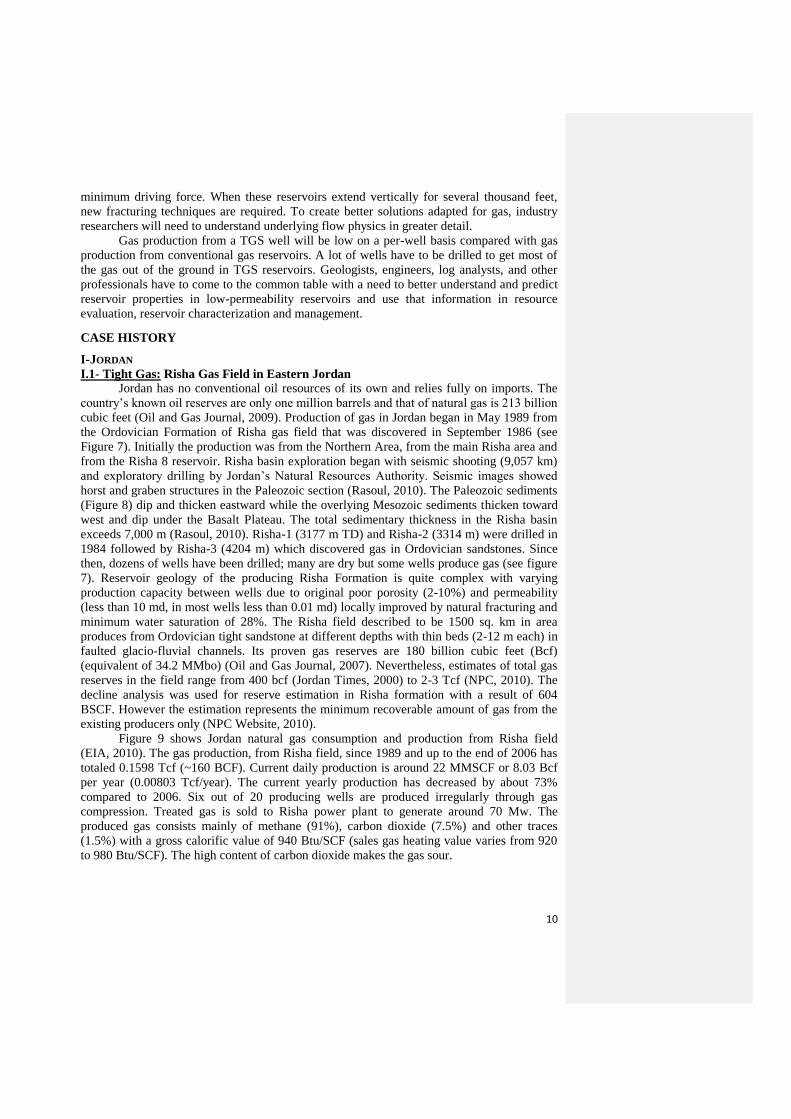
Figure 7). Initially the production was from the Northern Area, from the main Risha area and
from the Risha 8 reservoir. Risha basin exploration began with seismic shooting (9,057 km)
and exploratory drilling by Jordan‟s Natural Resources Authority. Seismic images showed
horst and graben structures in the Paleozoic section (Rasoul, 2010). The Paleozoic sediments
(Figure 8) dip and thicken eastward while the overlying Mesozoic sediments thicken toward
west and dip under the Basalt Plateau. The total sedimentary thickness in the Risha basin
exceeds 7,000 m (Rasoul, 2010). Risha-1 (3177 m TD) and Risha-2 (3314 m) were drilled in
1984 followed by Risha-3 (4204 m) which discovered gas in Ordovician sandstones. Since
then, dozens of wells have been drilled; many are dry but some wells produce gas (see figure
7). Reservoir geology of the producing Risha Formation is quite complex with varying
production capacity between wells due to original poor porosity (2-10%) and permeability
(less than 10 md, in most wells less than 0.01 md) locally improved by natural fracturing and
minimum water saturation of 28%. The Risha field described to be 1500 sq. km in area
produces from Ordovician tight sandstone at different depths with thin beds (2-12 m each) in
faulted glacio-fluvial channels. Its proven gas reserves are 180 billion cubic feet (Bcf)
(equivalent of 34.2 MMbo) (Oil and Gas Journal, 2007). Nevertheless, estimates of total gas
reserves in the field range from 400 bcf (Jordan Times, 2000) to 2-3 Tcf (NPC, 2010). The
decline analysis was used for reserve estimation in Risha formation with a result of 604
BSCF. However the estimation represents the minimum recoverable amount of gas from the
existing producers only (NPC Website, 2010).
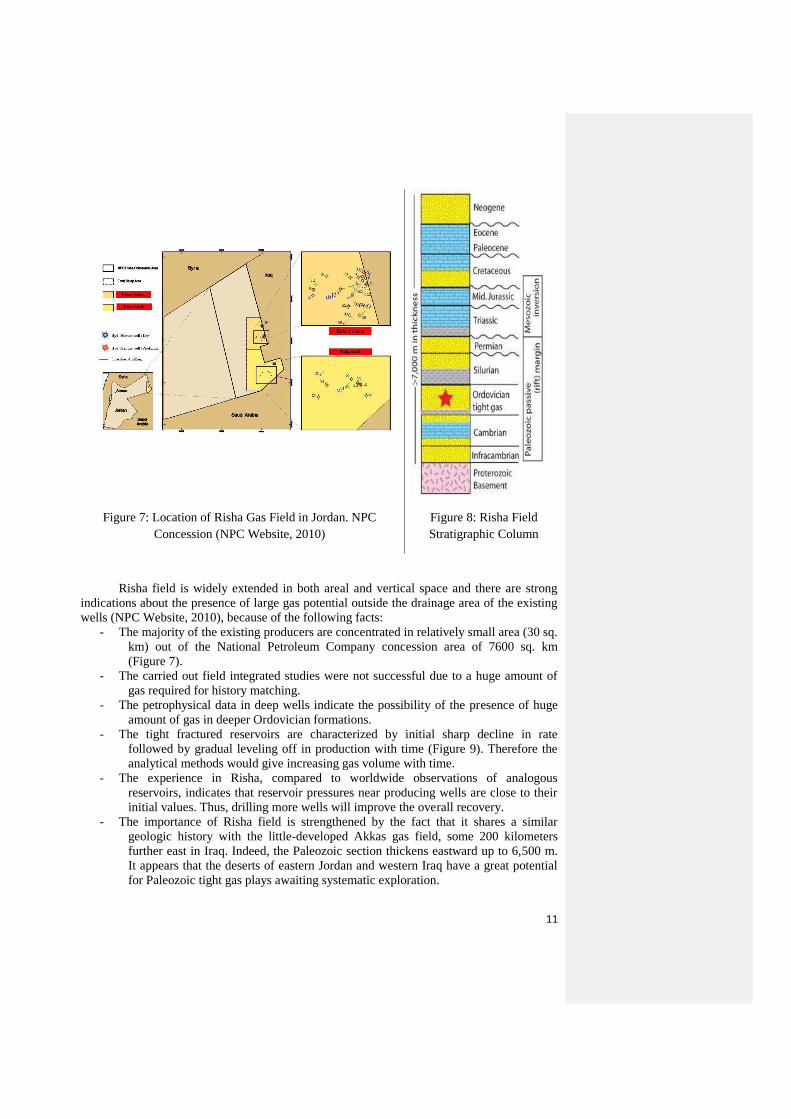
Figure 9 shows Jordan natural gas consumption and production from Risha field
(EIA, 2010). The gas production, from Risha field, since 1989 and up to the end of 2006 has
totaled 0.1598 Tcf (~160 BCF). Current daily production is around 22 MMSCF or 8.03 Bcf
per year (0.00803 Tcf/year). The current yearly production has decreased by about 73%
compared to 2006. Six out of 20 producing wells are produced irregularly through gas
compression. Treated gas is sold to Risha power plant to generate around 70 Mw. The
produced gas consists mainly of methane (91%), carbon dioxide (7.5%) and other traces
(1.5%) with a gross calorific value of 940 Btu/SCF (sales gas heating value varies from 920
to 980 Btu/SCF). The high content of carbon dioxide makes the gas sour.
11
Figure 7: Location of Risha Gas Field in Jordan. NPC
Concession (NPC Website, 2010)
Figure 8: Risha Field
Stratigraphic Column
Risha field is widely extended in both areal and vertical space and there are strong
indications about the presence of large gas potential outside the drainage area of the existing
wells (NPC Website, 2010), because of the following facts:
- The majority of the existing producers are concentrated in relatively small area (30 sq.
km) out of the National Petroleum Company concession area of 7600 sq. km
(Figure 7).
- The carried out field integrated studies were not successful due to a huge amount of
gas required for history matching.
- The petrophysical data in deep wells indicate the possibility of the presence of huge
amount of gas in deeper Ordovician formations.
- The tight fractured reservoirs are characterized by initial sharp decline in rate
followed by gradual leveling off in production with time (Figure 9). Therefore the
analytical methods would give increasing gas volume with time.
- The experience in Risha, compared to worldwide observations of analogous
reservoirs, indicates that reservoir pressures near producing wells are close to their
initial values. Thus, drilling more wells will improve the overall recovery.
- The importance of Risha field is strengthened by the fact that it shares a similar
geologic history with the little-developed Akkas gas field, some 200 kilometers
further east in Iraq. Indeed, the Paleozoic section thickens eastward up to 6,500 m.
It appears that the deserts of eastern Jordan and western Iraq have a great potential
for Paleozoic tight gas plays awaiting systematic exploration.
12
- Proper investment and application of modern technology for tight sand gas could
result in increasing the production significantly from Risha field.
Figure 9: Jordan Natural Gas Consumption and Production from Risha Gas Field.
Based on the production history shown in Figure 9, one can see that during the initial
stage of production, gas productivity grows fast, mainly because more wells were brought in,
and kept operating at high reservoir pressure. Risha wells yields gas with the content
discussed earlier, and the reservoir pressure drops a little. The first steady gas production was
reached in 1994 and lasted until the year 2001. In 2000, the NPC in collaboration with
Geoquest (a division of Schlumberger) had conducted a detailed study of the Risha gas field.
Consequently, and during the years 2002-2005, Weatherford had drilled one well using UBD
technology and re-entered three other wells for production stimulation. This resulting in
increasing the gas production and be shifted to a new steady state (see Figure 9).
Most of the wells drilled after 1986 penetrated only the Risha member (upper section)
of the Dubeidib. The NPC has set itself an ambitious target to increase gas production from
the field to 300 MMSCFD by 2015. Because the gas production from Risha field southern
area (Figure 7) had begun in August 2003, with few wells drilled so far, and to slow down the
decline in gas production, in October 2009, British Petroleum (BP) signed a deal with the
government of Jordan to explore and develop the natural gas resources of the Risha Basin.
During the first phase of the project, BP will explore the area totaling about 7,000 sq. km
along the Jordanian-Iraqi border for 3-4 years at a cost of $237 million. If the exploration
yields successful results, BP will then invest US$8-10 billion to produce 300-1,000 million
cubic feet (mcf) per day. If all goes well, the Jordanian government will receive 50% of the
produced gas, with the other half going to BP and NPC. This will significantly boost Jordan‟s
natural gas and electricity production.
I.2- Shale Gas:
The most comprehensive study about shale gas resources in Jordan was carried out by
Luning et al. (2005). In their study they have identified three lower hot shale depocenters in
Jordan, which are located in the western Risha, eastern Wadi Sirhan, and Jafr areas. The
eastern Risha area was part of a larger scale paleohigh covering northeast Jordan, most of
Syria and Iraq, and north-central Saudi Arabia (Qusaiba area). At least in Jordan, the high
coincides with the depocenter of the latest Ordovician glaciation.
Thermal maturity increases from immature in the Southern Desert outcrops to late or
postmature in northern Jordan. Organic richness and pyrolysis data decline significantly with
13
increasing thermal maturity caused by hydrocarbon generation. Prior to maturation,
maximum organic richness was interpreted to have considerably exceeded 10% (TOC) with
good S2 yields (up to 74 mg/g) as reflected in the values of the immature lower hot shale in
two exploration wells in the Jafr and Southern Desert areas (Luning et al. 2005). Konert et al.
(2001) estimated that Silurian sourced hydrocarbons in the range of about 1 trillion bbl of oil
equivalent were initially reservoired on the Arabian plate. The oil and gas discoveries in the
Risha and Wadi Sirhan areas demonstrate the existence of the Silurian hydrocarbon system in
Jordan, however, with little exploration success so far. This may partly be caused by the low
level of exploration in Jordan (Beydoun et al., 1994). For further exploration of shale gas in
Jordan, more efforts have to be put towards carrying out a proper workflow for Silurian plays
shale gas resource development where Ordovician reservoir quality and timing of maturation
are not overlooked.
II-TRAVIS PEAK FORMATION IN EASTERN TEXAS, USA
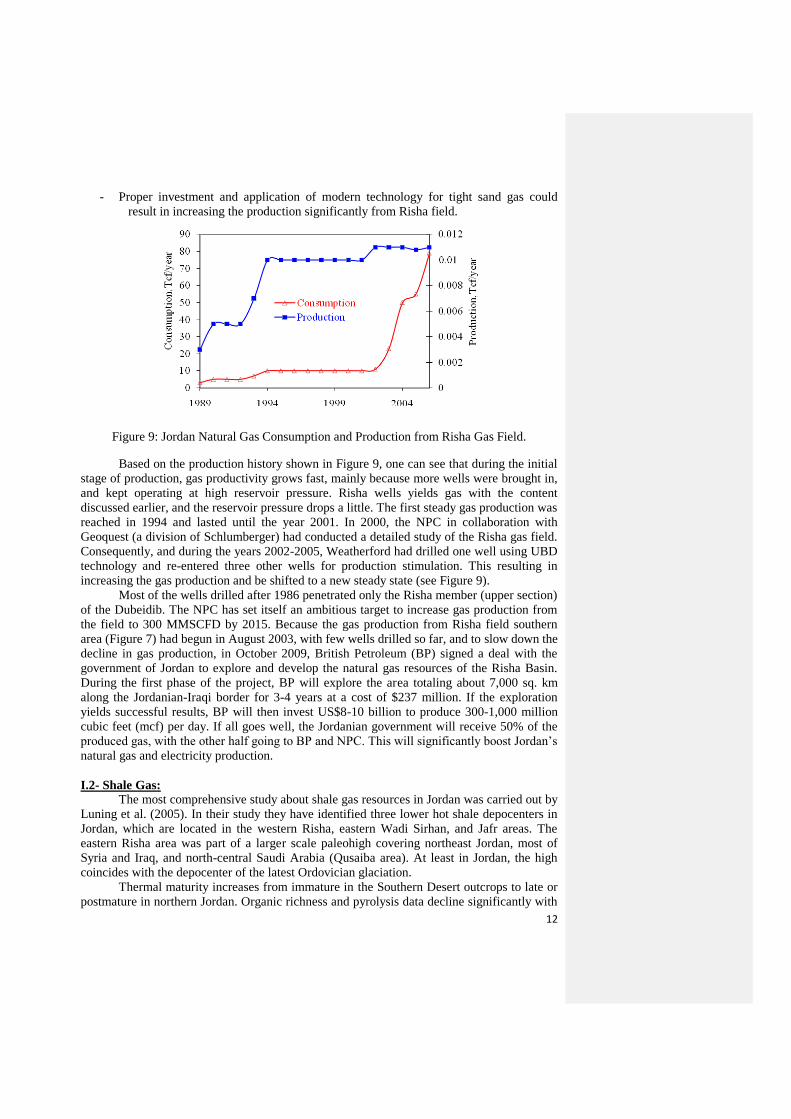
The Travis Peak formation located in four counties, early Cretaceous age, in east
Texas north Louisiana (Figure 10; Ogueri, 2007) was studied extensively by different
researchers and oil and gas producers. The Cotton Valley and Travis Peak Formations are the
main tight gas reservoirs in this area. A comprehensive analysis of Travis Peak Reservoirs in
Eastern Texas was carried out by Holditch et al. (1987). Travis Peak is a complex sand
dispersal system that is typically 1500-2000 ft thick and contains both lenticular and blanket
sandstones (Holditch et al., 1987; Dutton et al., 1992). Some of the sandstones are high
permeability intervals, but an immense majority of the sands are actually low permeability.
On a regional basis most of the Travis Peak is gas bearing; however a few sandstone intervals
in almost every well produces water (Holditch et al., 1987).
Figure 10: Tight Gas Basins in the United States
Travis Peak tight sandstones have produced gas since the 1940‟s. Along the west
margin of the East Texas Basin, southeast-trending Travis Peak sandstones belts were
deposited by the Ancestral Red River fluvial-deltaic system. The sandstones are fine-grained,
moderately well sorted, subangular to subrounded, quartz arenites and subarkoses; reservoir
quality decreases with depth, primarily due to diagenetic quartz overgrowths. Evaluation of
drilling mud densities suggests that strata deeper than 12,500 ft may be overpressured.
Assessment of the geothermal gradient (1.6 °F/100 ft) indicates that overpressure may be
Deleted:
14
relict, resulting from hydrocarbon generation by Smackover and Bossier formation potential
source rocks.
Along the west margin of the East Texas Basin, hydrocarbon occurs in structural,
stratigraphic, and combination traps associated with salt deformation. Downdip extension of
Travis Peak production will depend on the: 1) burial history and diagenesis; 2) reservoir
sedimentary facies; and 3) structural setting. Potential Travis Peak hydrocarbon plays
include: updip pinch-outs of sandstones; sandstone pinch-outs at margins of salt-withdrawal
basins; domal traps above salt structures; and deepwater sands. The Travis Peak was
deposited as a complex of delta lobes on a broad, shallow shelf. Most of the initial deposits
were reworked by fluvial and marine processes as the depocenters for the sediment shifted
back and forth across the shelf (Soeder, 1990).
During the second half of eighties (1986-1990) Gas Research Institute's (GRI) TGS
program was heavily involved in research on low permeability formations with a main focus
to improve the general understanding of producing tight reservoirs, while a specific focus was
to advance the technology involving hydraulic fracturing (Holditch et al., 1988). The
uniqueness of the conducted research is in the fact that the laboratories had been actual gas
wells (staged field experiments, SFE-1,2,3,4) completed in the Travis Peak Formation in east
Texas . The SFE program resulted in the collection of a wealth of data. Other researchers,
including one of the co-authors of this paper (SFE 2, Khlaifat, 1998), had continued this work
by carrying out other research components.
Travis Peak cumulative gas production was 1.43 Tfc from January 1, 1961, through
December 31, 2005. Mean daily gas production from 923 wells was 925,000 cubic
ft/well/day, during the best year of production (Li, 2007). The number of Travis Peak gas
wells in “high-cost” (tight sandstone) fields increased from 18 in the decade 1966-75 to 333
in the decade 1996-2005, when high-cost fields accounted for 33.2% of the Travis Peak gas
production. However, 2005 gas production from high cost fields accounted for 63.2% of the
Travis Peak total production, indicating that production from high-cost gas wells has
increased noticeably. The 10.7% production increase in 2005 over 2004 production made the
East Texas to have the third-highest growth rate among major U.S. production sites, trailing
only the Uinta-Piceance Basin straddling Colorado and Utah (also an unconventional gas
play, with a growth rate of 18.2%) and the Fort Worth Basin (driven by Barnett Shale
production, with a growth rate of 13.7%).
At the end of 2005, some 66 operators were active in East Texas and there were 7,684
producing wells (Clouser and Wagman, 2006). In East Texas (and nearby North Louisiana,
which is geologically related), TGS include four individual pays: Travis Peak, Cotton Valley,
Bossier (found between 12,000 and 14,000 feet), and Deep Bossier (at 15,000 feet and
deeper). Travis Peak and Deep Bossier development has been limited to East Texas.
Excluding these two plays, estimates for the Cotton Valley/Bossier plays in East Texas and
North Louisiana is an ultimate resource potential of about 39 Tcf, with 20 Tcf of undeveloped
resource, assuming wide-scale infill development with density of 80 acres per well (Clouser
and Wagman, 2006). Closer well spacing would substantially increase the resource estimate.
Dutton and Diggs (1992) studied the Travis Peak formation lithology and concluded
that: Most Travis Peak sandstones are fine to very fine grained (62.5 to 250 microns)
quartzarenties and subarkoses having an average composition of 95% quartz, 4% feldspar,
and 1% rock fragments. Most clean fluvial and paralic sandstones are moderately sorted to
well sorted.
Regarding the formation alteration, it was found that the three significant petrographic
variables for a regression with porosity were sorting, quartz cement, and carbonate cement
(Dutton and Diggs, 1992). The observed decline in porosity and permeability between 6000
15
and 10000 feet in Travis Peak sandstones was interpreted to result from the following
combination of diagenetic and physical modifications with depth: (1) increased quartz
cement, (2) decreased secondary porosity, and (3) greater overburden pressure that closes
narrow pore throats but does not significantly change grain packing.
III-SAHARAN BASINS, ALGERIA
III. 1 Tight Gas
The first commercial oil discovery in Algeria was in 1948 in Oued Guttirini (about
150 km south of the capital, Algiers). Intensive exploration activities in the fifties of last
century resulted in several oil and gas findings in Saharan platform. Algerian national
operator, SONATRACH, went beyond the production from conventional resources to explore
and produce the unconventional that was previously unproducible. Today in Algeria,
unconventional gas development has steadily grown in importance – especially headline
plays such as Ordovician, Devonian (Frasnian) and Silurian tight and shale gas in the Saharan
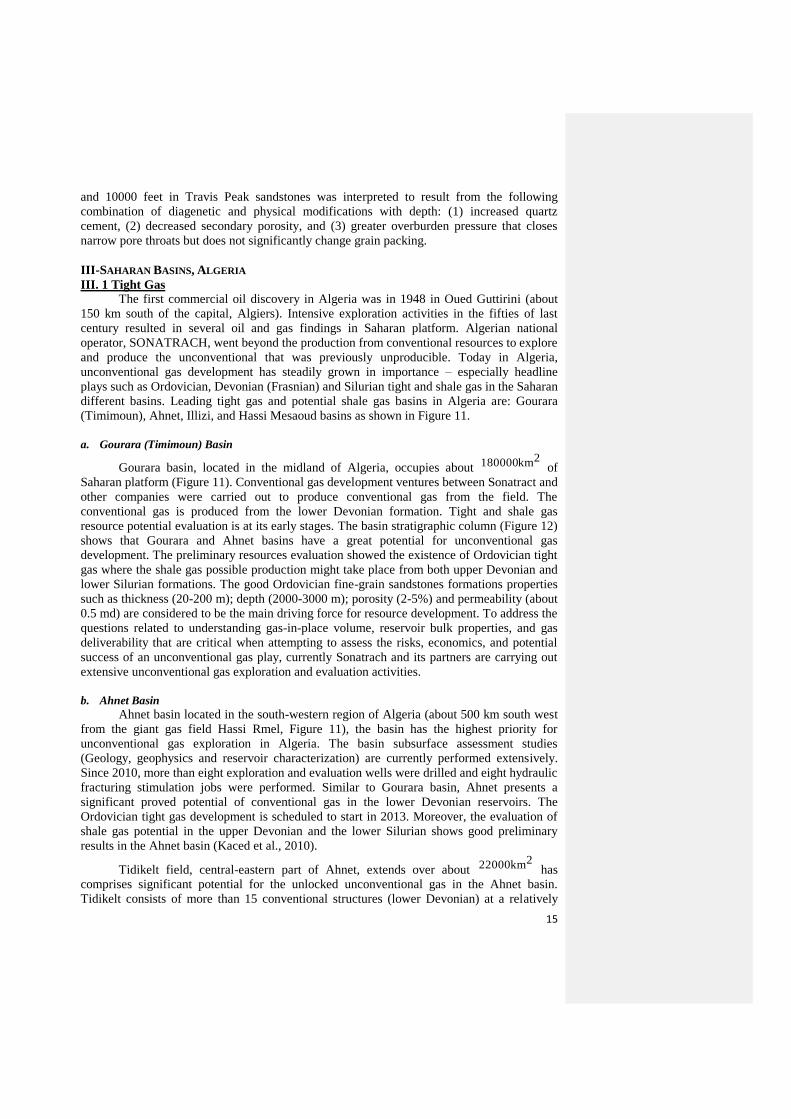
different basins. Leading tight gas and potential shale gas basins in Algeria are: Gourara
(Timimoun), Ahnet, Illizi, and Hassi Mesaoud basins as shown in Figure 11.
a. Gourara (Timimoun) Basin
Gourara basin, located in the midland of Algeria, occupies about 2km180000 of
Saharan platform (Figure 11). Conventional gas development ventures between Sonatract and
other companies were carried out to produce conventional gas from the field. The
conventional gas is produced from the lower Devonian formation. Tight and shale gas
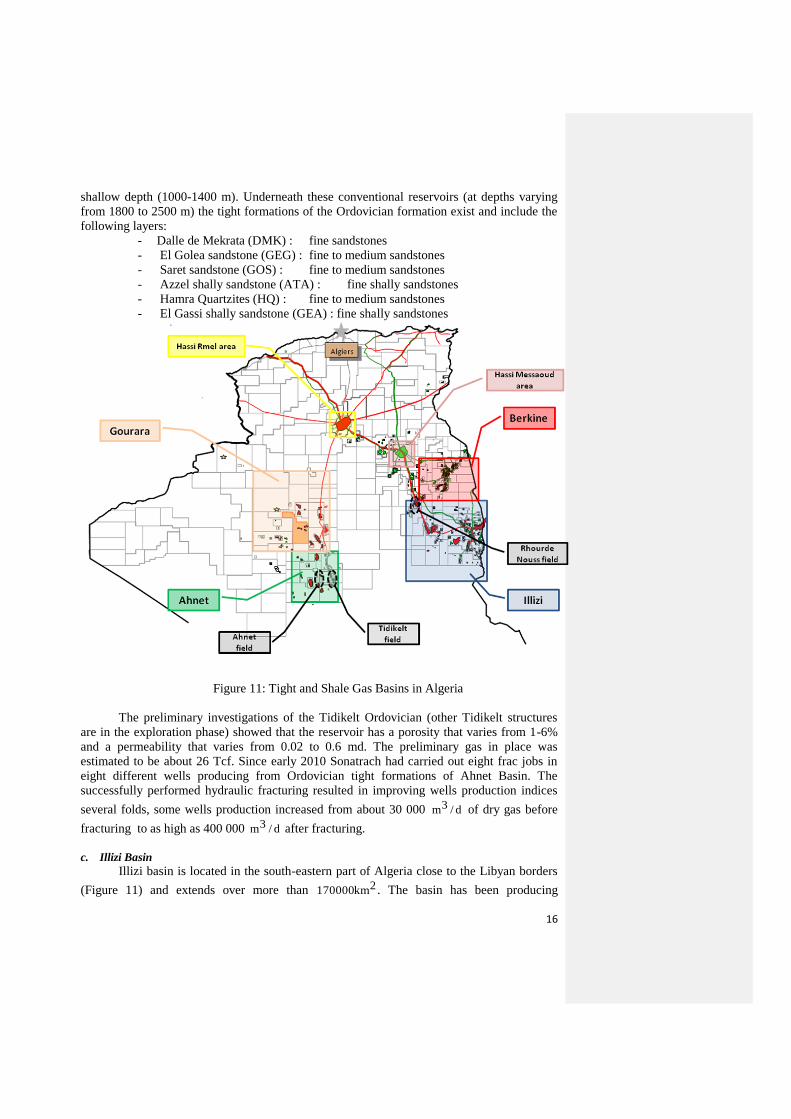
resource potential evaluation is at its early stages. The basin stratigraphic column (Figure 12)
shows that Gourara and Ahnet basins have a great potential for unconventional gas
development. The preliminary resources evaluation showed the existence of Ordovician tight
gas where the shale gas possible production might take place from both upper Devonian and
lower Silurian formations. The good Ordovician fine-grain sandstones formations properties
such as thickness (20-200 m); depth (2000-3000 m); porosity (2-5%) and permeability (about
0.5 md) are considered to be the main driving force for resource development. To address the
questions related to understanding gas-in-place volume, reservoir bulk properties, and gas
deliverability that are critical when attempting to assess the risks, economics, and potential
success of an unconventional gas play, currently Sonatrach and its partners are carrying out
extensive unconventional gas exploration and evaluation activities.
b. Ahnet Basin
Ahnet basin located in the south-western region of Algeria (about 500 km south west
from the giant gas field Hassi Rmel, Figure 11), the basin has the highest priority for
unconventional gas exploration in Algeria. The basin subsurface assessment studies
(Geology, geophysics and reservoir characterization) are currently performed extensively.
Since 2010, more than eight exploration and evaluation wells were drilled and eight hydraulic
fracturing stimulation jobs were performed. Similar to Gourara basin, Ahnet presents a
significant proved potential of conventional gas in the lower Devonian reservoirs. The
Ordovician tight gas development is scheduled to start in 2013. Moreover, the evaluation of
shale gas potential in the upper Devonian and the lower Silurian shows good preliminary
results in the Ahnet basin (Kaced et al., 2010).
Tidikelt field, central-eastern part of Ahnet, extends over about 2km22000 has
comprises significant potential for the unlocked unconventional gas in the Ahnet basin.
Tidikelt consists of more than 15 conventional structures (lower Devonian) at a relatively
16
shallow depth (1000-1400 m). Underneath these conventional reservoirs (at depths varying
from 1800 to 2500 m) the tight formations of the Ordovician formation exist and include the
following layers:
- Dalle de Mekrata (DMK) : fine sandstones
- El Golea sandstone (GEG) : fine to medium sandstones
- Saret sandstone (GOS) : fine to medium sandstones
- Azzel shally sandstone (ATA) : fine shally sandstones
- Hamra Quartzites (HQ) : fine to medium sandstones
- El Gassi shally sandstone (GEA) : fine shally sandstones
Figure 11: Tight and Shale Gas Basins in Algeria
The preliminary investigations of the Tidikelt Ordovician (other Tidikelt structures
are in the exploration phase) showed that the reservoir has a porosity that varies from 1-6%
and a permeability that varies from 0.02 to 0.6 md. The preliminary gas in place was
estimated to be about 26 Tcf. Since early 2010 Sonatrach had carried out eight frac jobs in
eight different wells producing from Ordovician tight formations of Ahnet Basin. The
successfully performed hydraulic fracturing resulted in improving wells production indices
several folds, some wells production increased from about 30 000 d/3m of dry gas before
fracturing to as high as 400 000 d/3m after fracturing.
c. Illizi Basin
Illizi basin is located in the south-eastern part of Algeria close to the Libyan borders
(Figure 11) and extends over more than 2km170000 . The basin has been producing
17
conventional oil and gas since early 70s. Intensive exploration and evaluation activities of the
tight Ordovician gas and lower Silurian shale gas started in late 90s. The already available
dense piping network and surface facilities in Illizi area is an asset that will encourages the
investment in Illizi tight and shale gas development. A good example of tight gas reservoir in
Illizi field is Rhourde Nouss (Figure 11).
Figure 12: Gourara and Ahnet Stratigraphic Column (Modified from Algeria, 2007)
The fine grain sandstone of hamra quartzites formation in the Ordovician is
characterized by a porosity varying from 2-8% and a low permeability (0.03 md). High
density of reservoir natural fractures is the main production driving force where the open
fracture permeability could reach 100 md. Extensive geomechanical evaluations (sonic logs,
images log, geomechanical tests on core samples, production and well tests) is needed to
distinguish between open and closed natural fractures, decide the orientation of
slanted/horizontal well and improve the quality of completion. Moreover, to produce tight
Rhourde Nouss formation (0.03 md) at an economic rate hydraulic fracturing implementation
strategy in on-going.
d. Hassi Messaoud Basin (Tight Oil)
Hassi Messaoud reservoir located in the east-southern part of Algeria (Figure 11)
produces about day/Mm65 3 of o45 API oil from a thick Cambro-Ordovician sandstone
formation (Achi et. Al, 2009). The reservoir has been in production since 1958. The shaly
sandstone contains silt interbeds (0.2-0.4m thick) that extend from meters to kilometers.
Tectonic activities resulted in fraccing the reservoir naturally in some parts. Fractures are

18
either open or plugged with some materials such as shale, silica, anhydrite, pyrite and
bitumen.
The reservoir permeability ranges from 1 md in the matrix to 100 md in open fissures
layers. The porosity varies within the four reservoir formations from 6 to 12 %. The reservoir
initial oil saturation was 80% (undersaturated). Most of the reservoir productive zones were
under missible gas flooding. The pressure of five reservoir zones is maintained by water
injection (Achi et. Al, 2009). Vertical wells development was applied until 1995. Hydraulic
fracturing was extensively used, more than 300 wells, to compensate for low permeability or
to bypass nearby wellbore damage (matrix treatment). Production was activated throughout
the field by means of gaslift.
In order to develop the reservoir area where conventional vertical drilling deemed
unsuccessful, horizontal drilling technology was utilized in mid 1990s. It started with
medium radius infill wells in lower permeability (tight) areas and at the peripheries of zones
where heterogeneities are high and reservoir continuity is uncertain.
III. 2 Shale Gas
Gas shales will be the fastest-growing parts of conventional and unconventional plays,
evidenced by the impatience of SONATRACH to explore it. The Silurian and Devonian
(Frasnian) hot shales can be mapped across most of the Algerian basins within the Saharan
Platform and their characteristics vary within both Eastern and Western provinces. The
Algerian gas shale basins are summarized in Table 2.
Table 2: Summary of Algeria Potential Shale Gas Basins Basin Age/
Formation
Thickness,
m
Depth, m TOC,
%
Maturity Remarks
Illizi Silurian >30 >3 Dry gas Southern part of Illizi has a wet
gas maturity
Berkine Silurian,
Frasnian
4000-6000 1.6 Dry gas Contains the best qualities source
rocks. HP: 4000-11000 psi
Mouydir 2-3 Possible production of CO2
Ahnet-
Gourara
Silurian,
Frasnian
~ 160 1.5-5 Most
potential basin
Bechar Silurian
(S),
Frasnian
(F)
20-140 <3000 (S)
<2000 (F)
gas Contains
excellent qualities source rocks
Tindouf Silurian 30-200 2-6 Dry gas
(North),
Oil and
Cond. (S)
Average potential in the north of
the basin. Frasnian is not really a
Potential play.
Reggane Silurian >3500 2 Dry gas

19
Based on the data above and the analysis carried out by Kaced et al. 2010, the best
basins for the exploration of shale gas plays in the Saharan platform are: the western part of
Illizi, Berkine, Ahnet-Gourara and Bechar basins. Geochemical modeling for both Silurian
and Frasnian shale gas plays in the Saharan basins estimated the resources as 2480 Tcf.
Frasnien of the Ahnet basin had shown strong gas concentrations in drilling mud which
makes it a good source rock (Kaced et al. 2010).
CONCLUSIONS
The following conclusions can be drawn from the paper:
- There is an enormous volume of unconventional gas to supply world energy needs for
many decades to come to be found and produced.
- Although TGS production is growing in more than 35 countries, gas production from a
TGS well is low compared with gas production from conventional reservoirs on a per-
well basis.
- A bundle of wells have to be drilled to get most of the gas out of the unconventional
reservoirs.
- Small well spacing is required to deplete a low-permeability reservoir in a 20- to 30-
year time frame.
- The capital cost of unconventional gas production is high because of the need for more
rigs, equipment and people.
- The driving forces to bring much of unconventional TGS to market are: increased oil
and gas prices; decline in conventional oil and gas production; and improvement in
drilling, completion and hydraulic fracturing technologies.
- Understanding and predicting reservoir properties, needed for resource evaluation,
reservoir characterization and management, in low-permeability reservoirs requires a
team work of geoscientists, engineers and other professionals.
- The three considered cases show that tight and shale gas reservoirs have a huge future
potential for production.
REFERENCES
Achi B., Bouazza L., Zeghouani R., Ferhat A., Olaoye B., and Helou H., Successful Multi-
Stage Hydraulic Fracturing of Openhole Horizontal Wells in Hassi Messaoud Oilfield.
International Petroleum Technology Conference, Doha-Qatar, 7-9 Dece 2009. IPTC
13021.
Algeria Well Evaluation Conference, 2007. Sonatrach, Algeria.
Beydoun, Z. R., Futyan A. R. I., and Jawzi A. H., Jordan revisited: Hydrocarbons habitat and
potential: Journal of Petroleum Geology, v. 17, 1994, pp. 177–194.
Clouser G. and Wagman D., East Texas Thrives: One of the world‟s most heavily drilled
regions thrives as unconventional gas plays take off. Oil and Gas Investor, Tight Gas,
March 2006, pp 8-10.
DGMK German Society for Petroleum and Coal Science and Technology. Website:
http://www.dgmk.de/, sited: July 25th 2010.
Dutton, S.P., and T.N. Diggs, 1992, Evolution of porosity and permeability in the Lower
Cretaceous Travis Peak Formation, East Texas: American Association of Petroleum
Geologists Bulletin Bull., v. 76, n. 2, p. 252-269.
GTI E&P Services, Tight Gas Resources Map of the United States. GTI E&P Services,
Houston, 2001.
20
Holditch S A, Robinson B M and Whitehead W S, The analysis of Travis Peak Reservoirs in
Eastern Texas. SPE/DOE paper 16427, Low pwermeability reservoirs symposium,
Denver, Colorado, May 18-19, 1987.
Holditch S A, Robinson B M, Whitehead W S and Ely J W, The GRI Staged Field
Experiment. SPE Formation Evaluation, September 1988.
Holditch S., Tight Gas Sands, JPT, June 2006, pp 86-93.
Holditch S., Perry K. and Lee J., 2007, Unconventional Gas Reservoirs – Tight Gas, Coal
Seams, and Shales. Working Document of the National Petroleum Council on Global Oil
and Gas Study.
IEA (International Energy Agency) Report, 2005.
Jordan Times, 12 March 2000
Kaced, M., Djebbar, T., Arab, M. (2010) "Uncovering the Potential of Shale Gas Plays in
Algeria", Shale Gas World, Europe 2010, Warsaw, Poland.
Kawata Y. and Fujita K, 2001. Some Prediction of Possible Unconventional Hydrocarbon
Availability Until 2100. SPE Paper 68755, SPE Asia Pacific Oil and Gas Conference,
Jakarta, 17-19 April, 2007.
Khlaifat A. and Qutob H., Unconventional Tight Gas Reservoirs – Future Energy Source.
Materials in Jordan, Amman, Jordan, 10-12 April, 2010.
Khlaifat A., 1998, Two Phase Flow through Low Permeability Fractured Tight Sand Porous
Media, PhD thesis, Illinois Institute of Technology, Chicago, USA
Konert G., Afifi A. M., Al-Hajri S. A., de Groot K., Al Naim A. A., and Droste H. J.,
Paleozoic stratigraphy and hydrocarbon habitat of the Arabian plate: AAPG Memoir 74,
2001. pp. 483–515.
Law, B.E.: “Basin Centered Gas Systems,” AAPG (2002) 86, pp.1891–1919.
Law B.E. and Curtis J.B., 2002, Introduction to Unconventional Petroleum Systems: AAPG
Bulletin, v. 86, pp 1851-1852.
Li, Yamin, 2007, MS, Evaluation Of Travis Peak Gas Reservoirs, West Margin of The East
Texas Basin, M.S. thesis, Texas A&M University, 118 p.
Luning S., Shahin Y.M, Loydell D., Al-Rabi H.T., Masri A., Tarawneh B., and Kolonic S,
Anatomy of a World-Class Source Rock: Distribution and Depositional Model of Silurian
Organic-Rich Shales in Jordan and Implications for Hydrocarbon Potential. AAPG
Bulletin, V. 89, No. 10 (October 2005), pp. 1397-1427.
Masters, J.A., Deep Basin Gas Trap, Western Canada. AAPG Bulletin, Vol. 63, No. 2, pp
152-181, 1979.
Naik, G.C.: “Tight Gas Reservoirs – An Unconventional Natural Energy Source for the
Future,” http://www.pinedaleonline.com/socioeconomic/pdfs/tight_gas.pdf, sited: August
23rd 2010.
NPC Webpage, cited August 3rd 2010, http://www.npc.com.jo/
Ogueri O S, Completion methods in thick multilayered tight gas sands, MSc Thesis, Texas
A&M Uni, Dec. 2007.
Oil and Gas Journal, 2 July 2007
Oil & Gas Journal, 21 December 2009.
Qutob H. and Khlaifat A., The Middle East: The World's Oil Wonder. Materials in Jordan,
Amman, Jordan, 10-12 April, 2010.
Rasoul Sorkhabi, Paleozoic Tight Gas Plays in Jordan, GEO ExPro Magazine No. 1, 2010.
Rogner, Hans-Holger. 1996, An Assessment of World Hydrocarbon Resources, IIASA, WP-
96–26, Laxenburg, Austria.
Shanley, Keith W., Robert M. Cluff, John W. Robinson, 2004, Factors controlling prolific
gas production from low-permeability sandstone reservoirs: Implications for resource
21
assessment, prospect development, and risk analysis. AAPG Bulletin, V. 88, No. 8, pp
1083-1121.
Soeder, D. J. (1984) Reservoir Properties and the Pore Structure of Tight Gas Sands. AAPG
Bulletin, 68, 4.
Soeder, D. J., and Randolph, P. L. (1984) Porosity, Permeability, and Pore Structure of the
Tight Mesa Verde Sandstone, Piceance Bacin, CO. SPE.
Soeder, D. J. and P. Chowdiah, 1990, Pore Geometry in High and and Low Permeability
Sandstones, Travis Peak Formation, East Texas: SPE Formation Evaluation, Dec 1990, p.
421-430. SPE Paper 17729.
Surdam, R.C.:” Wyoming and the 21st Century: The Age of Natural Gas,” 1995 Proceedings
of a Workshop on the Future of Natural Gas in Wyoming, Laramie, Wyoming, Institute
for Energy Research.
United States Energy Information Administration web page: http://www.eia.doe.gov/ cited
August 3, 2010.
Worldwide Look at Reserves and Production, Oil & Gas Journal, Vol. 106, No. 48
(December 22, 2008), pp. 22-23.


![OnlineCompanion Tight\u0026Compact UC[1]](https://img.dokumen.tips/doc/110x75/634b245de2b881b8bf01b845/onlinecompanion-tightu0026compact-uc1.jpg)


