Embed Size (px)
Citation preview

UCLAUCLA Electronic Theses and Dissertations
TitleOccupational epidemiology in vulnerable populations: Occupational physical activity and cerebrovascular disease in older women and parental occupational exposures and childhood cancer
Permalinkhttps://escholarship.org/uc/item/8ct172s2
AuthorHall, Clinton James
Publication Date2018 Peer reviewed|Thesis/dissertation
eScholarship.org Powered by the California Digital LibraryUniversity of California

UNIVERSITY OF CALIFORNIA
Los Angeles
Occupational epidemiology in vulnerable populations:
Occupational physical activity and cerebrovascular disease in older women
and parental occupational exposures and childhood cancer
A dissertation submitted in partial satisfaction
of the requirements for the degree Doctor of Philosophy
in Epidemiology
by
Clinton James Hall
2018

© Copyright by
Clinton James Hall
2018

ii
ABSTRACT OF DISSERTATION
Occupational epidemiology in vulnerable populations:
Occupational physical activity and cerebrovascular disease in older women
and parental occupational exposures and childhood cancer
by
Clinton James Hall
Doctor of Philosophy in Epidemiology
University of California, Los Angeles, 2018
Professor Beate R. Ritz, Chair
Occupation has a profound impact on worker health. Some working populations, such as
older workers and pregnant women, are inherently vulnerable to hazardous exposures;
identifying and quantifying occupational risk factors in these populations is important to the
health and wellbeing of the population as a whole. This dissertation is composed of three
independent exercises in occupational epidemiology that examine associations between (1)
occupational physical activity and cerebrovascular disease in a cohort of older women; (2)
parental occupational exposure to livestock or animal dust and the risk for childhood cancer in
offspring; and (3) parental occupation and the risk for childhood germ cell tumors in Denmark.

iii
The first analysis in this dissertation is a prospective cohort study of 31,270 women aged
30-74 years and employed outside the home at study enrollment. Information on occupational
physical activity (OPA) for current job, longest held job, and cumulatively for all jobs held since
age 18, in addition to information on lifestyle factors, was assessed via interviews at study
enrollment. After classifying OPA into four categories ranked by intensity (mostly sitting, sitting
and standing equally, mostly standing, and mostly dynamic work), we used Cox proportional
hazard regression models adjusted for socio-demographic, biologic, and behavioral factors to
estimate the risk of incident stroke and transient ischemic attack (TIA) across levels of OPA.
There were 715 incident diagnoses of stroke (n=441) and TIA (n=274) reported by participants
or next of kin over an average follow up of 6 years. Compared to mostly sitting, mostly dynamic
OPA at the current job was associated with an increased risk for TIA (hazards ratio [HR]=1.65;
95% confidence interval [CI]=1.07-2.48), while mostly dynamic OPA at the longest held job was
associated with an increased risk of stroke (HR=1.45; 95% CI=1.06-1.97). Associations were
stronger among women without cardiovascular disease or hypertension at baseline.
The second analysis in this dissertation is a population-based case-control study of 4,474
childhood cancer cases diagnosed 1968-2015 in Denmark and 422,022 birth year- and sex-
matched controls. Using a job-exposure matrix, we identified parental occupational exposure to
livestock or animal dust. Using multivariable conditional logistic regression, we estimated an
increased risk for all central nervous system tumors in the offspring of fathers occupationally
exposed to livestock or animal dust from the index child’s birth to cancer diagnosis (odds ratio
[OR]=1.27; 95% CI=1.00-1.63). There was an increased risk for astrocytoma in the offspring of
mothers exposed from conception to birth (OR=1.89; 95% CI=1.00-3.57) and an increased risk
for neuroblastoma in the offspring of mothers exposed from birth to diagnosis (OR=1.88; 95%

iv
CI=0.99-3.56). We examined births 1989+ to assess a period when exposures were more
intensive due to a policy change regulating farm size and estimated a decreased risk for acute
lymphoblastic leukemia in the offspring of fathers exposed after birth (OR=0.56; 95% CI=0.32-
1.00).
The final analysis in this dissertation is a population-based case-control study of parental
occupation and the risk for childhood germ cell tumors (GCTs) in offspring. Utilizing a linked
database of five nationwide Danish registries, this study consisted of 164 childhood GCT cases
(<17 years old) diagnosed 1968-2015 and 15,513 birth year- and sex-matched controls.
Conditional multivariable logistic regression was used to analyze the association between
paternal and maternal occupation and childhood GCT risk in offspring, stratifying by common
histologic subtypes (i.e., yolk sac tumor and teratoma) when possible. Parental occupational
exposure to specific chemicals and social contact was assessed via JEMs applied to the
individual parental employment histories. We found an increased risk of GCTs in the offspring
of mothers occupationally exposed to high/very high social contact from child’s conception to
birth, especially among yolk sac tumors (OR=3.50; 95% CI=1.65, 7.43); this association
persisted when examining maternal occupational exposure from birth to diagnosis (OR=2.77;
95% CI=1.29, 5.57). We also observed an elevated risk of all GCTs in the offspring of mothers
who worked in the textile, clothing, and leather industry from birth to diagnosis (OR=2.19; 95%
CI=1.09, 4.40). Paternal employment in the agriculture, forestry, and fishing industry from
child’s birth to diagnosis was associated with an increased risk of teratomas in offspring
(OR=2.73; 95% CI=1.14, 6.78).

v
The dissertation of Clinton James Hall is approved.
Ondine Solveig von Ehrenstein
Niklas Krause
Michael L. Prelip
Beate R. Ritz, Committee Chair
vi
TABLE OF CONTENTS
LIST OF TABLES……………………………………………………………………….... viii
LIST OF ABBREVIATIONS……………………………………………………………... xi
VITA……………………………………………………………………………………..... xiii
Chapter 1. Introduction and background…………………………………………………. 1
1.1 Occupational epidemiology………………………………………………........ 1
1.1.1 Vulnerable populations……………………………………………… 3
1.2 Cerebrovascular disease………………………………………………………. 4
1.2.1 Risk factors for cerebrovascular disease…………………………...... 5
1.2.2 Physical activity health paradox…………………………………….. 9
1.3 Childhood cancer……………………………………………………………… 11
1.3.1 Risk factors for childhood cancer…………………………………… 12
1.3.2 Infection and childhood cancer……………………………………… 13
1.4 Childhood germ cell tumors…………………………………………………… 17
1.4.1 Risk factors for childhood germ cell tumors………………………… 17
1.5 Occupational exposures and childhood cancer………………………………... 20
1.5.1 Preconception………………………………………………………... 20
1.5.2 Pregnancy……………………………………………………………. 21
1.5.3 After birth……………………………………………………………. 21
1.6 Lifestyle characteristics of relevant occupations……………………………… 22
1.7 Objective………………………………………………………………………. 23
Chapter 2. Occupational physical activity and the 6-year incidence of stroke
and transient ischemic attack in women…………………………………………………… 24
2.1 Abstract………………………………………………………………………… 24
2.2 Introduction……………………………………………………………………. 25
2.3 Methods……………………………………………………………………....... 26
2.4 Results…………………………………………………………………………. 33
2.5 Discussion……………………………………………………………………… 37
2.6 Tables………………………………………………………………………...… 47
Chapter 3. Parental occupational exposure to livestock or animal dust and the risk
for childhood cancer in offspring………………………………………………………….. 65
3.1 Abstract………………………………………………………………………… 65
3.2 Introduction……………………………………………………………………. 65
3.3 Methods………………………………………………………………………... 67
3.4 Results…………………………………………………………………………. 70
3.5 Discussion……………………………………………………………………… 72
3.6 Tables…………………………………………………………………………... 78

vii
Chapter 4. Parental occupation and childhood germ cell tumor risk in Denmark,
1968-2015…………………………………………………………………………………. 87
4.1 Abstract………………………………………………………………………... 87
4.2 Introduction……………………………………………………………………. 88
4.3 Methods………………………………………………………………………... 89
4.4 Results…………………………………………………………………………. 94
4.5 Discussion……………………………………………………………………... 96
4.6 Tables………………………………………………………………………….. 101
Chapter 5. Public health relevance……………………………………………………….. 106
Chapter 6. References…………………………………………………………………….. 108

viii
LIST OF TABLES
Table 2.1. Characteristics of the study population, stratified by baseline hypertension status.
Sister Study, 2004-2016, N=31270.
Table 2.2. Occupational physical activity and incident stroke risk (n=441): Hazard ratios and
95% confidence intervals from Cox regression analyses with incremental adjustment for
potential confounders. Sister Study, 2004-2016, N=31270.
Table 2.3. Occupational physical activity and incident TIA risk (n=274): Hazard ratios and 95%
confidence intervals from Cox regression analyses with incremental adjustment for potential
confounders. Sister Study, 2004-2016, N=31270.
Table 2.4. Cumulative exposure to mostly dynamic occupational physical activity and incident
stroke and TIA risk: Hazard ratios and 95% confidence intervals from fully-adjusted Cox
regression analyses. Sister Study, 2004-2016, N=31270.
Table 2.5. Occupational physical activity and incident stroke risk (n=441) by baseline
cardiovascular disease (CVD): Hazard ratios and 95% confidence intervals from fully-adjusted
Cox regression models. Sister Study, 2004-2016, N=31270.
Table 2.6. Occupational physical activity and incident TIA risk (n=274) by cardiovascular
disease (CVD): Hazard ratios and 95% confidence intervals from fully-adjusted Cox regression
models. Sister Study, 2004-2016, N=31270.
Table 2.7. Occupational physical activity and incident stroke risk (n=441) by baseline
hypertension status: Hazard ratios and 95% confidence intervals from fully-adjusted Cox
regression models. Sister Study, 2004-2016, N=31270.
Table 2.8. Occupational physical activity and incident TIA risk (n=274) by baseline
hypertension status: Hazard ratios and 95% confidence intervals from fully-adjusted Cox
regression models. Sister Study, 2004-2016, N=31270.
Supplementary Table 2.1. Characteristics of the study population, stratified by baseline
cardiovascular disease (CVD) status. Sister Study, 2004-2016, N=31270.
Supplementary Table 2.2. Occupational physical activity and incident stroke risk (n=441) by
pre-existing cardiovascular disease (CVD) status: Hazard ratios and 95% confidence intervals
from Cox regression models adjusted for all potential confounders except rate pressure product.
Sister Study, 2004-2016, N=31270.
Supplementary Table 2.3. Occupational physical activity and incident TIA risk (n=274) by pre-
existing cardiovascular disease (CVD) status: Hazard ratios and 95% confidence intervals from
Cox regression models adjusted for all potential confounders except rate pressure product. Sister
Study, 2004-2016, N=31270.

ix
Supplementary Table 2.4. Occupational physical activity and incident stroke risk (n=441) by
baseline hypertension status: Hazard ratios and 95% confidence intervals from Cox regression
models adjusted for all potential confounders except rate pressure product. Sister Study, 2004-
2016, N=31270.
Supplementary Table 2.5. Occupational physical activity and incident TIA risk (n=274) by
baseline hypertension status: Hazard ratios and 95% confidence intervals from Cox regression
models adjusted for all potential confounders except rate pressure product. Sister Study, 2004-
2016, N=31270.
Supplementary Table 2.6. Leisure time physical activity (LTPA) and incident stroke and TIA
risk: Hazard ratios and 95% confidence intervals from fully-adjusted Cox regression analyses.
Sister Study, 2004-2016, N=31270.
Supplementary Table 2.7. Cross-tabulation of participant responses to occupational physical
activity for current and longest held jobs.
Supplementary Table 2.8. Prevalence of occupational industry among women who reported
mostly dynamic work for current or longest held job.
Table 3.1. Prevalence of occupations selected for inclusion in the livestock/animal dust job-
exposure matrix, stratified by parent, exposure period of interest, and case/control status.
Table 3.2. Demographic, gestational, and parental characteristics of population cases and
controls.
Table 3.3. Adjusted odds ratios for paternal occupational exposure to livestock or animal dust
and the risk of childhood cancer in offspring, stratified by exposure window.
Table 3.4. Adjusted odds ratios for maternal occupational exposure to livestock or animal dust
and the risk of childhood cancer in offspring, stratified by exposure window.
Supplementary Table 3.1. Adjusted odds ratios for paternal employment in hog slaughtering
and the risk of childhood cancer in offspring, stratified by exposure window.
Supplementary Table 3.2. Adjusted odds ratios for paternal occupational exposure to livestock
or animal dust and the risk of childhood cancer in offspring among births 1989+, stratified by
exposure window.
Supplementary Table 3.3. Adjusted odds ratios for paternal occupational exposure to livestock
or animal dust and the risk of childhood cancer in offspring, stratified by place of birth and
exposure window.

x
Supplementary Table 3.4. Adjusted odds ratios for maternal occupational exposure to livestock
or animal dust and the risk of childhood cancer in offspring among births 1989+, stratified by
exposure window.
Supplementary Table 3.5. Adjusted odds ratios for maternal occupational exposure to livestock
or animal dust and the risk of childhood cancer in offspring, stratified by place of birth and
exposure window.
Table 4.1. Demographic characteristics of germ cell tumor cases and controls (1968-2015).
Table 4.2. Odds ratios and 95% confidence intervals for the association between paternal
occupational exposures and germ cell tumor risk in offspring, stratified by exposure window
(1968-2015).
Table 4.3. Odds ratios and 95% confidence intervals for the association between paternal
occupational exposures, yolk sac tumor, and teratoma risk in offspring, stratified by exposure
window (1968-2015).
Table 4.4. Odds ratios and 95% confidence intervals for the association between maternal
occupational exposures and germ cell tumor risk in offspring, stratified by exposure window
(1968-2015).
Table 4.5. Odds ratios and 95% confidence intervals for the association between maternal
occupational exposures, yolk sac tumor, and teratoma risk in offspring, stratified by exposure
window (1968-2015).

xi
LIST OF ABBREVIATIONS
Acute lymphoblastic leukemia (ALL)
Body mass index (BMI)
Cardiovascular disease (CVD)
Central nervous system (CNS)
Confidence interval (CI)
Developmental origins of health and disease (DOHaD)
Germ cell tumor (GCT)
Hazards ratio (HR)
Job-exposure matrix (JEM)
Leisure time physical activity (LTPA)
International Agency for Research on Cancer (IARC)
International Classification of Childhood Cancer (ICCC)
International Classification of Diseases for Oncology (ICD-O)
International Standard Industrial Classification for All Economic Activities (ISIC)
Metabolic equivalent task (MET)
Methicillin-resistant Staphyloccussaureas (MRSA)
National Institute for Occupational Safety and Health (NIOSH)
National Occupational Research Agenda (NORA)
Odds ratio (OR)
Occupational physical activity (OPA)
Occupational Safety and Health Administration (OSHA)

xii
Population attributable risk (PAR)
Socioeconomic status (SES)
Transient ischemic attack (TIA)
World Health Organization (WHO)

xiii
VITA
EDUCATION
2014 Bachelor of Arts, Public Health Studies
The Johns Hopkins University, Baltimore, MD
PEER REVIEWED PUBLICATIONS
Hall C, Ritz B, Cockburn M, Davidson TB, Heck JE. Risk of malignant childhood germ cell
tumors in relation to demographic, gestational and perinatal characteristics. Cancer Epidemiol.
2017. DOI 10.1016/j.canep.2016.12.002.
Laster M, Soohoo M, Hall C, Streja E, Rhee CM, Ravel VA, Reddy U, Norris KC, Salusky IB,
Kalantar-Zadeh K. Racial-ethnic disparities in mortality and kidney transplant outcomes among
pediatric dialysis patients. Pediatr. Nephrol. 2016. DOI 10.1007/s00467-016-3530-2.

1
Chapter 1. Introduction and background
1.1 Occupational epidemiology
Physicians and other health professionals have noted the impact of occupation on health
for centuries; Bernardino Ramazzini, widely considered the “father of occupational medicine,”
described a variety of occupation-related diseases and their causes in his book De Morbis
Artificum, published in 1700.1 Even some of the earliest epidemiologic investigations began by
examining occupation and occupation-related exposures: In 1775—decades before Jon Snow
removed the handle from the water pump on Broad Street—a man named Percival Pott identified
soot as the cause of scrotal cancer in London chimney sweeps. This is largely considered to be
the first instance of clear-cut supporting evidence for chemical carcinogenesis resulting from an
occupational exposure.2 Since Percival Pott’s work, there have been thousands of epidemiologic
investigations into occupational hazards—ranging from chemical exposures to ergonomic and
organizational factors such as shift work—that have resulted in the creation of numerous
agencies, such as the Occupational Safety and Health Administration (OSHA) and the National
Institute for Occupational Safety and Health (NIOSH), with the mission to implement
regulations to control hazardous exposures on the job and to protect the health and safety of
workers.
Despite this, occupational exposures still have a profound impact on worker health.
Although declining with time, there were nearly 2.9 million nonfatal workplace injuries and
illnesses reported by private industry employers in the United States in 2015, a rate of 3.0 cases
per 100 equivalent full-time workers.3 In the public sector, an estimated 752,000 injury and
illnesses were reported in 2015 from the nearly 18.4 million state and local government workers,
resulting in a rate of 5.1 cases per 100 full-time workers; this is relatively unchanged from the
2
previous year (5.0 cases) but is notably higher than the rate among private industry workers,
likely explained by differential reporting between these sectors and a larger proportion of high-
risk jobs in the public sector, like policing and firefighting.3
In the United States, there were also 4,826 fatal occupational injuries in 2015, a rate of
3.4 per 100,000 full-time equivalent workers; this is a notable decrease from a rate of 4.2 in
2006, but it has remained relatively stable since 2009.4 Globally, an estimated 2.3 million deaths
in 2014 were attributed to occupation—approximately 2 million of which were due to work-
related diseases while the remainder were due to occupational injuries.5 Together, cardiovascular
(circulatory) diseases and cancers were responsible for more than two-thirds of work-related
deaths,5 which demonstrates the importance of studying and identifying chronic occupational
exposures, as chronic non-infectious diseases are the main long-term consequences of an
unhealthy work environment.
The perceived risk of occupational injury or illness is in stark contrast to its actual risk;
many underestimate the mundane tasks associated with their occupation, but it is often ordinary
job requirements that, over time, can lead to harmful outcomes.6 This highlights the need for
occupational epidemiology in discovering and quantifying work-related hazards and
disseminating findings to both the public and the appropriate agencies—like OSHA or NIOSH—
that are designed to minimize risk through regulations, training, consultations, enforcement, and
guidelines that advocate a healthy working environment.
This dissertation will focus on three different projects in the realm of occupational
epidemiology. The first examines the relationship between occupational physical activity (OPA)
and cerebrovascular disease (i.e., stroke and transient ischemic attack [TIA]) in older women.
The second project explores the relationship between parental occupational exposure to livestock

3
around pregnancy and the risk of childhood cancer in offspring, while the third investigates
parental occupational exposures, assessed via job exposure matrices (JEMs) and job titles, and
the risk of childhood germ cell tumors (GCTs) in offspring. Although distinct, these projects are
complementary exercises in occupational epidemiology that seek to identify and quantify the
risks associated with occupational exposures in vulnerable populations.
1.1.1 Vulnerable populations
By investigating occupational exposures in older women, pregnant women, and children,
this dissertation is focused on identifying risk factors in vulnerable populations. The study on
OPA and cerebrovascular disease in women inherently address a primary research priority
outlined by the National Occupational Research Agenda (NORA) in their 2002 publication, “The
Changing Organization of Work and the Safety and Health of Working People.” This publication
noted that more research was needed to examine the effect of organizational stressors that are
specific to women and older workers, as they may be disproportionally exposed to certain
occupational risks.7 The Sister Study, which will be the cohort utilized in the analysis of OPA
and cerebrovascular disease, is comprised solely of women, 52% of whom were over the age of
55 at baseline, making it a suitable cohort to examine occupational risk factors for chronic
cerebrovascular diseases in this vulnerable and understudied older female population. Similarly,
the projects on parental occupation and childhood cancer address NORA research priorities by
focusing on pregnant women. Due to the inherent nature of their condition and elevated
sensitivity of the developing fetus to environmental toxins, pregnant women represent a
particularly vulnerable and understudied population in the workforce.

4
1.2 Cerebrovascular disease
Using the World Health Organization (WHO)’s diagnostic criteria, stroke is a type of
cerebrovascular disease classically defined as “rapidly developing clinical signs [symptoms8] of
focal (at times, global) disturbances of cerebral function, lasting more than 24 hours or leading to
death with no apparent cause other than that of vascular origin.”9 There are three subtypes of
stroke: ischemic stroke, intracerebral hemorrhage, and subarachnoid hemorrhage. Ischemic
strokes are marked by the obstruction of a blood vessel due to a blood clot or (typically
atherosclerotic) plaque production, while hemorrhagic strokes occur when a blood vessel in the
brain ruptures and bleeds; both result in a lack of oxygen and nutrients to the brain, causing cell
death.10 Intracerebral and subarachnoid hemorrhage differ based on the location of the ruptured
vessel: the former denotes a rupture inside the brain, while the latter indicates a bleed just outside
the brain, in the subarachnoid space. Both lead to compression of affected brain regions with
symptoms similar to ischemic stroke. While the WHO’s definition of stroke is commonly
accepted in the epidemiologic literature, it does not account for transient ischemic attacks
(TIAs), also known as “mini-strokes,” which refer to a “brief episode of neurologic dysfunction
caused by focal brain or retinal ischemia, with clinical symptoms typically lasting less than 1
hour [but up to <24 hours10] and without evidence of acute infarction.”11 TIAs are similar to
ischemic strokes insofar as they are caused by a blood clot, but the clot is only temporary and
TIAs do not usually result in permanent brain damage, whereas stroke is likely to.10
Stroke—when considered separately from all other cardiovascular diseases—ranks fifth
among all causes of death in the United States and is the leading cause of long-term disability.12
According to the most recent statistics, 7.2 million individuals aged 20 or older self-reported
having had a stroke; prevalence increases with age for both sexes and is known to vary by

5
race/ethnicity.12 According to the CDC, 2.5% of non-Hispanic whites aged 18 or older have a
history of stroke compared to 4.5% of non-Hispanic blacks, 1.8% of Asian/Pacific Islanders,
2.4% of Hispanics (of any race), 5.4% of American Indian/Alaska Natives, and 4.7% of other
races or multiracial people.13 Of all strokes, 87% are ischemic and 13% are hemorrhagic, of the
latter, 10% are intracerebral and 3% subarachnoid. Each year, approximately 795,000 people
experience a stroke—about 610,000 of these are first attacks and the remaining 185,000 are
recurrent attacks.12 According to recent statistics, TIAs are less prevalent than stroke, affecting
about 5 million people in the United States; however, prevalence is suspected to be greater as
many patients who experience symptoms consistent with a TIA fail to report it to their healthcare
provider.14 The incidence of TIA increases with age and varies by sex and race/ethnicity, with
men, blacks, and Mexican Americans showing higher rates of TIA than their female and non-
Hispanic white counterparts.15, 16 Around 15% of all strokes are heralded by a TIA, and TIAs
confer a substantial short- and long-term risk of stroke, hospitalization for cardiovascular events,
and death.17, 18
1.2.1 Risk factors for cerebrovascular disease
Several risk factors for cerebrovascular disease have been well established in the
literature, many of which are elements of an unhealthy lifestyle that elevate individual risk for a
variety of diseases, such as CVD; these risk factors include hypertension, smoking, high
cholesterol, heavy alcohol consumption, and obesity.10, 19 However, it has been shown that
elements of a healthy lifestyle—like diet high in fish, grains, fruits and vegetables or being
physically active during leisure time—can reduce stroke risk.20, 21 Previous cardiac events and
other comorbidities, such as migraine or type-II diabetes, have also been shown to increase the
risk of stroke.10, 22 The most common cardiac precursor to stroke is atrial fibrillation, which
6
causes the heart to quiver and beat irregularly; this can result in an inefficient heartbeat that
leaves residual blood in the atria, where it can pool, clot, and eventually result in an embolism,
leading to ischemic stroke.10 Other cardiovascular conditions, like coronary heart disease (such
as angina and myocardial infarction), atherosclerosis, aneurysms, and comorbidities such as
obesity, diabetes, and dyslipidemia similarly raise an individual’s risk for stroke.10
Psychosocial factors such as stress and depression have been shown to increase stroke
risk, especially in women. A recent meta-analysis of ten prospective cohort studies and four
case-control studies found that those who reported general or work stress and/or stressful life
events (i.e., death of a family member) were at an increased risk for stroke compared to those
who did not report any types of stress (HR=1.33; 95% CI=1.17, 1.50).23 There was an increased
risk across stroke subtypes, but the risk was more pronounced for hemorrhagic stroke (HR=1.73;
95% CI=1.33, 2.25) than it was for ischemic stroke (HR=1.40; 95% CI=1.00, 1.97). The meta-
analysis also revealed stark differences by sex, with stress impacting stroke risk in women
(HR=1.90; 95% CI=1.40, 2.56) significantly more than men (HR=1.24; 95% CI=1.13, 1.36).
However, there is no clear explanation for this difference between sexes and is uncertain whether
these results indicate that women experience higher levels of stress, are more likely to report
stress, or if perceptions of stress are different between men and women.23 Regardless, the results
of this meta-analysis are in agreement with a literature review of work-related stress among
women—suggesting that work stress and job strain may be more powerful predictors of stroke
risk in women than in men.24
Stress is not the only psychosocial factor to influence stroke risk; a recent study of
incident stroke in women found that those who reported a history of depression, antidepressant
medication use, a current depression diagnosis, and a low Mental Health Index score were all at

7
an increased risk of stroke. However, for each cycle they collected information, those who
reported current depression were at a higher risk for stroke (HR=1.41; 95% CI=1.18, 1.67) than
were those only reported a history of depression (HR=1.23; 95% CI=0.97, 1.56), compared with
women who never reported a depression diagnosis or antidepressant medication use.25 The
mechanisms to explain an increased risk of stroke for psychosocial stress and depression have
yet to be fully elucidated. Potential mechanisms involve the impact of perceived stress on
vascular inflammation or oxidative stress, key elements of the basic pathophysiology of vascular
disease.23, 26 Objective stressors also contribute to disease risk, perhaps even more than perceived
stressors; one study of San Francisco transit operators found that hypertension risk was higher
among those who did not perceive observed stressors compared with those who perceived and
report the same job stressors.27 Stress may also increase catecholamine release and sympathetic
activation, which may directly or indirectly affect the vascular system through increases in heart
rate or blood pressure, thickening of the intima media of arterial vessel walls, or advancing
carotid arterial disease.26, 28 Depression may influence stroke risk directly through
neuroendocrine, immunological, or inflammatory pathways,29, 30 or indirectly through its
association with unhealthy behaviors, like smoking, inactivity, and obesity.31
There are some suspected occupational risk factors for stroke in addition to work-related
stress, but literature in the field is sparse. Occupational noise exposure has been positively
associated with stroke incidence and intracerebral hemorrhagic stroke mortality in some
studies,32, 33 but other reports have not corroborated these findings.34 There is also mixed
evidence regarding occupational exposure to particles and stroke risk. Two studies reported
positive associations between stroke risk or mortality and aluminum potroom workers and army
cooks,35, 36 occupations which indicate potential particle exposure; however, a more recent

8
analysis did not find similar results.37 Yet, a subsequent study found a positive association
between occupational exposure to both small (<1μm) and large (>1μm) particles and ischemic
stroke; associations were stronger for persons exposed for at least five years compared with those
who were ever exposed.38 There has been no evidence to link agricultural exposures with stroke
risk.39
A recent, multi-country case-control study investigated the impact of ten established
risk/protective factors (i.e., hypertension, smoking status, waist-to-hip ratio, diet risk score,
regular physical activity, alcohol intake, psychosocial factors, diabetes status, cardiac causes, and
the ratio of apolipoproteins B to A1) on stroke risk by calculating population attributable risks
(PARs), finding that they account for about 90% of the risk of stroke. However, the extent to
which each factor accounted for stroke risk was dependent on the subtype; for example, the PAR
for self-reported hypertension was 44.5% for intracerebral hemorrhage, but 31.5% for ischemic
stroke. However, the direction of each risk factor (i.e., positive or negative) was consistent across
subtypes.19 While these findings appear to indicate that risk factors for stroke are well-known, it
is important to note that PARs of different risk factors are not limited to a sum total of 100% and
there is infinite room for additional risks. Recent evidence also suggests that some established
risk factors require a deeper investigation. For example, while general physical activity was a
risk factor mentioned in the review cited above, the authors did not collect or evaluate any data
specifically on OPA. The failure to differentiate between occupational and leisure time physical
activity may be problematic because recent evidence suggests these two types of physical
activity may have opposite effects on CVD outcomes.21, 40, 41 While the risk factors listed by the
reviewers are generally in agreement with decades of research into factors that influence stroke
9
risk, research has yet to investigate the specific role of occupational risk factors including an
examination of potentially paradoxical health effects of OPA and LTPA.
1.2.2 The physical activity health paradox
Physical activity has a profound impact on health and the hazards associated with a
sedentary lifestyle are well-documented.42-44 However, the term “physical activity” is vague and
may involve leisure-time physical activities (i.e., exercise, sports, hobbies), commuting physical
activities (i.e., walking, cycling), household chores, and/or occupational physical activities. Until
recently, all domains of physical activity have been considered to confer similar health-
promoting benefits,45, 46 and current World Health Organization (WHO) recommendations
regarding physical activity do not distinguish between LTPA and OPA.47 However, prospective
cohort studies report conflicting findings regarding the benefits of OPA: some studies show that
high OPA is associated with improved health,40, 48, 49 while others demonstrate that high OPA
impairs health,50-52 and a recent review of the newer literature concludes that high levels of OPA
are associated with a 24% increased risk of CVD, while high levels of LTPA are associated with
a 24% decrease in CVD.53 The phenomenon of such differential effects of different types of
physical activity has been called the “physical activity health paradox.”54, 55
A potential biological explanation for the contrasting effects of LTPA and OPA lies in
differential blood pressure responses to physical activity.41 Elevated systolic blood pressure is an
established risk factor for CVD,56 and daily measurements of blood pressure have been shown to
predict cardiovascular events.57 Furthermore, physical activity plays an important role in the
daily variations in blood pressure;58, 59 LTPA like cycling and walking has been shown to reduce
blood pressure,60 but OPA like lifting and carrying heavy objects is known to significantly raise
blood pressure in the short- and long-term.41, 61 Therefore different effects on systolic blood
10
pressure may explain the differential impacts of LTPA and OPA on CVD health. However,
another biological factor of interest is heart rate; elevated resting and average 24-hour heart rate,
which is a known independent risk factor for CVD.62-64 High OPA over extended periods of time
has been shown to increase 24-hour heart rate, an association not observed with shorter duration
high levels of LTPA.65 For instance, the Belgian Physical Fitness Study reported a more than 3-
fold increased all-cause mortality risk among working men in the upper tertile of ambulatory 24-
hour heart rate (HR=3.21; 95% CI=1.22-8.44).66 Yet, there are other aspects of OPA and LTPA
that can contribute to differential disease risk.
Structurally, the nature of OPA is different from LTPA, which may lead to poorer CVD
outcomes through increased worker stress and fatigue. Participation in LTPA is voluntary and
the participant is generally in complete control of their actions, including how much to do and
when and how long to rest. Conversely, OPA is an employment requirement and usually
performed with little worker input: employees do not typically have control over work tasks,
work hours, work speed, and other psychosocial, organizational, or ergonomic stressors that may
be present in the work environment and determine the type, intensity, and duration of OPA. OPA
is typically performed for longer time periods than LTPA and with less recovery time between
and after activities. In addition to the biologic effects mentioned previously, this can result in
exhaustion and fatigue, which has been associated with an increase in CVD and stroke.67-69
Taken together, these biologic and structural differences between OPA and LTPA help explain
the physical activity health paradox.
1.3 Childhood cancer
Childhood cancers are rare diseases with relatively unknown etiology. Approximately
10% of all pediatric cancers can be attributed to inherited genetic traits, while de novo somatic

11
mutations account for the remaining 90%.70 As a result, many childhood cancers are thought to
originate prenatally or from early childhood exposures. The developmental origin of health and
disease (DOHaD) hypothesis is used to support the notion that some childhood cancers have a
prenatal origin; this hypothesis emerged nearly 30 years ago after epidemiologists found high
correlations between birthweight and rates of adult death from ischemic heart disease.71 The
DOHaD hypothesis suggested that the fetus’s adaptation to the intrauterine environment (i.e.,
undernutrition) resulted in permanent fetal programming that shaped the body’s structure,
function, and metabolism—in addition to contributing to adult disease.72 While this theory first
applied to adult CVD, it has also been extended to the study of adult cancers and other chronic
diseases; however, it has not explicitly examined with respect to childhood cancer. Nevertheless,
it can be used to support the notion that prenatal exposures can affect long-term disease risk.
There is some evidence for the prenatal origin of pediatric cancer; these cancers commonly co-
occur with congenital malformations, and prenatal factors like birthweight have been
consistently associated with cancer risk in children, for some cancer types.73-76 Furthermore,
some childhood cancer cells possess embryonal features;77 however, it is not yet known whether
these cancers arise from embryonal cells in utero or as a consequence of a single oncogenic
event in a more mature prenatal cell.78 While biological pathways have not yet been fully
elucidated, epigenetic events involving DNA methylation and hormonal signaling via the
placenta are likely mechanisms related to carcinogenesis.79-82
In the United States, there are approximately 15,700 incident cancers diagnosed annually
among individuals aged <20 years.65, 83 There are several different types of childhood cancers,
but leukemias and CNS tumors are the most commonly diagnosed.84 The incidence rate of all
pediatric cancers in the United States has been slightly increasing at an annual rate of 0.6% since

12
1975.84 While incidence may be increasing, mortality has substantially declined with time;
despite this, childhood cancer remains the leading cause of death by disease among children in
the United States.84 Worldwide, an estimated 163,300 new childhood cancer cases occurred
among children 0-14 years of age in 2012, with an estimated 80,000 deaths; similar to the U.S.,
global mortality has been declining over the past 40 years, but more developed countries have
been experiencing an increase in incidence rates since the 1970s.85 Reasons for these trends are
largely unknown but may be in part to improved diagnosis and reporting methods; trends in
developing countries are difficult to capture due to inadequate reporting and a small amount of
resources.
1.3.1 Risk factors for childhood cancer
There are few established risk factors for childhood cancer, likely due to their rarity.
Genetic risk factors explain 5-10% of all childhood cancer cases, leaving the remaining 90%
with mostly unknown etiology.75 Demographic risk factors impact the distribution of childhood
cancer cases in the population: non-Hispanic white children and boys are more likely to be
diagnosed with cancer in childhood, but age at diagnosis is largely determined by tumor
histology; for example, acute lymphoblastic leukemia (ALL) is known for its peak incidence at
2-5 years old, whereas bone sarcoma incidence peaks in adolescence.75 Ionizing radiation and
prior chemotherapy are among the few established risk factors for childhood cancer, with few
other environmental factors have been causally linked to childhood cancer development.75, 86, 87
Intrinsic risk factors for childhood cancers—like birthweight, parental age, and congenital
anomalies—have been well established in the literature. The risk of several cancers, such as
ALL88 and CNS tumors,89 has been shown to rise as linear function of birthweight, while others,
like neuroblastoma,90 have been associated with low birthweight. Other cancers, like acute

13
myeloid leukemia, show a U-shaped relationship with birthweight.75 Congenital malformations
have also been consistently associated with childhood cancer risk.73, 74 Some congenital
anomalies, like Down syndrome, have been clearly linked to a specific childhood cancer (in this
instance, ALL),91 but due to the rarity of both individual birth defects and individual childhood
cancers, specific associations have not yet been full elucidated for all congenital malformations
and cancer types.
1.3.2 Infection and childhood cancer
Exposure to infection (either in utero or after birth) has been investigated in the etiology
of several childhood cancers, though most studies focus on leukemia and brain tumors.92-97 Two
competing hypotheses exist for the role of infection in childhood cancer development; Greaves’s
views infection as conferring protection against cancer,98 while Kinlen’s suggests exposure to
infection in utero or in early life increases cancer risk.99 While these hypotheses were originally
developed to investigate increasing leukemia rates, they are now thought to be possible for many
cancers. Greaves’s “delayed infection” hypothesis asserts that exposure to infections in early life
primes the immune system and confers protection against cancer development later in life, while
those who don’t have early life exposure to infections are at an increased risk of cancer
development. Conversely, Kinlen’s “population mixing” hypothesis claims that cancers like
leukemia have an infective origin due to unusual population mixing; for example, people who
live in geographically isolated areas may elude exposure to common infective agents—to these
groups, “incomers” can introduce infective agents that result in dramatic consequences. Kinlen
views leukemia as one of these consequences, arising as a result of a rare, abnormal immune
response to infection.99-101 Kinlen has used evidence from isolated nuclear reprocessing plants in
Britain to support this notion; in his studies, he showed that there was an excess number of

14
childhood leukemia cases after an influx of “incomers” to the area, whom he theorizes were
responsible for localized epidemics due to increased contact between susceptible (i.e., those who
were already living in the isolated are) and infected (i.e., “incomers”) individuals.100, 102, 103
While these hypotheses have increased research interest in infection and childhood cancer,
specifically childhood leukemia,93, 95, 104-106 no studies have yet to identify a specific infectious
agent relevant to the etiology of childhood leukemia. Some cancers, however, do have an
established viral cause: Burkitt’s lymphoma and Epstein-Barr virus; liver cancer and Hepatitis B
and C viruses; cervical cancer and human papillomavirus; and Kaposi’s sarcoma and human
herpesvirus-8 and Kaposi’s sarcoma herpesvirus.107, 108
While not all cancers have an established viral cause, infectious agents are suspected in
the etiology of many neoplasms, including childhood brain tumors. Studies have shown that
viruses can cause brain tumors in animals,109-112 but evidence for an association with humans is
less conclusive. Nevertheless, one study has reported a positive association between prior
Toxoplasma gondii infection and gliomas in adults,113 while others have suggested associations
between maternal infection during pregnancy and childhood brain tumor risk in offspring.94, 97, 114
Furthermore, there is evidence to suggest that infections may only be relevant to the etiology of
certain brain tumor subtypes. For example, JC polyomavirus has been widely studied as a
candidate etiologic agent for CNS tumors because it has been shown to induce brain tumors in
animal models111, 112 and has been detected in pediatric and adult CNS tumor subtypes with
varied frequencies.115 However, studies have generally reported a high prevalence in glial tumors
and low to no prevalence in medulloblastomas,116-118 bolstering the idea that infections are only
pertinent to certain histologic subtypes of brain tumors.

15
Rarer childhood cancers have been less frequently examined with respect to infection
and these studies tend to yield mixed results. Few studies have assessed the role of infection in
the etiology of childhood rhabdomyosarcoma, a malignant tumor of developing skeletal muscle.
One study found no association between infection and rhabdomyosarcoma, but detected positive
associations between incomplete immunization schedules and cancer risk.119 These findings
corroborate the results of previous study based on 33 rhabdomyosarcoma cases that detected
inverse associations with complete immunization schedules and cancer risk.120 Another study
from the Children’s Oncology Group reported inverse associations between rhabdomyosarcoma
and allergies and hives, suggesting that atopic exposures in early life alter the immune system
and protect against cancer development later in life.121, 122 This report also estimated inverse
associations between rhabdomyosarcoma, day care attendance, and breastfeeding for more than
one year, further suggesting immune system development has a role in tumor onset.
The literature is mixed with respect to infection’s role in the development of
neuroblastoma. An English cohort study of 266,710 live births in Cumbria from 1950-1991
found an increased risk of neuroblastoma among the children of “incomers” (i.e., children of
parents who were both born outside the study area),123 a proxy for population mixing; however, a
later study from Northern England could not corroborate these findings, though it only included
birth 1975-1994 and excluded the county of Cumbria in its study population.124 A South Korean
ecologic study reported a temporal correlation between neuroblastoma diagnoses and recent
human parainfluenza virus, but this study design limits the generalizability of their findings.125
Alternatively, a case-control study of 538 neuroblastoma cases estimated an inverse association
between select childhood infections (e.g., chickenpox, mumps, and measles), day care
attendance, and neuroblastoma risk, but noted that positive associations were observed for other

16
childhood infections, like ear infection.126 These mixed results suggest a need for more research
in the area.
Few studies have investigated infection in the etiology of Wilms tumor. However, a
report from the Children’s Oncology Group estimated an inverse association between Wilms
tumor and breastfeeding; while there is no clear mechanism to explain this association, the
authors noted that breast milk contains agents that can protect against infection or potentially
carcinogenic agents.127 Evidence for an association with maternal infection during pregnancy is
less clear: A case-control study of 202 Wilms tumor cases revealed an increased risk of tumor
development among the children of mothers who reported a vaginal infection in pregnancy,128
but a later study of the same size could not corroborate these findings.129
There is little evidence suggesting infection plays a role in the etiology of childhood bone
tumors, however there are few studies on these rare tumors. An Austrian case-control study of
juvenile bone tumors found positive associations between tumor development and history of
measles and mumps, but an inverse association with a history of chickenpox and
dermal/respiratory allergies.130 This report also found an inverse association between
breastfeeding and bone tumor risk in boys, but other studies have not been able to link
breastfeeding and childhood bone tumors.131 Other studies have reported positive associations
between parental farming exposures and both Ewing’s sarcoma and osteosarcoma in
offspring,132-135 but these studies did not distinguish between livestock and crop work, making it
difficult to identify the most relevant exposure.
1.4 Childhood germ cell tumors
Childhood GCTs are an assorted group of malignant and benign neoplasms that are
believed to originate from primordial germ cells, but vary with respect to their clinical

17
presentation, histopathology, and biologic characteristics.76, 136, 137 GCTs in children under 15 are
rare, comprising only 3.5% of all pediatric cancers.138 In the United States, the incidence rate of
GCTs for children <15 is approximately 6.0 per million,139 while in Europe it is estimated to be
4.8 per million.140 In young children, there are two common subtypes of GCTs: yolk sac tumors
and teratomas.141 While few studies have stratified by histologic subtype, some evidence
suggests these subtypes have distinct etiologies and ages at diagnosis, as well as heterogenous
tumor DNA methylation signatures.76, 141-145
1.4.1 Risk factors for childhood germ cell tumors
Likely due to their rarity, the etiology of childhood GCTs is largely unknown; however,
studies have reported consistent positive associations between cancer incidence and
Asian/Pacific Islander race, abnormal fetal growth, birth defects like cryptorchidism, and
congenital malformations.76, 146-150 Increasing maternal age has been positively associated with
childhood GCT risk in several studies,146, 151, 152 but there has been inconsistent evidence with
respect to other maternal factors. One study reported a decreased risk of GCTs in mothers who
had a diet high in fruits and vegetables during pregnancy,153 but this association was only
pertinent to male offspring. Another study reported maternal vitamin supplementation to be
inversely associated with GCT risk in offspring;145 however, a stratified analysis revealed this
association to be null for yolk sac tumors. Prolonged breastfeeding (> 12 months) was positively
associated with cancer risk in a study of 105 childhood GCT cases,154 but a more recent analysis
with double the sample size failed to corroborate these findings.155 Parental drinking has not
been linked with GCT risk in offspring.156 The role of smoking is less clear; an exploratory
analysis revealed no association between paternal smoking and GCT risk in children, but
estimated an inverse association between cancer risk and the number of cigarettes smoked by the

18
mother during pregnancy, which the authors credited to differences in recall.154 Other studies
have not been able to elucidate a clear relationship between parental smoking and childhood
GCT risk.156-159 No studies have found an association between exposure to female hormones in
utero or fertility treatment and childhood GCT risk.151, 160
Several studies have found that both high and low birthweight are positively associated
with GCT risk. A registry-based study of 152 childhood testicular GCT cases <15 years revealed
a U-shaped relationship between birth weight and cancer incidence, finding increased risks
among children with high (>4000g) and low (<2500g) birth weight. When the authors used the
Ponderal index (birth weight divided by the cubed value of birth length) to classify growth, a
similar U-shaped relationship was observed.146 While findings for high birth weight have been
corroborated by other studies,154, 156, 160 a recent analysis found that an initially observed positive
association between low birth weight (and low gestational age) and GCT risk became null after
excluding cases diagnosed within 5 days of birth.76 This study only observed an association for
low birth weight with teratomas and credited it to reverse causation; that is, the teratoma was
likely the reason for early, presumably induced, delivery—and therefore low birth weight—as
teratomas are increasingly diagnosed in utero.161
The relationship between socioeconomic status (SES) and GCT risk is unclear. A
population-based study of four Scandinavian countries reported an increased risk of GCTs with
lower levels of maternal education146 and these results were consistent with a population-based
study of young California children.76 However, a pooled population-based analysis of five US
states (including California births over a nine-year period) did not find an association between
childhood GCTs and maternal education.162 Conversely, a nationwide study in the United States

19
reported a lower risk of childhood GCTs in higher-poverty areas; however, poverty metrics were
on the county-level, making it difficult to compare with individual measures of SES.163
Few studies have investigated parental occupational exposures in the etiology of
childhood GCTs. These studies have reported positive associations between parental
occupational exposure to chemicals or solvents (maternal odds ratio [OR]=4.6; 95% CI=1.9,
11.3; paternal OR=2.2; 95% CI=1.1, 4.7) and plastic/resin fumes (maternal OR=12.0; 95%
CI=1.9, 75.0; paternal OR=2.5; 95% CI=1.0, 6.5) and childhood GCT risk in offspring;154
however, results were mixed or null for other occupational exposures, such as exhaust fumes,
radiation, dyes, and farm animals.154, 158 Both occupational and non-occupational studies have
been unable to link parental pesticide exposure and childhood GCT risk.143, 155, 164 Non-
occupational studies of certain chemicals have shown conflicting results with respect to in utero
or early life exposure and childhood GCT risk. One recent analysis found that ambient exposure
to dichloromethane (a solvent often used in paint removers and other chemical processes) during
pregnancy and the first year of life was positively associated with childhood GCTs, particularly
teratomas.165 Another study estimated a weak positive association between traffic-related air
pollution in pregnancy and childhood GCT risk, mostly for teratomas.144 Similarly, a Spanish
case-control study estimated an imprecise but positive effect for childhood GCTs and proximity
to urban areas with traffic pollution.166 However, other case-control studies were unable to
corroborate these findings.154, 155, 167
While family history of testicular cancer is an established risk factor for adult testicular
GCT development,168 the role of family history of cancer in the etiology of childhood GCTs is
less clear.154, 158, 169, 170 One study reported an increased risk of malignant GCTs in children who
had a first-degree relative with cancer,154 but other studies did not corroborate this finding.158, 170

20
A more recent study could not find an association between GCT risk and family history of cancer
overall, but reported that a family history of cancer with onset <40 years was associated with an
increased risk of GCTs in males, but a reduced risk of cancer in females. Similarly, they found a
positive association between family history of melanoma and cancer development in males, but
an inverse association between family history of ovarian or uterine cancers and GCT
development in girls.169 Evidence has been mixed with respect to whether GCTs are a part of Li-
Fraumeni syndrome.171, 172
1.5 Occupational exposures and childhood cancer
Parental occupational exposures have been frequently examined in the etiology of
childhood cancer; however, there is no well-established theory for the biological mechanisms by
which these exposures would impact cancer risk in offspring. Nevertheless, there is evidence to
suggest that exposures during preconception, pregnancy, and after birth may be relevant to the
etiology of childhood cancer, though mechanisms differ by the timeframe of interest.
1.5.1 Preconception
Preconception exposures are intended to capture the period of spermatogenesis, the
process by which new sperm cells are created; it can take between 74-120 days until they are
fully matured in the epididymis, during which time developing cells are susceptible to factors
like oxidative stress, which has the potential to alter paternal DNA.173-175 Studies in rats have
shown that exposure to toluene, an organic solvent used in many industries and commercial
products, directly induced oxidative DNA damage to spermatozoa.176 Furthermore, studies in
humans have shown occupational noise and heat exposure, as well as exposure to polycyclic
aromatic hydrocarbons, to be associated with DNA damage and fragmentation in sperm.177, 178
21
Exposures that result in sperm damage have the potential to create germline mutations that are
passed on to children and contribute to carcinogenesis. While several studies have identified
agents that induce oxidative DNA damage in sperm, no mutagens or carcinogens have been
identified in the etiology of childhood cancer in paternal offspring.
1.5.2 Pregnancy
In utero occupational exposures have been frequently examined in the etiology of
childhood cancers and are rooted in the idea that changes to the prenatal environment lead to
altered fetal programming, resulting in permanent changes that affect long-term disease risk.71, 80,
179 It is well-established that certain agents can cross the placenta and expose the developing
fetus, but few agents have been identified as causing cancer in offspring with the exception of
diethylstilbestrol, a synthetic form of estrogen that was prescribed to women in the mid-1900s to
prevent miscarriage.180-182 This is perhaps the most notorious case of in utero exposure and
cancer in offspring, but researchers have continued to examine other maternal exposures during
pregnancy in order to assess their impact on offspring health, including cancer development.
Most studies of maternal occupational exposures and childhood cancers examine the risk of
leukemias and brain tumors, but studies of rarer childhood cancers are sparse.183
1.5.3 After birth
Parental occupational exposures after birth have been investigated in few studies of
childhood cancer, most of which examine exposures such as pesticides or infectious agents. For
agents like pesticides and dusts, exposure residues can be brought home by parents from clothing
or skin and transferred to children directly or through buildup of dusts in the home or in
vehicles.184, 185 Parents who work in occupations that include a high risk of infection, such as

22
daycare workers186, 187 or livestock farmers,188-190 also have the potential to expose their children
at home. One study of hog operation workers found that family members of infected workers
were likely to experience the same infection,191 while other studies have supported the role of
household networks in disease transmission.192 These post-birth exposures have the potential to
cause cancer in children through mechanisms described previously.
1.6 Lifestyle characteristics of relevant occupations
As this dissertation utilizes occupational data from Danish populations, it is important to
note the differential rates of certain lifestyle characteristics (e.g., smoking) across relevant
Danish occupations. Specifically, within the farming industry smoking rates differ by the type of
product farmed. A 1988 study based on survey responses from 1,175 farmers (70% response
rate) indicated that smoking was more prevalent among dairy farmers (41.9%) and dairy/pig
farmers (37.1%) than only pig farmers (35.7%) or non-livestock farmers (35.1%).193 More recent
evidence has shown that the prevalence of smoking among female farmers is lower than that of
other female workers (15% vs. 25%).194 However, smoking rates for other occupations within
the farming industry, like butchers and slaughterhouse workers, have been noted to be higher
than the smoking rates for other Danish occupations.195, 196 Overall smoking prevalence in
Denmark has decreased over time;197 however, the smallest reductions were observed among
women and those with low educational attainment. With respect to alcohol consumption, one
study found that female farmers were more likely to be nondrinkers (57.9%) than controls
(53.8%);194 however, information on other lifestyle characteristics in the Danish working
population is sparse.

23
1.7 Objective
In this dissertation, we will investigate the role of various occupational exposures and
their influence on the health outcomes in certain vulnerable populations. Specifically, we will
examine the impact of exposure to OPA and the 6-year incidence of stroke and TIA in a cohort
of older working women; parental occupational exposure to livestock or animal dust and the risk
of childhood cancers in offspring; and the role of parental occupational exposures, assessed via
JEMs and job titles, and the risk of childhood GCTs in offspring.

24
Chapter 2. Occupational physical activity and 6-year incidence of stroke and transient
ischemic attack in women
2.1 Abstract
Recent evidence suggests leisure time physical activity (LTPA) is beneficial to cardiovascular
health, but occupational physical activity (OPA) is detrimental; however, data on OPA and
cerebrovascular disease are limited. This study aims to assess the relationship between OPA,
stroke, and transient ischemic attack (TIA) in a cohort of US women. Information on OPA
(current job, longest held job, and cumulatively for all jobs held since age 18) and lifestyle
factors was assessed via interviews at enrollment for 31,270 Sister Study participants aged 30-74
years and employed at baseline. OPA was assessed in 4-6 categories ranked by intensity (mostly
sitting, sitting/standing equally, mostly standing, continuous walking/movement, and two levels
of heavy physical labor); the highest three OPA levels were combined and labeled “mostly
dynamic work.” Associations between OPA and incident cerebrovascular disease during an
average follow-up of six years were assessed in Cox proportional hazard regression models
adjusted for socio-demographic, biological, and behavioral factors including LTPA. In this
study, 715 incident diagnoses of stroke (n=441) and TIA (n=274) were reported by participants
or next of kin. Compared to mostly sitting, mostly dynamic OPA at the current job was
associated with an increased risk of TIA (hazard ratio [HR]=1.63; 95% confidence interval
[CI]=1.07-2.48), while mostly dynamic OPA at the longest held job was associated with an
increased risk of stroke (HR=1.45; 95% CI=1.06-1.97). Associations were stronger among
women without cardiovascular disease or hypertension at baseline. The results of this
comprehensive analysis suggest that mostly dynamic OPA is positively associated with
incidence of stroke and TIA in women, further corroborating the notion of the physical activity
health paradox.
25
2.2 Introduction
While stroke and TIA are relatively rare, stroke is among the leading causes of death and
is the leading cause of long-term disability in the United States.198 Stroke and TIA share a similar
pathophysiology and are mostly distinguished by the duration of clinical symptoms; TIAs (also
known as “mini-strokes”) are acute, lasting <24 hours, while stroke symptoms last for 24 hours
or more and can lead to permanent disability or death.11, 199 Like cardiovascular disease (CVD),
stroke occurrence is associated with socio-demographic, lifestyle, and environmental factors.199
Racial and sex differences have been well-established;198 although men have an overall higher
risk of developing stroke, it is more prevalent in women because of their average longer
lifespan.198, 199
Risk factors for stroke and TIA noted in the literature are mainly elements of an
unhealthy lifestyle which elevate an individual’s risk for a variety of diseases, such as CVD;
these risk factors include hypertension, smoking, high cholesterol, heavy alcohol consumption,
and obesity.19, 199 In contrast, elements of a healthy lifestyle—like diet high in fish, grains, fruits
and vegetables or participation in high levels of LTPA—have been associated with lower stroke
risk.20, 21, 200
While LTPA is protective of cerebrovascular disease, the role of occupational physical
activity (OPA) in the etiology of stroke and TIA is less clearly understood, especially in women.
No studies have examined the relationship between OPA and TIA, and only a handful have
examined stroke as an outcome,21, 201-206 with fewer providing sex-specific results.21, 203-206 In
women, lower OPA jobs were generally associated with a higher risk of stroke;21, 203-205 however,
some studies did not have the statistical power to investigate higher levels of OPA.204, 205
Furthermore, most of these studies relied on crude exposure assessment, categorizing OPA into

26
2-3 non-specific levels (e.g., low, moderate, and high) with arbitrary cut-points.21, 201, 203, 204 In
contrast, one study used a validated questionnaire to assess OPA207 and found that, in women,
stroke risk moderately increased with higher levels of OPA.206 Only one study was able to
examine a large number of stroke cases (n=1,366) and also adjusted for other types of physical
activity (i.e., LTPA, commuting physical activity) when examining the OPA-stroke relationship,
finding slightly protective effects of higher OPA on incident stroke risk in women.21
These older studies appear to conflict with recent reviews of the epidemiological
literature that suggest paradoxical health effects for physical activity, with OPA being positively
and LTPA being inversely related to CVD and mortality53, 65, 208-210 or having no effect at all after
adjustment for OPA.51, 211, 212 A similar paradoxical effect was recently reported for Parkinson’s
disease, a neuro-degenerative disorder.213
The current study aimed to investigate the relationship between OPA and incident stroke
and TIA, separately for current job, longest held job, and all jobs relying on a cumulative
lifetime exposure measure. This analysis overcame several methodological limitations of
previous studies by employing posture-based OPA exposure assessment, comprehensive
adjustment for potentially confounding factors including LTPA, and use of a sufficiently large
cohort of working women followed for an average of 6 years.
2.3 Methods
Study population. Subjects were participants in the Sister Study, a prospective cohort
study originally designed to assess genetic and environmental risk factors for breast cancer
(http://sisterstudy.niehs.nih.gov). Between 2003 and 2009, the Sister Study enrolled 50,884
women aged 30-74 who resided in the US or Puerto Rico and who were breast cancer-free at
enrollment but had a sister with breast cancer. At baseline, written informed consent was

27
obtained and interviews were conducted. Women were excluded from the present analysis if
they were unemployed or homemakers at enrollment (n=18,039) or if they did not report
occupational physical activity for their current job (n=63); additionally, a vanguard group of
women who completed a non-comparable version of the occupational questionnaire were
excluded from analyses (n=1,512), resulting in an analytic cohort of 31,270 women. The Internal
Review Boards at the National Institute of Environmental Health Sciences, Copernicus Group,
and the University of California, Los Angeles approved the study.
Outcome assessment. Incident stroke and TIA cases were self-reported doctor’s
diagnoses reported on annual health follow-ups between 2005 and 2015. If a participant died
prior to the annual health follow-up, next of kin were contacted to report any known diseases that
were diagnosed over the previous follow-up period. Fatal cases were confirmed via the National
Death Index and/or the individual’s death certificate throughout follow-up. In this analysis, fatal
and nonfatal cases are grouped together because there were few confirmed fatal cases of stroke
(n=8) and no confirmed fatal cases of TIA. Reporting an event did not make participants
ineligible for subsequent events, e.g., if a participant reported a TIA at the first follow up and a
stroke at the second follow up, they were considered events in both analyses.
Assessment of occupational physical activity. At enrollment, study participants completed
a computer-assisted telephone interview in which they were asked to report detailed information
for all jobs, military service, and volunteer work performed after age 18 for at least 10 hours per
week. For each job, participants were asked, “Which of the following best describes your usual
physical activity while on the job?” The possible responses were: (1) mostly sitting, with some
standing and/or walking; (2) sitting and standing equally (may include some walking); (3) mostly
standing with some walking; (4) continuous walking or other movements that increase your heart

28
rate slightly; (5) heavy manual labor that causes sweating or increases your heart substantially;
and (6) sporadic heavy manual labor. Due to small numbers, the latter two categories were
collapsed in preliminary analyses into a group labeled “heavy manual labor.” However, because
there were still few events in this exposure group, it was further combined with “continuous
walking or other movements” into a category labeled “mostly dynamic work,” resulting in a
four-level exposure variable for OPA: mostly sitting, sitting and standing equally, mostly
standing, and mostly dynamic work. This report primarily uses the four-level OPA measure and
separately assesses OPA for participants’ current job and longest held job. Based on the entire
reported life job history after age 18, a cumulative measure of high levels of OPA was created as
the proportion of work years spent performing “mostly dynamic work” (0, >0-<0.25, 0.25-<0.50,
0.50-<0.75, and ≥0.75).
Selection of covariates. Potential confounders were identified using a priori knowledge
and directed acyclic graphs, as well as change-in-estimate criteria. Traditional cardiovascular
risk factors such as age, body mass index (BMI), smoking status, alcohol intake, and LTPA were
selected for inclusion due to their strong influence on stroke risk199 and association with OPA.214
Work-related factors, like night work and discrimination at work, were selected for adjustment
because they have been shown to increase CVD risk in other studies.215, 216 Additionally, heart
rate and systolic and diastolic blood pressure, which are known, independent hemodynamic risk
factors for CVD,56, 217, 218 were included for adjustment; however, these factors may also be
considered potential mediators of the OPA-CVD relationship and therefore analyses were
performed both with and without adjustment for these hemodynamic risk factors. In final
analyses, we used the product of heart rate and pulse pressure (rate*pressure; where pulse
pressure = systolic minus diastolic blood pressure) to adjust for these hemodynamic factors.

29
A variety of other covariates were assessed, but not used for adjustment in final statistical
models. Socioeconomic factors including race/ethnicity, income, and education level were
examined as potential confounders but not employed in final models because they did not change
effect estimates by more than 5%. We created a simple sum diet score based on participants’
responses to an extensive food frequency questionnaire, as well as a variable to indicate job
strain as derived from a 17-item Job Content Questionnaire,219 both of which were empirically
found not to be confounders in exploratory analyses and therefore removed from our final
adjustment sets. We assessed the role of both mistreatment/harassment at work and
discrimination at work but chose to only adjust for the latter because it was a more inclusive
measure and empirically more predictive of stroke risk. Additionally, we explored individual
hemodynamic measures (e.g., heart rate or systolic and diastolic blood pressure, each alone
instead of the combined rate pressure product) as potential confounders but did not include these
variables in final models because our operationalization as one variable (i.e., rate pressure
product) was empirically more predictive of stroke risk.
Assessment of behavioral factors. At baseline, LTPA was assessed using metabolic
equivalent task (MET) hours per week in concordance with established guidelines.220
Participants were asked to recall information on all sport/exercise activities performed during the
last 12 months, including the number of hours spent per week on each activity. Weekly energy
expenditures were determined using MET values for each activity. Each participant’s LTPA was
classified based on the World Health Organization (WHO) guidelines for adults: (1) at least 150
minutes of moderate-intensity physical activity (3-<6 METs) per week or (2) at least 75 minutes
of vigorous physical activity (6+ METs) per week.47 Those who met both requirements were
classified in the latter category to reflect more dynamic LTPA. Women who participated in

30
moderate-intensity or vigorous LTPA, but not for the recommended amount of time per week,
were classified as “insufficient activity time to meet requirements.” Women who only
participated in LTPA at MET values of <3 were categorized as such, as were study participants
who did not partake in any LTPA. We also explored adjustment for LTPA by categorizing both
raw and corrected MET values,221 but chose not to employ these variables because WHO
recommendation-based categories were empirically shown to better control confounding in
exploratory analyses.
Information on lifetime smoking and alcohol consumption was ascertained per
questionnaires at baseline. Participants were categorized into never smokers, former smokers,
and current smokers. Detailed information on alcohol consumption habits over the past 12
months was collected and participants were categorized based on findings from the current
alcohol-CVD literature:222, 223 never drinkers, former drinkers, consuming <1-3 drinks/day, and
consuming >3 drinks/day.
Assessment of anthropometric and hemodynamic factors. At the time of enrollment,
current height, weight, heart rate, and systolic and diastolic blood pressure were measured during
home or office visits by trained study personnel. Body mass index (BMI) was calculated as
weight (kg)/height (m) squared and categorized according to WHO definitions: underweight
(<18.5 kg/m2), normal (18.5–24.9 kg/m2), overweight (25–29.9 kg/m2), obese (30–34.9 kg/m2),
severely obese (35–39.9 kg/m2) and morbidly obese (≥40 kg/m2).
Blood pressure was measured by trained study personnel after participants sat and rested
for a few minutes. Up to three sitting measurements of systolic and diastolic pressure were taken
1-2 minutes apart and a left-right-left protocol was used if both arms were available;224 these
measures were then averaged for analyses after checking for outliers. Blood pressure values

31
were considered to be outliers if systolic blood pressure was less than 80 mmHg or greater than
180 mmHg; if diastolic blood pressure was less than 40 mmHg or greater than 100 mmHg; or if
large discrepancies existed between the systolic or diastolic blood pressure measures. After
individual inspection of these data, three confirmed outliers were removed and the remaining
values were averaged. Heart rate was measured by trained study personnel via palpation of the
radial pulse for 1 full minute after participants were instructed to rest for at least 5 minutes. Heart
rate values were considered to be outliers if they were less than 40 beats per minute or greater
than 100 beats per minute. After individual inspection, two confirmed outliers were removed and
set to missing.
We created values for pulse pressure, defined by the difference between systolic and
diastolic pressure readings, and the rate pressure product, defined by the product of the pulse
pressure and heart rate. Both measures have been shown to be independent predictors of CVD
risk225, 226 and were used to explore the role of hemodynamic factors when controlling for
potential confounding.
Hypertension at baseline was assessed in multiple ways. During baseline questionnaires,
participants were asked, “Has a doctor or other health professional ever told you that you had
high blood pressure or hypertension, or that you had borderline high blood pressure other than
during pregnancy?” If participants responded “yes” to either hypertension or borderline
hypertension, they were asked whether or not they had ever taken medication for their high blood
pressure. In the present analysis, participants were categorized as having hypertension if they
self-reported a doctor’s diagnosis of hypertension, self-reported antihypertensive medication use,
or had baseline blood pressure measurements that indicated hypertension (systolic blood pressure

32
≥135 and/or diastolic blood pressure ≥85) according to established clinical guidelines for at
home measurements in effect at that time.227
Assessment of other covariates. Information on working night shifts was collected at
baseline (ever vs. never). Discrimination at work was assessed in the first follow-up
questionnaire dedicated to stress and coping topics (approximately one year after enrollment).
Participants were separately asked if they had “ever been treated unfairly in job hiring,
promotion or firing due to” their sex, age, race/ethnicity, sexual orientation, or illness/medical
condition. If the participant had responded “yes” to any of these five questions, they were
classified as ever experiencing discrimination at work.
Statistical analyses. Multivariable-adjusted Cox regression models were used to estimate
hazard ratios (HRs) and 95% confidence intervals (CIs) for the relationships between OPA and
stroke or TIA, with days since study enrollment used as the timescale. In initial analyses, four
levels of adjustment were explored: (1) age-adjusted only; (2) adjustment for age and behavioral
factors (smoking, alcohol consumption, BMI, and LTPA); (3) adjustment for age, behavioral
factors, and work-related factors (discrimination, night work); and (4) adjustment for age,
behavioral factors, work-related factors, and potentially mediating hemodynamic factors (rate
pressure product). All subsequent analyses are based on fully-adjusted models; supplementary
analyses provide results without adjustment for the rate pressure product. For each model and
covariate, the Cox proportionality assumption was assessed by examining the relationship
between scaled Schoenfeld residuals and time; for any covariate that violated the proportionality
assumption, an interaction term with time and the covariate was added to the model.228
Sensitivity analyses were performed with stratification by two baseline health
characteristics: hypertension status and pre-existing cardiovascular disease status. Pre-existing

33
CVD was assessed by self-reported doctor’s diagnosis of previous myocardial infarction, angina,
congestive heart failure, arrhythmia, stroke, or TIA at baseline. We did not exclude those who
reported a previous stroke or TIA at baseline because a previous cerebrovascular event does not
exclude an individual from experiencing a subsequent event, but rather increases their risk of
experiencing such an event.199 A further sensitivity analysis, stratified CVD into coronary heart
disease (angina, myocardial infarction) versus the remaining CVD listed; these analyses adjusted
only for age due to small subsample sizes. All statistical analyses were conducted using SAS,
Version 9.4 (SAS Institute Inc., Cary, NC, USA).
2.4 Results
During an average of 5.7 (SD 2.3) years of follow-up, 441 incident stroke diagnoses and
274 incident TIA diagnoses were reported by participants or next of kin, resulting in incidence
rates of 221 and 140 per 100,000 person-years, respectively. There were 148 cases where both a
stroke and TIA were reported. Population characteristics, stratified by whether or not a
cerebrovascular event was reported during follow-up, are shown in Table 1. Those with a
cerebrovascular event during follow-up were older at baseline, more likely to be current
smokers, but less likely to be current drinkers compared to event-free women. With respect to
physical activity, those with a cerebrovascular event less likely to participate in any LTPA, more
likely to report OPA involving continuous walking/movements for both current and longest held
job, and more likely to ever work a job involving dynamic OPA compared to event-free women.
Regarding other occupational characteristics, women without a cerebrovascular event during
follow-up were less likely to ever work a night shift or ever face discrimination at work. All
hemodynamic measures were higher among those who experienced a cerebrovascular event
34
during follow up compared to event-free women. Supplementary Table 2.1 shows population
characteristics stratified by baseline CVD status.
Table 2.2 shows the associations of OPA level with stroke incidence in models with
incremental adjustment for potential confounders (models 1-4), separately for current and longest
held job. Compared with women who reported mostly sitting at their current job (the reference
group), women who reported sitting and standing equally had a 15% higher risk of stroke (age-
adjusted HR=1.15; 95% CI=0.91-1.45, model 1). Women who reported mostly dynamic work at
their longest held job experienced a 55% higher risk of stroke compared with those who reported
mostly sitting (age-adjusted HR=1.55; 95% CI=1.17-2.06). This association appeared to be
driven by women who reported OPA as continuous walking or other movements that raised their
heart rate slightly (age-adjusted HR=1.62; 95% CI=1.21-2.16), but not by women with heavy
manual labor jobs (age-adjusted HR=1.03; 95% CI=0.43-2.51). Further adjustment for
behavioral, work-related, and hemodynamic factors only slightly attenuated these risks.
Table 2.3 displays OPA effects on TIA incidence with incremental adjustment for
confounders, separately for current and longest held job. Compared with women who reported
mostly sitting at their current job, higher risks of TIA were observed for all other levels of OPA.
Increasing physical workloads determined by the current job show a strong monotonic positive
association with TIA incidence across OPA levels. For the longest held job, age-adjusted models
show a 43% increased age-adjusted risk of TIA for mostly dynamic work (driven by those who
reported OPA that slightly raises heart rate), but this association was substantially attenuated in
fully-adjusted model 4.
Table 2.4 shows incident stroke and TIA diagnoses by the proportion of cumulative years
of exposure to mostly dynamic work with associated hazard ratios and 95% confidence intervals

35
derived from fully-adjusted Cox regression models. For stroke, risk increased monotonically
from 0 to 75% and peaked among women who were exposed 50-75% of their work years
(HR=1.69; 95% CI=1.12-2.55), exposure above 75% did not further increase risk. For TIA, risk
was highest among women exposed 25-50% of their work years (HR=1.82; 95% CI=1.19-2.76);
however, those exposed less than 50% or more than 75% of their work years were also at a
substantially increased risk (HR=1.62), but not women exposed 50-75% of their working years
(HR=1.03).
Table 2.5 displays the number of incident stroke cases for each OPA level by baseline
CVD status with fully-adjusted hazard ratios and 95% confidence intervals. Among women
without CVD at baseline, increased risks were observed for those who reported sitting and
standing equally, mostly standing, and mostly dynamic work at their current job, and for those
who reported mostly standing and mostly dynamic work at their longest held job.
Among women with CVD at baseline, an increased risk of stroke was observed for those
who reported sitting and standing equally or mostly dynamic work at both their current and
longest held job.
Table 2.6 displays the number of diagnosed incident TIA cases for each OPA level by
baseline CVD status with fully-adjusted hazard ratios and 95% confidence intervals. Among
women without CVD, those who reported mostly standing or mostly dynamic work at their
current job were at a substantially increased risk of TIA. Respective risk estimates based on the
longest held job were much lower and those who reported sitting and standing equally displayed
a decreased risk of TIA compared with those who reported mostly sitting. Among women with
CVD, those who reported sitting and standing equally at their current job experienced a 2.4-fold
increased risk of TIA. Mostly standing and mostly dynamic work at the current job were also

36
associated with increased risks compared with mostly sitting. For the longest held job, women
with CVD who reported sitting and standing equally and mostly dynamic work were at an
increased risk of TIA.
Analyses by CVD status at baseline were also performed without adjustment by
potentially mediating hemodynamic factors (rate pressure product) and showed similar stroke
and TIA risks (Supplementary Tables 2.2-2.3).
Table 2.7 shows the number of diagnosed incident stroke cases for each OPA level by
baseline hypertension status with fully-adjusted hazard ratios and 95% confidence intervals.
Risk patterns differed between those with and without hypertension. Among women without
hypertension, mostly dynamic work was associated with an increased risk of stroke for both
current and longest held job. Mostly standing or sitting and standing equally were associated
with a decreased stroke risk for the longest held job. The lowest risk for stroke was observed for
those mostly standing at their longest held job (HR=0.56; 95% CI=0.34-0.90); however, in
models without adjustment for potentially mediating hemodynamic factors (Supplementary
Table 2.4), mostly standing was not associated with any substantially reduced risk (HR=0.92;
95% CI=0.61-1.41) and, for current job, with an increased risk (HR=1.16; 95% CI=0.77-1.73).
Among women with hypertension, sitting and standing equally was associated with an
increased risk of stroke at the current job, while mostly dynamic work was associated with a
decreased risk. For the longest held job, all levels of OPA other than mostly sitting were
associated with increased risks of stroke. Risks were similar in models without adjustment for
potentially mediating hemodynamic factors (Supplementary Table 2.4).
Table 2.8 displays number of diagnosed incident TIA cases for each OPA level by
baseline hypertension status with fully-adjusted hazard ratios and 95% confidence intervals. For

37
women without hypertension at baseline, an increased risk of TIA was observed for all OPA
categories other than mostly sitting at the current job. In contrast, for the longest held job, sitting
and standing equally and mostly standing were associated with reduced TIA risks, while mostly
dynamic work was associated with an increased risk of TIA compared with mostly sitting.
Among women with hypertension at baseline, an increased risk of TIA was observed for
all OPA categories other than mostly sitting at the current job with the highest risk for mostly
dynamic work (HR=1.93; 95% CI=1.08-3.43). Mostly standing and mostly dynamic work at the
longest held job were also associated with increased risks of TIA.
Results from models without adjustment for potentially mediating hemodynamic factors
are presented in Supplementary Table 2.5 and indicate that adjustment for the rate pressure
product reduced most effect estimates substantially.
Though this study was intended to examine the effects of OPA, we report the effects of
WHO recommended levels of LTPA on stroke and TIA risk in Supplementary Table 2.6. If we
consider these models to represent a preliminary assessment of the independent role of LTPA on
cerebrovascular disease incidence, higher recommended levels of LTPA were inversely
associated with both stroke and TIA risk. We estimated an inversely monotonic relationship
between higher LTPA and stroke risk, with the strongest protective effect observed among those
who participated in LTPA at >6 METs for 75+ minutes each week (HR=0.56; 95% CI=0.37,
0.85) compared with those who participated in no LTPA (the reference group). The relationship
with TIA was less clear, though most levels of LTPA were protective of TIA risk.
2.5 Discussion
Summary of results. Overall, this comprehensive analysis found that OPA intensity and
duration were generally positively associated with the risk of stroke and TIA among women. The

38
effect estimates, however, varied by the specific exposures and outcomes analyzed; monotonic
positive dose-response relationships of OPA with TIA were found for current job, and with
stroke for longest held job. In analyses of cumulative exposure, a smaller proportion of work
years performing mostly dynamic OPA was associated with TIA risk, while a larger proportion
was associated with stroke risk. Associations also differed by baseline CVD and hypertension
status; stronger associations between OPA, stroke, and TIA were observed among women
without these conditions than among women with these conditions at baseline.
Comparison of models with and without adjustment for hemodynamic factors indicated
possible mediation of OPA effects by heart rate and blood pressure, especially for stroke risk
among women without baseline hypertension; however, a formal mediation analysis was not
performed in the absence of repeat measurements of heart rate and blood pressure. We accounted
for recommended levels of LTPA in adjusted regression models and found that the highest levels
of LTPA were inversely associated with both stroke and TIA risk.
The physical activity health paradox. Our results are consistent with the concept of the
physical activity health paradox which, in brief, asserts that high LTPA is beneficial to
cardiovascular health, while high OPA is detrimental.208 Although high levels of OPA have
historically been viewed as being beneficial to the cardiovascular system, recent evidence
suggests that high OPA is an occupational health hazard;53, 209, 210 the results of our study
corroborate this notion for the first time with respect to cerebrovascular diseases. There are
several hypotheses that explain the underlying mechanisms of this paradox; broadly, these can be
grouped into two domains: biologic differences and structural differences between OPA and
LTPA.65
Biologic differences include sustained inflammatory responses and prolonged elevation

39
of heart rate and blood pressure, all of which are associated with OPA but not with LTPA.
Inflammation markers (e.g., C-reactive protein) have been shown to increase during all types of
physical activity in the short-term, remaining elevated until the body has recovered.229 High
levels of OPA for prolonged periods during the work day—or over several days—without
sufficient recovery time can result in sustained inflammation, one of the proposed mechanism in
the development of atherosclerosis and other types of CVD.51, 230, 231 Similarly, elevated resting
and average 24-hour heart rate and blood pressure are known independent risk factors for
CVD.62-64, 232 High OPA over extended periods of time has been shown to increase 24-hour heart
rate, an association not observed with shorter duration high levels of LTPA.65 For instance, the
Belgian Physical Fitness Study reported a more than 3-fold increased all-cause mortality risk
among working men in the upper tertile of ambulatory 24-hour heart rate (HR=3.21; 95%
CI=1.22-8.44).66 Likewise, prolonged static OPA and heavy lifting have been shown to elevate
blood pressure, even after working hours.41 LTPA involving heavy lifting is common, but
usually occurs for short periods of time and under controlled conditions, resulting in little impact
on 24-hour blood pressure. In fact, short-term high intensity training can increase
cardiorespiratory fitness, in turn lowering heart rate during rest and work; this reduces relative
aerobic workloads (energy expenditure at work expressed as percent of cardiorespiratory fitness),
which has been shown to be a stronger predictor of CVD than absolute measures of energy
expenditure.233, 234
Structurally, the nature of OPA is different from LTPA, which may lead to poorer CVD
outcomes through increased worker stress and fatigue. Participation in LTPA is voluntary and
the participant is generally in complete control of their actions, including how much to do and
when and how long to rest. Conversely, OPA is an employment requirement and usually

40
performed with little worker input: employees do not typically have control over work tasks,
work hours, work speed, and other psychosocial, organizational, or ergonomic stressors that may
be present in the work environment and determine the type, intensity, and duration of OPA. OPA
is typically performed for longer time periods than LTPA and with less recovery time between
and after activities. In addition to sustained inflammation as mentioned above, this can result in
exhaustion and fatigue, which has been previously associated with an increase in CVD and
stroke risk.67-69
The healthy worker survivor effect. It is important to acknowledge the possible impact of
the so-called “healthy worker survivor effect” in analyses of occupational exposures and health.
This concept can generally be described as a continuous selection process in which healthier
workers remain in the workforce and unhealthier workers self-select out of the workforce. This
phenomenon has previously been well-described and typically results in a conservative bias, i.e.,
attenuation of the effect of an occupational exposure.235 For this reason, we expect the effect
estimates in our study to underrepresent the true effect of OPA on stroke and TIA risk in women.
In our study, the healthy worker survivor effect is operating in two ways. First, our study
was conducted in a population of women who were employed at baseline; we did not include
women who had already left the workforce, perhaps for health reasons under study, which would
again lead to a conservative bias. These women were excluded to assure consistency for the
analyses of OPA exposure assessment based on current and longest held job (women not in the
workforce at baseline would have only been considered in analyses of longest held job). This
enabled us to compare the impact of using these alternative exposure assessment methods.
Furthermore, including these women would have introduced misclassification of some self-
reported covariates used for adjustment. For example, some health behaviors are dependent on

41
employment status,236 especially among older adults;237 because many covariates were only
collected at baseline, we expected that adjusting for behaviors (e.g., LTPA) reported at times of
unemployment when analyzing the impact of OPA at times of employment would bias our
adjusted effect estimates in an unclear direction.
Second, our sensitivity analyses with stratification by baseline CVD status revealed
different risk patterns that are also reflective of the healthy worker survivor effect. Individuals
who developed CVD (and did not leave the workforce entirely because of their disease) may
have transitioned from more demanding mostly dynamic work to more sitting work, resulting in
an apparent higher risk of cerebrovascular disease the subgroup currently working jobs with
lower levels of OPA. Results from Supplementary Table 2.7 support this notion: A larger
percentage of individuals reported more dynamic levels of OPA for their longest held job but
lower OPA for their current job, while a smaller percentage of women reported lower OPA at
their longest held job and more dynamic OPA at their current job. These results were similar or
stronger when restricted to women with CVD at baseline (results not shown), but nevertheless
reflect the transition from high to low OPA in this population. At the same time, women without
CVD at baseline are able to perform at higher OPA levels and constitute a highly selected group
of the most resilient women with lower a priori risk for stroke and TIA, resulting in a downward
conservative bias of cerebrovascular disease risks associated with high levels of OPA.
Identification of the healthy worker survivor effect is important when interpreting the overall
results of this study. We hypothesize the inclusion of all working women regardless of health
status likely led to a conservative bias in our effect estimates. We therefore believe the true
impact of dynamic OPA on stroke and TIA risk to be greater than estimated in this study.

42
The role of hemodynamic factors. Heart rate and blood pressure (combined as rate
pressure product in our study) are hemodynamic cardiovascular risk factors that can be viewed
both as mediators and confounders of the relationships between OPA and cerebrovascular
disease; therefore, we chose to present results without (in models 3) and with adjustment for rate
pressure product (in models 4). In most instances, adjustment for the rate pressure product did
not substantially change effect estimates with the exception of analyses stratified by baseline
hypertension status: Adjustment for the rate pressure product considerably changed the effects of
OPA on cerebrovascular events among normotensive women (Supplementary Tables 2.4-2.5).
There are competing explanations for these results. First, it is possible that hemodynamic factors
are mediators in the relationship between OPA, stroke, and TIA; if so, the rate pressure product
would be an intermediary on the causal path from exposure to outcome and controlling for it
would introduce bias as a result of overadjustment.238 Conversely, it may be that hemodynamic
factors are not substantially determined by OPA but instead need to be considered potential
confounders that need to be controlled; hence we provide results with and without adjustment for
the rate pressure product.
In this study, women who reported cerebrovascular events had different hemodynamic
characteristics than event-free women; however, these characteristics were also dependent on
baseline hypertension status. Normotensive women who reported a stroke or TIA had, on
average, higher values for all hemodynamic factors compared with normotensive women who
did not report a cerebrovascular event (results not shown). Among hypertensive women, the
opposite was true—hypertensive women who reported a cerebrovascular event had lower mean
blood pressure than those who did not report a stroke or TIA. However, hypertensive women
who reported cerebrovascular disease during follow-up were also more likely to report a

43
previous cardiovascular event at baseline; we hypothesize their lower mean blood pressure
measurements were likely a product of better clinical blood pressure management post-event.
Strengths and limitations. Key strengths of this study include large sample size as well as
detailed and complete information on occupational history and most relevant CVD risk factors
including demographic, behavioral, work-related, and hemodynamic covariates. Potential bias
from exposure misclassification was reduced by the availability and use of relatively detailed and
specific OPA exposure measures. Most previous cohort studies broadly categorized OPA into 2-
3 levels based on mostly arbitrary high/low cut-points,21, 201, 203, 204 while our study employed a
detailed, rank-order categorization with 4-6 levels of OPA describing specific combinations of
work postures and dynamic work reflecting increasing physical demands. Though this exposure
assessment tool has not been validated, it is an improvement from previous studies that relied on
non-specific categorizations such as “high” and “low” OPA. Only one previous study used a
validated questionnaire for exposure assessment207 and its results were similar to ours insofar as
it found increasing OPA to be positively associated with stroke risk.206 Furthermore, in the Sister
Study, OPA was assessed for each job held for at least 6 months since age 18, allowing for the
creation and analysis of a cumulative OPA exposure measure in addition to measures based on
current or longest held job. Using three different measures of OPA allowed us to assess whether
or not there was a differential impact of more recent OPA (i.e., current job) and past OPA (i.e.,
longest held job and cumulative exposure to dynamic work) on the risk of stroke and TIA.
Although there is substantial overlap in participant's reported OPA for current and longest held
job (see Supplementary Table 2.7), differences exist (chi-square test p-value <0.0001) and may
be responsible for the differential results regarding stroke and TIA. Conversely, these results
could be a product of the healthy worker survivor effect—stroke may only be associated with

44
dynamic OPA at the longest held job because strokes often result in death or long-term disability.
If women who experience a stroke are likely to drop out of the workforce or switch to lower
OPA jobs, those who currently work jobs with dynamic OPA would consist of the healthiest and
most resilient individuals, thus diluting the observed association between dynamic OPA at the
current job and stroke.
Detailed information on important covariates allowed us to address confounding by
considering a wide array of variables for adjustment and by employing incremental adjustment
for potential confounders with sets of related variables. Additionally, adjusting for LTPA (as
defined by WHO recommendation-based categories) allowed us to consider an important
confounder that, to our knowledge, only one other study on the topic has taken into account. In
addition, preliminary results on the independent LTPA effects from analytic models including
both LTPA and OPA allowed us to determine if our results are compatible with the physical
activity health paradox, which had not yet been examined for cerebrovascular diseases.
Our decision to analyze TIA as an outcome in addition to stroke is rarely seen in the
epidemiologic literature on cerebrovascular disease. While stroke and TIA share many risk
factors and are physiologically similar diseases,199 they have potentially different impacts on
functioning and quality of life. TIAs may represent an earlier stage of cerebrovascular disease
than stroke and experiencing a TIA puts individuals at a high risk of stroke development in the
future; in fact, it is estimated that 15% of all strokes are heralded by a TIA.18 Additionally, TIAs
confer a substantial short- and long-term risk of hospitalization for cardiovascular events and
death in addition to stroke.17 To our knowledge, this is the first study to report the impact of OPA
on both stroke and TIA.

45
Our study was limited by the self-reported nature in which exposure and outcome were
collected. Although next of kin were contacted in instances when the study participant died, very
few of the cerebrovascular events in this study population were confirmed fatal by death records
(n=8). We were unable to examine major stroke subtypes because this information was not
collected as self-report was not expected to be reliable; however, nonfatal stroke cases are more
likely to be ischemic than hemorrhagic and as such, we assume most reported stroke cases to be
ischemic.199 Although these subtypes share most risk factors, the extent to which these risk
factors impact each subtype differs and thus our study would have been strengthened if we could
have examined each subtype independently.19, 199 While we were able to explore the role of
potentially mediating hemodynamic factors by examining models with and without adjustment
for the rate pressure product, our study would have benefited from repeated measures of heart
rate and blood pressure in order to conduct mediation analyses that take into account changes
over time. Furthermore, because stroke and TIA are relatively rare diseases, sample size limited
the precision of some of our risk estimates. Yet, this is one of the largest studies to date that has
explored the association between OPA and cerebrovascular disease in women. Furthermore,
incidence rates of stroke in our study population are similar to those seen in comparable
populations,239 strengthening the generalizability of our results.
This study provides further support for the concept of the physical activity health paradox
and suggests that increasingly dynamic OPA is a risk factor for both stroke and TIA for women
in the workforce. Additional studies are needed to corroborate these findings and would benefit
from more comprehensive exposure assessment with additional information on static workloads
(carrying, lifting, holding tools, etc.) and work hour data, thus allowing for more precise
assessment of cumulative exposure to OPA. Objective measures from accelerometers and heart

46
rate monitors would be desirable exposure assessment tools because they allow for the
continuous measurement of relative aerobic workloads that take into account the
cardiorespiratory fitness of the individual worker. Though it may not be feasible to implement
these tools in a large cohort study, they could be used in smaller validation studies to assess the
validity of self-reported exposure measures. Furthermore, this study would also benefit from
using medical data that allowed for stratification by stroke subtype.

47
2.6 Tables
Table 2.1. Characteristics of the study population, stratified by cerebrovascular disease event
status. Sister Study, 2004-2016, N=31270.a
Characteristic
No cerebrovascular
event reported
(N=30,703)
Cerebrovascular
event reportedb
(N=567)
Age 53.0 ±7.6 57.7 ±8.0
Race/ethnicity
Non-Hispanic White 25295 82.4% 452 79.7%
Non-Hispanic Black 3146 10.3% 74 13.1%
Hispanic 1450 4.7% 24 4.2%
Other 802 2.6% 17 3.0%
Missing 10 0.0% 0 0.0%
Occupational physical activity, current job
Mostly sitting 16808 54.7% 282 49.7%
Sitting and standing equally 6546 21.3% 132 23.3%
Mostly standing 4790 15.6% 97 17.1%
Continuous walking/movementsc 2292 7.5% 50 8.8%
Heavy manual labord 261 0.9% 6 1.1%
Sporadic heavy manual labor 6 0.0% 0 0.0%
Occupational physical activity, longest held job
Mostly sitting 14895 48.5% 267 47.1%
Sitting and standing equally 6766 22.0% 115 20.3%
Mostly standing 5704 18.6% 106 18.7%
Continuous walking/movementsc 2910 9.5% 73 12.9%
Heavy manual labord 419 1.4% 6 1.1%
Sporadic heavy manual labor 4 0.0% 0 0.0%
Proportion of work years performing mostly
dynamic worke
0 22117 72.0% 374 66.0%
>0.00-<0.25 3875 12.6% 77 13.6%
0.25-<0.50 2276 7.4% 60 10.6%
0.50-<0.75 1314 4.3% 31 5.5%
≥0.75 1121 3.7% 25 4.4%
Leisure time physical activity
None 5300 17.3% 130 22.9%
All activity <3 METs 18117 59.0% 321 56.6%
Insufficient activity time to meet requirements 1108 3.6% 28 4.9%
3-<6 METs for 150+ minutes/week 1527 5.0% 34 6.0%
6+ METs for 75+ minutes/week 4651 15.2% 54 9.5%
Alcohol consumption

48
Never drinker 933 3.0% 29 5.1%
Former drinker 4124 13.4% 112 19.8%
<1-3 drinks/day 25414 82.8% 422 74.4%
>3 drinks/day 190 0.6% 1 0.2%
Missing 42 0.1% 3 0.5%
Smoking Status
Never smoker 17820 58.0% 282 49.7%
Former smoker 10287 33.5% 221 40.0%
Current smoker 2583 8.4% 64 11.3%
Missing 13 0.0% 0 0.0%
Body mass index
<18.5 315 1.0% 8 1.4%
18.5-24.9 11578 37.7% 148 26.1%
25.0-29.9 9576 31.2% 167 29.5%
30.0-34.9 5239 17.1% 147 25.9%
35.0-39.9 2456 8.0% 62 10.9%
≥40.0 1503 5.0% 35 6.2%
Missing 9 0.0% 0 0.0%
Ever face discrimination at work
Yes 7077 23.1% 180 31.8%
No 20302 66.1% 321 56.6%
Missing 3324 10.8% 66 11.6%
Ever work night shifts
Yes 9432 30.7% 195 34.4%
No 21271 69.3% 372 65.6%
Resting heart rate 69.0 ±8.2 70.2 ±8.5
Systolic blood pressure 114.0 ±13.3 119.7 ±14.9
Diastolic blood pressure 72.6 ±8.8 74.5 ±8.8
Pulse pressure 41.5 ±9.1 45.2 ±11.2
Rate pressure productf 2862.4 ±730.8 3178.7 ±930.5 aData presented as number percentage% and mean ± standard deviation where appropriate. bDefined by reported stroke or TIA during follow-up. cSelf-reported OPA as “continuous walking or other movements that increase your heart rate
slightly” dSelf-reported OPA as “heavy manual labor that causes sweating or increases your heart
substantially” eDynamic physical activity at work defined as self-reported OPA as “continuous walking or
movements that raise your heart rate slightly,” “heavy manual labor that causes sweating or
increases your heart substantially,” or “sporadic heavy manual labor.” fRate pressure product defined as the product of pulse pressure and resting heart rate.

49

50

51
Table 2.4. Cumulative exposure to mostly dynamic occupational physical activity and incident stroke and TIA risk: Hazard
ratios and 95% confidence intervals from fully-adjusted Cox regression analyses. Sister Study, 2004-2016, N=31270.
Cumulative occupational physical activity Stroke (n=441) TIA (n=274)
Case N/
Exposed N HRa 95% CI
Case N/
Exposed N HRa 95% CI
Proportion of work years performing
mostly dynamic workb
0 291/22200 1.00 - 175/22316 1.00 -
>0-<0.25 60/3892 1.15 0.85-1.57 40/3912 1.62 1.12-2.35
0.25-<0.50 45/2291 1.49 1.05-2.12 34/2302 1.82 1.19-2.76
0.50-<0.75 27/1318 1.69 1.12-2.55 11/1334 1.03 0.52-2.03
≥0.75 18/1128 1.35 0.80-2.28 14/1132 1.62 0.89-2.95 aModels adjust for age, leisure time physical activity, alcohol, smoking, body mass index, discrimination at work, night work,
and rate pressure product bMostly dynamic work defined as self-reported occupational physical activity of “continuous walking or movements that raise
your heart rate slightly,” “heavy manual labor that causes sweating or increases your heart substantially,” or “sporadic heavy
manual labor.”

52
Table 2.5. Occupational physical activity and incident stroke risk (n=441) by baseline cardiovascular disease
(CVD): Hazard ratios and 95% confidence intervals from fully-adjusted Cox regression models. Sister Study,
2004-2016, N=31270.
Cardiovascular disease status at baseline
Without CVD (n=25019) With CVDa (n=6251)
Occupational physical activity
Case N/
Exposed N HRb 95% CI
Case N/
Exposed N HRb 95% CI
Current job
Mostly sitting 149/13514 1.00 - 76/3351 1.00 -
Sitting and standing equally 64/5292 1.11 0.82-1.50 41/1281 1.59 1.03-2.46
Mostly standing 51/3864 1.15 0.82-1.62 19/953 1.06 0.61-1.85
Mostly dynamic work 28/2057 1.21 0.78-1.88 13/517 1.25 0.64-2.46 Longest held job
Mostly sitting 128/12059 1.00 - 70/2905 1.00 -
Sitting and standing equally 60/5411 1.01 0.73-1.40 36/1364 1.10 0.69-1.74
Mostly standing 57/4574 1.19 0.85-1.65 26/1153 0.98 0.58-1.64
Mostly dynamic work 47/2683 1.67 1.16-2.39 17/670 1.30 0.71-2.36 aDefined by self-reported doctor’s diagnosis of congestive heart failure, mitral valve prolapse, arrhythmia, stroke,
TIA, angina, or myocardial infarction at baseline. bModels adjust for age, leisure time physical activity, alcohol, smoking, body mass index, discrimination at work,
night work, and rate pressure product.

53
Table 2.6. Occupational physical activity and incident TIA risk (n=274) by cardiovascular disease (CVD): Hazard
ratios and 95% confidence intervals from fully-adjusted Cox regression models. Sister Study, 2004-2016,
N=31270.
Cardiovascular disease status at baseline
Without CVD (n=25019) With CVDa (n=6251)
Occupational physical activity
Case N/
Exposed N HRb 95% CI
Case N/
Exposed N HRb 95% CI
Current job
Mostly sitting 149/13514 1.00 - 76/3351 1.00 -
Sitting and standing equally 64/5292 1.09 0.74-1.62 41/1281 2.40 1.27-4.55
Mostly standing 51/3864 1.34 0.90-1.99 19/953 1.80 0.80-4.06
Mostly dynamic work 28/2057 1.70 1.06-2.72 13/517 1.24 0.45-3.45 Longest held job
Mostly sitting 128/12059 1.00 - 70/2905 1.00 -
Sitting and standing equally 60/5411 0.69 0.45-1.06 36/1364 1.64 0.85-3.16
Mostly standing 57/4574 1.02 0.69-1.51 26/1153 1.03 0.46-2.30
Mostly dynamic work 47/2683 1.12 0.70-1.77 17/670 1.31 0.52-3.30 aCVD defined by self-reported doctor’s diagnosis of congestive heart failure, mitral valve prolapse, arrhythmia,
stroke, TIA, angina, or myocardial infarction at baseline. bModels adjust for age, leisure time physical activity, alcohol, smoking, body mass index, discrimination at work,
night work, and rate pressure product.

54
Table 2.7. Occupational physical activity and incident stroke risk (n=441) by baseline hypertension status: Hazard
ratios and 95% confidence intervals from fully-adjusted Cox regression models. Sister Study, 2004-2016,
N=31270.
Hypertension status at baseline
Without hypertension (n=21893) With hypertensiona (n=9377)
Occupational physical activity
Case N/
Exposed N HRb 95% CI
Case N/
Exposed N HRb 95% CI
Current job
Mostly sitting 100/11792 1.00 - 125/5073 1.00 -
Sitting and standing equally 46/4597 0.98 0.67-1.43 59/1976 1.23 0.88-1.73
Mostly standing 38/3465 0.78 0.49-1.23 32/1352 1.04 0.68-1.59
Mostly dynamic work 27/1828 1.58 1.00-2.50 14/746 0.64 0.32-1.28 Longest held job
Mostly sitting 96/10525 1.00 - 102/4439 1.00 -
Sitting and standing equally 40/4740 0.70 0.47-1.06 56/2045 1.21 0.84-1.73
Mostly standing 36/4044 0.56 0.34-0.90 47/1683 1.39 0.95-2.03
Mostly dynamic work 39/2373 1.71 1.15-2.55 25/980 1.15 0.70-1.89 aDefined by baseline systolic blood pressure ≥135, diastolic blood pressure ≥85, self-reported doctor's diagnosis of
hypertension, or self-reported antihypertensive medication use. bModels adjust for age, leisure time physical activity, alcohol, smoking, body mass index, discrimination at work,
night work, and rate pressure product.

55
Table 2.8. Occupational physical activity and incident TIA risk (n=274) by baseline hypertension status: Hazard
ratios and 95% confidence intervals from fully-adjusted Cox regression models. Sister Study, 2004-2016, N=31270.
Hypertension status at baseline
Without hypertension (n=21893) With hypertensiona (n=9377)
Occupational physical activity
Case N/
Exposed N HRb 95% CI
Case N/
Exposed N HRb 95% CI
Current job
Mostly sitting 59/11833 1.00 - 66/5132 1.00 -
Sitting and standing equally 30/4613 1.18 0.73-1.90 36/1999 1.36 0.87-2.12
Mostly standing 33/3470 1.41 0.88-2.26 18/1366 1.08 0.62-1.88
Mostly dynamic work 16/1839 1.41 0.77-2.57 16/744 1.93 1.08-3.43 Longest held job
Mostly sitting 67/10554 1.00 - 63/4478 1.00 -
Sitting and standing equally 22/4758 0.61 0.36-1.02 27/2074 0.93 0.58-1.51
Mostly standing 30/4050 0.82 0.50-1.33 26/1704 1.16 0.72-1.88
Mostly dynamic work 19/2393 1.16 0.67-2.02 20/985 1.27 0.71-2.28 aDefined by baseline systolic blood pressure ≥135, diastolic blood pressure ≥85, self-reported doctor's diagnosis of
hypertension, or self-reported antihypertensive medication use. bModels adjust for age, leisure time physical activity, alcohol, smoking, body mass index, discrimination at work,
night work, and rate pressure product.

56
Supplementary Table 2.1. Characteristics of the study population, stratified by baseline
cardiovascular disease (CVD) status. Sister Study, 2004-2016, N=31270.a
Characteristic
Without CVD
(N=25019)
With CVDb
(N=6251)
Age 52.7 ±7.6 54.5 ±7.6
Race/ethnicity
Non-Hispanic White 20581 82.3% 5166 82.6%
Non-Hispanic Black 2541 10.2% 679 10.9%
Hispanic 1212 4.8% 262 4.2%
Other 676 2.7% 143 2.3%
Missing 9 0.0% 1 0.0%
Occupational physical activity, current job
Mostly sitting 13663 54.6% 3472 54.8%
Sitting and standing equally 5356 21.4% 1322 21.2%
Mostly standing 3915 15.7% 972 15.6%
Continuous walking/movementsc 1862 7.4% 480 7.7%
Heavy manual labord 218 0.9% 49 0.8%
Sporadic heavy manual labor 5 0.0% 1 0.0%
Occupational physical activity, longest held job
Mostly sitting 12187 48.7% 2975 47.6%
Sitting and standing equally 5471 21.9% 1410 22.6%
Mostly standing 4631 18.5% 1179 18.9%
Continuous walking/movementsc 2369 9.5% 614 9.8%
Heavy manual labord 352 1.4% 73 1.2%
Sporadic heavy manual labor 4 0.0% 0 0.0%
Proportion of work years performing mostly
dynamic worke
0 18055 72.2% 4436 71.0%
>0-<0.25 3133 12.5% 819 13.1%
0.25-<0.50 1828 7.3% 508 8.1%
0.50-<0.75 1077 4.3% 268 4.3%
≥0.75 926 3.7% 220 3.5%
Leisure time physical activity
None 4322 17.3% 1108 17.7%
All activity <3 METs 869 3.5% 267 4.3%
Insufficient activity time to meet requirements 14784 59.1% 3654 58.5%
3-<6 METs for 150+ minutes/week 1243 5.0% 318 5.1%
6+ METs for 75+ minutes/week 3801 15.2% 904 14.5%
Alcohol consumption
Never drinker 755 3.0% 207 3.3%
Former drinker 3327 13.3% 909 14.5%

57
<1-3 drinks/day 20749 82.9% 5087 81.4%
>3 drinks/day 154 0.6% 37 0.6%
Missing 34 0.1% 11 0.2%
Smoking Status
Never smoker 14543 58.1% 3559 56.9%
Former smoker 8319 33.3% 2189 35.0%
Current smoker 2146 8.6% 501 8.0%
Missing 11 0.1% 2 0.0%
Body mass index
<18.5 235 0.9% 88 1.4%
18.5-24.9 9359 37.4% 2367 37.9%
25.0-29.9 7802 31.2% 1941 31.1%
30.0-34.9 4342 17.4% 1044 16.7%
35.0-39.9 2019 8.1% 499 8.0%
≥40.0 1253 5.0% 312 5.0%
Missing 9 0.0% 0 0.0%
Ever face discrimination at work
Yes 5596 22.4% 1661 26.6%
No 16670 66.6% 3953 63.2%
Missing 2753 11.0% 637 10.2%
Ever work night shifts
Yes 7545 30.2% 2082 33.3%
No 17474 69.8% 4169 66.7%
Resting heart rate 69.1 ±8.2 68.6 ±8.2
Systolic blood pressure 113.9 ±13.2 114.9 ±13.4
Diastolic blood pressure 72.6 ±8.8 72.6 ±8.8
Pulse pressure 41.3 ±9.1 42.3 ±9.5
Rate pressure productf 2858.1 ±731.2 2908.1 ±754.1 aData presented as number percentage% and mean ± standard deviation where appropriate. bCVD defined as self-reported doctor's diagnosis of congestive heart failure, mitral valve prolapse,
arrhythmia, stroke, TIA, angina, or myocardial infarction at baseline. cSelf-reported OPA as “continuous walking or other movements that increase your heart rate
slightly” dSelf-reported OPA as “heavy manual labor that causes sweating or increases your heart
substantially” eDynamic physical activity at work defined as self-reported OPA of “continuous walking or
movements that raise your heart rate slightly,” “heavy manual labor that causes sweating or
increases your heart substantially,” or “sporadic heavy manual labor.” fRate pressure product defined as the product of pulse pressure and resting heart rate.

58
Supplementary Table 2.2. Occupational physical activity and incident stroke risk (n=441) by pre-existing
cardiovascular disease (CVD) status: Hazard ratios and 95% confidence intervals from Cox regression models
adjusted for all potential confounders except rate pressure product. Sister Study, 2004-2016, N=31270.
Cardiovascular disease status at baseline
Without CVD (n=25019) With CVDa (n=6251)
Occupational physical activity
Case N/
Exposed N HRb 95% CI
Case N/
Exposed N HRb 95% CI
Current job
Mostly sitting 149/13514 1.00 - 76/3351 1.00 -
Sitting and standing equally 64/5292 1.12 0.82-1.51 41/1281 1.66 1.08-2.54
Mostly standing 51/3864 1.17 0.83-1.64 19/953 1.05 0.60-1.83
Mostly dynamic work 28/2057 1.25 0.81-1.92 13/517 1.25 0.64-2.46 Longest held job
Mostly sitting 128/12059 1.00 - 70/2905 1.00 -
Sitting and standing equally 60/5411 0.99 0.72-1.37 36/1364 1.13 0.72-1.78
Mostly standing 57/4574 1.19 0.86-1.65 26/1153 0.96 0.57-1.62
Mostly dynamic work 47/2683 1.68 1.18-2.40 17/670 1.28 0.70-2.33 aCVD defined by self-reported doctor’s diagnosis of congestive heart failure, mitral valve prolapse, arrhythmia,
stroke, TIA, angina, or myocardial infarction at baseline. bModels adjust for age, leisure time physical activity, alcohol, smoking, body mass index, discrimination at work,
and night work.

59
Supplementary Table 2.3. Occupational physical activity and incident TIA risk (n=274) by pre-existing
cardiovascular disease (CVD) status: Hazard ratios and 95% confidence intervals from Cox regression models
adjusted for all potential confounders except rate pressure product. Sister Study, 2004-2016, N=31270.
Cardiovascular disease status at baseline
Without CVD (n=25019) With CVDa (n=6251)
Occupational physical activity
Case N/
Exposed N HRb 95% CI
Case N/
Exposed N HRb 95% CI
Current job
Mostly sitting 149/13514 1.00 - 76/3351 1.00 -
Sitting and standing equally 64/5292 1.11 0.76-1.64 41/1281 2.34 1.25-4.36
Mostly standing 51/3864 1.33 0.90-1.98 19/953 1.71 0.77-3.79
Mostly dynamic work 28/2057 1.74 1.10-2.77 13/517 1.11 0.41-3.03 Longest held job
Mostly sitting 128/12059 1.00 - 70/2905 1.00 -
Sitting and standing equally 60/5411 0.69 0.45-1.05 36/1364 1.53 0.80-2.91
Mostly standing 57/4574 1.04 0.71-1.53 26/1153 1.02 0.46-2.27
Mostly dynamic work 47/2683 1.17 0.75-1.85 17/670 1.28 0.52-3.14 aCVD defined by self-reported doctor’s diagnosis of congestive heart failure, mitral valve prolapse, arrhythmia,
stroke, TIA, angina, or myocardial infarction at baseline. bModels adjust for age, leisure time physical activity, alcohol, smoking, body mass index, discrimination at work,
and night work.

60
Supplementary Table 2.4. Occupational physical activity and incident stroke risk (n=441) by baseline hypertension
status: Hazard ratios and 95% confidence intervals from Cox regression models adjusted for all potential confounders
except rate pressure product. Sister Study, 2004-2016, N=31270.
Hypertension status at baseline
Without hypertension (n=21893) With hypertensiona (n=9377)
Occupational physical activity
Case N/
Exposed N HRb 95% CI
Case N/
Exposed N HRb 95% CI
Current job
Mostly sitting 100/11792 1.00 - 125/5073 1.00 -
Sitting and standing equally 46/4597 1.16 0.81-1.68 59/1976 1.24 0.89-1.73
Mostly standing 38/3465 1.16 0.77-1.73 32/1352 1.06 0.69-1.61
Mostly dynamic work 27/1828 1.57 1.00-2.47 14/746 0.71 0.37-1.36 Longest held job
Mostly sitting 96/10525 1.00 - 102/4439 1.00 -
Sitting and standing equally 40/4740 0.88 0.59-1.30 56/2045 1.20 0.84-1.72
Mostly standing 36/4044 0.92 0.61-1.41 47/1683 1.34 0.92-1.95
Mostly dynamic work 39/2373 1.83 1.23-2.73 25/980 1.19 0.73-1.94 aHypertension defined by baseline systolic blood pressure ≥135, diastolic blood pressure ≥85, self-reported doctor's
diagnosis of hypertension, or self-reported antihypertensive medication use. bModels adjust for age, leisure time physical activity, alcohol, smoking, body mass index, discrimination at work, and
night work.
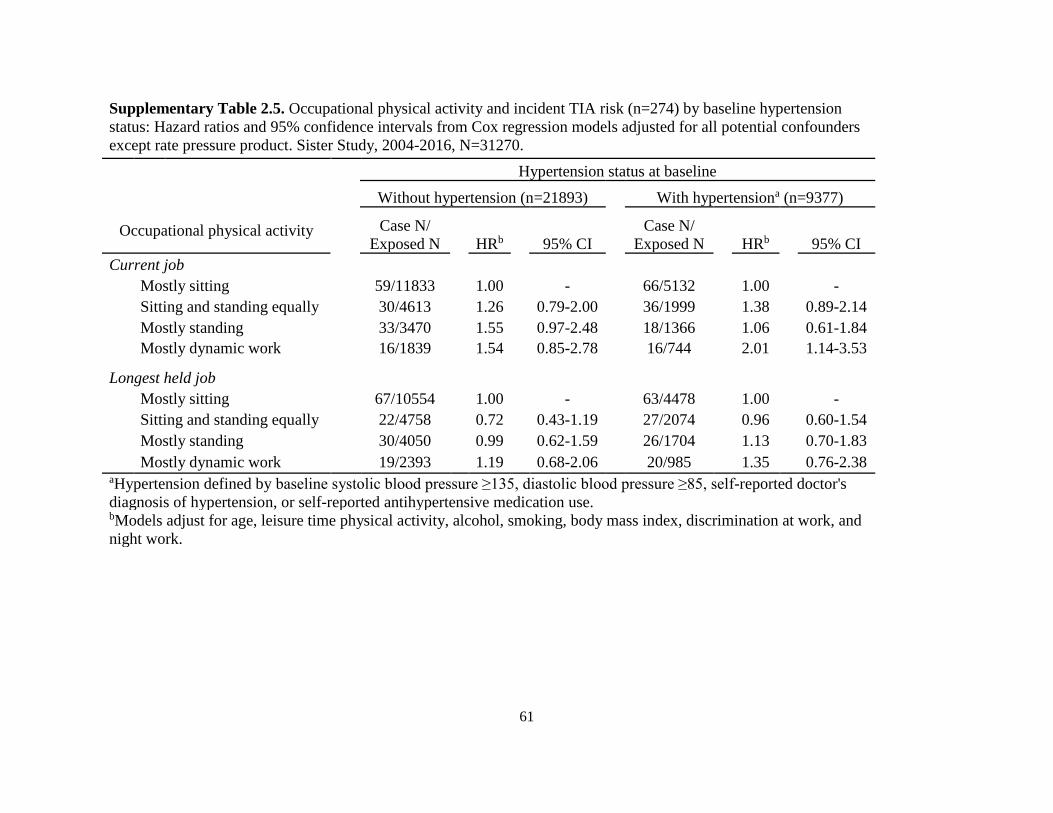
61
Supplementary Table 2.5. Occupational physical activity and incident TIA risk (n=274) by baseline hypertension
status: Hazard ratios and 95% confidence intervals from Cox regression models adjusted for all potential confounders
except rate pressure product. Sister Study, 2004-2016, N=31270.
Hypertension status at baseline
Without hypertension (n=21893) With hypertensiona (n=9377)
Occupational physical activity
Case N/
Exposed N HRb 95% CI
Case N/
Exposed N HRb 95% CI
Current job
Mostly sitting 59/11833 1.00 - 66/5132 1.00 -
Sitting and standing equally 30/4613 1.26 0.79-2.00 36/1999 1.38 0.89-2.14
Mostly standing 33/3470 1.55 0.97-2.48 18/1366 1.06 0.61-1.84
Mostly dynamic work 16/1839 1.54 0.85-2.78 16/744 2.01 1.14-3.53 Longest held job
Mostly sitting 67/10554 1.00 - 63/4478 1.00 -
Sitting and standing equally 22/4758 0.72 0.43-1.19 27/2074 0.96 0.60-1.54
Mostly standing 30/4050 0.99 0.62-1.59 26/1704 1.13 0.70-1.83
Mostly dynamic work 19/2393 1.19 0.68-2.06 20/985 1.35 0.76-2.38 aHypertension defined by baseline systolic blood pressure ≥135, diastolic blood pressure ≥85, self-reported doctor's
diagnosis of hypertension, or self-reported antihypertensive medication use. bModels adjust for age, leisure time physical activity, alcohol, smoking, body mass index, discrimination at work, and
night work.

62
Supplementary Table 2.6. Leisure time physical activity (LTPA) and incident stroke and TIA risk: Hazard ratios and 95% confidence
intervals from fully-adjusted Cox regression analyses. Sister Study, 2004-2016, N=31270.
Leisure time physical activityb Stroke (n=441) TIA (n=274)
Case N/
Exposed N HRa 95% CI
Case N/
Exposed N HRa 95% CI
No LTPA 106/5324 1.00 - 67/5363 1.00 -
All activity <3 METs 24/1112 0.91 0.56-1.48 13/1123 0.61 0.31-1.22
Insufficient activity to meet requirements 251/18187 0.79 0.61-1.01 147/18291 0.86 0.62-1.20
Meets requirement of 3-<6 METs at 150+ mins/week 20/1541 0.71 0.42-1.18 20/1541 1.04 0.59-1.86
Meets requirement of 6+ METs at 75+ minutes/week 40/4665 0.56 0.37-0.85 27/4678 0.60 0.35-1.02 aModels adjust for age, occupational physical activity (current job), alcohol, smoking, body mass index, discrimination at work, night
work, and rate pressure product bLTPA categorized according to WHO recommendation-based categories; those who met both requirements listed were classified in the
latter category in order to reflect more dynamic LTPA

63
Supplementary Table 2.7. Cross-tabulation of participant responses to occupational
physical activity for current and longest held jobs.
Occupational physical activity,
longest held job
Occupational physical activity, current job
Mostly
sitting
Sitting
and
standing
equally
Mostly
standing
Continuous
walking/
movements
Heavy
manual
labor
Mostly sitting 13077 1053 698 294 40
Sitting and standing equally 1857 4302 448 244 39
Mostly standing 1319 835 3354 269 33
Continuous walking/movements 730 420 334 1468 31
Heavy manual labor 110 68 53 67 136

64
Supplementary Table 2.8. Prevalence of occupational industry among women
who reported mostly dynamic work for current or longest held job.
Occupational industry Current job Longest held job
n (%) n (%)
Agriculture 56 (2.1) 85 (2.5)
Construction 35 (1.3) 47 (1.4)
Manufacturing 79 (3.0) 164 (4.8)
Retail 340 (13.0) 377 (11.0)
Transportation 93 (3.6) 152 (4.4)
Finance 63 (2.4) 60 (1.8)
Education 382 (14.6) 407 (11.9)
Medical/Healthcare 775 (29.6) 996 (29.1)
Social work 95 (3.6) 125 (3.7)
Entertainment 218 (8.3) 430 (12.6)
Service-based 191 (7.3) 203 (5.9)
Administrative 71 (2.7) 95 (2.8)
Other 217 (8.3) 276 (8.1)
Total 2615 3417

65
Chapter 3. Parental occupational exposure to livestock or animal dust and the risk for
childhood cancer in offspring
3.1 Abstract
In this population-based case-control study of Danish children aged <17 years, we identified
4,474 childhood cancer cases diagnosed 1968-2015 and frequency matched them to cancer-free
controls by birth year and sex (n=422,022). Using a job exposure matrix (JEM), we identified
parental occupational exposure to livestock and animal dust. Multivariable conditional logistic
regression was used to estimate associations with childhood cancer risk. We estimated an
increased risk for all central nervous system tumors in the offspring of fathers occupationally
exposed to livestock or animal dust from the index child’s birth to cancer diagnosis (OR=1.27;
95% CI=1.00, 1.63). We also detected an increased risk for astrocytoma in the offspring of
mothers exposed from conception to birth (OR=1.89; 95% CI=1.00, 3.57) and an increased risk
for neuroblastoma in the offspring of mothers exposed from birth to diagnosis (OR=1.88; 95%
CI=0.99, 3.56). We examined births 1989+ to assess a period when exposures were more
intensive due to a policy change regulating farm size and estimated a decreased risk for acute
lymphoblastic leukemia in the offspring of fathers exposed after birth (OR=0.56; 95% CI=0.32,
1.00). Our results suggest that parental occupational exposure to livestock or animal dust may be
implicated in the etiology of some childhood cancers, which could be due to infection or
inflammatory/immune responses in utero or after birth.
3.2 Introduction
Occupational exposure to livestock has been linked to outbreaks of zoonoses such as Q-
fever and Methicillin-resistant Staphyloccussaureas (MRSA), especially among pig and cattle
farmers in Europe.188-190, 240 These and other livestock-associated infections may spread from

66
animals to humans through direct contact or through contact with animal dander, particles from
decomposing waste,241 and aerosols generated by animal activity.242 These infections can also
spread from human to human, particularly in the households of infected workers.191 Exposure to
animal dusts from animal particles like hair, dander, or droppings can contribute to the spread of
infection and may contain additional inflammatory agents, such as particulate matter or
endotoxin.243, 244 While large studies of adult cancers have revealed both positive and negative
associations between cancer risk and occupational livestock work or animal contact,245-248
research on whether or how this affects cancer risk in offspring is sparse.
Most childhood cancer studies of livestock risk have assessed the two most common
pediatric cancer types, brain tumors and leukemia. Most but not all epidemiologic studies of
childhood central nervous system (CNS) tumors have found positive associations with parental
or childhood exposure to animals.249-254 Studies of childhood leukemia have largely found no
association with parental or childhood exposure to animals;252, 255-257 however, one case-control
study reported a decreased risk of acute lymphoblastic leukemia (ALL) with early childhood
exposure to certain farm animals (i.e., cows, sheep, and poultry),93 while a recent ecologic study
reported a positive association between childhood leukemia and increasing density of hog
operations.258 Likely due to their rarity, other types of childhood cancer have not been widely
studied in relation to parental or childhood livestock exposures.132, 134, 252, 259
There are several hypothesized mechanisms by which parental or childhood animal
exposure could affect the development of childhood cancer. Etiologic agents of interest include
zoonotic viruses, microbes, and animal dusts. Particulate matter and endotoxin from animal
origin260-262 can lead to chronic systemic inflammation and result in increased oxidative stress.263-
265 Oxidative stress is intricately involved in the process of carcinogenesis266 and has also been

67
shown to alter paternal DNA during spermatogenesis174, 175 and affect childhood development in
utero and after birth.267 Similarly, maternal infections during pregnancy can also interfere with
fetal development;268 because the developing fetal brain is particularly vulnerable to infection,269
this suggests a role for infections in the etiology of childhood brain tumors specifically. Studies
have shown that viruses can cause brain tumors in animals.109-112 However, evidence for an
association with humans is less conclusive; one study has reported a positive association between
prior Toxoplasma gondii infection and gliomas in adults,113 while other viruses have been
detected, albeit with varying frequencies, in a number of pediatric and adult CNS tumor
subtypes.115
Exposure after birth (due to a buildup of animal dusts in the home or parent-to-child
transmission of exposure residues) could lead to carcinogenesis through changes to immune
responses,243, 244 or by directly transforming cells via inserting oncogenes into the host
genome.265 Alternatively, Greaves’s “delayed infection” hypothesis suggests a protective role of
infection for leukemia, asserting that exposure to common infections during early childhood
reduces cancer risk.98, 270
In this population-based case control study of Danish children, we utilized a job-exposure
matrix (JEM) to assess parental occupations with exposure to livestock or animal dust in order to
examine the role of these types of exposures in the etiology of a variety of childhood cancers.
3.3 Methods
This case-control study is based on a linked database of all childhood cancers in Denmark
(<17 years old) diagnosed between 1968 and 2015. The database utilized four different Danish
data sources: the Central Population Registry (data available 1968-2014),271 the Cancer Registry
(1968-2015),272 the Supplementary Pension Fund (1964-2014),273 and the Medical Birth Registry

68
(1973-2014).274 Linkage of these data sources was conducted by using a unique personal
identification number allocated to each individual living in Denmark by the Central Population
Registry. Because this was a record-based study, informed consent was not required. Approval
for this study was received from the Danish Data Protection Agency and the human subjects’
protection board at the University of California, Los Angeles.
We identified childhood cancer cases from the Cancer Registry and grouped them
according to the International Classification of Childhood Cancer (ICCC), Version 1 until 2003
and Version 3 thereafter. Histological subtypes of childhood cancer were identified using the
International Classification of Diseases for Oncology (ICD-O), Version 1 until 2003 and Version
3 thereafter. Overall, 5,669 cases of childhood cancer were identified. Controls, who were free of
cancer at the date of diagnosis of the corresponding case, were randomly selected from the
Central Population Registry and individually matched to cases by birth year and sex. Cases and
controls were excluded from analyses if they were born outside of Denmark (n=5), did not have
any parental occupational history for the time periods of interest (n=32,972), or were a case (or
corresponding control) of a cancer type with fewer than 5 exposed cases throughout all four
exposure windows (n=131,983). Our final sample consisted of 4,474 childhood cancer cases and
422,022 controls.
The source of parental information varies by child’s birth year; this has been described in
detail previously.152 We obtained information on maternal and gestational factors from the
Medical Birth Registry. Date of conception was calculated using child’s gestational age as listed
in the Medical Births Registry. For children born 1968-1972, no gestational age variable was
available, and those children were assigned the average gestational age in the Danish population
(40 weeks). For children born 1973-1977, a categorical gestational age variable in week ranges

69
(i.e., 37-42 weeks) was reported by midwives; to create a continuous variable, we assigned each
child the midpoint value of their gestational age category. Children born 1978-1996 had
gestational age recorded in weeks, and those born after 1997 had a value recorded in days. After
creating a uniform gestational age variable, missing values remained in 3.9% of children. To
address this, we used multiple imputations to assign children a gestational age value, using
birthweight, birth length, placental weight, child’s sex, birth place, maternal smoking status,
labor interventions or procedures, and presence of congenital malformations as predictors when
available. To address any potential biases introduced by our gestational age assignments, we
conducted a sensitivity analysis using only children who had a recorded gestational age variable.
For births prior to 1997, all data was primarily reported by midwives; since 1997, variables were
automatically populated from the National Patient Register, though some information continued
to be reported by midwives, like smoking status.
We obtained occupational histories for the parents of cases and controls from the
Supplementary Pension Fund, which is compulsory for all salaried employees in Denmark aged
18-66 years who work at least nine hours per week; in 1978, persons aged 16-17 were
additionally included. Students, individuals who are self-employed, and those born before April
1st, 1897 are not covered by the Supplementary Pension Fund.273 The Danish industry code used
for exposure classification is a five-digit extended version of the United Nation’s four-digit
International Standard Industrial Classification of All Economic Activities codes.275 Occupations
with animal dust exposure were identified using the Danish version of the Nordic Occupational
Cancer Study job-exposure matrix,276 while occupations with livestock exposure were
additionally identified by an expert on Danish occupational health (J.H.). In order to avoid
potential competing exposures (e.g., pesticides), we only included occupational codes which

70
specified work with livestock but not crops. Parents were classified as exposed if they had ever
worked a job identified by our JEM during the timeframes of interest (Table 3.1).
Multivariable conditional logistic regression was used to examine associations between
parental occupational exposure to livestock or animal dust during different developmental
periods (i.e., preconception, pregnancy, and childhood) and the risk of childhood cancer in
offspring.
We considered potential confounders identified in previous studies,250, 252, 254 including
parental age. We adjusted for other covariates, including parity (0, 1, or ≥2) and maternal
smoking status (ever vs. never, in a sensitivity analysis of births 1991+ when smoking data were
available), but effect estimates did not change by more than 10% and therefore these covariates
were not included in final models. Because hog slaughtering was the most common profession in
the JEM for mothers and fathers, we conducted a sensitivity analysis to examine the impact of
these jobs alone; however, sample size only allowed for an analysis of paternal occupational
exposure. We additionally conducted analyses stratified by child’s birthplace (urban vs.
rural/small towns). In order to address the impact of more intense livestock farming exposures
over time, we conducted an analysis limited to births 1989+ to reflect the changes in livestock
farming after the passage of a 1989 law that allowed famers to increase the size of their
landholdings to 125 hectares.277
All statistical analyses were conducted using SAS, Version 9.4 (SAS Institute Inc., Cary,
NC, USA).
3.4 Results
Demographic and gestational characteristics were similar between cases and controls,
though a larger percentage of case mothers were multiparous at the time of birth of the index

71
child compared with control mothers (Table 3.2). More detailed information on covariates in
relation to specific cancer types in this population has been reported previously.152 Parents were
frequently employed in the same occupation throughout the entire study period. Pearson
correlation analyses revealed occupational livestock or animal dust exposures to be moderately
correlated across the exposure periods of interest (fathers: r2=0.66; mothers: r2=0.60).
Paternal employment during both exposure windows was associated with an increased
risk for CNS tumors in offspring, although associations were stronger with exposure from child’s
birth to cancer diagnosis (Table 3.3). We also observed an increased risk for germ cell tumor and
rhabdomyosarcoma in the offspring of fathers occupationally exposed after birth. These
associations were similar in sensitivity analyses restricting to paternal employment in hog
slaughtering (Supplementary Table 3.1). Stronger associations were estimated for CNS tumors
related to exposures during the preconception period, and for germ cell tumor and
rhabdomyosarcoma in relation to exposures after birth.
For births 1989+ (presumably a time period with higher exposure), we found that paternal
risks associated with CNS tumors were attenuated (Supplementary Table 3.2). This analysis also
suggested an increased risk of bone tumors and Wilms tumor in the offspring of fathers
occupationally exposed during preconception, and a similarly increased risk for
rhabdomyosarcoma in the offspring of fathers exposed from birth to diagnosis. Furthermore, we
detected an inverse association for acute lymphoblastic leukemia (ALL) in the offspring of
fathers exposed from birth to diagnosis for births 1989+ (OR=0.56; 95% CI=0.32, 1.00).
In sensitivity analyses stratified by child’s birthplace (urban vs. rural/small towns), we
observed an increased risk for CNS tumors in the offspring of fathers exposed from
preconception to conception if they were born in urban areas but not rural areas (Supplementary

72
Table 3.3); however, paternal employment from child birth to diagnosis was associated with an
increased risk for CNS tumors in offspring born in both urban and rural areas. We also observed
an increased risk for Wilms tumor in the offspring of fathers exposed to livestock or animal dust
from preconception to conception if they were born in rural areas/small towns.
With respect to maternal exposures, the risk for astrocytoma increased in the offspring of
mothers occupationally exposed from conception to birth. For neuroblastoma, we estimated an
increased risk in relation to maternal exposure from birth to diagnosis (Table 3.4). In sensitivity
analysis restricted to births 1989+, the effect estimates for both astrocytoma and neuroblastoma
strengthened (OR=2.95; 95% CI=1.37, 6.36 and OR=2.93; 95% CI=1.35, 6.35, respectively)
(Supplementary Table 3.4). We observed a decreased risk for all CNS tumors in the offspring of
mothers exposed after birth among births 1989+ (OR=0.40; 95% CI=0.18, 0.90).
For children born in rural areas or small towns, but not for the urban born, the risk for
bone tumors increased with maternal exposure from conception to birth (Supplementary Table
3.5). For children born in rural areas/small towns, associations with both astrocytoma and
neuroblastoma were attenuated with maternal exposure from conception to birth and birth to
diagnosis, respectively.
3.5 Discussion
Earlier studies of parental livestock exposure have mostly examined maternal farm
residence with data collection and exposure assessment relying mainly on questionnaires.249-251,
254 This study is one of the few to utilize registry-based occupational information to examine the
impact of animal exposure in the offspring of exposed parents.252, 253, 257 Our results suggest that
parental occupational exposure to livestock or animal dust may play a role in the etiology of
childhood cancer, but the impact of these exposures largely differs by cancer type. For rarer

73
types of childhood cancers, such as neuroblastoma, rhabdomyosarcoma, germ cell tumor, bone
tumors, and Wilms tumor, our findings suggest parental occupational exposure to livestock or
animal dust as a risk factor. During the latter half of the study period (1989+), our findings
suggest a decreased risk for ALL in offspring of fathers exposed after the index child’s birth,
which is consistent with studies that have implicated early exposure to infectious diseases as
protective for ALL.93, 270, 278, 279
Our findings did not corroborate past studies that reported positive associations between
maternal exposure to animals and all CNS tumors in offspring;249-252 however, our negative
findings for exposure after birth are similar to a case-control study which detected inverse
associations between exposure to specific animals (i.e., sheep, goats, and birds) in the first three
years of life and childhood brain tumors.249 We observed this decreased risk only when
examining births 1989+. Larger land holdings allow for larger herd sizes: the average swine herd
size increased from 169 pigs per year and farm in 1982 to nearly 3,000 in 2012; while cattle
numbers have more than halved over the same period (reflecting a trend towards specialization in
swine production), the average herd size more than doubled from 53 to 127 per holding.280
Studies have shown that increasing herd size is predictive of seropositivity of certain zoonoses
within herds and that herd size is positively associated with an increased risk of persistent
infection within herds.281-283 Because of this, we expect there to be a greater risk of infection in
exposed workers during the latter half of the study period, which may explain why we observed
higher effect estimates (when sample size allowed) among births 1989+. This was also reflected
in our findings for a specific subtype of CNS tumors, astrocytoma; we observed positive
associations during pregnancy which became stronger when assessing births 1989+. Only one
previous study of maternal animal exposure stratified by multiple subtypes, but it similarly found

74
an increased risk of astroglial tumors among mothers exposed to animals during pregnancy.249
Our results are mixed as they reveal both positive and inverse associations between maternal
exposure and the risk of CNS tumors and their subtypes in offspring; however, it is possible that
farm animal-related exposure is only implicated in the development of certain subtypes, e.g.
astrocytomas and other glial tumors.
We also estimated positive associations between paternal occupational exposure,
particularly exposure after birth, and all CNS tumors in offspring; while this relationship was
weakened when examining exposures 1989+, the number of exposed cases was more than halved
therefore producing a more imprecise estimate. Our results are similar to a previous study that
examined paternal occupation in Great Britain, which found an increased risk for all CNS tumors
with exposure to animals.253 Similarly, a record-based analysis of parental occupation around
conception in Denmark revealed an increased risk for CNS tumors in the offspring of fathers
who worked as butchers (OR=7.0); while some data overlaps with the present study, only cases
born 1968-1984 were included in this older analysis.284 Our results are inconsistent with respect
to parental exposure after births and total CNS tumor risk in offspring, as positive associations
were observed with paternal exposure, while inverse associations were detected with maternal
exposure. It is unclear why this disparity occurred.
While large confidence intervals limited the interpretation of our childhood leukemia
findings, our results are generally compatible with an inverse relationship between parental
occupational exposure and leukemia risk in offspring, particularly for exposures after birth. For
births 1989+, we detected an inverse relationship between paternal occupational exposure after
the index child’s birth and ALL in offspring. Our findings are compatible with Greaves’s
“delayed infection” hypothesis, which suggests that exposure to common infections in early life

75
is protective for childhood ALL,98 particularly subtype c-ALL, though we could not examine this
in the present analysis because subtype information is not available in Cancer Registry records.
Nevertheless, our results support the protective role of infection in the etiology of childhood
leukemia.
We also detected associations with some rare types of childhood cancer. Although the
literature is sparse with respect to most of these cancer types, some studies have investigated the
role of animal exposures in their etiology. For neuroblastoma, one occupational analysis found
that case mothers were more likely to report exposure to animal fur or feather dust compared
with control mothers,285 while other studies have reported inconsistent associations between
agriculture or farm work and neuroblastoma risk in offspring, with wide confidence intervals.252,
286, 287 To our knowledge, no study has previously reported on occupational or non-occupational
animal contact and childhood germ cell tumor risk; while some evidence suggests that
histological subtypes of germ cell tumors have different risk factors,76 the exposed cases in our
study consisted of heterogenous histologic types. With respect to rhabdomyosarcoma, an Italian
case-control study found paternal employment as a butcher (OR=14.2) and maternal employment
as a farmer (OR=7.0) to be associated with an increased risk of child’s development of soft tissue
sarcomas, though these estimates were based on a small number of cases.259 To the best of our
knowledge this is the first study to report on these exposures in relation to Wilms tumor.
More studies have investigated the role of parental farming exposures in the etiology of
childhood bone tumors, but these did not differentiate between livestock and crop work, making
it difficult to discern the relevant exposure. In these reports, parental farming exposures were
associated with an increased risk of both Ewing’s sarcoma and osteosarcoma in offspring.132-135
Our findings did not appear to be driven by a specific histologic subtype of bone tumor; of the

76
six cases born 1989+ with fathers exposed from preconception to conception, three were Ewing’s
sarcoma cases and three were osteosarcoma cases. Similarly, of the five cases with mothers
exposed from conception to birth, only one was a Ewing’s sarcoma case while two were
osteosarcoma cases. Our findings add to the body of literature on parental farm exposures and
bone tumors in offspring and suggest that animal exposure may be relevant to their etiology,
though it is possible other farm-related exposures are also implicated in childhood bone tumor
development.
Our study was not affected by recall bias or selective participation due to its record-based
nature. Because it was registry-based, we were unable to determine whether or not the parent
listed is the biological parent for some birth years, though we have no reason to believe this
would vary by case status.152 We also utilized a JEM that includes a variety of understudied
occupations that were selected to indicate specific exposure livestock and animal dust, such as
furriers, pig farmers, and veterinarians. Previous studies have relied on cruder types of exposure
assessment, combining together all farming jobs or using farm residence to assess exposure;249-
251, 254 these approaches inherently include competing exposures, such as pesticides, that may
contribute to cancer development in children.288 While the occupations included in our JEM were
selected so they are not likely to include any competing exposures such as pesticides, the
possibility of residual confounding still exists. Our study was limited by the small number of
childhood cases, which resulted in imprecise estimates and the inability to stratify by subtype in
some instances.
Our findings suggest that parental occupational exposure to livestock or animal dust may
be implicated in the etiology of childhood cancer, perhaps due to exposure to infections or other
inflammatory responses related to farm animal contact during pregnancy of after birth. Further

77
epidemiologic and mechanistic research is needed to further elucidate the relationship between
these exposures and childhood cancer, with an emphasis on identifying specific hazardous and
etiologic agents.
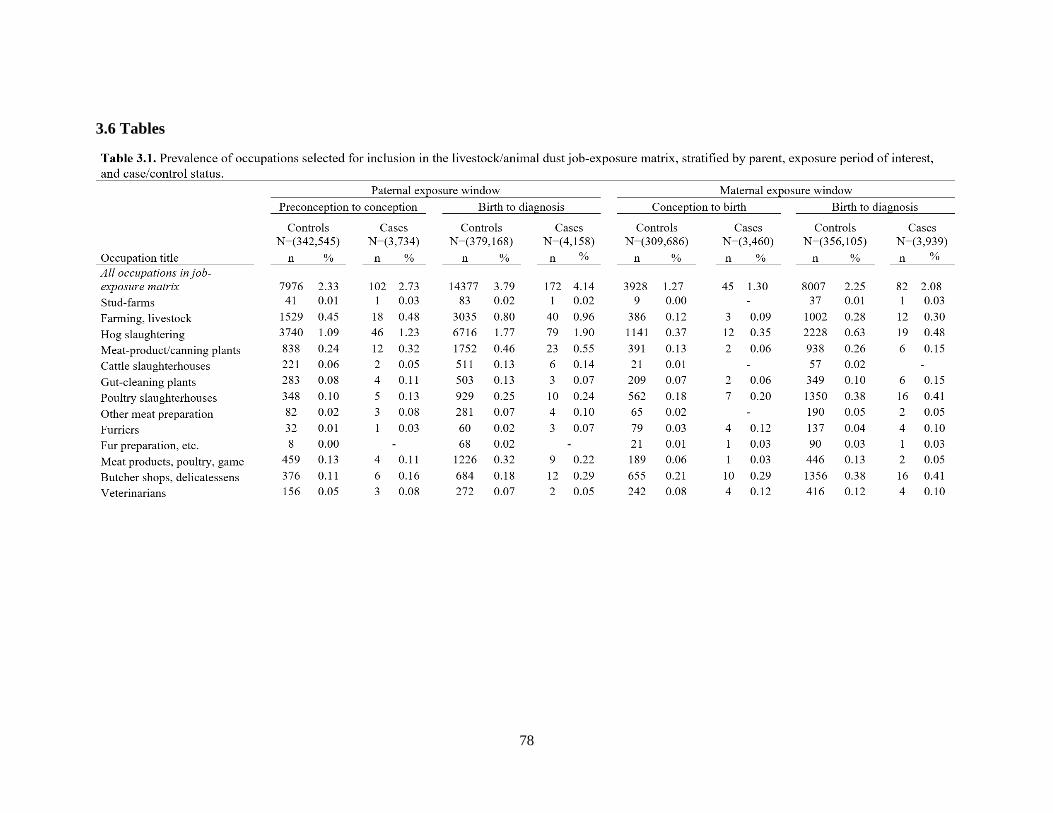
78
3.6 Tables

79
Table 3.2. Demographic, gestational, and parental characteristics
of population cases and controls.
Characteristic
Cases
(N=4,474)
Controls
(N=422,022)
N % N %
Child's sex
Male 2411 53.9 227086 53.8
Female 2063 46.1 194936 46.2
Child's birthplace
Urban 1564 35.0 145295 34.4
Rural/Small towns 2910 65.0 276725 65.6
Missing 0 2
Maternal age (years)
≤ 26 1332 29.8 127938 30.3
26-30 1695 37.9 158618 37.6
31-35 1016 22.7 99256 23.5
≥ 36 431 9.6 36210 8.6
Paternal age (years)
≤ 25 692 15.6 68805 16.4
26-30 1551 34.9 142719 34.0
31-35 1287 29.0 124356 29.6
≥ 36 915 20.6 84044 20.0
Missing 29 2098
Family socioeconomic status
High 413 12.6 41217 13.4
Medium-high 575 17.5 53464 17.4
Medium 612 18.6 56191 18.3
Medium-low 1123 34.2 103577 33.7
Low 562 17.2 53162 17.3
Missing 1189 114411
Parity
0 353 7.9 35347 8.4
1 1874 41.9 204703 48.5
2+ 2247 50.2 181972 43.1
Data available for births 1991+
Maternal smoking status
Smoker 492 25.8 46303 25.1
Non-smoker 1413 74.2 137956 74.9
Missing 69 6320

80
Table 3.3. Adjusted odds ratios for paternal occupational exposure to livestock or animal dust and the risk
of childhood cancer in offspring, stratified by exposure window.
Cancer type Paternal exposure window
Preconception to conception Birth to diagnosis
N % ORa aORb (95% CI) N % ORa aORb (95% CI)
Controls 7976 2.33 14377 3.79 Leukemias 34 2.41 1.06 1.07 (0.76-1.51) 54 3.43 0.91 0.93 (0.71-1.22) ALL 27 2.39 1.06 1.07 (0.73-1.57) 42 3.35 0.89 0.91 (0.67-1.24) AML 6 3.03 1.30 1.31 (0.58-2.95) 9 3.98 1.05 1.06 (0.54-2.07)
CNS tumors 34 2.76 1.20 1.19 (0.84-1.67) 68 4.85 1.28 1.27 (1.00-1.63) Astrocytoma 6 1.50 0.64 0.62 (0.28-1.40) 15 3.20 0.82 0.80 (0.48-1.34) Medulloblastoma 2 1.20 - 6 3.28 0.89 0.86 (0.38-1.94)
Bone tumors 7 3.52 1.48 1.50 (0.70-3.20) 10 4.24 1.08 1.10 (0.58-2.08)
Germ cell tumor 1 0.72 - 9 6.21 1.60 1.64 (0.83-3.23)
Neuroblastoma 9 3.32 1.40 1.39 (0.72-2.72) 9 3.20 0.86 0.86 (0.44-1.67)
Retinoblastoma 5 3.94 1.70 1.71 (0.69-4.19) 7 5.11 1.56 1.55 (0.72-3.33)
Rhabdomyosarcoma 4 2.99 - 9 6.47 1.71 1.68 (0.85-3.32)
Wilms tumors 8 3.60 1.58 1.58 (0.78-3.21) 6 2.46 0.64 0.66 (0.29-1.48) aCrude odds ratios. bOdds ratios adjusted for paternal age (continuous).

81
Table 3.4. Adjusted odds ratios for maternal occupational exposure to livestock or animal dust and the
risk of childhood cancer in offspring, stratified by exposure window.
Cancer type Maternal exposure window
Conception to birth Birth to diagnosis
N % ORa aORb (95% CI) N % ORa aORb (95% CI)
Controls 3928 1.27 8007 2.25 Leukemias 12 0.92 0.72 0.74 (0.42-1.30) 31 2.07 0.93 0.95 (0.66-1.36) ALL 9 0.86 0.67 0.69 (0.36-1.33) 18 1.50 0.67 0.69 (0.43-1.09) AML 2 1.04 - 8 3.64 1.59 1.69 (0.83-3.43)
CNS tumors 15 1.28 1.00 0.98 (0.59-1.64) 25 1.84 0.81 0.79 (0.53-1.18) Astrocytoma 10 2.58 1.99 1.89 (1.00-3.57) 11 2.40 1.04 1.00 (0.55-1.83) Medulloblastoma 2 1.33 - 1 0.57 -
Bone tumors 5 2.53 2.01 2.02 (0.83-4.92) 7 3.00 1.31 1.33 (0.62-2.82)
Germ cell tumor 2 1.65 - 4 2.92 -
Neuroblastoma 4 1.63 - 10 3.98 1.86 1.88 (0.99-3.56)
Retinoblastoma 4 3.64 - 3 2.70 -
Rhabdomyosarcoma 0 0.00 - 1 0.73 -
Wilms tumors 3 1.61 - 1 0.48 - aCrude odds ratios. bOdds ratios adjusted for maternal age (continuous).

82
Supplementary Table 3.1. Adjusted odds ratios for paternal employment in hog slaughtering and the
risk of childhood cancer in offspring, stratified by exposure window.
Cancer type
Paternal exposure window
Preconception to conception Birth to diagnosis
N % ORa 95% CI N % ORa 95% CI
Controls 3740 1.09 6716 1.77 Leukemias 11 0.78 0.74 0.41-1.35 21 1.34 0.78 0.51-1.21 ALL 10 0.88 0.84 0.45-1.57 18 1.43 0.85 0.53-1.35 AML 1 0.51 - 2 0.88 -
CNS tumors 19 1.54 1.43 0.91-2.26 31 2.21 1.23 0.86-1.76 Astrocytoma 4 1.00 - 8 1.71 0.89 0.44-1.80 Medulloblastoma 1 0.60 - 2 1.09 -
Bone tumors 2 1.01 - 6 2.54 1.41 0.63-3.18
Germ cell tumor 1 0.72 - 6 4.14 2.23 0.98-5.09
Neuroblastoma 4 1.48 - 5 1.78 0.98 0.40-2.38
Retinoblastoma 2 1.57 - 3 2.19 -
Rhabdomyosarcoma 3 2.24 - 5 3.60 2.02 0.82-4.97
Wilms tumors 4 1.80 - 2 0.82 - aOdds ratios adjusted for paternal age (continuous).

83
Supplementary Table 3.2. Adjusted odds ratios for paternal occupational exposure to livestock
or animal dust and the risk of childhood cancer in offspring among births 1989+, stratified by
exposure window.
Cancer type Paternal exposure window
Preconception to conception Birth to diagnosis
N % ORa 95% CI N % ORa 95% CI
Controls 4206 2.38 6939 3.58
Leukemias 13 1.86 0.82 0.47-1.41 18 2.31 0.68 0.42-1.09 ALL 9 1.60 0.71 0.37-1.37 12 1.93 0.56 0.32-1.00 AML 3 2.97 - 4 3.51 -
CNS tumors 17 2.67 1.10 0.68-1.79 30 4.27 1.14 0.79-1.66 Astrocytoma 2 1.03 - 7 3.17 0.81 0.38-1.72 Medulloblastoma 1 1.33 - 3 3.70 -
Bone tumors 6 6.19 2.85 1.24-6.56 5 4.35 1.14 0.46-2.82
Germ cell tumor 0 0.00 - 4 5.88 -
Neuroblastoma 5 4.10 1.62 0.66-3.98 5 3.76 1.17 0.48-2.87
Retinoblastoma 3 4.69 - 2 2.90 -
Rhabdomyosarcoma 3 3.75 - 6 7.32 2.24 0.96-5.22
Wilms tumors 5 5.05 2.25 0.91-5.59 2 1.85 - aOdds ratios adjusted for paternal age (continuous).

84
Supplementary Table 3.3. Adjusted odds ratios for paternal occupational exposure to livestock
or animal dust and the risk of childhood cancer in offspring, stratified by place of birth and
exposure window.
Cancer type Paternal exposure window
Preconception to conception Birth to diagnosis
N % ORa 95% CI N % ORa 95% CI
Place of birth: urban areas
Controls 998 0.88 2024 1.55
Leukemias 3 0.64 - 9 1.69 1.15 0.59-2.24 ALL 2 0.77 - 7 1.60 1.12 0.52-2.37 AML 0 0.00 - 1 1.52 -
CNS tumors 7 1.63 1.94 0.91-4.15 13 2.56 1.71 0.98-2.99 Astrocytoma 2 1.45 - 2 1.21 - Medulloblastoma 1 1.85 - 3 5.08 -
Bone tumors 1 1.59 - 1 1.33 -
Germ cell tumor 0 0.00 - 1 1.85 -
Neuroblastoma 0 0.00 - 0 0.00 -
Retinoblastoma 0 0.00 - 0 0.00 -
Rhabdomyosarcoma 1 1.85 - 2 3.57 -
Wilms tumors 0 0.00 - 1 1.23 -
Place of birth: rural areas/small towns
Controls 6978 3.05 12353 4.97
Leukemias 31 3.30 1.12 0.78-1.61 45 4.33 0.90 0.66-1.21
ALL 24 3.23 1.11 0.74-1.67 35 4.28 0.90 0.64-1.26
AML 6 4.26 1.40 0.62-3.18 8 5.00 1.02 0.50-2.08
CNS tumors 27 3.36 1.09 0.74-1.61 55 6.14 1.23 0.94-1.62
Astrocytoma 4 1.52 - 13 4.28 0.85 0.48-1.48
Medulloblastoma 1 0.89 - 3 2.42 -
Bone tumors 6 4.41 1.43 0.63-3.26 9 5.59 1.10 0.56-2.17
Germ cell tumor 1 1.09 - 8 8.79 1.83 0.88-3.82
Neuroblastoma 9 5.49 1.71 0.87-3.37 9 5.33 1.09 0.55-2.13
Retinoblastoma 5 5.75 1.95 0.78-4.84 7 7.78 1.87 0.86-4.08
Rhabdomyosarcoma 3 3.75 - 7 8.43 1.71 0.78-3.75
Wilms tumors 8 5.41 1.92 0.94-3.92 5 3.07 0.64 0.26-1.55 aOdds ratios adjusted for paternal age (continuous).

85
Supplementary Table 3.4. Adjusted odds ratios for maternal occupational exposure to
livestock or animal dust and the risk of childhood cancer in offspring among births 1989+,
stratified by exposure window.
Cancer type Maternal exposure window
Conception to birth Birth to diagnosis
N % ORa 95% CI N % ORa 95% CI
Controls 1932 1.16 3779 2.02
Leukemias 5 0.71 0.63 0.26-1.51 13 1.65 0.86 0.50-1.50 ALL 4 0.71 - 8 1.27 0.67 0.33-1.35 AML 1 0.90 - 4 3.36 -
CNS tumors 8 1.28 1.04 0.51-2.09 6 0.85 0.40 0.18-0.90 Astrocytoma 7 3.52 2.95 1.37-6.36 4 1.79 - Medulloblastoma 0 0.00 - 0 0.00 -
Bone tumors 2 1.98 - 4 3.39 -
Germ cell tumor 1 1.67 - 3 4.41 -
Neuroblastoma 2 1.57 - 7 5.47 2.93 1.35-6.35
Retinoblastoma 2 3.13 - 2 3.03 -
Rhabdomyosarcoma 0 0.00 - 0 0.00 -
Wilms tumors 1 1.03 - 0 0.00 - aOdds ratios adjusted for maternal age (continuous).

86
Supplementary Table 3.5. Adjusted odds ratios for maternal occupational exposure to livestock
or animal dust and the risk of childhood cancer in offspring, stratified by place of birth and
exposure window.
Cancer type Maternal exposure window
Conception to birth Birth to diagnosis
N % ORa 95% CI N % ORa 95% CI
Place of birth: urban areas
Controls 578 0.55 1226 1.01 Leukemias 2 0.45 - 4 0.79 - ALL 1 0.28 - 3 0.73 - AML 1 1.64 - 0 0.00 -
CNS tumors 4 0.93 - 7 1.41 1.39 0.65-2.98 Astrocytoma 3 2.19 - 3 1.84 - Medulloblastoma 1 1.96 - 1 1.72 -
Bone tumors 0 0.00 - 1 1.25 -
Germ cell tumor 0 0.00 - 0 0.00 -
Neuroblastoma 1 2.08 - 3 3.16 -
Retinoblastoma 3 8.33 - 2 5.41 -
Rhabdomyosarcoma 0 0.00 - 0 0.00 -
Wilms tumors 0 0.00 - 0 0.00 -
Place of birth: rural areas/small towns
Controls 3350 1.64 6781 2.89
Leukemias 10 1.16 0.72 0.39-1.35 27 2.71 0.97 0.66-1.43
ALL 8 1.16 0.73 0.36-1.47 15 1.89 0.68 0.41-1.13
AML 1 0.76 - 8 5.23 1.84 0.90-3.77
CNS tumors 11 1.48 0.88 0.48-1.59 18 2.08 0.68 0.43-1.09
Astrocytoma 7 2.80 1.61 0.75-3.43 8 2.71 0.88 0.43-1.78
Medulloblastoma 1 1.01 - 0 0.00 -
Bone tumors 5 3.76 2.46 1.00-6.07 6 3.92 1.42 0.62-3.23
Germ cell tumor 2 2.50 - 4 4.49 -
Neuroblastoma 2 1.34 - 7 4.49 1.57 0.73-3.39
Retinoblastoma 1 1.35 - 1 1.35 -
Rhabdomyosarcoma 0 0.00 - 1 1.23 -
Wilms tumors 3 2.44 - 1 0.73 - aOdds ratios adjusted for maternal age (continuous).

87
Chapter 4. Parental occupation and childhood germ cell tumor risk in Denmark, 1968-2015
4.1 Abstract
Childhood germ cell tumors (GCTs) are a rare group of neoplasms with varying
histologic characteristics and relatively unknown etiology. Utilizing a linked database of five
nationwide Danish registries, we developed a population-based case-control study of all
childhood GCT cases in Denmark (<17 years old) diagnosed 1968-2015 (n=164) and birth year-
matched controls (n=15,513). We conducted conditional multivariable logistic regression to
analyze the association between parental occupation and childhood GCT risk in offspring,
stratifying by common histologic subtype (i.e., yolk sac tumor and teratoma) when possible. We
assessed parental exposures to specific chemicals, social contact, and shiftwork by job-exposure
matrices (JEMs) applied to the individual parental employment histories. We found an increased
risk of GCTs in the offspring of mothers occupationally exposed to high/very high social contact
from child’s conception to birth, especially among yolk sac tumors (OR=3.50; 95% CI=1.65,
7.43); this association persisted when examining maternal occupational exposure from birth to
diagnosis (OR=2.77; 95% CI=1.29, 5.57). We also observed an elevated risk of all GCTs in the
offspring of mothers who worked in the textile, clothing, and leather industry from birth to
diagnosis (OR=2.19; 95% CI=1.09, 4.40). Paternal employment in the agriculture, forestry, and
fishing industry from child’s birth to diagnosis was associated with an increased risk of
teratomas in offspring (OR=2.73; 95% CI=1.14, 6.78). Our findings suggest that parental
occupation around pregnancy and after birth may be implicated in the etiology of childhood
GCTs, with results varying by histologic subtype.

88
4.2 Introduction
Childhood germ cell tumors (GCTs) are a rare group of heterogenous neoplasms with
largely unknown etiology.141 In Europe, the incidence rate of GCTs for children ages 0-14 is
estimated to be 4.8 per million.140 In children, the two most common GCT subtypes are yolk sac
tumors and teratomas; these subtypes may have different risk factors,76, 141 but few studies have
stratified by histologic subtype.
Despite the rarity of epidemiologic studies on childhood GCTs, consistent positive
associations have been observed between cancer incidence and Asian/Pacific Islander race, birth
defects, and abnormal fetal growth,76, 146 the latter of which suggest that prenatal exposures are
consequential to childhood GCT development. While parental occupation has been examined as
a risk factor in the etiology of several childhood cancers, few studies have specifically examined
the role of parental occupation in the development of childhood GCTs. These reports have
shown positive associations between parental occupational exposure to chemicals/solvents and
plastic/resin fumes and childhood GCT risk in offspring;154 however, results were mixed or null
for other occupational exposures, such as exhaust fumes, and no studies stratified by histologic
subtype.154, 158 Occupational and non-occupational studies have not been able to link parental
pesticide exposure and childhood GCT risk.143, 155, 164
Non-occupational studies of certain chemicals or chemical groups have shown conflicting
results with respect to in utero or early life exposure and childhood GCT risk. Our group recently
found that ambient exposure to dichloromethane (a solvent often used in paint removers and
other chemical processes) during pregnancy and the first year of life was positively associated
with childhood GCTs, particularly teratomas.165 We also previously estimated a weak positive
association between traffic-related air pollution in pregnancy and childhood GCT risk, mostly for

89
teratomas.144 Similarly, a Spanish case-control study estimated an imprecise but positive effect
for childhood GCTs and proximity to urban areas with traffic pollution.166 However, other case-
control studies were unable to corroborate these findings.154, 155, 167
In this relatively large, Danish population-based case-control study, we sought to
examine associations between parental occupation and offspring’s risk for childhood GCT.
Furthermore, we separately assessed two common histologic subtypes (i.e., teratoma and yolk
sac tumor) to better elucidate the role of parental occupation in the etiology of this rare childhood
cancer.
4.3 Methods
This population-based case-control study utilizes a linked database comprised of five
nationwide Danish registries: The Central Population Registry (data available 1968-2017),271 the
Danish Cancer Registry (1968-2015),272 the Supplementary Pension Fund (1964-2014),273 the
Medical Birth Register (1973-2014),274 and the National Patient Register (1977-2017).289 Exact
linkage of information between registries is possible due to the existence of a 10-digit unique
personal identifier, including information on birth day and sex, which has been applied to all
residents in Denmark since 1968.
Childhood GCT cases (<17 years old) were identified according to the International
Classification of Childhood Cancer (ICCC), Version 1 until 2003 and Version 3 thereafter, with
codes 101-105 (n=166). Histologic subtypes of GCTs were identified using the International
Classification of Diseases for Oncology (ICD-O), Version 1 until 2003 and Version 3 thereafter:
yolk sac tumors (ICD-O code 9071; n=47) and teratomas (ICD-O codes 9080-9084; n=61) were
most common in our population, while 58 GCT cases were coded as neither a teratoma nor a
yolk sac tumor (germinomas, n=23; embryonal carcinoma, n=12; other, n=23). Controls, all of

90
whom were free of cancer at the date of diagnosis of the corresponding case, were randomly
selected from the Central Population Registry and individually matched to cases at a 1:100 ratio
by year of birth and sex, and had had to be alive at the date of diagnosis of the corresponding
case. All children had to be born in Denmark in order to be eligible for this study. Cases and
controls were excluded if both parents had no records in the Supplementary Pension Fund for all
time periods of interest (n=1,087 including 2 cases). Our analytic dataset consisted of 164 GCT
cases and 15,513 controls. Because this was a record-based study, informed consent was not
required. Approval for this study was received from the Danish Data Protection Agency and the
human subjects’ protection board at the University of California, Los Angeles.
The source of parental information varies by child’s birth year and has been described in
detail elsewhere.152 We obtained information on maternal and pregnancy related factors,
including pregnancy and eventual labor complications from the Medical Birth Registry. We
calculated date of conception using the child’s gestational age as listed in the Medical Birth
Registry. From 1968-1972, no gestational age variable was collected; therefore, children born
during this period were assigned the average gestational age in the Danish population (40 weeks
or 280 days). For the period 1973-1977, we had access to a categorical gestational age variable
imputed in weeks and collected by midwives. Children born between 1978-1996 also had
gestational age recorded in weeks. To transform this into a continuous variable, we assigned each
child the midpoint value of their gestational age category. Children born after 1997 had a
gestational age value recorded in days. For the 3.9% of children who had missing gestational
age, multiple imputation was performed using birthweight, birth length, placental weight, child’s
sex, birth place, maternal smoking status, labor interventions or procedures, and presence of
congenital malformations as predictors when available. Information on maternal smoking status

91
was first collected in 1991 and we created a binary variable to indicate whether the mother had
ever smoked during pregnancy. Prior to 1997, information in the Medical Birth Registry was
primarily provided by midwives; after 1997, most variables were automatically populated from
hospital databases, though some information (e.g., smoking status) continued to be reported by
midwives.
The National Patient Registry, a population-based administrative registry that has
collected data from all Danish hospital since 1977,289 was used to collect information on
diagnosis of cryptorchidism (undescended testicle), a relatively strong risk factor for GCT
development in males.147 The National Patient Registry classified diagnoses according to the
International Classification of Disease (ICD), Version 8 until 1993, with ICD-10 used thereafter;
cryptorchidism was identified using ICD-8 code 752.1X and ICD-10 codes 53.XX. Validation
studies have reported that accuracy of information in the National Patient Registry varies by
diagnoses, with generally high positive predictive values ranging from below 15% to 100%,
though no specific information on validity of cryptorchidism was available.289
The Supplementary Pension Fund, established in 1964, was used to obtain employment
histories for the parents of cases and controls. At its inception, the Supplementary Pension Fund
was compulsory for all salaried employees in Denmark aged 18-66 working at least nine hours
per week; in 1978, persons aged 16-17 were additionally included. Individuals who are self-
employed, students, and those born prior to April 1st, 1897 are not covered by the Supplementary
Pension Fund.273 All jobs held from three months before pregnancy for fathers and from
conception for mothers, and until diagnosis or corresponding dates for controls were used to
categorize industries and sub-industries according to a Danish five-digit detailed version of the
International Standard Industrial Classification of All Economic Activities (ISIC).275
92
We targeted two different exposure periods for both mothers and fathers. For fathers, we
examined jobs held from three months preconception to birth and from birth to the index child’s
cancer diagnosis. For mothers, we examined jobs held from conception to birth and from birth to
the index child’s cancer diagnosis.
We also utilized previously constructed JEMs276 to examine occupational exposure to
chemicals/solvents previously associated with GCTs: benzene, dichloromethane, gasoline, and
toluene.144, 165 The Danish JEMs were based off Finnish JEMs created as a part of the Nordic
Occupational Cancer Study; the Danish version of the JEMs was based on measurements in
Denmark by J.H.290 The JEMs include industry-specific exposure estimates over four time
periods: 1945-1959, 1960-1974, 1975-1984, and 1985+. Utilizing these JEMs, we created a
binary exposure variable to indicate whether or not a parent had been exposed during the
exposure windows listed previously. We additionally conducted a sensitivity analysis for JEM
analyses of gasoline and toluene by restricting exposure to years after 1974, when benzene was
less commonly used, as these solvents tend to be highly correlated.
We also examined occupational social contact by employing a JEM that replicated
previous work by Kinlen et. al. and was updated for the Danish population based on the advice
of experts in Danish occupational health.101 Briefly, occupations with “very high” social contact
predominantly consisted of elementary school teachers, daycare workers, and physicians, while
“high” social contact occupations consisted of other teachers, healthcare professionals, hotel
workers, pilots, police, hairdressers, and workers in the transportation industry; due to sample
size restrictions, these two categories were combined. Occupations with “low” social contact
(i.e., agricultural jobs) were included with all other jobs (“medium” social contact) to comprise
the reference group.

93
Upon noticing an increased risk of GCTs in the offspring of mothers employed in
hospital and health care work, we speculated that it could be due to known carcinogens such as
infection or shiftwork. Thus, in a supplementary analysis, we utilized a previously constructed
JEM276 to assess maternal shiftwork exposure from conception to birth only. Occupations with
“high” and “medium” shiftwork exposure were grouped together, while occupations with “low”
shiftwork exposure were combined with all other jobs to make up the reference group. Some
occupational codes belonged to more than one shiftwork exposure category; if this was the case,
individuals were assigned the highest exposure category.
We employed conditional logistic regression to examine the association between parental
occupation and childhood GCT risk in offspring. After considering adjustment for confounders
identified in previous studies,143, 146, 154 we adjusted for place of birth (parish) obtained from the
Central Population Register and classified as urban and rural/small towns, and parental age
(continuous; maternal age for maternal exposures and paternal age for paternal exposures). We
additionally adjusted for maternal smoking status (ever v. never) in a sensitivity analyses of
births after 1990, when the variable was first available. We also conducted sensitivity analyses,
restricting to older mothers (ages 30+) and stratifying by child’s place of birth (urban v.
rural/small towns) and by child’s age at diagnosis (<9 v. 9-16). When sample size allowed, we
conducted sensitivity analyses differentiating the two most common histologic subtypes of GCTs
in our population: teratomas and yolk sac tumors. In all analyses, we report on occupational
exposures in which there were at least five exposed cases in either exposure window for mothers
and fathers respectively.
All statistical analyses were conducted using SAS, Version 9.4 (SAS Institute Inc., Cary,
NC, USA).
94
4.4 Results
In our population, girls were more likely to be diagnosed with a yolk sac tumor, while
boys were more commonly diagnosed with teratoma (Table 4.1). As expected, a significantly
higher percentage of case males had a diagnosis of cryptorchidism compared with control males.
Compared with control parents, the parents of GCT cases were more likely to be older
(≥36 years old) at the index child’s birth and less likely to be ≤25 years. Children with teratomas
were more likely to be born in small towns or rural areas, while children with yolk sac tumors
were more likely to be born in urban areas, compared with controls.
Among fathers who worked in professional, scientific, and technical activities from three
months preconception to the index child’s birth, we estimated an increased risk of GCTs in
offspring; however, this association was weaker when examining fathers employed in this
industry from birth to the index child’s cancer diagnosis (Table 4.2). We found an increased risk
in GCTs in the offspring of fathers who held jobs in human health and social work activities
from the child’s birth to cancer diagnosis. This association was particularly pronounced among
fathers employed in the sub-industry hospital and practitioner work from birth to cancer
diagnosis. There were no associations between paternal exposure to specific solvents or social
contact (as derived from JEMs) and childhood GCT risk in offspring.
In subgroup analyses of histologic subtype, we estimated an increased risk of teratomas
in the offspring of fathers employed in agriculture, forestry, and fishing from the child’s birth to
cancer diagnosis (Table 4.3). There were no clear associations between paternal employment and
yolk sac tumor risk in offspring.
Risk of GCTs were increased in the offspring of mothers employed in education and
human health and social work activities from the index child’s conception to birth (Table 4.4).

95
Among industry subcategories, these associations were stronger among the children of mothers
who were employed in hospital and practitioner work and welfare institutions. Most of these
associations persisted when examining mothers employed from the child’s birth to cancer
diagnosis; however, the association with welfare institutions was substantially weaker and less
precise. We observed an increased risk of GCTs in offspring among mothers employed in the
textile, clothing, and leather industry from the child’s birth to cancer diagnosis. For exposure to
solvents and social contact via JEMs, we estimated an increased risk of GCT in the offspring of
mothers who were exposed to high/very high social contact from conception to birth, but not
from birth to diagnosis. We also saw an increased risk of GCTs in mothers exposed to
high/medium shiftwork from conception to birth (OR=1.71; 95% CI=1.16, 2.50); this association
was slightly more pronounced for yolk sac tumors (OR=2.18; 95% CI=1.10, 4.34) than teratomas
(OR=1.71; 95% CI=0.92, 3.19).
We found a substantial increased risk of yolk sac tumors in the offspring of mothers
employed in both education and human health and social work activities from the child’s
conception to birth and from birth to cancer diagnosis (Table 4.5). Similarly, risk in yolk sac
tumors was increased in the offspring of mothers exposed to high/very high occupational social
contact from conception to birth and from birth to diagnosis. Risks for teratomas were also
elevated in the offspring of mothers employed in human health and social work activities from
the child’s conception to birth; this association was attenuated when examining maternal
employment from child’s birth to cancer diagnosis.
Sensitivity analyses adjusting for maternal smoking (births 1991+ only), restricting to
mothers aged 30 and older, and stratification by child’s age at diagnosis resulted in no substantial
changes in effect estimates. Stratification by child’s place of birth, however, suggested higher

96
effect estimates for maternal employment in human health and social work activities among
children born in rural/small towns compared with those born in urban areas (OR=2.29; 95%
CI=1.43, 3.67 vs. OR=1.05; 95% CI=0.52, 2.14 for employment from conception to birth and
OR=2.70; 95% CI=1.77, 4.14 vs. OR=0.87; 95% CI=0.46, 1.62 for employment from birth to
diagnosis).
4.5 Discussion
This is one of few studies that examine parental occupation and childhood GCT risk and,
to our knowledge, the first to examine specific histologic subtypes. The results of our population-
based case-control study suggest that parental employment around pregnancy may influence the
risk of GCTs in offspring; additionally, our findings suggest that certain exposures may be
particularly relevant to certain GCT histologic subtypes of (i.e., yolk sac tumor or teratoma).
Across exposure windows, we found a consistent increased risk of GCTs, particularly
yolk sac tumors, in the offspring of mothers who worked in the education and healthcare
industries. While it is difficult to discern specific risk factors in these broad trades, a subgroup
analysis of the healthcare industry indicated that these associations were primarily driven by
women employed in hospital/practitioner work and welfare institutions, where night shift work is
common. Sample size did not allow for a subgroup analysis in the education sectors. These
associations could potentially be related to infectious and immunologic causes or to shiftwork
and radiation. To our knowledge, no studies have investigated the role parental shiftwork may
play in the etiology of childhood GCTs with the exception of the present analysis, which
uncovered a positive association between maternal exposure from conception to birth, especially
among yolk sac tumors. While radiation has been implicated as a risk factor for certain childhood
cancers like leukemia and central nervous system tumors,75, 291, 292 evidence for an association

97
with childhood GCTs is less clear. Past studies of radiation exposure have grouped GCTs with
other solid tumors, likely due to their rarity, yielding inconsistent findings.255, 292, 293
Nevertheless, our sensitivity analysis stratified by place of birth indicated higher risks among
children born in rural areas/small towns compared with those born in urban areas. This suggests
that infectious and immunologic causes may play a role based on the population mixing
hypothesis which, in short, asserts that people who live in areas with lower population densities
(i.e., rural areas) are more susceptible to infectious agents introduced by “incomers” who migrate
to the area.100 Our JEM-driven analysis suggested a moderately positive association between
high/very high maternal occupational social contact and all GCTs in the offspring of mothers
employed from conception to birth, but not from birth to diagnosis. This suggests in utero
exposures may be more relevant for GCT etiology than exposures after birth. For mothers with
occupational information in both exposure windows, there was a moderately high correlation
between employment in the healthcare industry during pregnancy and from the child’s birth to
diagnosis (r2=0.71), making it difficult to distinguish impacts of exposure according to time
period.
Associations between maternal employment in the education and healthcare industries
and GCT risk in offspring were mostly driven by associations with yolk sac tumors, as were
associations with occupational social contact. It may be that immunologic or infectious causes
are more relevant to the etiology of yolk sac tumors than teratomas. One previous study found no
relationship between infections in pregnancy and GCT risk in offspring, however, associations
were not stratified by subtype.154 To our knowledge, no other study has examined maternal
exposure to infections around pregnancy and GCT risk in offspring. Infections may play a role in
yolk sac tumor development though methylation of the GATA-4 transcription factor. Laboratory

98
studies have shown that GATA-4 is expressed in human GCT lines that exhibit yolk sac
differentiation, indicating a possible underlying biological process for these pediatric tumors.294,
295 Other studies have shown methylation of GATA-4 to be associated with the development of
gastric cancer and chronic gastritis; and this was closely correlated with Helicobacter pylori
infection, suggesting an infectious basis for gastric cancer.296, 297 Taken together, it is possible
that in utero or postnatal infection plays a role in pediatric yolk sac tumor development.
We also observed an increased risk of GCTs in the offspring of mothers employed in the
textile, clothing, and leather industry from child’s birth to cancer diagnosis. The case numbers
did not allow us to determine if this was driven by a specific histologic subtype. Textile workers
are typically exposed to textile-related dusts, including endotoxin, with minimal exposure to
solvents; however, such exposure is common in dyeing and printing operations.218, 298
Occupational textile work has mostly been associated with an increased risk of bladder and lung
cancer in adults, with dye and asbestos exposure respectively identified as the etiologic agents of
interest.299 Yet, a study of parental occupation at periconception reported a positive association
between occupational exposure to textile dust and childhood cancer in offspring for a combined
category of solid tumors with different histologic makeups (including GCTs).255 Other studies
have reported a positive association between parental occupational dust or solvent exposure and
GCTs in offspring,154, 155 but it is unclear if these parents were employed in the textile industry.
Our JEM-driven analyses of occupational exposure to specific solvents revealed an
elevated point estimate for GCT development in the offspring of mothers exposed to
dichloromethane (also known as methylene chloride) from conception to birth, albeit imprecise.
Dichloromethane is a solvent used in aerosols, paint removers, adhesives, and many
chemical/industrial processes; it was recently classified as a probable human carcinogen (Group

99
2A) by the International Agency for Research on Cancer (IARC).300 Our point estimate was
similar to a recent analysis of California children (<6 years old) that suggested a positive
relationship between ambient dichloromethane exposure during pregnancy (OR=1.52; 95%
CI=1.11, 2.08) and GCT risk, particularly among teratomas.165 We did not have sufficient sample
size to stratify by histologic subtype in our analysis; of the nine case mothers exposed from
conception to birth, only two had a child diagnosed with teratoma. In utero exposure to
dichloromethane may disrupt differentiation and migration of early primordial germ cells during
neonatal development, leading to carcinogenesis.165, 301
We found few associations between paternal employment and GCT risk in offspring. A
positive association with childhood GCT was observed in the offspring of fathers employed in
professional, scientific, and technical activities from three months preconception to conception;
however, this grouping is a compilation of various occupations, with five case fathers employed
in data processing, three in legal services, accounting, bookkeeping, and three in engineering,
land inspectors, and architects. This occupational group may be a proxy for higher SES, though
there was little difference in SES between cases and controls in our study. We found a
moderately positive association between GCT risk in offspring and paternal employment in the
agriculture, forestry, and fishing industry from birth to diagnosis; analyses of histologic
subgroups suggested this was primarily driven by teratomas. Of the six exposed cases, three had
fathers were employed in crop farming, one in livestock farming, one in fur faming, and one in
agriculture, suggesting that pesticide exposure may be relevant in the etiology of teratomas. Past
studies of occupational pesticide exposure have found no relationship with GCT risk in
offspring;143, 154, 155 however, some of these studies relied on self-reported exposure data154, 155
and only one stratified by histologic subtype.143

100
This population-based case control study is record-based in nature, thus recall bias and
self-selection due to participation does not affect exposure assessment or generate selection bias;
however, because we relied solely on objectively recorded employment histories, JEMs,
nondifferential misclassification is likely and would most likely bias our effect estimates towards
the null. Limitations include the use of a social contact JEM that has not been validated for the
presumed exposures associated with the employment historries,101 though studies have
previously found employment in healthcare and education industries to be associated with high
rates of infectious disease.302, 303 While we were able to stratify by histologic subtype in most
instances, we lacked the sample size to do so for all occupational exposures. Nevertheless, this
epidemiologic study is among the largest to examine parental occupational risk factors for
childhood GCT development in offspring and was strengthened by the use of objective records,
including a reliable cancer registry that captured cases over an extended period of time, and
based in a country with free access to health care for all residents.
Our findings suggest that parental occupation, especially in the education and healthcare
industries, may play a role in the etiology of GCT in offspring, though the exact mechanism by
which these occupations impact childhood cancer risk in offspring is unknown. Further research
is needed to corroborated the risk factors we identified, especially studies that are able to
distinguish between histologic subtypes of childhood GCT.

101
4.6 Tables
Table 4.1. Demographic characteristics of germ cell tumor cases and controls (1968-2015).
Characteristic
Controls
(N=15,513)
Germ cell tumor cases (n=164)
All GCTs
Teratomas
(n=61)
Yolk sac
tumors
(n=45)
Child's sex
Female 7,177 (46.3) 75 (45.7) 31 (50.8) 16 (35.6)
Male 8,336 (53.7) 89 (54.3) 30 (49.2) 29 (64.4)
Cryptorchidisma
Yes 206 (3.6) 6 (9.8) 2 (10.5) 1 (4.3)
No 5,573 (96.4) 55 (90.2) 17 (89.5) 22 (95.7)
Missing 109 0 0 0 Maternal age group
≤25 4,790 (30.9) 45 (27.4) 17 (27.9) 13 (28.9)
26-30 5,834 (37.6) 64 (39.0) 24 (39.3) 19 (42.2)
31-35 3,629 (23.4) 35 (21.3) 12 (19.7) 7 (15.6)
≥36 1,260 (8.1) 20 (12.2) 8 (13.1) 6 (13.3) Paternal age group
≤25 2,569 (16.7) 18 (11.0) 5 (8.2) 5 (11.1)
26-30 5,339 (34.6) 60 (26.6) 20 (32.8) 17 (37.8)
31-35 4,590 (29.8) 49 (29.9) 21 (34.4) 12 (26.7)
≥36 2,920 (18.9) 37 (22.6) 15 (24.6) 11 (24.4)
Missing 95 0 0 0 Place of birth
Urban 5,300 (34.2) 58 (35.4) 17 (27.9) 21 (46.7)
Small town or rural 10,213 (65.8) 106 (64.6) 44 (72.1) 24 (53.3) Family socioeconomic status
High 1,519 (13.1) 15 (12.6) 7 (16.7) 3 (10.0)
Medium-high 2,008 (17.4) 21 (17.6) 7 (16.7) 7 (23.3)
Medium 2,019 (17.5) 21 (17.6) 8 (19.0) 3 (10.0)
Medium-low 3,960 (34.2) 40 (33.6) 13 (31.0) 11 (36.7)
Low 2,057 (17.8) 22 (18.5) 7 (16.7) 6 (20.0)
Missing 3,950 45 19 15 aInformation on cryptorchidism is reported only for males and is available for births 1977+.

102
Table 4.2. Odds ratios and 95% confidence intervals for the association between paternal occupational exposures and germ cell
tumor risk in offspring, stratified by exposure window (1968-2015).
Paternal exposure window
Three months preconception to birth Birth to diagnosis
Occupational exposure Case N/
Control N ORa
aORb (95% CI) Case N/
Control N ORa
aORb (95% CI)
Total 143/13396 145/13480
Occupational industry
Agriculture, forestry, fishing 3/470 - - 10/724 1.36 1.44 (0.75, 2.79)
Manufacturing
39/3556
1.04 1.06 (0.73, 1.53) 51/4859
0.95 0.98 (0.69, 1.39) Food and drink industry
9/691
1.25 1.28 (0.65, 2.53) 16/1122
1.37 1.43 (0.84, 2.44)
Iron, metal works, foundries
20/1878
0.99 1.01 (0.63, 1.62) 26/2769
0.83 0.85 (0.56, 1.32)
Water supply, sewerage, etc.
3/154
- -
5/460
1.04 1.05 (0.42, 2.61)
Construction
15/1767
0.75 0.77 (0.45, 1.32) 24/2514
0.86 0.89 (0.57, 1.39)
Retail and wholesale trade
29/2189
1.29 1.31 (0.87, 1.97) 33/3285
0.92 0.93 (0.63, 1.38)
Transportation and storage
14/1122
1.21 1.22 (0.70, 2.12) 19/1766
1.01 1.03 (0.63, 1.68)
Accommodation and food service activities
2/291
- -
7/519
1.25 1.25 (0.58, 2.70)
Information and communication
7/585
1.15 1.14 (0.53, 2.45) 7/805
0.78 0.77 (0.36, 1.65)
Financial and insurance activities
4/445
- -
5/621
0.77 0.76 (0.31, 1.87)
Professional, scientific, and technical activities
11/581
1.88 1.85 (0.99, 3.46) 15/967
1.51 1.49 (0.86, 2.57)
Administrative and support service activities
2/368
- -
5/868
0.51 0.51 (0.21, 1.26)
Public administration and defense
22/2175
0.95 0.94 (0.59, 1.48) 40/3364
1.16 1.15 (0.79, 1.67)
Education
6/353
1.58 1.51 (0.66, 3.48) 10/718
1.30 1.25 (0.65, 2.40)
Human health and social work activities
7/662
1.00 0.97 (0.45, 2.09) 20/1247
1.60 1.57 (0.97, 2.54) Hospital and practitioner work
6/501
1.13 1.10 (0.48, 2.51) 18/970
1.85 1.82 (1.10, 3.02)
Other service activities
2/184
- - 7/444
1.52 1.49 (0.69, 3.23)
Job exposure matrix
Benzene 13/1385 0.84 0.85 (0.48, 1.51) 26/2199 1.09 1.11 (0.72, 1.72)
Dichloromethane 19/1962 0.89 0.90 (0.55, 1.46) 33/2989 1.02 1.04 (0.70, 1.54)
Gasoline 11/1253 0.79 0.80 (0.43, 1.48) 23/2013 1.05 1.07 (0.68, 1.69)
Birth years >1974c 10/1054 0.91 0.92 (0.48, 1.76) 18/1632 1.06 1.09 (0.65, 1.81)
Toluene 20/2101 0.85 0.87 (0.54, 1.39) 36/3259 1.02 1.04 (0.71, 1.53)
Birth years >1974c 18/1762 0.98 0.99 (0.60, 1.65) 31/2673 1.15 1.17 (0.77, 1.78)
High/very high social contact 11/925 1.14 1.10 (0.59, 2.04) 18/1658 1.04 1.02 (0.62, 1.68) aCrude odds ratios. bOdds ratios adjusted for birth place (urban v. small towns/rural) and paternal age (continuous).
cRestricted to years when benzene was less commonly used.

103
Table 4.3. Odds ratios and 95% confidence intervals for the association between paternal occupational exposures, yolk sac tumor,
and teratoma risk in offspring, stratified by exposure window (1968-2015).
Paternal exposure window
Three months preconception to birth Birth to diagnosis
Occupational exposure Case N/
Control N ORa
aORb (95% CI) Case N/
Control N ORa
aORb (95% CI)
Yolk sac tumors 39/13396 41/13480
Occupational industry
Manufacturing
9/3556
0.81 0.85 (0.40, 1.82) 12/4859
0.87 0.96 (0.48, 1.92)
Retail and wholesale trade
9/2189
1.57 1.58 (0.74, 3.36) 8/3285
1.03 1.06 (0.48, 2.32)
Public administration and defense
5/2175
0.78 0.75 (0.29, 1.94) 10/3364
1.31 1.26 (0.61, 2.60)
Job exposure matrix
High/very high social contact 5/925 1.88 1.70 (0.66, 4.38) 6/1658 1.56 1.41 (0.58, 3.40)
Teratomas 52/13396 49/13480
Occupational industry
Agriculture, forestry, fishing 2/470 - - 6/724 2.73 2.78 (1.14, 6.78)
Manufacturing 14/3556 1.07 1.07 (0.57, 1.99) 16/4859 0.83 0.84 (0.45, 1.55)
Food and drink industry 5/691 1.96 2.02 (0.79, 5.16) 6/1122 1.57 1.60 (0.66, 3.88)
Iron, metal works, foundries 7/1878 1.01 1.02 (0.46, 2.28) 7/2769 0.66 0.66 (0.30, 1.50)
Construction 10/1767 1.54 1.60 (0.79, 3.23) 11/2514 1.31 1.34 (0.67, 2.68)
Retail and wholesale trade 10/2189 1.20 1.24 (0.62, 2.50) 10/3285 0.79 0.81 (0.40, 1.64)
Transportation and storage 4/1122 - - 6/1766 0.97 1.00 (0.42, 2.37)
Public administration and defense 9/2175 1.11 1.08 (0.52, 2.22) 15/3364 1.44 1.44 (0.77, 2.70)
Human health and social work activities 4/662 - - 5/1247 1.17 1.14 (0.44, 2.93) aCrude odds ratios. bOdds ratios adjusted for birth place (urban v. small towns/rural) and paternal age (continuous).

104
Table 4.4. Odds ratios and 95% confidence intervals for the association between maternal occupational exposures and germ cell tumor
risk in offspring, stratified by exposure window (1968-2015).
Maternal exposure window
Conception to birth Birth to diagnosis
Occupational exposure Case N/
Control N ORa
aORb (95% CI) Case N/
Control N ORa
aORb (95% CI)
Total 121/11261 137/12510
Occupational industry
Manufacturing
16/1615
0.89 0.92 (0.54, 1.58) 29/2744
0.98 1.03 (0.67, 1.57) Textile, clothing, and leather industry
1/277
- - 9/434
2.07 2.19 (1.09, 4.40)
Iron, metal works, foundries
7/534
1.29 1.33 (0.62, 2.89) 16/1083
1.45 1.52 (0.89, 2.59)
Retail and wholesale trade
11/1371
0.73 0.77 (0.41, 1.44) 22/2310
0.87 0.90 (0.57, 1.44)
Transportation and storage
5/274
1.73 1.71 (0.69, 4.25) 5/490
0.96 0.96 (0.39, 2.36)
Accommodation and food service activities
1/258
- -
5/661
0.70 0.77 (0.31, 1.89)
Information and communication
3/337
- - 8/595
1.23 1.24 (0.60, 2.56)
Financial and insurance activities
8/446
1.73 1.69 (0.81, 3.50)
10/604
1.66 1.64 (0.85, 3.15)
Professional, scientific, and technical activities
2/341
- - 5/607
0.78 0.78 (0.32, 1.92)
Administrative and support service activities
0/209
- -
6/732
0.78 0.79 (0.34, 1.81)
Public administration and defense
40/3734
1.01 0.98 (0.66, 1.44) 66/6813
0.81 0.82 (0.58, 1.16)
Education
8/326
2.40 2.30 (1.10, 4.79) 13/862
1.46 1.42 (0.79, 2.55)
Human health and social work activities
38/2294
1.75 1.73 (1.17, 2.56) 58/3697
1.79 1.79 (1.27, 2.54) Hospital and practitioner work
32/1818
1.86 1.82 (1.21, 2.75) 51/2892
2.00 1.99 (1.39, 2.83)
Daycares, kindergartens, and homes for children 1/189 - - 5/433 1.12 1.13 (0.46, 2.80)
Welfare institutions 8/333 2.23 2.25 (1.08, 4.67) 12/844 1.37 1.39 (0.76, 2.55)
Other service activities
1/240
- - 6/578
0.96 0.97 (0.42, 2.22)
Job exposure matrix
Benzene 2/496 - - 11/1131 0.91 0.96 (0.51, 1.80)
Dichloromethane 9/661 1.33 1.37 (0.69, 2.71) 12/1312 0.84 0.87 (0.48, 1.59)
Gasoline 2/449 - - 11/1042 1.00 1.06 (0.56, 1.99)
Birth years >1974c 2/386 - - 7/852 0.78 0.80 (0.37, 1.74)
Toluene 5/754 0.61 0.66 (0.26, 1.58) 15/1592 0.87 0.90 (0.52, 1.56)
Birth years >1974c 5/650 0.71 0.72 (0.29, 1.78) 10/1318 0.69 0.70 (0.36, 1.36)
High/very high social contact 14/946 1.45 1.43 (0.82, 2.49) 24/2042 1.16 1.15 (0.74, 1.80) aCrude odds ratios. bOdds ratios adjusted for birth place (urban v. small towns/rural) and maternal age (continuous).
cRestricted to years when benzene was less commonly used.

105
Table 4.5. Odds ratios and 95% confidence intervals for the association between maternal occupational exposures, yolk sac tumor, and
teratoma risk in offspring, stratified by exposure window (1968-2015).
Maternal exposure window
Conception to birth Birth to diagnosis
Occupational exposure Case N/
Control N ORa
aORb (95% CI) Case N/
Control N ORa
aORb (95% CI)
Yolk sac tumors 34/11261 38/12510
Occupational industry
Manufacturing
4/1615
0.78 0.85 (0.29, 2.48) 6/2744
0.87 0.89 (0.36, 2.18)
Public administration and defense
11/3734
0.96 1.03 (0.50, 2.13) 13/6813
0.67 0.69 (0.34, 1.39)
Education
5/326
5.07 4.59 (1.69, 12.45) 6/862
3.63 3.57 (1.42, 9.01)
Human health and social work activities
14/2294
2.85 2.73 (1.36, 5.48) 20/3697
3.52 3.48 (1.82, 6.68) Hospital and practitioner work
11/1818
2.57 2.56 (1.23, 5.32) 17/2892
3.39 3.41 (1.77, 6.56)
Job exposure matrix
High/very high social contact 9/946 3.77 3.50 (1.65, 7.43) 10/2042 2.85 2.77 (1.29, 5.57)
Teratomas 44/11261 46/12510
Occupational industry
Manufacturing 6/1615 0.94 0.93 (0.39, 2.25) 10/2744 1.03 1.07 (0.52, 2.21)
Retail and wholesale trade 3/1371 - - 9/2310 1.12 1.17 (0.55, 2.48)
Public administration and defense 14/3734 0.98 0.92 (0.48, 1.76) 22/6813 0.88 0.88 (0.48, 1.61)
Human health and social work activities 15/2294 2.06 2.15 (1.14, 4.06) 16/3697 1.33 1.35 (0.72, 2.52)
Hospital and practitioner work 12/1818 2.00 2.02 (1.03, 3.98) 14/2892 1.48 1.49 (0.78, 2.83)
Job exposure matrix
High/very high social contact 3/946 - - 5/2042 0.71 0.72 (0.28, 1.85) aCrude odds ratios. bOdds ratios adjusted for birth place (urban v. small towns/rural) and maternal age (continuous).

106
Chapter 5. Public health relevance
In this dissertation, we report on cerebrovascular disease and childhood cancer as they
relate to occupational exposures in vulnerable populations. It is important to note the public
health relevance of our findings, particularly the burdens associated with these rare diseases and
the steps that can be taken to prevent them.
There are substantial economic and social costs associated with cerebrovascular disease.
In the United States, the average third-party and out-of-pocket costs accompanying an ischemic
stroke hospitalization from 2006-2015 ranged from $24,448 for patients discharged without a
disability to $73,903 for patients discharged with disability. In the first year after discharge, total
mean costs for patients without a disability were $30,132, while the cost for patients with a
disability were $46,850.304 In addition to increasing economic burden, strokes reduce quality of
life and limit everyday functioning. A study of stroke patients in Luxembourg found that two
years post-event, 44.7% of patients reported impaired sensory function, 35.1% had impaired
motor function, and 31.9% reported impaired memory function.305 As the average lifespan of the
population continues to increase, stroke incidence—and the associated economic and social
costs—are expected to increase as well, further highlighting the need for prevention of
cerebrovascular disease.
While our findings regarding OPA and cerebrovascular disease are relatively novel, our
results have the potential to impact real-world policies given corroboration from additional
studies. In our analysis, women who reported mostly dynamic work were most commonly
employed in the healthcare, entertainment, education, or retail industries (see Supplementary
Table 2.8). Because jobs in these industries often involve prolonged standing, long hours, and—
with respect to the healthcare and retail industries—varying work schedules, they are perhaps the
107
most effective industries to target worksite interventions aimed at reducing high levels of OPA.
Potential policies of interest include increasing the frequency and duration of breaks at work and
reducing work hours; however, worker input is strongly encouraged when designing any
worksite intervention, given they are made aware of the hazards of their job.
Childhood cancers are inherently associated with high costs because they are diagnosed
early in life and require serious medical treatment. Although the burden of treatment varies by
cancer type, a study of 1,651 pediatric and adolescent cancer patients in Utah found that, 10
years after diagnosis, patients with cancer incurred an average of $51,723 more in charges, spent
more time in the hospital, and were more frequently admitted to the hospital compared with
children without cancer.306 In fact, this study estimated that children diagnosed with cancer in
2014 would incur over $800 million more in hospital charges by 2024 compared with cancer-free
children. While advances in medicine have made it easier to treat childhood cancer and reduce
mortality rates, there has been little progress with respect to not only prevention of childhood
cancer, but identifying etiologic agents associated with this rare disease.
Our studies of parental occupational exposures and childhood cancer in offspring less
clearly lend themselves to real-world policy changes. However, our findings add to a growing
body of literature on the etiology of childhood cancer, where many studies face similar
limitations—namely, small sample size and the difficulty utilizing a prospective study design.
Nevertheless, our findings are important, should be considered in light of these limitations, and
will hopefully encourage more research in this relatively understudied field.

108
Chapter 6. References
1. Ramazzini B. Diseases of workersed. New York,: Hafner Pub. Co., 1964. xlvii, 549 p.
2. Checkoway H, Pearce N, Kriebel D. Research methods in occupational epidemiology,
2nd ed. New York: Oxford University Press, 2004. xiv, 372 p.
3. Employer-Related Workplace Injuries and Illnesses - 2015. United States Department
of Labor, 2016.
4. Current Population Survey, Census of Fatal Occupational Injuries. United States
Department of Labor, 2016.
5. Global Estimates of Occupational Accidents and Work-Related Illnesses, 2014.
Tampere University of Technology, Workplace Safety & Health Institute, VTT Technical
Research Centre of Finland, 2014.
6. Takala J, Hamalainen P, Saarela KL, Yun LY, Manickam K, Jin TW, Heng P, Tjong
C, Kheng LG, Lim S, Lin GS. Global estimates of the burden of injury and illness at work in
2012. J Occup Environ Hyg 2014;11: 326-37.
7. Sauter SL, Safety NIfO, Health. The changing organization of work and the safety and
health of working people: knowledge gaps and research directionsed.: Dept. of Health and
Human Services, Centers for Disease Control and Prevention, National Institute for Occupational
Safety and Health, 2002.
8. Malmgren R, Warlow C, Bamford J, Sandercock P. Geographical and secular trends in
stroke incidence. Lancet 1987;2: 1196-200.
9. The world health report 2000: health systems improving performance. World Health
Organization, 2000.

109
10. Risk Factors for Cerebrovascular Disease and Strokeed. New York: Oxford
University Press, 2016.
11. Albers GW, Caplan LR, Easton JD, Fayad PB, Mohr JP, Saver JL, Sherman DG,
Group TIAW. Transient ischemic attack--proposal for a new definition. N Engl J Med 2002;347:
1713-6.
12. Benjamin EJ, Blaha MJ, Chiuve SE, Cushman M, Das SR, Deo R, de Ferranti SD,
Floyd J, Fornage M, Gillespie C, Isasi CR, Jimenez MC, et al. Heart Disease and Stroke
Statistics-2017 Update: A Report From the American Heart Association. Circulation 2017.
13. Centers for Disease C, Prevention. Prevalence of stroke--United States, 2006-2010.
MMWR Morb Mortal Wkly Rep 2012;61: 379-82.
14. Johnston SC, Fayad PB, Gorelick PB, Hanley DF, Shwayder P, van Husen D,
Weiskopf T. Prevalence and knowledge of transient ischemic attack among US adults.
Neurology 2003;60: 1429-34.
15. Morgenstern LB, Smith MA, Lisabeth LD, Risser JM, Uchino K, Garcia N, Longwell
PJ, McFarling DA, Akuwumi O, Al-Wabil A, Al-Senani F, Brown DL, et al. Excess stroke in
Mexican Americans compared with non-Hispanic Whites: the Brain Attack Surveillance in
Corpus Christi Project. Am J Epidemiol 2004;160: 376-83.
16. Kleindorfer D, Panagos P, Pancioli A, Khoury J, Kissela B, Woo D, Schneider A,
Alwell K, Jauch E, Miller R, Moomaw C, Shukla R, et al. Incidence and short-term prognosis of
transient ischemic attack in a population-based study. Stroke 2005;36: 720-3.
17. Hankey GJ. Long-term outcome after ischaemic stroke/transient ischaemic attack.
Cerebrovasc Dis 2003;16 Suppl 1: 14-9.
18. Hankey GJ. Transient ischaemic attacks and stroke. Med J Aust 2000;172: 394-400.
110
19. O'Donnell MJ, Xavier D, Liu L, Zhang H, Chin SL, Rao-Melacini P, Rangarajan S,
Islam S, Pais P, McQueen MJ, Mondo C, Damasceno A, et al. Risk factors for ischaemic and
intracerebral haemorrhagic stroke in 22 countries (the INTERSTROKE study): a case-control
study. Lancet 2010;376: 112-23.
20. Larsson SC, Akesson A, Wolk A. Healthy diet and lifestyle and risk of stroke in a
prospective cohort of women. Neurology 2014;83: 1699-704.
21. Hu G, Sarti C, Jousilahti P, Silventoinen K, Barengo NC, Tuomilehto J. Leisure time,
occupational, and commuting physical activity and the risk of stroke. Stroke 2005;36: 1994-9.
22. Miah K, von Arbin M, Britton M, de Faire U, Helmers C, Maasing R. Prognosis in
acute stroke with special reference to some cardiac factors. J Chronic Dis 1983;36: 279-88.
23. Booth J, Connelly L, Lawrence M, Chalmers C, Joice S, Becker C, Dougall N.
Evidence of perceived psychosocial stress as a risk factor for stroke in adults: a meta-analysis.
BMC Neurol 2015;15: 233.
24. Toivanen S. Social Determinants of Stroke as Related to Stress at Work among
Working Women: A Literature Review. Stroke Res Treat 2012;2012: 873678.
25. Pan A, Okereke OI, Sun Q, Logroscino G, Manson JE, Willett WC, Ascherio A, Hu
FB, Rexrode KM. Depression and incident stroke in women. Stroke 2011;42: 2770-5.
26. Kotlega D, Golab-Janowska M, Masztalewicz M, Ciecwiez S, Nowacki P. The
emotional stress and risk of ischemic stroke. Neurol Neurochir Pol 2016;50: 265-70.
27. Greiner BA, Krause N, Ragland D, Fisher JM. Occupational stressors and
hypertension: a multi-method study using observer-based job analysis and self-reports in urban
transit operators. Soc Sci Med 2004;59: 1081-94.

111
28. Everson-Rose SA, Roetker NS, Lutsey PL, Kershaw KN, Longstreth WT, Jr., Sacco
RL, Diez Roux AV, Alonso A. Chronic stress, depressive symptoms, anger, hostility, and risk of
stroke and transient ischemic attack in the multi-ethnic study of atherosclerosis. Stroke 2014;45:
2318-23.
29. Musselman DL, Evans DL, Nemeroff CB. The relationship of depression to
cardiovascular disease: epidemiology, biology, and treatment. Arch Gen Psychiatry 1998;55:
580-92.
30. Shimbo D, Chaplin W, Crossman D, Haas D, Davidson KW. Role of depression and
inflammation in incident coronary heart disease events. Am J Cardiol 2005;96: 1016-21.
31. Strine TW, Mokdad AH, Dube SR, Balluz LS, Gonzalez O, Berry JT, Manderscheid
R, Kroenke K. The association of depression and anxiety with obesity and unhealthy behaviors
among community-dwelling US adults. Gen Hosp Psychiatry 2008;30: 127-37.
32. Gopinath B, Thiagalingam A, Teber E, Mitchell P. Exposure to workplace noise and
the risk of cardiovascular disease events and mortality among older adults. Prev Med 2011;53:
390-4.
33. Fujino Y, Iso H, Tamakoshi A, group Js. A prospective cohort study of perceived
noise exposure at work and cerebrovascular diseases among male workers in Japan. J Occup
Health 2007;49: 382-8.
34. Stokholm ZA, Bonde JP, Christensen KL, Hansen AM, Kolstad HA. Occupational
noise exposure and the risk of stroke. Stroke 2013;44: 3214-6.
35. Ronneberg A. Mortality and cancer morbidity in workers from an aluminium smelter
with prebaked carbon anodes--Part III: Mortality from circulatory and respiratory diseases.
Occup Environ Med 1995;52: 255-61.

112
36. Coggon D, Wield G. Mortality of army cooks. Scand J Work Environ Health
1993;19: 85-8.
37. Toren K, Bergdahl IA, Nilsson T, Jarvholm B. Occupational exposure to particulate
air pollution and mortality due to ischaemic heart disease and cerebrovascular disease. Occup
Environ Med 2007;64: 515-9.
38. Sjogren B, Lonn M, Fremling K, Feychting M, Nise G, Kauppinen T, Plato N,
Wiebert P, Gustavsson P. Occupational exposure to particles and incidence of stroke. Scand J
Work Environ Health 2013;39: 295-301.
39. Rinsky JL, Hoppin JA, Blair A, He K, Beane Freeman LE, Chen H. Agricultural
exposures and stroke mortality in the Agricultural Health Study. J Toxicol Environ Health A
2013;76: 798-814.
40. Salonen JT, Slater JS, Tuomilehto J, Rauramaa R. Leisure time and occupational
physical activity: risk of death from ischemic heart disease. Am J Epidemiol 1988;127: 87-94.
41. Clays E, De Bacquer D, Van Herck K, De Backer G, Kittel F, Holtermann A.
Occupational and leisure time physical activity in contrasting relation to ambulatory blood
pressure. BMC Public Health 2012;12: 1002.
42. Mokdad AH, Marks JS, Stroup DF, Gerberding JL. Correction: actual causes of death
in the United States, 2000. JAMA 2005;293: 293-4.
43. Leitzmann MF, Park Y, Blair A, Ballard-Barbash R, Mouw T, Hollenbeck AR,
Schatzkin A. Physical activity recommendations and decreased risk of mortality. Arch Intern
Med 2007;167: 2453-60.
44. Kujala UM, Kaprio J, Sarna S, Koskenvuo M. Relationship of leisure-time physical
activity and mortality: the Finnish twin cohort. JAMA 1998;279: 440-4.

113
45. Hu G, Eriksson J, Barengo NC, Lakka TA, Valle TT, Nissinen A, Jousilahti P,
Tuomilehto J. Occupational, commuting, and leisure-time physical activity in relation to total
and cardiovascular mortality among Finnish subjects with type 2 diabetes. Circulation 2004;110:
666-73.
46. Paffenbarger RS, Jr., Hyde RT, Wing AL, Hsieh CC. Physical activity, all-cause
mortality, and longevity of college alumni. N Engl J Med 1986;314: 605-13.
47. Global recommendations on physical activity for health. World Health Organization,
2010.
48. Barengo NC, Hu G, Lakka TA, Pekkarinen H, Nissinen A, Tuomilehto J. Low
physical activity as a predictor for total and cardiovascular disease mortality in middle-aged men
and women in Finland. Eur Heart J 2004;25: 2204-11.
49. Paffenbarger RS, Hale WE. Work activity and coronary heart mortality. N Engl J
Med 1975;292: 545-50.
50. Kristal-Boneh E, Harari G, Melamed S, Froom P. Association of physical activity at
work with mortality in Israeli industrial employees: the CORDIS study. J Occup Environ Med
2000;42: 127-35.
51. Krause N, Brand RJ, Kaplan GA, Kauhanen J, Malla S, Tuomainen TP, Salonen JT.
Occupational physical activity, energy expenditure and 11-year progression of carotid
atherosclerosis. Scand J Work Environ Health 2007;33: 405-24.
52. Holtermann A, Mortensen OS, Burr H, Sogaard K, Gyntelberg F, Suadicani P.
Physical demands at work, physical fitness, and 30-year ischaemic heart disease and all-cause
mortality in the Copenhagen Male Study. Scand J Work Environ Health 2010;36: 357-65.

114
53. Li J, Loerbroks A, Angerer P. Physical activity and risk of cardiovascular disease:
what does the new epidemiological evidence show? Curr Opin Cardiol 2013;28: 575-83.
54. Holtermann A, Mortensen OS, Burr H, Sogaard K, Gyntelberg F, Suadicani P. The
interplay between physical activity at work and during leisure time--risk of ischemic heart
disease and all-cause mortality in middle-aged Caucasian men. Scand J Work Environ Health
2009;35: 466-74.
55. Holme I, Helgeland A, Hjermann I, Leren P, Lund-Larsen PG. Physical activity at
work and at leisure in relation to coronary risk factors and social class. A 4-year mortality
follow-up. The Oslo study. Acta Med Scand 1981;209: 277-83.
56. Lewington S, Clarke R, Qizilbash N, Peto R, Collins R, Prospective Studies C. Age-
specific relevance of usual blood pressure to vascular mortality: a meta-analysis of individual
data for one million adults in 61 prospective studies. Lancet 2002;360: 1903-13.
57. Hansen TW, Kikuya M, Thijs L, Bjorklund-Bodegard K, Kuznetsova T, Ohkubo T,
Richart T, Torp-Pedersen C, Lind L, Jeppesen J, Ibsen H, Imai Y, et al. Prognostic superiority of
daytime ambulatory over conventional blood pressure in four populations: a meta-analysis of
7,030 individuals. J Hypertens 2007;25: 1554-64.
58. Kario K, Schwartz JE, Pickering TG. Ambulatory physical activity as a determinant
of diurnal blood pressure variation. Hypertension 1999;34: 685-91.
59. Gretler DD, Carlson GF, Montano AV, Murphy MB. Diurnal blood pressure
variability and physical activity measured electronically and by diary. Am J Hypertens 1993;6:
127-33.

115
60. Eicher JD, Maresh CM, Tsongalis GJ, Thompson PD, Pescatello LS. The additive
blood pressure lowering effects of exercise intensity on post-exercise hypotension. Am Heart J
2010;160: 513-20.
61. Astrand I. Circulatory responses to arm exercise in different work positions. Scand J
Clin Lab Invest 1971;27: 293-7.
62. Palatini P. Heart rate: a strong predictor of mortality in subjects with coronary artery
disease. Eur Heart J 2005;26: 943-5.
63. Palatini P, Julius S. Elevated heart rate: a major risk factor for cardiovascular disease.
Clin Exp Hypertens 2004;26: 637-44.
64. Palatini P. Elevated heart rate as a predictor of increased cardiovascular morbidity. J
Hypertens Suppl 1999;17: S3-10.
65. Holtermann A, Krause N, van der Beek AJ, Straker L. The physical activity paradox:
six reasons why occupational physical activity (OPA) does not confer the cardiovascular health
benefits that leisure time physical activity does. Br J Sports Med 2017.
66. Korshøj M, Lidegaard M, Kittel F, Van Herck K, De Backer G, De Bacquer D,
Holtermann A, Clays E. The relation of ambulatory heart rate with all-cause mortality among
middle-aged men: a prospective cohort study. PLoS One 2015;10: e0121729.
67. Kang MY, Park H, Seo JC, Kim D, Lim YH, Lim S, Cho SH, Hong YC. Long
working hours and cardiovascular disease: a meta-analysis of epidemiologic studies. J Occup
Environ Med 2012;54: 532-7.
68. Lee DW, Hong YC, Min KB, Kim TS, Kim MS, Kang MY. The effect of long
working hours on 10-year risk of coronary heart disease and stroke in the Korean population: the

116
Korea National Health and Nutrition Examination Survey (KNHANES), 2007 to 2013. Ann
Occup Environ Med 2016;28: 64.
69. Collins S. Occupational factors, fatigue, and cardiovascular disease. Cardiopulm Phys
Ther J 2009;20: 28-31.
70. Saletta F, Dalla Pozza L, Byrne JA. Genetic causes of cancer predisposition in
children and adolescents. Transl Pediatr 2015;4: 67-75.
71. Barker DJ. The origins of the developmental origins theory. J Intern Med 2007;261:
412-7.
72. Wadhwa PD, Buss C, Entringer S, Swanson JM. Developmental origins of health and
disease: brief history of the approach and current focus on epigenetic mechanisms. Semin Reprod
Med 2009;27: 358-68.
73. Fisher PG, Reynolds P, Von Behren J, Carmichael SL, Rasmussen SA, Shaw GM.
Cancer in children with nonchromosomal birth defects. J Pediatr 2012;160: 978-83.
74. Botto LD, Flood T, Little J, Fluchel MN, Krikov S, Feldkamp ML, Wu Y, Goedken
R, Puzhankara S, Romitti PA. Cancer risk in children and adolescents with birth defects: a
population-based cohort study. PLoS One 2013;8: e69077.
75. Spector LG, Pankratz N, Marcotte EL. Genetic and nongenetic risk factors for
childhood cancer. Pediatr Clin North Am 2015;62: 11-25.
76. Hall C, Ritz B, Cockburn M, Davidson TB, Heck JE. Risk of malignant childhood
germ cell tumors in relation to demographic, gestational, and perinatal characteristics. Cancer
Epidemiol 2017;46: 42-9.

117
77. Valent P, Bonnet D, De Maria R, Lapidot T, Copland M, Melo JV, Chomienne C,
Ishikawa F, Schuringa JJ, Stassi G, Huntly B, Herrmann H, et al. Cancer stem cell definitions
and terminology: the devil is in the details. Nat Rev Cancer 2012;12: 767-75.
78. Marshall GM, Carter DR, Cheung BB, Liu T, Mateos MK, Meyerowitz JG, Weiss
WA. The prenatal origins of cancer. Nat Rev Cancer 2014;14: 277-89.
79. Bazer FW, Johnson GA, Wu G. Amino acids and conceptus development during the
peri-implantation period of pregnancy. Adv Exp Med Biol 2015;843: 23-52.
80. Fleming TP, Velazquez MA, Eckert JJ. Embryos, DOHaD and David Barker. J Dev
Orig Health Dis 2015;6: 377-83.
81. Joss-Moore LA, Lane RH. The developmental origins of adult disease. Curr Opin
Pediatr 2009;21: 230-4.
82. Joss-Moore LA, Lane RH. Epigenetics and the developmental origins of disease: the
key to unlocking the door of personalized medicine. Epigenomics 2012;4: 471-3.
83. Cancer Facts & Figures 2014. American Cancer Society, 2014.
84. Ward E, DeSantis C, Robbins A, Kohler B, Jemal A. Childhood and adolescent
cancer statistics, 2014. CA Cancer J Clin 2014;64: 83-103.
85. Szymanska-Czerwinska M, Galinska EM, Niemczuk K, Knap JP. Prevalence of
Coxiella burnetii Infection in Humans Occupationally Exposed to Animals in Poland. Vector
Borne Zoonotic Dis 2015;15: 261-7.
86. Ron E, Modan B, Boice JD, Jr., Alfandary E, Stovall M, Chetrit A, Katz L. Tumors
of the brain and nervous system after radiotherapy in childhood. N Engl J Med 1988;319: 1033-
9.
118
87. Tucker MA, Meadows AT, Boice JD, Jr., Stovall M, Oberlin O, Stone BJ, Birch J,
Voute PA, Hoover RN, Fraumeni JF, Jr. Leukemia after therapy with alkylating agents for
childhood cancer. J Natl Cancer Inst 1987;78: 459-64.
88. Hjalgrim LL, Westergaard T, Rostgaard K, Schmiegelow K, Melbye M, Hjalgrim H,
Engels EA. Birth weight as a risk factor for childhood leukemia: a meta-analysis of 18
epidemiologic studies. Am J Epidemiol 2003;158: 724-35.
89. Harder T, Plagemann A, Harder A. Birth weight and subsequent risk of childhood
primary brain tumors: a meta-analysis. Am J Epidemiol 2008;168: 366-73.
90. Heck JE, Ritz B, Hung RJ, Hashibe M, Boffetta P. The epidemiology of
neuroblastoma: a review. Paediatr Perinat Epidemiol 2009;23: 125-43.
91. Mezei G, Sudan M, Izraeli S, Kheifets L. Epidemiology of childhood leukemia in the
presence and absence of Down syndrome. Cancer Epidemiol 2014;38: 479-89.
92. Bithell JF, Draper GJ, Gorbach PD. Association between malignant disease in
children and maternal virus infections. Br Med J 1973;1: 706-8.
93. Rudant J, Orsi L, Menegaux F, Petit A, Baruchel A, Bertrand Y, Lambilliotte A,
Robert A, Michel G, Margueritte G, Tandonnet J, Mechinaud F, et al. Childhood acute leukemia,
early common infections, and allergy: The ESCALE Study. Am J Epidemiol 2010;172: 1015-27.
94. Dickinson HO, Nyari TA, Parker L. Childhood solid tumours in relation to infections
in the community in Cumbria during pregnancy and around the time of birth. Br J Cancer
2002;87: 746-50.
95. Marcotte EL, Ritz B, Cockburn M, Yu F, Heck JE. Exposure to infections and risk of
leukemia in young children. Cancer Epidemiol Biomarkers Prev 2014;23: 1195-203.

119
96. McNally RJ, Cairns DP, Eden OB, Alexander FE, Taylor GM, Kelsey AM, Birch JM.
An infectious aetiology for childhood brain tumours? Evidence from space-time clustering and
seasonality analyses. Br J Cancer 2002;86: 1070-7.
97. Linos A, Kardara M, Kosmidis H, Katriou D, Hatzis C, Kontzoglou M, Koumandakis
E, Tzartzatou-Stathopoulou F. Reported influenza in pregnancy and childhood tumour. Eur J
Epidemiol 1998;14: 471-5.
98. Greaves M. Infection, immune responses and the aetiology of childhood leukaemia.
Nat Rev Cancer 2006;6: 193-203.
99. Kinlen LJ. Infection and childhood leukemia. Cancer Causes Control 1998;9: 237-9.
100. Kinlen L. Evidence for an infective cause of childhood leukaemia: comparison of a
Scottish new town with nuclear reprocessing sites in Britain. Lancet 1988;2: 1323-7.
101. Kinlen LJ. High-contact paternal occupations, infection and childhood leukaemia:
five studies of unusual population-mixing of adults. Br J Cancer 1997;76: 1539-45.
102. Kinlen L. Childhood leukaemia, nuclear sites, and population mixing. Br J Cancer
2011;104: 12-8.
103. Kinlen LJ, O'Brien F, Clarke K, Balkwill A, Matthews F. Rural population mixing
and childhood leukaemia: effects of the North Sea oil industry in Scotland, including the area
near Dounreay nuclear site. BMJ 1993;306: 743-8.
104. Smith M. Considerations on a possible viral etiology for B-precursor acute
lymphoblastic leukemia of childhood. J Immunother 1997;20: 89-100.
105. Maia Rda R, Wunsch Filho V. Infection and childhood leukemia: review of
evidence. Rev Saude Publica 2013;47: 1172-85.

120
106. McKinney PA, Juszczak E, Findlay E, Smith K, Thomson CS. Pre- and perinatal
risk factors for childhood leukaemia and other malignancies: a Scottish case control study. Br J
Cancer 1999;80: 1844-51.
107. Boccardo E, Villa LL. Viral origins of human cancer. Curr Med Chem 2007;14:
2526-39.
108. McLaughlin-Drubin ME, Munger K. Viruses associated with human cancer.
Biochim Biophys Acta 2008;1782: 127-50.
109. Copeland DD, Vogel FS, Bigner DD. The induction of intractranial neoplasms by
the inoculation of avian sarcoma virus in perinatal and adult rats. J Neuropathol Exp Neurol
1975;34: 340-58.
110. Swenberg JA. Chemical- and virus-induced brain tumors. Natl Cancer Inst Monogr
1977;46: 3-10.
111. Horie Y, Motoi M, Ogawa K. Early stages of development of rat brain tumors
induced by JC virus: a sequential histological and immunohistochemical study. Acta Med
Okayama 1989;43: 271-9.
112. Walker DL, Padgett BL, ZuRhein GM, Albert AE, Marsh RF. Human papovavirus
(JC): induction of brain tumors in hamsters. Science 1973;181: 674-6.
113. Schuman LM, Choi NW, Gullen WH. Relationship of central nervous system
neoplasms to Toxoplasma gondii infection. Am J Public Health Nations Health 1967;57: 848-56.
114. Fear NT, Roman E, Ansell P, Bull D. Malignant neoplasms of the brain during
childhood: the role of prenatal and neonatal factors (United Kingdom). Cancer Causes Control
2001;12: 443-9.

121
115. Saddawi-Konefka R, Crawford JR. Chronic viral infection and primary central
nervous system malignancy. J Neuroimmune Pharmacol 2010;5: 387-403.
116. Kim JY, Koralnik IJ, LeFave M, Segal RA, Pfister LA, Pomeroy SL.
Medulloblastomas and primitive neuroectodermal tumors rarely contain polyomavirus DNA
sequences. Neuro Oncol 2002;4: 165-70.
117. Eftimov T, Enchev Y, Tsekov I, Simeonov P, Kalvatchev Z, Encheva E. JC
polyomavirus in the aetiology and pathophysiology of glial tumours. Neurosurg Rev 2016;39:
47-53.
118. Del Valle L, Gordon J, Assimakopoulou M, Enam S, Geddes JF, Varakis JN,
Katsetos CD, Croul S, Khalili K. Detection of JC virus DNA sequences and expression of the
viral regulatory protein T-antigen in tumors of the central nervous system. Cancer Res 2001;61:
4287-93.
119. Sankaran H, Danysh HE, Scheurer ME, Okcu MF, Skapek SX, Hawkins DS,
Spector LG, Erhardt EB, Grufferman S, Lupo PJ. The Role of Childhood Infections and
Immunizations on Childhood Rhabdomyosarcoma: A Report From the Children's Oncology
Group. Pediatr Blood Cancer 2016;63: 1557-62.
120. Grufferman S, Wang HH, DeLong ER, Kimm SY, Delzell ES, Falletta JM.
Environmental factors in the etiology of rhabdomyosarcoma in childhood. J Natl Cancer Inst
1982;68: 107-13.
121. Lupo PJ, Zhou R, Skapek SX, Hawkins DS, Spector LG, Scheurer ME, Fatih Okcu
M, Melin B, Papworth K, Erhardt EB, Grufferman S. Allergies, atopy, immune-related factors
and childhood rhabdomyosarcoma: a report from the Children's Oncology Group. Int J Cancer
2014;134: 431-6.

122
122. Sherman PW, Holland E, Sherman JS. Allergies: their role in cancer prevention. Q
Rev Biol 2008;83: 339-62.
123. Dickinson HO, Parker L, Salotti J, Birch P. Paternal preconceptional irradiation,
population mixing and solid tumors in the children of radiation workers (England). Cancer
Causes Control 2002;13: 183-9.
124. Nyari TA, Dickinson HO, Hammal DM, Parker L. Childhood solid tumours in
relation to population mixing around the time of birth. Br J Cancer 2003;88: 1370-4.
125. Shim KS, Kim MH, Shim CN, Han M, Lim IS, Chae SA, Yun SW, Lee NM, Yi
DY, Kim H. Seasonal trends of diagnosis of childhood malignant diseases and viral prevalence
in South Korea. Cancer Epidemiol 2017;51: 118-24.
126. Menegaux F, Olshan AF, Neglia JP, Pollock BH, Bondy ML. Day care, childhood
infections, and risk of neuroblastoma. Am J Epidemiol 2004;159: 843-51.
127. Saddlemire S, Olshan AF, Daniels JL, Breslow NE, Bunin GR, Ross JA. Breast-
feeding and Wilms tumor: a report from the Children's Oncology Group. Cancer Causes Control
2006;17: 687-93.
128. Bunin GR, Kramer S, Marrero O, Meadows AT. Gestational risk factors for Wilms'
tumor: results of a case-control study. Cancer Res 1987;47: 2972-7.
129. Olshan AF, Breslow NE, Falletta JM, Grufferman S, Pendergrass T, Robison LL,
Waskerwitz M, Woods WG, Vietti TJ, Hammond GD. Risk factors for Wilms tumor. Report
from the National Wilms Tumor Study. Cancer 1993;72: 938-44.
130. Frentzel-Beyme R, Becher H, Salzer-Kuntschik M, Kotz R, Salzer M. Factors
affecting the incident juvenile bone tumors in an Austrian case-control study. Cancer Detect
Prev 2004;28: 159-69.
123
131. Martin RM, Gunnell D, Owen CG, Smith GD. Breast-feeding and childhood cancer:
A systematic review with metaanalysis. Int J Cancer 2005;117: 1020-31.
132. Hum L, Kreiger N, Finkelstein MM. The relationship between parental occupation
and bone cancer risk in offspring. Int J Epidemiol 1998;27: 766-71.
133. Holman CD, Reynolds PM, Byrne MJ, Trotter JM, Armstrong BK. Possible
infectious etiology of six cases of Ewing's sarcoma in Western Australia. Cancer 1983;52: 1974-
6.
134. Valery PC, Williams G, Sleigh AC, Holly EA, Kreiger N, Bain C. Parental
occupation and Ewing's sarcoma: pooled and meta-analysis. Int J Cancer 2005;115: 799-806.
135. Valery PC, McWhirter W, Sleigh A, Williams G, Bain C. Farm exposures, parental
occupation, and risk of Ewing's sarcoma in Australia: a national case-control study. Cancer
Causes Control 2002;13: 263-70.
136. Yalcin B, Demir HA, Tanyel FC, Akcoren Z, Varan A, Akyuz C, Kutluk T,
Buyukpamukcu M. Mediastinal germ cell tumors in childhood. Pediatric hematology and
oncology 2012;29: 633-42.
137. Isaacs H, Jr. Perinatal (fetal and neonatal) germ cell tumors. J Pediatr Surg 2004;39:
1003-13.
138. Linet MS, Ries LA, Smith MA, Tarone RE, Devesa SS. Cancer surveillance series:
recent trends in childhood cancer incidence and mortality in the United States. J Natl Cancer Inst
1999;91: 1051-8.
139. Howlader N NA, Krapcho M, et. al., SEER Cancer Statistics Review, 1975-2011.
National Cancer Institute, 2011.

124
140. Kaatsch P, Hafner C, Calaminus G, Blettner M, Tulla M. Pediatric germ cell tumors
from 1987 to 2011: incidence rates, time trends, and survival. Pediatrics 2015;135: e136-43.
141. Murray MJ, Nicholson JC, Coleman N. Biology of childhood germ cell tumours,
focussing on the significance of microRNAs. Andrology 2015;3: 129-39.
142. Amatruda JF, Ross JA, Christensen B, Fustino NJ, Chen KS, Hooten AJ, Nelson H,
Kuriger JK, Rakheja D, Frazier AL, Poynter JN. DNA methylation analysis reveals distinct
methylation signatures in pediatric germ cell tumors. BMC Cancer 2013;13: 313.
143. Chen Z, Stewart PA, Davies S, Giller R, Krailo M, Davis M, Robison L, Shu XO.
Parental occupational exposure to pesticides and childhood germ-cell tumors. Am J Epidemiol
2005;162: 858-67.
144. Heck JE, Wu J, Lombardi C, Qiu J, Meyers TJ, Wilhelm M, Cockburn M, Ritz B.
Childhood cancer and traffic-related air pollution exposure in pregnancy and early life. Environ
Health Perspect 2013;121: 1385-91.
145. Johnson KJ, Poynter JN, Ross JA, Robison LL, Shu XO. Pediatric germ cell tumors
and maternal vitamin supplementation: a Children's Oncology Group study. Cancer Epidemiol
Biomarkers Prev 2009;18: 2661-4.
146. Stephansson O, Wahnstrom C, Pettersson A, Sorensen HT, Tretli S, Gissler M,
Troisi R, Akre O, Grotmol T. Perinatal risk factors for childhood testicular germ-cell cancer: a
Nordic population-based study. Cancer Epidemiol 2011;35: e100-4.
147. Leslie SW, Villanueva CA. Cryptorchidism StatPearlsed. Treasure Island (FL),
2017.
125
148. Altmann AE, Halliday JL, Giles GG. Associations between congenital
malformations and childhood cancer. A register-based case-control study. Br J Cancer 1998;78:
1244-9.
149. Poynter JN, Amatruda JF, Ross JA. Trends in incidence and survival of pediatric
and adolescent patients with germ cell tumors in the United States, 1975 to 2006. Cancer
2010;116: 4882-91.
150. Lee J, Chia KS, Cheung KH, Chia SE, Lee HP. Birthweight and the risk of early
childhood cancer among Chinese in Singapore. Int J Cancer 2004;110: 465-7.
151. Puumala SE, Ross JA, Wall MM, Spector LG. Pediatric germ cell tumors and
parental infertility and infertility treatment: a Children's Oncology Group report. Cancer
Epidemiol 2011;35: e25-31.
152. Contreras ZA, Hansen J, Ritz B, Olsen J, Yu F, Heck JE. Parental age and childhood
cancer risk: A Danish population-based registry study. Cancer Epidemiol 2017;49: 202-15.
153. Musselman JR, Jurek AM, Johnson KJ, Linabery AM, Robison LL, Shu XO, Ross
JA. Maternal dietary patterns during early pregnancy and the odds of childhood germ cell
tumors: A Children's Oncology Group study. Am J Epidemiol 2011;173: 282-91.
154. Shu XO, Nesbit ME, Buckley JD, Krailo MD, Robinson LL. An exploratory
analysis of risk factors for childhood malignant germ-cell tumors: report from the Childrens
Cancer Group (Canada, United States). Cancer Causes Control 1995;6: 187-98.
155. Chen Z, Robison L, Giller R, Krailo M, Davis M, Davies S, Shu XO. Environmental
exposure to residential pesticides, chemicals, dusts, fumes, and metals, and risk of childhood
germ cell tumors. Int J Hyg Environ Health 2006;209: 31-40.

126
156. Chen Z, Robison L, Giller R, Krailo M, Davis M, Gardner K, Davies S, Shu XO.
Risk of childhood germ cell tumors in association with parental smoking and drinking. Cancer
2005;103: 1064-71.
157. McGlynn KA, Zhang Y, Sakoda LC, Rubertone MV, Erickson RL, Graubard BI.
Maternal smoking and testicular germ cell tumors. Cancer Epidemiol Biomarkers Prev 2006;15:
1820-4.
158. Johnston HE, Mann JR, Williams J, Waterhouse JA, Birch JM, Cartwright RA,
Draper GJ, Hartley AL, McKinney PA, Hopton PA, et al. The Inter-Regional, Epidemiological
Study of Childhood Cancer (IRESCC): case-control study in children with germ cell tumours.
Carcinogenesis 1986;7: 717-22.
159. Weir HK, Marrett LD, Kreiger N, Darlington GA, Sugar L. Pre-natal and peri-natal
exposures and risk of testicular germ-cell cancer. Int J Cancer 2000;87: 438-43.
160. Shankar S, Davies S, Giller R, Krailo M, Davis M, Gardner K, Cai H, Robison L,
Shu XO. In utero exposure to female hormones and germ cell tumors in children. Cancer
2006;106: 1169-77.
161. Holterman AX, Filiatrault D, Lallier M, Youssef S. The natural history of
sacrococcygeal teratomas diagnosed through routine obstetric sonogram: a single institution
experience. J Pediatr Surg 1998;33: 899-903.
162. Carozza SE, Puumala SE, Chow EJ, Fox EE, Horel S, Johnson KJ, McLaughlin CC,
Reynolds P, Von Behren J, Mueller BA, Spector LG. Parental educational attainment as an
indicator of socioeconomic status and risk of childhood cancers. Br J Cancer 2010;103: 136-42.
163. Pan IJ, Daniels JL, Zhu K. Poverty and childhood cancer incidence in the United
States. Cancer Causes Control 2010;21: 1139-45.

127
164. Rodvall Y, Dich J, Wiklund K. Cancer risk in offspring of male pesticide applicators
in agriculture in Sweden. Occup Environ Med 2003;60: 798-801.
165. Park AS, Ritz B, Ling C, Cockburn M, Heck JE. Exposure to ambient
dichloromethane in pregnancy and infancy from industrial sources and childhood cancers in
California. Int J Hyg Environ Health 2017;220: 1133-40.
166. Garcia-Perez J, Morales-Piga A, Gomez-Barroso D, Tamayo-Uria I, Pardo
Romaguera E, Lopez-Abente G, Ramis R. Residential proximity to environmental pollution
sources and risk of rare tumors in children. Environ Res 2016;151: 265-74.
167. Ghosh JK, Heck JE, Cockburn M, Su J, Jerrett M, Ritz B. Prenatal exposure to
traffic-related air pollution and risk of early childhood cancers. Am J Epidemiol 2013;178: 1233-
9.
168. Forman D, Oliver RT, Brett AR, Marsh SG, Moses JH, Bodmer JG, Chilvers CE,
Pike MC. Familial testicular cancer: a report of the UK family register, estimation of risk and an
HLA class 1 sib-pair analysis. Br J Cancer 1992;65: 255-62.
169. Poynter JN, Radzom AH, Spector LG, Puumala S, Robison LL, Chen Z, Ross JA,
Shu XO. Family history of cancer and malignant germ cell tumors in children: a report from the
Children's Oncology Group. Cancer Causes Control 2010;21: 181-9.
170. Walker AH, Ross RK, Haile RW, Henderson BE. Hormonal factors and risk of
ovarian germ cell cancer in young women. Br J Cancer 1988;57: 418-22.
171. Giambartolomei C, Mueller CM, Greene MH, Korde LA. A mini-review of familial
ovarian germ cell tumors: an additional manifestation of the familial testicular germ cell tumor
syndrome. Cancer Epidemiol 2009;33: 31-6.
128
172. Hartley AL, Birch JM, Kelsey AM, Marsden HB, Harris M, Teare MD. Are germ
cell tumors part of the Li-Fraumeni cancer family syndrome? Cancer Genet Cytogenet 1989;42:
221-6.
173. Amann RP. The cycle of the seminiferous epithelium in humans: a need to revisit? J
Androl 2008;29: 469-87.
174. Aitken RJ, Baker MA, Sawyer D. Oxidative stress in the male germ line and its role
in the aetiology of male infertility and genetic disease. Reprod Biomed Online 2003;7: 65-70.
175. Aitken RJ, Krausz C. Oxidative stress, DNA damage and the Y chromosome.
Reproduction 2001;122: 497-506.
176. Nakai N, Murata M, Nagahama M, Hirase T, Tanaka M, Fujikawa T, Nakao N,
Nakashima K, Kawanishi S. Oxidative DNA damage induced by toluene is involved in its male
reproductive toxicity. Free Radic Res 2003;37: 69-76.
177. Jurewicz J, Radwan M, Sobala W, Radwan P, Bochenek M, Hanke W. Effects of
occupational exposure - is there a link between exposure based on an occupational questionnaire
and semen quality? Systems Biology in Reproductive Medicine 2014;60: 227-33.
178. Hsu PC, Chen IY, Pan CH, Wu KY, Pan MH, Chen JR, Chen CJ, Chang-Chien GP,
Hsu CH, Liu CS, Wu MT. Sperm DNA damage correlates with polycyclic aromatic
hydrocarbons biomarker in coke-oven workers. Int Arch Occup Environ Health 2006;79: 349-56.
179. Gillman MW. Developmental origins of health and disease. N Engl J Med 2005;353:
1848-50.
180. Herbst AL, Ulfelder H, Poskanzer DC. Adenocarcinoma of the vagina. Association
of maternal stilbestrol therapy with tumor appearance in young women. N Engl J Med 1971;284:
878-81.
129
181. Verloop J, van Leeuwen FE, Helmerhorst TJ, van Boven HH, Rookus MA. Cancer
risk in DES daughters. Cancer Causes Control 2010;21: 999-1007.
182. Hilakivi-Clarke L. Maternal exposure to diethylstilbestrol during pregnancy and
increased breast cancer risk in daughters. Breast Cancer Res 2014;16: 208.
183. Savitz DA, Chen JH. Parental occupation and childhood cancer: review of
epidemiologic studies. Environ Health Perspect 1990;88: 325-37.
184. Hyland C, Laribi O. Review of take-home pesticide exposure pathway in children
living in agricultural areas. Environ Res 2017;156: 559-70.
185. Thompson B, Coronado GD, Grossman JE, Puschel K, Solomon CC, Islas I, Curl
CL, Shirai JH, Kissel JC, Fenske RA. Pesticide take-home pathway among children of
agricultural workers: study design, methods, and baseline findings. J Occup Environ Med
2003;45: 42-53.
186. Gilbert NL, Gyorkos TW, Beliveau C, Rahme E, Muecke C, Soto JC.
Seroprevalence of parvovirus B19 infection in daycare educators. Epidemiol Infect 2005;133:
299-304.
187. Ford-Jones EL, Kitai I, Davis L, Corey M, Farrell H, Petric M, Kyle I, Beach J,
Yaffe B, Kelly E, Ryan G, Gold R. Cytomegalovirus infections in Toronto child-care centers: a
prospective study of viral excretion in children and seroconversion among day-care providers.
Pediatr Infect Dis J 1996;15: 507-14.
188. Nielsen SY, Molbak K, Nybo Andersen AM, Brink Henriksen T, Kantso B, Krogfelt
KA, Hjollund NH. Prevalence of Coxiella burnetii in women exposed to livestock animals,
Denmark, 1996 to 2002. Euro Surveill 2013;18.

130
189. Lewis HC, Molbak K, Reese C, Aarestrup FM, Selchau M, Sorum M, Skov RL.
Pigs as source of methicillin-resistant Staphylococcus aureus CC398 infections in humans,
Denmark. Emerg Infect Dis 2008;14: 1383-9.
190. Bosnjak E, Hvass AM, Villumsen S, Nielsen H. Emerging evidence for Q fever in
humans in Denmark: role of contact with dairy cattle. Clin Microbiol Infect 2010;16: 1285-8.
191. Nadimpalli M, Stewart JR, Pierce E, Pisanic N, Love DC, Hall D, Larsen J, Carroll
KC, Tekle T, Perl TM, Heaney CD. Livestock-Associated, Antibiotic-Resistant Staphylococcus
aureus Nasal Carriage and Recent Skin and Soft Tissue Infection among Industrial Hog
Operation Workers. PLoS One 2016;11: e0165713.
192. Ma J, van den Driessche P, Willeboordse FH. Effective degree household network
disease model. J Math Biol 2013;66: 75-94.
193. Iversen M, Dahl R, Korsgaard J, Hallas T, Jensen EJ. Respiratory symptoms in
Danish farmers: an epidemiological study of risk factors. Thorax 1988;43: 872-7.
194. Zhu JL, Hjollund NH, Andersen AM, Olsen J. Occupational exposure to pesticides
and pregnancy outcomes in gardeners and farmers: a study within the Danish National Birth
Cohort. J Occup Environ Med 2006;48: 347-52.
195. Kristensen TS, Lynge E. Lung cancer among butchers and slaughterhouse workers.
Scand J Work Environ Health 1993;19: 137-47.
196. , ed. Smoking rates in Danish occupations, 2018.
197. Osler M, Prescott E, Gottschau A, Bjerg A, Hein HO, Sjol A, Schnohr P. Trends in
smoking prevalence in Danish adults, 1964-1994. The influence of gender, age, and education.
Scand J Soc Med 1998;26: 293-8.

131
198. Benjamin EJ, Blaha MJ, Chiuve SE, Cushman M, Das SR, Deo R, de Ferranti SD,
Floyd J, Fornage M, Gillespie C, Isasi CR, Jimenez MC, et al. Heart Disease and Stroke
Statistics-2017 Update: A Report From the American Heart Association. Circulation 2017;135:
e146-e603.
199. Seshadri S, Debette Sp. Risk factors for cerebrovascular disease and strokeed.
Oxford ; New York: Oxford University Press, 2016. xi, 476 pages.
200. Willey JZ, Voutsinas J, Sherzai A, Ma H, Bernstein L, Elkind MSV, Cheung YK,
Wang SS. Trajectories in Leisure-Time Physical Activity and Risk of Stroke in Women in the
California Teachers Study. Stroke 2017;48: 2346-52.
201. Okada H, Horibe H, Yoshiyuki O, Hayakawa N, Aoki N. A prospective study of
cerebrovascular disease in Japanese rural communities, Akabane and Asahi. Part 1: evaluation of
risk factors in the occurrence of cerebral hemorrhage and thrombosis. Stroke 1976;7: 599-607.
202. Kumar A, Prasad M, Kathuria P. Sitting occupations are an independent risk factor
for Ischemic stroke in North Indian population. Int J Neurosci 2014;124: 748-54.
203. Salonen JT, Puska P, Tuomilehto J. Physical activity and risk of myocardial
infarction, cerebral stroke and death: a longitudinal study in Eastern Finland. Am J Epidemiol
1982;115: 526-37.
204. Nakayama T, Date C, Yokoyama T, Yoshiike N, Yamaguchi M, Tanaka H. A 15.5-
year follow-up study of stroke in a Japanese provincial city. The Shibata Study. Stroke 1997;28:
45-52.
205. Lapidus L, Bengtsson C. Socioeconomic factors and physical activity in relation to
cardiovascular disease and death. A 12 year follow up of participants in a population study of
women in Gothenburg, Sweden. Br Heart J 1986;55: 295-301.

132
206. Evenson KR, Rosamond WD, Cai J, Toole JF, Hutchinson RG, Shahar E, Folsom
AR. Physical activity and ischemic stroke risk. The atherosclerosis risk in communities study.
Stroke 1999;30: 1333-9.
207. Baecke JA, Burema J, Frijters JE. A short questionnaire for the measurement of
habitual physical activity in epidemiological studies. Am J Clin Nutr 1982;36: 936-42.
208. Holtermann A, Hansen JV, Burr H, Sogaard K, Sjogaard G. The health paradox of
occupational and leisure-time physical activity. Br J Sports Med 2012;46: 291-5.
209. Kukkonen-Harjula K. Physical activity and cardiovascular health-work and leisure
differ. Scand J Work Environ Health 2007;33: 401-4.
210. Karlqvist LK, Harenstam A, Leijon O, Scheele P, Group MOAR. Excessive physical
demands in modern worklife and characteristics of work and living conditions of persons at risk.
Scand J Work Environ Health 2003;29: 363-77.
211. Krause N, Arah OA, Kauhanen J. Physical activity and 22-year all-cause and
coronary heart disease mortality. Am J Ind Med 2017;60: 976-90.
212. Krause N, Brand RJ, Arah OA, Kauhanen J. Occupational physical activity and 20-
year incidence of acute myocardial infarction: results from the Kuopio Ischemic Heart Disease
Risk Factor Study. Scand J Work Environ Health 2015;41: 124-39.
213. Shih IF, Liew Z, Krause N, Ritz B. Lifetime occupational and leisure time physical
activity and risk of Parkinson's disease. Parkinsonism Relat Disord 2016;28: 112-7.
214. Smith L, McCourt O, Sawyer A, Ucci M, Marmot A, Wardle J, Fisher A. A review
of occupational physical activity and sedentary behaviour correlates. Occup Med (Lond)
2016;66: 185-92.

133
215. Brown DL, Feskanich D, Sanchez BN, Rexrode KM, Schernhammer ES, Lisabeth
LD. Rotating night shift work and the risk of ischemic stroke. Am J Epidemiol 2009;169: 1370-7.
216. Udo T, Grilo CM. Cardiovascular disease and perceived weight, racial, and gender
discrimination in U.S. adults. J Psychosom Res 2017;100: 83-8.
217. Cooney MT, Vartiainen E, Laatikainen T, Juolevi A, Dudina A, Graham IM.
Elevated resting heart rate is an independent risk factor for cardiovascular disease in healthy men
and women. Am Heart J 2010;159: 612-9 e3.
218. MacMahon S, Peto R, Cutler J, Collins R, Sorlie P, Neaton J, Abbott R, Godwin J,
Dyer A, Stamler J. Blood pressure, stroke, and coronary heart disease. Part 1, Prolonged
differences in blood pressure: prospective observational studies corrected for the regression
dilution bias. Lancet 1990;335: 765-74.
219. Karasek R, Brisson C, Kawakami N, Houtman I, Bongers P, Amick B. The Job
Content Questionnaire (JCQ): an instrument for internationally comparative assessments of
psychosocial job characteristics. J Occup Health Psychol 1998;3: 322-55.
220. Ainsworth BE, Haskell WL, Whitt MC, Irwin ML, Swartz AM, Strath SJ, O'Brien
WL, Bassett DR, Jr., Schmitz KH, Emplaincourt PO, Jacobs DR, Jr., Leon AS. Compendium of
physical activities: an update of activity codes and MET intensities. Med Sci Sports Exerc
2000;32: S498-504.
221. Kozey S, Lyden K, Staudenmayer J, Freedson P. Errors in MET estimates of
physical activities using 3.5 ml x kg(-1) x min(-1) as the baseline oxygen consumption. J Phys
Act Health 2010;7: 508-16.

134
222. Zhang C, Qin YY, Chen Q, Jiang H, Chen XZ, Xu CL, Mao PJ, He J, Zhou YH.
Alcohol intake and risk of stroke: a dose-response meta-analysis of prospective studies. Int J
Cardiol 2014;174: 669-77.
223. Reynolds K, Lewis B, Nolen JD, Kinney GL, Sathya B, He J. Alcohol consumption
and risk of stroke: a meta-analysis. JAMA 2003;289: 579-88.
224. Pickering TG, Hall JE, Appel LJ, Falkner BE, Graves J, Hill MN, Jones DW, Kurtz
T, Sheps SG, Roccella EJ. Recommendations for blood pressure measurement in humans and
experimental animals: part 1: blood pressure measurement in humans: a statement for
professionals from the Subcommittee of Professional and Public Education of the American
Heart Association Council on High Blood Pressure Research. Circulation 2005;111: 697-716.
225. Blacher J, Staessen JA, Girerd X, Gasowski J, Thijs L, Liu L, Wang JG, Fagard RH,
Safar ME. Pulse pressure not mean pressure determines cardiovascular risk in older hypertensive
patients. Arch Intern Med 2000;160: 1085-9.
226. Wang A, Tao J, Guo X, Liu X, Luo Y, Liu X, Huang Z, Chen S, Zhao X, Jonas JB,
Wu S. The product of resting heart rate times blood pressure is associated with high brachial-
ankle pulse wave velocity. PLoS One 2014;9: e107852.
227. Joint National Committee on Prevention Detection Evaluation and Treatment of
High Blood Pressure. The seventh report of the Joint National Committee on Prevention,
Detection, Evaluation, and Treatment of High Blood Pressure : complete reported. Bethesda,
MD: The Program, 2004. xiv, 86 p.
228. Cox DR. Regression Models and Life-Tables. Journal of the Royal Statistical
Society Series B (Methodological) 1972;34: 187-220.

135
229. Kasapis C, Thompson PD. The effects of physical activity on serum C-reactive
protein and inflammatory markers: a systematic review. J Am Coll Cardiol 2005;45: 1563-9.
230. Ku DN, Giddens DP, Zarins CK, Glagov S. Pulsatile flow and atherosclerosis in the
human carotid bifurcation. Positive correlation between plaque location and low oscillating shear
stress. Arteriosclerosis 1985;5: 293-302.
231. Glagov S, Zarins C, Giddens DP, Ku DN. Hemodynamics and atherosclerosis.
Insights and perspectives gained from studies of human arteries. Arch Pathol Lab Med 1988;112:
1018-31.
232. He J, Whelton PK. Elevated systolic blood pressure as a risk factor for
cardiovascular and renal disease. J Hypertens Suppl 1999;17: S7-13.
233. Krause N, Brand RJ, Kaplan GA, Kauhanen J, Malla S, Tuomainen T, Salonen JT.
Occupational physical activity, energy expenditure, and 11-year progression of carotid
atherosclerosis. Scand J Work Environ Health 2007;33: 405-24.
234. Krause N, Brand RJ, Arah O, Kauhanen J. Ocupational physical activity and 20-year
incidence of acute myocardial infarction: results from the Kuopio Ischemic Heart Disease Risk
Factor Study. Scand J Work Environ Health 2015;41: 124-39.
235. Arrighi HM, Hertz-Picciotto I. The evolving concept of the healthy worker survivor
effect. Epidemiology 1994;5: 189-96.
236. Merchant JA, Kelly KM, Burmeister LF, Lozier MJ, Amendola A, Lind DP,
KcKeen A, Slater T, Hall JL, Rohlman DS, Buikema BS. Employment status matters: a
statewide survey of quality-of-life, prevention behaviors, and absenteeism and presenteeism. J
Occup Environ Med 2014;56: 686-98.

136
237. Kachan D, Fleming LE, Christ S, Muennig P, Prado G, Tannenbaum SL, Yang X,
Caban-Martinez AJ, Lee DJ. Health Status of Older US Workers and Nonworkers, National
Health Interview Survey, 1997-2011. Prev Chronic Dis 2015;12: E162.
238. Schisterman EF, Cole SR, Platt RW. Overadjustment bias and unnecessary
adjustment in epidemiologic studies. Epidemiology 2009;20: 488-95.
239. Madsen TE, Khoury J, Alwell K, Moomaw CJ, Rademacher E, Flaherty ML, Woo
D, Mackey J, De Los Rios La Rosa F, Martini S, Ferioli S, Adeoye O, et al. Sex-specific stroke
incidence over time in the Greater Cincinnati/Northern Kentucky Stroke Study. Neurology
2017;89: 990-6.
240. Goerge T, Lorenz MB, van Alen S, Hubner NO, Becker K, Kock R. MRSA
colonization and infection among persons with occupational livestock exposure in Europe:
Prevalence, preventive options and evidence. Vet Microbiol 2015.
241. Nehme B, Letourneau V, Forster RJ, Veillette M, Duchaine C. Culture-independent
approach of the bacterial bioaerosol diversity in the standard swine confinement buildings, and
assessment of the seasonal effect. Environ Microbiol 2008;10: 665-75.
242. Cole D, Todd L, Wing S. Concentrated swine feeding operations and public health:
a review of occupational and community health effects. Environ Health Perspect 2000;108: 685-
99.
243. Liebers V, Raulf-Heimsoth M, Bruning T. Health effects due to endotoxin inhalation
(review). Arch Toxicol 2008;82: 203-10.
244. Liebers V, Bruning T, Raulf-Heimsoth M. Occupational endotoxin-exposure and
possible health effects on humans. Am J Ind Med 2006;49: 474-91.

137
245. Reif J, Pearce N, Fraser J. Cancer risks in New Zealand farmers. Int J Epidemiol
1989;18: 768-74.
246. Reif JS, Pearce NE, Fraser J. Cancer risks among New Zealand meat workers. Scand
J Work Environ Health 1989;15: 24-9.
247. Beane Freeman LE, Deroos AJ, Koutros S, Blair A, Ward MH, Alavanja M, Hoppin
JA. Poultry and livestock exposure and cancer risk among farmers in the agricultural health
study. Cancer Causes Control 2012;23: 663-70.
248. t Mannetje A, Eng A, Pearce N. Farming, growing up on a farm, and haematological
cancer mortality. Occup Environ Med 2012;69: 126-32.
249. Efird JT, Holly EA, Preston-Martin S, Mueller BA, Lubin F, Filippini G, Peris-
Bonet R, McCredie M, Cordier S, Arslan A, Bracci PM. Farm-related exposures and childhood
brain tumours in seven countries: results from the SEARCH International Brain Tumour Study.
Paediatr Perinat Epidemiol 2003;17: 201-11.
250. Holly EA, Bracci PM, Mueller BA, Preston-Martin S. Farm and animal exposures
and pediatric brain tumors: results from the United States West Coast Childhood Brain Tumor
Study. Cancer Epidemiol Biomarkers Prev 1998;7: 797-802.
251. Yeni-Komshian H, Holly EA. Childhood brain tumours and exposure to animals and
farm life: a review. Paediatr Perinat Epidemiol 2000;14: 248-56.
252. Kristensen P, Andersen A, Irgens LM, Bye AS, Sundheim L. Cancer in offspring of
parents engaged in agricultural activities in Norway: incidence and risk factors in the farm
environment. Int J Cancer 1996;65: 39-50.
253. Keegan TJ, Bunch KJ, Vincent TJ, King JC, O'Neill KA, Kendall GM, MacCarthy
A, Fear NT, Murphy MF. Case-control study of paternal occupation and social class with risk of

138
childhood central nervous system tumours in Great Britain, 1962-2006. Br J Cancer 2013;108:
1907-14.
254. Christensen JS, Mortensen LH, Roosli M, Feychting M, Tynes T, Andersen TV,
Schmidt LS, Poulsen AH, Aydin D, Kuehni CE, Prochazka M, Lannering B, et al. Brain tumors
in children and adolescents and exposure to animals and farm life: a multicenter case-control
study (CEFALO). Cancer Causes Control 2012;23: 1463-73.
255. McKinney PA, Fear NT, Stockton D, Investigators UKCCS. Parental occupation at
periconception: findings from the United Kingdom Childhood Cancer Study. Occup Environ
Med 2003;60: 901-9.
256. van Steensel-Moll HA, Valkenburg HA, van Zanen GE. Childhood leukemia and
parental occupation. A register-based case-control study. Am J Epidemiol 1985;121: 216-24.
257. Keegan TJ, Bunch KJ, Vincent TJ, King JC, O'Neill KA, Kendall GM, MacCarthy
A, Fear NT, Murphy MF. Case-control study of paternal occupation and childhood leukaemia in
Great Britain, 1962-2006. Br J Cancer 2012;107: 1652-9.
258. Booth BJ, Jones RR, Turyk ME, Freels S, Patel DM, Stayner LT, Ward MH.
Livestock and poultry density and childhood cancer incidence in nine states in the USA. Environ
Res 2017;159: 444-51.
259. Magnani C, Pastore G, Luzzatto L, Carli M, Lubrano P, Terracini B. Risk factors for
soft tissue sarcomas in childhood: a case-control study. Tumori 1989;75: 396-400.
260. Basinas I, Schlunssen V, Takai H, Heederik D, Omland O, Wouters IM, Sigsgaard
T, Kromhout H. Exposure to inhalable dust and endotoxin among Danish pig farmers affected by
work tasks and stable characteristics. Ann Occup Hyg 2013;57: 1005-19.

139
261. Basinas I, Sigsgaard T, Heederik D, Takai H, Omland O, Andersen NT, Wouters
IM, Bonlokke JH, Kromhout H, Schlunssen V. Exposure to inhalable dust and endotoxin among
Danish livestock farmers: results from the SUS cohort study. J Environ Monit 2012;14: 604-14.
262. Ciccolini M, Dahl J, Chase-Topping ME, Woolhouse ME. Disease transmission on
fragmented contact networks: livestock-associated Methicillin-resistant Staphylococcus aureus in
the Danish pig-industry. Epidemics 2012;4: 171-8.
263. McClendon CJ, Gerald CL, Waterman JT. Farm animal models of organic dust
exposure and toxicity: insights and implications for respiratory health. Curr Opin Allergy Clin
Immunol 2015;15: 137-44.
264. Xu X, He L, Zhang A, Li Q, Hu W, Chen H, Du J, Shen J. Toxoplasma gondii
isolate with genotype Chinese 1 triggers trophoblast apoptosis through oxidative stress and
mitochondrial dysfunction in mice. Exp Parasitol 2015;154: 51-61.
265. Kuper H, Adami HO, Trichopoulos D. Infections as a major preventable cause of
human cancer. J Intern Med 2000;248: 171-83.
266. Klaunig JE, Kamendulis LM. The role of oxidative stress in carcinogenesis. Annu
Rev Pharmacol Toxicol 2004;44: 239-67.
267. Granot E, Kohen R. Oxidative stress in childhood--in health and disease states. Clin
Nutr 2004;23: 3-11.
268. Adams Waldorf KM, McAdams RM. Influence of infection during pregnancy on
fetal development. Reproduction 2013;146: R151-62.
269. Cordeiro CN, Tsimis M, Burd I. Infections and Brain Development. Obstet Gynecol
Surv 2015;70: 644-55.

140
270. Greaves MF, Alexander FE. An infectious etiology for common acute lymphoblastic
leukemia in childhood? Leukemia 1993;7: 349-60.
271. Pedersen CB. The Danish Civil Registration System. Scand J Public Health
2011;39: 22-5.
272. Gjerstorff ML. The Danish Cancer Registry. Scand J Public Health 2011;39: 42-5.
273. Hansen J, Lassen CF. The Supplementary Pension Fund Register. Scand J Public
Health 2011;39: 99-102.
274. Knudsen LB, Olsen J. The Danish Medical Birth Registry. Dan Med Bull 1998;45:
320-3.
275. United Nations. Statistical Office. International standard industrial classification of
all economic activitiesed. New York,: United Nations, 1968. iii, 48 p.
276. Kauppinen T, Heikkila P, Plato N, Woldbaek T, Lenvik K, Hansen J, Kristjansson
V, Pukkala E. Construction of job-exposure matrices for the Nordic Occupational Cancer Study
(NOCCA). Acta Oncol 2009;48: 791-800.
277. Prosterman RL, Hanstad TM. Legal impediments to effective rural land relations in
Eastern Europe and Central Asia : a comparative perspectiveed. Washington, D.C.: World
Bank, 1999. ix, 325 p.
278. Jourdan-Da Silva N, Perel Y, Mechinaud F, Plouvier E, Gandemer V, Lutz P,
Vannier JP, Lamagnere JL, Margueritte G, Boutard P, Robert A, Armari C, et al. Infectious
diseases in the first year of life, perinatal characteristics and childhood acute leukaemia. Br J
Cancer 2004;90: 139-45.

141
279. Gilham C, Peto J, Simpson J, Roman E, Eden TO, Greaves MF, Alexander FE,
Investigators U. Day care in infancy and risk of childhood acute lymphoblastic leukaemia:
findings from UK case-control study. BMJ 2005;330: 1294.
280. Andersen BH. Agriculture in Denmark. In: Larsson S. Paths to a Sustainable
Agricultural System: Pathways to a Nordic agricultural and food system with reduced emissions
of greenhouse gases and air poulltantsed. Denmark: Nordic Council of Ministers, 2016.
281. Agger JF, Paul S. Increasing prevalence of Coxiella burnetii seropositive Danish
dairy cattle herds. Acta Vet Scand 2014;56: 46.
282. Paul S, Agger JF, Markussen B, Christoffersen AB, Agerholm JS. Factors associated
with Coxiella burnetii antibody positivity in Danish dairy cows. Prev Vet Med 2012;107: 57-64.
283. Ersboll AK, Ersboll BK, Houe H, Alban L, Kjeldsen AM. Spatial modelling of the
between-herd infection dynamics of bovine virus diarrhoea virus (BVDV) in dairy herds in
Denmark. Prev Vet Med 2010;97: 83-9.
284. Olsen JH, de Nully Brown P, Schulgen G, Jensen OM. Parental employment at time
of conception and risk of cancer in offspring. Eur J Cancer 1991;27: 958-65.
285. De Roos AJ, Olshan AF, Teschke K, Poole C, Savitz DA, Blatt J, Bondy ML,
Pollock BH. Parental occupational exposures to chemicals and incidence of neuroblastoma in
offspring. Am J Epidemiol 2001;154: 106-14.
286. Olshan AF, De Roos AJ, Teschke K, Neglia JP, Stram DO, Pollock BH, Castleberry
RP. Neuroblastoma and parental occupation. Cancer Causes Control 1999;10: 539-49.
287. Bunin GR, Ward E, Kramer S, Rhee CA, Meadows AT. Neuroblastoma and parental
occupation. Am J Epidemiol 1990;131: 776-80.

142
288. Chen M, Chang CH, Tao L, Lu C. Residential Exposure to Pesticide During
Childhood and Childhood Cancers: A Meta-Analysis. Pediatrics 2015;136: 719-29.
289. Schmidt M, Schmidt SA, Sandegaard JL, Ehrenstein V, Pedersen L, Sorensen HT.
The Danish National Patient Registry: a review of content, data quality, and research potential.
Clin Epidemiol 2015;7: 449-90.
290. Seals RM, Kioumourtzoglou MA, Gredal O, Hansen J, Weisskopf MG.
Occupational formaldehyde and amyotrophic lateral sclerosis. Eur J Epidemiol 2017;32: 893-9.
291. Nikkila A, Erme S, Arvela H, Holmgren O, Raitanen J, Lohi O, Auvinen A.
Background radiation and childhood leukemia: A nationwide register-based case-control study.
Int J Cancer 2016;139: 1975-82.
292. Spycher BD, Lupatsch JE, Zwahlen M, Roosli M, Niggli F, Grotzer MA,
Rischewski J, Egger M, Kuehni CE, Swiss Pediatric Oncology G, Swiss National Cohort Study
G. Background ionizing radiation and the risk of childhood cancer: a census-based nationwide
cohort study. Environ Health Perspect 2015;123: 622-8.
293. Meinert R, Kaletsch U, Kaatsch P, Schuz J, Michaelis J. Associations between
childhood cancer and ionizing radiation: results of a population-based case-control study in
Germany. Cancer Epidemiol Biomarkers Prev 1999;8: 793-9.
294. Siltanen S, Anttonen M, Heikkila P, Narita N, Laitinen M, Ritvos O, Wilson DB,
Heikinheimo M. Transcription factor GATA-4 is expressed in pediatric yolk sac tumors. Am J
Pathol 1999;155: 1823-9.
295. Siltanen S, Heikkila P, Bielinska M, Wilson DB, Heikinheimo M. Transcription
factor GATA-6 is expressed in malignant endoderm of pediatric yolk sac tumors and in
teratomas. Pediatr Res 2003;54: 542-6.

143
296. Alvarez MC, Ladeira MS, Scaletsky IC, Pedrazzoli J, Jr., Ribeiro ML. Methylation
pattern of THBS1, GATA-4, and HIC1 in pediatric and adult patients infected with Helicobacter
pylori. Dig Dis Sci 2013;58: 2850-7.
297. Wen XZ, Akiyama Y, Pan KF, Liu ZJ, Lu ZM, Zhou J, Gu LK, Dong CX, Zhu BD,
Ji JF, You WC, Deng DJ. Methylation of GATA-4 and GATA-5 and development of sporadic
gastric carcinomas. World J Gastroenterol 2010;16: 1201-8.
298. Paudyal P, Semple S, Niven R, Tavernier G, Ayres JG. Exposure to dust and
endotoxin in textile processing workers. Ann Occup Hyg 2011;55: 403-9.
299. Singh Z, Chadha P. Textile industry and occupational cancer. J Occup Med Toxicol
2016;11: 39.
300. Humans IWGotEoCRt. IARC Monographs on the Evaluation of Carcinogenic Risks
to Humansed., vol. 110. Lyon, France: International Agency for Research on Cancer, 2017.
301. Oosterhuis JW LL. Germ Cell Tumors from a Developmental Perspective: Cells of
Origin, Pathogenesis, and Molecular Biology (Emerging Patterns). In: Nogales F JR. Pathology
and Biology of Human Germ Cell Tumorsed.: Springer, Berlin, Heidelberg, 2017.
302. Huttunen R, Syrjanen J. Healthcare workers as vectors of infectious diseases. Eur J
Clin Microbiol Infect Dis 2014;33: 1477-88.
303. Tak S, Groenewold M, Alterman T, Park RM, Calvert GM. Excess risk of head and
chest colds among teachers and other school workers. J Sch Health 2011;81: 560-5.
304. Mu F, Hurley D, Betts KA, Messali AJ, Paschoalin M, Kelley C, Wu EQ. Real-
world costs of ischemic stroke by discharge status. Curr Med Res Opin 2017;33: 371-8.
305. Baumann M, Couffignal S, Le Bihan E, Chau N. Life satisfaction two-years after
stroke onset: the effects of gender, sex occupational status, memory function and quality of life

144
among stroke patients (Newsqol) and their family caregivers (Whoqol-bref) in Luxembourg.
BMC Neurol 2012;12: 105.
306. Kaul S, Barbeau B, Wright J, Fluchel M, Kirchhoff AC, Nelson RE. Statewide
Longitudinal Hospital Use and Charges for Pediatric and Adolescent Patients With Cancer. J
Oncol Pract 2015;11: e468-75.


