Embed Size (px)
Citation preview

UCLAUCLA Electronic Theses and Dissertations
TitleCharacterizing Neurotrauma and Astroglial Injury Biomarkers by Proteomics and Mass Spectrometry
Permalinkhttps://escholarship.org/uc/item/70p4t7v8
AuthorShen, Sean
Publication Date2016 Peer reviewed|Thesis/dissertation
eScholarship.org Powered by the California Digital LibraryUniversity of California

UNIVERSITY OF CALIFORNIA
Los Angeles
Characterizing Neurotrauma and Astroglial Injury Biomarkers
by Proteomics and Mass Spectrometry
A dissertation submitted in partial satisfaction
of the requirements for the degree Doctor of Philosophy
in Biochemistry and Molecular Biology
by
Sean Shen
2016

© Copyright by
Sean Shen
2016

ii
ABSTRACT OF THE DISSERTATION
Characterizing Neurotrauma and Astroglial Injury Biomarkers
by Proteomics and Mass Spectrometry
by
Sean Shen
Doctor of Philosophy in Biochemistry and Molecular Biology
University of California, Los Angeles, 2016
Professor Joseph Ambrose Loo, Chair
Neurotraumatic injury has long been a leading cause of death and disability
worldwide. Recently, the debilitating long term effects of chronic, mild traumatic brain
injuries (TBIs) have gained increased public attention. In order to protect individuals most
at risk (e.g. military personnel and athletes) from such injuries, improved diagnostics in
the form of a biomarker panel capable of rapidly and sensitively detecting mild TBIs are
needed. Despite the large number of TBI biomarker studies in the literature, the
development of a clinically relevant protein signature remains elusive.
In contrast to diseases with singular mechanistic dysfunction, neurotrauma is
characterized by the disruption to multiple cellular pathways that contribute to the
sequelae of secondary pathophysiology that determines patient outcome and recovery.
This complexity has been a confounding factor in the identification of effective biomarkers.
In an effort to circumvent this hurdle, our group implemented a central nervous system

iii
(CNS) specific cell injury model to examine preferentially released injury related proteins
as candidate diagnostics.
Comparative analysis of a TBI CSF proteome and preferentially released proteins
from our injury model revealed a panel of astroglial injury related candidate biomarkers
including aldolase C (ALDOC), brain lipid binding protein (BLBP), glutamine synthetase
(GS), astrocytic phosphoprotein PEA15 (PEA15), and glial fibrillary acidic protein (GFAP)
and its trauma-generated breakdown products (BDPs). Immediate and robust release of
ALDOC, BLBP, and PEA15 were associated more with acute cell wounding than cell
death observed after biomechanical injury. In contrast, GFAP release correlated primarily
with cell death. The sensitivity and selectivity of our biomarkers for neurotrauma were
evaluated in human TBI and Yucatan swine spinal cord injury (SCI) CSF samples.
Verification studies demonstrated the ability of our astroglial biomarker panel to
differentiate injury from non-injury with elevated signals detectable an hour after injury.
Additionally, differential CSF concentration kinetics were observed over a 1-week period
post-injury indicative of a long diagnostic window. CSF concentration of biomarkers
GFAP, ALDOC, and BLBP correlated strongly with the extent of tissue loss after SCI at 7
days. Taken together, our data demonstrates the successful application of proteomics to
the identification and verification of new neurotrauma biomarkers that exhibit potential for
not only detecting but defining injury severity.

iv
This dissertation of Sean Shen is approved.
Gal Bitan
Jorge Torres
Joseph Ambrose Loo, Committee Chair
University of California, Los Angeles
2016

v
TABLE OF CONTENTS
CHAPTER 1: TRAUMATIC BRAIN INJURY – CLINICAL AND MOLECULAR
PATHOLOGIES .............................................................................................................. 1
1.1 INTRODUCTION ................................................................................................... 1
1.2 CLASSIFICATON OF TRAUMATIC BRAIN INJURY ............................................. 3
1.3 CLINICAL PATHOLOGIES OF NEUROTRAUMA ................................................. 6
1.4 THE MOLECULAR PATHOPHYSIOLOGY OF NEUROTRAUMA ....................... 10
1.5 CONCLUSION ..................................................................................................... 18
1.6 REFERENCES .................................................................................................... 20
CHAPTER 2: ADDRESSING THE NEEDS OF TRAUMATIC BRAIN INJURY WITH
CLINICAL PROTEOMICS ........................................................................................... 30
2.1 INTRODUCTION ................................................................................................ 30
2.2 DISCUSSION ....................................................................................................... 32
2.3 CONCLUSIONS ................................................................................................. 53
2.4 FIGURES ............................................................................................................. 54
2.5 TABLES ............................................................................................................... 55
2.6 REFERENCES ................................................................................................... 56
CHAPTER 3: NEW ASTROGLIAL INJURY DEFINED BIOMARKERS FOR
NEUROTRAUMA ASSESSMENT ................................................................................. 78
3.1 INTRODUCTION ................................................................................................. 78
3.2 RESULTS ............................................................................................................ 81
2.3 DISCUSSION ....................................................................................................... 93
3.4 METHODS ......................................................................................................... 102
2.5 FIGURES ........................................................................................................... 112
3.6 TABLES ............................................................................................................. 129
3.7 SUPPLEMENTAL FIGURES ............................................................................. 158
3.8 REFERENCES .................................................................................................. 174
CHAPTER 4: ASSESSMENT OF ASTROGLIAL INJURY DEFINED BIOMARKERS IN
SPINAL CORD INJURY .............................................................................................. 198
4.1 INTRODUCTION ............................................................................................... 198
4.2 RESULTS .......................................................................................................... 201
4.3 DISCUSSION ..................................................................................................... 207

vi
4.4 METHODS ......................................................................................................... 209
4.5 FIGURES ........................................................................................................... 213
4.6 TABLES ............................................................................................................. 233
4.7 REFERENCES .................................................................................................. 239
CHAPTER 5: CHARACTERIZING THE PREFERENTIAL RELEASE OF PROTEIN
SUBPOPULATIONS BY INJURED ASTROCYTES .................................................... 243
5.1 INTRODUCTION ............................................................................................... 243
5.2 RESULTS .......................................................................................................... 245
5.3 DISCUSSION ..................................................................................................... 250
5.4 METHODS ......................................................................................................... 255
5.5 FIGURES ........................................................................................................... 259
5.6 TABLES ............................................................................................................. 269
5.7 REFERENCES .................................................................................................. 312
CHAPTER 6: FUTURE DIRECTIONS FOR SPINAL CORD AND HEAD TRAUMA ... 320
6.1 INTRODUCTION ............................................................................................... 320
6.2 RESULTS .......................................................................................................... 321
6.3 DISCUSSION ..................................................................................................... 325
6.4 CONCLUDING REMARKS ................................................................................ 328
6.5 METHODS ......................................................................................................... 333
6.6 FIGURES ........................................................................................................... 335
6.7 TABLES ............................................................................................................. 337
6.8 REFERENCES .................................................................................................. 352

vii
LIST OF FIGURES AND TABLES
Figure 2.1: ..................................................................................................................... 54 Table 2.1: ...................................................................................................................... 55 Figure 3.1: ................................................................................................................... 112 Figure 3.2: ................................................................................................................... 113 Figure 3.3: ................................................................................................................... 116 Figure 3.4: ................................................................................................................... 118 Figure 3.5: ................................................................................................................... 120 Figure 3.6: ................................................................................................................... 123 Figure 3.7: ................................................................................................................... 125 Figure 3.8: ................................................................................................................... 128 Table 3.1: .................................................................................................................... 130 Table 3.2: .................................................................................................................... 131 Table 3.3: .................................................................................................................... 133 Table 3.4: .................................................................................................................... 148 Table 3.5: .................................................................................................................... 149 Table 3.6: .................................................................................................................... 152 Table 3.7: .................................................................................................................... 154 Table 3.8: .................................................................................................................... 155 Table 3.9: .................................................................................................................... 157 S3.1: ............................................................................................................................ 158 S3.2: ............................................................................................................................ 160 S3.3: ............................................................................................................................ 161 S3.4: ............................................................................................................................ 162 S3.5: ............................................................................................................................ 163 S3.6: ............................................................................................................................ 164 S3.7: ............................................................................................................................ 165 S3.8: ............................................................................................................................ 167 S3.9: ............................................................................................................................ 168 S3.10: .......................................................................................................................... 170 S3.11: .......................................................................................................................... 171 S3.12: .......................................................................................................................... 173 Figure 4.1: ................................................................................................................... 213 Figure 4.2: ................................................................................................................... 214 Figure 4.3: ................................................................................................................... 215 Figure 4.4: ................................................................................................................... 216 Figure 4.5: ................................................................................................................... 218 Figure 4.6: ................................................................................................................... 219 Figure 4.7: ................................................................................................................... 220 Figure 4.8: ................................................................................................................... 222 Figure 4.9: ................................................................................................................... 224 Figure 4.10: ................................................................................................................. 225 Figure 4.11: ................................................................................................................. 226 Figure 4.12: ................................................................................................................. 228 Figure 4.13: ................................................................................................................. 230 Figure 4.14: ................................................................................................................. 232

viii
Table 4.1: .................................................................................................................... 233 Table 4.2: .................................................................................................................... 235 Table 4.3: .................................................................................................................... 236 Table 4.4: .................................................................................................................... 238 Figure 5.1: ................................................................................................................... 259 Figure 5.2: ................................................................................................................... 261 Figure 5.3: ................................................................................................................... 262 Figure 5.4: ................................................................................................................... 263 Figure 5.5: ................................................................................................................... 265 Figure 5.6: ................................................................................................................... 266 Figure 5.7: ................................................................................................................... 267 Figure 5.8: ................................................................................................................... 268 Table 5.1: .................................................................................................................... 269 Table 5.2: .................................................................................................................... 271 Table 5.3: .................................................................................................................... 273 Table 5.4: .................................................................................................................... 274 Table 5.5: .................................................................................................................... 276 Table 5.6: .................................................................................................................... 289 Table 5.7: .................................................................................................................... 299 Table 5.8: .................................................................................................................... 311 Figure 6.1: ................................................................................................................... 335 Figure 6.2: ................................................................................................................... 336 Table 6.1: .................................................................................................................... 338 Table 6.2: .................................................................................................................... 339 Table 6.3: .................................................................................................................... 341 Table 6.4: .................................................................................................................... 344 Table 6.5: .................................................................................................................... 351

ix
DEDICATION
I would like to dedicate this work to my mother (Xinfang), father (Zhongnan), and to all
my family and friends who have supported me throughout this long journey.
To my WindRose family, thanks for your constant encouragement.
To the memory of Daniel Cho, my brother from another mother.

x
ACKNOWLEDGEMENTS
I would like to thank my mentor, Professor Joseph A. Loo, for giving me this
research opportunity and for his constant support and guidance throughout my graduate
studies. I am forever thankful to Joe for taking a chance on me and trusting me to not only
work with top of the line mass spectrometers but also to be so closely involved in the
installation of new instruments. I will remember the encouraging, insightful, and kind
demeanor that Joe conducts himself as something to aspire toward.
I would like to thank Ina-Beate Wanner for the opportunity to work on her traumatic
brain injury project. Her words of encouragement, criticisms, and patience have pushed
me throughout my graduate training. I have met few people in my life with as much
passion and dedication to her work. I would like to also thank members of the Wanner lab
Julia Halford and Jacklynn Levine for all their help on the neurobiology side of the project
and collaborative discussions.
Additionally, I would like to thank Rachel Loo for all the knowledge and expertise
she has shared with me over the years on sample preparation and biochemical methods.
To past and present Loo lab members, I would like to extend my appreciation for
your support, both professional and personal. I would especially like to thank Carly
Ferguson, Hong Nguyen, Pete Wongkongkathep, Huilin Li, Reid O’Brien Johnson, Dyna
Shirasaki, and my undergraduate student Eric Wang. I would also like to express my
sincere gratitude to my good friends Keith Cheung and Subhajit Poddar for their advice
and input throughout my graduate work.

xi
Finally, I would like to thank my committee members, Professors Gal Bitan,
Catherine Clarke, Jorge Torres, James Wohlschlegel, and Joe Loo for their guidance and
advice.

xii
Chapter 2 of this dissertation is version of a version of S. Shen, R. R. O. Loo, I. B.
Wanner, J. A. Loo, Addressing the needs of traumatic brain injury with clinical proteomics.
Clinical proteomics 11, 1-13 (2014), reprinted with permissions. I would like to
acknowledge my co-authors Rachel R. Ogorzalek Loo, Ina B. Wanner, and Joseph A.
Loo.
Chapter 3 of this dissertation is a manuscript in preparation entitled “New Astroglial
Injury Defined Biomarkers for Neurotrauma Assessment.” I would like to acknowledge Ina
B. Wanner, Julia Halford, Kyohei Itamura, and Jacklynn Levine their work on cellular
characterization and immunoblot studies in addition to data analysis, assembly, and figure
preparation; Gregg Czerwieniec for work on MRM-MS and mass spectrometry studies;
Dalton Dietrich, Paul Vespa, David Hovda for their input on traumatic brain injury (TBI)
pathophysiology; and Ross Bullock, Paul Vespa, Thomas Glenn, and Stefania Mondella
for providing TBI patient biofluid samples and input on clinical analysis.
I would like to acknowledge Ina B. Wanner, Julia Halford, Kyohei Itamura, and
Jacklynn Levine for their work on preparing stretch injured astrocytes, immunoblot
analysis of swine SCI CSF samples, and immunohistology of spinal cords described in
Chapters 4 and 5 of this dissertation.
I would like to acknowledge our Department of Defense collaborators Rachel
Kinsler, Andrew Mayer, Jonathan DeShaw, and Salam Rahmatalla for their work in
developing and executing the spinal cord injury model, cerebrospinal fluid (CSF)
collection, post-injury transportation, and surgery which contributed to the elucidation of
astroglial injury defined biomarkers in assessing swine spinal cord injury and
characterization of swine SCI CSF proteomics in Chapters 4 and 6 respectively.

xiii
I would also like to acknowledge my undergraduate student Eric Wang for his
contributions to sample preparation for the work presented in Chapter 4.

xiv
VITA
2003 – 2007 Bachelors of Arts, University of California, Berkeley
Molecular Cell Biology
2007 – 2009 Research Associate I, WindRose Analytica
2009 – 2010 Research Associate II, Ajinomoto Althea
2011 – 2012 Teaching Assistant, UCLA
2014 - 2015 Technology Fellow, UCLA Office of Intellectual Property
2015 Excellence in Biochemical Research Fellowship

xv
PUBLICATIONS
Shen, S., Loo, R. R. O., Wanner, I.-B. & Loo, J. A. Addressing the Needs of Traumatic Brain Injury with Clinical Proteomics. Clinical Proteomics 2014, 11:11. Dzialo, M.C., Travaglini, K.J., Shen, S., Loo, J.A., Clarke, S.G. A New Type of Protein Lysine Methyltransferase Trimethylates Lys-79 of Elongation Factor 1A. Biochemical and Biophysical Research Communications 2014, 455:382-389 Dzialo, M.C., Travaglini, K.J., Shen, S., Roy, K., Chanfreau, G.F., Loo, J.A., Clarke, S.G. Translational Roles of Elongation Factor 2 Protein Lysine Methylation. Journal of Biological Chemistry 2014, 289:30511-30524 Buehler, D.*, Marsden, M.*, Shen, S., Toso, D. B., Wu, X., Loo, J. A., Zhou, Z. H., Kickhoefer, V. A., Wender, P. A., Zack, J. A., & Rome, L. H. Bioengineered Vaults: Self-Assembling Protein Shell-Lipophilic Core Nanoparticles for Drug Delivery. ACS Nano 2014, 8:7723-7732
PRESENTATIONS
Shen, S., Halford, J., Wanner, I.B., Loo, J.A. Characterizing Traumatic Brain Injury with New Astroglial Injury Biomarkers Measured by Targeted MS. American Society of Mass Spectrometry Annual Conference. San Antonio, TX. June 2016 Shen, S., Itamura, K., Halford, J., Wanner, I.B., Loo, J.A. Measuring Acute Traumatic Brain Injury Biomarkers by Targeted Mass Spectrometry. American Society of Mass Spectrometry Annual Conference. St. Louis, MO. June 2015 Shen, S., Wanner, I.B., Loo, J.A. Discovery and Verification of Neurotrauma Markers by High Mass Accuracy/High Resolution Mass Spectrometry. American Society of Mass Spectrometry Annual Conference. Baltimore, MA. June 2014 Shen, S., Wanner, I.B., Czerwieniec, G., Loo, J.A. Selection and Quantification of Neurotrauma Markers by Mass Spectrometry. American Society of Mass Spectrometry Annual Conference. Minneapolis, MN. June 2013 Shen, S., Ferguson, C., Loo, R.R.O., Loo, J.A. Highly Multiple Charging with 2-nitrophloronolgluncinol by MALDI Time-of-Flight Mass Spectrometry. American Society of Mass Spectrometry Annual Conference. Vancouver, CA. May 2012
1
CHAPTER 1: TRAUMATIC BRAIN INJURY – CLINICAL AND MOLECULAR
PATHOLOGIES
1.1 INTRODUCTION
Impact and Healthcare Significance of Traumatic Brain Injury (TBI)
Neurotrauma to the central nervous system (CNS) is a serious public health
worldwide. Most commonly, neurotrauma is experienced in the form a traumatic brain
injury or TBI. Examining the US alone, TBI is most common in infants and toddlers,
adolescents and the elderly (1). The US National Institute of Neurological Disorders and
Stroke estimates that 2.5-6.5 million Americans have had one or multiple TBIs. In the US
military there were over 212,000 service men and women diagnosed with some form of
TBI between January 2000-May 2011, roughly accounting for one-third of all injured US
soldiers, making TBI the signature injury of the wars in Iraq and Afghanistan compared to
past wars (2). TBI contributes to over one third of all injury-related deaths, yet 75-90% of
all brain trauma cases are considered to be mild TBI (mTBI), many without visible wounds
that often are undiagnosed (3). The documented long term disability associated with
repeated head trauma coupled with inadequate diagnostic measures highlight the
immediate need for increased understanding of TBI pathology and how to treat it. Better
diagnostic tools are needed to detect head injuries, especially mTBI, as well as to confirm
and monitor the severity of TBI in order to determine the best course of action acutely
and later post-injury. This is of special urgency for military personnel and athletes of all
kinds who are most at risk for repeated head injury. This introduction presents TBI as a
biomechanical injury and characterizes the clinical pathologies and their underlying
molecular processes. Chapter 2 will discuss some of the challenges to discovering new

2
biomarkers. In Chapters 3-6, results of proteomic efforts in this field will be discussed as
they relate to insights that can be gleamed for future study and development of
neurotrauma diagnostics and therapeutics.

3
1.2 CLASSIFICATON OF TRAUMATIC BRAIN INJURY
TBI is a Biomechanical Injury
Traumatic brain injury is defined as focal or diffuse brain damage from external
trauma. The principle mechanisms of focal brain damage include contusion, laceration,
and intracranial hemorrhage. Diffuse brain injury occurs from abrupt acceleration and
deceleration type injuries that result in diffuse axonal damage and brain edema. While a
TBI is initiated from one of the above two types of primary injury, assessment and
treatment is further complicated by the onset of secondary non-mechanical damage (4-
6). No treatment exists for primary injuries outside of preventative measures. Secondary
pathologies ranging from ischemic events to edema, however, are sensitive to therapeutic
interventions. Proper management of secondary sequelae is essential to positive long
term patient outcome and brain function.
Classification of TBI severity
Classification of the severity of traumatic brain injury is of clinical interest as it
directly affects the type of acute and post-acute medical care administered. Typically, TBI
severity is determined based on single indicators such as the Glasgow Coma Scale
(GCS), duration of post-traumatic amnesia, and loss of consciousness. The GCS is a
neurocognitive examination of eye function, response to verbal commands, and motor
function graded on a scale of 1-14 where scores of 13 or higher correlate with a mild brain
injury, 9-12 to a moderate injury, and 8 or lower a severe injury (7). And while these
measures correlate with severity and outcome, each may be influenced by indirect
factors. Early sedation and patient intoxication have both been demonstrated to have

4
suppressive effects on GCS values (8, 9). Classification schemes that combine single
indicators of GCS, loss of consciousness, amnesia as well as a myriad of other clinical
criteria such as patient survival, presentation of hematoma/hemorrhage, and patient
reported symptoms have demonstrated effectiveness ex post facto (10). However,
classification after the fact offers little benefit to patient treatment and outcome. Coupled
with the frequent lack of complete documentation of severity indicators, standardization
of classification for clinical and research purposes necessitates a simple yet
unencumbered diagnostic.
Concussive Neurotrauma
Perhaps the most impactful type of TBI is concussive injury. While concussive
injuries are classified as a mild TBI (mTBI), they nonetheless possess the potential to
affect a patient’s long term mental status. Studies estimate that anywhere between 1.5
and 4 million US athletes suffer a concussive mTBI annually (11, 12). Early symptoms of
a concussion include but are not limited to changes in behavior, loss of emotional control,
impairments to memory/attention, headache, and in rare cases catastrophic brain injury
known as the second impact syndrome (13). Second impact syndrome (SIS) is defined
as when a patient sustains a head injury, most commonly a mTBI, and subsequently
endures a second injury before the symptoms of the first have fully cleared, resulting in
catastrophic and typically fatal brain swelling (14, 15). However, it is scientifically unclear
whether it is the repeated injury or delayed onset of cerebral swelling form the initial blow
to the head that is responsible for these rare occurrences (16). Despite this controversy,
the anecdotal reports of SIS have brought attention to the dangers of chronic head

5
trauma. Studies to this effect have identified a positive correlation of greater symptom
severity, time to recover, and the earlier onset of age associated cognitive decline (also
known as chronic traumatic encephalopathy (CTE)) in patients with a history of repeated
concussions. These findings refuted the previous perception of concussive sports injuries
as benign. Public awareness and outcry from this new information has been instrumental
in changing how our sports medicine professionals treat and manage those individuals
most at risk. Major sports organizations, most prominently the National Football League
(NFL), have been at the forefront of this backlash resulting in the institution of new
protocols and procedures to ensure player safety.

6
1.3 CLINICAL PATHOLOGIES OF NEUROTRAUMA
Diffuse Axonal Injury
Biomechanical stretching of neuronal axons causes membrane disruption and
depolarization. This increase in axolemmal permeability has been shown to persist for 6
hours post-injury (17, 18) with the influx of calcium. As a result, neurofilaments undergo
compaction by calcium activated calpain proteolysis or neurofilament phosphorylation,
leading to loss of stability and breakdown (19, 20). As axons begin to develop
abnormalities and breaks, an accumulation of organelles occurs at the site of damage
due to the continued transport along intact segments. Signs of axotomy or axonal
severing can be observed as early as 4 hours post-injury and persist for days to weeks
(21).
Edema and Elevated Intracranial Pressure
Brain edema, or swelling, is a critical pathophysiology resulting from neurotrauma
(TBI, ischemia, etc.). Brain edema is defined as the abnormal accumulation of fluid within
the parenchyma. In most organ systems the parenchyma refers to structural and
connective tissues. In the brain, however, the parenchyma is comprised of the functional
tissue consisting of neurons and glial cells. Edema is categorized as either vasogenic or
cytotoxic (22). Vasogenic edema occurs when excess fluid accumulates in the brain
around cells, usually originating from blood vessels. This is believed to occur following a
traumatic compromise of the blood brain barrier (23). Swelling resulting from the
accumulation of fluid within cells is classified as cytotoxic edema. Cytotoxic edema most
commonly results from ischemic events, where inadequate oxygen and glucose content

7
impede cell survival. Both forms of edema are experienced in TBI, making treatment of
resulting neuropathologies challenging.
Edema is well documented in TBI to raise intracranial pressure (ICP), a secondary
pathology of the initial mechanical insult that is frequently associated with death and poor
prognosis among TBI survivors (24). Assessing the extent of swelling by computed
tomography (CT) scans (25) shortly after injury has demonstrated high correlation
between patient outcome to severity of brain swelling. In severe cases, patient mortality
may occur in as little at 36 hours despite aggressive clinical interventions (22). A study of
the proteomic alterations may reveal trends between protein levels and patient ICP. Such
a multidisciplinary study could identify signature proteins that may act as a less invasive
surrogate measure for ICP, traditionally monitored by insertion of a catheter into different
areas of the brain. Furthermore, potential surrogate protein markers could be monitored
during treatment (both clinical and experimentally) as an indication of the modality’s
effectiveness.
Neuroinflammation
Following the onset of cell death, a complex interplay of immunological and
inflammatory responses is observed in neurotrauma. Both the primary insult and resulting
secondary sequelae activate cellular mediators ranging from proinflammatory cytokines,
prostaglandins, and components of the complement system. These mediators then
induce chemokines and adhesion molecules, recruit immune cells, and activate glial cells
(26). While, many of these components of the inflammatory response contribute to acute

8
and chronic neurological detriment, the immune response is also responsible for long-
term repair and recovery post-trauma.
Delayed CNS injury is another hallmark of neurotrauma with inflammatory
response mediators implicated in the process. Upregulation of cellular adhesion
molecules are responsible for tissue infiltration by leukocytes. These leukocytes are then
responsible for the elimination of injured but also adjacent healthy tissues based on
spreading depressions. This occurs on a time scale ranging from hours to weeks as
astrocytes and microglial begin to synthesize the structural filament components of the
neuroscar (26).
Acutely after injury proinflammatory enzymes tumor necrosis factor (TNFα),
interleukin-1 (IL-1), and interleukin-6 (IL-6) are upregulated. IL-1, released immediately
following CNS damage from activated glial cells, induces a variety of beneficial actions
involved in restoring ionic balance through reduction in EAA glutamate release,
enhancement of gamma-amino butyric acid (GABA), the primary neuroinhibitory signaling
amino acid, and modulation of NMDA. IL-1 also upregulates the production of nitric oxide
(NO) which contributes both protective and neurotoxic effects (27). TNFα is a key
mediator of tissue inflammation implicated in the development of an assortment of
neurological conditions. TNF related signaling pathways function through two receptors,
p55 and p75. While the functions of p75 in the brain are unknown, activation of p55 is
responsible for the induction of apoptosis in the CNS. IL-6 is involved in various signaling
pathways that lead to gene activation related to recovery processes (26, 28).
Modulation of these inflammatory mediators have shown positive experimental
evidence for in the CNS damages at both acute and late (48h) time-points post-TBI.

9
Agents inhibiting TNFα improve short and long-term outcome in rats (29) while studies
have shown IL-6 to have neuroprotective effects by increasing CNS healing (30).
Transgenic mice lacking complement C3 or C5 exhibit reduced secondary damage
compared to control (26). While not necessarily specific to TBI neurotrauma, changes in
neuroimmune responses are critical to treatment of neurotrauma sequelae.
Chemical/biochemical agents with the ability to modulate these immune responses may
represent potential therapies in TBI management.
Cerebral Blood Flow
In the healthy brain, cerebral blood flow (CBF) is tightly coupled to cerebral glucose
metabolism. However, post-trauma, cerebral blood flow is deregulated leading to a
decoupling of blood and oxygen flow with cellular energy requirements. Experimental
evidence in rat fluid procession models have shown a decrease in CBF by as much as
50% of normal levels in the post-traumatic state. This reduction in CBF limits the oxygen
available to cerebral tissue necessary to meet the metabolic needs of injured and
recovering cells in a damaging energy crisis (31, 32).

10
1.4 THE MOLECULAR PATHOPHYSIOLOGY OF NEUROTRAUMA
General Molecular Pathophysiology of TBI
Upon sustaining a TBI, mechanical shear and deformation forces initiate a complex
cascade of neurochemical and metabolic events. These events begin with the impairment
of cerebral blood flow (CBF) resulting in ischemic conditions (33, 34). The resulting
anaerobic conditions and increased cellular metabolism results in an energy crisis, As
energy dependent ion pumps fail, ionic balance is disrupted resulting in the indiscriminate
release of excitatory amino acids (EEA) that only furthers ion imbalances and causes the
activation of signaling pathways for cell death (4).
Ionic Imbalance and Neurotransmitter Release
Acutely following mechanical trauma to brain tissue, neuronal membranes become
compromised, axons are stretched, and voltage-gated potassium channels are opened.
Increases in potassium extracellular potassium concentrations cause nonspecific axon
depolarization and results in the indiscriminant release of excitatory amino acid (EEA)
glutamate which further increases extracellular potassium concentrations through the
activation of, N-methyl-D-aspartate (NMDA), α-amino-3-hydroxy-5-methyl-4-
isoxazolpropionate (AMPA). This massive excitation of neurons is followed by neuronal
suppression, a phenomenon known as spreading depression (35) where the sections of
the brain undergo waves of electrophysiological hyperactivity followed by a waves of
inactivity. Distinct from classical spreading depression, post-traumatic spreading
depression affects both focal and diffuse areas of injury simultaneously. Early loss of

11
consciousness, memory loss, and confusion may be manifestations of a spreading
depression state post-injury (32).
Under normal conditions, elevated extracellular potassium are absorbed by
surrounding astroglial cells (36). Potassium released by neurons causes a passive influx
of potassium into surrounding astrocytes. This causes an astrocyte depolarization and
leads to current conduction along the cell and to cells coupled to them. As this potassium
generated current is propagated to the endfeet of astrocytes which terminate on the
surface of cerebral arterioles, potassium is siphoned from astrocyte feet onto their
adjacent arteriole walls. The increase in potassium content in arterioles causes
vasodilation and is important to the regulation of cerebral blood flow (36). While this
process is sufficient in accommodating mild perturbations in extracellular potassium, it is
unable to compensate for the larger levels of ionic imbalance generated from injury as
post-traumatic astrocytes exhibit reduction/loss of inward potassium uptake and
subsequent conduction (37). This loss of ionic homeostasis is likely involved in the
impairments to learning and memory that patients experience after a TBI.
Neurons restore ionic balance by activating energy dependent sodium/potassium
pumps. In post-TBI conditions however, energy stores are rapidly depleted resulting in
rapid by inefficient anaerobic glycolysis acutely 30 minutes to 4 hours after injury in rats
(38). This increase in glycolysis known as hyper-metabolism results from diminished CBF
and the disparity between cellular glucose supply and demand creates an energy crisis.
It is hypothesized that this energy deficient state is responsible for post-injury vulnerability
where cerebral tissue is less equipped to respond adequately to subsequent injury
leading to increased trauma severity and extended post-acute deficits (32). Additionally,

12
increased anaerobic production of energy results in an extracellular accumulation of
lactate which contributes to acidosis, membrane compromise, and cerebral swelling (13).
Mitochondrial Dysfunction in TBI
In addition to increased potassium ion levels, calcium accumulation is also
observed in the wake of neurotrauma (39). Elevated extracellular potassium ion
concentrations in the post-traumatic state, triggers the unregulated release of excitatory
amino acids that bind and activate NMDA receptors. Activated NMDA receptors create a
pore that allows calcium ions to enter the cells. Calcium is key to the pathophysiology of
trauma induced secondary sequela. When intracellular calcium increases above normal
homeostatic levels, attack and digestion of cellular proteins, lipids and DNA occur as a
result of the activation of proteases, lipases, and nucleases (40). As a result of increased
calcium dependent enzymatic activation, cells are subject to an overproduction of
neurotoxin free radicals, disruption of cytoskeletal organization, and or signaling
cascades leading to cell death.
Neurons and glia cells respond to this increase in intracellular calcium by
sequestering the excess within the mitochondria (41). Under normal conditions, calcium
provides benefit to the mitochondrial by stimulating oxidation-phosphorylation and ATP
synthesis. However, overloaded mitochondrial calcium has been shown to activate the
production of reactive oxygen species. Increases in ROS can further modulate calcium
dynamics by augmenting the calcium surge, thus generating a self-amplified loop of
cellular damage through calcium dependent initiation of apoptosis or necrosis.

13
Additionally, calcium stimulates oxidative phosphorylation by allosteric activation
of tricarboxylic acid (TCA) cycle enzymes leading to faster respiratory chain activity and
increased oxygen consumption that is restricted under ischemic conditions experienced
in the post-TBI state. Additionally, calcium concentrations in excess of physiological
conditions disrupt the respiration process by increasing cytochrome c dislocation from the
inner membrane through either competitive inhibition of negatively charged cadiolipin
binding sites or activation of cyctochrome c release pathways (42).
Altered Glucose Metabolism in TBI
The human brain functions primary on glucose and the energy it generates through
the glycolytic and tricarboxylic acid pathways. Alterations in cerebral glucose metabolism
(CMRglc) is a hallmark response to neurotrauma. Chemically labeled (18F-DG and 14C-
DG) glucose analogs have been used extensively in the study of glucose metabolism.
Once cleaved, these isotopes are trapped in cells allowing glucose accumulation to be
monitored. Using autoradiographic visualization, rapid glucose uptake is observed
acutely in the post-traumatic state followed by an extensive period of glucose metabolism
depression (38). Immediately following head injury, large increases in cerebral glucose
metabolism are observed. This increase has been shown to be attenuated by
administration of kynurenic acid, an inhibitor of NMDA receptors involved in proliferation
of cellular ionic imbalances (43). Consequently, this initial increase in glucose metabolism
is believed to be in response to the higher cellular energy demands necessary to restore
ionic homeostasis and neuronal membrane potential. This period of hyperglycolysis has
been observed for up to 8 days in severe TBI patients (44). The described acute CMRglc

14
period is followed by a period of metabolic depression in both animal and human studies
(45) that correlate with the magnitude of injury severity. Consistent with experimental
data, glucose metabolism rates in select regions of the brain – thalamus, cerebellum, and
brain stem – showed significant positive correlation with levels of consciousness
measured by the Glasgow Coma Scale (GCS) (46)
This delayed wave of glucose metabolism is believed to be the result of the
contributions of changes in cerebral blood flow, defects in glucose transporter function,
and or decreased metabolic demand for glucose. The rapid increase in glucose
metabolism in the acute phase of injury correlates to increased consumption during a
period of blood flow decline (41) generating an energy crisis. One explanation is that the
increased energy burden quickly depletes glucose stores and in the presence of
insufficient glucose replenishment from blood, glycolysis pathways are unable to keep up
and CMRglc rates decline. However, experimental data proving this is so far unclear. In
contrast, experimental studies rats showed no change to blood glucose after injury
suggesting no substrate limitation (47).
A second reason is proposed to be related to decreases in neuronal glucose
transporter GLUT1 (48) resulting in impaired glucose transport from blood to brain cells.
Hattori et al (46) demonstrated lower glucose accumulation in brain regions within
contusion sites. It is possible that inhibition of glucose transport across the blood brain
barrier is substantially affected in the post-TBI state.
Lastly, cells may experience a decreased metabolic demand as it prioritizes other
repair related functions in response to trauma. As it relates to glycolytic processing, proton
nuclear magnetic resonance (NMR) studies have uncovered increases in the amount of

15
glucose diverted to the synthesis of nucleic acid precursors in the acute time phase (3-24
hours) post-injury (49). This increase in DNA synthesis is likely a cellular response to both
DNA damage and upregulation of genes involved in repair and recovery pathways. In
support of this, nicotinamide dinucleotide (NAD+), essential electron acceptors in the
respiratory pathways, concentrations have been shown to decrease after injury (50). This
can be explained by higher NAD+ consumption from DNA repair enzymes as Poly-ADP
ribose polymerase (PARP) (51) in response to the elevated cellular levels of ROS. Thus,
reductions in NAD+ levels may be responsible for glycolytic inhibition as the cell
reorganizes its needs in the aftermath of traumatic injury.
Astrocytes and their Response to Injury
Astrocytes are an abundant class of glial cell in the central nervous system that
provides both structural and functional support to neurons. In healthy tissue, astrocytes
play crucial roles in functions related to energy provision, blood flow, regulation,
maintenance of ionic balance, and neurotransmitter recycling (52, 53).
In healthy tissue, astrocytes regulate important and related functions between
cerebral blood flow and the metabolic demand of neurons. Studies have demonstrated
the ability of astrocytes to elicit bidirectional vasculature changes in adjacent blood
vessels through activation of calcium sensitive signaling pathways (54). Astrocytes
regulate changes in CBF in response to the metabolic needs of neurons. An increase in
astrocytic anaerobic glycolysis is observed under reduced oxygen conditions, leading to
increases in lactate release that result in increased vasodilation (55). Astrocytes also play
crucial roles in maintaining ionic homeostasis through uptake and release of water in

16
response to neuropeptide signals and bidirectional aquaporin channels (56). Regulation
of EAA glutamate is another central role of astrocytes in their neuronal interactions. EEAs
are cleared from neuronal synapses by astrocytes via glutamate transporters, recycled
back to glutamine, and then released and re-absorbed by neurons (57).
Perhaps most interesting, is the key role astrocytes play in response to injury.
Following CNS insult such as mechanical trauma, infection, ischemia, and
neurodegenerative disease, astrocytes undergo a changes to molecular expression and
morphology known collectively as reactive astrogliosis. Reactive astrocytes are
characterized by increased expression of glial fibrillary acidic protein (GFAP) among other
intermediate filament proteins involved in the hallmark star-like morphological change
associated with cellular hypertrophy (52). New evidence has defined the mechanism of
reactive astrogliosis to be a graded one. Changes to gene expression and
intra/intercellular signaling are proportional to the severity of injury. Despite the
appearance of hypertrophy, mild and moderate cases of astrogliosis are believed to be
recoverable after injury resolution (53). In severe cases, higher activation of astrocytes is
documented to result in the formation of a glial scar that creates a barrier that limits the
spread of inflammation (58).
While reactive astrogliosis has traditionally been associated with the formation of
a glial scar that inhibits axonal regeneration, new research has identified a myriad of
beneficial and essential injury responses (59). Reactive astrocytes confer neuronal
protection through the uptake of excitotoxic levels of glutamate that accompanies
indiscriminant membrane depolarization (60-62). Ablation experiments have also
implicated reactive astrocytes in limiting the infiltration of inflammatory cells, repair of the

17
blood brain barrier (63), protection against immune related demyelination (63), and
reduction of hydrocephalus (60, 64). Molecular mediators of reactive astrogliosis are
released by a number of CNS cells and while much is still unknown, considerable
evidence suggest that different signaling mechanisms (STAT3, interleukin-6, leukemia
inhibitory factor) may initiate functional changes proportionate to the extent of injury (62,
65, 66).

18
1.5 CONCLUSION
Traumatic brain injury is a major healthcare crisis for which there is currently
inadequate diagnostic, let alone therapeutic, measures. In order to tackle this silent
epidemic, we must first develop conclusive metrics for injury identification and
classification for both clinical and research standardization. Currently, there is no clinically
validated biofluid marker for TBI/neurotrauma despite the volume of TBI biomarker
studies. And while the list of potential candidate biomarkers identified by proteomics is
encouraging to the mission, it raises the question of which potential biomarkers should
be prioritized for verification purposes. It is here that systems biology and an
understanding of the underlying molecular mechanisms associated with observed clinical
pathologies could provide an additional level of selection on top of biofluid abundance
and tissue enrichment to aid researchers in discriminating the top candidates for
validation studies.
While an effective biomarker does not necessarily require a direct relationship to
the biology of injury, biomarkers with biological relevance to the resulting molecular
sequelae have been shown to be the most promising. An example of such markers is
GFAP, an astroglial-specific intermediate filament, whose expression increases shortly
after injury as astrocytes attempt to maintain homeostasis and promote recovery (67).
Mediators of this processes such as IL-1β may offer insights into potential therapeutic
targets for future study (68). In our project, we have benefited from the understanding of
calcium mediated calpain activation resulting from ionic imbalances in membrane
compromised cells that lead to proteolytic breakdown products (69) that may offer
additional nuance into the severity and progression of TBI. Other examples include

19
elevated post-trauma levels of proteins involved in free radical clearance (70), stress
response (71), and immune response (26) associated with altered metabolic, signaling,
and repair functions.
A more complete understanding of the mechanisms involved in injury response is
also an essential tool for researchers to better design injury models to isolate specific
responses within the complex web of neurotraumatic insult. In our research, this has
helped us to select astrocytes as an in vitro model given their involvement in so many
regulatory elements ranging from maintenance of ionic and fluid homeostasis to
metabolism to blood flow. Alterations in signaling pathways, molecular pathologies of
membrane permeability, and a graded reactivity lead us to believe that investigation of
astroglial responses to injury may help to identify proteomic signatures of injury that are
released proportionate to the severity of injury.

20
1.6 REFERENCES
1. M. Faul, L. Xu, M. M. Wald, V. G. Coronado, Traumatic Brain Injury in the United
States: Emergency Department Visits, Hospitalizations and Deaths 2002–2006.
(Centers for Disease Control and Prevention, National Center for Injury Prevention
and Control, Atlanta, GA, 2010).
2. J. E. Risdall, D. K. Menon, Traumatic brain injury. Phil Trans Royal Soc London,
Series B, Biol Sci 366, (2011).
3. W. A. Gordon, M. Brown, M. Sliwinski, M. R. Hibbard, N. Patti, M. J. Weiss, R.
Kalinsky, M. Sheerer, The enigma of "hidden" traumatic brain injury. J Head
Trauma Rehabil 13, (1998).
4. C. Werner, K. Engelhard, Pathophysiology of traumatic brain injury. British journal
of anaesthesia 99, 4-9 (2007); published online EpubJul (10.1093/bja/aem131).
5. L. F. Marshall, Head injury: recent past, present, and future. Neurosurgery 47, 546-
561 (2000).
6. J. Nortje, D. K. Menon, Traumatic brain injury: physiology, mechanisms, and
outcome. Current Opinion in Neurology 17, 711-718 (2004).
7. G. Teasdale, B. Jennett, Assessment of coma and impaired consciousness: a
practical scale. The Lancet 304, 81-84 (1974).
8. R. D. Zafonte, F. M. Hammond, N. R. Mann, D. L. Wood, K. L. Black, S. R. Millis,
Relationship between glasgow coma scale and functional outcome. American
journal of physical medicine & rehabilitation 75, 364-369 (1996).

21
9. M. P. Kelly, C. T. Johnson, N. Knoller, D. A. Drubach, M. M. Winslow, Substance
abuse, traumatic brain injury and neuropsychological outcome. Brain injury 11,
391-402 (1997).
10. J. F. Malec, A. W. Brown, C. L. Leibson, J. T. Flaada, J. N. Mandrekar, N. N. Diehl,
P. K. Perkins, The mayo classification system for traumatic brain injury severity. J
Neurotrauma 24, 1417-1424 (2007); published online EpubSep
(10.1089/neu.2006.0245).
11. J. A. Langlois, W. Rutland-Brown, M. M. Wald, The Epidemiology and Impact of
Traumatic Brain Injury. Journal of Head Trauma Rehabilitation 21, 375-378 (2006).
12. K. M. Guskiewicz, M. McCrea, S. W. Marshall, Cumulative Effects Associated With
Recurrent Concussion in Collegiate Football Players The NCAA Concussion
Study. JAMA 19, 2549-2555 (2003).
13. G. Barkhoudarian, D. A. Hovda, C. C. Giza, The molecular pathophysiology of
concussive brain injury. Clinics in sports medicine 30, 33-48, vii-iii (2011);
published online EpubJan (10.1016/j.csm.2010.09.001).
14. R. C. Cantu, Second-impact syndrome. Clinics in sports medicine 17, 37-44
(1998).
15. P. McCrory, Does second impact syndrome exist? Clinical Journal of Sport
Medicine 11, 144-149 (2001).
16. P. McCory, G. Davis, M. Makdissi, Second Impact Syndrome or Cerebral Swelling
after Sporting Head Injury. Current Sports Medicine Reports 11, 21-23 (2012).
17. J. T. Povlishock, E. Pettus, in Mechanisms of Secondary Brain Damage in
Cerebral Ischemia and Trauma. (Springer, 1996), pp. 81-86.

22
18. E. H. Pettus, C. W. Christman, M. L. Giebel, J. T. Povlishock, Traumatically
Induced Altered Membrane Permeability: Its Relationship to Traumatically Induced
Reactive Axonal Change. Journal of Neurotrauma 11, 507-522 (1994).
19. G. V. W. Johnson, J. A. Greenwood, A. C. Costello, J. C. Troncoso, The regulatory
role of calmodulin in the proteolysis of individual neurofilament proteins by calpain.
Neurochemical Research 16, 869-873 (1991)10.1007/bf00965535).
20. R. A. Nixon, The Regulation of Neurofilament Protein Dynamics by
Phosphorylation: Clues to Neurofibrillary Pathobiology Brain Pathology 3, 29-38
(1993).
21. J. T. Povlishock, C. W. Christman, The pathobiology of traumatically induced
axonal injury in animals and human: a review of current thoughts. Journal of
Neurotrauma 12, 555-564 (1995).
22. A. Marmarou, A review of progress in understanding the pathophysiology and
treatment of brain edema. Neurosurgery Focus 22, 1-10 (2007).
23. P. Barzó, A. Marmarou, P. Fatouros, F. Corwin, J. Dunbar, Magnetic resonance
imaging-monitored acute blood-brain barrier changes in experimental traumatic
brain injury. Journal of neurosurgery 85, 1113-1121 (1996).
24. H. Feldmann, G. Klages, F. Gärtner, J. Scharfenberg, in Proceedings of the 6th
European Congress of Neurosurgery. (Springer, 1979), pp. 74-77.
25. H. M. Eisenberg, H. E. Gary Jr, E. F. Aldrich, C. Saydjari, B. Turner, M. A. Foulkes,
J. A. Jane, A. Marmarou, L. F. Marshall, H. F. Young, Initial CT findings in 753
patients with severe head injury: a report from the NIH Traumatic Coma Data Bank.
Journal of neurosurgery 73, 688-698 (1990).

23
26. S. M. Lucas, N. J. Rothwell, R. M. Gibson, The role of inflammation in CNS injury
and disease. British journal of pharmacology 147 Suppl 1, S232-240 (2006);
published online EpubJan (10.1038/sj.bjp.0706400).
27. C. Bogdon, Nitric oxide and the immune response. Nature 2, 907-916 (2001).
28. N. J. Van Wagoner, E. N. Benveniste, Interleukin-6 expression and regulation in
astrocytes. Journal of neuroimmunology 100, 124-139 (1999).
29. E. Tobinick, N. M. Kim, G. Reyzin, H. Rodriguez-Romanacce, V. DePuy, Selective
TNF Inhibition for Chronic Stroke and Traumatic Brain Injury. CNS drugs 26, 1051-
1070 (2012).
30. S. A. Loddick, A. V. Turnbull, N. J. Rothwell, Cerebral interleukin-6 is
neuroprotective during permanent focal cerebral ischemia in the rat. Journal of
Cerebral Blood Flow & Metabolism 18, 176-179 (1998).
31. F. Velarde, D. Fisher, D. Hovda, P. Adelson, D. Becker, Fluid percussion injury
induces prolonged changes in cerebral blood flow. J Neurotrauma 9, 402 (1992).
32. C. C. Giza, D. A. Hovda, The Neurometabolic Cascade of Concussion. Journal of
Athletic Training 36, 228-235 (2001).
33. D. A. Bruce, A. Alavi, L. Bilaniuk, C. Dolinskas, W. Obrist, B. Uzzell, Diffuse
cerebral swelling following head injuries in children: the syndrome of “malignant
brain edema”. Journal of neurosurgery 54, 170-178 (1981).
34. H. K. Richards, S. Simac, S. Piechnik, J. D. Pickard, Uncoupling of cerebral blood
flow and metabolism after cerebral contusion in the rat. Journal of Cerebral Blood
Flow & Metabolism 21, 779-781 (2001).

24
35. A. J. Church, R. D. Andrew, Spreading Depression Expands Traumatic Injury in
Neocortical Brain Slices. Journal of Neurotrauma 22, 277-290 (2005).
36. O. B. Paulson, E. A. Newman, Does the Release of Potassium from Astrocyte
Endfeet Regulate Cerebral Blood Flow? Science 237, 896-898 (1987).
37. R. D'Ambrosio, D. O. Maris, M. S. Grady, R. H. Winn, D. Janigro, Impaired K+
Homeostasis and Altered Electrophysiological Properties of Post-Traumatic
Hippocampal Glia. Journal of Neuroscience 19, 8152-8162 (1999).
38. A. Yoshino, D. A. Hovda, T. Kawamata, Y. Katayama, D. P. Becker, Dynamic
changes in local cerebral glucose utilization following cerebral concussion in rats:
evidence of a hyper-and subsequent hypometabolic state. Brain research 561,
106-119 (1991).
39. C. L. Osteen, A. H. Moore, M. L. Prins, D. A. Hovda, Age-Dependency of
45Calcium Accumulation Following Lateral Fluid Percussion: Acute and Delayed
Patterns. Journal of Neurotrauma 18, 141-162 (2001).
40. W. Young, I. Koreh, Potassium and Calcium Changes in Injured Spinal Cords.
Brain research 365, 42-53 (1985).
41. M. Prins, T. Greco, D. Alexander, C. C. Giza, The pathophysiology of traumatic
brain injury at a glance. Disease models & mechanisms 6, 1307-1315 (2013);
published online EpubNov (10.1242/dmm.011585).
42. T. I. Peng, M. J. Jou, Oxidative stress caused by mitochondrial calcium overload.
Ann N Y Acad Sci 1201, 183-188 (2010); published online EpubJul
(10.1111/j.1749-6632.2010.05634.x).

25
43. T. Kawamata, Y. Katayama, D. A. Hovda, A. Yoshino, D. P. Becker, Administration
of excitatory amino acid antagonists via microdialysis attenuates the increase in
glucose utilization seen following concussive brain injury. Journal of Cerebral
Blood Flow & Metabolism 12, 12-24 (1992).
44. M. Bergsneider, D. A. Hovda, E. Shalmon, D. F. Kelly, P. M. Vespa, N. A. Martin,
M. E. Phelps, D. L. McArthur, M. J. Caron, J. F. Kraus, Cerebral hyperglycolysis
following severe traumatic brain injury in humans: a positron emission tomography
study. Journal of neurosurgery 86, 241-251 (1997).
45. M. O’Connell, A. Seal, J. Nortje, P. Al-Rawi, J. Coles, T. Fryer, D. Menon, J.
Pickard, P. Hutchinson, in Intracranial Pressure and Brain Monitoring XII.
(Springer, 2005), pp. 165-168.
46. N. Hattori, S.-C. Huang, H.-M. Wu, E. Yeh, T. C. Glenn, P. M. Vespa, D. McArthur,
M. E. Phelps, D. A. Hovda, M. Bergsneider, Correlation of regional metabolic rates
of glucose with Glasgow Coma Scale after traumatic brain injury. Journal of
Nuclear Medicine 44, 1709-1716 (2003).
47. M. L. Prins, D. A. Hovda, Mapping cerebral glucose metabolism during spatial
learning: interactions of development and traumatic brain injury. Journal of
neurotrauma 18, 31-46 (2001).
48. R. Balabanov, H. Goldman, S. Murphy, G. Pellizon, C. Owen, J. Rafols, P. Dore-
Duffy, Endothelial cell activation following moderate traumatic brain injury.
Neurological research, (2013).
49. B. L. Bartnik, R. L. Sutton, M. Fukushima, N. G. Harris, D. A. Hovda, S. M. Lee,
Upregulation of pentose phosphate pathway and preservation of tricarboxylic acid

26
cycle flux after experimental brain injury. Journal of neurotrauma 22, 1052-1065
(2005).
50. M. A. Satchell, X. Zhang, P. M. Kochanek, C. E. Dixon, L. W. Jenkins, J. Melick,
C. Szabó, R. S. Clark, A dual role for poly‐ADP‐ribosylation in spatial memory
acquisition after traumatic brain injury in mice involving NAD+ depletion and
ribosylation of 14‐3‐3γ. Journal of neurochemistry 85, 697-708 (2003).
51. C. C. Alano, P. Garnier, W. Ying, Y. Higashi, T. M. Kauppinen, R. A. Swanson,
NAD+ Depletion Is Necessary and Sufficient forPoly (ADP-Ribose) Polymerase-1-
Mediated Neuronal Death. The Journal of Neuroscience 30, 2967-2978 (2010).
52. Z. Yang, K. K. W. Wang, Glial fibrillary acidic protein: from intermediate filament
assembly and gliosis to neurobiomarker. Cell 38, 364-374 (2015).
53. M. V. Sofroniew, Molecular dissection of reactive astrogliosis and glial scar
formation. Trends in neurosciences 32, 638-647 (2009).
54. G. R. Gordon, S. J. Mulligan, B. A. MacVicar, Astrocyte control of the
cerebrovasculature. Glia 55, 1214-1221 (2007).
55. G. R. Gordon, H. B. Choi, R. L. Rungta, G. C. Ellis-Davies, B. A. MacVicar, Brain
metabolism dictates the polarity of astrocyte control over arterioles. Nature 456,
745-749 (2008).
56. M. Simard, M. Nedergaard, The neurobiology of glia in the context of water and
ion homeostasis. Neuroscience 129, 877-896 (2004).
57. K. Kam, R. Nicoll, Excitatory synaptic transmission persists independently of the
glutamate–glutamine cycle. The Journal of Neuroscience 27, 9192-9200 (2007).

27
58. R. R. Voskuhl, R. S. Peterson, B. Song, Y. Ao, L. B. J. Morales, S. Tiwari-Woodruff,
M. V. Sofroniew, Reactive astrocytes form scar-like perivascular barriers to
leukocytes during adaptive immune inflammation of the CNS. The Journal of
neuroscience 29, 11511-11522 (2009).
59. M. V. Sofroniew, H. V. Vinters, Astrocytes: biology and pathology. Acta
Neuropathol 119, (2010).
60. T. G. Bush, N. Puvanachandra, C. H. Horner, A. Polito, T. Ostenfeld, C. N.
Svendsen, L. Mucke, M. H. Johnson, M. V. Sofroniew, Leukocyte infiltration,
neuronal degeneration, and neurite outgrowth after ablation of scar-forming,
reactive astrocytes in adult transgenic mice. Neuron 23, 297-308 (1999).
61. J. D. Rothstein, M. Dykes-Hoberg, C. A. Pardo, L. A. Bristol, L. Jin, R. W. Kuncl,
Y. Kanai, M. A. Hediger, Y. Wang, J. P. Schielke, Knockout of glutamate
transporters reveals a major role for astroglial transport in excitotoxicity and
clearance of glutamate. Neuron 16, 675-686 (1996).
62. R. A. Swanson, W. Ying, T. M. Kauppinen, Astrocyte influences on ischemic
neuronal death. Current molecular medicine 4, 193-205 (2004).
63. J. R. Faulkner, J. E. Herrmann, M. J. Woo, K. E. Tansey, N. B. Doan, M. V.
Sofroniew, Reactive astrocytes protect tissue and preserve function after spinal
cord injury. The Journal of Neuroscience 24, 2143-2155 (2004).
64. Z. Zador, S. Stiver, V. Wang, G. T. Manley, in Aquaporins. (Springer, 2009), pp.
159-170.
65. S. Okada, M. Nakamura, H. Katoh, T. Miyao, T. Shimazaki, K. Ishii, J. Yamane, A.
Yoshimura, Y. Iwamoto, Y. Toyama, Conditional ablation of Stat3 or Socs3

28
discloses a dual role for reactive astrocytes after spinal cord injury. Nature
medicine 12, 829-834 (2006).
66. A. D. R. Garcia, N. B. Doan, T. Imura, T. G. Bush, M. V. Sofroniew, GFAP-
expressing progenitors are the principal source of constitutive neurogenesis in
adult mouse forebrain. Nature neuroscience 7, 1233-1241 (2004).
67. R. Hausmann, R. Riess, A. Fieguth, P. Betz, Immunohistochemical investigations
on the course of astroglial GFAP expression following human brain injury.
International journal of legal medicine 113, 70-75 (2000).
68. L. M. Herx, V. W. Yong, Interleukin-1β is required for the early evolution of reactive
astrogliosis following CNS lesion. Journal of Neuropathology & Experimental
Neurology 60, 961-971 (2001).
69. L. Papa, L. M. Lewis, J. L. Falk, Z. Zhang, S. Silvestri, P. Giordano, G. M. Brophy,
J. A. Demery, N. K. Dixit, I. Ferguson, M. C. Liu, J. Mo, L. Akinyi, K. Schmid, S.
Mondello, C. S. Robertson, F. C. Tortella, R. L. Hayes, K. K. Wang, Elevated levels
of serum glial fibrillary acidic protein breakdown products in mild and moderate
traumatic brain injury are associated with intracranial lesions and neurosurgical
intervention. Ann Emerg Med 59, 471-483 (2012); published online EpubJun
(10.1016/j.annemergmed.2011.08.021).
70. A. Lewen, P. Matz, P. H. CHAN, Free radical pathways in CNS injury. Journal of
neurotrauma 17, 871-890 (2000).
71. J. Truettner, R. Schmidt-Kastner, R. Busto, O. Alonso, J. Loor, W. D. Dietrich, M.
Ginsberg, Expression of brain-derived neurotrophic factor, nerve growth factor,

29
and heat shock protein HSP70 following fluid percussion brain injury in rats.
Journal of neurotrauma 16, 471-486 (1999).

30
CHAPTER 2: ADDRESSING THE NEEDS OF TRAUMATIC BRAIN INJURY
WITH CLINICAL PROTEOMICS
2.1 INTRODUCTION
A general goal of “proteomics” is to comprehend the relationship between the
body’s proteins and how they change by disease to understand human
pathophysiology, and ultimately to provide therapeutic and diagnostic tools. The
completion of the human genome provided researchers with the blueprint for life;
proteomics offers the potential means for analyzing the expressed genome.
Proteomics attempts to determine how genes function within the genome and how
they communicate with each other to (hopefully) lead to important new insights into
disease mechanisms. The potential of proteomics to advance biomedical research is
high because the key functional components of biochemical systems and the cellular
targets of therapeutic agents, namely proteins, are being studied. Mapping
proteomes from injured tissues, cells and biofluids can potentially reveal new protein
targets to explore mechanisms of insults and to provide candidate lists for new
disease indicators or injury biomarkers as diagnostic or prognostic tools for the clinic.
A biomarker could be simply a molecule, such as a protein whose presence or
abundance in a biological sample signals a disease or insult to an organ. Thus, they
are quantifiable molecules that indicate a pathophysiological process. A biomarker in
accessible body fluids or tissues could greatly enhance our ability to identify patients
at risk, with invisible wounds or predict outcome of serious injury. A sensitive and
specific disease or injury marker such as an early protein abnormality could provide

31
a warning sign prior to being symptomatic, and hence could result in more effective
preventative care or treatment options to improve outcome.

32
2.2 DISCUSSION
The challenges of clinical proteomics and biomarkers
The goal of clinical proteomics to discover new disease or injury biomarkers is
challenging. Beyond the number of human genes coding for proteins, proteins are
processed and modified, comprising an important dimension of information to which
present proteomic technologies have but limited access. The total mRNA population,
accounting for alternate splicing, RNA editing, and use of alternate promoters could
contain 250,000 transcripts, while various protein modifications could increase the
size of the human proteome to over 500,000 members (1). Cellular proteins and their
post-translational modifications (PTMs) change with the cell cycle, environmental
conditions, developmental stage, and metabolic state. Independent of these
variables, biomarkers should reliably detect changes in health status, a specific
disease, or indicate whether an insult like a toxic exposure or trauma has occurred.
Clearly, we need proteomic approaches that advance beyond identifying proteins to
elucidating their co- and post-translational modifications, to following the dynamics of
those modifications, and to linking those modifications to specific diseases or cellular
responses to an insult that inflicted an organ. Despite all of the significant advances
in technologies in proteomics since its inception in the mid-1990s, with the
development of more sensitive mass spectrometry detectors and more selective and
specific strategies for sample processing and handling, no clinically validated disease
biomarker has been discovered by proteomics to date (2).

33
Meeting the challenge with targeted screens, focused selection strategies, and
clinical validation
What are the major factors that hindered finding robust disease and injury
biomarkers and how can these be overcome? The complexity of clinical samples
themselves is a significant limiting factor. Plasma and serum, i.e., blood, have been
biofluids of choice for measuring levels of proteins and other biomolecules for clinical
testing, as they can be sampled noninvasively. Plasma is a protein-rich information
source containing what blood circulation has encountered on its journey
throughout the body and tissue perfusion. The tremendous analytical challenge
of the large number of plasma proteins lays in their unbalanced abundance:
albumin constitutes over 50% of the plasma proteins (at 30–50 mg/mL) and the
most abundant 22 proteins in plasma represent approximately 99% of the total
protein content in plasma leaving the majority of proteins at very low abundance.
The estimated dynamic range of protein concentrations in human plasma may be
up to 12 orders of magnitude (3).
Disease or insults trigger acute events, secondary and chronic sequelae,
including inflammation, wound healing, and adaptive changes that the compromised
body undergoes in response to the unhealthy state. In an effort to identify original
disease causes or injury factors a simple experimental model can facilitate a
targeted screen circumventing secondary, less disease-specific events. As such,
scientific experimental model design follows controlled strategies for reproducibility
and simplicity that can facilitate the initial discovery by limiting candidate markers to
those proteins that are related to a disease origin or injury cause (4,5). One common

34
proteomics workflow involves a 2-dimensional separation prior to protein
identification to reduce sample complexity (Figure 1). Proteins can be sorted by
charge (isoelectric point) and size using two-dimensional polyacrylamide gel
electrophoresis (2D-PAGE) and can be enzymatically digested within the gel matrix.
Despite being developed over 3 decades ago (6,7), 2D-PAGE remains one of the
most powerful separation techniques for proteomic workflows and was instrumental
in early protein biomarker research. Following separation, gels are stained and
differentially expressed protein spots excised, enzymatically digested with trypsin,
and identified by MS requiring only sufficiently accurate mass measurements (low
part-per million range) performed on one or two tryptic peptides to identify silver
stained protein spots (8).
A second strategy advocates first enzymatically (e.g., with trypsin) or chemically
cleaving (“breaking”) a complex mixture of cellular proteins, and then “sorting” the
peptides by one or more steps of chromatography. MS analyzes the recovered
fragments as in the previous approach, and software matches the fragments to the
proteins from which they are derived. Examples of this experimental approach
include multidimensional protein identification technology (MudPIT) that couples two
or more dimensions of chromatographic separations, e.g., strong cation exchange
(SCX) with reversed phase chromatography (9,10). While the outlined approaches
have been instrumental in biomarker discovery research, the extensive sample
preparation and time required in gel fractionation and long HPLC LC-MS/MS
analyses make discovery proteomics feasible for only limited numbers of samples
per project (11,12). A simplified disease or injury model using a controlled

35
experimental design may help to relieve a proteomic screen from confounding
complexities of clinical samples (4,13-15).
A straightforward selection of suitable marker candidates from the ‘long list’ of
identified injury or disease specifically changed proteins should arrive at a
manageable ‘short list’ of possible disease marker candidates. A tailored selection
strategy will consider injury cause, marker candidates with the necessary reporting
power for the cause as well as organ specificity and exclusion of proteins normally
present in healthy plasma and tissues. The subsequent validation of selected disease
or injury markers from a group of candidates may occur stepwise starting with a
preclinical smaller cohort of patients and controls, allowing to test for normality (16).
Following initial confirmation, a larger subject cohort can be enrolled in clinical trials
allowing for receiver operating characteristic curve analyses that will establish the
basis for biomarker suitability in the clinic (17). Currently, the majority of biomarker
validation studies have been performed by enzyme-linked immunosorbent assay
(ELISA). This highly sensitive method is limited for use early in the verification
process, as antibody pairs have to be optimized for specificity and sensitivity for each
marker separately. As mass spectrometry measurements improve in sensitivity to
match immunoassay detection limits (pg/ mL), a targeted and quantitative mass
spectrometry application can provide multiplex capacity and absolute specificity by
gas-phase sequence determination, making it an ideal alternative for assessing
validity of selected marker candidates.
The need for markers of Traumatic Brain Injury (TBI)

36
Neurotrauma to the central nervous system (CNS) is a serious public health
problem in the US; among US civilians, TBI is most common in infants and toddlers,
adolescents and the elderly (18). The US National Institute of Neurological Disorders
and Stroke estimates that 2.5-6.5 million Americans have had one or multiple TBIs
(19). In the US military there were over 212,000 service men and women diagnosed
with some form of TBI between January 2000-May 2011, roughly accounting for one-
third of all injured US soldiers, making TBI the signature injury of the wars in Iraq and
Afghanistan compared to past wars (20). TBI contributes to over one third of all injury-
related deaths, yet 75-90% of all brain trauma cases are considered to be mild TBI
(mTBI), many without visible wounds that often are undiagnosed (21). Better
diagnostic tools are needed to detect head injuries, especially mTBI, to confirm and
to monitor the severity of TBI in order to determine the best course of action acutely
and later post-injury. The neurotrauma field has currently still no chemical diagnostic
marker in clinical use. Here we will outline briefly the spectrum of TBI and give
examples where a surrogate chemical marker assay for TBI would be of great benefit
to patients, high risk populations, their families and doctors.
Head injuries can be classified into penetrating and non-penetrating TBI.
Penetrating TBI involves physical compromise of the skull by an external object
resulting in specific, focused injury most commonly characterized by hemorrhages
and lesions. Non-penetrating TBI, is much more difficult to assess, as injuries may
not be visible or located precisely. Closed head injuries are caused by rapid
acceleration and deceleration of the brain within the skull and inflict shear and
deformation forces on gray matter tissue and white matter tracts (22). Each trauma

37
patient is a unique injury case with individual complexity, thus the field distinguishes
mainly between severe and mild TBI (mTBI) as opposite ends of a clinical spectrum
of manifestations. Evaluating and predicting outcome in severe TBI is often
problematic, especially for patients without visible wounds such as infants.
Diagnostic neurotrauma tools include imaging techniques, neurocognitive
examinations, and for severe TBI patients, the determination of post-traumatic
amnesia, but they provide only estimates of the dynamically evolving injury process.
Functional MRI (fMRI) and the detection of regional blood flow changes (e.g., PET
scans) are not always available, cannot be obtained in critically ill patients, and are
not definitive. Radiological brain scans on infants and toddlers are widely
considered problematic because the radiation dose endangers the developing brain.
Absence of imaging in the pediatric clinical praxis prevents distinguishing brain injury
from frequent intestinal flu or even infant irritability (23). Non-accidental head injury,
or “Shaken Baby” syndrome, caused by rotation-acceleration strains on the brain
in the still loosely connected infant skull causes bleeding and swelling that can lead
to catastrophic intracranial damage and can severely impair normal brain
development (and can even lead to death) (23). Undiagnosed victims may be sent
back to continued abuse. On the other hand, imaging does not distinguish inflicted
head injury from non-traumatic bleeding, originating from a trauma independent
condition – a situation in which legal authorities, parents and care-givers would
greatly benefit from an assay for brain trauma-specific chemicals (24,25).
Mechanical impacts traumatizing the brain obviously need to be clinically
differentiated from trauma in other organs or from other non-traumatic brain injuries

38
like stroke, ischemia, bleeding diseases, poisoning, epilepsy or chronic
degenerative diseases for proper treatment and activities in the operating room and
the courtrooms (26). Monitoring daily progression of a severe TBI patient by
repeated imaging can be quite impractical, considering life supporting intensive care
instrumentation. A fluid derived chemical marker for compromised brain cell viability
will be a useful added measure of the patients evolving status and could aid in
outcome prognosis.
For the vast majority of mTBI/concussion patients, there are no objective
diagnostic or prognostic tools (27). A ready diagnostic tool at point of care acutely
after TBI is needed especially for high-risk individuals (e.g., athletes, military
personnel). An objective and unambiguous trauma biochemical assay would be
valuable for legal authorities in forensic cases that currently rely on
neuropsychological testing that lacks premorbid base rates and is subject to
malingering and subjective interpretation. Thus, for high-risk groups, for mild and
severe TBI cases as well as for all pediatric neurotrauma patients, there is an urgent
need for an accurate, unambiguous chemical measure indicating that a significant
impact to the brain had occurred.
Moreover, a second hit to a concussed, vulnerable brain can, in rare cases,
have a catastrophic outcome with permanent brain damage or even death (known
as the second impact syndrome) (28). Several repeated concussions over time can
in later years cumulate in irreversible brain damage with devastating psychological
and cognitive decline, a pathological condition now defined as chronic traumatic
encephalopathy (CTE) (29,30). Military personnel and veterans with mild TBI often

39
suffer from post-traumatic stress disorder (PTSD) after being exposed to blast
waves from explosive devices (31,32).
Certain areas of the brain may be more susceptible to concussive trauma. A
recent study investigated longitudinal changes in global and regional brain volume
in patients one year after mTBI and correlated such changes with clinical and
neurocognitive metrics. Magnetic resonance imaging data showed measureable
global brain atrophy, larger than that in control subjects one year after mTBI.
Atrophy was found in specific regions of the cingulate cortex independent of the site
of initial trauma. The cingulate cortex’s role in rational cognitive functions such as
empathy, impulse control, and emotion correlate strongly with the patient’s observed
clinical symptoms of increased depression and anxiety (33). These finding are
supported by an independent study of National Football League players and
referees using positron emission tomography (PET) with a tau specific tracer that
showed higher densities of tau tangles in regions of the brain involved in a nearby
region (caudate nucleus) that is also associated with learning, memory, emotion,
and language comprehension. The deposition of tau tangles is consistent with
those observed in CTE autopsy patients (34).
Current evaluation of concussion is basically an assessment of neurocognitive
deficits, often not immediate and requires extensive neuropsychological testing that
is subject to motivational confounds, while critical care treatment decisions have to
be made immediately by emergency clinical personnel and surgeons. Severity
classification of TBI patients relies on assessing the level of consciousness,
commonly with the Glasgow Coma Scale (GCS), which is an insensitive measure.

40
Testing relies on verbal communication, and proper motor control and eye function,
which are often impaired after TBI. Brain function-altering substances such as drugs,
alcohol, pain medication, sedatives, or even induced coma as part of emergency and
intensive care routine obviously compromise the use of memory recall and the GCS.
Although predictors of TBI exist, such as the Standardized Assessment of
Concussion test, these tools offer little insight into the pathology of the disease
beyond determining whether a concussion has occurred or not. Because of this lack
of insight into TBI, licensed health care providers of concussive sports injury are
conservative in their approach to player safety after injury with the hope that
coordination between sideline and clinical practitioners will aid in improving our
understanding of the extent of impairment for various types of sports related
concussions (35).
Current potential TBI biomarker candidates
An ideal biomarker should be both specific to head trauma as well as
sufficiently sensitive to be measured and quantified reproducibly in patient blood or
other peripheral or proximal fluid samples (such as CSF) by an assay of choice.
These markers should be acutely released into the fluids following injury and show a
distinct temporal signal pattern. The identification of a unique TBI biomarker(s) or
surrogate brain cell injury markers that meet these criteria would provide physicians
with an objective method for early diagnosis of brain injury and enable early
assessment of severity, intervention, and monitoring disease progression (36).
Multiple neurotrauma signature markers would allow for correlation analyses with

41
improved statistical power using multivariant logistic regression or similar analyses
(37). Finding candidate TBI markers is pursued typically by these strategies: (1)
Classical deduction chooses proteins with literature reported association to brain
injury or its secondary events like inflammation, axonal degeneration or reactive
astrogliosis. (2) Hypothesis driven animal trauma model studies report changes in
specific proteins using available antibodies or pathway tailored kits (38). (3) Discovery
of trauma associated proteins using a proteomic screen of samples derived from
animal injury models or small patient cohorts (39-43). Surprisingly, few screens address
the impact of mechanical trauma on brain cells, i.e., cell death (13,14,44). After briefly
summarizing currently investigated candidate TBI markers, we will evaluate challenges
and alternatives in identifying TBI markers.
Inflammatory markers
Part of the pathology of CNS injury is characterized by secondary effects,
including the inflammatory response to TBI. Cytokines are key mediators in the
process of (neuro)inflammation (45) and increased concentrations of these
compounds have been associated with severe CNS injury as well as post-traumatic
hypoxia (46,47). For example, elevated levels of interleukin-10 (IL-10), an anti-
inflammatory cytokine, was measured in low pg/mL levels in CSF and low-mid pg/mL
levels in serum (Table 1) and correlated with severe TBI determined by the GCS
(46,48-50). Higher Il-10 serum levels illustrate the systemic nature of an
inflammatory response. Such responses are systemic in nature and not specific to
TBI, but occur with any insult, hence inflammatory markers are not ‘pointing to brain

42
injury’.
Neuronal markers
With their elongated axonal and dendritic processes, neurons are exposed to
shear forces associated with the whiplash trauma of a concussion. Acute plasma
membrane permeablility, or mechanoporation, compromises cell integrity and is
linked to diffuse axonal injury in response to a mechanical impact (71-73). Tau
protein is a member of microtubule-associated proteins involved in maintaining
cytoskeletal structure and axonal transport. It is expressed by CNS neurons and
oligodendrocytes and found primarily in axons (74). Traditionally used in the
diagnosis of Alzheimer’s disease, elevated levels of Tau in CSF and serum have
been linked to CNS insults like TBI and stroke (62,75). CSF and serum studies of
TBI patients have measured elevated Tau protein concentrations in the 1000 ng/mL
range in young adult TBI patients, whereas it is three orders of magnitude lower in
neonates with brain insults (59,65,66). Because of Tau’s chronic accumulation after
various CNS insults, it seems less useful as an acute head trauma marker.
Mylein basic protein (MBP) is released with myelin debris that accumulates
with axonal damage in the injured brain or spinal cord. MBP is one of three proteins
comprising the myelin sheath essential for axonal impulse conduction (76). MBP
markers have shown promise in the appraisal of TBI with serum levels in the low-
mid ng/mL range (77,78). Similar to GFAP (vide infra), studies have demonstrated
degradation of MBP isoforms as a result of TBI (79,80).
Neuron Specific Enolase (NSE), Microtubule-associated protein 2 (MAP-2)

43
and ubiquitin C-term hydrolase L1 (UCH-L1) all display differential expression
patterns in TBI patients. NSE, a glycolytic enzyme isoform of neurons, has been
documented to increase following head trauma (77), but has a slow elimination
process, making it difficult to distinguish between primary and secondary injuries
(81). Additionally, NSE is released during the process of hemolysis, making it difficult
to pin down the source of injury (82).
Microtubule-associated protein 2 (MAP-2) is a cytoskeletal-associated protein
localized to dendrites of neurons that is believed to function in the growth and
maturation of dendrites as well as cytoskeletal organization (83). Previous studies
have demonstrated that MAP-2 is absent from damaged regions of the brain and that
serum levels increase early after injury (84). Mondello et al. assessed the long-term
release of MAP-2 in blood 6 months post trauma by ELISA immunoassay and found
that severe TBI patients had significantly higher serums levels of MAP-2 compared to
normal non-TBI patients. TBI patients in a vegetative state, as assessed by the GCS,
however, showed no increase in serum MAP-2 versus controls. This suggests that
MAP-2 could provide insight into the mechanism of neuronal remodeling as well as
discriminate between patients with deficits in consciousness and increased risk of
unfavorable outcomes (70).
Ubiquitin C-terminal hydrolase-L1 (UCH-L1) has been identified in a cell death
culture assay and is verified by ELISA to be significantly increased in TBI patients
(85). Neurodegenerative marker UCH-L1 fluid levels are also elevated in ischemia,
vasospasm, infarction, and carbon monoxide poisoning (86-88). UCH-L1 is a
proteolytically stable, abundant neuronal protein (69,70,85,89). Future studies will
44
show whether these proteins would be present in mTBI subjects without significant
brain cell death.
Trauma specific breakdown products of neuronal and glial cytoskeletal proteins
Spectrin breakdown products (SBDPs) have been identified as potential TBI
biomarkers in rat CSF fluid (90). αII-Spectrin is the submembraneous cortical
cytoskeleton of neurons and astroglia, sharing 50-59% homology with the abundant
erythroid α-spectrin (44,91). Cell-death associated spectrin fragments of molecular
weight 150 kDa (SBDP150) and two N-terminal fragments at 145 kDa (SBDP145)
and 120 kDa (SBDP120) cleaved by calpain and caspase-3 have been identified in
a cell death culture model (87,92,93). Using a sandwich ELISA methodology,
Mondello et al. showed both SBDP145 and SBDP120 increased in patients post-
TBI, with SBDP145 present immediately post-trauma and SBDP120 most accurately
measured 24 hr post-injury. SBDP CSF levels greater than specific thresholds
were shown to correlate with poor outcome and mortality and the temporal
expression of SBDP for non-surviving patients differed from that of surviving
patients. Thus, if cross-reactivity and breakdown specificity is controlled, SBDPs in
CSF may aid to predict the severity of injury and mortality (69).
Astroglial markers
Astroglia are the most abundant cells in the human cerebral cortex (94) and
respond to insult by becoming reactive, a process that involves gene expression,
morphological changes, proliferation, and the formation of a glial scar around lesions

45
(95-99). However, astrocytes are also trauma victims as they are especially
vulnerable to acidosis, pressure elevation, and hypoxic/ischemic damage, known co-
morbidities of TBI (100-103). Human astrocytes display very long thin processes that
cross through several laminae from the pia to the ventricular walls, so called
interlaminar processes and are hence vulnerable to shear and deformation forces
similar to those that cause diffuse axonal injury in white matter tracks (104,105). Two
of the most well studied TBI marker candidates are S100β and glial fibrillary acidic
protein (GFAP), both glial proteins. S100β is a calcium binding protein that is
predominantly produced by astrocytes within the CNS. Because S100β is also
produced in a variety of non-CNS cells (e.g., lymphocytes, bone marrow, adipocytes,
and glia of peripheral nerves), brain specificity is its problem (106). It has, however,
been reported that the few extracranial sources of S100β are short lived compared
to S100β from cerebral lesions (107,108). Elevated S100β concentrations have been
measured in the ng/mL and pg/mL range in TBI patient CSF and serum, respectively
(51,53). Despite the immediate spike in S100β levels, it has been found that S100β
measurements taken 24 hours post TBI offer the most prognostic value for patient
outcome due to initial interference from external S100β (52). S100β is released into
the perivascular space immediately following blood brain barrier (BBB) compromise
and may serve as a BBB-permeability marker (109). Additionally, higher levels of
S100β have been correlated to patients suffering from post-traumatic hypoxia,
demonstrating the interrelation between secondary effects and amplified biomarker
expulsion (46).
GFAP is an intermediate filament that is highly enriched in CNS astroglia, but

46
is also expressed in Schwann cells and olfactory ensheathing glia of peripheral
nerves (110-112). GFAP levels are persistently elevated after severe TBI in CSF and
serum, relate to poor outcome, and are predictive for mortality (54,55,113). Serum
levels of GFAP show high variability or no elevation after mTBI, yet reports are
confounded by varying delimitation of ‘mild’ as to include more moderate cases with
lesions and positive imaging signals or not. Thus the discriminative power of GFAP
as a mild neurotrauma biomarker is conflicted (56,114). Measured CSF levels of
several biomarkers in boxers acutely after one or repeated blows to the head as
well as after 14 days, revealed elevated levels of GFAP with large variations among
the boxers suffering a concussion (56). GFAP breakdown products are found after
TBI and are being explored as insult-specific markers (114-116).
Strategies for addressing the challenges in identifying and validating new TBI
biomarkers
For a brain cell specific protein to be a trauma marker, either it should be
selectively expressed in response to the trauma and then discharged into fluids, or
cytosolic proteins released solely from injured neurons and glia with compromised
membrane integrity or dying brain cells (73,117). A suitable study design to identify
fluid-derived trauma specific proteins would employ a targeted proteomic screen on
a defined trauma model. Experimental animal injury models were developed with
the effort to mimic human TBI as closely as possible while underlying cellular and
molecular mechanisms of acute trauma are still scantly investigated. The predominant
criterion is to recapitulate the clinical manifestation of TBI over studies using

47
simplified reproducible trauma models with the goal to determine primary cellular
injury consequences (4,5). Most commonly used injury models include focal injuries
with the animal’s head in a fixed position, like fluid percussion and controlled cortical
impact, which produce a focal contusion with hematoma and hemorrhage while the
dura remains intact (118,119). Also used is Marmarou’s weight drop model where
distributed forces cause diffuse injury with the animal’s head unrestrained in a helmet
and the brain is therefore subjected to rotational forces as well (120,121). Blast
injury models historically use shock tubes and larger animals, but have been
adapted recently to rodents as well as investigated for milder blast effects from
explosion exposures in the field (122).
Developing biochemical markers of TBI by proteomics and mass spectrometry
Proteomic studies of injured brain or spinal cord tissue are being done in
these injury models and are providing lists of protein changes that are difficult to
interpret due to the complexity of events at and around a dynamically changing
lesion site and variations between models (39,40,42). Injury zones are not
reproducibly defined from lab to lab as histopathological analyses have for long not
followed standardized analysis and reporting criteria (5). Tissue derived protein
signals are products of a changing composition of viable, injured, and dead cells as
well as infiltrating non-neural cells, that complicate the interpretation of proteomic
studies (97,99). An effort has been made in recent years to standardize and
compare severities of commonly used TBI animal models across centers (123).
Defining common data elements for collection, analysis protocols, and reporting of

48
fluid samples and histopathological defining features of injury models will help this
field in interpreting proteomic and biomarker preclinical studies as well as clinical
data collection and interpretation (124-126).
Proteomic TBI marker projects on biofluids using rodent injury models have
been few due to naturally limited available fluid amounts (42,127), but biofluid
neurotrauma marker candidates have been studied in pig blast injury models (128-
132). Human proteomic analyses have started from severe trauma patient’s CSF and
plasma from individual patients (41,133). Bioinformatics analysis tools are expected
to facilitate systems level understanding of neurotrauma protein changes (134,135).
While bioinformatics tools are indispensable for classification, consensus-based data
collection, and data mining, they will not make the bottleneck of biomarker candidate
selection much easier.
Hanrieder et al. describes a workflow using matrix-assisted laser desorption
ionization time-of-flight (MALDI- TOF) MS/MS in conjunction with off-line nano-LC
sample fractionation (136). In their study, ventricular CSF samples from 3 severe TBI
patients displaying different symptoms were taken at various time points post-trauma
and analyzed by nano-LC MALDI-TOF MS/MS to determine temporal protein
expression changes. CSF samples were digested with trypsin and labeled with
isobaric tags for relative and absolute quantitation using the iTRAQ method
(137,138). Labeled tryptic digests were then separated on a nano-flow LC system
equipped with online fraction collection capable of depositing fractions directly onto
MALDI sample plates for MALDI-TOF MS/MS-based identification and quantification.
Several proteins were increased after injury. Additionally, relative quantification using

49
iTRAQ labeling revealed temporal changes in protein expression for several
inflammation-related proteins (e.g., serum amyloid, fibroinogen alpha chain,
ceruloplasmin) as well as known neurotrauma-related proteins (GFAP, NSE).
Due to the confounding complexity of clinical TBI and clinic-resembling animal
injury models, we propose a targeted proteomic screen using a well-characterize in
vitro cell-based trauma model as a starting point for TBI marker candidate
identification (139-144). This will limit protein changes to those directly related to an
acute mechanical trauma by applying an abrupt pressure pulse inflicting shear forces
and deformation onto cortical brain cells in a reproducible fashion at various severities
(142). We are finding robust cellular release patterns that correlate with cell injury
and cell death of rodent and human astrocytes matured and stretched in a prototype
of this injury model (139). A suitable selection strategy needs to be applied to any
trauma-release protein list to eliminate proteins found in healthy human plasma and
to focus on brain-specific proteins (145,146).
Verifying biochemical markers for TBI by proteomics and mass spectrometry
One analytical challenge that is unique to TBI for measuring candidate
biomarkers lays in the unpredictably fluctuating protein concentrations among CSF
samples from different TBI patients (low microgram/ml to several mg/ml range). This
may be due to as variables such as the patient’s varying blood–brain barrier integrity,
hemorrhage, brain cell protein leakage, as well as waves of brain cell death. This is
unlike healthy CSF or plasma with constant and physiologically controlled protein
levels allowing for sample preparation with reproducible protein amounts (147).

50
These injury specific variables can be addressed only by relating all measurements
to raw, unprocessed sample volume regardless of depletion and other processing
steps including optimizing protein amounts for trypsin digestion or immunoassay
applications. There are also injury-related but not-trauma specific secondary
changes in protein composition in trauma CSF that could be caused by secondary
infection due to hospitalization that could reduce protein amounts or bacterial
proteins present in the samples. Such samples should be omitted from an initial
biomarker validation study.
The accepted “gold standard” of single-protein measurements is the ELISA
immunoassay, which takes advantage of the specificity and diversity of IgG antigen
recognition. Yet, while ELISA is well touted for its high sensitivity (~1 pg/mL), it is
not without limitations (148). ELISA methods rely on antibodies for protein detection
and assay development ideally uses two antibodies against different epitopes of the
candidate TBI marker. Non-specific binding of immunoglobulins to abundant plasma
proteins may contribute to a background problem, limiting the availability of suitable
highly specific antibodies ideally from different host animals to cancel out non-
specific binding. The availability of such antibody pairs often requires de novo
generation, lengthening the assay development time. Thus, the lack of multiplex
capacity may exclude using the ELISA platform as initial validation tool of candidate
TBI markers in patient samples (149).
By not relying on antibody-antigen binding, quantitative mass spectrometry is
well suited to meet the challenge of overcoming the verification bottleneck where
immunoassays cannot be applied. MRM-MS is quickly becoming the preferred

51
method of candidate biomarker verification because of the discriminating power of
mass analyzers to accurately measure and quantify multiple specific proteins within
a single sample set. Specific peptide fragments (via trypsin digestion) corresponding
to the candidate proteins are selected to act as stoichiometric representatives (or
surrogates) within a complex patient CSF or blood sample. The mass spectrometer
(usually a triple quadrupole analyzer) is then set to scan for the precursor peptide
ion, fragment the precursor in the collision cell, and then select for a specific
precursor fragment (known as a transition). Because the mass spectrometer is not
expending resources scanning through all the ions within a complex patient sample,
the signal from less abundant peptides are no longer being masked by highly
abundant ions, partially addressing the problems with high dynamic range
limitations. Additionally, MRM provides a more cost-effective alternative for
quantification compared to traditional ELISA methods by using stable isotope-
labeled internal standards of the selective candidate peptides. Using the method of
isotope dilution (150), isotopically labeled peptides are spiked into digested CSF or
blood samples and the relative peak heights between the endogenous peptides and
isotope-labeled peptides are used to quantify selected candidate biomarkers. This
approach has been greatly aided by the increased availability of stable isotope-
labeled standard (SIS) peptides manufactured and sold by life science companies
(151). MRM-MS has long been a method of choice for detecting marker metabolites
for amino acids, organic acids, and fatty acid disorders in newborns (152). The
success of these quantitative methods in candidate biomarker discovery/verification
has been well documented in a variety of samples such as synovial fluid (153), CSF

52
(154), and plasma (155).
The MRM-MS platform is ideally suited to address the challenge of validating
several marker candidates at once (multiplexing) and measuring their levels together
with candidate TBI markers reported in the literature. This is in large part due to
advances in in pre-analysis enrichment methods (156) as well as improvements in
both sensitivity and speed of modern mass spectrometers that allow for detection and
quantitation in the low-mid ng/mL concentration range. Hybrid Orbitrap mass
spectrometers such as the Q-Exactive have demonstrated the ability to detect up to
10 amol of heavy SIS peptides in the presence of 10 ng- 1 ug of yeast tryptic digest
background with up to 10 ppm mass accuracy (157). Coupled with the high re- solving
power of Orbitrap detectors (up to 140 K for the Q-Exactive) and fast duty cycles to
collect full MS/MS spectra, these instruments should be able to confidently identify
surrogate peptides. When comparing the low cost of SIS peptide generation from
commercial sources to the cost of antibody generation and capacity to multiplex more
than ten within a single analytical sample, the mass spectrometry platform is a
feasible choice for TBI candidate marker verification for the early preclinical validation
stage. Following this initial verification, antibodies will be generated only for the most
robustly detected TBI marker candidates for ELISA assay development for future
clinical trials and diagnostic use.

53
2.3 CONCLUSIONS
Combining a targeted screen, a focused selection strategy, and a stepwise
approach from preclinical validation towards clinical translation offers a feasible
pipeline for candidate TBI marker identification and preparation for its diagnostic
use. Validation through a stepwise increasing sample cohort and moving from
severe TBI CSF to matching plasma samples and then to mTBI plasma samples will
provide verification where experimental analyses and patient samples are matched
with appropriate positive controls along the way.
Moreover, the emergence of targeted MS-technologies brings promise to the
development of an efficient biomarker discovery to verification pipeline for TBI. This
pipeline could consist of the initial application of proteomics technologies in the form
of comparative 2D-PAGE and shotgun LC-MS/MS to identify and discover candidate
biomarkers from trauma and healthy subject samples. This is followed by the
development of quantitative MRM-MS to assess the biological significance of these
markers followed by clinical validation in a larger scale. With the possibility of
multiplexing using proteomic methods such as MRM-MS, the time required for pre-
clinical verification can be reduced as tens of marker candidate proteins can be
monitored concurrently in clinical samples. This process will help narrow the pool
of potential surrogates from which the most specific and easily measured candidates
can be chosen for clinical validation and assay development.

54
2.4 FIGURES
Figure 2.1: Candidate Biomarker Discovery and Verification Workflow.
Bottom-up proteomics strategies, such as shotgun proteomics (multidimensional LC-
MS/MS) and 2D-PAGE/MS, can be applied to identify putative candidate markers (left).
Candidate protein markers can be subsequently verified and confirmed by targeted
proteomics using standard ELISA methods or multiple reaction monitoring (MRM)-MS
(right). MRM-MS offers the advantages of an antibody-independent platform with
capabilities for multiplexing.
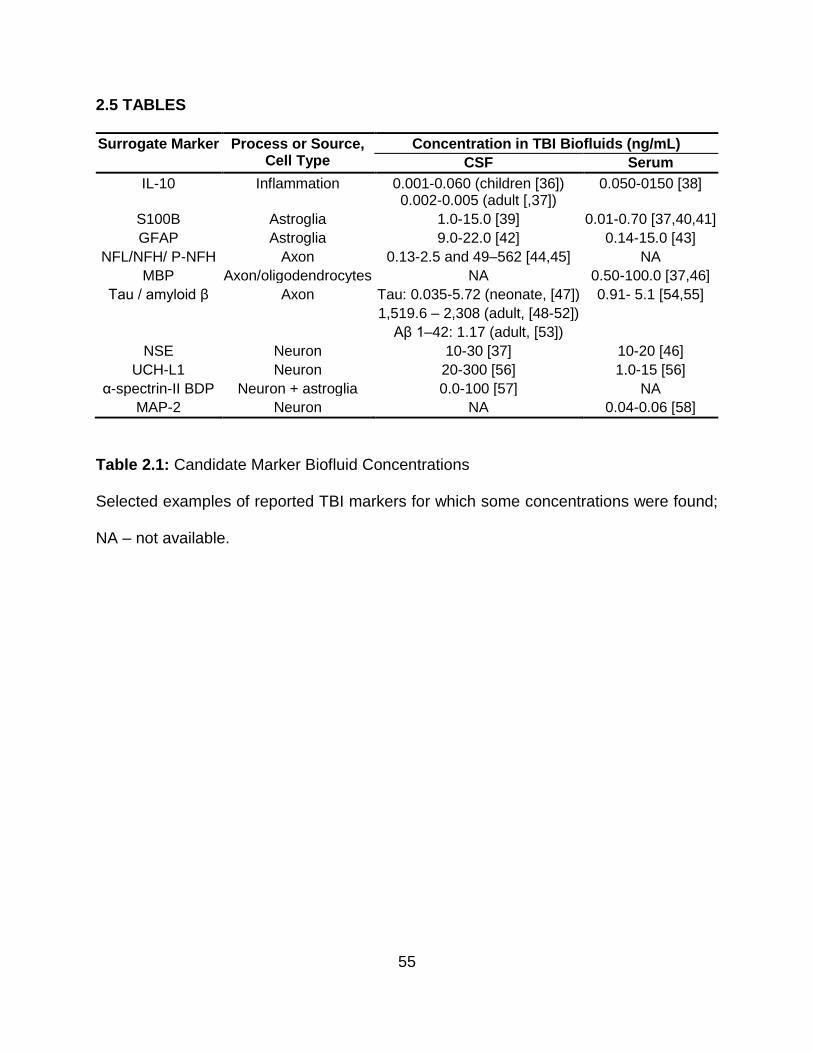
55
2.5 TABLES
Surrogate Marker Process or Source, Cell Type
Concentration in TBI Biofluids (ng/mL)
CSF Serum
IL-10 Inflammation 0.001-0.060 (children [36]) 0.002-0.005 (adult [,37])
0.050-0150 [38]
S100B Astroglia 1.0-15.0 [39] 0.01-0.70 [37,40,41]
GFAP Astroglia 9.0-22.0 [42] 0.14-15.0 [43]
NFL/NFH/ P-NFH Axon 0.13-2.5 and 49–562 [44,45] NA
MBP Axon/oligodendrocytes NA 0.50-100.0 [37,46]
Tau / amyloid β Axon Tau: 0.035-5.72 (neonate, [47]) 0.91- 5.1 [54,55]
1,519.6 – 2,308 (adult, [48-52])
Aβ 1–42: 1.17 (adult, [53])
NSE Neuron 10-30 [37] 10-20 [46]
UCH-L1 Neuron 20-300 [56] 1.0-15 [56]
α-spectrin-II BDP Neuron + astroglia 0.0-100 [57] NA
MAP-2 Neuron NA 0.04-0.06 [58]
Table 2.1: Candidate Marker Biofluid Concentrations
Selected examples of reported TBI markers for which some concentrations were found;
NA – not available.

56
2.6 REFERENCES
1. Alam SL, Atkins JF, Gesteland RF: Programmed ribosomal frameshifting: much
ado about knotting! Proc Natl Acad Sci U S A 1999, 96:14177–14179.
2. Poste G: Bring on the biomarkers. Nature 2011, 469:156–157.
3. Anderson L: Candidate-based proteomics in the search for biomarkers of
cardiovascular disease. J Physiol 2005, 563:23–60.
4. Spaethling JM, Geddes-Klein DM, Miller WJ, von Reyn CR, Singh P, Mesfin M,
Bernstein SJ, Meaney DF: Linking impact to cellular and molecular sequelae of
CNS injury: modeling in vivo complexity with in vitro simplicity. Prog Brain Res
2007, 161:27–39.
5. Kazanis I: CNS injury research; reviewing the last decade: methodological errors
and a proposal for a new strategy. Brain Res Brain Res Rev 2005, 50:377–386.
6. Klose J: Protein mapping by combined isoelectric focusing and electrophoresis of
mouse tissues. Humangenetik 1975, 26:231–243.
7. O'Farrell PH: High resolution two-dimensional electrophoresis of proteins.
J Biol Chem 1975, 250:4007–4021.
8. Nielsen ML, Bennett KL, Larsen B, Moniatte M, Mann M: Peptide end sequencing
by orthogonal MALDI tandem mass spectrometry. J Proteome Res 2002, 1:63–
71.
9. Washburn MP, Wolters D, Yates JR: Large-scale analysis of the yeast proteome
by multidimensional protein identification technology. Nature Biotechnol 2001,
19:242–247.
10. Wolters DA, Washburn MP, Yates JR III: An automated multidimensional protein

57
identification technology for shotgun proteomics. Anal Chem 2001, 73:5683–
5690.
11. Matt P, Fu Z, Fu Q, Van Eyk JE: Biomarker discovery: proteome fractionation and
separation in biological samples. Physiol Genomics 2007, 33:12–17.
12. Parker CE, Pearson TW, Anderson NL, Borchers CH: Mass-spectrometry-based
clinical proteomics – a review and prospective. Analyst 1830, 2010:135.
13. Siman R, McIntosh TK, Soltesz KM, Chen Z, Neumar RW, Roberts VL: Proteins
released from degenerating neurons are surrogate markers for acute brain
damage. Neurobiol Dis 2004, 16:311–320.
14. Siman R, Toraskar N, Dang A, McNeil E, McGarvey M, Plaum J, Maloney E,
Grady MS: A panel of neuron-enriched proteins as markers for traumatic brain
injury in humans. J Neurotrauma 2009, 26:1867–1877.
15. Rifai N, Gillette MA, Carr SA: Protein biomarker discovery and validation: the long
and uncertain path to clinical utility. Nat Biotechnol 2006, 24:971–983.
16. Shapiro SS, Wilk MB: An analysis of variance test for normality (complete
samples). Biometrika 1965, 52:591–611.
17. Borchers CH, Parker CE: Improving the biomarker pipeline. Clin Chem 2010,
56:1786–1788.
18. Faul M, Xu L, Wald MM, Coronado VG: Traumatic Brain Injury in the United
States: Emergency Department Visits, Hospitalizations and Deaths 2002–2006.
Atlanta, GA: Centers for Disease Control and Prevention, National Center for
Injury Prevention and Control; 2010. http://www.cdc.gov/traumaticbraininjury/
pdf/blue_book.pdf.

58
19. National Institute of Neurological Disorders and Stroke: Traumatic Brain Injury:
Hope Through Research. 2002. http://www.ninds.nih.gov/disorders/
tbi/tbi_htr.pdf.
20. Risdall JE, Menon DK: Traumatic brain injury. Phil Trans Royal Soc London,
Series B, Biol Sci 2011, 366:241–250.
21. Gordon WA, Brown M, Sliwinski M, Hibbard MR, Patti N, Weiss MJ, Kalinsky R,
Sheerer M: The enigma of "hidden" traumatic brain injury. J Head Trauma Rehabil
1998, 13:39–56.
22. North SH, Shriver-Lake LC, Taitt CR, Ligler FS: Rapid Analytical Methods for On-
Site Triage for Traumatic Brain Injury. Ann Rev Anal Chem 2012, 5:35–56.
23. Squier W: The "Shaken Baby" syndrome: pathology and mechanisms.
Acta Neuropathol 2011, 122:519–542.
24. Geddes JF, Tasker RC, Hackshaw AK, Nickols CD, Adams GGW, Whitwell HL,
Scheimberg I: Dural haemorrhage in non-traumatic infant deaths: does it explain
the bleeding in 'shaken baby syndrome'? Neuropath Appl Neuro 2003, 29:14–22.
25. Laposata ME, Laposata M: Children with signs of abuse: when is it not child
abuse? Am J Clin Pathol 2005, 123 (Suppl): S119–S124.
26. Yokobori S, Hosein K, Burks S, Sharma I, Gajavelli S, Bullock R: Biomarkers for
the clinical differential diagnosis in traumatic brain injury–a systematic review.
CNS Neurosci Ther 2013, 19:556–565.
27. Bettermann K, Slocomb JE: Clinical Relevance of Biomarkers for Traumatic Brain
Injury. In Biomarkers for Traumatic Brain Injury. Edited by Thurston D.
Cambridge: Royal Society of Chemistry; 2012:1–18.

59
28. Cobb S, Battin B: Second-impact syndrome. J Sch Nurs 2004, 20:262–267.
29. Baugh CM, Stamm JM, Riley DO, Gavett BE, Shenton ME, Lin A, Nowinski CJ,
Cantu RC, McKee AC, Stern RA: Chronic traumatic encephalopathy:
neurodegeneration following repetitive concussive and subconcussive brain
trauma. Brain Imaging Behav 2012, 6:244–254.
30. Stein TD, Alvarez VE, McKee AC: Chronic traumatic encephalopathy: a spectrum
of neuropathological changes following repetitive brain trauma in athletes and
military personnel. Alzheimers Res Ther 2014, 6:4.
31. Kennedy JE, Leal FO, Lewis JD, Cullen MA, Amador RR: Posttraumatic stress
symptoms in OIF/OEF service members with blast-related and non-blast-related
mild TBI. Neurorehabil 2010, 26:223–231.
32. Cifu DX, Taylor BC, Carne WF, Bidelspach D, Sayer NA, Scholten J, Campbell
EH: Traumatic brain injury, posttraumatic stress disorder, and pain diagnoses in
OIF/OEF/OND Veterans. J Rehabil Res Dev 2014, 50:1169–1176.
33. Zhou Y, Kierans A, Kenul D, Ge Y, Rath J, Reaume J, Grossman RI, Lui YW: Mild
traumatic brain injury: longitudinal regional brain volume changes. Radiology
2013, 267:880–890.
34. Small GW, Kepe V, Siddarth P, Ercoli LM, Merrill DA, Donoghue N, Bookheimer
SY, Martinez J, Omalu B, Bailes J, Carrio J: PET scanning of brain tau in retired
national football league players: preliminary findings. Am J Geriat Psych 2013,
12:138–144.
35. Giza CC, Kutcher JS, Ashwal S, Barth J, Getchius TSD, Gioia GA, Gronseth GS,
Guskiewicz K, Mandel S, Manley G, McKeag DB, Thurman DJ, Zafonte R:

60
Summary of evidence-based guideline update: evaluation and management of
concussion in sports: Report of the Guideline Development Subcommittee of the
American Academy of Neurology. Neurology 2013, 80:2250–2257.
36. Bakay RAE, Ward AA Jr: Enzymatic changes in serum and cerebrospinal fluid in
neurological I njury. J Neurosurg 1983, 58:27–37.
37. Diaz-Arrastia R, Wang KK, Papa L, Sorani MD, Yue JK, Puccio AM, McMahon
PJ, Inoue T, Yuh EL, Lingsma HF, Maas AI, Valadka AB, Okonkwo DO, Manley,
The Track-Tbi Investigators GT, Casey IS, Cheong M, Cooper SR, Dams-
O'Connor K, Gordon WA, Hricik AJ, Menon DK, Mukherjee P, Schnyer DM, Sinha
TK, Vassar MJ: Acute biomarkers of traumatic brain injury: relationship between
plasma levels of ubiquitin C-Terminal Hydrolase-L1 and Glial Fibrillary Acidic
Protein. J Neurotrauma 2014, 31:19–25.
38. Light M, Minor KH, DeWitt P, Jasper KH, Davies SJ: Multiplex array proteomics
detects increased MMP-8 in CSF after spinal cord injury. J Neuroinflammation
2012, 9:122.
39. Yan X, Liu J, Luo Z, Ding Q, Mao X, Yan M, Yang S, Hu X, Huang J, Luo Z:
Proteomic profiling of proteins in rat spinal cord induced by contusion injury.
Neurochem Int 2010, 56:971–983.
40. Boutte AM, Yao C, Kobeissy F, May Lu XC, Zhang Z, Wang KK, Schmid K,
Tortella FC, Dave JR: Proteomic analysis and brain-specific systems biology in a
rodent model of penetrating ballistic-like brain injury. Electrophoresis 2012,
33:3693–3704.
41. Sjodin MO, Bergquist J, Wetterhall M: Mining ventricular cerebrospinal fluid from
61
patients with traumatic brain injury using hexapeptide ligand libraries to search
for trauma biomarkers. J Chromatogr B Analyt Technol Biomed Life Sci 2010,
878:2003. 2012.
42. Crawford F, Crynen G, Reed J, Mouzon B, Bishop A, Katz B, Ferguson S, Phillips
J, Ganapathi V, Mathura V, Roses A, Mullan M: Identification of plasma
biomarkers of TBI outcome using proteomic approaches in an APOE mouse
model. J Neurotrauma 2012, 29:246–260.
43. Ottens AK, Bustamante L, Golden EC, Yao C, Hayes RL, Wang KK, Tortella FC,
Dave JR: Neuroproteomics: a biochemical means to discriminate the extent and
modality of brain injury. J Neurotrauma 2010, 27:1837–1852.
44. Guingab-Cagmat JD, Newsom K, Vakulenko A, Cagmat EB, Kobeissy FH,
Zoltewicz S, Wang KK, Anagli J: In vitro MS-based proteomic analysis and
absolute quantification of neuronal-glial injury biomarkers in cell culture system.
Electrophoresis 2012, 33:3786–3797.
45. Woodcock T, Morganti-Kossmann MC: The Role of Markers of Inflammation in
Traumatic Brain Injury. Front Neurol 2013, 4:18.
46. Yan EB, Satgunaseelan L, Paul E, Bye N, Nguyen P, Agyapomaa D, Kossmann
T, Rosenfeld JV, Morganti-Kossmann MC: Post-Traumatic Hypoxia Is Associated
with Prolonged Cerebral Cytokine Production, Higher Serum Biomarker Levels,
and Poor Outcome in Patients with Severe Traumatic Brain Injury. J Neurotrauma
2014. doi:10.1089/neu.2013.3087.
47. Kadhim HJ, Duchateau J, Sebire G: Cytokines and brain injury: invited review. J
Intensive Care Med 2008, 23:236–249.

62
48. Bell MJ, Kochanek PM, Doughty LA, Carcillo JA, Adelson PD, Clark RS,
Wisniewski SR, Whalen MJ, DeKosky ST: Interleukin-6 and interleukin-10 in
cerebropinal fluid after severe traumatic brain injury in children. J Neurotrauma
1997, 14:451–457.
49. Schneider Soares FM, Menezes de Souza N, Libório Schwarzbold M, Paim Diaz
A, Costa Nunes J, Hohl A, Nunes Abreu da Silva P, Vieira J, Lisboa de Souza R,
Moré Bertotti M, Schoder Prediger RD, Neves Linhares M, Bafica A, Walz R:
Interleukin-10 Is an independent biomarker of severe traumatic brain injury
prognosis. Neuroimmunomodulation 2012, 19:377–385.
50. Kamm K, VanderKolk W, Lawrence C, Jonker M, Davis AT: The effect of
traumatic brain injury upon the concentration and expression of interleukin-1β and
Interleukin-10 in the Rat. J Trauma: Injury, Infection, Critical Care 2006, 60:152–
157.
51. Goyal A, Failla MD, Niyonkuru C, Amin K, Fabio A, Berger RP, Wagner AK:
S100b as a prognostic biomarker in outcome prediction for patients with severe
traumatic brain injury. J Neurotraum 2013, 30:946–957.
52. Egea-Guerrero JJ, Murillo-Cabezas F, Gordillo-Escobar E, Rodríguez-Rodríguez
A, Enamorado-Enamorado J, Revuelto-Rey J, Pacheco-Sánchez M, León-Justel
A, Domínguez-Roldán JM, Vilches-Arenas A: S100B protein may detect brain
death development after severe traumatic brain injury. J Neurotraum 2013,
30:1762–1769.
53. Petzold A, Keir G, Lim D, Smith M, Thompson EJ: Cerebrospinal fluid (CSF) and
serum S100B: release and wash-out pattern. Brain Research Bulletin 2003,

63
61:281–285.
54. Fraser DD, Close TE, Rose KL, Ward R, Mehl M, Farrell C, Lacroix J, Creery D,
Kesselman M, Stanimirovic D, Hutchison JS: Severe traumatic brain injury in
children elevates glial fibrillary acidic protein in cerebrospinal fluid and serum*.
Pediatric Critical Care Medicine 2011, 12:319–324.
55. Nylén K, Öst M, Csajbok LZ, Nilsson I, Blennow K, Nellgård B, Rosengren L:
Increased serum-GFAP in patients with severe traumatic brain injury is related to
outcome. J Neurol Sci 2006, 240:85–91.
56. Neselius S, Brisby H, Theodorsson A, Blennow K, Zetterberg H, Marcusson J:
CSF-biomarkers in Olympic boxing: diagnosis and effects of repetitive head
trauma. PLoS One 2012, 7: e33606.
57. Neselius S, Zetterberg H, Blennow K, Marcusson J, Brisby H: Increased CSF
levels of phosphorylated neurofilament heavy protein following bout in amateur
boxers. PLoS One 2013, 8: e81249.
58. Berger RP, Adelson PD, Pierce MC, Dulani T, Cassidy LD, Kochanek PM: Serum
neuron-specific enolase, S100B, and myelin basic protein concentrations after
inflicted and noninflicted traumatic brain injury in children. J Neurosurg (Pediatrics
1) 2005, 103:61–68.
59. Takahashi K, Hasegawa S, Maeba S, Fukunaga S, Motoyama M, Hamano H,
Ichiyama T: Serum tau protein level serves as a predictive factor for neurological
prognosis in neonatal asphyxia. Brain and Development 2013.
10.1016/j.braindev.2013.10.007.
60. Liliang P-C, Liang C-L, Weng H-C, Lu K, Wang K-W, Chen H-J, Chuang J-H: Tau

64
proteins in serum predict outcome after severe traumatic brain injury. J Surg Res
2010, 160:302–307.
61. Neselius S, Zetterberg H, Blennow K, Randall J, Wilson D, Marcusson J, Brisby
H: Olympic boxing is associated with elevated levels of the neuronal protein tau
in plasma. Brain Inj 2013, 27:425–433.
62. Franz G, Beer R, Kampfl A, Engelhardt K, Schmutzhard E, Ulmer H,
Deisenhammer F: Amyloid beta 1–42 and tau in cerebrospinal fluid after severe
traumatic brain injury. Neurology 2003, 60:1457–1461.
63. Shiiya N, Kunihara T, Miyatake T, Matsuzaki K, Yasuda K: Tau protein in the
cerebrospinal fluid is a marker of brain injury after aortic surgery. Ann Thorac Surg
2004, 77:2034–2038.
64. Tsitsopoulos PP, Marklund N: Amyloid-beta peptides and tau protein as
biomarkers in cerebrospinal and interstitial fluid following traumatic brain injury: a
review of experimental and clinical studies. Front Neurol 2013, 4:79.
65. Zemlan FP, Rosenberg WS, Luebbe PA, Campbell TA, Dean GE, Weiner NE,
Cohen JA, Rudick RA, Woo D: Quantification of axonal damage in traumatic brain
injury: affinity purification and characterization of cerebrospinal fluid tau proteins.
J Neurochem 1999, 72:741–750.
66. Emmerling MR, Morganti-Kossmann MC, Kossmann T, Stahel PF, Watson MD,
Evans LM, Mehta PD, Spiegel K, Kuo YM, Roher AE, Raby CA: Traumatic brain
injury elevates the Alzheimer's amyloid peptide A beta 42 in human CSF. A
possible role for nerve cell injury. Ann N Y Acad Sci 2000, 903:118–122.
67. Raby CA, Morganti-Kossmann MC, Kossmann T, Stahel PF, Watson MD, Evans

65
LM, Mehta PD, Spiegel K, Kuo YM, Roher AE, Emmerling MR: Traumatic brain
injury increases beta-amyloid peptide 1–42 in cerebrospinal fluid. J Neurochem
1998, 71:2505–2509.
68. Mondello S, Akinyi L, Buki A, Robicsek SA, Gabrielli A, Tepas J, Papa L, Brophy
GM, Tortella F, Hayes RL, Wang KKW: Clinical Utility of Serum Levels of
Ubiquitin-C Terminal Hydrolase as a Biomarker for Severe Traumatic Brain Injury.
Neurosurgery 2012, 70:666–675.
69. Mondello S, Robicsek SA, Gabrielli A, Brophy GM, Papa L, Tepas J, Robertson
C, Buki A, Scharf D, Jixiang M, Akinyi L, Muller U, Wang KKW, Hayes RL: αII-
Spectrin Breakdown Products (SBDPs): Diagnosis and Outcome in Severe
Traumatic Brain Injury Patients. J Neurotrauma 2010, 27:1203–1213.
70. Mondello S, Gabrielli A, Catani S, D’Ippolito M, Jeromin A, Ciaramella A, Bossù
P, Schmid K, Tortella F, Wang KKW, Hayes RL, Formisano R: Increased levels
of serum MAP-2 at 6-months correlate with improved outcome in survivors of
severe traumatic brain injury. Brain Injury 2012, 26:1629–1635.
71. Whalen MJ, Dalkara T, You Z, Qiu J, Bermpohl D, Mehta N, Suter B, Bhide PG,
Lo EH, Ericsson M, Moskowitz MA: Acute plasmalemma permeability and
protracted clearance of injured cells after controlled cortical impact in mice. J
Cereb Blood Flow Metab 2008, 28:490–505.
72. Farkas O, Lifshitz J, Povlishock JT: Mechanoporation induced by diffuse
traumatic brain injury: an irreversible or reversible response to injury? J Neurosci
2006, 26:3130–3140.
73. Barbee KA: Mechanical cell injury. Ann N Y Acad Sci 2005, 1066:67–84.
66
74. Binder LI, Frankfurter A, Rebhun LI: The Distribution of Tau in the Mammalian
Central Nervous System. J Cell Biol 1985, 101:1371–1378.
75. Bitsch A, Horn C, Kemmling Y, Seipelt M, Hellenbrand U, Stiefel M, Ciesielczyk
B, Cepek L, Bahn E, Ratzka P, Prange H, Otto M: Serum Tau protein level as a
marker of axonal damage in acute ischemic stroke. European Neurology 2001,
47:45–51.
76. Arroyo EJ, Schere SS: On the molecular architecture of myelinated fibers.
Histochem Cell Biol 2000, 133:1–18.
77. Woertgen C, Rothoerl RD, Holzschuh M, Metz C, Brawanski A: Comparison of
serial S-100 and NSE serum measurements after severe head injury. Acta
Neurochirurgica 1997, 139:1161–1165.
78. Yamazaki Y, Yada K, Morii S, Kitahara T, Ohwada T: Diagnostic significance of
serum neuron-specific enolase and myelin basic protein assay in patients with
acute head injury. Surgical Neurology 1995, 43:267–270.
79. Liu MC, Akle V, Zheng W, Kitlen J, O'Steen B, Larner SF, Dave JR, Tortella FC,
Hayes RL, Wang KKW: Extensive degradation of myelin basic protein isoforms
by calpain following traumatic brain injury. J Neurochem 2006, 98:700–712.
80. Ottens AK, Golden EC, Bustamante L, Hayes RL, Denslow ND, Wang KKW:
Proteolysis of multiple myelin basic protein isoforms after neurotrauma:
characterization by mass spectrometry. J Neurochem 2008, 104:1404–1414.
81. Ross SA, Cunningham RT, Johnston CF, Rowlands BJ: Neuron-specific enolase
as an aid to outcome predicition in head injury. Brit J Neurosurg 1996, 10:471–
476.

67
82. Johnsson P: Markers of cerebral ischemia after cardiac surgery.
J Cardiothorac Vasc Anesth 1996, 10:120–126.
83. Caceres A, Payne MR, Binder LI, Steward O: Immunocytochemical Localization
of Actin and Microtubule-Associated Protein MAP2 in Dendritic Spines. Proc Natl
Acad Sci USA 1983, 80:1738–1742.
84. Kitagawa K, Matsumoto M, Niinobe M, Mikoshiba K, Hata R, Ueda H, Handa N,
Fukunaga R, Isaka Y, Kimura K, Kamada T: Microtubule-Associated Protein 2 as
a sensitive marker for cerebral ischemic damage-immunohistochemical
invetigation of dendritic damage. Neuroscience 1989, 31:401–411.
85. Berger RP, Hayes RL, Richichi R, Beers SR, Wang KKW: Serum Concentrations
of Ubiquitin C-Terminal Hydrolase-L1 and αII-Spectrin Breakdown Product 145
kDa Correlate with Outcome after Pediatric TBI. J Neurotrauma 2012, 29:162–
167.
86. Liu MC, Akinyi L, Scharf D, Mo JX, Larner SF, Muller U, Oli MW, Zheng WR,
Kobeissy F, Papa L, Lu XC, Dave JR, Tortella FC, Hayes RL, Wang KKW:
Ubiquitin C-terminal hydrolase-L1 as a biomarker for ischemic and traumatic brain
injury in rats. Eur J Neurosci 2010, 31:722–732.
87. Siman R, Giovannone N, Toraskar N, Frangos S, Stein SC, Levine JM, Kumar
MA: Evidence that a panel of neurodegeneration biomarkers predicts vasospasm,
infarction, and outcome in aneurysmal subarachnoid hemorrhage. PLoS One
2011, 6:e28938.
88. Pang L, Wu Y, Dong N, Xu DH, Wang DW, Wang ZH, Li XL, Bian M, Zhao HJ,
Liu XL, Zhang N: Elevated serum ubiquitin C-terminal hydrolase-L1 levels in

68
patients with carbon monoxide poisoning. Clin Biochem 2014, 47:72–76.
89. Papa L, Akinyi L, Liu MC, Pineda JA, Tepas JJ, Oli MW, Zheng W, Robinson G,
Robicsek SA, Gabrielli A, Heaton SC, Hannay HJ, Demery JA, Brophy GM, Layon
J, Robertson CS, Hayes RL, Wang KKW: Ubiquitin C-terminal hydrolase is a
novel biomarker in humans for severe traumatic brain injury. Crit Care Med 2010,
38:138–144.
90. Pike BR, Flint J, Dutta S, Johnson E, Wang KKW, Hayes RL: Accumulation of
non-erythroid αII-spectrin and calpain-cleaved αII-spectrin breakdown products in
cerebrospinal fluid after traumatic brain injury in rats. J Neurochem 2001,
78:1297–1306.
91. Tomas M, Marin MP, Portoles M, Megias L, Gomez-Lechon MJ, Renau-Piqueras
J: Ethanol affects calmodulin and the calmodulin-binding proteins neuronal nitric
oxide synthase and alphaII-spectrin (alpha-fodrin) in the nucleus of growing and
differentiated rat astrocytes in primary culture. Toxicol In Vitro 2007, 21:1039–
1049.
92. Siman R, Giovannone N, Hanten G, Wilde EA, McCauley SR, Hunter JV, Li X,
Levin HS, Smith DH: Evidence That the Blood Biomarker SNTF Predicts Brain
Imaging Changes and Persistent Cognitive Dysfunction in Mild TBI Patients.
Front Neurol 2013, 4:190.
93. Riederer BM, Zagon IS, Goodman SR: Brain spectrin (240/235) and brain
spectrin(240/235E): two distinct spectrin subtypes with different locations within
Mammalian neural cells. J Cell Biol 1986, 102:2088–2097.
94. Azevedo FA, Carvalho LR, Grinberg LT, Farfel JM, Ferretti RE, Leite RE, Jacob
69
Filho W, Lent R, Herculano-Houzel S: Equal numbers of neuronal and
nonneuronal cells make the human brain an isometrically scaled-up primate
brain. J Comp Neurol 2009, 513:532–541.
95. Reier PJ, Houle JD: The glial scar: its bearing on axonal elongation and
transplantation approaches to CNS repair. Adv Neurol 1988, 47:87–138.
96. McGraw J, Hiebert GW, Steeves JD: Modulating astrogliosis after neurotrauma.
J Neurosci Res 2001, 63:109–115.
97. Wanner IB, Anderson MA, Song B, Levine J, Fernandez A, Gray-Thompson Z,
Ao Y, Sofroniew MV: Glial scar borders are formed by newly proliferated,
elongated astrocytes that interact to corral inflammatory and fibrotic cells via
STAT3-dependent mechanisms after spinal cord injury. J Neurosci 2013,
33:12870–12886.
98. Sofroniew MV, Vinters HV: Astrocytes: biology and pathology. Acta Neuropathol
2010, 119:7–35.
99. Burda JE, Sofroniew MV: Reactive gliosis and the multicellular response to CNS
damage and disease. Neuron 2014, 81:229–248.
100. Li DR, Zhang F, Wang Y, Tan XH, Qiao DF, Wang HJ, Michiue T, Maeda H:
Quantitative analysis of GFAP- and S100 protein-immunopositive astrocytes to
investigate the severity of traumatic brain injury. Legal Med 2012, 14:84–92.
101. Gelot A, Villapol S, Billette de Villemeur T, Renolleau S, Charriaut-Marlangue C:
Astrocytic demise in the developing rat and human brain after hypoxic-ischemic
damage. Dev Neurosci 2009, 31:459–470.
102. Chen Y, Swanson RA: Astrocytes and brain injury. J Cereb Blood Flow Metab

70
2003, 23:137–149.
103. Liu D, Smith CL, Barone FC, Ellison JA, Lysko PG, Li K, Simpson IA: Astrocytic
demise precedes delayed neuronal death in focal ischemic rat brain. Brain Res
Mol Brain Res 1999, 68:29–41.
104. Colombo JA, Yanez A, Lipina SJ: Interlaminar astroglial processes in the cerebral
cortex of non human primates: response to injury. J Hirnforsch 1997, 38:503–
512.
105. Colombo JA, Yanez A, Puissant V, Lipina S: Long, interlaminar astroglial cell
processes in the cortex of adult monkeys. J Neurosci Res 1995, 40:551–556.
106. Shakeri M, Mahdkhah A, Panahi F: S100B protein as a post-traumatic biomarker
for prediction of brain death in association with patient outcomes. Arch Trauma
Res 2013, 2:76–80.
107. Korfias S, Stranjalis G, Psachoulia C, Vasiliadis C, Pitaridis M, Boviatsis E, Sakas
DE: Slight and short-lasting increase of serum S-100B protein in extra-cranial
trauma. Brain Injury 2006, 20:867–872.
108. Thelin EP, Johannesson L, Nelson D, Bellander B-M: S100B is an important
outcome predictor in traumatic brain injury. J Neurotraum 2013, 30:519–528.
109. Marchi N, Cavaglia M, Fazio V, Bhudia S, Hallene K, Janigro D: Peripheral
markers of blood–brain barrier damage. Clinica Chimica Acta 2004, 342:1–12.
110. Mancardi GL, Cadoni A, Tabaton M, Schenone A, Zicca A, De Martini I, Bianchini
D, Damiani G, Zaccheo D: Schwann cell GFAP expression increases in axonal
neuropathies. J Neurol Sci 1991, 102:177–183.
111. Pellitteri R, Spatuzza M, Stanzani S, Zaccheo D: Biomarkers expression in rat
71
olfactory ensheathing cells. Front Biosci 2010, 2:289–298.
112. Eng LF, Ghirnikar RS: GFAP and astrogliosis. Brain Pathol 1994, 4:229–237.
113. Lumpkins KM, Bochicchio GV, Keledjian K, Simard JM, McCunn M, Scalea T:
Glial fibrillary acidic protein is highly correlated with brain injury. J Trauma 2008,
65:778–782. discussion 782–774.
114. Papa L, Lewis LM, Falk JL, Zhang Z, Silvestri S, Giordano P, Brophy GM, Demery
JA, Dixit NK, Ferguson I, Liu MC, Mo J, Akinyi L, Schmid K, Mondello S,
Robertson CS, Tortella FC, Hayes RL, Wang KKW: Elevated levels of serum glial
fibrillary acidic protein breakdown products in mild and moderate traumatic brain
injury are associated with intracranial lesions and neurosurgical intervention. Ann
Emerg Med 2012, 59:471–483.
115. Okonkwo DO, Yue JK, Puccio AM, Panczykowski DM, Inoue T, McMahon PJ,
Sorani MD, Yuh EL, Lingsma HF, Maas AI, Valadka AB, Manley, Transforming
R, Clinical Knowledge In Traumatic Brain Injury Investigators Including GT, Casey
SS, Cheong M, Cooper SR, Dams-O'Connor K, Gordon WA, Hricik AJ,
Hochberger K, Menon DK, Mukherjee P, Sinha TK, Schnyer DM, Vassar MJ:
GFAP-BDP as an acute diagnostic marker in traumatic brain injury: results from
the prospective transforming research and clinical knowledge in traumatic brain
injury study. J Neurotrauma 2013, 30:1490–1497.
116. Zoltewicz JS, Scharf D, Yang B, Chawla A, Newsom KJ, Fang L: Characterization
of Antibodies that Detect Human GFAP after Traumatic Brain Injury. Biomarker
Insights 2012, 7:71–79.
117. Lafrenaye AD, McGinn MJ, Povlishock JT: Increased intracranial pressure after

72
diffuse traumatic brain injury exacerbates neuronal somatic membrane poration
but not axonal injury: evidence for primary intracranial pressure-induced neuronal
perturbation. J Cereb Blood Flow Metab 2012, 32:1919–1932.
118. Thompson HJ, Lifshitz J, Marklund N, Grady MS, Graham DI, Hovda DA,
McIntosh TK: Lateral fluid percussion brain injury: a 15-year review and
evaluation. J Neurotrauma 2005, 22:42–75.
119. Smith DH, Soares HD, Pierce JS, Perlman KG, Saatman KE, Meaney DF, Dixon
CE, McIntosh TK: A model of parasagittal controlled cortical impact in the mouse:
cognitive and histopathologic effects. J Neurotrauma 1995, 12:169–178.
120. Foda MA, Marmarou A: A new model of diffuse brain injury in rats. Part II:
Morphological characterization. J Neurosurg 1994, 80:301–313.
121. Marmarou A, Foda MA, van den Brink W, Campbell J, Kita H, Demetriadou K: A
new model of diffuse brain injury in rats. Part I: Pathophysiology and
biomechanics. J Neurosurg 1994, 80:291–300.
122. Risling M, Davidsson J: Experimental animal models for studies on the
mechanisms of blast-induced neurotrauma. Front Neurol 2012, 3:30.
123. Kochanek PM, Bramlett H, Dietrich WD, Dixon CE, Hayes RL, Povlishock J,
Tortella FC, Wang KK: A novel multicenter preclinical drug screening and
biomarker consortium for experimental traumatic brain injury: operation brain
trauma therapy. J Trauma 2011, 71: S15–S24.
124. Yue JK, Vassar MJ, Lingsma HF, Cooper SR, Okonkwo DO, Valadka AB, Gordon
WA, Maas AI, Mukherjee P, Yuh EL, Puccio AM, Schnyer DM, Manley GT, Track-
Tbi I, Casey SS, Cheong M, Dams-O'Connor K, Hricik AJ, Knight EE, Kulubya

73
ES, Menon DK, Morabito DJ, Pacheco JL, Sinha TK: Transforming research and
clinical knowledge in traumatic brain injury pilot: multicenter implementation of the
common data elements for traumatic brain injury. J Neurotrauma 2013, 30:1831–
1844.
125. Hicks R, Giacino J, Harrison-Felix C, Manley G, Valadka A, Wilde EA: Progress
in developing common data elements for traumatic brain injury research: version
two–the end of the beginning. J Neurotrauma 2013, 30:1852–1861.
126. Manley GT, Diaz-Arrastia R, Brophy M, Engel D, Goodman C, Gwinn K, Veenstra
TD, Ling G, Ottens AK, Tortella F, Hayes RL: Common data elements for
traumatic brain injury: recommendations from the biospecimens and biomarkers
working group. Arch Phys Med Rehabil 2010, 91:1667–1672.
127. Lubieniecka JM, Streijger F, Lee JH, Stoynov N, Liu J, Mottus R, Pfeifer T, Kwon
BK, Coorssen JR, Foster LJ, Grigliatti TA, Tetzlaff W: Biomarkers for severity of
spinal cord injury in the cerebrospinal fluid of rats. PLoS One 2011, 6: e19247.
128. Svetlov SI, Prima V, Kirk DR, Gutierrez H, Curley KC, Hayes RL, Wang KKW:
Morphologic and biochemical characterization of brain injury in a model of
controlled blast overpressure exposure. J Trauma: Injury, Infection, Critical Care
2010, 69:795–804.
129. Svetlov SI, Prima V, Glushakova O, Svetlov A, Kirk DR, Gutierrez H, Serebruany
VL, Curley KC, Wang KK, Hayes RL: Neuro-glial and systemic mechanisms of
pathological responses in rat models of primary blast overpressure compared to
"composite" blast. Front Neurol 2012, 3:15.

74
130. Ahmed FA, Kamnaksh A, Kovesdi E, Long JB, Agoston DV: Long-term
consequences of single and multiple mild blast exposure on select physiological
parameters and blood-based biomarkers. Electrophoresis 2013, 34:2229–2233.
131. Ahmed F, Gyorgy A, Kamnaksh A, Ling G, Tong L, Parks S, Agoston D:
Time-dependent changes of protein biomarker levels in the cerebrospinal fluid
after blast traumatic brain injury. Electrophoresis 2012, 33:3705–3711.
132. Gyorgy A, Ling G, Wingo D, Walker J, Tong L, Parks S, Januszkiewicz A, Baumann
R, Agoston DV: Time-dependent changes in serum biomarker levels after blast
traumatic brain injury. J Neurotrauma 2011, 28:1121–1126.
133. Zetterberg H, Smith DH, Blennow K: Biomarkers of mild traumatic brain injury in
cerebrospinal fluid and blood. Nature Rev Neurol 2013, 9:201–210.
134. Guingab-Cagmat JD, Cagmat EB, Hayes RL, Anagli J: Integration of proteomics,
bioinformatics, and systems biology in traumatic brain injury biomarker discovery.
Front Neurol 2013, 4:61.
135. Agoston DV, Risling M, Bellander BM: Bench-to-bedside and bedside back to the
bench; coordinating clinical and experimental traumatic brain injury studies. Front
Neurol 2012, 3:3.
136. Hanrieder J, Wetterhall M, Enblad P, Hillered L, Bergquist J: Temporally resolved
differential proteomic analysis of human ventricular CSF for monitoring traumatic
brain injury biomarker candidates. J Neurosci Meth 2009, 177:469–478.
137. Ross PL: Multiplexed Protein Quantitation in Saccharomyces cerevisiae Using
Amine-reactive Isobaric Tagging Reagents. Mol Cell Proteomics 2004, 3:1154–
1169.

75
138. Wiese S, Reidegeld KA, Meyer HE, Warscheid B: Protein labeling by iTRAQ: A
new tool for quantitative mass spectrometry in proteome research. Proteomics
2007, 7:340–350.
139. Wanner IB: An in vitro trauma model to study rodent and human astrocyte
reactivity. Methods Mol Biol 2012, 814:189–219.
140. Wanner IB, Deik M, Torres M, Rosendahl AR, Neary JT, Lemmon VP, Bixby JL: A
new in vitro model of the glial scar inhibits axon growth. Glia 2008, 56:1691–1709.
141. Sondej M, Doran P, Loo JA, Wanner I: Sample preparation of primary astrocyte
cellular and released proteins for 2-D gel electrophoresis and protein identification
by mass spectrometry. In Sample preparation in biological mass spectrometry.
Edited by Ivanov A, Lazarev A. Dordrecht: Springer; 2011:829–849.
142. Ellis EF, McKinney JS, Willoughby KA, Liang S, Povlishock JT: A new model for
rapid stretch-induced injury of cells in culture: characterization of the model using
astrocytes. J Neurotrauma 1995, 12:325–339.
143. Ellis EF, Willoughby KA, Sparks SA, Chen T: S100B protein is released from rat
neonatal neurons, astrocytes, and microglia by in vitro trauma and anti-S100
increases trauma-induced delayed neuronal injury and negates the protective
effect of exogenous S100B on neurons. J Neurochem 2007, 101:1463–1470.
144. Rzigalinski BA, Weber JT, Willoughby KA, Ellis EF: Intracellular free calcium
dynamics in stretch-injured astrocytes. J Neurochem 1998, 70:2377–2385.
145. Schenk S, Schoenhals GJ, de Souza G, Mann M: A high confidence, manually
validated human blood plasma protein reference set. BMC Med Genomics 2008,
1:41.
76
146. Omenn GS, States DJ, Adamski M, Blackwell TW, Menon R, Hermjakob H,
Apweiler R, Haab BB, Simpson RJ, Eddes JS, Kapp EA, Moritz RL, Chan DW, Rai
AJ, Admon A, Aebersold R, Eng J, Hancock WS, Hefta SA, Meyer H, Paik YK, Yoo
JS, Ping P, Pounds J, Adkins J, Qian X, Wang R, Wasinger V, Wu CY, Zhao X,
Zeng R, Archakov A, Tsugita A, Beer I, Pandey A, Pisano M, Andrews P, Tammen
H, Speicher DW, Hanash SM: Overview of the HUPO Plasma Proteome Project:
results from the pilot phase with 35 collaborating laboratories and multiple
analytical groups, generating a core dataset of 3020 proteins and a publicly-
available database. Proteomics 2005, 5:3226–3245.
147. Waybright TJ: Preparation of human cerebrospinal fluid for proteomics biomarker
analysis. Methods Mol Biol 2013, 1002:61–70.
148. Theilacker N, Roller EE, Barbee KD, Franzreb M, Huang X: Multiplexed protein
analysis using encoded antibody-conjugated microbeads. J Royal Soc Interf 2011,
8:1104–1113.
149. Kingsmore SF: Multiplexed protein measurement: technologies and applications
of protein and antibody arrays. Nat Rev Drug Discov 2006, 5:310–320.
150. Barr JR, Maggio VL, Patterson DG Jr, Cooper GR, Henderson LO, Turner WE,
Smith SJ, Hannon H, Needham LL, Sampson EJ: Isotope dilution-mass
spectrometric quantification of specific proteins: model application with
apoliprotein A-1. Clin Chem 1996, 42:1672–1682.
151. Gerber SA, Rush J, Stemman O, Kirschner MW, Gygi SP: Absolute quantification
of proteins and phosphoproteins from cell lysates by tandem MS. Proc Natl Acad
Sci U S A 2003, 100:6940–6945.

77
152. Roschinger W, Olgemoller B, Fingerhut R, Liebl B, Roscher AA: Advances in
analytical mass spectrometry to improve screening for inherited metabolic
diseases. Eur J Pediat 2003, 162: S67–S76.
153. Liao H, Wu J, Kuhn E, Chin W, Chang B, Jones MD, O'Neil S, Clauser KR, Karl J,
Hasler F, Roubenoff R, Zolg W, Guild BC: Use of mass spectrometry to identify
protein biomarkers of disease severity in the synovial fluid and serum of patients
with rheumatoid arthritis. Arth Rheum 2004, 50:3792–3803.
154. Struys EA, Jansen EEW, De Meer K, Jakobs C: Determination of S-
Adenosylmethionine and S-Adenosulhomocysteine in Plasma and Cerebrospinal
Fluid by Stable-Isotope DIlution Tandem Mass Spectrometry. Clin Chem 2000,
46:1650–1656.
155. Anderson L, Anderson NG, Haines LR, Hardie DB, Olafson RW, Pearson TW:
Mass Spectrometric Quantification of Peptides and Proteins Using Stable Isotope
Standards and Capture by Anti-peptide Antibodies (SISCAPA). J Proteome Res
2004, 3:235–244.
156. Ahn YH, Lee YJ, Lee YJ, Kim Y-S, Ko JH, Yoo JS: Quantitative Analysis of an
Aberrant Glycoform of TIMP1 from Colon Cancer Serum by L-PHA-Enrichment
and SISCAPA with MRM Mass Spectrometry. J Proteome Res 2009, 8:4216–
4224.
157. Zhang Y, Hao Z, Kellmann M, Huhmer A: HR/AM Targeted Peptide Quantitation
on a Q Exactive MS: a Unique Combination of High Selectivity, Sensitivity, and
Throughput. 2012. http://planetorbitrap.com/data/uploads/ZFS1334248563484_A
N554_63517_HRAM-Q_Exactive_0412S.pdf
78
CHAPTER 3: NEW ASTROGLIAL INJURY DEFINED BIOMARKERS FOR
NEUROTRAUMA ASSESSMENT
3.1 INTRODUCTION
Traumatic brain injury (TBI) is “the most complex disease known to man” (1). It is
a global public health concern affecting over 2.5 million cases per year in the United
States alone and is the leading cause of death and disability among the youth (2). The
spectrum of TBI covers a wide range of severities with multiple adverse outcomes (3).
Severe TBI, characterized by extended periods of coma, results in variable degrees of
brain dysfunction that are difficult to predict (4). The most common TBIs are mild, and
occur frequently particularly during sports practice and routine military operations. Some
mild TBI patients develop persistent or even permanent neurological deficits, which would
be desirable to predict (5, 6). Repeated sub-concussive impacts and cumulative mild TBIs
can increase the risk for neurological deficits, so real-time diagnosis is essential for safe
return-to play/duty to prevent repeated exposure of at-risk individuals (7).
Injury evolution and eventual outcome are difficult to prognosticate, and current
approaches to assess TBI patients, based on Glasgow Coma Scale (GCS) scores or
computed tomography (CT) scans, are often insufficient to adequately capture the TBI
complexity (8-10). While CT scans are common, and readily report macroscopic brain
lesions, the detection of diffuse microstructural injuries and metabolic dysfunction after
TBI require more refined structural and functional imaging techniques that are less
commonly available (11, 12).

79
Information about microstructural injuries such as fiber damage and cell membrane
permeability (mechanoporation) can provide insight into very early cellular and structural
pathophysiology and are accompanied by protein alterations and degradation at the
molecular level (13-19). We believe that further understanding of cellular injury
mechanisms, and their protein signatures are a resource for sensitive and acute
diagnostic tools, needed for accurate assessment of neurotrauma injury magnitude (20).
Multiple studies have been conducted to identify biomarker candidates that can
offer superior diagnostic and prognostic information. GFAP, neuron specific enolase,
neurofilaments, tau, ubiquitin C-terminal hydrolase (UCHL1) and S100β have been
chosen based on neuropathological presence or known expression in neurons or glia
without elucidating their trauma-induced release mechanisms. The utility of these
biomarkers is limited by short-lived biofluid presence, extra-cranial sources, delayed
circulatory appearance and age-dependent liabilities, all of which hamper their individual
clinical translation (21-23). Most protein biomarker mining studies have drawbacks,
including failure to address fluid changes, differences in time-scales between rodent and
human pathophysiology and proteomic analytical challenges that obstruct the
identification of new, low abundance biomarkers (24-28). Furthermore, selection of
suitable biomarker candidates from untargeted (i.e., global) proteomic discovery
experiments are difficult and are typically unsuccessful (29-32). These examples
emphasize the need for a new class of biomarkers associated directly and immediately
with a traumatic impact to the brain.
In this study, astrocytes were chosen, given their central roles in the neuro-
vascular unit, brain metabolism, blood-flow and blood-brain barrier (BBB) (33-37).

80
Astrocytes outnumber neurons in the human neocortical white matter, are vulnerable and
responsive to injury and thereby participate to white matter injury (16, 38-41). Significant
amounts of cellular proteins were found to be released into fluids minutes after abrupt
astrocyte stretch-injury, suggesting astrocytes as the ideal carriers for neurotrauma
biomarkers (32).
In the present work, we determined a TBI CSF proteome and a strategy to
overcome the typical ‘proteomics bottlenecks’. This selection strategy capitalized on
astrocyte-enrichment and our previous work on trauma-released proteins in a simple
culture injury model to identify a panel of new biomarker candidates (32, 37, 42). The
study identified astroglial injury-defined (AID) biomarker release from traumatized human
astrocytes, documents their elevation in TBI patients during the first post-injury days, and
explores their presence in serum of mild TBI patients. Importantly, establishing
biomarkers of cell wounding and cell death may provide future biosignatures of brain cell
compromise and demise that could facilitate our understanding of TBI pathophysiology.

81
3.2 RESULTS
Cerebrospinal fluid of TBI patients carries a signature of trauma-released astroglial
proteins.
Analytical liquid chromatography-tandem mass spectrometry (LC-MS/MS)
identified proteins in CSF of 19 TBI patients and 9 control subjects. Among the 484
proteins identified in TBI CSF, 232 were unique to TBI, while 252 proteins overlapped
with the control CSF proteome (Figure 3.1). To select neurotrauma biomarker candidates,
we determined the overlap with previously published trauma-released proteins
determined from fluids of stretch-injured mouse astrocytes using a 2D gel analysis
approach (Supplement Figure S3.1) (32). To improve specificity, we then determined
astrocyte-enriched proteins using gene array data, and excluded proteins present in
healthy plasma or abundant in extracranial tissues (42-45). Four candidate astroglial
injury-associated proteins were identified: aldolase C (ALDOC) which is one of the most
astrocyte-enriched proteins and also one of the highest expressed proteins in the brain
(32, 46), glutamine synthetase (GS), brain lipid binding protein (BLBP), and astrocytic
phosphoprotein 15 (PEA15).
Traumatized human astrocytes show membrane wounding, reactivity and cell death at
different times post-injury.
Differentiated, serum-free human astrocytes grown on deformable membranes
received pressure-pulses that produced diffuse shear and stretch injuries reminiscent of
an abrupt traumatic force (32, 47, 48). Subpopulations of traumatized human astrocytes
displayed membrane wounding, died or underwent reactivity by acquiring star-shaped

82
morphology and GFAP up-regulation (Figure 3.2) as previously shown (48-50). Wounded
cells displayed beaded, fragmented and amputated processes with elevated GFAP
signals as soon as 30min post-stretching, earlier than reported gene expression changes
(Figure 3.2C) (50, 51). By analyzing nuclear shape and membrane integrity, intact,
wounded and demised astrocytes could be distinguished (see Methods, Figure 2D-F). In
both mild and severely stretched cultures the population of wounded cells, increased 16-
fold over controls 30min after injury, constituting a fraction of 20% of stretched astrocytes
(Figure 3.2E, S3.2A). By two days after stretching, this population decreased
substantially. By contrast, the rate of cell death was low at 30min post- injury and
continued to rise over time until two days post-injury, when cell death differed significantly
between mild and severe pressure pulsed cultures (Figure 3.2F, S3.2B). Mechanical
trauma caused severity-independent acute membrane wounding and protracted severity-
dependent cell death.
Different biomarkers and release kinetics correlate with astrocyte wounding and cell
death.
Fluid immunoblotting from control and stretched cultures provided release kinetics
of AID biomarkers over time (Figure 3.3A). GFAP, ALDOC, BLBP and PEA15 levels
showed logarithmic release levels up to three orders of magnitude (Figure 3.3B-E). GFAP
fluid levels show clear temporal and severity differences, while ALDOC, BLBP and PEA15
levels remained similarly elevated at each timepoint and across the two severities (Figure
3.3B-E). GFAP fluid levels were 5-7 fold elevated between 30min to 1-2 days post-injury
(p<0.013, Figure 3.3B). After mild stretching, GFAP levels at 30min rose only three-fold,

83
which was not significantly different from control levels. In contrast, fluid levels of ALDOC,
BLBP and PEA15 at 30min after mild stretching rose much higher and significantly over
those of controls (60-460x; p<0.0001). Their release after mild stretching was not
significantly different from severe stretching at any timepoint post-injury (2-3x). Yet, GFAP
release levels were significantly higher 5h after severe versus those after mild stretching
(5x, p=0.042). The data suggest the release of cytosolic biomarkers ALDOC, BLBP and
PEA15 relates to both early cell wounding and later cell death, while the release of
cytoskeletal GFAP, particularly its small proteolytic fragments, follows the slow
accumulation of dead cells. We tested for an association between astroglial biomarker
release and cell fates by plotting each biomarker’s levels against cell wounding and cell
death rates from cultures of all conditions, and determining their Spearman correlations
(Figure 3.3F-I). ALDOC, BLBP, and PEA15 associated with cell wounding. ALDOC and
BLBP also correlated with cell death. GFAP had the strongest correlation with cell death,
while it did not correlate with cell wounding. ALDOC and PEA15 release also correlated
well with each other while all other marker pairs had moderate correlation (Table 3.5).
This is the first report of the early, robust release of ALDOC, BLBP and PEA15 from
human astrocytes after mild and severe injury.
Characterization of glial fibrillary acidic protein break-down products
We also identified and measured new trauma-generated small GFAP proteolytic
breakdown products (BDPs, 18, 20 and 25kD) that only appeared 1-2 days after injury
(S3.3). Intact GFAP and its BDPs were further characterized through immunoprecipitation
from stretched astrocyte conditioned media and whole cell lysates. Peptide mapping of

84
immunoprecipitated products revealed a core sequence of amino acids common to all
observed breakdown products (including our new lower MW species) starting at alanine
residue 71 (S3.4). Generation of smaller BDPs appears to result from additional C-
terminal cleavage. These N and C-terminal cleavages are believed to be the result of
calpain and caspase activation following injury and are consistent with the reported
cleavage sites reported in the literature (52). However, we were unable to identify BDP
unique peptides by PRM-MS based on the reported non-tryptic N-terminal cleavage site.
This leaves some room for doubt for the exact sequence of these BDPs.
Trauma caused astroglial biomarker depletion and disassembly in wounded and dying
cell populations.
Cell analyses using dye uptake and biomarker immunofluorescence further
substantiated the correlation between biomarker release and cell fate. Viable GFAP-
expressing control astrocytes displayed cytoskeletal filaments (Figure 3.4A1). Acutely
after stretching, a population of GFAP-positive cells lost cytoskeletal fiber definition
(Figure 3.4A2). While the number of GFAP-positive cells did not decrease significantly
after injury, stretching did significantly increase the fraction of astrocytes with non-fibrous
GFAP (Figure 3.4I). GFAP filament disruption was associated with cell integrity
compromise (Figure 3.4E).
Control images show robust BLBP expression in GFAP-positive astrocytes. By
30min after stretching, bright BLBP signal decreased, while the remaining GFAP signal
distribution were altered (S3.5). The population of cells with bright BLBP signals nearly
disappeared 30min after stretching (Figure 3.4C2, G). ALDOC and PEA15 were

85
ubiquitously expressed in control astrocytes (Figures 3.4B, D). Membrane wounding, with
occasional blebbing 30min after stretching, was associated with ALDOC and PEA15
signal decreases (Figures 3.4B2, and D2, arrowheads and arrows) and occurred in 29-
39% of leaky cells, and in 11-14% of cells with intact membranes (Figure 3.4F, H). Rapid
post-injury resealing of mechanoporated cells could explain the depletion of markers from
cells with intact membranes. Altogether, ~17% of astrocytes were depleted of PEA15 and
ALDOC acutely after stretching. Cell fluorescence measurements 30min after injury
confirmed acute protein loss by demonstrating significant signal intensity reduction from
control levels for ALDOC (by 34%), BLBP (by 29%), and PEA15 (by 43%) in
subpopulations of stretched astrocytes (Figure 3.4J, p<0.001).
This human trauma model documents hyper-acute release of cytosolic markers
ALDOC, BLBP and PEA15 was associated with cytosolic protein loss in a subpopulation
of wounded astrocytes, likely through plasmalemmal irregularities as was also suggested
by previous time-lapse studies (32). In contrast, GFAP was temporarily retained,
undergoing cytoskeletal filament loss and redistribution followed by delayed release with
further fragmentation. The two trauma-inflicted release kinetics highlight different, cell-
fate associated astroglial biomarker classes.
Clinical study documents distinct AID biomarker CSF and blood profiles in TBI patients
across all severities.
We measured AID biomarkers, apolipoprotein B (APOB), a serum protein,
prostaglandin synthase (PTGDS), a CSF standard, and known biomarkers GFAP and
S100β in CSF of 26 severe TBI patients and 13 control subjects (Table 3.6, Figure 3.5).

86
ALDOC, BLBP, PEA15 and small BDPs of GFAP presence in clinical blood samples was
established in 22 severe and 15 mild TBI patients along with 12 control subjects (Figure
3.8). The average age was 42 among severe and mild TBI patients, and 39 among control
subjects. Severe and mild TBI patients included 71% male, and 59% of control subjects
were male. Severe TBI patients had on average a GCS score of 5.5, ranging between 3
to 11 and the survival rate was 85%. Most severe TBI patients (92%) had intracerebral
hemorrhage with one or more neuroimaging findings of contusions, subdural hematoma,
subarachnoid or intraventricular hemorrhage. Diffuse axonal injury was reported in 42%,
epidural hematomas and edema were each found in 21%, ischemia in 8% and midline
shift in 4% of the severe TBI patients. Injury causes among all TBI patients involved motor
vehicles in 43%, falls in 41% and other causes including violence and football in 16% of
the cases (Table 3.6). Multiple samples per patient from different post-injury times were
analyzed from 8 TBI patients (6 severe and 3 mild TBI patients), and data were separated
by day post-injury except post-injury days 4 and 5, which were averaged because
individual immunoblot biomarker optical density (OD) measures did not significantly differ
(not shown). Variances in biomarker levels were larger between TBI patients than within
subjects.
Boxplots of normalized immunoblot densities show significantly elevated TBI CSF
levels for GFAP, ALDOC, BLBP, GS, PEA15 and S100B, which were 2-4 orders of
magnitude greater than control levels, or controls had no measurable signal as for PEA15,
small (18-25 kD) GFAP BDPs and ALDOC BDP (Figures 3.5 D-K, Table 3.7, S3.6 and
not shown). Longitudinal trajectories differed between new and known astroglial
biomarkers in TBI CSF, as GFAP and S100β signals decreased significantly after the first

87
day post-injury, with mean GFAP levels over 11-fold lower on later post-injury days
(Figure 3.5A, D). In contrast, ALDOC and GS means remained elevated across all days
post-injury (Figure 3.5A, F, G). BLBP and PEA15 signals fluctuated over time and across
patients without significant mean decreases across days post-injury (Figure 3.5A, H, I).
About 50% of all TBI CSF samples displayed a new trauma-generated 38kD ALDOC
fragment, found predominantly on later post-injury days (Figure 3.5C). The temporal
differences in enzymatic cleavage pattern between GFAP and ALDOC as well as the
short half-lives of BLBP and PEA15 document highly variable proteolysis and clearance
kinetics. Overall, AID biomarkers, including their BDPs, were robustly elevated after TBI
and had an extended detection window when compared to GFAP and S100. Time after
injury responses were also measured by MRM-MS which demonstrated similar trends
compared to immunoblot densities for GFAP, ALDOC, BLBP, and GS (S3.7)
Analyses included also evaluation of fluid standards. The CSF standard PTGDS
was secreted at high levels in healthy controls and was decreased over ten-fold in TBI
patients; it was often undetectable on injury day and early post-injury days suggesting
dysregulated CSF balance (53, 54) (Figure 3.5A, K). Serum protein apolipoprotein B
(APOB), absent in control CSF, was significantly elevated acutely after TBI with
concentrations decreasing during subsequent post-injury days (Figure 3.5A, J). A
reported ischemic episode on the third post-injury day in one severe TBI patient was
accompanied by a secondary CSF peak of APOB as well as BLBP and PEA15 levels, the
latter two documenting secondary astroglial damage (Figure 3.5A). These are the first
quantitative APOB measurements used as intraventricular bleeding marker in human TBI,

88
although APOB has been documented previously in a rodent spinal cord injury CSF
proteomic study (25).
Preliminary correlation of AID biomarkers with TBI patient survival were explored
for three markers. Acutely depleted PTGDS levels were later restored to higher, near
control, levels in TBI survivors but recovered less or not at all in TBI patients who had
died (S3.8A). Mean PEA15 levels for surviving TBI patients were over one-thousand fold
higher than those of non-surviving TBI patients (S3.8B). Small GFAP fragments (25 kD
doublet, 20 kD, 18 kD BDP) were measured in TBI patients for the first time (Figure 3.5A,
B, S3.8C). Small GFAP BDP amounts differed between survivors and non-survivors by
an order of magnitude more than total GFAP levels (S3.8C). Each TBI patient had
different large and small GFAP fragment profiles, which is a first indication for individual
degradation kinetics reflecting patient heterogeneity. Together with the unique
association to cell death, small GFAP fragments add specificity to TBI severity
assessment. While we were unable to measure GFAP BDPs by MRM-MS, intact GFAP,
ALDOC, BLBP, and GS concentrations were assessed in relation to TBI patient survival
as well (S3.9). Similarly, elevated biomarker concentrations were observed in deceased
patients compared to survivors. However, given the low number of mortalities compared
to survivors, additional clinical studies are needed to determine outcome correlations of
this panel.
AID biomarker concentrations were quantified using antibodies and quantitative mass
spectrometry.

89
Our work represents the first use of multiple reaction monitoring (MRM)-MS to
systematically quantify levels of neurotrauma biomarkers in TBI patients (Figure 3.6).
MRM-MS of GFAP, ALDOC and BLBP show higher levels in TBI than control CSF (Figure
3.6A). Biomarker concentrations were determined using the ratio of the amount of CSF-
derived endogenous peptides to the known amount of isotope-labeled standard peptides
(Figure 3.6 B-D). GFAP immunoblot densities and MRM measurements showed high
correlations between the two independent methods (Figure 3.6B). A comparison of
immunoblot and MRM longitudinal CSF measurements shows matching profiles for
astroglial biomarkers in one severe TBI survivor from as early as 3h to 5 days post-injury
(S3.10).
MRM-MS provides antibody-independent concentration comparisons among AID
biomarkers in TBI patients’ CSF (Figures 3.6C, D). Highest levels were measured for
ALDOC, followed by GFAP (2.5-fold lower) on injury day, and both were significantly
higher than levels for BLBP (29-70-fold lower) and GS (3 orders of magnitude less, Figure
3.6C, Table 3.7). By 3 days post-TBI, ALDOC concentrations were significantly higher
GFAP concentrations, differing by an order of magnitude, documenting prolonged
ALDOC stability in CSF over that of GFAP (Figure 3.6D). MRM and immunoblot pure
protein measurements resulted in similar detection limits for ALDOC, BLBP and GFAP
(Table 3.8). Matching MRM and immunoblot interquartile concentration ranges show a
wide dynamic range in AID biomarker levels after TBI (Tables 3.7, 3.8).
Multivariate Factor analysis of AID biomarkers documents TBI patient diversity.

90
Spearman correlation coefficients between biomarker pairs are listed (Table 3.9).
Strongest correlations were between cell death-associated, lower GFAP fragments,
serum protein APOB (0.9), and S100 (0.87-0.85) that may reflect an association
between intraventricular bleeding and astroglial demise. BLBP and PEA15 correlated
robustly (0.8), suggesting similar CSF profiles. Markers with different temporal profiles
and stability tended to correlate poorly like ALDOC and GS levels with those of GFAP, its
small BDPs, and S100β (Figure 3.5A, Table 3.9). Astroglial biomarker levels related
negatively with PTGDS indicating diverging profiles (53, 54). Proteolytic fragments for
ALDOC and GFAP did not co-vary, suggesting different proteolytic degradation patterns
(see Discussion). The correlations support the diversity of this panel and reflect
differences in biomarker appearance and clearance after TBI.
We used an exploratory machine-learning Factor analysis for unsupervised
grouping of AID biomarker profiles into ‘Factors’ based on Spearman correlations and
known for revealing common underlying trends (55). The algorithm sorted AID biomarkers
into two factors. These two factors and PTGDS accounted for 84% of the cohort’s
biomarker variance. Factor A was comprised of GFAP, its lower BDPs, S100β and APOB.
‘Factor B’ contained ALDOC, its 38kD fragment, BLBP, GS and PEA15 (Figure 3.7A).
Thus, Factor A reflected markers of astroglial demise and bleeding corresponding with
tissue loss, whereas Factor B represented markers of astroglial wounding, associating
with tissue compromise. The resulting categories were reliable, as they had high
communality expressed by factor correlation coefficients (Figure 3.7A, Cronbach’s ).
This TBI patient based, unbiased factor classification independently confirmed a grouping
of astroglial biomarkers based on release from wounded or dying astrocytes in vitro

91
(Figures 3.2-3.4). Factors A and B separated TBI patients between controls and non-
survivors, (Figure 3.7B). Exploratory classification tree analysis partitioned controls and
TBI patients using a Factor B boundary and a Factor A boundary separated TBI survivors
from non-survivors with one outlier (Figure 3.7B, C) (56). Both factors were robustly
elevated in TBI patients versus controls (Figure 3.7D, E). Factor A temporal CSF profiles
decreased over post-injury days and differed between TBI survivors and non-survivors,
while Factor B profiles were more stable over time and indifferent to survival status
(Figures 3.7D, E).
AID biomarkers are elevated in the blood after severe TBI and in a subgroup of mild TBI
patients.
ALDOC, BLBP, PEA15 and GFAP BDPs were detected in blood samples depleted
of abundant proteins. All four markers were robustly elevated in 50 plasma and serum
samples of 22 severe TBI patients compared to 12 control subjects (Figure 3.8A-E, Table
3.6). Their concentrations reached up to 20 ng/ml (Table 3.8). Cell wounding markers
ALDOC, BLBP and PEA15 were significantly elevated over controls as early as 3h on
injury day in blood of severe TBI patients (Figure 3.8A-E, S8). Blood ALDOC levels rose
significantly between injury day (88-fold over controls) and subsequent two post-injury
days (over 300-fold above controls, Figure 3.8A, C). Mean injury day blood levels for
BLBP and PEA15 were elevated over control levels (122-fold and 40-fold, respectively).
(Figure 3.8A, D, E). For the same TBI patient, BLBP and PEA15 were elevated in serum
prior to their presence in CSF (S3.11). In contrast, a 25 kD GFAP fragment was
consistently absent on injury day and appeared robustly on the first post-injury day in

92
blood of severe TBI patients, beginning as early as 22h post-TBI, GFAP was first elevated
in CSF followed by overnight decrease and appearance in the circulation, with levels up
to 4 orders of magnitude higher than those of controls in CSF (Figure 3.8A, B, S3.11).
ALDOC levels showed at 3 and 34h in CSF and in blood (S3.11A). These same patient
observations illustrate that different fluid kinetics for these four astroglial biomarkers can
exist.
The presence of AID biomarkers was explored in 15 mild TBI patients within the
first injury day, a relevant time window for mild TBI diagnosis (57). Preliminary data show
elevation of ALDOC, BLBP and PEA15 in serum as early as one hour after mild TBI
compared to control serum and at similar levels as found after severe TBI (Figure 3.8F,
S3.12). ALDOC was present in 80%, PEA15 in 60% and BLBP in 47% of this cohort of
mild TBI patients irrespective of CT status. In contrast, GFAP BDPs (37, 25 or 20 kD)
were only found in 27% of the samples (S3.12). In some mild TBI patients, sera signals
appeared in the same range as those in severe TBI sera, consistent with similarly
observed in vitro release profiles from wounded human astrocytes after mild and severe
stretching.

93
2.3 DISCUSSION
A new panel of astroglial, injury-defined (AID) biomarkers from the TBI CSF
proteome and a list of trauma-released, astrocyte-enriched proteins is presented. AID
biomarkers are qualified by release from wounded and dying human traumatized
astrocytes. Clinical confirmation in TBI patients shows robust AID biomarker elevation in
CSF and blood of TBI patients with broad post-injury profiles and provides a new concept
for a biosignature of brain cell compromise and demise.
There are unmet requirements for assessing TBI patients.
Presently, the initial assessment of TBI patients relies on the GCS scores and on
CT scans, which both correlate poorly with outcome and functional compromise after TBI
(58, 59). Mild TBI victims are assessed using behavioral testing and cognitive
questionnaires (60). These tests rely on subjective self-reporting and require baseline
assessment. An unbiased brain injury signature is needed that can assess TBI and
identify complicated injuries among mild TBI patients (5, 57). On-site diagnosis of TBI
patients, particularly of athletes, military personnel and urgent care situations, would
provide early information for advising on initial treatment decisions or transportation
choices. Instant release with the primary trauma event and concomitant presence in the
circulation are prerequisites for future real-time neurotrauma biomarkers. Based on this
rationale, connecting acute cellular injury processes and biomarker presence can
facilitate this goal. Few animal studies address primary cellular injury events or early
biomarker release (61-64). After mild TBI, GFAP’s passage into the circulation is delayed,
making its use as urgent care tool less helpful (65). In contrast, UCHL1 declines on injury

94
day limiting interpretation of samples collected at various times after injury (65, 66). Thus,
limitations exist among current neurotrauma biomarker candidates (67, 68). This study
provides biomarkers of brain cell wounding that address current limitations, as they were
released instantly and robustly after severe and mild TBI.
Overcoming proteomic bottlenecks of biomarker identification and a multiplex
standardized TBI assay.
Proteomics provides a comprehensive view of protein changes after neurotrauma,
yet clinically useful neurotrauma biomarkers remain elusive (29, 31). A major hurdle has
been the selection of clinically relevant biomarkers from extensive lists of identified
proteins, which our controlled human trauma model and selection strategy have cleared
(31, 69) Typically, one or two biomarkers are investigated, resulting in diverse profiles
and sensitivities due to non-standardized assays (23, 70). Further, efficient throughput
quantifying multiple biomarker candidates requires a standardized assay to enable
biomarker comparisons (71, 72) (23, 70). MRM-MS is favored as a multiplex, antibody-
independent assay for standardized simultaneous measurement of multiple candidate
biomarkers, but until the present study, had not yet been applied systematically in the
neurotrauma field (57, 70, 73).
Astrocyte trauma responses are heterogeneous.
We previously documented molecular heterogeneity among human and mouse
astrocytes based on variable expression of astroglial markers and their different trauma
responses (32, 48). Morphological signs of astrocyte wounding were found early and

95
scattered in stretch-injured cultures, which could indicate both, selective astrocyte
vulnerability and ‘hot spots’ of focal tensile forces. Distinct subpopulations of wounded
human astrocytes underwent depletion of cytosolic proteins and GFAP filament
disassembly, while adjacent cells seemed unchanged, illustrating the diffuse injury
distribution in this trauma model. Rapid post-injury GFAP filament disassembly and
brighter immunofluorescence associated with cell membrane wounding were found prior
to reported gene expression changes (32, 51). Such GFAP changes are similar to
reported alteration in GFAP antigenicity after acid treatment, mediated by rapidly elevated
calcium, and calpain activation, but are new in mechanically wounded astrocytes (74, 75).
The depletion of key metabolic proteins, together with cytoskeletal filament disassembly
in mechanoporated astrocytes, likely exacerbates their compromise, making a
subpopulation of traumatized astrocytes vulnerable to a second mechanical blow or other
stressors that can lead to cell death.
Mechanical trauma-induced reactivity with characteristic shape changes and
upregulation of astroglial markers occurred within hours and evolved over days post-injury
in human astrocytes (48). Trauma-induced activation of signal transducer and activator
of transcription 3 increases oxidative metabolism and upregulates expression of GFAP,
ALDOC, BLBP and PEA15 during reactive gliosis, boosting astroglial resilience and could
amplify delayed release in case of a secondary insult, as was observed in one TBI patient
(32, 39, 76-78). Thus, acute membrane wounding, neuroprotective astrogliosis as well as
delayed astroglial demise document cell fate heterogeneity that is reflected in diverse
astroglial markers, their release, and expression after neurotrauma.

96
AID biomarkers monitor acute trauma pathology of astroglial membrane wounding and
fiber damage.
Plasmalemmal permeability (mechanoporation) is an early and enduring pathology
in acutely traumatized brain and spinal cord tissues, and mechanoporation is a hallmark
of diffuse axonal injury, which is characterized by process beading and fragmentation (13,
14, 79, 80). Diffuse axonal damage is also a morbidity in mild TBI patients with post-
concussive symptoms (81, 82). How long mechanoporated cells endure in a
compromised state, and whether they recover or undergo protracted cell death are open
questions (83). The present study documents profiles of astroglial biomarker release after
pressure-pulse stretching that correlated with cellular features of human astroglial
wounding, mechanoporation, and delayed cell death. We show human astroglial fiber
damage, including beading and process disintegration, shortly after mechanical trauma.
Astroglial fiber damage is also seen in vivo early after mouse spinal cord crush injury, in
the traumatically injured primate cortex, reported as clasmatodendrosis, and in human
cerebral cortex after traumatic intracranial injury where it is associated with protein
degradation markers (16, 32, 84). This histopathology is particularly relevant for human
white matter injury, because astrocytes outnumber neurons in the human neocortical
white matter, and human astrocytes carry over-sized processes (38, 41, 85, 86). Thus,
astroglial wounding-released biomarkers may provide biofluid-accessible tools to
investigate diffuse glial fiber damage acutely after neurotrauma.
AID biomarkers may have possible roles as biosignatures and for manifesting metabolic
depression.

97
Astrocytes maintain a high rate of active oxidative glucose metabolism, express
overall high levels of glycolytic and tricarboxyl acid (TCA) cycle enzymes and carry a large
number of mitochondria in their perisynaptic processes (37, 42). Astroglial GS and BLBP
have important roles for synaptic plasticity at the tripartite synapse complex in glutamate
recycling and regulation of fatty acid uptake (87, 88). ALDOC is a central glycolytic
enzyme providing the substrate for lactate and ATP production and its product
glyceraldehyde-3-phosphate controls cell fate and astrocyte-neuron crosstalk (36).
PEA15 is a main regulator of glucose metabolism, and high PEA15 levels make cells
resistant to glucose deprivation by adapting to different metabolic states (89, 90).
Astrocytes couple synaptic metabolic demand as they adjust local blood flow by
ensheathing both compartments with their endfeet (88, 91). Vital astroglial metabolism is
essential for maintaining neuro-metabolic coupling and brain energy homeostasis.
The majority of TBI patients undergo metabolic depression indicated by reduced
cerebral oxidative metabolism and associated with an imbalance of lactate, pyruvate,
glutamate and glucose (11, 92, 93). Decreased cerebral glucose metabolism is measured
in mild and severe TBI patients using positron emission tomography scanning (11, 58).
Reduced oxidative glucose metabolism is demonstrated after lateral fluid percussion, a
rat cerebral concussion model with astrocyte metabolism being initially reduced and sub-
acutely supportive for restoring metabolic homeostasis (94-96). One reason for impaired
energetic needs of injured cells may be selective depletion of several glycolytic and TCA
cycle enzymes as well as GS, PEA15 and BLBP as they are acutely released in vitro.
ALDOC and PEA15 are reduced in vivo and in perilesional wounded astrocytes acutely
after mouse crush spinal cord injury (32). The present study links fluid release of BLBP,

98
ALDOC and PEA15 with concomitant cellular protein loss in traumatized human
astrocytes, supports a concept of cellular compromise and identifies biofluid AID markers
signals as possible candidate indicators of metabolic depression after TBI.
GFAP release and degradation associate with astrocyte death after severe TBI
It has been assumed that biomarkers are released due to cell death after
neurotrauma (23). Severe TBI with lesions and contusions are associated with tissue
demise, vascular damage, and perilesional, irreversible astrocyte swelling leading to
cytotoxic edema (97-99). Astrocyte demise is reported after lateral fluid percussion in the
rat cortex and in the peri-lesional mouse spinal cord one day after contusion (100, 101).
Human post-mortem cerebral and hippocampal cell counts document progressive
astroglial death by means of different mortality times after TBI, that relate to injury severity
(102). Our human trauma model shows delayed and severity-dependent astroglial cell
death preceded by GFAP release and associated with the appearance of small GFAP
BDPs. Similar findings, albeit only considering total GFAP signal, were obtained by
stretching rat hippocampal slice cultures (103). Thus, trauma-inflicted astroglial cell death
can be monitored using GFAP, particularly by its small, more selectively cell death-
associated fragments. GFAP degradation is related to caspase activation in models of
Alzheimer’s and Alexander disease (104-106). The present study is the first to associate
small GFAP fragment generation with cell death in traumatized human astrocytes. Our
explorative clinical data indicates small GFAP BDP levels differ substantially between
survivors and non-survivors compared to those of total GFAP amounts. Thus, small
GFAP fragments in biofluids may help to specifically monitor astroglial demise after TBI.

99
Kinetic diversity among astroglial neurotrauma biomarkers
Biomarker profiles fluctuate given injury complexity and irregular secondary events
in severe TBI patients (107). Astroglial biomarkers also displayed marker-specific
kinetics. ALDOC had remarkable CSF stability over time after TBI and is reported to last
up to three weeks in sheep and cow blood (108, 109). A 38kD ALDOC BDP of later post-
injury days could be a product of proteolysis by calpain or cathepsin (110-112). In
contrast, GFAP displayed massive degradation into large fragments that had been
previously detected after TBI, amyotrophic lateral sclerosis and oxidative frontotemporal
lobe degeneration (113-115), and also into small fragments associated with caspase
activation, which have not been measured after TBI (104-106). We quantified large and
small GFAP fragments in TBI patients in this study, and observed that overall GFAP CSF
levels decreased drastically from the second post-injury day onwards, concurrent with
fragments appearing transiently in blood. Delayed biomarker passage into the circulation
may occur via glial-mediated overnight CSF clearance (116). In contrast, BLBP and
PEA15 signals were more variable, which could reflect short biofluid stability, (117).
Overall, these observations reveal a new diversity in biofluid kinetics among different
astroglial biomarkers.
Hyper-acute presence of AID markers indicates astroglial release immediate to the
traumatic impact and documents direct passage into the circulation. This may be possible,
since perivascular astrocyte sheets cover endothelial tubes nearly completely in brain
microvessels and are part of the blood-brain diffusion barrier (118, 119). Astrocytes
function as gatekeepers in the neuro-vascular unit and their damage results in BBB

100
permeability (33, 120). TBI causes microvasculature disruption and astroglial fiber
damage (16, 80, 121, 122). ALDOC is present in astroglial process endings and could be
directly released with their rupture (32). Animal and clinical studies show BBB disruption
in the early hours post-injury after mild TBI, blast shock waves, and mild fluid percussion
injury (123-125). Blood elevation of cytosolic astroglial marker, S100, indicates BBB
permeability and is elevated after mild TBI including repeated sub-concussive events
(126-128). Hence, cytosolic astroglial proteins are situated for immediate release into the
circulation upon BBB disruption after TBI.
AID biomarker panel limitation, uniqueness and significance for future TBI patient
assessment and monitoring
Confounding variables of age and gender were matched in this study, while
medications and comorbidities were not controlled for. Methodological rigor is provided
by using two technically independent assays to validate biomarker measurements. Data
analysis was separated by day, yet considering the short-lived nature of some
biomarkers, future finer resolved kinetic studies are advised.
Selection of candidate biomarkers was achieved using astrocyte enrichment and
trauma-release, not warranting brain exclusiveness. All markers are highly enriched in
the CNS; ALDOC is one of the most abundant brain proteins and is highly brain enriched
(46, 129). BLBP, GS and PEA15 are also highest expressed in the CNS, with selective
presence in other tissues (S1). To our knowledge, the combined biofluid elevation of any
two or more astrocyte-enriched biomarkers presented here points exclusively and
sensitively to brain injury.

101
Biomarker panels are anticipated to improve TBI patient assessment compared to
a single biomarker (130). Several neurotrauma biomarkers have been previously
combined to evaluate patients with brain or spinal cord injuries (131, 132). Unsupervised
factor analysis has been used for psychological and cognitive self-rated scores to assess
TBI patients (133, 134). To our knowledge, this is the first study applying Factor analysis
to a small neurotrauma biomarker panel. AID biomarker factors derived from TBI patients
coincided with cell fate assignment, thereby clinically validating the trauma model’s
classification. Aldolases (ALDOC) and fatty acid binding proteins (BLBP/FABP7) have
been previously considered as biomarkers of brain injury and cerebrovascular disease,
but isoforms were not always distinguished (117, 135). Linking cell fate and biomarkers
is unique to this study and delivers novel fluid biosignatures for traumatized brain tissue.
Correlating biomarkers and cell fates and documenting differences in individual
biomarker’s kinetic are new observations with significance for future neurotrauma
biomarker studies. Overall, our translational and exploratory clinical studies document
elevation of AID biomarkers in CSF and blood of severe and in serum of mild TBI patients,
supporting their further study for TBI patient assessment.

102
3.4 METHODS
Donors, patients and samples
All CSF and plasma samples were collected prospectively under protocols
approved by the local ethics committee of all the sites involved and stored at UCLA.
Written informed consent was obtained from patients or legal authorized representatives
before enrollment. The CSF samples from TBI subjects were collected directly from
ventriculostomy catheters, every 6h up to a maximum of 5d following injury. Blood
samples were collected by venipuncture. CSF and blood samples were aliquoted, and
stored at−80°C until the time of analysis.
Adult patients with severe head injury and requiring a ventricular catheter for
intracranial pressure monitoring were included in the discovery set. Inclusion criteria were
a Glasgow Coma Scale (GCS) score of eight or less post-resuscitation or on presentation.
Exclusion criteria were no informed consent, patients younger than 18 years of age,
female patients that were or may have been pregnant, known history of neurological
disease, and Injury Severity Score greater than 15. Treatment of patients, according to
international guidelines, was targeted at a normal ICP and maintaining cerebral perfusion
pressure.
The CSF control samples were obtained by lumbar drain from patients with an
unruptured aneurysm or was donated from healthy subjects (Precision Med). This study
group included also adult patients presenting to the hospital emergency department within
4 hours after sustaining blunt trauma to the head resulting in mild TBI (GCS 13-15) or
moderate TBI (GCS 9-12). Individuals under the age of 18 years, pregnant women,

103
prisoners, subjects who did not require a CT scan as part of their clinical evaluation or
with previous history of psychotic illness or neurological disease were excluded.
CSF Proteomics
CSF volumes from TBI patients and healthy subjects corresponding to 50-300µg
of total protein content measured by BCA assay was dried down by vacuum centrifugation
and reconstituted in 100 µL of 50 mM ammonium bicarbonate pH 8.3 solution (Sigma-
Aldrich),0.1% deoxycholatic acid. Cysteine disulfides were reduced by addition of tris(2-
carboxyethyl)-phosphine (10 mM, Thermo Scientific) and incubated at 50°C for 1h then
adjusted to room temperature. Free cysteines were alkylated with iodoacetamide (20mM,
Sigma-Aldrich). for 30 min at 37°C in the dark. Trypsin (500ng/µL 50 mM ammonium
bicarbonate, sequencing grade, Promega) was added to CSF samples at a 1:25 enzyme
to protein ratio and digested for 16-18h overnight at 37°C. Samples were acidified with
5% formic acid (v/v) and centrifuged at 13K rpm to pellet deoxycholic acid precipitate. The
supernatant was then transferred to a separate microcentrifuge tube and dried by vacuum
centrifugation.
CSF tryptic digests were reconstituted in 100µL of 0.1% formic acid, 3%
acetonitrile for LC-MS/MS. Samples were desalted using a C18 trap column connected
to C18 PepMap reversed phase HPLC column for peptide separation. CSF samples were
analyzed using a LTQ-Orbitrap or Q-Exactive Orbitrap mass spectrometer (Thermo).
Peptide separation was done in a 60 or 120min gradient from 5-35% of mobile phase
(100% acetonitrile, 0.1% formic acid). Analysis on the Q-Exactive was performed in the
positive ion mode with settings: resolution –70,000; m/z range–300-2000; maximum MS1

104
injection time–50ms; MS automatic gain control (AGC) target–1x10⁶. Acquisition was set
to record up to 10 confirmatory product ion spectra (MS2) per full scan spectrum by
selecting precursor ions of decreasing signal intensity with 30sec dynamic and charge
state exclusions to exclude signals with unassigned charge, charge +1, and charges >+5.
MS2 instrument settings were: resolution – 35,000; maximum MS2 injection time –
100ms; MS2 AGC target – 2x10⁵; fixed first mass m/z–100.
The data was searched using Mascot (Matrix Science) against the human subset
of the SwissProt database. Oxidation of methionine was set as a variable modification
with carbamidomethylation of cysteine was set as a fixed modification. Enzyme specificity
was set to C-terminal cleavage at arginine and lysine with up to 2 mixed cleavages
allowed. Strict m/z error tolerances were set to 15 ppm in MS mode and 0.01Da in MS2
mode. Peptide spectral matches were validated against a decoy database using the
percolator algorithm at a 5% false discovery rate.
Human astroglial injury model, cell permeability and viability assay, immunocytochemistry
Primary human astrocytes were prepared from donated, de-identified human fetal
cerebral neocortex at 16-19 gestational weeks as described (48). Briefly, in calcium and
magnesium-free Hank’s buffered saline solution (HBSS) mechanically dissociated tissue
was filtered through 70 µm and 10 µm nylon meshes (Nitex) into culture medium (DMEM-
F12) with 10% fetal bovine serum (FBS, Atlanta Biol.). Neural progenitor cells were
removed by 30mincentrifugation at 30,000 X g in a HBSS-buffered 33% Percoll gradient
(Sigma). The top fraction was washed and diluted in DMEM/F12, 10% FBS and
astrocytes cultured in T150 cell culture-treated plastic flasks (Corning). Confluent cultures

105
were shaken for 4 days at 200rpm on a shaker in an incubator. Astrocytes were treated
in 0.25% trypsin/EDTA followed by gently mechanical dissociation, and washed cells
were seeded onto collagen I-coated silastic membrane culture plates (6 well Bioflex,
Flexcell Intl.) at a density of ~ 135,000 human cells / 962mm2. Upon confluence, medium
was replaced by DMEM/F12 with 10% heat-inactivated horse serum (Atlanta Biol.) that
was then stepwise reduced. Serum-free astrocytes in 2ml DMEM/F12 were stretch-
injured using one mild (2.6-4.0psi) or severe (4.4-5.3psi) 50ms nitrogen pressure pulse
with the CIC II pressure controller (Custom Design and Fabrication Inc.). Cell death rates
significantly differed between mild and severe pulses, providing 2 outcome defined
distinct severities in this human trauma model (see Results, Figure 3.2).
Cells were incubated with 0.025 µg/ml propidium iodide (PI) in Leibowitz’ L15
(Gibco) for 10min at 37°C followed by four rinses in L15. Dye was crosslinked to DNA of
leaky cells by 5min exposure to UV light. Cells were fixed in freshly depolymerized 4%
paraformaldehyde in Tris-buffered saline for 30min at 4°C. Rinsed cells were
permeabilized with 0.3% Triton in buffer and blocked in 5% normal donkey serum in
buffer, followed by overnight, incubation with primary antibody at 4°C diluted in blocking
solution (Table 3.1). After rinsing, secondary antibodies (Table 3.2) were applied in
blocking solution for 1h at room temperature. Cultures were rinsed and stained in
bisbenzimide nuclear dye (Hoechst, 1:75 in distilled water) for 5min, rinsed, dried and
coverslipped (Fluorogel, Biomedia). Hardened cultures were mounted on slides (32, 48).
Immunoblotting, sub-saturated densitometry and technical variance

106
Culture trauma fluids, conditioned medium, was collected from 6 cultures (12mL)
and samples prepared as described (32). Briefly, protease inhibitors (Roche) and
dithiothreitol (5mM, Calbiochem) were added and fluids concentrated by ultrafiltration to
one twentieth of the original volume (Vivaspin, VWR). Clinical biofluid samples were
treated following common data element recommendations (136). CSF and blood samples
were thawed and supplied with EDTA (pH7.4 to 1mM) and protease inhibitors bestatin
(40µM), pepstatin A (10µM) and phosphoramidon (10µM). Samples were centrifuged for
10min at 16,060g at 4ºC to remove lipids. Plasma and serum samples were depleted of
albumin and immunoglobulins (IgGs) using immunoaffinity columns (ProteoPrep,
PROTIA Sigma) and concentrated by ultrafiltration (Vivaspin, VWR). Depletion removed
~ 85% of original protein concentration, including ~10-15% non-albumin or non-IgG
protein.
Samples were denatured (5min at 100ºC followed by ice), biofluids reduced, by
adding 1% β mercaptoethanol and all samples adjusted to Laemmli Sample Buffer
(2%SDS, 125mM TrisHCL pH6.8, 10% glycerol, 0.6% bromphenol blue) followed by
immunoblotting as previously described (32). Fluid analyses were normalized by volume
(30μL/lane). Proteins were separated in 200mM glycine 25mM Tris 0.1% SDS for 30min
at 100V followed by 1h at 120V in and transferred onto nitrocellulose (Hybond-ECL,
Amersham) with 20% methanol in same buffer. Proteins were reversibly stained using
0.1% Ponceau S in 5% acetic acid. Protein concentrations were determined by assay
(Pierce 660) against bovine serum albumin dilutions. Proteins > 30kD and 10-25kD were
separated on 10% and 15% polyacrylamide, 2% SDS Tris-based gels. Respectively. A
molecular weight standard (Precision Plus Kaleidoscope, Bio-Rad) and His-tagged pure

107
proteins ALDOC, BLBP, PEA15 (EnCor Biotech. Inc) and GFAP full size, 37 and 20kD
fragments (Abbott Diagnostics) at various concentrations diluted in 0.5% bovine serum
albumin were analyzed in parallel.
Blots were blocked for 30min with 10% non-fat milk in Tris-buffered saline with
0.05% Tween-20 (TBST) before overnight incubation at 4ºC with primary antibodies
diluted in 5% BSA in TBST (Table 3.1) (32). Isoform specific antibodies were used for
ALDOC and BLBP, because organs outside the CNS express other isoforms of these
proteins that are released after injury (137, 138). Washed blots were incubated for 1hr at
room temperature with peroxidase-conjugated secondary antibody (Thermo, Table 3.2).
Washed blots were incubated for 5min in enhanced chemiluminescence substrate (West
Pico ECL, Thermo Scientific). Film (Denville) captured signal, using same sequence of
exposure lengths consistently.
Signal levels were measured from scanned films using a bio-imaging and analysis
system with background correction (Autochemie Systems, UVP). Post-hoc normalization
of sub-saturated signals across multiple exposures covered 2-4 orders of magnitude. The
relative standard deviation for scaled exposure readings ranged from 11-33%. Wet
experimental replicates produced signals that varied from the sample mean by 20±14%.
Overall, analysis variance fell one order of magnitude below significant cross-condition
differences. In the trauma model, variation in release of each biomarker due to base
astroglial expression varied no more than 1-2 z-scores (not shown).
We controlled for the combined use of serum and plasma samples by comparing
serum and plasma marker signals in the same subject, which resulted in similar results
for all blood-compatible biomarkers, except for GFAP, which showed additional non-

108
specific bands in plasma compared to serum samples (not shown). Hence, only the new
and specific 25 kDa GFAP BDP was quantified in blood.
Quantitation of Biomarkers in CSF using multiple reaction monitoring mass-spectrometry
Peptides specific to each biomarker were designed and same, synthetic standard
peptides with heavy isotope labeled arginine (6C144N15) and lysine (6C132N15) were
purchased (Thermo Scientific). Peptide standards were prepared in 5% acetonitrile
(5pmol/µL) and spiked into CSF samples to concentrations between 25-75pmol per mL
of CSF. CSF samples are then reduced, alkylated, and digested as described above.
Digested CSF peptides were dried by vacuum centrifugation and reconstituted in
0.1% formic acid, 3% acetonitrile in water. Samples were desalted using an on-line C18
trap column prior to LC-MS/MS analysis. Peptides were separated on a 5%-35% gradient
of mobile phase B (0.1% formic acid in acetonitrile) over 40 min on a C18 PepMap
reversed phase HPLC column. Samples were analyzed using either a Q-Exactive
Orbitrap MS or a 4000 QTRAP triple quadrupole MS (AB Sciex). MRM-MS analysis was
performed with the Q-Exactive (by parallel reaction monitoring) targeting an inclusion list
of precursor peptide ions (Table 3.3) for MS2 analysis with the following parameters:
resolution 17500, AGC target 2x10⁵, maximum ion injection time 50ms, isolation window
3.0Da, fixed first mass 100, normalized collision energy 27.
Biomarker specific precursor peptide ions are listed in Table 3.3. These precursor
ions were fragmented by higher energy collisional dissociation or collision activated
dissociation depending on the MS instrument, into their component product ions.
Biomarker abundance was calculated based on the area under the curve (AUC) of the

109
precursor to product ion transitions for each biomarker specific peptide using Pinpoint
(Thermo) and Skyline (MacCoss Lab). 3 transitions were summed per biomarker specific
peptide and the ratio of the endogenous peptide signal to its heavy labeled counterpart
was determined. Biomarker concentrations were calculated based on each peptide’s
endogenous to heavy standard signal ratio, heavy standard concentration, protein
molecular weight (MW), and a dimensional conversion factor according to the formula:
Endogenous protein concentration (ng/mL) = 𝑒𝑛𝑑𝑜𝑔𝑒𝑛𝑜𝑢𝑠
𝑠𝑡𝑎𝑛𝑑𝑎𝑟𝑑𝑟𝑎𝑡𝑖𝑜 ×
25𝑓𝑚𝑜𝑙
µ𝐿 × 𝑝𝑟𝑜𝑡𝑒𝑖𝑛 𝑀𝑊 ×
1
1000 .
Statistical Analyses
Optical density (OD) measurements were log-transformed for normal distribution,
standardized and replicates were averaged. Multiple replicates of each MRM sample
were measured (analytical replicates). Same day patient samples were independently
prepared 3 times assuring experimental MRM-MS and immunoblotting consistencies
(experimental replicates). Same day patient replicates with different draw times were
analyzed in parallel and averaged for graphs and statistical analyses and are shown.
Signal specificity was validated using multiple specific antibodies for ALDOC, GFAP and
BLBP (Table 3.1).
Cell fate (death, wounding) mean differences between early and late post-injury
and between different pressure pulse severities were determined using mixed model
analysis of variance (ANOVA) allowing for non-constant variance and random donors
effects. Percent leaky/wounded and dead cells were normally distributed but had
dissimilar standard deviations. Donor-paired log-transformed biomarker culture fluid

110
levels were compared over time and at two different stretch severities using repeated
measures ANOVA, mixed model with homogeneous variances over time (139). The
associations between biomarker levels and astroglial fate were quantified using the
Spearman correlation coefficient. (rs and p, Sigmaplot). Single cell immunofluorescence
densities were compared between stretched and control astrocytes using Student’s or
Welch’s t-tests or Mann-Whitney U test depending on data distribution. TBI patient CSF
and blood biomarker densitometry levels were compared to controls and over time by
ANOVA with independence of each timepoint (for CSF) and repeated measures ANOVA,
mixed model with non-constant intra-class variances over time.
Spearman correlation of ranks was determined between biomarker immunoblot
densities and MRM-MS biomarker specific peptide measures. A quantile-quantile plot
was generated assessing the strength of the Spearman correlation. MRM-MS
concentration differences across biomarkers were compared using repeated measures
ANOVA mixed model with non-constant variance.
A multivariate factor analysis based on Spearman correlations, was conducted for
CSF samples across all injury days. Signals for GFAP (50-37kDa) and total GFAP
(Spearman correlation 0.988) differed only slightly, as did those of 40 kDa ALDOC and
total ALDOC (0.983), so one entry ‘ALDOC’ and ‘GFAP’ was used (Table 3.9). GFAP
small BDPs (25-18 kD) and ALDOC 38 kD BDP signals varied from their main bands and
were treated as additional biomarkers. Factor extraction was made for maximal
differences between factors (varimax criterion). Factor values were computed by adding
each marker after multiplying each biomarkers’ signal with its weight (loading). Biomarker

111
weight cutoff for loading was 0.51. Factor values were only computed for CSF samples
with available readings for all factor components (biomarkers).
Classification tree analysis partitioned the CSF sample cohort by determining
factor thresholds using Factors A and B amounts calculated of TBI survivors, non-
survivors and Controls (56). Statistical analyses were conducted using Sigmaplot, Excel,
Instat (Graphpad), JMP and SAS version 9.4.

112
2.5 FIGURES
Figure 3.1: Venn diagram shows astrocyte proteomic signature of neurotrauma in
cerebrospinal fluid
Venn diagram documents LC-MS/MS proteomes of CSF from 19 severe TBI patients (484
proteins) and 9 healthy subjects (402 proteins, Crl, Table 3.4). A published astrocyte
trauma-release proteome of 59 proteins showed 38 proteins overlapped (64%, purple
outline) with the clinical CSF proteomes (32). A subset of 14 proteins of the CSF and
trauma model proteomes were 2-fold astrocyte enriched (black outline, (42). Proteins also
present in healthy plasma or abundant in tissues outside the CNS were excluded. Thus,
Aldolase C (ALDOC) was identified among 5 candidates present in TBI and control CSF.
Among 4 proteins exclusive in TBI CSF was glutamine synthetase (GS). Among the
additional 5 trauma-released, astrocyte enriched proteins were astrocytic phosphoprotein
15 (PEA15) and brain-lipid binding protein (BLBP), which were considered despite
absence in CSF proteomes, due to limited LC-MS/MS sensitivity.

113
Figure 3.2: Mechanical trauma causes acute membrane wounding, reactivity and
delayed cell death in human astrocytes
(A) GFAP (green) is weakly expressed in uninjured, differentiated neocortical astrocytes.
(B) Reactive astrocytes 1d post-injury were star-shaped with enlarged processes and

114
upregulated GFAP. (C) Acutely wounded, mechanoporated astrocytes 30min after
stretching had taken up PI (red), had bright GFAP signals and beaded (arrows),
disintegrated or amputated (asterisks) processes. (D) Nuclear morphologies differentiate
(D1) viable astrocytes with large, oval-shaped pale Höchst-positive nuclei (blue); (D2)
membrane-wounded astrocytes show large pale Höchst stained, non-pyknotic nuclei with
PI-positive nucleoli (pink); and (D3) dead astrocytes with condensed chromatin, bright
Höchst and PI-positive small, pyknotic nuclei (pink). E) After mild (2.6 – 4.0 PSI, small red
dot) and severe (4.4 - 5.3 PSI, large red dot p<0.001) pressure-pulse stretching, median
fraction of leaky cells was elevated at 30min (p<0.0001) and 2d post-injury (P<0.01, mild)
and was decreased between 30min and 2d post-injury (triangles, P< 0.01). (F) Cell death
fractions were elevated at 30min (p<0.05, mild; p<0.01 severe; *) and 2d post-injury
(p<0.01, mild; p<0.001 severe; *) in stretched cultures. Severe stretched cultures had
higher cell death rates than mild ones at 2d post-injury (black dot, p<0.001). The increase
between early and late cell death rates was significant for both severities (triangle,
p<0.0001).

115

116
Figure 3.3: Human astroglial biomarker release is defined by membrane wounding
and cell death after mechanical trauma
(A) Immunoblots for GFAP, ALDOC, BLBP and PEA15 from conditioned medium (fluid)
samples of unstretched (control, Crl), mild (2.6-4 psi, small red dot) and severe (4.4-5.3
psi, large red dot) stretched astrocyte cultures at 30min (30’) and 2d post- injury. Small
GFAP BDPs (25-18 kD) are absent at 30min and appear 2d post- injury whereas ALDOC,
BLBP and PEA15 fluid signals are present 30min post-injury and at 2d. Ponceau S shows
protein amounts of same volumes per lane. B-E: Fluid sample geometric means of optical
densities (OD) for total GFAP (B), ALDOC (C), BLBP (D) and PEA15 (E) of unstretched
and at 30min, 5h, 1d and 2d after mild and severe stretching. Asterisks indicate significant
differences between stretch-injured and control (GFAP 5h mild stretch: p = 0.005, all
others p < 0.001; number of donors on x-axis). GFAP levels increased between early and
later time-points (triangles, among mild stretched between 30min and 1d: p=0.018,
between 30min and 2d p = 0.012; among severe stretched between 30min and 1d: p =
0.013, between 30min and 2d: p = 0.01). GFAP release differed at 5h between mild and
severe stretching (black dot, p=0.042). F-J: Biplots correlate biomarker levels for GFAP
(F), ALDOC (G) BLBP (H) and PEA15 (I) on the y-axes with percent membrane wounded
astrocytes (red) and percent cell death (black) on x-axes. Spearman correlations (rs) are
given with p-values and best fit lines for significant ones.

117

118
Figure 3.4: Acute cell wounding is associated with depletion of astroglial markers
and GFAP filament disruption
Human astrocytes show GFAP (white, A), ALDOC (B), BLBP (C) and PEA15 (D) signals
(green) in unstretched (control) and 30min post-stretched cultures. (A1) PI-negative,
intact astrocytes display filament assembled, fibrous GFAP. (A2) Membrane-wounded,
PI-positive (pink) astrocytes had homogeneous, non-fibrous GFAP. (B1) Intact astrocytes
express ALDOC. (B2) Leaky astrocytes (PI-positive, red) show plasmalemma blebbling
(arrowheads) and dim ALDOC. (C1) Group of intact astrocytes with bright BLBP
expression. (C2) Membrane-wounded astrocytes had dim BLBP signal. (D1) Intact
astrocytes expressed PEA15 homogeneously. (D2) PEA15 was depleted from PI-positive
astrocytes (red nuclei, arrows). (E) Proportions of fibrous (striped) and non-fibrous (gray)
GFAP in intact (blue) and leaky (pink) astrocytes with percentage of each population
listed. Stretching increased non-fibrous GFAP signals in intact (p=0.006) and leaky
populations (p<0.001, n=5). (F) Intact astrocytes had strong ALDOC expression (bright,
green). Stretching increased the fraction of ALDOC depleted cells (dim), in intact (p=0.02)
and leaky (p=0.03) astrocytes, and signal loss was greater in leaky than intact stretched
cells (p<0.001, n=6). (G) Brightly BLBP-stained GFAP-positive intact astrocyte population
decreased 30min after stretching (p=0.007) and almost disappeared from leaky cells
(n=5). (H) The majority of intact astrocytes were PEA15-positive and their percentage
diminished 30min after stretching in intact and leaky astrocytes (p<0.01), with greater
signal loss in leaky than intact stretched cells (p<0.0001, n=6). (I) Percent GFAP
expressing astrocytes with fibrous and non-fibrous GFAP cell populations. The shift from
fibrous to non-fibrous GFAP fraction changed acutely post-injury (p<0.01, asterisk),

119
without significant reduction in GFAP-expressing cells. (J) Percentages of bright and dim
cells differed between control and 30min post-stretch cultures for ALDOC (p=0.001),
BLBP (p=0.007) and PEA15 (p=0.003). (K) Stretching reduced cellular ALDOC, BLBP,
and PEA15 fluorescence intensities 30 min post-injury (p<0.001, n=3-5).

120
Figure 3.5: CSF profiles of marker panel in TBI patients on injury day and
consecutive 5 days are diverse
121
(A) Immunoblots of GFAP (50kD with BDPs 37, 25, 20 and 18kD), S100β (10kD), ALDOC
(40kD), GS (45kD), BLBP (15kD) and PEA15 (15kD) of 30 µl CSF samples from injury
day (i) and subsequent 5 post-injury days (i+1 to i+5) of a severe 54 year old male TBI
patient (1a.-1f.) alongside 30µl control CSF of a 24 year old male (I.). Bleeding indicator
APOB (130 and 250kD) had variable intensity over time post-injury and was absent from
healthy CSF; CSF marker PTGDS (22kD) had robust signal in Crl CSF but was absent
acutely after TBI and 1d post-injury, and signals recovered stepwise on subsequent post-
injury days. (B) Six CSF samples (30µl/lane) from four TBI patients (2.-5.) show variable
signals of GFAP and large BDPs (50-37kD), and new small GFAP BDPs (25/23kD
doublet, 20kD, 18kD) on injury day (patients 2., 3., 4a.) and 1d post-injury (4b., 5.) and
control CSF of a 22 year old male (II.). (C) CSF immunoblots (30µl/lane) show full size
ALDOC (40kD) in five TBI patients (6.-10.) and variable intensity of 38kD ALDOC BDP
on four days post-injury in three TBI patients (8.-10.) while a Crl subject showed no
ALDOC (III.). (D-K) Jitterplots (replicates averaged) and box-and-whisker plots, median
(line) and geometric mean (dashed) show logarithmic scaled immunoblot optical densities
(OD) of GFAP, S100β and AID biomarker CSF signals of 20-25 TBI patients on injury day
and subsequent 5 post-injury days and 8-11 Controls (n: subjects numbers per day). (D)
Total GFAP (separate BDPs, S5) was elevated on all TBI days (black *, p<0.05) and
declined over time (red *, p<0.001, i+4/5 p=0.002). (E) S100β was increased on each TBI
day versus controls. (F) ALDOC (p< 0.004) and (G) GS (p < 0.001) were elevated on
each day in TBI CSF versus Crls without significant decline. (H) BLBP (p< 0.03) and (I)
PEA15 (p< 0.004) had elevated mean levels in TBI on indicated days. Serum protein
APOB (J) was elevated in TBI versus Crl CSF (p<0.005). CSF standard PTGDS was

122
decreased in TBI versus Crl (p< 0.004) with levels depleted to various extents followed
by recovery.

123
Figure 3.6: MRM mass spectrometry provides concentration comparison of AID
biomarkers
(A) MRM-MS traces of specific peptides for GFAP, ALDOC and BLBP of three product
ion traces (y #) with given mass over charge (m/z) values and their retention time (min,
x-axis) of biomarker specific precursor ions of m/z 549.816 (for GFAP-specific peptide),
m/z 526.970 (ALDOC) and m/z 446.256 (BLBP). Traces are of CSF samples from a 21
year old male severe TBI patient (left) and a 24 year old male Control (right). (B) Biplot

124
shows log MRM values of endogenous/standard GFAP peptide ion ratios (x-axis) over
log GFAP immunoblot densities in TBI patients’ CSF samples with regression line and
Spearman correlation (r.s.=0.874, p<0.0001). Insert scatterplot of normal distributed
residuals (y-axis) over normal quantiles (x-axis, Pearson coefficient R2=0.991, p<0.0001)
validates accuracy of the two independent methods. (C) Mean MRM concentrations for
GFAP, BLBP, GS and ALDOC on injury day in TBI patients. ALDOC had 2.5-fold higher
concentrations than GFAP. GFAP and ALDOC levels were over two orders larger than
those of BLBP (p<0.001) and over three orders higher than GS (p<0.002). (D) Mean CSF
concentrations on the third post-injury day of ALDOC were 10-fold higher than those of
GFAP (p=0.008). BLBP levels were lower than ALDOC and GFAP levels (p<0.001) and
mean ALDOC levels were three orders of magnitude higher than those of GS (p=0.02).

125
Figure 3.7: Unsupervised multivariate biomarker analysis stratifies TBI patients
using factors
(A) Unsupervised factor analysis grouped biomarkers S100, GFAP, small GFAP BDPs
and APOB into Factor A (gray), ALDOC, 38 kD ALDOC BDP, BLBP, GS and PEA15 into
Factor B (green), given with their respective loading and Cronbach’s coefficients for
each factors reliability. (B) Scatterplot shows Factors A (x-axis) and Factor B (y-axis) CSF
biomarker levels (z-units) from 12 subjects with signals for all biomarkers and they were
partitioned between control and TBI (green dashed line) and between survivors and non-
survivors (gray line). N=number of observations. (C) Classification tree boundaries that

126
partitioned controls, survivors and non-survivors of TBI using Factor thresholds. (D)
Standardized means of Factor A plotted over time post-injury show difference between
TBI survivor and non-survivors on several post-injury days (p<0.03) and decreases over
days post-injury in both TBI patient groups (P<0.005). (E) Factor B means differed
between TBI and Controls (P<0.001) but means did not differ significantly in survival or
temporal profiles. n=number of subjects (D, E).

127

128
Figure 3.8: AID biomarkers are elevated in severe and mild TBI patient’s blood with
unique kinetics
(A) Immunoblot signals for GFAP (25 kD BDP), aldolase A+C, ALDO (mab E9), PEA15
and BLBP in depleted 30µl plasma samples of a control subject (VI.) and 3 severe TBI
patients on injury day and following 2-4 post-injury days. B-E) Scatterplots show levels in
plasma with temporal profiles for GFAP 25 kD BDP (B), ALDOC (mab 5C9) (C), BLBP
(D) and PEA15 (E). Same patient data shown in A are connected by gray lines. (B) GFAP
25 kD BDP was absent on injury day and elevated on post-injury days 1-5 (p<0.0001).
(C) ALDOC levels were elevated in TBI (p<0.027) on injury day, first and second post-
injury days (p<0.009) followed by decrease thereafter (between i+1 and i+4/5 p=0.041).
(D) Mean BLBP levels were increased on injury day in TBI (p=0.0067), stayed elevated
on the first post-injury day and decreased subsequently (p< 0.017). (E) PEA15 levels
were increased on injury day in TBI (p=0.024) and decreased thereafter (p<0.036). (F)
Pilot data show acute post-injury serum presence (see post-injury h) of ALDO (mab E9),
BLBP and PEA15 in CT-positive and CT-negative mild TBI patients while GFAP BDPs
were absent or weak.

129
3.6 TABLES
Name Antibodies (Company) Epitope
GFAP
Rabbit polyclonal anti-GFAP (DAKO,
Z0334)
Whole cow GFAP; recognizes full size
GFAP and large and small breakdown
products (BDPs).
Chicken polyclonal anti GFAP
(ThermoFisher Scientific, PA1-10004)
Whole bovine GFAP; Recognizes full
size GFAP, large and small BDPs
ALDOC
Rabbit affinity purified polyclonal anti-
ALDOC (Genetex, GTX102284)
Recombinant ALDOC fragment amino
acids 10-163 (P09972)
Rabbit Serum 88 (Encor, gift) Recombinant whole ALDOC and BDP
Several monoclonal ALDOC
antibodies (Encor): IgG1 mab 1A1
(MCA-1A1), IgG1 mab E9 (MCA-E9),
IgG1 mab 4A9 (MCA-4A9), IgG1 mab
5C9
Mab 1A1: C-terminal peptide
Mab E9: Recombinant whole protein
Mab 4A9: N-terminal peptide
(MPHSYPALSAEQKKELS)
Mab 5C9: N-terminus
GS
Rabbit IgG fraction polyclonal anti GS
(Sigma, G2781)
GS peptide amino acids 357-373,
Mouse mab IgG2A to GS clone 6 (BD
Transduction, 610517)
Full size GS
PEA15 Rabbit polyclonal affinity purified anti
PEA15 (Cell Signaling)
Human PEA15 peptide surrounding
Leu60
BLBP Affinity purified rabbit polyclonal anti –
FABP7 (Millipore)
GST-tagged recombinant full size
human FABP7, specific to BLBP

130
= FABP7
Affinity purified rabbit polyclonal anti-
FABP7 clone RB22973(Abgent)
C-terminal human FABP7 peptide
amino acids 104-132, specific to BLBP
APOB
Rabbit affinity purified polyclonal IgG
anti-APOB (PTGlab, 20578-1-AP)
Unspecified APOB peptide
APOB 120-130 kD observed band, full
size 516 kD
PTGDS Rabbit affinity purified IgG anti-PTGDS
(USBiological, P9053-24D)
Synthetic human PTGDS peptide amino
acids 120-190
Table 3.1: Primary antibodies
Listed are primary antibodies, commercial source, and epitopes used for Western blotting
and immunocytochemistry.

131
Application Host, target, conjugate Dilution Company Catalog # Im
mu
no-
blo
ttin
g
Goat anti-rabbit IgG, HRP 1:10,000 Thermo Fisher 31460
Goat anti-mouse IgG, HRP 1:10,000 Thermo Fisher 31430
Goat anti-chicken IgY, HRP 1:10,000 Thermo Fisher SA1-72012
Imm
unocyto
che
mis
try
Donkey anti-rabbit IgG, AlexaFluor 488 1:150 JacksonImmuno 711-545-
152
Donkey anti-rabbit IgG, AlexaFluor 647 1:150 JacksonImmuno 711-605-
152
Donkey anti-rabbit IgG, Cy 3 1:250 JacksonImmuno 711-165-
152
Donkey anti-mouse IgG, AlexaFluor
488 1:200 JacksonImmuno
715-545-
151
Donkey anti-mouse IgG, Cy 3 1:150 JacksonImmuno 715-165-
151
Donkey anti-chicken IgY, AlexaFluor
647 1:80 JacksonImmuno
703-605-
155
Donkey anti-goat IgG, AlexaFluor 488 1:100 JacksonImmuno 705-545-
003
Donkey anti-rat IgG, AlexaFluor 594 1:250 JacksonImmuno 712-585-
150
Table 3.2: Secondary antibodies
Listed are secondary detection antibodies used for Western blots and
immunocytochemistry with dilution and commercial sources.

132
Name Peptide Sequence Measured MRM Transition
GFAP ALAAELNQLR(Heavy) 554.821 (2+) --> 924.514 (1+, y8)
554.821 (2+) --> 853.477 (1+, y7)
554.821 (2+) --> 782.439 (1+, y6)
ALAAELNQLR(Light) 549.816 (2+) --> 914.505 (1+, y8)
549.816 (2+) --> 843.468 (1+, y8)
549.816 (2+) --> 722.431 (1+, y8)
LADVYQAELR (Heavy) 594.758 (2+) --> 1003.508 (1+, y8)
594.758 (2+) --> 789.413 (1+, y6)
594.758 (2+) --> 626.350 (1+, y5)
LADVYQAELR (Light) 589.314 (2+) --> 993.500 (1+, y8)
589.314 (2+) --> 779.405 (1+, y6)
589.314 (2+) --> 616.341 (1+, y5)
ALDOC TPSALAILENANVLAR (Heavy) 831.974 (2+) --> 1193.688 (1+ y11)
831.974 (2+) --> 1122.651 (1+ y10)
831.974 (2+) --> 1009.566 (1+ y9)
TPSALAILENANVLAR (Light) 826.970 (2+) --> 1183.679 (1+, y11)
826.970 (2+) --> 1112.642 (1+, y10)
826.970 (2+) --> 999.558 (1+, y9)
GS DIVEAHYR (Heavy) 506.758 (2+) --> 784.398 (1+, y6)
506.758 (2+) --> 685.329 (1+, y5)
506.758 (2+) --> 556.287 (1+, y4)
DIVEAHYR (Light) 501.753 (2+) --> 774.389 (1+, y6)
501.753 (2+) --> 675.321 (1+, y5)
501.753 (2+) --> 546.278 (1+, y4)

133
BLBP ALGVGFATR (Heavy) 451.260 (2+) --> 717.392 (1+, y7)
= FABP7 451.260 (2+) --> 660.370 (1+, y6)
451.260 (2+) --> 561.302 (1+, y5)
ALGVGFATR (Light) 446.256 (2+) --> 707.384 (1+, y7)
446.256 (2+) --> 650.362 (1+, y6)
446.256 (2+) --> 551.294 (1+, y5)
APOB SPAFTDLHLR (Heavy) 389.545 (3+) --> 764.429 (1+, y6)
389.545 (3+) --> 663.381 (1+, y5)
389.545 (3+) --> 491.771 (2+, y8)
SPAFTDLHLR (Light) 386.208 (3+) --> 754.421 (1+ y6)
386.208 (3+) --> 653.373 (1+ y5)
386.208 (3+) --> 486.767 (2+ y8)
PTGDS APEAQVSVQPNFQQDK (Heavy) 897.449 (2+) --> 1297.663 (1+, y11)
897.449 (2+) --> 1198.594 (1+, y10)
897.449 (2+) --> 884.435 (1+, y7)
APEAQVSVQPNFQQDK (Light) 893.442 (2+) --> 1289.648 (1+, y11)
893.442 (2+) --> 1190.580 (1+, y10)
893.442 (2+) --> 876.421 (1+, y7)
Table 3.3: MRM peptides and ion transitions
Human CSF biomarker-specific peptide precursor ions were selected for MRM-MS based
on the above peptide and ion transition list. MRM-MS was operated in positive ion mode.
m/z and charge state (CS [z]) values for each peptide listed.

134
Accession Protein Name
TBI Only CSF Proteins
O94760 N(G),N(G)-dimethylarginine dimethylaminohydrolase 1
P11142 Heat shock cognate 71 kDa protein
P18206 Vinculin
P15104 Glutamine synthetase (GS) (EC 6.3.1.2)
P12277 Creatine kinase B-type
Q06830 Peroxiredoxin-1
P31946 14-3-3 protein beta/alpha
P62258 14-3-3 protein epsilon
P61981 14-3-3 protein gamma
P63104 14-3-3 protein zeta/delta
P23528 Cofilin-1
O75874 Isocitrate dehydrogenase cytoplasmic
P00558 Phosphoglycerate kinase 1
P13796 Plastin-2
P67936 Tropomyosin alpha-4 chain
Q13885 Tubulin beta-2A chain
P27348 14-3-3 protein theta
Q16555 Dihydropyrimidinase-related protein 2
P21333 Filamin-A
Q12765 Secernin-1
P06753 Tropomyosin alpha-3 chain
P14136 Glial fibrillary acidic protein
P30041 Peroxiredoxin-6
P08670 Vimentin
P80108 Phosphatidylinositol-glycan-specific phospholipase D
P00491 Purine nucleoside phosphorylase
P25713 Metallothionein-3
P00918 Carbonic anhydrase 2
Q01469 Fatty acid-binding protein, epidermal
P30043 Flavin reductase
Q06033 Inter-alpha-trypsin inhibitor heavy chain H3
P02545 Prelamin-A/C
P26447 Protein S100-A4
P09382 Galectin-1
P09429 High mobility group protein B1
P26583 High mobility group protein B2
P18669 Phosphoglycerate mutase 1
Q71U36 Tubulin alpha-1A chain
P04040 Catalase
P21291 Cysteine and glycine-rich protein 1
P26038 Moesin
P06703 Protein S100-A6

135
P28799 Granulins
Heat shock-related 70 kDa protein 2
P35998 26S protease regulatory subunit 7
P68032 Actin, alpha cardiac muscle 1
P63261 Actin, cytoplasmic 2
P00568 Adenylate kinase isoenzyme 1
Q01518 Adenylyl cyclase-associated protein 1
P12814 Alpha-actinin-1
P04083 Annexin A1
P04114 Apolipoprotein B-100
P02655 Apolipoprotein C-II
Q13790 Apolipoprotein F
O14791 Apolipoprotein L1
O95445 Apolipoprotein M
P08519 Apolipoprotein(a)
P07738 Bisphosphoglycerate mutase
P04003 C4b-binding protein alpha chain
P20851 C4b-binding protein beta chain
P05937 Calbindin
P00915 Carbonic anhydrase 1
P16152 Carbonyl reductase
P15169 Carboxypeptidase N catalytic chain
P22792 Carboxypeptidase N subunit 2
P49913 Cathelicidin antimicrobial peptide
O43866 CD5 antigen-like
P06276 Cholinesterase
P00740 Coagulation factor IX
P05160 Coagulation factor XIII B chain
P02745 Complement C1q subcomponent subunit A
P31146 Coronin-1A
P02741 C-reactive protein
P06732 Creatine kinase M-type
P13716 Delta-aminolevulinic acid dehydratase
P81605 Dermcidin
P15090 Fatty acid-binding protein, adipocyte
P02792 Ferritin light chain
Q9UGM5 Fetuin-B
O75636 Ficolin-3
P05062 Fructose-bisphosphate aldolase B
P06744 Glucose-6-phosphate isomerase
P35754 Glutaredoxin-1
P78417 Glutathione S-transferase omega-1
P09211 Glutathione S-transferase P
P69891 Hemoglobin subunit gamma-1
P26927 Hepatocyte growth factor-like protein

136
P10412 Histone H1.4
P16401 Histone H1.5
P62805 Histone H4
Q86YZ3 Hornerin
Q14520 Hyaluronan-binding protein 2
P01591 Immunoglobulin J chain
P02533 Keratin, type I cytoskeletal 14
P35908 Keratin, type II cytoskeletal 2 epidermal
P13647 Keratin, type II cytoskeletal 5
P02788 Lactotransferrin
P30740 Leukocyte elastase inhibitor
P18428 Lipopolysaccharide-binding protein
P00338 L-lactate dehydrogenase A chain
P14151 L-selectin
Q9Y5Y7 Lymphatic vessel endothelial hyaluronic acid receptor 1
P14174 Macrophage migration inhibitory factor
P14780 Matrix metalloproteinase-9
P11137 Microtubule-associated protein 2
P19105 Myosin regulatory light chain 12A
P12882 Myosin-1
P12883 Myosin-7
P35579 Myosin-9
P59665 Neutrophil defensin 1
P80188 Neutrophil gelatinase-associated lipocalin
P30044 Peroxiredoxin-5, mitochondrial
P02775 Platelet basic protein
P02776 Platelet factor 4
P20742 Pregnancy zone protein
P07737 Profilin-1
P27918 Properdin
P25786 Proteasome subunit alpha type-1
P28072 Proteasome subunit beta type-6
P05109 Protein S100-A8
Q9UK55 Protein Z-dependent protease inhibitor
Q92954 Proteoglycan 4
P31150 Rab GDP dissociation inhibitor alpha
P52565 Rho GDP-dissociation inhibitor 1
P52566 Rho GDP-dissociation inhibitor 2
P0DJI8 Serum amyloid A-1 protein
P0DJI9 Serum amyloid A-2 protein
P02743 Serum amyloid P-component
P04278 Sex hormone-binding globulin
Q9H299 SH3 domain-binding glutamic acid-rich-like protein 3
P10599 Thioredoxin
P07996 Thrombospondin-1
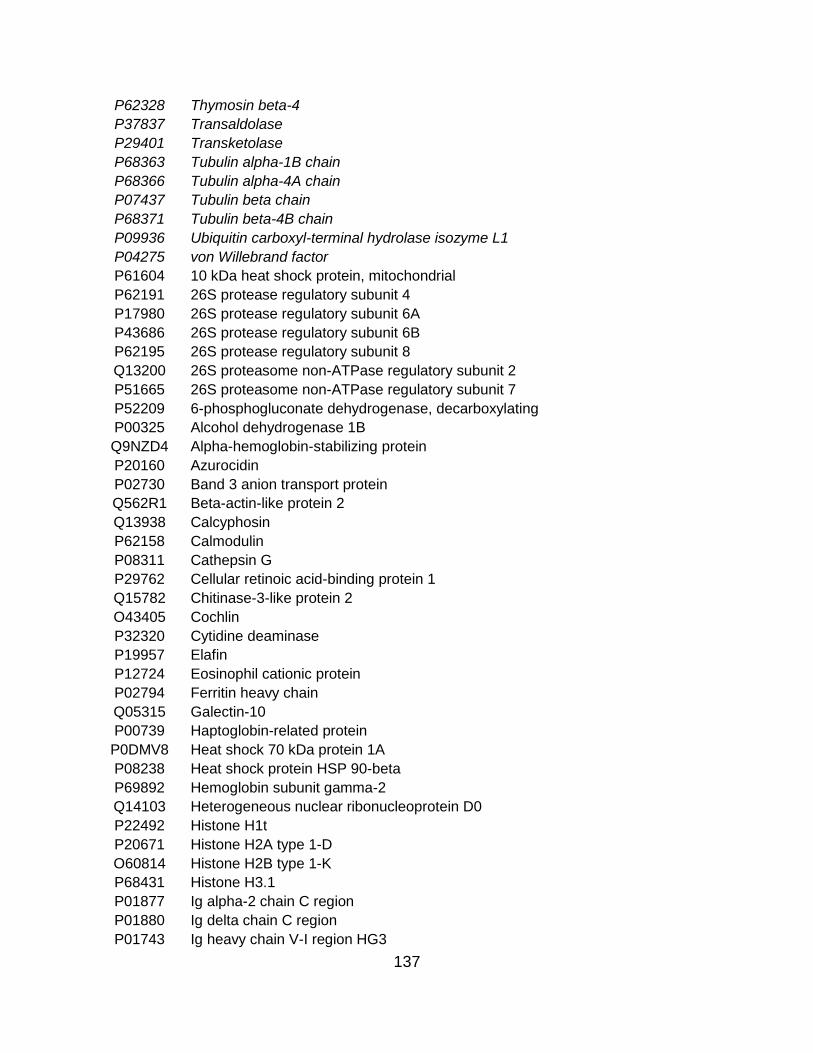
137
P62328 Thymosin beta-4
P37837 Transaldolase
P29401 Transketolase
P68363 Tubulin alpha-1B chain
P68366 Tubulin alpha-4A chain
P07437 Tubulin beta chain
P68371 Tubulin beta-4B chain
P09936 Ubiquitin carboxyl-terminal hydrolase isozyme L1
P04275 von Willebrand factor
P61604 10 kDa heat shock protein, mitochondrial
P62191 26S protease regulatory subunit 4
P17980 26S protease regulatory subunit 6A
P43686 26S protease regulatory subunit 6B
P62195 26S protease regulatory subunit 8
Q13200 26S proteasome non-ATPase regulatory subunit 2
P51665 26S proteasome non-ATPase regulatory subunit 7
P52209 6-phosphogluconate dehydrogenase, decarboxylating
P00325 Alcohol dehydrogenase 1B
Q9NZD4 Alpha-hemoglobin-stabilizing protein
P20160 Azurocidin
P02730 Band 3 anion transport protein
Q562R1 Beta-actin-like protein 2
Q13938 Calcyphosin
P62158 Calmodulin
P08311 Cathepsin G
P29762 Cellular retinoic acid-binding protein 1
Q15782 Chitinase-3-like protein 2
O43405 Cochlin
P32320 Cytidine deaminase
P19957 Elafin
P12724 Eosinophil cationic protein
P02794 Ferritin heavy chain
Q05315 Galectin-10
P00739 Haptoglobin-related protein
P0DMV8 Heat shock 70 kDa protein 1A
P08238 Heat shock protein HSP 90-beta
P69892 Hemoglobin subunit gamma-2
Q14103 Heterogeneous nuclear ribonucleoprotein D0
P22492 Histone H1t
P20671 Histone H2A type 1-D
O60814 Histone H2B type 1-K
P68431 Histone H3.1
P01877 Ig alpha-2 chain C region
P01880 Ig delta chain C region
P01743 Ig heavy chain V-I region HG3

138
P23083 Ig heavy chain V-I region V35
P06331 Ig heavy chain V-II region ARH-77
P01824 Ig heavy chain V-II region WAH
P01769 Ig heavy chain V-III region GA
P01762 Ig heavy chain V-III region TRO
P01779 Ig heavy chain V-III region TUR
P01594 Ig kappa chain V-I region AU
P01604 Ig kappa chain V-I region Kue
P01605 Ig kappa chain V-I region Lay
P01608 Ig kappa chain V-I region Roy
P01610 Ig kappa chain V-I region WEA
P01611 Ig kappa chain V-I region Wes
P01616 Ig kappa chain V-II region MIL
P04206 Ig kappa chain V-III region GOL
P06311 Ig kappa chain V-III region IARC/BL41
P01624 Ig kappa chain V-III region POM
P01623 Ig kappa chain V-III region WOL
P04211 Ig lambda chain V region 4A
P01701 Ig lambda chain V-I region NEW
P01702 Ig lambda chain V-I region NIG-64
P04208 Ig lambda chain V-I region WAH
P06889 Ig lambda chain V-IV region MOL
A0M8Q6 Ig lambda-7 chain C region
P04220 Ig mu heavy chain disease protein
P09960 Leukotriene A-4 hydrolase
P08637 Low affinity immunoglobulin gamma Fc region receptor III-A
Q9BZG9 Ly-6/neurotoxin-like protein 1
P40121 Macrophage-capping protein
P08493 Matrix Gla protein
P02686 Myelin basic protein
P20916 Myelin-associated glycoprotein
P24158 Myeloblastin
P05164 Myeloperoxidase
P60660 Myosin light polypeptide 6
P29966 Myristoylated alanine-rich C-kinase substrate
P22894 Neutrophil collagenase
P59666 Neutrophil defensin 3
P08246 Neutrophil elastase
P10153 Non-secretory ribonuclease
P20472 Parvalbumin alpha
O75594 Peptidoglycan recognition protein 1
P15259 Phosphoglycerate mutase 2
P0CG48 Polyubiquitin-C
P31949 Protein S100-A11
P80511 Protein S100-A12

139
P04271 Protein S100-B
P48539 Purkinje cell protein 4
P48741 Putative heat shock 70 kDa protein 7
Q9HD89 Resistin
P63313 Thymosin beta-10
P07951 Tropomyosin beta chain
Q13509 Tubulin beta-3 chain
P04350 Tubulin beta-4A chain
Q9BW30 Tubulin polymerization-promoting protein family member 3
Q9Y279 V-set and immunoglobulin domain-containing protein 4
TBI and Control CSF Proteins
P02649 Apolipoprotein E
P10909 Clusterin
P09972 Fructose-bisphosphate aldolase C
P60709 Actin, cytoplasmic 1
P07195 L-lactate dehydrogenase B chain
P13645 Keratin, type I cytoskeletal 10
P00441 Superoxide dismutase
P06733 Alpha-enolase
P06396 Gelsolin
P19823 Inter-alpha-trypsin inhibitor heavy chain H2
P30086 Phosphatidylethanolamine-binding protein 1
P04075 Fructose-bisphosphate aldolase A
P40925 Malate dehydrogenase, cytoplasmic
P32119 Peroxiredoxin-2
P04406 Glyceraldehyde-3-phosphate dehydrogenase
P00751 Complement factor B
P62937 Peptidyl-prolyl cis-trans isomerase A
P01023 Alpha-2-macroglobulin
P01019 Angiotensinogen
P16070 CD44 antigen
P0C0L5 Complement C4-B
P01034 Cystatin-C
Q12805 EGF-containing fibulin-like extracellular matrix protein 1
P18065 Insulin-like growth factor-binding protein 2
P36955 Pigment epithelium-derived factor
Q13228 Selenium-binding protein 1
Q14515 SPARC-like protein 1
P19320 Vascular cell adhesion protein 1
P36222 Chitinase-3-like protein 1
Q9UBP4 Dickkopf-related protein 3
O14594 Neurocan core protein
O00584 Ribonuclease T2
O14498 Immunoglobulin superfamily containing leucine-rich repeat protein

140
P01871 Ig mu chain C region
P06681 Complement C2
P07108 Acyl-CoA-binding protein
P07225 Vitamin K-dependent protein S
P08294 Extracellular superoxide dismutase
P09486 SPARC
P12259 Coagulation factor V
P13473 Lysosome-associated membrane glycoprotein 2
P17900 Ganglioside GM2 activator
P19022 Cadherin-2
P43251 Biotinidase
P49908 Selenoprotein P
P78324 Tyrosine-protein phosphatase non-receptor type substrate 1
Q08380 Galectin-3-binding protein
Q12841 Follistatin-related protein 1
Q13449 Limbic system-associated membrane protein
Q13740 CD166 antigen
Q14118 Dystroglycan
Q8WXD2 Secretogranin-3
Q96GW7 Brevican core protein
Q9P121 Neurotrimin
P02768 Serum albumin
P02787 Serotransferrin
P01024 Complement C3
P00450 Ceruloplasmin
P01008 Antithrombin-III
P00738 Haptoglobin
P02656 Apolipoprotein C-III
P02790 Hemopexin
P07339 Cathepsin D
P07602 Prosaposin
P07858 Cathepsin B
P08571 Monocyte differentiation antigen CD14
P08697 Alpha-2-antiplasmin
P09871 Complement C1s subcomponent
P13591 Neural cell adhesion molecule 1
P16870 Carboxypeptidase E
P23142 Fibulin-1
P43652 Afamin
P61769 Beta-2-microglobulin
Q12907 Vesicular integral-membrane protein VIP36
P02763 Alpha-1-acid glycoprotein 1
P19652 Alpha-1-acid glycoprotein 2
P01011 Alpha-1-antichymotrypsin
P01009 Alpha-1-antitrypsin

141
P04217 Alpha-1B-glycoprotein
P02765 Alpha-2-HS-glycoprotein
P02647 Apolipoprotein A-I
P02652 Apolipoprotein A-II
P06727 Apolipoprotein A-IV
P02654 Apolipoprotein C-I
P05090 Apolipoprotein D
P17174 Aspartate aminotransferase, cytoplasmic
O75882 Attractin
P98160 Basement membrane-specific heparan sulfate proteoglycan core protein
P02749 Beta-2-glycoprotein 1
Q96KN2 Beta-Ala-His dipeptidase
P55290 Cadherin-13
O94985 Calsyntenin-1
Q96IY4 Carboxypeptidase B2
Q9NQ79 Cartilage acidic protein 1
P43121 Cell surface glycoprotein MUC18
P00742 Coagulation factor X
P00748 Coagulation factor XII
P02452 Collagen alpha-1
P08123 Collagen alpha-2
P02746 Complement C1q subcomponent subunit B
P02747 Complement C1q subcomponent subunit C
P00736 Complement C1r subcomponent
Q9NZP8 Complement C1r subcomponent-like protein
P0C0L4 Complement C4-A
P01031 Complement C5
P13671 Complement component C6
P10643 Complement component C7
P07357 Complement component C8 alpha chain
P07358 Complement component C8 beta chain
P07360 Complement component C8 gamma chain
P02748 Complement component C9
P00746 Complement factor D
P08603 Complement factor H
Q03591 Complement factor H-related protein 1
P36980 Complement factor H-related protein 2
P05156 Complement factor I
P08185 Corticosteroid-binding globulin
Q16610 Extracellular matrix protein 1
P02671 Fibrinogen alpha chain
P02675 Fibrinogen beta chain
P02679 Fibrinogen gamma chain
P02751 Fibronectin
P09104 Gamma-enolase

142
P22352 Glutathione peroxidase 3
P69905 Hemoglobin subunit alpha
P68871 Hemoglobin subunit beta
P02042 Hemoglobin subunit delta
P05546 Heparin cofactor 2
P04196 Histidine-rich glycoprotein
P16403 Histone H1.2
P22692 Insulin-like growth factor-binding protein 4
P24592 Insulin-like growth factor-binding protein 6
Q16270 Insulin-like growth factor-binding protein 7
P35858 Insulin-like growth factor-binding protein complex acid labile subunit
P19827 Inter-alpha-trypsin inhibitor heavy chain H1
Q14624 Inter-alpha-trypsin inhibitor heavy chain H4
P29622 Kallistatin
P35527 Keratin, type I cytoskeletal 9
P04264 Keratin, type II cytoskeletal 1
P01042 Kininogen-1
P02750 Leucine-rich alpha-2-glycoprotein
P51884 Lumican
P61626 Lysozyme C
P07333 Macrophage colony-stimulating factor 1 receptor
P01033 Metalloproteinase inhibitor 1
P20774 Mimecan
P02144 Myoglobin
Q96PD5 N-acetylmuramoyl-L-alanine amidase
O15394 Neural cell adhesion molecule 2
O00533 Neural cell adhesion molecule L1-like protein
P55058 Phospholipid transfer protein
P03952 Plasma kallikrein
P05155 Plasma protease C1 inhibitor
P05154 Plasma serine protease inhibitor
P00747 Plasminogen
Q15113 Procollagen C-endopeptidase enhancer 1
P41222 Prostaglandin-H2 D-isomerase
P02760 Protein AMBP
Q99497 Protein deglycase DJ-1
P06702 Protein S100-A9
P00734 Prothrombin
P14618 Pyruvate kinase PKM
P02753 Retinol-binding protein 4
P07998 Ribonuclease pancreatic
Q86VB7 Scavenger receptor cysteine-rich type 1 protein M130
P35542 Serum amyloid A-4 protein
P27169 Serum paraoxonase/arylesterase 1
O00391 Sulfhydryl oxidase 1

143
P22105 Tenascin-X
P05452 Tetranectin
P05543 Thyroxine-binding globulin
Q15582 Transforming growth factor-beta-induced protein ig-h3
P02766 Transthyretin
P60174 Triosephosphate isomerase
P02774 Vitamin D-binding protein
P04004 Vitronectin
P54289 Voltage-dependent calcium channel subunit alpha-2/delta-1
P25311 Zinc-alpha-2-glycoprotein
P63267 Actin, gamma-enteric smooth muscle
P05067 Amyloid beta A4 protein
P51693 Amyloid-like protein 1
O43505 Beta-1,4-glucuronyltransferase 1
P80723 Brain acid soluble protein 1
P07711 Cathepsin L1
P13987 CD59 glycoprotein
Q8TCZ2 CD99 antigen-like protein 2
Q8N126 Cell adhesion molecule 3
Q8NFZ8 Cell adhesion molecule 4
P10645 Chromogranin-A
P12109 Collagen alpha-1 chain
Q12860 Contactin-1
Q9P0K1 Disintegrin and metalloproteinase domain-containing protein 22
Q13822 Ectonucleotide pyrophosphatase/phosphodiesterase family member 2
O94919 Endonuclease domain-containing 1 protein
P54764 Ephrin type-A receptor 4
P61916 Epididymal secretory protein E1
Q96KK5 Histone H2A type 1-H
P01876 Ig alpha-1 chain C region
P01857 Ig gamma-1 chain C region
P01859 Ig gamma-2 chain C region
P01860 Ig gamma-3 chain C region
P01861 Ig gamma-4 chain C region
P01764 Ig heavy chain V-III region 23
P01766 Ig heavy chain V-III region BRO
P01767 Ig heavy chain V-III region BUT
P01768 Ig heavy chain V-III region CAM
P01781 Ig heavy chain V-III region GAL
P01765 Ig heavy chain V-III region TIL
P01834 Ig kappa chain C region
P01593 Ig kappa chain V-I region AG
P01597 Ig kappa chain V-I region DEE
P01598 Ig kappa chain V-I region EU
P01613 Ig kappa chain V-I region Ni

144
P01606 Ig kappa chain V-I region OU
P01617 Ig kappa chain V-II region TEW
P01619 Ig kappa chain V-III region B6
P04207 Ig kappa chain V-III region CLL
P01620 Ig kappa chain V-III region SIE
P04433 Ig kappa chain V-III region VG
P04434 Ig kappa chain V-III region VH
P01625 Ig kappa chain V-IV region Len
P80748 Ig lambda chain V-III region LOI
P01714 Ig lambda chain V-III region SH
P0CG04 Ig lambda-1 chain C regions
P0CG05 Ig lambda-2 chain C regions
P0CG06 Ig lambda-3 chain C regions
Q9Y6R7 IgGFc-binding protein
B9A064 Immunoglobulin lambda-like polypeptide 5
P01344 Insulin-like growth factor II
Q92876 Kallikrein-6
O94772 Lymphocyte antigen 6H
P04156 Major prion protein
P41271 Neuroblastoma suppressor of tumorigenicity 1
P05408 Neuroendocrine protein 7B2
Q92823 Neuronal cell adhesion molecule
O95502 Neuronal pentraxin receptor
O15240 Neurosecretory protein VGF
Q02818 Nucleobindin-1
P10451 Osteopontin
Q96FE7 Phosphoinositide-3-kinase-interacting protein 1
Q9H3G5 Probable serine carboxypeptidase CPVL
Q9UHG2 ProSAAS
Q92520 Protein FAM3C
Q99435 Protein kinase C-binding protein NELL2
P05060 Secretogranin-1
P13521 Secretogranin-2
O75326 Semaphorin-7A
Q5TFQ8 Signal-regulatory protein beta-1 isoform 3
P04216 Thy-1 membrane glycoprotein
P13611 Versican core protein
Q8TAG5 V-set and transmembrane domain-containing protein 2A
Q8TEU8 WAP, Kazal, immunoglobulin, Kunitz and NTR domain-containing protein 2
Healthy CSF Proteins Only
P11021 78 kDa glucose-regulated protein
P24593 Insulin-like growth factor-binding protein 5
Q08431 Lactadherin
P04180 Phosphatidylcholine-sterol acyltransferase

145
Q06481 Amyloid-like protein 2
Q16620 BDNF/NT-3 growth factors receptor
P11362 Fibroblast growth factor receptor 1
P22304 Iduronate 2-sulfatase
Q86UX2 Inter-alpha-trypsin inhibitor heavy chain H5
Q96KG7 Multiple epidermal growth factor-like domains protein 10
P23471 Receptor-type tyrosine-protein phosphatase zeta
Q9NPR2 Semaphorin-4B
O14773 Tripeptidyl-peptidase 1
P30530 Tyrosine-protein kinase receptor UFO
Q99969 Retinoic acid receptor responder protein 2
P26992 Ciliary neurotrophic factor receptor subunit alpha
O95967 EGF-containing fibulin-like extracellular matrix protein 2
P21802 Fibroblast growth factor receptor 2
P98095 Fibulin-2
Q8NBJ4 Golgi membrane protein 1
P21246 Pleiotrophin
O15031 Plexin-B2
P51888 Prolargin
O60883 Prosaposin receptor GPR37L1
O75711 Scrapie-responsive protein 1
Q9Y646 Carboxypeptidase Q
Q01459 Di-N-acetylchitobiase
P40189 Interleukin-6 receptor subunit beta
Q92859 Neogenin
Q6UX71 Plexin domain-containing protein 2
P23470 Receptor-type tyrosine-protein phosphatase gamma
O60241 Adhesion G protein-coupled receptor B2
P49641 Alpha-mannosidase 2x
P55283 Cadherin-4
Q9BY67 Cell adhesion molecule 1
Q9Y287 Integral membrane protein 2B
Q9HCB6 Spondin-1
P08253 72 kDa type IV collagenase
P27797 Calreticulin
P02461 Collagen alpha-1 chain
P12111 Collagen alpha-3 chain
P14625 Endoplasmin
Q9UBQ6 Exostosin-like 2
P14314 Glucosidase 2 subunit beta
O75144 ICOS ligand
Mannosyl-oligosaccharide 1,2-alpha-mannosidase IA
P16035 Metalloproteinase inhibitor 2
Q7Z7M0 Multiple epidermal growth factor-like domains protein 8
P32004 Neural cell adhesion molecule L1

146
P14543 Nidogen-1
P23515 Oligodendrocyte-myelin glycoprotein
Q6UXB8 Peptidase inhibitor 16
P23284 Peptidyl-prolyl cis-trans isomerase B
Q96S96 Phosphatidylethanolamine-binding protein 4
Q96NZ9 Proline-rich acidic protein 1
Q9NYQ8 Protocadherin Fat 2
P23468 Receptor-type tyrosine-protein phosphatase delta
Q13332 Receptor-type tyrosine-protein phosphatase S
P34096 Ribonuclease 4
Q9Y6N7 Roundabout homolog 1
Q8WZ42 Titin
Q24JP5 Transmembrane protein 132A
Q9BRK5 45 kDa calcium-binding protein
O94910 Adhesion G protein-coupled receptor L1
O00468 Agrin
P07686 Beta-hexosaminidase subunit beta
Q9BQT9 Calsyntenin-3
Q8N3J6 Cell adhesion molecule 2
Q99674 Cell growth regulator with EF hand domain protein 1
Q6UW01 Cerebellin-3
Q16568 Cocaine- and amphetamine-regulated transcript protein
P39060 Collagen alpha-1 chain
P08174 Complement decay-accelerating factor
Q02246 Contactin-2
Q9C0A0 Contactin-associated protein-like 4
P07585 Decorin
P09417 Dihydropteridine reductase
P52799 Ephrin-B2
O94769 Extracellular matrix protein 2
Q8IWU5 Extracellular sulfatase Sulf-2
Q9UBX5 Fibulin-5
P14207 Folate receptor beta
Q6MZW2 Follistatin-related protein 4
O00451 GDNF family receptor alpha-2
P48058 Glutamate receptor 4
Q16769 Glutaminyl-peptide cyclotransferase
Q9Y2T3 Guanine deaminase
Q8IZP7 Heparan-sulfate 6-O-sulfotransferase 3
P18136 Ig kappa chain V-III region HIC
P01622 Ig kappa chain V-III region Ti
Q969P0 Immunoglobulin superfamily member 8
Q9NX62 Inositol monophosphatase 3
Q9UMF0 Intercellular adhesion molecule 5
O43291 Kunitz-type protease inhibitor 2

147
Q8N2S1 Latent-transforming growth factor beta-binding protein 4
Q9NT99 Leucine-rich repeat-containing protein 4B
P42785 Lysosomal Pro-X carboxypeptidase
P09603 Macrophage colony-stimulating factor 1
P22897 Macrophage mannose receptor 1
P55083 Microfibril-associated glycoprotein 4
Q16653 Myelin-oligodendrocyte glycoprotein
Q9NY97 N-acetyllactosaminide beta-1,3-N-acetylglucosaminyltransferase 2
Q9ULB1 Neurexin-1
Q9P2S2 Neurexin-2
Q9Y4C0 Neurexin-3
Q9NPD7 Neuritin
O94856 Neurofascin
Q7Z3B1 Neuronal growth regulator 1
Q15818 Neuronal pentraxin-1
P47972 Neuronal pentraxin-2
Q5BLP8 Neuropeptide-like protein C4orf48
Q99574 Neuroserpin
Q14112 Nidogen-2
Q14982 Opioid-binding protein/cell adhesion molecule
Q99983 Osteomodulin
P19021 Peptidyl-glycine alpha-amidating monooxygenase
P01127 Platelet-derived growth factor subunit B
Q9NZ53 Podocalyxin-like protein 2
P01210 Proenkephalin-A
Q5FWE3 Proline-rich transmembrane protein 3
P01303 Pro-neuropeptide Y
O15354 Prosaposin receptor GPR37
O60888 Protein CutA
P48745 Protein NOV homolog
Q8WZA1 Protein O-linked-mannose beta-1,2-N-acetylglucosaminyltransferase 1
Q9Y5F6 Protocadherin gamma-C5
C9JVW0 Putative transmembrane protein INAFM1
Q92932 Receptor-type tyrosine-protein phosphatase N2
Q16849 Receptor-type tyrosine-protein phosphatase-like N
P78509 Reelin
O75787 Renin receptor
Q9BZR6 Reticulon-4 receptor
Q6NW40 RGM domain family member B
Q93091 Ribonuclease K6
Q9BYH1 Seizure 6-like protein
Q6UXD5 Seizure 6-like protein 2
Q53EL9 Seizure protein 6 homolog
Q96PX8 SLIT and NTRK-like protein 1
Q8WVQ1 Soluble calcium-activated nucleotidase 1

148
Q9H4F8 SPARC-related modular calcium-binding protein 1
O60279 Sushi domain-containing protein 5
Q08629 Testican-1
Q92563 Testican-2
O43493 Trans-Golgi network integral membrane protein 2
O75509 Tumor necrosis factor receptor superfamily member 21
Q6UX73 UPF0764 protein C16orf89
Q9UPU3 VPS10 domain-containing receptor SorCS3
A6NLU5 V-set and transmembrane domain-containing protein 2B
Q15904 V-type proton ATPase subunit S1
Q9ULF5 Zinc transporter ZIP10
Table 3.4: TBI and Control CSF proteomes
Analytical mass spectrometry, by LC-MS/MS on LTQ-Orbitrap and Q-Exactive Orbitrap
mass spectrometers was conducted on CSF from 19 severe and moderate TBI patients
and 9 Control donors. Proteins were identified by MASCOT database searching
(SwissProt, Homo sapiens, ≥2 unique peptides, 95% peptide confidence) to arrive at
cumulative conservative TBI and healthy CSF protein lists using same conditions. These
CSF proteomes served as clinical correlates to determine the signature of a previously
identified astrocytic trauma-release proteome. Proteins from the mouse trauma release
proteome found in TBI CSF are highlighted in yellow (32). Astrocyte enriched proteins are
highlighted in blue (42). Proteins from both categories of trauma release and astrocyte
enrichment are highlighted in green. Italics indicate proteins present in plasma proteomes
(43, 44).

149
% Dead Total
GFAP ALDOC BLBP PEA15
%
Leaky
-0.0402 0.337 0.759 0.499 0.785 r s (Spearman)
0.809 0.155 < 0.001 0.0338 < 0.001 p value
38 19 20 18 20 Number of observations
% Dead
0.719 0.452 0.543 0.405
< 0.001 0.044 0.0194 0.0754
19 20 18 20
Total
GFAP
0.595 0.493 0.456
< 0.001 < 0.001 < 0.001
54 42 54
ALDOC
0.398 0.681
0.0084 < 0.001
43 55
BLBP
0.499
< 0.001
43
Table 3.5: Spearman correlations between culture trauma fluid biomarkers and
astrocyte cell fates
The p-values for Spearman correlations of ranks are shown for culture-released total
GFAP (full size band and all fragments), ALDOC, BLBP and PEA15 as well as their
correlation to rates of cell wounding (leaky membranes) and cell death. Numbers of
culture observations for control and all post-stretching data are included.

150

151

152
Table 3.6: TBI patient data, clinical samples and conducted experimental analyses
(A) Figure IDs are roman italic numbers that refer to signals of control subject CSF and
blood samples shown in Figures 3.5 and 3.8. Gender and age are listed for 17 healthy
subjects who donated CSF, obtained by lumbar drain, blood or both. Sample
measurements and replicates are listed for immunoblotting (IB), MRM-MS and proteome
analyses (LC-MS/MS). (B) Italicized figure IDs list severe TBI patients whose CSF,
obtained by ventriculostomy or/and blood samples are shown in Figures 3.5 and 3.8 with
gender and age. Injury cause including motor vehicle accidents (MVA) and gunshot
wound (GSW) is listed. Post-resuscitation GCS scores, survival and computed
tomography (CT) findings are given. CT scan reports include presence of intracerebral
hemorrhage (ICH) including one or more findings of contusion (Cnts), subdural hematoma
(SDH), subarachnoid hemorrhage (SAH) or intraventricular hemorrhage (IVH). Further,

153
presence of epidural hematoma (EDH), diffuse Axonal Injury (DAI), ischemia (Is) and
edema or midline shift (Edm, mdls) are reported. Post-injury days are given for CSF,
plasma and serum samples averaging multiple same-day samples for analyses. Italicized
figure IDs indicate mild TBI patients whose serum IB data are shown in Figure 3.8F.
Gender, age, injury cause, GCS score and CT normal (CT-) or abnormal CT (CT+) is
listed with scan findings as well as post-injury hrs are given for serum samples.

154
GFAP ALDOC BLBP GS PEA15 APOB PTGDS
Minimum OD 0.001 0.017 0.005 0.000 0.002 0.001 0.00039
Maximum OD 6.629 1.391 3.660 0.982 4.173 0.845 1.116
Orders of magnitude 4.1 1.9 2.9 3.4 3.3 3.0 3.5
# of observations 54 102 48 51 44 51 40
Table 3.7: Dynamic ranges of biomarker levels in CSF
Listed are minimum and maximum optical density readings for astrocyte injury biomarkers
GFAP, ALDOC, BLBP, GS and PEA15, as well as bleeding indicator APOB and CSF
standard PTGDS. Resulting signal ranges are given in orders of magnitude and number
of observation are listed (italic).

155
Marker Detection Limit
Interquartile Concentration Range
Immunoblot MRM
Immunoblot MRM Blood CSF CSF
ALDOC 0.2-1ng 58pg 1ng/mL - 13.3 ng/mL 600ng/mL - 1.3μg/mL 361ng/mL-1.5μg/mL
BLBP ~50pg 1pg 0ng/mL - 20ng/mL 2.3ng/mL - 20ng/mL 3.1ng/mL-14.4ng/mL
GFAP 8-40pg 1pg 267pg/mL - 20ng/mL 2.7ng/mL - 253ng/mL 86ng/mL-544ng/mL
Table 3.8: Concentrations and detection limits of ALDOC, BLBP and GFAP in TBI
CSF and blood
Pure protein dilution series in 0.5 % serum albumin were used to calibrate immunoblot
densitometry signals and determine their approximate detection limits in TBI CSF and
blood. Known amounts of heavy isotope labeled biomarker-specific peptides were used
as standards to determine MRM-MS interquartile ranges in TBI CSF.

156
Variable by Variable Spearman
corr. p
value n =
observations
GFAP total GFAP large
BDPs 0.9877
< 0.0001
64 Very strong
ALDOC total ALDOC 40 kD 0.9833 <
0.0001 121
APOB GFAP small
BDPs 0.898
< 0.001 42
S100β GFAP small
BDPs 0.87
< 0.001 54
APOB S100β 0.847 0 44
PEA15 BLBP 0.8054 <.0001
* 46
GFAP total GFAP small
BDPs 0.757
< 0.001 64 Strong
S100β GFAP total 0.7391 <.0001
* 54 APOB GS 0.726 0 44
BLBP ALDOC total 0.6816 <.0001
* 56
PEA15 S100β 0.6772 <.0001
* 43
GS AldoC total 0.6724 <.0001
* 53 APOB BLBP 0.638 0 44
GS BLBP 0.603 <.0001
* 49 APOB ALDOC total 0.602 0 46
BLBP GFAP small
BDPs 0.59
< 0.001 54 Moderate
BLBP S100β 0.5833 <.0001
* 51
GS S100β 0.5826 <.0001
* 46
PEA15 GFAP total 0.5755 <.0001
* 47
GS GFAP small
BDPs 0.573
< 0.001 51
PEA15 GFAP small
BDPs 0.572
< 0.001 47
PEA15 ALDOC total 0.5589 <.0001
* 49
GS ALDOC 38kD
BDP 0.549 0.0009
33 APOB GFAP total 0.541 0.0002 42
PEA15 GS 0.5334 <.0001
* 49
BLBP ALDOC 38kD
BDP 0.532 0.0003
41

157
BLBP GFAP total 0.5149 <.0001
* 54 APOB PEA15 0.506 0.0002 48
ALDOC total ALDOC 38kD
BPD 0.506
< 0.001 59
ALDOC total GFAP small
BDPs 0.477
< 0.001 61
ALDOC total S100β 0.4503 0.0005
* 56
ALDOC total GFAP total 0.3927 0.0017
* 61 Weak
GS GFAP total 0.3275 0.0190
* 51 P<0.05
PEA15 ALDOC 38kD
BDP 0.309 0.0749
34 Very weak
APOB ALDOC 38kD
BDP 0.261 0.1353
34 PTGDS ALDOC total 0.017 0.893 61
PTGDS ALDOC 38kD
BDP -0.024 0.8779
42 ALDOC 38kD
BDP GFAP small
BDPs -0.029 0.8628
39
S100β ALDOC 38kD
BDP -0.04 0.808
39 None PTGDS GS -0.13 0.3641 59 PTGDS APOB -0.183 0.2344 44 PTGDS BLBP -0.198 0.1473 57
GFAP total ALDOC 38kD
BDP -0.201 0.221
39
PTGDS GFAP small
BDPs -0.251 0.055
59
PTGDS PEA15 -0.307 0.0356 47 P<0.05 PTGDS S100β -0.314 0.0248 54
PTGDS GFAP total -0.446 0.0004 58 Moderate
Table 3.9: Biomarker panel correlations from CSF of severe TBI patients
Spearman rank correlation coefficients are given for all pairs of new and known astroglial
neurotrauma biomarkers and CSF standards with their p-values and number of CSF
samples analyzed. Coefficients >0.8-0.99 are considered very strong, 0.6-0.8 strong,
moderate >0.4-0.6, weak <0.4 and divergent if coefficients were <-0.3.

158
3.7 SUPPLEMENTAL FIGURES
S3.1: The flow chart illustrates the AID biomarker selection strategy
Flow chart shows steps used to arrive at this astroglial biomarker panel. First, TBI and
control CSF proteomes both generated by same LC-MS/MS settings were compiled and
compared against each other (Table 3.4). 59 significantly trauma-changed proteins were
previously identified by 2D gel analysis of culture medium (CM) from stretched astrocytes,
the majority of which was present in the CSF proteomes (32). Then, astrocyte enriched
proteins, by larger than 2-fold, were selected among the CSF and the trauma model
proteome lists (42). From the resulting 14 candidates, those proteins present in healthy
donor plasma were removed, including coactosin-like protein 1, heat shock cognate
71kDa protein, vinculin, apolipoprotein E, clusterin and lactate dehydrogenase B (43, 44).
Proteins with dominant expression outside the central nervous system (CNS) were also
excluded: transgelin, F-box only protein 2 and N, N-dimethyl arginine dimethyl

159
aminohydrolase 1 (45). Resulting astroglial neurotrauma biomarker candidates were
ALDOC, GS, BLBP and PEA15, all with predominant expression in the CNS, with some
presence outside of the CNS for GS and PEA15 (45).

160
S3.2: Human astrocyte cell leak and cell death populations show trends over time
with combined severities
Shown are arithmetic means of percent (A) leaky (membrane wounded) and (B) dead
astrocytes at various timepoints post-stretching, combining different pressure pulses.
Percent leaky cells were elevated at 30min against control and percent dead cells were
elevated by 2 days against control and 30min post-injury levels using Kruskal-Wallis
ANOVA on ranks (p<0.001). One-day post-injury cell death rates nearly reached
significance versus controls (p=0.052) in n=8-13 donors.

161
S3.3: Culture trauma temporal fluid profiles of full size GFAP plus large BDPs and
small GFAP BDPs are different
(A) Mean fluid levels of full size GFAP (50 kD) and larger proteolytic breakdown products
(large BDPs: 47, 42, 37 kD) were significantly elevated over controls at all times post-
stretching (asterisks), showed severity difference at 5h (black dot) and their release
increased significantly between 30min and 1-2 days post-injury (triangles). (B) Small
GFAP fragments (25, 20 and 18kD BDPs) were only released significantly more than
controls by 1 and 2 days post-injury (asterisks). Levels also differed significantly between
timepoints (triangles).

162
S3.4: Peptide mapping of glial fibrillary acidic protein break-down products
Glial fibrillary acidic protein (GFAP) break-down products (BDPs) were
immunoprecipitated from the conditioned medium (CM) and whole cell lysates (WCL) of
stretch injured astrocytes. Immunoprecipitated proteins were separated by SDS-PAGE
and stained with Sypro Ruby. Bands corresponding to the intact 49 kDa GFAP and 42,
38, 25, and 20 kDa BDPs were excised and in-gel digested with trypsin. LC-MS/MS
peptide mapping identified a common core region starting from alanine residue 71 for all
BDPs. Lower molecular weight BDPs are generated from additional C-terminal
cleavages.

163
S3.5: BLBP and GFAP are co-expressed in human astrocytes
A population of control human astrocytes show robust GFAP (white) and BLBP (green)
expression (A, B). 30min post-stretching, BLBP signals were depleted. The same cells
retained GFAP, but with altered distribution showing filament-disassembled or focal
presence in process endings (C, D). Membrane-wounded cells have PI-positive nuclei
(red).

164
S3.6: TBI patient CSF trajectories are shown separately for full size plus large
fragments and for small GFAP BDPs
Plots show CSF levels in Control and TBI patients of normalized GFAP optical densities
(A) for “upper” signal range (50kD and large BDPs <50-37kD) and (B) for “lower” GFAP
bands (BDPs sizes between 18-25kD). All severe TBI patients had robust elevation in
upper GFAP levels upper bands on injury day followed by decreases on later post-injury
days (red asterisks). Smaller sized GFAP BDPs had variable signal levels and means
decreased between one and 4-5 post-injury days. (A) Large GFAP signals (50-37kD)
were elevated on all TBI days versus Crl (p<0.06) and declined over time as indicated in
red (p <0.05, repeated measures ANOVA, see Methods). (B) Small GFAP BDPs (25-
18kD) were elevated in TBI versus Crl (p < 0.03) and declined between first post-injury
day later post-injury days (p< 0.05).

165
S3.7: TBI patient CSF trajectories for astroglial injury-defined biomarkers
measured by MRM-MS
Astroglial injury-defined biomarkers GFAP, ALDOC, BLBP, and GS were measured in
TBI patient CSF by MRM-MS. (A) GFAP was elevated on all TBI days compared to control
(grey *, p <0.01). (B) ALDOC was elevated on all TBI days compared to control (grey *, p
<0.01). (C) BLBP was elevated on all TBI days compared to control (grey *, p <0.05). (D)

166
GS was elevated on all TBI days compared to control (grey *, p <0.05).

167
S3.8: Temporal CSF trends for PTGDS, PEA15 and small GFAP BDPs differ between
TBI survivors and non-survivors
Explorative trend lines plot geometric mean levels of (A) PTGDS, (B) PEA15 and (C)
small GFAP fragments in Controls (black), TBI survivors (red) and non-survivors (blue)
with lower and upper bound error bars (95% confidence interval). CSF post-injury
trajectories of GFAP lower BDPs are significantly elevated in non-survivors versus
survivors by 28-fold on the first and 388-fold on the third post-injury day. PEA15 means
are elevated over up to three orders of magnitude in non-survivors versus survivors. Mean
PTGDS levels decrease more in survivors than non-survivors, and levels recover
gradually for survivors, resulting in significantly higher means on the third post-injury day
compared to non-survivors of TBI. Statistical test was multiple measures ANOVA, mixed
model, with non-constant intraclass variance (139).

168
S3.9: Temporal CSF trends for GFAP, ALDOC, BLBP, and GS differ between TBI
survivors and non-survivors
Explorative trend lines plot geometric mean levels of CSF biomarker concentrations
between TBI survivors and non-survivors. Survivor concentration profiles over time was
shown in grey, blue, pink, and orange for (A) GFAP, (B) ALDOC, (C) BLBP, and (D) GS
respectively. Non-survivor traces are displayed in red dashed lines. Patient n is listed by

169
color under each injury day post-TBI. SEM around the geometric mean are displayed by
the error bars.

170
S3.10: Immunological and mass spectrometry measurements show comparable
CSF profiles of a severe TBI patient
Shown are temporal profiles of (A) GFAP, (B) ALDOC, (C) GS and (D) BLBP in
longitudinal CSF samples of a severe TBI patient ‘1’ every 6h post-TBI. Biomarker levels
were measured using immunoblot densitometry (continued lines, optical densities, left y-
axes) and MRM-MS (dashed lines, ng/ml, right y-axes).

171
S3.11: Appearance of AID biomarkers in CSF and serum are different
Presence of GFAP, ALDOC, BLBP and PEA15 at 3 and 34h (first day post-injury) in CSF
and serum of a severe TBI patient (patient 1, Table 3.6). Temporal profile of same

172
markers in concurrent CSF and serum samples of same patient. AID markers were
elevated in serum acutely post-TBI, prior to GFAP elevation.

173
S3.12: Immunoblots shows distinct presence of AID biomarkers on injury day
among 15 mild TBI patients
Composite shows immunoblots of pure proteins, depleted sera from control (Crl) and 15
mild TBI patients (clinical data see Table 3.6) between 1-31h post-concussion for GFAP
25 kD BDP, ALDOC, BLBP and PEA15. Absence (-) or presence (+) of CT findings in
those patients are given. Exposure times match those shown for severe TBI patients
(Figure 3.8A).

174
3.8 REFERENCES
1. J. L. Wheble, D. K. Menon, TBI-the most complex disease in the most complex
organ: the CENTER-TBI trial-a commentary. Journal of the Royal Army Medical
Corps 162, 87-89 (2016); published online EpubApr (10.1136/jramc-2015-
000472).
2. B. Roozenbeek, A. I. Maas, D. K. Menon, Changing patterns in the epidemiology
of traumatic brain injury. Nature reviews. Neurology 9, 231-236 (2013); published
online EpubApr (10.1038/nrneurol.2013.22).
3. S. B. Rosenbaum, M. L. Lipton, Embracing chaos: the scope and importance of
clinical and pathological heterogeneity in mTBI. Brain imaging and behavior 6, 255-
282 (2012); published online EpubJun (10.1007/s11682-012-9162-7).
4. M. E. Brogan, J. J. Provencio, Spectrum of catastrophic brain injury: coma and
related disorders of consciousness. J Crit Care 29, 679-682 (2014); published
online EpubAug (10.1016/j.jcrc.2014.04.014).
5. A. Buki, N. Kovacs, E. Czeiter, K. Schmid, R. P. Berger, F. Kobeissy, D. Italiano,
R. L. Hayes, F. C. Tortella, E. Mezosi, A. Schwarcz, A. Toth, O. Nemes, S.
Mondello, Minor and repetitive head injury. Advances and technical standards in
neurosurgery 42, 147-192 (2015)10.1007/978-3-319-09066-5_8).
6. K. M. Helmick, C. A. Spells, S. Z. Malik, C. A. Davies, D. W. Marion, S. R. Hinds,
Traumatic brain injury in the US military: epidemiology and key clinical and
research programs. Brain imaging and behavior 9, 358-366 (2015); published
online EpubSep (10.1007/s11682-015-9399-z).

175
7. R. A. Stern, D. O. Riley, D. H. Daneshvar, C. J. Nowinski, R. C. Cantu, A. C.
McKee, Long-term consequences of repetitive brain trauma: chronic traumatic
encephalopathy. PM R 3, S460-467 (2011); published online EpubOct
(10.1016/j.pmrj.2011.08.008).
8. G. L. Sternbach, The Glasgow coma scale. J Emerg Med 19, 67-71 (2000).
9. E. W. Steyerberg, N. Mushkudiani, P. Perel, I. Butcher, J. Lu, G. S. McHugh, G.
D. Murray, A. Marmarou, I. Roberts, J. D. Habbema, A. I. Maas, Predicting
outcome after traumatic brain injury: development and international validation of
prognostic scores based on admission characteristics. PLoS medicine 5, e165;
discussion e165 (2008); published online EpubAug 5
(10.1371/journal.pmed.0050165).
10. N. A. Mushkudiani, C. W. Hukkelhoven, A. V. Hernandez, G. D. Murray, S. C. Choi,
A. I. Maas, E. W. Steyerberg, A systematic review finds methodological
improvements necessary for prognostic models in determining traumatic brain
injury outcomes. Journal of clinical epidemiology 61, 331-343 (2008); published
online EpubApr (10.1016/j.jclinepi.2007.06.011).
11. M. Bergsneider, D. A. Hovda, S. M. Lee, D. F. Kelly, D. L. McArthur, P. M. Vespa,
J. H. Lee, S. C. Huang, N. A. Martin, M. E. Phelps, D. P. Becker, Dissociation of
cerebral glucose metabolism and level of consciousness during the period of
metabolic depression following human traumatic brain injury. Journal of
neurotrauma 17, 389-401 (2000); published online EpubMay
(10.1089/neu.2000.17.389).

176
12. T. B. Meier, P. S. Bellgowan, R. Singh, R. Kuplicki, D. W. Polanski, A. R. Mayer,
Recovery of cerebral blood flow following sports-related concussion. JAMA
neurology 72, 530-538 (2015); published online EpubMay
(10.1001/jamaneurol.2014.4778).
13. O. Farkas, J. Lifshitz, J. T. Povlishock, Mechanoporation induced by diffuse
traumatic brain injury: an irreversible or reversible response to injury? The Journal
of neuroscience : the official journal of the Society for Neuroscience 26, 3130-3140
(2006).
14. K. A. Barbee, Mechanical cell injury. Ann N Y Acad Sci 1066, 67-84 (2005);
published online EpubDec (10.1196/annals.1363.006).
15. J. T. Povlishock, E. H. Pettus, Traumatically induced axonal damage: evidence for
enduring changes in axolemmal permeability with associated cytoskeletal change.
Acta neurochirurgica. Supplement 66, 81-86 (1996).
16. J. A. Colombo, A. Yanez, S. J. Lipina, Interlaminar astroglial processes in the
cerebral cortex of non human primates: response to injury. J Hirnforsch 38, 503-
512 (1997).
17. D. H. Smith, K. Uryu, K. E. Saatman, J. Q. Trojanowski, T. K. McIntosh, Protein
accumulation in traumatic brain injury. Neuromolecular medicine 4, 59-72
(2003)10.1385/NMM:4:1-2:59).
18. A. Buki, R. Siman, J. Q. Trojanowski, J. T. Povlishock, The role of calpain-mediated
spectrin proteolysis in traumatically induced axonal injury. Journal of
neuropathology and experimental neurology 58, 365-375 (1999).
177
19. M. A. Hemphill, S. Dauth, C. J. Yu, B. E. Dabiri, K. K. Parker, Traumatic brain injury
and the neuronal microenvironment: a potential role for neuropathological
mechanotransduction. Neuron 85, 1177-1192 (2015); published online EpubMar
18 (10.1016/j.neuron.2015.02.041).
20. S. Mondello, U. Muller, A. Jeromin, J. Streeter, R. L. Hayes, K. K. Wang, Blood-
based diagnostics of traumatic brain injuries. Expert Review of Molecular
Diagnostics 11, 65-78 (2011).
21. A. Petzold, Glial fibrillary acidic protein is a body fluid biomarker for glial pathology
in human disease. Brain research 1600, 17-31 (2015); published online EpubMar
10 (10.1016/j.brainres.2014.12.027).
22. P. K. Dash, J. Zhao, G. Hergenroeder, A. N. Moore, Biomarkers for the diagnosis,
prognosis, and evaluation of treatment efficacy for traumatic brain injury.
Neurotherapeutics : the journal of the American Society for Experimental
NeuroTherapeutics 7, 100-114 (2010).
23. S. H. Chou, C. S. Robertson, M. Participants in the International Multi-disciplinary
Consensus Conference on the Multimodality, Monitoring biomarkers of cellular
injury and death in acute brain injury. Neurocritical care 21 Suppl 2, S187-214
(2014); published online EpubDec (10.1007/s12028-014-0039-z).
24. A. M. Boutte, C. Yao, F. Kobeissy, X. C. May Lu, Z. Zhang, K. K. Wang, K. Schmid,
F. C. Tortella, J. R. Dave, Proteomic analysis and brain-specific systems biology
in a rodent model of penetrating ballistic-like brain injury. Electrophoresis 33, 3693-
3704 (2012); published online EpubDec (10.1002/elps.201200196).

178
25. J. M. Lubieniecka, F. Streijger, J. H. Lee, N. Stoynov, J. Liu, R. Mottus, T. Pfeifer,
B. K. Kwon, J. R. Coorssen, L. J. Foster, T. A. Grigliatti, W. Tetzlaff, Biomarkers
for severity of spinal cord injury in the cerebrospinal fluid of rats. PloS one 6,
e19247 (2011)10.1371/journal.pone.0019247).
26. S. Roche, A. Gabelle, S. Lehmann, Clinical proteomics of the cerebrospinal fluid:
Towards the discovery of new biomarkers. Proteomics Clin Appl 2, 428-436
(2008); published online EpubMar (10.1002/prca.200780040).
27. M. O. Sjodin, J. Bergquist, M. Wetterhall, Mining ventricular cerebrospinal fluid
from patients with traumatic brain injury using hexapeptide ligand libraries to
search for trauma biomarkers. Journal of chromatography. B, Analytical
technologies in the biomedical and life sciences 878, 2003-2012 (2010).
28. J. Hanrieder, M. Wetterhall, P. Enblad, L. Hillered, J. Bergquist, Temporally
resolved differential proteomic analysis of human ventricular CSF for monitoring
traumatic brain injury biomarker candidates. Journal of neuroscience methods
177, 469-478 (2009).
29. P. N. Lizhnyak, A. K. Ottens, Proteomics: in pursuit of effective traumatic brain
injury therapeutics. Expert review of proteomics 12, 75-82 (2015); published online
EpubFeb (10.1586/14789450.2015.1000869).
30. G. Poste, Bring on the biomarkers. Nature 469, 156-157 (2011).
31. G. Poste, Biospecimens, biomarkers, and burgeoning data: the imperative for
more rigorous research standards. Trends in molecular medicine 18, 717-722
(2012); published online EpubDec (10.1016/j.molmed.2012.09.003).

179
32. J. Levine, E. Kwon, M. Sondej, P. Paez, G. Czerwieniec, Y. Ao, M. V. Sofroniew,
J. A. Loo, I. B. Wanner, Traumatically injured astrocytes release a proteomic
signature modulated by STAT3 dependent cell survival. Glia 64, 668-694 (2016).
33. V. Muoio, P. B. Persson, M. M. Sendeski, The neurovascular unit - concept review.
Acta Physiol (Oxf) 210, 790-798 (2014); published online EpubApr
(10.1111/apha.12250).
34. P. J. Magistretti, Neuron-glia metabolic coupling and plasticity. Exp Physiol 96,
407-410 (2011).
35. L. Hertz, Bioenergetics of cerebral ischemia: a cellular perspective.
Neuropharmacology 55, 289-309 (2008); published online EpubSep
(10.1016/j.neuropharm.2008.05.023).
36. P. Mamczur, B. Borsuk, J. Paszko, Z. Sas, J. Mozrzymas, J. R. Wisniewski, A.
Gizak, D. Rakus, Astrocyte-neuron crosstalk regulates the expression and
subcellular localization of carbohydrate metabolism enzymes. Glia 63, 328-340
(2015); published online EpubFeb (10.1002/glia.22753).
37. D. Lovatt, U. Sonnewald, H. S. Waagepetersen, A. Schousboe, W. He, J. H. Lin,
X. Han, T. Takano, S. Wang, F. J. Sim, S. A. Goldman, M. Nedergaard, The
transcriptome and metabolic gene signature of protoplasmic astrocytes in the adult
murine cortex. The Journal of neuroscience : the official journal of the Society for
Neuroscience 27, 12255-12266 (2007); published online EpubNov 7
(10.1523/JNEUROSCI.3404-07.2007).
38. D. P. Pelvig, H. Pakkenberg, A. K. Stark, B. Pakkenberg, Neocortical glial cell
numbers in human brains. Neurobiology of aging 29, 1754-1762 (2008).

180
39. I. B. Wanner, M. A. Anderson, B. Song, J. Levine, A. Fernandez, Z. Gray-
Thompson, Y. Ao, M. V. Sofroniew, Glial scar borders are formed by newly
proliferated, elongated astrocytes that interact to corral inflammatory and fibrotic
cells via STAT3-dependent mechanisms after spinal cord injury. The Journal of
neuroscience : the official journal of the Society for Neuroscience 33, 12870-12886
(2013); published online EpubJul 31 (10.1523/JNEUROSCI.2121-13.2013).
40. D. R. Li, T. Ishikawa, L. Quan, D. Zhao, T. Michiue, B. L. Zhu, H. J. Wang, H.
Maeda, Morphological analysis of astrocytes in the hippocampus in mechanical
asphyxiation. Leg Med (Tokyo) 12, 63-67 (2010); published online EpubMar
(10.1016/j.legalmed.2009.11.005).
41. F. A. Azevedo, L. R. Carvalho, L. T. Grinberg, J. M. Farfel, R. E. Ferretti, R. E.
Leite, W. Jacob Filho, R. Lent, S. Herculano-Houzel, Equal numbers of neuronal
and nonneuronal cells make the human brain an isometrically scaled-up primate
brain. The Journal of comparative neurology 513, 532-541 (2009).
42. J. D. Cahoy, B. Emery, A. Kaushal, L. C. Foo, J. L. Zamanian, K. S.
Christopherson, Y. Xing, J. L. Lubischer, P. A. Krieg, S. A. Krupenko, W. J.
Thompson, B. A. Barres, A transcriptome database for astrocytes, neurons, and
oligodendrocytes: a new resource for understanding brain development and
function. The Journal of neuroscience : the official journal of the Society for
Neuroscience 28, 264-278 (2008).
43. G. S. Omenn, D. J. States, M. Adamski, T. W. Blackwell, R. Menon, H. Hermjakob,
R. Apweiler, B. B. Haab, R. J. Simpson, J. S. Eddes, E. A. Kapp, R. L. Moritz, D.
W. Chan, A. J. Rai, A. Admon, R. Aebersold, J. Eng, W. S. Hancock, S. A. Hefta,
181
H. Meyer, Y. K. Paik, J. S. Yoo, P. Ping, J. Pounds, J. Adkins, X. Qian, R. Wang,
V. Wasinger, C. Y. Wu, X. Zhao, R. Zeng, A. Archakov, A. Tsugita, I. Beer, A.
Pandey, M. Pisano, P. Andrews, H. Tammen, D. W. Speicher, S. M. Hanash,
Overview of the HUPO Plasma Proteome Project: results from the pilot phase with
35 collaborating laboratories and multiple analytical groups, generating a core
dataset of 3020 proteins and a publicly-available database. Proteomics 5, 3226-
3245 (2005).
44. S. Schenk, G. J. Schoenhals, G. de Souza, M. Mann, A high confidence, manually
validated human blood plasma protein reference set. BMC Med Genomics 1, 41
(2008).
45. M. Kapushesky, T. Adamusiak, T. Burdett, A. Culhane, A. Farne, A. Filippov, E.
Holloway, A. Klebanov, N. Kryvych, N. Kurbatova, P. Kurnosov, J. Malone, O.
Melnichuk, R. Petryszak, N. Pultsin, G. Rustici, A. Tikhonov, R. S. Travillian, E.
Williams, A. Zorin, H. Parkinson, A. Brazma, Gene Expression Atlas update--a
value-added database of microarray and sequencing-based functional genomics
experiments. Nucleic acids research 40, D1077-1081 (2012); published online
EpubJan (10.1093/nar/gkr913).
46. H. Haimoto, K. Kato, Highly Sensitive Enzyme-Immunoassay for Human-Brain
Aldolase-C. Clin Chim Acta 154, 203-212 (1986); published online EpubFeb 15
(Doi 10.1016/0009-8981(86)90032-X).
47. E. F. Ellis, J. S. McKinney, K. A. Willoughby, S. Liang, J. T. Povlishock, A new
model for rapid stretch-induced injury of cells in culture: characterization of the
model using astrocytes. Journal of neurotrauma 12, 325-339 (1995).
182
48. I. B. Wanner, An in vitro trauma model to study rodent and human astrocyte
reactivity. Methods in molecular biology 814, 189-219 (2012)10.1007/978-1-
61779-452-0_14).
49. J. Strotmann, I. Wanner, J. Krieger, K. Raming, H. Breer, Expression of odorant
receptors in spatially restricted subsets of chemosensory neurones. Neuroreport
3, 1053-1056 (1992).
50. I. B. Wanner, M. Deik, M. Torres, A. R. Rosendahl, J. T. Neary, V. P. Lemmon, J.
L. Bixby, A new in vitro model of the glial scar inhibits axon growth. Glia 56, 1691-
1709 (2008).
51. D. A. Hinkle, S. A. Baldwin, S. W. Scheff, P. M. Wise, GFAP and S100beta
expression in the cortex and hippocampus in response to mild cortical contusion.
Journal of neurotrauma 14, 729-738 (1997).
52. Z. Zhang, J. S. Zoltewicz, S. Mondello, K. J. Newsom, Z. Yang, B. Yang, F.
Kobeissy, J. Guingab, O. Glushakova, S. Robicsek, S. Heaton, A. Buki, J. Hannay,
M. S. Gold, R. Rubenstein, X. C. Lu, J. R. Dave, K. Schmid, F. Tortella, C. S.
Robertson, K. K. Wang, Human traumatic brain injury induces autoantibody
response against glial fibrillary acidic protein and its breakdown products. PLoS
One 9, e92698 (2014)10.1371/journal.pone.0092698).
53. K. Watanabe, Y. Urade, M. Mader, C. Murphy, O. Hayaishi, Identification of beta-
trace as prostaglandin D synthase. Biochemical and biophysical research
communications 203, 1110-1116 (1994); published online EpubSep 15
(10.1006/bbrc.1994.2297).

183
54. J. Clausen, Proteins in normal cerebrospinal fluid not found in serum. Proc Soc
Exp Biol Med 107, 170-172 (1961).
55. L. R. Fabrigar, D. T. Wegener, Exploratory factor analysis. Understanding statistics
(Oxford University Press, Oxford ; New York, 2012), pp. viii, 159 p.
56. L. Breiman, Classification and regression trees. The Wadsworth
statistics/probability series (Wadsworth International Group, Belmont, Calif.,
1984), pp. x, 358 p.
57. H. Zetterberg, K. Blennow, Fluid markers of traumatic brain injury. Molecular and
cellular neurosciences 66, 99-102 (2015); published online EpubMay
(10.1016/j.mcn.2015.02.003).
58. M. Bergsneider, D. A. Hovda, D. L. McArthur, M. Etchepare, S. C. Huang, N.
Sehati, P. Satz, M. E. Phelps, D. P. Becker, Metabolic recovery following human
traumatic brain injury based on FDG-PET: time course and relationship to
neurological disability. The Journal of head trauma rehabilitation 16, 135-148
(2001).
59. A. R. Mayer, P. S. Bellgowan, F. M. Hanlon, Functional magnetic resonance
imaging of mild traumatic brain injury. Neurosci Biobehav Rev 49, 8-18 (2015);
published online EpubFeb (10.1016/j.neubiorev.2014.11.016).
60. P. McCrory, W. H. Meeuwisse, M. Aubry, B. Cantu, J. Dvorak, R. J. Echemendia,
L. Engebretsen, K. Johnston, J. S. Kutcher, M. Raftery, A. Sills, B. W. Benson, G.
A. Davis, R. G. Ellenbogen, K. Guskiewicz, S. A. Herring, G. L. Iverson, B. D.
Jordan, J. Kissick, M. McCrea, A. S. McIntosh, D. Maddocks, M. Makdissi, L.
Purcell, M. Putukian, K. Schneider, C. H. Tator, M. Turner, Consensus statement

184
on concussion in sport: the 4th International Conference on Concussion in Sport
held in Zurich, November 2012. British journal of sports medicine 47, 250-258
(2013); published online EpubApr (10.1136/bjsports-2013-092313).
61. A. M. Boutte, Y. Deng-Bryant, D. Johnson, F. C. Tortella, J. R. Dave, D. A. Shear,
K. E. Schmid, Serum Glial Fibrillary Acidic Protein Predicts Tissue Glial Fibrillary
Acidic Protein Break-Down Products and Therapeutic Efficacy after Penetrating
Ballistic-Like Brain Injury. Journal of neurotrauma 33, 147-156 (2016); published
online EpubJan 1 (10.1089/neu.2014.3672).
62. S. Mondello, D. A. Shear, H. M. Bramlett, C. E. Dixon, K. E. Schmid, W. D. Dietrich,
K. K. Wang, R. L. Hayes, O. Glushakova, M. Catania, S. P. Richieri, J. T.
Povlishock, F. C. Tortella, P. M. Kochanek, Insight into Pre-Clinical Models of
Traumatic Brain Injury Using Circulating Brain Damage Biomarkers: Operation
Brain Trauma Therapy. Journal of neurotrauma 33, 595-605 (2016); published
online EpubMar 15 (10.1089/neu.2015.4132).
63. J. S. Zoltewicz, S. Mondello, B. Yang, K. J. Newsom, F. Kobeissy, C. Yao, X. C.
Lu, J. R. Dave, D. A. Shear, K. Schmid, V. Rivera, T. Cram, J. Seaney, Z. Zhang,
K. K. Wang, R. L. Hayes, F. C. Tortella, Biomarkers track damage after graded
injury severity in a rat model of penetrating brain injury. Journal of neurotrauma 30,
1161-1169 (2013); published online EpubJul 1 (10.1089/neu.2012.2762).
64. M. J. Whalen, T. Dalkara, Z. You, J. Qiu, D. Bermpohl, N. Mehta, B. Suter, P. G.
Bhide, E. H. Lo, M. Ericsson, M. A. Moskowitz, Acute plasmalemma permeability
and protracted clearance of injured cells after controlled cortical impact in mice.
Journal of cerebral blood flow and metabolism : official journal of the International

185
Society of Cerebral Blood Flow and Metabolism 28, 490-505 (2008); published
online EpubMar (10.1038/sj.jcbfm.9600544).
65. L. Papa, G. M. Brophy, R. D. Welch, L. M. Lewis, C. F. Braga, C. N. Tan, N. J.
Ameli, M. A. Lopez, C. A. Haeussler, D. I. Mendez Giordano, S. Silvestri, P.
Giordano, K. D. Weber, C. Hill-Pryor, D. C. Hack, Time Course and Diagnostic
Accuracy of Glial and Neuronal Blood Biomarkers GFAP and UCH-L1 in a Large
Cohort of Trauma Patients With and Without Mild Traumatic Brain Injury. JAMA
neurology 73, 551-560 (2016); published online EpubMay 1
(10.1001/jamaneurol.2016.0039).
66. W. Carr, A. M. Yarnell, R. Ong, T. Walilko, G. H. Kamimori, U. da Silva, R. M.
McCarron, M. L. LoPresti, Ubiquitin carboxy-terminal hydrolase-l1 as a serum
neurotrauma biomarker for exposure to occupational low-level blast. Frontiers in
neurology 6, 49 (2015)10.3389/fneur.2015.00049).
67. P. Shahim, T. Linemann, D. Inekci, M. A. Karsdal, K. Blennow, Y. Tegner, H.
Zetterberg, K. Henriksen, Serum Tau Fragments Predict Return to Play in
Concussed Professional Ice Hockey Players. Journal of neurotrauma, (2016);
published online EpubMay 2 (10.1089/neu.2014.3741).
68. B. A. Plog, M. Nedergaard, Why have we not yet developed a simple blood test for
TBI? Expert review of neurotherapeutics 15, 465-468 (2015); published online
EpubMay (10.1586/14737175.2015.1031112).
69. M. Latterich, J. E. Schnitzer, Streamlining biomarker discovery. Nature
biotechnology 29, 600-602 (2011); published online EpubJul (10.1038/nbt.1917).

186
70. F. G. Strathmann, S. Schulte, K. Goerl, D. J. Petron, Blood-based biomarkers for
traumatic brain injury: Evaluation of research approaches, available methods and
potential utility from the clinician and clinical laboratory perspectives. Clinical
biochemistry, (2014); published online EpubJan 31
(10.1016/j.clinbiochem.2014.01.028).
71. T. A. Addona, X. Shi, H. Keshishian, D. R. Mani, M. Burgess, M. A. Gillette, K. R.
Clauser, D. Shen, G. D. Lewis, L. A. Farrell, M. A. Fifer, M. S. Sabatine, R. E.
Gerszten, S. A. Carr, A pipeline that integrates the discovery and verification of
plasma protein biomarkers reveals candidate markers for cardiovascular disease.
Nature biotechnology 29, 635-643 (2011).
72. M. A. Gillette, S. A. Carr, Quantitative analysis of peptides and proteins in
biomedicine by targeted mass spectrometry. Nature methods 10, 28-34 (2013);
published online EpubJan (10.1038/nmeth.2309).
73. J. Lemoine, T. Fortin, A. Salvador, A. Jaffuel, J. P. Charrier, G. Choquet-
Kastylevsky, The current status of clinical proteomics and the use of MRM and
MRM(3) for biomarker validation. Expert review of molecular diagnostics 12, 333-
342 (2012); published online EpubMay (10.1586/erm.12.32).
74. Y. B. Lee, S. Du, H. Rhim, E. B. Lee, G. J. Markelonis, T. H. Oh, Rapid increase
in immunoreactivity to GFAP in astrocytes in vitro induced by acidic pH is mediated
by calcium influx and calpain I. Brain research 864, 220-229 (2000).
75. S. Du, A. Rubin, S. Klepper, C. Barrett, Y. C. Kim, H. W. Rhim, E. B. Lee, C. W.
Park, G. J. Markelonis, T. H. Oh, Calcium influx and activation of calpain I mediate

187
acute reactive gliosis in injured spinal cord. Experimental neurology 157, 96-105
(1999); published online EpubMay (10.1006/exnr.1999.7041).
76. R. E. White, D. M. McTigue, L. B. Jakeman, Regional heterogeneity in astrocyte
responses following contusive spinal cord injury in mice. The Journal of
comparative neurology 518, 1370-1390 (2010); published online EpubApr 15
(10.1002/cne.22282).
77. N. C. Reich, STAT3 revs up the powerhouse. Science signaling 2, pe61
(2009)10.1126/scisignal.290pe61).
78. J. Wegrzyn, R. Potla, Y. J. Chwae, N. B. Sepuri, Q. Zhang, T. Koeck, M. Derecka,
K. Szczepanek, M. Szelag, A. Gornicka, A. Moh, S. Moghaddas, Q. Chen, S.
Bobbili, J. Cichy, J. Dulak, D. P. Baker, A. Wolfman, D. Stuehr, M. O. Hassan, X.
Y. Fu, N. Avadhani, J. I. Drake, P. Fawcett, E. J. Lesnefsky, A. C. Larner, Function
of mitochondrial Stat3 in cellular respiration. Science 323, 793-797 (2009);
published online EpubFeb 6 (10.1126/science.1164551).
79. D. Kilinc, G. Gallo, K. A. Barbee, Mechanical membrane injury induces axonal
beading through localized activation of calpain. Experimental neurology 219, 553-
561 (2009); published online EpubOct (10.1016/j.expneurol.2009.07.014).
80. J. Sword, T. Masuda, D. Croom, S. A. Kirov, Evolution of neuronal and astroglial
disruption in the peri-contusional cortex of mice revealed by in vivo two-photon
imaging. Brain : a journal of neurology 136, 1446-1461 (2013); published online
EpubMay (10.1093/brain/awt026).
81. J. J. Bazarian, J. Zhong, B. Blyth, T. Zhu, V. Kavcic, D. Peterson, Diffusion tensor
imaging detects clinically important axonal damage after mild traumatic brain

188
injury: a pilot study. Journal of neurotrauma 24, 1447-1459 (2007); published
online EpubSep (10.1089/neu.2007.0241).
82. Kirov, II, A. Tal, J. S. Babb, J. Reaume, T. Bushnik, T. A. Ashman, S. Flanagan,
R. I. Grossman, O. Gonen, Proton MR spectroscopy correlates diffuse axonal
abnormalities with post-concussive symptoms in mild traumatic brain injury.
Journal of neurotrauma 30, 1200-1204 (2013); published online EpubJul 1
(10.1089/neu.2012.2696).
83. A. D. Lafrenaye, M. J. McGinn, J. T. Povlishock, Increased intracranial pressure
after diffuse traumatic brain injury exacerbates neuronal somatic membrane
poration but not axonal injury: evidence for primary intracranial pressure-induced
neuronal perturbation. Journal of cerebral blood flow and metabolism : official
journal of the International Society of Cerebral Blood Flow and Metabolism 32,
1919-1932 (2012); published online EpubOct (10.1038/jcbfm.2012.95).
84. K. Sakai, T. Fukuda, K. Iwadate, Beading of the astrocytic processes
(clasmatodendrosis) following head trauma is associated with protein degradation
pathways. Brain injury : [BI] 27, 1692-1697
(2013)10.3109/02699052.2013.837198).
85. J. A. Colombo, S. Gayol, A. Yanez, P. Marco, Immunocytochemical and electron
microscope observations on astroglial interlaminar processes in the primate
neocortex. Journal of neuroscience research 48, 352-357 (1997); published online
EpubMay 15 (
86. N. A. Oberheim, X. Wang, S. Goldman, M. Nedergaard, Astrocytic complexity
distinguishes the human brain. Trends in neurosciences 29, 547-553 (2006).

189
87. J. R. Gerstner, W. M. Vanderheyden, T. LaVaute, C. J. Westmark, L. Rouhana, A.
I. Pack, M. Wickens, C. F. Landry, Time of day regulates subcellular trafficking,
tripartite synaptic localization, and polyadenylation of the astrocytic Fabp7 mRNA.
The Journal of neuroscience : the official journal of the Society for Neuroscience
32, 1383-1394 (2012); published online EpubJan 25 (10.1523/JNEUROSCI.3228-
11.2012).
88. A. Schousboe, S. Scafidi, L. K. Bak, H. S. Waagepetersen, M. C. McKenna,
Glutamate metabolism in the brain focusing on astrocytes. Advances in
neurobiology 11, 13-30 (2014)10.1007/978-3-319-08894-5_2).
89. A. Eckert, B. C. Bock, K. E. Tagscherer, T. L. Haas, K. Grund, J. Sykora, C. Herold-
Mende, V. Ehemann, M. Hollstein, H. Chneiweiss, O. D. Wiestler, H. Walczak, W.
Roth, The PEA-15/PED protein protects glioblastoma cells from glucose
deprivation-induced apoptosis via the ERK/MAP kinase pathway. Oncogene 27,
1155-1166 (2008); published online EpubFeb 14 (10.1038/sj.onc.1210732).
90. P. Mergenthaler, A. Kahl, A. Kamitz, V. van Laak, K. Stohlmann, S. Thomsen, H.
Klawitter, I. Przesdzing, L. Neeb, D. Freyer, J. Priller, T. J. Collins, D. Megow, U.
Dirnagl, D. W. Andrews, A. Meisel, Mitochondrial hexokinase II (HKII) and
phosphoprotein enriched in astrocytes (PEA15) form a molecular switch governing
cellular fate depending on the metabolic state. Proceedings of the National
Academy of Sciences of the United States of America 109, 1518-1523 (2012);
published online EpubJan 31 (10.1073/pnas.1108225109).
91. P. J. Magistretti, Neuron-glia metabolic coupling and plasticity. J Exp Biol 209,
2304-2311 (2006); published online EpubJun (10.1242/jeb.02208).

190
92. N. R. Stein, D. L. McArthur, M. Etchepare, P. M. Vespa, Early cerebral metabolic
crisis after TBI influences outcome despite adequate hemodynamic resuscitation.
Neurocritical care 17, 49-57 (2012); published online EpubAug (10.1007/s12028-
012-9708-y).
93. P. Vespa, M. Bergsneider, N. Hattori, H. M. Wu, S. C. Huang, N. A. Martin, T. C.
Glenn, D. L. McArthur, D. A. Hovda, Metabolic crisis without brain ischemia is
common after traumatic brain injury: a combined microdialysis and positron
emission tomography study. Journal of cerebral blood flow and metabolism :
official journal of the International Society of Cerebral Blood Flow and Metabolism
25, 763-774 (2005); published online EpubJun (10.1038/sj.jcbfm.9600073).
94. B. L. Bartnik, S. M. Lee, D. A. Hovda, R. L. Sutton, The fate of glucose during the
period of decreased metabolism after fluid percussion injury: a 13C NMR study.
Journal of neurotrauma 24, 1079-1092 (2007)
95. D. A. Hovda, A. Yoshino, T. Kawamata, Y. Katayama, D. P. Becker, Diffuse
prolonged depression of cerebral oxidative metabolism following concussive brain
injury in the rat: a cytochrome oxidase histochemistry study. Brain research 567,
1-10 (1991).
96. B. L. Bartnik-Olson, U. Oyoyo, D. A. Hovda, R. L. Sutton, Astrocyte oxidative
metabolism and metabolite trafficking after fluid percussion brain injury in adult
rats. Journal of neurotrauma 27, 2191-2202 (2010); published online EpubDec
(10.1089/neu.2010.1508).

191
97. R. Bullock, W. L. Maxwell, D. I. Graham, G. M. Teasdale, J. H. Adams, Glial
swelling following human cerebral contusion: an ultrastructural study. Journal of
neurology, neurosurgery, and psychiatry 54, 427-434 (1991).
98. N. Hattori, S. C. Huang, H. M. Wu, W. Liao, T. C. Glenn, P. M. Vespa, M. E. Phelps,
D. A. Hovda, M. Bergsneider, PET investigation of post-traumatic cerebral blood
volume and blood flow. Acta neurochirurgica. Supplement 86, 49-52 (2003).
99. R. L. Sutton, D. A. Hovda, P. D. Adelson, E. C. Benzel, D. P. Becker, Metabolic
changes following cortical contusion: relationships to edema and morphological
changes. Acta neurochirurgica. Supplementum 60, 446-448 (1994).
100. X. Zhao, A. Ahram, R. F. Berman, J. P. Muizelaar, B. G. Lyeth, Early loss of
astrocytes after experimental traumatic brain injury. Glia 44, 140-152 (2003);
published online EpubNov (10.1002/glia.10283).
101. J. M. Lytle, J. R. Wrathall, Glial cell loss, proliferation and replacement in the
contused murine spinal cord. The European journal of neuroscience 25, 1711-
1724 (2007); published online EpubMar (10.1111/j.1460-9568.2007.05390.x).
102. D. R. Li, F. Zhang, Y. Wang, X. H. Tan, D. F. Qiao, H. J. Wang, T. Michiue, H.
Maeda, Quantitative analysis of GFAP- and S100 protein-immunopositive
astrocytes to investigate the severity of traumatic brain injury. Leg Med (Tokyo) 14,
84-92 (2012); published online EpubMar (10.1016/j.legalmed.2011.12.007).
103. V. Di Pietro, A. M. Amorini, G. Lazzarino, K. M. Yakoub, S. D'Urso, G. Lazzarino,
A. Belli, S100B and Glial Fibrillary Acidic Protein as Indexes to Monitor Damage
Severity in an In Vitro Model of Traumatic Brain Injury. Neurochemical research
40, 991-999 (2015); published online EpubMay (10.1007/s11064-015-1554-9).

192
104. P. E. Mouser, E. Head, K. H. Ha, T. T. Rohn, Caspase-mediated cleavage of glial
fibrillary acidic protein within degenerating astrocytes of the Alzheimer's disease
brain. The American journal of pathology 168, 936-946 (2006); published online
EpubMar (10.2353/ajpath.2006.050798).
105. T. T. Rohn, L. W. Catlin, W. W. Poon, Caspase-cleaved glial fibrillary acidic protein
within cerebellar white matter of the Alzheimer's disease brain. International
journal of clinical and experimental pathology 6, 41-48 (2013).
106. M. H. Chen, T. L. Hagemann, R. A. Quinlan, A. Messing, M. D. Perng, Caspase
cleavage of GFAP produces an assembly-compromised proteolytic fragment that
promotes filament aggregation. ASN neuro 5, e00125
(2013)10.1042/AN20130032).
107. R. B. Borgens, P. Liu-Snyder, Understanding secondary injury. The Quarterly
review of biology 87, 89-127 (2012).
108. D. G. Jones, Stability and storage characteristics of enzymes in sheep blood.
Research in veterinary science 38, 307-311 (1985).
109. D. G. Jones, Stability and storage characteristics of enzymes in cattle blood.
Research in veterinary science 38, 301-306 (1985).
110. S. Pontremoli, E. Melloni, M. Michetti, F. Salamino, B. Sparatore, B. L. Horecker,
Limited proteolysis of liver aldolase and fructose 1,6-bisphosphatase by lysosomal
proteinases: effect on complex formation. Proceedings of the National Academy
of Sciences of the United States of America 79, 2451-2454 (1982).
111. M. K. Offermann, J. F. Chlebowski, J. S. Bond, Action of cathepsin D on fructose-
1,6-bisphosphate aldolase. The Biochemical journal 211, 529-534 (1983).

193
112. M. F. Hopgood, S. E. Knowles, F. J. Ballard, Proteolysis of N-ethylmaleimide-
modified aldolase loaded into erythrocyte ghosts: prevention by inhibitors of
calpain. The Biochemical journal 259, 237-242 (1989).
113. J. S. Zoltewicz, D. Scharf, B. Yang, A. Chawla, K. J. Newsom, L. Fang,
Characterization of Antibodies that Detect Human GFAP after Traumatic Brain
Injury. Biomark Insights 7, 71-79 (2012)10.4137/BMI.S9873).
114. K. Fujita, T. Kato, M. Yamauchi, M. Ando, M. Honda, Y. Nagata, Increases in
fragmented glial fibrillary acidic protein levels in the spinal cords of patients with
amyotrophic lateral sclerosis. Neurochemical research 23, 169-174 (1998).
115. A. Martinez, M. Carmona, M. Portero-Otin, A. Naudi, R. Pamplona, I. Ferrer, Type-
dependent oxidative damage in frontotemporal lobar degeneration: cortical
astrocytes are targets of oxidative damage. Journal of neuropathology and
experimental neurology 67, 1122-1136 (2008); published online EpubDec
(10.1097/NEN.0b013e31818e06f3).
116. B. A. Plog, M. L. Dashnaw, E. Hitomi, W. Peng, Y. Liao, N. Lou, R. Deane, M.
Nedergaard, Biomarkers of traumatic injury are transported from brain to blood via
the glymphatic system. The Journal of neuroscience : the official journal of the
Society for Neuroscience 35, 518-526 (2015); published online EpubJan 14
(10.1523/JNEUROSCI.3742-14.2015).
117. M. M. Pelsers, T. Hanhoff, D. Van der Voort, B. Arts, M. Peters, R. Ponds, A. Honig,
W. Rudzinski, F. Spener, J. R. de Kruijk, A. Twijnstra, W. T. Hermens, P. P.
Menheere, J. F. Glatz, Brain- and heart-type fatty acid-binding proteins in the brain:

194
tissue distribution and clinical utility. Clinical chemistry 50, 1568-1575 (2004);
published online EpubSep (10.1373/clinchem.2003.030361).
118. T. M. Mathiisen, K. P. Lehre, N. C. Danbolt, O. P. Ottersen, The perivascular
astroglial sheath provides a complete covering of the brain microvessels: an
electron microscopic 3D reconstruction. Glia 58, 1094-1103 (2010).
119. M. Nuriya, T. Shinotsuka, M. Yasui, Diffusion properties of molecules at the blood-
brain interface: potential contributions of astrocyte endfeet to diffusion barrier
functions. Cerebral cortex 23, 2118-2126 (2013); published online EpubSep
(10.1093/cercor/bhs198).
120. C. L. Willis, L. Leach, G. J. Clarke, C. C. Nolan, D. E. Ray, Reversible disruption
of tight junction complexes in the rat blood-brain barrier, following transitory focal
astrocyte loss. Glia 48, 1-13 (2004); published online EpubOct
(10.1002/glia.20049).
121. M. M. Saw, J. Chamberlain, M. Barr, M. P. Morgan, J. R. Burnett, K. M. Ho,
Differential disruption of blood-brain barrier in severe traumatic brain injury.
Neurocritical care 20, 209-216 (2014); published online EpubApr
(10.1007/s12028-013-9933-z).
122. A. F. Logsdon, B. P. Lucke-Wold, R. C. Turner, J. D. Huber, C. L. Rosen, J. W.
Simpkins, Role of Microvascular Disruption in Brain Damage from Traumatic Brain
Injury. Compr Physiol 5, 1147-1160 (2015); published online EpubJul 1
(10.1002/cphy.c140057).
123. R. R. Hicks, D. H. Smith, D. H. Lowenstein, R. Saint Marie, T. K. McIntosh, Mild
experimental brain injury in the rat induces cognitive deficits associated with
195
regional neuronal loss in the hippocampus. Journal of neurotrauma 10, 405-414
(1993).
124. A. Korn, H. Golan, I. Melamed, R. Pascual-Marqui, A. Friedman, Focal cortical
dysfunction and blood-brain barrier disruption in patients with Postconcussion
syndrome. J Clin Neurophysiol 22, 1-9 (2005).
125. A. K. Shetty, V. Mishra, M. Kodali, B. Hattiangady, Blood brain barrier dysfunction
and delayed neurological deficits in mild traumatic brain injury induced by blast
shock waves. Front Cell Neurosci 8, 232 (2014)10.3389/fncel.2014.00232).
126. D. Vajtr, O. Benada, J. Kukacka, R. Prusa, L. Houstava, P. Toupalik, R. Kizek,
Correlation of ultrastructural changes of endothelial cells and astrocytes occurring
during blood brain barrier damage after traumatic brain injury with biochemical
markers of BBB leakage and inflammatory response. Physiological research /
Academia Scientiarum Bohemoslovaca 58, 263-268 (2009).
127. N. Marchi, J. J. Bazarian, V. Puvenna, M. Janigro, C. Ghosh, J. Zhong, T. Zhu, E.
Blackman, D. Stewart, J. Ellis, R. Butler, D. Janigro, Consequences of repeated
blood-brain barrier disruption in football players. PloS one 8, e56805
(2013)10.1371/journal.pone.0056805).
128. N. Marchi, M. Cavaglia, V. Fazio, S. Bhudia, K. Hallene, D. Janigro, Peripheral
markers of blood-brain barrier damage. Clin Chim Acta 342, 1-12 (2004); published
online EpubApr (10.1016/j.cccn.2003.12.008).
129. V. J. Willson, R. J. Thompson, Human brain aldolase C4 isoenzyme: purification,
radioimmunoassay, and distribution in human tissues. Annals of clinical
biochemistry 17, 114-121 (1980).

196
130. N. D. Silverberg, A. J. Gardner, J. R. Brubacher, W. J. Panenka, J. J. Li, G. L.
Iverson, Systematic review of multivariable prognostic models for mild traumatic
brain injury. Journal of neurotrauma 32, 517-526 (2015); published online EpubApr
15 (10.1089/neu.2014.3600).
131. B. K. Kwon, F. Streijger, N. Fallah, V. K. Noonan, L. M. Belanger, L. Ritchie, S. J.
Paquette, T. Ailon, M. C. Boyd, J. Street, C. G. Fisher, M. F. Dvorak, Cerebrospinal
Fluid Biomarkers To Stratify Injury Severity and Predict Outcome in Human
Traumatic Spinal Cord Injury. Journal of neurotrauma, (2016); published online
EpubAug 15 (10.1089/neu.2016.4435).
132. J. E. Buonora, A. M. Yarnell, R. C. Lazarus, M. Mousseau, L. L. Latour, S. B. Rizoli,
A. J. Baker, S. G. Rhind, R. Diaz-Arrastia, G. P. Mueller, Multivariate analysis of
traumatic brain injury: development of an assessment score. Front Neurol 6, 68
(2015)10.3389/fneur.2015.00068).
133. D. L. Bohac, J. F. Malec, A. M. Moessner, Factor analysis of the Mayo-Portland
Adaptability Inventory: Structure and validity. Brain Injury 11, 469-482 (1997);
published online EpubJul (Doi 10.1080/713802185).
134. J. DeJong, J. Donders, A confirmatory factor analysis of the California Verbal
Learning Test--Second Edition (CVLT-II) in a traumatic brain injury sample.
Assessment 16, 328-336 (2009); published online EpubDec
(10.1177/1073191109336989).
135. M. Asaka, T. Kimura, S. Nishikawa, M. Saitoh, T. Miyazaki, T. Takatori, E. Alpert,
Serum aldolase isozyme levels in patients with cerebrovascular diseases. The
American journal of the medical sciences 300, 291-295 (1990).

197
136. G. T. Manley, R. Diaz-Arrastia, M. Brophy, D. Engel, C. Goodman, K. Gwinn, T. D.
Veenstra, G. Ling, A. K. Ottens, F. Tortella, R. L. Hayes, Common data elements
for traumatic brain injury: recommendations from the biospecimens and
biomarkers working group. Archives of physical medicine and rehabilitation 91,
1667-1672 (2010); published online EpubNov (10.1016/j.apmr.2010.05.018).
137. G. Haralambie, Serum Aldolase Isoenzymes in Athletes at Rest and after Long-
Lasting Exercise. Int J Sports Med 2, 31-36 (1981)DOI 10.1055/s-2008-1034581).
138. O. Ruzgar, A. K. Bilge, Z. Bugra, S. Umman, E. Yilmaz, B. Ozben, B. Umman, M.
Meric, The use of human heart-type fatty acid-binding protein as an early
diagnostic biochemical marker of myocardial necrosis in patients with acute
coronary syndrome, and its comparison with troponin-T and creatine kinase-
myocardial band. Heart and vessels 21, 309-314 (2006); published online
EpubSep (10.1007/s00380-006-0908-2).
139. M. J. Crowder, D. J. Hand, in Monographs on statistics and applied probability.
(Chapman and Hall, London ; New York, 1990), chap. 1-3, pp. 1-59.

198
CHAPTER 4: ASSESSMENT OF ASTROGLIAL INJURY DEFINED BIOMARKERS
IN SPINAL CORD INJURY
4.1 INTRODUCTION
The long term debilitating effects of CNS injury in the form of head or spinal cord
trauma is a major occupational concern for military personnel. High quality care and
symptom mitigation for cases of severe neurotrauma starts with rapid, safe, and effective
field transportation to emergency medical care centers (1, 2). Presently, there are
reported clinical cases of spinal cord injury (SCI) patients’ conditions worsening as a
result of transport to hospitals (3-5). Field care providers have reported on the severe
pain experienced by casualties of SCI and traumatic brain injury (TBI) patients during
bumpy and high vibrational ground and air transport. The present standard of care
dictates the immobilization of SCI patients prior to transport, a procedure that may delay
time to treatment. Currently, the interactions of patient immobilization, dynamic transport
environment, and recovery and outcome are not clearly understood. It is believed that
SCI and TBI patients may be especially sensitive to repeated vibrational shock resulting
from vehicle transport (2, 6) Because the extent of patient recovery is heavily dependent
on early treatment (hours post-injury), a better understanding regarding transport effects
is needed to better manage SCI casualties (7, 8).
In order to accurately assess whether the effects of vehicle transport exacerbate
patient outcome, accurate diagnostics tools are needed to quantitatively assess and
monitor injury state from the initial point of care to the medical treatment center to post-
treatment patient outcome. This requires further preclinical research into the dynamics of

199
vehicular shock on pathology to better optimize transport protocols for improved patient
outcome. Biomarkers capable of detecting the presence of injury that also relate to the
severity of injury represent a minimally invasive, quantitative assessment of disease
progression. To this end, we applied our astroglial injury derived (AID) protein biomarkers,
initially identified for head injury, to the study of the effects of ground medical vehicle
evacuation in a recoverable spinal cord injury animal model. While exact disease
pathologies between head and spine injury differ, the high concentration of astroglia in
the spinal cord make the application of our AID biomarkers to SCI assessment relevant
as all astrocytes are believed to react to injury through a process of reactive astrogliosis
with characteristic upregulation of GFAP expression and development of star like
morphology (9). Consequently, biomechanical trauma induced plasmalemmal
permeability and cell death should result in similar populations of astroglial protein release
in a SCI model. What this study will uncover is whether these markers are (1) specific to
SCI, (2) whether AID marker concentrations are capable of stratifying injury severity, and
(3) whether transport post-SCI affects biofluid concentrations of our AID biomarkers.
Additionally, the occurrence of traumatic head trauma has been documented to
occur concomitantly with spinal cord injury as a result of both classes of injuries resulting
from high kinetic accidents such as falls and traffic accidents (10). SCIs and TBIs are the
naturally occurring secondary injuries from the indirect forces of the initial trauma.
Cervical SCI, for example, occurs from the indirect forces to the spine from initial head
injury (11). Because TBI patients suffer from cognitive and emotional deficits (e.g.
attention deficits, inability to concentrate, memory loss, irritability, and impulse control),
rehabilitation of patients suffering from both TBI concurrent with SCI is typically results in

200
poor patient outcome (12-14). The co-occurrence of TBI with SCI is estimated at
approximately 40-60% (15, 16), making the need for better diagnostics tools essential as
patients suffering from both conditions will require modified rehabilitative approaches.
The application of astroglial injury markers to SCI may set the foundation for better
diagnostics of concomitant injury. Should AID biomarkers demonstrate SCI utility, future
studies in dual TBI/SCI injury models may uncover distinct concentration profiles that
indiscriminately identifies the presence of both injuries, allowing physicians to adjust
treatment modalities to optimize patient care and recovery. In this chapter, we examine
the application of 3 previously described (Chapter 3) biomarkers, glial fibrillary acidic
protein (GFAP), aldolase C (ALDOC), and brain lipid binding protein (BLBP), for astroglial
injury.

201
4.2 RESULTS
A total of 21 yucatan swine specimens were injured using a modified weight drop
injury mechanism onto an exposed spinal cord (17). These animals were divided into 3
experimental groups – uninjured (sham) animals (n=7), SCI injured animals without
vehicular transport (7), and SCI injured animals subjected to vehicular transport.
Cerebrospinal fluid (CSF) was extracted by lumbar puncture for each at animal within all
three experimental groups at the following 5 time-points – baseline (pre-SCI), 15-30m
post-SCI, 2-3h post-SCI, 2d post-SCI, and 7d post-SCI (Figure 4.1). Animals in our
vehicle transport cohort were subjected to ground transport under experimentally
controlled vibrational forces along the Aberdeen Test Center track (Figure 4.2) in New
Mexico. Transported animals were exposed to vehicle speeds ranging from 5 mph to 25
mph with respect to the extent of vibrational forces with a maximum exposure time not
exceeding 1 hour.
AID biomarkers are sensitively detected in CSF and specific to SCI
Significantly elevated (p ≤ 0.02) AID biomarker concentrations for GFAP, ALDOC,
and BLBP were observed acutely after SCI injury compared to pre-injury baseline levels
(Figure 4.3). Geometric means of GFAP CSF concentrations were measured at 25.9
ng/mL (± 23.9) and 15.1 ng/mL (± 31.3) 20 minutes and 2.7 hours after SCI respectively
before dropping off to baseline levels by 2 days post SCI. Similar observations were made
for ALDOC, displaying acute concentrations of 14.5 ng/mL (± 38.3) and 1.59 ng/mL (±
38.7) before dropping out in the post-acute period. BLBP levels also exhibited an early
concentration drop off with concentrations of 13.9 ng/mL (± 34.0) at 20 minutes and 6.3

202
ng/mL (± 27.9) at 2.7 hours. Natural log transformed geometric means were calculated
due to the large concentration differences observed between injury and non-injury
conditions. Unlike arithmetic mean, geometric means tend to dampen the effects of
outliers. The large standard errors (SE) measured from aggregative concentration values
at each time-point can be explained by the large spread in concentration for GFAP (0-
3484.9 ng/mL), ALDOC (0-9397.0 ng/mL), and BLBP (0-2132.8 ng/mL). This variance is
further assessed in later sections through evaluation of single animal biomarker profiles
and differences in pathophysiological injury responses. GS was also evaluated as part of
our AID SCI panel but was too weakly detected by PRM-MS for meaningful interpretation
(Figure 4.14).
High CSF biomarker concentration variance observed within SCI injured animals
Examination of individual animal CSF concentrations post-injury revealed distinct
temporal profiles within our SCI swine cohort (Figure 4.4). As a whole, GFAP, ALDOC,
and BLBP concentrations were observed to rise hyper-acutely (within 20 minutes) after
surgery and weight drop before returning to base line levels by 2 days. 10 and 9 swine
specimens maintained elevated GFAP and BLBP concentrations through the post-
transport time-point (2.7h) while 1 animal displayed elimination of GFAP and BLBP
respectively within the same time frame. 3 and 4 animals displayed no observable GFAP
and BLBP readings (Figure 4.4A, C). ALDOC levels were similarly maintained in 7 of 14
specimens through the two acute post-SCI time-points with concentrations dropping out
for 4 animals by 2.7h. ALDOC was not observed in 3 of 14 animals (Figure 4.4A). These

203
animal specific differences in biomarker CSF concentration highlight inter-specimen
heterogeneity.
Weight-drop SCI varies in injury severity and outcome
Severity of pathophysiological damage was assessed at the impact site of
surgically excised spinal cords from specimens sacrificed at 7 days. Considerable
physical injury and molecular pathophysiology was observed at the impact site between
animals in the SCI cohort. This was displayed in the varying degrees of bleeding and
hemorrhage present at the injury cavity (Figure 4.5A). Various amounts of astroglial white
matter damage, visualized by immunohistological staining, were observed around the
injury site as shown by GFAP beading representing glial fiber fragmentation (Figure 4.5B).
Consistent with visual observations of differential lesion severities, total injury, measured
by the combined expansion of tissue loss and white matter fragmentation, confirmed a
range of injury severities between animals (Figure 4.5C, Table 4.1). Injury severity was
further assessed by each individual animal’s ability to recovery ambulation after surgery
rated by the Porcine Thoracic Injury Behavioral Scale (PTIBS) (17). Compared to baseline
mobility scores, all animals exhibited diminished ambulation following SCI (Table 4.1).
Exceptions to this trend were observed for animals exhibiting minor tissue loss cavitation
and white matter beading. Overall, a negative correlation (Spearman r.s. = -0.885, p-value
<0.001) was observed between SCI cavity length and recoverable mobility (Figure 4.6).
Biomarker levels and trajectories document trauma severity by the presence and size of
an injury lesion

204
Immunohistological assessment revealed differential responses to SCI injury,
resulting in a range of ambulatory recoveries. This physiological response difference is
believed to explain the large standard deviations in acute CSF biomarker readings
presented in Figure 4.3. To further investigate the relationship between trauma physiology
and proximal fluid concentration, CSF concentrations of GFAP, ALDOC, and BLBP were
distinguished between lesion positive (n=9) and negative (n=3) animals. Figure 4.7
demonstrates a distinct concentration difference between animals with measurable injury
cavities at 7 days compared to those without. Biomarker concentration values were
natural log transformed to calculate the geometric mean. This minimizes the skewing
effects of non-normally distributed data that results from both injury response and
individual specimen heterogeneity. GFAP, ALDOC, BLBP levels remained elevated in
lesion positive animals for up to 2.7 hours after injury in biofluid compared to animals
exhibiting minimal tissue loss with correspondingly high mobility 7 days after injury. T-
tests (one-tailed) between cavity +/- animal showed highly significant (p-values < 0.01)
differences in proximal fluid concentrations for GFAP, ALDOC, and BLBP 0.3h after
injury. Additionally, 2.7h hour differences were also significant for biomarkers GFAP and
ALDOC but not BLBP (Figure 4.8).
Next, we examined the correlation between GFAP, ALDOC, and BLBP
concentrations with cavity length. Strong (r.s. = 0.773, p-value < 0.001) to very strong (r.s.
= 0.991 and 0.829, p-values < 0.001) spearman correlations were observed for BLBP,
GFAP, and ALDOC respectively (Figure 4.9). Having demonstrated a relationship
between physiological injury and biomarker concentrations, further stratification of injury
severity was evaluated based on a combination of tissue loss diameter and radiation of

205
astroglial damage visualized by GFAP immunohistochemical staining around the injury
site. Total injury was classified based on the total diameter of tissue loss and astroglial
disintegration around the impact site (Table 4.1). However, lower correlation was obtained
between this classification metric and biofluid concentration of our markers (Table 4.2).
Strong negative correlation was observed between 7 day PTIBS scores and AID
biomarker CSF concentrations for GFAP and ALDOC with weaker association for BLBP
(Figure 4.10). Based on these findings, further SCI segregation was performed based on
cavity size and 7 day ambulation scores. Using these two criteria, 14 SCI were further
stratified into mild (n=5), moderate (n=6), and severe SCI (n=3) injury groups. This more
in-depth injury classification uncovered additional differences between animals based on
AID biomarker concentrations (Figure 4.11). Statistical analysis highlighted the strongest
distinction between both severe and mild (p-value < 0.001) and severe and moderate (p-
value < 0.01) SCI for ALDOC at 0.3h post-injury (Figure 4.12). Significant distinctions
were also observed for GFAP and BLBP at 0.3h between the three different injury groups.
Additionally, BLBP was observed to be significantly different at 2.7h post injury as well
(Figure 4.12).
Effect of transportation inconclusive
The assessment of transportation related effects on biofluid biomarker
concentrations was inconclusive. Natural log transformed means for each marker over
time did not show apparent increases in concentration or immediate alternations in kinetic
profiles (Figure 4.13) when segregated (n=7 for each group) by whether ground
transportation effects were experienced. It was noted that the profile of GFAP showed a
206
slower reduction in slope from 20m to 2.7h after injury. The effects of transportation on
the rate of CSF concentration changes was subsequently evaluated but no significance
(p-value < 0.05) was established between animals (Table 4.3). The lowest p-values (0.14-
0.15) were observed for GFAP between 20m and 2.7h and ALDOC between 20m and 7
days.

207
4.3 DISCUSSION
The contusion SCI model used in this study produced less severe injuries to those
reported in the literature using the same weight drop contusion apparatus (17, 18). In
comparison to these studies where injured animals never recovered ambulation, half of
the animals investigated in this study experienced recoverable injury along with higher
mean PTIBS scores. Despite precise optimization of injury settings, histopathology
revealed a range of injury severities at the site of impact. While our measured injury
response was less consistent compared to previous groups, this injury response
heterogeneity allowed a graded scale of severity, based on both lesion presence, size,
diffuse astroglial damage expansion around the site of injury, and functional recovery, to
be established and assessed in relation to the sensitivity and prognostic utility of our
astroglial injury derived (AID) biomarker panel of GFAP, ALDOC, and BLBP.
Rapid identification of GFAP, ALDOC, and BLBP in SCI but not healthy animal
CSF demonstrated the successful application of AID biomarkers, developed originally for
traumatic head injury, to the study of spinal cord contusion-like injuries. Our results
highlighted the utility of AID biomarkers to not only identify the presence of SCI but also
provide quantitative metrics that associate with pathophysiological and functional
observations. In the acute post-injury phase (20m – 2.7h), GFAP, ALDOC, and BLBP
displayed a graded CSF concentration response when animals were segregated based
on presence of a 7 day lesion cavity as well as the combined expansion of tissue loss
and astroglial fiber damage. Analysis of the relationship between tissue damage and
behavioral locomotion at 7 days also revealed a strong association. Taken together, these
findings suggest that robust and immediate elevation of GFAP, ALDOC, and BLBP can

208
successfully identify the severity of SCI and also predict the degree of functional recovery
a week after injury.
Acute phase detection of surrogate signals of injury offers the promise of improved
trauma management under hostile environments where decisions with long-lasting health
implications need to be made quickly. Graded concentration signals may equip medical
personnel with better diagnostic and prognostic tools to triage wounded soldiers in
combat. In addition to severe injury, our AID biomarkers demonstrated the capacity to
evaluate mild forms of injury where minor or no tissue loss was experienced. A sensitive
measure for mild SCI has some applications for rapid on-field diagnostics that can be
used to evaluate athletes immediately after injury to allow proper resting of individuals
who have undergone a neurotraumatic event.
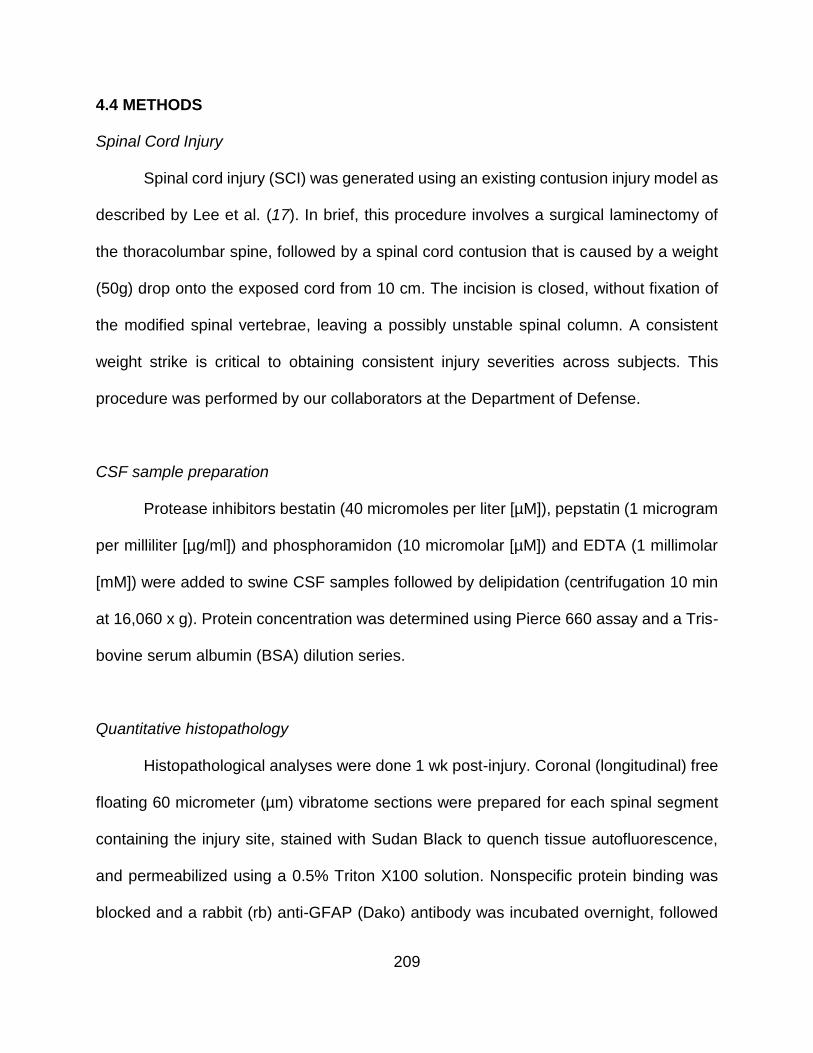
209
4.4 METHODS
Spinal Cord Injury
Spinal cord injury (SCI) was generated using an existing contusion injury model as
described by Lee et al. (17). In brief, this procedure involves a surgical laminectomy of
the thoracolumbar spine, followed by a spinal cord contusion that is caused by a weight
(50g) drop onto the exposed cord from 10 cm. The incision is closed, without fixation of
the modified spinal vertebrae, leaving a possibly unstable spinal column. A consistent
weight strike is critical to obtaining consistent injury severities across subjects. This
procedure was performed by our collaborators at the Department of Defense.
CSF sample preparation
Protease inhibitors bestatin (40 micromoles per liter [µM]), pepstatin (1 microgram
per milliliter [µg/ml]) and phosphoramidon (10 micromolar [µM]) and EDTA (1 millimolar
[mM]) were added to swine CSF samples followed by delipidation (centrifugation 10 min
at 16,060 x g). Protein concentration was determined using Pierce 660 assay and a Tris-
bovine serum albumin (BSA) dilution series.
Quantitative histopathology
Histopathological analyses were done 1 wk post-injury. Coronal (longitudinal) free
floating 60 micrometer (µm) vibratome sections were prepared for each spinal segment
containing the injury site, stained with Sudan Black to quench tissue autofluorescence,
and permeabilized using a 0.5% Triton X100 solution. Nonspecific protein binding was
blocked and a rabbit (rb) anti-GFAP (Dako) antibody was incubated overnight, followed

210
by detection using an AlexaFluor 488 donkey anti-rb secondary antibody. Bleeding was
detected using a goat Cy3-conjugated anti-swine immunoglobulin (SwIgG) stain on
repeated sections of each injured and sham animal.
Spinal tissue atrophy: rostro-caudal lesion expansion and white matter fiber damage
(clasmatodendrosis)
Longitudinal sections were collected ~0.5 mm from the dorsal surface until past
the lesion, approximately over a depth of 3.5 to 4 mm (~48 sections/cord). As a proxy for
spinal tissue atrophy, the average rostro-caudal length of the cavity was determined from
measurements in 2 to 4 sections, covering a depth of >1 mm. All available sections of
animals without lesion were examined to confirm lesion absence. Adjacent spinal
segments were sectioned and stained if the injury expanded beyond the edge of the initial
trimmed injury segment.
The abundance of astroglial process injury was used as proxy for white matter fiber
damage. Glial fibrillary acidic protein (GFAP) staining was used to identify white matter
and to quantify clasmatodendrosis (19-21). White matter was identified by uniquely
organized, highly aligned, and brightly stained GFAP fibers.
Quantitation of Biomarkers in CSF using parrallel reaction monitoring- mass spectrometry
Synthetic standard peptides designed with stable isotope labeled arginine (6C13
14H 4N15 2O) and lysine (6C13 14H 2N15 2O) were purchased (Thermo Scientific)
corresponding to our surrogate biomarker peptides. Peptide standards were prepared in
5% acetonitrile in water at a concentration of 5pmol/µL. Heavy peptide standards were

211
spiked into CSF samples to concentrations of 25 fmol/µL. CSF samples are then reduced,
alkylated, and digested as described previously (Chapter 3).
Digested CSF peptides are dried by vacuum centrifugation and reconstituted in
0.1% formic acid, 3% acetonitrile in water. Samples are desalted using an on-line C18
trap column prior to LC-MS/MS analysis. Peptides were separated on a 5%-35% gradient
of mobile phase B (0.1% formic acid in acetonitrile) over 40 minutes on a C18 PepMap
(Thermo) reversed phase HPLC column. Samples were analyzed by a parallel-reaction-
monitoring (PRM-MS) workflow on a Q-Exactive Orbitrap MS operating in targeted-MS2
mode with an inclusion list of precursor peptide ions (Table 4.4) for MS2 analysis with the
following parameters: resolution 17500, AGC target 2x10⁵, maximum ion injection time
50ms, isolation window 3.0 Da, fixed first mass 100, and normalized collision energy
(NCE) 27.
Multiple-reaction-monitoring-mass spectrometry (MRM-MS) measured biomarker
peptide specific precursor-product ion transitions isolated for monitoring. These precursor
ions were fragmented by higher-energy collisional dissociation (HCD) into their
component ions. Biomarker abundance was calculated based on the area under the curve
(AUC) of precursor to product ion transitions of each biomarker specific peptide using
Skyline (MacCoss Lab). The 3 transitions were summed and ratios of endogenous
peptide to their heavy labeled counterparts were determined. Biomarker concentrations
were calculated based on each peptide’s ratio of endogenous peptide AUC over added
standard, heavy labeled peptide AUC, concentration of the labeled standard peptide,
protein molecular weight (MW), and a dimensional conversion factor according to the
following formula:

212
Endogenous protein concentration (ng/mL) = [endogenous/standard ratio × 50fmol heavy
standard × protein MW × 1/1000]/[0.02 x raw CSF volume].
Statistical analysis
Biomarker concentration associations with functional recovery and
immunohistology were performed by Spearman analysis using SIgmaplot. Determination
of significance between injury severity stratifications, transportation effects, and
development of tissue loss cavitation was performed by one-tailed t-test analysis using
Excel (Microsoft) and Graphpad (Prism).
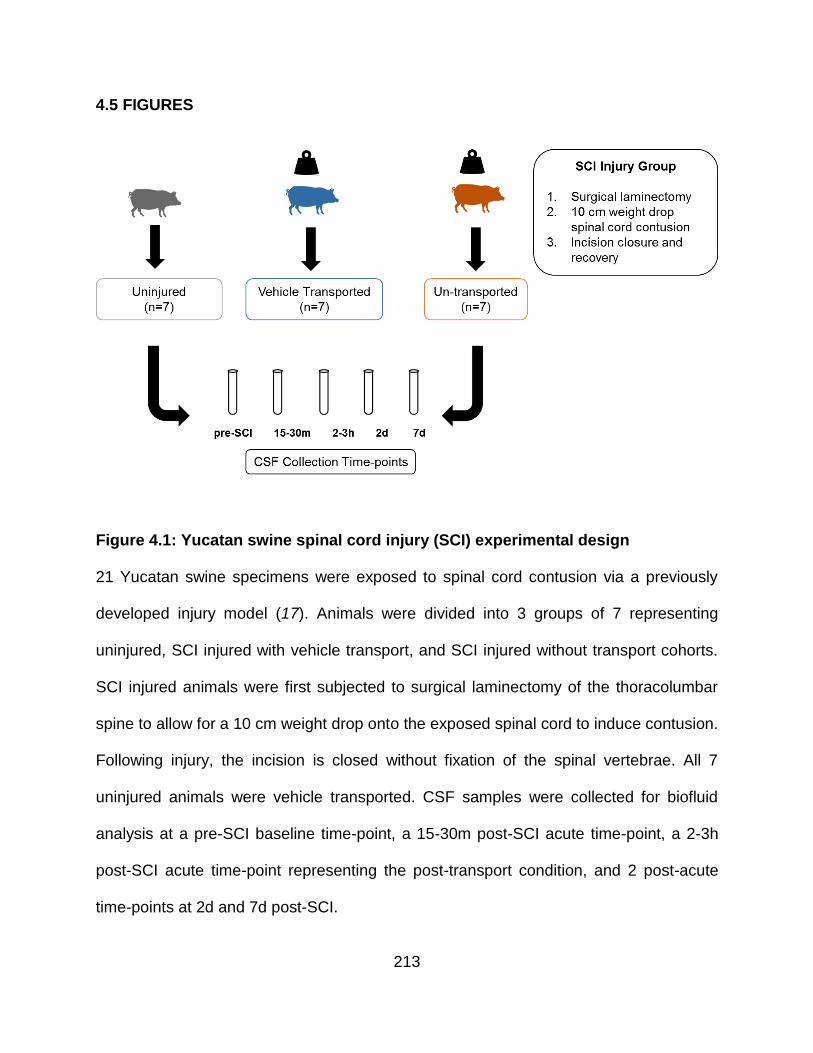
213
4.5 FIGURES
Figure 4.1: Yucatan swine spinal cord injury (SCI) experimental design
21 Yucatan swine specimens were exposed to spinal cord contusion via a previously
developed injury model (17). Animals were divided into 3 groups of 7 representing
uninjured, SCI injured with vehicle transport, and SCI injured without transport cohorts.
SCI injured animals were first subjected to surgical laminectomy of the thoracolumbar
spine to allow for a 10 cm weight drop onto the exposed spinal cord to induce contusion.
Following injury, the incision is closed without fixation of the spinal vertebrae. All 7
uninjured animals were vehicle transported. CSF samples were collected for biofluid
analysis at a pre-SCI baseline time-point, a 15-30m post-SCI acute time-point, a 2-3h
post-SCI acute time-point representing the post-transport condition, and 2 post-acute
time-points at 2d and 7d post-SCI.

214
Figure 4.2: Test track layout and pass sequence for transportation effect
assessment
The figure above displays the vehicle route used to evaluate effects of field transport.
Routes labeled 1-5 represent areas of the test track with different levels of surface
unevenness that SCI animals were driven over to assess the impact of vibrational forces.

215
Figure 4.3: AID biomarkers GFAP, ALDOC, and BLBP acutely elevated after SCI
Comparison of cerebrospinal fluid (CSF) levels of glial fibrillary acidic protein (GFAP, A),
aldolase C (ALDOC, B), and brain lipid binding protein (BLBP, C) in Yucatan swine at
pre- spinal cord injury (SCI) baseline (Bl) versus acute (20m, 2.7h) and post-acute (2d,
7d) time-points after SCI. For GFAP, ALDOC, and BLBP, CSF concentrations were
predominantly elevated within the first 24h of injury compared to baseline levels. Average
CSF collection times are displayed on the x-axis with geometric means of concentration
values (ng/mL ± SD) on the y-axis.

216
Figure 4.4: Individual temporal concentration profiles demonstrate animal specific
biomarker responses to SCI
AID biomarker concentrations for glial fibrillary acidic protein (GFAP, A), aldolase C
(ALDOC, B), and brain lipid binding protein (BLBP, C) were plotted with respect to time
pre- and post-spinal cord injury (SCI) from individual Yucatan swine cerebrospinal fluid.
While GFAP, ALDOC, and BLBP concentrations are all elevated post-SCI, distinct
differences (log10 y-axis) in protein concentrations (ng/mL) are observed between

217
animals. Concentration values of 0 were adjusted to 0.1 to accommodate the log10 y-axis
scaling. Concentration values from 14 different animals are represented at each time-
point.

218
Figure 4.5: Heterogeneous injury response observed in spinal cord injury (SCI)
cohort
10 cm weight drop induced SCI contusion resulted in heterogeneous injury response at
the site of impact (A). Tissue loss at the injury site was quantified by the diameter of lesion
with bruises and hemorrhage. Astroglial damage was measured by visualization of white
matter glial fibrillary acidic protein (GFAP) staining around the site of injury. Glial fiber
disintegration (B) represents reversible, diffuse white matter injury. Total injury (C) was
measured by the combination of both lesion cavity diameter (red) and expansion of white
matter fragmentation (grey).

219
Figure 4.6: SCI-related cavity length correlates negatively to animal recovery
A spearman correlation of r.s. = -0.885 (p <0.001) was observed for spinal cord injury site
cavitation, measured by tissue loss, and ambulatory recovery at 7 days, measured by the
Porcine Thoracic Injury Behavioral Scale (PTIBS). PTIBS is graded from 1-10, with higher
values representing higher recovered mobility. Data from this biplot indicates that high
tissue (7 days) loss associates with poor recovery of walking at 7 days.
Recovery (PTIBS)
2 4 6 8 10
Cavit
y L
en
gth
(m
m)
0.1
1
10
100
Crawl Walk
rs = -0.885
p < 0.001

220
Figure 4.7: AID biomarkers display different concentration and temporal dynamics
between animals with varying degrees of injury in cerebrospinal fluid
14 SCI injured animals were separated into cavity negative (-, yellow) and positive (+,
red) injury groups based on extent of tissue damage. 7 uninjured (sham) pigs were also
analyzed as the control group (grey). Geometric means of PRM-MS CSF concentrations
for glial fibrillary acidic protein (GFAP, A), aldolase C (ALDOC, B), and brain lipid binding
protein (BLBP, C) were plotted for 5 experimental time points (baseline (Bl), 20m, 2.7h,

221
2d, and 7d post-SCI) with 69% confidence intervals on a log10 y-scale. Concentration
values of 0 were changed to 0.01 to accommodate log scaling for graphic visualization.

222
Figure 4.8: Animals that develop an injury lesion exhibit significantly higher CSF
biomarker concentrations acutely after injury
14 SCI injured animals were separated into cavity negative (-, yellow) and positive (+,
red) injury groups based on extent of tissue damage. 7 uninjured (sham) pigs were also
analyzed as the control group (grey). Geometric means of PRM-MS CSF concentrations
for glial fibrillary acidic protein (GFAP, A), aldolase C (ALDOC, B), and brain lipid binding
protein (BLBP, C) were plotted for 5 experimental time points (baseline (Bl), 20m, 2.7h,
2d, and 7d post-SCI) with 69% confidence intervals on a log10 y-scale. Concentration

223
values of 0 were changed to 0.01 to accommodate log scaling for graphic visualization.
A one-tailed, t-test was used to evaluate mean differences in biomarker concentrations
between cavity + and – animals. GFAP and ALDOC levels were determined to be
statistically higher up to 2.7h after injury while BLBP displayed quicker clearance kinetics
and was only significantly different from the lesion negative group at 20m post-SCI.

224
Figure 4.9: CSF concentrations of GFAP, ALDOC, and BLBP associate positively
with extent of tissue loss measured at 7 days
Biplots show strong negative Spearman correlation between CSF concentrations of
GFAP (A), ALDOC (B), and BLBP (C) and 7 day injury site cavitation measured by tissue
loss.

225
Figure 4.10: GFAP, ALDOC, and BLBP may be predictive of functional recovery in
spinal cord injury
Biplots show strong negative Spearman correlation between CSF concentrations of
GFAP (A), ALDOC (B), and BLBP (C) and ambulatory recovery graded by the Porcine
Thoracic Injury Behavioral Scale (PTIBS).

226
Figure 4.11: AID biomarkers demonstrate differences in CSF concentration profiles
over time between injury severity assessed by cavity formation and 7 day
ambulatory recovery
14 SCI injured animals were separated into mild (yellow, n=5), moderate (orange, n=6),
and severe (red, n=3) injury groups based on extent of tissue damage and recovery of
ambulation at 7 days (Table 4.1). 7 uninjured (sham) pigs were also analyzed as the
control group (grey). Geometric means of PRM-MS CSF concentrations for glial fibrillary
acidic protein (GFAP, A), aldolase C (ALDOC, B), and brain lipid binding protein (BLBP,
C) were plotted for 5 experimental time points (baseline (Bl), 20m, 2.7h, 2d, and 7d post-

227
SCI) with 69% confidence intervals on a log10 y-scale. Concentration values of 0 were
changed to 0.01 to accommodate log scaling for graphic visualization.

228
Figure 4.12: AID biomarkers may be capable of distinguishing between varying
levels of injury severity in the hyper acute post-injury period.
14 SCI injured animals were separated into mild (yellow ,n=5), moderate (orange, n=6),
and severe (red, n=3) injury groups based on extent of tissue damage and recovery of
ambulation at 7 days (Table 4.1). 7 uninjured (sham) pigs were also analyzed as the
control group (grey). Geometric means of PRM-MS CSF concentrations for glial fibrillary
acidic protein (GFAP, A), aldolase C (ALDOC, B), and brain lipid binding protein (BLBP,
C) were plotted for 5 experimental time points (baseline (Bl), 20m, 2.7h, 2d, and 7d post-

229
SCI) with 69% confidence intervals on a log10 y-scale. Concentration values of 0 were
changed to 0.01 to accommodate log scaling for graphic visualization.
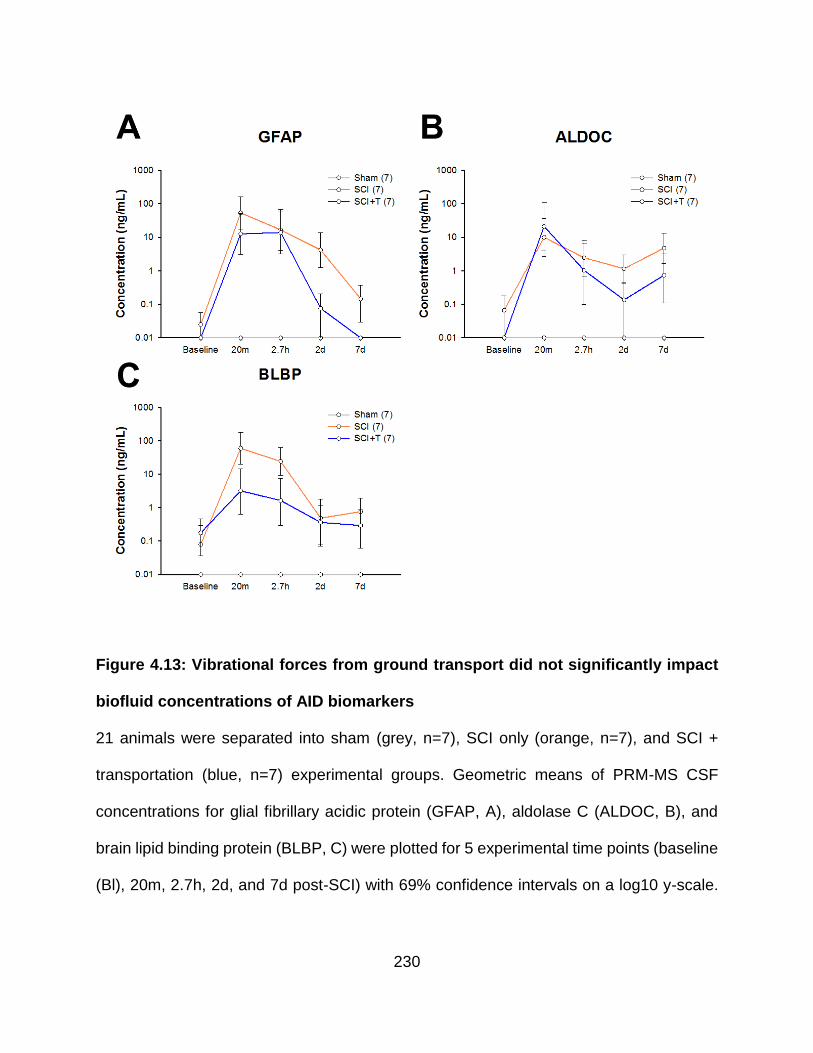
230
Figure 4.13: Vibrational forces from ground transport did not significantly impact
biofluid concentrations of AID biomarkers
21 animals were separated into sham (grey, n=7), SCI only (orange, n=7), and SCI +
transportation (blue, n=7) experimental groups. Geometric means of PRM-MS CSF
concentrations for glial fibrillary acidic protein (GFAP, A), aldolase C (ALDOC, B), and
brain lipid binding protein (BLBP, C) were plotted for 5 experimental time points (baseline
(Bl), 20m, 2.7h, 2d, and 7d post-SCI) with 69% confidence intervals on a log10 y-scale.

231
Concentration values of 0 were changed to 0.01 to accommodate log scaling for graphic
visualization.

232
Figure 4.14: GS was weakly detected in pig SCI CSF samples
(A) Line and (B) bar graph representations of GS CSF concentration in sham injured and
SCI (separated into cavity negative (yellow) and positive (red)) swine. Natural log
transformed means are plotted with corresponding 69% confidence intervals. However,
GS was poorly detected in CSF by MRM-MS, resulting in too few values for adequate
analysis.

233
4.6 TABLES
Animal
PTIBS
(7day)
Total-Injury
(mm)
Cavity
(mm)
0.3h CSF
GFAP
(ng/mL)
0.3h CSF
ALDOC
(ng/mL)
0.3h CSF
BLBP
(ng/mL)
43-090 9.8 47.6 0.0 0.0 0.0 1.1
46-091 8.4 8.8 6.8 24.1 33.7 0.0
42-131 9.9 0.0 0.0 0.0 0.0 0.0
47-094 9.9 5.6 0.0 0.0 0.0 0.0
46-030 4.5 8.8 7.2 64.4 9.0 67.2
42-115 9.8 6.2 0.9 17.7 35.8 26.2
42-101 3 13.4 9.9 75.6 1893.5 0.0
43-031 9.3 0.0 0.0 0.0 2.3 37.4
43-082 4.2 11.2 7.9 57.0 1.4 202.7
42-017 9.3 9.4 8.3 85.7 1.7 95.0
42-127 3.8 11.7 10.2 355.0 40.6 289.2
42-068 1.9 27.9 18.0 401.7 717.7 323.8
45-157 3.4 32.0 30.8 1729.4 668.5 389.6
42-132 3.1 46.0 36.0 2584.9 9397.0 2132.8
Table 4.1: Spinal cord impact site injury severity measured by astroglial beading
and tissue loss cavity size
Extent of pathophysiological damage following weight drop spinal cord injury (SCI) was
quantified by physical and histological examination of excised spinal cord from animals
sacrificed after the 7 day time-point. Tissue loss at 7 days was quantified by the diameter

234
of the lesion cavity and extent of clasmatodendrosis was quantified by the distance
astroglial beading measured from the site of injury visualized by immunostaining. Total
injury was measured by combination of both these parameters. Ambulatory recovery at 7
days is presented as a Porcine Thoracic Injury Behavioral Scale (PTIBS) score. PTIBS
is graded from 1-10, with higher values representing higher recovered mobility. Animals
highlighted in green, yellow, and red represent our classification of mild, moderate, and
severe SCI respectively.

235
Spearman Correlations
Biomaker Cavity Length
(mm) PTIBS Total Injury Expansion
(mm)
GFAP r.s. 0.991 -0.847 0.647
p *** *** *
ALDOC r.s. 0.824 -0.848 0.484
p *** *** ns
BLBP r.s. 0.773 -0.622 0.560
p *** * *
Table 4.2: Spearman correlations for biofluid biomarker concentrations to
immunohistology and functional recovery
The table lists Spearman correlations (r.s.) between biomarkers GFAP, ALDOC, BLBP
and corresponding histopathological (tissue loss diameter and total injury expansion
including tissue cavity and diffusion of astroglial fiber damage) and functional
observations (mobility at 7 days post-injury was assessed using the Porcine Thoracic
Injury Behavioral Scale (PTIBS))

236
SCI SCI+T
Biomarker Slope [ng/(mL*h)] Mean (ng/(mL*h)) Mean (ng/(mL*h)) p-value
GFAP m (20m-2.7h) -74.9 55.1 0.14
m (20m-7d) -2.7 -2.0 0.40
ALDOC m (20m-2.7h) -42.0 193.4 0.36
m (20m-7d) -1.5 -8.5 0.15
BLBP m (20m-2.7h) -51.1 -34.7 0.34
m (20m-7d) -1.4 -2.1 0.48
Table 4.3: t-test of AID biomarker slope changes between transported and un-
transported animals
Effects of transport on CSF concentration of astroglial injury-defined biomarkers were
measured by assessing the rate of changes within the hyper-active post-injury time-points
(20m, 2.7h) and the hyper-acute and post-acute post-injury time-points (20m, 2d). Rate
of change was defined by change in biomarker concentration over time in hours.

237
Name Peptide Sequence Measured MRM Transition
GFAP ALAAELNQLR(Heavy) 554.821 (2+) --> 924.514 (1+, y8)
554.821 (2+) --> 853.477 (1+, y7)
554.821 (2+) --> 782.439 (1+, y6)
ALAAELNQLR(Light) 549.816 (2+) --> 914.505 (1+, y8)
549.816 (2+) --> 843.468 (1+, y8)
549.816 (2+) --> 722.431 (1+, y8)
LADVYQAELR (Heavy) 594.758 (2+) --> 1003.508 (1+, y8)
594.758 (2+) --> 789.413 (1+, y6)
594.758 (2+) --> 626.350 (1+, y5)
LADVYQAELR (Light) 589.314 (2+) --> 993.500 (1+, y8)
589.314 (2+) --> 779.405 (1+, y6)
589.314 (2+) --> 616.341 (1+, y5)
ALDOC TPSALAILENANVLAR (Heavy) 831.974 (2+) --> 1193.688 (1+ y11)
831.974 (2+) --> 1122.651 (1+ y10)
831.974 (2+) --> 1009.566 (1+ y9)
TPSALAILENANVLAR (Light) 826.970 (2+) --> 1183.679 (1+, y11)
826.970 (2+) --> 1112.642 (1+, y10)
826.970 (2+) --> 999.558 (1+, y9)
GS DIVEAHYR (Heavy) 506.758 (2+) --> 784.398 (1+, y6)
506.758 (2+) --> 685.329 (1+, y5)
506.758 (2+) --> 556.287 (1+, y4)
DIVEAHYR (Light) 501.753 (2+) --> 774.389 (1+, y6)
501.753 (2+) --> 675.321 (1+, y5)
501.753 (2+) --> 546.278 (1+, y4)
BLBP ALGVGFATR (Heavy) 451.260 (2+) --> 717.392 (1+, y7)
= FABP7 451.260 (2+) --> 660.370 (1+, y6)
451.260 (2+) --> 561.302 (1+, y5)
ALGVGFATR (Light) 446.256 (2+) --> 707.384 (1+, y7)

238
446.256 (2+) --> 650.362 (1+, y6)
446.256 (2+) --> 551.294 (1+, y5)
Table 4.4: PRM-MS precursor ion inclusion list and measured transitions
The above table lists PRM-MS transitions monitored for quantitative mass spectrometry
analysis of biomarkers GFAP, ALDOC, BLBP, and GS in Yucatan swine SCI CSF.

239
4.7 REFERENCES
1. M. Hauswald, A re-conceptualisation of acute spinal care. Emergency medicine
journal : EMJ 30, 720-723 (2013); published online EpubSep (10.1136/emermed-
2012-201847).
2. N. Theodore, B. Aarabi, S. S. Dhall, D. E. Gelb, R. J. Hurlbert, C. J. Rozzelle, T.
C. Ryken, B. C. Walters, M. N. Hadley, Transportation of patients with acute
traumatic cervical spine injuries. Neurosurgery 72 Suppl 2, 35-39 (2013); published
online EpubMar (10.1227/NEU.0b013e318276edc5).
3. E. R. Haut, B. T. Kalish, D. T. Efron, A. H. Haider, K. A. Stevens, A. N. Kieninger,
E. E. Cornwell, 3rd, D. C. Chang, Spine immobilization in penetrating trauma: more
harm than good? The Journal of trauma 68, 115-120; discussion 120-111 (2010);
published online EpubJan (10.1097/TA.0b013e3181c9ee58).
4. J. S. Harrop, G. M. Ghobrial, R. Chitale, K. Krespan, L. Odorizzi, T. Fried, M.
Maltenfort, M. Cohen, A. Vaccaro, Evaluating initial spine trauma response: injury
time to trauma center in PA, USA. Journal of clinical neuroscience : official journal
of the Neurosurgical Society of Australasia 21, 1725-1729 (2014); published online
EpubOct (10.1016/j.jocn.2014.03.011).
5. A. E. Ropper, M. T. Neal, N. Theodore, Acute management of traumatic cervical
spinal cord injury. Practical neurology 15, 266-272 (2015); published online
EpubAug (10.1136/practneurol-2015-001094).
6. M. N. Hadley, Cervical Spine Immobilization before Admission to the Hospital.
Neurosurgery 50, S7-S17 (2002).

240
7. H. J. Hachen, Emergency transportation in the event of acute spinal cord lesion.
Paraplegia 12, 33-37 (1974); published online EpubMay (10.1038/sc.1974.6).
8. G. A. Zach, W. Seiler, P. Dollfus, Treatment results of spinal cord injuries in the
Swiss Parplegic Centre of Basle. Paraplegia 14, 58-65 (1976); published online
EpubMay (10.1038/sc.1976.9).
9. A. E. Kerstetter, R. H. Miller, Isolation and culture of spinal cord astrocytes.
Methods in molecular biology 814, 93-104 (2012)10.1007/978-1-61779-452-0_7).
10. A. Tolonen, J. Turkka, O. Salonen, E. Ahoniemi, H. Alaranta, Traumatic brain injury
is under-diagnosed in patients with spinal cord injury. Journal of rehabilitation
medicine 39, 622-626 (2007); published online EpubOct (10.2340/16501977-
0101).
11. A. Mahmoud, S. Rengachary, R. Zafonte, Biomechanics of associated spine
injuries in head-injured patients. Topics in Spinal Cord Injury Rehabilitation 5, 41-
46 (1999).
12. E. Roth, G. Davidoff, P. Thomas, R. Doljanac, M. Dijkers, S. Berent, J. Morris, G.
Yarkony, A controlled study of neuropsychological deficits in acute spinal cord
injury patients. Paraplegia 27, 480-489 (1989); published online EpubDec
(10.1038/sc.1989.75).
13. J. N. K. Hsiang, T. Yueng, A. L. M. Yu, W. S. Poon, High-risk mild head injury.
Journal of Neurosurger 87, 234-238 (1997).
14. M. R. Garnett, A. M. Blamire, B. Rajagopalan, P. Styles, T. A. D. Cadoux-Hudson,
Evidence for cellular damage in normal-appearing white matter correlates with

241
injury severity in patients following traumatic brain injury: A magnetic resonance
spectroscopy study. Brain 123, 1403-1409 (2000).
15. G. Davidoff, E. Roth, J. Morris, J. Bleiberg, P. R. Meyer, Assessment of closed
head injury in trauma-related spinal cord injury. Paraplegia 24, 97-104 (1986).
16. G. Davidoff, P. Thomas, M. Johnson, S. Berent, M. Dijkers, R. Doljanac, Closed
head injury in acute traumatic spinal cord injury: incidence and risk factors.
Archives of physical medicine and rehabilitation 69, 869-872 (1988).
17. J. H. Lee, C. F. Jones, E. B. Okon, L. Anderson, S. Tigchelaar, P. Kooner, T.
Godbey, B. Chua, G. Gray, R. Hildebrandt, P. Cripton, W. Tetzlaff, B. K. Kwon, A
novel porcine model of traumatic thoracic spinal cord injury. Journal of
neurotrauma 30, 142-159 (2013); published online EpubFeb 1
(10.1089/neu.2012.2386).
18. F. Streijger, J. H. Lee, N. Manouchehri, A. D. Melnyk, J. Chak, S. Tigchelaar, K.
So, E. B. Okon, S. Jiang, R. Kinsler, K. Barazanji, P. A. Cripton, B. K. Kwon,
Responses of the Acutely Injured Spinal Cord to Vibration that Simulates Transport
in Helicopters or Mine-Resistant Ambush-Protected Vehicles. Journal of
neurotrauma, (2016); published online EpubJul 5 (10.1089/neu.2016.4456).
19. J. A. Colombo, A. Yanez, S. J. Lipina, Interlaminar astroglial processes in the
cerebral cortex of non human primates: response to injury. J Hirnforsch 38, (1997).
20. U. Ito, Y. Hakamata, E. Kawakami, K. Oyanagi, Degeneration of astrocytic
processes and their mitochondria in cerebral cortical regions peripheral to the
cortical infarction heterogeneity of their disintegration is closely associated with

242
disseminated selective neuronal necrosis and maturation of injury. Stroke 40,
2173-2181 (2009).
21. M. G. Salter, R. Fern, The mechanisms of acute ischemic injury in the cell
processes of developing white matter astrocytes. Journal of Cerebral Blood Flow
& Metabolism 28, 588-601 (2008).

243
CHAPTER 5: CHARACTERIZING THE PREFERENTIAL RELEASE OF PROTEIN
SUBPOPULATIONS BY INJURED ASTROCYTES
5.1 INTRODUCTION
Traumatic central nervous system (CNS) injury is caused by direct physical
damage to the brain or spinal cord resulting diffuse axonal damage in addition to
immediate hemorrhage and contusion at the site of injury. Traumatic brain injury (TBI) is
perhaps the most common form of CNS damage that affects more than 57 million
hospitalizations globally. Over 5 million people are estimated to live with TBI-related
disabilities and is the most common cause of disability in individuals under 30 (1, 2).
Traumatic brain injury is of increasing concern to military personnel, emergency
responders, and athletes with the leading causes from blast injury, violence, and falls.
Despite the immense health and financial costs associated with TBI, current
evaluation of injury is limited by the insensitivity of standard neurocognitive assessments
such as the Glasgow Coma Scale (GCS). These tests measure a patient’s level of
consciousness and cognitive function and rely solely on verbal communication, motor
function, and memory related responses. At best, improper assessment results from
deficiencies in clinical expertise and at worst, these test may be subject to motivational
confounds from business pressures. Better diagnostic measures, in the form of an easy
to administer and decipher biofluid biomarker assay offer the potential of unambiguous
identification of injury with the promise of quantitative and standardized severity
categorization.

244
Despite advances in proteomic screening methods, no established biomarker for
TBI is currently used clinically in the US. Proteomic screening of injured CNS tissue and
patient biofluids have identified a wealth of potential biomarkers for neurotrauma. The
challenge, however, lies in the interpretation of these long candidate lists due to the
complexity of events at and around a dynamically changing injury site and variations
between trauma models (3-5). Tissue derived protein signals are products of a changing
composition of viable, injured, and dead cells as well as infiltrating non-neural cells, all of
which complicate the interpretation of proteomic studies (6, 7).
Due to the confounding complexity of clinical TBI and clinic-resembling animal
injury models, we propose a targeted proteomic screen using a well-characterized in vitro
cell-based trauma model as a starting point for TBI marker candidate identification (8-12).
This will limit protein changes to those directly related to an acute mechanical trauma by
applying an abrupt pressure pulse inflicting shear forces and deformation onto cortical
brain cells in a reproducible fashion at various severities. We identified robust cellular
release patterns that correlate with cell injury and cell death and apply a suitable selection
strategy that builds on our previous work in clinical samples toward the ultimate goal of a
blood based diagnostic.

245
5.2 RESULTS
Astrocyte cultures derived from 3 different human fetal cerebral neocortex
donations were subjected to biomechanical trauma from nitrogen pressure pulses to
evaluate the impact of injury on released and intracellular proteomes. Additionally, the
effect of injury severity was assessed using either mild or severe stretch parameters
defined by the application of 50 ms of nitrogen gas flow at 2.6-4.0 or 4.4-5.3 psi
respectively. The effect of injury on astrocyte release proteomes and intracellular
proteomes were assessed by collection and trypsin digestion of conditioned medium (CM)
and whole cell lysates (WCL). Relative quantitation between injured and un-stretched
astrocytes was performed using isobaric labeling with TMT 6-plex mass tags (Figure 5.1)
and LC-MS/MS. This approach allows for the simultaneous comparison of proteomes
before and after treatment based on the ratios of the relative intensities of the differential
reporter ions cleaved from the isobaric mass tags during higher-energy collisional
dissociation (HCD). Because precursor co-isolation negatively impacts reporter ion
quantification, trypsin digested samples were subjected to strong cation exchange (SCX)
pre-fractionation. Pre-fractionation reduces the occurrence of precursor co-elution
through improved chromatographic separation to improve the accuracy of quantitative
results (13-15). Additionally, peptides with co-isolation percentages higher than 50% were
also excluded from TMT ratio calculations (Methods).
Stretched astrocytes release different populations of injury-related proteins
TMT ratios for CM proteins released after exposure to mild or severe pressure
stretch conditions were averaged to determine relative fold changes to control conditions

246
(un-stretched). Intensities from replicate analyses were evaluated by paired, 1-tailed t-
test to determine statistically significant (p < 0.05) quantitative observations. A fold
change (FC) of greater than 2 compared to control was selected for biological
significance. These statistical and biological boundaries were selected to identify released
proteins of interest from our injury model and visualized in the volcano plots presented in
Figure 5.2. For each time-point evaluated, severe stretching resulted in more abundant
(FC>3 and above) release of injury-related proteins compared to mild stretch conditions.
Difference in differentially released proteins were most apparent between severe and mild
stretching at 5 and 24 hours (Figure 5.3). At 48 hours, minimal change in CM protein
abundances were observed between mild and severe injury groups.
Distinct size profiles observed for injury released proteins in conditioned medium
Cellular membrane permeability is a hallmark of diffuse axonal injury in traumatic
brain injury (TBI) (16, 17). This phenomenon has also been demonstrated by our group
following biomechanical injury in vitro (Chapter 3). Building upon this, we examined the
relationship between released protein molecular weights (MW) and mechanoporated
astrocytes using our trauma model. Using the released protein selection criteria described
above, the MW distributions of CM proteins with at least a 2-fold increase relative to
control were compared. Figure 5.4A displays median MWs of differentially released
(FC>2) proteins for all experimental conditions along with 1.5 interquartile ranges.
Comparison of stretch severities at 5 and 24 hours denote lower median MWs and tighter
size distributions in elevated CM proteins for astrocytes stretched with 4.0 psi or lower.
No real difference is observed at 48 hours between mild and severe injury groups,

247
consistent with minimal changes in release abundances examined previously. Looking
deeper at the effect on stretching on the various sub-populations of differentially released
proteins, an inverse relationship between CM abundance (measured by FC) and mean
MWs is observed (Figure 5.4B, Table 5.1) in the mildly stretched cohort. At both 5 and 24
hours, the mean MW of proteins with 3-fold CM increase are measured at 36.6 ± 26.67
kDa and 15.7 ± 7.95 kDa compared to 57.96 ± 74.5 kDa and 45.87 ± 58.4 kDa
respectively. These observations are suggestive of the preferential release of lower MW
proteins from injured astrocytes. Overall, released protein MWs rise with time after injury
for all stretch conditions that likely relate to temporal changes in cell death dynamics.
Intracellular protein expression dynamics relatively unchanged following injury
Astrocyte whole cell lysates (WCL) corresponding to post-injury CM fluid samples
were also harvested at 5, 24, and 48 hours post-stretch injury. Given prior evidence
suggestive of protein leakage from injured cells, a corresponding change in intracellular
protein concentrations was expected from cell lysates. However, in contrast to the
significant changes to CM protein concentrations, little deviation from baseline protein
levels was measured from TMT labeled WCL peptides. Even at more modest expression
deviations of ± 1.25-fold relative to control, very few WCL proteins were statistically or
biologically altered in our stretch trauma model (Figure 5.5).
Select proteins display corresponding expression and release trends
Looking further at the WCL proteins displaying differential expression (Table 5.2),
thymosin beta-4, thymosin beta-10, and 14 kDa phosphohistidine phosphatase were

248
observed to exhibit a 25% reduction in intracellular protein concentration at 5 hours post
stretch injury. All 3 proteins also exhibited a correspondingly high increase (2<FC<4) in
CM protein concentration that is consistent with subpopulations of cells with membrane
irregularities as demonstrated in Chapter 3. Peptidyl-prolyl cis-trans isomerase FKBP10,
myosin regulatory light polypeptide 9, and reticulon-4 all showed a modest, but
statistically significant (~1.25-fold) increase from baseline levels. These proteins exhibited
around a 2-fold increase in CM concentration after injury with the exception of reticulon-
4 (FC ~ 1.25). The high MW of reticulon-4 is consistent with our hypothesis. At 24 hours,
thymosin beta proteins and transgelin continue to be decreased in WCL but highly
increased (FC>3) in CM. Adenylyl cyclase-associated protein 1 is decreased in WCL at
48h and very highly increased in CM. Ubiquitin-conjugating enzyme E2 N, calponin-3,
actin-related protein-2, and plasminogen activator inhibitor 1 are 1.25-fold elevated in
WCL with very high CM elevations. This population of proteins exhibiting matching
intracellular and released protein dynamics in response to injury may represent good
biomarkers for biomechanical neurotrauma.
Identification of potential astrocyte injury protein signatures with respect to time and
severity
A major goal of our astrocyte injury model is to identify highly abundant, ideally
central nervous system (CNS) enriched protein biomarkers sensitive and specific to
neurotraumatic injury. As part of this characterization, several stepwise comparisons were
performed in an attempt to identify both differentiating (with respect to time and injury
severity) and common trauma signatures. First, differentially released (FC>2) CM

249
proteins were compared at all time-points (5h, 24h, and 48h) with respect to our trauma
severity (Figure 5.6). This uncovered a common core of proteins between mild and severe
stretch released proteins as well as subgroups of proteins potentially specific to both
severity of injury and time after injury. Because a strict fold change cut off of 2 was
selected, these injury-time specific subpopulations were further curated manually to
eliminate proteins that were also observed with approximate (FC slightly less than 2)
abundance changes at other time-points (Table 5.3). A last round of selection was
performed to identify proteins observed from both severities of stretch injury and at time
points post-trauma (Figure 5.7).
Top neurotraumatic injury biomarker identification
Signature injury markers identified from our quantitative astrocyte trauma model
were further narrowed using the filtering strategy presented in Figure 5.8. As described
previously (Chapter 3), we established a human TBI cerebrospinal fluid (CSF)
traumatome that included proteins observed in TBI CSF only as well as proteins
measured in both 19 TBI and 9 healthy patients. Next, to reduce the contributions from
non-CNS specific organ systems and toward the development of a blood based assay,
proteins derived from blood (18, 19) were filtered. The final candidate list (Table 5.4) was
graded on the following criteria: (1) Observed in human TBI CSF traumatome
(preferentially TBI CSF only), (2) observed at multiple time-points in in vitro trauma model,
(3) low MW, (4) demonstrates relationship between WCL and CM concentrations in
response to injury, (5) not observed in blood proteome and (6) relative elevation across
all stretch trauma conditions.

250
5.3 DISCUSSION
Application of quantitative proteomics to a well-defined in vitro injury mode was
used to further characterize cellular changes with regard to both release and intracellular
proteomes following traumatic injury in astrocytes. Our findings contribute to the
continued elucidation of astrocyte response to injury with an emphasis on temporal
dynamics and reported plasma membrane compromise as they relate to the identification
of diagnostic protein signatures for traumatic CNS injury.
Mechanical injury may result in preferential release of lower molecular weight proteins
Pressure pulse (2.6 – 5.3 psi, 50 ms) induced stretch injury resulted in significant
changes to the release proteomes of astrocytes in culture. Differential release of proteins
was inferred from increase in protein abundances measured in conditioned media (CM)
compared to healthy un-stretched cells at three time-points from 5 to 48 hours after injury.
Plasmalemma damage is a documented cellular response that occurs early after injury
before the onset of other injury related sequelae (17, 20-22). Membrane irregularities
coupled with the wide spread occurrence of apoptotic and neurotic cell death (23-26) after
TBI are responsible for the changes to protein abundance in astrocyte CM. Both our
studies (Chapter 3) and published literature support the findings that the early sequelae
after neurotraumatic insult is dominated by changes to the cellular integrity. The non-
discriminant release of proteins from mechanoporated cells is most likely a function of
cellular protein molecular weight. This is supported by our in vitro study which identified
subpopulations of more differentially released proteins (FC>3) that occupy a much lower
distribution of molecular weights (MWs) compared to the entire population of differentially

251
released proteins (defined as FC>2). This preferential release of lower MW protein
species is most apparent under what we define as mild pressure stretching due to the
lower extent of early cell death as previously described (Chapter 3).
Further evidence for preferential release of lower MW species is presented in the
comparison of intracellular expression changes measured in WCL to corresponding
increases in CM concentrations. Reticulon-4, also known as Nog-66 receptor 4, was
observed to be 1.25-fold (p<0.05) elevated in whole cell lysates (WCLs) at 5 hours after
injury but only mildly elevated in CM (FC ~1.3). In contrast to smaller proteins observed
elevated in both WCL and CM at 5 hours, the modest increase in reticulon-4 CM
abundance despite elevated cellular expression is likely a consequence of its larger (102
kDa) size. In stark contrast, 3 proteins, thymosin beta-4, thymosin beta-10, and transgelin
(MW range 5-23 kDa) were observed to be highly elevated (average FC>3) in CM in the
acute time-point despite a decrease in intracellular concentrations. While it is unclear
whether increased injury induces increased expression of these proteins, this evidence
supports the notion that their low MW facilitates their cellular departure after trauma.
Mild trauma may generate comparable levels of cell death as severe trauma
Severe stretch trauma resulted in higher CM concentrations of released proteins.
This is believed to result from the complete release of cytosolic contents accompanying
increased cell death (27, 28). While differences in highly differentially released proteins
(FC>3) were most apparent between 5 and 24 hours, differences between mild and
severe trauma were minimized by 48 hours with near equal percentages of matching
proteins between injury conditions exhibiting 3-fold or higher concentration increases in

252
CM. This indirect evidence suggests that the extent of secondary sequelae related to cell
death processes may be comparable between mild and severe TBI, highlighting the
health risk of these invisible wounds. Additionally, from a diagnostic standpoint, this
finding points to the importance of time with respect to detection of injury as well as
biofluid marker concentrations as they relate to patient prognoses. Time-related increases
in cell death will greatly alter the effective concentrations of disease-associated proteins,
necessitating differential acceptance ranges depending on when diagnostics were
administered. It is important to note that what we have defined as mild and severe in our
in vitro trauma system may not correlate with observed pathophysiological manifestations
of clinical defined injury severity in patients.
New low molecular weight acute neurotraumatic injury signatures
Comparative analysis of release profiles after injury resulted in the identification of
subsets of protein signatures that may potentially aid in the elucidation of the underlying
molecular cascade of traumatic astrocyte injury. Stretching of astrocytes in vitro yielded
increased release of ribosomal protein subunits, heat shock proteins, components of the
ubiquitin-proteasome complex, and caspases associated with increases in protein
synthesis, stress response (29-31), injury-related abnormal protein degradation (32, 33),
and apoptosis (34). It is still unclear whether biomechanical trauma is responsible for the
systematic alteration of pathways associated with disease despite the presentation of a
host of molecular pathologies (35, 36). Consequently, it is possible that identified proteins
with increased release profiles may be purely associated with increased membrane
permeability. Because of this, preferential value was assigned to low MW proteins in our

253
selection of new neurotraumatic biomarkers. In addition to MW considerations, priority
was given based on representation within our previously established human TBI CSF
traumatome (Chapter 3) and proteins not normally present in blood circulation. However,
representation in the blood protein did not necessarily exclude candidate proteins given
the fact that well established TBI marker ubiquitin carboxyl-terminal hydrolase isozyme
L1 (UCHL1) (37) is naturally present in blood but with diagnostically relevant
concentrations after injury (38). Aldolase C (39) and protein 14-3-3 (40) were also
identified by our filtering strategy, further strengthening the validity of our approach as our
group has characterized these two candidates in clinical samples. Of particular interest
are new candidates from the thymosin family of proteins (5 kDa), 14 kDa phosphohistidine
phosphatase (14 kDa), and transgelin (23 kDa) that exhibited corresponding decreases
in intracellular protein concentrations after injury. This is strongly suggestive of their
preferential leak into surrounding fluid. Ezrin, an actin-related protein, was another
interesting hit from our screen that is reported to be present in high concentration
extracellularly after TBI. Ezrin localization has been observed on astrocyte lamellipodia
and around cellular debris suggesting dual roles in motility and immune recruitment after
injury (41, 42). Superoxide dismutase (SOD1) presents another biological relevant
candidate given the increases in brain reactive oxygen species (ROS) generation that
accompanies mitochondrial dysfunction after trauma. Increased SOD1 expression is
consistent with the neuroprotective process with previous studies demonstrating partial
ablation of ischemia related symptoms with SOD1 overexpression or supplementation
(43, 44).

254
Conclusions
The proteomic response to both injury-induced astrocyte plasmalemma
compromise and cell death have been evaluated in this work with strong implications for
preferential release of low MW species after injury. This was observed to be especially
apparent with regard to injury severity at acute time points within 24 hours of injury in vitro
that is believed to be related to the early onset of membrane compromise but prior to the
onset of secondary sequelae leading to widespread cell death. This early occurrence of
membrane compromise is of special interest due to its diagnostic implications. Low MW
biomarkers that are preferentially released as a result of cellular mechanoporation may
capture the development of early traumatic sequelae specific for TBI in the hyper-acute
post-injury period. Applications of this are of particular importance to healthcare for
athletes where a rapid diagnostic tool may prevent incorrect medical clearance of players
with diffuse axonal damage from a concussive injury. We have presented a manually
curated list of low MW candidates that are robustly detected not only in vitro but also in
clinical TBI patient CSF. Future verification in biological relevant injury systems will
determine the utility of these candidates and whether protein size should be a
consideration for neurotraumatic injury biomarkers.

255
5.4 METHODS
Fetal astrocyte culture and mechanical stretch injury
Primary human astrocytes were prepared as previously described (45). Donated
human fetal cerebral neocortex at 16-19 gestational weeks was de-identified, cleaned
and mechanically dissociated in calcium and magnesium-free Hank’s buffered saline
solution (HBSS) before filtering through 70 µm and 10 µm nylon meshes (Nitex) in culture
medium (DMEM-F12) with 10% fetal bovine serum (FBS). Astrocytes were separated
from neural progenitor cells by 30min centrifugation at 30,000xg (J6B Sorvall centrifuge,
rotor SA600) in a HBSS-buffered 33% Percoll gradient (Sigma). The top fraction was
washed and diluted in DMEM/F12, 10% FBS and cultured in T150 cell culture-treated
plastic flasks (Corning). Confluent cultures were shaken for 4 days at 200rpm on a shaker
in an incubator. Astrocytes were mechanically dissociated following brief treatment in
0.25% trypsin/EDTA, washed, collected by centrifugation at 400 x g in a clinical centrifuge
(IEC) and seeded onto collagen I-coated silastic membrane culture plates (6 well Bioflex)
at a density of ~ 135,000 human cells / 962mm2. Upon confluence, medium was replaced
by DMEM/F12 with 10% heat-inactivated horse serum (Atlanta Biol.) that was
subsequently stepwise reduced. Differentiated serum-free astrocytes in 2ml DMEM/F12
were stretch-injured using one mild (2.6-4.0psi) or one severe (4.4-5.3psi) 50ms nitrogen
pressure pulse with the CIC II pressure controller (Custom Design and Fabrication Inc.).
TMT isobaric labeling
Stretched and un-stretched fetal human astrocytes lysates (WCL) and their
conditioned media (CM) were labeled with isobaric TMT sixplex mass tags (Thermo).

256
Cultured astrocytes were stretched at various severities, described above and harvested
along with their surrounding culture media for analysis at various time-points. Astrocyte
WCLs were precipitated using cold acetone and then re-suspended in 100 µL of 100 mM
triethyl ammonium bicarbonate (TEAB), 0.1% deoxycholate. Samples were then reduced
and alkylated with TCEP and IAM for 1 hour (55°C) and 30 minutes (37°C) respectively.
2.5 µg of trypsin per 100 µg of protein added for overnight digestion at 37°C. CM samples
were measured by BCA and 100 µg of sample treated directly to reduction, alkylation,
and trypsin digestion.
TMT isobaric label reagent sets were used per manufacturer’s instructions. Prior
to use TMT label reagents were equilibrated to room temperature. 0.8 mg vials of each
label (m/z 126-131) were reconstituted in 41 µL of anhydrous acetonitrile (ACN) and
allowed to dissolve for 5 minutes with occasional vortexing. Entire aliquots of WCL or CM
were added directly to TMT reagent vials. Labeling reaction was carried out at room
temperature for 1 hour and then quenched with 8 µL of 5% hydroxylamine with 15 minute
incubation. Equal volumes of sample were then combined for fractionation and analysis.
Replicates from three separate experiments were labeled with TMT mass tags as
described in the table below (both WCL and CM). Samples were labeled according to
Table 5.5.
Offline SCX fractionation
TMT labeled samples were fractionated by C18/SCX spin-tips prepared in-house.
200 µL Eppendorf tips were packed (in order) with equal amounts of SCX and C18
packing (Empore). Spin-tips were conditioned sequentially with 100 µL of methanol, C18

257
elution buffer (80% ACN, 5% acetic acid (HOAc)), and loading buffer (3% ACN, 0.5%
HOAc), spinning down at 2K x g between solvents changes. 100 µL of SCX buffer (30%
ACN, 500 mM ammonium acetate, 0.5% HOAc) was added to condition SCX packing
following by 100 µL of loading buffer to re-equilibrate. Up to 50 µg of sample was then
added to the conditioned spin-tip with 100 µL loading buffer and spun down at 2K x g. 20
µL of C18 elution buffer was added to elute peptides onto SCX filter. Stepwise elution
with increasing ammonium acetate (25, 50, 100, 200, and 500 mM) in 30% ACN, 0.5%
HOAc was performed to fractionate samples. Fractionated samples were dried by
vacuum centrifugation and reconstituted with 3% ACN, 0.1% formic acid (FA) in water to
concentration of 0.5 mg/mL.
Protein identification and TMT quantification by nano-LC-MS/MS
Fractionated peptides were injected onto an Acclaim PepMap 100, 75 µm X 2cm
C18 (Thermo) trap column and EASY-Spray PepMap RSLC, C18, 2µm, 75 µM X 25 cm
analytical column (Thermo) attached to an EASY nLC 1000 (Proxeon). The flow rate of
the mobile phase was set to 300 nL/min. Peptides were separated with a 0.1% FA in
water (A) and 0.1% FA in ACN (B) mobile phase system as follows: 5-35% B over 90
minutes, 35-60% B over 30 minutes. Peptides were introduced from the nano-HPLC to
Q-Exactive (Thermo), an Orbitrap mass spectrometer, operating with a Top10 duty cycle
consisting of 1 full scan (70,000 resolution, AGC 1e6, 100 ms max IT, 200-2000 m/z)
followed by 10 consecutive data-dependent MS2 (HCD) acquisitions (17,500 resolution,
AGC 1e5, 100 ms max IT, 4 m/z isolation window, 100 m/z fixed first mass, and NCE 30).

258
A dynamic exclusion of 30 secs was applied and peptides with unassigned charge or
charge state 1 were excluded from MS2 analysis.
Raw data files were searched in Proteome Discoverer v1.4 (Thermo) configured
with MASCOT (Matrix Science) to identify and quantify proteins based on mass, peptide
spectral matches (PSM), and reporter ion intensities. Peptide mass data was matched
against the human SwissProt database with the following search parameters: Enzyme –
trypsin, 2 missed cleavages allowed, 10 ppm and 0.05 Da MS1 and MS2 mass
tolerances, static modifications – carbamidomethyl (C), and dynamic modifications –
TMT6plex (K, N-term), oxidation (M). Protein identifications were validated by searching
against a reverse sequence decoy database with a FDR of 0.05 and a minimum of 2
unique peptides. Common contaminant proteins were manually excised from protein ID
lists (46). Relative quantitation of TMT reported ions were performed off the most
confident centroid peak with 20 ppm mass tolerance. Precursor ions with high co-isolation
interference were excluded from ratio calculations in Proteome Discoverer based on the
following formula:
% Isolation Interference = 100 x [1-( 𝑝𝑟𝑒𝑐𝑢𝑟𝑠𝑜𝑟 𝑖𝑛𝑡𝑒𝑛𝑠𝑖𝑡𝑦 𝑖𝑛 𝑖𝑠𝑜𝑙𝑎𝑡𝑖𝑜𝑛 𝑤𝑖𝑛𝑑𝑜𝑤
𝑡𝑜𝑡𝑎𝑙 𝑖𝑛𝑡𝑒𝑛𝑠𝑖𝑡𝑦 𝑖𝑛 𝑖𝑠𝑜𝑙𝑎𝑡𝑖𝑜𝑛 𝑤𝑖𝑛𝑑𝑜𝑤)].
Statistical analysis was performed using a combination of Excel (Microsoft) and Graph
Pad 7 (Prism).

259
5.5 FIGURES
Figure 5.1: Relative quantitation by TMT isobaric mass tags workflow

260
261
Figure 5.2: Astrocyte-released protein fold changes measured in conditioned
media at after injury
Conditioned media (CM) was collected pre-injury and at 5 (A), 24 (B), and 48 (C) hours
(h) post mild (left) or severe (right) stretch injury. Astrocyte released proteins from different
conditions were cleaved with trypsin and labeled with isobaric TMT mass tags. Dotted
vertical and horizontal lines designate boundaries for measured 2-fold CM concentrations
compared to control and statistical significance (p-value <0.05) of change calculated by
paired, 1-tailed t-test. Proteins with fold change (FC) >2, >3, and >4 are represented in
yellow, orange, and red respectively. Higher severity mechanical injury induces higher
subpopulations of proteins released with respect to FC.

262
Figure 5.3: Higher intensity pressure pulse stretching induces greater release of
injury-related proteins from astrocytes
The percentage of proteins with relative fold change (FC) increases in condition medium
(CM) relative to un-stretched cells are represented in bar graph format. FCs of >2, >3,
and >4 measured by TMT labeling are represented in yellow, orange, and red respectively
for CM collected at 5, 24, and 48 hours (h) following mild or severe pressure stretching.
CM Fold Change
5h M
ild
5h S
ever
e
24h M
ild
24h S
ever
e
48h M
ild
48h S
ever
e
0
20
40
60
80
100FC>2
FC>3
FC>4
% P
rote
ins

263
Figure 5.4: Stretch injury may induce preferential release of lower molecular weight
protein species
Molecular weight (MW) analysis of astrocyte-released proteins in conditioned media (CM)
at various 5, 24, and 48 hours (h) after mild (M) or severe (S) stretch injury. (A) Box
whisker plots displaying median MWs with Tukey (1.5 interquartile ranges) whiskers of 2-
fold differentially released astrocyte proteins in CM for each experimental group. From 5h
to 24h, higher stretch severity induces release proteins exhibiting a higher MW range with
little difference in protein sizes by 48 hours with regard to extent of injury. (B) Bar graphs
displaying mean MWs of proteins released with fold changes (FCs) of >2 and >3 at 5h,
24h, and 48h collection time-points post mild mechanical injury. Error bars display full
range of released protein MWs. A general trend is observed that possibly highlights the
preferential release of lower MW proteins in response to injury.

264

265
Figure 5.5: Little change observed in intracellular protein concentrations in
response to injury from astrocyte whole cell lysates
Whole cell lysate (WCL) was collected pre-injury and after mild (left) and severe (right)
stretch injury at 5 hours (h) (A), 24h (B), and 48h (C). Intracellular proteins were cleaved
with trypsin and labeled with isobaric TMT mass tags. Dotted vertical and horizontal lines
designate boundaries for measured fold changes (FC) of <0.5, 0<0.75, >1.25, and >2 (left
to right). WCL concentrations were compared to control and statistical significance (p-
value <0.05) of change calculated by paired, 1-tailed t-test. Proteins with FC <0.75 and
>1.25 are represented in light blue and yellow respectively. Minimal protein concentration
changes within cells were measured in response to injury.

266
Figure 5.6: Comparison of proteomic release profiles resulting from astrocytes
injured by mild and severe stretching
Comparative analysis of conditioned medium (CM) proteins with 2-fold elevation relative
to control after mild or severe stretch injury at 5, 24, and 48 hour (h) collection time-points
after injury. Distinct injury severity related protein profiles are observed at 5h (A), 24h (B),
and 48h (C).

267
Figure 5.7: A common subpopulation of injury released proteins may represent
strong candidates of neurotraumatic injury
Proteins observed in both mild and severe injury groups at each time-point (5h, 24h, and
48h, Figure 5.6) were compared against each other. The 32 proteins overlapping between
all three groups represent the most robustly observed injury released proteins in astrocyte
conditioned media. This list of 32 proteins were further filter to arrive at final candidate
lists.

268
Figure 5.8: Astrocyte injury related release biomarker filtering strategy
Differentially (FC>2) released injury proteins identified by relative quantitation with TMT
isobaric mass labels were filtered using the above scheme. Severity/Time specific
proteins were manually curated based on exclusivity to time or injury conditions. Proteins
were then compared to the UCLA human traumatic brain injury (TBI) cerebrospinal fluid
(CSF) proteome (Chapter 3) in an attempt to identify potentially robust in vivo candidates.
Finally a blood protein filter was applied based on published blood proteomes (18, 19).
Manual addition of select proteins was also added to our candidate lists (Table 5.3) as
described in the Results and Discussion sections.

269
5.6 TABLES
5h Mild 24h Mild 48h Mild
MW (kDa) FC>2 FC>3 FC>2 FC>3 FC>2 FC>3 Minimum 5.05 5.05 5.05 5.05 5.05 5.05
25% Percentile 22.6 17.93 18 9.086 27.97 26.79 Median 36.67 28.75 27.73 14.87 45.97 42.59
75% Percentile 59.81 47.5 47.14 23.06 72.72 70.39 Maximum 628.7 123.5 284.4 27.37 628.7 628.7
Mean 57.96 36.6 45.87 15.7 70.29 66.54 Std. Deviation 74.5 26.67 58.35 7.95 81.11 78.75
n 235 53 51 6 365 325
5h Severe 24h Severe 48h Severe MW (kDa) FC>2 FC>3 FC>2 FC>3 FC>2 FC>3 Minimum 5.05 5.05 5.05 5.05 5.05 5.05
25% Percentile 22.81 20.32 23.73 22.81 27.91 27.42 Median 38.57 31.33 40.4 39.4 45.97 44.72
75% Percentile 61.58 51.61 65.29 68.6 73.58 73.21 Maximum 628.7 628.7 468.5 468.5 628.7 628.7
Mean 57.37 52.11 61.79 65.27 70.72 68.53 Std. Deviation 73.34 78.23 66.98 75.62 81.52 78.53
n 236 125 199 129 361 340
Table 5.1: Differentially released CM protein molecular weight statistics

270
Differentially Expressed WCL Proteins (5h Mild)
Accession Description MW [kDa]
P63313 Thymosin beta-10 5.0 P62328 Thymosin beta-4 5.0 Q96AY3 Peptidyl-prolyl cis-trans isomerase FKBP10 64.2 Q9NQC3 Reticulon-4 129.9 P05121 Plasminogen activator inhibitor 1 45.0 Q9UDY4 DnaJ homolog subfamily B member 4 37.8 P24844 Myosin regulatory light polypeptide 9 19.8
Differentially Expressed WCL Proteins (5h Severe)
Accession Description MW [kDa]
Q9NRX4 14 kDa phosphohistidine phosphatase 13.8
Differentially Expressed WCL Proteins (24h Mild)
Accession Description MW [kDa]
P63313 Thymosin beta-10 5.0 P62328 Thymosin beta-4 5.0 Q01995 Transgelin 22.6 Q8NBS9 Thioredoxin domain-containing protein 5 47.6 P62266 40S ribosomal protein S23 15.8 Q7KZF4 Staphylococcal nuclease domain-containing protein 1 101.9 P50454 Serpin H1 46.4
Differentially Expressed WCL Proteins (24h Severe)
Accession Description MW [kDa]
P62328 Thymosin beta-4 5.0 Q01995 Transgelin 22.6 Q8NBS9 Thioredoxin domain-containing protein 5 47.6
Differentially Expressed WCL Proteins (48h Severe)
Accession Description MW (kDa)
P61088 Ubiquitin-conjugating enzyme E2 N 17.1 P05121 Plasminogen activator inhibitor 1 45.0 P35268 60S ribosomal protein L22 14.8 Q9Y2B0 Protein canopy homolog 2 20.6 P62424 60S ribosomal protein L7a 30.0
Differentially Expressed WCL Proteins (48h Severe)
Accession Description MW (kDa)
Q01518 Adenylyl cyclase-associated protein 1 51.9 P61088 Ubiquitin-conjugating enzyme E2 N 17.1 Q99439 Calponin-2 33.7 P61160 Actin-related protein 2 44.7 P05121 Plasminogen activator inhibitor 1 45.0 P35268 60S ribosomal protein L22 14.8 Q9Y2B0 Protein canopy homolog 2 20.6

271
Table 5.2: Differentially expressed whole cell lysate proteins at post-injury
conditions
Whole cell lysate proteins with expression differences at 5, 24, and 48 hours (h) after mild
or severe stretch injury. Proteins with a 25% reduction in intracellular concentrations are
displayed in italics. Remaining proteins represent intracellular increases of 25%. Bolded
proteins exhibited corresponding increases in time-point and stretch severity matched
conditioned medium.

272
Unique 5h Protein Signatures Accession Description 5hr
Mild 5h Severe MW(kDa)
P68402 Platelet-activating factor acetylhydrolase IB subunit
beta
2.7 25.6 P61247 40S ribosomal protein S3a 2.5 29.9 Q13643 Four and a half LIM domains
protein 3 2.2 31.2
P20930 Filaggrin 2.2 434.9 P15121 Aldose reductase 2.2 35.8 P62841 40S ribosomal protein S15 2.2 17.0 Q14315 Filamin-C 2.1 290.8 P29692 Elongation factor 1-delta 2.1 31.1 P35237 Serpin B6 2.1 42.6 P17174 Aspartate aminotransferase,
cytoplasmic 2.0 46.2
P05387 60S acidic ribosomal protein P2
2.0 11.7 Q9BWD1 Acetyl-CoA acetyltransferase,
cytosolic 4.8 41.3
O95782 AP-2 complex subunit alpha-1 3.4 107.5 P28300 Protein-lysine 6-oxidase 2.3 46.9
Unique 24h Protein Signatures
Accession Description 24h Mild
24h Severe MW(kDa) P12109 Collagen alpha-1(VI) chain 6.3 108.5 P24821 Tenascin 6.1 240.7 Q4ZHG4 Fibronectin type III domain-
containing protein 1 5.7 205.4
Q15121 Astrocytic phosphoprotein PEA-15
5.6 15.0 P30101 Protein disulfide-isomerase A3 4.5 56.7 Q9H4D0 Calsyntenin-2 4.5 106.9 P05997 Collagen alpha-2(V) chain 4.4 144.8 Q8NBS9 Thioredoxin domain-containing
protein 5 4.4 47.6
P39687 Acidic leucine-rich nuclear phosphoprotein 32 family
member A
4.3 28.6 P01008 Antithrombin-III 4.3 52.6 Q12805 EGF-containing fibulin-like
extracellular matrix protein 1 4.3 54.6
P07237 Protein disulfide-isomerase 4.2 57.1 Q92626 Peroxidasin homolog 4.2 165.2 P49327 Fatty acid synthase 4.0 273.3 P28838 Cytosol aminopeptidase 3.8 56.1 P35555 Fibrillin-1 3.8 312.0 P01033 Metalloproteinase inhibitor 1 3.8 23.2 Q969H8 UPF0556 protein C19orf10 3.8 18.8 P09972 Fructose-bisphosphate
aldolase C 3.8 39.4
Q02818 Nucleobindin-1 3.8 53.8 P08572 Collagen alpha-2(IV) chain 3.5 167.4 P18065 Insulin-like growth factor-
binding protein 2 3.4 34.8
P16035 Metalloproteinase inhibitor 2 3.4 24.4 P05204 Non-histone chromosomal
protein HMG-17 3.3 9.4
P07996 Thrombospondin-1 3.3 129.3 P98160 Basement membrane-specific
heparan sulfate proteoglycan core protein
3.3 468.5 O94985 Calsyntenin-1 3.3 109.7 Q9UI42 Carboxypeptidase A4 3.3 47.3 Q15063 Periostin 3.3 93.3 Q15582 Transforming growth factor-
beta-induced protein ig-h3 3.3 74.6
Q9UBP4 Dickkopf-related protein 3 3.2 38.4 P05121 Plasminogen activator inhibitor
1 3.2 45.0
P19827 Inter-alpha-trypsin inhibitor heavy chain H1
3.1 101.3 P01709 Ig lambda chain V-II region
MGC 3.0 11.6
P21810 Biglycan 3.0 41.6 Q14767 Latent-transforming growth
factor beta-binding protein 2 2.9 194.9
P12107 Collagen alpha-1(XI) chain 2.8 181.0

273
P23284 Peptidyl-prolyl cis-trans isomerase B
2.8 23.7 O14818 Proteasome subunit alpha
type-7 2.8 27.9
P24593 Insulin-like growth factor-binding protein 5
2.7 30.6 P02461 Collagen alpha-1(III) chain 2.5 138.5 Q08380 Galectin-3-binding protein 2.5 65.3 Q16270 Insulin-like growth factor-
binding protein 7 2.4 29.1
P62906 60S ribosomal protein L10a 2.4 24.8 Q14766 Latent-transforming growth
factor beta-binding protein 1 2.3 186.7
Q96HC4 PDZ and LIM domain protein 5 2.0 63.9
Unique 48h Protein Signatures Accession Description 48hr
Mild 48h Severe MW(kDa)
Q14697 Neutral alpha-glucosidase AB 3.8 106.8 O00410 Importin-5 7.9 123.5 Q01105 Protein SET 5.1 33.5 P26639 Threonine--tRNA ligase,
cytoplasmic 3.3 83.4
Table 5.3: Potential time and injury severity specific signatures
Unique released protein signatures identified from workflows presented in Figure 5.6 and
5.7. Results of comparative analysis were manually filtered to include for not only injury
related release proteins observed only under specified time and trauma levels but also
proteins that were measured in only low abundances (~2-fold less) at other time-points.
For 24 hour unique protein signatures, the presence of high 48 hour concentrations in CM
was ignored given increase in associated cell death resulting in high overall released
protein abundances.

274
Top Neurotraumatic Injury Biomarker Candidates
Accession Description 5hr M
5h S
24h M
24h S
48h M
48h S
MW (kDa)
P09493 Tropomyosin alpha-1 chain 2.5 3.1 2.1 6.8 5.3 7.6 32.7 P62328/ P63313
Thymosin beta-4 / Thymosin beta-10 4.4 5.0 3.5 5.4 8.4 11.9 5.0
P62937 Peptidyl-prolyl cis-trans isomerase A 3.5 3.8 2.0 2.5 5.1 7.1 18.0
P00441 Superoxide dismutase [Cu-Zn] 2.6 3.0 3.8 4.8 4.9 6.3 15.9
P09936 Ubiquitin carboxyl-terminal hydrolase
isozyme L1 3.7 3.9 2.6 3.8 4.8 6.7 24.8
P63104 14-3-3 protein zeta/delta 2.8 2.7 2.2 3.5 4.4 6.1 27.7
P09972 Fructose-bisphosphate aldolase C 2.4 2.4 1.9 3.8 3.6 4.9 39.4
Q01995 Transgelin 3.5 3.9 2.8 3.4 6.3 9.1 22.6
Q9NRX4 14 kDa phosphohistidine
phosphatase 2.4 2.3 3.8 3.1 3.6 5.1 13.8
P62158 Calmodulin 2.2 3.5 2.4 4.8 5.1 8.2 16.8
P07951 Tropomyosin beta chain 2.1 2.6 2.3 3.6 5.1 7.1 32.8
Q15121 Astrocytic phosphoprotein PEA-15 2.8 3.6 1.8 5.6 5.8 8.5 15.0
P15311 Ezrin 2.6 3.7 2.9 3.1 4.8 8.3 69.4
Table 5.4: Top protein biomarker candidates for neurotraumatic injury
List of top neurotraumatic injury markers displaying proteomic fold changes relative to
control in conditioned medium (CM) at 5, 24, and 48 hours (h) after mild (M) or severe (S)
stretch injury. This list was manually curated based on whole cell lysate (WCL) and CM
protein dynamics in a stretch injury astrocyte culture system and filtering strategy against
human traumatic brain injury (TBI) cerebrospinal fluid (CSF) proteomes and blood
proteomes (Figure 5.8). Proteins highlighted in red and orange represent proteins
observed in TBI CSF and both TBI and healthy CSF respectively. Italicized entries
represent proteins observed in the blood proteome (18, 19, 47). Bolded proteins represent
proteins with corresponding WCL and CM protein abundance changes in response to
stretch injury in vitro. Because many promising TBI biomarkers are also present normally
in blood (ubiquitin carboxyl-terminal hydrolase isozyme L1, fructose-bisphosphate

275
aldolase C), overlap with blood proteome lists did not exclude inclusion in our candidate
list.
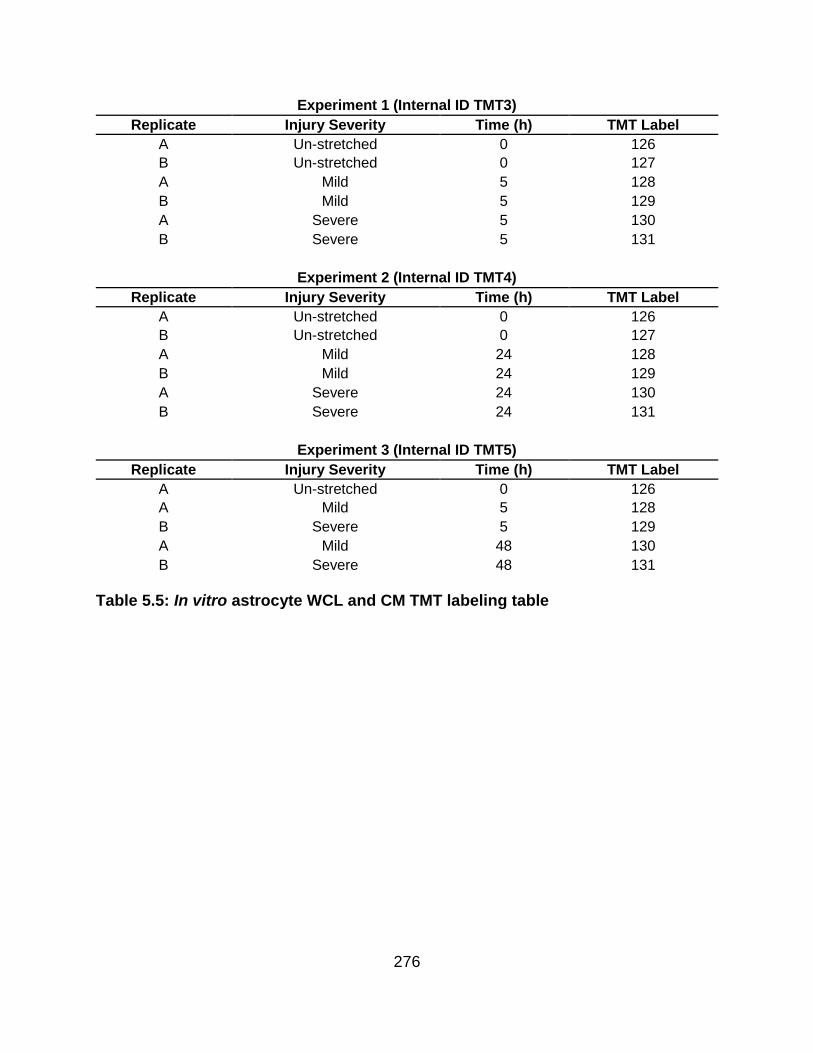
276
Experiment 1 (Internal ID TMT3)
Replicate Injury Severity Time (h) TMT Label
A Un-stretched 0 126
B Un-stretched 0 127
A Mild 5 128
B Mild 5 129
A Severe 5 130
B Severe 5 131
Experiment 2 (Internal ID TMT4)
Replicate Injury Severity Time (h) TMT Label
A Un-stretched 0 126
B Un-stretched 0 127
A Mild 24 128
B Mild 24 129
A Severe 24 130
B Severe 24 131
Experiment 3 (Internal ID TMT5)
Replicate Injury Severity Time (h) TMT Label
A Un-stretched 0 126
A Mild 5 128
B Severe 5 129
A Mild 48 130
B Severe 48 131
Table 5.5: In vitro astrocyte WCL and CM TMT labeling table

277
Accession Description #
Peptides PSMs 5h M 5h S
MW [kDa]
P07437 Tubulin beta chain 21 285 6.5 9.9 49.6
Q71U36 Tubulin alpha-1A chain 22 231 6.0 7.8 50.1
O60664 Perilipin-3 2 2 4.9 6.5 47.0
P40261 Nicotinamide N-
methyltransferase 8 41 4.2 6.1 29.6
Q9NTK5 Obg-like ATPase 1 3 6 3.5 5.8 44.7
P06703 Protein S100-A6 3 142 4.5 5.5 10.2
O00410 Importin-5 8 14 4.1 5.4 123.5
P04406 Glyceraldehyde-3-phosphate
dehydrogenase 20 1264 4.2 5.4 36.0
P30044 Peroxiredoxin-5, mitochondrial 4 10 3.7 5.1 22.1
P62328 Thymosin beta-4 4 14 4.4 5.0 5.0
P62857 40S ribosomal protein S28 2 2 3.9 5.0 7.8
P61970 Nuclear transport factor 2 4 19 3.7 5.0 14.5
P78417 Glutathione S-transferase
omega-1 5 9 3.6 5.0 27.5
P04792 Heat shock protein beta-1 14 46 3.1 4.9 22.8
P58546 Myotrophin 3 6 3.5 4.9 12.9
O75874 Isocitrate dehydrogenase
[NADP] cytoplasmic 10 35 3.4 4.8 46.6
P31946 14-3-3 protein beta/alpha 17 288 3.6 4.8 28.1
P54687 Branched-chain-amino-acid aminotransferase, cytosolic
3 3 3.4 4.8 42.9
Q9BWD1 Acetyl-CoA acetyltransferase,
cytosolic 2 15 4.8 41.3
Q9HC38 Glyoxalase domain-containing
protein 4 2 3 3.4 4.8 34.8
P62701 40S ribosomal protein S4, X
isoform 3 6 3.3 4.6 29.6
P68036 Ubiquitin-conjugating enzyme E2
L3 6 10 3.2 4.6 17.9
P20962 Parathymosin 2 5 2.7 4.6 11.5
Q04917 14-3-3 protein eta 9 180 3.2 4.6 28.2
Q96C90 Protein phosphatase 1 regulatory
subunit 14B 2 2 4.5 15.9
Q9UGI8 Testin 3 4 3.5 4.5 48.0
P55786 Puromycin-sensitive
aminopeptidase 16 28 3.1 4.4 103.2
P30085 UMP-CMP kinase 6 31 3.4 4.4 22.2
P12277 Creatine kinase B-type 4 15 2.9 4.4 42.6
P30041 Peroxiredoxin-6 6 31 2.8 4.3 25.0
P30153
Serine/threonine-protein phosphatase 2A 65 kDa
regulatory subunit A alpha isoform
8 19 3.1 4.3 65.3
P08729 Keratin, type II cytoskeletal 7 14 48 3.0 4.2 51.4

278
Q14847 LIM and SH3 domain protein 1 9 16 2.9 4.1 29.7
Q15819 Ubiquitin-conjugating enzyme E2
variant 2 2 8 3.2 4.1 16.4
P05783 Keratin, type I cytoskeletal 18 9 26 2.9 4.1 48.0
P47756 F-actin-capping protein subunit
beta 6 20 3.2 4.1 31.3
Q13642 Four and a half LIM domains
protein 1 11 45 3.1 4.1 36.2
P17655 Calpain-2 catalytic subunit 6 13 3.3 4.0 79.9
P27348 14-3-3 protein theta 17 216 3.2 4.0 27.7
P68363 Tubulin alpha-1B chain 22 234 3.2 4.0 50.1
P46821 Microtubule-associated protein
1B 12 19 2.9 3.9 270.5
Q15843 NEDD8 2 2 2.9 3.9 9.1
P39019 40S ribosomal protein S19 4 6 2.8 3.9 16.1
P02511 Alpha-crystallin B chain 5 29 2.5 3.9 20.1
Q01995 Transgelin 21 1730 3.5 3.9 22.6
P09936 Ubiquitin carboxyl-terminal
hydrolase isozyme L1 15 437 3.7 3.9 24.8
Q15746 Myosin light chain kinase,
smooth muscle 2 3 2.9 3.9 210.6
Q53FA7 Quinone oxidoreductase PIG3 2 2 2.8 3.9 35.5
P20618 Proteasome subunit beta type-1 4 10 2.9 3.8 26.5
P18085 ADP-ribosylation factor 4 3 8 2.7 3.8 20.5
P62937 Peptidyl-prolyl cis-trans
isomerase A 19 333 3.5 3.8 18.0
P61204 ADP-ribosylation factor 3 4 10 3.0 3.8 20.6
P14550 Alcohol dehydrogenase
[NADP(+)] 9 27 3.0 3.8 36.5
Q7KZF4 Staphylococcal nuclease
domain-containing protein 1 6 15 2.8 3.8 101.9
Q14019 Coactosin-like protein 7 20 3.0 3.8 15.9
Q9Y570 Protein phosphatase
methylesterase 1 2 6 2.9 3.7 42.3
O95394 Phosphoacetylglucosamine
mutase 5 14 2.9 3.7 59.8
P14324 Farnesyl pyrophosphate
synthase 3 3 3.0 3.7 48.2
Q9H4A4 Aminopeptidase B 4 9 2.9 3.7 72.5
P52209 6-phosphogluconate
dehydrogenase, decarboxylating 15 46 2.8 3.7 53.1
P13693 Translationally-controlled tumor
protein 6 54 3.3 3.7 19.6
P15311 Ezrin 22 134 2.6 3.7 69.4
Q15121 Astrocytic phosphoprotein PEA-
15 5 102 2.8 3.6 15.0
P34932 Heat shock 70 kDa protein 4 9 16 2.9 3.6 94.3
P23528 Cofilin-1 15 439 3.0 3.6 18.5

279
P22314 Ubiquitin-like modifier-activating
enzyme 1 15 29 3.7 3.6 117.8
P61160 Actin-related protein 2 8 37 2.6 3.6 44.7
Q15404 Ras suppressor protein 1 7 17 2.9 3.6 31.5
P28066 Proteasome subunit alpha type-5 2 2 2.9 3.5 26.4
P61960 Ubiquitin-fold modifier 1 2 2 2.8 3.5 9.1
Q15942 Zyxin 6 10 2.7 3.5 61.2
Q12765 Secernin-1 4 7 2.7 3.5 46.4
P62979 Ubiquitin-40S ribosomal protein
S27a 11 140 2.6 3.5 18.0
P22392 Nucleoside diphosphate kinase B 8 90 3.0 3.5 17.3
P60981 Destrin 10 207 2.9 3.5 18.5
P60900 Proteasome subunit alpha type-6 3 3 2.6 3.5 27.4
P62158 Calmodulin 3 10 2.2 3.5 16.8
P61978 Heterogeneous nuclear
ribonucleoprotein K 2 2 2.4 3.5 50.9
Q01469 Fatty acid-binding protein,
epidermal 3 8 2.2 3.5 15.2
P52565 Rho GDP-dissociation inhibitor 1 3 10 3.3 3.4 23.2
Q14974 Importin subunit beta-1 12 23 2.6 3.4 97.1
Q99584 Protein S100-A13 3 5 2.4 3.4 11.5
P63208 S-phase kinase-associated
protein 1 3 3 2.7 3.4 18.6
P10599 Thioredoxin 7 28 2.7 3.4 11.7
Q96FW1 Ubiquitin thioesterase OTUB1 3 5 2.7 3.4 31.3
O95782 AP-2 complex subunit alpha-1 2 2 3.4 107.5
Q06830 Peroxiredoxin-1 10 38 2.7 3.4 22.1
P46940 Ras GTPase-activating-like
protein IQGAP1 21 54 2.7 3.4 189.1
P12955 Xaa-Pro dipeptidase 2 2 2.5 3.4 54.5
Q9NVA2 Septin-11 4 8 2.5 3.4 49.4
P53396 ATP-citrate synthase 10 20 2.8 3.4 120.8
Q8WUM4 Programmed cell death 6-
interacting protein 3 3 2.2 3.3 96.0
P11766 Alcohol dehydrogenase class-3 3 3 2.7 3.3 39.7
P36871 Phosphoglucomutase-1 11 34 2.7 3.3 61.4
P37837 Transaldolase 5 16 2.4 3.3 37.5
O75368 SH3 domain-binding glutamic
acid-rich-like protein 5 13 2.8 3.3 12.8
Q07955 Serine/arginine-rich splicing
factor 1 2 32 2.2 3.3 27.7
P06733 Alpha-enolase 29 1290 3.0 3.3 47.1
Q99497 Protein DJ-1 9 75 2.7 3.3 19.9
P68371 Tubulin beta-4B chain 19 255 2.5 3.3 49.8
Q16851 UTP--glucose-1-phosphate
uridylyltransferase 5 11 2.5 3.3 56.9

280
P14174 Macrophage migration inhibitory
factor 4 49 2.9 3.3 12.5
P29966 Myristoylated alanine-rich C-
kinase substrate 4 4 2.6 3.2 31.5
P32119 Peroxiredoxin-2 5 15 2.3 3.2 21.9
P08107 Heat shock 70 kDa protein 1A/1B 9 20 2.4 3.2 70.0
Q01813 ATP-dependent 6-
phosphofructokinase, platelet type
3 4 2.4 3.2 85.5
Q09666 Neuroblast differentiation-associated protein AHNAK
9 31 2.4 3.2 628.7
P00558 Phosphoglycerate kinase 1 28 267 2.7 3.2 44.6
P21266 Glutathione S-transferase Mu 3 9 31 2.9 3.2 26.5
P62241 40S ribosomal protein S8 3 8 2.5 3.2 24.2
Q01518 Adenylyl cyclase-associated
protein 1 17 74 2.5 3.2 51.9
Q9ULV4 Coronin-1C 8 26 2.5 3.1 53.2
P67936 Tropomyosin alpha-4 chain 16 130 2.7 3.1 28.5
P37802 Transgelin-2 15 255 2.7 3.1 22.4
P14618 Pyruvate kinase PKM 37 1061 2.8 3.1 57.9
P09382 Galectin-1 9 217 3.1 3.1 14.7
P25786 Proteasome subunit alpha type-1 5 8 2.2 3.1 29.5
P09493 Tropomyosin alpha-1 chain 15 126 2.5 3.1 32.7
P21291 Cysteine and glycine-rich protein
1 11 94 2.6 3.1 20.6
P09211 Glutathione S-transferase P 11 135 2.9 3.1 23.3
Q14204 Cytoplasmic dynein 1 heavy
chain 1 9 12 2.8 3.1 532.1
Q9H299 SH3 domain-binding glutamic
acid-rich-like protein 3 5 29 3.3 3.0 10.4
Q16527 Cysteine and glycine-rich protein
2 6 19 2.5 3.0 20.9
P13639 Elongation factor 2 21 92 2.6 3.0 95.3
P09960 Leukotriene A-4 hydrolase 14 35 2.5 3.0 69.2
Q9Y696 Chloride intracellular channel
protein 4 16 251 3.6 3.0 28.8
Q16555 Dihydropyrimidinase-related
protein 2 8 13 2.4 3.0 62.3
Q96CX2 BTB/POZ domain-containing
protein KCTD12 3 5 2.3 3.0 35.7
P26641 Elongation factor 1-gamma 8 17 2.6 3.0 50.1
Q92820 Gamma-glutamyl hydrolase 4 11 2.6 3.0 35.9
P00441 Superoxide dismutase [Cu-Zn] 8 65 2.6 3.0 15.9
P06744 Glucose-6-phosphate isomerase 17 127 2.6 3.0 63.1
Q14192 Four and a half LIM domains
protein 2 7 50 3.8 3.0 32.2
P07195 L-lactate dehydrogenase B chain 16 157 2.5 3.0 36.6

281
Q04446 1,4-alpha-glucan-branching
enzyme 5 6 2.5 2.9 80.4
Q9Y617 Phosphoserine aminotransferase 14 138 2.6 2.9 40.4
O75083 WD repeat-containing protein 1 27 126 2.6 2.9 66.2
P07737 Profilin-1 10 284 2.7 2.9 15.0
P80723 Brain acid soluble protein 1 5 7 2.4 2.9 22.7
P26038 Moesin 31 292 2.6 2.9 67.8
Q05682 Caldesmon 16 95 2.8 2.9 93.2
P68032 Actin, alpha cardiac muscle 1 20 1041 2.7 2.9 42.0
P11216 Glycogen phosphorylase, brain
form 4 5 2.4 2.8 96.6
O00299 Chloride intracellular channel
protein 1 10 34 2.5 2.8 26.9
P26022 Pentraxin-related protein PTX3 9 34 2.2 2.8 41.9
P00338 L-lactate dehydrogenase A chain 29 452 2.7 2.8 36.7
P62258 14-3-3 protein epsilon 15 226 2.2 2.8 29.2
P12814 Alpha-actinin-1 57 1326 2.5 2.8 103.0
P07602 Prosaposin 8 71 2.4 2.8 58.1
P00966 Argininosuccinate synthase 13 64 2.6 2.8 46.5
P50395 Rab GDP dissociation inhibitor
beta 21 235 2.4 2.8 50.6
P26639 Threonine--tRNA ligase,
cytoplasmic 6 8 2.2 2.8 83.4
P62826 GTP-binding nuclear protein Ran 7 25 2.3 2.8 24.4
Q16658 Fascin 16 99 3.5 2.8 54.5
P63104 14-3-3 protein zeta/delta 20 358 2.8 2.7 27.7
P60842 Eukaryotic initiation factor 4A-I 11 30 3.1 2.7 46.1
P18669 Phosphoglycerate mutase 1 16 273 2.5 2.7 28.8
P42771 Cyclin-dependent kinase inhibitor
2A, isoforms 1/2/3 2 2 2.1 2.7 16.5
P13645 Keratin, type I cytoskeletal 10 9 12 2.1 2.7 58.8
P21980 Protein-glutamine gamma-
glutamyltransferase 2 6 14 3.0 2.7 77.3
P68104 Elongation factor 1-alpha 1 15 144 2.4 2.7 50.1
P48163 NADP-dependent malic enzyme 4 5 2.7 64.1
P11142 Heat shock cognate 71 kDa
protein 30 304 2.6 2.7 70.9
Q9UBG0 C-type mannose receptor 2 7 11 2.4 2.7 166.6
P07858 Cathepsin B 3 5 2.2 2.7 37.8
P18206 Vinculin 62 559 2.5 2.7 123.7
P04075 Fructose-bisphosphate aldolase
A 21 412 2.4 2.7 39.4
O15144 Actin-related protein 2/3 complex
subunit 2 11 31 2.1 2.7 34.3
P60709 Actin, cytoplasmic 1 22 1650 2.4 2.6 41.7
Q9Y3B8 Oligoribonuclease, mitochondrial 6 11 2.2 2.6 26.8

282
P13797 Plastin-3 20 95 2.3 2.6 70.8
P09651 Heterogeneous nuclear
ribonucleoprotein A1 6 43 2.9 2.6 38.7
P51911 Calponin-1 7 12 2.2 2.6 33.1
P31949 Protein S100-A11 5 68 2.4 2.6 11.7
P60174 Triosephosphate isomerase 16 525 2.4 2.6 30.8
P07951 Tropomyosin beta chain 16 133 2.1 2.6 32.8
P00568 Adenylate kinase isoenzyme 1 6 17 2.6 2.6 21.6
Q14195 Dihydropyrimidinase-related
protein 3 17 64 2.3 2.6 61.9
Q9NZU5 LIM and cysteine-rich domains
protein 1 9 16 2.0 2.6 40.8
P30086 Phosphatidylethanolamine-
binding protein 1 11 66 2.6 2.5 21.0
Q96AY3 Peptidyl-prolyl cis-trans
isomerase FKBP10 6 16 2.0 2.5 64.2
P61088 Ubiquitin-conjugating enzyme E2
N 5 12 2.1 2.5 17.1
Q92499 ATP-dependent RNA helicase
DDX1 2 2 3.7 2.5 82.4
P61158 Actin-related protein 3 9 31 2.3 2.5 47.3
P21333 Filamin-A 107 1119 2.5 2.5 280.6
P49720 Proteasome subunit beta type-3 3 3 2.2 2.5 22.9
Q14738 Serine/threonine-protein phosphatase 2A 56 kDa
regulatory subunit delta isoform 4 7 2.9 2.5 69.9
P62942 Peptidyl-prolyl cis-trans
isomerase FKBP1A 4 16 2.3 2.5 11.9
P61981 14-3-3 protein gamma 18 297 2.3 2.5 28.3
O43707 Alpha-actinin-4 55 782 2.2 2.5 104.8
P63241 Eukaryotic translation initiation
factor 5A-1 3 229 2.3 2.5 16.8
Q14103 Heterogeneous nuclear
ribonucleoprotein D0 6 10 2.0 2.4 38.4
P40925 Malate dehydrogenase,
cytoplasmic 12 61 2.5 2.4 36.4
Q8NBS9 Thioredoxin domain-containing
protein 5 7 8 2.0 2.4 47.6
P19022 Cadherin-2 6 10 1.8 2.4 99.7
P09972 Fructose-bisphosphate aldolase
C 8 90 2.4 2.4 39.4
O14498 Immunoglobulin superfamily
containing leucine-rich repeat protein
6 20 2.1 2.4 46.0
Q9Y490 Talin-1 37 90 2.3 2.3 269.6
P04080 Cystatin-B 4 73 2.9 2.3 11.1
Q9BRA2 Thioredoxin domain-containing
protein 17 5 13 2.4 2.3 13.9
O43852 Calumenin 13 38 2.0 2.3 37.1
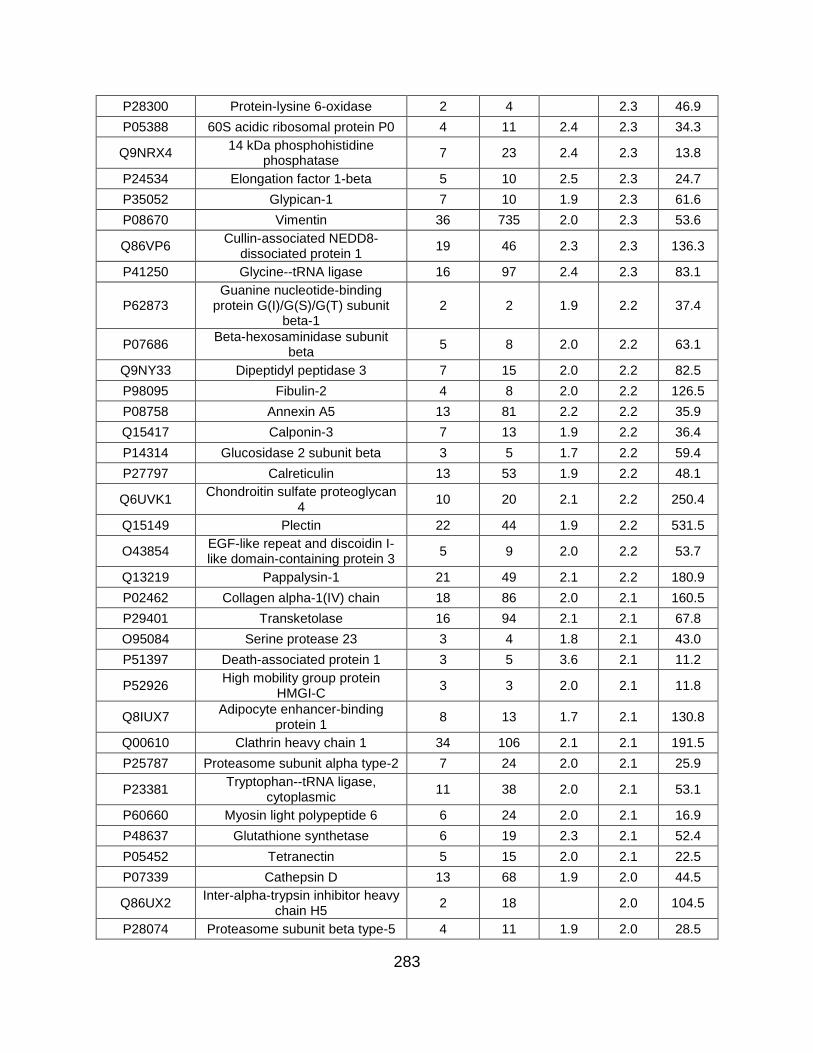
283
P28300 Protein-lysine 6-oxidase 2 4 2.3 46.9
P05388 60S acidic ribosomal protein P0 4 11 2.4 2.3 34.3
Q9NRX4 14 kDa phosphohistidine
phosphatase 7 23 2.4 2.3 13.8
P24534 Elongation factor 1-beta 5 10 2.5 2.3 24.7
P35052 Glypican-1 7 10 1.9 2.3 61.6
P08670 Vimentin 36 735 2.0 2.3 53.6
Q86VP6 Cullin-associated NEDD8-
dissociated protein 1 19 46 2.3 2.3 136.3
P41250 Glycine--tRNA ligase 16 97 2.4 2.3 83.1
P62873 Guanine nucleotide-binding
protein G(I)/G(S)/G(T) subunit beta-1
2 2 1.9 2.2 37.4
P07686 Beta-hexosaminidase subunit
beta 5 8 2.0 2.2 63.1
Q9NY33 Dipeptidyl peptidase 3 7 15 2.0 2.2 82.5
P98095 Fibulin-2 4 8 2.0 2.2 126.5
P08758 Annexin A5 13 81 2.2 2.2 35.9
Q15417 Calponin-3 7 13 1.9 2.2 36.4
P14314 Glucosidase 2 subunit beta 3 5 1.7 2.2 59.4
P27797 Calreticulin 13 53 1.9 2.2 48.1
Q6UVK1 Chondroitin sulfate proteoglycan
4 10 20 2.1 2.2 250.4
Q15149 Plectin 22 44 1.9 2.2 531.5
O43854 EGF-like repeat and discoidin I-like domain-containing protein 3
5 9 2.0 2.2 53.7
Q13219 Pappalysin-1 21 49 2.1 2.2 180.9
P02462 Collagen alpha-1(IV) chain 18 86 2.0 2.1 160.5
P29401 Transketolase 16 94 2.1 2.1 67.8
O95084 Serine protease 23 3 4 1.8 2.1 43.0
P51397 Death-associated protein 1 3 5 3.6 2.1 11.2
P52926 High mobility group protein
HMGI-C 3 3 2.0 2.1 11.8
Q8IUX7 Adipocyte enhancer-binding
protein 1 8 13 1.7 2.1 130.8
Q00610 Clathrin heavy chain 1 34 106 2.1 2.1 191.5
P25787 Proteasome subunit alpha type-2 7 24 2.0 2.1 25.9
P23381 Tryptophan--tRNA ligase,
cytoplasmic 11 38 2.0 2.1 53.1
P60660 Myosin light polypeptide 6 6 24 2.0 2.1 16.9
P48637 Glutathione synthetase 6 19 2.3 2.1 52.4
P05452 Tetranectin 5 15 2.0 2.1 22.5
P07339 Cathepsin D 13 68 1.9 2.0 44.5
Q86UX2 Inter-alpha-trypsin inhibitor heavy
chain H5 2 18 2.0 104.5
P28074 Proteasome subunit beta type-5 4 11 1.9 2.0 28.5
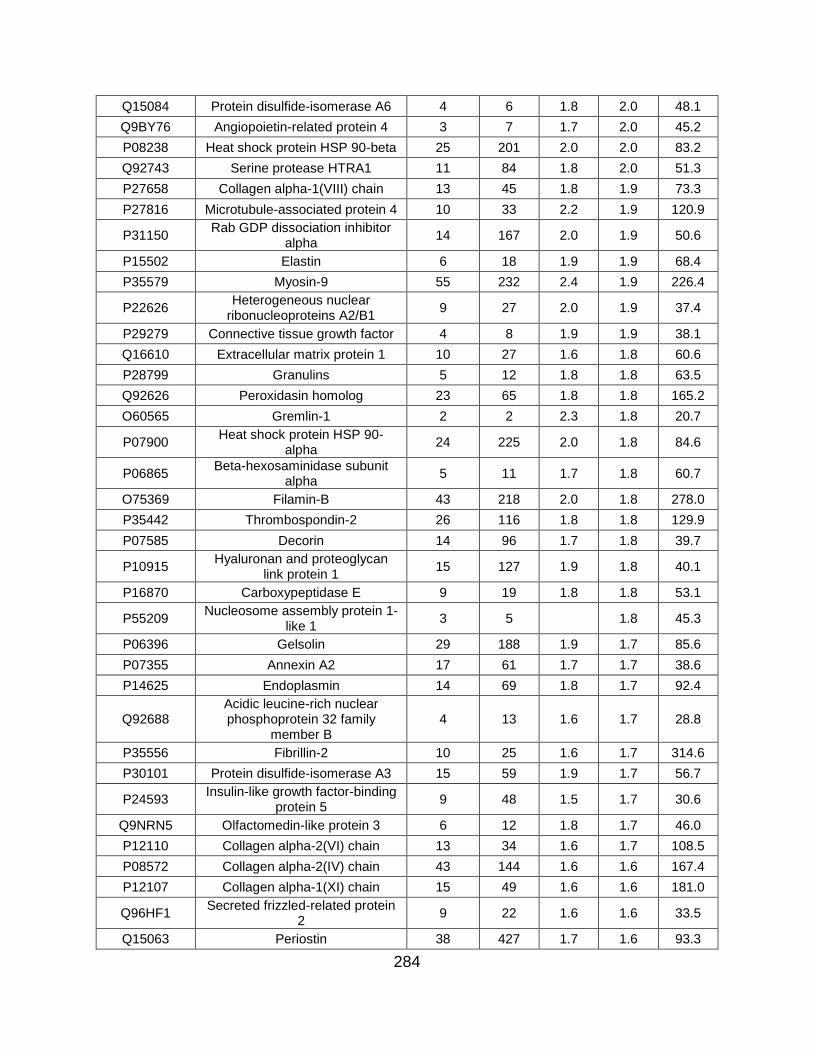
284
Q15084 Protein disulfide-isomerase A6 4 6 1.8 2.0 48.1
Q9BY76 Angiopoietin-related protein 4 3 7 1.7 2.0 45.2
P08238 Heat shock protein HSP 90-beta 25 201 2.0 2.0 83.2
Q92743 Serine protease HTRA1 11 84 1.8 2.0 51.3
P27658 Collagen alpha-1(VIII) chain 13 45 1.8 1.9 73.3
P27816 Microtubule-associated protein 4 10 33 2.2 1.9 120.9
P31150 Rab GDP dissociation inhibitor
alpha 14 167 2.0 1.9 50.6
P15502 Elastin 6 18 1.9 1.9 68.4
P35579 Myosin-9 55 232 2.4 1.9 226.4
P22626 Heterogeneous nuclear
ribonucleoproteins A2/B1 9 27 2.0 1.9 37.4
P29279 Connective tissue growth factor 4 8 1.9 1.9 38.1
Q16610 Extracellular matrix protein 1 10 27 1.6 1.8 60.6
P28799 Granulins 5 12 1.8 1.8 63.5
Q92626 Peroxidasin homolog 23 65 1.8 1.8 165.2
O60565 Gremlin-1 2 2 2.3 1.8 20.7
P07900 Heat shock protein HSP 90-
alpha 24 225 2.0 1.8 84.6
P06865 Beta-hexosaminidase subunit
alpha 5 11 1.7 1.8 60.7
O75369 Filamin-B 43 218 2.0 1.8 278.0
P35442 Thrombospondin-2 26 116 1.8 1.8 129.9
P07585 Decorin 14 96 1.7 1.8 39.7
P10915 Hyaluronan and proteoglycan
link protein 1 15 127 1.9 1.8 40.1
P16870 Carboxypeptidase E 9 19 1.8 1.8 53.1
P55209 Nucleosome assembly protein 1-
like 1 3 5 1.8 45.3
P06396 Gelsolin 29 188 1.9 1.7 85.6
P07355 Annexin A2 17 61 1.7 1.7 38.6
P14625 Endoplasmin 14 69 1.8 1.7 92.4
Q92688 Acidic leucine-rich nuclear phosphoprotein 32 family
member B 4 13 1.6 1.7 28.8
P35556 Fibrillin-2 10 25 1.6 1.7 314.6
P30101 Protein disulfide-isomerase A3 15 59 1.9 1.7 56.7
P24593 Insulin-like growth factor-binding
protein 5 9 48 1.5 1.7 30.6
Q9NRN5 Olfactomedin-like protein 3 6 12 1.8 1.7 46.0
P12110 Collagen alpha-2(VI) chain 13 34 1.6 1.7 108.5
P08572 Collagen alpha-2(IV) chain 43 144 1.6 1.6 167.4
P12107 Collagen alpha-1(XI) chain 15 49 1.6 1.6 181.0
Q96HF1 Secreted frizzled-related protein
2 9 22 1.6 1.6 33.5
Q15063 Periostin 38 427 1.7 1.6 93.3

285
P36578 60S ribosomal protein L4 4 8 2.0 1.6 47.7
P12111 Collagen alpha-3(VI) chain 45 124 1.7 1.6 343.5
P08603 Complement factor H 11 20 1.6 1.6 139.0
O76061 Stanniocalcin-2 6 78 1.5 1.5 33.2
Q76M96 Coiled-coil domain-containing
protein 80 16 69 1.7 1.5 108.1
P02545 Prelamin-A/C 8 42 1.8 1.5 74.1
P61769 Beta-2-microglobulin 4 41 1.6 1.5 13.7
O00391 Sulfhydryl oxidase 1 20 123 1.7 1.5 82.5
P08476 Inhibin beta A chain 16 35 1.6 1.5 47.4
Q99715 Collagen alpha-1(XII) chain 59 175 1.5 1.5 332.9
Q9UBP4 Dickkopf-related protein 3 8 34 1.5 1.4 38.4
P01033 Metalloproteinase inhibitor 1 8 236 1.6 1.4 23.2
Q9UI42 Carboxypeptidase A4 10 29 1.4 1.4 47.3
Q9UBX5 Fibulin-5 5 12 1.5 1.4 50.1
P07237 Protein disulfide-isomerase 16 95 1.6 1.4 57.1
P07942 Laminin subunit beta-1 17 42 1.5 1.4 197.9
Q16777 Histone H2A type 2-C 3 25 1.4 1.4 14.0
P10909 Clusterin 10 91 1.3 52.5
P18065 Insulin-like growth factor-binding
protein 2 15 97 1.6 1.3 34.8
P29692 Elongation factor 1-delta 4 9 2.1 1.3 31.1
P13611 Versican core protein 16 87 1.5 1.3 372.6
Q15582 Transforming growth factor-beta-
induced protein ig-h3 28 676 1.5 1.3 74.6
P12109 Collagen alpha-1(VI) chain 34 285 1.5 1.3 108.5
Q9NQC3 Reticulon-4 2 2 1.5 1.2 129.9
P62633 Cellular nucleic acid-binding
protein 3 10 1.9 1.2 19.4
O15540 Fatty acid-binding protein, brain 3 34 1.5 1.2 14.9
P00749 Urokinase-type plasminogen
activator 4 20 1.3 0.8 48.5
P01011 Alpha-1-antichymotrypsin 2 3 0.8 47.6
P02790 Hemopexin 2 3 1.2 0.8 51.6
Q6NXT2 Histone H3.3C 2 5 0.7 0.7 15.2
P01024 Complement C3 5 40 0.7 187.0
P01709 Ig lambda chain V-II region MGC 2 15 0.7 11.6
P02787 Serotransferrin 3 30 0.6 77.0
P00738 Haptoglobin 6 227 0.6 45.2
Q13907 Isopentenyl-diphosphate Delta-
isomerase 1 2 4 26.3
P07814 Bifunctional glutamate/proline--
tRNA ligase 2 4 170.5
O14818 Proteasome subunit alpha type-7 4 5 27.9

286
Q06210 Glutamine--fructose-6-phosphate aminotransferase [isomerizing] 1
3 5 78.8
Q01105 Protein SET 2 2 33.5
P42574 Caspase-3 2 3 31.6
O75711 Scrapie-responsive protein 1 2 2 11.1
P62269 40S ribosomal protein S18 2 3 17.7
Q14011 Cold-inducible RNA-binding
protein 2 2 18.6
Q96FQ6 Protein S100-A16 3 7 11.8
O95678 Keratin, type II cytoskeletal 75 4 8 59.5
O95865 N(G),N(G)-dimethylarginine dimethylaminohydrolase 2
3 8 29.6
Q96KP4 Cytosolic non-specific
dipeptidase 3 4 52.8
Q9BQE3 Tubulin alpha-1C chain 19 216 49.9
P09104 Gamma-enolase 7 558 47.2
Q15181 Inorganic pyrophosphatase 4 6 32.6
O00469 Procollagen-lysine,2-
oxoglutarate 5-dioxygenase 2 6 6 84.6
P62081 40S ribosomal protein S7 3 4 22.1
Q13509 Tubulin beta-3 chain 15 180 50.4
Q01082 Spectrin beta chain, non-
erythrocytic 1 5 5 274.4
P10768 S-formylglutathione hydrolase 3 4 31.4
P04264 Keratin, type II cytoskeletal 1 14 88 66.0
O43776 Asparagine--tRNA ligase,
cytoplasmic 4 7 62.9
Q13308 Inactive tyrosine-protein kinase 7 7 12 118.3
P62273 40S ribosomal protein S29 2 2 6.7
Q05707 Collagen alpha-1(XIV) chain 2 2 193.4
P24844 Myosin regulatory light
polypeptide 9 6 20 19.8
O95965 Integrin beta-like protein 1 4 7 53.9
P59998 Actin-related protein 2/3 complex
subunit 4 3 3 19.7
P13667 Protein disulfide-isomerase A4 2 3 72.9
Q6IBS0 Twinfilin-2 2 2 39.5
P46781 40S ribosomal protein S9 2 2 22.6
P35527 Keratin, type I cytoskeletal 9 7 130 62.0
P00491 Purine nucleoside phosphorylase 2 4 32.1
P49368 T-complex protein 1 subunit
gamma 2 2 60.5
P06737 Glycogen phosphorylase, liver
form 4 4 97.1
Q16363 Laminin subunit alpha-4 3 7 202.4
Q13200 26S proteasome non-ATPase
regulatory subunit 2 4 7 100.1

287
P67809 Nuclease-sensitive element-
binding protein 1 4 8 35.9
P55060 Exportin-2 2 2 110.3
Q9P1F3 Costars family protein ABRACL 2 2 9.1
P63244 Guanine nucleotide-binding protein subunit beta-2-like 1
2 2 35.1
P01034 Cystatin-C 8 51 15.8
P28482 Mitogen-activated protein kinase
1 2 6 41.4
P46783 40S ribosomal protein S10 2 4 18.9
P36222 Chitinase-3-like protein 1 4 4 42.6
P35908 Keratin, type II cytoskeletal 2
epidermal 11 64 65.4
Q86YZ3 Hornerin 12 20 282.2
Q08629 Testican-1 4 4 49.1
P55083 Microfibril-associated
glycoprotein 4 5 105 28.6
O60814 Histone H2B type 1-K 2 3 13.9
P11021 78 kDa glucose-regulated protein 14 77 1.8 72.3
P30043 Flavin reductase (NADPH) 2 2 2.3 22.1
Q13813 Spectrin alpha chain, non-
erythrocytic 1 8 19 1.8 284.4
Q14315 Filamin-C 26 205 2.1 290.8
P17174 Aspartate aminotransferase,
cytoplasmic 6 10 2.0 46.2
P35237 Serpin B6 6 12 2.1 42.6
P04083 Annexin A1 7 51 1.9 38.7
P05387 60S acidic ribosomal protein P2 3 4 2.0 11.7
P13489 Ribonuclease inhibitor 7 12 2.0 49.9
P11047 Laminin subunit gamma-1 13 35 1.6 177.5
O94760 N(G),N(G)-dimethylarginine dimethylaminohydrolase 1
5 12 1.5 31.1
P61247 40S ribosomal protein S3a 2 3 2.5 29.9
P28070 Proteasome subunit beta type-4 4 11 1.7 29.2
Q96D15 Reticulocalbin-3 2 3 1.6 37.5
Q08431 Lactadherin 4 18 1.5 43.1
Q7Z304 MAM domain-containing protein
2 16 47 1.7 77.5
P50454 Serpin H1 17 94 1.5 46.4
P02795 Metallothionein-2 3 21 3.0 6.0
P23284 Peptidyl-prolyl cis-trans
isomerase B 8 123 1.5 23.7
P68402 Platelet-activating factor
acetylhydrolase IB subunit beta 3 23 2.7 25.6
P55072 Transitional endoplasmic
reticulum ATPase 4 4 2.5 89.3
P15018 Leukemia inhibitory factor 2 24 1.8 22.0

288
P36873 Serine/threonine-protein
phosphatase PP1-gamma catalytic subunit
2 4 1.6 37.0
P51858 Hepatoma-derived growth factor 2 4 1.9 26.8
P24043 Laminin subunit alpha-2 11 20 1.7 343.7
P20908 Collagen alpha-1(V) chain 30 127 1.5 183.4
Q13643 Four and a half LIM domains
protein 3 4 8 2.2 31.2
P07093 Glia-derived nexin 14 121 1.6 44.0
P62841 40S ribosomal protein S15 2 2 2.2 17.0
Q02818 Nucleobindin-1 13 52 1.5 53.8
P21810 Biglycan 21 674 1.4 41.6
P02751 Fibronectin 103 5607 1.5 262.5
Q9Y4K0 Lysyl oxidase homolog 2 10 46 1.4 86.7
Q14697 Neutral alpha-glucosidase AB 4 6 2.2 106.8
P24821 Tenascin 48 370 1.4 240.7
Q02809 Procollagen-lysine,2-
oxoglutarate 5-dioxygenase 1 23 122 1.4 83.5
Q14767 Latent-transforming growth factor
beta-binding protein 2 27 127 1.5 194.9
Q9P2E9 Ribosome-binding protein 1 3 6 1.5 152.4
Q9BWS9 Chitinase domain-containing
protein 1 3 13 1.4 44.9
Q9Y240 C-type lectin domain family 11
member A 2 2 1.8 35.7
P15121 Aldose reductase 4 11 2.2 35.8
Q14766 Latent-transforming growth factor
beta-binding protein 1 14 34 1.5 186.7
Q14118 Dystroglycan 4 8 1.7 97.4
P16035 Metalloproteinase inhibitor 2 11 39 1.5 24.4
P98160 Basement membrane-specific heparan sulfate proteoglycan
core protein 30 146 1.4 468.5
P02461 Collagen alpha-1(III) chain 44 179 1.5 138.5
P02765 Alpha-2-HS-glycoprotein 2 3 0.5 39.3
P35555 Fibrillin-1 76 522 1.5 312.0
P20930 Filaggrin 5 6 2.2 434.9
P01023 Alpha-2-macroglobulin 22 200 1.1 163.2
P62906 60S ribosomal protein L10a 2 4 1.6 24.8
Q4ZHG4 Fibronectin type III domain-
containing protein 1 11 22 1.5 205.4
P07996 Thrombospondin-1 46 387 1.4 129.3
O94985 Calsyntenin-1 8 26 1.3 109.7
O00468 Agrin 15 44 1.6 217.1
P41222 Prostaglandin-H2 D-isomerase 2 2 1.4 21.0
P14136 Glial fibrillary acidic protein 8 33 1.3 49.8

289
P06753 Tropomyosin alpha-3 chain 10 79 2.6 32.9
Q9UJ70 N-acetyl-D-glucosamine kinase 5 9 1.8 37.4
P16070 CD44 antigen 2 15 1.5 81.5
P46777 60S ribosomal protein L5 3 6 1.8 34.3
Q12841 Follistatin-related protein 1 22 718 1.4 35.0
P46108 Adapter molecule crk 2 2 1.7 33.8
Q9H4D0 Calsyntenin-2 10 22 1.3 106.9
P17936 Insulin-like growth factor-binding
protein 3 11 42 1.6 31.7
Q12805 EGF-containing fibulin-like
extracellular matrix protein 1 17 89 1.3 54.6
Q16270 Insulin-like growth factor-binding
protein 7 21 1187 1.3 29.1
P51884 Lumican 12 92 1.2 38.4
Q08380 Galectin-3-binding protein 21 137 1.3 65.3
P05121 Plasminogen activator inhibitor 1 24 1641 1.3 45.0
Q10471 Polypeptide N-
acetylgalactosaminyltransferase 2
9 46 1.3 64.7
P02452 Collagen alpha-1(I) chain 86 1945 1.3 138.9
P05997 Collagen alpha-2(V) chain 37 117 1.4 144.8
P61916 Epididymal secretory protein E1 5 14 1.3 16.6
P08123 Collagen alpha-2(I) chain 74 1563 1.4 129.2
P02768 Serum albumin 16 381 1.3 69.3
P08253 72 kDa type IV collagenase 25 131 1.2 73.8
P09486 SPARC 20 3614 1.3 34.6
O95967 EGF-containing fibulin-like
extracellular matrix protein 2 4 18 1.3 49.4
Table 5.6: Differentially released conditioned medium proteins at 5 hours
Astrocyte-released proteins measured in condition media from TMT experiments
comparing protein abundance between mild and severe stretched cells in conditioned
media collected 5 hours post-injury.
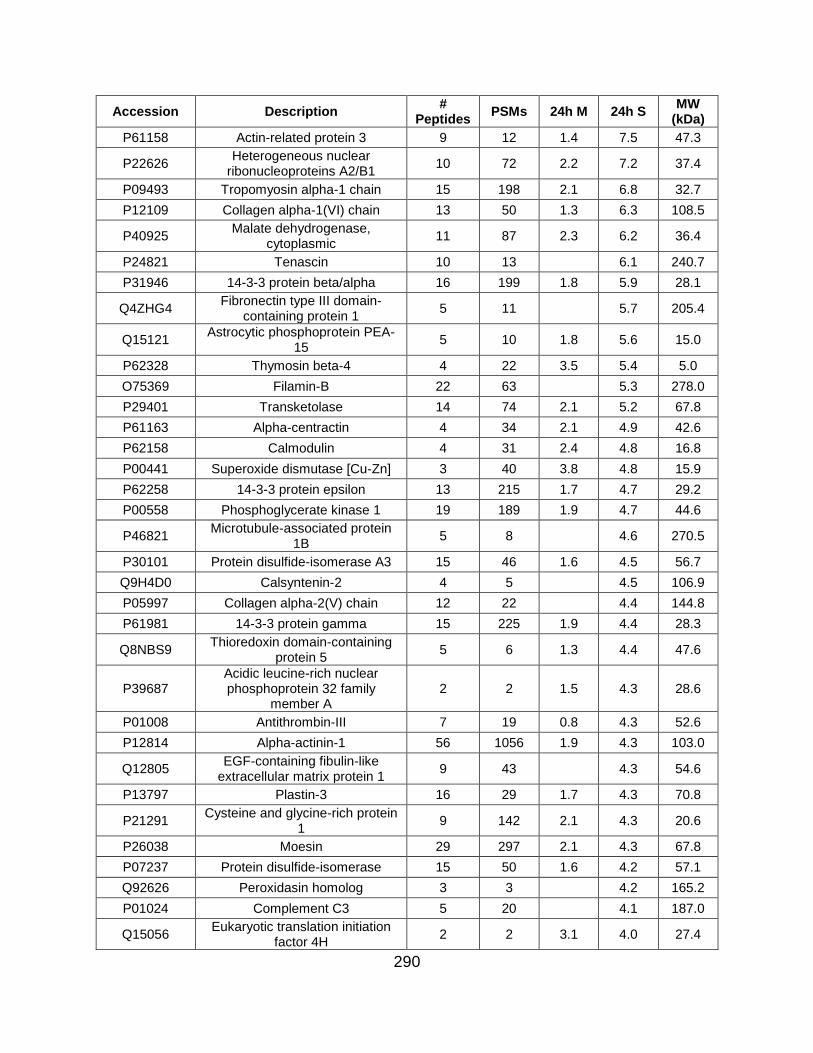
290
Accession Description #
Peptides PSMs 24h M 24h S
MW (kDa)
P61158 Actin-related protein 3 9 12 1.4 7.5 47.3
P22626 Heterogeneous nuclear
ribonucleoproteins A2/B1 10 72 2.2 7.2 37.4
P09493 Tropomyosin alpha-1 chain 15 198 2.1 6.8 32.7
P12109 Collagen alpha-1(VI) chain 13 50 1.3 6.3 108.5
P40925 Malate dehydrogenase,
cytoplasmic 11 87 2.3 6.2 36.4
P24821 Tenascin 10 13 6.1 240.7
P31946 14-3-3 protein beta/alpha 16 199 1.8 5.9 28.1
Q4ZHG4 Fibronectin type III domain-
containing protein 1 5 11 5.7 205.4
Q15121 Astrocytic phosphoprotein PEA-
15 5 10 1.8 5.6 15.0
P62328 Thymosin beta-4 4 22 3.5 5.4 5.0
O75369 Filamin-B 22 63 5.3 278.0
P29401 Transketolase 14 74 2.1 5.2 67.8
P61163 Alpha-centractin 4 34 2.1 4.9 42.6
P62158 Calmodulin 4 31 2.4 4.8 16.8
P00441 Superoxide dismutase [Cu-Zn] 3 40 3.8 4.8 15.9
P62258 14-3-3 protein epsilon 13 215 1.7 4.7 29.2
P00558 Phosphoglycerate kinase 1 19 189 1.9 4.7 44.6
P46821 Microtubule-associated protein
1B 5 8 4.6 270.5
P30101 Protein disulfide-isomerase A3 15 46 1.6 4.5 56.7
Q9H4D0 Calsyntenin-2 4 5 4.5 106.9
P05997 Collagen alpha-2(V) chain 12 22 4.4 144.8
P61981 14-3-3 protein gamma 15 225 1.9 4.4 28.3
Q8NBS9 Thioredoxin domain-containing
protein 5 5 6 1.3 4.4 47.6
P39687 Acidic leucine-rich nuclear phosphoprotein 32 family
member A 2 2 1.5 4.3 28.6
P01008 Antithrombin-III 7 19 0.8 4.3 52.6
P12814 Alpha-actinin-1 56 1056 1.9 4.3 103.0
Q12805 EGF-containing fibulin-like
extracellular matrix protein 1 9 43 4.3 54.6
P13797 Plastin-3 16 29 1.7 4.3 70.8
P21291 Cysteine and glycine-rich protein
1 9 142 2.1 4.3 20.6
P26038 Moesin 29 297 2.1 4.3 67.8
P07237 Protein disulfide-isomerase 15 50 1.6 4.2 57.1
Q92626 Peroxidasin homolog 3 3 4.2 165.2
P01024 Complement C3 5 20 4.1 187.0
Q15056 Eukaryotic translation initiation
factor 4H 2 2 3.1 4.0 27.4

291
P17174 Aspartate aminotransferase,
cytoplasmic 4 4 1.8 4.0 46.2
P37802 Transgelin-2 14 170 1.7 4.0 22.4
P49327 Fatty acid synthase 2 2 4.0 273.3
O75083 WD repeat-containing protein 1 10 42 1.8 3.9 66.2
Q9BVA1 Tubulin beta-2B chain 15 116 2.1 3.9 49.9
Q14847 LIM and SH3 domain protein 1 5 25 2.2 3.9 29.7
P09382 Galectin-1 6 119 2.0 3.9 14.7
Q96C90 Protein phosphatase 1 regulatory
subunit 14B 2 3 3.9 15.9
P51397 Death-associated protein 1 2 3 2.9 3.9 11.2
P68036 Ubiquitin-conjugating enzyme E2
L3 5 15 1.7 3.8 17.9
P28838 Cytosol aminopeptidase 2 2 3.8 56.1
P52565 Rho GDP-dissociation inhibitor 1 3 18 2.3 3.8 23.2
P35555 Fibrillin-1 23 86 1.3 3.8 312.0
P62942 Peptidyl-prolyl cis-trans
isomerase FKBP1A 3 12 2.2 3.8 11.9
P0CG48 Polyubiquitin-C 3 23 2.4 3.8 77.0
P01033 Metalloproteinase inhibitor 1 7 158 1.5 3.8 23.2
Q969H8 UPF0556 protein C19orf10 2 2 3.8 18.8
P09936 Ubiquitin carboxyl-terminal
hydrolase isozyme L1 14 241 2.6 3.8 24.8
Q9BRA2 Thioredoxin domain-containing
protein 17 2 4 3.8 13.9
P09972 Fructose-bisphosphate aldolase
C 7 81 1.9 3.8 39.4
P23396 40S ribosomal protein S3 4 5 3.8 26.7
P04083 Annexin A1 5 15 1.3 3.8 38.7
Q02818 Nucleobindin-1 4 5 3.8 53.8
P07900 Heat shock protein HSP 90-
alpha 21 146 1.8 3.7 84.6
P06396 Gelsolin 19 113 1.3 3.7 85.6
O43707 Alpha-actinin-4 43 681 1.6 3.7 104.8
Q14192 Four and a half LIM domains
protein 2 6 24 1.9 3.7 32.2
P26022 Pentraxin-related protein PTX3 3 6 3.7 41.9
P07951 Tropomyosin beta chain 17 204 2.3 3.6 32.8
P10909 Clusterin 8 85 1.2 3.6 52.5
P08238 Heat shock protein HSP 90-beta 17 109 1.6 3.5 83.2
P63104 14-3-3 protein zeta/delta 20 328 2.2 3.5 27.7
P08572 Collagen alpha-2(IV) chain 14 57 3.5 167.4
P27816 Microtubule-associated protein 4 7 12 1.7 3.5 120.9
P31150 Rab GDP dissociation inhibitor
alpha 14 51 1.5 3.5 50.6

292
Q9H299 SH3 domain-binding glutamic
acid-rich-like protein 3 5 41 3.3 3.5 10.4
P35579 Myosin-9 21 27 2.3 3.4 226.4
Q53FA7 Quinone oxidoreductase PIG3 2 2 3.4 35.5
P62826 GTP-binding nuclear protein Ran 4 6 1.8 3.4 24.4
P07737 Profilin-1 9 172 1.9 3.4 15.0
P35237 Serpin B6 4 5 1.4 3.4 42.6
P18065 Insulin-like growth factor-binding
protein 2 11 103 1.3 3.4 34.8
P06703 Protein S100-A6 3 26 2.3 3.4 10.2
Q01995 Transgelin 19 989 2.8 3.4 22.6
P60174 Triosephosphate isomerase 15 305 2.1 3.4 30.8
P16035 Metalloproteinase inhibitor 2 4 11 3.4 24.4
Q71U36 Tubulin alpha-1A chain 15 163 3.4 50.1
P04406 Glyceraldehyde-3-phosphate
dehydrogenase 14 369 1.8 3.4 36.0
P60709 Actin, cytoplasmic 1 19 1242 1.8 3.4 41.7
P04075 Fructose-bisphosphate aldolase
A 18 368 2.1 3.4 39.4
P30085 UMP-CMP kinase 5 26 1.7 3.4 22.2
P10599 Thioredoxin 3 20 2.0 3.4 11.7
P30086 Phosphatidylethanolamine-
binding protein 1 10 118 2.2 3.3 21.0
P05204 Non-histone chromosomal
protein HMG-17 2 2 3.3 9.4
O75368 SH3 domain-binding glutamic
acid-rich-like protein 4 7 2.1 3.3 12.8
P07996 Thrombospondin-1 33 247 3.3 129.3
P98160 Basement membrane-specific heparan sulfate proteoglycan
core protein 11 23 3.3 468.5
P19105 Myosin regulatory light chain 12A 3 6 1.4 3.3 19.8
O94985 Calsyntenin-1 2 2 3.3 109.7
Q9UI42 Carboxypeptidase A4 7 46 3.3 47.3
P21333 Filamin-A 84 791 1.8 3.3 280.6
P30153
Serine/threonine-protein phosphatase 2A 65 kDa
regulatory subunit A alpha isoform
2 2 3.3 65.3
P13693 Translationally-controlled tumor
protein 3 42 1.9 3.3 19.6
Q15063 Periostin 15 80 1.2 3.3 93.3
Q14315 Filamin-C 20 70 1.5 3.3 290.8
Q15582 Transforming growth factor-beta-
induced protein ig-h3 13 49 1.2 3.3 74.6
Q9NY33 Dipeptidyl peptidase 3 4 4 3.2 82.5
Q15417 Calponin-3 4 7 1.9 3.2 36.4

293
P21266 Glutathione S-transferase Mu 3 4 12 2.2 3.2 26.5
Q9UBP4 Dickkopf-related protein 3 6 14 3.2 38.4
P05121 Plasminogen activator inhibitor 1 15 430 3.2 45.0
P32119 Peroxiredoxin-2 6 51 1.8 3.2 21.9
Q92820 Gamma-glutamyl hydrolase 3 3 3.2 35.9
P07195 L-lactate dehydrogenase B chain 13 193 1.8 3.2 36.6
P49720 Proteasome subunit beta type-3 3 5 3.2 22.9
P09211 Glutathione S-transferase P 6 64 2.3 3.2 23.3
P68371 Tubulin beta-4B chain 14 86 1.6 3.1 49.8
P68032 Actin, alpha cardiac muscle 1 17 856 2.0 3.1 42.0
P06733 Alpha-enolase 22 526 2.4 3.1 47.1
Q9Y696 Chloride intracellular channel
protein 4 11 89 1.8 3.1 28.8
Q9Y617 Phosphoserine aminotransferase 12 60 1.5 3.1 40.4
P18669 Phosphoglycerate mutase 1 15 149 2.0 3.1 28.8
P19827 Inter-alpha-trypsin inhibitor heavy
chain H1 2 3 3.1 101.3
P80723 Brain acid soluble protein 1 2 2 3.1 22.7
P15311 Ezrin 23 179 2.9 3.1 69.4
P30046 D-dopachrome decarboxylase 4 9 1.7 3.1 12.7
Q9NRX4 14 kDa phosphohistidine
phosphatase 6 34 3.8 3.1 13.8
P01709 Ig lambda chain V-II region MGC 2 6 3.0 11.6
Q13219 Pappalysin-1 4 4 3.0 180.9
P23528 Cofilin-1 13 253 2.5 3.0 18.5
P02795 Metallothionein-2 3 5 2.0 3.0 6.0
P31949 Protein S100-A11 5 65 1.9 3.0 11.7
P52209 6-phosphogluconate
dehydrogenase, decarboxylating 2 3 3.0 53.1
P21810 Biglycan 15 174 1.2 3.0 41.6
P14618 Pyruvate kinase PKM 34 636 1.9 3.0 57.9
P18206 Vinculin 64 551 1.9 3.0 123.7
P28066 Proteasome subunit alpha type-5 3 9 1.6 3.0 26.4
Q14103 Heterogeneous nuclear
ribonucleoprotein D0 4 7 3.0 38.4
P61970 Nuclear transport factor 2 2 2 1.5 3.0 14.5
P04792 Heat shock protein beta-1 13 60 1.9 2.9 22.8
Q562R1 Beta-actin-like protein 2 8 435 2.9 42.0
P15531 Nucleoside diphosphate kinase A 5 51 2.9 17.1
Q14767 Latent-transforming growth factor
beta-binding protein 2 11 36 2.9 194.9
O00299 Chloride intracellular channel
protein 1 6 12 1.8 2.9 26.9
Q16658 Fascin 11 29 1.6 2.9 54.5

294
Q96T49 Protein phosphatase 1 regulatory
inhibitor subunit 16B 2 2 2.9 63.5
P12107 Collagen alpha-1(XI) chain 3 12 2.8 181.0
P50395 Rab GDP dissociation inhibitor
beta 18 100 1.5 2.8 50.6
Q13642 Four and a half LIM domains
protein 1 9 35 1.7 2.8 36.2
P08107 Heat shock 70 kDa protein 1A/1B 7 14 1.6 2.8 70.0
Q06830 Peroxiredoxin-1 9 135 2.3 2.8 22.1
P04080 Cystatin-B 3 83 1.6 2.8 11.1
P23284 Peptidyl-prolyl cis-trans
isomerase B 7 27 1.3 2.8 23.7
O14818 Proteasome subunit alpha type-7 4 4 1.8 2.8 27.9
P37837 Transaldolase 5 6 1.8 2.8 37.5
P28482 Mitogen-activated protein kinase
1 2 2 2.8 41.4
P48637 Glutathione synthetase 3 3 2.7 52.4
Q16881 Thioredoxin reductase 1,
cytoplasmic 3 3 2.7 70.9
P07355 Annexin A2 12 53 1.8 2.7 38.6
P60660 Myosin light polypeptide 6 4 9 1.6 2.7 16.9
P40261 Nicotinamide N-
methyltransferase 4 13 1.9 2.7 29.6
P61088 Ubiquitin-conjugating enzyme E2
N 4 12 1.8 2.7 17.1
P22314 Ubiquitin-like modifier-activating
enzyme 1 5 5 2.7 117.8
Q16527 Cysteine and glycine-rich protein
2 5 14 1.6 2.7 20.9
P24593 Insulin-like growth factor-binding
protein 5 8 70 2.7 30.6
P48163 NADP-dependent malic enzyme 3 3 2.6 64.1
P07339 Cathepsin D 13 77 2.6 44.5
Q9UBR2 Cathepsin Z 2 2 2.6 33.8
O75874 Isocitrate dehydrogenase
[NADP] cytoplasmic 2 2 2.6 46.6
P16152 Carbonyl reductase [NADPH] 1 3 6 2.0 2.6 30.4
P68363 Tubulin alpha-1B chain 15 163 2.6 50.1
P25786 Proteasome subunit alpha type-1 6 16 2.0 2.6 29.5
Q99733 Nucleosome assembly protein 1-
like 4 2 2 2.5 42.8
P02461 Collagen alpha-1(III) chain 22 47 2.5 138.5
Q32P51 Heterogeneous nuclear
ribonucleoprotein A1-like 2 3 7 2.3 2.5 34.2
P27348 14-3-3 protein theta 15 158 1.7 2.5 27.7
P41250 Glycine--tRNA ligase 2 3 2.5 83.1
Q00610 Clathrin heavy chain 1 2 2 2.5 191.5

295
Q01518 Adenylyl cyclase-associated
protein 1 12 38 1.9 2.5 51.9
P61160 Actin-related protein 2 6 36 1.8 2.5 44.7
P51911 Calponin-1 4 5 2.5 33.1
Q08380 Galectin-3-binding protein 12 61 0.8 2.5 65.3
P62937 Peptidyl-prolyl cis-trans
isomerase A 14 239 2.0 2.5 18.0
P15289 Arylsulfatase A 2 2 2.4 53.6
P63167 Dynein light chain 1, cytoplasmic 2 2 2.4 10.4
Q16270 Insulin-like growth factor-binding
protein 7 17 904 2.4 29.1
P14174 Macrophage migration inhibitory
factor 3 8 2.1 2.4 12.5
P62906 60S ribosomal protein L10a 4 5 1.7 2.4 24.8
P30044 Peroxiredoxin-5, mitochondrial 2 3 2.4 22.1
Q9NTK5 Obg-like ATPase 1 2 2 2.4 44.7
O15145 Actin-related protein 2/3 complex
subunit 3 2 2 2.4 20.5
P46940 Ras GTPase-activating-like
protein IQGAP1 16 19 2.3 189.1
Q14766 Latent-transforming growth factor
beta-binding protein 1 2 5 2.3 186.7
P02462 Collagen alpha-1(IV) chain 6 27 2.3 160.5
Q9Y3B8 Oligoribonuclease, mitochondrial 2 3 2.3 26.8
P24534 Elongation factor 1-beta 5 11 2.0 2.3 24.7
P13667 Protein disulfide-isomerase A4 2 2 2.3 72.9
P00966 Argininosuccinate synthase 3 4 1.7 2.2 46.5
P14625 Endoplasmin 9 13 2.2 92.4
P01009 Alpha-1-antitrypsin 3 75 2.2 46.7
P27797 Calreticulin 10 106 1.5 2.1 48.1
Q9NZU5 LIM and cysteine-rich domains
protein 1 4 9 1.8 2.0 40.8
P14324 Farnesyl pyrophosphate
synthase 3 11 2.2 2.0 48.2
Q96HC4 PDZ and LIM domain protein 5 2 2 2.0 63.9
P14314 Glucosidase 2 subunit beta 3 5 1.5 2.0 59.4
Q76M96 Coiled-coil domain-containing
protein 80 5 6 1.9 108.1
P06753 Tropomyosin alpha-3 chain 8 87 1.9 32.9
P20742 Pregnancy zone protein 4 26 0.8 1.9 163.8
P00568 Adenylate kinase isoenzyme 1 5 9 3.2 1.9 21.6
P0C0L4 Complement C4-A 4 9 1.9 192.7
P02751 Fibronectin 72 1126 1.9 262.5
O00151 PDZ and LIM domain protein 1 2 2 1.9 36.0
P61812 Transforming growth factor beta-
2 3 6 1.8 47.7

296
Q9NR12 PDZ and LIM domain protein 7 2 2 1.8 49.8
P08253 72 kDa type IV collagenase 14 42 1.8 73.8
Q14118 Dystroglycan 3 3 1.8 97.4
P30043 Flavin reductase (NADPH) 2 2 1.8 22.1
Q15084 Protein disulfide-isomerase A6 5 7 1.8 48.1
P55786 Puromycin-sensitive
aminopeptidase 5 8 1.8 103.2
Q13813 Spectrin alpha chain, non-
erythrocytic 1 9 11 2.1 1.8 284.4
O15144 Actin-related protein 2/3 complex
subunit 2 4 9 2.0 1.8 34.3
Q9Y281 Cofilin-2 6 139 1.6 1.7 18.7
P07093 Glia-derived nexin 14 62 1.7 44.0
Q02809 Procollagen-lysine,2-
oxoglutarate 5-dioxygenase 1 4 4 1.7 83.5
Q12905 Interleukin enhancer-binding
factor 2 3 3 1.7 43.0
P35241 Radixin 9 50 1.7 68.5
P23142 Fibulin-1 2 2 1.7 77.2
Q99538 Legumain 3 4 1.7 49.4
P00338 L-lactate dehydrogenase A chain 18 397 1.9 1.7 36.7
P10915 Hyaluronan and proteoglycan
link protein 1 7 36 1.6 40.1
P28070 Proteasome subunit beta type-4 4 8 1.6 1.6 29.2
Q99439 Calponin-2 2 5 1.6 33.7
P07437 Tubulin beta chain 14 133 1.8 1.6 49.6
P35908 Keratin, type II cytoskeletal 2
epidermal 5 16 1.6 65.4
Q14204 Cytoplasmic dynein 1 heavy
chain 1 3 3 1.6 532.1
P05388 60S acidic ribosomal protein P0 4 6 1.6 34.3
P11021 78 kDa glucose-regulated protein 12 72 1.4 1.6 72.3
P02545 Prelamin-A/C 8 26 1.7 1.5 74.1
P02788 Lactotransferrin 2 13 1.5 78.1
O95336 6-phosphogluconolactonase 4 6 1.5 27.5
O15511 Actin-related protein 2/3 complex
subunit 5 2 2 1.5 16.3
P11142 Heat shock cognate 71 kDa
protein 18 76 1.8 1.5 70.9
O76061 Stanniocalcin-2 3 13 1.5 33.2
P02511 Alpha-crystallin B chain 5 76 1.9 1.5 20.1
O43852 Calumenin 4 5 1.5 37.1
Q16181 Septin-7 2 4 1.4 50.6
P50454 Serpin H1 10 32 1.5 1.4 46.4
P60900 Proteasome subunit alpha type-6 2 3 1.4 27.4

297
P52926 High mobility group protein
HMGI-C 2 2 1.4 11.8
P68104 Elongation factor 1-alpha 1 10 47 1.9 1.4 50.1
P22392 Nucleoside diphosphate kinase B 6 83 2.2 1.4 17.3
Q16853 Membrane primary amine
oxidase 2 2 1.4 84.6
P29279 Connective tissue growth factor 4 6 1.4 38.1
P36871 Phosphoglucomutase-1 6 19 1.6 1.4 61.4
P25787 Proteasome subunit alpha type-2 2 2 1.4 25.9
Q99627 COP9 signalosome complex
subunit 8 2 2 1.4 23.2
Q15181 Inorganic pyrophosphatase 3 3 1.4 32.6
P01023 Alpha-2-macroglobulin 10 134 1.4 163.2
P13639 Elongation factor 2 12 25 2.3 1.3 95.3
P63241 Eukaryotic translation initiation
factor 5A-1 4 23 2.0 1.3 16.8
P08670 Vimentin 34 520 1.8 1.3 53.6
P67809 Nuclease-sensitive element-
binding protein 1 5 11 1.7 1.3 35.9
P09960 Leukotriene A-4 hydrolase 7 11 2.1 1.3 69.2
Q05682 Caldesmon 23 189 2.3 1.3 93.2
P15121 Aldose reductase 3 5 1.3 35.8
Q99497 Protein DJ-1 7 53 1.9 1.3 19.9
P17936 Insulin-like growth factor-binding
protein 3 9 33 1.3 1.3 31.7
P01034 Cystatin-C 4 11 1.2 15.8
Q14019 Coactosin-like protein 6 42 2.4 1.2 15.9
P60981 Destrin 4 17 2.1 1.2 18.5
P61769 Beta-2-microglobulin 2 14 1.2 13.7
P67936 Tropomyosin alpha-4 chain 16 152 2.5 1.2 28.5
Q14974 Importin subunit beta-1 3 3 1.1 97.1
Q8NCW5 NAD(P)H-hydrate epimerase 2 3 1.1 31.7
Q99584 Protein S100-A13 4 6 1.8 1.1 11.5
Q07955 Serine/arginine-rich splicing
factor 1 3 3 27.7
Q7Z304 MAM domain-containing protein
2 10 26 77.5
P02774 Vitamin D-binding protein 2 20 52.9
P13645 Keratin, type I cytoskeletal 10 5 11 58.8
Q01105 Protein SET 2 2 33.5
P20618 Proteasome subunit beta type-1 2 3 26.5
Q13185 Chromobox protein homolog 3 2 2 20.8
P11766 Alcohol dehydrogenase class-3 2 2 39.7
P08123 Collagen alpha-2(I) chain 54 715 129.2
P35052 Glypican-1 5 5 61.6

298
P07942 Laminin subunit beta-1 3 3 197.9
Q15019 Septin-2 3 3 41.5
Q14195 Dihydropyrimidinase-related
protein 3 4 5 61.9
P35442 Thrombospondin-2 8 18 129.9
P08729 Keratin, type II cytoskeletal 7 8 17 51.4
Q15746 Myosin light chain kinase,
smooth muscle 3 4 210.6
P30041 Peroxiredoxin-6 3 3 25.0
P60983 Glia maturation factor beta 2 4 16.7
P35527 Keratin, type I cytoskeletal 9 10 97 62.0
P34932 Heat shock 70 kDa protein 4 3 3 94.3
P09104 Gamma-enolase 6 115 47.2
Q9ULV4 Coronin-1C 6 6 53.2
P49590 Probable histidine--tRNA ligase,
mitochondrial 2 2 56.9
P27658 Collagen alpha-1(VIII) chain 4 6 73.3
P00738 Haptoglobin 7 160 45.2
Q9BRF8 Serine/threonine-protein phosphatase CPPED1
2 2 35.5
Q15149 Plectin 5 5 531.5
Q16555 Dihydropyrimidinase-related
protein 2 3 3 62.3
Q16610 Extracellular matrix protein 1 8 17 60.6
P09486 SPARC 16 837 34.6
P28074 Proteasome subunit beta type-5 2 3 28.5
Q99715 Collagen alpha-1(XII) chain 8 10 332.9
P07585 Decorin 4 5 39.7
P25789 Proteasome subunit alpha type-4 3 6 29.5
Q10471 Polypeptide N-
acetylgalactosaminyltransferase 2
2 2 64.7
Q14393 Growth arrest-specific protein 6 2 2 79.6
Q14011 Cold-inducible RNA-binding
protein 2 2 18.6
P04264 Keratin, type II cytoskeletal 1 16 91 66.0
P02452 Collagen alpha-1(I) chain 69 1061 138.9
Q96KP4 Cytosolic non-specific
dipeptidase 2 2 52.8
Q96HF1 Secreted frizzled-related protein
2 2 2 33.5
O00391 Sulfhydryl oxidase 1 9 26 82.5
Q12841 Follistatin-related protein 1 21 442 35.0
P08476 Inhibin beta A chain 2 2 47.4
Q9Y4K0 Lysyl oxidase homolog 2 3 3 86.7
P61586 Transforming protein RhoA 2 2 21.8

299
P51884 Lumican 11 88 38.4
Q9HC38 Glyoxalase domain-containing
protein 4 3 3 34.8
P01860 Ig gamma-3 chain C region 2 2 41.3
P20908 Collagen alpha-1(V) chain 8 20 183.4
Q9H4A4 Aminopeptidase B 3 4 72.5
P46777 60S ribosomal protein L5 3 3 34.3
Q86VP6 Cullin-associated NEDD8-
dissociated protein 1 2 2 136.3
O00468 Agrin 5 5 217.1
P63010 AP-2 complex subunit beta 2 2 104.5
P08758 Annexin A5 8 12 1.8 35.9
P47756 F-actin-capping protein subunit
beta 2 3 31.3
P07602 Prosaposin 9 19 1.3 58.1
P26639 Threonine--tRNA ligase,
cytoplasmic 2 2 1.9 83.4
Q12906 Interleukin enhancer-binding
factor 3 3 3 95.3
P62241 40S ribosomal protein S8 2 6 24.2
P60842 Eukaryotic initiation factor 4A-I 6 14 1.8 46.1
O95865 N(G),N(G)-dimethylarginine dimethylaminohydrolase 2
5 5 1.9 29.6
P81605 Dermcidin 2 13 11.3
P06744 Glucose-6-phosphate isomerase 12 60 1.6 63.1
Q16851 UTP--glucose-1-phosphate
uridylyltransferase 6 9 1.6 56.9
Q9BUF5 Tubulin beta-6 chain 9 56 49.8
Q9Y490 Talin-1 18 21 2.2 269.6
Table 5.7: Differentially released conditioned medium proteins at 24 hours
Astrocyte-released proteins measured in condition media from TMT experiments
comparing protein abundance between mild and severe stretched cells in conditioned
media collected 24 hours post-injury.

300
Accession Description #
Peptides PSMs 48h M 48h S
MW (kDa)
P62328 Thymosin beta-4 4 14 8.4 11.9 5.0
P07437 Tubulin beta chain 20 225 6.5 11.6 49.6
O60664 Perilipin-3 2 2 7.4 11.5 47.0
P20962 Parathymosin 2 5 5.4 11.5 11.5
P68032 Actin, alpha cardiac muscle 1 20 619 5.9 10.4 42.0
Q01995 Transgelin 20 1047 6.3 9.1 22.6
Q15121 Astrocytic phosphoprotein PEA-
15 5 102 5.8 8.5 15.0
Q71U36 Tubulin alpha-1A chain 22 173 5.7 8.4 50.1
P15311 Ezrin 20 95 4.8 8.3 69.4
P37802 Transgelin-2 15 206 6.0 8.3 22.4
P22392 Nucleoside diphosphate kinase B 7 62 5.3 8.2 17.3
P62979 Ubiquitin-40S ribosomal protein
S27a 11 140 5.1 8.2 18.0
P62158 Calmodulin 3 10 5.1 8.2 16.8
P05388 60S acidic ribosomal protein P0 4 9 5.6 8.2 34.3
P60709 Actin, cytoplasmic 1 22 1101 5.3 8.1 41.7
Q9H299 SH3 domain-binding glutamic
acid-rich-like protein 3 5 15 5.3 8.1 10.4
O00410 Importin-5 8 14 7.9 123.5
P62857 40S ribosomal protein S28 2 2 4.5 7.9 7.8
P13693 Translationally-controlled tumor
protein 6 37 5.7 7.8 19.6
P23528 Cofilin-1 15 332 5.4 7.7 18.5
P09493 Tropomyosin alpha-1 chain 15 109 5.3 7.6 32.7
P05783 Keratin, type I cytoskeletal 18 9 26 5.2 7.5 48.0
P30044 Peroxiredoxin-5, mitochondrial 4 10 5.1 7.4 22.1
P08670 Vimentin 34 567 5.2 7.3 53.6
P04406 Glyceraldehyde-3-phosphate
dehydrogenase 20 907 4.2 7.3 36.0
P47756 F-actin-capping protein subunit
beta 6 20 4.9 7.3 31.3
P67936 Tropomyosin alpha-4 chain 15 108 5.2 7.2 28.5
P13797 Plastin-3 20 73 4.6 7.2 70.8
P50395 Rab GDP dissociation inhibitor
beta 21 173 4.5 7.2 50.6
Q06830 Peroxiredoxin-1 9 36 4.8 7.2 22.1
P07951 Tropomyosin beta chain 16 112 5.1 7.1 32.8
P62937 Peptidyl-prolyl cis-trans
isomerase A 19 265 5.1 7.1 18.0
P42574 Caspase-3 2 3 4.6 7.0 31.6
P07195 L-lactate dehydrogenase B chain 16 115 4.7 6.9 36.6
P31946 14-3-3 protein beta/alpha 16 170 5.1 6.9 28.1
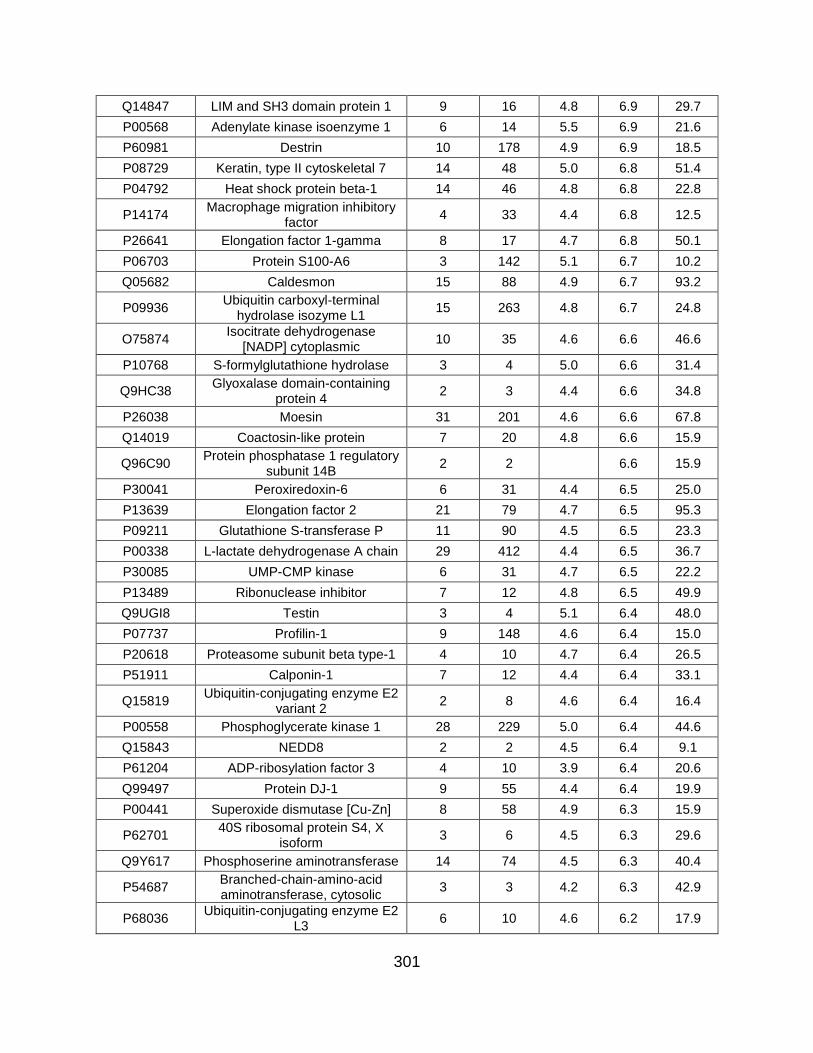
301
Q14847 LIM and SH3 domain protein 1 9 16 4.8 6.9 29.7
P00568 Adenylate kinase isoenzyme 1 6 14 5.5 6.9 21.6
P60981 Destrin 10 178 4.9 6.9 18.5
P08729 Keratin, type II cytoskeletal 7 14 48 5.0 6.8 51.4
P04792 Heat shock protein beta-1 14 46 4.8 6.8 22.8
P14174 Macrophage migration inhibitory
factor 4 33 4.4 6.8 12.5
P26641 Elongation factor 1-gamma 8 17 4.7 6.8 50.1
P06703 Protein S100-A6 3 142 5.1 6.7 10.2
Q05682 Caldesmon 15 88 4.9 6.7 93.2
P09936 Ubiquitin carboxyl-terminal
hydrolase isozyme L1 15 263 4.8 6.7 24.8
O75874 Isocitrate dehydrogenase
[NADP] cytoplasmic 10 35 4.6 6.6 46.6
P10768 S-formylglutathione hydrolase 3 4 5.0 6.6 31.4
Q9HC38 Glyoxalase domain-containing
protein 4 2 3 4.4 6.6 34.8
P26038 Moesin 31 201 4.6 6.6 67.8
Q14019 Coactosin-like protein 7 20 4.8 6.6 15.9
Q96C90 Protein phosphatase 1 regulatory
subunit 14B 2 2 6.6 15.9
P30041 Peroxiredoxin-6 6 31 4.4 6.5 25.0
P13639 Elongation factor 2 21 79 4.7 6.5 95.3
P09211 Glutathione S-transferase P 11 90 4.5 6.5 23.3
P00338 L-lactate dehydrogenase A chain 29 412 4.4 6.5 36.7
P30085 UMP-CMP kinase 6 31 4.7 6.5 22.2
P13489 Ribonuclease inhibitor 7 12 4.8 6.5 49.9
Q9UGI8 Testin 3 4 5.1 6.4 48.0
P07737 Profilin-1 9 148 4.6 6.4 15.0
P20618 Proteasome subunit beta type-1 4 10 4.7 6.4 26.5
P51911 Calponin-1 7 12 4.4 6.4 33.1
Q15819 Ubiquitin-conjugating enzyme E2
variant 2 2 8 4.6 6.4 16.4
P00558 Phosphoglycerate kinase 1 28 229 5.0 6.4 44.6
Q15843 NEDD8 2 2 4.5 6.4 9.1
P61204 ADP-ribosylation factor 3 4 10 3.9 6.4 20.6
Q99497 Protein DJ-1 9 55 4.4 6.4 19.9
P00441 Superoxide dismutase [Cu-Zn] 8 58 4.9 6.3 15.9
P62701 40S ribosomal protein S4, X
isoform 3 6 4.5 6.3 29.6
Q9Y617 Phosphoserine aminotransferase 14 74 4.5 6.3 40.4
P54687 Branched-chain-amino-acid aminotransferase, cytosolic
3 3 4.2 6.3 42.9
P68036 Ubiquitin-conjugating enzyme E2
L3 6 10 4.6 6.2 17.9

302
Q09666 Neuroblast differentiation-associated protein AHNAK
9 31 4.7 6.2 628.7
P58546 Myotrophin 3 6 4.9 6.2 12.9
P18206 Vinculin 59 371 4.5 6.2 123.7
P46821 Microtubule-associated protein
1B 12 19 4.5 6.2 270.5
P78417 Glutathione S-transferase
omega-1 5 9 4.6 6.2 27.5
P27348 14-3-3 protein theta 17 107 4.6 6.1 27.7
P68104 Elongation factor 1-alpha 1 15 136 4.0 6.1 50.1
P21266 Glutathione S-transferase Mu 3 8 24 4.8 6.1 26.5
P80723 Brain acid soluble protein 1 5 7 5.1 6.1 22.7
O75711 Scrapie-responsive protein 1 2 2 5.5 6.1 11.1
P63104 14-3-3 protein zeta/delta 19 209 4.4 6.1 27.7
P51858 Hepatoma-derived growth factor 2 4 4.1 6.0 26.8
Q04917 14-3-3 protein eta 9 73 4.5 6.0 28.2
P30153
Serine/threonine-protein phosphatase 2A 65 kDa
regulatory subunit A alpha isoform
8 19 4.1 6.0 65.3
P18085 ADP-ribosylation factor 4 3 8 4.0 6.0 20.5
Q9BVA1 Tubulin beta-2B chain 17 204 3.9 6.0 49.9
P61981 14-3-3 protein gamma 18 187 4.3 5.9 28.3
P40261 Nicotinamide N-
methyltransferase 8 41 4.3 5.9 29.6
P14324 Farnesyl pyrophosphate
synthase 3 3 4.5 5.9 48.2
P60842 Eukaryotic initiation factor 4A-I 9 25 4.5 5.9 46.1
P09382 Galectin-1 9 167 4.5 5.9 14.7
P01033 Metalloproteinase inhibitor 1 8 193 5.1 5.9 23.2
P06733 Alpha-enolase 29 1110 4.5 5.9 47.1
P18669 Phosphoglycerate mutase 1 16 178 4.3 5.9 28.8
P68363 Tubulin alpha-1B chain 22 176 4.3 5.9 50.1
Q53FA7 Quinone oxidoreductase PIG3 2 2 4.1 5.9 35.5
P55786 Puromycin-sensitive
aminopeptidase 16 28 4.0 5.9 103.2
P40925 Malate dehydrogenase,
cytoplasmic 11 36 4.1 5.9 36.4
P61970 Nuclear transport factor 2 4 19 4.5 5.8 14.5
Q16658 Fascin 15 57 4.7 5.8 54.5
Q9Y570 Protein phosphatase
methylesterase 1 2 6 4.3 5.8 42.3
P62258 14-3-3 protein epsilon 15 127 4.3 5.8 29.2
Q14195 Dihydropyrimidinase-related
protein 3 16 38 4.5 5.8 61.9
Q86VP6 Cullin-associated NEDD8-
dissociated protein 1 18 38 4.3 5.8 136.3

303
P61158 Actin-related protein 3 9 31 4.1 5.8 47.3
P12814 Alpha-actinin-1 56 921 4.0 5.7 103.0
P06744 Glucose-6-phosphate isomerase 16 102 4.5 5.7 63.1
P04075 Fructose-bisphosphate aldolase
A 20 357 4.1 5.7 39.4
Q9BQE3 Tubulin alpha-1C chain 19 158 4.5 5.7 49.9
P63208 S-phase kinase-associated
protein 1 3 3 4.4 5.7 18.6
Q15404 Ras suppressor protein 1 7 17 4.2 5.7 31.5
P21333 Filamin-A 104 619 4.3 5.7 280.6
P30101 Protein disulfide-isomerase A3 15 56 3.8 5.7 56.7
P17655 Calpain-2 catalytic subunit 6 13 4.9 5.7 79.9
O75368 SH3 domain-binding glutamic
acid-rich-like protein 5 13 4.4 5.6 12.8
Q15942 Zyxin 6 10 3.8 5.6 61.2
O95394 Phosphoacetylglucosamine
mutase 5 14 4.0 5.6 59.8
P28066 Proteasome subunit alpha type-5 2 2 4.5 5.6 26.4
O95782 AP-2 complex subunit alpha-1 2 2 4.4 5.6 107.5
Q9BRA2 Thioredoxin domain-containing
protein 17 5 13 4.6 5.6 13.9
P25786 Proteasome subunit alpha type-1 5 8 3.5 5.6 29.5
Q9ULV4 Coronin-1C 8 26 4.4 5.6 53.2
P29966 Myristoylated alanine-rich C-
kinase substrate 4 4 4.1 5.6 31.5
O43707 Alpha-actinin-4 54 525 4.0 5.5 104.8
Q9NTK5 Obg-like ATPase 1 3 6 3.7 5.5 44.7
P62942 Peptidyl-prolyl cis-trans
isomerase FKBP1A 2 11 4.3 5.5 11.9
P61088 Ubiquitin-conjugating enzyme E2
N 5 12 3.7 5.5 17.1
P36871 Phosphoglucomutase-1 11 34 3.9 5.5 61.4
P61978 Heterogeneous nuclear
ribonucleoprotein K 2 2 4.0 5.5 50.9
P52926 High mobility group protein
HMGI-C 3 3 4.5 5.5 11.8
P32119 Peroxiredoxin-2 5 15 4.0 5.5 21.9
Q9UBG0 C-type mannose receptor 2 7 11 4.4 5.4 166.6
P14625 Endoplasmin 14 69 3.7 5.4 92.4
P23284 Peptidyl-prolyl cis-trans
isomerase B 8 97 3.8 5.4 23.7
Q13642 Four and a half LIM domains
protein 1 11 45 4.6 5.4 36.2
P07602 Prosaposin 8 71 4.0 5.4 58.1
P60174 Triosephosphate isomerase 15 390 3.9 5.4 30.8
P26022 Pentraxin-related protein PTX3 9 34 4.3 5.4 41.9
P60660 Myosin light polypeptide 6 6 24 4.3 5.4 16.9

304
Q15746 Myosin light chain kinase,
smooth muscle 2 3 4.5 5.4 210.6
P35237 Serpin B6 4 7 4.0 5.3 42.6
P10599 Thioredoxin 7 28 4.0 5.3 11.7
P23381 Tryptophan--tRNA ligase,
cytoplasmic 11 38 3.8 5.3 53.1
P61769 Beta-2-microglobulin 4 35 5.1 5.3 13.7
P22626 Heterogeneous nuclear
ribonucleoproteins A2/B1 7 21 3.6 5.3 37.4
P16035 Metalloproteinase inhibitor 2 7 20 4.4 5.3 24.4
P15121 Aldose reductase 3 5 4.3 5.3 35.8
P21291 Cysteine and glycine-rich protein
1 11 56 4.3 5.3 20.6
O00299 Chloride intracellular channel
protein 1 10 34 4.3 5.2 26.9
P14550 Alcohol dehydrogenase
[NADP(+)] 9 27 4.0 5.2 36.5
O75083 WD repeat-containing protein 1 26 76 4.1 5.2 66.2
Q01469 Fatty acid-binding protein,
epidermal 3 8 3.5 5.2 15.2
P22314 Ubiquitin-like modifier-activating
enzyme 1 15 29 3.8 5.2 117.8
P61960 Ubiquitin-fold modifier 1 2 2 4.3 5.2 9.1
P53396 ATP-citrate synthase 10 20 3.8 5.2 120.8
P11142 Heat shock cognate 71 kDa
protein 30 230 3.7 5.1 70.9
Q16851 UTP--glucose-1-phosphate
uridylyltransferase 5 11 3.6 5.1 56.9
Q9Y490 Talin-1 36 84 3.9 5.1 269.6
Q9NRX4 14 kDa phosphohistidine
phosphatase 5 10 3.6 5.1 13.8
P52565 Rho GDP-dissociation inhibitor 1 3 10 4.7 5.1 23.2
Q01105 Protein SET 2 2 5.1 33.5
P68371 Tubulin beta-4B chain 18 194 3.6 5.1 49.8
Q96FW1 Ubiquitin thioesterase OTUB1 3 5 3.7 5.1 31.3
P27797 Calreticulin 13 53 3.6 5.1 48.1
P27816 Microtubule-associated protein 4 8 17 3.6 5.1 120.9
P31949 Protein S100-A11 5 66 4.3 5.1 11.7
Q92743 Serine protease HTRA1 11 84 4.6 5.1 51.3
P30086 Phosphatidylethanolamine-
binding protein 1 11 43 3.8 5.1 21.0
O15144 Actin-related protein 2/3 complex
subunit 2 10 25 3.7 5.1 34.3
P14618 Pyruvate kinase PKM 37 818 3.9 5.1 57.9
P24534 Elongation factor 1-beta 4 8 3.5 5.0 24.7
Q15417 Calponin-3 7 13 3.8 5.0 36.4
P05387 60S acidic ribosomal protein P2 3 4 3.6 5.0 11.7

305
Q14974 Importin subunit beta-1 12 23 4.1 5.0 97.1
Q04446 1,4-alpha-glucan-branching
enzyme 3 4 4.4 5.0 80.4
Q99584 Protein S100-A13 3 5 3.8 5.0 11.5
Q01518 Adenylyl cyclase-associated
protein 1 14 50 3.7 5.0 51.9
Q9BWD1 Acetyl-CoA acetyltransferase,
cytosolic 2 15 3.7 5.0 41.3
P09651 Heterogeneous nuclear
ribonucleoprotein A1 5 14 3.6 5.0 38.7
P14314 Glucosidase 2 subunit beta 3 5 3.6 5.0 59.4
Q92820 Gamma-glutamyl hydrolase 4 11 4.1 5.0 35.9
Q12765 Secernin-1 4 7 3.8 5.0 46.4
P09972 Fructose-bisphosphate aldolase
C 8 54 3.6 4.9 39.4
P52209 6-phosphogluconate
dehydrogenase, decarboxylating 15 46 3.9 4.9 53.1
P98095 Fibulin-2 4 8 4.0 4.9 126.5
O43852 Calumenin 13 38 4.0 4.9 37.1
Q7KZF4 Staphylococcal nuclease
domain-containing protein 1 6 15 3.7 4.9 101.9
P12109 Collagen alpha-1(VI) chain 34 285 4.5 4.9 108.5
Q9NVA2 Septin-11 4 8 4.0 4.9 49.4
O43854 EGF-like repeat and discoidin I-like domain-containing protein 3
5 9 4.4 4.9 53.7
P07858 Cathepsin B 3 5 3.8 4.9 37.8
P04080 Cystatin-B 4 54 4.0 4.9 11.1
P25787 Proteasome subunit alpha type-2 6 14 3.7 4.9 25.9
Q14738 Serine/threonine-protein phosphatase 2A 56 kDa
regulatory subunit delta isoform 4 5 3.5 4.9 69.9
P62906 60S ribosomal protein L10a 2 4 3.5 4.9 24.8
O76061 Stanniocalcin-2 6 78 5.1 4.9 33.2
P28300 Protein-lysine 6-oxidase 2 4 4.0 4.9 46.9
Q9H4A4 Aminopeptidase B 4 9 3.9 4.8 72.5
P63241 Eukaryotic translation initiation
factor 5A-1 3 216 3.6 4.8 16.8
P29401 Transketolase 15 51 3.6 4.8 67.8
Q13813 Spectrin alpha chain, non-
erythrocytic 1 6 9 3.7 4.8 284.4
P11216 Glycogen phosphorylase, brain
form 4 5 3.9 4.8 96.6
P41250 Glycine--tRNA ligase 16 95 3.6 4.8 83.1
P12277 Creatine kinase B-type 4 15 3.0 4.8 42.6
P37837 Transaldolase 5 16 3.4 4.8 37.5
Q14315 Filamin-C 23 119 3.9 4.8 290.8
P60900 Proteasome subunit alpha type-6 3 3 3.5 4.8 27.4

306
Q00610 Clathrin heavy chain 1 30 73 3.8 4.8 191.5
P12955 Xaa-Pro dipeptidase 2 2 3.4 4.8 54.5
O60565 Gremlin-1 2 2 4.4 4.8 20.7
P02511 Alpha-crystallin B chain 5 29 3.5 4.7 20.1
P62241 40S ribosomal protein S8 3 8 3.6 4.7 24.2
P34932 Heat shock 70 kDa protein 4 9 16 3.5 4.7 94.3
P02545 Prelamin-A/C 7 11 3.7 4.7 74.1
P11021 78 kDa glucose-regulated protein 14 70 3.4 4.7 72.3
P08238 Heat shock protein HSP 90-beta 23 124 3.7 4.7 83.2
P46940 Ras GTPase-activating-like
protein IQGAP1 21 54 3.6 4.7 189.1
Q8NBS9 Thioredoxin domain-containing
protein 5 7 8 3.5 4.6 47.6
Q14204 Cytoplasmic dynein 1 heavy
chain 1 9 12 3.8 4.6 532.1
Q16555 Dihydropyrimidinase-related
protein 2 8 13 3.5 4.6 62.3
P28074 Proteasome subunit beta type-5 3 9 3.5 4.6 28.5
P35579 Myosin-9 54 223 3.8 4.6 226.4
Q9Y696 Chloride intracellular channel
protein 4 15 184 4.0 4.6 28.8
Q96CX2 BTB/POZ domain-containing
protein KCTD12 3 5 4.0 4.6 35.7
Q02818 Nucleobindin-1 13 46 4.6 4.6 53.8
Q15084 Protein disulfide-isomerase A6 4 6 3.2 4.6 48.1
Q01813 ATP-dependent 6-
phosphofructokinase, platelet type
3 4 3.1 4.5 85.5
O00391 Sulfhydryl oxidase 1 19 116 4.5 4.5 82.5
P00966 Argininosuccinate synthase 11 26 3.4 4.5 46.5
Q15149 Plectin 22 44 3.6 4.5 531.5
P61160 Actin-related protein 2 8 37 3.6 4.5 44.7
P31150 Rab GDP dissociation inhibitor
alpha 14 129 3.6 4.5 50.6
P55072 Transitional endoplasmic
reticulum ATPase 2 2 3.1 4.4 89.3
P12110 Collagen alpha-2(VI) chain 13 34 4.2 4.4 108.5
P20908 Collagen alpha-1(V) chain 30 116 4.0 4.4 183.4
P07237 Protein disulfide-isomerase 16 77 3.5 4.4 57.1
Q9NZU5 LIM and cysteine-rich domains
protein 1 7 14 3.3 4.4 40.8
P39019 40S ribosomal protein S19 4 6 3.2 4.4 16.1
Q8WUM4 Programmed cell death 6-
interacting protein 3 3 3.7 4.4 96.0
P02462 Collagen alpha-1(IV) chain 18 86 3.7 4.3 160.5

307
O14498 Immunoglobulin superfamily
containing leucine-rich repeat protein
6 20 3.7 4.3 46.0
P21980 Protein-glutamine gamma-
glutamyltransferase 2 6 14 3.7 4.3 77.3
P09960 Leukotriene A-4 hydrolase 13 30 3.3 4.3 69.2
Q14103 Heterogeneous nuclear
ribonucleoprotein D0 4 8 3.4 4.3 38.4
P12111 Collagen alpha-3(VI) chain 45 124 3.9 4.3 343.5
Q96AY3 Peptidyl-prolyl cis-trans
isomerase FKBP10 6 16 3.4 4.3 64.2
Q07955 Serine/arginine-rich splicing
factor 1 2 32 3.4 4.3 27.7
Q14767 Latent-transforming growth factor
beta-binding protein 2 26 82 4.0 4.3 194.9
P07355 Annexin A2 16 54 3.5 4.3 38.6
P08107 Heat shock 70 kDa protein 1A/1B 9 20 3.3 4.2 70.0
O75369 Filamin-B 36 125 3.5 4.2 278.0
P11766 Alcohol dehydrogenase class-3 3 3 3.3 4.2 39.7
P42771 Cyclin-dependent kinase inhibitor
2A, isoforms 1/2/3 2 2 4.1 4.2 16.5
P06396 Gelsolin 29 160 3.4 4.2 85.6
O95965 Integrin beta-like protein 1 4 7 3.7 4.2 53.9
P39687 Acidic leucine-rich nuclear phosphoprotein 32 family
member A 3 7 3.4 4.1 28.6
P07900 Heat shock protein HSP 90-
alpha 24 149 3.4 4.1 84.6
Q13219 Pappalysin-1 21 49 3.8 4.1 180.9
P04083 Annexin A1 7 35 3.4 4.1 38.7
P13611 Versican core protein 16 54 3.2 4.1 372.6
P50454 Serpin H1 17 67 2.9 4.1 46.4
P19022 Cadherin-2 6 10 3.2 4.0 99.7
Q9BY76 Angiopoietin-related protein 4 3 7 2.9 4.0 45.2
P10915 Hyaluronan and proteoglycan
link protein 1 15 127 3.9 4.0 40.1
Q14192 Four and a half LIM domains
protein 2 6 17 3.5 4.0 32.2
P07093 Glia-derived nexin 13 100 3.7 4.0 44.0
P05452 Tetranectin 5 15 3.8 4.0 22.5
Q96D15 Reticulocalbin-3 2 3 3.3 4.0 37.5
P49720 Proteasome subunit beta type-3 3 3 3.3 4.0 22.9
P07585 Decorin 14 96 3.9 4.0 39.7
P35442 Thrombospondin-2 26 113 3.8 4.0 129.9
Q9NY33 Dipeptidyl peptidase 3 5 11 3.3 4.0 82.5
P18065 Insulin-like growth factor-binding
protein 2 15 97 3.9 3.9 34.8

308
O94760 N(G),N(G)-dimethylarginine dimethylaminohydrolase 1
4 8 3.1 3.9 31.1
Q76M96 Coiled-coil domain-containing
protein 80 16 69 3.8 3.9 108.1
P17174 Aspartate aminotransferase,
cytoplasmic 6 10 3.3 3.9 46.2
P24043 Laminin subunit alpha-2 11 20 3.7 3.9 343.7
Q92626 Peroxidasin homolog 23 65 3.5 3.9 165.2
P35555 Fibrillin-1 73 446 3.2 3.9 312.0
Q16527 Cysteine and glycine-rich protein
2 5 17 3.2 3.9 20.9
Q9Y3B8 Oligoribonuclease, mitochondrial 6 11 3.3 3.9 26.8
Q8IUX7 Adipocyte enhancer-binding
protein 1 8 13 3.5 3.9 130.8
Q9NRN5 Olfactomedin-like protein 3 6 12 4.1 3.9 46.0
P01034 Cystatin-C 8 51 3.3 3.8 15.8
P07686 Beta-hexosaminidase subunit
beta 5 8 3.1 3.8 63.1
Q9UBP4 Dickkopf-related protein 3 8 34 3.6 3.8 38.4
O95084 Serine protease 23 3 4 3.5 3.8 43.0
Q9UI42 Carboxypeptidase A4 9 27 4.0 3.8 47.3
P11047 Laminin subunit gamma-1 13 35 3.0 3.8 177.5
P30043 Flavin reductase (NADPH) 2 2 3.5 3.8 22.1
Q14766 Latent-transforming growth factor
beta-binding protein 1 14 34 3.5 3.7 186.7
P48163 NADP-dependent malic enzyme 4 5 3.2 3.7 64.1
Q4ZHG4 Fibronectin type III domain-
containing protein 1 11 17 2.9 3.7 205.4
P08758 Annexin A5 9 24 3.1 3.7 35.9
P29279 Connective tissue growth factor 4 8 3.3 3.6 38.1
Q6UVK1 Chondroitin sulfate proteoglycan
4 10 20 3.7 3.6 250.4
Q15063 Periostin 38 425 3.5 3.6 93.3
P05997 Collagen alpha-2(V) chain 36 110 3.6 3.5 144.8
P35556 Fibrillin-2 10 25 3.2 3.5 314.6
P16870 Carboxypeptidase E 9 19 3.1 3.5 53.1
P08123 Collagen alpha-2(I) chain 74 1436 3.7 3.5 129.2
P35052 Glypican-1 7 10 2.8 3.5 61.6
P07339 Cathepsin D 13 68 3.4 3.5 44.5
P41222 Prostaglandin-H2 D-isomerase 2 2 3.2 3.5 21.0
P21810 Biglycan 21 599 3.2 3.4 41.6
P02751 Fibronectin 102 4800 3.6 3.4 262.5
P08603 Complement factor H 11 20 3.1 3.4 139.0
Q9H4D0 Calsyntenin-2 10 20 3.1 3.4 106.9
P62826 GTP-binding nuclear protein Ran 7 25 2.7 3.4 24.4

309
P27658 Collagen alpha-1(VIII) chain 13 45 3.2 3.4 73.3
P26639 Threonine--tRNA ligase,
cytoplasmic 6 8 3.3 83.4
Q15582 Transforming growth factor-beta-
induced protein ig-h3 28 647 3.2 3.3 74.6
Q7Z304 MAM domain-containing protein
2 16 47 3.2 3.3 77.5
Q02809 Procollagen-lysine,2-
oxoglutarate 5-dioxygenase 1 22 117 3.8 3.3 83.5
O00468 Agrin 14 29 2.9 3.3 217.1
P15502 Elastin 6 18 3.5 3.3 68.4
P02461 Collagen alpha-1(III) chain 44 177 3.3 3.3 138.5
P24593 Insulin-like growth factor-binding
protein 5 9 48 3.3 3.3 30.6
P04264 Keratin, type II cytoskeletal 1 13 42 2.6 3.3 66.0
P13667 Protein disulfide-isomerase A4 2 3 2.8 3.3 72.9
P08572 Collagen alpha-2(IV) chain 43 144 3.0 3.3 167.4
P17936 Insulin-like growth factor-binding
protein 3 11 38 3.2 3.3 31.7
Q12841 Follistatin-related protein 1 22 590 3.5 3.2 35.0
P13645 Keratin, type I cytoskeletal 10 9 12 2.6 3.2 58.8
P28799 Granulins 5 12 3.0 3.2 63.5
Q16610 Extracellular matrix protein 1 10 27 3.0 3.2 60.6
O94985 Calsyntenin-1 7 24 2.8 3.2 109.7
Q08431 Lactadherin 4 18 2.7 3.1 43.1
P55083 Microfibril-associated
glycoprotein 4 4 52 3.5 3.1 28.6
Q9Y4K0 Lysyl oxidase homolog 2 9 38 2.7 3.1 86.7
Q16270 Insulin-like growth factor-binding
protein 7 21 879 2.9 3.1 29.1
P02452 Collagen alpha-1(I) chain 86 1758 3.2 3.1 138.9
P06865 Beta-hexosaminidase subunit
alpha 5 11 2.5 3.1 60.7
P12107 Collagen alpha-1(XI) chain 15 47 3.0 3.1 181.0
P05121 Plasminogen activator inhibitor 1 24 1059 3.1 3.1 45.0
Q9UBX5 Fibulin-5 5 12 2.6 3.0 50.1
Q14118 Dystroglycan 4 8 3.1 3.0 97.4
P10909 Clusterin 9 86 2.9 3.0 52.5
P07996 Thrombospondin-1 46 364 3.8 3.0 129.3
Q96HF1 Secreted frizzled-related protein
2 9 22 3.0 3.0 33.5
P09486 SPARC 20 3097 3.2 3.0 34.6
Q16363 Laminin subunit alpha-4 3 7 2.4 3.0 202.4
Q16777 Histone H2A type 2-C 2 2 2.6 2.9 14.0
P08476 Inhibin beta A chain 16 35 3.0 2.9 47.4

310
Q9BWS9 Chitinase domain-containing
protein 1 3 13 2.2 2.9 44.9
Q10471 Polypeptide N-
acetylgalactosaminyltransferase 2
6 16 2.7 2.9 64.7
Q99715 Collagen alpha-1(XII) chain 59 175 2.8 2.9 332.9
P36873 Serine/threonine-protein
phosphatase PP1-gamma catalytic subunit
2 4 2.4 2.9 37.0
P07942 Laminin subunit beta-1 17 42 2.8 2.8 197.9
P55209 Nucleosome assembly protein 1-
like 1 3 5 2.3 2.8 45.3
P35908 Keratin, type II cytoskeletal 2
epidermal 9 15 2.3 2.8 65.4
O95678 Keratin, type II cytoskeletal 75 4 8 2.1 2.7 59.5
P08253 72 kDa type IV collagenase 23 74 2.5 2.7 73.8
P35527 Keratin, type I cytoskeletal 9 7 38 2.1 2.6 62.0
Q08380 Galectin-3-binding protein 21 128 2.8 2.6 65.3
Q12805 EGF-containing fibulin-like
extracellular matrix protein 1 17 75 2.7 2.6 54.6
P24821 Tenascin 35 150 2.9 2.6 240.7
P98160 Basement membrane-specific heparan sulfate proteoglycan
core protein 23 99 2.3 2.5 468.5
O95967 EGF-containing fibulin-like
extracellular matrix protein 2 3 6 2.5 2.5 49.4
P51884 Lumican 12 75 2.3 2.3 38.4
P01023 Alpha-2-macroglobulin 11 13 1.6 2.0 163.2
P02768 Serum albumin 15 81 1.7 1.9 69.3
P02765 Alpha-2-HS-glycoprotein 2 3 1.9 39.3
Q06210 Glutamine--fructose-6-phosphate aminotransferase [isomerizing] 1
3 5 78.8
Q86UX2 Inter-alpha-trypsin inhibitor heavy
chain H5 2 18 104.5
P48637 Glutathione synthetase 5 13 52.4
Q9P2E9 Ribosome-binding protein 1 3 6 152.4
O00469 Procollagen-lysine,2-
oxoglutarate 5-dioxygenase 2 6 6 84.6
Q9Y240 C-type lectin domain family 11
member A 2 2 35.7
Q96FQ6 Protein S100-A16 3 7 11.8
P28070 Proteasome subunit beta type-4 4 11 29.2
P07814 Bifunctional glutamate/proline--
tRNA ligase 2 4 170.5
P62081 40S ribosomal protein S7 3 4 22.1
P62269 40S ribosomal protein S18 2 3 17.7
P68402 Platelet-activating factor
acetylhydrolase IB subunit beta 3 11 25.6
Q13308 Inactive tyrosine-protein kinase 7 7 12 118.3

311
Q13907 Isopentenyl-diphosphate Delta-
isomerase 1 2 4 26.3
P46781 40S ribosomal protein S9 2 2 22.6
Q13509 Tubulin beta-3 chain 14 169 50.4
Q05707 Collagen alpha-1(XIV) chain 2 2 193.4
P06737 Glycogen phosphorylase, liver
form 4 4 97.1
P67809 Nuclease-sensitive element-
binding protein 1 4 8 35.9
P62873 Guanine nucleotide-binding
protein G(I)/G(S)/G(T) subunit beta-1
2 2 37.4
Q13200 26S proteasome non-ATPase
regulatory subunit 2 4 7 100.1
P55060 Exportin-2 2 2 110.3
P00491 Purine nucleoside phosphorylase 2 4 32.1
Q6IBS0 Twinfilin-2 2 2 39.5
Q9P1F3 Costars family protein ABRACL 2 2 9.1
Q01082 Spectrin beta chain, non-
erythrocytic 1 3 3 274.4
P63244 Guanine nucleotide-binding protein subunit beta-2-like 1
2 2 35.1
P24844 Myosin regulatory light
polypeptide 9 6 20 19.8
P02795 Metallothionein-2 3 10 6.0
Q15181 Inorganic pyrophosphatase 4 6 3.2 32.6
O95865 N(G),N(G)-dimethylarginine dimethylaminohydrolase 2
3 8 3.0 29.6
Q14697 Neutral alpha-glucosidase AB 4 6 3.8 106.8
Q96KP4 Cytosolic non-specific
dipeptidase 3 4 3.6 52.8
P59998 Actin-related protein 2/3 complex
subunit 4 3 3 4.1 19.7
O14818 Proteasome subunit alpha type-7 4 5 3.4 27.9
O43776 Asparagine--tRNA ligase,
cytoplasmic 4 7 4.0 62.9
P09104 Gamma-enolase 7 539 3.4 47.2
Table 5.8: Differentially released conditioned medium proteins at 48 hours
Astrocyte-released proteins measured in condition media from TMT experiments
comparing protein abundance between mild and severe stretched cells in conditioned
media collected 48 hours post-injury.

312
5.7 REFERENCES
1. S. C. Choi, R. Bullock, Design and statistical issues in multicenter trials of severe
head injury. Neurological research 23, 190-192 (2001); published online EpubMar-
Apr (10.1179/016164101101198325).
2. J. A. Langlois, W. Rutland-Brown, M. M. Wald, The Epidemiology and Impact of
Traumatic Brain Injury. Journal of Head Trauma Rehabilitation 21, 375-378 (2006).
3. G. Franz, R. Beer, A. Kampfl, K. Engelhardt, E. Schmutzhard, H. Ulmer, F.
Deisenhammer, Amyloid beta 1–42 and tau in cerebrospinal fluid after severe
traumatic brain injury. Neurology 60, (2003).
4. N. Shiiya, T. Kunihara, T. Miyatake, K. Matsuzaki, K. Yasuda, Tau protein in the
cerebrospinal fluid is a marker of brain injury after aortic surgery. Ann Thorac Surg
77, (2004).
5. P. P. Tsitsopoulos, N. Marklund, Amyloid-beta peptides and tau protein as
biomarkers in cerebrospinal and interstitial fluid following traumatic brain injury: a
review of experimental and clinical studies. Front Neurol 4, (2013).
6. I. B. Wanner, M. A. Anderson, B. Song, J. Levine, A. Fernandez, Z. Gray-
Thompson, Y. Ao, M. V. Sofroniew, Glial scar borders are formed by newly
proliferated, elongated astrocytes that interact to corral inflammatory and fibrotic
cells via STAT3-dependent mechanisms after spinal cord injury. J Neurosci 33,
(2013).
7. J. E. Burda, M. V. Sofroniew, Reactive gliosis and the multicellular response to
CNS damage and disease. Neuron 81, (2014).

313
8. I. B. Wanner, An in vitro trauma model to study rodent and human astrocyte
reactivity. Methods in molecular biology 814, (2012).
9. I. B. Wanner, M. Deik, M. Torres, A. R. Rosendahl, J. T. Neary, V. P. Lemmon, J.
L. Bixby, A new in vitro model of the glial scar inhibits axon growth. Glia 56, (2008).
10. M. Sondej, P. Doran, J. A. Loo, I. Wanner, in Sample preparation in biological mass
spectrometry, A. Ivanov, A. Lazarev, Eds. (Springer, Dordrecht, 2011).
11. E. F. Ellis, J. S. McKinney, K. A. Willoughby, S. Liang, J. T. Povlishock, A new
model for rapid stretch-induced injury of cells in culture: characterization of the
model using astrocytes. Journal of neurotrauma 12, (1995).
12. E. F. Ellis, K. A. Willoughby, S. A. Sparks, T. Chen, S100B protein is released from
rat neonatal neurons, astrocytes, and microglia by in vitro trauma and anti-S100
increases trauma-induced delayed neuronal injury and negates the protective
effect of exogenous S100B on neurons. J Neurochem 101, (2007).
13. A. Sandberg, R. M. Branca, J. Lehtio, J. Forshed, Quantitative accuracy in mass
spectrometry based proteomics of complex samples: the impact of labeling and
precursor interference. Journal of proteomics 96, 133-144 (2014); published online
EpubJan 16 (10.1016/j.jprot.2013.10.035).
14. H. Wang, S. Alvarez, L. M. Hicks, Comprehensive comparison of iTRAQ and label-
free LC-based quantitative proteomics approaches using two Chlamydomonas
reinhardtii strains of interest for biofuels engineering. Journal of proteome research
11, 487-501 (2012); published online EpubJan 1 (10.1021/pr2008225).

314
15. M. Bantscheff, M. Boesche, D. Eberhard, T. Matthieson, G. Sweetman, B. Kuster,
Robust and Sensitive iTRAQ Quantification on an LTQ Orbitrap Mass
Spectrometer. Molecular & Cellular Proteomics 7, 1702-1713 (2008)10.1074/).
16. E. H. Pettus, C. W. Christman, M. L. Giebel, J. T. Povlishock, Traumatically
Induced Altered Membrane Permeability: Its Relationship to Traumatically Induced
Reactive Axonal Change. Journal of Neurotrauma 11, 507-522 (1994).
17. O. Farkas, J. Lifshitz, J. T. Povlishock, Mechanoporation Induced by Diffuse
Traumatic Brain Injury: An Irreversible or Reversible Response to Injury? The
Journal of Neuroscience 25, 3130-3140 (2006).
18. S. Schenk, G. J. Schoenhals, G. de Souza, M. Mann, A high confidence, manually
validated human blood plasma protein reference set. BMC medical genomics 1,
41 (2008); published online EpubSep 15 (10.1186/1755-8794-1-41).
19. V. Nanjappa, J. K. Thomas, A. Marimuthu, B. Muthusamy, A. Radhakrishnan, R.
Sharma, A. Ahmad Khan, L. Balakrishnan, N. A. Sahasrabuddhe, S. Kumar, B. N.
Jhaveri, K. V. Sheth, R. Kumar Khatana, P. G. Shaw, S. M. Srikanth, P. P. Mathur,
S. Shankar, D. Nagaraja, R. Christopher, S. Mathivanan, R. Raju, R. Sirdeshmukh,
A. Chatterjee, R. J. Simpson, H. C. Harsha, A. Pandey, T. S. Prasad, Plasma
Proteome Database as a resource for proteomics research: 2014 update. Nucleic
acids research 42, D959-965 (2014); published online EpubJan
(10.1093/nar/gkt1251).
20. M. J. Whalen, T. Dalkara, Z. You, J. Qiu, D. Bermpohl, N. Mehta, B. Suter, P. G.
Bhide, E. H. Lo, M. Ericsson, M. A. Moskowitz, Acute plasmalemma permeability
and protracted clearance of injured cells after controlled cortical impact in mice.

315
Journal of cerebral blood flow and metabolism : official journal of the International
Society of Cerebral Blood Flow and Metabolism 28, 490-505 (2008); published
online EpubMar (10.1038/sj.jcbfm.9600544).
21. R. H. Singleton, J. T. Povlishock, Identification and characterization of
heterogeneous neuronal injury and death in regions of diffuse brain injury:
evidence for multiple independent injury phenotypes. The Journal of neuroscience
: the official journal of the Society for Neuroscience 24, 3543-3553 (2004);
published online EpubApr 7 (10.1523/JNEUROSCI.5048-03.2004).
22. M. C. LaPlaca, G. R. Prado, Neural mechanobiology and neuronal vulnerability to
traumatic loading. Journal of Biomechanics 43, 71-78 (2010).
23. R. S. B. Clark, P. M. Kochanek, S. C. Watkins, M. Chen, C. E. Dixon, N. A.
Seidberg, J. Melick, J. E. Loeffert, P. D. Nathaniel, K. L. Jin, S. H. Graham,
Caspase-3 Mediated Neuronal Death AfterTraumatic Brain Injury in Rats. Journal
of Neurochemistry 74, 740-753 (2000).
24. A. Degterev, Z. Huang, M. Boyce, Y. Li, P. Jagtap, N. Mizushima, G. D. Cuny, T.
J. Mitchison, M. A. Moskowitz, J. Yuan, Chemical inhibitor of nonapoptotic cell
death with therapeutic potential for ischemic brain injury. Nature chemical biology
1, 112-119 (2005); published online EpubJul (10.1038/nchembio711).
25. R. S. Clark, P. M. Kochanek, P. D. Adelson, M. J. Bell, J. A. Carcillo, M. Chen, S.
R. Wisniewski, K. Janesko, M. J. Whalen, S. H. Graham, Increases in bcl-2 protein
in cerebrospinal fluid and evidence for programmed cell death in infants and
children after severe traumatic brain injury. The Journal of pediatrics 137, 197-204
(2000); published online EpubAug (10.1067/mpd.2000.106903).

316
26. A. K. Ottens, L. Bustamante, E. C. Golden, C. Yao, R. L. Hayes, K. K. Wang, F. C.
Tortella, J. R. Dave, Neuroproteomics: a biochemical means to discriminate the
extent and modality of brain injury. J Neurotrauma 27, 1837-1852 (2010);
published online EpubOct (10.1089/neu.2010.1374).
27. K. E. Saatman, K. J. F. Feeko, R. L. Pape, R. Raghupathi, Differential Behavioral
and Histopathological Responses to Graded Cortical Impact Injury in Mice. Journal
of Neurotrauma 23, 1241-1253 (2006).
28. J. M. Spaethling, D. M. Geddes-Klein, W. J. Miller, C. R. von Reyn, P. Singh, M.
Mesfin, S. J. Bernstein, D. F. Meaney, Linking impact to cellular and molecular
sequelae of CNS injury: Modeling in vivo complexity with in vitro simplicity. 161,
27-39 (2007)10.1016/s0079-6123(06)61003-0).
29. J. Y. Kim, N. Kim, Z. Zheng, J. E. Lee, M. A. Yenari, The 70 kDa heat shock protein
protects against experimental traumatic brain injury. Neurobiology of disease 58,
289-295 (2013); published online EpubOct (10.1016/j.nbd.2013.06.012).
30. J. Y. Kim, M. A. Yenari, The immune modulating properties of the heat shock
proteins after brain injury. Anatomy & cell biology 46, 1-7 (2013); published online
EpubMar (10.5115/acb.2013.46.1.1).
31. D. L. Feinstein, E. Galea, D. A. Aquino, G. C. Li, H. Xu, D. J. Reis, Heat Shock
Protein 70 Suppresses Astroglial-inducible Nitric-oxide Synthase Expression by
Decreasing NFkB Activation. The Journal of Biological Chemistry 271, 17724-
17732 (1996).
32. X. Yao, J. Liu, J. T. McCabe, Ubiquitin and ubiquitin-conjugated protein expression
in the rat cerebral cortex and hippocampus following traumatic brain injury (TBI).

317
Brain research 1182, 116-122 (2007); published online EpubNov 28
(10.1016/j.brainres.2007.08.076).
33. M. Majetschak, D. R. King, U. Krehmeier, L. T. Busby, C. Thome, S. Vajkoczy, K.
G. Proctor, Ubiquitin immunoreactivity in cerebrospinal fluid after traumatic brain
injury: Clinical and experimental findings. Critical Care Medicine 33, 1589-1594
(2005)10.1097/01.ccm.0000169883.41245.23).
34. K. Dikranian, R. Cohen, C. Mac Donald, Y. Pan, D. Brakefield, P. Bayly, A.
Parsadanian, Mild traumatic brain injury to the infant mouse causes robust white
matter axonal degeneration which precedes apoptotic death of cortical and
thalamic neurons. Experimental neurology 211, 551-560 (2008); published online
EpubJun (10.1016/j.expneurol.2008.03.012).
35. P. N. Lizhnyak, A. K. Ottens, Proteomics: in pursuit of effective traumatic brain
injury therapeutics. Expert review of proteomics 12, 75-82 (2015); published online
EpubFeb (10.1586/14789450.2015.1000869).
36. G. Barkhoudarian, D. A. Hovda, C. C. Giza, The molecular pathophysiology of
concussive brain injury. Clinics in sports medicine 30, 33-48, vii-iii (2011);
published online EpubJan (10.1016/j.csm.2010.09.001).
37. L. Papa, L. Akinyi, M. C. Liu, J. A. Pineda, J. J. Tepas, 3rd, M. W. Oli, W. Zheng,
G. Robinson, S. A. Robicsek, A. Gabrielli, S. C. Heaton, H. J. Hannay, J. A.
Demery, G. M. Brophy, J. Layon, C. S. Robertson, R. L. Hayes, K. K. Wang,
Ubiquitin C-terminal hydrolase is a novel biomarker in humans for severe traumatic
brain injury. Crit Care Med 38, 138-144 (2010); published online EpubJan
(10.1097/CCM.0b013e3181b788ab).

318
38. S. Mondello, A. Linnet, A. Buki, S. Robiscek, A. Gabrielli, J. Tepas, L. Papa, G. M.
Brophy, F. Tortella, R. L. Hayes, K. K. Wang, Clinical Utility of Serum Levels of
Ubiquitin C-Terminal Hydrolase as a Biomarker for Severe Traumatic Brain Injury.
Neurosurgery 70, 666-675 (2011)10.1227/NEU.0b013e318236a809).
39. E. P. Thelin, D. Just, A. Frostell, A. Haggmark-Manberg, M. Risling, M. Svensson,
P. Nilsson, B. M. Bellander, Protein profiling in serum after traumatic brain injury
in rats reveals potential injury markers. Behavioural brain research, (2016);
published online EpubAug 31 (10.1016/j.bbr.2016.08.058).
40. R. Siman, T. K. McIntosh, K. M. Soltesz, Z. Chen, R. W. Neumar, V. L. Roberts,
Proteins released from degenerating neurons are surrogate markers for acute
brain damage. Neurobiology of disease 16, 311-320 (2004); published online
EpubJul (10.1016/j.nbd.2004.03.016).
41. C. Loov, A. G. Nadadhur, L. Hillered, F. Clausen, A. Erlandsson, Extracellular
ezrin: a novel biomarker for traumatic brain injury. J Neurotrauma 32, 244-251
(2015); published online EpubFeb 15 (10.1089/neu.2014.3517).
42. C. Loov, G. Shevchenko, A. Geeyarpuram Nadadhur, F. Clausen, L. Hillered, M.
Wetterhall, A. Erlandsson, Identification of injury specific proteins in a cell culture
model of traumatic brain injury. PLoS One 8, e55983
(2013)10.1371/journal.pone.0055983).
43. M. Fujimura, T. Tominaga, P. H. Chan, Neuroprotective effect of an antioxidant in
ischemic brain injury. Neurocritical care 2, 59-66 (2005).
44. H. Endo, C. Nito, H. Kamada, F. Yu, P. H. Chan, Reduction in oxidative stress by
superoxide dismutase overexpression attenuates acute brain injury after

319
subarachnoid hemorrhage via activation of Akt/glycogen synthase kinase-3β
survival signaling. Journal of Cerebral Blood Flow & Metabolism 27, 975-982
(2007).
45. I. B. Wanner, An in vitro trauma model to study rodent and human astrocyte
reactivity. Methods in molecular biology 814, 189-219 (2012)10.1007/978-1-
61779-452-0_14).
46. K. Hodge, S. T. Have, L. Hutton, A. I. Lamond, Cleaning up the masses: exclusion
lists to reduce contamination with HPLC-MS/MS. Journal of proteomics 88, 92-103
(2013); published online EpubAug 2 (10.1016/j.jprot.2013.02.023).
47. G. S. Omenn, D. J. States, M. Adamski, T. W. Blackwell, R. Menon, H. Hermjakob,
R. Apweiler, B. B. Haab, R. J. Simpson, J. S. Eddes, E. A. Kapp, R. L. Moritz, D.
W. Chan, A. J. Rai, A. Admon, R. Aebersold, J. Eng, W. S. Hancock, S. A. Hefta,
H. Meyer, Y. K. Paik, J. S. Yoo, P. Ping, J. Pounds, J. Adkins, X. Qian, R. Wang,
V. Wasinger, C. Y. Wu, X. Zhao, R. Zeng, A. Archakov, A. Tsugita, I. Beer, A.
Pandey, M. Pisano, P. Andrews, H. Tammen, D. W. Speicher, S. M. Hanash,
Overview of the HUPO Plasma Proteome Project: results from the pilot phase with
35 collaborating laboratories and multiple analytical groups, generating a core
dataset of 3020 proteins and a publicly-available database. Proteomics 5, 3226-
3245 (2005); published online EpubAug (10.1002/pmic.200500358).

320
CHAPTER 6: FUTURE DIRECTIONS FOR SPINAL CORD AND HEAD TRAUMA
6.1 INTRODUCTION
Swine is an important biomedical model for the study of human diseases given its
similarities with the human genome. This has allowed researchers the ability to generate
transgenic models for the study of specific human diseases. Additionally, comparison of
predicted porcine sequences to predicted human orthologues has not only demonstrated
high primary sequence identity but also similarities in disease related amino acid point
mutations (1). Here we examine the differences in global proteomic changes between
healthy and spinal cord injured (SCI) Yucatan swine with the goal of identifying new
candidate markers for SCI. Top candidates were selected based on CNS enrichment and
overlap between candidates from our astrocyte injury model.
Additionally, we also evaluated the effects of pre-analytical factors that may
influence both the qualitative and quantitative analyses of biofluid proteomes (2).
Cerebrospinal fluid (CSF), a filtrate of plasma, is the most proximal fluid to the central
nervous system (CNS). As such, CSF is perhaps the most valuable biofluid source to
monitor and identify differential protein signatures in neurological trauma and diseases. It
has been documented in the literature that even small degrees of blood contamination
can have large manifestations in protein compositions measured between control and
healthy states (3, 4). We evaluated the issue of blood contamination through the
development of hemolysis blood protein assay.

321
6.2 RESULTS
Blood contamination of CSF and hemolysis analysis
Blood contamination critically alters the protein composition of a CSF sample, as
blood protein concentrations exceeds that of CSF by a factor of 200 to 1 (3). In our present
study of Yucatan swine SCI CSF, our team identified significant, persistent blood
contamination. The effects of blood contamination were observed by our collaborators in
their SDS-PAGE separations of specimen CSF. Ponceau S staining confirmed the
presence of blood in CSF, illustrated by the ~60kDa sized blood-derived albumin signal
in samples (Figure 6.1). The presence of high blood protein signal manifested itself in our
shotgun CSF analysis in the form of relatively low protein IDs. To establish an
approximate but quantitative assessment of blood contamination, we employed spectral
counting (5, 6), a label-free mass spectrometry based quantitative proteomics analysis.
This method calculated a normalized spectral abundance factor (NSAF) based on the
number of peptide MS/MS spectra used in protein identification as a measure of its
abundance. Observed spectral counts are normalized based on protein size to account
for smaller proteins having fewer peptides identified compared to large proteins. Based
on previous reports of blood contamination, hemoglobin was chosen as a surrogate
marker for hemolysis (7, 8). It should be noted that under normal physiological conditions,
red blood cells are unable to cross the blood spinal cord barrier (BSCB). And while BSCB
compromise has been documented to occur rapidly after SCI (9, 10), high blood
contamination was also observed in both baseline CSF and sham uninjured animals as
well. This data suggested that not all cases of blood contamination were injury related
and that inconsistent CSF collection procedures were also an issue.

322
Figure 6.1 demonstrates an example sample comparison of qualitative Ponceau S
staining observations with our label-free MS quantitation. For pig 43-031, high relative
abundances of hemoglobin and albumin associated with both low protein identifications
within the run and a thick blood-derived albumin band on the gel. Upon completion of the
entire SCI CSF shotgun dataset, we found that lower protein IDs correlated better with
increased albumin signal than total hemoglobin content, albeit both correlations were
poor. Using the data from Table 6.1, elevated albumin content of greater than 10%
generally correlated to reduced protein IDs with a Spearman correlation coefficient
of -0.517 compared to -0.329 for total hemoglobin signal. As a result of these findings,
albumin content, in addition to hemoglobin content will be evaluated moving forward for
a blood contamination assay. Depletion procedures using cibacron blue and commercial
top 12 blood protein spin columns were also assessed for swine biofluids. This, however,
caused complete removal or marked reduction of all biomarker signals and is thus not an
option for improving IDs from proteomic screenings of contaminated swine CSF samples.
Establishing a pig spinal cord injury cerebrospinal fluid proteome
Injured animals 43-031, 42-115, 42-068, 43-082, and 42-127 were used in our
identification of a spinal cord injury-related proteome or “traumatome.” Exclusion of the
remaining 9 SCI and 7 sham uninjured animals was based on the results of our
hemoglobin blood contamination assay (Table 6.1). Triplicate analyses of CSF from
baseline and SCI time-points 20m, 2.7h, 2d, and 7d were performed using a top-10 data-
dependent workflow. A total of 413 proteins were identified from 5 baseline CSF samples.
462 and 537 proteins were identified for the acute SCI (20m and 2.7h) and all SCI time-

323
points, respectively. Proteins were identified from database searching against a Sus
scrofa (pig) reference proteome (UP00008227) consisting of 26,101 proteins transcribed
from a reference genome established by the Swine Genome Sequencing Consortium (11,
12). However, in contrast to the well curate SwissProt human reference proteome, a large
portion of the Sus scrofa reference proteome consisted of uncharacterized proteins,
offering little insight or information into protein level differences between SCI and healthy
CSF. To circumvent this road block, uncharacterized pig protein IDs were converted to
ENSEMBL gene IDs to identify human orthologues and their corresponding gene
products. This resulted in a total 340, 385 and 435 proteins successfully identified from
baseline CSF, acute SCI CSF, and all SCI CSF.
The 340 proteins identified from baseline samples were used as our reference
healthy CSF proteome. This was compared with proteins identified in our acute SCI time-
points. This window acutely post-injury was chosen based on concerns over the rapid
onset of proteolysis after injury as well as protein clearance into the blood as early as
overnight after injury (13). Comparative analysis (Figure 6.2) revealed 100 proteins
specific to SCI CSF acutely after injury that constitutes an acute SCI traumatome (Table
6.4) The 285 overlapping proteins from both conditions is shown in Table 6.5.
Identification of new spinal cord injury biomarkers
Proteins within our SCI traumatome were then evaluated for candidate biomarkers
based on the criteria of central nervous system tissue enrichment. This was performed
with the aid of the Human Protein Atlas (14, 15), which presents a map of the human
tissue proteome compiled using a combination of quantitative transcriptomics from tissue

324
and organs and microarray immunohistochemistry-based protein profiling on tissue.
Furthermore, despite shotgun data hindered by blood protein contamination, proteomic
profiles from additional SCI samples 46-030, 47-094, 42-132 and sham animals 46-149,
47-050, 47-051, 47-052, 47-018, and 46-101 were additionally considered in narrowing
our brain enriched candidate list. A total of 12 SCI specific-brain enriched candidates were
identified in 8 SCI samples (Table 6.2). Several of these proteins were also observed in
6 uninjured samples. While their presence in control CSF may potentially lower their
specificity, it does not necessarily exclude their diagnostic value. Additionally, the fact that
these were identified despite high blood contamination and low proteomic depth may be
a beneficial quality when considering biomarker robustness and sensitivity. Of these 12
proteins, lumican, carboxypeptidase E, and glial fibrillary acidic protein (GPAP) were also
observed to be preferentially released by injured astrocytes.

325
6.3 DISCUSSION
Improved CSF extraction and blood contamination assay needed
Vasculature damage and breakdown of the blood spinal-cord barrier is a
documented consequence of spinal cord injury in both human patients and animal models
(9, 10, 16, 17). This pathology complicates analysis of proximal fluid proteomics such as
CSF in identifying changes in protein compositions as a result of injury as the
concentration of protein in CSF is very low (0.2-0.5%) compared to blood. As a result,
minor blood contamination during the collection of CSF may be highly consequential to
the observed protein profiles. While the presence of blood signatures may be expected
for animals who had experienced a severe SCI as characterized in Chapter 4, high levels
of blood protein were also observed in baseline and un-injured animal samples. This led
to the suspicion of issues with CSF sample collection prior to MS analysis.
A label-free quantitative assay utilizing the number of MS2 acquisitions as a
surrogate measure of protein abundance within a run was used to assess all shotgun
analysis of SCI CSF. Red blood cells (RBC) are unable to cross an intact BSCB. However,
constituent RBC proteins released by hemolysis are clear identifiers of blood
contamination in sample. This combined with previous studies (7, 8) led us to choose
hemoglobin percentage per sample as a metric for adequate CSF extraction. While initial
results showed promising results with strong associations to qualitative staining results
and protein IDs, later samples encountered lower spearman associations (-0.329) with
proteomic depth. Additionally, hemoglobin was not detected in some samples. This
observation could be related to the stability of hemoglobin. Hemoglobin is not normally
present in CSF and thus could be more susceptible to the degradative processes

326
compared to native CSF proteins (3). It is also possible that our added protease cocktail
did not confer protection or that degradation occurred prior to addition. These unknown
factors represent additional pre-analytical considerations to be evaluated in future
animals.
From our data, albumin content was found to associate more strongly with the
number of identified CSF proteins (Spearman r.s. -0.517). This may prove to be a better
measure of sample purity to be further evaluated. Additional blood specific, abundant
proteins such as catalase, peroxiredoxin, and carbonic anhydrase I (2, 7) may also be
evaluated in our assay.
Lumican and carboxypeptidase E are two interesting SCI biomarker candidates
While identification of completely CNS-specific proteins has proved challenging,
we were able to identify a group of proteins in our swine SCI traumatome that are CNS
enriched with the aid of the Human Protein Tissue Atlas. Inferences of organ specificity
in pigs was made based on high similarities between domestic pigs and humans in terms
of anatomy, physiology, and genetics (1, 18, 19). From this CNS-enriched, list, new
candidate protein lumican (F1SQ09) was identified only in severely injured animals along
with known biomarker GFAP. It should be noted that low-to-no GFAP levels were
measured in many of our mild-moderately injured SCI cohort. Co-identification of GFAP
and lumican by less sensitive untargeted MS experiments suggest both sensitivity and
selectivity as a candidate diagnostic. Lumican is a 40 kDa keratin sulfate proteoglycan
that regulates collagen fibril assembly that is commonly associated with scarring as a
result of injury. While this evidence suggests injury specificity, lumican, despite being

327
more highly expressed in the brain, is ubiquitously distributed throughout the
mesenchymal tissue (20). How lumican protein levels change after injury and whether
these measures can be distinguished from co-morbidities associated with CNS injury will
need to be assessed.
Carboxypeptidase E (CPE) represents the second of our top SCI (and potentially
TBI) new biomarker candidates. CPE is responsible for processing neuropeptides
involved in regulating CNS responses to stimuli and stresses. Previous reports in the
literature have demonstrated that CPE has a neuroprotective effect in the CNS and that
disruption of CPE function by changes in calcium dynamics leads to greater adverse
effects (21, 22). CPE has been shown to reduce ER stress and apoptosis in models of
diabetes through prohormone processing (23). While previously regarded as a
housekeeping enzyme, these findings demonstrate the potential for CPE to be
differentially expressed or regulated in response to stress.
After culling through our top candidate lists from SCI and astroglial injury (Chapter
5), we have arrived at 12 priority proteins (14 kDa phosphohistidine phosphatase,
calmodulin, CPE, ezrin, lumican, peptidyl-prolyl cis-trans isomerase A, superoxide
dismutase, transgelin, tropomyosin alpha-1, tropomyosin beta chain, tymosin beta-3,
tymosin beta-10) for further verification in our readily available SCI injury model. Skyline
was used to identify top peptide candidates from spectral libraries (Peptide Atlas) that are
unique to a pig protein background. An inclusion list for these top peptides in included in
Table 6.3.

328
6.4 CONCLUDING REMARKS
A major hurdle to the development of diagnostic tools and therapeutic agents for
neurotraumatic head and spine injury lies in our inadequate characterization of the
disease state. As discussed in previous chapters, traumatic brain injury (TBI)
classification through clinical point of care neurocognitive assessments are insensitive
and post-hoc multivariate classifications schemes lack standardizations between
research and clinical groups. So despite the large number of TBI and spinal cord injury
(SCI) biomarker studies, evidence of their clinical utility has thus far been underwhelming.
Perhaps the biggest hurdle to the overarching biomarker goal has been inadequately
defined injury models on a cellular level with special focus on protein levels changes that
are most relevant to disease pathology. Achievement of a more nuanced understanding
of proteomic changes related to injury sequelae requires development in the following
areas. First, an effort must be made to collect more complete clinical data that includes
multiple time-matched Glasgow coma scale (GCS) scores, ICPs for severe patients,
imaging data, long-term functional recovery, and whether any medications were
administered after injury. Clinical cerebrospinal fluid (CSF) samples are already difficult
to acquire as evidence by our limited cohort of TBI patient CSF samples and incomplete
patient information further hinders our ability to categorize patients for analysis.
Secondly, and most challengingly, the field must strive to establish a more
objective molecular fingerprint of TBI. Our research has focused on the identification of a
proteins that are discriminate of TBI and robustly detectable after injury. Our verification
studies have narrowed its focus to proteins with enriched astroglial contributions in the
central nervous system (CNS) with less emphasis on their relation to the molecular

329
pathologies of neurotrauma. While, our markers have demonstrated the ability to define
injury, we observe a wide range of concentration responses in proximal fluid from patient
to patient. This variance in our data arises from either injury response heterogeneity
(individuals develop different pathophysiological responses to similar injury forces) or
from the differing severities of trauma within our patient cohort. We can abate the
influences of these sources of variance by more quantitatively defining the extent of injury
through specific molecular markers of post-traumatic processes such as mitochondrial
dysfunction, cellular ionic imbalance, increased glutamate levels, cell death, and
membrane compromise. Our markers have started along this path by examining
extracellular concentrations of proteins as they relate to cell wounding. However, because
the neurotraumatic disease state arises not from singular pathway irregularities but a
multitude of dysfunction, additional markers are needed to adequately define individual
mechanisms associated with initial injury. Markers related to increased levels of oxidative
stress, cell death, decrease in cellular integrity, and immunity will help us to better
characterize both cell based and animal injury research models. And while many of these
markers may lack CNS specificity, they are none the less beneficial in this context to
establishing a continuum of injury for graded fluid biomarker assessment. So in our efforts
to identify clinically relevant biomarkers, we may need to first take a step back and
establish better metrics to define the molecular taxonomy of CNS injury as they relate to
both TBI and SCI.
The other hand of TBI management is therapeutic interventions. Drug
development in TBI is straddled with variables related to population heterogeneity.
Further limiting the success of research studies is the lack of mechanistic measures of

330
efficacy (and also safety) as described above. The importance of establishing molecular
signatures extends beyond its associated diagnostic potential but also increases the
value of preclinical research into new therapies by establishing more sensitive and
hopefully standardized criteria for outcome measures. On the clinical end, this may
ensure more accurate enrollment of and assessment of clinical trials by allowing clinicians
to isolate only patients of a specific severity or patients with specific pathway related
marker elevations. When considering the study of therapeutic effects of new treatment
modalities, time is another critical factor for neurotraumatic studies that requires further
investigation. Temporal proteomic profiling allows for characterization of the evolution of
biochemical processes that mechanically injured cells experience. Although this is a very
resource and analysis intensive process, it is the only way to accurately capture the
dynamic events of TBI. Protein level trends visualized in the form of rate of clearance or
accumulation may also possess more utility than concentration alone when considering
how individual responses to injury may shift the timing of disease related sequences. This
can be missed from a static picture of disease. We have started some work in this area
by examining changes in preferentially released proteins from stretched astrocytes with
relation to time and characterizing our astroglial injury biomarkers up to week after injury
in clinical TBI patient samples. Still, additional proteomic work examining this dynamic
window will tell a better story of injury as it relates to protein expression, release,
degradation, and clearance.
Finally, it is important to address animal injury models. While many models exist
in the literature (24), we should focus on those that produce injury as reproducibly as
possible. In our swine SCI experiments, we observed variable levels of injury from our

331
weight drop contusion model. While contusion models may best mimic the type of injury
patients may experience in everyday life, they may not be the most effective at
establishing reproducible severities of injury that are needed for research models.
Focusing on our pig SCI work, we may consider the use of a clip compression model (25,
26). This model provides a combination compression-contusion type injury using a
procedure that involves a laminectomy of the spine. Following surgery, a clip is closed at
a specific force around the spinal cord to produce an acute injury and then left to
compress the cord. This produces a combinatory compression, contusion type injury that
has been shown to produce graded responses. The simplicity of this design seems more
conducive to reproducibility compared to weight drop models where small deviations to
the impact site have large physiological consequences. Additionally, this technique can
be used to occlude blood flow to induce ischemic events for study. These type of
compression forces may also more closely mimic the type of compression forces
experienced in blast related TBI and SCI. While observations of injury response
heterogeneity are important to the field, consistent trauma models are more beneficial to
the goal of establishing defining molecular indicators of injury.
Great strides have been made in this field of neurotrauma study. However, the
limited progress toward a clinical useable marker in the last decade necessitates the need
to reevaluate our initial approaches. Cell and animal based injury models offer a
controlled and less confounded platform for comparative proteomic analysis but still
suffers from an incomplete molecular signature. A shift in focus to the characterization
distinct markers for metabolic, homeostatic, signaling, and regenerative abnormalities

332
after injury as they relate to cell death or functional recovery may address present issues
with reproducibility and variability of experimental models and results.

333
6.5 METHODS
Shotgun proteomics of swine cerebrospinal fluid
Volumes of swine CSF corresponding to 25 µg of protein measured by BCA protein
assay were reduced, alkylated, and digested with trypsin for bottom-up proteomic
analysis as previously described. 25 µg of digested protein was targeted for sample
preparation. Digested samples were desalted online using a C18 reversed phase trap
column before peptide separation on a C18 reversed phase column. Eluting peptides
were analyzed on a Q-Exactive Orbitrap mass spectrometer operating in Top10 data-
dependent acquisition as previously described. Duplicate to triplicate analyses of each
sample were searched using Proteome Discoverer 1.4 software configured with MASCOT
against a sus scrofa (pig) reference proteome (UP00008227) consisting of 26,101
proteins transcribed from a reference genome by the Swine Genome Sequencing
Consortium (11, 12). Proteins identified by only one unique peptide were not considered.
A subset of uncharacterized proteins were identified by homology to human gene
products using Ensembl Biomart (27, 28) web-based conversion tools.
Quantitative label-free proteomics
Spectral counting, a form of label-free quantitation, was used to calculate a
normalized spectral abundance factor (NSAF) (5, 6) value for each protein. NSAF values
were used to assess blood contamination/hemolysis through quantitation of hemoglobin
and albumin levels in CSF samples. NSAF was calculated for each protein k by the
following equation: NSAFk = [(SpC/L)k ]/ [Σ (SpC/L)] where SpC is the number of spectral

334
counts (or number of MS/MS spectra) for protein k divided by the protein’s length (L),
divided by the sum of all spectral counts (SpC/L) for all proteins in identified in the sample.
Blood depletion by cibacron blue and Top12 spin columns
50 µL of bloody CSF samples were depleted of α1-acid glycoprotein, α1-
antitrypsin, α2-macroglubulin, albumin, apolipoprotein A-I/II, fibrinogen, haptoglobin, IgA,
IgG, IgM, transferrin using Top 12 abundant protein depletion spin columns (PierceTM).
CSF was added directly to the resin slurry in the column and incubated with occasional
(every 5 min) gentle end-over-end mixing for 60 minutes at room temperature. Depleted
CSF was eluted off the column by centrifugation at 1000 x g for 2 minutes.
Alternatively, cibacron blue affinity depletion was assessed using a PierceTM
albumin depletion kit. 50 µL of CSF was diluted in 1:1 in binding/wash buffer to reduce
salt concentration for proper albumin binding. 400 µL of slurry was added to each spin
column and equilibrated per manufacturer’s instructions. 200 µL of diluted CSF was
applied was applied to the resin and allowed to incubate for 5 minutes at room
temperature. Samples was centrifuged at 12,000 x g for 1 minute and flow through
reapplied for maximal albumin binding. Unbound proteins were released with addition of
50 µL of 25mM Tris, 25mM NaCl; pH 7.5 with centrifugation at 12,000 x g for 1 minute.
This elution was repeated 3 more times with sequential flow-throughs combined and dried
by vacuum centrifugation prior to analysis.

335
6.6 FIGURES
Figure 6.1: High hemoglobin and albumin content observed in CSF corresponding
to low numbers of protein IDs
Hemolysis marker hemoglobin and albumin were measured in swine CSF samples for
animal 43-031 (p031) by spectral counting (left). Ponceau S staining of 30 µL CSF by
SDS-PAGE is shown on the right. Presence of blood protein is indicated by the ~60 kDa
blood derived albumin band designated by the red arrows. Increased blood protein signal
by Ponceau S corresponds to blood protein abundances measured by MS and accounts
for the low protein identifications (IDs) compared to samples without high blood protein
measurements by MS and Ponceau staining. Time points BL, Ac, pT, 2d, 7d correspond
to baseline, 15-30min post-SCI, 2-3h post-SCI, 2 days and 7 days post-SCI.

336
Figure 6.2: Comparison of baseline and acute spinal cord injury cerebrospinal fluid
samples identifies a trauma specific proteome
Baseline and acute (20 minutes – 2.7 hours) post spinal cord injury (SCI) cerebrospinal
(CSF) samples from animals 43-031, 42-115, 42-068, 43-082, and 42-127 analyzed by a
Top 10 data-dependent acquisition workflow. Baseline proteins and SCI proteins were
compared to identify 100 proteins specific to injury, termed the SCI traumatome.

337
6.7 TABLES
Condition Animal Time point % Hb (A+B) % Albumin %Albumin+%Hb #IDs
SCI 47-094 Baseline 2.7% 17.3% 20.0% 61 SCI 47-094 2.7 hr 13.2% 17.2% 30.5% 40 SCI 47-094 7 d 11.8% 11.1% 22.9% 33 SCI 42-068 Baseline 2.9% 10.0% 12.8% 155 SCI 42-068 20 min 4.4% 7.5% 11.9% 255 SCI 42-068 2.7 hr 8.5% 6.4% 14.9% 266 SCI 42-068 2 d 6.6% 10.6% 17.2% 68 SCI 42-068 7 d 7.5% 8.7% 16.3% 206 SCI 43-082 Baseline 19.8% 25.1% 44.9% 57 SCI 43-082 20 min 8.8% 26.6% 35.5% 183 SCI 43-082 2.7 hr 8.5% 20.2% 28.8% 184 SCI 43-082 2 d 31.3% 15.3% 46.6% 94 SCI 43-082 7 d 0.9% 18.0% 18.9% 123 SCI 42-127 Baseline 5.6% 8.5% 14.1% 193 SCI 42-127 20 min 3.2% 8.8% 12.0% 214 SCI 42-127 2.7 hr 12.7% 7.3% 20.0% 192 SCI 42-127 2 d 6.2% 9.3% 15.5% 200 SCI 42-127 7 d 7.7% 6.5% 14.2% 273 SCI 43-031 Baseline 14.6% 11.1% 25.7% 42 SCI 43-031 20 min 5.3% 8.7% 14.0% 265 SCI 43-031 2.7 hr 5.4% 9.9% 15.3% 260 SCI 43-031 2 d 18.1% 12.2% 30.3% 71 SCI 43-031 7 d 2.1% 8.9% 11.0% 234
SCI+ 43-090 20 min 4.9% 7.1% 12.0% 35 SCI+ 43-090 2.7 hr 18.3% 10.6% 28.9% 65 SCI+ 43-090 2 d 21.8% 13.0% 34.8% 35 SCI+ 42-101 2 d 24.9% 22.4% 47.3% 25 SCI+ 46-030 Baseline 1.5% 12.9% 14.4% 47 SCI+ 46-030 20 min 2.7% 17.3% 20.0% 28 SCI+ 46-030 2 d 11.2% 17.8% 29.0% 14 SCI+ 46-030 7 d 13.9% 11.0% 24.9% 26 SCI+ 42-132 Baseline 16.2% 15.5% 31.6% 60 SCI+ 42-132 20 min 8.4% 15.0% 23.4% 62 SCI+ 42-132 2 d 7.1% 16.6% 23.8% 46 SCI+ 42-132 7 d 9.7% 11.0% 20.6% 48 SCI+ 46-091 Baseline 28.1% 15.6% 43.7% 17 SCI+ 46-091 2.7 hr 12.5% 19.1% 31.5% 17 SCI+ 46-091 2 d 15.0% 15.7% 30.7% 24 SCI+ 46-091 7 d 12.2% 21.3% 33.5% 17 SCI+ 42-115 Baseline 15.5% 8.5% 24.0% 350 SCI+ 42-115 20 min 32.8% 5.0% 37.7% 229 SCI+ 42-115 2.7 hr 4.9% 12.8% 17.8% 282 SCI+ 42-115 2 d 10.0% 8.4% 18.4% 225 SCI+ 42-115 7 d 10.7% 6.3% 17.0% 238 SCI+ 42-131 2.7 hr 23.9% 29.9% 53.9% 10 SCI+ 42-131 2 d 42.2% 34.7% 76.9% 7
SHAM 47-018 20 min 57.3% 5.4% 62.7% 46 SHAM 47-018 2 d 4.4% 14.9% 19.3% 17 SHAM 47-018 7 d 36.2% 11.0% 47.2% 30 SHAM 47-050 Baseline 22.8% 14.1% 36.9% 71 SHAM 47-050 2 d 42.3% 25.9% 68.2% 50 SHAM 47-050 7 d 3.3% 14.4% 17.7% 30

338
SHAM 47-051 Baseline 8.5% 15.0% 23.5% 18 SHAM 47-051 20 min 5.2% 17.7% 22.9% 47 SHAM 47-051 7 d 27.7% 14.3% 42.0% 38 SHAM 47-052 Baseline 1.4% 12.6% 14.0% 70 SHAM 47-052 20 min 1.6% 16.1% 17.7% 55 SHAM 47-052 7 d 19.7% 17.4% 37.1% 68 SHAM 46-101 20 min 61.5% 8.0% 69.5% 25 SHAM 46-101 2.7 hr 2.8% 10.4% 13.2% 15 SHAM 46-101 2 d 47.4% 20.5% 67.9% 19 SHAM 46-101 7 d 43.3% 14.2% 57.5% 20 SHAM 42-121 2.7 hr 18.5% 14.7% 33.2% 53 SHAM 46-149 Baseline 13.3% 21.6% 34.9% 66 SHAM 46-149 20 min 20.5% 25.2% 45.7% 30 SHAM 46-149 2.7 hr 22.2% 30.7% 52.9% 34 SHAM 46-149 7 d 19.6% 21.8% 41.4% 38
Table 6.1: Hemoglobin and albumin content in spinal cord injury and sham injured
animals
Hemoglobin and albumin content measured by spectral counting are displayed in the
table above. The number of protein identifications (IDs) are displayed in the rightmost
column.

339
Table 6.2: Top spinal cord injury related biomarker proteins
The table above presents spinal cord injury (SCI) specific, CNS enriched candidates
identified in SCI and sham injured animal samples. Black boxes denote presence in
cerebrospinal fluid (CSF). Animal IDs were abbreviated for space. Specimens 46-030,
43-090, 42-127, 43-082, 47-094, 42-068, 42-132, 46-149, 47-050, 47-051, 47-052, 47-
018, and 46-101 are abbreviated as 30, 90, 127, 82, 94, 68, 132, 149, 50, 51, 52, 18, and
101 respectively. Lumican, glial fibrillary acidic protein, and carboxypeptidase E were also
identified as preferentially released from injured astrocytes.

340
Protein Peptide m/z
14 kDa phosphohistidine phosphatase
WAEYHADIYDK 705.8199
Calmodulin EAFSLFDK 478.7398
Calmodulin DGNGYISAAELR 633.3097
Carboxypeptidase E SGSAHEYSSSPDDAIFQSLAR 1113.0089
Carboxypeptidase E TYWEDNK 478.2114
Carboxypeptidase E SNAQGIDLNR 544.2782
Carboxypeptidase E FPPEETLK 480.7555
Carboxypeptidase E DGDYWR 406.1721
Ezrin LFFLQVK 447.7760
Ezrin SGYLSSER 449.7169
Ezrin IQVWHAEHR 588.3071
Ezrin IGFPWSEIR 552.7955
Ezrin APDFVFYAPR 591.8007
Ezrin SQEQLAAELAEYTAK 826.4123
Ezrin EDEVEEWQHR 678.7944
Ezrin QLLTLSSELSQAR 723.4016
Ezrin IGFPWSEIR 552.7955
Ezrin FVIKPIDK 480.2999
Ezrin APDFVFYAPR 591.8007
Ezrin ALQLEEER 494.2589
Ezrin IALLEEAR 457.7689
Lumican NNQIDHIDEK 613.2940
Lumican SLEDLQLTHNK 649.3410
Lumican EDAVSAAFK 469.2349
Lumican FNALQYLR 512.7824
Lumican ILGPLSYSK 489.2869
Peptidyl-prolyl cis-trans isomerase A FEDENFILK 577.7900
Peptidyl-prolyl cis-trans isomerase A VSFELFADK 528.2740
Peptidyl-prolyl cis-trans isomerase A FDDENFILK 570.7822
Peptidyl-prolyl cis-trans isomerase A TEWLDGK 424.7111
Peptidyl-prolyl cis-trans isomerase A HVVFGK 343.7028
Superoxide dismutase [Cu-Zn] GDGPVQGIINFEQK 751.3859
Superoxide dismutase [Cu-Zn] HVGDLGNVTADK 613.3122
Transgelin YDEELEER 541.7355
Transgelin LGFQVWLK 495.7922
Transgelin NGVILSK 365.7265
Transgelin LVNSLYPDGSKPVK 758.9221
Transgelin AAEDYGVIK 483.2506
Transgelin LGFQVWLK 495.7922
Transgelin LVNSLYPDGSKPVK 758.9221
Transgelin EFTESQLQEGK 648.3093

341
Tropomyosin alpha-1 chain LVIIESDLER 593.8375
Tropomyosin alpha-1 chain SIDDLEDELYAQK 769.8647
Tropomyosin alpha-1 chain ATDAEADVASLNR 666.8231
Tropomyosin alpha-1 chain IQLVEEELDR 622.3301
Tropomyosin alpha-1 chain LATALQK 372.7343
Tropomyosin alpha-1 chain LVIIESDLER 593.8375
Tropomyosin alpha-1 chain SIDDLEDELYAQK 769.8647
Tropomyosin beta chain QLEEEQQALQK 672.3437
Tropomyosin beta chain TIDDLEDEVYAQK 769.8647
Tymosin beta-4 PDMAEIEK 466.7233
Tymosin beta-10 PDMGEIASFDK 605.2764
Table 6.3: Selected PRM-MS peptides for top spinal cord and astroglial injury
derived biomarkers
Top candidates preferentially released from injured astrocytes and CNS enriched proteins
from our spinal cord injury (SCI) traumatome are displayed in the table above. Top peptide
observations from online spectral libraries were selected and filtered for PRM-MS
compatibility.

342
Accession Description
F1SDR7 14-3-3 protein beta/alpha
I3LLI8 14-3-3 protein epsilon
F1SA98 14-3-3 protein theta
F1RQQ8 Alpha-1,4 glucan phosphorylase
I3LLP2 Alpha-amylase 1
D0G0C7 Antioxidant protein 1 homolog
F2Z5E2 Antithrombin-III
Q29248 Apolipoprotein A-I
F1SCV9 Apolipoprotein B-100
K7GN63 Apolipoprotein D
A4D7T6 Brain-type fatty acid-binding protein
I3L5X9 Calsyntenin-1
A1XF98 Cartilage acidic protein 1
P15175 Cathelin
K7GLE2 CD44 antigen
B3F0B7 Cellular retinoic acid binding protein 1
I3VKE6 Ceruloplasmin
I3LD22 Cochlin
P10668 Cofilin-1
Q1HNM7 Collagen alpha-1
Q8HYS4 Collagen type 5 alpha 1
Q69DK9 Complement C1qC
Q69DL3 Complement C1r
F1SBS4 Complement C3
F1RQW2 Complement C4-A
A0SEH0 Complement component C6
F1SMJ6 Complement component C9
F1S133 Complement factor I
F1S3P6 Connective tissue growth factor
F1RJ76 C-reactive protein
Q29594 Creatine kinase B-type
Q9GJX2 Diazepam binding inhibitor
G9F6X9 Dihydropyrimidinase-like 2
Q0R678 DJ-1 protein
O97788 Fatty acid-binding protein, adipocyte
I3LQR9 Fibrinogen alpha chain
K7GSU8 Fibroblast growth factor receptor 2
I3L5W3 Ficolin-2
K7GS06 Four and a half LIM domains protein 1
I3LCN1 Gamma-enolase
P20305 Gelsolin

343
F1RR02 Glial fibrillary acidic protein
P80031 Glutathione S-transferase P
A0SNU7 Glyceraldehyde-3-phosphate dehydrogenase
F1RFQ7 GTP-binding nuclear protein Ran
F1S9Q3 Heat shock cognate 71 kDa protein
O02705 Heat shock protein HSP 90-alpha
F1RGX4 Hemoglobin subunit theta-1
K7GLP2 Hemoglobin subunit theta-1
L8B0R9 IgG heavy chain
L8B0U1 IgG heavy chain
L8B0V6 IgG heavy chain
I3LU56 Inducible T-cell co-stimulator ligand
B3TFF0 Insulin-like growth factor 2
P79263 Inter-alpha-trypsin inhibitor heavy chain H4
I3L697 Intercellular adhesion molecule 5
I3LLY8 Keratin, type II cytoskeletal 79
F1SD69 Legumain
P12068 Lysozyme C
F1RL77 Macrophage colony-stimulating factor 1 receptor
K7GPG1 Metalloproteinase inhibitor 1
I3LQ45 Metallothionein-3
F1RTN3 Moesin
F1SKJ1 Myosin-9
F1SRZ3 Neuroendocrine protein 7B2
P14287 Osteopontin
K7GKJ8 Phosphoglycerate kinase
D0G784 Phosphoglycerate kinase
K7GNI9 Phosphoglycerate kinase 1
F1S8Y5 Phosphoglycerate mutase 1
P01304 Pro-neuropeptide Y
F1RII4 Protein deglycase DJ-1
I3LBK0 Protein IGKV2-28
I3L5R6 Protein S100
I3L893 Rab GDP dissociation inhibitor alpha
I3LGK3 Ribonuclease pancreatic
P81405 Saposin-B-Val
A4H2R5 Secreted protein, acidic, cysteine-rich
F1ST01 Selenium-binding protein 1
I3LC80 Semaphorin-7A
I3LQF4 Semaphorin-7A
F1S9C0 Serum amyloid A protein
F1SFA1 Serum paraoxonase/arylesterase 1

344
K7GL06 Signal-regulatory protein beta-1
I3LG87 Somatostatin
Z4YP82 SPARC
F1RQB3 SPARC
I3LM94 SPARC-related modular calcium-binding protein 1
Q9TTB8 Tissue inhibitor of metalloproteinase-2
Q1PC32 Triosephosphate isomerase
F2Z5T5 Tubulin alpha-1A chain
F1SR80 Tubulin alpha-1A chain
Q2XVP4 Tubulin alpha-1B chain
F1SHC1 Tubulin alpha-1C chain
Q767L7 Tubulin beta chain
F2Z5B2 Tubulin beta-2B chain
F2Z571 Tubulin beta-4B chain
Q6SEG5 Ubiquitin carboxyl-terminal hydrolase isozyme L1
I3LCZ6 Uncharacterized protein
P02543 Vimentin
Table 6.4: Proteins in our Yucatan swine spinal cord injury cerebrospinal fluid
traumatome

345
Accession Description
F1RJF7 45 kDa calcium-binding protein
F1RF11 72 kDa type IV collagenase
F1RS36 78 kDa glucose-regulated protein
F1SHP1 A disintegrin and metalloproteinase with thrombospondin motifs 1
F1RM86 ADAM DEC1
P00571 Adenylate kinase isoenzyme 1
F1RUM1 Afamin
I3LGD9 Agrin
Q29014 Alpha-1 acid glycoprotein
Q19PY1 Alpha-1,4 glucan phosphorylase
F1SCC7 Alpha-1-antichymotrypsin
F1SCD0 Alpha-1-antichymotrypsin
F1SCC6 Alpha-1-antichymotrypsin
Q9GMA9 Alpha-1-antichymotrypsin 2
Q9GMA8 Alpha-1-antichymotrypsin 3
I3L818 Alpha-2-antiplasmin
K7GQ48 Alpha-2-macroglobulin
F1SLX2 Alpha-2-macroglobulin
K9J6H8 Alpha-2-macroglobulin
F1S573 Alpha-amylase
A0A0B8RW31 Amyloid beta -like protein 1
Q2XQA0 Amyloid beta A4 protein
F1S6E8 Amyloid-like protein 2
K7GPQ7 Angiotensinogen
Q7M364 Antithrombin III
Q19AZ5 Antithrombin protein
A0A0F6TNY5 APOB
A0A0C3SG01 Apolipoprotein A-I
F1S1A9 Apolipoprotein A-II
P27917 Apolipoprotein C-III
F1SQX9 Apolipoprotein D
I3LLD8
Basement membrane-specific heparan sulfate proteoglycan core protein
F1RUS9 Beta-1,4-glucuronyltransferase 1
I3LGN5 Beta-2-glycoprotein 1
Q07717 Beta-2-microglobulin
A5PF00 B-factor, properdin
F1SRL9 Brain acid soluble protein 1
F1RP38 Brevican core protein
F1S0J2 C4b-binding protein alpha chain
F1S0J3 C4b-binding protein beta chain
K7GT48 Cadherin-2
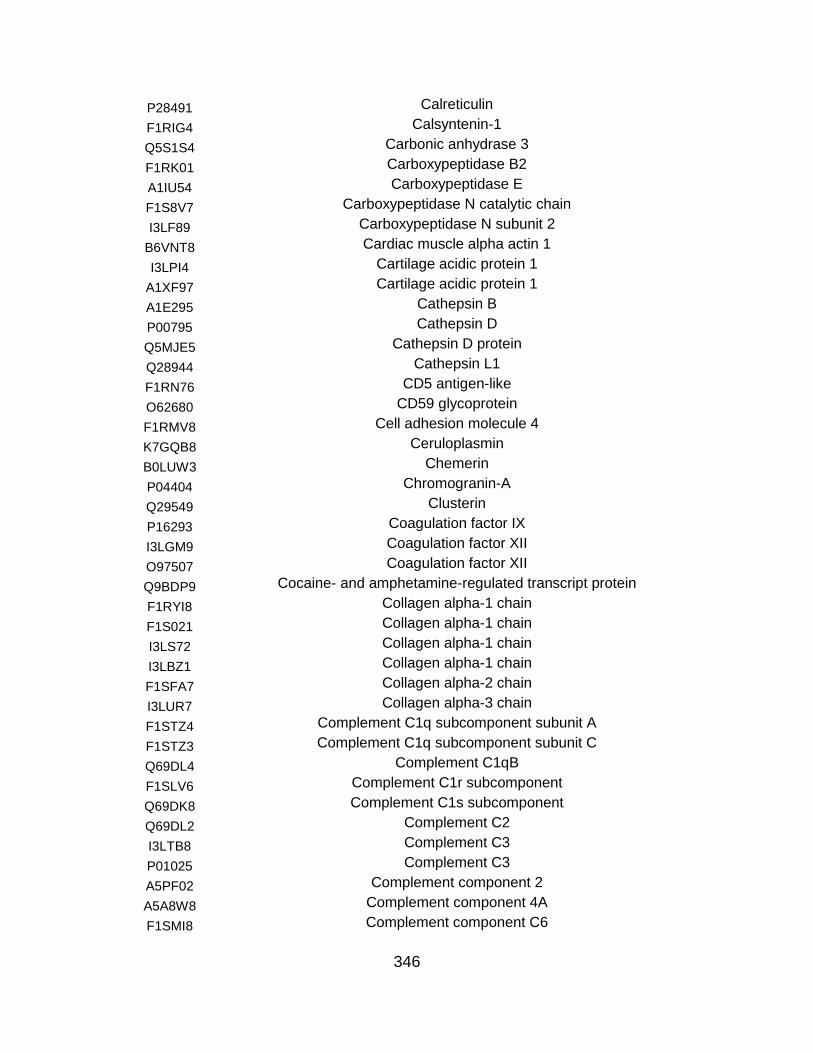
346
P28491 Calreticulin
F1RIG4 Calsyntenin-1
Q5S1S4 Carbonic anhydrase 3
F1RK01 Carboxypeptidase B2
A1IU54 Carboxypeptidase E
F1S8V7 Carboxypeptidase N catalytic chain
I3LF89 Carboxypeptidase N subunit 2
B6VNT8 Cardiac muscle alpha actin 1
I3LPI4 Cartilage acidic protein 1
A1XF97 Cartilage acidic protein 1
A1E295 Cathepsin B
P00795 Cathepsin D
Q5MJE5 Cathepsin D protein
Q28944 Cathepsin L1
F1RN76 CD5 antigen-like
O62680 CD59 glycoprotein
F1RMV8 Cell adhesion molecule 4
K7GQB8 Ceruloplasmin
B0LUW3 Chemerin
P04404 Chromogranin-A
Q29549 Clusterin
P16293 Coagulation factor IX
I3LGM9 Coagulation factor XII
O97507 Coagulation factor XII
Q9BDP9 Cocaine- and amphetamine-regulated transcript protein
F1RYI8 Collagen alpha-1 chain
F1S021 Collagen alpha-1 chain
I3LS72 Collagen alpha-1 chain
I3LBZ1 Collagen alpha-1 chain
F1SFA7 Collagen alpha-2 chain
I3LUR7 Collagen alpha-3 chain
F1STZ4 Complement C1q subcomponent subunit A
F1STZ3 Complement C1q subcomponent subunit C
Q69DL4 Complement C1qB
F1SLV6 Complement C1r subcomponent
Q69DK8 Complement C1s subcomponent
Q69DL2 Complement C2
I3LTB8 Complement C3
P01025 Complement C3
A5PF02 Complement component 2
A5A8W8 Complement component 4A
F1SMI8 Complement component C6

347
Q9TUQ3 Complement component C7
F1S788 Complement component C8 alpha chain
F1S790 Complement component C8 beta chain
A0SEG9 Complement component C9
F1RQW6 Complement factor B
P51779 Complement factor D
K7GPW1 Complement factor I
Q8MI72 Complement regulator factor H
K7GK71 Contactin-1
K7GL63 Contactin-1
F1SCF1 Corticosteroid-binding globulin
B5A562 C-reactive protein
Q5XLD3 Creatine kinase M-type
F1RRU7 C-type mannose receptor 2
F1RU34 Cystatin-B
F1S5H0 Cytokine-like protein 1
Q29243 Dystroglycan
F1S280 Ectonucleotide pyrophosphatase/phosphodiesterase family member 2
F8SIP2 EGF-containing fibulin-like extracellular matrix protein 1
F1RU22 EGF-containing fibulin-like extracellular matrix protein 2
I3LNM9 Endogenous retrovirus group V member 1 Env polyprotein
A0A0B8RSY9 Enolase 1
B5M6R3 Ephrin receptor A4
O97763 Epididymal secretory protein E1
I3LC64 Extracellular matrix protein 1
A0A0B8RTR5 Extracellular matrix protein 1
F1SFI6 Fetuin-B
Q9TV36 Fibrillin-1
Q28936 Fibrinogen A-alpha-chain
P14460 Fibrinogen alpha chain
F1RX36 Fibrinogen alpha chain
I3L651 Fibrinogen beta chain
F1RX35 Fibrinogen gamma chain
Q8MIP7 Fibroleukin
F1S6B5 Fibromodulin
F1SS24 Fibronectin
F1SPG5 Fibulin-2
F1SD87 Fibulin-5
Q29041 Ficolin-2
I3LQH7 Flavin reductase
U3GT97 Fstl1
Q6J267 Galectin

348
F1RVN0 Glutathione S-transferase P
P00355 Glyceraldehyde-3-phosphate dehydrogenase
A5GFT7 GNAS complex locus
F1S4I1 Golgi membrane protein 1
Q8SPS7 Haptoglobin
F1SA70 Heat shock-related 70 kDa protein 2
P01965 Hemoglobin subunit alpha
P02067 Hemoglobin subunit beta
P50828 Hemopexin
F1RKY2 Heparin cofactor 2
F1S8N1 Hepatocyte growth factor activator
F1SFI5 Histidine-rich glycoprotein
F1STC5 Ig kappa chain C region
P01846 Ig lambda chain C region
K7ZRK0 IgA heavy chian constant region
L8B0S2 IgG heavy chain
L8B0U3 IgG heavy chain
L8B0U8 IgG heavy chain
L8B0V2 IgG heavy chain
L8B0W0 IgG heavy chain
L8B0X5 IgG heavy chain
L8B180 IgG heavy chain
K7ZPU8 IgG heavy chian constant region
K7ZJP7 IgM heavy chain constant region
F1RUQ0 Immunoglobulin J chain
F1SIE1 Immunoglobulin superfamily containing leucine-rich repeat protein
F1RJW5 Immunoglobulin superfamily member 8
Q29545 Inhibitor of carbonic anhydrase
A6ZIC9 Insulin-like growth factor binding protein 6
C7EDN1 Insulin-like growth factor binding protein 7
P24853 Insulin-like growth factor-binding protein 2
E9KYT3 Insulin-like growth factor-binding protein 4
F1RVH7 Insulin-like growth factor-binding protein 7
Q8MJI5 Insulin-like-growth factor 2 preproprotein
F1RP09 Integrin beta-like protein 1
F1SH96 Inter-alpha-trypsin inhibitor heavy chain H1
Q29052 Inter-alpha-trypsin inhibitor heavy chain H1
O02668 Inter-alpha-trypsin inhibitor heavy chain H2
F1SH94 Inter-alpha-trypsin inhibitor heavy chain H3
F1RUM0 Inter-alpha-trypsin inhibitor heavy chain H5
P20305-2 Isoform 2 of Gelsolin
A5A758 Keratin 1
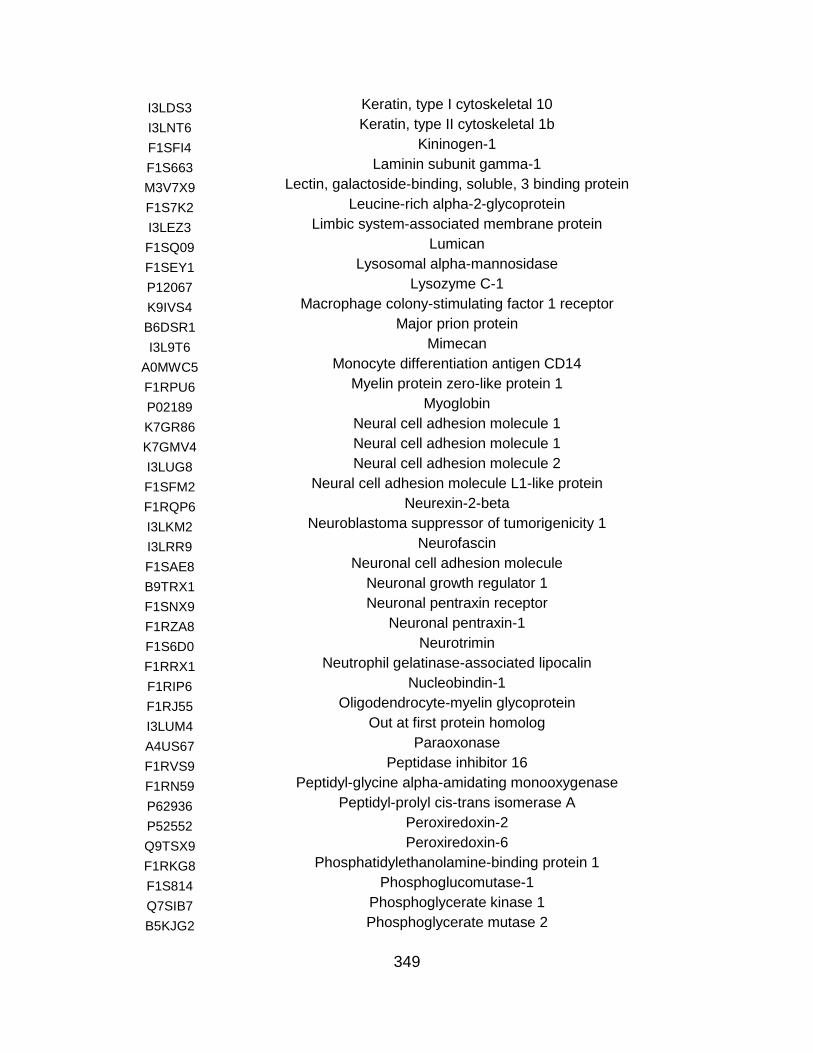
349
I3LDS3 Keratin, type I cytoskeletal 10
I3LNT6 Keratin, type II cytoskeletal 1b
F1SFI4 Kininogen-1
F1S663 Laminin subunit gamma-1
M3V7X9 Lectin, galactoside-binding, soluble, 3 binding protein
F1S7K2 Leucine-rich alpha-2-glycoprotein
I3LEZ3 Limbic system-associated membrane protein
F1SQ09 Lumican
F1SEY1 Lysosomal alpha-mannosidase
P12067 Lysozyme C-1
K9IVS4 Macrophage colony-stimulating factor 1 receptor
B6DSR1 Major prion protein
I3L9T6 Mimecan
A0MWC5 Monocyte differentiation antigen CD14
F1RPU6 Myelin protein zero-like protein 1
P02189 Myoglobin
K7GR86 Neural cell adhesion molecule 1
K7GMV4 Neural cell adhesion molecule 1
I3LUG8 Neural cell adhesion molecule 2
F1SFM2 Neural cell adhesion molecule L1-like protein
F1RQP6 Neurexin-2-beta
I3LKM2 Neuroblastoma suppressor of tumorigenicity 1
I3LRR9 Neurofascin
F1SAE8 Neuronal cell adhesion molecule
B9TRX1 Neuronal growth regulator 1
F1SNX9 Neuronal pentraxin receptor
F1RZA8 Neuronal pentraxin-1
F1S6D0 Neurotrimin
F1RRX1 Neutrophil gelatinase-associated lipocalin
F1RIP6 Nucleobindin-1
F1RJ55 Oligodendrocyte-myelin glycoprotein
I3LUM4 Out at first protein homolog
A4US67 Paraoxonase
F1RVS9 Peptidase inhibitor 16
F1RN59 Peptidyl-glycine alpha-amidating monooxygenase
P62936 Peptidyl-prolyl cis-trans isomerase A
P52552 Peroxiredoxin-2
Q9TSX9 Peroxiredoxin-6
F1RKG8 Phosphatidylethanolamine-binding protein 1
F1S814 Phosphoglucomutase-1
Q7SIB7 Phosphoglycerate kinase 1
B5KJG2 Phosphoglycerate mutase 2

350
F1RPC1 Phosphoinositide-3-kinase-interacting protein 1
Q0PM28 Pigment epithelium-derived factor
F1S715 Plasma alpha-L-fucosidase
F1RZN7 Plasma kallikrein
Q8WMN7 Plasma phospholipid transfer protein
F1SJW8 Plasma protease C1 inhibitor
P06867 Plasminogen
F1SB81 Plasminogen
I3LEE6 Procollagen C-endopeptidase enhancer 1
I3LEB3 ProSAAS
F1SMK6 Prosaposin receptor GPR37
E3VVJ2 Prosaposin variant 2
Q29095 Prostaglandin-H2 D-isomerase
P04366 Protein AMBP
F1SJF9 Protein FAM3C
F1STC2 Protein IGKV2D-40
A0A075B7I6 Protein IGLV3-27
A0A075B7H9 Protein IGLV8-61
A0A075B7H6 Protein IGLV8-61
A0A075B7J0 Protein IGLV8-61
A0A075B7I9 Protein IGLV8-61
A0A075B7I5 Protein IGLV8-61
F1SGY4 Protein kinase C-binding protein NELL2
F1S279 Protein NOV homolog
Q29094 Protein S
B3STX9 Prothrombin
A0A0B8S031 Pyruvate kinase
F1SLX4 Receptor-type tyrosine-protein phosphatase zeta
F1SC80 Retinol-binding protein 4
I3LDZ2 Ribonuclease 4
P00671 Ribonuclease pancreatic
Q7M329 Ribonuclease T2
I3LIJ2 Scrapie-responsive protein 1
B2DCZ8 Secreted frizzled-related protein 4
A6N9J9 Secreted phosphoprotein 1
Q9GLG4 Secretogranin-1
Q5FZP5 Secretogranin-2
F1RYP7 Secretogranin-3
F1RG83 Seizure 6-like protein
I3LBX3 Seizure 6-like protein 2
K9IVC4 Semaphorin-7A isoform 1 preproprotein
B3CL06 Serotransferrin

351
P09571 Serotransferrin
F1S9B8 Serum amyloid A-4 protein
A3RIE0 SPARCL-1
Q95ME5 Superoxide dismutase [Cu-Zn]
P04178 Superoxide dismutase [Cu-Zn]
Q007T6 Superoxide dismutase [Cu-Zn]
A8D737 T-cadherin
F1SRC8 Tetranectin
P82460 Thioredoxin
F1S981 Thrombospondin type-1 domain-containing protein 7B
F1RF28 Thrombospondin-4
K7GL43 Thy-1 membrane glycoprotein
B7TJ02 Thymosin beta 4 X-linked
C0JPM4 Tissue inhibitor of metalloproteases-2
O11780 Transforming growth factor-beta-induced protein ig-h3
P50390 Transthyretin
P00761 Trypsin
Q9TT86 Type I collagen alpha1
Q1T7A9 Type VI collagen alpha-1 chain
G9F6X7
Tyrosine 3-monooxygenase tryptophan 5-monooxygenase activation protein
I3LN42 Vitamin D-binding protein
I3LSF4 Vitamin K-dependent protein S
I3LQM5 vitamin K-dependent protein S
P48819 Vitronectin
O77773 Voltage-dependent calcium channel subunit alpha-2/delta-1
F1SF08 V-set and transmembrane domain-containing protein 2A
K9IWA3 V-type proton ATPase subunit S1
F1RTB4
WAP, Kazal, immunoglobulin, Kunitz and NTR domain-containing protein 2
F1RNP2 Zinc-alpha-2-glycoprotein
Table 6.5: Proteins common to baseline and acute spinal cord injury cerebrospinal
fluid

352
6.8 REFERENCES
1. F. Meurens, A. Summerfield, H. Nauwynck, L. Saif, V. Gerdts, The pig: a model
for human infectious diseases. Trends in microbiology 20, 50-57 (2012); published
online EpubJan (10.1016/j.tim.2011.11.002).
2. E. Aasebo, J. A. Opsahl, Y. Bjorlykke, K. M. Myhr, A. C. Kroksveen, F. S. Berven,
Effects of blood contamination and the rostro-caudal gradient on the human
cerebrospinal fluid proteome. PloS one 9, e90429
(2014)10.1371/journal.pone.0090429).
3. F. S. Berven, A. C. Kroksveen, M. Berle, T. Rajalahti, K. Flikka, R. Arneberg, K. M.
Myhr, C. Vedeler, O. M. Kvalheim, R. J. Ulvik, Pre-analytical influence on the low
molecular weight cerebrospinal fluid proteome. Proteomics. Clinical applications
1, 699-711 (2007); published online EpubJul (10.1002/prca.200700126).
4. A. H. Simonsen, J. M. Bahl, P. B. Danborg, V. Lindstrom, S. O. Larsen, A. Grubb,
N. H. Heegaard, G. Waldemar, Pre-analytical factors influencing the stability of
cerebrospinal fluid proteins. Journal of neuroscience methods 215, 234-240
(2013); published online EpubMay 15 (10.1016/j.jneumeth.2013.03.011).
5. B. Zybailov, M. K. Coleman, L. Florens, M. P. Washburn, Correlation of Relative
Abundance Ratios Derived from Peptide Ion Chromatograms and Spectrum
Counting for Quantitative Proteomic Analysis Using Stable Isotope Labeling.
Analytical Chemistry 77, 6218-6224 (2005).
6. B. Zybailov, A. L. Mosley, M. E. Sardiu, M. K. Coleman, L. Florens, M. P.
Washburn, Statistical Analysis of Membrane Proteome Expression Changes in
Saccharomyces cerevisiae. Journal of Proteome Research 5, 2339-2347 (2006).
353
7. J.-S. You, V. Gelfanova, M. D. Knierman, F. A. Witzmann, M. Wang, J. E. Hale,
The impact of blood contamination on the proteome of cerebrospinal fluid.
Proteomics 5, 290-296 (2005)10.1002/pmic.200400889).
8. K. Laks, T. Kirsipuu, T. Dmitrijeva, A. Salumets, P. Palumaa, Assessment of Blood
Contamination in Biological Fluids Using MALDI-TOF MS. The protein journal 35,
171-176 (2016); published online EpubJun (10.1007/s10930-016-9657-y).
9. P. G. Popovich, P. J. Horner, B. B. Mullin, B. T. Stokes, A Quantitative Spatial
Analysis of the Blood–Spinal Cord Barrier I. Permeability Changes after
Experimental Spinal Contusion Injury. Experimental Neurology 142, 258-275
(1996).
10. V. Bartanusz, D. Jezova, B. Alajajian, M. Digicaylioglu, The blood-spinal cord
barrier: morphology and clinical implications. Annals of neurology 70, 194-206
(2011); published online EpubAug (10.1002/ana.22421).
11. A. L. Archibald, L. Bolund, C. Churcher, M. Fredholm, M. A. Groenen, B. Harlizius,
K.-T. Lee, D. Milan, J. Rogers, M. F. Rothschild, Pig genome sequence-analysis
and publication strategy. BMC genomics 11, 1 (2010).
12. L. B. Schook, J. E. Beever, J. Rogers, S. Humphray, A. Archibald, P. Chardon, D.
Milan, G. Rohrer, K. Eversole, Swine Genome Sequencing Consortium (SGSC): a
strategic roadmap for sequencing the pig genome. Comparative and functional
genomics 6, 251-255 (2005)10.1002/cfg.479).
13. B. A. Plog, M. L. Dashnaw, E. Hitomi, W. Peng, Y. Liao, N. Lou, R. Deane, M.
Nedergaard, Biomarkers of traumatic injury are transported from brain to blood via
the glymphatic system. The Journal of neuroscience : the official journal of the

354
Society for Neuroscience 35, 518-526 (2015); published online EpubJan 14
(10.1523/JNEUROSCI.3742-14.2015).
14. M. Uhlén, E. Björling, C. Agaton, C. A.-K. Szigyarto, B. Amini, E. Andersen, A.-C.
Andersson, P. Angelidou, A. Asplund, C. Asplund, A human protein atlas for
normal and cancer tissues based on antibody proteomics. Molecular & Cellular
Proteomics 4, 1920-1932 (2005).
15. M. Uhlen, L. Fagerberg, B. M. Hallstrom, C. Lindskog, P. Oksvold, A. Mardinoglu,
A. Sivertsson, C. Kampf, E. Sjostedt, A. Asplund, I. Olsson, K. Edlund, E.
Lundberg, S. Navani, C. A. Szigyarto, J. Odeberg, D. Djureinovic, J. O. Takanen,
S. Hober, T. Alm, P. H. Edqvist, H. Berling, H. Tegel, J. Mulder, J. Rockberg, P.
Nilsson, J. M. Schwenk, M. Hamsten, K. von Feilitzen, M. Forsberg, L. Persson, F.
Johansson, M. Zwahlen, G. von Heijne, J. Nielsen, F. Ponten, Proteomics. Tissue-
based map of the human proteome. Science 347, 1260419 (2015); published
online EpubJan 23 (10.1126/science.1260419).
16. L. J. Noble, J. R. Wrathall, Blood-Spinal Cord Barrier Disruption Proximal to a
Spinal Cord Transection in the Rat: Time Course and Pathways Associated with
Protein Leakage. Experimental Neurology 99, 567-578 (1988).
17. J. T. Maikos, D. I. Shreiber, Immediate damage to the blood-spinal cord barrier
due to mechanical trauma. Journal of neurotrauma 24, 492-507 (2007); published
online EpubMar (10.1089/neu.2006.0149).
18. T. P. Sullivan, W. H. Eaglstein, S. C. Davis, P. Mertz, The pig as a model for human
wound healing. Wound Repair and Regeneration 9, 66-76 (2001).

355
19. Z. Ibrahim, J. Busch, M. Awwad, R. Wagner, K. Wells, D. K. Cooper, Selected
physiologic compatibilities and incompatibilities between human and porcine organ
systems. Xenotransplantation 13, 488-499 (2006); published online EpubNov
(10.1111/j.1399-3089.2006.00346.x).
20. S. Chakravarti, Functions of lumican and fibromodulin: lessons from knockout
mice. Glycoconjugate journal 19, 287-293 (2002).
21. A. Zhou, M. Minami, X. Zhu, S. Bae, J. Minthorne, J. Lan, Z. G. Xiong, R. P. Simon,
Altered biosynthesis of neuropeptide processing enzyme carboxypeptidase E after
brain ischemia: molecular mechanism and implication. Journal of cerebral blood
flow and metabolism : official journal of the International Society of Cerebral Blood
Flow and Metabolism 24, 612-622 (2004); published online EpubJun
(10.1097/01.WCB.0000118959.03453.17).
22. A. Chen, L. J. Xiong, Y. Tong, M. Mao, The neuroprotective roles of BDNF in
hypoxic ischemic brain injury. Biomedical reports 1, 167-176 (2013); published
online EpubMar (10.3892/br.2012.48).
23. K. D. Jeffrey, E. U. Alejandro, D. S. Luciani, T. B. Kalynyak, X. Hu, H. Li, Y. Lin, R.
R. Townsend, K. S. Polonsky, J. D. Johnson, Carboxypeptidase E mediates
palmitate-induced beta-cell ER stress and apoptosis. Proceedings of the National
Academy of Sciences of the United States of America 105, 8452-8457 (2008);
published online EpubJun 17 (10.1073/pnas.0711232105).
24. T. Cheriyan, D. J. Ryan, J. H. Weinreb, J. Cheriyan, J. C. Paul, V. Lafage, T.
Kirsch, T. J. Errico, Spinal cord injury models: a review. Spinal cord 52, 588-595
(2014); published online EpubAug (10.1038/sc.2014.91).

356
25. M. Joshi, M. G. Fehlings, Development and characterization of a novel, graded
model of clip compressive spinal cord injury in the mouse: Part 1. Clip design,
behavioral outcomes, and histopathology. Journal of neurotrauma 19, 175-190
(2002).
26. J. A. Zivin, U. DeGirolami, Spinal cord infarction: a highly reproducible stroke
model. Stroke 11, 200-202 (1980).
27. B. L. Aken, S. Ayling, D. Barrell, L. Clarke, V. Curwen, S. Fairley, J. Fernandez
Banet, K. Billis, C. Garcia Giron, T. Hourlier, K. Howe, A. Kahari, F. Kokocinski, F.
J. Martin, D. N. Murphy, R. Nag, M. Ruffier, M. Schuster, Y. A. Tang, J. H. Vogel,
S. White, A. Zadissa, P. Flicek, S. M. Searle, The Ensembl gene annotation
system. Database : the journal of biological databases and curation 2016,
(2016)10.1093/database/baw093).
28. R. J. Kinsella, A. Kahari, S. Haider, J. Zamora, G. Proctor, G. Spudich, J. Almeida-
King, D. Staines, P. Derwent, A. Kerhornou, P. Kersey, P. Flicek, Ensembl
BioMarts: a hub for data retrieval across taxonomic space. Database : the journal
of biological databases and curation 2011, bar030
(2011)10.1093/database/bar030).


