Embed Size (px)
Citation preview
TV EVERYWHERE /OTTCTVE
© CTV Media, Inc – 2017
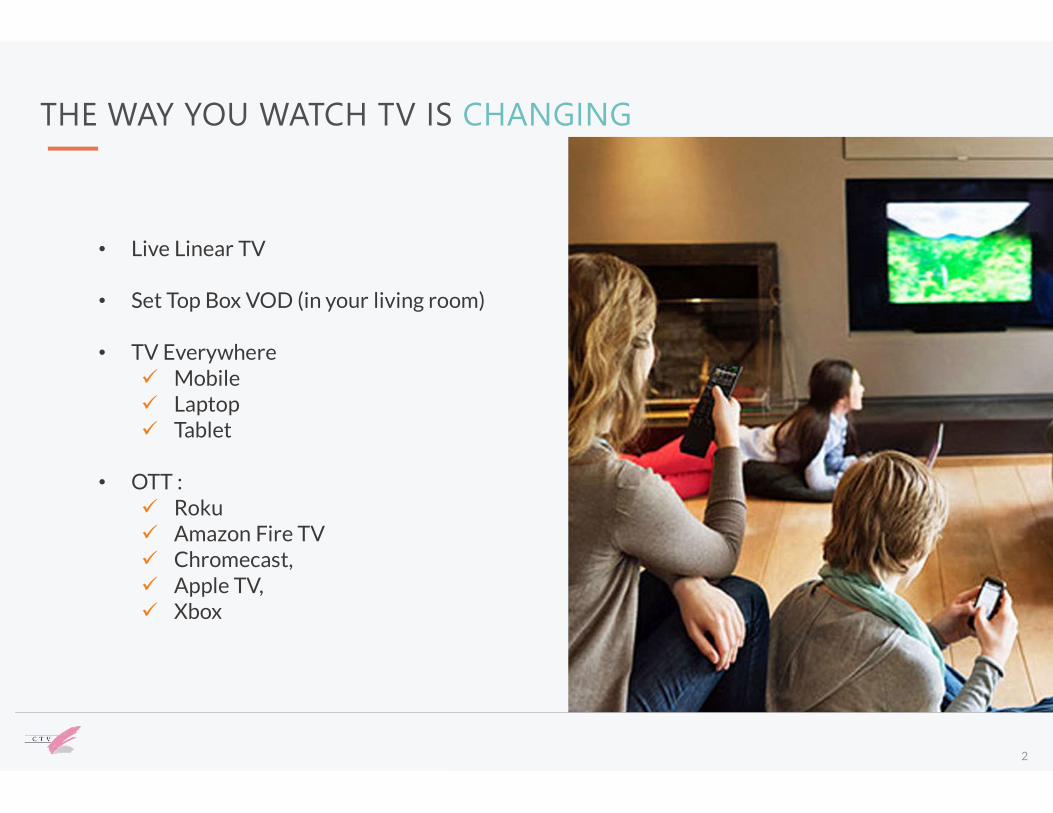
• Live Linear TV
• Set Top Box VOD (in your living room)
• TV Everywhere Mobile Laptop Tablet
• OTT : Roku Amazon Fire TV Chromecast, Apple TV, Xbox
2
THE WAY YOU WATCH TV IS CHANGING
2
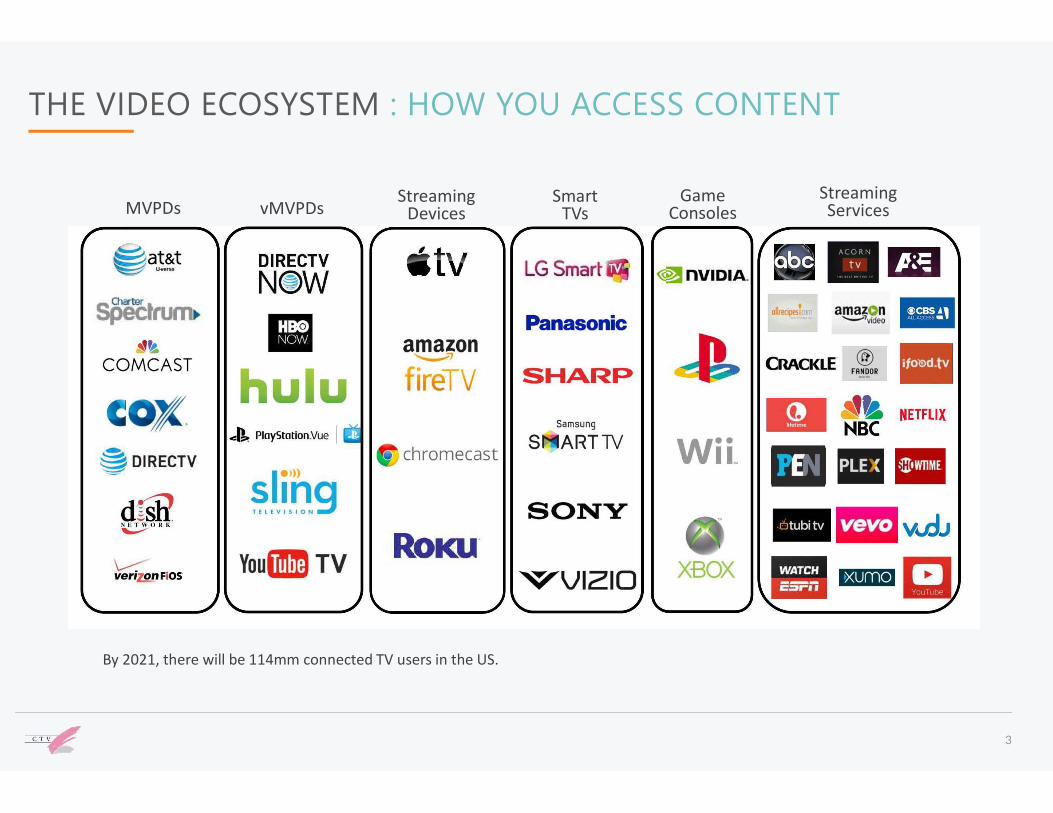
THE VIDEO ECOSYSTEM : HOW YOU ACCESS CONTENT
3
MVPDs
By 2021, there will be 114mm connected TV users in the US.
StreamingServices
SmartTVs
GameConsoles
StreamingDevicesvMVPDs
74%
12%
3% 11%Multi-Channel HHS
OTA HHs
vMVPD-only HHs
OTT-only HHs
4
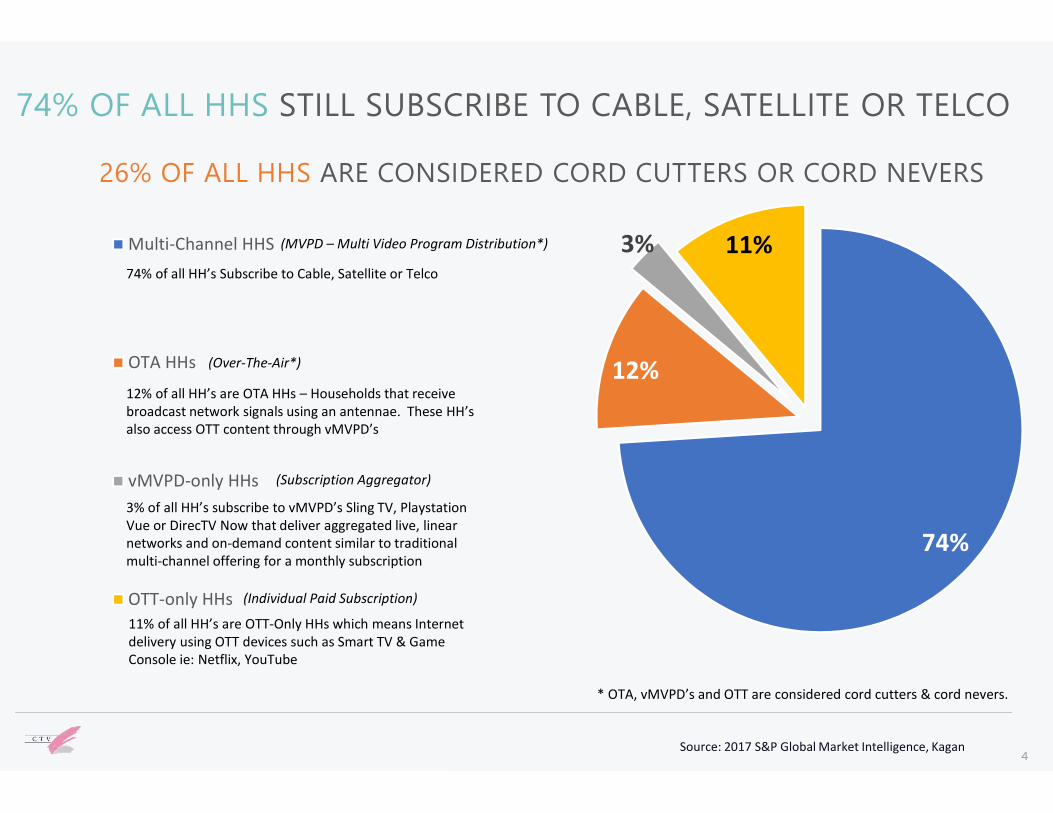
74% OF ALL HHS STILL SUBSCRIBE TO CABLE, SATELLITE OR TELCO
26% OF ALL HHS ARE CONSIDERED CORD CUTTERS OR CORD NEVERS
4
74% of all HH’s Subscribe to Cable, Satellite or Telco
12% of all HH’s are OTA HHs – Households that receive broadcast network signals using an antennae. These HH’s also access OTT content through vMVPD’s
Source: 2017 S&P Global Market Intelligence, Kagan
3% of all HH’s subscribe to vMVPD’s Sling TV, Playstation Vue or DirecTV Now that deliver aggregated live, linear networks and on-demand content similar to traditional multi-channel offering for a monthly subscription
11% of all HH’s are OTT-Only HHs which means Internet delivery using OTT devices such as Smart TV & Game Console ie: Netflix, YouTube
(MVPD – Multi Video Program Distribution*)
(Over-The-Air*)
(Subscription Aggregator)
(Individual Paid Subscription)
* OTA, vMVPD’s and OTT are considered cord cutters & cord nevers.
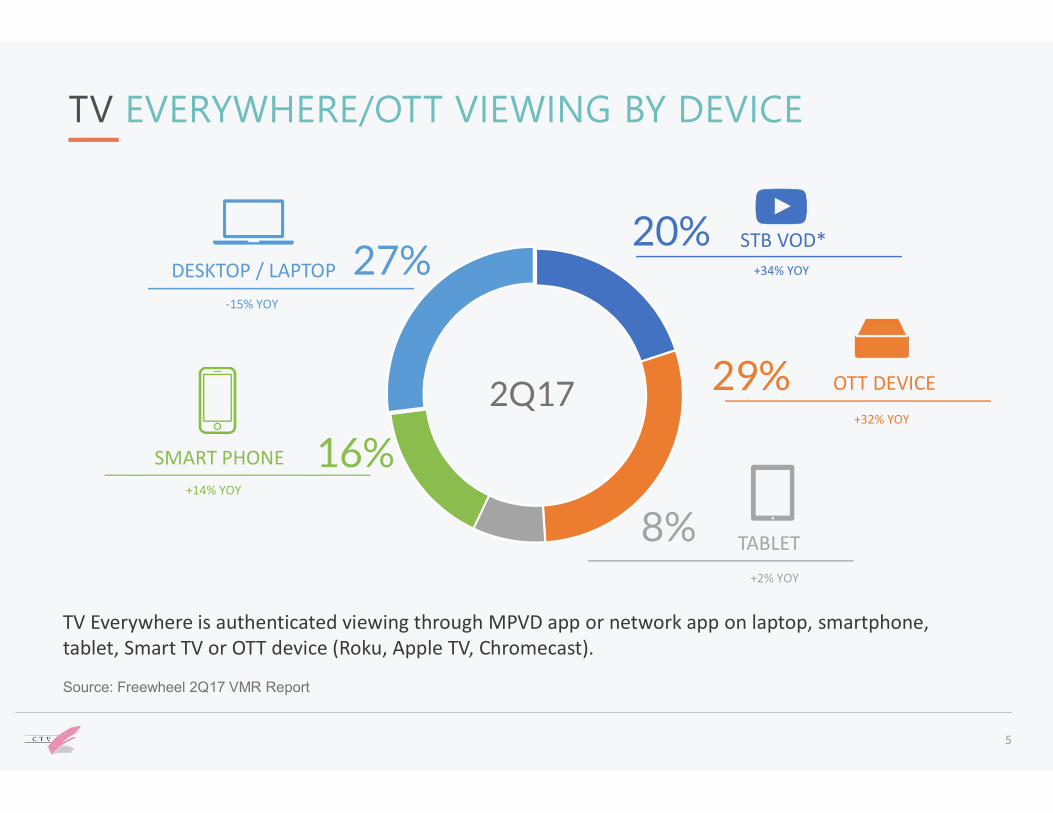
TV EVERYWHERE/OTT VIEWING BY DEVICE
5
Source: Freewheel 2Q17 VMR Report
16%
29%
8%
STB VOD*+34% YOY
OTT DEVICE
TABLET
SMART PHONE
DESKTOP / LAPTOP
+32% YOY
+2% YOY
+14% YOY
-15% YOY
27%20%
2Q17
TV Everywhere is authenticated viewing through MPVD app or network app on laptop, smartphone, tablet, Smart TV or OTT device (Roku, Apple TV, Chromecast).
6
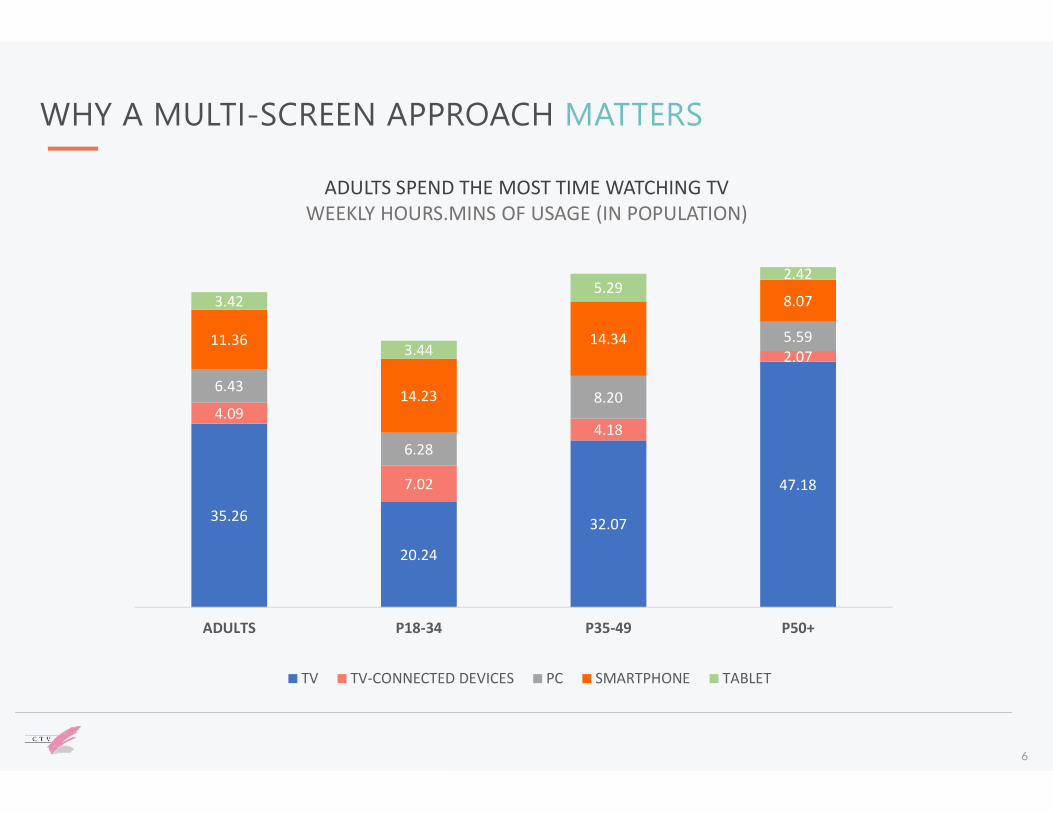
WHY A MULTI-SCREEN APPROACH MATTERS
6
ADULTS SPEND THE MOST TIME WATCHING TVWEEKLY HOURS.MINS OF USAGE (IN POPULATION)
35.26
20.24
32.07
47.18
4.09
7.02
4.18
2.07
6.43
6.28
8.20
5.5911.36
14.23
14.34
8.073.42
3.44
5.292.42
ADULTS P18-34 P35-49 P50+
TV TV-CONNECTED DEVICES PC SMARTPHONE TABLET
THE NEXT BIG THING IN ADVERTISING IS HERE
7
OTT/TVE viewing combines the power of digital advertising with the premium content of traditional television, creating one of the most compelling environments for viewers to engage with both content and the advertiser’s message.
• DESIREABLE AUDIENCES: OTT allows marketers to reach viewers who are harder to find on traditional TV, including affluent millennials and cord cutters. The median OTT viewer is 23 years younger than TV viewers, and their median household income is nearly $10k higher per year than traditional TV households.
• ENGAGED VIEWERS: Over one-third of OTT visits are over an hour long and viewers complete 98% of all premium video ads.
• BRAND LIFT: OTT campaigns produce a greater lift in brand awareness and favorability than desktop and mobile according to a recent Hulu study, demonstrating the engaged OTT viewing environment is more conducive to promoting brands than other digitalchannels.
• INCREMENTAL REACH: Advertisers should not be concerned that OTT audiences overlap with people they’re reaching through linear buys. In reality, OTT has compensated for a large part of the primetime TV ratings decline, replacing traditionaltelevision for many viewers. We found that viewers treat OTT devices just like traditional television – they watch a large amount of live streamed content and tune in mostly during the popular, primetime TV hours. Therefore, marketers who only advertise through linear TV spots would miss out on these OTT audiences, who are watching the same content during the same time period, but on a different platform.
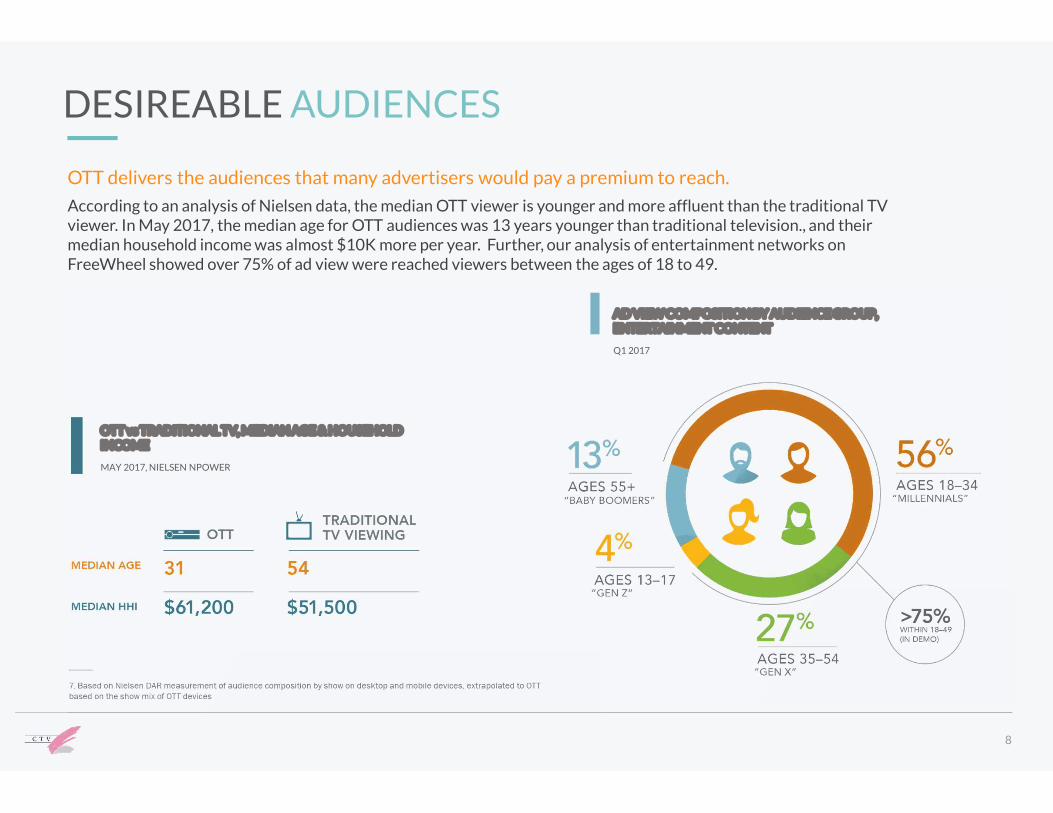
OTT delivers the audiences that many advertisers would pay a premium to reach.According to an analysis of Nielsen data, the median OTT viewer is younger and more affluent than the traditional TV viewer. In May 2017, the median age for OTT audiences was 13 years younger than traditional television., and their median household income was almost $10K more per year. Further, our analysis of entertainment networks on FreeWheel showed over 75% of ad view were reached viewers between the ages of 18 to 49.
DESIREABLE AUDIENCES
8
AD VIEW COMPOSITION BY AUDIENCE GROUP, ENTERTAINMENT CONTENT
Q1 2017
OTT vs TRADITIONAL TV, MEDIAN AGE & HOUSEHOLD INCOME
MAY 2017, NIELSEN NPOWER
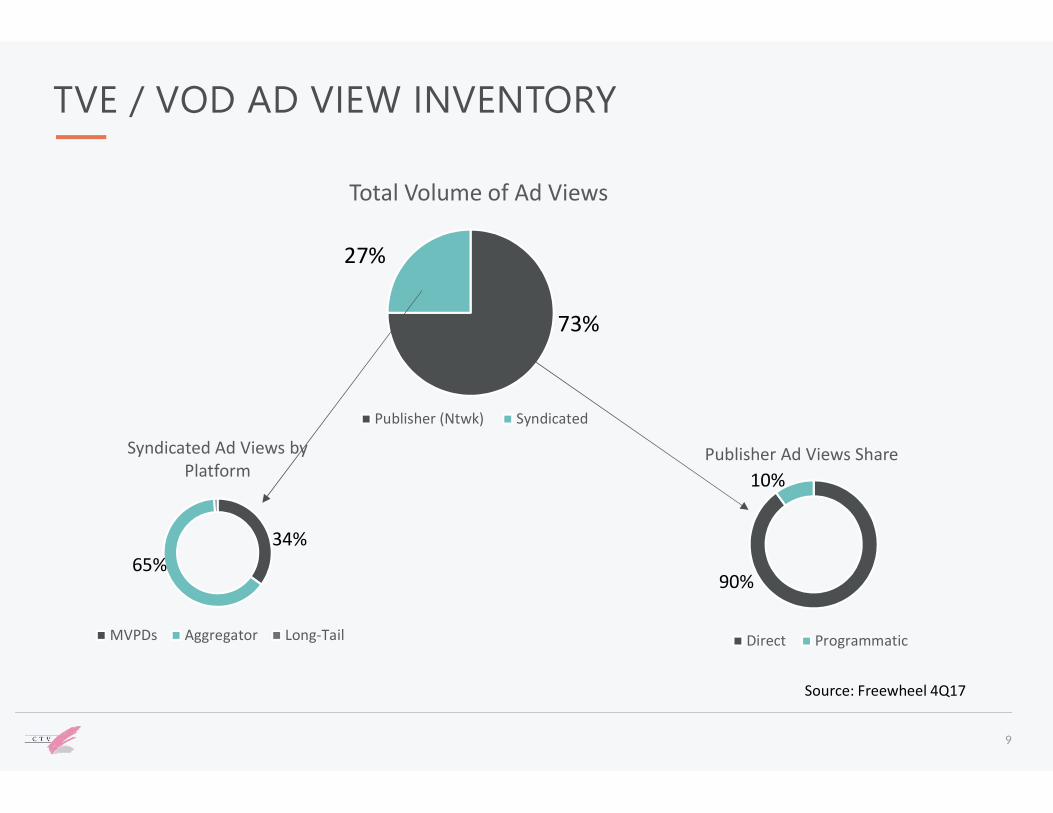
TVE / VOD AD VIEW INVENTORY
9
Total Volume of Ad Views
Publisher (Ntwk) Syndicated
73%
Source: Freewheel 4Q17
27%
Syndicated Ad Views by Platform
MVPDs Aggregator Long-Tail
34%
Publisher Ad Views Share
Direct Programmatic
90%
10%
65%
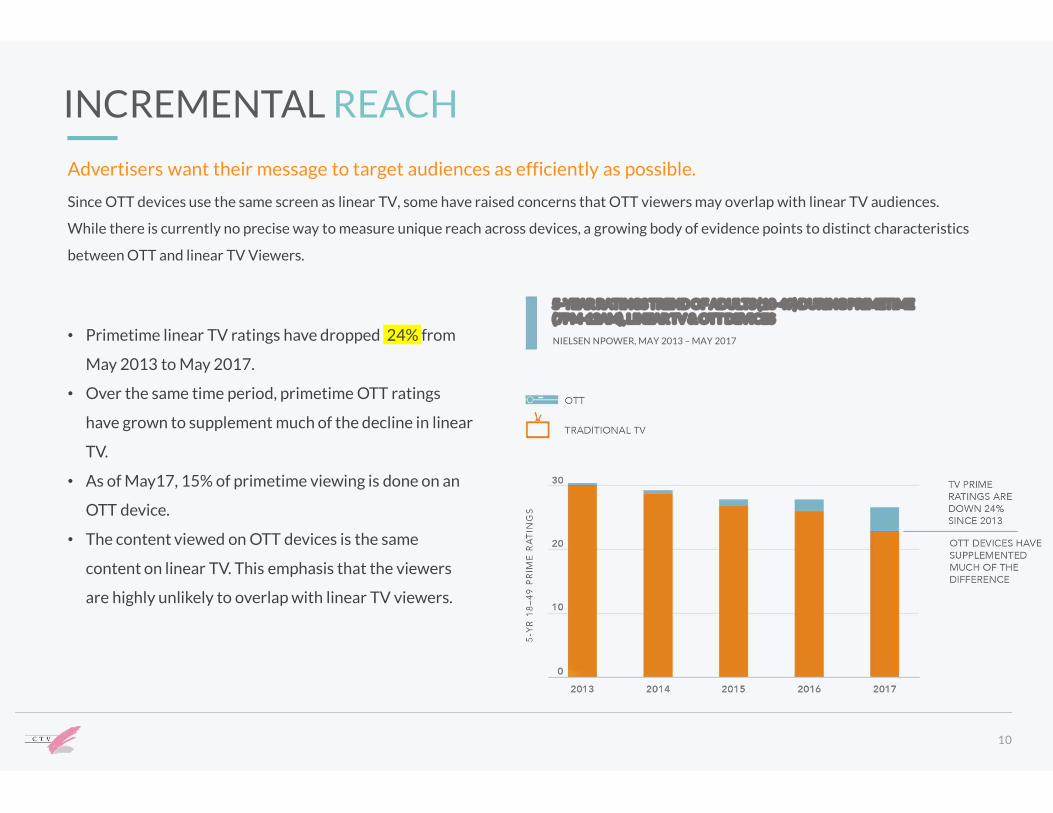
Advertisers want their message to target audiences as efficiently as possible.
Since OTT devices use the same screen as linear TV, some have raised concerns that OTT viewers may overlap with linear TV audiences.
While there is currently no precise way to measure unique reach across devices, a growing body of evidence points to distinct characteristics
between OTT and linear TV Viewers.
INCREMENTAL REACH
10
• Primetime linear TV ratings have dropped 24% from
May 2013 to May 2017.
• Over the same time period, primetime OTT ratings
have grown to supplement much of the decline in linear
TV.
• As of May17, 15% of primetime viewing is done on an
OTT device.
• The content viewed on OTT devices is the same
content on linear TV. This emphasis that the viewers
are highly unlikely to overlap with linear TV viewers.
5-YEAR RATINGS TREND OF ADULTS (18-49) DURING PRIMETIME (7PM-12AM), LINEAR TV & OTT DEVICES
NIELSEN NPOWER, MAY 2013 – MAY 2017
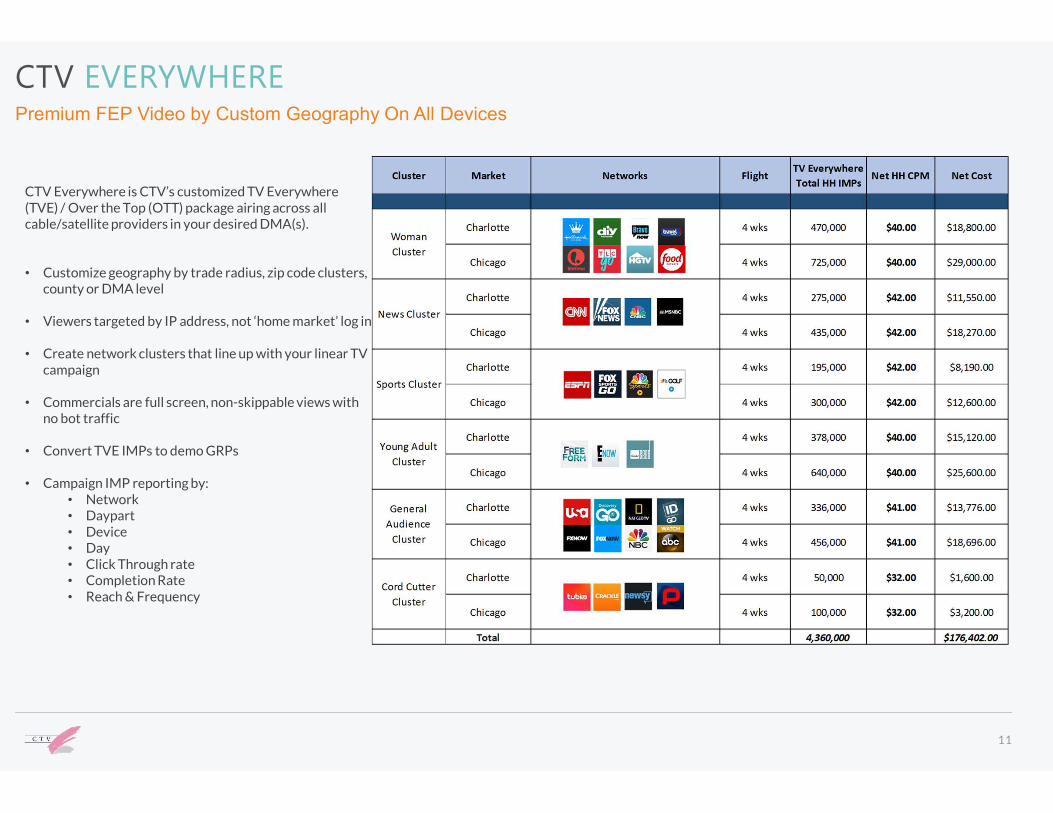
CTV EVERYWHEREPremium FEP Video by Custom Geography On All Devices
CTV Everywhere is CTV’s customized TV Everywhere (TVE) / Over the Top (OTT) package airing across all cable/satellite providers in your desired DMA(s).
• Customize geography by trade radius, zip code clusters, county or DMA level
• Viewers targeted by IP address, not ‘home market’ log in
• Create network clusters that line up with your linear TV campaign
• Commercials are full screen, non-skippable views with no bot traffic
• Convert TVE IMPs to demo GRPs
• Campaign IMP reporting by:• Network• Daypart• Device• Day• Click Through rate• Completion Rate• Reach & Frequency
11
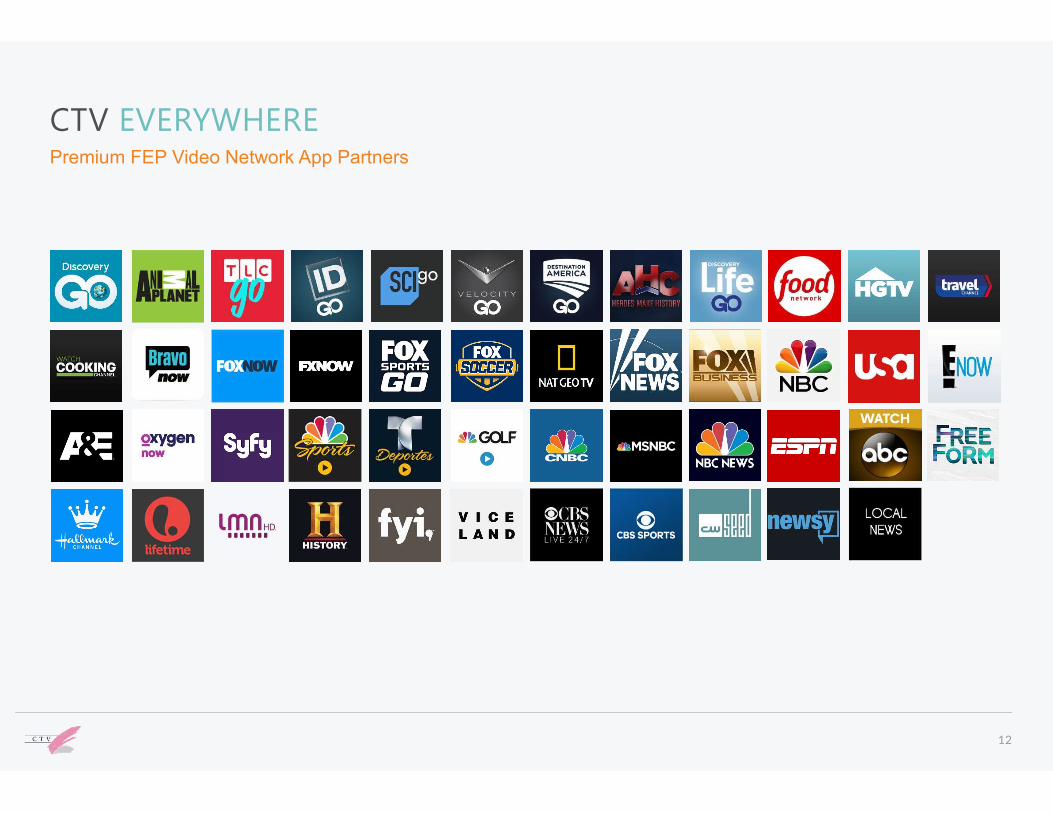
CTV EVERYWHEREPremium FEP Video Network App Partners
12
Audience ViewingSTB Data
13
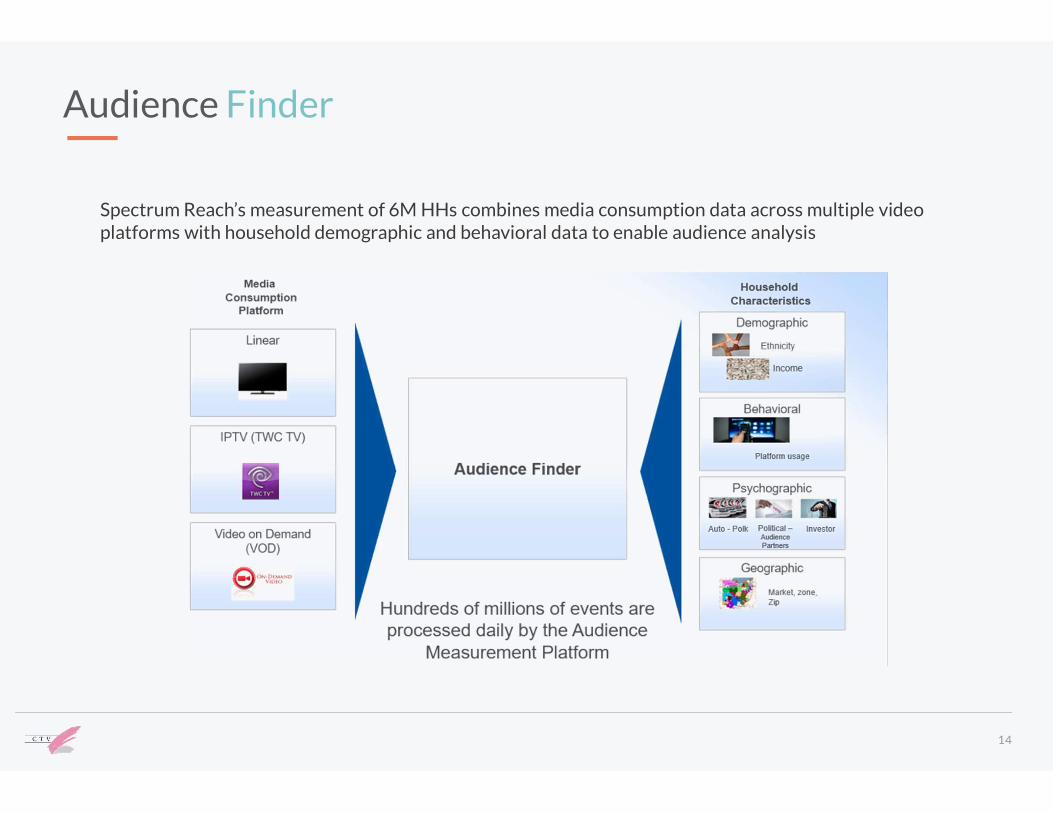
Spectrum Reach’s measurement of 6M HHs combines media consumption data across multiple video platforms with household demographic and behavioral data to enable audience analysis
Audience Finder
14
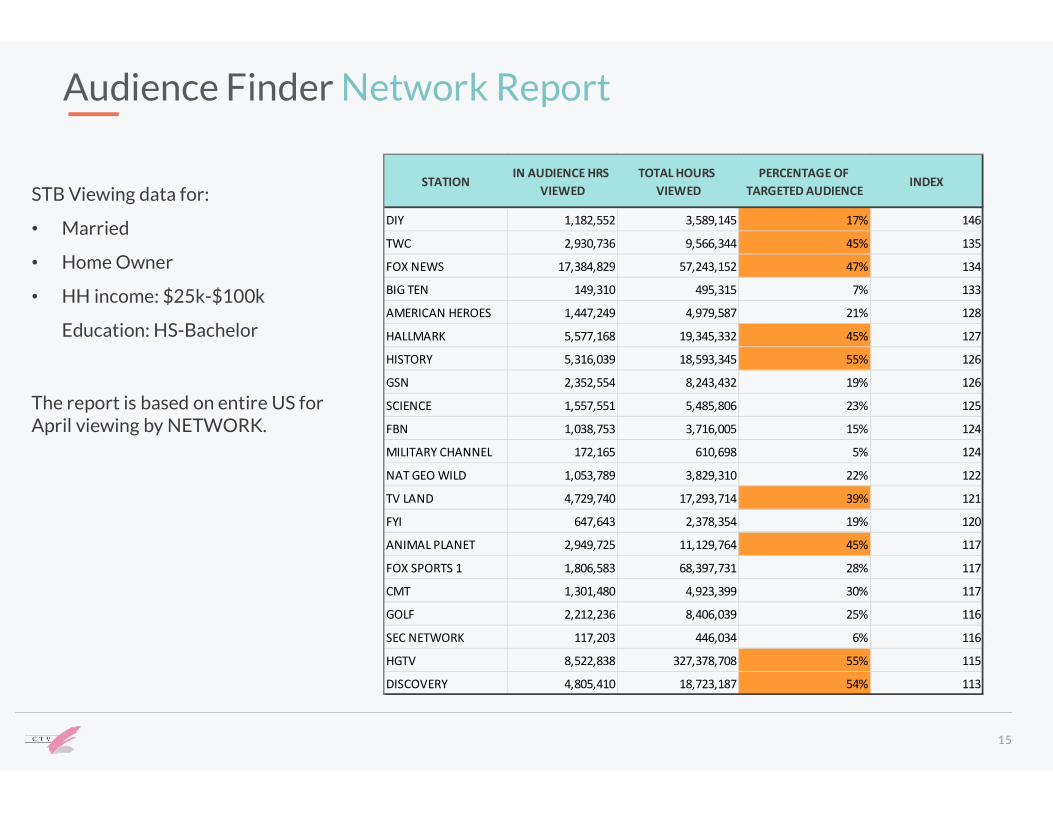
STB Viewing data for:
• Married
• Home Owner
• HH income: $25k-$100k
Education: HS-Bachelor
The report is based on entire US for April viewing by NETWORK.
Audience Finder Network Report
15
STATIONIN AUDIENCE HRS
VIEWEDTOTAL HOURS
VIEWEDPERCENTAGE OF
TARGETED AUDIENCEINDEX
DIY 1,182,552 3,589,145 17% 146
TWC 2,930,736 9,566,344 45% 135
FOX NEWS 17,384,829 57,243,152 47% 134
BIG TEN 149,310 495,315 7% 133
AMERICAN HEROES 1,447,249 4,979,587 21% 128
HALLMARK 5,577,168 19,345,332 45% 127
HISTORY 5,316,039 18,593,345 55% 126
GSN 2,352,554 8,243,432 19% 126
SCIENCE 1,557,551 5,485,806 23% 125
FBN 1,038,753 3,716,005 15% 124
MILITARY CHANNEL 172,165 610,698 5% 124
NAT GEO WILD 1,053,789 3,829,310 22% 122
TV LAND 4,729,740 17,293,714 39% 121
FYI 647,643 2,378,354 19% 120
ANIMAL PLANET 2,949,725 11,129,764 45% 117
FOX SPORTS 1 1,806,583 68,397,731 28% 117
CMT 1,301,480 4,923,399 30% 117
GOLF 2,212,236 8,406,039 25% 116
SEC NETWORK 117,203 446,034 6% 116
HGTV 8,522,838 327,378,708 55% 115
DISCOVERY 4,805,410 18,723,187 54% 113
THANK YOU!REBECCA VAN [email protected]
1490 Manning Pkwy, Powell, OH 43065LGA
614.848.5800
Contact us:
facebook.com/ctvmediainc
Twitter.com/ctvmedia
Follow us on:
16


