Embed Size (px)
Citation preview
S54 68th AACC Annual Scientific Meeting Abstracts, 2016
Tuesday, August 2, 9:30 am – 5:00 pm Endocrinology/Hormones
Tuesday, August 2, 2016
Poster Session: 9:30 AM ‑ 5:00 PM
Endocrinology/Hormones
A-161Systemic inflammation affects human osteocyte signaling
J. L. Pathak1, A. D. Bakker2, F. P. Luyten3, P. Verschueren3, W. F. Lems4, J. Klein-Nulend2, N. Bravenboer5. 1School of Pharmaceutical Science and Technology (SPST), Tianjin University, Tianjin, China, 2Department of Oral Cell Biology, Academic Centre for Dentistry Amsterdam (ACTA), University of Amsterdam and VU University Amsterdam, MOVE Research Institute Amsterdam, Amsterdam, Netherlands, 3Skeletal Biology and Engineering Research Centre, KU Leuven, Leuven, Belgium, 4Department of Rheumatology, VU University Medical Center, MOVE Research Institute Amsterdam, Amsterdam, Netherlands, 5Department of Clinical Chemistry, VU University Medical Center, MOVE Research Institute Amsterdam, Amsterdam, Netherlands
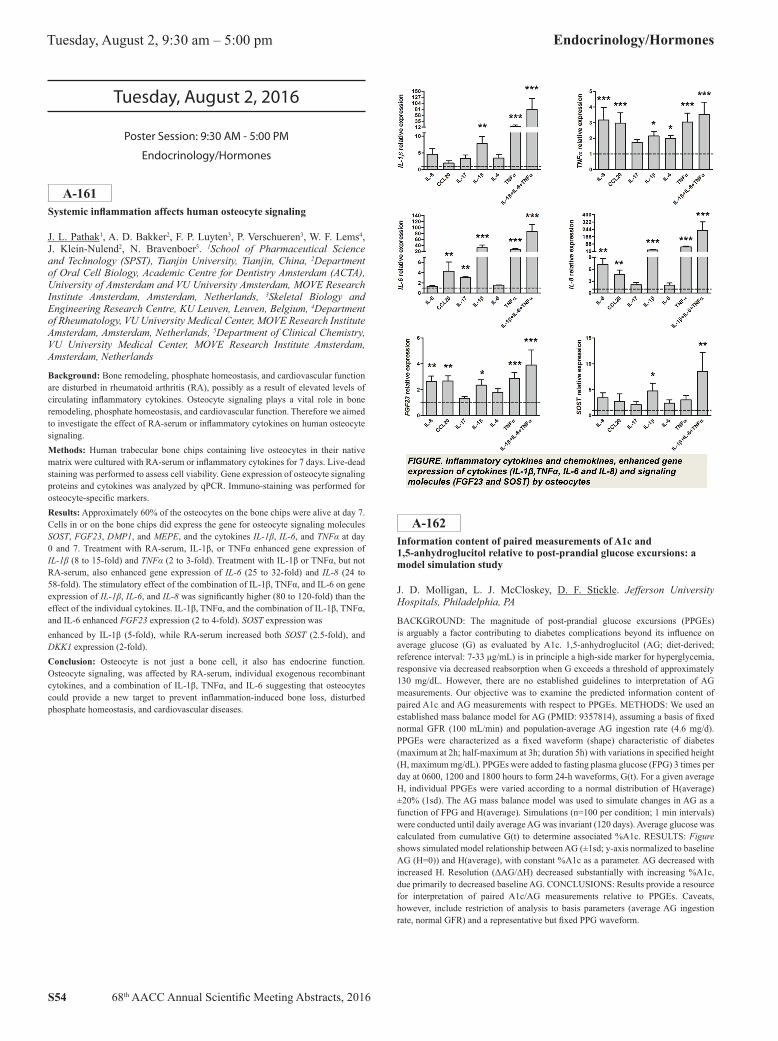
Background: Bone remodeling, phosphate homeostasis, and cardiovascular function are disturbed in rheumatoid arthritis (RA), possibly as a result of elevated levels of circulating inflammatory cytokines. Osteocyte signaling plays a vital role in bone remodeling, phosphate homeostasis, and cardiovascular function. Therefore we aimed to investigate the effect of RA-serum or inflammatory cytokines on human osteocyte signaling.Methods: Human trabecular bone chips containing live osteocytes in their native matrix were cultured with RA-serum or inflammatory cytokines for 7 days. Live-dead staining was performed to assess cell viability. Gene expression of osteocyte signaling proteins and cytokines was analyzed by qPCR. Immuno-staining was performed for osteocyte-specific markers.Results: Approximately 60% of the osteocytes on the bone chips were alive at day 7. Cells in or on the bone chips did express the gene for osteocyte signaling molecules SOST, FGF23, DMP1, and MEPE, and the cytokines IL-1β, IL-6, and TNFα at day 0 and 7. Treatment with RA-serum, IL-1β, or TNFα enhanced gene expression of IL-1β (8 to 15-fold) and TNFα (2 to 3-fold). Treatment with IL-1β or TNFα, but not RA-serum, also enhanced gene expression of IL-6 (25 to 32-fold) and IL-8 (24 to 58-fold). The stimulatory effect of the combination of IL-1β, TNFα, and IL-6 on gene expression of IL-1β, IL-6, and IL-8 was significantly higher (80 to 120-fold) than the effect of the individual cytokines. IL-1β, TNFα, and the combination of IL-1β, TNFα, and IL-6 enhanced FGF23 expression (2 to 4-fold). SOST expression wasenhanced by IL-1β (5-fold), while RA-serum increased both SOST (2.5-fold), and DKK1 expression (2-fold).Conclusion: Osteocyte is not just a bone cell, it also has endocrine function. Osteocyte signaling, was affected by RA-serum, individual exogenous recombinant cytokines, and a combination of IL-1β, TNFα, and IL-6 suggesting that osteocytes could provide a new target to prevent inflammation-induced bone loss, disturbed phosphate homeostasis, and cardiovascular diseases.
A-162Information content of paired measurements of A1c and 1,5-anhydroglucitol relative to post-prandial glucose excursions: a model simulation study
J. D. Molligan, L. J. McCloskey, D. F. Stickle. Jefferson University Hospitals, Philadelphia, PA
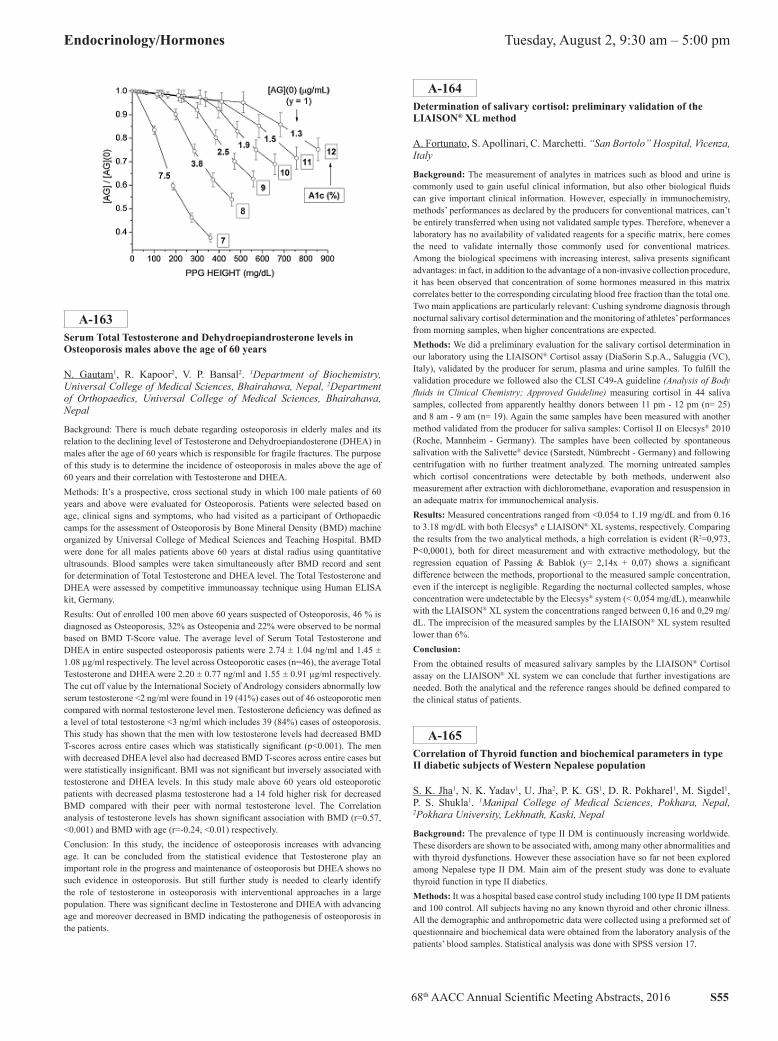
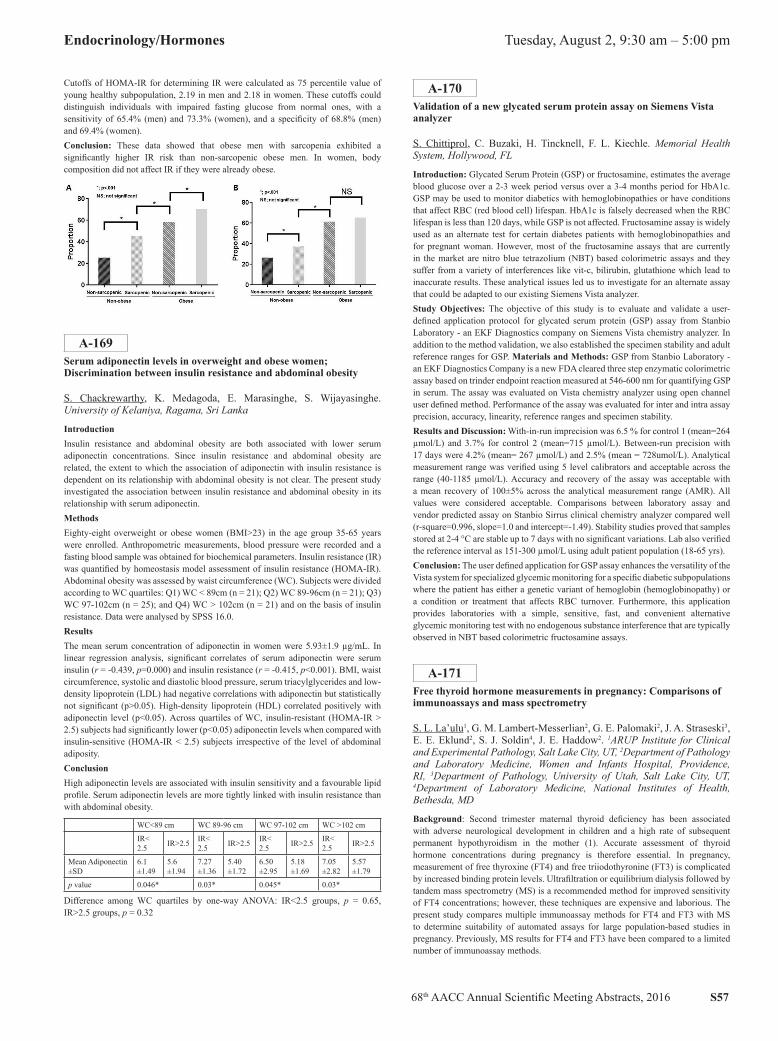
BACKGROUND: The magnitude of post-prandial glucose excursions (PPGEs) is arguably a factor contributing to diabetes complications beyond its influence on average glucose (G) as evaluated by A1c. 1,5-anhydroglucitol (AG; diet-derived; reference interval: 7-33 μg/mL) is in principle a high-side marker for hyperglycemia, responsive via decreased reabsorption when G exceeds a threshold of approximately 130 mg/dL. However, there are no established guidelines to interpretation of AG measurements. Our objective was to examine the predicted information content of paired A1c and AG measurements with respect to PPGEs. METHODS: We used an established mass balance model for AG (PMID: 9357814), assuming a basis of fixed normal GFR (100 mL/min) and population-average AG ingestion rate (4.6 mg/d). PPGEs were characterized as a fixed waveform (shape) characteristic of diabetes (maximum at 2h; half-maximum at 3h; duration 5h) with variations in specified height (H, maximum mg/dL). PPGEs were added to fasting plasma glucose (FPG) 3 times per day at 0600, 1200 and 1800 hours to form 24-h waveforms, G(t). For a given average H, individual PPGEs were varied according to a normal distribution of H(average) ±20% (1sd). The AG mass balance model was used to simulate changes in AG as a function of FPG and H(average). Simulations (n=100 per condition; 1 min intervals) were conducted until daily average AG was invariant (120 days). Average glucose was calculated from cumulative G(t) to determine associated %A1c. RESULTS: Figure shows simulated model relationship between AG (±1sd; y-axis normalized to baseline AG (H=0)) and H(average), with constant %A1c as a parameter. AG decreased with increased H. Resolution (ΔAG/ΔH) decreased substantially with increasing %A1c, due primarily to decreased baseline AG. CONCLUSIONS: Results provide a resource for interpretation of paired A1c/AG measurements relative to PPGEs. Caveats, however, include restriction of analysis to basis parameters (average AG ingestion rate, normal GFR) and a representative but fixed PPG waveform.
68th AACC Annual Scientific Meeting Abstracts, 2016 S55
Endocrinology/Hormones Tuesday, August 2, 9:30 am – 5:00 pm
A-163Serum Total Testosterone and Dehydroepiandrosterone levels in Osteoporosis males above the age of 60 years
N. Gautam1, R. Kapoor2, V. P. Bansal2. 1Department of Biochemistry, Universal College of Medical Sciences, Bhairahawa, Nepal, 2Department of Orthopaedics, Universal College of Medical Sciences, Bhairahawa, Nepal
Background: There is much debate regarding osteoporosis in elderly males and its relation to the declining level of Testosterone and Dehydroepiandosterone (DHEA) in males after the age of 60 years which is responsible for fragile fractures. The purpose of this study is to determine the incidence of osteoporosis in males above the age of 60 years and their correlation with Testosterone and DHEA.Methods: It’s a prospective, cross sectional study in which 100 male patients of 60 years and above were evaluated for Osteoporosis. Patients were selected based on age, clinical signs and symptoms, who had visited as a participant of Orthopaedic camps for the assessment of Osteoporosis by Bone Mineral Density (BMD) machine organized by Universal College of Medical Sciences and Teaching Hospital. BMD were done for all males patients above 60 years at distal radius using quantitative ultrasounds. Blood samples were taken simultaneously after BMD record and sent for determination of Total Testosterone and DHEA level. The Total Testosterone and DHEA were assessed by competitive immunoassay technique using Human ELISA kit, Germany.Results: Out of enrolled 100 men above 60 years suspected of Osteoporosis, 46 % is diagnosed as Osteoporosis, 32% as Osteopenia and 22% were observed to be normal based on BMD T-Score value. The average level of Serum Total Testosterone and DHEA in entire suspected osteoporosis patients were 2.74 ± 1.04 ng/ml and 1.45 ± 1.08 µg/ml respectively. The level across Osteoporotic cases (n=46), the average Total Testosterone and DHEA were 2.20 ± 0.77 ng/ml and 1.55 ± 0.91 µg/ml respectively. The cut off value by the International Society of Andrology considers abnormally low serum testosterone <2 ng/ml were found in 19 (41%) cases out of 46 osteoporotic men compared with normal testosterone level men. Testosterone deficiency was defined as a level of total testosterone <3 ng/ml which includes 39 (84%) cases of osteoporosis. This study has shown that the men with low testosterone levels had decreased BMD T-scores across entire cases which was statistically significant (p<0.001). The men with decreased DHEA level also had decreased BMD T-scores across entire cases but were statistically insignificant. BMI was not significant but inversely associated with testosterone and DHEA levels. In this study male above 60 years old osteoporotic patients with decreased plasma testosterone had a 14 fold higher risk for decreased BMD compared with their peer with normal testosterone level. The Correlation analysis of testosterone levels has shown significant association with BMD (r=0.57, <0.001) and BMD with age (r=-0.24, <0.01) respectively.Conclusion: In this study, the incidence of osteoporosis increases with advancing age. It can be concluded from the statistical evidence that Testosterone play an important role in the progress and maintenance of osteoporosis but DHEA shows no such evidence in osteoporosis. But still further study is needed to clearly identify the role of testosterone in osteoporosis with interventional approaches in a large population. There was significant decline in Testosterone and DHEA with advancing age and moreover decreased in BMD indicating the pathogenesis of osteoporosis in the patients.
A-164Determination of salivary cortisol: preliminary validation of the LIAISON® XL method
A. Fortunato, S. Apollinari, C. Marchetti. “San Bortolo” Hospital, Vicenza, Italy
Background: The measurement of analytes in matrices such as blood and urine is commonly used to gain useful clinical information, but also other biological fluids can give important clinical information. However, especially in immunochemistry, methods’ performances as declared by the producers for conventional matrices, can’t be entirely transferred when using not validated sample types. Therefore, whenever a laboratory has no availability of validated reagents for a specific matrix, here comes the need to validate internally those commonly used for conventional matrices. Among the biological specimens with increasing interest, saliva presents significant advantages: in fact, in addition to the advantage of a non-invasive collection procedure, it has been observed that concentration of some hormones measured in this matrix correlates better to the corresponding circulating blood free fraction than the total one. Two main applications are particularly relevant: Cushing syndrome diagnosis through nocturnal salivary cortisol determination and the monitoring of athletes’ performances from morning samples, when higher concentrations are expected.Methods: We did a preliminary evaluation for the salivary cortisol determination in our laboratory using the LIAISON® Cortisol assay (DiaSorin S.p.A., Saluggia (VC), Italy), validated by the producer for serum, plasma and urine samples. To fulfill the validation procedure we followed also the CLSI C49-A guideline (Analysis of Body fluids in Clinical Chemistry; Approved Guideline) measuring cortisol in 44 saliva samples, collected from apparently healthy donors between 11 pm - 12 pm (n= 25) and 8 am - 9 am (n= 19). Again the same samples have been measured with another method validated from the producer for saliva samples: Cortisol II on Elecsys® 2010 (Roche, Mannheim - Germany). The samples have been collected by spontaneous salivation with the Salivette® device (Sarstedt, Nümbrecht - Germany) and following centrifugation with no further treatment analyzed. The morning untreated samples which cortisol concentrations were detectable by both methods, underwent also measurement after extraction with dichloromethane, evaporation and resuspension in an adequate matrix for immunochemical analysis.Results: Measured concentrations ranged from <0.054 to 1.19 mg/dL and from 0.16 to 3.18 mg/dL with both Elecsys® e LIAISON® XL systems, respectively. Comparing the results from the two analytical methods, a high correlation is evident (R2=0,973, P<0,0001), both for direct measurement and with extractive methodology, but the regression equation of Passing & Bablok (y= 2,14x + 0,07) shows a significant difference between the methods, proportional to the measured sample concentration, even if the intercept is negligible. Regarding the nocturnal collected samples, whose concentration were undetectable by the Elecsys® system (< 0,054 mg/dL), meanwhile with the LIAISON® XL system the concentrations ranged between 0,16 and 0,29 mg/dL. The imprecision of the measured samples by the LIAISON® XL system resulted lower than 6%.Conclusion:From the obtained results of measured salivary samples by the LIAISON® Cortisol assay on the LIAISON® XL system we can conclude that further investigations are needed. Both the analytical and the reference ranges should be defined compared to the clinical status of patients.
A-165Correlation of Thyroid function and biochemical parameters in type II diabetic subjects of Western Nepalese population
S. K. Jha1, N. K. Yadav1, U. Jha2, P. K. GS1, D. R. Pokharel1, M. Sigdel1, P. S. Shukla1. 1Manipal College of Medical Sciences, Pokhara, Nepal, 2Pokhara University, Lekhnath, Kaski, Nepal
Background: The prevalence of type II DM is continuously increasing worldwide. These disorders are shown to be associated with, among many other abnormalities and with thyroid dysfunctions. However these association have so far not been explored among Nepalese type II DM. Main aim of the present study was done to evaluate thyroid function in type II diabetics.Methods: It was a hospital based case control study including 100 type II DM patients and 100 control. All subjects having no any known thyroid and other chronic illness. All the demographic and anthropometric data were collected using a preformed set of questionnaire and biochemical data were obtained from the laboratory analysis of the patients’ blood samples. Statistical analysis was done with SPSS version 17.
S56 68th AACC Annual Scientific Meeting Abstracts, 2016
Tuesday, August 2, 9:30 am – 5:00 pm Endocrinology/Hormones
Results: In this study we found overall of 17% prevalence in DM cases with Thyroid disorders and amongst this, 11.76% with Primary Hypothyroidism, 76.48% with Sub clinical Hypothyroidism and 11.76% with Sub clinical hyperthyroidism. A statistical significant difference was noted between cases-DM and controls with respect to BMI (p<0.000), arm circumference (p<0.000), FT3 (p<0.004), TSH (p<0.000), FBS (p<0.000), PP(P <0.000), HbA1C (p<0.000), TC (p<0.000), TG(p<0.005) and LDL (p<0.018) respectively. In this study, the mean±SD of FT3, FT4 and TSH in control and DM were found to be (2.43±0.64 and 2.67±0.93 with p-value 0.004), (1.06±0.27 and 1.15±0.31 with p-value 0.31) and (2.62±1.42 and 3.70±5.13 with p-value 0.00). Analysis between serum FT3, FT4 and TSH with respect to baseline characteristics and biochemical parameter of the study subjects showed negative significant correlation (p<0.05) between FT3 with region in DM, positive significant correlation between FT4 with Age in DM, positive significant correlation (p<0.05) between TSH with TC in DM.Conclusion: This study confirms that thyroid dysfunctions is also common among Nepalese type II DM patients. Our study also reveal that prevalence of thyroid dysfunction is more common in type II DM. It is thus recommended that these group of population should be routinely screened for asymptomatic thyroid dysfunctions besides their usual treatment.
A-166Graves disease: Patients with hyperthyroid status have a higher risk of developing type 2 diabetes
M. RIBERI1, M. Gaston2, A. Castillo1. 1LABORATORIO CASTILLO-CHIDIAK, CORDOBA, Argentina, 2Departamento de Química, Facultad de Ciencias Exactas, Físicas y Naturales, Universidad Nacional de Córdoba, CORDOBA, Argentina
Background. Graves’ disease (GD) is a multi-systemic autoimmune disorder caused by thyroid stimulating antibodies that bind to and activate the thyroid stimulating hormone (TSH) receptor on thyroid cells (TRAbs). Common findings are low serum concentration of TSH, positive TRAbs, and high concentrations of anti-thyroid peroxidase antibodies (ATPO). In insulin-dependent diabetics, hyperthyroidism may aggravate glucose intolerance by multiple mechanisms, decreasing responsiveness to insulin. An association between type 1 diabetes mellitus (DM) and autoimmune reaction to thyroid antigens, including anti-thyroid antibodies (ATPO) in pediatric patients with positive TRAbs, was recently reported. The objective of this study is to investigate the association between thyroid status, serum TSH levels, positive TRAbs and ATPO, and the potential risk to develop type 2 DM based on insulin levels in adults. Methods. The study was conducted in 64 patients between May 2014 and October 2015. The mean subject age was 47 ± 18 years old and the male/female ratio was 11 (17.7% male):51 (82.3%female). Pregnant women and patients under 25 years of age were excluded. We measured TRAbs, ATPO, TSH, and insulin concentrations in euthyroids (TSH = 1.10 to 9.00 µU/mL) and hyperthyroids (TSH between 0.01 to 0.44 µU/mL). TRAbs were measured by second generation thyrotropin-binding inhibitor immunoglobulin (TBII) assay (DiaMetra, Italy). The cut-off for positive TRAbs was 1.50 UI/L. ATPO, TSH and insulin concentrations were determined by chemiluminescent microparticle immunoassay (CMIA) using a Advia Centaur (Siemens, USA). The cut off for positive ATPO was > 37 UI/mL, reference interval for TSH was 0.4 to 4.4 µU/mL and for insulin was 5 to 20 µU/mL. Data obtained for all measurements of TRAbs, ATPO, TSH and insulin in both groups was analyzed using the Student’s t-test. A p value < 0.05 represented a significant difference. Data was expressed as mean ± standard error of the mean (SEM). Results. As expected, TSH serum concentrations were significantly decreased in hyperthyroid patients (0.13 ± 0.03) compared with euthyroid patients (3.31 ± 0.48) (t=12.79; p < 0.05). We observed a significant increase in TRAbs levels in hyperthyroid patients (7.67 ± 1.91) compared with euthyroid patients (2.23 ± 0.40) (t=2.07; p < 0.05). In addition, we reported a significant enhacement on ATPO levels in hyperthyroid patients (650.8 ± 84.82) versus euthyroid patients (296.2 ± 85.30) (t=3.03; p < 0.05). Similarly, higher insulin levels were observed in hyperthyroid patients (15.35 ± 1.94) versus euthyroid patients (9.94 ± 1.43) (t=2.51; p < 0.05). Conclusions. Based on the results of the present study we conclude that thyroid autoimmunity is associated with female gender, the presence of anti-thyroid and TSH receptor antibodies, and low levels of TSH. Importantly, higher mean insulin concentrations were observed in hyperthyroid patients. The presence of TRAbs and high insulin concentrations in patients with TSH between 0.01-0.44 µU/mL and positive ATPO, may indicate a higher risk of developing type 2 Diabetes Mellitus in adults. We recommend evaluation of TRAbs and insulin levels in at-risk populations.
A-167Contributory Antioxidant Role of Testosterone and Oxidative Stress Biomarkers in Males Exposed to Mixed Chemicals in an Automobile Repair Community.
S. A. Adekola, M. A. Charles-Davies, A. A. Onifade, S. U. Okoli. University of Ibadan, Ibadan, Oyo state, Nigeria
Background: Testosterone is a known androgenic and anabolic steroid, primarily secreted in the testes. It plays an important role in the development of testes and prostate, and has a range of biological actions. There is evidence that exposure to mixed chemicals in the work place leads to generation of free radicals and inadequate antioxidants leading to oxidative stress, which may serve as an early indicator of a pathophysiologic state. Based on findings, testosterone show direct antioxidant effects by increasing the activities of antioxidant enzymes like glutathione peroxidase, thus indirectly contributing to antioxidant capacity.Objective: To evaluate the antioxidant role of testosterone as well as the relationship between testosterone and oxidative stress biomarkers in males exposed to mixed chemicals in the automobile repair community.Methods: The study included 43 participants aged 22- 60years exposed to mixed chemicals (EMC) from the automobile repair community. Forty (40) apparently healthy, unexposed, age matched controls were recruited after informed consent. Demographic, sexual and anthropometric characteristics were obtained from pre- test structured questionnaires using standard methods. Blood samples (10mls) were collected from each subject into plain bottles and sera obtained were used for biochemical analyses. Serum levels of testosterone and luteinizing hormone (LH) were determined by enzyme immunoassay method, EIA (Immunometrics UK.LTD). Levels of total antioxidant capacity (TAC), total plasma peroxide (TPP), Malondialdehyde (MDA), hydrogen peroxide (H2O2), glutathione peroxide (GPX), superoxide dismutase (SOD), glutathione-S-transferase (GST), and reduced glutathione (GSH) were determined using spectrophotometric methods respectively. Results obtained were analyzed using the Student’s t-test and Chi-square test for quantitative variables and qualitative variables respectively. Multiple regression was used to find associations and relationships between the variables.Results: Significant higher concentrations of TPP, MDA, OSI, H2O2 and GST were observed in EMC compared with controls (p<0.001). Within EMC, significantly higher levels of testosterone, LH and TAC were observed in eugonadic when compared with hypogonadic participants (p<0.001). Diastolic blood pressure, waist circumference, waist height ratio and waist hip ratio were significantly higher in participants EMC compared with the controls. Sexual history and dietary intake showed that the controls had normal erection during sex and took more vegetables in their diet which may therefore be beneficial.Conclusion: The significantly increased levels of total antioxidant capacity in males exposed to mixed chemicals despite their exposure may probably reflect the contributory antioxidant role testosterone that prevents oxidative stress.
A-168Homeostasis model assessment of insulin resistance in a general adult population in Korea: Additive association of sarcopenia and obesity with insulin resistance
S. Kwon, J. Rim, Y. Lee, J. Kim, S. Lee. Yonsei University College of Medicine, Seoul, Korea, Republic of
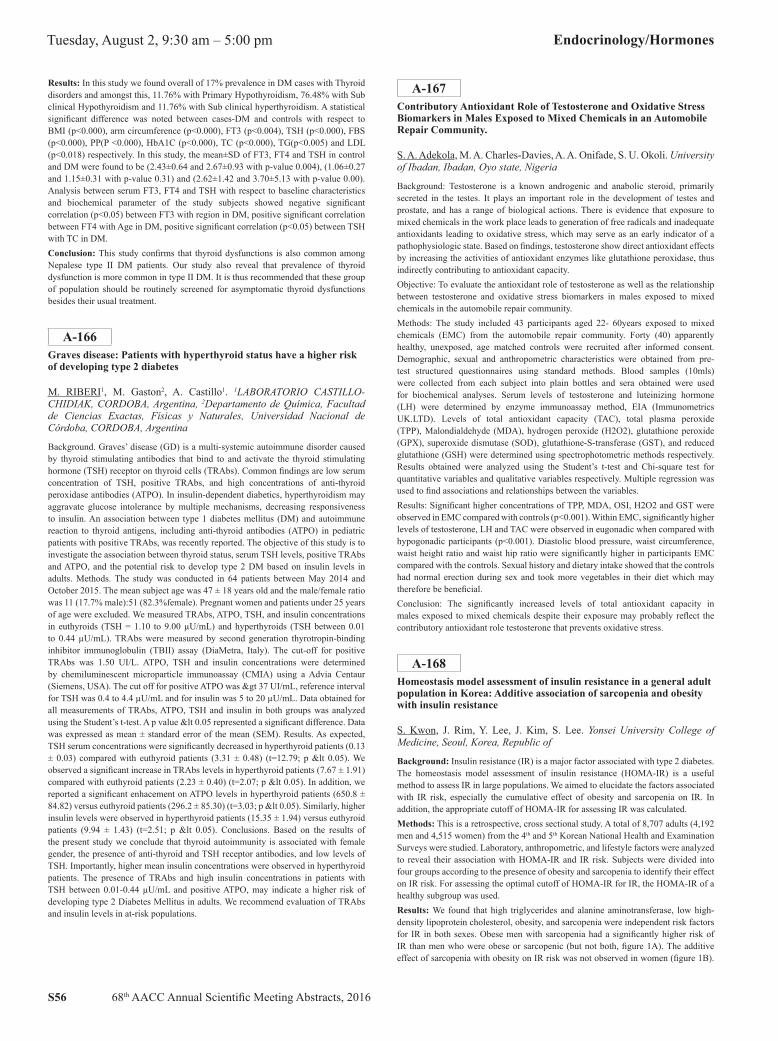
Background: Insulin resistance (IR) is a major factor associated with type 2 diabetes. The homeostasis model assessment of insulin resistance (HOMA-IR) is a useful method to assess IR in large populations. We aimed to elucidate the factors associated with IR risk, especially the cumulative effect of obesity and sarcopenia on IR. In addition, the appropriate cutoff of HOMA-IR for assessing IR was calculated.Methods: This is a retrospective, cross sectional study. A total of 8,707 adults (4,192 men and 4,515 women) from the 4th and 5th Korean National Health and Examination Surveys were studied. Laboratory, anthropometric, and lifestyle factors were analyzed to reveal their association with HOMA-IR and IR risk. Subjects were divided into four groups according to the presence of obesity and sarcopenia to identify their effect on IR risk. For assessing the optimal cutoff of HOMA-IR for IR, the HOMA-IR of a healthy subgroup was used.Results: We found that high triglycerides and alanine aminotransferase, low high-density lipoprotein cholesterol, obesity, and sarcopenia were independent risk factors for IR in both sexes. Obese men with sarcopenia had a significantly higher risk of IR than men who were obese or sarcopenic (but not both, figure 1A). The additive effect of sarcopenia with obesity on IR risk was not observed in women (figure 1B).
68th AACC Annual Scientific Meeting Abstracts, 2016 S57
Endocrinology/Hormones Tuesday, August 2, 9:30 am – 5:00 pm
Cutoffs of HOMA-IR for determining IR were calculated as 75 percentile value of young healthy subpopulation, 2.19 in men and 2.18 in women. These cutoffs could distinguish individuals with impaired fasting glucose from normal ones, with a sensitivity of 65.4% (men) and 73.3% (women), and a specificity of 68.8% (men) and 69.4% (women).Conclusion: These data showed that obese men with sarcopenia exhibited a significantly higher IR risk than non-sarcopenic obese men. In women, body composition did not affect IR if they were already obese.
A-169Serum adiponectin levels in overweight and obese women; Discrimination between insulin resistance and abdominal obesity
S. Chackrewarthy, K. Medagoda, E. Marasinghe, S. Wijayasinghe. University of Kelaniya, Ragama, Sri Lanka
IntroductionInsulin resistance and abdominal obesity are both associated with lower serum adiponectin concentrations. Since insulin resistance and abdominal obesity are related, the extent to which the association of adiponectin with insulin resistance is dependent on its relationship with abdominal obesity is not clear. The present study investigated the association between insulin resistance and abdominal obesity in its relationship with serum adiponectin.Methods Eighty-eight overweight or obese women (BMI>23) in the age group 35-65 years were enrolled. Anthropometric measurements, blood pressure were recorded and a fasting blood sample was obtained for biochemical parameters. Insulin resistance (IR) was quantified by homeostasis model assessment of insulin resistance (HOMA-IR). Abdominal obesity was assessed by waist circumference (WC). Subjects were divided according to WC quartiles: Q1) WC < 89cm (n = 21); Q2) WC 89-96cm (n = 21); Q3) WC 97-102cm (n = 25); and Q4) WC > 102cm (n = 21) and on the basis of insulin resistance. Data were analysed by SPSS 16.0.ResultsThe mean serum concentration of adiponectin in women were 5.93±1.9 µg/mL. In linear regression analysis, significant correlates of serum adiponectin were serum insulin (r = -0.439, p=0.000) and insulin resistance (r = -0.415, p<0.001). BMI, waist circumference, systolic and diastolic blood pressure, serum triacylglycerides and low-density lipoprotein (LDL) had negative correlations with adiponectin but statistically not significant (p>0.05). High-density lipoprotein (HDL) correlated positively with adiponectin level (p<0.05). Across quartiles of WC, insulin-resistant (HOMA-IR > 2.5) subjects had significantly lower (p<0.05) adiponectin levels when compared with insulin-sensitive (HOMA-IR < 2.5) subjects irrespective of the level of abdominal adiposity.ConclusionHigh adiponectin levels are associated with insulin sensitivity and a favourable lipid profile. Serum adiponectin levels are more tightly linked with insulin resistance than with abdominal obesity.
WC<89 cm WC 89-96 cm WC 97-102 cm WC >102 cm
IR< 2.5 IR>2.5 IR<
2.5 IR>2.5 IR< 2.5 IR>2.5 IR<
2.5 IR>2.5
Mean Adiponectin±SD
6.1±1.49
5.6±1.94
7.27±1.36
5.40±1.72
6.50±2.95
5.18±1.69
7.05±2.82
5.57±1.79
p value 0.046* 0.03* 0.045* 0.03*
Difference among WC quartiles by one-way ANOVA: IR<2.5 groups, p = 0.65, IR>2.5 groups, p = 0.32
A-170Validation of a new glycated serum protein assay on Siemens Vista analyzer
S. Chittiprol, C. Buzaki, H. Tincknell, F. L. Kiechle. Memorial Health System, Hollywood, FL
Introduction: Glycated Serum Protein (GSP) or fructosamine, estimates the average blood glucose over a 2-3 week period versus over a 3-4 months period for HbA1c. GSP may be used to monitor diabetics with hemoglobinopathies or have conditions that affect RBC (red blood cell) lifespan. HbA1c is falsely decreased when the RBC lifespan is less than 120 days, while GSP is not affected. Fructosamine assay is widely used as an alternate test for certain diabetes patients with hemoglobinopathies and for pregnant woman. However, most of the fructosamine assays that are currently in the market are nitro blue tetrazolium (NBT) based colorimetric assays and they suffer from a variety of interferences like vit-c, bilirubin, glutathione which lead to inaccurate results. These analytical issues led us to investigate for an alternate assay that could be adapted to our existing Siemens Vista analyzer.Study Objectives: The objective of this study is to evaluate and validate a user-defined application protocol for glycated serum protein (GSP) assay from Stanbio Laboratory - an EKF Diagnostics company on Siemens Vista chemistry analyzer. In addition to the method validation, we also established the specimen stability and adult reference ranges for GSP. Materials and Methods: GSP from Stanbio Laboratory - an EKF Diagnostics Company is a new FDA cleared three step enzymatic colorimetric assay based on trinder endpoint reaction measured at 546-600 nm for quantifying GSP in serum. The assay was evaluated on Vista chemistry analyzer using open channel user defined method. Performance of the assay was evaluated for inter and intra assay precision, accuracy, linearity, reference ranges and specimen stability.Results and Discussion: With-in-run imprecision was 6.5 % for control 1 (mean=264 µmol/L) and 3.7% for control 2 (mean=715 µmol/L). Between-run precision with 17 days were 4.2% (mean= 267 µmol/L) and 2.5% (mean = 728umol/L). Analytical measurement range was verified using 5 level calibrators and acceptable across the range (40-1185 µmol/L). Accuracy and recovery of the assay was acceptable with a mean recovery of 100±5% across the analytical measurement range (AMR). All values were considered acceptable. Comparisons between laboratory assay and vendor predicted assay on Stanbio Sirrus clinical chemistry analyzer compared well (r-square=0.996, slope=1.0 and intercept=-1.49). Stability studies proved that samples stored at 2-4 °C are stable up to 7 days with no significant variations. Lab also verified the reference interval as 151-300 µmol/L using adult patient population (18-65 yrs).Conclusion: The user defined application for GSP assay enhances the versatility of the Vista system for specialized glycemic monitoring for a specific diabetic subpopulations where the patient has either a genetic variant of hemoglobin (hemoglobinopathy) or a condition or treatment that affects RBC turnover. Furthermore, this application provides laboratories with a simple, sensitive, fast, and convenient alternative glycemic monitoring test with no endogenous substance interference that are typically observed in NBT based colorimetric fructosamine assays.
A-171Free thyroid hormone measurements in pregnancy: Comparisons of immunoassays and mass spectrometry
S. L. La’ulu1, G. M. Lambert-Messerlian2, G. E. Palomaki2, J. A. Straseski3, E. E. Eklund2, S. J. Soldin4, J. E. Haddow2. 1ARUP Institute for Clinical and Experimental Pathology, Salt Lake City, UT, 2Department of Pathology and Laboratory Medicine, Women and Infants Hospital, Providence, RI, 3Department of Pathology, University of Utah, Salt Lake City, UT, 4Department of Laboratory Medicine, National Institutes of Health, Bethesda, MD
Background: Second trimester maternal thyroid deficiency has been associated with adverse neurological development in children and a high rate of subsequent permanent hypothyroidism in the mother (1). Accurate assessment of thyroid hormone concentrations during pregnancy is therefore essential. In pregnancy, measurement of free thyroxine (FT4) and free triiodothyronine (FT3) is complicated by increased binding protein levels. Ultrafiltration or equilibrium dialysis followed by tandem mass spectrometry (MS) is a recommended method for improved sensitivity of FT4 concentrations; however, these techniques are expensive and laborious. The present study compares multiple immunoassay methods for FT4 and FT3 with MS to determine suitability of automated assays for large population-based studies in pregnancy. Previously, MS results for FT4 and FT3 have been compared to a limited number of immunoassay methods.
S58 68th AACC Annual Scientific Meeting Abstracts, 2016
Tuesday, August 2, 9:30 am – 5:00 pm Endocrinology/Hormones
Methods: Residual sera (n=60) for the comparative study were collected, aliquoted, and distributed by the Women and Infants (WIH) laboratory; TSH concentrations were within the reference interval (0.3-5.0 µIU/mL) in 50 samples, elevated in 8 samples, and low in 2. Ultrafiltration followed by liquid chromatography-tandem mass spectrometry was performed as previously described (2). Immunoassay platforms for FT4 and FT3 testing included the Abbott Architect i2000SR, Roche cobas e602, Beckman Coulter Dxl, and Siemens Immulite 2000. Formal pairwise method comparisons were performed, after logarithmic transformation. This study was approved by the WIH IRB.Results: Of the 60 samples, one failed MS quality control for FT4 (hypothyroid) and 18 for FT3 (14 euthyroid and 4 hypothyroid); 41 samples remained. FT4 correlations between the four immunoassays ranged between 0.82 and 0.93; correlations between MS and the four immunoassays, however, were lower (r values: 0.74, 0.74, 0.66, and 0.71 for Architect, cobas, DxI, and Immulite, respectively). Among the three samples with TSH elevations, all four immunoassays ordered the FT4 results the same as MS. FT3 correlations between the four immunoassays ranged between 0.46 and 0.89; correlations between MS and the immunoassays were low (r values: 0.27, 0.40, 0.37, and 0.18, respectively).Conclusions: FT4 immunoassay measurements appear to be a reasonable surrogate for MS in pregnant euthyroid patients. Agreements between immunoassays for FT4 are high. MS was unable to reliably determine FT3 in 18 pregnancy samples, and agreement between the remaining 41 FT3 MS results with immunoassays was poor. Agreement was also poor between FT3 immunoassays. These results generate concern regarding the reliability and usefulness of FT3 assays in samples from pregnancy. The measurement of total T3 as an alternative to fT3 is currently under investigation.
A-172Inappropriate Inpatient HbA1c Repeat Testing
R. Hawkins. Tan Tock Seng Hospital, Singapore, Singapore
Background: There is presently much interest in reducing waste in health care. In laboratory medicine, unnecessary repeat testing is such a focus and HbA1c measurement with its known biological half-life and monitoring requirements is a good model test. This study examined the pattern of repeat HbA1c testing in inpatients at a 1400 bed general hospital in Singapore (note that HbA1c is not used for diagnosis of diabetes mellitus in Singapore). Methods: Anonymised details of all HbA1c testing (Beckman-Coulter DxC-800 immunoturbidometric assay) for 2014 were extracted from the laboratory information system for analysis in Excel. Inappropriate repeat testing was defined as a retest interval < 60 days (Association of Clinical Biochemistry UK Minimum Retesting Interval guidelines). Logistic regression analysis was performed using age, sex, HbA1c, race and hospital discipline to predict repeat testing within different time frames. Results: There were 13875 tests (38 per day). 1152 (9%) were repeat samples (1012 duplicates, 127 triplicates, 13 quadruplicates). The cumulative distribution of the repeat tests was: 8.5% within 3 days of the initial test, 11.1% within 7 days, 13.7% within 14 days, 15.6% within 21 days, 18.3% within 30 days, 29% within 60 days and 42.9% within 90 days. The significant predictors of repeat testing < 60 d were: increasing age, surgical (vs. medical) discipline and higher HbA1c. For repeats < 7 days, surgical discipline and higher HbA1c were the only significant predictors while for < 3 days, higher HbA1c was the sole predictor. Conclusion: Inappropriate repeats earlier than 60 days represent 2.4% of all HbA1c measurements on inpatients or 332 tests per year. The strongest predictors of early repeat testing are increased HbA1c and surgical patients. Poor clinician understanding of the timeframe for HbA1c change may contribute to this practice - better education and/or introduction of computerized minimum retest interval guidelines should reduce such over-requesting.
A-173Association between Subclinical Thyroid Dysfunction and Bone Mineral Density
S. Lim, H. Yu, M. Kwon, H. Woo, H. Park. Kangbuk Samsung Hospital, Sungkyunkwan University School of Medicine, Seoul, Korea, Republic of
Background: Overt hypo/hyperthyroidism is a clear risk factor for osteoporotic fractures. Recent evidence suggests that subtle alterations in thyroid function found in subclinical thyroid dysfunction, characterized by abnormal thyroid-stimulating hormone (TSH) with normal free thyroxine (fT4), may increase bone turnover. However, it remains unclear whether similar risk applies to subclinical thyroid dysfunction and whether it has adverse health consequences. Here we investigated the association between serum TSH and bone mineral density (BMD), aiming to
evaluate whether differences in THS levels influence bone status in a Korean healthy population.Methods: Data were collected from healthy subjects who underwent a comprehensive examination at Kangbuk Samsung Hospital Total Healthcare Center in Seoul during January 2011-December 2014. 7,992 participants were included; 760 had subclinical thyroid dysfunction (48 had subclinical hyperthyroidism and 712 had subclinical hypothyroidism) and 7,232 were age- and sex-matched healthy participants. Serum TSH and fT4 levels were measured using cobas e602 (Roche Diagnostics; Tokyo, Japan) and BMD of the lumbar spine was measured using X-rays (Prodigy; GE Healthcare Technologies, Madison, WI, USA).Results: We included 48 subclinical hyperthyroidism patients (6 men and 42 women; mean age = 43.1 years; range: 25-73 years), 712 subclinical hypothyroidism patients (165 men and 547 women; mean age = 42.5 years; range: 22-75 years) and 7,232controls (2532 men and 4700 women; mean age = 42.6 years; range: 20-80 years) (P=0.906). Mean serum TSH level was 1.10±0.77ng/dL in the Subclinical hyperT patients, 5.65±1.45 ng/dL in the Subclinical hypoT patients,and1.99±0.09ng/dL in the controls (P = 0.000). BMD was 1.18±0.13g/cm2 in the Subclinical hyperT patients, 1.16±0.15 g/cm2 in the Subclinical hypoT patients and 1.15±0.15 g/cm2 in the controls (P= 0.200). T-score of young-adults was found to be 0.21±1.11 in the Subclinical hyperT group, 0.00±1.21 in the Subclinical hypoT group and -0.09±1.25in the controls (P= 0.046). Between each subclinical thyroid dysfunction group and the normal group were compared BMD and T-scoreConclusion: We investigated the association between serum TSH and BMD, and evaluated whether differences in THS levels influence bone status. We found that subclinical thyroid dysfunction may not have any adverse effects on bone mineral density in healthy Korean individuals.
A-174Analysis of three Alternative Markers of Hyperglycemia; Glycated Albumin, 1,5-anhydroglucitol and Fructosamine
H. Yu, S. Lim, M. Kwon, H. Woo, H. Park. Kangbuk Samsung Hospital, Sungkyunkwan University School of Medicine, Seoul, Korea, Republic of
Background: Hemoglobin A1c (HbA1c) has been treated as a most common marker for Diabetes mellitus (DM). There has been recent interest in non-traditional markers of hyperglycemia, such as glycated albumin (GA), 1,5-anhydroglucitol (1,5AG), and fructosamine. These are known to reflect shorter period of hyperglycemic state while HbA1c apply more than 2-3 months of long term period of hyperglycemia. In this study, we aimed to investigate the correlations of three markers with the levels of fasting glucose and HbA1c, and to assess their potential utility for early identifying of inaccurately reflect hyperglycemia in non-DM.Methods: A total of 2,193 participants were included (252; diagnosed as DM and 1,941; non-DM) who underwent a comprehensive examination at our institute form August 2013 to September 2014. We determined three markers using by the Modular P. Pearson correlation analysis was used to investigate the correlation, and receiver operating characteristics (ROC) curve analysis was used to identify cut-off of three markers in our institute. And then we determined that abnormal results of three markers in non-DM with normal HbA1c level.Results: A mean age was 51.9±9.4 years (range 34-80) and 194 male (77.0%) in DM, and 50.8±8.05 years (22-77) and 1,396 male (71.9%) in non-DM. Fasting glucose and HbA1c had significant difference; 133.9±39.5 vs. 97.7±13.1 mg/dL, and 6.9±1.09 vs. 5.7±0.4% (P<0.001). Also, GA, 1,5AG, and fructosamine showed significant difference; 16.7±4.8 vs. 12.6±1.8%, 9.2±7.1 vs. 17.8±7.6 ug/mL, and 295.5±49.7 vs. 246.2±22.4 umol/L (P<0.001). Three markers showed good correlation with fasting glucose and HbA1c, showing correlation coefficient (r) value of 0.681 and 0.730 in GA, -0.373 and -0.500 in 1,5AG, and 0.679 and 0.724 in fructosamine, respectively. In ROC curves, cut-off value of GA was 14.2% (AUC 0.91), 1,5AG was 10.4 ug/mL (AUC 0.90), and fructosamine was 261 umol/L (AUC 0.89). We found abnormal results for three markers in 384 non-DM. Among non-DM with normal HbA1c, 1.5% (24/1,642) participates were higher GA (manufacture provided reference ≥16.0%), 31.7% (356/1,124) were lower 1,5AG (<14 umol/L), and 2.4% (28/1,173) were fructosamine (≥285 umol/L).Conclusion: The mean level of GA, 1,5AG, and fructosamine showed significant difference in DM and non-DM, and the showed good correlation with fasting glucose and HbA1c. We assumed that the population with normal HbA1c but abnormal GA, 1,5AG, and/or fructosamine could be considered having potential risk of hyperglycemia. These alternative markers should be evaluated as useful screening tools for early diagnosis and monitoring of hyperglycemia.
68th AACC Annual Scientific Meeting Abstracts, 2016 S59
Endocrinology/Hormones Tuesday, August 2, 9:30 am – 5:00 pm
A-175The development of a method for detecting IGF-I misuse in elite athletes
N. Guha1, Y. Dennis2, W. Boehning3, C. Bartlett4, D. A. Cowan4, P. H. Sonksen3, D. Boehning3, R. I. G. Holt3. 1Oxford University Hospitals NHS Foundation Trust, Oxford, United Kingdom, 2University of Oxford, Oxford, United Kingdom, 3University of Southampton, Southampton, United Kingdom, 4King’s College London, London, United Kingdom
Background: Growth hormone (GH) and insulin-like growth factor-I (IGF-I) have anabolic and metabolic effects that make them attractive as performance-enhancing drugs. Both substances are included in the World Anti-Doping Agency (WADA) list of prohibited substances because of their potential to improve performance and the risks of harm to the athlete’s health. The GH-2000 and GH-2004 research teams developed a method to detect GH misuse based on changes in GH-sensitive serum peptides - the GH-2000 biomarker method. As GH misuse detection methods have improved, athletes may have turned to IGF-I as an additional or alternative doping agent. Recombinant human IGF-I (rhIGF-I) is structurally identical to endogenous IGF-I and the main challenge in detecting rhIGF-I misuse is to distinguish exogenous from endogenous IGF-I. We previously showed that serum IGF-I increases in recreational athletes after administration of rhIGF-I/rhIGF binding protein-3 (rhIGFBP-3) complex for 28 days.Objective: To assess whether measuring other GH-sensitive serum markers, in addition to IGF-I, could improve the sensitivity and specificity of a test for detecting IGF-I misuse.Methods: Serum samples had been stored from a randomised, double-blind, placebo-controlled rhIGF-I/rhIGFBP-3 administration study. 56 recreational athletes (30 men, 26 women, age 18-30 years) were randomly assigned to receive placebo, low dose (30 mg/day) or high dose (60 mg/day) rhIGF-I/rhIGFBP-3 complex. Treatment was self-administered by subcutaneous injection for 28 days. The following serum peptides were measured during the four-week treatment and eight-week washout period, using commercial immunoassays: IGF-II, IGFBP-2, IGFBP-3, acid-labile subunit (ALS), osteocalcin, procollagen type I carboxyterminal propeptide (PICP) and type 1 collagen cross-linked carboxy-terminal telopeptide (ICTP).On each visit day, marker concentrations were compared between treatment groups using one-way ANOVA. Logistic regression was used to determine which combinations of markers could discriminate between treatment and placebo groups, creating four “IGF score” formulae. Useful markers were then measured in serum samples collected from 250 elite athletes (161 men, 89 women) and IGF scores were calculated. Decision limits for each score were estimated using the mean and standard deviation of scores in elite athletes. Values above the decision limit suggest an athlete has misused rhIGF-I/rhIGFBP-3. An age-correction factor was incorporated into the score formulae because all scores decreased significantly with age.Results: IGFBP-2 increased and IGF-II decreased in both women and men in response to rhIGF-I/rhIGFBP-3 administration. When these markers were combined with IGF-I results in IGF score formulae, all scores increased rapidly during the first week of drug administration, remained elevated throughout the administration period and then declined. On Day 21 of the administration study, the IGF scores had an estimated sensitivity of 80-94% with specificity of 99.99% (equivalent to the WADA-required false-positive rate of 1 in 10,000).Conclusions: Serum IGF-I, IGF-II and IGFBP-2 concentrations change in response to rhIGF-I/rhIGFBP-3 administration. These markers have been combined to create IGF score formulae. We have proposed decision limits for the IGF scores, based on marker concentrations in 250 elite athletes, which could be used to detect doping with IGF-I.
A-176Thyroid autoantibodies in pregnancy: changes across trimesters and association with intrauterine growth restriction in a multi-ethnic population
C. K. M. Ho, E. T. H. Tan, K. H. Tan. KK Women’s and Children’s Hospital, Singaproe, Singapore
BackgroundSubclinical thyroid diseases are relatively common in women but the significance of detectable thyroid autoantibodies in pregnant women with no clinical thyroid disease is currently unclear. This study aimed to determine the serum levels of thyroid peroxidase antibody (TPO-Ab) and thyroglobulin antibody (Tg-Ab) across all three
trimesters in pregnant women in a multi-ethnic cohort. An association between thyroid autoantibodies in maternal blood and intrauterine growth restriction (IUGR) was also investigated.Methods926 women with singleton pregnancies confirmed by ultrasonography at less than 14 weeks of amenorrhoea were recruited to this study conducted at a maternity hospital. Exclusion criteria included chronic medical conditions, aneuploidy, fetal anomalies and pregnancies ending in termination, miscarriage or fetal death. Women who were on any thyroid medication or had a history of thyroid disease were also excluded from subsequent analyses.IUGR was defined by estimated fetal weight or abdominal circumference less than the 5th percentile (adjusted for gender and ethnicity) in the presence of either oligohydramnios or abnormal umbilical artery flow or both after 22 weeks of gestation.Participants attended four separate study visits during pregnancy. Venous blood samples were taken at 9-14 weeks (visit 1), 18-22 weeks (visit 2), 28-32 weeks (visit 3), and 34-39 weeks (visit 4). Serum TPO-Ab and Tg-Ab concentrations were measured using Abbott i2000 immunoassays according to the manufacturer’s protocols.Statistical analyses (chi-squared and Kruskal-Wallis tests) were performed using the Analyse-it software.ResultsMedian serum TPO-Ab levels demonstrated a mild decreasing trend with increasing gestational age, and were 0.49, 0.49, 0.48 and 0.45 IU/ml at study visits 1, 2, 3 and 4, respectively (p<0.05). In comparison, median serum Tg-Ab levels decreased from 1.25 IU/ml at visit 1, to 1.09 IU/ml at visit 2, 1.02 IU/ml at visit 3, and 1.00 IU/ml at visit 4 (p<0.0001). The proportion of women tested positive for Tg-Ab (4.11 IU/ml or above) also decreased from 20.2% to 15.3%, 14.4% and 13.6% at study visits 1, 2, 3 and 4, respectively (p<0.05).Women tested positive for both TPO-Ab and Tg-Ab during study visit 2, 3 or 4 were found to be at increased risk of having babies with IUGR; the odds ratios for IUGR in this study group were 2.1 (95% CI, 1.1-4.0) at visit 2, 2.2 (95% CI, 1.1-4.2) at visit 3, and 2.4 (95% CI, 1.2-4.9) at visit 4, compared to controls.ConclusionsMaternal serum concentrations of TPO-Ab and Tg-Ab decreased with increasing gestational age in this study on women with uncomplicated singleton pregnancies. Positivity for both autoantibodies in the mother during the second or third trimester was associated with an increased risk of IUGR of the fetus.
A-177Evaluation of TSH, FT4 and FT3 assay using a novel automated analyzer for chemiluminescent enzyme immunoassay (AIA-CL2400).
E. Mori, A. Tobita, H. Shimosaka, S. Okubo, M. Kurano, H. Ikeda, Y. Yatomi. The University of Tokyo Hospital, Tokyo, Japan
Background: The measurement for free thyroxine (FT4), free triiodothyronine (FT3), and thyroid stimulating hormone (TSH) requires high sensitivity, accuracy and rapidness in clinical laboratories. AIA-CL2400 is a newly developed analyzer with chemiluminescent enzyme immunoassay technique, which automatically measures TSH with a two-step sandwich enzyme immunoassay and FT4 and FT3 with one-step delayed competitive enzyme immunoassays. The aim of the present study is to perform an analytical validation of TSH, FT4 and FT3 assays using the AIA-CL2400 analyzer.Methods: We investigated the within-run and between-day precision, the analytical sensitivity, and the influences of interfering substances for TSH, FT4 and FT3 assays. We also validated linearity and recovery and determined effective sensitivity for the TSH assay. We performed a correlation analysis with an AIA-2000 analyzer based on fluorescent enzyme immunoassay technique. We measured thyroid hormone concentrations in subjects with various thyroid diseases and investigated the correlation between serum TSH, FT4 and FT3 levels. The study was performed in collaboration with the Tosoh Corporation.Results: The coefficients of variation (CV) of within-run and between-day precision on the AIA-CL2400 were less than 3.0% and 3.4% (TSH), 3.9% and 5.8% (FT4) and 3.1% and 5.0% (FT3), respectively. The minimal detectable concentration defined as two standard deviations of the blank was 0.0007 μIU/mL (TSH), 0.008 ng/dL (FT4) and 0.10 pg/mL (FT3). Hemoglobin (up to 445 mg/dL), free bilirubin (up to 18.5 mg/dL), and conjugated bilirubin (up to 17.6 mg/dL) had no effects on these assays. Turbidity did not influence TSH and FT4 assays; however it decreased the values of FT3 in high concentration range. The dilution linearity was validated up to a dilution factor of 625 for the TSH assay. The recovery rate was above 90.1% and the effective
S60 68th AACC Annual Scientific Meeting Abstracts, 2016
Tuesday, August 2, 9:30 am – 5:00 pm Endocrinology/Hormones
sensitivity was 0.0027 μIU/mL. Correlation with the AIA-2000 analyzer revealed that the slopes and correlation coefficients were 0.950 and 0.994 (TSH), 1.069 and 0.991 (FT4), and 0.935 and 0.993 (FT3), respectively. The distribution of thyroid hormone concentrations in various thyroid diseases was concordant with the clinical characteristics of each disease and the time course of treatment. The correlation of each hormone supports the existence of the negative feedback between thyroid hormones and TSH.Conclusion: These results indicated that TSH, FT4 and FT3 assays with the AIA-CL2400 analyzer have excellent sensitivity, precision, and correlation with the AIA-2000 analyzer. Considering that these assays on the AIA-CL2400 analyzer measures more rapidly and require a smaller amount of sample compared to the AIA-2000 analyzer, the TSH, FT4 and FT3 assays on the AIA-CL2400 analyzer will be useful for clinical diagnosis and provide more efficient routine analytical performance in clinical laboratories. Disclaimer: The performance characteristics presented for TSH, FT4 and FT3 are based on an independent, third party study. They do not represent performance claims made by the manufacturer of these assays. The TSH, FT4 and FT3 assays have not yet been reviewed or cleared to be legally marketed in the United States.
A-178Development and Validation of a Dried Blood Spot Method for Leptin
J. A. Maggiore, C. Cruzan, K. Urek, E. Roth, A. Gruszecki, D. Quig. Doctor’s Data, Inc., Saint Charles, IL
Background: Leptin is a hormone produced by adipocytes to provide a satiety (fullness) signal to the hypothalamus. In individuals with obesity, leptin levels may remain elevated in circulation due adipose tissue abundance, and leptin resistance may ensue. Recent interest in the analysis of blood leptin has increased among the medical community related to its association with the development of the metabolic syndrome and pre-diabetes. With increasing awareness of the need to detect metabolic syndrome before progression to adult-onset diabetes, a convenient, precise, and accurate method for leptin testing was sought. Our aim was to develop and validate leptin testing in dried blood spot (DBS) samples. Our laboratory has previously validated blood spot methods for other metabolic markers, namely hemoglobin A1c, high-sensitivity C-reactive protein, and insulin. The addition of leptin to this menu of blood spot analytes is designed to provide additional insight into the contributing factors of compromised metabolic control. Single use and self-retracting bloodletting devices enable the self-collection of capillary blood by lay users. Highly-standardized filter paper collection and transport media are increasingly used for clinical laboratory testing. The employment of sensitive enzyme-linked immunosorbent assays (ELISA) that require sample pre-dilution facilitates the expansion of DBS offerings in clinical laboratories for the reliable analysis of emerging metabolic markers, including leptin.Methods: Capillary blood samples are collected using SurgiLance™ sterile lancets, and spotted onto PerkinElmer® 226 Spot Saver Cards and permitted to dry. Cards are desiccant packaged and shipped via standard postage to the laboratory. From a 50 µL blood drop, ten 3-millimeter spots are punched using a calibrated hole punch and extracted into 280 µL buffered solution, equivalent to the specified serum dilution of the ELISA kit. Extracts are analyzed via an ELISA microplate assay from Alpco Diagnostics. Results are read from 5-point DBS calibration curves, derived from Alpco-provided calibration standards. Analytical precision, linearity, recovery, trueness, reference interval and stability of DBS leptin were assessed.Results: The intra-assay and total imprecision coefficients of variation (CV) (n=20) at 8.9 ng/mL were 3.7% and 5.4%, and at 12.4 ng/mL were 3.2% and 6.3%, respectively. Leptin in DBS was confirmed linear between 1.0 - 71.0 ng/mL, with recovery between 94.3% - 117.9% (n=8). Volunteer donors provided samples to permit sample matrix comparison. Least-squares regression analysis comparing leptin values in serum to DBS (n=45, range 1.1 - 50.0 ng/mL) yielded a correlation coefficient of 0.986, y = 0.932x + 0.365; standard error of estimate (Sy/x) = 1.76. Reference intervals of 1.8 - 20.0 ng/mL and 4.7 - 39.0 ng/mL were confirmed in adult males and females, respectively. Leptin in DBS demonstrated stability for 19 days with collection cards desiccated in sealed Ziploc™ bags at 25oC or lower.Conclusion: This analytical method for determining DBS leptin using the Alpco ELISA kit has been validated to be precise and accurate. The collection system for this method has proven to be well-accepted by lay users, with 99% of submitted samples of adequate quantity and quality. The transportation system provides extended stability, enabling shipping from remote locations to a central laboratory for analysis.
A-179Comparison of the Associations of Circulating Total Adiponectin and Adiponectin Multimeric Complexes According to Metabolic and Glycemic Status
O. A. Mojiminiyi, N. Abdella. Faculty of Medicine, Kuwait University, Kuwait, Kuwait
Introduction and Objectives: Adiponectin, a protective adipokine that increases insulin sensitivity (IS) and regulates glucose metabolism circulates in plasma as high (HMW), medium (MMW) and low molecular weight forms (LMW). Studies show the HMW form as the best indicator of IS. This study compares Total Adiponectin (TA) and the multimeric complexes according to their associations with metabolic and glycemic status.Methods: Fasting TA, HMW, MMW, LMW, insulin, glucose, lipid profile and HbA1c were measured in 66 patients with Type 2 diabetes (T2DM) and 59 non-diabetic first degree relatives. Clinical and anthropometric data were recorded. Subjects were classified by adiposity, insulin resistance (IR - homeostasis model assessment) and the number of the criteria of the Metabolic Syndrome (MetS) (International Diabetes Federation).Results: TA (r = -0.21 & -0.24), HMW (r = -0.37 & -0.38) were significantly (p<0.05) inversely correlated with BMI and waist circumference respectively but MMW and LMW were not. TA (r = 0.23 & -0.24), HMW (r = 0.40 & -0.39) were significantly correlated with IS and IR respectively but MMW and LMW were not. Compared to HMW, Receiver Operating Characteristic (ROC) analysis showed that TA had the higher area under the curve for diagnoses of MetS (0.749 vs 0.712) and T2DM (0.644 vs 0.612) whereas HMW had the higher area under the ROC curve for diagnosis of IR (0.629 vs 0.689)Conclusions:Circulating TA and multimeric complexes show variable associations with metabolic indices and glycemic status. Our results suggest that MMW and LMW forms of adiponectin are not a major determinants of the metabolic perturbations of the adipokine. HMW is a better predictor of IR but TA is a better predictor of T2DM and MetS. As multimerisation is genetically determined, the predominant form of adiponectin could be the main determinant of the metabolic phenotype and disease associations. Multimeric forms should always be considered in the interpretation of the associations of circulating adiponectin.
A-180Higher FT4 or TSH Below the Normal Range are Associated with an Increased Risk of Dementia: a Meta-analysis of 10 Studies
Y. Wu, W. Cui, Y. Pei, F. Wang, D. Xu. Peking Union Medical College Hospital, Peking Union Medical College and Chinese Academy of Medical Sciences, Beijing, China
Background: Observational studies of thyroid function and dementia have reported conflicting results. This study is to address the conflicting results of the contribution of thyroid-stimulating hormone (TSH) and free thyroxine (FT4) in participants with dementia.Methods: We reviewed cohort and case-control studies from MEDLINE, EMBASE and Web of Science that focused on the association between serum TSH, FT4 and dementia. Studies were initially included in the detailed assessment if they met the following criteria: 1) sufficient information on the study population; 2) cohort or case-control studies; 3) clear criteria for outcome (dementia or Alzheimer’s disease); 4) sufficient data to calculate risk estimates of the association between FT4 and TSH levels and dementia or AD: relative risk (RR), hazard ratio (HR), or odds ratio (OR) with 95% confidence intervals (CIs) or the number of outcome events; 5) adjustments for potential confounders; and 6) valid measurements of FT4 and TSH. We excluded studies that were cross-sectional, lacked usable data, or focused on vascular dementia or dementia secondary to other diseases. If multiple reports used the same population, the study with the longest follow-up was included. Reviews, case reports, abstracts and conference proceedings were excluded. Two reviewers independently collected the data and assessed the study quality by the Newcastle Ottawa Scale (NOS). Any disagreement between the two investigators was resolved by consensus or by discussion with a third reviewer.Results: Two case-control and eight cohort studies published from 2003 to 2015 that evaluated a total of 24721 participants, including 1372 patients with dementia, were finally included. Most studies controlled for some conventional risk factors, including age (n=10), gender (n=10) and thyroid medication (n=7). All the included studies
68th AACC Annual Scientific Meeting Abstracts, 2016 S61
Endocrinology/Hormones Tuesday, August 2, 9:30 am – 5:00 pm
were of high quality by NOS and scored from 7 to 9. The average score was 7.4, and the follow-up duration ranged from 4 to 17 years. The relationships between dementia and the per standard deviation (SD) increment of FT4 (random RR=1.08, 95% CI 1.00-1.17) and TSH (fixed RR=0.91, 95% CI 0.84-0.99) were well established. TSH levels in the low category were associated with an increased risk of dementia (fixed RR=1.55, 95% CI 1.24-1.94). However, the positive association was confined to TSH levels below the normal range (fixed RR=1.68, 95% CI 1.25-2.24), not those in the lower tertile of the normal range (fixed RR=1.39, 95% CI 0.98-1.97). Additionally, dementia was not significantly associated with high TSH levels. In the analysis of three studies focused on men, no positive association between dementia and the low or high categories of TSH were found. Furthermore, all the models showed stability in the sensitivity analysis performed by omitting each study and no significant publication bias were detected by Egger’s test.Conclusion: This meta-analysis suggests that patients with higher FT4 levels and those with TSH levels below the normal range have an increased risk of dementia. However, a relationship between lower tertile of TSH within the normal range and dementia was not well established, and more studies are urgently needed.
A-181Novel assay for oxytocin using bioluminescence enzyme immunoassay
K. Karasawa, Y. Sano, H. Arakawa. Showa Univ., Tokyo, Japan
Background:The neurohypophyseal peptide hormone oxytocin acts in the central nervous system and plays an important role in various complex social behaviors, including affiliation, sexual behavior, social recognition, stress buffering, aggression, and trust. There is increased interest in measuring peripheral oxytocin levels to better understand the role of this peptide in human social behavior. The levels of oxytocin in plasma have been measured by radioimmunoassays and enzyme immunoassays (EIA), but the many reported methods lack sufficient sensitivity and specificity for oxytocin. We have already developed an EIA using colorimetric with a high affinity and high specificity antibody towards oxytocin, and published in 2015 AACC Annual Meeting. In this study, we report a highly sensitive EIA by bioluminescence to increase the sensitivity of detection for oxytocin.Methods:Antibody: Anti-oxytocin antiserum was obtained by immunizing rabbits with oxytocin-bovine thyroglobulin conjugate prepared by the glutaraldehyde method.Assay method: Oxytocin sample was added to a second-antibody-immobilized magnetic particles and reacted overnight at 4 °C. Biotinylated oxytocin was then added for 1 hour at 4 oC, followed by the addition of streptavidin-biotinylated-luciferase complex and incubation for 30 min at room temperature. The sample was then washed three times with buffer to separate bound/free and the activity of luciferase bound to antibody was measured by bioluminescent assay with luciferin, ATP, Mg2+ and O2.
Examination of cross-reactivity:The cross-reactivities of three oxytocin-like peptides, [Arg8]-vasopressin (AVP), [Lys8]-vasopressin (LVP), and [Arg8]-vasotocin (VT) with oxytocin were examined by cross-reactivity tests.Results:The proposed method is based on the principle of competitive EIA using anti-oxytocin antibody from rabbit and biotinylated oxytocin as the labeled antigen. First, the detection limit of biotinylated luciferase was examined using luciferin-luciferase reaction and measured up to 1×10-21 mol/assay. Next, seven labeled antigens were prepared and used to develop a bioluminescence EIA. The labeled antigen comprised biotin chemically bound to oxytocin containing 0 to 6 lysines, providing bridge-link heterology. Rabbits were immunized with oxytocin bound through the N-terminus to the carrier protein bovine thyroglobulin. The produced antibody and the seven biotinylated oxytocins were used in various combinations. The sensitivity of the EIA improved as the number of lysine residues increased; consequently, biotinylated oxytocin bridged with 5 lysines was used thereafter. A standard curve range for oxytocin was 1.0 to 1000 pg /assay. The detection limit of the assay was 1.0 pg and the reproducibility of each point in the standard curve had an average coefficient of variation value (n = 5) of 5.3 %. The specificity of the assay was tested using three compounds with structures similar to that of oxytocin: AVP, LVP, and VT. Cross-reactivity with all three compounds was less than 0.01%, indicating that this antiserum is very highly specific for oxytocin. In addition, there was a good correlation of oxytocin measured values between colorimetric assay and bioluminescent assay (r = 0.9665, n = 48).Conclusions:The bioluminescent method is sensitive and more specific than conventional immunoassays for oxytocin and can be applied to the determination of plasma oxytocin levels.
A-182Age and gender related differences in concentrations of parathyroid hormone-related protein measured by LC-MS/MS
M. M. Kushnir1, J. Hunsaker1, J. A. Straseski2. 1ARUP Institute for Clinical and Experimental Pathology, Salt Lake City, UT, 2Department of Pathology, University of Utah, Salt Lake City, UT
Background: Measurement of parathyroid hormone related protein (PTHrP) is diagnostically useful in patients suspected of hypercalcemia of malignancy. PTHrP and its gene are also known to be expressed in number of normal cells and tissues. We previously developed a method for the measurement of PTHrP in plasma using LC-MS/MS and established reference intervals in healthy adults. Measurable concentrations of PTHrP were observed in plasma samples of all participants, suggesting that PTHrP is present in circulation in health. The aim of this study was to evaluate associations between PTHrP concentrations and age in men and women and to evaluate between-gender differences. Methods: The LC-MS/MS method was fully validated according to CLSI guidelines and is in routine use in a clinical laboratory. The analysis was performed as follows, stable isotope-labeled internal standard was added to samples and PTHrP was enriched using anti-PTHrP antibody conjugated to magnetic beads, digested with trypsin and samples were analyzed by LC-MS/MS. The lower limit of quantification and upper limit of linearity of the assay were 0.3 and 1100 pmol/L, respectively. Total imprecision of the method was < 10%. Specificity of the measurements was confirmed by monitoring two mass transitions of PTHrP and the internal standard. Using this method we analyzed 284 plasma samples collected from adults: 132 men (age 18-81 y, mean 40 y) and 152 women (age 18-84 y, mean 41 y). Differences between groups were evaluated using nonparametric statistics; p-values ≤0.05 were considered as statistically significant. Results: Overall, significantly higher PTHrP concentrations were observed in women compared to men (p<0.0001). In women, the highest concentrations were observed in the 21-30 y group; concentrations were the lowest in the 41-50 y group and were progressively higher in the groups of older women. Statistically significant differences in concentration were observed between the age groups of women 18-30 y and 31-40 y (p<0.0078); 18-40 y and 41-50 y (p<0.0405); and 41-50 y and 51-84 y (p=0.0001). Statistically significant higher concentrations were observed in women of post-menopausal age (>50 y vs. <50 y, p=0.0009). In men, the lowest concentrations were observed between the ages of 21 and 50 y. In men, significantly lower concentrations were observed in the age group 51-60 y, as compared to 61-81 y (p=0.019). Statistically significantly higher concentrations were observed in women than in men in the age groups of 21-30 y (p=0.0017), and 51-84 y (p=0.0054). Conclusion: Concentrations of PTHrP were higher in women than in men and were statistically significantly higher in older individuals in both sexes. The highest concentrations of PTHrP were observed in women 21-30 y and >51 y, and in men >71 y. This sex and age distribution overlaps with some age-related diseases, including osteoporosis; these observations raise questions regarding PTHrP’s involvement in disorders of calcium regulation associated with age.
A-183Development of an Anti-Müllerian Hormone Assay on the ADVIA Centaur XP Immunoassay System*
J. Bogdanovic1, T. Chuang1, A. Jacewicz1, T. Tran1, S. Sinha2, A. Han2, M. Sharma3, W. Bedzyk3, D. Hovanec-Burns1. 1Siemens Healthcare Diagnostics, Tarrytown, NY, 2Siemens Healthcare Diagnostics, Los Angeles, CA, 3Siemens Healthcare Diagnostics, Newark, DE
Background: Anti-Müllerian hormone (AMH), or Müllerian-inhibiting substance, is a transforming growth factor beta protein that controls proliferation and differentiation in various cell types, including embryonic and adult tissues. AMH levels vary with gender and age but are also influenced by other biological fluctuations. In published clinical studies, in-vitro AMH levels are known to correlate with the antral follicle count for assessment of the ovarian reserve and the onset of menopause. Abnormal AMH values are also known to be associated with polycystic ovarian syndrome and existence of specific tumors. The objective of this study was to evaluate the initial analytical characteristics of an AMH assay from Siemens Healthcare Diagnostics on the ADVIA Centaur® XP Immunoassay System*. Methods: A single-pass sandwich immunoassay for the detection of AMH has been developed using direct chemiluminescent technology, which uses two antibodies to AMH. The first antibody in the lite reagent is a mouse monoclonal anti-AMH antibody labeled with acridinium ester. The second antibody in the solid phase is a biotinylated mouse monoclonal anti-AMH antibody, which is coupled to streptavidin coated magnetic particles. A direct relationship exists between the amount of AMH present in the patient sample and the
S62 68th AACC Annual Scientific Meeting Abstracts, 2016
Tuesday, August 2, 9:30 am – 5:00 pm Endocrinology/Hormones
amount of relative light units (RLUs) detected by the system. Method comparison (using 45 female and 5 male samples; age: 1 month to 53 years), precision (three levels with means of 0.55, 5.5, 16.4 ng/mL), and linearity studies were performed using the ADVIA Centaur XP system. Stability of the native purified AMH was also evaluated up to 51 days at 2-8°C. Results: Method comparison between the ADVIA Centaur XP AMH assay and the predicate assay showed a Passing-Bablok regression slope of 1.00 (dose range from 0.10 ng/mL to 22.4 ng/mL; n = 44) and slope of 1.02 (dose range from 0.10 ng/mL to 112 ng/mL; n = 47; three samples were excluded due to the dose being below detection limit in both assays). Repeatability coefficients of variance (CV) for three samples at the concentrations stated above were 3.7%, 2.1%, and 2.5%, while within-lab precision CVs were 8.0%, 3.8%, and 4.9%. Assay linearity was demonstrated from 0.10 ng/mL to 67 ng/mL (linear regression slope: 0.95; 95% confidence interval: 0.92-0.99). The stability study for the purified AMH after storage in protein buffer at 2-8°C showed average dose recovery of 99% as compared to the AMH concentrations measured on Day 0 (0.30-5.68 ng/mL). Conclusion: The results from the studies have demonstrated reproducible and scalable performance that is also comparable to a widely used method. Stability of the native purified AMH will improve the performance of the assay with enhanced in-use and storage life of the calibrator and quality control materials. *Disclaimer: Under feasibility evaluation. Not available for sale and its future availability cannot be guaranteed.
A-184Analytical Performance Characteristics of the New Beckman Coulter Access TSH (3rd IS) Assay
W. Dietz, L. Radde, C. Lundeen, P. Krohn, M. Shukarey, B. Dumke, T. Pierson, K. Paulsen, M. Szabo. Beckman Coulter, Chaska, MN
Background:Beckman Coulter has developed a new highly sensitive 3rd generation TSH assay for use on the Access Immunoassay Systems called the Access TSH (3rd IS) assay. TSH (thyroid-stimulating hormone) is the principal regulator of thyroid function, stimulating the synthesis and release of thyroid hormones thyroxine (T4) and triiodothyronine (T3). The principal clinical use for TSH measurement is for the assessment of thyroid status.Methods:The new Beckman Coulter Access TSH (3rd IS) assay is a paramagnetic particle, chemiluminescent sandwich immunoassay for the quantitative determination of thyroid-stimulating hormone in human serum and lithium heparin plasma. Two mouse monoclonal antibodies are utilized in the sandwich assay, one as an anti-hTSH alkaline phosphatase conjugate and the other is immobilized on paramagnetic particles. The Access TSH (3rd IS) is standardized to the third WHO International Standard NIBSC code: 81/565 and achieves 3rd generation TSH sensitivity (0.01 µIU/mL with 10% CV).Results:The Access TSH (3rd IS) assay demonstrated acceptable linearity throughout the analytical measuring range of 0.005 to approximately 50.0 µIU/mL and is capable of measuring samples above the range using sample dilution with recovery of ≥ 93%. The LoB for the TSH (3rd IS) assay was measured at 0.0004 µIU/mL, the LoD was measured at 0.0008 µIU/mL, and the LoQ was measured at 0.0013 µIU/mL. Four samples ranging from concentrations of 0.02 - 38.76 µIU/mL were used to test for assay imprecision over 20 days. Within-run imprecision was 2 - 4% and total imprecision was 3 - 6% for the samples. No cross reactivity was observed to hCG at 1,000,000 mIU/mL (< 0.010%), to hFSH at 1,000 mIU/mL (< 0.10%), or to hLH at 3,000 mIU/mL (< 0.10%). No interference was detected from endogenous interferences bilirubin (450 µg/mL), hemoglobin (10 mg/mL), or triglycerides/Intra Lipid (33 mg/mL). No hook effect was observed for samples up to 1,000 µIU/mL TSH concentration.Conclusions:The new Beckman Coulter Access TSH (3rd IS) assay is a 3rd generation TSH assay capable of TSH measurement in hyperthyroid patient samples down to 0.001 µIU/mL with the accuracy and precision expected from a 3rd generation TSH assay.
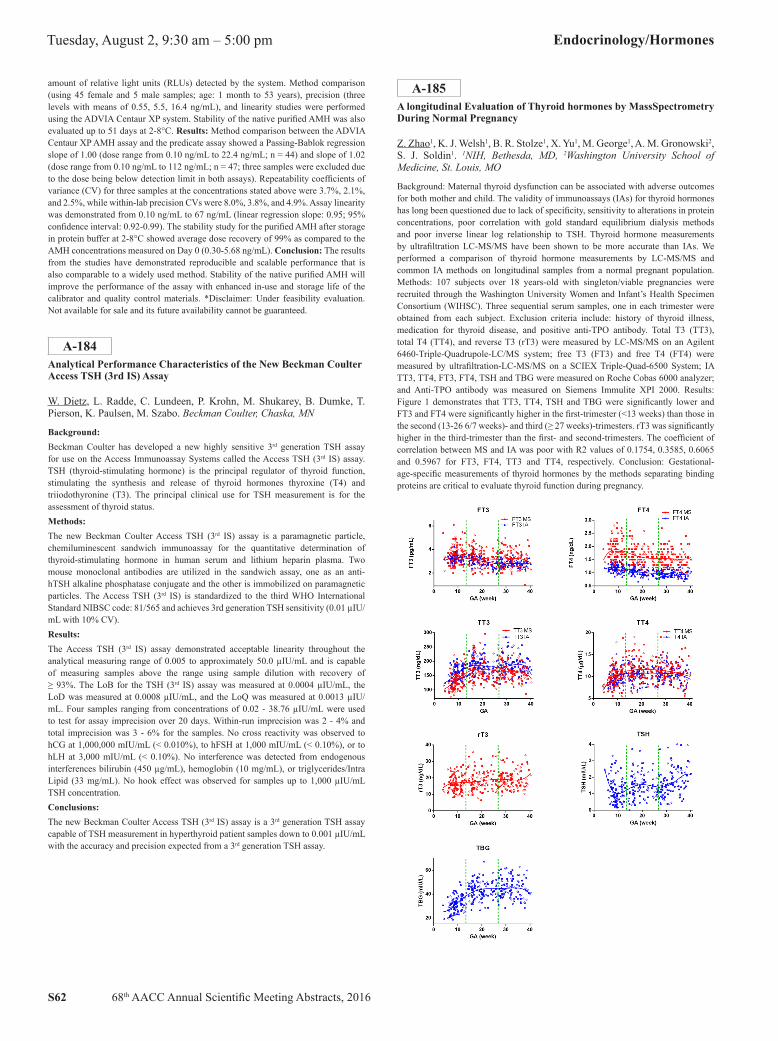
A-185A longitudinal Evaluation of Thyroid hormones by MassSpectrometry During Normal Pregnancy
Z. Zhao1, K. J. Welsh1, B. R. Stolze1, X. Yu1, M. George1, A. M. Gronowski2, S. J. Soldin1. 1NIH, Bethesda, MD, 2Washington University School of Medicine, St. Louis, MO
Background: Maternal thyroid dysfunction can be associated with adverse outcomes for both mother and child. The validity of immunoassays (IAs) for thyroid hormones has long been questioned due to lack of specificity, sensitivity to alterations in protein concentrations, poor correlation with gold standard equilibrium dialysis methods and poor inverse linear log relationship to TSH. Thyroid hormone measurements by ultrafiltration LC-MS/MS have been shown to be more accurate than IAs. We performed a comparison of thyroid hormone measurements by LC-MS/MS and common IA methods on longitudinal samples from a normal pregnant population. Methods: 107 subjects over 18 years-old with singleton/viable pregnancies were recruited through the Washington University Women and Infant’s Health Specimen Consortium (WIHSC). Three sequential serum samples, one in each trimester were obtained from each subject. Exclusion criteria include: history of thyroid illness, medication for thyroid disease, and positive anti-TPO antibody. Total T3 (TT3), total T4 (TT4), and reverse T3 (rT3) were measured by LC-MS/MS on an Agilent 6460-Triple-Quadrupole-LC/MS system; free T3 (FT3) and free T4 (FT4) were measured by ultrafiltration-LC-MS/MS on a SCIEX Triple-Quad-6500 System; IA TT3, TT4, FT3, FT4, TSH and TBG were measured on Roche Cobas 6000 analyzer; and Anti-TPO antibody was measured on Siemens Immulite XPI 2000. Results: Figure 1 demonstrates that TT3, TT4, TSH and TBG were significantly lower and FT3 and FT4 were significantly higher in the first-trimester (<13 weeks) than those in the second (13-26 6/7 weeks)- and third (≥ 27 weeks)-trimesters. rT3 was significantly higher in the third-trimester than the first- and second-trimesters. The coefficient of correlation between MS and IA was poor with R2 values of 0.1754, 0.3585, 0.6065 and 0.5967 for FT3, FT4, TT3 and TT4, respectively. Conclusion: Gestational-age-specific measurements of thyroid hormones by the methods separating binding proteins are critical to evaluate thyroid function during pregnancy.
68th AACC Annual Scientific Meeting Abstracts, 2016 S63
Endocrinology/Hormones Tuesday, August 2, 9:30 am – 5:00 pm
A-186Assessment of Gender-Related Differences in Vitamin D levels, Cardiovascular Risk factors in Saudi Patients with Diabetes Mellitus
A. ALJOHI1, M. Abudawood2, K. Almousa1, S. Sobki1, S. Ansar2. 1Prince Sultan Military Medical City, Riyadh, Saudi Arabia, 2King Saud University, Riyadh, Saudi Arabia
Diabetes is a major risk factor for cardiovascular disease (CVD) including coronary heart disease, stroke and peripheral artery disease. CVD remains a leading cause of mortality throughout the world, affecting both women and men. This study aimed to assess gender based differences in cardiovascular risk factors among adults with diabetes mellitus (T2DM). This hospital-based cross-sectional study involving subjects was divided into two gender based groups; male diabetic (n=800) and non-diabetic (n=800); female diabetic (n=800) and non-diabetic (n=800) for each comparison. Blood samples were analyzed for fasting glucose (fg), HbA1c, total cho-lesterol (Tc), triglycerides (Tg), low density lipoprotein cholesterol (LDL-C), high density lipoprotein cholesterol (HDL-C) and serum levels of 25(OH)-vitamin D in all groups. All the glycemic control parameters, lipid profile parameters were found significantly different in diabetic vs non-diabetic group (p<0.0001) in both genders. Triglyceride (Tg) level was borderline high in T2DM patients in both genders. However, HDL-C levels were significantly lower in diabetic group as compared to non diabetic group in both genders. The results also show that vitamin D concentration was lower in diabetic patients than the healthy individuals. Although the mean concentration of vitamin D in males in both groups was equal but in the women with diabetes was lower than the healthy women. Routine screening of these parameters in T2DM patients may assist early detection of these parameters and prevent risk of CVD. Women with diabetes mellitus are at higher risk of cardiovascular disease compared to men and this may be a result of greater clustering of risk factors among women. This indicates overall poor risk factor control but worse among women, emphasizing the need for better implementation of guideline recommendations for management of diabetes to reduce future cardiovascular diseases.
A-187Testing for TSH receptor stimulating immunoglobulins: performances of a novel fully automated assay with improved specificity.
d. GRUSON, B. Ferracin. Cliniques Universitaires St Luc, bruxelles, Belgium
Background: Measurement of TSH receptor autoantibodies (TRAb) is important for the diagnosis and monitoring of Graves’ disease (GD). Several automated methods for testing are available but are not yet standardized and not specific of TSH receptor stimulating immunoglobulin (TSI). Our objective was to determine the performances of a novel automated assay with improved specificity for TSI. Methods: We evaluated the IMMULITE® TSI assay (Siemens), a fully automated immunoassay based on the chimeric receptor that specifically binds TSI but not blocking autoantibodies. Assay‘s imprecision was assessed with five pools of serum samples and with two levels of control materials. The linearity of the assay was tested a eight points dilution test of high titer samples. Reference values were determined with samples from 90 male healthy volunteers free of thyroid diseases and medications. Method comparison was performed with a second-generation TRAb enzyme immunoassay Medizym® as well as with the Cobas® 8000 and Kryptor® TRAb automated immunoassays. Results: Between run coefficients of variation were 6.5 and 4.7% for concentrations of 1.0 and 22.6 IU/L, respectively. The limit of quantification of the IMMULITE assay, determined with the precision profile built with the 5 pools of serum, was below 0.1 IU/L. The dilution test covered a range of concentrations ranging from 40 to 0.32 IU/L and the mean recovery was 108 %, confirming assay’s linearity. The concordance correlation coefficients between the TSI and TRAb assays were 0.82, 0.68 and 0.82 with Medizym®, Cobas® and Kryptor® methods, respectively. The TSI levels measured with the IMMULITE assay in healthy volunteers were below 0.10 IU/L. The receiving operator curve analysis of patients with active Graves disease patients with other thyroid disorders and healthy controls revealed an AUC of 0.99 resulting in a sensitivity of 100% and a specificity of 99% at a TRAb level of 0.40 IU/L. Conclusions: Our data showed excellent analytical and clinical performances for this novel fully automated assay with an improved specificity for stimulating antibodies.
A-188Evaluation of HbA1c turbidimetric immunoassay on the new high-throughput analyzer cobas c513 against ion exchange HPLC method and assessment of HbF interference on HbA1c measurement
P. Reimundo1, H. Valbuena2, S. Bérgamo1, I. Comas1, R. Martínez-López3, R. Ferrer1, D. Beneítez4, E. Casis5. 1Service of Clinical Biochemistry, Hospital Universitari Vall d’Hebron, Barcelona, Spain, 2Clinical Laboratories, Hospital Nostra Senyora de Meritxell, Escaldes-Engordany, Andorra, 3Service of Clinical Analysis, Complejo Hospitalario y Universitario de Albacete, Albacete, Spain, 4Service of Hematology, Hospital Universitari Vall d’Hebron, Barcelona, Spain, 5Management of Clinical Laboratories, Hospital Universitari Vall d’Hebron, Barcelona, Spain
Background: diabetes mellitus is a serious lifelong condition characterized by hyperglycemia as a consequence of defective insulin activity. Its prevalence is rapidly increasing worldwide, which turns this disease into a major public health priority. Diabetic patients, and especially those with a poor control of blood glucose levels, are at high risk for subsequent microvascular and macrovascular complications. Glycated hemoglobin (HbA1c) is a useful diagnostic test for those at risk of suffering diabetes, and the preferred laboratory test to monitor glycemic control in patients treated for diabetes and other glucose-metabolism disorders. There are different methods available for HbA1c measurement, differing in accuracy, specificity and/or processing speed, as well as in the presence/absence of interferences by hemoglobin structural variants, chemically modified hemoglobins or high fetal hemoglobin (HbF) concentrations. More specifically, it has been previously described that anomalous HbF levels (>2%) cause negative interference in HbA1c measurement by turbidimetric immunoassay, but not by ion exchange HPLC, thus obtaining falsely decreased HbA1c results by the first method.Objective: the first objective of this study was to compare Tina-quant HbA1c Generation 3 turbidimetric inhibition immunoassay (TINIA) on the new high-throughput analyzer cobas c513, with an ion exchange HPLC method, widely stablished in clinical laboratories for measuring HbA1c. The second objective was to determine the interference in HbA1c measurement caused by anomalous HbF concentrations, when using turbidimetric immunoassay on the new cobas c513 analyzer.Methods: in order to compare both methods, HbA1c concentrations were analyzed in parallel in 143 whole blood samples on a cobas c513 analyzer and on a Menarini HA-8180V analyzer. Statistical analysis was performed using Pearson’s coefficient and Passing-Bablok regression (MedCalc 12.5 software).To determine the effect of HbF on HbA1c measurement, HbA1c concentrations were determined in parallel in 50 whole blood samples containing anomalous HbF levels (range 4.2 to 13.5%), again using the turbidimetric immunoassay and the ion exchange HPLC. HbF levels were measured by ion exchange HPLC on a Bio-Rad Variant II analyzer.Results: a strong positive correlation was observed between Tina-quant HbA1c Generation 3 TINIA and the ion exchange HPLC (Spearman r: 0,9964; P<0,0001; 95% CI r: 0,9949-0,9974). Besides, method comparison demonstrated that both methods are equivalent (Passing-Bablok regression equation: y=0,0116667+1,005556x; 95% CI intercept: -0,08000-0,09308; 95% CI slope: 0,9923-1,0200).Measurement of HbA1c on samples with anomalous HbF concentrations yielded lower values by the turbidimetric immunoassay on the cobas c513 than by the ion exchange HPLC method. This difference was directly proportional to the HbF concentration in the samples. NGSP criterion stablishes that a difference in HbA1c greater than 7% implies clinical significance; following this criterion it was observed that HbF concentrations greater than 10% produce a significant interference on HbA1c results on the new cobas c513 analyzer.Conclusion: Tina-quant HbA1c Generation 3 TINIA implemented on the new analyzer cobas c513 shows excellent analytical performance, representing an optimal choice for high-throughput laboratories. HbF concentrations greater than 10% produce a clinical significant negative interference on HbA1c measurements by this method. Further research, including more samples with high HbF levels, should be conducted to confirm these results.
S64 68th AACC Annual Scientific Meeting Abstracts, 2016
Tuesday, August 2, 9:30 am – 5:00 pm Endocrinology/Hormones
A-189Utilization review of vitamin 1,25 (OH)2D testing in a large teaching hospital
C. Gavva1, I. A. Hashim2. 1Department of Pathology, University of Texas Southwestern Medical Center, Dallas, TX, 2Department of Pathology, Parkland Health and Hospital System and University of Texas Southwestern Medical Center, Dallas, TX
Background: Consensus opinion supported by recent guidelines [1] recommend against measuring vitamin 1,25(OH)2D unless the patient has an acquired vitamin 25(OH)D metabolic disorder such as chronic kidney disease, sarcoidosis, and lymphomas or an inherited disorder including congenital rickets and hereditary phosphate-losing conditions. For most other patients, vitamin 25(OH)D should be measured to screen for vitamin D deficiency as vitamin 1,25(OH)2D has a short half-life and does not accurately represent vitamin D status. Despite available knowledge, requests for vitamin 1,25(OH)2D as a screening test for vitamin D deficiency continue to be received into the laboratory. The purpose of this study is to determine the extent of inappropriate vitamin 1,25(OH)2D orders, the level of training among ordering caregivers, and if significant, identify a potential solution to reduce unwarranted testing.Methods: The electronic medical records of all patients with vitamin 1,25(OH)2D orders over a 3 months period (7/1/2015 - 9/30/2015) at Parkland Hospital were reviewed to assess whether they were diagnosed with or suspected of having chronic kidney disease, primary hyperparathyroidism, hypoparathyroidism, lymphoma associated with hypercalcemia, a chronic granuloma-forming disorder, or an inherited vitamin D metabolic disorder. The ordering caregiver as well as their training level was also assessed.Results: There were 341 vitamin 1,25(OH)2D orders over the study period. Two orders were cancelled due to insufficient sample volume. Of the remaining 339 results, there were 330 unique patients with a total of 9 results being duplicate orders. One hundred forty-eight of the 330 patients (45%) did not have an appropriate indication for vitamin 1,25(OH)2D testing. Those 330 patients had testing ordered by 164 different caregivers. Thirty three of 62 attending physicians (53%), 17 of 53 residents and fellows (32%), 12 of 30 interns (40%), and 9 of 19 (47%) physician assistants or nurse practitioners ordered vitamin 1,25(OH)2D inappropriately. There was no significant difference in the ordering practices of caregivers at different training levels (p-value 0.14).Conclusions: At a reimbursable healthcare cost of $52 per test, there was an approximate wastage of $31,000 in excessive annualized vitamin 1,25(OH)2D tests. Vitamin 1,25(OH)2D tests were inappropriately ordered regardless of caregiver training level. More efforts are needed to educate ordering providers of all training levels on appropriate vitamin D testing as well as implementing further restrictions in the electronic medical record to prevent unnecessary orders. These restrictions may include best practice advisories or hard stops. By preventing unwarranted testing, health care costs will be reduced without a negative impact on patient care.1. Holick M, et al. Evaluation, Treatment, and Prevention of Vitamin D Deficiency: an Endocrine Society Clinical Practice Guideline. The Journal of Clinical Endocrinology & Metabolism. 2011; 96: 1911-30.
A-190Comparison of thyroid function test between two automated immunoassay analyzers
S. Kang, Y. Jeon, M. Kim, W. Lee. KyungHee University Cllege of Medicine, Seoul, Korea, Republic of
Background: Thyroid function test (TFT) provides a starting point for differential diagnosis of disease associated with thyroid. While the accuracy and precision of the test have to be guaranteed, difference between assay methods or platforms is inevitable. The aim of this study is to evaluate and compare two automated immunoassay analyzers of their thyroid stimulating hormone (TSH), free thyroxine (FT4), and triiodothyronine (T3) results along with the distribution of functional thyroid status corresponding to TFT result.Methods: During the period from October to November 2015, 121 residual samples with results of TSH, FT4 and T3 using ADVIA Centaur XP analyzer (Siemens Healthcare Diagnostics, Munich, Germany) were retrospectively selected. The specimens were stored at -70℃ and analyzed using Architect i2000 analyzer (Abbott Laboratories, Singapore) at two months interval. Statistical analyses were done using correlation analysis and Bland-Altman plot. The distribution of TFT patterns based on FT4 and TSH was compared using kappa statistics. The reference range of ADVIA Centaur XP and Architect was adopted from
the manufacturer (Centaur: 0.550-4.780 mIU/L (TSH), 11.46-22.65 pmol/L (FT4), and 0.01-0.03 nmol/L (T3), Architect: 0.350-4.940 mIU/L (TSH), 9.01-19.05 pmol/L (FT4), and 0.01-0.02 nmol/L (T3)).Results: The TSH, FT4, and T3 values of Centaur statistically correlated with Architect (rho Spearman’s: 0.997, 0.907, and 0.880; P<0.001). The percent biases of TSH, FT4, and T3 on the Bland-Altman plots were 10.3% (95% CI; -83.5-104.0), 5.1% (-26.7-37.0), and -12.9% (-41.4-15.69), respectively. Two analyzers represented moderate agreement (Cohen’s weighted kappa coefficient= 0.415). An apparent difference of distribution of functional thyroid status based on FT4 and TSH was observed. The number (%) of cases with low FT4 and normal TSH in Centaur and Architect were 39 (32.3%) and 3 (2.5%), respectively. The cases with low FT4 and low TSH were 12 (9.9%) and 2 (1.7%), respectively. Underlying causes of patterns with low FT4 and normal or low TSH included rare condition such as central hypothyroidism, although other laboratory data and clinical information were not part of the investigation in this study. On the other hand, the number of cases with normal FT4 and TSH in Centaur and Architect were 4 (3.3%) and 57 (47.1%), respectively. Most of those discrepancies were observed at lower limit of reference ranges of FT4 or TSH.Conclusion: Centaur assay demonstrated moderate agreement with Architect regarding TFT result. When stratified according to defined reference range by manufacturers, there were considerable discrepancies in interpretation of TFT results between two instruments. The standardization of thyroid hormone measurements is not yet. Therefore, the specialists of laboratory medicine have to know about the differences between methods or instruments and communicate with clinicians in interpreting the TFT results.
A-191Development of an Enhanced Chemiluminescent C-peptide Assay* on VITROS® 5600 Integrated and VITROS® 3600 and ECi/ECiQ Immunodiagnostic Systems
H. Groth, M. Auger, L. Ernst, T. Jakubowski, M. Kantar, L. Sprague, K. Teugeman, T. Tubbs. Ortho Clinical Diagnostics, Rochester, NY
Background: C-peptide is a useful biomarker to assess beta-cell function in the pancreas. Additionally, c-peptide measurements are used as an aid in the diagnosis of hypoglycemia, diabetes mellitus and insulinoma. We have developed a prototype enhanced chemiluminescent assay for the quantitative measurement of c-peptide in serum and plasma for use on the VITROS® 5600 Integrated and VITROS® 3600 and ECi/ECiQ Immunodiagnostic Systems. Methods: Precision was evaluated per CLSI EP05-A3 by testing a 5 member panel in duplicate 2 times per day for 20 days. Cross reactivity with proinsulin was assessed up to 1000ng/ml; and cross reactivity with insulin was assessed up to 26,396µIU/mL. A total of 110 samples that spanned the assay range were tested in the prototype assay and an aliquot was sent out for testing on a commercially available automated c-peptide test. The sample set included random samples, fasting samples, and post meal samples collected from in house volunteer participants as well as archived samples purchased from a vendor. LoB, LoD, LoQ were evaluated per CLSI EP17-A2 by testing 100 replicates of 1 LoB fluid and 5 LoD fluids over 5 days. High dose hook was assessed up to 200ng/mL. Testing was conducted across two reagent lots and three VITROS® systems. Results: The within lab %CVs ranged from 2.8% to 3.8% on the VITROS® 3600 and 2.1% to 3.6% on the VITROS® ECi for samples ranging in concentration from 0.28 to 12.4ng/mL. At 1000ng/mL, the observed % cross reactivity for proinsulin was 0.5%. At 26,396µIU/mL of insulin, no cross reactivity was detected. For the method comparison, Deming regression analysis yielded slopes ranging from 0.98 to 1.04, intercepts ranging from -0.02 to 0.07, and Pearson Correlation Coefficients ranging from 0.98 to 0.99 among the VITROS® 5600, VITROS® 3600 and VITROS® ECi systems. The overall mean % bias for the prototype method ranged from 0.56% to 4.25% among the VITROS®
5600, VITROS® 3600 and VITROS® ECi compared to the commercially available automated comparator method. The LoB was 0.009ng/mL, The LoD was 0.027ng/mL, and the LoQ at 20% CV was 0.045ng/mL. No high dose hook was observed for the assay up to 200ng/mL. Conclusion: Preliminary performance data demonstrate that the prototype assay has excellent precision, minimal to no cross reactivity with proinsulin and insulin, excellent correlation with a commercially available method, an LoQ consistent with other commercially available methods, and shows no high dose hook up to 200ng/mL.*Under development
68th AACC Annual Scientific Meeting Abstracts, 2016 S65
Endocrinology/Hormones Tuesday, August 2, 9:30 am – 5:00 pm
A-192IMMULITE 2000 IGF-I Assay Restandardization to 1st WHO IS for Insulin-like Growth Factor-I, NIBSC Code 02/254*
D. Evans1, A. Peacey1, P. Sibley2, C. Medve1, J. Wen1, S. Wade2, G. Johnson2, J. Younger2, D. Kiaei1, J. Lei1. 1Siemens Healthcare Dx, Tarrytown, NY, 2Siemens Healthcare Dx, Llanberis, United Kingdom
Background: The IMMULITE® 2000 IGF-I assay from Siemens Healthcare is a solid-phase, enzyme-labeled, chemiluminescent immunometric method for in vitro diagnostic use with the IMMULITE 2000 Systems Analyzers - for the quantitative measurement of insulin-like growth factor I (IGF-I) in serum or heparinized plasma, as an aid in the evaluation of growth disorders. The IMMULITE 2000 IGF-I assay has been restandardized to the 1st WHO International Standard for IGF-I, NIBSC code 02/254, with full performance verification studies carried out to demonstrate its appropriate analytical performance. Methods: Alignment of the restandardized IMMULITE 2000 IGF-I assay to the WHO standard was demonstrated by accurate recovery of various gravimetrically prepared WHO 1st IS 02/254 spiking solutions in native patient samples. A method comparison of 164 native patient sera with IGF-I concentrations ranging from 23.0 to 900.0 ng/mL was conducted between the restandardized IMMULITE 2000 IGF-I assay and the IDS-iSYS IGF-I assay (which claims alignment to WHO 1st IS 02/254). Reference intervals are presented for N = 1321 individuals aged 29 days to 90 years. The data is stratified by age and gender per the recommendations for normative data made in the Consensus Statement on the Standardization and Evaluation of Growth Hormone and Insulin-like Growth Factor Assays (Clemmons, 2011). Gender-specific reference intervals are also presented for Tanner Stages 1 to 5. Repeatability and within lab precision was determined per CLSI EP-5A3. Six patient serum pools were assayed in duplicate in two runs per day over 20 days. Additional performance studies included diagnostic sensitivity (CLSI EP17-A2), linearity (CLSI EP6-A) and cross-reactivity (CLSI EP7-A2). Results: Mean recovery of the WHO 1st IS 02/254 spiking solutions was 3%, with individual sample recoveries ranging from -1 to 9%.The Passing-Bablok linear regression slope is 0.84 (95% confidence interval 0.83 to 0.86) and intercept 1.9 ng/mL (95% confidence interval -2.3 to 5.1 ng/mL). The restandardized IMMULITE 2000 IGF-I assay shows acceptable repeatability and within-lab precision. Samples at 60 ng/mL IGF-1 were seen to have repeatability of 7% CV or better and within-lab precision less than 8% CV. Samples with dose recoveries of 100 ng/mL or greater show repeatability %CV less than 5% and within-lab precision less than 6%. The restandardized IMMULITE 2000 assay demonstrated an LOD of ≤15 ng/mL and an LOQ of ≤25 ng/mL. Linearity studies demonstrate that the assay is linear across the measuring interval from the limit of detection to 1000 ng/mL. The restandardized assay shows no significant interference from hemolysis, lipemia, or icterus and less than 1% cross-reactivity to IGF-II, insulin, proinsulin, TSH, and LH. Lot-to-lot variability estimated by method comparison studies showed less than 3% variation between three unique verification reagent lots. Conclusion: The restandardized IMMULITE 2000 IGF-I assay is closely aligned to the WHO 1st IS 02/254 and compares well with the IDS-iSYS IGF-I assay. The restandardized IMMULITE 2000 IGF-I assay also demonstrates appropriate precision and sensitivity, is linear and shows no significant interference in the presence of hemolysis, lipemia, or icterus. *Disclaimer: Product availability may vary from country to country and is subject to varying regulatory requirements.
A-193Performance Evaluation of an IGFBP-3 Assay on the ADVIA Centaur Systems
O. Quraishi, M. Smith, S. DiFrancesco, K. Osae-Kwapong, R. Dougherty, S. Lin, D. Hovanec-Burns. Siemens Healthcare, Tarrytown, NY
Objective: Insulin-Like Growth Factor Binding Protein 3 (IGFBP-3) has been shown to be the major carrier of circulating IGF-I and IGF-II, and used as an adjunct to HGH and IGF-I testing in the diagnosis and follow-up of growth disorders. Siemens Healthcare Laboratory Diagnostics is developing a fully automated ADVIA Centaur® IGFBP-3 assay* in a chemiluminescent immunoassay format for the quantitative detection of IGFBP-3 in serum or plasma using monoclonal antibodies specific for human IGFBP-3 and ISODIZAE-NHS, a charge-neutral double-zwitterionic acridinium ester label (Natrajan A & Sharpe D (2013) Org. Biomol. Chem., 11, 1026-1039).Methods: The diagnostic sensitivity of the assay was evaluated and the results were reported in ng/mL (CLSI EP17-A2). Method comparison against the IDS-iSYS and IMMULITE 2000/XPi IGFBP-3 assays, and between ADVIA Centaur XP and CP Systems, were evaluated using 50 apparently healthy patient samples (CLSI EP9-A3).
Additional performance studies included linearity (CLSI EP17-A2), cross-reactivity to IGF-I, IGF-II, IGFBP-1, IGFBP-2, IGFBP-4, IGFBP-5 and IGFBP-6 (CLSI EP7-A2), and precision using a 20-day protocol on two systems, two runs/day (CLSI EP5-A3). Finally, the stability of the reagents was assessed by measuring onboard stability and the calibration interval of the assay (CLSI EP25-A).Results: The ADVIA Centaur IGFBP-3 assay in development had a LoB/LoD/LoQ of 25/40/80 ng/mL, respectively, on ADVIA Centaur XP with a working range up to 16,000 ng/mL. ADVIA Centaur XP and Centaur CP agreed with a slope of 1.000 and R2 = 0.990, whereas comparisons between ADVIA Centaur XP IGFBP-3 and IDS-iSYS and IMMULITE 2000/XPi IGFBP-3 had slopes and R squared values of 1.026 and 0.966, and 1.003 and 0.966, respectively. Between run and between day precision of the ADVIA Centaur IGFBP-3 assay showed <5% CV on both ADVIA Centaur XP and ADVIA Centaur CP Systems for patient samples covering IGFBP-3 concentrations of 800-7,000 ng/mL. The assay demonstrated no cross-reactivity to IGF-I, IGF-II or any of the IGF Binding Proteins, and exhibited excellent linearity from LOQ to 16,000 ng/mL having a weighted linear fit slope of 1.05 and intercept of -1.60. The assay had 35 days onboard stability (OBS) and a 35 day calibration interval.Conclusion: The results of these studies show good performance of the fully automated ADVIA Centaur IGFBP-3 assay and good agreement with the IDS-iSYS and IMMULITE 2000/XPi assays.* For investigational use only. The performance characteristics of this product have not been established. Not available for sale.Part Number A91DX-CAI-160033-GC1-4A00
A-194OPTIMIZING CORTISOL AFTER INSULIN STIMULUS IN CHILDREN: WHEN AND HOW MANY TIMES SHOULD WE COLLECT BLOOD SAMPLES TO ACCURATELY EXCLUDE HYPOCORTISOLISM
Y. Schrank, R. Fontes, G. Rivelli, E. M. Ribeiro, M. D. Freire, O. F. Silva. DASA - Brazil, Rio de Janeiro, Brazil
Background: The insulin tolerance test (ITT) was developed in the late 1960s, and remains as the ‘gold standard’ test to determine the need for cortisol replacement in patients with hypothalamic-pituitary-adrenal disease. It assesses the integrated central and peripheral responses to a stressful event caused by hypoglycemia. However, this test is unpleasant for patients, is resource-consuming, and is not without risk. It has to be performed in a specialized unit with adequate supervision, and patients with documented ischemic heart disease or seizure disorders should not undergo ITT and require alternative diagnostic tests. Despite wide experience, uncertainty remains regarding the optimal duration of the test.Objectives:In order to optimize the specimen collection for the ITT we studied timing of peak cortisol value. The aim of our study was to examine whether the cortisol stimulation test could be performed with fewer samples without compromising its diagnostic value. Methods: We performed a cross-sectional retrospective examination of 297 consecutive children submitted to cortisol stimulation test with insulin who showed a positive response (cortisol ≥ 18 mcg/dL) to the stimulus. Regular insulin was applied intravenously at a dose of 0.075 units/kg body weight. If hypoglycemia was not reached 40 minutes after insulin administration, an additional dose, sufficient to achieve blood glucose levels below 40 mg/dL, was applied. Blood samples for cortisol and glucose determination were taken at time 0, during hypoglycemia and 30, 60 and 90 minutes after hypoglycemia. Serum cortisol concentration was tested with the Cobas analyzer electrochemiluminescence immunoassay and glucose was tested by an enzymatic method. A test was considered responsive when peak cortisol at any time ≥ 18 mcg/dL. Results: Adequate hypoglycaemia (glucose < 40 mg/dL) was achieved in all patients. A second insulin dose to achieve hypoglycemia was necessary in 3% of our series. No significant side effects were recorded. The mean age of our patients was 9.9 ± 3, range 5-16 years, with male:female ratio 2:1. Median cortisol values at time 0, during hypoglycemia and 30, 60 and 90 minutes after hypoglycemia were respectively 11.2, 13.9, 21, and 14.2 mcg/dL.. The majority, 178 (60 %) of our patients showed peak cortisol 30 minutes after hypoglycemia, which usually corresponds to 60 minutes after insulin administration. Seventy six (25.6 %) showed peak cortisol 60 minutes after hypoglycemia (which usually corresponds to 90 minutes after insulin administration), however 74% of this patients showed cortisol ≥ 18 mcg/dL at any other collection time before. Twenty (6.7%) of our 297 patients showed cortisol ≥ 18 mcg/dL at this time (60 minutes after hypoglycemia) with no cortisol positive answer at any other time. However half of these patients showed a cortisol level ≥ 17 mcg/dL at any other time before the collection 60 minutes after hypoglycemia. Conclusion: As cortisol release happens after hypoglycemia, it seems rational to collect samples
S66 68th AACC Annual Scientific Meeting Abstracts, 2016
Tuesday, August 2, 9:30 am – 5:00 pm Endocrinology/Hormones
in accordance with the documentation of the event and not in pre-established times. Collection of cortisol after ITT can be optimized, without sacrifying sensitivity, by collecting only three specimens for cortisol and glucose determination: time 0, during hypoglycemia and 30 minutes after hypoglycemia.
A-195A Laboratory Comparison Study of the Roche cobas and Siemens IMMULITE 2000 Adrenocorticotropic Hormone (ACTH) Assays
Z. Shajani-Yi1, S. L. La’ulu2, T. J. Brough3, J. S. Straseski4, M. A. Cervinski1. 1Geisel School of Medicine/Dartmouth-Hitchcock Medical Center, Hanover, NH, 2ARUP Institute for Clinical and Experimental Pathology, Salt Lake CIty, UT, 3Dartmouth-Hitchcock Medical Center, Lebanon, NH, 4Department of Pathology, University of Utah, Salt Lake City, UT
Background: The measurement of plasma adrenocorticotropic hormone (ACTH) concentration is integral to the diagnosis of ACTH-dependent and ACTH-independent Cushing’s Disease and primary, secondary and tertiary adrenal insufficiency. The objective of our study was to validate the Roche cobas ACTH assay including a split-sample comparison to the Siemens IMMULITE 2000 assay.Methods: Precision, linearity and carryover studies on the Roche cobas ACTH assay were performed using a cobas e601 analyzer. A method comparison to the Siemens IMMULITE 2000 ACTH assay included 79 patient samples spanning the linear range of the Roche assay. Data was analyzed using EP Evaluator.Results: The Roche cobas ACTH assay demonstrated acceptable within-day imprecision using Roche PreciControl QC material with coefficients of variation (CV) of 0.8% and 1.0% at mean ACTH concentrations of 49.9 pg/mL and 755.1 pg/mL, respectively. The day-to- day imprecision study demonstrated CVs of 2.1% and 1.5% at ACTH concentrations of 37.3 pg/mL and 895.7 pg/mL, respectively. The Roche ACTH assay was verified as linear from 1 to 1500 pg/mL and did not display significant carryover. In an attempt to independently verify the Roche cobas ACTH assay performance and to supplement the two concentrations of Roche PreciControl QC material we assayed the Siemens ACTH QC material on the Roche assay. The Siemens QC material demonstrated day-to-day imprecision of 1.2% and 1.4% with observed means of 10.4 pg/mL and 130.0 pg/mL, respectively. Interestingly, the observed concentrations of the Siemens QC material on the Roche assay was between two and four-fold lower than the Siemens expected range, implying non-commutability of the Siemens QC material on the Roche platform. We also tested the opposite combination; analysis of the Roche QC material with the Siemens assay demonstrated within-day imprecision of 2.6% and 1.7% with ACTH concentrations of 56.4 pg/mL and 970.6 pg/mL, values similar to those obtained on the Roche platform. A patient sample comparison study between the Roche cobas and Siemens IMMULITE platforms using Deming regression analysis yielded the following equation (95% confidence intervals): Roche cobas ACTH = 0.708(0.662-0.754)x Siemens IMMULITE ACTH + 0.689(0.644-0.735) , r=0.9606.Conclusion: The Roche cobas ACTH assay demonstrated acceptable precision over a twenty-day period; however, the Roche cobas assay demonstrated a negative proportional bias as compared to the Siemens IMMULITE 2000 ACTH assay. We hypothesize that the inter-assay bias is related to differences in assay design. The Roche assay uses two monoclonal antibodies targeted to epitopes between ACTH amino acids (AA) 9-12 and 36-39, whereas the Siemens assay uses one monoclonal antibody targeted to ACTH AA 18-39 and one polyclonal antibody targeted to ACTH AA 1-24. Due to differences in assay design the Siemens assay may recognize the ACTH degradation product corticotrophin-like intermediary lobe peptide (CLIP) (ACTH AA 18-39) possibly contributing to positive bias relative to the Roche assay. Similarly the Roche assay likely demonstrates negative bias relative to the Siemens assay due to competition between full-length ACTH and CLIP for one of the two antibodies on the Roche assay. We are currently further investigating the cause of this inter-assay bias.
A-196Accuracy Evaluation of Five Routine Glycosylated Hemoglobin Assays in Patients with Hemoglobin Variants in Korean Population
Y. Yun1, M. Ji1, S. Chun2, K. Kwon3, S. Jeon4, J. Song4. 1Konkuk Univserity Medical Center and School of Medicine, Seoul, Korea, Republic of, 2University of Ulsan College of Medicine and Asan Medical Center, Seoul, Korea, Republic of, 3Chungnam National University Hospital, Daejeon, Korea, Republic of, 4Seoul National University College of Medicine, Seoul, Korea, Republic of
Background: Hemoglobin A1c (HbA1c) is a biomarker for the monitoring of glycemic status and also used for the diagnosis of diabetes. However, accurate quantification of HbA1c has been a challenge in patients with Hb variants. We evaluated the impact of various Hb variants on five routine glycosylated hemoglobin assays (1 capillary electrophoresis, 1 immunoassay, and 3 high-performance liquid chromatography [HPLC] assays) compared with the reference measurement using LC-MS/MS. Methods: The whole blood samples showing various flags (variant window, suspected variant peak, duplex peak, abnormally high HbF, high labile HbA1c and low HbA0) or no results on routine HbA1c assays were collected between September 2013 and August 2014 from four University hospitals in Korea (n=188). Twenty normal samples without any flag were collected as controls. Samples were assayed using the following analyzers: Sebia CAPILLARYS 2 Flex Piercing (Sebia); Roche COBAS INTEGRA 800 (Roche); Bio-Rad Variant II turbo (Bio-Rad); Arkray ADAMS HA-8180 (Arkray); Tosoh G8 (Tosoh). Hb electrophoresis (HbEP) was performed for all samples, and abnormal HbEP results suspicious for Hb variant were confirmed with peptide sequencing of Hb alpha and beta chains by LC-MS/MS. HbA1c target values were determined using LC-MS/MS. Results: A total of 114 samples proceeded to peptide sequencing. The most common genotype was Hb G-Coushatta (n=46), followed by Hb Queens (n=41), Hb Chad (n=4), Hb Yamagata (n=4), Hb Ube-4 (n=3), Hb Fort de France (n=1), and Hb Hoshida (n=1). One sample showed both Hb G-Coushatta and Queens, and remaining 13 samples (8 HbD zone/alpha variant suspected, 3 HbD zone/beta variant suspected, 2 other variant suspected) showed undetermined results. The mean absolute bias [(routine assay result (HbA1c unit, %)) - (LC-MS/MS result)] of samples suspicious for Hb variants were 0.045 (Sebia), 0.025 (Roche), -0.199 (Bio-Rad, 5 outliers excluded), -0.945 (Arkray) and -1.341 (Tosoh) with the mean relative % bias ranged from -20.5% to 0.9%. In control samples (n=20), the mean absolute bias (HbA1c unit, %) was ranged from -0.102 (Sebia) to 0.128 (Tosoh), with the mean relative % bias of -1.4% (Sebia) to 1.6% (Tosoh). The Bio-Rad assay reported significantly overestimated results (mean HbA1c value, 43.3%) in 5 samples, comprised of 4 Hb Yamagata and 1 undetermined variant. All HbA1c results of control samples are within the criteria of ±6% compared with the target value, which is recommended by the NGSP. However, in samples with Hb variants, the proportions of results outside ±6% were very different according to the assay used; 19.3% (Sebia, 21/109), 16.7% (Roche, 19/114), 59.6% (Bio-Rad, 68/114), 93.2% (Arkray, 69/74), and 94.7% (Tosoh, 108/114). The Arkray assay reported no results in about one third of samples with Hb variants. Conclusion: In Korean population, the most common Hb variants were G-Coushatta (40.4%) and Queens (36.0%). HbA1c results of 5 routine assays in patients with Hb variants showed various degree of bias compared with those of LC-MS/MS. Some HPLC assays showed considerable negative bias (relative % bias ranged from -20.5 to -15.1%) and most of the results exceeded the NGSP criteria 6% in samples with Hb variant.
A-197Evaluate the performance of steroid hormone measurements through external quality assessment program in China.
Y. Wang, J. Wang, C. Zhang. National Center for Clinical Laboratories, Beijing, China
Background: Presently, most steroid hormones are analyzed by immunoassays with automated analyzers. However, the comparable results from different instruments were important for diagnosis. To some degree, the external quality assessment (EQA) can assess the state of the art analytical performance of the laboratory. In the study, we evaluate the comparability of hormones measurements (cortisol, estradiol, progesterone, testosterone) among the participated laboratories through three years’ EQA program in China.Methods: There were two surveys every year and each survey has five samples. 201301,201302, 201401,201402,201501, 201502 were used to represent the six surveys from 2013 to 2015. The samples were measured along with patient specimens one time and results were submitted online timely. The participants were classified into several groups according to the testing systems they adopted. Robust mean value
68th AACC Annual Scientific Meeting Abstracts, 2016 S67
Endocrinology/Hormones Tuesday, August 2, 9:30 am – 5:00 pm
and robust coefficient of variation were calculated using the algorithm A described in ISO 13528. The robust mean value of each group was assigned as the target value for peer group. The CV of target value for peer group was used to calculate the between group CV in each survey. The within-group mean CV was the mean value of robust CV of five samples for each group in one survey. The result of each sample was calculated acceptable if within±25% of target value. Scores for each laboratory were calculated as the percentage of the acceptable samples in one survey and scores above 80% were considered passing based on the CLIA’88.Results: The quantity of laboratories for the four analytes (cortisol 385-589, estradiol 1058-1422, progesterone1057-1430, testosterone 1062-1427) were increasing and there is no significant difference(all above 85%) between the percentages of laboratories scoring above 80 from 2013 to 2015. The laboratories were divided into 8 major peer groups: Abbott, Beckman Access, Beckman DXI/DXC, Roche, Siemens Immulite, Siemens Centaur, Diasorin, and Tosoh. For cortisol, Abbott has the largest within-group mean CV (8%-16%) for each survey in three years. The other seven groups showed no significant changes (remain about 8%). For estradiol, Beckman Access (201301/10.15%, 201502/21.08%), Siemens Immulite (201301/7.85%, 201502/10.62%) have increasing within-group mean CV among the six surveys. For progesterone and testosterone, the survey of 201502 was not included for it contains a very low concentration (about 3.0nmol/L) sample. For progesterone, the within CVS of 8 groups were all decreasing except for 201521. For testosterone, the within mean CVS of Roche(201311/12.6%,201511/5.8%) and DiaSorin (201311/10%,201511/8%) were decreasing while Beckman DXI/DXC and Siemens Centaur keep increasing and can be up to 10%. As to the between group CV, four analytes all showed a decline especially for estradiol from 38.49% of 201301 to 18.91% of 201502.Conclusions: The diverse and complex within-group CV changes suggest the reproducibility of the same brand instrument was not desirable. However, the decreasing between group CV showed the comparability of different instruments was improving. The manufactures have a very big promotion space in the aspect of guaranteeing the stability of the instruments and the specificity of the methods to improve measurement performance.
A-198Linear Regression of NHANES Fasting Glucose to Hemoglobin A!c Equivalent to Nathan’s Average Glucose Derivation from Hemoglobin A1c: Fasting Glucose is the Poor Man’s A1c
T. Higgins1, Y. Qiu2, G. S. Cembrowski2. 1DynaLife, Edmonton, AB, Canada, 2Alberta Health Services, Edmonton, AB, Canada
Introduction: Nathan’s linear regression equation for relating average glucose to hemoglobin A1c [HbA1c] (data obtained from 3 months of 507 subjects’ continuous glucose monitoring data) is now used by many clinical laboratories to transform patient HbA1c into estimated glucose (eAG). In our investigations of hematocrit’s influence on Nathan’s equation, we discovered almost the same equation relating fasting glucose and HbA1c.Methods: All of the HbA1c, related fasting glucose, age, gender, ethnicity, waist circumference, hemoglobin and hematocrit data were extracted from the US National Health and Examination Survey (NHANES) for the years 1999 to 2012. All subjects with incomplete data were excluded. Linear regression was used to determine the relationship between fasting glucose and HbA1c for the entire population, and then separately for all men, all women, for Mexican Americans (MA), NonHispanic Blacks (NHB), NonHispanic Whites (NHW) and MA, NHB and NHW with hematocrits between 30 and 50%.Results: A total of 18694 subjects were identified who had the requisite examinations. The Table compares our regression statistics to Nathan’s.
Glucose vs HbA1c N Slope Y Intercept RxR
Nathan et al 507 28.7 -46.7 0.84
All subjects 18694 28.1 -52.6 0.68
Male 9239 27.8 -52.5 0.68
Female 9455 28.0 -51.0 0.68
MA (Code 1) 4816 28.7 -54.8 0.78
NHB (Code 4) 4792 27.0 -50.2 0.64
NHW (Code 3) 9086 29.0 -55.0 0.63
MA (30%<Hct<50%) 4621 28.7 -55.1 0.78
NHB (30%<Hct<50%) 4671 27.0 -50.4 0.65
NHW (30%<Hct<50%) 8779 28.8 -54.7 0.63
Conclusions: Hba1c is usually thought of as average blood glucose but correlates very well with the fasting glucose which is usually the daily nadir of glucose
concentrations. HbA1c is highly correlated to both long term glucose and to a slightly lesser extent to fasting glucose and with surprisingly the same regression coefficients. Fasting glucose thus can be used to calculate HbA1c using Nathan’s formula and can be used for quality assurance purposes in cases of discrepant measured fasting glucose and HbA1c values.
A-199Access Estradiol Sensitive immunoassay, performance of a new sensitive and accurate automated assay
E. Romeu1, P. Melchionno1, N. Germain1, H. Fonteneau1, D. Riviere1, P. Denizot1, T. L. Mclernon2, G. J. G. Bradley2, M. Navratil2. 1Beckman-Coulter, Marseille, France, 2Beckman-Coulter, Chaska, MN
Background: Commercially estradiol immunoassays are efficient for the assessment of female reproductive function i.e. infertility, oligo-amenorrhea, menopausal status and monitoring of ovulation induction during in vitro fertilization. However they generally have insufficient sensitivity and/or accuracy for assessment of inborn errors of sex-steroid metabolism, disorders of puberty, estrogen deficiency in men, therapeutic drug monitoring during low-dose female hormone replacement therapy and antiestrogen treatment.Methods: Within-run and within-laboratory were calculated based on five serum samples tested over 20 days according to CLSI EP05-A3. Method comparison was assessed according to CLSI EP09-A3 by measuring eighty-nine samples covering the physiological variability (male, female, post-menopausal) and the range of estradiol concentrations (≈2-4000 pg/mL) on ID-GC/MS and Beckman Coulter Access Estradiol Sensitive immunoassay. Correlation was assessed using Pearson correlation. Calibration curve and open vial calibrator stability were assessed according to CLSI EP25-A.Results: The Access Sensitive Estradiol assay is traceable to JCTLM-approved methods according to ISO 17511, covering a measuring range from 15 to 5000 pg/mL. Within-run and within-laboratory are below 6% and 8%, respectively, for a sample at 30 pg/mL and below 3% and 4%, respectively, for a sample at 200 pg/mL. Limit of Detection (LoD) was 10 pg/mL. Limit of Quantitation (LoQ) was 15 pg/mL. Compared to the ID-GCMS method, the Pearson correlation was above 0.98, the method comparison exhibited a slope within 1.00+/-0.05 with an intercept below 5 pg/mL. The calibration curve and open vial calibrator stability are 31 and 90 days, respectively.Conclusion: The Beckman Coulter Access Sensitive Estradiol assay is accurate and precise down to 15 pg/mL, making it an efficient tool for assessing estradiol status of children, males and monitoring females under antiestrogen or hormonal treatment.
A-200Performance evaluation of the Lifotronic H9,a new HbA1c analyser
D. Wen, X. Zhang, S. Xu, M. Suo. Zhongshan Hospital Affiliated to Sun Yat-sen University, Zhongshan city,Guangdong Province, China
Background: Hemoglobin A1c(HbA1c) is a powerful tool for both monitoring long-term glycemic control, and to diagnostic diabetes. Ion-exchange HPLC (IE-HPLC) assay has been consolidated as a gold standard to measure HbA1c, This study was aimed to evaluate the analytical performance of a new IE-HPLC analyser to measure HbA1c (Lifotronic H9) . and evaluate Lifotronic H9 in comparison to two other widely used HPLC systems(Primus Ultra2 ®boronate affinity HPCL and Bio-Rad Variant II turbo2.0® ion exchange HPLC) in patients with normal and abnormal Hb.Methods: The current study was conducted at the Sun Yat-sen University affiliated Zhongshan hospital laboratory. All studies were evaluated using CLSI guidelines. The precision, accuracy, linearity and interference were evaluated according to CLSI protocols EP5-A2, EP9-A3, EP6-A and EP7-A2 respectively. Measurements of HbA1c by the three methods were made in blood from 124 patients with normal Hb(HbA )and 34 patients with abnormal Hb(Hb E).Primus Ultra2 was used as comparative system, and the other 2 systems were test systems. Comparative analysis and bias evaluation were conducted on the results from three detection systems, Appropriateness of data for linear regression analysis was checked regards CLSI EP9-A3 document, then performed both linear regression and difference plot analyses.Results: The within-run imprecision values(CV%) were less than 1.75% and the total imprecision values(CV%) were less than 2.02%. Bias using reference samples from NGSP ranged from -2.78 to 2.63%. The linearity of was excellent in the range between 3.0% and 18.0%.Comparison of both methods against Primus Ultra2 demonstrated significant correlation (Lifotronic H9: r = 0.997; slope= 0.96; intercept =0.20; Bio-
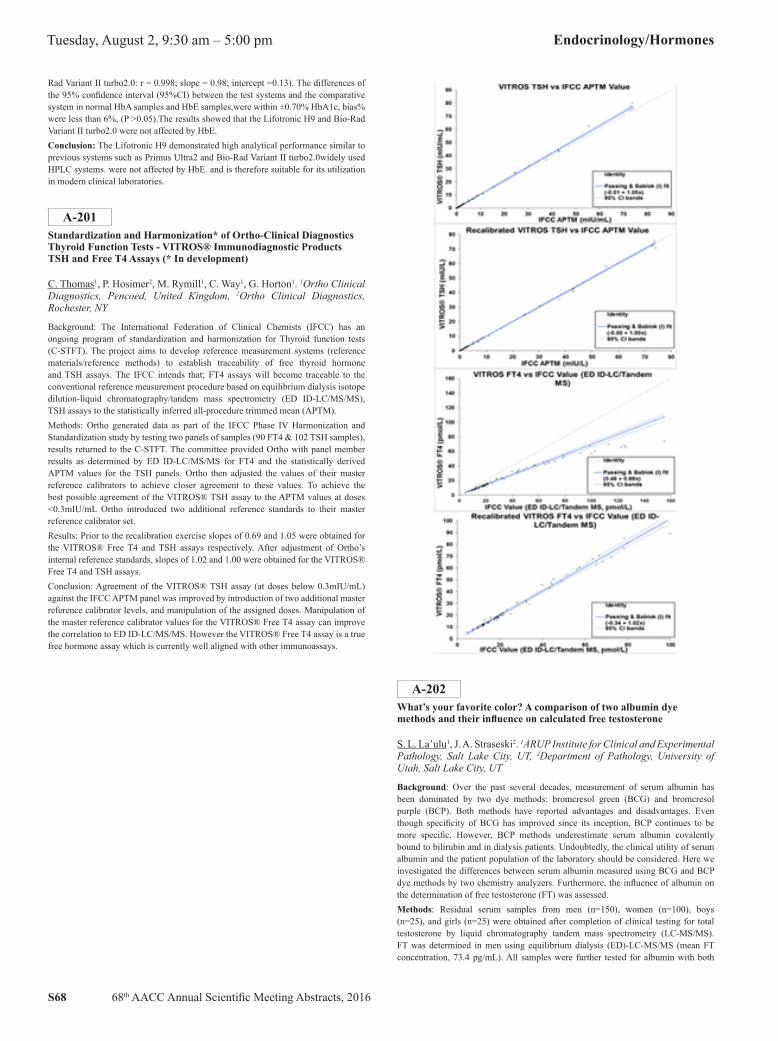
S68 68th AACC Annual Scientific Meeting Abstracts, 2016
Tuesday, August 2, 9:30 am – 5:00 pm Endocrinology/Hormones
Rad Variant II turbo2.0: r = 0.998; slope = 0.98; intercept =0.13). The differences of the 95% confidence interval (95%CI) between the test systems and the comparative system in normal HbA samples and HbE samples,were within ±0.70% HbA1c, bias% were less than 6%, (P >0.05).The results showed that the Lifotronic H9 and Bio-Rad Variant II turbo2.0 were not affected by HbE.Conclusion: The Lifotronic H9 demonstrated high analytical performance similar to previous systems such as Primus Ultra2 and Bio-Rad Variant II turbo2.0widely used HPLC systems. were not affected by HbE. and is therefore suitable for its utilization in modern clinical laboratories.
A-201Standardization and Harmonization* of Ortho-Clinical Diagnostics Thyroid Function Tests - VITROS® Immunodiagnostic Products TSH and Free T4 Assays (* In development)
C. Thomas1, P. Hosimer2, M. Rymill1, C. Way1, G. Horton1. 1Ortho Clinical Diagnostics, Pencoed, United Kingdom, 2Ortho Clinical Diagnostics, Rochester, NY
Background: The International Federation of Clinical Chemists (IFCC) has an ongoing program of standardization and harmonization for Thyroid function tests (C-STFT). The project aims to develop reference measurement systems (reference materials/reference methods) to establish traceability of free thyroid hormone and TSH assays. The IFCC intends that; FT4 assays will become traceable to the conventional reference measurement procedure based on equilibrium dialysis isotope dilution-liquid chromatography/tandem mass spectrometry (ED ID-LC/MS/MS), TSH assays to the statistically inferred all-procedure trimmed mean (APTM).Methods: Ortho generated data as part of the IFCC Phase IV Harmonization and Standardization study by testing two panels of samples (90 FT4 & 102 TSH samples), results returned to the C-STFT. The committee provided Ortho with panel member results as determined by ED ID-LC/MS/MS for FT4 and the statistically derived APTM values for the TSH panels. Ortho then adjusted the values of their master reference calibrators to achieve closer agreement to these values. To achieve the best possible agreement of the VITROS® TSH assay to the APTM values at doses <0.3mIU/mL Ortho introduced two additional reference standards to their master reference calibrator set.Results: Prior to the recalibration exercise slopes of 0.69 and 1.05 were obtained for the VITROS® Free T4 and TSH assays respectively. After adjustment of Ortho’s internal reference standards, slopes of 1.02 and 1.00 were obtained for the VITROS® Free T4 and TSH assays.Conclusion: Agreement of the VITROS® TSH assay (at doses below 0.3mIU/mL) against the IFCC APTM panel was improved by introduction of two additional master reference calibrator levels, and manipulation of the assigned doses. Manipulation of the master reference calibrator values for the VITROS® Free T4 assay can improve the correlation to ED ID-LC/MS/MS. However the VITROS® Free T4 assay is a true free hormone assay which is currently well aligned with other immunoassays.
A-202What’s your favorite color? A comparison of two albumin dye methods and their influence on calculated free testosterone
S. L. La’ulu1, J. A. Straseski2. 1ARUP Institute for Clinical and Experimental Pathology, Salt Lake City, UT, 2Department of Pathology, University of Utah, Salt Lake City, UT
Background: Over the past several decades, measurement of serum albumin has been dominated by two dye methods: bromcresol green (BCG) and bromcresol purple (BCP). Both methods have reported advantages and disadvantages. Even though specificity of BCG has improved since its inception, BCP continues to be more specific. However, BCP methods underestimate serum albumin covalently bound to bilirubin and in dialysis patients. Undoubtedly, the clinical utility of serum albumin and the patient population of the laboratory should be considered. Here we investigated the differences between serum albumin measured using BCG and BCP dye methods by two chemistry analyzers. Furthermore, the influence of albumin on the determination of free testosterone (FT) was assessed.Methods: Residual serum samples from men (n=150), women (n=100), boys (n=25), and girls (n=25) were obtained after completion of clinical testing for total testosterone by liquid chromatography tandem mass spectrometry (LC-MS/MS). FT was determined in men using equilibrium dialysis (ED)-LC-MS/MS (mean FT concentration, 73.4 pg/mL). All samples were further tested for albumin with both
68th AACC Annual Scientific Meeting Abstracts, 2016 S69
Endocrinology/Hormones Tuesday, August 2, 9:30 am – 5:00 pm
the BCG and BCP dye methods using the Abbott ARCHITECT ci8200 and Roche cobas c702. FT was calculated using the Vermeulen equation, where total testosterone determined by LC-MS/MS and sex hormone binding globulin measured by Roche Modular E170 were used (mean calculated FT concentrations ranged from 71.3-73.7 pg/mL). The following comparisons were made: 1) albumin comparisons between the two dyes (BCG and BCP) for each analyzer, along with comparing the same dye between the ARCHTECT and c702, 2) comparisons of calculated FT using different albumins, and 3) comparison of calculated FT with directly measured FT in men; including calculated FT using a generic albumin value of 4.3 g/dL. Significance was characterized as p-values <0.05, determined by paired t-tests.Results: For all populations combined, serum albumin mean concentrations were 4.4, 4.3, 4.2, and 4.1 g/dL for the ARCHITECT BCG, ARCHITECT BCP, c702 BCG and c702 BCP, respectively. When comparing these 4 datasets against each other, the associations were all significantly different (p-values ≤0.0001). To evaluate whether or not these significant differences in albumin influenced calculation of FT, each albumin dataset was entered into the Vermeulen equation, and all other variables remained the same. Comparisons of calculated FT were all significantly different (p-values ≤0.0001), except for c702 BCG vs. c702 BCP (p-value 0.818); indicating that calculated FT would not be influenced by albumin dye method used on the c702. Calculated FT was compared to FT by ED-LC-MS/MS in men and was found to be significant only for the ARCHITECT BCG method (p-value 0.034).Conclusions: Comparisons of the albumin methods show that they are statistically different. However, when albumin is used for determination of FT, most do not show a significant impact, as indicated by the comparison of calculated and directly measured FT in men. Due to the potential significant differences that could occur, careful evaluation is recommended when selecting and switching albumin dye methods; the clinical use of serum albumin testing and the patient populations served by the laboratory should be considered.
A-203Comparison of iPTH Assays on the ADVIA Centaur and Roche Modular E170 Analyzers and Biotin Interference Evaluation
C. Ahnadi1, B. Plouffe2, A. Grant1. 1CRED, Centre Hospitalier Universitaire de Sherbrooke, Sherbrooke, QC, Canada, 2Siemens Healthcare Diagnostics, Tarrytown, NY
Background: The intact parathyroid hormone (iPTH) consists of 84 amino acids secreted from the parathyroid glands. iPTH is the major circulating factor regulating extracellular calcium concentration. The measurement of intact PTH provides a more-accurate assessment of parathyroid tissue secretory status, especially in patients with renal impairment. Several commercial immunoassays are available for testing iPTH. However, the presence of high endogenous levels of biotin may interfere with immunoassays that use biotin-streptavidin mechanisms in their assay designs. The objective of this study was to compare the ADVIA Centaur® iPTH assay from Siemens Healthcare and the Roche Modular E170 iPTH assay and to determine the effect of biotin on iPTH concentration. Both immunoassays use the biotin-streptavidin interaction in their assay designs. The ADVIA Centaur iPTH assay was designed to eliminate interference from high endogenous levels of biotin.Methods: The method comparison was performed for the ADVIA Centaur iPTH and Roche Modular E170 iPTH assays using a total of 1089 EDTA plasma samples from predialysis patients with end-stage renal disease (ESRD). The effect of exogenous biotin was studied on the ADVIA Centaur iPTH and Roche Modular E170 iPTH assays to evaluate the interfering role of biotin. Various amounts of free biotin were added (0, 10, 25, 50, 100, 150, and 200 µg/L) to three plasma pools with known concentrations of iPTH (50, 200, and 620 pg/mL, respectively).Results: The comparison between the two methods showed good correlation, but there were significant between-method differences in iPTH concentrations. Linear regression analysis yielded the following: ADVIA Centaur = 1.41(Roche Modular E170) − 16.2; R = 0.982. The addition of exogenous biotin (0, 10, 25, 50, 100, 150, and 200 µg/L) to the three plasma pools resulted in a decrease of iPTH determined on the Roche Modular E170 analyzer (percent recoveries: 100, 99, 95, 91, 76, 51, and 40%, respectively); however, the percent recoveries were unchanged for iPTH measured on the ADVIA Centaur analyzer (100, 97, 98, 100, 102, 103, and 102%, respectively).Conclusion: The ADVIA Centaur iPTH and Roche Modular E170 iPTH assays showed good correlation in predialysis patients with ESRD despite between-method differences in iPTH concentrations. An in vitro interference study showed that the ADVIA Centaur iPTH assay was unaffected by high concentration of biotin, whereas the Roche Modular E170 iPTH assay was affected, especially at higher biotin concentrations.
A-204Assessment of full thyroid profile in pediatric primary care focusing on the use of serum thyrotropin and free thyroxine only. Less is more?
V. Zaidman, J. Lazzati, M. Maceiras, V. Herzovich, A. Belgorosky, E. A. Chaler. Hospital de Pediatría Garrahan, Buenos Aires, Argentina
Background: It has been widely accepted that the major changes in thyroid function in adult subjects may initially be studied with the assessment of serum thyrotropin (TSH) and free thyroxine (fT4) only; however, there is little evidence whether the same criteria can be used in the pediatric population. Objective: The aim of this study was to describe the distribution of results obtained and subsequent medical management in a pediatric population assessing serum full thyroid profile focusing on serum TSH and fT4 only.Methods: We retrospectively analyzed consecutive patients in whom thyroid function was studied with a full thyroid test seen between November 2014 and September 2015. Samples were tested on the day at the same laboratory. We excluded those subjects who were not seen by a physician after the studies, those who were treated with levothyroxine, methimazole, or antiepileptic drugs, and seriously ill patients. The remaining 5739 subjects were categorized according to age from one week to 12 years. TSH, T3, and fT4 were measured with Architect i4000 (Abbott) and total T4 IMMULITE 2000 (Siemens).Results: Subjects with serum TSH and fT4 within the reference interval (RI) according to age were selected (n = 4008, 69.83% of total). From this group, children who had T3 and/or T4 outside the RI were selected (n = 391, 9.75%). For both analytes, 9.75% of healthy subjects is statistically expected to be found outside the RI ((0.95)2). In the clinical chart (CC) of 381 patients (97.4%) no comment was made on thyroid function or the thyroid profile was reported to be normal, in spite of T3 and/or T4 being outside the RI; maybe because in all cases T3 and/or T4 were within the reference change value (RCV) on the limits of the RI. In 10 patients (2.6%) a comment was made in the CC; five patients were sent home without further interventions, in one patient with high T3 and T4 high serum levels of Thyroxine-Binding Globulin were found, and four were finally treated with levothyroxine. All of them had T4 and fT4 at the 10th percentile of the RI and two additionally had TSH above the 90th percentile of the RI.Conclusion: Of the study population, 69.83% presented with normal TSH and fT4 levels. Of these patients, 9.75% had T3 and/or T4 outside the RI, which is statistically acceptable for a normal population. As to the 10 patients that had some comment in their CC regarding test results, only four were put on treatment, and all had fT4 below the 10th percentile and two had TSH above the 90th percentile as well. Screening of serum TSH and fT4 only may be useful in children tested to rule out thyroid disease. It is recommended to assess fT4 and TSH results with a stricter RI with a range between the 10th and 90th percentile considered acceptable. A prospective study in a pediatric population would be necessary to clinically confirm these results as well as the subsequent medical management.
A-205Plasma calcitonin: maintaining assay harmonisation following method transfer
X. Hong, J. Ellis. Canterbury Health Laboratories, Christchurch, New Zealand
Background: Plasma calcitonin is known to be an unstable analyte and vulnerable to repeated freeze-thaw cycles, incurring risk of sample rejection through thawing in transit when sent to another centre. We therefore undertook a method comparison between the Siemens Immulite method employed at the referral centre and the Roche platform, with a view to enable processing within our own laboratory. Roche Elecsys/Cobas and Siemens Immulite are both two site immunometric assays that measure the mature 32 amino acid monomer of calcitonin. Both methods are calibrated to WHO 89/620 and with similar sample requirements. Objective: To compare calcitonin measurement by the Roche and Siemens assays and examine the clinical concordance of results. To examine the effect of freeze-thaw cycles on calcitonin measurement. Methods: Clinical specimens (n=47) were exchanged between the two laboratories (June 2013 to December 2014). All samples were stored and transported frozen. Three patient samples with different calcitonin levels were run 10 times (9 times for one sample as it was insufficient for the tenth run) on the same day to assess within run imprecision. Another 3 samples with different levels of plasma calcitonin were analysed over 15 days to test for between run imprecision. Three different samples with high calcitonin levels were diluted serially to test for assay linearity. To justify the validity of including twice thawed samples in the method comparison, 9 samples that
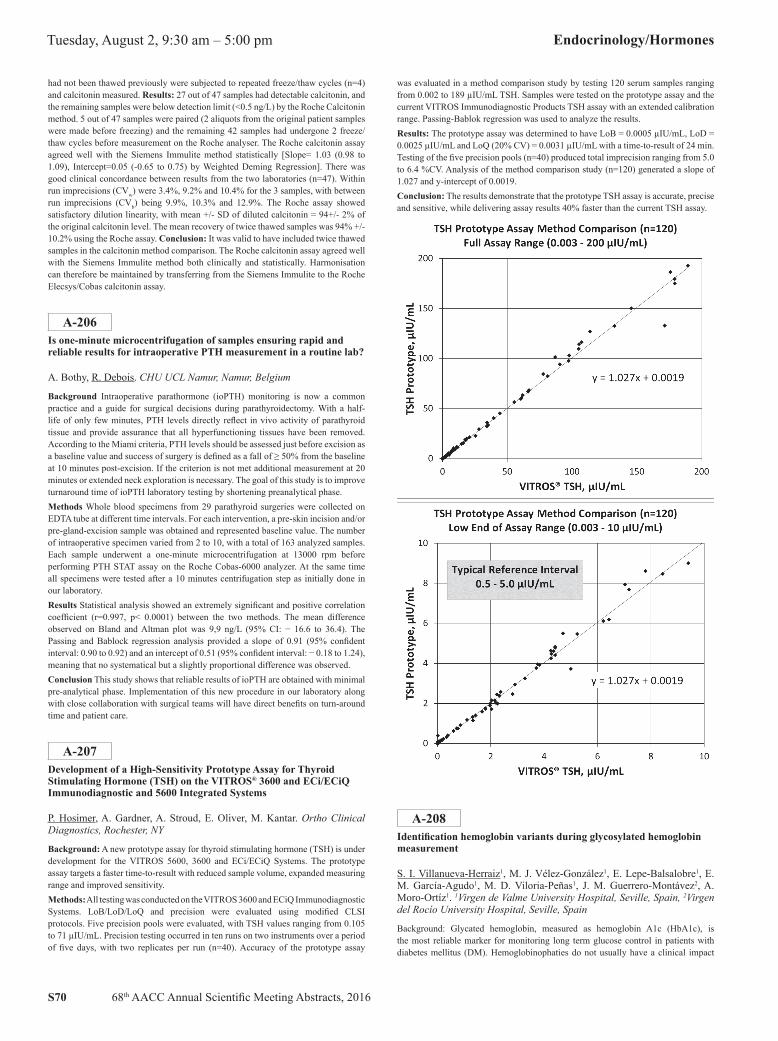
S70 68th AACC Annual Scientific Meeting Abstracts, 2016
Tuesday, August 2, 9:30 am – 5:00 pm Endocrinology/Hormones
had not been thawed previously were subjected to repeated freeze/thaw cycles (n=4) and calcitonin measured. Results: 27 out of 47 samples had detectable calcitonin, and the remaining samples were below detection limit (<0.5 ng/L) by the Roche Calcitonin method. 5 out of 47 samples were paired (2 aliquots from the original patient samples were made before freezing) and the remaining 42 samples had undergone 2 freeze/thaw cycles before measurement on the Roche analyser. The Roche calcitonin assay agreed well with the Siemens Immulite method statistically [Slope= 1.03 (0.98 to 1.09), Intercept=0.05 (-0.65 to 0.75) by Weighted Deming Regression]. There was good clinical concordance between results from the two laboratories (n=47). Within run imprecisions (CVw) were 3.4%, 9.2% and 10.4% for the 3 samples, with between run imprecisions (CVb) being 9.9%, 10.3% and 12.9%. The Roche assay showed satisfactory dilution linearity, with mean +/- SD of diluted calcitonin = 94+/- 2% of the original calcitonin level. The mean recovery of twice thawed samples was 94% +/- 10.2% using the Roche assay. Conclusion: It was valid to have included twice thawed samples in the calcitonin method comparison. The Roche calcitonin assay agreed well with the Siemens Immulite method both clinically and statistically. Harmonisation can therefore be maintained by transferring from the Siemens Immulite to the Roche Elecsys/Cobas calcitonin assay.
A-206Is one-minute microcentrifugation of samples ensuring rapid and reliable results for intraoperative PTH measurement in a routine lab?
A. Bothy, R. Debois. CHU UCL Namur, Namur, Belgium
Background Intraoperative parathormone (ioPTH) monitoring is now a common practice and a guide for surgical decisions during parathyroidectomy. With a half-life of only few minutes, PTH levels directly reflect in vivo activity of parathyroid tissue and provide assurance that all hyperfunctioning tissues have been removed. According to the Miami criteria, PTH levels should be assessed just before excision as a baseline value and success of surgery is defined as a fall of ≥ 50% from the baseline at 10 minutes post-excision. If the criterion is not met additional measurement at 20 minutes or extended neck exploration is necessary. The goal of this study is to improve turnaround time of ioPTH laboratory testing by shortening preanalytical phase.Methods Whole blood specimens from 29 parathyroid surgeries were collected on EDTA tube at different time intervals. For each intervention, a pre-skin incision and/or pre-gland-excision sample was obtained and represented baseline value. The number of intraoperative specimen varied from 2 to 10, with a total of 163 analyzed samples. Each sample underwent a one-minute microcentrifugation at 13000 rpm before performing PTH STAT assay on the Roche Cobas-6000 analyzer. At the same time all specimens were tested after a 10 minutes centrifugation step as initially done in our laboratory.Results Statistical analysis showed an extremely significant and positive correlation coefficient (r=0.997, p< 0.0001) between the two methods. The mean difference observed on Bland and Altman plot was 9,9 ng/L (95% CI: − 16.6 to 36.4). The Passing and Bablock regression analysis provided a slope of 0.91 (95% confident interval: 0.90 to 0.92) and an intercept of 0.51 (95% confident interval: − 0.18 to 1.24), meaning that no systematical but a slightly proportional difference was observed.Conclusion This study shows that reliable results of ioPTH are obtained with minimal pre-analytical phase. Implementation of this new procedure in our laboratory along with close collaboration with surgical teams will have direct benefits on turn-around time and patient care.
A-207Development of a High-Sensitivity Prototype Assay for Thyroid Stimulating Hormone (TSH) on the VITROS® 3600 and ECi/ECiQ Immunodiagnostic and 5600 Integrated Systems
P. Hosimer, A. Gardner, A. Stroud, E. Oliver, M. Kantar. Ortho Clinical Diagnostics, Rochester, NY
Background: A new prototype assay for thyroid stimulating hormone (TSH) is under development for the VITROS 5600, 3600 and ECi/ECiQ Systems. The prototype assay targets a faster time-to-result with reduced sample volume, expanded measuring range and improved sensitivity.Methods: All testing was conducted on the VITROS 3600 and ECiQ Immunodiagnostic Systems. LoB/LoD/LoQ and precision were evaluated using modified CLSI protocols. Five precision pools were evaluated, with TSH values ranging from 0.105 to 71 µIU/mL. Precision testing occurred in ten runs on two instruments over a period of five days, with two replicates per run (n=40). Accuracy of the prototype assay
was evaluated in a method comparison study by testing 120 serum samples ranging from 0.002 to 189 µIU/mL TSH. Samples were tested on the prototype assay and the current VITROS Immunodiagnostic Products TSH assay with an extended calibration range. Passing-Bablok regression was used to analyze the results.Results: The prototype assay was determined to have LoB = 0.0005 µIU/mL, LoD = 0.0025 µIU/mL and LoQ (20% CV) = 0.0031 µIU/mL with a time-to-result of 24 min. Testing of the five precision pools (n=40) produced total imprecision ranging from 5.0 to 6.4 %CV. Analysis of the method comparison study (n=120) generated a slope of 1.027 and y-intercept of 0.0019.Conclusion: The results demonstrate that the prototype TSH assay is accurate, precise and sensitive, while delivering assay results 40% faster than the current TSH assay.
A-208Identification hemoglobin variants during glycosylated hemoglobin measurement
S. I. Villanueva-Herraiz1, M. J. Vélez-González1, E. Lepe-Balsalobre1, E. M. García-Agudo1, M. D. Viloria-Peñas1, J. M. Guerrero-Montávez2, A. Moro-Ortíz1. 1Virgen de Valme University Hospital, Seville, Spain, 2Virgen del Rocío University Hospital, Seville, Spain
Background: Glycated hemoglobin, measured as hemoglobin A1c (HbA1c), is the most reliable marker for monitoring long term glucose control in patients with diabetes mellitus (DM). Hemoglobinophaties do not usually have a clinical impact
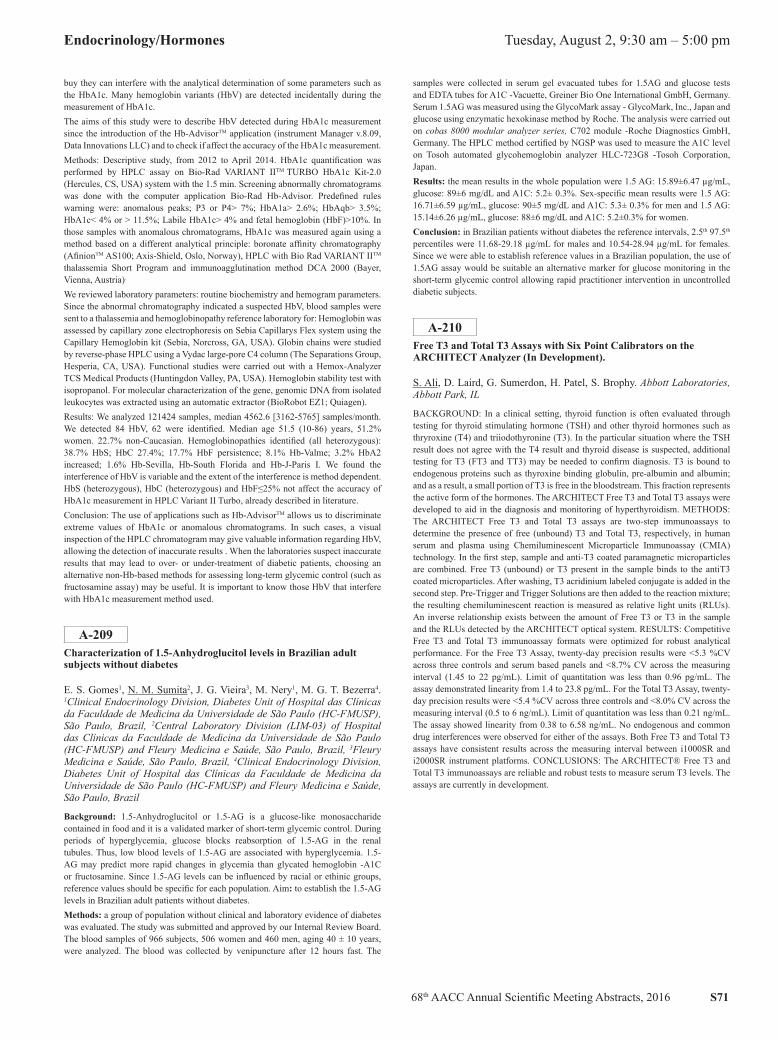
68th AACC Annual Scientific Meeting Abstracts, 2016 S71
Endocrinology/Hormones Tuesday, August 2, 9:30 am – 5:00 pm
buy they can interfere with the analytical determination of some parameters such as the HbA1c. Many hemoglobin variants (HbV) are detected incidentally during the measurement of HbA1c.The aims of this study were to describe HbV detected during HbA1c measurement since the introduction of the Hb-AdvisorTM application (instrument Manager v.8.09, Data Innovations LLC) and to check if affect the accuracy of the HbA1c measurement.Methods: Descriptive study, from 2012 to April 2014. HbA1c quantification was performed by HPLC assay on Bio-Rad VARIANT IITM TURBO HbA1c Kit-2.0 (Hercules, CS, USA) system with the 1.5 min. Screening abnormally chromatograms was done with the computer application Bio-Rad Hb-Advisor. Predefined rules warning were: anomalous peaks; P3 or P4> 7%; HbA1a> 2.6%; HbAqb> 3.5%; HbA1c< 4% or > 11.5%; Labile HbA1c> 4% and fetal hemoglobin (HbF)>10%. In those samples with anomalous chromatograms, HbA1c was measured again using a method based on a different analytical principle: boronate affinity chromatography (AfinionTM AS100; Axis-Shield, Oslo, Norway), HPLC with Bio Rad VARIANT IITM thalassemia Short Program and immunoagglutination method DCA 2000 (Bayer, Vienna, Austria).
We reviewed laboratory parameters: routine biochemistry and hemogram parameters. Since the abnormal chromatography indicated a suspected HbV, blood samples were sent to a thalassemia and hemoglobinopathy reference laboratory for: Hemoglobin was assessed by capillary zone electrophoresis on Sebia Capillarys Flex system using the Capillary Hemoglobin kit (Sebia, Norcross, GA, USA). Globin chains were studied by reverse-phase HPLC using a Vydac large-pore C4 column (The Separations Group, Hesperia, CA, USA). Functional studies were carried out with a Hemox-Analyzer TCS Medical Products (Huntingdon Valley, PA, USA). Hemoglobin stability test with isopropanol. For molecular characterization of the gene, genomic DNA from isolated leukocytes was extracted using an automatic extractor (BioRobot EZ1; Quiagen).Results: We analyzed 121424 samples, median 4562.6 [3162-5765] samples/month. We detected 84 HbV, 62 were identified. Median age 51.5 (10-86) years, 51.2% women. 22.7% non-Caucasian. Hemoglobinopathies identified (all heterozygous): 38.7% HbS; HbC 27.4%; 17.7% HbF persistence; 8.1% Hb-Valme; 3.2% HbA2 increased; 1.6% Hb-Sevilla, Hb-South Florida and Hb-J-Paris I. We found the interference of HbV is variable and the extent of the interference is method dependent. HbS (heterozygous), HbC (heterozygous) and HbF≤25% not affect the accuracy of HbA1c measurement in HPLC Variant II Turbo, already described in literature.Conclusion: The use of applications such as Hb-AdvisorTM allows us to discriminate extreme values of HbA1c or anomalous chromatograms. In such cases, a visual inspection of the HPLC chromatogram may give valuable information regarding HbV, allowing the detection of inaccurate results . When the laboratories suspect inaccurate results that may lead to over- or under-treatment of diabetic patients, choosing an alternative non-Hb-based methods for assessing long-term glycemic control (such as fructosamine assay) may be useful. It is important to know those HbV that interfere with HbA1c measurement method used.
A-209Characterization of 1.5-Anhydroglucitol levels in Brazilian adult subjects without diabetes
E. S. Gomes1, N. M. Sumita2, J. G. Vieira3, M. Nery1, M. G. T. Bezerra4. 1Clinical Endocrinology Division, Diabetes Unit of Hospital das Clínicas da Faculdade de Medicina da Universidade de São Paulo (HC-FMUSP), São Paulo, Brazil, 2Central Laboratory Division (LIM-03) of Hospital das Clínicas da Faculdade de Medicina da Universidade de São Paulo (HC-FMUSP) and Fleury Medicina e Saúde, São Paulo, Brazil, 3Fleury Medicina e Saúde, São Paulo, Brazil, 4Clinical Endocrinology Division, Diabetes Unit of Hospital das Clínicas da Faculdade de Medicina da Universidade de São Paulo (HC-FMUSP) and Fleury Medicina e Saúde, São Paulo, Brazil
Background: 1.5-Anhydroglucitol or 1.5-AG is a glucose-like monosaccharide contained in food and it is a validated marker of short-term glycemic control. During periods of hyperglycemia, glucose blocks reabsorption of 1.5-AG in the renal tubules. Thus, low blood levels of 1.5-AG are associated with hyperglycemia. 1.5-AG may predict more rapid changes in glycemia than glycated hemoglobin -A1C or fructosamine. Since 1.5-AG levels can be influenced by racial or ethinic groups, reference values should be specific for each population. Aim: to establish the 1.5-AG levels in Brazilian adult patients without diabetes.Methods: a group of population without clinical and laboratory evidence of diabetes was evaluated. The study was submitted and approved by our Internal Review Board. The blood samples of 966 subjects, 506 women and 460 men, aging 40 ± 10 years, were analyzed. The blood was collected by venipuncture after 12 hours fast. The
samples were collected in serum gel evacuated tubes for 1.5AG and glucose tests and EDTA tubes for A1C -Vacuette, Greiner Bio One International GmbH, Germany. Serum 1.5AG was measured using the GlycoMark assay - GlycoMark, Inc., Japan and glucose using enzymatic hexokinase method by Roche. The analysis were carried out on cobas 8000 modular analyzer series, C702 module -Roche Diagnostics GmbH, Germany. The HPLC method certified by NGSP was used to measure the A1C level on Tosoh automated glycohemoglobin analyzer HLC-723G8 -Tosoh Corporation, Japan.Results: the mean results in the whole population were 1.5 AG: 15.89±6.47 µg/mL, glucose: 89±6 mg/dL and A1C: 5.2± 0.3%. Sex-specific mean results were 1.5 AG: 16.71±6.59 µg/mL, glucose: 90±5 mg/dL and A1C: 5.3± 0.3% for men and 1.5 AG: 15.14±6.26 µg/mL, glucose: 88±6 mg/dL and A1C: 5.2±0.3% for women.Conclusion: in Brazilian patients without diabetes the reference intervals, 2.5th 97.5th percentiles were 11.68-29.18 µg/mL for males and 10.54-28.94 µg/mL for females. Since we were able to establish reference values in a Brazilian population, the use of 1.5AG assay would be suitable an alternative marker for glucose monitoring in the short-term glycemic control allowing rapid practitioner intervention in uncontrolled diabetic subjects.
A-210Free T3 and Total T3 Assays with Six Point Calibrators on the ARCHITECT Analyzer (In Development).
S. Ali, D. Laird, G. Sumerdon, H. Patel, S. Brophy. Abbott Laboratories, Abbott Park, IL
BACKGROUND: In a clinical setting, thyroid function is often evaluated through testing for thyroid stimulating hormone (TSH) and other thyroid hormones such as thryroxine (T4) and triiodothyronine (T3). In the particular situation where the TSH result does not agree with the T4 result and thyroid disease is suspected, additional testing for T3 (FT3 and TT3) may be needed to confirm diagnosis. T3 is bound to endogenous proteins such as thyroxine binding globulin, pre-albumin and albumin; and as a result, a small portion of T3 is free in the bloodstream. This fraction represents the active form of the hormones. The ARCHITECT Free T3 and Total T3 assays were developed to aid in the diagnosis and monitoring of hyperthyroidism. METHODS: The ARCHITECT Free T3 and Total T3 assays are two-step immunoassays to determine the presence of free (unbound) T3 and Total T3, respectively, in human serum and plasma using Chemiluminescent Microparticle Immunoassay (CMIA) technology. In the first step, sample and anti-T3 coated paramagnetic microparticles are combined. Free T3 (unbound) or T3 present in the sample binds to the antiT3 coated microparticles. After washing, T3 acridinium labeled conjugate is added in the second step. Pre-Trigger and Trigger Solutions are then added to the reaction mixture; the resulting chemiluminescent reaction is measured as relative light units (RLUs). An inverse relationship exists between the amount of Free T3 or T3 in the sample and the RLUs detected by the ARCHITECT optical system. RESULTS: Competitive Free T3 and Total T3 immunoassay formats were optimized for robust analytical performance. For the Free T3 Assay, twenty-day precision results were <5.3 %CV across three controls and serum based panels and <8.7% CV across the measuring interval (1.45 to 22 pg/mL). Limit of quantitation was less than 0.96 pg/mL. The assay demonstrated linearity from 1.4 to 23.8 pg/mL. For the Total T3 Assay, twenty-day precision results were <5.4 %CV across three controls and <8.0% CV across the measuring interval (0.5 to 6 ng/mL). Limit of quantitation was less than 0.21 ng/mL. The assay showed linearity from 0.38 to 6.58 ng/mL. No endogenous and common drug interferences were observed for either of the assays. Both Free T3 and Total T3 assays have consistent results across the measuring interval between i1000SR and i2000SR instrument platforms. CONCLUSIONS: The ARCHITECT® Free T3 and Total T3 immunoassays are reliable and robust tests to measure serum T3 levels. The assays are currently in development.
S72 68th AACC Annual Scientific Meeting Abstracts, 2016
Tuesday, August 2, 9:30 am – 5:00 pm Endocrinology/Hormones
A-211Elecsys® AMH immunoassay: Evaluation of the novel assay’s precision under routine conditions
A. Algeciras-Schminich1, A. D. Pierce2, M. A. Lessig2, D. Pardue3, R. E. Ostlund4. 1Clinical Immunoassay Laboratory, Laboratory Medicine and Pathology, Mayo Clinic, Rochester, MN, 2Nationwide Laboratory Services, Fort Lauderdale, FL, 3Roche Diagnostics Operations, Indianapolis, IN, 4Division of Endocrinology, Metabolism and Lipid Research, Washington University, St Louis, MO
Background: Measurement of ovarian reserve levels plays a key role in predicting treatment response to controlled ovarian stimulation (COS) in assisted reproductive therapy. Anti-Müllerian Hormone (AMH), released from ovarian granulosa cells leading to serum levels proportional to the number of developing follicles in the ovaries, is a promising marker for assessing the ovarian reserve and optimizing in vitro fertilization treatments. Currently available manual AMH assays exhibit limitations with respect to run time and reliability of results. The Elecsys® AMH assay is a fully automated sandwich electrochemiluminescence immunoassay for the in vitro quantitative determination of AMH in human serum and lithium heparin plasma. The aim of this study was to evaluate the technical performance of this immunoassay in terms of precision under routine conditions.Methods: Three laboratories in the United States evaluated the reproducibility performance of the assay according to CLSI EP-15-A2 guidelines using a cobas e 411 analyzer. Precision experiments were performed with Human Serum Pools (HSP) generated using human serum from postmenopausal women (BIOMEX GmbH), known to contain very low levels of AMH. Tested AMH concentrations, covering major parts of the measuring range (0.2-20 ng/ml [1.4-143 pmol/L]) were obtained by adding fetal bovine serum with high levels of AMH to these pools. Subsequently, the pools were aliquoted and stored frozen until measurement at the respective sites. In total, the analyzed imprecision pool consisted of five HSPs (HSP 01-05) and two PreciControl AMH samples (PC01=1.0 ng/ml [7.14 pmol/L] and PC02=5.0 ng/ml [35.7 pmol/L]). The sample pools were tested in replicates of three in one run per day for five days.Variance component analysis was calculated for the reproducibility experiment according to CLSI-EP15-A2 using ANOVA Type 1 approach for unbalanced data. The two-sided 95% confidence intervals (CI) for reproducibility coefficients of variance (CVs) were calculated using a chi-square-based approach to construct CIs which relied on the original Satterthwaite approximation for degrees of freedom. Measurements were captured using the WinCAEv software and the statistical analysis conducted using R Version 3.0.1. Validation of the reproducibility dataset and results were performed using SAS Version 9.3.Results: For the reproducibility experiments, the CVs (95% CI) were shown to be <5.5% across all three sites (HSP01 3.99% [2.68-7.77], HSP02 4.05% [2.79-7.42], HSP03 3.45% [2.33-6.66], HSP04 4.62% [3.01-9.80], HSP05 4.38% [2.94-8.48], PC01 5.24% [3.46-10.69] and PC02 4.70% [3.18-8.91]. The CVs for repeatability were all <2% (HSP01 1.58% [1.34-1.92], HSP02 1.74% [1.48-2.12], HSP03 1.41% [1.19-1.71], HSP04 1.69% [1.44-2.06], HSP05 1.69% [1.43-2.06], PC01 1.42% [1.21-1.73] and PC02 1.89% [1.60-2.30]).Conclusion: The fully automated Elecsys AMH immunoassay run on the cobas e 411 under routine conditions demonstrated very good precision performance in the concentration range of 0.2-20 ng/mL (1.4-143 pmol/L). Consequently, the availability of this immunoassay will represent a fast and reliable alternative to conventionally used manual methods for AMH testing.Disclaimer: This product is not cleared or approved for use in the USA.
A-212Monitoring of the standardization and harmonization status of FT4 and TSH assays by use of patient medians.
L. A. De Grande1, K. Goossens1, K. Van Uytfanghe2, L. M. Thienpont3. 1Department of Pharmaceutical Analysis, Ghent University, Ghent, Belgium, 2Ref4U, Laboratory of Toxicology, Faculty of Pharmaceutical Sciences, Ghent University, Ghent, Belgium, 3Thienpont & Stöckl Wissenschaftliches Consulting GbR, Rennertshofen, Germany
Background: For the diagnosis of thyroid dysfunction clinicians rely in first instance on TSH and FT4 testing. However, the lack of comparability between assays is an issue for patient safety. Therefore, the IFCC Committee for Standardization of Thyroid Function Tests (C-STFT) is involved in standardization/ harmonization efforts. Once assay recalibration to generate comparable results will be accomplished,
the C-STFT will be challenged to monitor sustainability of this status. We believe this will be possible by applying our recently developed Percentiler and Flagger. They are intended to serve as quality indicator for stability of performance (Percentiler) and flagging rate (Flagger). Although the recalibration of FT4 and TSH assays is not yet completed, we considered it worth to start applying the tools in the pre-implementation phase, because it would allow us to timely recruit participants and build experience.Methods: For the Percentiler, laboratories calculate and electronically send us instrument-specific daily medians from outpatient results. For the Flagger, daily flagging rates (% hypo and hyper) are reported. We developed software and user interfaces to plot the course of the instrument-specific moving medians (Percentiler) and flagging rates (Flagger) in comparison to instrument-based peer group medians. Laboratories have access via a lab-specific password. They see their own plots and data, including their long term median(s) in comparison to the peer group. Laboratories can visually infer whether the performance of their instruments and of their peer is stable, i.e., when the moving medians remain between desirable bias limits proposed by us. For the Percentiler, these are guided by biological variation and state-of-the-art performance, i.e., ±3.3% for FT4 and ±7.7% for TSH, respectively. For the Flagger, the limits are preliminary set at ±30% of the long-term flagging rate.Results: In the Percentiler, we currently have 77 participants with 147 instruments, from which we distinguish 4 peer groups (n >15); in the Flagger, only 29 laboratories with 38 instruments participate. From our short time experience we see already that for FT4 and TSH the moving medians are more variable than for clinical chemistry analytes; in spite of this, most laboratories have satisfactory stability of performance. Nevertheless, we sometimes observe significant shifts due to lot changes, differences between instruments, drifts or saw-tooth patterns due to reagent instability. Since we group laboratories according to instrument peer, we can also monitor/compare the stability of instruments. We also see the interplaying effect between the Percentiler and Flagger, i.e., an increase of the median values in the Percentiler results in a decrease of the %-hypo and increase of the %-hyper in the Flagger, and vice versa.Conclusion: By starting to use the Percentiler and Flagger applications for the C-STFT, we showed their utility for monitoring the stability of FT4 and TSH performance in laboratories and instruments and the effect of instability on the flagging rate. This gives evidence that the tools will also be useful to document the sustainability of the post-standardization/harmonization status. Nonetheless, we need to recruit more participants, so that all instruments participating in the C-STFT activities are represented.
A-213Establishing reference intervals for hCG in postmenopausal women
K. Patel, A. Qavi, K. Hock, A. Gronowski. Washington University, Saint Louis, MO
Background: Human chorionic gonadotropin (hCG) screening tests are performed in nearly all female patients prior to any medical intervention regardless of age. Plasma hCG concentrations have been shown to increase with age due to pituitary secretion, resulting in positive hCG in the absence of pregnancy. We previously recommended that an hCG cutoff of 14.0 IU/L be used for women >55 years of age. However, it remains unknown whether concentrations greater than 14.0 IU/L can be expected in women with advanced age. Additionally, the relationship between FSH and hCG has not been examined in postmenopausal women. Our objectives were to establish serum hCG reference intervals and correlate FSH and hCG concentrations in non-pregnant postmenopausal females age >55 years.METHODS: A total of 796 residual plasma samples from women >55 years were collected with 303, 269, and 224 samples belonging to the age groups 55-69, 70-84, and >85 years, respectively. FSH and hCG were measured using the Abbott Architect. Patients with FSH <8.0 IU/L were assumed to be on hormone replacement therapy and were excluded. All positive hCG samples were analyzed for heterophile antibody interference and 3 were excluded. Patient chart review was performed for each positive hCG sample. 4 were excluded due to malignancy.RESULTS: 10% (67/676) of women age >55 years had plasma hCG >5 IU/L. There were 22, 21, and 24 patients with hCG >5 IU/L in the age groups 55-69, 70-84, and >85 years, respectively. The hCG concentrations observed in each age group were as follows: 55-69 years maximum =12.4 IU/L and 97th percentile = 11.7 IU/L; 70-84 years maximum = 18.09 IU/L, 97th percentile = 9.12 IU/L, and >85 years maximum = 11.1 IU/L and 97th percentile = 10.9 IU/L. We found no correlation between hCG and FSH concentrations. Additionally, hCG concentrations did not continue to increase with age over 55 years.CONCLUSIONS: In women>55 years of age, plasma FSH concentrations do not predict hCG concentrations and age-specific reference intervals are not needed beyond 55 years. This study confirms that our previously recommended cutoff of 14 IU/L should be used for women >55 years of age.
68th AACC Annual Scientific Meeting Abstracts, 2016 S73
Endocrinology/Hormones Tuesday, August 2, 9:30 am – 5:00 pm
A-214Total Vitamin D or bio available vitamin D?
M. YAGCI, N. EREN, S. CIGERLİ, G. CELEBİ, B. KURAN. Sişli Etfal Trainig and Research Hospital, İstanbul, Turkey
Background: Prior studies showed conflicting results regarding the association between 25hydroxyvitamin D (25(OH)D) levels and bone health. Clinical assessment of vitamin D status often relies on measuring total circulating 25hydroxyvitamin D, but much of each vitamin D metabolite is bound to plasma vitamin D-binding protein (VDBP), such that the percentage of free vitamin is very low. According to the ‘ free hormone hypothesis ’ only the free form is biologically active. Our first goal was to determine whether the free and bio available 25(OH)D, associates more strongly with BMD (Bone mineral density), calcium and PTH than levels of total 25(OH)D. We used three different way to measured to free 25hydroxyvitamin D. First two way, calculated from total 25(OH)D, DBP, and serum albumin levels which we called in this subject Bikle method and Vermeulen method. The third way was direct quantitation of circulating free 25 hydroxyvitamin D (25(OH)D)levels with Elisa method, which has recently become available.Our second goal was to compare direct quantitation of circulating free 25 hydroxyvitamin D (25(OH)D)levels to calculated free 25(OH)D levels in and their relationships to intact PTH (iPTH) and bone health, a biomarker of 25(OH)D effect in postmenopausal healthy womenMethods:96 healthy postmenopausal women, who come for screening BMD and didn’t use vitamin supplements, were evaluated in this study. Lumbar spine, neck of femur and total femur BMD was measured in all subjects using dual-energy X ray absorptiometry. Clinical, diet, and laboratory information also was gathered at this time. Associations with demographic factors and measures of vitamin d forms and BMD results were examined. “Vitamin D binding protein” and “direct quantitation of circulating free 25hydroxyvitamin D” was measured from stored serum samples. We determined free and bio available (free + albumin bound) 25(OH)D using previously validated formulas(named Bikle and Vermeulen) and using “direct quantitation elisa method of free 25 hydroxyvitamin D” Results: Calculated free 25(OH)D levels varied considerably from direct measurements of free 25(OH)D with discrepancies. In univariate regression analysis, bio available (calculated) and total 25(OH)D all together, was significantly associated with parathyroid hormone levels but direct quantitation form of free vitamin d wasnt.(p=0,001, 0,003) BMD was not associated with total 25(OH)D levels. But bio available 25(OH)D (only calculated form) levels remained independently associated with femur total BMD in backward method regression models adjusting for age, body mass index (p=0,040). Conclusion: Using the free and bio available forms of 25(OH) D doesnt noticeably informative on vitamin D status than total 25(OH)D. But this subject concluded that free and bio available 25(OH)D (not direct form) are more strongly correlated with BMD than total 25(OH)D. So future studies should continue to explore the relationship between free and bio available 25(OH)D and health outcomes. Further evaluation of directly measured free 25(OH)D levels to determine its role in research and clinical management of patients is needed.We think about vitamin d, have to clarify true indicator of vitamin D measurement, firstly start from “how little do we know” and “what we dont know” questions
A-215Use of liquid chromatography/tandem mass spectrometry to assess diurnal effects of steroids and neurosteroids
K. J. Welsh1, B. R. Stolze1, L. S. Masika1, K. Nayak2, M. Sigdel2, J. Jonklaas2, S. J. Soldin1. 1National Institutes of Health, Bethesda, MD, 2Georgetown University, Washington, DC
Background: Alterations of the hypothalamic-pituitary-adrenal system are reported in a number of conditions. Diurnal variation has been demonstrated for cortisol and a number of steroids using liquid chromatography-tandem mass spectrometry (LC-MSMS) with significantly higher circulating levels in the morning, indicating the need to develop time-specific reference intervals. Neurosteroids are a class of steroids with central nervous system modulation activity. The neurosteroids allopregnanolone, dehydroepiandrosterone (DHEA), tetrahydro-11-deoxycortisol, and tetrahydro-11-deoxycorticosterone are key mediators of the stress response and are linked to several neurologic, endocrine, and psychiatric disorders; however, diurnal variation of these neurosteroids and reference intervals have not been previously evaluated. Our aim is to develop reference intervals for LC-MSMS measurement of a steroid profile and neurosteroids, and assess if diurnal variation could also be observed in neurosteroids.Methods: Early morning serum samples were collected between 6:00 am to 8:00 am, and evening serum samples between 6:00 pm to 8:00 pm from 24 healthy volunteers.
Study volunteers were generally healthy with no current or past major illnesses. LC-MSMS was used to measure a steroid profile that includes androstenedione, cortisol, corticosterone, cortisone, 11-deoxycortisol, 17-α-hydroxyprogesterone, and testosterone. The neurosteroids allopregnanolone, DHEA, tetrahydro-11-deoxycortisol, and tetrahydro-11-deoxycorticosterone were also measured. The paired sample Wilcoxon test was used to compare differences between morning and evening values.Results: The median values and 2.5th - 97.5th percentiles for morning and evening steroid levels are shown in Table 1. Statistically significant differences were observed between morning and evening values for all steroids and the neurosteroid DHEA. The neurosteroids allopregnanolone, tetrahydro-11-deoxycortisol, and tetrahydro-11-deoxycorticosterone were undetectable in most of the normal volunteers.Conclusions: Time-specific reference intervals are essential to evaluate the clinical relevance of steroid profiles and the neurosteroid DHEA.Table 1. Morning and evening steroid profiles measured by LC-MSMS. Data shown are the median (2.5th - 97.5th percentile).
Morning Evening p-value
Androstenedione, ng/dL 66.5 (33.8 – 188.0) 46.5 (28.2 – 186.1) 0.0005
Cortisol, ng/dL 12.0 (6.5 – 20.8) 3.95 (1.8 – 11.1) <0.0001
Corticosterone, ng/mL 1.41 (0.46 – 5.0) 0.45 (0.1 – 1.6) 0.0001
Cortisone, ng/mL 20.9 (11.9 – 29.9) 8.1 (3.9 – 23.9) <0.0001
DHEA, ng/dL 239.0 (61.3 – 693.0) 191.0 (43.0 – 438.4) 0.002
11-deoxycortisol, ng/dL 39.0 (0.6 – 112.3) 11.6 (0.0 – 59.4) 0.0012
17-α-hydroxyprogesterone, ng/dL 29.8 (1.1 – 158.2) 11.5 (0.0 – 154.9) 0.0006
A-216Comparison of HbA1c values from the Alere Afinion and Tosoh G8 HbA1c Analyzers Before and After Tosoh Assay Recalibration
A. M. Ferguson, D. Burford, T. Johnson, L. Vargas, L. Stokes, B. Heimberger, U. Garg. Children’s Mercy Hospitals and Clinics, Kansas Ctiy, MO
Background: Analysis of hemoglobin A1c (HbA1c) is a cornerstone in the management of patients with diabetes. Although Point-of-Care (POC) HbA1c devices are not recommended for use in the diagnosis of diabetes, they are used frequently in physician offices and clinics to monitor the glycemic control of patients. An added benefit of POC analyzers is the rapid analysis time, which allows clinicians to give a result to the patient during the office visit and counsel the patient based on that result. Our institution uses two methodologies for measuring HbA1c: a HPLC method (Tosoh G8) in the laboratory and a POC boronate affinity method (Alere Afinion) at satellite locations. It is not uncommon for diabetic patients in our hospital system to be seen at different clinic locations and have HbA1c testing done by both methods. All methods for measuring HbA1c undergo an accuracy based evaluation with comparison to National Glycohemoglobin Standardization Program (NGSP) reference methods. Historically, when the results of the Tosoh peer group had been compared to the reference method in College of American Pathologists (CAP) surveys, the results had been consistently higher than the reference method. In response to customer concerns, in 2015 the manufacturer recalibrated the Tosoh assay to bring HbA1c values closer to the reference method. In contrast, the Afinion assay has been shown to have a negative bias compared to reference methods when measuring HbA1c values greater than 8%. As many of our patients have HbA1c values above 8% and could have measurements performed by both instruments, we wanted to compare values from both methods before and after the Tosoh recalibration. Methods: Analysis of data from comparison studies of HbA1c results assayed by the Afinion and the Tosoh before and after recalibration in 2015. Pre-recalibration data included initial validation and method comparison studies between the Tosoh G8 and the Alere Afinion HbA1c analyzers. Post-recalibration data was gathered from method comparison studies performed on new lots of Afinion cartridges. Results: Initial method comparison studies showed that results from the Afinion had a negative bias when compared to the Tosoh (y=0.9531x-0.2164). This was especially pronounced at values above 8%, where the majority of specimens from the Tosoh were higher than the Afinion. After a preliminary evaluation of the data comparing the Afinion to the Tosoh after manufacturer recalibration of the assay, this bias has decreased, but is still present (y=1.0197x-0.3396). Further analysis will be done to focus on HbA1c values greater than 8%. Conclusions: After recalibration of the Tosoh assay, the agreement between the two assays, particularly at values above 8%, is better.
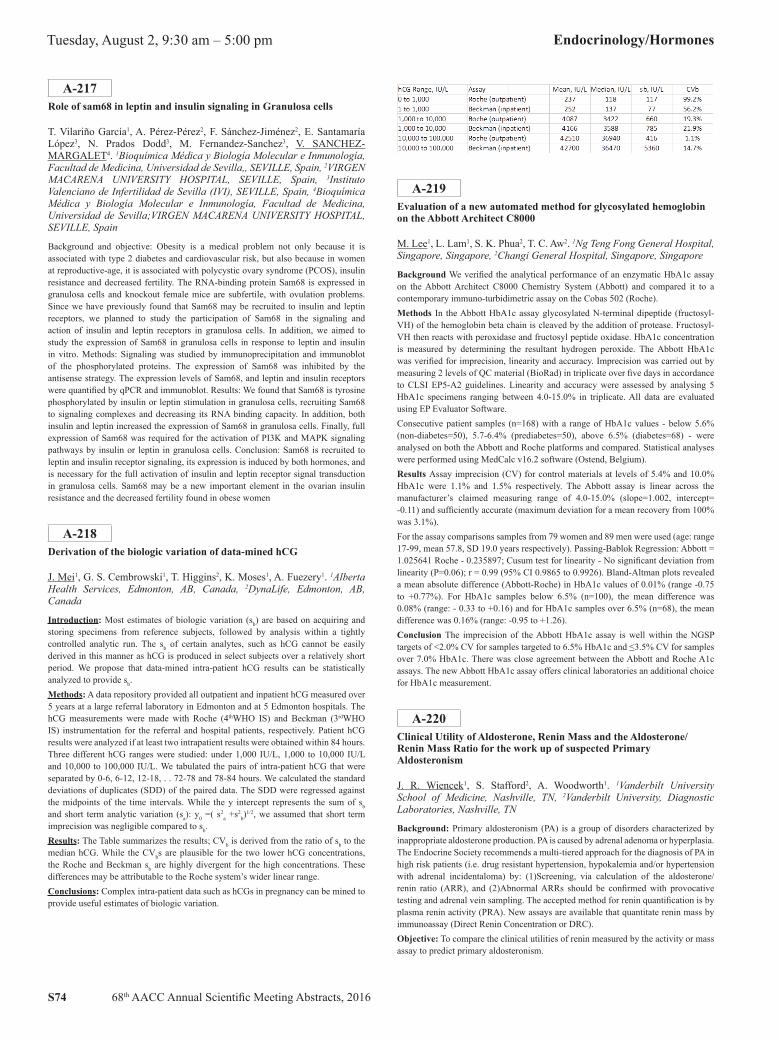
S74 68th AACC Annual Scientific Meeting Abstracts, 2016
Tuesday, August 2, 9:30 am – 5:00 pm Endocrinology/Hormones
A-217Role of sam68 in leptin and insulin signaling in Granulosa cells
T. Vilariño García1, A. Pérez-Pérez2, F. Sánchez-Jiménez2, E. Santamaría López3, N. Prados Dodd3, M. Fernandez-Sanchez3, V. SANCHEZ-MARGALET4. 1Bioquímica Médica y Biología Molecular e Inmunología, Facultad de Medicina, Universidad de Sevilla,, SEVILLE, Spain, 2VIRGEN MACARENA UNIVERSITY HOSPITAL, SEVILLE, Spain, 3Instituto Valenciano de Infertilidad de Sevilla (IVI), SEVILLE, Spain, 4Bioquímica Médica y Biología Molecular e Inmunología, Facultad de Medicina, Universidad de Sevilla;VIRGEN MACARENA UNIVERSITY HOSPITAL, SEVILLE, Spain
Background and objective: Obesity is a medical problem not only because it is associated with type 2 diabetes and cardiovascular risk, but also because in women at reproductive-age, it is associated with polycystic ovary syndrome (PCOS), insulin resistance and decreased fertility. The RNA-binding protein Sam68 is expressed in granulosa cells and knockout female mice are subfertile, with ovulation problems. Since we have previously found that Sam68 may be recruited to insulin and leptin receptors, we planned to study the participation of Sam68 in the signaling and action of insulin and leptin receptors in granulosa cells. In addition, we aimed to study the expression of Sam68 in granulosa cells in response to leptin and insulin in vitro. Methods: Signaling was studied by immunoprecipitation and immunoblot of the phosphorylated proteins. The expression of Sam68 was inhibited by the antisense strategy. The expression levels of Sam68, and leptin and insulin receptors were quantified by qPCR and immunoblot. Results: We found that Sam68 is tyrosine phosphorylated by insulin or leptin stimulation in granulosa cells, recruiting Sam68 to signaling complexes and decreasing its RNA binding capacity. In addition, both insulin and leptin increased the expression of Sam68 in granulosa cells. Finally, full expression of Sam68 was required for the activation of PI3K and MAPK signaling pathways by insulin or leptin in granulosa cells. Conclusion: Sam68 is recruited to leptin and insulin receptor signaling, its expression is induced by both hormones, and is necessary for the full activation of insulin and leptin receptor signal transduction in granulosa cells. Sam68 may be a new important element in the ovarian insulin resistance and the decreased fertility found in obese women
A-218Derivation of the biologic variation of data-mined hCG
J. Mei1, G. S. Cembrowski1, T. Higgins2, K. Moses1, A. Fuezery1. 1Alberta Health Services, Edmonton, AB, Canada, 2DynaLife, Edmonton, AB, Canada
Introduction: Most estimates of biologic variation (sb) are based on acquiring and storing specimens from reference subjects, followed by analysis within a tightly controlled analytic run. The sb of certain analytes, such as hCG cannot be easily derived in this manner as hCG is produced in select subjects over a relatively short period. We propose that data-mined intra-patient hCG results can be statistically analyzed to provide sb.Methods: A data repository provided all outpatient and inpatient hCG measured over 5 years at a large referral laboratory in Edmonton and at 5 Edmonton hospitals. The hCG measurements were made with Roche (4thWHO IS) and Beckman (3rdWHO IS) instrumentation for the referral and hospital patients, respectively. Patient hCG results were analyzed if at least two intrapatient results were obtained within 84 hours. Three different hCG ranges were studied: under 1,000 IU/L, 1,000 to 10,000 IU/L and 10,000 to 100,000 IU/L. We tabulated the pairs of intra-patient hCG that were separated by 0-6, 6-12, 12-18, . . 72-78 and 78-84 hours. We calculated the standard deviations of duplicates (SDD) of the paired data. The SDD were regressed against the midpoints of the time intervals. While the y intercept represents the sum of sb and short term analytic variation (sa): y0 =( s2
a +s2b)
1/2, we assumed that short term imprecision was negligible compared to sb.Results: The Table summarizes the results; CVb is derived from the ratio of sb to the median hCG. While the CVbs are plausible for the two lower hCG concentrations, the Roche and Beckman sb are highly divergent for the high concentrations. These differences may be attributable to the Roche system’s wider linear range.Conclusions: Complex intra-patient data such as hCGs in pregnancy can be mined to provide useful estimates of biologic variation.
A-219Evaluation of a new automated method for glycosylated hemoglobin on the Abbott Architect C8000
M. Lee1, L. Lam1, S. K. Phua2, T. C. Aw2. 1Ng Teng Fong General Hospital, Singapore, Singapore, 2Changi General Hospital, Singapore, Singapore
Background We verified the analytical performance of an enzymatic HbA1c assay on the Abbott Architect C8000 Chemistry System (Abbott) and compared it to a contemporary immuno-turbidimetric assay on the Cobas 502 (Roche).Methods In the Abbott HbA1c assay glycosylated N-terminal dipeptide (fructosyl-VH) of the hemoglobin beta chain is cleaved by the addition of protease. Fructosyl-VH then reacts with peroxidase and fructosyl peptide oxidase. HbA1c concentration is measured by determining the resultant hydrogen peroxide. The Abbott HbA1c was verified for imprecision, linearity and accuracy. Imprecision was carried out by measuring 2 levels of QC material (BioRad) in triplicate over five days in accordance to CLSI EP5-A2 guidelines. Linearity and accuracy were assessed by analysing 5 HbA1c specimens ranging between 4.0-15.0% in triplicate. All data are evaluated using EP Evaluator Software.Consecutive patient samples (n=168) with a range of HbA1c values - below 5.6% (non-diabetes=50), 5.7-6.4% (prediabetes=50), above 6.5% (diabetes=68) - were analysed on both the Abbott and Roche platforms and compared. Statistical analyses were performed using MedCalc v16.2 software (Ostend, Belgium).Results Assay imprecision (CV) for control materials at levels of 5.4% and 10.0% HbA1c were 1.1% and 1.5% respectively. The Abbott assay is linear across the manufacturer’s claimed measuring range of 4.0-15.0% (slope=1.002, intercept= -0.11) and sufficiently accurate (maximum deviation for a mean recovery from 100% was 3.1%).For the assay comparisons samples from 79 women and 89 men were used (age: range 17-99, mean 57.8, SD 19.0 years respectively). Passing-Bablok Regression: Abbott = 1.025641 Roche - 0.235897; Cusum test for linearity - No significant deviation from linearity (P=0.06); r = 0.99 (95% CI 0.9865 to 0.9926). Bland-Altman plots revealed a mean absolute difference (Abbott-Roche) in HbA1c values of 0.01% (range -0.75 to +0.77%). For HbA1c samples below 6.5% (n=100), the mean difference was 0.08% (range: - 0.33 to +0.16) and for HbA1c samples over 6.5% (n=68), the mean difference was 0.16% (range: -0.95 to +1.26).Conclusion The imprecision of the Abbott HbA1c assay is well within the NGSP targets of <2.0% CV for samples targeted to 6.5% HbA1c and ≤3.5% CV for samples over 7.0% HbA1c. There was close agreement between the Abbott and Roche A1c assays. The new Abbott HbA1c assay offers clinical laboratories an additional choice for HbA1c measurement.
A-220Clinical Utility of Aldosterone, Renin Mass and the Aldosterone/Renin Mass Ratio for the work up of suspected Primary Aldosteronism
J. R. Wiencek1, S. Stafford2, A. Woodworth1. 1Vanderbilt University School of Medicine, Nashville, TN, 2Vanderbilt University, Diagnostic Laboratories, Nashville, TN
Background: Primary aldosteronism (PA) is a group of disorders characterized by inappropriate aldosterone production. PA is caused by adrenal adenoma or hyperplasia. The Endocrine Society recommends a multi-tiered approach for the diagnosis of PA in high risk patients (i.e. drug resistant hypertension, hypokalemia and/or hypertension with adrenal incidentaloma) by: (1)Screening, via calculation of the aldosterone/renin ratio (ARR), and (2)Abnormal ARRs should be confirmed with provocative testing and adrenal vein sampling. The accepted method for renin quantification is by plasma renin activity (PRA). New assays are available that quantitate renin mass by immunoassay (Direct Renin Concentration or DRC).Objective: To compare the clinical utilities of renin measured by the activity or mass assay to predict primary aldosteronism.
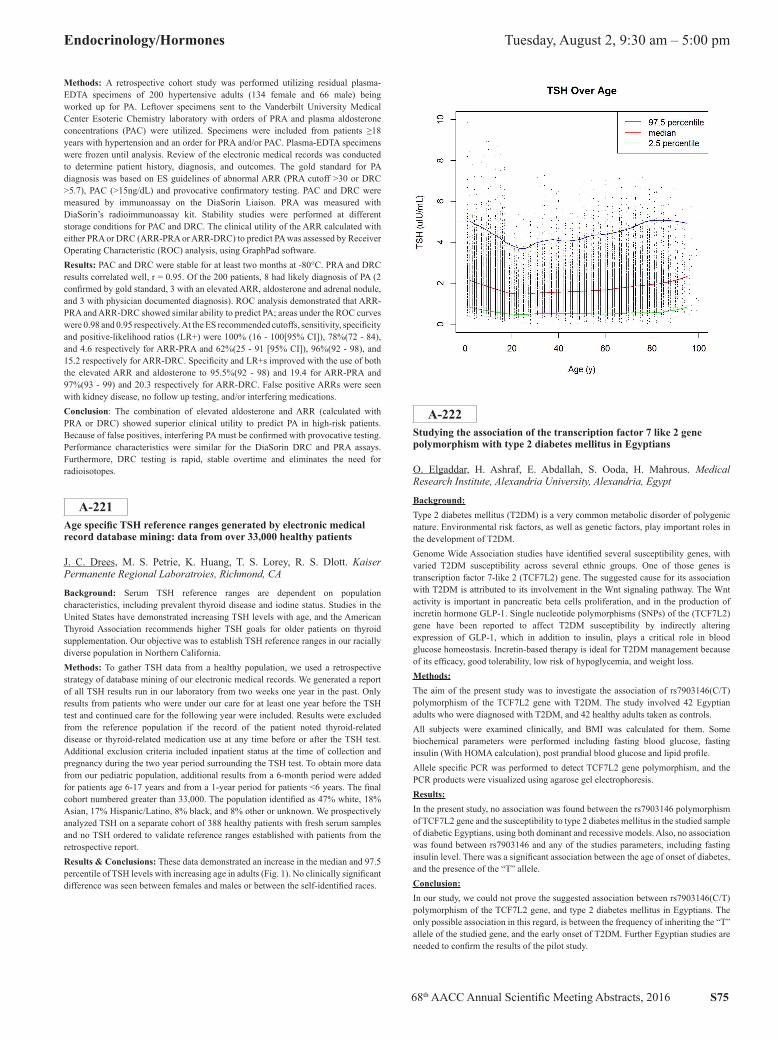
68th AACC Annual Scientific Meeting Abstracts, 2016 S75
Endocrinology/Hormones Tuesday, August 2, 9:30 am – 5:00 pm
Methods: A retrospective cohort study was performed utilizing residual plasma-EDTA specimens of 200 hypertensive adults (134 female and 66 male) being worked up for PA. Leftover specimens sent to the Vanderbilt University Medical Center Esoteric Chemistry laboratory with orders of PRA and plasma aldosterone concentrations (PAC) were utilized. Specimens were included from patients ≥18 years with hypertension and an order for PRA and/or PAC. Plasma-EDTA specimens were frozen until analysis. Review of the electronic medical records was conducted to determine patient history, diagnosis, and outcomes. The gold standard for PA diagnosis was based on ES guidelines of abnormal ARR (PRA cutoff >30 or DRC >5.7), PAC (>15ng/dL) and provocative confirmatory testing. PAC and DRC were measured by immunoassay on the DiaSorin Liaison. PRA was measured with DiaSorin’s radioimmunoassay kit. Stability studies were performed at different storage conditions for PAC and DRC. The clinical utility of the ARR calculated with either PRA or DRC (ARR-PRA or ARR-DRC) to predict PA was assessed by Receiver Operating Characteristic (ROC) analysis, using GraphPad software.Results: PAC and DRC were stable for at least two months at -80°C. PRA and DRC results correlated well, r = 0.95. Of the 200 patients, 8 had likely diagnosis of PA (2 confirmed by gold standard, 3 with an elevated ARR, aldosterone and adrenal nodule, and 3 with physician documented diagnosis). ROC analysis demonstrated that ARR-PRA and ARR-DRC showed similar ability to predict PA; areas under the ROC curves were 0.98 and 0.95 respectively. At the ES recommended cutoffs, sensitivity, specificity and positive-likelihood ratios (LR+) were 100% (16 - 100[95% CI]), 78%(72 - 84), and 4.6 respectively for ARR-PRA and 62%(25 - 91 [95% CI]), 96%(92 - 98), and 15.2 respectively for ARR-DRC. Specificity and LR+s improved with the use of both the elevated ARR and aldosterone to 95.5%(92 - 98) and 19.4 for ARR-PRA and 97%(93 - 99) and 20.3 respectively for ARR-DRC. False positive ARRs were seen with kidney disease, no follow up testing, and/or interfering medications.Conclusion: The combination of elevated aldosterone and ARR (calculated with PRA or DRC) showed superior clinical utility to predict PA in high-risk patients. Because of false positives, interfering PA must be confirmed with provocative testing. Performance characteristics were similar for the DiaSorin DRC and PRA assays. Furthermore, DRC testing is rapid, stable overtime and eliminates the need for radioisotopes.
A-221Age specific TSH reference ranges generated by electronic medical record database mining: data from over 33,000 healthy patients
J. C. Drees, M. S. Petrie, K. Huang, T. S. Lorey, R. S. Dlott. Kaiser Permanente Regional Laboratroies, Richmond, CA
Background: Serum TSH reference ranges are dependent on population characteristics, including prevalent thyroid disease and iodine status. Studies in the United States have demonstrated increasing TSH levels with age, and the American Thyroid Association recommends higher TSH goals for older patients on thyroid supplementation. Our objective was to establish TSH reference ranges in our racially diverse population in Northern California.Methods: To gather TSH data from a healthy population, we used a retrospective strategy of database mining of our electronic medical records. We generated a report of all TSH results run in our laboratory from two weeks one year in the past. Only results from patients who were under our care for at least one year before the TSH test and continued care for the following year were included. Results were excluded from the reference population if the record of the patient noted thyroid-related disease or thyroid-related medication use at any time before or after the TSH test. Additional exclusion criteria included inpatient status at the time of collection and pregnancy during the two year period surrounding the TSH test. To obtain more data from our pediatric population, additional results from a 6-month period were added for patients age 6-17 years and from a 1-year period for patients <6 years. The final cohort numbered greater than 33,000. The population identified as 47% white, 18% Asian, 17% Hispanic/Latino, 8% black, and 8% other or unknown. We prospectively analyzed TSH on a separate cohort of 388 healthy patients with fresh serum samples and no TSH ordered to validate reference ranges established with patients from the retrospective report.Results & Conclusions: These data demonstrated an increase in the median and 97.5 percentile of TSH levels with increasing age in adults (Fig. 1). No clinically significant difference was seen between females and males or between the self-identified races.
A-222Studying the association of the transcription factor 7 like 2 gene polymorphism with type 2 diabetes mellitus in Egyptians
O. Elgaddar, H. Ashraf, E. Abdallah, S. Ooda, H. Mahrous. Medical Research Institute, Alexandria University, Alexandria, Egypt
Background:Type 2 diabetes mellitus (T2DM) is a very common metabolic disorder of polygenic nature. Environmental risk factors, as well as genetic factors, play important roles in the development of T2DM.Genome Wide Association studies have identified several susceptibility genes, with varied T2DM susceptibility across several ethnic groups. One of those genes is transcription factor 7-like 2 (TCF7L2) gene. The suggested cause for its association with T2DM is attributed to its involvement in the Wnt signaling pathway. The Wnt activity is important in pancreatic beta cells proliferation, and in the production of incretin hormone GLP-1. Single nucleotide polymorphisms (SNPs) of the (TCF7L2) gene have been reported to affect T2DM susceptibility by indirectly altering expression of GLP-1, which in addition to insulin, plays a critical role in blood glucose homeostasis. Incretin-based therapy is ideal for T2DM management because of its efficacy, good tolerability, low risk of hypoglycemia, and weight loss.Methods:The aim of the present study was to investigate the association of rs7903146(C/T) polymorphism of the TCF7L2 gene with T2DM. The study involved 42 Egyptian adults who were diagnosed with T2DM, and 42 healthy adults taken as controls.All subjects were examined clinically, and BMI was calculated for them. Some biochemical parameters were performed including fasting blood glucose, fasting insulin (With HOMA calculation), post prandial blood glucose and lipid profile.Allele specific PCR was performed to detect TCF7L2 gene polymorphism, and the PCR products were visualized using agarose gel electrophoresis.Results:In the present study, no association was found between the rs7903146 polymorphism of TCF7L2 gene and the susceptibility to type 2 diabetes mellitus in the studied sample of diabetic Egyptians, using both dominant and recessive models. Also, no association was found between rs7903146 and any of the studies parameters, including fasting insulin level. There was a significant association between the age of onset of diabetes, and the presence of the “T” allele.Conclusion:In our study, we could not prove the suggested association between rs7903146(C/T) polymorphism of the TCF7L2 gene, and type 2 diabetes mellitus in Egyptians. The only possible association in this regard, is between the frequency of inheriting the “T” allele of the studied gene, and the early onset of T2DM. Further Egyptian studies are needed to confirm the results of the pilot study.
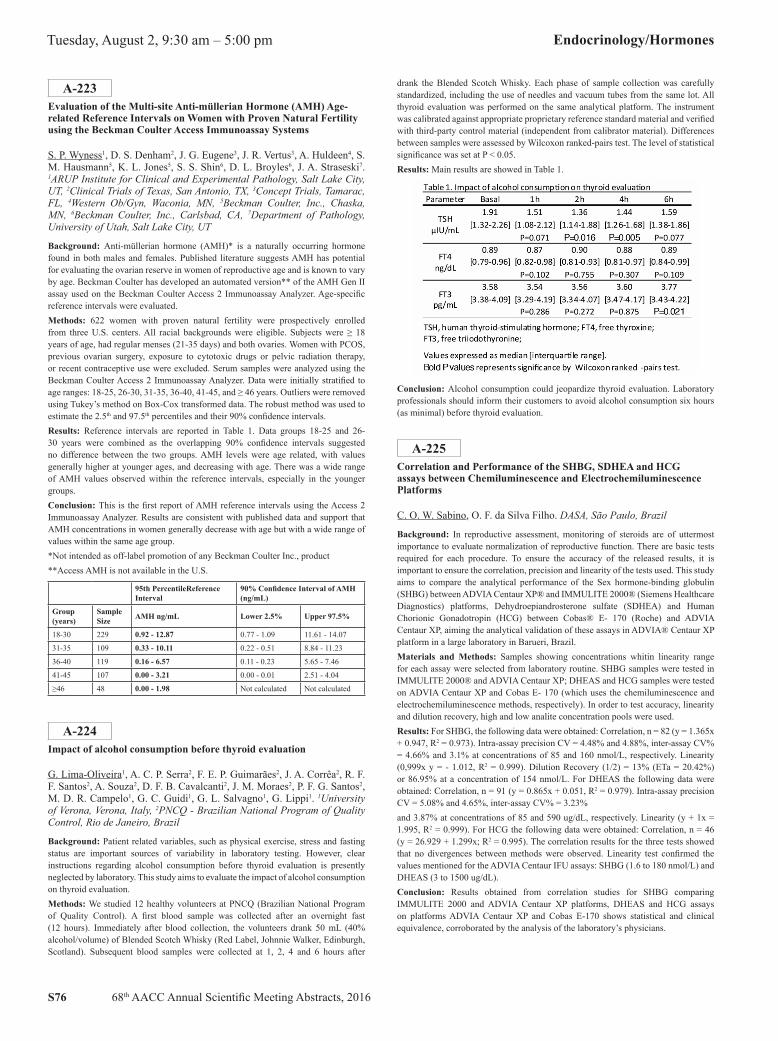
S76 68th AACC Annual Scientific Meeting Abstracts, 2016
Tuesday, August 2, 9:30 am – 5:00 pm Endocrinology/Hormones
A-223Evaluation of the Multi-site Anti-müllerian Hormone (AMH) Age-related Reference Intervals on Women with Proven Natural Fertility using the Beckman Coulter Access Immunoassay Systems
S. P. Wyness1, D. S. Denham2, J. G. Eugene3, J. R. Vertus3, A. Huldeen4, S. M. Hausmann5, K. L. Jones5, S. S. Shin6, D. L. Broyles6, J. A. Straseski7. 1ARUP Institute for Clinical and Experimental Pathology, Salt Lake City, UT, 2Clinical Trials of Texas, San Antonio, TX, 3Concept Trials, Tamarac, FL, 4Western Ob/Gyn, Waconia, MN, 5Beckman Coulter, Inc., Chaska, MN, 6Beckman Coulter, Inc., Carlsbad, CA, 7Department of Pathology, University of Utah, Salt Lake City, UT
Background: Anti-müllerian hormone (AMH)* is a naturally occurring hormone found in both males and females. Published literature suggests AMH has potential for evaluating the ovarian reserve in women of reproductive age and is known to vary by age. Beckman Coulter has developed an automated version** of the AMH Gen II assay used on the Beckman Coulter Access 2 Immunoassay Analyzer. Age-specific reference intervals were evaluated.Methods: 622 women with proven natural fertility were prospectively enrolled from three U.S. centers. All racial backgrounds were eligible. Subjects were ≥ 18 years of age, had regular menses (21-35 days) and both ovaries. Women with PCOS, previous ovarian surgery, exposure to cytotoxic drugs or pelvic radiation therapy, or recent contraceptive use were excluded. Serum samples were analyzed using the Beckman Coulter Access 2 Immunoassay Analyzer. Data were initially stratified to age ranges: 18-25, 26-30, 31-35, 36-40, 41-45, and ≥ 46 years. Outliers were removed using Tukey’s method on Box-Cox transformed data. The robust method was used to estimate the 2.5th and 97.5th percentiles and their 90% confidence intervals.Results: Reference intervals are reported in Table 1. Data groups 18-25 and 26-30 years were combined as the overlapping 90% confidence intervals suggested no difference between the two groups. AMH levels were age related, with values generally higher at younger ages, and decreasing with age. There was a wide range of AMH values observed within the reference intervals, especially in the younger groups.Conclusion: This is the first report of AMH reference intervals using the Access 2 Immunoassay Analyzer. Results are consistent with published data and support that AMH concentrations in women generally decrease with age but with a wide range of values within the same age group.*Not intended as off-label promotion of any Beckman Coulter Inc., product**Access AMH is not available in the U.S.
95th PercentileReference Interval
90% Confidence Interval of AMH (ng/mL)
Group (years)
Sample Size AMH ng/mL Lower 2.5% Upper 97.5%
18-30 229 0.92 - 12.87 0.77 - 1.09 11.61 - 14.07
31-35 109 0.33 - 10.11 0.22 - 0.51 8.84 - 11.23
36-40 119 0.16 - 6.57 0.11 - 0.23 5.65 - 7.46
41-45 107 0.00 - 3.21 0.00 - 0.01 2.51 - 4.04
≥46 48 0.00 - 1.98 Not calculated Not calculated
A-224Impact of alcohol consumption before thyroid evaluation
G. Lima-Oliveira1, A. C. P. Serra2, F. E. P. Guimarães2, J. A. Corrêa2, R. F. F. Santos2, A. Souza2, D. F. B. Cavalcanti2, J. M. Moraes2, P. F. G. Santos2, M. D. R. Campelo1, G. C. Guidi1, G. L. Salvagno1, G. Lippi1. 1University of Verona, Verona, Italy, 2PNCQ - Brazilian National Program of Quality Control, Rio de Janeiro, Brazil
Background: Patient related variables, such as physical exercise, stress and fasting status are important sources of variability in laboratory testing. However, clear instructions regarding alcohol consumption before thyroid evaluation is presently neglected by laboratory. This study aims to evaluate the impact of alcohol consumption on thyroid evaluation.Methods: We studied 12 healthy volunteers at PNCQ (Brazilian National Program of Quality Control). A first blood sample was collected after an overnight fast (12 hours). Immediately after blood collection, the volunteers drank 50 mL (40% alcohol/volume) of Blended Scotch Whisky (Red Label, Johnnie Walker, Edinburgh, Scotland). Subsequent blood samples were collected at 1, 2, 4 and 6 hours after
drank the Blended Scotch Whisky. Each phase of sample collection was carefully standardized, including the use of needles and vacuum tubes from the same lot. All thyroid evaluation was performed on the same analytical platform. The instrument was calibrated against appropriate proprietary reference standard material and verified with third-party control material (independent from calibrator material). Differences between samples were assessed by Wilcoxon ranked-pairs test. The level of statistical significance was set at P < 0.05.Results: Main results are showed in Table 1.
Conclusion: Alcohol consumption could jeopardize thyroid evaluation. Laboratory professionals should inform their customers to avoid alcohol consumption six hours (as minimal) before thyroid evaluation.
A-225Correlation and Performance of the SHBG, SDHEA and HCG assays between Chemiluminescence and Electrochemiluminescence Platforms
C. O. W. Sabino, O. F. da Silva Filho. DASA, São Paulo, Brazil
Background: In reproductive assessment, monitoring of steroids are of uttermost importance to evaluate normalization of reproductive function. There are basic tests required for each procedure. To ensure the accuracy of the released results, it is important to ensure the correlation, precision and linearity of the tests used. This study aims to compare the analytical performance of the Sex hormone-binding globulin (SHBG) between ADVIA Centaur XP® and IMMULITE 2000® (Siemens Healthcare Diagnostics) platforms, Dehydroepiandrosterone sulfate (SDHEA) and Human Chorionic Gonadotropin (HCG) between Cobas® E- 170 (Roche) and ADVIA Centaur XP, aiming the analytical validation of these assays in ADVIA® Centaur XP platform in a large laboratory in Barueri, Brazil.Materials and Methods: Samples showing concentrations whitin linearity range for each assay were selected from laboratory routine. SHBG samples were tested in IMMULITE 2000® and ADVIA Centaur XP; DHEAS and HCG samples were tested on ADVIA Centaur XP and Cobas E- 170 (which uses the chemiluminescence and electrochemiluminescence methods, respectively). In order to test accuracy, linearity and dilution recovery, high and low analite concentration pools were used.Results: For SHBG, the following data were obtained: Correlation, n = 82 (y = 1.365x + 0.947, R2 = 0.973). Intra-assay precision CV = 4.48% and 4.88%, inter-assay CV% = 4.66% and 3.1% at concentrations of 85 and 160 nmol/L, respectively. Linearity (0,999x y = - 1.012, R2 = 0.999). Dilution Recovery (1/2) = 13% (ETa = 20.42%) or 86.95% at a concentration of 154 nmol/L. For DHEAS the following data were obtained: Correlation, n = 91 (y = 0.865x + 0.051, R2 = 0.979). Intra-assay precision CV = 5.08% and 4.65%, inter-assay CV% = 3.23%and 3.87% at concentrations of 85 and 590 ug/dL, respectively. Linearity (y + 1x = 1.995, R2 = 0.999). For HCG the following data were obtained: Correlation, n = 46 (y = 26.929 + 1.299x; R2 = 0.995). The correlation results for the three tests showed that no divergences between methods were observed. Linearity test confirmed the values mentioned for the ADVIA Centaur IFU assays: SHBG (1.6 to 180 nmol/L) and DHEAS (3 to 1500 ug/dL).Conclusion: Results obtained from correlation studies for SHBG comparing IMMULITE 2000 and ADVIA Centaur XP platforms, DHEAS and HCG assays on platforms ADVIA Centaur XP and Cobas E-170 shows statistical and clinical equivalence, corroborated by the analysis of the laboratory’s physicians.
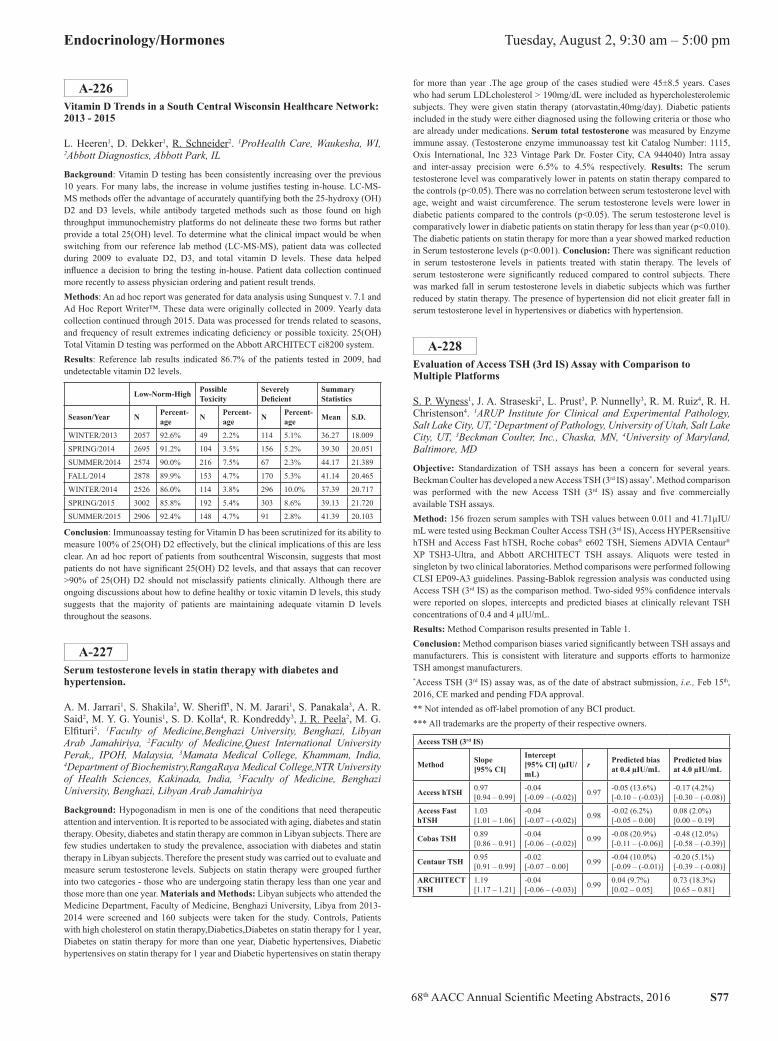
68th AACC Annual Scientific Meeting Abstracts, 2016 S77
Endocrinology/Hormones Tuesday, August 2, 9:30 am – 5:00 pm
A-226Vitamin D Trends in a South Central Wisconsin Healthcare Network: 2013 - 2015
L. Heeren1, D. Dekker1, R. Schneider2. 1ProHealth Care, Waukesha, WI, 2Abbott Diagnostics, Abbott Park, IL
Background: Vitamin D testing has been consistently increasing over the previous 10 years. For many labs, the increase in volume justifies testing in-house. LC-MS-MS methods offer the advantage of accurately quantifying both the 25-hydroxy (OH) D2 and D3 levels, while antibody targeted methods such as those found on high throughput immunochemistry platforms do not delineate these two forms but rather provide a total 25(OH) level. To determine what the clinical impact would be when switching from our reference lab method (LC-MS-MS), patient data was collected during 2009 to evaluate D2, D3, and total vitamin D levels. These data helped influence a decision to bring the testing in-house. Patient data collection continued more recently to assess physician ordering and patient result trends.Methods: An ad hoc report was generated for data analysis using Sunquest v. 7.1 and Ad Hoc Report Writer™. These data were originally collected in 2009. Yearly data collection continued through 2015. Data was processed for trends related to seasons, and frequency of result extremes indicating deficiency or possible toxicity. 25(OH) Total Vitamin D testing was performed on the Abbott ARCHITECT ci8200 system.Results: Reference lab results indicated 86.7% of the patients tested in 2009, had undetectable vitamin D2 levels.
Low-Norm-High Possible Toxicity
Severely Deficient
Summary Statistics
Season/Year N Percent-age N Percent-
age N Percent-age Mean S.D.
WINTER/2013 2057 92.6% 49 2.2% 114 5.1% 36.27 18.009
SPRING/2014 2695 91.2% 104 3.5% 156 5.2% 39.30 20.051
SUMMER/2014 2574 90.0% 216 7.5% 67 2.3% 44.17 21.389
FALL/2014 2878 89.9% 153 4.7% 170 5.3% 41.14 20.465
WINTER/2014 2526 86.0% 114 3.8% 296 10.0% 37.39 20.717
SPRING/2015 3002 85.8% 192 5.4% 303 8.6% 39.13 21.720
SUMMER/2015 2906 92.4% 148 4.7% 91 2.8% 41.39 20.103
Conclusion: Immunoassay testing for Vitamin D has been scrutinized for its ability to measure 100% of 25(OH) D2 effectively, but the clinical implications of this are less clear. An ad hoc report of patients from southcentral Wisconsin, suggests that most patients do not have significant 25(OH) D2 levels, and that assays that can recover >90% of 25(OH) D2 should not misclassify patients clinically. Although there are ongoing discussions about how to define healthy or toxic vitamin D levels, this study suggests that the majority of patients are maintaining adequate vitamin D levels throughout the seasons.
A-227Serum testosterone levels in statin therapy with diabetes and hypertension.
A. M. Jarrari1, S. Shakila2, W. Sheriff1, N. M. Jarari1, S. Panakala3, A. R. Said2, M. Y. G. Younis1, S. D. Kolla4, R. Kondreddy3, J. R. Peela2, M. G. Elfituri5. 1Faculty of Medicine,Benghazi University, Benghazi, Libyan Arab Jamahiriya, 2Faculty of Medicine,Quest International University Perak,, IPOH, Malaysia, 3Mamata Medical College, Khammam, India, 4Department of Biochemistry,RangaRaya Medical College,NTR University of Health Sciences, Kakinada, India, 5Faculty of Medicine, Benghazi University, Benghazi, Libyan Arab Jamahiriya
Background: Hypogonadism in men is one of the conditions that need therapeutic attention and intervention. It is reported to be associated with aging, diabetes and statin therapy. Obesity, diabetes and statin therapy are common in Libyan subjects. There are few studies undertaken to study the prevalence, association with diabetes and statin therapy in Libyan subjects. Therefore the present study was carried out to evaluate and measure serum testosterone levels. Subjects on statin therapy were grouped further into two categories - those who are undergoing statin therapy less than one year and those more than one year. Materials and Methods: Libyan subjects who attended the Medicine Department, Faculty of Medicine, Benghazi University, Libya from 2013-2014 were screened and 160 subjects were taken for the study. Controls, Patients with high cholesterol on statin therapy,Diabetics,Diabetes on statin therapy for 1 year, Diabetes on statin therapy for more than one year, Diabetic hypertensives, Diabetic hypertensives on statin therapy for 1 year and Diabetic hypertensives on statin therapy
for more than year .The age group of the cases studied were 45±8.5 years. Cases who had serum LDLcholesterol > 190mg/dL were included as hypercholesterolemic subjects. They were given statin therapy (atorvastatin,40mg/day). Diabetic patients included in the study were either diagnosed using the following criteria or those who are already under medications. Serum total testosterone was measured by Enzyme immune assay. (Testosterone enzyme immunoassay test kit Catalog Number: 1115, Oxis International, Inc 323 Vintage Park Dr. Foster City, CA 944040) Intra assay and inter-assay precision were 6.5% to 4.5% respectively. Results: The serum testosterone level was comparatively lower in patents on statin therapy compared to the controls (p<0.05). There was no correlation between serum testosterone level with age, weight and waist circumference. The serum testosterone levels were lower in diabetic patients compared to the controls (p<0.05). The serum testosterone level is comparatively lower in diabetic patients on statin therapy for less than year (p<0.010). The diabetic patients on statin therapy for more than a year showed marked reduction in Serum testosterone levels (p<0.001). Conclusion: There was significant reduction in serum testosterone levels in patients treated with statin therapy. The levels of serum testosterone were significantly reduced compared to control subjects. There was marked fall in serum testosterone levels in diabetic subjects which was further reduced by statin therapy. The presence of hypertension did not elicit greater fall in serum testosterone level in hypertensives or diabetics with hypertension.
A-228Evaluation of Access TSH (3rd IS) Assay with Comparison to Multiple Platforms
S. P. Wyness1, J. A. Straseski2, L. Prust3, P. Nunnelly3, R. M. Ruiz4, R. H. Christenson4. 1ARUP Institute for Clinical and Experimental Pathology, Salt Lake City, UT, 2Department of Pathology, University of Utah, Salt Lake City, UT, 3Beckman Coulter, Inc., Chaska, MN, 4University of Maryland, Baltimore, MD
Objective: Standardization of TSH assays has been a concern for several years. Beckman Coulter has developed a new Access TSH (3rd IS) assay*. Method comparison was performed with the new Access TSH (3rd IS) assay and five commercially available TSH assays.Method: 156 frozen serum samples with TSH values between 0.011 and 41.71µIU/mL were tested using Beckman Coulter Access TSH (3rd IS), Access HYPERsensitive hTSH and Access Fast hTSH, Roche cobas® e602 TSH, Siemens ADVIA Centaur® XP TSH3-Ultra, and Abbott ARCHITECT TSH assays. Aliquots were tested in singleton by two clinical laboratories. Method comparisons were performed following CLSI EP09-A3 guidelines. Passing-Bablok regression analysis was conducted using Access TSH (3rd IS) as the comparison method. Two-sided 95% confidence intervals were reported on slopes, intercepts and predicted biases at clinically relevant TSH concentrations of 0.4 and 4 µIU/mL.Results: Method Comparison results presented in Table 1.Conclusion: Method comparison biases varied significantly between TSH assays and manufacturers. This is consistent with literature and supports efforts to harmonize TSH amongst manufacturers.*Access TSH (3rd IS) assay was, as of the date of abstract submission, i.e., Feb 15th, 2016, CE marked and pending FDA approval.** Not intended as off-label promotion of any BCI product.*** All trademarks are the property of their respective owners.
Access TSH (3rd IS)
Method Slope[95% CI]
Intercept[95% CI] (µIU/mL)
r Predicted bias at 0.4 µIU/mL
Predicted bias at 4.0 µIU/mL
Access hTSH 0.97[0.94 – 0.99]
-0.04[-0.09 – (-0.02)] 0.97 -0.05 (13.6%)
[-0.10 – (-0.03)]-0.17 (4.2%)[-0.30 – (-0.08)]
Access Fast hTSH
1.03[1.01 – 1.06]
-0.04[-0.07 – (-0.02)] 0.98 -0.02 (6.2%)
[-0.05 – 0.00]0.08 (2.0%)[0.00 – 0.19]
Cobas TSH 0.89[0.86 – 0.91]
-0.04[-0.06 – (-0.02)] 0.99 -0.08 (20.9%)
[-0.11 – (-0.06)]-0.48 (12.0%)[-0.58 – (-0.39)]
Centaur TSH 0.95[0.91 – 0.99]
-0.02[-0.07 – 0.00] 0.99 -0.04 (10.0%)
[-0.09 – (-0.01)]-0.20 (5.1%)[-0.39 – (-0.08)]
ARCHITECT TSH
1.19[1.17 – 1.21]
-0.04[-0.06 – (-0.03)] 0.99 0.04 (9.7%)
[0.02 – 0.05]0.73 (18.3%)[0.65 – 0.81]
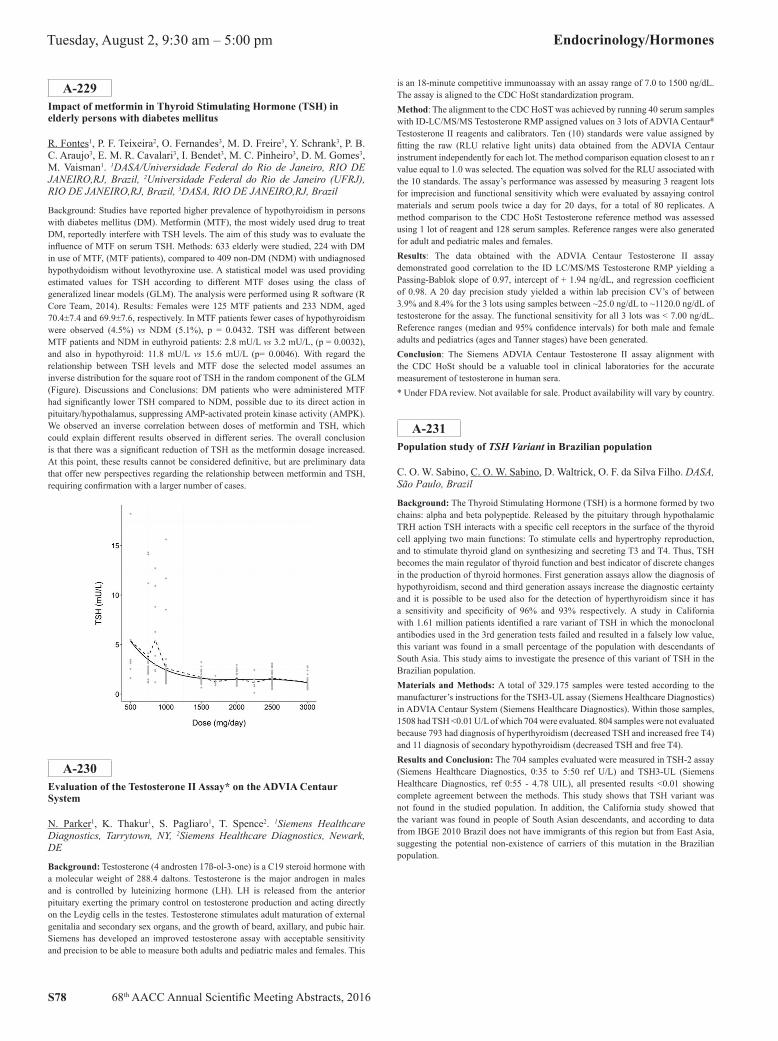
S78 68th AACC Annual Scientific Meeting Abstracts, 2016
Tuesday, August 2, 9:30 am – 5:00 pm Endocrinology/Hormones
A-229Impact of metformin in Thyroid Stimulating Hormone (TSH) in elderly persons with diabetes mellitus
R. Fontes1, P. F. Teixeira2, O. Fernandes3, M. D. Freire3, Y. Schrank3, P. B. C. Araujo3, E. M. R. Cavalari3, I. Bendet3, M. C. Pinheiro3, D. M. Gomes3, M. Vaisman1. 1DASA/Universidade Federal do Rio de Janeiro, RIO DE JANEIRO,RJ, Brazil, 2Universidade Federal do Rio de Janeiro (UFRJ), RIO DE JANEIRO,RJ, Brazil, 3DASA, RIO DE JANEIRO,RJ, Brazil
Background: Studies have reported higher prevalence of hypothyroidism in persons with diabetes mellitus (DM). Metformin (MTF), the most widely used drug to treat DM, reportedly interfere with TSH levels. The aim of this study was to evaluate the influence of MTF on serum TSH. Methods: 633 elderly were studied, 224 with DM in use of MTF, (MTF patients), compared to 409 non-DM (NDM) with undiagnosed hypothydoidism without levothyroxine use. A statistical model was used providing estimated values for TSH according to different MTF doses using the class of generalized linear models (GLM). The analysis were performed using R software (R Core Team, 2014). Results: Females were 125 MTF patients and 233 NDM, aged 70.4±7.4 and 69.9±7.6, respectively. In MTF patients fewer cases of hypothyroidism were observed (4.5%) vs NDM (5.1%), p = 0.0432. TSH was different between MTF patients and NDM in euthyroid patients: 2.8 mU/L vs 3.2 mU/L, (p = 0.0032), and also in hypothyroid: 11.8 mU/L vs 15.6 mU/L (p= 0.0046). With regard the relationship between TSH levels and MTF dose the selected model assumes an inverse distribution for the square root of TSH in the random component of the GLM (Figure). Discussions and Conclusions: DM patients who were administered MTF had significantly lower TSH compared to NDM, possible due to its direct action in pituitary/hypothalamus, suppressing AMP-activated protein kinase activity (AMPK). We observed an inverse correlation between doses of metformin and TSH, which could explain different results observed in different series. The overall conclusion is that there was a significant reduction of TSH as the metformin dosage increased. At this point, these results cannot be considered definitive, but are preliminary data that offer new perspectives regarding the relationship between metformin and TSH, requiring confirmation with a larger number of cases.
A-230Evaluation of the Testosterone II Assay* on the ADVIA Centaur System
N. Parker1, K. Thakur1, S. Pagliaro1, T. Spence2. 1Siemens Healthcare Diagnostics, Tarrytown, NY, 2Siemens Healthcare Diagnostics, Newark, DE
Background: Testosterone (4 androsten 17ß-ol-3-one) is a C19 steroid hormone with a molecular weight of 288.4 daltons. Testosterone is the major androgen in males and is controlled by luteinizing hormone (LH). LH is released from the anterior pituitary exerting the primary control on testosterone production and acting directly on the Leydig cells in the testes. Testosterone stimulates adult maturation of external genitalia and secondary sex organs, and the growth of beard, axillary, and pubic hair. Siemens has developed an improved testosterone assay with acceptable sensitivity and precision to be able to measure both adults and pediatric males and females. This
is an 18-minute competitive immunoassay with an assay range of 7.0 to 1500 ng/dL. The assay is aligned to the CDC HoSt standardization program.Method: The alignment to the CDC HoST was achieved by running 40 serum samples with ID-LC/MS/MS Testosterone RMP assigned values on 3 lots of ADVIA Centaur® Testosterone II reagents and calibrators. Ten (10) standards were value assigned by fitting the raw (RLU relative light units) data obtained from the ADVIA Centaur instrument independently for each lot. The method comparison equation closest to an r value equal to 1.0 was selected. The equation was solved for the RLU associated with the 10 standards. The assay’s performance was assessed by measuring 3 reagent lots for imprecision and functional sensitivity which were evaluated by assaying control materials and serum pools twice a day for 20 days, for a total of 80 replicates. A method comparison to the CDC HoSt Testosterone reference method was assessed using 1 lot of reagent and 128 serum samples. Reference ranges were also generated for adult and pediatric males and females.Results: The data obtained with the ADVIA Centaur Testosterone II assay demonstrated good correlation to the ID LC/MS/MS Testosterone RMP yielding a Passing-Bablok slope of 0.97, intercept of + 1.94 ng/dL, and regression coefficient of 0.98. A 20 day precision study yielded a within lab precision CV’s of between 3.9% and 8.4% for the 3 lots using samples between ~25.0 ng/dL to ~1120.0 ng/dL of testosterone for the assay. The functional sensitivity for all 3 lots was < 7.00 ng/dL. Reference ranges (median and 95% confidence intervals) for both male and female adults and pediatrics (ages and Tanner stages) have been generated.Conclusion: The Siemens ADVIA Centaur Testosterone II assay alignment with the CDC HoSt should be a valuable tool in clinical laboratories for the accurate measurement of testosterone in human sera.* Under FDA review. Not available for sale. Product availability will vary by country.
A-231Population study of TSH Variant in Brazilian population
C. O. W. Sabino, C. O. W. Sabino, D. Waltrick, O. F. da Silva Filho. DASA, São Paulo, Brazil
Background: The Thyroid Stimulating Hormone (TSH) is a hormone formed by two chains: alpha and beta polypeptide. Released by the pituitary through hypothalamic TRH action TSH interacts with a specific cell receptors in the surface of the thyroid cell applying two main functions: To stimulate cells and hypertrophy reproduction, and to stimulate thyroid gland on synthesizing and secreting T3 and T4. Thus, TSH becomes the main regulator of thyroid function and best indicator of discrete changes in the production of thyroid hormones. First generation assays allow the diagnosis of hypothyroidism, second and third generation assays increase the diagnostic certainty and it is possible to be used also for the detection of hyperthyroidism since it has a sensitivity and specificity of 96% and 93% respectively. A study in California with 1.61 million patients identified a rare variant of TSH in which the monoclonal antibodies used in the 3rd generation tests failed and resulted in a falsely low value, this variant was found in a small percentage of the population with descendants of South Asia. This study aims to investigate the presence of this variant of TSH in the Brazilian population.Materials and Methods: A total of 329.175 samples were tested according to the manufacturer’s instructions for the TSH3-UL assay (Siemens Healthcare Diagnostics) in ADVIA Centaur System (Siemens Healthcare Diagnostics). Within those samples, 1508 had TSH <0.01 U/L of which 704 were evaluated. 804 samples were not evaluated because 793 had diagnosis of hyperthyroidism (decreased TSH and increased free T4) and 11 diagnosis of secondary hypothyroidism (decreased TSH and free T4).Results and Conclusion: The 704 samples evaluated were measured in TSH-2 assay (Siemens Healthcare Diagnostics, 0:35 to 5:50 ref U/L) and TSH3-UL (Siemens Healthcare Diagnostics, ref 0:55 - 4.78 UIL), all presented results <0.01 showing complete agreement between the methods. This study shows that TSH variant was not found in the studied population. In addition, the California study showed that the variant was found in people of South Asian descendants, and according to data from IBGE 2010 Brazil does not have immigrants of this region but from East Asia, suggesting the potential non-existence of carriers of this mutation in the Brazilian population.
68th AACC Annual Scientific Meeting Abstracts, 2016 S79
Endocrinology/Hormones Tuesday, August 2, 9:30 am – 5:00 pm
A-232Investigtation of posture specific reference intervals for plasma metanephrine and normetanephrine
J. M. Boyd1, G. Kline2, H. Sadrzadeh1. 1Calgary Laboratory Services, Calgary, AB, Canada, 2University of Calgary, Calgary, AB, Canada
Introduction: Metanephrines, the metabolites of catecholamines, are tested in the investigation and workup of pheochromocytoma and paraganglioma (PPGL). In the majority of cases of PPGL, plasma metanephrine (PM) and/or normetanephrine (PNM) are elevated at least 2 times the upper limit of normal. Like many other tests, PM and PNM are affected by many preanalytical variables such as diet, drugs, exercise and stress that may result in a slightly elevated result in the absence of PPGL. Also, several studies have recently shown that collection posture is a significant preanalytical interference as patients without PPGL have lower PM and PNM if they are supine for 30 min prior to phlebotomy. The 2014 PPGL guidelines from the American Endocrine Society recommend supine collection for plasma metanephrines to reduce the number of false positive results. However, most laboratories do not require supine collection for plasma metanephrines and do not provide a posture specific reference range. In this study, we investigated our laboratory population to determine the performance of our current reference intervals with and without collection posture specifications.Materials & Methods: All PM and PNM results between May 2010 and September 2015 were requested from our laboratory information system. Patient information was deidentified and the final data set obtained included the numerical metanephrines result, order date, and collection location. Data was analyzed using Microsoft Excel 2007 into histograms displaying the distribution of patient results and was compared to the current reference intervals of <0.5 nmol/L for metanephrine and <0.9 nmol/L for normetanephrine.Results: The data pull resulted in 5452 plasma metanephrines results from 5068 patients. All specimens were assumed to be collected in the seated position (as indicated in our SOP), with the exception of samples collected at our local endocrinology testing unit which is known to collect after 30 min in the supine position. This subgroup consisted of 313 specimens on 269 patients and was analyzed separately. No effect of posture was observed between PM collected in the supine and seated position; epinephrine, the precursor for PM, is an adrenal catecholamine and should not change with posture. However, the distribution of PNM collected in the seated position had a large tail that extended over the upper limit of normal (0.9 ng/mL) , resulting in 14% of all patients between 0.9 and 1.8 nmol/L. Only 7% of patients collected in the supine position fell into this range, which shows the clear effect of posture. Norepinephrine, the precursor for PNM, is secreted from both the CNS and is expected to change with posture.Conclusion: Collection of plasma metanephrines in the seated position can lead to a significant number of slightly elevated PNM results in patients who do not have PPGL. Investigation of posture specific reference ranges should be considered.
A-233Validity of Free and Bioavailable Testosterone Calculations Using Abbott Architect Total Testosterone and Sex Hormone Binding Globulin Immunoassay Results
D. E. Palmer-Toy1, C. Tabata1, O. C. Hszieh1, D. W. Chandler2, K. Chun2, B. Holmquist2. 1Kaiser Permanente - Southern California Permanente Medical Group, North Hollywood, CA, 2Endocrine Sciences - LabCorp, Calabasas, CA
Objective: Comparison of directly-measured and calculated free (fT) and bioavailable testosterone (BioT) concentrations.Background: In the diagnosis of testosterone deficiency in men and excess in women, clinicians often rely upon calculated fT and bioT derived from web-calculators. The accuracy of such calculations should be formally validated for the specific immunoassays employed.Methodology: Sera from thirty seven patients were used, including a mixture of men and women. Measurement of fT and bioT was performed using tandem mass spectrometry after equilibrium dialysis or ammonium sulfate precipitation, respectively. Abbott Architect total testosterone (T) and sex hormone binding globulin (SHBG) immunoassay results were used in fT and BioT calculations applying the Vermeulen formulae with measured (bromcreosol green and purple) or fixed (4.3 g/dL) albumin concentrations. The Abbott SHBG assay was recalibrated after completion of our measurements, so fT and BioT were calculated using both SHBG results with the former calibration and after numeric adjustment for the new calibration: SHBG (recalibrated) = 0.94 *SHBG (old calibration) - 0.2
Results:Concentration span: T (LC/MS) 7 - 1287 ng/dL; SHBG (Abbott) 18 - 89 nmol/L; fT (LC/MS) 0.5 - 284 pg/mL; BioT (LC/MS) 1 - 952 ng/dL.Correlation studies:T (Abbott) = 1.14 * T (LC/MS) -22.6; R2 = 0.989fT (Calc) = 1.53 * fT (LC/MS) + 0.58 ; R2 = 0.952 [old SHBG calibration; Alb = 4.3 g/dL]fT (Calc) = 1.30 * fT (LC/MS) + 0.25; R2 = 0.981 [SHBG recalibration; Alb = 4.3 g/dL]BioT(Calc) = 1.11 * BioT (LC/MS) + 42.3; R2 = 0.932 [old SHBG calibration; Alb = 4.3 g/dL]BioT(Calc) = 1.14 * BioT (LC/MS) + 47.2; R2 = 0.924 [SHBG recalibration; Alb = 4.3 g/dL]Calculated fT and BioT with fixed or BCP or BCG measured albumin did not differ significantly.Qualitatively, there was significant dispersion among BioT results in the crucial range of 150 - 450 ng/dL with or without SHBG recalibration.Conclusions:1. fT results calculated from Abbott Architect T and SHBG results and the Vermeulen formula with fixed albumin concentration correlate well, but do not correspond to directly measured results. Transformed reference ranges should be transferrable.2. SHBG recalibration has improved the fT correlation3. BioT results calculated from Abbott Architect T and SHBG results and the Vermeulen formula did not correlate well across the typical clinical decision range.4. SHBG recalibration did not improve the BioT correlation.5. Use of measured rather than fixed albumin concentration did not significantly alter the fT or BioT correlation.
A-234Modification of commercially available GLP-1 method to support clinical trials
M. Raines, P. Amin, A. Sethi. Pacific Biomarkers, Seattle, WA
RelevanceCommercial GLP-1 assays vary considerably in sensitivity and lot-to-lot variation. Optimization of the GLP-1 Active and Total assays from Mesoscale Discovery (MSD) would provide consistent and reproducible results suitable for utility in clinical trials.ObjectiveThe objective of this study was to modify and re-evaluate the GLP-1 Active and Total assays produced by Mesoscale Discovery (MSD) for improved consistency and reproducibility.MethodsThe GLP-1 Active and Total assays (MSD) were used, although externally sourced GLP-1 reference material was used as standard instead of kit standards and the measurable range was modified. Each new kit lot (5-10 total) was qualified for acceptable QC performance, linearity, and sensitivity. Normal ranges were determined using twenty or more fasting P800 EDTA plasma samples. Over two hundred P800 EDTA plasma clinical samples were reanalyzed after three months of initial testing for GLP-1 analysis.ResultsThe modified GLP-1 Active and Total assays use 7 non-zero standards covering 0.25 – 180 pmol/L and 0.8 – 600 pmol/L, respectively. The lowest levels serve as the limit of quantitation and anchor points. Quality control samples analyzed in more than 200 separate runs covering the past 2.3 years indicate that more than 90% of the runs yielded values within 40% of the established mean QC value. This data also supports 2.3 year stability at -70°C for GLP-1 Total and Active in EDTA plasma stabilized with DPP-IV and protease inhibitors. Expected normal ranges for P800 EDTA plasma from fasting donors were < 2.89 pmol/L and < 8.4 pmol/L for GLP-1 Active and Total, respectively. Elevated GLP-1 values (> 2.89 pmol/L and >8.4 pmol/L) were observed in a subset of Type 2 diabetes and nonfasting donors. Regression analysis of two sets of GLP-1 Active and Total showed highly concordant data with a correlation coefficient of 0.979 and 0.962 and slopes of 0.99 and 1.01, respectively supporting the reproducibility of the modified GLP-1 Active and Total assays.ConclusionIn summary, modified versions of the GLP-1 Active and Total assays minimize lot-to-lot variation and yields suitable performance to measure GLP-1 in clinical trials.

S80 68th AACC Annual Scientific Meeting Abstracts, 2016
Tuesday, August 2, 9:30 am – 5:00 pm Endocrinology/Hormones
A-235A Sudden Manufacturer Discontinuation Makes Free Testosterone Testing Quite Testy
A. J. McShane, R. Kreller, M. Strizzi, S. Wang. Cleveland Clinic, Cleveland, OH
Introduction: Testosterone is a hormone that stimulates the development of male genital and secondary sex characteristics. In women, it has a role as an estrogen precursor. Elevated testosterone can lead to premature puberty in males or virilization in females. Conversely, decreased testosterone may lead to hypogonadism in males and decreased libido in females. Testosterone is primarily found tightly bound to sex hormone binding globulin (SHBG) and loosely bound to albumin in blood. Measurement of the free fraction is indicated in patients with abnormal SHBG. It can be obtained via equilibrium dialysis or ultrafiltration. In our laboratory, radioactive (tritium-labeled) testosterone is added to the patient’s serum. After equilibration, the sample is filtered through a low molecular weight cut-off filter which allows the free testosterone to pass through. The activity of the retentate and filtrate is then measured to determine the ratio of free over total testosterone. This is then multiplied by the total testosterone to achieve the free testosterone levels. Our commercially purchased, tritiated testosterone is purified via column chromatography before use to remove potential radioactive impurities. However, the commercial provider of the column is discontinuing its production. Three alternatives to the current chromatography were purposed for this high-volume test: in-house column assembly, a new column manufacturer, and forgoing column purification. The first option was abandoned because of potential differences in column-to-column performance, without strict quality control parameters. The latter options were evaluated to determine an acceptable replacement for the discontinued columns. Methods: Twenty-six patients were compared between the current and potential columns. An additional 26 patients were compared between the current columns and a column-less sample preparation. We further compared the column-less approach with the current columns using 100 additional samples (50 males and 50 females). Results: In the current versus potential column study, Deming regression of the free testosterone levels revealed a slope of 0.926, a correlation coefficient of 0.9929, and a mean percent bias of -6.19%. The column-less comparison gave a slope of 1.405, a correlation coefficient of 0.9772, and a free testosterone mean bias of +33.76% affirming that a freely-filtered, radioactive impurity exists in our commercial radioactive testosterone. The regression formula from the current column versus column-less methodologies was used to correct this bias, and applied to the 100 sample study. The Deming regression comparison of the 100 patients, after the correction, gave a slope of 0.914, a correlation coefficient of 0.9872, and a mean percent bias of -4.27%. Conclusion: A new column-less technique gave similar results (bias <5%) for free testosterone levels, to the discontinued commercial columns. The column-less technique requires a correction; however, has the added benefit of requiring less radioactive material and significantly reducing technician time.
A-236Determination of Reference Intervals in Apparently Healthy Pediatric Subjects for IMMULITE Thyroid and ADVIA Centaur TSH3UL Assays
B. Plouffe1, T. Mardovina1, S. Gafary1, R. Marcus1, R. Levine1, V. Bitcom1, R. Levy1, R. Molinaro1, R. H. Christenson2. 1Siemens Healthcare Diagnostics, Tarrytown, NY, 2The University of Maryland School of Medicine, Baltimore, MD
Background: Establishing age-specific reference intervals for thyroid hormones improves interpretation of laboratory measurements and facilitates diagnosis of endocrine diseases in pediatric practice. A challenge for establishing pediatric reference intervals has been the availability of samples from well-characterized healthy pediatric subjects. This study used methodology consistent with CLSI guidelines to pedigree and collect samples from apparently healthy pediatric subjects presenting for regular well-child care. It then determined reference intervals for IMMULITE® Thyroid and ADVIA Centaur® TSH3UL assays from Siemens Healthcare Diagnostics.Methods: Eight U.S. sites prospectively collected samples from apparently healthy pediatric subjects under institutionally approved consent/assent procedures. Subjects were normal according to CDC weight- and height-based growth charts, were assessed by pediatricians and determined to be free of chronic and acute diseases, were not on medication, had no family history of thyroid dysfunction and no visible or palpable goiters, and were negative for anti-thyroglobulin anti-thyroid peroxidase antibodies. Three age strata were analyzed, each with approximately equal numbers of males and females. Samples were tested at a central laboratory in singleton using
the IMMULITE 2000 and ADVIA Centaur Immunoassay Systems. For the two older subgroups, the respective lower and upper reference limits were defined as the 2.5th and 97.5th percentiles of test results. For the infant subgroup, a robust method (Horn and Pesce) was used to calculate the reference intervals.Results:
System Assaya Infants (1-23 months)
Children (2-12 years)
Adolescents(13-20 years)
2.5-97.5th n 2.5-97.5th n 2.5-97.5th n
IMMULITE TSH 3G 0.83-6.5b 90 0.58-4.1 195 0.39-4.0 148
IMMULITE FT3 3.6-7.5 90 3.7-6.6 195 3.1-5.9 148
IMMULITE FT4 0.80-1.27 90 0.74-1.28 195 0.75-1.27 148
IMMULITE T3 116-241 90 109-206 195 93-170 148
IMMULITE T4 6.2-11.8 90 5.4-11.1 195 4.9-10.2 148
ADVIA Centaur TSH3UL 0.87-6.15b 94 0.67-4.16 198 0.48-4.17 150
aUnits: TSH 3G—µIU/mL; FT3—pg/mL; FT4—ng/dL; T3—ng/dL; T4—µg/dL; TSH3UL—µIU/mL. bInfant group Upper Reference Limit 90% CI is 5.58 to 7.65 µIU/mL for IMMULITE TSH 3G and 5.32 to 6.98 µIU/mL for ADVIA Centaur TSH3UL.Conclusion: Pediatric reference intervals were established for the IMMULITE Thyroid and ADVIA Centaur TSH3UL assays using rigorously pedigreed samples. These data will assist with the appropriate interpretation of thyroid measurements in pediatric patients.*Pediatric reference intervals for IMMULITE FT4 and TSH 3G assays are under FDA review. Product availability varies by country.
A-237Establishing a clinical cutoff for aldosterone-direct renin concentration ratio using retrospective data
D. Orton1, A. Leung2, G. Kline2, A. Chin1. 1Calgary Laboratory Services, Calgary, AB, Canada, 2University of Calgary Cumming School of Medicine, Calgary, AB, Canada
Objective: To characterize aldosterone-direct renin concentration ratio (DRC-ARR) ranges appropriate for evaluation of primary aldosteronism using population data for validated plasma renin activity ARR (PRA-ARR) as a benchmark. Relevance: The ARR is the standard screening test for primary aldosteronism. Past methods used to derive the ARR mainly employed the PRA, but with increased workloads and automation capabilities, the DRC has become more widespread. However, studies focusing on appropriate ARR cutoffs for primary aldosteronism using DRC are lacking. Methodology: Data was obtained from Calgary Laboratory Services from January, 2010 to December, 2015. The renin method changed from PRA to DRC in February, 2014, thus allowing analysis of data for both methods within a single population. Indirect comparison of the performance of DRC-based ARR and PRA thresholds was assessed using ROC curve analysis analyses using PRA-ARR values as the gold standard. Renin levels from each method were also evaluated for classification of “low renin” status. Results: Results from 5864 patients were obtained (associated with 6074 PRA-ARRs and 1405 DRC-ARRs). The Canadian Hypertension Education Program PRA-ARR threshold of >550 pmol/L/ng/mL/h showed a prevalence of PA of 37.2%. Within the elevated PRA-ARR patients, “low renin” was defined as the 95th percentile of the renin values obtained (<2.05ng/mL/h). Using a DRC-ARR value of >25 pmol/LmIU/L the prevalence was 38.9% and “low renin” was <28.0 mIU/L. Employing these low renin values for prediction of elevated ARR demonstrated sensitivities and specificities of 95% and 49% for PRA <2.05 ng/mL/h and 95% and 56% for DRC <28.0 mIU/L. Conclusions: A DRC-ARR threshold of >25 pmol/L/mIU/L performed with similar high sensitivity to the conventional PRA-ARR threshold of >550 pmol/L/ng/mL/h for PA. Additionally, DRC levels <28.0 mIU/L should be considered compatible with low-renin status in a hypertension population. Retrospective assessment of laboratory data is a useful tool to establish reference intervals and cutoff for clinical management of patients.
68th AACC Annual Scientific Meeting Abstracts, 2016 S81
Endocrinology/Hormones Tuesday, August 2, 9:30 am – 5:00 pm
A-238Frequency of Pseudohyper- and Pseudohypo-calcemia in an Emergency Department Setting at a large Tertiary Care Hospital
S. Roychoudhury, M. Solanki, L. Bilello, S. Weinerman, L. K. Bjornson. North Shore University Hospital, Northwell Hofstra School of Medicine, Manhasset, NY
Introduction: The total serum/plasma calcium (Ca) concentration consists of three fractions with approximately 15% bound to organic & inorganic anions, 40% bound to albumin and 45% containing the physiologically active “ionized calcium” or more accurately the free & unbound calcium (CaIO). Total calcium (Ca) is part of the basic metabolic panel and is most often used as the primary indicator of calcium status because the assay is easily automated, rapid & cost effective. However, the CaIO (free or ionized calcium) concentration is considered to be a more accurate indicator of calcium status since it is the physiologically active fraction & is tightly regulated by parathyroid hormone & vitamin D. The concordance between total & ionized calcium measurements is moderate in healthy subjects and is poor in patients with severe acid-base disorders, hyperparathyroidism, hyperphosphatemia, or chronic kidney disease. Total calcium concentrations can change independently of ionized calcium concentrations and vice versa. If the Ca concentration is elevated in the setting of a normal CaIO, it is termed pseudohypercalcemia., and if Ca is low with a normal CaIO, it is termed pseudohypocalcemia.Objective / Methods: This study was designed to determine the frequency of pseudohyper- and pseudohypo-calcemia and to calculate concordance of Ca & CaIO measurements from patients in an Emergency Department setting. Ca measurements were performed on the Roche Modular P800 system using 0-cresol-phthalein complexone and CaIO measurements performed on the Radiometer 827 blood gas system using ISE (ion selective electrode) methodology.Results/Discussion: A computer search of the data base from the E. D. of a large tertiary care hospital in Long Island, NY identified 334 patients with paired Ca & CaIO results from specimens drawn within 1 hour on each patient. No clinical history or other lab results were considered for this study. Based on the Ca concentration (reference range 8.4 - 10.5 mg/dL), 7 out of 334 patients (2.1%) were classified hypercalcemic, 307 (91.9%) normocalcemic and 20 (6.0%) hypocalcemic. In the hypercalcemic group, 2 of 7 patients had normal CaIO results (reference range 1.12 - 1.30 mmol/L) and were classified as pseudohypercalcemic (0.6% of total group / 28.6% of hypercalcemic group). In the hypocalcemic group 14 of 20 patients had normal CaIO results and were classified as pseudohypocalcemic (4.2% of total group / 70% of hypocalcemic group). Additionally, in the 307 patients classified as normocalcemic by Ca, 36 had abnormal CaIO concentrations (29 low & 7 high CaIO) showing an 88.3% concordance between Ca & CaIO.Conclusion: The frequency of pseudohypercalcemia is very low in the whole group (0.6%) but was 28.6% for the hypercalcemic group. The frequency of pseudohypocalcemia was higher in the whole group (4.2%) and much higher (70%) in the hypocalcemic group. Concordance of Ca & CaIO in the normocalcemic group was 88.3%. These results indicate that ionized calcium measurements should be considered, especially in hypo- and hyper-calcemia classified by Ca concentrations.


