Embed Size (px)
Citation preview

Photo by Kathi Kube at Discover Magazine
U.S. Department of Transportation
Federal Railroad Administration
Risk Evaluation Framework and Selected Metrics for Tank Cars Carrying Hazardous Materials
Office of Research and Development Washington, DC 20590
DOT/FRA/ORD-15/07 Final Report May 2015

NOTICE
This document is disseminated under the sponsorship of the Department of Transportation in the interest of information exchange. The United States Government assumes no liability for its contents or use thereof. Any opinions, findings and conclusions, or recommendations expressed in this material do not necessarily reflect the views or policies of the United States Government, nor does mention of trade names, commercial products, or organizations imply endorsement by the United States Government. The United States Government assumes no liability for the content or use of the material contained in this document.
NOTICE
The United States Government does not endorse products or manufacturers. Trade or manufacturers’ names appear herein solely because they are considered essential to the objective of this report.

i
REPORT DOCUMENTATION PAGE Form Approved OMB No. 0704-0188
Public reporting burden for this collection of information is estimated to average 1 hour per response, including the time for reviewing instructions, searching existing data sources, gathering and maintaining the data needed, and completing and reviewing the collection of information. Send comments regarding this burden estimate or any other aspect of this collection of information, including suggestions for reducing this burden, to Washington Headquarters Services, Directorate for Information Operations and Reports, 1215 Jefferson Davis Highway, Suite 1204, Arlington, VA 22202-4302, and to the Office of Management and Budget, Paperwork Reduction Project (0704-0188), Washington, DC 20503.
1. AGENCY USE ONLY (Leave blank)
2. REPORT DATE May 2015
3. REPORT TYPE AND DATES COVERED Technical Report
September 2009 – September 2012
4. TITLE AND SUBTITLE Risk Evaluation Framework and Selected Metrics for Tank Cars Carrying Hazardous Materials
5. FUNDING NUMBERS
6. AUTHOR(S) Alan Bing, Anthony Dizon, Jennifer Brickett, Andrew Papson, and Laurence O’Rourke
7. PERFORMING ORGANIZATION NAME(S) AND ADDRESS(ES) ICF International Booz Allen Hamilton, Inc. P.O. Box 7777 8283 Greensboro Drive Philadelphia, PA 19175 McLean, VA 22102
8. PERFORMING ORGANIZATION REPORT NUMBER
9. SPONSORING/MONITORING AGENCY NAME(S) AND ADDRESS(ES) U.S. Department of Transportation Federal Railroad Administration Office of Railroad Policy and Development Office of Research and Development Washington, DC 20590
10. SPONSORING/MONITORING AGENCY REPORT NUMBER
DOT/FRA/ORD-15/07
11. SUPPLEMENTARY NOTES COTR: Francisco González, III
12a. DISTRIBUTION/AVAILABILITY STATEMENT This document is available to the public through the FRA Web site at http://www.fra.dot.gov.
12b. DISTRIBUTION CODE
13. ABSTRACT (Maximum 200 words) This report presents an analysis of train accident and hazmat release data to quantify the likelihood of a hazmat release. The harm caused by a hazmat release is characterized as the end result of a chain of events, with each link in the chain being characterized by risk metrics that determine likelihood of occurrence.
The chain of events is typically comprised of the following: 1) Freight train accident (due to an infrastructure or equipment defect) failure of signal or communications equipment, human error, or miscellaneous cause; 2) One or more freight cars derailed in accident, as a function of accident type, train speed, etc.; 3) Hazmat tank cars among derailed cars, depending on hazmat car routing practice; 4) Derailed hazmat tank car releases following a train accident; and 5) Harm to people, property, and/or the environment from exposure to released hazmat.
Analysis and findings in this report will provide regulatory, industry, and general public stakeholders a better understanding of the “chain of events” leading to a hazmat release from a tank car, the impact of risk reduction measures that can be applied at different links along the chain of events, and a quantifiable risk model representing the chain of events leading to a hazmat release. 14. SUBJECT TERMS Risk evaluation, tank car, toxic by inhalation, poisonous by inhalation, hazardous materials
15. NUMBER OF PAGES 132
16. PRICE CODE
17. SECURITY CLASSIFICATION OF REPORT Unclassified
18. SECURITY CLASSIFICATION OF THIS PAGE Unclassified
19. SECURITY CLASSIFICATION OF ABSTRACT Unclassified
20. LIMITATION OF ABSTRACT
NSN 7540-01-280-5500 Standard Form 298 (Rev. 2-89) Prescribed by ANSI Std. 239-18
298-102

ii
METRIC/ENGLISH CONVERSION FACTORS
ENGLISH TO METRIC METRIC TO ENGLISH
LENGTH (APPROXIMATE) LENGTH (APPROXIMATE) 1 inch (in) = 2.5 centimeters (cm) 1 millimeter (mm) = 0.04 inch (in) 1 foot (ft) = 30 centimeters (cm) 1 centimeter (cm) = 0.4 inch (in)
1 yard (yd) = 0.9 meter (m) 1 meter (m) = 3.3 feet (ft) 1 mile (mi) = 1.6 kilometers (km) 1 meter (m) = 1.1 yards (yd)
1 kilometer (km) = 0.6 mile (mi)
AREA (APPROXIMATE) AREA (APPROXIMATE) 1 square inch (sq in, in2) = 6.5 square centimeters (cm2) 1 square centimeter (cm2) = 0.16 square inch (sq in, in2)
1 square foot (sq ft, ft2) = 0.09 square meter (m2) 1 square meter (m2) = 1.2 square yards (sq yd, yd2) 1 square yard (sq yd, yd2) = 0.8 square meter (m2) 1 square kilometer (km2) = 0.4 square mile (sq mi, mi2) 1 square mile (sq mi, mi2) = 2.6 square kilometers (km2) 10,000 square meters (m2) = 1 hectare (ha) = 2.5 acres
1 acre = 0.4 hectare (he) = 4,000 square meters (m2)
MASS - WEIGHT (APPROXIMATE) MASS - WEIGHT (APPROXIMATE) 1 ounce (oz) = 28 grams (gm) 1 gram (gm) = 0.036 ounce (oz) 1 pound (lb) = 0.45 kilogram (kg) 1 kilogram (kg) = 2.2 pounds (lb)
1 short ton = 2,000 pounds (lb)
= 0.9 tonne (t) 1 tonne (t)
= =
1,000 kilograms (kg) 1.1 short tons
VOLUME (APPROXIMATE) VOLUME (APPROXIMATE) 1 teaspoon (tsp) = 5 milliliters (ml) 1 milliliter (ml) = 0.03 fluid ounce (fl oz)
1 tablespoon (tbsp) = 15 milliliters (ml) 1 liter (l) = 2.1 pints (pt) 1 fluid ounce (fl oz) = 30 milliliters (ml) 1 liter (l) = 1.06 quarts (qt)
1 cup (c) = 0.24 liter (l) 1 liter (l) = 0.26 gallon (gal) 1 pint (pt) = 0.47 liter (l)
1 quart (qt) = 0.96 liter (l) 1 gallon (gal) = 3.8 liters (l)
1 cubic foot (cu ft, ft3) = 0.03 cubic meter (m3) 1 cubic meter (m3) = 36 cubic feet (cu ft, ft3) 1 cubic yard (cu yd, yd3) = 0.76 cubic meter (m3) 1 cubic meter (m3) = 1.3 cubic yards (cu yd, yd3)
TEMPERATURE (EXACT) TEMPERATURE (EXACT)
[(x-32)(5/9)] °F = y °C [(9/5) y + 32] °C = x °F
QUICK INCH - CENTIMETER LENGTH CONVERSION10 2 3 4 5
InchesCentimeters 0 1 3 4 52 6 1110987 1312
QUICK FAHRENHEIT - CELSIUS TEMPERATURE CONVERSIO -40° -22° -4° 14° 32° 50° 68° 86° 104° 122° 140° 158° 176° 194° 212°
°F
°C -40° -30° -20° -10° 0° 10° 20° 30° 40° 50° 60° 70° 80° 90° 100°
For more exact and or other conversion factors, see NIST Miscellaneous Publication 286, Units of Weights and Measures. Price $2.50 SD Catalog No. C13 10286 Updated 6/17/98

iii
Forward
Given that a release of hazardous material from a damaged railroad tank car after a train accident could cause serious harm, the risks associated with such incidents have been the subjects of numerous research and analysis efforts and many risk-related technical reports and papers have been published. Government agencies with regulatory oversight jurisdiction and industry associations have developed a body of regulations, standards and best practices to ensure safe transportation of hazardous materials by rail, and they are continually being updated as new information becomes available.
Because of the subject’s complexity, most research and analysis efforts are focused on one aspect of hazmat transportation safety – either the construction of tank cars to contain the hazardous material in the event of an accident, the root causes of an accident involving hazardous material, or the specific hazards posed by a particular class of hazardous material shipped by rail. At its outset, the research effort described in this report similarly focused on the risks associated with transporting a material that is a toxic inhalation hazard (TIH), or poison inhalation hazard (PIH), by railroad tank cars. However, the focus evolved as the project moved forward, and instead the team worked toward a broader understanding of the full sequence of events leading to the release of hazardous material from a damaged or improperly handled tank car. Moreover, by the time the project was completed, the volume and types of hazmat shipments conducted by rail had significantly changed (due to recent developments in the oil and natural gas industries as well as a growth in the use of hazmat unit trains).
This report describes the overall sequence of events in a hazardous material release, starting from the accident which caused the release and leading up to the consequences of a release. Data from publicly available sources was analyzed, and the frequencies and conditional probabilities along the chain of events between the originating accident and the consequences of a release were quantified. This report does not attempt to provide comprehensive risk analysis or evaluation for railroad hazmat transportation, but instead offers metrics (i.e., frequencies and conditional probabilities along the chain of events) that support the preparation of risk evaluations and illustrate the key factors affecting risk.

iv
Contents
Forward .................................................................................................................................... iii
Illustrations .................................................................................................................................... vi
Tables ................................................................................................................................... vii
Executive Summary ........................................................................................................................ 1
1. Introduction ................................................................................................................. 6 1.1 Overview ..................................................................................................................... 6 1.2 Objectives .................................................................................................................... 7 1.3 Scope ........................................................................................................................... 8 1.4 Organization of the report ........................................................................................... 8
2. Methodology.............................................................................................................. 11 2.1 Overview ................................................................................................................... 11 2.2 Data Sources .............................................................................................................. 16 2.3 Definition and Calculation of Risk Metrics .............................................................. 22 2.4 Using the Risk Metrics .............................................................................................. 28
3. Analysis of Risk Metrics ........................................................................................... 30 3.1 Overview ................................................................................................................... 30 3.2 Baseline Metrics for Train Accidents and Cars Derailed in a Train Accident .......... 31 3.3 Accidents and Cars Derailed in Trains with One or More Hazmat Cars .................. 40 3.4 Analysis of Hazmat Car Derailments and Releases from Hazmat Cars .................... 44
4. Risk Reduction Analysis ........................................................................................... 49 4.1 Overview ................................................................................................................... 49 4.2 Positive Train Control (PTC) .................................................................................... 50 4.3 Rail Defect Management through Rail Integrity Rule .............................................. 51 4.4 Electronically Controlled Pneumatic (ECP) Brakes ................................................. 53
5. Conclusions and Recommendations .......................................................................... 56 5.1 Overview ................................................................................................................... 56 5.2 Analysis Objectives ................................................................................................... 56 5.3 Discussion of Key Accident and Hazmat Release Risk Metrics ............................... 57 5.4 Future Considerations ................................................................................................ 62
6. References ................................................................................................................. 64
Abbreviations and Acronyms ....................................................................................................... 66
Introduction to Appendices and Data Used in Report .................................................................. 68
Appendix A. Total and Hazmat-Specific US Railroad Traffic Data .................................... A-1
Appendix B. Development of the Accident Cause Grouping Scheme and Calculation of Baseline Freight Train Accident Frequencies ............................................................................. B-1

v
Appendix C. Calculation of Baseline Accident and Cars Derailed Data for Trains With Hazmat Cars in the Consist ......................................................................................................... C-1
Appendix D. Hazmat Releases and Hazmat Release Accidents .......................................... D-1
Appendix E. Estimated Railroad Accidents, Car derailments and Hazmat Releases after Implementation of Risk Reduction Measures ..............................................................................E-1
Appendix F. Hazmat Consequences ......................................................................................... F-1
Appendix G. Abbreviated List of Hazmat Consequences .................................................... G-1

vi
Illustrations
Figure 1. Chain of Events in a Tank Car Hazmat Incident .......................................................... 12
Figure 2. Fault Tree for Hazardous Materials Releases ............................................................... 14
Figure 3. Accidents on Main Line Track ..................................................................................... 34
Figure 4. Accidents by Cause Group and Track Class ................................................................ 37
Figure 5. Percent of Cars in a Consist Derailed by Accident Type ............................................. 40
Figure 6. Example Risk Reduction Application .......................................................................... 50
Figure 7. Chain of Events for a Tank Car Hazmat Incident ........................................................ 57

vii
Tables
Table 1. Overall Rail Traffic Totals on U.S. Railroads (2004–2008).......................................... 17
Table 2. Distribution of Car and Train-Miles by FRA Track Class – Class I Railroads (1991) . 18
Table 3. Tank Car Hazmat Carloads by Year (2004–2008) ........................................................ 19
Table 4. Hazmat Carloads and Car-Miles by Railcar Type (2004–2008) ................................... 19
Table 5. FRA RAIRS Threshold Reporting Requirement ........................................................... 20
Table 6. Accident Cause Categories ............................................................................................ 20
Table 7. FRA Track Classes and Speed Limits for Freight Trains .............................................. 23
Table 8. Summary of Accident and Car Derailment Metrics from Table A2.5 ........................... 33
Table 9. Top Ten Accident Causes .............................................................................................. 35
Table 10. Top Ten Accidents Causes by Cars Derailed .............................................................. 38
Table 11. Accident, Train-Miles and Accident Frequency by FRA Track Class ........................ 39
Table 12. Comparison of Accident Numbers and Percentages between All Trains and Hazmat Trains .................................................................................................................................... 41
Table 13. Top Ten Accident Causes for Hazmat Trains .............................................................. 42
Table 14. Comparison of Numbers and Percentages of Cars Derailed between All Trains and Hazmat Trains ....................................................................................................................... 43
Table 15. Top Ten Accident Cause Groups for Derailed Cars in Hazmat Trains ....................... 43
Table 16. Hazmat Car Derailment Metrics .................................................................................. 45
Table 17. Car Derailment Frequencies ........................................................................................ 46
Table 18. Top Ten Accident Cause Groups for Hazmat Releases ............................................... 47
Table 19. Cars Releasing per Accident ........................................................................................ 48
Table 20. Analysis Results for Positive Train Control ................................................................ 51
Table 21. Analysis Results for Improved Rail Flaw Inspection and Maintenance Practices ...... 53
Table 22. Analysis Results for ECP Brakes................................................................................. 54
Table 23. Accident and Car Derailment Frequencies .................................................................. 57
Table 24. Leading Accident Causes............................................................................................. 58
Table 25. Leading Accident Causes by Cars Derailed ................................................................ 59
Table 26. Estimate of Derailed Hazmat Cars (2004 – 2008) ....................................................... 60
Table 27. Leading Accident Cause Groups for Hazmat Releases ............................................... 60
Table 28. Percentage Reduction in Cars Derailed from Risk Reduction Actions ....................... 61

viii
Table A-1 Freight Train-Miles and Car-Miles, 2004 - 2008 ...................................................... A-2
Table A-2 Distribution of Train Miles by FRA Track Class ...................................................... A-2
Table A-3 Comparison of Distribution of Train-Miles by FRA Track Class From Two SurveysA-3
Table A-4 Non-Class I Railroad Statistics .................................................................................. A-3
Table A-5 US and Canadian Hazmat Carload Statistics ............................................................. A-5
Table A-6 Summary of Tank Car and Hazmat Traffic on the US Rail System 2004-2008 ....... A-6
Table A-7 US Rail Hazmat Traffic in Tank cars by DOT Hazard Class .................................... A-6
Table F-1 High Volume Materials by Hazmat Class ................................................................... F-2

1
Executive Summary
Overview United States freight railroads carry substantial volumes of hazardous materials (hazmat) in tank cars, exceeding 1 million carloads per year. A train accident in which hazmat is released can have serious consequences, including loss of life and injury to people near the site of the accident as well as damage to property and the environment. Because of potentially severe consequences, safety regulations and industry standards have been developed specifically to prevent or to reduce the chances of such accidents occurring and releasing hazmat. These regulations and standards encompass design, construction, maintenance, and inspection of hazmat tank cars, as well as numerous railroad operating practices applicable to trains conveying hazmat cars.
Due to the lethal properties of toxic inhalation hazard (TIH) or poison inhalation hazard (PIH) commodities, principally chlorine and anhydrous ammonia, transporting them is of particular concern to the Government and industry. Moreover, the crashworthiness and structural performance of railroad tank cars carrying TIH have come under greater scrutiny due to serious accidents that occurred in Minot, North Dakota on January 18, 2002; in Macdona, Texas on June 28, 2004; and in Graniteville, South Carolina on January 6, 2005. Consequently, safety regulations and industry standards have been proposed to reduce the risk of TIH releases, which include: requiring tank cars that carry TIH materials to be more robust, installing Positive Train Control (PTC) on routes with specific TIH volumes, and re-routing TIH shipments away from areas with high population density. To evaluate the effectiveness of various initiatives to reduce the occurrence of hazmat releases and the consequences in terms of harm to people, property, and the environment, it is essential to define the chain of events that lead to a release of hazmat. The chain of events can provide a framework to formulate a quantitative risk model. In this report, the framework, which is based on the chain of events and publically available data, is used to calculate baseline risk metrics (i.e. frequencies and conditional probabilities) and populate a risk model. The risk model is then used to estimate the change in one or more risk metrics that would result from applying the safety initiative. This report describes the chain of events that lead to a hazmat release, defines the corresponding risk metrics and how they vary with equipment and operational factors, and describes estimates of selected risk metrics before and after implementation of risk reduction initiatives. This report does not include cost/benefit analysis of risk reduction measures.

2
Analysis The chain of events that lead to a hazmat release and consequent harm is shown in Figure ES1.
Figure ES1. Hazmat Release Chain of Events The chain of events is:
1. A train accident occurs, characterized by the frequency due to different causes. 2. The number of cars damaged or derailed in the accident, which is a function of train
length, speed, and accident cause. 3. The probability that each damaged or derailed car will contain hazmat is considered, as
well as the nature of the hazmat in each car if present. These factors are functions of the numbers and types of hazmat being shipped over the portion of the US rail system under study.
4. The probability that the contents in the damaged or derailed car will be released is considered, this is a function of tank car specification, and to some degree, train speed, train length, and accident cause.
5. The harm caused by the release of hazmat, which is a function of the hazmat product being released and the emergency response actions after the release.
This analysis concentrates on the early links in the chain of events. Specifically, it focuses on the train accident, which initiates the chain, leads to car derailments, and affects which factors other than tank car design might influence the conditional probability of release from a damaged or derailed tank car. The considerations that led to this decision are:
• Past and ongoing statistical and engineering studies have covered the relationship between tank car design features (e.g. tank and head thickness, design and placement of valves and fittings, etc.) and the conditional probability of release given a damaged or derailed car. The present work relies on information from these efforts.
• It is preferable to focus on preventing the train accident from occurring in the first place, although an effective emergency response to a hazmat release is essential and can limit the harm from the release. All releases have the potential to cause substantial harm, even with the best emergency response.
• Several safety initiatives are being considered or implemented that would reduce hazmat releases (especially PIH materials) by preventing the initial accident or stopping the car from being derailed. The relative effectiveness of these initiatives is estimated and described in this report.

3
The specific risk metrics associated with the chain of events and those used in a hazmat release risk model are shown in Table ES1. Event frequencies are expressed as the number of events over a defined operational parameter such as train-miles or hazmat shipments. The risk metrics analyzed in this report are shown in bold italics. Risk metrics were taken from an analysis of data from the Federal Railroad Administration (FRA) Rail Accident/Incident Reporting System (RAIRS) and the Pipeline and Hazardous Materials Safety Administration (PHMSA) database of hazmat releases for the calendar years 2004 to 2008 The five-year period was a compromise between obtaining a database that was large enough database for analysis and finding data that reasonably represented operating conditions of that time frame. Data on railroad and hazmat traffic for the period were compiled from information obtained from the Association of American Railroads (AAR) / Bureau of Explosives (BOE) as well as the Surface Transportation Board (STB) rail freight waybill sample, and it was used to normalize the risk metrics.
Table ES1. Risk Metrics
Risk Metric Function of Train accident frequency Accident cause, FRA Track Class, Railroad Type
(Class I or non-Class I) Car derailment probability Train speed, train length, loading
Conditional probability of car containing hazmat Relative volumes of freight and hazmat
shipments on route being analyzed Conditional probability of release from derailed car
Tank car design/construction, train speed, accident cause
Conditional probability of harm from release Hazmat type, emergency response action
The baseline analysis described in this report gives estimates on the numbers of accidents and derailed cars for different accident-cause groups. These results provide a database of risk metrics for freight shipments by rail in general and hazmat shipments in particular. One notable observation from this data is that broken rails, welds, and other rail defects are the most frequent causes of hazmat release accidents. Accidents from rail defects were 13 percent of freight train accidents, 26 percent of freight car derailments, and 47 percent of hazmat releases. Risk Reduction Measures This report examined three safety initiatives that are designed to reduce the number of train accidents that could lead to hazmat releases:
• Application of Positive Train Control (PTC) • Implementation of a new Rail Integrity Rule developed through the Railroad Advisory
Committee (RSAC) • Implementation of Electronically Controlled Pneumatic (ECP) brakes
4
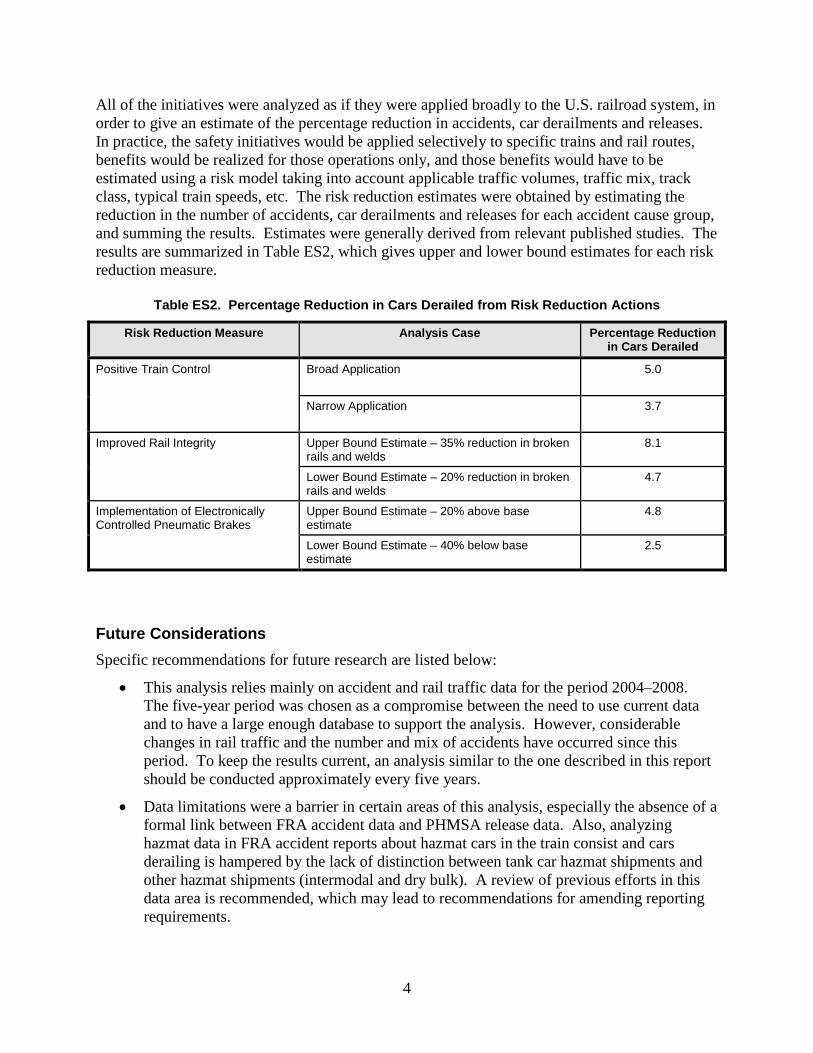
All of the initiatives were analyzed as if they were applied broadly to the U.S. railroad system, in order to give an estimate of the percentage reduction in accidents, car derailments and releases. In practice, the safety initiatives would be applied selectively to specific trains and rail routes, benefits would be realized for those operations only, and those benefits would have to be estimated using a risk model taking into account applicable traffic volumes, traffic mix, track class, typical train speeds, etc. The risk reduction estimates were obtained by estimating the reduction in the number of accidents, car derailments and releases for each accident cause group, and summing the results. Estimates were generally derived from relevant published studies. The results are summarized in Table ES2, which gives upper and lower bound estimates for each risk reduction measure.
Table ES2. Percentage Reduction in Cars Derailed from Risk Reduction Actions
Risk Reduction Measure Analysis Case Percentage Reduction in Cars Derailed
Positive Train Control Broad Application
5.0
Narrow Application
3.7
Improved Rail Integrity Upper Bound Estimate – 35% reduction in broken rails and welds
8.1
Lower Bound Estimate – 20% reduction in broken rails and welds
4.7
Implementation of Electronically Controlled Pneumatic Brakes
Upper Bound Estimate – 20% above base estimate
4.8
Lower Bound Estimate – 40% below base estimate
2.5
Future Considerations Specific recommendations for future research are listed below:
• This analysis relies mainly on accident and rail traffic data for the period 2004–2008. The five-year period was chosen as a compromise between the need to use current data and to have a large enough database to support the analysis. However, considerable changes in rail traffic and the number and mix of accidents have occurred since this period. To keep the results current, an analysis similar to the one described in this report should be conducted approximately every five years.
• Data limitations were a barrier in certain areas of this analysis, especially the absence of a formal link between FRA accident data and PHMSA release data. Also, analyzing hazmat data in FRA accident reports about hazmat cars in the train consist and cars derailing is hampered by the lack of distinction between tank car hazmat shipments and other hazmat shipments (intermodal and dry bulk). A review of previous efforts in this data area is recommended, which may lead to recommendations for amending reporting requirements.

5
• Due to recent developments in the energy industry, high-volume shipments of ethanol and crude oil have grown and there might be future increases in liquefied natural gas (LNG) shipments. Use of hazmat unit trains is growing, and serious accidents involving these trains have occurred. Research into potential risks associated with hazmat unit train accidents leading to releases from multiple cars is recommended. In addition, energy industry developments should be monitored to identify future growth in hazmat unit train traffic and large multicar hazmat shipments.
• Review of the TIH releases compiled by the RSI-AAR Tank Car Safety Project (Treichel, 2006), supplemented by more recent data, and makes it clear that chlorine is by far the most hazardous of these materials because of its extreme toxicity and relatively high volume of shipments. Continued research into this commodity is warranted.
• Given that track defects play a major role in causing accidents that result in hazmat releases, researching the effectiveness of intensive track inspection and maintenance, as well as possible speed limits, in areas where high hazmat volume is combined with high population density is essential.
• Hazmat releases from accidents caused by broken rails and welds were highly ranked, and should be further studied. Other highly-ranked accidents causes, which warrant further study, include train handling problems and obstruction collisions. Automated freight car inspection is suggested as an approach to reduce equipment-caused accidents.

6
1. Introduction
1.1 Overview Substantial quantities of hazardous materials (hazmat), typically in bulk quantities of up to 100 tons, are shipped over the U.S. railroad network in tank cars. If released into the open air from a damaged tank car in the event of accident, these materials can cause serious harm to people, property, and the environment. Although train accidents resulting in a release of hazmat into the environment are a rare event (about 40 annually out of more than a million carload shipment), a small number of releases have had catastrophic consequences, including large-scale pollution, property damage and multiple fatalities. Because of this exposure to a rare but catastrophic event, responsible government agencies and the railroad and chemical industries continue to work on reducing risk by upgrading regulations, standards and practices applicable to railroad hazmat transportation.
Hazmat safety regulations1 and practices are structured to reduce the risk of accidents involving hazmat shipments and minimize the release of hazmat into the environment. The regulations cover the design, construction, inspection, maintenance, and use of hazmat tank cars, as well as operating practices applicable to trains conveying hazmat in tank cars. The primary goal of these regulations and corresponding safety initiatives is to protect the people in zones that could be affected by a hazmat release, while secondary goals are preventing harm to property and the environment, as well as maximizing the ease of evacuations after a release.
Safely shipping toxic inhalation hazard (TIH) chemicals, or poison inhalation hazard (PIH) chemicals, is important to the Government and industry due to the lethal nature of these materials. Fatal accidents involving TIH occurred in Minot, North Dakota on January 18, 2002 [1]; in Macdona, Texas on June 28, 2004 [2]; and in Graniteville, South Carolina on January 6, 2005 [3]. Subsequently, safety regulations were issued to reduce the risk of train collisions and derailments, which mandated the installation of Positive Train Control (PTC) on routes used for TIH shipments,2 required that railroads consider alternate routings for TIH where the risk exposure is lower3, and required more robust tank cars transporting TIH materials.4
Efforts to evaluate the effectiveness of proposed changes in railroad tank car safety regulations, standards and practices, for PIH and other hazardous materials, has been hampered by the lack of readily available comparative risk data for all steps in the chain of events that lead to a hazmat release. This is especially true when comparing the benefits of risk reduction actions at different points in the chain of events; for example, evaluating the benefits from installing Positive Train Control (PTC) on selected routes and comparing them with the benefits gained from changes in tank car design. 1 Primary safety regulations and corresponding laws for accidents and hazmat release include CFR Title 49: Transportation §172.102 Special Provisions; CFR Title 49: Transportation §174 Carriage by Rail; Rail Safety Improvement Act of October 2008; CFR Title 49: Transportation §100-199 provides regulations regarding hazardous materials in general; and CFR Title 49: Transportation §200-299. 2 Mandated by the Rail Safety Improvement Act of October 2008 3 PHMSA Final Rule HM-232e, published on November 26, 2008 4 PHMSA Final Rule HM-246, published on January 13, 2009

7
1.2 Objectives The primary objective of this report is to describe the chain of events for a tank car involved in a train accident. The chain of events comprises the following steps:
1. Freight train accident, which is due to an infrastructure or equipment defect, failure of signal or communications equipment, human error, or miscellaneous cause;
2. One or more freight cars derailed in an accident, which depends on the type of accident, train speed, and other factors;
3. Hazmat tank cars are among the derailed cars, which depends on hazmat car routing practices;
4. Derailed hazmat tank car releases hazmat following a train accident; and
5. Released hazmat causes harm to people, property and/or the environment
Each step along the chain is assigned an event frequency or conditional probability. For the purposes of this report, the chain of events provides a framework for risk evaluations and the event frequencies or conditional probabilities represent risk metrics.
The other objectives of this report are described as follows:
1. Identify metrics that quantify the risks associated with train hazmat shipments that are moving over a specific railroad route segment, including the chance that a train or shipment will be in an accident, that a hazmat tank car will be derailed in an accident, and the probability that hazmat is released from one or more of the derailed tank cars.
2. Using FRA and PHMSA accident data, quantify base case risk metrics as a function of railroad operating parameters–such as railroad class and FRA track class–for each independent link in the chain of events. The base case represents railroad and hazmat transportation practices over the period 2004-2008, before the risk reduction measures outlined below were implemented.
3. Using the same metrics, analyze the risks and consequences of hazmat releases after implementation of safety improvements which include:
• Installation of Positive Train Control (PTC) as mandated by the Rail Safety Improvement Act (RSIA) of October 2008,
• Implementation of a “Rail Integrity Rule” for enhanced inspection procedures and processes to reduce broken rails and welds, which was developed through the Railroad Safety Advisory Committee (RSAC),5 and
• Application of Electronically Controlled Pneumatic (ECP) brakes to train conveying loaded TIH cars.
5 FRA established the RSAC to provide a forum for developing consensus recommendations to the Administrator of FRA on rulemakings and other safety program issues. RSAC includes representation from railroads, labor organizations, suppliers, manufacturers, and other interested parties. The final rule on improving rail integrity was published in the Federal Register on January 24, 2014.

8
Finally, future research activities will be recommended based on the findings of this report.
1.3 Scope This analysis addresses the transportation of hazardous materials as designated by the US Department of Transportation (DOT) in railroad tank cars on the general rail system of the United States. It excludes consideration of hazmat in packaging other than tank cars (such as hazmat carried in intermodal containers, dry bulk materials carried in covered hopper cars). When tank cars release hazardous materials such as liquids and compressed gases, these incidents are of the highest concern because of the large volume (up to 100 tons) that could be released from a single damaged car and the ease with which released liquids and gases can flow away from the accident site to cause harm to people, property, and the environment. Additionally, the analysis is limited to hazardous materials released as a consequence of FRA-reportable train accidents6 and excludes non-accident releases such as during loading or unloading tank cars at a terminal.
Any analysis of hazmat risks requires: (1) information on the occurrence of accidents, hazmat releases or other undesired events, and (2) data on the exposure to risk, which is represented by information on the volume of hazmat traffic moving through the US railroad network. In this analysis, accident and release data were obtained from databases maintained by FRA and PHMSA. Railroad and hazmat traffic data were obtained from data reported to STB and railroad industry publications. Since many hazmat shipments travel between the U.S. and Canada, shipment data was carefully analyzed to exclude the portion of international movements outside the U.S.
The analysis concentrates on the early steps in the chain of events leading up to a release, using accident and release data from 2004 through 2008. Risk metrics are defined and numerical values are developed to characterize frequencies and conditional probabilities the probabilities at different points along the chain of events. The analysis shows the dependence of accident and release risks on train type, track class, accident cause and speed, tank characteristics, and other factors.
1.4 Organization of the report The report is organized into the following chapters.
Chapter 2 – Methodology describes the analytical process, which includes the following elements:
• An overview which describes the steps in the chain of events that lead to a release and lists the risk metrics that quantify the likelihood and consequences of train accidents, car derailments and damage, damage to a hazmat car if among the derailed cars, and hazmat release;
6 CFR Title 49: Transportation §225 Railroad Accidents/Incidents: Reports Classification, and Investigations. Any collision, derailment, fire, explosion, act of God, or other event involving the operation of on-track equipment (standing or moving) that results in total damages to all railroads involved in the event that is greater than the current reporting threshold (year 2006 $7,700 US or $9,300 CDN) to railroad on-track equipment, signals, track, track structures, and roadbed.

9
• A description of the data sources used for determining risk metrics, with particular attention paid to the different criteria and reporting requirements applicable to data used in the databases. This step in the process also includes the methodologies used to generate links between data sources;
• Definitions of risk factors that may affect the likelihood and consequences accidents, derailments, or hazmat releases;
• Analysis methodologies used to quantify risk metrics (based on available data) as a function of risk factors identified for each step in the chain of events leading to hazmat releases; and
• A methodology for evaluating the change in values of risk metrics due to implementation of selected risk reduction measures, specifically in terms of accidents, car derailments and hazmat releases prevented.
Chapter 3 – Analysis of Risk Metrics describes and evaluates results from the analysis of train accidents and car derailments by:
• Calculating train accident and car derailment counts and frequencies, including tables summarizing the results as a function of railroad operating and infrastructure conditions such as track class, railroad type, and accident type;
• Calculating the probability that a derailed car is a tank car and contains hazmat, as well as the probability of hazmat release upon derailment.
Chapter 4 – Risk Reduction Analysis estimates the changes in individual risk for each link in the chain of events and the overall risk due to implementation of risk reduction measures such as
• Installation of Positive Train Control (PTC),
• Implementation of the Rail Integrity Rule to reduce the occurrence of broken rails, and
• Application of Electronically Controlled Pneumatic (ECP) brakes. Chapter 5 – The final chapter, Conclusions and Recommendations, provides a detailed discussion of hazmat releases and the harm that releases cause. This part of the process includes:
• A review of the factors related to train accidents causes, car derailment causes and hazmat releases;
• A discussion about the differences between the types and severity of accidents to main line freight trains in general versus trains with a hazmat car in the consist;
• A discussion about the efficacy of selected risk reduction efforts that are designed to reduce hazmat car derailments and releases;
• A qualitative discussion about release parameters (size, material released) and the resulting harm, including the types of harm (people, property, and environment) and their prevalence;
• Recommendations regarding strategies and operational procedures to reduce the risk of hazmat release, and suggestions for future research to better understand the relevant risks.

10
Appendices – Provides select tables that cover accidents, derailments, hazardous material releases, and other key elements of the analysis presented in this report.

11
2. Methodology
2.1 Overview This chapter describes the analytical process used in this study, which includes:
• A detailed description of the chain of events, beginning with an initial train accident up to the release of a hazardous material from a railroad tank car. This description includes a fault tree of railroad and hazmat accidents from which the descriptive metrics are defined.
• A discussion and description of available data sources for calculating numerical values for the metrics, with particular attention paid to the reporting criteria (which are used to generate the data for the current analysis and any resulting limitations).
• Detailed definitions for the metrics that were selected for this study and the procedures for deriving the metrics from the available data. This includes the functional parameters that influence metric values (such as FRA track class for accident frequency, or tank car specification for the conditional probability of release) and how these are addressed in the analysis.
• The methodology used to calculate a risk metric (i.e. frequencies and conditional probabilities) for each step along the chain of events as a function of applicable risk factors. Details of the data generated for this analysis are provided in Appendices.
• Details of how the metrics may be applied in hazmat transportation risk analyses, including the evaluation of benefits from implementing selected risk reduction measures.
The first stage in this study is developing a detailed framework for the analysis of risks arising from the rail transportation of hazardous materials. As stated in the Scope section, the risks examined in this report occur when bulk shipments of hazardous materials are carried in railroad tank cars and are released in train accidents reported to the FRA. Dry bulk materials carried in hopper cars, non-bulk shipments, and releases that are not a result of a train accident are not included.
Almost all serious hazmat release events occur from tank cars in train accidents and thus fit within this report’s scope. Once the framework for analyzing risks is developed, event frequencies and conditional probabilities are calculated using data in the public domain. Baseline frequencies and conditional probabilities are derived from data for 2004-2008 and are combined with the results of statistical and engineering analyses to estimate the level of risk reduction for selected risk reduction measures.
The sequence of events that leads to a release is illustrated in Figure 1, which also lists the primary factors that affect the associated risk metrics. The risk metrics are event frequencies and conditional probabilities that quantify the likelihood of the event at each step along the chain and the chance that the next event will be triggered by the preceding event. The blue blocks identify the primary hazmat release chain (from an initiating train accident to a hazmat release), and the gray blocks identify branches of the chain that do not lead to a hazmat release. The analysis pertains to trains on main track only.

12
Figure 1. Chain of Events in a Tank Car Hazmat Incident
The steps in the primary chain are listed below and correspond to the numbers in the illustration.
1. A freight train accident, which is characterized by accident frequency per accident causes, type of railroad, and FRA track class.
2. The number of cars derailed in the accident, which is a function of train length, speed and accident cause. One branch in the chain accounts for FRA-reportable accidents in which no freight cars are derailed, and thus cannot lead to a hazmat car damage and release. Metrics for steps 1 and 2 are calculated for all freight trains, whether or not there is a hazmat car in the train consist.
3. The probability that the derailed car will contain hazmat. This is a function of the volume of hazmat being shipped over the portion of the US rail system under study. One branch in the chain accounts for accidents where there are no derailed hazmat cars. Metrics may be calculated for all hazmat or for selected materials.
4. The probability that the contents in the derailed hazmat car will be released, which is a function of the tank car specification and to some degree the accident cause and the train’s speed and length. One branch in the chain accounts for accident consequences that are not related to the released hazmat.
5. The harm caused by the released hazmat, which is a function of the hazmat product being released and emergency response actions after the release.
Although this study is concerned with the chain of events for accidents involving releases of hazardous materials, the same approach may be applied to analyze freight railroad accidents in general. Non-hazmat consequences include casualties to railroad staff, contractors and bystanders, and damage to property owned by the railroad, shippers and others.

13
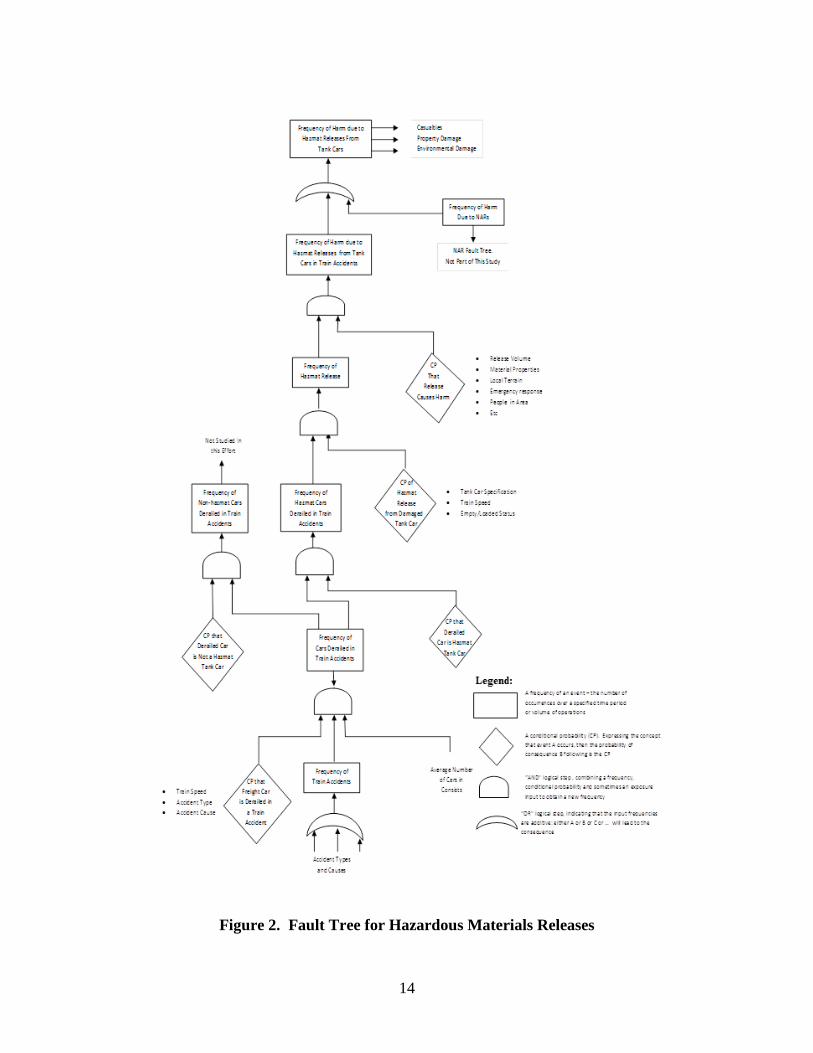
Up to this point in the analysis, the description of a train accident leading to a hazmat release has been qualitative – a narrative description of the events and factors that may affect the likelihood and severity of a hazmat release at each stage along the chain of events. The next stage is to define and quantify selected risk metrics that would allow an analyst to estimate hazmat risk (i.e. the likelihood and consequences of a hazmat release) for a given railroad route or system, and/or for specific hazmat shipments. One way to identify and define the parameters for a complex risk analysis process, such as the rail transportation of hazardous materials, is to construct a fault tree (Figure 2). The chain of events shown in Figure 1 is illustrated in more detail by the fault tree. A fault tree shows the logical relationships between individual events and the risk metrics (frequencies and conditional probabilities) that quantify the likelihood and severity of the event at each step along the chain. The “top event” in the chain of events is at the top of the fault tree in Figure 2, and it measures the consequences which occur when tank cars release hazmat after a train accident happens. These consequences involve harm to people, property and the environment, often quantified by the number of human casualties as well as the costs of property damage and environmental clean-up. A key objective of this report is to identify the factors that affect the frequency and consequences of hazmat spills and quantify the associated metrics at each step along the chain of events, and for a variety of railroads operations infrastructure and equipment scenarios. These data may then be used to carry out a variety of analyses to estimate the risk of hazmat spills and the resulting consequences for these scenarios, and to evaluate risk reduction measures that could reduce the harm. Descending from the top event, the first “OR” step (refer to the legend in Figure 2) shows that the harm is the sum of accident-caused hazmat releases and non-accident releases (NARs), which are not analyzed in this report. In turn, the first “AND” step (refer to the legend in Figure 2) shows that the harm is the product of release frequency and other factors that quantify the harmfulness of the release–volume, exposure of people to the release, etc. Continuing down the fault tree, the next logical step shows that release frequency is the product of the frequency of accident-caused hazmat tank car derailments and the conditional probability of release. As with all frequencies and conditional probabilities used in this analysis, those values can be applied to all U.S. railroad traffic for any subset of traffic or railroad operations. The fault tree is generic and it can be applied to any accident cause, hazmat commodity, or tank car type.
In essence, the fault tree shows the frequencies and conditional probabilities that are the primary parameters in quantifying the likelihood and severity of harm, from a hazmat release down to the initiating train accident frequency shown at the bottom of the fault tree.
14
Figure 2. Fault Tree for Hazardous Materials Releases

15
The fault tree defines the parameters that characterize the steps in the chain of events:
Step 1. The frequency with which a train operating on the U.S. railroad network will be involved in a FRA-reportable accident. This parameter is based on detailed data showing how frequency varies as a function of factors such as FRA track class, railroad type, and accident cause and type.
Step 2. The conditional probability that one or more cars in the consist will be damaged or derailed as a consequence of the accident, and the extent to which derailment probability for hazmat cars differs from that for individual freight cars in general.
Step 3. The probability that one or more of the derailed or damaged cars will contain hazmat leading to the possibility of tank rupture and release of some or all contents. This probability is a function of the volume of hazmat carloads relative to all carloads.
Step 4. The conditional probability that a derailed and damaged tank car will lose containment of its lading, exposing the area around the accident site to harm.
Step 5. The consequences of exposure to the released hazardous material for people, property, and the environment around the accident site. Although the study does not include this step, the data and chain of events approach demonstrated in this report can be adapted to include this step for any other railroad accident concerns.
In this analysis, the metrics defined for steps 1 and 2 are for all railroad operations and from step 3 onward, the metric specifically applies to hazmat shipments. To illustrate how the analysis works, this expression calculates the freight car derailment frequency from the following input metrics:
Freight Car Derailment Frequency (e.g. cars derailed per year)
= Train Accident Frequency (e.g. freight trains in accidents per year)
× Exposure (average number of cars per train)
× Conditional probability that a car will be derailed in an accident
This procedure is repeated up to the fault tree to calculate the frequencies at each stage.
Risk metrics were calculated for each step in the sequence of events using current railroad and tank car operations and accident data to yield baseline metrics. These metrics were calculated for the period 2004-2008, which contained the most recent data available at the time the analysis was initiated. The railroad and rail hazmat community can use this study to understand how these metrics and therefore risks vary with railroad infrastructure, operations, and equipment.
As described above, this study examines the accident frequency, the chance that a car will be derailed in an accident, the chance that a tank car will be damaged to the point of releasing some or all of its contents, and provides some information on the types of materials released (e.g. TIH or other). The study’s analysis also includes a determination of absolute counts for incidents as well as normalized incident rates, based on the premise that both measurements are useful to FRA and other stakeholders in investigating risk reduction opportunities. The study concentrates on the earlier steps in the chain of events, and does not seek to address the impact areas of different types of release as a function of hazmat properties, risks related to population density around the accident site, and related factors.

16
Baseline accident frequencies are calculated for each FRA track class and accident type (e.g. collisions, derailments, and other) using accident counts and estimates of train-miles by track class. The immediate consequence of a train accident is often car derailment and the conditional probability of derailment can be expressed as the number or fraction of cars derailed in the accident. Additionally, car derailment frequencies (cars derailed per million car-miles) may combine train accident frequency and car derailment probabilities. Lastly, hazmat risk is measured by the conditional probability of release (the probability that a damaged tank car will release some or all of its contents if the car is damaged in an accident).
The above metrics were estimated again after risk reduction measures were implemented. The following report sections describe the data sources used in calculating base risk metrics, the limitations of the available data, and the specific metrics used for this analysis. The choice of metrics is necessarily constrained by the data sources; if the data or a credible estimate is not available, an otherwise desirable metric cannot be calculated or used.
2.2 Data Sources The following section summarizes the data assembled for this analysis, including any data limitations that affect the interpretation or use of the analysis. Appendix A contains the complete description of the data sets and detailed calculations that support the analyses and results in the main report. Except where otherwise noted, all data are from the five-year period from January 1, 2004 to December 31, 2008, and for railroad and hazmat movements in the United States railroad network only. This period was the most recent period when all data sets of interest were available once analysis started in early 2010. Additionally, all data are from freight trains in main track accidents. Accidents to light locomotives, work trains and passenger trains are not included because there are no hazmat cars involved, and accidents on yard, siding, and industrial track are analyzed separately.
Traffic Data – All Trains and Traffic 2.2.1The primary source for railroad traffic data is the Surface Transportation Board (STB). The Board receives an annual sample of rail freight waybills that contains comprehensive details of shipments on the U.S. railroad network, including origins, destinations, routing, tonnages, commodities, railcar types, and other details [4]. In addition, Class I freight railroads, which are defined by STB as those with an annual revenue exceeding $250 million in 1991 dollars (equivalent to $379 million in 2009 dollars) are required to submit and publish detailed financial and operations data to STB for use in regulatory proceedings. The majority (over 90 percent) of U.S. railroad traffic moves over seven Class I railroads. This data is submitted to the STB by each Class I railroad each year in R1 Annual Reports [4]. Using these reports the AAR publishes a publically-available annual compilation of Class I railroad traffic [5] that contains industry-wide totals. In addition, the AAR periodically publishes a less detailed, longer term summary of railroad finances and operations called “Ten-Year Trends.”7 In combination, these sources 7 According to Transportation in America, non-Class I traffic was 5.2 percent of rail traffic as measured by ton-miles. According to AAR’s Railroad Ten Year Trends, 2000-2009, non-Class I railroads account for 10.4 percent of rail industry employees. Since non-Class I railroads are deemed to have more labor-intensive terminal and way freight operations (and shorter trains), the percentage of traffic is expected to be lower than the percentage of employees.

17
provide the Class I railroad traffic data needed to normalize and compare risk metrics, such as the number of train-miles or car-miles traveled.
The remaining traffic moves over smaller railroads, termed Class II and III railroads by STB, as well as and regional and local railroads. The STB and AAR definitions differ in detail, but Class II or regional railroads are usually substantial operations with at least $20 million revenue, and there are more than 500 Class III and local or short line railroads. Detailed traffic data are not reported to STB by non-Class I railroads, therefore approximate estimates must be developed. Two sources were used: Past editions of ENO Transportation Foundation’s Transportation in America [6], and regular reports of car-loadings published in the railroad trade press from data supplied by the AAR affiliate Railinc [7]. Non-Class I traffic was estimated to be 5.5 percent of national car-miles and 7.5 percent of national train-miles. However, since no complete source for non-Class I railroad traffic exists, these estimates must be treated with caution.
A summary of rail traffic estimates derived from various sources for the analysis period (2004 through 2008 inclusive) is provided in Table 1.
Table 1. Overall Rail Traffic Totals on U.S. Railroads (2004–2008)
Railroad Type Class I Railroads
Non-Class I Railroads
All Railroads Notes
Freight Train-Miles (millions) 2,174 203 2,377
Non-Class I railroads train-miles (7.5 % of Class I)
All Car-Miles (millions) 189,150 10,402 199,552
Non-Class I railroads car-miles (5.5% of Class I)
The railroad industry maintains highly detailed records of railroad shipments in a computer system called TRAIN II. This data is used to track the locations of all railroad cars and shipments in the US for ongoing operations management and analyze the past history of rail operations. However, these data include extensive confidential information on both the railroads’ and shippers’ businesses; the data is not generally available to the public and is not used in this study.
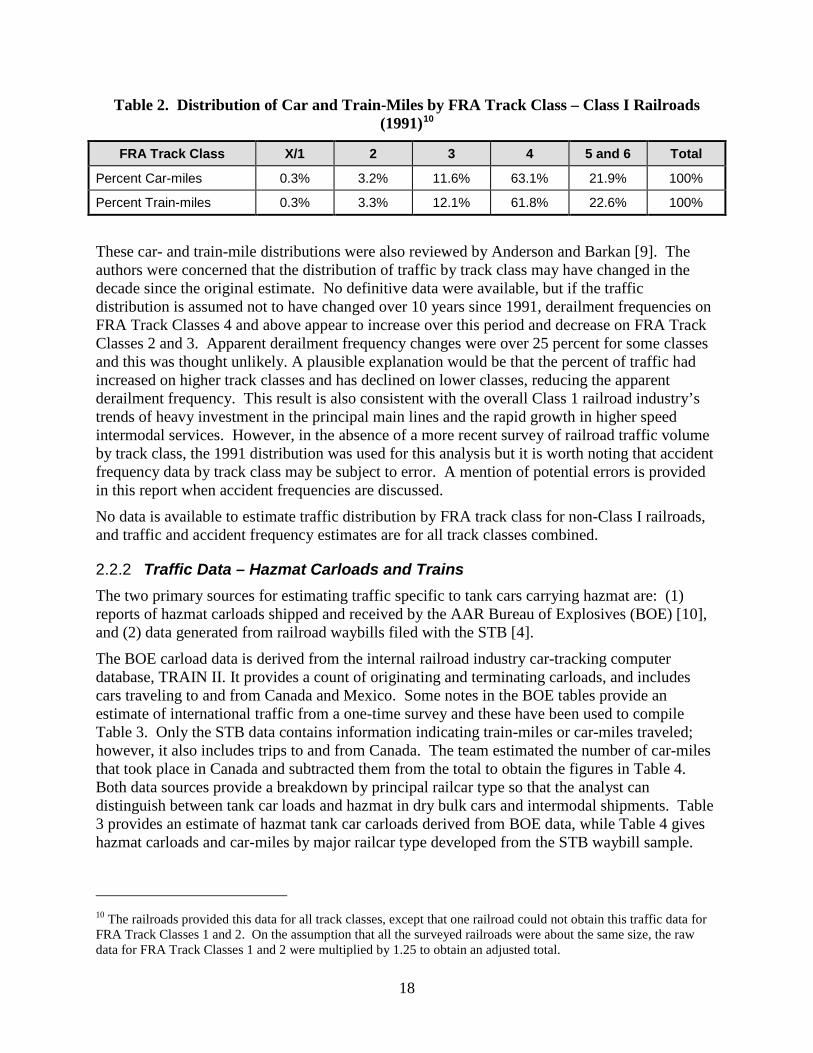
In order to estimate traffic volume by track class, data was obtained from a 1993 survey of five selected Class I railroads. It provided one-year traffic data for 1991 by nominal FRA track class, as shown in Table 2 [8]. This report assumes that traffic distribution by track class is little changed from 1990 to the late 2000s. Cross-checks of these distributions with another survey8 show that the traffic estimates for FRA Class X9 and Class 1 track vary widely and should be treated with caution, particularly within risk metrics.
8 AAR collected traffic data for a random sample of 580 one-mile track segments from the entire U.S. railroad network, including both Class I and non-Class I track, which show Track Class X/1as 0.88% of all traffic. 9 Excepted track per FRA CFR §213.
18
Table 2. Distribution of Car and Train-Miles by FRA Track Class – Class I Railroads (1991)10
FRA Track Class X/1 2 3 4 5 and 6 Total
Percent Car-miles 0.3% 3.2% 11.6% 63.1% 21.9% 100%
Percent Train-miles 0.3% 3.3% 12.1% 61.8% 22.6% 100%
These car- and train-mile distributions were also reviewed by Anderson and Barkan [9]. The authors were concerned that the distribution of traffic by track class may have changed in the decade since the original estimate. No definitive data were available, but if the traffic distribution is assumed not to have changed over 10 years since 1991, derailment frequencies on FRA Track Classes 4 and above appear to increase over this period and decrease on FRA Track Classes 2 and 3. Apparent derailment frequency changes were over 25 percent for some classes and this was thought unlikely. A plausible explanation would be that the percent of traffic had increased on higher track classes and has declined on lower classes, reducing the apparent derailment frequency. This result is also consistent with the overall Class 1 railroad industry’s trends of heavy investment in the principal main lines and the rapid growth in higher speed intermodal services. However, in the absence of a more recent survey of railroad traffic volume by track class, the 1991 distribution was used for this analysis but it is worth noting that accident frequency data by track class may be subject to error. A mention of potential errors is provided in this report when accident frequencies are discussed.
No data is available to estimate traffic distribution by FRA track class for non-Class I railroads, and traffic and accident frequency estimates are for all track classes combined.
Traffic Data – Hazmat Carloads and Trains 2.2.2The two primary sources for estimating traffic specific to tank cars carrying hazmat are: (1) reports of hazmat carloads shipped and received by the AAR Bureau of Explosives (BOE) [10], and (2) data generated from railroad waybills filed with the STB [4].
The BOE carload data is derived from the internal railroad industry car-tracking computer database, TRAIN II. It provides a count of originating and terminating carloads, and includes cars traveling to and from Canada and Mexico. Some notes in the BOE tables provide an estimate of international traffic from a one-time survey and these have been used to compile Table 3. Only the STB data contains information indicating train-miles or car-miles traveled; however, it also includes trips to and from Canada. The team estimated the number of car-miles that took place in Canada and subtracted them from the total to obtain the figures in Table 4. Both data sources provide a breakdown by principal railcar type so that the analyst can distinguish between tank car loads and hazmat in dry bulk cars and intermodal shipments. Table 3 provides an estimate of hazmat tank car carloads derived from BOE data, while Table 4 gives hazmat carloads and car-miles by major railcar type developed from the STB waybill sample.
10 The railroads provided this data for all track classes, except that one railroad could not obtain this traffic data for FRA Track Classes 1 and 2. On the assumption that all the surveyed railroads were about the same size, the raw data for FRA Track Classes 1 and 2 were multiplied by 1.25 to obtain an adjusted total.

19
The two tables show reasonable agreement between the estimated carloads moving on U.S. track between the two data sets: 5,924,000 from BOE and 6,061,000 from waybill analysis.
Table 3. Tank Car Hazmat Carloads by Year (2004–2008)
U.S. Tank Car Hazmat Carloads 2004 2005 2006 2007 2008
Total 2004-2008
Originating 1,013,079 1,006,747 1,024,652 1,100,811 1,114,394 5,259,683
Terminating 1,138,101 1,118,721 1,136,795 1,198,457 1,196,077 5,788,151
Total Estimated Car Movements on U.S. Network
1,164,569 1,144,918 1,163,506 1,226,693 1,224,370 5,924,054
Source: AAR/BOE
Table 4. Hazmat Carloads and Car-Miles by Railcar Type (2004–2008)
Car Type Million Car-Miles Thousand Carloads
Average Length of Haul in U.S.
Average Carload
All Tank Cars 8,728 10,631 820 88.0
Hazmat Tank Car 4,761 6,061 785 87.5
Dry Bulk Hazmat 240 322 745 96.8
Intermodal Hazmat 3,603 2,467 1,460 15.0
All Hazmat 8,604 8,850 NA NA
Source: STB Waybill sample, U.S. Network only, excluding Canadian movements Appendix A describes the derivation of these values. Note that the BOE data is not in the public domain, and distribution is subject to some restrictions due to security and other concerns. The more detailed STB data are also subject to restrictions for commercial confidentiality reasons. In both cases the researcher must request the data for the responsible parties and, if the data are made available to them, agree to the appropriate restrictions.
Accident and Derailment Data – All Trains 2.2.3The primary source for train accident data in this analysis was FRA’s Railroad Accident/Incident Reporting System (RAIRS), compiled and maintained by FRA’s Office of Safety [11]. The data from this system is available as annual compilations of railroad accidents that meet FRA’s reporting requirements. The most significant requirement is that the damage value to the railroad exceeds a specified threshold. The thresholds for the data used in this analysis are listed in Table 5.

20
Table 5. FRA RAIRS Threshold Reporting Requirement
Year 2004 2005 2006 2007 2008
Threshold ($) 6,700 6,700 7,700 8,200 8,500
Source: FRA RAIRS
The RAIRS data provides details on track accidents and car derailments that are organized by cause group, railroad type, track class, and accident type; it contains more than 400 unique cause codes to indicate the primary reasons for accidents and derailments. In the present analysis, these cause codes were grouped into 5 major categories as shown in Table 6. These major categories were further subdivided into 51 accident cause groups to assess the most prevalent causes of accidents and derailed cars. Results from the analysis of the RAIRS data are presented in Appendix B.
Table 6. Accident Cause Categories Accident Cause Categories
Track Defects
Signal and Communications Defects
Equipment Defects
Human Factor/Operations
Miscellaneous Causes
Source: FRA RAIRS
Accident and Derailment Data – Hazmat Trains and Cars 2.2.4This section describes data that is specific to railroad hazmat cars involved in accidents and hazmat releases. Consequences specific to hazmat cars arise when a hazmat car is derailed, damaged or loses containment of its lading as a result of an accident. For this analysis, data specific to hazmat cars involved in accidents come from three sources11:
1. FRA RAIRS accident reports [11],
2. PHMSA hazmat release reports [12],
3. Railway Supply Institute – Association of American Railroads Database.12
FRA RAIRS accident reports include counts of hazmat cars in a train consist, as well as counts of hazmat cars derailed, hazmat cars releasing, and hazmat car evacuations. These reports do not contain details on the specific type of hazardous material released, the volume or weight of material released, or the types of hazmat car involved, and are also subject to the FRA RAIRS damage cost reporting threshold limit.
11 The important point to note about these different databases is that the reporting criteria and data elements differ for hazmat cars reported to FRA as damaged or derailed in a train accident. 12 This database and associated technical reports are prepared as part of the Railroad Tank Car Safety Research and Test Project, a joint effort of these two railroad industry associations.

21
PHMSA requires a report for all events involving the release of hazmat into the environment, regardless of volume or weight, and it must identify if the release is the result of a train accident or another cause. The reports (known as 5800 reports) include the car number, material released, volume or weight of hazmat released, details of hazmat-related casualties and costs, and many other factors. This report is different than the one required for reporting train accidents to FRA.
An extensive database of damaged tank cars has been compiled by the RSI-AAR Tank Car Safety Research and Test Project. This project, initiated in 1965, sought to compile and analyze data on the damage sustained by tank cars in train accidents. Tank cars can be included in the database if they have sustained damage to components that are unique to them, such as the tank itself, inlets and outlets, head shields, insulation, and lining. Tank cars that only sustain damage to components common to all freight cars, such as trucks and couplers, are not included. Primarily, the data is compiled from information provided by car repair shops, and includes all tank cars, including those used for non-hazmat commodities. The data includes information on hazmat car specification, the details of the damage to tank car-specific components, and it indicates whether or not there was loss of car contents. Since this is a private database, maintained by the sponsoring industry associations, there is no public access to the raw data. However, the RSI and AAR regularly participate in tank car safety projects undertaken by FRA and PHMSA, which both utilize the data.
Hazmat Release Data 2.2.5PHMSA maintains an Incident Reports Database that is the primary source for hazmat release details. PHMSA requires that all hazmat releases, however small, be reported on the 5800 form, which gives details of the event, including material involved, the quantity released, type of hazmat container, casualties, evacuations, etc. Releases caused by train accidents form a subset of these reports, which include all transportation modes and non-accident releases, as well as accident-related releases. PHMSA includes all releases, not just releases in accidents reportable to FRA. Therefore, the PHMSA database will always contain more train accident-caused releases than the FRA train accident database.
A significant effort was made in the present work to link PHMSA’s release data to FRA RAIRS’ data during the time period of interest. A summary version of the linked database is provided in Appendix D. This linkage is important because FRA RAIRS accident reports do not distinguish between hazmat in tank cars and in other car types (e.g. dry bulk and TOFC/COFC cars), while the PHMSA data includes details of car type and the material released from each car.
Consequences of Hazmat Release Data 2.2.6Apart from casualties and evacuations, FRA accident reports do not have any information about other consequences of a release. For example, these reports do not distinguish between casualties caused by the original accident and casualties that are a direct consequence of a hazmat release. The PHMSA database does provide this information. Human casualties are clearly the most important. Other consequences include cost of cleanup and rebuilding efforts, and disruption to normal railroad and other activities in the area affected by the release. However, neither database provides broader information on the kinds of consequences that are expected from releases of the different materials or how damage and casualties are caused. To provide a context for the raw data, Appendix F includes tables that list the harmful properties of the leading chemical(s) in each DOT hazard class, as defined in 49 CFR Part 172. Hazard

22
Classes 2.2 and 2.3 include the key TIH materials chlorine and anhydrous ammonia. Information in Appendix F can be used to estimate how often different kinds of consequences can result from hazmat releases; it also includes the number of carloads shipped in the period 2004-2008 and the number of releases for each hazard class.
2.3 Definition and Calculation of Risk Metrics The risk metrics in this report are the primary quantitative inputs for quantitative risk analyses that are related to hazmat transportation safety. The fault tree in Figure 2 defines the metrics (i.e. frequencies and conditional probabilities) that may be used to calculate the risk of train accidents, damage to railroad tank cars containing hazmat, and hazmat releases. These metrics depend on railroad infrastructure, equipment and operating conditions for the railroad routes or hazmat shipments that are the subject of this analysis. This section defines each metric, identifies the factors which influence the value of each metric, and explains how the metric may be calculated from available data sources. Chapter 3 of this report provides metric values as well as a detailed discussion of each risk metric, including tables and figures where required. This data can be used by analysts to estimate hazmat risks for a wide variety of situations.
Train Accident Risk Metrics 2.3.1The first risk metric along the chain of events (i.e. Step 1 in the chain of events) is train accident frequency. The customary measure for this metric is accidents per million train-miles. This general approach to analyzing accident frequency is similar to an approach from a previous railroad hazmat risk model.13 A complementary metric of accidents per million car-miles may also be used, if accident frequency is considered to be a function of freight car-miles.
Car-mile and train-mile accident frequency is obtained by dividing freight train accident counts by the applicable exposure parameters: estimated car and train miles traffic by track class and railroad type (Class I and non-Class I). Since some accidents may involve more than one freight train, the best metric to use is the number of trains or cars in train accidents. Accident frequencies are calculated from the following formulas: Accident Frequency Train-Miles = Number Trains in of Accidents ÷ Train Miles Accident Frequency Car-Miles = Number of Trains in Accidents ÷ Car-Miles
The distinction between car-mile and train mile accidents and their corresponding accident causes is explained in this section.
In this analysis, accident metrics are sorted by railroad class, FRA track class, accident type (i.e. collisions, derailments, and other accidents), and accident cause group, as described above. The primary factors that affect train accident frequency are discussed below. Type of Railroad. Railroad traffic and accident data have been collected for two groups of railroads (Class I and non-Class I). Traffic and accident data are available by track class for Class I railroads, but all other railroads cannot be separated by track-class.
13 This model was prepared over the period 1989 through 1995 for the Inter Industry Rail Safety Task Force, comprising representatives from the railroad and chemical industry, as well as tank car builders.

23
• Class I railroads, as defined by STB, comprise seven railroads: Burlington Northern Santa Fe, Canadian National, Canadian Pacific, CSX Transportation, Kansas City Southern, Norfolk Southern, and Union Pacific.
• Non-Class I railroads, comprising all railroads not classified as Class I by STB, are typically regional and short line railroads.
Track Quality, as indicated by FRA Track Class. FRA defines six track classes for freight railroad operations (higher classes are reserved for higher speed passenger operations). Each class is defined by the maximum speed permitted for operation and a set of minimum track quality and inspection requirements. Most main line railroad routes belong to FRA Track Class 4 or 5, with secondary and branch lines belonging to Class 2 or 3.
Table 7. FRA Track Classes and Speed Limits for Freight Trains FRA Track Class Maximum Freight Train Speed
(mph)
1 10
2 25
3 40
4 60
5 79*
6 79*
*Limit without train control or cab signals before RSIA PTC requirements are effective
Type and Cause of Accident. Derailments are usually caused by track or equipment problems (cars and locomotive component failures). Collisions are generally caused by human errors. To study accident cause effects, the several hundred accident causes encoded in the FRA accident reporting system have been condensed into 51 main cause groups, belonging to 5 major accident categories. Then the cause groups are identified as either car-mile related or train-mile related. For car-mile causes, accident frequency is primarily dependent the number of car miles operated, which makes accidents more frequent on long trains. For train-mile causes, accident frequency is primarily dependent on the number of train miles operated (independently of train length). This approach allows the analysis to include the effects of train length in accident frequency. The distinction is explained as follows:
• For train-mile related causes, the likelihood of an accident is proportional to the number of train-miles operated. Failure to observe signals and instructions (i.e. cause group 05H) leading to a collision is largely related to train-miles operated rather that number of cars in the train. Also, the division between train-mile and car-mile is not exact, and there are some complexities. For example, a train-handling-caused accident (i.e. an operator error) is partly related to train size as longer trains may be more difficult to control, but accidents caused by a failure to observe a signal would probably be unrelated to train length and would depend primarily on exposure—the number of train-miles operated.

24
• For car-mile related causes, the likelihood of an accident is generally dependent on the number of car-miles operated. For example, bearing failure likelihood is directly proportional to the number of bearings in a train. On average, bearing failure accident frequency will be a function of number of cars in a train × train-miles. Car-mile causes include most equipment failures and many track component failures, on the premise that such failures are proportional to the number of load cycles imposed on the track.
This grouping scheme of car-mile and train mile related causes, as well as the assignment to car-mile and train-mile dependence, was informed by expert judgment and a regression analysis by Schafer and Barkan [13].
Other factors that have not been analyzed in this project because of a lack of suitable data but which may affect accident frequency, are:
• Type of Train. With few exceptions, tank car hazmat shipments are merchandise trains made up of a mix of cars and different items; they move through one or more en-route classification yards, and often move in local or way freight trains at the beginning and end of the freight movement. These trains may be exposed to different hazards than unit or intermodal trains; therefore, the use of national risk data may be misleading for hazmat shipments. It has not been possible to analyze train type effects in this report, because data to estimate exposure (train- and car-miles operated) and train accidents reported to FRA by type of train is lacking.
• Signal System Type. During the 2004–2008 period covered by this analysis, freight routes are typically equipped with a variety of signal and train control systems, including Automatic Train Control (ATC), cab signals, centralized traffic control (CTC), wayside block and interlocking signals, and structured radio messages (e.g., Direct Train Control or Track Warrant Control). ATC and automatic cab signals can override the train operator in specified circumstances to prevent an error, but there are few installations of these systems on freight railroads during the period analyzed. All other control systems rely on the train operator to control the train in response to wayside signals and spoken orders transmitted by radio. There is major difficulty calculating train accident risk by these signal system types, partly because normalization metrics (e.g., train-miles and car-miles for each signal type are not available. Additionally, signal system type and track class data are partly co-linear. That is, lower track class is has more unsignaled (dark) territory, making it analytically difficult to separate signal system and track class effects. Installation of Positive Train Control (PTC) on selected routes was mandated by RSIA (2008), and an estimate of risk reduction due to PTC implementation has been included in the analysis of risk reduction measures.
Freight Car Derailment Risk Metrics 2.3.2In this analysis, the consequences of a freight train accident are measured by the number (or fraction) of freight cars in a train consist that are derailed in an accident. Since, in almost all cases, a hazmat release is preceded by the derailment of the hazmat car, the probability that a car is derailed is Step 2 in the sequence of events leading to a release.
The conditional probability of derailment is the average fraction of cars that are derailed in a train consist after an accident:

25
Conditional Probability of Derailment = Number of Cars Derailed ÷ Number of Cars in Consist
Combining the formulas for Step 1 and Step 2, the overall frequency of freight car derailment can be defined as:
Car Derailment Frequency Train-Miles = Accident Frequency Train-Miles × Average Number of Cars in the Consist × Conditional Probability of Derailment
Freight car derailment probabilities and frequencies may be presented as a function of train speed, type and cause of the accident, train length, and whether the car is empty or loaded. Since FRA data include counts of laden (loaded) and unladen (empty and residual) cars in the consist and among the derailed cars, it is useful to display and directly analyze derailed data on cars, rather than going through the intermediate step of using train accident data and then estimating the conditional probability of car derailment.
A basic assumption which underlies the analysis of cars derailed in accidents is that hazmat tank cars are no more or less likely to derail than other car types under the same operating conditions. If the probability of derailment for hazmat cars differs from the average for all cars, it is assumed to be due to differences in operating conditions, especially as hazmat cars normally move in general mixed freight trains which contain a mix of laden and unladen cars and cars of different types.
Hazmat Release Risk Metrics 2.3.3The metric for the probability of hazmat release is the fraction or percentage of hazmat tank cars that release some or all of their contents after a derailment, normally termed the Conditional Probability of Release (CPR). CPR is defined as follows:
Conditional Probability of Hazmat Release = Cars with Hazmat Releases ÷ Number of Cars Derailed
Numerical values for CPR may be derived from different data sources which yield different numerical values and should be interpreted and used in different ways. The principal variants of CPR are:
CPR (All Hazmat Cars): The conditional probability of a release from a hazmat car given that the hazmat car is derailed in a FRA-reportable train accident. This parameter can be calculated from RAIRS data, but it has significant limitations:
• It includes all hazmat car types (tank, dry bulk, intermodal) as identified in reportable train accidents, and includes derailments of both loaded hazmat cars and empty cars containing residual quantities of hazmat.
• It provides no information about the hazmat commodities carried in the derailed car or the quantity released.
Note that in this definition, the hazmat car includes all freight cars identified and containing hazmat on the waybill, and includes both laden cars and unladen cars containing residual quantities of hazmat, and hazmat contained in intermodal containers.
CPR (Hazmat Tank Cars): The conditional probability of release from a hazmat tank car, given the car is derailed in an FRA-reportable train accident. This is the ideal measure for

26
estimating the likelihood of hazmat release from tank cars, but unfortunately, there is no easy way to obtain a numerical value. FRA accident reports on derailed and releasing cars do not distinguish between tank cars and other car types, or between laden and residual cars. Only approximate CPR estimates can be obtained by making assumptions about derailment probabilities among different car types.
CPR definitions from the RSI-AAR Railroad Tank Car Safety Research and Test Project: The major difference between the tank car damage and release data maintained for this project and the RAIRS database is that this project only includes tank cars that sustain damage to the tank itself and service equipment, rather than the larger number of derailed cars reported in FRA-reportable accidents. Therefore, CPR values from these two databases will be different with no easy way to make comparisons.
Hazmat releases from damaged tank cars tend to be bimodal, either relatively small or large enough to be a significant fraction of the contents of a laden car. Releases are small either because the car was unladen and contained residual quantities of hazmat, or because damage to a laden car was minor (i.e. service equipment damage). Due to data limitations, the CPR for loaded tank cars containing hazmat is therefore evaluated for both small releases and large releases.
In using these measures, it must be remembered that CPR is simply a measure of a tank car’s resistance to damage in an accident. Changing the tank car design to reduce estimated CPR values for elected tank car types is only one of many risk reduction actions that can be taken to reduce hazmat release risks.
Effects of Tank Car Design Features on CPR 2.3.4The present work concentrates on the earlier steps in the chain of events leading to the derailment of a hazmat car and the potential for the car to be severely damaged and release some or all of its contents. No attempt has been made to analyze the variations in CPR as a function of tank car design – shell and head thickness, details of top and bottom (if present) outlets, material and welding specifications, etc. Many of these factors were the subject of extensive analysis [14] using data from the RSI-AAR Railroad Tank Car Safety Research and Test Project, and repeating this analysis is beyond the scope of this FRA-sponsored effort.
The results from the analysis in Report 05-02 [14], together with additional material, have been the basis for continuing discussions and analysis of risk reduction through tank car design improvements. The estimated CPR values should be interpreted with attention to the criteria for inclusion in the database, which is discussed in Section 4.1 of the Report 05-02 [14]. The report includes details of the regression analyses and the confidence boundaries, which yielded the CPR estimates. Because of the great interest in these results, some general comments are provided below:
• Whatever the limitations of the RSI-AAR Safety Project data and individual analyses, the industry database is the only available source of data for analyzing the dependence of CPR on key tank car design factors, such as head and shell thickness, outlets, use of head shields, jackets, and shelf couplers.
• Because of the variation in the numbers of complete records in the database from different time periods, types of damage, size of release, and other factors, analysis results

27
should only be used to make comparative estimates of CPR differences with data from a specific dataset. For example, it is acceptable to conclude that increasing shell thickness from one-half inch to five-eighths of an inch lowers CPR by approximately 20 percent, but concluding that CPR is a certain percent for a car with a specific set of features is only true for the specific dataset analyzed.
• The regression analysis can only include a limited set of independent variables as described in the report. Other variables that are not in this analysis may affect CPR. For example, if there are systematic variations in CPR resulting from the evolution of material requirements or manufacturing practices over time, CPR results may be misleading when applied to current conditions.
• Data records used in the analysis in Report 05-02 were from 1995 and earlier because there had been a significant lag in processing raw data. However, the RSI-AAR Safety Project has made considerable efforts to catch up, and it is understood that several more years’ data are available. A repeat analysis using only more recent data – after 1990 when there may have been more stability in the tank car features and design – would be desirable, if this has not already been done. Of course such an analysis would be dependent on the number of qualified records available.
• The data from Report 05-02 has been used to extrapolate CPR estimates for different tank car head and shell thickness to thicknesses that are beyond current practice and then draw conclusions about the reduction in CPR that would result from using the higher thicknesses.
This may be subject to considerable error given that there are very few observations of releases at the higher thicknesses, a fact which reduces confidence in statistically-derived CPR values and in any extrapolations.
To illustrate this point, the RSI-AAR Safety Project compiled a list of TIH releases between 1969 and 2005 [15] and the author later changed the end year to 2009. Between 1990 and 2009 there were 22 releases averaging a little over one a year, plus one very serious multicar TIH release accident at Minot, North Dakota on January 18, 2002, where there were 11 TIH releases. Random factors could have a big effect on the actual release history and thus affect statistical projections.
Hazmat Release Consequences 2.3.5The last link in the chain of events (i.e. Step 5) is the nature and severity of harm resulting from the release. Harm may be categorized into three broad areas:
• Harm to people, typically caused by fires, explosion and/or a release of toxic material, specifically TIH materials. These releases often result in evacuations to prevent exposure of the public to hazardous materials, and are included in FRA and PHMSA reporting.
• Harm to property, also typically caused by fires and explosions, which includes related emergency responses. Official reports may omit some of these consequences, especially harm to non-railroad property, costs of cleanup efforts, and disruptions to railroad and other operations.
• Harm to the environment, earth, bodies of water, or the atmosphere, potentially leading to costly cleanup efforts. Cleanup costs are estimated in PHMSA reports.

28
The analysis takes the data from the five-year period between 2004 and 2008 and documents the number of small and larger releases reported to PHMSA, as well as the occurrence of each type of harm. Because very few releases of TIH occurred in the five-year period, the analysis aims to take a longer-term look at release probabilities. Given the wide range of hazmat properties transported by railroad in tank cars and other car types, the size of the release from laden and unladen cars, and range of emergency response actions required, this analysis does not address release consequences in detail.
It is important to note that a train accident that leads to a release will have both consequences arising specifically from the release of a hazardous material to the environment, such as a fire, explosion or damage to the environment, as well as consequences that would be present even if there were no hazmat cars in the consist (such as impact damage to cars and locomotives and train crew casualties). Since the focus of this project is to detail the chain of events associated with hazmat transportation up to the point of hazmat release, post-release consequences such as pollution and property damage were not considered to the fullest extent possible. Also, the analysis does not evaluate how improved emergency response and clean up procedures can mitigate the severity of consequences.
2.4 Using the Risk Metrics The risk metrics defined in this report may be used in either one of two ways. The first use is estimating the risk (i.e. frequency and consequences) of a hazmat spill from a railroad tank car caused by a train accident for a defined railroad system, railroad region or specific route. The alternative use is estimating the risk of a hazmat spill from a railroad tank car caused by a train accident for a specific shipment between origin and destination. The analyses use the same metrics but are structured slightly differently.
For a specific railroad system, region or route, the analysis begins by dividing the routes being analyzed into line segments with constant operating parameters, such as railroad type, train speed and track class. Then accident frequency and car derailment frequency are calculated for each segment using the accident and car derailment tables in Appendix B. Given the volume and types of hazmat moving over each line segment, the probability that the derailed car is a hazmat car can be calculated, and the conditional probability of release (CPR) for each car type, the frequency of releases and nature of hazmat released may be calculated. The final step would be to estimate harm caused by these releases by using information on the population at risk near the rail line and examining other geographical features that determine vulnerability to harm from the release.
For an analysis that is concerned with the risk due to a specific hazmat movement, the analysis begins by dividing the route taken by the shipment into segments with constant operating parameters, and estimating train accident and car derailment frequencies for each line segment. The car derailment frequencies apply directly to the specific hazmat shipment. Therefore, the tank car type used for the shipment, train speed on each segment, and the conditional probability of release (CPR) data are used to calculate release frequency. Then harm from the release is calculated as above.
Primarily, this study uses risk metrics to estimate the nationwide reduction in hazmat risk from selected risk reduction measures. The baseline accident and car derailment tables compiled in Appendix B are adjusted in order to estimate reductions in accidents and car derailments from

29
the application of PTC, ECP, and the potential future implementation of a “Rail Integrity Rule.” Estimated reductions are derived by first identifying accident cause groups where accident occurrence would be affected by implementation of a risk reduction measure (e.g. 08T for broken rails or welds or the rail integrity rule, or 05H, failure to obey signals for PTC), then totaled after using expert knowledge to estimate the size of the reduction for each individual cause group, accident type, track class, and railroad type. This total provides an estimate of benefits for the particular risk reduction measure and also illustrates a methodology that can be applied to other risk reduction measures (in the event that estimates of reductions in accidents and cars derailed can be derived for relevant accident cause groups).

30
3. Analysis of Risk Metrics
3.1 Overview This chapter describes how to calculate the risk metrics for each step along the chain of events, using the framework and data sources described and identified in Chapter 2. Then analysts can use these risk metrics in risk models for a specific railroad operation or hazmat commodity. The numerical values presented in this chapter are derived from nationwide railroad operations and accident data from 2004 to 2008, and only apply to specific railroads or portions of the national system that are related to variations in FRA Track Class and railroad type (Class I and non-Class I).
This chapter focuses on metrics that are associated with three of the steps in the chain of events:
• Freight train accidents on main track by accident cause groups as a function of FRA Track Class and railroad type.
• Freight car derailments on main track by accident cause group as a function of FRA Track Class, railroad type, and train speed.
• Hazmat car derailments and hazmat releases as a function of accident cause, tank car type, train speed and other factors.
Some general information is provided on hazmat release severity and consequences, but this last step in the chain of events has not been analyzed in any detail.
Much of this analysis is organized around accident-cause groups derived from RAIRS data, which was briefly mentioned in Section 2.2.3. Train accidents are reported to RAIRS using over 400 individual cause codes. Trying to tease out important trends from this large number of causes can be cumbersome, and often there are too few accidents reported under individual causes to provide an adequate sample. Combining the 400 cause codes into a smaller number of cause groups of related accidents helps focus the analysis, which highlights important trends and relationships. Appendix B explains how individual FRA causes have been combined into 51 individual cause groups (Table A2.1), and provides definitions for the resulting cause groups (Table A2.2). These cause groups were then assigned to one of two categories as being “train-mile related” and “car-mile related” because in some cause groups, accident occurrence is mainly a function of car-miles operated (for example, those due to equipment defects) and in other cause groups accident occurrence is mainly a function of train-miles operated (for example, grade crossing collisions). The distinction between car-mile and train-mile cause groups is not always obvious or clean. In earlier versions of this approach, selection was by expert judgment. Later statistical analysis by University of Illinois researchers [13] improved on the original, and the improved version is used in this report.
In practice, historic accident data can be used to calculate two accident frequencies – accidents per train-mile for the train-mile causes and accidents per car-mile for the car-mile causes. Then, given details of car and train-miles over a specific railroad line segment, the accident frequency data may be used to calculate an estimate of overall accident frequency on that line. The distinction between car and train-mile accidents can also be used to develop estimates in the reduction in accidents and car derailments that would follow implementation of a risk reduction measure, as explained in Chapter 4. When accident frequency estimates do not need to be

31
sensitive to train length, a simple calculation of accidents or cars derailed per train-mile may be used; discussing historic accident data would be one example. Full details of calculations and applications of accidents by cause group are provided in Appendix B.
Section 3.2 discusses how train accident frequency and car derailment probability depends on accident type and cause, railroad type (Class I vs. non-Class I), and FRA Track Class. The train accident is Step 1 in the chain of events, and the derailment of cars is Step 2, which can eventually lead to a hazmat spill and its consequences. Information on accident frequencies and car derailment probability is critical in understanding the factors that affect hazmat car derailments that precede a hazmat release in Steps 3 and 4 of the chain of events. Section 3.3 provides a detailed discussion of the factors that determine if a derailed car contains hazmat or not, whether that car will release some or all of its contents if it contains hazmat, and includes an overview of the consequences of the release.
The data in this Chapter should be used with caution. Subsequent to the time period on which the analysis is based (2004-2008), there have been significant changes in the volumes and commodity mix of hazmat carried on the U.S. network. Thus, the data in this report is useful to provide a general overview of rail hazmat transportation risks. However, the source data should be updated and the analysis repeated where critical decisions depend on analysis results.
3.2 Baseline Metrics for Train Accidents and Cars Derailed in a Train Accident
Overview 3.2.1Train accident metrics are calculated for freight trains operating on main line track. Accidents involving light locomotives, work trains, and passenger trains are not included (because there are no hazmat cars involved). Accidents on yard, siding, and industrial track must be analyzed separately.
Detailed tabulations of trains and cars derailed for trains in accidents and cars derailed in accidents can be found in Appendix B (Tables A2.3 and A2.4). Appendix B also provides a summary of base-case frequencies for accidents per train-mile and cars derailed per train- and car-mile. These tables provided the source data for this section.
Table A2.3 provides counts of accidents to freight trains only (trains must have at least one freight car in the train consist) by individual cause group as well as totals for track, equipment, human factors and miscellaneous causes for the following categories:
• By FRA Track Class for derailments, collisions and other accidents and the corresponding totals on Class I railroads. Separate accident counts are also provided for “train-mile” and “car-mile” accidents.
• For derailments, collisions and other accidents and the corresponding totals for non-Class I railroads. Accidents by FRA Track Class are not provided for non-Class I railroads because the counts are often very low and, more importantly, no estimates are available for train miles by Track Class for non-Class I railroads from which to calculate accident frequencies. As for Class I railroads, separate counts are also provided for “train-mile” and “car-mile” accidents.
• Totals by cause group and for track, equipment, human factors and miscellaneous causes for all railroads.

32
These data may be combined with estimates of train miles from Chapter 2, Tables 1 and 2, and the more detailed railroad traffic data in Appendix A to calculate accident frequencies.
Table A2.4 provides counts of cars derailed in accidents using the same layout and level of detail as for Table A2.3.
Table A2.5 provides a variety of accident and cars derailed frequencies derived from Tables A.3 and A2.4, specifically:
• Overall accident frequencies by FRA Track Class for Class I railroads and for all track classes combiner for non-Class I railroads, including the underlying accident counts and traffic volume estimates from which the frequencies were derived.
• Cars derailed in train accidents per billion car-miles for each track class on Class I railroads and all FRA Track Classes combined for non-Class I railroads.
• Statistics for the average number of cars derailed in accidents by FRA Track Class for Class I railroads and for all track classes combined for non-Class I railroads, including the underlying counts of cars derailed and traffic volume estimates from which the averages were derived.
• Separate accident frequencies (accidents per million train miles) for “train-mile” accident causes and car derailment frequencies for “car-mile” accidents. These numbers may be used with the formula described below to calculate accident occurrence estimates for a specific line segment based on railroad type, FRA Track Class and rail traffic volumes.
• The average number of cars derailed by FRA Track Class and accident type (derailment, collision and other accidents) for Class I railroads and for all FRA Track Classes combined for non-Class I railroads.
The detailed information for accident and car derailment frequencies provided in Table A2.5 is summarized in Table 8. The data in Table 8 is used in this Chapter and elsewhere in this report to prepare graphics and tables illustrating how operations and infrastructure factors affect the likelihood of a freight train accident and resulting freight car derailment probabilities and hazmat releases.

33
Table 8. Summary of Accident and Car Derailment Metrics from Table A2.5
Metric Accident Type
Class I Railroads by FRA Track Class All Class I
Railroads* Non-Class I Railroads
Overall Total
2 3 4 5 and above
Accident Frequency: Accidents per Million Train-Miles
Derailments 4.343 1.315 0.482 0.354 0.813 4.195 1.066
Collisions 0.368 0.146 0.066 0.064 0.096 0.168 0.101
Other 0.592 0.496 0.334 0.395 0.362 0.650 0.383
All Types 5.304 1.958 0.881 0.712 1.270 5.014 1.551 Freight Cars Derailed per Billion Car-Miles
Derailments 469.0 174.6 64.5 46.7 96.1 532 120.1
Collisions 12.39 4.01 3.14 3.07 3.7 7.45 3.94
Other 6.28 3.97 2.27 1.64 2.5 7.45 2.80
All Types 487.7 182.6 69.9 51.4 102.4 547 126.8 Average Number of Freight Cars Derailed in Train Accidents
Derailments 7.3 8.9 9.5 8.9 8.2 6.35 7.68
Collisions 2.27 1.83 3.41 3.26 2.72 2.22 2.66
Other 0.72 0.53 0.48 0.38 0.49 1.82 0.12
All Types 6.0 6.0 5.2 4.4 5.3 5.46 5.58 *Accident frequencies for FRA Track Class X/1 are not reliable and have been omitted from this table, but totals do include these track classes because total accident numbers are small.
The data in Tables A2.3, A2.4 and A2.5 provides:
• First and foremost, a broad understanding of the relative importance that different accident-cause groups and accident types can have on hazmat car derailments and releases. In almost all cases, a hazmat car that releases its contents in an accident derailed first. Therefore, accident causes that result in the most car derailments are those that are most significant with regard to hazmat releases. This knowledge may be used to guide decisions regarding where to invest resources to reduce the chance of accidents and freight car derailments.
• Baseline data that can be used to estimate the chance of accidents on a specific rail route or railroad territory.
• Baseline data for developing estimates of the benefits in reduced accidents, car derailments and hazmat releases.
• Baseline data that can be used to conduct similar investigations of freight railroad safety issues.

34
Distribution of Freight Train Accidents by Railroad Type, Accident Type 3.2.2and Accident Cause
The first distribution factor to be examined is the distribution of accidents among track classes and between Class I and non-Class I railroads (Figure 3 below).
Figure 3. Accidents on Main Line Track
This distribution factor is notable for the large number of accidents on the lower track classes on Class I railroads and on non-Class I railroads. Fifty-eight percent of all mainline accidents are on non-Class I railroads and on Class I railroads on FRA Track Classes 3 and below, but these track classes account for only 20 percent of train miles. Accident frequencies (accidents per train mile) are much higher on this lower class track, but this does not translate into more releases. This is likely because the speeds, as well as the number of derailed cars and the severity of impacts suffered by hazmat tank cars in the train consist, are lower.
Table 9 is a list of the top ten accident causes by the number of accidents. Grade crossing accidents have been omitted from this analysis. While grade crossing collisions dominate accident numbers, they are considered a minor factor in an analysis that is concerned with hazmat releases. This would not be true if the analysis approach is used to investigate a different kind of accidents.

35
Table 9. Top Ten Accident Causes
Rank Cause Group FRA Accident Cause and
Type* Number
of Accidents
Percent of All Accidents*
Ref. Name This Cause Cumulative
1 08T Broken Rail Track Defect Derailment 526 14.1 14.1 2 04T Track Geometry Track Defect Derailment 286 7.6 21.7 3 03T Wide Gauge Track Defect Derailment 188 5.0 26.7 4 01M Obstruction
Collision Miscellaneous Collision 184 4.9 31.5
5 10E Bearing Failure Equipment Derailment 162 4.3 35.8 6 10H Over speed Human Factors Derailment or
Collision 141 3.7 39.5
7 09H Train Handling Human Factors Derailment 136 3.6 43.1 8 03M Lading
Problems Miscellaneous Derailment or Collision 127 3.4 46.5
9 05H Passed Signal, Etc. Human Factors Collision 123 3.3 49.8
10 12E Broken Wheel Equipment Derailment 119 3.2 53.0
All Other Cause Groups 1,770 47.0 100.0
*Grade crossing accidents are omitted from this analysis, both from the ranking and from the calculation of percentages of accidents. Although grade crossing accidents are the most numerous (at 787), very few freight cars are derailed – only 308, fewer than one derailed car for every two grade crossing collisions. Since a car derailment is a necessary precursor to a hazmat release, grade crossing collisions are a minor factor in hazmat safety.
Table 9 shows that the top ten accident cause groups account for 53 % of all accidents, which is led by derailments caused by broken rails and welds at 14 % of all accidents. The remaining 40 cause groups (not including grade crossing collisions) account for the remaining 47 % of all accidents. The top accident cause group, by a wide margin, is broken rails and welds, which therefore, must be a major focus of risk reduction efforts. The top three accident cause groups are all due to track defects, with broken rails more associated with higher FRA Track Classes and higher speeds, and track geometry and wide gauge defects associated with lower-speed and lower quality track. Surprisingly, obstruction collision is number four in the accident ranking (and is also significant in the cars derailed ranking discussed below). This suggests that further investigation of the underlying accident reports is desirable to properly understand these accidents, and to develop corresponding risk reduction measures. Two accident cause groups, over speed (ranked number 6) and passed signal and related events (ranked number 9), include many accidents that could be potentially prevented by PTC and are addressed in Chapter 4, which describes the analysis of risk reduction measures.
Broken rails and welds are clearly the leading accident cause group. No other cause group shows a significant percentage of accidents on which to focus accident prevention efforts. Accident prevention efforts must be distributed over multiple accident cause groups if substantial reductions in the number of accidents are to be achieved.

36
Figure 4 shows a different and more detailed way of presenting the distribution of accidents among accident cause groups and FRA Track Classes for Class I railroads. Note that non-Class I railroads are not included in this graphic. Color coding (from green to red) is used to highlight accident cause groups and FRA Track Classes at places where lower and higher numbers of accidents are observed. This enables the eye to pick out clusters of accidents that could be of concern for railroad safety in general and rail hazmat transportation in particular. Any cluster that combines a larger number of accidents and higher track classes is of special concern, because higher speeds on higher FRA Track Class is likely to increase the severity of consequences. Five clusters stand out in Figure 4 as follows, but not in order of importance.
• Equipment defects on FRA Track Classes 3, 4 and 5, concentrating on truck components such as journal bearings, wheels, axles and other truck components.
• A cluster of human factors related accidents, mostly concerned with compliance with signals and operating instructions, including speed, use of switches and signal compliance. These accidents are widely distributed over track classes, but those on FRA Track Classes 1 and 2 are likely to be low-speed events that cause limited consequences. Train handling errors, typically leading to excessive buff and draft forces and derailment are the “odd man out” in this group. Safe handling of throttle and brakes can be technically difficult, and need different counter-measures than errors that are due to inattention or distraction.
• A cluster of miscellaneous accidents that include obstruction collisions, grade crossing collisions and lading problems. As previously mentioned, grade crossing collisions lead to few derailed cars, and are of limited concern for hazmat release accidents.
• Broken rails and welds cause a large number of accidents on track classes, and are the cause of the largest number of accidents on FRA Track Classes 3, 4 and 5 (Grade crossing collisions excepted).
In general, the message conveyed by Figure 4 is consistent with the “top ten” accident cause table. The same accident causes predominate, with the distribution of accidents among FRA Track Classes as a rough proxy for train speed.

37
Figure 4. Accidents by Cause Group and Track Class
Count
Low High
Cause Categories Track 1 Track 2 Track 3 Track 4Track 5+Equipment Defects 01E Air Hose Defect 0 2 1 4 1
02E Brake Rigging Defect 1 6 2 8 303E Handbrake Defects 1 0 0 0 004E UDE (Car or Loco) 1 0 0 4 005E Other Brake Defect 0 5 12 10 106E Centerplate/Carbody Defects 9 11 26 32 807E Coupler Defects 5 5 21 53 1208E Truck Structure Defects 0 1 4 9 709E Sidebearing, Suspension Defects 23 43 19 25 710E Bearing failure 3 15 38 84 2211E Other Axle/Journal Defects 3 9 16 38 1512E Broken Wheels 2 9 25 68 1513E Other Wheel Defects 10 20 14 36 514E TOFC/COFC Defects 0 2 1 2 015E Loco Trucks/Bearings/Wheels 2 4 6 15 1016E Loco Electrical and Fires 0 1 3 12 117E All Other Locomotive Defects 0 4 2 7 018E All Other Car Defects 6 2 7 11 420E Track/Train Interaction 0 2 2 10 5
Human Factors/Operations 01H Brake Operation (Main Line) 10 12 15 23 402H Handbrake Operations 19 11 19 9 303H Brake Operations (Other) 2 1 1 2 004H Employee Physical Condition 0 3 1 0 305H Failure to Obey/Display Signals 7 9 24 64 1906H Radio Communications Error 1 1 4 4 007H Switching Rules 21 11 13 11 208H Mainline Rules 9 7 12 30 509H Train Handling (excl Brakes) 41 34 23 32 610H Train Speed 37 26 31 34 1311H Use of Switches 35 12 14 19 512H Miscellaneous Human Factors 4 3 18 16 2
Miscel laneous 01M Obstructions 14 26 35 73 3602M Grade Crossing Collisions 11 45 129 465 13703M Lading Problems 22 32 26 36 1104M Track-Train Interaction 12 40 26 18 505M Other Miscellaneous 10 30 14 24 4
Signal & Communication Defects 01S Signal failures 4 0 6 1 5Track Defects 01T Roadbed Defects 19 13 10 9 3
02T Non-Traffic, Weather Causes 7 11 10 7 003T Wide Gauge 107 48 19 13 104T Track Geometry (excl. Wide Gauge) 80 101 51 50 405T Buckled Track 31 32 24 29 106T Rail Defects at Bolted Joint 10 6 5 12 607T Joint Bar Defects 5 6 7 20 1308T Broken Rails or Welds 168 139 89 106 2409T Other Rail and Joint Defects 4 16 7 15 310T Turnout Defects - Switches 40 16 14 9 511T Turnout Defects - Frogs 1 3 3 4 012T Misc. Track and Structure Defects 31 19 9 5 4
Cause Groups

38
Distribution of Cars Derailed by Railroad Type, Accident Type, and 3.2.3Accident Cause
While the distribution of freight train accidents plays an important part in understanding the early steps in the chain of events leading to a hazmat release and release consequences, car derailment (Step 2) is of greater significance. In almost all cases, a hazmat release is preceded by derailment of the hazmat car. Table 10 is a list of the “top ten” accident cause groups for freight car derailments.
Table 10. Top Ten Accidents Causes by Cars Derailed
Cause Group FRA Accident Cause and Type
Number of Cars
Derailed
Percent of All Cars Derailed
Rank Ref Name This Cause Cumulative
1 08T Broken Rail Track Defect Derailment 5,475 21.6 21.6 2 04T Track Geometry Track Defect Derailment 1,594 6.3 27.8 3 03T Wide Gauge Track Defect Derailment 1,510 5.9 33.8 4 05T Buckled Track Track Defect Derailment 1,139 4.5 38.3
5 01M Obstruction Collision Miscellaneous Collision 1,055 4.2 42.4
6 09H Train Handling Human Factors Derailment 1,014 4.0 46.4
7 09T Other Rail and Joint Defects Track Defects Derailment 879 3.5 49.9
8 10E Bearing Failure Equipment Derailment 786 3.1 53.0
9 12E Broken Wheel Equipment Derailment 774 3.0 56.0
10 04M Track-Train Interaction
Track and Equipment Derailment 654 2.6 58.6
All Other Cause Groups 10,509 41.4 100.0
Key observations from this table are as follows.
• The “top ten” accident cause groups account for nearly 59 percent of derailed cars, with the remaining 41 percent distributed among the remaining 41 cause groups, which include grade crossing collisions, unlike the top ten accident list of Table 9.
• Broken rails and welds are by far the leading cause group for derailed cars, causing more than three times as many derailed cars as the next most significant cause group, and over 20 percent of all derailed cars in train accidents. This is a function of the larger numbers of cars derailed in accidents caused by train defects and the generally higher speeds at which these accidents occur.
• The next three highest causes of derailed cars are also all related to track defects. Track geometry and wide gauge are typical of lower track classes and thus lower train speeds. However, buckled track accidents tend to occur on all track classes and can be significant in terms of damage to a derailed tank car, which leads to the potential for causing a release.

39
• As with the accident cause list, obstruction accidents are ranked fifth highest in terms of the number of derailed cars, which leads to the conclusion that this accident cause group should receive further study.
• The remaining accident cause groups in this “top ten” list of derailed cars are distributed among a variety of causes, including bearing failures, wheel failures, and train handing errors. Notably, human factors accidents caused by over speed, failure to observe signals and operating rules that were present on the “top ten” list of accidents by cause group have dropped off the list for cars derailed.
Full details of the numbers of cars derailed by FRA Track Class, railroad type, and accident type are given in Appendix B.
Influence of Train Speed and FRA Track Class on Accidents and Cars 3.2.4Derailed
Train speed and FRA Track Class are factors that have significant but different effects on the likelihood of a train accident and the number or fraction of cars derailed. First, accident frequency (accidents per million train-miles) is strongly dependent on FRA Track Class, as illustrated in Table 11. Table 11 also shows the corresponding train miles and the number of accidents by FRA Track Class. Accidents, accident frequency, and train miles for non-Class I railroads is provided in a separate column, since no breakdown of train-miles by track class for these railroads is available. All data in Table 11 is derived from data in Table 8 and Appendix B.
Table 11. Accident, Train-Miles and Accident Frequency by FRA Track Class
Parameter Class I Railroads Non-Class I Railroads
FRA Track Class 2 3 4 5 and over All All Classes
Accidents (2004-2008) 475 643 1478 437 3,448 1,103
Train Miles (millions) 89.6 328.4 1677.3 613.4 2,714 220
Accident Frequency 5.301 1.958 0.881 0.712 1.270 5.014
Table 11 shows that accident frequency is strongly dependent on FRA Track Class, but because the majority (88 percent) of Class I railroad train-miles are on FRA Track Class 4 and above, the majority of accidents (56 percent) are still on the higher track classes.
Obviously, poorer track quality is the principal reason that accident frequencies are higher on lower track classes, in spite of lower permitted train speeds. However, it is important to remember that operations on FRA Track Classes 2 and 3 are much more likely to involve local freight operations with regular en-route switching movements, and no automatic block signals or centralized traffic control (CTC). Both these factors may increase accident frequency. However, it is difficult to find any evidence that train speed per se affects accident frequency, independently of track quality, signal system in use, or the nature of train operations.

40
Train speed and accident type does most definitely affect the numbers of freight cars derailed in a train accident, as illustrated in Figure 5.
Figure 5. Percent of Cars in a Consist Derailed by Accident Type
The percentage of freight cars derailed by speed increases from 7.3 percent to 15.2 percent in derailment accidents, as speed range increases from 0-15 mph to 46-60 mph. Freight cars derailed in collision accidents show the same trend, but the percentages are substantially lower than for derailments. The percentages of freight cars derailed in “other” accidents (the majority of which are grade crossing collisions) is very small. Since collisions comprise only 6 percent of train accidents, and the low average fraction of cars derailed in other accidents, it is clear that the vast majority of derailed freight cars (about 90 percent) are a consequence of derailment accidents.
3.3 Accidents and Cars Derailed in Trains with One or More Hazmat Cars Appendix C, specifically Tables A3.3, A3.4 and A3.5, provides detailed data on the numbers of accidents and freight cars derailed in accidents which included trains that have at least one hazmat car. The purpose of this analysis is to test the assumption (as discussed in Section 3.2) that the distribution of such accidents among railroad type, FRA Track Class on Class I railroads, accident type, cause category and accident cause group is the same as or very similar for all accidents.
Tables A3.1 and A3.2 are organized in exactly the same way as Tables A2.3 and A2.4; they show accident counts by accident cause, railroad type, accident type and FRA Track Class. Table A3.3 gives a summary of hazmat train accident data and uses a similar format to Table A2.5, but the contents are different because the data on train and car-miles for trains with hazmat cars in the consist is not available. This means it is not possible to calculate accident frequencies for these trains. Instead, Table A3.3 provides accident cars derailed counts for train- and car-

41
mile accidents and in total so that the distribution of accidents between railroad type, track class, and cause groups can be compared and discussed.
Four comparison tests are performed:
• Is there any difference in the distribution of accidents by railroad type and track class between trains with hazmat cars and all trains? A difference would imply that hazmat train operations are distributed differently over the network than all trains.
• Is there any difference between the percentage of accidents in the top ten accident causes when trains with hazmat cars are compared to all trains? A difference would imply that hazmat trains suffer a different mix of accident causes and influence the numbers of cars derailed in those accidents.
• Compare the percentage of trains with hazmat cars derailed in accidents to the percentage of all trains involved in such accidents. A difference would supports the hypothesis that the different mix of accidents is having an effect on car derailments and/or some other factor (such as average train speed) is affecting car derailments.
• A comparison between the percentage of trains with hazmat cars derailed in the top ten accidents versus all trains. Any differences would imply that, as for Test 2, that there is some factor at work that produces a change, and that it may be possible to suggest (but not prove) why the change exists.
The first comparison is summarized in Table 12 which contains the numbers and percentages for the distribution of accidents for all trains versus hazmat trains. The numbers in the table indicate that hazmat trains are more likely to operate on Class I railroads of FRA Track Classes 2 and above, and less likely to operate on FRA Track Class X (or “excepted track”)14 and Class 1 or on non-Class I railroads. In contrast, hazmat trains are more likely to operate on higher FRA Track Classes and on Class I railroads. The net effect of this shift is that hazmat trains may be slightly less likely to have an accident than all trains, but the difference will be small.
Table 12. Comparison of Accident Numbers and Percentages between All Trains and Hazmat Trains
Class I Railroads Non Class I Total
X and 1 2 3 4 5 and over All
All Trains
Number 415 475 643 1478 437 3448 1103 4551
Percent 9.2 10.4 14.1 32.5 9.6 75.8 24.2 100
Hazmat Trains
Number 107 163 236 509 144 1159 283 1442
Percent 7.4 11.3 16,4 35.3 10.0 80.4 19.6 100
14Excepted track is defined in §213.4 of the Track Safety Standards in Title 49 in the Code of Federal Regulations.

42
Table 13 gives the top ten causes of hazmat train accidents. When compared with the top ten accident causes for all trains in Table 9, broken rails and welds and track geometry remain as number 1 and 2 cause groups, but there are some differences in the cause groups ranked 3 through 10.
Table 13. Top Ten Accident Causes for Hazmat Trains
Rank Cause Group FRA Accident Cause and
Type Number
of Accidents
Percent of All Accidents*
Ref. Name This Cause Cumulative
1 08T Broken Rail Track Defect Derailment 148 12.6 12.6
2 04T Track Geometry Track Defect Derailment 101 8.6 21.2
3 09H Train Handling Human Factors Derailment 58 5.2 26.4
4 10E Bearing Failure Equipment Derailment 52 4.4 30.8
5 10H Over Speed Human Factors Derailment or collision 47 4.0 34.8
6 10H Passed Signal, Etc. Human Factors Collision 44 3.8 38.5
7 03T Wide Gauge Track Defect Derailment 43 3.7 42.1
8 09E Suspension Defect Mechanical Derailment 40 3.4 45.5
9 07E Coupler Defect Equipment Derailment 39 3.3 48.8
10 06E Centerplate/Car Body Equipment Derailment 34 2.9 51.8
All Other Cause Groups 564 48.2 100.0
TOTAL 1,170 100.0 -
*Grade crossing accidents are omitted from this analysis, both from the ranking and from the calculation of percentages of accidents. Although grade crossing accidents are the most numerous (at 271), very few freight cars are derailed - fewer than one derailed car for every two grade crossing collisions. Since a car derailment is a necessary precursor to a hazmat release, grade crossing collisions are a minor factor in hazmat safety.
The most obvious difference in Table 13 versus all trains is that equipment failures are more likely to be the cause of hazmat train accidents. This may be due to the wider variety of freight cars moving in general merchandise trains in which most hazmat cars travel, and the possible poorer condition of these cars, than for all trains. All trains, taken as a group, would include many intermodal and unit trains with few hazmat cars, and they might be better maintained. However, the change in the mix of accident cause groups is unlikely to have much effect on the chance of a hazmat car derailment.
Table 14 shows a comparison of freight cars derailed by track class and railroad type between all trains and trains with at least one hazmat car in the consist.

43
Table 14. Comparison of Numbers and Percentages of Cars Derailed between All Trains and Hazmat Trains
Class I Railroads Non Class I Total
X and 1 2 3 4 5 and over All
All Trains
Number 1872 2952 3831 8348 2128 19370 6019 25389
Percent 7.3 11.6 15.1 32.9 8.4 76.3 23.7 100
Hazmat Trains
Number 455 1059 1472 2956 665 6642 1675 8317
Percent 5.5 12.7 17.70 35.5 8.0 79.9 20.1 100
The results in Table 14 are consistent with those in Table 13. If Table 14 is compared with the distribution of cars derailed for all trains, there is a shift in the distribution of cars derailed in accidents to hazmat trains away from very low FRA Class track (Classes X and 1) and from non-Class I railroads to Class I railroads of FRA Track Class 2 and above. The shifts are not great and the net effect on accident likelihood and severity are likely small. Table 15 lists the top 10 causes of derailed cars and, for comparison with the corresponding table for all trains, the distribution of cars derailed in accidents to hazmat trains.
Table 15. Top Ten Accident Cause Groups for Derailed Cars in Hazmat Trains
Rank Cause Group FRA Accident Cause and
Type Number of Cars Derailed
Percent of All Derailed Cars
Ref. Name This Cause Cumulative
1 08T Broken Rail Track Defect Derailment 1,256 18.9 18.9
2 09H Train Handling Human Factors Derailment 444 6.7 25.6
3 04T Train Geometry Track defect Derailment 440 6.6 32.2
4 09E Suspension Defects Equipment Derailment 300 4.5 36.7
5 03M Lading Problems Miscellaneous Derailment or
Collision 242 3.6 40.3
6 01M Obstructions Miscellaneous Collision 241 3.6 44.0
7 11E Bearings, Axles Equipment Derailment 240 3.6 47.6
8 03T Wide Gauge Track Defect Derailment 238 3.6 51.2
9 07E Brake Operation Human Factors Derailment 231 3.5 54.7
10 06E Track-Train Interaction Miscellaneous Derailment 220 3.3 58.0
All Other Cause Groups 2,789 42.0 100.0
TOTAL 6,641 100.0 -

44
When the data in Table 16 is compared to the data in Table 11, the top cause (rail and weld defects) is somewhat less dominant (18.9 percent of derailed cars versus 21.6 percent for all trains), and there is a clear shift away from track defect causes to equipment and miscellaneous causes. This result is consistent with the results in Table 13, which showed that hazmat trains are less likely than all trains to operate on very poor track where accidents caused by track defects are most likely to occur.
In conclusion, these tests indicate that when the chance that a freight car will be derailed between all freight trains is compared with the chance that a derailment will occurs in freight trains having one or more hazmat cars in the consist, there is little difference. However, while broken rails and welds remains the dominant cause group for train accidents and derailed cars, there is a definite difference in the mix of accident causes responsible for accidents to all trains and the mix of causes responsible for trains with hazmat cars in the consist. Accidents to hazmat trains have a more diverse mix of causes, with significant number of accidents due to miscellaneous and equipment defect causes, compared with the greater importance of track defect causes for all trains. This may influence consideration of where to focus risk reduction efforts for hazmat trains.
3.4 Analysis of Hazmat Car Derailments and Releases from Hazmat Cars Three sources of data are available for analyzing hazmat car derailments in accidents and releases from hazmat cars; unfortunately they have different and overlapping reporting criteria. These sources are:
• FRA accident reports contained in RAIRS – Has counts of hazmat cars that were derailed and released hazmat. However, information about the types of hazmat cars involved, the contents of the car or cars involved, and the materials released is lacking. These data include all types of hazmat cars, including dry bulk hazmat cars and packaged materials contained in intermodal shipments as well as hazmat tank cars.
• PHMSA database of hazmat releases – Gives full details of the hazmat container, material released and consequences, but lacks an automatic connection to the FRA Accident report on the same event. For this project, PHMSA reports of releases from hazmat tank cars were linked to the corresponding accident data in RAIRS to create a database of 212 releases for the five years 2004-2008. In particular, this database allows analysis of releases by accident cause and railroad operations factors. This database also includes all types of hazmat shipments – tank car commodity, dry bulk and packaged materials.
• Private database maintained by the AAR/RPI Tank Car Safety Project – Contains data on damaged tank cars, including cars that lost their lading. The reporting criteria for this source are quite different from the other sources and focuses only on accidents that result in damage to the tank car tank and its attachments, such as inlet and outlet valves and relief valve. The principal application for this data is to study the probability of release from damaged tank cars as a function of tank car type, (Step 4 in the Chain of Events). This data source was not used in compiling this report.
The following paragraphs use the FRA and PHMSA data to examine: 1) the probability that a hazmat car will derail, given that the train it is in is derailed in a FRA-reportable train accident

45
(Step 3 in the chain of events), and 2) if the hazmat car is derailed, the probability that hazmat will be released (Step 4 in the chain of events).
Hazmat Car Derailment Probability 3.4.1A basic assumption behind this analysis is that hazmat cars have the same probability of being derailed in an accident is very similar to that for all freight cars. The analyses described in Section 3.3 showed that the distribution in train accidents by FRA Track Class and railroad type changed little between the group of all trains and trains with one or more hazmat cars in the consist. There were, however, some differences in the mix of accident causes between hazmat trains and all trains that could affect car derailment probabilities.
It is not possible to directly calculate car derailment probabilities between either hazmat trains and all trains, or between hazmat cars and all freight cars, because no data is available on train-miles and car-miles for trains with one or more hazmat cars in the consist. Instead, it is possible to compare the derailment frequency for freight and hazmat cars using estimated car-miles. This data is only available for the U.S. as a whole – more analysis would be required to estimate the distribution of hazmat car-miles by FRA Track Class and railroad type. The analysis is described below and supported by the data contained in Table 16.
Table 16. Hazmat Car Derailment Metrics
Loaded/Empty State All Car-Miles (billions) Hazmat Tank Car-Miles
(billions) All Cars Loaded 111,507 4,761
Empty 88,651 4,285*
Total 200,158 9,046 Cars Derailed Loaded 18,950 809**
Empty 6,439 655**
Total 25,839 1,404
Derailment Frequencies Loaded 169.0 cars derailed per billion car-miles
Empty 72.6 cars derailed per billion car-miles
All Cars 126.8 cars derailed per billion car-miles *Estimated assuming empty hazmat car mileage is 90% for loaded car mileage, since most hazmat cars return to point of origin with residual hazmat for reload. Residual cars are considered hazmat cars for reporting purposes. **Using car derailment frequency calculated for all derailed cars, assiming no difference between all cars and hazmat cars.
The data for “All Cars” in Table 16 is taken from Appendices A and B, Table A-1 and Section A-3. Loaded hazmat tank-car miles are also taken from Appendix A, and are shown in Table A-6. The empty hazmat tank-car miles are estimated assuming empty car-miles are 90% of loaded car-miles. Most tank cars are owned or leased to an individual shipper and used for a single product. Empty hazmat tank cars usually contain residual quantities of hazmat after unloading,

46
and are still considered hazmat cars on waybills and will be reported as such in accident reports. The numbers for derailed loaded and empty hazmat tank cars are estimated assuming that tank car derailment frequencies are the same as for all cars.
The first point to note from Table 16 is that the data for “All Cars” show that the car derailment frequency for loaded cars is more than twice as great as empty cars. The greater mass of loaded cars means that the energy dissipated in an accident is correspondingly higher than for empty cars, which means that much more vehicle and track damage occurs.
If estimates of empty and loaded derailed hazmat tank cars are combined, an estimate of 1,404 derailed cars results, versus a total of 1,594 derailed hazmat cars of all types that were reported to FRA over the same period (190 cars or 13.5 percent higher). The difference is partly because the estimates were made for hazmat tank cars rather than hazmat cars of all types. Dry bulk hazmat car miles are about 5 percent of hazmat tank car miles; if the same derailment frequencies apply, about 70 cars would be added to the total. The remaining 8.5 percent difference must be due to other types of hazmat car derailments reported to FRA (for example, intermodal cars containing hazmat shipments) as well as errors in the various estimates. Given the uncertainties in the analysis, the results are credible, and that it is reasonable to use the car derailment frequencies shown in Table 16 for both all freight cars and hazmat cars in railroad risk analyses.
Derailment frequencies by FRA Track Class and railroad type can be found in Table 8 and repeated below in Table 17. These frequencies may be used in hazmat risk analyses of Steps 2 and 3 of the chain of events for hazmat cars as well as for all freight cars. Further analysis would be required to obtain the equivalent frequencies for loaded and empty cars, but the source data is readily available in RAIRS.
Table 17. Car Derailment Frequencies
Metric Accident Type
Class I Railroads by FRA Track Class All Class I
Railroads* Non-Class I Railroads
Overall Total
2 3 4 5 and above
Freight Cars Derailed per Billion Car-Miles
Derailments 469.0 174.6 64.5 46.7 96.1 532 120.1
Collisions 12.39 4.01 3.14 3.07 3.7 7.45 3.94
Other 6.28 3.97 2.27 1.64 2.5 7.45 2.80
All Types 487.7 182.6 69.9 51.4 102.4 547 126.8
Analysis of Hazmat Releases 3.4.2For the purposes of this report, a database of release and accident data was prepared by combining all train accident releases on main track from the PHMSA database for the period between 2004 and 2008 inclusive with FRA accident data for the same events. The accident data were located in the FRA database by finding the appropriate RAIRS accident reports via matching accident dates, railroads, and location, which yielded a total of 212 cars releasing in

47
111 accidents on main track. Releases on yard, siding and industrial tracks are not included. Slightly more than 13 percent of the 1,694 derailed hazmat cars in this database had a reportable release. Actual release percentages depend heavily on tank car specification.
The release data was analyzed to identify the accident-cause groups associated with hazmat release. Table 18 shows the top ten causes, which are ranked by the total number of cars that released hazmat. The results show that once again, rail defect-caused accidents are the leading cause of accidents that lead to hazmat releases. However, these results must be treated with considerable caution, since the sample size for each cause group is very small. In particular, a single track-defect-caused accident caused 20 releases, which sharply increased the percentage of releases attributable to this cause. It is probably safer to conclude that rail and weld defects are responsible for between 20 and 25 percent of hazmat releases.
Table 18. Top Ten Accident Cause Groups for Hazmat Releases
Rank Cause Group FRA Accident Cause and
Type Number
of Releases
Percent of All Accidents*
Ref. Name This Cause Cumulative
1 08T Broken Rail Track Defect Derailment 65 30.7 30.7
2 04T Track Geometry Track Defect Derailment 21 8.6 40.5
3 10E Bearing Failure Equipment Defect Derailment 17 5.2 48.6
4 09E Suspension Defect
Equipment Defect Derailment 13 4.4 54.7
5 01M Obstruction Collision Miscellaneous Collision 10 4.0 59.4
6 03M Lading Problems Miscellaneous Collision or
Derailment 9 3.8 63.7
7 03T Wide Gauge Track Defect Derailment 9 3.7 67.9
8 05H Failure to Obey Signals, Etc. Human Factors Collision 9 3.4 72.2
9 07E Coupler Defect Equipment Defect Derailment 7 3.3 75.5
10 09T Suspension Defect Track Defect Derailment 7 2.9 78.8
All Other Cause Groups 45 21.2 100.0
TOTAL 212 100.0 -
The releases were also analyzed to determine the percentage of large releases, which is defined as more than 5 percent of typical estimated car capacity. This analysis showed that in 45 out of 119 accidents, 86 cars out of 212 had large releases. The remaining releases were small releases with relatively small quantities of material, from residue cars or had releases through a relief valve. Because of the very small sample size, no reliable conclusions regarding accident-cause groups associated with large releases can be drawn. Finally, the distribution of releasing cars per
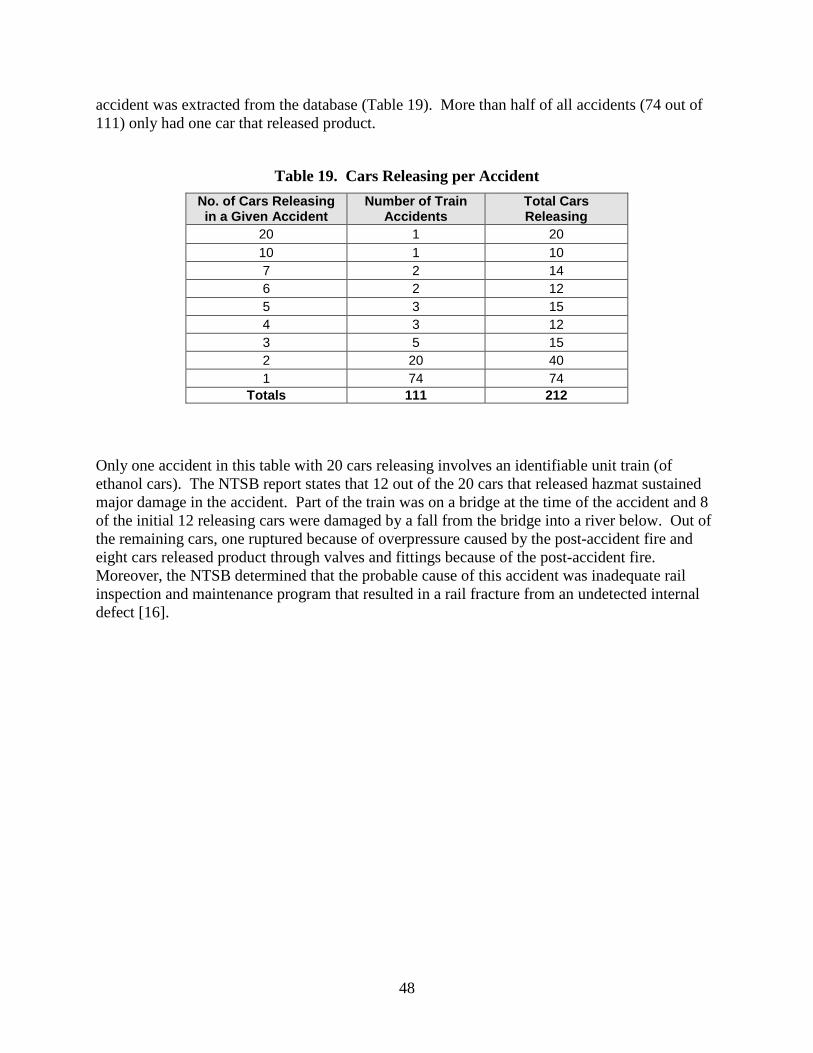
48
accident was extracted from the database (Table 19). More than half of all accidents (74 out of 111) only had one car that released product.
Table 19. Cars Releasing per Accident No. of Cars Releasing in a Given Accident
Number of Train Accidents
Total Cars Releasing
20 1 20 10 1 10 7 2 14 6 2 12 5 3 15 4 3 12 3 5 15 2 20 40 1 74 74
Totals 111 212
Only one accident in this table with 20 cars releasing involves an identifiable unit train (of ethanol cars). The NTSB report states that 12 out of the 20 cars that released hazmat sustained major damage in the accident. Part of the train was on a bridge at the time of the accident and 8 of the initial 12 releasing cars were damaged by a fall from the bridge into a river below. Out of the remaining cars, one ruptured because of overpressure caused by the post-accident fire and eight cars released product through valves and fittings because of the post-accident fire. Moreover, the NTSB determined that the probable cause of this accident was inadequate rail inspection and maintenance program that resulted in a rail fracture from an undetected internal defect [16].

49
4. Risk Reduction Analysis
4.1 Overview This analysis focuses on risk reduction, in which measures aimed at reducing the number of train accidents are implemented and, consequently, the number of freight cars that are derailed in accidents are reduced. Since a hazmat release is always preceded by damage to the derailed hazmat car, the analysis in this section is concerned only with Steps 1 and 2 in the Chain of Events. This analysis focused on three potential risk reduction measures:
1. Installation of Positive Train Control (PTC), as mandated by the Rail Safety Improvement Act (RSIA) of October 2008 and accompanying FRA implementation regulations;
2. Implementation of a “Rail Integrity Rule” developed through the Railroad Safety Advisory Committee (RSAC) to enhance rail testing procedures and processes to reduce the occurrence of broken rails; and
3. Application of Electronically Controlled Pneumatic (ECP) brakes to trains conveying loaded TIH cars.
To estimate potential risk reductions in train accidents and derailed cars, an estimated risk reduction factor was applied to each accident cause group, FRA track class, and railroad type (Class I and non-Class I). First, the analysis identified accident cause groups where the number of accidents could be reduced by implementing a specific accident risk reduction measure. For example, improving rail flaw detection technology and reducing the time or traffic interval between inspections will reduce the frequency of rail flaw accidents, while implementing PTC will prevent most over-speed accidents and failures to respond to a restrictive signal. Second, the analysis has to estimate the reduction in accidents in each cause group when a risk reduction technique is implemented. This is more difficult, and must depend on available research results and professional estimates. For PTC implementation, detailed analyses have been performed in the past, and generally PTC is considered very effective in performing the functions for which it has been designed. In contrast, only limited information is available on the effectiveness of Electronically Controlled Pneumatic (ECP) brakes in reducing accident occurrences, and any estimate is subject to uncertainty regarding the number of accidents that would be prevented by its implementation. Details of the analysis for each risk reduction measure, including reference sources on which the risk reduction estimates were based are provided is Sections 4.2, 4.3 and 4.4 below. An illustrative example of this analysis is shown in Figure 6.

50
Figure 6. Example Risk Reduction Application
To estimate the number of accidents after a risk reduction measure is implemented, the number of accidents or cars derailed for each cause group, track class, accident type and railroad type are multiplied by an adjustment factor between 0 and 1. The adjustment factors are estimates of the fractional reduction in accidents or cars derailed that would follow implementation in each case. Next, the resulting numbers of accidents and cars derailed are summed to yield totals for system wide accidents and cars derailed, for comparison with pre-implementation numbers. Appendix E contains spreadsheets that contain accidents and cars derailed data for each risk reduction measure that was analyzed.
4.2 Positive Train Control (PTC) Most freight trains operations in the United States rely on the skill and experience of the train crew to ensure that they avoid accidents by complying with line side signals and operating instructions. PTC systems supplement the train crew’s capabilities by enforcing compliance with signals and instructions via computer and communications systems in the dispatching office and on the train. Under current FRA regulations and the RSIA of 2008 [25], railroads are now required to install PTC on selected route segments with TIH traffic by 2015. The principal capabilities of required PTC systems are designed to achieve four primary goals:
• Prevent train-to-train collisions • Prevent over-speed events, both with regard to permanent speed limits and temporary
slow orders • Prevent incursion into authorized work zones. • Prevent movement through switches set in the wrong position.
PTC performance has been the subject of a number of FRA studies. Specifically, References [17], [18], and [19] were consulted for this project. For example, Reference [17] included a very detailed review of FRA accident reports over a ten-year period between 1988 and 1997, which concluded that a PTC system with capabilities roughly similar to those being considered in 2012 would have prevented about 600 accidents, or 60 per year.
For this analysis, this study followed the procedure in Section 4.1 and identified the cause groups where accidents could be prevented by PTC. These cause groups included most human factor-related accidents, plus a small number of obstruction and grade crossing accidents that could be prevented if PTC is linked to obstacle detection systems. The size of risk reduction was estimated by expert judgment that weighed the mix of accidents in the cause group, the PTC system’s capabilities, and the likely application of the system to different railroads and track
Train Mileor Total
Car Mile Base Adjustment After Base Adjustment After Base Adjustment After Base Adjustment After Track and Structure Defects (CM)
TM 01T Roadbed Defects 4 1.00 4 5 1.00 5 9 1.00 9 1 1.00 1 31TM 02T Non-Traffic, Weather Causes 3 1.00 3 5 1.00 5 6 1.00 6 0 1.00 0 18TM 03T Wide Gauge 18 1.00 18 10 1.00 10 9 1.00 9 1 1.00 1 76TM 04T Track Geometry (excl. Wide Gauge) 56 1.00 56 36 1.00 36 48 1.00 48 4 1.00 4 179CM 05T Buckled Track 9 1.00 9 14 1.00 14 25 1.00 25 1 1.00 1 53CM 06T Rail Defects at Bolted Joint 2 1.00 2 4 1.00 4 11 1.00 11 6 1.00 6 26CM 07T Joint Bar Defects 2 1.00 2 6 1.00 6 20 1.00 20 13 1.00 13 44CM 08T Broken Rails or Welds 67 1.00 67 59 0.93 55 100 0.85 85 24 0.85 20 295CM 09T Other Rail and Joint Defects 5 1.00 5 5 1.00 5 14 1.00 14 3 1.00 3 28CM 10T Turnout Defects - Switches 5 1.00 5 11 1.00 11 9 1.00 9 5 1.00 5 49CM 11T Turnout Defects - Frogs 1 1.00 1 3 1.00 3 4 1.00 4 0 1.00 0 9TM 12T Misc. Track and Structure Defects 8 1.00 8 6 1.00 6 5 1.00 5 4 1.00 4 41
Total Track and Structure Defects 180 180 164 160 260 245 62 58 849
Signal and Communications Defects (TM)
CM 01S Signal failures 0 1.00 0 5 1.00 5 1 1.00 1 1 1.00 1 11
Track Class 2 Track Class 3 Track Class 4 Track Class 5 & 6Cause Group Derailment on Class I Railroads

51
classes. The details of this analysis are presented in a set of spreadsheets (Figures A5.1 A and B, and Figure A5.2 A and B) which give results of the risk reduction analysis for two PTC cases (Broad Implementation and Narrow Implementation). Broad Implementation assumes that PTC is installed on all tracks of FRA Track Class 3 and above, as well as routes that carry half the total traffic volume (train-miles) on FRA Track Class 2 on Class I railroads and non-Class I railroads. Narrow Implementation assumes that PTC is installed FRA Track Classes 4 and above on Class I railroads only. Table 20 gives nationwide estimates for accidents and cars derailed before implementation, estimates after implementation, and the percentage of reduction in accidents and cars derailed in each case.
Table 20. Analysis Results for Positive Train Control
Analysis Case Accidents Cars Derailed
Number Percent Reduction Number Percent
Reduction Before Implementation 4,551 NA 25,389 NA
Broad Implementation 4,247 6.7 24,117 5.0
Narrow Implementation 4,323 5.0 24,454 3.7 The estimate for the Broad Implementation case was a reduction of 304 accidents over five years, which compares well with the 1999 estimate of 600 accidents prevented over ten years. Undoubtedly, there are several caveats to this result, as both traffic volumes and accident frequencies have varied over the time between the analyses, but overall the close agreement between the two estimates provides some confidence in the risk reduction estimates. Given that the chance of a hazmat release is proportional to the number of freight cars derailed, PTC provides only a relatively limited risk reduction for hazmat releases of 5.0 percent for the Broad Implementation case, because the vast majority of freight train accidents are derailments caused by non-PTC-preventable track and equipment defects. PTC prevents accidents attributable to human factors and operations causes (for example, collisions, over speed, work zone incursions, and misaligned switches). Other accidents may be preventable (e.g. grade crossing warning system malfunctions or hot bearings) to the extent automatic alarms are linked to the PTC system.
The result for the Broad Implementation case is representative of risk reduction for hazmat shipments because the RSIA mandate applies to almost all railroad routes used for hazmat shipments. The Narrow Implementation may be more representative of the benefits for the railroad system as a whole.
4.3 Rail Defect Management through Rail Integrity Rule Broken rails have long been recognized as a major cause of railroad accidents and they have been the subject of research and tests by both FRA and the rail industry for many years. Primarily, rail failure accidents are prevented by conducting rail flaw inspections with

52
specialized equipment. Current FRA track safety standards (49 CFR Part 213.237) require that FRA Track Classes 4 and above have inspections annually or every 40 million gross tons (MGT), whichever is more frequent. Additionally, tracks carrying passengers must be inspected annually or every 30 MGT. Many railroads have developed their own rail inspection requirements that exceed these minimum requirements, based on published research and their own in-house findings.15
Since rail failures continue to be a major cause of hazmat release accidents (causing about 35 percent of tank car hazmat releases), an initial rough estimate of the potential benefit of changing inspection practices was derived using the procedure described at the beginning of Chapter 4. The proposed rail integrity rule is expected to require changes to rail inspection practices and standards that should reduce the occurrence of accidents due to broken rails and welds, primarily by reducing the volume of traffic between inspections and targeting inspections at tracks most likely to develop rail flaws, which would result in failures and accidents. The estimates for this report leveraged an analysis from the early 1990s that estimated the reduction in accidents due to more frequent rail inspection [20]. Reference [21] gave an estimate of a 23 percent accident reduction if the interval between inspections were reduced to 75 percent of then-current industry practice, and a 38 percent reduction if the interval were reduced to 50 percent. A more recent paper, Reference [22], suggests that a reduction in inspection intervals would result in a comparable reduction in service defects. In this analysis, service defects (i.e. defects found by means other than scheduled tests) are assumed to be a reasonable proxy for accidents caused by rail failure.
Based on the sources referenced above, a high estimate of 35 percent reduction in rail-flaw-caused accidents and a low estimate of 20 percent reduction are suggested from implementation of the rail integrity rule, compared to the data from 2004 through 2008. An estimate of the reductions in accidents and cars derailed was also calculated using the process described in Section 4.1. A 30 percent reduction in rail flaw-caused accidents was used as a reference analysis case, and the overall reductions in accidents and cars derailed that would occur given the high and low estimates were calculated. The reductions were applied to FRA Track Class 3 and above on Class I railroads to Cause Groups 06T (Rail Defects at Bolted Joint) and 08T (Broken Rails or Welds), and were halved to 17.5 percent and 10 percent for FRA Track Class 2 and for non-Class I railroads with Cause Groups 07T (Joint Bar Defects) and 09T (Other Rail and Joint Defects). The reductions were halved because rail flaw detection systems are less likely to find defects in Groups 07T and 09T, and that inspection may not be required on all FRA Track Class 2 rail. The results from this analysis are shown in Table 21.
15 In January 2014, FRA amended the Track Safety Standards and established requirements for performance-based risk management for scheduling inspection frequencies to detect rail defects. http://www.fra.dot.gov/Elib/Document/3546

53
Table 21. Analysis Results for Improved Rail Flaw Inspection and Maintenance Practices
Analysis Case Accidents Cars Derailed
Number Percent Reduction Number Percent
Reduction Before Implementation 4,551 NA 25,389 NA
Reference Case 4,432 2.6 23,616 7.0
Upper Bound - 35% Reduction 4,412 3.1 23,321 8.1
Lower Bound - 20% Reduction 4,472 1.7 24,207 4.7
From this analysis, the higher estimate (35 percent reduction in flaw-related accidents) shows a 3.1 percent overall accident reduction and an 8.1 percent car derailment reduction. For a lower estimate (20 percent reduction), there may be a 1.7 percent overall accident reduction, and a 4.7 percent overall car derailment reduction.
These estimates of reductions in rail and joint defect-caused accidents are consistent with the results in Appendix B (Tables A2.4 and A2.5), which suggest that rail and joint defect-caused accidents are responsible for approximately 30 percent of cars derailed in freight train accidents. A review of 212 hazmat releases indicated that 35 percent of releases result from rail and joint defect accidents, which makes it consistent with risk reduction estimates that suggest releases from a derailed car will be somewhat more likely at the higher speeds associated with rail flaw accidents.
4.4 Electronically Controlled Pneumatic (ECP) Brakes Traditional pneumatic (compressed air) brakes used on freight trains rely on air pressure alone for control. A compressed air pipe runs the length of each car, connected by flexible hoses at each coupling. On each car, the pipe connects to a brake control valve and then to the air cylinders that apply the brake shoes or disks. To control the train brakes, the engineer makes a controlled reduction in the brake line air pressure, which causes the brake valve on each car to admit air to the brake cylinders from an air reservoir, also on each car, and apply the brakes. Brakes are released by restoring air pressure in the train pipe and air cylinders from the locomotive air supply.
A major disadvantage of this system is that braking actions take several seconds to propagate along a long train (of 10,000 feet or more), which can cause longitudinal buff and draft forces to build up along the train. These forces can be can be difficult to control, despite improved brake valve designs and advanced end-of-train devices which provide the ability to provide some braking control. The result is that derailment accidents due to excessive buff and draft forces continue to be a problem.
Some passenger trains (mostly commuter EMUs) have long used electrical brake controls on each car, operated from the engineer’s cab, to improve brake controllability and shorten stopping distances, but this approach was considered too costly for freight trains. However, the advent of smaller, low power electronic devices has enabled the development of practical electronic controls for freight train pneumatic brakes. In addition to a number of operations benefits, safety benefits of these ECP brakes may include:

54
• Fewer derailments caused by excessive buff and draft forces during service or emergency braking;
• Safe braking that is less dependent on highly skilled train crews; • Reduced stopping distances, typically 40 to 60 percent less for regular service braking
and for emergency braking (potentially contributing to accident avoidance in some situations, for example, in the event of an obstruction on the track or a belated response to signal indications or operating instructions); and
• Fewer cars reaching the point of derailment following a derailment of a car towards the front of the train.
Similar but reduced benefits are also possible when a train employs distributed power – remotely controlled locomotive units distributed through the train. Generally, the more points of electronic brake control through the train, the greater the benefit.
At the time of writing, there is little quantitative information which can be used to estimate the safety benefits of ECP brakes. The existing literature (for example, References [23] and [24]) discusses benefits in general terms, but numbers are lacking. For this project, the analyst prepared a reference analysis case which used expert judgment to identify accident cause groups where accidents could be prevented by ECP brakes and estimate the magnitude of the reduction. The assumptions for this reference case were
• A 50 percent reduction in train handling and braking related accidents (i.e. Cause Groups 01H and 09H)
• A 20 percent reduction in accidents caused by failure to comply with signals and instructions, including communications errors (i.e. Cause Groups 05H, 06H, and 10H)
• A 10 percent reduction in obstruction and grade crossing collisions (i.e. Cause Groups 01M and 02M)
The results for the reference case are shown in Tables A5.4A and B. Table 22 summarizes the results and suggests possible low and high estimates for risk reduction for this case. The high estimate is 20 percent above the reference estimate and the low estimate is 40 percent below the reference estimate.
Table 22. Analysis Results for ECP Brakes
Analysis Case Accidents Cars Derailed
Number Percent Reduction Number Percent
Reduction Before Implementation 4,551 NA 25,389 NA
Reference Case 4,309 5.3 24,345 4.1
Upper Bound +20% 4,261 6.4 24,162 4.8
Lower Bound -40% 4,406 3.2 24,763 2.5
Assuming the universal application and use of ECP brakes, the results showed a 5.3 percent overall accident reduction for the reference case with upper and lower bound estimates of 6.4 percent and 3.2 percent. The reduction in derailed freight cars for the reference case (which is

55
proportional to reduction in hazmat releases) was 4.1 percent, with upper and lower bound estimates of 4.8 percent and 2.5 percent. These likely represent maxima, since actual use of ECP brakes will probably be limited to unit and intermodal trains at first, then gradually expanding to general line haul freight; however, ECP brakes will rarely be used on local freight and short line operations. ECP brakes cannot prevent most accidents that are due to track and equipment defects, although they may mitigate the consequences.

56
5. Conclusions and Recommendations
5.1 Overview This chapter provides a brief summary of the analyses that have been carried out, the principal results of that analysis, and the conclusions that can be drawn from those results. A short section on recommendations for future work concludes this report.
5.2 Analysis Objectives The broad objective of the analysis was to examine the causes and consequences of hazardous materials releases following railroad train accidents, with an emphasis on the initial steps in the chain of events that led up to a release. The specific items within this objective were:
• Understand the chain of events that can lead to a hazardous material release and the subsequent consequences.
• Understand the key risk metrics that quantify the likelihood and severity of each event along the chain of events, and comment on the significance of the metrics for hazmat transportation safety
• Perform initial evaluations of a specified set of risk reduction actions
The analysis relied primarily on train accident data for the period 2004-2008 from the RAIRS database, and on hazmat release reports submitted to PHMSA for the same period.
The Chain of Events 5.2.1Figure 7 depicts the Chain of Events (as seen in Figure 1), which illustrates the steps that lead from a train accident to the consequences of a hazmat release. The source of data for the analyses of Steps 1 and 2 were railroad accident reports from RAIRS for 2004 to 2008, which were used to compile tables of freight trains in accidents on main track as well as freight cars derailed in main track accidents by accident cause group, FRA Track Class and railroad type (Class I or non-Class I). These tables and definitions of accident cause groups (each of which is a combination of similar individual FRA accident causes) can be found in Appendix B. The data in the tables from Appendix B, together with railroad traffic volume data discussed in Chapter 2 and detailed in Appendix A, were used to estimate freight train accident frequencies and freight car derailment probabilities.
Analyses of Steps 3 and 4 were supported by data on the numbers of hazmat cars derailed accidents and hazmat releases, the detailed information on hazmat releases in train accidents compiled by PHMSA, and data on hazmat traffic as described in Appendix A. All data was from the period 2004-2008. This data was used to analyze hazmat car derailment and hazmat release probabilities by accident cause group.
Finally, Chapter 4 contains an estimate of the reduction in numbers of freight train accidents and derailed freight cars due to three risk reduction measures (taken individually).

57
Figure 7. Chain of Events for a Tank Car Hazmat Incident
5.3 Discussion of Key Accident and Hazmat Release Risk Metrics
Accident Frequencies and Car Derailment Probabilities 5.3.1
This section summarizes and comments on the principal analysis findings concerned with Steps 1 and 2 of the chain of events (a train accident followed by derailment of one or more cars in the train). The metrics analyzed involve train accident frequencies and the probabilities that freight cars will derail in the accident. The data is from freight train operations on main track over the period 2004-2008, whether or not hazmat cars were in the train consist. The findings are summarized in Table 23.
Table 23. Accident and Car Derailment Frequencies
Metric 2004-2008 Class I Railroads by FRA Track Class All Class I
Railroads
Non-Class I
Railroads
Overall Total 2 3 4 5 and
above
Train-Miles (Millions) 89.6 328.4 1677.3 613.4 2714 220 2943
Car-Miles (Millions) 6053 21941 119354 41424 189150 11009 20159
Accidents 475 643 1478 437 3448 1103 4551
Derailed Freight Cars in Accidents 2952 4006 8348 2128 19370 6019 25389
Train Accidents per Million Train-Miles
5.30 1.96 0.88 0.71 1.270 5.01 1.55
Car Derailments per Billion Car-Miles 487.7 182.6 69.9 51.4 102.4 547 126.8
The main observations from this data, and the detailed analysis documented in Appendix B are:

58
• From the Class I railroad data, accident frequencies are strongly dependent on FRA Track Class – lower classes have much higher accident frequencies. Although 78 percent of railroad traffic train-miles is operated on track of FRA Class 4 and above on Class I railroads, only 42 percent of accidents are on these track classes.
• Car derailment frequencies show a similar pattern, with the same trend of higher frequencies on lower track classes. Eighty percent of car-miles are operated on FRA Track Classes of 4 and above on Class I railroad track, but 41 percent of car derailments on the same tracks.
• The frequencies of accidents and car derailments on non-Class I railroads are similar to those on FRA Track Class 2. Operations on non-Class I railroads are similar to those on FRA Track Class 2 – as well as lower track quality, the routes are not equipped with higher performance signal and train control systems, and operations may involve switching movements on main track to drop-off and pick up cars from customers.
• The majority (69 percent) of accidents on main track are derailments involving a single train. Of the remainder, 18 percent are highway grade crossing and collisions and miscellaneous accident types make up 14 percent.
• Because derailment accidents result in far more derailed cars that other accident types, 95% of derailed freight cars are due to derailment accidents. Especially, rail-highway grade crossing collisions cause few freight car derailments. Since a hazmat car derailment precedes a release, efforts to reduce the number of releases should be focused on the causes of derailment accidents.
Table 24 and Table 25 list the leading causes of train accidents and derailed freight cars respectively.
Table 24. Leading Accident Causes
Accident Cause Group and Accident Type* Number of Accidents
Percent of All Accidents*
This Cause Cumulative
Broken Rail Track defect Derailment 526 14.1 14.1 Track Geometry Track Defect Derailment 286 7.6 21.7 Wide Gauge Track Defect Derailment 188 5.0 26.7 Obstruction Collision Miscellaneous Collision 184 4.9 31.5 Bearing Failure Equipment Derailment 162 4.3 35.8
*Grade crossing accidents are omitted from this analysis.
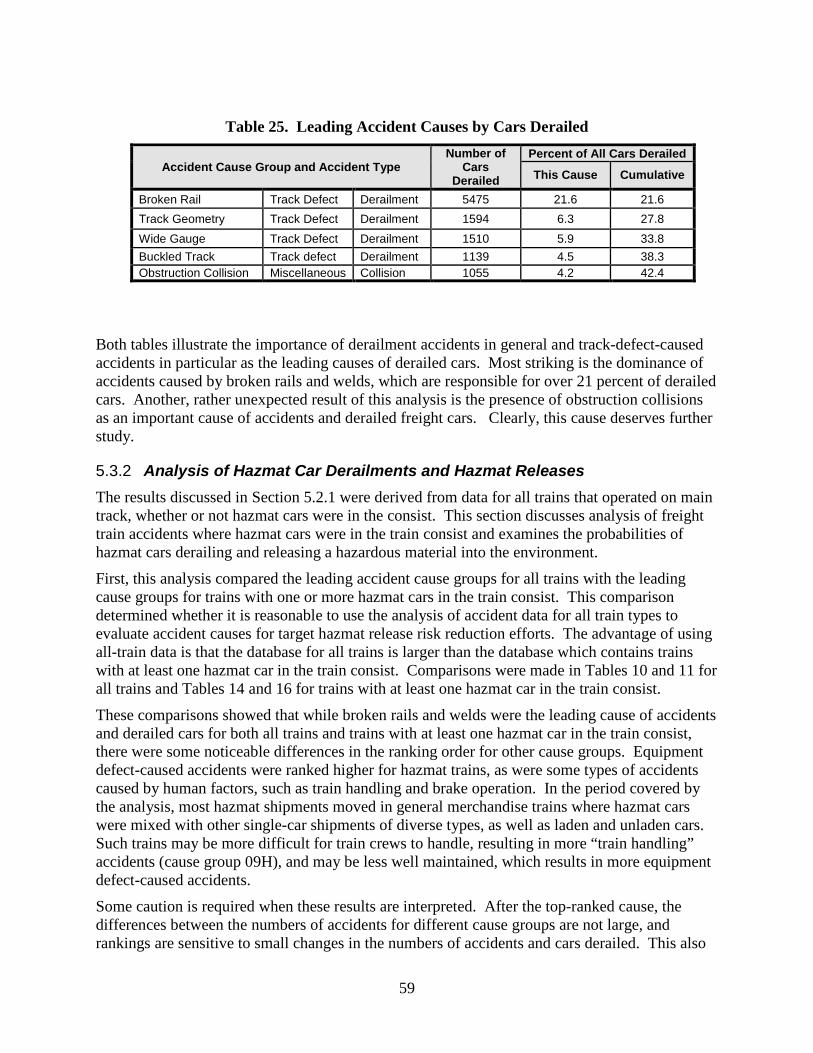
59
Table 25. Leading Accident Causes by Cars Derailed
Accident Cause Group and Accident Type Number of
Cars Derailed
Percent of All Cars Derailed
This Cause Cumulative
Broken Rail Track Defect Derailment 5475 21.6 21.6 Track Geometry Track Defect Derailment 1594 6.3 27.8 Wide Gauge Track Defect Derailment 1510 5.9 33.8 Buckled Track Track defect Derailment 1139 4.5 38.3 Obstruction Collision Miscellaneous Collision 1055 4.2 42.4
Both tables illustrate the importance of derailment accidents in general and track-defect-caused accidents in particular as the leading causes of derailed cars. Most striking is the dominance of accidents caused by broken rails and welds, which are responsible for over 21 percent of derailed cars. Another, rather unexpected result of this analysis is the presence of obstruction collisions as an important cause of accidents and derailed freight cars. Clearly, this cause deserves further study.
Analysis of Hazmat Car Derailments and Hazmat Releases 5.3.2The results discussed in Section 5.2.1 were derived from data for all trains that operated on main track, whether or not hazmat cars were in the consist. This section discusses analysis of freight train accidents where hazmat cars were in the train consist and examines the probabilities of hazmat cars derailing and releasing a hazardous material into the environment.
First, this analysis compared the leading accident cause groups for all trains with the leading cause groups for trains with one or more hazmat cars in the train consist. This comparison determined whether it is reasonable to use the analysis of accident data for all train types to evaluate accident causes for target hazmat release risk reduction efforts. The advantage of using all-train data is that the database for all trains is larger than the database which contains trains with at least one hazmat car in the train consist. Comparisons were made in Tables 10 and 11 for all trains and Tables 14 and 16 for trains with at least one hazmat car in the train consist.
These comparisons showed that while broken rails and welds were the leading cause of accidents and derailed cars for both all trains and trains with at least one hazmat car in the train consist, there were some noticeable differences in the ranking order for other cause groups. Equipment defect-caused accidents were ranked higher for hazmat trains, as were some types of accidents caused by human factors, such as train handling and brake operation. In the period covered by the analysis, most hazmat shipments moved in general merchandise trains where hazmat cars were mixed with other single-car shipments of diverse types, as well as laden and unladen cars. Such trains may be more difficult for train crews to handle, resulting in more “train handling” accidents (cause group 09H), and may be less well maintained, which results in more equipment defect-caused accidents.
Some caution is required when these results are interpreted. After the top-ranked cause, the differences between the numbers of accidents for different cause groups are not large, and rankings are sensitive to small changes in the numbers of accidents and cars derailed. This also

60
means that using nation-wide statistics is a reasonable basis for analyzing reductions in accidents and cars derailed from specific risk reduction measures.
As a further check on the validity of this conclusion, the total of derailed hazmat cars reported to FRA (1594) was compared with an estimate of derailed tank cars derived from national loaded and empty freight car derailment frequencies. The result of this analysis is summarized in Table 26.
Table 26. Estimate of Derailed Hazmat Cars (2004 – 2008)
Metric Value
Loaded Hazmat Tank Car-Miles 4761 billion
Empty Hazmat Tank Car Miles 4285 billion
Estimated Loaded Tank Cars Derailed
809
Estimated Empty Hazmat Tank Cars Derailed
595
Estimated Total Hazmat Tank Cars Derailed
1404
Estimated Dry Bulk Hazmat Cars Derailed
70
All Derailed Hazmat Cars as reported to FRA
1594
This table shows that there is a difference of 120 derailed hazmat cars between the estimates based on national average derailment frequencies and actual FRA reports. This difference is probably due to errors which occur when an estimate is compiled from multiple data sources, but a small part may be due to reported hazmat car derailments that are neither tank nor dry bulk cars. Then the causes of accidents that resulted in a hazmat release were tabulated (see Table 27).
Table 27. Leading Accident Cause Groups for Hazmat Releases
Cause Group FRA Accident Cause and
Type Number of Releases*
Percent of All Accidents*
Ref. Name This Cause Cumulative
08T Broken Rail Track Defect Derailment 65 30.7 30.7
04T Track Geometry Track Defect Derailment 21 8.6 40.5
10E Bearing Failure Equipment Defect Derailment 17 5.2 48.6
09E Suspension Defect
Equipment Defect Derailment 13 4.4 54.7
01M Obstruction Collision Miscellaneous Collision 10 4.0 59.4
*Out of a total of 212 releases

61
The results from Table 27 emphasize, once again, the dominance of accidents caused by broken rail and welds. The specific figures must be treated with caution, however, because of the small sample of accidents with individual causes. Analysis of a larger data set would reduce the influence of individual accidents on the result.
Risk Reduction Analysis 5.3.3The possible impact of three risk reduction actions on reducing hazmat car derailments was analyzed:
• Installation of PTC on U.S. mainline railroads, where PTC meets the functional requirements of the Rail Safety Improvement Act of 2008.
• Implementation of the Rail Integrity Rule developed through RSAC.
• Application of Electronically Controlled Pneumatic brakes currently being tested by the railroad industry.
First, the reduction in accidents and cars derailed that would occur when each risk reduction is implemented was estimated for each accident cause group, and all three reductions were added together to obtain an estimate of the overall industry-wide estimate. Given that the effectiveness of these risk reduction approaches are uncertain and it is not clear how widely they might be applied to the industry, high and low estimates were prepared in each case. Published research was used to develop the estimates. The results are summarized in Table 28.
Table 28. Percentage Reduction in Cars Derailed from Risk Reduction Actions
Risk Reduction Measure Analysis Case Percentage Reduction in Cars Derailed
Positive Train Control Broad Application
5.0
Narrow Application
3.7
Improved Rail Integrity Base Estimate
7.0
Upper Bound Estimate – 35% reduction in broken rails and welds
8.1
Lower Bound Estimate – 20% reduction in broken rails and welds
4.7
Implementation of Electronically Controlled Pneumatic Brakes
Base Estimate
4.1
Upper Bound Estimate – 20% above base estimate
4.8
Lower Bound Estimate – 40% below base estimate
2.5
These results suggest that the three risk reduction measures considered in this report provide incremental benefits at best. But once the chain of events has initiated, the strategies for mitigating risk of hazmat releases are limited. The “best” risk-reduction strategy might be to

62
prevent train accidents from occurring in the first place, as opposed to mitigating the severity of events later in the chain. In addition, these measures reduce the risks of other accidents on the territory or trains on which they are implemented, providing additional benefits.
5.4 Future Considerations This analysis has provided a large volume of detailed data on the causes of freight train accidents and derailed freight cars that may be used to derive estimates of the probability that hazmat cars will derail, given that the railroad type (Class I or non-Class I) and FRA Track Class (for Class I railroads) are known. This data may be used in two ways:
(1) Follow an individual hazmat shipment from origin to destination, using details of each route segment traversed by the car, or
(2) Estimate the overall hazmat car derailment probability on a specific rail segment, given the volume of hazmat traffic on the segment.
This approach to analyzing data may also be used to estimate other railroad accident risks for specific shipments or over specific railroad territories, and it may be adapted to research other railroad safety problems.
When the research for this report was conducted, some difficulties were encountered that were specific to generating risk metrics for rail hazmat transportation. Currently, sources for the data that is needed to develop hazmat risk estimates are fragmented and disconnected, often with different reporting criteria and content. If this analysis is to be repeated in the future, there should be an active effort to formalize cross references between FRA train accident data and PHMSA reports of accident caused releases. Additionally, FRA reports should be enhanced with car type information (tank, dry bulk, intermodal) and specify whether the car is loaded or empty. The data should be as up-to-date as possible to reflect the current operating environment.
Further investigation into enhanced track inspections of track segments with high hazmat volume may provide additional details relevant to the specific causes of accidents and the practices that mitigate those accidents. A predictive risk model can be developed in recognition of the fact that high-hazard releases are rare and must rely on probabilities to evaluate rare occurrences.
Below are recommendations for future research:
• This analysis relies mainly on accident and rail traffic data for the period 2004–2008. The five-year period was chosen as a compromise between the need to use current data and the need for a large enough database to support the analysis. However, considerable changes in rail traffic and the number and mix of accidents have occurred since this period. To keep the results current, it is desirable to re-do this or a similar analysis approximately every five years, especially when the volume and mix of hazmat shipments is changing.
• Data limitations have been a barrier in some areas of this analysis, particularly the absence of a formal link between FRA accident data and PHMSA release data. Also, analyzing hazmat data in FRA accident reports which feature hazmat cars in the train consist and cars derailing was hampered by the lack of distinction between tank car hazmat shipments and other hazmat shipments (intermodal and dry bulk). Reviewing previous efforts in this data area is recommended and may lead to recommendations for amending reporting requirements. Additionally, identify trains in accidents as being unit,

63
intermodal, or general mixed freight trains, as there could be measureable differences in accident statistics between these train types.
• A recent change has been the growth of high-volume shipments of ethanol and crude oil as well as possible future increases in liquefied natural gas (LNG) shipments, all associated with developments in the energy industry. Use of hazmat unit trains is growing, and serious accidents involving these trains have occurred. Research into potential risks associated with hazmat unit train accidents leading to releases from multiple cars is recommended. In addition, energy industry developments should be monitored to identify future growth in hazmat unit train traffic and large multicar hazmat shipments.
• Review of the TIH releases compiled by the RSI-AAR Tank Car Safety and Test Project (Treichel, 2006), supplemented by more recent data, indicates that chlorine is by far the most hazardous of these materials because of its extreme toxicity and relatively high volume of shipments. Continued research into this commodity is warranted.
• Given the significance of track-defect caused accidents in hazmat releases, research into the following areas are essential:
o Effectiveness of intensive track inspection and maintenance.
o Possible speed limits, in areas where high hazmat volume is combined with high population density.
• The top accident cause group is broken rails and welds, which should be further studied. Other leading accident cause groups, which warrant further study, include train handling problems and obstruction collisions. Automated freight car inspection is suggested as an approach to reduce equipment-caused accidents.

64
6. References
1. NTSB (National Transportation Safety Board), “Derailment of Canadian Pacific Railway Freight Train 292-16 and Subsequent Release of Anhydrous Ammonia Near Minot, North Dakota, January 18, 2002,” Railroad Accident Report NTSB/RAR-04/01, PB2004-916301, March 2004. http://www.ntsb.gov/doclib/reports/2004/RAR0401.pdf
2. NTSB (National Transportation Safety Board), “Collision of Union Pacific Railroad Train MHOTU-23 With BNSF Railway Company Train MEAP-TUL-126-D With Subsequent Derailment and Hazardous Materials Release, Macdona, Texas, June 28, 2004,” Railroad Accident Report NTSB/RAR-06/03, PB2006-916303, July 2006. http://www.ntsb.gov/doclib/reports/2006/RAR0603.pdf
3. NTSB (National Transportation Safety Board), “Collision of Norfolk Southern Freight Train 192 With Standing Norfolk Southern Local Train P22 With Subsequent Hazardous Materials Release at Graniteville, South Carolina January 6, 2005,” Railroad Accident Report NTSB/RAR-05/04, PB2005-916304, November 2005. http://www.ntsb.gov/doclib/reports/2005/RAR0504.pdf
4. STB (Surface Transportation Board), http://www.stb.dot.gov
5. AAR Annual Compilation from STB R1 Reports
6. Eno Transportation Foundation, Inc., Transportation in America. 7. https://www.railinc.com/rportal/web/guest/home
8. REFERENCE for TABLE 2.
9. Anderson, R., and C.P.L. Barkan, “Railroad Accident Rates for Use in Transportation Risk Analysis,” Transportation Research Record: Journal of the Transportation Research Board, No. 1863, Transportation Research Board of the National Academies, Washington, DC, 2004, pp. 88-98. http://railtec.illinois.edu/articles/Files/Journal%20Articles/2004/Anderson%20and%20Barkan%202004.pdf
10. BOE (Bureau of Explosives), Annual Report of Hazardous Materials Transported by Rail, Washington, D.C., Association of American Railroads.
11. FRA (Federal Railroad Administration), RAIRS (Railroad Accident/Incident Reporting System), http://safetydata.fra.dot.gov/officeofsafety/default.aspx
12. PHMSA (Pipeline and Hazardous Materials Safety Administration), Incident Reports Database, https://hazmatonline.phmsa.dot.gov/IncidentReportsSearch/
13. Schafer, D.H., and C.P.L. Barkan, “Relationship Between Train Length and Accident Causes and Rates,” Transportation Research Record: Journal of the Transportation Research Board, No. 2043, Transportation Research Board of the National Academies, Washington, DC, 2008, pp. 73-82. http://ict.illinois.edu/railroad/CEE/pdf/Schafer%20and%20Barkan%202008.pdf

65
14. Treichel, T., et al., “Safety Performance of Tank Cars in Accidents: Probabilities of Lading Loss,” Railway Supply Institute – Association of American Railroads, Railroad Tank Car Safety Research and Test Project Report No. RA 05-02, January 2006.
15. Treichel, T., “List of Accident-Caused Releases of Toxic Inhalation Hazard (TIH) Materials from Tank Cars, 1965-2005,” Railway Supply Institute – Association of American Railroads, Railroad Tank Car Safety Research and Test Project Report No. RA 06-05, June 2006.
16. NTSB (National Transportation Safety Board), “Derailment of Norfolk Southern Railway Company Train 68QB119 with Release of Hazardous Materials and Fire, New Brighton, Pennsylvania, October 20, 2006,” Railroad Accident Report NTSB/RAR-08/02, PB2008-916302, May 2008. http://www.ntsb.gov/doclib/reports/2008/RAR0802.pdf
17. “Implementation of Positive Train Control Systems,” Report to the Railroad Safety Advisory Committee to the Federal Railroad Administrator, August 1999. https://rsac.fra.dot.gov/meetings/19990908.php
18. “Benefits and Costs of Positive Train Control,” Report in Response to Request of Appropriations Committees, August 2004. https://rsac.fra.dot.gov/document.php?type=public&name=PTC+Letters_ptc_ben_cost_report.pdf
19. Bing, A., and E. Sherrock, “Risk Analyses for the IDOT Positive Train Control System to Determine Optimum Communications Timeout: Comparison to Cab Signal Systems with Continuous Train Stop and with Speed Control,” DOT/FRA/ORD-09/21, November 2009. http://www.fra.dot.gov/eLib/details/L01509
20. Orringer, O., “Control of Rail Integrity By Self-Adaptive Scheduling of Rail Tests,” Volpe Center Final Report to FRA, DOT/FRA/ORD-90/05, June 1990. http://www.volpe.dot.gov/coi/pis/docs/integrity/railint.pdf
21. “Railroad Accident and Risk Reduction Option Effectiveness and Data,” Private Report submitted to the Inter-Industry Rail Safety Task Force, February 1995.
22. Jeong, D.Y., and J.E. Gordon, “Evaluation of Rail Test Frequencies Using Risk Analysis,” Proceedings of the 2009 ASME Joint Rail Conference, JRC2009-63009, Pueblo, Colorado, March 2009. http://ntl.bts.gov/lib/35000/35200/35227/JRC2009-63009.pdf
23. Booz, Allen and Hamilton, “ECP Brake System for Freight Service,” Final Report for FRA, May 2006. https://docs.google.com/document/d/1k2nQf6J2ROjGEShBN80upI109X2Wy-byn-LgiowhnYM/edit?hl=en_GB&pli=1
24. Dingler, M.H., Y.C Lai, and C.P.L. Barkan, “Effects of Communications-Based Train Control and Electronically Controlled Pneumatic Brakes on Railroad Capacity,” Transportation Research Record: Journal of the Transportation Research Board, No. 2159, Transportation Research Board of the National Academies, Washington, DC, 2010, pp. 77-84. http://ict.uiuc.edu/railroad/CEE/pdf/Dingler%20et%20al%202010-1.pdf
25. United States Congress Public Law 110-432, Rail Safety Improvement Act of 2008, passed October 16, 2008

66
Abbreviations and Acronyms
AAR Association of American Railroads
AREMA American Railway Engineering and Maintenance-of-Way Association
ASLRRA American Short Line and Regional Railroad Association
ASME American Society of Mechanical Engineers
ATC Automatic Train Control
BOE Bureau of Explosives
CFR Code of Federal Regulations
CM Car Mile
CMA Coordinated Mechanical Associations
COFC Container on Flat Car
CP Conditional Probability
CPR Conditional Probability of Release
CTC Centralized Traffic Control
DOT Department of Transportation
ECP Electronically Controlled Pneumatic
FRA Federal Railroad Administration
Hazmat Hazardous Material
HPV High Production Volume
IRIS Integrated Risk Information System
LNG Liquefied Natural Gas
MGT Million Gross Tons
NARs Non-Accident Releases
NTSB National Transportation Safety Board
PHMSA Pipeline and Hazardous Materials Safety Administration
PIH Poison Inhalation Hazard
PTC Positive Train Control
RAIRS Railroad Accident and Incident Reporting System
RSAC Railroad Safety Advisory Committee
RSI Railway Supply Institute
RSIA Rail Safety Improvement Act

67
STB Surface Transportation Board
STCC Standard Transportation Commodity Code
TIH Toxic Inhalation Hazard
TM Train Mile
TOFC Trailer on Flat Car
TRB Transportation Research Board
U.S. DOT U.S. Department of Transportation

68
Introduction to Appendices and Data Used in Report
This introduction summarizes the content and purpose of the appendices and describes how each data set plays a role in quantifying risk metrics that can characterize railroad hazmat transportation risks. The individual Appendices describe the data sets and detailed calculations that support the analyses and results presented in the main report.
Except where otherwise noted, all data are for the five year period from January 1, 2004 to December 31, 2008, and for railroad and hazmat movements in the United States. When the analysis started in early 2010, this was the most recent period for which all data sets of interest were available.
Appendix A: Total and Hazmat-Specific US Railroad Traffic Data
As is customary in risk analysis, accident frequency is calculated from the number of accidents divided by a measure of exposure to risk. In this case, exposure to risk is measured by train-miles and car-miles (loaded and empty) operating on the US railroad network. Similarly, hazmat traffic is measured by the car-loads and car-miles of hazardous materials that are moving on the US railroad network.
The primary source for traffic data was the Surface Transportation Board (STB) sample of rail freight waybills, which provides railroad train-miles as well as loaded and empty car-miles by major car type for all traffic. With more detailed analysis, the sample of waybills also provides estimates of hazmat traffic parameters by commodity and car type (tank car, dry bulk car and intermodal). A secondary source that was used to check hazmat data was a count of hazmat carloads that was originally compiled by the AAR Bureau of Explosives (BOE) from data in Train II, the database used within the railroad industry to track freight shipments.
Although both sources ultimately rely on waybills created for rail freight shipments, only the STB waybill sample provides length–of-haul data. The end results of these analyses are estimates of hazmat carloads and car-miles by car type (tank, dry bulk and intermodal cars), and commodity on the US rail network. The estimates take into account that a significant fraction of hazmat shipments move between the US and Canada and are counted among US carload originations and terminations, and they ensure that only US hazmat car movements and car-miles are counted.
Appendix B: Development of Accident Cause Grouping Scheme and Calculation of Baseline Freight Train Accident Frequencies
The primary source of railroad accident data is the Railroad Accident and Incident Reporting System (RAIRS), which is compiled by the FRA Office of Safety. This data from the reference period 2004-2008 is analyzed to provide tabulations of accidents and derailed cars that are sorted by accident cause group. Each accident cause group is a combination of individual accident causes as reported to FRA, and they may be used to highlight the most prevalent causes of accidents and derailed cars and estimate benefits from accident reduction measures. The specific tabulations presented comprise:

69
• Accidents classified by accident type (derailment, collision, other), railroad type (Class I and non-Class I), FRA Track Class (Class I railroads only), and accident cause group.
• Cars derailed by accident type, railroad type, FRA track class, and accident cause group
All data are for freight trains in main track accidents. Accidents to light locomotives, work trains and passenger trains are not included (because there are no hazmat cars involved), while accidents on yard, siding and industrial track are analyzed separately.
The information from these tables, hazmat traffic data from Appendix A and overall railroad traffic data from AAR, FRA and STB, are used to calculate selected accident frequency metrics for use in risk analysis and evaluating risk reduction measures.
Appendix C: Calculation of Baseline Accident and Cars Derailed Data for Trains Conveying Hazmat Cars
This appendix provides baseline data similar to that provided in Appendix B, but for trains that include at least one hazmat car in the consist. The specific data tables provided in this appendix cover:
• Accidents to trains with one or more hazmat cars in the consist. • Cars derailed in accidents that involve trains with one or more hazmat cars in the consist.
Both tables in Appendix C are broken down using the same format as the “all accidents” table above. All data are for freight trains that are operating on main track and have one or more hazmat cars in the consist. These tables do not include accidents that involve freight trains with no hazmat cars in the consist, light locomotives, work trains, or passenger trains (because there are no hazmat cars involved), while accidents on yard, siding and industrial track are analyzed separately. Hazmat cars include all cars that are identified on car waybills as containing hazmat, this includes loaded and residue cars. Information from these data are used to compile estimates of frequencies for train accidents and car derailments for trains with hazmat cars in the consist.
Appendix D: Hazmat Releases and Hazmat Release Accidents
This appendix describes the hazmat release database from FRA and PHMSA data, and an abbreviated table giving characteristics of each accident and for car types and materials released.
Appendix E: Estimated Railroad Accidents, Car Derailments, and Hazmat Releases after Implementation of Risk Reduction Measures
The same table format used in Appendix C is used for accident and car derailment counts that are adjusted by the estimated reductions in accidents and car derailments after selected risk reduction measures have been implemented. The reduction in accidents with PTC is estimated for each individual cause group, accident type, track class and railroad type and totaled to create an estimate of PTC benefits and illustrate a methodology that can be used to estimate benefits from

70
any accident risk reduction measure, given that estimates of reductions in accidents and cars derailed can be derived for relevant accident cause groups. In this case, the assumption is that PTC performance and installations are as required by the Rail Safety Improvement Act of 2008 and accompanying FRA implementation regulations [25].
Appendix F: Accident Consequences
This appendix presents data which describes the consequences of a hazardous material car derailment – the sequence of events that starts with a car being derailed, leads to a hazmat car that is damaged to the point of releasing some or all of its contents, and ends with the effects of that release. The data compilations discussed in this appendix includes:
• A description of data from the RSI-AAR database of damaged and releasing railroad tank cars, and estimated of release probabilities as presented in Reference [14].
• Data to support analysis of differences in reporting criteria and estimates of the conditional probability of release from damaged railroad tank cars in Treichel and from FRA train accident data.
• Railroad accident and hazmat release data for the period 2004-2008 compiled from FRA and PHMSA accident and release reports.
• Information of the nature and severity of release consequences, combined with statistical data on release frequency.

A-1
Appendix A. Total and Hazmat-Specific US Railroad Traffic Data
Introduction A.1This appendix assembles US railroad freight traffic data needed to calculate railroad accident risk metrics, specifically accident frequencies for all rail traffic and for hazardous materials traffic. Traffic data, usually freight train-miles and freight car-miles, are typically the denominator in frequency calculations and the numerator is the counts of accidents and cars derailed.
The principal sources of freight railroad traffic or activity data are:
• The Association of American Railroads (AAR), which publishes annual financial traffic and operations data for Class I railroads that are derived from the annual reports submitted to the Surface Transportation Board (STB) and internal railroad industry business systems. The most useful data source is the periodic ”Ten Year Trends” report (reference) summarizing the annual financial, traffic and operations reports, and the source for much of the data provided in this appendix.
• The AAR Bureau of Explosives, which compiles data on hazardous materials shipments and hazmat related accidents and releases.
• The STB, which compiles an annual sample of railroad waybills containing comprehensive details of shipments on the US railroad network, including origins, destinations, routing, tonnages, commodities, railcar types and other details. This data were used to add details to hazmat shipment data compiled by the AAR Bureau of Explosives.
The following paragraphs describe railroad total and hazmat traffic data assembled for this project, covering the five-year period 2004-2008 inclusive.
U.S. Class 1 Railroad Freight Train-Miles and Car-Miles A.2Accident frequencies are obtained by dividing the number of trains in accidents by the aggregated train and car miles operated over a selected time period on Class I and non-Class I railroads. In addition, estimating the breakdown of train and car miles by nominal FRA track class is done to support the calculation of accident frequencies by track class.

A-2
Freight train car-miles and train-miles were obtained from STB, the AAR annual publication Analysis of Class I railroads and AAR Ten Year Trends (refs), and are given in Table A-1.
Table A-1 Freight Train-Miles and Car-Miles, 2004 - 2008
Year Freight Train-Miles (1000s) Freight Car-Miles (millions)
Loaded Empty Total
2004 534,696 21,168 15,903 37,071
2005 547,566 21,470 16,242 37,712
2006 563,607 21,668 17,287 38,955
2007 543,575 21,141 17,045 38,186
2008 524,223 20,556 16,670 37,226
Total, Class I 2,713,667 106,003 83,147 189,150
Class I railroad train and car-miles by FRA Track Class were estimated from two previous surveys. A survey of five selected Class I railroads performed in 1992 and 1993 contained one-year traffic data for 1990 by nominal FRA Track Class. The railroads provided this data for all track classes, except one railroad could not obtain traffic data for FRA Track Classes 1 and 2. It was assumed that all the surveyed railroads were about the same size, so the raw data for FRA track classes 1 and 2 were multiplied by 1.25 to obtain an adjusted total. The identity of the specific railroad that submitted partial data was confidential, so it was impossible to make any adjustments that reflected the characteristics of that individual railroad. Next, the distribution of train-miles and car-miles by track class was expressed as a percentage and applied to the train and car-mile totals in the table above. This approach assumes that the distribution of traffic by FRA track class on Class I railroads has changed little over the last decade.
The resulting distribution is shown in Table A-2.
Table A-2 Distribution of Train Miles by FRA Track Class FRA Track
Class X/1 2 3 4 5 and 6 Total
Percent Car-miles
0.30 3.20 11.60 63.10 21.90 100
Percent Train-miles
0.30 3.30 12.10 61.80 22.60 100
Subsequent to completing this estimate, the AAR located data from another traffic sample, in which traffic data was collected from a random sample of 580 one-mile track segments from the entire US railroad network, including both Class I and non-Class I track.
The data is believed to be for the year 1989. The table on the next page compares the percentage distribution of car-miles between the two samples:

A-3
Table A-3 Comparison of Distribution of Train-Miles by FRA Track Class From Two Surveys
FRA Track Class X/1 2 3 4 5 and 6 Total
% Car-miles, Class I Survey
0.30 3.20 11.60 63.10 21.90 100
% Car-miles, One-mile segment survey
0.88 3.16 9.50 63.91 22.55 100
Given the difficulty of obtaining this type of data, this comparison shows good agreement, indicating that the data for traffic by track class used in this analysis is reasonably accurate. However, it is clear that any estimate of traffic on FRA Class X/1 track is unreliable and the corresponding estimate of accident frequency is highly unreliable. The estimate of traffic on FRA Class 2 track may also be somewhat unreliable, and the resulting accident frequency used with caution, due to low total traffic and the possibilities of error.
Non-Class I Freight Train-Miles and Car-Miles A.3Detailed traffic data are not reported to STB by non-Class I railroads, and only approximate estimates can be developed. The estimates of total railroad traffic provided in the ENO Foundation publication “Transportation in America” [6] in the late 1990s indicate that non-class I railroad traffic averaged about 71 billion ton-miles per year from 1995-1999. This is 5.2% of Class I traffic. Estimates of non-Class I traffic for the period of interest are not available directly, but other business parameters are quoted in Ten Year Trends, and figures for 2006 (the mid-point of the period of interest) are detailed in Table A-4.
Table A-4 Non-Class I Railroad Statistics Measure Class I Non-Class I All Percentage
Non-Class I
Miles of Road Operated 119,684* 50,878 170,562 29.8%
Employees 167,581 19,376 186,957 10.4%
Revenue ($ millions) 50,315 3,643 53,958 6.75%
Cars Originated (1000s)
32,114 4,422 36,536 12.1%
*Includes trackage rights.
The number of non-Class I railroads (regional, local and terminal) appears little changed since the late 1990s, when the earlier estimate of 5.2 percent of national rail ton-miles was made. Working estimates for car and train-miles for non-Class I railroads of 5.5% of national car-miles and 7.5% of national train miles are based on the following:
Non-Class I train-miles, 2004-2008: 220 million
Non-Class I car-miles, 2004-2008: 11,009 million

A-4
US Railroad Hazardous Materials and Tank Car Traffic Volumes A.4
A.4.1 Introduction An estimate of hazardous materials traffic volumes (activity levels) was needed to estimate risks for all hazmat in general and specifically for materials shipped in railroad tank cars. Risks involving releases of tank car materials (liquids and compressed gases) are of the highest concern because of the large volume (up to 100 tons) that could be released from a damaged car and ease with which fluids can flow away from the immediate area of the accident and cause harm to people and property off the right of way. However, efforts to estimate rail hazmat traffic data were complicated by variations in reporting and content between traffic, accident and hazmat release databases, notably:
• FRA RAIRS accident reports include details of the number of hazmat cars in trains in accidents, hazmat cars derailed and hazmat cars releasing, but do not distinguish between hazmat in tank cars versus hazmat in other car types (dry bulk and container cars), and there is no information about the types of hazmat involved. Also, minor accidents causing damage of a value below the FRA reporting threshold, are not in the database.
• PHMSA hazmat release reports include full details of the type and quantity of hazmat released in accident-caused releases, but no information the accident that caused the release. PHMSA also includes all releases, not just releases in accidents reportable to FRA. Therefore, there will always be more train accident-caused releases reported the PHMSA that are reported in FRA train accident reports.
• The data in the database assembled by RSA/AAR on damaged and releasing tank cars only includes cars that receive damage to the tank and its attachments, and does not include cars that have received damage to other components such as trucks and wheels that would be counted in FRA accident reports. Also, reports to RSA/AAR cover all tank cars, hazmat and non-hazmat alike.
• A significant fraction of hazmat traffic travels to or from Canada, thus records of hazmat carload originations or terminations in the US may fail to count all carloads that cross the border. A very small portion of traffic also crosses the US/Mexico border, but does not have a material impact on traffic volume estimates.
In order to fully quantify the risk metrics for the sequence of events leading to a hazmat release, it is necessary to quantify hazmat shipments for the primary car or shipment types (tank, dry bulk and intermodal), and tank car shipments for both hazardous and non-hazardous commodities. The key metric for shipments is hazmat car-miles on the US rail system, because it is the most direct measure of accident exposure. In addition, estimates of tank car –miles by commodity group are needed to quantify variations in release risk by commodity.
This section of Appendix A documents methodologies that were used to analyze rail hazmat traffic volumes for use in rail hazmat risk analysis. A preliminary analysis used only hazmat carload origin and termination data published annually by the AAR Bureau of Explosives (BOE) [10], and is described in Section A.4.2. Section A.4.3 describes a more detailed analysis for which the STB Rail Freight Waybill Sample is the primary source.

A-5
A.4.2 Preliminary Tank Car Rail Hazmat Traffic Estimate This analysis of BOE data provided an estimate of rail tank car hazmat carloads moving on the US rail network, including shipments that either terminate or originate in Canada. These data do not include an estimate of hazmat car-miles. The estimate relies on a statement in BOE Annual Reports [10] that approximately 2% of aggregate US and Canada tank carloads originate in the US and move to Canada. This estimate is derived from a one-time analysis of data in the internal railroad shipment tracking computer TRAIN II, which is mentioned in BOE Annual Reports. Thus the total of hazmat carloads moving on US tracks is calculated from total terminations plus 2% of total US + Canadian shipments as shown in Table A-5. Note that 10-15% of terminations in the US originate in Canada.
Table A-5 US and Canadian Hazmat Carload Statistics Year 2004 2005 2006 2007 2008 Total
US Hazmat Carloads
Originating 1,013,079 1,006,747 1,024,652 1,100,811 1,114,394 5,259,683
Terminating 1,138,101 1,118,721 1,136,795 1,198,457 1,196,077 5,788,151
Difference 125,022 1,119,74 112,143 97,646 81,683 528,468
Canadian Carloads
Originating 310,307 303,079 310,881 310,967 300,254 1,535,488
Terminating 178,486 180,105 190,017 196,347 204,088 949,043
Difference 131,821 122,974 120,864 114,620 98,166 596,445
Total US + Canada 1,323,386 1,309,826 1,335,533 1,411,779 1,414,648 6,795,172
Est. US Movements 1,164,569 1,144,918 1,163,506 1,226,693 1,224,370 5,924,054
Multiplier on US Originations
1.15 1.14 1.14 1.11 1.10 NA
A.4.3 Detailed Rail Hazmat Traffic Analysis This analysis focuses on four rail hazmat traffic volume metrics: 1) carloads originated; 2) freight tons originated; 3) car-miles; and 4) ton-miles. All values are totals for the years 2004 – 2008 (inclusive).
All metrics are calculated separately for different categories of rail car: tank car, intermodal car (COFC / TOFC), bulk car (hoppers, gondolas, etc.) and miscellaneous/other. The rail traffic parameters exclusively focus on tank car shipments, although the analysis could be expanded to all car types if needed.
Rail traffic parameters are calculated for several groups of materials:
• Fifteen specific materials, identified as materials of interest based on volumes, environmental and other consequences, and number of accidents
• All hazardous materials by DOT hazard class; approximately 15 categories • All hazmat moving in tank cars • All tank car rail commodities (hazardous and non-hazardous), as a baseline parameter
corresponding tom criteria for including a tank car in the RSA/AAR tank car damage database.

A-6
The paragraphs below describe the results of the analysis, data sources used, challenges encountered, and how they were overcome. Results of Analysis
Summary results tables are presented in Table A-6. First, data derived for nationwide shipments of hazardous materials by rail are presented by car-type for the five years 2004-2008, and may be compared with the simple analysis of tank car hazardous materials traffic in section A.4.2. These data comprise carloads on the US system, car-miles on the US system, average distance moved on the US system and average carload in tons.
Table A-6 Summary of Tank Car and Hazmat Traffic on the US Rail System 2004-2008 Car Type Million Car-Miles Thousand
Carloads Average Length
of Haul in US Average Carload
Hazmat Tank Car 4761 6061 785 87.5
All Tank Cars 8728 10631 820 88.0
Dry Bulk Hazmat 240 322 745 96.8
Intermodal Hazmat 3603 2467 1460 15.0
All Hazmat 8604 8850 NA NA
More detail is in Table A-7 below, which shows four metrics by DOT hazardous materials classes for tank car shipments: all hazmat cars, all rail cars, and all DOT classes. These tables only show results for tank car shipments.
Table A-7 US Rail Hazmat Traffic in Tank cars by DOT Hazard Class
DOT Class Car-Miles
x 1, 000,000 Ton-Miles
X 1,000,000 Cars Orig.
x1000 Tons Orig.
x1000 2.1 762 54,290 1,006 71,665 2.2 194 15,412 335 26,535 2.3 147 12,697 225 19,600 3 1,772 160,550 1,995 178,761 4.1 131 13,182 151 15,137 4.2 10 934 7 602 4.3 3 239 2 148 5.1 48 4,575 64 6,139 5.2 - - - - 6.1 111 9,908 142 12,574 7 - - - - 8 855 81,265 1,289 122,908 9 718 65,481 836 75,968 All tank car hazmat shipments 4,761 419,176 6,061 530,639 All tank car shipments, incl. non-hazmat 8,728 772,235 10,631 935,636
Data Sources and Methodology

A-7
The greatest challenge in performing the hazmat traffic analysis was assembling a comprehensive set of data on shipments of hazardous material. Hazmat is regulated or overseen by several public agencies and private groups, and each group collects certain data that other groups do not. Further, portions of these data sets are available as publicly available reports, while portions are only available on a confidential or private basis. It was necessary to assemble together portions of several public and private databases in order to have a comprehensive data set.
The result is a unique data set of hazardous material activity that is not available from any other agency or industry source. It is the combination of several public and private data sets, and is the only way we could analyze database activity. Our final data set, and the knowledge of how it was constructed, may be useful for future analyses of hazmat activity (or other non-hazmat materials as well). Data source: STB Waybill Sample Database
The Surface Transportation Board maintains a database of rail shipment waybills, which describe the type of goods shipped, origins and destinations of shipments, and many other metrics. The agency provides access to both public and confidential versions of the database, and publishes summary reports based on the data.
Access to the database is restricted due to sensitive information contained in the waybills. All waybills include the costs incurred and rates charged by the railroads, and are used by the agency to monitor the prices charged. In addition, the waybills for certain hazardous materials (TIH, PIH) are considered sensitive because they specify in great detail the location and movements of these highly hazardous materials. The full database is restricted to internal agency use.
In addition, the STB publishes a public version of the waybill database with much of the sensitive data stripped out. The public version contains key information about cars, tons, and distances, but does not break down the information to specific commodities.
Our analysis required access to both the public and private version of the raw waybill databases. While the public database was sufficient for describing overall activity in the industry, such as activity for all hazmat materials or all tank cars, it was not detailed enough to provide details on specific hazardous materials. For this information we obtained access to a redacted version of the private database that included the fields necessary for our analysis but did not include sensitive pricing information. The published waybill summary reports, while helpful for an overview, did not break down information by categories such as car type and were not used in this analysis. Further, the published summaries contain information on volumes (cars originated, tons originated) but no information on distance, and were not suitable for determining ton-miles or car-miles. Public Waybill Database
The public database contains all fields needed for an overview of rail shipments, but is missing key fields that are needed for a detailed analysis. Using the public database we were able to determine the total volume of rail shipments (of all car types) during the analysis periods. Using data on cars, tons, and distance, we were able to determine all activity metrics by car type. While the public database does not specify specific commodities, it identifies commodity groups by the first two digits of the seven-digit STCC code. This would have been sufficient to characterize activity with hazmat overall, if we didn’t have the detailed information in the private database.

A-8
While the public waybill database was available for download on the STB website, we could not access information for all of our analysis years (2004 through 2008). The website currently hosts data from 2007, 2008, and 2009. Through Internet archive searches, we located the 2006 database as well. Based on these data points, we extrapolated the data to years 2004 and 2005, in order to build a complete data set for our years of analysis. STB offers archived versions of prior years as a data purchase, but we determined that for the purposes of an overview the three years of available data were sufficient. Private Waybill Database
Because the data in the public database was limited, we relied on the private waybill database to perform the vast majority of the activity analysis. The private version was needed to break down shipments by specific commodities and to link the commodity STCC codes with other data sources. After processing, our summary of the waybill database contained approximately 250,000 sampled waybills (each representing 40 – 100 individual shipments). We assembled data for all years from 2004 through 2008.
We obtained the private database through direct contact with STB. Because this project is for FRA, we were given limited access to the data. First, the authors and the FRA project manager signed a confidentiality agreement that required us to limit the use and storage of the data. We were given access to the fields in the database related to the type of commodity shipped, the amount of material, and the distance shipped including origins, destinations, and states that the shipment passed through. We only obtained access to shipments containing hazardous materials in the waybill database.
The full commodity identifier (seven digit STCC code) was crucial for cross-linking the waybill databases with other data sources on materials, DOT classes, and accidents. Without this information, the data analysis would not have been feasible. However, the waybill database lacked key information that needed to be cross-referenced from other sources. The DB did not include commodity name or DOT hazard class, both of which were required for the activity analysis. These additional data inputs are described below in more detail.
Using the commodity-level data, we summarized all activity metrics for specific commodities of interest as well as hazmat as a whole. These shipments were broken down by car type. As a quality check, our waybill results were largely consistent with car origination data reported by BOE (described later).
We encountered several significant challenges in working with the waybills. Each was overcome by combining external data sources and additional analysis. Challenges overcome in the waybill analysis
The first challenge, mentioned above, was to supplement the waybills with additional information about material names and DOT hazard classes. The material names were pulled from a descriptive database of hazardous materials maintained by BOE and the data was synched using the seven-digit STCC. DOT hazard classes were obtained from data tables in the CFR also synched by STCC code.
The material name is necessary for several reasons. First, a single material type often ships under several STCC codes, so it is necessary to determine all the codes associated with a material in order to calculate the activity for the material. Second, much of the accident data only identifies

A-9
materials by name rather than by STCC code, so the only way to sync activity and accidents is through the material names.
Once these data sources were identified, the process of synching the two databases was trivial. However, the BOE hazardous material database was particularly difficult to obtain.
The second challenge was to identify all STCC codes associated with particular materials, which was needed to calculate the activity metrics. There was no direct way to accomplish this task. Instead, it required professional judgment.
Hazardous materials are identified in different ways (e.g., by DOT proper shipping name, STCC code, hazmat code, UN/NA code, and DOT class). In the STB waybill database, a commodity name may appear more than once under a different Hazardous Material (Hazmat) Code number. According to AAR:
“Due to differing contract rates, produce differences (e.g., concentration of the product in solution), and shipper differentiation, a commodity with the same DOT ‘Proper Shipping Name,’ e.g., Liquefied Petroleum Gas, may be assigned several different Hazardous Material Code numbers. In transportation, these may present essentially the same type and degree of hazard.” 16
We aggregated the tank car originations for each material listed more than once under the same proper shipping name, but under a different Hazmat code. In addition, we also aggregated data listed as “liquefied petroleum gas” and “petroleum gases, liquefied” since these are both acceptable proper shipping names for the same material.
The third challenge was to review and adjust the shipping distances shown in the waybill database. For international shipments, we needed to ensure that the travel distance in our analysis was only for the portion of the trip within the US, and did not include the movement of shipments within Canada or Mexico. A cursory analysis of the waybills shows that they did include international components – if the length of a route into Canada is over 3,000 miles long, it clearly includes an international component.
This problem took the most time to resolve. Approximately 20 percent of waybills entered Canada, and just 0.1 percent entered Mexico. Thus, any adjustment to the length of the international routes had a large impact on the total results, especially for specific materials that often passed between US and Canada.
This problem was resolved by listing out the route in full (all of the states that a particular route passed through) and comparing routes that included Canada against routes that did not include Canada. For example, a particular Canadian waybill could pass through Ohio, Pennsylvania, and New York, before entering Canada, and it would be compared against dozens of waybills that passed through the same US states without entering Canada. The average length of these routes is assumed to be representative of the “domestic length” of the international movement. We overwrote the length of the Canadian movement with this average, confident that it now represented just the US portion. Data Source: BOE Hazardous Material Database
16 “Annual Report of Hazardous Materials Transported by Rail: Calendar Year 2009.” Report BOE 09-1. Association of American Railroads; Bureau of Explosives. July 2010. p. 4.

A-10
While the waybill DB contained the majority of the information needed for this analysis, it lacked key fields needed for the complete analysis. The Hazardous Materials Database maintained by BOE added many of these fields. Without the BOE source, the waybill analysis would not be sufficient to compare against accident metrics.
BOE maintains a data set that provides descriptive information on each hazardous material, primarily including material name and hazard class. The data file typically costs several thousand dollars to access, however we obtained informal access through a contact.
Most importantly, we used the database to connect STCC codes with the material names. Without these material names it would not have been possible to identify all STCC codes for a particular material or connect material activity with accident data. Once we obtained a copy of the database and converted it to a compatible format, it was trivial to import the material names into the main waybill database.
The BOE data set contained additional information, which may have been helpful, but was ultimately not used. The DB listed the UNID of each material, which could have been aggregated into summary activity for each UNID. Ultimately, we chose not to use this information in the final results.
The BOE data set lacked DOT hazard codes for each material which was surprising. Because parts of the final results needed to incorporate activity by DOT hazard code, we needed an additional data source for this information. Data Source: CFR Section 172
Section 172 of the Code of Federal Regulations includes requirements for shipping and labeling hazardous materials, and this report includes a table of DOT Hazard Codes for each hazardous material that STCC codes. Because we had obtained the STCC codes for each material through the private waybill database, it was trivial to import the tables from CFR 172 into our master analysis file and add DOT IDs to each material name in the adjusted waybill DB. Data Source: BOE Hazmat Summary Reports
As part of its oversight of hazmat materials, BOE publishes summary reports of tank car hazmat shipments within North America. The tank car reports contain detailed data on specific commodities for all analysis years 2004 – 2008, but are limited in the metrics they measure. Specifically, the reports measure carloads originated and tons originated, but do not report distance shipped, car-miles, or ton-miles.
However, the BOE reports are a useful tool for crosschecking our waybill results, to make sure our final numbers are consistent with BOE findings and provide confidence that our waybill analysis is sound. The BOE hazmat summaries do not use waybill data. Instead, they are pulled from the TRAIN II data set maintained by AAR. AAR’s TRAIN II database is developed from information provided by all major freight railroads, many short lines, and many regional railroads. These entities provide waybill information, car interchanges, and other car movement events. Data on hazardous material traffic estimates is derived from the waybill information. Hazardous material traffic estimates from STB’s waybill database and AAR’s TRAIN II database differ because almost all railroads submit data to STB. In addition, STB’s waybill

A-11
database only includes shipments that terminate in the U.S. An analysis of the TRAIN II database indicates that intra-Canadian shipments account for 11% of U.S. and Canadian tank car originations and shipments from the U.S. to Canada account for 2% of the loads. When these differences are taken into account, data on tank car traffic in the STB waybill database and the TRAIN II database are generally within 3 percent of each other.17 The STB waybill database is generally considered more accurate for aggregated hazardous material traffic volumes (i.e., 2-digit commodities). Except for intermodal traffic, the STB waybill database is considered to be less accurate for all except the largest 7-digit commodities due to small waybill sample sizes.18 Since the TRAIN II database is proprietary to industry groups, we used the STB waybill data to calculate our metrics. To ensure that we correctly selected and aggregated data for the materials of interest, for each material we compared tank car originations calculated from the STB waybill sample to tank car originations listed in the 2004-2008 BoE Annual Reports of Hazardous Materials Transported by Rail; these tank car originations are derived from TRAIN II. With the exception of gasoline and diesel, we found that tank car originations for each material were within 25% difference of each other. We found this difference acceptable given the differences in the two databases, as described above. For gasoline, tank car originations calculated from the BoE reports were almost 3x higher than the STB waybill data. For diesel, tank car originations were over 6x higher than the STB waybill database. Since the AAR TRAIN II database is generally considered more accurate for traffic volumes for 7-commodites, we scaled the STB tank car origination data for diesel and gasoline to match the tank car originations calculated from the BoE reports.
17 “Annual Report of Hazardous Materials Transported by Rail: Calendar Year 2009.” Report BOE 09-1. Association of American Railroads; Bureau of Explosives. July 2010. p. 1. 18 “Annual Report of Hazardous Materials Transported by Rail: Calendar Year 2009.” Report BOE 09-1. Association of American Railroads; Bureau of Explosives. July 2010. p. 1.

B-1
Appendix B. Development of the Accident Cause Grouping Scheme and Calculation of Baseline Freight Train Accident Frequencies
Introduction and General Approach B.1This appendix provides a detailed description of the data sources and analyses used to calculate base freight train accident frequencies. Base accident frequencies are those for conventional freight trains operating on main line track of the US railroad system, not involving special car types or the effects of planned train accident risk reduction efforts, including implementation of Positive Train Control. Because of their size and complexity, the tables in Appendix B are included in a separate ZIP file that is available in FRA’s eLibrary.
The general approach to calculating accident rates is based on that originally developed for a previous hazardous materials risk model, and subsequently modified by the author and other researchers. As well as base train freight train accident frequencies, a breakdown of accident causes by accident-cause group (as defined below) is provided. This breakdown can be used to identify leading causes of accidents and car derailments, and then estimate the reduction in accidents and car derailments due to implementation of different safety improvement measures. In addition, by identifying accident causes as relating either to train miles or car miles it is possible to estimate accident frequency variations by train length and variations in track class and railroad type. The resulting risk measures may be used in a risk model to calculate accident risks over a specific line segment, given infrastructure and operations characteristics.
The 400+ accident causes defined in the FRA rail accident reporting system (RAIRS) are combined into 51 cause groups, each of which is a combination of similar individual accident causes. The cause groups are then divided into two groups, car-mile related and train-mile related. In the earlier version of the grouping scheme, the assignment to car-mile and train-mile dependence was by expert judgment. The rationale for the car-mile /train mile distinction is that some accident causes are mainly a function of train miles operated and some are mainly a function of car-miles operated. Failing to make this distinction would mean that calculated accident frequency would be correct for average train lengths, but less accurate when train length differs from the average. The two paragraphs below explain this distinction in more detail:
• Car-mile related causes are those for which the likelihood of an accident is generally dependant on the number of car-miles operated. For example, bearing failure likelihood is directly proportional to the number of bearings in a train. Car mile causes include a majority of equipment failures, and also many track component failures, on the premise that such failures are proportional to the number of load cycles imposed on the track.
• Train-mile related causes are those for which the likelihood of an accident is proportional to the number of train-miles operated. For example, the likelihood of an operator error leading to a collision is independent of the size of the train, and depends primarily on exposure – the number of train-miles operated.

B-2
Subsequent regression analysis let to modifications of the original division of car-mile and train mile related cause groups, indicating that the initial understanding of accident mechanisms needed further consideration. In most cases a logical argument can be made for the revised assignment. For example accidents due to train handling, whether or not associated with train braking were originally categorized as train-mile-related human factors accidents, but analysis showed a stronger relationship with car-miles, perhaps because train handling difficulties are more serious with longer trains.
Car-mile and train-mile accident frequencies are obtained by dividing car-and train-accident counts by the applicable exposure parameters – estimated car and train mile traffic by track class and railroad type (Class I and non-Class I) Given the accident frequencies, an estimate of the accident risk to a train travelling over a specific line segment is given by the formula:
Train Accident Frequency on a Route Segment (accidents/year)=
Length of Segment (miles) x Trains/year over the segment x [(Train-Mile Accident Frequency) +
(Number of Cars in the Train) x (car-mile accident frequency)]
Further details of the main-line accident frequency calculations are:
• Accident frequencies are calculated specifically for freight trains operating on main line track. Accidents in yards and sidings and on industry tracks not included, nor are accidents to other types of train such as light locomotives, work trains, and accidents involving switching activities performed on main-line track. Accident frequency analysis for switching accidents is discussed separately.
• Separate accident frequencies are calculated for Class I and non-Class I railroads, on the premise that infrastructure conditions, operating methods and the nature of operations on local and regional railroads differ significantly from those on Class I railroads, resulting in different accident frequencies. FRA accident analyses support this premise. Freight operations over track owned by passenger railroads are included with non-Class I railroads.
• For Class I railroads only, separate accident rates are calculated by track class for classes 2, 3, 4, and for classes 5 and 6 combined. This is made possible by the availability of traffic estimates (train-miles and car-miles) by FRA track class for Class I railroads. FRA class 1 track is omitted because of a lack of reliable data. Also, there are few hazmat movements over FRA Class 1 track. Note that FRA track class is being used as a proxy for all aspects of operations and infrastructure that might vary by track class, including speed of operation, type of operation, track condition and train control method. Also, actual track condition on Class I railroads is often substantially better than FRA minima. Observed accident frequencies apply to typical track conditions for a given designated FRA Class, not for track of marginal quality for the track class.
• Accident frequencies for non-Class I railroads are for all FRA track classes combined. Traffic data by FRA track class are not available for non-Class I railroads, and in any case the lower number of main line accidents on non-Class I railroads means that a calculation of accident rates by track class would be unreliable.

B-3
• For both Class I and non-Class I railroads, separate accident frequencies are calculated for derailments, collisions, and other accidents. The reason for doing this is to permit (if required) separate calculations of accident consequences by type of accident. Typically derailments have the most severe consequences, followed by collisions (many of which only damage or derail the locomotives) and other accidents. Most ‘other accidents’ are grade crossing collisions reported as train accidents or collisions with obstructions, many of which only damage the lead locomotive.
• National level accident frequencies may be calculated for freight trains on main track by using national traffic data in place of line segment traffic data, and results expressed as accidents per train- or car-mile.
Selection of Accident Cause Groups B.2The estimation of accident frequencies after a change in operating or engineering practices requires an analysis of how the likelihood of an accident is increased or decreased by the change. The overall change in accident frequency is the net result of the effect of the change of likelihood of accidents due to each individual accident cause. The FRA accident reporting system uses a detailed list of approximately 400 accident causes. Attempting to estimate the effect of a change on each individual cause would be very cumbersome and hampered by small sample sizes in for many causes. To simplify such calculations, individual accident causes have been combined into 51 groups of similar or related causes. The causes within each group generally share causal mechanisms, and will react in the same way to a specific change in operating, engineering or equipment practices.
Table A2.1 details the assignment of individual FRA accident causes to the cause groups, using the list of causes from the FRA reporting guide dated May 1, 2003, plus additional cause descriptions added by FRA to 2010. Note that a revised FRA Guide has been issued, to be effective June 1, 2011, but the 2003 guide with periodic amendments to the cause list was effective for during the period 2004 – 2008 and at the time data was downloaded for this analysis.
Table A2.2 lists the accident cause groups selected for this analysis. The grouping scheme is very similar to that developed for hazardous materials risk models used in prior projects, with amendments to reflect additions to FRA accident cause codes up to mid 2010, and revisions to the train-mile and car-mile cause group allocations discussed above. The Table shows both the current car-mile and train-mile allocation of cause groups, and changes from the original allocation. The latter are provided for researchers (mainly at AAR and University of Illinois at Champaign-Urbana who may have used the earlier version at some point in the past.

B-4
Analysis of FRA Accident Data B.3Data on main line freight train accidents for a selected time period are required for calculating base accident rates. Base accident frequencies are those for current conventional freight train operations without inclusion of unusual car types in the consist. The data were developed as follows: • Select a suitable time period from which to take the data. The period between January 1,
2004 and December 31, 2008 was chosen. This period was considered to be reasonably representative of current freight railroad operating conditions, while providing a sufficiently large sample of accidents to enable meaningful analysis. The calendar year 2008 was the most recent data available at the time that the analysis for this project was initiated.
• Select the subset of trains in accidents for analysis. Accident frequencies for main-line
freight train operations were required, thus all trains in accidents reported as occurring on main line track (track type 1 in box 20 of the FRA reporting form), and to a freight train (train type 1 in box 25 of the FRA form) were selected. All records in the FRA database were searched, so that all freight trains involved in a main track accident were counted, including each train involved in multi-freight-train accidents. These selection criteria also mean that accidents to other train types, including work trains or equipment, passenger trains, light locomotives and cuts of cars are not included.
• Define accident types. Three accident types were defined:
− Derailments, type 1 in box 7 of the FRA reporting form − Train-to-train collisions, types 2 to 6 and type 8 in box 7 of the FRA form − Other accidents, covering all accidents not defined as collisions or derailments, type 7 (grade
crossing collisions) and types 9 – 13. The majority of these accidents are obstruction collisions and miscellaneous events such as fires and extreme weather events.
• Obtain counts of trains in accidents. For Class I railroads, counts of trains in accidents by track class, cause group and accident type were obtained from the FRA RAIRS accident database for the selected time period, giving the data contained in Table A2.3. Non-Class I railroad accident counts were obtained by cause group and accident type only are also shown in Table A2.3. Class I railroads were selected using the railroad identifications defined by the FRA in the accident reporting guide, and include all Class I’s operating during the period for which data were analyzed, including operationally integrated subsidiaries. Because exposure data are not available by track class for non-Class I railroads, it not possible to calculate accident rates by track class, and accident data by track class are not required. Also the total number of non-Class I railroad trains in accidents over the selected period is relatively low (935 compared with 3185 for Class I railroads), so there would be relatively few trains in accidents for each cause group/track class combination.
• Obtain counts of cars derailed in accidents. Counts of cars derailed in accidents by cause group and (for Class I railroads) FRA track class were obtained from the FRA accident database and are shown in Table A2.4. Given hazmat car derailment risk exposure calculated in car-miles, derailment frequency is obtained by dividing cars derailed by car-miles.

B-5
Derailment frequencies can be calculated by individual accident cause group, track class, railroad type and for overall US railroad operations.
B-6
Calculation of Baseline Accident Frequencies B.4 Frequencies for each railroad type, track class and accident type are simply obtained by dividing the number of trains in accidents in the 5 year period by the corresponding exposure, as shown in Table A2.5. The data needed to carry out this calculation are presented in Tables A2.3 and 2.4, as described above. Table A2.3 gives a full breakdown of train accidents by Cause Group, Accident Type (derailments, collisions and other) and Railroad Type (Class I and non-Class I). Table A2.4 provides an equivalent breakdown of cars derailed by cause group, accident type and railroad type. Table A2.5 provides baseline accident frequencies and car derailment metrics derived from the Tables A2.3 and A2.4 Accident frequencies are measures as accidents per million train miles, as well as car derailment frequencies per billion car-miles. Table A2.5 also includes a calculation of cars derailed per accident for all combinations of car-mile and train-mile accidents and accident type for Class I, non-Class I and all railroads together. These data are further described and discussed in Chapter 3 of the main Report, including the rationale for selecting specific risk metrics, how the metrics are used in hazmat risk models, to identify the leading causes of hazmat releases, and evaluate risk reduction measures.
The baseline accident frequencies are in the tables listed below.
• Table A2.1: Relationship Between FRA Accident Causes and Cause Groups • Table A2.2: Accident Cause Groups Used in Analysis • Table A2.3: Trains in Accidents by Cause Group and Track Class - Class I and Non-
Class I Railroads • Table A 2.4: Cars Derailed in Accidents by Cause Group, Track Class, Accident Type
and Railroad Type • Table A2.5. Accident frequencies and Car Derailment Metrics (cont.)
These tables are in a PDF file that is located in FRA’s eLibrary:
http://www.fra.dot.gov/eLib/Details/L16358

C-1
Appendix C. Calculation of Baseline Accident and Cars Derailed Data for Trains With Hazmat Cars in the Consist
This appendix provides data on accidents and cars derailed in trains that include at least one hazmat car, as shown in the waybills for the cars in the train. These counts are shown in Tables A3.1 and A3.2 by accident cause, track class and railroad type. It is not possible to calculate accident frequencies for train accidents involving trains with hazmat cars because the corresponding estimates of train and car-miles are lacking, comparison between these data and the data for all trains can indicate whether cars in hazmat trains are more or less likely to be derailed in accidents and whether there are variations in the mix of accident cause between hazmat trains and all trains.
Tables A3.1 and A3.2 contain the same accident and cars derailed data as Tables A2.3 and A2.4, but only for trains that have at least one hazmat car in the consist. The data are used to compare the distribution of accident causes and cars derailed by Cause Group, Track Class and Railroad Type between hazmat trains and all trains, and to calculate the number of cars derailed per accident. TableA3.3. provided summary data on the numbers of accidents and cars derailed by FRA Track Class for Class I railroads, and for Class I vs. non-Class I railroads. These data are discussed in Chapter 3 of the main Report, in particular to review the distribution of accidents and cars derailed as compared with the corresponding data for all railroads, and to compare the top 1 causes of accidents and cars derailed.
The baseline accident data for trains with a hazmat car in the consist are in the following tables:
• Table A3.1: Hazmat Trains in Accidents • Table A3.2. Cars Derailed in Hazmat Trains in Accidents • Table A3.3. Accidents and Car Derailment Metrics
These tables are contained in a file that is located in FRA’s eLibrary:
http://www.fra.dot.gov/eLib/Details/L16358

D-1
Appendix D. Hazmat Releases and Hazmat Release Accidents
The data provided in Appendix D is Table 4.1 which provides a summary of the data used to prepare the analysis of hazmat releases in Section 3.4.2. The sources for these data were the FRA RAIRS Accident/Incident reports, PHMSA 5800 reports of hazmat releases in train accidents, and the definitions of accident Cause Groups provided in Appendix B.
• Table A4.1 is a reduced version of a more detailed table compiled by combining data from FRA and PHMSA reports from the same accident. The reduced table contains the following data for 212 hazmat releases during period 2004-2008 for which matching FRA and PHMSA reports could be found. A separate line is provided for each hazmat car for which a release was reported, whether or not there was only one releasing car of multiple releasing cars in an individual accident.
• A reference number • The name and type of railroad (Class I or non-Class I) on which the release occurred • The FRA Track Class • The Accident Cause Group and whether the accident is primarily a function of train-miles
or car-miles • The numbers of hazmat cars in the consist, derailed or damaged and releasing in the
accident (from the FRA accident report) • The released commodity and the DOT commodity class to which the released material
belonged • The quantity released, in gallons for liquid, pounds for solids and cubic feet for gases.
Appendix F lays out an analysis of release consequences, especially focused on the approximately 100 larger-volume releases. Although Appendix F is useful as a stand-alone product, an extension of the analysis of releases is suggested. This could comprise a review of how often different kinds of consequences occur and the aggregate harm associated with these events, and may help focus risk reduction efforts on the most harmful events.
To view Table A4.1, download a Excel spreadsheet which resides at the following location in the FRA eLibrary:
http://www.fra.dot.gov/eLib/Details/L16358

E-1
Appendix E. Estimated Railroad Accidents, Car Derailments and Hazmat Releases after Implementation of Risk Reduction Measures
The accident and car derailment tables compiled in Appendix C are repeated with accident and car derailment counts, adjusted by the estimated reductions in accidents and car derailments after implementation of selected risk reduction measures. Estimates of the reduction in accidents after implementation of each risk reduction measure are developed for each individual cause group, accident type, track class and railroad type and totaled. This provides both an estimate of benefits from each risk reduction measure, and illustrates a methodology that can be used to estimate benefits from any accident risk reduction measure. The primary inputs in each case are estimates of reductions in accidents and cars derailed, derived for relevant accident cause groups from the available literature. This analysis process was applied for each risk reduction measure, as described in Chapter 4.
The specific risk reduction measures analyzed are as follows:
1. “Broad Installation” of Positive Train Control (PTC), as mandated by the Rail Safety Improvement Act (RSIA) of October 2008 and accompanying FRA implementation regulations. The term “Broad Installation” is defined in Chapter 4.
2. “Narrow Installation” of Positive Train Control (PTC), as mandated by the Rail Safety Improvement Act (RSIA) of October 2008 and accompanying FRA implementation regulations. The term “Narrow Installation” is defined in Chapter 4.
3. Implementation of a “Rail Integrity Rule” developed through the Railroad Safety Advisory Committee (RSAC) to enhance rail testing procedures and processes to reduce the occurrence of broken rails.
The detailed results are presented in a set of 6 tables, providing estimates of the reduction of accidents and derailed freight cars for each of the analysis cases, as follows:
• Table A5.1 A. PTC Broad Implementation – Trains in Accidents • Table A5.1 B. PTC Broad Implementation – Cars Derailed in Accidents • Table A5.2 A. PTC Narrow Implementation – Trains in Accidents • Table A5.2 B. PTC Narrow Implementation – Cars Derailed in Accidents • Table A5.3 A. 30% reduction in Rail Defects – Trains in Accidents • Table A5.3 B. 30% reduction in Rail Defects – Cars Derailed in Accidents
To view these tables, download the Risk Evaluation Tables file from FRA’s eLibrary:
http://www.fra.dot.gov/eLib/Details/L16358

F-1
Appendix F. Hazmat Consequences This analysis required the compilation of data sources for hazmat materials as ancillary material. It was found that the only reports identified that addressed these areas were quantitative analyses that provided quantitative/cost results of damage occurring to the environment and human health from hazardous material spills. Additionally, TRB Special Report 283 indicates that there are gaps in the research on the impacts of acute releases of significant quantities of hazardous materials. The report states,
“A comprehensive basis for the quantification and ranking of the environmental hazards posed by various materials in transportation is needed. The development of such a system would provide carriers, shippers, regulators, risk analysts, and the public with an objective basis for evaluating and comparing the environmental risk posed by hazardous materials in transportation.”19
The specific steps that were followed when compiling information to fill this gap are as follows:
1. Review Reports with Qualitative Analysis of Hazardous Materials Spills – Reviewed the Web sites below for reports that qualitatively describe the consequences of hazardous material spills on human health, the environment, and property.
• TRB
• DOT
• Hazardous Materials Cooperative Research Program
• Volpe
• General Google Searches
2. Condensed Hazmat List to only High Volume Materials – Since there are hundreds of hazardous materials transported by tank cars, every hazardous material could not be reviewed. As such, the top high volume materials in each DOT hazardous material class were selected, and analysis focused on the impacts of those materials. These top materials (as listed in Table 1 below) were selected to represent the highest volume hazardous materials within the same hazmat classes, using the AAR BOE 2009 Annual Report of Hazardous Materials Transported by Rail. The only exception was for Class 4.1 which only listed one material, and so a few additional materials were added to the list. We also chose one material for each sub class in Class 2 (Class 2 has a total of 3 subclasses), since Class 2 includes TIH materials, which are particularly dangerous.
• Several materials were listed more than once under the same DOT Proper Shipping name, but under a different Hazmat code. The BOE report states that “due to differing contract rates, produce differences (e.g., concentration of the product in solution), and shipper differentiation, a commodity with the same DOT ‘Proper Shipping Name,’ e.g., Liquefied Petroleum Gas, may be assigned several different Hazardous Material Code numbers. In
19 http://onlinepubs.trb.org/onlinepubs/sr/sr283.pdf

F-2
transportation, these may present essentially the same type and degree of hazard.” 20 As such, materials that were listed more than once were aggregated under the same proper shipping name, but under a different Hazmat code. After these aggregations, total tank car originations for gasoline were higher than diesel (the second high volume material selected for Class 3), so gasoline was added to the condensed list.
These resulting lists of materials shown in Table F-1 comprise between 50 and 60 percent of the total hazmat carloads transported by rail in tank cars.
Table F-1 High Volume Materials by Hazmat Class
Hazmat Class Material 2.1 – Flammable Gas Petroleum Gases, Liquefied
2.2 – Non-Flammable/Non-Poisonous Compressed Gas
Ammonia, Anhydrous
2.3 – Gas Poisonous by Inhalation Chlorine
3 – Flammable and Combustible Liquids
Alcohols, N.O.S.
Diesel Fuel
Gasoline
4.1 – Flammable Solids Sulfur Molten
5.1 – Oxidizers and Organic Peroxides
Hydrogen Peroxide, Stabilized
Ammonium Nitrate, Liquid
6.1 – Poisonous/Toxic Materials
Phenol, Molten
Toluene Diisocyanate
8 – Corrosive Materials Sodium Hydroxide Solution
Sulfuric Acid
9 – Miscellaneous Hazmats
Elevated Temperature Liquid, N.O.S.
Sulfur, Molten
20 “Annual Report of Hazardous Materials Transported by Rail: Calendar Year 2009.” Report BOE 09-1. Association of American Railroads; Bureau of Explosives. July 2010. p. 4.

F-3
3. Described and Documented Hazardous Materials in Condensed List – A number of resources were used to identify and describe the following areas for each hazardous material selected:
• Characteristics of each hazardous material
• Emergency response
• Acute consequences of a spill of each hazardous material under three headings:
- Health effects
- Environmental hazards
- Property damage, usually as a result of a fire or explosion
Resources used to complete this analysis included:
• 2008 Emergency Response Guidebook
• EPA IRIS: http://www.epa.gov/IRIS/
• ATSDR Tox Profiles: http://www.atsdr.cdc.gov/toxprofiles/index.asp
• Toxnet: http://toxnet.nlm.nih.gov/
• ChemID: http://chem.sis.nlm.nih.gov/chemidplus/
• EPA REDs: http://www.epa.gov/oppsrrd1/reregistration/status.htm (only for pesticides)
• EPA HPV documents: http://www.epa.gov/hpv/ (only for high production volume chemicals)
• PubMed: http://www.ncbi.nlm.nih.gov/pubmed/
• NIOSH Pocket Guide: http://www.cdc.gov/niosh/npg/
• Material Safety Data Sheets
• Google Search Results of the review were documented in a comprehensive table, which is included in Appendix E of this report.
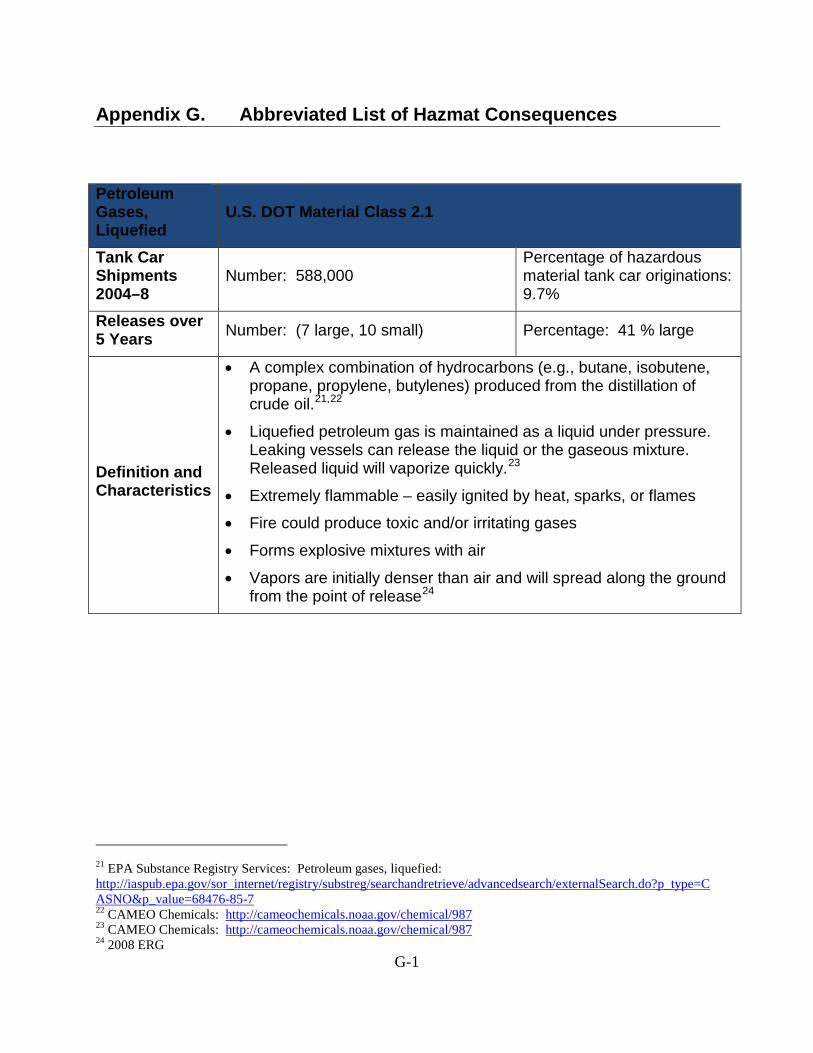
G-1
Appendix G. Abbreviated List of Hazmat Consequences
Petroleum Gases, Liquefied
U.S. DOT Material Class 2.1
Tank Car Shipments 2004–8
Number: 588,000 Percentage of hazardous material tank car originations: 9.7%
Releases over 5 Years Number: (7 large, 10 small) Percentage: 41 % large
Definition and Characteristics
• A complex combination of hydrocarbons (e.g., butane, isobutene, propane, propylene, butylenes) produced from the distillation of crude oil.21,22
• Liquefied petroleum gas is maintained as a liquid under pressure. Leaking vessels can release the liquid or the gaseous mixture. Released liquid will vaporize quickly.23
• Extremely flammable – easily ignited by heat, sparks, or flames
• Fire could produce toxic and/or irritating gases
• Forms explosive mixtures with air
• Vapors are initially denser than air and will spread along the ground from the point of release24
21 EPA Substance Registry Services: Petroleum gases, liquefied: http://iaspub.epa.gov/sor_internet/registry/substreg/searchandretrieve/advancedsearch/externalSearch.do?p_type=CASNO&p_value=68476-85-7 22 CAMEO Chemicals: http://cameochemicals.noaa.gov/chemical/987 23 CAMEO Chemicals: http://cameochemicals.noaa.gov/chemical/987 24 2008 ERG

G-2
Emergency Response25
• Immediate Response
- Isolate spill or leak area for > 100 m (330 ft) in all directions. - Stay upwind.
- Keep out of low areas.
• Evacuation
- Large Spill: Initial downwind evacuation for > 800 m (1/2 mile)
• Fire: If rail car is involved in a fire, isolate and consider evacuation for 1600 meters (1 mi) in all directions.
Health Effects
• Concentrations > 2% can cause depression of the general central nervous system.26
• Concentrations > 10% will cause dizziness; high concentrations will cause asphyxiation.27
• Contact with gas may cause burns, severe injury, and/or frostbite.28
Environmental Hazards • Will not harm aquatic life29
Property Damage • Property at risk from explosion/fire
25 2008 ERG 26 “Material Safety Data Bulletin for Commercial Propane, LPG 4905752.” http:www.drakegas.com/downloads/msds.txt 27 CAMEO Chemicals: http://cameochemicals.noaa.gov/chemical/987 28 2008 ERG 29 CAMEO Chemicals: http://cameochemicals.noaa.gov/chemical/987

G-3
Ammonia, Anhydrous U.S. DOT Material Class 2.2
Tank Car Shipments 2004–8
Number: 228,000 Percentage of hazardous material tank car originations: 3.8%
Releases over 5 Years Number: (0 large, 2 small) Percentage: 0% large
Definition and Characteristics
• Ammonia is a clear, colorless gas that has a strong odor.
• Ammonia is transported as a liquid under its own vapor pressure.30
• Toxic by inhalation
• Generally regarded as nonflammable – may burn, but not readily ignite
• Reacts with water – boils and produces poisonous, visible vapor cloud31,32
• When heated, cylinders may explode and when exposed to fire, may vent toxic and/or corrosive gas.33
Emergency Response34
• Immediate Response
- Isolate spill or leak area for > 100 m (330 ft) in all directions. - Stay upwind.
- Heavier than air and will spread along ground and collect in low or confined areas (e.g., sewers, tanks, basements)
• Evacuation
- Small Spill: Isolate in all directions 100 ft, then protect persons that are downwind and within 0.1 mi
- Large Spill: Isolate in all directions 500 ft, then protect persons that are downwind and within 0.5 mi (day) and within 1.4 mi (night)
• Fire: If railcar is involved in a fire, isolate and consider evacuation for 1600 m (1 mi) in all directions
30 NOAA CAMEO Chemicals: http://cameochemicals.noaa.gov/chemical/4860 31 NOAA CAMEO Chemicals: http://cameochemicals.noaa.gov/chemical/4860 32 2008 ERG 33 2008 ERG 34 2008 ERG

G-4
Health Effects
• Toxic – potentially fatal if inhaled or absorbed through skin
• Contact with gas or liquid gas can result in burns, severe injury, and/or frostbite.35
• Exposure to a dense cloud of ammonia may severely burn skin, eyes, throat, or lungs. If severe enough, these burns could cause permanent lung disease, blindness, or death.36
• An ammonia concentration of 700 ppm causes eye irritation and a concentration of 5000 ppm can cause immediate death from inflammation, spasm, or edema of the larynx.37
Environmental Hazards
• Ammonia can harm aquatic life in very low concentrations.
• Ammonia is potentially dangerous if it enters water intakes38
Property Damage • Property at risk from explosion/fire
35 2008 ERG 36 ATSDR Public Health Statement for Ammonia: http://www.atsdr.cdc.gov/phs/phs.asp?id=9&tid=2 37 NOAA CAMEO Chemicals: http://cameochemicals.noaa.gov/chemical/4860 38 NOAA CAMEO Chemicals: http://cameochemicals.noaa.gov/chemical/4860

G-5
Chlorine U.S. DOT Material Class 2.3
Tank Car Originations 2004–2008
Number: 168,000 Percentage of hazardous material tank car originations: 2.8%
Releases over 5 Years Number: (1 large/3 small) Percentage: 25% large
Definition and Characteristics
• Chlorine is a green/yellow gas that has a pungent, suffocating odor.39
• Chlorine is shipped as a pressurized liquid.40
• If spilled, chlorine will evaporate quickly and form a green/yellow cloud. This vapor cloud will be denser than air and can spread several miles from the point of release.
• Chlorine is broken down by sunlight within minutes.41
• Toxic by inhalation
• Does not burn, but, like oxygen, supports combustion
• Reacts with water – boils and produces poisonous, visible vapor cloud42
39 NOAA CAMEO Chemicals: http://cameochemicals.noaa.gov/chemical/2862 40 Harvard study: http://belfercenter.ksg.harvard.edu/files/Rail-Transportation-of-Toxic-Inhalation-Hazards-Final.pdf 41 ATSDR toxfaqs 42 NOAA CAMEO Chemicals: http://cameochemicals.noaa.gov/chemical/2862

G-6
Emergency Response43
• Immediate Response
- Isolate spill or leak area for > 100 m (330 ft) in all directions. - Stay upwind.
- Heavier than air and will spread along ground and collect in low or confined areas (e.g., sewers, tanks, basements)
• Evacuation
- Small Spill: Isolate in all directions 200 ft, then protect persons that are downwind and within 0.3 mi (day) and within 1.0 mi (night)
- Large Spill: Isolate in all directions 2,000 ft, then protect persons that are downwind and within 2.2 mi (day) and within 5 mi (night)
• Fire: If railcar is involved in a fire, isolate and consider evacuation for 800 m (1/2 mi) in all directions.
Health Effects
• Toxic – high concentrations of chlorine gas are deadly to humans within minutes of release.44 Effects from lower concentrations, between 1 and 30 ppm range, from mild nose irritation to chest pain, vomiting, breathing difficulty, and coughing.45
• Contact with gas or liquefied gas may result in burns, severe injury, and/or frostbite.46
• If chlorine is inhaled at very high concentrations, it can break down in the lungs and form hydrochloric acid, which will burn lung tissue and cause pulmonary edema, flooding of the lungs with liquid, which causes drowning. The following factors determine the extent of the poisoning: quantity of gas, settling, and time of exposure.47
• The Department of Health and Human Services (DHHS), the International Agency for Research on Cancer (IARC), and the EPA have not classified the human carcinogenicity of chlorine.48
43 2008 ERG 44 Harvard study: http://belfercenter.ksg.harvard.edu/files/Rail-Transportation-of-Toxic-Inhalation-Hazards-Final.pdf 45 ATSDR Public Health Statement for Chlorine 46 2008 ERG 47 Harvard study: http://belfercenter.ksg.harvard.edu/files/Rail-Transportation-of-Toxic-Inhalation-Hazards-Final.pdf 48 ATSDR ToxFAQs

G-7
Environmental Hazards
• Chlorine can harm aquatic life in very low concentrations.
• Chlorine is potentially dangerous if it enters water intakes.49
• Runoff from control of fire could potentially cause pollution.50
Property Damage • Property at risk from explosion/fire
49 NOAA CAMEO Chemicals: http://cameochemicals.noaa.gov/chemical/4860 50 2008 ERG

G-8
Alcohols, N.O.S. U.S. DOT Material Class 3
Tank Car Originations 2004–2008
Number: 742,000
Percentage of hazardous material tank car originations: 12.2%
Releases over 5 Years Number: (31 large/8 small) Percentage: 78%
large
Definition and Characteristics
• An alcohol mixture containing up to 5% of petroleum products51
• Before shipment, ethanol is denatured with 2–5% natural gasoline. This makes the Alcohols N.O.S. product undrinkable.52
• Alcohols N.O.S. is most often a colorless liquid.53 • Highly flammable – easily ignited by heat, sparks, or
flames • Vapors could form explosive mixture with air. • Runoff to sewer could create an explosion or fire
hazard.54
51 CFR Title 49: Transportation §172.102 Special Provisions 52 Ethanol Producer Magazine: http://www.ethanolproducer.com/article.jsp?article_id=5788 for a real life example 53 CAMEO Chemicals: http://cameochemicals.noaa.gov/chemical/19336 54 2008 ERG

G-9
Emergency Response55
• Immediate Response - Isolate spill or leak area for > 50 m (150 ft) in all
directions. - Stay upwind. - Most vapors are heavier than air and will spread
along the ground and collect in low or confined areas (e.g., sewers, tanks, basements).
• Evacuation - Large Spill: Initial downwind evacuation > 300 m
(1,000 ft) • Fire: If tank car is involved in a fire, isolate and
consider evacuation for 800 m (1/2 mi) in all directions.
Health Effects
• Inhalation or contact with substance could potentially irritate or burn eyes and skin.
• A fire could produce irritating, corrosive and/or toxic gases.
• Vapors could cause suffocation or dizziness.56 • Inhalation will irritate the respiratory tract.57
55 2008 ERG 56 2008 ERG 57 Material Safety Data Sheet for Denatured Alcohol, Alcohols N.O.S.” http://www.hvchemical.com/msds/deal.htm

G-10
Environmental Hazards
• Runoff from control of fire could cause pollution.58 • At high concentrations, ethanol may be toxic to
aquatic life. • In high concentrations, an ethanol release into surface
water could deplete or significantly lower the dissolved oxygen content in the surface water; this could occur within a short timeframe and could potentially cause a fish kill from reduced oxygen content.59
• Ethanol will biodegrade readily and evaporate when released into the soil, but could leach into groundwater. 60
Property Damage • Potential property damage from explosions or fires
58 2008 ERG 59 “Health, Environmental, and Economic Impacts of Adding Ethanol to Gasoline in the Northeast States: Volume 3 – Water Resources and Associated Health Impacts.” New England Interstate Water Pollution Control Commission. July 2001. 60 Material Safety Data Sheet for Denatured Alcohol, Alcohols N.O.S. http://www.hvchemical.com/msds/deal.htm

G-11
Gasoline U.S. DOT Material Class 3
Tank Car Originations 2004–2008
Number: 157,000
Percentage of hazardous material tank car originations: 2.6%
Releases over 5 Years Number: (1 large/0 small) Percentage: 100%
large
Definition and Characteristics
• Gasoline is a clear to amber-colored, volatile liquid that has a petroleum-like odor.61
• On average, gasoline contains over 150 chemicals, including small amounts of automotive gasoline, benzene, and toluene.62
• Gasoline floats on water.63 • Highly flammable – easily ignited by heat, sparks, or
flames • Vapors could form explosive mixtures with air. • Fire could produce irritating, corrosive and/or toxic
gases. • Runoff to sewer may cause a fire or an explosion
hazard.64
61 CAMEO Chemicals: http://cameochemicals.noaa.gov/chemical/11498 62 ATSDR ToxFAQsTM for Automotive Gasoline: http://www.atsdr.cdc.gov/toxfaqs/TF.asp?id=467&tid=83 63 CAMEO Chemicals: http://cameochemicals.noaa.gov/chemical/11498 64 2008 ERG

G-12
Emergency Response65
• Immediate Response - Isolate spill or leak area for > 50 m (150 ft) in all
directions. - Stay upwind. - Most vapors heavier than air and will spread along
the ground and collect in low or confined areas (e.g., sewers, tanks, and basements).
• Evacuation - Large Spill: Initial downwind evacuation > 300 m
(1,000 ft) • Fire: If tank car is involved in a fire, isolate and
consider evacuation for 800 m (1/2 mi) in all directions.
Health Effects
• Inhalation or contact with the substance can irritate or burn the eyes and skin.
• Vapors can cause suffocation or dizziness.66 • Inhalation of vapor above recommended exposure
limit can cause headaches, drowsiness, nausea, and can cause unconsciousness or death.67
• The Department of Health and Human Services and the International Agency for Research on Cancer have not classified the carcinogenicity of automotive gasoline.68
Environmental Hazards
• May harm aquatic life in very low concentrations. • Results in fouling to shoreline • Potentially dangerous if enters waterways.69 • Runoff from control of fire or dilution water could
cause pollution.70 65 2008 ERG 66 2008 ERG 67 Material Safety Data Sheet for Gasoline 4908175. http://www.greatlakespetroleum.com/documents/MSDS_Gas_87.pdf 68 ATSDR ToxFAQsTM for Automotive Gasoline: http://www.atsdr.cdc.gov/toxfaqs/TF.asp?id=467&tid=83 69 CAMEO Chemicals: http://cameochemicals.noaa.gov/chemical/11498

G-13
Property Damage • Property at risk from explosion/fire
70 2008 ERG

G-14
Diesel Fuel U.S. DOT Material Class 3
Tank Car Originations 2004–2008
Number: 234,000
Percentage of hazardous material tank car originations: 3.9%
Releases over 5 Years Number: (0 large/1 small) Percentage: 0 % large
Definition and Characteristics
• Diesel fuel is a liquid with a yellow to dark color and a petroleum-like odor.
• Diesel fuel floats on water.71 • Substance can be transported at a high temperature. • Highly flammable – easily ignited by heat, sparks, or
flames • Vapors can form explosive mixtures with air. • Runoff to sewer can create an explosion or fire
hazard.72
Emergency Response73
• Immediate Response - Isolate spill or leak area for > 50 m (150 ft) in all
directions. - Stay upwind. - Most vapors heavier than air and will spread along
the ground and collect in low or confined areas (e.g., sewers, tanks, and basements)
• Evacuation - Large Spill: Initial downwind evacuation > 300 m
(1,000 ft) • Fire: If tank car is involved in a fire, isolate and
consider evacuation for 800 m (1/2 mi) in all
71 CAMEO Chemicals: http://cameochemicals.noaa.gov/chemical/11452 72 2008 ERG 73 2008 ERG

G-15
directions.
Health Effects
• Inhalation or contact with the substance can irritate or burn the eyes and skin.
• Fire could produce irritating, corrosive, toxic gases.74 • Exposure to high concentrations will cause nose,
throat, and lung irritation. Effects may also include headaches, dizziness, loss of coordination, unconsciousness, coma, respiratory failure, and even death.75
Environmental Hazards
• Runoff from control of fire or dilution water can cause pollution.76
• May harm aquatic life in very low concentrations • Results in fouling to shoreline • Potentially dangerous if entering waterways 77
Property Damage • Property at risk from explosion/fire
74 2008 ERG 75 Material Safety Data Sheet for Diesel fuel 4912186. http://www.hess.com/ehs/msds/9909DieselFuelAllTypes.pdf 76 2008 ERG 77 CAMEO Chemicals: http://cameochemicals.noaa.gov/chemical/11452

G-16
Sulfur, Molten U.S. DOT Material Class 4.1 & 9
Tank Car Originations 2004–2008
Number: 318,000
Percentage of hazardous material tank car originations: 5.2%
Releases over 5 Years Number: (0 large/2 small) Percentage: 0% large
Definition and Characteristics
• Sulfur, molten is a light yellow-colored crystalline solid that is transported as a yellow to red-colored liquid.
• Transported at an elevated temperature to prevent solidification to facilitate transport
• If released, cools rapidly and solidifies.78 • Fire or explosion hazard – flammable/combustible
material • Friction, heat, sparks or flames may ignite material. • May burn rapidly with a flare burning effect • Fire could produce irritating/toxic gases. • Powders, dusts, shavings, borings, may burn or
explode with violence. • May reignite after original fire is extinguished79
Emergency Response80
• Immediate Response - Isolate spill or leak area for > 25 m (75 ft) in all
directions. - Stay upwind.
• Evacuation - Large Spill: Initial downwind evacuation > 100 m
(330 ft) • Fire: If tank car is involved in a fire, isolate and
78 CAMEO Chemicals: http://cameochemicals.noaa.gov/chemical/4562 79 2008 ERG 80 2008 ERG

G-17
consider evacuation for 800 m (1/2 mi) in all directions.
Health Effects • Contact could cause severe burns to skin and eyes.81,82
Environmental Hazards
• Will harm aquatic life in high concentrations • Potentially dangerous if entering water intakes83 • Runoff from control of fire could cause pollution.84
Property Damage • Property at risk from explosion/fire
81 2008 ERG 82 CAMEO Chemicals: http://cameochemicals.noaa.gov/chemical/4562 83 CAMEO Chemicals: http://cameochemicals.noaa.gov/chemical/4562 84 2008 ERG
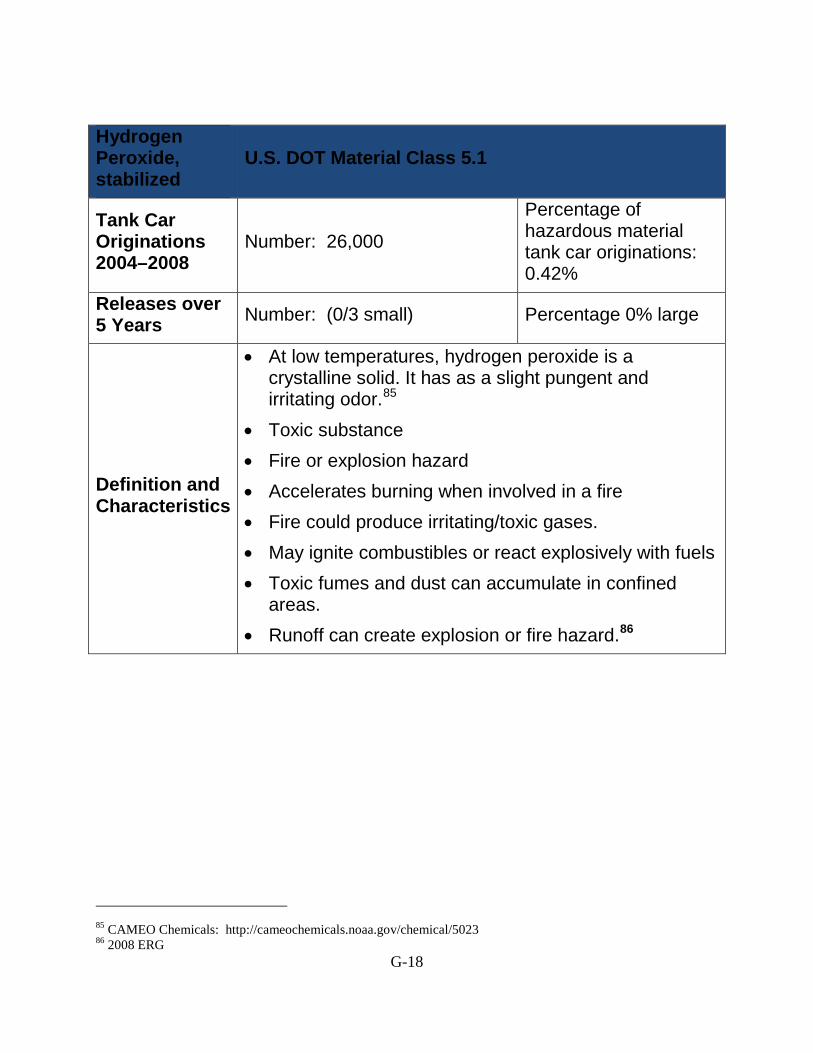
G-18
Hydrogen Peroxide, stabilized
U.S. DOT Material Class 5.1
Tank Car Originations 2004–2008
Number: 26,000
Percentage of hazardous material tank car originations: 0.42%
Releases over 5 Years Number: (0/3 small) Percentage 0% large
Definition and Characteristics
• At low temperatures, hydrogen peroxide is a crystalline solid. It has as a slight pungent and irritating odor.85
• Toxic substance • Fire or explosion hazard • Accelerates burning when involved in a fire • Fire could produce irritating/toxic gases. • May ignite combustibles or react explosively with fuels • Toxic fumes and dust can accumulate in confined
areas. • Runoff can create explosion or fire hazard.86
85 CAMEO Chemicals: http://cameochemicals.noaa.gov/chemical/5023 86 2008 ERG

G-19
Emergency Response87
• Immediate Response - Isolate spill or leak area for > 50 m (150 ft) in all
directions for liquids and 25 m (75 ft) for solids. - Stay upwind. - Keep out of low areas.
• Evacuation - For a spill, increase in the downwind direction for
up to 50 m (150 ft) • Fire: If tank car is involved in a fire, isolate and
consider evacuation for 800 m (1/2 mi) in all directions.
Health Effects
• Exposure will irritate the eyes, nose, and throat; substance is harmful if inhaled.88
• Inhalation, ingestion, or contact of skin/eyes with vapors, dust, or actual substance can cause severe burns, injury, or death.89
Environmental Hazards
• The effect of hydrogen peroxide on aquatic life is unknown, but the substance could be harmful if it enters a water intake.90
• Runoff from control of fire or dilution water can cause pollution.91
Property Damage • Property at risk from explosion/fire
87 2008 ERG 88 CAMEO Chemicals: http://cameochemicals.noaa.gov/chemical/5023 89 2008 ERG 90 CAMEO Chemicals: http://cameochemicals.noaa.gov/chris/HPO.pdf 91 2008 ERG

G-20
Ammonium Nitrate Liquid U.S. DOT Material Class 5.1
Tank Car Originations 2004–2008
Number: 18,000
Percentage of hazardous material tank car originations: 0.3%
Releases over 5 Years Number: (7 large/2 small) Percentage: 78%
large
Definition and Characteristics
• White crystals dissolved in water • Fires involving this material will produce toxic oxides
of nitrogen.92 • Accelerates burning when in a fire • Could decompose explosively if heated or in a fire • Explodes from contamination or heat • May ignite combustibles or react explosively with fuels • Runoff may create explosion or fire hazard.93
Emergency Response
• Immediate Response - Isolate spill or leak area for > 50 m (150 ft) in all
directions for liquids and 25 m (75 ft) for solids. - Stay upwind. - Keep out of low areas.
• Evacuation - Large spill: initial downwind evacuation of > 100 m
(330 ft) • Fire: If tank car is involved in a fire, isolate and
consider evacuation for 800 m (1/2 mi) in all directions.
Health Effects • Inhalation, ingestion, or contact with skin/eyes with
92 CAMEO Chemicals: http://cameochemicals.noaa.gov/chemical/5397 93 2008 ERG

G-21
vapors, dust, or actual substance can cause severe burns, injury, or death.
• Fire could produce irritating/toxic gases.94 Environmental Hazards
• Runoff from control of fire or dilution water could cause pollution.95
Property Damage • Property at risk from explosion/fire
94 2008 ERG 95 2008 ERG

G-22
Phenol, Molten U.S. DOT Material Class 6.1 Tank Car Originations 2004–2008
Number: 52,000 Percentage of hazardous material tank car originations: 0.86%
Releases over 5 Years Number: (2 large/0 small) Percentage: 100%
Definition and Characteristics
• Phenol, molten is a white crystalline solid that is transported at an elevated temperature, forming a semisolid.96
• May be shipped in molten form • Toxic substance • Burns, but does not readily ignite • When heated, vapors can form explosive mixtures. • Contact with metal can produce hydrogen gas that is
flammable. • Fire can produce irritating/corrosive/toxic gases.97
Emergency Response
• Immediate Response - Isolate spill or leak area for > 50 m (150 ft) in all
directions for liquids and 25 m (75 ft) for solids. - Stay upwind. - Keep out of low areas.
• Evacuation - For a spill, increase isolation distance up to 50 m
(150 ft), as needed. • Fire: If tank car is involved in a fire, isolate and consider
evacuation for 800 m (1/2 mi) in all directions.
Health Effects • Toxic substance – inhalation, skin contact, or ingestion can cause death or severe injury
96 CAMEO Chemicals: http://cameochemicals.noaa.gov/chemical/4200 97 2008 ERG

G-23
• Contact with heated substance can cause severe burns to skin/eyes.
• Effects from inhalation or contact may be delayed.98
Environmental Hazards
• Runoff from control of fire or dilution water may be corrosive and toxic and lead to pollution.99
• Waterways may be polluted from runoff.100 Property Damage • Property at risk from explosion/fire
98 2008 ERG 99 2008 ERG 100 CAMEO Chemicals: http://cameochemicals.noaa.gov/chemical/4200
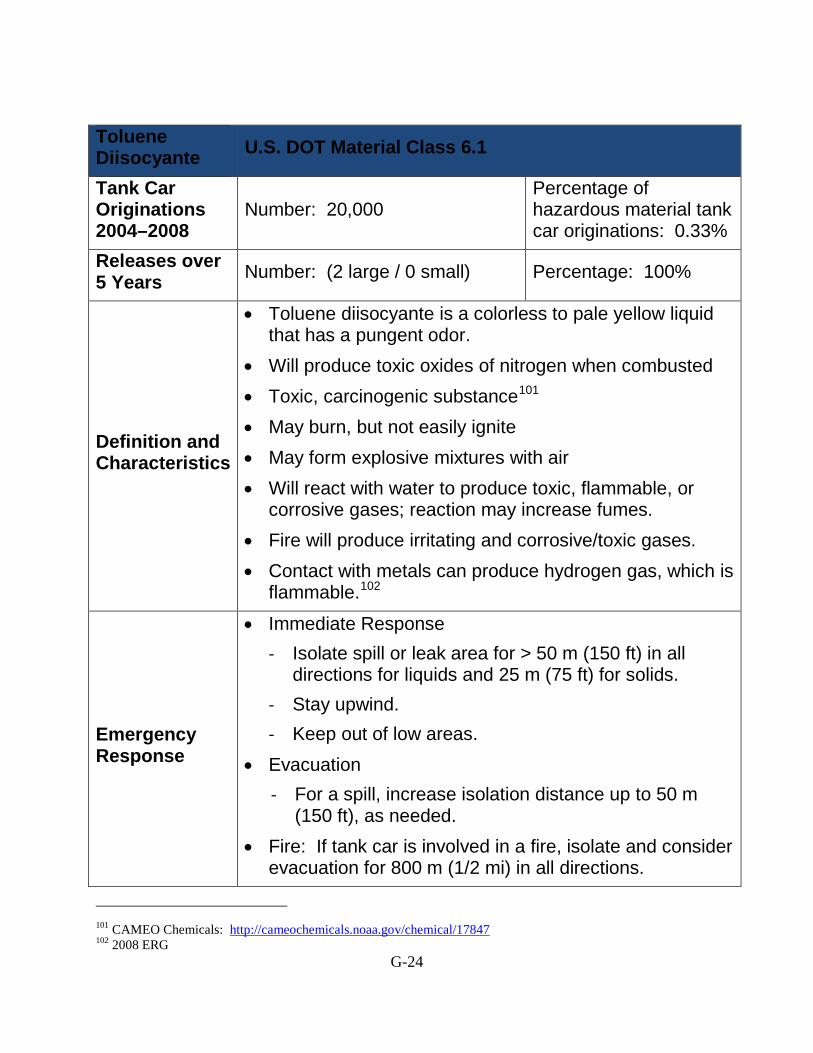
G-24
Toluene Diisocyante U.S. DOT Material Class 6.1
Tank Car Originations 2004–2008
Number: 20,000 Percentage of hazardous material tank car originations: 0.33%
Releases over 5 Years Number: (2 large / 0 small) Percentage: 100%
Definition and Characteristics
• Toluene diisocyante is a colorless to pale yellow liquid that has a pungent odor.
• Will produce toxic oxides of nitrogen when combusted • Toxic, carcinogenic substance101 • May burn, but not easily ignite • May form explosive mixtures with air • Will react with water to produce toxic, flammable, or
corrosive gases; reaction may increase fumes. • Fire will produce irritating and corrosive/toxic gases. • Contact with metals can produce hydrogen gas, which is
flammable.102
Emergency Response
• Immediate Response - Isolate spill or leak area for > 50 m (150 ft) in all
directions for liquids and 25 m (75 ft) for solids. - Stay upwind. - Keep out of low areas.
• Evacuation - For a spill, increase isolation distance up to 50 m
(150 ft), as needed. • Fire: If tank car is involved in a fire, isolate and consider
evacuation for 800 m (1/2 mi) in all directions.
101 CAMEO Chemicals: http://cameochemicals.noaa.gov/chemical/17847 102 2008 ERG

G-25
Health Effects
• Exposure to vapors will irritate the respiratory system. • High vapor concentrations are toxic.103 • Toxic substance – inhalation, skin contact, or ingestion
can cause death or severe injury • Contact with heated substance can cause severe burns
to skin/eyes.104 Environmental Hazards
• Runoff from control of fire or dilution water may be
corrosive/toxic and cause pollution.105 Property Damage
• Property at risk from explosion/fire
103 CAMEO Chemicals: http://cameochemicals.noaa.gov/chemical/17847 104 2008 ERG 105 2008 ERG

G-26
Sulfuric Acid U.S. DOT Material Class 8 Tank Car Originations 2004–2008
Number: 329,000 Percentage of hazardous material tank car originations: 5.5%
Releases over 5 Years Number: (1 large/4 small) Percentage: 20% large
Definition and Characteristics
• Colorless, oily liquid106 • Will sink and mix violently with water, releasing
corrosive and/or toxic gases and runoff.107,108 • May be shipped in a molten form • May burn, but will not readily ignite • Will react with water to produce toxic/corrosive gases
and runoff • Contact with metals may produce hydrogen gas, which
is flammable. • Toxic and flammable gases may accumulate in confined
areas.109
Emergency Response
• Immediate Response - Isolate spill or leak area for > 50 m (150 ft) in all
directions. - Stay upwind. - Keep out of low areas.
• Evacuation - For a spill, increase isolation distance up to 50 m
(150 ft), as needed. • Fire: If tank car is involved in a fire, isolate and consider
evacuation for 800 m (1/2 mi) in all directions.
106 CAMEO Chemicals: http://cameochemicals.noaa.gov/chemical/5193 107 CAMEO Chemicals: http://cameochemicals.noaa.gov/chemical/5193 108 2008 ERG 109 2008 ERG
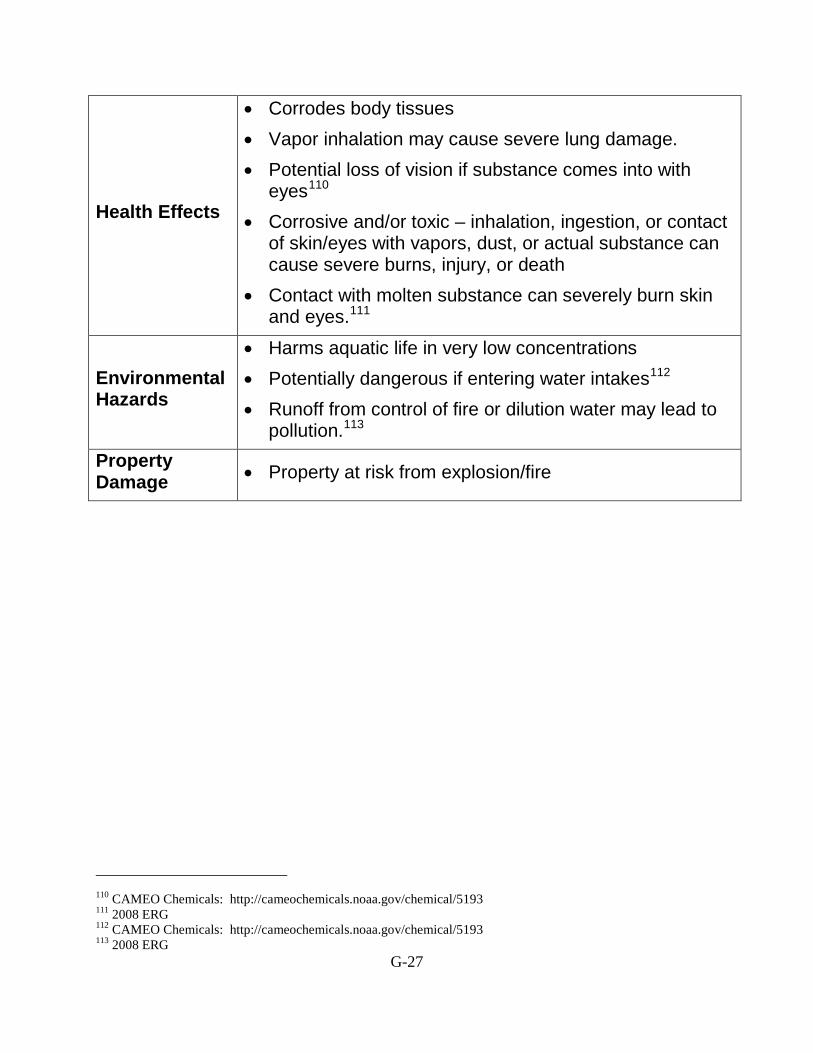
G-27
Health Effects
• Corrodes body tissues • Vapor inhalation may cause severe lung damage. • Potential loss of vision if substance comes into with
eyes110 • Corrosive and/or toxic – inhalation, ingestion, or contact
of skin/eyes with vapors, dust, or actual substance can cause severe burns, injury, or death
• Contact with molten substance can severely burn skin and eyes.111
Environmental Hazards
• Harms aquatic life in very low concentrations • Potentially dangerous if entering water intakes112 • Runoff from control of fire or dilution water may lead to
pollution.113 Property Damage • Property at risk from explosion/fire
110 CAMEO Chemicals: http://cameochemicals.noaa.gov/chemical/5193 111 2008 ERG 112 CAMEO Chemicals: http://cameochemicals.noaa.gov/chemical/5193 113 2008 ERG

G-28
Elevated Temperature Liquid, N.O.S.
U.S. DOT Material Class 9
Tank Car Originations 2004–2008
Number: 481,000 Percentage of hazardous material tank car originations: 7.9%
Releases over 5 Years Number: (1 large / 0 small) Percentage: 100%
Definition and Characteristics
• Includes molten metals, molten salts, etc.114 • Can be shipped hot • Highly flammable – easily ignited by heat, sparks, or
flames • Vapors can form explosive mixtures with air. • Runoff to sewer may lead to an explosion or fire
hazard.115
Emergency Response
• Immediate Response - Isolate spill or leak area for > 50 m (150 ft) in all
directions. - Stay upwind. - Keep out of low areas.
• Evacuation - For a large spill, initial downwind evacuation of > 300
m (1,000 ft), as needed. • Fire: If tank car is involved in a fire, isolate and consider
evacuation for 800 m (1/2 mi) in all directions.
114 Columbia Analytical Services. http://www.caslab.com/Elevated_temperature_2566-_-/ 115 2008 ERG

G-29
Health Effects
• Inhalation and contact with substance and can irritate and burn skin/eyes.
• Fire can produce irritating, corrosive/toxic gases. • Vapors can lead to dizziness or suffocation.116
Environmental Hazards
• Runoff from control of fire or dilution water can lead to pollution.117
Property Damage • Property at risk from explosion/fire
116 2008 ERG 117 2008 ERG


