Embed Size (px)
Citation preview
MOX–Report No. 25/2012
Treelet decomposition of mobile phone data forderiving city usage and mobility pattern in the Milan
urban region
Manfredini, F.; Pucci, P.; Secchi, P.; Tagliolato, P.;Vantini, S.; Vitelli, V.
MOX, Dipartimento di Matematica “F. Brioschi”Politecnico di Milano, Via Bonardi 9 - 20133 Milano (Italy)
[email protected] http://mox.polimi.it

Treelet decomposition of mobile phone data for
deriving city usage and mobility pattern in the Milan
urban region
Fabio Manfredini a, Paola Pucci a, Piercesare Secchi b,
Paolo Tagliolato a, Simone Vantini b, Valeria Vitelli c
a Politecnico di Milano, Dipartimento di Architettura e Piani�cazione, Milano, Italyb Politecnico di Milano, MOX - Dipartimento di Matematica, Milano, Italy
c Ecole Centrale Paris and Supelec, Chair on Systems Science and the Energeticchallenge, European Foundation for New Energy - Électricité de France, Paris, France
Keywords: Urban Studies, Mobility, Mobile Phone Network Data Analysis, Ur-ban Computing, Geographic Analysis, Nonparametric Statistics, Spatial Databasesand GIS.
2010 AMS Subject Classi�cation: 62H11, 62H20, 62P30.
Abstract
The paper presents a novel geo-statistical unsupervised learning tech-nique aimed at identifying useful information on hidden patterns of mo-bile phone use. These hidden patterns regard di�erent usages of the cityin time and in space which are related to individual mobility, outliningthe potential of this technology for the urban planning community. Themethodology allows to obtain a reference basis that reports the speci�ce�ect of some activities on the Erlang data recorded and a set of mapsshowing the contribution of each activity to the local Erlang signal. Weselected some results as signi�cant for explaining speci�c mobility and cityusages patterns (commuting, nightly activities, distribution of residences,non systematic mobility) and tested their signi�cance and their interpreta-tion from an urban analysis and planning perspective at the Milan urbanregion scale.
1 Introduction
Interpretative tools for the identi�cation of mobility practices in the contempo-rary metropolis are needed, not only for some known limitations of traditional
1
data sources but also because new forms of mobility are emerging, describingnew city dynamics and time-variations in the use of urban spaces by temporarypopulations. Traditional data sources for urban and mobility investigations (i.e.surveys, census) have some known limitations, including high cost of surveys,di�culty of data updating, di�culty of describing city dynamics and time de-pendent variations in intensity of urban spaces usages by temporary populationsat di�erent scales. These new forms of mobility, close to the daily mobility, arecharacterized both by being based on the use of transportation system, and bythe e�cient appropriation of information technologies (internet, mobile phone).They intensi�ed the density of the moves with which we can read diversi�ed usesof the city, that traditional sources of analysis are unable to return with continu-ity. As underlined by some authors Kaufmann (2002); Sheller and Urry (2006),changes in management of mobility in the contemporary cities are a useful key forunderstanding the transformations of times, places and modes of social life andwork programs, structuring the metropolitan areas. In this perspective, mobilitymay represent a tool of both knowledge and project for urban planners, providedthat a better understanding of di�erent patterns of mobility in the form of "activebiographies", which increase the range of "post-fordist living and labor styles"Nuvolati (2003), is available. Considering the role of mobility practices in socialand spatial di�erentiation, it becomes important to formulate pertinent analyt-ical approaches, aimed at describing the di�erent densities of use of the city asa new challenge and a prerequisite for understanding the city and its dynamics.Hence, from an analytical point of view, it becomes important to accompany thetraditional quantitative approaches referred to a geographic displacement thattends to focus on movement in space and time, in an aggregate way and forlimited periods, with data sources able to describe �ne grain over-time variationin urban movements.
In this direction, an interesting contribution may come from mobile phonenetwork data as a potential tool for the development of real-time monitoring,useful to describe urban dynamics as it has been tested in several experimen-tal studies Ratti et al. (2006); Ahas and Mark (2005); Gonzalez et al. (2008).The application researches focused on two di�erent products. Some studies dealwith aspects of representation of the data, emphasizing the aspects most directlyevocative, to highlight how these data may represent the "Mobile landscapes"Ratti et al. (2006). Other studies focus on data-mining analysis to building meth-ods for managing large amounts of data, and on the construction of instrumentscapable of deriving summary information and relevant data on cell-phone Ahasand Mark (2005). As opposed to the more traditional methods of urban surveys,the use of aggregated and anonymous mobile phone network data has shownpromise for large-scale surveys with notably smaller e�orts and costs Readeset al. (2007). If we consider the observed and aggregated telephone tra�c as theresult of individual behaviours and habits, we can treat mobile phone data as auseful source on the real use of the cities, capturing for example traces of tempo-rary populations, which are di�cult to intercept by traditional data sources, butwhich, at the same time, increasingly a�ect urban practices both quantitativelyand qualitatively.
An increasing number of studies concerns the exploitation of mobile phone
2
data in urban analysis and planning Becker et al. (2011). In particular an in-teresting issue regards the classi�cation of urban spaces according to their users'practices and behaviours Reades et al. (2007); Soto and Frías-Martínez (2011a).In Soto and Frías-Martínez (2011b) the authors outline the fact that city areasare generally not characterized by just one speci�c use, and for this reason theyintroduce the use of c-means, a fuzzy unsupervised clustering technique for landuse classi�cation, which returns for each area a certain grade of membership toeach class. In the same paper fuzziness is then abandoned to favour the identi�-cation of areas with a clearly de�ned use. We want to drive the reader's intuitionon the interesting point that di�erent �basic� pro�les of city usages can concurin the same place and that the overall observed usage of a certain place is thesuperimposition of layers of these basic pro�les.
In this article we experiment a novel geo-statistical unsupervised learningtechnique �nalized to identify useful information on hidden patterns of mobilephone use regarding di�erent usages of the city in time and in space which arerelated to individual mobility, outlining the potential of this technology in theurban planning community. The results return new maps of the region, eachdescribing the intensity of one of the identi�ed mobility pattern on the territory.
The territorial distribution of the intensity of these patterns allows us toreconstruct the density of use of urban spaces in di�erent temporal, and territorialscales as a precondition:
• to identify temporary populations and di�erent forms of mobility thatstructure the relationships in the contemporary city;
• to propose diversi�ed management policies and mobility services that cityusers require, increasing the e�ciency of the supply of public services.
2 Data
For the present research we had the opportunity to use the same data that feedsthe CityLive platform developed by Telecom Italia for the real time evaluationof urban dynamics based on the anonymous monitoring of mobile phone net-works. Telephone tra�c is anonimously recorded by each cell of the network asthe average number of concurrent contacts in a time unit. Telecom Italia elabo-rate then these measurements obtaining their distribution by means of weightedinterpolations, throughout a tessellation of the territory in squared areas (pixels).
In the Telecom Italia database, the metropolitan area of Milan is dividedinto a uniform grid (lattice) S0 of 97× 109 pixels. For each pixel, Telecom Italiamade available the average number of mobile phones simultaneously using thenetwork for calling, for every 15-minute time interval along a period of 14 days.This quantity is called Erlang and, to a �rst approximation, can be consideredproportional to the number of active people in that pixel at that time interval,hence providing information about people density and mobility. Technically theErlang Exj relevant to the pixel x ∈ S0 and to the jth quarter of an hour iscomputed as:
Exj =1
15ΣQq=1|T
qxj | , (1)
3
where T qxj indicates the time interval (or union of intervals) in which the qth
mobile phone is using the network for calling within pixel x and during thejth quarter of an hour. |T q
xj | indicates the length of T qxj expressed in minutes.
The number of potential phones using the network is indicated with Q. Eventhough the phone company uses equation (1) to compute Exj , the meaning ofthis quantity is better understood from its equivalent representation:
Exj =1
15
∫ 15j
15(j−1)Nx(t)dt . (2)
where Nx(t) indicates the number of mobile phones using the network within thepixel x at time t. Equation (2) shows that Exj is the temporal mean over thejth quarter of an hour of the number of mobile phones using the network withinpixel x.
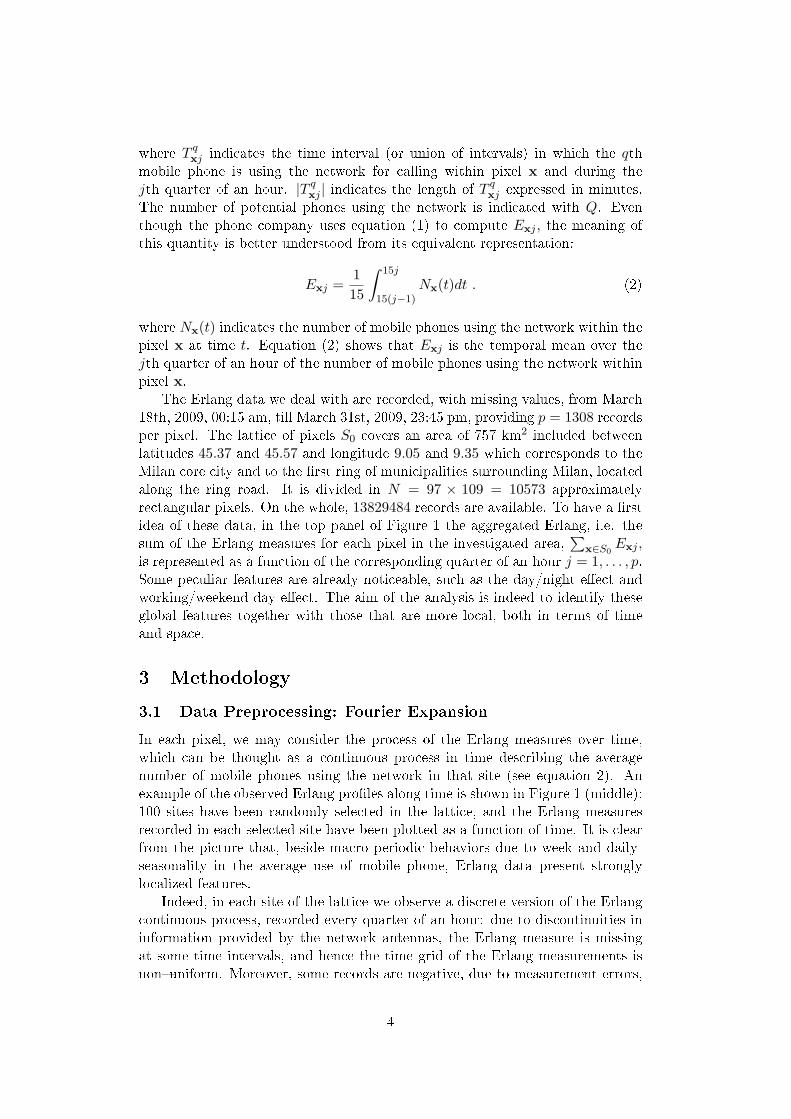
The Erlang data we deal with are recorded, with missing values, from March18th, 2009, 00:15 am, till March 31st, 2009, 23:45 pm, providing p = 1308 recordsper pixel. The lattice of pixels S0 covers an area of 757 km2 included betweenlatitudes 45.37 and 45.57 and longitude 9.05 and 9.35 which corresponds to theMilan core city and to the �rst ring of municipalities surrounding Milan, locatedalong the ring road. It is divided in N = 97 × 109 = 10573 approximatelyrectangular pixels. On the whole, 13829484 records are available. To have a �rstidea of these data, in the top panel of Figure 1 the aggregated Erlang, i.e. thesum of the Erlang measures for each pixel in the investigated area,
∑x∈S0
Exj ,is represented as a function of the corresponding quarter of an hour j = 1, . . . , p.Some peculiar features are already noticeable, such as the day/night e�ect andworking/weekend day e�ect. The aim of the analysis is indeed to identify theseglobal features together with those that are more local, both in terms of timeand space.
3 Methodology
3.1 Data Preprocessing: Fourier Expansion
In each pixel, we may consider the process of the Erlang measures over time,which can be thought as a continuous process in time describing the averagenumber of mobile phones using the network in that site (see equation 2). Anexample of the observed Erlang pro�les along time is shown in Figure 1 (middle):100 sites have been randomly selected in the lattice, and the Erlang measuresrecorded in each selected site have been plotted as a function of time. It is clearfrom the picture that, beside macro periodic behaviors due to week and daily-seasonality in the average use of mobile phone, Erlang data present stronglylocalized features.
Indeed, in each site of the lattice we observe a discrete version of the Erlangcontinuous process, recorded every quarter of an hour: due to discontinuities ininformation provided by the network antennas, the Erlang measure is missingat some time intervals, and hence the time grid of the Erlang measurements isnon�uniform. Moreover, some records are negative, due to measurement errors,
4
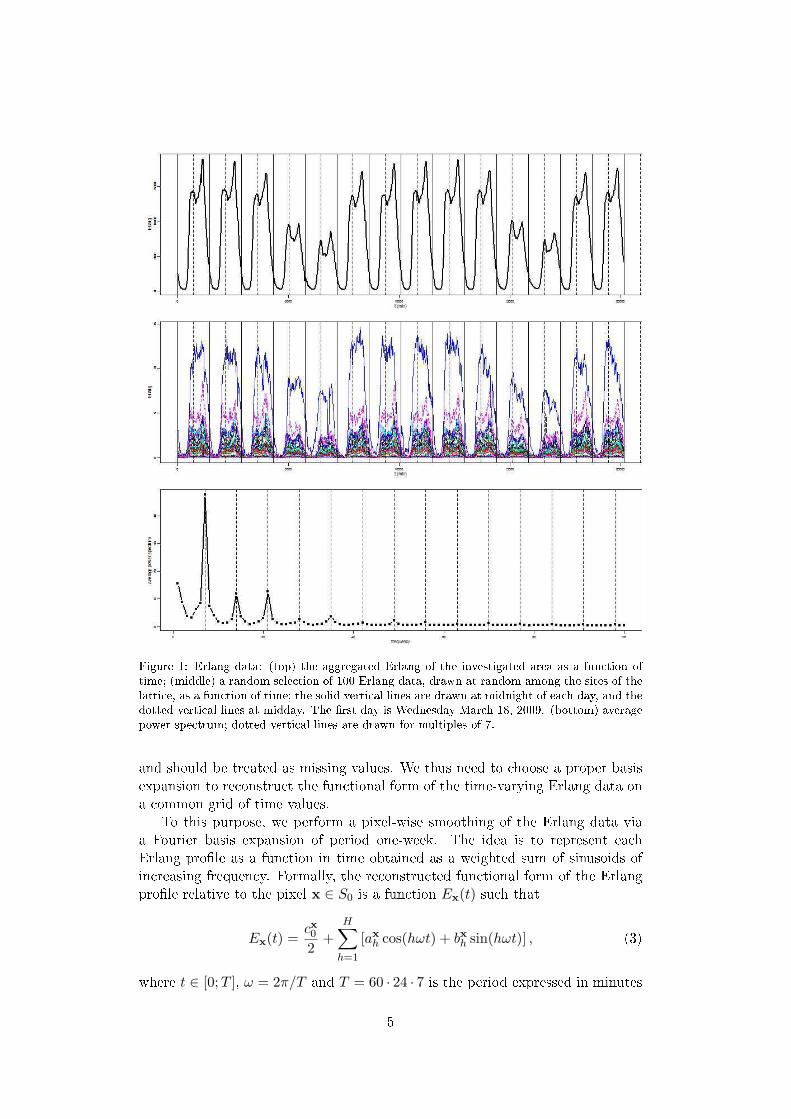
Figure 1: Erlang data: (top) the aggregated Erlang of the investigated area as a function oftime; (middle) a random selection of 100 Erlang data, drawn at random among the sites of thelattice, as a function of time; the solid vertical lines are drawn at midnight of each day, and thedotted vertical lines at midday. The �rst day is Wednesday March 18, 2009. (bottom) averagepower spectrum; dotted vertical lines are drawn for multiples of 7.
and should be treated as missing values. We thus need to choose a proper basisexpansion to reconstruct the functional form of the time-varying Erlang data ona common grid of time values.
To this purpose, we perform a pixel-wise smoothing of the Erlang data viaa Fourier basis expansion of period one-week. The idea is to represent eachErlang pro�le as a function in time obtained as a weighted sum of sinusoids ofincreasing frequency. Formally, the reconstructed functional form of the Erlangpro�le relative to the pixel x ∈ S0 is a function Ex(t) such that
Ex(t) =cx02
+H∑
h=1
[axh cos(hωt) + bxh sin(hωt)] , (3)
where t ∈ [0;T ], ω = 2π/T and T = 60 · 24 · 7 is the period expressed in minutes
5
with the coe�cients cx0 , ax
h and bxh estimated through ordinary least squares.In Figure 1 (bottom) the average power spectrum of the Telecom Italia
database is reported. This plot shows, for each frequency, the relevant aver-age contribution of the corresponding sinusoid to the Erlang pro�les observedwithin the investigated area. From a graphical inspection of the plot, it is clearthat the frequencies signi�cantly contributing to the Erlang time variation arethe smaller ones (all less than 7), capturing the di�erence among days or blocks ofdays (e.g., the working and weekend days variation), and the frequencies multipleof 7, capturing the recurring daily dynamics. Note that if only the frequenciesmultiple of 7 were present, the Erlang pro�les would be daily-periodic. For anextensive description of smoothing procedures for functional data we refer toRamsay and Silverman (2005).
3.2 Dimensional Reduction: Treelet Decomposition
Erlang measures can give insight on di�erent aspects of the urban area theyare referred to, and their analysis can be developed with various scopes: thesegmentation of the area into districts characterized by homogeneous telephonicpatterns; the identi�cation of a set of �reference signals� able to describe the dif-ferent patterns of utilization of the mobile phone network in time; the descriptionof the in�uence of each detected telephonic pattern in each site of the lattice.
In this work, we assume that a limited number of time�varying basis func-tions, common to the entire area under investigation, are su�cient to describepixel-by-pixel all the corresponding Erlang pro�les. Indeed we will interpret thebasis functions as describing the Erlang pro�le associated to a speci�c temporaldynamic related to a human activity. More formally, we assume the followingmodel for the generation of Erlang data
Ex(t) =K∑k=1
dxkψk(t) + ǫx(t), (4)
where {ψ1(t), . . . , ψK(t)} is the set of time�varying basis functions and dx1, . . . , dxKdescribe their contribution to the Erlang pro�le relative to the pixel x. Thequantity ǫx(t) represents an error term describing unstructured variability of theErlang data.
In the statistical literature, the process leading to the identi�cation of the�nite dimensional basis {ψ1(t), . . . , ψK(t)} and of the coe�cients dx1, . . . , dxKis known as dimensionality reduction. A very common procedure for dimensionreduction is Principal Component Analysis Ramsay and Silverman (2005). Inthis work we use a method known as treelet analysis introduced in Lee et al.(2008). Before describing the details, it is worth noticing that di�erently fromBecker et al. (2011) and Calabrese et al. (2011) where CDR data are analyzedand studied from a Lagrangian perspective (i.e, the atoms of the analysis areusers and the focus is in the identi�cation of a limited number of prototypicalusers associated to interpretable time-patterns), here Erlang data are analyzedand studied from an Eulerian perspective (i.e, the atoms of the analysis are pixelsand the focus is identifying a limited number of prototypical pixels associated tointerpretable time-patterns).
6
Treelets (i.e., the estimates of the basis functions ψ1(t), . . . , ψK(t)) have beenoriginally proposed as a surrogate of wavelets for dealing with unordered vari-ables. Nevertheless, we found them to be an e�ective dimension reduction tech-nique for Erlang pro�les and, more generally, for data with peculiar functionalfeatures, like spikes, periodicity, outliers.
Similarly to wavelets, the treelet decomposition has the property of followinga hierarchical structure interpretable in a multiscale framework. Di�erently fromwavelets, treelets are data-driven. More speci�cally, the treelet analysis generatesa sparse multiscale orthonormal set on functions iteratively detected throughnested pairwise Principal Component Analysis. See Lee et al. (2008) for furtherdetails.
Once the treelets ψ1(t), . . . , ψK(t) have been identi�ed, for each pixel x ∈S0 their respective contributions dx1, . . . , dxK to the Erlang pro�le Ex(t) areobtained by orthogonal projection.
3.3 Spatial Smoothing: Bagging Voronoi Tessellations
The contribution dxr of the r-th treelet ψr(t) to the local Erlang pro�le Ex(t) isexpected to vary smoothly in space because of the spatial dependence betweenErlang pro�les recorded in close sites which is induced by the arbitrary segmen-tation of the area and by the mobility of phone users. Thus an improved estimateof dxr for pixel x can be obtained by borrowing information from neighboringpixels. In an urban setting, the identi�cation of an optimal neighborhood systemis not a trivial issue because of the unisotropic and dishomogeneous nature ofthe urban matrix. Indeed, detecting close sites is more an aim of the analysisthan a starting point.
For this reason we decided to exploit spatial dependence in a fully non para-metric setting using a Bagging strategy based on Voronoi tessellations proposedin Secchi et al. (2012). We refer to this paper for a deeper understanding ofthe rationale behind the Bagging Voronoi Tessellation strategy, which is howevereasily described:
(i) we build a neighborhood system by randomly generating a Voronoi tessel-lation covering the entire area under study;
(ii) for each neighborhood (i.e. for each element of the tessellation) we exploitspatial dependence by computing the median of the values dxr relativeto the pixels x within the neighborhood. We attribute the value of thatmedian to each pixel x within the neighborhood;
(iii) we then repeat steps (i) and (ii) B times (known as bootstrap replicates).
At the end of the B bootstrap iterations, to each pixel x corresponds a sample ofB medians; this sample is summarized by its median d̂xr which provides an im-proved estimate of dxr, taking into account spatial dependence. By plotting, foreach pixel in the lattice S0, the value d̂xr we obtain a smooth surface describingthe variation in space of the contribution of the treelet ψr(t) to the local Erlangpro�les and thus identifying regions within the urban matrix that are similarwith respect to the human activity characterized by the treelet ψr(t).
7
On the whole, the entire methodology allows us to identify:
• a reference basis {ψ1(t), . . . , ψK(t)}, i.e the set of basis functions describingthe speci�c e�ects on the Erlang data of some human activities recordedin the area. In the top panels of Figures 2-7 a selection of the most easilyinterpretable treelets is reported;
• a set of maps, i.e. the set of spatially�varying functions {d̂1(x), . . . , d̂K(x)})showing pixel-by-pixel the contribution of each treelet to the local Erlangpro�le. In the top panels of Figures 2-7 the maps corresponding to thetreelets illustrated on top are reported.
4 Case study: experimenting Milan mobility patterns
4.1 Case study: Milan
In our work, urban planning expert knowledge showed the potential of thismethodology. We discuss in the present paragraph the speci�c case of the Milanurban region. We analyzed and mapped �hidden mobile phone use patterns�derived from the treelets analysis in order to verify the potential of this methodfor explaining spatial urban usage and mobility patterns.
Milan is an urban region which goes far beyond its administrative boundaries.The core city and the whole urban area have been a�ected in the last 20 yearsby relevant changes in their spatial structures and have generated new relation-ships between centre and suburbs. Daily mobility patterns are now even morecomplex than in the past when a hierarchical structures of cities was present andthe physical relationship between jobs and homes was the main reason of mo-bility. Now the commuter �ows describe only a minor part of the overall urbanmovements (about the 29 percent, excluding returning home). Daily mobilityis generated by many other reasons which are becoming increasingly relevant.These non-systematic �ows are related to individual habits and are the e�ects ofdiversi�ed and complex uses of the Milan urban region. For the intrinsic char-acteristics of this kind of mobility, it is di�cult to measure its dimension and itsintensity, in space and in time and systematic studies or sources which providethis information in Italy do not exist. Within the Milan urban region servicesand activities are distributed in a wide territory and there is a plurality of placeswith speci�c meanings for mobile populations. At the moment, the urban regionof Milan is a densely populated, integrated area where 4.000.000 inhabitants live,where there are 370.000 �rms, covered by huge �ows of people moving daily inthis wide area. Mapping overall mobility in space and in time therefore requiresnew data sources, able to adequately describe mobility patterns.
4.2 Testing the treelets
Among the dozens of treelets produced applying the methodology explained inthe previous section, we selected some results as signi�cant for explaining speci�cmobility and city usages patterns and tested their signi�cance and their inter-pretation from an urban analysis and planning perspective at the Milan scale.
8
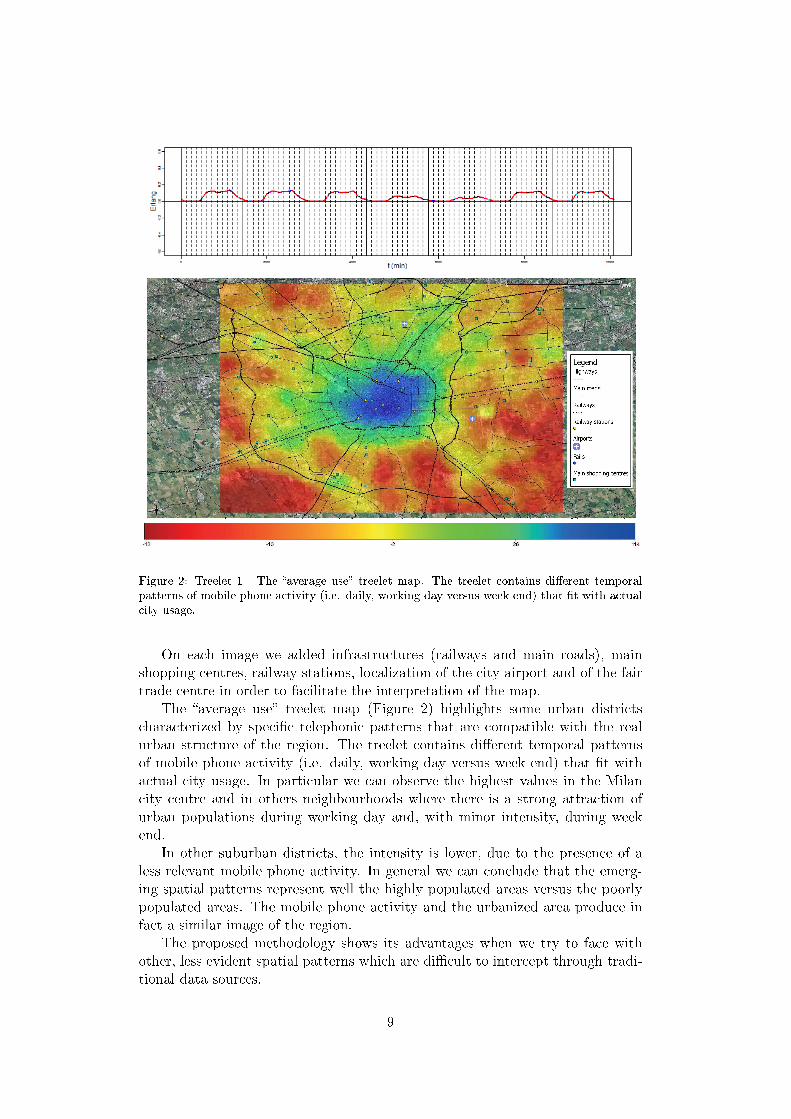
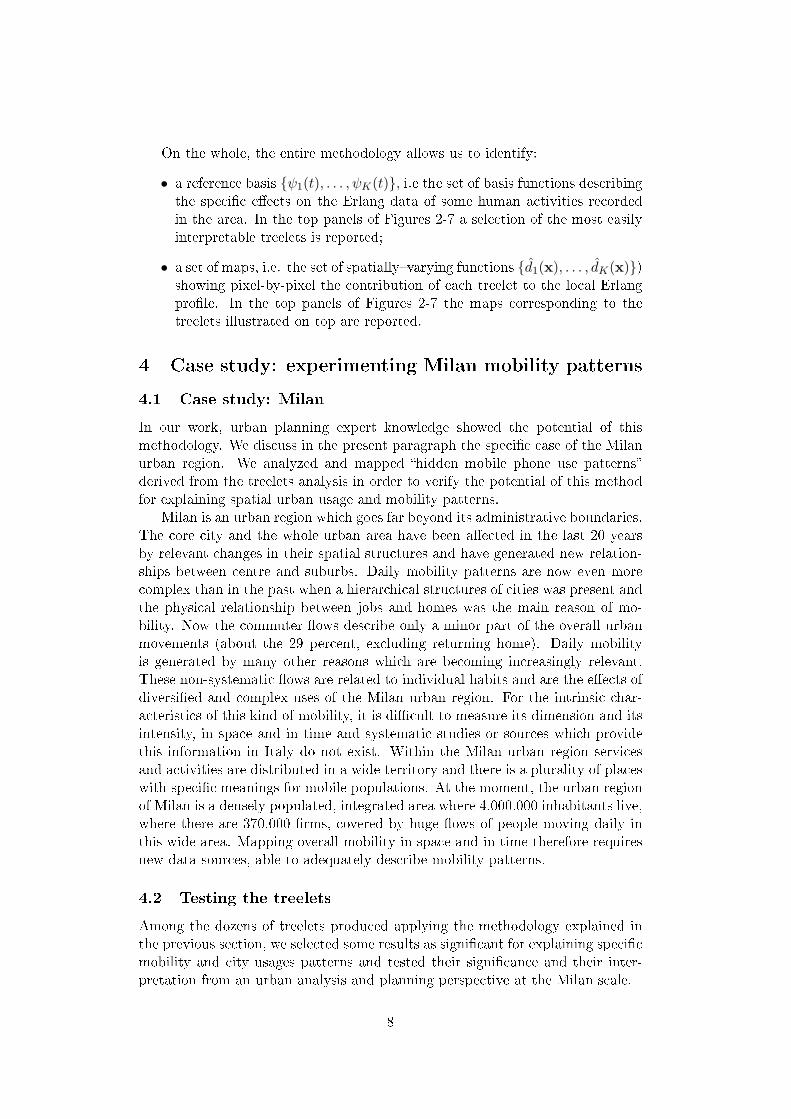
Figure 2: Treelet 1 - The �average use� treelet map. The treelet contains di�erent temporalpatterns of mobile phone activity (i.e. daily, working day versus week end) that �t with actualcity usage.
On each image we added infrastructures (railways and main roads), mainshopping centres, railway stations, localization of the city airport and of the fairtrade centre in order to facilitate the interpretation of the map.
The �average use� treelet map (Figure 2) highlights some urban districtscharacterized by speci�c telephonic patterns that are compatible with the realurban structure of the region. The treelet contains di�erent temporal patternsof mobile phone activity (i.e. daily, working day versus week end) that �t withactual city usage. In particular we can observe the highest values in the Milancity centre and in others neighbourhoods where there is a strong attraction ofurban populations during working day and, with minor intensity, during weekend.
In other suburban districts, the intensity is lower, due to the presence of aless relevant mobile phone activity. In general we can conclude that the emerg-ing spatial patterns represent well the highly populated areas versus the poorlypopulated areas. The mobile phone activity and the urbanized area produce infact a similar image of the region.
The proposed methodology shows its advantages when we try to face withother, less evident spatial patterns which are di�cult to intercept through tradi-tional data sources.
9

Figure 3: Treelet 2 - Nightly activity. Hot spots highlight the presence of night work: orga-nization of the International Milan Design Week Exhibition district (North-West); deliveringand distributing products in the Fruit and Vegetable Wholesale market (second circular ringof the city - South East); scarce nighly activity inside the city centre.
Figure 3 (Treelet 2) is about the density of mobile phone activity late at night(in particular from midnight until 8 am). We can observe here some interestinghot spots where the values are very high. For example, the exhibition district inthe Northern Western side of the map. In the considered period an importantFair (the 2009 International Milan Design Week) was held and the peak �ts wellwith the nightly activities necessary for the mounting and the organization ofthe site. Another point of interest is the Fruit and Vegetable Wholesale marketin the South Eastern part of the region where consistent night work happensfor delivering and distributing products that come from whole Italy and abroad.The city centre is characterized by a relative low value, according to the absenceof relevant nightly activity inside it.
Figure 4 (Treelet 33) puts in evidence some locations with high concentra-tion of mobile phone activity during the evening of the working days and duringdaytime (from 8 am until 8 pm) of the week end. It shows a signi�cant correspon-dence with main residential districts of the Milan urban region. It highlights arelevant concentration of homes along the second circular ring of the city, wherethe density of resident population reaches the highest value of Milan, but alsoin some municipalities with a residential pro�le and social housing in the south,
10
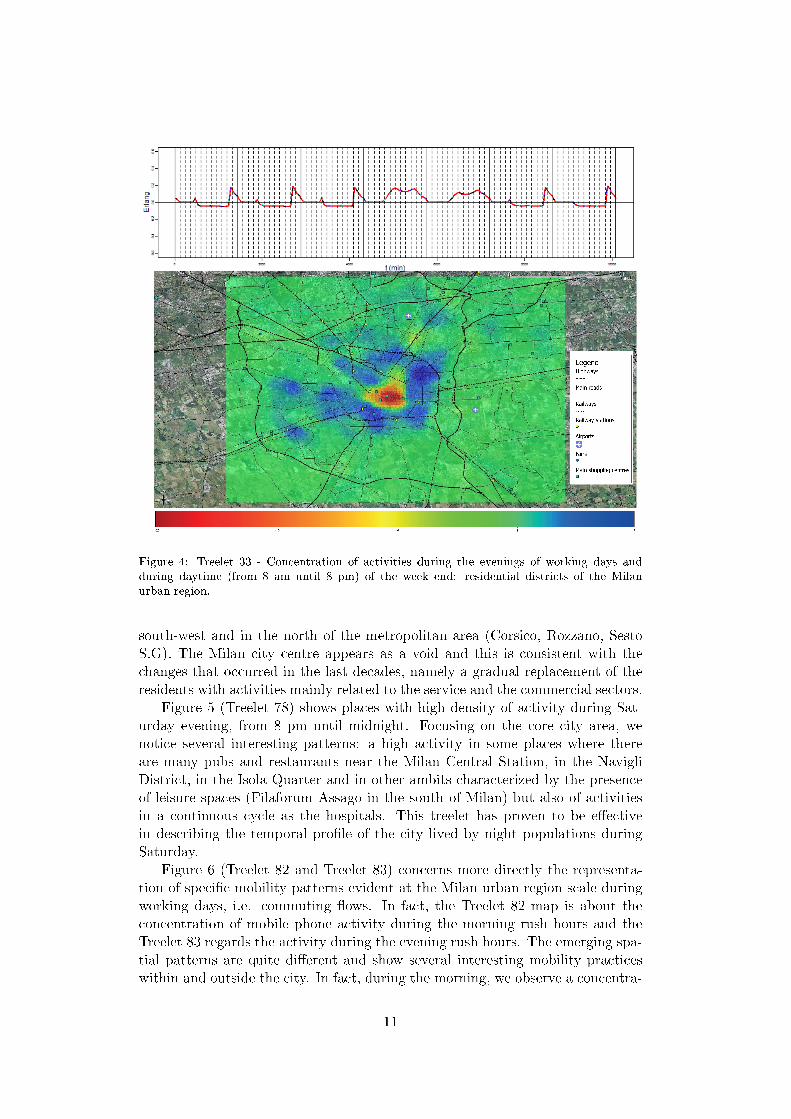
Figure 4: Treelet 33 - Concentration of activities during the evenings of working days andduring daytime (from 8 am until 8 pm) of the week end: residential districts of the Milanurban region.
south-west and in the north of the metropolitan area (Corsico, Rozzano, SestoS.G). The Milan city centre appears as a void and this is consistent with thechanges that occurred in the last decades, namely a gradual replacement of theresidents with activities mainly related to the service and the commercial sectors.
Figure 5 (Treelet 78) shows places with high density of activity during Sat-urday evening, from 8 pm until midnight. Focusing on the core city area, wenotice several interesting patterns: a high activity in some places where thereare many pubs and restaurants near the Milan Central Station, in the NavigliDistrict, in the Isola Quarter and in other ambits characterized by the presenceof leisure spaces (Filaforum Assago in the south of Milan) but also of activitiesin a continuous cycle as the hospitals. This treelet has proven to be e�ectivein describing the temporal pro�le of the city lived by night populations duringSaturday.
Figure 6 (Treelet 82 and Treelet 83) concerns more directly the representa-tion of speci�c mobility patterns evident at the Milan urban region scale duringworking days, i.e. commuting �ows. In fact, the Treelet 82 map is about theconcentration of mobile phone activity during the morning rush hours and theTreelet 83 regards the activity during the evening rush hours. The emerging spa-tial patterns are quite di�erent and show several interesting mobility practiceswithin and outside the city. In fact, during the morning, we observe a concentra-
11
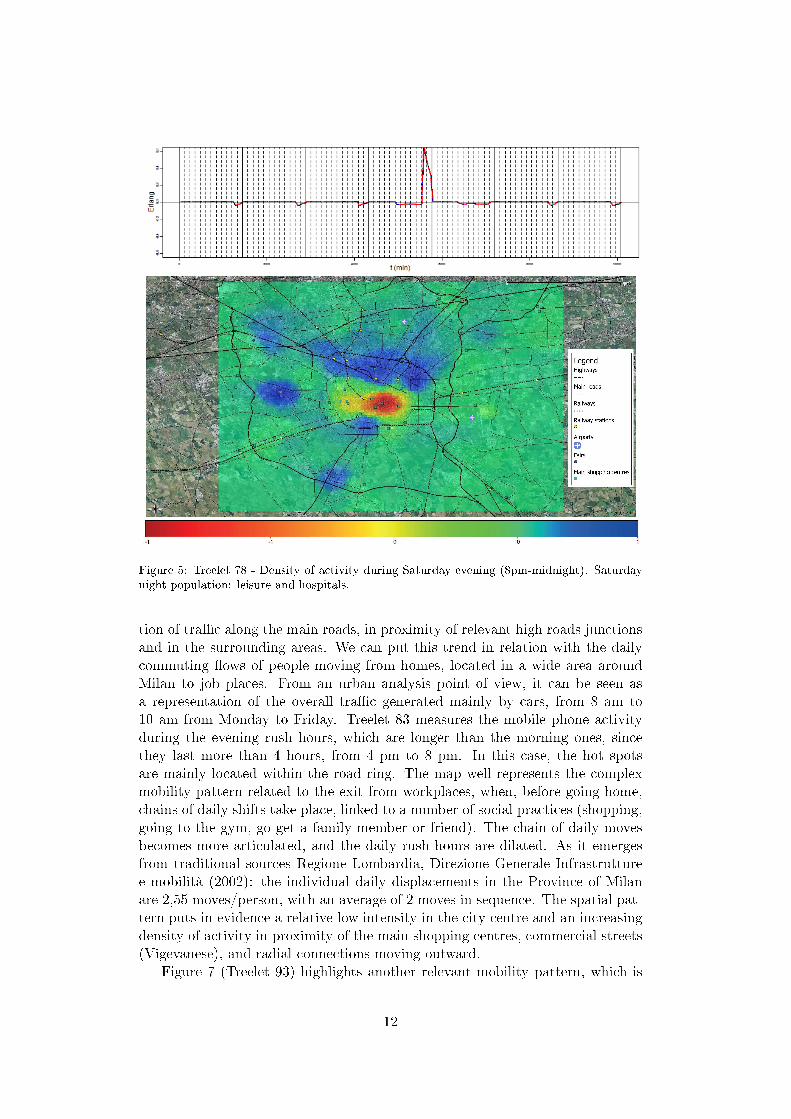
Figure 5: Treelet 78 - Density of activity during Saturday evening (8pm-midnight). Saturdaynight population: leisure and hospitals.
tion of tra�c along the main roads, in proximity of relevant high roads junctionsand in the surrounding areas. We can put this trend in relation with the dailycommuting �ows of people moving from homes, located in a wide area aroundMilan to job places. From an urban analysis point of view, it can be seen asa representation of the overall tra�c generated mainly by cars, from 8 am to10 am from Monday to Friday. Treelet 83 measures the mobile phone activityduring the evening rush hours, which are longer than the morning ones, sincethey last more than 4 hours, from 4 pm to 8 pm. In this case, the hot spotsare mainly located within the road ring. The map well represents the complexmobility pattern related to the exit from workplaces, when, before going home,chains of daily shifts take place, linked to a number of social practices (shopping,going to the gym, go get a family member or friend). The chain of daily movesbecomes more articulated, and the daily rush hours are dilated. As it emergesfrom traditional sources Regione Lombardia, Direzione Generale Infrastrutturee mobilità (2002): the individual daily displacements in the Province of Milanare 2,55 moves/person, with an average of 2 moves in sequence. The spatial pat-tern puts in evidence a relative low intensity in the city centre and an increasingdensity of activity in proximity of the main shopping centres, commercial streets(Vigevanese), and radial connections moving outward.
Figure 7 (Treelet 93) highlights another relevant mobility pattern, which is
12
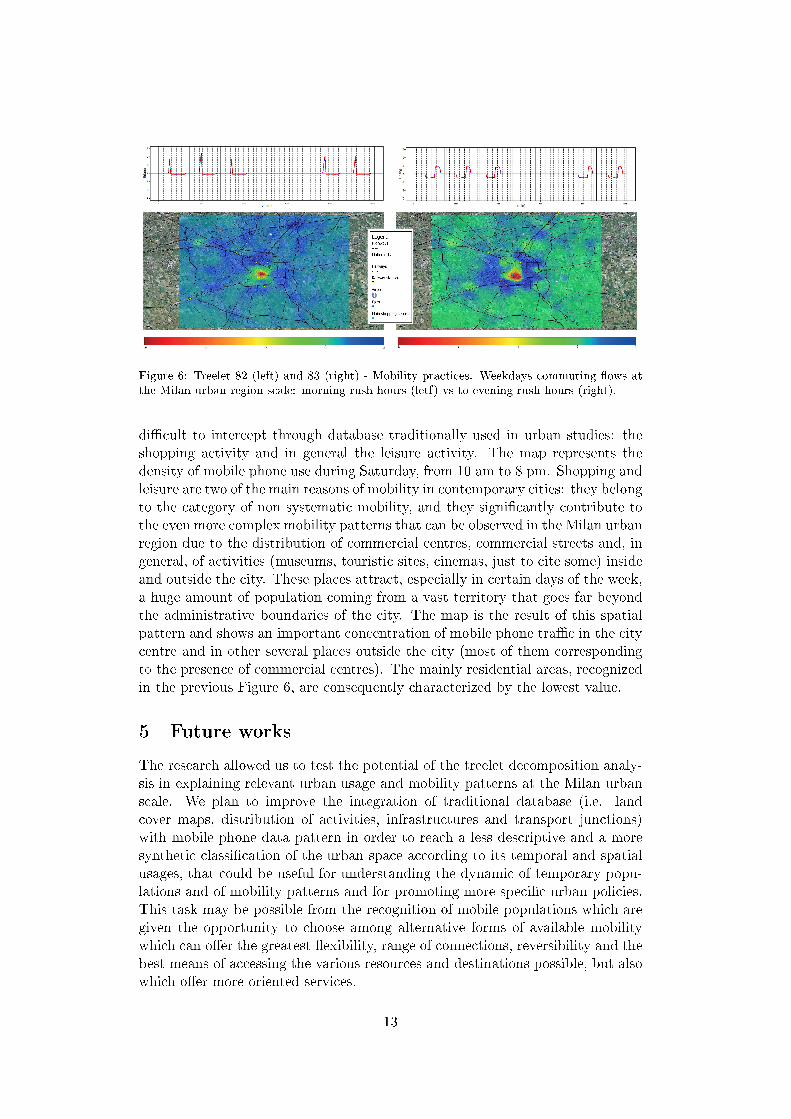
Figure 6: Treelet 82 (left) and 83 (right) - Mobility practices. Weekdays commuting �ows atthe Milan urban region scale: morning rush hours (letf) vs to evening rush hours (right).
di�cult to intercept through database traditionally used in urban studies: theshopping activity and in general the leisure activity. The map represents thedensity of mobile phone use during Saturday, from 10 am to 8 pm. Shopping andleisure are two of the main reasons of mobility in contemporary cities: they belongto the category of non systematic mobility, and they signi�cantly contribute tothe even more complex mobility patterns that can be observed in the Milan urbanregion due to the distribution of commercial centres, commercial streets and, ingeneral, of activities (museums, touristic sites, cinemas, just to cite some) insideand outside the city. These places attract, especially in certain days of the week,a huge amount of population coming from a vast territory that goes far beyondthe administrative boundaries of the city. The map is the result of this spatialpattern and shows an important concentration of mobile phone tra�c in the citycentre and in other several places outside the city (most of them correspondingto the presence of commercial centres). The mainly residential areas, recognizedin the previous Figure 6, are consequently characterized by the lowest value.
5 Future works
The research allowed us to test the potential of the treelet decomposition analy-sis in explaining relevant urban usage and mobility patterns at the Milan urbanscale. We plan to improve the integration of traditional database (i.e. landcover maps, distribution of activities, infrastructures and transport junctions)with mobile phone data pattern in order to reach a less descriptive and a moresynthetic classi�cation of the urban space according to its temporal and spatialusages, that could be useful for understanding the dynamic of temporary popu-lations and of mobility patterns and for promoting more speci�c urban policies.This task may be possible from the recognition of mobile populations which aregiven the opportunity to choose among alternative forms of available mobilitywhich can o�er the greatest �exibility, range of connections, reversibility and thebest means of accessing the various resources and destinations possible, but alsowhich o�er more oriented services.
13

Figure 7: Treelet 93 - Mobility practices. Saturday (10am- 8pm), shopping and leisure activity.
Acknowledgment
The authors would like to acknowledge Piero Lovisolo, Dario Parata and Mas-simo Colonna, Tilab - Telecom Italia for their collaboration during the researchproject. This work was supported by Telecom Italia. We also thank Paolo Dildafor helping us in the preparation of the �gures.
References
Ahas, R. and Mark, Ü. (2005), �Location based services�new challenges for plan-ning and public administration?� Futures, 37, 547�561.
Becker, R. A., Caceres, R., Hanson, K., Loh, J. M., Urbanek, S., Varshavsky, A.,and Volinsky, C. (2011), �A Tale of One City: Using Cellular Network Datafor Urban Planning,� IEEE - Pervasive Computing, 10, 18�26.
Calabrese, F., Lorenzo, G. D., Liu, L., and Ratti, C. (2011), �Estimating Origin-Destination Flows Using Mobile Phone Location Data,� IEEE - Pervasive
Computing, 10, 36�44.
Gonzalez, M. C., Hidalgo, C. A., and Barabasi, A.-L. (2008), �Understanding
14

individual human mobility patterns,� Nature, 453, 779�782, m3: 10.1038/na-ture06958; 10.1038/nature06958.
Kaufmann, V. (2002), Re-thinking mobility contemporary sociology, Ashgate.
Lee, A. B., Nadler, B., and Wasserman, L. (2008), �Treelets � An adaptive multi-scale basis for sparse unordered data,� The Annals of Applied Statistics, 2,435�471.
Nuvolati, G. (2003), �Resident and Non-resident Populations: Quality of Life,Mobility and Time Policy,� The journal of regional analysis & policy, 33(2),67 �83.
Ramsay, J. O. and Silverman, B. W. (2005), Functional Data Analysis, Springer.
Ratti, C., Pulselli, R. M., Williams, S., and Frenchman, D. (2006), �Mobile Land-scapes: using location data from cell phones for urban analysis,� Environmentand Planning B: Planning and Design, 33, 727�748.
Reades, J., Calabrese, F., Sevtsuk, A., and Ratti, C. (2007), �Cellular Census:Explorations in Urban Data Collection,� IEEE Pervasive Computing, 6, 30�38.
Regione Lombardia, Direzione Generale Infrastrutture e mobilità (2002),�Indagine Origine/Destinazione regionale 2002 - sintesi,� Tech. rep., RegioneLombardia.
Secchi, P., Vantini, S., and Vitelli, V. (2012), �Bagging Voronoi classi�ers forclustering spatial functional data,� International Journal of Applied Earth Ob-servations and Geoinformation, doi: 10.1016/j.jag.2012.03.006.
Sheller, M. and Urry, J. (2006), �The new mobilities paradigm,� Environment
and Planning A, 38, 207�226.
Soto, V. and Frías-Martínez, E. (2011a), �Automated land use identi�cation usingcell-phone records,� in Proceedings of the 3rd ACM international workshop on
MobiArch, ACM, pp. 17�22.
� (2011b), �Robust Land Use Characterization of Urban Landscapes using CellPhone Data,� The First Workshop on Pervasive Urban Applications (PURBA).
15
MOX Technical Reports, last issuesDipartimento di Matematica “F. Brioschi”,
Politecnico di Milano, Via Bonardi 9 - 20133 Milano (Italy)
23/2012 Fabio Nobile, Christian Vergara
Partitioned algorithms for fluid-structure interaction problems in haemo-
dynamics
25/2012 Manfredini, F.; Pucci, P.; Secchi, P.; Tagliolato, P.; Van-
tini, S.; Vitelli, V.
Treelet decomposition of mobile phone data for deriving city usage and
mobility pattern in the Milan urban region
24/2012 Antonietti, P.F.; Giani, S.; Houston, P.
hpVersion Composite Discontinuous Galerkin Methods for Elliptic Prob-
lems on Complicated Domains
22/2012 Ettinger, B.; Passerini, T.;Perotto, S.; Sangalli, L.M.
Regression models for data distributed over non-planar domains
21/2012 Guglielmi, A.; Ieva, F.; Paganoni, A.M.; Ruggeri, F.; Sori-
ano, J.
Semiparametric Bayesian models for clustering and classification in
presence of unbalanced in-hospital survival
20/2012 Ieva, F.; Paganoni, A. M.; Zanini, P.
Statistical models for detecting Atrial Fibrillation events
19/2012 Faggiano, E.; Antiga, L.; Puppini, G.; Quarteroni, A.; Lu-
ciani G.B.; Vergara, C.
Helical Flows and Asymmetry of Blood Jet in Dilated Ascending Aorta
with Normally Functioning Bicuspid Valve
18/2012 Formaggia, L.; Vergara, C.
Prescription of general defective boundary conditions in fluid-dynamics
17/2012 Manzoni, A.; Quarteroni, A.; Gianluigi Rozza, G.
Computational reduction for parametrized PDEs: strategies and appli-
cations
16/2012 Cutri’, E.; Zunino, P.; Morlacchi, S.; Chiastra, C.; Migli-
avacca, F.
Drug delivery patterns for different stenting techniques in coronary bi-
furcations: a comparative computational study


