Embed Size (px)
Citation preview
This is an Open Access article distributed under the terms of the Creative Commons Attribution License (http://creativecommons.org/licenses/by/4.0/), which permits unre-stricted use, distribution, and reproduction in any medium, provided the original author and source are credited.
Copyright © 2022 The Author(s). Published by Vilnius Gediminas Technical University
*Corresponding author. E-mail: [email protected]
Business: Theory and Practice ISSN 1648-0627 / eISSN 1822-4202
2022 Volume 23 Issue 1: 14–25
https://doi.org/10.3846/btp.2022.13687
their targeted consumer segments. Lifestyle-based seg-mentation provides advantages of identifying consumer tendencies, values, attitudes, and behavior (Yeo et al., 2020).
An interesting outline for this research problem is smartphone purchasing decisions. A smartphone is a life-style-laden product (Hamka et al., 2014) because it offers a set of integrated features such as text and voice devices, video, game, and internet for various functions including communication, social network, multimedia entertain-ment, mobile commerce, and more (Hamka et al., 2014). Furthermore, there are more than 100 million smartphone users, which makes Indonesia the 4th largest in the world (Rahmayani, 2015). In general, 80% of the global popu-lation, both in developed and developing countries, own mobile phones (Saprikis et al., 2018).
The Digital Industry Association for Australia devel-oped a mobile phone use index that was closely associ-ated with consumer lifestyle profiles (Mackay & Weidlich, 2013). These profiles include smartphone ownership, us-age, the type of service provider, advertising, and market-ing. Furthermore, Kim and Park (2014) extended previous studies by associating lifestyle factor with mobile phones
LIFESTYLE SEGMENTATION: MOBILE PHONE PURCHASE VIS-À-VIS CONSUMPTION DECISION
Albert Kriestian Novi Adhi NUGRAHA *, Yunita Budi Rahayu SILINTOWE , Eristia Lidia PARAMITA
Department of Management, Faculty of Economics and Business, Universitas Kristen Satya Wacana, Salatiga, Indonesia
Received 7 October 2020; accepted 19 August 2021
Abstract. Prior studies intensively rely on lifestyle segmentation to investigate the patterns of purchase and consumption decisions. However, the literature does not specifically relate lifestyle profiles with the types of consumer decisions (i.e., purchasing vs. consumption decisions). Therefore, this research analyzed the issue by surveying 626 residents of Salatiga city, Indonesia, as the participants through self-administered questionnaires. By analyzing the data with factor, cluster, and chi-square analysis, this paper demonstrated that purchase decisions (i.e., the choice of brand name and country of origin) are not associated with lifestyle segments, while consumption decisions differ among the segments. Meanwhile, lifestyle is more likely associated with enduring (i.e., consumption decisions) than occasional behaviors (i.e., purchase decisions) such as the purchase of a mobile phone and its related services.
Keywords: lifestyle profile, factor analysis, cluster analysis, brand name, country of origin.
JEL Classification: M31.
Introduction
Marketing has shifted from mass marketing to prod-uct-based marketing to consumer target-based market-ing (James et al., 2017). The latter assumes the need for market segmentation by utilizing some variables such as geographic, demographic, behavioral, and lifestyle ones (James et al., 2017). Prior studies used lifestyle to inves-tigate consumer behavior in various purchasing settings such as food (Nie & Zepeda, 2011; Witzling & Shaw, 2019), fashion (Li et al., 2012), and refrigerator (Krishnan, 2011). Besides, the literature also extends the analysis to service-related consumer behavior, such as banks (Sangle & Awasthi, 2011), electric suppliers (Sanquist et al., 2012), and tourism providers (Mahika, 2011).
Applying lifestyle as the basis for consumer segmenta-tion is motivated by the argument that marketers need to better understand their customers before designing marketing strategies (Assael, 2005). Also, previous studies have shown that consumers with different lifestyles exhibit varying behaviors (Krishnan, 2011). Consequently, mar-keters need to segment the market (Sharma et al., 2020) and differentiate their strategies and tactics according to
Business: Theory and Practice, 2022, 23(1): 14–25 15
purchasing and usage behaviors for early adopters. There-fore, this study aimed to extend previous research, par-ticularly Kim and Park (2014). This was achieved by fo-cusing on the association between lifestyles and purchase decisions of mobile phones (i.e., brand name and country of origin), their associated services (i.e., mobile service provider), and consumption decision (i.e., mobile phone use).
Brand name is a sign of offers and represents consum-ers’ expectations of product quality and risk (Zenker & Braun, 2017). Similarly, country of origin (COO) enables consumers to summarize their beliefs about a particular product attributes or to develop a halo effect to infer the quality (Knight & Calantone, 2000). Furthermore, brand name reflects the way consumers express their lifestyle (Çifci et al., 2016), and COO influences their evaluation through their opinions towards a country associated with a certain product (Shepard, 2016). For instance, consum-ers previously perceived Chinese products to be inferior (Volodzko, 2015). However, these products, such as mo-bile phones, have improved their quality dramatically (Shepard, 2016) and begun to dominate the Indonesian phone market (Yusuf, 2017).
Besides purchase decisions, marketers also use life-style-based segmentation to understand consumption pat-terns. In this regard, segmentation has been analyzed in various contexts both for goods (Candan & Kapucu, 2018) and services (George-Ufot et al., 2017). However, previ-ous studies rarely compared the ability of lifestyle factors to explain the differences in both types of consumer be-havior, particularly in their product choices (i.e., brand choice) and their usage behaviour. This situation motivates the current study to fill the gap in the existing literature by empirically demonstrating the roles of lifestyle variables in segmenting both consumer actions. Hence, the objective of the article is to test the relevance of lifestyles in distin-guishing market segments in the context of purchase deci-sions of mobile phones and associated services and mobile phone usage behaviour. Purchase and consumption are two important consumer actions for marketers because purchase generates revenue streams while consumption experience influences consumer satisfaction, leading to brand loyalty (Assael, 2005). The choice of mobile phone product is based on its position as a lifestyle product (Candan & Kapucu, 2018), making it omnipresent.
Furthermore, the following questions were asked: “does lifestyle-based segmentation distinguish purchase and consumption decisions of mobile phones?” The ef-fectiveness of lifestyle-based segmentation determines marketers’ use of such profiles for customizing product offers to their customers. After completing data collection and analysis using a set of quantitative tools, the findings addressed the research question and hypotheses. This was followed by the discussion, the conclusion which offers theoretical and managerial implications, as well as sugges-tions for future research.
1. Theoretical framework
1.1. Lifestyle and its typology
Lifestyle is defined as “a mixture of habits, conventional ways of doing things, and reasoned behavior” (Nie & Ze-peda, 2011). In the psychological and sociological term, it refers to the way one exhibits unique characteristics in interacting with others that translate into lifestyle (Yu, 2015). Lifestyle is often used together with other terms such as “the way, quality and standard of living,” “patterns of behavior,” “values,” and “attitudes,” and even those terms are sometimes used interchangeably (Niezgoda & Kowalska, 2020). Lifestyle is influenced by both internal factors such as demographics, beliefs, attitudes, past ex-periences, and personalities, as well as external factors such as social, cultural, and material (Candan & Kapucu, 2018). Lifestyle is among the useful variables in market segmentation, considering that individuals with similar-socio-demographic profiles may express different behav-iours (Díaz et al., 2018). Therefore, given the characteris-tic uniqueness, marketers need to appreciate lifestyle as a basis for consumer segmentation and utilize it to design strategic marketing planning for their products (Hassan et al., 2015).
Two popular measurements of lifestyle are the activi-ties, interests, opinions (AIO) introduced by Wells and Tigert in the early 1970s, and the value, attitude, and life-styles (VALS) introduced by Mitchell in the early 1980s that focus on US population (Yu, 2015). The AIO trans-lates consumers’ lifestyle into their activities (i.e., what they do, what they buy, and how they spend time), in-terests (i.e., preferences and priority), and opinions (how they view some issues in local, domestic, and global set-tings) (M. Kim & C. Kim, 2020). Meanwhile, the VALS instrument covers sociodemographic profiles, personal life, which includes habits and activities, as well as per-ceived values which include attitudes, beliefs, hopes, prejudices, and demands (Yu, 2011). Besides the AIO and VALS lifestyle typologies, there are also others such as the Sinus-Milieu Model that divides subjects into ten groups or commonly labeled as milieus (Ernst & Briegel, 2017), and the Euro-Socio-Styles typology that is developed in the context of European societies and divides the subjects into eight groups (Franzen & Moriarty, 2009).
1.2. Lifestyle and purchasing behaviors
Previous studies related lifestyle measurement to consum-er behavior (i.e., purchase and consumption behavior). For example, Kim and Park (2014) identified the mobile phone purchase and use behaviors of early adopters. In particular, they focused on the evaluation of predictive factors of purchase decisions. Similarly, other studies evaluated the role of lifestyle in explaining the adoption of mobile TV (Leung & Chen, 2017), the purchase of refrig-erator (Krishnan, 2011), food (Jang, 2017), and fashion in multi-brand stores (Choi & Park, 2018). With its dynamic nature, brand helps consumers express themselves and
16 A. K. N. A. Nugraha et al. Lifestyle segmentation: mobile phone purchase vis-à-vis consumption decision
their personal lifestyle (Adina et al., 2015). Meanwhile, consumers in emerging markets are constantly transform-ing their lifestyle, especially in the immerse exposure of materialism and consumerism (Siahtiri & Lee, 2019). In this respect, the degree of brand sustainability, as meas-ured by repeat purchases, depends on the ability to sat-isfy consumers’ needs in achieving a particular lifestyle (Nam et al., 2011). Interestingly, few studies investigated the relationship between lifestyle and the choice of mobile phone brands, especially in the Indonesian setting. Also, mobile phone use has been a lifestyle in the country be-cause many people spend more time using it than those from other countries (Amin, 2014).
Besides brand name, country of origin (COO) likely helps one infer quality (Adina et al., 2015). The COO re-fers to the country in which a particular product is made (Zeugner-Roth & Žabkar, 2015). This arguably affects con-sumers choice (Fischer & Zeugner-Roth, 2017), especial-ly when the brands country of origin fits in the product category association (Adina et al., 2015). Meanwhile, the international marketing literature has focused on COO and its impact on consumer behavior (Andéhn et al., 2016), especially when producers primarily rely on export markets in selling their products. For instance, Chinese manufacturers continuously improve their product qual-ity, which enhances acceptance from both domestic and international consumers (Shepard, 2016).
In relation to lifestyle, COO is directly associated with its dimensions, particularly opinions and values. For in-stance, consumer ethnocentrism affects the preference for domestic and foreign brands (Harcar & Kaynak, 2015). This ethnocentrism refers to the biased preference for do-mestic products than for foreign (Balabanis & Siamagka, 2017) because of the normative belief that purchasing or consuming foreign products will harm the domestic econ-omy, reduce job opportunities for local people, and even unpatriotic (Fernández-Ferrín et al., 2018). Similar to ethnocentrism, consumer animosity is the reluctance to-wards foreign products due to lingering antipathy or anger towards past or ongoing political, military, economic, or diplomatic events (Klein et al., 1998). In contrast, consum-ers may also have positive feelings towards specific coun-tries that they have direct personal experiences or nor-mative exposures (Asseraf & Shoham, 2017). Meanwhile, those from developing regions likely prefer products from developed countries because they consider these products to have higher qualities and more positive symbolic and emotional benefits (Zeugner-Roth & Žabkar, 2015). Given these examples, COO potentially creates either positive or negative consumer evaluations that depend on the product category and the specific countries (Asseraf & Shoham, 2017). Therefore, COO is likely associated with the par-ticular expressions of lifestyle (i.e., opinions and values).
Based on the previous studies on the role of lifestyle-based segmentation in distinguishing consumer purchase decision, the first research hypothesis was proposed as follows:
H1: Lifestyle-based segmentation distinguishes mobile phone purchase decisions.
1.3. Lifestyle and consumption behaviors
Lifestyle has also been used to profile consumers based on their consumption behaviors (James et al., 2017). Previ-ous studies examined the effectiveness of lifestyle-based segmentation in distinguishing consumption behaviors for various products, such as sustainable food (Thøgersen, 2017), smartphone (Candan & Kapucu, 2018), and in-dustries’ electric (George-Ufot et al., 2017). Interestingly, many studies focused on the relationship between lifestyle and food consumption patterns (Barrett et al., 2017; Rob-erts et al., 2018; Viljoen et al., 2018), although lifestyle is also used for other products, such as mobile phones (i.e., smartphones) (Candan & Kapucu, 2018).
Currently, mobile phones, widely known as smart-phones, offer various applications to their users (M.-J. Kim & Park, 2014). The features that evolve along with the in-creased technology convergence enable the users to have access to broader services such as social media, informa-tion, multimedia entertainment, mobile commerce, and others (Hamka et al., 2014). Consequently, current mo-bile phones enable their users to participate in various activities and express their opinions by using only a sin-gle device regardless of their location. This phenomenon has drawn “scholars” attention to investigate how smart-phone as an alternative platform facilitate users to carry out their daily activities such as shopping (Wang et al., 2015), banking (Yu, 2015), watching Tv (Leung & Chen, 2017), listening to music (Sinclair & Tinson, 2017), gam-ing (Balakrishnan & Griffiths, 2018), and other activities. These examples indicate that such activities, interests, and opinions express consumers’ lifestyles. Therefore, the AIO elements are likely appropriate to evaluate the conformity between lifestyle and consumer behavior (i.e., mobile pur-chase and consumption decision). Moreover, Yu (2011) incorporated the use of AIO elements with values as a critical element of the VALS to develop e-lifestyle meas-urements.
Based on the argument that lifestyle-based segmenta-tion likely differentiates consumption decisions, the sec-ond research hypothesis was formulated as follows:
H2: Lifestyle-based segmentation distinguishes mobile phone consumption decisions.
2. Methodology
2.1. Data collection
The current study used a quantitative approach to ex-plain and generalize the patterns of mobile purchase and consumption behavior based on lifestyle segmentation. The primary data were collected through a survey that required the respondents to fill in the self-administered questionnaires. The questionnaires consisted of several question types, ranging from sociodemographic profiles
Business: Theory and Practice, 2022, 23(1): 14–25 17
(age, gender, and employment), purchase decision, us-age behaviour, and lifestyle measurement. In this respect, the current study modified Kim and Park (2014) and Van Huy et al. (2019) to fit its purposes better. Specifi-cally, purchase decision was measured by brand choice (Uddin et al., 2014), and usage behaviour was operation-alized by extending Kim and Park (2014). Furthermore, the study borrowed and modified the lifestyle measure-ment that had been used in a previous study (Jadczaková, 2010). From the 80 initial items that measured lifestyle, the following modification was made. Firstly, 17 question items that were previously associated with a fashion prod-uct purchasing or consumption decisions were modified to fit the context of mobile phone. Secondly, two ques-tion items that were initially related to country of origin were adjusted with the Indonesian context. Thirdly, the double-barreled questions were broken down (see Appen-dix A). This study used the lifestyle measurement of Jad-czaková that was developed from the Euro-Socio-Styles, VALS, Sinus Milieus, dan Experience-Milieus typologies (Jadczaková, 2010). Also, the lifestyle questions used a 5-point Likert scale that ranges from “strongly disagree” to “strongly agree”. Furthermore, the questions related to the purchasing and use of mobile phones were expressed by the responses that were measured with the nominal or categorical indicator (yes or no).
The survey period was between May–July 2018. The population for the current study was the residents of Sa-latiga City in Indonesia. The sample was selected using the non-probability sampling method and the purposive sampling technique based on the eligibility criteria (i.e., respondents should have mobile phone purchase and consumption experience). The survey initially drew 740 respondents. After addressing missing data and normality issues, the SPSS statistical software was used to analyze only 626 respondents. The final sample remained within the required sample size for factor analysis, ranging from
three to twenty times the number of variables (i.e., 80 initial items) and absolute ranges from 100 to over 1,000 (Mundfrom et al., 2005). Subsequently, a Chi-square test was used to determine whether the sample proportion is indifferent from the population proportion. The Chi-square statistic is not significant at the 1% significance level, indicating that the sample proportion does not dif-fer from the population proportion (χ2 = 8.330, and p = 0.040).
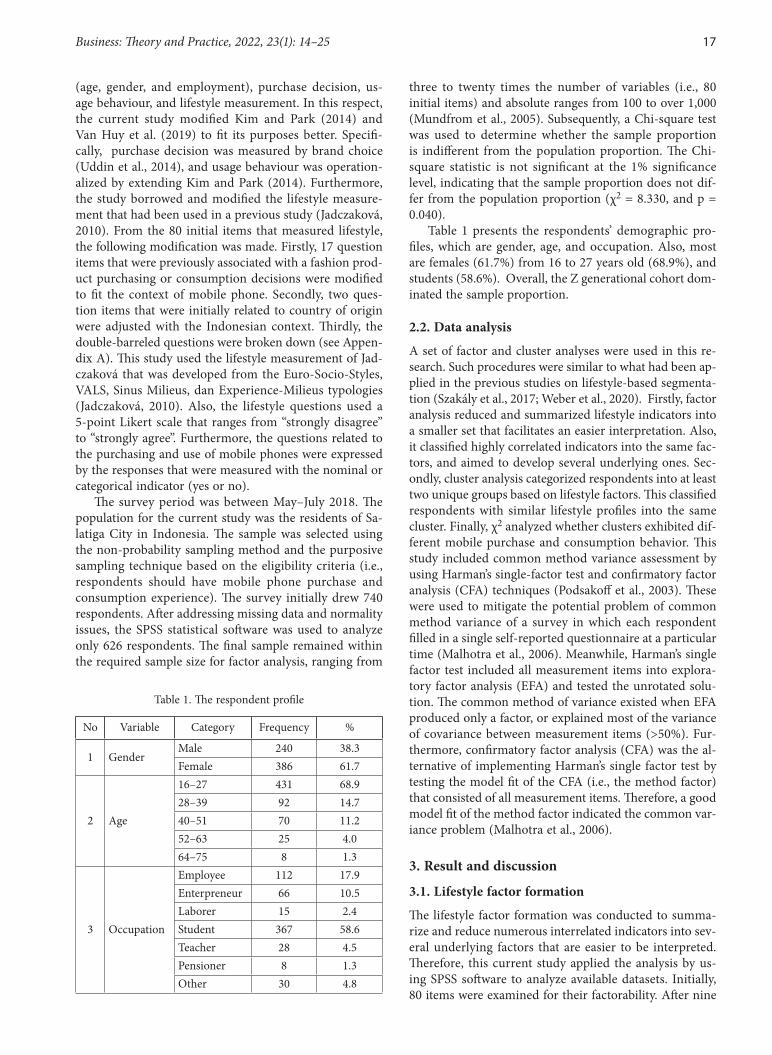
Table 1 presents the respondents’ demographic pro-files, which are gender, age, and occupation. Also, most are females (61.7%) from 16 to 27 years old (68.9%), and students (58.6%). Overall, the Z generational cohort dom-inated the sample proportion.
2.2. Data analysis
A set of factor and cluster analyses were used in this re-search. Such procedures were similar to what had been ap-plied in the previous studies on lifestyle-based segmenta-tion (Szakály et al., 2017; Weber et al., 2020). Firstly, factor analysis reduced and summarized lifestyle indicators into a smaller set that facilitates an easier interpretation. Also, it classified highly correlated indicators into the same fac-tors, and aimed to develop several underlying ones. Sec-ondly, cluster analysis categorized respondents into at least two unique groups based on lifestyle factors. This classified respondents with similar lifestyle profiles into the same cluster. Finally, χ2 analyzed whether clusters exhibited dif-ferent mobile purchase and consumption behavior. This study included common method variance assessment by using Harman’s single-factor test and confirmatory factor analysis (CFA) techniques (Podsakoff et al., 2003). These were used to mitigate the potential problem of common method variance of a survey in which each respondent filled in a single self-reported questionnaire at a particular time (Malhotra et al., 2006). Meanwhile, Harman’s single factor test included all measurement items into explora-tory factor analysis (EFA) and tested the unrotated solu-tion. The common method of variance existed when EFA produced only a factor, or explained most of the variance of covariance between measurement items (>50%). Fur-thermore, confirmatory factor analysis (CFA) was the al-ternative of implementing Harman’s single factor test by testing the model fit of the CFA (i.e., the method factor) that consisted of all measurement items. Therefore, a good model fit of the method factor indicated the common var-iance problem (Malhotra et al., 2006).
3. Result and discussion
3.1. Lifestyle factor formation
The lifestyle factor formation was conducted to summa-rize and reduce numerous interrelated indicators into sev-eral underlying factors that are easier to be interpreted. Therefore, this current study applied the analysis by us-ing SPSS software to analyze available datasets. Initially, 80 items were examined for their factorability. After nine
Table 1. The respondent profile
No Variable Category Frequency %
1 GenderMale 240 38.3Female 386 61.7
2 Age
16–27 431 68.928–39 92 14.740–51 70 11.252–63 25 4.064–75 8 1.3
3 Occupation
Employee 112 17.9Enterpreneur 66 10.5Laborer 15 2.4Student 367 58.6Teacher 28 4.5Pensioner 8 1.3Other 30 4.8
18 A. K. N. A. Nugraha et al. Lifestyle segmentation: mobile phone purchase vis-à-vis consumption decision
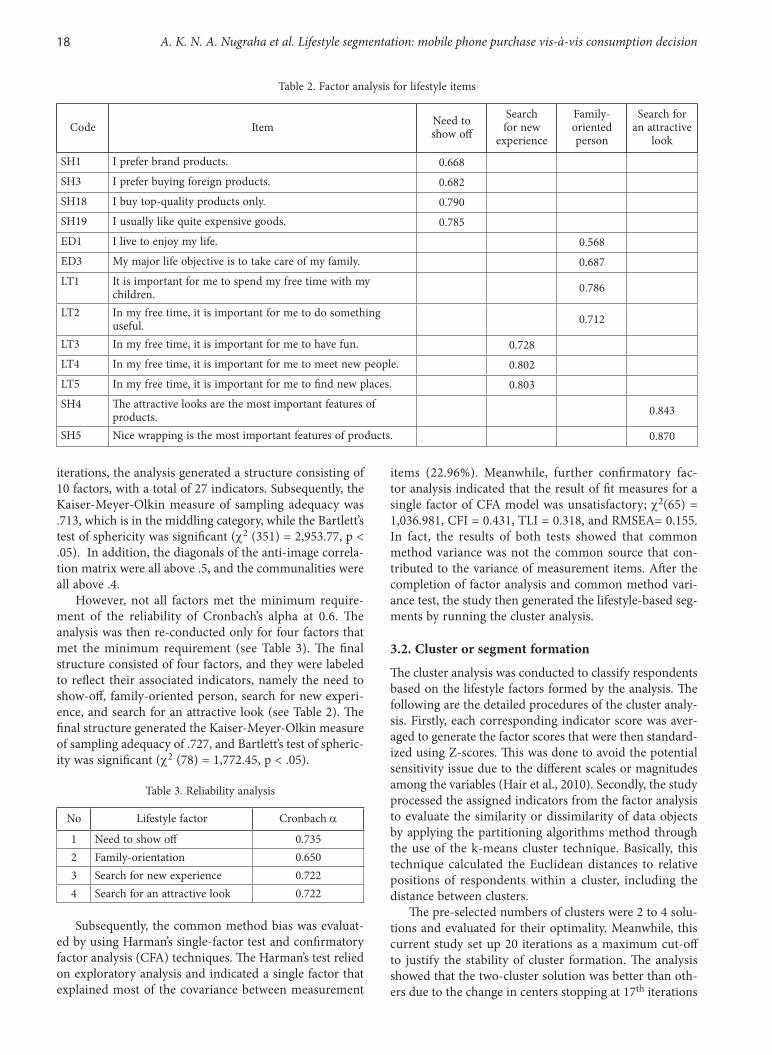
iterations, the analysis generated a structure consisting of 10 factors, with a total of 27 indicators. Subsequently, the Kaiser-Meyer-Olkin measure of sampling adequacy was .713, which is in the middling category, while the Bartlett’s test of sphericity was significant (χ2 (351) = 2,953.77, p < .05). In addition, the diagonals of the anti-image correla-tion matrix were all above .5, and the communalities were all above .4.
However, not all factors met the minimum require-ment of the reliability of Cronbach’s alpha at 0.6. The analysis was then re-conducted only for four factors that met the minimum requirement (see Table 3). The final structure consisted of four factors, and they were labeled to reflect their associated indicators, namely the need to show-off, family-oriented person, search for new experi-ence, and search for an attractive look (see Table 2). The final structure generated the Kaiser-Meyer-Olkin measure of sampling adequacy of .727, and Bartlett’s test of spheric-ity was significant (χ2 (78) = 1,772.45, p < .05).
Table 3. Reliability analysis
No Lifestyle factor Cronbach α
1 Need to show off 0.7352 Family-orientation 0.6503 Search for new experience 0.7224 Search for an attractive look 0.722
Subsequently, the common method bias was evaluat-ed by using Harman’s single-factor test and confirmatory factor analysis (CFA) techniques. The Harman’s test relied on exploratory analysis and indicated a single factor that explained most of the covariance between measurement
items (22.96%). Meanwhile, further confirmatory fac-tor analysis indicated that the result of fit measures for a single factor of CFA model was unsatisfactory; χ2(65) = 1,036.981, CFI = 0.431, TLI = 0.318, and RMSEA= 0.155. In fact, the results of both tests showed that common method variance was not the common source that con-tributed to the variance of measurement items. After the completion of factor analysis and common method vari-ance test, the study then generated the lifestyle-based seg-ments by running the cluster analysis.
3.2. Cluster or segment formation
The cluster analysis was conducted to classify respondents based on the lifestyle factors formed by the analysis. The following are the detailed procedures of the cluster analy-sis. Firstly, each corresponding indicator score was aver-aged to generate the factor scores that were then standard-ized using Z-scores. This was done to avoid the potential sensitivity issue due to the different scales or magnitudes among the variables (Hair et al., 2010). Secondly, the study processed the assigned indicators from the factor analysis to evaluate the similarity or dissimilarity of data objects by applying the partitioning algorithms method through the use of the k-means cluster technique. Basically, this technique calculated the Euclidean distances to relative positions of respondents within a cluster, including the distance between clusters.
The pre-selected numbers of clusters were 2 to 4 solu-tions and evaluated for their optimality. Meanwhile, this current study set up 20 iterations as a maximum cut-off to justify the stability of cluster formation. The analysis showed that the two-cluster solution was better than oth-ers due to the change in centers stopping at 17th iterations
Table 2. Factor analysis for lifestyle items
Code Item Need to show off
Searchfor new
experience
Family-oriented person
Search for an attractive
look
SH1 I prefer brand products. 0.668SH3 I prefer buying foreign products. 0.682SH18 I buy top-quality products only. 0.790SH19 I usually like quite expensive goods. 0.785ED1 I live to enjoy my life. 0.568ED3 My major life objective is to take care of my family. 0.687LT1 It is important for me to spend my free time with my
children. 0.786
LT2 In my free time, it is important for me to do something useful. 0.712
LT3 In my free time, it is important for me to have fun. 0.728LT4 In my free time, it is important for me to meet new people. 0.802LT5 In my free time, it is important for me to find new places. 0.803SH4 The attractive looks are the most important features of
products. 0.843
SH5 Nice wrapping is the most important features of products. 0.870
Business: Theory and Practice, 2022, 23(1): 14–25 19
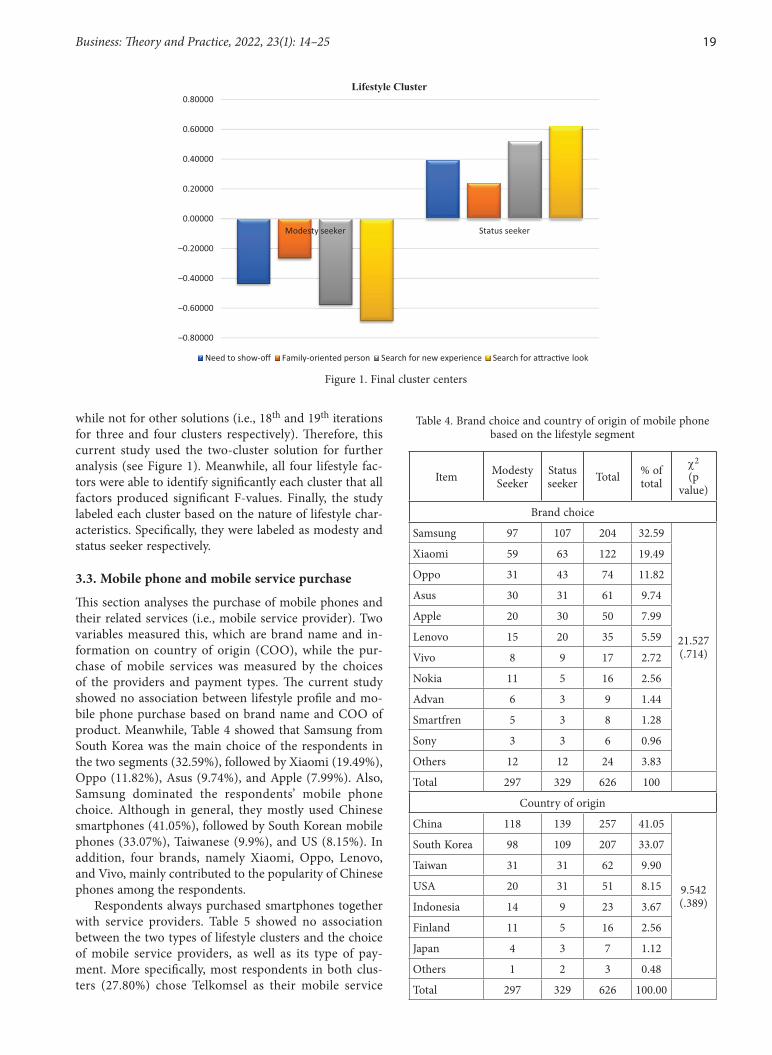
while not for other solutions (i.e., 18th and 19th iterations for three and four clusters respectively). Therefore, this current study used the two-cluster solution for further analysis (see Figure 1). Meanwhile, all four lifestyle fac-tors were able to identify significantly each cluster that all factors produced significant F-values. Finally, the study labeled each cluster based on the nature of lifestyle char-acteristics. Specifically, they were labeled as modesty and status seeker respectively.
3.3. Mobile phone and mobile service purchase
This section analyses the purchase of mobile phones and their related services (i.e., mobile service provider). Two variables measured this, which are brand name and in-formation on country of origin (COO), while the pur-chase of mobile services was measured by the choices of the providers and payment types. The current study showed no association between lifestyle profile and mo-bile phone purchase based on brand name and COO of product. Meanwhile, Table 4 showed that Samsung from South Korea was the main choice of the respondents in the two segments (32.59%), followed by Xiaomi (19.49%), Oppo (11.82%), Asus (9.74%), and Apple (7.99%). Also, Samsung dominated the respondents’ mobile phone choice. Although in general, they mostly used Chinese smartphones (41.05%), followed by South Korean mobile phones (33.07%), Taiwanese (9.9%), and US (8.15%). In addition, four brands, namely Xiaomi, Oppo, Lenovo, and Vivo, mainly contributed to the popularity of Chinese phones among the respondents.
Respondents always purchased smartphones together with service providers. Table 5 showed no association between the two types of lifestyle clusters and the choice of mobile service providers, as well as its type of pay-ment. More specifically, most respondents in both clus-ters (27.80%) chose Telkomsel as their mobile service
Figure 1. Final cluster centers
–0.80000
–0.60000
–0.40000
–0.20000
0.00000
0.20000
0.40000
0.60000
0.80000
Modesty sutatSrekees seeker
Lifestyle Cluster
Need to show-off Family-oriented person Search for new experience Search for a�rac�ve look
Table 4. Brand choice and country of origin of mobile phone based on the lifestyle segment
Item Modesty Seeker
Status seeker Total % of
total
χ2 (p
value)
Brand choice
Samsung 97 107 204 32.59
21.527 (.714)
Xiaomi 59 63 122 19.49
Oppo 31 43 74 11.82
Asus 30 31 61 9.74
Apple 20 30 50 7.99
Lenovo 15 20 35 5.59
Vivo 8 9 17 2.72
Nokia 11 5 16 2.56
Advan 6 3 9 1.44
Smartfren 5 3 8 1.28
Sony 3 3 6 0.96
Others 12 12 24 3.83
Total 297 329 626 100
Country of origin
China 118 139 257 41.05
9.542 (.389)
South Korea 98 109 207 33.07
Taiwan 31 31 62 9.90
USA 20 31 51 8.15
Indonesia 14 9 23 3.67
Finland 11 5 16 2.56
Japan 4 3 7 1.12
Others 1 2 3 0.48
Total 297 329 626 100.00
20 A. K. N. A. Nugraha et al. Lifestyle segmentation: mobile phone purchase vis-à-vis consumption decision
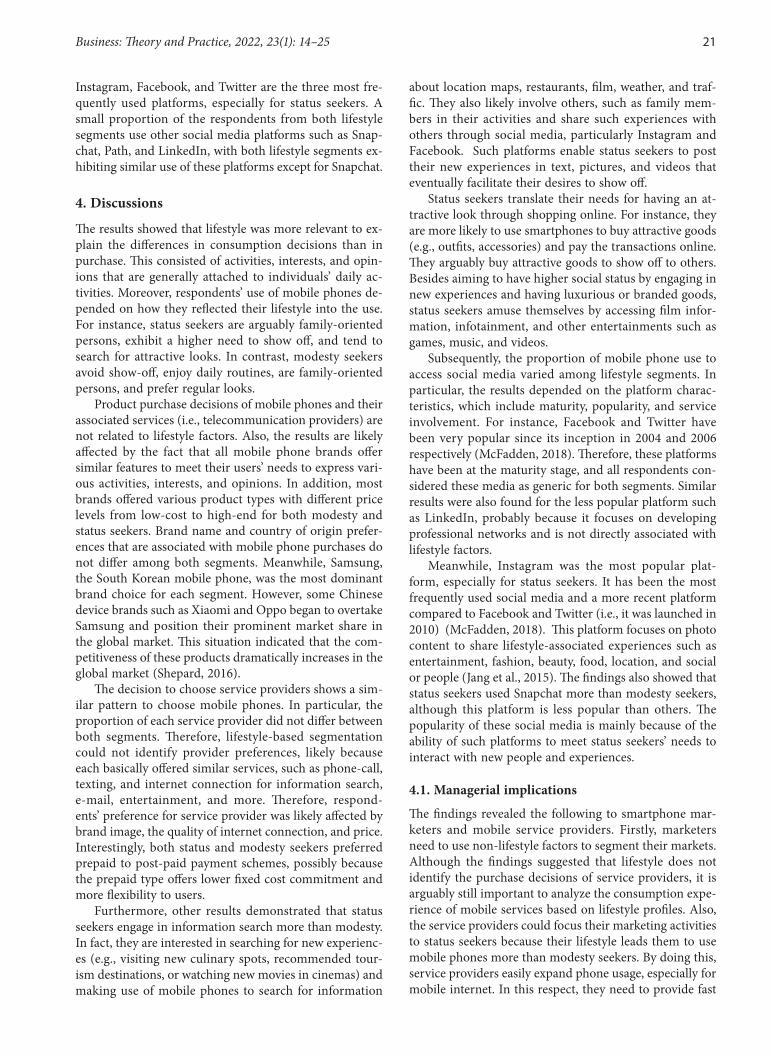
providers, followed by Indosat (24.92), and Tri (22.04%). Meanwhile, the majority from both clusters preferred pre-paid scheme (80.03%) to the post-paid method. Overall, the pattern of service providers purchase was similar to mobile phone.
Table 5. The choice and type of payment of mobile service provider
Item Modestyseeker
Status seeker Total % of the
totalχ2
(p-value)
Mobil service provider
Telkomsel 80 94 174 27.80
4.801 (.570)
Indosat 75 81 156 24.92Tri 58 80 138 22.04Axis 41 36 77 12.30XL Axiata 36 32 68 10.86Others 7 6 13 2.08Total 297 329 626 100.00
Type of mobile service payment
Prepaid 242 259 501 80.03 .743 (.389)Post-paid 55 70 125 19.97
Total 297 329 626 100.00
3.4. Mobile usage behavior
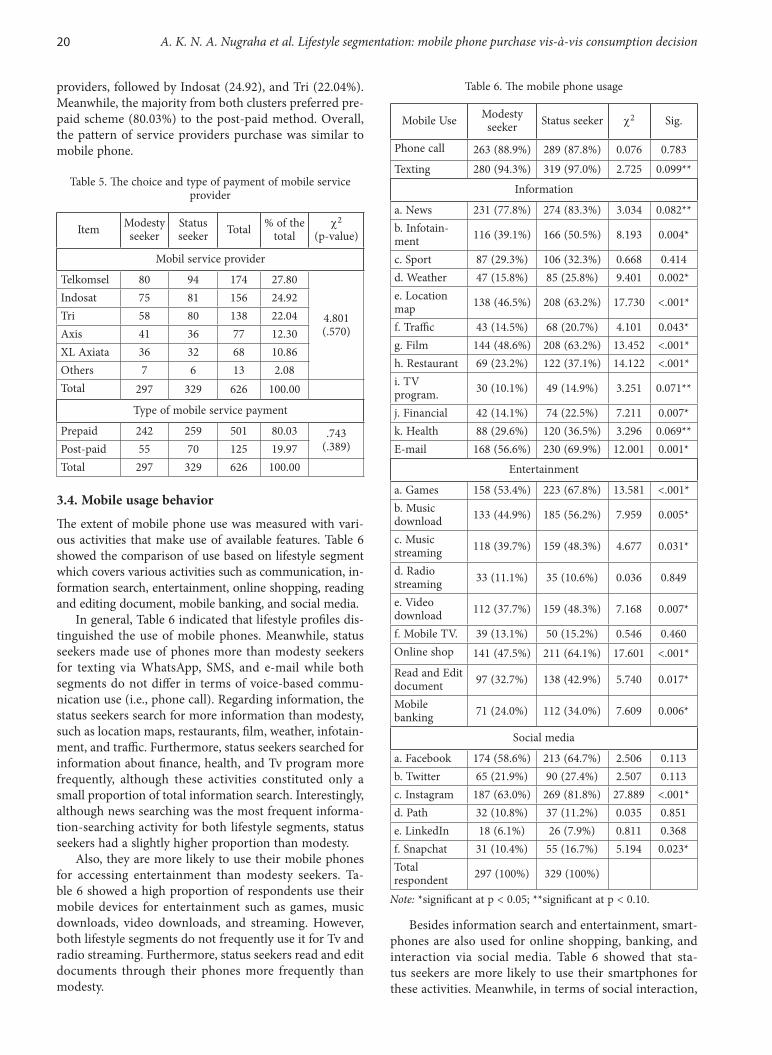
The extent of mobile phone use was measured with vari-ous activities that make use of available features. Table 6 showed the comparison of use based on lifestyle segment which covers various activities such as communication, in-formation search, entertainment, online shopping, reading and editing document, mobile banking, and social media.
In general, Table 6 indicated that lifestyle profiles dis-tinguished the use of mobile phones. Meanwhile, status seekers made use of phones more than modesty seekers for texting via WhatsApp, SMS, and e-mail while both segments do not differ in terms of voice-based commu-nication use (i.e., phone call). Regarding information, the status seekers search for more information than modesty, such as location maps, restaurants, film, weather, infotain-ment, and traffic. Furthermore, status seekers searched for information about finance, health, and Tv program more frequently, although these activities constituted only a small proportion of total information search. Interestingly, although news searching was the most frequent informa-tion-searching activity for both lifestyle segments, status seekers had a slightly higher proportion than modesty.
Also, they are more likely to use their mobile phones for accessing entertainment than modesty seekers. Ta-ble 6 showed a high proportion of respondents use their mobile devices for entertainment such as games, music downloads, video downloads, and streaming. However, both lifestyle segments do not frequently use it for Tv and radio streaming. Furthermore, status seekers read and edit documents through their phones more frequently than modesty.
Besides information search and entertainment, smart-phones are also used for online shopping, banking, and interaction via social media. Table 6 showed that sta-tus seekers are more likely to use their smartphones for these activities. Meanwhile, in terms of social interaction,
Table 6. The mobile phone usage
Mobile Use Modestyseeker Status seeker χ2 Sig.
Phone call 263 (88.9%) 289 (87.8%) 0.076 0.783
Texting 280 (94.3%) 319 (97.0%) 2.725 0.099**
Information
a. News 231 (77.8%) 274 (83.3%) 3.034 0.082**b. Infotain-ment 116 (39.1%) 166 (50.5%) 8.193 0.004*
c. Sport 87 (29.3%) 106 (32.3%) 0.668 0.414d. Weather 47 (15.8%) 85 (25.8%) 9.401 0.002*e. Location map 138 (46.5%) 208 (63.2%) 17.730 <.001*
f. Traffic 43 (14.5%) 68 (20.7%) 4.101 0.043*g. Film 144 (48.6%) 208 (63.2%) 13.452 <.001*h. Restaurant 69 (23.2%) 122 (37.1%) 14.122 <.001*i. TV program. 30 (10.1%) 49 (14.9%) 3.251 0.071**
j. Financial 42 (14.1%) 74 (22.5%) 7.211 0.007*k. Health 88 (29.6%) 120 (36.5%) 3.296 0.069**E-mail 168 (56.6%) 230 (69.9%) 12.001 0.001*
Entertainment
a. Games 158 (53.4%) 223 (67.8%) 13.581 <.001*b. Music download 133 (44.9%) 185 (56.2%) 7.959 0.005*
c. Music streaming 118 (39.7%) 159 (48.3%) 4.677 0.031*
d. Radio streaming 33 (11.1%) 35 (10.6%) 0.036 0.849
e. Video download 112 (37.7%) 159 (48.3%) 7.168 0.007*
f. Mobile TV. 39 (13.1%) 50 (15.2%) 0.546 0.460Online shop 141 (47.5%) 211 (64.1%) 17.601 <.001*
Read and Edit document 97 (32.7%) 138 (42.9%) 5.740 0.017*
Mobile banking 71 (24.0%) 112 (34.0%) 7.609 0.006*
Social media
a. Facebook 174 (58.6%) 213 (64.7%) 2.506 0.113b. Twitter 65 (21.9%) 90 (27.4%) 2.507 0.113c. Instagram 187 (63.0%) 269 (81.8%) 27.889 <.001*d. Path 32 (10.8%) 37 (11.2%) 0.035 0.851e. LinkedIn 18 (6.1%) 26 (7.9%) 0.811 0.368f. Snapchat 31 (10.4%) 55 (16.7%) 5.194 0.023*Total respondent 297 (100%) 329 (100%)
Note: *significant at p < 0.05; **significant at p < 0.10.
Business: Theory and Practice, 2022, 23(1): 14–25 21
Instagram, Facebook, and Twitter are the three most fre-quently used platforms, especially for status seekers. A small proportion of the respondents from both lifestyle segments use other social media platforms such as Snap-chat, Path, and LinkedIn, with both lifestyle segments ex-hibiting similar use of these platforms except for Snapchat.
4. Discussions
The results showed that lifestyle was more relevant to ex-plain the differences in consumption decisions than in purchase. This consisted of activities, interests, and opin-ions that are generally attached to individuals’ daily ac-tivities. Moreover, respondents’ use of mobile phones de-pended on how they reflected their lifestyle into the use. For instance, status seekers are arguably family-oriented persons, exhibit a higher need to show off, and tend to search for attractive looks. In contrast, modesty seekers avoid show-off, enjoy daily routines, are family-oriented persons, and prefer regular looks.
Product purchase decisions of mobile phones and their associated services (i.e., telecommunication providers) are not related to lifestyle factors. Also, the results are likely affected by the fact that all mobile phone brands offer similar features to meet their users’ needs to express vari-ous activities, interests, and opinions. In addition, most brands offered various product types with different price levels from low-cost to high-end for both modesty and status seekers. Brand name and country of origin prefer-ences that are associated with mobile phone purchases do not differ among both segments. Meanwhile, Samsung, the South Korean mobile phone, was the most dominant brand choice for each segment. However, some Chinese device brands such as Xiaomi and Oppo began to overtake Samsung and position their prominent market share in the global market. This situation indicated that the com-petitiveness of these products dramatically increases in the global market (Shepard, 2016).
The decision to choose service providers shows a sim-ilar pattern to choose mobile phones. In particular, the proportion of each service provider did not differ between both segments. Therefore, lifestyle-based segmentation could not identify provider preferences, likely because each basically offered similar services, such as phone-call, texting, and internet connection for information search, e-mail, entertainment, and more. Therefore, respond-ents’ preference for service provider was likely affected by brand image, the quality of internet connection, and price. Interestingly, both status and modesty seekers preferred prepaid to post-paid payment schemes, possibly because the prepaid type offers lower fixed cost commitment and more flexibility to users.
Furthermore, other results demonstrated that status seekers engage in information search more than modesty. In fact, they are interested in searching for new experienc-es (e.g., visiting new culinary spots, recommended tour-ism destinations, or watching new movies in cinemas) and making use of mobile phones to search for information
about location maps, restaurants, film, weather, and traf-fic. They also likely involve others, such as family mem-bers in their activities and share such experiences with others through social media, particularly Instagram and Facebook. Such platforms enable status seekers to post their new experiences in text, pictures, and videos that eventually facilitate their desires to show off.
Status seekers translate their needs for having an at-tractive look through shopping online. For instance, they are more likely to use smartphones to buy attractive goods (e.g., outfits, accessories) and pay the transactions online. They arguably buy attractive goods to show off to others. Besides aiming to have higher social status by engaging in new experiences and having luxurious or branded goods, status seekers amuse themselves by accessing film infor-mation, infotainment, and other entertainments such as games, music, and videos.
Subsequently, the proportion of mobile phone use to access social media varied among lifestyle segments. In particular, the results depended on the platform charac-teristics, which include maturity, popularity, and service involvement. For instance, Facebook and Twitter have been very popular since its inception in 2004 and 2006 respectively (McFadden, 2018). Therefore, these platforms have been at the maturity stage, and all respondents con-sidered these media as generic for both segments. Similar results were also found for the less popular platform such as LinkedIn, probably because it focuses on developing professional networks and is not directly associated with lifestyle factors.
Meanwhile, Instagram was the most popular plat-form, especially for status seekers. It has been the most frequently used social media and a more recent platform compared to Facebook and Twitter (i.e., it was launched in 2010) (McFadden, 2018). This platform focuses on photo content to share lifestyle-associated experiences such as entertainment, fashion, beauty, food, location, and social or people (Jang et al., 2015). The findings also showed that status seekers used Snapchat more than modesty seekers, although this platform is less popular than others. The popularity of these social media is mainly because of the ability of such platforms to meet status seekers’ needs to interact with new people and experiences.
4.1. Managerial implications
The findings revealed the following to smartphone mar-keters and mobile service providers. Firstly, marketers need to use non-lifestyle factors to segment their markets. Although the findings suggested that lifestyle does not identify the purchase decisions of service providers, it is arguably still important to analyze the consumption expe-rience of mobile services based on lifestyle profiles. Also, the service providers could focus their marketing activities to status seekers because their lifestyle leads them to use mobile phones more than modesty seekers. By doing this, service providers easily expand phone usage, especially for mobile internet. In this respect, they need to provide fast
22 A. K. N. A. Nugraha et al. Lifestyle segmentation: mobile phone purchase vis-à-vis consumption decision
and reliable internet connections to ensure users’ positive experience. Secondly, it was suggested that service provid-ers expand mobile phone features that fit their consumers’ lifestyle characteristics. Furthermore, they need to contin-uously create attractive offers, especially to maintain their existing customers (i.e., status seekers). Given the sig-nificant association between consumption experience and consumer lifestyle profiles, service providers need to focus on the use of consumption situation attributes for the sta-tus seeker segment. Thirdly, in the context of marketing communication, they need to emphasize consumption situation attributes as a basis for their product advertise-ments. However, the higher proportion of prepaid mobile service users relative to that of post-paid poses challenges for the service providers to maintain consumer loyalty. This is because prepaid schemes offer more flexibility to search for alternative providers with lower switching costs.
4.2. Limitations
The current study analyzed the purchase decision of only mobile phones based on brand name (Kim & Park, 2014), country of origin (Yunus & Rashid, 2016) and excluded other product attributes such as price, design, quality, and features. This is because these two attributes arguably summarized others (Knight & Calantone, 2000; Sam-mut‐Bonnici, 2015), both for consumers who have lim-ited knowledge or no prior experience with the products and those who already made the purchases and aimed to reduce risks or shorten decision making routes for their next purchases. Brand and country of origin are essential in the cognitive-based economy (Assael, 2005). However, the current study did not cover the cognitive elements of purchase decisions and only focused on behavioral aspects (i.e., the choice of brand name and COO). This limited the ability to explain the rationale of the decisions. Lastly, the current study does not generalize results to characterize Indonesian consumers due to its limited sample (i.e., only from one city). Therefore, future research may accommo-date the need for broader sample scope.
4.3. Research implication and further research
These findings underscore the importance of exploring various moderating variables to explain the effectiveness of lifestyle-based segmentation in understanding various consumer profiles. Therefore, this paper advised future studies to elaborate on the role of lifestyle in identifying consumers’ behavior based on the frequency of purchase and consumption, behaviors for different product catego-ries, and also for low and high product involvement. The results arguably inform marketers in applying the lifestyle factor to understand consumption behavior better.
Future studies are also suggested to compare the use of behavioral and cognitive approaches to generate a better understanding of consumer behavior for different types of product involvement. Such studies potentially generate comprehensive insights about consumers and factors that motivate them to exhibit such behavior. Also, subsequent
studies may focus on the strength of association between brand name and COO as summary cues for price, design, quality, and features between potential and actual custom-ers.
Conclusions
Lifestyle factors allow lifestyle-based segmentation to bet-ter explain the differences in consumer behavior. Based on this behavior, the simple structure indicated that not all lifestyle measures should be included. In this study, four relevant lifestyle factors were indicated, which are the need to show-off, family-oriented person, search for new experience, and search for an attractive look.
Meanwhile, the lifestyle factor is more relevant to iden-tify behavior in using mobile services than the purchase behavior of smartphones and the choice of service pro-viders. Also, lifestyle expresses consumers’ daily activities, interests, opinions, and values. Therefore, involvement in lifestyle measures could be translated into various mobile service features. In fact, consumers are more likely to use available features when their lifestyle characteristics fit better with mobile service features.
Purchasing phones and their associated services are generally occasional, while the decisions to use them are more routine. These findings imply that lifestyle fits more in routine than occasional consumer (both purchasing and consumption) behaviors. Furthermore, lifestyle-based segmentation likely explains the segment differences when consumers make frequent purchasing or consumption de-cisions. This argument is consistent with the definition of lifestyle that includes an element of habit (Nie & Zepeda, 2011) which is in everyday parlance as a …“... frequent, persistent, or customary behavior ”...” (Gardner, 2015).
Author contributions
Albert Kriestian Novi Adhi NUGRAHA: Ideas, creation of model, development of methodology, data analysis, data visualization, writing initial draft, and arranging English translation and proofreading.
Yunita Budi Rahayu SILINTOWE: Ideas, project ad-ministration, budget, data collection management, data analysis.
Eristia Lidia PARAMITA: Ideas, project administra-tion, budget, data collection management.
Disclosure statement
Authors do not have any competing financial, professional, or personal interests from other parties.
ReferencesAmin, K. (2014). Indonesians spend most time on smartphones
in the world. The Jakarta Post. https://www.thejakartapost.com/news/2014/06/05/indonesians-spend-most-time-smart-phones-world.html
Business: Theory and Practice, 2022, 23(1): 14–25 23
Andéhn, M., Nordin, F., & Nilsson, M. (2016). Facets of country image and brand equity: Revisiting the role of product catego-ries in country‐of‐origin effect research. Journal of Consumer Behaviour, 15(3), 225–238. https://doi.org/10.1002/cb.1550
Assael, H. (2005). Consumer behavior: A strategic approach. Houghton Mifflin Company.
Asseraf, Y., & Shoham, A. (2017). Destination branding: The role of consumer affinity. Journal of Destination Marketing & Man-agement, 6(4), 375–384. https://doi.org/10.1016/j.jdmm.2016.06.004
Balabanis, G., & Siamagka, N.-T. (2017). Inconsistencies in the behavioural effects of consumer ethnocentrism: The role of brand, product category and country of origin. International Marketing Review, 34(2), 166–182. https://doi.org/10.1108/IMR-03-2015-0057
Balakrishnan, J., & Griffiths, M. (2018). Loyalty towards online games, gaming addiction, and purchase intention towards on-line mobile in-game features. Computers in Human Behavior, 87, 238–246. https://doi.org/10.1016/j.chb.2018.06.002
Barrett, P., Imamura, F., Brage, S., Griffin, S. J., Wareham, N. J., & Forouhi, N. G. (2017). Sociodemographic, lifestyle and be-havioural factors associated with consumption of sweetened beverages among adults in Cambridgeshire, UK: the Fenland study. Public Health Nutrition, 20(15), 2766–2777. https://doi.org/10.1017/S136898001700177X
Candan, F. B., & Kapucu, H. (2018). The effect of lifestyle on conspicuous consumption. In O. Ekşi & F. B. Candan (Eds.), Current debates in business studies (Vol. 15, pp. 109–125). IJO-PEC Publication Limited.
Choi, M., & Park, K. (2018). Differences in awareness, attitude and purchase intention of multi-brand stores among fashion lifestyle groups. Journal of the Korean Society of Clothing Tex-tiles, 42(3), 438–451. https://doi.org/10.5850/JKSCT.2018.42.3.438
Christea, A., Capatina, G., & Stoenescu, R.-D. (2015). Country-of-origin effects on perceived brand positioning. Procedia Economics Finance, 23, 422–427. https://doi.org/10.1016/S2212-5671(15)00383-4
Çifci, S., Ekinci, Y., Whyatt, G., Japutra, A., Molinillo, S., & Siala, H. (2016). A cross validation of consumer-based brand equity models: Driving customer equity in retail brands. Jour-nal of Business Research, 69(9), 3740–3747. https://doi.org/10.1016/j.jbusres.2015.12.066
Díaz, A., Gómez, M., Molina, A., & Santos, J. (2018). A segmen-tation study of cinema consumers based on values and life-style. Journal of Retailing and Consumer Services, 41, 79–89. https://doi.org/10.1016/j.jretconser.2017.12.001
Ernst, A., & Briegel, R. (2017). A dynamic and spatially explicit psychological model of the diffusion of green electricity across Germany. Journal of Environmental Psychology, 52, 183–193. https://doi.org/10.1016/j.jenvp.2016.12.003
Fernández-Ferrín, P., Calvo-Turrientes, A., Bande, B., Artaraz-Miñón, M., & Galán-Ladero, M. M. (2018). The valuation and purchase of food products that combine local, regional and traditional features: The influence of consumer ethnocen-trism. Food Quality and Preference, 64, 138–147. https://doi.org/10.1016/j.foodqual.2017.09.015
Fischer, P. M., & Zeugner-Roth, K. P. (2017). Disentangling country-of-origin effects: The interplay of product ethnicity, national identity, and consumer ethnocentrism. Marketing Letters, 28(2), 189–204. https://doi.org/10.1007/s11002-016-9400-7
Franzen, G., & Moriarty, S. E. (2009). The science and art of branding. M.E. Sharpe, Inc.
Gardner, B. (2015). A review and analysis of the use of ‘habit’ in understanding, predicting and influencing health-related behaviour. Health Psychology Review, 9(3), 277–295. https://doi.org/10.1080/17437199.2013.876238
George-Ufot, G., Qu, Y., & Orji, I. J. (2017). Sustainable lifestyle factors influencing industries’ electric consumption patterns using Fuzzy logic and DEMATEL: The Nigerian perspective. Journal of Cleaner Production, 162, 624–634. https://doi.org/10.1016/j.jclepro.2017.05.188
Hair, J. F., Tatham, R. L., Anderson, R. E., & Black, W. (2010). Multivariate data analysis. Pearson Prentice Hall Upper Sad-dle River, NJ.
Hamka, F., Bouwman, H., De Reuver, M., & Kroesen, M. (2014). Mobile customer segmentation based on smartphone meas-urement. Telematics and Informatics, 31(2), 220–227. https://doi.org/10.1016/j.tele.2013.08.006
Harcar, T., & Kaynak, E. (2015). The impact of country-of-origin and ethnocentrism: An experimental study of consumer taste preferences for soft drinks at cross-cultural level. Journal of Euromarketing, 24(2–3), 120–131. https://doi.org/10.9768/0024.02-3.120
Hassan, S. H., Ramayah, T., Mohamed, O., & Maghsoudi, A. (2015). E-Lifestyle conceptualization: Measurement model validation using variance based structural equation modeling (SEM-PLS). Modern Applied Science, 9(2), 307–319. https://doi.org/10.5539/mas.v9n2p307
Jadczaková, V. (2010). Evaluation and analysis of questionnaire lifestyle segmentation. Department of Statistics and Operation Analysis. Mendel University.
James, A., Ravichandran, S., Chuang, N. K., & Bolden, E. (2017). Using lifestyle analysis to develop lodging packages for stay-cation travelers: An exploratory study. Journal of Quality As-surance in Hospitality and Tourism, 18(4), 387–415. https://doi.org/10.1080/1528008X.2016.1250240
Jang, J.-S. (2017). The comparative study on the purchase of con-venience foods according to the food-related lifestyle in Chi-nese students. The Korean Journal of Food Nutrition, 30(1), 105–111. https://doi.org/10.9799/ksfan.2017.30.1.105
Jang, J. Y., Han, K., Shih, P. C., & Lee, D. (2015). Generation like: Comparative characteristics in Instagram. In Proceedings of the 33rd Annual ACM Conference on Human Factors in Com-puting Systems, 4039–4042. https://doi.org/10.1145/2702123.2702555
Kim, M.-J., & Park, J. (2014). Mobile phone purchase and us-age behaviours of early adopter groups in Korea. Behaviour & Information Technology, 33(7), 693–703. https://doi.org/10.1080/0144929X.2013.796001
Kim, M., & Kim, C. (2020). Lifestyle and travel motivation of the elderly in South Korea: Baseline characteristics and the relationship between demographic factors. International Jour-nal of Hospitality & Tourism Administration, 21(2), 141–164. https://doi.org/10.1080/15256480.2018.1464417
Klein, J. G., Ettenson, R., & Morris, M. D. (1998). The animos-ity model of foreign product purchase: An empirical test in the people’s Republic of China. Journal of Marketing, 62(1), 89–100. https://doi.org/10.1177/002224299806200108
Knight, G. A., & Calantone, R. J. (2000). A flexible model of consumer country-of-origin perceptions: A cross-cultural in-vestigation. International Marketing Review, 17(2), 127–145. https://doi.org/10.1108/02651330010322615
Krishnan, J. (2011). Lifestyle-A tool for understanding buyer be-havior. International Journal of Economics and Management, 5(1), 283–298.
24 A. K. N. A. Nugraha et al. Lifestyle segmentation: mobile phone purchase vis-à-vis consumption decision
Leung, L., & Chen, C. (2017). Extending the theory of planned behavior: A study of lifestyles, contextual factors, mobile viewing habits, TV content interest, and intention to adopt mobile TV. Telematics Informatics, 34(8), 1638–1649. https://doi.org/10.1016/j.tele.2017.07.010
Li, G., Li, G., & Kambele, Z. (2012). Luxury fashion brand con-sumers in China: Perceived value, fashion lifestyle, and will-ingness to pay. Journal of Business Research, 65(10), 1516–1522. https://doi.org/10.1016/j.jbusres.2011.10.019
Mackay, M. M., & Weidlich, O. (2013). Australian mobile phone lifestyle index. AIMIA-The Digital Industry Association of Australia. http://www.sponsor-ed.com.au/app/webroot/up-loaded_files/media/Ampli%202013%20Report_Final_Octo-ber%2024.pdf
Mahika, E.-C. (2011). Current trends in tourist motivation. Cac-tus Tourism Journal, 2(2), 15–24.
Malhotra, N. K., Kim, S. S., & Patil, A. (2006). Common method variance in is research: A comparison of alternative approach-es and a reanalysis of past research. Management Science, 52(12), 1865–1883. https://doi.org/10.1287/mnsc.1060.0597
McFadden, C. (2018). A chronological history of social media. In-teresting Engineering. https://interestingengineering.com/a-chronological-history-of-social-media
Mundfrom, D. J., Shaw, D. G., & Ke, T. L. (2005). Minimum sam-ple size recommendations for conducting factor analyses. In-ternational Journal of Testing, 5(2), 159–168. https://doi.org/10.1207/s15327574ijt0502_4
Nam, J., Ekinci, Y., & Whyatt, G. (2011). Brand equity, brand loy-alty and consumer satisfaction. Annals of Tourism Research, 38(3), 1009–1030. https://doi.org/10.1016/j.annals.2011.01.015
Nie, C., & Zepeda, L. (2011). Lifestyle segmentation of US food shoppers to examine organic and local food consumption. Appetite, 57(1), 28–37. https://doi.org/10.1016/j.appet.2011.03.012
Niezgoda, A., & Kowalska, K. (2020). Sharing economy and life-style changes, as exemplified by the tourism market. Sustain-ability, 12(13), 5351. https://doi.org/10.3390/su12135351
Podsakoff, P. M., MacKenzie, S. B., Lee, J.-Y., & Podsakoff, N. P. (2003). Common method biases in behavioral research: A critical review of the literature and recommended remedies. Journal of Applied Psychology, 88(5), 879. https://doi.org/10.1037/0021-9010.88.5.879
Rahmayani, I. (2015). Indonesia raksasa teknologi digital Asia. https://www.kominfo.go.id/content/detail/6095/indonesia-raksasa-teknologi-digital-asia/0/sorotan_media
Roberts, K., Cade, J., Dawson, J., & Holdsworth, M. (2018). Em-pirically derived dietary patterns in UK adults are associated with sociodemographic characteristics, lifestyle, and diet quality. Nutrients, 10(2), 1–17. https://doi.org/10.3390/nu10020177
Sammut‐Bonnici, T. (2015). Brand and branding. In Wiley Ency-clopedia of Management (pp. 1–3). Wiley.https://doi.org/10.1002/9781118785317.weom120161
Sangle, P. S., & Awasthi, P. (2011). Consumer’s expectations from mobile CRM services: A banking context. Business Process Management Journal, 17(6), 898–918. https://doi.org/10.1108/14637151111182684
Sanquist, T. F., Orr, H., Shui, B., & Bittner, A. C. (2012). Lifestyle factors in US residential electricity consumption. Energy Pol-icy, 42, 354–364. https://doi.org/10.1016/j.enpol.2011.11.092
Saprikis, V., Markos, A., Zarmpou, T., & Vlachopoulou, M. (2018). Mobile shopping consumers’ behavior: An explorato-
ry study and review. Journal of Theoretical Applied Electronic Commerce Research, 13(1), 71–90. https://doi.org/10.4067/S0718-18762018000100105
Sharma, P., Singh, S., & Misra, R. (2020). Wine-related lifestyle segmentation in the context of urban Indian consumers. In-ternational Journal of Wine Business Research, 32(4).https://doi.org/10.1108/IJWBR-05-2019-0036
Shepard, W. (2016). How “made in China” became cool. Forbes. https://www.forbes.com/sites/wadeshepard/2016/05/22/how-made-in-china-became-cool/#1eae713f77a4
Siahtiri, V., & Lee, W. J. (Thomas). (2019). How do materialists choose prominent brands in emerging markets? Journal of Retailing Consumer Services, 46, 133–138. https://doi.org/10.1016/j.jretconser.2017.08.021
Sinclair, G., & Tinson, J. (2017). Psychological ownership and music streaming consumption. Journal of Business Research, 71, 1–9. https://doi.org/10.1016/j.jbusres.2016.10.002
Szakály, Z., Popp, J., Kontor, E., Kovács, S., Pető, K., & Jasák, H. (2017). Attitudes of the lifestyle of health and sustainability segment in Hungary. Sustainability, 9(10), 1763. https://doi.org/10.3390/su9101763
Thøgersen, J. (2017). Sustainable food consumption in the nexus between national context and private lifestyle: A multi-level study. Food Quality and Preference, 55, 16–25. https://doi.org/10.1016/j.foodqual.2016.08.006
Uddin, M. R., Lopa, N. Z., & Oheduzzaman, M. (2014). Fac-tors affecting customers’ buying decisions of mobile phone: A study on Khulna City, Bangladesh. International Journal of Managing Value and Supply Chains, 5(2), 21–28. https://doi.org/10.5121/ijmvsc.2014.5203
Van Huy, L., Chi, M. T. T., Lobo, A., Nguyen, N., & Long, P. H. (2019). Effective segmentation of organic food consumers in Vietnam using food-related lifestyles. Sustainability, 11(5), 1237. https://doi.org/10.3390/su11051237
Viljoen, A. T., van der Spuy, E., & du Rand, G. E. (2018). Food consumption, lifestyle patterns, and body mass index of a group of white South African students. International Journal of Consumer Studies, 42(5), 533–546. https://doi.org/10.1111/ijcs.12465
Volodzko, D. (2015). How “made in China” became a stigma. The Diplomat. https://thediplomat.com/2015/07/how-made-in-china-became-a-stigma/
Wang, R. J.-H., Malthouse, E. C., & Krishnamurthi, L. (2015). On the go: How mobile shopping affects customer purchase behavior. Journal of Retailing, 91(2), 217–234. https://doi.org/10.1016/j.jretai.2015.01.002
Weber, W., Reinhardt, A., & Rossmann, C. (2020). Lifestyle seg-mentation to explain the online health information–seeking behavior of older adults: Representative telephone survey. Journal of Medical Internet Research, 22(6), e15099. https://doi.org/10.2196/15099
Witzling, L., & Shaw, B. R. (2019). Lifestyle segmentation and political ideology: Toward understanding beliefs and behav-ior about local food. Appetite, 132, 106–113. https://doi.org/10.1016/j.appet.2018.10.003
Yeo, G. E., Cho, M.-S., & Oh, J. (2020). Food-related lifestyle segmentation and beverage attribute’ selection: Toward understanding of sugar-reduced beverages choice. British Food Journal, 122(12), 3663–3677. https://doi.org/10.1108/BFJ-10-2019-0817
Yu, C.-S. (2011). Construction and validation of an e-lifestyle instrument. Internet Research, 21(3), 214–235. https://doi.org/10.1108/10662241111139282
Business: Theory and Practice, 2022, 23(1): 14–25 25
Yu, C.-S. (2015). Using e-lifestyle to analyze mobile banking adopters and non-adopters. Journal of Global Information Technology Management, 18(3), 188–213. https://doi.org/10.1080/1097198X.2015.1070619
Yunus, N. S. N. M., & Rashid, W. E. W. (2016). The influence of country-of-origin on consumer purchase intention: The mo-bile phones brand from China. Procedia Economics Finance, 37, 343–349. https://doi.org/10.1016/S2212-5671(16)30135-6
Yusuf, O. (2017). Daftar 5 besar merek smartphone di Indonesia. Kompas.Com. http://tekno.kompas.com/read/2017/11/23/08410067/daftar-5-besar-merek-smartphone-di-indonesia
Zenker, S., & Braun, E. (2017). Questioning a “one size fits all” city brand: Developing a branded house strategy for place brand management. Journal of Place Management Develop-ment, 10(3), 270–287. https://doi.org/10.1108/JPMD-04-2016-0018
Zeugner-Roth, K. P., & Žabkar, V. (2015). Bridging the gap be-tween country and destination image: Assessing common fac-ets and their predictive validity. Journal of Business Research, 68(9), 1844–1853. https://doi.org/10.1016/j.jbusres.2015.01.012