Embed Size (px)
Citation preview
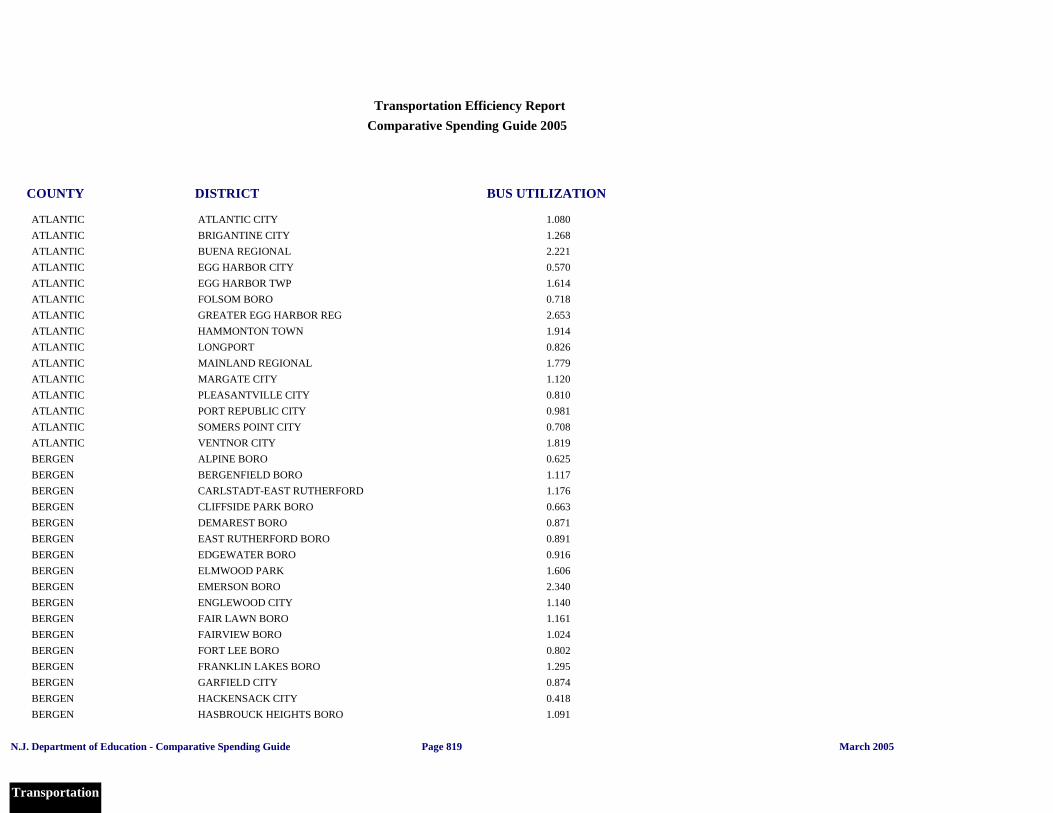
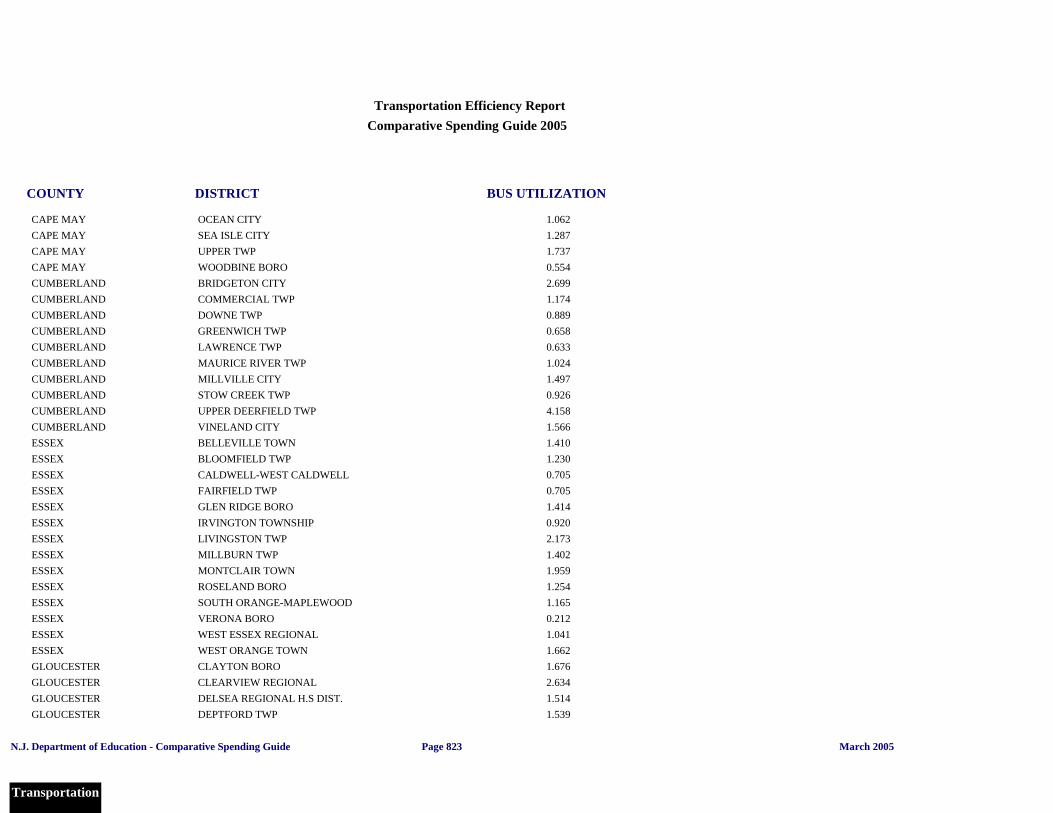
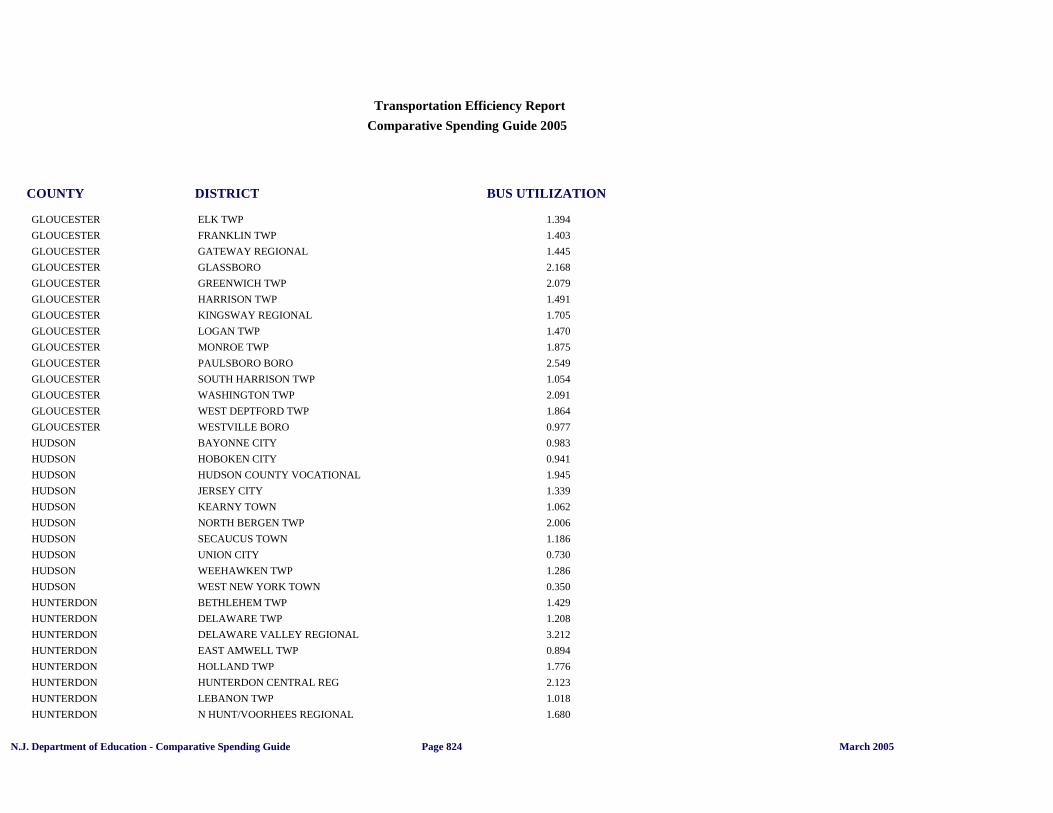
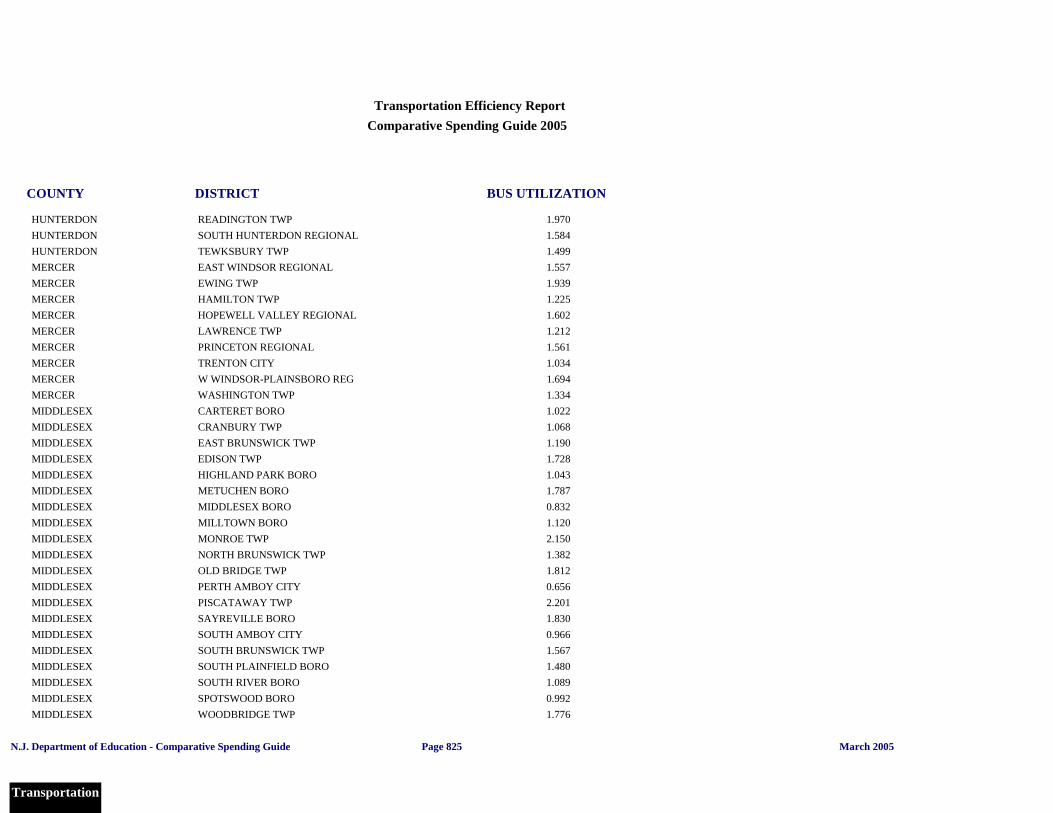
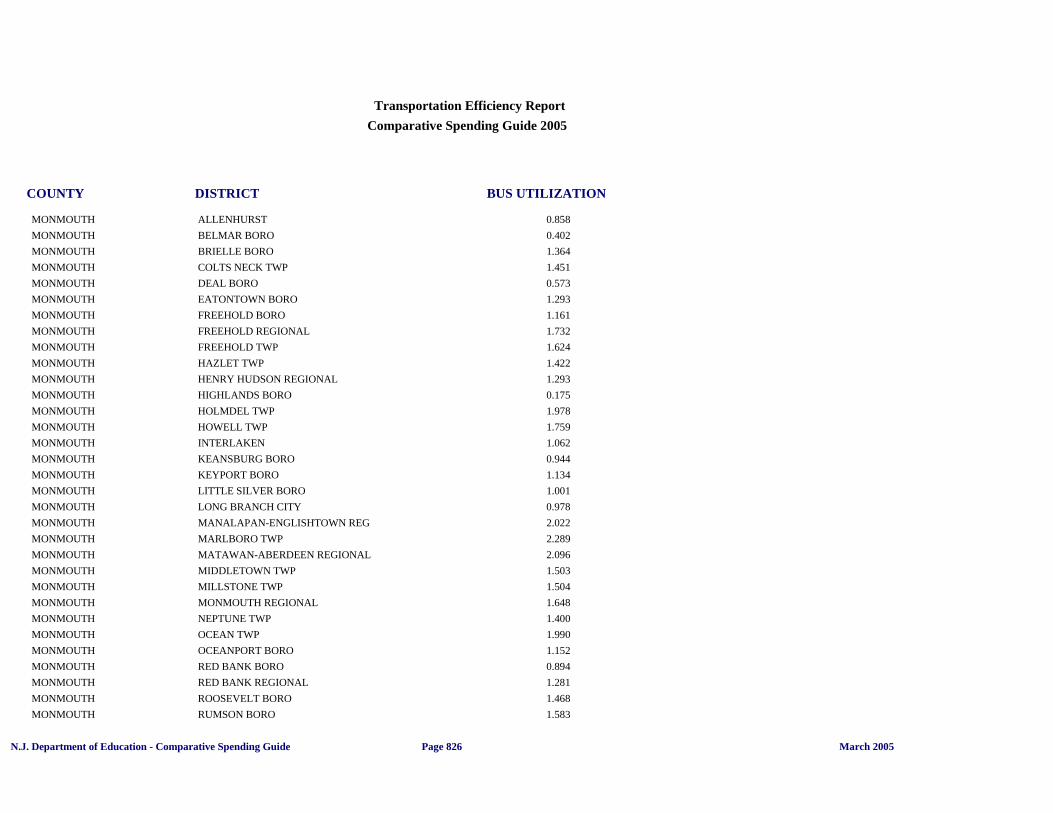
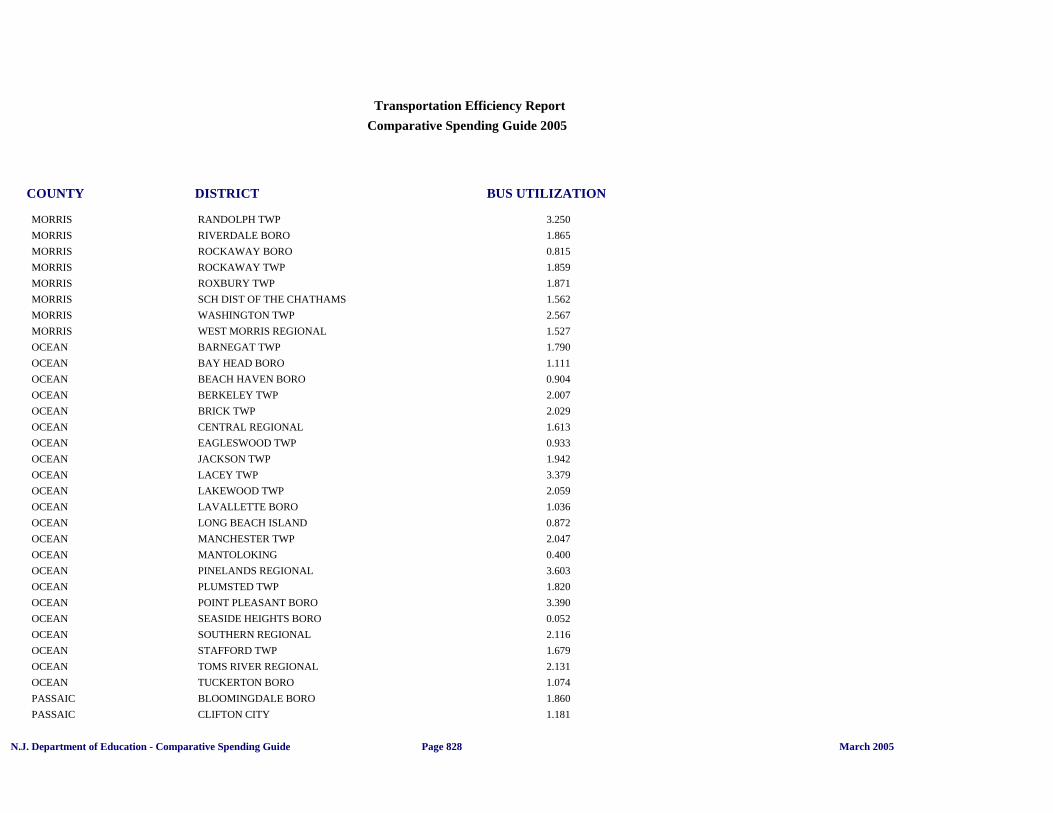
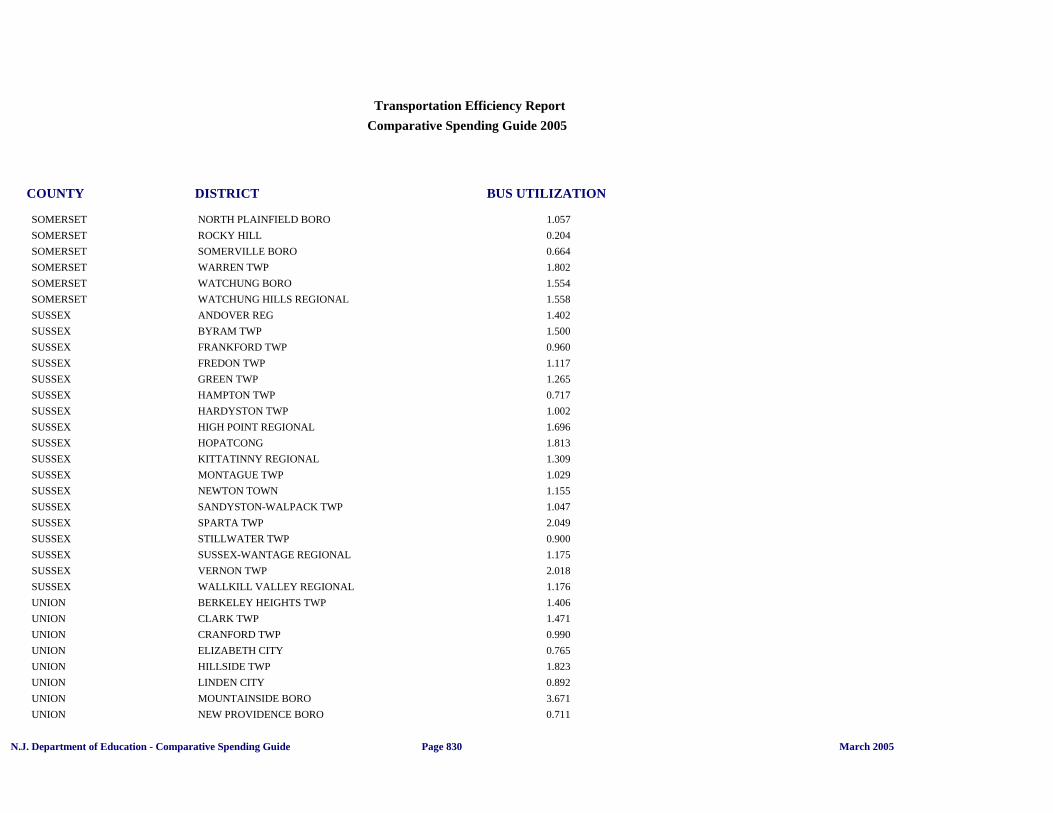
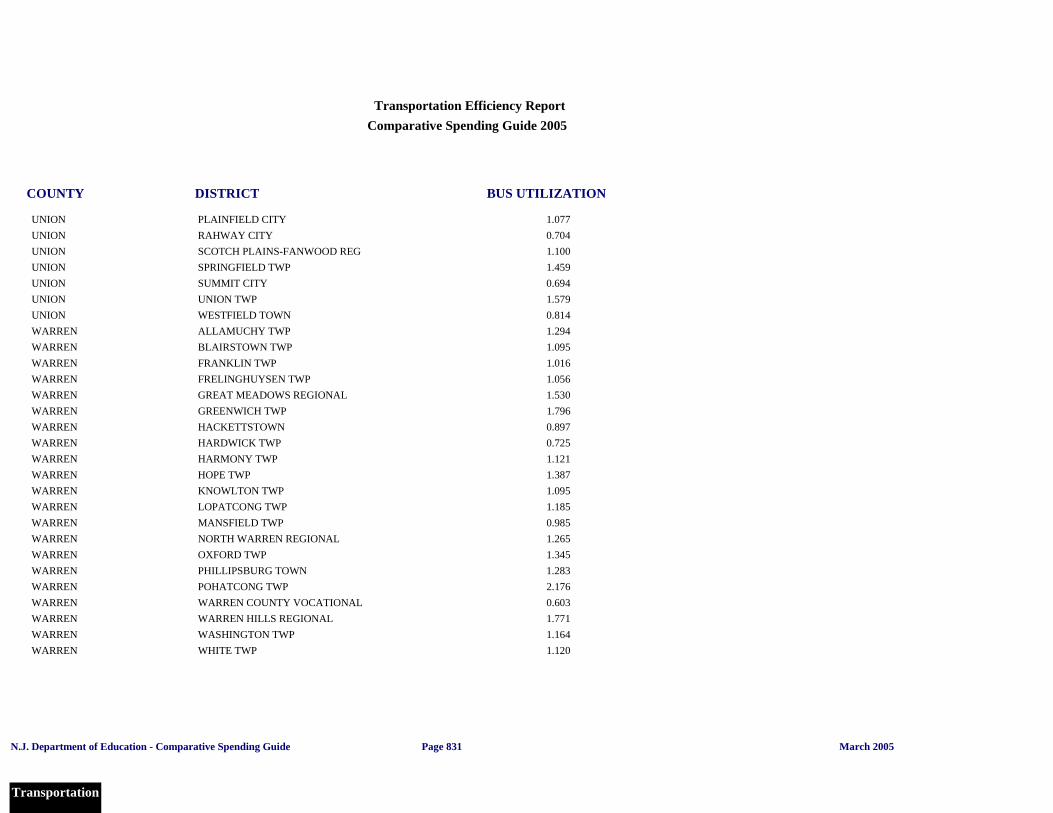
COUNTY DISTRICT BUS UTILIZATION
Transportation Efficiency ReportComparative Spending Guide 2005
ATLANTIC ATLANTIC CITY 1.080ATLANTIC BRIGANTINE CITY 1.268ATLANTIC BUENA REGIONAL 2.221ATLANTIC EGG HARBOR CITY 0.570ATLANTIC EGG HARBOR TWP 1.614ATLANTIC FOLSOM BORO 0.718ATLANTIC GREATER EGG HARBOR REG 2.653ATLANTIC HAMMONTON TOWN 1.914ATLANTIC LONGPORT 0.826ATLANTIC MAINLAND REGIONAL 1.779ATLANTIC MARGATE CITY 1.120ATLANTIC PLEASANTVILLE CITY 0.810ATLANTIC PORT REPUBLIC CITY 0.981ATLANTIC SOMERS POINT CITY 0.708ATLANTIC VENTNOR CITY 1.819BERGEN ALPINE BORO 0.625BERGEN BERGENFIELD BORO 1.117BERGEN CARLSTADT-EAST RUTHERFORD 1.176BERGEN CLIFFSIDE PARK BORO 0.663BERGEN DEMAREST BORO 0.871BERGEN EAST RUTHERFORD BORO 0.891BERGEN EDGEWATER BORO 0.916BERGEN ELMWOOD PARK 1.606BERGEN EMERSON BORO 2.340BERGEN ENGLEWOOD CITY 1.140BERGEN FAIR LAWN BORO 1.161BERGEN FAIRVIEW BORO 1.024BERGEN FORT LEE BORO 0.802BERGEN FRANKLIN LAKES BORO 1.295BERGEN GARFIELD CITY 0.874BERGEN HACKENSACK CITY 0.418BERGEN HASBROUCK HEIGHTS BORO 1.091
N.J. Department of Education - Comparative Spending Guide March 2005
Transportation
Page 819
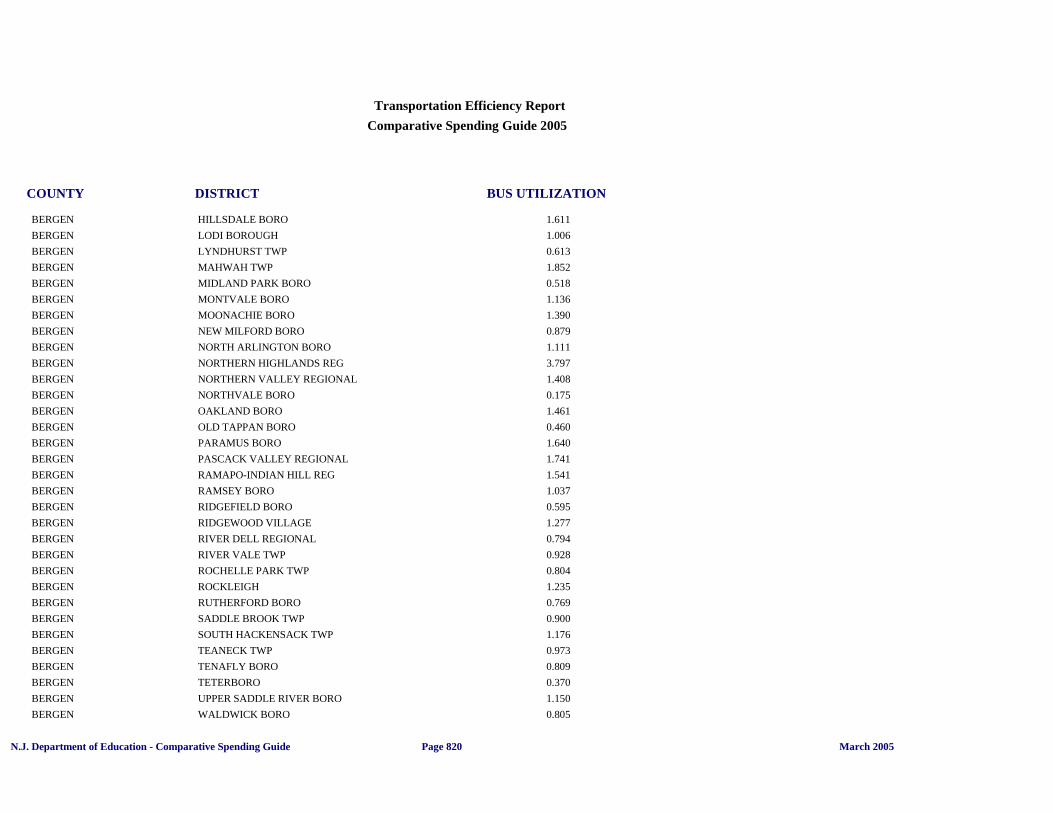
COUNTY DISTRICT BUS UTILIZATION
Transportation Efficiency ReportComparative Spending Guide 2005
BERGEN HILLSDALE BORO 1.611BERGEN LODI BOROUGH 1.006BERGEN LYNDHURST TWP 0.613BERGEN MAHWAH TWP 1.852BERGEN MIDLAND PARK BORO 0.518BERGEN MONTVALE BORO 1.136BERGEN MOONACHIE BORO 1.390BERGEN NEW MILFORD BORO 0.879BERGEN NORTH ARLINGTON BORO 1.111BERGEN NORTHERN HIGHLANDS REG 3.797BERGEN NORTHERN VALLEY REGIONAL 1.408BERGEN NORTHVALE BORO 0.175BERGEN OAKLAND BORO 1.461BERGEN OLD TAPPAN BORO 0.460BERGEN PARAMUS BORO 1.640BERGEN PASCACK VALLEY REGIONAL 1.741BERGEN RAMAPO-INDIAN HILL REG 1.541BERGEN RAMSEY BORO 1.037BERGEN RIDGEFIELD BORO 0.595BERGEN RIDGEWOOD VILLAGE 1.277BERGEN RIVER DELL REGIONAL 0.794BERGEN RIVER VALE TWP 0.928BERGEN ROCHELLE PARK TWP 0.804BERGEN ROCKLEIGH 1.235BERGEN RUTHERFORD BORO 0.769BERGEN SADDLE BROOK TWP 0.900BERGEN SOUTH HACKENSACK TWP 1.176BERGEN TEANECK TWP 0.973BERGEN TENAFLY BORO 0.809BERGEN TETERBORO 0.370BERGEN UPPER SADDLE RIVER BORO 1.150BERGEN WALDWICK BORO 0.805
N.J. Department of Education - Comparative Spending Guide March 2005Page 820
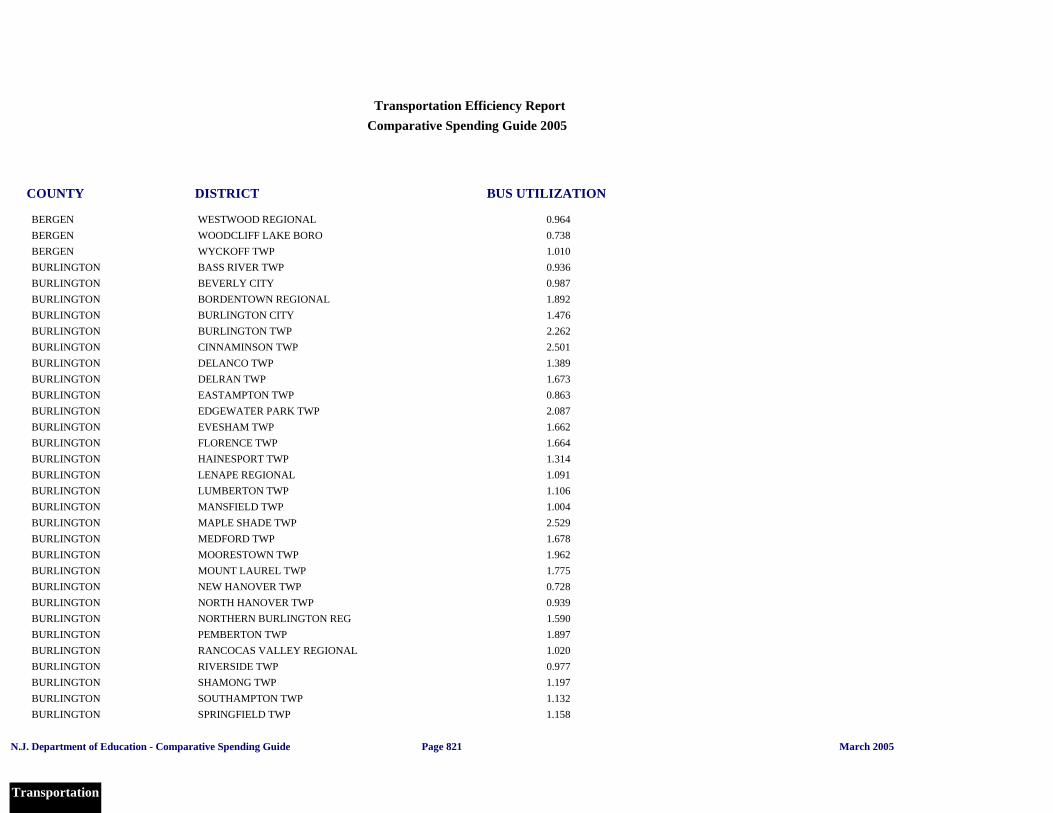
COUNTY DISTRICT BUS UTILIZATION
Transportation Efficiency ReportComparative Spending Guide 2005
BERGEN WESTWOOD REGIONAL 0.964BERGEN WOODCLIFF LAKE BORO 0.738BERGEN WYCKOFF TWP 1.010BURLINGTON BASS RIVER TWP 0.936BURLINGTON BEVERLY CITY 0.987BURLINGTON BORDENTOWN REGIONAL 1.892BURLINGTON BURLINGTON CITY 1.476BURLINGTON BURLINGTON TWP 2.262BURLINGTON CINNAMINSON TWP 2.501BURLINGTON DELANCO TWP 1.389BURLINGTON DELRAN TWP 1.673BURLINGTON EASTAMPTON TWP 0.863BURLINGTON EDGEWATER PARK TWP 2.087BURLINGTON EVESHAM TWP 1.662BURLINGTON FLORENCE TWP 1.664BURLINGTON HAINESPORT TWP 1.314BURLINGTON LENAPE REGIONAL 1.091BURLINGTON LUMBERTON TWP 1.106BURLINGTON MANSFIELD TWP 1.004BURLINGTON MAPLE SHADE TWP 2.529BURLINGTON MEDFORD TWP 1.678BURLINGTON MOORESTOWN TWP 1.962BURLINGTON MOUNT LAUREL TWP 1.775BURLINGTON NEW HANOVER TWP 0.728BURLINGTON NORTH HANOVER TWP 0.939BURLINGTON NORTHERN BURLINGTON REG 1.590BURLINGTON PEMBERTON TWP 1.897BURLINGTON RANCOCAS VALLEY REGIONAL 1.020BURLINGTON RIVERSIDE TWP 0.977BURLINGTON SHAMONG TWP 1.197BURLINGTON SOUTHAMPTON TWP 1.132BURLINGTON SPRINGFIELD TWP 1.158
N.J. Department of Education - Comparative Spending Guide March 2005
Transportation
Page 821
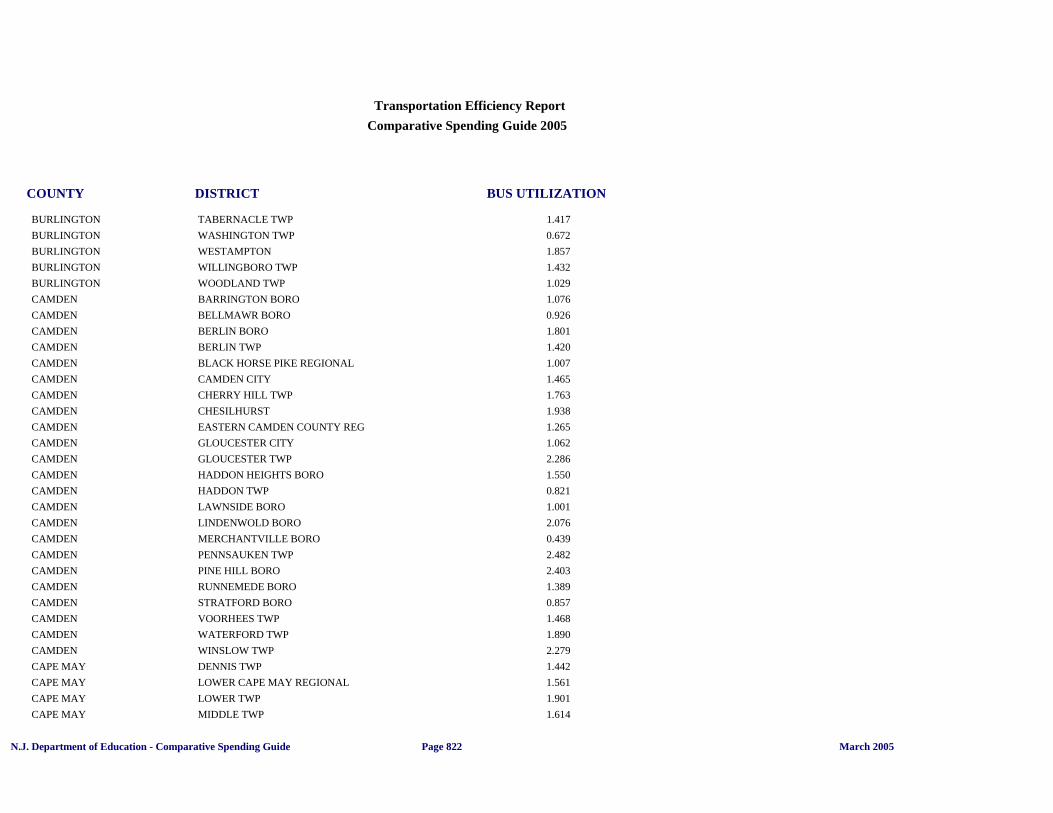
COUNTY DISTRICT BUS UTILIZATION
Transportation Efficiency ReportComparative Spending Guide 2005
BURLINGTON TABERNACLE TWP 1.417BURLINGTON WASHINGTON TWP 0.672BURLINGTON WESTAMPTON 1.857BURLINGTON WILLINGBORO TWP 1.432BURLINGTON WOODLAND TWP 1.029CAMDEN BARRINGTON BORO 1.076CAMDEN BELLMAWR BORO 0.926CAMDEN BERLIN BORO 1.801CAMDEN BERLIN TWP 1.420CAMDEN BLACK HORSE PIKE REGIONAL 1.007CAMDEN CAMDEN CITY 1.465CAMDEN CHERRY HILL TWP 1.763CAMDEN CHESILHURST 1.938CAMDEN EASTERN CAMDEN COUNTY REG 1.265CAMDEN GLOUCESTER CITY 1.062CAMDEN GLOUCESTER TWP 2.286CAMDEN HADDON HEIGHTS BORO 1.550CAMDEN HADDON TWP 0.821CAMDEN LAWNSIDE BORO 1.001CAMDEN LINDENWOLD BORO 2.076CAMDEN MERCHANTVILLE BORO 0.439CAMDEN PENNSAUKEN TWP 2.482CAMDEN PINE HILL BORO 2.403CAMDEN RUNNEMEDE BORO 1.389CAMDEN STRATFORD BORO 0.857CAMDEN VOORHEES TWP 1.468CAMDEN WATERFORD TWP 1.890CAMDEN WINSLOW TWP 2.279CAPE MAY DENNIS TWP 1.442CAPE MAY LOWER CAPE MAY REGIONAL 1.561CAPE MAY LOWER TWP 1.901CAPE MAY MIDDLE TWP 1.614
N.J. Department of Education - Comparative Spending Guide March 2005Page 822
COUNTY DISTRICT BUS UTILIZATION
Transportation Efficiency ReportComparative Spending Guide 2005
CAPE MAY OCEAN CITY 1.062CAPE MAY SEA ISLE CITY 1.287CAPE MAY UPPER TWP 1.737CAPE MAY WOODBINE BORO 0.554CUMBERLAND BRIDGETON CITY 2.699CUMBERLAND COMMERCIAL TWP 1.174CUMBERLAND DOWNE TWP 0.889CUMBERLAND GREENWICH TWP 0.658CUMBERLAND LAWRENCE TWP 0.633CUMBERLAND MAURICE RIVER TWP 1.024CUMBERLAND MILLVILLE CITY 1.497CUMBERLAND STOW CREEK TWP 0.926CUMBERLAND UPPER DEERFIELD TWP 4.158CUMBERLAND VINELAND CITY 1.566ESSEX BELLEVILLE TOWN 1.410ESSEX BLOOMFIELD TWP 1.230ESSEX CALDWELL-WEST CALDWELL 0.705ESSEX FAIRFIELD TWP 0.705ESSEX GLEN RIDGE BORO 1.414ESSEX IRVINGTON TOWNSHIP 0.920ESSEX LIVINGSTON TWP 2.173ESSEX MILLBURN TWP 1.402ESSEX MONTCLAIR TOWN 1.959ESSEX ROSELAND BORO 1.254ESSEX SOUTH ORANGE-MAPLEWOOD 1.165ESSEX VERONA BORO 0.212ESSEX WEST ESSEX REGIONAL 1.041ESSEX WEST ORANGE TOWN 1.662GLOUCESTER CLAYTON BORO 1.676GLOUCESTER CLEARVIEW REGIONAL 2.634GLOUCESTER DELSEA REGIONAL H.S DIST. 1.514GLOUCESTER DEPTFORD TWP 1.539
N.J. Department of Education - Comparative Spending Guide March 2005
Transportation
Page 823
COUNTY DISTRICT BUS UTILIZATION
Transportation Efficiency ReportComparative Spending Guide 2005
GLOUCESTER ELK TWP 1.394GLOUCESTER FRANKLIN TWP 1.403GLOUCESTER GATEWAY REGIONAL 1.445GLOUCESTER GLASSBORO 2.168GLOUCESTER GREENWICH TWP 2.079GLOUCESTER HARRISON TWP 1.491GLOUCESTER KINGSWAY REGIONAL 1.705GLOUCESTER LOGAN TWP 1.470GLOUCESTER MONROE TWP 1.875GLOUCESTER PAULSBORO BORO 2.549GLOUCESTER SOUTH HARRISON TWP 1.054GLOUCESTER WASHINGTON TWP 2.091GLOUCESTER WEST DEPTFORD TWP 1.864GLOUCESTER WESTVILLE BORO 0.977HUDSON BAYONNE CITY 0.983HUDSON HOBOKEN CITY 0.941HUDSON HUDSON COUNTY VOCATIONAL 1.945HUDSON JERSEY CITY 1.339HUDSON KEARNY TOWN 1.062HUDSON NORTH BERGEN TWP 2.006HUDSON SECAUCUS TOWN 1.186HUDSON UNION CITY 0.730HUDSON WEEHAWKEN TWP 1.286HUDSON WEST NEW YORK TOWN 0.350HUNTERDON BETHLEHEM TWP 1.429HUNTERDON DELAWARE TWP 1.208HUNTERDON DELAWARE VALLEY REGIONAL 3.212HUNTERDON EAST AMWELL TWP 0.894HUNTERDON HOLLAND TWP 1.776HUNTERDON HUNTERDON CENTRAL REG 2.123HUNTERDON LEBANON TWP 1.018HUNTERDON N HUNT/VOORHEES REGIONAL 1.680
N.J. Department of Education - Comparative Spending Guide March 2005Page 824
COUNTY DISTRICT BUS UTILIZATION
Transportation Efficiency ReportComparative Spending Guide 2005
HUNTERDON READINGTON TWP 1.970HUNTERDON SOUTH HUNTERDON REGIONAL 1.584HUNTERDON TEWKSBURY TWP 1.499MERCER EAST WINDSOR REGIONAL 1.557MERCER EWING TWP 1.939MERCER HAMILTON TWP 1.225MERCER HOPEWELL VALLEY REGIONAL 1.602MERCER LAWRENCE TWP 1.212MERCER PRINCETON REGIONAL 1.561MERCER TRENTON CITY 1.034MERCER W WINDSOR-PLAINSBORO REG 1.694MERCER WASHINGTON TWP 1.334MIDDLESEX CARTERET BORO 1.022MIDDLESEX CRANBURY TWP 1.068MIDDLESEX EAST BRUNSWICK TWP 1.190MIDDLESEX EDISON TWP 1.728MIDDLESEX HIGHLAND PARK BORO 1.043MIDDLESEX METUCHEN BORO 1.787MIDDLESEX MIDDLESEX BORO 0.832MIDDLESEX MILLTOWN BORO 1.120MIDDLESEX MONROE TWP 2.150MIDDLESEX NORTH BRUNSWICK TWP 1.382MIDDLESEX OLD BRIDGE TWP 1.812MIDDLESEX PERTH AMBOY CITY 0.656MIDDLESEX PISCATAWAY TWP 2.201MIDDLESEX SAYREVILLE BORO 1.830MIDDLESEX SOUTH AMBOY CITY 0.966MIDDLESEX SOUTH BRUNSWICK TWP 1.567MIDDLESEX SOUTH PLAINFIELD BORO 1.480MIDDLESEX SOUTH RIVER BORO 1.089MIDDLESEX SPOTSWOOD BORO 0.992MIDDLESEX WOODBRIDGE TWP 1.776
N.J. Department of Education - Comparative Spending Guide March 2005
Transportation
Page 825
COUNTY DISTRICT BUS UTILIZATION
Transportation Efficiency ReportComparative Spending Guide 2005
MONMOUTH ALLENHURST 0.858MONMOUTH BELMAR BORO 0.402MONMOUTH BRIELLE BORO 1.364MONMOUTH COLTS NECK TWP 1.451MONMOUTH DEAL BORO 0.573MONMOUTH EATONTOWN BORO 1.293MONMOUTH FREEHOLD BORO 1.161MONMOUTH FREEHOLD REGIONAL 1.732MONMOUTH FREEHOLD TWP 1.624MONMOUTH HAZLET TWP 1.422MONMOUTH HENRY HUDSON REGIONAL 1.293MONMOUTH HIGHLANDS BORO 0.175MONMOUTH HOLMDEL TWP 1.978MONMOUTH HOWELL TWP 1.759MONMOUTH INTERLAKEN 1.062MONMOUTH KEANSBURG BORO 0.944MONMOUTH KEYPORT BORO 1.134MONMOUTH LITTLE SILVER BORO 1.001MONMOUTH LONG BRANCH CITY 0.978MONMOUTH MANALAPAN-ENGLISHTOWN REG 2.022MONMOUTH MARLBORO TWP 2.289MONMOUTH MATAWAN-ABERDEEN REGIONAL 2.096MONMOUTH MIDDLETOWN TWP 1.503MONMOUTH MILLSTONE TWP 1.504MONMOUTH MONMOUTH REGIONAL 1.648MONMOUTH NEPTUNE TWP 1.400MONMOUTH OCEAN TWP 1.990MONMOUTH OCEANPORT BORO 1.152MONMOUTH RED BANK BORO 0.894MONMOUTH RED BANK REGIONAL 1.281MONMOUTH ROOSEVELT BORO 1.468MONMOUTH RUMSON BORO 1.583
N.J. Department of Education - Comparative Spending Guide March 2005Page 826

COUNTY DISTRICT BUS UTILIZATION
Transportation Efficiency ReportComparative Spending Guide 2005
MONMOUTH RUMSON-FAIR HAVEN REG 1.954MONMOUTH SEA BRIGHT BORO 0.632MONMOUTH SHORE REGIONAL 1.306MONMOUTH TINTON FALLS 1.318MONMOUTH UNION BEACH 1.000MONMOUTH UPPER FREEHOLD REGIONAL 1.762MONMOUTH WALL TWP 1.951MONMOUTH WEST LONG BRANCH BORO 1.643MORRIS BOONTON TOWN 0.420MORRIS BOONTON TWP 1.872MORRIS BUTLER BORO 1.048MORRIS CHESTER TWP 1.532MORRIS DENVILLE TWP 2.078MORRIS DOVER TOWN 1.138MORRIS EAST HANOVER TWP 1.585MORRIS FLORHAM PARK BORO 1.115MORRIS HANOVER PARK REGIONAL 3.771MORRIS HANOVER TWP 2.072MORRIS JEFFERSON TWP 1.994MORRIS KINNELON BORO 1.367MORRIS LINCOLN PARK BORO 1.964MORRIS LONG HILL TWP 1.555MORRIS MADISON BORO 1.079MORRIS MENDHAM TWP 2.683MORRIS MONTVILLE TWP 2.054MORRIS MORRIS HILLS REGIONAL 1.770MORRIS MORRIS PLAINS BORO 1.808MORRIS MORRIS SCHOOL DISTRICT 1.575MORRIS MOUNT OLIVE TWP 2.403MORRIS MOUNTAIN LAKES BORO 1.358MORRIS PARSIPPANY-TROY HILLS TWP 2.028MORRIS PEQUANNOCK TWP 1.118
N.J. Department of Education - Comparative Spending Guide March 2005
Transportation
Page 827
COUNTY DISTRICT BUS UTILIZATION
Transportation Efficiency ReportComparative Spending Guide 2005
MORRIS RANDOLPH TWP 3.250MORRIS RIVERDALE BORO 1.865MORRIS ROCKAWAY BORO 0.815MORRIS ROCKAWAY TWP 1.859MORRIS ROXBURY TWP 1.871MORRIS SCH DIST OF THE CHATHAMS 1.562MORRIS WASHINGTON TWP 2.567MORRIS WEST MORRIS REGIONAL 1.527OCEAN BARNEGAT TWP 1.790OCEAN BAY HEAD BORO 1.111OCEAN BEACH HAVEN BORO 0.904OCEAN BERKELEY TWP 2.007OCEAN BRICK TWP 2.029OCEAN CENTRAL REGIONAL 1.613OCEAN EAGLESWOOD TWP 0.933OCEAN JACKSON TWP 1.942OCEAN LACEY TWP 3.379OCEAN LAKEWOOD TWP 2.059OCEAN LAVALLETTE BORO 1.036OCEAN LONG BEACH ISLAND 0.872OCEAN MANCHESTER TWP 2.047OCEAN MANTOLOKING 0.400OCEAN PINELANDS REGIONAL 3.603OCEAN PLUMSTED TWP 1.820OCEAN POINT PLEASANT BORO 3.390OCEAN SEASIDE HEIGHTS BORO 0.052OCEAN SOUTHERN REGIONAL 2.116OCEAN STAFFORD TWP 1.679OCEAN TOMS RIVER REGIONAL 2.131OCEAN TUCKERTON BORO 1.074PASSAIC BLOOMINGDALE BORO 1.860PASSAIC CLIFTON CITY 1.181
N.J. Department of Education - Comparative Spending Guide March 2005Page 828

COUNTY DISTRICT BUS UTILIZATION
Transportation Efficiency ReportComparative Spending Guide 2005
PASSAIC HALEDON BORO 0.434PASSAIC HAWTHORNE BORO 0.686PASSAIC LAKELAND REGIONAL 1.095PASSAIC LITTLE FALLS TWP 1.328PASSAIC NORTH HALEDON BORO 0.908PASSAIC PASSAIC CITY 1.076PASSAIC PASSAIC VALLEY REGIONAL 1.410PASSAIC PATERSON CITY 1.180PASSAIC RINGWOOD BORO 2.826PASSAIC TOTOWA BORO 0.846PASSAIC WAYNE TWP 1.760PASSAIC WEST MILFORD TWP 1.806PASSAIC WEST PATERSON BORO 0.913SALEM ALLOWAY TWP 0.892SALEM ELSINBORO TWP 0.656SALEM LOWER ALLOWAYS CREEK 1.267SALEM MANNINGTON TWP 0.639SALEM OLDMANS TWP 1.471SALEM PENNS GRV-CARNEY'S PT REG 1.248SALEM PENNSVILLE 1.522SALEM PITTSGROVE TWP 2.296SALEM QUINTON TWP 0.925SALEM UPPER PITTSGROVE TWP 1.518SALEM WOODSTOWN-PILESGROVE REG 1.116SOMERSET BEDMINSTER TWP 1.398SOMERSET BOUND BROOK BORO 0.962SOMERSET BRANCHBURG TWP 2.050SOMERSET BRIDGEWATER-RARITAN REG 2.004SOMERSET FRANKLIN TWP 1.267SOMERSET GREEN BROOK TWP 1.696SOMERSET HILLSBOROUGH TWP 2.187SOMERSET MONTGOMERY TWP 1.884
N.J. Department of Education - Comparative Spending Guide March 2005
Transportation
Page 829
COUNTY DISTRICT BUS UTILIZATION
Transportation Efficiency ReportComparative Spending Guide 2005
SOMERSET NORTH PLAINFIELD BORO 1.057SOMERSET ROCKY HILL 0.204SOMERSET SOMERVILLE BORO 0.664SOMERSET WARREN TWP 1.802SOMERSET WATCHUNG BORO 1.554SOMERSET WATCHUNG HILLS REGIONAL 1.558SUSSEX ANDOVER REG 1.402SUSSEX BYRAM TWP 1.500SUSSEX FRANKFORD TWP 0.960SUSSEX FREDON TWP 1.117SUSSEX GREEN TWP 1.265SUSSEX HAMPTON TWP 0.717SUSSEX HARDYSTON TWP 1.002SUSSEX HIGH POINT REGIONAL 1.696SUSSEX HOPATCONG 1.813SUSSEX KITTATINNY REGIONAL 1.309SUSSEX MONTAGUE TWP 1.029SUSSEX NEWTON TOWN 1.155SUSSEX SANDYSTON-WALPACK TWP 1.047SUSSEX SPARTA TWP 2.049SUSSEX STILLWATER TWP 0.900SUSSEX SUSSEX-WANTAGE REGIONAL 1.175SUSSEX VERNON TWP 2.018SUSSEX WALLKILL VALLEY REGIONAL 1.176UNION BERKELEY HEIGHTS TWP 1.406UNION CLARK TWP 1.471UNION CRANFORD TWP 0.990UNION ELIZABETH CITY 0.765UNION HILLSIDE TWP 1.823UNION LINDEN CITY 0.892UNION MOUNTAINSIDE BORO 3.671UNION NEW PROVIDENCE BORO 0.711
N.J. Department of Education - Comparative Spending Guide March 2005Page 830
COUNTY DISTRICT BUS UTILIZATION
Transportation Efficiency ReportComparative Spending Guide 2005
UNION PLAINFIELD CITY 1.077UNION RAHWAY CITY 0.704UNION SCOTCH PLAINS-FANWOOD REG 1.100UNION SPRINGFIELD TWP 1.459UNION SUMMIT CITY 0.694UNION UNION TWP 1.579UNION WESTFIELD TOWN 0.814WARREN ALLAMUCHY TWP 1.294WARREN BLAIRSTOWN TWP 1.095WARREN FRANKLIN TWP 1.016WARREN FRELINGHUYSEN TWP 1.056WARREN GREAT MEADOWS REGIONAL 1.530WARREN GREENWICH TWP 1.796WARREN HACKETTSTOWN 0.897WARREN HARDWICK TWP 0.725WARREN HARMONY TWP 1.121WARREN HOPE TWP 1.387WARREN KNOWLTON TWP 1.095WARREN LOPATCONG TWP 1.185WARREN MANSFIELD TWP 0.985WARREN NORTH WARREN REGIONAL 1.265WARREN OXFORD TWP 1.345WARREN PHILLIPSBURG TOWN 1.283WARREN POHATCONG TWP 2.176WARREN WARREN COUNTY VOCATIONAL 0.603WARREN WARREN HILLS REGIONAL 1.771WARREN WASHINGTON TWP 1.164WARREN WHITE TWP 1.120
N.J. Department of Education - Comparative Spending Guide March 2005
Transportation
Page 831

THIS PAGE INTENTIONALLY LEFT BLANK
N.J. Department of Education - Comparative Spending Guide March 2005Page 832
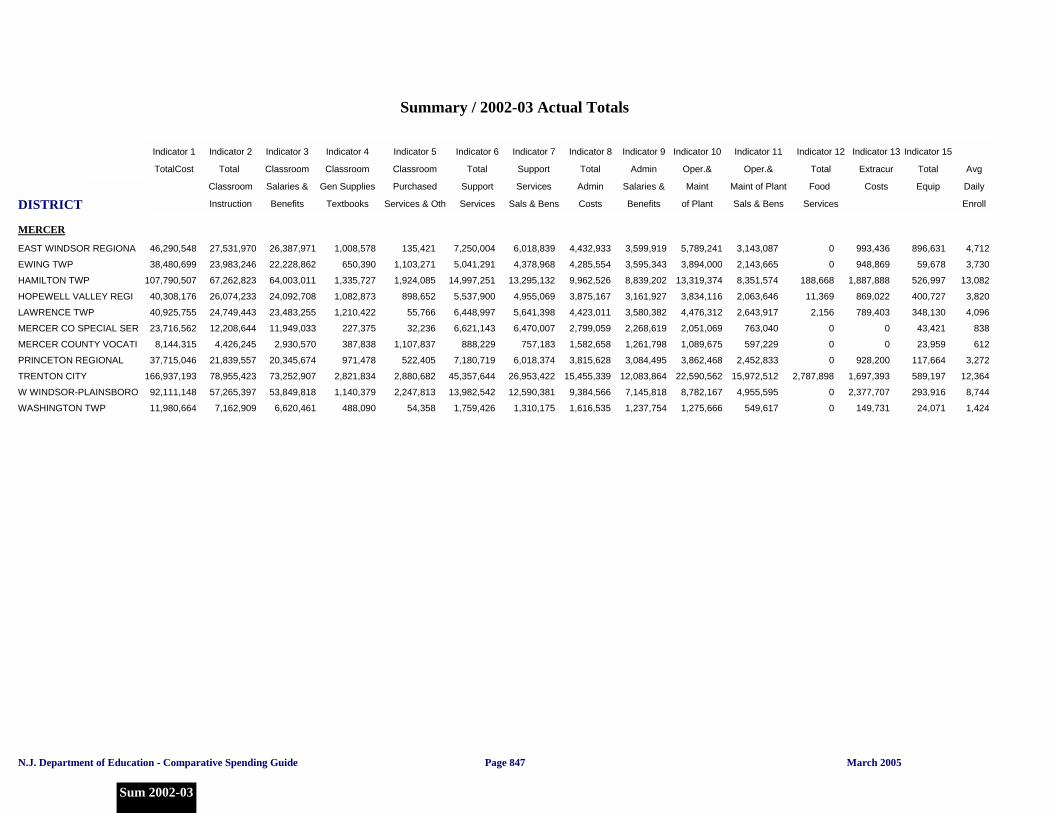
DISTRICT
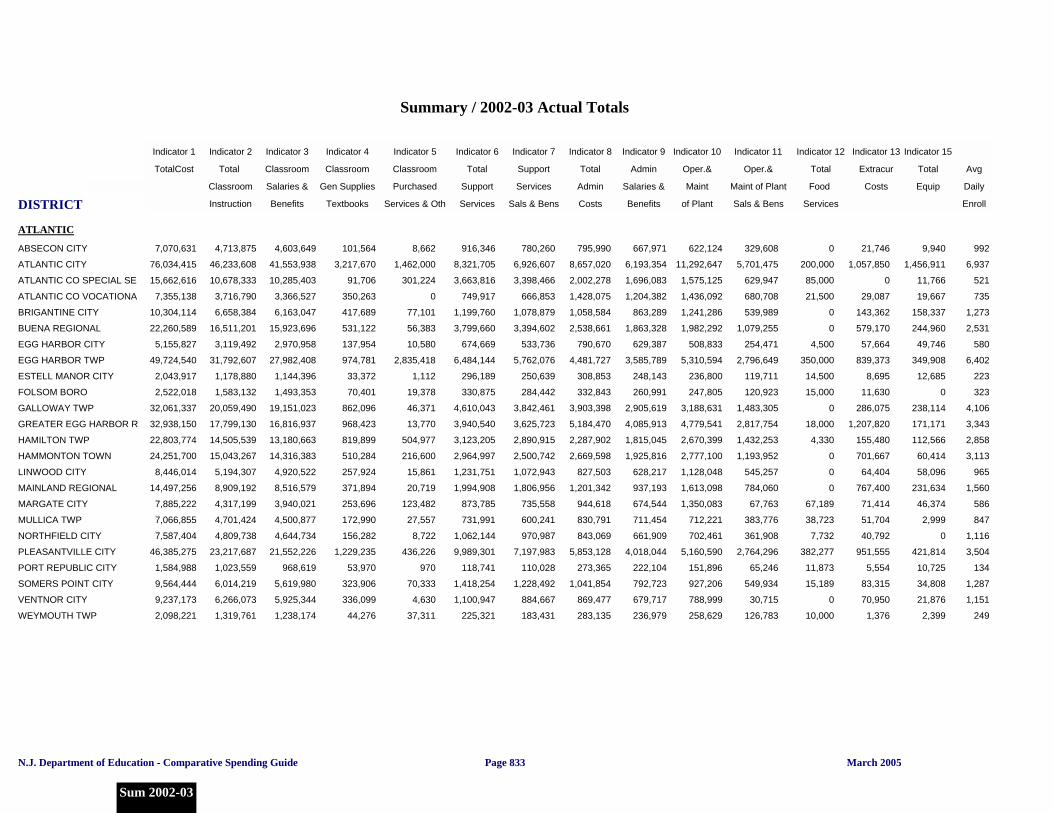
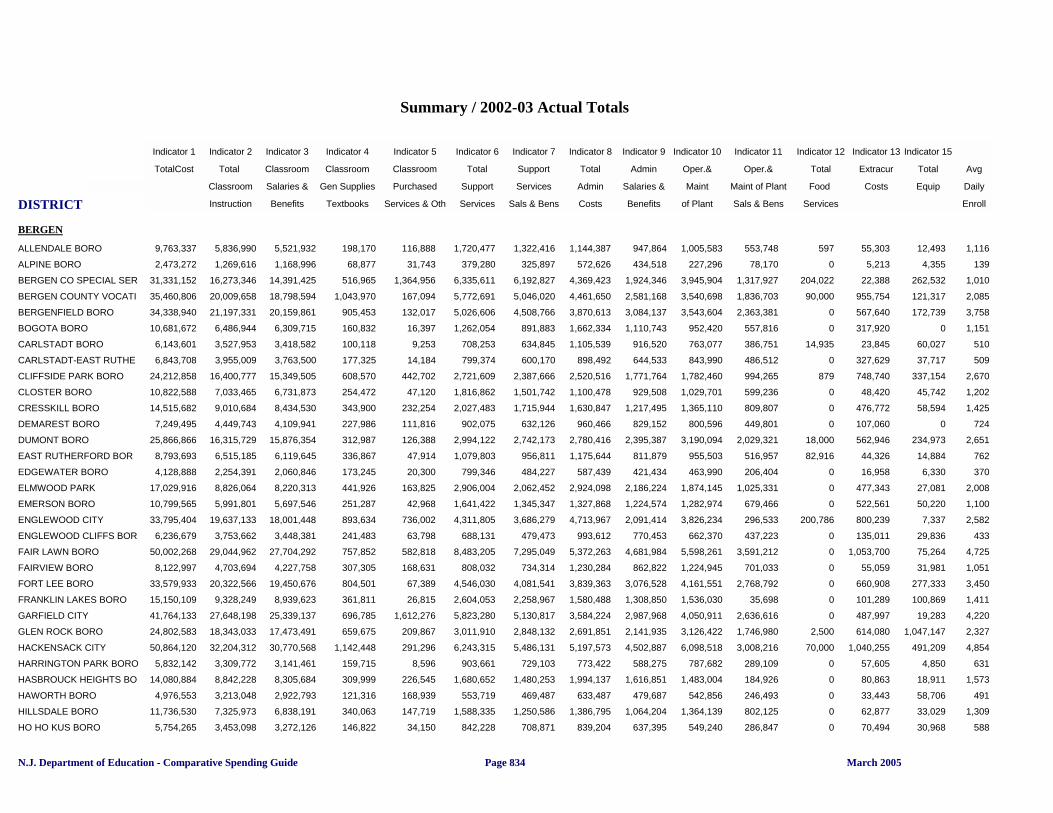
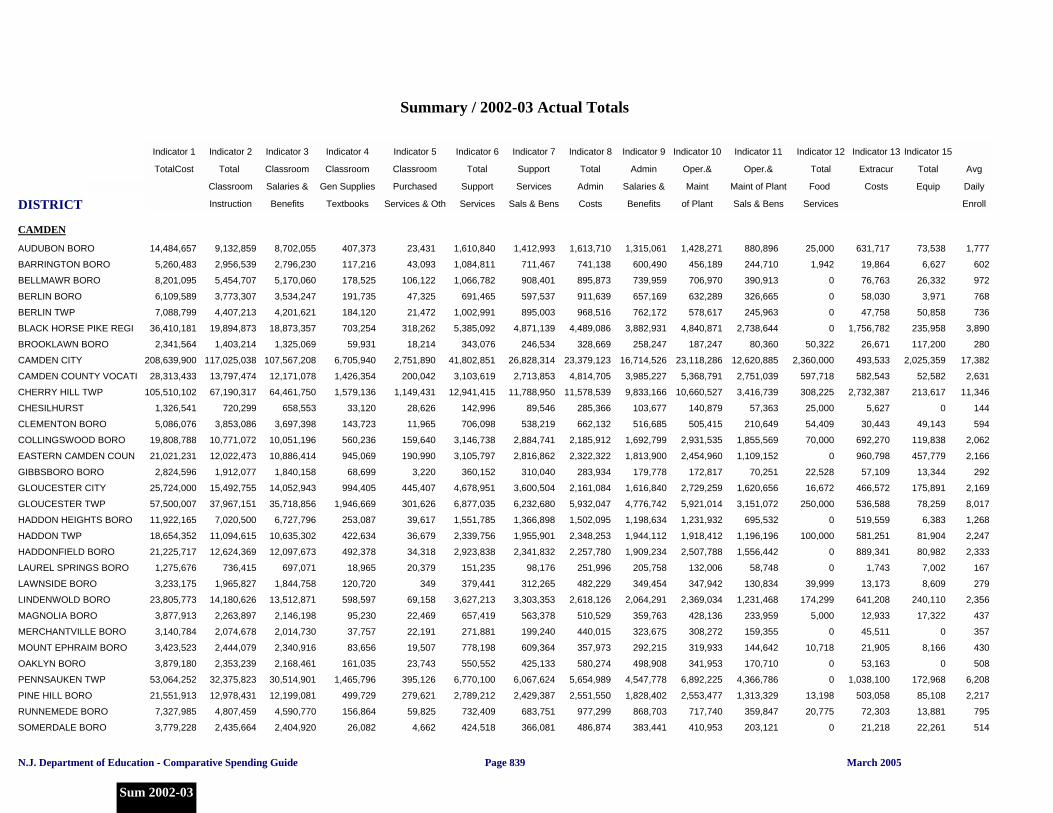
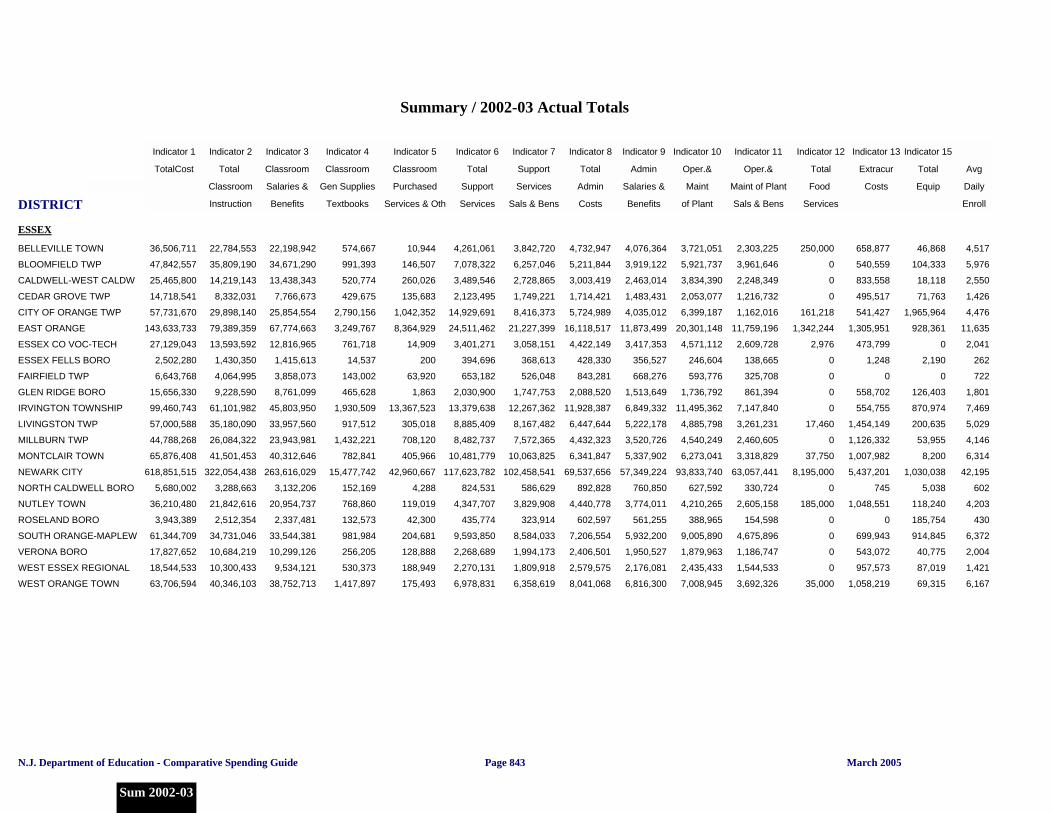
Summary / 2002-03 Actual Totals
Indicator 1 Indicator 2 Indicator 3 Indicator 4 Indicator 5 Indicator 6 Indicator 7 Indicator 8 Indicator 9 Indicator 10 Indicator 11 Indicator 12 Indicator 13 Indicator 15
TotalCost Total Classroom Classroom Classroom Total Support Total Admin Oper.& Oper.& Total Extracur Total Avg
Per Pupil Classroom Salaries & Gen Supplies Purchased Support Services Admin Salaries & Maint Maint of Plant Food Costs Equip Daily
Instruction Benefits Textbooks Services & Oth Services Sals & Bens Costs Benefits of Plant Sals & Bens Services Enroll
ATLANTIC
7,070,631ABSECON CITY 4,713,875 4,603,649 101,564 8,662 916,346 780,260 795,990 667,971 622,124 329,608 0 21,746 9,940 992
76,034,415ATLANTIC CITY 46,233,608 41,553,938 3,217,670 1,462,000 8,321,705 6,926,607 8,657,020 6,193,354 11,292,647 5,701,475 200,000 1,057,850 1,456,911 6,937
15,662,616ATLANTIC CO SPECIAL SE 10,678,333 10,285,403 91,706 301,224 3,663,816 3,398,466 2,002,278 1,696,083 1,575,125 629,947 85,000 0 11,766 521
7,355,138ATLANTIC CO VOCATIONA 3,716,790 3,366,527 350,263 0 749,917 666,853 1,428,075 1,204,382 1,436,092 680,708 21,500 29,087 19,667 735
10,304,114BRIGANTINE CITY 6,658,384 6,163,047 417,689 77,101 1,199,760 1,078,879 1,058,584 863,289 1,241,286 539,989 0 143,362 158,337 1,273
22,260,589BUENA REGIONAL 16,511,201 15,923,696 531,122 56,383 3,799,660 3,394,602 2,538,661 1,863,328 1,982,292 1,079,255 0 579,170 244,960 2,531
5,155,827EGG HARBOR CITY 3,119,492 2,970,958 137,954 10,580 674,669 533,736 790,670 629,387 508,833 254,471 4,500 57,664 49,746 580
49,724,540EGG HARBOR TWP 31,792,607 27,982,408 974,781 2,835,418 6,484,144 5,762,076 4,481,727 3,585,789 5,310,594 2,796,649 350,000 839,373 349,908 6,402
2,043,917ESTELL MANOR CITY 1,178,880 1,144,396 33,372 1,112 296,189 250,639 308,853 248,143 236,800 119,711 14,500 8,695 12,685 223
2,522,018FOLSOM BORO 1,583,132 1,493,353 70,401 19,378 330,875 284,442 332,843 260,991 247,805 120,923 15,000 11,630 0 323
32,061,337GALLOWAY TWP 20,059,490 19,151,023 862,096 46,371 4,610,043 3,842,461 3,903,398 2,905,619 3,188,631 1,483,305 0 286,075 238,114 4,106
32,938,150GREATER EGG HARBOR R 17,799,130 16,816,937 968,423 13,770 3,940,540 3,625,723 5,184,470 4,085,913 4,779,541 2,817,754 18,000 1,207,820 171,171 3,343
22,803,774HAMILTON TWP 14,505,539 13,180,663 819,899 504,977 3,123,205 2,890,915 2,287,902 1,815,045 2,670,399 1,432,253 4,330 155,480 112,566 2,858
24,251,700HAMMONTON TOWN 15,043,267 14,316,383 510,284 216,600 2,964,997 2,500,742 2,669,598 1,925,816 2,777,100 1,193,952 0 701,667 60,414 3,113
8,446,014LINWOOD CITY 5,194,307 4,920,522 257,924 15,861 1,231,751 1,072,943 827,503 628,217 1,128,048 545,257 0 64,404 58,096 965
14,497,256MAINLAND REGIONAL 8,909,192 8,516,579 371,894 20,719 1,994,908 1,806,956 1,201,342 937,193 1,613,098 784,060 0 767,400 231,634 1,560
7,885,222MARGATE CITY 4,317,199 3,940,021 253,696 123,482 873,785 735,558 944,618 674,544 1,350,083 67,763 67,189 71,414 46,374 586
7,066,855MULLICA TWP 4,701,424 4,500,877 172,990 27,557 731,991 600,241 830,791 711,454 712,221 383,776 38,723 51,704 2,999 847
7,587,404NORTHFIELD CITY 4,809,738 4,644,734 156,282 8,722 1,062,144 970,987 843,069 661,909 702,461 361,908 7,732 40,792 0 1,116
46,385,275PLEASANTVILLE CITY 23,217,687 21,552,226 1,229,235 436,226 9,989,301 7,197,983 5,853,128 4,018,044 5,160,590 2,764,296 382,277 951,555 421,814 3,504
1,584,988PORT REPUBLIC CITY 1,023,559 968,619 53,970 970 118,741 110,028 273,365 222,104 151,896 65,246 11,873 5,554 10,725 134
9,564,444SOMERS POINT CITY 6,014,219 5,619,980 323,906 70,333 1,418,254 1,228,492 1,041,854 792,723 927,206 549,934 15,189 83,315 34,808 1,287
9,237,173VENTNOR CITY 6,266,073 5,925,344 336,099 4,630 1,100,947 884,667 869,477 679,717 788,999 30,715 0 70,950 21,876 1,151
2,098,221WEYMOUTH TWP 1,319,761 1,238,174 44,276 37,311 225,321 183,431 283,135 236,979 258,629 126,783 10,000 1,376 2,399 249
N.J. Department of Education - Comparative Spending Guide March 2005
Sum 2002-03
Page 833
DISTRICT
Summary / 2002-03 Actual Totals
Indicator 1 Indicator 2 Indicator 3 Indicator 4 Indicator 5 Indicator 6 Indicator 7 Indicator 8 Indicator 9 Indicator 10 Indicator 11 Indicator 12 Indicator 13 Indicator 15
TotalCost Total Classroom Classroom Classroom Total Support Total Admin Oper.& Oper.& Total Extracur Total Avg
Per Pupil Classroom Salaries & Gen Supplies Purchased Support Services Admin Salaries & Maint Maint of Plant Food Costs Equip Daily
Instruction Benefits Textbooks Services & Oth Services Sals & Bens Costs Benefits of Plant Sals & Bens Services Enroll
BERGEN
9,763,337ALLENDALE BORO 5,836,990 5,521,932 198,170 116,888 1,720,477 1,322,416 1,144,387 947,864 1,005,583 553,748 597 55,303 12,493 1,116
2,473,272ALPINE BORO 1,269,616 1,168,996 68,877 31,743 379,280 325,897 572,626 434,518 227,296 78,170 0 5,213 4,355 139
31,331,152BERGEN CO SPECIAL SER 16,273,346 14,391,425 516,965 1,364,956 6,335,611 6,192,827 4,369,423 1,924,346 3,945,904 1,317,927 204,022 22,388 262,532 1,010
35,460,806BERGEN COUNTY VOCATI 20,009,658 18,798,594 1,043,970 167,094 5,772,691 5,046,020 4,461,650 2,581,168 3,540,698 1,836,703 90,000 955,754 121,317 2,085
34,338,940BERGENFIELD BORO 21,197,331 20,159,861 905,453 132,017 5,026,606 4,508,766 3,870,613 3,084,137 3,543,604 2,363,381 0 567,640 172,739 3,758
10,681,672BOGOTA BORO 6,486,944 6,309,715 160,832 16,397 1,262,054 891,883 1,662,334 1,110,743 952,420 557,816 0 317,920 0 1,151
6,143,601CARLSTADT BORO 3,527,953 3,418,582 100,118 9,253 708,253 634,845 1,105,539 916,520 763,077 386,751 14,935 23,845 60,027 510
6,843,708CARLSTADT-EAST RUTHE 3,955,009 3,763,500 177,325 14,184 799,374 600,170 898,492 644,533 843,990 486,512 0 327,629 37,717 509
24,212,858CLIFFSIDE PARK BORO 16,400,777 15,349,505 608,570 442,702 2,721,609 2,387,666 2,520,516 1,771,764 1,782,460 994,265 879 748,740 337,154 2,670
10,822,588CLOSTER BORO 7,033,465 6,731,873 254,472 47,120 1,816,862 1,501,742 1,100,478 929,508 1,029,701 599,236 0 48,420 45,742 1,202
14,515,682CRESSKILL BORO 9,010,684 8,434,530 343,900 232,254 2,027,483 1,715,944 1,630,847 1,217,495 1,365,110 809,807 0 476,772 58,594 1,425
7,249,495DEMAREST BORO 4,449,743 4,109,941 227,986 111,816 902,075 632,126 960,466 829,152 800,596 449,801 0 107,060 0 724
25,866,866DUMONT BORO 16,315,729 15,876,354 312,987 126,388 2,994,122 2,742,173 2,780,416 2,395,387 3,190,094 2,029,321 18,000 562,946 234,973 2,651
8,793,693EAST RUTHERFORD BOR 6,515,185 6,119,645 336,867 47,914 1,079,803 956,811 1,175,644 811,879 955,503 516,957 82,916 44,326 14,884 762
4,128,888EDGEWATER BORO 2,254,391 2,060,846 173,245 20,300 799,346 484,227 587,439 421,434 463,990 206,404 0 16,958 6,330 370
17,029,916ELMWOOD PARK 8,826,064 8,220,313 441,926 163,825 2,906,004 2,062,452 2,924,098 2,186,224 1,874,145 1,025,331 0 477,343 27,081 2,008
10,799,565EMERSON BORO 5,991,801 5,697,546 251,287 42,968 1,641,422 1,345,347 1,327,868 1,224,574 1,282,974 679,466 0 522,561 50,220 1,100
33,795,404ENGLEWOOD CITY 19,637,133 18,001,448 893,634 736,002 4,311,805 3,686,279 4,713,967 2,091,414 3,826,234 296,533 200,786 800,239 7,337 2,582
6,236,679ENGLEWOOD CLIFFS BOR 3,753,662 3,448,381 241,483 63,798 688,131 479,473 993,612 770,453 662,370 437,223 0 135,011 29,836 433
50,002,268FAIR LAWN BORO 29,044,962 27,704,292 757,852 582,818 8,483,205 7,295,049 5,372,263 4,681,984 5,598,261 3,591,212 0 1,053,700 75,264 4,725
8,122,997FAIRVIEW BORO 4,703,694 4,227,758 307,305 168,631 808,032 734,314 1,230,284 862,822 1,224,945 701,033 0 55,059 31,981 1,051
33,579,933FORT LEE BORO 20,322,566 19,450,676 804,501 67,389 4,546,030 4,081,541 3,839,363 3,076,528 4,161,551 2,768,792 0 660,908 277,333 3,450
15,150,109FRANKLIN LAKES BORO 9,328,249 8,939,623 361,811 26,815 2,604,053 2,258,967 1,580,488 1,308,850 1,536,030 35,698 0 101,289 100,869 1,411
41,764,133GARFIELD CITY 27,648,198 25,339,137 696,785 1,612,276 5,823,280 5,130,817 3,584,224 2,987,968 4,050,911 2,636,616 0 487,997 19,283 4,220
24,802,583GLEN ROCK BORO 18,343,033 17,473,491 659,675 209,867 3,011,910 2,848,132 2,691,851 2,141,935 3,126,422 1,746,980 2,500 614,080 1,047,147 2,327
50,864,120HACKENSACK CITY 32,204,312 30,770,568 1,142,448 291,296 6,243,315 5,486,131 5,197,573 4,502,887 6,098,518 3,008,216 70,000 1,040,255 491,209 4,854
5,832,142HARRINGTON PARK BORO 3,309,772 3,141,461 159,715 8,596 903,661 729,103 773,422 588,275 787,682 289,109 0 57,605 4,850 631
14,080,884HASBROUCK HEIGHTS BO 8,842,228 8,305,684 309,999 226,545 1,680,652 1,480,253 1,994,137 1,616,851 1,483,004 184,926 0 80,863 18,911 1,573
4,976,553HAWORTH BORO 3,213,048 2,922,793 121,316 168,939 553,719 469,487 633,487 479,687 542,856 246,493 0 33,443 58,706 491
11,736,530HILLSDALE BORO 7,325,973 6,838,191 340,063 147,719 1,588,335 1,250,586 1,386,795 1,064,204 1,364,139 802,125 0 62,877 33,029 1,309
5,754,265HO HO KUS BORO 3,453,098 3,272,126 146,822 34,150 842,228 708,871 839,204 637,395 549,240 286,847 0 70,494 30,968 588
N.J. Department of Education - Comparative Spending Guide March 2005Page 834
DISTRICT
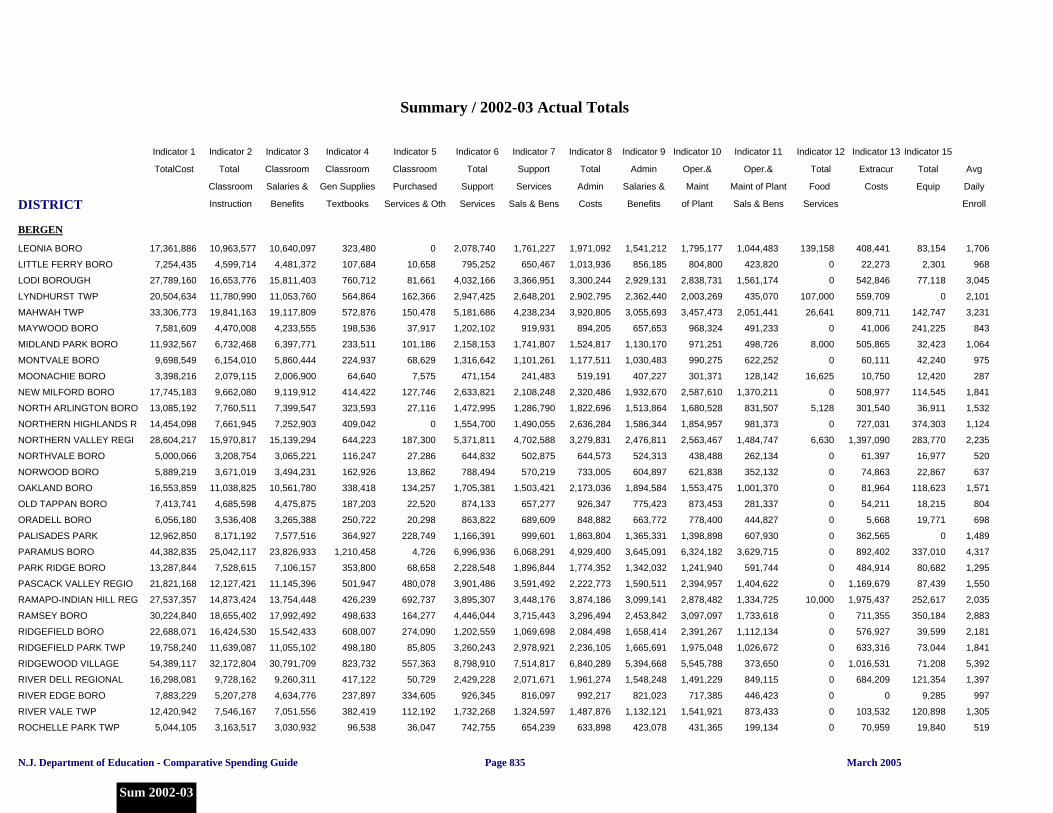
Summary / 2002-03 Actual Totals
Indicator 1 Indicator 2 Indicator 3 Indicator 4 Indicator 5 Indicator 6 Indicator 7 Indicator 8 Indicator 9 Indicator 10 Indicator 11 Indicator 12 Indicator 13 Indicator 15
TotalCost Total Classroom Classroom Classroom Total Support Total Admin Oper.& Oper.& Total Extracur Total Avg
Per Pupil Classroom Salaries & Gen Supplies Purchased Support Services Admin Salaries & Maint Maint of Plant Food Costs Equip Daily
Instruction Benefits Textbooks Services & Oth Services Sals & Bens Costs Benefits of Plant Sals & Bens Services Enroll
BERGEN
17,361,886LEONIA BORO 10,963,577 10,640,097 323,480 0 2,078,740 1,761,227 1,971,092 1,541,212 1,795,177 1,044,483 139,158 408,441 83,154 1,706
7,254,435LITTLE FERRY BORO 4,599,714 4,481,372 107,684 10,658 795,252 650,467 1,013,936 856,185 804,800 423,820 0 22,273 2,301 968
27,789,160LODI BOROUGH 16,653,776 15,811,403 760,712 81,661 4,032,166 3,366,951 3,300,244 2,929,131 2,838,731 1,561,174 0 542,846 77,118 3,045
20,504,634LYNDHURST TWP 11,780,990 11,053,760 564,864 162,366 2,947,425 2,648,201 2,902,795 2,362,440 2,003,269 435,070 107,000 559,709 0 2,101
33,306,773MAHWAH TWP 19,841,163 19,117,809 572,876 150,478 5,181,686 4,238,234 3,920,805 3,055,693 3,457,473 2,051,441 26,641 809,711 142,747 3,231
7,581,609MAYWOOD BORO 4,470,008 4,233,555 198,536 37,917 1,202,102 919,931 894,205 657,653 968,324 491,233 0 41,006 241,225 843
11,932,567MIDLAND PARK BORO 6,732,468 6,397,771 233,511 101,186 2,158,153 1,741,807 1,524,817 1,130,170 971,251 498,726 8,000 505,865 32,423 1,064
9,698,549MONTVALE BORO 6,154,010 5,860,444 224,937 68,629 1,316,642 1,101,261 1,177,511 1,030,483 990,275 622,252 0 60,111 42,240 975
3,398,216MOONACHIE BORO 2,079,115 2,006,900 64,640 7,575 471,154 241,483 519,191 407,227 301,371 128,142 16,625 10,750 12,420 287
17,745,183NEW MILFORD BORO 9,662,080 9,119,912 414,422 127,746 2,633,821 2,108,248 2,320,486 1,932,670 2,587,610 1,370,211 0 508,977 114,545 1,841
13,085,192NORTH ARLINGTON BORO 7,760,511 7,399,547 323,593 27,116 1,472,995 1,286,790 1,822,696 1,513,864 1,680,528 831,507 5,128 301,540 36,911 1,532
14,454,098NORTHERN HIGHLANDS R 7,661,945 7,252,903 409,042 0 1,554,700 1,490,055 2,636,284 1,586,344 1,854,957 981,373 0 727,031 374,303 1,124
28,604,217NORTHERN VALLEY REGI 15,970,817 15,139,294 644,223 187,300 5,371,811 4,702,588 3,279,831 2,476,811 2,563,467 1,484,747 6,630 1,397,090 283,770 2,235
5,000,066NORTHVALE BORO 3,208,754 3,065,221 116,247 27,286 644,832 502,875 644,573 524,313 438,488 262,134 0 61,397 16,977 520
5,889,219NORWOOD BORO 3,671,019 3,494,231 162,926 13,862 788,494 570,219 733,005 604,897 621,838 352,132 0 74,863 22,867 637
16,553,859OAKLAND BORO 11,038,825 10,561,780 338,418 134,257 1,705,381 1,503,421 2,173,036 1,894,584 1,553,475 1,001,370 0 81,964 118,623 1,571
7,413,741OLD TAPPAN BORO 4,685,598 4,475,875 187,203 22,520 874,133 657,277 926,347 775,423 873,453 281,337 0 54,211 18,215 804
6,056,180ORADELL BORO 3,536,408 3,265,388 250,722 20,298 863,822 689,609 848,882 663,772 778,400 444,827 0 5,668 19,771 698
12,962,850PALISADES PARK 8,171,192 7,577,516 364,927 228,749 1,166,391 999,601 1,863,804 1,365,331 1,398,898 607,930 0 362,565 0 1,489
44,382,835PARAMUS BORO 25,042,117 23,826,933 1,210,458 4,726 6,996,936 6,068,291 4,929,400 3,645,091 6,324,182 3,629,715 0 892,402 337,010 4,317
13,287,844PARK RIDGE BORO 7,528,615 7,106,157 353,800 68,658 2,228,548 1,896,844 1,774,352 1,342,032 1,241,940 591,744 0 484,914 80,682 1,295
21,821,168PASCACK VALLEY REGIO 12,127,421 11,145,396 501,947 480,078 3,901,486 3,591,492 2,222,773 1,590,511 2,394,957 1,404,622 0 1,169,679 87,439 1,550
27,537,357RAMAPO-INDIAN HILL REG 14,873,424 13,754,448 426,239 692,737 3,895,307 3,448,176 3,874,186 3,099,141 2,878,482 1,334,725 10,000 1,975,437 252,617 2,035
30,224,840RAMSEY BORO 18,655,402 17,992,492 498,633 164,277 4,446,044 3,715,443 3,296,494 2,453,842 3,097,097 1,733,618 0 711,355 350,184 2,883
22,688,071RIDGEFIELD BORO 16,424,530 15,542,433 608,007 274,090 1,202,559 1,069,698 2,084,498 1,658,414 2,391,267 1,112,134 0 576,927 39,599 2,181
19,758,240RIDGEFIELD PARK TWP 11,639,087 11,055,102 498,180 85,805 3,260,243 2,978,921 2,236,105 1,665,691 1,975,048 1,026,672 0 633,316 73,044 1,841
54,389,117RIDGEWOOD VILLAGE 32,172,804 30,791,709 823,732 557,363 8,798,910 7,514,817 6,840,289 5,394,668 5,545,788 373,650 0 1,016,531 71,208 5,392
16,298,081RIVER DELL REGIONAL 9,728,162 9,260,311 417,122 50,729 2,429,228 2,071,671 1,961,274 1,548,248 1,491,229 849,115 0 684,209 121,354 1,397
7,883,229RIVER EDGE BORO 5,207,278 4,634,776 237,897 334,605 926,345 816,097 992,217 821,023 717,385 446,423 0 0 9,285 997
12,420,942RIVER VALE TWP 7,546,167 7,051,556 382,419 112,192 1,732,268 1,324,597 1,487,876 1,132,121 1,541,921 873,433 0 103,532 120,898 1,305
5,044,105ROCHELLE PARK TWP 3,163,517 3,030,932 96,538 36,047 742,755 654,239 633,898 423,078 431,365 199,134 0 70,959 19,840 519
N.J. Department of Education - Comparative Spending Guide March 2005
Sum 2002-03
Page 835
DISTRICT
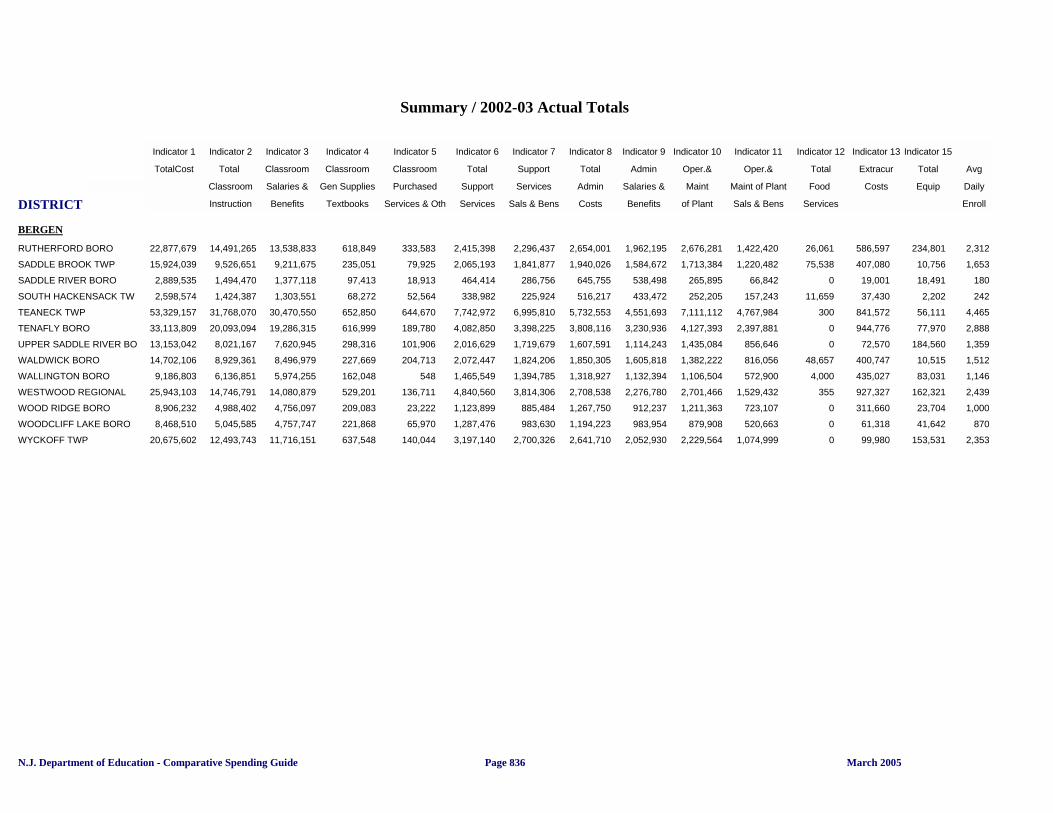
Summary / 2002-03 Actual Totals
Indicator 1 Indicator 2 Indicator 3 Indicator 4 Indicator 5 Indicator 6 Indicator 7 Indicator 8 Indicator 9 Indicator 10 Indicator 11 Indicator 12 Indicator 13 Indicator 15
TotalCost Total Classroom Classroom Classroom Total Support Total Admin Oper.& Oper.& Total Extracur Total Avg
Per Pupil Classroom Salaries & Gen Supplies Purchased Support Services Admin Salaries & Maint Maint of Plant Food Costs Equip Daily
Instruction Benefits Textbooks Services & Oth Services Sals & Bens Costs Benefits of Plant Sals & Bens Services Enroll
BERGEN
22,877,679RUTHERFORD BORO 14,491,265 13,538,833 618,849 333,583 2,415,398 2,296,437 2,654,001 1,962,195 2,676,281 1,422,420 26,061 586,597 234,801 2,312
15,924,039SADDLE BROOK TWP 9,526,651 9,211,675 235,051 79,925 2,065,193 1,841,877 1,940,026 1,584,672 1,713,384 1,220,482 75,538 407,080 10,756 1,653
2,889,535SADDLE RIVER BORO 1,494,470 1,377,118 97,413 18,913 464,414 286,756 645,755 538,498 265,895 66,842 0 19,001 18,491 180
2,598,574SOUTH HACKENSACK TW 1,424,387 1,303,551 68,272 52,564 338,982 225,924 516,217 433,472 252,205 157,243 11,659 37,430 2,202 242
53,329,157TEANECK TWP 31,768,070 30,470,550 652,850 644,670 7,742,972 6,995,810 5,732,553 4,551,693 7,111,112 4,767,984 300 841,572 56,111 4,465
33,113,809TENAFLY BORO 20,093,094 19,286,315 616,999 189,780 4,082,850 3,398,225 3,808,116 3,230,936 4,127,393 2,397,881 0 944,776 77,970 2,888
13,153,042UPPER SADDLE RIVER BO 8,021,167 7,620,945 298,316 101,906 2,016,629 1,719,679 1,607,591 1,114,243 1,435,084 856,646 0 72,570 184,560 1,359
14,702,106WALDWICK BORO 8,929,361 8,496,979 227,669 204,713 2,072,447 1,824,206 1,850,305 1,605,818 1,382,222 816,056 48,657 400,747 10,515 1,512
9,186,803WALLINGTON BORO 6,136,851 5,974,255 162,048 548 1,465,549 1,394,785 1,318,927 1,132,394 1,106,504 572,900 4,000 435,027 83,031 1,146
25,943,103WESTWOOD REGIONAL 14,746,791 14,080,879 529,201 136,711 4,840,560 3,814,306 2,708,538 2,276,780 2,701,466 1,529,432 355 927,327 162,321 2,439
8,906,232WOOD RIDGE BORO 4,988,402 4,756,097 209,083 23,222 1,123,899 885,484 1,267,750 912,237 1,211,363 723,107 0 311,660 23,704 1,000
8,468,510WOODCLIFF LAKE BORO 5,045,585 4,757,747 221,868 65,970 1,287,476 983,630 1,194,223 983,954 879,908 520,663 0 61,318 41,642 870
20,675,602WYCKOFF TWP 12,493,743 11,716,151 637,548 140,044 3,197,140 2,700,326 2,641,710 2,052,930 2,229,564 1,074,999 0 99,980 153,531 2,353
N.J. Department of Education - Comparative Spending Guide March 2005Page 836

DISTRICT
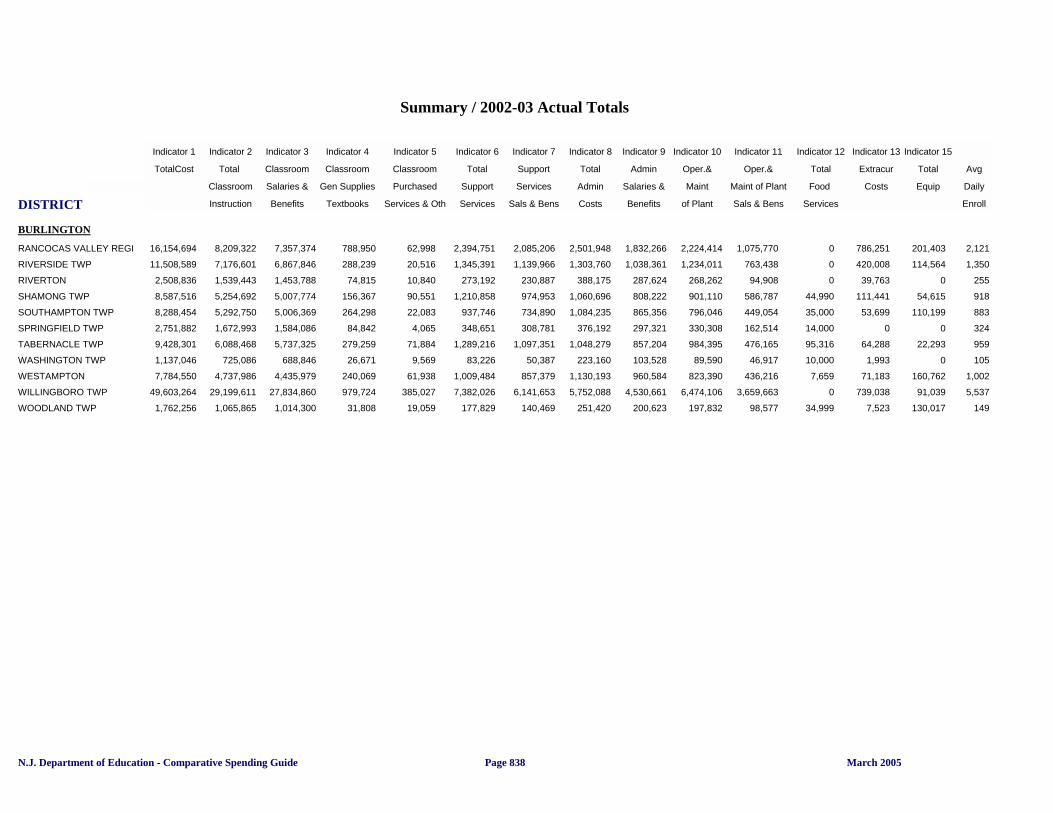
Summary / 2002-03 Actual Totals
Indicator 1 Indicator 2 Indicator 3 Indicator 4 Indicator 5 Indicator 6 Indicator 7 Indicator 8 Indicator 9 Indicator 10 Indicator 11 Indicator 12 Indicator 13 Indicator 15
TotalCost Total Classroom Classroom Classroom Total Support Total Admin Oper.& Oper.& Total Extracur Total Avg
Per Pupil Classroom Salaries & Gen Supplies Purchased Support Services Admin Salaries & Maint Maint of Plant Food Costs Equip Daily
Instruction Benefits Textbooks Services & Oth Services Sals & Bens Costs Benefits of Plant Sals & Bens Services Enroll
BURLINGTON
1,523,426BASS RIVER TWP 856,842 826,874 20,461 9,507 205,264 180,574 262,238 202,572 186,716 110,644 12,366 0 0 152
3,248,939BEVERLY CITY 1,952,873 1,770,497 128,676 53,700 607,302 436,955 324,446 262,043 330,309 117,953 8,736 15,511 44,205 315
18,569,949BORDENTOWN REGIONAL 10,438,951 9,739,172 627,803 57,222 3,067,704 2,585,473 2,278,994 1,740,087 2,253,331 1,477,987 0 694,542 198,964 2,011
19,753,798BURLINGTON CITY 11,695,440 10,599,118 826,265 270,057 3,013,034 2,598,208 2,406,515 1,862,922 1,943,867 1,143,800 20,000 626,116 127,603 1,782
25,953,688BURLINGTON CO SPEC SE 19,375,459 18,717,521 450,192 207,746 1,015,360 780,501 2,578,322 1,942,204 2,428,552 1,226,569 343,495 45,156 11,542 1,229
22,950,775BURLINGTON CO VOCATI 14,252,719 13,237,368 737,044 278,307 2,198,257 2,016,079 4,257,382 3,581,939 3,711,175 2,173,420 0 916,902 225,410 1,690
28,122,490BURLINGTON TWP 18,133,396 16,167,446 1,034,965 930,985 3,192,775 2,643,529 3,583,958 3,055,643 2,712,391 246,327 0 589,123 203,573 3,832
2,618,343CHESTERFIELD TWP 1,459,988 1,381,097 70,283 8,608 412,985 325,848 428,274 344,737 292,794 157,653 8,300 13,454 7,300 267
23,069,648CINNAMINSON TWP 14,472,491 13,644,049 484,059 344,383 2,845,976 2,191,275 2,650,877 2,080,091 2,423,973 1,225,092 0 776,833 26,115 2,559
3,473,363DELANCO TWP 2,369,598 2,278,217 74,648 16,733 339,147 194,231 835,745 695,913 429,093 295,222 10,000 24,655 0 371
20,747,737DELRAN TWP 12,357,608 11,533,431 751,370 72,807 2,342,884 2,028,196 2,745,599 1,964,978 2,699,265 602,415 0 595,374 142,789 2,639
6,421,429EASTAMPTON TWP 3,662,886 3,501,920 121,883 39,083 959,930 811,275 914,060 658,001 753,227 348,865 2,000 115,738 27,734 821
7,606,854EDGEWATER PARK TWP 4,605,361 4,431,911 152,814 20,636 1,273,766 1,056,837 822,423 658,358 838,607 468,498 0 26,191 7,956 940
42,236,525EVESHAM TWP 26,308,741 25,119,851 1,159,722 29,168 5,896,442 4,860,644 4,349,399 3,513,477 5,157,640 2,895,090 26,411 503,325 567,874 5,431
14,146,084FLORENCE TWP 9,412,921 8,989,832 357,771 65,318 2,681,902 2,397,628 2,215,187 1,690,434 1,769,776 1,264,097 0 425,862 0 1,555
4,718,370HAINESPORT TWP 2,882,504 2,712,709 157,936 11,859 744,565 496,562 574,875 429,006 464,205 261,430 0 37,154 0 558
64,052,400LENAPE REGIONAL 34,641,176 32,789,104 1,681,772 170,300 8,528,604 7,249,475 9,197,662 7,144,216 7,661,115 4,242,297 0 3,260,860 745,458 6,730
12,528,853LUMBERTON TWP 9,923,475 9,517,871 385,757 19,385 1,879,763 1,660,029 1,327,520 1,137,034 1,429,373 653,789 0 104,018 0 1,668
4,594,550MANSFIELD TWP 2,899,382 2,749,785 139,926 9,671 829,920 655,309 569,248 485,171 296,000 178,636 0 0 2,310 634
19,264,764MAPLE SHADE TWP 12,066,535 11,420,924 463,143 182,468 2,590,953 2,036,237 2,176,740 1,750,749 1,867,626 956,818 0 505,717 102,220 2,104
4,513,432MEDFORD LAKES BORO 2,898,140 2,839,667 26,565 31,908 606,944 412,965 575,501 429,002 352,887 184,803 0 79,960 0 544
25,103,138MEDFORD TWP 15,911,222 14,959,219 679,363 272,640 3,367,228 3,048,710 3,118,352 2,378,750 2,522,621 1,379,664 0 123,302 490,502 2,983
36,126,376MOORESTOWN TWP 21,002,934 19,765,909 681,301 555,724 6,879,530 5,587,919 3,454,301 2,969,330 3,523,676 1,656,992 0 1,084,148 44,653 4,065
12,168,666MOUNT HOLLY TWP 6,918,943 6,520,732 303,286 94,925 1,927,899 1,656,991 1,582,695 1,238,505 1,414,153 760,549 116,476 208,500 23,347 1,132
37,958,211MOUNT LAUREL TWP 23,572,446 22,744,141 636,156 192,149 4,869,323 4,325,880 4,328,119 3,195,905 3,991,762 2,227,781 0 193,339 252,449 4,538
1,985,411NEW HANOVER TWP 1,117,009 1,054,663 62,346 0 243,548 107,250 359,964 291,730 232,517 80,959 16,000 16,373 30,847 163
13,276,712NORTH HANOVER TWP 7,670,885 7,269,682 334,974 26,500 1,977,274 1,656,942 1,915,790 1,483,326 1,313,023 685,045 307,162 77,749 53,149 1,395
17,684,252NORTHERN BURLINGTON 11,897,579 11,284,913 516,441 96,225 2,814,489 2,475,499 2,397,245 2,010,029 2,611,372 1,695,975 0 841,735 224,810 1,850
9,317,207PALMYRA BORO 5,364,001 5,007,566 228,235 128,200 1,294,742 972,980 1,177,985 904,050 1,096,677 456,344 0 280,926 115,918 1,101
1,213,650PEMBERTON BOROUGH 568,368 543,714 20,933 3,721 229,762 185,890 393,588 290,187 141,517 71,620 4,000 2,794 24,488 100
72,312,143PEMBERTON TWP 42,046,512 38,414,056 1,812,153 1,820,303 11,429,319 9,570,464 9,229,612 7,134,355 7,227,755 3,928,757 200,000 887,425 1,202,769 5,816
N.J. Department of Education - Comparative Spending Guide March 2005
Sum 2002-03
Page 837
DISTRICT
Summary / 2002-03 Actual Totals
Indicator 1 Indicator 2 Indicator 3 Indicator 4 Indicator 5 Indicator 6 Indicator 7 Indicator 8 Indicator 9 Indicator 10 Indicator 11 Indicator 12 Indicator 13 Indicator 15
TotalCost Total Classroom Classroom Classroom Total Support Total Admin Oper.& Oper.& Total Extracur Total Avg
Per Pupil Classroom Salaries & Gen Supplies Purchased Support Services Admin Salaries & Maint Maint of Plant Food Costs Equip Daily
Instruction Benefits Textbooks Services & Oth Services Sals & Bens Costs Benefits of Plant Sals & Bens Services Enroll
BURLINGTON
16,154,694RANCOCAS VALLEY REGI 8,209,322 7,357,374 788,950 62,998 2,394,751 2,085,206 2,501,948 1,832,266 2,224,414 1,075,770 0 786,251 201,403 2,121
11,508,589RIVERSIDE TWP 7,176,601 6,867,846 288,239 20,516 1,345,391 1,139,966 1,303,760 1,038,361 1,234,011 763,438 0 420,008 114,564 1,350
2,508,836RIVERTON 1,539,443 1,453,788 74,815 10,840 273,192 230,887 388,175 287,624 268,262 94,908 0 39,763 0 255
8,587,516SHAMONG TWP 5,254,692 5,007,774 156,367 90,551 1,210,858 974,953 1,060,696 808,222 901,110 586,787 44,990 111,441 54,615 918
8,288,454SOUTHAMPTON TWP 5,292,750 5,006,369 264,298 22,083 937,746 734,890 1,084,235 865,356 796,046 449,054 35,000 53,699 110,199 883
2,751,882SPRINGFIELD TWP 1,672,993 1,584,086 84,842 4,065 348,651 308,781 376,192 297,321 330,308 162,514 14,000 0 0 324
9,428,301TABERNACLE TWP 6,088,468 5,737,325 279,259 71,884 1,289,216 1,097,351 1,048,279 857,204 984,395 476,165 95,316 64,288 22,293 959
1,137,046WASHINGTON TWP 725,086 688,846 26,671 9,569 83,226 50,387 223,160 103,528 89,590 46,917 10,000 1,993 0 105
7,784,550WESTAMPTON 4,737,986 4,435,979 240,069 61,938 1,009,484 857,379 1,130,193 960,584 823,390 436,216 7,659 71,183 160,762 1,002
49,603,264WILLINGBORO TWP 29,199,611 27,834,860 979,724 385,027 7,382,026 6,141,653 5,752,088 4,530,661 6,474,106 3,659,663 0 739,038 91,039 5,537
1,762,256WOODLAND TWP 1,065,865 1,014,300 31,808 19,059 177,829 140,469 251,420 200,623 197,832 98,577 34,999 7,523 130,017 149
N.J. Department of Education - Comparative Spending Guide March 2005Page 838
DISTRICT
Summary / 2002-03 Actual Totals
Indicator 1 Indicator 2 Indicator 3 Indicator 4 Indicator 5 Indicator 6 Indicator 7 Indicator 8 Indicator 9 Indicator 10 Indicator 11 Indicator 12 Indicator 13 Indicator 15
TotalCost Total Classroom Classroom Classroom Total Support Total Admin Oper.& Oper.& Total Extracur Total Avg
Per Pupil Classroom Salaries & Gen Supplies Purchased Support Services Admin Salaries & Maint Maint of Plant Food Costs Equip Daily
Instruction Benefits Textbooks Services & Oth Services Sals & Bens Costs Benefits of Plant Sals & Bens Services Enroll
CAMDEN
14,484,657AUDUBON BORO 9,132,859 8,702,055 407,373 23,431 1,610,840 1,412,993 1,613,710 1,315,061 1,428,271 880,896 25,000 631,717 73,538 1,777
5,260,483BARRINGTON BORO 2,956,539 2,796,230 117,216 43,093 1,084,811 711,467 741,138 600,490 456,189 244,710 1,942 19,864 6,627 602
8,201,095BELLMAWR BORO 5,454,707 5,170,060 178,525 106,122 1,066,782 908,401 895,873 739,959 706,970 390,913 0 76,763 26,332 972
6,109,589BERLIN BORO 3,773,307 3,534,247 191,735 47,325 691,465 597,537 911,639 657,169 632,289 326,665 0 58,030 3,971 768
7,088,799BERLIN TWP 4,407,213 4,201,621 184,120 21,472 1,002,991 895,003 968,516 762,172 578,617 245,963 0 47,758 50,858 736
36,410,181BLACK HORSE PIKE REGI 19,894,873 18,873,357 703,254 318,262 5,385,092 4,871,139 4,489,086 3,882,931 4,840,871 2,738,644 0 1,756,782 235,958 3,890
2,341,564BROOKLAWN BORO 1,403,214 1,325,069 59,931 18,214 343,076 246,534 328,669 258,247 187,247 80,360 50,322 26,671 117,200 280
208,639,900CAMDEN CITY 117,025,038 107,567,208 6,705,940 2,751,890 41,802,851 26,828,314 23,379,123 16,714,526 23,118,286 12,620,885 2,360,000 493,533 2,025,359 17,382
28,313,433CAMDEN COUNTY VOCATI 13,797,474 12,171,078 1,426,354 200,042 3,103,619 2,713,853 4,814,705 3,985,227 5,368,791 2,751,039 597,718 582,543 52,582 2,631
105,510,102CHERRY HILL TWP 67,190,317 64,461,750 1,579,136 1,149,431 12,941,415 11,788,950 11,578,539 9,833,166 10,660,527 3,416,739 308,225 2,732,387 213,617 11,346
1,326,541CHESILHURST 720,299 658,553 33,120 28,626 142,996 89,546 285,366 103,677 140,879 57,363 25,000 5,627 0 144
5,086,076CLEMENTON BORO 3,853,086 3,697,398 143,723 11,965 706,098 538,219 662,132 516,685 505,415 210,649 54,409 30,443 49,143 594
19,808,788COLLINGSWOOD BORO 10,771,072 10,051,196 560,236 159,640 3,146,738 2,884,741 2,185,912 1,692,799 2,931,535 1,855,569 70,000 692,270 119,838 2,062
21,021,231EASTERN CAMDEN COUN 12,022,473 10,886,414 945,069 190,990 3,105,797 2,816,862 2,322,322 1,813,900 2,454,960 1,109,152 0 960,798 457,779 2,166
2,824,596GIBBSBORO BORO 1,912,077 1,840,158 68,699 3,220 360,152 310,040 283,934 179,778 172,817 70,251 22,528 57,109 13,344 292
25,724,000GLOUCESTER CITY 15,492,755 14,052,943 994,405 445,407 4,678,951 3,600,504 2,161,084 1,616,840 2,729,259 1,620,656 16,672 466,572 175,891 2,169
57,500,007GLOUCESTER TWP 37,967,151 35,718,856 1,946,669 301,626 6,877,035 6,232,680 5,932,047 4,776,742 5,921,014 3,151,072 250,000 536,588 78,259 8,017
11,922,165HADDON HEIGHTS BORO 7,020,500 6,727,796 253,087 39,617 1,551,785 1,366,898 1,502,095 1,198,634 1,231,932 695,532 0 519,559 6,383 1,268
18,654,352HADDON TWP 11,094,615 10,635,302 422,634 36,679 2,339,756 1,955,901 2,348,253 1,944,112 1,918,412 1,196,196 100,000 581,251 81,904 2,247
21,225,717HADDONFIELD BORO 12,624,369 12,097,673 492,378 34,318 2,923,838 2,341,832 2,257,780 1,909,234 2,507,788 1,556,442 0 889,341 80,982 2,333
1,275,676LAUREL SPRINGS BORO 736,415 697,071 18,965 20,379 151,235 98,176 251,996 205,758 132,006 58,748 0 1,743 7,002 167
3,233,175LAWNSIDE BORO 1,965,827 1,844,758 120,720 349 379,441 312,265 482,229 349,454 347,942 130,834 39,999 13,173 8,609 279
23,805,773LINDENWOLD BORO 14,180,626 13,512,871 598,597 69,158 3,627,213 3,303,353 2,618,126 2,064,291 2,369,034 1,231,468 174,299 641,208 240,110 2,356
3,877,913MAGNOLIA BORO 2,263,897 2,146,198 95,230 22,469 657,419 563,378 510,529 359,763 428,136 233,959 5,000 12,933 17,322 437
3,140,784MERCHANTVILLE BORO 2,074,678 2,014,730 37,757 22,191 271,881 199,240 440,015 323,675 308,272 159,355 0 45,511 0 357
3,423,523MOUNT EPHRAIM BORO 2,444,079 2,340,916 83,656 19,507 778,198 609,364 357,973 292,215 319,933 144,642 10,718 21,905 8,166 430
3,879,180OAKLYN BORO 2,353,239 2,168,461 161,035 23,743 550,552 425,133 580,274 498,908 341,953 170,710 0 53,163 0 508
53,064,252PENNSAUKEN TWP 32,375,823 30,514,901 1,465,796 395,126 6,770,100 6,067,624 5,654,989 4,547,778 6,892,225 4,366,786 0 1,038,100 172,968 6,208
21,551,913PINE HILL BORO 12,978,431 12,199,081 499,729 279,621 2,789,212 2,429,387 2,551,550 1,828,402 2,553,477 1,313,329 13,198 503,058 85,108 2,217
7,327,985RUNNEMEDE BORO 4,807,459 4,590,770 156,864 59,825 732,409 683,751 977,299 868,703 717,740 359,847 20,775 72,303 13,881 795
3,779,228SOMERDALE BORO 2,435,664 2,404,920 26,082 4,662 424,518 366,081 486,874 383,441 410,953 203,121 0 21,218 22,261 514
N.J. Department of Education - Comparative Spending Guide March 2005
Sum 2002-03
Page 839
DISTRICT
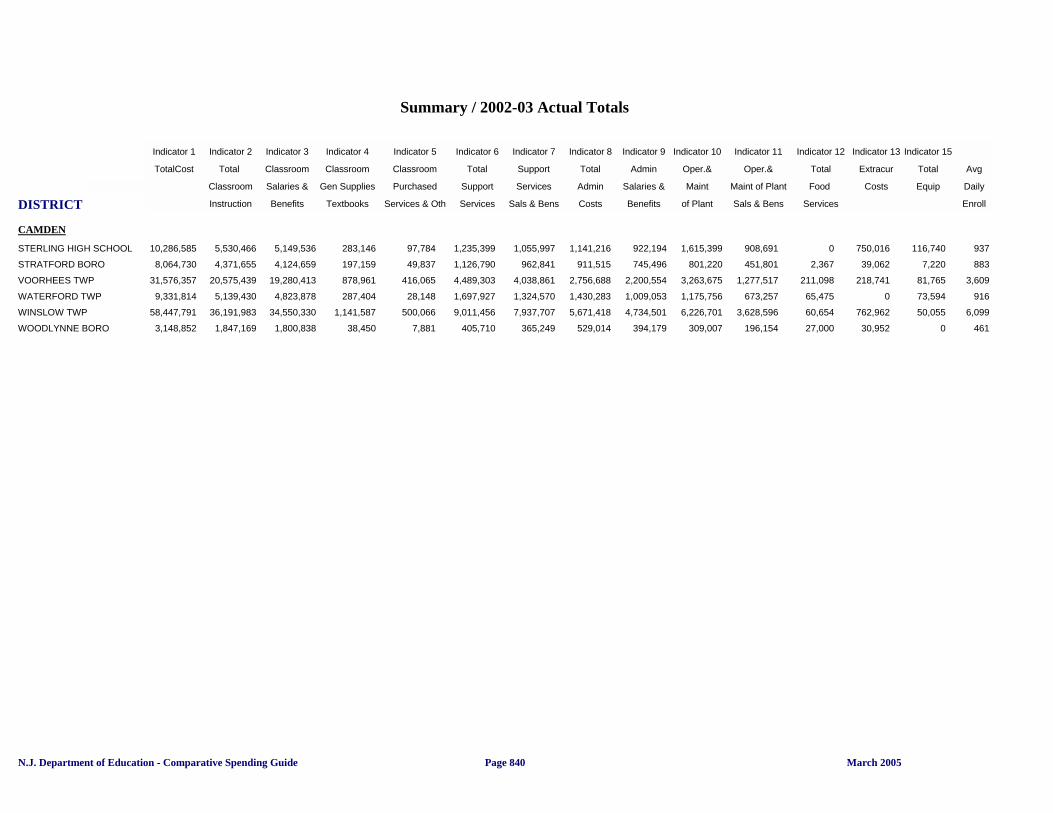
Summary / 2002-03 Actual Totals
Indicator 1 Indicator 2 Indicator 3 Indicator 4 Indicator 5 Indicator 6 Indicator 7 Indicator 8 Indicator 9 Indicator 10 Indicator 11 Indicator 12 Indicator 13 Indicator 15
TotalCost Total Classroom Classroom Classroom Total Support Total Admin Oper.& Oper.& Total Extracur Total Avg
Per Pupil Classroom Salaries & Gen Supplies Purchased Support Services Admin Salaries & Maint Maint of Plant Food Costs Equip Daily
Instruction Benefits Textbooks Services & Oth Services Sals & Bens Costs Benefits of Plant Sals & Bens Services Enroll
CAMDEN
10,286,585STERLING HIGH SCHOOL 5,530,466 5,149,536 283,146 97,784 1,235,399 1,055,997 1,141,216 922,194 1,615,399 908,691 0 750,016 116,740 937
8,064,730STRATFORD BORO 4,371,655 4,124,659 197,159 49,837 1,126,790 962,841 911,515 745,496 801,220 451,801 2,367 39,062 7,220 883
31,576,357VOORHEES TWP 20,575,439 19,280,413 878,961 416,065 4,489,303 4,038,861 2,756,688 2,200,554 3,263,675 1,277,517 211,098 218,741 81,765 3,609
9,331,814WATERFORD TWP 5,139,430 4,823,878 287,404 28,148 1,697,927 1,324,570 1,430,283 1,009,053 1,175,756 673,257 65,475 0 73,594 916
58,447,791WINSLOW TWP 36,191,983 34,550,330 1,141,587 500,066 9,011,456 7,937,707 5,671,418 4,734,501 6,226,701 3,628,596 60,654 762,962 50,055 6,099
3,148,852WOODLYNNE BORO 1,847,169 1,800,838 38,450 7,881 405,710 365,249 529,014 394,179 309,007 196,154 27,000 30,952 0 461
N.J. Department of Education - Comparative Spending Guide March 2005Page 840
DISTRICT
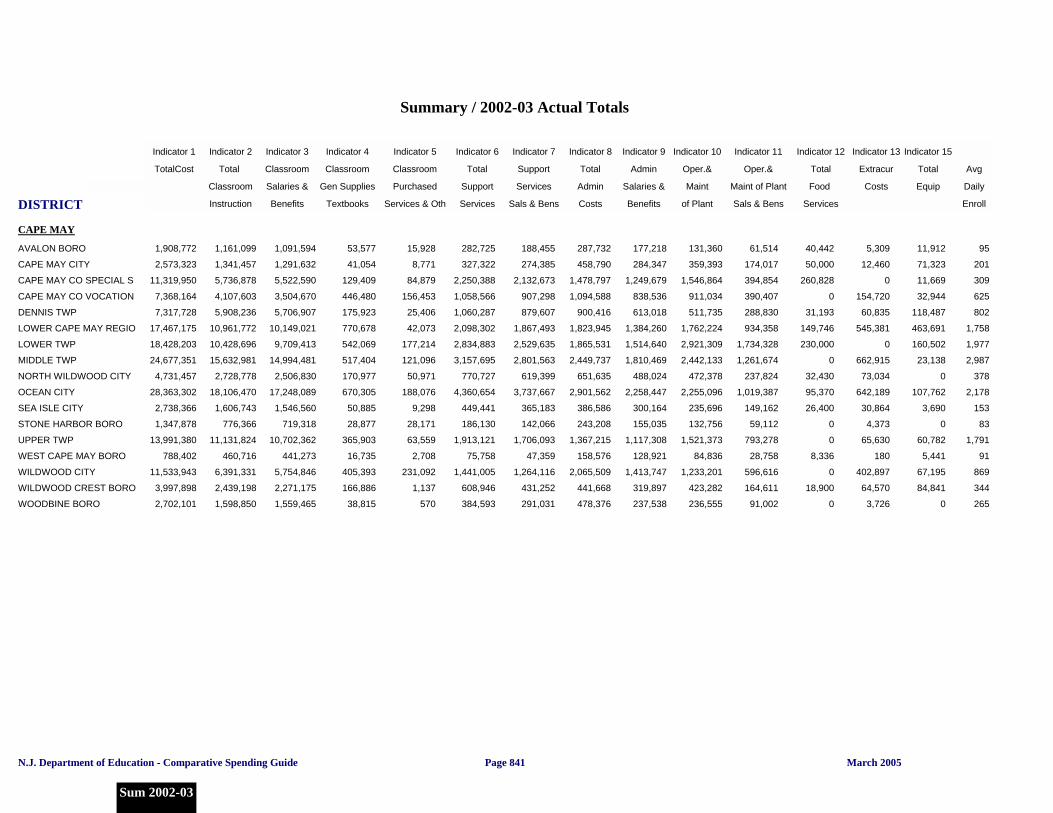
Summary / 2002-03 Actual Totals
Indicator 1 Indicator 2 Indicator 3 Indicator 4 Indicator 5 Indicator 6 Indicator 7 Indicator 8 Indicator 9 Indicator 10 Indicator 11 Indicator 12 Indicator 13 Indicator 15
TotalCost Total Classroom Classroom Classroom Total Support Total Admin Oper.& Oper.& Total Extracur Total Avg
Per Pupil Classroom Salaries & Gen Supplies Purchased Support Services Admin Salaries & Maint Maint of Plant Food Costs Equip Daily
Instruction Benefits Textbooks Services & Oth Services Sals & Bens Costs Benefits of Plant Sals & Bens Services Enroll
CAPE MAY
1,908,772AVALON BORO 1,161,099 1,091,594 53,577 15,928 282,725 188,455 287,732 177,218 131,360 61,514 40,442 5,309 11,912 95
2,573,323CAPE MAY CITY 1,341,457 1,291,632 41,054 8,771 327,322 274,385 458,790 284,347 359,393 174,017 50,000 12,460 71,323 201
11,319,950CAPE MAY CO SPECIAL S 5,736,878 5,522,590 129,409 84,879 2,250,388 2,132,673 1,478,797 1,249,679 1,546,864 394,854 260,828 0 11,669 309
7,368,164CAPE MAY CO VOCATION 4,107,603 3,504,670 446,480 156,453 1,058,566 907,298 1,094,588 838,536 911,034 390,407 0 154,720 32,944 625
7,317,728DENNIS TWP 5,908,236 5,706,907 175,923 25,406 1,060,287 879,607 900,416 613,018 511,735 288,830 31,193 60,835 118,487 802
17,467,175LOWER CAPE MAY REGIO 10,961,772 10,149,021 770,678 42,073 2,098,302 1,867,493 1,823,945 1,384,260 1,762,224 934,358 149,746 545,381 463,691 1,758
18,428,203LOWER TWP 10,428,696 9,709,413 542,069 177,214 2,834,883 2,529,635 1,865,531 1,514,640 2,921,309 1,734,328 230,000 0 160,502 1,977
24,677,351MIDDLE TWP 15,632,981 14,994,481 517,404 121,096 3,157,695 2,801,563 2,449,737 1,810,469 2,442,133 1,261,674 0 662,915 23,138 2,987
4,731,457NORTH WILDWOOD CITY 2,728,778 2,506,830 170,977 50,971 770,727 619,399 651,635 488,024 472,378 237,824 32,430 73,034 0 378
28,363,302OCEAN CITY 18,106,470 17,248,089 670,305 188,076 4,360,654 3,737,667 2,901,562 2,258,447 2,255,096 1,019,387 95,370 642,189 107,762 2,178
2,738,366SEA ISLE CITY 1,606,743 1,546,560 50,885 9,298 449,441 365,183 386,586 300,164 235,696 149,162 26,400 30,864 3,690 153
1,347,878STONE HARBOR BORO 776,366 719,318 28,877 28,171 186,130 142,066 243,208 155,035 132,756 59,112 0 4,373 0 83
13,991,380UPPER TWP 11,131,824 10,702,362 365,903 63,559 1,913,121 1,706,093 1,367,215 1,117,308 1,521,373 793,278 0 65,630 60,782 1,791
788,402WEST CAPE MAY BORO 460,716 441,273 16,735 2,708 75,758 47,359 158,576 128,921 84,836 28,758 8,336 180 5,441 91
11,533,943WILDWOOD CITY 6,391,331 5,754,846 405,393 231,092 1,441,005 1,264,116 2,065,509 1,413,747 1,233,201 596,616 0 402,897 67,195 869
3,997,898WILDWOOD CREST BORO 2,439,198 2,271,175 166,886 1,137 608,946 431,252 441,668 319,897 423,282 164,611 18,900 64,570 84,841 344
2,702,101WOODBINE BORO 1,598,850 1,559,465 38,815 570 384,593 291,031 478,376 237,538 236,555 91,002 0 3,726 0 265
N.J. Department of Education - Comparative Spending Guide March 2005
Sum 2002-03
Page 841
DISTRICT
Summary / 2002-03 Actual Totals
Indicator 1 Indicator 2 Indicator 3 Indicator 4 Indicator 5 Indicator 6 Indicator 7 Indicator 8 Indicator 9 Indicator 10 Indicator 11 Indicator 12 Indicator 13 Indicator 15
TotalCost Total Classroom Classroom Classroom Total Support Total Admin Oper.& Oper.& Total Extracur Total Avg
Per Pupil Classroom Salaries & Gen Supplies Purchased Support Services Admin Salaries & Maint Maint of Plant Food Costs Equip Daily
Instruction Benefits Textbooks Services & Oth Services Sals & Bens Costs Benefits of Plant Sals & Bens Services Enroll
CUMBERLAND
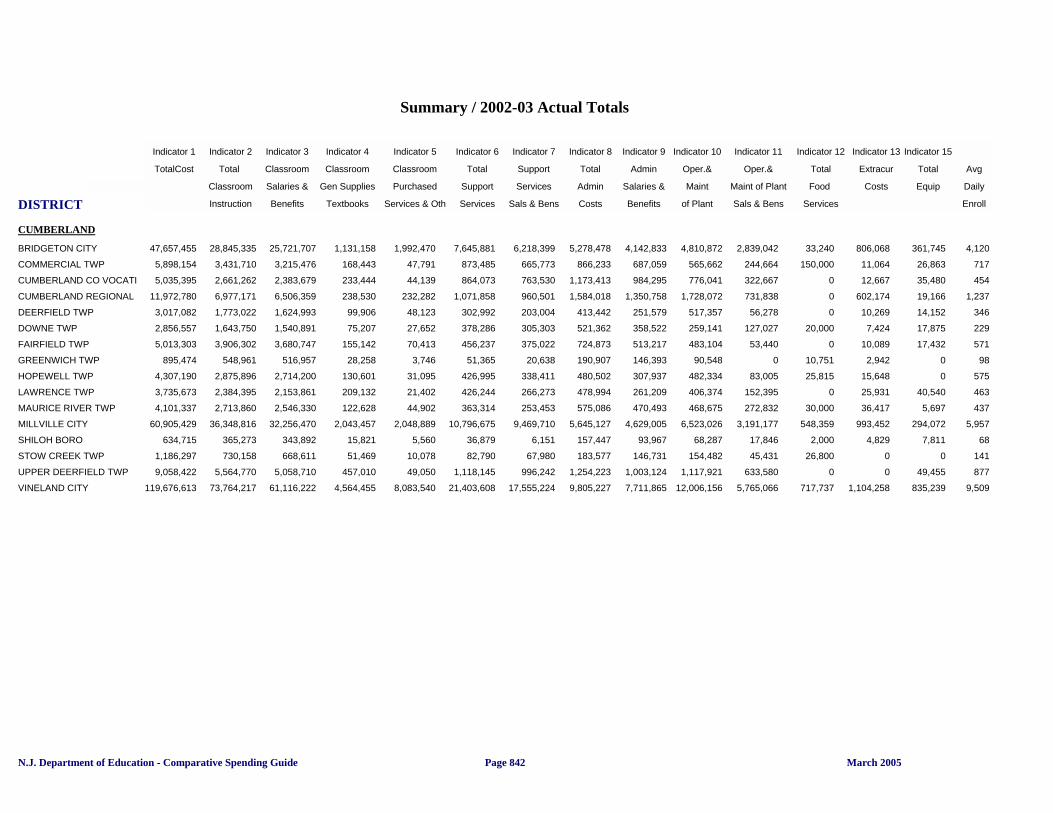
47,657,455BRIDGETON CITY 28,845,335 25,721,707 1,131,158 1,992,470 7,645,881 6,218,399 5,278,478 4,142,833 4,810,872 2,839,042 33,240 806,068 361,745 4,120
5,898,154COMMERCIAL TWP 3,431,710 3,215,476 168,443 47,791 873,485 665,773 866,233 687,059 565,662 244,664 150,000 11,064 26,863 717
5,035,395CUMBERLAND CO VOCATI 2,661,262 2,383,679 233,444 44,139 864,073 763,530 1,173,413 984,295 776,041 322,667 0 12,667 35,480 454
11,972,780CUMBERLAND REGIONAL 6,977,171 6,506,359 238,530 232,282 1,071,858 960,501 1,584,018 1,350,758 1,728,072 731,838 0 602,174 19,166 1,237
3,017,082DEERFIELD TWP 1,773,022 1,624,993 99,906 48,123 302,992 203,004 413,442 251,579 517,357 56,278 0 10,269 14,152 346
2,856,557DOWNE TWP 1,643,750 1,540,891 75,207 27,652 378,286 305,303 521,362 358,522 259,141 127,027 20,000 7,424 17,875 229
5,013,303FAIRFIELD TWP 3,906,302 3,680,747 155,142 70,413 456,237 375,022 724,873 513,217 483,104 53,440 0 10,089 17,432 571
895,474GREENWICH TWP 548,961 516,957 28,258 3,746 51,365 20,638 190,907 146,393 90,548 0 10,751 2,942 0 98
4,307,190HOPEWELL TWP 2,875,896 2,714,200 130,601 31,095 426,995 338,411 480,502 307,937 482,334 83,005 25,815 15,648 0 575
3,735,673LAWRENCE TWP 2,384,395 2,153,861 209,132 21,402 426,244 266,273 478,994 261,209 406,374 152,395 0 25,931 40,540 463
4,101,337MAURICE RIVER TWP 2,713,860 2,546,330 122,628 44,902 363,314 253,453 575,086 470,493 468,675 272,832 30,000 36,417 5,697 437
60,905,429MILLVILLE CITY 36,348,816 32,256,470 2,043,457 2,048,889 10,796,675 9,469,710 5,645,127 4,629,005 6,523,026 3,191,177 548,359 993,452 294,072 5,957
634,715SHILOH BORO 365,273 343,892 15,821 5,560 36,879 6,151 157,447 93,967 68,287 17,846 2,000 4,829 7,811 68
1,186,297STOW CREEK TWP 730,158 668,611 51,469 10,078 82,790 67,980 183,577 146,731 154,482 45,431 26,800 0 0 141
9,058,422UPPER DEERFIELD TWP 5,564,770 5,058,710 457,010 49,050 1,118,145 996,242 1,254,223 1,003,124 1,117,921 633,580 0 0 49,455 877
119,676,613VINELAND CITY 73,764,217 61,116,222 4,564,455 8,083,540 21,403,608 17,555,224 9,805,227 7,711,865 12,006,156 5,765,066 717,737 1,104,258 835,239 9,509
N.J. Department of Education - Comparative Spending Guide March 2005Page 842
DISTRICT
Summary / 2002-03 Actual Totals
Indicator 1 Indicator 2 Indicator 3 Indicator 4 Indicator 5 Indicator 6 Indicator 7 Indicator 8 Indicator 9 Indicator 10 Indicator 11 Indicator 12 Indicator 13 Indicator 15
TotalCost Total Classroom Classroom Classroom Total Support Total Admin Oper.& Oper.& Total Extracur Total Avg
Per Pupil Classroom Salaries & Gen Supplies Purchased Support Services Admin Salaries & Maint Maint of Plant Food Costs Equip Daily
Instruction Benefits Textbooks Services & Oth Services Sals & Bens Costs Benefits of Plant Sals & Bens Services Enroll
ESSEX
36,506,711BELLEVILLE TOWN 22,784,553 22,198,942 574,667 10,944 4,261,061 3,842,720 4,732,947 4,076,364 3,721,051 2,303,225 250,000 658,877 46,868 4,517
47,842,557BLOOMFIELD TWP 35,809,190 34,671,290 991,393 146,507 7,078,322 6,257,046 5,211,844 3,919,122 5,921,737 3,961,646 0 540,559 104,333 5,976
25,465,800CALDWELL-WEST CALDW 14,219,143 13,438,343 520,774 260,026 3,489,546 2,728,865 3,003,419 2,463,014 3,834,390 2,248,349 0 833,558 18,118 2,550
14,718,541CEDAR GROVE TWP 8,332,031 7,766,673 429,675 135,683 2,123,495 1,749,221 1,714,421 1,483,431 2,053,077 1,216,732 0 495,517 71,763 1,426
57,731,670CITY OF ORANGE TWP 29,898,140 25,854,554 2,790,156 1,042,352 14,929,691 8,416,373 5,724,989 4,035,012 6,399,187 1,162,016 161,218 541,427 1,965,964 4,476
143,633,733EAST ORANGE 79,389,359 67,774,663 3,249,767 8,364,929 24,511,462 21,227,399 16,118,517 11,873,499 20,301,148 11,759,196 1,342,244 1,305,951 928,361 11,635
27,129,043ESSEX CO VOC-TECH 13,593,592 12,816,965 761,718 14,909 3,401,271 3,058,151 4,422,149 3,417,353 4,571,112 2,609,728 2,976 473,799 0 2,041
2,502,280ESSEX FELLS BORO 1,430,350 1,415,613 14,537 200 394,696 368,613 428,330 356,527 246,604 138,665 0 1,248 2,190 262
6,643,768FAIRFIELD TWP 4,064,995 3,858,073 143,002 63,920 653,182 526,048 843,281 668,276 593,776 325,708 0 0 0 722
15,656,330GLEN RIDGE BORO 9,228,590 8,761,099 465,628 1,863 2,030,900 1,747,753 2,088,520 1,513,649 1,736,792 861,394 0 558,702 126,403 1,801
99,460,743IRVINGTON TOWNSHIP 61,101,982 45,803,950 1,930,509 13,367,523 13,379,638 12,267,362 11,928,387 6,849,332 11,495,362 7,147,840 0 554,755 870,974 7,469
57,000,588LIVINGSTON TWP 35,180,090 33,957,560 917,512 305,018 8,885,409 8,167,482 6,447,644 5,222,178 4,885,798 3,261,231 17,460 1,454,149 200,635 5,029
44,788,268MILLBURN TWP 26,084,322 23,943,981 1,432,221 708,120 8,482,737 7,572,365 4,432,323 3,520,726 4,540,249 2,460,605 0 1,126,332 53,955 4,146
65,876,408MONTCLAIR TOWN 41,501,453 40,312,646 782,841 405,966 10,481,779 10,063,825 6,341,847 5,337,902 6,273,041 3,318,829 37,750 1,007,982 8,200 6,314
618,851,515NEWARK CITY 322,054,438 263,616,029 15,477,742 42,960,667 117,623,782 102,458,541 69,537,656 57,349,224 93,833,740 63,057,441 8,195,000 5,437,201 1,030,038 42,195
5,680,002NORTH CALDWELL BORO 3,288,663 3,132,206 152,169 4,288 824,531 586,629 892,828 760,850 627,592 330,724 0 745 5,038 602
36,210,480NUTLEY TOWN 21,842,616 20,954,737 768,860 119,019 4,347,707 3,829,908 4,440,778 3,774,011 4,210,265 2,605,158 185,000 1,048,551 118,240 4,203
3,943,389ROSELAND BORO 2,512,354 2,337,481 132,573 42,300 435,774 323,914 602,597 561,255 388,965 154,598 0 0 185,754 430
61,344,709SOUTH ORANGE-MAPLEW 34,731,046 33,544,381 981,984 204,681 9,593,850 8,584,033 7,206,554 5,932,200 9,005,890 4,675,896 0 699,943 914,845 6,372
17,827,652VERONA BORO 10,684,219 10,299,126 256,205 128,888 2,268,689 1,994,173 2,406,501 1,950,527 1,879,963 1,186,747 0 543,072 40,775 2,004
18,544,533WEST ESSEX REGIONAL 10,300,433 9,534,121 530,373 188,949 2,270,131 1,809,918 2,579,575 2,176,081 2,435,433 1,544,533 0 957,573 87,019 1,421
63,706,594WEST ORANGE TOWN 40,346,103 38,752,713 1,417,897 175,493 6,978,831 6,358,619 8,041,068 6,816,300 7,008,945 3,692,326 35,000 1,058,219 69,315 6,167
N.J. Department of Education - Comparative Spending Guide March 2005
Sum 2002-03
Page 843
DISTRICT
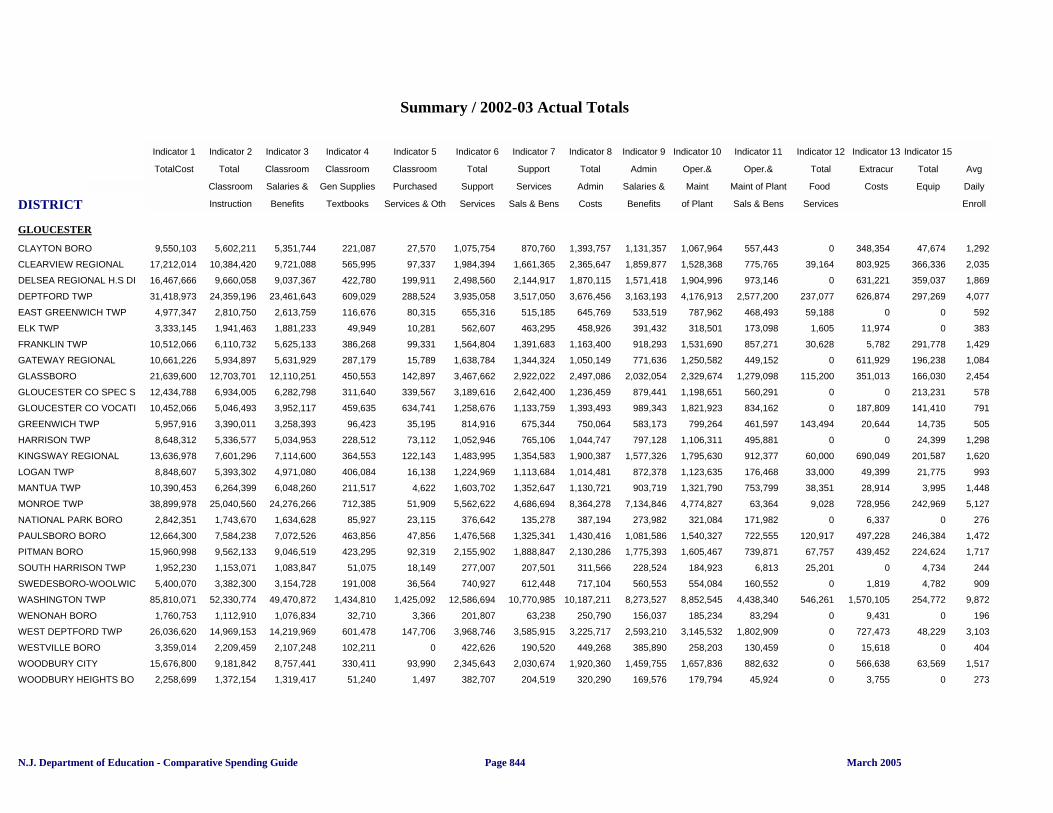
Summary / 2002-03 Actual Totals
Indicator 1 Indicator 2 Indicator 3 Indicator 4 Indicator 5 Indicator 6 Indicator 7 Indicator 8 Indicator 9 Indicator 10 Indicator 11 Indicator 12 Indicator 13 Indicator 15
TotalCost Total Classroom Classroom Classroom Total Support Total Admin Oper.& Oper.& Total Extracur Total Avg
Per Pupil Classroom Salaries & Gen Supplies Purchased Support Services Admin Salaries & Maint Maint of Plant Food Costs Equip Daily
Instruction Benefits Textbooks Services & Oth Services Sals & Bens Costs Benefits of Plant Sals & Bens Services Enroll
GLOUCESTER
9,550,103CLAYTON BORO 5,602,211 5,351,744 221,087 27,570 1,075,754 870,760 1,393,757 1,131,357 1,067,964 557,443 0 348,354 47,674 1,292
17,212,014CLEARVIEW REGIONAL 10,384,420 9,721,088 565,995 97,337 1,984,394 1,661,365 2,365,647 1,859,877 1,528,368 775,765 39,164 803,925 366,336 2,035
16,467,666DELSEA REGIONAL H.S DI 9,660,058 9,037,367 422,780 199,911 2,498,560 2,144,917 1,870,115 1,571,418 1,904,996 973,146 0 631,221 359,037 1,869
31,418,973DEPTFORD TWP 24,359,196 23,461,643 609,029 288,524 3,935,058 3,517,050 3,676,456 3,163,193 4,176,913 2,577,200 237,077 626,874 297,269 4,077
4,977,347EAST GREENWICH TWP 2,810,750 2,613,759 116,676 80,315 655,316 515,185 645,769 533,519 787,962 468,493 59,188 0 0 592
3,333,145ELK TWP 1,941,463 1,881,233 49,949 10,281 562,607 463,295 458,926 391,432 318,501 173,098 1,605 11,974 0 383
10,512,066FRANKLIN TWP 6,110,732 5,625,133 386,268 99,331 1,564,804 1,391,683 1,163,400 918,293 1,531,690 857,271 30,628 5,782 291,778 1,429
10,661,226GATEWAY REGIONAL 5,934,897 5,631,929 287,179 15,789 1,638,784 1,344,324 1,050,149 771,636 1,250,582 449,152 0 611,929 196,238 1,084
21,639,600GLASSBORO 12,703,701 12,110,251 450,553 142,897 3,467,662 2,922,022 2,497,086 2,032,054 2,329,674 1,279,098 115,200 351,013 166,030 2,454
12,434,788GLOUCESTER CO SPEC S 6,934,005 6,282,798 311,640 339,567 3,189,616 2,642,400 1,236,459 879,441 1,198,651 560,291 0 0 213,231 578
10,452,066GLOUCESTER CO VOCATI 5,046,493 3,952,117 459,635 634,741 1,258,676 1,133,759 1,393,493 989,343 1,821,923 834,162 0 187,809 141,410 791
5,957,916GREENWICH TWP 3,390,011 3,258,393 96,423 35,195 814,916 675,344 750,064 583,173 799,264 461,597 143,494 20,644 14,735 505
8,648,312HARRISON TWP 5,336,577 5,034,953 228,512 73,112 1,052,946 765,106 1,044,747 797,128 1,106,311 495,881 0 0 24,399 1,298
13,636,978KINGSWAY REGIONAL 7,601,296 7,114,600 364,553 122,143 1,483,995 1,354,583 1,900,387 1,577,326 1,795,630 912,377 60,000 690,049 201,587 1,620
8,848,607LOGAN TWP 5,393,302 4,971,080 406,084 16,138 1,224,969 1,113,684 1,014,481 872,378 1,123,635 176,468 33,000 49,399 21,775 993
10,390,453MANTUA TWP 6,264,399 6,048,260 211,517 4,622 1,603,702 1,352,647 1,130,721 903,719 1,321,790 753,799 38,351 28,914 3,995 1,448
38,899,978MONROE TWP 25,040,560 24,276,266 712,385 51,909 5,562,622 4,686,694 8,364,278 7,134,846 4,774,827 63,364 9,028 728,956 242,969 5,127
2,842,351NATIONAL PARK BORO 1,743,670 1,634,628 85,927 23,115 376,642 135,278 387,194 273,982 321,084 171,982 0 6,337 0 276
12,664,300PAULSBORO BORO 7,584,238 7,072,526 463,856 47,856 1,476,568 1,325,341 1,430,416 1,081,586 1,540,327 722,555 120,917 497,228 246,384 1,472
15,960,998PITMAN BORO 9,562,133 9,046,519 423,295 92,319 2,155,902 1,888,847 2,130,286 1,775,393 1,605,467 739,871 67,757 439,452 224,624 1,717
1,952,230SOUTH HARRISON TWP 1,153,071 1,083,847 51,075 18,149 277,007 207,501 311,566 228,524 184,923 6,813 25,201 0 4,734 244
5,400,070SWEDESBORO-WOOLWIC 3,382,300 3,154,728 191,008 36,564 740,927 612,448 717,104 560,553 554,084 160,552 0 1,819 4,782 909
85,810,071WASHINGTON TWP 52,330,774 49,470,872 1,434,810 1,425,092 12,586,694 10,770,985 10,187,211 8,273,527 8,852,545 4,438,340 546,261 1,570,105 254,772 9,872
1,760,753WENONAH BORO 1,112,910 1,076,834 32,710 3,366 201,807 63,238 250,790 156,037 185,234 83,294 0 9,431 0 196
26,036,620WEST DEPTFORD TWP 14,969,153 14,219,969 601,478 147,706 3,968,746 3,585,915 3,225,717 2,593,210 3,145,532 1,802,909 0 727,473 48,229 3,103
3,359,014WESTVILLE BORO 2,209,459 2,107,248 102,211 0 422,626 190,520 449,268 385,890 258,203 130,459 0 15,618 0 404
15,676,800WOODBURY CITY 9,181,842 8,757,441 330,411 93,990 2,345,643 2,030,674 1,920,360 1,459,755 1,657,836 882,632 0 566,638 63,569 1,517
2,258,699WOODBURY HEIGHTS BO 1,372,154 1,319,417 51,240 1,497 382,707 204,519 320,290 169,576 179,794 45,924 0 3,755 0 273
N.J. Department of Education - Comparative Spending Guide March 2005Page 844
DISTRICT
Summary / 2002-03 Actual Totals
Indicator 1 Indicator 2 Indicator 3 Indicator 4 Indicator 5 Indicator 6 Indicator 7 Indicator 8 Indicator 9 Indicator 10 Indicator 11 Indicator 12 Indicator 13 Indicator 15
TotalCost Total Classroom Classroom Classroom Total Support Total Admin Oper.& Oper.& Total Extracur Total Avg
Per Pupil Classroom Salaries & Gen Supplies Purchased Support Services Admin Salaries & Maint Maint of Plant Food Costs Equip Daily
Instruction Benefits Textbooks Services & Oth Services Sals & Bens Costs Benefits of Plant Sals & Bens Services Enroll
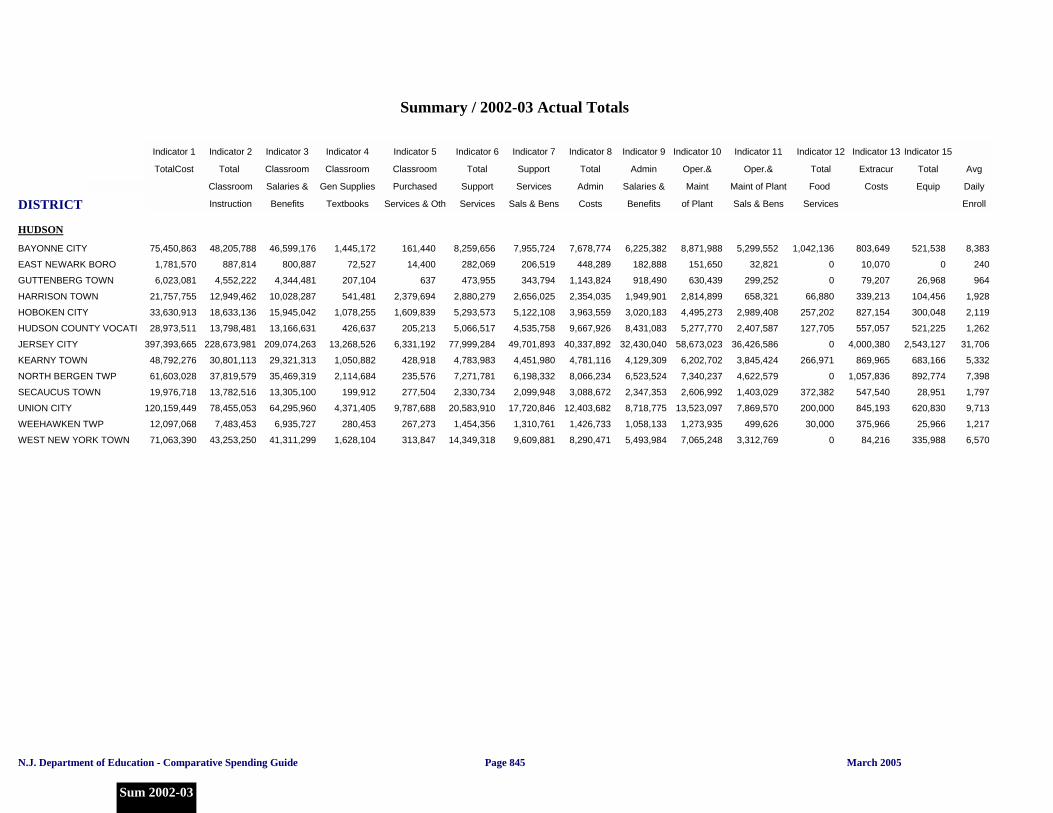
HUDSON
75,450,863BAYONNE CITY 48,205,788 46,599,176 1,445,172 161,440 8,259,656 7,955,724 7,678,774 6,225,382 8,871,988 5,299,552 1,042,136 803,649 521,538 8,383
1,781,570EAST NEWARK BORO 887,814 800,887 72,527 14,400 282,069 206,519 448,289 182,888 151,650 32,821 0 10,070 0 240
6,023,081GUTTENBERG TOWN 4,552,222 4,344,481 207,104 637 473,955 343,794 1,143,824 918,490 630,439 299,252 0 79,207 26,968 964
21,757,755HARRISON TOWN 12,949,462 10,028,287 541,481 2,379,694 2,880,279 2,656,025 2,354,035 1,949,901 2,814,899 658,321 66,880 339,213 104,456 1,928
33,630,913HOBOKEN CITY 18,633,136 15,945,042 1,078,255 1,609,839 5,293,573 5,122,108 3,963,559 3,020,183 4,495,273 2,989,408 257,202 827,154 300,048 2,119
28,973,511HUDSON COUNTY VOCATI 13,798,481 13,166,631 426,637 205,213 5,066,517 4,535,758 9,667,926 8,431,083 5,277,770 2,407,587 127,705 557,057 521,225 1,262
397,393,665JERSEY CITY 228,673,981 209,074,263 13,268,526 6,331,192 77,999,284 49,701,893 40,337,892 32,430,040 58,673,023 36,426,586 0 4,000,380 2,543,127 31,706
48,792,276KEARNY TOWN 30,801,113 29,321,313 1,050,882 428,918 4,783,983 4,451,980 4,781,116 4,129,309 6,202,702 3,845,424 266,971 869,965 683,166 5,332
61,603,028NORTH BERGEN TWP 37,819,579 35,469,319 2,114,684 235,576 7,271,781 6,198,332 8,066,234 6,523,524 7,340,237 4,622,579 0 1,057,836 892,774 7,398
19,976,718SECAUCUS TOWN 13,782,516 13,305,100 199,912 277,504 2,330,734 2,099,948 3,088,672 2,347,353 2,606,992 1,403,029 372,382 547,540 28,951 1,797
120,159,449UNION CITY 78,455,053 64,295,960 4,371,405 9,787,688 20,583,910 17,720,846 12,403,682 8,718,775 13,523,097 7,869,570 200,000 845,193 620,830 9,713
12,097,068WEEHAWKEN TWP 7,483,453 6,935,727 280,453 267,273 1,454,356 1,310,761 1,426,733 1,058,133 1,273,935 499,626 30,000 375,966 25,966 1,217
71,063,390WEST NEW YORK TOWN 43,253,250 41,311,299 1,628,104 313,847 14,349,318 9,609,881 8,290,471 5,493,984 7,065,248 3,312,769 0 84,216 335,988 6,570
N.J. Department of Education - Comparative Spending Guide March 2005
Sum 2002-03
Page 845
DISTRICT
Summary / 2002-03 Actual Totals
Indicator 1 Indicator 2 Indicator 3 Indicator 4 Indicator 5 Indicator 6 Indicator 7 Indicator 8 Indicator 9 Indicator 10 Indicator 11 Indicator 12 Indicator 13 Indicator 15
TotalCost Total Classroom Classroom Classroom Total Support Total Admin Oper.& Oper.& Total Extracur Total Avg
Per Pupil Classroom Salaries & Gen Supplies Purchased Support Services Admin Salaries & Maint Maint of Plant Food Costs Equip Daily
Instruction Benefits Textbooks Services & Oth Services Sals & Bens Costs Benefits of Plant Sals & Bens Services Enroll
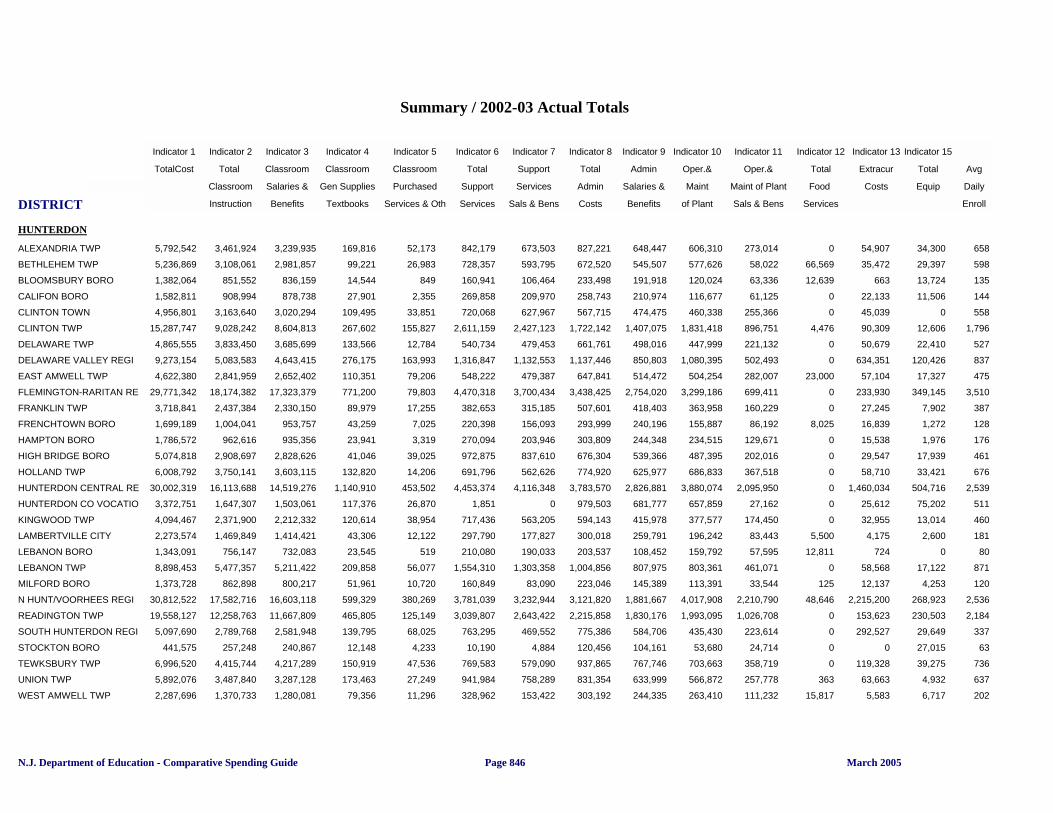
HUNTERDON
5,792,542ALEXANDRIA TWP 3,461,924 3,239,935 169,816 52,173 842,179 673,503 827,221 648,447 606,310 273,014 0 54,907 34,300 658
5,236,869BETHLEHEM TWP 3,108,061 2,981,857 99,221 26,983 728,357 593,795 672,520 545,507 577,626 58,022 66,569 35,472 29,397 598
1,382,064BLOOMSBURY BORO 851,552 836,159 14,544 849 160,941 106,464 233,498 191,918 120,024 63,336 12,639 663 13,724 135
1,582,811CALIFON BORO 908,994 878,738 27,901 2,355 269,858 209,970 258,743 210,974 116,677 61,125 0 22,133 11,506 144
4,956,801CLINTON TOWN 3,163,640 3,020,294 109,495 33,851 720,068 627,967 567,715 474,475 460,338 255,366 0 45,039 0 558
15,287,747CLINTON TWP 9,028,242 8,604,813 267,602 155,827 2,611,159 2,427,123 1,722,142 1,407,075 1,831,418 896,751 4,476 90,309 12,606 1,796
4,865,555DELAWARE TWP 3,833,450 3,685,699 133,566 12,784 540,734 479,453 661,761 498,016 447,999 221,132 0 50,679 22,410 527
9,273,154DELAWARE VALLEY REGI 5,083,583 4,643,415 276,175 163,993 1,316,847 1,132,553 1,137,446 850,803 1,080,395 502,493 0 634,351 120,426 837
4,622,380EAST AMWELL TWP 2,841,959 2,652,402 110,351 79,206 548,222 479,387 647,841 514,472 504,254 282,007 23,000 57,104 17,327 475
29,771,342FLEMINGTON-RARITAN RE 18,174,382 17,323,379 771,200 79,803 4,470,318 3,700,434 3,438,425 2,754,020 3,299,186 699,411 0 233,930 349,145 3,510
3,718,841FRANKLIN TWP 2,437,384 2,330,150 89,979 17,255 382,653 315,185 507,601 418,403 363,958 160,229 0 27,245 7,902 387
1,699,189FRENCHTOWN BORO 1,004,041 953,757 43,259 7,025 220,398 156,093 293,999 240,196 155,887 86,192 8,025 16,839 1,272 128
1,786,572HAMPTON BORO 962,616 935,356 23,941 3,319 270,094 203,946 303,809 244,348 234,515 129,671 0 15,538 1,976 176
5,074,818HIGH BRIDGE BORO 2,908,697 2,828,626 41,046 39,025 972,875 837,610 676,304 539,366 487,395 202,016 0 29,547 17,939 461
6,008,792HOLLAND TWP 3,750,141 3,603,115 132,820 14,206 691,796 562,626 774,920 625,977 686,833 367,518 0 58,710 33,421 676
30,002,319HUNTERDON CENTRAL RE 16,113,688 14,519,276 1,140,910 453,502 4,453,374 4,116,348 3,783,570 2,826,881 3,880,074 2,095,950 0 1,460,034 504,716 2,539
3,372,751HUNTERDON CO VOCATIO 1,647,307 1,503,061 117,376 26,870 1,851 0 979,503 681,777 657,859 27,162 0 25,612 75,202 511
4,094,467KINGWOOD TWP 2,371,900 2,212,332 120,614 38,954 717,436 563,205 594,143 415,978 377,577 174,450 0 32,955 13,014 460
2,273,574LAMBERTVILLE CITY 1,469,849 1,414,421 43,306 12,122 297,790 177,827 300,018 259,791 196,242 83,443 5,500 4,175 2,600 181
1,343,091LEBANON BORO 756,147 732,083 23,545 519 210,080 190,033 203,537 108,452 159,792 57,595 12,811 724 0 80
8,898,453LEBANON TWP 5,477,357 5,211,422 209,858 56,077 1,554,310 1,303,358 1,004,856 807,975 803,361 461,071 0 58,568 17,122 871
1,373,728MILFORD BORO 862,898 800,217 51,961 10,720 160,849 83,090 223,046 145,389 113,391 33,544 125 12,137 4,253 120
30,812,522N HUNT/VOORHEES REGI 17,582,716 16,603,118 599,329 380,269 3,781,039 3,232,944 3,121,820 1,881,667 4,017,908 2,210,790 48,646 2,215,200 268,923 2,536
19,558,127READINGTON TWP 12,258,763 11,667,809 465,805 125,149 3,039,807 2,643,422 2,215,858 1,830,176 1,993,095 1,026,708 0 153,623 230,503 2,184
5,097,690SOUTH HUNTERDON REGI 2,789,768 2,581,948 139,795 68,025 763,295 469,552 775,386 584,706 435,430 223,614 0 292,527 29,649 337
441,575STOCKTON BORO 257,248 240,867 12,148 4,233 10,190 4,884 120,456 104,161 53,680 24,714 0 0 27,015 63
6,996,520TEWKSBURY TWP 4,415,744 4,217,289 150,919 47,536 769,583 579,090 937,865 767,746 703,663 358,719 0 119,328 39,275 736
5,892,076UNION TWP 3,487,840 3,287,128 173,463 27,249 941,984 758,289 831,354 633,999 566,872 257,778 363 63,663 4,932 637
2,287,696WEST AMWELL TWP 1,370,733 1,280,081 79,356 11,296 328,962 153,422 303,192 244,335 263,410 111,232 15,817 5,583 6,717 202
N.J. Department of Education - Comparative Spending Guide March 2005Page 846
DISTRICT
Summary / 2002-03 Actual Totals
Indicator 1 Indicator 2 Indicator 3 Indicator 4 Indicator 5 Indicator 6 Indicator 7 Indicator 8 Indicator 9 Indicator 10 Indicator 11 Indicator 12 Indicator 13 Indicator 15
TotalCost Total Classroom Classroom Classroom Total Support Total Admin Oper.& Oper.& Total Extracur Total Avg
Per Pupil Classroom Salaries & Gen Supplies Purchased Support Services Admin Salaries & Maint Maint of Plant Food Costs Equip Daily
Instruction Benefits Textbooks Services & Oth Services Sals & Bens Costs Benefits of Plant Sals & Bens Services Enroll
MERCER
46,290,548EAST WINDSOR REGIONA 27,531,970 26,387,971 1,008,578 135,421 7,250,004 6,018,839 4,432,933 3,599,919 5,789,241 3,143,087 0 993,436 896,631 4,712
38,480,699EWING TWP 23,983,246 22,228,862 650,390 1,103,271 5,041,291 4,378,968 4,285,554 3,595,343 3,894,000 2,143,665 0 948,869 59,678 3,730
107,790,507HAMILTON TWP 67,262,823 64,003,011 1,335,727 1,924,085 14,997,251 13,295,132 9,962,526 8,839,202 13,319,374 8,351,574 188,668 1,887,888 526,997 13,082
40,308,176HOPEWELL VALLEY REGI 26,074,233 24,092,708 1,082,873 898,652 5,537,900 4,955,069 3,875,167 3,161,927 3,834,116 2,063,646 11,369 869,022 400,727 3,820
40,925,755LAWRENCE TWP 24,749,443 23,483,255 1,210,422 55,766 6,448,997 5,641,398 4,423,011 3,580,382 4,476,312 2,643,917 2,156 789,403 348,130 4,096
23,716,562MERCER CO SPECIAL SER 12,208,644 11,949,033 227,375 32,236 6,621,143 6,470,007 2,799,059 2,268,619 2,051,069 763,040 0 0 43,421 838
8,144,315MERCER COUNTY VOCATI 4,426,245 2,930,570 387,838 1,107,837 888,229 757,183 1,582,658 1,261,798 1,089,675 597,229 0 0 23,959 612
37,715,046PRINCETON REGIONAL 21,839,557 20,345,674 971,478 522,405 7,180,719 6,018,374 3,815,628 3,084,495 3,862,468 2,452,833 0 928,200 117,664 3,272
166,937,193TRENTON CITY 78,955,423 73,252,907 2,821,834 2,880,682 45,357,644 26,953,422 15,455,339 12,083,864 22,590,562 15,972,512 2,787,898 1,697,393 589,197 12,364
92,111,148W WINDSOR-PLAINSBORO 57,265,397 53,849,818 1,140,379 2,247,813 13,982,542 12,590,381 9,384,566 7,145,818 8,782,167 4,955,595 0 2,377,707 293,916 8,744
11,980,664WASHINGTON TWP 7,162,909 6,620,461 488,090 54,358 1,759,426 1,310,175 1,616,535 1,237,754 1,275,666 549,617 0 149,731 24,071 1,424
N.J. Department of Education - Comparative Spending Guide March 2005
Sum 2002-03
Page 847
DISTRICT
Summary / 2002-03 Actual Totals
Indicator 1 Indicator 2 Indicator 3 Indicator 4 Indicator 5 Indicator 6 Indicator 7 Indicator 8 Indicator 9 Indicator 10 Indicator 11 Indicator 12 Indicator 13 Indicator 15
TotalCost Total Classroom Classroom Classroom Total Support Total Admin Oper.& Oper.& Total Extracur Total Avg
Per Pupil Classroom Salaries & Gen Supplies Purchased Support Services Admin Salaries & Maint Maint of Plant Food Costs Equip Daily
Instruction Benefits Textbooks Services & Oth Services Sals & Bens Costs Benefits of Plant Sals & Bens Services Enroll
MIDDLESEX
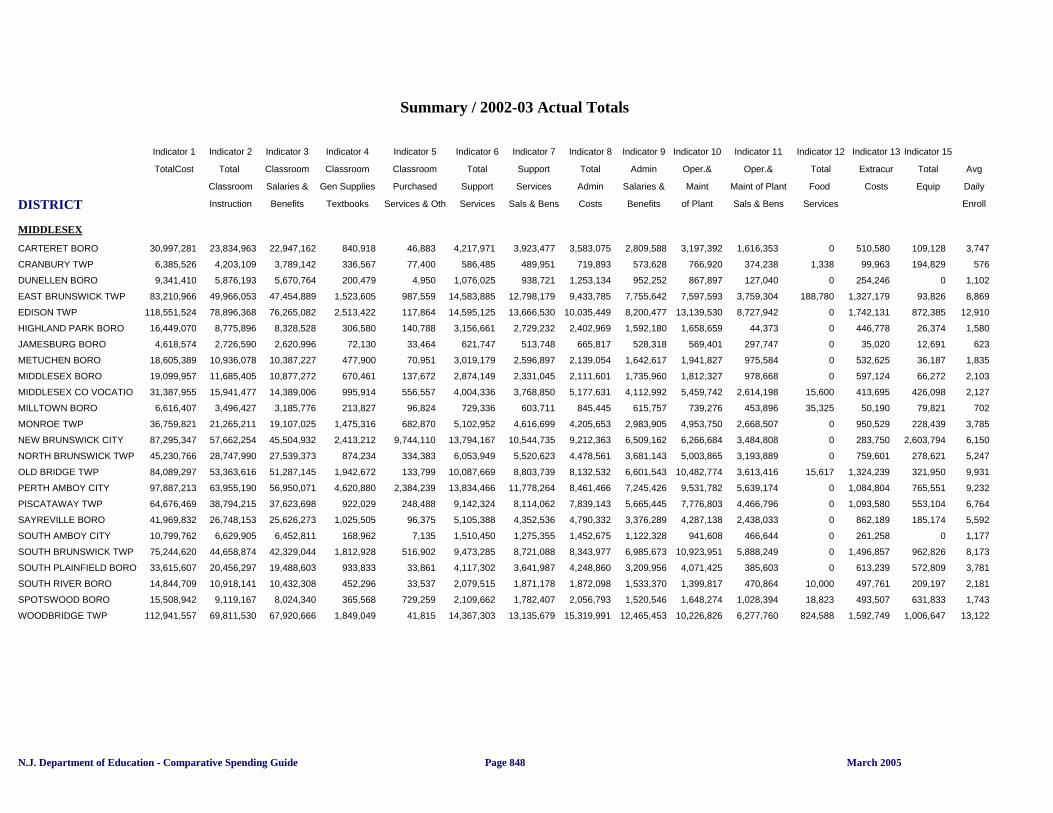
30,997,281CARTERET BORO 23,834,963 22,947,162 840,918 46,883 4,217,971 3,923,477 3,583,075 2,809,588 3,197,392 1,616,353 0 510,580 109,128 3,747
6,385,526CRANBURY TWP 4,203,109 3,789,142 336,567 77,400 586,485 489,951 719,893 573,628 766,920 374,238 1,338 99,963 194,829 576
9,341,410DUNELLEN BORO 5,876,193 5,670,764 200,479 4,950 1,076,025 938,721 1,253,134 952,252 867,897 127,040 0 254,246 0 1,102
83,210,966EAST BRUNSWICK TWP 49,966,053 47,454,889 1,523,605 987,559 14,583,885 12,798,179 9,433,785 7,755,642 7,597,593 3,759,304 188,780 1,327,179 93,826 8,869
118,551,524EDISON TWP 78,896,368 76,265,082 2,513,422 117,864 14,595,125 13,666,530 10,035,449 8,200,477 13,139,530 8,727,942 0 1,742,131 872,385 12,910
16,449,070HIGHLAND PARK BORO 8,775,896 8,328,528 306,580 140,788 3,156,661 2,729,232 2,402,969 1,592,180 1,658,659 44,373 0 446,778 26,374 1,580
4,618,574JAMESBURG BORO 2,726,590 2,620,996 72,130 33,464 621,747 513,748 665,817 528,318 569,401 297,747 0 35,020 12,691 623
18,605,389METUCHEN BORO 10,936,078 10,387,227 477,900 70,951 3,019,179 2,596,897 2,139,054 1,642,617 1,941,827 975,584 0 532,625 36,187 1,835
19,099,957MIDDLESEX BORO 11,685,405 10,877,272 670,461 137,672 2,874,149 2,331,045 2,111,601 1,735,960 1,812,327 978,668 0 597,124 66,272 2,103
31,387,955MIDDLESEX CO VOCATIO 15,941,477 14,389,006 995,914 556,557 4,004,336 3,768,850 5,177,631 4,112,992 5,459,742 2,614,198 15,600 413,695 426,098 2,127
6,616,407MILLTOWN BORO 3,496,427 3,185,776 213,827 96,824 729,336 603,711 845,445 615,757 739,276 453,896 35,325 50,190 79,821 702
36,759,821MONROE TWP 21,265,211 19,107,025 1,475,316 682,870 5,102,952 4,616,699 4,205,653 2,983,905 4,953,750 2,668,507 0 950,529 228,439 3,785
87,295,347NEW BRUNSWICK CITY 57,662,254 45,504,932 2,413,212 9,744,110 13,794,167 10,544,735 9,212,363 6,509,162 6,266,684 3,484,808 0 283,750 2,603,794 6,150
45,230,766NORTH BRUNSWICK TWP 28,747,990 27,539,373 874,234 334,383 6,053,949 5,520,623 4,478,561 3,681,143 5,003,865 3,193,889 0 759,601 278,621 5,247
84,089,297OLD BRIDGE TWP 53,363,616 51,287,145 1,942,672 133,799 10,087,669 8,803,739 8,132,532 6,601,543 10,482,774 3,613,416 15,617 1,324,239 321,950 9,931
97,887,213PERTH AMBOY CITY 63,955,190 56,950,071 4,620,880 2,384,239 13,834,466 11,778,264 8,461,466 7,245,426 9,531,782 5,639,174 0 1,084,804 765,551 9,232
64,676,469PISCATAWAY TWP 38,794,215 37,623,698 922,029 248,488 9,142,324 8,114,062 7,839,143 5,665,445 7,776,803 4,466,796 0 1,093,580 553,104 6,764
41,969,832SAYREVILLE BORO 26,748,153 25,626,273 1,025,505 96,375 5,105,388 4,352,536 4,790,332 3,376,289 4,287,138 2,438,033 0 862,189 185,174 5,592
10,799,762SOUTH AMBOY CITY 6,629,905 6,452,811 168,962 7,135 1,510,450 1,275,355 1,452,675 1,122,328 941,608 466,644 0 261,258 0 1,177
75,244,620SOUTH BRUNSWICK TWP 44,658,874 42,329,044 1,812,928 516,902 9,473,285 8,721,088 8,343,977 6,985,673 10,923,951 5,888,249 0 1,496,857 962,826 8,173
33,615,607SOUTH PLAINFIELD BORO 20,456,297 19,488,603 933,833 33,861 4,117,302 3,641,987 4,248,860 3,209,956 4,071,425 385,603 0 613,239 572,809 3,781
14,844,709SOUTH RIVER BORO 10,918,141 10,432,308 452,296 33,537 2,079,515 1,871,178 1,872,098 1,533,370 1,399,817 470,864 10,000 497,761 209,197 2,181
15,508,942SPOTSWOOD BORO 9,119,167 8,024,340 365,568 729,259 2,109,662 1,782,407 2,056,793 1,520,546 1,648,274 1,028,394 18,823 493,507 631,833 1,743
112,941,557WOODBRIDGE TWP 69,811,530 67,920,666 1,849,049 41,815 14,367,303 13,135,679 15,319,991 12,465,453 10,226,826 6,277,760 824,588 1,592,749 1,006,647 13,122
N.J. Department of Education - Comparative Spending Guide March 2005Page 848
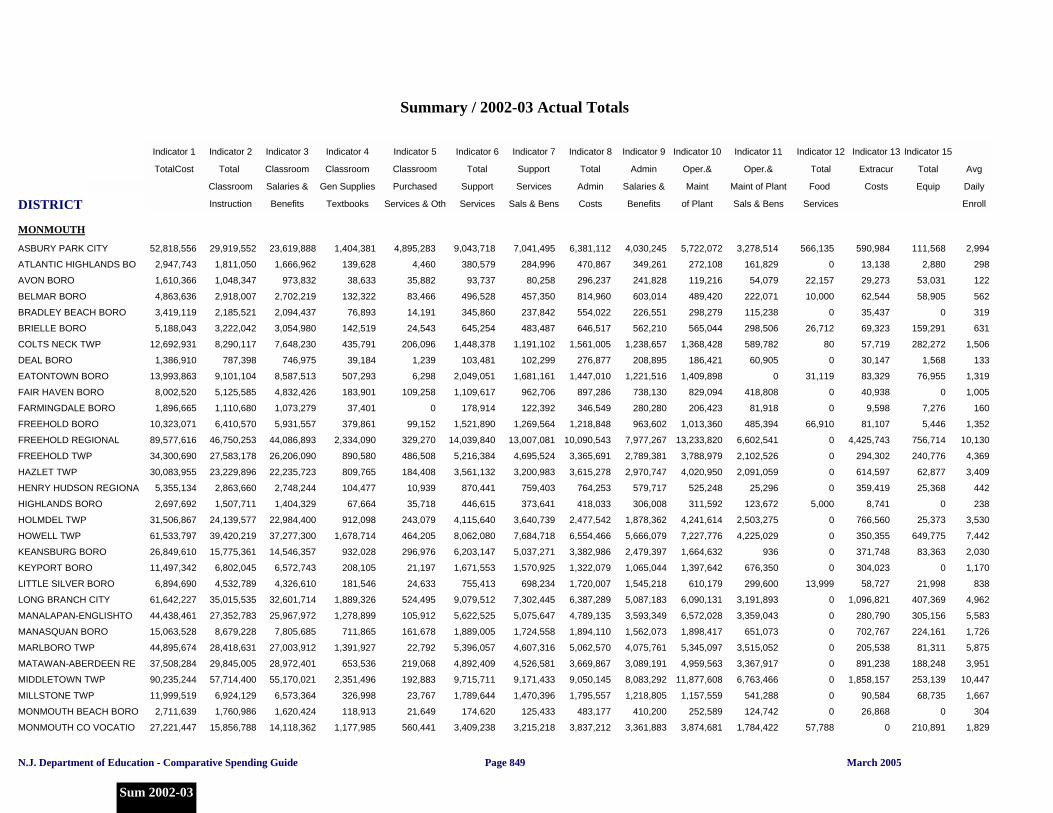
DISTRICT
Summary / 2002-03 Actual Totals
Indicator 1 Indicator 2 Indicator 3 Indicator 4 Indicator 5 Indicator 6 Indicator 7 Indicator 8 Indicator 9 Indicator 10 Indicator 11 Indicator 12 Indicator 13 Indicator 15
TotalCost Total Classroom Classroom Classroom Total Support Total Admin Oper.& Oper.& Total Extracur Total Avg
Per Pupil Classroom Salaries & Gen Supplies Purchased Support Services Admin Salaries & Maint Maint of Plant Food Costs Equip Daily
Instruction Benefits Textbooks Services & Oth Services Sals & Bens Costs Benefits of Plant Sals & Bens Services Enroll
MONMOUTH
52,818,556ASBURY PARK CITY 29,919,552 23,619,888 1,404,381 4,895,283 9,043,718 7,041,495 6,381,112 4,030,245 5,722,072 3,278,514 566,135 590,984 111,568 2,994
2,947,743ATLANTIC HIGHLANDS BO 1,811,050 1,666,962 139,628 4,460 380,579 284,996 470,867 349,261 272,108 161,829 0 13,138 2,880 298
1,610,366AVON BORO 1,048,347 973,832 38,633 35,882 93,737 80,258 296,237 241,828 119,216 54,079 22,157 29,273 53,031 122
4,863,636BELMAR BORO 2,918,007 2,702,219 132,322 83,466 496,528 457,350 814,960 603,014 489,420 222,071 10,000 62,544 58,905 562
3,419,119BRADLEY BEACH BORO 2,185,521 2,094,437 76,893 14,191 345,860 237,842 554,022 226,551 298,279 115,238 0 35,437 0 319
5,188,043BRIELLE BORO 3,222,042 3,054,980 142,519 24,543 645,254 483,487 646,517 562,210 565,044 298,506 26,712 69,323 159,291 631
12,692,931COLTS NECK TWP 8,290,117 7,648,230 435,791 206,096 1,448,378 1,191,102 1,561,005 1,238,657 1,368,428 589,782 80 57,719 282,272 1,506
1,386,910DEAL BORO 787,398 746,975 39,184 1,239 103,481 102,299 276,877 208,895 186,421 60,905 0 30,147 1,568 133
13,993,863EATONTOWN BORO 9,101,104 8,587,513 507,293 6,298 2,049,051 1,681,161 1,447,010 1,221,516 1,409,898 0 31,119 83,329 76,955 1,319
8,002,520FAIR HAVEN BORO 5,125,585 4,832,426 183,901 109,258 1,109,617 962,706 897,286 738,130 829,094 418,808 0 40,938 0 1,005
1,896,665FARMINGDALE BORO 1,110,680 1,073,279 37,401 0 178,914 122,392 346,549 280,280 206,423 81,918 0 9,598 7,276 160
10,323,071FREEHOLD BORO 6,410,570 5,931,557 379,861 99,152 1,521,890 1,269,564 1,218,848 963,602 1,013,360 485,394 66,910 81,107 5,446 1,352
89,577,616FREEHOLD REGIONAL 46,750,253 44,086,893 2,334,090 329,270 14,039,840 13,007,081 10,090,543 7,977,267 13,233,820 6,602,541 0 4,425,743 756,714 10,130
34,300,690FREEHOLD TWP 27,583,178 26,206,090 890,580 486,508 5,216,384 4,695,524 3,365,691 2,789,381 3,788,979 2,102,526 0 294,302 240,776 4,369
30,083,955HAZLET TWP 23,229,896 22,235,723 809,765 184,408 3,561,132 3,200,983 3,615,278 2,970,747 4,020,950 2,091,059 0 614,597 62,877 3,409
5,355,134HENRY HUDSON REGIONA 2,863,660 2,748,244 104,477 10,939 870,441 759,403 764,253 579,717 525,248 25,296 0 359,419 25,368 442
2,697,692HIGHLANDS BORO 1,507,711 1,404,329 67,664 35,718 446,615 373,641 418,033 306,008 311,592 123,672 5,000 8,741 0 238
31,506,867HOLMDEL TWP 24,139,577 22,984,400 912,098 243,079 4,115,640 3,640,739 2,477,542 1,878,362 4,241,614 2,503,275 0 766,560 25,373 3,530
61,533,797HOWELL TWP 39,420,219 37,277,300 1,678,714 464,205 8,062,080 7,684,718 6,554,466 5,666,079 7,227,776 4,225,029 0 350,355 649,775 7,442
26,849,610KEANSBURG BORO 15,775,361 14,546,357 932,028 296,976 6,203,147 5,037,271 3,382,986 2,479,397 1,664,632 936 0 371,748 83,363 2,030
11,497,342KEYPORT BORO 6,802,045 6,572,743 208,105 21,197 1,671,553 1,570,925 1,322,079 1,065,044 1,397,642 676,350 0 304,023 0 1,170
6,894,690LITTLE SILVER BORO 4,532,789 4,326,610 181,546 24,633 755,413 698,234 1,720,007 1,545,218 610,179 299,600 13,999 58,727 21,998 838
61,642,227LONG BRANCH CITY 35,015,535 32,601,714 1,889,326 524,495 9,079,512 7,302,445 6,387,289 5,087,183 6,090,131 3,191,893 0 1,096,821 407,369 4,962
44,438,461MANALAPAN-ENGLISHTO 27,352,783 25,967,972 1,278,899 105,912 5,622,525 5,075,647 4,789,135 3,593,349 6,572,028 3,359,043 0 280,790 305,156 5,583
15,063,528MANASQUAN BORO 8,679,228 7,805,685 711,865 161,678 1,889,005 1,724,558 1,894,110 1,562,073 1,898,417 651,073 0 702,767 224,161 1,726
44,895,674MARLBORO TWP 28,418,631 27,003,912 1,391,927 22,792 5,396,057 4,607,316 5,062,570 4,075,761 5,345,097 3,515,052 0 205,538 81,311 5,875
37,508,284MATAWAN-ABERDEEN RE 29,845,005 28,972,401 653,536 219,068 4,892,409 4,526,581 3,669,867 3,089,191 4,959,563 3,367,917 0 891,238 188,248 3,951
90,235,244MIDDLETOWN TWP 57,714,400 55,170,021 2,351,496 192,883 9,715,711 9,171,433 9,050,145 8,083,292 11,877,608 6,763,466 0 1,858,157 253,139 10,447
11,999,519MILLSTONE TWP 6,924,129 6,573,364 326,998 23,767 1,789,644 1,470,396 1,795,557 1,218,805 1,157,559 541,288 0 90,584 68,735 1,667
2,711,639MONMOUTH BEACH BORO 1,760,986 1,620,424 118,913 21,649 174,620 125,433 483,177 410,200 252,589 124,742 0 26,868 0 304
27,221,447MONMOUTH CO VOCATIO 15,856,788 14,118,362 1,177,985 560,441 3,409,238 3,215,218 3,837,212 3,361,883 3,874,681 1,784,422 57,788 0 210,891 1,829
N.J. Department of Education - Comparative Spending Guide March 2005
Sum 2002-03
Page 849
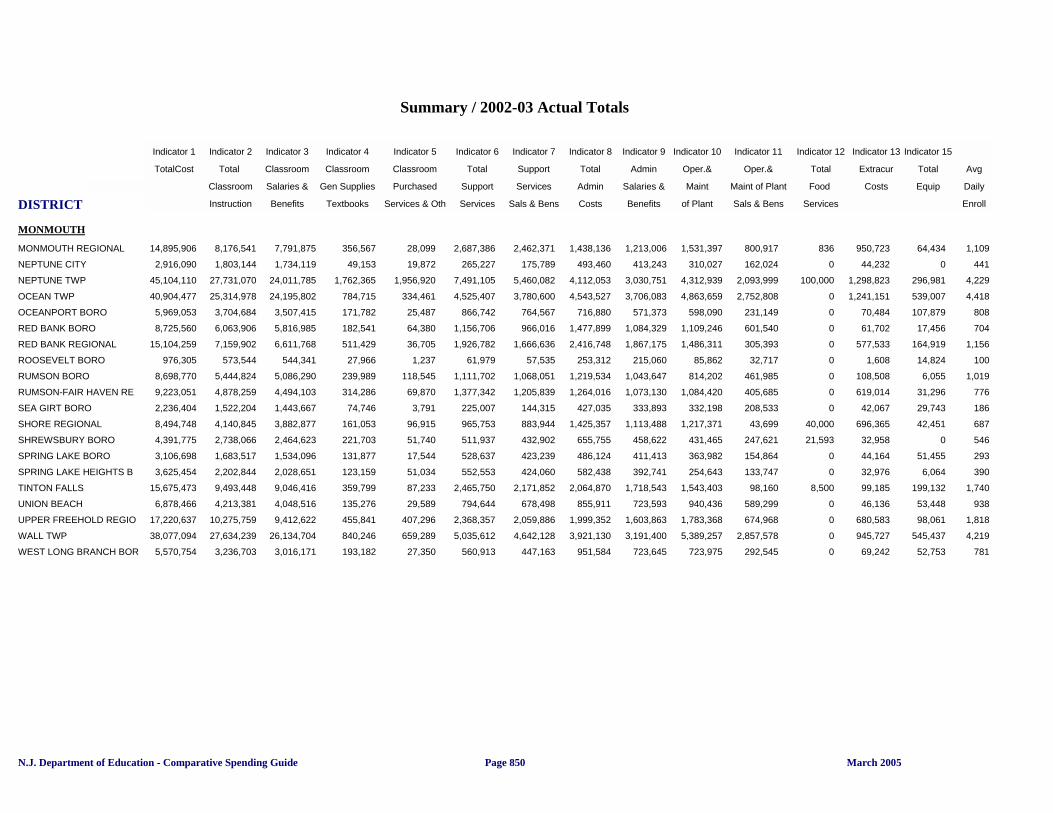
DISTRICT
Summary / 2002-03 Actual Totals
Indicator 1 Indicator 2 Indicator 3 Indicator 4 Indicator 5 Indicator 6 Indicator 7 Indicator 8 Indicator 9 Indicator 10 Indicator 11 Indicator 12 Indicator 13 Indicator 15
TotalCost Total Classroom Classroom Classroom Total Support Total Admin Oper.& Oper.& Total Extracur Total Avg
Per Pupil Classroom Salaries & Gen Supplies Purchased Support Services Admin Salaries & Maint Maint of Plant Food Costs Equip Daily
Instruction Benefits Textbooks Services & Oth Services Sals & Bens Costs Benefits of Plant Sals & Bens Services Enroll
MONMOUTH
14,895,906MONMOUTH REGIONAL 8,176,541 7,791,875 356,567 28,099 2,687,386 2,462,371 1,438,136 1,213,006 1,531,397 800,917 836 950,723 64,434 1,109
2,916,090NEPTUNE CITY 1,803,144 1,734,119 49,153 19,872 265,227 175,789 493,460 413,243 310,027 162,024 0 44,232 0 441
45,104,110NEPTUNE TWP 27,731,070 24,011,785 1,762,365 1,956,920 7,491,105 5,460,082 4,112,053 3,030,751 4,312,939 2,093,999 100,000 1,298,823 296,981 4,229
40,904,477OCEAN TWP 25,314,978 24,195,802 784,715 334,461 4,525,407 3,780,600 4,543,527 3,706,083 4,863,659 2,752,808 0 1,241,151 539,007 4,418
5,969,053OCEANPORT BORO 3,704,684 3,507,415 171,782 25,487 866,742 764,567 716,880 571,373 598,090 231,149 0 70,484 107,879 808
8,725,560RED BANK BORO 6,063,906 5,816,985 182,541 64,380 1,156,706 966,016 1,477,899 1,084,329 1,109,246 601,540 0 61,702 17,456 704
15,104,259RED BANK REGIONAL 7,159,902 6,611,768 511,429 36,705 1,926,782 1,666,636 2,416,748 1,867,175 1,486,311 305,393 0 577,533 164,919 1,156
976,305ROOSEVELT BORO 573,544 544,341 27,966 1,237 61,979 57,535 253,312 215,060 85,862 32,717 0 1,608 14,824 100
8,698,770RUMSON BORO 5,444,824 5,086,290 239,989 118,545 1,111,702 1,068,051 1,219,534 1,043,647 814,202 461,985 0 108,508 6,055 1,019
9,223,051RUMSON-FAIR HAVEN RE 4,878,259 4,494,103 314,286 69,870 1,377,342 1,205,839 1,264,016 1,073,130 1,084,420 405,685 0 619,014 31,296 776
2,236,404SEA GIRT BORO 1,522,204 1,443,667 74,746 3,791 225,007 144,315 427,035 333,893 332,198 208,533 0 42,067 29,743 186
8,494,748SHORE REGIONAL 4,140,845 3,882,877 161,053 96,915 965,753 883,944 1,425,357 1,113,488 1,217,371 43,699 40,000 696,365 42,451 687
4,391,775SHREWSBURY BORO 2,738,066 2,464,623 221,703 51,740 511,937 432,902 655,755 458,622 431,465 247,621 21,593 32,958 0 546
3,106,698SPRING LAKE BORO 1,683,517 1,534,096 131,877 17,544 528,637 423,239 486,124 411,413 363,982 154,864 0 44,164 51,455 293
3,625,454SPRING LAKE HEIGHTS B 2,202,844 2,028,651 123,159 51,034 552,553 424,060 582,438 392,741 254,643 133,747 0 32,976 6,064 390
15,675,473TINTON FALLS 9,493,448 9,046,416 359,799 87,233 2,465,750 2,171,852 2,064,870 1,718,543 1,543,403 98,160 8,500 99,185 199,132 1,740
6,878,466UNION BEACH 4,213,381 4,048,516 135,276 29,589 794,644 678,498 855,911 723,593 940,436 589,299 0 46,136 53,448 938
17,220,637UPPER FREEHOLD REGIO 10,275,759 9,412,622 455,841 407,296 2,368,357 2,059,886 1,999,352 1,603,863 1,783,368 674,968 0 680,583 98,061 1,818
38,077,094WALL TWP 27,634,239 26,134,704 840,246 659,289 5,035,612 4,642,128 3,921,130 3,191,400 5,389,257 2,857,578 0 945,727 545,437 4,219
5,570,754WEST LONG BRANCH BOR 3,236,703 3,016,171 193,182 27,350 560,913 447,163 951,584 723,645 723,975 292,545 0 69,242 52,753 781
N.J. Department of Education - Comparative Spending Guide March 2005Page 850
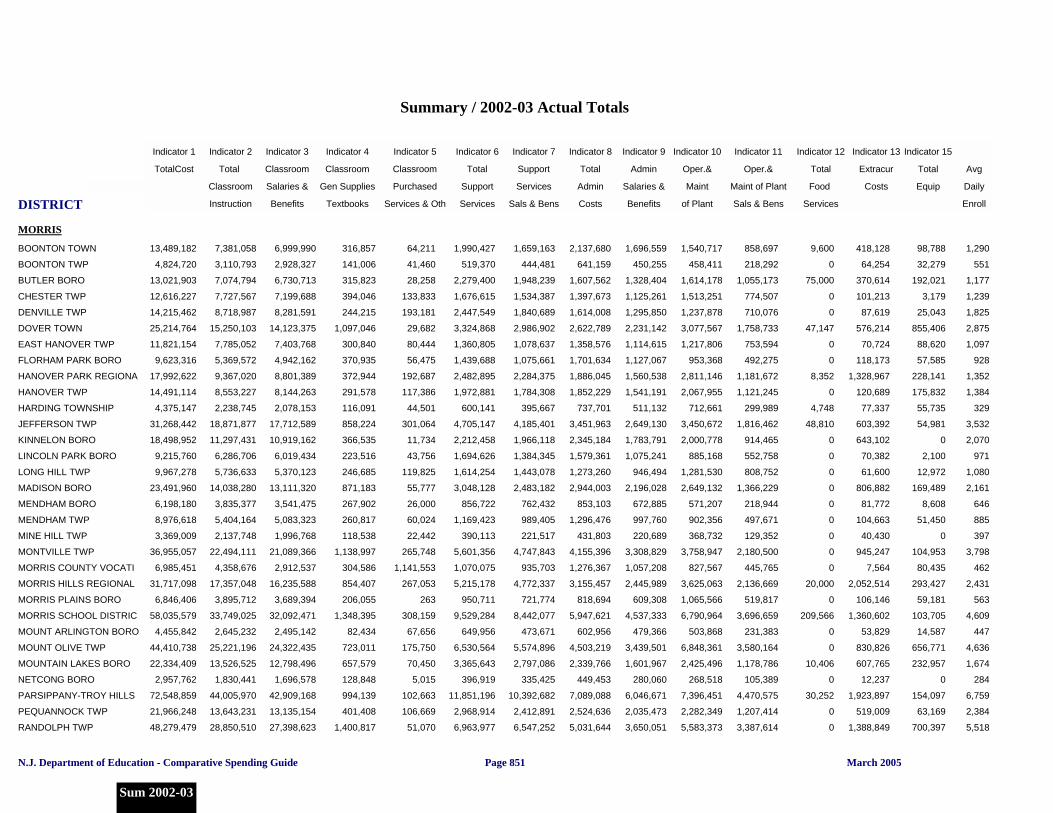
DISTRICT
Summary / 2002-03 Actual Totals
Indicator 1 Indicator 2 Indicator 3 Indicator 4 Indicator 5 Indicator 6 Indicator 7 Indicator 8 Indicator 9 Indicator 10 Indicator 11 Indicator 12 Indicator 13 Indicator 15
TotalCost Total Classroom Classroom Classroom Total Support Total Admin Oper.& Oper.& Total Extracur Total Avg
Per Pupil Classroom Salaries & Gen Supplies Purchased Support Services Admin Salaries & Maint Maint of Plant Food Costs Equip Daily
Instruction Benefits Textbooks Services & Oth Services Sals & Bens Costs Benefits of Plant Sals & Bens Services Enroll
MORRIS
13,489,182BOONTON TOWN 7,381,058 6,999,990 316,857 64,211 1,990,427 1,659,163 2,137,680 1,696,559 1,540,717 858,697 9,600 418,128 98,788 1,290
4,824,720BOONTON TWP 3,110,793 2,928,327 141,006 41,460 519,370 444,481 641,159 450,255 458,411 218,292 0 64,254 32,279 551
13,021,903BUTLER BORO 7,074,794 6,730,713 315,823 28,258 2,279,400 1,948,239 1,607,562 1,328,404 1,614,178 1,055,173 75,000 370,614 192,021 1,177
12,616,227CHESTER TWP 7,727,567 7,199,688 394,046 133,833 1,676,615 1,534,387 1,397,673 1,125,261 1,513,251 774,507 0 101,213 3,179 1,239
14,215,462DENVILLE TWP 8,718,987 8,281,591 244,215 193,181 2,447,549 1,840,689 1,614,008 1,295,850 1,237,878 710,076 0 87,619 25,043 1,825
25,214,764DOVER TOWN 15,250,103 14,123,375 1,097,046 29,682 3,324,868 2,986,902 2,622,789 2,231,142 3,077,567 1,758,733 47,147 576,214 855,406 2,875
11,821,154EAST HANOVER TWP 7,785,052 7,403,768 300,840 80,444 1,360,805 1,078,637 1,358,576 1,114,615 1,217,806 753,594 0 70,724 88,620 1,097
9,623,316FLORHAM PARK BORO 5,369,572 4,942,162 370,935 56,475 1,439,688 1,075,661 1,701,634 1,127,067 953,368 492,275 0 118,173 57,585 928
17,992,622HANOVER PARK REGIONA 9,367,020 8,801,389 372,944 192,687 2,482,895 2,284,375 1,886,045 1,560,538 2,811,146 1,181,672 8,352 1,328,967 228,141 1,352
14,491,114HANOVER TWP 8,553,227 8,144,263 291,578 117,386 1,972,881 1,784,308 1,852,229 1,541,191 2,067,955 1,121,245 0 120,689 175,832 1,384
4,375,147HARDING TOWNSHIP 2,238,745 2,078,153 116,091 44,501 600,141 395,667 737,701 511,132 712,661 299,989 4,748 77,337 55,735 329
31,268,442JEFFERSON TWP 18,871,877 17,712,589 858,224 301,064 4,705,147 4,185,401 3,451,963 2,649,130 3,450,672 1,816,462 48,810 603,392 54,981 3,532
18,498,952KINNELON BORO 11,297,431 10,919,162 366,535 11,734 2,212,458 1,966,118 2,345,184 1,783,791 2,000,778 914,465 0 643,102 0 2,070
9,215,760LINCOLN PARK BORO 6,286,706 6,019,434 223,516 43,756 1,694,626 1,384,345 1,579,361 1,075,241 885,168 552,758 0 70,382 2,100 971
9,967,278LONG HILL TWP 5,736,633 5,370,123 246,685 119,825 1,614,254 1,443,078 1,273,260 946,494 1,281,530 808,752 0 61,600 12,972 1,080
23,491,960MADISON BORO 14,038,280 13,111,320 871,183 55,777 3,048,128 2,483,182 2,944,003 2,196,028 2,649,132 1,366,229 0 806,882 169,489 2,161
6,198,180MENDHAM BORO 3,835,377 3,541,475 267,902 26,000 856,722 762,432 853,103 672,885 571,207 218,944 0 81,772 8,608 646
8,976,618MENDHAM TWP 5,404,164 5,083,323 260,817 60,024 1,169,423 989,405 1,296,476 997,760 902,356 497,671 0 104,663 51,450 885
3,369,009MINE HILL TWP 2,137,748 1,996,768 118,538 22,442 390,113 221,517 431,803 220,689 368,732 129,352 0 40,430 0 397
36,955,057MONTVILLE TWP 22,494,111 21,089,366 1,138,997 265,748 5,601,356 4,747,843 4,155,396 3,308,829 3,758,947 2,180,500 0 945,247 104,953 3,798
6,985,451MORRIS COUNTY VOCATI 4,358,676 2,912,537 304,586 1,141,553 1,070,075 935,703 1,276,367 1,057,208 827,567 445,765 0 7,564 80,435 462
31,717,098MORRIS HILLS REGIONAL 17,357,048 16,235,588 854,407 267,053 5,215,178 4,772,337 3,155,457 2,445,989 3,625,063 2,136,669 20,000 2,052,514 293,427 2,431
6,846,406MORRIS PLAINS BORO 3,895,712 3,689,394 206,055 263 950,711 721,774 818,694 609,308 1,065,566 519,817 0 106,146 59,181 563
58,035,579MORRIS SCHOOL DISTRIC 33,749,025 32,092,471 1,348,395 308,159 9,529,284 8,442,077 5,947,621 4,537,333 6,790,964 3,696,659 209,566 1,360,602 103,705 4,609
4,455,842MOUNT ARLINGTON BORO 2,645,232 2,495,142 82,434 67,656 649,956 473,671 602,956 479,366 503,868 231,383 0 53,829 14,587 447
44,410,738MOUNT OLIVE TWP 25,221,196 24,322,435 723,011 175,750 6,530,564 5,574,896 4,503,219 3,439,501 6,848,361 3,580,164 0 830,826 656,771 4,636
22,334,409MOUNTAIN LAKES BORO 13,526,525 12,798,496 657,579 70,450 3,365,643 2,797,086 2,339,766 1,601,967 2,425,496 1,178,786 10,406 607,765 232,957 1,674
2,957,762NETCONG BORO 1,830,441 1,696,578 128,848 5,015 396,919 335,425 449,453 280,060 268,518 105,389 0 12,237 0 284
72,548,859PARSIPPANY-TROY HILLS 44,005,970 42,909,168 994,139 102,663 11,851,196 10,392,682 7,089,088 6,046,671 7,396,451 4,470,575 30,252 1,923,897 154,097 6,759
21,966,248PEQUANNOCK TWP 13,643,231 13,135,154 401,408 106,669 2,968,914 2,412,891 2,524,636 2,035,473 2,282,349 1,207,414 0 519,009 63,169 2,384
48,279,479RANDOLPH TWP 28,850,510 27,398,623 1,400,817 51,070 6,963,977 6,547,252 5,031,644 3,650,051 5,583,373 3,387,614 0 1,388,849 700,397 5,518
N.J. Department of Education - Comparative Spending Guide March 2005
Sum 2002-03
Page 851
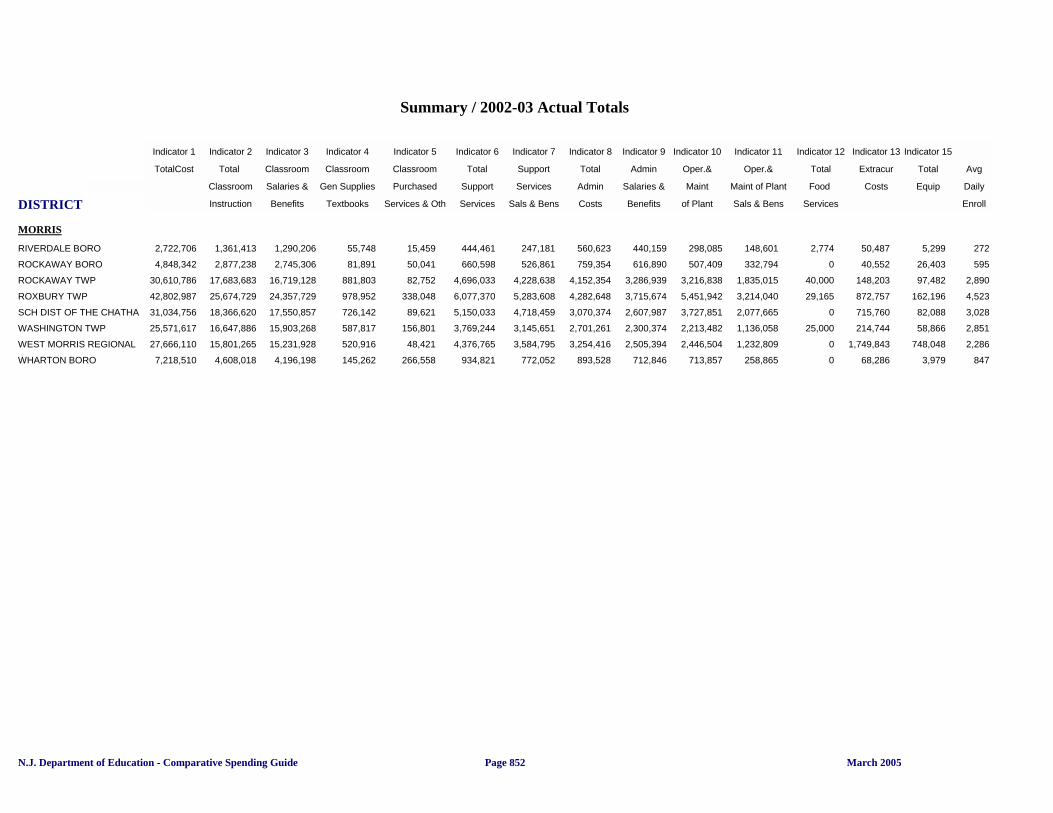
DISTRICT
Summary / 2002-03 Actual Totals
Indicator 1 Indicator 2 Indicator 3 Indicator 4 Indicator 5 Indicator 6 Indicator 7 Indicator 8 Indicator 9 Indicator 10 Indicator 11 Indicator 12 Indicator 13 Indicator 15
TotalCost Total Classroom Classroom Classroom Total Support Total Admin Oper.& Oper.& Total Extracur Total Avg
Per Pupil Classroom Salaries & Gen Supplies Purchased Support Services Admin Salaries & Maint Maint of Plant Food Costs Equip Daily
Instruction Benefits Textbooks Services & Oth Services Sals & Bens Costs Benefits of Plant Sals & Bens Services Enroll
MORRIS
2,722,706RIVERDALE BORO 1,361,413 1,290,206 55,748 15,459 444,461 247,181 560,623 440,159 298,085 148,601 2,774 50,487 5,299 272
4,848,342ROCKAWAY BORO 2,877,238 2,745,306 81,891 50,041 660,598 526,861 759,354 616,890 507,409 332,794 0 40,552 26,403 595
30,610,786ROCKAWAY TWP 17,683,683 16,719,128 881,803 82,752 4,696,033 4,228,638 4,152,354 3,286,939 3,216,838 1,835,015 40,000 148,203 97,482 2,890
42,802,987ROXBURY TWP 25,674,729 24,357,729 978,952 338,048 6,077,370 5,283,608 4,282,648 3,715,674 5,451,942 3,214,040 29,165 872,757 162,196 4,523
31,034,756SCH DIST OF THE CHATHA 18,366,620 17,550,857 726,142 89,621 5,150,033 4,718,459 3,070,374 2,607,987 3,727,851 2,077,665 0 715,760 82,088 3,028
25,571,617WASHINGTON TWP 16,647,886 15,903,268 587,817 156,801 3,769,244 3,145,651 2,701,261 2,300,374 2,213,482 1,136,058 25,000 214,744 58,866 2,851
27,666,110WEST MORRIS REGIONAL 15,801,265 15,231,928 520,916 48,421 4,376,765 3,584,795 3,254,416 2,505,394 2,446,504 1,232,809 0 1,749,843 748,048 2,286
7,218,510WHARTON BORO 4,608,018 4,196,198 145,262 266,558 934,821 772,052 893,528 712,846 713,857 258,865 0 68,286 3,979 847
N.J. Department of Education - Comparative Spending Guide March 2005Page 852
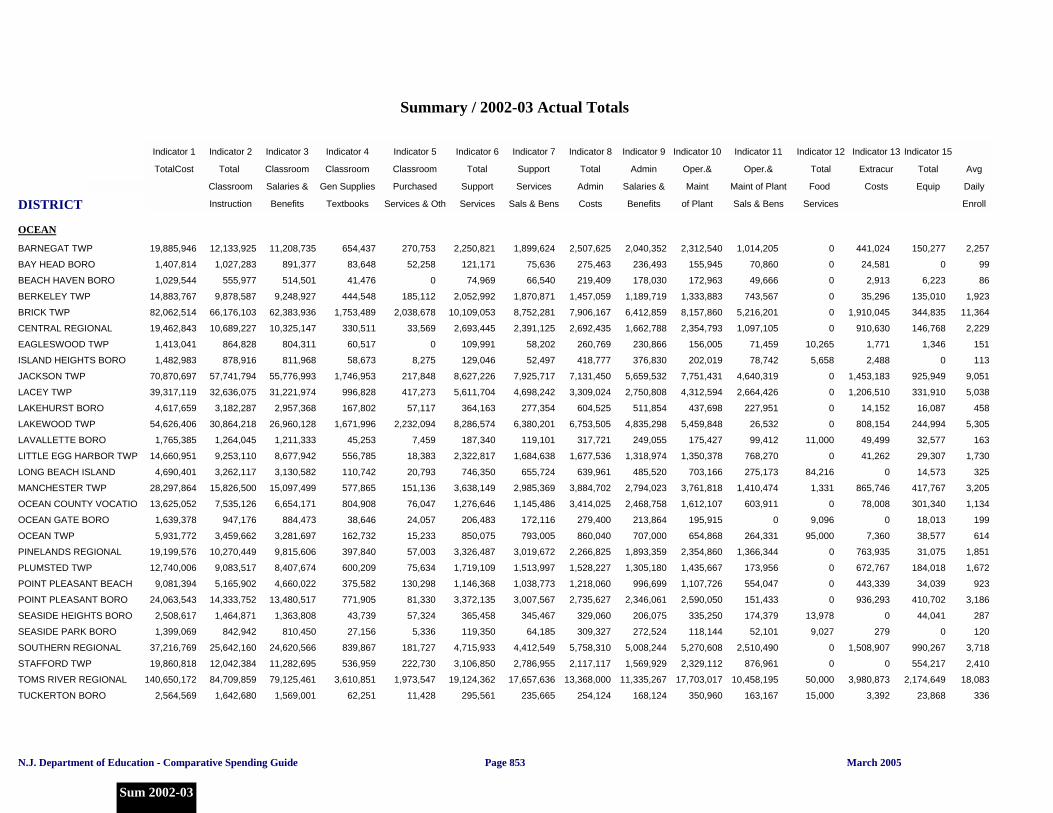
DISTRICT
Summary / 2002-03 Actual Totals
Indicator 1 Indicator 2 Indicator 3 Indicator 4 Indicator 5 Indicator 6 Indicator 7 Indicator 8 Indicator 9 Indicator 10 Indicator 11 Indicator 12 Indicator 13 Indicator 15
TotalCost Total Classroom Classroom Classroom Total Support Total Admin Oper.& Oper.& Total Extracur Total Avg
Per Pupil Classroom Salaries & Gen Supplies Purchased Support Services Admin Salaries & Maint Maint of Plant Food Costs Equip Daily
Instruction Benefits Textbooks Services & Oth Services Sals & Bens Costs Benefits of Plant Sals & Bens Services Enroll
OCEAN
19,885,946BARNEGAT TWP 12,133,925 11,208,735 654,437 270,753 2,250,821 1,899,624 2,507,625 2,040,352 2,312,540 1,014,205 0 441,024 150,277 2,257
1,407,814BAY HEAD BORO 1,027,283 891,377 83,648 52,258 121,171 75,636 275,463 236,493 155,945 70,860 0 24,581 0 99
1,029,544BEACH HAVEN BORO 555,977 514,501 41,476 0 74,969 66,540 219,409 178,030 172,963 49,666 0 2,913 6,223 86
14,883,767BERKELEY TWP 9,878,587 9,248,927 444,548 185,112 2,052,992 1,870,871 1,457,059 1,189,719 1,333,883 743,567 0 35,296 135,010 1,923
82,062,514BRICK TWP 66,176,103 62,383,936 1,753,489 2,038,678 10,109,053 8,752,281 7,906,167 6,412,859 8,157,860 5,216,201 0 1,910,045 344,835 11,364
19,462,843CENTRAL REGIONAL 10,689,227 10,325,147 330,511 33,569 2,693,445 2,391,125 2,692,435 1,662,788 2,354,793 1,097,105 0 910,630 146,768 2,229
1,413,041EAGLESWOOD TWP 864,828 804,311 60,517 0 109,991 58,202 260,769 230,866 156,005 71,459 10,265 1,771 1,346 151
1,482,983ISLAND HEIGHTS BORO 878,916 811,968 58,673 8,275 129,046 52,497 418,777 376,830 202,019 78,742 5,658 2,488 0 113
70,870,697JACKSON TWP 57,741,794 55,776,993 1,746,953 217,848 8,627,226 7,925,717 7,131,450 5,659,532 7,751,431 4,640,319 0 1,453,183 925,949 9,051
39,317,119LACEY TWP 32,636,075 31,221,974 996,828 417,273 5,611,704 4,698,242 3,309,024 2,750,808 4,312,594 2,664,426 0 1,206,510 331,910 5,038
4,617,659LAKEHURST BORO 3,182,287 2,957,368 167,802 57,117 364,163 277,354 604,525 511,854 437,698 227,951 0 14,152 16,087 458
54,626,406LAKEWOOD TWP 30,864,218 26,960,128 1,671,996 2,232,094 8,286,574 6,380,201 6,753,505 4,835,298 5,459,848 26,532 0 808,154 244,994 5,305
1,765,385LAVALLETTE BORO 1,264,045 1,211,333 45,253 7,459 187,340 119,101 317,721 249,055 175,427 99,412 11,000 49,499 32,577 163
14,660,951LITTLE EGG HARBOR TWP 9,253,110 8,677,942 556,785 18,383 2,322,817 1,684,638 1,677,536 1,318,974 1,350,378 768,270 0 41,262 29,307 1,730
4,690,401LONG BEACH ISLAND 3,262,117 3,130,582 110,742 20,793 746,350 655,724 639,961 485,520 703,166 275,173 84,216 0 14,573 325
28,297,864MANCHESTER TWP 15,826,500 15,097,499 577,865 151,136 3,638,149 2,985,369 3,884,702 2,794,023 3,761,818 1,410,474 1,331 865,746 417,767 3,205
13,625,052OCEAN COUNTY VOCATIO 7,535,126 6,654,171 804,908 76,047 1,276,646 1,145,486 3,414,025 2,468,758 1,612,107 603,911 0 78,008 301,340 1,134
1,639,378OCEAN GATE BORO 947,176 884,473 38,646 24,057 206,483 172,116 279,400 213,864 195,915 0 9,096 0 18,013 199
5,931,772OCEAN TWP 3,459,662 3,281,697 162,732 15,233 850,075 793,005 860,040 707,000 654,868 264,331 95,000 7,360 38,577 614
19,199,576PINELANDS REGIONAL 10,270,449 9,815,606 397,840 57,003 3,326,487 3,019,672 2,266,825 1,893,359 2,354,860 1,366,344 0 763,935 31,075 1,851
12,740,006PLUMSTED TWP 9,083,517 8,407,674 600,209 75,634 1,719,109 1,513,997 1,528,227 1,305,180 1,435,667 173,956 0 672,767 184,018 1,672
9,081,394POINT PLEASANT BEACH 5,165,902 4,660,022 375,582 130,298 1,146,368 1,038,773 1,218,060 996,699 1,107,726 554,047 0 443,339 34,039 923
24,063,543POINT PLEASANT BORO 14,333,752 13,480,517 771,905 81,330 3,372,135 3,007,567 2,735,627 2,346,061 2,590,050 151,433 0 936,293 410,702 3,186
2,508,617SEASIDE HEIGHTS BORO 1,464,871 1,363,808 43,739 57,324 365,458 345,467 329,060 206,075 335,250 174,379 13,978 0 44,041 287
1,399,069SEASIDE PARK BORO 842,942 810,450 27,156 5,336 119,350 64,185 309,327 272,524 118,144 52,101 9,027 279 0 120
37,216,769SOUTHERN REGIONAL 25,642,160 24,620,566 839,867 181,727 4,715,933 4,412,549 5,758,310 5,008,244 5,270,608 2,510,490 0 1,508,907 990,267 3,718
19,860,818STAFFORD TWP 12,042,384 11,282,695 536,959 222,730 3,106,850 2,786,955 2,117,117 1,569,929 2,329,112 876,961 0 0 554,217 2,410
140,650,172TOMS RIVER REGIONAL 84,709,859 79,125,461 3,610,851 1,973,547 19,124,362 17,657,636 13,368,000 11,335,267 17,703,017 10,458,195 50,000 3,980,873 2,174,649 18,083
2,564,569TUCKERTON BORO 1,642,680 1,569,001 62,251 11,428 295,561 235,665 254,124 168,124 350,960 163,167 15,000 3,392 23,868 336
N.J. Department of Education - Comparative Spending Guide March 2005
Sum 2002-03
Page 853
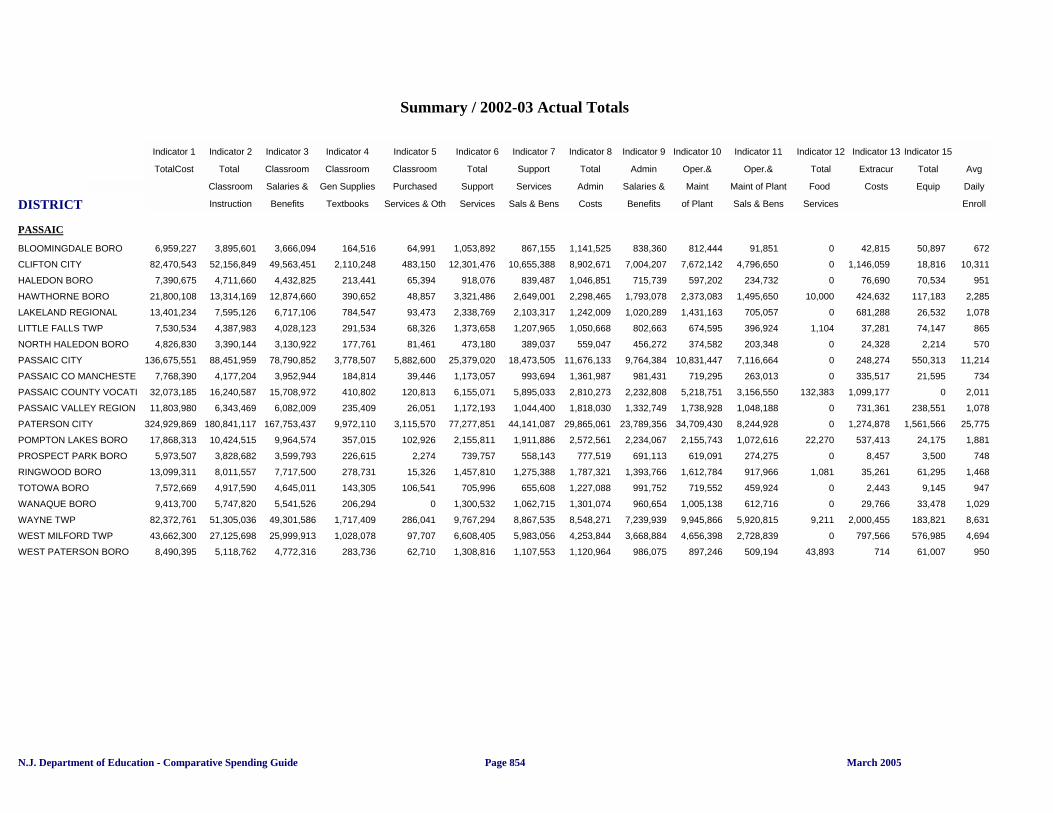
DISTRICT
Summary / 2002-03 Actual Totals
Indicator 1 Indicator 2 Indicator 3 Indicator 4 Indicator 5 Indicator 6 Indicator 7 Indicator 8 Indicator 9 Indicator 10 Indicator 11 Indicator 12 Indicator 13 Indicator 15
TotalCost Total Classroom Classroom Classroom Total Support Total Admin Oper.& Oper.& Total Extracur Total Avg
Per Pupil Classroom Salaries & Gen Supplies Purchased Support Services Admin Salaries & Maint Maint of Plant Food Costs Equip Daily
Instruction Benefits Textbooks Services & Oth Services Sals & Bens Costs Benefits of Plant Sals & Bens Services Enroll
PASSAIC
6,959,227BLOOMINGDALE BORO 3,895,601 3,666,094 164,516 64,991 1,053,892 867,155 1,141,525 838,360 812,444 91,851 0 42,815 50,897 672
82,470,543CLIFTON CITY 52,156,849 49,563,451 2,110,248 483,150 12,301,476 10,655,388 8,902,671 7,004,207 7,672,142 4,796,650 0 1,146,059 18,816 10,311
7,390,675HALEDON BORO 4,711,660 4,432,825 213,441 65,394 918,076 839,487 1,046,851 715,739 597,202 234,732 0 76,690 70,534 951
21,800,108HAWTHORNE BORO 13,314,169 12,874,660 390,652 48,857 3,321,486 2,649,001 2,298,465 1,793,078 2,373,083 1,495,650 10,000 424,632 117,183 2,285
13,401,234LAKELAND REGIONAL 7,595,126 6,717,106 784,547 93,473 2,338,769 2,103,317 1,242,009 1,020,289 1,431,163 705,057 0 681,288 26,532 1,078
7,530,534LITTLE FALLS TWP 4,387,983 4,028,123 291,534 68,326 1,373,658 1,207,965 1,050,668 802,663 674,595 396,924 1,104 37,281 74,147 865
4,826,830NORTH HALEDON BORO 3,390,144 3,130,922 177,761 81,461 473,180 389,037 559,047 456,272 374,582 203,348 0 24,328 2,214 570
136,675,551PASSAIC CITY 88,451,959 78,790,852 3,778,507 5,882,600 25,379,020 18,473,505 11,676,133 9,764,384 10,831,447 7,116,664 0 248,274 550,313 11,214
7,768,390PASSAIC CO MANCHESTE 4,177,204 3,952,944 184,814 39,446 1,173,057 993,694 1,361,987 981,431 719,295 263,013 0 335,517 21,595 734
32,073,185PASSAIC COUNTY VOCATI 16,240,587 15,708,972 410,802 120,813 6,155,071 5,895,033 2,810,273 2,232,808 5,218,751 3,156,550 132,383 1,099,177 0 2,011
11,803,980PASSAIC VALLEY REGION 6,343,469 6,082,009 235,409 26,051 1,172,193 1,044,400 1,818,030 1,332,749 1,738,928 1,048,188 0 731,361 238,551 1,078
324,929,869PATERSON CITY 180,841,117 167,753,437 9,972,110 3,115,570 77,277,851 44,141,087 29,865,061 23,789,356 34,709,430 8,244,928 0 1,274,878 1,561,566 25,775
17,868,313POMPTON LAKES BORO 10,424,515 9,964,574 357,015 102,926 2,155,811 1,911,886 2,572,561 2,234,067 2,155,743 1,072,616 22,270 537,413 24,175 1,881
5,973,507PROSPECT PARK BORO 3,828,682 3,599,793 226,615 2,274 739,757 558,143 777,519 691,113 619,091 274,275 0 8,457 3,500 748
13,099,311RINGWOOD BORO 8,011,557 7,717,500 278,731 15,326 1,457,810 1,275,388 1,787,321 1,393,766 1,612,784 917,966 1,081 35,261 61,295 1,468
7,572,669TOTOWA BORO 4,917,590 4,645,011 143,305 106,541 705,996 655,608 1,227,088 991,752 719,552 459,924 0 2,443 9,145 947
9,413,700WANAQUE BORO 5,747,820 5,541,526 206,294 0 1,300,532 1,062,715 1,301,074 960,654 1,005,138 612,716 0 29,766 33,478 1,029
82,372,761WAYNE TWP 51,305,036 49,301,586 1,717,409 286,041 9,767,294 8,867,535 8,548,271 7,239,939 9,945,866 5,920,815 9,211 2,000,455 183,821 8,631
43,662,300WEST MILFORD TWP 27,125,698 25,999,913 1,028,078 97,707 6,608,405 5,983,056 4,253,844 3,668,884 4,656,398 2,728,839 0 797,566 576,985 4,694
8,490,395WEST PATERSON BORO 5,118,762 4,772,316 283,736 62,710 1,308,816 1,107,553 1,120,964 986,075 897,246 509,194 43,893 714 61,007 950
N.J. Department of Education - Comparative Spending Guide March 2005Page 854
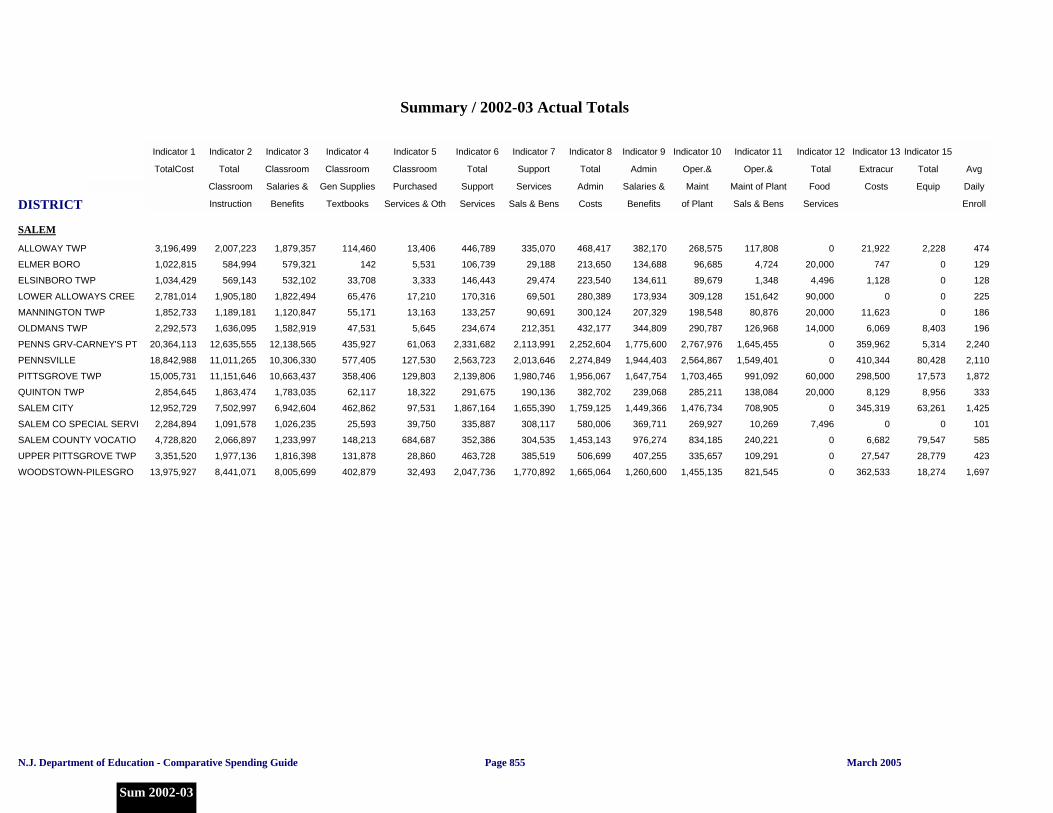
DISTRICT
Summary / 2002-03 Actual Totals
Indicator 1 Indicator 2 Indicator 3 Indicator 4 Indicator 5 Indicator 6 Indicator 7 Indicator 8 Indicator 9 Indicator 10 Indicator 11 Indicator 12 Indicator 13 Indicator 15
TotalCost Total Classroom Classroom Classroom Total Support Total Admin Oper.& Oper.& Total Extracur Total Avg
Per Pupil Classroom Salaries & Gen Supplies Purchased Support Services Admin Salaries & Maint Maint of Plant Food Costs Equip Daily
Instruction Benefits Textbooks Services & Oth Services Sals & Bens Costs Benefits of Plant Sals & Bens Services Enroll
SALEM
3,196,499ALLOWAY TWP 2,007,223 1,879,357 114,460 13,406 446,789 335,070 468,417 382,170 268,575 117,808 0 21,922 2,228 474
1,022,815ELMER BORO 584,994 579,321 142 5,531 106,739 29,188 213,650 134,688 96,685 4,724 20,000 747 0 129
1,034,429ELSINBORO TWP 569,143 532,102 33,708 3,333 146,443 29,474 223,540 134,611 89,679 1,348 4,496 1,128 0 128
2,781,014LOWER ALLOWAYS CREE 1,905,180 1,822,494 65,476 17,210 170,316 69,501 280,389 173,934 309,128 151,642 90,000 0 0 225
1,852,733MANNINGTON TWP 1,189,181 1,120,847 55,171 13,163 133,257 90,691 300,124 207,329 198,548 80,876 20,000 11,623 0 186
2,292,573OLDMANS TWP 1,636,095 1,582,919 47,531 5,645 234,674 212,351 432,177 344,809 290,787 126,968 14,000 6,069 8,403 196
20,364,113PENNS GRV-CARNEY'S PT 12,635,555 12,138,565 435,927 61,063 2,331,682 2,113,991 2,252,604 1,775,600 2,767,976 1,645,455 0 359,962 5,314 2,240
18,842,988PENNSVILLE 11,011,265 10,306,330 577,405 127,530 2,563,723 2,013,646 2,274,849 1,944,403 2,564,867 1,549,401 0 410,344 80,428 2,110
15,005,731PITTSGROVE TWP 11,151,646 10,663,437 358,406 129,803 2,139,806 1,980,746 1,956,067 1,647,754 1,703,465 991,092 60,000 298,500 17,573 1,872
2,854,645QUINTON TWP 1,863,474 1,783,035 62,117 18,322 291,675 190,136 382,702 239,068 285,211 138,084 20,000 8,129 8,956 333
12,952,729SALEM CITY 7,502,997 6,942,604 462,862 97,531 1,867,164 1,655,390 1,759,125 1,449,366 1,476,734 708,905 0 345,319 63,261 1,425
2,284,894SALEM CO SPECIAL SERVI 1,091,578 1,026,235 25,593 39,750 335,887 308,117 580,006 369,711 269,927 10,269 7,496 0 0 101
4,728,820SALEM COUNTY VOCATIO 2,066,897 1,233,997 148,213 684,687 352,386 304,535 1,453,143 976,274 834,185 240,221 0 6,682 79,547 585
3,351,520UPPER PITTSGROVE TWP 1,977,136 1,816,398 131,878 28,860 463,728 385,519 506,699 407,255 335,657 109,291 0 27,547 28,779 423
13,975,927WOODSTOWN-PILESGRO 8,441,071 8,005,699 402,879 32,493 2,047,736 1,770,892 1,665,064 1,260,600 1,455,135 821,545 0 362,533 18,274 1,697
N.J. Department of Education - Comparative Spending Guide March 2005
Sum 2002-03
Page 855
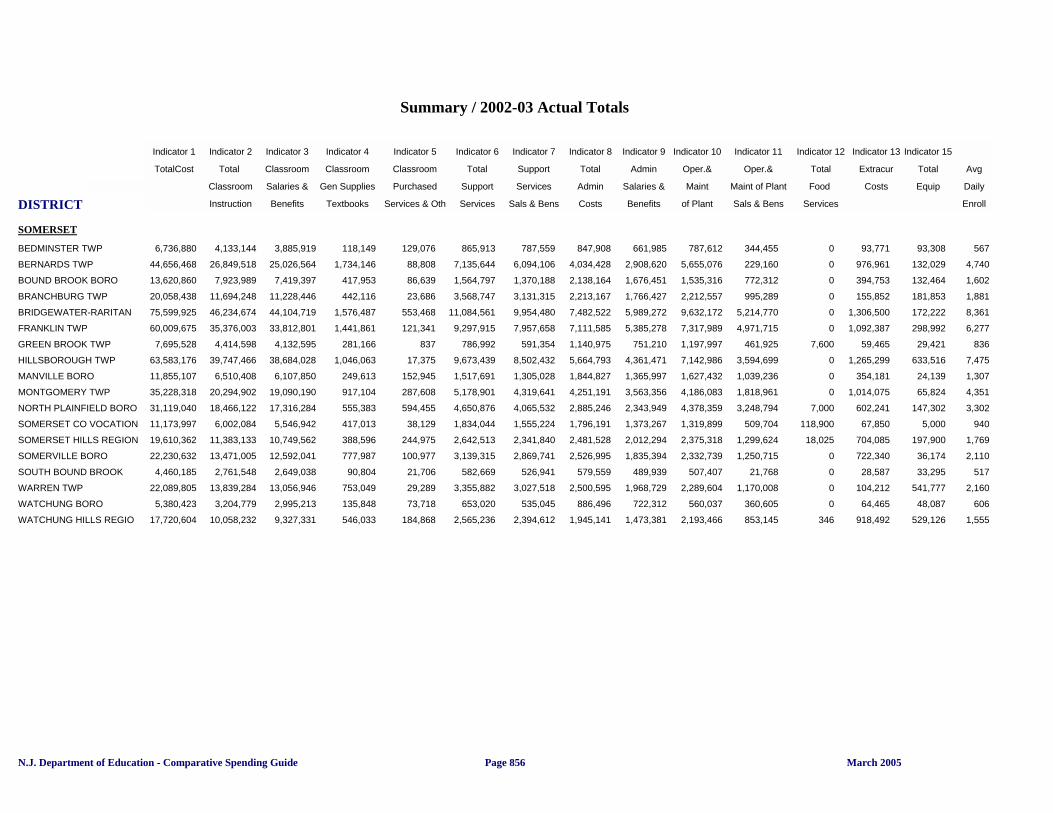
DISTRICT
Summary / 2002-03 Actual Totals
Indicator 1 Indicator 2 Indicator 3 Indicator 4 Indicator 5 Indicator 6 Indicator 7 Indicator 8 Indicator 9 Indicator 10 Indicator 11 Indicator 12 Indicator 13 Indicator 15
TotalCost Total Classroom Classroom Classroom Total Support Total Admin Oper.& Oper.& Total Extracur Total Avg
Per Pupil Classroom Salaries & Gen Supplies Purchased Support Services Admin Salaries & Maint Maint of Plant Food Costs Equip Daily
Instruction Benefits Textbooks Services & Oth Services Sals & Bens Costs Benefits of Plant Sals & Bens Services Enroll
SOMERSET
6,736,880BEDMINSTER TWP 4,133,144 3,885,919 118,149 129,076 865,913 787,559 847,908 661,985 787,612 344,455 0 93,771 93,308 567
44,656,468BERNARDS TWP 26,849,518 25,026,564 1,734,146 88,808 7,135,644 6,094,106 4,034,428 2,908,620 5,655,076 229,160 0 976,961 132,029 4,740
13,620,860BOUND BROOK BORO 7,923,989 7,419,397 417,953 86,639 1,564,797 1,370,188 2,138,164 1,676,451 1,535,316 772,312 0 394,753 132,464 1,602
20,058,438BRANCHBURG TWP 11,694,248 11,228,446 442,116 23,686 3,568,747 3,131,315 2,213,167 1,766,427 2,212,557 995,289 0 155,852 181,853 1,881
75,599,925BRIDGEWATER-RARITAN 46,234,674 44,104,719 1,576,487 553,468 11,084,561 9,954,480 7,482,522 5,989,272 9,632,172 5,214,770 0 1,306,500 172,222 8,361
60,009,675FRANKLIN TWP 35,376,003 33,812,801 1,441,861 121,341 9,297,915 7,957,658 7,111,585 5,385,278 7,317,989 4,971,715 0 1,092,387 298,992 6,277
7,695,528GREEN BROOK TWP 4,414,598 4,132,595 281,166 837 786,992 591,354 1,140,975 751,210 1,197,997 461,925 7,600 59,465 29,421 836
63,583,176HILLSBOROUGH TWP 39,747,466 38,684,028 1,046,063 17,375 9,673,439 8,502,432 5,664,793 4,361,471 7,142,986 3,594,699 0 1,265,299 633,516 7,475
11,855,107MANVILLE BORO 6,510,408 6,107,850 249,613 152,945 1,517,691 1,305,028 1,844,827 1,365,997 1,627,432 1,039,236 0 354,181 24,139 1,307
35,228,318MONTGOMERY TWP 20,294,902 19,090,190 917,104 287,608 5,178,901 4,319,641 4,251,191 3,563,356 4,186,083 1,818,961 0 1,014,075 65,824 4,351
31,119,040NORTH PLAINFIELD BORO 18,466,122 17,316,284 555,383 594,455 4,650,876 4,065,532 2,885,246 2,343,949 4,378,359 3,248,794 7,000 602,241 147,302 3,302
11,173,997SOMERSET CO VOCATION 6,002,084 5,546,942 417,013 38,129 1,834,044 1,555,224 1,796,191 1,373,267 1,319,899 509,704 118,900 67,850 5,000 940
19,610,362SOMERSET HILLS REGION 11,383,133 10,749,562 388,596 244,975 2,642,513 2,341,840 2,481,528 2,012,294 2,375,318 1,299,624 18,025 704,085 197,900 1,769
22,230,632SOMERVILLE BORO 13,471,005 12,592,041 777,987 100,977 3,139,315 2,869,741 2,526,995 1,835,394 2,332,739 1,250,715 0 722,340 36,174 2,110
4,460,185SOUTH BOUND BROOK 2,761,548 2,649,038 90,804 21,706 582,669 526,941 579,559 489,939 507,407 21,768 0 28,587 33,295 517
22,089,805WARREN TWP 13,839,284 13,056,946 753,049 29,289 3,355,882 3,027,518 2,500,595 1,968,729 2,289,604 1,170,008 0 104,212 541,777 2,160
5,380,423WATCHUNG BORO 3,204,779 2,995,213 135,848 73,718 653,020 535,045 886,496 722,312 560,037 360,605 0 64,465 48,087 606
17,720,604WATCHUNG HILLS REGIO 10,058,232 9,327,331 546,033 184,868 2,565,236 2,394,612 1,945,141 1,473,381 2,193,466 853,145 346 918,492 529,126 1,555
N.J. Department of Education - Comparative Spending Guide March 2005Page 856
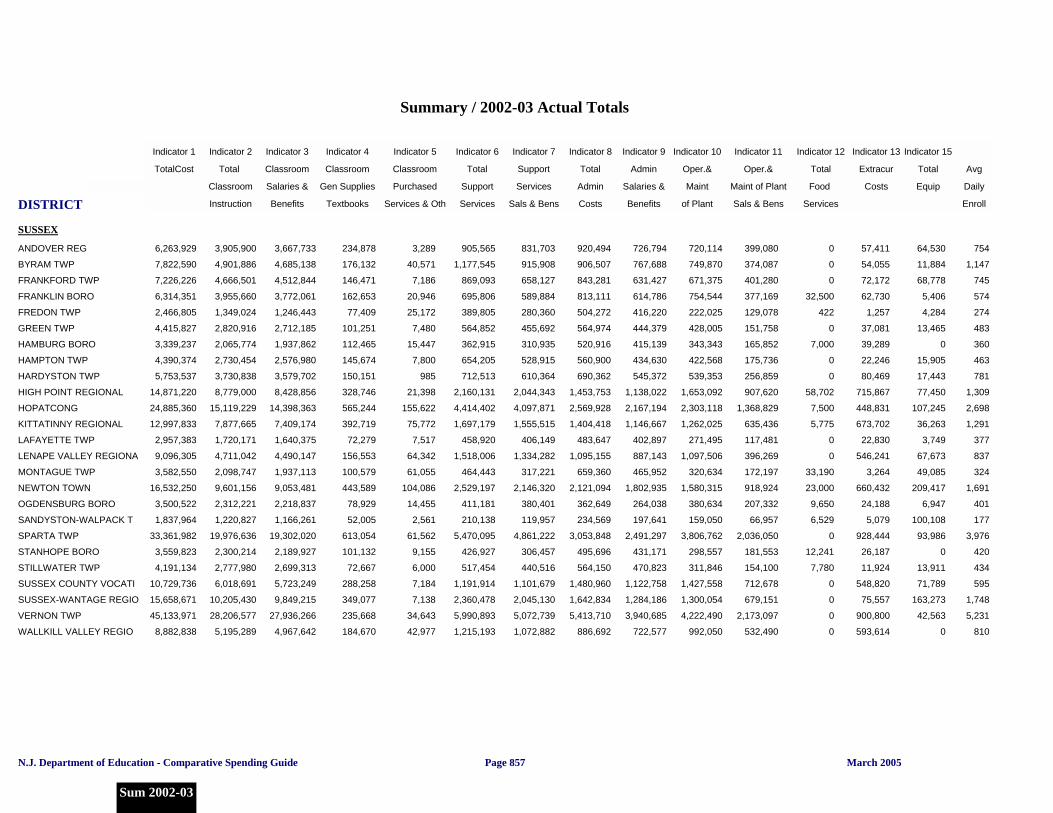
DISTRICT
Summary / 2002-03 Actual Totals
Indicator 1 Indicator 2 Indicator 3 Indicator 4 Indicator 5 Indicator 6 Indicator 7 Indicator 8 Indicator 9 Indicator 10 Indicator 11 Indicator 12 Indicator 13 Indicator 15
TotalCost Total Classroom Classroom Classroom Total Support Total Admin Oper.& Oper.& Total Extracur Total Avg
Per Pupil Classroom Salaries & Gen Supplies Purchased Support Services Admin Salaries & Maint Maint of Plant Food Costs Equip Daily
Instruction Benefits Textbooks Services & Oth Services Sals & Bens Costs Benefits of Plant Sals & Bens Services Enroll
SUSSEX
6,263,929ANDOVER REG 3,905,900 3,667,733 234,878 3,289 905,565 831,703 920,494 726,794 720,114 399,080 0 57,411 64,530 754
7,822,590BYRAM TWP 4,901,886 4,685,138 176,132 40,571 1,177,545 915,908 906,507 767,688 749,870 374,087 0 54,055 11,884 1,147
7,226,226FRANKFORD TWP 4,666,501 4,512,844 146,471 7,186 869,093 658,127 843,281 631,427 671,375 401,280 0 72,172 68,778 745
6,314,351FRANKLIN BORO 3,955,660 3,772,061 162,653 20,946 695,806 589,884 813,111 614,786 754,544 377,169 32,500 62,730 5,406 574
2,466,805FREDON TWP 1,349,024 1,246,443 77,409 25,172 389,805 280,360 504,272 416,220 222,025 129,078 422 1,257 4,284 274
4,415,827GREEN TWP 2,820,916 2,712,185 101,251 7,480 564,852 455,692 564,974 444,379 428,005 151,758 0 37,081 13,465 483
3,339,237HAMBURG BORO 2,065,774 1,937,862 112,465 15,447 362,915 310,935 520,916 415,139 343,343 165,852 7,000 39,289 0 360
4,390,374HAMPTON TWP 2,730,454 2,576,980 145,674 7,800 654,205 528,915 560,900 434,630 422,568 175,736 0 22,246 15,905 463
5,753,537HARDYSTON TWP 3,730,838 3,579,702 150,151 985 712,513 610,364 690,362 545,372 539,353 256,859 0 80,469 17,443 781
14,871,220HIGH POINT REGIONAL 8,779,000 8,428,856 328,746 21,398 2,160,131 2,044,343 1,453,753 1,138,022 1,653,092 907,620 58,702 715,867 77,450 1,309
24,885,360HOPATCONG 15,119,229 14,398,363 565,244 155,622 4,414,402 4,097,871 2,569,928 2,167,194 2,303,118 1,368,829 7,500 448,831 107,245 2,698
12,997,833KITTATINNY REGIONAL 7,877,665 7,409,174 392,719 75,772 1,697,179 1,555,515 1,404,418 1,146,667 1,262,025 635,436 5,775 673,702 36,263 1,291
2,957,383LAFAYETTE TWP 1,720,171 1,640,375 72,279 7,517 458,920 406,149 483,647 402,897 271,495 117,481 0 22,830 3,749 377
9,096,305LENAPE VALLEY REGIONA 4,711,042 4,490,147 156,553 64,342 1,518,006 1,334,282 1,095,155 887,143 1,097,506 396,269 0 546,241 67,673 837
3,582,550MONTAGUE TWP 2,098,747 1,937,113 100,579 61,055 464,443 317,221 659,360 465,952 320,634 172,197 33,190 3,264 49,085 324
16,532,250NEWTON TOWN 9,601,156 9,053,481 443,589 104,086 2,529,197 2,146,320 2,121,094 1,802,935 1,580,315 918,924 23,000 660,432 209,417 1,691
3,500,522OGDENSBURG BORO 2,312,221 2,218,837 78,929 14,455 411,181 380,401 362,649 264,038 380,634 207,332 9,650 24,188 6,947 401
1,837,964SANDYSTON-WALPACK T 1,220,827 1,166,261 52,005 2,561 210,138 119,957 234,569 197,641 159,050 66,957 6,529 5,079 100,108 177
33,361,982SPARTA TWP 19,976,636 19,302,020 613,054 61,562 5,470,095 4,861,222 3,053,848 2,491,297 3,806,762 2,036,050 0 928,444 93,986 3,976
3,559,823STANHOPE BORO 2,300,214 2,189,927 101,132 9,155 426,927 306,457 495,696 431,171 298,557 181,553 12,241 26,187 0 420
4,191,134STILLWATER TWP 2,777,980 2,699,313 72,667 6,000 517,454 440,516 564,150 470,823 311,846 154,100 7,780 11,924 13,911 434
10,729,736SUSSEX COUNTY VOCATI 6,018,691 5,723,249 288,258 7,184 1,191,914 1,101,679 1,480,960 1,122,758 1,427,558 712,678 0 548,820 71,789 595
15,658,671SUSSEX-WANTAGE REGIO 10,205,430 9,849,215 349,077 7,138 2,360,478 2,045,130 1,642,834 1,284,186 1,300,054 679,151 0 75,557 163,273 1,748
45,133,971VERNON TWP 28,206,577 27,936,266 235,668 34,643 5,990,893 5,072,739 5,413,710 3,940,685 4,222,490 2,173,097 0 900,800 42,563 5,231
8,882,838WALLKILL VALLEY REGIO 5,195,289 4,967,642 184,670 42,977 1,215,193 1,072,882 886,692 722,577 992,050 532,490 0 593,614 0 810
N.J. Department of Education - Comparative Spending Guide March 2005
Sum 2002-03
Page 857
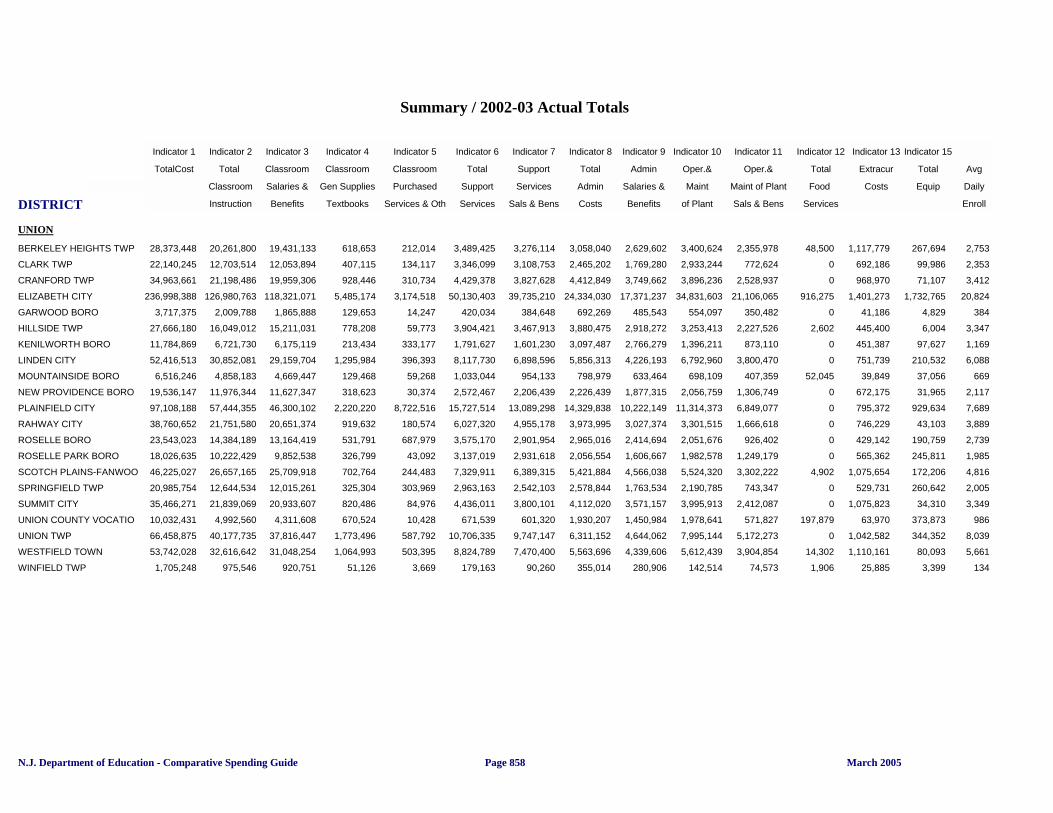
DISTRICT
Summary / 2002-03 Actual Totals
Indicator 1 Indicator 2 Indicator 3 Indicator 4 Indicator 5 Indicator 6 Indicator 7 Indicator 8 Indicator 9 Indicator 10 Indicator 11 Indicator 12 Indicator 13 Indicator 15
TotalCost Total Classroom Classroom Classroom Total Support Total Admin Oper.& Oper.& Total Extracur Total Avg
Per Pupil Classroom Salaries & Gen Supplies Purchased Support Services Admin Salaries & Maint Maint of Plant Food Costs Equip Daily
Instruction Benefits Textbooks Services & Oth Services Sals & Bens Costs Benefits of Plant Sals & Bens Services Enroll
UNION
28,373,448BERKELEY HEIGHTS TWP 20,261,800 19,431,133 618,653 212,014 3,489,425 3,276,114 3,058,040 2,629,602 3,400,624 2,355,978 48,500 1,117,779 267,694 2,753
22,140,245CLARK TWP 12,703,514 12,053,894 407,115 134,117 3,346,099 3,108,753 2,465,202 1,769,280 2,933,244 772,624 0 692,186 99,986 2,353
34,963,661CRANFORD TWP 21,198,486 19,959,306 928,446 310,734 4,429,378 3,827,628 4,412,849 3,749,662 3,896,236 2,528,937 0 968,970 71,107 3,412
236,998,388ELIZABETH CITY 126,980,763 118,321,071 5,485,174 3,174,518 50,130,403 39,735,210 24,334,030 17,371,237 34,831,603 21,106,065 916,275 1,401,273 1,732,765 20,824
3,717,375GARWOOD BORO 2,009,788 1,865,888 129,653 14,247 420,034 384,648 692,269 485,543 554,097 350,482 0 41,186 4,829 384
27,666,180HILLSIDE TWP 16,049,012 15,211,031 778,208 59,773 3,904,421 3,467,913 3,880,475 2,918,272 3,253,413 2,227,526 2,602 445,400 6,004 3,347
11,784,869KENILWORTH BORO 6,721,730 6,175,119 213,434 333,177 1,791,627 1,601,230 3,097,487 2,766,279 1,396,211 873,110 0 451,387 97,627 1,169
52,416,513LINDEN CITY 30,852,081 29,159,704 1,295,984 396,393 8,117,730 6,898,596 5,856,313 4,226,193 6,792,960 3,800,470 0 751,739 210,532 6,088
6,516,246MOUNTAINSIDE BORO 4,858,183 4,669,447 129,468 59,268 1,033,044 954,133 798,979 633,464 698,109 407,359 52,045 39,849 37,056 669
19,536,147NEW PROVIDENCE BORO 11,976,344 11,627,347 318,623 30,374 2,572,467 2,206,439 2,226,439 1,877,315 2,056,759 1,306,749 0 672,175 31,965 2,117
97,108,188PLAINFIELD CITY 57,444,355 46,300,102 2,220,220 8,722,516 15,727,514 13,089,298 14,329,838 10,222,149 11,314,373 6,849,077 0 795,372 929,634 7,689
38,760,652RAHWAY CITY 21,751,580 20,651,374 919,632 180,574 6,027,320 4,955,178 3,973,995 3,027,374 3,301,515 1,666,618 0 746,229 43,103 3,889
23,543,023ROSELLE BORO 14,384,189 13,164,419 531,791 687,979 3,575,170 2,901,954 2,965,016 2,414,694 2,051,676 926,402 0 429,142 190,759 2,739
18,026,635ROSELLE PARK BORO 10,222,429 9,852,538 326,799 43,092 3,137,019 2,931,618 2,056,554 1,606,667 1,982,578 1,249,179 0 565,362 245,811 1,985
46,225,027SCOTCH PLAINS-FANWOO 26,657,165 25,709,918 702,764 244,483 7,329,911 6,389,315 5,421,884 4,566,038 5,524,320 3,302,222 4,902 1,075,654 172,206 4,816
20,985,754SPRINGFIELD TWP 12,644,534 12,015,261 325,304 303,969 2,963,163 2,542,103 2,578,844 1,763,534 2,190,785 743,347 0 529,731 260,642 2,005
35,466,271SUMMIT CITY 21,839,069 20,933,607 820,486 84,976 4,436,011 3,800,101 4,112,020 3,571,157 3,995,913 2,412,087 0 1,075,823 34,310 3,349
10,032,431UNION COUNTY VOCATIO 4,992,560 4,311,608 670,524 10,428 671,539 601,320 1,930,207 1,450,984 1,978,641 571,827 197,879 63,970 373,873 986
66,458,875UNION TWP 40,177,735 37,816,447 1,773,496 587,792 10,706,335 9,747,147 6,311,152 4,644,062 7,995,144 5,172,273 0 1,042,582 344,352 8,039
53,742,028WESTFIELD TOWN 32,616,642 31,048,254 1,064,993 503,395 8,824,789 7,470,400 5,563,696 4,339,606 5,612,439 3,904,854 14,302 1,110,161 80,093 5,661
1,705,248WINFIELD TWP 975,546 920,751 51,126 3,669 179,163 90,260 355,014 280,906 142,514 74,573 1,906 25,885 3,399 134
N.J. Department of Education - Comparative Spending Guide March 2005Page 858

DISTRICT
Summary / 2002-03 Actual Totals
Indicator 1 Indicator 2 Indicator 3 Indicator 4 Indicator 5 Indicator 6 Indicator 7 Indicator 8 Indicator 9 Indicator 10 Indicator 11 Indicator 12 Indicator 13 Indicator 15
TotalCost Total Classroom Classroom Classroom Total Support Total Admin Oper.& Oper.& Total Extracur Total Avg
Per Pupil Classroom Salaries & Gen Supplies Purchased Support Services Admin Salaries & Maint Maint of Plant Food Costs Equip Daily
Instruction Benefits Textbooks Services & Oth Services Sals & Bens Costs Benefits of Plant Sals & Bens Services Enroll
WARREN
3,334,014ALLAMUCHY TWP 2,049,754 1,940,457 75,615 33,682 403,745 313,143 438,002 339,560 399,024 219,692 0 28,906 13,335 358
2,740,659ALPHA BORO 1,775,628 1,718,352 39,107 18,169 428,087 332,234 335,053 273,695 197,958 117,626 2,350 1,582 2,010 271
8,247,185BELVIDERE TOWN 4,694,832 4,542,221 140,194 12,417 1,185,517 1,058,532 1,061,260 852,275 835,598 362,114 0 469,978 26,893 974
5,816,596BLAIRSTOWN TWP 3,888,854 3,782,325 104,486 2,043 947,089 714,360 581,491 504,650 429,549 194,884 20,570 2,299 4,874 753
2,821,525FRANKLIN TWP 1,764,610 1,655,146 80,677 28,787 408,619 316,364 345,862 292,725 274,762 123,869 11,000 7,025 0 366
1,895,221FRELINGHUYSEN TWP 1,157,242 1,101,577 26,319 29,346 217,998 102,750 333,101 279,708 177,775 83,954 8,000 1,104 0 210
8,334,357GREAT MEADOWS REGIO 5,284,893 5,085,273 147,870 51,750 1,126,381 988,866 1,025,958 849,284 852,096 454,221 37,290 0 0 1,060
5,545,851GREENWICH TWP 3,578,373 3,276,895 246,138 55,340 772,782 512,097 639,942 525,424 554,753 199,849 0 0 5,789 882
18,819,119HACKETTSTOWN 10,810,830 10,284,774 409,354 116,702 3,465,723 3,242,252 2,090,775 1,707,276 1,783,529 691,353 0 660,367 154,255 1,865
3,142,154HARMONY TWP 1,769,519 1,655,562 80,814 33,143 592,324 406,106 396,797 318,247 359,398 181,594 0 24,115 11,536 318
2,127,056HOPE TWP 1,162,138 1,099,627 33,000 29,511 260,398 193,021 457,347 378,991 225,021 127,568 3,000 19,152 34,001 188
3,038,319KNOWLTON TWP 1,862,824 1,765,135 56,500 41,189 445,761 331,405 436,349 307,219 272,939 135,832 0 17,509 8,068 367
5,599,402LOPATCONG TWP 3,883,428 3,735,040 132,848 15,540 534,564 450,910 717,549 560,525 463,862 213,718 0 0 23,116 832
5,513,134MANSFIELD TWP 3,771,669 3,629,844 109,956 31,869 700,783 617,059 569,879 489,137 467,400 274,990 0 0 48,148 744
9,697,729NORTH WARREN REGION 5,710,110 5,405,712 243,339 61,059 1,334,344 997,163 1,052,452 815,954 886,777 449,707 0 571,644 3,789 973
2,884,728OXFORD TWP 1,739,259 1,649,215 66,887 23,157 283,239 248,501 464,693 379,387 369,966 116,451 21,069 3,331 15,624 347
43,472,338PHILLIPSBURG TOWN 24,965,517 21,756,934 904,659 2,303,924 7,809,445 7,093,118 4,914,990 3,655,481 4,736,646 3,008,470 6,921 942,789 106,694 3,499
3,361,220POHATCONG TWP 2,060,504 1,958,981 81,226 20,297 432,584 373,901 483,364 402,348 379,219 148,139 0 5,548 50,472 389
2,314,231WARREN CO SPECIAL SE 1,203,573 1,094,446 35,862 73,265 571,651 457,519 382,901 273,503 131,533 0 0 0 0 97
4,886,316WARREN COUNTY VOCATI 2,600,627 2,427,156 139,350 34,121 605,413 503,307 941,866 721,718 709,852 262,095 22,268 85,697 52,788 364
19,774,089WARREN HILLS REGIONAL 11,522,077 10,389,483 571,850 560,744 2,894,650 2,603,502 2,217,764 1,697,570 2,087,571 1,266,623 0 1,038,697 119,613 2,066
5,088,176WASHINGTON BORO 3,330,641 3,230,037 100,604 0 745,492 507,152 549,494 425,756 437,916 245,736 24,477 156 0 595
5,700,018WASHINGTON TWP 3,305,913 3,135,835 129,682 40,396 1,064,950 843,758 749,721 652,200 513,614 256,590 22,423 30,834 56,813 636
4,123,827WHITE TWP 2,632,056 2,473,775 96,602 61,679 518,982 426,947 471,006 309,547 384,930 193,357 0 72,566 0 448
N.J. Department of Education - Comparative Spending Guide March 2005
Sum 2002-03
Page 859
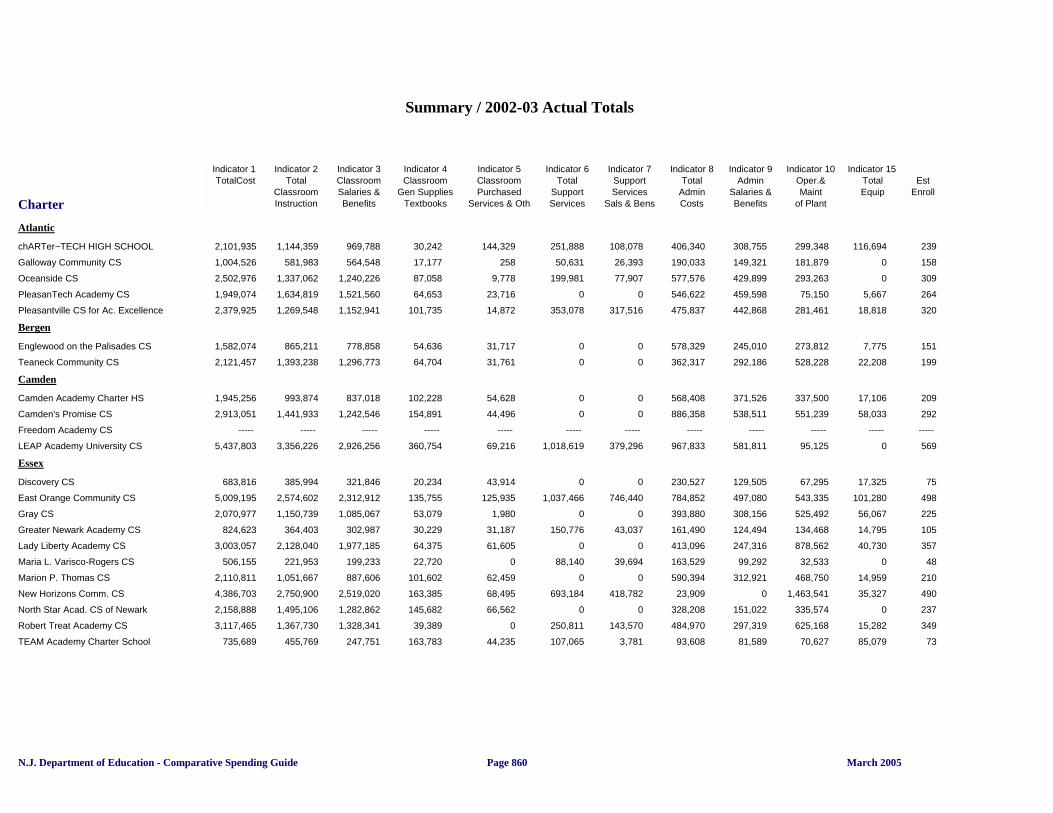
Charter
Summary / 2002-03 Actual Totals
Indicator 1 Indicator 2 Indicator 3 Indicator 4 Indicator 5 Indicator 6 Indicator 7 Indicator 8 Indicator 9 Indicator 10 Indicator 15 TotalCost Total Classroom Classroom Classroom Total Support Total Admin Oper.& Total Est
Classroom Salaries & Gen Supplies Purchased Support Services Admin Salaries & Maint Equip Enroll Instruction Benefits Textbooks Services & Oth Services Sals & Bens Costs Benefits of Plant
Atlantic
2,101,935chARTer~TECH HIGH SCHOOL 1,144,359 969,788 30,242 144,329 251,888 108,078 406,340 308,755 299,348 116,694 239
1,004,526Galloway Community CS 581,983 564,548 17,177 258 50,631 26,393 190,033 149,321 181,879 0 158
2,502,976Oceanside CS 1,337,062 1,240,226 87,058 9,778 199,981 77,907 577,576 429,899 293,263 0 309
1,949,074PleasanTech Academy CS 1,634,819 1,521,560 64,653 23,716 0 0 546,622 459,598 75,150 5,667 264
2,379,925Pleasantville CS for Ac. Excellence 1,269,548 1,152,941 101,735 14,872 353,078 317,516 475,837 442,868 281,461 18,818 320
Bergen
1,582,074Englewood on the Palisades CS 865,211 778,858 54,636 31,717 0 0 578,329 245,010 273,812 7,775 151
2,121,457Teaneck Community CS 1,393,238 1,296,773 64,704 31,761 0 0 362,317 292,186 528,228 22,208 199
Camden
1,945,256Camden Academy Charter HS 993,874 837,018 102,228 54,628 0 0 568,408 371,526 337,500 17,106 209
2,913,051Camden's Promise CS 1,441,933 1,242,546 154,891 44,496 0 0 886,358 538,511 551,239 58,033 292
----- Freedom Academy CS ----- ----- ----- ----- ----- ----- ----- ----- ----- ----- -----
5,437,803LEAP Academy University CS 3,356,226 2,926,256 360,754 69,216 1,018,619 379,296 967,833 581,811 95,125 0 569
Essex
683,816Discovery CS 385,994 321,846 20,234 43,914 0 0 230,527 129,505 67,295 17,325 75
5,009,195East Orange Community CS 2,574,602 2,312,912 135,755 125,935 1,037,466 746,440 784,852 497,080 543,335 101,280 498
2,070,977Gray CS 1,150,739 1,085,067 53,079 1,980 0 0 393,880 308,156 525,492 56,067 225
824,623Greater Newark Academy CS 364,403 302,987 30,229 31,187 150,776 43,037 161,490 124,494 134,468 14,795 105
3,003,057Lady Liberty Academy CS 2,128,040 1,977,185 64,375 61,605 0 0 413,096 247,316 878,562 40,730 357
506,155Maria L. Varisco-Rogers CS 221,953 199,233 22,720 0 88,140 39,694 163,529 99,292 32,533 0 48
2,110,811Marion P. Thomas CS 1,051,667 887,606 101,602 62,459 0 0 590,394 312,921 468,750 14,959 210
4,386,703New Horizons Comm. CS 2,750,900 2,519,020 163,385 68,495 693,184 418,782 23,909 0 1,463,541 35,327 490
2,158,888North Star Acad. CS of Newark 1,495,106 1,282,862 145,682 66,562 0 0 328,208 151,022 335,574 0 237
3,117,465Robert Treat Academy CS 1,367,730 1,328,341 39,389 0 250,811 143,570 484,970 297,319 625,168 15,282 349
735,689TEAM Academy Charter School 455,769 247,751 163,783 44,235 107,065 3,781 93,608 81,589 70,627 85,079 73
N.J. Department of Education - Comparative Spending Guide March 2005Page 860
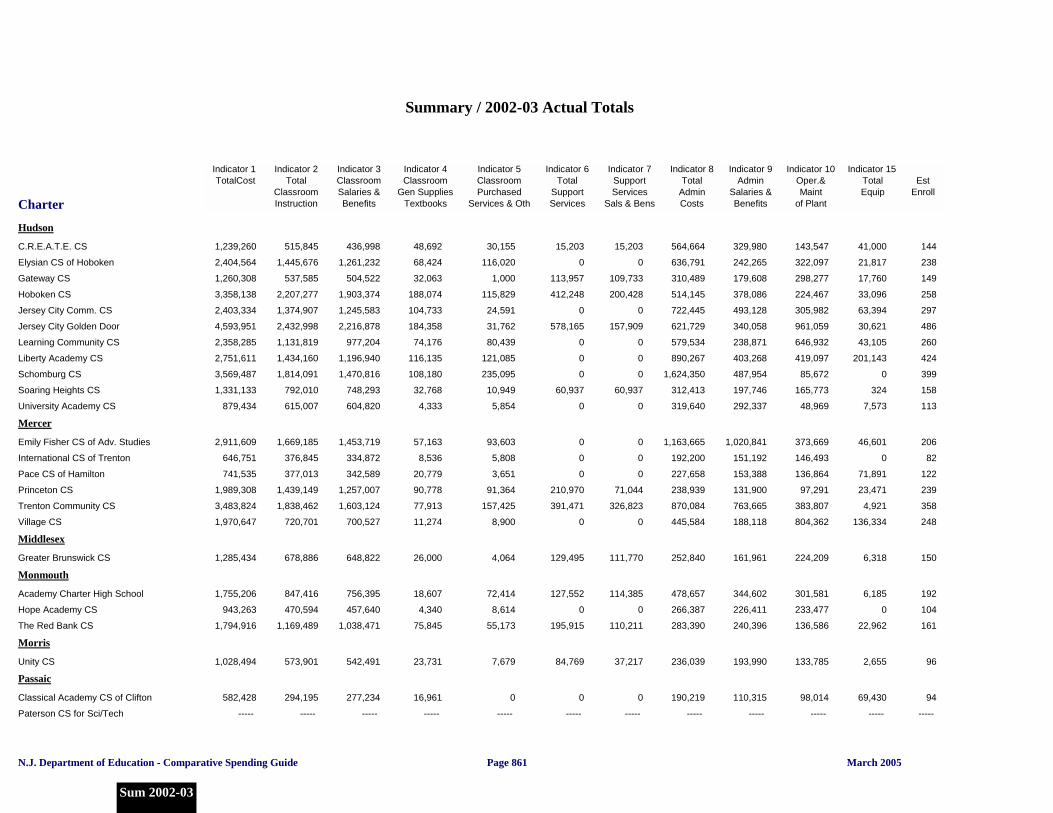
Charter
Summary / 2002-03 Actual Totals
Indicator 1 Indicator 2 Indicator 3 Indicator 4 Indicator 5 Indicator 6 Indicator 7 Indicator 8 Indicator 9 Indicator 10 Indicator 15 TotalCost Total Classroom Classroom Classroom Total Support Total Admin Oper.& Total Est
Classroom Salaries & Gen Supplies Purchased Support Services Admin Salaries & Maint Equip Enroll Instruction Benefits Textbooks Services & Oth Services Sals & Bens Costs Benefits of Plant
Hudson
1,239,260C.R.E.A.T.E. CS 515,845 436,998 48,692 30,155 15,203 15,203 564,664 329,980 143,547 41,000 144
2,404,564Elysian CS of Hoboken 1,445,676 1,261,232 68,424 116,020 0 0 636,791 242,265 322,097 21,817 238
1,260,308Gateway CS 537,585 504,522 32,063 1,000 113,957 109,733 310,489 179,608 298,277 17,760 149
3,358,138Hoboken CS 2,207,277 1,903,374 188,074 115,829 412,248 200,428 514,145 378,086 224,467 33,096 258
2,403,334Jersey City Comm. CS 1,374,907 1,245,583 104,733 24,591 0 0 722,445 493,128 305,982 63,394 297
4,593,951Jersey City Golden Door 2,432,998 2,216,878 184,358 31,762 578,165 157,909 621,729 340,058 961,059 30,621 486
2,358,285Learning Community CS 1,131,819 977,204 74,176 80,439 0 0 579,534 238,871 646,932 43,105 260
2,751,611Liberty Academy CS 1,434,160 1,196,940 116,135 121,085 0 0 890,267 403,268 419,097 201,143 424
3,569,487Schomburg CS 1,814,091 1,470,816 108,180 235,095 0 0 1,624,350 487,954 85,672 0 399
1,331,133Soaring Heights CS 792,010 748,293 32,768 10,949 60,937 60,937 312,413 197,746 165,773 324 158
879,434University Academy CS 615,007 604,820 4,333 5,854 0 0 319,640 292,337 48,969 7,573 113
Mercer
2,911,609Emily Fisher CS of Adv. Studies 1,669,185 1,453,719 57,163 93,603 0 0 1,163,665 1,020,841 373,669 46,601 206
646,751International CS of Trenton 376,845 334,872 8,536 5,808 0 0 192,200 151,192 146,493 0 82
741,535Pace CS of Hamilton 377,013 342,589 20,779 3,651 0 0 227,658 153,388 136,864 71,891 122
1,989,308Princeton CS 1,439,149 1,257,007 90,778 91,364 210,970 71,044 238,939 131,900 97,291 23,471 239
3,483,824Trenton Community CS 1,838,462 1,603,124 77,913 157,425 391,471 326,823 870,084 763,665 383,807 4,921 358
1,970,647Village CS 720,701 700,527 11,274 8,900 0 0 445,584 188,118 804,362 136,334 248
Middlesex
1,285,434Greater Brunswick CS 678,886 648,822 26,000 4,064 129,495 111,770 252,840 161,961 224,209 6,318 150
Monmouth
1,755,206Academy Charter High School 847,416 756,395 18,607 72,414 127,552 114,385 478,657 344,602 301,581 6,185 192
943,263Hope Academy CS 470,594 457,640 4,340 8,614 0 0 266,387 226,411 233,477 0 104
1,794,916The Red Bank CS 1,169,489 1,038,471 75,845 55,173 195,915 110,211 283,390 240,396 136,586 22,962 161
Morris
1,028,494Unity CS 573,901 542,491 23,731 7,679 84,769 37,217 236,039 193,990 133,785 2,655 96
Passaic
582,428Classical Academy CS of Clifton 294,195 277,234 16,961 0 0 0 190,219 110,315 98,014 69,430 94
----- Paterson CS for Sci/Tech ----- ----- ----- ----- ----- ----- ----- ----- ----- ----- -----
N.J. Department of Education - Comparative Spending Guide March 2005
Sum 2002-03
Page 861
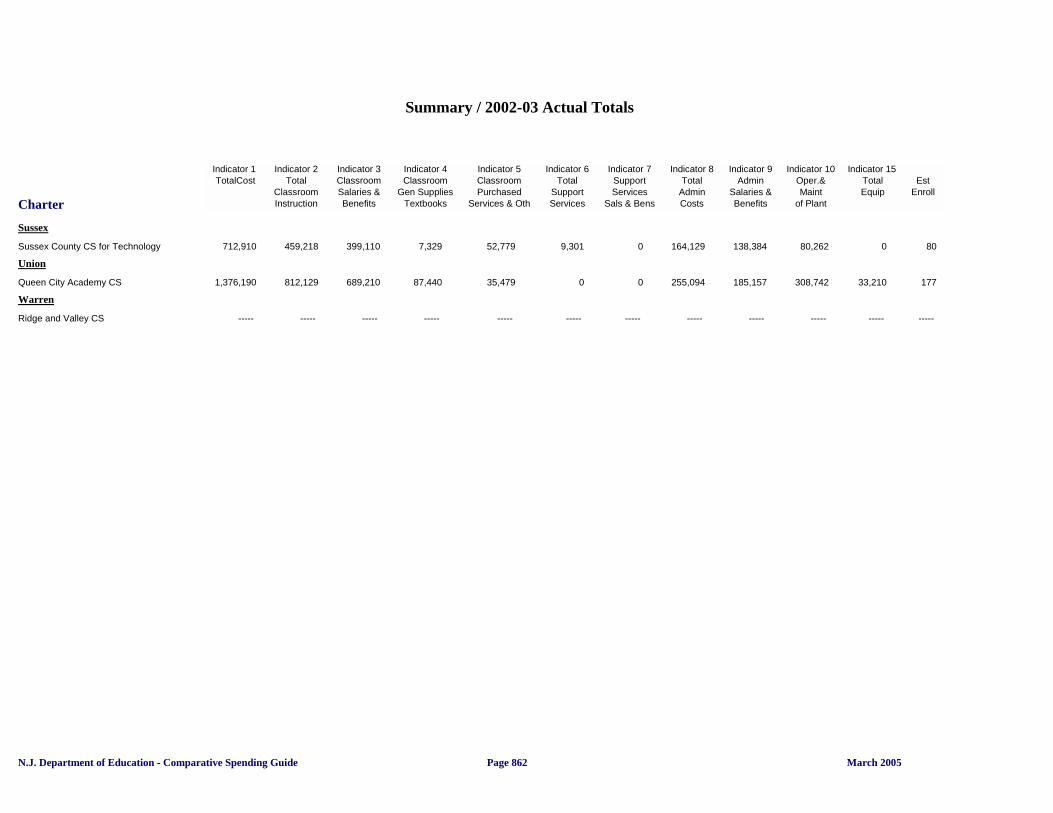
Charter
Summary / 2002-03 Actual Totals
Indicator 1 Indicator 2 Indicator 3 Indicator 4 Indicator 5 Indicator 6 Indicator 7 Indicator 8 Indicator 9 Indicator 10 Indicator 15 TotalCost Total Classroom Classroom Classroom Total Support Total Admin Oper.& Total Est
Classroom Salaries & Gen Supplies Purchased Support Services Admin Salaries & Maint Equip Enroll Instruction Benefits Textbooks Services & Oth Services Sals & Bens Costs Benefits of Plant
Sussex
712,910Sussex County CS for Technology 459,218 399,110 7,329 52,779 9,301 0 164,129 138,384 80,262 0 80
Union
1,376,190Queen City Academy CS 812,129 689,210 87,440 35,479 0 0 255,094 185,157 308,742 33,210 177
Warren
----- Ridge and Valley CS ----- ----- ----- ----- ----- ----- ----- ----- ----- ----- -----
N.J. Department of Education - Comparative Spending Guide March 2005Page 862

DISTRICT
Summary / 2003-04 Actual Totals
Indicator 1 Indicator 2 Indicator 3 Indicator 4 Indicator 5 Indicator 6 Indicator 7 Indicator 8 Indicator 9 Indicator 10 Indicator 11 Indicator 12 Indicator 13 Indicator 15
TotalCost Total Classroom Classroom Classroom Total Support Total Admin Oper.& Oper.& Total Extracur Total Avg
Per Pupil Classroom Salaries & Gen Supplies Purchased Support Services Admin Salaries & Maint Maint of Plant Food Costs Equip Daily
Instruction Benefits Textbooks Services & Oth Services Sals & Bens Costs Benefits of Plant Sals & Bens Services Enroll
Indicator 1 Total Cost
ATLANTIC
7,325,553ABSECON CITY 4,906,963 4,770,543 112,907 23,513 895,771 826,472 855,976 715,413 642,719 354,284 0 23,615 0 964
77,975,985ATLANTIC CITY 47,622,135 44,174,293 1,772,934 1,674,908 8,365,174 6,898,552 9,120,706 6,501,223 11,265,323 5,940,504 250,000 784,265 615,998 6,949
15,819,826ATLANTIC CO SPECIAL SE 9,263,777 8,963,395 202,228 98,154 3,213,195 2,940,365 1,739,536 1,432,725 1,420,733 571,548 90,000 0 142,435 514
7,663,494ATLANTIC CO VOCATIONA 3,357,731 3,067,253 273,711 16,767 796,112 727,474 1,564,417 1,324,369 1,765,525 785,787 106,623 18,868 6,047 759
11,074,234BRIGANTINE CITY 7,025,471 6,631,443 324,305 69,723 1,349,138 1,236,253 1,066,380 901,371 1,494,175 637,875 0 135,118 81,531 1,209
23,109,181BUENA REGIONAL 13,838,139 13,166,641 617,357 54,141 3,747,841 3,426,793 2,638,525 1,915,760 2,165,036 1,200,284 0 595,543 209,078 2,534
5,155,837EGG HARBOR CITY 3,117,926 2,984,674 123,910 9,342 485,225 379,224 978,675 801,794 512,734 256,149 0 61,277 30,738 526
58,030,348EGG HARBOR TWP 33,485,692 32,137,065 1,183,143 165,484 7,690,546 6,995,049 4,947,537 4,026,870 10,009,027 3,566,243 435,000 899,565 180,931 6,741
2,232,945ESTELL MANOR CITY 1,311,527 1,283,986 26,373 1,168 302,303 259,349 332,657 268,168 263,007 127,425 15,665 7,786 9,111 216
2,717,382FOLSOM BORO 1,777,044 1,574,028 96,196 106,820 347,998 312,504 339,771 277,611 239,420 116,509 0 11,773 2,256 322
33,669,162GALLOWAY TWP 20,634,207 19,768,003 819,650 46,554 5,037,972 4,116,921 4,513,452 3,062,910 3,172,738 1,573,542 79,520 216,680 18,820 3,966
34,992,431GREATER EGG HARBOR R 19,201,555 18,047,147 1,135,271 19,137 3,835,503 3,523,977 5,335,436 4,274,154 5,318,846 2,967,890 27,881 1,262,831 304,942 3,477
23,890,188HAMILTON TWP 15,102,432 14,007,142 577,683 517,607 3,180,354 3,004,209 2,435,344 1,931,852 3,017,141 1,494,987 2,511 129,960 73,682 2,953
24,605,285HAMMONTON TOWN 15,185,468 14,727,450 382,783 75,235 3,363,230 3,057,836 2,677,638 1,887,676 2,640,987 1,078,622 0 576,653 3,134 3,241
9,304,572LINWOOD CITY 5,794,107 5,484,137 293,955 16,015 1,346,345 1,184,861 892,323 682,092 1,200,717 597,467 0 71,081 24,076 1,029
15,743,466MAINLAND REGIONAL 9,568,947 9,151,270 396,111 21,566 2,228,133 1,966,134 1,247,796 898,572 1,815,808 852,305 0 869,288 102,140 1,622
8,157,679MARGATE CITY 4,479,665 4,068,925 288,008 122,732 858,264 725,757 955,509 688,708 1,462,788 72,164 71,190 61,648 56,713 587
6,809,241MULLICA TWP 4,546,235 4,389,571 124,897 31,767 670,528 607,832 814,227 711,161 703,889 367,147 38,675 35,687 7,347 820
8,360,353NORTHFIELD CITY 5,304,326 4,941,974 351,191 11,161 1,212,743 940,474 1,072,453 695,208 721,636 377,136 6,034 43,161 29,739 1,104
47,998,288PLEASANTVILLE CITY 26,164,490 24,432,295 1,067,840 664,355 9,739,944 7,190,744 5,414,602 4,041,712 5,033,977 3,008,329 59,447 1,076,356 93,143 3,552
1,659,183PORT REPUBLIC CITY 1,064,608 1,000,250 64,233 125 111,790 103,298 321,268 262,010 143,062 67,133 13,623 4,833 0 134
10,097,106SOMERS POINT CITY 6,245,722 5,821,237 326,748 97,737 1,430,428 1,240,387 1,180,859 868,452 995,261 553,749 0 92,164 0 1,248
9,620,992VENTNOR CITY 6,421,839 6,208,488 205,416 7,935 1,149,041 995,186 963,609 754,523 868,568 26,770 0 70,543 9,552 1,125
2,217,544WEYMOUTH TWP 1,396,875 1,310,179 51,750 34,946 239,448 207,847 294,091 238,310 272,841 124,170 10,000 4,289 0 250
N.J. Department of Education - Comparative Spending Guide March 2005
Sum 2003-04
Page 863
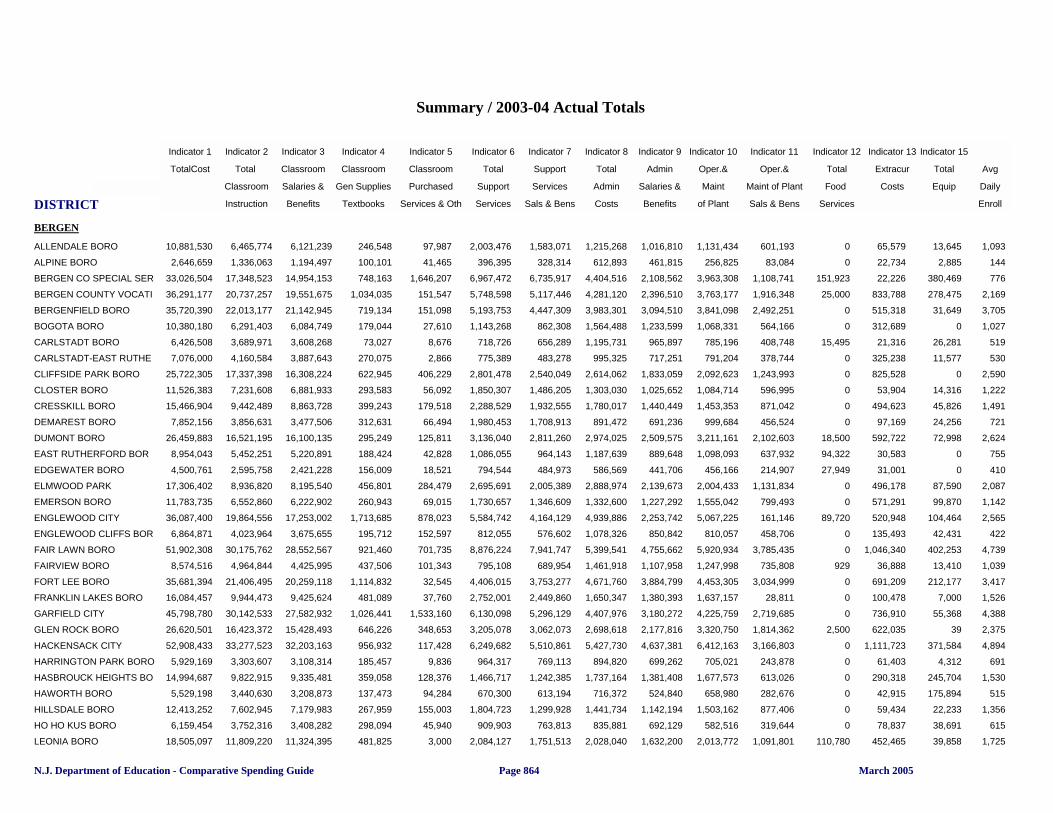
DISTRICT
Summary / 2003-04 Actual Totals
Indicator 1 Indicator 2 Indicator 3 Indicator 4 Indicator 5 Indicator 6 Indicator 7 Indicator 8 Indicator 9 Indicator 10 Indicator 11 Indicator 12 Indicator 13 Indicator 15
TotalCost Total Classroom Classroom Classroom Total Support Total Admin Oper.& Oper.& Total Extracur Total Avg
Per Pupil Classroom Salaries & Gen Supplies Purchased Support Services Admin Salaries & Maint Maint of Plant Food Costs Equip Daily
Instruction Benefits Textbooks Services & Oth Services Sals & Bens Costs Benefits of Plant Sals & Bens Services Enroll
Indicator 1 Total Cost
BERGEN
10,881,530ALLENDALE BORO 6,465,774 6,121,239 246,548 97,987 2,003,476 1,583,071 1,215,268 1,016,810 1,131,434 601,193 0 65,579 13,645 1,093
2,646,659ALPINE BORO 1,336,063 1,194,497 100,101 41,465 396,395 328,314 612,893 461,815 256,825 83,084 0 22,734 2,885 144
33,026,504BERGEN CO SPECIAL SER 17,348,523 14,954,153 748,163 1,646,207 6,967,472 6,735,917 4,404,516 2,108,562 3,963,308 1,108,741 151,923 22,226 380,469 776
36,291,177BERGEN COUNTY VOCATI 20,737,257 19,551,675 1,034,035 151,547 5,748,598 5,117,446 4,281,120 2,396,510 3,763,177 1,916,348 25,000 833,788 278,475 2,169
35,720,390BERGENFIELD BORO 22,013,177 21,142,945 719,134 151,098 5,193,753 4,447,309 3,983,301 3,094,510 3,841,098 2,492,251 0 515,318 31,649 3,705
10,380,180BOGOTA BORO 6,291,403 6,084,749 179,044 27,610 1,143,268 862,308 1,564,488 1,233,599 1,068,331 564,166 0 312,689 0 1,027
6,426,508CARLSTADT BORO 3,689,971 3,608,268 73,027 8,676 718,726 656,289 1,195,731 965,897 785,196 408,748 15,495 21,316 26,281 519
7,076,000CARLSTADT-EAST RUTHE 4,160,584 3,887,643 270,075 2,866 775,389 483,278 995,325 717,251 791,204 378,744 0 325,238 11,577 530
25,722,305CLIFFSIDE PARK BORO 17,337,398 16,308,224 622,945 406,229 2,801,478 2,540,049 2,614,062 1,833,059 2,092,623 1,243,993 0 825,528 0 2,590
11,526,383CLOSTER BORO 7,231,608 6,881,933 293,583 56,092 1,850,307 1,486,205 1,303,030 1,025,652 1,084,714 596,995 0 53,904 14,316 1,222
15,466,904CRESSKILL BORO 9,442,489 8,863,728 399,243 179,518 2,288,529 1,932,555 1,780,017 1,440,449 1,453,353 871,042 0 494,623 45,826 1,491
7,852,156DEMAREST BORO 3,856,631 3,477,506 312,631 66,494 1,980,453 1,708,913 891,472 691,236 999,684 456,524 0 97,169 24,256 721
26,459,883DUMONT BORO 16,521,195 16,100,135 295,249 125,811 3,136,040 2,811,260 2,974,025 2,509,575 3,211,161 2,102,603 18,500 592,722 72,998 2,624
8,954,043EAST RUTHERFORD BOR 5,452,251 5,220,891 188,424 42,828 1,086,055 964,143 1,187,639 889,648 1,098,093 637,932 94,322 30,583 0 755
4,500,761EDGEWATER BORO 2,595,758 2,421,228 156,009 18,521 794,544 484,973 586,569 441,706 456,166 214,907 27,949 31,001 0 410
17,306,402ELMWOOD PARK 8,936,820 8,195,540 456,801 284,479 2,695,691 2,005,389 2,888,974 2,139,673 2,004,433 1,131,834 0 496,178 87,590 2,087
11,783,735EMERSON BORO 6,552,860 6,222,902 260,943 69,015 1,730,657 1,346,609 1,332,600 1,227,292 1,555,042 799,493 0 571,291 99,870 1,142
36,087,400ENGLEWOOD CITY 19,864,556 17,253,002 1,713,685 878,023 5,584,742 4,164,129 4,939,886 2,253,742 5,067,225 161,146 89,720 520,948 104,464 2,565
6,864,871ENGLEWOOD CLIFFS BOR 4,023,964 3,675,655 195,712 152,597 812,055 576,602 1,078,326 850,842 810,057 458,706 0 135,493 42,431 422
51,902,308FAIR LAWN BORO 30,175,762 28,552,567 921,460 701,735 8,876,224 7,941,747 5,399,541 4,755,662 5,920,934 3,785,435 0 1,046,340 402,253 4,739
8,574,516FAIRVIEW BORO 4,964,844 4,425,995 437,506 101,343 795,108 689,954 1,461,918 1,107,958 1,247,998 735,808 929 36,888 13,410 1,039
35,681,394FORT LEE BORO 21,406,495 20,259,118 1,114,832 32,545 4,406,015 3,753,277 4,671,760 3,884,799 4,453,305 3,034,999 0 691,209 212,177 3,417
16,084,457FRANKLIN LAKES BORO 9,944,473 9,425,624 481,089 37,760 2,752,001 2,449,860 1,650,347 1,380,393 1,637,157 28,811 0 100,478 7,000 1,526
45,798,780GARFIELD CITY 30,142,533 27,582,932 1,026,441 1,533,160 6,130,098 5,296,129 4,407,976 3,180,272 4,225,759 2,719,685 0 736,910 55,368 4,388
26,620,501GLEN ROCK BORO 16,423,372 15,428,493 646,226 348,653 3,205,078 3,062,073 2,698,618 2,177,816 3,320,750 1,814,362 2,500 622,035 39 2,375
52,908,433HACKENSACK CITY 33,277,523 32,203,163 956,932 117,428 6,249,682 5,510,861 5,427,730 4,637,381 6,412,163 3,166,803 0 1,111,723 371,584 4,894
5,929,169HARRINGTON PARK BORO 3,303,607 3,108,314 185,457 9,836 964,317 769,113 894,820 699,262 705,021 243,878 0 61,403 4,312 691
14,994,687HASBROUCK HEIGHTS BO 9,822,915 9,335,481 359,058 128,376 1,466,717 1,242,385 1,737,164 1,381,408 1,677,573 613,026 0 290,318 245,704 1,530
5,529,198HAWORTH BORO 3,440,630 3,208,873 137,473 94,284 670,300 613,194 716,372 524,840 658,980 282,676 0 42,915 175,894 515
12,413,252HILLSDALE BORO 7,602,945 7,179,983 267,959 155,003 1,804,723 1,299,928 1,441,734 1,142,194 1,503,162 877,406 0 59,434 22,233 1,356
6,159,454HO HO KUS BORO 3,752,316 3,408,282 298,094 45,940 909,903 763,813 835,881 692,129 582,516 319,644 0 78,837 38,691 615
18,505,097LEONIA BORO 11,809,220 11,324,395 481,825 3,000 2,084,127 1,751,513 2,028,040 1,632,200 2,013,772 1,091,801 110,780 452,465 39,858 1,725
N.J. Department of Education - Comparative Spending Guide March 2005Page 864
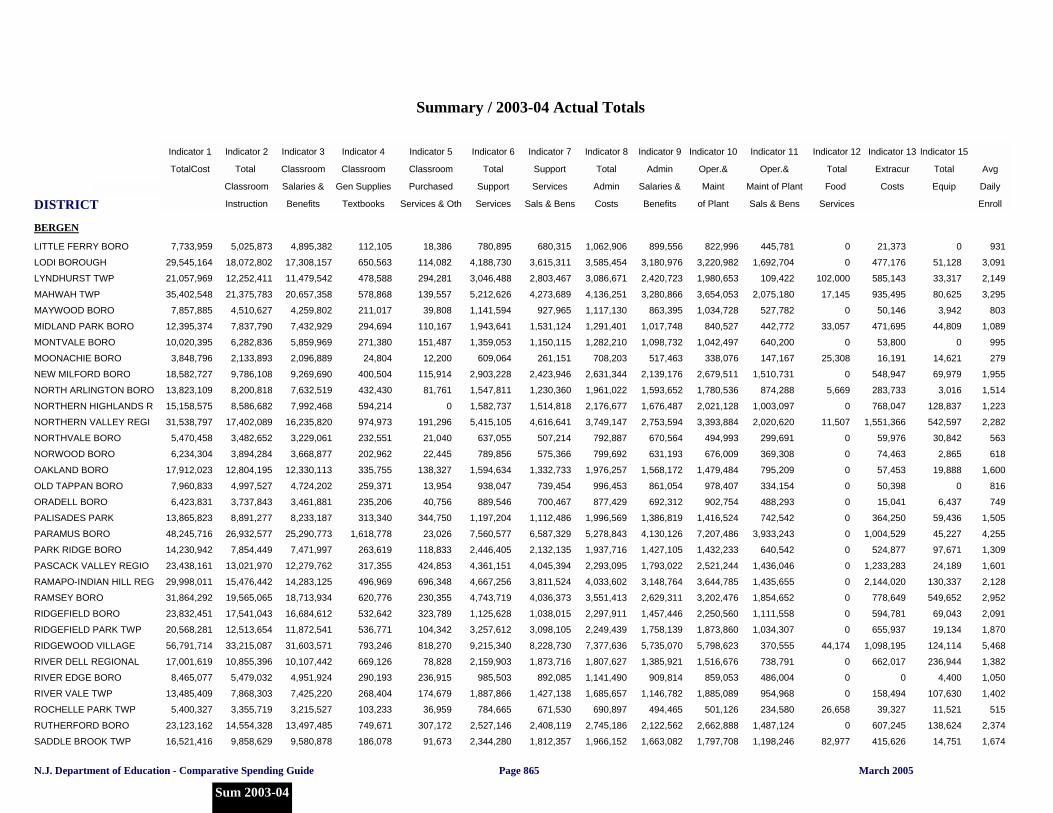
DISTRICT
Summary / 2003-04 Actual Totals
Indicator 1 Indicator 2 Indicator 3 Indicator 4 Indicator 5 Indicator 6 Indicator 7 Indicator 8 Indicator 9 Indicator 10 Indicator 11 Indicator 12 Indicator 13 Indicator 15
TotalCost Total Classroom Classroom Classroom Total Support Total Admin Oper.& Oper.& Total Extracur Total Avg
Per Pupil Classroom Salaries & Gen Supplies Purchased Support Services Admin Salaries & Maint Maint of Plant Food Costs Equip Daily
Instruction Benefits Textbooks Services & Oth Services Sals & Bens Costs Benefits of Plant Sals & Bens Services Enroll
Indicator 1 Total Cost
BERGEN
7,733,959LITTLE FERRY BORO 5,025,873 4,895,382 112,105 18,386 780,895 680,315 1,062,906 899,556 822,996 445,781 0 21,373 0 931
29,545,164LODI BOROUGH 18,072,802 17,308,157 650,563 114,082 4,188,730 3,615,311 3,585,454 3,180,976 3,220,982 1,692,704 0 477,176 51,128 3,091
21,057,969LYNDHURST TWP 12,252,411 11,479,542 478,588 294,281 3,046,488 2,803,467 3,086,671 2,420,723 1,980,653 109,422 102,000 585,143 33,317 2,149
35,402,548MAHWAH TWP 21,375,783 20,657,358 578,868 139,557 5,212,626 4,273,689 4,136,251 3,280,866 3,654,053 2,075,180 17,145 935,495 80,625 3,295
7,857,885MAYWOOD BORO 4,510,627 4,259,802 211,017 39,808 1,141,594 927,965 1,117,130 863,395 1,034,728 527,782 0 50,146 3,942 803
12,395,374MIDLAND PARK BORO 7,837,790 7,432,929 294,694 110,167 1,943,641 1,531,124 1,291,401 1,017,748 840,527 442,772 33,057 471,695 44,809 1,089
10,020,395MONTVALE BORO 6,282,836 5,859,969 271,380 151,487 1,359,053 1,150,115 1,282,210 1,098,732 1,042,497 640,200 0 53,800 0 995
3,848,796MOONACHIE BORO 2,133,893 2,096,889 24,804 12,200 609,064 261,151 708,203 517,463 338,076 147,167 25,308 16,191 14,621 279
18,582,727NEW MILFORD BORO 9,786,108 9,269,690 400,504 115,914 2,903,228 2,423,946 2,631,344 2,139,176 2,679,511 1,510,731 0 548,947 69,979 1,955
13,823,109NORTH ARLINGTON BORO 8,200,818 7,632,519 432,430 81,761 1,547,811 1,230,360 1,961,022 1,593,652 1,780,536 874,288 5,669 283,733 3,016 1,514
15,158,575NORTHERN HIGHLANDS R 8,586,682 7,992,468 594,214 0 1,582,737 1,514,818 2,176,677 1,676,487 2,021,128 1,003,097 0 768,047 128,837 1,223
31,538,797NORTHERN VALLEY REGI 17,402,089 16,235,820 974,973 191,296 5,415,105 4,616,641 3,749,147 2,753,594 3,393,884 2,020,620 11,507 1,551,366 542,597 2,282
5,470,458NORTHVALE BORO 3,482,652 3,229,061 232,551 21,040 637,055 507,214 792,887 670,564 494,993 299,691 0 59,976 30,842 563
6,234,304NORWOOD BORO 3,894,284 3,668,877 202,962 22,445 789,856 575,366 799,692 631,193 676,009 369,308 0 74,463 2,865 618
17,912,023OAKLAND BORO 12,804,195 12,330,113 335,755 138,327 1,594,634 1,332,733 1,976,257 1,568,172 1,479,484 795,209 0 57,453 19,888 1,600
7,960,833OLD TAPPAN BORO 4,997,527 4,724,202 259,371 13,954 938,047 739,454 996,453 861,054 978,407 334,154 0 50,398 0 816
6,423,831ORADELL BORO 3,737,843 3,461,881 235,206 40,756 889,546 700,467 877,429 692,312 902,754 488,293 0 15,041 6,437 749
13,865,823PALISADES PARK 8,891,277 8,233,187 313,340 344,750 1,197,204 1,112,486 1,996,569 1,386,819 1,416,524 742,542 0 364,250 59,436 1,505
48,245,716PARAMUS BORO 26,932,577 25,290,773 1,618,778 23,026 7,560,577 6,587,329 5,278,843 4,130,126 7,207,486 3,933,243 0 1,004,529 45,227 4,255
14,230,942PARK RIDGE BORO 7,854,449 7,471,997 263,619 118,833 2,446,405 2,132,135 1,937,716 1,427,105 1,432,233 640,542 0 524,877 97,671 1,309
23,438,161PASCACK VALLEY REGIO 13,021,970 12,279,762 317,355 424,853 4,361,151 4,045,394 2,293,095 1,793,022 2,521,244 1,436,046 0 1,233,283 24,189 1,601
29,998,011RAMAPO-INDIAN HILL REG 15,476,442 14,283,125 496,969 696,348 4,667,256 3,811,524 4,033,602 3,148,764 3,644,785 1,435,655 0 2,144,020 130,337 2,128
31,864,292RAMSEY BORO 19,565,065 18,713,934 620,776 230,355 4,743,719 4,036,373 3,551,413 2,629,311 3,202,476 1,854,652 0 778,649 549,652 2,952
23,832,451RIDGEFIELD BORO 17,541,043 16,684,612 532,642 323,789 1,125,628 1,038,015 2,297,911 1,457,446 2,250,560 1,111,558 0 594,781 69,043 2,091
20,568,281RIDGEFIELD PARK TWP 12,513,654 11,872,541 536,771 104,342 3,257,612 3,098,105 2,249,439 1,758,139 1,873,860 1,034,307 0 655,937 19,134 1,870
56,791,714RIDGEWOOD VILLAGE 33,215,087 31,603,571 793,246 818,270 9,215,340 8,228,730 7,377,636 5,735,070 5,798,623 370,555 44,174 1,098,195 124,114 5,468
17,001,619RIVER DELL REGIONAL 10,855,396 10,107,442 669,126 78,828 2,159,903 1,873,716 1,807,627 1,385,921 1,516,676 738,791 0 662,017 236,944 1,382
8,465,077RIVER EDGE BORO 5,479,032 4,951,924 290,193 236,915 985,503 892,085 1,141,490 909,814 859,053 486,004 0 0 4,400 1,050
13,485,409RIVER VALE TWP 7,868,303 7,425,220 268,404 174,679 1,887,866 1,427,138 1,685,657 1,146,782 1,885,089 954,968 0 158,494 107,630 1,402
5,400,327ROCHELLE PARK TWP 3,355,719 3,215,527 103,233 36,959 784,665 671,530 690,897 494,465 501,126 234,580 26,658 39,327 11,521 515
23,123,162RUTHERFORD BORO 14,554,328 13,497,485 749,671 307,172 2,527,146 2,408,119 2,745,186 2,122,562 2,662,888 1,487,124 0 607,245 138,624 2,374
16,521,416SADDLE BROOK TWP 9,858,629 9,580,878 186,078 91,673 2,344,280 1,812,357 1,966,152 1,663,082 1,797,708 1,198,246 82,977 415,626 14,751 1,674
N.J. Department of Education - Comparative Spending Guide March 2005
Sum 2003-04
Page 865
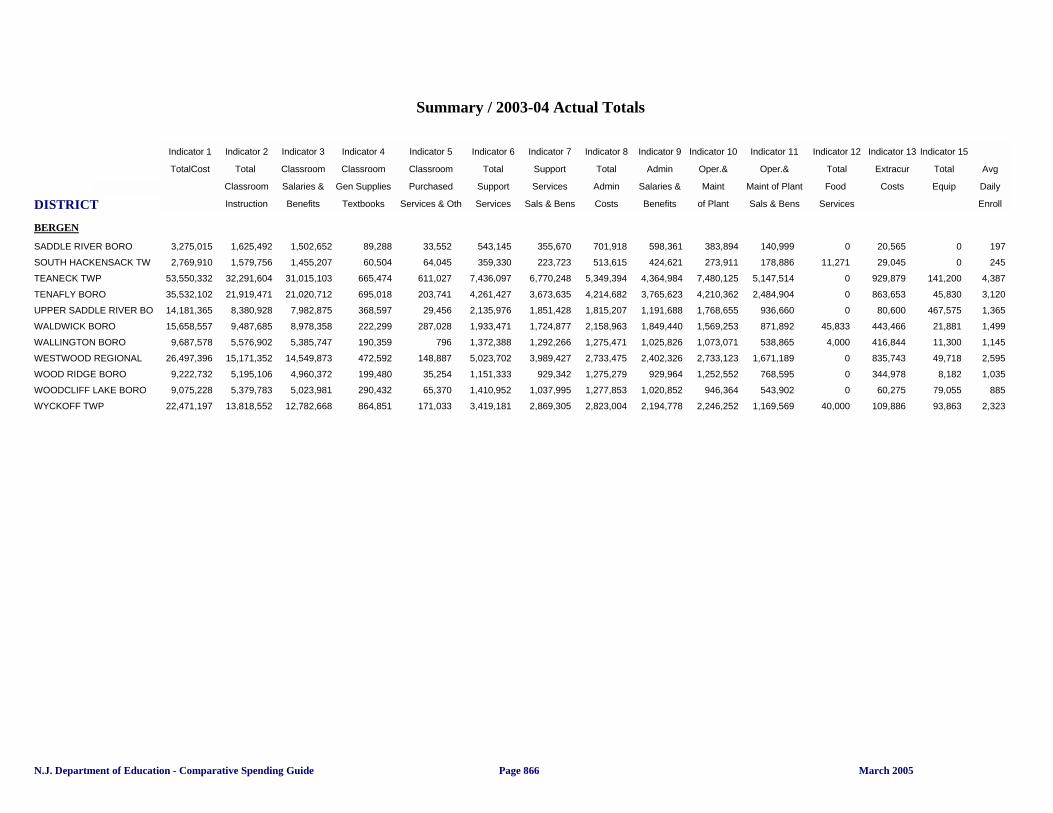
DISTRICT
Summary / 2003-04 Actual Totals
Indicator 1 Indicator 2 Indicator 3 Indicator 4 Indicator 5 Indicator 6 Indicator 7 Indicator 8 Indicator 9 Indicator 10 Indicator 11 Indicator 12 Indicator 13 Indicator 15
TotalCost Total Classroom Classroom Classroom Total Support Total Admin Oper.& Oper.& Total Extracur Total Avg
Per Pupil Classroom Salaries & Gen Supplies Purchased Support Services Admin Salaries & Maint Maint of Plant Food Costs Equip Daily
Instruction Benefits Textbooks Services & Oth Services Sals & Bens Costs Benefits of Plant Sals & Bens Services Enroll
Indicator 1 Total Cost
BERGEN
3,275,015SADDLE RIVER BORO 1,625,492 1,502,652 89,288 33,552 543,145 355,670 701,918 598,361 383,894 140,999 0 20,565 0 197
2,769,910SOUTH HACKENSACK TW 1,579,756 1,455,207 60,504 64,045 359,330 223,723 513,615 424,621 273,911 178,886 11,271 29,045 0 245
53,550,332TEANECK TWP 32,291,604 31,015,103 665,474 611,027 7,436,097 6,770,248 5,349,394 4,364,984 7,480,125 5,147,514 0 929,879 141,200 4,387
35,532,102TENAFLY BORO 21,919,471 21,020,712 695,018 203,741 4,261,427 3,673,635 4,214,682 3,765,623 4,210,362 2,484,904 0 863,653 45,830 3,120
14,181,365UPPER SADDLE RIVER BO 8,380,928 7,982,875 368,597 29,456 2,135,976 1,851,428 1,815,207 1,191,688 1,768,655 936,660 0 80,600 467,575 1,365
15,658,557WALDWICK BORO 9,487,685 8,978,358 222,299 287,028 1,933,471 1,724,877 2,158,963 1,849,440 1,569,253 871,892 45,833 443,466 21,881 1,499
9,687,578WALLINGTON BORO 5,576,902 5,385,747 190,359 796 1,372,388 1,292,266 1,275,471 1,025,826 1,073,071 538,865 4,000 416,844 11,300 1,145
26,497,396WESTWOOD REGIONAL 15,171,352 14,549,873 472,592 148,887 5,023,702 3,989,427 2,733,475 2,402,326 2,733,123 1,671,189 0 835,743 49,718 2,595
9,222,732WOOD RIDGE BORO 5,195,106 4,960,372 199,480 35,254 1,151,333 929,342 1,275,279 929,964 1,252,552 768,595 0 344,978 8,182 1,035
9,075,228WOODCLIFF LAKE BORO 5,379,783 5,023,981 290,432 65,370 1,410,952 1,037,995 1,277,853 1,020,852 946,364 543,902 0 60,275 79,055 885
22,471,197WYCKOFF TWP 13,818,552 12,782,668 864,851 171,033 3,419,181 2,869,305 2,823,004 2,194,778 2,246,252 1,169,569 40,000 109,886 93,863 2,323
N.J. Department of Education - Comparative Spending Guide March 2005Page 866

DISTRICT
Summary / 2003-04 Actual Totals
Indicator 1 Indicator 2 Indicator 3 Indicator 4 Indicator 5 Indicator 6 Indicator 7 Indicator 8 Indicator 9 Indicator 10 Indicator 11 Indicator 12 Indicator 13 Indicator 15
TotalCost Total Classroom Classroom Classroom Total Support Total Admin Oper.& Oper.& Total Extracur Total Avg
Per Pupil Classroom Salaries & Gen Supplies Purchased Support Services Admin Salaries & Maint Maint of Plant Food Costs Equip Daily
Instruction Benefits Textbooks Services & Oth Services Sals & Bens Costs Benefits of Plant Sals & Bens Services Enroll
Indicator 1 Total Cost
BURLINGTON
1,568,367BASS RIVER TWP 861,536 805,253 47,053 9,230 225,132 182,677 267,574 215,961 199,897 119,768 12,819 630 0 135
3,032,949BEVERLY CITY 1,904,562 1,740,411 99,139 65,012 478,759 326,616 279,528 199,209 316,236 80,547 30,934 20,569 33,845 290
20,277,135BORDENTOWN REGIONAL 11,316,445 10,549,163 681,779 62,413 3,193,502 2,740,742 2,465,299 1,849,983 2,443,496 1,553,139 0 708,801 7,416 2,002
21,685,663BURLINGTON CITY 12,618,388 11,538,013 839,801 240,574 3,760,106 3,113,276 2,442,718 1,940,794 2,172,164 1,239,197 20,000 628,679 150,545 1,826
28,689,267BURLINGTON CO SPEC SE 21,380,679 20,382,223 461,407 537,049 1,108,886 830,301 2,647,258 2,084,663 2,756,831 1,420,207 518,201 58,375 0 1,222
24,365,946BURLINGTON CO VOCATI 13,441,358 12,456,467 680,217 304,674 2,107,059 1,817,268 4,137,245 3,373,575 3,829,278 1,998,122 0 848,588 140,857 1,796
30,593,587BURLINGTON TWP 19,420,002 17,514,865 1,029,447 875,690 4,292,703 3,751,589 3,239,729 2,559,739 2,949,678 242,155 0 638,747 119,056 4,094
2,779,974CHESTERFIELD TWP 1,490,229 1,400,019 81,371 8,839 489,249 364,942 462,413 374,256 304,396 175,189 19,301 11,986 0 273
23,984,031CINNAMINSON TWP 14,539,554 13,921,078 446,292 172,184 2,913,528 2,327,969 2,865,266 2,173,459 2,674,579 1,287,872 0 851,428 104,063 2,417
3,712,938DELANCO TWP 2,151,676 2,021,568 100,321 29,787 322,722 188,432 771,107 641,587 435,432 280,069 10,874 21,127 0 368
22,807,889DELRAN TWP 13,677,673 13,079,885 539,214 58,574 2,483,805 2,118,292 3,132,734 2,093,358 2,865,426 734,803 0 638,924 15,485 2,764
6,656,378EASTAMPTON TWP 3,936,174 3,679,071 200,427 56,676 926,209 751,339 913,738 664,058 729,787 308,300 0 133,236 0 827
7,859,784EDGEWATER PARK TWP 4,853,777 4,617,994 205,344 30,439 1,248,085 1,062,632 815,348 523,600 871,313 469,039 0 29,147 21,750 917
45,389,173EVESHAM TWP 28,204,648 27,163,236 1,012,973 28,439 6,211,161 5,275,346 4,782,994 3,746,253 5,399,070 3,274,672 2,091 501,350 179,900 5,333
14,781,913FLORENCE TWP 8,315,964 7,900,159 373,147 42,658 2,364,480 2,158,639 1,996,880 1,441,034 1,715,145 1,127,447 0 390,010 0 1,565
5,387,718HAINESPORT TWP 3,312,476 3,081,021 219,074 12,381 807,601 561,638 650,078 498,749 547,929 307,397 0 54,662 9,293 601
79,206,217LENAPE REGIONAL 40,795,727 38,595,506 1,943,861 113,734 8,702,032 7,891,097 11,034,299 8,720,671 9,267,447 5,123,474 0 4,161,197 664,041 6,773
14,675,839LUMBERTON TWP 8,983,187 8,354,916 573,912 54,359 2,173,149 1,847,692 1,663,982 1,413,628 1,746,427 801,049 0 108,315 59,410 1,758
5,693,881MANSFIELD TWP 3,372,623 3,171,072 184,028 17,523 1,073,594 866,311 663,102 544,193 584,562 322,394 0 0 42,416 669
20,542,881MAPLE SHADE TWP 12,619,518 11,911,952 548,777 158,789 2,610,275 2,157,882 2,451,848 1,877,567 2,211,938 1,076,825 10,000 561,462 24,533 2,304
4,702,529MEDFORD LAKES BORO 3,117,542 2,972,767 78,798 65,977 487,813 378,298 585,802 467,970 448,138 228,083 0 63,234 15,786 548
26,336,083MEDFORD TWP 16,329,504 15,330,714 607,673 391,117 3,441,062 3,085,519 3,194,511 2,416,049 2,801,682 1,556,760 0 110,244 553,656 2,979
40,127,949MOORESTOWN TWP 23,573,474 22,270,412 507,413 795,649 7,523,059 6,187,254 3,725,771 3,086,559 3,959,352 1,768,386 0 1,147,053 6,019 4,183
13,004,286MOUNT HOLLY TWP 7,451,427 6,912,561 320,892 217,974 1,984,352 1,742,505 1,540,925 1,309,934 1,673,989 798,463 122,109 231,484 0 1,107
41,114,708MOUNT LAUREL TWP 25,462,036 24,357,358 907,820 196,858 5,443,755 4,965,242 4,466,469 3,170,713 4,658,178 2,483,948 0 201,442 320,085 4,575
2,013,643NEW HANOVER TWP 1,137,161 1,081,075 53,803 2,283 165,603 109,538 407,697 309,771 269,450 105,822 17,515 16,217 12,199 161
14,295,880NORTH HANOVER TWP 8,416,216 7,954,775 377,210 84,231 1,976,219 1,672,464 2,129,042 1,700,244 1,421,897 721,211 242,244 88,463 367,847 1,345
19,279,386NORTHERN BURLINGTON 11,108,496 10,136,100 870,379 102,017 2,792,444 2,576,616 2,407,007 2,005,903 2,250,568 1,191,465 25,693 694,932 620,390 1,892
9,487,185PALMYRA BORO 5,568,054 5,160,390 306,315 101,349 1,211,436 999,659 1,294,494 926,093 1,005,943 486,226 0 299,303 29,699 1,123
1,393,989PEMBERTON BOROUGH 632,961 601,502 25,034 6,425 235,187 213,722 382,883 244,642 133,879 76,086 4,000 4,791 0 91
78,685,582PEMBERTON TWP 45,616,397 40,867,102 2,689,388 2,059,907 13,879,056 11,664,457 8,172,413 6,209,663 7,673,247 4,220,030 1,087,966 898,728 887,642 5,729
17,577,889RANCOCAS VALLEY REGI 8,896,234 7,875,531 783,038 237,665 2,355,542 2,039,110 3,099,726 2,243,937 2,254,599 1,118,490 0 915,932 45,459 2,202
N.J. Department of Education - Comparative Spending Guide March 2005
Sum 2003-04
Page 867
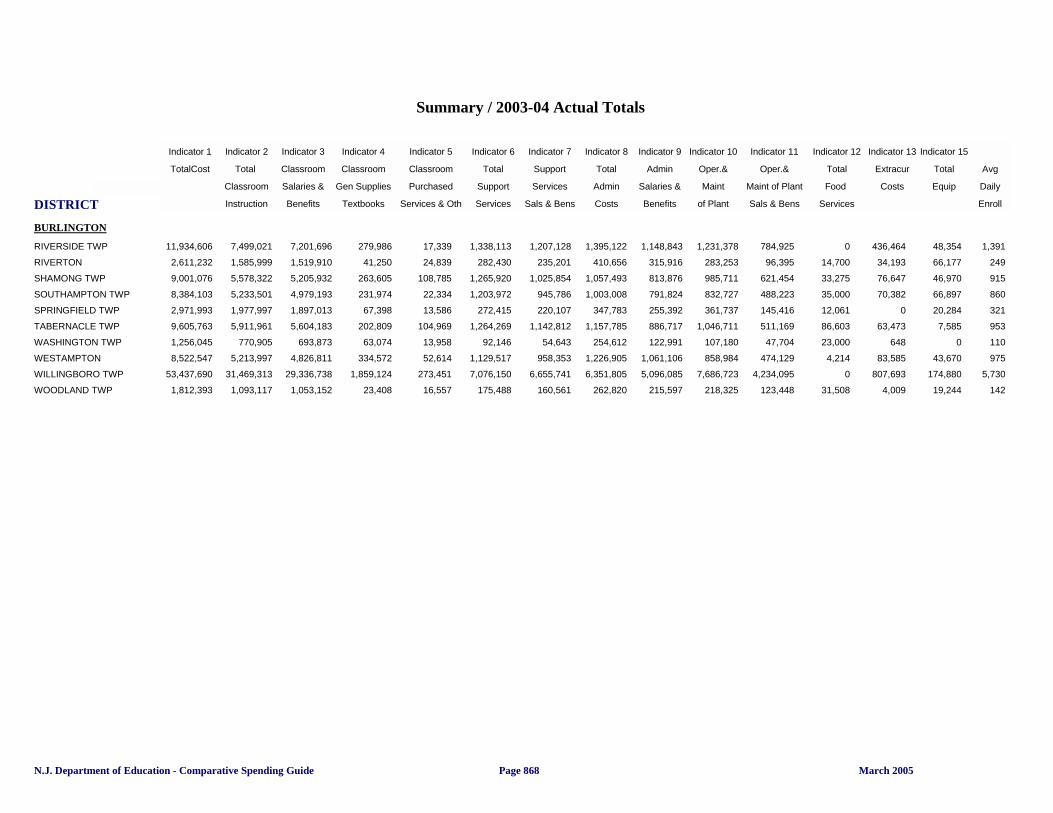
DISTRICT
Summary / 2003-04 Actual Totals
Indicator 1 Indicator 2 Indicator 3 Indicator 4 Indicator 5 Indicator 6 Indicator 7 Indicator 8 Indicator 9 Indicator 10 Indicator 11 Indicator 12 Indicator 13 Indicator 15
TotalCost Total Classroom Classroom Classroom Total Support Total Admin Oper.& Oper.& Total Extracur Total Avg
Per Pupil Classroom Salaries & Gen Supplies Purchased Support Services Admin Salaries & Maint Maint of Plant Food Costs Equip Daily
Instruction Benefits Textbooks Services & Oth Services Sals & Bens Costs Benefits of Plant Sals & Bens Services Enroll
Indicator 1 Total Cost
BURLINGTON
11,934,606RIVERSIDE TWP 7,499,021 7,201,696 279,986 17,339 1,338,113 1,207,128 1,395,122 1,148,843 1,231,378 784,925 0 436,464 48,354 1,391
2,611,232RIVERTON 1,585,999 1,519,910 41,250 24,839 282,430 235,201 410,656 315,916 283,253 96,395 14,700 34,193 66,177 249
9,001,076SHAMONG TWP 5,578,322 5,205,932 263,605 108,785 1,265,920 1,025,854 1,057,493 813,876 985,711 621,454 33,275 76,647 46,970 915
8,384,103SOUTHAMPTON TWP 5,233,501 4,979,193 231,974 22,334 1,203,972 945,786 1,003,008 791,824 832,727 488,223 35,000 70,382 66,897 860
2,971,993SPRINGFIELD TWP 1,977,997 1,897,013 67,398 13,586 272,415 220,107 347,783 255,392 361,737 145,416 12,061 0 20,284 321
9,605,763TABERNACLE TWP 5,911,961 5,604,183 202,809 104,969 1,264,269 1,142,812 1,157,785 886,717 1,046,711 511,169 86,603 63,473 7,585 953
1,256,045WASHINGTON TWP 770,905 693,873 63,074 13,958 92,146 54,643 254,612 122,991 107,180 47,704 23,000 648 0 110
8,522,547WESTAMPTON 5,213,997 4,826,811 334,572 52,614 1,129,517 958,353 1,226,905 1,061,106 858,984 474,129 4,214 83,585 43,670 975
53,437,690WILLINGBORO TWP 31,469,313 29,336,738 1,859,124 273,451 7,076,150 6,655,741 6,351,805 5,096,085 7,686,723 4,234,095 0 807,693 174,880 5,730
1,812,393WOODLAND TWP 1,093,117 1,053,152 23,408 16,557 175,488 160,561 262,820 215,597 218,325 123,448 31,508 4,009 19,244 142
N.J. Department of Education - Comparative Spending Guide March 2005Page 868

DISTRICT
Summary / 2003-04 Actual Totals
Indicator 1 Indicator 2 Indicator 3 Indicator 4 Indicator 5 Indicator 6 Indicator 7 Indicator 8 Indicator 9 Indicator 10 Indicator 11 Indicator 12 Indicator 13 Indicator 15
TotalCost Total Classroom Classroom Classroom Total Support Total Admin Oper.& Oper.& Total Extracur Total Avg
Per Pupil Classroom Salaries & Gen Supplies Purchased Support Services Admin Salaries & Maint Maint of Plant Food Costs Equip Daily
Instruction Benefits Textbooks Services & Oth Services Sals & Bens Costs Benefits of Plant Sals & Bens Services Enroll
Indicator 1 Total Cost
CAMDEN
15,097,231AUDUBON BORO 9,533,590 9,076,944 402,644 54,002 1,724,470 1,525,054 1,675,305 1,396,177 1,457,722 915,405 9,000 617,857 11,100 1,748
5,667,917BARRINGTON BORO 3,234,950 2,995,060 153,269 86,621 1,029,052 872,241 897,475 662,465 476,603 259,241 0 27,897 0 604
8,425,390BELLMAWR BORO 5,560,936 5,270,487 215,164 75,285 1,085,481 948,178 983,861 815,186 736,033 377,580 0 56,991 55,758 1,052
6,339,621BERLIN BORO 4,087,321 3,857,908 166,084 63,329 711,477 663,710 917,988 781,296 485,816 260,768 35,000 59,161 19,074 762
6,844,185BERLIN TWP 4,697,453 4,501,962 160,546 34,945 715,520 623,047 771,690 575,417 575,160 201,400 0 30,980 16,620 701
36,600,578BLACK HORSE PIKE REGI 19,728,662 18,816,359 614,904 297,399 5,624,629 5,241,329 4,935,235 4,379,206 4,606,022 2,774,533 0 1,698,765 66,497 3,936
2,593,367BROOKLAWN BORO 1,664,634 1,555,261 77,315 32,058 312,855 248,729 365,612 281,770 192,193 76,419 25,039 33,033 32,364 274
211,915,373CAMDEN CITY 120,408,567 111,257,291 6,268,827 2,882,449 42,790,965 28,576,173 23,639,187 17,759,186 20,925,494 12,767,218 2,248,504 1,179,997 643,495 15,725
29,046,541CAMDEN COUNTY VOCATI 14,189,324 12,737,095 1,231,033 221,196 3,274,186 2,988,601 4,769,040 3,885,623 5,494,869 2,769,830 518,580 747,872 86,734 2,556
111,547,661CHERRY HILL TWP 71,132,076 68,131,486 1,731,149 1,269,441 13,435,572 12,462,635 13,320,671 11,241,249 10,774,256 3,585,705 0 2,830,778 71,390 11,484
1,584,703CHESILHURST 913,593 845,025 43,050 25,518 144,388 65,942 310,107 211,216 171,917 57,264 20,000 7,321 5,700 142
4,888,206CLEMENTON BORO 3,211,188 3,073,445 106,835 30,908 564,704 402,405 553,392 444,375 481,595 183,084 30,000 17,021 0 596
19,908,088COLLINGSWOOD BORO 11,066,569 10,439,621 469,999 156,949 2,981,491 2,794,444 2,259,479 1,836,699 2,868,893 1,974,849 0 718,358 68,979 2,012
21,762,758EASTERN CAMDEN COUN 12,645,892 11,283,771 1,194,854 167,267 3,524,797 3,355,625 1,827,497 1,480,752 2,514,467 1,142,077 0 1,098,099 301,965 2,119
3,104,920GIBBSBORO BORO 2,115,343 2,047,679 62,157 5,507 391,452 349,377 301,897 186,095 187,811 77,331 30,080 62,358 0 300
27,186,409GLOUCESTER CITY 16,216,023 15,055,625 861,790 298,608 4,995,815 4,052,459 2,333,569 1,780,655 2,854,493 1,739,882 0 544,957 346,618 2,099
60,588,044GLOUCESTER TWP 39,928,992 37,768,926 1,969,894 190,172 7,109,533 6,751,668 6,289,177 5,055,017 6,274,957 3,261,669 387,000 580,851 80,113 7,980
12,803,060HADDON HEIGHTS BORO 7,660,976 7,355,597 245,490 59,889 1,679,841 1,472,756 1,614,117 1,274,490 1,256,137 759,926 0 582,017 33,462 1,257
20,565,052HADDON TWP 11,992,971 11,197,378 763,406 32,187 2,505,512 2,103,461 2,592,471 2,116,682 2,415,093 1,365,213 126,600 636,590 136,193 2,227
22,823,974HADDONFIELD BORO 12,988,703 12,387,355 566,961 34,387 3,429,082 2,810,709 2,455,898 2,047,562 3,029,166 1,863,319 0 906,653 0 2,308
1,379,647LAUREL SPRINGS BORO 798,776 748,134 28,996 21,646 162,922 102,186 272,888 216,857 141,922 61,928 0 642 0 171
2,959,811LAWNSIDE BORO 1,723,593 1,645,426 21,415 56,752 370,491 287,740 479,344 359,682 301,677 140,937 80,087 4,619 0 267
25,197,407LINDENWOLD BORO 15,269,979 14,502,067 703,820 64,092 3,222,496 2,855,238 2,869,452 2,193,598 2,926,064 1,542,819 175,936 686,204 207,743 2,381
4,217,626MAGNOLIA BORO 2,517,339 2,412,647 67,904 36,788 600,409 473,038 568,783 369,169 479,308 255,606 15,000 36,787 11,314 430
3,231,013MERCHANTVILLE BORO 2,123,827 2,005,471 57,832 60,524 264,496 193,739 453,669 332,171 336,838 21,642 22,394 29,789 0 363
3,647,730MOUNT EPHRAIM BORO 2,113,908 1,995,948 87,331 30,629 728,696 573,805 410,205 309,153 346,079 146,988 10,638 20,756 0 446
3,920,874OAKLYN BORO 2,398,989 2,205,913 165,043 28,033 569,627 364,771 564,609 469,461 333,499 110,695 0 54,149 0 498
54,995,707PENNSAUKEN TWP 33,399,569 32,312,459 917,944 169,166 6,944,603 5,958,907 5,934,096 4,710,823 7,249,582 4,612,768 0 1,126,964 452,595 6,072
23,307,849PINE HILL BORO 15,571,958 14,727,906 522,938 321,114 2,365,721 1,993,235 2,199,508 1,655,810 2,465,400 1,208,525 16,694 536,695 84,819 2,250
7,856,362RUNNEMEDE BORO 4,996,133 4,701,360 273,771 21,002 734,717 699,041 1,019,302 913,588 1,027,913 386,115 22,302 55,994 0 786
4,328,772SOMERDALE BORO 2,788,349 2,707,906 75,850 4,593 400,134 303,433 552,879 429,628 443,557 216,933 12,000 18,542 0 516
11,322,542STERLING HIGH SCHOOL 6,063,128 5,477,373 541,983 43,772 1,362,336 1,138,683 1,280,685 1,008,762 1,855,412 984,150 0 728,462 137,122 961
N.J. Department of Education - Comparative Spending Guide March 2005
Sum 2003-04
Page 869
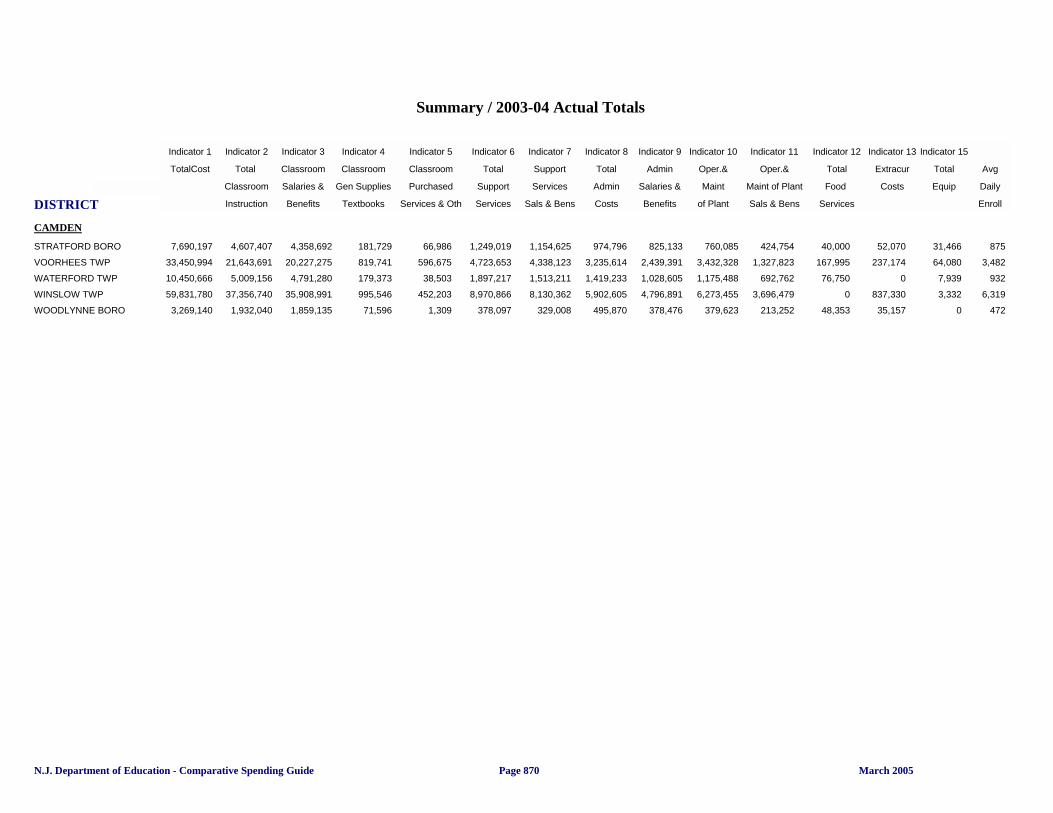
DISTRICT
Summary / 2003-04 Actual Totals
Indicator 1 Indicator 2 Indicator 3 Indicator 4 Indicator 5 Indicator 6 Indicator 7 Indicator 8 Indicator 9 Indicator 10 Indicator 11 Indicator 12 Indicator 13 Indicator 15
TotalCost Total Classroom Classroom Classroom Total Support Total Admin Oper.& Oper.& Total Extracur Total Avg
Per Pupil Classroom Salaries & Gen Supplies Purchased Support Services Admin Salaries & Maint Maint of Plant Food Costs Equip Daily
Instruction Benefits Textbooks Services & Oth Services Sals & Bens Costs Benefits of Plant Sals & Bens Services Enroll
Indicator 1 Total Cost
CAMDEN
7,690,197STRATFORD BORO 4,607,407 4,358,692 181,729 66,986 1,249,019 1,154,625 974,796 825,133 760,085 424,754 40,000 52,070 31,466 875
33,450,994VOORHEES TWP 21,643,691 20,227,275 819,741 596,675 4,723,653 4,338,123 3,235,614 2,439,391 3,432,328 1,327,823 167,995 237,174 64,080 3,482
10,450,666WATERFORD TWP 5,009,156 4,791,280 179,373 38,503 1,897,217 1,513,211 1,419,233 1,028,605 1,175,488 692,762 76,750 0 7,939 932
59,831,780WINSLOW TWP 37,356,740 35,908,991 995,546 452,203 8,970,866 8,130,362 5,902,605 4,796,891 6,273,455 3,696,479 0 837,330 3,332 6,319
3,269,140WOODLYNNE BORO 1,932,040 1,859,135 71,596 1,309 378,097 329,008 495,870 378,476 379,623 213,252 48,353 35,157 0 472
N.J. Department of Education - Comparative Spending Guide March 2005Page 870
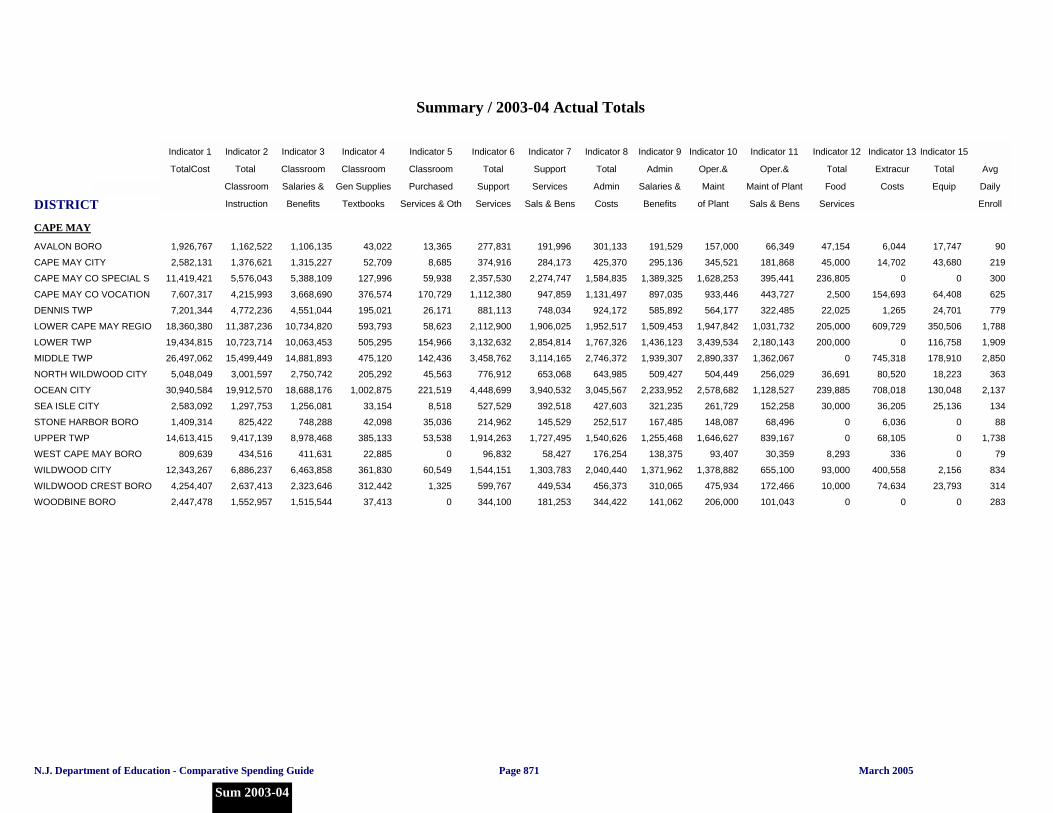
DISTRICT
Summary / 2003-04 Actual Totals
Indicator 1 Indicator 2 Indicator 3 Indicator 4 Indicator 5 Indicator 6 Indicator 7 Indicator 8 Indicator 9 Indicator 10 Indicator 11 Indicator 12 Indicator 13 Indicator 15
TotalCost Total Classroom Classroom Classroom Total Support Total Admin Oper.& Oper.& Total Extracur Total Avg
Per Pupil Classroom Salaries & Gen Supplies Purchased Support Services Admin Salaries & Maint Maint of Plant Food Costs Equip Daily
Instruction Benefits Textbooks Services & Oth Services Sals & Bens Costs Benefits of Plant Sals & Bens Services Enroll
Indicator 1 Total Cost
CAPE MAY
1,926,767AVALON BORO 1,162,522 1,106,135 43,022 13,365 277,831 191,996 301,133 191,529 157,000 66,349 47,154 6,044 17,747 90
2,582,131CAPE MAY CITY 1,376,621 1,315,227 52,709 8,685 374,916 284,173 425,370 295,136 345,521 181,868 45,000 14,702 43,680 219
11,419,421CAPE MAY CO SPECIAL S 5,576,043 5,388,109 127,996 59,938 2,357,530 2,274,747 1,584,835 1,389,325 1,628,253 395,441 236,805 0 0 300
7,607,317CAPE MAY CO VOCATION 4,215,993 3,668,690 376,574 170,729 1,112,380 947,859 1,131,497 897,035 933,446 443,727 2,500 154,693 64,408 625
7,201,344DENNIS TWP 4,772,236 4,551,044 195,021 26,171 881,113 748,034 924,172 585,892 564,177 322,485 22,025 1,265 24,701 779
18,360,380LOWER CAPE MAY REGIO 11,387,236 10,734,820 593,793 58,623 2,112,900 1,906,025 1,952,517 1,509,453 1,947,842 1,031,732 205,000 609,729 350,506 1,788
19,434,815LOWER TWP 10,723,714 10,063,453 505,295 154,966 3,132,632 2,854,814 1,767,326 1,436,123 3,439,534 2,180,143 200,000 0 116,758 1,909
26,497,062MIDDLE TWP 15,499,449 14,881,893 475,120 142,436 3,458,762 3,114,165 2,746,372 1,939,307 2,890,337 1,362,067 0 745,318 178,910 2,850
5,048,049NORTH WILDWOOD CITY 3,001,597 2,750,742 205,292 45,563 776,912 653,068 643,985 509,427 504,449 256,029 36,691 80,520 18,223 363
30,940,584OCEAN CITY 19,912,570 18,688,176 1,002,875 221,519 4,448,699 3,940,532 3,045,567 2,233,952 2,578,682 1,128,527 239,885 708,018 130,048 2,137
2,583,092SEA ISLE CITY 1,297,753 1,256,081 33,154 8,518 527,529 392,518 427,603 321,235 261,729 152,258 30,000 36,205 25,136 134
1,409,314STONE HARBOR BORO 825,422 748,288 42,098 35,036 214,962 145,529 252,517 167,485 148,087 68,496 0 6,036 0 88
14,613,415UPPER TWP 9,417,139 8,978,468 385,133 53,538 1,914,263 1,727,495 1,540,626 1,255,468 1,646,627 839,167 0 68,105 0 1,738
809,639WEST CAPE MAY BORO 434,516 411,631 22,885 0 96,832 58,427 176,254 138,375 93,407 30,359 8,293 336 0 79
12,343,267WILDWOOD CITY 6,886,237 6,463,858 361,830 60,549 1,544,151 1,303,783 2,040,440 1,371,962 1,378,882 655,100 93,000 400,558 2,156 834
4,254,407WILDWOOD CREST BORO 2,637,413 2,323,646 312,442 1,325 599,767 449,534 456,373 310,065 475,934 172,466 10,000 74,634 23,793 314
2,447,478WOODBINE BORO 1,552,957 1,515,544 37,413 0 344,100 181,253 344,422 141,062 206,000 101,043 0 0 0 283
N.J. Department of Education - Comparative Spending Guide March 2005
Sum 2003-04
Page 871
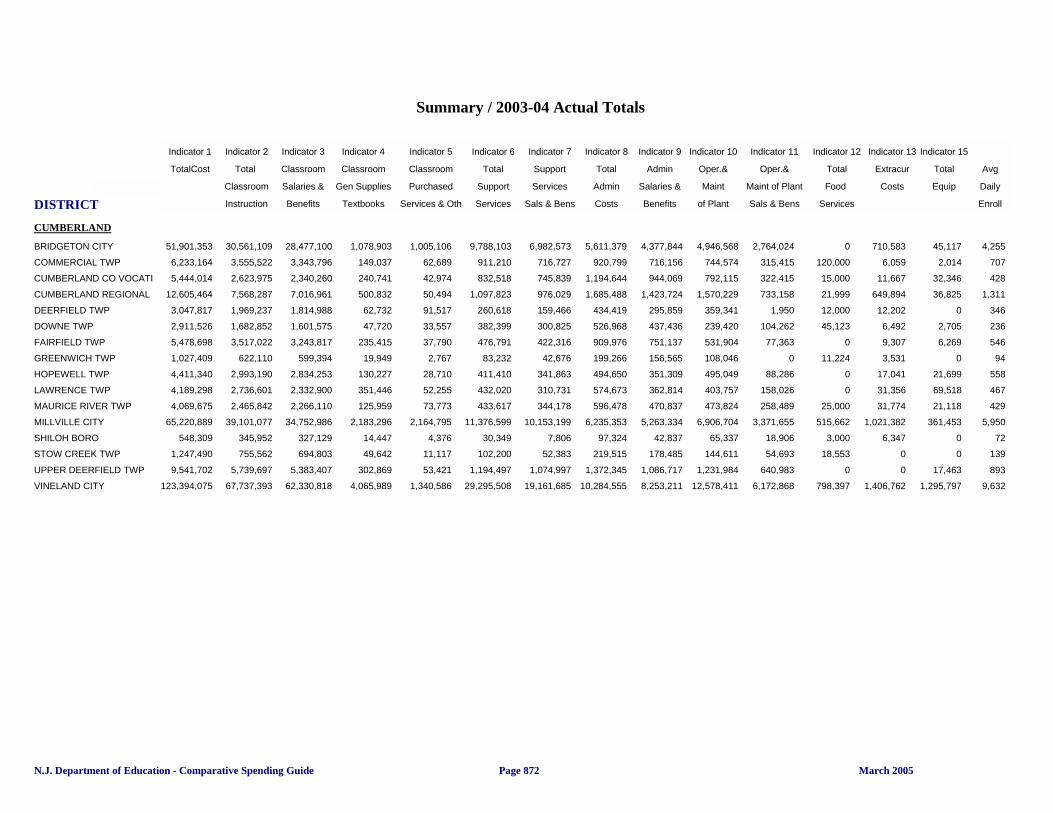
DISTRICT
Summary / 2003-04 Actual Totals
Indicator 1 Indicator 2 Indicator 3 Indicator 4 Indicator 5 Indicator 6 Indicator 7 Indicator 8 Indicator 9 Indicator 10 Indicator 11 Indicator 12 Indicator 13 Indicator 15
TotalCost Total Classroom Classroom Classroom Total Support Total Admin Oper.& Oper.& Total Extracur Total Avg
Per Pupil Classroom Salaries & Gen Supplies Purchased Support Services Admin Salaries & Maint Maint of Plant Food Costs Equip Daily
Instruction Benefits Textbooks Services & Oth Services Sals & Bens Costs Benefits of Plant Sals & Bens Services Enroll
Indicator 1 Total Cost
CUMBERLAND
51,901,353BRIDGETON CITY 30,561,109 28,477,100 1,078,903 1,005,106 9,788,103 6,982,573 5,611,379 4,377,844 4,946,568 2,764,024 0 710,583 45,117 4,255
6,233,164COMMERCIAL TWP 3,555,522 3,343,796 149,037 62,689 911,210 716,727 920,799 716,156 744,574 315,415 120,000 6,059 2,014 707
5,444,014CUMBERLAND CO VOCATI 2,623,975 2,340,260 240,741 42,974 832,518 745,839 1,194,644 944,069 792,115 322,415 15,000 11,667 32,346 428
12,605,464CUMBERLAND REGIONAL 7,568,287 7,016,961 500,832 50,494 1,097,823 976,029 1,685,488 1,423,724 1,570,229 733,158 21,999 649,894 36,825 1,311
3,047,817DEERFIELD TWP 1,969,237 1,814,988 62,732 91,517 260,618 159,466 434,419 295,859 359,341 1,950 12,000 12,202 0 346
2,911,526DOWNE TWP 1,682,852 1,601,575 47,720 33,557 382,399 300,825 526,968 437,436 239,420 104,262 45,123 6,492 2,705 236
5,478,698FAIRFIELD TWP 3,517,022 3,243,817 235,415 37,790 476,791 422,316 909,976 751,137 531,904 77,363 0 9,307 6,269 546
1,027,409GREENWICH TWP 622,110 599,394 19,949 2,767 83,232 42,676 199,266 156,565 108,046 0 11,224 3,531 0 94
4,411,340HOPEWELL TWP 2,993,190 2,834,253 130,227 28,710 411,410 341,863 494,650 351,309 495,049 88,286 0 17,041 21,699 558
4,189,298LAWRENCE TWP 2,736,601 2,332,900 351,446 52,255 432,020 310,731 574,673 362,814 403,757 158,026 0 31,356 69,518 467
4,069,675MAURICE RIVER TWP 2,465,842 2,266,110 125,959 73,773 433,617 344,178 596,478 470,837 473,824 258,489 25,000 31,774 21,118 429
65,220,889MILLVILLE CITY 39,101,077 34,752,986 2,183,296 2,164,795 11,376,599 10,153,199 6,235,353 5,263,334 6,906,704 3,371,655 515,662 1,021,382 361,453 5,950
548,309SHILOH BORO 345,952 327,129 14,447 4,376 30,349 7,806 97,324 42,837 65,337 18,906 3,000 6,347 0 72
1,247,490STOW CREEK TWP 755,562 694,803 49,642 11,117 102,200 52,383 219,515 178,485 144,611 54,693 18,553 0 0 139
9,541,702UPPER DEERFIELD TWP 5,739,697 5,383,407 302,869 53,421 1,194,497 1,074,997 1,372,345 1,086,717 1,231,984 640,983 0 0 17,463 893
123,394,075VINELAND CITY 67,737,393 62,330,818 4,065,989 1,340,586 29,295,508 19,161,685 10,284,555 8,253,211 12,578,411 6,172,868 798,397 1,406,762 1,295,797 9,632
N.J. Department of Education - Comparative Spending Guide March 2005Page 872
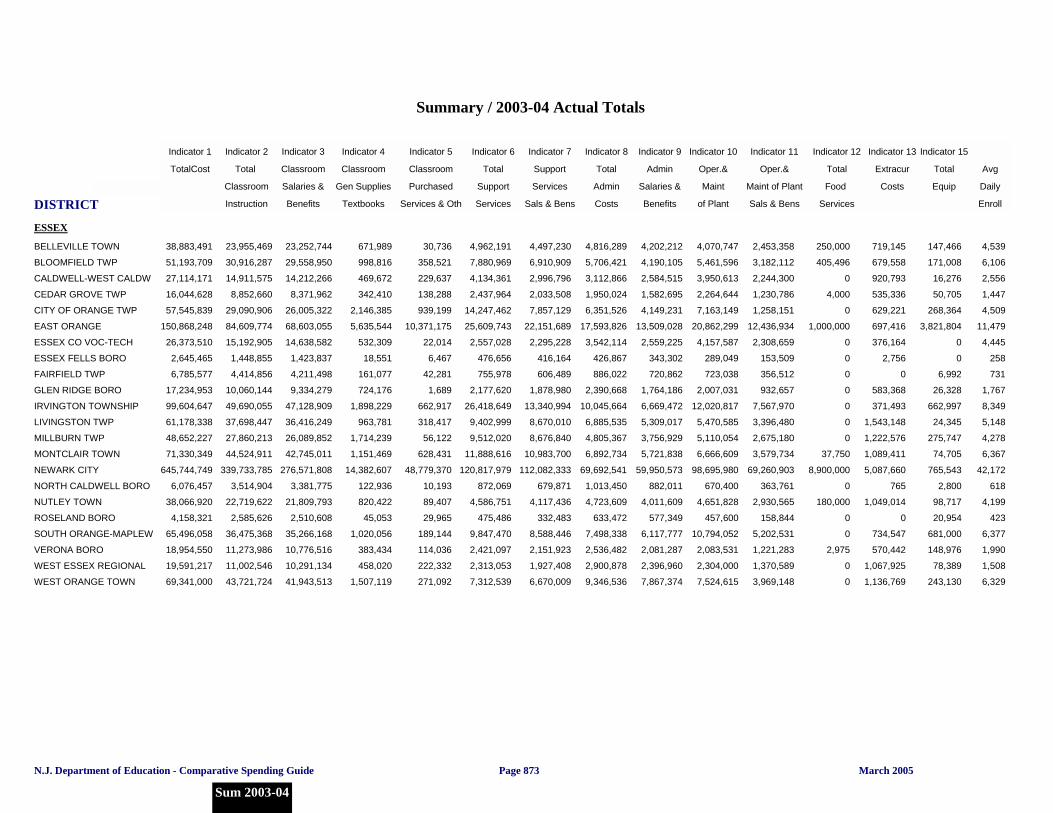
DISTRICT
Summary / 2003-04 Actual Totals
Indicator 1 Indicator 2 Indicator 3 Indicator 4 Indicator 5 Indicator 6 Indicator 7 Indicator 8 Indicator 9 Indicator 10 Indicator 11 Indicator 12 Indicator 13 Indicator 15
TotalCost Total Classroom Classroom Classroom Total Support Total Admin Oper.& Oper.& Total Extracur Total Avg
Per Pupil Classroom Salaries & Gen Supplies Purchased Support Services Admin Salaries & Maint Maint of Plant Food Costs Equip Daily
Instruction Benefits Textbooks Services & Oth Services Sals & Bens Costs Benefits of Plant Sals & Bens Services Enroll
Indicator 1 Total Cost
ESSEX
38,883,491BELLEVILLE TOWN 23,955,469 23,252,744 671,989 30,736 4,962,191 4,497,230 4,816,289 4,202,212 4,070,747 2,453,358 250,000 719,145 147,466 4,539
51,193,709BLOOMFIELD TWP 30,916,287 29,558,950 998,816 358,521 7,880,969 6,910,909 5,706,421 4,190,105 5,461,596 3,182,112 405,496 679,558 171,008 6,106
27,114,171CALDWELL-WEST CALDW 14,911,575 14,212,266 469,672 229,637 4,134,361 2,996,796 3,112,866 2,584,515 3,950,613 2,244,300 0 920,793 16,276 2,556
16,044,628CEDAR GROVE TWP 8,852,660 8,371,962 342,410 138,288 2,437,964 2,033,508 1,950,024 1,582,695 2,264,644 1,230,786 4,000 535,336 50,705 1,447
57,545,839CITY OF ORANGE TWP 29,090,906 26,005,322 2,146,385 939,199 14,247,462 7,857,129 6,351,526 4,149,231 7,163,149 1,258,151 0 629,221 268,364 4,509
150,868,248EAST ORANGE 84,609,774 68,603,055 5,635,544 10,371,175 25,609,743 22,151,689 17,593,826 13,509,028 20,862,299 12,436,934 1,000,000 697,416 3,821,804 11,479
26,373,510ESSEX CO VOC-TECH 15,192,905 14,638,582 532,309 22,014 2,557,028 2,295,228 3,542,114 2,559,225 4,157,587 2,308,659 0 376,164 0 4,445
2,645,465ESSEX FELLS BORO 1,448,855 1,423,837 18,551 6,467 476,656 416,164 426,867 343,302 289,049 153,509 0 2,756 0 258
6,785,577FAIRFIELD TWP 4,414,856 4,211,498 161,077 42,281 755,978 606,489 886,022 720,862 723,038 356,512 0 0 6,992 731
17,234,953GLEN RIDGE BORO 10,060,144 9,334,279 724,176 1,689 2,177,620 1,878,980 2,390,668 1,764,186 2,007,031 932,657 0 583,368 26,328 1,767
99,604,647IRVINGTON TOWNSHIP 49,690,055 47,128,909 1,898,229 662,917 26,418,649 13,340,994 10,045,664 6,669,472 12,020,817 7,567,970 0 371,493 662,997 8,349
61,178,338LIVINGSTON TWP 37,698,447 36,416,249 963,781 318,417 9,402,999 8,670,010 6,885,535 5,309,017 5,470,585 3,396,480 0 1,543,148 24,345 5,148
48,652,227MILLBURN TWP 27,860,213 26,089,852 1,714,239 56,122 9,512,020 8,676,840 4,805,367 3,756,929 5,110,054 2,675,180 0 1,222,576 275,747 4,278
71,330,349MONTCLAIR TOWN 44,524,911 42,745,011 1,151,469 628,431 11,888,616 10,983,700 6,892,734 5,721,838 6,666,609 3,579,734 37,750 1,089,411 74,705 6,367
645,744,749NEWARK CITY 339,733,785 276,571,808 14,382,607 48,779,370 120,817,979 112,082,333 69,692,541 59,950,573 98,695,980 69,260,903 8,900,000 5,087,660 765,543 42,172
6,076,457NORTH CALDWELL BORO 3,514,904 3,381,775 122,936 10,193 872,069 679,871 1,013,450 882,011 670,400 363,761 0 765 2,800 618
38,066,920NUTLEY TOWN 22,719,622 21,809,793 820,422 89,407 4,586,751 4,117,436 4,723,609 4,011,609 4,651,828 2,930,565 180,000 1,049,014 98,717 4,199
4,158,321ROSELAND BORO 2,585,626 2,510,608 45,053 29,965 475,486 332,483 633,472 577,349 457,600 158,844 0 0 20,954 423
65,496,058SOUTH ORANGE-MAPLEW 36,475,368 35,266,168 1,020,056 189,144 9,847,470 8,588,446 7,498,338 6,117,777 10,794,052 5,202,531 0 734,547 681,000 6,377
18,954,550VERONA BORO 11,273,986 10,776,516 383,434 114,036 2,421,097 2,151,923 2,536,482 2,081,287 2,083,531 1,221,283 2,975 570,442 148,976 1,990
19,591,217WEST ESSEX REGIONAL 11,002,546 10,291,134 458,020 222,332 2,313,053 1,927,408 2,900,878 2,396,960 2,304,000 1,370,589 0 1,067,925 78,389 1,508
69,341,000WEST ORANGE TOWN 43,721,724 41,943,513 1,507,119 271,092 7,312,539 6,670,009 9,346,536 7,867,374 7,524,615 3,969,148 0 1,136,769 243,130 6,329
N.J. Department of Education - Comparative Spending Guide March 2005
Sum 2003-04
Page 873
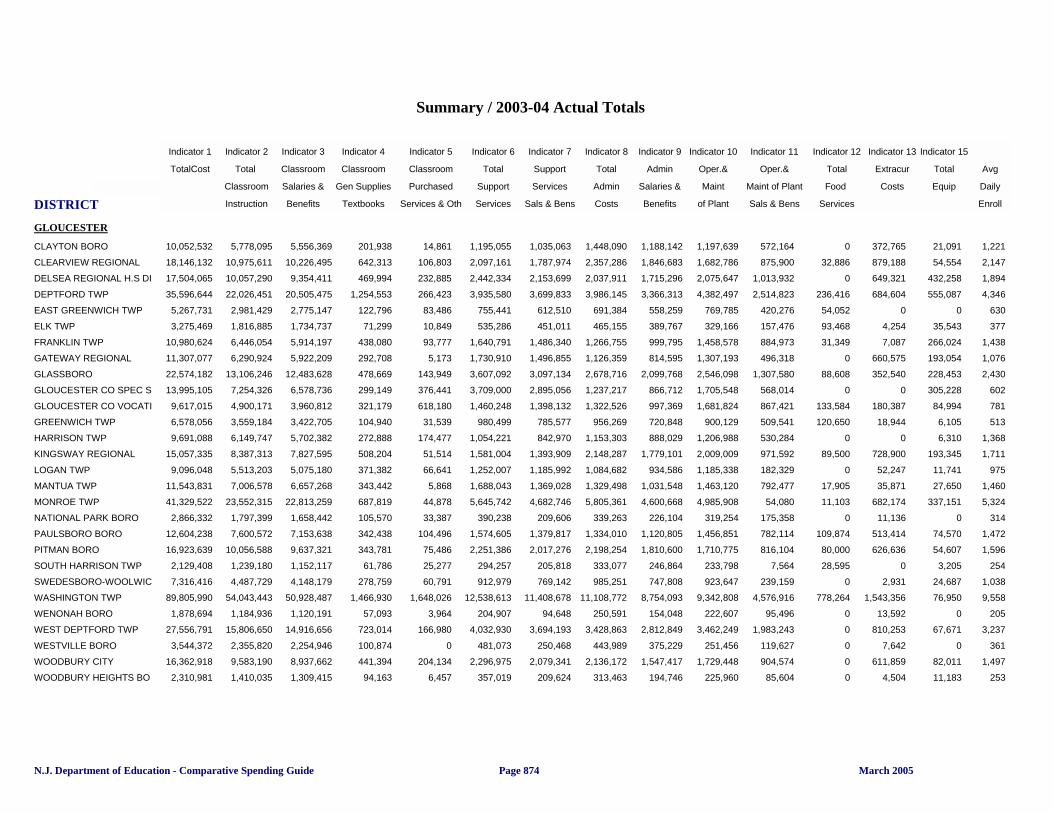
DISTRICT
Summary / 2003-04 Actual Totals
Indicator 1 Indicator 2 Indicator 3 Indicator 4 Indicator 5 Indicator 6 Indicator 7 Indicator 8 Indicator 9 Indicator 10 Indicator 11 Indicator 12 Indicator 13 Indicator 15
TotalCost Total Classroom Classroom Classroom Total Support Total Admin Oper.& Oper.& Total Extracur Total Avg
Per Pupil Classroom Salaries & Gen Supplies Purchased Support Services Admin Salaries & Maint Maint of Plant Food Costs Equip Daily
Instruction Benefits Textbooks Services & Oth Services Sals & Bens Costs Benefits of Plant Sals & Bens Services Enroll
Indicator 1 Total Cost
GLOUCESTER
10,052,532CLAYTON BORO 5,778,095 5,556,369 201,938 14,861 1,195,055 1,035,063 1,448,090 1,188,142 1,197,639 572,164 0 372,765 21,091 1,221
18,146,132CLEARVIEW REGIONAL 10,975,611 10,226,495 642,313 106,803 2,097,161 1,787,974 2,357,286 1,846,683 1,682,786 875,900 32,886 879,188 54,554 2,147
17,504,065DELSEA REGIONAL H.S DI 10,057,290 9,354,411 469,994 232,885 2,442,334 2,153,699 2,037,911 1,715,296 2,075,647 1,013,932 0 649,321 432,258 1,894
35,596,644DEPTFORD TWP 22,026,451 20,505,475 1,254,553 266,423 3,935,580 3,699,833 3,986,145 3,366,313 4,382,497 2,514,823 236,416 684,604 555,087 4,346
5,267,731EAST GREENWICH TWP 2,981,429 2,775,147 122,796 83,486 755,441 612,510 691,384 558,259 769,785 420,276 54,052 0 0 630
3,275,469ELK TWP 1,816,885 1,734,737 71,299 10,849 535,286 451,011 465,155 389,767 329,166 157,476 93,468 4,254 35,543 377
10,980,624FRANKLIN TWP 6,446,054 5,914,197 438,080 93,777 1,640,791 1,486,340 1,266,755 999,795 1,458,578 884,973 31,349 7,087 266,024 1,438
11,307,077GATEWAY REGIONAL 6,290,924 5,922,209 292,708 5,173 1,730,910 1,496,855 1,126,359 814,595 1,307,193 496,318 0 660,575 193,054 1,076
22,574,182GLASSBORO 13,106,246 12,483,628 478,669 143,949 3,607,092 3,097,134 2,678,716 2,099,768 2,546,098 1,307,580 88,608 352,540 228,453 2,430
13,995,105GLOUCESTER CO SPEC S 7,254,326 6,578,736 299,149 376,441 3,709,000 2,895,056 1,237,217 866,712 1,705,548 568,014 0 0 305,228 602
9,617,015GLOUCESTER CO VOCATI 4,900,171 3,960,812 321,179 618,180 1,460,248 1,398,132 1,322,526 997,369 1,681,824 867,421 133,584 180,387 84,994 781
6,578,056GREENWICH TWP 3,559,184 3,422,705 104,940 31,539 980,499 785,577 956,269 720,848 900,129 509,541 120,650 18,944 6,105 513
9,691,088HARRISON TWP 6,149,747 5,702,382 272,888 174,477 1,054,221 842,970 1,153,303 888,029 1,206,988 530,284 0 0 6,310 1,368
15,057,335KINGSWAY REGIONAL 8,387,313 7,827,595 508,204 51,514 1,581,004 1,393,909 2,148,287 1,779,101 2,009,009 971,592 89,500 728,900 193,345 1,711
9,096,048LOGAN TWP 5,513,203 5,075,180 371,382 66,641 1,252,007 1,185,992 1,084,682 934,586 1,185,338 182,329 0 52,247 11,741 975
11,543,831MANTUA TWP 7,006,578 6,657,268 343,442 5,868 1,688,043 1,369,028 1,329,498 1,031,548 1,463,120 792,477 17,905 35,871 27,650 1,460
41,329,522MONROE TWP 23,552,315 22,813,259 687,819 44,878 5,645,742 4,682,746 5,805,361 4,600,668 4,985,908 54,080 11,103 682,174 337,151 5,324
2,866,332NATIONAL PARK BORO 1,797,399 1,658,442 105,570 33,387 390,238 209,606 339,263 226,104 319,254 175,358 0 11,136 0 314
12,604,238PAULSBORO BORO 7,600,572 7,153,638 342,438 104,496 1,574,605 1,379,817 1,334,010 1,120,805 1,456,851 782,114 109,874 513,414 74,570 1,472
16,923,639PITMAN BORO 10,056,588 9,637,321 343,781 75,486 2,251,386 2,017,276 2,198,254 1,810,600 1,710,775 816,104 80,000 626,636 54,607 1,596
2,129,408SOUTH HARRISON TWP 1,239,180 1,152,117 61,786 25,277 294,257 205,818 333,077 246,864 233,798 7,564 28,595 0 3,205 254
7,316,416SWEDESBORO-WOOLWIC 4,487,729 4,148,179 278,759 60,791 912,979 769,142 985,251 747,808 923,647 239,159 0 2,931 24,687 1,038
89,805,990WASHINGTON TWP 54,043,443 50,928,487 1,466,930 1,648,026 12,538,613 11,408,678 11,108,772 8,754,093 9,342,808 4,576,916 778,264 1,543,356 76,950 9,558
1,878,694WENONAH BORO 1,184,936 1,120,191 57,093 3,964 204,907 94,648 250,591 154,048 222,607 95,496 0 13,592 0 205
27,556,791WEST DEPTFORD TWP 15,806,650 14,916,656 723,014 166,980 4,032,930 3,694,193 3,428,863 2,812,849 3,462,249 1,983,243 0 810,253 67,671 3,237
3,544,372WESTVILLE BORO 2,355,820 2,254,946 100,874 0 481,073 250,468 443,989 375,229 251,456 119,627 0 7,642 0 361
16,362,918WOODBURY CITY 9,583,190 8,937,662 441,394 204,134 2,296,975 2,079,341 2,136,172 1,547,417 1,729,448 904,574 0 611,859 82,011 1,497
2,310,981WOODBURY HEIGHTS BO 1,410,035 1,309,415 94,163 6,457 357,019 209,624 313,463 194,746 225,960 85,604 0 4,504 11,183 253
N.J. Department of Education - Comparative Spending Guide March 2005Page 874

DISTRICT
Summary / 2003-04 Actual Totals
Indicator 1 Indicator 2 Indicator 3 Indicator 4 Indicator 5 Indicator 6 Indicator 7 Indicator 8 Indicator 9 Indicator 10 Indicator 11 Indicator 12 Indicator 13 Indicator 15
TotalCost Total Classroom Classroom Classroom Total Support Total Admin Oper.& Oper.& Total Extracur Total Avg
Per Pupil Classroom Salaries & Gen Supplies Purchased Support Services Admin Salaries & Maint Maint of Plant Food Costs Equip Daily
Instruction Benefits Textbooks Services & Oth Services Sals & Bens Costs Benefits of Plant Sals & Bens Services Enroll
Indicator 1 Total Cost
HUDSON
78,249,438BAYONNE CITY 49,094,641 47,241,596 1,674,992 178,053 9,125,053 8,568,396 8,195,263 6,483,271 9,018,935 5,416,898 968,108 909,419 401,813 8,502
1,671,862EAST NEWARK BORO 1,016,048 955,989 42,560 17,499 180,571 143,271 328,132 154,014 136,891 53,012 0 5,284 37,405 227
6,316,497GUTTENBERG TOWN 3,929,380 3,734,825 184,206 10,349 453,031 324,549 1,177,842 872,873 667,454 286,358 0 50,113 5,011 972
22,416,677HARRISON TOWN 14,082,746 10,923,100 467,945 2,691,701 3,061,791 2,876,607 2,305,670 1,794,733 2,421,665 455,913 51,483 328,378 165,350 1,934
----- HOBOKEN CITY ----- ----- ----- ----- ----- ----- ----- ----- ----- ----- ----- ----- ----- -----
27,937,386HUDSON COUNTY VOCATI 11,049,188 10,240,371 568,140 240,677 3,754,706 3,236,062 7,849,733 6,525,921 4,495,500 1,751,238 193,088 497,342 1,225,658 1,166
428,098,535JERSEY CITY 243,703,733 211,380,132 23,983,033 8,340,568 77,205,041 49,715,877 38,397,718 33,295,235 62,979,719 39,037,449 0 4,013,583 937,321 30,366
52,200,226KEARNY TOWN 32,300,339 30,645,292 993,352 661,695 6,006,967 5,483,329 5,232,555 4,525,003 6,367,814 3,944,342 326,259 880,900 68,561 5,393
67,024,467NORTH BERGEN TWP 41,320,789 38,679,014 2,131,508 510,267 8,446,002 7,160,656 8,270,098 6,739,683 7,819,929 4,978,064 0 1,118,470 477,463 7,474
21,390,829SECAUCUS TOWN 13,244,372 12,816,628 419,388 8,356 2,310,844 2,152,782 2,359,118 1,709,846 2,520,009 1,313,505 381,946 542,802 343,315 1,872
131,437,392UNION CITY 80,595,878 63,693,154 5,594,227 11,308,497 20,000,153 17,192,653 13,587,670 8,870,082 14,186,886 7,789,196 150,000 909,797 435,548 10,032
12,549,417WEEHAWKEN TWP 7,799,261 7,158,535 321,735 318,991 1,470,860 1,427,585 1,562,565 1,159,574 1,210,595 525,358 55,000 390,174 28,253 1,201
81,904,451WEST NEW YORK TOWN 46,079,977 43,821,591 1,537,647 720,739 16,908,224 10,564,912 9,657,798 6,871,887 6,763,269 3,761,171 0 738,835 85,891 6,599
N.J. Department of Education - Comparative Spending Guide March 2005
Sum 2003-04
Page 875
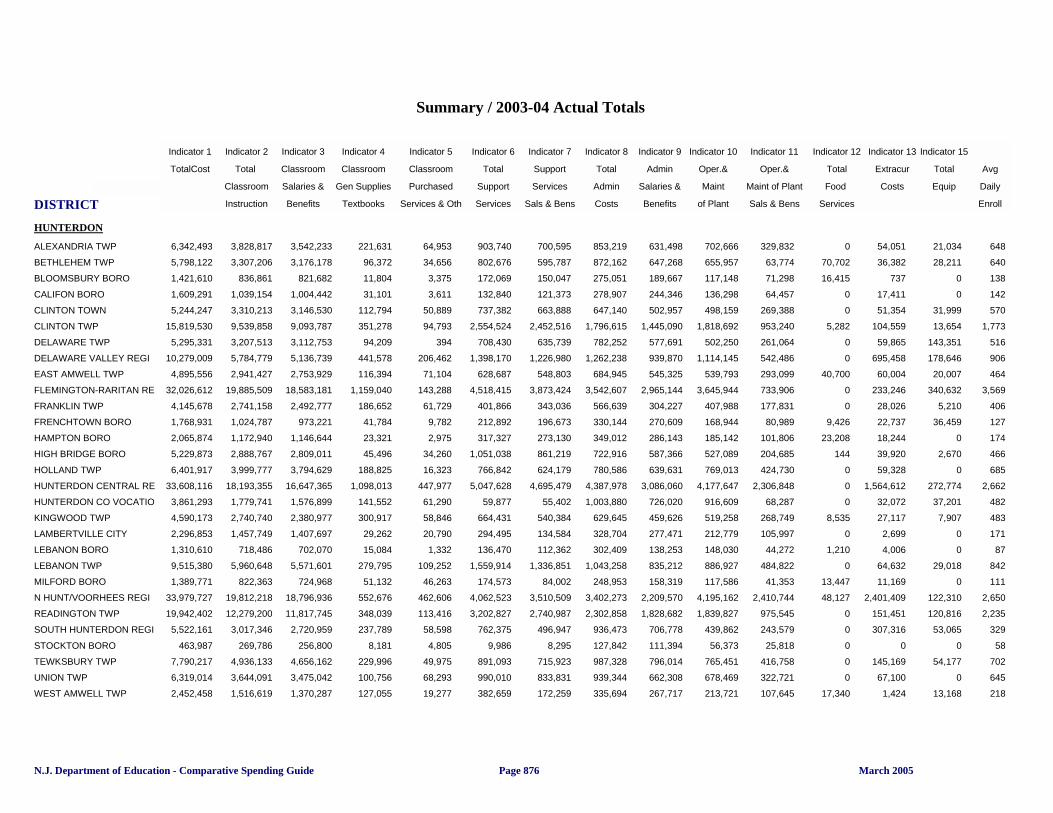
DISTRICT
Summary / 2003-04 Actual Totals
Indicator 1 Indicator 2 Indicator 3 Indicator 4 Indicator 5 Indicator 6 Indicator 7 Indicator 8 Indicator 9 Indicator 10 Indicator 11 Indicator 12 Indicator 13 Indicator 15
TotalCost Total Classroom Classroom Classroom Total Support Total Admin Oper.& Oper.& Total Extracur Total Avg
Per Pupil Classroom Salaries & Gen Supplies Purchased Support Services Admin Salaries & Maint Maint of Plant Food Costs Equip Daily
Instruction Benefits Textbooks Services & Oth Services Sals & Bens Costs Benefits of Plant Sals & Bens Services Enroll
Indicator 1 Total Cost
HUNTERDON
6,342,493ALEXANDRIA TWP 3,828,817 3,542,233 221,631 64,953 903,740 700,595 853,219 631,498 702,666 329,832 0 54,051 21,034 648
5,798,122BETHLEHEM TWP 3,307,206 3,176,178 96,372 34,656 802,676 595,787 872,162 647,268 655,957 63,774 70,702 36,382 28,211 640
1,421,610BLOOMSBURY BORO 836,861 821,682 11,804 3,375 172,069 150,047 275,051 189,667 117,148 71,298 16,415 737 0 138
1,609,291CALIFON BORO 1,039,154 1,004,442 31,101 3,611 132,840 121,373 278,907 244,346 136,298 64,457 0 17,411 0 142
5,244,247CLINTON TOWN 3,310,213 3,146,530 112,794 50,889 737,382 663,888 647,140 502,957 498,159 269,388 0 51,354 31,999 570
15,819,530CLINTON TWP 9,539,858 9,093,787 351,278 94,793 2,554,524 2,452,516 1,796,615 1,445,090 1,818,692 953,240 5,282 104,559 13,654 1,773
5,295,331DELAWARE TWP 3,207,513 3,112,753 94,209 394 708,430 635,739 782,252 577,691 502,250 261,064 0 59,865 143,351 516
10,279,009DELAWARE VALLEY REGI 5,784,779 5,136,739 441,578 206,462 1,398,170 1,226,980 1,262,238 939,870 1,114,145 542,486 0 695,458 178,646 906
4,895,556EAST AMWELL TWP 2,941,427 2,753,929 116,394 71,104 628,687 548,803 684,945 545,325 539,793 293,099 40,700 60,004 20,007 464
32,026,612FLEMINGTON-RARITAN RE 19,885,509 18,583,181 1,159,040 143,288 4,518,415 3,873,424 3,542,607 2,965,144 3,645,944 733,906 0 233,246 340,632 3,569
4,145,678FRANKLIN TWP 2,741,158 2,492,777 186,652 61,729 401,866 343,036 566,639 304,227 407,988 177,831 0 28,026 5,210 406
1,768,931FRENCHTOWN BORO 1,024,787 973,221 41,784 9,782 212,892 196,673 330,144 270,609 168,944 80,989 9,426 22,737 36,459 127
2,065,874HAMPTON BORO 1,172,940 1,146,644 23,321 2,975 317,327 273,130 349,012 286,143 185,142 101,806 23,208 18,244 0 174
5,229,873HIGH BRIDGE BORO 2,888,767 2,809,011 45,496 34,260 1,051,038 861,219 722,916 587,366 527,089 204,685 144 39,920 2,670 466
6,401,917HOLLAND TWP 3,999,777 3,794,629 188,825 16,323 766,842 624,179 780,586 639,631 769,013 424,730 0 59,328 0 685
33,608,116HUNTERDON CENTRAL RE 18,193,355 16,647,365 1,098,013 447,977 5,047,628 4,695,479 4,387,978 3,086,060 4,177,647 2,306,848 0 1,564,612 272,774 2,662
3,861,293HUNTERDON CO VOCATIO 1,779,741 1,576,899 141,552 61,290 59,877 55,402 1,003,880 726,020 916,609 68,287 0 32,072 37,201 482
4,590,173KINGWOOD TWP 2,740,740 2,380,977 300,917 58,846 664,431 540,384 629,645 459,626 519,258 268,749 8,535 27,117 7,907 483
2,296,853LAMBERTVILLE CITY 1,457,749 1,407,697 29,262 20,790 294,495 134,584 328,704 277,471 212,779 105,997 0 2,699 0 171
1,310,610LEBANON BORO 718,486 702,070 15,084 1,332 136,470 112,362 302,409 138,253 148,030 44,272 1,210 4,006 0 87
9,515,380LEBANON TWP 5,960,648 5,571,601 279,795 109,252 1,559,914 1,336,851 1,043,258 835,212 886,927 484,822 0 64,632 29,018 842
1,389,771MILFORD BORO 822,363 724,968 51,132 46,263 174,573 84,002 248,953 158,319 117,586 41,353 13,447 11,169 0 111
33,979,727N HUNT/VOORHEES REGI 19,812,218 18,796,936 552,676 462,606 4,062,523 3,510,509 3,402,273 2,209,570 4,195,162 2,410,744 48,127 2,401,409 122,310 2,650
19,942,402READINGTON TWP 12,279,200 11,817,745 348,039 113,416 3,202,827 2,740,987 2,302,858 1,828,682 1,839,827 975,545 0 151,451 120,816 2,235
5,522,161SOUTH HUNTERDON REGI 3,017,346 2,720,959 237,789 58,598 762,375 496,947 936,473 706,778 439,862 243,579 0 307,316 53,065 329
463,987STOCKTON BORO 269,786 256,800 8,181 4,805 9,986 8,295 127,842 111,394 56,373 25,818 0 0 0 58
7,790,217TEWKSBURY TWP 4,936,133 4,656,162 229,996 49,975 891,093 715,923 987,328 796,014 765,451 416,758 0 145,169 54,177 702
6,319,014UNION TWP 3,644,091 3,475,042 100,756 68,293 990,010 833,831 939,344 662,308 678,469 322,721 0 67,100 0 645
2,452,458WEST AMWELL TWP 1,516,619 1,370,287 127,055 19,277 382,659 172,259 335,694 267,717 213,721 107,645 17,340 1,424 13,168 218
N.J. Department of Education - Comparative Spending Guide March 2005Page 876
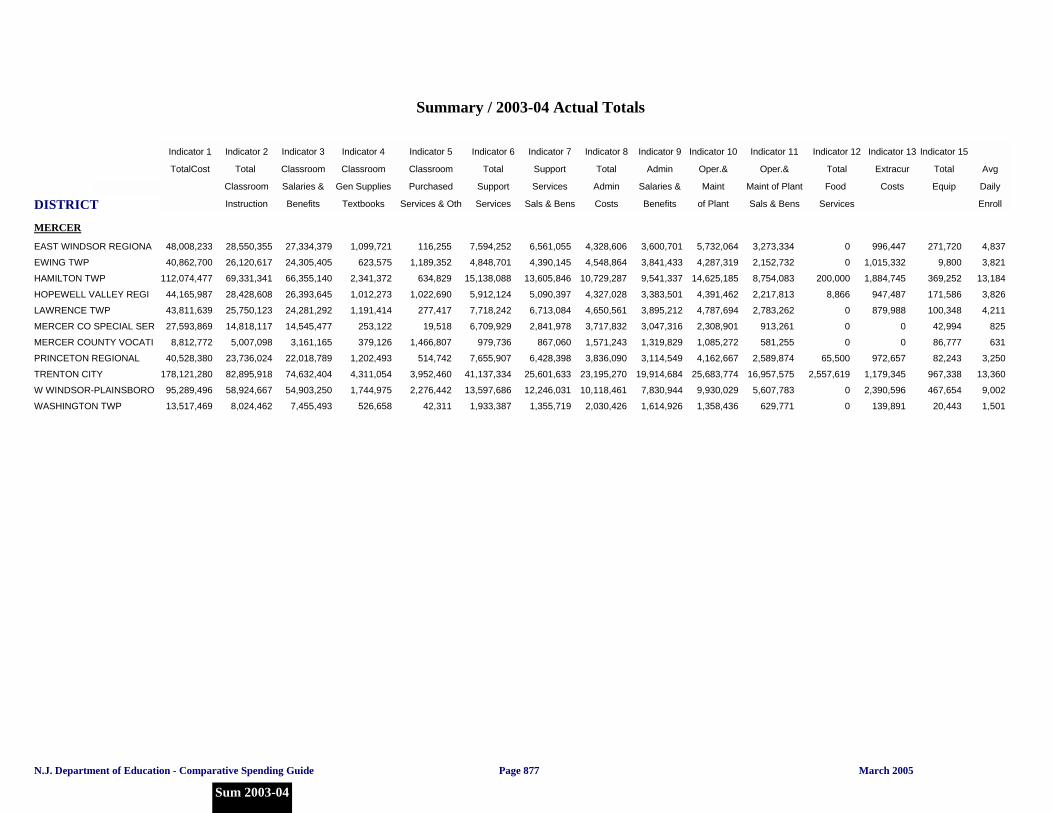
DISTRICT
Summary / 2003-04 Actual Totals
Indicator 1 Indicator 2 Indicator 3 Indicator 4 Indicator 5 Indicator 6 Indicator 7 Indicator 8 Indicator 9 Indicator 10 Indicator 11 Indicator 12 Indicator 13 Indicator 15
TotalCost Total Classroom Classroom Classroom Total Support Total Admin Oper.& Oper.& Total Extracur Total Avg
Per Pupil Classroom Salaries & Gen Supplies Purchased Support Services Admin Salaries & Maint Maint of Plant Food Costs Equip Daily
Instruction Benefits Textbooks Services & Oth Services Sals & Bens Costs Benefits of Plant Sals & Bens Services Enroll
Indicator 1 Total Cost
MERCER
48,008,233EAST WINDSOR REGIONA 28,550,355 27,334,379 1,099,721 116,255 7,594,252 6,561,055 4,328,606 3,600,701 5,732,064 3,273,334 0 996,447 271,720 4,837
40,862,700EWING TWP 26,120,617 24,305,405 623,575 1,189,352 4,848,701 4,390,145 4,548,864 3,841,433 4,287,319 2,152,732 0 1,015,332 9,800 3,821
112,074,477HAMILTON TWP 69,331,341 66,355,140 2,341,372 634,829 15,138,088 13,605,846 10,729,287 9,541,337 14,625,185 8,754,083 200,000 1,884,745 369,252 13,184
44,165,987HOPEWELL VALLEY REGI 28,428,608 26,393,645 1,012,273 1,022,690 5,912,124 5,090,397 4,327,028 3,383,501 4,391,462 2,217,813 8,866 947,487 171,586 3,826
43,811,639LAWRENCE TWP 25,750,123 24,281,292 1,191,414 277,417 7,718,242 6,713,084 4,650,561 3,895,212 4,787,694 2,783,262 0 879,988 100,348 4,211
27,593,869MERCER CO SPECIAL SER 14,818,117 14,545,477 253,122 19,518 6,709,929 2,841,978 3,717,832 3,047,316 2,308,901 913,261 0 0 42,994 825
8,812,772MERCER COUNTY VOCATI 5,007,098 3,161,165 379,126 1,466,807 979,736 867,060 1,571,243 1,319,829 1,085,272 581,255 0 0 86,777 631
40,528,380PRINCETON REGIONAL 23,736,024 22,018,789 1,202,493 514,742 7,655,907 6,428,398 3,836,090 3,114,549 4,162,667 2,589,874 65,500 972,657 82,243 3,250
178,121,280TRENTON CITY 82,895,918 74,632,404 4,311,054 3,952,460 41,137,334 25,601,633 23,195,270 19,914,684 25,683,774 16,957,575 2,557,619 1,179,345 967,338 13,360
95,289,496W WINDSOR-PLAINSBORO 58,924,667 54,903,250 1,744,975 2,276,442 13,597,686 12,246,031 10,118,461 7,830,944 9,930,029 5,607,783 0 2,390,596 467,654 9,002
13,517,469WASHINGTON TWP 8,024,462 7,455,493 526,658 42,311 1,933,387 1,355,719 2,030,426 1,614,926 1,358,436 629,771 0 139,891 20,443 1,501
N.J. Department of Education - Comparative Spending Guide March 2005
Sum 2003-04
Page 877
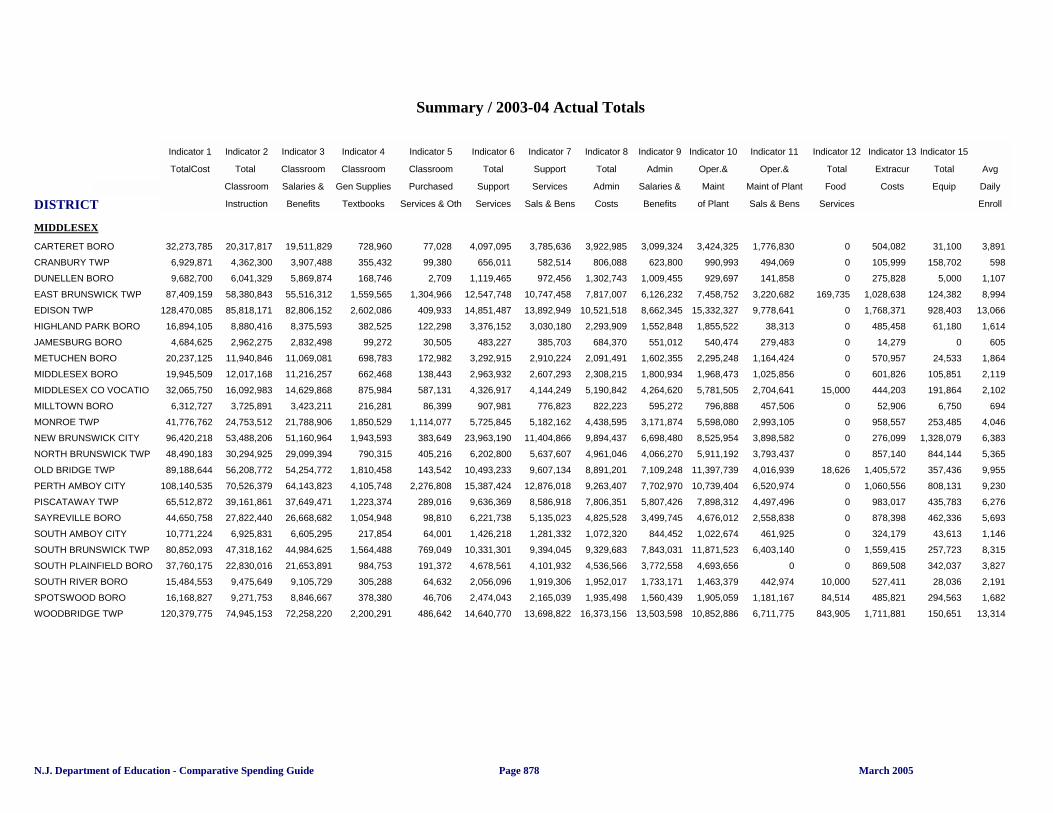
DISTRICT
Summary / 2003-04 Actual Totals
Indicator 1 Indicator 2 Indicator 3 Indicator 4 Indicator 5 Indicator 6 Indicator 7 Indicator 8 Indicator 9 Indicator 10 Indicator 11 Indicator 12 Indicator 13 Indicator 15
TotalCost Total Classroom Classroom Classroom Total Support Total Admin Oper.& Oper.& Total Extracur Total Avg
Per Pupil Classroom Salaries & Gen Supplies Purchased Support Services Admin Salaries & Maint Maint of Plant Food Costs Equip Daily
Instruction Benefits Textbooks Services & Oth Services Sals & Bens Costs Benefits of Plant Sals & Bens Services Enroll
Indicator 1 Total Cost
MIDDLESEX
32,273,785CARTERET BORO 20,317,817 19,511,829 728,960 77,028 4,097,095 3,785,636 3,922,985 3,099,324 3,424,325 1,776,830 0 504,082 31,100 3,891
6,929,871CRANBURY TWP 4,362,300 3,907,488 355,432 99,380 656,011 582,514 806,088 623,800 990,993 494,069 0 105,999 158,702 598
9,682,700DUNELLEN BORO 6,041,329 5,869,874 168,746 2,709 1,119,465 972,456 1,302,743 1,009,455 929,697 141,858 0 275,828 5,000 1,107
87,409,159EAST BRUNSWICK TWP 58,380,843 55,516,312 1,559,565 1,304,966 12,547,748 10,747,458 7,817,007 6,126,232 7,458,752 3,220,682 169,735 1,028,638 124,382 8,994
128,470,085EDISON TWP 85,818,171 82,806,152 2,602,086 409,933 14,851,487 13,892,949 10,521,518 8,662,345 15,332,327 9,778,641 0 1,768,371 928,403 13,066
16,894,105HIGHLAND PARK BORO 8,880,416 8,375,593 382,525 122,298 3,376,152 3,030,180 2,293,909 1,552,848 1,855,522 38,313 0 485,458 61,180 1,614
4,684,625JAMESBURG BORO 2,962,275 2,832,498 99,272 30,505 483,227 385,703 684,370 551,012 540,474 279,483 0 14,279 0 605
20,237,125METUCHEN BORO 11,940,846 11,069,081 698,783 172,982 3,292,915 2,910,224 2,091,491 1,602,355 2,295,248 1,164,424 0 570,957 24,533 1,864
19,945,509MIDDLESEX BORO 12,017,168 11,216,257 662,468 138,443 2,963,932 2,607,293 2,308,215 1,800,934 1,968,473 1,025,856 0 601,826 105,851 2,119
32,065,750MIDDLESEX CO VOCATIO 16,092,983 14,629,868 875,984 587,131 4,326,917 4,144,249 5,190,842 4,264,620 5,781,505 2,704,641 15,000 444,203 191,864 2,102
6,312,727MILLTOWN BORO 3,725,891 3,423,211 216,281 86,399 907,981 776,823 822,223 595,272 796,888 457,506 0 52,906 6,750 694
41,776,762MONROE TWP 24,753,512 21,788,906 1,850,529 1,114,077 5,725,845 5,182,162 4,438,595 3,171,874 5,598,080 2,993,105 0 958,557 253,485 4,046
96,420,218NEW BRUNSWICK CITY 53,488,206 51,160,964 1,943,593 383,649 23,963,190 11,404,866 9,894,437 6,698,480 8,525,954 3,898,582 0 276,099 1,328,079 6,383
48,490,183NORTH BRUNSWICK TWP 30,294,925 29,099,394 790,315 405,216 6,202,800 5,637,607 4,961,046 4,066,270 5,911,192 3,793,437 0 857,140 844,144 5,365
89,188,644OLD BRIDGE TWP 56,208,772 54,254,772 1,810,458 143,542 10,493,233 9,607,134 8,891,201 7,109,248 11,397,739 4,016,939 18,626 1,405,572 357,436 9,955
108,140,535PERTH AMBOY CITY 70,526,379 64,143,823 4,105,748 2,276,808 15,387,424 12,876,018 9,263,407 7,702,970 10,739,404 6,520,974 0 1,060,556 808,131 9,230
65,512,872PISCATAWAY TWP 39,161,861 37,649,471 1,223,374 289,016 9,636,369 8,586,918 7,806,351 5,807,426 7,898,312 4,497,496 0 983,017 435,783 6,276
44,650,758SAYREVILLE BORO 27,822,440 26,668,682 1,054,948 98,810 6,221,738 5,135,023 4,825,528 3,499,745 4,676,012 2,558,838 0 878,398 462,336 5,693
10,771,224SOUTH AMBOY CITY 6,925,831 6,605,295 217,854 64,001 1,426,218 1,281,332 1,072,320 844,452 1,022,674 461,925 0 324,179 43,613 1,146
80,852,093SOUTH BRUNSWICK TWP 47,318,162 44,984,625 1,564,488 769,049 10,331,301 9,394,045 9,329,683 7,843,031 11,871,523 6,403,140 0 1,559,415 257,723 8,315
37,760,175SOUTH PLAINFIELD BORO 22,830,016 21,653,891 984,753 191,372 4,678,561 4,101,932 4,536,566 3,772,558 4,693,656 0 0 869,508 342,037 3,827
15,484,553SOUTH RIVER BORO 9,475,649 9,105,729 305,288 64,632 2,056,096 1,919,306 1,952,017 1,733,171 1,463,379 442,974 10,000 527,411 28,036 2,191
16,168,827SPOTSWOOD BORO 9,271,753 8,846,667 378,380 46,706 2,474,043 2,165,039 1,935,498 1,560,439 1,905,059 1,181,167 84,514 485,821 294,563 1,682
120,379,775WOODBRIDGE TWP 74,945,153 72,258,220 2,200,291 486,642 14,640,770 13,698,822 16,373,156 13,503,598 10,852,886 6,711,775 843,905 1,711,881 150,651 13,314
N.J. Department of Education - Comparative Spending Guide March 2005Page 878
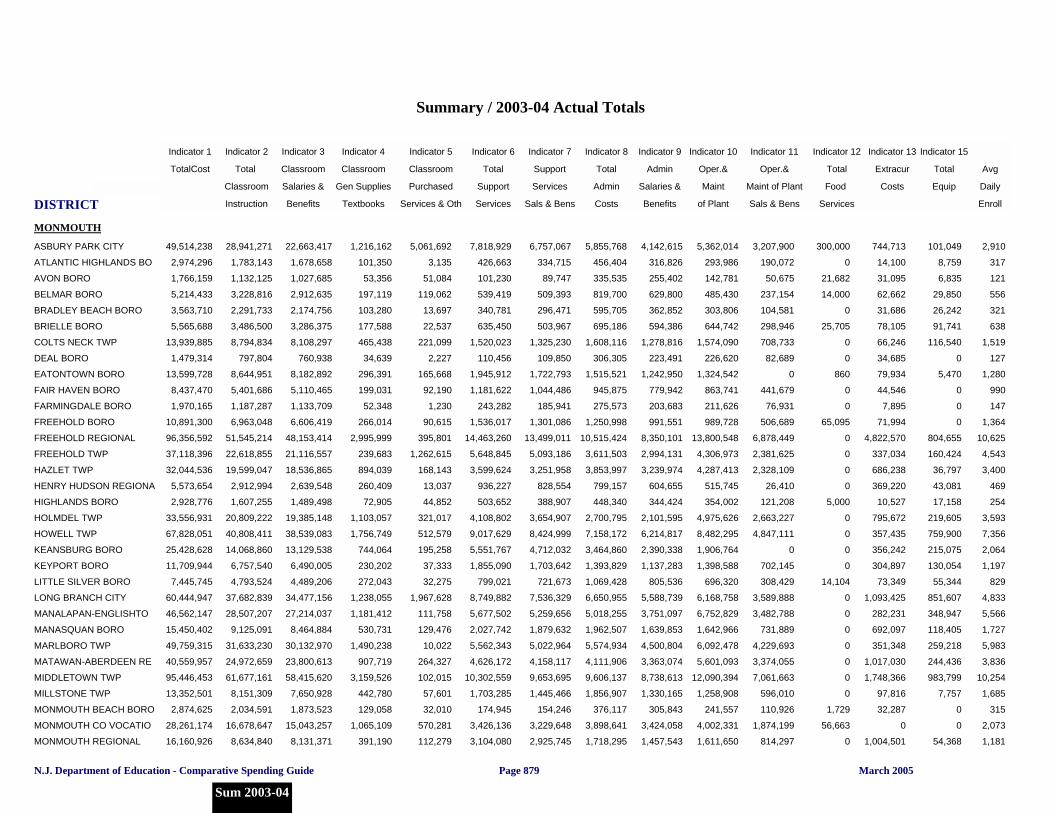
DISTRICT
Summary / 2003-04 Actual Totals
Indicator 1 Indicator 2 Indicator 3 Indicator 4 Indicator 5 Indicator 6 Indicator 7 Indicator 8 Indicator 9 Indicator 10 Indicator 11 Indicator 12 Indicator 13 Indicator 15
TotalCost Total Classroom Classroom Classroom Total Support Total Admin Oper.& Oper.& Total Extracur Total Avg
Per Pupil Classroom Salaries & Gen Supplies Purchased Support Services Admin Salaries & Maint Maint of Plant Food Costs Equip Daily
Instruction Benefits Textbooks Services & Oth Services Sals & Bens Costs Benefits of Plant Sals & Bens Services Enroll
Indicator 1 Total Cost
MONMOUTH
49,514,238ASBURY PARK CITY 28,941,271 22,663,417 1,216,162 5,061,692 7,818,929 6,757,067 5,855,768 4,142,615 5,362,014 3,207,900 300,000 744,713 101,049 2,910
2,974,296ATLANTIC HIGHLANDS BO 1,783,143 1,678,658 101,350 3,135 426,663 334,715 456,404 316,826 293,986 190,072 0 14,100 8,759 317
1,766,159AVON BORO 1,132,125 1,027,685 53,356 51,084 101,230 89,747 335,535 255,402 142,781 50,675 21,682 31,095 6,835 121
5,214,433BELMAR BORO 3,228,816 2,912,635 197,119 119,062 539,419 509,393 819,700 629,800 485,430 237,154 14,000 62,662 29,850 556
3,563,710BRADLEY BEACH BORO 2,291,733 2,174,756 103,280 13,697 340,781 296,471 595,705 362,852 303,806 104,581 0 31,686 26,242 321
5,565,688BRIELLE BORO 3,486,500 3,286,375 177,588 22,537 635,450 503,967 695,186 594,386 644,742 298,946 25,705 78,105 91,741 638
13,939,885COLTS NECK TWP 8,794,834 8,108,297 465,438 221,099 1,520,023 1,325,230 1,608,116 1,278,816 1,574,090 708,733 0 66,246 116,540 1,519
1,479,314DEAL BORO 797,804 760,938 34,639 2,227 110,456 109,850 306,305 223,491 226,620 82,689 0 34,685 0 127
13,599,728EATONTOWN BORO 8,644,951 8,182,892 296,391 165,668 1,945,912 1,722,793 1,515,521 1,242,950 1,324,542 0 860 79,934 5,470 1,280
8,437,470FAIR HAVEN BORO 5,401,686 5,110,465 199,031 92,190 1,181,622 1,044,486 945,875 779,942 863,741 441,679 0 44,546 0 990
1,970,165FARMINGDALE BORO 1,187,287 1,133,709 52,348 1,230 243,282 185,941 275,573 203,683 211,626 76,931 0 7,895 0 147
10,891,300FREEHOLD BORO 6,963,048 6,606,419 266,014 90,615 1,536,017 1,301,086 1,250,998 991,551 989,728 506,689 65,095 71,994 0 1,364
96,356,592FREEHOLD REGIONAL 51,545,214 48,153,414 2,995,999 395,801 14,463,260 13,499,011 10,515,424 8,350,101 13,800,548 6,878,449 0 4,822,570 804,655 10,625
37,118,396FREEHOLD TWP 22,618,855 21,116,557 239,683 1,262,615 5,648,845 5,093,186 3,611,503 2,994,131 4,306,973 2,381,625 0 337,034 160,424 4,543
32,044,536HAZLET TWP 19,599,047 18,536,865 894,039 168,143 3,599,624 3,251,958 3,853,997 3,239,974 4,287,413 2,328,109 0 686,238 36,797 3,400
5,573,654HENRY HUDSON REGIONA 2,912,994 2,639,548 260,409 13,037 936,227 828,554 799,157 604,655 515,745 26,410 0 369,220 43,081 469
2,928,776HIGHLANDS BORO 1,607,255 1,489,498 72,905 44,852 503,652 388,907 448,340 344,424 354,002 121,208 5,000 10,527 17,158 254
33,556,931HOLMDEL TWP 20,809,222 19,385,148 1,103,057 321,017 4,108,802 3,654,907 2,700,795 2,101,595 4,975,626 2,663,227 0 795,672 219,605 3,593
67,828,051HOWELL TWP 40,808,411 38,539,083 1,756,749 512,579 9,017,629 8,424,999 7,158,172 6,214,817 8,482,295 4,847,111 0 357,435 759,900 7,356
25,428,628KEANSBURG BORO 14,068,860 13,129,538 744,064 195,258 5,551,767 4,712,032 3,464,860 2,390,338 1,906,764 0 0 356,242 215,075 2,064
11,709,944KEYPORT BORO 6,757,540 6,490,005 230,202 37,333 1,855,090 1,703,642 1,393,829 1,137,283 1,398,588 702,145 0 304,897 130,054 1,197
7,445,745LITTLE SILVER BORO 4,793,524 4,489,206 272,043 32,275 799,021 721,673 1,069,428 805,536 696,320 308,429 14,104 73,349 55,344 829
60,444,947LONG BRANCH CITY 37,682,839 34,477,156 1,238,055 1,967,628 8,749,882 7,536,329 6,650,955 5,588,739 6,168,758 3,589,888 0 1,093,425 851,607 4,833
46,562,147MANALAPAN-ENGLISHTO 28,507,207 27,214,037 1,181,412 111,758 5,677,502 5,259,656 5,018,255 3,751,097 6,752,829 3,482,788 0 282,231 348,947 5,566
15,450,402MANASQUAN BORO 9,125,091 8,464,884 530,731 129,476 2,027,742 1,879,632 1,962,507 1,639,853 1,642,966 731,889 0 692,097 118,405 1,727
49,759,315MARLBORO TWP 31,633,230 30,132,970 1,490,238 10,022 5,562,343 5,022,964 5,574,934 4,500,804 6,092,478 4,229,693 0 351,348 259,218 5,983
40,559,957MATAWAN-ABERDEEN RE 24,972,659 23,800,613 907,719 264,327 4,626,172 4,158,117 4,111,906 3,363,074 5,601,093 3,374,055 0 1,017,030 244,436 3,836
95,446,453MIDDLETOWN TWP 61,677,161 58,415,620 3,159,526 102,015 10,302,559 9,653,695 9,606,137 8,738,613 12,090,394 7,061,663 0 1,748,366 983,799 10,254
13,352,501MILLSTONE TWP 8,151,309 7,650,928 442,780 57,601 1,703,285 1,445,466 1,856,907 1,330,165 1,258,908 596,010 0 97,816 7,757 1,685
2,874,625MONMOUTH BEACH BORO 2,034,591 1,873,523 129,058 32,010 174,945 154,246 376,117 305,843 241,557 110,926 1,729 32,287 0 315
28,261,174MONMOUTH CO VOCATIO 16,678,647 15,043,257 1,065,109 570,281 3,426,136 3,229,648 3,898,641 3,424,058 4,002,331 1,874,199 56,663 0 0 2,073
16,160,926MONMOUTH REGIONAL 8,634,840 8,131,371 391,190 112,279 3,104,080 2,925,745 1,718,295 1,457,543 1,611,650 814,297 0 1,004,501 54,368 1,181
N.J. Department of Education - Comparative Spending Guide March 2005
Sum 2003-04
Page 879
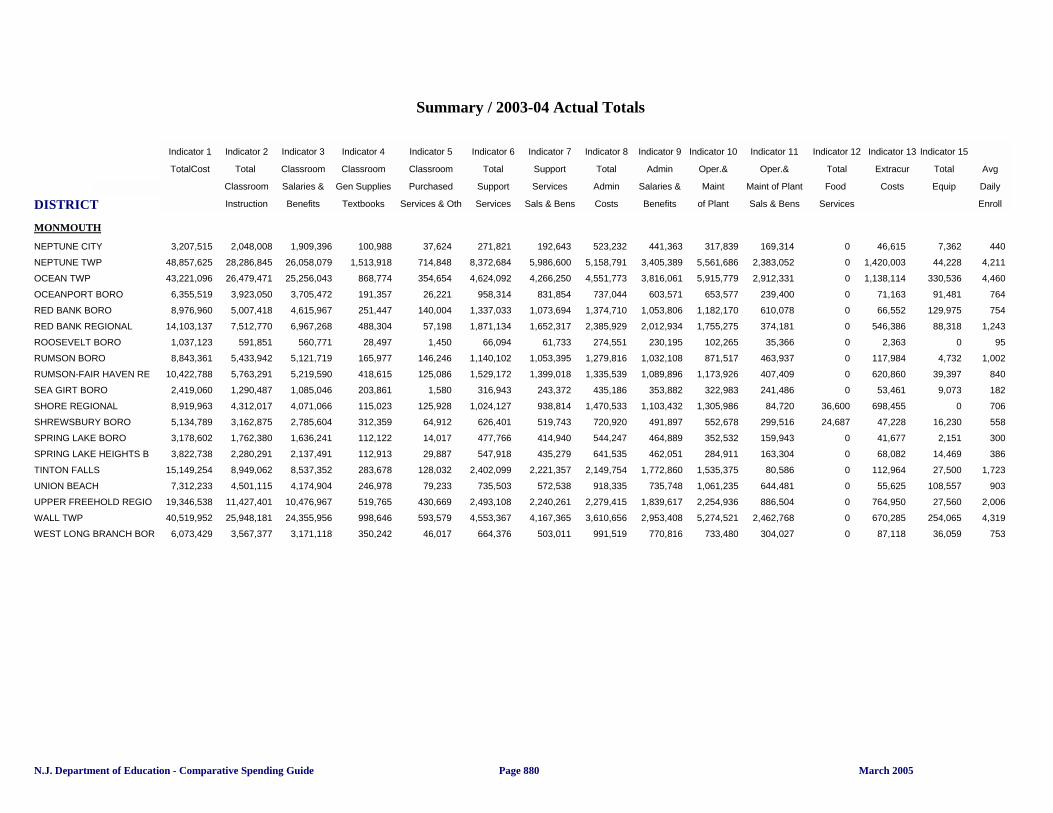
DISTRICT
Summary / 2003-04 Actual Totals
Indicator 1 Indicator 2 Indicator 3 Indicator 4 Indicator 5 Indicator 6 Indicator 7 Indicator 8 Indicator 9 Indicator 10 Indicator 11 Indicator 12 Indicator 13 Indicator 15
TotalCost Total Classroom Classroom Classroom Total Support Total Admin Oper.& Oper.& Total Extracur Total Avg
Per Pupil Classroom Salaries & Gen Supplies Purchased Support Services Admin Salaries & Maint Maint of Plant Food Costs Equip Daily
Instruction Benefits Textbooks Services & Oth Services Sals & Bens Costs Benefits of Plant Sals & Bens Services Enroll
Indicator 1 Total Cost
MONMOUTH
3,207,515NEPTUNE CITY 2,048,008 1,909,396 100,988 37,624 271,821 192,643 523,232 441,363 317,839 169,314 0 46,615 7,362 440
48,857,625NEPTUNE TWP 28,286,845 26,058,079 1,513,918 714,848 8,372,684 5,986,600 5,158,791 3,405,389 5,561,686 2,383,052 0 1,420,003 44,228 4,211
43,221,096OCEAN TWP 26,479,471 25,256,043 868,774 354,654 4,624,092 4,266,250 4,551,773 3,816,061 5,915,779 2,912,331 0 1,138,114 330,536 4,460
6,355,519OCEANPORT BORO 3,923,050 3,705,472 191,357 26,221 958,314 831,854 737,044 603,571 653,577 239,400 0 71,163 91,481 764
8,976,960RED BANK BORO 5,007,418 4,615,967 251,447 140,004 1,337,033 1,073,694 1,374,710 1,053,806 1,182,170 610,078 0 66,552 129,975 754
14,103,137RED BANK REGIONAL 7,512,770 6,967,268 488,304 57,198 1,871,134 1,652,317 2,385,929 2,012,934 1,755,275 374,181 0 546,386 88,318 1,243
1,037,123ROOSEVELT BORO 591,851 560,771 28,497 1,450 66,094 61,733 274,551 230,195 102,265 35,366 0 2,363 0 95
8,843,361RUMSON BORO 5,433,942 5,121,719 165,977 146,246 1,140,102 1,053,395 1,279,816 1,032,108 871,517 463,937 0 117,984 4,732 1,002
10,422,788RUMSON-FAIR HAVEN RE 5,763,291 5,219,590 418,615 125,086 1,529,172 1,399,018 1,335,539 1,089,896 1,173,926 407,409 0 620,860 39,397 840
2,419,060SEA GIRT BORO 1,290,487 1,085,046 203,861 1,580 316,943 243,372 435,186 353,882 322,983 241,486 0 53,461 9,073 182
8,919,963SHORE REGIONAL 4,312,017 4,071,066 115,023 125,928 1,024,127 938,814 1,470,533 1,103,432 1,305,986 84,720 36,600 698,455 0 706
5,134,789SHREWSBURY BORO 3,162,875 2,785,604 312,359 64,912 626,401 519,743 720,920 491,897 552,678 299,516 24,687 47,228 16,230 558
3,178,602SPRING LAKE BORO 1,762,380 1,636,241 112,122 14,017 477,766 414,940 544,247 464,889 352,532 159,943 0 41,677 2,151 300
3,822,738SPRING LAKE HEIGHTS B 2,280,291 2,137,491 112,913 29,887 547,918 435,279 641,535 462,051 284,911 163,304 0 68,082 14,469 386
15,149,254TINTON FALLS 8,949,062 8,537,352 283,678 128,032 2,402,099 2,221,357 2,149,754 1,772,860 1,535,375 80,586 0 112,964 27,500 1,723
7,312,233UNION BEACH 4,501,115 4,174,904 246,978 79,233 735,503 572,538 918,335 735,748 1,061,235 644,481 0 55,625 108,557 903
19,346,538UPPER FREEHOLD REGIO 11,427,401 10,476,967 519,765 430,669 2,493,108 2,240,261 2,279,415 1,839,617 2,254,936 886,504 0 764,950 27,560 2,006
40,519,952WALL TWP 25,948,181 24,355,956 998,646 593,579 4,553,367 4,167,365 3,610,656 2,953,408 5,274,521 2,462,768 0 670,285 254,065 4,319
6,073,429WEST LONG BRANCH BOR 3,567,377 3,171,118 350,242 46,017 664,376 503,011 991,519 770,816 733,480 304,027 0 87,118 36,059 753
N.J. Department of Education - Comparative Spending Guide March 2005Page 880

DISTRICT
Summary / 2003-04 Actual Totals
Indicator 1 Indicator 2 Indicator 3 Indicator 4 Indicator 5 Indicator 6 Indicator 7 Indicator 8 Indicator 9 Indicator 10 Indicator 11 Indicator 12 Indicator 13 Indicator 15
TotalCost Total Classroom Classroom Classroom Total Support Total Admin Oper.& Oper.& Total Extracur Total Avg
Per Pupil Classroom Salaries & Gen Supplies Purchased Support Services Admin Salaries & Maint Maint of Plant Food Costs Equip Daily
Instruction Benefits Textbooks Services & Oth Services Sals & Bens Costs Benefits of Plant Sals & Bens Services Enroll
Indicator 1 Total Cost
MORRIS
13,736,225BOONTON TOWN 7,527,770 7,201,458 264,125 62,187 2,107,442 1,796,100 2,132,940 1,730,175 1,511,928 809,892 0 442,309 47,436 1,317
5,140,374BOONTON TWP 3,257,342 3,118,239 105,927 33,176 638,990 587,962 697,570 419,644 448,671 200,040 0 68,829 9,304 542
13,696,204BUTLER BORO 7,388,203 7,045,399 316,725 26,079 2,340,416 2,016,203 1,738,907 1,368,333 1,842,519 1,139,703 4,090 382,069 20,901 1,146
13,558,883CHESTER TWP 8,378,347 7,815,932 380,130 182,285 1,753,300 1,540,039 1,621,150 1,278,548 1,629,273 910,778 0 128,956 13,358 1,285
15,274,589DENVILLE TWP 9,576,233 9,064,407 309,090 202,736 2,368,393 1,867,669 1,737,546 1,386,748 1,356,305 789,774 0 99,530 7,021 1,905
27,179,889DOVER TOWN 16,331,043 15,519,891 751,217 59,935 3,835,489 3,474,573 2,913,663 2,463,418 3,408,166 1,870,288 0 616,625 859,530 2,938
12,491,772EAST HANOVER TWP 8,081,110 7,674,191 315,668 91,251 1,393,392 1,202,315 1,441,643 1,176,479 1,434,205 800,409 0 98,239 159,888 1,132
10,527,203FLORHAM PARK BORO 5,966,185 5,400,107 472,529 93,549 1,471,654 1,204,886 1,727,094 1,239,140 1,163,127 576,559 0 149,967 147,620 932
18,844,021HANOVER PARK REGIONA 10,169,431 9,581,108 394,749 193,574 2,588,308 2,393,954 1,981,231 1,678,258 2,557,824 1,284,228 10,891 1,398,363 187,974 1,431
15,574,575HANOVER TWP 9,169,767 8,612,793 441,005 115,969 2,198,786 2,022,506 2,004,284 1,662,551 1,988,361 1,132,287 0 130,425 126,705 1,469
4,523,381HARDING TOWNSHIP 2,365,703 2,219,026 112,580 34,097 526,587 405,925 794,839 578,723 750,103 211,911 2,458 78,964 7,122 335
33,892,915JEFFERSON TWP 20,350,770 18,948,298 813,121 589,351 4,913,551 4,582,006 3,797,416 2,844,633 3,972,377 2,084,887 56,642 649,601 22,306 3,580
20,113,143KINNELON BORO 11,908,247 11,371,321 394,343 142,583 2,742,512 2,426,784 2,555,616 2,044,891 2,189,157 1,008,653 1,000 716,612 47,185 2,079
9,862,910LINCOLN PARK BORO 5,748,082 5,393,757 279,664 74,661 1,479,090 1,269,269 1,609,454 1,032,396 967,795 571,088 0 58,657 15,059 977
10,392,734LONG HILL TWP 6,106,745 5,767,481 262,887 76,377 1,603,098 1,465,703 1,289,528 1,038,164 1,332,467 889,221 0 60,896 2,365 1,096
25,191,659MADISON BORO 14,957,641 14,047,401 785,944 124,296 3,207,710 2,789,807 3,134,404 2,427,321 2,987,798 1,520,983 0 898,982 129,231 2,222
6,573,552MENDHAM BORO 3,969,302 3,668,807 270,310 30,185 844,982 756,458 1,058,109 818,248 625,266 227,305 0 75,893 29,457 666
9,524,173MENDHAM TWP 5,709,747 5,337,688 298,301 73,758 1,236,234 992,884 1,392,307 1,123,767 932,253 550,189 0 117,823 6,679 872
3,313,426MINE HILL TWP 2,060,579 1,885,917 159,876 14,786 403,140 233,301 471,344 275,371 348,874 127,581 0 29,489 0 380
40,037,205MONTVILLE TWP 23,707,959 22,355,002 1,055,558 297,399 6,489,053 5,584,250 4,431,762 3,436,494 4,358,776 2,444,970 0 1,049,656 85,529 3,938
7,972,705MORRIS COUNTY VOCATI 4,706,482 2,668,643 378,541 1,659,298 937,213 810,338 1,536,495 1,287,424 900,143 482,022 0 11,894 54,833 420
35,733,016MORRIS HILLS REGIONAL 17,965,094 16,786,869 1,013,290 164,935 5,187,405 4,833,749 3,450,560 2,731,545 6,494,155 2,279,970 0 2,344,402 785,588 2,608
7,306,076MORRIS PLAINS BORO 4,225,858 4,011,582 214,276 0 1,008,953 784,352 864,224 656,937 1,086,768 530,169 0 111,197 65,064 568
61,948,490MORRIS SCHOOL DISTRIC 35,485,832 33,545,031 1,638,556 302,245 10,882,826 9,733,788 6,387,421 4,927,517 6,943,180 3,921,485 236,405 1,459,912 610,837 4,631
4,784,810MOUNT ARLINGTON BORO 2,857,312 2,646,524 132,717 78,071 757,891 569,163 549,396 461,693 572,784 234,654 0 42,802 0 444
49,289,613MOUNT OLIVE TWP 28,052,938 26,975,734 890,131 187,073 7,255,205 6,174,675 4,859,387 3,789,034 7,554,357 3,974,423 0 900,740 536,880 4,769
23,667,352MOUNTAIN LAKES BORO 14,392,794 13,544,909 785,461 62,424 3,667,909 3,036,974 2,449,411 1,692,860 2,394,588 1,287,276 29,220 681,915 266,663 1,643
3,256,083NETCONG BORO 2,050,091 1,914,801 133,921 1,369 393,538 334,361 501,626 357,191 293,121 126,628 1,000 16,576 7,713 288
79,744,789PARSIPPANY-TROY HILLS 47,487,389 46,071,578 1,279,794 136,017 13,100,332 11,299,159 8,133,873 6,501,767 8,573,934 4,868,925 36,991 2,104,019 271,175 6,948
23,300,583PEQUANNOCK TWP 14,770,788 13,943,717 532,271 294,800 2,917,927 2,529,681 2,847,681 2,268,732 2,180,825 1,116,287 0 554,427 110,848 2,398
52,272,308RANDOLPH TWP 31,177,082 29,569,292 1,558,600 49,190 7,412,838 7,015,505 5,535,414 3,916,241 6,181,653 3,665,198 0 1,479,158 490,594 5,492
3,083,417RIVERDALE BORO 1,425,130 1,346,112 57,804 21,214 640,212 443,019 649,706 520,370 314,080 148,625 1,205 51,109 0 279
N.J. Department of Education - Comparative Spending Guide March 2005
Sum 2003-04
Page 881
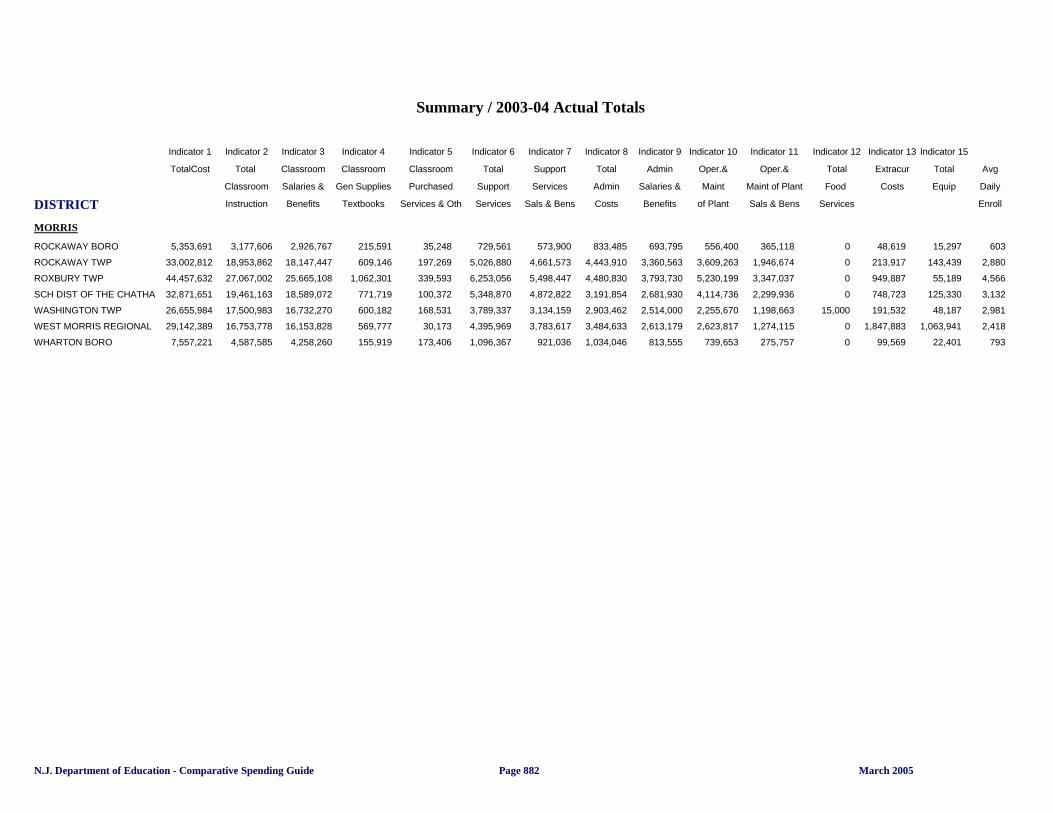
DISTRICT
Summary / 2003-04 Actual Totals
Indicator 1 Indicator 2 Indicator 3 Indicator 4 Indicator 5 Indicator 6 Indicator 7 Indicator 8 Indicator 9 Indicator 10 Indicator 11 Indicator 12 Indicator 13 Indicator 15
TotalCost Total Classroom Classroom Classroom Total Support Total Admin Oper.& Oper.& Total Extracur Total Avg
Per Pupil Classroom Salaries & Gen Supplies Purchased Support Services Admin Salaries & Maint Maint of Plant Food Costs Equip Daily
Instruction Benefits Textbooks Services & Oth Services Sals & Bens Costs Benefits of Plant Sals & Bens Services Enroll
Indicator 1 Total Cost
MORRIS
5,353,691ROCKAWAY BORO 3,177,606 2,926,767 215,591 35,248 729,561 573,900 833,485 693,795 556,400 365,118 0 48,619 15,297 603
33,002,812ROCKAWAY TWP 18,953,862 18,147,447 609,146 197,269 5,026,880 4,661,573 4,443,910 3,360,563 3,609,263 1,946,674 0 213,917 143,439 2,880
44,457,632ROXBURY TWP 27,067,002 25,665,108 1,062,301 339,593 6,253,056 5,498,447 4,480,830 3,793,730 5,230,199 3,347,037 0 949,887 55,189 4,566
32,871,651SCH DIST OF THE CHATHA 19,461,163 18,589,072 771,719 100,372 5,348,870 4,872,822 3,191,854 2,681,930 4,114,736 2,299,936 0 748,723 125,330 3,132
26,655,984WASHINGTON TWP 17,500,983 16,732,270 600,182 168,531 3,789,337 3,134,159 2,903,462 2,514,000 2,255,670 1,198,663 15,000 191,532 48,187 2,981
29,142,389WEST MORRIS REGIONAL 16,753,778 16,153,828 569,777 30,173 4,395,969 3,783,617 3,484,633 2,613,179 2,623,817 1,274,115 0 1,847,883 1,063,941 2,418
7,557,221WHARTON BORO 4,587,585 4,258,260 155,919 173,406 1,096,367 921,036 1,034,046 813,555 739,653 275,757 0 99,569 22,401 793
N.J. Department of Education - Comparative Spending Guide March 2005Page 882

DISTRICT
Summary / 2003-04 Actual Totals
Indicator 1 Indicator 2 Indicator 3 Indicator 4 Indicator 5 Indicator 6 Indicator 7 Indicator 8 Indicator 9 Indicator 10 Indicator 11 Indicator 12 Indicator 13 Indicator 15
TotalCost Total Classroom Classroom Classroom Total Support Total Admin Oper.& Oper.& Total Extracur Total Avg
Per Pupil Classroom Salaries & Gen Supplies Purchased Support Services Admin Salaries & Maint Maint of Plant Food Costs Equip Daily
Instruction Benefits Textbooks Services & Oth Services Sals & Bens Costs Benefits of Plant Sals & Bens Services Enroll
Indicator 1 Total Cost
OCEAN
21,183,026BARNEGAT TWP 13,271,750 11,754,903 663,407 660,399 2,230,511 1,854,429 2,528,633 2,082,816 2,422,917 1,138,516 0 397,465 393,785 2,262
1,419,608BAY HEAD BORO 878,406 786,965 30,466 60,975 135,387 45,932 240,483 196,565 153,280 62,000 0 18,361 0 86
1,062,294BEACH HAVEN BORO 588,336 560,539 27,797 0 75,651 60,379 222,019 195,147 166,629 52,518 0 6,165 16,733 90
16,045,756BERKELEY TWP 10,672,797 10,036,110 453,067 183,620 2,105,462 1,935,045 1,605,245 1,365,357 1,473,337 804,511 0 41,814 159,338 1,874
88,439,483BRICK TWP 57,477,166 53,619,090 1,865,471 1,992,605 10,857,421 9,600,811 7,976,763 6,536,194 8,390,544 5,568,075 0 2,109,573 304,235 11,320
21,105,734CENTRAL REGIONAL 11,286,050 10,806,310 456,417 23,323 2,787,812 2,555,559 3,015,246 1,812,361 2,868,140 1,209,642 0 993,078 473,061 2,335
1,573,585EAGLESWOOD TWP 968,259 912,277 55,982 0 108,058 60,507 281,861 246,975 194,358 81,290 10,912 1,220 0 151
1,480,280ISLAND HEIGHTS BORO 917,544 852,529 63,601 1,414 100,069 56,363 252,803 207,670 200,747 72,614 6,971 2,146 0 102
77,092,899JACKSON TWP 48,065,893 46,096,918 1,675,259 293,716 9,505,699 8,545,171 8,004,105 6,478,516 8,806,436 5,271,861 0 1,526,310 64,195 9,347
43,095,835LACEY TWP 26,997,084 25,262,952 1,295,137 438,995 5,910,757 5,126,304 3,419,576 2,867,726 5,152,895 3,045,056 0 1,267,840 307,935 5,038
4,834,764LAKEHURST BORO 3,206,403 2,966,549 202,191 37,663 459,118 381,950 682,026 584,062 458,235 222,464 0 13,740 3,616 479
54,622,555LAKEWOOD TWP 32,571,843 29,058,650 1,419,352 2,093,841 8,555,181 7,089,679 6,990,772 5,259,985 5,460,438 28,665 0 845,068 14,900 5,388
1,868,744LAVALLETTE BORO 1,155,998 1,096,480 40,136 19,382 189,820 104,416 289,737 204,972 179,836 93,436 11,000 41,153 52,948 156
15,961,559LITTLE EGG HARBOR TWP 10,144,095 9,534,171 586,137 23,787 2,433,366 1,928,510 1,819,408 1,475,092 1,482,112 798,050 0 66,639 36,542 1,743
4,976,394LONG BEACH ISLAND 2,715,671 2,528,270 161,911 25,490 711,542 607,838 645,534 505,637 771,738 296,017 91,394 0 101,450 299
30,083,680MANCHESTER TWP 17,078,516 16,351,309 558,449 168,758 3,890,043 3,145,052 3,858,835 2,980,217 3,916,534 1,497,063 1,476 956,194 1,056,186 3,230
14,650,467OCEAN COUNTY VOCATIO 8,177,795 7,045,385 1,054,596 77,814 1,426,518 1,265,842 3,389,761 2,691,636 1,850,696 526,651 0 112,553 175,459 1,276
1,724,676OCEAN GATE BORO 951,116 879,009 45,076 27,031 239,739 186,827 292,772 227,269 217,559 57,092 13,614 0 0 181
6,255,879OCEAN TWP 4,159,019 3,972,602 170,242 16,175 709,658 631,283 655,455 549,832 641,342 219,276 88,000 2,405 19,653 588
20,439,782PINELANDS REGIONAL 11,053,610 10,519,143 433,048 101,419 3,573,302 3,277,366 2,389,961 1,826,327 2,409,898 1,404,259 0 801,882 105,796 1,912
13,745,800PLUMSTED TWP 7,678,455 7,251,997 336,865 89,593 1,925,032 1,753,091 1,680,670 1,436,256 1,674,422 223,083 0 746,757 54,046 1,724
9,319,468POINT PLEASANT BEACH 5,291,557 4,948,020 212,306 140,340 1,152,390 887,397 1,249,420 1,064,409 1,140,785 580,470 0 440,152 34,039 915
25,620,457POINT PLEASANT BORO 15,104,546 14,450,122 571,321 83,103 3,755,425 3,536,857 2,796,822 2,503,771 2,844,794 288,543 0 1,005,173 79,605 3,144
2,677,813SEASIDE HEIGHTS BORO 1,455,485 1,264,571 124,054 66,860 389,269 371,404 527,448 407,017 241,004 137,476 57,777 0 0 276
1,367,252SEASIDE PARK BORO 815,275 779,983 30,581 4,711 111,873 56,817 319,049 259,917 110,330 45,831 9,928 798 0 123
41,136,424SOUTHERN REGIONAL 23,989,636 22,621,978 891,715 475,943 4,156,527 3,888,009 6,494,696 5,770,443 5,232,357 2,278,110 0 1,356,085 996,228 3,857
21,187,686STAFFORD TWP 12,859,249 12,194,926 470,187 194,136 3,453,235 3,194,154 2,197,640 1,771,042 2,342,621 945,850 0 0 479,853 2,437
148,221,204TOMS RIVER REGIONAL 89,433,352 84,083,001 3,590,152 1,760,199 19,179,645 18,096,266 14,669,152 12,524,926 18,564,412 11,323,724 0 4,445,543 1,729,600 18,185
2,690,017TUCKERTON BORO 1,660,603 1,521,104 124,452 15,047 399,497 331,905 234,704 140,486 375,361 170,857 5,000 12,736 3,729 331
N.J. Department of Education - Comparative Spending Guide March 2005
Sum 2003-04
Page 883
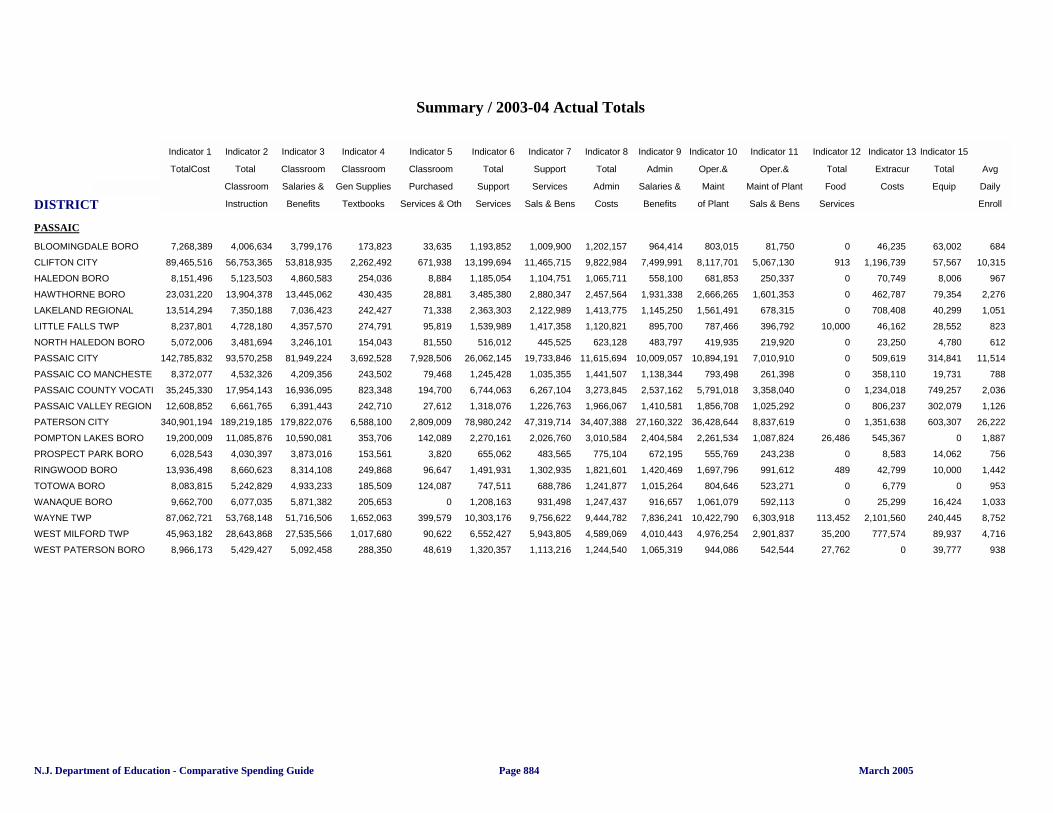
DISTRICT
Summary / 2003-04 Actual Totals
Indicator 1 Indicator 2 Indicator 3 Indicator 4 Indicator 5 Indicator 6 Indicator 7 Indicator 8 Indicator 9 Indicator 10 Indicator 11 Indicator 12 Indicator 13 Indicator 15
TotalCost Total Classroom Classroom Classroom Total Support Total Admin Oper.& Oper.& Total Extracur Total Avg
Per Pupil Classroom Salaries & Gen Supplies Purchased Support Services Admin Salaries & Maint Maint of Plant Food Costs Equip Daily
Instruction Benefits Textbooks Services & Oth Services Sals & Bens Costs Benefits of Plant Sals & Bens Services Enroll
Indicator 1 Total Cost
PASSAIC
7,268,389BLOOMINGDALE BORO 4,006,634 3,799,176 173,823 33,635 1,193,852 1,009,900 1,202,157 964,414 803,015 81,750 0 46,235 63,002 684
89,465,516CLIFTON CITY 56,753,365 53,818,935 2,262,492 671,938 13,199,694 11,465,715 9,822,984 7,499,991 8,117,701 5,067,130 913 1,196,739 57,567 10,315
8,151,496HALEDON BORO 5,123,503 4,860,583 254,036 8,884 1,185,054 1,104,751 1,065,711 558,100 681,853 250,337 0 70,749 8,006 967
23,031,220HAWTHORNE BORO 13,904,378 13,445,062 430,435 28,881 3,485,380 2,880,347 2,457,564 1,931,338 2,666,265 1,601,353 0 462,787 79,354 2,276
13,514,294LAKELAND REGIONAL 7,350,188 7,036,423 242,427 71,338 2,363,303 2,122,989 1,413,775 1,145,250 1,561,491 678,315 0 708,408 40,299 1,051
8,237,801LITTLE FALLS TWP 4,728,180 4,357,570 274,791 95,819 1,539,989 1,417,358 1,120,821 895,700 787,466 396,792 10,000 46,162 28,552 823
5,072,006NORTH HALEDON BORO 3,481,694 3,246,101 154,043 81,550 516,012 445,525 623,128 483,797 419,935 219,920 0 23,250 4,780 612
142,785,832PASSAIC CITY 93,570,258 81,949,224 3,692,528 7,928,506 26,062,145 19,733,846 11,615,694 10,009,057 10,894,191 7,010,910 0 509,619 314,841 11,514
8,372,077PASSAIC CO MANCHESTE 4,532,326 4,209,356 243,502 79,468 1,245,428 1,035,355 1,441,507 1,138,344 793,498 261,398 0 358,110 19,731 788
35,245,330PASSAIC COUNTY VOCATI 17,954,143 16,936,095 823,348 194,700 6,744,063 6,267,104 3,273,845 2,537,162 5,791,018 3,358,040 0 1,234,018 749,257 2,036
12,608,852PASSAIC VALLEY REGION 6,661,765 6,391,443 242,710 27,612 1,318,076 1,226,763 1,966,067 1,410,581 1,856,708 1,025,292 0 806,237 302,079 1,126
340,901,194PATERSON CITY 189,219,185 179,822,076 6,588,100 2,809,009 78,980,242 47,319,714 34,407,388 27,160,322 36,428,644 8,837,619 0 1,351,638 603,307 26,222
19,200,009POMPTON LAKES BORO 11,085,876 10,590,081 353,706 142,089 2,270,161 2,026,760 3,010,584 2,404,584 2,261,534 1,087,824 26,486 545,367 0 1,887
6,028,543PROSPECT PARK BORO 4,030,397 3,873,016 153,561 3,820 655,062 483,565 775,104 672,195 555,769 243,238 0 8,583 14,062 756
13,936,498RINGWOOD BORO 8,660,623 8,314,108 249,868 96,647 1,491,931 1,302,935 1,821,601 1,420,469 1,697,796 991,612 489 42,799 10,000 1,442
8,083,815TOTOWA BORO 5,242,829 4,933,233 185,509 124,087 747,511 688,786 1,241,877 1,015,264 804,646 523,271 0 6,779 0 953
9,662,700WANAQUE BORO 6,077,035 5,871,382 205,653 0 1,208,163 931,498 1,247,437 916,657 1,061,079 592,113 0 25,299 16,424 1,033
87,062,721WAYNE TWP 53,768,148 51,716,506 1,652,063 399,579 10,303,176 9,756,622 9,444,782 7,836,241 10,422,790 6,303,918 113,452 2,101,560 240,445 8,752
45,963,182WEST MILFORD TWP 28,643,868 27,535,566 1,017,680 90,622 6,552,427 5,943,805 4,589,069 4,010,443 4,976,254 2,901,837 35,200 777,574 89,937 4,716
8,966,173WEST PATERSON BORO 5,429,427 5,092,458 288,350 48,619 1,320,357 1,113,216 1,244,540 1,065,319 944,086 542,544 27,762 0 39,777 938
N.J. Department of Education - Comparative Spending Guide March 2005Page 884

DISTRICT
Summary / 2003-04 Actual Totals
Indicator 1 Indicator 2 Indicator 3 Indicator 4 Indicator 5 Indicator 6 Indicator 7 Indicator 8 Indicator 9 Indicator 10 Indicator 11 Indicator 12 Indicator 13 Indicator 15
TotalCost Total Classroom Classroom Classroom Total Support Total Admin Oper.& Oper.& Total Extracur Total Avg
Per Pupil Classroom Salaries & Gen Supplies Purchased Support Services Admin Salaries & Maint Maint of Plant Food Costs Equip Daily
Instruction Benefits Textbooks Services & Oth Services Sals & Bens Costs Benefits of Plant Sals & Bens Services Enroll
Indicator 1 Total Cost
SALEM
3,373,007ALLOWAY TWP 2,144,902 1,926,222 179,816 38,864 423,673 346,511 467,883 388,543 311,790 138,931 0 24,759 18,651 487
953,651ELMER BORO 491,735 446,738 39,794 5,203 97,776 27,964 251,658 142,978 108,495 7,296 3,600 385 0 76
1,003,425ELSINBORO TWP 535,871 513,514 19,355 3,002 128,148 31,228 250,127 137,773 86,311 1,032 2,800 168 0 117
2,482,844LOWER ALLOWAYS CREE 1,691,426 1,608,102 64,132 19,192 176,150 67,381 289,141 185,322 266,581 119,401 25,000 0 11,721 219
1,925,153MANNINGTON TWP 1,238,099 1,179,844 48,044 10,211 166,391 139,479 302,569 208,921 199,725 89,883 16,000 2,368 0 177
2,531,039OLDMANS TWP 1,598,266 1,528,661 67,007 2,598 223,920 186,123 393,910 309,111 282,512 120,895 12,500 7,261 84,921 224
21,753,903PENNS GRV-CARNEY'S PT 13,553,937 13,055,870 394,856 103,211 2,334,180 2,065,558 2,436,229 1,821,190 3,063,460 1,877,195 0 353,699 84,991 2,251
19,513,894PENNSVILLE 11,169,049 10,373,963 711,795 83,291 2,705,034 2,215,720 2,413,377 2,084,904 2,756,939 1,548,566 0 448,495 26,948 2,014
16,328,570PITTSGROVE TWP 9,605,560 8,832,809 642,095 130,656 2,346,888 2,172,331 1,823,815 1,507,840 1,930,561 1,053,693 30,000 469,258 112,189 1,893
3,110,374QUINTON TWP 2,008,285 1,918,149 65,387 24,524 355,133 259,659 409,850 256,653 303,630 134,975 25,000 8,475 20,744 352
12,780,034SALEM CITY 7,362,262 6,987,086 286,402 88,774 1,731,268 1,571,346 1,899,544 1,611,719 1,452,892 669,323 0 331,106 45,400 1,406
2,437,613SALEM CO SPECIAL SERVI 1,192,988 1,106,351 52,550 34,087 352,827 327,100 608,262 405,992 278,535 538 5,000 0 0 96
4,488,829SALEM COUNTY VOCATIO 1,972,791 1,046,988 109,281 816,522 578,084 488,203 1,001,898 766,468 848,414 223,884 63,554 13,899 42,049 480
3,382,788UPPER PITTSGROVE TWP 1,580,267 1,521,363 35,044 23,860 371,495 270,828 1,079,737 941,606 330,786 96,102 0 20,503 0 421
15,036,949WOODSTOWN-PILESGRO 8,940,313 8,453,919 458,787 27,607 2,205,363 1,946,603 1,797,691 1,329,527 1,621,707 903,097 40,205 427,052 15,549 1,702
N.J. Department of Education - Comparative Spending Guide March 2005
Sum 2003-04
Page 885
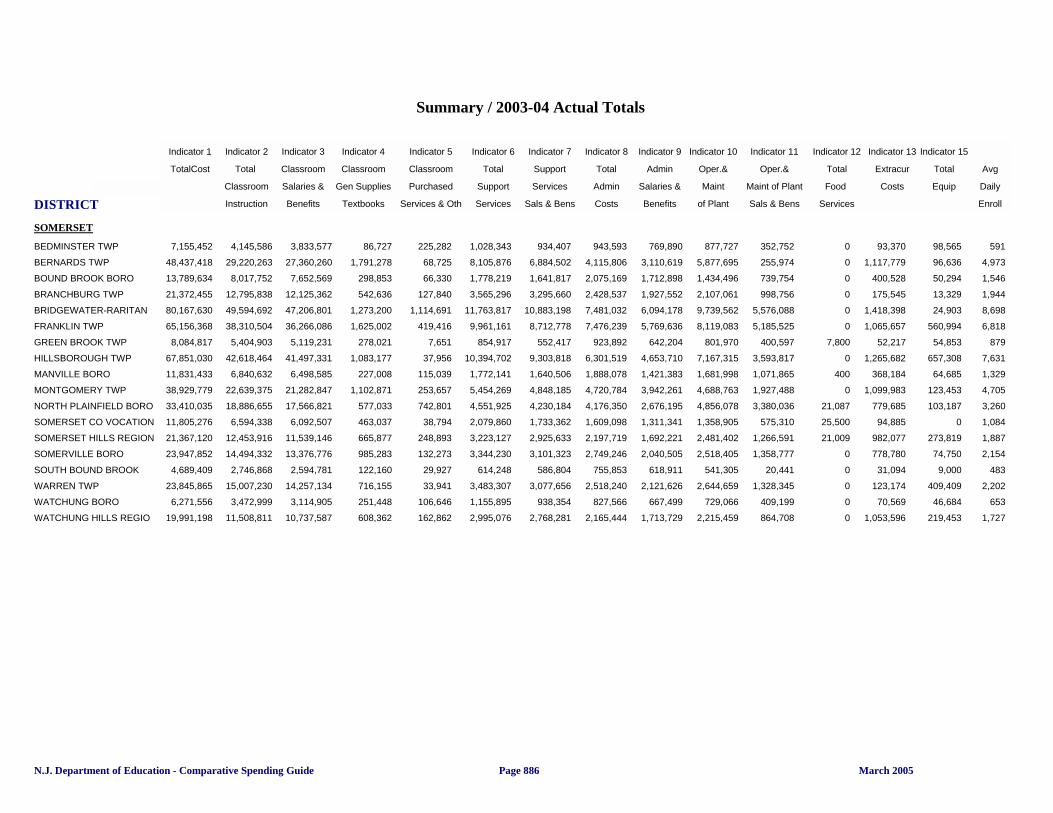
DISTRICT
Summary / 2003-04 Actual Totals
Indicator 1 Indicator 2 Indicator 3 Indicator 4 Indicator 5 Indicator 6 Indicator 7 Indicator 8 Indicator 9 Indicator 10 Indicator 11 Indicator 12 Indicator 13 Indicator 15
TotalCost Total Classroom Classroom Classroom Total Support Total Admin Oper.& Oper.& Total Extracur Total Avg
Per Pupil Classroom Salaries & Gen Supplies Purchased Support Services Admin Salaries & Maint Maint of Plant Food Costs Equip Daily
Instruction Benefits Textbooks Services & Oth Services Sals & Bens Costs Benefits of Plant Sals & Bens Services Enroll
Indicator 1 Total Cost
SOMERSET
7,155,452BEDMINSTER TWP 4,145,586 3,833,577 86,727 225,282 1,028,343 934,407 943,593 769,890 877,727 352,752 0 93,370 98,565 591
48,437,418BERNARDS TWP 29,220,263 27,360,260 1,791,278 68,725 8,105,876 6,884,502 4,115,806 3,110,619 5,877,695 255,974 0 1,117,779 96,636 4,973
13,789,634BOUND BROOK BORO 8,017,752 7,652,569 298,853 66,330 1,778,219 1,641,817 2,075,169 1,712,898 1,434,496 739,754 0 400,528 50,294 1,546
21,372,455BRANCHBURG TWP 12,795,838 12,125,362 542,636 127,840 3,565,296 3,295,660 2,428,537 1,927,552 2,107,061 998,756 0 175,545 13,329 1,944
80,167,630BRIDGEWATER-RARITAN 49,594,692 47,206,801 1,273,200 1,114,691 11,763,817 10,883,198 7,481,032 6,094,178 9,739,562 5,576,088 0 1,418,398 24,903 8,698
65,156,368FRANKLIN TWP 38,310,504 36,266,086 1,625,002 419,416 9,961,161 8,712,778 7,476,239 5,769,636 8,119,083 5,185,525 0 1,065,657 560,994 6,818
8,084,817GREEN BROOK TWP 5,404,903 5,119,231 278,021 7,651 854,917 552,417 923,892 642,204 801,970 400,597 7,800 52,217 54,853 879
67,851,030HILLSBOROUGH TWP 42,618,464 41,497,331 1,083,177 37,956 10,394,702 9,303,818 6,301,519 4,653,710 7,167,315 3,593,817 0 1,265,682 657,308 7,631
11,831,433MANVILLE BORO 6,840,632 6,498,585 227,008 115,039 1,772,141 1,640,506 1,888,078 1,421,383 1,681,998 1,071,865 400 368,184 64,685 1,329
38,929,779MONTGOMERY TWP 22,639,375 21,282,847 1,102,871 253,657 5,454,269 4,848,185 4,720,784 3,942,261 4,688,763 1,927,488 0 1,099,983 123,453 4,705
33,410,035NORTH PLAINFIELD BORO 18,886,655 17,566,821 577,033 742,801 4,551,925 4,230,184 4,176,350 2,676,195 4,856,078 3,380,036 21,087 779,685 103,187 3,260
11,805,276SOMERSET CO VOCATION 6,594,338 6,092,507 463,037 38,794 2,079,860 1,733,362 1,609,098 1,311,341 1,358,905 575,310 25,500 94,885 0 1,084
21,367,120SOMERSET HILLS REGION 12,453,916 11,539,146 665,877 248,893 3,223,127 2,925,633 2,197,719 1,692,221 2,481,402 1,266,591 21,009 982,077 273,819 1,887
23,947,852SOMERVILLE BORO 14,494,332 13,376,776 985,283 132,273 3,344,230 3,101,323 2,749,246 2,040,505 2,518,405 1,358,777 0 778,780 74,750 2,154
4,689,409SOUTH BOUND BROOK 2,746,868 2,594,781 122,160 29,927 614,248 586,804 755,853 618,911 541,305 20,441 0 31,094 9,000 483
23,845,865WARREN TWP 15,007,230 14,257,134 716,155 33,941 3,483,307 3,077,656 2,518,240 2,121,626 2,644,659 1,328,345 0 123,174 409,409 2,202
6,271,556WATCHUNG BORO 3,472,999 3,114,905 251,448 106,646 1,155,895 938,354 827,566 667,499 729,066 409,199 0 70,569 46,684 653
19,991,198WATCHUNG HILLS REGIO 11,508,811 10,737,587 608,362 162,862 2,995,076 2,768,281 2,165,444 1,713,729 2,215,459 864,708 0 1,053,596 219,453 1,727
N.J. Department of Education - Comparative Spending Guide March 2005Page 886
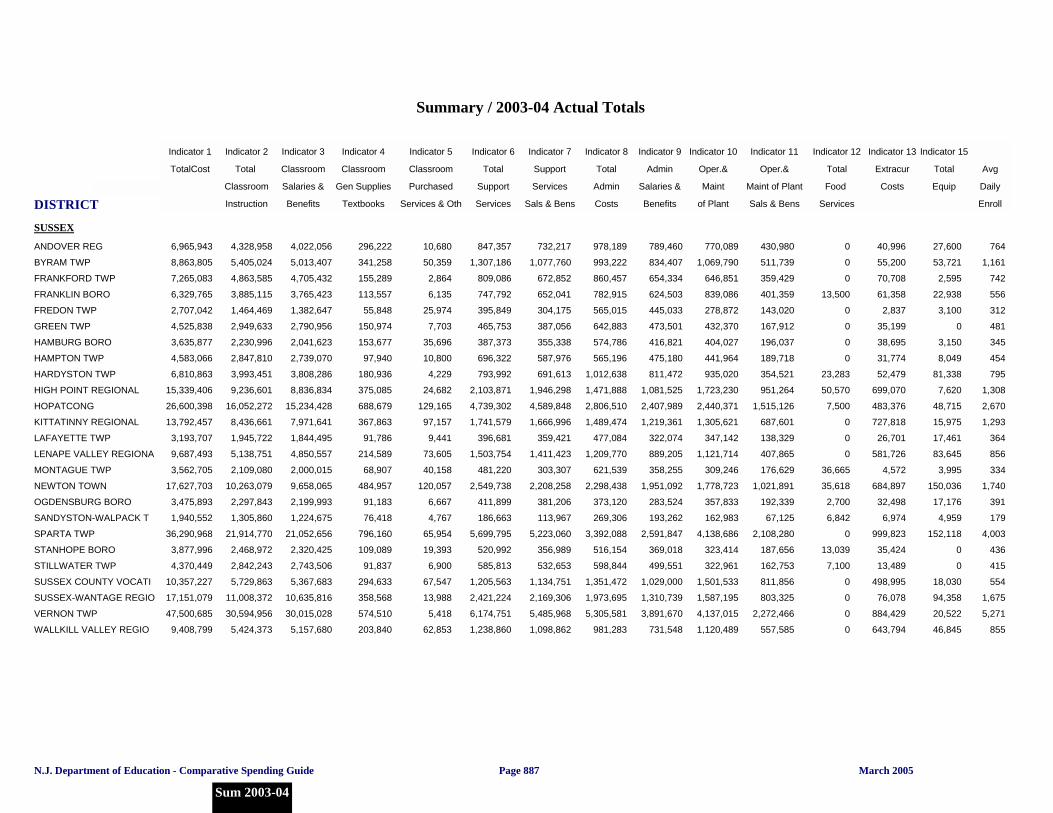
DISTRICT
Summary / 2003-04 Actual Totals
Indicator 1 Indicator 2 Indicator 3 Indicator 4 Indicator 5 Indicator 6 Indicator 7 Indicator 8 Indicator 9 Indicator 10 Indicator 11 Indicator 12 Indicator 13 Indicator 15
TotalCost Total Classroom Classroom Classroom Total Support Total Admin Oper.& Oper.& Total Extracur Total Avg
Per Pupil Classroom Salaries & Gen Supplies Purchased Support Services Admin Salaries & Maint Maint of Plant Food Costs Equip Daily
Instruction Benefits Textbooks Services & Oth Services Sals & Bens Costs Benefits of Plant Sals & Bens Services Enroll
Indicator 1 Total Cost
SUSSEX
6,965,943ANDOVER REG 4,328,958 4,022,056 296,222 10,680 847,357 732,217 978,189 789,460 770,089 430,980 0 40,996 27,600 764
8,863,805BYRAM TWP 5,405,024 5,013,407 341,258 50,359 1,307,186 1,077,760 993,222 834,407 1,069,790 511,739 0 55,200 53,721 1,161
7,265,083FRANKFORD TWP 4,863,585 4,705,432 155,289 2,864 809,086 672,852 860,457 654,334 646,851 359,429 0 70,708 2,595 742
6,329,765FRANKLIN BORO 3,885,115 3,765,423 113,557 6,135 747,792 652,041 782,915 624,503 839,086 401,359 13,500 61,358 22,938 556
2,707,042FREDON TWP 1,464,469 1,382,647 55,848 25,974 395,849 304,175 565,015 445,033 278,872 143,020 0 2,837 3,100 312
4,525,838GREEN TWP 2,949,633 2,790,956 150,974 7,703 465,753 387,056 642,883 473,501 432,370 167,912 0 35,199 0 481
3,635,877HAMBURG BORO 2,230,996 2,041,623 153,677 35,696 387,373 355,338 574,786 416,821 404,027 196,037 0 38,695 3,150 345
4,583,066HAMPTON TWP 2,847,810 2,739,070 97,940 10,800 696,322 587,976 565,196 475,180 441,964 189,718 0 31,774 8,049 454
6,810,863HARDYSTON TWP 3,993,451 3,808,286 180,936 4,229 793,992 691,613 1,012,638 811,472 935,020 354,521 23,283 52,479 81,338 795
15,339,406HIGH POINT REGIONAL 9,236,601 8,836,834 375,085 24,682 2,103,871 1,946,298 1,471,888 1,081,525 1,723,230 951,264 50,570 699,070 7,620 1,308
26,600,398HOPATCONG 16,052,272 15,234,428 688,679 129,165 4,739,302 4,589,848 2,806,510 2,407,989 2,440,371 1,515,126 7,500 483,376 48,715 2,670
13,792,457KITTATINNY REGIONAL 8,436,661 7,971,641 367,863 97,157 1,741,579 1,666,996 1,489,474 1,219,361 1,305,621 687,601 0 727,818 15,975 1,293
3,193,707LAFAYETTE TWP 1,945,722 1,844,495 91,786 9,441 396,681 359,421 477,084 322,074 347,142 138,329 0 26,701 17,461 364
9,687,493LENAPE VALLEY REGIONA 5,138,751 4,850,557 214,589 73,605 1,503,754 1,411,423 1,209,770 889,205 1,121,714 407,865 0 581,726 83,645 856
3,562,705MONTAGUE TWP 2,109,080 2,000,015 68,907 40,158 481,220 303,307 621,539 358,255 309,246 176,629 36,665 4,572 3,995 334
17,627,703NEWTON TOWN 10,263,079 9,658,065 484,957 120,057 2,549,738 2,208,258 2,298,438 1,951,092 1,778,723 1,021,891 35,618 684,897 150,036 1,740
3,475,893OGDENSBURG BORO 2,297,843 2,199,993 91,183 6,667 411,899 381,206 373,120 283,524 357,833 192,339 2,700 32,498 17,176 391
1,940,552SANDYSTON-WALPACK T 1,305,860 1,224,675 76,418 4,767 186,663 113,967 269,306 193,262 162,983 67,125 6,842 6,974 4,959 179
36,290,968SPARTA TWP 21,914,770 21,052,656 796,160 65,954 5,699,795 5,223,060 3,392,088 2,591,847 4,138,686 2,108,280 0 999,823 152,118 4,003
3,877,996STANHOPE BORO 2,468,972 2,320,425 109,089 19,393 520,992 356,989 516,154 369,018 323,414 187,656 13,039 35,424 0 436
4,370,449STILLWATER TWP 2,842,243 2,743,506 91,837 6,900 585,813 532,653 598,844 499,551 322,961 162,753 7,100 13,489 0 415
10,357,227SUSSEX COUNTY VOCATI 5,729,863 5,367,683 294,633 67,547 1,205,563 1,134,751 1,351,472 1,029,000 1,501,533 811,856 0 498,995 18,030 554
17,151,079SUSSEX-WANTAGE REGIO 11,008,372 10,635,816 358,568 13,988 2,421,224 2,169,306 1,973,695 1,310,739 1,587,195 803,325 0 76,078 94,358 1,675
47,500,685VERNON TWP 30,594,956 30,015,028 574,510 5,418 6,174,751 5,485,968 5,305,581 3,891,670 4,137,015 2,272,466 0 884,429 20,522 5,271
9,408,799WALLKILL VALLEY REGIO 5,424,373 5,157,680 203,840 62,853 1,238,860 1,098,862 981,283 731,548 1,120,489 557,585 0 643,794 46,845 855
N.J. Department of Education - Comparative Spending Guide March 2005
Sum 2003-04
Page 887
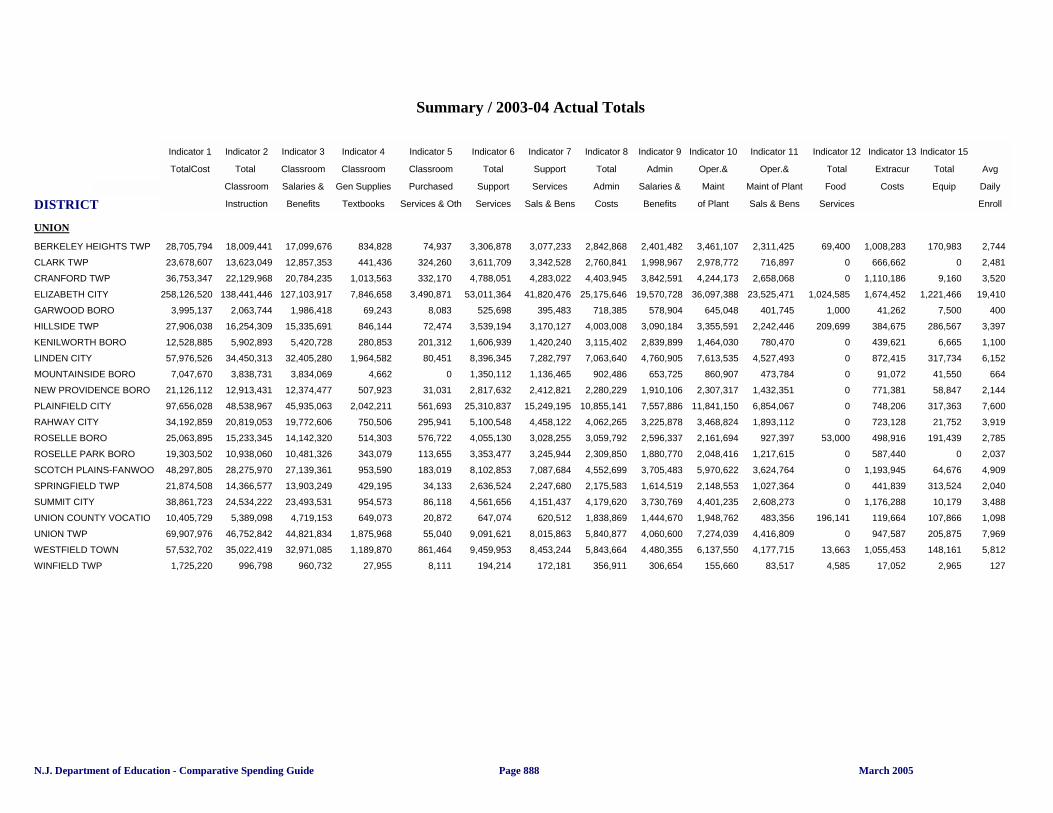
DISTRICT
Summary / 2003-04 Actual Totals
Indicator 1 Indicator 2 Indicator 3 Indicator 4 Indicator 5 Indicator 6 Indicator 7 Indicator 8 Indicator 9 Indicator 10 Indicator 11 Indicator 12 Indicator 13 Indicator 15
TotalCost Total Classroom Classroom Classroom Total Support Total Admin Oper.& Oper.& Total Extracur Total Avg
Per Pupil Classroom Salaries & Gen Supplies Purchased Support Services Admin Salaries & Maint Maint of Plant Food Costs Equip Daily
Instruction Benefits Textbooks Services & Oth Services Sals & Bens Costs Benefits of Plant Sals & Bens Services Enroll
Indicator 1 Total Cost
UNION
28,705,794BERKELEY HEIGHTS TWP 18,009,441 17,099,676 834,828 74,937 3,306,878 3,077,233 2,842,868 2,401,482 3,461,107 2,311,425 69,400 1,008,283 170,983 2,744
23,678,607CLARK TWP 13,623,049 12,857,353 441,436 324,260 3,611,709 3,342,528 2,760,841 1,998,967 2,978,772 716,897 0 666,662 0 2,481
36,753,347CRANFORD TWP 22,129,968 20,784,235 1,013,563 332,170 4,788,051 4,283,022 4,403,945 3,842,591 4,244,173 2,658,068 0 1,110,186 9,160 3,520
258,126,520ELIZABETH CITY 138,441,446 127,103,917 7,846,658 3,490,871 53,011,364 41,820,476 25,175,646 19,570,728 36,097,388 23,525,471 1,024,585 1,674,452 1,221,466 19,410
3,995,137GARWOOD BORO 2,063,744 1,986,418 69,243 8,083 525,698 395,483 718,385 578,904 645,048 401,745 1,000 41,262 7,500 400
27,906,038HILLSIDE TWP 16,254,309 15,335,691 846,144 72,474 3,539,194 3,170,127 4,003,008 3,090,184 3,355,591 2,242,446 209,699 384,675 286,567 3,397
12,528,885KENILWORTH BORO 5,902,893 5,420,728 280,853 201,312 1,606,939 1,420,240 3,115,402 2,839,899 1,464,030 780,470 0 439,621 6,665 1,100
57,976,526LINDEN CITY 34,450,313 32,405,280 1,964,582 80,451 8,396,345 7,282,797 7,063,640 4,760,905 7,613,535 4,527,493 0 872,415 317,734 6,152
7,047,670MOUNTAINSIDE BORO 3,838,731 3,834,069 4,662 0 1,350,112 1,136,465 902,486 653,725 860,907 473,784 0 91,072 41,550 664
21,126,112NEW PROVIDENCE BORO 12,913,431 12,374,477 507,923 31,031 2,817,632 2,412,821 2,280,229 1,910,106 2,307,317 1,432,351 0 771,381 58,847 2,144
97,656,028PLAINFIELD CITY 48,538,967 45,935,063 2,042,211 561,693 25,310,837 15,249,195 10,855,141 7,557,886 11,841,150 6,854,067 0 748,206 317,363 7,600
34,192,859RAHWAY CITY 20,819,053 19,772,606 750,506 295,941 5,100,548 4,458,122 4,062,265 3,225,878 3,468,824 1,893,112 0 723,128 21,752 3,919
25,063,895ROSELLE BORO 15,233,345 14,142,320 514,303 576,722 4,055,130 3,028,255 3,059,792 2,596,337 2,161,694 927,397 53,000 498,916 191,439 2,785
19,303,502ROSELLE PARK BORO 10,938,060 10,481,326 343,079 113,655 3,353,477 3,245,944 2,309,850 1,880,770 2,048,416 1,217,615 0 587,440 0 2,037
48,297,805SCOTCH PLAINS-FANWOO 28,275,970 27,139,361 953,590 183,019 8,102,853 7,087,684 4,552,699 3,705,483 5,970,622 3,624,764 0 1,193,945 64,676 4,909
21,874,508SPRINGFIELD TWP 14,366,577 13,903,249 429,195 34,133 2,636,524 2,247,680 2,175,583 1,614,519 2,148,553 1,027,364 0 441,839 313,524 2,040
38,861,723SUMMIT CITY 24,534,222 23,493,531 954,573 86,118 4,561,656 4,151,437 4,179,620 3,730,769 4,401,235 2,608,273 0 1,176,288 10,179 3,488
10,405,729UNION COUNTY VOCATIO 5,389,098 4,719,153 649,073 20,872 647,074 620,512 1,838,869 1,444,670 1,948,762 483,356 196,141 119,664 107,866 1,098
69,907,976UNION TWP 46,752,842 44,821,834 1,875,968 55,040 9,091,621 8,015,863 5,840,877 4,060,600 7,274,039 4,416,809 0 947,587 205,875 7,969
57,532,702WESTFIELD TOWN 35,022,419 32,971,085 1,189,870 861,464 9,459,953 8,453,244 5,843,664 4,480,355 6,137,550 4,177,715 13,663 1,055,453 148,161 5,812
1,725,220WINFIELD TWP 996,798 960,732 27,955 8,111 194,214 172,181 356,911 306,654 155,660 83,517 4,585 17,052 2,965 127
N.J. Department of Education - Comparative Spending Guide March 2005Page 888
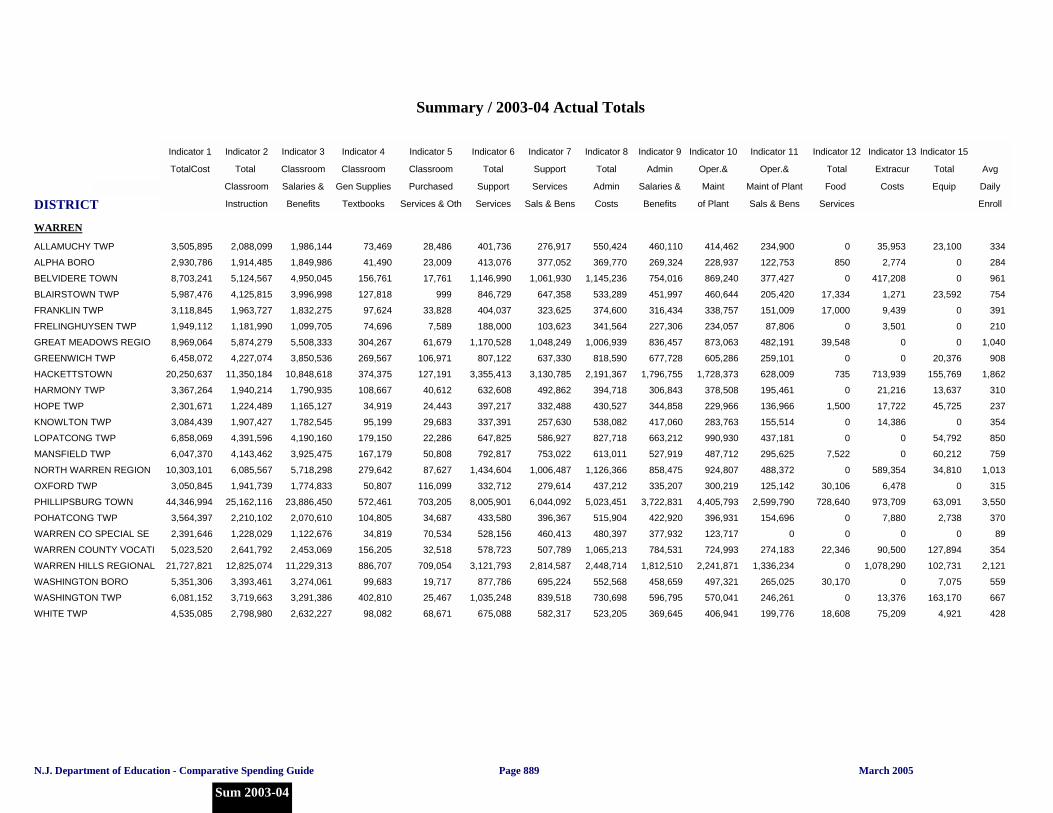
DISTRICT
Summary / 2003-04 Actual Totals
Indicator 1 Indicator 2 Indicator 3 Indicator 4 Indicator 5 Indicator 6 Indicator 7 Indicator 8 Indicator 9 Indicator 10 Indicator 11 Indicator 12 Indicator 13 Indicator 15
TotalCost Total Classroom Classroom Classroom Total Support Total Admin Oper.& Oper.& Total Extracur Total Avg
Per Pupil Classroom Salaries & Gen Supplies Purchased Support Services Admin Salaries & Maint Maint of Plant Food Costs Equip Daily
Instruction Benefits Textbooks Services & Oth Services Sals & Bens Costs Benefits of Plant Sals & Bens Services Enroll
Indicator 1 Total Cost
WARREN
3,505,895ALLAMUCHY TWP 2,088,099 1,986,144 73,469 28,486 401,736 276,917 550,424 460,110 414,462 234,900 0 35,953 23,100 334
2,930,786ALPHA BORO 1,914,485 1,849,986 41,490 23,009 413,076 377,052 369,770 269,324 228,937 122,753 850 2,774 0 284
8,703,241BELVIDERE TOWN 5,124,567 4,950,045 156,761 17,761 1,146,990 1,061,930 1,145,236 754,016 869,240 377,427 0 417,208 0 961
5,987,476BLAIRSTOWN TWP 4,125,815 3,996,998 127,818 999 846,729 647,358 533,289 451,997 460,644 205,420 17,334 1,271 23,592 754
3,118,845FRANKLIN TWP 1,963,727 1,832,275 97,624 33,828 404,037 323,625 374,600 316,434 338,757 151,009 17,000 9,439 0 391
1,949,112FRELINGHUYSEN TWP 1,181,990 1,099,705 74,696 7,589 188,000 103,623 341,564 227,306 234,057 87,806 0 3,501 0 210
8,969,064GREAT MEADOWS REGIO 5,874,279 5,508,333 304,267 61,679 1,170,528 1,048,249 1,006,939 836,457 873,063 482,191 39,548 0 0 1,040
6,458,072GREENWICH TWP 4,227,074 3,850,536 269,567 106,971 807,122 637,330 818,590 677,728 605,286 259,101 0 0 20,376 908
20,250,637HACKETTSTOWN 11,350,184 10,848,618 374,375 127,191 3,355,413 3,130,785 2,191,367 1,796,755 1,728,373 628,009 735 713,939 155,769 1,862
3,367,264HARMONY TWP 1,940,214 1,790,935 108,667 40,612 632,608 492,862 394,718 306,843 378,508 195,461 0 21,216 13,637 310
2,301,671HOPE TWP 1,224,489 1,165,127 34,919 24,443 397,217 332,488 430,527 344,858 229,966 136,966 1,500 17,722 45,725 237
3,084,439KNOWLTON TWP 1,907,427 1,782,545 95,199 29,683 337,391 257,630 538,082 417,060 283,763 155,514 0 14,386 0 354
6,858,069LOPATCONG TWP 4,391,596 4,190,160 179,150 22,286 647,825 586,927 827,718 663,212 990,930 437,181 0 0 54,792 850
6,047,370MANSFIELD TWP 4,143,462 3,925,475 167,179 50,808 792,817 753,022 613,011 527,919 487,712 295,625 7,522 0 60,212 759
10,303,101NORTH WARREN REGION 6,085,567 5,718,298 279,642 87,627 1,434,604 1,006,487 1,126,366 858,475 924,807 488,372 0 589,354 34,810 1,013
3,050,845OXFORD TWP 1,941,739 1,774,833 50,807 116,099 332,712 279,614 437,212 335,207 300,219 125,142 30,106 6,478 0 315
44,346,994PHILLIPSBURG TOWN 25,162,116 23,886,450 572,461 703,205 8,005,901 6,044,092 5,023,451 3,722,831 4,405,793 2,599,790 728,640 973,709 63,091 3,550
3,564,397POHATCONG TWP 2,210,102 2,070,610 104,805 34,687 433,580 396,367 515,904 422,920 396,931 154,696 0 7,880 2,738 370
2,391,646WARREN CO SPECIAL SE 1,228,029 1,122,676 34,819 70,534 528,156 460,413 480,397 377,932 123,717 0 0 0 0 89
5,023,520WARREN COUNTY VOCATI 2,641,792 2,453,069 156,205 32,518 578,723 507,789 1,065,213 784,531 724,993 274,183 22,346 90,500 127,894 354
21,727,821WARREN HILLS REGIONAL 12,825,074 11,229,313 886,707 709,054 3,121,793 2,814,587 2,448,714 1,812,510 2,241,871 1,336,234 0 1,078,290 102,731 2,121
5,351,306WASHINGTON BORO 3,393,461 3,274,061 99,683 19,717 877,786 695,224 552,568 458,659 497,321 265,025 30,170 0 7,075 559
6,081,152WASHINGTON TWP 3,719,663 3,291,386 402,810 25,467 1,035,248 839,518 730,698 596,795 570,041 246,261 0 13,376 163,170 667
4,535,085WHITE TWP 2,798,980 2,632,227 98,082 68,671 675,088 582,317 523,205 369,645 406,941 199,776 18,608 75,209 4,921 428
N.J. Department of Education - Comparative Spending Guide March 2005
Sum 2003-04
Page 889
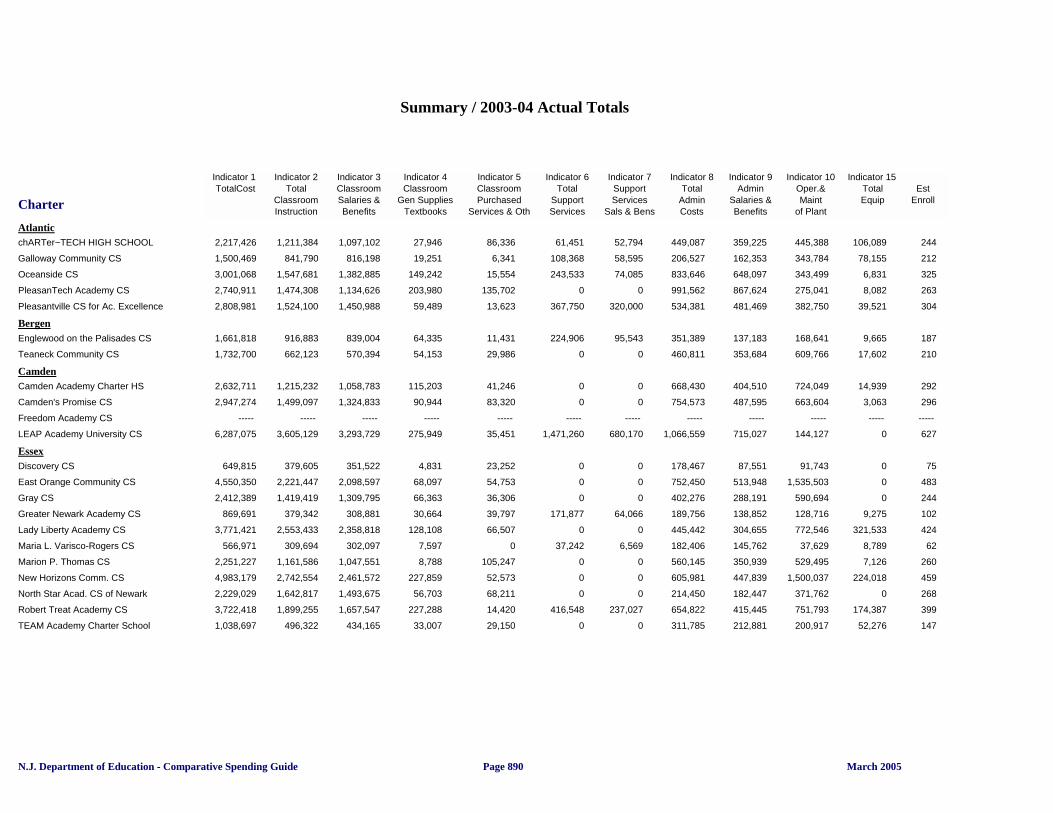
Charter
Summary / 2003-04 Actual Totals
Indicator 1 Indicator 2 Indicator 3 Indicator 4 Indicator 5 Indicator 6 Indicator 7 Indicator 8 Indicator 9 Indicator 10 Indicator 15 TotalCost Total Classroom Classroom Classroom Total Support Total Admin Oper.& Total Est
Classroom Salaries & Gen Supplies Purchased Support Services Admin Salaries & Maint Equip Enroll Instruction Benefits Textbooks Services & Oth Services Sals & Bens Costs Benefits of Plant
AtlanticchARTer~TECH HIGH SCHOOL 2,217,426 1,211,384 1,097,102 27,946 86,336 61,451 52,794 449,087 359,225 445,388 106,089 244
Galloway Community CS 1,500,469 841,790 816,198 19,251 6,341 108,368 58,595 206,527 162,353 343,784 78,155 212
Oceanside CS 3,001,068 1,547,681 1,382,885 149,242 15,554 243,533 74,085 833,646 648,097 343,499 6,831 325
PleasanTech Academy CS 2,740,911 1,474,308 1,134,626 203,980 135,702 0 0 991,562 867,624 275,041 8,082 263
Pleasantville CS for Ac. Excellence 2,808,981 1,524,100 1,450,988 59,489 13,623 367,750 320,000 534,381 481,469 382,750 39,521 304
BergenEnglewood on the Palisades CS 1,661,818 916,883 839,004 64,335 11,431 224,906 95,543 351,389 137,183 168,641 9,665 187
Teaneck Community CS 1,732,700 662,123 570,394 54,153 29,986 0 0 460,811 353,684 609,766 17,602 210
CamdenCamden Academy Charter HS 2,632,711 1,215,232 1,058,783 115,203 41,246 0 0 668,430 404,510 724,049 14,939 292
Camden's Promise CS 2,947,274 1,499,097 1,324,833 90,944 83,320 0 0 754,573 487,595 663,604 3,063 296
Freedom Academy CS ----- ----- ----- ----- ----- ----- ----- ----- ----- ----- ----- -----
LEAP Academy University CS 6,287,075 3,605,129 3,293,729 275,949 35,451 1,471,260 680,170 1,066,559 715,027 144,127 0 627
EssexDiscovery CS 649,815 379,605 351,522 4,831 23,252 0 0 178,467 87,551 91,743 0 75
East Orange Community CS 4,550,350 2,221,447 2,098,597 68,097 54,753 0 0 752,450 513,948 1,535,503 0 483
Gray CS 2,412,389 1,419,419 1,309,795 66,363 36,306 0 0 402,276 288,191 590,694 0 244
Greater Newark Academy CS 869,691 379,342 308,881 30,664 39,797 171,877 64,066 189,756 138,852 128,716 9,275 102
Lady Liberty Academy CS 3,771,421 2,553,433 2,358,818 128,108 66,507 0 0 445,442 304,655 772,546 321,533 424
Maria L. Varisco-Rogers CS 566,971 309,694 302,097 7,597 0 37,242 6,569 182,406 145,762 37,629 8,789 62
Marion P. Thomas CS 2,251,227 1,161,586 1,047,551 8,788 105,247 0 0 560,145 350,939 529,495 7,126 260
New Horizons Comm. CS 4,983,179 2,742,554 2,461,572 227,859 52,573 0 0 605,981 447,839 1,500,037 224,018 459
North Star Acad. CS of Newark 2,229,029 1,642,817 1,493,675 56,703 68,211 0 0 214,450 182,447 371,762 0 268
Robert Treat Academy CS 3,722,418 1,899,255 1,657,547 227,288 14,420 416,548 237,027 654,822 415,445 751,793 174,387 399
TEAM Academy Charter School 1,038,697 496,322 434,165 33,007 29,150 0 0 311,785 212,881 200,917 52,276 147
N.J. Department of Education - Comparative Spending Guide March 2005Page 890
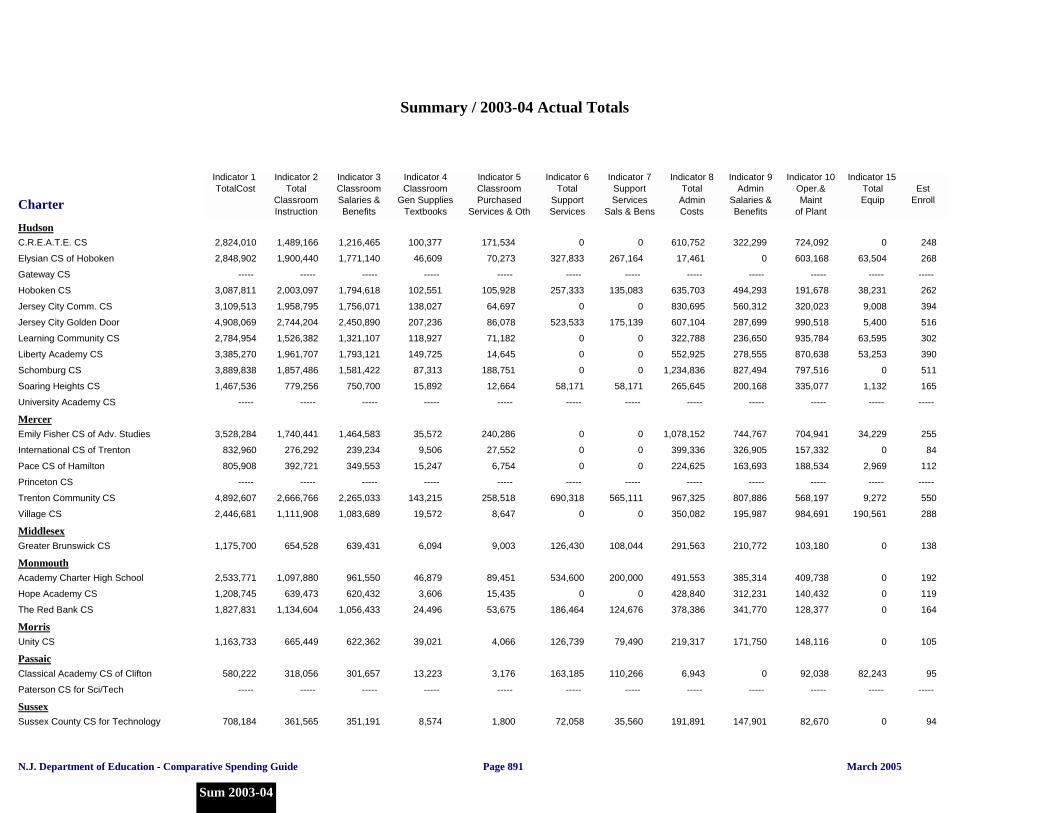
Charter
Summary / 2003-04 Actual Totals
Indicator 1 Indicator 2 Indicator 3 Indicator 4 Indicator 5 Indicator 6 Indicator 7 Indicator 8 Indicator 9 Indicator 10 Indicator 15 TotalCost Total Classroom Classroom Classroom Total Support Total Admin Oper.& Total Est
Classroom Salaries & Gen Supplies Purchased Support Services Admin Salaries & Maint Equip Enroll Instruction Benefits Textbooks Services & Oth Services Sals & Bens Costs Benefits of Plant
HudsonC.R.E.A.T.E. CS 2,824,010 1,489,166 1,216,465 100,377 171,534 0 0 610,752 322,299 724,092 0 248
Elysian CS of Hoboken 2,848,902 1,900,440 1,771,140 46,609 70,273 327,833 267,164 17,461 0 603,168 63,504 268
Gateway CS ----- ----- ----- ----- ----- ----- ----- ----- ----- ----- ----- -----
Hoboken CS 3,087,811 2,003,097 1,794,618 102,551 105,928 257,333 135,083 635,703 494,293 191,678 38,231 262
Jersey City Comm. CS 3,109,513 1,958,795 1,756,071 138,027 64,697 0 0 830,695 560,312 320,023 9,008 394
Jersey City Golden Door 4,908,069 2,744,204 2,450,890 207,236 86,078 523,533 175,139 607,104 287,699 990,518 5,400 516
Learning Community CS 2,784,954 1,526,382 1,321,107 118,927 71,182 0 0 322,788 236,650 935,784 63,595 302
Liberty Academy CS 3,385,270 1,961,707 1,793,121 149,725 14,645 0 0 552,925 278,555 870,638 53,253 390
Schomburg CS 3,889,838 1,857,486 1,581,422 87,313 188,751 0 0 1,234,836 827,494 797,516 0 511
Soaring Heights CS 1,467,536 779,256 750,700 15,892 12,664 58,171 58,171 265,645 200,168 335,077 1,132 165
University Academy CS ----- ----- ----- ----- ----- ----- ----- ----- ----- ----- ----- -----
MercerEmily Fisher CS of Adv. Studies 3,528,284 1,740,441 1,464,583 35,572 240,286 0 0 1,078,152 744,767 704,941 34,229 255
International CS of Trenton 832,960 276,292 239,234 9,506 27,552 0 0 399,336 326,905 157,332 0 84
Pace CS of Hamilton 805,908 392,721 349,553 15,247 6,754 0 0 224,625 163,693 188,534 2,969 112
Princeton CS ----- ----- ----- ----- ----- ----- ----- ----- ----- ----- ----- -----
Trenton Community CS 4,892,607 2,666,766 2,265,033 143,215 258,518 690,318 565,111 967,325 807,886 568,197 9,272 550
Village CS 2,446,681 1,111,908 1,083,689 19,572 8,647 0 0 350,082 195,987 984,691 190,561 288
MiddlesexGreater Brunswick CS 1,175,700 654,528 639,431 6,094 9,003 126,430 108,044 291,563 210,772 103,180 0 138
MonmouthAcademy Charter High School 2,533,771 1,097,880 961,550 46,879 89,451 534,600 200,000 491,553 385,314 409,738 0 192
Hope Academy CS 1,208,745 639,473 620,432 3,606 15,435 0 0 428,840 312,231 140,432 0 119
The Red Bank CS 1,827,831 1,134,604 1,056,433 24,496 53,675 186,464 124,676 378,386 341,770 128,377 0 164
MorrisUnity CS 1,163,733 665,449 622,362 39,021 4,066 126,739 79,490 219,317 171,750 148,116 0 105
PassaicClassical Academy CS of Clifton 580,222 318,056 301,657 13,223 3,176 163,185 110,266 6,943 0 92,038 82,243 95
Paterson CS for Sci/Tech ----- ----- ----- ----- ----- ----- ----- ----- ----- ----- ----- -----
SussexSussex County CS for Technology 708,184 361,565 351,191 8,574 1,800 72,058 35,560 191,891 147,901 82,670 0 94
N.J. Department of Education - Comparative Spending Guide March 2005
Sum 2003-04
Page 891
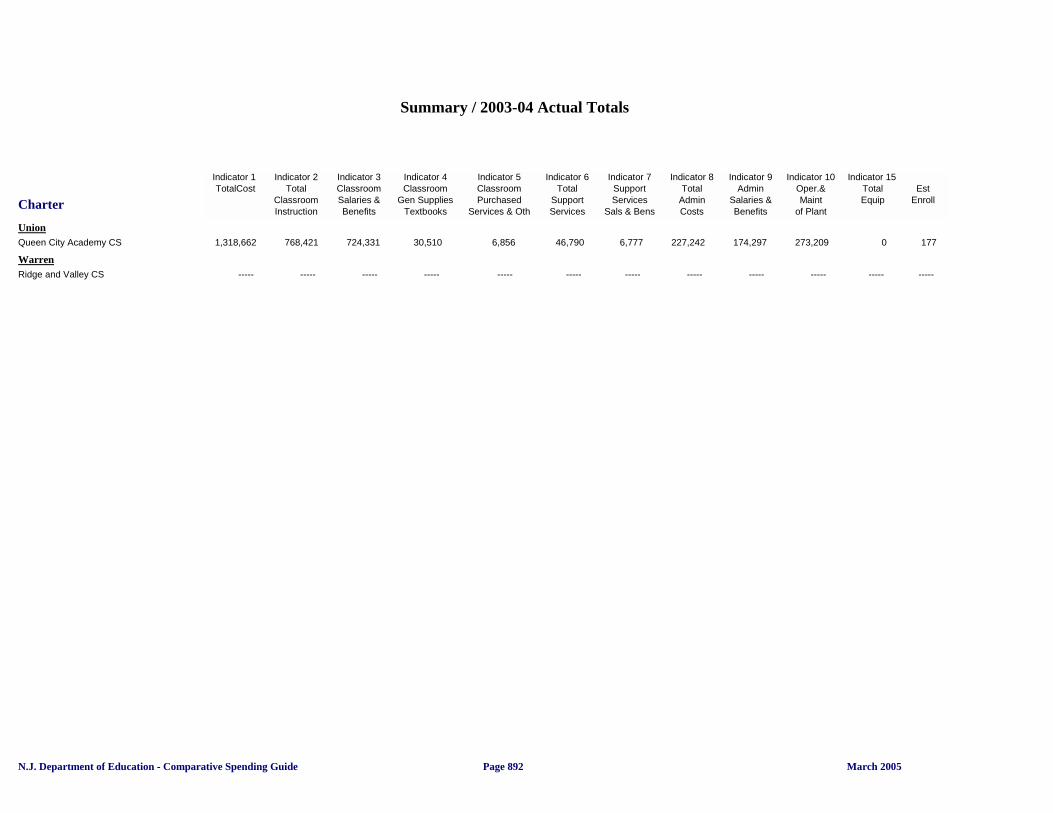
Charter
Summary / 2003-04 Actual Totals
Indicator 1 Indicator 2 Indicator 3 Indicator 4 Indicator 5 Indicator 6 Indicator 7 Indicator 8 Indicator 9 Indicator 10 Indicator 15 TotalCost Total Classroom Classroom Classroom Total Support Total Admin Oper.& Total Est
Classroom Salaries & Gen Supplies Purchased Support Services Admin Salaries & Maint Equip Enroll Instruction Benefits Textbooks Services & Oth Services Sals & Bens Costs Benefits of Plant
UnionQueen City Academy CS 1,318,662 768,421 724,331 30,510 6,856 46,790 6,777 227,242 174,297 273,209 0 177
WarrenRidge and Valley CS ----- ----- ----- ----- ----- ----- ----- ----- ----- ----- ----- -----
N.J. Department of Education - Comparative Spending Guide March 2005Page 892
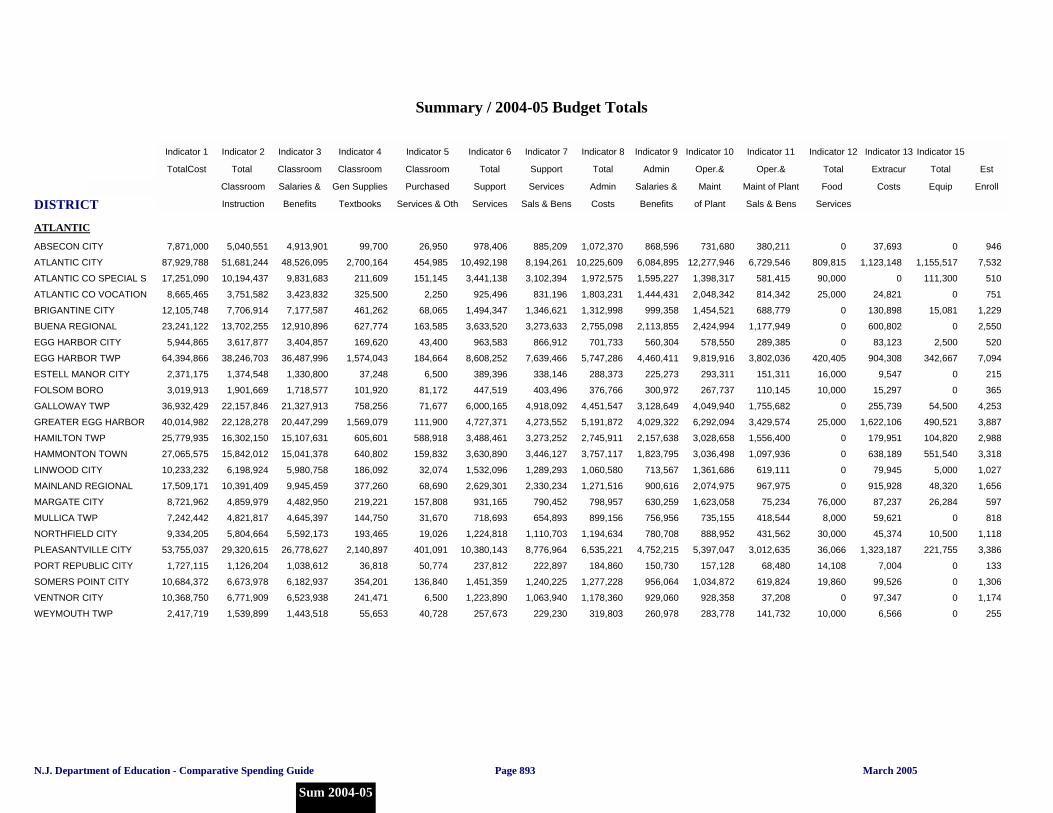
DISTRICT
Indicator 1 Indicator 2 Indicator 3 Indicator 4 Indicator 5 Indicator 6 Indicator 7 Indicator 8 Indicator 9 Indicator 10 Indicator 11 Indicator 12 Indicator 13 Indicator 15
TotalCost Total Classroom Classroom Classroom Total Support Total Admin Oper.& Oper.& Total Extracur Total Est
Per Pupil Classroom Salaries & Gen Supplies Purchased Support Services Admin Salaries & Maint Maint of Plant Food Costs Equip Enroll
Instruction Benefits Textbooks Services & Oth Services Sals & Bens Costs Benefits of Plant Sals & Bens Services
Summary / 2004-05 Budget Totals
Indicator 1 Total Cost
ATLANTIC
7,871,000ABSECON CITY 5,040,551 4,913,901 99,700 26,950 978,406 885,209 1,072,370 868,596 731,680 380,211 0 37,693 0 946
87,929,788ATLANTIC CITY 51,681,244 48,526,095 2,700,164 454,985 10,492,198 8,194,261 10,225,609 6,084,895 12,277,946 6,729,546 809,815 1,123,148 1,155,517 7,532
17,251,090ATLANTIC CO SPECIAL S 10,194,437 9,831,683 211,609 151,145 3,441,138 3,102,394 1,972,575 1,595,227 1,398,317 581,415 90,000 0 111,300 510
8,665,465ATLANTIC CO VOCATION 3,751,582 3,423,832 325,500 2,250 925,496 831,196 1,803,231 1,444,431 2,048,342 814,342 25,000 24,821 0 751
12,105,748BRIGANTINE CITY 7,706,914 7,177,587 461,262 68,065 1,494,347 1,346,621 1,312,998 999,358 1,454,521 688,779 0 130,898 15,081 1,229
23,241,122BUENA REGIONAL 13,702,255 12,910,896 627,774 163,585 3,633,520 3,273,633 2,755,098 2,113,855 2,424,994 1,177,949 0 600,802 0 2,550
5,944,865EGG HARBOR CITY 3,617,877 3,404,857 169,620 43,400 963,583 866,912 701,733 560,304 578,550 289,385 0 83,123 2,500 520
64,394,866EGG HARBOR TWP 38,246,703 36,487,996 1,574,043 184,664 8,608,252 7,639,466 5,747,286 4,460,411 9,819,916 3,802,036 420,405 904,308 342,667 7,094
2,371,175ESTELL MANOR CITY 1,374,548 1,330,800 37,248 6,500 389,396 338,146 288,373 225,273 293,311 151,311 16,000 9,547 0 215
3,019,913FOLSOM BORO 1,901,669 1,718,577 101,920 81,172 447,519 403,496 376,766 300,972 267,737 110,145 10,000 15,297 0 365
36,932,429GALLOWAY TWP 22,157,846 21,327,913 758,256 71,677 6,000,165 4,918,092 4,451,547 3,128,649 4,049,940 1,755,682 0 255,739 54,500 4,253
40,014,982GREATER EGG HARBOR 22,128,278 20,447,299 1,569,079 111,900 4,727,371 4,273,552 5,191,872 4,029,322 6,292,094 3,429,574 25,000 1,622,106 490,521 3,887
25,779,935HAMILTON TWP 16,302,150 15,107,631 605,601 588,918 3,488,461 3,273,252 2,745,911 2,157,638 3,028,658 1,556,400 0 179,951 104,820 2,988
27,065,575HAMMONTON TOWN 15,842,012 15,041,378 640,802 159,832 3,630,890 3,446,127 3,757,117 1,823,795 3,036,498 1,097,936 0 638,189 551,540 3,318
10,233,232LINWOOD CITY 6,198,924 5,980,758 186,092 32,074 1,532,096 1,289,293 1,060,580 713,567 1,361,686 619,111 0 79,945 5,000 1,027
17,509,171MAINLAND REGIONAL 10,391,409 9,945,459 377,260 68,690 2,629,301 2,330,234 1,271,516 900,616 2,074,975 967,975 0 915,928 48,320 1,656
8,721,962MARGATE CITY 4,859,979 4,482,950 219,221 157,808 931,165 790,452 798,957 630,259 1,623,058 75,234 76,000 87,237 26,284 597
7,242,442MULLICA TWP 4,821,817 4,645,397 144,750 31,670 718,693 654,893 899,156 756,956 735,155 418,544 8,000 59,621 0 818
9,334,205NORTHFIELD CITY 5,804,664 5,592,173 193,465 19,026 1,224,818 1,110,703 1,194,634 780,708 888,952 431,562 30,000 45,374 10,500 1,118
53,755,037PLEASANTVILLE CITY 29,320,615 26,778,627 2,140,897 401,091 10,380,143 8,776,964 6,535,221 4,752,215 5,397,047 3,012,635 36,066 1,323,187 221,755 3,386
1,727,115PORT REPUBLIC CITY 1,126,204 1,038,612 36,818 50,774 237,812 222,897 184,860 150,730 157,128 68,480 14,108 7,004 0 133
10,684,372SOMERS POINT CITY 6,673,978 6,182,937 354,201 136,840 1,451,359 1,240,225 1,277,228 956,064 1,034,872 619,824 19,860 99,526 0 1,306
10,368,750VENTNOR CITY 6,771,909 6,523,938 241,471 6,500 1,223,890 1,063,940 1,178,360 929,060 928,358 37,208 0 97,347 0 1,174
2,417,719WEYMOUTH TWP 1,539,899 1,443,518 55,653 40,728 257,673 229,230 319,803 260,978 283,778 141,732 10,000 6,566 0 255
N.J. Department of Education - Comparative Spending Guide March 2005
Sum 2004-05
Page 893
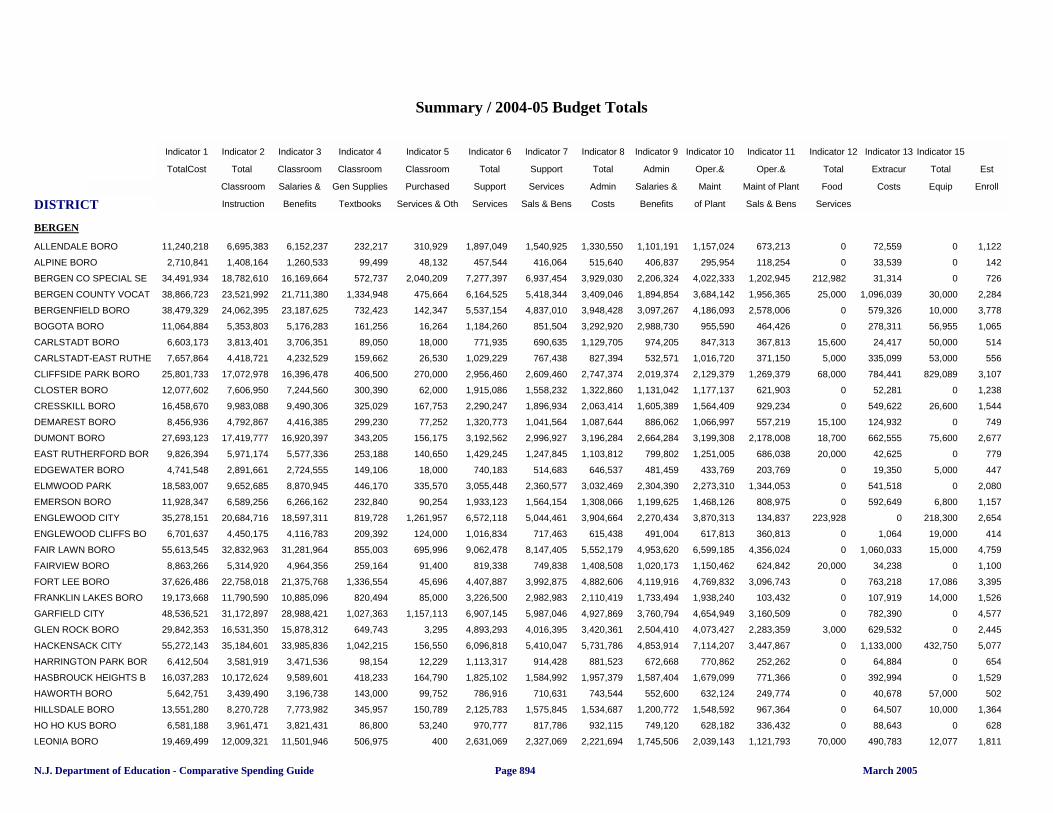
DISTRICT
Indicator 1 Indicator 2 Indicator 3 Indicator 4 Indicator 5 Indicator 6 Indicator 7 Indicator 8 Indicator 9 Indicator 10 Indicator 11 Indicator 12 Indicator 13 Indicator 15
TotalCost Total Classroom Classroom Classroom Total Support Total Admin Oper.& Oper.& Total Extracur Total Est
Per Pupil Classroom Salaries & Gen Supplies Purchased Support Services Admin Salaries & Maint Maint of Plant Food Costs Equip Enroll
Instruction Benefits Textbooks Services & Oth Services Sals & Bens Costs Benefits of Plant Sals & Bens Services
Summary / 2004-05 Budget Totals
Indicator 1 Total Cost
BERGEN
11,240,218ALLENDALE BORO 6,695,383 6,152,237 232,217 310,929 1,897,049 1,540,925 1,330,550 1,101,191 1,157,024 673,213 0 72,559 0 1,122
2,710,841ALPINE BORO 1,408,164 1,260,533 99,499 48,132 457,544 416,064 515,640 406,837 295,954 118,254 0 33,539 0 142
34,491,934BERGEN CO SPECIAL SE 18,782,610 16,169,664 572,737 2,040,209 7,277,397 6,937,454 3,929,030 2,206,324 4,022,333 1,202,945 212,982 31,314 0 726
38,866,723BERGEN COUNTY VOCAT 23,521,992 21,711,380 1,334,948 475,664 6,164,525 5,418,344 3,409,046 1,894,854 3,684,142 1,956,365 25,000 1,096,039 30,000 2,284
38,479,329BERGENFIELD BORO 24,062,395 23,187,625 732,423 142,347 5,537,154 4,837,010 3,948,428 3,097,267 4,186,093 2,578,006 0 579,326 10,000 3,778
11,064,884BOGOTA BORO 5,353,803 5,176,283 161,256 16,264 1,184,260 851,504 3,292,920 2,988,730 955,590 464,426 0 278,311 56,955 1,065
6,603,173CARLSTADT BORO 3,813,401 3,706,351 89,050 18,000 771,935 690,635 1,129,705 974,205 847,313 367,813 15,600 24,417 50,000 514
7,657,864CARLSTADT-EAST RUTHE 4,418,721 4,232,529 159,662 26,530 1,029,229 767,438 827,394 532,571 1,016,720 371,150 5,000 335,099 53,000 556
25,801,733CLIFFSIDE PARK BORO 17,072,978 16,396,478 406,500 270,000 2,956,460 2,609,460 2,747,374 2,019,374 2,129,379 1,269,379 68,000 784,441 829,089 3,107
12,077,602CLOSTER BORO 7,606,950 7,244,560 300,390 62,000 1,915,086 1,558,232 1,322,860 1,131,042 1,177,137 621,903 0 52,281 0 1,238
16,458,670CRESSKILL BORO 9,983,088 9,490,306 325,029 167,753 2,290,247 1,896,934 2,063,414 1,605,389 1,564,409 929,234 0 549,622 26,600 1,544
8,456,936DEMAREST BORO 4,792,867 4,416,385 299,230 77,252 1,320,773 1,041,564 1,087,644 886,062 1,066,997 557,219 15,100 124,932 0 749
27,693,123DUMONT BORO 17,419,777 16,920,397 343,205 156,175 3,192,562 2,996,927 3,196,284 2,664,284 3,199,308 2,178,008 18,700 662,555 75,600 2,677
9,826,394EAST RUTHERFORD BOR 5,971,174 5,577,336 253,188 140,650 1,429,245 1,247,845 1,103,812 799,802 1,251,005 686,038 20,000 42,625 0 779
4,741,548EDGEWATER BORO 2,891,661 2,724,555 149,106 18,000 740,183 514,683 646,537 481,459 433,769 203,769 0 19,350 5,000 447
18,583,007ELMWOOD PARK 9,652,685 8,870,945 446,170 335,570 3,055,448 2,360,577 3,032,469 2,304,390 2,273,310 1,344,053 0 541,518 0 2,080
11,928,347EMERSON BORO 6,589,256 6,266,162 232,840 90,254 1,933,123 1,564,154 1,308,066 1,199,625 1,468,126 808,975 0 592,649 6,800 1,157
35,278,151ENGLEWOOD CITY 20,684,716 18,597,311 819,728 1,261,957 6,572,118 5,044,461 3,904,664 2,270,434 3,870,313 134,837 223,928 0 218,300 2,654
6,701,637ENGLEWOOD CLIFFS BO 4,450,175 4,116,783 209,392 124,000 1,016,834 717,463 615,438 491,004 617,813 360,813 0 1,064 19,000 414
55,613,545FAIR LAWN BORO 32,832,963 31,281,964 855,003 695,996 9,062,478 8,147,405 5,552,179 4,953,620 6,599,185 4,356,024 0 1,060,033 15,000 4,759
8,863,266FAIRVIEW BORO 5,314,920 4,964,356 259,164 91,400 819,338 749,838 1,408,508 1,020,173 1,150,462 624,842 20,000 34,238 0 1,100
37,626,486FORT LEE BORO 22,758,018 21,375,768 1,336,554 45,696 4,407,887 3,992,875 4,882,606 4,119,916 4,769,832 3,096,743 0 763,218 17,086 3,395
19,173,668FRANKLIN LAKES BORO 11,790,590 10,885,096 820,494 85,000 3,226,500 2,982,983 2,110,419 1,733,494 1,938,240 103,432 0 107,919 14,000 1,526
48,536,521GARFIELD CITY 31,172,897 28,988,421 1,027,363 1,157,113 6,907,145 5,987,046 4,927,869 3,760,794 4,654,949 3,160,509 0 782,390 0 4,577
29,842,353GLEN ROCK BORO 16,531,350 15,878,312 649,743 3,295 4,893,293 4,016,395 3,420,361 2,504,410 4,073,427 2,283,359 3,000 629,532 0 2,445
55,272,143HACKENSACK CITY 35,184,601 33,985,836 1,042,215 156,550 6,096,818 5,410,047 5,731,786 4,853,914 7,114,207 3,447,867 0 1,133,000 432,750 5,077
6,412,504HARRINGTON PARK BOR 3,581,919 3,471,536 98,154 12,229 1,113,317 914,428 881,523 672,668 770,862 252,262 0 64,884 0 654
16,037,283HASBROUCK HEIGHTS B 10,172,624 9,589,601 418,233 164,790 1,825,102 1,584,992 1,957,379 1,587,404 1,679,099 771,366 0 392,994 0 1,529
5,642,751HAWORTH BORO 3,439,490 3,196,738 143,000 99,752 786,916 710,631 743,544 552,600 632,124 249,774 0 40,678 57,000 502
13,551,280HILLSDALE BORO 8,270,728 7,773,982 345,957 150,789 2,125,783 1,575,845 1,534,687 1,200,772 1,548,592 967,364 0 64,507 10,000 1,364
6,581,188HO HO KUS BORO 3,961,471 3,821,431 86,800 53,240 970,777 817,786 932,115 749,120 628,182 336,432 0 88,643 0 628
19,469,499LEONIA BORO 12,009,321 11,501,946 506,975 400 2,631,069 2,327,069 2,221,694 1,745,506 2,039,143 1,121,793 70,000 490,783 12,077 1,811
N.J. Department of Education - Comparative Spending Guide March 2005Page 894
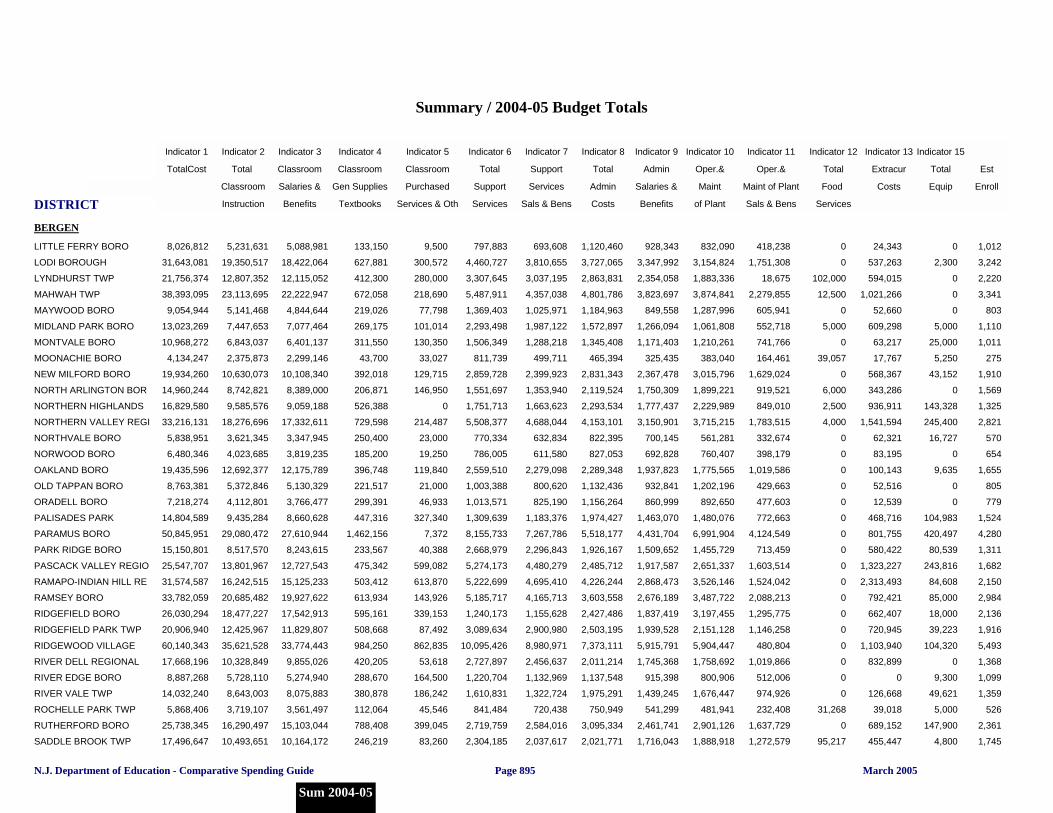
DISTRICT
Indicator 1 Indicator 2 Indicator 3 Indicator 4 Indicator 5 Indicator 6 Indicator 7 Indicator 8 Indicator 9 Indicator 10 Indicator 11 Indicator 12 Indicator 13 Indicator 15
TotalCost Total Classroom Classroom Classroom Total Support Total Admin Oper.& Oper.& Total Extracur Total Est
Per Pupil Classroom Salaries & Gen Supplies Purchased Support Services Admin Salaries & Maint Maint of Plant Food Costs Equip Enroll
Instruction Benefits Textbooks Services & Oth Services Sals & Bens Costs Benefits of Plant Sals & Bens Services
Summary / 2004-05 Budget Totals
Indicator 1 Total Cost
BERGEN
8,026,812LITTLE FERRY BORO 5,231,631 5,088,981 133,150 9,500 797,883 693,608 1,120,460 928,343 832,090 418,238 0 24,343 0 1,012
31,643,081LODI BOROUGH 19,350,517 18,422,064 627,881 300,572 4,460,727 3,810,655 3,727,065 3,347,992 3,154,824 1,751,308 0 537,263 2,300 3,242
21,756,374LYNDHURST TWP 12,807,352 12,115,052 412,300 280,000 3,307,645 3,037,195 2,863,831 2,354,058 1,883,336 18,675 102,000 594,015 0 2,220
38,393,095MAHWAH TWP 23,113,695 22,222,947 672,058 218,690 5,487,911 4,357,038 4,801,786 3,823,697 3,874,841 2,279,855 12,500 1,021,266 0 3,341
9,054,944MAYWOOD BORO 5,141,468 4,844,644 219,026 77,798 1,369,403 1,025,971 1,184,963 849,558 1,287,996 605,941 0 52,660 0 803
13,023,269MIDLAND PARK BORO 7,447,653 7,077,464 269,175 101,014 2,293,498 1,987,122 1,572,897 1,266,094 1,061,808 552,718 5,000 609,298 5,000 1,110
10,968,272MONTVALE BORO 6,843,037 6,401,137 311,550 130,350 1,506,349 1,288,218 1,345,408 1,171,403 1,210,261 741,766 0 63,217 25,000 1,011
4,134,247MOONACHIE BORO 2,375,873 2,299,146 43,700 33,027 811,739 499,711 465,394 325,435 383,040 164,461 39,057 17,767 5,250 275
19,934,260NEW MILFORD BORO 10,630,073 10,108,340 392,018 129,715 2,859,728 2,399,923 2,831,343 2,367,478 3,015,796 1,629,024 0 568,367 43,152 1,910
14,960,244NORTH ARLINGTON BOR 8,742,821 8,389,000 206,871 146,950 1,551,697 1,353,940 2,119,524 1,750,309 1,899,221 919,521 6,000 343,286 0 1,569
16,829,580NORTHERN HIGHLANDS 9,585,576 9,059,188 526,388 0 1,751,713 1,663,623 2,293,534 1,777,437 2,229,989 849,010 2,500 936,911 143,328 1,325
33,216,131NORTHERN VALLEY REGI 18,276,696 17,332,611 729,598 214,487 5,508,377 4,688,044 4,153,101 3,150,901 3,715,215 1,783,515 4,000 1,541,594 245,400 2,821
5,838,951NORTHVALE BORO 3,621,345 3,347,945 250,400 23,000 770,334 632,834 822,395 700,145 561,281 332,674 0 62,321 16,727 570
6,480,346NORWOOD BORO 4,023,685 3,819,235 185,200 19,250 786,005 611,580 827,053 692,828 760,407 398,179 0 83,195 0 654
19,435,596OAKLAND BORO 12,692,377 12,175,789 396,748 119,840 2,559,510 2,279,098 2,289,348 1,937,823 1,775,565 1,019,586 0 100,143 9,635 1,655
8,763,381OLD TAPPAN BORO 5,372,846 5,130,329 221,517 21,000 1,003,388 800,620 1,132,436 932,841 1,202,196 429,663 0 52,516 0 805
7,218,274ORADELL BORO 4,112,801 3,766,477 299,391 46,933 1,013,571 825,190 1,156,264 860,999 892,650 477,603 0 12,539 0 779
14,804,589PALISADES PARK 9,435,284 8,660,628 447,316 327,340 1,309,639 1,183,376 1,974,427 1,463,070 1,480,076 772,663 0 468,716 104,983 1,524
50,845,951PARAMUS BORO 29,080,472 27,610,944 1,462,156 7,372 8,155,733 7,267,786 5,518,177 4,431,704 6,991,904 4,124,549 0 801,755 420,497 4,280
15,150,801PARK RIDGE BORO 8,517,570 8,243,615 233,567 40,388 2,668,979 2,296,843 1,926,167 1,509,652 1,455,729 713,459 0 580,422 80,539 1,311
25,547,707PASCACK VALLEY REGIO 13,801,967 12,727,543 475,342 599,082 5,274,173 4,480,279 2,485,712 1,917,587 2,651,337 1,603,514 0 1,323,227 243,816 1,682
31,574,587RAMAPO-INDIAN HILL RE 16,242,515 15,125,233 503,412 613,870 5,222,699 4,695,410 4,226,244 2,868,473 3,526,146 1,524,042 0 2,313,493 84,608 2,150
33,782,059RAMSEY BORO 20,685,482 19,927,622 613,934 143,926 5,185,717 4,165,713 3,603,558 2,676,189 3,487,722 2,088,213 0 792,421 85,000 2,984
26,030,294RIDGEFIELD BORO 18,477,227 17,542,913 595,161 339,153 1,240,173 1,155,628 2,427,486 1,837,419 3,197,455 1,295,775 0 662,407 18,000 2,136
20,906,940RIDGEFIELD PARK TWP 12,425,967 11,829,807 508,668 87,492 3,089,634 2,900,980 2,503,195 1,939,528 2,151,128 1,146,258 0 720,945 39,223 1,916
60,140,343RIDGEWOOD VILLAGE 35,621,528 33,774,443 984,250 862,835 10,095,426 8,980,971 7,373,111 5,915,791 5,904,447 480,804 0 1,103,940 104,320 5,493
17,668,196RIVER DELL REGIONAL 10,328,849 9,855,026 420,205 53,618 2,727,897 2,456,637 2,011,214 1,745,368 1,758,692 1,019,866 0 832,899 0 1,368
8,887,268RIVER EDGE BORO 5,728,110 5,274,940 288,670 164,500 1,220,704 1,132,969 1,137,548 915,398 800,906 512,006 0 0 9,300 1,099
14,032,240RIVER VALE TWP 8,643,003 8,075,883 380,878 186,242 1,610,831 1,322,724 1,975,291 1,439,245 1,676,447 974,926 0 126,668 49,621 1,359
5,868,406ROCHELLE PARK TWP 3,719,107 3,561,497 112,064 45,546 841,484 720,438 750,949 541,299 481,941 232,408 31,268 39,018 5,000 526
25,738,345RUTHERFORD BORO 16,290,497 15,103,044 788,408 399,045 2,719,759 2,584,016 3,095,334 2,461,741 2,901,126 1,637,729 0 689,152 147,900 2,361
17,496,647SADDLE BROOK TWP 10,493,651 10,164,172 246,219 83,260 2,304,185 2,037,617 2,021,771 1,716,043 1,888,918 1,272,579 95,217 455,447 4,800 1,745
N.J. Department of Education - Comparative Spending Guide March 2005
Sum 2004-05
Page 895
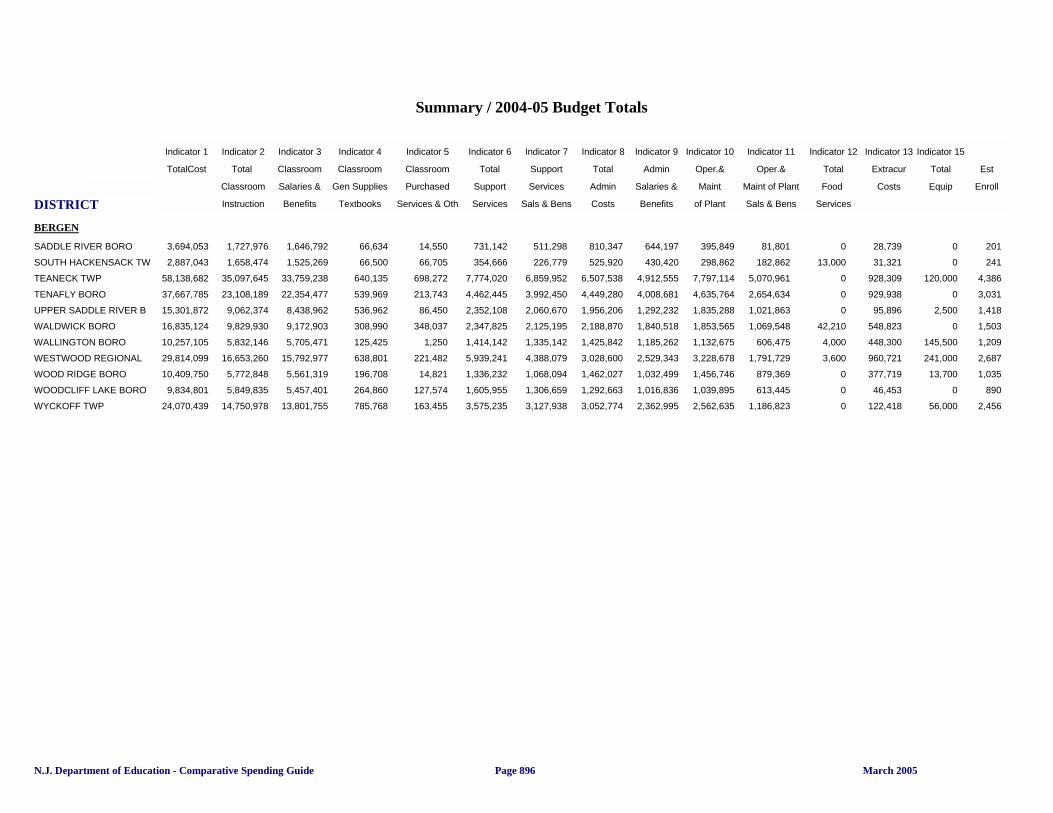
DISTRICT
Indicator 1 Indicator 2 Indicator 3 Indicator 4 Indicator 5 Indicator 6 Indicator 7 Indicator 8 Indicator 9 Indicator 10 Indicator 11 Indicator 12 Indicator 13 Indicator 15
TotalCost Total Classroom Classroom Classroom Total Support Total Admin Oper.& Oper.& Total Extracur Total Est
Per Pupil Classroom Salaries & Gen Supplies Purchased Support Services Admin Salaries & Maint Maint of Plant Food Costs Equip Enroll
Instruction Benefits Textbooks Services & Oth Services Sals & Bens Costs Benefits of Plant Sals & Bens Services
Summary / 2004-05 Budget Totals
Indicator 1 Total Cost
BERGEN
3,694,053SADDLE RIVER BORO 1,727,976 1,646,792 66,634 14,550 731,142 511,298 810,347 644,197 395,849 81,801 0 28,739 0 201
2,887,043SOUTH HACKENSACK TW 1,658,474 1,525,269 66,500 66,705 354,666 226,779 525,920 430,420 298,862 182,862 13,000 31,321 0 241
58,138,682TEANECK TWP 35,097,645 33,759,238 640,135 698,272 7,774,020 6,859,952 6,507,538 4,912,555 7,797,114 5,070,961 0 928,309 120,000 4,386
37,667,785TENAFLY BORO 23,108,189 22,354,477 539,969 213,743 4,462,445 3,992,450 4,449,280 4,008,681 4,635,764 2,654,634 0 929,938 0 3,031
15,301,872UPPER SADDLE RIVER B 9,062,374 8,438,962 536,962 86,450 2,352,108 2,060,670 1,956,206 1,292,232 1,835,288 1,021,863 0 95,896 2,500 1,418
16,835,124WALDWICK BORO 9,829,930 9,172,903 308,990 348,037 2,347,825 2,125,195 2,188,870 1,840,518 1,853,565 1,069,548 42,210 548,823 0 1,503
10,257,105WALLINGTON BORO 5,832,146 5,705,471 125,425 1,250 1,414,142 1,335,142 1,425,842 1,185,262 1,132,675 606,475 4,000 448,300 145,500 1,209
29,814,099WESTWOOD REGIONAL 16,653,260 15,792,977 638,801 221,482 5,939,241 4,388,079 3,028,600 2,529,343 3,228,678 1,791,729 3,600 960,721 241,000 2,687
10,409,750WOOD RIDGE BORO 5,772,848 5,561,319 196,708 14,821 1,336,232 1,068,094 1,462,027 1,032,499 1,456,746 879,369 0 377,719 13,700 1,035
9,834,801WOODCLIFF LAKE BORO 5,849,835 5,457,401 264,860 127,574 1,605,955 1,306,659 1,292,663 1,016,836 1,039,895 613,445 0 46,453 0 890
24,070,439WYCKOFF TWP 14,750,978 13,801,755 785,768 163,455 3,575,235 3,127,938 3,052,774 2,362,995 2,562,635 1,186,823 0 122,418 56,000 2,456
N.J. Department of Education - Comparative Spending Guide March 2005Page 896

DISTRICT
Indicator 1 Indicator 2 Indicator 3 Indicator 4 Indicator 5 Indicator 6 Indicator 7 Indicator 8 Indicator 9 Indicator 10 Indicator 11 Indicator 12 Indicator 13 Indicator 15
TotalCost Total Classroom Classroom Classroom Total Support Total Admin Oper.& Oper.& Total Extracur Total Est
Per Pupil Classroom Salaries & Gen Supplies Purchased Support Services Admin Salaries & Maint Maint of Plant Food Costs Equip Enroll
Instruction Benefits Textbooks Services & Oth Services Sals & Bens Costs Benefits of Plant Sals & Bens Services
Summary / 2004-05 Budget Totals
Indicator 1 Total Cost
BURLINGTON
1,823,421BASS RIVER TWP 1,002,566 949,566 37,200 15,800 316,701 266,701 237,245 172,160 237,032 141,576 28,651 0 0 130
3,252,221BEVERLY CITY 1,925,782 1,763,380 129,802 32,600 608,403 461,403 336,601 228,301 341,516 103,716 0 33,676 23,000 344
21,142,927BORDENTOWN REGIONA 11,670,611 10,724,721 822,662 123,228 3,554,298 2,940,108 2,672,026 2,082,554 2,305,680 1,435,050 0 795,214 67,538 2,095
23,442,341BURLINGTON CITY 13,619,145 12,724,003 711,984 181,658 4,072,913 3,528,053 2,589,463 2,043,196 2,432,369 1,354,688 10,000 677,016 16,450 1,846
33,966,722BURLINGTON CO SPEC S 26,122,336 25,290,986 571,550 259,800 979,846 774,596 3,177,815 2,464,094 2,860,076 1,503,441 520,000 58,340 11,800 1,120
27,449,454BURLINGTON CO VOCATI 15,134,447 14,049,312 815,727 269,408 2,605,880 2,442,199 4,098,143 3,341,934 4,514,652 2,397,790 0 1,094,102 0 1,805
34,233,192BURLINGTON TWP 23,212,527 21,237,705 1,149,812 824,108 4,299,064 3,445,883 2,896,607 2,226,698 3,107,894 228,052 0 717,100 202,732 4,229
3,201,925CHESTERFIELD TWP 1,691,561 1,567,436 99,545 24,580 686,417 529,117 421,307 321,907 365,957 185,657 7,800 18,007 0 314
25,621,247CINNAMINSON TWP 15,317,124 14,591,572 486,692 238,860 3,175,023 2,565,238 3,060,623 2,321,062 2,899,699 1,424,353 0 995,193 48,048 2,527
4,069,864DELANCO TWP 2,418,312 2,280,146 101,841 36,325 666,317 527,517 482,609 375,559 468,885 312,735 10,000 23,635 82,758 383
25,671,213DELRAN TWP 15,396,726 14,553,244 773,988 69,494 2,934,321 2,522,747 3,044,346 2,374,346 3,567,614 929,377 0 715,978 27,100 2,805
6,988,420EASTAMPTON TWP 4,016,868 3,777,624 164,810 74,434 1,093,932 941,053 953,672 702,283 790,890 350,435 5,000 128,059 0 826
8,613,154EDGEWATER PARK TWP 5,100,723 4,862,723 228,000 10,000 1,453,686 1,172,786 1,043,012 776,862 925,013 482,313 0 43,031 94,163 911
51,817,959EVESHAM TWP 32,136,226 30,701,914 1,311,612 122,700 6,990,272 5,696,442 5,114,633 4,225,223 6,530,778 3,854,285 85,166 582,662 276,668 5,358
15,741,926FLORENCE TWP 8,887,066 8,499,805 337,180 50,081 2,526,017 2,216,446 2,166,345 1,597,569 1,725,717 1,104,095 0 436,781 0 1,648
6,198,210HAINESPORT TWP 3,732,149 3,416,194 304,155 11,800 1,007,164 689,378 747,502 548,702 617,875 322,310 0 75,332 0 659
85,007,553LENAPE REGIONAL 48,790,663 45,655,985 2,565,705 568,973 12,150,846 10,873,997 8,516,737 5,673,570 10,991,141 6,030,072 0 3,729,276 764,927 7,262
16,821,725LUMBERTON TWP 9,817,105 9,299,096 446,594 71,415 2,431,511 1,992,255 2,184,419 1,620,009 2,229,842 888,898 0 140,847 42,770 1,852
6,571,747MANSFIELD TWP 3,907,952 3,663,102 218,350 26,500 1,073,828 826,278 841,918 670,168 748,049 413,951 0 0 0 730
22,178,711MAPLE SHADE TWP 13,767,317 12,944,524 587,665 235,128 2,920,530 2,330,453 2,513,244 2,115,098 2,232,950 1,116,116 10,000 636,957 0 2,170
5,385,391MEDFORD LAKES BORO 3,387,705 3,214,443 92,877 80,385 654,659 463,594 676,347 507,597 594,645 344,869 0 72,035 0 553
31,985,118MEDFORD TWP 19,404,215 17,922,385 1,114,175 367,655 4,006,377 3,553,812 3,947,619 2,953,824 3,866,296 2,015,796 0 218,400 0 3,105
43,410,949MOORESTOWN TWP 25,527,278 23,859,693 775,169 892,416 8,524,740 6,870,792 3,702,768 3,100,734 4,244,075 1,921,708 0 1,208,287 0 4,297
13,082,020MOUNT HOLLY TWP 7,808,076 7,119,938 367,086 321,052 2,083,456 1,918,350 1,485,218 1,178,151 1,458,426 840,195 0 246,843 15,000 1,094
43,496,689MOUNT LAUREL TWP 27,179,457 26,135,893 855,914 187,650 5,725,347 5,107,486 5,189,025 3,583,563 4,752,317 2,599,600 0 225,761 385,228 4,694
2,356,324NEW HANOVER TWP 1,384,016 1,264,856 76,160 17,000 325,908 236,208 293,088 256,138 305,947 113,947 28,000 19,365 0 164
16,050,422NORTH HANOVER TWP 9,532,529 8,916,095 401,049 215,385 2,398,447 2,023,092 1,902,307 1,573,571 1,944,171 759,171 150,000 102,521 93,300 1,408
22,256,293NORTHERN BURLINGTON 12,442,748 11,694,324 476,860 267,964 3,195,490 2,853,697 2,787,974 2,142,758 3,007,828 1,431,915 10,000 773,334 291,185 2,133
10,216,676PALMYRA BORO 5,924,405 5,641,349 187,433 95,623 1,432,314 1,148,045 1,328,932 970,575 1,170,426 572,319 0 316,770 1,200 1,217
1,476,081PEMBERTON BOROUGH 692,083 629,285 40,858 21,940 313,186 261,536 268,947 186,547 170,806 75,505 21,644 8,427 0 93
87,788,428PEMBERTON TWP 52,604,202 47,462,984 2,427,061 2,714,157 16,422,757 14,115,910 7,850,963 6,632,738 8,343,789 4,730,895 200,000 1,103,545 408,072 5,837
20,530,112RANCOCAS VALLEY REGI 10,521,427 8,992,712 1,069,400 459,315 3,260,134 2,910,259 2,840,401 1,865,401 2,758,071 1,289,371 0 1,073,996 0 2,350
N.J. Department of Education - Comparative Spending Guide March 2005
Sum 2004-05
Page 897
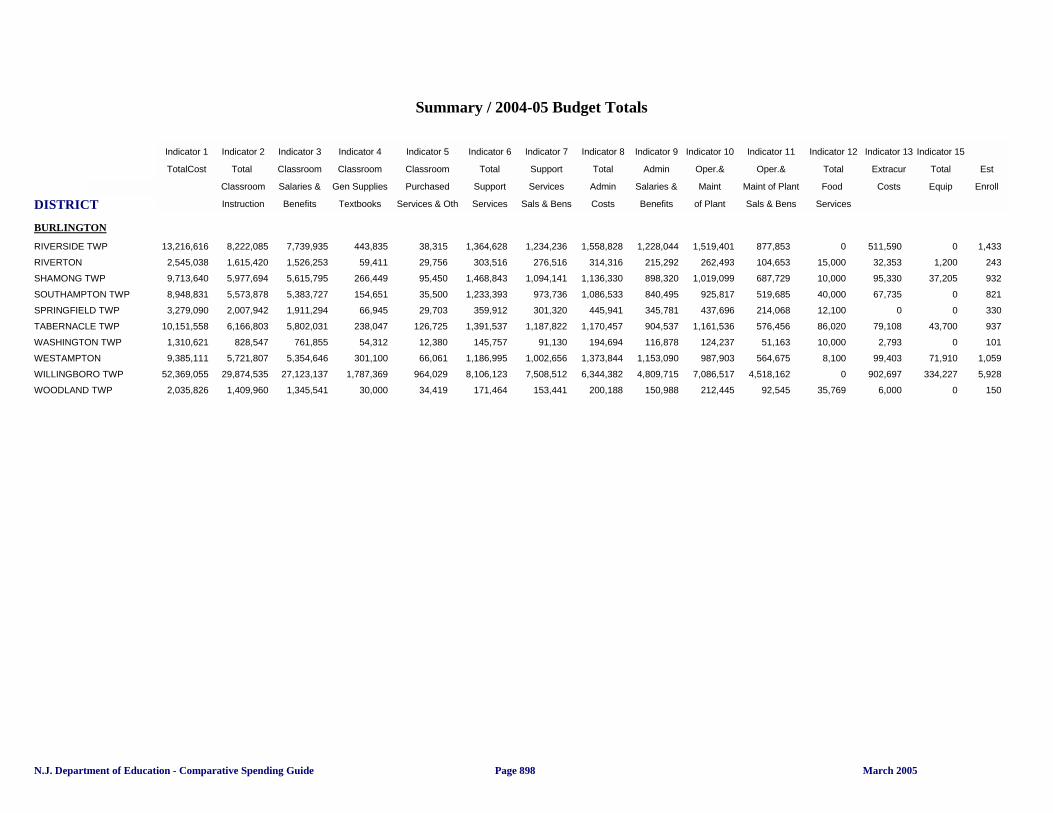
DISTRICT
Indicator 1 Indicator 2 Indicator 3 Indicator 4 Indicator 5 Indicator 6 Indicator 7 Indicator 8 Indicator 9 Indicator 10 Indicator 11 Indicator 12 Indicator 13 Indicator 15
TotalCost Total Classroom Classroom Classroom Total Support Total Admin Oper.& Oper.& Total Extracur Total Est
Per Pupil Classroom Salaries & Gen Supplies Purchased Support Services Admin Salaries & Maint Maint of Plant Food Costs Equip Enroll
Instruction Benefits Textbooks Services & Oth Services Sals & Bens Costs Benefits of Plant Sals & Bens Services
Summary / 2004-05 Budget Totals
Indicator 1 Total Cost
BURLINGTON
13,216,616RIVERSIDE TWP 8,222,085 7,739,935 443,835 38,315 1,364,628 1,234,236 1,558,828 1,228,044 1,519,401 877,853 0 511,590 0 1,433
2,545,038RIVERTON 1,615,420 1,526,253 59,411 29,756 303,516 276,516 314,316 215,292 262,493 104,653 15,000 32,353 1,200 243
9,713,640SHAMONG TWP 5,977,694 5,615,795 266,449 95,450 1,468,843 1,094,141 1,136,330 898,320 1,019,099 687,729 10,000 95,330 37,205 932
8,948,831SOUTHAMPTON TWP 5,573,878 5,383,727 154,651 35,500 1,233,393 973,736 1,086,533 840,495 925,817 519,685 40,000 67,735 0 821
3,279,090SPRINGFIELD TWP 2,007,942 1,911,294 66,945 29,703 359,912 301,320 445,941 345,781 437,696 214,068 12,100 0 0 330
10,151,558TABERNACLE TWP 6,166,803 5,802,031 238,047 126,725 1,391,537 1,187,822 1,170,457 904,537 1,161,536 576,456 86,020 79,108 43,700 937
1,310,621WASHINGTON TWP 828,547 761,855 54,312 12,380 145,757 91,130 194,694 116,878 124,237 51,163 10,000 2,793 0 101
9,385,111WESTAMPTON 5,721,807 5,354,646 301,100 66,061 1,186,995 1,002,656 1,373,844 1,153,090 987,903 564,675 8,100 99,403 71,910 1,059
52,369,055WILLINGBORO TWP 29,874,535 27,123,137 1,787,369 964,029 8,106,123 7,508,512 6,344,382 4,809,715 7,086,517 4,518,162 0 902,697 334,227 5,928
2,035,826WOODLAND TWP 1,409,960 1,345,541 30,000 34,419 171,464 153,441 200,188 150,988 212,445 92,545 35,769 6,000 0 150
N.J. Department of Education - Comparative Spending Guide March 2005Page 898

DISTRICT
Indicator 1 Indicator 2 Indicator 3 Indicator 4 Indicator 5 Indicator 6 Indicator 7 Indicator 8 Indicator 9 Indicator 10 Indicator 11 Indicator 12 Indicator 13 Indicator 15
TotalCost Total Classroom Classroom Classroom Total Support Total Admin Oper.& Oper.& Total Extracur Total Est
Per Pupil Classroom Salaries & Gen Supplies Purchased Support Services Admin Salaries & Maint Maint of Plant Food Costs Equip Enroll
Instruction Benefits Textbooks Services & Oth Services Sals & Bens Costs Benefits of Plant Sals & Bens Services
Summary / 2004-05 Budget Totals
Indicator 1 Total Cost
CAMDEN
15,802,942AUDUBON BORO 9,904,717 9,387,380 421,937 95,400 1,813,856 1,653,793 1,804,155 1,479,305 1,590,004 1,013,004 0 644,242 12,500 1,688
6,355,360BARRINGTON BORO 3,629,312 3,421,627 128,985 78,700 1,329,787 1,133,747 781,138 601,038 580,638 304,529 2,000 32,485 26,000 611
8,942,851BELLMAWR BORO 5,855,732 5,550,003 241,229 64,500 1,226,868 1,042,068 986,744 836,994 728,524 405,524 100 75,275 50,000 1,080
6,931,149BERLIN BORO 4,397,516 4,131,781 194,935 70,800 756,825 700,334 963,185 824,808 703,512 335,959 0 65,688 14,795 761
7,229,299BERLIN TWP 4,231,376 4,026,352 155,824 49,200 1,094,990 937,940 946,651 718,470 848,367 382,717 5,500 42,436 30,200 709
41,585,175BLACK HORSE PIKE REGI 21,477,430 20,324,728 612,952 539,750 7,019,337 6,460,264 5,559,657 4,114,554 5,287,187 3,009,125 255,000 1,977,667 160,000 4,262
2,560,373BROOKLAWN BORO 1,616,095 1,579,895 36,200 0 332,782 262,166 356,802 280,599 205,096 78,391 26,214 23,384 22,556 291
229,968,552CAMDEN CITY 130,535,310 121,358,318 5,917,816 3,259,176 35,059,178 31,333,699 30,756,806 20,444,376 29,120,038 15,334,452 2,300,000 1,567,161 610,837 15,239
32,517,709CAMDEN COUNTY VOCAT 15,474,654 14,036,230 1,305,924 132,500 3,668,129 3,414,429 5,686,793 4,813,793 6,430,965 3,224,839 500,000 691,450 250,000 3,140
124,519,784CHERRY HILL TWP 79,012,986 74,681,769 2,294,995 2,036,222 16,006,897 15,002,961 14,553,334 11,671,789 11,853,587 4,207,049 0 2,891,895 195,900 11,619
1,743,870CHESILHURST 1,037,491 939,566 50,525 47,400 251,956 197,581 223,624 123,624 167,876 62,376 34,348 6,440 0 167
5,263,747CLEMENTON BORO 3,178,180 3,032,181 123,998 22,001 721,980 520,450 722,371 575,239 581,178 256,270 0 22,038 0 600
22,496,212COLLINGSWOOD BORO 12,441,378 11,739,075 532,603 169,700 3,546,177 3,296,500 2,486,495 1,992,279 3,050,078 2,016,393 50,000 912,375 23,900 2,015
23,316,894EASTERN CAMDEN COUN 12,791,082 12,087,093 495,458 208,531 3,832,467 3,512,347 2,200,952 1,664,341 3,046,629 1,210,792 0 1,253,763 66,669 2,197
3,336,830GIBBSBORO BORO 2,156,639 2,082,558 68,950 5,131 450,172 391,438 320,086 199,870 307,022 107,204 20,000 65,699 0 289
31,855,545GLOUCESTER CITY 18,628,067 17,314,730 982,698 330,639 5,828,097 4,446,795 2,788,942 2,035,714 3,671,104 2,061,255 0 687,840 143,109 2,311
65,558,768GLOUCESTER TWP 43,374,339 41,325,061 1,984,578 64,700 7,421,604 6,850,132 6,901,668 5,216,893 6,914,013 3,443,223 300,000 623,460 72,550 7,975
13,940,434HADDON HEIGHTS BORO 8,297,254 7,988,334 246,425 62,495 1,838,584 1,640,003 1,672,759 1,294,784 1,390,072 834,872 0 623,540 26,000 1,275
21,694,480HADDON TWP 12,837,602 12,027,669 768,447 41,486 3,004,655 2,597,208 2,367,730 1,913,672 2,352,995 1,495,472 125,000 695,474 104,900 2,188
24,513,238HADDONFIELD BORO 14,140,846 13,478,750 606,421 55,675 3,528,717 3,042,991 2,723,964 2,125,060 3,152,674 1,993,472 0 941,544 17,500 2,300
1,528,216LAUREL SPRINGS BORO 901,885 845,828 21,768 34,289 202,551 141,834 271,787 225,308 147,552 46,377 0 1,941 4,000 162
3,213,303LAWNSIDE BORO 1,840,983 1,773,749 66,334 900 533,366 502,766 371,878 248,192 434,850 195,600 30,000 2,226 7,000 274
25,429,228LINDENWOLD BORO 15,418,913 14,621,896 559,988 237,029 3,425,258 3,006,523 3,156,502 2,452,402 2,381,985 1,113,485 0 838,090 99,751 2,497
4,596,890MAGNOLIA BORO 2,785,675 2,631,560 119,215 34,900 697,107 548,572 555,975 338,688 500,538 273,823 18,000 39,595 0 436
3,556,618MERCHANTVILLE BORO 2,329,535 2,185,415 77,730 66,390 338,692 238,455 464,851 319,653 382,268 24,148 0 41,272 0 344
4,206,582MOUNT EPHRAIM BORO 2,413,354 2,229,728 134,750 48,876 862,362 677,397 452,164 332,071 408,462 185,112 20,000 32,270 0 456
4,055,954OAKLYN BORO 2,481,651 2,373,530 71,857 36,264 582,220 327,174 598,415 498,823 340,162 125,663 0 53,506 0 482
59,363,965PENNSAUKEN TWP 35,395,769 34,336,226 975,143 84,400 7,443,160 6,545,250 7,152,862 5,571,937 7,699,070 4,965,316 0 1,272,160 9,500 6,064
23,296,338PINE HILL BORO 14,439,835 13,781,985 385,300 272,550 2,779,406 2,376,736 2,501,598 1,949,113 2,740,865 1,431,065 10,600 612,589 24,100 2,220
8,439,627RUNNEMEDE BORO 5,497,321 5,207,082 237,124 53,115 869,684 803,687 997,815 842,015 962,833 462,483 25,000 86,974 0 788
4,646,949SOMERDALE BORO 3,003,174 2,894,512 100,062 8,600 440,319 351,685 701,978 471,016 471,951 241,194 5,000 24,527 0 506
11,710,496STERLING HIGH SCHOOL 6,315,672 5,804,713 370,709 140,250 1,380,884 1,209,844 1,353,439 1,073,304 1,781,186 980,111 0 857,256 132,973 1,030
N.J. Department of Education - Comparative Spending Guide March 2005
Sum 2004-05
Page 899
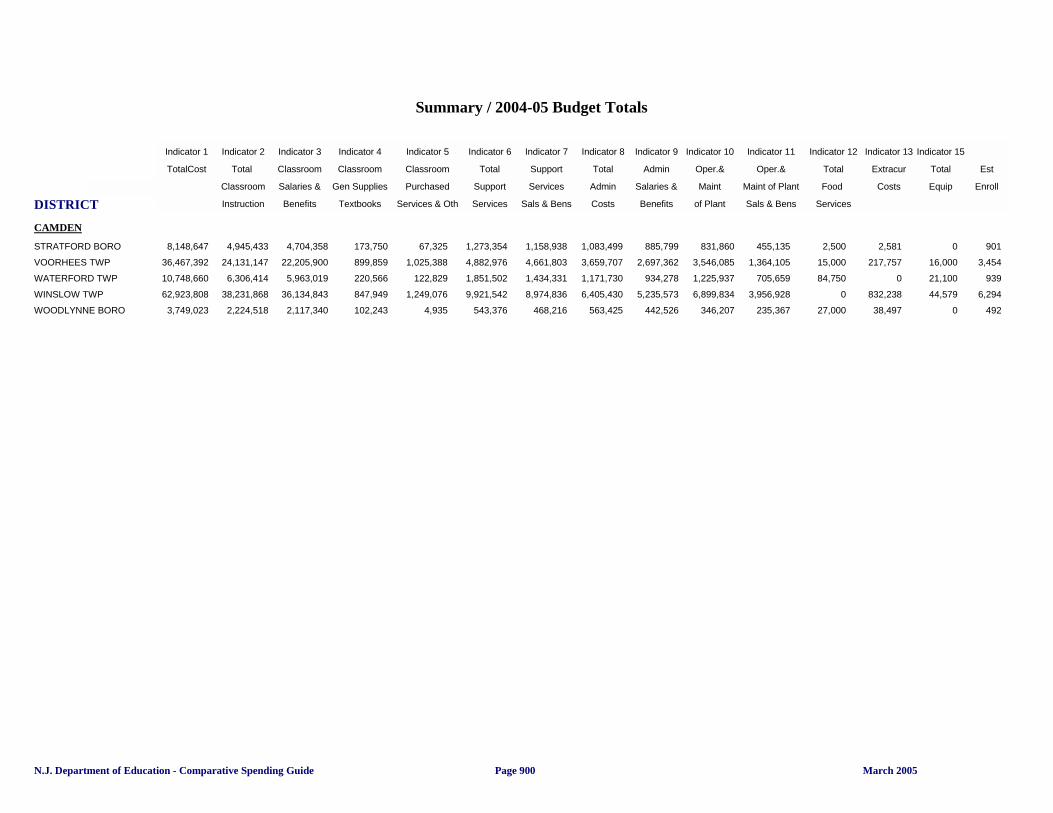
DISTRICT
Indicator 1 Indicator 2 Indicator 3 Indicator 4 Indicator 5 Indicator 6 Indicator 7 Indicator 8 Indicator 9 Indicator 10 Indicator 11 Indicator 12 Indicator 13 Indicator 15
TotalCost Total Classroom Classroom Classroom Total Support Total Admin Oper.& Oper.& Total Extracur Total Est
Per Pupil Classroom Salaries & Gen Supplies Purchased Support Services Admin Salaries & Maint Maint of Plant Food Costs Equip Enroll
Instruction Benefits Textbooks Services & Oth Services Sals & Bens Costs Benefits of Plant Sals & Bens Services
Summary / 2004-05 Budget Totals
Indicator 1 Total Cost
CAMDEN
8,148,647STRATFORD BORO 4,945,433 4,704,358 173,750 67,325 1,273,354 1,158,938 1,083,499 885,799 831,860 455,135 2,500 2,581 0 901
36,467,392VOORHEES TWP 24,131,147 22,205,900 899,859 1,025,388 4,882,976 4,661,803 3,659,707 2,697,362 3,546,085 1,364,105 15,000 217,757 16,000 3,454
10,748,660WATERFORD TWP 6,306,414 5,963,019 220,566 122,829 1,851,502 1,434,331 1,171,730 934,278 1,225,937 705,659 84,750 0 21,100 939
62,923,808WINSLOW TWP 38,231,868 36,134,843 847,949 1,249,076 9,921,542 8,974,836 6,405,430 5,235,573 6,899,834 3,956,928 0 832,238 44,579 6,294
3,749,023WOODLYNNE BORO 2,224,518 2,117,340 102,243 4,935 543,376 468,216 563,425 442,526 346,207 235,367 27,000 38,497 0 492
N.J. Department of Education - Comparative Spending Guide March 2005Page 900
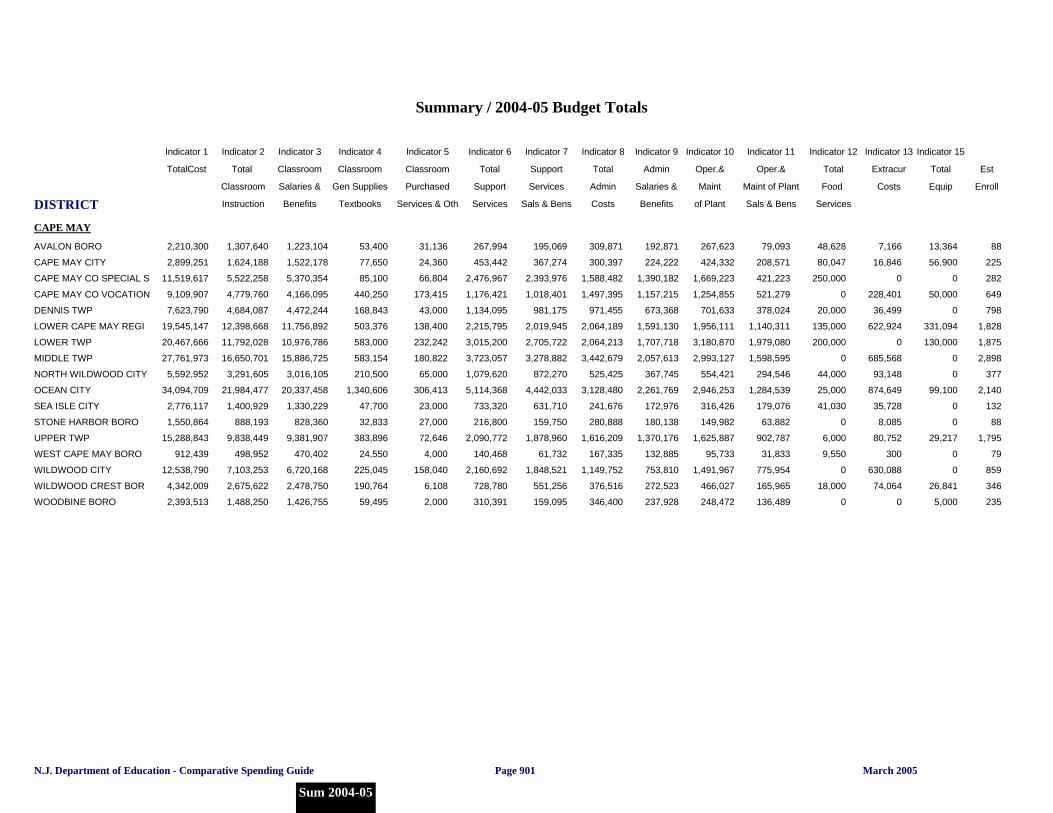
DISTRICT
Indicator 1 Indicator 2 Indicator 3 Indicator 4 Indicator 5 Indicator 6 Indicator 7 Indicator 8 Indicator 9 Indicator 10 Indicator 11 Indicator 12 Indicator 13 Indicator 15
TotalCost Total Classroom Classroom Classroom Total Support Total Admin Oper.& Oper.& Total Extracur Total Est
Per Pupil Classroom Salaries & Gen Supplies Purchased Support Services Admin Salaries & Maint Maint of Plant Food Costs Equip Enroll
Instruction Benefits Textbooks Services & Oth Services Sals & Bens Costs Benefits of Plant Sals & Bens Services
Summary / 2004-05 Budget Totals
Indicator 1 Total Cost
CAPE MAY
2,210,300AVALON BORO 1,307,640 1,223,104 53,400 31,136 267,994 195,069 309,871 192,871 267,623 79,093 48,628 7,166 13,364 88
2,899,251CAPE MAY CITY 1,624,188 1,522,178 77,650 24,360 453,442 367,274 300,397 224,222 424,332 208,571 80,047 16,846 56,900 225
11,519,617CAPE MAY CO SPECIAL S 5,522,258 5,370,354 85,100 66,804 2,476,967 2,393,976 1,588,482 1,390,182 1,669,223 421,223 250,000 0 0 282
9,109,907CAPE MAY CO VOCATION 4,779,760 4,166,095 440,250 173,415 1,176,421 1,018,401 1,497,395 1,157,215 1,254,855 521,279 0 228,401 50,000 649
7,623,790DENNIS TWP 4,684,087 4,472,244 168,843 43,000 1,134,095 981,175 971,455 673,368 701,633 378,024 20,000 36,499 0 798
19,545,147LOWER CAPE MAY REGI 12,398,668 11,756,892 503,376 138,400 2,215,795 2,019,945 2,064,189 1,591,130 1,956,111 1,140,311 135,000 622,924 331,094 1,828
20,467,666LOWER TWP 11,792,028 10,976,786 583,000 232,242 3,015,200 2,705,722 2,064,213 1,707,718 3,180,870 1,979,080 200,000 0 130,000 1,875
27,761,973MIDDLE TWP 16,650,701 15,886,725 583,154 180,822 3,723,057 3,278,882 3,442,679 2,057,613 2,993,127 1,598,595 0 685,568 0 2,898
5,592,952NORTH WILDWOOD CITY 3,291,605 3,016,105 210,500 65,000 1,079,620 872,270 525,425 367,745 554,421 294,546 44,000 93,148 0 377
34,094,709OCEAN CITY 21,984,477 20,337,458 1,340,606 306,413 5,114,368 4,442,033 3,128,480 2,261,769 2,946,253 1,284,539 25,000 874,649 99,100 2,140
2,776,117SEA ISLE CITY 1,400,929 1,330,229 47,700 23,000 733,320 631,710 241,676 172,976 316,426 179,076 41,030 35,728 0 132
1,550,864STONE HARBOR BORO 888,193 828,360 32,833 27,000 216,800 159,750 280,888 180,138 149,982 63,882 0 8,085 0 88
15,288,843UPPER TWP 9,838,449 9,381,907 383,896 72,646 2,090,772 1,878,960 1,616,209 1,370,176 1,625,887 902,787 6,000 80,752 29,217 1,795
912,439WEST CAPE MAY BORO 498,952 470,402 24,550 4,000 140,468 61,732 167,335 132,885 95,733 31,833 9,550 300 0 79
12,538,790WILDWOOD CITY 7,103,253 6,720,168 225,045 158,040 2,160,692 1,848,521 1,149,752 753,810 1,491,967 775,954 0 630,088 0 859
4,342,009WILDWOOD CREST BOR 2,675,622 2,478,750 190,764 6,108 728,780 551,256 376,516 272,523 466,027 165,965 18,000 74,064 26,841 346
2,393,513WOODBINE BORO 1,488,250 1,426,755 59,495 2,000 310,391 159,095 346,400 237,928 248,472 136,489 0 0 5,000 235
N.J. Department of Education - Comparative Spending Guide March 2005
Sum 2004-05
Page 901

DISTRICT
Indicator 1 Indicator 2 Indicator 3 Indicator 4 Indicator 5 Indicator 6 Indicator 7 Indicator 8 Indicator 9 Indicator 10 Indicator 11 Indicator 12 Indicator 13 Indicator 15
TotalCost Total Classroom Classroom Classroom Total Support Total Admin Oper.& Oper.& Total Extracur Total Est
Per Pupil Classroom Salaries & Gen Supplies Purchased Support Services Admin Salaries & Maint Maint of Plant Food Costs Equip Enroll
Instruction Benefits Textbooks Services & Oth Services Sals & Bens Costs Benefits of Plant Sals & Bens Services
Summary / 2004-05 Budget Totals
Indicator 1 Total Cost
CUMBERLAND
58,590,563BRIDGETON CITY 34,541,572 32,126,806 1,559,086 855,680 10,660,604 8,966,634 5,853,986 4,171,713 5,944,089 3,351,833 0 1,242,285 712,980 4,460
7,169,898COMMERCIAL TWP 4,101,112 3,817,401 246,711 37,000 1,145,276 974,409 929,242 684,092 829,601 392,176 150,000 14,667 12,000 689
6,657,198CUMBERLAND CO VOCAT 3,173,225 2,709,535 357,600 106,090 881,508 761,008 1,490,298 1,172,813 1,093,862 407,521 10,000 28,847 41,800 496
13,729,323CUMBERLAND REGIONAL 8,299,678 7,550,079 410,450 339,149 1,197,060 1,014,410 1,970,166 1,701,666 1,577,726 707,476 5,999 667,285 95,600 1,453
3,334,236DEERFIELD TWP 2,067,417 1,932,664 75,842 58,911 409,987 339,536 436,922 253,321 399,226 2,503 6,500 14,058 0 336
3,357,215DOWNE TWP 2,024,631 1,891,400 91,356 41,875 511,272 392,164 469,625 372,185 272,250 118,111 25,000 8,999 32,000 233
5,681,551FAIRFIELD TWP 3,561,003 3,393,294 130,107 37,602 598,092 535,713 949,579 729,252 531,103 41,505 0 22,098 0 532
1,080,341GREENWICH TWP 650,406 618,670 27,686 4,050 97,302 49,569 212,294 164,769 104,525 0 12,000 3,813 0 97
4,761,744HOPEWELL TWP 3,197,321 2,981,896 160,425 55,000 497,316 421,866 549,640 368,940 497,484 82,284 0 19,983 0 537
4,600,186LAWRENCE TWP 2,919,797 2,516,562 333,217 70,018 541,560 334,623 626,810 429,369 455,505 174,290 0 40,178 26,589 484
4,604,095MAURICE RIVER TWP 2,722,769 2,546,509 131,525 44,735 607,561 489,364 574,763 434,518 565,056 308,443 30,000 51,147 13,133 426
74,454,396MILLVILLE CITY 44,072,568 38,012,838 3,451,810 2,607,920 13,121,201 11,197,139 7,516,372 5,955,905 7,892,703 3,841,767 577,811 1,209,451 176,726 6,032
658,681SHILOH BORO 343,501 320,790 15,500 7,211 92,384 61,984 128,862 57,632 84,540 14,114 3,000 6,393 0 68
1,343,985STOW CREEK TWP 791,784 733,434 42,300 16,050 179,816 155,061 174,438 135,618 164,336 55,876 22,000 1,250 0 131
9,631,585UPPER DEERFIELD TWP 6,105,863 5,784,711 246,152 75,000 1,250,849 1,146,847 1,084,629 831,309 1,185,244 650,694 0 0 5,000 965
138,122,169VINELAND CITY 78,370,163 71,244,805 5,736,282 1,389,076 26,120,681 21,487,023 14,087,839 10,024,704 15,076,510 6,702,269 750,000 1,773,877 1,823,660 9,637
N.J. Department of Education - Comparative Spending Guide March 2005Page 902
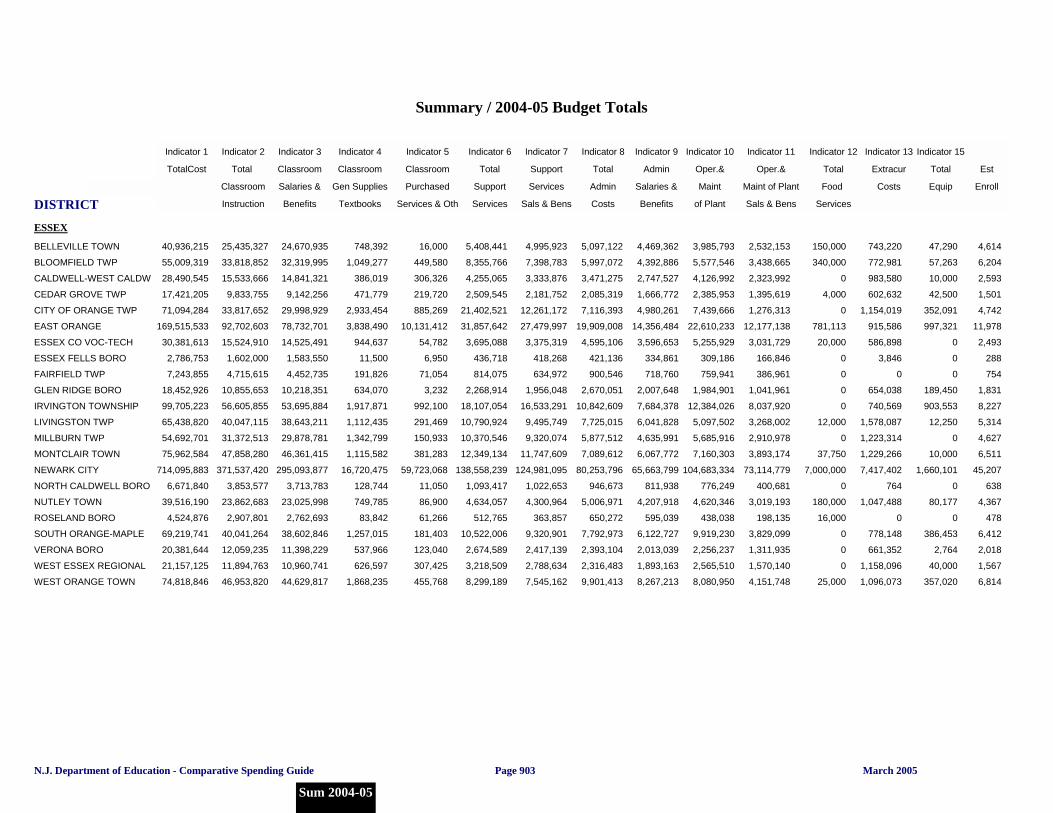
DISTRICT
Indicator 1 Indicator 2 Indicator 3 Indicator 4 Indicator 5 Indicator 6 Indicator 7 Indicator 8 Indicator 9 Indicator 10 Indicator 11 Indicator 12 Indicator 13 Indicator 15
TotalCost Total Classroom Classroom Classroom Total Support Total Admin Oper.& Oper.& Total Extracur Total Est
Per Pupil Classroom Salaries & Gen Supplies Purchased Support Services Admin Salaries & Maint Maint of Plant Food Costs Equip Enroll
Instruction Benefits Textbooks Services & Oth Services Sals & Bens Costs Benefits of Plant Sals & Bens Services
Summary / 2004-05 Budget Totals
Indicator 1 Total Cost
ESSEX
40,936,215BELLEVILLE TOWN 25,435,327 24,670,935 748,392 16,000 5,408,441 4,995,923 5,097,122 4,469,362 3,985,793 2,532,153 150,000 743,220 47,290 4,614
55,009,319BLOOMFIELD TWP 33,818,852 32,319,995 1,049,277 449,580 8,355,766 7,398,783 5,997,072 4,392,886 5,577,546 3,438,665 340,000 772,981 57,263 6,204
28,490,545CALDWELL-WEST CALDW 15,533,666 14,841,321 386,019 306,326 4,255,065 3,333,876 3,471,275 2,747,527 4,126,992 2,323,992 0 983,580 10,000 2,593
17,421,205CEDAR GROVE TWP 9,833,755 9,142,256 471,779 219,720 2,509,545 2,181,752 2,085,319 1,666,772 2,385,953 1,395,619 4,000 602,632 42,500 1,501
71,094,284CITY OF ORANGE TWP 33,817,652 29,998,929 2,933,454 885,269 21,402,521 12,261,172 7,116,393 4,980,261 7,439,666 1,276,313 0 1,154,019 352,091 4,742
169,515,533EAST ORANGE 92,702,603 78,732,701 3,838,490 10,131,412 31,857,642 27,479,997 19,909,008 14,356,484 22,610,233 12,177,138 781,113 915,586 997,321 11,978
30,381,613ESSEX CO VOC-TECH 15,524,910 14,525,491 944,637 54,782 3,695,088 3,375,319 4,595,106 3,596,653 5,255,929 3,031,729 20,000 586,898 0 2,493
2,786,753ESSEX FELLS BORO 1,602,000 1,583,550 11,500 6,950 436,718 418,268 421,136 334,861 309,186 166,846 0 3,846 0 288
7,243,855FAIRFIELD TWP 4,715,615 4,452,735 191,826 71,054 814,075 634,972 900,546 718,760 759,941 386,961 0 0 0 754
18,452,926GLEN RIDGE BORO 10,855,653 10,218,351 634,070 3,232 2,268,914 1,956,048 2,670,051 2,007,648 1,984,901 1,041,961 0 654,038 189,450 1,831
99,705,223IRVINGTON TOWNSHIP 56,605,855 53,695,884 1,917,871 992,100 18,107,054 16,533,291 10,842,609 7,684,378 12,384,026 8,037,920 0 740,569 903,553 8,227
65,438,820LIVINGSTON TWP 40,047,115 38,643,211 1,112,435 291,469 10,790,924 9,495,749 7,725,015 6,041,828 5,097,502 3,268,002 12,000 1,578,087 12,250 5,314
54,692,701MILLBURN TWP 31,372,513 29,878,781 1,342,799 150,933 10,370,546 9,320,074 5,877,512 4,635,991 5,685,916 2,910,978 0 1,223,314 0 4,627
75,962,584MONTCLAIR TOWN 47,858,280 46,361,415 1,115,582 381,283 12,349,134 11,747,609 7,089,612 6,067,772 7,160,303 3,893,174 37,750 1,229,266 10,000 6,511
714,095,883NEWARK CITY 371,537,420 295,093,877 16,720,475 59,723,068 138,558,239 124,981,095 80,253,796 65,663,799 104,683,334 73,114,779 7,000,000 7,417,402 1,660,101 45,207
6,671,840NORTH CALDWELL BORO 3,853,577 3,713,783 128,744 11,050 1,093,417 1,022,653 946,673 811,938 776,249 400,681 0 764 0 638
39,516,190NUTLEY TOWN 23,862,683 23,025,998 749,785 86,900 4,634,057 4,300,964 5,006,971 4,207,918 4,620,346 3,019,193 180,000 1,047,488 80,177 4,367
4,524,876ROSELAND BORO 2,907,801 2,762,693 83,842 61,266 512,765 363,857 650,272 595,039 438,038 198,135 16,000 0 0 478
69,219,741SOUTH ORANGE-MAPLE 40,041,264 38,602,846 1,257,015 181,403 10,522,006 9,320,901 7,792,973 6,122,727 9,919,230 3,829,099 0 778,148 386,453 6,412
20,381,644VERONA BORO 12,059,235 11,398,229 537,966 123,040 2,674,589 2,417,139 2,393,104 2,013,039 2,256,237 1,311,935 0 661,352 2,764 2,018
21,157,125WEST ESSEX REGIONAL 11,894,763 10,960,741 626,597 307,425 3,218,509 2,788,634 2,316,483 1,893,163 2,565,510 1,570,140 0 1,158,096 40,000 1,567
74,818,846WEST ORANGE TOWN 46,953,820 44,629,817 1,868,235 455,768 8,299,189 7,545,162 9,901,413 8,267,213 8,080,950 4,151,748 25,000 1,096,073 357,020 6,814
N.J. Department of Education - Comparative Spending Guide March 2005
Sum 2004-05
Page 903
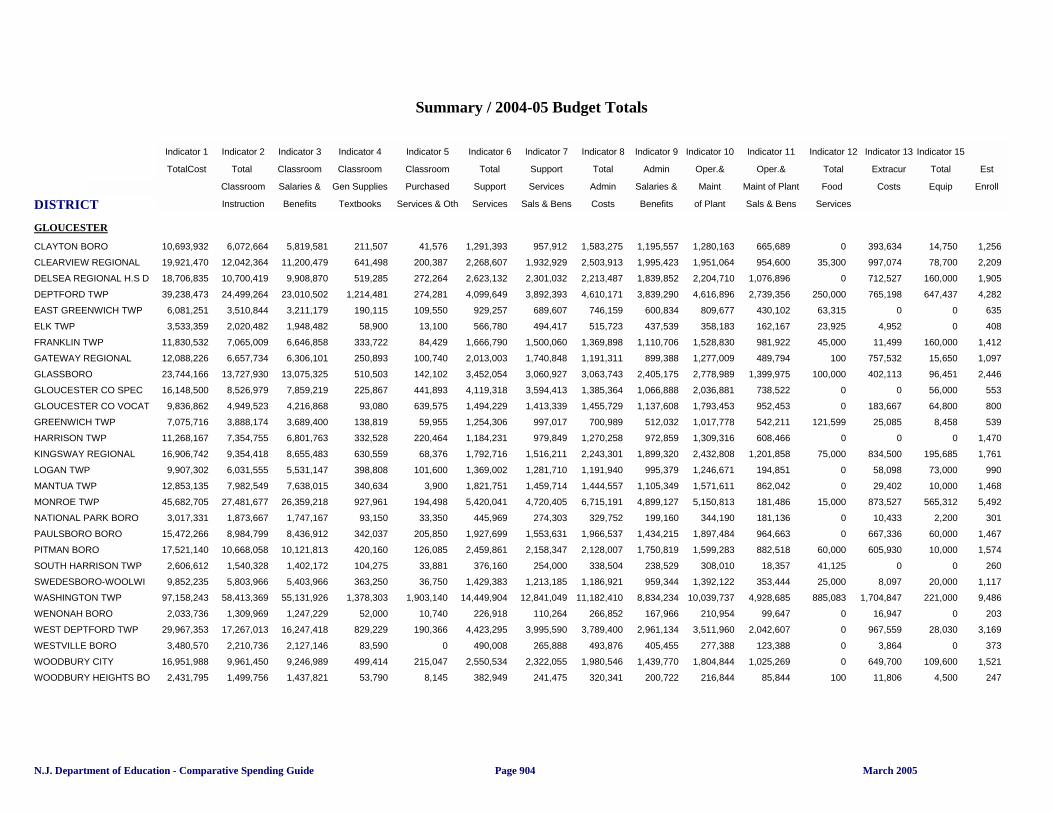
DISTRICT
Indicator 1 Indicator 2 Indicator 3 Indicator 4 Indicator 5 Indicator 6 Indicator 7 Indicator 8 Indicator 9 Indicator 10 Indicator 11 Indicator 12 Indicator 13 Indicator 15
TotalCost Total Classroom Classroom Classroom Total Support Total Admin Oper.& Oper.& Total Extracur Total Est
Per Pupil Classroom Salaries & Gen Supplies Purchased Support Services Admin Salaries & Maint Maint of Plant Food Costs Equip Enroll
Instruction Benefits Textbooks Services & Oth Services Sals & Bens Costs Benefits of Plant Sals & Bens Services
Summary / 2004-05 Budget Totals
Indicator 1 Total Cost
GLOUCESTER
10,693,932CLAYTON BORO 6,072,664 5,819,581 211,507 41,576 1,291,393 957,912 1,583,275 1,195,557 1,280,163 665,689 0 393,634 14,750 1,256
19,921,470CLEARVIEW REGIONAL 12,042,364 11,200,479 641,498 200,387 2,268,607 1,932,929 2,503,913 1,995,423 1,951,064 954,600 35,300 997,074 78,700 2,209
18,706,835DELSEA REGIONAL H.S D 10,700,419 9,908,870 519,285 272,264 2,623,132 2,301,032 2,213,487 1,839,852 2,204,710 1,076,896 0 712,527 160,000 1,905
39,238,473DEPTFORD TWP 24,499,264 23,010,502 1,214,481 274,281 4,099,649 3,892,393 4,610,171 3,839,290 4,616,896 2,739,356 250,000 765,198 647,437 4,282
6,081,251EAST GREENWICH TWP 3,510,844 3,211,179 190,115 109,550 929,257 689,607 746,159 600,834 809,677 430,102 63,315 0 0 635
3,533,359ELK TWP 2,020,482 1,948,482 58,900 13,100 566,780 494,417 515,723 437,539 358,183 162,167 23,925 4,952 0 408
11,830,532FRANKLIN TWP 7,065,009 6,646,858 333,722 84,429 1,666,790 1,500,060 1,369,898 1,110,706 1,528,830 981,922 45,000 11,499 160,000 1,412
12,088,226GATEWAY REGIONAL 6,657,734 6,306,101 250,893 100,740 2,013,003 1,740,848 1,191,311 899,388 1,277,009 489,794 100 757,532 15,650 1,097
23,744,166GLASSBORO 13,727,930 13,075,325 510,503 142,102 3,452,054 3,060,927 3,063,743 2,405,175 2,778,989 1,399,975 100,000 402,113 96,451 2,446
16,148,500GLOUCESTER CO SPEC 8,526,979 7,859,219 225,867 441,893 4,119,318 3,594,413 1,385,364 1,066,888 2,036,881 738,522 0 0 56,000 553
9,836,862GLOUCESTER CO VOCAT 4,949,523 4,216,868 93,080 639,575 1,494,229 1,413,339 1,455,729 1,137,608 1,793,453 952,453 0 183,667 64,800 800
7,075,716GREENWICH TWP 3,888,174 3,689,400 138,819 59,955 1,254,306 997,017 700,989 512,032 1,017,778 542,211 121,599 25,085 8,458 539
11,268,167HARRISON TWP 7,354,755 6,801,763 332,528 220,464 1,184,231 979,849 1,270,258 972,859 1,309,316 608,466 0 0 0 1,470
16,906,742KINGSWAY REGIONAL 9,354,418 8,655,483 630,559 68,376 1,792,716 1,516,211 2,243,301 1,899,320 2,432,808 1,201,858 75,000 834,500 195,685 1,761
9,907,302LOGAN TWP 6,031,555 5,531,147 398,808 101,600 1,369,002 1,281,710 1,191,940 995,379 1,246,671 194,851 0 58,098 73,000 990
12,853,135MANTUA TWP 7,982,549 7,638,015 340,634 3,900 1,821,751 1,459,714 1,444,557 1,105,349 1,571,611 862,042 0 29,402 10,000 1,468
45,682,705MONROE TWP 27,481,677 26,359,218 927,961 194,498 5,420,041 4,720,405 6,715,191 4,899,127 5,150,813 181,486 15,000 873,527 565,312 5,492
3,017,331NATIONAL PARK BORO 1,873,667 1,747,167 93,150 33,350 445,969 274,303 329,752 199,160 344,190 181,136 0 10,433 2,200 301
15,472,266PAULSBORO BORO 8,984,799 8,436,912 342,037 205,850 1,927,699 1,553,631 1,966,537 1,434,215 1,897,484 964,663 0 667,336 60,000 1,467
17,521,140PITMAN BORO 10,668,058 10,121,813 420,160 126,085 2,459,861 2,158,347 2,128,007 1,750,819 1,599,283 882,518 60,000 605,930 10,000 1,574
2,606,612SOUTH HARRISON TWP 1,540,328 1,402,172 104,275 33,881 376,160 254,000 338,504 238,529 308,010 18,357 41,125 0 0 260
9,852,235SWEDESBORO-WOOLWI 5,803,966 5,403,966 363,250 36,750 1,429,383 1,213,185 1,186,921 959,344 1,392,122 353,444 25,000 8,097 20,000 1,117
97,158,243WASHINGTON TWP 58,413,369 55,131,926 1,378,303 1,903,140 14,449,904 12,841,049 11,182,410 8,834,234 10,039,737 4,928,685 885,083 1,704,847 221,000 9,486
2,033,736WENONAH BORO 1,309,969 1,247,229 52,000 10,740 226,918 110,264 266,852 167,966 210,954 99,647 0 16,947 0 203
29,967,353WEST DEPTFORD TWP 17,267,013 16,247,418 829,229 190,366 4,423,295 3,995,590 3,789,400 2,961,134 3,511,960 2,042,607 0 967,559 28,030 3,169
3,480,570WESTVILLE BORO 2,210,736 2,127,146 83,590 0 490,008 265,888 493,876 405,455 277,388 123,388 0 3,864 0 373
16,951,988WOODBURY CITY 9,961,450 9,246,989 499,414 215,047 2,550,534 2,322,055 1,980,546 1,439,770 1,804,844 1,025,269 0 649,700 109,600 1,521
2,431,795WOODBURY HEIGHTS BO 1,499,756 1,437,821 53,790 8,145 382,949 241,475 320,341 200,722 216,844 85,844 100 11,806 4,500 247
N.J. Department of Education - Comparative Spending Guide March 2005Page 904
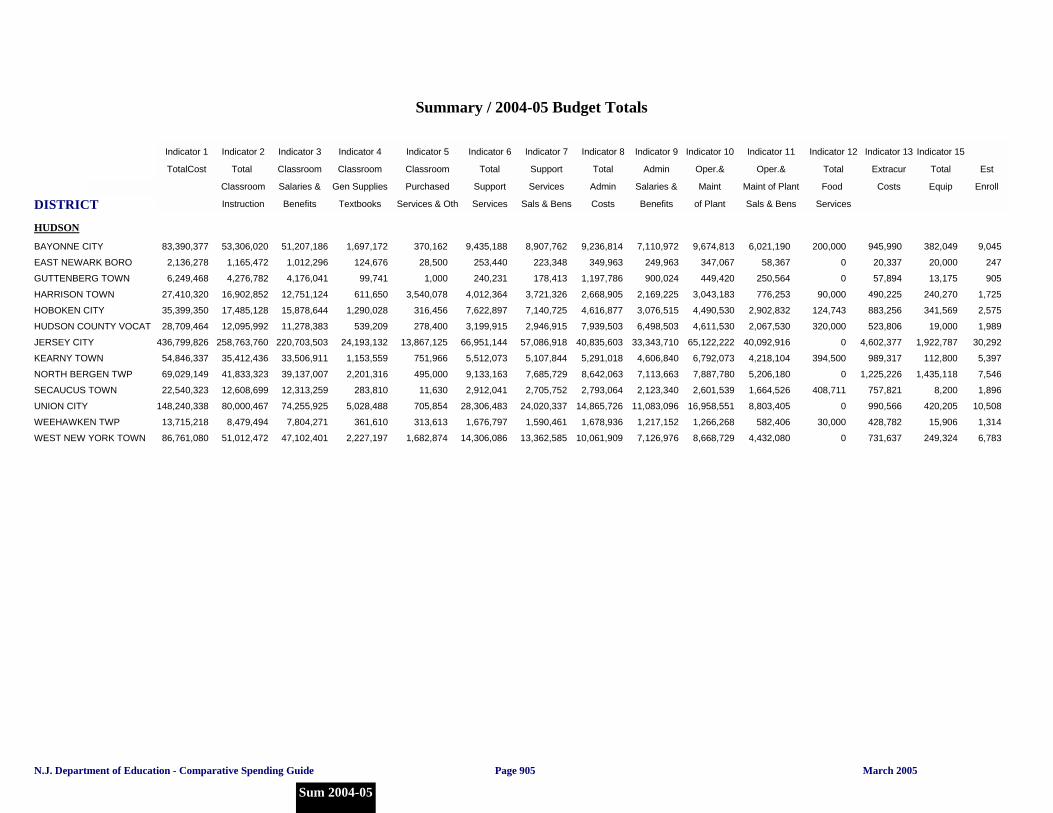
DISTRICT
Indicator 1 Indicator 2 Indicator 3 Indicator 4 Indicator 5 Indicator 6 Indicator 7 Indicator 8 Indicator 9 Indicator 10 Indicator 11 Indicator 12 Indicator 13 Indicator 15
TotalCost Total Classroom Classroom Classroom Total Support Total Admin Oper.& Oper.& Total Extracur Total Est
Per Pupil Classroom Salaries & Gen Supplies Purchased Support Services Admin Salaries & Maint Maint of Plant Food Costs Equip Enroll
Instruction Benefits Textbooks Services & Oth Services Sals & Bens Costs Benefits of Plant Sals & Bens Services
Summary / 2004-05 Budget Totals
Indicator 1 Total Cost
HUDSON
83,390,377BAYONNE CITY 53,306,020 51,207,186 1,697,172 370,162 9,435,188 8,907,762 9,236,814 7,110,972 9,674,813 6,021,190 200,000 945,990 382,049 9,045
2,136,278EAST NEWARK BORO 1,165,472 1,012,296 124,676 28,500 253,440 223,348 349,963 249,963 347,067 58,367 0 20,337 20,000 247
6,249,468GUTTENBERG TOWN 4,276,782 4,176,041 99,741 1,000 240,231 178,413 1,197,786 900,024 449,420 250,564 0 57,894 13,175 905
27,410,320HARRISON TOWN 16,902,852 12,751,124 611,650 3,540,078 4,012,364 3,721,326 2,668,905 2,169,225 3,043,183 776,253 90,000 490,225 240,270 1,725
35,399,350HOBOKEN CITY 17,485,128 15,878,644 1,290,028 316,456 7,622,897 7,140,725 4,616,877 3,076,515 4,490,530 2,902,832 124,743 883,256 341,569 2,575
28,709,464HUDSON COUNTY VOCAT 12,095,992 11,278,383 539,209 278,400 3,199,915 2,946,915 7,939,503 6,498,503 4,611,530 2,067,530 320,000 523,806 19,000 1,989
436,799,826JERSEY CITY 258,763,760 220,703,503 24,193,132 13,867,125 66,951,144 57,086,918 40,835,603 33,343,710 65,122,222 40,092,916 0 4,602,377 1,922,787 30,292
54,846,337KEARNY TOWN 35,412,436 33,506,911 1,153,559 751,966 5,512,073 5,107,844 5,291,018 4,606,840 6,792,073 4,218,104 394,500 989,317 112,800 5,397
69,029,149NORTH BERGEN TWP 41,833,323 39,137,007 2,201,316 495,000 9,133,163 7,685,729 8,642,063 7,113,663 7,887,780 5,206,180 0 1,225,226 1,435,118 7,546
22,540,323SECAUCUS TOWN 12,608,699 12,313,259 283,810 11,630 2,912,041 2,705,752 2,793,064 2,123,340 2,601,539 1,664,526 408,711 757,821 8,200 1,896
148,240,338UNION CITY 80,000,467 74,255,925 5,028,488 705,854 28,306,483 24,020,337 14,865,726 11,083,096 16,958,551 8,803,405 0 990,566 420,205 10,508
13,715,218WEEHAWKEN TWP 8,479,494 7,804,271 361,610 313,613 1,676,797 1,590,461 1,678,936 1,217,152 1,266,268 582,406 30,000 428,782 15,906 1,314
86,761,080WEST NEW YORK TOWN 51,012,472 47,102,401 2,227,197 1,682,874 14,306,086 13,362,585 10,061,909 7,126,976 8,668,729 4,432,080 0 731,637 249,324 6,783
N.J. Department of Education - Comparative Spending Guide March 2005
Sum 2004-05
Page 905
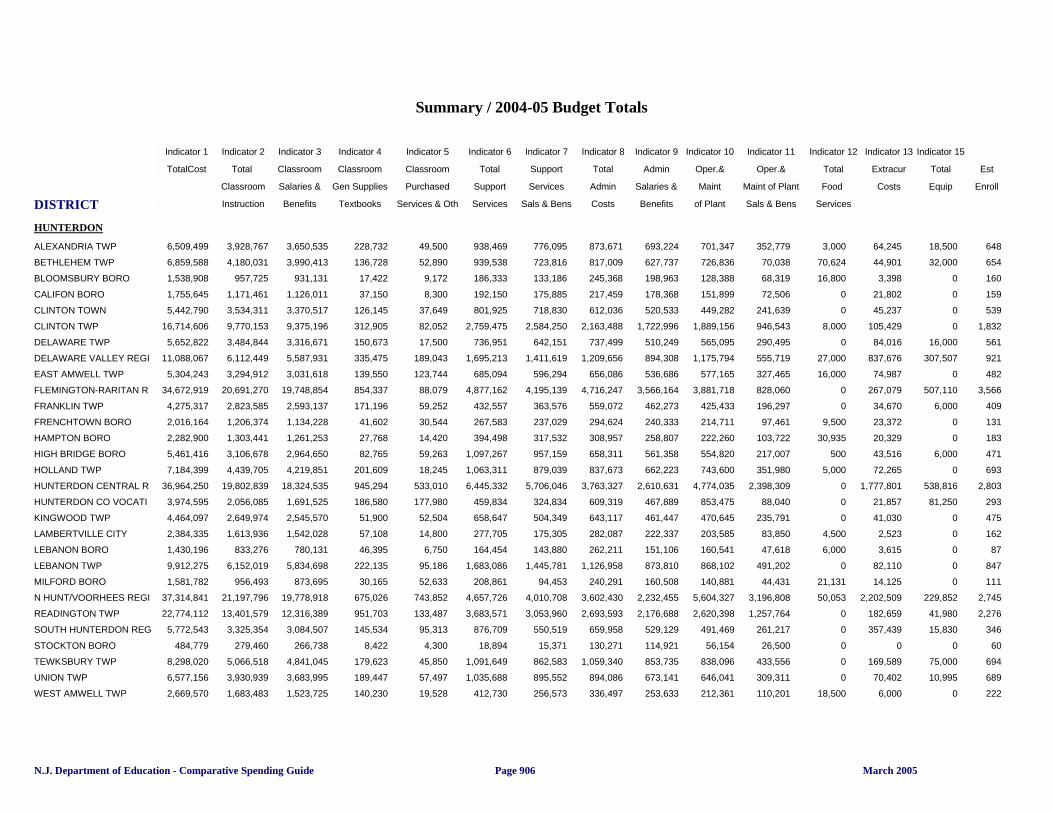
DISTRICT
Indicator 1 Indicator 2 Indicator 3 Indicator 4 Indicator 5 Indicator 6 Indicator 7 Indicator 8 Indicator 9 Indicator 10 Indicator 11 Indicator 12 Indicator 13 Indicator 15
TotalCost Total Classroom Classroom Classroom Total Support Total Admin Oper.& Oper.& Total Extracur Total Est
Per Pupil Classroom Salaries & Gen Supplies Purchased Support Services Admin Salaries & Maint Maint of Plant Food Costs Equip Enroll
Instruction Benefits Textbooks Services & Oth Services Sals & Bens Costs Benefits of Plant Sals & Bens Services
Summary / 2004-05 Budget Totals
Indicator 1 Total Cost
HUNTERDON
6,509,499ALEXANDRIA TWP 3,928,767 3,650,535 228,732 49,500 938,469 776,095 873,671 693,224 701,347 352,779 3,000 64,245 18,500 648
6,859,588BETHLEHEM TWP 4,180,031 3,990,413 136,728 52,890 939,538 723,816 817,009 627,737 726,836 70,038 70,624 44,901 32,000 654
1,538,908BLOOMSBURY BORO 957,725 931,131 17,422 9,172 186,333 133,186 245,368 198,963 128,388 68,319 16,800 3,398 0 160
1,755,645CALIFON BORO 1,171,461 1,126,011 37,150 8,300 192,150 175,885 217,459 178,368 151,899 72,506 0 21,802 0 159
5,442,790CLINTON TOWN 3,534,311 3,370,517 126,145 37,649 801,925 718,830 612,036 520,533 449,282 241,639 0 45,237 0 539
16,714,606CLINTON TWP 9,770,153 9,375,196 312,905 82,052 2,759,475 2,584,250 2,163,488 1,722,996 1,889,156 946,543 8,000 105,429 0 1,832
5,652,822DELAWARE TWP 3,484,844 3,316,671 150,673 17,500 736,951 642,151 737,499 510,249 565,095 290,495 0 84,016 16,000 561
11,088,067DELAWARE VALLEY REGI 6,112,449 5,587,931 335,475 189,043 1,695,213 1,411,619 1,209,656 894,308 1,175,794 555,719 27,000 837,676 307,507 921
5,304,243EAST AMWELL TWP 3,294,912 3,031,618 139,550 123,744 685,094 596,294 656,086 536,686 577,165 327,465 16,000 74,987 0 482
34,672,919FLEMINGTON-RARITAN R 20,691,270 19,748,854 854,337 88,079 4,877,162 4,195,139 4,716,247 3,566,164 3,881,718 828,060 0 267,079 507,110 3,566
4,275,317FRANKLIN TWP 2,823,585 2,593,137 171,196 59,252 432,557 363,576 559,072 462,273 425,433 196,297 0 34,670 6,000 409
2,016,164FRENCHTOWN BORO 1,206,374 1,134,228 41,602 30,544 267,583 237,029 294,624 240,333 214,711 97,461 9,500 23,372 0 131
2,282,900HAMPTON BORO 1,303,441 1,261,253 27,768 14,420 394,498 317,532 308,957 258,807 222,260 103,722 30,935 20,329 0 183
5,461,416HIGH BRIDGE BORO 3,106,678 2,964,650 82,765 59,263 1,097,267 957,159 658,311 561,358 554,820 217,007 500 43,516 6,000 471
7,184,399HOLLAND TWP 4,439,705 4,219,851 201,609 18,245 1,063,311 879,039 837,673 662,223 743,600 351,980 5,000 72,265 0 693
36,964,250HUNTERDON CENTRAL R 19,802,839 18,324,535 945,294 533,010 6,445,332 5,706,046 3,763,327 2,610,631 4,774,035 2,398,309 0 1,777,801 538,816 2,803
3,974,595HUNTERDON CO VOCATI 2,056,085 1,691,525 186,580 177,980 459,834 324,834 609,319 467,889 853,475 88,040 0 21,857 81,250 293
4,464,097KINGWOOD TWP 2,649,974 2,545,570 51,900 52,504 658,647 504,349 643,117 461,447 470,645 235,791 0 41,030 0 475
2,384,335LAMBERTVILLE CITY 1,613,936 1,542,028 57,108 14,800 277,705 175,305 282,087 222,337 203,585 83,850 4,500 2,523 0 162
1,430,196LEBANON BORO 833,276 780,131 46,395 6,750 164,454 143,880 262,211 151,106 160,541 47,618 6,000 3,615 0 87
9,912,275LEBANON TWP 6,152,019 5,834,698 222,135 95,186 1,683,086 1,445,781 1,126,958 873,810 868,102 491,202 0 82,110 0 847
1,581,782MILFORD BORO 956,493 873,695 30,165 52,633 208,861 94,453 240,291 160,508 140,881 44,431 21,131 14,125 0 111
37,314,841N HUNT/VOORHEES REGI 21,197,796 19,778,918 675,026 743,852 4,657,726 4,010,708 3,602,430 2,232,455 5,604,327 3,196,808 50,053 2,202,509 229,852 2,745
22,774,112READINGTON TWP 13,401,579 12,316,389 951,703 133,487 3,683,571 3,053,960 2,693,593 2,176,688 2,620,398 1,257,764 0 182,659 41,980 2,276
5,772,543SOUTH HUNTERDON REG 3,325,354 3,084,507 145,534 95,313 876,709 550,519 659,958 529,129 491,469 261,217 0 357,439 15,830 346
484,779STOCKTON BORO 279,460 266,738 8,422 4,300 18,894 15,371 130,271 114,921 56,154 26,500 0 0 0 60
8,298,020TEWKSBURY TWP 5,066,518 4,841,045 179,623 45,850 1,091,649 862,583 1,059,340 853,735 838,096 433,556 0 169,589 75,000 694
6,577,156UNION TWP 3,930,939 3,683,995 189,447 57,497 1,035,688 895,552 894,086 673,141 646,041 309,311 0 70,402 10,995 689
2,669,570WEST AMWELL TWP 1,683,483 1,523,725 140,230 19,528 412,730 256,573 336,497 253,633 212,361 110,201 18,500 6,000 0 222
N.J. Department of Education - Comparative Spending Guide March 2005Page 906
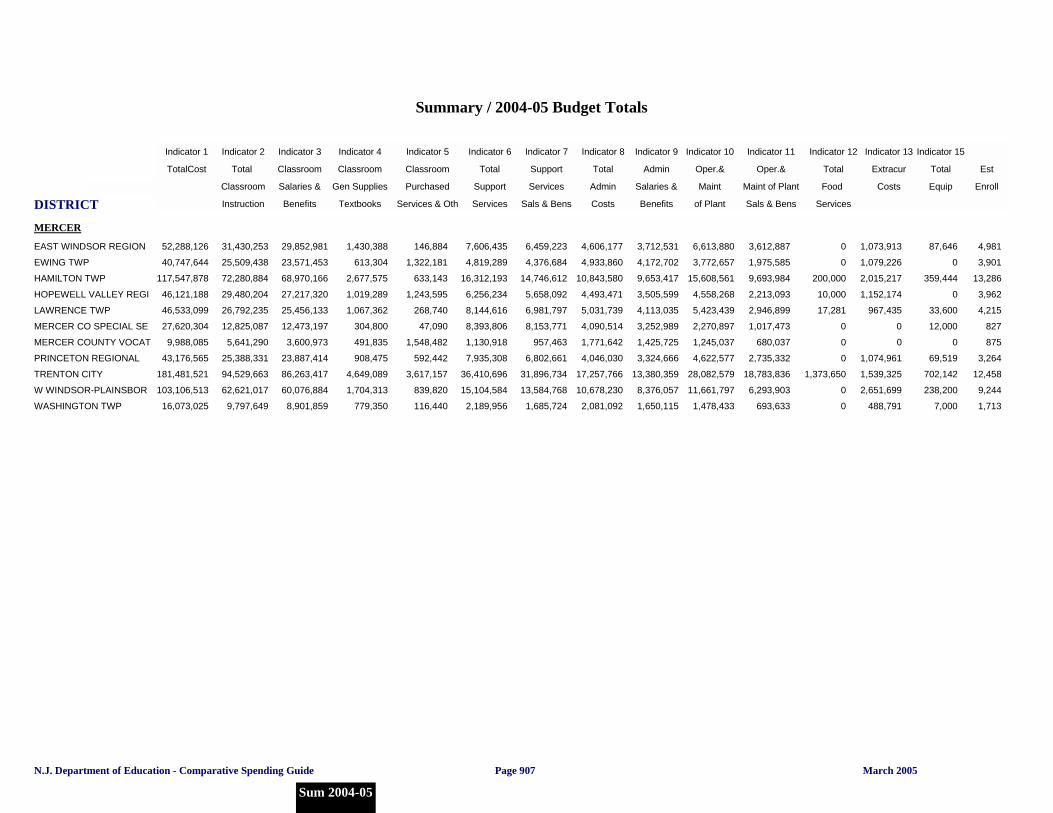
DISTRICT
Indicator 1 Indicator 2 Indicator 3 Indicator 4 Indicator 5 Indicator 6 Indicator 7 Indicator 8 Indicator 9 Indicator 10 Indicator 11 Indicator 12 Indicator 13 Indicator 15
TotalCost Total Classroom Classroom Classroom Total Support Total Admin Oper.& Oper.& Total Extracur Total Est
Per Pupil Classroom Salaries & Gen Supplies Purchased Support Services Admin Salaries & Maint Maint of Plant Food Costs Equip Enroll
Instruction Benefits Textbooks Services & Oth Services Sals & Bens Costs Benefits of Plant Sals & Bens Services
Summary / 2004-05 Budget Totals
Indicator 1 Total Cost
MERCER
52,288,126EAST WINDSOR REGION 31,430,253 29,852,981 1,430,388 146,884 7,606,435 6,459,223 4,606,177 3,712,531 6,613,880 3,612,887 0 1,073,913 87,646 4,981
40,747,644EWING TWP 25,509,438 23,571,453 613,304 1,322,181 4,819,289 4,376,684 4,933,860 4,172,702 3,772,657 1,975,585 0 1,079,226 0 3,901
117,547,878HAMILTON TWP 72,280,884 68,970,166 2,677,575 633,143 16,312,193 14,746,612 10,843,580 9,653,417 15,608,561 9,693,984 200,000 2,015,217 359,444 13,286
46,121,188HOPEWELL VALLEY REGI 29,480,204 27,217,320 1,019,289 1,243,595 6,256,234 5,658,092 4,493,471 3,505,599 4,558,268 2,213,093 10,000 1,152,174 0 3,962
46,533,099LAWRENCE TWP 26,792,235 25,456,133 1,067,362 268,740 8,144,616 6,981,797 5,031,739 4,113,035 5,423,439 2,946,899 17,281 967,435 33,600 4,215
27,620,304MERCER CO SPECIAL SE 12,825,087 12,473,197 304,800 47,090 8,393,806 8,153,771 4,090,514 3,252,989 2,270,897 1,017,473 0 0 12,000 827
9,988,085MERCER COUNTY VOCAT 5,641,290 3,600,973 491,835 1,548,482 1,130,918 957,463 1,771,642 1,425,725 1,245,037 680,037 0 0 0 875
43,176,565PRINCETON REGIONAL 25,388,331 23,887,414 908,475 592,442 7,935,308 6,802,661 4,046,030 3,324,666 4,622,577 2,735,332 0 1,074,961 69,519 3,264
181,481,521TRENTON CITY 94,529,663 86,263,417 4,649,089 3,617,157 36,410,696 31,896,734 17,257,766 13,380,359 28,082,579 18,783,836 1,373,650 1,539,325 702,142 12,458
103,106,513W WINDSOR-PLAINSBOR 62,621,017 60,076,884 1,704,313 839,820 15,104,584 13,584,768 10,678,230 8,376,057 11,661,797 6,293,903 0 2,651,699 238,200 9,244
16,073,025WASHINGTON TWP 9,797,649 8,901,859 779,350 116,440 2,189,956 1,685,724 2,081,092 1,650,115 1,478,433 693,633 0 488,791 7,000 1,713
N.J. Department of Education - Comparative Spending Guide March 2005
Sum 2004-05
Page 907
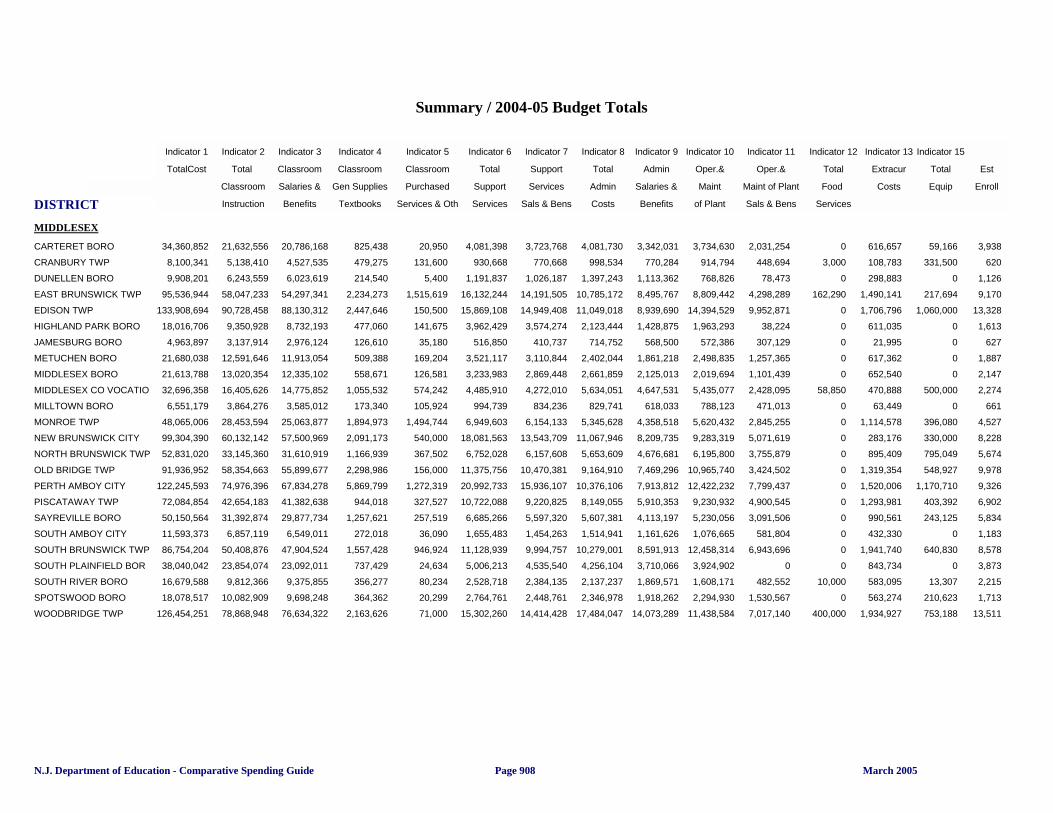
DISTRICT
Indicator 1 Indicator 2 Indicator 3 Indicator 4 Indicator 5 Indicator 6 Indicator 7 Indicator 8 Indicator 9 Indicator 10 Indicator 11 Indicator 12 Indicator 13 Indicator 15
TotalCost Total Classroom Classroom Classroom Total Support Total Admin Oper.& Oper.& Total Extracur Total Est
Per Pupil Classroom Salaries & Gen Supplies Purchased Support Services Admin Salaries & Maint Maint of Plant Food Costs Equip Enroll
Instruction Benefits Textbooks Services & Oth Services Sals & Bens Costs Benefits of Plant Sals & Bens Services
Summary / 2004-05 Budget Totals
Indicator 1 Total Cost
MIDDLESEX
34,360,852CARTERET BORO 21,632,556 20,786,168 825,438 20,950 4,081,398 3,723,768 4,081,730 3,342,031 3,734,630 2,031,254 0 616,657 59,166 3,938
8,100,341CRANBURY TWP 5,138,410 4,527,535 479,275 131,600 930,668 770,668 998,534 770,284 914,794 448,694 3,000 108,783 331,500 620
9,908,201DUNELLEN BORO 6,243,559 6,023,619 214,540 5,400 1,191,837 1,026,187 1,397,243 1,113,362 768,826 78,473 0 298,883 0 1,126
95,536,944EAST BRUNSWICK TWP 58,047,233 54,297,341 2,234,273 1,515,619 16,132,244 14,191,505 10,785,172 8,495,767 8,809,442 4,298,289 162,290 1,490,141 217,694 9,170
133,908,694EDISON TWP 90,728,458 88,130,312 2,447,646 150,500 15,869,108 14,949,408 11,049,018 8,939,690 14,394,529 9,952,871 0 1,706,796 1,060,000 13,328
18,016,706HIGHLAND PARK BORO 9,350,928 8,732,193 477,060 141,675 3,962,429 3,574,274 2,123,444 1,428,875 1,963,293 38,224 0 611,035 0 1,613
4,963,897JAMESBURG BORO 3,137,914 2,976,124 126,610 35,180 516,850 410,737 714,752 568,500 572,386 307,129 0 21,995 0 627
21,680,038METUCHEN BORO 12,591,646 11,913,054 509,388 169,204 3,521,117 3,110,844 2,402,044 1,861,218 2,498,835 1,257,365 0 617,362 0 1,887
21,613,788MIDDLESEX BORO 13,020,354 12,335,102 558,671 126,581 3,233,983 2,869,448 2,661,859 2,125,013 2,019,694 1,101,439 0 652,540 0 2,147
32,696,358MIDDLESEX CO VOCATIO 16,405,626 14,775,852 1,055,532 574,242 4,485,910 4,272,010 5,634,051 4,647,531 5,435,077 2,428,095 58,850 470,888 500,000 2,274
6,551,179MILLTOWN BORO 3,864,276 3,585,012 173,340 105,924 994,739 834,236 829,741 618,033 788,123 471,013 0 63,449 0 661
48,065,006MONROE TWP 28,453,594 25,063,877 1,894,973 1,494,744 6,949,603 6,154,133 5,345,628 4,358,518 5,620,432 2,845,255 0 1,114,578 396,080 4,527
99,304,390NEW BRUNSWICK CITY 60,132,142 57,500,969 2,091,173 540,000 18,081,563 13,543,709 11,067,946 8,209,735 9,283,319 5,071,619 0 283,176 330,000 8,228
52,831,020NORTH BRUNSWICK TWP 33,145,360 31,610,919 1,166,939 367,502 6,752,028 6,157,608 5,653,609 4,676,681 6,195,800 3,755,879 0 895,409 795,049 5,674
91,936,952OLD BRIDGE TWP 58,354,663 55,899,677 2,298,986 156,000 11,375,756 10,470,381 9,164,910 7,469,296 10,965,740 3,424,502 0 1,319,354 548,927 9,978
122,245,593PERTH AMBOY CITY 74,976,396 67,834,278 5,869,799 1,272,319 20,992,733 15,936,107 10,376,106 7,913,812 12,422,232 7,799,437 0 1,520,006 1,170,710 9,326
72,084,854PISCATAWAY TWP 42,654,183 41,382,638 944,018 327,527 10,722,088 9,220,825 8,149,055 5,910,353 9,230,932 4,900,545 0 1,293,981 403,392 6,902
50,150,564SAYREVILLE BORO 31,392,874 29,877,734 1,257,621 257,519 6,685,266 5,597,320 5,607,381 4,113,197 5,230,056 3,091,506 0 990,561 243,125 5,834
11,593,373SOUTH AMBOY CITY 6,857,119 6,549,011 272,018 36,090 1,655,483 1,454,263 1,514,941 1,161,626 1,076,665 581,804 0 432,330 0 1,183
86,754,204SOUTH BRUNSWICK TWP 50,408,876 47,904,524 1,557,428 946,924 11,128,939 9,994,757 10,279,001 8,591,913 12,458,314 6,943,696 0 1,941,740 640,830 8,578
38,040,042SOUTH PLAINFIELD BOR 23,854,074 23,092,011 737,429 24,634 5,006,213 4,535,540 4,256,104 3,710,066 3,924,902 0 0 843,734 0 3,873
16,679,588SOUTH RIVER BORO 9,812,366 9,375,855 356,277 80,234 2,528,718 2,384,135 2,137,237 1,869,571 1,608,171 482,552 10,000 583,095 13,307 2,215
18,078,517SPOTSWOOD BORO 10,082,909 9,698,248 364,362 20,299 2,764,761 2,448,761 2,346,978 1,918,262 2,294,930 1,530,567 0 563,274 210,623 1,713
126,454,251WOODBRIDGE TWP 78,868,948 76,634,322 2,163,626 71,000 15,302,260 14,414,428 17,484,047 14,073,289 11,438,584 7,017,140 400,000 1,934,927 753,188 13,511
N.J. Department of Education - Comparative Spending Guide March 2005Page 908
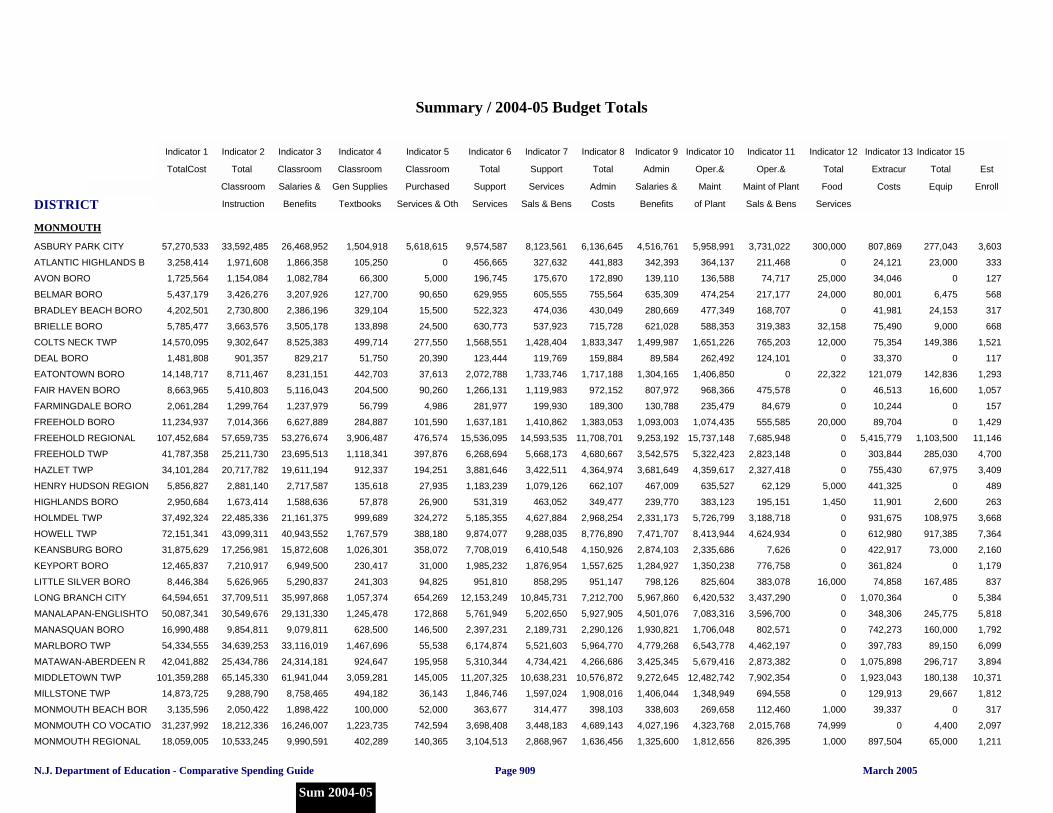
DISTRICT
Indicator 1 Indicator 2 Indicator 3 Indicator 4 Indicator 5 Indicator 6 Indicator 7 Indicator 8 Indicator 9 Indicator 10 Indicator 11 Indicator 12 Indicator 13 Indicator 15
TotalCost Total Classroom Classroom Classroom Total Support Total Admin Oper.& Oper.& Total Extracur Total Est
Per Pupil Classroom Salaries & Gen Supplies Purchased Support Services Admin Salaries & Maint Maint of Plant Food Costs Equip Enroll
Instruction Benefits Textbooks Services & Oth Services Sals & Bens Costs Benefits of Plant Sals & Bens Services
Summary / 2004-05 Budget Totals
Indicator 1 Total Cost
MONMOUTH
57,270,533ASBURY PARK CITY 33,592,485 26,468,952 1,504,918 5,618,615 9,574,587 8,123,561 6,136,645 4,516,761 5,958,991 3,731,022 300,000 807,869 277,043 3,603
3,258,414ATLANTIC HIGHLANDS B 1,971,608 1,866,358 105,250 0 456,665 327,632 441,883 342,393 364,137 211,468 0 24,121 23,000 333
1,725,564AVON BORO 1,154,084 1,082,784 66,300 5,000 196,745 175,670 172,890 139,110 136,588 74,717 25,000 34,046 0 127
5,437,179BELMAR BORO 3,426,276 3,207,926 127,700 90,650 629,955 605,555 755,564 635,309 474,254 217,177 24,000 80,001 6,475 568
4,202,501BRADLEY BEACH BORO 2,730,800 2,386,196 329,104 15,500 522,323 474,036 430,049 280,669 477,349 168,707 0 41,981 24,153 317
5,785,477BRIELLE BORO 3,663,576 3,505,178 133,898 24,500 630,773 537,923 715,728 621,028 588,353 319,383 32,158 75,490 9,000 668
14,570,095COLTS NECK TWP 9,302,647 8,525,383 499,714 277,550 1,568,551 1,428,404 1,833,347 1,499,987 1,651,226 765,203 12,000 75,354 149,386 1,521
1,481,808DEAL BORO 901,357 829,217 51,750 20,390 123,444 119,769 159,884 89,584 262,492 124,101 0 33,370 0 117
14,148,717EATONTOWN BORO 8,711,467 8,231,151 442,703 37,613 2,072,788 1,733,746 1,717,188 1,304,165 1,406,850 0 22,322 121,079 142,836 1,293
8,663,965FAIR HAVEN BORO 5,410,803 5,116,043 204,500 90,260 1,266,131 1,119,983 972,152 807,972 968,366 475,578 0 46,513 16,600 1,057
2,061,284FARMINGDALE BORO 1,299,764 1,237,979 56,799 4,986 281,977 199,930 189,300 130,788 235,479 84,679 0 10,244 0 157
11,234,937FREEHOLD BORO 7,014,366 6,627,889 284,887 101,590 1,637,181 1,410,862 1,383,053 1,093,003 1,074,435 555,585 20,000 89,704 0 1,429
107,452,684FREEHOLD REGIONAL 57,659,735 53,276,674 3,906,487 476,574 15,536,095 14,593,535 11,708,701 9,253,192 15,737,148 7,685,948 0 5,415,779 1,103,500 11,146
41,787,358FREEHOLD TWP 25,211,730 23,695,513 1,118,341 397,876 6,268,694 5,668,173 4,680,667 3,542,575 5,322,423 2,823,148 0 303,844 285,030 4,700
34,101,284HAZLET TWP 20,717,782 19,611,194 912,337 194,251 3,881,646 3,422,511 4,364,974 3,681,649 4,359,617 2,327,418 0 755,430 67,975 3,409
5,856,827HENRY HUDSON REGION 2,881,140 2,717,587 135,618 27,935 1,183,239 1,079,126 662,107 467,009 635,527 62,129 5,000 441,325 0 489
2,950,684HIGHLANDS BORO 1,673,414 1,588,636 57,878 26,900 531,319 463,052 349,477 239,770 383,123 195,151 1,450 11,901 2,600 263
37,492,324HOLMDEL TWP 22,485,336 21,161,375 999,689 324,272 5,185,355 4,627,884 2,968,254 2,331,173 5,726,799 3,188,718 0 931,675 108,975 3,668
72,151,341HOWELL TWP 43,099,311 40,943,552 1,767,579 388,180 9,874,077 9,288,035 8,776,890 7,471,707 8,413,944 4,624,934 0 612,980 917,385 7,364
31,875,629KEANSBURG BORO 17,256,981 15,872,608 1,026,301 358,072 7,708,019 6,410,548 4,150,926 2,874,103 2,335,686 7,626 0 422,917 73,000 2,160
12,465,837KEYPORT BORO 7,210,917 6,949,500 230,417 31,000 1,985,232 1,876,954 1,557,625 1,284,927 1,350,238 776,758 0 361,824 0 1,179
8,446,384LITTLE SILVER BORO 5,626,965 5,290,837 241,303 94,825 951,810 858,295 951,147 798,126 825,604 383,078 16,000 74,858 167,485 837
64,594,651LONG BRANCH CITY 37,709,511 35,997,868 1,057,374 654,269 12,153,249 10,845,731 7,212,700 5,967,860 6,420,532 3,437,290 0 1,070,364 0 5,384
50,087,341MANALAPAN-ENGLISHTO 30,549,676 29,131,330 1,245,478 172,868 5,761,949 5,202,650 5,927,905 4,501,076 7,083,316 3,596,700 0 348,306 245,775 5,818
16,990,488MANASQUAN BORO 9,854,811 9,079,811 628,500 146,500 2,397,231 2,189,731 2,290,126 1,930,821 1,706,048 802,571 0 742,273 160,000 1,792
54,334,555MARLBORO TWP 34,639,253 33,116,019 1,467,696 55,538 6,174,874 5,521,603 5,964,770 4,779,268 6,543,778 4,462,197 0 397,783 89,150 6,099
42,041,882MATAWAN-ABERDEEN R 25,434,786 24,314,181 924,647 195,958 5,310,344 4,734,421 4,266,686 3,425,345 5,679,416 2,873,382 0 1,075,898 296,717 3,894
101,359,288MIDDLETOWN TWP 65,145,330 61,941,044 3,059,281 145,005 11,207,325 10,638,231 10,576,872 9,272,645 12,482,742 7,902,354 0 1,923,043 180,138 10,371
14,873,725MILLSTONE TWP 9,288,790 8,758,465 494,182 36,143 1,846,746 1,597,024 1,908,016 1,406,044 1,348,949 694,558 0 129,913 29,667 1,812
3,135,596MONMOUTH BEACH BOR 2,050,422 1,898,422 100,000 52,000 363,677 314,477 398,103 338,603 269,658 112,460 1,000 39,337 0 317
31,237,992MONMOUTH CO VOCATIO 18,212,336 16,246,007 1,223,735 742,594 3,698,408 3,448,183 4,689,143 4,027,196 4,323,768 2,015,768 74,999 0 4,400 2,097
18,059,005MONMOUTH REGIONAL 10,533,245 9,990,591 402,289 140,365 3,104,513 2,868,967 1,636,456 1,325,600 1,812,656 826,395 1,000 897,504 65,000 1,211
N.J. Department of Education - Comparative Spending Guide March 2005
Sum 2004-05
Page 909
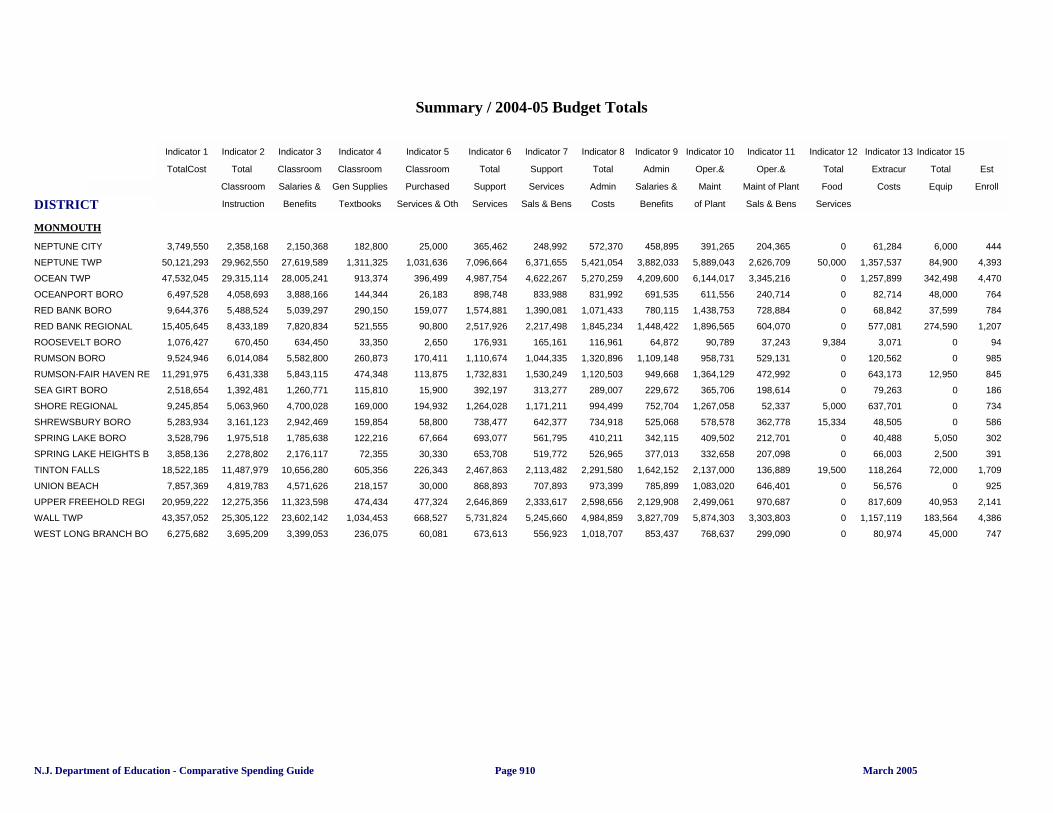
DISTRICT
Indicator 1 Indicator 2 Indicator 3 Indicator 4 Indicator 5 Indicator 6 Indicator 7 Indicator 8 Indicator 9 Indicator 10 Indicator 11 Indicator 12 Indicator 13 Indicator 15
TotalCost Total Classroom Classroom Classroom Total Support Total Admin Oper.& Oper.& Total Extracur Total Est
Per Pupil Classroom Salaries & Gen Supplies Purchased Support Services Admin Salaries & Maint Maint of Plant Food Costs Equip Enroll
Instruction Benefits Textbooks Services & Oth Services Sals & Bens Costs Benefits of Plant Sals & Bens Services
Summary / 2004-05 Budget Totals
Indicator 1 Total Cost
MONMOUTH
3,749,550NEPTUNE CITY 2,358,168 2,150,368 182,800 25,000 365,462 248,992 572,370 458,895 391,265 204,365 0 61,284 6,000 444
50,121,293NEPTUNE TWP 29,962,550 27,619,589 1,311,325 1,031,636 7,096,664 6,371,655 5,421,054 3,882,033 5,889,043 2,626,709 50,000 1,357,537 84,900 4,393
47,532,045OCEAN TWP 29,315,114 28,005,241 913,374 396,499 4,987,754 4,622,267 5,270,259 4,209,600 6,144,017 3,345,216 0 1,257,899 342,498 4,470
6,497,528OCEANPORT BORO 4,058,693 3,888,166 144,344 26,183 898,748 833,988 831,992 691,535 611,556 240,714 0 82,714 48,000 764
9,644,376RED BANK BORO 5,488,524 5,039,297 290,150 159,077 1,574,881 1,390,081 1,071,433 780,115 1,438,753 728,884 0 68,842 37,599 784
15,405,645RED BANK REGIONAL 8,433,189 7,820,834 521,555 90,800 2,517,926 2,217,498 1,845,234 1,448,422 1,896,565 604,070 0 577,081 274,590 1,207
1,076,427ROOSEVELT BORO 670,450 634,450 33,350 2,650 176,931 165,161 116,961 64,872 90,789 37,243 9,384 3,071 0 94
9,524,946RUMSON BORO 6,014,084 5,582,800 260,873 170,411 1,110,674 1,044,335 1,320,896 1,109,148 958,731 529,131 0 120,562 0 985
11,291,975RUMSON-FAIR HAVEN RE 6,431,338 5,843,115 474,348 113,875 1,732,831 1,530,249 1,120,503 949,668 1,364,129 472,992 0 643,173 12,950 845
2,518,654SEA GIRT BORO 1,392,481 1,260,771 115,810 15,900 392,197 313,277 289,007 229,672 365,706 198,614 0 79,263 0 186
9,245,854SHORE REGIONAL 5,063,960 4,700,028 169,000 194,932 1,264,028 1,171,211 994,499 752,704 1,267,058 52,337 5,000 637,701 0 734
5,283,934SHREWSBURY BORO 3,161,123 2,942,469 159,854 58,800 738,477 642,377 734,918 525,068 578,578 362,778 15,334 48,505 0 586
3,528,796SPRING LAKE BORO 1,975,518 1,785,638 122,216 67,664 693,077 561,795 410,211 342,115 409,502 212,701 0 40,488 5,050 302
3,858,136SPRING LAKE HEIGHTS B 2,278,802 2,176,117 72,355 30,330 653,708 519,772 526,965 377,013 332,658 207,098 0 66,003 2,500 391
18,522,185TINTON FALLS 11,487,979 10,656,280 605,356 226,343 2,467,863 2,113,482 2,291,580 1,642,152 2,137,000 136,889 19,500 118,264 72,000 1,709
7,857,369UNION BEACH 4,819,783 4,571,626 218,157 30,000 868,893 707,893 973,399 785,899 1,083,020 646,401 0 56,576 0 925
20,959,222UPPER FREEHOLD REGI 12,275,356 11,323,598 474,434 477,324 2,646,869 2,333,617 2,598,656 2,129,908 2,499,061 970,687 0 817,609 40,953 2,141
43,357,052WALL TWP 25,305,122 23,602,142 1,034,453 668,527 5,731,824 5,245,660 4,984,859 3,827,709 5,874,303 3,303,803 0 1,157,119 183,564 4,386
6,275,682WEST LONG BRANCH BO 3,695,209 3,399,053 236,075 60,081 673,613 556,923 1,018,707 853,437 768,637 299,090 0 80,974 45,000 747
N.J. Department of Education - Comparative Spending Guide March 2005Page 910
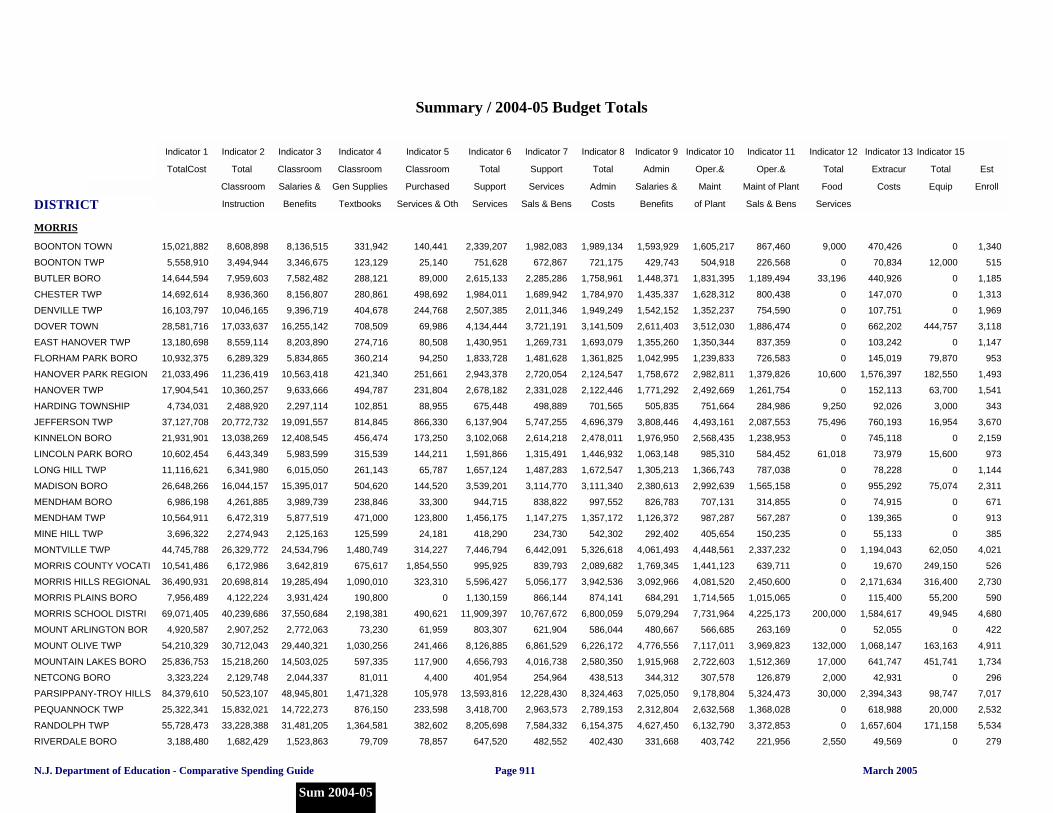
DISTRICT
Indicator 1 Indicator 2 Indicator 3 Indicator 4 Indicator 5 Indicator 6 Indicator 7 Indicator 8 Indicator 9 Indicator 10 Indicator 11 Indicator 12 Indicator 13 Indicator 15
TotalCost Total Classroom Classroom Classroom Total Support Total Admin Oper.& Oper.& Total Extracur Total Est
Per Pupil Classroom Salaries & Gen Supplies Purchased Support Services Admin Salaries & Maint Maint of Plant Food Costs Equip Enroll
Instruction Benefits Textbooks Services & Oth Services Sals & Bens Costs Benefits of Plant Sals & Bens Services
Summary / 2004-05 Budget Totals
Indicator 1 Total Cost
MORRIS
15,021,882BOONTON TOWN 8,608,898 8,136,515 331,942 140,441 2,339,207 1,982,083 1,989,134 1,593,929 1,605,217 867,460 9,000 470,426 0 1,340
5,558,910BOONTON TWP 3,494,944 3,346,675 123,129 25,140 751,628 672,867 721,175 429,743 504,918 226,568 0 70,834 12,000 515
14,644,594BUTLER BORO 7,959,603 7,582,482 288,121 89,000 2,615,133 2,285,286 1,758,961 1,448,371 1,831,395 1,189,494 33,196 440,926 0 1,185
14,692,614CHESTER TWP 8,936,360 8,156,807 280,861 498,692 1,984,011 1,689,942 1,784,970 1,435,337 1,628,312 800,438 0 147,070 0 1,313
16,103,797DENVILLE TWP 10,046,165 9,396,719 404,678 244,768 2,507,385 2,011,346 1,949,249 1,542,152 1,352,237 754,590 0 107,751 0 1,969
28,581,716DOVER TOWN 17,033,637 16,255,142 708,509 69,986 4,134,444 3,721,191 3,141,509 2,611,403 3,512,030 1,886,474 0 662,202 444,757 3,118
13,180,698EAST HANOVER TWP 8,559,114 8,203,890 274,716 80,508 1,430,951 1,269,731 1,693,079 1,355,260 1,350,344 837,359 0 103,242 0 1,147
10,932,375FLORHAM PARK BORO 6,289,329 5,834,865 360,214 94,250 1,833,728 1,481,628 1,361,825 1,042,995 1,239,833 726,583 0 145,019 79,870 953
21,033,496HANOVER PARK REGION 11,236,419 10,563,418 421,340 251,661 2,943,378 2,720,054 2,124,547 1,758,672 2,982,811 1,379,826 10,600 1,576,397 182,550 1,493
17,904,541HANOVER TWP 10,360,257 9,633,666 494,787 231,804 2,678,182 2,331,028 2,122,446 1,771,292 2,492,669 1,261,754 0 152,113 63,700 1,541
4,734,031HARDING TOWNSHIP 2,488,920 2,297,114 102,851 88,955 675,448 498,889 701,565 505,835 751,664 284,986 9,250 92,026 3,000 343
37,127,708JEFFERSON TWP 20,772,732 19,091,557 814,845 866,330 6,137,904 5,747,255 4,696,379 3,808,446 4,493,161 2,087,553 75,496 760,193 16,954 3,670
21,931,901KINNELON BORO 13,038,269 12,408,545 456,474 173,250 3,102,068 2,614,218 2,478,011 1,976,950 2,568,435 1,238,953 0 745,118 0 2,159
10,602,454LINCOLN PARK BORO 6,443,349 5,983,599 315,539 144,211 1,591,866 1,315,491 1,446,932 1,063,148 985,310 584,452 61,018 73,979 15,600 973
11,116,621LONG HILL TWP 6,341,980 6,015,050 261,143 65,787 1,657,124 1,487,283 1,672,547 1,305,213 1,366,743 787,038 0 78,228 0 1,144
26,648,266MADISON BORO 16,044,157 15,395,017 504,620 144,520 3,539,201 3,114,770 3,111,340 2,380,613 2,992,639 1,565,158 0 955,292 75,074 2,311
6,986,198MENDHAM BORO 4,261,885 3,989,739 238,846 33,300 944,715 838,822 997,552 826,783 707,131 314,855 0 74,915 0 671
10,564,911MENDHAM TWP 6,472,319 5,877,519 471,000 123,800 1,456,175 1,147,275 1,357,172 1,126,372 987,287 567,287 0 139,365 0 913
3,696,322MINE HILL TWP 2,274,943 2,125,163 125,599 24,181 418,290 234,730 542,302 292,402 405,654 150,235 0 55,133 0 385
44,745,788MONTVILLE TWP 26,329,772 24,534,796 1,480,749 314,227 7,446,794 6,442,091 5,326,618 4,061,493 4,448,561 2,337,232 0 1,194,043 62,050 4,021
10,541,486MORRIS COUNTY VOCATI 6,172,986 3,642,819 675,617 1,854,550 995,925 839,793 2,089,682 1,769,345 1,441,123 639,711 0 19,670 249,150 526
36,490,931MORRIS HILLS REGIONAL 20,698,814 19,285,494 1,090,010 323,310 5,596,427 5,056,177 3,942,536 3,092,966 4,081,520 2,450,600 0 2,171,634 316,400 2,730
7,956,489MORRIS PLAINS BORO 4,122,224 3,931,424 190,800 0 1,130,159 866,144 874,141 684,291 1,714,565 1,015,065 0 115,400 55,200 590
69,071,405MORRIS SCHOOL DISTRI 40,239,686 37,550,684 2,198,381 490,621 11,909,397 10,767,672 6,800,059 5,079,294 7,731,964 4,225,173 200,000 1,584,617 49,945 4,680
4,920,587MOUNT ARLINGTON BOR 2,907,252 2,772,063 73,230 61,959 803,307 621,904 586,044 480,667 566,685 263,169 0 52,055 0 422
54,210,329MOUNT OLIVE TWP 30,712,043 29,440,321 1,030,256 241,466 8,126,885 6,861,529 6,226,172 4,776,556 7,117,011 3,969,823 132,000 1,068,147 163,163 4,911
25,836,753MOUNTAIN LAKES BORO 15,218,260 14,503,025 597,335 117,900 4,656,793 4,016,738 2,580,350 1,915,968 2,722,603 1,512,369 17,000 641,747 451,741 1,734
3,323,224NETCONG BORO 2,129,748 2,044,337 81,011 4,400 401,954 254,964 438,513 344,312 307,578 126,879 2,000 42,931 0 296
84,379,610PARSIPPANY-TROY HILLS 50,523,107 48,945,801 1,471,328 105,978 13,593,816 12,228,430 8,324,463 7,025,050 9,178,804 5,324,473 30,000 2,394,343 98,747 7,017
25,322,341PEQUANNOCK TWP 15,832,021 14,722,273 876,150 233,598 3,418,700 2,963,573 2,789,153 2,312,804 2,632,568 1,368,028 0 618,988 20,000 2,532
55,728,473RANDOLPH TWP 33,228,388 31,481,205 1,364,581 382,602 8,205,698 7,584,332 6,154,375 4,627,450 6,132,790 3,372,853 0 1,657,604 171,158 5,534
3,188,480RIVERDALE BORO 1,682,429 1,523,863 79,709 78,857 647,520 482,552 402,430 331,668 403,742 221,956 2,550 49,569 0 279
N.J. Department of Education - Comparative Spending Guide March 2005
Sum 2004-05
Page 911
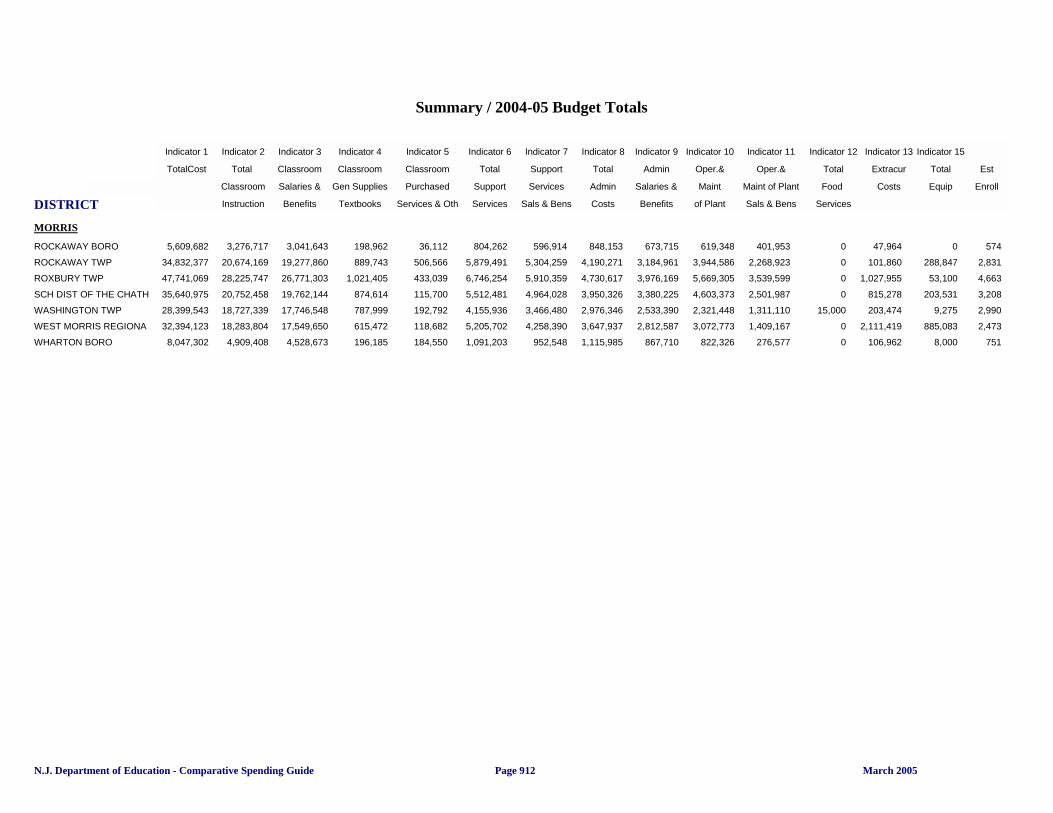
DISTRICT
Indicator 1 Indicator 2 Indicator 3 Indicator 4 Indicator 5 Indicator 6 Indicator 7 Indicator 8 Indicator 9 Indicator 10 Indicator 11 Indicator 12 Indicator 13 Indicator 15
TotalCost Total Classroom Classroom Classroom Total Support Total Admin Oper.& Oper.& Total Extracur Total Est
Per Pupil Classroom Salaries & Gen Supplies Purchased Support Services Admin Salaries & Maint Maint of Plant Food Costs Equip Enroll
Instruction Benefits Textbooks Services & Oth Services Sals & Bens Costs Benefits of Plant Sals & Bens Services
Summary / 2004-05 Budget Totals
Indicator 1 Total Cost
MORRIS
5,609,682ROCKAWAY BORO 3,276,717 3,041,643 198,962 36,112 804,262 596,914 848,153 673,715 619,348 401,953 0 47,964 0 574
34,832,377ROCKAWAY TWP 20,674,169 19,277,860 889,743 506,566 5,879,491 5,304,259 4,190,271 3,184,961 3,944,586 2,268,923 0 101,860 288,847 2,831
47,741,069ROXBURY TWP 28,225,747 26,771,303 1,021,405 433,039 6,746,254 5,910,359 4,730,617 3,976,169 5,669,305 3,539,599 0 1,027,955 53,100 4,663
35,640,975SCH DIST OF THE CHATH 20,752,458 19,762,144 874,614 115,700 5,512,481 4,964,028 3,950,326 3,380,225 4,603,373 2,501,987 0 815,278 203,531 3,208
28,399,543WASHINGTON TWP 18,727,339 17,746,548 787,999 192,792 4,155,936 3,466,480 2,976,346 2,533,390 2,321,448 1,311,110 15,000 203,474 9,275 2,990
32,394,123WEST MORRIS REGIONA 18,283,804 17,549,650 615,472 118,682 5,205,702 4,258,390 3,647,937 2,812,587 3,072,773 1,409,167 0 2,111,419 885,083 2,473
8,047,302WHARTON BORO 4,909,408 4,528,673 196,185 184,550 1,091,203 952,548 1,115,985 867,710 822,326 276,577 0 106,962 8,000 751
N.J. Department of Education - Comparative Spending Guide March 2005Page 912
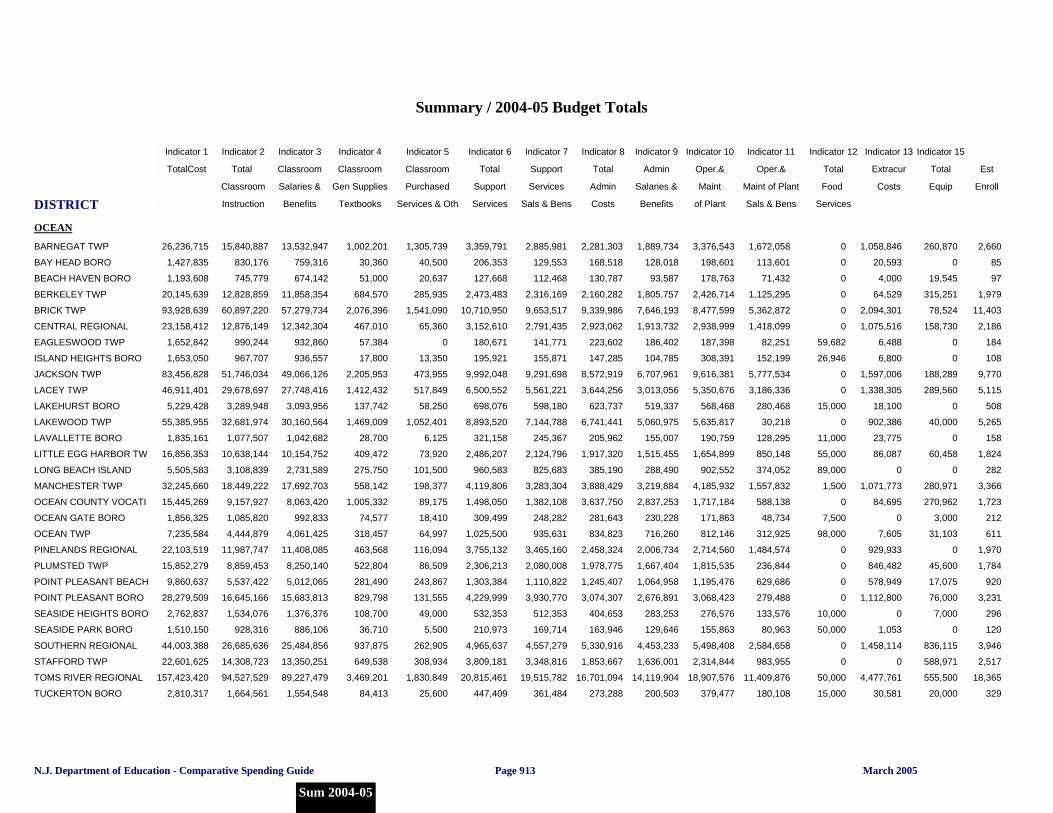
DISTRICT
Indicator 1 Indicator 2 Indicator 3 Indicator 4 Indicator 5 Indicator 6 Indicator 7 Indicator 8 Indicator 9 Indicator 10 Indicator 11 Indicator 12 Indicator 13 Indicator 15
TotalCost Total Classroom Classroom Classroom Total Support Total Admin Oper.& Oper.& Total Extracur Total Est
Per Pupil Classroom Salaries & Gen Supplies Purchased Support Services Admin Salaries & Maint Maint of Plant Food Costs Equip Enroll
Instruction Benefits Textbooks Services & Oth Services Sals & Bens Costs Benefits of Plant Sals & Bens Services
Summary / 2004-05 Budget Totals
Indicator 1 Total Cost
OCEAN
26,236,715BARNEGAT TWP 15,840,887 13,532,947 1,002,201 1,305,739 3,359,791 2,885,981 2,281,303 1,889,734 3,376,543 1,672,058 0 1,058,846 260,870 2,660
1,427,835BAY HEAD BORO 830,176 759,316 30,360 40,500 206,353 129,553 168,518 128,018 198,601 113,601 0 20,593 0 85
1,193,608BEACH HAVEN BORO 745,779 674,142 51,000 20,637 127,668 112,468 130,787 93,587 178,763 71,432 0 4,000 19,545 97
20,145,639BERKELEY TWP 12,828,859 11,858,354 684,570 285,935 2,473,483 2,316,169 2,160,282 1,805,757 2,426,714 1,125,295 0 64,529 315,251 1,979
93,928,639BRICK TWP 60,897,220 57,279,734 2,076,396 1,541,090 10,710,950 9,653,517 9,339,986 7,646,193 8,477,599 5,362,872 0 2,094,301 78,524 11,403
23,158,412CENTRAL REGIONAL 12,876,149 12,342,304 467,010 65,360 3,152,610 2,791,435 2,923,062 1,913,732 2,938,999 1,418,099 0 1,075,516 158,730 2,186
1,652,842EAGLESWOOD TWP 990,244 932,860 57,384 0 180,671 141,771 223,602 186,402 187,398 82,251 59,682 6,488 0 184
1,653,050ISLAND HEIGHTS BORO 967,707 936,557 17,800 13,350 195,921 155,871 147,285 104,785 308,391 152,199 26,946 6,800 0 108
83,456,828JACKSON TWP 51,746,034 49,066,126 2,205,953 473,955 9,992,048 9,291,698 8,572,919 6,707,961 9,616,381 5,777,534 0 1,597,006 188,289 9,770
46,911,401LACEY TWP 29,678,697 27,748,416 1,412,432 517,849 6,500,552 5,561,221 3,644,256 3,013,056 5,350,676 3,186,336 0 1,338,305 289,560 5,115
5,229,428LAKEHURST BORO 3,289,948 3,093,956 137,742 58,250 698,076 598,180 623,737 519,337 568,468 280,468 15,000 18,100 0 508
55,385,955LAKEWOOD TWP 32,681,974 30,160,564 1,469,009 1,052,401 8,893,520 7,144,788 6,741,441 5,060,975 5,635,817 30,218 0 902,386 40,000 5,265
1,835,161LAVALLETTE BORO 1,077,507 1,042,682 28,700 6,125 321,158 245,367 205,962 155,007 190,759 128,295 11,000 23,775 0 158
16,856,353LITTLE EGG HARBOR TW 10,638,144 10,154,752 409,472 73,920 2,486,207 2,124,796 1,917,320 1,515,455 1,654,899 850,148 55,000 86,087 60,458 1,824
5,505,583LONG BEACH ISLAND 3,108,839 2,731,589 275,750 101,500 960,583 825,683 385,190 288,490 902,552 374,052 89,000 0 0 282
32,245,660MANCHESTER TWP 18,449,222 17,692,703 558,142 198,377 4,119,806 3,283,304 3,888,429 3,219,884 4,185,932 1,557,832 1,500 1,071,773 280,971 3,366
15,445,269OCEAN COUNTY VOCATI 9,157,927 8,063,420 1,005,332 89,175 1,498,050 1,382,108 3,637,750 2,837,253 1,717,184 588,138 0 84,695 270,962 1,723
1,856,325OCEAN GATE BORO 1,085,820 992,833 74,577 18,410 309,499 248,282 281,643 230,228 171,863 48,734 7,500 0 3,000 212
7,235,584OCEAN TWP 4,444,879 4,061,425 318,457 64,997 1,025,500 935,631 834,823 716,260 812,146 312,925 98,000 7,605 31,103 611
22,103,519PINELANDS REGIONAL 11,987,747 11,408,085 463,568 116,094 3,755,132 3,465,160 2,458,324 2,006,734 2,714,560 1,484,574 0 929,933 0 1,970
15,852,279PLUMSTED TWP 8,859,453 8,250,140 522,804 86,509 2,306,213 2,080,008 1,978,775 1,667,404 1,815,535 236,844 0 846,482 45,600 1,784
9,860,637POINT PLEASANT BEACH 5,537,422 5,012,065 281,490 243,867 1,303,384 1,110,822 1,245,407 1,064,958 1,195,476 629,686 0 578,949 17,075 920
28,279,509POINT PLEASANT BORO 16,645,166 15,683,813 829,798 131,555 4,229,999 3,930,770 3,074,307 2,676,891 3,068,423 279,488 0 1,112,800 76,000 3,231
2,762,837SEASIDE HEIGHTS BORO 1,534,076 1,376,376 108,700 49,000 532,353 512,353 404,653 283,253 276,576 133,576 10,000 0 7,000 296
1,510,150SEASIDE PARK BORO 928,316 886,106 36,710 5,500 210,973 169,714 163,946 129,646 155,863 80,963 50,000 1,053 0 120
44,003,388SOUTHERN REGIONAL 26,685,636 25,484,856 937,875 262,905 4,965,637 4,557,279 5,330,916 4,453,233 5,498,408 2,584,658 0 1,458,114 836,115 3,946
22,601,625STAFFORD TWP 14,308,723 13,350,251 649,538 308,934 3,809,181 3,348,816 1,853,667 1,636,001 2,314,844 983,955 0 0 588,971 2,517
157,423,420TOMS RIVER REGIONAL 94,527,529 89,227,479 3,469,201 1,830,849 20,815,461 19,515,782 16,701,094 14,119,904 18,907,576 11,409,876 50,000 4,477,761 555,500 18,365
2,810,317TUCKERTON BORO 1,664,561 1,554,548 84,413 25,600 447,409 361,484 273,288 200,503 379,477 180,108 15,000 30,581 20,000 329
N.J. Department of Education - Comparative Spending Guide March 2005
Sum 2004-05
Page 913
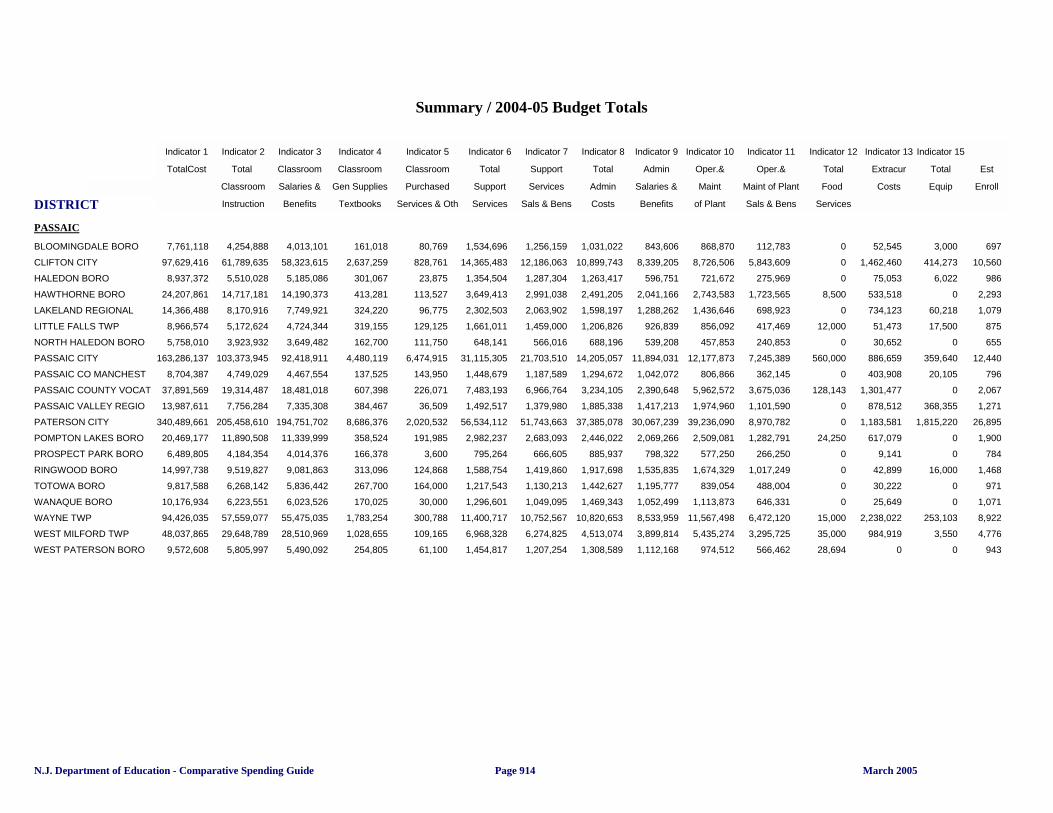
DISTRICT
Indicator 1 Indicator 2 Indicator 3 Indicator 4 Indicator 5 Indicator 6 Indicator 7 Indicator 8 Indicator 9 Indicator 10 Indicator 11 Indicator 12 Indicator 13 Indicator 15
TotalCost Total Classroom Classroom Classroom Total Support Total Admin Oper.& Oper.& Total Extracur Total Est
Per Pupil Classroom Salaries & Gen Supplies Purchased Support Services Admin Salaries & Maint Maint of Plant Food Costs Equip Enroll
Instruction Benefits Textbooks Services & Oth Services Sals & Bens Costs Benefits of Plant Sals & Bens Services
Summary / 2004-05 Budget Totals
Indicator 1 Total Cost
PASSAIC
7,761,118BLOOMINGDALE BORO 4,254,888 4,013,101 161,018 80,769 1,534,696 1,256,159 1,031,022 843,606 868,870 112,783 0 52,545 3,000 697
97,629,416CLIFTON CITY 61,789,635 58,323,615 2,637,259 828,761 14,365,483 12,186,063 10,899,743 8,339,205 8,726,506 5,843,609 0 1,462,460 414,273 10,560
8,937,372HALEDON BORO 5,510,028 5,185,086 301,067 23,875 1,354,504 1,287,304 1,263,417 596,751 721,672 275,969 0 75,053 6,022 986
24,207,861HAWTHORNE BORO 14,717,181 14,190,373 413,281 113,527 3,649,413 2,991,038 2,491,205 2,041,166 2,743,583 1,723,565 8,500 533,518 0 2,293
14,366,488LAKELAND REGIONAL 8,170,916 7,749,921 324,220 96,775 2,302,503 2,063,902 1,598,197 1,288,262 1,436,646 698,923 0 734,123 60,218 1,079
8,966,574LITTLE FALLS TWP 5,172,624 4,724,344 319,155 129,125 1,661,011 1,459,000 1,206,826 926,839 856,092 417,469 12,000 51,473 17,500 875
5,758,010NORTH HALEDON BORO 3,923,932 3,649,482 162,700 111,750 648,141 566,016 688,196 539,208 457,853 240,853 0 30,652 0 655
163,286,137PASSAIC CITY 103,373,945 92,418,911 4,480,119 6,474,915 31,115,305 21,703,510 14,205,057 11,894,031 12,177,873 7,245,389 560,000 886,659 359,640 12,440
8,704,387PASSAIC CO MANCHEST 4,749,029 4,467,554 137,525 143,950 1,448,679 1,187,589 1,294,672 1,042,072 806,866 362,145 0 403,908 20,105 796
37,891,569PASSAIC COUNTY VOCAT 19,314,487 18,481,018 607,398 226,071 7,483,193 6,966,764 3,234,105 2,390,648 5,962,572 3,675,036 128,143 1,301,477 0 2,067
13,987,611PASSAIC VALLEY REGIO 7,756,284 7,335,308 384,467 36,509 1,492,517 1,379,980 1,885,338 1,417,213 1,974,960 1,101,590 0 878,512 368,355 1,271
340,489,661PATERSON CITY 205,458,610 194,751,702 8,686,376 2,020,532 56,534,112 51,743,663 37,385,078 30,067,239 39,236,090 8,970,782 0 1,183,581 1,815,220 26,895
20,469,177POMPTON LAKES BORO 11,890,508 11,339,999 358,524 191,985 2,982,237 2,683,093 2,446,022 2,069,266 2,509,081 1,282,791 24,250 617,079 0 1,900
6,489,805PROSPECT PARK BORO 4,184,354 4,014,376 166,378 3,600 795,264 666,605 885,937 798,322 577,250 266,250 0 9,141 0 784
14,997,738RINGWOOD BORO 9,519,827 9,081,863 313,096 124,868 1,588,754 1,419,860 1,917,698 1,535,835 1,674,329 1,017,249 0 42,899 16,000 1,468
9,817,588TOTOWA BORO 6,268,142 5,836,442 267,700 164,000 1,217,543 1,130,213 1,442,627 1,195,777 839,054 488,004 0 30,222 0 971
10,176,934WANAQUE BORO 6,223,551 6,023,526 170,025 30,000 1,296,601 1,049,095 1,469,343 1,052,499 1,113,873 646,331 0 25,649 0 1,071
94,426,035WAYNE TWP 57,559,077 55,475,035 1,783,254 300,788 11,400,717 10,752,567 10,820,653 8,533,959 11,567,498 6,472,120 15,000 2,238,022 253,103 8,922
48,037,865WEST MILFORD TWP 29,648,789 28,510,969 1,028,655 109,165 6,968,328 6,274,825 4,513,074 3,899,814 5,435,274 3,295,725 35,000 984,919 3,550 4,776
9,572,608WEST PATERSON BORO 5,805,997 5,490,092 254,805 61,100 1,454,817 1,207,254 1,308,589 1,112,168 974,512 566,462 28,694 0 0 943
N.J. Department of Education - Comparative Spending Guide March 2005Page 914
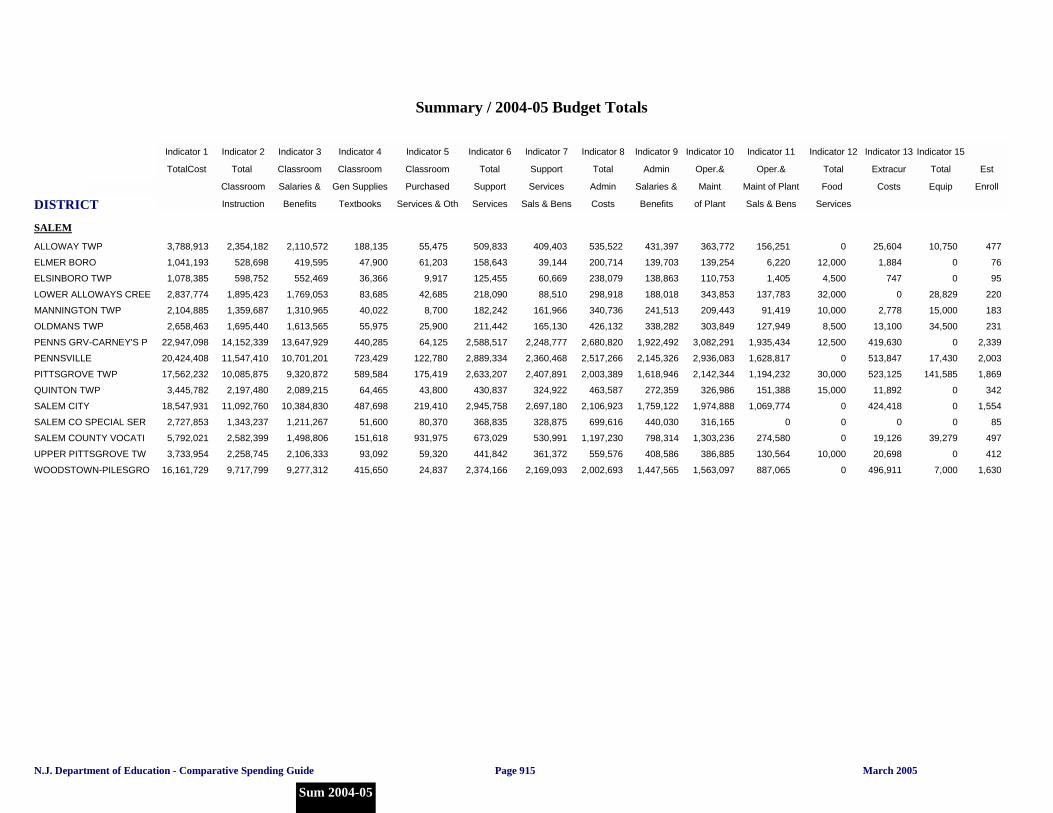
DISTRICT
Indicator 1 Indicator 2 Indicator 3 Indicator 4 Indicator 5 Indicator 6 Indicator 7 Indicator 8 Indicator 9 Indicator 10 Indicator 11 Indicator 12 Indicator 13 Indicator 15
TotalCost Total Classroom Classroom Classroom Total Support Total Admin Oper.& Oper.& Total Extracur Total Est
Per Pupil Classroom Salaries & Gen Supplies Purchased Support Services Admin Salaries & Maint Maint of Plant Food Costs Equip Enroll
Instruction Benefits Textbooks Services & Oth Services Sals & Bens Costs Benefits of Plant Sals & Bens Services
Summary / 2004-05 Budget Totals
Indicator 1 Total Cost
SALEM
3,788,913ALLOWAY TWP 2,354,182 2,110,572 188,135 55,475 509,833 409,403 535,522 431,397 363,772 156,251 0 25,604 10,750 477
1,041,193ELMER BORO 528,698 419,595 47,900 61,203 158,643 39,144 200,714 139,703 139,254 6,220 12,000 1,884 0 76
1,078,385ELSINBORO TWP 598,752 552,469 36,366 9,917 125,455 60,669 238,079 138,863 110,753 1,405 4,500 747 0 95
2,837,774LOWER ALLOWAYS CREE 1,895,423 1,769,053 83,685 42,685 218,090 88,510 298,918 188,018 343,853 137,783 32,000 0 28,829 220
2,104,885MANNINGTON TWP 1,359,687 1,310,965 40,022 8,700 182,242 161,966 340,736 241,513 209,443 91,419 10,000 2,778 15,000 183
2,658,463OLDMANS TWP 1,695,440 1,613,565 55,975 25,900 211,442 165,130 426,132 338,282 303,849 127,949 8,500 13,100 34,500 231
22,947,098PENNS GRV-CARNEY'S P 14,152,339 13,647,929 440,285 64,125 2,588,517 2,248,777 2,680,820 1,922,492 3,082,291 1,935,434 12,500 419,630 0 2,339
20,424,408PENNSVILLE 11,547,410 10,701,201 723,429 122,780 2,889,334 2,360,468 2,517,266 2,145,326 2,936,083 1,628,817 0 513,847 17,430 2,003
17,562,232PITTSGROVE TWP 10,085,875 9,320,872 589,584 175,419 2,633,207 2,407,891 2,003,389 1,618,946 2,142,344 1,194,232 30,000 523,125 141,585 1,869
3,445,782QUINTON TWP 2,197,480 2,089,215 64,465 43,800 430,837 324,922 463,587 272,359 326,986 151,388 15,000 11,892 0 342
18,547,931SALEM CITY 11,092,760 10,384,830 487,698 219,410 2,945,758 2,697,180 2,106,923 1,759,122 1,974,888 1,069,774 0 424,418 0 1,554
2,727,853SALEM CO SPECIAL SER 1,343,237 1,211,267 51,600 80,370 368,835 328,875 699,616 440,030 316,165 0 0 0 0 85
5,792,021SALEM COUNTY VOCATI 2,582,399 1,498,806 151,618 931,975 673,029 530,991 1,197,230 798,314 1,303,236 274,580 0 19,126 39,279 497
3,733,954UPPER PITTSGROVE TW 2,258,745 2,106,333 93,092 59,320 441,842 361,372 559,576 408,586 386,885 130,564 10,000 20,698 0 412
16,161,729WOODSTOWN-PILESGRO 9,717,799 9,277,312 415,650 24,837 2,374,166 2,169,093 2,002,693 1,447,565 1,563,097 887,065 0 496,911 7,000 1,630
N.J. Department of Education - Comparative Spending Guide March 2005
Sum 2004-05
Page 915
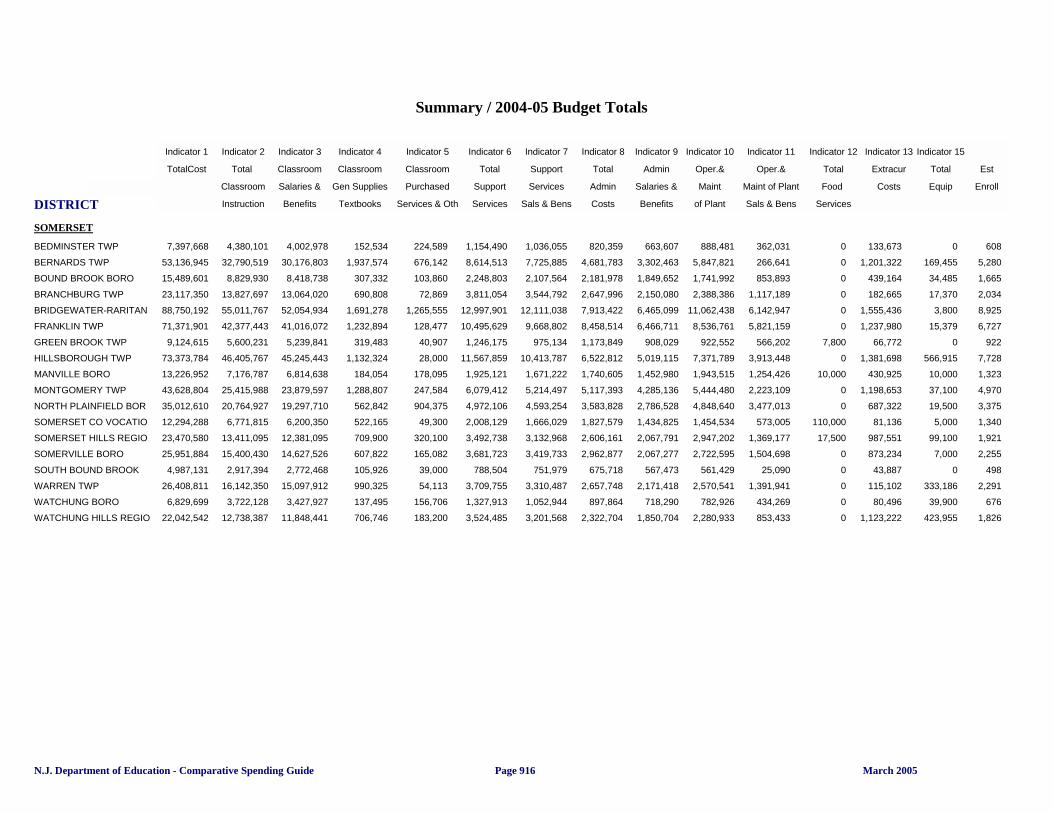
DISTRICT
Indicator 1 Indicator 2 Indicator 3 Indicator 4 Indicator 5 Indicator 6 Indicator 7 Indicator 8 Indicator 9 Indicator 10 Indicator 11 Indicator 12 Indicator 13 Indicator 15
TotalCost Total Classroom Classroom Classroom Total Support Total Admin Oper.& Oper.& Total Extracur Total Est
Per Pupil Classroom Salaries & Gen Supplies Purchased Support Services Admin Salaries & Maint Maint of Plant Food Costs Equip Enroll
Instruction Benefits Textbooks Services & Oth Services Sals & Bens Costs Benefits of Plant Sals & Bens Services
Summary / 2004-05 Budget Totals
Indicator 1 Total Cost
SOMERSET
7,397,668BEDMINSTER TWP 4,380,101 4,002,978 152,534 224,589 1,154,490 1,036,055 820,359 663,607 888,481 362,031 0 133,673 0 608
53,136,945BERNARDS TWP 32,790,519 30,176,803 1,937,574 676,142 8,614,513 7,725,885 4,681,783 3,302,463 5,847,821 266,641 0 1,201,322 169,455 5,280
15,489,601BOUND BROOK BORO 8,829,930 8,418,738 307,332 103,860 2,248,803 2,107,564 2,181,978 1,849,652 1,741,992 853,893 0 439,164 34,485 1,665
23,117,350BRANCHBURG TWP 13,827,697 13,064,020 690,808 72,869 3,811,054 3,544,792 2,647,996 2,150,080 2,388,386 1,117,189 0 182,665 17,370 2,034
88,750,192BRIDGEWATER-RARITAN 55,011,767 52,054,934 1,691,278 1,265,555 12,997,901 12,111,038 7,913,422 6,465,099 11,062,438 6,142,947 0 1,555,436 3,800 8,925
71,371,901FRANKLIN TWP 42,377,443 41,016,072 1,232,894 128,477 10,495,629 9,668,802 8,458,514 6,466,711 8,536,761 5,821,159 0 1,237,980 15,379 6,727
9,124,615GREEN BROOK TWP 5,600,231 5,239,841 319,483 40,907 1,246,175 975,134 1,173,849 908,029 922,552 566,202 7,800 66,772 0 922
73,373,784HILLSBOROUGH TWP 46,405,767 45,245,443 1,132,324 28,000 11,567,859 10,413,787 6,522,812 5,019,115 7,371,789 3,913,448 0 1,381,698 566,915 7,728
13,226,952MANVILLE BORO 7,176,787 6,814,638 184,054 178,095 1,925,121 1,671,222 1,740,605 1,452,980 1,943,515 1,254,426 10,000 430,925 10,000 1,323
43,628,804MONTGOMERY TWP 25,415,988 23,879,597 1,288,807 247,584 6,079,412 5,214,497 5,117,393 4,285,136 5,444,480 2,223,109 0 1,198,653 37,100 4,970
35,012,610NORTH PLAINFIELD BOR 20,764,927 19,297,710 562,842 904,375 4,972,106 4,593,254 3,583,828 2,786,528 4,848,640 3,477,013 0 687,322 19,500 3,375
12,294,288SOMERSET CO VOCATIO 6,771,815 6,200,350 522,165 49,300 2,008,129 1,666,029 1,827,579 1,434,825 1,454,534 573,005 110,000 81,136 5,000 1,340
23,470,580SOMERSET HILLS REGIO 13,411,095 12,381,095 709,900 320,100 3,492,738 3,132,968 2,606,161 2,067,791 2,947,202 1,369,177 17,500 987,551 99,100 1,921
25,951,884SOMERVILLE BORO 15,400,430 14,627,526 607,822 165,082 3,681,723 3,419,733 2,962,877 2,067,277 2,722,595 1,504,698 0 873,234 7,000 2,255
4,987,131SOUTH BOUND BROOK 2,917,394 2,772,468 105,926 39,000 788,504 751,979 675,718 567,473 561,429 25,090 0 43,887 0 498
26,408,811WARREN TWP 16,142,350 15,097,912 990,325 54,113 3,709,755 3,310,487 2,657,748 2,171,418 2,570,541 1,391,941 0 115,102 333,186 2,291
6,829,699WATCHUNG BORO 3,722,128 3,427,927 137,495 156,706 1,327,913 1,052,944 897,864 718,290 782,926 434,269 0 80,496 39,900 676
22,042,542WATCHUNG HILLS REGIO 12,738,387 11,848,441 706,746 183,200 3,524,485 3,201,568 2,322,704 1,850,704 2,280,933 853,433 0 1,123,222 423,955 1,826
N.J. Department of Education - Comparative Spending Guide March 2005Page 916
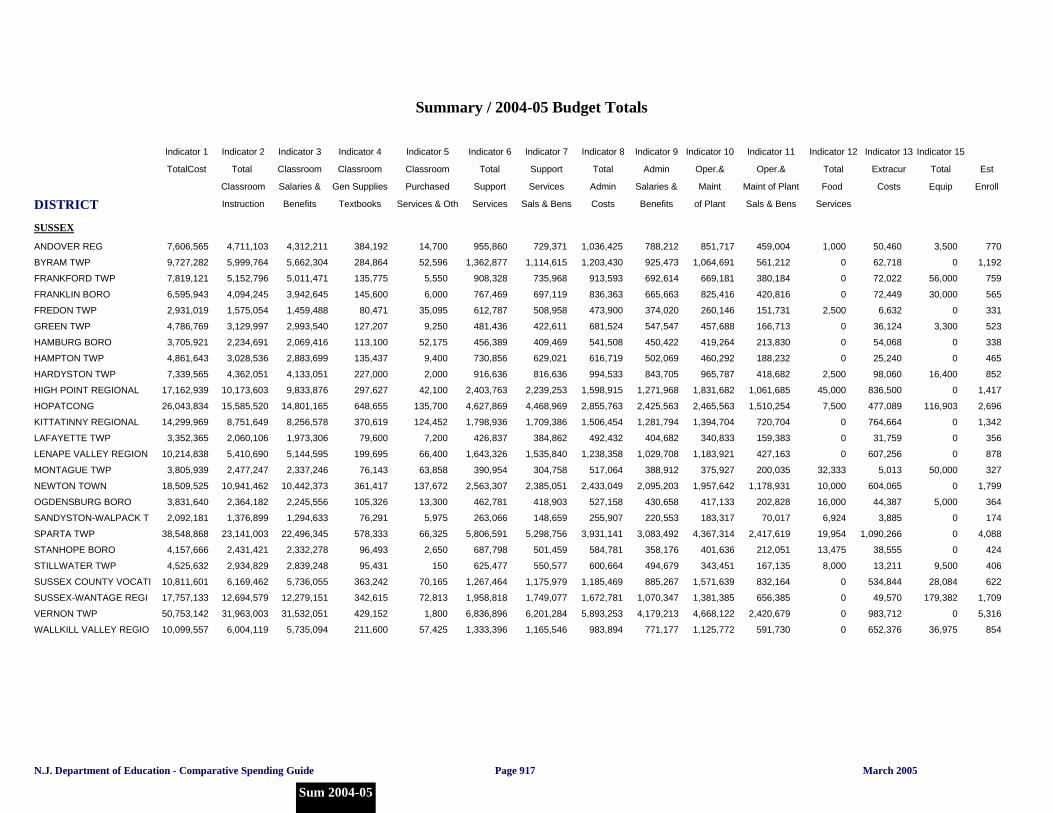
DISTRICT
Indicator 1 Indicator 2 Indicator 3 Indicator 4 Indicator 5 Indicator 6 Indicator 7 Indicator 8 Indicator 9 Indicator 10 Indicator 11 Indicator 12 Indicator 13 Indicator 15
TotalCost Total Classroom Classroom Classroom Total Support Total Admin Oper.& Oper.& Total Extracur Total Est
Per Pupil Classroom Salaries & Gen Supplies Purchased Support Services Admin Salaries & Maint Maint of Plant Food Costs Equip Enroll
Instruction Benefits Textbooks Services & Oth Services Sals & Bens Costs Benefits of Plant Sals & Bens Services
Summary / 2004-05 Budget Totals
Indicator 1 Total Cost
SUSSEX
7,606,565ANDOVER REG 4,711,103 4,312,211 384,192 14,700 955,860 729,371 1,036,425 788,212 851,717 459,004 1,000 50,460 3,500 770
9,727,282BYRAM TWP 5,999,764 5,662,304 284,864 52,596 1,362,877 1,114,615 1,203,430 925,473 1,064,691 561,212 0 62,718 0 1,192
7,819,121FRANKFORD TWP 5,152,796 5,011,471 135,775 5,550 908,328 735,968 913,593 692,614 669,181 380,184 0 72,022 56,000 759
6,595,943FRANKLIN BORO 4,094,245 3,942,645 145,600 6,000 767,469 697,119 836,363 665,663 825,416 420,816 0 72,449 30,000 565
2,931,019FREDON TWP 1,575,054 1,459,488 80,471 35,095 612,787 508,958 473,900 374,020 260,146 151,731 2,500 6,632 0 331
4,786,769GREEN TWP 3,129,997 2,993,540 127,207 9,250 481,436 422,611 681,524 547,547 457,688 166,713 0 36,124 3,300 523
3,705,921HAMBURG BORO 2,234,691 2,069,416 113,100 52,175 456,389 409,469 541,508 450,422 419,264 213,830 0 54,068 0 338
4,861,643HAMPTON TWP 3,028,536 2,883,699 135,437 9,400 730,856 629,021 616,719 502,069 460,292 188,232 0 25,240 0 465
7,339,565HARDYSTON TWP 4,362,051 4,133,051 227,000 2,000 916,636 816,636 994,533 843,705 965,787 418,682 2,500 98,060 16,400 852
17,162,939HIGH POINT REGIONAL 10,173,603 9,833,876 297,627 42,100 2,403,763 2,239,253 1,598,915 1,271,968 1,831,682 1,061,685 45,000 836,500 0 1,417
26,043,834HOPATCONG 15,585,520 14,801,165 648,655 135,700 4,627,869 4,468,969 2,855,763 2,425,563 2,465,563 1,510,254 7,500 477,089 116,903 2,696
14,299,969KITTATINNY REGIONAL 8,751,649 8,256,578 370,619 124,452 1,798,936 1,709,386 1,506,454 1,281,794 1,394,704 720,704 0 764,664 0 1,342
3,352,365LAFAYETTE TWP 2,060,106 1,973,306 79,600 7,200 426,837 384,862 492,432 404,682 340,833 159,383 0 31,759 0 356
10,214,838LENAPE VALLEY REGION 5,410,690 5,144,595 199,695 66,400 1,643,326 1,535,840 1,238,358 1,029,708 1,183,921 427,163 0 607,256 0 878
3,805,939MONTAGUE TWP 2,477,247 2,337,246 76,143 63,858 390,954 304,758 517,064 388,912 375,927 200,035 32,333 5,013 50,000 327
18,509,525NEWTON TOWN 10,941,462 10,442,373 361,417 137,672 2,563,307 2,385,051 2,433,049 2,095,203 1,957,642 1,178,931 10,000 604,065 0 1,799
3,831,640OGDENSBURG BORO 2,364,182 2,245,556 105,326 13,300 462,781 418,903 527,158 430,658 417,133 202,828 16,000 44,387 5,000 364
2,092,181SANDYSTON-WALPACK T 1,376,899 1,294,633 76,291 5,975 263,066 148,659 255,907 220,553 183,317 70,017 6,924 3,885 0 174
38,548,868SPARTA TWP 23,141,003 22,496,345 578,333 66,325 5,806,591 5,298,756 3,931,141 3,083,492 4,367,314 2,417,619 19,954 1,090,266 0 4,088
4,157,666STANHOPE BORO 2,431,421 2,332,278 96,493 2,650 687,798 501,459 584,781 358,176 401,636 212,051 13,475 38,555 0 424
4,525,632STILLWATER TWP 2,934,829 2,839,248 95,431 150 625,477 550,577 600,664 494,679 343,451 167,135 8,000 13,211 9,500 406
10,811,601SUSSEX COUNTY VOCATI 6,169,462 5,736,055 363,242 70,165 1,267,464 1,175,979 1,185,469 885,267 1,571,639 832,164 0 534,844 28,084 622
17,757,133SUSSEX-WANTAGE REGI 12,694,579 12,279,151 342,615 72,813 1,958,818 1,749,077 1,672,781 1,070,347 1,381,385 656,385 0 49,570 179,382 1,709
50,753,142VERNON TWP 31,963,003 31,532,051 429,152 1,800 6,836,896 6,201,284 5,893,253 4,179,213 4,668,122 2,420,679 0 983,712 0 5,316
10,099,557WALLKILL VALLEY REGIO 6,004,119 5,735,094 211,600 57,425 1,333,396 1,165,546 983,894 771,177 1,125,772 591,730 0 652,376 36,975 854
N.J. Department of Education - Comparative Spending Guide March 2005
Sum 2004-05
Page 917
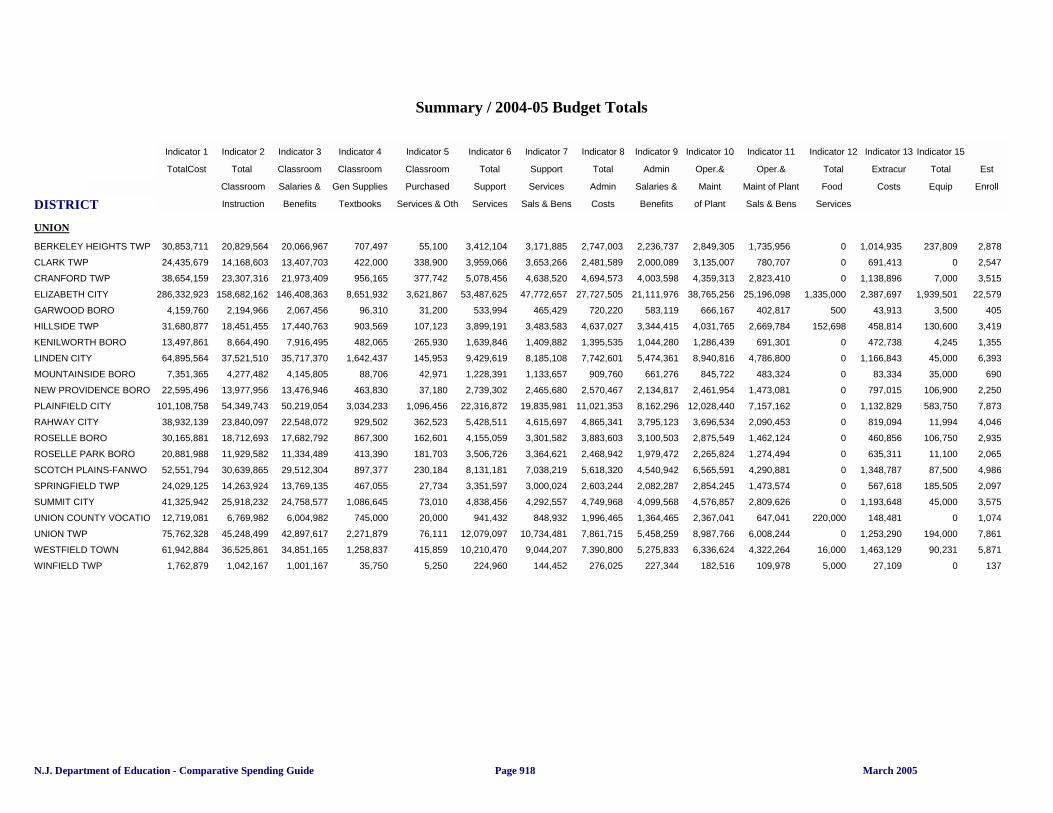
DISTRICT
Indicator 1 Indicator 2 Indicator 3 Indicator 4 Indicator 5 Indicator 6 Indicator 7 Indicator 8 Indicator 9 Indicator 10 Indicator 11 Indicator 12 Indicator 13 Indicator 15
TotalCost Total Classroom Classroom Classroom Total Support Total Admin Oper.& Oper.& Total Extracur Total Est
Per Pupil Classroom Salaries & Gen Supplies Purchased Support Services Admin Salaries & Maint Maint of Plant Food Costs Equip Enroll
Instruction Benefits Textbooks Services & Oth Services Sals & Bens Costs Benefits of Plant Sals & Bens Services
Summary / 2004-05 Budget Totals
Indicator 1 Total Cost
UNION
30,853,711BERKELEY HEIGHTS TWP 20,829,564 20,066,967 707,497 55,100 3,412,104 3,171,885 2,747,003 2,236,737 2,849,305 1,735,956 0 1,014,935 237,809 2,878
24,435,679CLARK TWP 14,168,603 13,407,703 422,000 338,900 3,959,066 3,653,266 2,481,589 2,000,089 3,135,007 780,707 0 691,413 0 2,547
38,654,159CRANFORD TWP 23,307,316 21,973,409 956,165 377,742 5,078,456 4,638,520 4,694,573 4,003,598 4,359,313 2,823,410 0 1,138,896 7,000 3,515
286,332,923ELIZABETH CITY 158,682,162 146,408,363 8,651,932 3,621,867 53,487,625 47,772,657 27,727,505 21,111,976 38,765,256 25,196,098 1,335,000 2,387,697 1,939,501 22,579
4,159,760GARWOOD BORO 2,194,966 2,067,456 96,310 31,200 533,994 465,429 720,220 583,119 666,167 402,817 500 43,913 3,500 405
31,680,877HILLSIDE TWP 18,451,455 17,440,763 903,569 107,123 3,899,191 3,483,583 4,637,027 3,344,415 4,031,765 2,669,784 152,698 458,814 130,600 3,419
13,497,861KENILWORTH BORO 8,664,490 7,916,495 482,065 265,930 1,639,846 1,409,882 1,395,535 1,044,280 1,286,439 691,301 0 472,738 4,245 1,355
64,895,564LINDEN CITY 37,521,510 35,717,370 1,642,437 145,953 9,429,619 8,185,108 7,742,601 5,474,361 8,940,816 4,786,800 0 1,166,843 45,000 6,393
7,351,365MOUNTAINSIDE BORO 4,277,482 4,145,805 88,706 42,971 1,228,391 1,133,657 909,760 661,276 845,722 483,324 0 83,334 35,000 690
22,595,496NEW PROVIDENCE BORO 13,977,956 13,476,946 463,830 37,180 2,739,302 2,465,680 2,570,467 2,134,817 2,461,954 1,473,081 0 797,015 106,900 2,250
101,108,758PLAINFIELD CITY 54,349,743 50,219,054 3,034,233 1,096,456 22,316,872 19,835,981 11,021,353 8,162,296 12,028,440 7,157,162 0 1,132,829 583,750 7,873
38,932,139RAHWAY CITY 23,840,097 22,548,072 929,502 362,523 5,428,511 4,615,697 4,865,341 3,795,123 3,696,534 2,090,453 0 819,094 11,994 4,046
30,165,881ROSELLE BORO 18,712,693 17,682,792 867,300 162,601 4,155,059 3,301,582 3,883,603 3,100,503 2,875,549 1,462,124 0 460,856 106,750 2,935
20,881,988ROSELLE PARK BORO 11,929,582 11,334,489 413,390 181,703 3,506,726 3,364,621 2,468,942 1,979,472 2,265,824 1,274,494 0 635,311 11,100 2,065
52,551,794SCOTCH PLAINS-FANWO 30,639,865 29,512,304 897,377 230,184 8,131,181 7,038,219 5,618,320 4,540,942 6,565,591 4,290,881 0 1,348,787 87,500 4,986
24,029,125SPRINGFIELD TWP 14,263,924 13,769,135 467,055 27,734 3,351,597 3,000,024 2,603,244 2,082,287 2,854,245 1,473,574 0 567,618 185,505 2,097
41,325,942SUMMIT CITY 25,918,232 24,758,577 1,086,645 73,010 4,838,456 4,292,557 4,749,968 4,099,568 4,576,857 2,809,626 0 1,193,648 45,000 3,575
12,719,081UNION COUNTY VOCATIO 6,769,982 6,004,982 745,000 20,000 941,432 848,932 1,996,465 1,364,465 2,367,041 647,041 220,000 148,481 0 1,074
75,762,328UNION TWP 45,248,499 42,897,617 2,271,879 76,111 12,079,097 10,734,481 7,861,715 5,458,259 8,987,766 6,008,244 0 1,253,290 194,000 7,861
61,942,884WESTFIELD TOWN 36,525,861 34,851,165 1,258,837 415,859 10,210,470 9,044,207 7,390,800 5,275,833 6,336,624 4,322,264 16,000 1,463,129 90,231 5,871
1,762,879WINFIELD TWP 1,042,167 1,001,167 35,750 5,250 224,960 144,452 276,025 227,344 182,516 109,978 5,000 27,109 0 137
N.J. Department of Education - Comparative Spending Guide March 2005Page 918
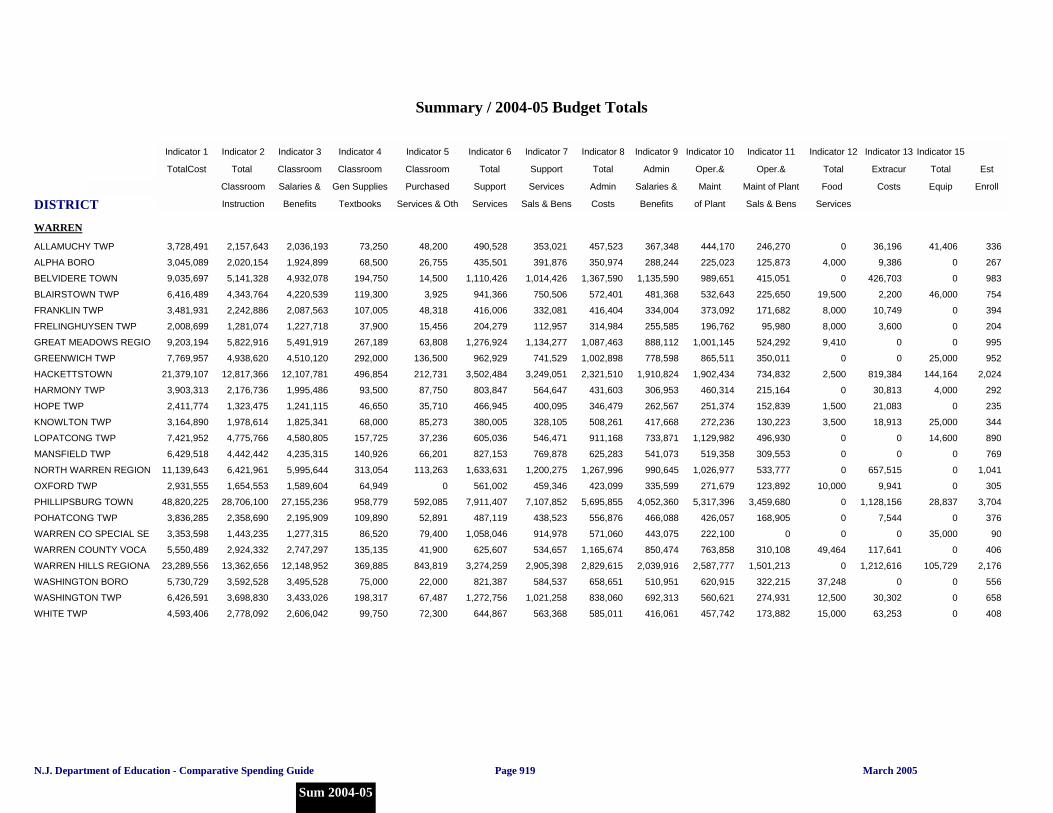
DISTRICT
Indicator 1 Indicator 2 Indicator 3 Indicator 4 Indicator 5 Indicator 6 Indicator 7 Indicator 8 Indicator 9 Indicator 10 Indicator 11 Indicator 12 Indicator 13 Indicator 15
TotalCost Total Classroom Classroom Classroom Total Support Total Admin Oper.& Oper.& Total Extracur Total Est
Per Pupil Classroom Salaries & Gen Supplies Purchased Support Services Admin Salaries & Maint Maint of Plant Food Costs Equip Enroll
Instruction Benefits Textbooks Services & Oth Services Sals & Bens Costs Benefits of Plant Sals & Bens Services
Summary / 2004-05 Budget Totals
Indicator 1 Total Cost
WARREN
3,728,491ALLAMUCHY TWP 2,157,643 2,036,193 73,250 48,200 490,528 353,021 457,523 367,348 444,170 246,270 0 36,196 41,406 336
3,045,089ALPHA BORO 2,020,154 1,924,899 68,500 26,755 435,501 391,876 350,974 288,244 225,023 125,873 4,000 9,386 0 267
9,035,697BELVIDERE TOWN 5,141,328 4,932,078 194,750 14,500 1,110,426 1,014,426 1,367,590 1,135,590 989,651 415,051 0 426,703 0 983
6,416,489BLAIRSTOWN TWP 4,343,764 4,220,539 119,300 3,925 941,366 750,506 572,401 481,368 532,643 225,650 19,500 2,200 46,000 754
3,481,931FRANKLIN TWP 2,242,886 2,087,563 107,005 48,318 416,006 332,081 416,404 334,004 373,092 171,682 8,000 10,749 0 394
2,008,699FRELINGHUYSEN TWP 1,281,074 1,227,718 37,900 15,456 204,279 112,957 314,984 255,585 196,762 95,980 8,000 3,600 0 204
9,203,194GREAT MEADOWS REGIO 5,822,916 5,491,919 267,189 63,808 1,276,924 1,134,277 1,087,463 888,112 1,001,145 524,292 9,410 0 0 995
7,769,957GREENWICH TWP 4,938,620 4,510,120 292,000 136,500 962,929 741,529 1,002,898 778,598 865,511 350,011 0 0 25,000 952
21,379,107HACKETTSTOWN 12,817,366 12,107,781 496,854 212,731 3,502,484 3,249,051 2,321,510 1,910,824 1,902,434 734,832 2,500 819,384 144,164 2,024
3,903,313HARMONY TWP 2,176,736 1,995,486 93,500 87,750 803,847 564,647 431,603 306,953 460,314 215,164 0 30,813 4,000 292
2,411,774HOPE TWP 1,323,475 1,241,115 46,650 35,710 466,945 400,095 346,479 262,567 251,374 152,839 1,500 21,083 0 235
3,164,890KNOWLTON TWP 1,978,614 1,825,341 68,000 85,273 380,005 328,105 508,261 417,668 272,236 130,223 3,500 18,913 25,000 344
7,421,952LOPATCONG TWP 4,775,766 4,580,805 157,725 37,236 605,036 546,471 911,168 733,871 1,129,982 496,930 0 0 14,600 890
6,429,518MANSFIELD TWP 4,442,442 4,235,315 140,926 66,201 827,153 769,878 625,283 541,073 519,358 309,553 0 0 0 769
11,139,643NORTH WARREN REGION 6,421,961 5,995,644 313,054 113,263 1,633,631 1,200,275 1,267,996 990,645 1,026,977 533,777 0 657,515 0 1,041
2,931,555OXFORD TWP 1,654,553 1,589,604 64,949 0 561,002 459,346 423,099 335,599 271,679 123,892 10,000 9,941 0 305
48,820,225PHILLIPSBURG TOWN 28,706,100 27,155,236 958,779 592,085 7,911,407 7,107,852 5,695,855 4,052,360 5,317,396 3,459,680 0 1,128,156 28,837 3,704
3,836,285POHATCONG TWP 2,358,690 2,195,909 109,890 52,891 487,119 438,523 556,876 466,088 426,057 168,905 0 7,544 0 376
3,353,598WARREN CO SPECIAL SE 1,443,235 1,277,315 86,520 79,400 1,058,046 914,978 571,060 443,075 222,100 0 0 0 35,000 90
5,550,489WARREN COUNTY VOCA 2,924,332 2,747,297 135,135 41,900 625,607 534,657 1,165,674 850,474 763,858 310,108 49,464 117,641 0 406
23,289,556WARREN HILLS REGIONA 13,362,656 12,148,952 369,885 843,819 3,274,259 2,905,398 2,829,615 2,039,916 2,587,777 1,501,213 0 1,212,616 105,729 2,176
5,730,729WASHINGTON BORO 3,592,528 3,495,528 75,000 22,000 821,387 584,537 658,651 510,951 620,915 322,215 37,248 0 0 556
6,426,591WASHINGTON TWP 3,698,830 3,433,026 198,317 67,487 1,272,756 1,021,258 838,060 692,313 560,621 274,931 12,500 30,302 0 658
4,593,406WHITE TWP 2,778,092 2,606,042 99,750 72,300 644,867 563,368 585,011 416,061 457,742 173,882 15,000 63,253 0 408
N.J. Department of Education - Comparative Spending Guide March 2005
Sum 2004-05
Page 919
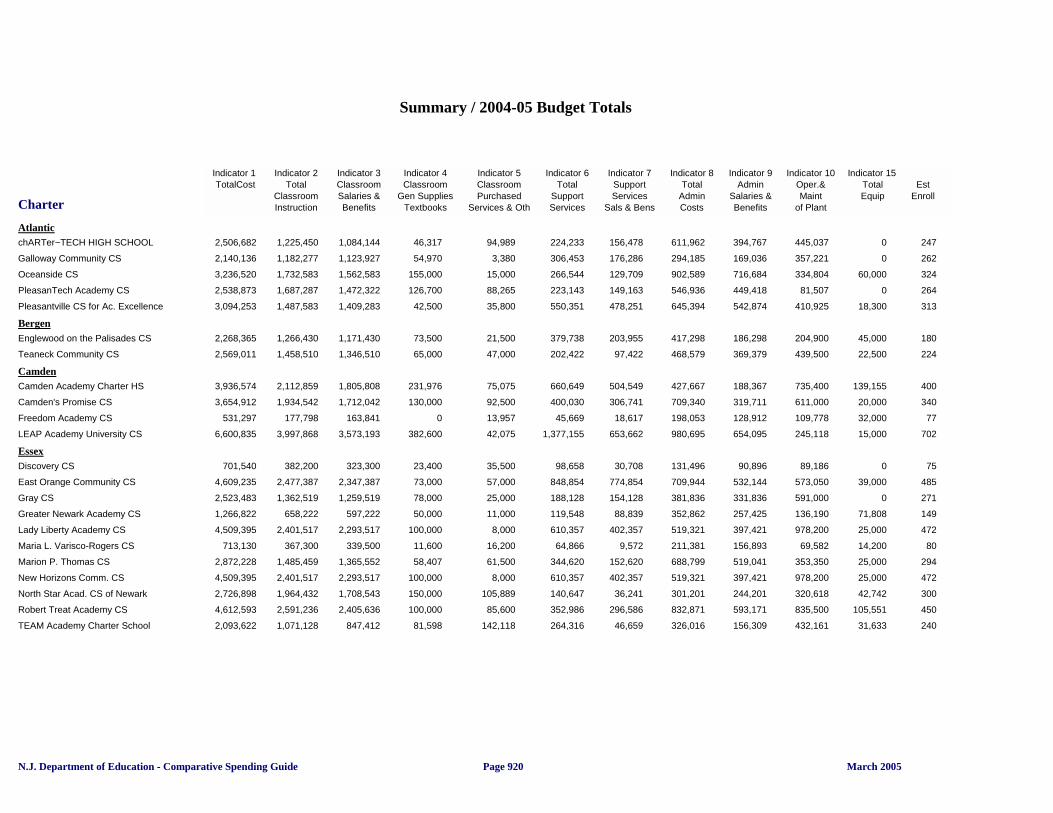
Charter
Summary / 2004-05 Budget Totals
Indicator 1 Indicator 2 Indicator 3 Indicator 4 Indicator 5 Indicator 6 Indicator 7 Indicator 8 Indicator 9 Indicator 10 Indicator 15 TotalCost Total Classroom Classroom Classroom Total Support Total Admin Oper.& Total Est
Classroom Salaries & Gen Supplies Purchased Support Services Admin Salaries & Maint Equip Enroll Instruction Benefits Textbooks Services & Oth Services Sals & Bens Costs Benefits of Plant
AtlanticchARTer~TECH HIGH SCHOOL 2,506,682 1,225,450 1,084,144 46,317 94,989 224,233 156,478 611,962 394,767 445,037 0 247
Galloway Community CS 2,140,136 1,182,277 1,123,927 54,970 3,380 306,453 176,286 294,185 169,036 357,221 0 262
Oceanside CS 3,236,520 1,732,583 1,562,583 155,000 15,000 266,544 129,709 902,589 716,684 334,804 60,000 324
PleasanTech Academy CS 2,538,873 1,687,287 1,472,322 126,700 88,265 223,143 149,163 546,936 449,418 81,507 0 264
Pleasantville CS for Ac. Excellence 3,094,253 1,487,583 1,409,283 42,500 35,800 550,351 478,251 645,394 542,874 410,925 18,300 313
BergenEnglewood on the Palisades CS 2,268,365 1,266,430 1,171,430 73,500 21,500 379,738 203,955 417,298 186,298 204,900 45,000 180
Teaneck Community CS 2,569,011 1,458,510 1,346,510 65,000 47,000 202,422 97,422 468,579 369,379 439,500 22,500 224
CamdenCamden Academy Charter HS 3,936,574 2,112,859 1,805,808 231,976 75,075 660,649 504,549 427,667 188,367 735,400 139,155 400
Camden's Promise CS 3,654,912 1,934,542 1,712,042 130,000 92,500 400,030 306,741 709,340 319,711 611,000 20,000 340
Freedom Academy CS 531,297 177,798 163,841 0 13,957 45,669 18,617 198,053 128,912 109,778 32,000 77
LEAP Academy University CS 6,600,835 3,997,868 3,573,193 382,600 42,075 1,377,155 653,662 980,695 654,095 245,118 15,000 702
EssexDiscovery CS 701,540 382,200 323,300 23,400 35,500 98,658 30,708 131,496 90,896 89,186 0 75
East Orange Community CS 4,609,235 2,477,387 2,347,387 73,000 57,000 848,854 774,854 709,944 532,144 573,050 39,000 485
Gray CS 2,523,483 1,362,519 1,259,519 78,000 25,000 188,128 154,128 381,836 331,836 591,000 0 271
Greater Newark Academy CS 1,266,822 658,222 597,222 50,000 11,000 119,548 88,839 352,862 257,425 136,190 71,808 149
Lady Liberty Academy CS 4,509,395 2,401,517 2,293,517 100,000 8,000 610,357 402,357 519,321 397,421 978,200 25,000 472
Maria L. Varisco-Rogers CS 713,130 367,300 339,500 11,600 16,200 64,866 9,572 211,381 156,893 69,582 14,200 80
Marion P. Thomas CS 2,872,228 1,485,459 1,365,552 58,407 61,500 344,620 152,620 688,799 519,041 353,350 25,000 294
New Horizons Comm. CS 4,509,395 2,401,517 2,293,517 100,000 8,000 610,357 402,357 519,321 397,421 978,200 25,000 472
North Star Acad. CS of Newark 2,726,898 1,964,432 1,708,543 150,000 105,889 140,647 36,241 301,201 244,201 320,618 42,742 300
Robert Treat Academy CS 4,612,593 2,591,236 2,405,636 100,000 85,600 352,986 296,586 832,871 593,171 835,500 105,551 450
TEAM Academy Charter School 2,093,622 1,071,128 847,412 81,598 142,118 264,316 46,659 326,016 156,309 432,161 31,633 240
N.J. Department of Education - Comparative Spending Guide March 2005Page 920
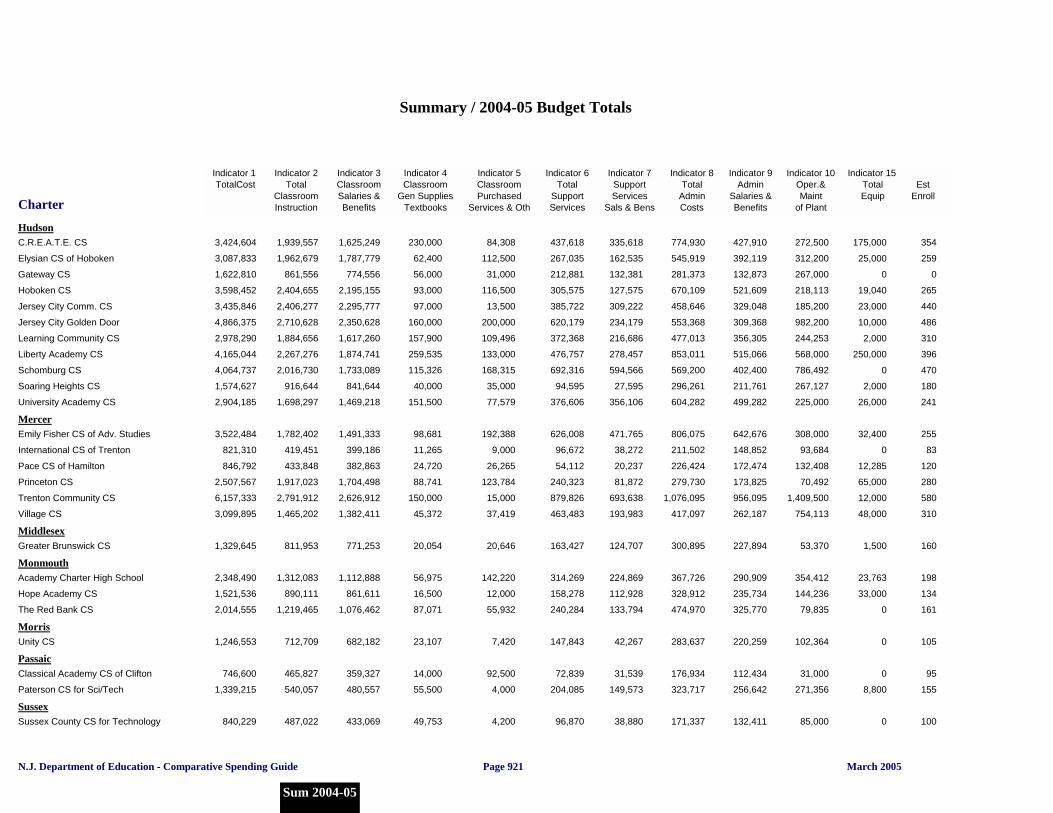
Charter
Summary / 2004-05 Budget Totals
Indicator 1 Indicator 2 Indicator 3 Indicator 4 Indicator 5 Indicator 6 Indicator 7 Indicator 8 Indicator 9 Indicator 10 Indicator 15 TotalCost Total Classroom Classroom Classroom Total Support Total Admin Oper.& Total Est
Classroom Salaries & Gen Supplies Purchased Support Services Admin Salaries & Maint Equip Enroll Instruction Benefits Textbooks Services & Oth Services Sals & Bens Costs Benefits of Plant
HudsonC.R.E.A.T.E. CS 3,424,604 1,939,557 1,625,249 230,000 84,308 437,618 335,618 774,930 427,910 272,500 175,000 354
Elysian CS of Hoboken 3,087,833 1,962,679 1,787,779 62,400 112,500 267,035 162,535 545,919 392,119 312,200 25,000 259
Gateway CS 1,622,810 861,556 774,556 56,000 31,000 212,881 132,381 281,373 132,873 267,000 0 0
Hoboken CS 3,598,452 2,404,655 2,195,155 93,000 116,500 305,575 127,575 670,109 521,609 218,113 19,040 265
Jersey City Comm. CS 3,435,846 2,406,277 2,295,777 97,000 13,500 385,722 309,222 458,646 329,048 185,200 23,000 440
Jersey City Golden Door 4,866,375 2,710,628 2,350,628 160,000 200,000 620,179 234,179 553,368 309,368 982,200 10,000 486
Learning Community CS 2,978,290 1,884,656 1,617,260 157,900 109,496 372,368 216,686 477,013 356,305 244,253 2,000 310
Liberty Academy CS 4,165,044 2,267,276 1,874,741 259,535 133,000 476,757 278,457 853,011 515,066 568,000 250,000 396
Schomburg CS 4,064,737 2,016,730 1,733,089 115,326 168,315 692,316 594,566 569,200 402,400 786,492 0 470
Soaring Heights CS 1,574,627 916,644 841,644 40,000 35,000 94,595 27,595 296,261 211,761 267,127 2,000 180
University Academy CS 2,904,185 1,698,297 1,469,218 151,500 77,579 376,606 356,106 604,282 499,282 225,000 26,000 241
MercerEmily Fisher CS of Adv. Studies 3,522,484 1,782,402 1,491,333 98,681 192,388 626,008 471,765 806,075 642,676 308,000 32,400 255
International CS of Trenton 821,310 419,451 399,186 11,265 9,000 96,672 38,272 211,502 148,852 93,684 0 83
Pace CS of Hamilton 846,792 433,848 382,863 24,720 26,265 54,112 20,237 226,424 172,474 132,408 12,285 120
Princeton CS 2,507,567 1,917,023 1,704,498 88,741 123,784 240,323 81,872 279,730 173,825 70,492 65,000 280
Trenton Community CS 6,157,333 2,791,912 2,626,912 150,000 15,000 879,826 693,638 1,076,095 956,095 1,409,500 12,000 580
Village CS 3,099,895 1,465,202 1,382,411 45,372 37,419 463,483 193,983 417,097 262,187 754,113 48,000 310
MiddlesexGreater Brunswick CS 1,329,645 811,953 771,253 20,054 20,646 163,427 124,707 300,895 227,894 53,370 1,500 160
MonmouthAcademy Charter High School 2,348,490 1,312,083 1,112,888 56,975 142,220 314,269 224,869 367,726 290,909 354,412 23,763 198
Hope Academy CS 1,521,536 890,111 861,611 16,500 12,000 158,278 112,928 328,912 235,734 144,236 33,000 134
The Red Bank CS 2,014,555 1,219,465 1,076,462 87,071 55,932 240,284 133,794 474,970 325,770 79,835 0 161
MorrisUnity CS 1,246,553 712,709 682,182 23,107 7,420 147,843 42,267 283,637 220,259 102,364 0 105
PassaicClassical Academy CS of Clifton 746,600 465,827 359,327 14,000 92,500 72,839 31,539 176,934 112,434 31,000 0 95
Paterson CS for Sci/Tech 1,339,215 540,057 480,557 55,500 4,000 204,085 149,573 323,717 256,642 271,356 8,800 155
SussexSussex County CS for Technology 840,229 487,022 433,069 49,753 4,200 96,870 38,880 171,337 132,411 85,000 0 100
N.J. Department of Education - Comparative Spending Guide March 2005
Sum 2004-05
Page 921

Charter
Summary / 2004-05 Budget Totals
Indicator 1 Indicator 2 Indicator 3 Indicator 4 Indicator 5 Indicator 6 Indicator 7 Indicator 8 Indicator 9 Indicator 10 Indicator 15 TotalCost Total Classroom Classroom Classroom Total Support Total Admin Oper.& Total Est
Classroom Salaries & Gen Supplies Purchased Support Services Admin Salaries & Maint Equip Enroll Instruction Benefits Textbooks Services & Oth Services Sals & Bens Costs Benefits of Plant
UnionQueen City Academy CS 1,814,186 986,639 876,639 88,000 22,000 148,750 33,450 334,597 217,472 344,200 48,500 198
WarrenRidge and Valley CS 634,974 338,008 336,508 0 1,500 17,453 0 132,282 101,351 147,231 0 90
N.J. Department of Education - Comparative Spending Guide March 2005Page 922


