Embed Size (px)
Citation preview
Science of the Total Environment 454-455 (2013) 482–489
Contents lists available at SciVerse ScienceDirect
Science of the Total Environment
j ourna l homepage: www.e lsev ie r .com/ locate /sc i totenv
Transcriptomic seasonal variations in a natural population of zebra mussel(Dreissena polymorpha)
Anna Navarro, Bruno Campos, Carlos Barata, Benjamin Piña ⁎Department of Environmental Chemistry, IDAEA-CSIC, Jordi Girona 18, 08034 Barcelona, Spain
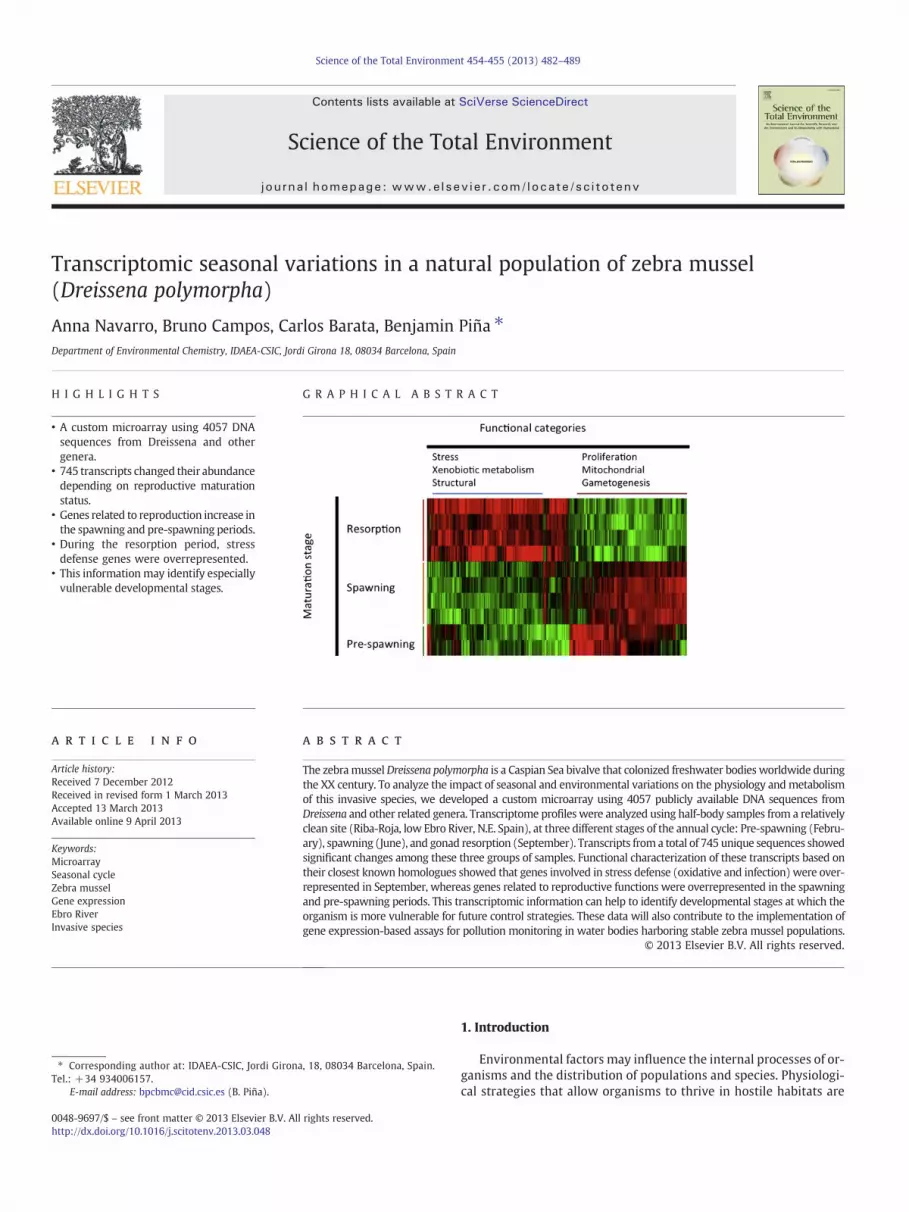
H I G H L I G H T S G R A P H I C A L A B S T R A C T
• A custom microarray using 4057 DNAsequences from Dreissena and othergenera.
• 745 transcripts changed their abundancedepending on reproductive maturationstatus.
• Genes related to reproduction increase inthe spawning and pre-spawning periods.
• During the resorption period, stressdefense genes were overrepresented.
• This informationmay identify especiallyvulnerable developmental stages.
⁎ Corresponding author at: IDAEA-CSIC, Jordi GironaTel.: +34 934006157.
E-mail address: [email protected] (B. Piña).
0048-9697/$ – see front matter © 2013 Elsevier B.V. Allhttp://dx.doi.org/10.1016/j.scitotenv.2013.03.048
a b s t r a c t
a r t i c l e i n f oArticle history:Received 7 December 2012Received in revised form 1 March 2013Accepted 13 March 2013Available online 9 April 2013
Keywords:MicroarraySeasonal cycleZebra musselGene expressionEbro RiverInvasive species
The zebramusselDreissena polymorpha is a Caspian Sea bivalve that colonized freshwater bodies worldwide duringthe XX century. To analyze the impact of seasonal and environmental variations on the physiology andmetabolismof this invasive species, we developed a custom microarray using 4057 publicly available DNA sequences fromDreissena and other related genera. Transcriptome profiles were analyzed using half-body samples from a relativelyclean site (Riba-Roja, low Ebro River, N.E. Spain), at three different stages of the annual cycle: Pre-spawning (Febru-ary), spawning (June), and gonad resorption (September). Transcripts from a total of 745 unique sequences showedsignificant changes among these three groups of samples. Functional characterization of these transcripts based ontheir closest known homologues showed that genes involved in stress defense (oxidative and infection) were over-represented in September, whereas genes related to reproductive functions were overrepresented in the spawningand pre-spawning periods. This transcriptomic information can help to identify developmental stages at which theorganism is more vulnerable for future control strategies. These data will also contribute to the implementation ofgene expression-based assays for pollution monitoring in water bodies harboring stable zebra mussel populations.
© 2013 Elsevier B.V. All rights reserved.
, 18, 08034 Barcelona, Spain.
rights reserved.
1. Introduction
Environmental factors may influence the internal processes of or-ganisms and the distribution of populations and species. Physiologi-cal strategies that allow organisms to thrive in hostile habitats are

483A. Navarro et al. / Science of the Total Environment 454-455 (2013) 482–489
poorly understood, particularly for invasive species. Zebra mussel(Dreissena polymorpha), an invasive bivalve species from the CaspianSea, has spread throughout freshwater systems all over the world,from European rivers to the East Coast of the USA. Its first detectionin Spain occurred in 2001 in the Riba-Roja dam (Ebro River, NE ofSpain; (Durán and Anadón, 2008; Strayed, 1991). The species hasbeen very problematic in those newly colonized areas because it in-terferes both with natural ecosystems and with industrial activities(Nalepa and Schloesser, 1993). Zebra mussel is therefore a paradig-matic case of the potentially devastating consequences of theaccidental or intentional introduction of alien species into new eco-systems (Pejchar and Mooney, 2009; Pimentel et al., 2005). On theother hand, and besides the interest for limiting its advance, studieson zebra mussel biology and physiology are fueled by its potentialutility in biomonitoring programs, as a sessile filter feeder apt to beused in studies of pollutant bioaccumulation and toxic effects(Morcillo et al., 1999; Regoli et al., 2001).
The analysis of changes in gene expression represents a powerfultool to characterize immediate cell responses to stressors, constitut-ing an early warning of the effect of contaminants. These changesalso represent a useful complement to existing monitoring methodsto study the effects of toxicants at the biochemical level (Faria et al.,2009, 2010). Microarray analysis allows a simultaneous quantifica-tion of a large number of gene transcripts, helping to define themode of action of pollutants in different species (Piña et al., 2007).However, microarray analysis requires a substantial knowledge ofthe species genome and Molecular Biology, two aspects that areparticularly lacking for aquatic organisms of ecological relevance(Denslow et al., 2007; Piña and Barata, 2011). Bivalves possessrelatively large genomes, with C values ranging from 0.65 to 5.4 pg(Venier et al., 2006), whereas the number of gene sequencescurrently deposited into gene databanks is still scarce and limitedto a small number of species, likeMytilus galloprovinciallis, Ruditapesphilippinarum, and Crassostrea gigas, (Milan et al., 2011; Piña andBarata, 2011; Saavedra and Bachere, 2006; Tanguy et al., 2008). Pub-lic DNA sequence repositories contain a limited, but substantialamount of gene sequences from Dreissena rostiformis (more than3000 sequences, see below) and a limited number of sequences forD. polymorpha. We used this existing information to design and val-idate a microarray intended to explore gene expression variability inD. polymorpha during the yearly life cycle. To our knowledge, this isthe first microarray analysis of the seasonal variations of adultzebra mussels from a natural, well-established population at the mo-lecular level. Our objective with this work is to develop geneexpression-based assay to monitor environmental stressors (includ-ing pollution) in water bodies using zebra mussel as sentinel species.
2. Material and methods
2.1. MicroArray design
The array for D. polymorpha was designed using the eArray toolfrom Agilent (https://erray.chem.agilent.com/erray/). A total of 4057sequences were compiled from the GeneBank using the EBI website(European Bioinformatic Institute, http://srs.ebi.ac.uk). From these se-quences, 3253 belong to Dreissena rostriformis, 705 to D. polymorphaand the rest to other bivalve species. An 8 × 15 Array (a slide with 8 ar-rays with 15,000 probes)was designed using primers of 60 nucleotides.Three probes for each sequence were designed following a positioncriteria zone (5′, center, and 3′), using the eArray software fromAgilent.Three extra probes were also designed from each gene, based in thecriteria of non self-complementation and low redundancy. After elimi-nating redundant probes, the array included three to six probes foreach GeneBank sequence. The design has been deposited at GEO withthe reference number GPL15152.
2.2. Animal sampling and morphological analysis
Adult zebra mussels (n = 10) of similar shell length were collect-ed from Riba Roja reservoir, a relatively pristine site located in thelower course of Ebro River (NE, Spain) (Lazzara et al., 2012). Half abody of each sample (sagittal cut) was placed in a cryogenic vialwith a 1 mL of RNA later® (Sigma-Aldrich, St. Louis, MO) and theother half was placed into a cassette and fixed in 4% buffered formal-dehyde (0.1 M phosphate buffer, pH 7.4) for 48 h. Samples fortranscriptomic analyses were stored at −80 °C until their use andthose in formalin processed for histology (see below). For the season-al study, 3 different months were chosen to get a complete represen-tation of the changes of the annual cycle for D. polymorpha: February,period when gonads are being developed; June, the spawning seasonand September, when the gonad is being re-absorbed (Lazzara et al.,2012). The experimental design included 2 samples from February(male and female) and 4 samples from June and September (2 malesand 2 females).
To determine gonadal cycle, fixed mussel half samples were sub-sequently rinsed with water and stored in 70% ethanol. Prior to paraf-fin embedding, individuals were transversally cut with a scalpel andboth the byssus and the foot were removed to facilitate the sectioningprocess. Both portions were then embedded in paraffin, cut at 7 μmand stained with Hematoxylin-Eosin Y. Histological preparationswere then examined under a light microscope to determine sex andgonadal maturation stage following conventional histological proce-dures according to the already described method (Juhel et al., 2003).
2.3. RNA extraction
Total RNA was isolated from the samples using Trizol reagent®protocol (Invitrogene). RNA concentration was measured by spectro-photometric absorption at 260 nm in a NanoDrop ND-1000 Spectro-photometer (NanoDrop Technologies, Delaware, DE). RNA qualitywas checked in an Agilent 2100 Bioanalyzer (Agilent Technologies,Santa Clara CA). The samples that did not show degradation wereused in the process of microarray analysis.
2.4. Sample preparation for microarray analysis
Total RNA samples were treated with DNAse I to remove genomicDNA contamination and labeledwith the Agilent One-ColorMicroarray—using Cyanine 3 (Cy3) dye. 500 ng of total RNA for each sample was usedas start material. After the amplification, labeling and purificationprocedure, samples were evaluated for yield and effectiveness of Cy3dye incorporation using the NanoDrop spectrophotometer. The samplesfor the analysis should present a specific activity ≥9.0 pmol Cy3/μgcRNA and a total labeling of at least 1.65 μg Cy3. Fragmentation of thecDNA was performed in the recommended blocking agent in 2× GEHybridization Blocking Buffer (Agilent, Gene Expression HybridizationKit). A final volume of 40 μl containing the fragmented cDNA wasadded to the 8 × 15 array and the hybridization proceeded for 17 h at65 °C.
Microarray slides were washed according the supplemental Agilentprotocol (“One-color Microarray-Based Gene expression analysis”) andkept in the dark. Fluorescence was recorded in an Agilent G2565CAscanner and raw data processed by the Agilent Feature Extraction Soft-ware v9.5. The quality of the Microarray data was evaluated manuallyusing the QualityControl report that provides the Agilent Software.
Raw expression data was imported into JMP Genomic v5 (SAS, Cary,NC) where the raw intensity data were normalized using Loess normal-ization with a smooth factor of 0.2. Then, data for each array werere-valuated for a quality control by distribution analysis, correlationanalysis and principal components to make sure that the normalizationwas effective to all samples. Differentially expressed transcripts wereidentified using One Way analysis of variance (ANOVA) with a False

Fig. 1. Hierarchical clustering for zebra mussel samples collected in February, June andSeptember. Each column corresponds to a single individual; “M” and “F” indicate maleand female samples, respectively. Rows correspond to individual probes in the array,only those showing significant variations are displayed. Green lines correspond to probesthat showed lowhybridization levels in a given individual; red ones indicatedhighhybrid-ization values. The scale on top indicates Pearson coefficients for the calculated distancesbetween samples.
484 A. Navarro et al. / Science of the Total Environment 454-455 (2013) 482–489
Discovery Rate of 5% (FDR) (Benjamini and Hochberg, 1995). Raw mi-croarray data have been deposited into the NCBI Gene ExpressionOmnibus (GEO) database (reference GSE35353).
Gene expression data were subjected to hierarchal clustering(Pearson correlation, complete linkage) and to self-organizing map(SOM) analysis using the MeV software (Saeed et al., 2003). Probesshowing significant variations among the different samples were an-alyzed by Blast at NCBI server (http://blast.ncbi.nlm.nih.gov/Blast.cgi)to identify homologues for gene identification/annotation purposes.
2.5. qRT-PCR
Total RNA was treated with DNAse I to remove genomic DNAcontamination. Quantities of 1 μg were retrotranscribed to cDNAusing First Strand cDNA Synthesis Kid Roche® (Germany) and storedat −20 °C. Aliquots of 10 ng were used to quantify specific transcriptsin Lightcycler® 480 Real Time PCR System (Roche, Germany) usingLightcycler 480 SYBR Green I Master® (Roche, Germany). Primers forqRT-PCR analysis of D. polymorpha MT, HSP70, HSP90 transcripts havebeen developed and described in a previous study (Navarro et al.,2011). Relative abundance values of all genes were calculated fromthe second derivative of their respective amplification curve, Cp valuescalculated by technical triplicates. Cp values of target genes were com-pared to the reference gene (ribosomal protein S3) as described(Navarro et al., 2011; Pfaffl, 2001). PCR efficiency values for referenceand tested genes were calculated as described (Pfaffl, 2001), and as-sumed to be close to 100% from these calculations (Navarro et al., 2011).
2.6. Statistics and microarray analyses
All statistics for qRT-PCR were performed using the SPSS 19 (SPSSInc, 2002) package. The calculations were performed using ΔCp values(Cp reference − Cp target) as this parameter follows a normal distribu-tion, assessed by Kolmogorov–Smirnov test. Statistical comparison ofmean values was done using One Way analysis of variance (ANOVA).
3. Results
3.1. Cluster definition
Maturation stages ofD. polymorpha individuals sampled in February,June and September were assessed by microscopic examination, whichconfirmed that animals were at the predicted pre-spawning, spawningand resorption stages, respectively (data not shown, (Araujo et al.,2010). Transcriptome analyses showed significant changes for a totalof 1479 probes (ANOVA p b 0.01), corresponding to 745 unique se-quences. Hierarchical clustering analysis of samples revealed twomain clusters, one including samples from September (gonadal resorp-tion) and the second one grouping the samples from June and February(pre-spawning and spawning periods, Fig. 1, (Juhel et al., 2003). Probeclustering showed two at least two well-defined patterns of seasonalvariations, one corresponding to probes with elevated hybridization inFebruary and June samples (the pre-spawning and spawning season),and a second one that corresponded to probes showing the highest sig-nal in September samples (Fig. 1, yellow boxes). No significant differ-ences were observed between male and female samples.
Variations in probe fluorescence among samples were classified inexpression patterns using Self-Organizing Maps (SOM, Fig. 2). Abouttwo-thirds of probes (1156 out of 1479) grouped into two out of thenine possible clusters (clusters 1 and 7, Fig. 2.) These two clustersbroadly correspond to the twomain patterns observed in the hierarchi-cal clustering analysis: Cluster 1 (517 probes, 232 unique sequences) in-cluded probes with maximal signals in June and February samples,whereas probes included in Cluster 7 (640 probes, 342 unique se-quences) peaked in September samples (Fig. 2). For simplicity, only
probes from these two clusters (hereafter nominated as Cluster A andB, respectively) were further analyzed.
3.2. Functional analysis of seasonal transcriptomic variations
Fig. 3 shows a functional analysis of genes corresponding to theprobes included in Clusters A and B. To reduce false adscriptions, only se-quences forwhich at least two probeswere included in any of the clusterswere considered. Ninety GenBank unique sequences fulfilled this criteri-on for cluster A, fifty-three from which matched to at least a known or aputative homologue in BLAST (p b 0.001, Table 1). Most of them couldbe included into three functional categories, mitochondrial components
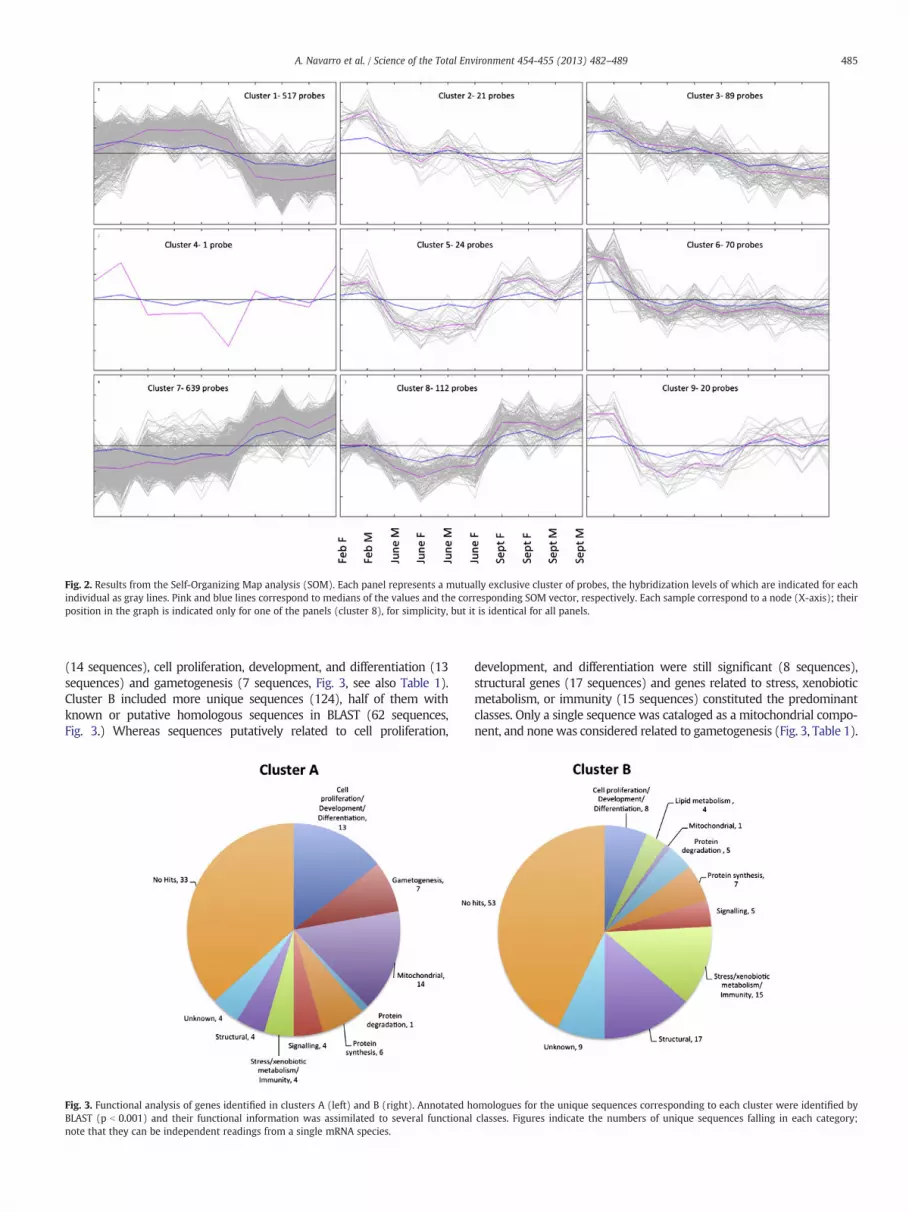
Fig. 2. Results from the Self-Organizing Map analysis (SOM). Each panel represents a mutually exclusive cluster of probes, the hybridization levels of which are indicated for eachindividual as gray lines. Pink and blue lines correspond to medians of the values and the corresponding SOM vector, respectively. Each sample correspond to a node (X-axis); theirposition in the graph is indicated only for one of the panels (cluster 8), for simplicity, but it is identical for all panels.
485A. Navarro et al. / Science of the Total Environment 454-455 (2013) 482–489
(14 sequences), cell proliferation, development, and differentiation (13sequences) and gametogenesis (7 sequences, Fig. 3, see also Table 1).Cluster B included more unique sequences (124), half of them withknown or putative homologous sequences in BLAST (62 sequences,Fig. 3.) Whereas sequences putatively related to cell proliferation,
Fig. 3. Functional analysis of genes identified in clusters A (left) and B (right). Annotated hBLAST (p b 0.001) and their functional information was assimilated to several functionalnote that they can be independent readings from a single mRNA species.
development, and differentiation were still significant (8 sequences),structural genes (17 sequences) and genes related to stress, xenobioticmetabolism, or immunity (15 sequences) constituted the predominantclasses. Only a single sequence was cataloged as a mitochondrial compo-nent, and none was considered related to gametogenesis (Fig. 3, Table 1).
omologues for the unique sequences corresponding to each cluster were identified byclasses. Figures indicate the numbers of unique sequences falling in each category;

Table 1Functional analysis of genes included in clusters A and B.
Cluster A Cluster B
n Relevant hitsa n Relevant hitsa
Cell proliferation/development/differentiation 13 Histone H2A, Histone H3 (5), Histone H4, HMG1,HMG20, Countin, Profilin, DHFR
8 BGT1, BGT2, pim3, Sox4
Gametogenesis 7 Enkurin (2), DMC1, Sperm outer dense fiberprotein (2), Tektin
0 None
Lipid metabolism 0 None 4 LDL-receptor (2), LDL proteinMitochondrial 14 ATP syn (2), COX II, COX III (3), NADH DH (4), CytC1 1 ADP,ATP carrier proteinProtein degradation 1 UBCL 5 Cathepsin (4)Protein synthesis 6 TFIIB, TEF, rpS3a, rpL17 7 TEF1 (4), rpL22, RNA exonuclease 1Signalling 4 Calmoludin (2), Pde10a 5 MRAS2, Thymosin, Tribbles (3)Stress/xenobiotic metabolism/Immunity 4 GST (2), sulfotransferase, kallikrein 15 Calmodulin (2), Ficolin, Cyt P450(3),
HSP70, HSP90, MT, Lysozyme,Structural 4 Actin, Tubulin (3) 17 Actin (12), Collagen (2), Tubulin (3)Unknown 4 9No Hits 33 53Total 90 124
a Numbers in brackets indicate the number of independent D. polymorpha sequences with significant homology with a given known gene. Single hits are not indicated.
486 A. Navarro et al. / Science of the Total Environment 454-455 (2013) 482–489
Differences in the number of genes belonging to the nine identified func-tional classes in both clusters were significant (2 × 9 contingency table,Chi-square, p b 10−4). Therefore, the functional analysis showed funda-mental differences between genes overrepresented in the pre- andspawning season and those mRNAs predominant during the resorptionprocess in the fall.
Identification of homologues forD. polymorpha genes reinforced theclear functional separation between the two clusters. For example,within the category of cell proliferation, development, and differentia-tion, cluster A included several chromatin components (histones,HMG proteins), dihydrofolate reductase, essential for nucleotide syn-thesis, and two putative homologues proliferation-related regulators,countin and profilin (Table 1, see also Supplementary Table 1 for an ex-tensive list of BLAST results for each single D. polymorpha sequence).Profilin is an actin-binding protein involved in the dynamic turnoverand restructuring of the actin cytoskeleton and is required for animaldevelopment (Witke et al., 2001), whereas countin is a regulator ofthe aggregated size of slime moulds and it is supposed to act ascell-counting factor (Brock and Gomer, 1999; Okuwa et al., 2001).BLAST searches revealed putative homologues of this gene in othergroups including protozoa, sponges and chordates. In contrast to thisproliferation and developmental-linked functions, Cluster B includedhomologues of four regulators of cell differentiation and proliferation,BTG1 and BTG2 (Guehenneux et al., 1997), Sox 4, (Penzo-Mendez,2010) and Pim3 (Mukaida et al., 2011). These results likely reflectsthe proliferative stage at the pre-spawning period, at which gametesare produced at very fast pace. This is consistentwith the predominanceof mRNAs from mitochondrial components, probable indicators of mi-tochondrial proliferation. It also explains the increased levels of homo-logues for meiosis-related genes, like DMC1 (Bishop et al., 1992) or forsperm-associated proteins, like enkurin (Sutton et al., 2004), tektin(Linck et al., 1982) or the sperm outer dense fiber proteins (Henkel etal., 1992) (Table 1).
Cluster B included a large subset of sequences homologous to stress-,xenobiotic- and infection-related proteins, including metallothionein,HSP70 and HSP90, cytochrome P450 and lysozyme (Table 1). Calmodu-lin can be considered a hyposmotic stress defense protein in bivalves(Pierce et al., 1989), as ferritin has been related to thermal stress andbacterial challenges (He et al., 2011; Jin et al., 2011). The lectin ficolinis also overexpressed as a response to bacterial infections (Araya et al.,2010). Whereas the simultaneous overexpression of these genes mayreflect an episodic stress on this particular population at this particulartime, we rather think that it may be related to the resting status duringthe resorption period. Functional categories “lipid metabolism” and“protein degradation” were also overrepresented in cluster B and thiscan also be related to metabolic changes throughout the annual cycle.
3.3. Comparison between microarray and qRT-PCR values
Analysis of mRNA abundance for different genes by qRT-PCRshowed a good correlation with the fluorescence intensity recordedon the microarray for most tested genes (Fig. 4A). The single excep-tion, cytochrome oxidase 1 or COI, appears underrepresented in themicroarray data, a result we attribute to the high sequence variabilityof this gene. We then conclude that the microarray provided an ade-quate quantification of most D. polymorpha genes, although putativesequence variations may well influence the relative results.
The pattern of elevatedmRNA levels of stress genes in the fall and ofmitochondrial components in winter–spring was also corroborated byqRT-PCR analyses. Fig. 4B shows mRNA levels of COI, MT, HSP90,HSP70 andMXR genes (Navarro et al., 2011) in additional zebra musselsamples from the three time points. The results show that COI followedthe abundance pattern associated to Cluster B (right panel), whereasthe rest of genes showed seasonal variations consistentwith the ClusterA (left panel). These results confirm the elevated expression of severalstress-related genes in the fall samples, as well as the high levels onmi-tochondrial components' transcripts during the pre-spawning season.Although the sequences present in the array, most of them from otherDreissena species, are probably imperfectmatches for D. polymorpha se-quences, these results illustrate the accuracy of the microarray data.
4. Discussion
Invasive alien species threaten ecosystems, habitats, and/or nativespecies. They constitute major drivers of the global environmentalchange directly attributed to human activities. Their impact is notlimited to the precarization or extinction of native species, particular-ly on islands and isolated ecosystems, but also includes serious im-pacts on the ecosystem processes that are fundamental to humanhealth and economy (Pejchar and Mooney, 2009). In the case ofzebra mussel, these effects include, besides the still poorly evaluatedeffects on the local malacofauna, the coating of boats and beachesand clogging water intakes required for water supplies and forcooling of hydroelectric and nuclear facilities (Pejchar and Mooney,2009; Pimentel et al., 2005). Eradication of the pest or mitigation ofit effects is the only possible responses once the alien species propa-gates out of control; however, the correct management of the affectedecosystem requires a profound knowledge of both invader and nativespecies (Hulme, 2006).
Analysis of gene expression by microarray techniques provides alarge amount of information that can be related to differentmodes of ac-tion of pollutants (Denslow et al., 2007). However, its application inaquatic organisms is still in the early stages, and only for a limited
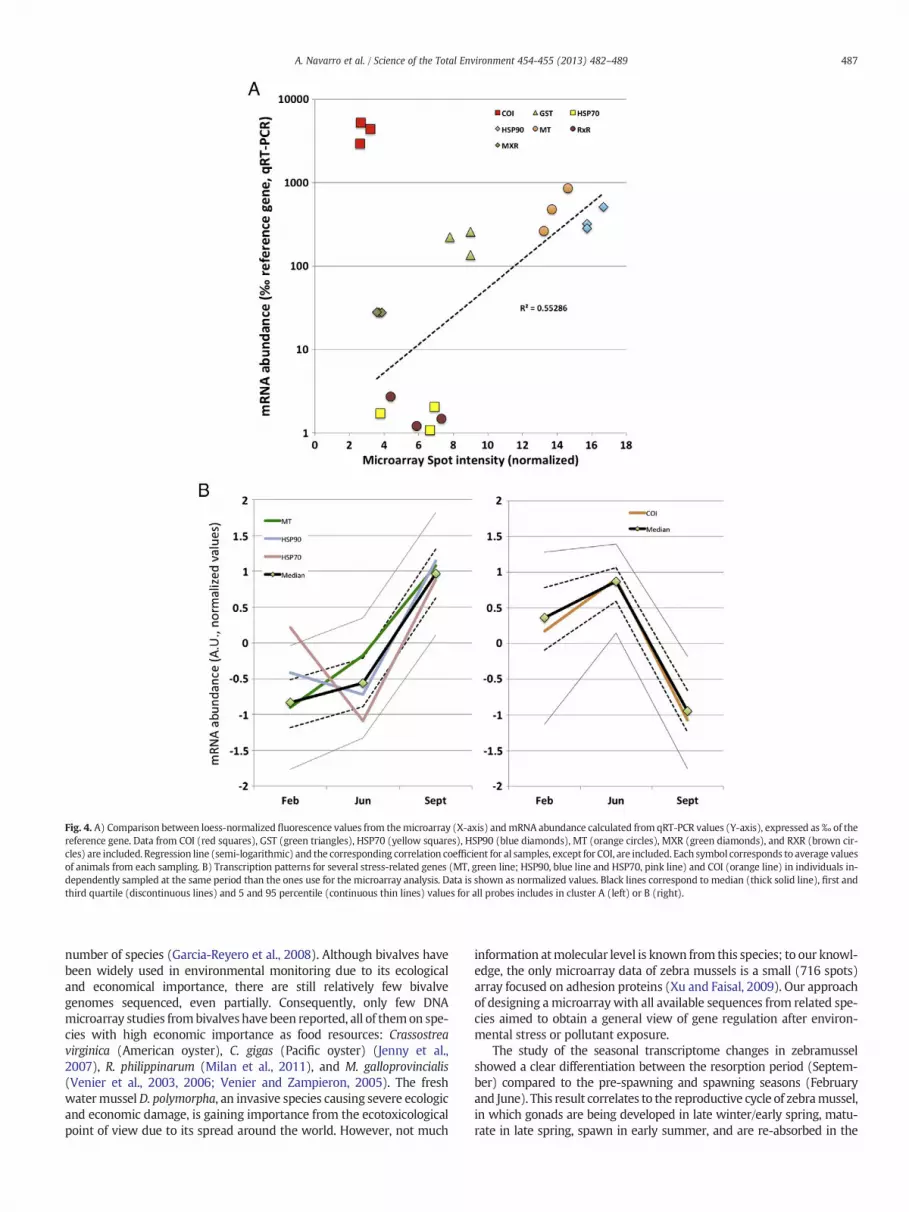
Fig. 4. A) Comparison between loess-normalized fluorescence values from themicroarray (X-axis) andmRNA abundance calculated from qRT-PCR values (Y-axis), expressed as‰ of thereference gene. Data from COI (red squares), GST (green triangles), HSP70 (yellow squares), HSP90 (blue diamonds), MT (orange circles), MXR (green diamonds), and RXR (brown cir-cles) are included. Regression line (semi-logarithmic) and the corresponding correlation coefficient for al samples, except for COI, are included. Each symbol corresponds to average valuesof animals from each sampling. B) Transcription patterns for several stress-related genes (MT, green line; HSP90, blue line and HSP70, pink line) and COI (orange line) in individuals in-dependently sampled at the same period than the ones use for the microarray analysis. Data is shown as normalized values. Black lines correspond to median (thick solid line), first andthird quartile (discontinuous lines) and 5 and 95 percentile (continuous thin lines) values for all probes includes in cluster A (left) or B (right).
487A. Navarro et al. / Science of the Total Environment 454-455 (2013) 482–489
number of species (Garcia-Reyero et al., 2008). Although bivalves havebeen widely used in environmental monitoring due to its ecologicaland economical importance, there are still relatively few bivalvegenomes sequenced, even partially. Consequently, only few DNAmicroarray studies frombivalves have been reported, all of themon spe-cies with high economic importance as food resources: Crassostreavirginica (American oyster), C. gigas (Pacific oyster) (Jenny et al.,2007), R. philippinarum (Milan et al., 2011), and M. galloprovincialis(Venier et al., 2003, 2006; Venier and Zampieron, 2005). The freshwatermusselD. polymorpha, an invasive species causing severe ecologicand economic damage, is gaining importance from the ecotoxicologicalpoint of view due to its spread around the world. However, not much
information atmolecular level is known from this species; to our knowl-edge, the only microarray data of zebra mussels is a small (716 spots)array focused on adhesion proteins (Xu and Faisal, 2009). Our approachof designing a microarraywith all available sequences from related spe-cies aimed to obtain a general view of gene regulation after environ-mental stress or pollutant exposure.
The study of the seasonal transcriptome changes in zebramusselshowed a clear differentiation between the resorption period (Septem-ber) compared to the pre-spawning and spawning seasons (Februaryand June). This result correlates to the reproductive cycle of zebramussel,in which gonads are being developed in late winter/early spring, matu-rate in late spring, spawn in early summer, and are re-absorbed in the

488 A. Navarro et al. / Science of the Total Environment 454-455 (2013) 482–489
fall (Borcherding, 1991;McMahon, 1996). Our results reflect the prolifer-ative activity during the process of gamete production, including gamete-and meiosis-related genes, chromatin synthesis and mitochondrial pro-liferation. The fact that only sperm-specific, but not oocyte-specificgenes have been identified in the pre-spawning season may well be aconsequence of our imperfect knowledge of the gametogenesis and ofthe composition of bivalves' sperm and oocytes. This same poor knowl-edge precludes a more extensive analysis of the results by qRT-PCR, asmany of the necessary specific D. polymorpha sequences are not known.
When studying natural populations during the reproductive cycle,physiological changes may be related both to the maturation status ofthe animals and to the changing environmental conditions, includingphotoperiod, temperature, stressors, etc. In our case, February andJune samples clustered together and separated from September sam-ples, although environmental conditions (temperature, water flow)in late Spring are more similar to those present in late Summer thanto those typical from Winter. Therefore, although we cannot ruleout environmental factors besides the zebra mussel physiologycompletely, we consider that most changes are indeed related to thematuration status of the zebra mussel population.
The anatomy of zebra mussel precludes a clean dissection of mantleor digestive gland, as gonadal tissue pervades the whole body. This, to-gether with the important anatomical changes occurring during theyearly reproductive cycle, prompted us to use half bodies to uniformthe starting material across all the studied period. However, this ap-proach prevents the correct evaluation of the variations on the relativeimportance of the different tissues occurring between the differentmaturation stages, a variation that should be added to the proliferativedifferences between pre- and post-spawning periods. Gonads representa major fraction of the total body in individuals at the pre-spawningstage, whereas they are essentially absent during the resorption period.A possible indication of this transition is given by the different structuralgenes predominating at the two stages. For example, Actin genesshowed a clear shift from the single D. polymorpha gene (AM230364)that predominates at the pre-spawning season to the complex situationat which no less than 12 different genes apparently contribute to theactin complement in the resorption period (not shown, see Supplemen-tary Table 1). A similar transition can be seen for the tubulin gene.
Microarray technology depends strongly on the accuracy of the cur-rent information about the genome and physiology of the analyzed spe-cies. In the case of zebra mussel, this knowledge is essentially lacking asneither the genome of the species nor the particulars of its biology andphysiology are sufficiently known.Mollusks are grossly underrepresent-ed in themicroarray datasets, with the oyster C. virginica as themost an-alyzed species (Piña and Barata, 2011), making it difficult to interpretthe results. We consider that the main difficulty in designing andinterpreting the zebra mussel microarray data lies not in the lack of ap-propriate sequences, but on their annotation and adscription to func-tional categories. We tried to circumvent this problem (as well as therelatively low number of available zebra mussel sequences) by utilizingDNA sequences fromclose species, using several probes (three to six) foreach sequence and interpreting the results using functional adscriptionsfrom the closest homologues. This approach allowed us to obtain usefulinformation from an ill-known, but ecologically and economically (ifonly for the problems it causes) relevant species as is the invasivezebramusselD. polymorpha. With this information, it should be possibleto develop gene expression-based assays to analyze the physiologicalstatus of these invasive populations and, therefore, to monitor boththe presence of stressors in the correspondingwater bodies and the sen-sitivity of the zebramussel to thedifferent changes in the environmentalconditions.
Supplementary Table 1. Blast results from probes included in Clus-ters A and B. This material is available free of charge via the Internet athttp://pubs.acs.org. Supplementary data associated with this articlecan be found, in the online version, at http://dx.doi.org/10.1016/j.scitotenv.2013.03.048.
Conflict of interest
The authors declare no conflict of interests.
Acknowledgments
This work has been supported by the Spanish Ministry of Environ-ment and Ministry of Science and Innovation (041/SGTB/2007/1.1,042/RN08/03.4, CGL2008-01898, and CTM2011-30471-C02-01). Wealso thank Dr. Nancy Denslow and her lab (University of Florida, FL)for their assistance on the training for microarray data analysis usingJMP® software.
References
Araujo R, Valladolid M, Gómez I. Life cycle and density of a newcomer population ofzebra mussels in the Ebro River, Spain. The zebra mussel in Europe. Leiden:Backhuys Publishers; 2010.
Araya MT, Markham F, Mateo DR, McKenna P, Johnson GR, Berthe FC, et al. Identifica-tion and expression of immune-related genes in hemocytes of soft-shell clams,Mya arenaria, challenged with Vibrio splendidus. Fish Shellfish Immunol 2010;29:557–64.
Benjamini Y, Hochberg Y. Controlling the false discovery rate: a practical approach tomultiple testing. J R Stat Soc 1995;57:289–300.
Bishop DK, Park D, Xu L, Kleckner N. DMC1: a meiosis-specific yeast homolog of E. colirecA required for recombination, synaptonemal complex formation, and cell cycleprogression. Cell 1992;69:439–56.
Borcherding J. The annual reproductive cycle of the freshwater mussel Dreissenapolymorpha Pallas in lakes. Oecologia 1991;87:208–18.
Brock DA, Gomer RH. A cell-counting factor regulating structure size in Dictyostelium.Genes Dev 1999;13:1960–9.
Denslow ND, Garcia-Reyero N, Barber DS. Fish ‘n’ chips: the use of microarrays foraquatic toxicology. Mol Biosyst 2007;3:172–7.
Durán C, Anadón A. The zebra mussel invasion in Spain and navigation rules. Aquat In-vasions 2008;3:315–24.
Faria M, Carrasco L, Diez S, Riva MC, Bayona JM, Barata C. Multi-biomarker responses inthe freshwater mussel Dreissena polymorpha exposed to polychlorobiphenyls andmetals. Comp Biochem Physiol C Toxicol Pharmacol 2009;149:281–8.
FariaM, Huertas D, Soto DX, Grimalt JO, Catalan J, RivaMC, et al. Contaminant accumulationandmulti-biomarker responses in field collected zebramussels (Dreissena polymorpha)and crayfish (Procambarus clarkii), to evaluate toxicological effects of industrial hazard-ous dumps in the Ebro river (NE Spain). Chemosphere 2010;78:232–40.
Garcia-Reyero N, Adelman I, Liu L, Denslow N. Gene expression profiles of fathead min-nows exposed to surface waters above and below a sewage treatment plant inMinnesota. Mar Environ Res 2008;66:134–6.
Guehenneux F, Duret L, Callanan MB, Bouhas R, Hayette S, Berthet C, et al. Cloning ofthe mouse BTG3 gene and definition of a new gene family (the BTG family) in-volved in the negative control of the cell cycle. Leukemia 1997;11:370–5.
He X, Zhang Y, Wu X, Xiao S, Yu Z. Cloning and characterization of two ferritin subunitgenes from bay scallop, Argopecten irradians (Lamarck 1819). Mol Biol Rep2011;38:2125–32.
Henkel R, Stalf T, Miska W. Isolation and partial characterization of the outer densefiber proteins from human spermatozoa. Biol Chem Hoppe Seyler 1992;373:685–9.
Hulme PE. Beyond control: wider implications for the management of biological inva-sions. J Appl Ecol 2006;43:835–47.
Jenny MJ, Chapman RW, Mancia A, Chen YA, McKillen DJ, Trent H, et al. A cDNA Micro-array for Crassostrea virginica and C-gigas. Marine Biotechnol 2007;9:577–91.
Jin C, Li C, Su X, Li T. Identification and characterization of a Tegillarca granosa ferritinregulated by iron ion exposure and thermal stress. Dev Comp Immunol 2011;35:745–51.
Juhel G, Culloty SC, O'Riordan RM, O'Connor J, De Faoite L, McNamara R. A histologicalstudy of the gametogenic cycle of the freshwater mussel Dreissena polymorpha(Pallas, 1771) in Lough Derg, Ireland. J Molluscan Stud 2003;69:365–73.
Lazzara R, Fernandes D, Faria M, López JF, Tauler R, Porte C. Changes in lipid contentand fatty acid composition along the reproductive cycle of the freshwater musselDreissena polymorpha: its modulation by clofibrate exposure. Sci Total Environ2012;432:195–201.
Linck RW, Albertini DF, Kenney DM, Langevin GL. Tektin filaments: chemically uniquefilaments of sperm flagellar microtubules. Prog Clin Biol Res 1982;80:127–32.
McMahon R. The physiological ecology of Zebra mussel, Dreissena polymorpha, in NorthAmerica and Europe. Am Zool 1996;36:339–63.
Milan M, Coppe A, Reinhardt R, Cancela LM, Leite RB, Saavedra C, et al. Transcriptome se-quencing and microarray development for the Manila clam, Ruditapes philippinarum:genomic tools for environmental monitoring. BMC Genomics 2011;12:234.
Morcillo Y, Albalat A, Porte C.Mussels as sentinels of organotin pollution: bioaccumulationand effects on P450-mediated aromatase activity. Environ Toxicol Chem 1999;18:1203–8.
Mukaida N, Wang YY, Li YY. Roles of Pim-3, a novel survival kinase, in tumorigenesis.Cancer Sci 2011;102:1437–42.
Nalepa T, Schloesser DW. Zebra mussels: biology, impacts, and control. Boca Raton,Florida: Lewis Publishers; 1993.

489A. Navarro et al. / Science of the Total Environment 454-455 (2013) 482–489
Navarro A, Faria M, Barata C, Piña B. Transcriptional response of stress genes to metalexposure in zebra mussel larvae and adults. Environ Pollut 2011;159:100–7.
Okuwa T, Katayama T, Takano A, Kodaira K, Yasukawa H. Two cell-counting factors reg-ulate the aggregate size of the cellular slime mold Dictyostelium discoideum. DevGrowth Differ 2001;43:735–44.
Pejchar L, Mooney HA. Invasive species, ecosystem services and human well-being.Trends Ecol Evol 2009;24:497–504.
Penzo-Mendez AI. Critical roles for SoxC transcription factors in development and can-cer. Int J Biochem Cell Biol 2010;42:425–8.
Pfaffl M. A new mathematical model for relative quantification in real-time RT-PCR.Nucleic Acids Res 2001;29:e45.
Pierce SK, Politis AD, Cronkite DH, Rowland LM, Smith Jr LH. Evidence of calmodulin in-volvement in cell volume recovery following hypo-osmotic stress. Cell Calcium1989;10:159–69.
Pimentel D, Zuniga R, Morrison D. Update on the environmental and economic costs asso-ciated with alien-invasive species in the United States. Ecol Econ 2005;52:273–88.
Piña B, Barata C. A genomic and ecotoxicological perspective of DNA array studies inaquatic environmental risk assessment. Aquat Toxicol 2011;105S:40–9.
Piña B, Casado M, Quirós L. Analysis of gene expression as a new tool in ecotoxicologyand environmental monitoring. Trac-Trends Anal Chem 2007;26:1145–54.
Regoli L, Chan HM, de Lafontaine Y, Mikaelian I. Organotins in zebra mussels (Dreissenapolymorpha) and sediments of the Quebec City Harbour area of the St. LawrenceRiver. Aquat Toxicol 2001;53:115–26.
Saavedra C, Bachere E. Bivalve genomics. Aquaculture 2006;256:1-14.Saeed AI, Sharov V, White J, Li J, LiangW, Bhagabati N, et al. TM4: a free, open-source sys-
tem for microarray data management and analysis. Biotechniques 2003;34:374–8.Strayed D. Projected distribution of the zebra mussel, Dreissena polymporpha, in North
America. Can J Fish Aquat Sci 1991;48:1389–95.Sutton KA, Jungnickel MK, Wang Y, Cullen K, Lambert S, Florman HM. Enkurin is a novel
calmodulin and TRPC channel binding protein in sperm. Dev Biol 2004;274:426–35.Tanguy A, Bierne N, Saavedra C, Pina B, Bachere E, Kube M, et al. Increasing genomic infor-
mation in bivalves throughnewEST collections in four species: development of newge-neticmarkers for environmental studies and genome evolution. Gene 2008;408:27–36.
Venier P, Zampieron C. Evidence of genetic damage in grass gobies and mussels fromthe Venice lagoon. Environ Int 2005;31:1053–64.
Venier P, Pallavicini A, De Nardi B, Lanfranchi G. Towards a catalogue of genes tran-scribed in multiple tissues of Mytilus galloprovincialis. Gene 2003;314:29–40.
Venier P, De Pitta C, Pallavicini A, Marsano F, Varotto L, Romualdi C, et al. Developmentof mussel mRNA profiling: Can gene expression trends reveal coastal water pollu-tion? Mutat Res 2006;602:121–34.
Witke W, Sutherland JD, Sharpe A, Arai M, Kwiatkowski DJ. Profilin I is essential for cellsurvival and cell division in early mouse development. Proc Natl Acad Sci U S A2001;98:3832–6.
XuW, Faisal M. Development of a cDNAmicroarray of zebramussel (Dreissena polymorpha)foot and its use in understanding the early stage of underwater adhesion. Gene2009;436:71–80.


