Embed Size (px)
Citation preview
RESEARCH ARTICLE Open Access
Digital gene expression analysis of thezebra finch genomeRobert Ekblom1,2*, Christopher N Balakrishnan3, Terry Burke1, Jon Slate1
Abstract
Background: In order to understand patterns of adaptation and molecular evolution it is important to quantifyboth variation in gene expression and nucleotide sequence divergence. Gene expression profiling in non-modelorganisms has recently been facilitated by the advent of massively parallel sequencing technology. Here weinvestigate tissue specific gene expression patterns in the zebra finch (Taeniopygia guttata) with special emphasison the genes of the major histocompatibility complex (MHC).
Results: Almost 2 million 454-sequencing reads from cDNA of six different tissues were assembled and analysed.A total of 11,793 zebra finch transcripts were represented in this EST data, indicating a transcriptome coverage ofabout 65%. There was a positive correlation between the tissue specificity of gene expression and non-synonymous to synonymous nucleotide substitution ratio of genes, suggesting that genes with a specialisedfunction are evolving at a higher rate (or with less constraint) than genes with a more general function. In linewith this, there was also a negative correlation between overall expression levels and expression specificity ofcontigs. We found evidence for expression of 10 different genes related to the MHC. MHC genes showed relativelytissue specific expression levels and were in general primarily expressed in spleen. Several MHC genes, includingMHC class I also showed expression in brain. Furthermore, for all genes with highest levels of expression in spleenthere was an overrepresentation of several gene ontology terms related to immune function.
Conclusions: Our study highlights the usefulness of next-generation sequence data for quantifying geneexpression in the genome as a whole as well as in specific candidate genes. Overall, the data show predictedpatterns of gene expression profiles and molecular evolution in the zebra finch genome. Expression of MHC genesin particular, corresponds well with expression patterns in other vertebrates.
BackgroundStudies of molecular evolution have until recentlyfocused on nucleotide divergence, while studies of varia-tion in gene expression profiles have mainly beenrestricted to a few model species such as Drosophilaand mice [1-4]. This is because the technologies forstudying gene expression have not been available (orhave been too costly to develop) for non-model species[5]. However, sequencing-based technologies for expres-sion profiling can now be utilised to this end. By count-ing the number of reads generated by sequencingof cDNA from different genes in the transcriptome,one can get an estimate of the expression level ofthese genes in the particular tissues sampled [6].
A complementary approach is to scan publicly availabledatabases of expressed sequence tags (ESTs) for thegenes of interest. In addition to microarrays, these stra-tegies, called digital transcriptomics, are today the mostcommonly used methods for investigating expressionpatterns [7]. Digital transcriptomics has received a greatdeal of attention, but the use of these methods has beenrestricted in many species by the requirement of havinga reference genome to evaluate and analyse the data.The advent of massively parallel (next-generation)
sequencing is now starting to change this picture byproviding a cost-effective way of generating largeamount of sequence data in species where there is noprior knowledge of the genome sequence [8-10]. Next-generation sequencing technology generally generatesmillions of short sequence reads, each read being tensto hundreds of base pairs long, depending on the
* Correspondence: [email protected] of Animal and Plant Sciences, University of Sheffield, AlfredDenny Building, Western Bank, Sheffield S10 2TN, UK
Ekblom et al. BMC Genomics 2010, 11:219http://www.biomedcentral.com/1471-2164/11/219
© 2010 Ekblom et al; licensee BioMed Central Ltd. This is an Open Access article distributed under the terms of the Creative CommonsAttribution License (http://creativecommons.org/licenses/by/2.0), which permits unrestricted use, distribution, and reproduction inany medium, provided the original work is properly cited.
specific platform. This enables detection of genes evenwith very low expression levels. Roche 454-sequencing[11], in particular, generates reads that are long enoughto be informative in the absence of a reference genome[12,13]. Here, we evaluate the use of 454-sequencing toinvestigate tissue specific gene expression profiles.Next-generation sequencing can be used to not only
describe genome-wide patterns of gene expression, butalso to characterise specific gene families or geneticpathways. To illustrate this point, we use the ecologi-cally important and widely studied genes of the majorhistocompatibility complex (MHC) for a more detailedanalysis. These genes are a very common focus of stu-dies that take a candidate gene approach to investigatefunctionally important genetic variation in immunefunction [14]. MHC genes are among the most variableof the vertebrate genomes [15-18]. In particular, theclassical MHC genes (class I and class II) exhibit anextraordinary level of polymorphism. This polymorph-ism is strongly associated to the role of these genes inregulating and triggering the adaptive immune response.Studies have found links between nucleic acid variationin the MHC genes and resistance to parasites [19,20],sexually selected ornaments [21], mate choice [22],maternal-foetal incompatibilities [23] and local adapta-tion [24]. Typically studies of MHC variation havefocused on sequence variation only in a few highly poly-morphic regions of class I and class II genes, while var-iation in other genes, regions and expression levels haslargely been ignored. The completion of the genomesequence of first the chicken (Gallus gallus) [25] andnow of the zebra finch (Warren et al. in press) haveopened the door for in-depth studies of organisationand expression of MHC genes in birds. There are strik-ing differences in the way the adaptive immune defenceoperates in birds compared to mammals [26] and itcould be envisioned that such studies will reveal newinsights in the evolution of vertebrate immunity.The aim of the present study was to investigate tissue-
specific gene expression patterns in the zebra finch.With the sequencing of its genome, the zebra finch hastaken a major step towards becoming an importantmodel system for bird genomics [27,28]. Outside ofsome recent studies of gene expression in brain [29-31],however, little is known about genome-scale, and organ-ism-wide patterns of gene expression in song birds. Inthis study we describe patterns of gene expressionacross six zebra finch tissues and explore the relation-ship between expression profiles of genes and character-istics of their molecular evolution. To this end, we use anext-generation sequencing (NGS) digital transcrip-tomics approach known as RNA-Seq [32,33]. This meth-odology was recently employed to study gene expressiondifferentiation between two subspecies of crow (Corvus
corone) [34], but as far as we are aware, this is the firsttime that a bird transcriptome has been characterised inmultiple tissues using an NGS RNA-Seq approach. Inaddition to global patterns of gene expression, we high-light patterns of expression in the genes of the MHC.Because of the complex history of duplication amongcertain MHC genes, gene expression profiles have thepotential to offer insight into the evolutionary fates ofthese duplicated genes. Importantly, characterizing theexpression of MHC genes will also facilitate downstreamstudies of these genes in ecological contexts by identify-ing functionally important loci.
ResultsAssembly of 454 sequencing readsAfter trimming and removal of contaminant sequences atotal of 1,882,439 reads were available, with a mean readlength of 83 nucleotides. 741,917 of these reads wereassembled (Additional file 1: Appendix s1) de-novo (therest were kept as singletons) into 49,606 contigs with amean contig length of 150 nucleotides (range 41-2,953;Figure 1) and a mean of 15 reads per contig. The totallength of all contigs was 7,439 kb. For read and contigstatistics for each tissue separately see Additional file 1:Appendix s2. 582 (1.2%) of the contigs showed signa-tures of multiple splice variants, as indicated by gaps inalignments between the contig and one or more of thereads that contribute to that contig.
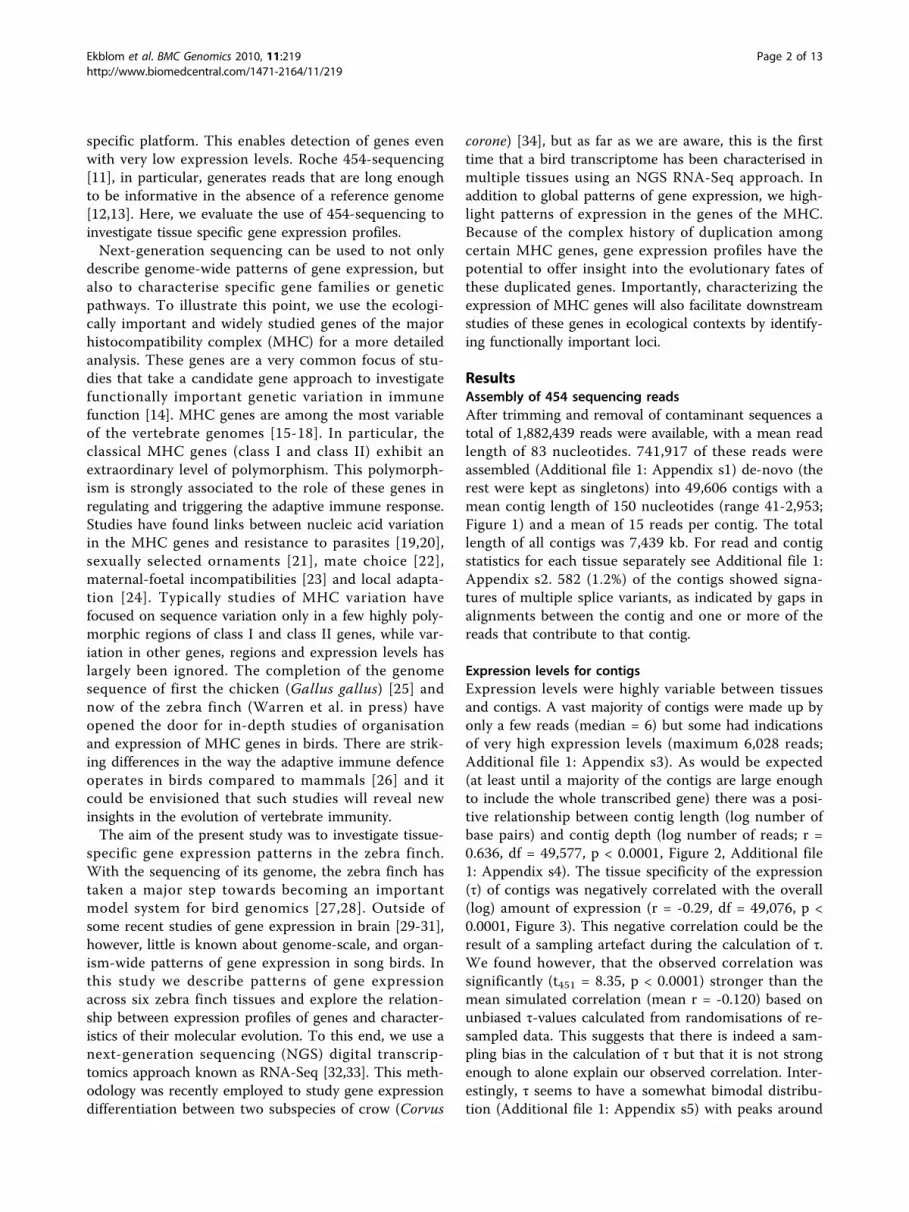
Expression levels for contigsExpression levels were highly variable between tissuesand contigs. A vast majority of contigs were made up byonly a few reads (median = 6) but some had indicationsof very high expression levels (maximum 6,028 reads;Additional file 1: Appendix s3). As would be expected(at least until a majority of the contigs are large enoughto include the whole transcribed gene) there was a posi-tive relationship between contig length (log number ofbase pairs) and contig depth (log number of reads; r =0.636, df = 49,577, p < 0.0001, Figure 2, Additional file1: Appendix s4). The tissue specificity of the expression(τ) of contigs was negatively correlated with the overall(log) amount of expression (r = -0.29, df = 49,076, p <0.0001, Figure 3). This negative correlation could be theresult of a sampling artefact during the calculation of τ.We found however, that the observed correlation wassignificantly (t451 = 8.35, p < 0.0001) stronger than themean simulated correlation (mean r = -0.120) based onunbiased τ-values calculated from randomisations of re-sampled data. This suggests that there is indeed a sam-pling bias in the calculation of τ but that it is not strongenough to alone explain our observed correlation. Inter-estingly, τ seems to have a somewhat bimodal distribu-tion (Additional file 1: Appendix s5) with peaks around
Ekblom et al. BMC Genomics 2010, 11:219http://www.biomedcentral.com/1471-2164/11/219
Page 2 of 13

0.5 and 0.75, indicating that the genes may group intotwo different classes of tissue specificity. However, onlya few contigs showed evidence of very low τ-values indi-cative of housekeeping genes.
Outlier contigs with high expression levelsThree contigs were found to have strikingly high overallexpression levels; following BLAST searches against thechicken and zebra finch gene databases they were foundto represent Albumin (6,028 reads), Heat Shock 90 kDaProtein 1 Beta (4,305 reads) and NADH DehydrogenaseSubunit 1 (4,753 reads). All of these are considered tobe so-called housekeeping genes (genes with equalexpression across tissues and treatments) and are alsohighly expressed in mammals. Some contigs were con-spicuous in having very strong expression in one or fewtissues. Genes represented by these include ElongationFactor 1-Alpha (1,268 reads in embryo), CytoplasmicBeta-Actin gene (1,185 reads in embryo), HaemoglobinAlpha (1,516 reads in spleen) and MHC Class II Asso-ciated Invariant Chain Ii (2,137 reads in spleen). Onecontig was found in high levels in testes (1,499 reads)but was almost completely absent in other tissues, the
BLAST search revealed that this originates from a con-tamination with DNA from a freshwater planarian(Schmidtea). This is likely to have occurred in thelaboratory that carried out the sequencing (theWashington University Genome Center), since the gen-ome of Schmidtea mediterranea was being sequencedthere at the same time as the zebra finch cDNA pre-paration. This contig, together with 26 other contigsresulting from contamination (mainly from planarians),was removed from the data before conducting down-stream analyses.
Coverage of the zebra finch transcriptome13,562 contigs from the de-novo assembly and 118,165of the non-assembled singletons gave significant BLASThits against at least one predicted zebra finch gene.Since the contigs were generally much shorter than thetotal cDNA length of the gene it was commonly foundthat several different contigs matched the same gene. Intotal 11,793 zebra finch transcripts present in the Bio-Mart database were found to correspond to the 454/EST transcriptome contigs and singletons. This repre-sents 65% of the total characterised zebra finch
Figure 1 Distribution of contig lengths (log) from 454 sequencing reads of all tissues combined.
Ekblom et al. BMC Genomics 2010, 11:219http://www.biomedcentral.com/1471-2164/11/219
Page 3 of 13
transctiptome (18,241 unique transcripts). The tran-scripts are derived from 11,567 different genes, suggest-ing that more than one splice variant was detected (andplaced in different contigs) for ~2% of the genes. Wealso identified potential novel splice variants for 270 ofthe expressed zebra finch genes, as indicated by gaps inthe alignments of the contig and the gene prediction.On average 38% of the lengths of represented transcriptswere covered by contig sequences and 370 transcriptswere fully covered.To further investigate the extent of transcriptomic
coverage, we investigated the presence of known genesin various metabolic pathways and signalling cascades
(Table 1)[35]. For the metabolic pathways about 85% ofthe genes were represented and for signalling cascadeswe found around 60%. 2,285 (19%) of all genes foundwere expressed in all investigated tissues and 2,998(25%) were expressed exclusively in one tissue (Table 2).Out of the 36,044 contigs that did not give any matchesto known predicted zebra finch transcripts, most(34,456) still gave highly significant BLAST hits (e < 1e-10) against the zebra finch genome sequence, suggestingthat these represent transcribed regions that have notyet been annotated. The remaining 1,588 contigs (thosethat did not match either the annotated zebra finchgenes or the genome sequence) may represent genes in
Figure 2 Positive relationship between length (log number of bases) and depth (log number of reads) of contigs for the wholedataset (all tissues combined). The line represents a linear regression of the data (slope = 0.33, Intercept = 4.23, R2 = 0.40, p < 0.0001).
Ekblom et al. BMC Genomics 2010, 11:219http://www.biomedcentral.com/1471-2164/11/219
Page 4 of 13

Figure 3 Total expression level plotted against tissue specificity of gene expression (τ) for all contigs.
Table 1 Number of genes for specific metabolic and signalling pathways identified in the zebra finch genome thatwere present in the transcriptome assembly presented here
GO number Biological process Total # zebra finch genes # present in this analysis % represented Mean τ (95% CI)
GO:0006096 Glycolysis 31 37 84 0.41 (0.30 - 0.51)
GO:0006094 Gluconeogenesis 7 6 86 0.56 (0.25 - 0.86)
GO:0006098 Pentose Phosphate 8 7 88 0.44 (0.31 - 0.56)
GO:0006101 Citrate metabolic processes 2 2 100 0.52 (NA)
GO:0007224 Hedgehog signalling pathways 15 7 47 0.50 (0.38 - 0.62)
GO:0007259 JAK/STAT cascade 8 5 63 0.55 (NA)
GO:0007219 Notch signalling 19 13 68 0.53 (0.42 - 0.65)
GO:0016055 WNT signalling 48 20 42 0.51 (0.38 - 0.64)
GO:0002224 Toll like receptor signalling 6 3 50 0.67 (NA)
- MHC genes 16 10 62 0.60 (0.40 - 0.80)
Number of MHC related genes included in this study is also given. The mean index of tissue specificity of expression (τ) and its 95% CI (when more than twoτ values) for each pathway is also given.
Ekblom et al. BMC Genomics 2010, 11:219http://www.biomedcentral.com/1471-2164/11/219
Page 5 of 13

regions of the genome that have not been sequencedand/or assembled in the current genome assembly, oradditional contamination from other organisms that arenot represented in GenBank.
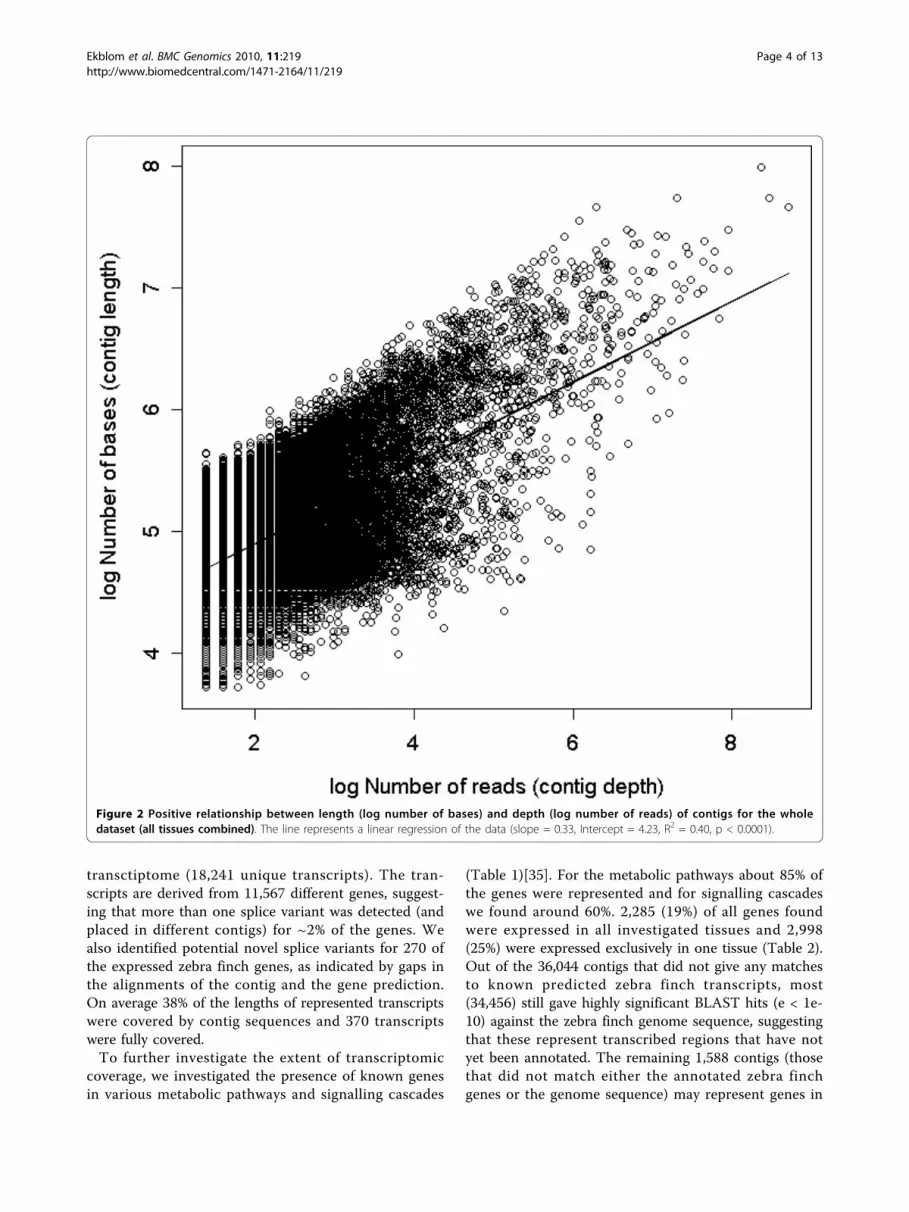
Analyses of gene expression profilesWe found a positive correlation between tissue specifi-city of expression (τ) and the ratio of non-synonymousto synonymous substitution rate (ω) when compared tothe chicken orthologue of the gene in question (rs =0.20, df = 7,342, p < 0.0001, Figure 4). There was also anegative correlation between total expression level ofthe gene and ω (rs = -0.071, df = 10,711, p < 0.0001,Additional file 1: Appendix s6). There was a weak posi-tive correlation between the length of the gene and thetotal level of gene expression (rs = 0.059, df = 10,711,p < 0.0001), and a negative correlation between genelength and τ (rs = -0.065, df = 7,342, p < 0.0001). Therewere differences in ω between the tissues in whichgenes were primarily expressed (Kruskal-Wallis test,c2 = 106.43, df = 5, p < 0.0001). Genes that wereprimarily expressed in the embryo had the lowest meanω-value (Table 2). The expression specificity (τ) of genesalso varied significantly between tissues of maximalexpression (ANOVA, F5 = 87.5, p < 0.0001). The lowesttissue specificity was found in genes with primaryexpression in embryo and muscle, while the highestτ was found in genes with maximal expression in skinand testes (Table 2).
Analysis of expression in relation to GO-termsThere were 20 gene ontology (GO) terms overrepre-sented (Fisher’s adjusted p < 0.05) in genes with highlevels of expression specificity (6 for “biological process”,2 for “cellular component” and 12 for “molecular func-tion"; Additional file 1: Appendix s7). These representprocesses such as cellular and organelle movement andspecific enzymatic processes (for example “lipid meta-bolic processes” and “carboxypeptidase activity”). Some
GO terms overrepresented in genes with high tissuespecificity are associated with reproduction (such as“sperm motility”) and immune defence (such as “foamcell differentiation”, “serine-type endopeptidase activity”and “chemokine activity”). Genes identified as havinglow tissue specificity of gene expression were signifi-cantly overrepresented for 47 different GO terms (19 for“biological process”, 14 for “cellular component” and 14for “molecular function"; Additional file 1: Appendix s8).These terms generally represented functions such asprotein synthesis and basal metabolic processes.Gene ontology terms overrepresented in genes primar-
ily expressed in embryo were mostly associated with celldivision and protein synthesis (Additional file 1: Appen-dix s9). Gene ontology associated with genes with high-est expression in liver indicated functions of specificmetabolic processes - reactions involving oxygen andenergy related processes (Additional file 1: Appendixs10). Also genes primarily expressed in muscles wereassociated with GO terms related to energy utilisationand especially the function of the mitochondria (Addi-tional file 1: Appendix s11). In genes with the highestexpression levels in skin there was an overrepresentationof GO terms related to cytoskeletal structures and cellproliferation (Additional file 1: Appendix s12). Of maininterest in relation to MHC and immune function weregenes with primary expression in spleen. GO termsassociated with expression in this tissue include “leuko-cyte adhesion”, “immune response”, “cell surface recep-tor linked signal transduction” and “chemokine activity”,but also several terms related to ribosomal activity(Additional file 1: Appendix s13). Lastly, there were alarge number of GO terms overrepresented in geneswith maximal expression in testes, including for example“spermatogenesis” and “microtubule motor activity”(Additional file 1: Appendix s14).
Validation of expression profiling: “housekeeping” genesWe specifically investigated expression patterns in fourwidely used housekeeping genes that have been shownto have similar levels of expression over a wide range oftissues and treatments in birds [36,37]. Two highlyexpressed genes, Ubiquitin (UB) and Glyceraldehyde-3-Phosphate Dehydrogenase (GAPDH), were representedby 7,160 and 12,397 reads, respectively. The tissue speci-ficities of gene expression (τ) for these were 0.15 for UBand 0.16 for GAPDH (both within the lower 3rd percen-tile of the total distribution of τ) Two genes with med-ium expression levels also had low gene expressionvariation between tissues. Ribosomal Protein S13(RPS13) was found in 395 reads and had a τ-value of0.20, while 60S Ribosomal Protein L30 (RPL30) wasfound in 326 reads with a τ-value of 0.21 (within thelower 7th percentile of the total distribution of τ).
Table 2 Mean dN/dS (ω) values and index of tissuespecificity of expression (τ) for genes with maximalexpression in each of the investigated six tissues,together with 95% confidence intervals (CI)
Tissue Nmax (Nunique) ω 95% CI (ω) τ 95% CI (τ)
Embryo 2,033 (454) 0.132 0.120 - 0.144 0.438 0.430 - 0.446
Liver 1,347 (552) 0.157 0.150 - 0.164 0.518 0.506 - 0.530
Muscle 738 (348) 0.278 0.015 - 0.541 0.458 0.440 - 0.475
Skin 964 (427) 0.155 0.145 - 0.165 0.561 0.547 - 0.574
Spleen 1,000 (368) 0.161 0.140 - 0.182 0.492 0.479 - 0.505
Testes 2,996 (849) 0.165 0.148 - 0.182 0.542 0.534 - 0.549
Nmax represents the number of genes with maximal expression in each of thetissues and the number within brackets (Nunique) is the number of geneswhich are expressed uniquely in that tissue.
Ekblom et al. BMC Genomics 2010, 11:219http://www.biomedcentral.com/1471-2164/11/219
Page 6 of 13
Case study of expression profiling: MHC genesWe surveyed expression data for 16 MHC-related genesfound in the zebra finch assembly and targeted BACsequencing (Balakrishnan et al. in review, GenBank:AC192433, AC191651, AC191861, AC192431,AC232985, AC232854). We found evidence for expres-sion of ten different MHC related genes in the zebrafinch (Table 3). Thus the coverage of these genes iscomparable to the rest of the genome (Table 1). Amongthese there was evidence for one expressed MHC class Iloci but we did not find expression of any MHC class IIloci in the present dataset. This is not to say that thereare no expressed MHC class II molecules in the zebra
finch, but only that these genes are expressed at too lowlevels in the sampled tissues to be detected using ourmethodology. The expression patterns of MHC geneswere generally tissue specific (τ ranging from 0.336 to0.833), with the highest expression levels for most genesin spleen. A detailed presentation of the expression forspecific MHC genes can be found in a separate supple-mentary text (Additional files 2 and 3). One of theMHC genes, CD74 (Ii) presents a case of alternativesplicing. As is true in many other species, we found evi-dence for at least two differently spliced isoforms of thisgene, represented by different contigs in our 454sequence assembly (Additional file 2; Figure s3).
Figure 4 Positive relationship between the rate of non-synonymous/synonymous substitution (log (ω+1)) and the index of specificityof gene expression (τ) for zebra finch against chicken comparisons of orthologous genes. The grey data points represent MHC genes.
Ekblom et al. BMC Genomics 2010, 11:219http://www.biomedcentral.com/1471-2164/11/219
Page 7 of 13

DiscussionWe have used transcriptomic data from six different tis-sues, generated by 454-sequencing [11], to investigateexpression patterns of different zebra finch genes. Ourresults highlight, in a new evolutionary lineage, a num-ber of trends in the evolution of gene expression pro-files. Genes with a high degree of tissue specificity inexpression levels also had high non-synonymous tosynonymous rate of nucleotide substitutions (dN/dS),while genes with high overall expression levels had lowdN/dS ratios. Thus genes with a more specialised func-tion (lower overall expression and higher degree of tis-sue specificity) seem to be evolving at a higher rate (orwith less constraint) than genes with a more generalfunction (high overall expression and low degree of tis-sue specificity). These results recapitulate those ofAxelsson and co-workers [38] who analysed chickenexpression profiles in conjunction with sequence diver-gence data from chicken and zebra finch. Similar pat-terns of molecular evolution and expression specificityhave also been found in mammals [39]. One importantconsequence of this finding for future studies of geneexpression is that genes under strong positive selectionmight be missed if RNA from the appropriate tissues isnot sequenced. In other words, the genes that are likelyto be relevant for explaining genetic variation in ecologi-cally important processes such as host-parasite co-evolu-tion or reproduction [40] may be relatively less likely tobe sequenced. This is particularly relevant in the presentstudy system because the vast majority of gene expres-sion studies in passerine birds have focussed on a singletissue, the brain.Overall about 65% of the annotated zebra finch tran-
scripts were covered by 454 sequencing in this study.An analysis of genes in well characterised metabolicpathways and signalling cascades [35] also corroborate
this number. There is also some indication that morethan one splice variant [41] was detected for some ofthe genes. Most of the contigs that did not match anyof the annotated zebra finch transcripts still gave highlyrelevant hits against the zebra finch genome, suggestingthat these represent novel genes that have yet to beannotated in the zebra finch genome. A few contigs thatdid not match anywhere in the zebra finch genomecould either be part of genetic regions that have notbeen sequenced in the present zebra finch genomeassembly or may represent contamination from otherorganisms. Higher coverage transcriptome sequencingwill be needed to complete the zebra finch transcrip-tome and to fully characterize splice-variants.Genes primarily expressed in embryo had low dN/dS
ratios, while genes with the highest expression in testesshowed high ratio. Low dN/dS ratios of embryonicallyexpressed genes may represent stabilizing selection andhigh evolutionary constraint on core developmental andhousekeeping genes [42]. High dN/dS in testes-expressedand reproductive genes has also been observed inhuman versus chimpanzee comparisons [40], in Droso-phila [43,44] and in mice [45]. Such a pattern may beattributable to sexual selection acting on genes impor-tant for traits involved in reproduction. High dN/dSvalues of genes expressed primarily in spleen is alsoconcordant with previous studies showing high rate ofevolution in genes involved in the immune system [46].Several of the MHC genes investigated in this study hadprimary expression in spleen and high dN/dS ratios ofthese genes are often seen as an indication of balancingselection acting on them [47].In addition to performing genome wide analyses we
also used the 454 transcriptome sequence data to investi-gate specific genes of interest. In particular, special atten-tion was given to genes of the major histocompatibillity
Table 3 Expression of zebra finch MHC genes in seven different tissues expressed as number of transcriptsper million (TPM) [57]
Gene Brain, EST Embryo Liver Muscle Skin Spleen Testes τ
TUBB 21.7 3.1 0.0 0.0 0.0 0.0 0.0 -
TRIM7.2 97.8 0.0 0.0 3.1 0.0 0.0 0.0 0.833
TRIM39 0.0 0.0 2.5 0.0 4.0 6.9 3.3 0.519
TRIM27 10.9 3.1 0.0 0.0 0.0 0.0 0.0 -
Ii 76.1 182.2 323.2 887.5 241.7 4,060.4 250.2 0.336
Class I 130.4 6.2 106.9 18.4 31.7 1,695.0 110.1 0.497
CIITA 0.0 0.0 0.0 0.0 0.0 10.4 0.0 -
CD1A 0.0 0.0 2.5 0.0 0.0 55.6 0.0 0.817
BRD2 21.7 0.0 0.0 0.0 0.0 0.0 0.0 -
B2M 10.9 0.0 45.8 9.2 27.7 896.1 43.4 0.602
Library size 92,040 323,897 392,890 325,646 252,349 287,902 299,755
The total number of reads in each tissue library after trimming (library size) and the tissue specificity of gene expression (τ) are also given (τ values based onthree or fewer reads are omitted, see Methods).
Ekblom et al. BMC Genomics 2010, 11:219http://www.biomedcentral.com/1471-2164/11/219
Page 8 of 13
complex (see Additional file 2 for details). We found evi-dence for expression of ten different genes associatedwith the major histocompatibility complex. Most of thesewere primarily expressed in spleen, although there werealso high levels of expression in brain and liver for some.Expression in the spleen is hardly surprising given thefunction of spleen in the immune defence. The expres-sion of MHC genes in the brain however, was only rela-tively recently discovered in mammals [48] and has notbeen previously described in birds. It will be of interest todetermine whether the role of the MHC in the brain isconserved across vertebrates. Furthermore, several geneontology terms related to immune response were overre-presented in genes with primary expression in spleen.Some GO terms related to immune response were alsooverrepresented in genes with high tissue specificity,indicating that many immune genes are expressed mainlyin a few specialised tissues.For a few known MHC genes we could not detect any
expression. This illustrates the fact that one may notnecessarily find specific genes of interest in a next gen-eration transcriptome sequencing dataset, especially ifthey are expressed at very low levels or only in specifictissues or life history stages. On the other hand, ongoingdevelopment of next generation sequencing technologiesmeans that deeper coverage will be obtained enablinggene finding of lowly expressed genes. Coverage ofMHC genes was within the range of other well charac-terised groups of genes related to specific metabolic andsignalling pathways. These genes had medium levels oftissue specificity of expression, and there was a tendencyfor MHC genes to have higher levels of expression spe-cificity (Table 1).In expression profiling it is preferable to use
sequences from a non-normalized cDNA library toavoid bias in the estimates of expression individualgenes [49]. In our case the only data available for geneexpression in different tissues came from cDNA librariesthat were normalized to increase the abundance of raretranscripts [50]. Thus there is a risk that our expressionestimates might be biased. In particular the expressionlevels of rare transcripts are probably overestimatedwhile the levels for very common transcripts should beunderestimated. This also means that estimates of tissuespecificity of gene expression (τ) may be underestimatedfor individual genes. We argue, however, that the com-parative analyses presented here can be performed usingthis dataset. There are at least four lines of evidencethat these analyses are valid. 1) There is still consider-able variation in expression levels between the differentgenes and tissues in our study, with many genes onlyexpressed in one or a few tissues. 2) The analysis con-cerning gene expression gave results in the predicteddirection. For example there was a positive relationship
between specificity of gene expression and dN/dS ratio[38]. 3) The expression of most MHC genes was by farstrongest in spleen which is what would be predictedfor genes involved in immune defence. Further, GOterms overrepresented for genes with maximal expres-sion in a certain tissue seemed to correspond well tothose expected given the biological functions of the dif-ferent tissues. 4) The expression levels of several house-keeping genes seemed to be stable across the differenttissues analysed here.One potential explanation for our failure to find 6 of
the 16 MHC genes surveyed is that the relatively shortcontigs generated here, in combination with oligo dTpriming, produced a strong 3’ bias in the 454 sequen-cing. Indeed, many of the 454 reads fell in the 3’untranslated region (UTR) of genes (Additional file 2:Figure s4). It is therefore possible that these MHC geneswere expressed, but the sequence reads only includedUTR sequence. To investigate this issue we collectedinformation from the avian MHC genes where the 3’UTR has been sequenced. UTR regions of avian MHCgenes are not well-described at this point but we found3’ UTR sequence data for MHC class IIB from chicken,turkey, quail, New Zealand robin (Petroica australis),Bengalese finch (Lonchura striata) and zebra finch(locus 2 from the genome sequence). For MHC class Iwe found data from chicken, turkey, quail, mallard duck(Anas platyrhynchos) and great reed warbler (Acrocepha-lus arundinaceus), and we also included data from duckCD74 (Ii). These sequences were blasted against allzebra finch 454 contigs and positive matches were veri-fied by a reciprocal BLAST against the zebra finch gen-ome and chicken transcriptome databases. Only two ofour contigs matched the 3’ UTR MHC sequences, bothrepresenting the CD74 (Ii) transcript. Therefore it isunlikely that the failure to detect more MHC genes canbe attributed solely to the short, and 3’ UTR biased,contigs we assembled. New and improved methods forlibrary preparation are now used to deal with this pro-blem of 3’ bias.In general, the contigs produced using de-novo
assembly of the 454-reads only partially covered thegene transcripts, with a mean contig length of only150 nucleotides. These data were produced using thefirst generation of the 454-sequencing system (GS20)for which maximal read lengths were only around 125bp. With application of the new generation of 454-sequencing (GS FLX Titanium), which generates moreand longer reads, one would expect to get longer con-tigs and more contigs covering the whole of the genecoding sequence [51]. On the other hand deeper cover-age of the transcriptome, and expression data onmore genes, would be obtained using Illumina/Solexaor ABI SOLLiD technology. Both of these approaches
Ekblom et al. BMC Genomics 2010, 11:219http://www.biomedcentral.com/1471-2164/11/219
Page 9 of 13

generates a much larger amount of reads compared to454 sequencing but at a cost of much shorter reads.They are thus particularly useful for species, like thezebra finch, that have a characterized genomesequence.This study highlights the utility of next-generation
sequencing data for expression pattern profiling. Thezebra finch genome sequence was recently released andthis, together with the gene predictions available, hasbeen very useful when analysing the data. Still, thismethodology would also work well when addressing anon-model species without any prior genome informa-tion [10]. In particular, the long read lengths of the newTitanium 454-generation means that many expressedgenes can be identified using comparative sequence ana-lysis against genomes of distantly related species. Thecombination of data on sequence and gene expressionvariation makes this strategy useful for future studies innovel species. However, our study also shows that itmay not always be possible to find and sequence specificgenes of interest using whole-transcriptome sequencing.For example, we did not find any MHC class II, TAP ortapasin sequences, even though there is no reason tobelieve that these are not present and expressed in thezebra finch genome. It may be that gene capture meth-ods [52] or more efficient cDNA normalization and ran-dom primed libraries are needed to be able to pick upspecific and very rare transcripts. Another approach toimproving the discovery of genes specifically involved inthe immune system would be to boost an immuneresponse prior to cDNA sampling.
ConclusionsOur analysis of the zebra finch transcriptome extendsconserved patterns of gene expression profiles andmolecular evolution to the avian lineage. Genes withlow overall and tissue specific expression were shownto evolve at a higher rate than genes with high andunspecific expression levels. Such genes were alsoshown to be related to biological functions such asreproduction and immune response. Furthermoregenes with primary expression in spleen were oftenrelated to the immune function (for example severalMHC genes). Our results highlight the usefulness ofnext-generation sequence data for investigating expres-sion profiles in the genome as well as in specific candi-date genes. However, as illustrated by our survey ofMHC genes, it is far from certain that all genes ofinterest will be present in a given transcriptomesequencing run. Therefore care must thus be taken toensure sampling of the appropriate tissues and lifestages if the aim of the sequencing run is to examinespecific gene families or physiological pathways.
MethodsSequence dataGene expression was analysed using 454 pyrosequencingdata generated by sequencing of cDNA from six differ-ent tissues (Embryo, Liver, Muscle, Skin, Spleen andTestes) of from pooled samples from six different zebrafinches in the University of Sheffield colony [53]. Rawdata (.sff files) from the GS20 sequencer were kindlyprovided by Wesley C. Warren (The Genome Center,Washington University School of Medicine). This repre-sent two sequencing runs of cDNA from each tissuetype, totalling 1,961,888 reads. Library construction ofpolyadenylated cDNA was performed using a variationof the Clontech SMART system, in which the 5’ and 3’PCR adapters contain type IIs restriction enzyme sites(MmeI). The optimally-cycled product was then normal-ized using a duplex-specific nuclease (DSN) that prefer-entially digests double-stranded DNA in the presence ofsingle-stranded DNA (Trimmer; Evrogen). For moredetails about cDNA synthesis and normalization see[50]. The produced sequence reads are also available asfasta files in the NCBI trace archive http://www.ncbi.nlm.nih.gov/Traces/trace.cgi?cmd=retrieve&s=search&-m=obtain&retrieve=Search&val=SPECIES_CODE%3D’TAENIOPYGIA+GUTTATA’+AND+CENTER_-NAME%3D’WUGSC’+AND+TRACE_TYPE_CODE%3D’454’. For expression analysis of MHC genes we alsoused EST libraries from zebra finch brain tissue down-loaded from the NCBI website. Coding sequences frommanually-annotated MHC genes were obtained byBLAST searches and HMMER gene prediction of thezebra finch genome, as described in Balakrishnan et al.(in review). After screening zebra finch BAC librariesusing probes designed for MHC genes, seven BACclones were sequenced at 6x coverage (Balakrishnanet al. in review). Predicted zebra finch gene sequences(cDNA, version 3.2.4.54) and chicken protein sequences(version 2.52) were downloaded from the ENSEMBL ftpsite http://www.ensembl.org/info/data/ftp/index.html.
454 assemblyTrimming and assemblies (both de-novo and templated,see below) of 454 sequence fragments were performedusing SeqMan NGen version 2.0 (DNASTAR, Inc.). Thesequences were trimmed of low-quality sequence, poly-A tails, Smart primer sequence from cDNA synthesisand 454 adaptor sequence before assembling into con-tigs. In order to avoid falsely joining reads that do notbelong to the same gene, we increased the match size to41 base pairs. This parameter defines the length ofsequences common to two or more sequences that areused to join reads together into contigs. For other para-meters we used default values or values suggested in the
Ekblom et al. BMC Genomics 2010, 11:219http://www.biomedcentral.com/1471-2164/11/219
Page 10 of 13

software manual for assembling 454 data (for completetrimming and assembly parameters see Additional file 1:Appendix s1). 454 reads for all six tissues were firstcombined in a full data de-novo assembly. In order toidentify contigs with multiple splice variants we alsosearched for gaps (defined here as more than 15 baseslong) in the alignments between all the individual readsand the best matching contig. Alternative isoformswould be expected to generate alignment gaps if a con-tig contains an extra (or different) exon which is notpresent in the read. In order to check for tissue specifi-city of expression, another assembly was then made foreach tissue separately using the contigs created by thefull data assembly as a sequence template. To investigateexpression of MHC genes specifically we also performeda templated assembly using zebra finch chromosome 16and MHC containing BAC sequences as a referencesequence (for more details about the MHC analyses seeAdditional file 2).
Transcriptomic analysisAll of the contigs and singletons from the de-novoassembly of 454 reads from all six different tissueswere blasted (BLASTN) against the Ensembl zebrafinch gene predictions using a cut-off e-value of 1e-10.Only the best BLAST (minimum e-value, maximumlength) hit from each contig was extracted. For eachunique gene we then combined the data on number ofreads for each corresponding contig and singletons(since most contigs did not cover the whole gene itwas common that several different contigs and single-tons gave BLAST hits to different parts of the samegene). To calculate the proportion of the individualgenes that were covered with our transcripts we usedthe length of the gene divided by the sum of the lengthof all contigs aligned to that gene. In the few caseswhere the total contig length was larger than the genelength (probably due to overlapping contigs) the genecoverage was set to 100%. We also searched for gapsin the alignments between the contigs and theEnsembl gene predictions, as these are indications ofthe presence of novel splice variants in the expressiondata. Data on gene length, name, genomic location anddN/dS ratio (compared to the chicken orthologue) werethen extracted from BioMart http://www.ensembl.org/biomart/martview/. Values of dN/dS for MHC genesnot annotated in Ensembl were calculated using thecodeml model in PAML4 [54] using the IDEA inter-face [55]. To investigate transcriptome coverage of ourcontigs and reads matching Ensembl contigs wesearched specifically for genes in well characterisedmetabolic pathways and signalling cascades. The speci-fic pathways investigated were chosen based on similarstudies e.g. [35]. We also searched (BLASTN) the
current assembly zebra finch genome (version 3.2.4)for matches to all contigs that did not produce goodhits to any annotated gene models in order to identifycandidates for new and non-annotated zebra finchgenes.
Tissue Specificity of Gene ExpressionWe calculated the index of tissue specificity of geneexpression (τ)[56], using the guidelines in [57]. Thus,the number of transcripts per million (TPM) was set to2 for tissues with no detected expression of the gene inquestion. Furthermore τ estimates based on 3 or fewerreads were removed from the analyses. This was doneto reduce the effect of sampling stochasticity whenexpression levels were very low. The theoretical range ofτ for a specific gene varies between 0 and 1, where 0means that the gene is equally expressed in all studiedtissues (housekeeping genes) and values approaching 1means that the gene is expressed specifically in one tis-sue [56]. The tissue of maximal expression was definedas the tissue with the highest number of reads for a spe-cific gene. Genes with less than four reads were alsoexcluded from lists of maximal expression.
Simulation to investigate bias in τTo investigate possible bias in the calculation of τ, wealso performed a simulation of τ calculated from re-sampled data. For each of the 452 levels of geneexpression in our data we randomly drew the samenumber of contigs as observed from the full distribu-tion of expression levels while keeping the relativeexpression levels between tissues constant. This proce-dure was iterated enough times to get the same num-ber of data points as for the observed data. As thesedata points all come from contigs with the sameexpression level, τ values calculated from these shouldbe unbiased with respect to expression. We then calcu-lated the correlation coefficient between total geneexpression and τ for each of these 452 simulated data-sets and compared these to the observed correlationcoefficient for the original dataset.
Gene ontology analysisThe five hundred genes with the highest and the fivehundred genes with lowest tissue specificity of expres-sion, as well as all genes with maximal expression foreach of the six tissues, were compared against all otherzebra finch genes with respect to associated gene ontol-ogy (GO) terms. GO terms more common in thesegenes than expected by chance (adjusted Fishers p <0.05) were identified using the CORNA algorithm [58],applied using the web interface provided by MichaelWatson at the Institute for Animal Health http://bioin-formatics.iah.ac.uk/tools/GOfinch.
Ekblom et al. BMC Genomics 2010, 11:219http://www.biomedcentral.com/1471-2164/11/219
Page 11 of 13
Statistical analysesSequence similarity searches were performed using astand-alone version of the BLAST (2.2.18) package [59].Handling of BLAST output files, assembly results andstatistical analyses were performed in R (2.7.2) statisticalcomputing language [60]. Total expression levels anddN/dS ratios of genes were not normally distributed(Kolmogorov-Smirnov test, p < 0.0001) and thereforenon-parametric tests were used for analyses involvingthese.
Additional file 1: Appendix s1 - s14. Additional tables and figures
Additional file 2: Appendix s15. Detailed survey of MHC genes
Additional file 3: Appendix s16. Alignment of the zebra finch MHCclass I gene
AcknowledgementsWe would like to thank Wesley Warren for sharing sequence data. SarahFollett assisted with RNA extractions and cDNA preparation. AlexiePapanicolaou and Owen Petchey provided help with computers. Threeanonymous referees provided valuable comments on the manuscript. REwas funded as a Marie Curie fellow on the European Commission Transfer ofKnowledge grant, MAERO. CNB was funded by National Institutes of HealthTraining Grant T32DC006612. Additional funding came from the UKBiotechnology and Biological Sciences Research Council (BBSRC) under grantnumber BBE0175091 (to JS & TB).
Author details1Department of Animal and Plant Sciences, University of Sheffield, AlfredDenny Building, Western Bank, Sheffield S10 2TN, UK. 2Department ofPopulation Biology and Conservation Biology, Uppsala University,Norbyvägen 18 D, SE-75236 Uppsala, Sweden. 3Institute for Genomic Biologyand Department of Molecular & Cellular Biology, University of Illinois, 1206West Gregory Drive MC-195, Urbana, IL 61801, USA.
Authors’ contributionsRE conducted the analyses and prepared the manuscript. CNB prepared andprovided BAC sequences and analyses of these and also contributed to thewriting of the manuscript. TB and JS helped plan the work, providedsignificant feedback on the results and the manuscript. All authors have readand approved the final version of the manuscript.
Received: 9 November 2009 Accepted: 1 April 2010Published: 1 April 2010
References1. Rottscheidt R, Harr B: Extensive additivity of gene expression
differentiates subspecies of the house mouse. Genetics 2007,177(3):1553-1567.
2. Artieri CG, Haerty W, Singh RS: Association between levels of codingsequence divergence and gene misregulation in Drosophila malehybrids. Journal of Molecular Evolution 2007, 65(6):697-704.
3. Ortiz-Barrientos D, Counterman BA, Noor MAF: Gene expressiondivergence and the origin of hybrid dysfunctions. Genetica 2007,129(1):71-81.
4. Nuzhdin SV, Wayne ML, Harmon KL, McIntyre LM: Common pattern ofevolution of gene expression level and protein sequence in Drosophila.Mol Biol Evol 2004, 21(7):1308-1317.
5. Naurin S, Bensch S, Hansson B, Johansson T, Clayton DF, Albrekt A-S,Schantz TV, Hasselquist D: A microarray for large-scale genomic andtranscriptional analyses of the zebra finch (Taeniopygia guttata) andother passerines. Molecular Ecology Resources 2008, 8(2):275-281.
6. ’t Hoen PAC, Ariyurek Y, Thygesen HH, Vreugdenhil E, Vossen RHAM, deMenezes RX, Boer JM, van Ommen G-JB, den Dunnen JT: Deep
sequencing-based expression analysis shows major advances inrobustness, resolution and inter-lab portability over five microarrayplatforms. Nucl Acids Res 2008, 36(21):141.
7. Murray D, Doran P, MacMathuna P, Moss A: In silico gene expressionanalysis - an overview. Molecular Cancer 2007, 6:50.
8. Emrich SJ, Barbazuk WB, Li L, Schnable PS: Gene discovery and annotationusing LCM-454 transcriptome sequencing. Genome Res 2007, 17(1):69-73.
9. Nielsen KL, Hogh AL, Emmersen J: DeepSAGE–digital transcriptomics withhigh sensitivity, simple experimental protocol and multiplexing ofsamples. Nucl Acids Res 2006, 34:e133.
10. Vera JC, Wheat CW, Fescemyer HW, Frilander MJ, Crawford DL, Hanski I,Marden JH: Rapid transcriptome characterization for a nonmodelorganism using 454 pyrosequencing. Molecular Ecology 2008,17(7):1636-1647.
11. Margulies M, Egholm M, Altman WE, Attiya S, Bader JS, Bemben LA, Berka J,Braverman MS, Chen Y-J, Chen Z, et al: Genome sequencing inmicrofabricated high-density picolitre reactors. Nature 2005,437(7057):376-380.
12. Eveland AL, McCarty DR, Koch KE: Transcript profiling by 3’-untranslatedregion sequencing resolves expression of gene families. Plant Physiol2008, 146(1):32-44.
13. Torres TT, Metta M, Ottenwälder B, Schlötterer C: Gene expression profilingby massively parallel sequencing. Genome Res 2008, 18(1):172-177.
14. Piertney S, Webster L: Characterising functionally important andecologically meaningful genetic diversity using a candidate geneapproach. Genetica 2010, 138(4):419-32.
15. Edwards SV, Hedrick PW: Evolution and ecology of MHC molecules: fromgenomics to sexual selection. Trends Ecol Evol 1998, 13(8):305-311.
16. Robinson J, Malik A, Parham P, Bodmer JG, Marsh SEG: IMGT/HLA database- a sequence database for the human major histocompatibility complex.Tissue Antigens 2000, 55:280-287.
17. Hosomichi K, Miller MM, Goto RM, Wang YJ, Suzuki S, Kulski JK, Nishibori M,Inoko H, Hanzawa K, Shiina T: Contribution of mutation, recombination,and gene conversion to chicken Mhc-B haplotype diversity. Journal ofImmunology 2008, 181(5):3393-3399.
18. Kulski JK, Shiina T, Anzai T, Kohara S, Inoko H: Comparative genomicanalysis of the MHC: the evolution of class I duplication blocks, diversityand complexity from shark to man. Immunological Reviews 2002,190(1):95-122.
19. Piertney SB, Oliver MK: The evolutionary ecology of the majorhistocompatibility complex. Heredity 2006, 96(1):7-21.
20. Westerdahl H: Passerine MHC: genetic variation and disease resistance inthe wild. Journal of Ornithology 2007, 148:469-477.
21. Hale ML, Verduijn MH, Møller AP, Wolff K, Petrie M: Is the peacock’s trainan honest signal of genetic quality at the major histocompatibilitycomplex?. Journal of Evolutionary Biology 2009, 22(6):1284-1294.
22. Penn DJ, Potts WK: The evolution of mating preferences and majorhistocompatibility complex genes. American Naturalist 1999,153(2):145-164.
23. Clarke B, Kirby DRS: Maintenance of histocompatibility polymorphisms.Nature 1966, 211:999-1000.
24. Ekblom R, Sæther SA, Jacobsson P, Fiske P, Sahlman T, Grahn M, Kålås JA,Höglund J: Spatial pattern of MHC class II variation in the great snipe(Gallinago media). Molecular Ecology 2007, 16(7):1439-1451.
25. International Chicken Genome Sequencing Consortium: Sequence andcomparative analysis of the chicken genome provide uniqueperspectives on vertebrate evolution. Nature 2004, 432(7018):695-716.
26. Kaiser P: The avian immune genome – a glass half-full or half-empty?.Cytogenetic and Genome Research 2007, 117(1-4):221-230.
27. Ellegren H: Molecular evolutionary genomics of birds. Cytogenetic andGenome Research 2007, 117(1-4):120-130.
28. Clayton DF, Balakrishnan CN, London SE: Integrating genomes, brain andbehavior in the study of songbirds. Current Biology 2009, 19:R865-R873.
29. Lovell PV, Clayton DF, Replogle KL, Mello CV: Birdsong transcriptomics:neurochemical specializations of the oscine song system. PLoS ONE 2008,3(10):e3440.
30. London SE, Dong S, Replogle K, Clayton DF: Developmental shifts in geneexpression in the auditory forebrain during the sensitive period for songlearning. Developmental Neurobiology 2009, 69(7):437-450.
31. Dong S, Replogle KL, Hasadsri L, Imai BS, Yau PM, Rodriguez-Zas S,Southey BR, Sweedler JV, Clayton DF: Discrete molecular states in the
Ekblom et al. BMC Genomics 2010, 11:219http://www.biomedcentral.com/1471-2164/11/219
Page 12 of 13
brain accompany changing responses to a vocal signal. Proceedings ofthe National Academy of Sciences 2009, 106(27):11364-11369.
32. Wang Z, Gerstein M, Snyder M: RNA-Seq: a revolutionary tool fortranscriptomics. Nat Rev Genet 2009, 10:57-63.
33. Wilhelm BT, Landry J-R: RNA-Seq–quantitative measurement ofexpression through massively parallel RNA-sequencing. Methods 2009,48(3):249-257.
34. Wolf JBW, Bayer T, Haubold B, Schilhabel M, Rosenstiel P, Tautz D:Nucleotide divergence vs. gene expression differentiation: comparativetranscriptome sequencing in natural isolates from the carrion crow andits hybrid zone with the hooded crow. Molecular Ecology 2010,19(s1):162-175.
35. Meyer E, Aglyamova GV, Wang S, Buchanan-Carter J, Abrego D,Colbourne JK, Willis BL, Matz MV: Sequencing and de novo analysis of acoral larval transcriptome using 454 GSFlx. BMC Genomics 2009, 10:219.
36. De Boever S, Vangestel C, De Backer P, Croubels S, Sys SU: Identificationand validation of housekeeping genes as internal control for geneexpression in an intravenous LPS inflammation model in chickens.Veterinary Immunology and Immunopathology 2008, 122(3-4):312-317.
37. de Jonge HJM, Fehrmann RSN, de Bont ESJM, Hofstra RMW, Gerbens F,Kamps WA, de Vries EGE, Zee van der AGJ, te Meerman GJ, ter Elst A:Evidence based selection of housekeeping genes. PLoS ONE 2007, 2(9):e898.
38. Axelsson E, Hultin-Rosenberg L, Brandstrom M, Zwahlen M, Clayton DF,Ellegren H: Natural selection in avian protein-coding genes expressed inbrain. Molecular Ecology 2008, 17(12):3008-3017.
39. Zhang L, Li W-H: Mammalian housekeeping genes evolve more slowlythan tissue-specific genes. Mol Biol Evol 2004, 21(2):236-239.
40. Nielsen R, Bustamante C, Clark AG, Glanowski S, Sackton TB, Hubisz MJ,Fledel-Alon A, Tanenbaum DM, Civello D, White TJ, et al: A scan forpositively selected genes in the genomes of humans and chimpanzees.PLoS Biology 2005, 3(6):e170.
41. Pan Q, Shai O, Lee LJ, Frey BJ, Blencowe BJ: Deep surveying of alternativesplicing complexity in the human transcriptome by high-throughputsequencing. Nat Genet 2008, 40(12):1413-1415.
42. Cutter AD, Ward S: Sexual and temporal dynamics of molecular evolutionin C. elegans development. Mol Biol Evol 2005, 22(1):178-188.
43. Betran E, Long M: Dntf-2r, a young drosophila retroposed gene withspecific male expression under positive darwinian selection. Genetics2003, 164(3):977-988.
44. Civetta A, Rajakumar SA, Brouwers B, Bacik JP: Rapid evolution and gene-specific patterns of selection for three genes of spermatogenesis inDrosophila. Mol Biol Evol 2006, 23(3):655-662.
45. Good JM, Nachman MW: Rates of protein evolution are positivelycorrelated with developmental timing of expression during mousespermatogenesis. Mol Biol Evol 2005, 22(4):1044-1052.
46. Wang ET, Kodama G, Baldi P, Moyzis RK: Global landscape of recentinferred Darwinian selection for Homo sapiens. Proc Natl Acad Sci USA2006, 103:135-140.
47. Hedrick PW: Balancing selection and MHC. Genetica 1999, 104:207-214.48. Corriveau RA, Huh GS, Shatz CJ: Regulation of class I MHC gene
expression in the developing and mature CNS by neural activity. Neuron1998, 21(3):505-520.
49. Froman DP, Kirby JD, Rhoads DD: An expressed sequence tag analysis ofthe chicken reproductive tract transcriptome. Poult Sci 2006,85(8):1438-1441.
50. Warren WC, Hillier LW, Marshall Graves JA, Birney E, Ponting CP, Grützner F,Belov K, Miller W, Clarke L, Chinwalla AT, Yang SP, Heger A, Locke DP,Miethke P, Waters PD, Veyrunes F, Fulton L, Fulton B, Graves T, Wallis J,Puente XS, López-Otín C, Ordóñez GR, Eichler EE, Chen L, Cheng Z,Deakin JE, Alsop A, Thompson K, Kirby P, et al: Genome analysis of theplatypus reveals unique signatures of evolution. Nature 2008,453(7192):175-183.
51. Janitz M: Next-Generation Genome Sequencing: Towards PersonalizedMedicine. Heidelberg: Wiley-VCH 2008.
52. Coombs A: The sequencing shakeup. Nat Biotech 2008, 26(10):1109-1112.53. Stapley J, Birkhead TR, Burke T, Slate J: A linkage map of the zebra finch
Taeniopygia guttata provides new insights into avian genome evolution.Genetics 2008, 179(1):651-667.
54. Yang Z: PAML 4: phylogenetic analysis by maximum likelihood. Mol BiolEvol 2007, 24(8):1586-1591.
55. Egan A, Mahurkar A, Crabtree J, Badger J, Carlton J, Silva J: IDEA: interactivedisplay for evolutionary analyses. BMC Bioinformatics 2008, 9:524.
56. Yanai I, Benjamin H, Shmoish M, Chalifa-Caspi V, Shklar M, Ophir R, Bar-Even A, Horn-Saban S, Safran M, Domany E, et al: Genome-wide midrangetranscription profiles reveal expression level relationships in humantissue specification. Bioinformatics 2005, 21(5):650-659.
57. Mank JE, Hultin-Rosenberg L, Zwahlen M, Ellegren H: Pleiotropic constrainthampers the resolution of sexual antagonism in vertebrate geneexpression. The American Naturalist 2008, 171(1):35-43.
58. Wu X, Watson M: CORNA: testing gene lists for regulation by microRNAs.Bioinformatics 2009, 25(6):832-833.
59. Altschul SF, Madden TL, Schaffer AA, Zhang J, Zhang Z, Miller W,Lipman DJ: Gapped BLAST and PSI-BLAST: a new generation of proteindatabase search programs. Nucl Acids Res 1997, 25(17):3389-3402.
60. R Development Core Team: R: a language and environment for statisticalcomputing. Vienna, Austria: R Foundation for Statistical Computing 2008.
doi:10.1186/1471-2164-11-219Cite this article as: Ekblom et al.: Digital gene expression analysis of thezebra finch genome. BMC Genomics 2010 11:219.
Submit your next manuscript to BioMed Centraland take full advantage of:
• Convenient online submission
• Thorough peer review
• No space constraints or color figure charges
• Immediate publication on acceptance
• Inclusion in PubMed, CAS, Scopus and Google Scholar
• Research which is freely available for redistribution
Submit your manuscript at www.biomedcentral.com/submit
Ekblom et al. BMC Genomics 2010, 11:219http://www.biomedcentral.com/1471-2164/11/219
Page 13 of 13


