Embed Size (px)
Citation preview

DOI: 10.1161/CIRCULATIONAHA.115.018802
1
Traffic-Related Air Pollution, Blood Pressure, and Adaptive Response of
Mitochondrial Abundance
Running title: Zhong et al.; Air Pollution, Mitochondria, and Blood Pressure
Jia Zhong, MS1*; Akin Cayir, PhD1,2*; Letizia Trevisi, PhD1; Marco Sanchez-Guerra, PhD1;
Xinyi Lin, PhD3; Cheng Peng, MS1; Marie-Abèle Bind, ScD1,4; Diddier Prada, MD, PhD1,5;
Hannah Laue, MS1; Kasey J.M. Brennan, BS1; Alexandra Dereix, BS1; David Sparrow, DSc6;
Pantel Vokonas, MD6; Joel Schwartz, PhD1; Andrea A. Baccarelli, MD, PhD, FAHA1
1Dept of Environmental Health, Harvard T.H. Chan School of Public Health, Boston, MA; 2Vocational Health College, Canakkale Onsekiz Mart University, Çanakkale, Turkey; 3Singapore
Institute for Clinical Sciences, Singapore; 4Dept of Statistics, Harvard University, Cambridge,
MA; 5Unidad de Investigación Biomédica en Cáncer, Instituto Nacional de Cancerología,
Mexico City, Mexico; 6VA Normative Aging Study, Veterans Affairs Boston Healthcare System
and the Dept of Medicine, Boston University School of Medicine, Boston, MA
*contributed equally
Address for Correspondence:
Andrea A. Baccarelli, MD, PhD, FAHA
Department of Environmental Health
Harvard T.H. Chan School of Public Health
Bldg 1, Rm G-5, 665 Huntington Ave
Boston, MA 02115
Tel: 617-432-2095
Fax: 617-432-6913
E-mail: [email protected]
Journal Subject Terms: Etiology; Epidemiology
1Dept of Environmental Health, Harvard T.H. Chan School of Public Health, BoBoBostststononn, , , MAMAMA;;;
Vocational Health College, Canakkale Onsekiz Mart University, Çanakkale, Turkey; 3Singapore
Innstststitititututute e e fofofor rr Clllinininicii al Sciences, Singapore; 4Deeptptpt ooof Statistics, Harvard d d UnUU iversity, Cambridge,
MAM ; 5Unnnididadadad ddde InInInvevevestststigigi acacacióióiónnn BiBiBiomomomédddicicicaaa en Cáánceeer,r,r, IIInsnsnstitutututototo NNNacaccioioionan l dedede CCCanananceroroololologígígíaaa,
MeMeMexix co City, MMexexico;; 666VA NNNormativeee AAgingngng Stuudyyy, VeVeVeteteterararannns AAAffffairs BBBoostooonnn Healallthhhcarre Sysssteem
ananand dd thheee DeDeDeptptpt oooff f MeMedidid cicicinenene, Booostststononon UUUnininiveveversisisitytyty SSSchchchoooooolll ofofof MMMedededicicicinnne,ee BBBososostototon,n,n, MMAA A
*c*c*cononontrtrtribibibuttutededed eeequqqualalallylly
by guest on December 14, 2015http://circ.ahajournals.org/Downloaded from by guest on December 14, 2015http://circ.ahajournals.org/Downloaded from by guest on December 14, 2015http://circ.ahajournals.org/Downloaded from by guest on December 14, 2015http://circ.ahajournals.org/Downloaded from by guest on December 14, 2015http://circ.ahajournals.org/Downloaded from
DOI: 10.1161/CIRCULATIONAHA.115.018802
2
Abstract
Background—Exposure to black carbon (BC), a tracer of vehicular-traffic-pollution, is
associated with increased blood pressure (BP). Identifying biological factors that attenuate BC
effects on BP can inform prevention. We evaluated the role of mitochondrial abundance, an
adaptive mechanism compensating for cellular-redox-imbalance, in the BC-BP relationship.
Methods and Result—At one or more visits among 675 older men from the Normative Aging
Study (observations=1,252), we assessed daily BP and ambient BC levels from a stationary
monitor. To determine blood mitochondrial abundance, we used whole blood to analyze
mitochondrial-to-nuclear DNA ratio (mtDNA/nDNA) using quantitative polymerase-chain-
reaction. Every standard deviation (SD) increase in 28-day BC moving average (MA) was
associated with 1.97 mm Hg (95%CI, 1.23-2.72; P<0.0001) and 3.46 mm Hg (95%CI, 2.06-4.87;
P<0.0001) higher diastolic and systolic (SBP) BP, respectively. Positive BC-BP associations
existed throughout all time windows. BC MAs (5-day to 28-day) were associated with increased
mtDNA/nDNA; every SD increase in 28-day BC MA was associated with 0.12 SD (95%CI,
0.03-0.20; P=0.007) higher mtDNA/nDNA. High mtDNA/nDNA significantly attenuated the
BC-SBP association throughout all time windows. The estimated effect of 28-day BC MA on
SBP was 1.95-fold larger for individuals at the lowest mtDNA/nDNA quartile midpoint (4.68
mm Hg; 95%CI, 3.03-6.33; P<0.0001), compared to the top quartile midpoint (2.40 mm Hg;
95%CI, 0.81-3.99; P=0.003).
Conclusions—In older adults, short- to moderate-term ambient BC levels were associated with
increased BP and blood mitochondrial abundance. Our findings indicate that increased blood
mitochondrial abundance is a compensatory response and attenuates the cardiac effects of BC.
Key words: epidemiology; oxidative stress; blood pressure; mitochondria; air pollution
P<0.0001) higher diastolic and systolic (SBP) BP, respectively. Positive BC-BP aaassssssococociaiaatititiononons s s
existed throughout all time windows. BC MAs (5-day to 28-day) were associated wiwiwithth iiincreas ddedd
mtDNA/nDNA; every SD increase in 28-day BC MA was associated with 0.12 SD (95%CI,
0.030303-0-0-0 22.200;0; PPP===0.000070707) higher mtDNA/nDNA. Higghhh mmmtDNA/nDNAAA signiiififificccantly attenuated the
BBBC--S- BP associaiaiattioonn ttthrhrhrouououghghghouououttt alala lll tititimemme winininddodowss. TTThe e e eesestititimmamateted dd efefeffefefectctct oof 2888-d-d-dayyy BBBCC MAMAMA ooon nn
SBSBSBPPP was 1.9555-fooldd larrrgeer fororr iiindnn ivididduaaalss at tttheee lowweeest mtmtmtDNDNDNAAA/nDnDDNA qqquuartttili eee midpdppooio ntt (444.6888 t
mm HHHg;g;g; 99955%5%CICII, 33.030303 6-6 33.33; PP<0<0<0 00.000001), cococompmpmpara ededed ttoo thhheee tototop pp qqquartititilelele mmmiididpopooint tt (2(2(2 4.44000 mmmmmm HHHg;gg;
95%CI 0 81-3 99; P=0 003)
by guest on December 14, 2015http://circ.ahajournals.org/Downloaded from

DOI: 10.1161/CIRCULATIONAHA.115.018802
3
The American Heart Association (AHA) has identified particulate matter (PM) pollution as a
primary contributor to cardiovascular morbidity and mortality, which is estimated to account for
~3.7 million premature deaths per year worldwide.1, 2 To facilitate cost-efficient abatement,3, 4
recent studies suggested substantial public health benefits could be realized by implementing
control for traffic-related PM pollution.5, 6 Black carbon (BC) – a combustion byproduct that
serves as a proxy for all traffic-related particles – has been associated with adverse
cardiovascular events, particularly due to rapid effects within days after exposure peaks.2, 7, 8 In
particular, short- to moderate-term (days to weeks) increases in ambient BC levels are associated
with subsequent increased blood pressure (BP), one of the primary intermediate outcomes
contributing to acute air pollution-related cardiovascular disease (CVD).2, 9 Determining the
impact of ambient BC on BP among vulnerable populations – such as older adults – is key to
developing targeted risk-reduction strategies.
Major efforts have been made in identifying the mechanistic pathways linking traffic-
related PM and increased BP over the past few decades. Oxidative stress has emerged as key
machinery underlying BC-associated cardiovascular events, due to the pro-inflammatory and
pro-oxidative properties of BC.5 Systemic oxidative stress – which reflects a disturbance in the
redox balance of circulating blood cells – can lead to cellular functional and pathologic changes,
and play a crucial role in different types of CVD.10-12 In response to oxidative stress, cells can
normally recover their redox balance by utilizing the endogenous antioxidant system.13, 14
However, an intensive intracellular reactive oxygen species (ROS) challenge can overwhelm the
antioxidant response and, in compensation, trigger mitochondrial over-production – an important
adaptive response following environmental challenge to reduce cellular oxidative stress.15, 16
Cellular mitochondrial mass is controlled through biogenesis and degradation, but
contributing to acute air pollution-related cardiovascular disease (CVD).2, 9 Deterrrmimiminininingngng ttthehehe
mpact of ambient BC on BP among vulnerable populations – such as older adults – is key to
deveeelololopipipingngng tttaraa geeeteteted d risk-reduction strategies.
Major efefeffofforrts ss hahahaveveve bbbeeeeeenn n mmamadedede iiin idddenenntiifyingngg theee mmmececechahh niniiststicicic pppatatathhwayyysss lililinknknkinining trtrtraffffifific-c-c-
eelalal teteted PM aaandnn iincncncreaaaseede BPPP ovovover ttthehh pppaasa t fefefewww deecaaadeees. Oxxxidadadatitiveveve sstrtrt essss haasss emememergegeged d aas kkkey
mamamachchchinininererery unnundedederlrlrlyiiyingngng BBBCCC-asasassososociciciatatatededed cccararardididiovoovasasascucculalalarrr eveevenenentststs, duddueee tototo ttthehehe ppprororo ii-infnfnflalalammmmmmatatatororory anananddd
by guest on December 14, 2015http://circ.ahajournals.org/Downloaded from

DOI: 10.1161/CIRCULATIONAHA.115.018802
4
external oxidative stressors can up-regulate the transcriptional/replication machinery of the
mitochondrial genome, resulting in increased mitochondrial abundance. Mitochondrial
abundance can be detected as an increased ratio of mitochondrial DNA to nuclear DNA copy
number (mtDNA/nDNA).15, 17 Elevated mtDNA/nDNA has been shown in peripheral blood cells
following oxidative stress and inflammation.18-20 However, to date, studies on the role of
mitochondrial abundance on pollution-related cardiovascular pathogenesis are absent.
Understanding how ambient BC might alter blood mitochondrial abundance and how this
alteration might impact BC-elicited cardiovascular effects in an aging population can aid the
development of preventative strategies.
In this study, we hypothesized that blood mitochondrial abundance is an adaptive
response following ambient BC exposure, which might buffer the impact of ambient BC on BP.
We utilized the Normative Aging Study to investigate the relationship of ambient BC levels at
multiple time windows (2-day to 28-day) with BP. We then examined the association of short- to
moderate-term ambient BC levels with blood mitochondrial abundance, and explored its role as
an effect modifier for the relationship between ambient BC and BP. In addition, we explored the
correlation between blood mitochondrial abundance and plasma inflammatory markers including
interleukin 6 (IL6), IL8, IL1 , tumor necrosis factor alpha (TNF ), TNF , C-reactive protein
(CRP), intercellular adhesion molecule-1 (ICAM-1), and vascular endothelial growth factor
(VEGF).
Methods
Study Population
The Normative Aging Study is a prospective cohort of older men established in Eastern
In this study, we hypothesized that blood mitochondrial abundance is an aaadadadaptptptivivive e e
esponse following ambient BC exposure, which might buffer the impact of ambient BC on BP.
We uuutititilililizezezeddd thththe NoNoNormative Aging Study to invessstititigggataa e the relationship ooof f f ambient BC levels at
mmmullltiple time wiwiwindnndowowws (2(2(2-d-d-dayayay tttoo 282828-d-d-daayay) wiwiwithhh BPP. WWWeee ttthehehennn eeexamamaminininededed ttthhehe asssssococociaiaiatititionono ooofff shshshororort-t-t- to
momomodedederate-tererermm m ammambiennnt BC lllevvvelee s wiww thhh bbblooodod mmitooccchononndddriaaalll abababununndddancnn eee, aanddd exxpxplorerereddd its rrrole ass
ananan eeeffffffecececttt momomodididifififiererer fffororor ttthehehe rrrelelelatatatioioionsnsnshihihippp bebebetwttweeeeeennn amamambibibienenenttt BCBCBC aaandndnd BBBPPP. IIInnn adadaddididitititiononon, weewe eeexppxplololorerereddd thththeee
by guest on December 14, 2015http://circ.ahajournals.org/Downloaded from

DOI: 10.1161/CIRCULATIONAHA.115.018802
5
Massachusetts by the United States Veterans Administration. The present study included 675
community-dwelling men with available data on ambient BC (at any of the time windows), BP
(systolic or diastolic), and blood mitochondrial abundance (Table 1). Participants were recalled
for visits every three to five years. We considered visits from April 1999 (i.e., the earliest date
with available mitochondrial DNA data) to December 2012, for a total of 1,252 visits (1-4 visits
per participant; average 1.9 visits). The study was approved by the institutional review boards of
all participating institutions. All subjects provided informed consent.
Blood Pressure
A physician measured the participant’s resting seated systolic BP (SBP) and diastolic BP (DBP)
in the morning at each visit using a standard mercury sphygmomanometer, following a AHA-
recommended protocol, as previously described.21 The means of the right and left arm
measurements were used. Three readings were taken and the average of the second and third
readings was used for statistical analysis.
Blood Mitochondrial Abundance and Plasma Inflammatory Markers
We measured blood mitochondrial abundance through mtDNA/nDNA, a widely used biomarker
representing the mitochondrial DNA copy number versus the nuclear DNA copy number.15, 17 At
every visit, mtDNA copy number was analyzed on whole blood samples, collected after
overnight fasting. We adapted a multiplex quantitative real-time polymerase chain reaction (RT-
PCR) method with minor modifications.22 To measure mtDNA copy number, we used the
mtDNA 12S ribosomal ribonucleic acid (RNA) TaqMan (Applied Biosystems, Waltham,
Massachusetts) probe (6FAM- 5’ TGCCAGCCACCGCG 3’-MGB). The sequences of primers
used for amplification in mtDNA were mtF805 (5’CCACGGGAAACAGCAGTGATT3’) and
mtR927 (5’CTATTGACTTGGGTTAATCGTGTGA3’). The quantity of mtDNA was corrected
n the morning at each visit using a standard mercury sphygmomanometer, followwwinining g g a a a AHAHAHA-A-A-
ecommended protocol, as previously described.21 The means of the right and left arm
measassurururemememenenentstt wwwererre used. Three readings were tataakekekenn and the average ofoff ttthe second and third
eeeadddings was usesesed fooor rr stttatatatisisistitiicacacalll anananalala ysyssiss.
BlBllooooood dd Mitooochchchonnnddrd ialll AAbA unnndadadancnce e e ananandd PlP aasasmmma IInffflaammmmm aaatororory yy MaMMarkrr ererers
WeWeWe mmmeaeaeasussurerereddd blblblooooooddd mimimitototochchchononondrdrdriaiaialll abababunnundadadancncnceee thththrrrouooughghgh mmmtDtDtDNANANA/n/n/nDNDNDNAAA, aaa widididelelely ussusededed bbbioioiomamamarkrkrkererer
by guest on December 14, 2015http://circ.ahajournals.org/Downloaded from
DOI: 10.1161/CIRCULATIONAHA.115.018802
6
by simultaneous measurement of a single copy nuclear Ribonuclease P gene. We used a
commercial kit to quantify nuclear DNA (nDNA) (TaqMan® RNase P Control Reagents Kit,
Applied Biosystems). RT-PCR assays were performed following a published protocol,22 using
Bio-Rad CFX384 Touch™ Real-Time PCR Detection System (Bio-Rad, Hercules, California).
All samples were run in triplicate. The mean of the three measurements was used for statistical
analysis. The within-run and between-run coefficients of variation of this assay were 3.35% and
3.26%, respectively. A laboratory reference DNA sample – which was a pool of 300 test samples
(20 μL taken from each sample, final concentration: 40 ng/μL) – was used to construct standard
curves (mtDNA and nDNA R2 0.99). The standard curves were used to quantify mtDNA and
nDNA copy numbers to standardize the mtDNA/nDNA obtained from all test samples in all
reactions.23 We used mtDNA/nDNA in the statistical analysis. A ratio value of 1 indicates that
the mtDNA/nDNA of the test sample is equal to the mtDNA/nDNA in the reference DNA pool
used in the assay.
Plasma inflammatory markers (IL6, IL8, IL1 , TNF , TNF , CRP, ICAM-1, and VEGF)
were measured using previously described methods.24, 25
Air Pollution and Weather Data
Daily ambient BC and PM2.5 levels were measured at a Harvard School of Public Health
monitoring site (Boston, MA), 1 km from the clinical examination site, using previously
described methods.21 We evaluated the average pollutant concentrations during different time
windows (2-day, 5-day, 7-day, 14-day, 21-day, and 28-day, before the time of BP measurement
and blood draw). We assigned exposure index to participants based on the visit date. Outdoor air
temperature, relative humidity, dew point temperature, and wind speed were obtained from the
Boston Logan airport weather station. The corresponding moving averages of outdoor apparent
nDNA copy numbers to standardize the mtDNA/nDNA obtained from all test sammmplplpleseses iiin n n alalall l l
eactions.23 We used mtDNA/nDNA in the statistical analysis. A ratio value of 1 indicates that
he mtmtmtDNDNDNA/A/A/nDnn NANANA of the test sample is equal tooo ttthehehe mtDNA/nDNA in ttthehh reference DNA pool
uuuseddd in the assaaayy.y
Plassmamm infnfnfllal mmmmmatory y y mmamarkkkererers ((I( LL6L , ,, ILILL8, IIL1 ,,, TTNT FFF , ,, TNTNTNFFF ,,, CRRRPP, IIICACACAM---1,1,1, and VEGGGFF)
weewererere mmmeaeaeasussurerereddd ussusinininggg prprpreveevioioioussuslylly dddesesescrcrcribibibededed mmmetetethohohodsdsds.24,24,, 2525
by guest on December 14, 2015http://circ.ahajournals.org/Downloaded from

DOI: 10.1161/CIRCULATIONAHA.115.018802
7
temperature and absolute humidity were calculated using previous reported methods.26, 27
Statistical Methods
We adjusted for potential confounders, selected based on literature evidence, i.e., age
(continuous), race (white/non-white), outdoor apparent temperature (continuous), absolute
humidity (continuous), season (winter/spring-fall/summer), highest education ( high
school/college/graduate school), weekday of the visit
(Monday/Tuesday/Wednesday/Thursday/Friday), and the visit date (continuous). To increase
efficiency, we adjusted for major risk factors for increased BP: Body Mass Index (BMI)
(continuous), smoking status (in pack years, continuous), physical activity (metabolic equivalent
of task-hours per week, continuous), alcohol use (<2 drinks/day/ 2 drinks/day), CRP>10 mg/L
(yes/no); use of calcium channel blockers, -blockers, and angiotensin-converting enzyme
inhibitors (yes/no). Due to high cell-type specificity of mitochondria contents, mtDNA/nDNA in
whole blood might be affected by differences in the proportions of cell types. We adjusted for
the percentage of major cell types containing mitochondria (i.e., lymphocytes, neutrophils, and
platelets).
Linear relationships were examined using graphical diagnostics and spline regression
models, no deviation from linearity was observed. We utilized the likelihood ratio test to
determine whether it is adequate to model the independent variables or the effect modifier with a
linear trend.
In our dataset, BC moving average at different time windows exhibited different
variability. To compare the magnitude of BC-BP associations across multiple time windows, we
presented the change in BP and mtDNA/nDNA per standard deviation (SD) increase in ambient
BC levels.
of task-hours per week, continuous), alcohol use (<2 drinks/day/ 2 drinks/day), CCCRPRPRP>1>1>1000 mgmgmg/L/L/L
yes/no); use of calcium channel blockers, -blockers, and angiotensin-converting enzyme
nhiibibibitototorsrsrs (((yeyeyes/nonoo).).) Due to high cell-type specifiiicicicitytyty of mitochondria cononontett nts, mtDNA/nDNA in
wwwhooole blood mimiighgghtt bebebe aaffffffecececteteed d d bybyby dddifififfefefereenceees in thheee prrropopopororrtititioononss ofoff ccelelell ll tyypes.s.s. WWWe ee adadadjujujustststeddd ffforoor
hhhee e pepepercentaaagegeg ooff f mmam jooor r cell tttypypypes cccooontttaiinininnnggg mmmitoochhonnndddriaa (iii.eee., lymymymphphphoccyteees, neututtrororophhilsss, annnd
plplplatatateleleletetets)s)s).
by guest on December 14, 2015http://circ.ahajournals.org/Downloaded from

DOI: 10.1161/CIRCULATIONAHA.115.018802
8
To account for repeated assessments for many participants, we utilized linear mixed
effect model with random intercept (compound symmetry covariance structure) to examine the
association between ambient BC levels and BP, as well as the association between ambient BC
levels and mtDNA/nDNA:
Yij = 0 + 1BCij + 2X2ij + … + pXpij + bi + ij (Model 1)
Where Yij was the BP or mtDNA/nDNA for participant i at visit j, 0 was the overall
intercept, bi was the separate random intercept for subject i, and bi ~ N(0, ), ij ~ N(0, 2). X2ij–
Xpij were the covariates including confounders and risk factors for increased BP, for
participant i at visit j. We also examined effect modification by mtDNA/nDNA by including
additionally the main effect of mtDNA/nDNA and an interaction term between mtDNA/nDNA
and BC. All analyses were performed using SAS 9.4 (SAS Institute, Cary, NC).
Results
Cohort Characteristics and Ambient BC Levels
The NAS is a cohort of aging men, between 55 and 100 years old at the first visit of the present
study. We acquired data on ambient BC levels, BP, and mtDNA/nDNA among 675 participants.
The baseline characteristics of the participants included in the final analysis are given in Table 1.
All participants were male, and 97.3% were white. Eighty-one percent of the participants were
overweight and 18.7% were diabetics. The study population included 4.3% current smokers and
20.4% heavy alcohol drinkers ( 2 drinks/day) (Table 1). During the study period (April 1999 –
December 2012), the 7-day BC moving average varied between 0.20 μg/m3 to 2.18 μg/m3, with
an average level of 1.02 μg/m3. The baseline average SBP and DBP was 131 mm Hg and 76 mm
Hg, respectively. Participants included or excluded from each analysis are similar in key baseline
characteristics (age, physical activity, alcohol use, diabetes, BMI, smoking status, SBP, and DBP)
additionally the main effect of mtDNA/nDNA and an interaction term between mtmtmtDNDNDNA/A/A/nDnDnDNANANA
and BC. All analyses were performed using SAS 9.4 (SAS Institute, Cary, NC).
RReRessusults
CCCohhoh rt Chararr ctterristiiicss anddd AAAmbieieientt BBC LeLeLevells
The NAS is a cohort of agigg nggg men, ,, between 55 and 100 yeyy ars old at the first visit of the pppresent
by guest on December 14, 2015http://circ.ahajournals.org/Downloaded from
DOI: 10.1161/CIRCULATIONAHA.115.018802
9
(data not shown).
Ambient BC Level and BP
Short- to moderate-term ambient BC levels were consistently associated with significantly
increased SBP and DBP (Figure 1). Every SD increase in the 2-day, 5-day, 7-day, 14-day, 21-
day, and 28-day BC moving average was associated with 1.79 mm Hg (95% confidence interval
(CI), 0.65, 2.92; P=0.002), 2.35 mm Hg (95% CI, 1.14, 3.55; P=0.0001), 2.83 mm Hg (95% CI,
1.57, 4.09; P<0.0001), 3.02 mm Hg (95% CI, 1.68, 4.35; P<0.0001); 3.10 mm Hg (95% CI, 1.71,
4.49; P<0.0001); and 3.46 mm Hg (95% CI, 2.06, 4.87; P<0.0001) increase in SBP, respectively.
Likewise, every SD increase in the 2-day, 5-day, 7-day, 14-day, 21-day, and 28-day BC moving
average was associated with 0.65 mm Hg (95% CI, 0.05, 1.24; P=0.03), 1.40 mm Hg (95% CI,
0.77, 2.03; P<0.0001), 1.73 mm Hg (95% CI, 1.07, 2.39; P<0.0001), 1.81 mm Hg (95% CI, 1.11,
2.52; P<0.0001); 1.91 mm Hg (95% CI, 1.17, 2.65; P<0.0001); and 1.97 mm Hg (95% CI, 1.23,
2.72; P<0.0001) increase in DBP, respectively (Table 2).
Ambient BC Level and Mitochondrial Abundance
The average ambient BC levels over the preceding time windows (2-day, 5-day, 7-day, 14-day,
21-day, and 28-day) were consistently positively associated with blood mitochondrial abundance
(Figure 2). Every SD increase in the 2-day, 5-day, 7-day, 14-day, 21-day, and 28-day BC
moving average was associated with 0.05 SD (95% CI, -0.01, 0.12; P=0.11), 0.12 SD (95% CI,
0.06, 0.19; P=0.0003), 0.14 SD (95% CI, 0.07, 0.21; P=0.0002), 0.15 SD (95% CI, 0.07, 0.23;
P=0.0002), 0.14 SD (95% CI, 0.06, 0.22; P=0.001), and 0.12 SD (95% CI, 0.03, 0.20; P=0.007)
increase in blood mtDNA/nDNA, respectively (Table 3).
BC and BP Association: Effect Modification by Blood Mitochondrial Abundance
The association of ambient BC levels with SBP was modified by blood mtDNA/nDNA across
average was associated with 0.65 mm Hg (95% CI, 0.05, 1.24; P=0.03), 1.40 mm m m HgHgHg (((959595% % % CICICI,
0.77, 2.03; P<0.0001), 1.73 mm Hg (95% CI, 1.07, 2.39; P<0.0001), 1.81 mm Hg (95% CI, 1.11
2.522;;; PPP<0<0<0.0.0.000000 1);;; 1.11 91 mm Hg (95% CI, 1.17, 2..656565; P<0.0001); and 1.979797 mm Hg (95% CI, 1.23,
222.7222; P<0.0001)1)1) inncrerereasasase e e ininin DBDBDBP,P,P, rrresee pppecctivvelee yyy (Tabbble 222).).).
AmAmAmbbibient BCBCC Leeve eele andndnd Mitittoccchoh ndndndriiialll Abububundn aanccce
ThThTheee avaaverereragagageee amamambibibienenenttt BCBCBC llleveevelelelsss ovoovererer ttthehehe ppprererecececedididingngng tttimimimeee wiiwindndndowoowsss (2(2(2 dd-dayaay, 555-dadaday, 777 dd-dayaay, 141414 dd-dayaay,
by guest on December 14, 2015http://circ.ahajournals.org/Downloaded from

DOI: 10.1161/CIRCULATIONAHA.115.018802
10
multiple time windows (P=0.05; P=0.04; P=0.03; P=0.01; P=0.01, for 5-day, 7-day, 14-day, 21-
day, and 28-day, respectively) (Table 4). Ambient BC levels had a relatively smaller impact on
SBP in individuals with higher blood mitochondrial abundance, compared to those with lower
blood mitochondrial abundance (Figure 3 and Supplemental Figure 1). For example, for
individuals whose mtDNA/nDNA was at the midpoint of the lowest quartile, the 28-day BC
moving average was estimated to be associated with 4.68 mm Hg (95%CI, 3.03, 6.33; P<0.0001)
increase in SBP. In comparison, the 28-day BC moving average was estimated to be associated
with 2.40 mm Hg (95%CI, 0.81, 3.99; P=0.003) increase in SBP among individuals whose
mtDNA/nDNA was at the midpoint of the top quartile. We did not observe significant effect
modification by blood mitochondrial abundance on 2-day BC-SBP association, and on the
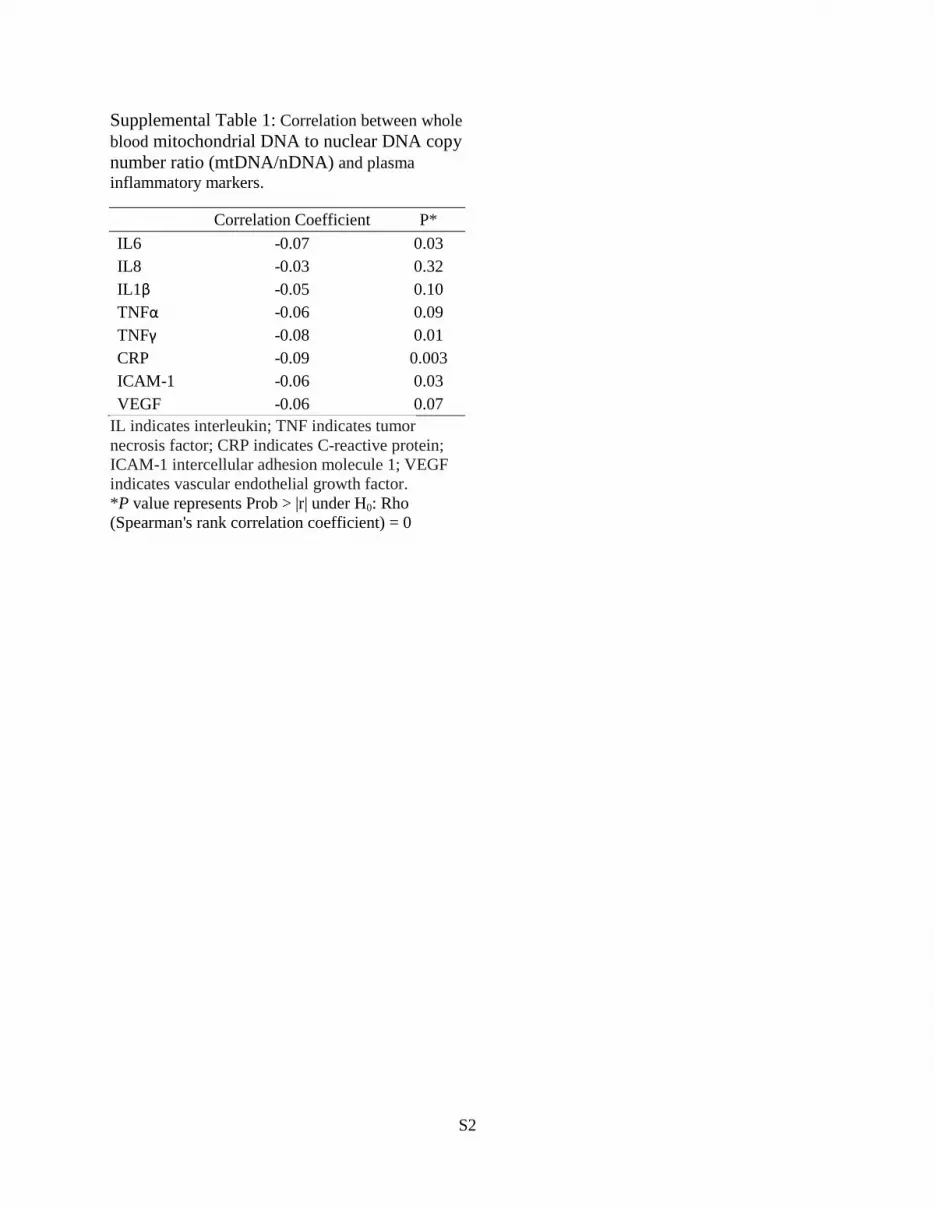
association between short-term ambient BC levels and DBP (Table 4). In addition, increased
blood mtDNA/nDNA was negatively correlated with plasma IL6, TNF , CRP, and ICAM-1
levels (P=0.03, P=0.01, P=0.003, P=0.03, respectively) (Supplemental Table 1).
Sensitivity Analyses
BC is the major component of fine particles (PM2.5); PM2.5 itself is a contributor to increased BP
and enhanced oxidative damage. In sensitivity analysis, we adjusted for the ambient PM2.5 levels
in the matching time window – to rule out the possibility that the observed effect was partially
due to confounding by ambient PM2.5. This adjustment did not affect our conclusion (Tables 2
and 3). In addition, we adjusted for the platelet/lymphocyte and platelet/neutrophil ratios to
minimize the influence from disproportional increase in platelets, and our conclusions remained
the same (data not shown).
Discussion
This study on a cohort of aging male Boston-area residents confirmed that short- to moderate-
modification by blood mitochondrial abundance on 2-day BC-SBP association, aandndnd ooon nn thththeee
association between short-term ambient BC levels and DBP (Table 4). In addition, increased
bloooodd d mtmtmtDNDNDNA/AA nDDDNANN was negatively correlatedd wwwititith plasma IL6, TNFF , CRP, and ICAM-1
eeeveeels (P( =0.03, PPP===0.0.001,, PPP==0=0.0.0.0030303,, PPP=0=0=0.003, rreese pppecttivvvely)y)y) (((SuSuSupppplelelememementntntaaal TTabbblelele 111)).).
Seeensnsnsitii ivity y AnAnA alllyssses
BCBCBC iiisss thththeee mamamajojojorrr cococompmpmponononenenenttt ofofof fffininineee papapartrtrticiciclelelesss (P(P(PMMM2.5););); PPPMMM2.5 iiitststselelelfff isisis aaa cccononontrtrtribibibuttutororor tttooo ininincrcrcreaeaeaseseseddd BPBPBP
by guest on December 14, 2015http://circ.ahajournals.org/Downloaded from

DOI: 10.1161/CIRCULATIONAHA.115.018802
11
term ambient BC levels are associated with increased BP. We showed that short- to moderate-
term ambient BC levels also increased peripheral blood mitochondrial abundance in older adults.
Further, individuals with higher blood mitochondrial abundance appeared less susceptible to the
impact of ambient BC levels on BP, compared to those with less blood mitochondrial abundance.
In the United States, the proportion of the population over the age of 65 is projected to
increase from 12.7% in 2000 to 20.3% in 2050.28 The AHA has emphasized that air pollution is
an ubiquitous public health threat, particularly for older people, who are especially susceptible to
air pollution-triggered CVD.2 BC, the byproduct of incomplete combustion of fossil fuels,
biofuels, and biomass, is the most effective form of PM (by mass) at absorbing solar energy and
is considered a potent trigger for systemic oxidative stress upon exposure.29 Increased BP related
to ambient BC levels is an alarming physiological change that may represent intermediate
mechanisms contributing to acute adverse cardiovascular events.2, 9
Consistent with our previous study, we confirmed the significant association between BP
and the average ambient BC level in the past 7 days.21 The present study presented a
comprehensive analysis of the short- to moderate-term cardiovascular effects of BC, ranging
from 2 days to 28 days. The estimated effect size of ambient BC levels increased gradually as the
time window of exposure increased, and the strongest estimated effect was observed for the 28-
day time window. The BP increase associated with ambient BC levels reflects the physiologic
effect of traffic-related air pollution that may contribute to the pathophysiological changes in the
cardiovascular system – which could be a potential mechanism linking air pollution and cardiac
morbidity and mortality in the aging population. In addition, the observed effect estimates for
ambient BC were increased with a larger magnitude after adjusting for ambient PM2.5 levels,
suggesting that the proportion of BC content in PM2.5 has a stronger effect on BP increases than
s considered a potent trigger for systemic oxidative stress upon exposure.29 Increeeasasasededed BBBP P P rererelalalattted
o ambient BC levels is an alarming physiological change that may represent intermediate
mechchhanananisisismsmsms ccconnntrtrtribii uting to acute adverse cardiovovovasasascular events.2, 9
Consisi tetetenntn wwwititithhh ououourr r prprprevevevioioioususus sstutt dydy, wewewe connfffirmmmededed ttthehehe sigigigniiifffiicicananant assooocicici tatatioioionn n bebeetwtwtweeeeeen n n BBBPffffff
annnd dd thththe averrragagage amamambienenentt t BCCC levevevel iiin nn thhhe pap sstst 777 daaysss.21 TTTheh ppprreresesesentntnt sstutut dddy preeeseseentn eddd aaa
cococompmpmprererehehehensnsnsiviiveee anananalalalyssysisisis ooofff thththeee shshshorororttt- tttooo momomodedederararatetete tt-tererermmm cacacardrdrdioioiovaavascscscullulararar eeeffffffececectststs ooofff BCBCBC, rararangngnginininggg
by guest on December 14, 2015http://circ.ahajournals.org/Downloaded from

DOI: 10.1161/CIRCULATIONAHA.115.018802
12
the actual BC mass.
Recent studies suggest that particle-induced oxidative stress initiates systemic
inflammatory response,30 which is considered a major mechanism underlying the cardiac
responses to air pollution. Mitochondria, the specialized cellular organelles that play a pivotal
role in energy production, are the main immediate target of ROS.11, 12 The role of mitochondrial
biogenesis and mitochondria DNA copy number maintenance in the determination of cell
survival and function under oxidative stress has been increasingly appreciated in recent years.
However, most studies have focused on inflammatory markers such as cytokines, and the role of
mitochondria in air pollution-related cardiovascular pathogenesis remains a major gap in current
knowledge. The amount of mitochondrial genomic content within a cell is normally controlled,31
but upon exposure to environmental stress, mitochondria biogenesis can be enhanced to increase
energy supply for eliminating damage to cellular components.12, 15 Malik and Czajka suggested
that mtDNA/nDNA increases when the cell's endogenous antioxidant response fails to recover its
redox balance.15 For example, exposure to air pollutants such as benzene was associated with
increases in blood mitochondrial genomic contents.32 Systemic oxidative stress stimulated by the
activation of PI3K/Akt signaling pathway could also result in increased mitochondrial DNA
copy number in leukocytes.20 Mitochondria proliferation and mitochondrial DNA amplification
under oxidative stress was observed even when overall cell division was under arrest.33 The
present study for the first time provides epidemiological evidence showing that ambient BC level
is linked with increased blood mitochondrial abundance, as reflected in elevated mtDNA/nDNA
in peripheral blood.
In addition, we demonstrated that high blood mitochondrial abundance attenuates the
association of ambient BC levels with BP. In in vivo studies, increased mitochondrial
knowledge. The amount of mitochondrial genomic content within a cell is normalalallylyly cccononontrtrtrolololleleled,dd 31
but upon exposure to environmental stress, mitochondria biogenesis can be enhanced to increase
enerrgygygy sssupupupplplply yy fooor elee iminating damage to cellulararr cccooomponents.12, 15 Maliliikk k and Czajka suggested
hhhattt mtDNA/n/ DNDNDNAA ininincrrreaeaeasseses s s whwhwhenenen tthehehe ccellll'l'l's eeendoogggenooouusus aaantntntiooxxixidadadantntnt rrresese ponsnsnse ee fafafaililils ss tooo rrrecccovovovererer its
eedododox xx balancncceee.15 Foro eeexaaamplelele, eexe popoposssurrre tto aaair pop llluuttannntsss suuchchch aaas bebebenznzzennne waaas asaa sociciciaata edd wwwithhh
nnncrcrcreaeaeasesesesss ininin bbblololoododod mmmitititococochohohondndndriririalalal gggenenenomomomicicic cccononontetetentntntsss.3232 SSSyssystetetemimimiccc oxooxidididatatativiiveee stststrereressssss ssstititimummulalalateteteddd bybby ttthehehee
by guest on December 14, 2015http://circ.ahajournals.org/Downloaded from

DOI: 10.1161/CIRCULATIONAHA.115.018802
13
biogenesis induced by over-expressing recombinant human mitochondrial transcription factor A
resulted in a 50% reduction in the oxidative damage to proteins following lipopolysaccharide
endotoxin challenge.16 Under the challenge of endogenous or exogenous ROS, increased
mitochondrial DNA copy number in aging tissues is a feedback response that compensates for
insufficient ROS cleavage and upholds the energy metabolism to rescue the cell.12, 34 In our study,
increased blood mitochondria abundance was linked with reduced inflammatory responses.
Collectively, evidence support our hypothesis that blood mitochondrial abundance is an adaptive
process following ambient BC exposure and reduces susceptibility to the cardiovascular effect of
BC, possibly by scavenging radical and suppressing inflammation. Further elucidation of the
changes in blood mitochondrial abundance in the process of stress response to render
cardiovascular tissue’s survival under oxidative stress is of prime importance for a better
understanding of cardio-pathogenesis related to air pollution.
Nevertheless, the stress response of mitochondria to oxidative stress may be a double-
edged sword. On one hand, the compensatory increase in blood mitochondrial proliferation
supplies energy to meet the need for blood cell survival.12 On the other hand, mitochondria are
the main intracellular source of ROS and play an important role in biological oxidation.11, 12
Excess ROS generated from the increased mitochondria can be pathogenic, initiating a vicious
cycle that leads to chronic oxidative damage and inflammation.11, 12, 15, 35, 36 Unfortunately, we
only measured blood mtDNA/nDNA and BP concurrently at each visit; therefore, we are not
able to assess the effect of continuously higher blood mitochondrial abundance on BP due to lack
of temporality. Future studies are warranted to shed light on the cardiovascular effect of
chronically elevated blood mitochondrial abundance due to traffic-related pollution.
This study has several strengths, including its repeated-measure design and relatively
changes in blood mitochondrial abundance in the process of stress response to rendndndererer
cardiovascular tissue’s survival under oxidative stress is of prime importance for a better
undedeersrsrstatatandndndinining gg offf cccara dio-pathogenesis related to aaairirir ppollution.
Neverthehehe ellesss, thththe e e stststrereressssss resesespopoponsnsnsee offf mmmiiti ochhhooondrdrriaiaia tttooo oooxidididatttiivivee ssstreess mmmaayay bbbe ee a dododoububublelele-
edddgegeged dd sword.d.d. Onn n oono e hahahand, thtthe ee compmpmpenennssas tooryryry incrreaaseee iin nn blbllooood dd mimimitooocchooonndririialall pprollilifefeferattiooon
uupppppplililieseses eeenenenergrgrgy tototo mmmeeeeeettt thththeee neneneededed fffororor bbblololoododod cccelelellll sussurvrrviviivalalal.1212 OOOnnn thththeee otototheheherrr hahahandndnd, mimimitototochchchononondrdrdriaiaia aaarerere
by guest on December 14, 2015http://circ.ahajournals.org/Downloaded from

DOI: 10.1161/CIRCULATIONAHA.115.018802
14
large sample size. In addition, we utilized a highly reproducible RT-PCR method to quantify the
mtDNA content from easy-to-obtain blood samples, which has been widely adapted in
epidemiological studies.37 To measure ambient traffic-related PM, we used daily BC monitor
data as a proxy, because variation in short- to moderate-term ambient air pollution was mostly
due to temporal variation rather than spatial variation.38 Measurement error, which is inherent in
air pollution epidemiological studies, cannot be completely avoided due to lack of personal
exposure assessment. However, misclassification is expected to be non-differential and bias
towards the null, because it was unlikely to be associated with participants’ BP status or
mitochondrial abundance. To limit confounding, we included in regression models an extensive
list of covariates. We conducted further analysis to evaluate the sensitivity of our results to
covariate specification, and our results were stable and robust. In addition, all BP measures were
conducted at the same time of the day to eliminate confounding due to diurnal variation. While
residual confounding due to unmeasured variables is possible, chances that the observed
association and effect modification reflected bias resulting from residual confounding are
minimized.
The present study has several limitations. Some of the eligible participants were excluded
from analysis due to missing BC data. They were similar in baseline characteristics (including
BP) with participants included in the analysis. Moreover, it is reasonable to assume that the
missingness was independent of ambient BC levels and participants’ mitochondrial abundance
based on study operation. Therefore, selection bias due to informative missingness was unlikely.
In addition, we standardized mtDNA/nDNA measurements to a lab reference DNA sample;
therefore, the absolute value of mtDNA/nDNA from the present study might not be directly
comparable to other studies. Finally, our findings are limited to male older individuals who were
ist of covariates. We conducted further analysis to evaluate the sensitivity of ourr rrresesesululultststs tttoo o
covariate specification, and our results were stable and robust. In addition, all BP measures were
conddducucucteteted d d atatat thee saaame time of the day to eliminatatatee e ccconfounding due to dddiuiui rnal variation. While
eeesiiiddual confof ununun idinggg dddueueue tttoo o unununmememeasasasurrredd vararariaaabless iiis pppososos isisiblblbleee, cchahahancncnceseses thhat thththe e e obobobseseservrvrvededed
assssososocicc ation ananand efefefffef ct mmmodifffiiicaaatitt onnn rrreffflelelectc eddd bbbias reeesullltiiingngng fffrooom mm rereresisidudd aaal connnfofofoundididinnng areee
mimiminininimimimizeezeddd.
by guest on December 14, 2015http://circ.ahajournals.org/Downloaded from

DOI: 10.1161/CIRCULATIONAHA.115.018802
15
residing in a lightly-polluted urban area. Our conclusion might not be generalizable to young
adults, females, or people living in other areas due to differential environmental and
physiological factors.
In summary, our results showed that, in older adults, levels of short- to moderate-term
ambient traffic-related PM were associated with increases in BP and blood mitochondrial
abundance. Individuals with higher blood mitochondrial abundance showed significantly weaker
association of ambient BC with BP. Our study provided a novel mechanistic perspective – the
compensatory increase in blood mitochondrial abundance following exposure to ambient BC
might be an adaptive response that attenuates individual susceptibility to post-exposure BP
increase in older people. Further investigation of the mitochondria-mediated oxidative responses
is warranted to provide insights into the physiologic effects of traffic-related pollution and may
help guide targeted prevention and novel pharmaceutical interventions.
Funding Sources: This study was supported by NIH grants R01ES015172, R21ES021895,
R01ES021733, R21ES021895, R01ES020836, R01ES021357, and P30ES000002; and U.S.
Environmental Protection Agency funding (RD-83479801). The Normative Aging Study is
supported by the Cooperative Studies Program/Epidemiology Research and Information Center
of the U.S. Department of Veterans Affairs (VA) and is a component of the Massachusetts
Veterans Epidemiology Research and Information Center, Boston, Massachusetts. David
Sparrow was supported by a VA Research Career Scientist award.
Conflict of Interest Disclosures: None.
References:
1. World Health Organization. Burden of disease from ambient air pollution for 2012. Department of Public Health, Social and Environmental Determinants of Health. Geneva, Switzerland. 2014. 2. Brook RD, Rajagopalan S, Pope CA, 3rd, Brook JR, Bhatnagar A, Diez-Roux AV, Holguin F,
ncrease in older people. Further investigation of the mitochondria-mediated oxidddatatativivive ee rererespspsponononssses
s warranted to provide insights into the physiologic effects of traffic-related pollution and may
helppp ggguiuiuidedede tttararargeteteted dd prevention and novel pharmamaacececeutuu ical interventions...
FuFuFunnnding Souruu cees:: Thhhiss studddy yy was sususuppppoorteddd bbby NNIHH grgrgraanantstss RRR011ES015551772,, RRR21ES0S0S0212 898995,
R01E1EES0S0S021212177733, RRR212121ESESES02202189555, R0R0R01ES000202020838383666, RRR00101ESESES020202131313575757, annnddd P3P3P30E0E0ES0SS 00000000002;2;2; anddd UU SS.S.
Environmental Protection Agency funding (RD-83479801) The Normative Aging Study is
by guest on December 14, 2015http://circ.ahajournals.org/Downloaded from

DOI: 10.1161/CIRCULATIONAHA.115.018802
16
Hong Y, Luepker RV, Mittleman MA, Peters A, Siscovick D, Smith SC, Jr., Whitsel L, Kaufman JD, American Heart Association Council on Epidemiology and Prevention, Council on the Kidney in Cardiovascular Disease, Council on Nutrition, Physical Activity & Metabolism. Particulate matter air pollution and cardiovascular disease: An update to the scientific statement from the american heart association. Circulation. 2010;121:2331-2378. 3. Li CZ, Budh E. Environmental objectives, cost efficiency, and multivariate stochastic control. Environ Model Assess. 2008;13:315-325.
4. Amann M, Asman A, Bertok I, Cofala J, Heyes C, Klimont Z, Rafaj P, Schöpp W, Wagner F. Cost-optimized reductions of air pollutant emissions in the EU member states to address the environmental objectives of the thematic strategy on air pollution. Laxenburg, Austria: International Institute for Applied Systems Analysis; 2007. 5. Anenberg SC, Schwartz J, Shindell D, Amann M, Faluvegi G, Klimont Z, Janssens-Maenhout G, Pozzoli L, Van Dingenen R, Vignati E, Emberson L, Muller NZ, West JJ, Williams M, Demkine V, Hicks WK, Kuylenstierna J, Raes F, Ramanathan V. Global air quality and health co-benefits of mitigating near-term climate change through methane and black carbon emission controls. Environ Health Perspect. 2012;120:831-839. 6. Janssen NA, Hoek G, Simic-Lawson M, Fischer P, van Bree L, ten Brink H, Keuken M, Atkinson RW, Anderson HR, Brunekreef B, Cassee FR. Black carbon as an additional indicator of the adverse health effects of airborne particles compared with PM10 and PM2.5. Environ Health Perspect. 2011;119:1691-1699. 7. Peters A, Liu E, Verrier RL, Schwartz J, Gold DR, Mittleman M, Baliff J, Oh JA, Allen G, Monahan K, Dockery DW. Air pollution and incidence of cardiac arrhythmia. Epidemiology. 2000;11:11-17. 8. Weichenthal S, Hatzopoulou M, Goldberg MS. Exposure to traffic-related air pollution during physical activity and acute changes in blood pressure, autonomic and micro-vascular function in women: A cross-over study. Part Fibre Toxicol. 2014;11:70. 9. Brook RD, Bard RL, Morishita M, Dvonch JT, Wang L, Yang HY, Spino C, Mukherjee B, Kaplan MJ, Yalavarthi S, Oral EA, Ajluni N, Sun Q, Brook JR, Harkema J, Rajagopalan S. Hemodynamic, autonomic, and vascular effects of exposure to coarse particulate matter air pollution from a rural location. Environ Health Perspect. 2014;122:624-630. 10. Dhalla NS, Temsah RM, Netticadan T. Role of oxidative stress in cardiovascular diseases. J Hypertens. 2000;18:655-673. 11. Lee HC, Wei YH. Mitochondrial role in life and death of the cell. J Biomed Sci. 2000;7:2-15. 12. Lee HC, Wei YH. Mitochondrial biogenesis and mitochondrial DNA maintenance of mammalian cells under oxidative stress. Int J Biochem Cell Biol. 2005;37:822-834. 13. Nordberg J, Arner ES. Reactive oxygen species, antioxidants, and the mammalian thioredoxin
mitigating near term climate change through methane and black carbon emission contror ls. EnvironHealth Perspect. 2012;120:831-839.
6. Janssen NA, Hoek G, Simic-Lawson M, Fischer P, van Bree L, ten Brink H, Keuken M, Atkinson RW, Anderson HR, Brunekreef B, Cassee FR. Black carbon as an additional indicator ofhe adadadveveversrsrseee hehehealththth eeeffects of airborne particles comommpapapared with PM10 and PMPMPM2.5. Environ Health
Peeerssspppect. 20001111;119:1691-1699.
7.77 PPPeters A, Liu EEE, Verrrriier RLRLRL,,, Schwartttz J, GGGolld DDRRR, MMititittltltlemememaaan MMM,,, Baliiiff f J, OOOhhh JA, AAAlll enn GGG, hMoMoMonananahan K,K,K, DDDoccckeery DDDW. AAAir rr popopollllutuu iooon anddd innnciddennncee e oofof caaardddiacacac aaarrrrhyhh thhhmmia.a.a. EpEpEpidemememioi looggygy. 200000;1;1;11:1:1:111111-17.
by guest on December 14, 2015http://circ.ahajournals.org/Downloaded from

DOI: 10.1161/CIRCULATIONAHA.115.018802
17
system. Free Radic Biol Med. 2001;31:1287-1312.
14. Rydstrom J. Mitochondrial NADPH, transhydrogenase and disease. Biochim Biophys Acta. 2006;1757:721-726. 15. Malik AN, Czajka A. Is mitochondrial DNA content a potential biomarker of mitochondrial dysfunction? Mitochondrion. 2013;13:481-492. 16. Thomas RR, Khan SM, Portell FR, Smigrodzki RM, Bennett JP, Jr. Recombinant human mitochondrial transcription factor A stimulates mitochondrial biogenesis and ATP synthesis, improves motor function after mptp, reduces oxidative stress and increases survival after endotoxin. Mitochondrion. 2011;11:108-118. 17. Malik AN, Shahni R, Iqbal MM. Increased peripheral blood mitochondrial DNA in type 2 diabetic patients with nephropathy. Diabetes Res Clin Pract. 2009;86:e22-24. 18. Chen S, Li Z, He Y, Zhang F, Li H, Liao Y, Wei Z, Wan G, Xiang X, Hu M, Xia K, Chen X, Tang J. Elevated mitochondrial DNA copy number in peripheral blood cells is associated with childhood autism. BMC Psychiatry. 2015;15:50.
19. Purdue MP, Hofmann JN, Colt JS, Hoxha M, Ruterbusch JJ, Davis FG, Rothman N, Wacholder S, Schwartz KL, Baccarelli A, Chow WH. A case-control study of peripheral blood mitochondrial DNA copy number and risk of renal cell carcinoma. PLoS One. 2012;7:e43149. 20. Liu CS, Tsai CS, Kuo CL, Chen HW, Lii CK, Ma YS, Wei YH. Oxidative stress-related alteration of the copy number of mitochondrial DNA in human leukocytes. Free Radic Res. 2003;37:1307-1317. 21. Mordukhovich I, Wilker E, Suh H, Wright R, Sparrow D, Vokonas PS, Schwartz J. Black carbon exposure, oxidative stress genes, and blood pressure in a repeated-measures study. Environ Health Perspect. 2009;117:1767-1772. 22. Andreu AL, Martinez R, Marti R, García-Arumí E. Quantification of mitochondrial DNA copy number: Pre-analytical factors. Mitochondrion. 2009;9:242-246. 23. Lin CS, Wang LS, Chou TY, Hsu WH, Lin HC, Lee SY, Lee MH, Chang SC, Wei YH. Cigarette smoking and hOGG1 Ser326Cys polymorphism are associated with 8-OHdG accumulation on mitochondrial DNA in thoracic esophageal squamous cell carcinoma. Ann Surg Oncol. 2013;20:379-388. 24. Fang SC, Mehta AJ, Alexeeff SE, Gryparis A, Coull B, Vokonas P, Christiani DC, Schwartz J. Residential black carbon exposure and circulating markers of systemic inflammation in elderly males: The Normative Aging Study. Environ Health Perspect. 2012;120:674-680. 25. Baccarelli A, Tarantini L, Wright RO, Bollati V, Litonjua AA, Zanobetti A, Sparrow D, Vokonas PS, Schwartz J. Repetitive element DNA methylation and circulating endothelial and
Tang J. Elevated mitochondrial DNA copy number in peripheral blood cells is associaatett d with childhood autism. BMC Psychiatry. 2015;15:50.
19. Purdue MP, Hofmann JN, Colt JS, Hoxha M, Ruterbusch JJ, Davis FG, Rothman N, Wacholder S, Schwartz KL, Baccarelli A, Chow WH. A case-control study of peripheral blood ttmitooochchchononondrdrdriaiaial l DNNNA AA copy number and risk of renanaall l cccell carcinoma. PLoSSS OOOne. 2012;7:e43149.
22020. Liu CS, Tsaiaiai CCS, KKKuououo CCCL,L,L, CCChhhenenen HHHWW,W LLLiiiiii CCCK, MMMa YSYSYS, WeWeWei YHYHYH... OxOxOxidididaative e e stststrereesssss -r-r-relllatatateddd alalalteeerar tion of the cococ py nnnuumbeeerr oofo mitochohhondriiialll DNNm AAA in hhhumumumannn leuuukkkocyteees. FrFrFreeee Radddiccc Rees.. 2000030303;3;3; 7:13070707-13313 77.7
212121. MoMoMordrdrdukkukhohohoviivichchch III, WiWiWilklklkererer EEE, SSSuhhuh HHH, WrWrWrigigighththt RRR, SpSpSparararrororow DDD, VoVoVokokokonananasss PSPSPS, ScScSchwhhwararartzttz JJJ. BlBlBlacacackkk
by guest on December 14, 2015http://circ.ahajournals.org/Downloaded from

DOI: 10.1161/CIRCULATIONAHA.115.018802
18
inflammation markers in the VA normative aging study. Epigenetics. 2010;5:222-228. 26. Hall JR, Brouillard RG. Water vapor pressure calculation. J Appl Physiol. 1985;58:2090. 27. Park SK, O'Neill MS, Vokonas PS, Sparrow D, Schwartz J. Effects of air pollution on heart rate variability: The VA normative aging study. Environ Health Perspect. 2005;113:304-309. 28. Wiener JM, Tilly J. Population ageing in the united states of america: Implications for public programmes. Int J Epidemiol. 2002;31:776-781.
29. Baumgartner J, Zhang Y, Schauer JJ, Huang W, Wang Y, Ezzati M. Highway proximity and black carbon from cookstoves as a risk factor for higher blood pressure in rural china. Proc Natl Acad Sci. 2014;111:13229-13234. 30. Brook RD, Franklin B, Cascio W, Hong Y, Howard G, Lipsett M, Luepker R, Mittleman M, Samet J, Smith SC, Jr., Tager I, Expert Panel on Population and Prevention Science of the American Heart Association. Air pollution and cardiovascular disease: A statement for healthcare professionals from the expert panel on population and prevention science of the American Heart Association. Circulation. 2004;109:2655-2671. 31. Attardi G, Schatz G. Biogenesis of mitochondria. Annu Rev Cell Biol. 1988;4:289-333. 32. Carugno M, Pesatori AC, Dioni L, Hoxha M, Bollati V, Albetti B, Byun HM, Bonzini M, Fustinoni S, Cocco P, Satta G, Zucca M, Merlo DF, Cipolla M, Bertazzi PA, Baccarelli A. Increased mitochondrial DNA copy number in occupations associated with low-dose benzene exposure. Environ Health Perspect. 2012;120:210-215. 33. Lee HC, Yin PH, Lu CY, Chi CW, Wei YH. Increase of mitochondria and mitochondrial DNA in response to oxidative stress in human cells. Biochem J. 2000;348 Pt 2:425-432. 34. Wei YH, Lee HC. Oxidative stress, mitochondrial DNA mutation, and impairment of antioxidant enzymes in aging. Exp Biol Med. 2002;227:671-682. 35. Collins LV, Hajizadeh S, Holme E, Jonsson IM, Tarkowski A. Endogenously oxidized mitochondrial DNA induces in vivo and in vitro inflammatory responses. J Leukoc Biol. 2004;75:995-1000. 36. Oka T, Hikoso S, Yamaguchi O, Taneike M, Takeda T, Tamai T, Oyabu J, Murakawa T, Nakayama H, Nishida K, Akira S, Yamamoto A, Komuro I, Otsu K. Mitochondrial DNA that escapes from autophagy causes inflammation and heart failure. Nature. 2012;485:251-255. 37. Cavelier L, Johannisson A, Gyllensten U. Analysis of mtDNA copy number and composition of single mitochondrial particles using flow cytometry and PCR. Exp Cell Res. 2000;259:79-85.
38. Beverland IJ, Cohen GR, Heal MR, Carder M, Yap C, Robertson C, Hart CL, Agius RM. A comparison of short-term and long-term air pollution exposure associations with mortality in two cohorts in scotland. Environ Health Perspect. 2012;120:1280-1285.
professionals from the expert panel on population and prevention science of the Ameriicac n Heart Association. Circulation. 2004;109:2655-2671.
31. Attardi G, Schatz G. Biogenesis of mitochondria. Annu Rev Cell Biol. 1988;4:289-333.
32. CaCaCarururugngngnooo M,MM PPPeeesatori AC, Dioni L, Hoxha M,, BoBoBollati V, Albetti B, BByuyuyun HM, Bonzini M, Fuuuststtiininoni S, CCCocco P, Satta G, Zucca M, Merlo DFFF, Cipolla M, Berererttazzi PA, Baccarelli A. nnncrrreased mitochchchonndrdrdriiaial ll DNDNDNA A A ccocopypypy nnnumumumbeber ininin occcupppatioioionnns aaassssssocociaii teteteddd wwiwithh lowoww-d-d-dososose ee bebebenznnzeneneneee
exexexpopoposure. Enviroon Heaaaltth Peeerssspect. 201122;12000:22210--215.
33. LeLeLeeee HCHCHC, Yiin nn PHHPH, LuLLu CCCY, CCChihihi CCCW, WWWeieiei YYYHHH. IIIncncrreeeasesee ooofff mimimittochchchoonondrdrdriaia aaandn mmmitititoocochhondndndririalalal DDDNANANAnnn rrresesespopoponsnsnseee tototo oooxiixidadadatititiveeve ssstrtrtresesessss ininin hhhummumananan cccelelellslsls. BiBiBiochehhem JJJ. 202020000000;3;3;3484848 PPPtttJJJJ 222:4:4:4252525 44-4323232.ttt
by guest on December 14, 2015http://circ.ahajournals.org/Downloaded from

DOI: 10.1161/CIRCULATIONAHA.115.018802
19
Clinical Perspective
Traffic-related pollution (black carbon, BC) is a pervasive environmental threat, particularly for
older individuals, who are especially susceptible to pollution-triggered cardiovascular morbidity
and mortality. Systemic oxidative stress is a key mechanism linking BC pollution and
cardiovascular events, and the role of mitochondria abundance in compensating for cellular-
redox-imbalance under oxidative stress has been increasingly appreciated. However, the
response of mitochondria in the peripheral blood upon ambient BC exposure remains unknown.
We utilized the Normative Aging Study to address a mechanistic question about cardiovascular
effects of air pollution: how does short- to moderate-term ambient BC alter blood mitochondrial
abundance; and how this alteration might impact BC-elicited cardiovascular effects. Our results
indicated that, in older adults, levels of short- to moderate-term ambient BC were associated with
increased blood pressure (BP) and blood mitochondrial abundance. In addition, individuals with
lower blood mitochondrial abundance were estimated to exhibit 1.95-fold larger effect of BC
with systolic BP, suggesting that increased blood mitochondrial abundance buffered the effect of
ambient BC on BP. The impact of our study is in the investigation of compensatory increase in
blood mitochondrial abundance as an adaptive response to reduce the cardiovascular effects of
ambient BC. The present study provides insights into the physiologic effects of traffic-related
pollution and may aid targeted risk-reduction and novel pharmaceutical interventions. Because of
the central role of oxidative stress in the pathogenesis of cardiovascular diseases, the study
results may provide novel perspective to the cardiovascular effect of other environmental risk
factors.
effects of air pollution: how does short- to moderate-term ambient BC alter blooddd mmmitititococochohohondndndriririal
abundance; and how this alteration might impact BC-elicited cardiovascular effects. Our results
ndiicacacateteted dd thththatatat, innn oooldl er adults, levels of short- to o momomoderate-term ambiennnttt BCBB were associated with
nnncrrreased blood dd prprp essssususureere (((BPBPBP))) aanand dd blblbloooooodd mimimitototocchondndndrialalal aaabububundndndanancecee. InInIn aaaddditioioon,n,n, iiindndndivivivididduauaualslsls wwwititith
oowewewer rr blood d d mimm tooochhonnndrrrial abababununundaaancncnce wweweree essstimatted ttooo exxxhihihibibiit 1...95955-foooldd laaargrgrgeree effffffeeect ofoff BCd
wiiwiththth sssyssystototolililiccc BPBPBP, sussuggggggesesestititingngng ttthahahattt ininincrcrcreaeaeaseseseddd blblblooooooddd mimimitototochchchononondrdrdriaiaialll abababunnundadadancncnceee bubbufffffferererededed ttthehehe eeeffffffecececttt ofofoff
by guest on December 14, 2015http://circ.ahajournals.org/Downloaded from

DOI: 10.1161/CIRCULATIONAHA.115.018802
20
Table 1. Baseline characteristics, black carbon (BC) levels, blood mitochondrial DNA to nuclear DNA copy number ratio (mtDNA/nDNA), and blood pressure (BP) in the Normative Aging Study (N=675), 1999-2012.
Characteristic N (%) BC
(μg/m3) Mean (SD)
SBP (mm Hg)
Mean (SD)
DBP (mm Hg)
Mean (SD)
mtDNA/nDNA* Mean (SD)
Age 55-69 years 215 (31.8) 1.29 (0.40) 129.8 (14.9) 79.2 (8.3) 1.04 (0.24) 70-79 years 340 (50.4) 1.23 (0.41) 131.0 (17.7) 74.8 (9.6) 1.00 (0.24) 80-89 years 117 (17.3) 1.17 (0.42) 132.3 (20.8) 72.4 (10.0) 1.01 (0.34) > 90 years 3 (0.4) 0.74 (--) 122.7 (15.3) 77.0 (6.6) 1.08 (0.09) Physical Activity <12 MET-hrs/wk 434 (64.3) 1.25 (0.41) 131.1 (17.7) 75.7 (9.6) 1.01 (0.27) 12-29 MET-hrs/wk 146 (21.6) 1.22 (0.41) 127.8 (15.8) 75.6 (10.1) 1.01 (0.22)
30 MET-hrs/wk 95 (14.1) 1.21 (0.42) 134.2 (18.2) 76.5 (9.0) 1.02 (0.29) Alcohol Use <2 drinks/day 537 (79.6) 1.24 (0.41) 130.3 (17.4) 76.1 (9.7) 1.02 (0.26)
2 drinks/day 138 (20.4) 1.20 (0.42) 132.7 (17.5) 74.8 (9.3) 1.00 (0.25) Diabetes No 549 (81.3) 1.25 (0.41) 130.1 (17.1) 76.2 (9.5) 1.01 (0.27) Yes 126 (18.7) 1.19 (0.41) 133.9 (18.3) 74.3 (10.0) 1.01 (0.22) Race Non-white 18 (2.7) 1.32 (0.47) 128.7 (13.5) 75.4 (9.5) 0.65 (0.44) White 657 (97.3) 1.23 (0.41) 130.8 (17.5) 75.8 (9.6) 1.02 (0.25) BMI <25 kg/m2 130 (19.3) 1.26 (0.41) 130.6 (19.0) 73.9 (9.0) 1.04 (0.32)
25 kg/m2 545 (80.7) 1.23 (0.41) 130.8 (17.1) 76.3 (9.7) 1.01 (0.24) Smoking Status Never 199 (29.4) 1.24 (0.41) 130.7 (17.4) 76.5 (9.4) 1.02 (0.24) Current 29 (4.3) 1.21 (0.41) 132.2 (15.7) 76.0 (6.6) 1.02 (0.31) Former 447 (66.2) 1.24 (0.41) 130.7 (17.6) 75.5 (9.9) 1.01 (0.27) Education
High School 177 (26.2) 1.26 (0.40) 131.3 (18.4) 75.5 (9.8) 1.00 (0.23) College 337 (49.9) 1.23 (0.41) 130.6 (17.5) 75.7 (9.6) 1.01 (0.28) Graduate School 161 (23.9) 1.21 (0.43) 130.5 (16.1) 76.4 (9.4) 1.04 (0.25) N indicates the number of participants; SBP and DBP indicate systolic and diastolic BP, respectively; SD indicates standard deviation; MET indicates metabolic equivalent of task; BMI indicates body mass index. * mtDNA/nDNA measurements reflects the average cellular mitochondrial abundance, calculated based on the ratio of copy number estimates of a mitochondrial gene to those of a nuclear gene. The ratio was scaled to a standard DNA sample presenting the relative mitochondrial content within a cell.
Alcohol Use <2 drinks/day 537 (79.6) 1.24 (0.41) 130.3 (17.4) 76.1 (9.7) 111.0002 2 2 (0(0(0.2.2.26)6)6)
2 drinks/day 138 (20.4) 1.20 (0.42) 132.7 (17.5) 74.8 (9.3) 111.00000 (((000.252525)) )Diabetes No 549 (81.3) 1.25 (0.41) 1130.1 (17.1) 76.222 (((9.5) 1.01 (0.27) Yeeesss 126 (18.7) 1.19 (0.41) 1133.9 (18.3) 74.33 (((1110.0) 1.01 (0.22) RRRaccce NoNN nn-n white 18 (((2.2.2.7) 1...322 (0.4.47)7 112888.7.7.7 (((1113...5) 75.444 ((9.555) 000.6. 55 (0( .4444) WhWhWhitititee 66657 (9(9(97.7.7.3)3) 1...2333 (000.4.41)) 113000.888 ((1117..5.5))) 7575.888 (((9.6)6)6) 111.022 (((0.2555) BMII<25 kg/m222 130 (19.3) 1.26 (0.41) 130.6 (19.0) 73.9 (9.0) 1.04 (0.32)
by guest on December 14, 2015http://circ.ahajournals.org/Downloaded from

DOI: 10.1161/CIRCULATIONAHA.115.018802
21
Table 2. Association of ambient black carbon (BC) levels with blood pressure (BP). Time Window Estimate* 95% CI P N n
Original Model† SBP 2-day 1.79 0.65 to 2.92 0.002 656 1243 (mm Hg) 5-day 2.35 1.14 to 3.55 0.0001 657 1252 7-day 2.83 1.57 to 4.09 <0.0001 657 1252
14-day 3.02 1.68 to 4.35 <0.0001 654 1234 21-day 3.10 1.71 to 4.49 <0.0001 649 1206 28-day 3.46 2.06 to 4.87 <0.0001 650 1211
DBP 2-day 0.65 0.05 to 1.24 0.03 656 1243 (mm Hg) 5-day 1.40 0.77 to 2.03 <0.0001 657 1252
7-day 1.73 1.07 to 2.39 <0.0001 657 1252 14-day 1.81 1.11 to 2.52 <0.0001 654 1234 21-day 1.91 1.17 to 2.65 <0.0001 649 1206 28-day 1.97 1.23 to 2.72 <0.0001 650 1211
Sensitivity Analysis Adjusting for PM2.5‡ SBP 2-day 3.72 2.27 to 5.16 <0.0001 606 1048 (mm Hg) 5-day 4.03 2.58 to 5.47 <0.0001 610 1058 7-day 4.29 2.85 to 5.73 <0.0001 610 1052
14-day 4.36 2.90 to 5.82 <0.0001 600 1021 21-day 4.19 2.68 to 5.70 <0.0001 585 984 28-day 4.32 2.78 to 5.86 <0.0001 583 985
DBP 2-day 1.64 0.89 to 2.38 <0.0001 606 1048 (mm Hg) 5-day 2.40 1.66 to 3.14 <0.0001 610 1058
7-day 2.59 1.85 to 3.33 <0.0001 610 1052 14-day 2.61 1.86 to 3.36 <0.0001 600 1021 21-day 2.54 1.77 to 3.31 <0.0001 585 984
28-day 2.49 1.71 to 3.26 <0.0001 583 985 SBP and DBP indicate systolic and diastolic BP, respectively; N and n indicate the number of participants and observations, respectively; PM2.5 indicates particulate matter up to 2.5 micrometers in size. * Estimate presents the increase in BP (mm Hg) per standard deviation (SD) increase in BC. † Results were adjusted for: apparent temperature and absolute humidity at the matching time window; race; percentage of major cell types (lymphocytes, neutrophils, and platelets); age; weekday; date of visit; body mass index; C-reactive protein>10 mg/L; smoking; alcohol use; season; physical activity; education level; use of calcium channel blockers, -blockers, and angiotensin-converting enzyme inhibitor. ‡ Results were adjusted for all the covariates listed above, and PM2.5 at the matching time window.
28-day 1.97 1.23 to 2.72 <0.0001 65000 111212121111
Sensitivity Analysis Adjusting for PM2.5‡ SBP 2-day 3.72 2.27 to 5.16 <0.0001 606 1048 mm m m HgHgHg))) 5-day 4.03 222.58 to 5.47 <0.00000001 610 1058
7-day y 4.29 222.85 to 5.73 <0.0001 610 1052 1141 -d-d-dayayay 4.3666 222.9000 ttto 555.8882 <<000.000000001 66000000 11102020211221--day 4.1999 222.6888 ttto o o 5.55 7770 <0.0000001 58555 98444 2228--d- ay 444.3.3.3222 222.7888 tttooo 555.868686 <<<0.00 000000010 5838383 98555
DBP 2-day 1 64 0 89 to 2 38 <0 0001 606 1048
by guest on December 14, 2015http://circ.ahajournals.org/Downloaded from

DOI: 10.1161/CIRCULATIONAHA.115.018802
22
Table 3. Association of ambient black carbon (BC) levels with blood mitochondrial DNA to nuclear DNA copy number ratio (mtDNA/nDNA). Time Window Estimate* 95% CI P N n
Original Model† 2-day 0.05 -0.01 to 0.12 0.11 656 1241 5-day 0.12 0.06 to 0.19 0.0003 657 1250 7-day 0.14 0.07 to 0.21 0.0002 657 1250 14-day 0.15 0.07 to 0.23 0.0002 654 1232 21-day 0.14 0.06 to 0.22 0.001 649 1204 28-day 0.12 0.03 to 0.20 0.007 650 1209
Sensitivity Analysis Adjusting for PM2.5‡
2-day 0.12 0.04 to 0.20 0.005 606 1046 5-day 0.17 0.09 to 0.25 <0.0001 610 1056 7-day 0.15 0.07 to 0.23 0.0002 610 1050 14-day 0.14 0.06 to 0.23 0.001 600 1019 21-day 0.12 0.03 to 0.21 0.008 585 982 28-day 0.09 0.00 to 0.17 0.05 583 983 N and n indicate the number of participants and observations, respectively; PM2.5 indicates particulate matter up to 2.5 micrometers in size. * Estimate presents the increase in standard deviation (SD) for mtDNA/nDNA per SD increase in BC. † Results were adjusted for: apparent temperature and absolute humidity at the matching time window; race; percentage of major cell types (lymphocytes, neutrophils, and platelets); age; weekday; date of visit; body mass index; C-reactive protein>10 mg/L; smoking; alcohol use; season; physical activity; education level; use of calcium channel blockers, -blockers, and angiotensin-converting enzyme inhibitor. ‡ Results were adjusted for all the covariates listed above and PM2.5 at the matching time window.
14-day 0.14 0.06 to 0.23 0.001 600 101010191919 21-day 0.12 0.03 to 0.21 0.008 5855 98989822228-day 0.09 0.00 to 0.17 0.05 583 983 N and n indicate the number of participants and observations, respectively; PM2.5 indicates particulate matter up to 2.5 micrometers in sssizizize.
EsEsstititimmamatte ppprerereseeents thththee increase in standard deviation (SDDD))) foor mtDNA/nDNAA ppper SD DD ininincrease in BC. † ReReResssults weree aaadjusteteed for:: apppppparent teteempmperature and absolluttte humididitity yy at thehehe mmmatchinng g time wwwinindow; raccce;ee ppepercccene tage of majooor rr ceelll tttypyy eseses (((lylylympmpmphhhocycycyteees, nnneuutroppphiiils, annnddd platatatelelelets)s)s); aaage; wwweekdkdkdayaya ; dateee ooofff viiisisisit;t;; bbododody yy mamamasssss nnndeeexx; C-reactive prrrottein>>100 mg/LLL; smoking; alccohol uuuse; sseaaason; ppphyhyhysssicccal accctivvity; eeeduucatttiooon leveeel;ll uuuse off f calciumm hhhananannnnel blockeeersrsrs, ---bllockeeerss, andd angngngiotensnsnsin---coono verrrtinnng ennzyyymeee innnhibbbitooor. ReReResususultltltsss wewewererere adjjjuususteeed dd fofofor alalallll the cococovariririatatates llisisisteteed d d abababovovve ee ananand dd PMPMPM2.522 aaat t t thtt eee mamamatctt hihihingngng tttimimmeee wiwiindndndowowow.
by guest on December 14, 2015http://circ.ahajournals.org/Downloaded from

DOI: 10.1161/CIRCULATIONAHA.115.018802
23
Table 4. Effect modification by blood mitochondrial DNA to nuclear DNA copy number ratio (mtDNA/nDNA), on the association of ambient black carbon (BC) with blood pressure (BP). SBP (mm Hg) DBP (mm Hg)
mtDNA/nDNA Estimate 95% CI P Estimate 95% CI P Q1 Midpoint 2.36 0.99 to 3.73 0.001 0.80 0.08 to 1.51 0.03 Q2 Midpoint 1.98 0.82 to 3.15 0.001 0.67 0.06 to 1.28 0.03 Q3 Midpoint 1.65 0.49 to 2.80 0.01 0.56 -0.05 to 1.17 0.07 Q4 Midpoint 1.09 -0.38 to 2.56 0.15 0.38 -0.40 to 1.15 0.34
2-day
Pinteraction 0.14 0.35 Q1 Midpoint 3.19 1.71 to 4.66 <0.0001 1.50 0.73 to 2.27 0.0001 Q2 Midpoint 2.69 1.43 to 3.95 <0.0001 1.44 0.79 to 2.10 <0.0001Q3 Midpoint 2.24 1.02 to 3.46 0.0003 1.39 0.76 to 2.03 <0.0001Q4 Midpoint 1.51 0.04 to 2.99 0.04 1.31 0.54 to 2.08 0.001
5-day
Pinteraction 0.05 0.67 Q1 Midpoint 3.76 2.23 to 5.3 <0.0001 1.93 1.13 to 2.73 <0.0001Q2 Midpoint 3.25 1.92 to 4.57 <0.0001 1.82 1.13 to 2.51 <0.0001Q3 Midpoint 2.79 1.51 to 4.06 <0.0001 1.72 1.06 to 2.39 <0.0001Q4 Midpoint 2.03 0.55 to 3.51 0.01 1.56 0.79 to 2.33 <0.0001
7-day
Pinteraction 0.04 0.39 Q1 Midpoint 4.01 2.39 to 5.62 <0.0001 2.00 1.15 to 2.85 <0.0001Q2 Midpoint 3.48 2.07 to 4.89 <0.0001 1.89 1.15 to 2.63 <0.0001Q3 Midpoint 3.02 1.68 to 4.37 <0.0001 1.80 1.09 to 2.50 <0.0001Q4 Midpoint 2.26 0.74 to 3.78 0.004 1.64 0.84 to 2.44 <0.0001
14-day
Pinteraction 0.03 0.40 Q1 Midpoint 4.22 2.56 to 5.88 <0.0001 2.17 1.29 to 3.05 <0.0001Q2 Midpoint 3.62 2.15 to 5.08 <0.0001 2.05 1.27 to 2.82 <0.0001Q3 Midpoint 3.08 1.68 to 4.48 <0.0001 1.94 1.20 to 2.68 <0.0001Q4 Midpoint 2.19 0.62 to 3.76 0.01 1.76 0.92 to 2.59 <0.0001
21-day
Pinteraction 0.01 0.33 Q1 Midpoint 4.68 3.03 to 6.33 <0.0001 2.21 1.34 to 3.09 <0.0001Q2 Midpoint 4.00 2.54 to 5.46 <0.0001 2.10 1.33 to 2.87 <0.0001Q3 Midpoint 3.40 1.99 to 4.80 <0.0001 1.99 1.25 to 2.74 <0.0001Q4 Midpoint 2.40 0.81 to 3.99 0.003 1.82 0.98 to 2.66 <0.0001
28-day
Pinteraction 0.01 0.36 N and n indicate the number of participants and observations, respectively; SBP and DBP indicate systolic and diastolic BP, respectively. Estimate represents that per standard deviation (SD) increase in mtDNA/nDNA, the lessened increase in BP (mm Hg) per SD increase in BC. Results were adjusted for: apparent temperature and absolute humidity at the matching time window; race; percentage of major cell types (lymphocytes, neutrophils, and platelets); age; weekday; date of visit; body mass index; C-reactive protein>10 mg/L; smoking; alcohol use; season; physical activity; education level; use of calcium channel blockers, -blockers, and angiotensin-converting enzyme inhibitor.
Q pQ2 Midpoint 3.25 1.92 to 4.57 <0.0001 1.82 1.13 to o o 2.2.2.515151 <<<0.0.0.00000001Q3 Midpoint 2.79 1.51 to 4.06 <0.0001 1.72 1.06 to 2.2.2.393939 <<<0.00 000000010101Q4 Midpoint 2.03 0.55 to 3.51 0.01 1.56 0.79 to 2.33 <0.0001
7-day
Pinteraactictc onP 0.04 0.39 Q1Q1Q1 Midddpppoint 4.01 2.39 to 5.6662 22 <0.0001 222.00 1.15 to 2.85 <0.0001Q222 MMMidididpopp inininttt 3.3.3.484848 222.00.07 tototo 444.899 <000.0.0.00000001 11 11 1.8.88999 1.151515 ttto o o 2.2.2 6333 <<<0.0.0.00000001Q3 Midddppoinntt 33.3.02 11.668 tooo 444.377 <000.0.0.00000001 111.80 111.00909 to 222.5550 <<<0.00000001Q4Q4Q4 MMMidddppop inntt 2.2622 000.7774 tototo 333.788 000.0000444 111.646464 000.8.8. 4 44 to 222.4444 <<<0.000001
1444-dadaay yy
PinteractionP 00.0 00303 0.00 4040 Q1 Midpoint 4.22 2.56 to 5.88 <0.0001 2.17 1.29 to 3.05 <0.00011
by guest on December 14, 2015http://circ.ahajournals.org/Downloaded from

DOI: 10.1161/CIRCULATIONAHA.115.018802
24
Figure Legends:
Figure 1. Association of ambient black carbon (BC) levels with blood pressure (BP), Normative
Aging Study, 1999-2012. Estimates represent the increase in BP per standard deviation increase
in BC. Results were adjusted for: apparent temperature and absolute humidity at the matching
time window; race; percentage of major cell types (lymphocytes, neutrophils, and platelets); age;
weekday; date of visit; body mass index; C-reactive protein>10 mg/L; smoking; alcohol use;
season; physical activity; education level; use of calcium channel blockers, -blockers, and
angiotensin-converting enzyme inhibitor.
Figure 2. Association of ambient black carbon (BC) levels with blood mitochondrial DNA to
nuclear DNA copy number ratio (mtDNA/nDNA), Normative Aging Study, 1999-2012.
Estimates represent the increase in standard deviation (SD) for mtDNA/nDNA per SD increase
in BC. Results were adjusted for: apparent temperature and absolute humidity at the matching
time window; race; percentage of major cell types (lymphocytes, neutrophils, and platelets); age;
weekday; date of visit; body mass index; C-reactive protein>10 mg/L; smoking; alcohol use;
season; physical activity; education level; use of calcium channel blockers, -blockers, and
angiotensin-converting enzyme inhibitor.
Figure 3. Association of ambient black carbon (BC) levels with systolic blood pressure (SBP) at
different blood mitochondrial DNA to nuclear DNA copy number ratio (mtDNA/nDNA) levels,
Normative Aging Study, 1999-2012. Results were adjusted for: apparent temperature and
absolute humidity at the matching time window; race; percentage of major cell types
Figure 2. Association of ambient black carbon (BC) levels with blood mitochondrial DNA to
nuclleaeaear r r DNDNDNA AA copypypy number ratio (mtDNA/nDNAAA),),), NNNormative Aging SStututudydd , 1999-2012.
EEEstiiimates represesesennt thththe ininincrcrcreaeaasesese ininin ssstatandnndard dd deeeviaatiooon (S(S(SD)D)D) fofofor mtmm DNDNDNAAA/nnDNANANA pererer SSSDDD iinincrcrcreaeaeaseee
nnn BBBC.CC Resululultstst wwwerrre adddjuuusteddd ffforoo : apapappapaareeentn ttteeemmpmperratttureee aaand d d abbbsosos lululutete hhumuumidititity y y at thehehe maatccchinggg
iiimememe wininindododow;;w; rrracacace;e;e; pppererercececentntntagagageee ofofof mamamajojojorrr cececellllll tttyppypeseses (((lyllympmpmphohohocyccytetetesss, nnneueeutttrororophphphilililsss, aaandndnd ppplalalateteteleleletststs););); aaagegege;;;;
by guest on December 14, 2015http://circ.ahajournals.org/Downloaded from

DOI: 10.1161/CIRCULATIONAHA.115.018802
25
(lymphocytes, neutrophils, and platelets); age; weekday; date of visit; body mass index; C-
reactive protein>10 mg/L; smoking; alcohol use; season; physical activity; education level; use
of calcium channel blockers, -blockers, and angiotensin-converting enzyme inhibitor.
by guest on December 14, 2015http://circ.ahajournals.org/Downloaded from

Figure 1 by guest on December 14, 2015http://circ.ahajournals.org/Downloaded from

Figure 2 by guest on December 14, 2015http://circ.ahajournals.org/Downloaded from

Figure 3 by guest on December 14, 2015http://circ.ahajournals.org/Downloaded from

Vokonas, Joel Schwartz and Andrea A. BaccarelliBind, Diddier Prada, Hannah Laue, Kasey J.M. Brennan, Alexandra Dereix, David Sparrow, Pantel
Jia Zhong, Akin Cayir, Letizia Trevisi, Marco Sanchez-Guerra, Xinyi Lin, Cheng Peng, Marie-AbèleAbundance
Traffic-Related Air Pollution, Blood Pressure, and Adaptive Response of Mitochondrial
Print ISSN: 0009-7322. Online ISSN: 1524-4539 Copyright © 2015 American Heart Association, Inc. All rights reserved.
is published by the American Heart Association, 7272 Greenville Avenue, Dallas, TX 75231Circulation published online December 11, 2015;Circulation.
http://circ.ahajournals.org/content/early/2015/12/11/CIRCULATIONAHA.115.018802World Wide Web at:
The online version of this article, along with updated information and services, is located on the
http://circ.ahajournals.org/content/suppl/2015/12/11/CIRCULATIONAHA.115.018802.DC1.htmlData Supplement (unedited) at:
http://circ.ahajournals.org//subscriptions/
is online at: Circulation Information about subscribing to Subscriptions:
http://www.lww.com/reprints Information about reprints can be found online at: Reprints:
document. Permissions and Rights Question and Answer available in the
Permissions in the middle column of the Web page under Services. Further information about this process isOnce the online version of the published article for which permission is being requested is located, click Request
can be obtained via RightsLink, a service of the Copyright Clearance Center, not the Editorial Office.Circulation Requests for permissions to reproduce figures, tables, or portions of articles originally published inPermissions:
by guest on December 14, 2015http://circ.ahajournals.org/Downloaded from

S1
SUPPLEMENTAL MATERIAL
S2
Supplemental Table 1: Correlation between whole
blood mitochondrial DNA to nuclear DNA copy
number ratio (mtDNA/nDNA) and plasma
inflammatory markers.
Correlation Coefficient P*
IL6 -0.07 0.03
IL8 -0.03 0.32
IL1β -0.05 0.10
TNFα -0.06 0.09
TNFγ -0.08 0.01
CRP -0.09 0.003
ICAM-1 -0.06 0.03
VEGF -0.06 0.07
IL indicates interleukin; TNF indicates tumor
necrosis factor; CRP indicates C-reactive protein;
ICAM-1 intercellular adhesion molecule 1; VEGF
indicates vascular endothelial growth factor.
*P value represents Prob > |r| under H0: Rho
(Spearman's rank correlation coefficient) = 0
S3
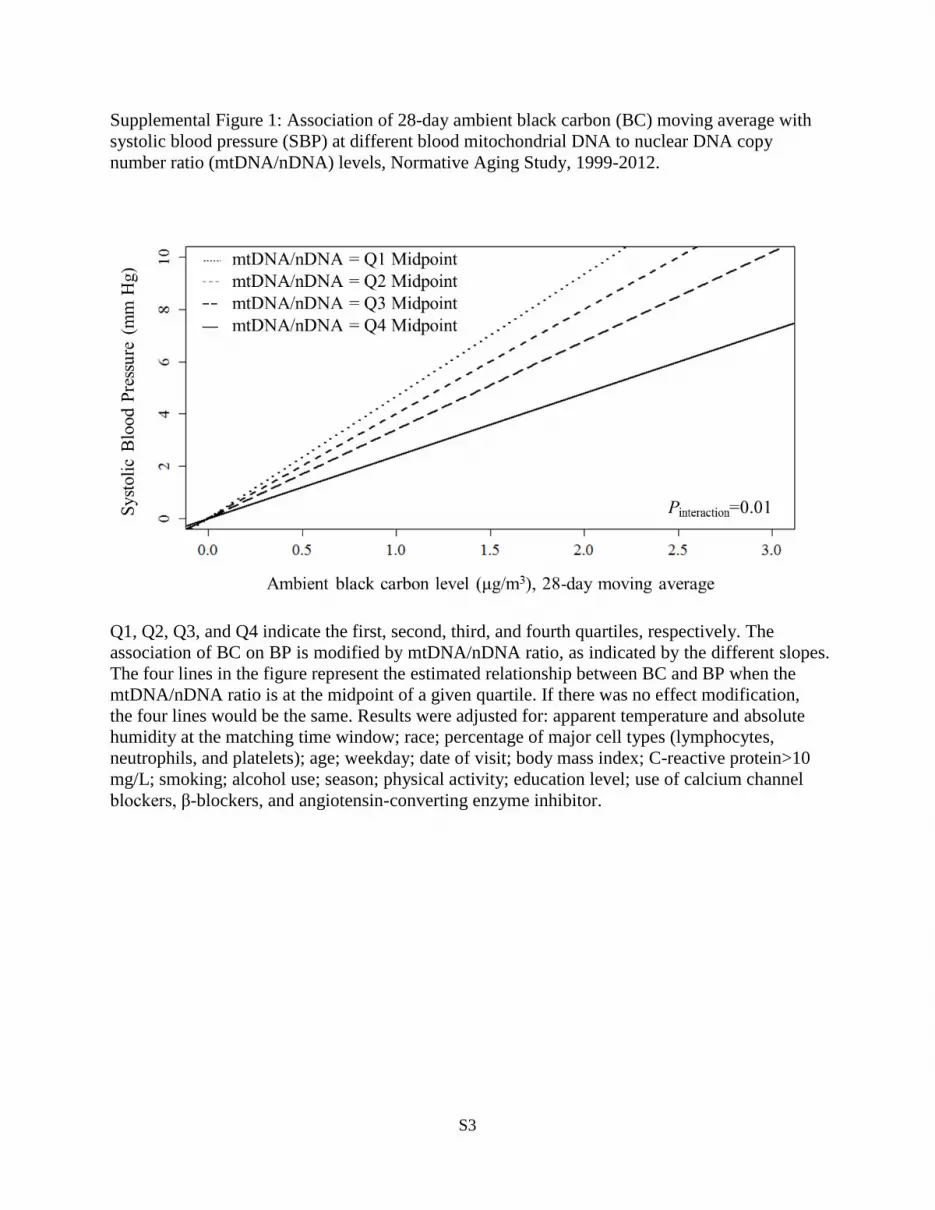
Supplemental Figure 1: Association of 28-day ambient black carbon (BC) moving average with
systolic blood pressure (SBP) at different blood mitochondrial DNA to nuclear DNA copy
number ratio (mtDNA/nDNA) levels, Normative Aging Study, 1999-2012.
Q1, Q2, Q3, and Q4 indicate the first, second, third, and fourth quartiles, respectively. The
association of BC on BP is modified by mtDNA/nDNA ratio, as indicated by the different slopes.
The four lines in the figure represent the estimated relationship between BC and BP when the
mtDNA/nDNA ratio is at the midpoint of a given quartile. If there was no effect modification,
the four lines would be the same. Results were adjusted for: apparent temperature and absolute
humidity at the matching time window; race; percentage of major cell types (lymphocytes,
neutrophils, and platelets); age; weekday; date of visit; body mass index; C-reactive protein>10
mg/L; smoking; alcohol use; season; physical activity; education level; use of calcium channel
blockers, β-blockers, and angiotensin-converting enzyme inhibitor.


