Embed Size (px)
Citation preview

Cover Page
1) Title of the paper:
Toward a simplified perceptual quality metric for watermarking
applications
2) authors’ affiliation and address:
IRCCyN-IVC, (UMR CNRS 6597), Polytech' Nantes
Rue Christian Pauc, La Chantrerie, 44306 NANTES, France.
Tel : 02.40.68.30.52
Fax : 02.40.68.32.32
3) e_mail address:
4) Journal & Publisher information:
SPIE Human Vision and Electronic Imaging
http://spie.org/electronic-imaging.xml
5) bibtex entry:
@conference{CPA2010,
author = {Maurizio Carosi, Vinod Pankajakshan, Florent
Autrusseau},
title = {Toward a simplified perceptual quality metric for
watermarking applications},
booktitle = {Proceedings of the SPIE conference on Electronic
Imaging},
year = {2010},
volume = {7542}
}
Towards a Simplified Perceptual Quality Metric forWatermarking Applications
Maurizio Carosi, Vinod Pankajakshan, Florent AutrusseauIRCCyN-IVC, Polytech’Nantes, rue Ch. Pauc, 44306, Nantes, FRANCE
ABSTRACTThis work is motivated by the limitations of statistical quality metrics to assess the quality of images distortedin distinct frequency ranges. Common quality metrics, which basically have been designed and tested for variouskind of global distortions, such as image coding may not be e!cient for watermarking applications, wherethe distortions might be restricted on a very narrow portion of the frequency spectrum. We hereby want topropose an objective quality metric whose performances do not depend on the distortion frequency range, butwe nevertheless want to provide a simplified objective quality metric in opposition to the complex Human VisualSystem (HVS) based quality metrics recently made available. The proposed algorithm is generic (not designedfor a particular distortion), and exploits the contrast sensitivity function (CSF) along with an adapted Minkowskierror pooling. The results show a high correlation between the proposed objective metric and the mean opinionscore (MOS) given by observers. A comparison with relevant existing objective quality metrics is provided.
1. INTRODUCTIONDuring the last couple of decades, digital watermarking has significantly been improved regarding various as-pects. Early works have mostly focused on robustness improvements, more recent research targeted on optimalsecurity. However, although of great importance, the watermark invisibility has not received much attentionand is commonly ensured by means of MSE or PSNR. Objective quality metrics (OQM) have sometimes beenexploited to ensure the watermark invisibility. The most commonly used quality metrics for digital watermark-ing are WPSNR [1] or SSIM [2]. The limitations of these metrics for watermarking applications were recentlypointed out [3].
In this work we particularly focus on the unsuitability of common statistical quality metrics (such as PSNR orSSIM) when comparing watermarking algorithms operating in di"erent frequency ranges. E"ectively, althoughthe PSNR might give a reasonable indication of the image quality when comparing watermarked images withvarious embedding strengths for a given watermarking algorithm, it can be ine!cient when comparing the PSNRoutputs for two techniques operating in di"erent frequency ranges. This observation might not hold for spreadspectrum techniques, where the watermark is basically spread over all the frequency spectrum. Nevertheless itis an important issue to keep in mind when comparing watermarking techniques operating in various frequencyranges, for instance, wavelet domain watermarking techniques might modulate the watermark in specific sub-bands.
Evidently the most e!cient way to assess the perceived quality of watermarked images is to run a subjectiveexperiment where human observers are asked to judge the quality of the displayed images. Subjective experimentsare very restrictive and require a specific setup. Objective quality assessment have recently been of great interestto the human vision community, OQM are designed to provide the best approximation of the observers’ qualityscore. We hereby propose an objective quality metric taking a very simple but yet important HVS feature intoaccount, and a comparison with several widely used objective quality metrics. Common HVS based objectivequality metrics are usually made of five distinct steps [4]: A pre-processing step can be used (such as thescreen non linearity function), CSF filtering is then performed, masking e"ects are considered (via a perceptualchannel decomposition), error normalisation can then be computed to provide a distortion map, and finally anerror pooling on this map provides a predicted quality score (commonly called predicted MOS, abbreviated as
Further author information: (Send correspondence to F.A)F.A: E-mail: [email protected], Telephone: (+33)240683052
MOSp), which supposedly correlates well with the MOS provided by human observers. Objective quality metricscan be of three di!erent kinds. No reference quality metrics compute a MOSp based on the distorted image only,Reduced Reference Quality Metrics use both the distorted images and some features collected from the originalimage. Finally, Full Reference Quality Metrics use both the original and distorted image to predict the qualityscore. In the watermarking context, Full Reference Quality Metrics can be considered.
This paper is structured as follows: In Section 2 we present a simplified perceptual quality metric, taking intoaccount some basic HVS properties for a better quality estimation independent of the watermark frequency. Thesubjective experiment protocol is detailed in Section 3 along with brief description of the subjective databaseswhich are used for evaluating the metrics performances. A performance comparison of the proposed metric witha number of commonly used OQMs is presented in Section 4. We finally give concluding remarks in Section 5.
2. PROPOSED METRICBasically, two very important steps in objective metrics design are the contrast sensitivity consideration anda proper error pooling. Our main goal in this work being to propose a simple, fast, but nevertheless e"cientobjective quality metric, we hereby restrict the proposed metric to contrast sensitivity modeling, combined withan optimized error pooling.
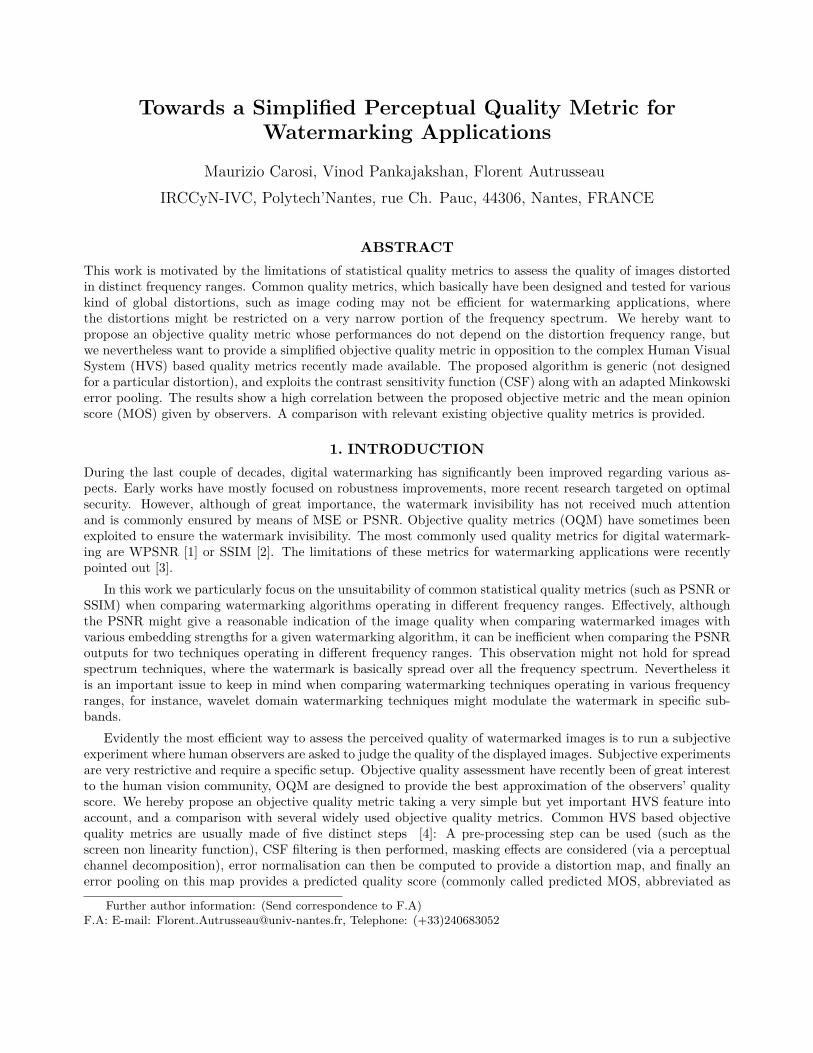
The sensitivity of the HVS varies with many factors, including luminance level or contrast. The ContrastSensitivity Function (CSF) (depicted in Figure 1) represents human sensitivity to spatial frequency. Using theCSF is essential when designing an objective quality metric, especially for watermarking applications, where thedistortions might occur in di!erent frequency ranges. The 2D CSF (inset in Figure 1) basically filters the Fourierspectrum of an image, thus enhancing the portions of the image having peak sensitivity.
Figure 1. 1D CSF along with the 2D version.
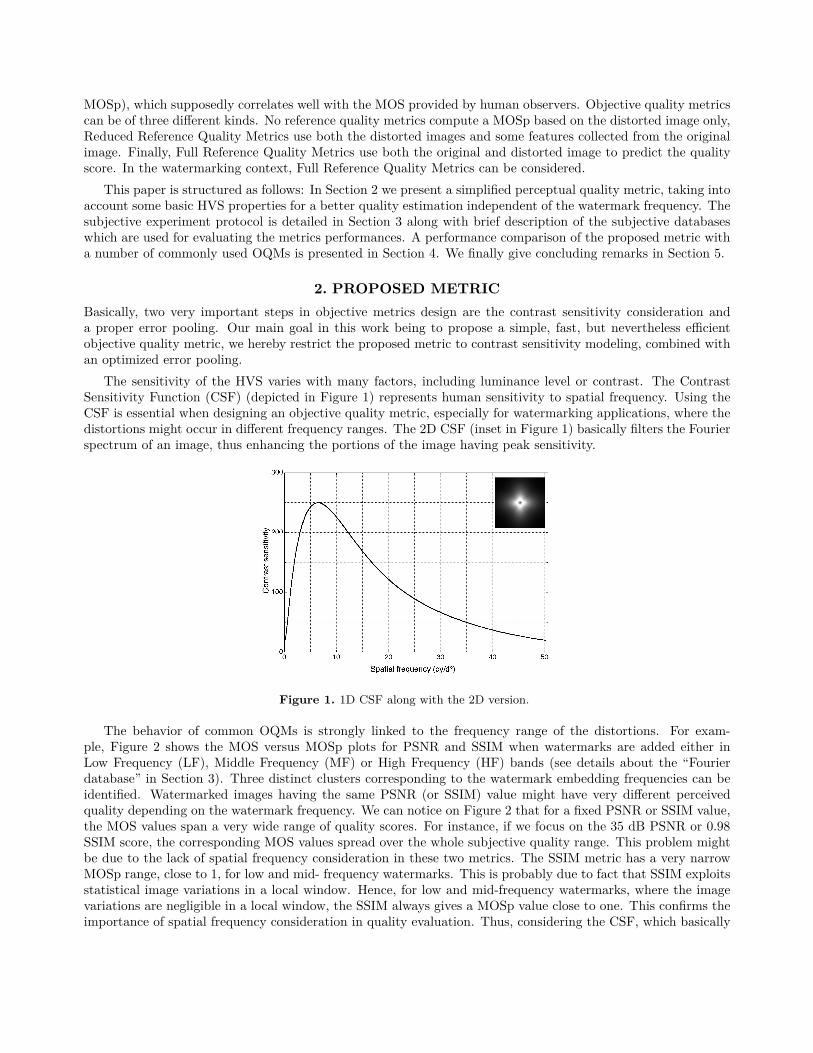
The behavior of common OQMs is strongly linked to the frequency range of the distortions. For exam-ple, Figure 2 shows the MOS versus MOSp plots for PSNR and SSIM when watermarks are added either inLow Frequency (LF), Middle Frequency (MF) or High Frequency (HF) bands (see details about the “Fourierdatabase” in Section 3). Three distinct clusters corresponding to the watermark embedding frequencies can beidentified. Watermarked images having the same PSNR (or SSIM) value might have very di!erent perceivedquality depending on the watermark frequency. We can notice on Figure 2 that for a fixed PSNR or SSIM value,the MOS values span a very wide range of quality scores. For instance, if we focus on the 35 dB PSNR or 0.98SSIM score, the corresponding MOS values spread over the whole subjective quality range. This problem mightbe due to the lack of spatial frequency consideration in these two metrics. The SSIM metric has a very narrowMOSp range, close to 1, for low and mid- frequency watermarks. This is probably due to fact that SSIM exploitsstatistical image variations in a local window. Hence, for low and mid-frequency watermarks, where the imagevariations are negligible in a local window, the SSIM always gives a MOSp value close to one. This confirms theimportance of spatial frequency consideration in quality evaluation. Thus, considering the CSF, which basically
weights the images spatial frequencies according to the HVS sensitivity may result in a better quality metric forsuch applications.
20 30 40 50 601
1.5
2
2.5
3
3.5
4
4.5
5
MOS
PSNR
LF
MF
HF
0.4 0.5 0.6 0.7 0.8 0.9 11
1.5
2
2.5
3
3.5
4
4.5
5
MOS
SSIM
Figure 2. Subjective scores as a function of PSNR and SSIM for Fourier domain watermarking in three distinct frequencyranges.
As previously explained, HVS based OQMs are usually made of five distinct steps [4]. We hereby want a fastbut nevertheless e!cient frequency independent quality metric. Being computationally expensive, the perceptualchannel decomposition is not considered in the proposed metric. Besides, the screen non-linearity function doesnot have a significant impact on the MOSp value, and furthermore makes the resulting MOSp values dependenton the viewing monitor. The proposed metric is thus restricted to a frequency weighting function (CSF) alongwith an appropriate error summation.
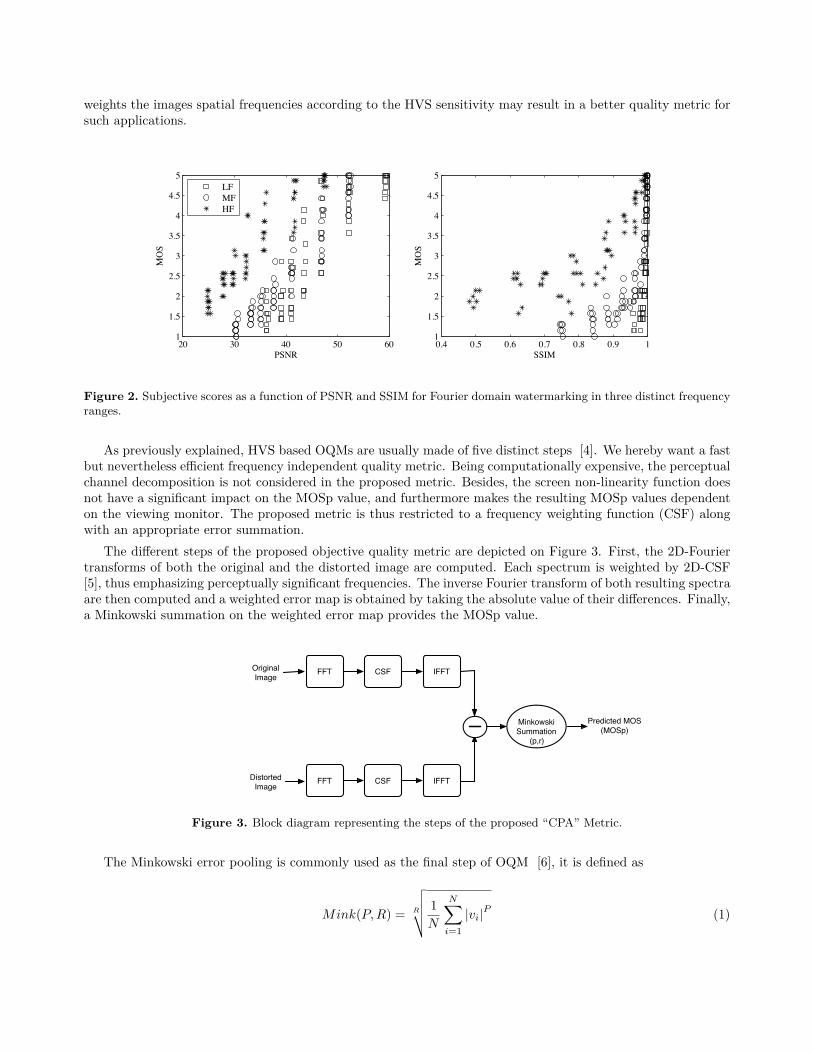
The di"erent steps of the proposed objective quality metric are depicted on Figure 3. First, the 2D-Fouriertransforms of both the original and the distorted image are computed. Each spectrum is weighted by 2D-CSF[5], thus emphasizing perceptually significant frequencies. The inverse Fourier transform of both resulting spectraare then computed and a weighted error map is obtained by taking the absolute value of their di"erences. Finally,a Minkowski summation on the weighted error map provides the MOSp value.
Original
ImageFFT CSF IFFT
Distorted
ImageFFT CSF IFFT
Minkowski
Summation(p,r)
Predicted MOS
(MOSp)
Figure 3. Block diagram representing the steps of the proposed “CPA” Metric.
The Minkowski error pooling is commonly used as the final step of OQM [6], it is defined as
Mink(P,R) = R
!""# 1N
N$
i=1|vi|P (1)
where N is the number of pixels in the image, and v(i) the absolute di!erence value at the ith spatial locationin the di!erence map. The generalized Minkowski summation, where P != R, provides additional flexibility foradjusting the response of individual parameters to changes in perceived quality. As a special case, Equation 1reduces to the mean absolute error (MAE) when R = P = 1, and the MSE if P = 2. Finally if R = P = 2 ,the Minkowski summation is equivalent to the RMSE. As P increases, more emphasis will be put at the imageregions of high distortions. A fine tuning of the error pooling step may lead to better metric performances.
3. EXPERIMENTAL SETUPThe performance of the proposed “CPA” metric was evaluated on four subjective data-sets. Among these sub-jective databases!, three are based on digital watermarking algorithms operating in various transformed spaces,and a coding database was also used for comparison purposes. All subjective scores (MOS) were collected in nor-malized viewing conditions as recommended by the International Telecommunications Union (ITU). Interestedreaders should refer to [3] for further details on the experimental setup. A pair comparison protocol was usedin the experiments. The original and the distorted images were displayed at a distance of six times the displayheight and the locations of both original and distorted images were known explicitly to the observers. Theobservers were asked to rate the impairments on a scale of five categories (5: “Imperceptible”, 4: “Perceptible,but not annoying”, 3: “Slightly annoying”, 2: “Annoying”, 1: “Very Annoying”). The same subjective protocolwas used in all the tested databases. We hereby give a brief description of the databases:
Database1 (Seven observers) This database consist of images marked using FFT-domain watermarking tech-nique. Five gray level input images were used, each being marked independently in six Perceptual sub-bands, corresponding to three di!erent frequency ranges (Low-, Medium- and High-frequency). Sevenembedding strengths were used in each Fourier sub-band, respectively 10%, 20%, 40%, 60%, 80%, 100%,140% of the JND mask thus generating 210 watermarked images (see [7] for details on the embed-ding technique and perceptual channel decomposition). Details on this database are provided on-line:http://www.irccyn.ec-nantes.fr/~autrusse/Databases/FourierSB/
Database2 (Seventeen observers) The perceived quality of 120 distorted images was assessed. Ten originalgray scale images were used (five natural images from the BOWS-2 database and five art images from theLouvre museum database), the “broken arrows” embedding technique [8] was used to generate six di!erentembedding strengths, with target PSNR of 20, 24, 28, 32, 36 and 40 dB†. Two scenarios were considered,the standard settings of the “Broken Arrows” watermarking technique were used and a slightly modifiedscheme where CSF weights [9] were applied prior to the wavelet domain embedding.
Database3 (Fourteen observers) Twelve gray scale input images were used (from the BOWS-2 database). 120distorted images were generated from five embedding strengths using either the Discrete Wavelet Transformor the Dual-Tree Complex Wavelet Transform. The watermark is multiplicatively embedded onto the sub-bands. The same embedding equation applies in both domains: y = x+!" |x|"w , where x stands for theoriginal wavelet coe"cient, ! is a strength parameter, w is the watermark, and y the marked coe"cient.The five embedding strengths were targeting PSNR values of 28, 32, 36, 40, and 44 dB‡.
Database4 (Nineteen observers) This database includes three types of coding distortions (JPEG, JPEG2000and LAR [10]). 120 distorted images were generated from these three codecs for 8 original color images,five compression rates were used for every codec . Interested readers might refer to [11] for further detailson this experiment. Please, note that this database was used for testing purpose, and to ensure the validityof the metric for non-watermarking distortion type.
The performance of the proposed quality metric was compared with twelve metrics from the “metrix_mux”package§ (MSE, PSNR, SSIM, MSSIM, VSNR, VIF, VIFP, UQI, IFC, NQM, WSNR, SNR), as well as C4[4]!Available on-line: http://www.irccyn.ec-nantes.fr/~autrusse/Publications.html#DB†Thanks to Patrick Bas for providing the marked images‡Thanks to Peter Meerwald for providing the marked images.§http://foulard.ece.cornell.edu/gaubatz/metrix_mux/
and Komparator [12], as both showed good performances for watermarking algorithm comparison purpose [3].The weighted PSNR (WPSNR) [1] was also included in this study, as it is widely used by the watermarkingcommunity. Due to space limitation, we hereby present a complete analysis for three widely used quality metricsin watermarking domain (PSNR, WPSNR, SSIM) and an advanced HVS based OQM (C4), a brief performanceanalysis will be given on all the remaining metrics from the metrix_mux package.
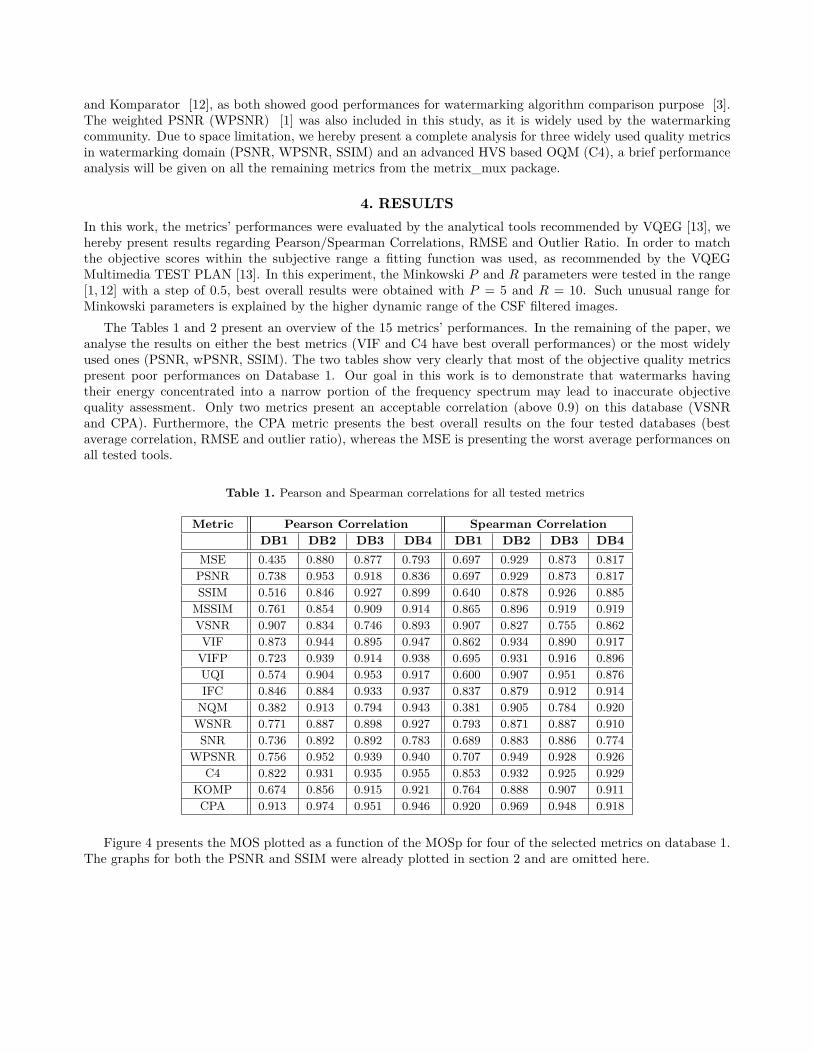
4. RESULTSIn this work, the metrics’ performances were evaluated by the analytical tools recommended by VQEG [13], wehereby present results regarding Pearson/Spearman Correlations, RMSE and Outlier Ratio. In order to matchthe objective scores within the subjective range a fitting function was used, as recommended by the VQEGMultimedia TEST PLAN [13]. In this experiment, the Minkowski P and R parameters were tested in the range[1, 12] with a step of 0.5, best overall results were obtained with P = 5 and R = 10. Such unusual range forMinkowski parameters is explained by the higher dynamic range of the CSF filtered images.
The Tables 1 and 2 present an overview of the 15 metrics’ performances. In the remaining of the paper, weanalyse the results on either the best metrics (VIF and C4 have best overall performances) or the most widelyused ones (PSNR, wPSNR, SSIM). The two tables show very clearly that most of the objective quality metricspresent poor performances on Database 1. Our goal in this work is to demonstrate that watermarks havingtheir energy concentrated into a narrow portion of the frequency spectrum may lead to inaccurate objectivequality assessment. Only two metrics present an acceptable correlation (above 0.9) on this database (VSNRand CPA). Furthermore, the CPA metric presents the best overall results on the four tested databases (bestaverage correlation, RMSE and outlier ratio), whereas the MSE is presenting the worst average performances onall tested tools.
Table 1. Pearson and Spearman correlations for all tested metrics
Metric Pearson Correlation Spearman CorrelationDB1 DB2 DB3 DB4 DB1 DB2 DB3 DB4
MSE 0.435 0.880 0.877 0.793 0.697 0.929 0.873 0.817PSNR 0.738 0.953 0.918 0.836 0.697 0.929 0.873 0.817SSIM 0.516 0.846 0.927 0.899 0.640 0.878 0.926 0.885
MSSIM 0.761 0.854 0.909 0.914 0.865 0.896 0.919 0.919VSNR 0.907 0.834 0.746 0.893 0.907 0.827 0.755 0.862VIF 0.873 0.944 0.895 0.947 0.862 0.934 0.890 0.917
VIFP 0.723 0.939 0.914 0.938 0.695 0.931 0.916 0.896UQI 0.574 0.904 0.953 0.917 0.600 0.907 0.951 0.876IFC 0.846 0.884 0.933 0.937 0.837 0.879 0.912 0.914
NQM 0.382 0.913 0.794 0.943 0.381 0.905 0.784 0.920WSNR 0.771 0.887 0.898 0.927 0.793 0.871 0.887 0.910SNR 0.736 0.892 0.892 0.783 0.689 0.883 0.886 0.774
WPSNR 0.756 0.952 0.939 0.940 0.707 0.949 0.928 0.926C4 0.822 0.931 0.935 0.955 0.853 0.932 0.925 0.929
KOMP 0.674 0.856 0.915 0.921 0.764 0.888 0.907 0.911CPA 0.913 0.974 0.951 0.946 0.920 0.969 0.948 0.918
Figure 4 presents the MOS plotted as a function of the MOSp for four of the selected metrics on database 1.The graphs for both the PSNR and SSIM were already plotted in section 2 and are omitted here.

Table 2. RMSE and Outlier ratio for all tested metrics
Metric RMSE Outlier RatioDB1 DB2 DB3 DB4 DB1 DB2 DB3 DB4
MSE 1.124 0.578 0.886 0.821 0.581 0.233 0.575 0.483PSNR 0.840 0.366 0.491 0.739 0.400 0.092 0.242 0.475SSIM 1.148 0.643 0.475 0.590 0.614 0.333 0.167 0.367
MSSIM 0.809 0.669 0.524 0.587 0.419 0.350 0.192 0.400VSNR 0.525 0.665 0.826 0.606 0.210 0.342 0.433 0.342VIF 0.638 0.398 0.552 0.434 0.319 0.125 0.267 0.242
VIFP 0.860 0.416 0.502 0.466 0.448 0.133 0.192 0.317UQI 1.020 0.514 0.393 0.539 0.510 0.200 0.125 0.308IFC 0.664 0.563 0.446 0.470 0.310 0.217 0.158 0.250
NQM 1.151 0.493 0.754 0.447 0.548 0.167 0.333 0.250WSNR 0.793 0.556 0.546 0.506 0.386 0.233 0.242 0.275SNR 0.843 0.545 0.561 0.838 0.410 0.225 0.267 0.467
WPSNR 0.815 0.37 0.426 0.462 0.390 0.067 0.175 0.267C4 0.717 0.442 0.440 0.400 0.352 0.142 0.175 0.208
KOMP 0.946 0.775 0.516 0.556 0.510 0.467 0.225 0.325CPA 0.508 0.273 0.382 0.439 0.200 0.025 0.108 0.267
25 30 35 40 45 50 55 60 651
1.5
2
2.5
3
3.5
4
4.5
5
MOS
WPSNR
LF
MF
HF
0.65 0.7 0.75 0.8 0.85 0.9 0.95 11
1.5
2
2.5
3
3.5
4
4.5
5
MOS
VIF
0.85 0.9 0.95 11
1.5
2
2.5
3
3.5
4
4.5
5
MOS
C4
5 10 15 20 25 30 35 40 451
1.5
2
2.5
3
3.5
4
4.5
5
MOS
CPA
Figure 4. MOS versus MOSp plots for the 4 selected metrics on Database 1.
Evidently a narrow and linear distribution of points is highly desirable. Contrary to similarity metrics, theproposed metric provides a measure of the di!erences between original and distorted images, thus yielding toa negative slope. As previously highlighted in Figure 2, separate clusters are formed for most metrics on thedatabase 1, each cluster corresponding to a particular frequency range. We can observe on this figure that thehighest is the watermark frequency, the lowest is the predicted score for a fixed perceptual quality. We can alsonotice that the narrowest point distribution is obtained with the proposed “CPA” metric, which furthermorepresents the straightest line distribution.
DB1 DB2 DB3 DB40.5
0.6
0.7
0.8
0.9
1
Pe
ars
on
Co
rre
latio
n
PSNR
WPSNR
SSIM
C4
VIF
CPA
DB1 DB2 DB3 DB40.5
0.6
0.7
0.8
0.9
1
Sp
ea
rma
n C
orr
ela
tio
n
DB1 DB2 DB3 DB40
0.2
0.4
0.6
0.8
1
RMSE
DB1 DB2 DB3 DB40
0.1
0.2
0.3
0.4
0.5
0.6
0.7
Outl
ier
Rati
o
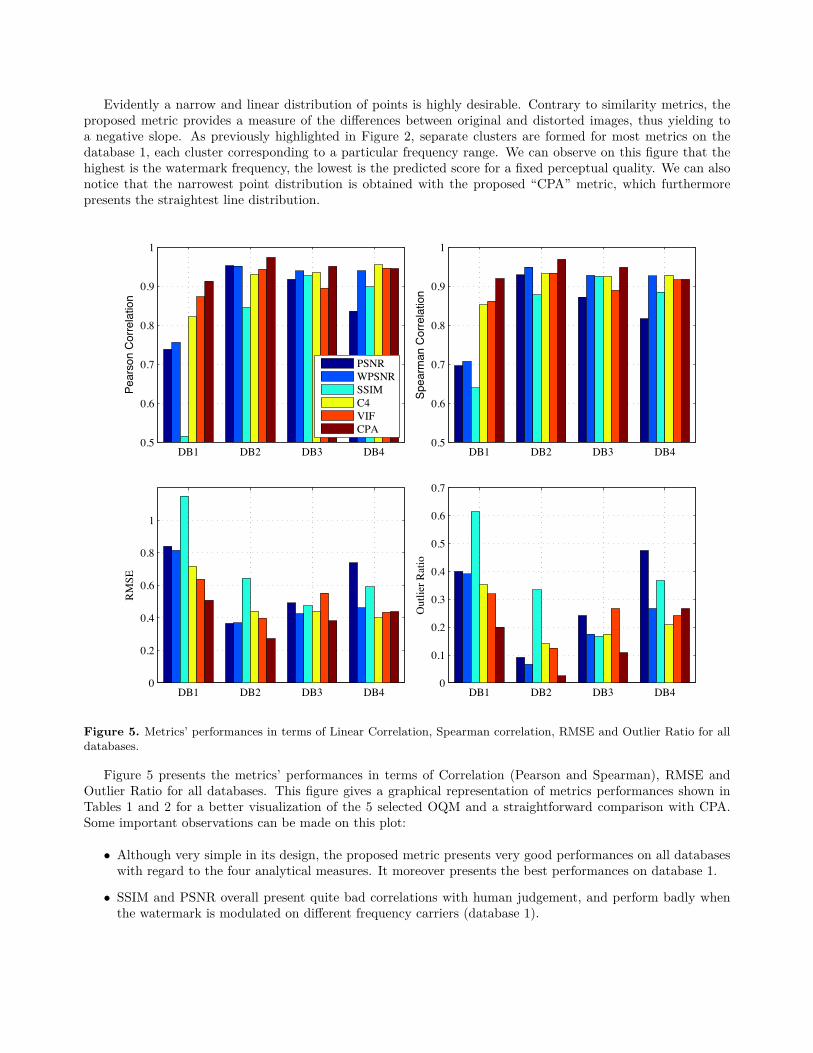
Figure 5. Metrics’ performances in terms of Linear Correlation, Spearman correlation, RMSE and Outlier Ratio for alldatabases.
Figure 5 presents the metrics’ performances in terms of Correlation (Pearson and Spearman), RMSE andOutlier Ratio for all databases. This figure gives a graphical representation of metrics performances shown inTables 1 and 2 for a better visualization of the 5 selected OQM and a straightforward comparison with CPA.Some important observations can be made on this plot:
• Although very simple in its design, the proposed metric presents very good performances on all databaseswith regard to the four analytical measures. It moreover presents the best performances on database 1.
• SSIM and PSNR overall present quite bad correlations with human judgement, and perform badly whenthe watermark is modulated on di!erent frequency carriers (database 1).
• A significant performance discrepancy is noticeable on database 1, this is actually due to the di!erentfrequency embedding,
• The C4 metric, although being a reduced reference metric, provides overall satisfactory results. This metrichas mostly been evaluated for coding distortions, and shows best performances on database 4.
• As briefly mentioned in the databases descriptions (section 3), some watermarking algorithms use a targetPSNR to determine the watermark strength (Databases 2 and 3). The PSNR is thus having its bestcorrelation on these two databases, which is expected as the MOSp values are evenly distributed (clusteredon the MOSp axis). We have nonetheless witnessed a very wide distribution of MOS versus MOSp plotsfor the PSNR, resulting in a somewhat important RMSE and Outlier Ratio (cf. in Fig. 5). Except fordatabase 4, the CPA metric presents the lowest RMSE and lowest Outlier Ratio, which is a very importantfeature if the metric is to be adapted for determining a target quality threshold.
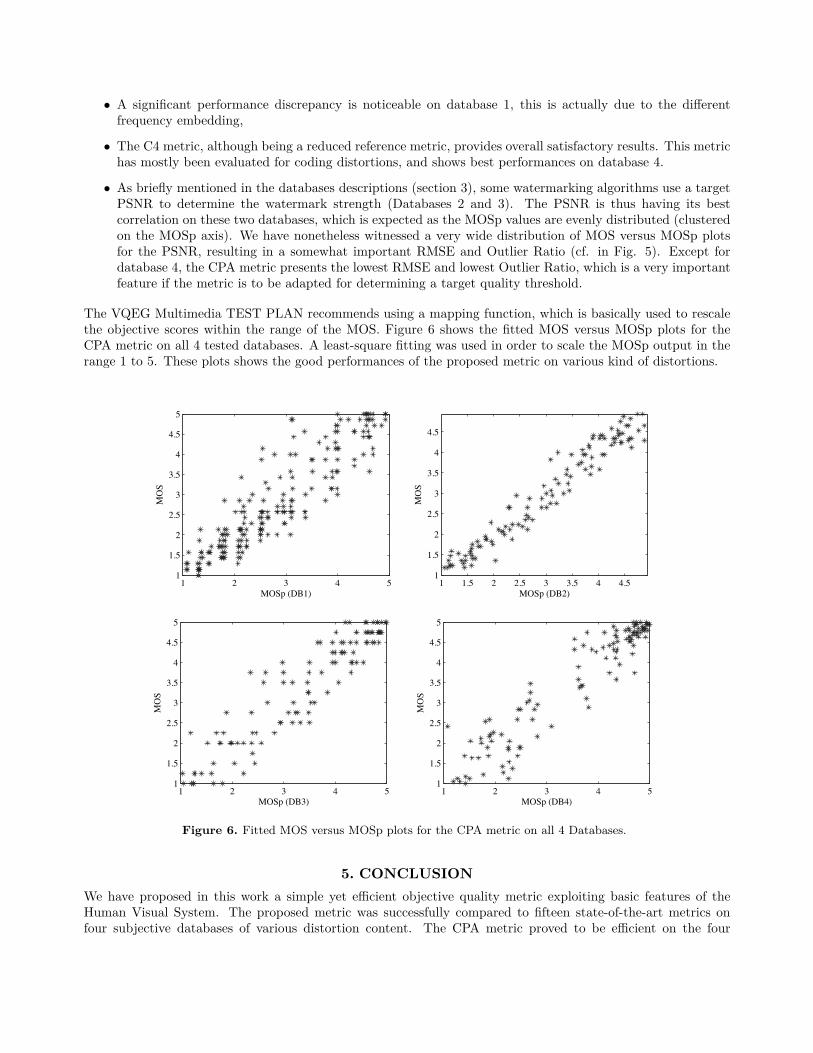
The VQEG Multimedia TEST PLAN recommends using a mapping function, which is basically used to rescalethe objective scores within the range of the MOS. Figure 6 shows the fitted MOS versus MOSp plots for theCPA metric on all 4 tested databases. A least-square fitting was used in order to scale the MOSp output in therange 1 to 5. These plots shows the good performances of the proposed metric on various kind of distortions.
1 2 3 4 51
1.5
2
2.5
3
3.5
4
4.5
5
MOSp (DB1)
MO
S
1 1.5 2 2.5 3 3.5 4 4.51
1.5
2
2.5
3
3.5
4
4.5
MOSp (DB2)
MO
S
1 2 3 4 51
1.5
2
2.5
3
3.5
4
4.5
5
MOSp (DB3)
MO
S
1 2 3 4 51
1.5
2
2.5
3
3.5
4
4.5
5
MOSp (DB4)
MO
S
Figure 6. Fitted MOS versus MOSp plots for the CPA metric on all 4 Databases.
5. CONCLUSIONWe have proposed in this work a simple yet e"cient objective quality metric exploiting basic features of theHuman Visual System. The proposed metric was successfully compared to fifteen state-of-the-art metrics onfour subjective databases of various distortion content. The CPA metric proved to be e"cient on the four
tested subjective databases, although its complexity is significantly lowered compared to complex HVS modelingexploited in C4. For most of the tested quality metrics, an e!cient quality estimation cannot be reachedfor a database containing distortions of various frequency ranges. The CPA metric showed the best overallperformances when a watermark is modulated onto di"erent frequency carriers. The narrow distribution (lowRMSE and Outlier Ratio) of the MOS versus MOSp plots for the proposed metric suggests that it could be usedin order to reach a target objective quality in watermarking techniques, this will be the focus of future research.We will furthermore focus on improving the metric by incorporating a simplified masking model.
ACKNOWLEDGMENTSThis work was partially funded by the ANR-Safimage research project. The authors wishes to thank RomualdPepion and Romain Cousseau for their help setting up the subjective experiments.
References[1] S. Voloshynovskiy, S. Pereira, A. Herrigel, N. Baumgartner, and T. Pun, “Generalized watermarking attack
based on watermark estimation and perceptual remodulation,” in SPIE Security and Watermarking ofMultimedia Contents, 3971, pp. 358–370, 2000.
[2] Z. Wang, A. C. Bovik, H. R. Sheikh, and E. P. Simoncelli, “Image quality assessment: From error visibilityto structural similarity,” IEEE Transactions on Image Processing 13(4), pp. 600–612, 2004.
[3] P. Le Callet, F. Autrusseau, and P. Campisi, Multimedia Forensics and Security, ch. IX, pp. 164–193. IdeaGroup Publishing, 2008.
[4] M. Carnec, P. Le Callet, and D. Barba, “Objective quality assessment of color images based on a genericperceptual reduced reference,” Signal Processing: Image Communication 23(4), pp. 239–256, 2008.
[5] S. Daly, “The visible di"erences predictor: An algorithm for the assessment of image fidelity,” tech. rep.,MIT Press, Cambridge, MA, pp. 179-206, 1993.
[6] Z. Wang and X. Shang, “Spatial pooling strategies for perceptual image quality assessment,” in IEEEInternational Conference on Image Processing, (Atlanta, GA), Oct. 8-11 2006.
[7] F. Autrusseau and P. Le Callet, “A robust image watermarking technique based on quantization noisevisibility thresholds,” Elsevier Signal Processing 87(6), pp. 1363–1383, 2007.
[8] T. Furon and P. Bas, “Broken arrows,” EURASIP Journal on Information Security 2008, pp. 1–13, 2008.
[9] D. Taubman and M. W. Marcellin, JPEG 2000 Image Compression Fundamentals, Standards and Practice,Kluwer Academic Publishers, 2001.
[10] O. Déforges, M. Babel, L. Bédat, and J. Ronsin, “Color lar codec: A color image representation andcompression scheme based on local resolution adjustment and self- extracting region representation,” IEEETransactions on Circuits and Systems for Video Technology 17(8), pp. 974–987, 2007.
[11] C. Strauss, F. Pasteau, F. Autrusseau, M. Babel, L. Bédat, and O. Déforges, “Subjective and objectivequality evaluation of LAR coded art images,” in IEEE International Conference on Multimedia and Expo,ICME 2009, (Cancun, Mexico), June 28 - July 3. 2009.
[12] D. Barba and P. Le Callet, “A robust quality metric for color image quality assessment,” in IEEE Interna-tional Conference on Image Processing, pp. 437–440, 2003.
[13] VQEG, “Video quality experts group: Current results and future directions, VCIP 2000,” 2000.


