Embed Size (px)
Citation preview

Seediscussions,stats,andauthorprofilesforthispublicationat:https://www.researchgate.net/publication/51541598
TotalZincIntakeMayModifytheGlucose-RaisingEffectofaZincTransporter(SLC30A8)Variant:A14-CohortMeta-analysis
ARTICLEinDIABETES·AUGUST2011
ImpactFactor:8.1·DOI:10.2337/db11-0176·Source:PubMed
CITATIONS
37
READS
68
56AUTHORS,INCLUDING:
JoseMOrdovas
TuftsUniversity
931PUBLICATIONS34,343CITATIONS
SEEPROFILE
IngaProkopenko
UniversityofOxford
118PUBLICATIONS16,063CITATIONS
SEEPROFILE
StephenKritchevsky
WakeForestSchoolofMedicine
409PUBLICATIONS21,078CITATIONS
SEEPROFILE
GeorgeDedoussis
HarokopionUniversityofAthens
236PUBLICATIONS8,271CITATIONS
SEEPROFILE
Availablefrom:JuliusS.Ngwa
Retrievedon:03February2016

Total Zinc Intake May Modify the Glucose-Raising Effectof a Zinc Transporter (SLC30A8) VariantA 14-Cohort Meta-analysisStavroula Kanoni,
1,2Jennifer A. Nettleton,
3Marie-France Hivert,
4Zheng Ye,
5Frank J.A. van Rooij,
6,7
Dmitry Shungin,8,9,10
Emily Sonestedt,9Julius S. Ngwa,
11Mary K. Wojczynski,
12Rozenn N. Lemaitre,
13
Stefan Gustafsson,14
Jennifer S. Anderson,15
Toshiko Tanaka,16
George Hindy,9Georgia Saylor,
15
Frida Renstrom,8,9,17
Amanda J. Bennett,18
Cornelia M. van Duijn,6,7
Jose C. Florez,19,20,21
Caroline S. Fox,22,23
Albert Hofman,6,7
Ron C. Hoogeveen,24,25
Denise K. Houston,26
Frank B. Hu,17
Paul F. Jacques,27
Ingegerd Johansson,10
Lars Lind,28
Yongmei Liu,29
Nicola McKeown,27,30
Jose Ordovas,31
James S. Pankow,32
Eric J.G. Sijbrands,7,33
Ann-Christine Syvänen,28
André G. Uitterlinden,6,7,33
Mary Yannakoulia,1M. Carola Zillikens,
33the MAGIC Investigators,*
Nick J. Wareham,5Inga Prokopenko,
18,34Stefania Bandinelli,
35Nita G. Forouhi,
5
L. Adrienne Cupples,11,22
Ruth J. Loos,5Goran Hallmans,
8Josée Dupuis,
11,22Claudia Langenberg,
5
Luigi Ferrucci,16
Stephen B. Kritchevsky,26
Mark I. McCarthy,18,34,36
Erik Ingelsson,14
Ingrid B. Borecki,12
Jacqueline C.M. Witteman,6,7
Marju Orho-Melander,9David S. Siscovick,
13
James B. Meigs,37
Paul W. Franks,8,9,17
and George V. Dedoussis1
OBJECTIVE—Many genetic variants have been associated withglucose homeostasis and type 2 diabetes in genome-wide associa-tion studies. Zinc is an essential micronutrient that is importantfor b-cell function and glucose homeostasis. We tested the hypoth-esis that zinc intake could influence the glucose-raising effect ofspecific variants.
RESEARCH DESIGN AND METHODS—We conducted a 14-cohort meta-analysis to assess the interaction of 20 genetic variantsknown to be related to glycemic traits and zinc metabolism withdietary zinc intake (food sources) and a 5-cohort meta-analysisto assess the interaction with total zinc intake (food sources
and supplements) on fasting glucose levels among individuals ofEuropean ancestry without diabetes.
RESULTS—We observed a significant association of total zincintake with lower fasting glucose levels (b-coefficient 6 SE per1 mg/day of zinc intake: 20.0012 6 0.0003 mmol/L, summaryP value = 0.0003), while the association of dietary zinc intakewas not significant. We identified a nominally significant interac-tion between total zinc intake and the SLC30A8 rs11558471 vari-ant on fasting glucose levels (b-coefficient 6 SE per A allele for1 mg/day of greater total zinc intake: 20.0017 6 0.0006 mmol/L,summary interaction P value = 0.005); this result suggests a stronger
From the 1Department of Nutrition-Dietetics, Harokopio University, Athens,Greece; the 2Wellcome Trust Sanger Institute, Hinxton, U.K.; the 3Division ofEpidemiology, Human Genetics, and Environmental Sciences, University ofTexas Health Science Center, Houston, Texas; the 4Department of Medicine,Division of Endocrinology, Université de Sherbrooke, Sherbrooke, Canada;the 5Medical Research Council Epidemiology Unit, Institute of MetabolicScience, Addenbrooke’s Hospital, Cambridge, U.K.; the 6Department ofEpidemiology, Erasmus Medical Center, Rotterdam, the Netherlands; 7TheNetherlands Genomics Initiative–Sponsored Netherlands Consortium forHealthy Aging (NGI-NCHA), Leiden, the Netherlands; the 8Genetic Epidemi-ology and Clinical Research Group, Department of Public Health and ClinicalMedicine, Section of Medicine, Umeå University Hospital, Umeå, Sweden;the 9Department of Clinical Sciences, Lund University, Malmö, Sweden;the 10Department of Odontology, Umeå University, Umeå, Sweden; the11Department of Biostatistics, Boston University School of Public Health,Boston, Massachusetts; the 12Division of Statistical Genomics, Department ofGenetics, Washington University School of Medicine, St. Louis, Missouri; the13Cardiovascular Health Research Unit, Department of Medicine and Epidemi-ology, University of Washington, Seattle, Washington; the 14Department of Medi-cal Epidemiology and Biostatistics, Karolinska Institutet, Stockholm,Sweden; the 15Baptist Medical Center, Wake Forest University, Winston-Salem, North Carolina; the 16Clinical Research Branch, National Institute onAging, Baltimore, Maryland; the 17Department of Nutrition, Harvard School ofPublic Health, Boston, Massachusetts; the 18Oxford Centre for Diabetes,Endocrinology, and Metabolism, University of Oxford, Churchill Hospital,Oxford, U.K.; the 19Diabetes Unit, Center for Human Genetic Research and Di-abetes Research Center, Massachusetts General Hospital, Boston, Massachusetts;the 20Program in Medical and Population Genetics, Broad Institute, Cam-bridge, Massachusetts; the 21Department of Medicine, Harvard MedicalSchool, Boston, Massachusetts; the 22Framingham Heart Study, NationalHeart, Lung, and Blood Institute, Framingham, Massachusetts; the 23Divisionof Endocrinology, Diabetes, and Hypertension, Brigham and Women’s Hospi-tal, Boston, Massachusetts; the 24Section of Atherosclerosis and Vascular Medi-cine, Department of Medicine, Baylor College of Medicine, Houston, Texas;
the 25Center for Cardiovascular Disease Prevention, Methodist DeBakey HeartCenter, Houston, Texas; the 26Sticht Center on Aging, Department of InternalMedicine, Section on Gerontology and Geriatric Medicine, Wake Forest Univer-sity School of Medicine, Winston-Salem, North Carolina; the 27Nutrition Epide-miology Program, U.S. Department of Agriculture Human Nutrition ResearchCenter on Aging (USDA HNRCA) at Tufts University, Boston, Massachusetts;the 28Department of Medical Sciences, Uppsala University, Uppsala, Sweden;the 29Department of Epidemiology and Prevention, Division of Public HealthSciences, Wake Forest University Health Sciences, Winston-Salem, North Car-olina; the 30Friedman School of Nutrition Science and Policy, Tufts University,Boston, Massachusetts; the 31Nutrition and Genomics Laboratory, Jean MayerUSDA HNRCA at Tufts University, Boston, Massachusetts; the 32Department ofEpidemiology, University of Minnesota, Minneapolis, Minnesota; the33Department of Internal Medicine, Erasmus Medical Center, Rotterdam, theNetherlands; the 34Wellcome Trust Centre for Human Genetics, University ofOxford, Oxford, U.K.; the 35Geriatric Unit, Azienda Sanitaria Firenze, Florence,Italy; the 36Oxford National Institute for Health Research Biomedical ResearchCentre, Churchill Hospital, Oxford, U.K.; and the 37General Medicine Division,Clinical Epidemiology Unit and Diabetes Research Unit, Massachusetts GeneralHospital, Boston, Massachusetts.
Corresponding authors: Stavroula Kanoni, [email protected];Paul W. Franks, [email protected]; and George V. Dedoussis, [email protected].
Received 10 February 2011 and accepted 1 June 2011.DOI: 10.2337/db11-0176This article contains Supplementary Data online at http://diabetes.
diabetesjournals.org/lookup/suppl/doi:10.2337/db11-0176/-/DC1.P.W.F. and G.V.D. contributed equally to this work.*A complete list of the MAGIC Investigators and institutions is provided in
the Supplementary Data.� 2011 by the American Diabetes Association. Readers may use this article
as long as the work is properly cited, the use is educational and not for profit,and the work is not altered. See http://creativecommons.org/licenses/by-nc-nd/3.0/ for details.
diabetes.diabetesjournals.org DIABETES, VOL. 60, SEPTEMBER 2011 2407
ORIGINAL ARTICLE

inverse association between total zinc intake and fasting glucosein individuals carrying the glucose-raising A allele compared withindividuals who do not carry it. None of the other interactiontests were statistically significant.
CONCLUSIONS—Our results suggest that higher total zinc in-take may attenuate the glucose-raising effect of the rs11558471SLC30A8 (zinc transporter) variant. Our findings also support evi-dence for the association of higher total zinc intake with lowerfasting glucose levels. Diabetes 60:2407–2416, 2011
Chronic elevations in fasting or postprandial glu-cose levels are the cardinal features of type 2diabetes (T2D), a common complex diseasecaused by the interplay of genetic and lifestyle
factors. Genome-wide association studies (GWAS) haveidentified genetic loci reproducibly associated with glyce-mic traits or T2D (1,2). These studies improved our under-standing of the mechanisms underlying impaired glucosehomeostasis and T2D, potentially aiding the development ofnovel and individualized medical therapies (3,4).
Modifiable lifestyle factors, such as diet and physicalactivity, influence glucose homeostasis and thus representimportant targets for T2D prevention and management (5).Zinc is an essential trace element found in most foods thatfacilitates catalytic, structural, and transcriptional actionswithin cells (6). Zinc is a critical component of the catalyticsite of .300 enzymes, including pancreatic carboxypep-tidases and RNA polymerases; coordinates with proteindomains; facilitates protein folding; produces structuressuch as zinc fingers; and regulates the expression ofmetallothioneins (7–9). Zinc is necessary in b-cells for insulincrystallization in hexamers (10). Moreover, it is cosecretedwith insulin and exerts insulinomimetic and antioxidantactions and participates in the regulation of b-cell mass(11,12). Zinc homeostasis is impaired in animal models ofdiabetes and in humans with diabetes (13,14). Indeed, zincsupplementation studies in animal models support a pro-tective effect of zinc against T2D, and in humans plasmalevels of zinc are inversely associated with the risk of T2D(13). Nevertheless, a causal link between zinc and T2Din humans is not well established. Data from population-based studies indicate that dietary and total zinc intake(food sources and supplements) may reduce T2D risk(15–17), but the few intervention studies investigatingthe effect of zinc supplementation on glucose meta-bolism, insulin homeostasis, or T2D risk have yieldedinconsistent results (13,18). Therefore, although zincsupplementation is a potential therapeutic and pre-ventive target for T2D, additional studies are neededbefore population-wide recommendations regarding zincintake can be advocated.
Knowledge of gene-environment interactions may en-hance our understanding of disease etiology and patho-genesis, as well as help personalize interventions. Werecently have demonstrated a favorable association ofwhole-grain intake with fasting glucose and insulin andobserved a potential interaction between the rs780094GCKR variant and whole-grain intake on fasting insulinconcentrations (19). Zinc intake previously has been shownto interact with genetic variants in relation to chronic dis-eases and inflammatory biomarkers (8,20–22) but not in thecontext of glycemic traits.
To address these gaps in the literature, we conducted ameta-analysis that included 14 cohorts, totaling up to 45,821
participants, to test the hypothesis that zinc intake modifiesthe cross-sectional association between fasting glucoselevels and genetic variants known to be related to glycemiaand zinc metabolism (2) in individuals of European descentwithout T2D.
RESEARCH DESIGN AND METHODS
The study sample for the current cross-sectional meta-analysis was combinedfrom 14 cohort studies (Supplementary Table 1), the majority of which areincluded in the CHARGE (Cohorts for Heart and Aging Research in GenomeEpidemiology) Consortium (23) and/or the Meta-Analyses of Glucose andInsulin-Related Traits Consortium (MAGIC). Ethical approval was obtained bylocal bioethical committees, and all participants provided signed informedconsent. Participants included in the current analyses did not have diabetes(defined as diagnosed self-reported diabetes and/or fasting glucose levels$7 mmol/L and/or use of antidiabetes medications) and had dietary data thatmet quality-control criteria (Supplementary Table 1).Anthropometric and blood glucose measurements. We calculated BMIas measured weight divided by the square of measured height (kg/m2) in allcohorts. We determined blood glucose levels in fasting plasma samples, withthe exceptions of participants in the Family Heart Study (FamHS), the Car-diovascular Health Study (CHS), the Rotterdam Study, and the AtherosclerosisRisk in Communities (ARIC) study, for whom we used fasting serum samples,and the Malmö Diet and Cancer (MDC) study, in which we used fasting whole-blood samples (Supplementary Table 1).Dietary assessment and zinc intake estimation. Dietary data were col-lected (Supplementary Table 1) and processed to estimate the mean dailydietary zinc intake using an appropriate nutrient/food composition databasefor each cohort (Supplementary Table 1). Supplemental zinc intake (singly orin a multiple-nutrient supplement) was recorded in five cohorts and wasquantified in milligrams per day. Total zinc intake was calculated as the sum ofdietary and supplemental intake.Genotyping and imputation. Twenty single nucleotide polymorphisms(SNPs) were included in the current meta-analysis (Tables 2 and 3 and Sup-plementary Data). Among these, 18 SNPs were recently associated with fast-ing glucose and/or fasting insulin levels in a large GWAS and meta-analysisstudy reported by the MAGIC (2). Two SNPs (rs10493846 and rs11167682)were selected for their potential role in zinc metabolism (24,25). A detaileddescription of the genotyping methods used for each study is provided inSupplementary Table 1.Statistical analysis. All cohort-specific statistical analyses followed a uniformanalytical plan. Linear regression models were applied to estimate the mag-nitude of the cross-sectional association of dietary and total zinc intake withfasting glucose levels, as well as the magnitude of the first-order SNP inter-actions (assuming an additive model) with dietary and total zinc intake onfasting glucose levels. All models were adjusted for age, sex, field center (in theARIC study, the CHS, the FamHS, the Health Aging and Body Composition[Health ABC] study, and the Aging In the CHIANTI area [InCHIANTI] study),and family structure by principal components (in the Framingham Heart Study[FHS] and the FamHS). Associations were further adjusted for BMI levels tolimit potentially confounding effects of adiposity.Meta-analysis. The sample size for the association analysis of dietary zincintake (food sources) with fasting glucose was 46,021 participants. Thesample size for the interaction analysis between dietary zinc intake and SNPsranged from 27,010 to 45,821 participants. Corresponding association andinteraction analyses of total zinc intake (food sources and supplements)included 34,533 and 18,158 to 34,333 participants, respectively. We performedpower calculations using Quanto version 1.2 (http://hydra.usc.edu/gxe). Ac-cordingly, at 80% power, P , 0.05 detected a difference of 0.0013 mmol/L onfasting glucose levels per 1 mg/day higher dietary zinc intake and 0.0008mmol/L in fasting glucose levels per 1 mg/day higher total zinc intake. At thesame power and critical a, our study was large enough to detect a minimalinteraction effect of 0.0031 mmol/L between dietary zinc intake (per 1 mg/day)and SNPs (per effect allele) on fasting blood glucose levels. Our study had80% power to detect a minimal interaction effect of 0.0012 mmol/L be-tween total zinc intake (per 1 mg/day) and SNPs (per effect allele) on fastingglucose levels.
We conducted an inverse variance-weighted, fixed–effect, meta-analyseson summary statistics provided by each cohort (METAL software, www.sph.umich.edu/csg/abecasis/metal/, for SNPs and zinc intake-interaction effects;SPSS 18.0, SPSS, Chicago, IL, for zinc-intake effects). Heterogeneity wasestimated by Cochran’s Q statistic and quantified by the I2 statistic (26).Statistical significance was defined as a P value #0.0025 (0.05 per 20 tests),after Bonferroni correction for multiple testing.
ZINC INTAKE–SNP INTERACTIONS ON GLUCOSE LEVELS
2408 DIABETES, VOL. 60, SEPTEMBER 2011 diabetes.diabetesjournals.org
RESULTS
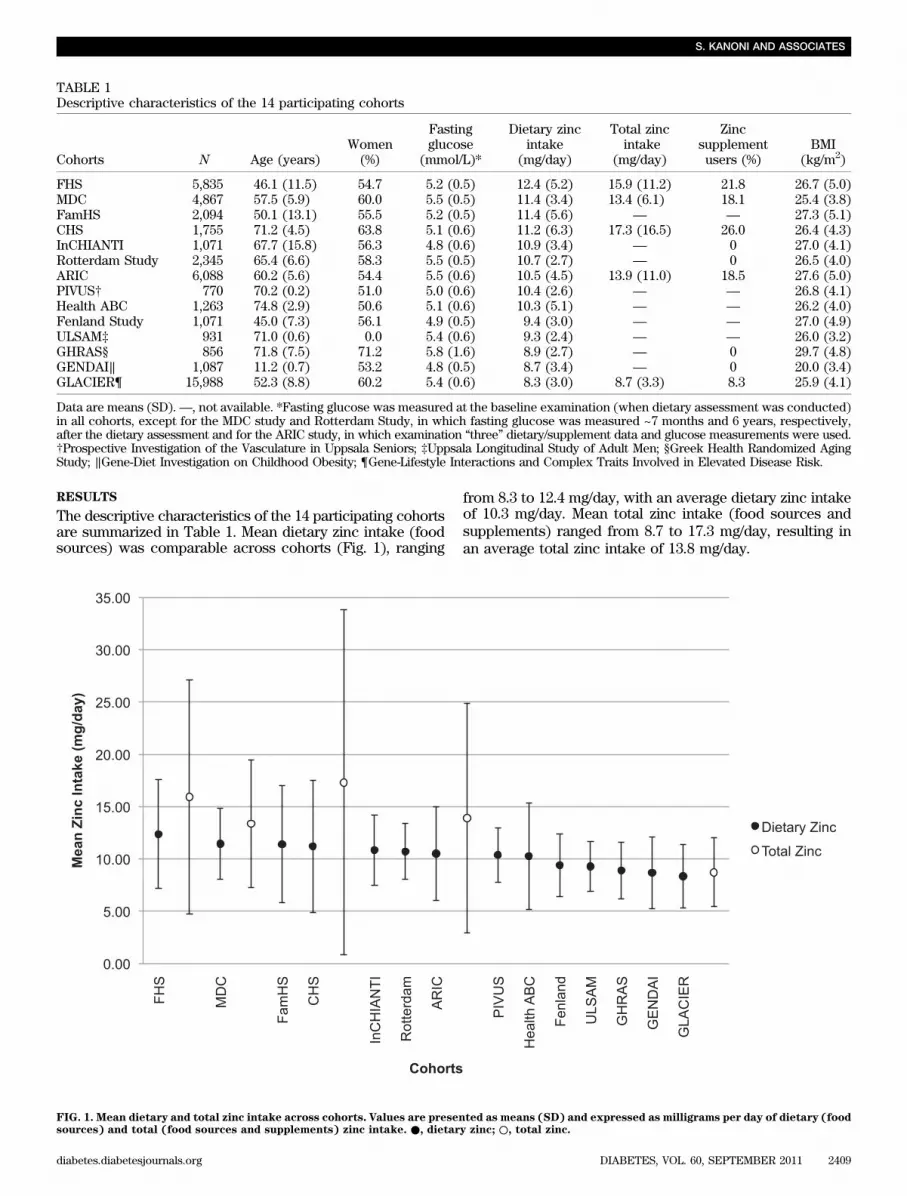
The descriptive characteristics of the 14 participating cohortsare summarized in Table 1. Mean dietary zinc intake (foodsources) was comparable across cohorts (Fig. 1), ranging
from 8.3 to 12.4 mg/day, with an average dietary zinc intakeof 10.3 mg/day. Mean total zinc intake (food sources andsupplements) ranged from 8.7 to 17.3 mg/day, resulting inan average total zinc intake of 13.8 mg/day.
TABLE 1Descriptive characteristics of the 14 participating cohorts
Cohorts N Age (years)Women(%)
Fastingglucose
(mmol/L)*
Dietary zincintake
(mg/day)
Total zincintake
(mg/day)
Zincsupplementusers (%)
BMI(kg/m2)
FHS 5,835 46.1 (11.5) 54.7 5.2 (0.5) 12.4 (5.2) 15.9 (11.2) 21.8 26.7 (5.0)MDC 4,867 57.5 (5.9) 60.0 5.5 (0.5) 11.4 (3.4) 13.4 (6.1) 18.1 25.4 (3.8)FamHS 2,094 50.1 (13.1) 55.5 5.2 (0.5) 11.4 (5.6) — — 27.3 (5.1)CHS 1,755 71.2 (4.5) 63.8 5.1 (0.6) 11.2 (6.3) 17.3 (16.5) 26.0 26.4 (4.3)InCHIANTI 1,071 67.7 (15.8) 56.3 4.8 (0.6) 10.9 (3.4) — 0 27.0 (4.1)Rotterdam Study 2,345 65.4 (6.6) 58.3 5.5 (0.5) 10.7 (2.7) — 0 26.5 (4.0)ARIC 6,088 60.2 (5.6) 54.4 5.5 (0.6) 10.5 (4.5) 13.9 (11.0) 18.5 27.6 (5.0)PIVUS† 770 70.2 (0.2) 51.0 5.0 (0.6) 10.4 (2.6) — — 26.8 (4.1)Health ABC 1,263 74.8 (2.9) 50.6 5.1 (0.6) 10.3 (5.1) — — 26.2 (4.0)Fenland Study 1,071 45.0 (7.3) 56.1 4.9 (0.5) 9.4 (3.0) — — 27.0 (4.9)ULSAM‡ 931 71.0 (0.6) 0.0 5.4 (0.6) 9.3 (2.4) — — 26.0 (3.2)GHRAS§ 856 71.8 (7.5) 71.2 5.8 (1.6) 8.9 (2.7) — 0 29.7 (4.8)GENDAI‖ 1,087 11.2 (0.7) 53.2 4.8 (0.5) 8.7 (3.4) — 0 20.0 (3.4)GLACIER¶ 15,988 52.3 (8.8) 60.2 5.4 (0.6) 8.3 (3.0) 8.7 (3.3) 8.3 25.9 (4.1)
Data are means (SD).—, not available. *Fasting glucose was measured at the baseline examination (when dietary assessment was conducted)in all cohorts, except for the MDC study and Rotterdam Study, in which fasting glucose was measured ~7 months and 6 years, respectively,after the dietary assessment and for the ARIC study, in which examination “three” dietary/supplement data and glucose measurements were used.†Prospective Investigation of the Vasculature in Uppsala Seniors; ‡Uppsala Longitudinal Study of Adult Men; §Greek Health Randomized AgingStudy; ‖Gene-Diet Investigation on Childhood Obesity; ¶Gene-Lifestyle Interactions and Complex Traits Involved in Elevated Disease Risk.
FIG. 1. Mean dietary and total zinc intake across cohorts. Values are presented as means (SD) and expressed as milligrams per day of dietary (foodsources) and total (food sources and supplements) zinc intake. ●, dietary zinc; ○, total zinc.
S. KANONI AND ASSOCIATES
diabetes.diabetesjournals.org DIABETES, VOL. 60, SEPTEMBER 2011 2409

FIG. 2. Forest plots of the effect associations of zinc intake with fasting glucose. A: The effect association of total zinc (food sources and sup-plements) intake (per 1 mg/day) (summary P value = 0.0003, n = 34,533). B: Effect association of dietary zinc (food sources) intake (per 1 mg/day)(summary P value = 0.52, N = 46,021). Fasting blood glucose is expressed in micromoles per liter, and all associations are adjusted for age and sex,field center (in the CHS, the InCHIANTI study, the ARIC study, and the Health ABC study), and family structure by principal components (in theFHS and the FamHS).
ZINC INTAKE–SNP INTERACTIONS ON GLUCOSE LEVELS
2410 DIABETES, VOL. 60, SEPTEMBER 2011 diabetes.diabetesjournals.org

TABLE
2Total
zincintake
andthe
geneticvariants
meta-analyzed
interactionson
fastingglucose
levels*
SNP
Chrom
osome
Nearest
geneEffect/otherallele
Effect
allelefrequency
nCohorts
Interaction(total
zinc3
SNPs)
[b(SE
)]Interaction
PI2(%
)(95%
CI)
Qtest
P
Glucose-relatedrs340874
1PROX1
C/T
0.5234,037
520.0012
(0.0005)0.03
0(0–79)
0.99rs780094
2GCKR
C/T
0.5834,307
50.0004
(0.0005)0.35
0(0–79)
0.97rs560887
2G6P
C2
C/T
0.7134,061
533
1025(0.0005)
0.950(0–79)
0.84rs11708067
3ADCY5
A/G
0.7634,111
520.0011
(0.0006)0.05
25(0–70)
0.25rs11920090
3SL
C2A
2T/A
0.8334,033
50.0003
(0.0007)0.70
42(0–79)
0.14rs2191349
7DGKB/TMEM195
T/G
0.5434,108
520.0002
(0.0005)0.71
0(0–79)
0.47rs4607517
7GCK
A/G
0.2134,333
520.0003
(0.0006)0.58
34(0–75)
0.19rs11558471
8SL
C30A
8A/G
0.7034,150
520.0017
(0.0006)0.005
0(0–79)
0.78rs7034200
9GLIS3
A/C
0.4933,874
523
1025(0.0005)
0.970(0–79)
0.76rs10885122
10ADRA2A
G/T
0.8533,933
50.0002
(0.0008)0.75
25(0–70)
0.25rs4506565
10TCF7L
2T/A
0.3218,235
40.0002
(0.0005)0.71
57(0–86)
0.07rs11605924
11CRY2
A/C
0.4734,137
50.0007
(0.0005)0.16
30(0–73)
0.22rs7944584
11MADD
A/T
0.6933,921
520.0004
(0.0006)0.44
8(0–81)
0.36rs174550
11FADS1
T/C
0.6634,172
520.0005
(0.0005)0.33
0(0–79)
0.82rs10830963
11MTNR1B
G/C
0.2834,009
50.0001
(0.0006)0.91
48(0–81)
0.11rs11071657
15C2C
D4B
A/G
0.6133,962
50.0003
(0.0005)0.55
9(0–81)
0.36Insulin-relatedrs4675095
2IR
S1T/A
0.0618,241
40.0003
(0.0008)0.74
0(0–85)
0.76rs35767
12IG
F1
G/A
0.8133,888
40.0001
(0.0007)0.92
0(0–79)
0.82Zinc-relatedrs10493846
1SE
C63D
1G/T
0.7418,158
420.0005
(0.0006)0.37
0(0–79)
0.61rs11167682
5SA
P30
LG/T
0.7618,249
50.0001
(0.0006)0.91
0(0–85)
0.91
I2,H
igginsheterogeneity
index;Qtest,C
ochranheterogeneity
test.*Estim
atesfor
theinteraction
between
totalzinc
intake(per
1mg/day
fromfood
sourcesand
supplements)
andSN
Ps
(pereffectallele)
onfasting
glucoselevels
(millim
olesper
liter),adjustedfor
ageand
sex,field
center(in
theCHSand
theARIC
study),andfam
ilystructure
byprincipalcom
ponents(in
theFHS).
Boldface
valuesrepresent
Pvalues
significantat
theconventional
levelof
0.05.
S. KANONI AND ASSOCIATES
diabetes.diabetesjournals.org DIABETES, VOL. 60, SEPTEMBER 2011 2411

Association of zinc intake and genetic variants withfasting glucose levels. We observed a significant associa-tion of total zinc intake with lower fasting glucose levels(summary P value = 0.0003), with an estimated 0.0012 mmol/Llower fasting glucose concentration per 1 mg greater dailytotal zinc intake (Fig. 2A). When we additionally adjustedfor BMI levels, the magnitude of the association was slightlyattenuated (b-coefficient 6 SE: 20.0009 6 0.0003 mmol/Lfasting glucose per 1 mg/day greater total zinc intake, sum-mary P value = 0.0037). In contrast, we did not observe asignificant association of dietary zinc intake with fasting glu-cose levels (Fig. 2B); however, we observed that the mag-nitude and direction of cohort-specific associations variednotably. After additional adjustments for BMI levels, theassociation between dietary zinc intake and fasting glu-cose levels remained nonsignificant (b-coefficient 6 SE:20.0005 6 0.0006, summary P value = 0.43).
In the meta-analysis, 16 of 20 SNPs were significantly as-sociated with fasting glucose levels (Supplementary Table 2).This was consistent with previous published data from theMAGIC (2) that included, as a subsample, roughly one-halfof all participants included in the current meta-analysis(Supplementary Table 1).Interaction of zinc intake and genetic variants onassociations with fasting glucose levels.We investigatedthe interactions between the genetic variants and totalzinc intake (available in five cohorts; Supplementary Ta-ble 3), and the strongest interaction we observed was forrs11558471 in SLC30A8 (b-coefficient 6 SE per A alleleof 1 mg/day greater total zinc intake: 20.0017 6 0.0006;summary interaction P value = 0.005) (Table 2 and Fig. 3).This interaction coefficient indicates that the glucose-raising effect of the risk allele (A) of rs11558471 dimin-ishes as total zinc intake increases (per 1 mg/day), withthe strongest inverse association between glucose andtotal zinc intake seen in individuals carrying both copies
of the risk allele. When we applied additional adjustmentfor BMI, the interaction between rs11558471 and totalzinc intake with fasting glucose was slightly attenuated(b-coefficient6 SE:20.00146 0.0006; summary interactionP value = 0.01).
Because the interaction effects reported above may beinfluenced by the total amount and source of zinc (i.e., di-etary or supplemental), we proceeded by stratifying theinteraction analyses by zinc supplement use (i.e., zinc sup-plement users and nonusers) (Fig. 4). As hypothesized, themagnitude of the interaction between total zinc intake andSLC30A8 variant was weaker among zinc-supplementnonusers (b-coefficient 6 SE: 20.0006 6 0.0014; summaryP value = 0.65) compared with zinc-supplement users(b-coefficient 6 SE: 20.0024 6 0.0009; summary P value =0.008).
Few of the additional tests of gene-times-zinc interac-tions yielded noteworthy results (Tables 2 and 3). Of these,the most statistically significant tests of interaction wereobserved for the rs340874 PROX1 (for total zinc intake)(Table 2), rs2191349 DGKB/TMEM195, and rs174550 FADS1variants (for dietary zinc intake) (Table 3 and Supplemen-tary Fig. 2; cohort-specific estimates shown in Supplemen-tary Table 4), although none of these P values withstoodcorrection for multiple testing.
DISCUSSION
Given the important role of zinc in b-cell function and in-sulin homeostasis (12), we hypothesized that zinc intakemight modify the effects of previously discovered glucose-raising genetic loci (2), many of which are thought toinfluence b-cell function. To test this hypothesis, we con-ducted a large-scale meta-analysis of up to 14 cohorts inwhich we assessed the interaction between zinc intake andglucose-associated genetic variants on fasting glucoselevels among individuals without T2D.
FIG. 3. Forest plot of the interaction between SLC30A8 rs11558471 and total zinc intake on fasting glucose. The rs11558471 effect is expressedper A allele, total zinc (food sources and supplements) intake per 1 mg/day, and fasting blood glucose in micromoles per liter. Associations areadjusted for age and sex, field center (in the CHS and the ARIC study), and family structure by principal components (in the FHS) (summaryP value = 0.0051, N = 34,150).
ZINC INTAKE–SNP INTERACTIONS ON GLUCOSE LEVELS
2412 DIABETES, VOL. 60, SEPTEMBER 2011 diabetes.diabetesjournals.org

The strongest interaction effect was detected for theSLC30A8 rs11558471 variant and total zinc intake (foodsources and supplements) on fasting glucose levels. Weestimated that, for individuals with the A/G genotype (i.e.,one glucose-raising allele), an average daily total zinc intakeof 14 mg (observed in our study) is associated with a 0.024mmol/L lower glucose concentration than seen in individ-uals with the G/G genotype (i.e., two non–glucose-raisingalleles). Concordantly, in individuals with both copies of therisk allele (i.e., A/A genotype), the magnitude of this asso-ciation was doubled (i.e., 0.048 mmol/L). An average dailytotal zinc intake of 14 mg could be achieved by a nutrientsupplement (~10 mg zinc) plus an average serving of redmeat or fish/seafood (~3 ounces) or three average servingsof dairy products (~2 cups of milk per yogurt and 3 ouncesof cheese). Further investigation of this interaction effectshowed that it was more evident among zinc supplementusers than among nonusers. We also observed a significantassociation of total zinc intake, but not dietary zinc intakealone, with lower fasting glucose levels. None of the otherinvestigated interactions between zinc intake (dietaryor total) and variants were statistically significant aftermultiple-testing adjustment.
Current findings in the context of gene-environmentinteraction investigations. The SLC30A8 gene encodesthe newly characterized ZnT8 zinc transporter (27). Zinchomeostasis depends on two families of transporters: theZIP (SLC39) family regulating cellular zinc influx and theZnT (SLC30) family regulating efflux (28). It has beenshown that the ZnT8 transporter is primarily expressed inb-cells and colocalizes with insulin-containing secretorygranules (29). Alterations in ZnT8 expression stronglymodulate insulin secretion (29,30). Moreover, it has re-cently been shown that ZnT8 b-cell–specific knockout(Znt8KO) mice are glucose intolerant have reduced b-cellzinc accumulation, have atypical insulin granules, havereduced first-phase glucose-stimulated insulin secretion,have reduced insulin-processing enzyme transcripts, andhave increased proinsulin levels (14). Furthermore, a ge-netic variant (rs13266634) in SLC30A8 has been reliablyassociated with fasting glucose levels and T2D risk inseveral GWAS (31–34). Of interest, observations suggestthat this variant impairs islet ZnT8 expression, insulinsecretion, or glucose homeostasis (35–37). In addition, thisvariant is associated with the production of a less activezinc transporter protein, suggesting less efficiency of zinc
FIG. 4. Forest plots of the SLC30A8 rs11558471 interaction with zinc intake on glucose, by zinc supplement use. The rs11558471 effect isexpressed per A allele, zinc intake per 1 mg/day, and fasting blood glucose in micromoles per liter. Associations are adjusted for age and sex, fieldcenter (in the CHS and the ARIC study), and family structure by principal components (in the FHS) (summary P value = 0.0077, N = 4,986 for zincsupplement users and summary P value = 0.65, n = 29,164 for zinc supplement nonusers).
S. KANONI AND ASSOCIATES
diabetes.diabetesjournals.org DIABETES, VOL. 60, SEPTEMBER 2011 2413

TABLE
3Dietary
zinc
intake
andthege
neticva
rian
tsmeta-an
alyzed
interactions
onfastinggluc
oseleve
ls*
SNP
Chrom
osom
eNea
rest
gene
Effec
t/othe
rallele
Effec
tallele
freq
uenc
yn
Coh
orts
Interaction
(total
zinc
3SN
Ps)
[b(SE)]
InteractionP
I2(%
)(95%
CI)
Qtest
P
Gluco
se-related
rs34
0874
1PROX1
C/T
0.52
45,525
1420.00
07(0.000
9)0.42
0(0–55
)0.93
rs78
0094
2GCKR
C/T
0.60
45,795
1420.00
06(0.000
9)0.52
19(0–56
)0.25
rs56
0887
2G6P
C2
C/T
0.70
45,549
140.00
01(0.001
)0.90
0(0–55
)0.79
rs11
7080
673
ADCY5
A/G
0.70
45,599
1420.00
05(0.001
1)0.65
0(0–55
)0.45
rs11
9200
903
SLC2A
2T/A
0.76
45,521
1420.00
04(0.001
3)0.78
30(0–63
)0.13
rs21
9134
97
DGKB/TMEM19
5T/G
0.54
45,596
1420.00
21(0.000
8)0.01
17(0–55
)0.27
rs46
0751
77
GCK
A/G
0.25
45,821
140.00
05(0.001
1)0.68
23(0–59
)0.21
rs11
5584
718
SLC30
A8
A/G
0.70
41,994
1020.00
09(0.001
1)0.39
0(0–62
)0.58
rs70
3420
09
GLIS3
A/C
0.48
45,362
140.00
03(0.000
9)0.68
0(0–55
)0.59
rs10
8851
2210
ADRA2A
G/T
0.81
45,421
1420.00
16(0.001
2)0.17
14(0–52
)0.31
rs45
0656
510
TCF7L
2T/A
0.32
27,010
1020.00
04(0.001
0)0.68
0(0–62
)0.73
rs11
6059
2411
CRY2
A/C
0.47
45,625
140.00
02(0.000
9)0.78
49(6–73
)0.01
9rs79
4458
411
MADD
A/T
0.65
45,409
140.00
08(0.001
0)0.44
24(0–60
)0.20
rs17
4550
11FADS1
T/C
0.63
45,660
1420.00
19(0.000
9)0.04
26(0–61
)0.18
rs10
8309
6311
MTNR1B
G/C
0.28
45,497
140.00
08(0.001
0)0.47
34(0–65
)0.10
rs11
0716
5715
C2C
D4B
A/G
0.59
45,450
1420.00
02(0.000
9)0.86
0(0–55
)0.83
Insulin
-related
rs46
7509
52
IRS1
T/A
0.07
29,729
1320.00
06(0.001
9)0.76
42(0–70
)0.06
rs35
767
12IG
F1
G/A
0.74
45,376
1420.00
03(0.001
3)0.83
0(0–55
)0.47
Zinc
-related
rs10
4938
461
SEC63
D1
G/T
0.74
29,646
1320.00
08(0.001
1)0.49
21(0–59
)0.23
rs11
1676
825
SAP30
LG/T
076
29,737
1320.00
03(0.001
1)0.81
0(0–57
)0.50
I2,H
iggins
heteroge
neityinde
x;Qtest,C
ochran
heteroge
neitytest.*Estim
ates
fortheinteractionbe
twee
ndietaryzinc
intake
(per
1mg/da
yfrom
food
source
s)an
dSN
Ps(per
effect
allele)
onfastinggluc
oseleve
ls(m
illim
oles
perliter),ad
justed
forag
ean
dsex,
fieldce
nter
(intheCHS,
theInCHIANTIstud
y,theARIC
stud
y,an
dtheHea
lthABCstud
y),a
ndfamily
structureby
principa
lco
mpo
nents(intheFHSan
dtheFam
HS).Boldfac
eva
lues
represen
tPva
lues
sign
ifica
ntat
theco
nven
tion
alleve
lof
0.05
.
ZINC INTAKE–SNP INTERACTIONS ON GLUCOSE LEVELS
2414 DIABETES, VOL. 60, SEPTEMBER 2011 diabetes.diabetesjournals.org

accumulation and insulin crystallization (38). It recently hasbeen demonstrated that the same variant does not affectinsulin secretion from human islets as well as islet expres-sions of SLC30A8 (39). It is noteworthy that rs13266634 isin strong linkage disequilibrium with rs11558471 (r2 = 0.96),included in the current study. Additional studies on thesetopics are important to provide evidence that variation atSLC30A8 influences the regulation of zinc transporter ac-tivity or the modulation of islet zinc content; this wouldsupport the biological plausibility of the statistical inter-action we report here.Current findings in the context of dietary epidemio-logical investigations. Our meta-analysis revealed a sig-nificant inverse association between total zinc intake andfasting glucose levels. Of interest, we did not observe thisassociation when only zinc derived from food sourceswas considered. This observation may be attributableto a number of factors, including differences in the bio-availability of dietary zinc compared with zinc supple-ments (40), a threshold effect of zinc intake on fastingglucose levels, or because when dietary and supple-mental zinc are combined the wider trait varianceaffords greater statistical power to detect associationsand interactions. The latter also is based on the powercalculations we performed (RESEARCH DESIGN AND METHODS).Moreover, the different dietary assessment tools used toassess dietary zinc intake across the participating cohortsmay have varied in precision to a greater extent thanwhen used to assess supplemental zinc intake. However,potential confounding lifestyle characteristics associatedwith supplement use were not considered in the currentstudy.
Our findings are in line with results from a large 24-year prospective study among women, demonstratinga significant association between total zinc intake andlower risk of T2D (17). In the same study, but in contrastto our results, dietary zinc intake also was associatedwith a lower risk of T2D after multiple adjustments fordietary and nondietary factors (17). In a cross-sectionalstudy of an Asian-Indian population (16), dietary zincintake was associated with a lower prevalence of T2Dand the metabolic syndrome. However, another study ofChinese adults did not observe a relationship betweendietary zinc intake and risk of hyperglycemia (15).However, it is worth mentioning that in the current studywe focused on fasting glucose levels in subjects withoutT2D, as opposed to the prevalence of T2D in the refer-enced studies.Strengths and limitations. The strengths of the currentwork include the large samples, the availability of stan-dardized exposure and outcome data, and the use of auniform analytical plan prior to meta-analysis. The advan-tages of meta-analyses like ours over individual studies orliterature-based meta-analysis include improved power todetect interaction effects and the minimization of recall biasand publication bias (41,42).
We selected the majority of the genetic variants includedin our meta-analysis on the basis of the results of GWASfor genetic main effects on insulin or glucose traits (2).This approach is convenient, and one can be confident thatthe genetic variants are reliably associated with the traitsof interest, which is rarely the case with conventional bi-ologic candidate-gene studies. Nevertheless, it may be thatthe variants that reach genome-wide significance in main-effect GWAS are less likely to interact with environmentalfactors because such interactions tend to weaken the
statistical significance of the main effects (43). Althoughthe effect estimates observed here are indeed small inmagnitude, it is important to bear in mind that these effectsare likely to be underestimated, given that the observedgenetic loci may not be causal and because the methods ofdetermining usual zinc intake are imprecise. Our approachdoes not preclude that other genetic variants not previouslyknown to be associated with glycemic traits might interactwith zinc intake.
As with all epidemiological studies assessing dietaryintake, systematic measurement error in the diet exposurecould have biased our results. However, there currentlyis no satisfactory biomarker for the assessment of di-etary zinc intake, and even though plasma zinc concen-tration seems to be a reliable marker of zinc status, ithas limited sensitivity in the normal range of zinc intake(44,45). The issues of dietary assessment validity versuscost-effectiveness in population-based studies have beenwidely discussed elsewhere (46,47), but it is unlikely thata glucose-associated genotype is associated with a ten-dency to misreport dietary intake. Furthermore, we didnot assess interactions of zinc with other nutrients; suchinteractions might influence the bioavailability of zinc(40). Systematic measurement error in the estimation ofdietary exposures in gene-environment interaction studiescould bias the estimation of the dietary main effect andlead to underestimates of the interaction between dietaryfactors and genetic variants, potentially raising type II errorrates (48).
We conducted a large-scale, gene-diet interaction meta-analysis in which we investigated the association betweenzinc intake (dietary and total) and fasting glucose levelsand the interactions between zinc intake and glucose-,insulin-, and zinc-related genetic variants on fasting glucoselevels. We showed that total zinc intake (food sources andsupplements), but not zinc from foods alone, is associatedwith lower fasting glucose levels in individuals without T2D.Our findings suggest that total zinc intake has a strongerinverse association with fasting glucose levels in indi-viduals carrying the glucose-raising A allele of rs11558471SLC30A8 (a b-cell zinc transporter), compared with indi-viduals carrying the G allele. The current study indicatesthat gene-environment interaction analyses can help elu-cidate our understanding of the biological pathways in-volved in micronutrient influences on systemic glucosehomeostasis.
ACKNOWLEDGMENTS
No potential conflicts of interest relevant to this articlewere reported.
S.K., J.A.N., M.-F.H., Z.Y., F.J.A.v.R., J.B.M., P.W.F., andG.V.D. drafted the manuscript. S.K., J.A.N., Z.Y., F.J.A.v.R.,D.S., E.S., J.S.N., M.K.W., R.N.L., S.G., J.S.A., T.T., G.H.,G.S., F.R., L.A.C., J.D., and P.W.F. performed the dataanalyses. S.K., M.-F.H., F.J.A.v.R., G.H., A.J.B., C.M.v.D.,J.C.F., C.S.F., D.K.H., F.B.H., P.F.J., I.J., L.L., Y.L., N.M.,J.O., A.-C.S., A.G.U., M.Y., I.P., S.B., L.F., E.I., and P.W.F.performed the experiments. C.M.D., A.H., A.G.U., N.J.W.,S.B., N.G.F., L.A.C., R.J.L., G.H., J.D., C.L., L.F., S.B.K., M.I.M.,E.I., I.B.B., J.C.M.W., M.O.-M., D.S.S., J.B.M., P.W.F., andG.V.D. contributed the reagents, materials, and analysistools. E.S., M.K.W., R.N.L., S.G., C.M.D., J.C.F., A.H., R.C.H.,D.K.H., F.B.H., P.F.J., L.L., N.M., J.S.P., E.J.G.S., A.G.U.,M.C.Z., L.A.C., J.D., C.L., E.I., J.C.M.W., M.O.-M., and D.S.S.reviewed and edited the manuscript.
S. KANONI AND ASSOCIATES
diabetes.diabetesjournals.org DIABETES, VOL. 60, SEPTEMBER 2011 2415

REFERENCES
1. McCarthy MI, Zeggini E. Genome-wide association studies in type 2 di-abetes. Curr Diab Rep 2009;9:164–171
2. Dupuis J, Langenberg C, Prokopenko I, et al.; DIAGRAM Consortium; GIANTConsortium; Global BPgen Consortium; Anders Hamsten on behalf of Pro-cardis Consortium; MAGIC Investigators. New genetic loci implicated infasting glucose homeostasis and their impact on type 2 diabetes risk. NatGenet 2010;42:105–116
3. Staiger H, Machicao F, Fritsche A, Häring HU. Pathomechanisms of type 2diabetes genes. Endocr Rev 2009;30:557–585
4. Wolfs MG, Hofker MH, Wijmenga C, van Haeften TW. Type 2 diabetesmellitus: new genetic insights will lead to new therapeutics. Curr Genomics2009;10:110–118
5. Bantle JP, Wylie-Rosett J, Albright AL, et al.; American Diabetes Associa-tion. Nutrition recommendations and interventions for diabetes: a positionstatement of the American Diabetes Association. Diabetes Care 2008;31(Suppl. 1):S61–S78
6. Prasad AS. Zinc: an overview. Nutrition 1995;11(Suppl.):93–997. Berg JM, Shi Y. The galvanization of biology: a growing appreciation for
the roles of zinc. Science 1996;271:1081–10858. Mocchegiani E, Malavolta M. Zinc-gene interaction related to inflammatory/
immune response in ageing. Genes Nutr 2008;3:61–759. Vallee BL, Falchuk KH. The biochemical basis of zinc physiology. Physiol
Rev 1993;73:79–11810. Scott DA. Crystalline insulin. Biochem J 1934;28:1591–160211. Rungby J. Zinc, zinc transporters and diabetes. Diabetologia 2010;53:1549–
155112. Wijesekara N, Chimienti F, Wheeler MB. Zinc, a regulator of islet function
and glucose homeostasis. Diabetes Obes Metab 2009;11(Suppl. 4):202–21413. Jansen J, Karges W, Rink L. Zinc and diabetes: clinical links and molecular
mechanisms. J Nutr Biochem 2009;20:399–41714. Wijesekara N, Dai FF, Hardy AB, et al. Beta cell-specific Znt8 deletion in
mice causes marked defects in insulin processing, crystallisation and se-cretion. Diabetologia 2010;53:1656–1668
15. Shi Z, Yuan B, Qi L, Dai Y, Zuo H, Zhou M. Zinc intake and the risk ofhyperglycemia among Chinese adults: the prospective Jiangsu NutritionStudy (JIN). J Nutr Health Aging 2010;14:332–335
16. Singh RB, Niaz MA, Rastogi SS, Bajaj S, Gaoli Z, Shoumin Z. Current zincintake and risk of diabetes and coronary artery disease and factors as-sociated with insulin resistance in rural and urban populations of NorthIndia. J Am Coll Nutr 1998;17:564–570
17. Sun Q, van Dam RM, Willett WC, Hu FB. Prospective study of zinc intakeand risk of type 2 diabetes in women. Diabetes Care 2009;32:629–634
18. Haase H, Overbeck S, Rink L. Zinc supplementation for the treatment orprevention of disease: current status and future perspectives. Exp Ger-ontol 2008;43:394–408
19. Nettleton JA, McKeown NM, Kanoni S, et al. Interactions of dietary whole-grain intake with fasting glucose- and insulin-related genetic loci in in-dividuals of European descent: a meta-analysis of 14 cohort studies.Diabetes Care 2010;33:2684–2691
20. Kanoni S, Dedoussis GV, Herbein G, et al. Assessment of gene-nutrientinteractions on inflammatory status of the elderly with the use of a zincdiet score: ZINCAGE study. J Nutr Biochem 2010;21:526–531
21. Mariani E, Neri S, Cattini L, et al. Effect of zinc supplementation on plasmaIL-6 and MCP-1 production and NK cell function in healthy elderly: in-teractive influence of +647 MT1a and -174 IL-6 polymorphic alleles. ExpGerontol 2008;43:462–471
22. Mocchegiani E, Giacconi R, Costarelli L, et al. Zinc deficiency and IL-6-174G/C polymorphism in old people from different European countries:effect of zinc supplementation: ZINCAGE study. Exp Gerontol 2008;43:433–444
23. Psaty BM, O’Donnell CJ, Gudnason V, et al.; CHARGE Consortium. Co-horts for Heart and Aging Research in Genomic Epidemiology (CHARGE)Consortium: design of prospective meta-analyses of genome-wide associ-ation studies from 5 cohorts. Circ Cardiovasc Genet 2009;2:73–80
24. Tanaka K, Miyamoto N, Shouguchi-Miyata J, Ikeda JE. HFM1, the humanhomologue of yeast Mer3, encodes a putative DNA helicase expressedspecifically in germ-line cells. DNA Seq 2006;17:242–246
25. Viiri KM, Jänis J, Siggers T, et al. DNA-binding and -bending activities ofSAP30L and SAP30 are mediated by a zinc-dependent module and mono-phosphoinositides. Mol Cell Biol 2009;29:342–356
26. Higgins JP, Thompson SG. Quantifying heterogeneity in a meta-analysis.Stat Med 2002;21:1539–1558
27. Chimienti F, Devergnas S, Favier A, Seve M. Identification and cloning ofa b-cell–specific zinc transporter, ZnT-8, localized into insulin secretorygranules. Diabetes 2004;53:2330–2337
28. Cousins RJ, Liuzzi JP, Lichten LA. Mammalian zinc transport, trafficking,and signals. J Biol Chem 2006;281:24085–24089
29. Chimienti F, Devergnas S, Pattou F, et al. In vivo expression and functionalcharacterization of the zinc transporter ZnT8 in glucose-induced insulinsecretion. J Cell Sci 2006;119:4199–4206
30. Fu Y, Tian W, Pratt EB, et al. Down-regulation of ZnT8 expression in INS-1rat pancreatic beta cells reduces insulin content and glucose-inducibleinsulin secretion. PLoS ONE 2009;4:e5679
31. Saxena R, Voight BF, Lyssenko V, et al.; Diabetes Genetics Initiative ofBroad Institute of Harvard and MIT, Lund University, and Novartis In-stitutes of BioMedical Research. Genome-wide association analysis iden-tifies loci for type 2 diabetes and triglyceride levels. Science 2007;316:1331–1336
32. Scott LJ, Mohlke KL, Bonnycastle LL, et al. A genome-wide associationstudy of type 2 diabetes in Finns detects multiple susceptibility variants.Science 2007;316:1341–1345
33. Sladek R, Rocheleau G, Rung J, et al. A genome-wide association studyidentifies novel risk loci for type 2 diabetes. Nature 2007;445:881–885
34. Zeggini E, Weedon MN, Lindgren CM, et al.; Wellcome Trust Case ControlConsortium (WTCCC). Replication of genome-wide association signals inUK samples reveals risk loci for type 2 diabetes. Science 2007;316:1336–1341
35. Kirchhoff K, Machicao F, Haupt A, et al. Polymorphisms in the TCF7L2,CDKAL1 and SLC30A8 genes are associated with impaired proinsulinconversion. Diabetologia 2008;51:597–601
36. Palmer ND, Goodarzi MO, Langefeld CD, et al. Quantitative trait analysisof type 2 diabetes susceptibility loci identified from whole genome asso-ciation studies in the Insulin Resistance Atherosclerosis Family Study.Diabetes 2008;57:1093–1100
37. Staiger H, Machicao F, Stefan N, et al. Polymorphisms within novel riskloci for type 2 diabetes determine beta-cell function. PLoS ONE 2007;2:e832
38. Nicolson TJ, Bellomo EA, Wijesekara N, et al. Insulin storage and glucosehomeostasis in mice null for the granule zinc transporter ZnT8 and studiesof the type 2 diabetes–associated variants. Diabetes 2009;58:2070–2083
39. Cauchi S, Del Guerra S, Choquet H, et al. Meta-analysis and functionaleffects of the SLC30A8 rs13266634 polymorphism on isolated human pan-creatic islets. Mol Genet Metab 2010;100:77–82
40. Hambidge KM, Miller LV, Westcott JE, Sheng X, Krebs NF. Zinc bio-availability and homeostasis. Am J Clin Nutr 2010;91:1478S–1483S
41. Hunter DJ. Gene-environment interactions in human diseases. Nat RevGenet 2005;6:287–298
42. Palla L, Higgins JP, Wareham NJ, Sharp SJ. Challenges in the use ofliterature-based meta-analysis to examine gene-environment interactions.Am J Epidemiol 2010;171:1225–1232
43. Murcray CE, Lewinger JP, Gauderman WJ. Gene-environment interactionin genome-wide association studies. Am J Epidemiol 2009;169:219–226
44. Gibson RS, Hess SY, Hotz C, Brown KH. Indicators of zinc status at thepopulation level: a review of the evidence. Br J Nutr 2008;99(Suppl. 3):S14–S23
45. Lowe NM, Fekete K, Decsi T. Methods of assessment of zinc status inhumans: a systematic review. Am J Clin Nutr 2009;89:2040S–2051S
46. Tucker KL. Assessment of usual dietary intake in population studies ofgene-diet interaction. Nutr Metab Cardiovasc Dis 2007;17:74–81
47. Serra-Majem L, Pfrimer K, Doreste-Alonso J, et al. Dietary assessmentmethods for intakes of iron, calcium, selenium, zinc and iodine. Br J Nutr2009;102(Suppl. 1):S38–S55
48. Greenwood DC, Gilthorpe MS, Cade JE. The impact of imprecisely mea-sured covariates on estimating gene-environment interactions. BMC MedRes Methodol 2006;6:21
ZINC INTAKE–SNP INTERACTIONS ON GLUCOSE LEVELS
2416 DIABETES, VOL. 60, SEPTEMBER 2011 diabetes.diabetesjournals.org