Embed Size (px)
Citation preview

The Astrophysical Journal, 736:82 (30pp), 2011 August 1 doi:10.1088/0004-637X/736/2/82C© 2011. The American Astronomical Society. All rights reserved. Printed in the U.S.A.
TORUS AND ACTIVE GALACTIC NUCLEUS PROPERTIES OF NEARBY SEYFERT GALAXIES: RESULTSFROM FITTING INFRARED SPECTRAL ENERGY DISTRIBUTIONS AND SPECTROSCOPY
Almudena Alonso-Herrero1,2,13
, Cristina Ramos Almeida3, Rachel Mason
4, Andres Asensio Ramos
5,6,
Patrick F. Roche7, Nancy A. Levenson
8, Moshe Elitzur
9, Christopher Packham
10, Jose Miguel Rodrıguez Espinosa
5,6,
Stuart Young11
, Tanio Dıaz-Santos12
, and Ana M. Perez-Garcıa5,6
1 Departamento de Astrofısica, Centro de Astrobiologıa, INTA-CSIC, Carretera de Torrejon a Ajalvir km 4, Torrejon de Ardoz,E-28850 Madrid, Spain; [email protected]
2 Steward Observatory, University of Arizona, Tucson, AZ 85721, USA3 Department of Physics & Astronomy, University of Sheffield, Sheffield S3 7RH, UK
4 Gemini Observatory, Northern Operations Center, 670 North A’ohoku Place, Hilo, HI 96720, USA5 Instituto de Astrofısica de Canarias, E-38205 La Laguna, Tenerife, Spain
6 Departamento de Astrofısica, Universidad de La Laguna, E-38205 La Laguna, Tenerife, Spain7 Astrophysics, Department of Physics, University of Oxford, DWB, Keble Road, Oxford OX1 3RH, UK
8 Gemini Observatory, Casilla 603, La Serena, Chile9 Department of Physics and Astronomy, University of Kentucky, Lexington, KY 40506-0055, USA
10 Astronomy Department, University of Florida, 211 Bryant Space Science Center, P.O. Box 112055, Gainesville, FL 32611-2055, USA11 Department of Physics, Rochester Institute of Technology, 84 Lomb Memorial Drive, Rochester, NY 14623, USA
12 Department of Physics, University of Crete, GR-71003 Heraklion, GreeceReceived 2010 December 22; accepted 2011 May 3; published 2011 July 11
ABSTRACT
We used the CLUMPY torus models and a Bayesian approach to fit the infrared spectral energy distributions andground-based high angular resolution mid-infrared spectroscopy of 13 nearby Seyfert galaxies. This allowed us toput tight constraints on torus model parameters such as the viewing angle i, the radial thickness of the torus Y, theangular size of the cloud distribution σtorus, and the average number of clouds along radial equatorial rays N0. Wefound that the viewing angle i is not the only parameter controlling the classification of a galaxy into type 1 ortype 2. In principle, type 2s could be viewed at any viewing angle i as long as there is one cloud along the line ofsight. A more relevant quantity for clumpy media is the probability for an active galactic nucleus (AGN) photon toescape unabsorbed. In our sample, type 1s have relatively high escape probabilities, Pesc ∼ 12%–44%, while type2s, as expected, tend to have very low escape probabilities. Our fits also confirmed that the tori of Seyfert galaxiesare compact with torus model radii in the range 1–6 pc. The scaling of the models to the data also provided the AGNbolometric luminosities Lbol(AGN), which were found to be in good agreement with estimates from the literature.When we combined our sample of Seyfert galaxies with a sample of PG quasars from the literature to span a rangeof Lbol(AGN) ∼ 1043–1047 erg s−1, we found plausible evidence of the receding torus. That is, there is a tendencyfor the torus geometrical covering factor to be lower (f2 ∼ 0.1–0.3) at high AGN luminosities than at low AGNluminosities (f2 ∼ 0.9–1 at ∼1043–1044 erg s−1). This is because at low AGN luminosities the tori appear to havewider angular sizes (larger σtorus) and more clouds along radial equatorial rays. We cannot, however, rule out thepossibility that this is due to contamination by extended dust structures not associated with the dusty torus at lowAGN luminosities, since most of these in our sample are hosted in highly inclined galaxies.
Key words: galaxies: nuclei – galaxies: Seyfert – galaxies: structure – infrared: galaxies
Online-only material: color figures
1. INTRODUCTION
The unified model for active galactic nuclei (AGNs) proposesthe ubiquitous presence of an obscuring torus around theirnuclei, with type 1 and type 2 AGNs being intrinsically similar(Antonucci 1993). The central region of an AGN (includingthe broad emission line region, BLR) is obscured when viewedalong directions close to the equatorial plane of the torus, and itis then classified as a type 2 AGN. In type 1 AGNs the viewingangle is close to the polar direction of the torus, and thus wehave a direct view of the central engine. This model receivedstrong support from the fact that broad lines have been revealedin the spectra of the polarized emission of a number of type 2AGNs (e.g., Antonucci & Miller 1985; Tran et al. 1992).
There is also indirect evidence of the presence of the dustytorus advocated by the unified model. First is the similarity
13 Associate Astronomer.
of Seyfert 1s and Seyfert 2s with respect to a given isotropicindicator of the AGN luminosity such as [O iii]λ5007, infrared(IR), hard X-ray, and radio luminosities of Seyferts (see, e.g.,Mulchaey et al. 1994; Alonso-Herrero et al. 1997; Nagar et al.1999). The ultraviolet (UV) and soft X-ray continua of Seyfert2s, on the other hand, are underluminous relative to the type 1sbecause they are not transmitted through the torus. Second, thepresence of double-cone morphology of the narrow-line region(NLR) structures (e.g., Pogge 1989; Wilson & Tsvetanov 1994;Schmitt et al. 2003), with orientations similar to those of radiojets (Nagar et al. 1999 and references therein), are interpretedas emission collimated by the torus.
The role of the extinction produced by the host galaxy cannotbe understated (Alonso-Herrero et al. 2003). For instance, forsome Seyfert 2s broad lines are identified in the near-IR (e.g.,Blanco et al. 1990; Ruiz et al. 1994; Goodrich et al. 1994;Veilleux et al. 1997; Ramos Almeida et al. 2009a), and counter-cones are seen in direct and/or polarized near-IR light (e.g.,
1

The Astrophysical Journal, 736:82 (30pp), 2011 August 1 Alonso-Herrero et al.
Packham et al. 1997 for NGC 1068; Maiolino et al. 2000 forCircinus). Finally, there is the tendency of intermediate types(Seyferts 1.8+1.9) to be hosted in edge-on galaxies (Maiolino& Rieke 1995).
In recent years much progress has been made toward un-derstanding the properties of the molecular dusty torus. Fromthe theoretical point of view, torus models with smooth den-sity distributions (e.g., Pier & Krolik 1993; Granato & Danese1994; Efstathiou & Rowan-Robinson 1995) have been super-seded by more complex clumpy dust distributions (e.g., Nenkovaet al. 2002; Honig et al. 2006; Nenkova et al. 2008a, 2008b;Schartmann et al. 2008; Honig & Kishimoto 2010). The clumpymodels reproduce well the near-IR and mid-IR emission of dif-ferent types of AGNs (e.g., Mason et al. 2006, 2009; Nenkovaet al. 2008b; Schartmann et al. 2008; Polletta et al. 2008; Moret al. 2009; Thompson et al. 2009; Nikutta et al. 2009; RamosAlmeida et al. 2009b, 2011, hereafter RA09, RA11, respec-tively; Honig et al. 2010; P. Lira et al. 2011, in preparation), andovercome some of the difficulties faced by smooth torus modelsin fitting IR data of AGNs (see, e.g., Alonso-Herrero et al. 2001,2003).
From the observational point of view, mid-IR interferometricobservations have revealed that the torus is relatively compact,with typical sizes of a few parsecs, geometrically thick, andwith evidence of clumpiness (e.g., Jaffe et al. 2004; Tristramet al. 2007, 2009; Burtscher et al. 2009; Raban et al. 2009).Also, direct mid-IR imaging observations of Circinus gave atorus size of �4 pc (Packham et al. 2005). In terms of theirmolecular gas, the tori contain ∼107 M�, extend for tens ofparsecs (typically radii of 30 pc) and have gas column densities,as derived from near-IR molecular hydrogen lines, ranging from1 to 10 × 1023 cm−2 (Davies et al. 2006; Hicks et al. 2009).
This is the third paper in a series using high angular resolutionIR observations, the CLUMPY torus models of Nenkova et al.(2008a, 2008b), and a Bayesian approach for fitting the data(Asensio Ramos & Ramos Almeida 2009) to derive the torusand AGN properties. In the first two papers of the series(RA09 and RA11), we fitted the IR photometric spectralenergy distributions (SEDs) of a sample of nearby Seyfert 1and Seyfert 2 galaxies. We constrained several torus modelparameters, namely its angular width and the average number ofclouds along radial equatorial rays, as well as the viewing angleto the torus. We found, in clear contrast with the simplest unifiedmodel predictions, that type 2s appear to have tori with widercloud distributions (the torus angular width σtorus parameter;see Figure 1 and Section 3.1) and more clumps than thoseof type 1s. This may suggest that some of the properties ofthe tori of type 1 and type 2 AGNs are intrinsically different.For a sample of nearby active galaxies, Honig et al. (2010)constrained the number of clouds along equatorial rays and theirdistribution using high angular resolution ground-based mid-IRspectroscopic observations, while fixing the other torus modelparameters. They found, however, no differences in the numberand distribution of clouds between type 1 and type 2 AGNs.
In this paper, we expand on our previous work by combiningphotometric SEDs with high angular resolution (∼0.′′3–0.′′4)mid-IR spectroscopic observations of a sample of 13 nearbySeyfert galaxies. For the first time in this work we fit thesedata for a sizeable sample of Seyferts to put tighter constraintson torus model parameters. This paper is organized as follows.Section 2 presents the new observations and the data compiledfrom the literature. Section 3 describes the clumpy dusty torusmodels and the modeling technique. A discussion of the fits and
Figure 1. Sketch of the CLUMPY models of Nenkova et al. (2008a, 2008b).The radial torus thickness Y is defined as the ratio between outer radius (Ro)and the dust sublimation radius (Rd). All the clouds have the same τV , and σtoruscharacterizes the width of the angular distribution of clouds. The number ofcloud encounters is a function of the viewing angle i, the width of the angulardistribution of the clouds σtorus, and the mean number of clouds along radialequatorial rays N0 (see Equation (2)).
inferred torus parameters is presented in Section 4. Section 5discusses the properties of the torus and AGN. Finally, ourconclusions are given in Section 6.
2. OBSERVATIONS
2.1. The Sample
Our sample is composed of 13 nearby Seyfert galaxies at amean distance of 38 Mpc (median of 31 Mpc). We selectedthe galaxies to have high (<0.′′8) angular resolution near-IR (1–5 μm) imaging, and mid-IR (8–20 μm) imaging andspectroscopy in the literature (Sections 2.3 and 2.4). Althoughthe sample is not complete and may not be representative, thehigh angular resolution IR data ensure that we can isolate the IRemission arising from the torus surrounding the AGN. Currentlysuch high angular resolution imaging and spectroscopy can onlybe attained from the ground using 8–10 m class telescopes(typically ∼0.′′3–0.′′4 at 10 μm). The properties of this samplerelevant to this work and the corresponding references aresummarized in Table 1. The sample includes type 1 and type 2Seyfert galaxies as well as Seyfert 2 galaxies with a broadcomponent detected in the near-IR. The bolometric luminositiesof the AGNs, Lbol, are taken from the works of Woo & Urry(2002) and Vasudevan et al. (2010), or estimated from the hardX-ray luminosities using a typical bolometric correction of 20(Elvis et al. 1994). The AGN bolometric luminosities of oursample span almost two orders of magnitude, from ∼1043 to1045 erg s−1. In terms of their X-ray neutral hydrogen columndensity, NH(X-ray), the sample contains both Compton thinobjects and Compton thick galaxies. We also list in Table 1two observational properties related to the torus, namely theopening angle of the ionization cones Θcone and the torussize s12 μm (FWHM), as derived from the modeling of mid-IR interferometric observations. These two parameters will becompared with the fitted torus model parameters in Section 5.1.
As explained in the Introduction, in addition to the IRphotometric SEDs we will fit ground-based mid-IR (∼8–13 μm)spectroscopy, including the 9.7 μm silicate feature. Shi et al.(2006) found that the 9.7 μm silicate features measured fromSpitzer/IRS spectroscopy of a large sample of AGNs varyfrom emission to absorption with increasing neutral hydrogencolumn densities. These authors interpreted this result witha scenario where the obscuring material is located in two
2

The Astrophysical Journal, 736:82 (30pp), 2011 August 1 Alonso-Herrero et al.
Table 1Properties of the Sample
Galaxy z d Type Ref. NH(X-ray) Ref. Θcone Ref. s12μm Ref. log Lbol Ref.(Mpc) (1022 cm−2) (deg) (pc) (erg s−1)
Circinus 0.001448 4 Sy2 A1 430. B1 80–90 C1 0.4, 2.0 D1 43.6 E1IC 4329A 0.016054 65 Sy1.2 A2 0.61 B2 · · · · · · <10.8 D2 45.0 E2IC 5063 0.011348 46 Sy2 A3 21.78 B2 60 C2 · · · · · · 44.3–44.7 E2MCG -5-23-16 0.008486 34 Sy2 (broad Paβ) A4 1.6 B3 · · · · · · 2.8 D2 44.4 E3NGC 1068 0.003793 15 Sy2 A5 >1000. B4 40, 65 C3 0.5 × 1.4, 3 × 4 D3 45.0 E4NGC 2110 0.007789 31 Sy2 (broad Brγ ) A6 2.84 B2 30 C4 · · · · · · 43.8–43.9 E2NGC 3227 0.003859 17 Sy1.5 A5 1.74 B2 60–70 C5 · · · · · · 43.2–43.5 E2NGC 4151 0.003319 13 Sy1.5 A5 6.9 B5 67, 75 C3 2 D4 43.7 E4NGC 5506 0.006181 25 NLSy1 (broad Paβ) A4, A7 2.78 B2 90–100 C6 · · · D2 44.1–44.3 E2NGC 7172 0.008683 35 Sy2 A2 8.19 B2 · · · · · · · · · · · · 43.7–43.8 E2NGC 7469 0.016317 66 Sy1 A5 0.05 B6 · · · · · · 10.5 D2 45.0–45.1 E2NGC 7582 0.005254 21 Sy2 (broad Brγ ) A6 5., �100. B7 86, 120 C3 · · · D2 43.3 E2NGC 7674 0.028924 118 Sy2 (broad Paβ) A8 >1000. B8 · · · C2 · · · · · · ∼45 E5
Notes. Distances are for H0 = 75 km s−1 Mpc−1 and for the nearby objects are taken from RA09 and RA11.References. (A1) Oliva et al. 1994; (A2) Veron-Cetty & Veron 2006; (A3) Colina et al. 1991; (A4) Blanco et al. 1990; (A5) Osterbrock & Martel 1993 and referencestherein; (A6) Reunanen et al. 2003; (A7) Nagar et al. 2002; (A8) Ruiz et al. 1994; (B1) Matt et al. 1999; (B2) Vasudevan et al. 2010; (B3) Perola et al. 2002; (B4)Risaliti et al. 1999; (B5) Beckmann et al. 2005; (B6) Guainazzi et al. 1994; (B7) Bianchi et al. 2009; (B8) Matt et al. 2000; (C1) Maiolino et al. 2000; (C2) Schmittet al. 2003; (C3) Wilson & Tsvetanov 1994; (C4) Pogge 1989; (C5) Mundell et al. 1995; (C6) Wilson et al. 1985, Maiolino et al. 1994; (D1) Tristram et al. 2007;(D2) Tristram et al. 2009; (D3) Raban et al. 2009; (D4) Burtscher et al. 2009; (E1) Moorwood et al. 1996; (E2) Vasudevan et al. 2010; (E3) from the 2–10 keV fluxof Weaver & Reynolds 1998 and applying a bolometric correction of 20; (E4) Woo & Urry 2002 and references therein; (E5) estimated from the scattered 2–10 keVluminosity by Malaguti et al. 1998.
different physical scales (0.1–10 pc disk and a large-scale diskextending up to 100 pc) with the dust distributed in cloudsof different properties. Although the mid-IR ground-basedspectroscopy in this work (see Sections 2.2 and 2.4) probesmuch smaller physical scales than those probed by the Spitzer/IRS data, it is of interest to place our sample of galaxies in thecontext of larger samples. In Figure 2, we show the apparentstrength of the 9.7 μm silicate feature (S9.7) as a function of theX-ray hydrogen column density for Seyfert 1s, Seyfert 2s, PGquasars, and 2MASS quasars adapted from the work of Shiet al. (2006). The strengths of the silicate feature in this figureare mostly measured from Spitzer/IRS spectroscopy14 and thuscorrespond to large physical sizes (at the mean distance of oursample ∼2 kpc). For NGC 4151, NGC 7469, and NGC 3227, S9.7were also measured from Spitzer/IRS spectroscopy (Thompsonet al. 2009), and for NGC 7582, NGC 7674, and IC 5063 fromground-based data (Honig et al. 2010 and Section 2.4). Fromthis figure, it is clear that our relatively small sample probeswell the observed ranges for Seyfert 1s and Seyfert 2s. We willcome back to this issue in Section 5.
2.2. New Observations
N-band spectroscopy of NGC 4151 was obtained withMichelle (Glasse et al. 1997) on the Gemini-North telescope on20070318 (Program ID GN-2006B-Q-18). The standard mid-IR chop–nod technique was employed for the observations, andthe chop and nod distances were 15′′. The low-N grating and2 pixel (0.′′36) slit were used, giving R ∼ 200. The slit wasorientated at 60 deg east of north, along the extended mid-IRemission discovered by Radomski et al. (2003). Two blocks ofspectroscopy were obtained, each of 450 s on-source (in theguided chop beam), and the galaxy nucleus was reacquired inbetween. Telluric standard stars were observed before and afterthe NGC 4151 spectroscopy, with the same observational setup.
14 The typical extraction apertures of the Shi et al. (2006) IRS short-low (SL)spectra were 6 pixels or 10.′′8.
Figure 2. Apparent strength of the 9.7 μm silicate feature vs. the X-ray hydrogencolumn density, adapted from the work of Shi et al. (2006). For the strength ofthe silicate feature, positive values mean the feature is observed in emission andnegative values in absorption. Star-like symbols are PG quasars, asterisks are2MASS quasars, circles are Seyfert 1s, and squares are Seyfert 2s. The filledsymbols indicate the galaxies in our sample. The triangles are those Seyfert2s in our sample with broad lines detected in the near-IR (see Table 1). TheX-ray column densities are from Shi et al. (2006) except for the galaxies in oursample, which are taken from the references given in Table 1. The strength ofthe silicate features are measured from Spitzer/IRS data and ground-based data(see Section 2.1).
(A color version of this figure is available in the online journal.)
Michelle data files contain planes consisting of the differenceimage for each chopped pair for each nod. The chopped pairswere examined for anomalously high background or electronic
3

The Astrophysical Journal, 736:82 (30pp), 2011 August 1 Alonso-Herrero et al.
noise, but none needed to be excluded from the final data set. Thechopped difference images were then combined until a singlefile was obtained for each spectroscopy block, and the files forthe two blocks were then averaged together. The resulting spec-trum was extracted in a 2 pixel aperture, wavelength-calibratedusing telluric lines, divided by the standard star, and multipliedby a blackbody spectrum.
Q-band (∼20 μm) spectroscopy of NGC 1068 was obtainedwith Michelle on 20090923 (Program ID GN-2009B-Q-58),using the same chop–nod technique. The 3 pixel (0.′′54) slit andlow-Q grating were used, for R ∼ 100, with the slit orientatedalong the ionization cones (20 deg east of north). The galaxynucleus was observed for a total of 1800 s on-source, andtelluric standard stars were observed before and after NGC 1068.The data reduction procedure was similar to that used for theNGC 4151 N-band spectroscopy, including extraction of thespectrum in a 2 pixel (0.′′36) aperture. However, cancellationof the strong and variable Q-band telluric lines was poor in theinitial, ratioed spectrum. This was improved by adding a slopingbaseline to the standard star spectra before dividing.15 The effecton the spectral slope of the resulting NGC 1068 spectrum issmall. The flux calibration was done with the telluric standardstars. The resulting flux densities are probably affected by slitlosses, and therefore in Section 2.4 we recalibrate the spectrawith photometric observations. Finally, the Q-band spectrumused for the modeling was rebinned using a 3 pixel box.
2.3. Published Unresolved Nuclear Fluxes
As discussed at length in our previous papers (Alonso-Herrero et al. 2001, 2003; RA09; RA11), high angular resolutionobservations are required to isolate the emission associated withthe torus, and with the direct view of the AGN in type 1s aswell. At the distances of our galaxies and the current angularresolutions of the near- and mid-IR imaging and spectroscopicobservations the torus emission appears unresolved. In the near-IR up to λ ∼ 2 μm, extended stellar emission arising in thehost galaxy contaminates and even dominates the nuclear fluxesof type 2 Seyferts (Alonso-Herrero et al. 1996; L. Videlaet al. 2011, in preparation) and is not negligible in type 1Seyferts (Kotilainen et al. 1992). At longer wavelengths (λ >3 μm) contamination by stellar photospheric emission is greatlyreduced. However, any extended nuclear emission not directlyrelated to the dusty torus, such as dusty clouds in the NLR andthe coronal line region (e.g., Bock et al. 2000; Alloin et al. 2000;Radomski et al. 2003; Packham et al. 2005; Mason et al. 2006;Roche et al. 2006; Reunanen et al. 2010) and/or dust heated byyoung massive stars (Siebenmorgen et al. 2004; Alonso-Herreroet al. 2006; Mason et al. 2007; Reunanen et al. 2010), needs to beremoved.
To isolate as much as possible the emission of the torus (andthe AGN when seen directly), we compiled high angular res-olution near- and mid-IR fluxes from the literature with esti-mates of the unresolved emission when available. These unre-solved fluxes are the result of removing, using various methods,the underlying near-IR stellar emission and the mid-IR emis-sion produced by star formation. The compiled photometryincludes near-IR ground-based and Hubble Space Telescope/NICMOS observations (with the NIC2 camera, angular resolu-tions 0.′′15–0.′′2) and ground-based mid-IR measurements withangular resolutions of �0.′′8. The only exception are the L-band
15 That is, fitting a continuum, multiplying by a few percent, adding that backto the star spectrum, and dividing by that instead.
measurements of Ward et al. (1987) for type 1 Seyferts (Table 1),but we use them as upper limits. All the mid-IR photometricpoints have angular resolutions in the range 0.′′3–0.′′5 to matchthe resolution and slit widths of the mid-IR spectroscopic data(see Section 2.4). When possible, for a given galaxy we tried tomatch the angular resolution of the photometric points to makesure we are modeling similar physical scales. Table 2 lists foreach galaxy in our sample the wavelengths and references of thephotometric data used to construct their SEDs. Finally, we usedthe Spitzer/IRS 30 μm continuum fluxes of Deo et al. (2009)for those galaxies in our sample without nuclear star formationas upper limits in our fits.
Based on discussions in the papers listed in Table 2 andcomparisons between different works, we use the followingerrors for our analysis. For near-IR ground-based data, exceptfor the NACO data (see below) of Prieto et al. (2010), weuse for the J band 30%, for the H and K bands 25%, andfor the L band 20%. These include the photometric error,the background subtraction uncertainty, and the uncertaintyfrom estimating the unresolved flux. For the last one we notethat the stellar emission contribution within a given aperturedecreases with increasing wavelength and thus the stellarcontribution has a minimum in the L-band (see, e.g., Kotilainenet al. 1992; Alonso-Herrero et al. 1996). The M-band fluxesare always considered as upper limits because estimating theunresolved component was not possible. For the NACO AOobservations of Prieto et al. (2010), which were measuredthrough 0.′′1–0.′′2 apertures, the smaller contamination by stellaremission when compared with natural seeing observationsresults in lower uncertainties. We therefore use 20% in J and15% in the HKLM NACO bands. Finally, for the NICMOS data,which have very stable photometric calibration and point-spreadfunctions, we use 20% in the J band, and 10%–20% in the Hand K bands (unless otherwise specified in the correspondingreferences). The estimated NICMOS uncertainties are basedon the comparison of the unresolved fluxes reported for thesame galaxies in different works (Alonso-Herrero et al. 2001;Quillen et al. 2001; Gallimore & Matthews 2003; Kishimotoet al. 2007). For the N- and Q-band measurements we use 15%and 25% errors, respectively, to account for the photometriccalibration and unresolved component uncertainties (see detailsin RA09).
We finally address the issue of possible variability of the near-IR fluxes and the simultaneity of the SEDs. Nine out of the 13galaxies in our sample have been reported to show variabilityin the near-IR: NGC 7674 (Quillen et al. 2000), NGC 1068, IC4329A, NGC 2110, MCG -5-23-16, NGC 5506, and NGC 7469(Glass 2004), NGC 3227 (Suganuma et al. 2006), and NGC 4151(Koshida et al. 2009). There are no reports on mid-IR variabilityof our sources. The typical variability in the near-IR is ∼40%on average, with amplitude variations around the median ofbetween 10% and 30% for our sample. For all these galaxies the1–2.2 μm data, when available, were taken simultaneously. TheLM fluxes in some cases were not simultaneous with the shorterwavelength fluxes. However, in most cases the LM fluxes aretaken as upper limits as there was no estimate of the unresolvedemission. Glass (2004) showed that the L-band variability istypically less than 20% around the median flux, which is withinthe photometric and unresolved emission uncertainties. We cantherefore assume that variability in the near-IR does not affectthe compiled SED within the above-discussed uncertainties ofthe unresolved measurements.
4

The Astrophysical Journal, 736:82 (30pp), 2011 August 1 Alonso-Herrero et al.
Table 2Wavelength Coverage of the Observations and References
Galaxy Near-IR SED Ref. Mid-IR SED Ref. Spectroscopy Ref.
Circinus JHKK′L′M ′ A1 8.7, 18.3 μm B1 N-band MIDI 0.′′60 C1IC 4329A HK A2 8.99, 11.88 μm B2 N-band VISIR 0.′′75 C2
L A3IC 5063 H A4 8.7, 18.3 μm B1 N-band T-ReCS 0.′′67 C3
K A5 10.5, 11.3, 11.9, 12.3 μm B2MCG -5-23-16 JHKL′M A2 8.59, 8.99, 11.88 μm B2 N-band VISIR 0.′′75 C2
18.72 μm B3NGC 1068 JHK A2 8.8, 18.3 μm B4 N-band Michelle 0.′′36 C4
LM A6 Q-band Michelle 0.′′54 This workNGC 2110 L′ A7 11.2 μm B5 N-band Michelle 0.′′36 C5
8.6, 9.0, 11.9 μm B220 μm B6
NGC 3227 HK A8 11.3 μm B1 N-band VISIR 0.′′75 C2L A3 8.99, 11.88 μm B2
NGC 4151 JHK A8 10.8, 18.2 μm B1 N-band Michelle 0.′′36 This workLM A3
NGC 5506 JHKL′ A1 11.3, 18.1 μm B1 N-band T-ReCS 0.′′36 C6M A3
NGC 7172 HKL′M A2 10.36 μm B1 N-band T-ReCS 0.′′36 C612.27 μm B7
NGC 7469 JHK A2 8.7, 18.3 μm B8 N-band VISIR 0.′′75 C2L′ A1 10.49, 11.25, 11.88, 12.27, 13 μm B2
NGC 7582 HKLM A1 10.8, 18.2 μm B1 N-band VISIR 0.′′75 C28.6, 9.0, 11.9 μm B2
NGC 7674 JHKL′M A2 12.81 μm B2 N-band VISIR 0.′′75 C2
References. (A1) Prieto et al. 2010; (A2) Alonso-Herrero et al. 2001; (A3) Ward et al. 1987, the photometry is used as an upper limit; (A4)Quillen et al. 2001; (A5) Kulkarni et al. 1998; (A6) Marco & Alloin 2000; (A7) Alonso-Herrero et al. 1998, the photometry is an upper limit;(A8) Alonso-Herrero et al. 2003; (B1) RA09; (B2) Honig et al. 2010; (B3) Reunanen et al. 2010; (B4) Tomono et al. 2001, for the 0.′′4 fluxes;(B5) Mason et al. 2009; (B6) Lawrence et al. 1985; (B7) Horst et al. 2008; (B8) RA11; (C1) Tristram et al. 2007; (C2) Honig et al. 2010; (C3)Young et al. 2007; (C4) Mason et al. 2006; (C5) Mason et al. 2009; (C6) Roche et al. 2007.
2.4. Published Ground-based Mid-IR Spectroscopy
The published mid-IR spectroscopy used in this work (seeTable 2) was obtained with four different instruments.
1. The Thermal-Region Camera Spectrograph (T-ReCS;Telesco et al. 1998) on the Gemini-South Telescope. TheT-ReCS data were obtained with the low-resolution grating,which provides a spectral resolution of R ∼ 100. The slitwidths were 0.′′67 (Young et al. 2007) and 0.′′36 (Roche et al.2006, 2007).
2. The Michelle instrument (Glasse et al. 1997) on the Gemini-North telescope. The Michelle observations (Mason et al.2006, 2009 and Section 2.2) were obtained with a 0.′′36 slitwidth and a spectral resolution of R ∼ 200 in the N band,and a 0.′′54 slit and R ∼ 100 in the Q band.
3. VISIR, the mid-IR imager and spectrograph mounted onthe 8.2 m UT3 telescope at the ESO/Paranal observatoryin Chile. The VISIR observations (Honig et al. 2010) wereobtained in a low spectral resolution mode (R ∼ 300) witha slit width of 0.′′75.
4. MIDI (Leinert et al. 2003), the mid-IR interferometerat the VLTI at the ESO/Paranal observatory. The MIDIobservations (Tristram et al. 2007) were taken with a 0.′′6width slit and R ∼ 30. The data used here are a “totalflux spectrum,” where four spectra are obtained for this,two for each telescope of the interferometer and two foreach “window” in MIDI. The spectrum was extracted in a6 pixel wide mask or 0.′′516, and calibrated individually forthe windows and telescopes.
Because the VISIR ground-based mid-IR spectra haveslightly higher spectral resolution than the other spectra, we re-binned them to contain approximately 150 spectral points. TheMIDI, T-ReCS, and Michelle spectra contain between 100 and200 spectral points. We did not attempt to remove any emissionlines (e.g., [S iv]10.51 μm) or broad features (e.g., polycyclicaromatic hydrocarbon (PAH) features) in the spectra.
The final step was to scale the spectra to the photometricpoints. This was mostly necessary for the spectra observedwith the narrowest slits (see Table 2) because of slit losses.As an example, in Figure 3 we show the original N- andQ-band spectra (Mason et al. 2006 and Section 2.1, respectively)of NGC 1068 together with the mid-IR photometric points ofTomono et al. (2001) for a circular aperture of 0.′′4 diameter,and the photometry through a rectangular 0.′′29 × 0.′′15 apertureafter deconvolution of the data. To match the angular resolutionsof the imaging and spectroscopic data, the NGC 1068 N- andQ-band spectra were scaled to their corresponding 0.′′4 photo-metric points. Finally, for all the N-band spectra in our samplewe added in quadrature the intrinsic error of the spectra and the15% error of the imaging data (see Section 2.3) used for scalingthe data, for each spectroscopic point. For the Q-band spectrumof NGC 1068, the associated error for scaling the spectrum is25%. These errors were added for the fitting.
3. MODELING OF THE DATA
3.1. Clumpy Torus Models
In this work we use an interpolated version (see Section 3.3)of the clumpy dusty torus models of Nenkova et al. (2002, 2008a,
5

The Astrophysical Journal, 736:82 (30pp), 2011 August 1 Alonso-Herrero et al.
Figure 3. Black lines are the original flux-calibrated Michelle N- and Q-bandspectra of NGC 1068 (see Mason et al. 2006 and Section 2.1, respectively). Thelarge and small square symbols are the photometry of Tomono et al. (2001) for acircular 0.′′4 diameter aperture on the original data, and for a 0.′′29×0.′′15 apertureon the deconvolved data, respectively. The green lines are the N- and Q-bandspectra scaled to the 0.′′4 photometric points at 8.7 and 18.5 μm photometricpoints. After the scaling, the Q-band spectrum was also rebinned (see the textfor details).
(A color version of this figure is available in the online journal.)
2008b) including the corrections for the previously erroneousAGN scaling factor (see the erratum by Nenkova et al. 2010).The CLUMPY models are described by the six parameters listedin Table 3 that we explain in the following (see also Figure 1). AnAGN with a bolometric luminosity Lbol(AGN) is surrounded bya torus of dusty clouds and all the clouds have the same opticaldepth τV , which is defined in the optical V band. The torusclouds are located between the inner radius of the torus Rd andthe outer radius of the torus Ro, and the torus radial thickness isdefined as Y = Ro/Rd. The inner radius of the torus is set bythe dust sublimation temperature (Tsub ≈ 1500 K):
Rd = 0.4
(1500 K
Tsub
)2.6 (Lbol(AGN)
1045 erg s−1
)0.5
pc. (1)
The angular distribution of the clouds is assumed to have asmooth boundary and it is described as a Gaussian with a widthparameter σtorus. The radial distribution is a declining powerlaw with index q (∝ r−q). The mean number of clouds alongradial equatorial rays is N0. The number of clouds along the lineof sight (LOS) at a viewing angle i (measured from the polardirection; see Figure 1) is
NLOS(i) = N0e−(90−i)2/σ 2
torus . (2)
In a clumpy dust distribution, the classification of an object asa type 1 or type 2 AGN is not truly a matter of the viewing anglebut of the probability for direct view of the AGN (see Figure 1and also Elitzur 2008). The probability for an AGN-producedphoton to escape through the torus along a viewing angle i whenall the clouds are optically thick (τV > 1) is
Pesc � e(−NLOS). (3)
In the models, the radiative transfer equations are solvedfor each clump and thus the solutions depend mainly on the
Table 3Parameters of the CLUMPY Torus Models
Parameter Symbol Interval
Torus radial thickness Y [5, 30]Torus angular width σtorus [15◦, 70◦]Number of clouds along an equatorial ray N0 [1, 15]Index of the radial density profile q [0, 3]Viewing angle i [0◦, 90◦]Optical depth per single cloud τV [5, 150]
Notes. Torus radial thickness: Y = Ro/Rd, where Ro is the outer radius and Rd
is the inner radius (Equation (1)). The cloud distribution between Rd and Ro isparameterized as r−q .
location of each clump within the torus, its optical depth,and the chosen dust composition. We adopt a dust extinctionprofile corresponding to the OHMc dust (i.e., the standard coldoxygen-rich interstellar medium (ISM) dust of Ossenkopf et al.1992). The total torus emission is calculated by integrating thesource function of the total number of clumps convolved withthe radiation propagation probability along the torus (Nenkovaet al. 2002). For Type 1 and intermediate-type Seyferts wherethere is an unobscured view of the AGN, it is also possibleto include its contribution to the resulting SED. The AGNcontinuum emission in these models is characterized with apiecewise power-law distribution (see Nenkova et al. 2008a fordetails).
We finally note that there is some evidence of the presenceof an extra hot dust component, originating very close to theAGN. Reverberation mapping (see discussion by Kishimotoet al. 2007) and near-IR interferometric observations (e.g.,Kishimoto et al. 2009 and references therein) of Seyfert galaxieshave shown that the sublimation radii appear to be smallerthan expected from Equation (1) (similar to the Barvainis 1987relation). However, in this work we take the simplest approachfor fitting the data assuming that all the near-IR emission isoriginating in the classical torus, with no additional hot dustcomponents.
3.2. Foreground Dust Components
In this section, we examine the possibility of having contri-butions to the observed IR SEDs and mid-IR spectra of Seyfertgalaxies from dust emission and absorption unrelated to theAGN. There are several pieces of evidence we can look into,namely the inclination of the galaxies, and the presence ofnuclear dust lanes and spatially resolved variations of the silicatefeature.
Approximately half of the galaxies in our sample have minor-to-major axis ratios of b/a < 0.5 (inclined host galaxies, seeTable 4), and as suggested by Deo et al. (2009), it is likelythat dust in the host galaxy disk can contribute significantlyto the observed silicate absorption and the long-wavelengthcontinuum. The only exception appears to be IC 4329A, which isa highly inclined system, but does not show silicate absorption.Deo et al. (2009) concluded for this galaxy that it is likelythat our LOS does not intersect any dense clouds in the hostgalaxy.
Using color maps Martini et al. (2003) showed that ingeneral the dust in the nuclear regions of Seyfert galaxiesis on physical scales not associated with those of the dustytorus. It is then likely that this dust is located in front of thenucleus (see also Regan & Mulchaey 1999) and arises from the
6

The Astrophysical Journal, 736:82 (30pp), 2011 August 1 Alonso-Herrero et al.
Table 4Axial Ratios, Foreground Extinction Measurements,
and Strength of the Silicate Feature
Galaxy b/a AV (frg) Ref. S9.7 Ref.(mag)
Circinus 0.44 9 A1, A2 −1.8/−2.4 B1IC 4329A 0.28 · · · · · · −0.02 B2IC 5063 0.68 7 A3 −0.3 B2MCG -5-23-16 0.46 >6 A4 −0.3 B2NGC 1068 0.85 · · · · · · −0.4 B3NGC 2110 0.74 5 A2 0.03 B2NGC 3227 0.68 · · · · · · 0.01 B4NGC 4151 0.71 · · · · · · 0.14 B4NGC 5506 0.30 �11 A5 −1.1/−1.4 B1NGC 7172 0.46 · · · · · · −3.2/−3.2 B1NGC 7469 0.72 · · · · · · 0.05 B4NGC 7582 0.42 8, 13 A6 −1.0 B2NGC 7674 0.91 ∼3–5 A7 −0.2 B2
Notes. The axial ratios are the ratio of the minor to major axis of the hostgalaxies and are taken from de Vaucouleurs et al. (1991), except for that ofNGC 7172 that is from Jarrett et al. (2003). S9.7 are the observed strengthsof the silicate feature, with positive numbers indicating that the feature is inemission, and negative numbers the feature is in absorption. For the Roche et al.(2007) galaxies, the two measurements correspond to fits to the feature doneusing two different silicate grain profiles.References. (A1) Maiolino et al. 2000; (A2) Storchi-Bergmann et al. 1999;(A3) Heisler & de Robertis 1999; (A4) Veilleux et al. 1997; (A5) Goodrichet al. 1994; (A6) Winge et al. 2000; (A7) Riffel et al. 2006; (B1) Roche et al.2007; (B2) Honig et al. 2010; (B3) Mason et al. 2006; (B4) Thompson et al.2009.
galactic ISM. In our sample, Circinus, IC 5063, NGC 5506,NGC 7582, NGC 2110, NGC 7172, and possibly NGC 7674show dust features in the nuclear (central ∼1′′–2′′) regions (see,e.g., Quillen et al. 1999; Maiolino et al. 2000; Martini et al.2003).
Some of the galaxies in our sample show variations of the9.7 μm silicate feature on scales of 1′′–2′′ indicating the presenceof extended dust components (Mason et al. 2006; Roche et al.2006, 2007: Colling et al. 2009). Similarly, the spatially resolvedmid-IR polarimetric observations of NGC 1068 (Packham et al.2007) can be explained with a geometrically, and optically thicktorus surrounded by a larger, more diffuse structure, associatedwith the dusty central regions of the host galaxy.
Roche et al. (2007) showed that NGC 5506 and NGC 7172,both with prominent nuclear dust lanes (see, e.g., Malkan et al.1998), have similar absorbing columns as derived from X-rayobservations and the 9.7 μm features, for the latter just by usinga foreground dust screen model. This suggests that some ofthe extinction measured from the 9.7 μm silicate feature mightarise in the galactic ISM (see also the discussion in Section 2.1,and Figure 2). In other words, in these two galaxies if thesilicate feature were to come only from the torus, it wouldbe shallower (at it is filled in by emission from warm dust alsoin the torus). These findings would also be consistent with thework of Guainazzi et al. (2005) who showed that the presenceof dust lanes on scales of 100 pc in Compton-thin Seyfert 2sis correlated with the X-ray obscuration, mostly in the X-raycolumn density range ∼1023–1024 cm−2. This was interpretedby these authors as due to the larger covering fraction of the gasin the dust lanes, rather than the parsec-scale dusty torus.
From a theoretical point of view, clumpy dusty modelscannot produce very deep silicate features (S9.7 < −1; see
Nenkova et al. 2008b; Elitzur 2008; Sirocky et al. 2008), whileobservations show that many Seyfert galaxies have relativelydeep silicate features (see Shi et al. 2006; Hao et al. 2007; Deoet al. 2009). In our sample, this includes Circinus, NGC 5506,NGC 7582, and NGC 7172 (see Table 4 and Figure 2). Byanalogy with those ULIRGs optically classified as type-2 AGNsand with deep silicate features modeled by Sirocky et al. (2008),the deep silicate features of some Seyfert 2 galaxies in oursample may be explained by additional obscuration by coldforeground dust.
For simplicity we will consider the extended dust compo-nent as a purely foreground medium producing only absorption.We note, however, that high angular resolution mid-IR spectro-scopic observations of the ionization cone dust of NGC 1068show evidence of components of both absorption and emis-sion. We use the IR extinction curve of Chiar & Tielens (2006)of the local ISM in the wavelength range ∼1–35 μm, which in-cludes the two silicate features at 9.7 and 18 μm. For extinctions(AV (frg) � 5 mag) the effects of foreground extinction cannotbe ignored, especially in the spectral region around the 9.7 μmsilicate feature.
Finally, it is important to note the possible degeneracybetween AGN type and the effects of foreground extinction.Using smooth density torus models, Alonso-Herrero et al.(2003) demonstrated that the reddened near-IR SED froma nearly face-on (polar view) torus (underlying Seyfert 1)looks similar to the intrinsic near-IR SED at a viewing anglecloser to a true Seyfert 2 (equatorial view) given sufficientlevels of foreground extinction (AV (frg) � 5 mag). Given thisdegeneracy in our fitting process we choose not to leave theforeground extinction as a free parameter (see Section 3.3), butinstead we use published values of the extinction as estimatedfrom near-IR measurements. Table 4 gives the values of theforeground extinction used in this work, only for galaxies withevidence of extended dust components and with AV (frg) �5 mag. The foreground extinction is applied to the torusemission, as well as to the AGN emission that is included forgalaxies with a direct view of the BLR.
3.3. Modeling Technique
The CLUMPY database now contains 1.2 × 10⁶ models,which are calculated for a fine grid of model parameters. Tofit the data we take a Bayesian approach to dealing with theinherent degeneracy of the torus model parameters (see RA09and RA11). In this work we use an updated version of theBayesClumpy code developed by Asensio Ramos & RamosAlmeida (2009). This tool uses a Bayesian inference to allowas much information as possible to be extracted from theobservations. We refer the reader to Asensio Ramos & RamosAlmeida (2009) for details on the interpolation methods andalgorithms used by BayesClumpy. However, it is important tonote that in using a Bayesian approach we do not make use ofthe original set of models of Nenkova et al. (2008a, 2008b), butrather of an interpolated version of them (see Figures 3 and 4in Asensio Ramos & Ramos Almeida 2009). The fineness ofthe grid of clumpy models makes interpolation an appropriatemethodology for our studies.
The new version of BayesClumpy allows, in addition to fittingphotometric points, for the possibility of fitting spectra. In thecase of photometric observations, BayesClumpy simulates thetransmission curve of the corresponding filter on the modelspectra. For the spectroscopic observations, the full information,
7

The Astrophysical Journal, 736:82 (30pp), 2011 August 1 Alonso-Herrero et al.
flux and associated uncertainty, is used. When both photometricSEDs and spectroscopy are fitted together, we use the datauncertainties discussed in Section 2 as weights for the fittingroutine. Under the assumption that the torus models are validsimultaneously for photometric and spectroscopic data andthat the noise in all observed points is mutually uncorrelated,the Bayesian approach is insensitive to the fact that thereare many more spectroscopic points than photometric ones.The reason is that, apart from the possible regularization thatcan be included in the prior distributions, we sample the fullposterior distribution and obtain marginalized posterior for eachparameter. The marginalization procedure takes into accountall possible values of the parameters producing good fits. Thisavoids the possible overfitting of the SED which is produced byneglecting the few photometric points.
The prior distributions for the model parameters are assumedto be truncated uniform distributions in the ranges given inTable 3. We note that in the most up-to-date version of theCLUMPY models after correcting for the erroneous AGNscaling factor (Nenkova et al. 2010), the optical depth of theindividual clouds only goes up to 150, instead of τV = 200 ofthe older models. The only prior information we use in this workis the viewing angle. For those galaxies in our sample with H2Omaser detections: Circinus (Greenhill et al. 2003) and NGC 1068(Greenhill et al. 1996) we restricted the viewing angles i tovalues in the range 60◦–90◦, that is, close to equatorial viewsthrough the torus. We can also use the accretion disk viewingangles deduced from X-ray observations of the Fe K α line as anadditional constraint, if we assume that the accretion disk andthe torus are coplanar. We found estimates for three galaxies inour sample, for MCG -5-23-16 is i ∼ 53◦ (Reeves et al. 2007),and for NGC 5506 and NGC 2110 is i ∼ 40◦ (Guainazzi et al.2010 and Weaver & Reynolds 1998). For these three galaxies,we assumed Gaussian distributions for this parameter with awidth of 10◦.
In addition to the six torus model parameters, there are twoextra parameters that can be fitted or fixed. The first parameteraccounts for the vertical displacement needed to match thefluxes of a given model to an observed SED/spectrum. Thisvertical shift, which we allow to vary freely, scales with theAGN bolometric luminosity (see Nenkova et al. 2008b) andwill be discussed in Sections 4.1 and 4.2. The second parameteris the foreground extinction (see Section 3.2 and Table 4) dueto the host galaxy, which is different from that produced by thetorus along the LOS (see RA09 and RA11).
For the modeling of the SED and spectroscopy of type 1Seyferts, the AGN contribution needs to be added to the torusemission (see Nenkova et al. 2008a for the assumed shape).In principle, the same should be done for those Seyfert 2s inour sample with broad lines detected in the near-IR, as thismeans we have a direct view of the BLR. However, most ofthese Seyfert 2s in our sample are also heavily affected byextinction (see Table 4). Kishimoto et al. (2007) demonstratedfor type 1 Seyferts that most of the unresolved emission at2.2 μm is produced by hot dust emission from the inner walls ofthe torus, and that there is a very small contribution from the bigblue bump emission (i.e., AGN emission) at this wavelength.Then there is the question for AGNs with broad lines andforeground extinctions AV � 5 mag of whether we are seeingAGN emission in the range 1–2 μm or not. We thus decided forthese galaxies to fit the data both including and not includingthe AGN emission. This will be discussed in more detail inSection 4.2.
4. RESULTS FROM FITS TO SED+SPECTROSCOPY
The results of the fitting process are the marginal posterior dis-tributions for the six free parameters that describe the CLUMPYmodels plus the vertical shift. These are the probability distri-butions of each parameter, which are represented as histograms.As explained in Section 3.1, except for the viewing angle of fivegalaxies, we use uniform priors for the rest of the parameters.If the observational data contain sufficient information for thefit, then the resulting probability distributions of the fitted torusmodel parameters will clearly differ from uniform distributions.In those cases the probabilities either show trends or are centeredat certain values within the considered intervals.
For each galaxy we translate the fitted torus model parametersinto two model spectra. The first one corresponds to themaximum-a-posteriori (MAP) values that represent the bestfit to the data. The second is the model produced with themedian value of the probability distribution of each parameter,which is characteristic of the observed SED+spectroscopy data.Figures 4–6 show these fits to the SED+spectroscopy forSeyferts 1s, Seyfert 2s, and Seyfert 2s with broad lines in thenear-IR, respectively. Figure 7 shows the marginal posteriordistributions of the six torus model parameters for IC 4329A.The marginal posterior distributions for the rest of the sample areshown in Appendix A. In Appendix B we also show for Circinus,NGC 1068, NGC 4151, and IC 4329A the two-dimensionalposterior distributions for all combinations of the torus modelparameters. This kind of two-dimensional distribution canbe used to check for possible correlations and degeneraciesbetween different torus model parameters for a given galaxy.Table 5 summarizes the statistics for the fitted torus modelparameters. In Sections 4.1–4.3 we discuss new constraints onthe torus model parameters when fitting the SED+spectroscopydata together, and in Section 4.4 we assess the improvementsobtained by adding mid-IR spectroscopy to the SED data.
4.1. Fits to Pure Seyfert 1s and Seyfert 2s
In this section we discuss the fits to the pure Seyfert 1s and2s,16 while the fits to those Seyfert 2s with broad lines detectedin the near-IR (including NGC 5506) are discussed separately inSection 4.2. As can be seen from Figures 4 and 5 (in blue), theCLUMPY torus models provide very good simultaneous fits tothe photometric SED and spectroscopy data of Seyfert 1s and 2s,in particular for those galaxies with low host galaxy foregroundextinction.
It is worth noting that all the Seyfert 1s except IC 4329Ashow a slight excess of emission in the near-IR above themedian torus+AGN model fits, which might be attributed to hotdust. Mor et al. (2009) included, apart from the torus emission,two extra components—hot dust and NLR emission—to fit theSpitzer/IRS spectra of PG quasars. These extra componentsprovided the additional flux need in the near-IR for their sample.It is not clear, however, whether such components are neededin our fits because the unresolved emission we used for ourfits probes typically a few tens of parsecs, while the Mor et al.(2009) data cover physical sizes on scales of a few kpc. Finally,the near-IR photometric points of our Seyfert 1s are well withinthe ±1σ confidence regions of the fitted models.
The only galaxy for which we could not get a good fit to boththe SED photometric points and the mid-IR spectroscopy was
16 In this work, pure type 1 AGNs have broad lines detected in the optical (i.e.,include types 1.5, 1.8, and 1.9), while pure type 2s do not have broad linesdetected either in the optical or in the near-IR.
8
The Astrophysical Journal, 736:82 (30pp), 2011 August 1 Alonso-Herrero et al.
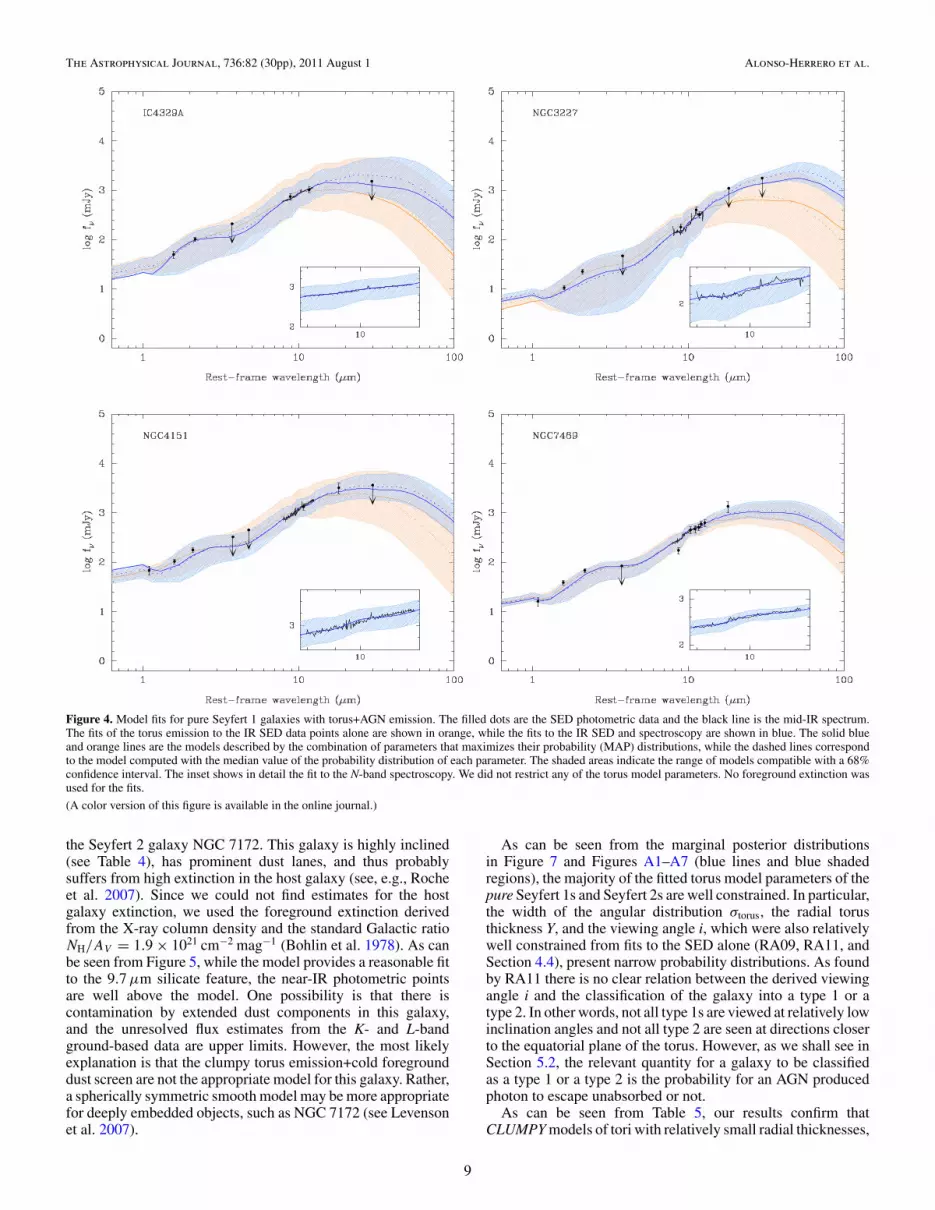
Figure 4. Model fits for pure Seyfert 1 galaxies with torus+AGN emission. The filled dots are the SED photometric data and the black line is the mid-IR spectrum.The fits of the torus emission to the IR SED data points alone are shown in orange, while the fits to the IR SED and spectroscopy are shown in blue. The solid blueand orange lines are the models described by the combination of parameters that maximizes their probability (MAP) distributions, while the dashed lines correspondto the model computed with the median value of the probability distribution of each parameter. The shaded areas indicate the range of models compatible with a 68%confidence interval. The inset shows in detail the fit to the N-band spectroscopy. We did not restrict any of the torus model parameters. No foreground extinction wasused for the fits.
(A color version of this figure is available in the online journal.)
the Seyfert 2 galaxy NGC 7172. This galaxy is highly inclined(see Table 4), has prominent dust lanes, and thus probablysuffers from high extinction in the host galaxy (see, e.g., Rocheet al. 2007). Since we could not find estimates for the hostgalaxy extinction, we used the foreground extinction derivedfrom the X-ray column density and the standard Galactic ratioNH/AV = 1.9 × 1021 cm−2 mag−1 (Bohlin et al. 1978). As canbe seen from Figure 5, while the model provides a reasonable fitto the 9.7 μm silicate feature, the near-IR photometric pointsare well above the model. One possibility is that there iscontamination by extended dust components in this galaxy,and the unresolved flux estimates from the K- and L-bandground-based data are upper limits. However, the most likelyexplanation is that the clumpy torus emission+cold foregrounddust screen are not the appropriate model for this galaxy. Rather,a spherically symmetric smooth model may be more appropriatefor deeply embedded objects, such as NGC 7172 (see Levensonet al. 2007).
As can be seen from the marginal posterior distributionsin Figure 7 and Figures A1–A7 (blue lines and blue shadedregions), the majority of the fitted torus model parameters of thepure Seyfert 1s and Seyfert 2s are well constrained. In particular,the width of the angular distribution σtorus, the radial torusthickness Y, and the viewing angle i, which were also relativelywell constrained from fits to the SED alone (RA09, RA11, andSection 4.4), present narrow probability distributions. As foundby RA11 there is no clear relation between the derived viewingangle i and the classification of the galaxy into a type 1 or atype 2. In other words, not all type 1s are viewed at relatively lowinclination angles and not all type 2 are seen at directions closerto the equatorial plane of the torus. However, as we shall see inSection 5.2, the relevant quantity for a galaxy to be classifiedas a type 1 or a type 2 is the probability for an AGN producedphoton to escape unabsorbed or not.
As can be seen from Table 5, our results confirm thatCLUMPY models of tori with relatively small radial thicknesses,
9

The Astrophysical Journal, 736:82 (30pp), 2011 August 1 Alonso-Herrero et al.
Figure 5. Model fits for pure Seyfert 2 galaxies with torus emission alone. Symbols and lines are as in Figure 4. Upper left panel: Circinus. We fixed the foregroundextinction to AV (frg) = 9 mag (Maiolino et al. 2000). We restricted the viewing angle to the range i = 60◦–90◦. Upper right panel: IC 5063. We did not restrict any ofthe torus model parameters. The foreground extinction was fixed to AV (frg) = 7 mag based on results by Heisler & de Robertis (1999). Lower left panel: NGC 1068.We restricted the viewing angle to the range i = 60◦–90◦ (see Section 3.3). For NGC 1068 the second inset shows in detail the fit to the Q-band spectroscopy. Lowerright panel: NGC 7172. Only the SED+spectroscopy fit is shown due to the limited number of photometric points in the near-IR. We did not restrict any of the torusmodel parameters. The foreground extinction was fixed to AV (frg) = 40 mag.
(A color version of this figure is available in the online journal.)
produce good fits with no need for very large tori. The fittedvalues are within the assumed range of Y = 5–30, and the datafor most galaxies can be fitted with tori with radial thicknessY ∼ 10–15. In Section 5.1, we will compare in more detailour derived physical sizes of the torus (in parsecs) with thosederived from the modeling of mid-IR interferometry.
The index of the power-law distribution q controls theplacement of clouds between the inner, hotter parts of the torusand the outer cooler regions (Nenkova et al. 2008b), and thusplays a role in the shape of the IR SED (see also Honig &Kishimoto 2010). The effects of changing q on the CLUMPYmodels are easier to see in type 1 objects (low values of i). Forsteep radial distributions (clouds concentrated near the innerradius of the torus) the near- and mid-IR SEDs become redder(see Figure 9 of Nenkova et al. 2008b), although including theAGN contribution always makes the model SEDs flatter. We findthat the fitted values of q for our Seyfert 1s are relatively small.However, the reverse for Seyfert 2s (seen at high inclinations)is not necessarily true. We also note that the sensitivity of the
SED to q for very small values of Y is highly reduced. Thisis because for such small tori the SED does not change muchwhether the clouds are distributed along the whole extent of thetorus (q = 0) or highly concentrated in its inner part (large q).This lack of sensitivity could result in posterior distributionsthat depend on the quality of the interpolation technique usedby BayesClumpy. Consequently, whenever the inferred Y is verysmall (e.g., NGC 1068), the inferred value of q should be treatedwith caution.
For a larger sample and using fits of the SEDs alone, RA11found statistically significant differences of q between type 1sand type 2s. RA11 found that the SEDs of type 1s were fittedwith small values of q, while those of type 2s required larger q.Honig et al. (2010), on the other hand, found the q parameter (|a|,in their notation) to be in the range 0–1.5 for both type 1s and2s. The other torus model parameters, N0 and τV , derived fromthe SED+spectroscopy data will be discussed in the context ofthe fits of the spectral region around the 9.7 μm silicate feature(Section 4.3). For a detailed discussion of the fits to individual
10

The Astrophysical Journal, 736:82 (30pp), 2011 August 1 Alonso-Herrero et al.
(a)
(b)
Figure 6. (a) Model fits for Seyfert 2 galaxies with broad lines detected in the near-IR. Upper left panel: MCG -5-23-16. Model fits are for torus emission alone.All symbols and lines are as in Figure 4. The viewing angle was restricted to a Gaussian distribution centered at i = 55◦ with a 10◦ width (see Section 3.3). Theforeground extinction was fixed to AV (frg) = 7 mag based on results by Veilleux et al. (1997). Upper right panel: NGC 2110. Model fits are for torus+AGN emission.The viewing angle was restricted to a Gaussian distribution centered at i = 40◦ with a 10◦ width (see Section 3.3). Only the SED+spectroscopy fit is shown due tothe limited number of photometric points in the near-IR. The foreground extinction was fixed to AV (frg) = 5 mag (Storchi-Bergmann et al. 1999). Lower left panel:NGC 5506. Model fits are for only for torus emission (see Section 4.2). The viewing angle was restricted to a Gaussian distribution centered at i = 40◦ with a 10◦width (see Section 3.3). The foreground extinction was fixed to AV (frg) = 11 mag (Goodrich et al. 1994). Lower right panel: NGC 7582. Model fits are for torusemission alone. We did not restrict any of the torus model parameters. The foreground extinction was fixed to AV (frg) = 13 mag (Winge et al. 2000). (b) NGC 7674.Model fits are for torus emission alone. We did not restrict any of the torus model parameters. The foreground extinction was fixed to AV (frg) = 5 mag.
(A color version of this figure is available in the online journal.)
11

The Astrophysical Journal, 736:82 (30pp), 2011 August 1 Alonso-Herrero et al.
Figure 7. Marginal posterior distributions of the free parameters that describe the CLUMPY models resulting from fitting the data for IC 4329A The SED alone fitsare shown in orange and the SED+spectroscopy fits are shown in blue. The solid and dashed lines indicate the MAP and median values of the distributions, and theshaded areas are the ±1σ values. We did not use a foreground extinction. The marginal posterior distributions for the rest of the sample are shown in Appendix A.
(A color version of this figure is available in the online journal.)
Table 5Fitted Torus Model Parameters from SED+Spectroscopy Data
Galaxy σtorus (deg) Y N0 q τV i (deg)
Median MAP Median MAP Median MAP Median MAP Median MAP Median MAP
Pure Type 1s
IC 4329A 24+4−4 28 11+6
−4 5 13+2−3 15 0.9+1.2
−0.7 0.0 105+20−20 130 51+8
−8 54
NGC 3227 49+9−6 44 17+3
−3 15 14+1−2 15 0.2+0.1
−0.1 0.1 146+3−6 149 24+11
−15 30
NGC 4151 19+4−2 16 10+1
−1 9 15+0−0 15 0.2+0.3
−0.1 0.0 120+15−14 116 63+4
−7 68
NGC 7469 21+3−3 20 12+2
−1 11 15+0−1 15 0.2+0.3
−0.2 0.0 142+5−9 148 58+3
−4 58
Pure Type 2s
Circinus 58+7−11 45 15+3
−2 15 9+4−1 15 0.7+0.4
−0.4 0.9 56+4−4 54 66+7
−4 61
IC 5063 60+5−7 47 13+8
−6 6 14+1−1 15 2.6+0.2
−1.6 0.8 130+8−19 99 82+5
−9 84
NGC 1068 26+6−4 21 6+2
−1 5 14+1−3 15 2.2+0.4
−0.3 2.0 49+4−3 49 88+2
−3 89
NGC 7172 61+6−8 68 16+5
−3 17 13+1−2 15 1.1+0.4
−0.5 1.5 59+8−6 52 77+8
−14 85
Type 2s with broad lines detected in near-IR
MCG -5-23-16 40+8−5 35 17+7
−5 14 12+2−4 15 2.0+0.3
−0.5 2.1 135+8−9 133 57+8
−8 59
NGC 2110 (+AGN) 64+4−10 70 17+8
−11 5 10+2−2 12 2.7+0.2
−0.2 2.7 147+2−4 150 43+8
−8 37
NGC 5506 43+3−3 40 15+2
−2 15 14+0−1 15 0.4+0.2
−0.2 0.3 100+6−6 99 34+6
−6 35
NGC 7582 48+6−6 49 22+4
−4 25 13+1−3 15 0.3+0.2
−0.2 0.1 89+9−11 97 12+17
−8 0
NGC 7674 28+8−7 24 14+6
−4 12 11+2−3 15 1.6+0.5
−0.8 2.2 137+8−11 148 63+9
−10 69
Note. Torus model parameters are listed for the median and ±1σ values around the median, and the MAP values.
sources and comparison with clumpy torus models fits in theliterature, we refer the reader to Appendix B.
As explained in Section 3.3, the shift applied to scale theCLUMPY models to the data is directly related to the bolometric
luminosity of the AGN. In this work we chose to leave theshift as a free parameter, but other works (e.g., Mor et al.2009) used it as a constraint for the fits. Figure 8 shows acomparison between the fitted AGN bolometric luminosities
12

The Astrophysical Journal, 736:82 (30pp), 2011 August 1 Alonso-Herrero et al.
Figure 8. Comparison between the AGN bolometric luminosities (medianvalues) as derived from the SED+spectroscopy fitting and those from theliterature. The solid line is the 1:1 relation, not a fit. Filled symbols as inFigure 2. For those galaxies with broad lines and high extinctions we show theinferred AGN bolometric luminosities from fits with and without the AGNcomponent. The former are indicated as “(+AGN).” Note that the derivedbolometric luminosities for NGC 2110 with and without the AGN componentare the same.
(A color version of this figure is available in the online journal.)
(Lmodelbol (AGN)) and AGN bolometric luminosities from the
literature. The latter were computed with different methods,including applying bolometric corrections and modeling of theSEDs (see Table 1 and Section 2.1). The typical uncertaintiesof the AGN bolometric luminosities from scaling the CLUMPYmodels are 0.1–0.2 dex. It is clear from this figure that theagreement between the bolometric luminosities is good forthe majority of pure Seyfert 1s and Seyfert 2s, with mostof our estimates within ∼0.4 dex of the 1:1 relation. Theonly exception is the Seyfert 1 NGC 7469. The fitted AGNbolometric luminosity for this galaxy is below two independentliterature estimates (e.g., Woo & Urry 2002; Vasudevan et al.2010). There is strong nuclear (∼0.′′2 ∼ 65 pc) star formationin this galaxy, but it only contributes a small fraction of theK-band luminosity within 0.′′2 (see, e.g., Davies et al. 2007 andreferences therein). However, the ground-based mid-IR nuclearspectrum of this galaxy (Honig et al. 2010) show faint 11.3 μmPAH emission, and the PAH emission becomes very prominentin the circumnuclear regions (Roche et al. 1991). It is then likelythat the mid-IR nuclear fluxes and spectroscopy of NGC 7469contain a contribution from star formation. A similar situationmay be the case for NGC 3227.
4.2. Fits to Seyfert 2s with Near-IR Broad Lines
Four galaxies in our sample are classified as Seyfert 2s, butthere are also reports in the literature of detections of broadlines in the near-IR (see Table 1 for references). Additionally,NGC 5506 has different spectral classifications in the literatureand there is some controversy about whether it has broadcomponents of the near-IR emission lines (Blanco et al. 1990;Ruiz et al. 1994: Goodrich et al. 1994; Veilleux et al. 1997).
Nagar et al. (2002) clearly detected BLR emission in the near-IR and classified NGC 5506 as a narrow-line Seyfert 1 (NLSy1).Given these facts we discuss NGC 5506 in this section.
As the near-IR data suggest, for this kind of galaxies we mayhave a direct view of the BLR, and thus in principle we shouldinclude the AGN component when modeling the data. However,some of these galaxies also tend to suffer from relatively highvalues of foreground extinction (Table 4). For these Seyfertswe performed the fits with and without the AGN components.In this section, we use other observational properties of thesegalaxies to determine whether the AGN component should beincluded or not for fitting their SED+spectroscopy data.
In Section 4.1, we showed that the model fits for pure Seyfert1s and 2s provided good constraints to the AGN bolometricluminosity. We can then use the comparison between the fittedAGN luminosity and those taken from the literature to determinewhether we need to add the AGN component. Figure 8 suggeststhat for NGC 5506, NGC 7582, NGC 7674, and MCG -5-23-16we do not need to add the AGN component. For NGC 2110 weobtained comparable bolometric luminosities (and other torusmodel parameters) with and without the AGN component. Thisis probably due to the lack of photometric points in the near-IRfor this galaxy. Finally, we note that when we included the AGNcomponent to fit the SED+spectroscopy data of NGC 5506 wecould not fit the data with the viewing angles inferred fromX-ray data (Section 3.2). This is in agreement with the luminos-ity comparison.
The fits of the Seyfert 2s with broad lines detected in thenear-IR are shown in Figure 6, while the marginal posteriordistributions are displayed in Appendix A (Figures A8–A12).For the three galaxies with moderate silicate features(MCG -5-23-16, NGC 2110, and NGC 7674; see Table 4) we areable to reproduce reasonably well the photometric SED pointsand the mid-IR spectroscopy, and the torus model parameters aremostly well constrained. As for the pure Seyfert 2 NGC 7172, thetwo galaxies with relatively deep silicate features in absorption(NGC 5506 and NGC 7582), it is possible to do a simultaneousfit of the photometry and mid-IR spectroscopy, although it isnot a good fit. Imanishi (2000) measured an unusual ratio be-tween the depths of the 3.4 μm carbonaceous dust absorptionand the 9.7 μm silicate dust in NGC 5506. He suggested thatthe obscuration toward the nucleus of NGC 5506 could be as-cribed mostly to dust in this host galaxy (>100 pc scale) andnot to the obscuring torus. This may also reflect differences ingrain populations (see Roche et al. 2007). The X-ray emissionof NGC 7582 indicates the presence of at least two absorbersof columns densities of ∼1024 cm−2 and (4–5) × 1022 cm−2,with the latter probably associated with large-scale obscuration(Bianchi et al. 2009).
4.3. Fits to the Silicate Feature
The insets of the upper panels of Figures 4–6 show in detailthe fits in the spectral region around the 9.7 μm silicate feature.For NGC 1068 we also show in Figure 5 the fit to the Q-bandspectrum. It is clear that the interpolated version of the Nenkovaet al. (2008a, 2008b) clumpy torus models produce excellentfits to the N-band silicate feature, and the ∼20 μm spectrumof NGC 1068. In particular for galaxies with low host galaxyextinctions and moderate silicate strengths (S9.7 > −1), the fitsto the silicate feature spectral region are also compatible withthose to the SED photometric points. This suggests that thedata mostly correspond to the torus emission. These galaxiesare all the pure Seyfert 1s (IC 4329A, NGC 3227, NGC 4151,
13

The Astrophysical Journal, 736:82 (30pp), 2011 August 1 Alonso-Herrero et al.
and NGC 7469), and NGC 1068, IC 5063, MCG -5-23-16, andNGC 7674.
We now discuss the fits of those galaxies with deep silicatefeatures. For the Circinus galaxy, which has a relatively deepsilicate feature (S9.7 = −1.8/−2.4; Roche et al. 2007; Table 4),CLUMPY torus models with the parameters given in Table 5 plusa foreground absorbing screen with AV (frg) = 9 mag reproducereasonably well the silicate feature and the photometric SED,except for the 18.3 μm flux. For the other galaxies (NGC 5506,NGC 7172, and NGC 7582), although the fits to the featureare qualitatively good, the models do not reproduce at thesame time all the photometric points. One possibility for thesethree galaxies is that there is an important contamination fromextended dust structures, while in Circinus, the closest galaxyin our sample (d = 4 Mpc) this contamination is minimized.
Nenkova et al. (2008b) emphasized that the clumpy torusdistributions produce more elaborate patterns of the 9.7 μm andthe 18 μm silicate features (see also Honig & Kishimoto 2010),while for smooth density models the silicate feature is alwaysin emission for face-on views and in absorption for edge-onviews. Besides, the CLUMPY torus models never produce verydeep silicate features, in contrast with smooth density models(e.g., Pier & Krolik 1993; Efstathiou & Rowan-Robinson 1995).When fitted together with the photometric SEDs we expect thesilicate feature to be mostly sensitive to the optical depth ofthe clouds τV , and the average number of clouds along radialequatorial rays N0. As an illustration of the complicated behaviorof the silicate feature in terms of the torus model parameters, wecan see that galaxies of the same type and with similar apparentdepths of the 9.7 μm silicate feature (e.g., type 1s IC 4329A andNGC 7469, and type 2s MCG -5-23-16 and IC 5063, see Honiget al. 2010) have different fitted values of N0 and τV (see Table 5and Appendix A).
A general result for our sample of Seyfert galaxies is thatthe average number of clouds along radial equatorial rays isnever very low, and is in the range N0 = 8–15. This is in goodagreement with the results of Nenkova et al. (2008b). However,Honig et al. (2010) inferred fewer clouds along equatorial raysfrom their fits to the mid-IR spectroscopy of Seyfert galaxies,but we note these authors fixed the value of σtorus, among otherparameters (see Appendix B for a more detailed discussion). Wealso note here, that the values of the optical depth of the cloudsτV in the corrected version of the models (see Nenkova et al.2010) only go up to 150, whereas the older version were up to200. In some cases (e.g., NGC 3227, NGC 7469) it appears as ifto compensate for limited values of τV , the fits are achieved withmore clouds along radial equatorial rays, close to the maximumvalue allowed by the models of N0 = 15.
While for most Seyferts in our sample CLUMPY torus modelswith a typical value of N0 = 12 produced good fits to the data,the Spitzer/IRS spectra of PG quasars were well fitted withtorus models containing a mean value of N0 = 5 (Mor et al.2009). This is well understood because most PG quasars showthe 9.7 μm silicate feature in emission (Shi et al. 2006; Haoet al. 2007), and the Nenkova et al. clumpy torus models withσtorus � 30◦ and N0 � 10 almost always produce the featurein absorption, for all viewing angles (see also discussions byNenkova et al. 2008b and Nikutta et al. 2009).
The optical depths of our sample of Seyferts show a broaddistribution, τV ∼ 50–150, with no obvious dependence onother torus model parameters or AGN type (see also Mor et al.2009). This result may be understood because the CLUMPYmodel near- and mid-IR SEDs and the strength of silicate feature
vary only slightly with varying i for a given set of N0 and σtorus,at τV > 100 (see Nenkova et al. 2008b). The IR data of the PGquasars studied by Mor et al. (2009) were fitted with τV � 100(Mor et al. 2009).
4.4. Comparison with Fits of SEDs Alone
In Figures 4–6, we also compare the fits done withSED+spectroscopy (blue lines and blue shaded regions) andSEDs alone (orange lines and orange shaded regions), exceptin cases of sparse SEDs. Some of our galaxies are in com-mon with the works of Ramos Almeida et al. (2009b, 2011).We have redone the SED alone fits for those galaxies to useconsistent errors with our work. In general we find that themain difference is that fits to SEDs alone tend to infer broaderprobability distributions of these torus model parameters (seeAppendix A). In particular, for galaxies with low foregroundextinctions the fits with SEDs alone produce compatible values(within the ±1σ values of the probability distributions) of σtorus,Y, and i when compared to the fits with SED+spectroscopy.
Most disagreements in the fitted parameters tend to occurfor N0, q, and τV . Some of these differences are explicable.For instance, N0 and q may trade off to yield an approximatelyconstant number of clouds in the inner region. Also, the opticaldepth of the individual clouds τV and the average number ofclouds along an equatorial ray N0 have a strong influence onthe depth of the 9.7 μm silicate feature and the shape of the∼8–13 μm emission. Note also that the SED alone fits of somepure type 1 Seyferts always tend to produce the 9.7 μm silicatefeature in emission (see Figure 4), while the observations showan almost featureless spectrum (IC 4329A, NGC 3227) or thefeature slightly in emission (NGC 4151). For the Seyfert 2s withlow host galaxy foreground extinction there is a better agreementfor these two parameters between fits with and without mid-IRspectroscopy.
The other important fact to note is that including mid-IR spectroscopy helps assess whether there is an importantcontribution from extended dust structures causing absorption(and possibly emission too). This is clearly the case for Circinus,NGC 5506, NGC 7172, and NGC 7582, which have relativelydeep silicate features. Indeed, the fits to the SEDs alone ofSeyfert 2s of RA09, which were done without foregroundextinction, only predicted moderately deep silicate featuresfor these galaxies. However, we reiterate that it is not alwayspossible to produced good simultaneous fits to the SEDs andspectroscopy of Seyferts with deep silicate features even whenthe host galaxy foreground extinction is included. It is possiblethat for the Seyfert galaxies with the deepest silicate featuresa clumpy medium in a torus-like configuration may not beappropriate to explain the observations (see, e.g., Levenson et al.2007).
5. PROPERTIES OF THE TORUS AND AGN
5.1. Torus Size and Angular Width
In this section, we discuss the two torus model parametersthat can be compared with observations, the torus size, and theangular width.
For each AGN, using the Y parameter, the bolometric lumi-nosity of the system derived from the fits, and Equation (1) wecomputed the physical radius rtorus of the torus. We used themedian value of the fitted torus radial thickness Y and AGNbolometric luminosity. As can be seen from Table 6, the torusradii derived from our fits to the SED+spectroscopy are between
14

The Astrophysical Journal, 736:82 (30pp), 2011 August 1 Alonso-Herrero et al.
Table 6AGN and Torus Model Properties Derived from the Fits
Galaxy Lmodelbol (AGN) rtorus Pesc Covering Factors
(erg s−1) (pc) (%) f (i) f2
Pure Type 1s
IC 4329A 44.6 2.7 41.8+43.8−27.3 0.80+0.22
−0.22 0.24+0.11−0.08
NGC 3227 43.0 0.7 11.6+8.8−4.9 1.36+0.06
−0.10 0.86+0.07−0.12
NGC 4151 43.7 0.9 15.7+13.1−8.2 0.46+0.22
−0.10 0.16+0.08−0.04
NGC 7469 44.5 2.6 27.8+17.3−11.5 0.61+0.14
−0.11 0.20+0.06−0.05
Pure Type 2s
Circinus 43.5 1.0 0.07+0.06−0.06 0.85+0.05
−0.09 0.89+0.04−0.10
IC 5063 44.3 2.4 0.0002+0.0005−0.0001 0.85+0.04
−0.10 0.96+0.02−0.07
NGC 1068 44.8 2.0 0.0001+0.0010−0.0001 0.32+0.11
−0.07 0.30+0.11−0.08
NGC 7172 44.0 2.0 0.001+0.01−0.001 0.85+0.10
−0.13 0.93+0.05−0.11
Type 2s with near-IR broad lines
MCG -5-23-16 44.1 2.3 0.4+1.3−0.3 0.80+0.19
−0.19 0.63+0.11−0.14
NGC 2110 (+AGN) 43.3 1.0 0.4+0.8−0.3 1.00+0.06
−0.06 0.94+0.04−0.11
NGC 5506 44.0 1.9 8.6+5.1−3.7 1.30+0.08
−0.10 0.72+0.07−0.07
NGC 7582 43.5 1.5 36.8+15.1−15.8 1.62+0.11
−0.20 0.83+0.06−0.14
NGC 7674 45.1 6.1 1.8+4.3−1.5 0.61+0.25
−0.24 0.36+0.15−0.14
Note. Lmodelbol (AGN) and rtorus were derived from the median values of the marginal posterior distributions.
rtorus ∼ 1 and 6 pc. Our fitted physical sizes are consistent withthe mid-IR interferometric results that the torus is relativelycompact (Tristram et al. 2007, 2009; Burtscher et al. 2009; Ra-ban et al. 2009).
Before we compare the torus radii with the 12 μm sizes in-ferred from mid-IR interferometric observations, it is necessaryto discuss some caveats. First, the modeling of the 12 μm in-terferometric observations requires structures on different phys-ical scales, as demonstrated for Circinus and NGC 1068 (seeTristram et al. 2007, 2009; Raban et al. 2009, and Table 1).However, the FWHM sizes of the cooler, more extended com-ponent could still be compared with model predictions. Second,Nenkova et al. (2008b) showed that for tori with Y = 10–30and various viewing angles, at 12 μm ∼60%–75% of the totalflux is enclosed within angular radii of θ ∼ 2–5θd. Here, θd isthe angular size at the inner radius of the torus. This is becausethe 12 μm emission traces warm dust, with T � 200 K, andis rather insensitive to cooler material further from the nuclei.Finally, the compact dusty torus is expected to blend into thegalaxy disk (e.g., Shi et al. 2006; Packham et al. 2007; Nenkovaet al. 2008b), and thus deriving the true size of the torus mightnot be straightforward.
With these considerations in mind, we can compare thesizes derived from the modeling of the 12 μm interferometricdata may not be appropriate. However, values of Y largerthan the 12 μm sizes from interferometric observations are anecessary, although not sufficient, condition for consistencybetween our modeling and the interferometric results. There areestimates of the 12 μm physical size of the torus through mid-IR interferometry for six galaxies in our sample (see Table 1for sizes and corresponding references). We find a relativelygood agreement, within a factor of two, between the fittedtorus sizes17 and the sizes inferred from mid-IR interferometry.The galaxy with the largest discrepancy is NGC 7469. Tristram
17 For comparison with the 12 μm sizes (FWHM) from mid-IR interferometricobservations, the rtorus values given in Table 6 need to be multiplied by two.
et al. (2009) inferred s12μm = 10.5 pc, whereas our fitted torussize is about 5 pc. We note, however, that the interferometricobservations of NGC 7469 were affected by large uncertaintiesin the determination of the total flux that may have compromisedthe derived physical size of the torus of this galaxy.
The torus model width of the angular distribution of theclouds, σtorus, is related to the opening angle of the ionizationcones, Θcone. The latter can be measured from emission lineimages, usually [O iii]λ5007 and/or Hα. Table 1 gives themeasured opening angles (measured from the polar direction)for our sample and corresponding references. It is important tonote that this comparison is not straightforward because therelation between the true opening angle of the cone andthe measured opening angle from line emission depends onthe gas distribution. For thin gas disks, Mulchaey et al. (1996)simulations showed that cone-shaped emission can be producedfor most viewing angles and that the observed angles areless than the true opening angle. We can try to make thiscomparison for galaxies with the observed widest ionizationcones, for which we can set more meaningful upper limits to thewidths of the torus. For the two galaxies with Θcone ∼ 100◦(NGC 5506 and NGC 7582, Table 1) the fitted σtorus arecompatible with the approximate limits set by the observations(σobs � 40◦–50◦). Note, however, the difficulties encounteredfor fitting the observations of these galaxies (Section 4.2).
5.2. AGN Escape Probability
One of most salient properties of the clumpy torus modelsis that there is always a finite probability for an obscured viewof the AGN, irrespective of the viewing angle (Nenkova et al.2008a, 2008b). In the simplest version of the unified model,type 1s would be observed in directions closer to the pole of thetorus (low values of i) than type 2s, but in a clumpy mediumthis is not necessarily so. Indeed, it is possible to have a type1 viewed at a relatively high i provided that the width of theangular size of the torus is small (for a given N0), as is the
15

The Astrophysical Journal, 736:82 (30pp), 2011 August 1 Alonso-Herrero et al.
Figure 9. Width of the torus σtorus vs. the complementary to the viewing angle β = 90 − i. We plot the median and the ±1σ values of the probability distributions ofthe fitted values. The dashed lines are lines of constant AGN escape probabilities Pesc (Equation (3)) for an average number of clouds along the radial equatorial raysof N0 = 12, which is representative of our sample (see Section 4.3). Filled symbols as in Figure 2.
(A color version of this figure is available in the online journal.)
case for NGC 4151 and IC 4329A. Note that two-dimensionalposterior distributions of these two galaxies show that the fittedvalues of i and σtorus are inversely correlated (Figures B3 and B4in Appendix B). Seyfert 2s can also be viewed from any angle, aslong as there is at least one cloud along the LOS. The probabilityof encountering a cloud is higher for increasing values of σtorus,N0, and i. The fact that not all type 2s in our sample requirevery broad angular distributions (large σtorus, e.g., NGC 1068in Figure 9), suggests that N0 and i must be high in thosecases. In Figure 9, the error bars reflect the ±1σ uncertaintyaround the median of the probability distributions of the fittedparameters.
A more relevant quantity for an AGN to be classified as a type1 or a type 2 is the probability for an AGN-produced photon toescape unabsorbed (Equation (3)). Since the escape probabilityis a highly nonlinear function of N0, i, and σtorus, we took fulladvantage of our Bayesian approach. We thus generated theposterior distributions for Pesc from the posterior distributionsof the relevant fitted parameters given in Table 5. As can be seenfrom the values in Table 6, all pure type 1s and type 2s haverespectively, relatively high (∼12%–44%) and low (�0.1%)AGN escape probabilities, as expected. The type 2 Seyfertswith broad lines detected in the near-IR show a range of escapeprobabilities. We note that these probabilities do not include theeffects of foreground extinction.
5.3. Covering Factors and a Receding Torus?
Observational (e.g., Simpson 2005) and theoretical (e.g.,Honig & Beckert 2007) arguments provide evidence of the so-
called receding torus (Lawrence 1991). In this scenario, thehigher fraction of type 1 AGNs at high AGN luminositiesis explained in terms of a decreasing covering factor of thetorus. Furthermore, Honig & Beckert (2007) and Nenkova et al.(2008b) argued that the decreasing fraction of type 2s at highluminosities not only arises from decreasing σtorus, but also fromdecreasing N0, or both.
In this work we calculated two different covering factorsusing our Bayesian approach. The first one is the geometricalcovering factor f2, which does not depend on the viewingangle, and is derived by integrating the AGN escape probability(Equation (3)) over all angles as put forward by Mor et al.(2009). If we define β = π/2 − i, then
f2 = 1 −∫ π/2
0Pesc(β) cos(β)dβ. (4)
A related quantity is the ratio between the torus luminosityintegrated over the entire wavelength range covered by thetorus models (∼0.2–700 μm) and the inferred AGN bolometricluminosity:
f (i) = Ltorus(i)
Lmodelbol (AGN)
. (5)
This ratio is the apparent covering factor (see Mor et al. 2009),because it depends on the viewing angle i (as well as on σtorusand N0), and can be understood as a reprocessing efficiency. Aswe did for Pesc, we generated the posterior distributions for f2and f (i) from the posterior distributions of the relevant fittedparameters given in Table 5. The median values and the ±1σ
16

The Astrophysical Journal, 736:82 (30pp), 2011 August 1 Alonso-Herrero et al.
Figure 10. AGN bolometric luminosities vs. the torus geometrical covering factor f2 (left panel) and AGN bolometric luminosities vs. the angular width of the clouddistribution of the torus σtorus (right panel). The quantities for our sample of Seyferts were derived from the SED+spectroscopy fits (filled symbols, as in Figure 2).The plotted uncertainties for f2 and σtorus are the ±1σ values of the posterior distributions of the fitted parameters. Also plotted are PG quasars (star-like symbols), forwhich Mor et al. (2009) derived the torus f2 and σtorus using the Nenkova et al. (2008b) models. The bolometric luminosities of the PG quasars are derived from theoptical luminosities (see Mor et al. 2009 for details).
(A color version of this figure is available in the online journal.)
values of the distributions of the geometrical covering factor andreprocessing efficiencies of our sample of Seyferts are given inTable 6.
The galaxies in our sample show a range of reprocessing effi-ciencies, although in general there is no clear dependency withany torus model parameters. In contrast, the torus geometricalcovering factor f2 appears to depend on the AGN bolometricluminosity, as can be seen from Figure 10 (left panel). We alsoincluded in this comparison high-luminosity AGNs. These arePG quasars, for which Mor et al. (2009) computed the torusf2 from N0 and σtorus as inferred from fits to Spitzer/IRS spec-troscopy. We note that these authors also used the Nenkova et al.(2008a, 2008b) torus models, but added extra components to fittheir data (see Section 4.1). Mor et al. (2009) calculated thePG quasars AGN bolometric luminosities using the observedoptical luminosities (see Mor et al. 2009 for more details). Forour sample of Seyfert galaxies the uncertainties in f2 take intoaccount the ±1σ values around the median of the probabilitydistribution of σtorus. When combining the PG quasars of Moret al. (2009) and our sample of Seyferts, there is a tendencyfor the torus covering factor f2 to decrease from f2 ∼ 0.9–1 atlow AGN luminosities (1043–1044 erg s−1) to f2 ∼ 0.1–0.3 athigh luminosities (�1045 erg s−1). Such tendency for the toruscovering factor to decrease with the bolometric luminosity ofthe AGN was already noted for PG quasars by Mor et al. (2009)when including an additional hot blackbody component to fittheir data.
A similar trend may also be present when comparing σtorusversus Lmodel
bol (AGN), with high-luminosity AGNs having nar-rower cloud angular distributions (Figure 10, right panel) thanlow-luminosity ones. We also found in Section 4 that on av-erage Seyfert galaxies (with bolometric luminosities in therange 1043–1045 erg s−1) are fitted with more clouds along aradial equatorial ray than PG quasars (bolometric luminosities�1045 erg s−1). Given these trends, it is not surprising that thetorus geometrical covering factor f2, which depends on both N0and σtorus, tends to be lower in the most luminous objects in oursample than in the less luminous ones.
The decreased torus covering factor at high AGN luminositiesmay provide some support for a receding torus at high luminosi-ties. We note, however, that in these comparisons there are fewtype 2 objects at high AGN luminosities, so we cannot ruleout a possible dependency of σtorus with the AGN type. Thatis, type 2s might have wider tori than type 1s as suggested bythe results of RA11. Finally a note of caution. A large fractionof the low-luminosity AGNs in our sample with wide angularcloud distributions are in highly inclined galaxies. Therefore,we cannot exclude the possibility that contamination from ex-tended dust features not directly related to the dusty torus hasresulted in large fitted values of σtorus. Finally, as we explainedin Section 2.1, our sample is not complete, and may not berepresentative, and thus this result needs to be explored for acomplete sample.
6. SUMMARY AND CONCLUSIONS
This is the third paper in a series performing detailed fits tothe unresolved IR emission of AGNs using the clumpy torusmodels of Nenkova et al. (2008b). In the first two papers of theseries (RA09 and RA11) we fitted only the photometric SEDs,while in this paper we also included high angular resolution(0.′′3–0.′′4) ground-based mid-IR spectroscopy. The sample inthis work is composed of 13 nearby (at a median distanceof 31 Mpc) Seyfert galaxies with bolometric luminositiesLbol(AGN) ∼ 1043–1045 erg s−1. The sample contains pure type1 and type 2 Seyferts, as well as Seyfert 2s with broad linesdetected in the near-IR. The galaxies also span a range in theobserved strength of the 9.7 μm silicate feature, going from mildemission to deep absorption, and in X-ray column densities,from Compton thin to Compton thick objects.
We compiled near- and mid-IR imaging and spectroscopydata taken with high angular resolution (∼0.′′3–0.′′8). We alsopresented new ground-based mid-IR spectroscopic observationsin the N-band of NGC 4151 and in the Q-band of NGC 1068. Wehave used an interpolated version of the clumpy torus models ofNenkova et al. (2008a, 2008b, 2010) and a Bayesian approach
17

The Astrophysical Journal, 736:82 (30pp), 2011 August 1 Alonso-Herrero et al.
to fit together the photometric SEDs and mid-IR spectroscopy.The fits provided the probability distributions for the six torusmodel parameters that describe the CLUMPY models (seeTable 3), plus the AGN bolometric luminosity. We included theeffects of foreground extinction in the host galaxy for galaxieswith evidence of extended dust structures and AV (frg) �5 mag. When compared to fits done using SEDs alone, the fitsto the SED+spectroscopy data result in smaller uncertainties(narrower probability distributions) for the angular distributionof the clouds σtorus, torus radial thickness Y, and viewingangle i.
The interpolated version of the Nenkova et al. (2008a, 2008b,2010) clumpy torus models provided good fits to the photo-metric SEDs and mid-IR spectroscopy of our sample, and inparticular for those Seyfert galaxies with low or moderate fore-ground extinctions (AV (frg) � 5–10 mag). For three AGNs withrelatively deep 9.7 μm silicate features and hosted in inclinedgalaxies with prominent dust lanes (NGC 5506, NGC 7172, andNGC 7582), we were not able to fit simultaneously the pho-tometric SEDs and mid-IR spectroscopy. These three galaxiesshow evidence of extended dust structures on scales of tens ofparsecs, not directly related to the dusty torus. In contrast, wewere able to fit reasonably well the data of Circinus. One possi-bility is that because Circinus is the closest galaxy in our sample(distance of 4 Mpc), the contamination by extended dusty struc-tures is reduced.
CLUMPY models with small tori (torus radial thickness in therange Y ∼ 10–15) provided adequate fits to the data. Combiningthe modeled AGN bolometric luminosities and the values of Y,we inferred that the physical radii of the tori of Seyfert galaxiesare between ∼1 pc and 6 pc. For the six galaxies in our samplewith 12 μm sizes derived in the literature from the modelingof mid-IR interferometric observations, we found a reasonablygood agreement.
The Nenkova et al. (2008b) models were also able to producegood fits to mid-IR high angular resolution spectroscopy, interms of the shape of the silicate feature and continuum slope andnot only the apparent strength of the feature. When combinedwith the photometric SEDs, the mid-IR spectroscopy allowedus to constrain the number of clouds along radial equatorial raysN0 and the optical depth of the individual clouds τV . We findthat the tori of Seyfert galaxies have typically N0 ∼ 8–15, andthe optical depth of the clouds are in the range τV = 50–150. Bycomparison, the tori of PG quasars (Lbol(AGN) > 1045 erg s−1)appear to contain fewer clouds along radial equatorial rays,typically N0 ∼ 5, with optical depths of τV � 100 (Mor et al.2009).
From the scaling of the models to the data, we derived theAGN bolometric luminosities, which were in good agreementwith those derived with other methods in the literature. As alsofound by RA11, the viewing angle i is not the only parametercontrolling the classification of a galaxy into type 1 or type 2.For instance, type 2s tend to be viewed at directions closer to theequatorial plane of the torus, but small values of i are permittedas long as there is one cloud along the LOS. This is because inclumpy media, there is always a finite probability for an AGNphoton to escape absorption, and this probability is a function ofi, σtorus, and N0. From our fits, we found that this probability isrelatively high in type 1s (Pesc ∼ 12%–42%), while it is foundto be low in pure type 2s (Pesc � 0.1%).
We finally discussed the possibility of a receding torus.We compared the results for our sample of relatively low-luminosity AGNs with those of the PG quasars analyzed by
Mor et al. (2009). Both samples combined together span arange of Lbol(AGN) ∼ 1043–1047 erg s−1. We found that high-luminosity AGNs (Lbol(AGN) � 1045 erg s−1) tend to havelower torus covering factors (f2 ∼ 0.1–0.3) because they havenarrower tori (smaller σtorus) and contain fewer clouds alongradial equatorial rays N0. In contrast lower luminosity ones(at Lbol(AGN) ∼ 1043–1044 erg s−1) tend to have high coveringfactors (f2 ∼ 0.9–1). This might explain the decreased observedfraction of type 2 AGNs at high luminosities. We note, however,that this result may be subject to some caveats. In particular,most of the AGNs in our sample at the low end of Lbol(AGN)are hosted in highly inclined galaxies, and it is possible thatcontamination by extended dust components not related to thedusty torus results in larger fitted values of σtorus. Also, asdiscussed in Section 2.1, our sample is not complete, and inparticular there are very few type 2s at high AGN luminosities.Therefore, our results need to be explored further, and to this endwe have been allocated time on the Gran Telescopio Canariaswith the mid-IR instrument CanariCam (Telesco et al. 2003) fora large mid-IR survey of AGNs (Levenson et al. 2008).
We thank an anonymous referee for scientific suggestionsthat helped improve the paper. We are very grateful to Sebas-tian Honig and Konrad Tristram for making their ground-basedmid-IR spectroscopy available to us and for enlightening discus-sions. A.A.-H. thanks the Astrophysics Department at OxfordUniversity, where most of this research was conducted, for theirwarm hospitality.
A.A.-H. acknowledges support from the Spanish Plan Na-cional del Espacio under grant ESP2007-65475-C02-01 andPlan Nacional de Astronomıa y Astrofısica under grantAYA2009-05705-E. C.R.A. and J.M.R.E. acknowledge theSpanish Ministry of Science and Innovation (MICINN)through Consolider-Ingenio 2010 Program grant CSD2006-00070: First Science with the GTC (http://www.iac.es/consolider-ingenio-gtc/). C.R.A. acknowledges financialsupport from STFC PDRA (ST/G001758/1). A.A.R. acknowl-edges financial support from AYA2010-18029 (Solar Mag-netism and Astrophysical Spectropolarimetry) and Consolider-Ingenio 2010 CSD2009-00038. C.P. acknowledges the NationalScience Foundation under grant number 0904421.
This work is based on observations obtained at the Gem-ini Observatory, which is operated by the Association of Uni-versities for Research in Astronomy, Inc., under a cooperativeagreement with the NSF on behalf of the Gemini partnership:the National Science Foundation (United States), the Scienceand Technology Facilities Council (United Kingdom), the Na-tional Research Council (Canada), CONICYT (Chile), the Aus-tralian Research Council (Australia), Ministerio da Ciencia eTecnologia (Brazil), and Ministerio de Ciencia, Tecnologıa eInnovacion Productiva (Argentina).
This research has made use of the NASA/IPAC ExtragalacticDatabase (NED) which is operated by the Jet PropulsionLaboratory, California Institute of Technology, under contractwith the National Aeronautics and Space Administration.
APPENDIX A
MARGINAL POSTERIOR DISTRIBUTIONS
In Figures A1–A12 we present the marginal posterior distri-butions of the fits to the SED+spectroscopy and SED alone forall the galaxies in the sample except for IC 4329A, which isshown in Figure 7.
18

The Astrophysical Journal, 736:82 (30pp), 2011 August 1 Alonso-Herrero et al.
Figure A1. Marginal posterior distributions of the free parameters that describe the CLUMPY models resulting from fitting the data for NGC 3227. The SED alonefits are shown in orange and the SED+spectroscopy fits are shown in blue. The solid and dashed lines indicate the MAP and median values of the distributions, andthe shaded areas are the ±1σ values. We did not use a foreground extinction.
(A color version of this figure is available in the online journal.)
Figure A2. Same as Figure A1 but for NGC 4151.
(A color version of this figure is available in the online journal.)
19

The Astrophysical Journal, 736:82 (30pp), 2011 August 1 Alonso-Herrero et al.
Figure A3. Same as Figure A1 but for NGC 7469.
(A color version of this figure is available in the online journal.)
Figure A4. Same as Figure A1 but for Circinus. We fixed the foreground extinction to AV (frg) = 9 mag (Maiolino et al. 2000). We restricted the viewing angle to therange i = 60◦–90◦.
(A color version of this figure is available in the online journal.)
20
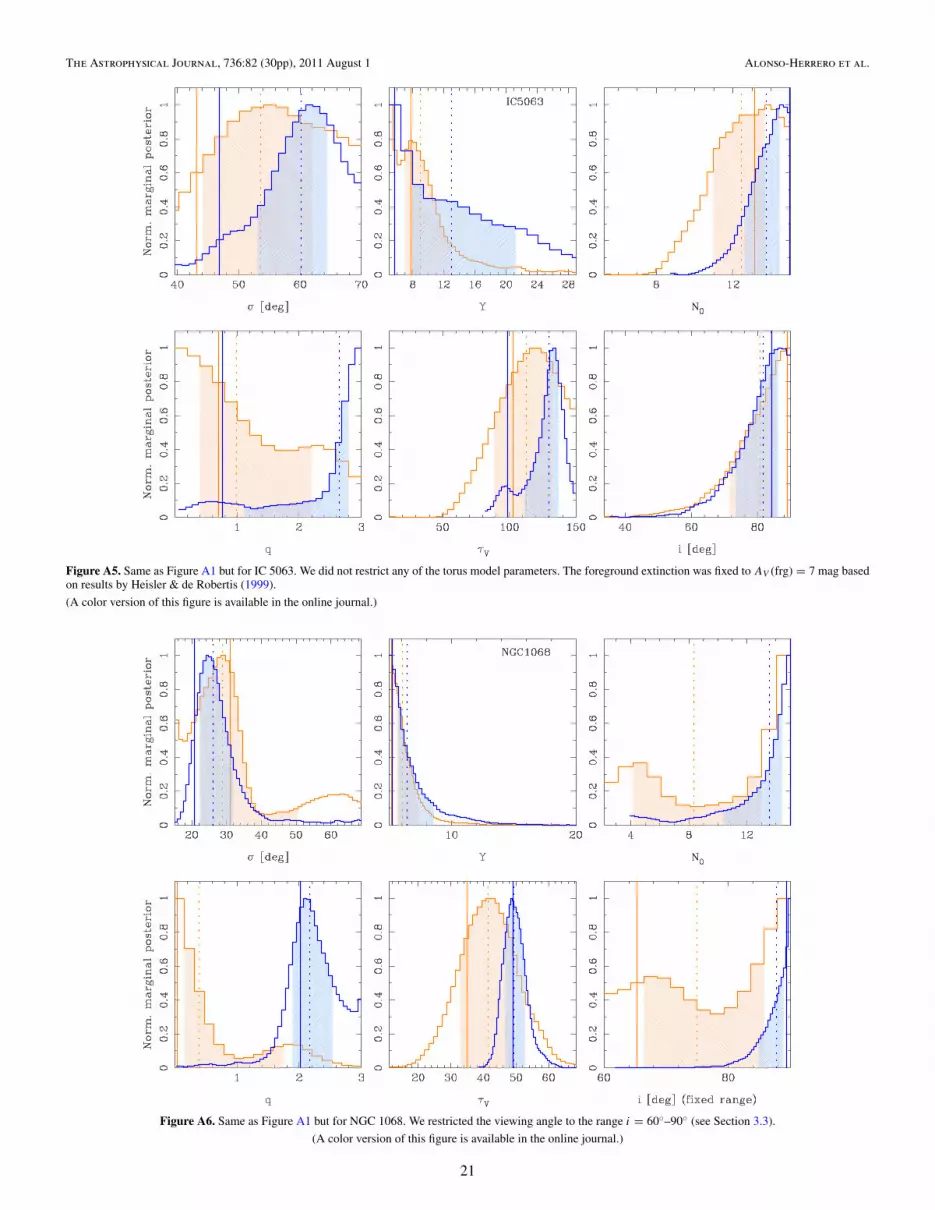
The Astrophysical Journal, 736:82 (30pp), 2011 August 1 Alonso-Herrero et al.
Figure A5. Same as Figure A1 but for IC 5063. We did not restrict any of the torus model parameters. The foreground extinction was fixed to AV (frg) = 7 mag basedon results by Heisler & de Robertis (1999).
(A color version of this figure is available in the online journal.)
Figure A6. Same as Figure A1 but for NGC 1068. We restricted the viewing angle to the range i = 60◦–90◦ (see Section 3.3).
(A color version of this figure is available in the online journal.)
21

The Astrophysical Journal, 736:82 (30pp), 2011 August 1 Alonso-Herrero et al.
Figure A7. Same as Figure A1 but for NGC 7172. Only the SED+spectroscopy fit is shown due to the limited number of photometric points in the near-IR. We didnot restrict any of the torus model parameters. The foreground extinction was fixed to AV (frg) = 40 mag.
(A color version of this figure is available in the online journal.)
Figure A8. Same as Figure A1 but for MCG -5-23-16. The viewing angle was restricted to a Gaussian distribution centered at i = 55◦ with a 10◦ width (seeSection 3.3). The foreground extinction was fixed to AV (frg) = 7 mag based on results by Veilleux et al. (1997).
(A color version of this figure is available in the online journal.)
22

The Astrophysical Journal, 736:82 (30pp), 2011 August 1 Alonso-Herrero et al.
Figure A9. Same as Figure A1 but for NGC 2110. The viewing angle was restricted to a Gaussian distribution centered at i = 40◦ with a 10◦ width (see Section 3.3).Only the SED+spectroscopy fit is shown due to the limited number of photometric points in the near-IR. The foreground extinction was fixed to AV (frg) = 5 mag(Storchi-Bergmann et al. 1999).
(A color version of this figure is available in the online journal.)
Figure A10. Same as Figure A1 but for NGC 5506. The viewing angle was restricted to a Gaussian distribution centered at i = 40◦ with a 10◦ width (see Section 3.3).The foreground extinction was fixed to AV (frg) = 11 mag (Goodrich et al. 1994).
(A color version of this figure is available in the online journal.)
23

The Astrophysical Journal, 736:82 (30pp), 2011 August 1 Alonso-Herrero et al.
Figure A11. Same as Figure A1 but for NGC 7582. We did not restrict any of the torus model parameters. The foreground extinction was fixed to AV (frg) = 13 mag(Winge et al. 2000).
(A color version of this figure is available in the online journal.)
Figure A12. Same as Figure A1 but for NGC 7674. Model fits are for torus emission alone. We did not restrict any of the torus model parameters. The foregroundextinction was fixed to AV (frg) = 5 mag.
(A color version of this figure is available in the online journal.)
24

The Astrophysical Journal, 736:82 (30pp), 2011 August 1 Alonso-Herrero et al.
Figure B1. Circinus. Two-dimensional marginal posterior distributions (joint distributions) for all combinations of the six torus model parameters for theSED+spectroscopy fit. The contours indicate the regions at 68% (solid lines) and 95% (dashed lines) confidence levels. See Asensio Ramos & Ramos Almeida(2009) for more details.
APPENDIX B
NOTES ON INDIVIDUAL SOURCES
In this appendix, we discuss in detail the fits to individualsources and compare them with similar fits done in the literature
with clumpy dusty torus models. We also show in Figures B1–B4the two-dimensional marginal distributions of four selectedsources: Circinus, NGC 1068, NGC 4151, and IC 4239A. Inthese figures, the contours indicate the 68% and 95% confidenceregions. These two-dimensional distributions can be used to
25

The Astrophysical Journal, 736:82 (30pp), 2011 August 1 Alonso-Herrero et al.
Figure B2. As Figure B1 but for NGC 1068.
assess whether or not certain torus model parameters arecorrelated.
Circinus. Circinus is a Seyfert 2 galaxy located at a distance of4 Mpc. The water maser observations of this galaxy (Greenhill
et al. 2003) trace a warped edge-on disk, thus indicating that thetorus is seen at a high inclination. We then used the viewingangle as a prior for our fits and restricted it to the rangei = 60◦–90◦. The fit to the photometric SED and mid-IR
26

The Astrophysical Journal, 736:82 (30pp), 2011 August 1 Alonso-Herrero et al.
Figure B3. As Figure B1 but for NGC 4151.
spectroscopy is shown in Figure 5, while the marginal posteriordistributions are in Figure A4. As can be seen from the latterfigure all the torus model parameters are nicely constrainedand our estimated value of the AGN bolometric luminositylog Lmodel
bol (AGN) = 43.5 erg s−1 is in excellent agreement with
that of Moorwood et al. (1996). Figure B1 shows that the fittedtorus model parameters of Circinus are not degenerate at the68% confidence level
Schartmann et al. (2008) fitted the photometric SED and mid-IR spectroscopy of Circinus using their clumpy torus models,
27
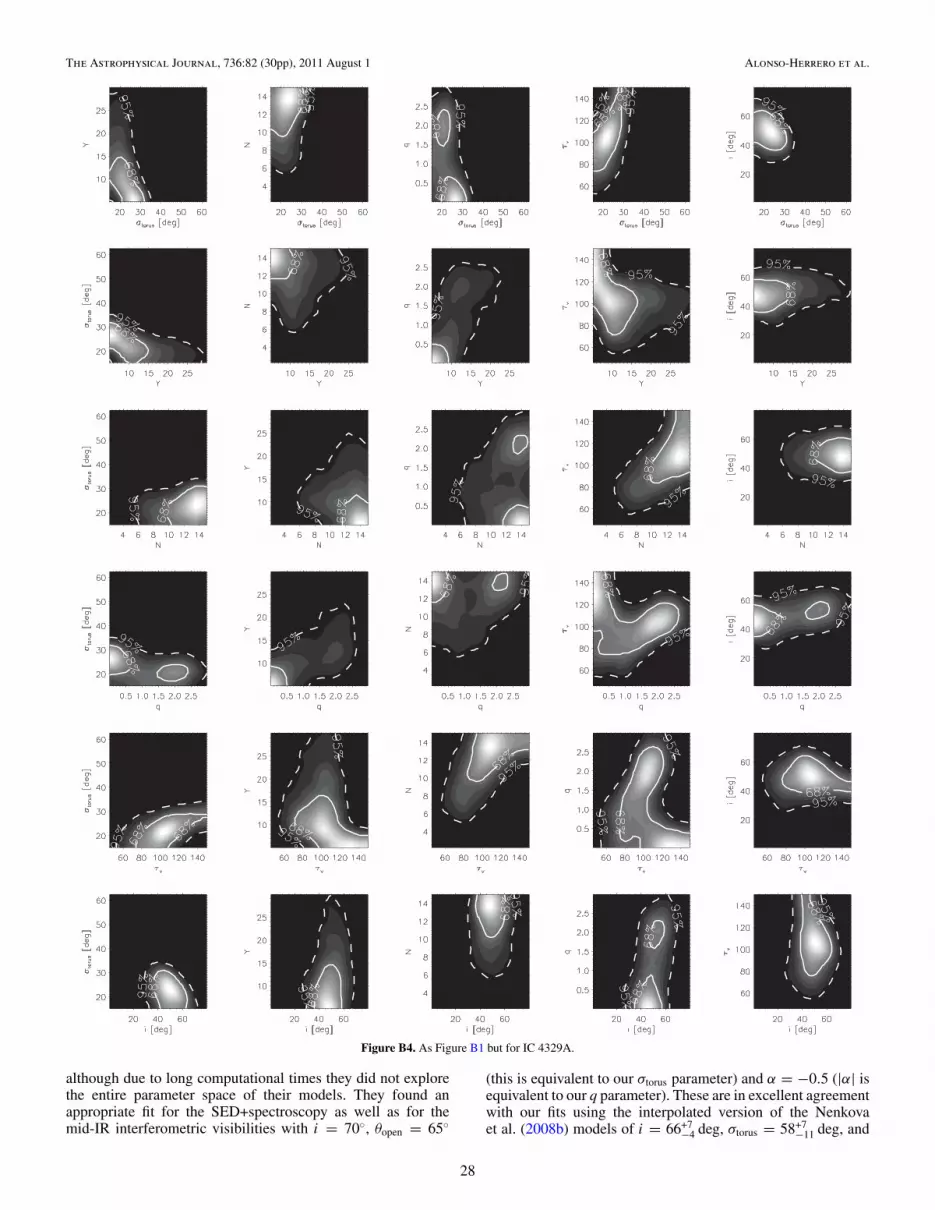
The Astrophysical Journal, 736:82 (30pp), 2011 August 1 Alonso-Herrero et al.
Figure B4. As Figure B1 but for IC 4329A.
although due to long computational times they did not explorethe entire parameter space of their models. They found anappropriate fit for the SED+spectroscopy as well as for themid-IR interferometric visibilities with i = 70◦, θopen = 65◦
(this is equivalent to our σtorus parameter) and α = −0.5 (|α| isequivalent to our q parameter). These are in excellent agreementwith our fits using the interpolated version of the Nenkovaet al. (2008b) models of i = 66+7
−4 deg, σtorus = 58+7−11 deg, and
28

The Astrophysical Journal, 736:82 (30pp), 2011 August 1 Alonso-Herrero et al.
q = 0.7+0.4−0.4 (see Table 5). The largest disagreement is in the
torus size since their modeling favors an outer radius of 30 pc.Our fitted AGN bolometric luminosity sets the dust sublimationradius (see Equation (1)) of Circinus at 0.07 pc, whereas thefitted radial extent of the torus Y translates into an outer radiusof rtorus = 2 pc (see Table 5).
NGC 1068. NGC 1068 is a Seyfert 2 galaxy at a distanceof 15 Mpc. As with Circinus, the water maser observations(Greenhill et al. 1996) suggest that the torus is viewed at a highinclination. We used i = 60◦–90◦ as a prior for our fits. Thefit to the photometric SED and mid-IR spectroscopy is shownin Figure 5. We note that the Nenkova et al. (2008a, 2008b)models provide an excellent fit to the photometric SED as wellas to the N-band and the Q-band spectroscopy of this galaxy.The marginal posterior distributions of NGC 1068 are shownin Figure A6, while the two-dimensional marginal distributionsare shown in Figure B2. These figures indicate that all the fittedtorus model parameters for NGC 1068 are nicely constrained.From our fits we derived an AGN bolometric luminosity oflog Lmodel
bol (AGN) = 44.8 erg s−1, which is in good agreementwith the estimates of Bock et al. (2000) and Vasudevan et al.(2010).
Honig et al. (2008) modeled the IR SED and VLTI/MIDIdata using the Honig et al. (2006) models. Their modeled toruswas found to have an LOS inclination of 90◦ with the clouds aredistributed according to a power law of r−3/2, a half-openingangle of the torus of ∼40◦. The average number of clouds,which obscure the AGN along the LOS toward the observer,was N0 = 10. Their fitted torus model parameters are in arelatively good agreement with our fitted values of i = 88+2
−3 deg,σtorus = 26+6
−4 deg, q = 2.2+0.4−0.3, and N0 = 14+1
−3 (see Table 5).Honig et al. (2008) also estimated the diameter of the dust torusto be ∼1.4–2 pc, depending on wavelength and orientation,whereas our fitted diameter is 4 pc.
Type 1s: IC 4329A, NGC 3227, and NGC 7469. These threeSeyfert 1s are in common with the work of Honig et al. (2010).They modeled the mid-IR spectroscopy of a sample of AGNusing their newest clumpy torus models (Honig & Kishimoto2010). Honig et al. (2010) showed that the mid-IR spectroscopyprovides sensitive constraints to the number of clouds alongthe equatorial direction and the index of power law (a intheir notation) of the cloud distribution. They fixed other torusparameters such as the opening angle (45◦), the radial extentto Rout = 150, τcloud = 50 (see Honig & Kishimoto 2010for a detailed discussion). We note that their model parameterswere also chosen to provide good estimates of the VLTI/MIDIobserved visibilities (see Honig et al. 2010 for more details).For the three Seyfert 1 galaxies in common with our studythey find indexes of the power-law distribution of |a| ∼ 0–1and N0 = 7.5–10, for their assumed typical viewing anglesof i = 30◦. These compare well with our fitted values ofq ∼ 0.2–0.9, although we tend to find slightly more cloudsalong the equatorial LOS (see Table 5).
Type 2s: IC 5063, MCG -5-23-16, NGC 2110, and NGC 7674.These four type 2 galaxies in our sample are in common withthe work of Honig et al. (2010). They modeled the mid-IRspectroscopy of these galaxies with the same parameters as thetype 1s in the previous section but with typical viewing anglesof i = 75◦. Their modeling finds indexes of the power-lawdistribution of the clouds |a| ∼ 0–1.5 and N0 ∼ 5. More cloudsalong the equatorial LOS are allowed in their modeling if theviewing angles for Seyfert 2s are smaller (i ∼ 60◦). Our fittedvalues of q, except for NGC 2110, are consistent with their
highest values of |a|, whereas we find N0 > 10 (median values,see Table 5).
REFERENCES
Alloin, D., Pantin, E., Lagage, P. O., & Granato, G. L. 2000, A&A, 363, 926Alonso-Herrero, A., Colina, L., Packham, C., Dıaz-Santos, T., Rieke, G. H.,
Radomski, J. T., & Telesco, C. M. 2006, ApJ, 652, L83Alonso-Herrero, A., Quillen, A. C., Rieke, G. H., Ivanov, V. D., & Efstathiou,
A. 2003, AJ, 126, 81Alonso-Herrero, A., Quillen, A. C., Simpson, C., Efstathiou, A., & Ward, M. J.
2001, AJ, 121, 136Alonso-Herrero, A., Simpson, C., Ward, M. J., & Wilson, A. S. 1998, ApJ, 495,
196Alonso-Herrero, A., Ward, M. J., & Kotilainen, J. K. 1996, MNRAS, 278, 902Alonso-Herrero, A., Ward, M. J., & Kotilainen, J. K. 1997, MNRAS, 288, 977Antonucci, R. 1993, ARA&A, 31, 473Antonucci, R., & Miller, J. 1985, ApJ, 297, 621Asensio Ramos, A., & Ramos Almeida, C. 2009, ApJ, 696, 2075Barvainis, R. 1987, ApJ, 320, 537Beckmann, V., Shrader, C. R., Gehrels, N., Soldi, S., Lubinski, P., Zdziarski, A.
A., Petrucci, P.-O., & Malzac, J. 2005, ApJ, 634, 939Bianchi, S., Piconcelli, E., Chiaberge, M., Jimenez Bailon, E., Matt, G., & Fiore,
F. 2009, ApJ, 695, 781Blanco, P. R., Ward, M. J., & Wright, G. S. 1990, MNRAS, 242, 4Bock, J. J., et al. 2000, AJ, 120, 2904Bohlin, R. C., Savage, B. D., & Drake, J. F. 1978, ApJ, 224, 132Burtscher, L., Jaffe, W., Raban, D., Meisenheimer, K., Tristram, K. R. W., &
Roettgering, H. 2009, ApJ, 705, L53Chiar, J. E., & Tielens, A. G. G. M. 2006, ApJ, 637, 774Colina, L., Sparks, W. B., & Macchetto, F. 1991, ApJ, 370, 102Colling, M. D., Roche, P. F., & Mason, R. E. 2009, MNRAS, 394, 2043Davies, R. I., Mueller Sanchez, F., Genzel, R., Tacconi, L. J., Hicks, E. K. S.,
Friedrich, S., & Sternberg, A. 2007, ApJ, 671, 1388Davies, R. I., et al. 2006, ApJ, 646, 754Deo, R. P., Richards, G. T., Crenshaw, D. M., & Kraemer, S. B. 2009, ApJ, 705,
14de Vaucouleurs, G., de Vaucouleurs, A., Corwin, H. G., Jr., Buta, R. J., Paturel,
G., & Fouque, P. 1991, Third Reference Catalogue of Bright Galaxies, Vol.1–3 (Berlin: Springer)
Efstathiou, A., & Rowan-Robinson, M. 1995, MNRAS, 273, 649Elitzur, M. 2008, New Astron. Rev., 52, 274Elvis, M., et al. 1994, ApJS, 95, 1Gallimore, J. F., & Matthews, L. D. 2003, in ASP Conf. Ser. 290, Active Galactic
Nuclei: From Central Engine to Host Galaxy, ed. S. Collin, F. Combes, & I.Shlosman (San Francisco, CA: ASP), 501
Glass, I. S. 2004, MNRAS, 350, 1049Glasse, A. C., Atad-Ettedgui, E. I., & Harris, J. W. 1997, Proc. SPIE, 2871,
1197Goodrich, R. W., Veilleux, S., & Hill, G. J. 1994, ApJ, 422, 521Granato, G. L., & Danese, L. 1994, MNRAS, 268, 235Greenhill, L. J., Gwinn, C. R., Antonucci, R., & Barvainis, R. 1996, ApJ, 472,
L21Greenhill, L. J., et al. 2003, ApJ, 590, 162Guainazzi, M., Bianchi, S., Matt, G., Dadina, M., Kaastra, J., Malzac, J., &
Risaliti, G. 2010, MNRAS, 406, 2013Guainazzi, M., Matsuoka, M., Piro, L., Mihara, T., & Yamauchi, M. 1994, ApJ,
436, L35Guainazzi, M., Matt, G., & Perola, G. C. 2005, A&A, 444, 119Hao, L., Weedman, D. W., Spoon, H. W. W., Marshall, J. A., Levenson, N. A.,
Elitzur, M., & Houck, J. R. 2007, ApJ, 655, L77Heisler, C. A., & de Robertis, M. M. 1999, AJ, 118, 2023Hicks, E. K. S., Davies, R. I., Malkan, M. A., Genzel, R., Tacconi, L. J., Mueller
Sanchez, F., & Sternberg, A. 2009, ApJ, 696, 448Honig, S. F., & Beckert, T. 2007, MNRAS, 380, 1172Honig, S. F., Beckert, T., Ohnaka, K., & Weigelt, G. 2006, A&A, 452, 459Honig, S. F., & Kishimoto, M. 2010, A&A, 523, 27Honig, S. F., Kishimoto, M., Gandhi, P., Smette, A., Asmus, D., Duschl, W.,
Polletta, M., & Weigelt, G. 2010, A&A, 515, 23Honig, S. F., Prieto, M. A., & Beckert, T. 2008, A&A, 485, 33Horst, H., Gandhi, P., Smette, A., & Duschl, W. J. 2008, A&A, 479, 389Imanishi, M. 2000, MNRAS, 313, 165Jaffe, W., et al. 2004, Nature, 429, 47Jarrett, T. H., Chester, T., Cutri, R., Schneider, S. E., & Huchra, J. P. 2003, AJ,
125, 525
29

The Astrophysical Journal, 736:82 (30pp), 2011 August 1 Alonso-Herrero et al.
Kishimoto, M., Honig, S. F., Antonucci, R., Kotani, T., Barvainis, R., Tristram,K. R. W., & Weigelt, G. 2009, A&A, 507, L57
Kishimoto, M., Honig, S. F., Beckert, T., & Weigelt, G. 2007, A&A, 476, 713Koshida, S., et al. 2009, ApJ, 700, L109Kotilainen, J. K., Ward, M. J., Boisson, C., Depoy, D. L., Smith, M. G., &
Bryant, L. R. 1992, MNRAS, 256, 125Kulkarni, V., et al. 1998, ApJ, 492, L121Lawrence, A. 1991, MNRAS, 252, 586Lawrence, A., Ward, M., Elvis, M., Fabbiano, G., Willner, S. P., Carleton, N. P.,
& Longmore, A. 1985, ApJ, 291, 117Leinert, C., et al. 2003, Ap&SS, 286, 73Levenson, N. A., Sirocky, M. M., Hao, L., Spoon, H. W. W., Marshall, J. A.,
Elitzur, M., & Houck, J. R. 2007, ApJ, 654, L45Levenson, N. A., et al. 2008, Proc. SPIE, 7014, 83Maiolino, R., Alonso-Herrero, A., Anders, S., Quillen, A., Rieke, M. J., Rieke,
G. H., & Tacconi-Garman, L. E. 2000, ApJ, 531, 219Maiolino, R., & Rieke, G. H. 1995, ApJ, 454, 95Maiolino, R., Stanga, R., Salvati, M., & Rodrıguez Espinosa, J. M. 1994, A&A,
290, 40Malaguti, G., et al. 1998, A&A, 331, 519Malkan, M. A., Gorjian, V., & Tam, R. 1998, ApJS, 117, 25Marco, O., & Alloin, D. 2000, A&A, 353, 465Martini, P., Regan, M. W., Mulchaey, J. S., & Pogge, R. W. 2003, ApJ, 589,
774Mason, R. E., Geballe, T. R., Packham, C., Levenson, N. A., Elitzur, M., Fisher,
R. S., & Perlman, E. 2006, ApJ, 640, 612Mason, R. E., Levenson, N. A., Packham, C., Elitzur, M., Radomski, J., Petric,
A. O., & Wright, G. S. 2007, ApJ, 659, 241Mason, R. E., Levenson, N. A., Shi, Y., Packham, C., Gorjian, V., Cleary, K.,
Rhee, J., & Werner, M. 2009, ApJ, 693, L136Matt, G., Fabian, A. C., Guainazzi, M., Iwasawa, K., Bassani, L., & Malaguti,
G. 2000, MNRAS, 318, 173Matt, G., et al. 1999, A&A, 341, L39Moorwood, A. F. M., Lutz, D., Oliva, E., Marconi, A., Netzer, H., Genzel, R.,
Sturm, E., & de Graauw, T. 1996, A&A, 315, L109Mor, R., Netzer, H., & Elitzur, M. 2009, ApJ, 705, 298Mulchaey, J. S., Koratkar, A., Ward, M. J., Wilson, A. S., Whittle, M.,
Antonucci, R. R. J., Kinney, A. L., & Hurt, T. 1994, ApJ, 436, 586Mulchaey, J. S., Wilson, A. S., & Tsvetanov, Z. 1996, ApJ, 467, 197Mundell, C. G., Holloway, A. J., Pedlar, A., Meaburn, J., Kukula, M. J., &
Axon, D. J. 1995, MNRAS, 275, 67Nagar, N. M., Oliva, E., Marconi, A., & Maiolino, R. 2002, A&A, 391, L21Nagar, N. M., Wilson, A. S., Mulchaey, J. S., & Gallimore, J. E. 1999, ApJS,
120, 209Nenkova, M., Ivezic, Z., & Elitzur, M. 2002, ApJ, 570, L9Nenkova, M., Sirocky, M. M., Ivezic, Z., & Elitzur, M. 2008a, ApJ, 685, 145Nenkova, M., Sirocky, M. M., Nikkuta, R., Ivezic, Z., & Elitzur, M. 2008b, ApJ,
685, 160Nenkova, M., Sirocky, M. M., Nikkuta, R., Ivezic, Z., & Elitzur, M. 2010, ApJ,
723, 1827Nikutta, R., Elitzur, M., & Lacy, M. 2009, ApJ, 707, 1550Oliva, E., Salvati, M., Moorwood, A. F. M., & Marconi, A. 1994, A&A, 288,
457Ossenkopf, V., Henning, T., & Mathis, J. S. 1992, A&A, 261, 567Osterbrock, D. E., & Martel, A. 1993, ApJ, 414, 552Packham, C., Radomski, J. T., Roche, P. F., Aitken, D. K., Perlman, E., Alonso-
Herrero, A., Colina, L., & Telesco, C. M. 2005, ApJ, 618, L17Packham, C., Young, S., Hough, J. H., Axon, D. J., & Bailey, J. A. 1997,
MNRAS, 288, 375Packham, C., et al. 2007, ApJ, 661, L29Perola, G. C., Matt, G., Cappi, M., Fiore, F., Guainazzi, M., Maraschi, L.,
Petrucci, P. O., & Piro, L. 2002, A&A, 389, 802Pier, E. A., & Krolik, J. H. 1993, ApJ, 418, 673Pogge, R. W. 1989, ApJ, 345, 730Polletta, M., Weedman, D., Honig, S., Lonsdale, C. J., Smith, H. E., & Houck,
J. 2008, ApJ, 675, 960
Prieto, M. A., Reunanen, J., Tristram, K. R. W., Neumayer, N., Fernandez-Ontiveros, J. A., Orienti, M., & Meisenheimer, K. 2010, MNRAS, 402, 724
Quillen, A. C., Alonso-Herrero, A., Rieke, M. J., Rieke, G. H., Ruiz, M., &Kulkarni, V. 1999, ApJ, 527, 696
Quillen, A. C., McDonald, C., Alonso-Herrero, A., Lee, A., Shaked, S., Rieke,M. J., & Rieke, G. H. 2001, ApJ, 547, 129
Quillen, A. C., Shaked, S., Alonso-Herrero, A., McDonald, C., Lee, A., Rieke,M. J., & Rieke, G. H. 2000, ApJ, 532, L17
Raban, D., Jaffe, W., Rottgering, H., Meisenheimer, K., & Tristram, K. R. W.2009, MNRAS, 394, 1325
Radomski, J. T., Pina, R. K., Packham, C., Telesco, C. M., De Buizer, J. M.,Fisher, R. S., & Robinson, A. 2003, ApJ, 587, 117
Ramos Almeida, C., Perez-Garcıa, A. M., & Acosta-Pulido, J. A. 2009a, ApJ,694, 1379
Ramos Almeida, C., et al. 2009b, ApJ, 702, 1127 (RA09)Ramos Almeida, C., et al. 2011, ApJ, 731, 92 (RA11)Reeves, J. N., et al. 2007, PASP, 59, 301Regan, M. W., & Mulchaey, J. S. 1999, AJ, 117, 2676Reunanen, J., Kotilainen, J. K., & Prieto, M. A. 2003, MNRAS, 343, 192Reunanen, J., Prieto, M. A., & Siebenmorgen, R. 2010, MNRAS, 402,
879Riffel, R., Rodrıguez-Ardila, A., & Pastoriza, M. G. 2006, A&A, 457,
61Risaliti, G., Maiolino, R., & Salvati, M. 1999, ApJ, 522, 157Roche, P. F., Aitken, D. K., Smith, C. H., & Ward, M. J. 1991, MNRAS, 248,
606Roche, P. F., Packham, C., Aitken, D. K., & Mason, R. E. 2007, MNRAS, 375,
99Roche, P. F., Packham, C., Telesco, C. M., Radomski, J. T., Alonso-Herrero, A.,
Aitken, D. K., Colina, L., & Perlman, E. 2006, MNRAS, 367, 1689Ruiz, M., Rieke, G. H., & Schmidt, G. D. 1994, ApJ, 423, 608Schartmann, M., Meisenheimer, K., Camenzind, M., Wolf, S., Tristram, K. R.
W., & Henning, T. 2008, A&A, 482, 67Schmitt, H. R., Donley, J. L., Antonucci, R. R. J., Hutchings, J. B., & Kinney,
A. L. 2003, ApJS, 148, 327Shi, Y., et al. 2006, ApJ, 653, 127Siebenmorgen, R., Krugel, E., & Spoon, H. W. W. 2004, A&A, 414, 123Simpson, C. 2005, MNRAS, 360, 565Sirocky, M. M., Levenson, N. A., Elitzur, M., Spoon, H. W. W., & Armus, L.
2008, ApJ, 678, 729Storchi-Bergmann, T., Winge, C., Ward, M. J., & Wilson, A. S. 1999, MNRAS,
304, 35Suganuma, M., et al. 2006, ApJ, 639, 46Telesco, C. M., Pina, R. K., Hanna, K. T., Julian, J. A., Hon, D. B., & Kisko,
T. M. 1998, Proc. SPIE, 3354, 534Telesco, C. M., et al. 2003, Proc. SPIE, 4841, 913Thompson, G. D., Levenson, N. A., Uddin, S. A., & Sirocky, M. M. 2009, ApJ,
697, 182Tomono, D., Doi, Y., Usuda, T., & Nishimura, T. 2001, ApJ, 557, 637Tran, H. D., Miller, J. S., & Kay, L. E. 1992, ApJ, 397, 452Tristram, K. R. W., et al. 2007, A&A, 474, 837Tristram, K. R. W., et al. 2009, A&A, 502, 67Vasudevan, R. V., Fabian, A. C., Gandhi, P., Winter, L. M., & Mushotzky, R. F.
2010, MNRAS, 402, 1081Veilleux, S., Goodrich, R. W., & Hill, G. J. 1997, ApJ, 477, 631Veron-Cetty, M.-P., & Veron, P. 2006, A&A, 455, 773Ward, M., Elvis, M., Fabbiano, G., Carleton, N. P., Willner, S. P., & Lawrence,
A. 1987, ApJ, 315, 74Weaver, K. A., & Reynolds, C. S. 1998, ApJ, 503, L39Wilson, A. S., Baldwin, J. A., & Ulvestad, J. S. 1985, ApJ, 291, 627Wilson, A. S., & Tsvetanov, Z. I. 1994, ApJ, 107, 1227Winge, C., Storchi-Bergmann, T., Ward, M. J., & Wilson, A. S. 2000, MNRAS,
316, 1Woo, J.-H., & Urry, C. M. 2002, ApJ, 579, 530Young, S., Packham, C., Mason, R. E., Radomski, J. T., & Telesco, C. M.
2007, MNRAS, 378, 888
30


