Embed Size (px)
Citation preview

To
MAPNRI
T0E
1
Anccwmdmaigt
nctNittlmptdrs
A0
Journal of Biomedical Optics 12�3�, 034019 �May/June 2007�
J
ime-resolved optical imager for assessment of cerebralxygenation
ichal Kacprzakdam Liebertiotr Sawoszorbert Zolekoman Maniewski
nstitute of Biocybernetics and BiomedicalEngineering
rojdena 42-109 Warsaw, Poland-mail: [email protected]
Abstract. A time-resolved optical instrument allowing for noninvasiveassessment of cerebral oxygenation is presented. The instrument isequipped with picosecond diode lasers, fast photodetectors, and time-correlated single photon counting electronics. This technology en-ables depth-resolved estimation of changes in absorption and, in con-sequence, assessment of changes in hemoglobin concentrations in thebrain cortex. Changes in oxyhemoglobin �HbO2� and deoxyhemoglo-bin �Hb� can be evaluated selectively in extra- and intracerebral tissuecompartments using the moments of distributions of times of flight ofphotons measured at two wavelengths in the near-infrared region. Thecombination of the data acquired from multiple sources and detectorslocated on the surface of the head with the depth-resolved analysis,based on the moments, enables imaging of cortex oxygenation. Re-sults of the tests on physical phantoms as well as in vivo validation ofthe instrument during the motor stimulation experiment arepresented. © 2007 Society of Photo-Optical Instrumentation Engineers.
�DOI: 10.1117/1.2743964�
Keywords: imaging systems; time-resolved imaging; tissue light propagation.Paper 06348R received Nov. 27, 2006; revised manuscript received Jan. 31, 2007;accepted for publication Feb. 5, 2007; published online May 31, 2007.
Introduction
bsorption of light in human tissues is relatively low in theear-infrared wavelength region. Thus, light from this so-alled “biological optical window” can penetrate even severalentimeters into the tissue. However, high scattering at theseavelengths causes optical transmission/reflectance measure-ents to have a limited spatial resolution. On the other hand,
ifferent spectral properties of oxy- and deoxyhemoglobineasurements of the tissue absorption at several wavelengths
llow for estimation of tissue oxygenation.1,2 This functionalnformation may be important for clinical assessment of oxy-enation of the brain,2–4 muscles,5,6 or for detection of breastumors.7
Recently it has been shown that the spatial resolution ofear-infrared spectroscopy �NIRS� can be improved by appli-ation of modern measurement techniques. Frequency- andime-domain techniques were developed and applied in manyIRS studies. These methods are based on the emission of
ntensity modulated light or picosecond light pulses into theissue. The specific advantage offered by these techniques ishat they allow for direct measurement of mean photon path-ength and the estimation of absolute concentrations of chro-
ophores. In the frequency-domain technique, analysis of thehase shift between the initial wave and the light detected onhe surface of the tissue is carried out.8 The phase shift isirectly related to the mean time of flight of photons. In time-esolved near infrared spectroscopy �TRNIRS�, emission ofhort �picosecond� light pulses and the analysis of the broad-
ddress all correspondence to Michal Kacprzak, IBIB PAN, Trojdena 4 - Warsaw
2-109, Poland; Tel: +48226599143ext113; Fax: +48226597030.ournal of Biomedical Optics 034019-
ening of the pulse during its travel between the points ofemission and detection is performed.9,10
NIRS has been successfully applied in the analysis of brainoxygenation in neonates and infants.11,12 In such cases theinfluence of the extracerebral tissue �skin, skull� on the signalsmeasured is small, and it can be neglected. Because of thesmall size of the head, even the tomographic reconstruction ofabsorption and the reduced scattering coefficient in the braintissue can be obtained.13–16 Application of frequency- or time-resolved NIRS is beneficial, especially when the head of anadult is examined and a depth-resolved analysis of the hemo-globin concentration changes must be applied to estimate oxy-genation of the brain tissue with higher accuracy. Recently,the time-domain method has been shown to allow for evalu-ation of changes of the optical properties, as well as changesof oxy- and deoxyhemoglobin concentrations with depthdiscrimination.17,18
Measurements of brain oxygenation changes caused byneuronal stimulus are often challenging because of the diffi-culties in determining the location of the focal point of stimu-lation on the surface of the cortex. In particular, proper posi-tioning of the optode on the surface of the head is importantwhen oxygenation changes are observed in neurophysiologi-cal experiments, i.e., during motor or visual stimulations. TheNIRS technique has been extensively tested in monitoringchanges of brain oxygenation in acute stroke,19 during hypo-thermic heart surgery,20 and in carotid arteryendarterectomy.21 Moreover, NIRS has been applied to esti-mate brain perfusion by analysis of the inflow and the wash-out of the optical contrast agent.22–24 In all these applications,
1083-3668/2007/12�3�/034019/14/$25.00 © 2007 SPIE
May/June 2007 � Vol. 12�3�1

aocatpt
ftbtweacsho
22Tcct
Gwb8iatt
Fas
Kacprzak et al.: Time-resolved optical imager for assessment…
J
large number of the emission and detection points locatedn the surface of the head can be applied. In consequence, thehanges of brain oxygenation and/or perfusion can be imaged,nd the ischemic areas can be localized. Several optical sys-ems allowing image changes of brain oxygenation have beenroposed. Continuous wave,25–27 frequency-domain,28,29 andime-domain30–34 systems have been reported.
We present a time-resolved optical instrument that allowsor noninvasive assessment of oxygenation of the brain cor-ex. The depth-resolved changes in oxy- and deoxyhemoglo-in levels can be calculated using the moments of distribu-ions of times of flight of photons �DTOFs� measured at twoavelengths in the near-infrared region. The instrument is
quipped with picosecond diode lasers, fast photodetectors,nd time-correlated single photon counting electronics. Theombination of data from multiple sources that are switchedequentially and detectors distributed on the surface of theead, with the depth-resolved analysis based on the momentsf DTOFs, enables imaging of cortex oxygenation.
Methods.1 Instrumentationhe TRNIRS system we developed is shown in Fig. 1. Itonsists of two semiconductor diode lasers and eight detectionhannels with time-correlated single photon counting elec-ronics.
A laser diode driver �PDL 808 Sepia, PicoQuant, Berlin,ermany� and two semiconductor laser heads operating atavelengths of 832 and 687 nm were used. Light pulses fromoth diodes were generated with the repetition rate of0 MHz. The light pulse trains from both diodes were shiftedn time by half of the repetition period. This temporal shiftllowed us to analyze distributions of times of flight of pho-ons at both wavelengths. To introduce laser light from the
ig. 1 Time-resolved NIR topography system for cerebral oxygenationnd SW2 are 1:9 optical switches, PMT is the photomultiplier tubes,ingle photon counting.
wo laser heads into two optical fibers, an adjustable optical
ournal of Biomedical Optics 034019-
setup with a 50:50 glass beam splitter �Thin Film ImagingTechnologies, Incorporated, Greenfield, Massachusetts� wasconstructed. After splitting the beams from the two lasers, thelight pulses are delivered sequentially to 18 locations on thehead �nine per each hemisphere� by using two optomechanicalswitches �Piezosystem jena, GmbH, Jena, Germany�. Theswitches are controlled with the PCI board NI-DAQ 6221�National Instruments, Austin, Texas� at a switching fre-quency of 10 Hz. The switching time is less than 5 ms. Thetips of the output fibers from the switches are positioned in a3�3 array on each hemisphere, and they are located directlyon the surface of the head, together with the detecting fiberbundles. An optode holder was constructed using a thermo-plastic material �WFR/Aquaplast Corporation, Wyckoff, NewJersey�, soft rubber, and Velcro strips �Figs. 2�a� and 2�b�� tofix the source fibers and the detecting bundles. For everysource-detector pair, the interoptode distance is 3 cm. Differ-ent sizes of the optode setups allowed us to fix the fibers andbundles on heads of different sizes.
The diffusely reflected light was delivered to the detectorsusing 1.5-m-long fiber bundles with a diameter of 4 mm andNA=0.54 �Loptek, Berlin, Germany�. Eight photomultipliertubes �R7400U-02, Hamamatsu Photonics, Japan� were usedfor detection of the diffusely reflected light. Each photomul-tiplier was located separately in the electrically shielded box,together with the high voltage unit and preamplifier. Thepower of the light delivered to photomultipliers was adjustedby the neutral density filters located between the fiber bundlesand the detectors. Independent PCI boards with time-correlated single photon counting electronics �SPC-134,Becker and Hickl, Berlin, Germany� were used for acquisitionof distribution of times of flight of photons. Recording ofDTOFs was triggered by the 10-Hz generator, which synchro-
g. SEPIA is the laser diode driver, LH1 and LH2 are lasers heads, SW1is the preamplifiers and TCSPC is the PCI boards for time-correlated
imaginAMP
nously controlled the optomechanical switches. To avoid data
May/June 2007 � Vol. 12�3�2

af
flm
sTpTs8mrsfDeP0
2Fmmofspctd
ce
F�
Kacprzak et al.: Time-resolved optical imager for assessment…
J
cquisition during the switching period, the trigger signalrom the generator was delayed by 5 ms.
The software for acquisition of distribution of times ofight of photons was developed in the LabView v.7 environ-ent �National Instruments�.The instrumental response function was measured by po-
itioning the source fibers in front of the detecting bundles.he detecting bundles were covered with a sheet of whiteaper to fill up the whole numerical aperture of the bundle.35
he instrumental response function as measured for everyource-detector pair at both wavelengths was not longer than00 ps �full width at half maximum �FWHM��. The measure-ent system in the presented configuration allows us to
ecord distributions of times of flight of photons for 32ource-detector pairs corresponding to 32 “banana” volumes,orming a 4�4 array on each hemisphere. The acquisition ofTOFs starts after the switching period is finished, and for
very location of the source it is completed within 95 ms.arallel acquisition of the two 4�4 spot maps takes about.9 s.
.2 Data Analysisor analysis of the measured data, algorithms based on aathematical model of the light transport in the turbidedia36 and a method of depth discrimination using moments
f the DTOFs18 were implemented. To separate informationrom the extra- and intracerebral layers of the head, so-calledensitivity factors were computed from the model of lightropagation in the tissue. These sensitivity factors bind thealculated statistical moments of DTOFs with the changes inhe absorption coefficient at different depths in the tissue un-er investigation.17,18,37
The phenomena of light propagation in the turbid mediuman be described by the time-dependent diffusion
38,39
ig. 2 Photography of �a� the optode holders of different size fixed onb� the head of the manniquin.
quation. The photon fluence rate ��r , t� as a function of
ournal of Biomedical Optics 034019-
time t and position in the tissue described by vector r dependson the optical properties of the medium:
1
c
�
�t��r,t� − D�2��r,t� + �a��r,t� = S�r,t� , �1�
where S�r , t� describes the photon source, c is the velocity ofthe light in the medium, D is the diffusion coefficient D= �3�s��−1, �a is the absorption coefficient of the medium, and�s� is the reduced scattering coefficient.40,41
By solving this equation for the semi-infinite, homogenousmedium, assuming a delta Dirac light source pulse, diffusereflectance Rh�� , t� can be derived as a function of time t anddistance � between the source and the detector38:
Rh��,t� = ��s��−1�4�Dc�−3/2t−5/2 exp�−
�2
4Dct− �act� .
�2�
Equation �2� describes light propagation in the medium withabsorption and the diffusion coefficient distributed homog-enously over the whole volume. When a change of absorptioncoefficient ��a appears in a small inclusion of a samplingvolume dVS inside the investigated medium in a location de-fined by vector r, the time-dependent change of diffuse reflec-tance �R�r ,� , t� on the surface of the medium at source-detector separation � can be calculated:
�R�r,�,t� = − ��adVS���r,t� � E�r,�,t�� , �3�
where � means operation of convolution. Function � de-scribes the time-dependent fluence rate of photons in the me-dium at the location r. E is the escape function, which de-scribes the probability that the photon emitted from location rwill reach the detector at distance � from the sourceposition.36
Distributions of times of flight of photons R diffusely re-flected from the medium with the inclusion located at r can bethen calculated using the formula:
R�r,�,t� = Rh��,t� + �R�r,�,t� . �4�
Normalized moment of order k of the distribution R�t� is de-fined by:
mk =�0
�
tkR�t�dt��0
�
R�t�dt . �5�
Changes in these moments of theoretical DTOFs caused bylocal changes of absorption ��a in a sampling volume dVSlocated at r can be calculated using the formulas18:
�A = − log� Ntot
Ntoth� , �6�
�t = t − th, �7�
May/June 2007 � Vol. 12�3�3

wtpq
ucattmt
FtsMe
0tf1ai
ttnfmt
tvtmmu
sottlm
Kacprzak et al.: Time-resolved optical imager for assessment…
J
�V = V − Vh, �8�
here �A is the change in attenuation, Ntot=�0�R�t�dt is the
otal number of photons, t=m1 is the mean time of flight ofhotons, and V=m2−m1
2 is the variance of the DTOF. Theuantities with index h refer to a homogeneous medium.
Furthermore, the obtained changes in the moments can besed in the calculation of sensitivity factors describinghanges of the moments �attenuation, the mean time of flight,nd the variance of the DTOF� caused by changes of absorp-ion in defined small volume dVS indexed by i. These sensi-ivity factors, called the mean partial pathlength �MPP�, the
ean time sensitivity factor �MTSF�, and the variance sensi-ivity factor �VSF�18 are:
MPPi =�A
��a,i, �9�
MTSFi =�t��a,i
, �10�
VSFi =�V
��a,i. �11�
or the analysis of the in vivo data, it has been assumed thathe medium can be simulated by a layered structure with theensitivity factors for the layers obtained by summing up
PPi, MTSFi, and VSFi in volumes corresponding to extrac-rebral and brain tissues.
Particularly, the medium was divided into voxels of size.2�0.2�0.2 cm. The sensitivity factor of the extracerebralissue was obtained by the integration of five layers of voxelsorming the tissue compartment of thickness 1 cm. The next5 layers were assumed to correspond to intracerebral tissue,nd the sensitivity factors for this layer were calculated byntegration of these layers.
The proposed method of calculation of the sensitivity fac-ors by using the diffusion approximation is much faster thanhe Monte Carlo algorithm described in Ref. 18. Unfortu-ately, this method can only be used to calculate sensitivityactors with the assumption that initially the medium is ho-ogeneous, and it gives significant errors in the vicinity of
he source and the detector positions.To provide the background optical properties for calcula-
ions of the sensitivity factors used for the analysis of the inivo data, �a and �s� were evaluated from the measurement ofhe DTOFs on the head of the subject. The method of
oments42 was used to obtain the optical properties of theedium with the assumption of homogeneity of the tissue
nder investigation.In Ref. 18 the authors used changes in the moments mea-
ured at four interoptode separations for estimation of changesf the absorption coefficient in ten layers of the tissue. Unfor-unately, our imaging system does not allow for a multidis-ance time-resolved measurement. Thus, we used the calcu-ated sensitivity factors together with changes in three
oments measured at a single interoptode distance to estimate
ournal of Biomedical Optics 034019-
changes of the absorption coefficient in two layers of the me-dium �corresponding to extra- and intracranial tissue� accord-ing to the algorithm proposed in Ref. 18.
A system of equations with two unknowns: ��a1 in thesuperficial layer and ��a2 in the deeper layer, and threeknowns represented by changes in three moments of DTOFs,together with their sensitivity factors for each layer, wassolved using the least squares method.
Changes of absorption coefficient ��a,j in the two layers�indexed by j� were estimated at two wavelengths. Thesechanges are related to the changes in concentrations of oxy-and deoxyhemoglobin ��cHbO2
and �cHb, respectively�:
��a,j��� = HbO2��� · �cHbO2j + Hb��� · �cHbj , �12�
where HbO2��� and Hb��� are the molar extinction coeffi-
cients of oxy- and deoxyhemoglobin, respectively. The molarextinction coefficients were taken from spectra published byWray et al.43
For every measured DTOF, background subtraction andcorrection for differential nonlinearity of the TCSPC electron-ics were performed. In calculation of the moments, integrationwas carried out for that part of the DTOF in which the numberof counts dropped below 1% of its maximum value.
3 Results of the Phantom Experiments3.1 Liquid PhantomStability, accuracy, and linearity of the imager were tested.The protocols used were similar to those proposed by theEuropean Network MEDPHOT �optical methods for medicaldiagnosis and monitoring of diseases�.44 For this purpose, thephysical, liquid phantom was constructed allowing for simul-taneous data acquisition from 32 source-detector pairs. A fishtank was filled with a solution of milk �3.5% fat� and water�3:1�, with black ink �Rotring, Germany� added to obtain op-tical properties in the range of the optical properties typical ofliving tissue. All the optodes at the two source-detector arrayswere placed on the same surface of the phantom to providemeasurements in semi-infinite geometry and to obtain thesame homogenous conditions for all the measured source-detector pairs. The optodes were located not closer than10 cm apart from the walls of the fish tank, which minimizedinfluence of ambient light or interactions of photons with thewalls.
3.2 Stability of the Apparatus32 DTOFs corresponding to all source-detector pairs weremeasured during 90 min just after switching on all the sub-units of the system. This test was repeated five times on con-secutive days, on the liquid phantom described before. Typi-cal time courses of the moments of DTOFs recorded duringthese experiments are presented in Fig. 3.
For the total number of detected photons Ntot and for vari-ance V in Fig. 3, a warm-up time necessary to avoid the lowfrequency drift was about 40 min. After this time, Ntot and Vwere stable, and the fluctuations of these signals were notlarger than ±2%. The mean time of flight of photons pre-sented in line �b� in Fig. 3 demonstrates a drift even after1.5 h. This effect was caused by the time drift of the laser
44
pulses, and it had a relatively low influence on the measuredMay/June 2007 � Vol. 12�3�4

catvmcte
cDtfi
Tsplap
ecvrr�smatciod
Fa�
Kacprzak et al.: Time-resolved optical imager for assessment…
J
hanges in the mean time of flight and the changes of thebsorption coefficient in shorter time periods. Unfortunately,his drift caused errors when the optical properties in absolutealues were calculated. To minimize this error, the measure-ents of the absolute values of the absorption and scattering
oefficients should be performed after a very long warm-upime �3 h� when the drift of the mean time of flight did notxceed 10% per 1 h.
The noise level of the measurement was also evaluated byalculation of the coefficient of variation of the moments ofTOFs for all the source-detector pairs. Coefficients of varia-
ions �CV� of the moments of DTOFs �see Fig. 4� were de-ned as the ratios of standard deviation and the mean value:
CV�x� =�x�x
* 100 % . �13�
he calculated coefficients of variations of the momentshowed that, for a typical range of number of counted photonser second �from 30,000 to 2,000,000�, the noise level wasower than 1%. For the variance, the noise level was higher,nd it reached a few percent for a low number of the countedhotons.
To prove the accuracy and linearity of the imager, phantomxperiments were carried out with different absorption coeffi-ients of the liquid. This experiment was carried out after aery long warm-up time period �3.5 h� to ensure small errorsesulting from the drift of the laser pulses. Statistics of theesults of absorption and the reduced scattering coefficients�a and �s�� measured in 32 source-detector pairs are pre-ented in Fig. 5. Both coefficients were calculated from theoments of DTOFs with the method described by Liebert et
l.42 The inaccuracy of the measurements of �a and �s� be-ween all 32 measured spots did not exceed 18% for bothoefficients in the worst cases. The error of the measurementncreased with the ink concentration in the phantom becausef the lower number of detected photons during the 60-s-long
ig. 3 Stability of the system, presented as the moment time coursesfter switching on the system: �a� Ntot is the total number of photons,b� mean time of flight of photons t, and �c� variance V of the DTOF.
ata acquisition period.
ournal of Biomedical Optics 034019-
3.3 Depth SensitivityTo validate depth sensitivity of the constructed imager, thelocal change of the optical properties in the phantom wasintroduced using a 2-mm-diam plastic black ball immersedinto the liquid and fixed using a transparent, thin fishing line�diameter of 0.2 mm�. It was assumed that the absorptioncoefficient of this small inclusion was very high and that theball did not scatter the light. The surface of the black ball wasrough, but it was possible that some light could be reflectedfrom that surface. The depth of the ball immersion in theliquid was changed from 0.5 up to 3.5 cm with a step of0.5 cm. The reduced scattering coefficient ��s�=7.0 cm−1�and the absorption coefficient ��a=0.12 cm−1� of the me-dium were estimated by calculating the moments of the mea-sured DTOFs as it was proposed in Ref. 42. The source-detector distance was 3 cm, thus the whole measurement areawas approximately 8.5�8.5 cm2 with a 4�4 pixel resolu-tion. Changes in the moments of DTOFs obtained after im-
Fig. 4 Coefficients of variation �CV� of the moments of the DTOFsversus number of photons collected. Statistics for all 32 source-detector pairs are presented: �a� total number of photons Ntot, �b�mean time of flight of photons t, and �c� variance V of the DTOF.Black dots represent a mean value, starlets stand for minimum andmaximum values of CV from all source-detector pairs.
mersion of the black ball, at various depths, were related to
May/June 2007 � Vol. 12�3�5

tss
vorfidd
rssswtm
Fsrm
Kacprzak et al.: Time-resolved optical imager for assessment…
J
he measurement in homogenous medium without this inclu-ion. The results of Ntot /Ntot0, �t, �V for 4�4 pixels forix depths are presented in Fig. 6.
Changes in the moments of DTOFs were visualized forarious locations of the ball in respect to the array of theptodes. In a series of experiments, the ball was located di-ectly below the detecting bundle, directly below the sourceber, in a middle position between the two sources and twoetectors, and in the middle between the source fiber and theetecting bundle.
It should be noted that the contrast in the Ntot /Ntot0 imagesapidly decreases with the depth of the location of the inclu-ion, whereas the contrast decrease for �t and �V is muchlower. It can be also pointed out that an inclusion locateduperficially causes an increase of the mean time of flight and,hen the inclusion is located deeper, the decrease of the mean
ime of flight occurs. A similar effect can be noted on the
ig. 5 Estimated absorption �a and reduced scattering �s� coefficientstandard deviation, and maximum and minimum values calculatedepresent standard deviations of calculated coefficients; a horizontalaximum and minimum levels.
aps obtained by the analysis of variance of the DTOFs. Ad-
ournal of Biomedical Optics 034019-
ditionally, a difference in the size of the inclusion positionedat locations different in respect to the array optodes can benoted.
The noted differences in the size and contrast of the inclu-sion, as provided by the images of the different moments, arerelated to a higher depth and longitudinal sensitivity of themean time of flight and variance of DTOF to the changes ofthe absorption coefficient, as compared to the sensitivity ofNtot.
18,45 The changes in the moments as a function of thedepth, obtained for inclusions located between the source andthe detector �case presented in Fig. 6�a��, are presented in Fig.7�a�. The total number of photons showed the highest sensi-tivity to the absorbing inclusion located superficially, but itdecreased rapidly with the depth. On the contrary, the meantime of flight and, to an even higher extent, the variance,shows a high sensitivity to absorption of an inclusion posi-tioned deeply. Moreover, changes in variance are positive
concentration of the black ink in a 25% water solution. Mean value,e full set of 32 source-detector pairs are presented. The rectanglesside rectangle is the median value; and vertical whiskers represent
versusfor thline in
when a change of absorption appears in superficial layers, and
May/June 2007 � Vol. 12�3�6

Fa
Kacprzak et al.: Time-resolved optical imager for assessment…
J
ig. 6 Maps of the moments of recorded DTOFs from the liquid phantom with the absorbing inclusion located at various positions in respect to the
rray of optodes.ournal of Biomedical Optics May/June 2007 � Vol. 12�3�034019-7

tdt
4Tmfjwg
tsuoswfifiaTtrm
Fcg
Kacprzak et al.: Time-resolved optical imager for assessment…
J
hey become negative when the absorbing inclusion is locatedeeper. A similar phenomenon can be observed for the sensi-ivity factor curves as a function of depth �see Fig. 7�b��.
Results of the In Vivo Experimento check the features of the system in the in vivo measure-ents on the human head, several tests with volunteers during
unctional motor stimulation were performed. 15 healthy sub-ects, the mean age of 30 years �nine females and six males�ere examined. Before the experiment, all the volunteersave informed consents.
The motor cortex stimulation was carried out by a volun-ary middle and index finger tapping with the thumb in aelf-paced mode at a frequency of about 3 to 4 Hz. The vol-nteer was examined in a comfortable sitting position, and theptode arrays were fixed on the head using flexible Velcrotrips. For every source fiber and detecting bundle, the hairas removed carefully from the space between the skin andber/fiber bundle tip. The source fibers and fiber bundles werexed in a stand that was positioned over the subject’s head tovoid bending in the holder and movement of the fibers tips.he optode arrays were positioned on the head in such a way
hat the source detector, in pair 10, on the left hemisphere andespectively in pair 27 on the right hemisphere �see Fig. 8�
ig. 7 Sensitivities of moments of DTOFs to the absorbing perturbatioompared with �b� sensitivities of moments estimated theoretically fouide readers’ eyes.
atched the C3 and C4 locations �according to the 10-20
ournal of Biomedical Optics 034019-
EEG system� corresponding to the position of the motor area.The finger tapping experiment lasted up to ten minutes and
was performed in a dark room. For all 15 subjects, two ex-periments were carried out. 20 cycles of 15-s long left-handfinger tapping was followed by 15 s of rest, and then the sameexperiment was repeated after 5 min of rest with the right-
ed at different depths in the medium. �a� Results of measurements aresponding optical properties of the medium. Lines are shown only to
n locatr corre
Fig. 8 The locations of source-detector pairs �1÷32� on the head.
May/June 2007 � Vol. 12�3�8

hb
moo
fflbsstmtp
Fsonpi8fi
Kacprzak et al.: Time-resolved optical imager for assessment…
J
and finger tapping. The subjects were instructed visually andy sound commands to start and finish the task.
The recorded DTOFs were analyzed by calculation of theiroments for both wavelengths. For every subject, the signals
f the moments were averaged synchronously with the cyclesf the finger tapping.
As an example, results of the motor stimulation experimentor one selected subject, averaged changes in Ntot, t, and Vor the selected emitter detector pair placed above the stimu-ated area are presented in Fig. 9. The vertical lines mark theeginning and end of the finger tapping period. In the subjecttudied, a typical change with the opposite polarity of theignal measured at the two wavelength appears in the meanime of flight and variance. These opposite changes in the
otor cortex activation are caused by changes of the absorp-ion coefficients at two wavelengths. During the finger tap-
ig. 9 Results of the motor stimulation experiment for one selectedubject. Time courses of changes of moments of the DTOFs averagedver all cycles of finger tapping: �a� Ntot /Ntot0 are the changes in totalumber of photons, �b� �t is the changes in mean time of flight ofhotons, and �c� �V is the changes in variance of the DTOF. Changesn moments are monitored at two wavelengths 687 nm �gray line� and32 nm �black line�. Vertical lines mark the beginning and end of thenger tapping task.
ing task, the concentration of oxyhemoglobin increases and
ournal of Biomedical Optics 034019-
the concentration of deoxyhemoglobin decreases. The totalabsorption coefficient at 832-nm wavelength increases and themean time of flight and variance decreases, respectively. Onthe other side of the isobestic point at 687 nm, the oppositephenomenon was observed. The trend in the Ntot courses wasprobably caused by the systemic changes in the blood flowduring the finger tapping or by movement artifacts.27 Similartrends of changes of moments were observed in most of theinvestigated subjects. The optical studies of motor-evoked re-sponse are often characterized by a change in blood volumerather than a significant change in oxygenation. If the bloodvolume increases due to a sudden inflow of oxygenated bloodto the stimulated cortex area, then the absorption will increaseat wavelengths located on both sides of the isobestic point.This effect may cause the observed drop of total number ofphotons at both wavelengths used in our investigations �Fig.9�a��.
Using the data analysis algorithms and theory described, aseparation of information originating from the intra- and ex-tracerebral layers was performed. Reconstructed signals of thechanges in concentration of oxy- ��cHbO2
� and deoxyhemo-globin ��cHb� in the intracerebral layer during the right-handfinger tapping task are presented in Fig. 10. Positioning ofsubplots presented in Fig. 10 correspond to the positioning ofsource-detector pairs according to the array shown in Fig.8�a�. In the left hemisphere, a distinct increase of �cHbO2
anda decrease of �cHb can be observed. A minor contralateralresponse of the motor cortex can also be observed.
Minor responses to the motor stimulation can be also notedin the whole image. These responses can be explained by thesystemic responses or by cross talk effects, which cannot beavoided in the data analysis process. Inaccuracy of the resultscan appear because of the assumption on the thickness of theextracerebral tissue layer. Another source of errors is the as-sumption on homogeneity of the tissue used in calculation ofthe sensitivity factors.
Time courses of �cHbO2and �cHb presented in Fig. 10
were obtained in one selected subject. In most of the investi-gated volunteers, much of the same trends were observed.
A sequence of images of �cHbO2and �cHb during the mo-
tor cortex activation for both hemispheres is presented in Fig.11.
The response of the motor cortex for the finger tappingtask is clearly visible on the contralateral side. An increase ofoxyhemoglobin is combined with a decrease of deoxyhemo-globin. A minor response to the motor stimulation can beobserved in the whole monitored region of the tissue and alsoin the ipsilateral site of the brain.
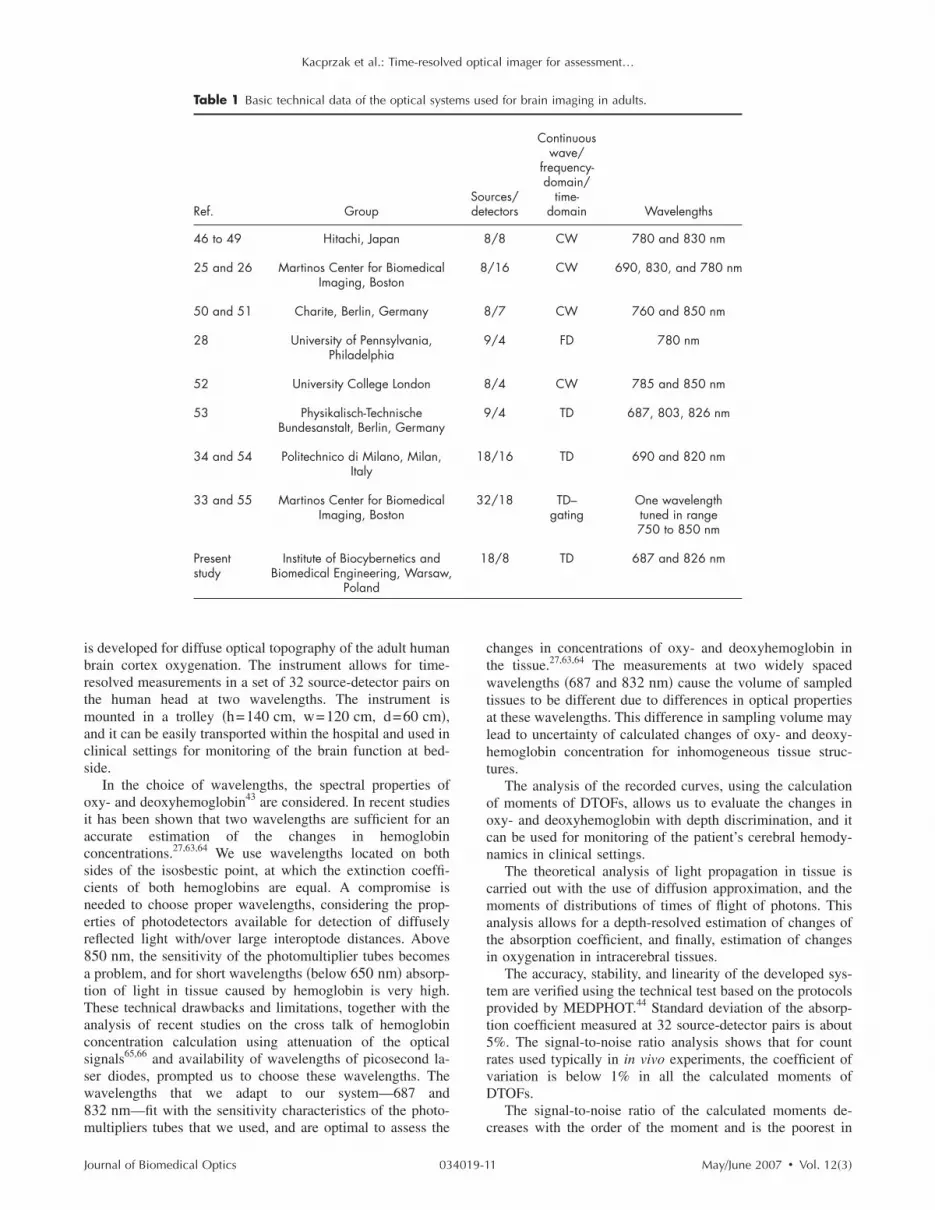
5 Discussion and ConclusionsNear-infrared spectroscopy enables us to assess the brain oxy-genation level in clinical conditions at bedside. In recentyears, this method has been intensively explored by manyresearch groups. Continuous wave, frequency domain, andmost advanced time domain systems were used with variousvalues of wavelengths in the near-infrared region. For evalu-ation of hemodynamics of the whole cortex regions �i.e., mo-tor and visual cortex�, multidetector systems were developed.A review of the NIRS imaging systems used in the experi-
46–55
ments on adult heads is presented in Table 1.May/June 2007 � Vol. 12�3�9

bIfamiht
evet
casTodafbtpr
iButisbsWnhn
Fv
Kacprzak et al.: Time-resolved optical imager for assessment…
J
Optical imaging systems developed in recent years haveeen used in many phantom studies and in vivo applications.n several reports, the authors used optical imaging systemsor tissue phantom studies,30,56 measurements on neonates,13,57
nd on animals.58–60 Comparison and review of these instru-ents can be found in Refs. 61 and 62. The systems presented
n Table 1 were successfully applied to evaluate human brainemodynamics in adults, particularly during the functional ac-ivation.
In the last few years, most up-to-date systems have beenquipped with time-resolved data acquisition. Most of the ad-anced instruments based on time-resolved spectroscopy arequipped with a large number of source-detector pairs, and 1o 3 wavelengths are used.
The original construction based on the intensified charge-oupled device �CCD� is limited only to one wavelength andnalysis of the time windows.33,55 Most of the time-domainystems that have recently been constructed are based on theCSPC technique for recording distributions of time of flightf photons. An interesting solution to increase the number ofetecting channels by providing four-anode photomultipliersnd routing signals from them was proposed by the grouprom Politechnico di Milano, which applied only four TCSPCoards.34,54 However, such a procedure leads to a decrease ofhe number of photons collected in individual channels in pro-ortion to their number, which decreases the signal-to-noiseatio.
The design of the instrument reported here is based on thedea realized in Physikalisch-Technische Bundesanstalt inerlin,53 in which four independent TCSPC channels weresed with four photomultipliers and with a 1�9 fiber switcho deliver the light pulses into nine points on the tissue undernvestigation. In such a solution, one map consists of 16ource-detector pairs for each of three wavelengths, and it cane recorded in less than 1 s. The time-domain imager de-cribed in the presented study is an extension of this design.e construct a system with eight independent TCSPC chan-
els, which enable us to measure optical signals with veryigh photon count rates compared to the solutions where sig-
ig. 10 Time courses of reconstructed changes in oxy- �black line� anertical line marks the beginning and end of the right-hand finger tap
d deoxy- �gray line� hemoglobin in the �a� left and �b� right hemisphere. Aping task.
al routing is applied. The time-resolved multichannel system
ournal of Biomedical Optics 034019-1
Fig. 11 Maps of oxy- and deoxyhemoglobin during the motor cortexstimulation experiment �LH being the left hemisphere and RH theright hemisphere�. During the right-hand finger tapping task, thechanges in chromophore concentration appear on the opposite
hemisphere.May/June 2007 � Vol. 12�3�0
ibrtmacs
oiacscner8atTacssw8m
Kacprzak et al.: Time-resolved optical imager for assessment…
J
s developed for diffuse optical topography of the adult humanrain cortex oxygenation. The instrument allows for time-esolved measurements in a set of 32 source-detector pairs onhe human head at two wavelengths. The instrument is
ounted in a trolley �h=140 cm, w=120 cm, d=60 cm�,nd it can be easily transported within the hospital and used inlinical settings for monitoring of the brain function at bed-ide.
In the choice of wavelengths, the spectral properties ofxy- and deoxyhemoglobin43 are considered. In recent studiest has been shown that two wavelengths are sufficient for anccurate estimation of the changes in hemoglobinoncentrations.27,63,64 We use wavelengths located on bothides of the isosbestic point, at which the extinction coeffi-ients of both hemoglobins are equal. A compromise iseeded to choose proper wavelengths, considering the prop-rties of photodetectors available for detection of diffuselyeflected light with/over large interoptode distances. Above50 nm, the sensitivity of the photomultiplier tubes becomesproblem, and for short wavelengths �below 650 nm� absorp-
ion of light in tissue caused by hemoglobin is very high.hese technical drawbacks and limitations, together with thenalysis of recent studies on the cross talk of hemoglobinoncentration calculation using attenuation of the opticalignals65,66 and availability of wavelengths of picosecond la-er diodes, prompted us to choose these wavelengths. Theavelengths that we adapt to our system—687 and32 nm—fit with the sensitivity characteristics of the photo-
Table 1 Basic technical data of the optical syste
Ref. Group
46 to 49 Hitachi, Japan
25 and 26 Martinos Center for BiomedicalImaging, Boston
50 and 51 Charite, Berlin, Germany
28 University of Pennsylvania,Philadelphia
52 University College London
53 Physikalisch-TechnischeBundesanstalt, Berlin, Germany
34 and 54 Politechnico di Milano, Milan,Italy
33 and 55 Martinos Center for BiomedicalImaging, Boston
Presentstudy
Institute of Biocybernetics andBiomedical Engineering, Warsaw,
Poland
ultipliers tubes that we used, and are optimal to assess the
ournal of Biomedical Optics 034019-1
changes in concentrations of oxy- and deoxyhemoglobin inthe tissue.27,63,64 The measurements at two widely spacedwavelengths �687 and 832 nm� cause the volume of sampledtissues to be different due to differences in optical propertiesat these wavelengths. This difference in sampling volume maylead to uncertainty of calculated changes of oxy- and deoxy-hemoglobin concentration for inhomogeneous tissue struc-tures.
The analysis of the recorded curves, using the calculationof moments of DTOFs, allows us to evaluate the changes inoxy- and deoxyhemoglobin with depth discrimination, and itcan be used for monitoring of the patient’s cerebral hemody-namics in clinical settings.
The theoretical analysis of light propagation in tissue iscarried out with the use of diffusion approximation, and themoments of distributions of times of flight of photons. Thisanalysis allows for a depth-resolved estimation of changes ofthe absorption coefficient, and finally, estimation of changesin oxygenation in intracerebral tissues.
The accuracy, stability, and linearity of the developed sys-tem are verified using the technical test based on the protocolsprovided by MEDPHOT.44 Standard deviation of the absorp-tion coefficient measured at 32 source-detector pairs is about5%. The signal-to-noise ratio analysis shows that for countrates used typically in in vivo experiments, the coefficient ofvariation is below 1% in all the calculated moments ofDTOFs.
The signal-to-noise ratio of the calculated moments de-
d for brain imaging in adults.
rces/ectors
Continuouswave/
frequency-domain/
time-domain Wavelengths
/8 CW 780 and 830 nm
/16 CW 690, 830, and 780 nm
/7 CW 760 and 850 nm
/4 FD 780 nm
/4 CW 785 and 850 nm
/4 TD 687, 803, 826 nm
/16 TD 690 and 820 nm
/18 TD–gating
One wavelengthtuned in range750 to 850 nm
8/8 TD 687 and 826 nm
ms use
Soudet
8
8
8
9
8
9
18
32
1
creases with the order of the moment and is the poorest in
May/June 2007 � Vol. 12�3�1

seditpcUstciCsmr
acabfiemlflttetaoiscttoiapnasmt
fiataanacawe
p
Kacprzak et al.: Time-resolved optical imager for assessment…
J
ignals representing the changes in variance. This phenom-non is related to the small number of late photonsetected.42,67 The signal-to-noise ratio can be improved by thencrease of the number of photons that arrive to the photode-ector, which can be potentially increased by increase of theower of the laser source, but such a solution needs an appli-ation of high power lasers and is restricted by ethical issues.nfortunately, the number of photons escaping from the tis-
ue at large source-detector separations is very limited. Addi-ionally, the high frequency pulses from the photomultiplierannot be processed by time-correlated single photon count-ng electronics because of the appearance of the pile-up effect.onsidering these limitations, in the depth-resolved recon-
truction of oxy- and deoxyhemoglobin, a low noise level ofoments �in particular t and V� is needed, and the count
ates should be as high as possible.For validation of the depth sensitivity of the instrument
nd the data analysis procedures, a liquid physical phantom isonstructed in which the local absorption inclusion is locatedt various depths. This local change of absorption is simulatedy the black plastic ball. Analysis of the recorded data con-rms that the time-resolved measurement allows us to differ-ntiate information from intra- and extracerebral tissues. Theeasured distributions of times of flight of photons are ana-
yzed using their moments �attenuation, the mean time ofight, and variance�. It has experimentally been confirmed
hat these moments of the DTOFs are differently sensitive tohe changes appearing in the superficial and deeper tissue lay-rs. In particular, it is noted that an increase in absorption ofhe superficial layer leads to an increase of t and V, whereasn increase of absorption in the deeper layer causes a decreasef both these moments. These phenomena may be very usefuln analysis of the responses caused by the cerebral functionaltimulation. During such stimulations, a certain systemic in-rease of oxygenation can be expected in both intra- and ex-racerebral tissues. This increase should be discriminated fromhe increase of oxygenation caused by the neuronal activationriginating from the stimulated cortical area. The systemicncrease of absorption may potentially cause an increase of tnd V originating from superficial tissues, which is superim-osed with the corresponding decrease of the moments origi-ating from the brain cortex. This superposition could lead tosuppression of the influence of the systemic stimulation of
ignals of the moments �t and V� measured, and thus to aore adequate contrast of changes of absorption caused by
he neuronal stimulation reflected in these moments.The results of the stimulation of the motor cortex by the
nger tapping task shows that the higher moments �t and V�llow us to image changes in the motor cortex area caused byhe functional stimulation with better contrast than the attenu-tion data. In attenuation signals, nonphysiological responsesre present, which are manifested as synchronous drops of theumber of photons at both wavelengths used. These responsesre present in all the optode positions on the head and can beonnected with the movement artifacts, which are difficult tovoid during finger tapping. Such problems tend to disappearhen the mean time of flight or variance of DTOF is consid-
red.The constructed instrument demonstrates relatively good
roperties when compared with other time-resolved spectros-
ournal of Biomedical Optics 034019-1
copy systems used in experiments on adults. The time-correlated single photon counting method with the indepen-dent acquisition channels allows us to measure DTOFs withhigh count rates of the detected photons �more than 1.5 mil-lion per second at one wavelength�. This characteristic of thesystem allows us to switch the source position without a sig-nificant decrease in the signal-to-noise ratio.
Our future work will focus on further testing of the systemon more realistic tissue phantoms as well as on comparison ofthe time-resolved optical imager with other imaging modali-ties, i.e., single photon emission computed tomography�SPECT� and functional magnetic resonance imaging �fMRI�in clinical settings. We also will consider an application of thepresented imager in measurements with exogenous dye.
AcknowledgmentsThis study has been supported by research project number3T11E00627 financed by the State Committee for ScientificResearch of the Republic of Poland.
References1. F. F. Jobsis, “Noninvasive, infrared monitoring of cerebral and myo-
cardial oxygen sufficiency and circulatory parameters,” Science 198,1264–1267 �1977�.
2. A. Villringer and B. Chance, “Non-invasive optical spectroscopy andimaging of human brain function,” Trends Neurosci. 20�10�, 435–442�1997�.
3. H. Obrig and A. Villringer, “Beyond the visible–imaging the humanbrain with light,” J. Cereb. Blood Flow Metab. 23�1�, 1–18 �2003�.
4. H. Obrig, R. Wenzel, M. Kohl, S. Horst, P. Wobst, J. Steinbrink, F.Thomas, and A. Villringer, “Near-infrared spectroscopy: does it func-tion in functional activation studies of the adult brain?” Int. J. Psy-chophysiol 35�2-3�, 125–142 �2000�.
5. T. Hamaoka, H. Iwane, T. Shimomitsu, T. Katsumura, N. Murase, S.Nishio, T. Osada, Y. Kurosawa, and B. Chance, “Noninvasive mea-sures of oxidative metabolism on working human muscles by near-infrared spectroscopy,” J. Appl. Physiol. 81�3�, 1410–1417 �1996�.
6. R. Boushel and C. A. Piantadosi, “Near-infrared spectroscopy formonitoring muscle oxygenation,” Acta Physiol. Scand. 168�4�, 615–622 �2000�.
7. D. Grosenick, H. Wabnitz, K. T. Moesta, J. Mucke, M. Moller, C.Stroszczynski, J. Stossel, B. Wassermann, P. M. Schlag, and H. Rin-neberg, “Concentration and oxygen saturation of haemoglobin of 50breast tumours determined by time-domain optical mammography,”Phys. Med. Biol. 49�7�, 1165–1181 �2004�.
8. B. Chance, M. Cope, E. Gratton, N. Ramanujam, and B. Tromberg,“Phase measurement of light absorption and scatter in human tissue,”Rev. Sci. Instrum. 69�10�, 3457–3481 �1998�.
9. B. Chance, S. Nioka, J. Kent, K. McCully, M. Fountain, R. Green-feld, and G. Holtom, “Time-resolved spectroscopy of hemoglobinand myoglobin in resting and ischemic muscle,” Anal. Biochem. 174,698–707 �1988�.
10. J. Hebden, R. Kruger, and K. Wong, “Time resolved imaging througha highly scattering medium,” Appl. Opt. 30, 788–794 �1991�.
11. M. Cope and D. Delpy, “System for long-term measurement of bloodand tissue oxygenation on newborn infants by near infra-red transil-lumination,” Med. Biol. Eng. Comput. 26, 289–294 �1988�.
12. M. Wolf, N. Brun, G. Greisen, M. Keel, K. vonSiebenthal, and H.Bucher, “Optimising the methodology of calculating the cerebralblood flow of newborn infants from near infra-red spectrophotometrydata,” Med. Biol. Eng. Comput. 34, 221–226 �1996�.
13. T. Austin, A. P. Gibson, G. Branco, R. M. Yusof, S. R. Arridge, J. H.Meek, J. S. Wyatt, D. T. Delpy, and J. C. Hebden, “Three dimen-sional optical imaging of blood volume and oxygenation in the neo-natal brain,” Neuroimage 31�4�, 1426–1433 �2006�.
14. A. P. Gibson, T. Austin, N. L. Everdell, M. Schweiger, S. R. Arridge,J. H. Meek, J. S. Wyatt, D. T. Delpy, and J. C. Hebden, “Three-dimensional whole-head optical tomography of passive motor evoked
responses in the neonate,” Neuroimage 30�2�, 521–528 �2006�.May/June 2007 � Vol. 12�3�2

1
1
1
1
1
2
2
2
2
2
2
2
2
2
2
3
3
3
Kacprzak et al.: Time-resolved optical imager for assessment…
J
5. J. C. Hebden, A. Gibson, T. Austin, R. M. Yusof, N. Everdell, D. T.Delpy, S. R. Arridge, J. H. Meek, and J. S. Wyatt, “Imaging changesin blood volume and oxygenation in the newborn infant brain usingthree-dimensional optical tomography,” Phys. Med. Biol. 49�7�,1117–1130 �2004�.
6. J. C. Hebden, A. Gibson, R. M. Yusof, N. Everdell, E. M. Hillman,D. T. Delpy, S. R. Arridge, T. Austin, J. H. Meek, and J. S. Wyatt,“Three-dimensional optical tomography of the premature infantbrain,” Phys. Med. Biol. 47�23�, 4155–4166 �2002�.
7. J. Steinbrink, H. Wabnitz, H. Obrig, A. Villringer, and H. Rinneberg,“Determining changes in NIR absorption using a layered model ofthe human head,” Phys. Med. Biol. 46�3�, 879–896 �2001�.
8. A. Liebert, H. Wabnitz, J. Steinbrink, H. Obrig, M. Moller, R. Mac-donald, A. Villringer, and H. Rinneberg, “Time-resolved multidis-tance near-infrared spectroscopy of the adult head:intracerebral andextracerebral absorption changes from moments of distribution oftimes of flight of photons,” Appl. Opt. 43�15�, 3037–3047 �2004�.
9. F. Vernieri, N. Rosato, F. Pauri, F. Tibuzzi, F. Passarelli, and P. M.Rossini, “Near infrared spectroscopy and transcranial Doppler inmonohemispheric stroke,” Eur. Neurol. 41�3�, 159–162 �1999�.
0. V. D. Kilpack, S. A. Stayer, E. D. McKenzie, C. D. Fraser, Jr., and D.B. Andropoulos, “Limiting circulatory arrest using regional low flowperfusion,” J. Extra Corpor. Technol. 36�2�, 133–138 �2004�.
1. P. Smielewski, M. Czosnyka, J. D. Pickard, and P. Kirkpatrick, “As-sessment of cerebrovascular reactivity in patients with carotid arterydisease using near-infrared spectroscopy,” Acta Neurochir. Suppl.(Wien) 71, 263–265 �1998�.
2. M. Kohl-Bareis, H. Obrig, J. Steinbrink, J. Malak, K. Uludag, and A.Villringer, “Noninvasive monitoring of cerebral blood flow by a dyebolus method: separation of brain from skin and skull signals,” J.Biomed. Opt. 7�3�, 464–470 �2002�.
3. A. Liebert, H. Wabnitz, J. Steinbrink, M. Moller, R. Macdonald, H.Rinneberg, A. Villringer, and H. Obrig, “Bed-side assessment of ce-rebral perfusion in stroke patients based on optical monitoring of adye bolus by time-resolved diffuse reflectance,” Neuroimage 24�2�,426–435 �2005�.
4. C. Terborg, S. Bramer, S. Harscher, M. Simon, and O. W. Witte,“Bedside assessment of cerebral perfusion reductions inpatients withacute ischaemic stroke by near-infrared spectroscopy and indocya-nine green,” J. Neurol., Neurosurg. Psychiatry 75�1�, 38–42 �2004�.
5. D. A. Boas, T. Gaudette, G. Strangman, X. Cheng, J. J. Marota, andJ. B. Mandeville, “The accuracy of near infrared spectroscopy andimaging during focal changes in cerebral hemodynamics,” Neuroim-age 13�1�, 76–90 �2001�.
6. M. A. Franceschini, S. Fantini, J. H. Thompson, J. P. Culver, and D.A. Boas, “Hemodynamic evoked response of the sensorimotor cortexmeasured noninvasively with near-infrared optical imaging,” Psycho-physiology 40�4�, 548–560 �2003�.
7. D. A. Boas, A. M. Dale, and M. A. Franceschini, “Diffuse opticalimaging of brain activation: approaches to optimizing image sensitiv-ity, resolution, and accuracy,” Neuroimage 23�1�, S275–288 �2004�.
8. B. Chance, E. Anday, S. Nioka, S. Zhou, L. Hong, K. Worden, C. Li,T. Murray, Y. Ovetsky, D. Pidikiti, and R. Thomas, “Anovel methodfor fast imaging of brain function, non-invasively, with light,” Opt.Express 2�10�, 411–423 �1998�.
9. R. M. Danen, Y. Wang, X. D. Li, W. S. Thayer, and A. G. Yodh,“Regional imager for low-resolution functional imaging of the brainwith diffusing near-infrared light,” Photochem. Photobiol. 67�1�,33–40 �1998�.
0. H. Eda, I. Oda, Y. Ito, Y. Wada, Y. Oikawa, Y. Tsunazawa, M.Takada, Y. Tsuchiya, Y. Yamashita, M. Oda, A. Sassaroli, Y. Yamada,and M. Tamura, “Multichannel time-resolved optical tomographicimaging system,” Rev. Sci. Instrum. 70�9�, 3595–3602 �1999�.
1. I. Miyai, H. C. Tanabe, I. Sase, H. Eda, I. Oda, I. Konishi, Y. Tsuna-zawa, T. Suzuki, T. Yanagida, and K. Kubota, “Cortical mapping ofgait in humans: a near-infrared spectroscopic topography study,”Neuroimage 14�5�, 1186–1192 �2001�.
2. H. Wabnitz, M. Moeller, A. Walter, R. Macdonald, R. Erdmann, O.Raitza, M. Kacprzak, A. Liebert, C. Drenckhahn, J. P. Dreier, S.Koch, and J. Steinbrink, “Depth-selective analysis of responses tofunctional stimulation recorded with a time-domain NIR brain im-ager, in Biomedical Optics Topical Meeting, Fort Lauderdale, FL,
paper ME34, Optical Society of America, Washington, D.C. �2006�.ournal of Biomedical Optics 034019-1
33. J. Selb, D. K. Joseph, and D. A. Boas, “Time-gated optical system fordepth-resolved functional brain imaging,” J. Biomed. Opt. 11�4�,044008 �2006�.
34. D. Contini, A. Pifferi, L. Spinelli, A. Torricelli, and R. Cubeddu,“Design and characterization of a two-wavelengthmultichannel time-resolved system for optical topography,” Biomedical Optics 2006Technical Digest, Optical Society of America, Washington, D.C.�2006�.
35. A. Liebert, H. Wabnitz, D. Grosenick, and R. Macdonald, “Fiberdispersion in time domain measurements compromising the accuracyof determination of optical properties of strongly scattering media,”J. Biomed. Opt. 8�3�, 512–516 �2003�.
36. M. Patterson and B. Pogue, “Mathematical model for time-resolvedand frequency-domain fluorescence spectroscopy in biological tis-sues,” Appl. Opt. 33, 1963–1974 �1994�.
37. M. Hiraoka, M. Firbank, M. Essenpris, M. Cope, S. R. Arridge, P.vanderZee, and D. T. Delpy, “A Monte Carlo investigation of opticalpathlength in inhomogeneous tissue and its application to near-infrared spectroscopy,” Phys. Med. Biol. 38, 1859–1876 �1993�.
38. M. S. Patterson, B. Chance, and B. C. Wilson, “Time resolved reflec-tance and transmittance for the non/invasive measurement of tissueoptical properties,” Appl. Opt. 28, 2331–2336 �1989�.
39. A. Ishimaru, “Diffusion of light in turbid material,” Appl. Opt. 28,2210–2215 �1989�.
40. K. Furutsu and Y. Yamada, “Diffusion approximation for adissipativerandom medium and the applications,” Phys. Rev. E 50�5�, 3634–3640 �1994�.
41. R. Pierrat, J. J. Greffet, and R. Carminati, “Photon diffusion coeffi-cient in scattering and absorbing media,” J. Opt. Soc. Am. A 23�5�,1106–1110 �2006�.
42. A. Liebert, H. Wabnitz, D. Grosenick, M. Moller, R. Macdonald, andH. Rinneberg, “Evaluation of optical properties of highly scatteringmedia by moments of distributions of times of flight of photons,”Appl. Opt. 42�28�, 5785–5792 �2003�.
43. S. Wray, M. Cope, D. T. Delpy, J. S. Wyatt, and E. O. Reynolds,“Characterization of the near infrared absorption spectra of cyto-chrome aa3 and haemoglobin for the non-invasive monitoring of ce-rebral oxygenation,” Biochim. Biophys. Acta 933�1�, 184–192 �1988�.
44. A. Pifferi, A. Torricelli, A. Bassi, P. Taroni, R. Cubeddu, H. Wabnitz,D. Grosenick, M. Moller, R. Macdonald, J. Swartling, T. Svensson, S.Andersson-Engels, R. L. van Veen, H. J. Sterenborg, J. M. Tualle, H.L. Nghiem, S. Avrillier, M. Whelan, and H. Stamm, “Performanceassessment of photon migration instruments: the MEDPHOT proto-col,” Appl. Opt. 44�11�, 2104–2114 �2005�.
45. R. Maniewski, A. Liebert, and M. Kacprzak, “Time resolved opticalspectroscopy system for cerebral oxygenation imaging,” Ann. Intl.Conf. IEEE Eng. Med. Biol. Soc., pp. 201–204 �2005�.
46. M. Igawa, Y. Atsumi, K. Takahashi, S. Shiotsuka, H. Hirasawa, R.Yamamoto, A. Maki, Y. Yamashita, and H. Koizumi, “Activation ofvisual cortex in REM sleep measured by 24-channel NIRS imaging,”Psychiatry Clin. Neurosci. 55�3�, 187–188 �2001�.
47. K. Takahashi, S. Ogata, Y. Atsumi, R. Yamamoto, S. Shiotsuka, A.Maki, Y. Yamashita, T. Yamamoto, H. Koizumi, H. Hirasawa, and M.Igawa, “Activation of the visual cortex imaged by 24 channel near-infrared spectroscopy,” J. Biomed. Opt. 5�1�, 93–96 �2000�.
48. A. Maki, Y. Yamashita, E. Watanabe, and H. Koizumi, “Visualizinghuman motor activity by using non-invasive optical topography,”Front Med. Biol. Eng. 7�4�, 285–297 �1996�.
49. A. Maki, Y. Yamashita, Y. Ito, E. Watanabe, Y. Mayanagi, and H.Koizumi, “Spatial and temporal analysis of human motoractivity us-ing noninvasive NIR topography,” Med. Phys. 22�12�, 1997–2005�1995�.
50. M. Kohl-Bareis, C. Buckow, H. Zank, H. Obrig, J. Steinbrink, and A.Villringer, “Near-infrared spectroscopic topographic imaging of cor-tical activation, Lecture Notes of ICB Seminar on Laser DopplerFlowmetry and Near Infrared Spectroscopy in Medical Diagnosis,Warsaw �2002�.
51. C. Buckow, M. Kohl, H. Zank, H. Obrig, K. Uludag, J. Steinbrink, H.Israel, and A. Villringer, “Assessment of cortival activation by multichannel topography,” Neuroimage 13�6�, S5 �2001�.
52. N. Everdell, A. Gibson, I. Tullis, T. Vaithianathan, J. Hebden, and D.Delpy, “A frequency multiplexed near-infrared topography systemfor imaging functional activation in the brain,” Rev. Sci. Instrum.
76�9�, 093705 �2005�.May/June 2007 � Vol. 12�3�3

5
5
5
5
5
5
5
6
Kacprzak et al.: Time-resolved optical imager for assessment…
J
3. H. Wabnitz, M. Moller, A. Walter, R. Macdonald, R. Erdmann, O.Raitza, M. Kacprzak, A. Liebert, C. Drenckhahn, J. P. Dreier, S.Koch, and J. Steinbrink, “Depth-selective analysis of responses tofunctional stimulation recorded with a time-domain NIR brain im-ager, “ in Biomedical Optics Topical Meeting 2006, Fort Lauderdale,FL, p. ME34, Optical Society of America, Washington DC �2006�.
4. A. Torricelli, D. Contini, A. Pifferi, L. Spinelli, R. Cubeddu, L.Craighero, and L. Fadiga, “Mapping cerebral hemodynamics in braincortex by multi-channel time-resolved near-infrared spectroscopy,”Biomed. Opt. 2006 Tech. Digest, Optical Society of America, Wash-ington, D.C. �2006�.
5. J. Selb, J. J. Stott, M. A. Franceschini, A. G. Sorensen, and D. A.Boas, “Improved sensitivity to cerebral hemodynamics during brainactivation with a time-gated optical system: analytical model andexperimental validation,” J. Biomed. Opt. 10�1�, 11013 �2005�.
6. F. E. W. Schmidt, M. E. Fry, E. M. C. Hillman, J. C. Hebden, and D.T. Delpy, “A 32-channel time-resolved instrument for medical opticaltomography,” Rev. Sci. Instrum. 71, 256–265 �2000�.
7. Y. Chen, S. M. Zhou, C. H. Xie, S. Nioka, M. Delivoria-Papadopoulos, E. Anday, and B. Chance, “Preliminary evaluation ofdual wavelength phased array imaging on neonatal brain function,” J.Biomed. Opt. 5�2�, 194–200 �2000�.
8. J. P. Culver, A. M. Siegel, J. J. Stott, and D. A. Boas, “Volumetricdiffuse optical tomography of brain activity,” Opt. Lett. 28�21�,2061–2063 �2003�.
9. A. M. Siegel, J. P. Culver, J. B. Mandeville, and D. A. Boas, “Tem-poral comparison of functional brain imaging with diffuse opticaltomography and fMRI during rat forepaw stimulation,” Phys. Med.Biol. 48�10�, 1391–1403 �2003�.
0. G. Yu, T. Durduran, D. Furuya, J. H. Greenberg, and A. G. Yodh,
ournal of Biomedical Optics 034019-1
“Frequency-domain multiplexing system for in vivo diffuse lightmeasurements of rapid cerebral hemodynamics,” Appl. Opt. 42�16�,2931–2939 �2003�.
61. E. Sevick, B. Chance, J. Leigh, S. Nioka, and M. Maris, “Quantita-tion of time- and frequency-resolved optical spectra for the determi-nation of tissue oxygenation,” Anal. Biochem. 195, 330–351 �1991�.
62. G. Strangman, D. A. Boas, and J. P. Sutton, “Non-invasive neuroim-aging using near-infrared light,” Biol. Psychiatry 52�7�, 679–693�2002�.
63. Y. Yamashita, A. Maki, and H. Koizumi, “Wavelength dependence ofthe precision of noninvasive optical measurement of oxy-, deoxy- andtotal-hemoglobin concentration,” Med. Phys. 28�6�, 1108–1114�2001�.
64. H. Sato, M. Kiguchi, F. Kawaguchi, and A. Maki, “Practicality ofwavelength selection to improve signal-to-noise ratio in near-infraredspectroscopy,” Neuroimage 21�4�, 1554–1562 �2004�.
65. D. A. Boas, K. Chen, D. Grebert, and M. A. Franceschini, “Improv-ing the diffuse optical imaging spatial resolution of the cerebral he-modynamic response to brain activation in humans,” Opt. Lett.29�13�, 1506–1508 �2004�.
66. K. Uludag, J. Steinbrink, A. Villringer, and H. Obrig, “Separabilityand cross talk: optimizing dual wavelength combinations for near-infrared spectroscopy of the adult head,” Neuroimage 22�2�, 583–589�2004�.
67. J. C. Hebden, S. Arridge, and M. Schwaiger, “Investigation of alter-native data types for time-resolved optical tomography,” in OSATrends in Optics and Photonics, Advances in Optical Imaging andPhoton Migration, R. Alfano and J. Fujimoto, Eds., pp. 162–167,OSA, Washington, D.C. �1998�.
May/June 2007 � Vol. 12�3�4


