Embed Size (px)
Citation preview

Experimental Cell Research 174 (1988) 319-329
Thrombospondin Binding by Human Squamous Carcinoma and Melanoma Cells: Relationship to Biological Activity
BRUCE L. RISER, JAMES VARANI,’ KAREN O’ROURKE, and VISHVA M. DIXIT
The Department of Pathology, University of Michigan Medical School, Ann Arbor, Michigan 48109
Human squamous carcinoma cells attach and spread on thrombospondin (TSP)-coated culture dishes but exhibit significant variability among individual cell lines in their degree of responsiveness. Using a highly responsive squamous carcinoma line and a cell line which is much less responsive (as well as a human melanoma cell line which does not respond at all in the adhesion assay), we have examined binding of exogenous radiolabeled TSP. The cells which were the most responsive to TSP in the adhesion assay bound the greatest amount of radiolabeled ligand. Binding was time- and dose-dependent, saturable, inhibitable with excess unlabeled TSP, reversible, and specific. The less-responsive squa- mous carcinoma cells bound only 25-30% of the amount of TSP bound by the highly responsive cells while the nonresponsive melanoma cells bound less than 10% of the amount bound by the highly responsive squamous carcinoma cells. Our previous studies (J. Varani et al. (1986) Exp. Cell Res. 167, 376) have shown that the highly responsive squamous carcinoma cells also synthesized the greatest amount of TSP as indicated by biosynthetic labeling studies. The less-responsive squamous carcinoma cells were interme- diate in synthetic activity and no synthetic activity was seen with the melanoma cells. These findings suggest that the amount of ligand bound may determine the degree of biological responsiveness and that endogenously synthesized TSP may be the source of that ligand. @ 1988 Academic PRSS, 1nc.
Thrombospondin (TSP) is a high molecular weight glycoprotein constituent of platelet a-granules. It is secreted during activation and plays a role in the secondary phase of platelet aggregation [l-5]. Past studies have shown that TSP is also synthesized by a number of different cell types in culture and is incorporat- ed into the extracellular matrix [6-lo]. Like other glycoprotein constituents of the extracellular matrix (e.g., laminin and tibronectin), TSP serves as an adhesion factor for cells. We demonstrated that human keratinocytes and squamous carci- noma cells attached and spread in response to TSP [II, 121. Under the same conditions, eight different melanoma and glioma lines failed to respond. Melano- ma cells do not appear to be universally unresponsive, however, since it has recently been shown that TSP induces attachment and spreading of G361 and C32 melanoma cell lines [ 131.
In our studies, we observed significant variability among squamous carcinoma cell lines in their degree of responsiveness to TSP. In the most responsive
’ To whom reprint requests should be addressed at: Department of Pathology, The University of Michigan Medical School, 1315 Catherine Road, Box 0054 Medical Science I, Ann Arbor, MI 48109.
319 Copyright @ 1988 by Academic Press, Inc. All rights of reproductmn in any form reserved
0014-4827/88 $03.00
320 Riser et al.
squamous carcinoma lines, greater than 70% of the cells attached and spread within 30 min of treatment while in the least responsive lines, only lO-12% of the cells responded [ 1 I]. In order to begin probing the cellular and molecular basis for the differences among the lines in their response to TSP, we have used a radioligand-binding assay to assess TSP binding by these cells. Two squamous carcinoma lines-the most highly responsive and the least responsive from the group used in our previous study-as well as one of the nonresponsive melanoma lines were used. Results from these studies indicated that the cells bound TSP in a receptor-mediated fashion and that the highly responsive squamous carcinoma cells bound significantly more of the ligand than either the low-responsive squa- mous carcinoma cells or the nonresponsive melanoma cells. Taken together with our previous studies showing a direct relationship between TSP biosynthesis and biological responsiveness in the cell-substrate adhesion assay [ 111, these findings suggest that the amount of ligand bound to the cell surface may determine the degree of biological responsiveness and that under natural conditions, endoge- nously synthesized TSP may be a source of that ligand.
MATERIALS AND METHODS &l/s. Two human squamous carcinoma cell lines (designated UM-SCC-1lB and UM-SCC-22B,
respectively) and one human melanoma cell line (designated SK-MEL-28) were used in these studies. The isolation and characterization of these lines have been described previously [14, 151. These lines were used in our recent studies characterizing the cell-substrate adhesion response to TSP [ll, 121. The UM-SCC-11B cells were among the most responsive of the squamous carcinoma lines while the UM-SCC-22B cells were the least responsive. Like the other melanoma cells examined, the SK-MEL- 28 cells were nonresponsive to TSP in the adhesion assay. For the present study, all three lines were grown in monolayer culture under identical conditions. The growth medium was Eagle’s minimal essential medium with Earle’s salts (MEM) supplemented with nonessential amino acids, 15% fetal bovine serum, 100 U/ml of penicillin and 100 ug/ml of streptomycin. Growth was at 37°C in medium equilibrated with 5 % CO*. The cells were subcultured by trypsinization as required.
Reagents. TSP was purified from the supernatant fluid of thrombin-activated platelets as described previously [4]. The purified TSP migrated as a single protein band with an apparent M, of 180 kDa when examined by sodium dodecyl sulfate-polyacrylamide gel electrophoresis (SDS-PAGE) under reducing conditions.
The production and characterization of polyclonal and monoclonal antibodies directed against TSP have been described previously [16-191. The monoclonal antibodies were purified from ascites fluid by ammonium sulfate precipitation followed by affinity chromatography on protein A-Sepharose. Purity was determined by SDS-PAGE.
Laminin was used in certain experiments. The laminin was prepared from the Englebreth-Holm- Swarm (EHS) tumor by the method of Timpl er al. [20]. Purity of the laminin was assessed by SDS-PAGE and by enzyme-linked immunosorbent assay (ELISA) [21]. When examined on a 7% SDS-polyacrylamide gel under reducing conditions, only two protein bands (at 200 and 400 kDa) were seen. The laminin reacted by ELISA with monospecific polyclonal anti-laminin antibodies at dilutions up to 1 : lo6 but did not react with antibodies to type IV collagen or fibronectin.
Adhesion assay. Cell attachment and spreading on TSP-coated wells of a 24-well dish were used as a measure of adhesion. TSP (25 l&well unless otherwise stated) was added to each well in 0.5 ml of serum-free MEM and incubated at 37°C for 2 h. Control wells received serum-free MEM alone. After incubation, the nonattached TSP was removed and the wells were washed one time. Each well then received 0.5 ml of MEM supplemented with 1% bovine serum albumin. The cells were added 15 min later and incubated at 37°C. At various times thereafter, the nonattached cells were removed and counted with an electronic particle counter. The wells were washed and flooded with 2 % glutaralde- hyde. The percentage of attached cells which were spread was determined microscopically using a calibrated grid.
TSP binding studies. TSP purified as described above was iodinated using immobilized chloramine-

Thrombospondin binding by tumor cells 321
T on nonporous polystyrene beads (Iodo-Beads, Pierce Chemical Co., Rockford, IL). Free iodide was removed by filtration on a Sephadex G-25 column. “‘1-TSP of high specific activity (2.2-3.2~ lo6 CPM/ug of protein was obtained. The ‘*‘I-TSP prepared in this way retained biological activity (i.e., in the adhesion assay). This material was used to assess TSP binding.
The binding studies were performed with cells in monolayer culture as described previously [22]. Cells (3.5~ 10’) were seeded into wells of a 24 well culture dish using MEM supplemented with 15 % fetal bovine serum as the culture medium. After incubation for 24 h at 37°C and 5% CO1, the cells were washed two times and reincubated in MEM supplemented with 200 pg of bovine serum albumin/ml. Two hours later, 0.25 ml of fresh MEM containing 200 ug of bovine serum albumin, appropriate amounts of ‘2SI-TSP, with or without lOO-fold excess of unlabeled TSP, was added to the cells. After an appropriate incubation period (normally 30 min at 25°C). the binding medium was aspirated and the monolayers were washed four times with cold binding medium. The cells were then removed by trypsinization and the entire contents were transferred to a vial for counting. The wells were then washed three additional times with binding medium and the fluid was added to the corresponding vials. All assays were run in duplicate or triplicate with parallel cultures used to determine cell numbers. Specific binding was defined as the total radioactivity bound minus the amount bound in the presence of lOO-fold excess unlabeled TSP and was adjusted in each experiment to a standard cell number. For comparative purposes, cells were removed from the wells by scraping and compared to cells removed by trypsinization. Virtually identical amounts of radioactivity were recovered. Wells which had received all the reactants except cells served as controls. The amount of lZ51-TSP bound to these wells with the entire surface available was less than 12% of the amount bound in the presence of the cells.
In some experiments, the cells were harvested with trypsin, washed two times in MEM supple- mented with 200 ug of bovine serum albumin/ml, and then examined for TSP binding in suspension. The binding studies on cells in suspension were carried out using the rapid filtration methods as described previously [23]. The same buffer, cell concentration, and concentrations of ligand were used to measure binding in suspension as were used in the monolayer binding studies.
Enzyme-linked immunosorbenr assay (ELISA). ELISAs were performed to quantify the amount of TSP secreted into the culture medium by the cells. Cells were plated at 3.5~10’ cells per well in growth medium and grown for 1 day. Following this, the wells were washed two times in serum-free MEM and the cells were incubated for an additional 2 h in MEM supplemented with 200 ug/ml of bovine serum albumin. After 2 h, the culture medium was harvested, clarified by low-speed centrifu- gation, and added to wells of a 96-well plate (Falcon Plastics, Oxnard, CA) from lots which had been prescreened for acceptability in ELISAs. We used 200 ul of the culture medium per well and incubated the wells for 4 h at 37°C. Control culture medium served as the control. Purified human platelet TSP (0.5-0.0005 ug per well) was also added to the assay plate to serve as a standard. After the 4-h incubation, the culture medium from the cells and the control culture medium were removed from the wells and the ELISA was then run exactly as described previously [21]. The cells from which the culture medium was obtained were harvested with trypsin and counted.
RESULTS TSP-Stimulated Attachment and Spreading
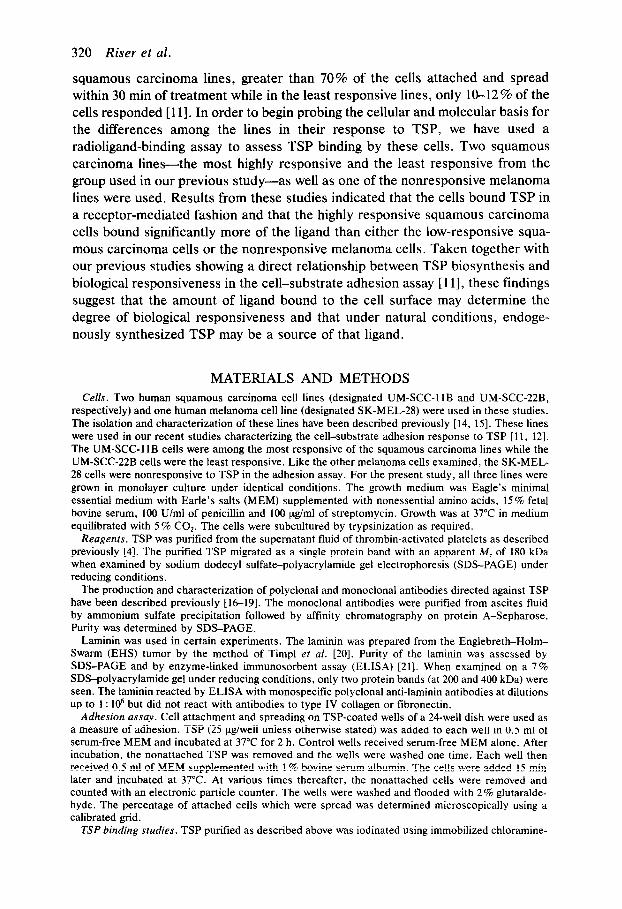
TSP-induced attachment and spreading of the three cell lines were examined in the first series of experiments. Kinetics of the response are shown in Fig. 1. Both of the squamous carcinoma lines (UM-XC-11 B and UM-SCC-22B) attached and spread over the same time course in response to TSP although the response was quantitatively greater with the UM-SCC-11B cells than with the UM-SCC-22B cells. The effects were seen as early as 15 min after plating. Differences between TSP-treated cells and the untreated control cells persisted for several hours, although the control cells also attached and spread after prolonged incubation (4-24 h). In contrast, the melanoma cells (SK-MEL-28) failed to attach and spread in response to TSP. These data are similar to what we have previously published [ 11, 121 and are presented here for comparison with ligand-binding data (following section).
322 Riser et al.
,oo UM-SCC-118
75
50
25
2
; kLz 0 15 30 60 120
5
Y 0 15 30 60 120
2 P
1oo SK-MEL-26 1
75 1
“‘L p 0 15 30 60 120
TIME tmlnutee)
Fig. 1. TSP-mediated attachment and spreading of UM-SCC-llB, UM-SCC-22B, and SK-MEL-28 cells. The TSP-coated wells were prepared and the adhesion assay was carried out as described under Materials and Methods section. The values shown represent the average percentage of cells that were attached and spread at each time point, based on duplicate wells in a single experiment. The individual values were within 10% of the average values. The experiment was repeated three times with very similar results. Substrates: TSP-coated, 0; plastic, 0.
Dose-response studies with both of the squamous carcinoma lines indicated that the response to TSP was dose-responsive over the range of 0.5-50 ug of TSP per well and that a half maximal response occurred at approximately 5 ug per well. Concentrations as high as 50 yg per well failed to elicit a positive response with the SK-MEL-28 cells. The dose-response data are similar to what we have reported previously [ 11, 121.
TSP-Binding Studies
The characteristics of ‘251-TSP binding were examined in detail using the UM- SCC-1lB cells. Time course studies (Fig. 2) indicated that binding was time dependent and that there was good accord between the kinetics of ligand binding and the kinetics of the biological response (compare Figs. 1 and 2). Ligand binding was concentration dependent over the range of 0.5-20 ug per reaction (Fig. 3) and was saturable. In the presence of loo-fold excess unlabeled TSP, binding was reduced by 60-70%. Analysis of the binding data shown in Fig. 3 by the Scatchard method [24] (Fig. 3, insert) was consistent with a single class of binding sites. At saturation, approximately 150 ng of TSP was bound per 3.5~ lo5

Thrombospondin binding by tumor cells 323
0 s 15 30 60 120
TIME lminutesl
Fig. 2. Time course of ‘*‘I-TSP binding to LJM-SCC-1lB cells. The binding assay was carried out as described under Materials and Methods. The values shown represent the average cpm of ‘*‘I-TSP bound at each time point, based on duplicate wells in a single experiment. The individual values were within 10% of the average values. The experiment was repeated two times with very similar results.
cells with half-maximal binding occurring at 3.5 vg per well (24 nA4). In order to distinguish TSP binding to cell surface components from binding to extracellular matrix components, two types of experiments were done. In the first, cells were removed from the wells by gently scraping and 12’1-TSP binding to the residual
400
300
,o
5 t z
200 0
z I
I
5 100
.OS .OS
.04 . .04 .
.03 .03 . .
.02 .02 \
.Ol .Ol 1 kl
50 50 100 150 Bound Bound TSP (ng)
0 1 5 10 20
“g I ‘251]-TSP
Fig. 3. Specific binding of ‘*jI-TSP to UM-SCC-1lB cells. The assay was carried out as described under Materials and Methods using a single time point (30 min). Each concentration of labeled TSP was added to the cells in the presence or absence of lOO-fold excess unlabeled TSP. The values shown represent the difference between the total binding of the ‘*‘I-TSP and the binding in the presence of excess unlabeled TSP. Nonspecific binding varied from 2540% of total binding. The values shown are averages based on four individual samples in two separate experiments. Insert: Scatchard plot of data.
22-888332
324 Riser et al.
TABLE 1
TSP binding to cells in monolayer, to extracellular matrix, and to cells in suspension
Incubation conditions ng of TSP
boundd
Cells in monolayeP 146+ 14 Extracellular matrixb 13f5 Cells in suspension’ 9125
’ TSP binding to cells in monolayer was determined from wells containing 3.5~ 10’ cells. The cells were incubated with 20 ug of ‘*?-TSP for 30 min.
b TSP binding to the extracellular matrix was determined exactly as described for cells in monolay- er except that the cells had been removed from the wells by gentle scraping immediately prior to assay.
’ TSP binding to cells in suspension was measured using cells immediately after removal from the extracellular matrix by trypsinization. Per reaction 3.5~ 16 cells were incubated with 20 ug of ‘251-TSP for 30 min. Following incubation, cells were separated from unbound ligand by rapid filtration.
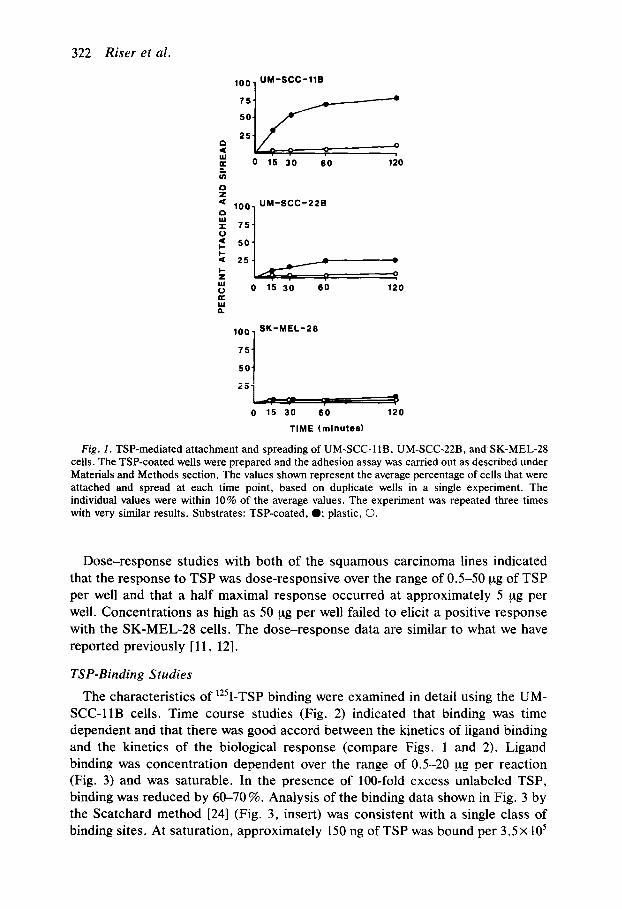
d The values shown represent the amount of TSP bound per 3.5 x 10’ cells (or to extracellular matrix from wells originally containing 3.5~ 10’ cells). The values are averages + the differences between the individual values and the averages based on two samples in a single experiment. Background binding and nonspecific binding have been subtracted. Binding to extracellular matrix and to cells in suspension were examined on three separate experiments with similar results.
matrix was determined. Binding to the residual matrix accounted for less than 10% of the binding observed in the presence of viable cells (Table 1). In contrast, when cells were removed from the matrix by trypsinization and then examined in suspension for TSP binding, the results were very similar to those observed in monolayer binding studies. That is, binding was time and concentration depend- ent. The amount bound at saturation was similar to that bound by cells in monolayer (Table 1). In addition, the concentration at which half-maximal bind- ing occurred (31 nM) was very similar to the concentration at which half maximal binding occurred to cells in monolayer (24 n&Q.
Additional studies with cells in monolayer were carried out to further charac-
TABLE 2
Reversibility of ‘2sI-TSP binding
Incubation conditions cpm of “‘1-TSP bound/
to 15 min 3.5X 10’ cells (specific)
2 pg ‘251-TSP buffer 41,308 (100%) 2 pg “‘1-TSP 200 ug TSP (unlabeled) 10,072 (24%)
Note. ‘251-TSP (2 ug) was added to culture wells. After 15 min at 25°C 200 ug unlabeled TSP or buffer alone was added. Unlabeled TSP (200 ug) was added to parallel cultures at time 0 and the resulting values was used to determine specific binding. The values shown represent the average cpm bound in duplicate wells in a single experiment. The individual values were within 10 % of the average values. The experiment was repeated two times with similar results.

Thrombospondin binding by tumor cells 325
TABLE 3
Inhibition of ‘2sI-TSP binding
Inhibitor cpm of ‘*‘I-TSP
hound/3.5 x 10’ cells” % Inhibition
Experiment Ab None 23,689 TSP 200 w 8,203 64 Laminin 400 Pi? 29,121 None
200 Pg 29,928 None 100 w 29,412 None
Experiment B’ None 9,675 - Mab A6.1 25 PEt 5,675 41 Mab A6.1 100 Pi? 3,116 68 Mab A6.1 25 Pi4 9,120 6 Mab A6.1 100 w 2,851 71 Mab A2.5 25 k2 848 91 Mab A2.5 100 P8 825 92 Mab D4.6 25 FLg 4,454 54 Mab D4.6 100 w 2,521 74
’ The values shown represent the average cpm bound in duplicate wells in a single experiment. The individual values were within 10% of the average values. The experiments were repeated two times with similar results.
b ‘251-TSP (2 ug) was added to the culture wells along with varying amounts of laminin. Binding was determined after 30 min.
’ ‘*‘I-TSP (2 ug) was incubated with the indicated amount of monoclonal antibody (Mab) for 1 h at 4°C. The ‘*‘I-TSP-Mab complex (in 250 ul) was then added to culture wells and binding was determined after 30 min. Antibody A6.1 is directed against the trypsin-resistant 70-kDa core of the TSP molecule. Antibody C6.7 is directed against the platelet-binding domain of the TSP molecule. Antibody A2.5 is directed against the heparin-binding domain of the TSP molecule. Antibody D4.6 is directed against Ca*+-dependent structures of the TSP molecule.
terize TSP binding. These studies showed that binding was reversible and specif- ic. Reversibility was demonstrated by exposing the cells to ‘251-TSP for 15 min and then treating them with loo-fold excess of the unlabeled ligand. When this was done, the amount of specific binding detected 30 min later was reduced by 76% (Table 2). Specificity was demonstrated by measuring TSP binding in the presence of laminin. Using a constant amount of ‘251-TSP (2 ug per well) and various amounts of laminin, we found that laminin had no inhibitory effects on binding at concentrations as high as 400 yg per reaction (Table 3).
A series of anti-TSP monoclonal antibodies were also examined for ability to interfere with “‘1-TSP binding. Appropriate amounts of each antibody were preincubated with a standard amount of TSP (2 ug) for 1 h at 4°C. Following this, binding experiments were carried out in the normal manner. The antibodies interfered with TSP binding in a dose-dependent manner (Table 3) and there was a good correlation between inhibition of binding and inhibition of TSP-induced adhesion [ 1 I].
The ability to measure the binding of exogenous TSP by cells which also
326 Riser et al.
TABLE 4
Immunoreactiue TSP in the culture fluid from UM-SCC-1 IB cells
TSP sourcea ODm
(mean + range)b
Buffer Buffer +
0.005 kg TSP 0.01 ug TSP 0.05 pg TSP 0.10 ug TSP 0.50 pg TSP
Culture fluid (2 h) Culture fluid (6 h)
0.006f0.013
0.160+0.011 0.450f0.010 0.917f0.001 1.050f0.019 1.445f0.042 0.7OlkO.029 0.975kO.062
’ The buffer consisted of 200 ul of MEM supplemented with 200 ug of bovine serum albumin per milliliter. Human platelet TSP was added to the same buffer to generate a standard curve. The culture fluids consisted of the same buffer incubated for 2 or 6 h in the presence of 3.5~ lo6 UM-SCC-I 1B cells.
* The values shown are the absorbance at 405 nm after 45 min of incubation for development of the enzyme substrate. All values are averages of duplicate wells in a single experiment. The experiment was repeated three times with similar results.
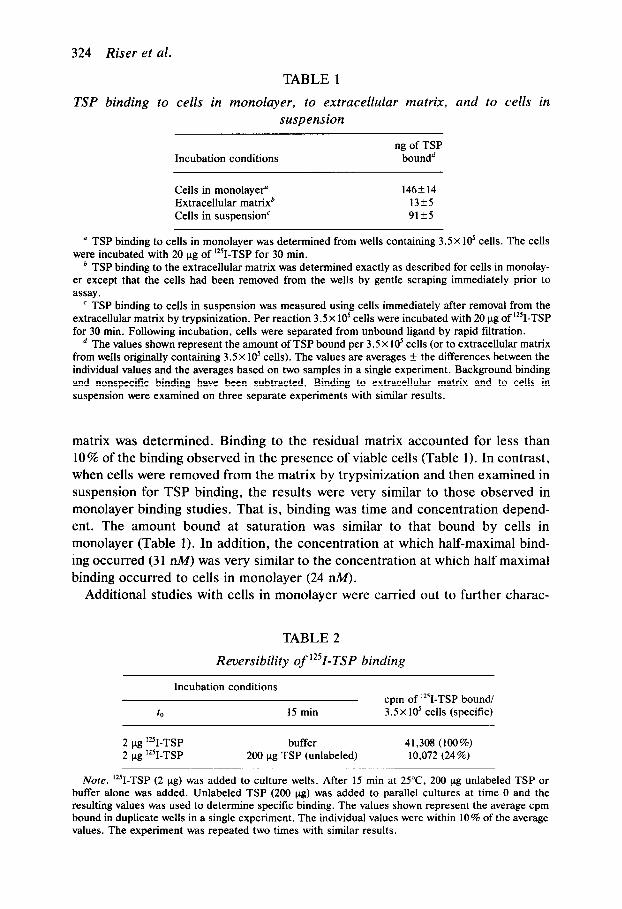
synthesize TSP raises the question of why the endogenous TSP does not interfere with binding of exogenous TSP. To address this question, we examined the amount of endogenous TSP secreted into the culture medium under the condi- tions of the binding assay. UM-SCC-1 1B cells were grown in a 24-well culture dish, washed in serum-free medium, and then incubated for 2 h in MEM supple- mented with 200 ug of bovine serum albumin/ml. At the end of the 2-h incubation period, the culture fluid was harvested and examined for immunoreactive TSP using a sensitive ELISA. MEM supplemented with 200 ug of bovine serum albumin/ml incubated in the absence of cells served as the negative control and various amounts of platelet TSP in the same buffer were used to generate a standard curve. Based on comparison with the standard curve, the amount of TSP in the culture fluid of the UM-SCC-11B cells was found to be 0.15 &ml (Table 4). Based on the binding data obtained with exogenous “‘1-TSP, the percentage of binding sites occupied with endogenous TSP was calculated to be less than 1% of the number available. The amount of TSP in the culture fluid increased at a linear rate through 6 h. After 6 h there was approximately 0.5 ug of TSP in the culture fluid (Table 4). This amount of TSP is sufficient to induce cell-substrate adhesion of the squamous carcinoma cells. This is of interest since our previous studies showed that the squamous carcinoma cells began to attach and spread in the absence of exogenous ligand after 4-6 h [ 1 I].
TSP binding by two other cell lines (UM-SCC-22B and SK-MEL-281 was also examined. The UM-SCC-22B cells bound ‘251-TSP in a concentration-dependent manner; binding was saturable and could be inhibited with excess unlabeled TSP (Fig. 4). In comparison to the UM-SCC-1 1B cells, the UM-SCC-22B cells bound much less TSP. The SK-MEL-28 cells also bound ‘2SI-TSP, but these cells bound

Thrombospondin binding by tumor cells 327
700- UM-SCC-116
g
v 500-
,P
0 2
x 300. UM-SCC-226 I 8
ioo- SK-MEL-28
*
0 1 2 5 10
ug 112511-TSP
Fig. 4. Specific binding of ‘251-TSP by UM-SCC-1 lB, UM-SCC-22B, and SK-MEL-28 cells. The binding assay was carried out as described under Materials and Methods using a single time point (30 mitt). The values shown represent specific binding. Nonspecific binding varied from 2540% of total binding. The values shown are averages based on duplicate samples in one experiment. The experi- ment was carried out two times with very similar results.
much smaller amounts than even the UM-XC-22B cells. Thus, there was a direct correlation between TSP binding and TSP-induced adhesion (compare Figs. 1 and 4).
DISCUSSION
Recent studies have shown that TSP, like other components of the extracellu- lar matrix, stimulates attachment and spreading of cells [ 1 l-131. In a recent study we showed that a whole series of human squamous carcinoma cell lines respond- ed to TSP but that there was significant variability among the lines in responsive- ness. In contrast, no observable attachment and spreading in response to TSP occurred in a series of melanoma or glioma lines [l 1, 121. The present study begins efforts to understand how responsiveness to TSP is regulated in human squamous carcinoma cells. Our studies indicate that squamous carcinoma cells bind TSP in a receptor-like fashion. Using ‘*‘I-TSP as the ligand, binding was found to be time dependent, concentration dependent, saturable, inhibitable with excess cold TSP, and reversible. Analysis of the binding data by the Scatchard method [24] provided data consistent with a single class of binding sites on the cells. There was good correlation between ligand binding and biological respon- siveness (cell-substrate adhesion). The kinetics and concentration dependence of ligand binding were in good accord with the kinetics and concentration depend- ence of the cell-substrate adhesion response. Further, ligand binding was inhibit- ed by a series of monoclonal antibodies (Table 3) which react with the TSP molecule [16-191 and which have previously been shown to inhibit TSP-induced cell-substrate adhesion [ 111. Finally, there was a direct relationship among the
328 Riser et al.
three cell lines examined in this study between TSP binding and TSP-induced cell-substrate adhesion (compare Figs. 1 and 4).
The nature of the TSP binding site(s) remains to be elucidated. Although most of our studies were carried out on cells in monolayer culture, the available data suggest that the majority of binding was to the cell surface rather than to the extracellular matrix laid down by the cells. This suggestion is based on a number of observations. First, direct binding studies using the wells from which cells had been removed by gentle scraping showed that less than 10% of the amount of ligand which bound to the intact cells bound to the residual matrix. Second, freshly trypsinized cells in suspension bound TSP with characteristics similar to those of cells in monolayer. Additionally, our recent studies 1111 using immuno- fluorescence techniques demonstrated that TSP is distributed uniformly over the cell surface in a punctate pattern. There was no suggestion of an extracellular matrix-like staining pattern. Finally, the TSP-binding characteristics of the cells used in this study were similar to the binding characteristics of Chinese hamster ovary cells [25], human monocytes [26], human platelets, C32 melanoma cells, and HT1080 fibrosarcoma cells [27]. It was shown with platelets, monocytes, and several tumor lines that an 88-kDa surface protein was responsible for TSP binding [26, 271. Furthermore, it was shown that equivalent binding was obtained with tumor cells in suspension and in monlayer. Taken together, these data suggest that while some binding may occur to extracellular matrix moieties, the majority of binding appears to be to the cells themselves.
In addition to the differences between the three cell lines in TSP binding, there are similar differences in TSP biosynthesis. It was recently shown that the highly responsive squamous carcinoma cells synthesized much more TSP than the less- responsive squamous carcinoma cells and melanoma cells. The melanoma cells, in fact, demonstrated no detectable synthetic activity [ll]. Further, there was a direct relationship between TSP biosynthesis and cell surface expression as seen by immunofluorescence [ 111. Taken together, these observations suggest that the capacity of cells to synthesize TSP is coregulated with their capacity to bind the molecule and respond to it. This supports the view that the expression of binding activity for this extracellular matrix molecule occurs, at least in part, to facilitate interaction with endogenously synthesized TSP. Whether the expression of re- ceptors for extracellular matrix molecules in general occurs primarily to facilitate interaction with endogenously synthesized ligand or with preformed molecules in the matrix is the subject of current debate [21, 28-301.
This study was supported in part by Grant CA36132 from the USPHS and by Grants BC-512 and IM-432 from the American Cancer Society.
REFERENCES 1. Baenziger, N. L., Brodie, G. N., and Majerus, P. W. (1972) J. Bid. Chem. 247, 2723-2731. 2. Phillips, D. R., Jennings, L. K., and Prasanna, H. (1980) J. Biol. Chem. 255, 11,629-l 1,635. 3. Gartner, T. K., Gerrard, J. M., White, J. G., and Williams, D. C. (1981) Nature 289, (London)
688-690.
Thrombospondin binding by tumor cells 329
4. Dixit, V. M., Grant, G. A., Santoro, S. A., and Frazier, W. A. (1984) J. Biol. Chem 259, lO,lOO-10,105.
5. Coligan, J. E., and Slayter, H. S. (1984) .Z. Biol. Chem. 259, 394-3948. 6. McPherson, J., Sage, H., and Bomstein, P. (1981) .Z. Biol. Chem. 256, 1130-1136. 7. Mosher, D. F., Doyle, M. J., and Jaffe, E. A. (1982) .Z. Cell EioZ. 93, 243-348. 8. Raugi, G. J., Mumby, S. M., Abbott-Brown, D., and Bomstein, P. (1982) J. Cell Biol. 95,
351-354. 9. Jaffe, E. A., Ruggiero, J. T., Leung, L. L. K., Doyle, M. J., McKeown-Longo, P. J., and
Mosher, D. F. (1983) Proc. Natl. Acad. Sci. USA 80, 990-1002. 10. Sage, H., Farin, F. M., Striker, G. E., and Fisher, A. B. (1983) Biochemistry 22, 2148-2155. 11. Varani, J., Dixit, V. M., Fligiel, S. E. G., McKeever, P. E., and Carey, T. E. (1986) Exp. Cell
Res. 167, 376-390. 12. Varani, J., Carey, T. E., Fligiel, S. E. G., McKeever, P. E., and Dixit, V. (1987) Znr. J. Cancer
39, 397403. 13. Roberts, D. D., Sherwood, J. A., and Ginsburg, V. (1987) J. Cell Biol. 104, 131-140. 14. Kimmel, K. A., and Carey, T. E. (1986) Cancer Res. 46, 3614-3623. 15. Carey, T. E., Takahashi, T., Resnick, L. A., Oettgen, H. F., and Old, L. J. (1976) Proc. Nat/.
Acad. Sci. USA 73, 327%3282. 16. Dixit, V. M., Haverstick, D. M., O’Rourke, K. M., Hennessy, S. W., Grant, G. A., Santaro, S.
A., and Frazier, W. A. (1985) Biochemistry 24,4270-4275. 17. Dixit, V. M., Haverstick, D. M., O’Rourke, K. M., Hennessy, S. W., Grant, G. A., Santoro, S.
A., and Frazier, W. A. (1987) Proc. Natl. Acad. Sci. USA 82, 3844-3848. 18. Galvin, N. J., Dixit, V. M., O’Rourke, K. M., Santoro, S. A., Grant, G. A., and Frazier, W. A.
(1985) J. Ce// Biol. 101, 1434-1441. 19. Dixit, V. M., O’Rourke, K. M., Grant, G. A., Santoro, S. A., and Frazier, W. A. (1986) .Z. Bio/.
Chem. 261, 1962-1968. 20. Timpl, R., Rohde, H., Robey, P. G., Rennard, S. I., Foidard, J. M., and Martin., G. R. (1979) J.
Biol. Chem. 254, 9933-9937. 21. Varani, J., Lovett, E. J., McCoy, J. P., Shibata, S., Maddox, D., Goldstein, I. J., and Wicha, M.
(1983) Amer. J. Puthol. 111, 27-34. 22. Terranova, V. P., Rao, C. N., Kalebic, T., Margulies, I. M., and Liotta, L. A. (1983) Proc. Nat/.
Acad. Sci. USA 80, 444-448. 23. Malinoff, H. L., McCoy, J. P., Varani, J., and Wicha, M. (1984) In?. .Z. Cancer 33, 651-655. 24. Scatchard, G. (1949) Ann. N.Y. Acad. Sci. 51, 660-672. 25. Murphy-Ullrich, J. E., Westrick, L. G., Esko, J. D., and Mosher, D. F. (1986) J. Cell Biol. 103,
93 a. 26. Silverstein, R. L., and Nachman, R. L. (1987) J. Clin. Znuest. 79, 862-874. 27. Asch, A. S., Bamwell, J., Silverstein, R. L., and Nachman, R. L. (1987) J. C/in. Znuest. 79,
1054-1061. 28. Terranova, V. P., Williams, J. E., Liotta, L. A., and Martin, G. R. (1984) Science 226, 982-985. 29. Barsky, S. H., Rao, C. N., Williams, J. E., and Liotta, L. A. (1984) .Z. C/in Znwst 74, 843-848. 30. Yamada, K. M., Akiyama, S. K., Hasegawa, T., Hasegawa, E., Humphries, M. J., Kennedy, D.
W., Nagata, K., Urushihara, H., Olden, K., and Chen, W. T. (1985) J. Cell Biochem. 28, 79-97.
Received February 16, 1987 Revised version received May 28, 1987
Printed in Sweden


