Embed Size (px)
Citation preview
Northeastern
Illinois
University
c©2004-2020 G. Anderson Thermal Physics – slide 1 / 72
Thermal PhysicsFree Energy and Chemical Thermodynamics
Greg Anderson
Department of Physics & AstronomyNortheastern Illinois University
Spring 2020
Northeastern
Illinois
University
Outline
c©2004-2020 G. Anderson Thermal Physics – slide 2 / 72
Potentials
Legendre Transforms
Phase Transformations
van der Waals
Mixtures
Northeastern
Illinois
University
James Clerk Maxell (1831-1879)
c©2004-2020 G. Anderson Thermal Physics – slide 3 / 72
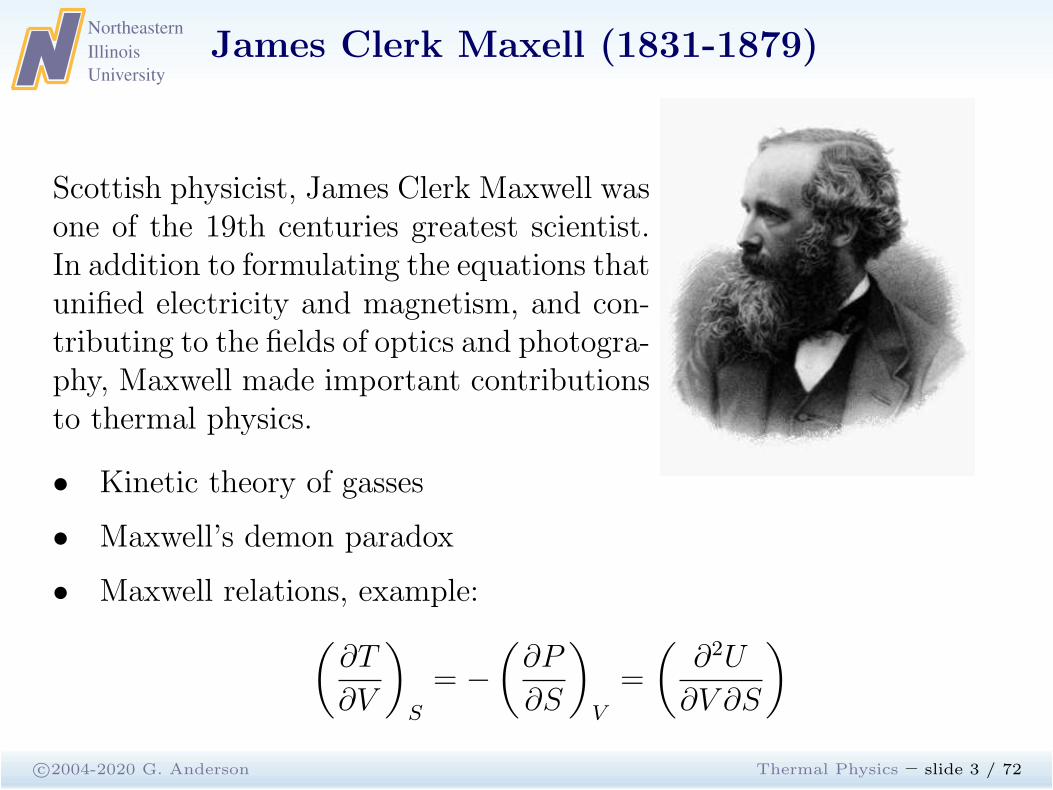
Scottish physicist, James Clerk Maxwell wasone of the 19th centuries greatest scientist.In addition to formulating the equations thatunified electricity and magnetism, and con-tributing to the fields of optics and photogra-phy, Maxwell made important contributionsto thermal physics.
• Kinetic theory of gasses
• Maxwell’s demon paradox
• Maxwell relations, example:
(
∂T
∂V
)
S
= −
(
∂P
∂S
)
V
=
(
∂2U
∂V ∂S
)

Northeastern
Illinois
University
Potentials
Maxwell
PotentialsThermodynamicPotentialsThermodynamicPotentials
Enthalpy
Enthalpy inChemicalProcessesStandardConditionsEnthalpy ofFormationStandardThermodynamicQuantities
Electrolysis I
Electrolysis II
Lead AcidBatteriesLead-AcidBattery
Lead AcidBattery
LegendreTransforms
PhaseTransformations
van der Waals
Mixturesc©2004-2020 G. Anderson Thermal Physics – slide 4 / 72
Northeastern
Illinois
University
Thermodynamic Potentials
c©2004-2020 G. Anderson Thermal Physics – slide 5 / 72
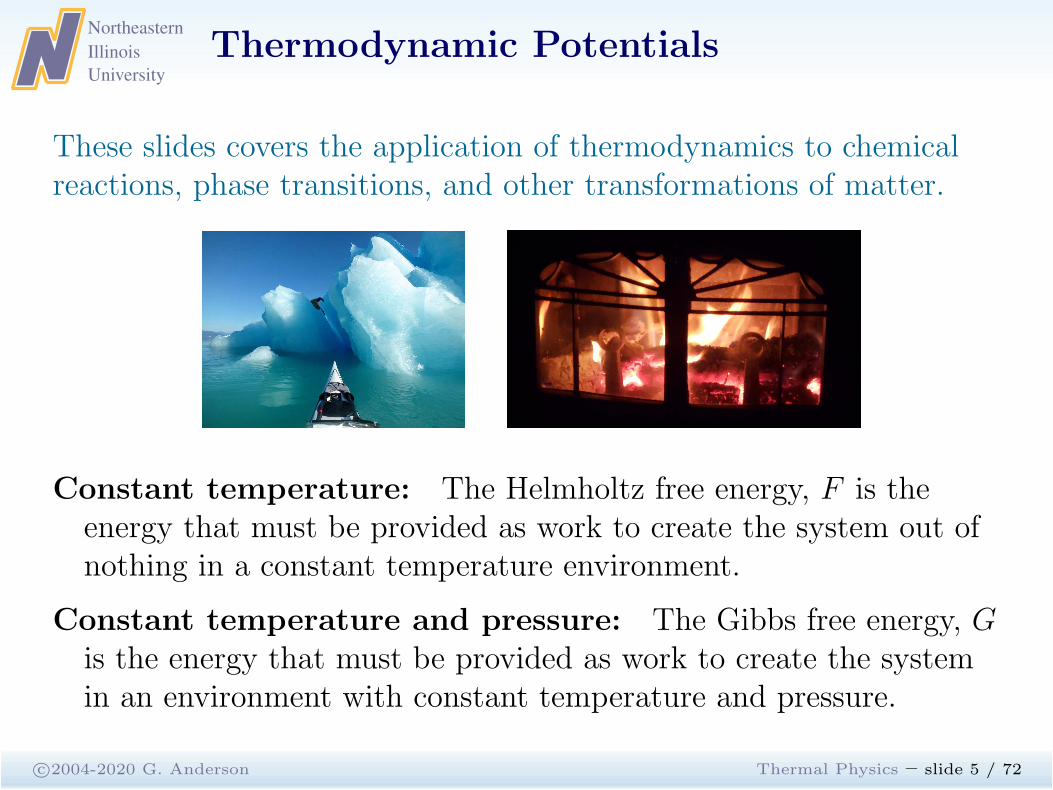
These slides covers the application of thermodynamics to chemicalreactions, phase transitions, and other transformations of matter.
Constant temperature: The Helmholtz free energy, F is theenergy that must be provided as work to create the system out ofnothing in a constant temperature environment.
Constant temperature and pressure: The Gibbs free energy, Gis the energy that must be provided as work to create the systemin an environment with constant temperature and pressure.
Northeastern
Illinois
University
Thermodynamic Potentials
c©2004-2020 G. Anderson Thermal Physics – slide 6 / 72
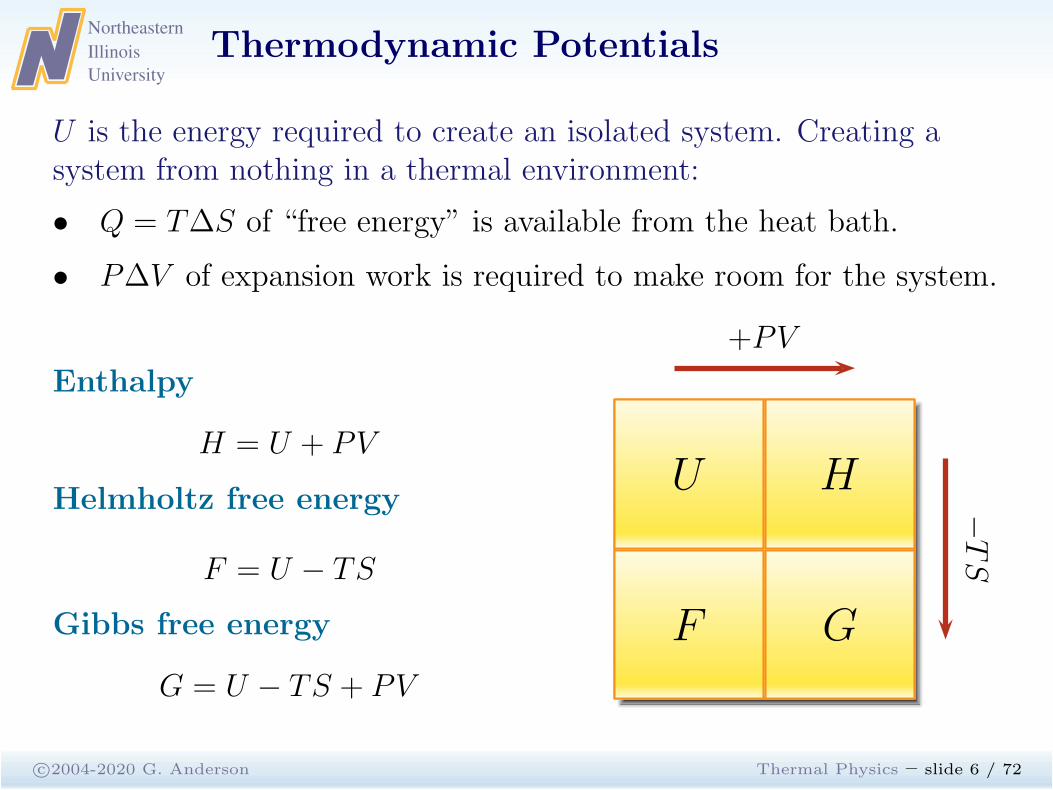
U is the energy required to create an isolated system. Creating asystem from nothing in a thermal environment:
• Q = T∆S of “free energy” is available from the heat bath.
• P∆V of expansion work is required to make room for the system.
Enthalpy
H = U + PV
Helmholtz free energy
F = U − TS
Gibbs free energy
G = U − TS + PV
U
F G
H
+PV
−TS
Northeastern
Illinois
University
Enthalpy
c©2004-2020 G. Anderson Thermal Physics – slide 7 / 72
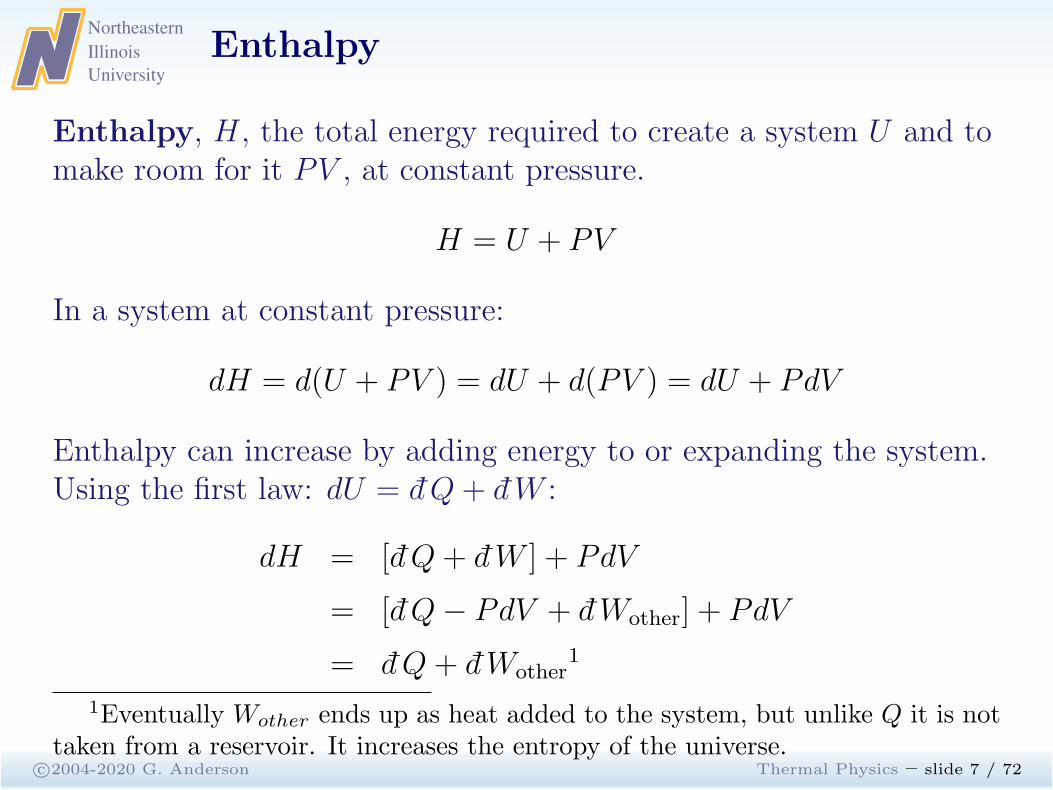
Enthalpy, H, the total energy required to create a system U and tomake room for it PV , at constant pressure.
H = U + PV
In a system at constant pressure:
dH = d(U + PV ) = dU + d(PV ) = dU + PdV
Enthalpy can increase by adding energy to or expanding the system.Using the first law: dU = d Q+ dW :
dH = [d Q+ dW ] + PdV
= [d Q− PdV + dWother] + PdV
= d Q+ dWother1
1Eventually Wother ends up as heat added to the system, but unlike Q it is nottaken from a reservoir. It increases the entropy of the universe.
Northeastern
Illinois
University
Enthalpy in Chemical Processes
c©2004-2020 G. Anderson Thermal Physics – slide 8 / 72
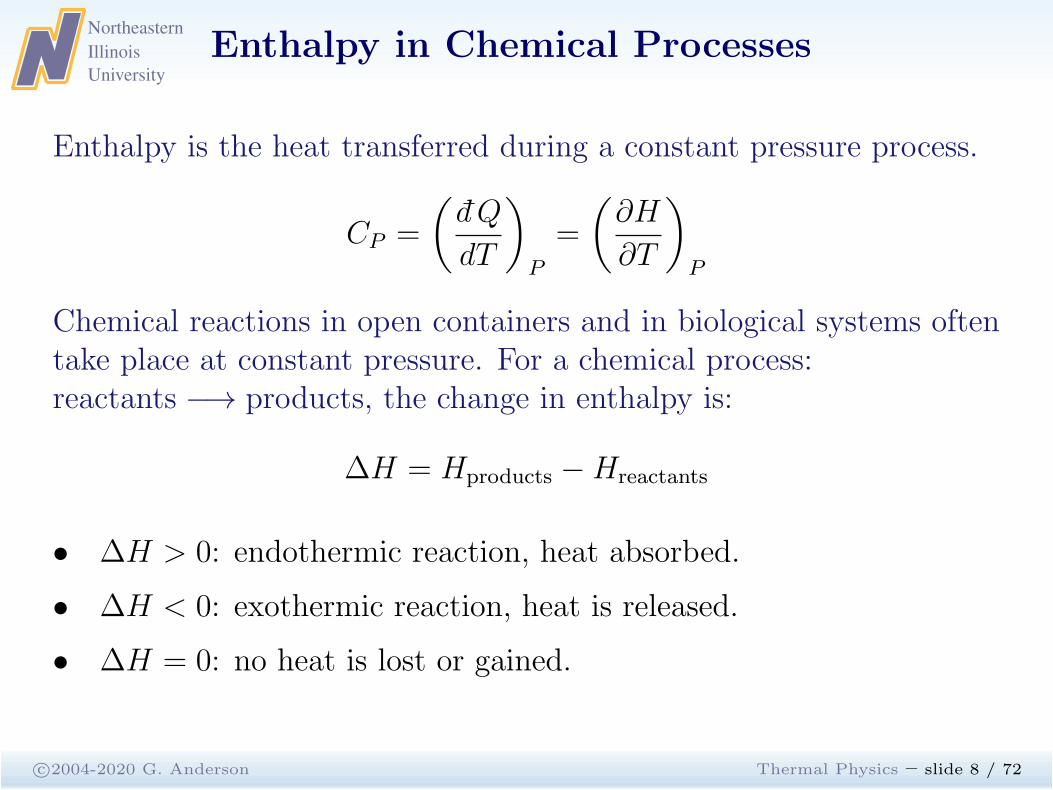
Enthalpy is the heat transferred during a constant pressure process.
CP =
(
d Q
dT
)
P
=
(
∂H
∂T
)
P
Chemical reactions in open containers and in biological systems oftentake place at constant pressure. For a chemical process:reactants −→ products, the change in enthalpy is:
∆H = Hproducts −Hreactants
• ∆H > 0: endothermic reaction, heat absorbed.
• ∆H < 0: exothermic reaction, heat is released.
• ∆H = 0: no heat is lost or gained.
Northeastern
Illinois
University
Standard Conditions
c©2004-2020 G. Anderson Thermal Physics – slide 9 / 72
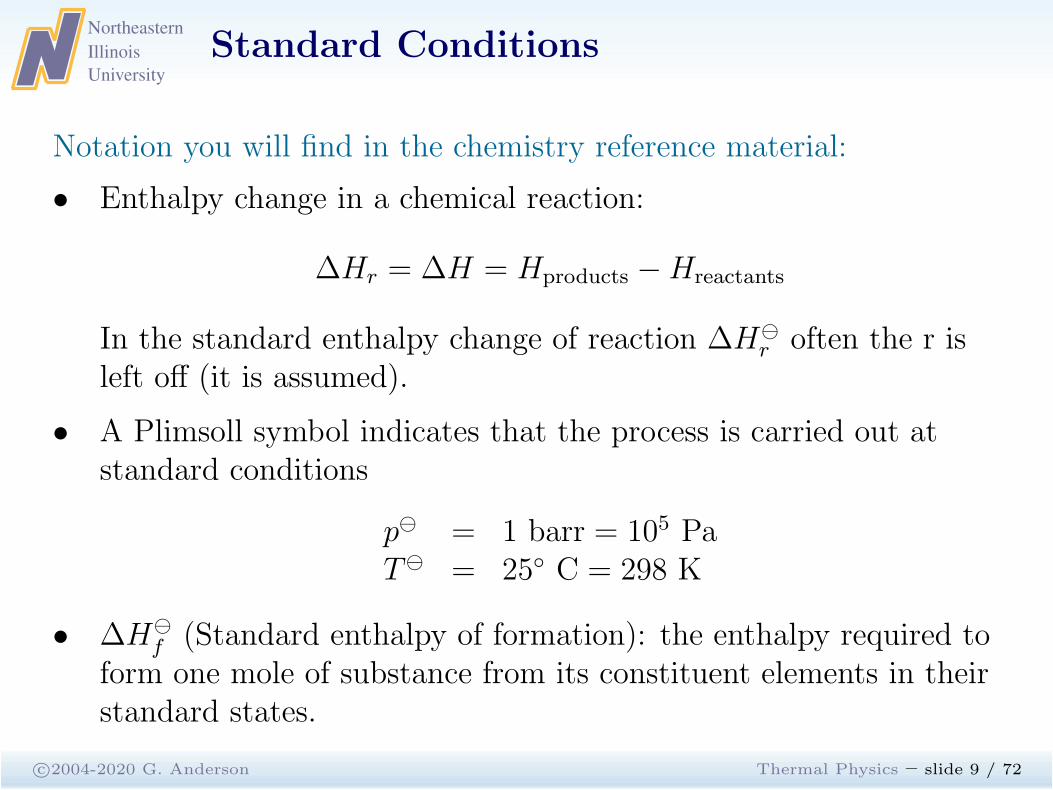
Notation you will find in the chemistry reference material:
• Enthalpy change in a chemical reaction:
∆Hr = ∆H = Hproducts −Hreactants
In the standard enthalpy change of reaction ∆H⊖
r often the r isleft off (it is assumed).
• A Plimsoll symbol indicates that the process is carried out atstandard conditions
p⊖ = 1 barr = 105 PaT⊖ = 25◦ C = 298 K
• ∆H⊖
f (Standard enthalpy of formation): the enthalpy required toform one mole of substance from its constituent elements in theirstandard states.
Northeastern
Illinois
University
Enthalpy of Formation
c©2004-2020 G. Anderson Thermal Physics – slide 10 / 72
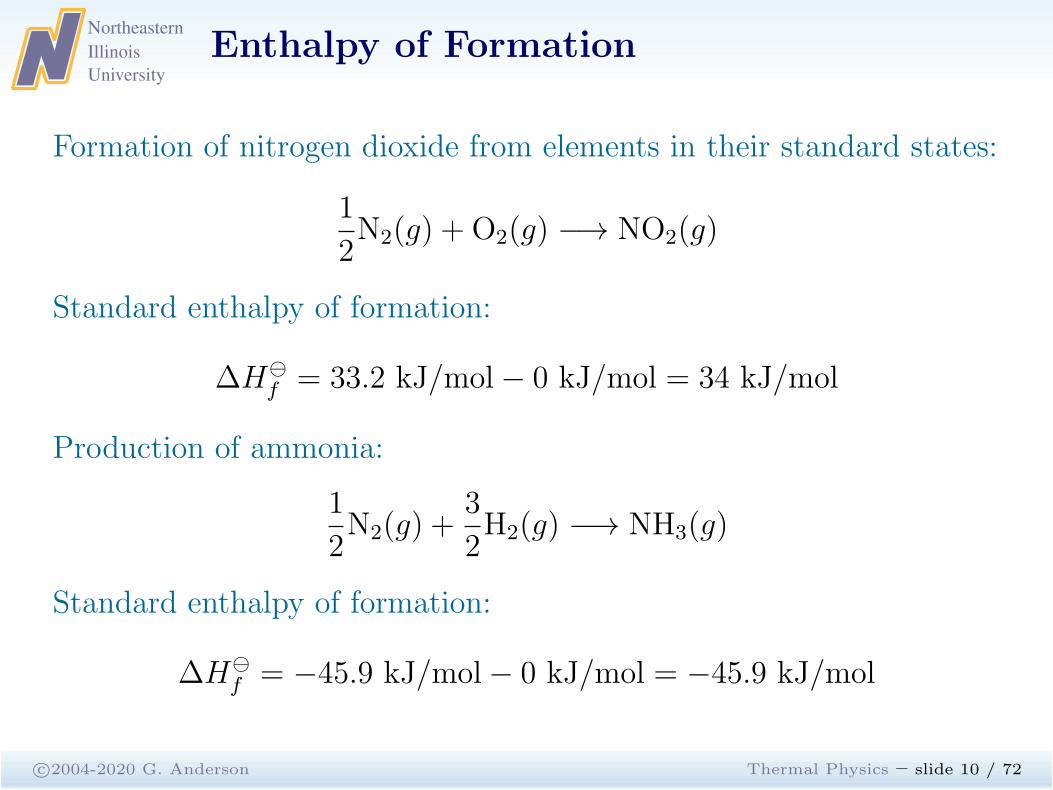
Formation of nitrogen dioxide from elements in their standard states:
1
2N2(g) + O2(g) −→ NO2(g)
Standard enthalpy of formation:
∆H⊖
f = 33.2 kJ/mol− 0 kJ/mol = 34 kJ/mol
Production of ammonia:
1
2N2(g) +
3
2H2(g) −→ NH3(g)
Standard enthalpy of formation:
∆H⊖
f = −45.9 kJ/mol− 0 kJ/mol = −45.9 kJ/mol
Northeastern
Illinois
University
Standard Thermodynamic Quantities
c©2004-2020 G. Anderson Thermal Physics – slide 11 / 72
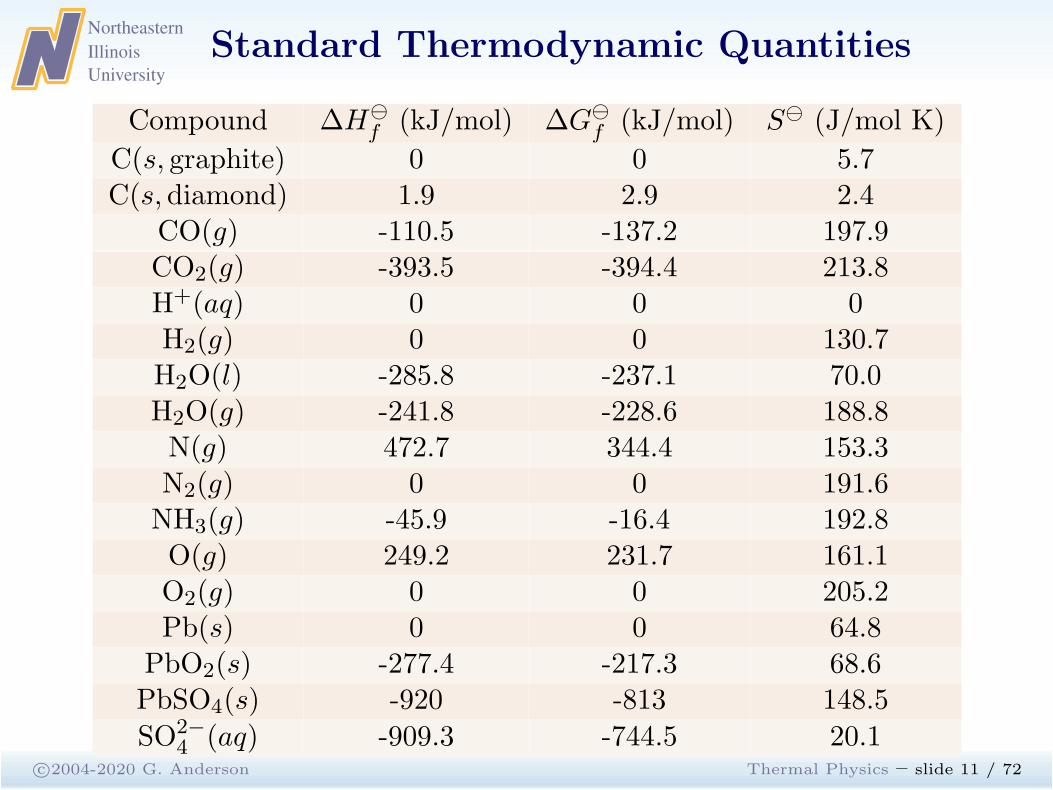
Compound ∆H⊖
f (kJ/mol) ∆G⊖
f (kJ/mol) S⊖ (J/mol K)
C(s, graphite) 0 0 5.7C(s, diamond) 1.9 2.9 2.4
CO(g) -110.5 -137.2 197.9CO2(g) -393.5 -394.4 213.8H+(aq) 0 0 0H2(g) 0 0 130.7H2O(l) -285.8 -237.1 70.0H2O(g) -241.8 -228.6 188.8N(g) 472.7 344.4 153.3N2(g) 0 0 191.6NH3(g) -45.9 -16.4 192.8O(g) 249.2 231.7 161.1O2(g) 0 0 205.2Pb(s) 0 0 64.8
PbO2(s) -277.4 -217.3 68.6PbSO4(s) -920 -813 148.5
SO2−4 (aq) -909.3 -744.5 20.1
Northeastern
Illinois
University
Electrolysis I
c©2004-2020 G. Anderson Thermal Physics – slide 12 / 72
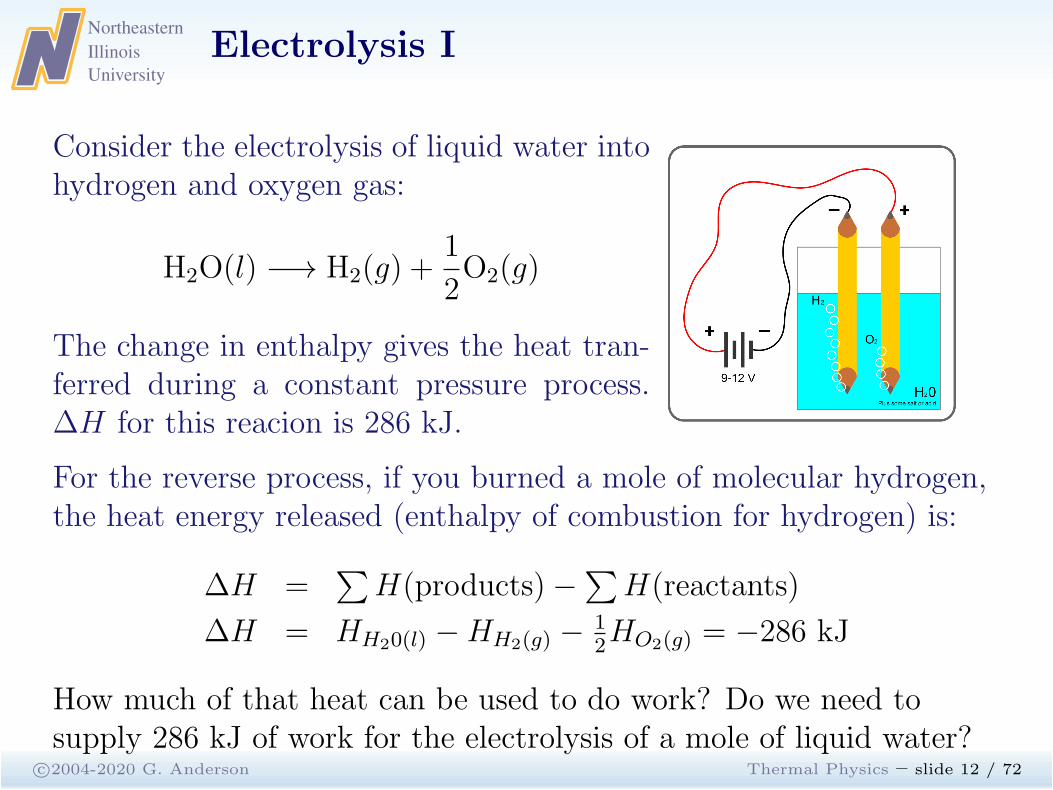
Consider the electrolysis of liquid water intohydrogen and oxygen gas:
H2O(l) −→ H2(g) +1
2O2(g)
The change in enthalpy gives the heat tran-ferred during a constant pressure process.∆H for this reacion is 286 kJ.
For the reverse process, if you burned a mole of molecular hydrogen,the heat energy released (enthalpy of combustion for hydrogen) is:
∆H =∑
H(products)−∑
H(reactants)
∆H = HH20(l) −HH2(g) −12HO2(g) = −286 kJ
How much of that heat can be used to do work? Do we need tosupply 286 kJ of work for the electrolysis of a mole of liquid water?
Northeastern
Illinois
University
Electrolysis II
c©2004-2020 G. Anderson Thermal Physics – slide 13 / 72
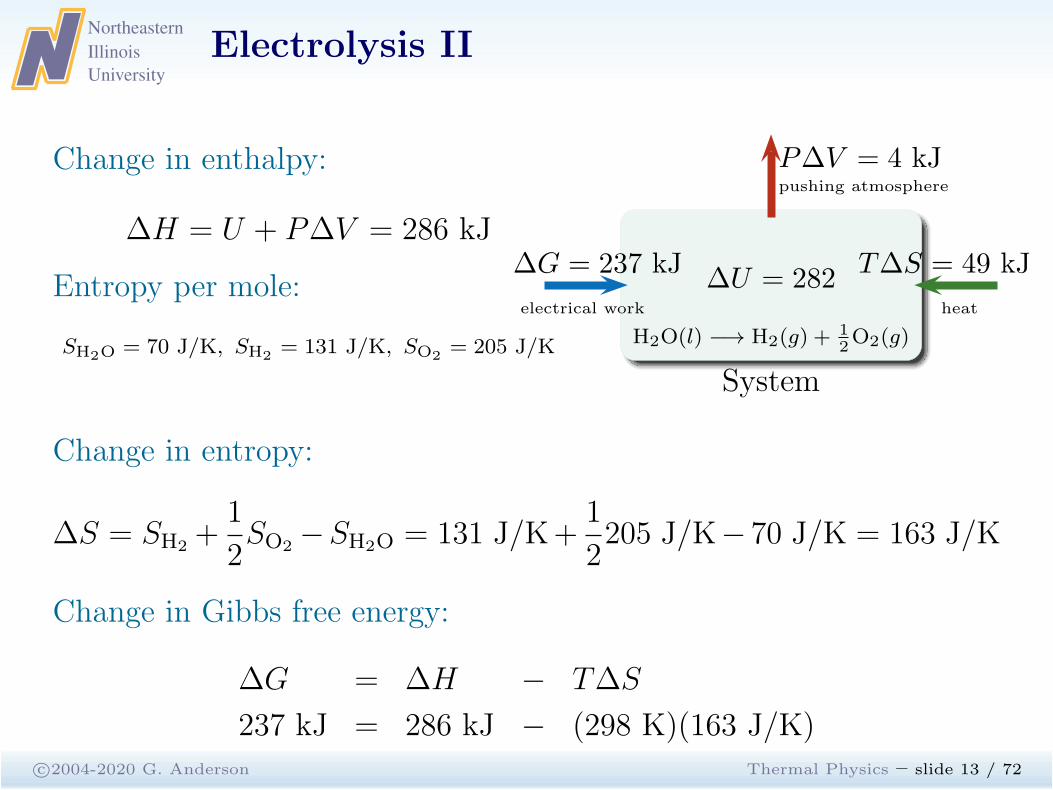
Change in enthalpy:
∆H = U + P∆V = 286 kJ
Entropy per mole:
SH2O = 70 J/K, SH2= 131 J/K, SO2
= 205 J/K
∆U = 282
H2O(l) −→ H2(g) +12O2(g)
System
P∆V = 4 kJpushing atmosphere
∆G = 237 kJ
electrical work
T∆S = 49 kJ
heat
Change in entropy:
∆S = SH2 +1
2SO2 −SH2O = 131 J/K+
1
2205 J/K− 70 J/K = 163 J/K
Change in Gibbs free energy:
∆G = ∆H − T∆S
237 kJ = 286 kJ − (298 K)(163 J/K)
Northeastern
Illinois
University
Lead Acid Batteries
c©2004-2020 G. Anderson Thermal Physics – slide 14 / 72
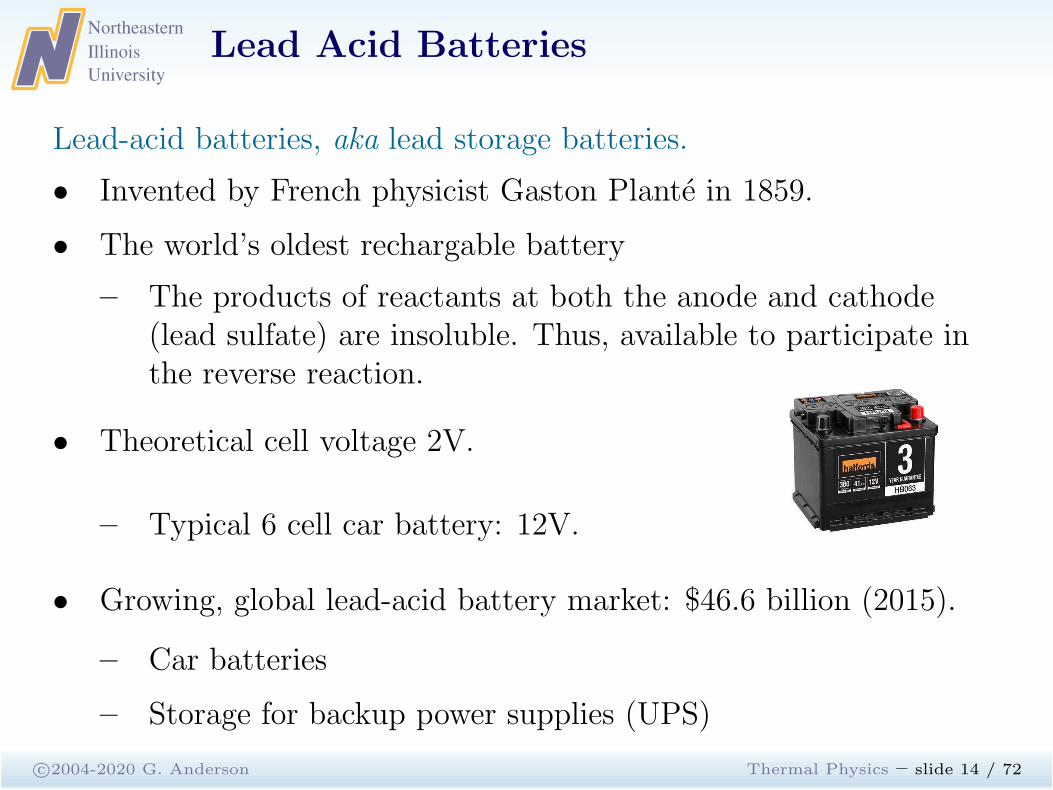
Lead-acid batteries, aka lead storage batteries.
• Invented by French physicist Gaston Plante in 1859.
• The world’s oldest rechargable battery
– The products of reactants at both the anode and cathode(lead sulfate) are insoluble. Thus, available to participate inthe reverse reaction.
• Theoretical cell voltage 2V.
– Typical 6 cell car battery: 12V.
• Growing, global lead-acid battery market: $46.6 billion (2015).
– Car batteries
– Storage for backup power supplies (UPS)
Northeastern
Illinois
University
Lead-Acid Battery
c©2004-2020 G. Anderson Thermal Physics – slide 15 / 72
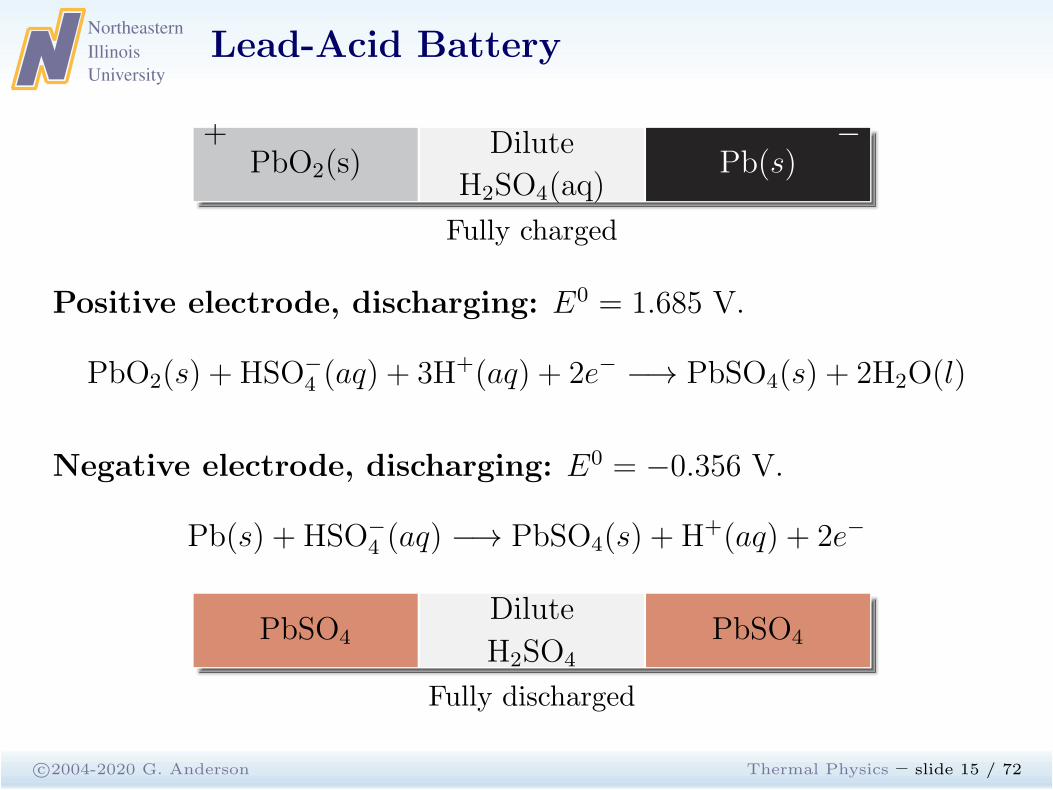
PbO2(s)+ Dilute
H2SO4(aq)Pb(s)
−
Fully charged
Positive electrode, discharging: E0 = 1.685 V.
PbO2(s) + HSO−
4 (aq) + 3H+(aq) + 2e− −→ PbSO4(s) + 2H2O(l)
Negative electrode, discharging: E0 = −0.356 V.
Pb(s) + HSO−
4 (aq) −→ PbSO4(s) + H+(aq) + 2e−
PbSO4Dilute
H2SO4
PbSO4
Fully discharged
Northeastern
Illinois
University
Lead Acid Battery
c©2004-2020 G. Anderson Thermal Physics – slide 16 / 72
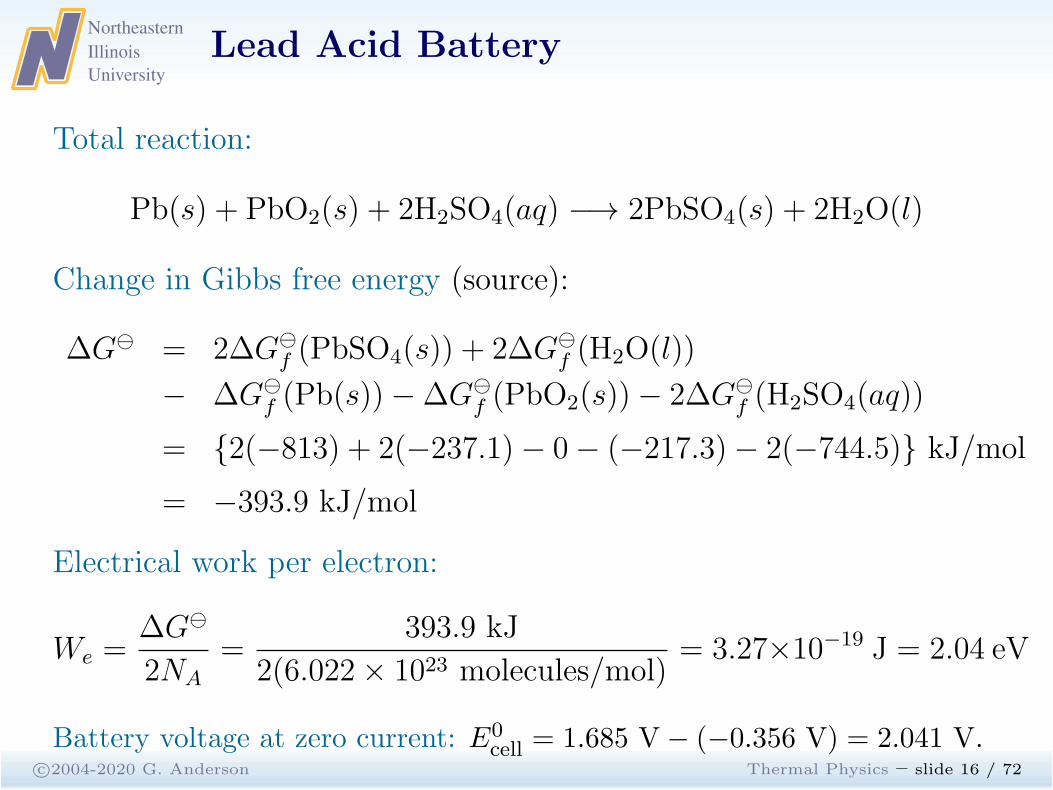
Total reaction:
Pb(s) + PbO2(s) + 2H2SO4(aq) −→ 2PbSO4(s) + 2H2O(l)
Change in Gibbs free energy (source):
∆G⊖ = 2∆G⊖
f (PbSO4(s)) + 2∆G⊖
f (H2O(l))
− ∆G⊖
f (Pb(s))−∆G⊖
f (PbO2(s))− 2∆G⊖
f (H2SO4(aq))
= {2(−813) + 2(−237.1)− 0− (−217.3)− 2(−744.5)} kJ/mol
= −393.9 kJ/mol
Electrical work per electron:
We =∆G⊖
2NA
=393.9 kJ
2(6.022× 10²³ molecules/mol)= 3.27×10⁻¹⁹ J = 2.04 eV
Battery voltage at zero current: E0cell = 1.685 V − (−0.356 V) = 2.041 V.
Northeastern
Illinois
University
Legendre Transforms
Maxwell
Potentials
LegendreTransforms
Legendre Trans.
ThermodynamicIdentity
Potentials &Transforms
Helmholtz I
Helmholtz II
Helmholtz
F Decreases
Gibbs IGibbs FreeEnergy
Gibbs II
Gibbs III
Gibbs IV
Gibbs V
G & µ
Grand Potenial
Summary
PhaseTransformations
van der Waals
Mixtures
c©2004-2020 G. Anderson Thermal Physics – slide 17 / 72
Northeastern
Illinois
University
Legendre Transformation
c©2004-2020 G. Anderson Thermal Physics – slide 18 / 72
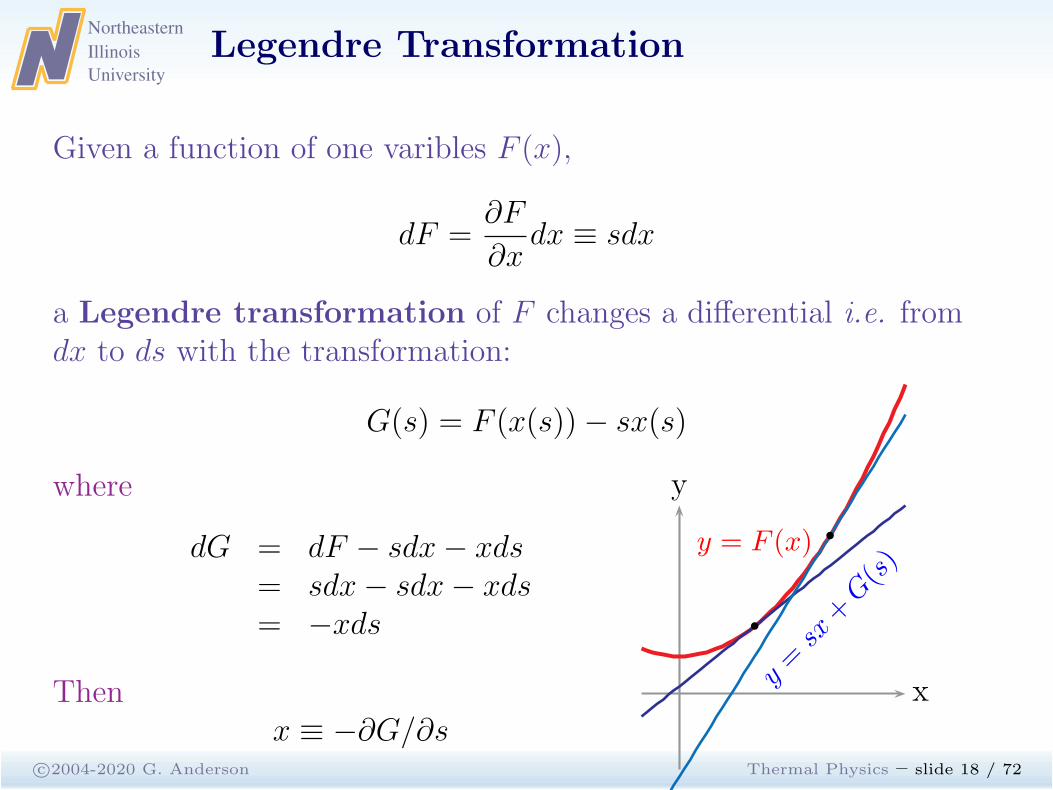
Given a function of one varibles F (x),
dF =∂F
∂xdx ≡ sdx
a Legendre transformation of F changes a differential i.e. fromdx to ds with the transformation:
G(s) = F (x(s))− sx(s)
where
dG = dF − sdx− xds= sdx− sdx− xds= −xds
Thenx ≡ −∂G/∂s
x
y
y = F (x)
y=
sx+
G(s
)
Northeastern
Illinois
University
Thermodynamic Identity
c©2004-2020 G. Anderson Thermal Physics – slide 19 / 72
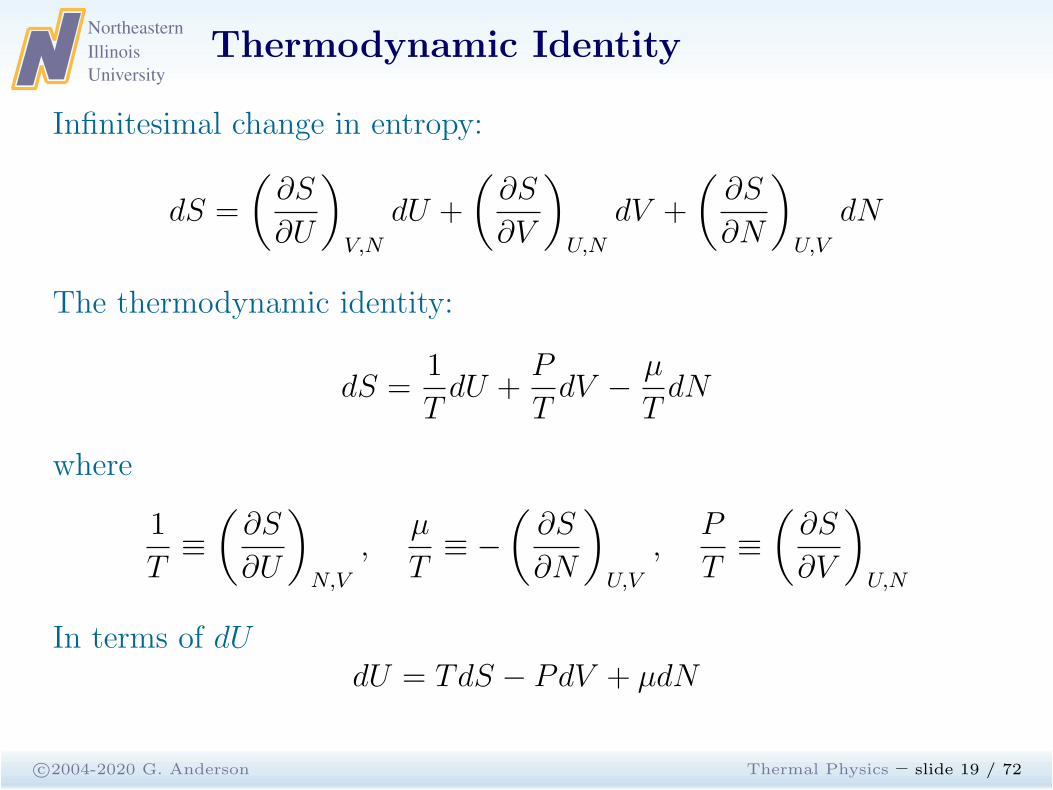
Infinitesimal change in entropy:
dS =
(
∂S
∂U
)
V,N
dU +
(
∂S
∂V
)
U,N
dV +
(
∂S
∂N
)
U,V
dN
The thermodynamic identity:
dS =1
TdU +
P
TdV −
µ
TdN
where
1
T≡
(
∂S
∂U
)
N,V
,µ
T≡ −
(
∂S
∂N
)
U,V
,P
T≡
(
∂S
∂V
)
U,N
In terms of dUdU = TdS − PdV + µdN
Northeastern
Illinois
University
Potentials & Transforms
c©2004-2020 G. Anderson Thermal Physics – slide 20 / 72
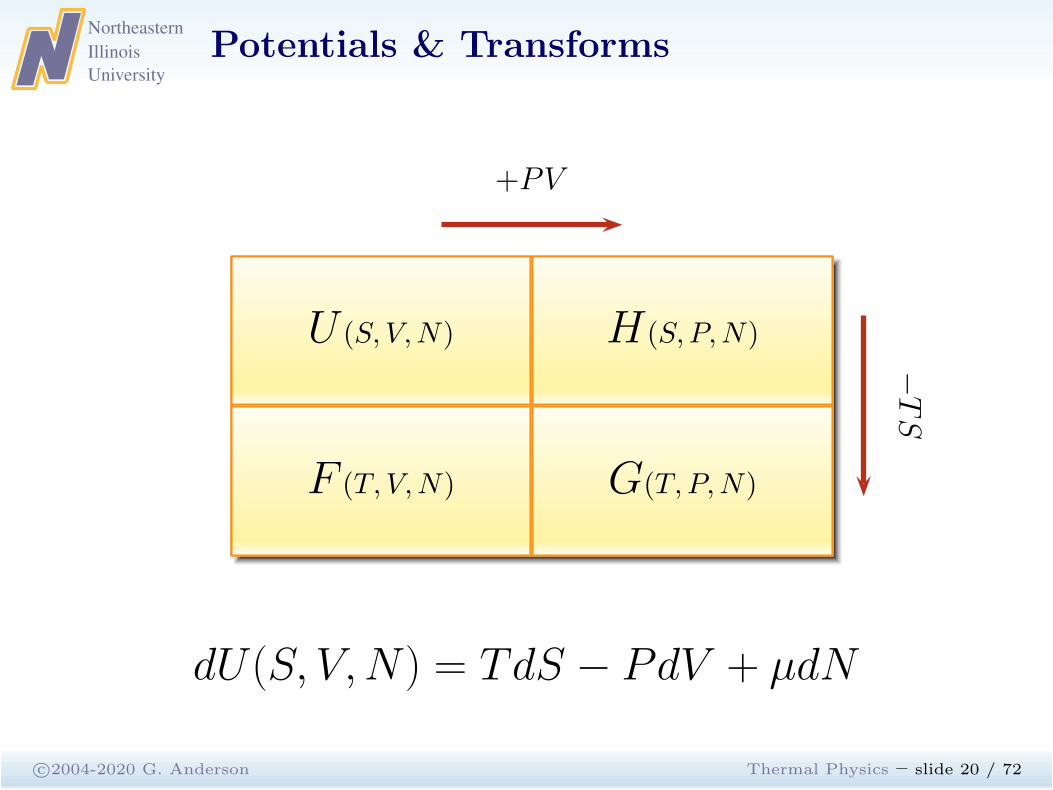
U (S, V,N)
F (T, V,N) G(T, P,N)
H (S, P,N)
+PV−TS
dU(S, V,N) = TdS − PdV + µdN
Northeastern
Illinois
University
Helmholtz Free Energy
c©2004-2020 G. Anderson Thermal Physics – slide 21 / 72
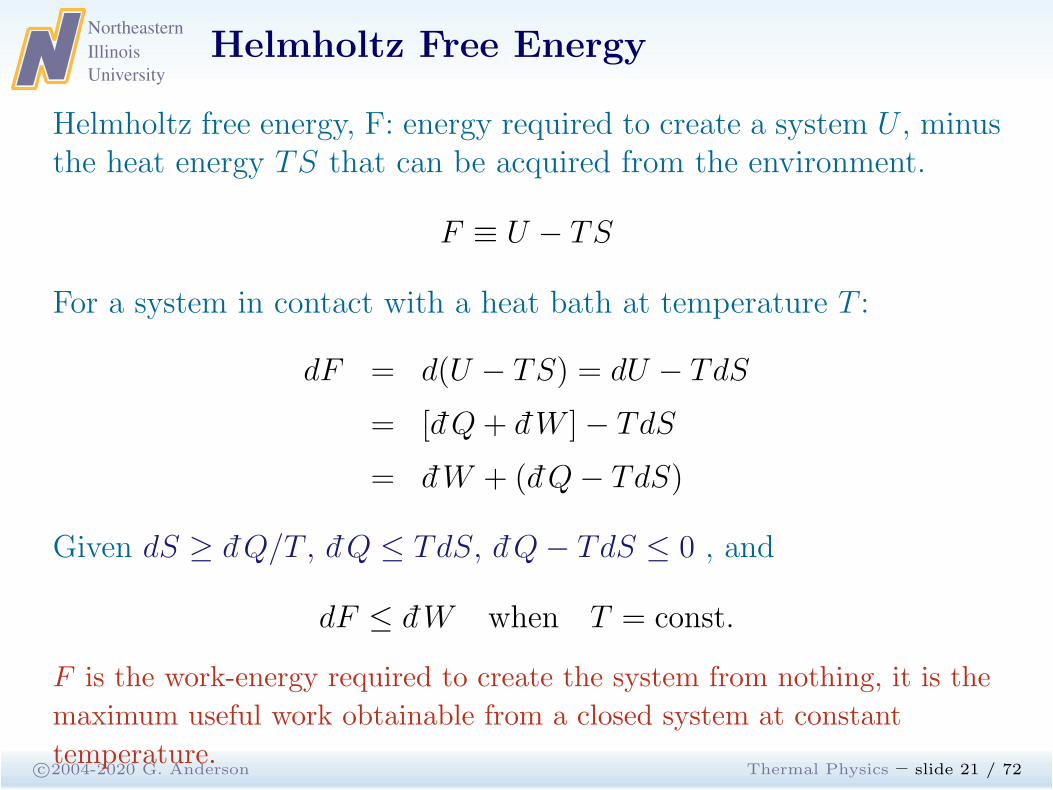
Helmholtz free energy, F: energy required to create a system U , minusthe heat energy TS that can be acquired from the environment.
F ≡ U − TS
For a system in contact with a heat bath at temperature T :
dF = d(U − TS) = dU − TdS
= [d Q+ dW ]− TdS
= dW + (d Q− TdS)
Given dS ≥ d Q/T , d Q ≤ TdS, d Q− TdS ≤ 0 , and
dF ≤ dW when T = const.
F is the work-energy required to create the system from nothing, it is the
maximum useful work obtainable from a closed system at constant
temperature.
Northeastern
Illinois
University
Helmholtz Free Energy II
c©2004-2020 G. Anderson Thermal Physics – slide 22 / 72
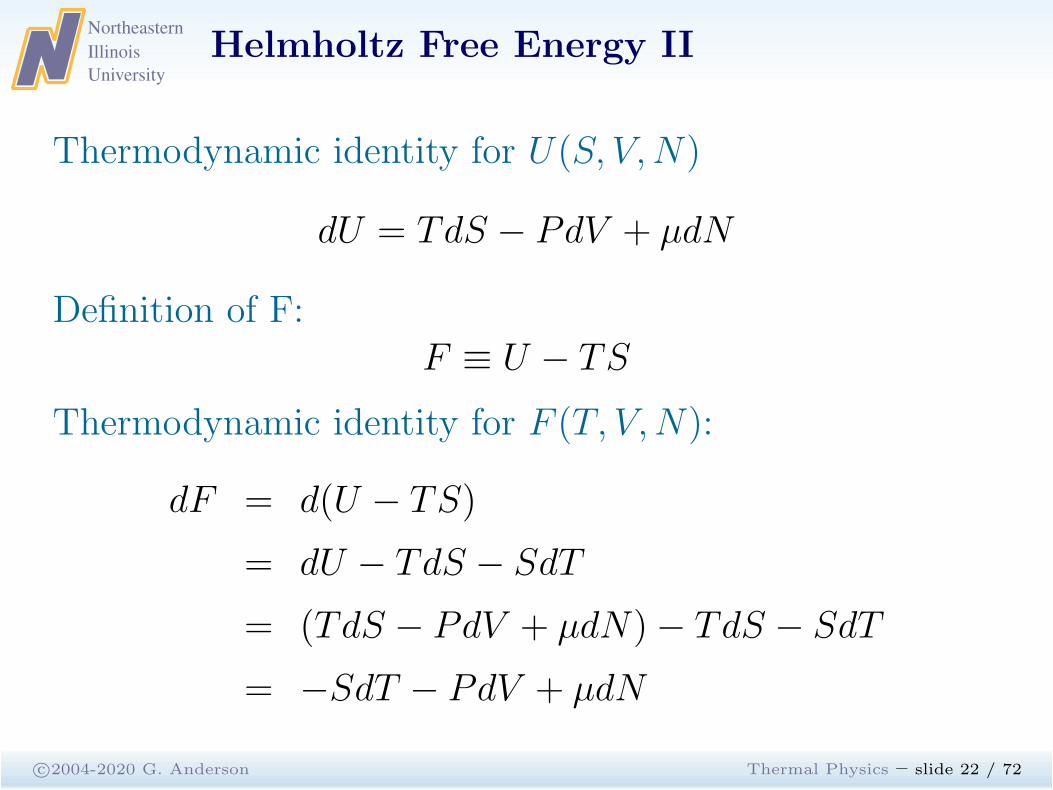
Thermodynamic identity for U(S, V,N)
dU = TdS − PdV + µdN
Definition of F:F ≡ U − TS
Thermodynamic identity for F (T, V,N):
dF = d(U − TS)
= dU − TdS − SdT
= (TdS − PdV + µdN)− TdS − SdT
= −SdT − PdV + µdN
Northeastern
Illinois
University
Helmholtz Function: Summary
c©2004-2020 G. Anderson Thermal Physics – slide 23 / 72
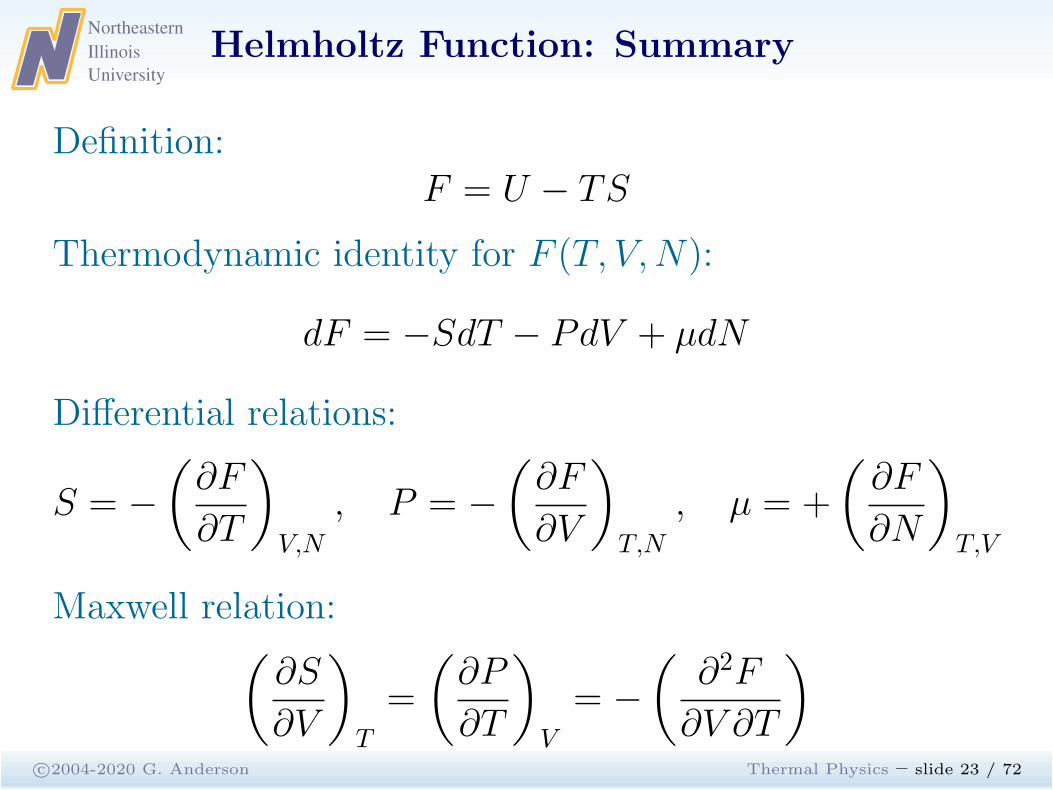
Definition:F = U − TS
Thermodynamic identity for F (T, V,N):
dF = −SdT − PdV + µdN
Differential relations:
S = −
(
∂F
∂T
)
V,N
, P = −
(
∂F
∂V
)
T,N
, µ = +
(
∂F
∂N
)
T,V
Maxwell relation:(
∂S
∂V
)
T
=
(
∂P
∂T
)
V
= −
(
∂2F
∂V ∂T
)
Northeastern
Illinois
University
F Decreases
c©2004-2020 G. Anderson Thermal Physics – slide 24 / 72
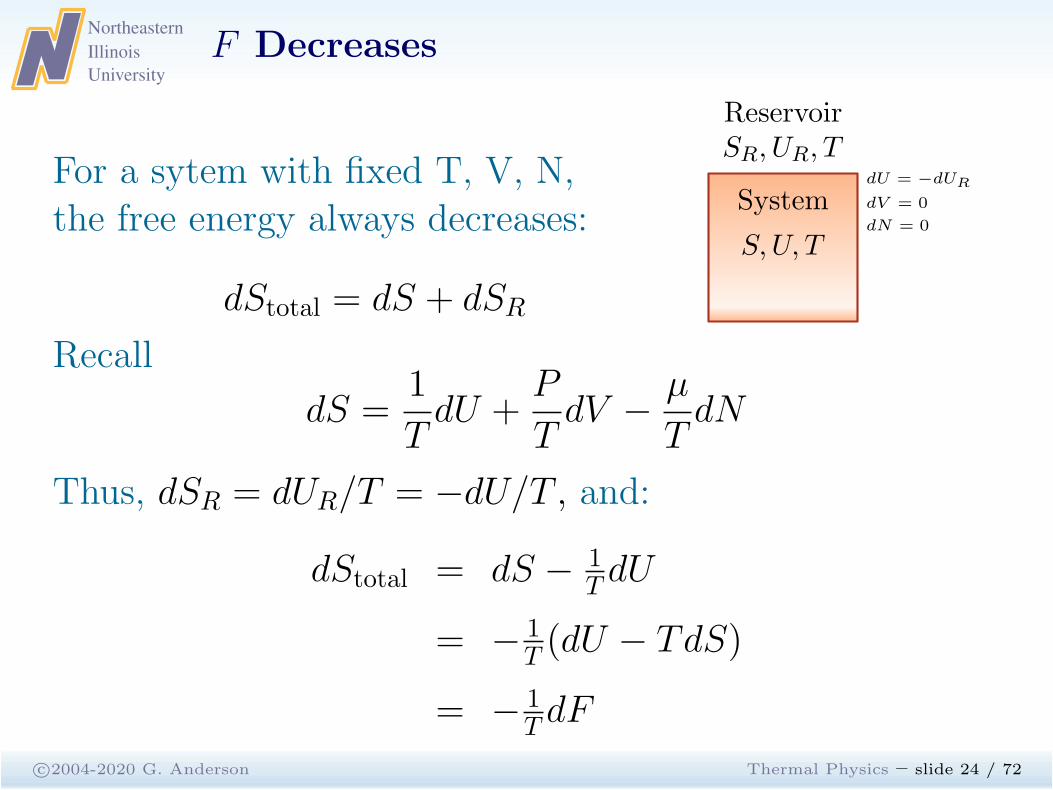
For a sytem with fixed T, V, N,the free energy always decreases:
dStotal = dS + dSR
ReservoirSR, UR, T
System
S,U, T
dU = −dUR
dV = 0
dN = 0
Recall
dS =1
TdU +
P
TdV −
µ
TdN
Thus, dSR = dUR/T = −dU/T , and:
dStotal = dS − 1T dU
= − 1T (dU − TdS)
= − 1T dF
Northeastern
Illinois
University
Gibbs Function
c©2004-2020 G. Anderson Thermal Physics – slide 25 / 72
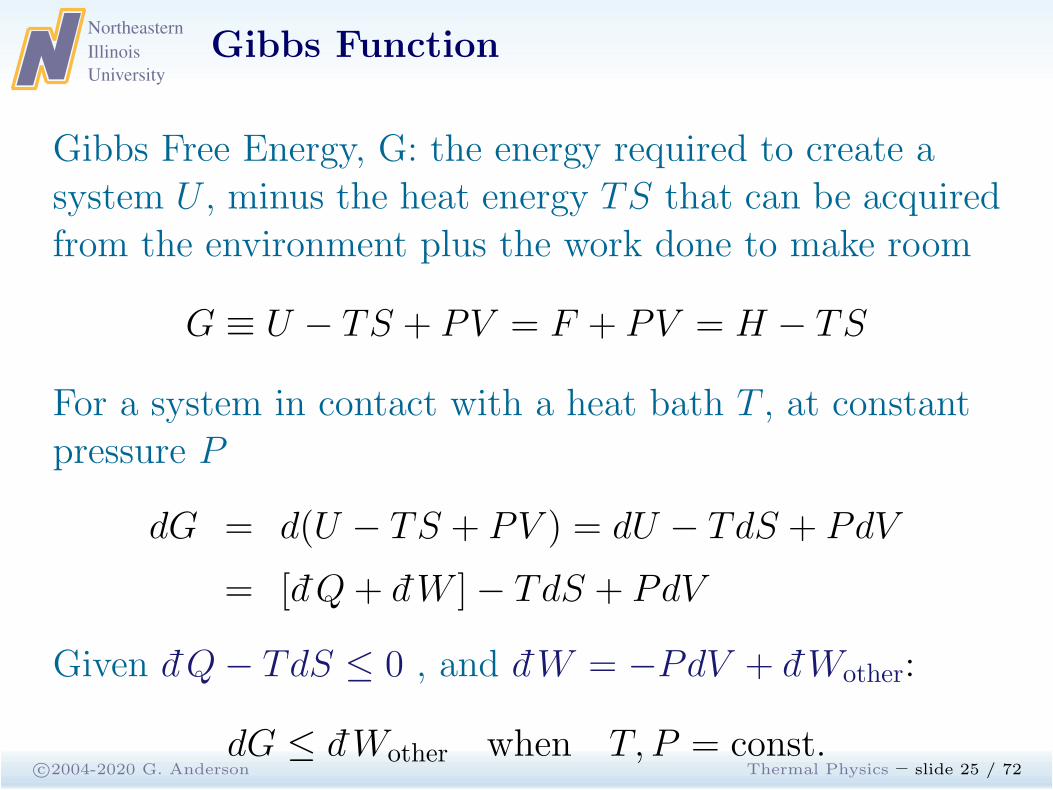
Gibbs Free Energy, G: the energy required to create asystem U , minus the heat energy TS that can be acquiredfrom the environment plus the work done to make room
G ≡ U − TS + PV = F + PV = H − TS
For a system in contact with a heat bath T , at constantpressure P
dG = d(U − TS + PV ) = dU − TdS + PdV
= [d Q+ dW ]− TdS + PdV
Given d Q− TdS ≤ 0 , and dW = −PdV + dWother:
dG ≤ dWother when T, P = const.
Northeastern
Illinois
University
Gibbs Free Energy
c©2004-2020 G. Anderson Thermal Physics – slide 26 / 72
∆G is an indicator of whether a reaction willspontaneously occur at contant temperature and pressuresince, in the absence of applied, non-mechanical work:
∆G ≤ 0
• A system at constant pressure in contact with a heatbath evolves to a state which minimizes G.
• Spontaneous processs lower the Gibbs function.
Northeastern
Illinois
University
Gibbs Free Energy II
c©2004-2020 G. Anderson Thermal Physics – slide 27 / 72
Thermodynamic identity for F (T, V,N)
dF = −SdT − PdV + µdN
Definition of G:
G ≡ U − TS + PV = F + PV = H − TS
Thermodynamic identity for G(T, P,N):
dG = d(U − TS + PV ) = d(F + PV )
= dF + PdV + V dP
= (−SdT − PdV + µdN) + PdV + V dP
= −SdT + V dP + µdN
Northeastern
Illinois
University
Gibbs Free Energy III
c©2004-2020 G. Anderson Thermal Physics – slide 28 / 72
DefinitionG = U − TS + PV
Thermodynamic identity for G(T, P,N):
dG = −SdT + V dP + µdN
Differential relations:
S = −
(
∂G
∂T
)
P,N
, V = +
(
∂G
∂P
)
T,N
, µ = +
(
∂G
∂N
)
T,P
Maxwell relation:
−
(
∂S
∂P
)
T
=
(
∂V
∂T
)
P
=
(
∂2G
∂P∂T
)
Northeastern
Illinois
University
Gibbs Free Energy IV
c©2004-2020 G. Anderson Thermal Physics – slide 29 / 72
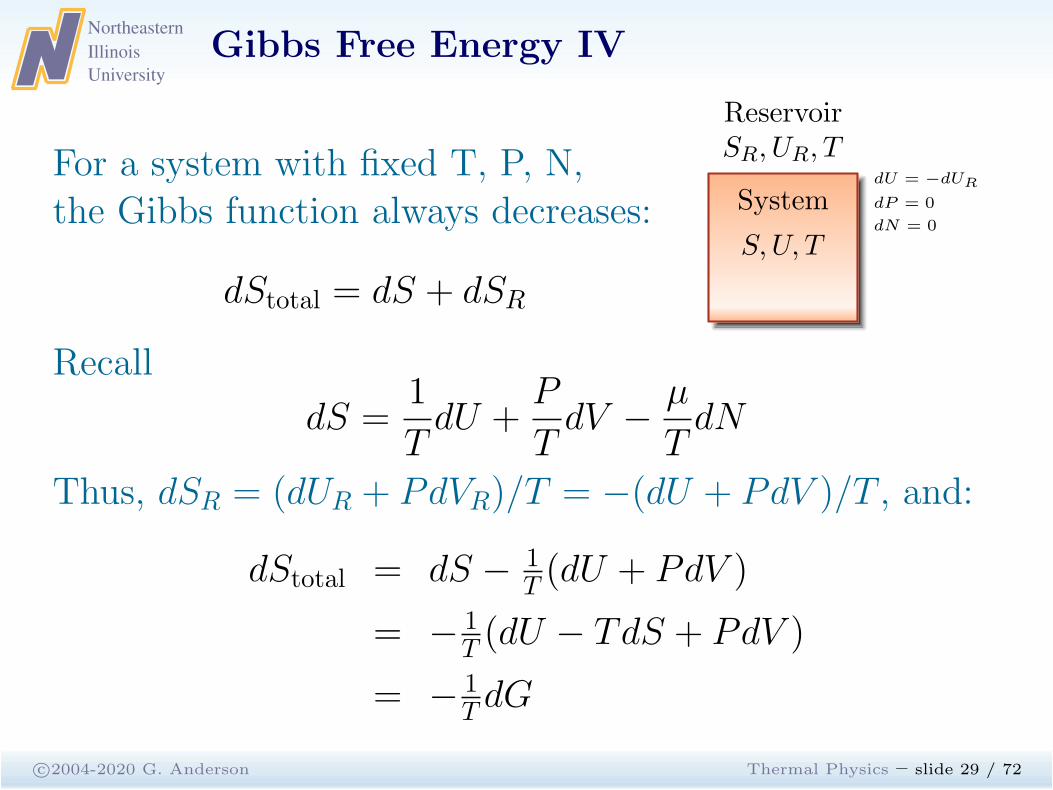
For a system with fixed T, P, N,the Gibbs function always decreases:
dStotal = dS + dSR
ReservoirSR, UR, T
System
S,U, T
dU = −dUR
dP = 0
dN = 0
Recall
dS =1
TdU +
P
TdV −
µ
TdN
Thus, dSR = (dUR + PdVR)/T = −(dU + PdV )/T , and:
dStotal = dS − 1T (dU + PdV )
= − 1T (dU − TdS + PdV )
= − 1T dG
Northeastern
Illinois
University
Gibbs Free Energy
c©2004-2020 G. Anderson Thermal Physics – slide 30 / 72
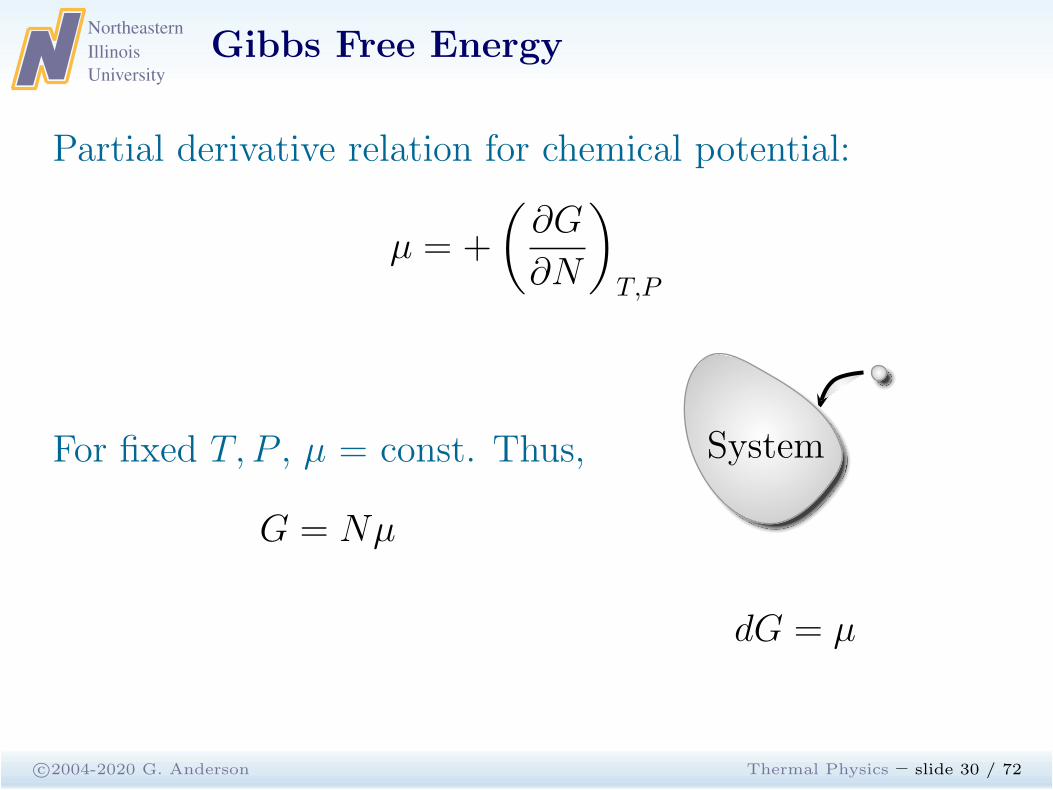
Partial derivative relation for chemical potential:
µ = +
(
∂G
∂N
)
T,P
For fixed T, P , µ = const. Thus,
G = Nµ
System
dG = µ
Northeastern
Illinois
University
The Gibbs Function and µ
c©2004-2020 G. Anderson Thermal Physics – slide 31 / 72
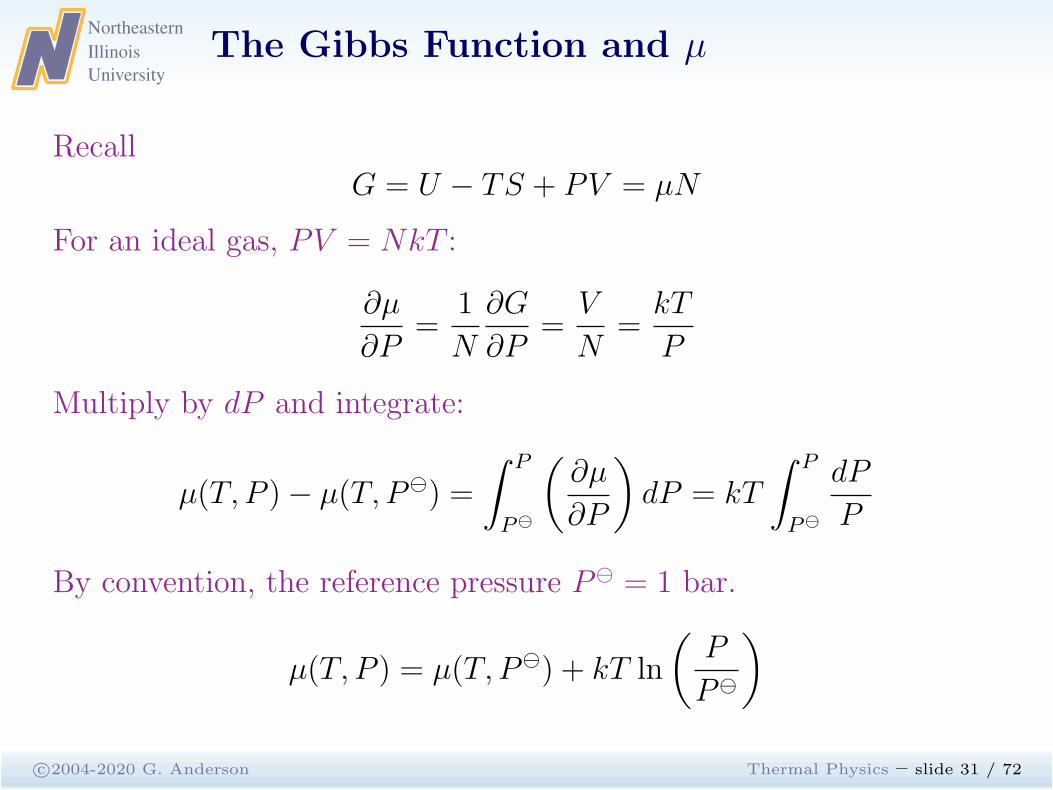
RecallG = U − TS + PV = µN
For an ideal gas, PV = NkT :
∂µ
∂P=
1
N
∂G
∂P=
V
N=
kT
P
Multiply by dP and integrate:
µ(T, P )− µ(T, P⊖) =
∫ P
P⊖
(
∂µ
∂P
)
dP = kT
∫ P
P⊖
dP
P
By convention, the reference pressure P⊖ = 1 bar.
µ(T, P ) = µ(T, P⊖) + kT ln
(
P
P⊖
)
Northeastern
Illinois
University
Grand Potenial
c©2004-2020 G. Anderson Thermal Physics – slide 32 / 72
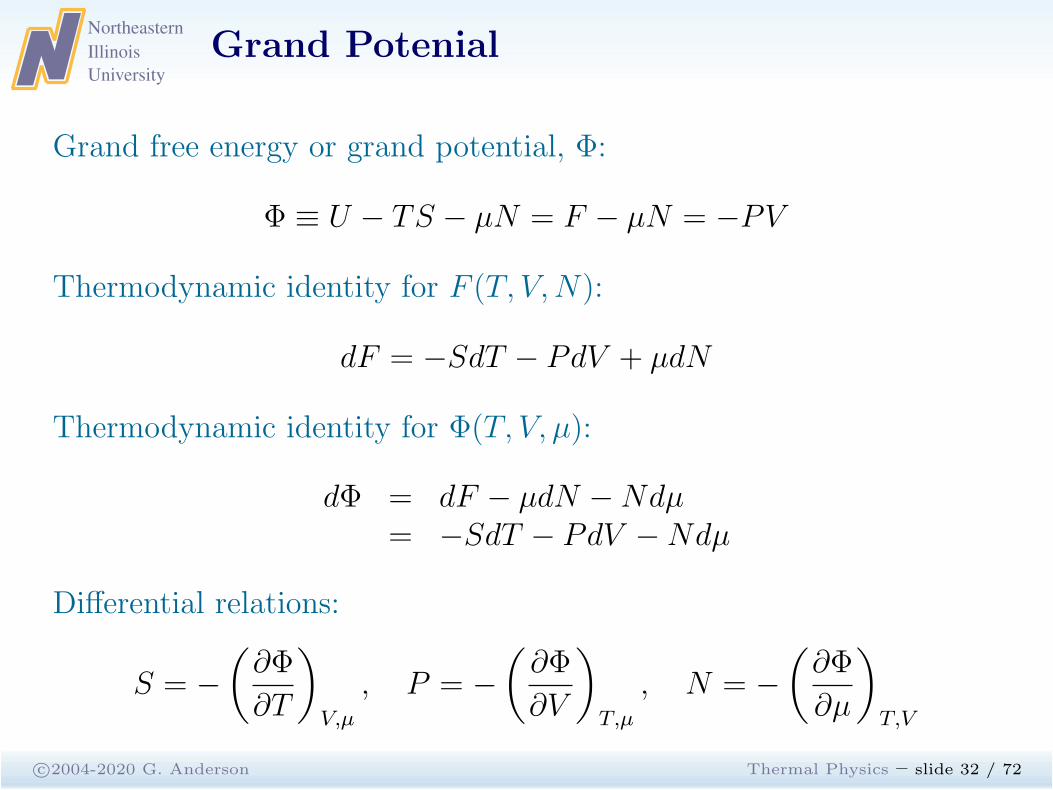
Grand free energy or grand potential, Φ:
Φ ≡ U − TS − µN = F − µN = −PV
Thermodynamic identity for F (T, V,N):
dF = −SdT − PdV + µdN
Thermodynamic identity for Φ(T, V, µ):
dΦ = dF − µdN −Ndµ= −SdT − PdV −Ndµ
Differential relations:
S = −
(
∂Φ
∂T
)
V,µ
, P = −
(
∂Φ
∂V
)
T,µ
, N = −
(
∂Φ
∂µ
)
T,V
Northeastern
Illinois
University
Summary
c©2004-2020 G. Anderson Thermal Physics – slide 33 / 72
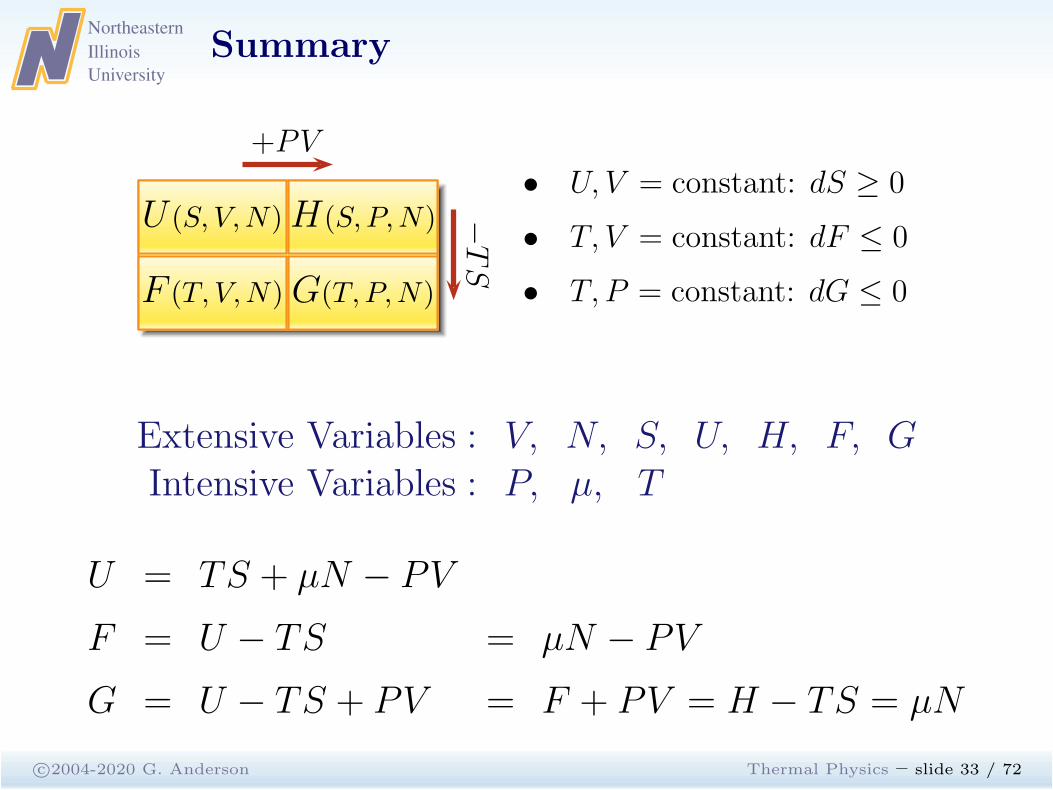
U (S, V,N)
F (T, V,N)G(T, P,N)
H(S, P,N)
+PV
−TS
• U, V = constant: dS ≥ 0
• T, V = constant: dF ≤ 0
• T, P = constant: dG ≤ 0
Extensive Variables : V, N, S, U, H, F, GIntensive Variables : P, µ, T
U = TS + µN − PV
F = U − TS = µN − PV
G = U − TS + PV = F + PV = H − TS = µN
Northeastern
Illinois
University
Phase Transformations
Maxwell
Potentials
LegendreTransforms
PhaseTransformations
Phases of MatterPhaseTransitionsEhrenfest’sClassificationClausius-Clapeyron
Phase Diagramfor H2O
WaterPhase Diagramfor CO2
Carbon Dioxide
Helium
Helium 4
G of C
PT CarbonCalciumCarbonateFree energy offormationCalciumCarbonate PhaseDiagram
van der Waalsc©2004-2020 G. Anderson Thermal Physics – slide 34 / 72
Northeastern
Illinois
University
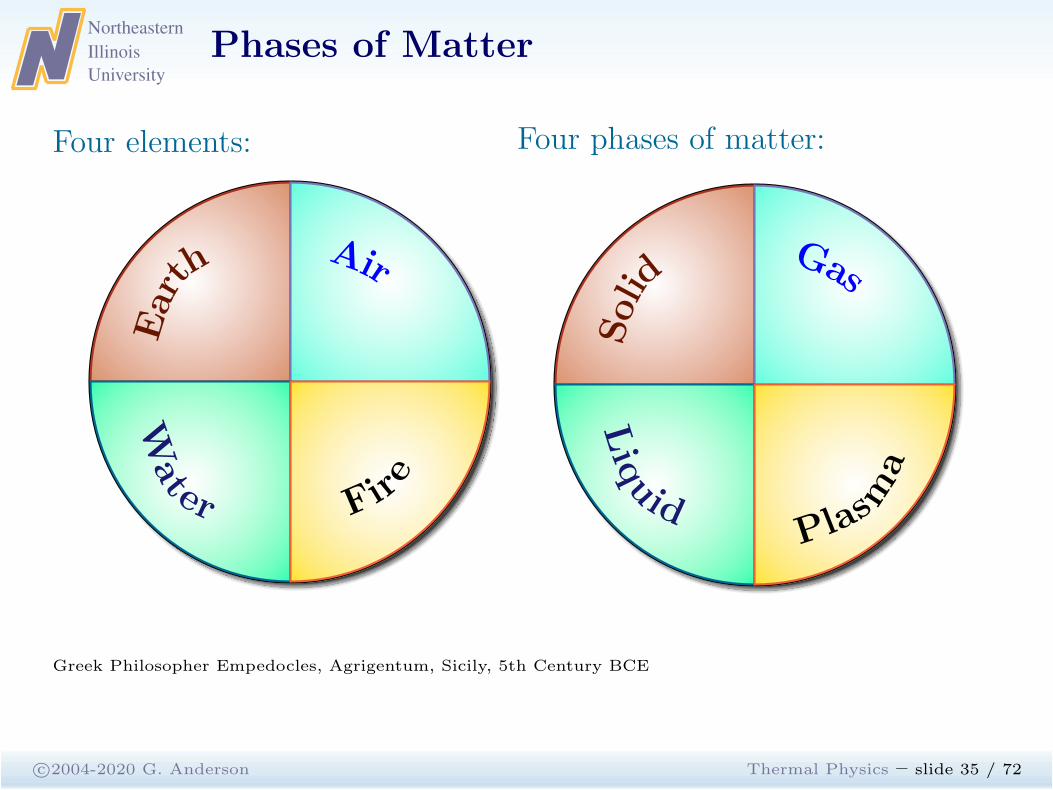
Phases of Matter
c©2004-2020 G. Anderson Thermal Physics – slide 35 / 72
Four elements:Earth
Air
Water Fir
e
Four phases of matter:
Solid
Gas
Liquid
Plasm
a
Greek Philosopher Empedocles, Agrigentum, Sicily, 5th Century BCE
Northeastern
Illinois
University
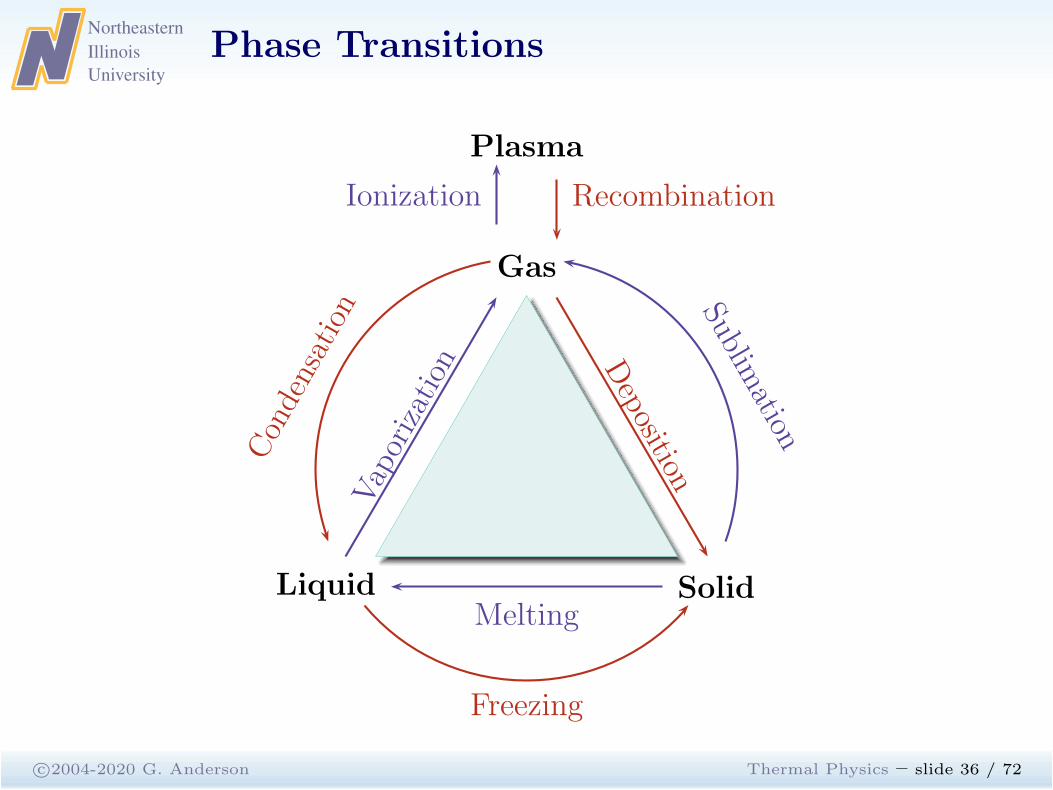
Phase Transitions
c©2004-2020 G. Anderson Thermal Physics – slide 36 / 72
Plasma
Gas
Liquid SolidMelting
Vaporization D
eposition
Ionization
Condensation Sublim
ation
Freezing
Recombination
Northeastern
Illinois
University
Ehrenfest’s Classification
c©2004-2020 G. Anderson Thermal Physics – slide 37 / 72
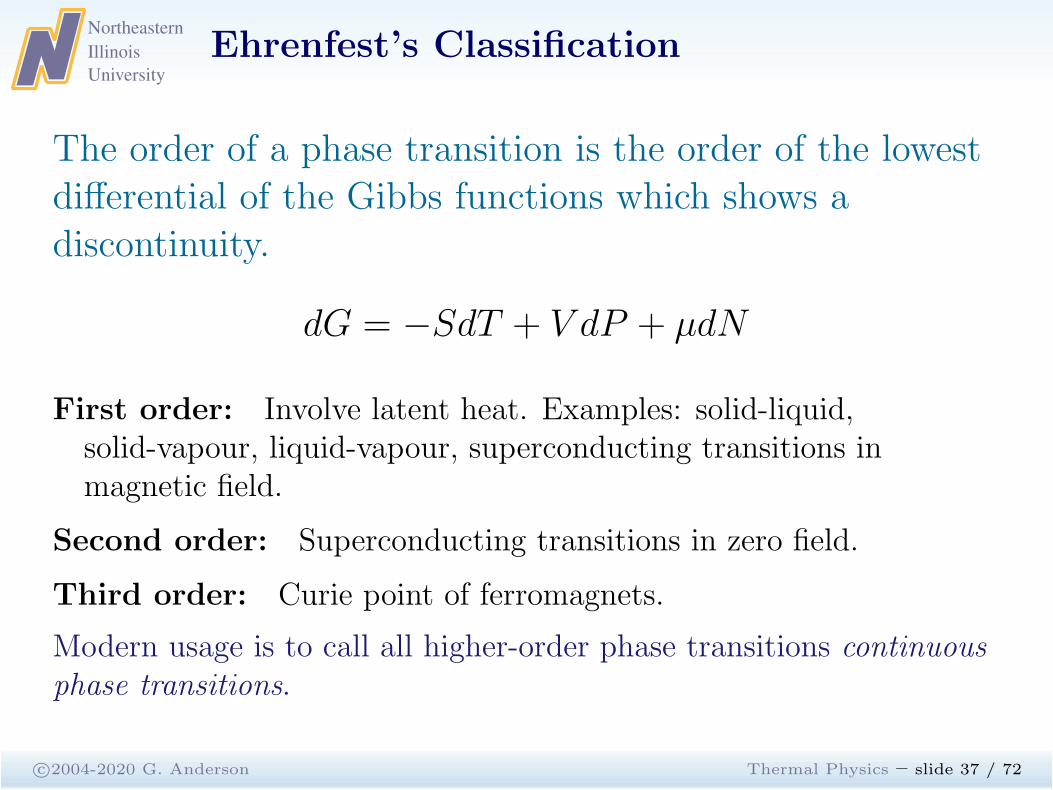
The order of a phase transition is the order of the lowestdifferential of the Gibbs functions which shows adiscontinuity.
dG = −SdT + V dP + µdN
First order: Involve latent heat. Examples: solid-liquid,solid-vapour, liquid-vapour, superconducting transitions inmagnetic field.
Second order: Superconducting transitions in zero field.
Third order: Curie point of ferromagnets.
Modern usage is to call all higher-order phase transitions continuousphase transitions.
Northeastern
Illinois
University
Clausius-Clapeyron Relation
c©2004-2020 G. Anderson Thermal Physics – slide 38 / 72
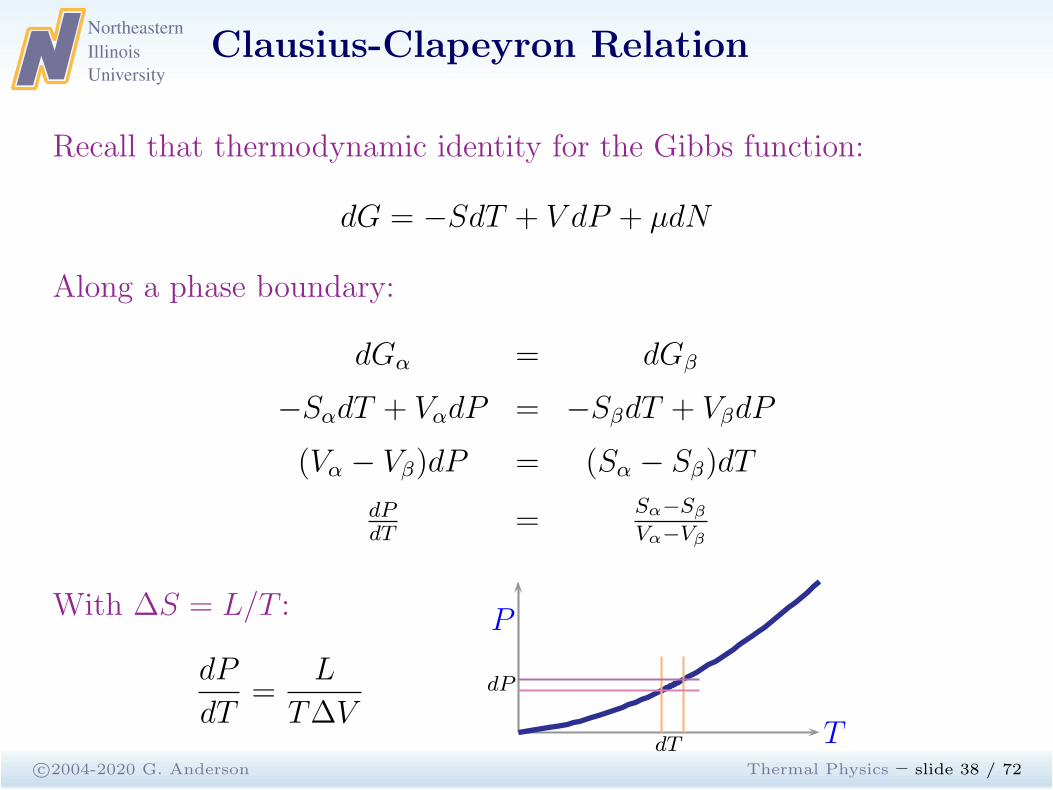
Recall that thermodynamic identity for the Gibbs function:
dG = −SdT + V dP + µdN
Along a phase boundary:
dGα = dGβ
−SαdT + VαdP = −SβdT + VβdP
(Vα − Vβ)dP = (Sα − Sβ)dT
dPdT
=Sα−Sβ
Vα−Vβ
With ∆S = L/T :
dP
dT=
L
T∆VdT
dP
P
T
Northeastern
Illinois
University
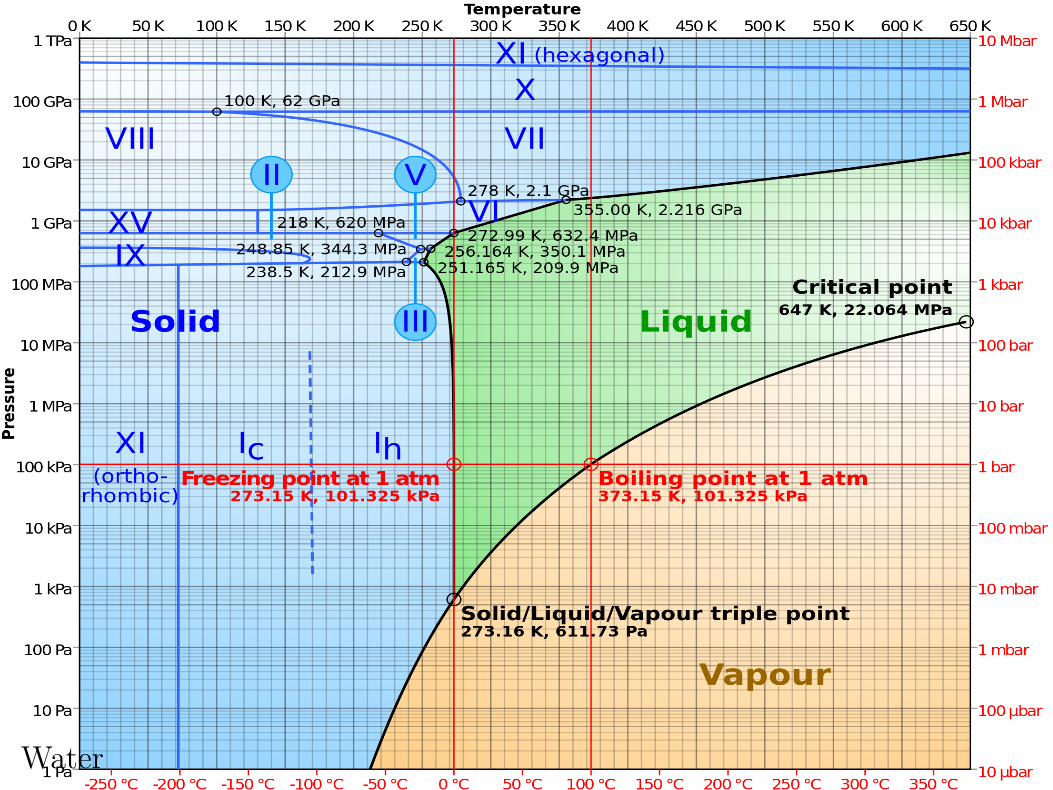
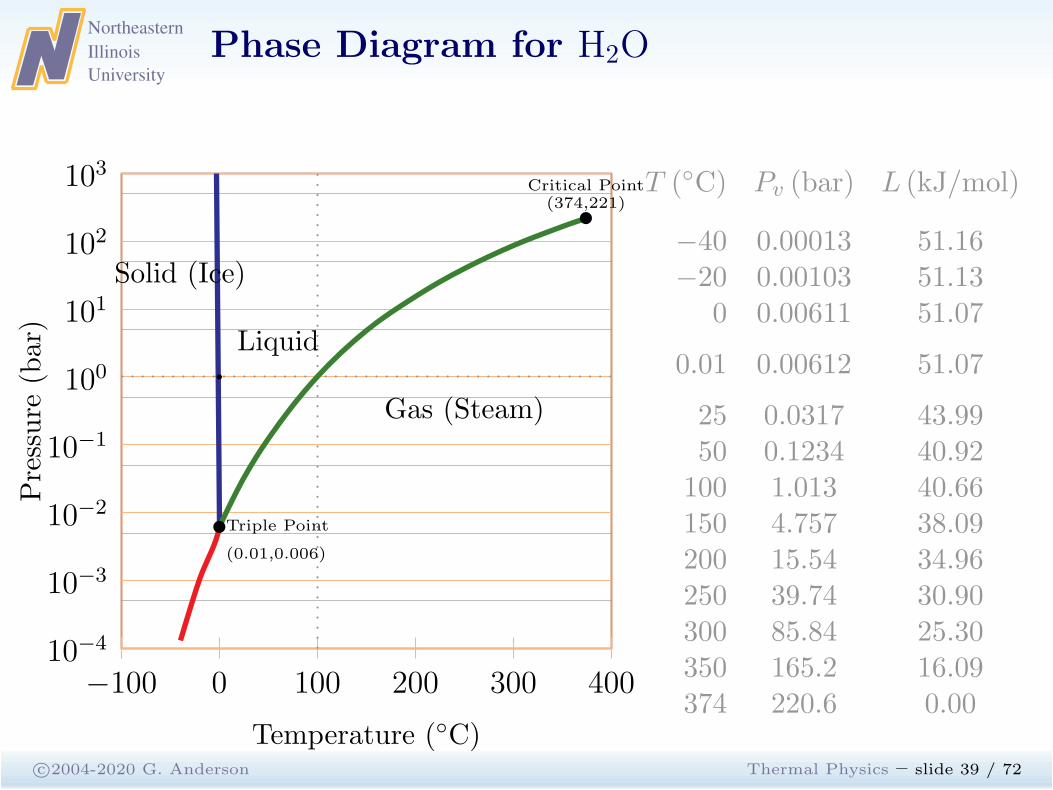
Phase Diagram for H2O
c©2004-2020 G. Anderson Thermal Physics – slide 39 / 72
−100 0 100 200 300 40010−4
10−3
10−2
10−1
100
101
102
103
Triple Point
(0.01,0.006)
Critical Point(374,221)
Solid (Ice)
Gas (Steam)
Liquid
Temperature (◦C)
Pressure
(bar)
b
T (◦C) Pv (bar) L (kJ/mol)
−40 0.00013 51.16−20 0.00103 51.13
0 0.00611 51.07
0.01 0.00612 51.07
25 0.0317 43.9950 0.1234 40.92100 1.013 40.66150 4.757 38.09200 15.54 34.96250 39.74 30.90300 85.84 25.30350 165.2 16.09374 220.6 0.00
Northeastern
Illinois
University
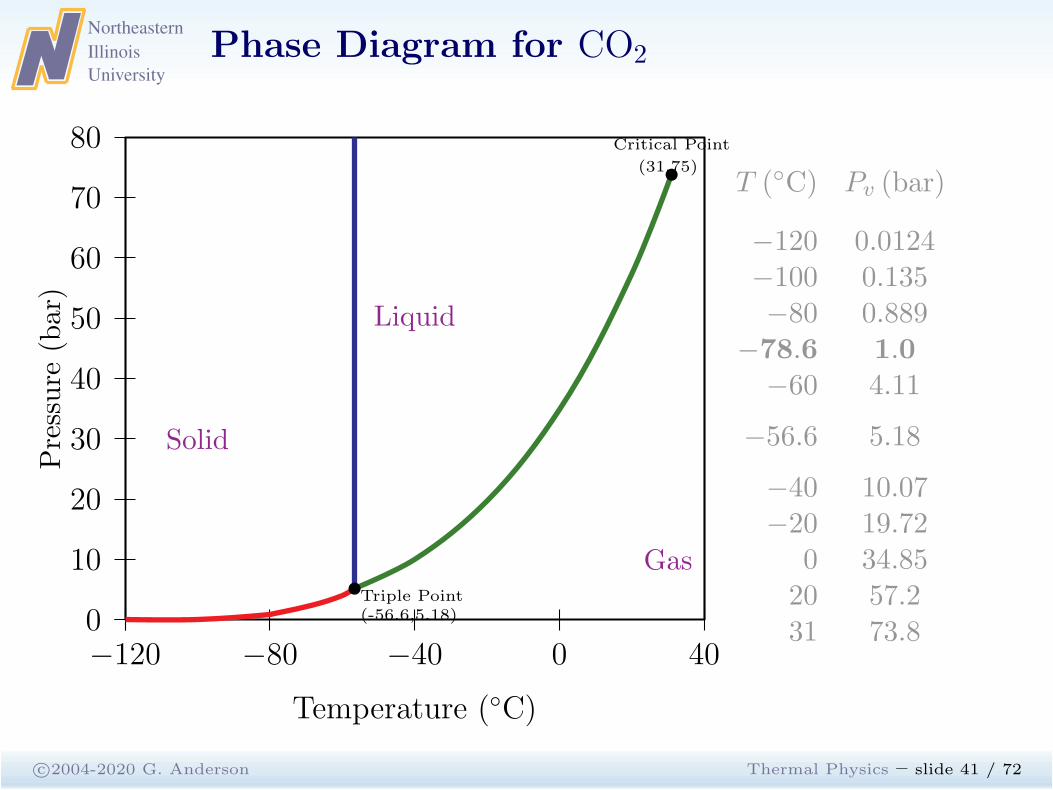
Phase Diagram for CO2
c©2004-2020 G. Anderson Thermal Physics – slide 41 / 72
−120 −80 −40 0 400
10
20
30
40
50
60
70
80
Triple Point(-56.6,5.18)
Critical Point
(31,75)
Solid
Gas
Liquid
Temperature (◦C)
Pressure
(bar)
T (◦C) Pv (bar)
−120 0.0124−100 0.135−80 0.889
−78.6 1.0−60 4.11
−56.6 5.18
−40 10.07−20 19.72
0 34.8520 57.231 73.8
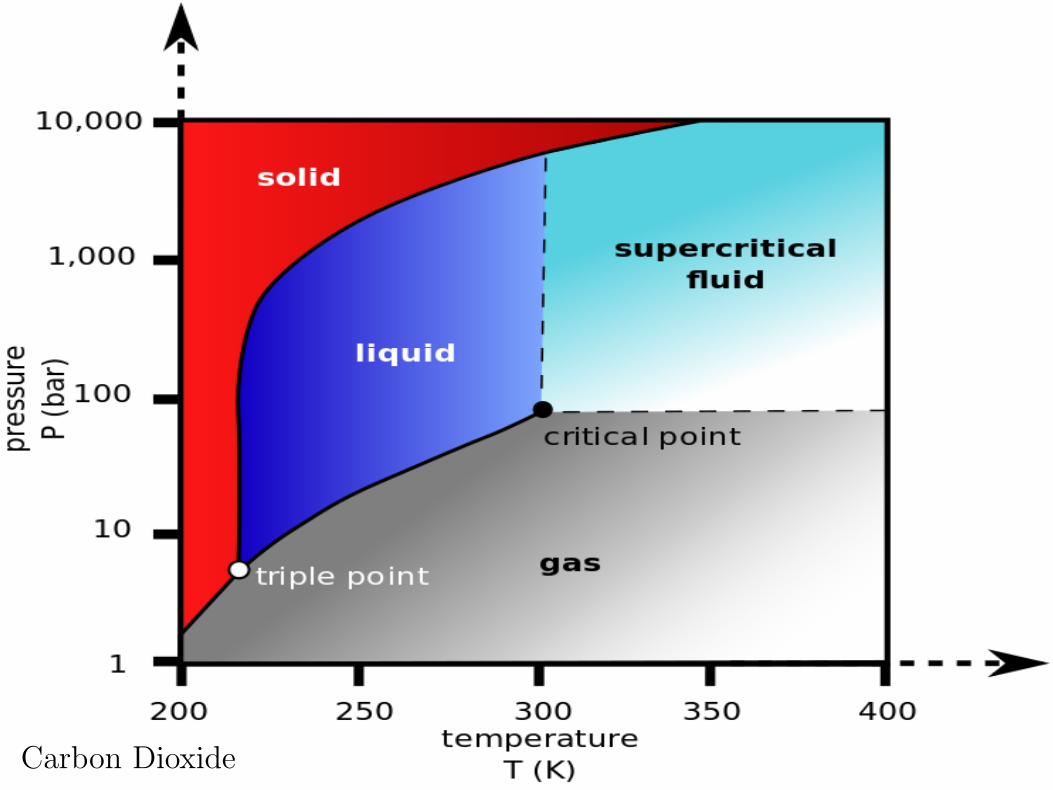
Carbon Dioxide
Northeastern
Illinois
University
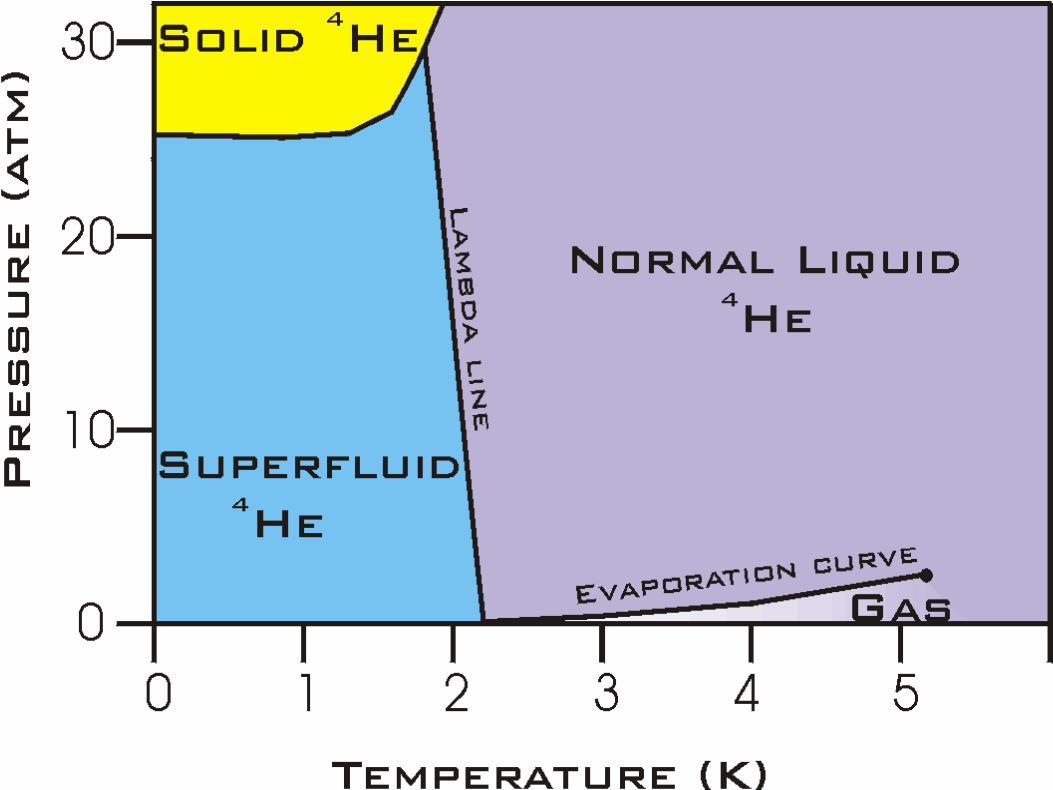
Helium
c©2004-2020 G. Anderson Thermal Physics – slide 43 / 72
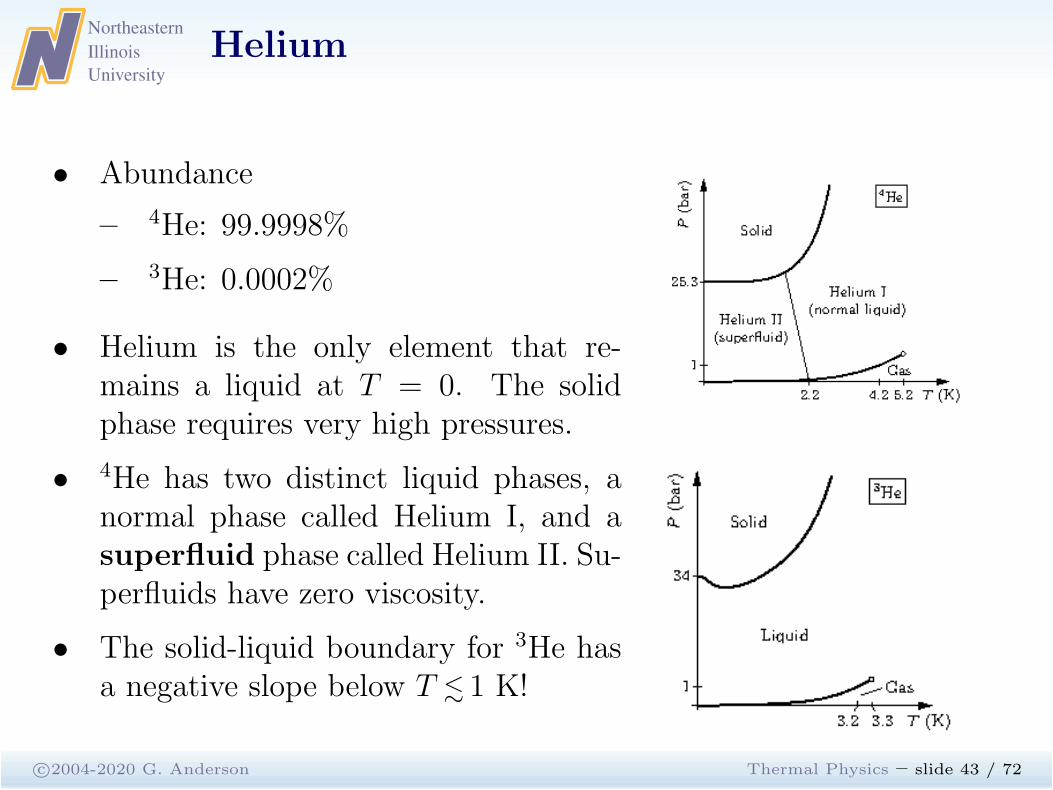
• Abundance
– 4He: 99.9998%
– 3He: 0.0002%
• Helium is the only element that re-mains a liquid at T = 0. The solidphase requires very high pressures.
• 4He has two distinct liquid phases, anormal phase called Helium I, and asuperfluid phase called Helium II. Su-perfluids have zero viscosity.
• The solid-liquid boundary for 3He hasa negative slope below T . 1 K!
Northeastern
Illinois
University
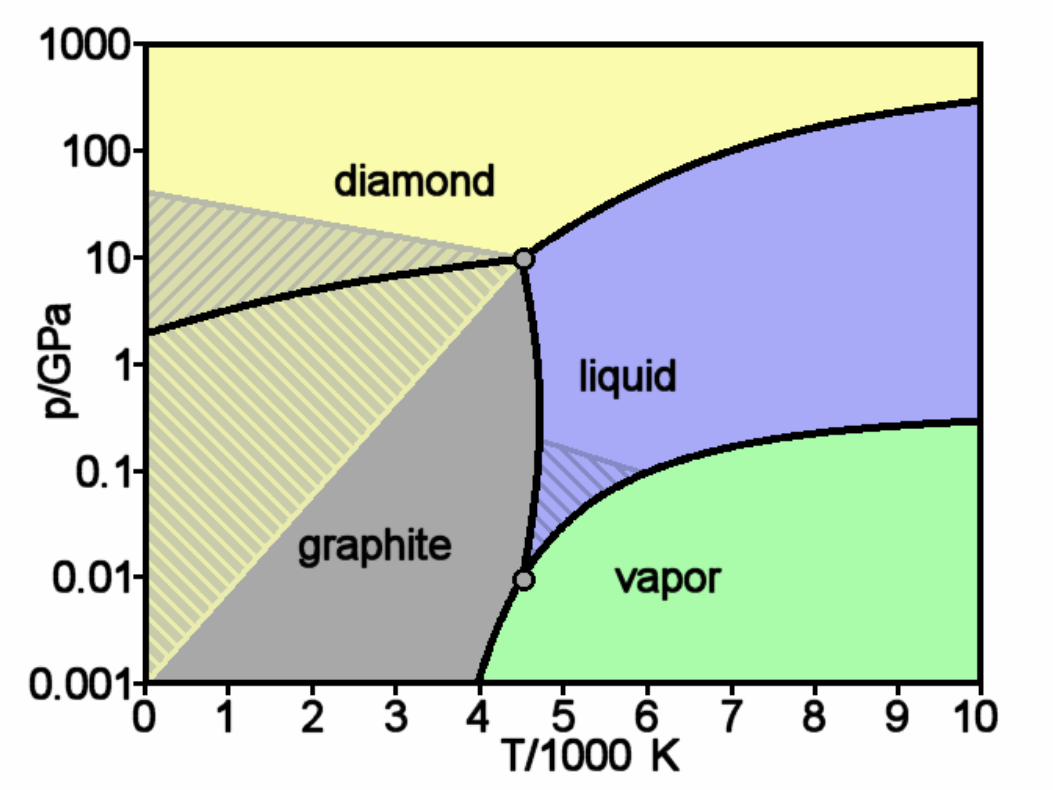
Diamond and Graphite
c©2004-2020 G. Anderson Thermal Physics – slide 45 / 72
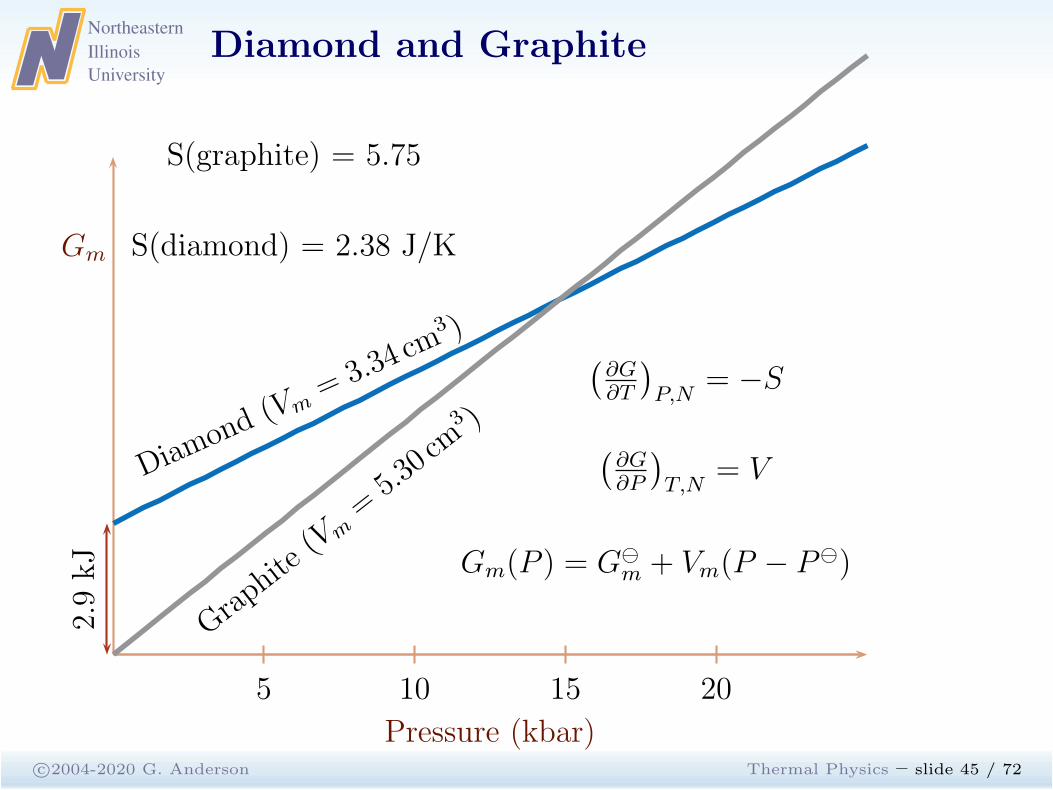
Gm
Pressure (kbar)
5 10 15 20
Diamo
nd(Vm
= 3.34 cm
3 )
Graphite(Vm
=5.30 cm3 )
(
∂G∂T
)
P,N= −S
(
∂G∂P
)
T,N= V
Gm(P ) = G⊖
m + Vm(P − P⊖)
2.9kJ
S(graphite) = 5.75
S(diamond) = 2.38 J/K
Northeastern
Illinois
University
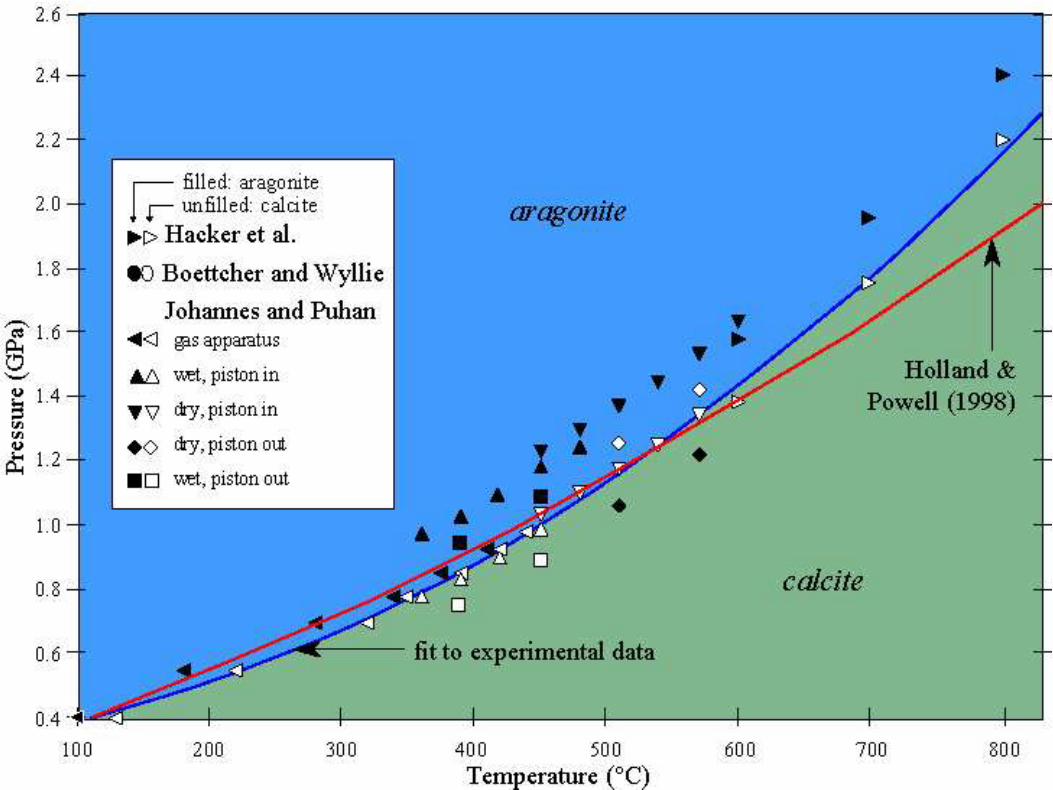
Calcium Carbonate
c©2004-2020 G. Anderson Thermal Physics – slide 47 / 72
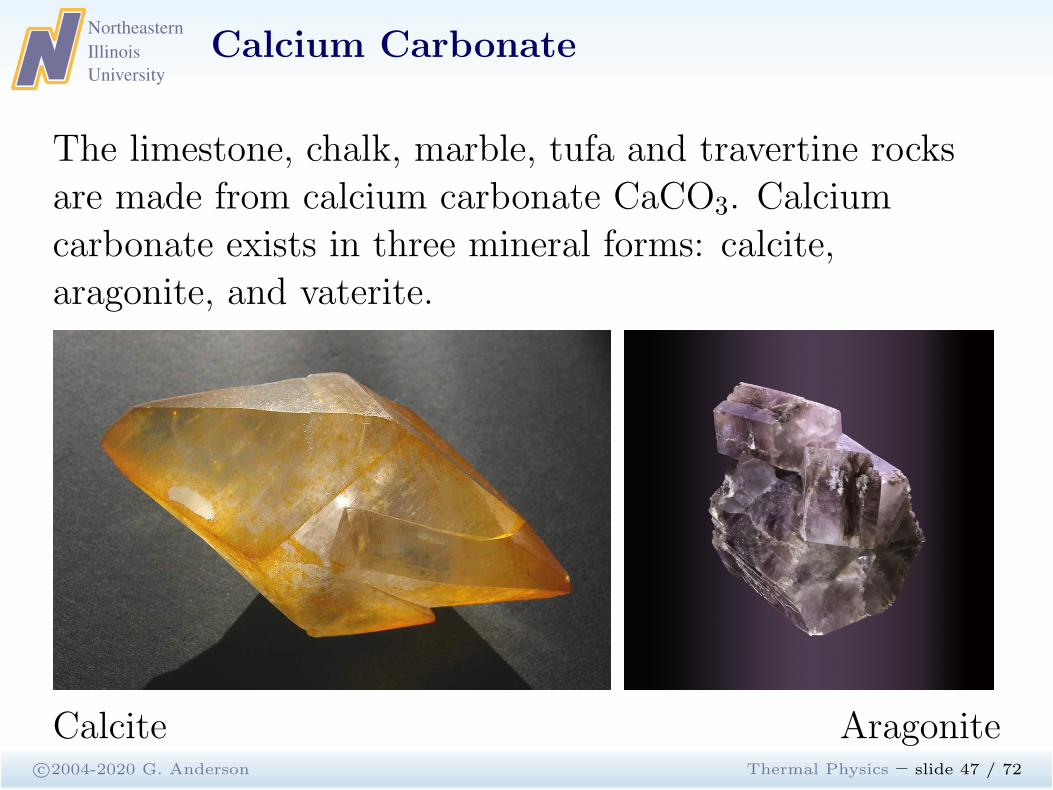
The limestone, chalk, marble, tufa and travertine rocksare made from calcium carbonate CaCO3. Calciumcarbonate exists in three mineral forms: calcite,aragonite, and vaterite.
Calcite Aragonite
Northeastern
Illinois
University
Free energy of formation
c©2004-2020 G. Anderson Thermal Physics – slide 48 / 72
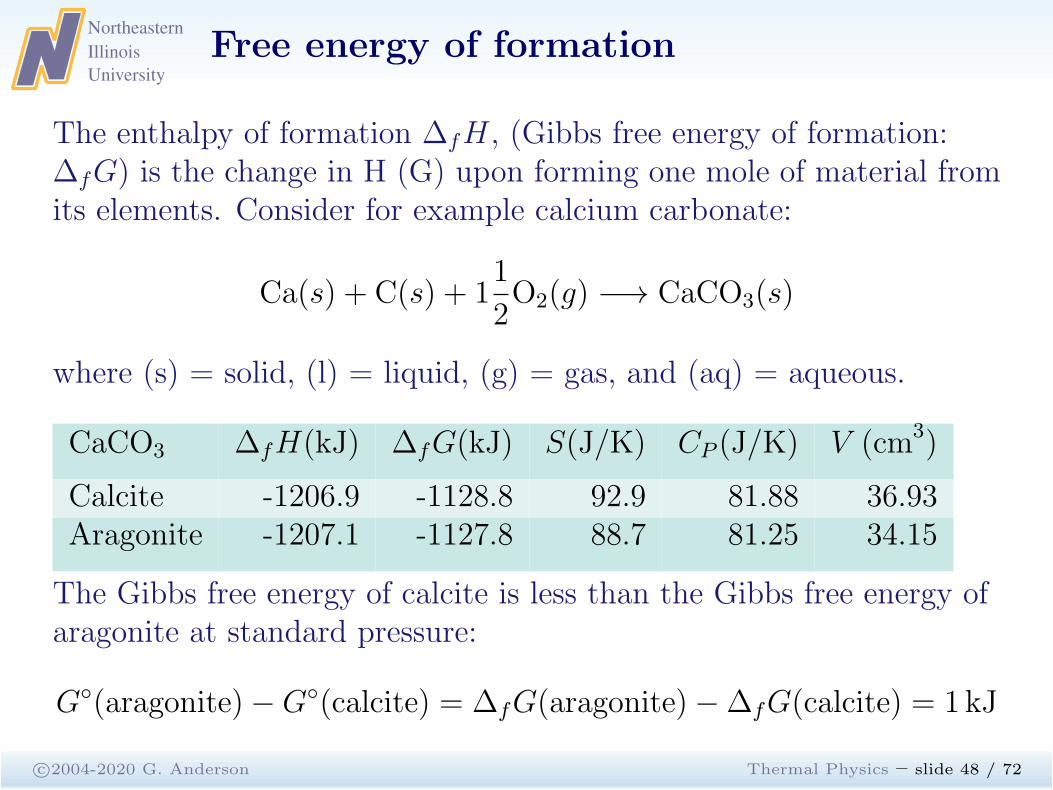
The enthalpy of formation ∆fH, (Gibbs free energy of formation:∆fG) is the change in H (G) upon forming one mole of material fromits elements. Consider for example calcium carbonate:
Ca(s) + C(s) + 11
2O2(g) −→ CaCO3(s)
where (s) = solid, (l) = liquid, (g) = gas, and (aq) = aqueous.
CaCO3 ∆fH(kJ) ∆fG(kJ) S(J/K) CP (J/K) V (cm3)
Calcite -1206.9 -1128.8 92.9 81.88 36.93Aragonite -1207.1 -1127.8 88.7 81.25 34.15
The Gibbs free energy of calcite is less than the Gibbs free energy ofaragonite at standard pressure:
G◦(aragonite)−G◦(calcite) = ∆fG(aragonite)−∆fG(calcite) = 1 kJ
Northeastern
Illinois
University
van der Waals Model
Maxwell
Potentials
LegendreTransforms
PhaseTransformations
van der Waals
Model
a & b
dimensionless
Gibbs Function
Parametric Plot
Parametric Plot
Parametric Plot
Parametric Plot
Maxwell Const.Fig. 5.22Isotherm
PV Diagram
PV Diagram
PT Diagram
Mixtures
c©2004-2020 G. Anderson Thermal Physics – slide 50 / 72
Northeastern
Illinois
University
The van der Waals Model
c©2004-2020 G. Anderson Thermal Physics – slide 51 / 72
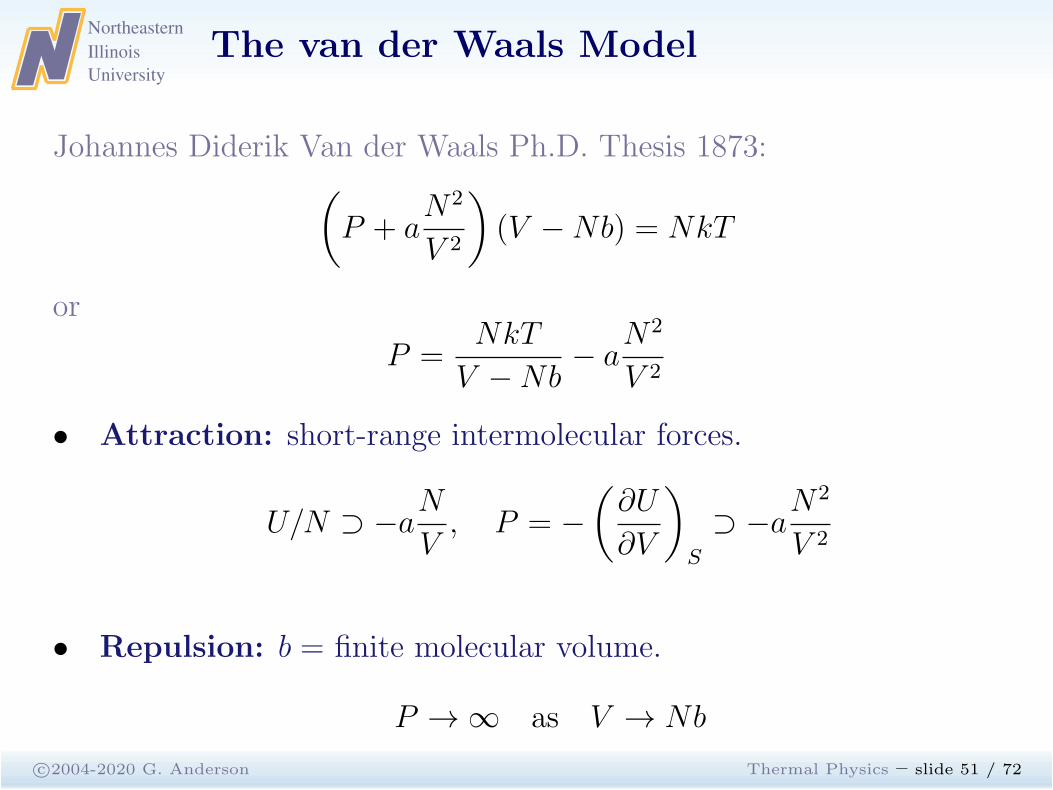
Johannes Diderik Van der Waals Ph.D. Thesis 1873:(
P + aN2
V 2
)
(V −Nb) = NkT
or
P =NkT
V −Nb− a
N2
V 2
• Attraction: short-range intermolecular forces.
U/N ⊃ −aN
V, P = −
(
∂U
∂V
)
S
⊃ −aN2
V 2
• Repulsion: b = finite molecular volume.
P → ∞ as V → Nb
Northeastern
Illinois
University
Empirical Constants
c©2004-2020 G. Anderson Thermal Physics – slide 52 / 72
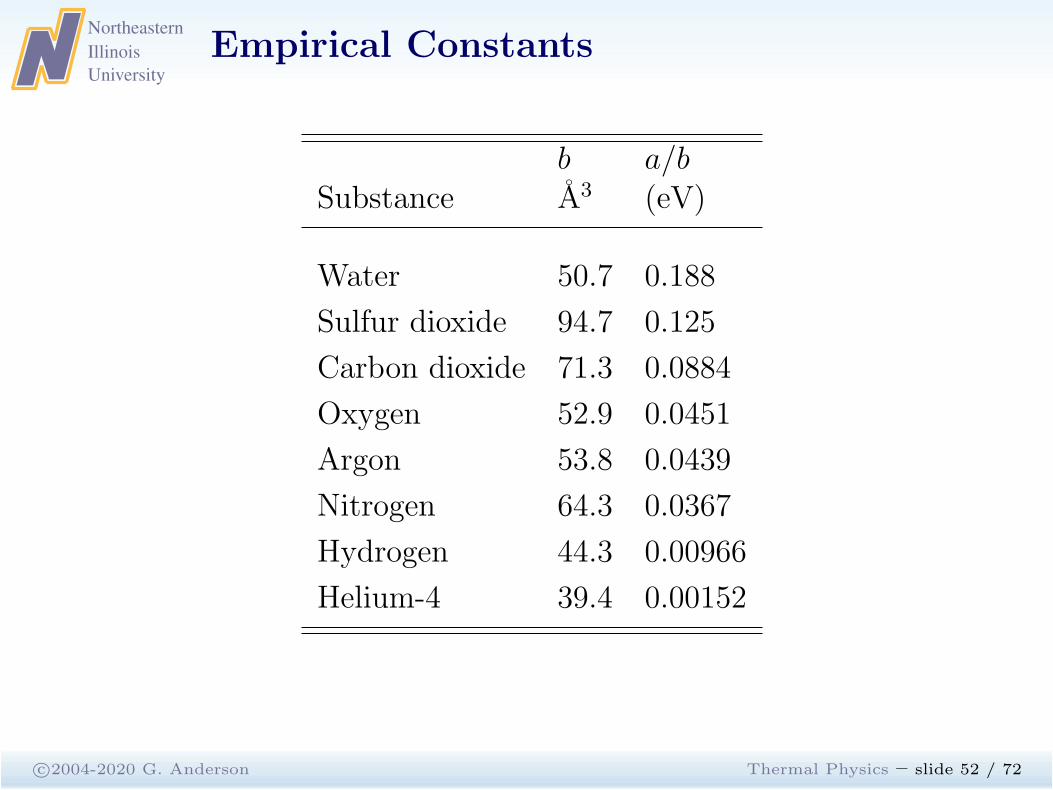
b a/bSubstance A3 (eV)
Water 50.7 0.188
Sulfur dioxide 94.7 0.125
Carbon dioxide 71.3 0.0884
Oxygen 52.9 0.0451
Argon 53.8 0.0439
Nitrogen 64.3 0.0367
Hydrogen 44.3 0.00966
Helium-4 39.4 0.00152
Northeastern
Illinois
University
Dimensionless van der Walls equation
c©2004-2020 G. Anderson Thermal Physics – slide 53 / 72
1 2 3 40
−1
−2
−3
1
2
3
4
p=
P/P
c
v = V/Vc
t = 1.2, 1.1, . . . , 0.7, 0.6
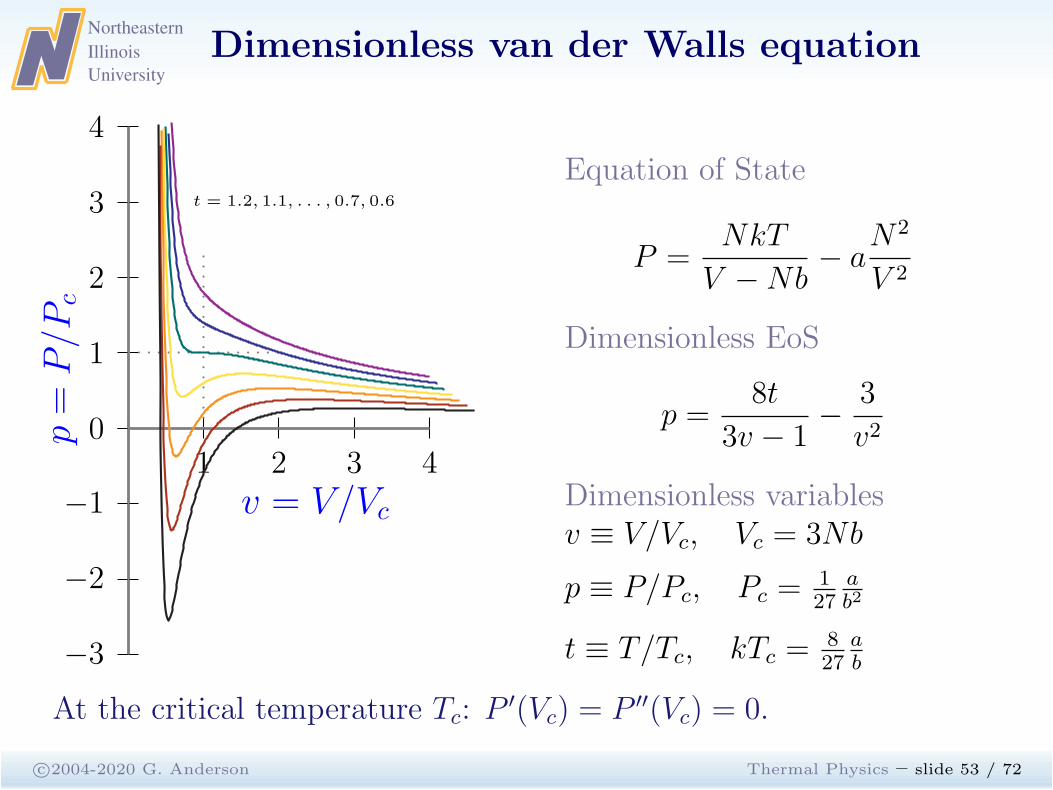
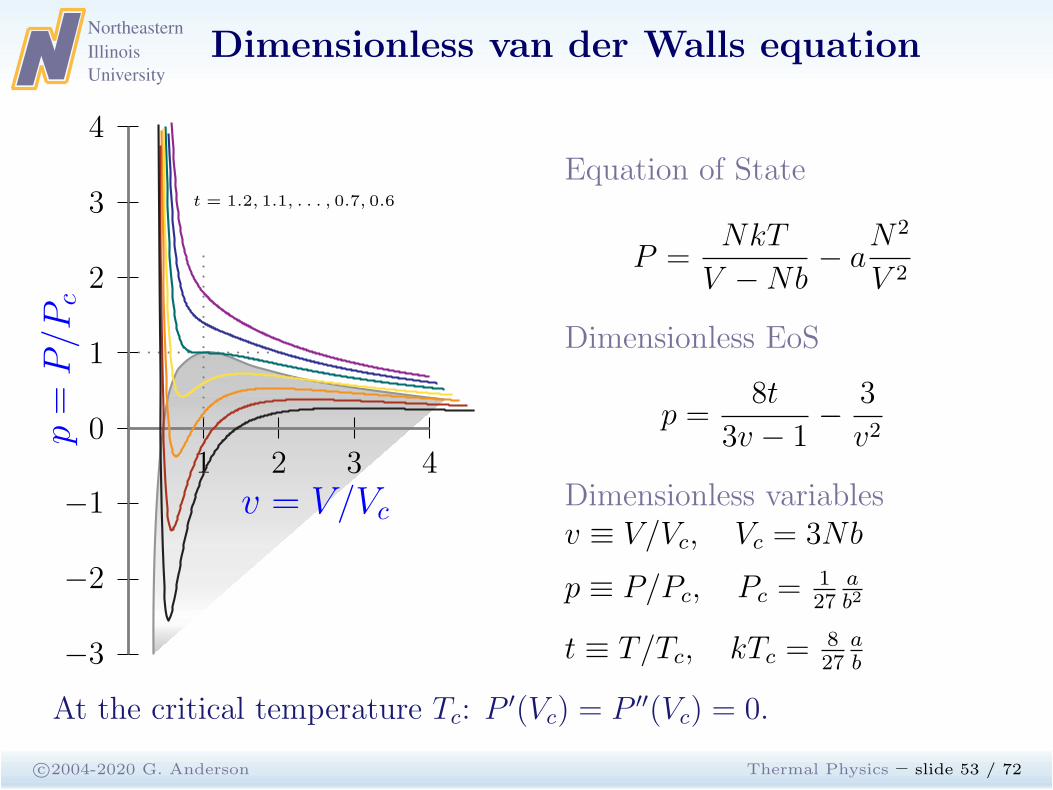
Equation of State
P =NkT
V −Nb− a
N2
V 2
Dimensionless EoS
p =8t
3v − 1−
3
v2
Dimensionless variablesv ≡ V/Vc, Vc = 3Nb
p ≡ P/Pc, Pc =127
ab2
t ≡ T/Tc, kTc =827
ab
At the critical temperature Tc: P′(Vc) = P ′′(Vc) = 0.
Northeastern
Illinois
University
Dimensionless van der Walls equation
c©2004-2020 G. Anderson Thermal Physics – slide 53 / 72
1 2 3 40
−1
−2
−3
1
2
3
4
p=
P/P
c
v = V/Vc
t = 1.2, 1.1, . . . , 0.7, 0.6
Equation of State
P =NkT
V −Nb− a
N2
V 2
Dimensionless EoS
p =8t
3v − 1−
3
v2
Dimensionless variablesv ≡ V/Vc, Vc = 3Nb
p ≡ P/Pc, Pc =127
ab2
t ≡ T/Tc, kTc =827
ab
At the critical temperature Tc: P′(Vc) = P ′′(Vc) = 0.
Northeastern
Illinois
University
Gibbs Function of a van der Waals Gas
c©2004-2020 G. Anderson Thermal Physics – slide 54 / 72
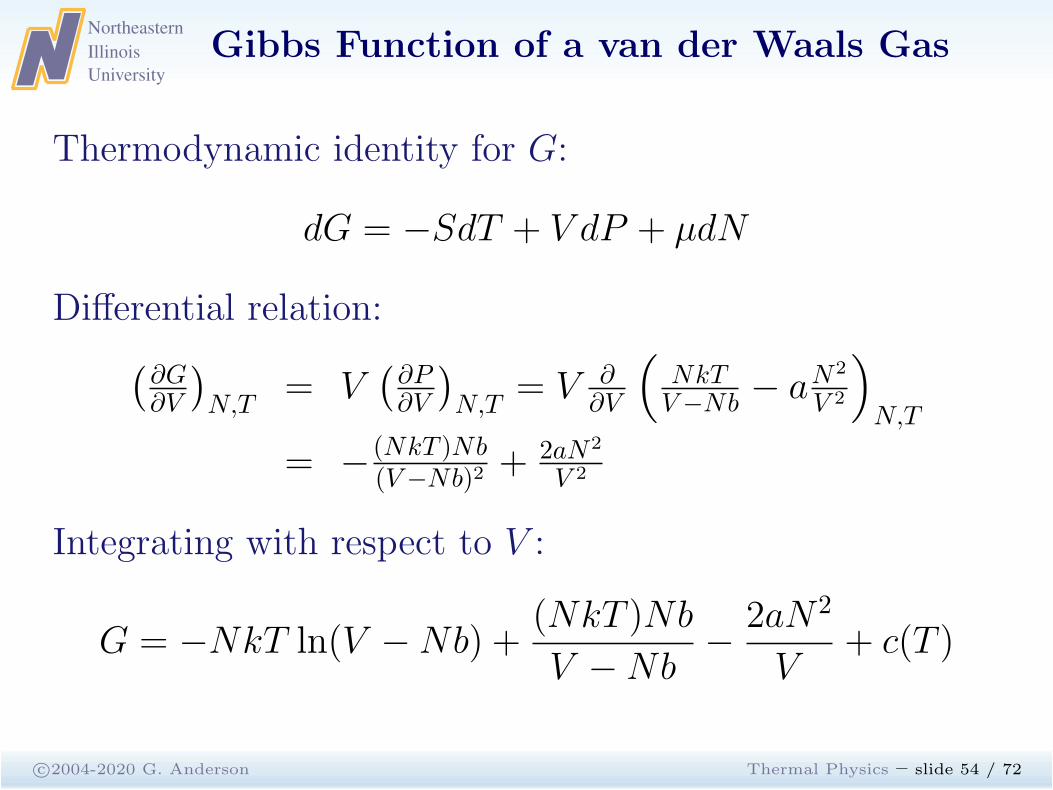
Thermodynamic identity for G:
dG = −SdT + V dP + µdN
Differential relation:(
∂G∂V
)
N,T= V
(
∂P∂V
)
N,T= V ∂
∂V
(
NkTV−Nb − aN2
V 2
)
N,T
= − (NkT )Nb(V−Nb)2 +
2aN2
V 2
Integrating with respect to V :
G = −NkT ln(V −Nb) +(NkT )Nb
V −Nb−
2aN 2
V+ c(T )
Northeastern
Illinois
University
Parametric van der Waals Plot
c©2004-2020 G. Anderson Thermal Physics – slide 55 / 72
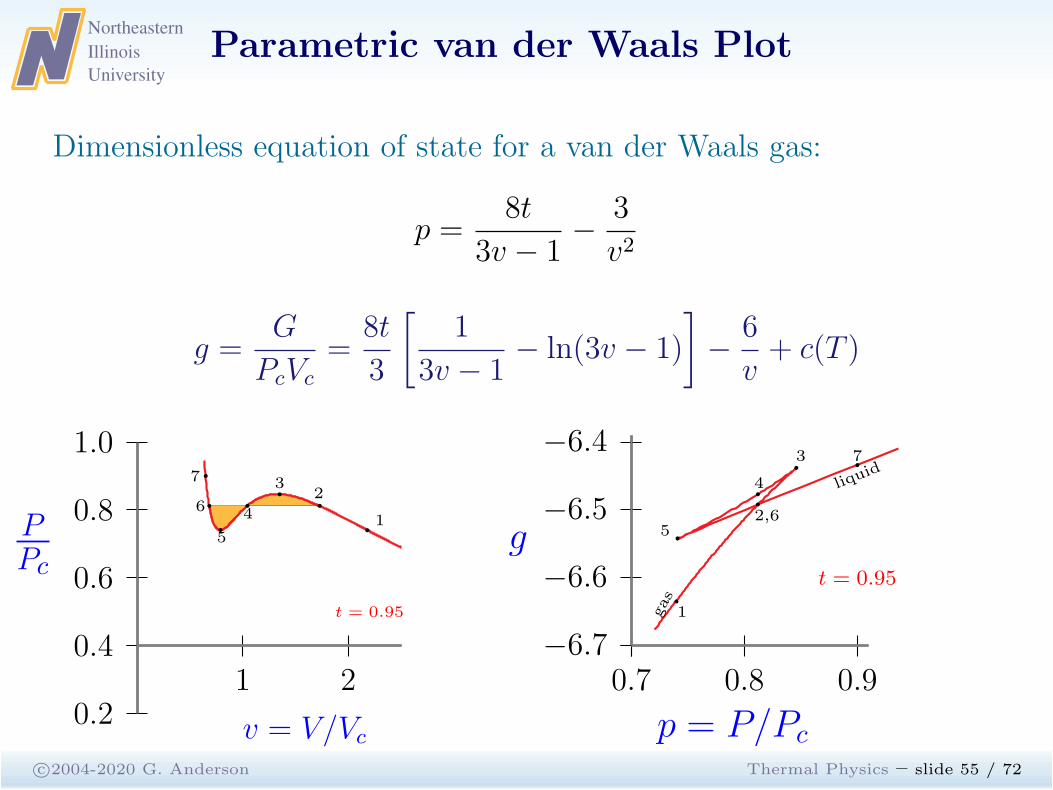
Dimensionless equation of state for a van der Waals gas:
p =8t
3v − 1−
3
v2
g =G
PcVc
=8t
3
[
1
3v − 1− ln(3v − 1)
]
−6
v+ c(T )
1 20.4
0.2
0.6
0.8
1.0
PPc
v = V/Vc
t = 0.95
b1
b2b
3b
4b
5
b6
b7
0.7 0.8 0.9−6.7
−6.6
−6.5
−6.4
t = 0.95
g
p = P/Pc
b
1
b3
b4b
2,6b5
b7
gas
liquid
Northeastern
Illinois
University
Parametric van der Waals Plot
c©2004-2020 G. Anderson Thermal Physics – slide 56 / 72
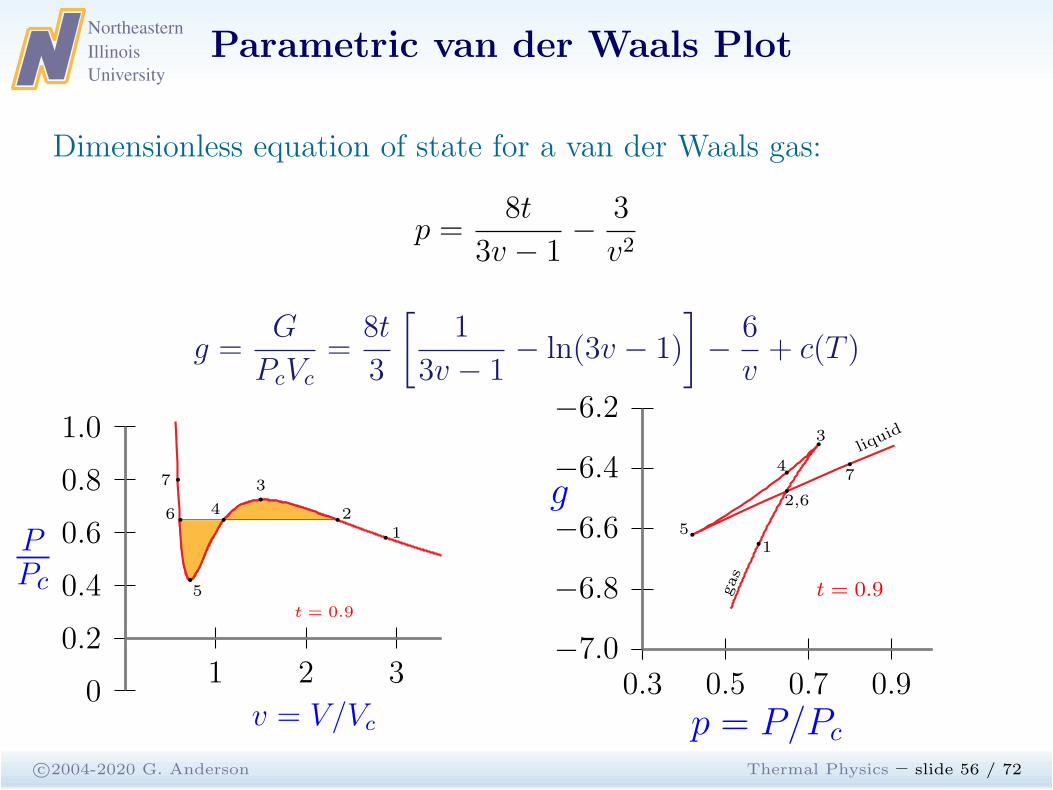
Dimensionless equation of state for a van der Waals gas:
p =8t
3v − 1−
3
v2
g =G
PcVc
=8t
3
[
1
3v − 1− ln(3v − 1)
]
−6
v+ c(T )
1 2 30.2
0
0.4
0.6
0.8
1.0
PPc
v = V/Vc
t = 0.9
b 1b 2
b3
b4
b
5
b6
b7
0.3 0.5 0.7 0.9−7.0
−6.8
−6.6
−6.4
−6.2
t = 0.9
g
p = P/Pc
b1
b3
b5
b
2,6
b4b
7
gas
liquid
Northeastern
Illinois
University
Parametric van der Waals Plot
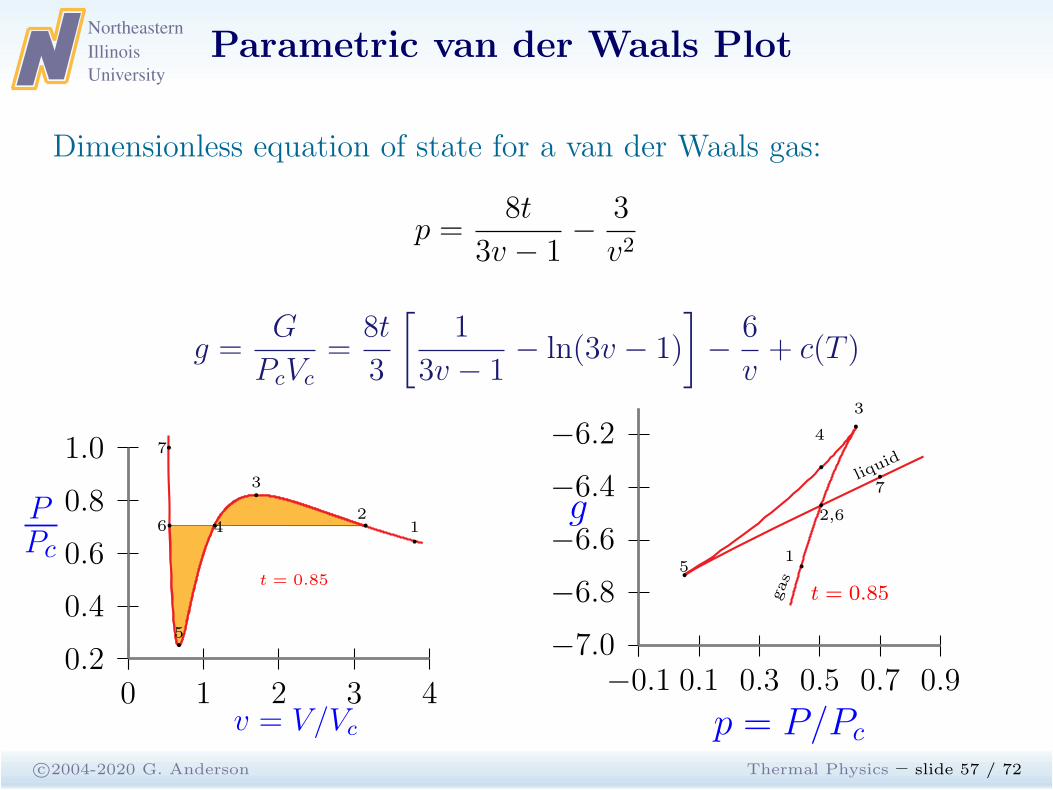
c©2004-2020 G. Anderson Thermal Physics – slide 57 / 72
Dimensionless equation of state for a van der Waals gas:
p =8t
3v − 1−
3
v2
g =G
PcVc
=8t
3
[
1
3v − 1− ln(3v − 1)
]
−6
v+ c(T )
0 1 2 3 40.2
0.4
0.6
0.8
1.0
PPc
v = V/Vc
t = 0.85
b1b
2
b3
b4
b5
b6
b7
−0.1 0.1 0.3 0.5 0.7 0.9−7.0
−6.8
−6.6
−6.4
−6.2
t = 0.85
g
p = P/Pc
b1
b
3
b5
b
2,6
b
4
b
7
gas
liquid
Northeastern
Illinois
University
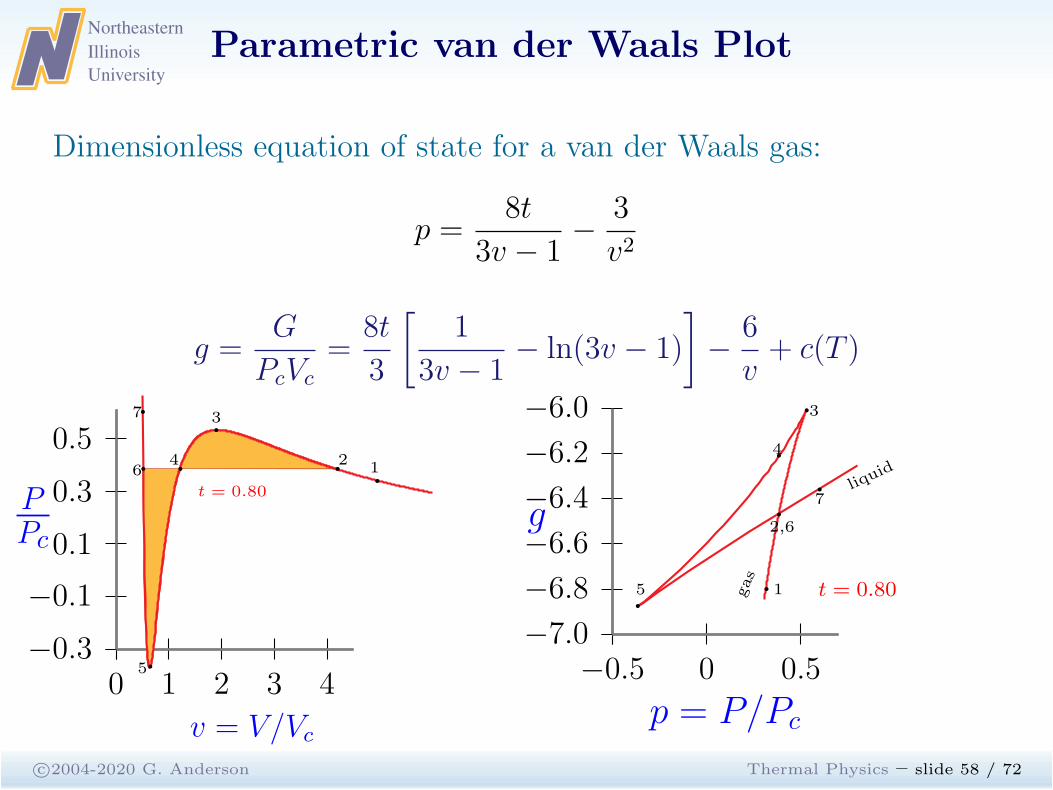
Parametric van der Waals Plot
c©2004-2020 G. Anderson Thermal Physics – slide 58 / 72
Dimensionless equation of state for a van der Waals gas:
p =8t
3v − 1−
3
v2
g =G
PcVc
=8t
3
[
1
3v − 1− ln(3v − 1)
]
−6
v+ c(T )
0 1 2 3 4−0.3
−0.1
0.1
0.3
0.5
PPc
v = V/Vc
t = 0.80b1b
2
b3
b4
b5
b6
b7
−0.5 0 0.5−7.0
−6.8
−6.6
−6.4
−6.2
−6.0
t = 0.80
g
p = P/Pc
b 1
b3
b
5
b
2,6
b4
b
7
gas
liquid
Northeastern
Illinois
University
Maxwell Construction
c©2004-2020 G. Anderson Thermal Physics – slide 59 / 72
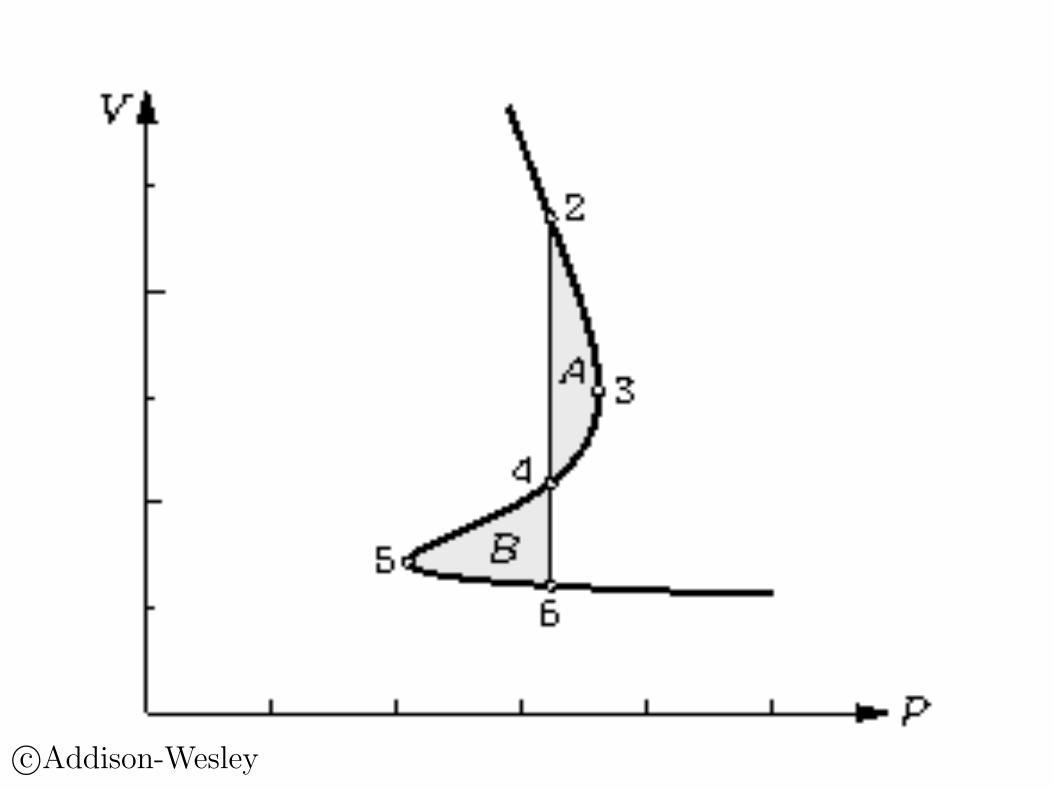
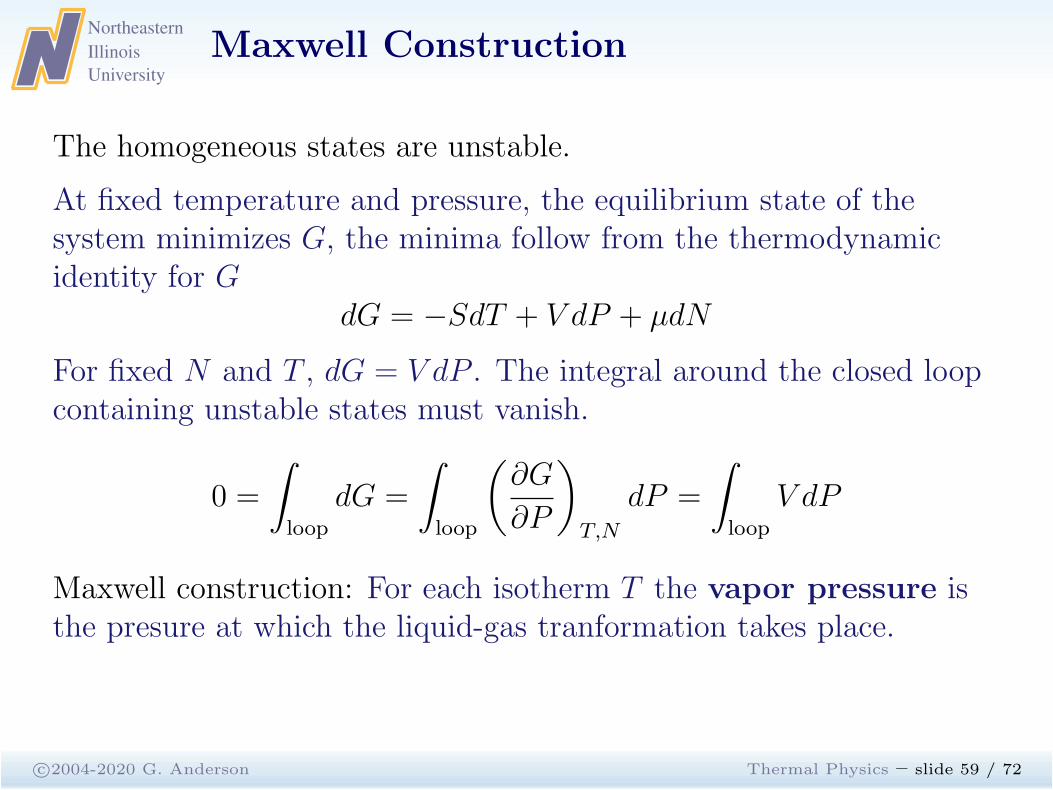
The homogeneous states are unstable.
At fixed temperature and pressure, the equilibrium state of thesystem minimizes G, the minima follow from the thermodynamicidentity for G
dG = −SdT + V dP + µdN
For fixed N and T , dG = V dP . The integral around the closed loopcontaining unstable states must vanish.
0 =
∫
loop
dG =
∫
loop
(
∂G
∂P
)
T,N
dP =
∫
loop
V dP
Maxwell construction: For each isotherm T the vapor pressure isthe presure at which the liquid-gas tranformation takes place.
Northeastern
Illinois
University
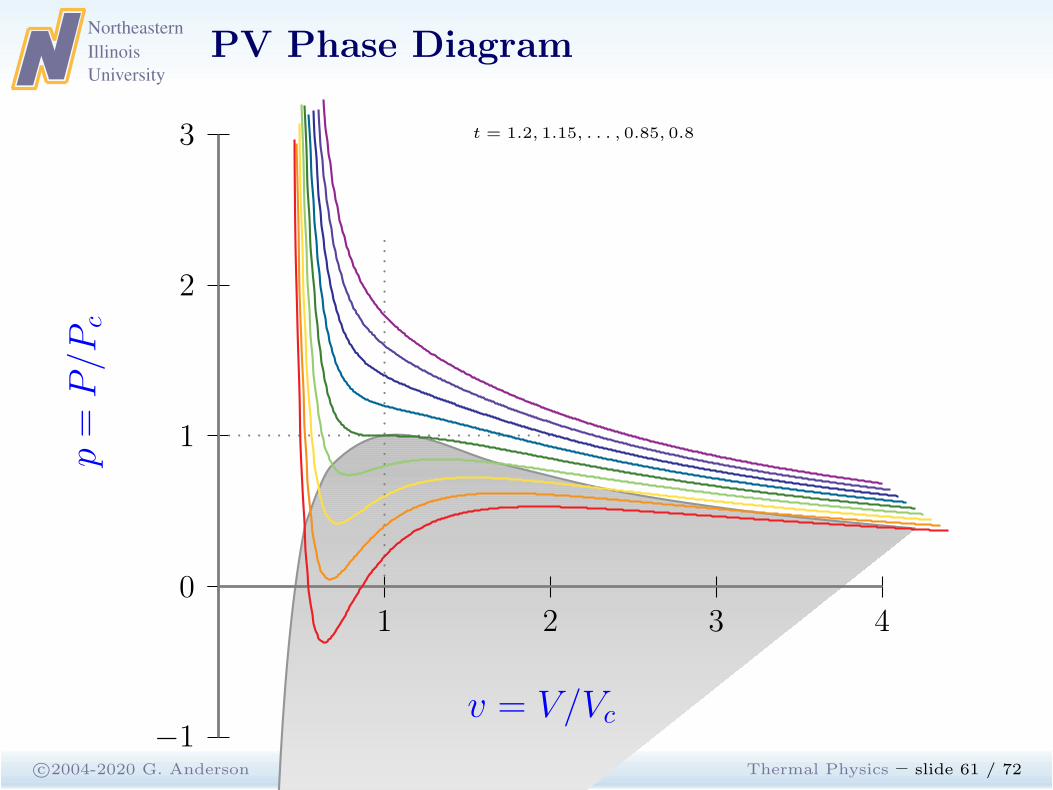
PV Phase Diagram
c©2004-2020 G. Anderson Thermal Physics – slide 61 / 72
1 2 3 40
−1
1
2
3
p=
P/P
c
v = V/Vc
t = 1.2, 1.15, . . . , 0.85, 0.8
Northeastern
Illinois
University
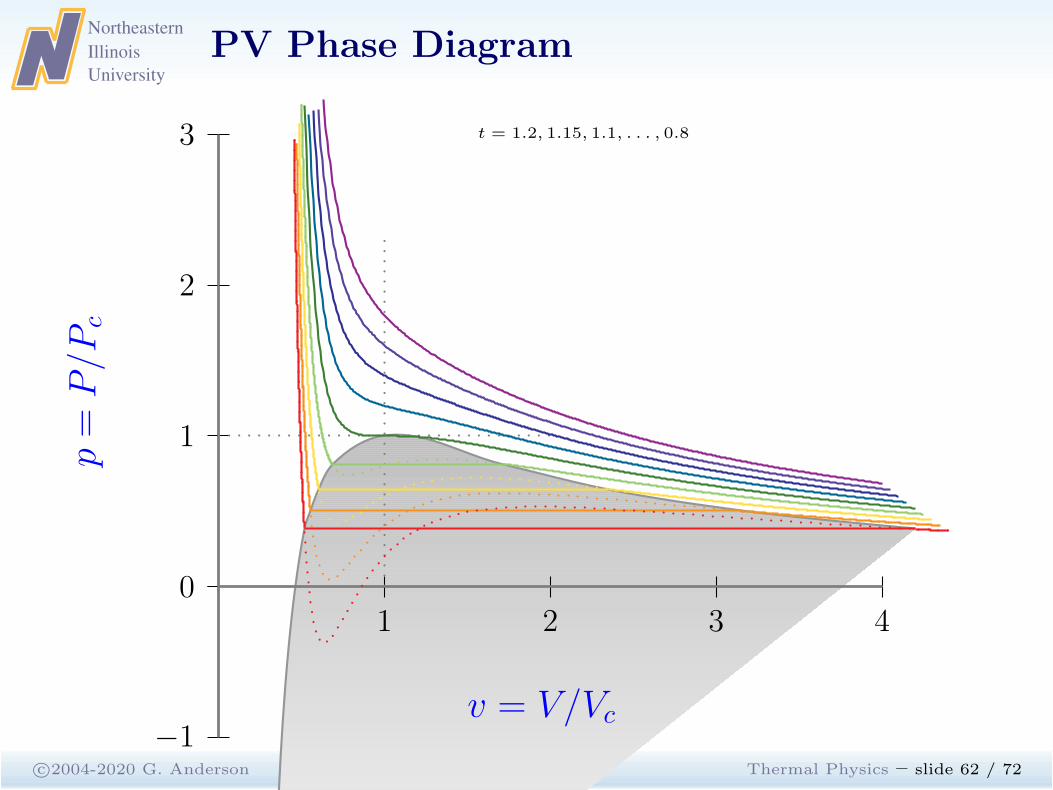
PV Phase Diagram
c©2004-2020 G. Anderson Thermal Physics – slide 62 / 72
1 2 3 40
−1
1
2
3
p=
P/P
c
v = V/Vc
t = 1.2, 1.15, 1.1, . . . , 0.8
Northeastern
Illinois
University
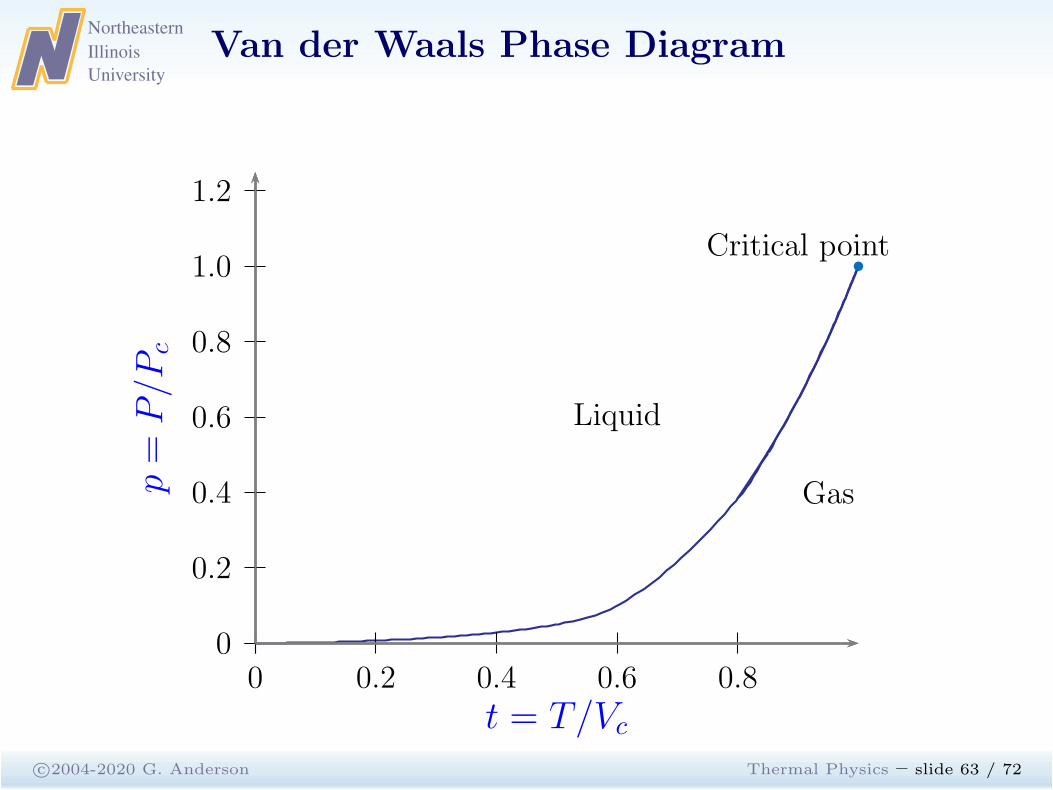
Van der Waals Phase Diagram
c©2004-2020 G. Anderson Thermal Physics – slide 63 / 72
0 0.2 0.4 0.6 0.80
0.2
0.4
0.6
0.8
1.0
1.2p=
P/P
c
t = T/Vc
b
Liquid
Gas
Critical point
Northeastern
Illinois
University
Mixtures
Maxwell
Potentials
LegendreTransforms
PhaseTransformations
van der Waals
Mixtures
Mixology
Entropy ofMixing
Free Energy &Mixing
Free Energy &Mixing II
Fig. 5.26 Mixing
Free Energy &Mixing III
Fig. 5.27 Mixing
Further Study
c©2004-2020 G. Anderson Thermal Physics – slide 64 / 72
Northeastern
Illinois
University
Mixology
c©2004-2020 G. Anderson Thermal Physics – slide 65 / 72
Change in Gibbs free energy G = U + PV − TS upon mixing:
∆Gmix = ∆Hmix − T∆Smix
Miscible: can be mixed in all proportions. Example water and
ethanol.
Immiscible: can not undergo mixing or blending. Example: oil
and water.
Ideal Mixing: U and V do not change upon mixing: ∆Hmix = 0
Solubility gap (Miscibiliy gap): a region in a phase diagram for amixture of components where the mixture exits and two or morephases. This occurs when the Gibbs free energy of the separatedsystem is lower than the fully mixed system.
Northeastern
Illinois
University
Entropy of Mixing
c©2004-2020 G. Anderson Thermal Physics – slide 66 / 72
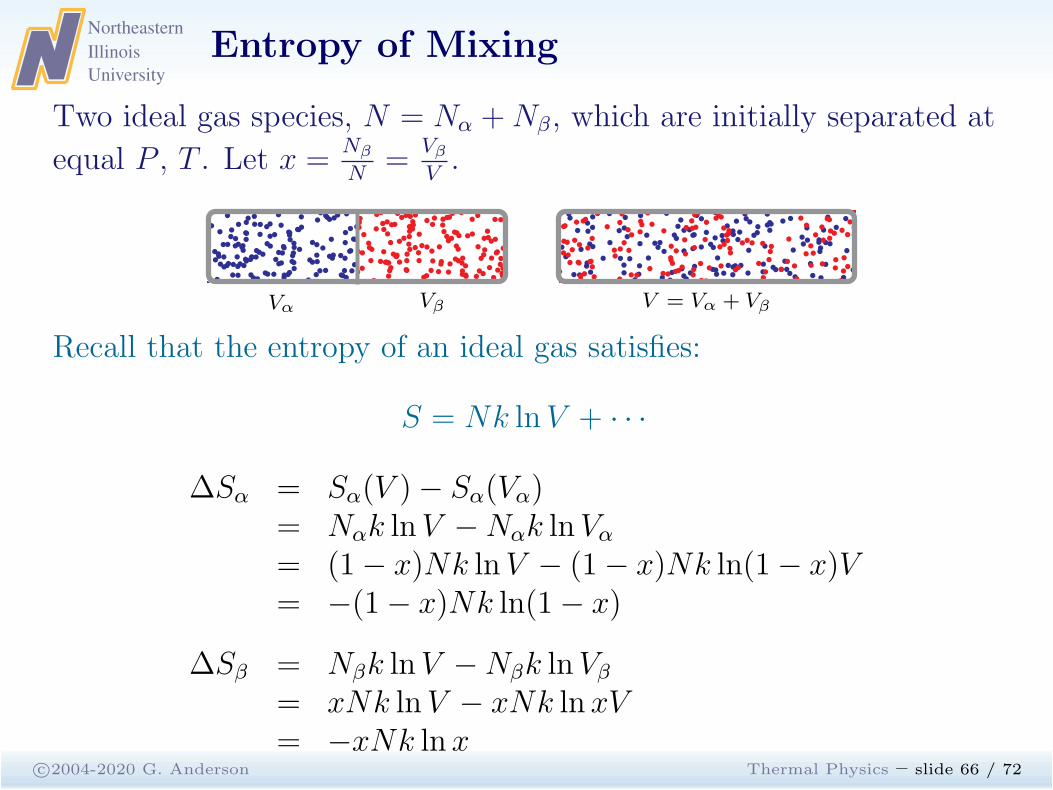
Two ideal gas species, N = Nα +Nβ, which are initially separated at
equal P , T . Let x =Nβ
N=
Vβ
V.
b
b
bb
b
b
b
b
bb
b
b
b
b
b
bb
b
bb
b
b
b
b
b
b
b
b
b
bb b
b
bb
b
b
bb
b
b b
b b
bb
b
b
b
bb
b
b
b
b
b
b
bbb
b
b
bb
b bb
b
b
bb
b
bbb
bb
b
bb
b
bb
bb
b
b
b
b
bb
b
b
b
b
bb
b
b bbbb b
b
b
b
b
b
b
bbb
bb b
b
bb
b
b
b
b
b
bb
b
b
b b
b
b
b
bb
bb
b b
b
b
b
b
b
b
b b bb
b
bb
b
b
b
b
b
b
b b
b
b
bb
b
bb
b
b b
b
b
b
b
b
bb
b
b b
b
b b
bb
b bb
b
bb
b
bb
b
b
b
b
bb
bb
b
b
b
bb
b
b
b
b
b
b
b
b
bb
b
bb
b
b bb
b
bbb
bbb
b
b
b
bb b
bbb
b
bb
b
b b
bb b
bb
b
bb
b
bb
b
b
b
bb
b
bb
b b
b
b b
b
b
b
b
b
bb
bb
b
b
bbb
bb
b
b
b
b
b
b b
b
b
b b b
b
b
Vα Vβ
bb
b
b
b
b
b
bb
b
b
b
bb
b
b
b
b
bb
b
b
b
b
b
bb
b
bbb
b b
bb
b bb
bb
b
b
b
bb
b
bb b
b bb
b
bb
bb
b
bb
b
b
b
b
bb b
bb
b
bb
bb
bb
b
b
b b
b
bb
bb
bbb
b
bb
b
b
b
b
bb
b
bb
bb
bb
b
b
b
bb
b
b
b
bb
b
b
bb
b
b
bb
bb b
b
b
bb
b
b
bb b
bb
b
b b
bb
b
b bb
b
b
bb
b
b
b
b
b
b
b
b
b bb
b
bb bb
b
bb
b
b
b
bb
b
b
b
bb
b b
bb
b
bb
b
b
b
bb
bb
bbb
b b
bb
b
b
b
b
b
b
b
b
b
bb
b
b
b
b
bb
b
b
b
b
bb
b
b
b
b
b
b
b
b
b
b b
b
b
b
b
b
b
b
b
b
b
bb
b
bb
bbbb
b
b
bb
b
b
b
b b
b
b
b
b
bb
b
bb
b
b
bb
b
bb
b
b
b
bb
b bb
b
b
b
b b
b
b
b b
b
b
b
bb b
V = Vα + Vβ
Recall that the entropy of an ideal gas satisfies:
S = Nk lnV + · · ·
∆Sα = Sα(V )− Sα(Vα)= Nαk lnV −Nαk lnVα
= (1− x)Nk lnV − (1− x)Nk ln(1− x)V= −(1− x)Nk ln(1− x)
∆Sβ = Nβk lnV −Nβk lnVβ
= xNk lnV − xNk ln xV= −xNk ln x
Northeastern
Illinois
University
Entropy of Mixing
c©2004-2020 G. Anderson Thermal Physics – slide 66 / 72
Two ideal gas species, N = Nα +Nβ, which are initially separated at
equal P , T . Let x =Nβ
N=
Vβ
V.
b b
b
bb
b
b
b
b
b
b
b
b
b
b
b
bb
bb
b
bb
bb
bb
b
b
b
b bb
bb
b
b
b
b
bb
bb
b
b bb
bb
b
bb
b
b
b
bb
b
bb
b
b
bb
b
b
b
b
b
bbb
bb
b
bb
b
bb
bb b
b
b
b b
b
b
b
b b
b
bb
b
b
b b
b
b
bb
b
bb
b
b
bb
b b
b
b
bb
b
bb
bb
b
b b
b
b
b
bb
b
b
b
b b
b
bb
bb
b
b
b
b
b
bb
b
bbb
b
b
b
b
b
b
b b
b
b bb
b
b b
b
b
b
b
b
b bbb
bb
b
bb
b
b
b
b
b
bb
b
b bb
b
b
bb
b
b
b
b
b
b
b
b bbb
bb
b
b b
b
b
b
b
b
b
b
bb
b
b
b
b
b
bb
b
b
b
b
b
bb
b
b
b
bb
b
b
b
b
b
b
bb
bb
bb
bb
b
b
b
b
b
b
b
bb
b
b
b
b
b
bb
b
bbb
b b
bb
b
bb
b
bbb
b
b
b
bb b
b
b
b
b
b
b
bb
b
b
b
Vα Vβ
b
b b
b
bbbb
b
b
b
b
bbb b
bbb
b
b
b
b
b
b
b
b
b
bb
bb
b
b
b
b
bbb
b b
bbbb b
b
b b
b
b
bbbb
b
b
b
b
b
b
bb
b
b
b
b
b
b
b
b
b
bb
b
b
b
bb
b
bb
b
b
b
b
b b
bb
b
bb
b
bb bb
b
bbb
b
b
bb
b
b
b
bb
bb
bb
bb
b
bb
bb
b
b
b
b
b
b
b
bb
b
b
b b
b
b
b
bb
b
b
b
b
b
bb
b
bb
b
b b
b
b
b
b
b
b
b
b
b
b
b
bb
b
bb
b
b
b b
b
bb
bb
b
b
b
b
b
bb
b
b
b
b
b
b
b
b
bb
b b b
b
bb
bb
b
bb
bb
b
bb
b
b
b
b
b
b
b
b b b
b
b
b bb
b
b
bb
bb
b
bb
b
b
b b
b
b
bb b
b
b
b bb
b
bb
b
b
b
b b
b b
bb
b
bbb b
b
b
b
b
bb
b
b
b b
b
bb
b
b
b
bb
b b
b
b
bb
b
bb
b bb
b
b
b
b
V = Vα + Vβ
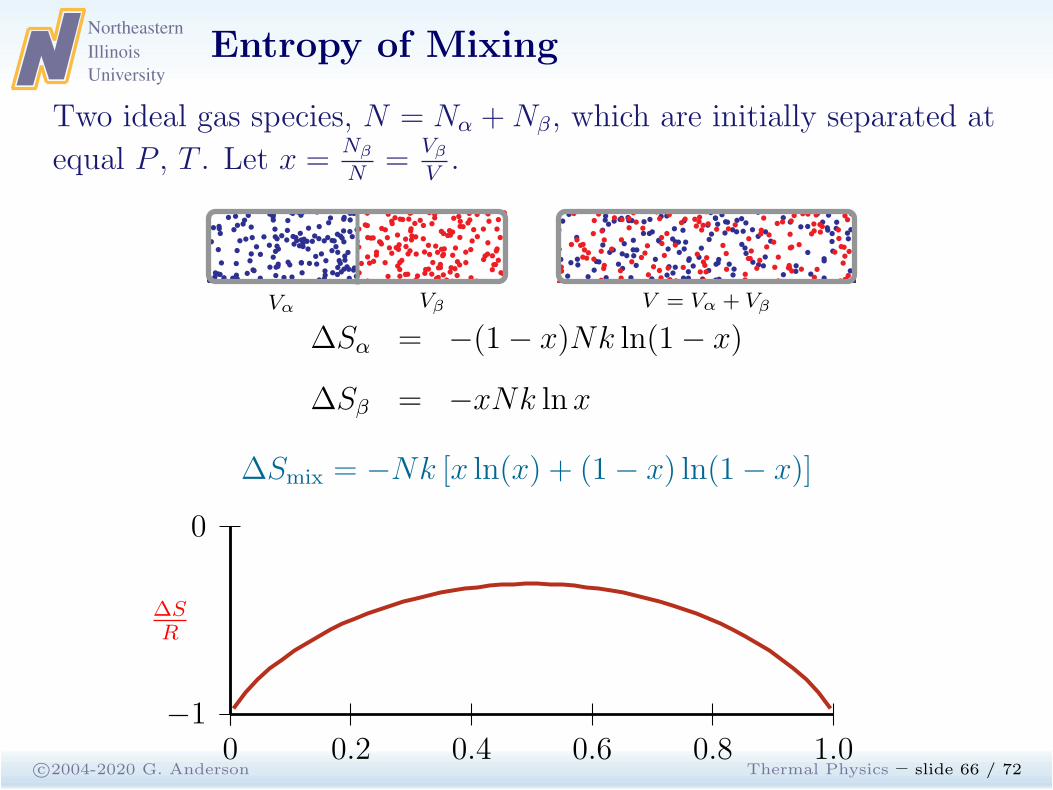
∆Sα = −(1− x)Nk ln(1− x)
∆Sβ = −xNk ln x
∆Smix = −Nk [x ln(x) + (1− x) ln(1− x)]
0 0.2 0.4 0.6 0.8 1.0−1
0
∆SR
Northeastern
Illinois
University
Free Energy & Mixing
c©2004-2020 G. Anderson Thermal Physics – slide 67 / 72
bb
b
b
b
bbb
b bb
b
bb
b
b
b
b
b
b
b
b
b
b
b
b
b
b
b
b
b
b
b
b
b
b
b
bb
b
b
b
bb
b
b
b
b
b
b
b
b
b
b
b
b
b
b
b
b
b
b
b
b
b
b
b
bb
b
b
b
b b
b
b
b
b
b
b
b
b
b
b
b
b
b
b
b
bb
b
b
bb
bb
bb
b
b
b
b
b
b
bb
b b
b
b
b
bb
bb
b
bb
b
b
b
b
b
b
b
b
b
bb
b
b
b
b
b
bb
bb
b
b
b
b b
b
bb
b
b
b
b
b
bb
b
b
b
bb
b
b
bbb
b
b
b
b
b
bb
b
b
b b
b
bb
b
b
b
b b
b
b
b
b
b
bb
b
b
b
b
b
b
b
b
bb
bb
b b
b
b
b
bb
b
bb
b
b
b
b
b
bb
b
b
b
bbbb
b
b
b
bb
b
b
b
b b
b
bbb
bb
b
bb b
bb
b
b
b
b
b
b
b
b
b
b
b
b
b
b
b
b
b
b
b
b
b
b
b
b
b
b
b
b
b
b
b
b
bb
b
b
b
b
bb
bb
b
b
b
bbb
b
b
b
b
b
b
b
b
b
b
b
b
b
b
b
b
b
b
b
b bb
bb
b
b
b
b
b
b
b
bbb
bb
bb
b
b
b
b
b
b
bb
b
b
b
b
b
b
b
b
b b
b
bb
b
b
b
b
b
b
b
b
b
b
b
b
b
bb
b
bb
b
bb b
b
bb
bb
b
b
b
bb b
b
b
b
b
b
b
b
b
b
b
b
b
b
bb
b
bb
b
bb
b
b
b
b
b
bb
b
b
bb
b
bb
b
b
b
bb
b
b
b
b
b
b
b
b
b
bb
b
b
b
bb
b
b
b
b
b
b
bb
b
b
b
b
b
b
b
b bb
b
b b
b
b
bb
b
b
b
b
b
b
b
b
bbb
b
b
b
b
b
b
b
b
b
bb
b
b
b
b
b
b
b
b bb
b
b
bb
bb
bb
b
bb
b
bb b
b
b b
b
b
bb
b b
b
b
b
b
b
bb
b
b
b
bb
b
b
b
b
b
b
b bb
bb
b
b
b
bb
b
b
b
b
b
b
b
b
b
b
b
b
bb
b
b
b
b
b
b
b
b
b
b
b
b
b
b
b
b
b
b
b
bb
b
b
b
b
bb
b
bb
b b
b
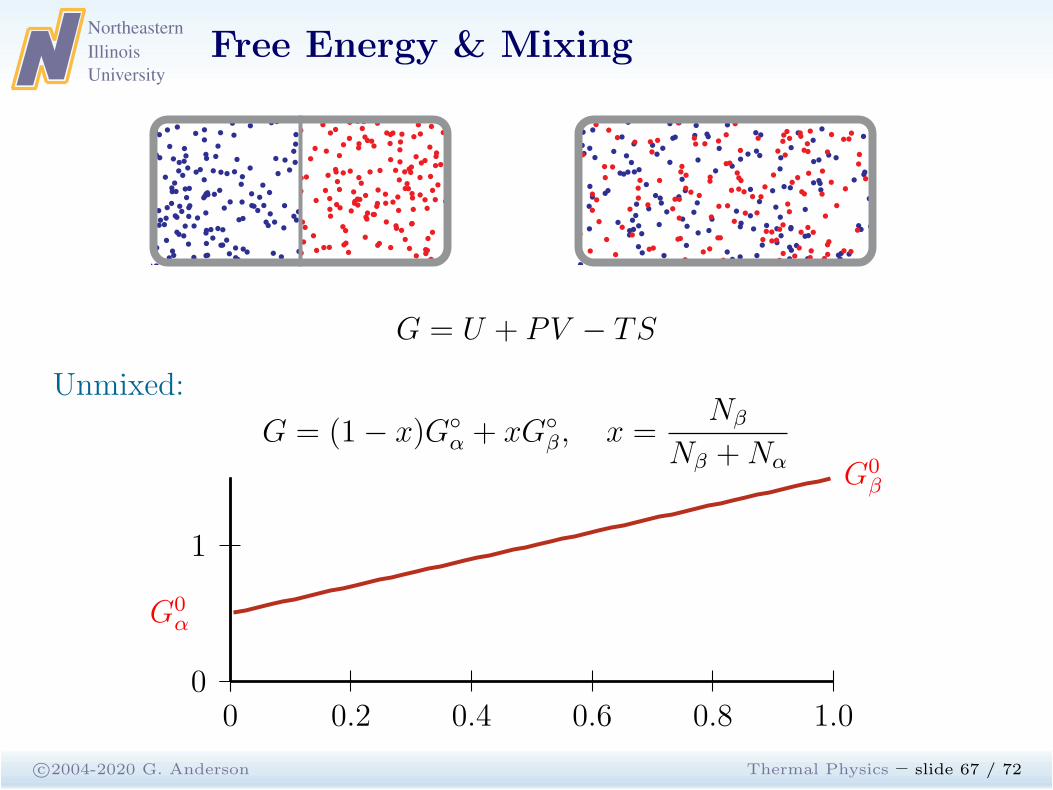
G = U + PV − TS
Unmixed:
G = (1− x)G◦
α + xG◦
β, x =Nβ
Nβ +Nα
0 0.2 0.4 0.6 0.8 1.00
1
G0α
G0β
Northeastern
Illinois
University
Free Energy & Mixing
c©2004-2020 G. Anderson Thermal Physics – slide 67 / 72
b
b b
b
b
b
b
b
b
b b
b
b
b
b
b
b
b
b
b
b
b
b
b
b
b
bb
b
b
b
b
b
b
b
b
b
b
bb
bb
b
b
b
b
b
b
b
b
bb
b
b
b
b
b
b
b
b
b
b
b
b
bb
b
b
b
bb
b
b
bb
b
b
b
b
b
b
b
b
b
b
b
bb
b
bb
b
b
b
b
b
b
b
b
bb
b
b
b
bb
b
b
b
bb
b
b
bb
b
b
b
b
b
bb
b
b
b
b
b
b
b
b
b
b
b
bb
b
b
bb
bb
b
bb
b
bb
b
b
b b
b
b
b
b
b
b
b
b
b
b
b
b
b
b
b
b
b
bb
b
b
b
b
b
bb
b
b
b
b
b
b
b
b
b
b
b
bb b
bb
bb
b
b
b
b
bbb
b
b b
b
b
b
b
b
b
b
bb
bb
b
b
b
b
b
b
b
b
b
b
bbb
b
b
b
b
b
b
b
b
b
b
b b
b
b
b
b
b
b
b
b
b
b
b
b
b
b
b
b
bb
b
b
b
b
b
b
b
bb
b
b
b
b
b
bb
b
bb
b
b
b
b
b
b b
b
b
bb
b
b
b
b
bb b
b
b
b
b
b
b
b
b
bb
b
b
b
b
bbb
b
b
b
b
b
bb
b b
b
b
bbb
b
b
b
b
b
b
b
b
bb
b
b
b
b
b
bb
b
b
b
b
b
b
b
b
b
b
b
b
b
b
b
b
b
b
b
b
b
b
bb
b
bb
b
b
b
bb
bb
b
b b
b
b
b
b b
b
b
b
b
b
b
bb
b
b
b
b
b
b
b
b
b
b
b
b
b
b
b
bb
b
bb
b
b
b
b
b
b
b
b
b
b
b
b
b bb
b
b
b
b
b
b
b b
bb
b bb
b
b
b
b
b
b
b
b
b
b
b
b
b
b
b
b
b
b
b b
b
b
b
bb
bb
b
bb
b
b
bb
b
b
b
b
b
b b
b
b
b
b
b
b
b
bb
b
b
b
b
b
b
b
b
b
b
b
b
b
b
b b
bb
bb
b
bb
b
b
b
bb
b
b
b
b
b
b
b
b
b
b
b
b
b
bb
bb
b
b
b
b
b
b
b
b
b
b
b
b
bb
b
b
b b
b
b
b
b
b
b
b
b
bb b
b
b
b
b
b
b
b
b b
bb
b
b b
b
b
b
b
b
b
b
b
b
bb
b
bb
b
bb
bbb
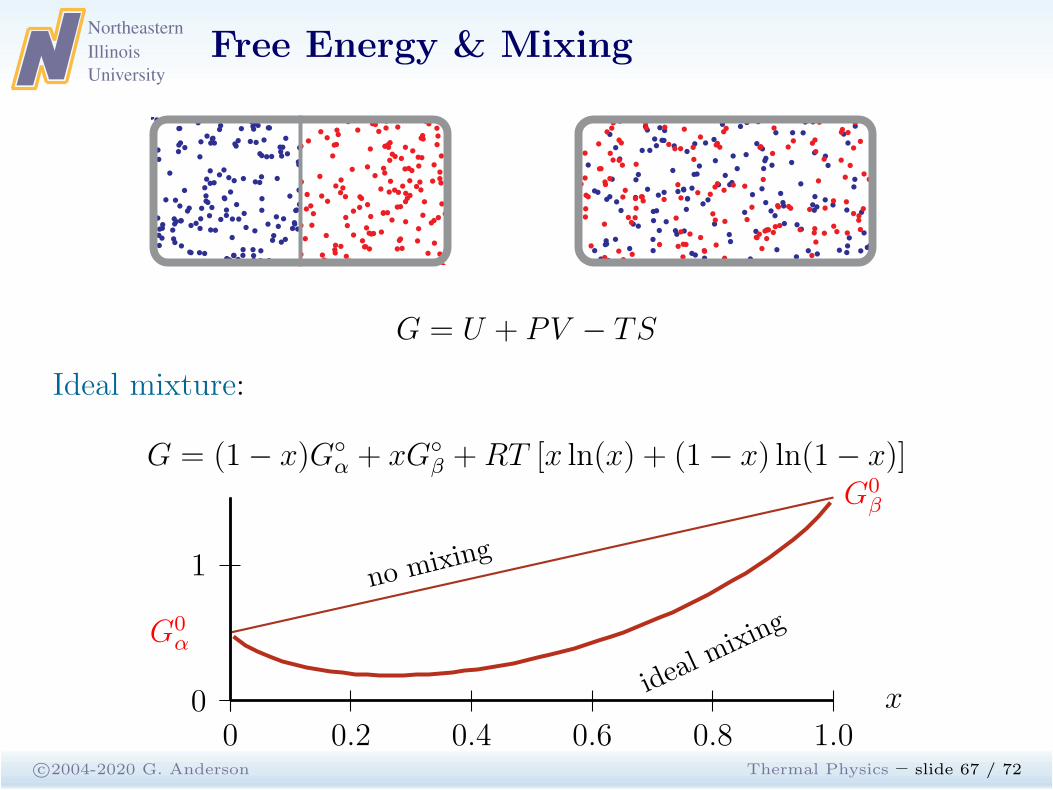
G = U + PV − TS
Ideal mixture:
G = (1− x)G◦
α + xG◦
β +RT [x ln(x) + (1− x) ln(1− x)]
no mixing
ideal m
ixing
0 0.2 0.4 0.6 0.8 1.00
1
x
G0α
G0β
Northeastern
Illinois
University
Free Energy & Mixing II
c©2004-2020 G. Anderson Thermal Physics – slide 68 / 72
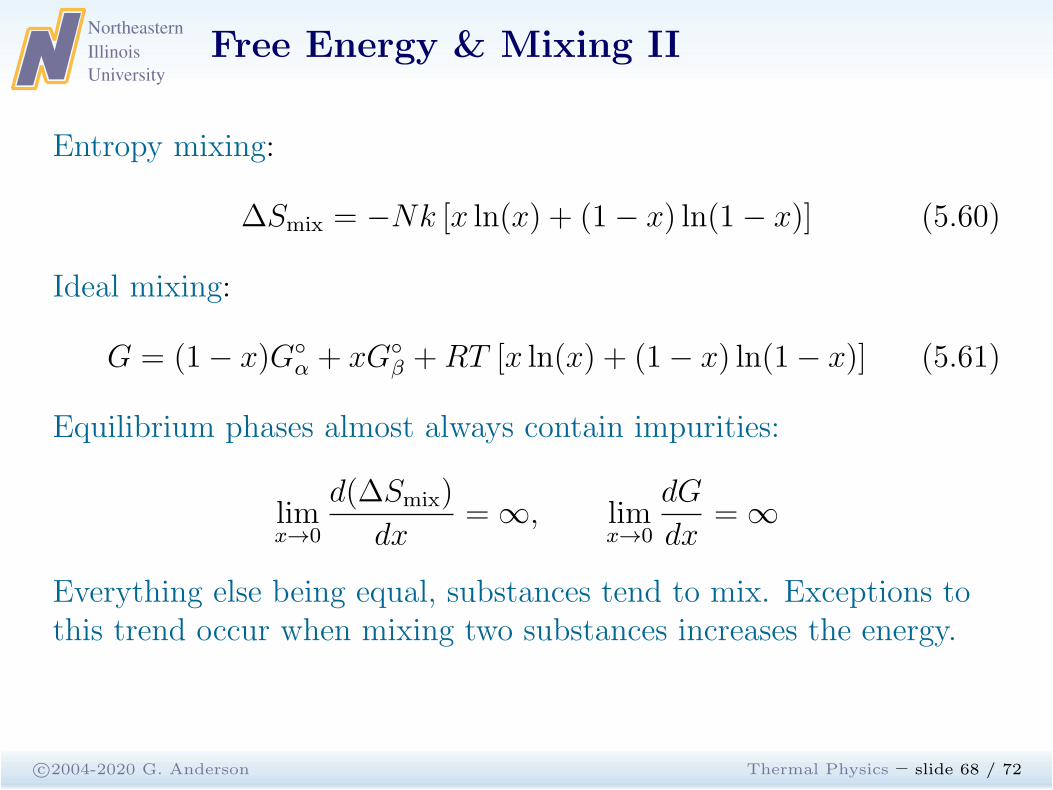
Entropy mixing:
∆Smix = −Nk [x ln(x) + (1− x) ln(1− x)] (5.60)
Ideal mixing:
G = (1− x)G◦
α + xG◦
β +RT [x ln(x) + (1− x) ln(1− x)] (5.61)
Equilibrium phases almost always contain impurities:
limx→0
d(∆Smix)
dx= ∞, lim
x→0
dG
dx= ∞
Everything else being equal, substances tend to mix. Exceptions tothis trend occur when mixing two substances increases the energy.
Northeastern
Illinois
University
Free Energy & Mixing III
c©2004-2020 G. Anderson Thermal Physics – slide 70 / 72
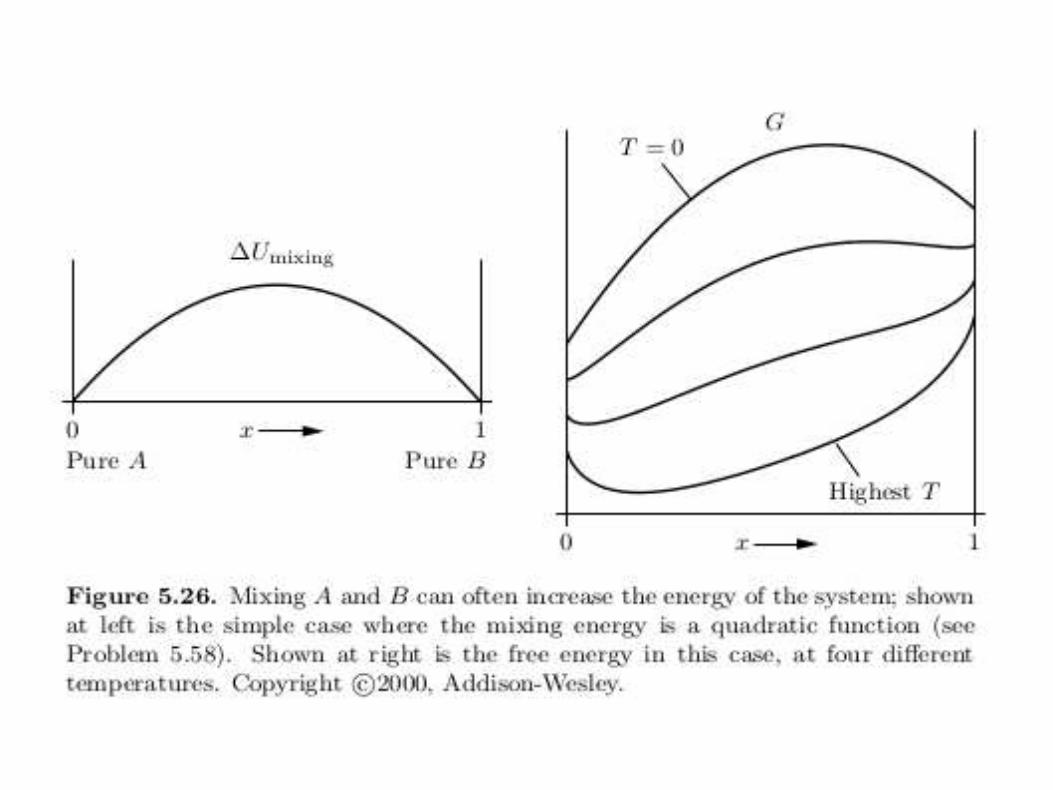
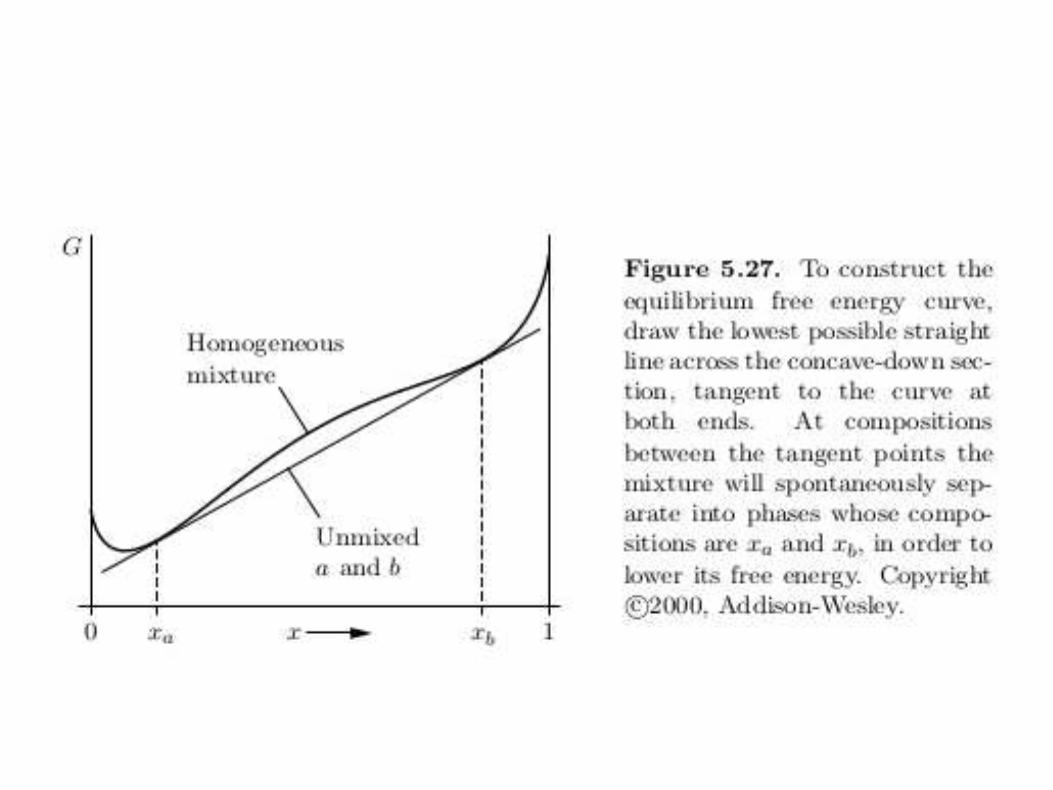
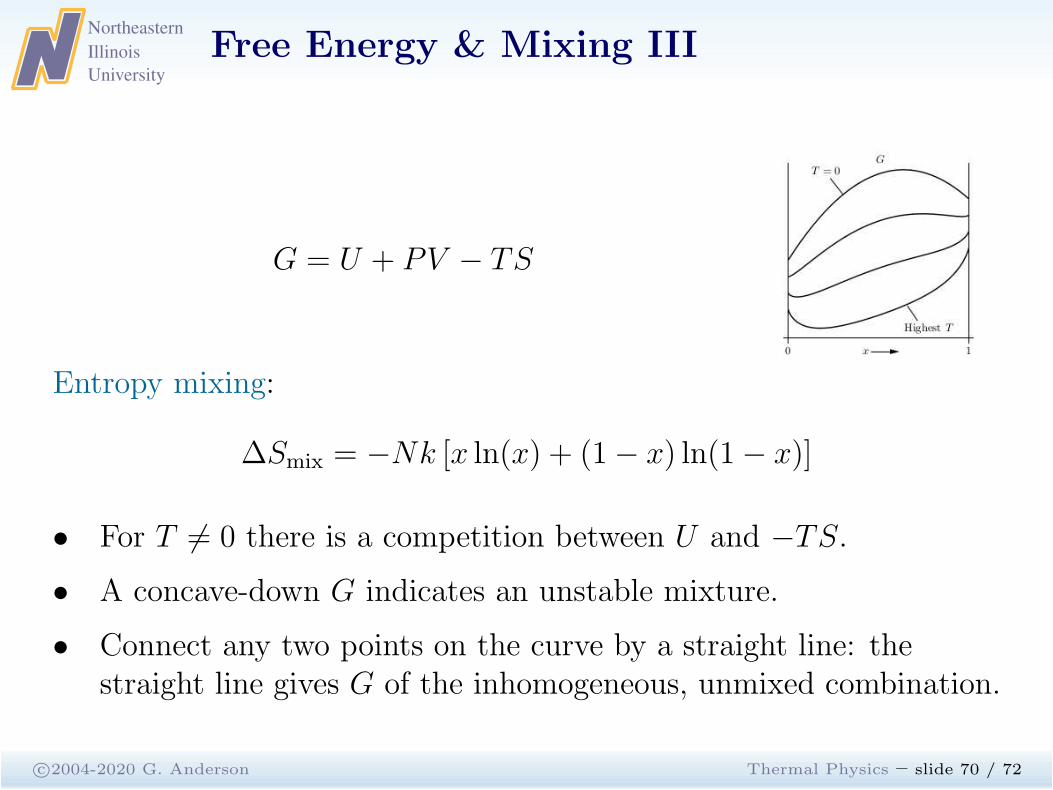
G = U + PV − TS
Entropy mixing:
∆Smix = −Nk [x ln(x) + (1− x) ln(1− x)]
• For T 6= 0 there is a competition between U and −TS.
• A concave-down G indicates an unstable mixture.
• Connect any two points on the curve by a straight line: thestraight line gives G of the inhomogeneous, unmixed combination.
Northeastern
Illinois
University
Further Study
c©2004-2020 G. Anderson Thermal Physics – slide 72 / 72
• Read page 192–194 on the experimental phase diagram fornitrogen and oxygen at atmospheric pressure.
• Read page 202–204 on osmotic pressure.