Embed Size (px)
Citation preview
VOL. 84, NO. B6 JOURNAL OF GEOPHYSICAL RESEARCH JUNE 10, 1979
Thermal Infrared Properties of the Martian Atmosphere 1. Global Behavior at 7, 9, 11, and 20 #m
TERRY Z. MARTIN,: ALAN R. PETERFREUND, x'9' ELLIS D. MINER a HUGH H. KIEFFER, x'4 AND GARRY' E. HUNT •
Infrared observations of Mars by the Viking infrared thermal mapper (IRTM) are presented for both conditions of a relatively clear and a dust-laden atmosphere. The 7-, 9-, 11-, and 20-#m bands of the IRTM respond differently to radiation emitted through and by a dusty atmosphere, permitting character- ization of the global atmospheric state, monitoring of secular changes, and derivation of optical depth information. Surface temperature behavior is found to be greatly modified by the diminution of insolation and thermal blanketing resulting from global dust storms. Brightness temperature at 7 •m (T?) is employed to estimate surface temperatures in the presence of dust absorption. The difference T?-T9 is strongly indicative of airborne dust when thermal contrast exists between the surface and atmosphere. The diurnal behavior of T7-T9 reveals changes in that contrast; the sign of the differential reverses as the surface, warmer than the atmosphere in daytime, becomes cooler than the atmosphere at night. IRTM observations of local areas at varying emission angle yield optical depths indicative of global trends. Two global dust storms in 1977 produced large optical depth changes; at 9 #m the optical depth became as large as 2.0.
INTRODUCTION
The effect of Martian atmospheric conditions upon mea- surements made by the Viking infrared thermal mapping (IRTM) experiments has been much greater than originally anticipated. The instruments, designed to study primarily sur- face thermal and reflective behavior, have returned a wealth of data with profound relevance to atmospheric thermal struc- ture, scattering properties, the nature of local dust storms, and modification of surface behavior by atmospheric phenomena. Outside of the CO2 15-#m band, airborne dust is principally responsible for atmospheric effects evident in IRTM data; dust can have a substantial impact on the Martian spectrum from visible wavelengths to the middle infrared. During the Viking primary mission (June-November 1976, Ls 85ø2147 ø) atmo- spheric opacity was low enough that substantial study of sur- face characteristics was possible [Kieffer et al., 1977]. In 1977, however, Mars approached perihelion; atmospheric dynamic activity increased, and large quantities of dust were injected irito'the atmosphere in two global and many local storms. This paper and the three which follow it in this volume (Martin and Kieffer [1979]; Peterfreund and Kieffer [1979]; Hunt [1979]; referred to here as papers 2-4) treat different aspects of the IRTM sensing of atmospheric phenomena. In this paper are presented results for the infrared wavelengths at which the instrument normally detects surface emission: 7, 9, 11, and 20 •m. Paper 2 addresses brightness temperatures in the 15-•m emission band of atmospheric CO2. Paper 3 deals with IRTM measurements of local dust storms, including maps of storm structure. Paper 4 is an analysis of the IRTM response to cloudy conditions and the usefulness of brightness temper- ature measurements.
t Department of Earth and Space Sciences, University of California, Los Angeles, California 90024.
: Presently at the Department of Geology, Arizona State University, Tempe, Arizona 85281.
a Jet Propulsion Laboratory, Pasadena, California 91103. 4 Presently at U.S. Geological Survey, Flagstaff, Arizona 86001. a Laboratory for Planetary Atmospheres, Department of Physics
and Astronomy, University College London, London WCIE 6BT England.
Copyright ¸ 1979 by the American Geophysical Union.
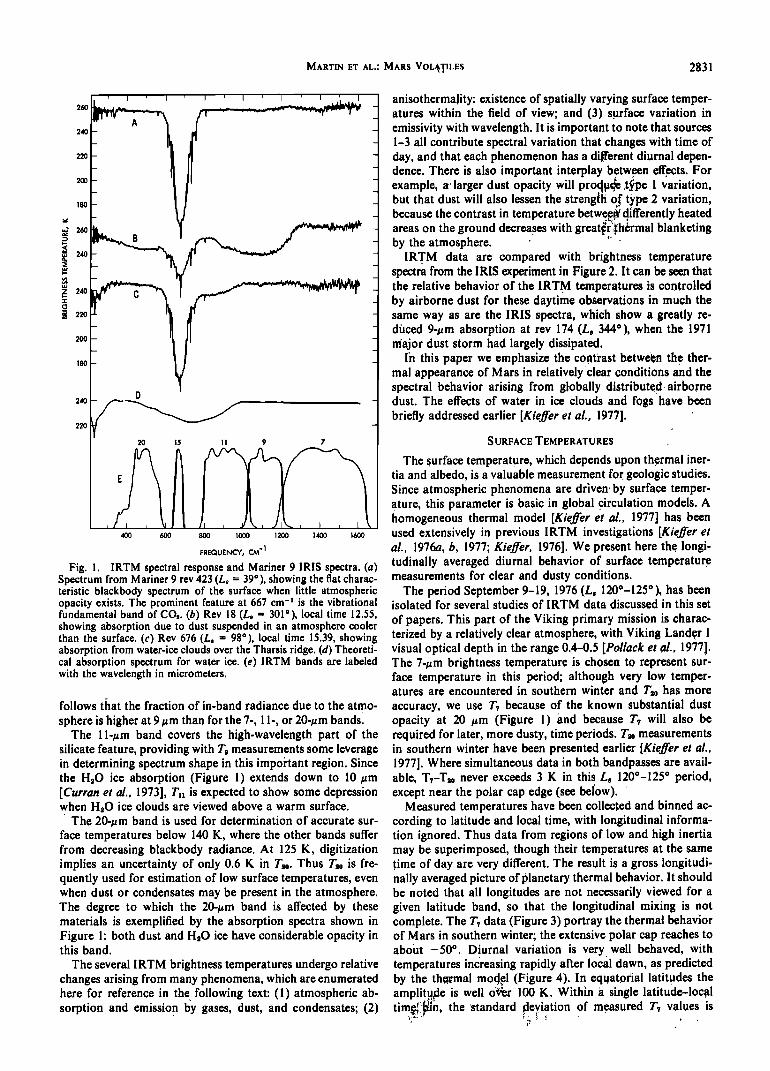
The above-mentioned surface-sensing channels of the I RTM were selected primarily for high-accuracy determina- tion of surface-emitted radiance over the entire expected range of Martian temperature: approximately 150-300 K. The 20- #m band has useable sensitivity down to less than 120 K, and the 7-#m band does not experience saturation below 335 K. The IRTM views Mars with four co-aligned telescopes that simultaneously obtain data in six wavelength bands, for seven spatial elements arranged in a chevron [Chase et al., 1978; Kieffer et al., 1977]. The 7-, 9-, and 15-#m 'bands share one telescope and chevron, and consequently those measurements are spatially separate from each other. The placement of the various bands in wavelength was intended to permit, in clear conditions, discrimination of surface emissivity differences arising from the nature of the silicate vibrational spectrum. Atmospheric modification of surface emission was well docu- mented by the infrared interferometer spectrometer (IRIS) ex- periment on Mariner 9; comparison of IRTM bands with IRIS spectra (Figure 1 ) shows the extent to which atmospheric effects were expected to appear in IRTM data.
The 7-#m band may be considered a 'surface' channel for most purposes, since there is comparatively little absorption in that band by airborne dust or ice [Hand et al., 1972; Curran et al., 1973]. The surface emissivity is expected to be near 1.0 at 7 #m in the absence of extensive fields of carbonate or nitrates [Hunt and Salisbury, 1974, 1975]. Although there is little accu- racy in the 7-#m measurements for surface temperatures below 160 K, that band is expected to give the best estimate of surface temperature when airborne dust is present. During much of the Viking extended mission, T, (the 7-#m brightness temperature) is typically the highest IRTM temperature in equatorial regions during the day and the lowest at night. The other bands receive proportionally more radiance from sus- pended dust, which is normally cooler than the surface in daytime and (in the lowest few kilometers) warmer at night.
The 9-#m band (Figure 1) covers the low-wavelength half of a broad vibrational feature typical of silicates that extends from 8.0 to 12.0 #m in IRIS spectra. Tg is expected to be the brightness temperature most affected by airborne dust and by deviations from unit surface emissivity. Often, Tg is the lowest measured temperature other than T•s during midday; assum- ing a typical positive lapse rate for the daytime atmosphere, it
Paper number 8B1228. 0148-0227 / 79/008 B- 1228501.00
2830
MARTIN ET AL..' MARS VOL•TILES 2831
260 -
240
220
20O
180
0
[ 220
200
180
220 -
20 15 11 9 7
400 600 800 I000 1200 1400 1600
FREQUENCY, CM '!
Fig. 1. IRTM spectral response and Mariner 9 IRIS spectra. (a) Spectrum from Mariner 9 rev 423 (L, = 39 ø), showing the flat charac- teristic blackbody spectrum of the surface when little atmospheric opacity exists. The prominent feature at 667 cm -• is the vibrational fundamental band of CO:. (b) Rev 18 (L, = 301ø), local time 12.55, showing absorption due to dust suspended in an atmosphere cooler than the surface. (c) Rev 676 (L, = 98 ø), local time 15.39, showing absorption from water-ice clouds over the Tharsis ridge. (d) Theoreti- cal absorption spectrum for water ice. (e) IRTM bands are labeled with the wavelength in micrometers.
follows that the fraction of in-band radiance due to the atmo- sphere is higher at 9/•m than for the 7-, 11-, or 20-/•m bands.
The 11-/•m band covers the high-wavelength part of the silicate feature, providing with T• measurements some leverage in determining spectrum shape in this important region. Since the H•.O ice absorption (Figure 1) extends down to 10/•m [Curran et al., 1973], T]] is expected to show some depression when H•.O ice clouds are viewed above a warm surface.
The 20-/zm band is used for determination of accurate sur- face temperatures below 140 K, where the other bands suffer from decreasing blackbody radiance. At 125 K, digitization implies an uncertainty of only 0.6 K in T•.0. Thus T•.0 is fre- quently used for estimation of low surface temperatures, even when dust or condensates may be present in the atmosphere. The degree to which the 20-/•m band is affected by these materials is exemplified by the absorption spectra shown in Figure 1' both dust and H•.O ice have considerable opacity in this band. •
The several IRTM brightness temperatures undergo relative changes arising from many phenomena, which are enumerated here for reference in the•following text: (1) atmospheric ab- sorption and emission by gases, dust, and condensates; (2)
anisothermality: existence of spatially varying surface temper- atures within the field of view; and (3) surface variation in emissivity with wavelength. It is important to note that sources 1-3 all contribute spectral variation that changes with time of day, and that each phenomenon has a different diurnal depen- dence. There is also important interplay between effects. For example, a larger dust opacity will pro•p& ;t•pe I variation, but that dust will also lessen the streng•li q[type 2 Variation, because the contrast in temperature betw•a; •ifferently heated areas on the ground decreases with great•r•.th/•rmal blanketing by the atmosphere.
IRTM data are compared with brightness temperature _
spectra from the IRIS experiment in Figure 2. It can be seen that the relative behavior of the IRTM temperatures is controlled by airborne dust for these daytime observations in much the same way as are the IRIS spectra, which. show a greatly re. duced 9-pm absorption at rev 174 (L, 344ø), when the 1971 major dust storm had largely dissipated.
lh this paper we emphasize the contrast'between the ther- mal appearance of Mars in relatively clear conditions and the spectral behavior arising from globally distributed airborne dust. The effects of water in ice clouds and fogs haVe been briefly addressed earlier [Kieffer et al., 1977].
SURFACE TEMPERATURES
The •urface temperature, which depends upon thermal iner- tia and albedo, is a valuable measurement for geologic studies. Since atmospheric phenomena are driven by surface temper- ature, this parameter is basic in global circulation models. A homogeneous thermal model [Kieffer' et al., 1977] has been used extensively in previous IRTM investigations [Kieffer et al., 1976a, b, 1977; Kieffer, 1976]. We present here the longi- tudinally averaged diurnal behavior of surface temperature measurements for clear and dusty conditions.
The period September 9-19, 1976 (L, 120ø-125 ø), has been isolated for several studies of IRTM data discussed in this set
of papers. This part of the Viking primary mission is charac- terized by a relatively clear atmosphere, with Viking Lander 1 visual optical depth in the range 0.4-0.5 [Pollack et al., 1977]. The 7-urn brightness temperature is Chosen to represent sur- face temperature in this period; although very'•low temper- atures are encountered in southern winter and Ta0 has more accuracy, we use T• because of the 'known substantial dust opacity at 20 #m (Figure l) and because T• will also be required for later, more dusty, time periods. T•0 measurements in southern winter have been presented earlier [Kieffer et al., 1977]. Where simultaneous data in both bandpasses are avail- able, T?-To.0 never exceeds 3 K in this L, 1200-125 ø period, except near the polar cap edge (see below).
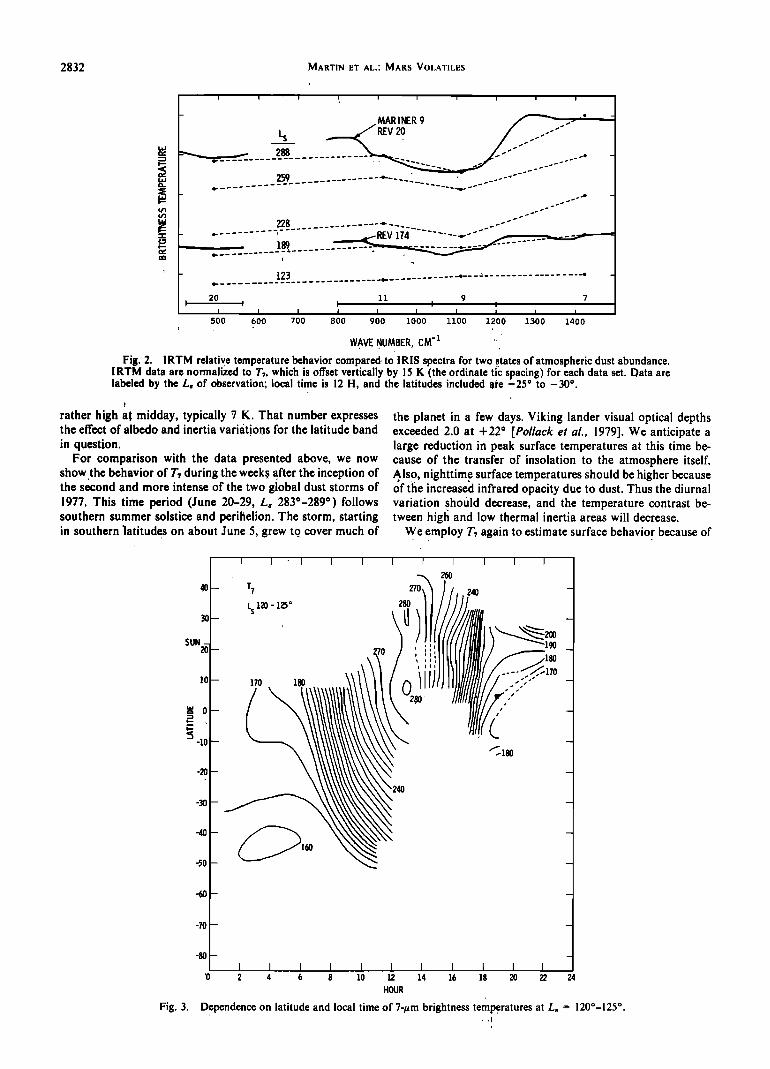
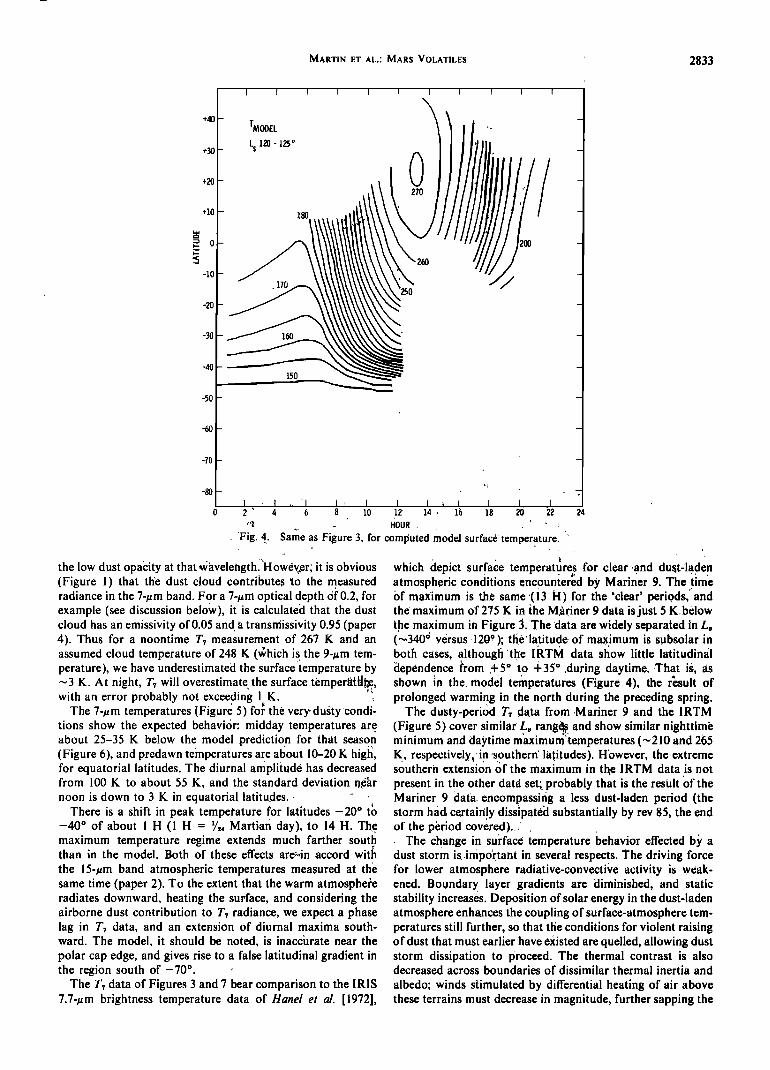
Measured temperatures have been collected and binned ac- cording to latitude and local time, with longitudinal informa- tion ignored. Thus data from regions of low and high inertia may be superimposed, though their temperatures at the same •t. ime of day are very different. The result is a gross longitudi- nally averaged picture of planetary thermal behavior. It should be noted that all longitudes are not necessarily viewed for a given latitude band, so that the longitudinal mixing is not complete. The T? data (Figure 3) portray the thermal behavior of Mars in southern winter; the extensive polar cap reaches to about -50 ø . Diurnal variation is very. well behaved, with temperatures indreasing rapidly after local dawn, as predicted by the thermal mocJ•.,el (Figure 4), In equatorial latitudes the amplit?,de is well ø•Eer 100 K. Within a single latitude-local time.•!l•in, the standard deviation of measured T? values is
,
2832 MARTIN ET AL.: MARS VOLATILES
I I ' I I I I
- _MARINER
Ls REV 20
259 ........
228 .......... .......... .......... --"_ .............. REV 1
- 189 ........................
t23 ........ •. ..... .• ....... -s.= .......
20 11 9 I i i I I
i i I i i i i i i i
800 900 1000 1100 1200' 13,00 1400 ß
WAVE NUMBER, CM-1 ;•
500 600 700
Fig. 2. IRTM relative temperature behavior compared to IRIS spectra for two states of atmospheric dust abundance. IRTM data are normalized to T7, which is offset vertically by I5 K (the ordinate t;c spacing) for each data set. Data are labeled by the L, of observation; local time is 12 H, and the latitudes included are -25 ø to -30 ø.
rather high at,midday, typically 7 K. That number expresses the effect of albedo and inertia variations for the latitude band
in question. For comparison with the data presented above, we now
show.the behavior of T? during the week•s a, fter the inception of the second and more intense of the two global dust storms of 1977. This time period (June 20-29, L, 2830-289 ø) follows southern summer solstice and perihelion. The storm, starting in southern •atitudes on about June 5, grew to. cover much of
the planet in a few days. Viking lander visual optical depths exceeded 2.0 at + 22 ø [Pollack et al., 1979]. We anticipate a large reduction in peak surface temperatures at this time be- cause of the transfer of insolation to the atmosphere itself. 61so, nighttim•e surface temperatures should be higher because of tlie increased infrared opacity due to dust. Thus the diurnal variation should decrease, and the temperature contrast be- tween higfi and low thermal inertia areas will decrease.
We employ T? again to estimate surface behavior because of _
L s 120 - 125 ø 280 • , _
,o- ,,o ,,o 0/It :::" - 280
-
:5 qo ' -
-70 -- -
I I I I I I I I I I I '0 2 4 6 8 10 12 14 16 18 20 22 24
HOUR
Fig. 3. Dependence on latitude and local time of 7-t•m brightness temperatures at L8 = 120ø-125 ø.
MARTIN ET AL.: MARS VOLATILES 2833
+40
+30
+20
+10
o
-10
-20
-30
-40
TMODEL
L s 120 - 125 ø - 180
-50-
-60 -
-70 -
,
o 2 ' 4 0 8 10 12 14 . 16 18 20 • • HOUR
'Pig. 4. Sa•½ as Figure 3, for computed model surface•tcmpcratur½.
the low dust opacity at that Wavelengthi'H owev,•er; it is obvious (Figure l)that the dust cloud contributes to the measured radiance in the 7-#m band. For a 7-#m optical depth of 0.2, for example (see discussion below), it is calculated that the dust cloud has an emissivity of 0.05 and a transmissivity 0.95 (paper 4). Thus for a noontime T7 measurement of 267 K and an assumed cloud temperature of 248 K (&hich is the 9-#m tem- perature), we have underestimated the surface temperature by
-3 K. At night, T7 will overestimate•the surface temperM•(•, with an error probably not exceeding 1 K.
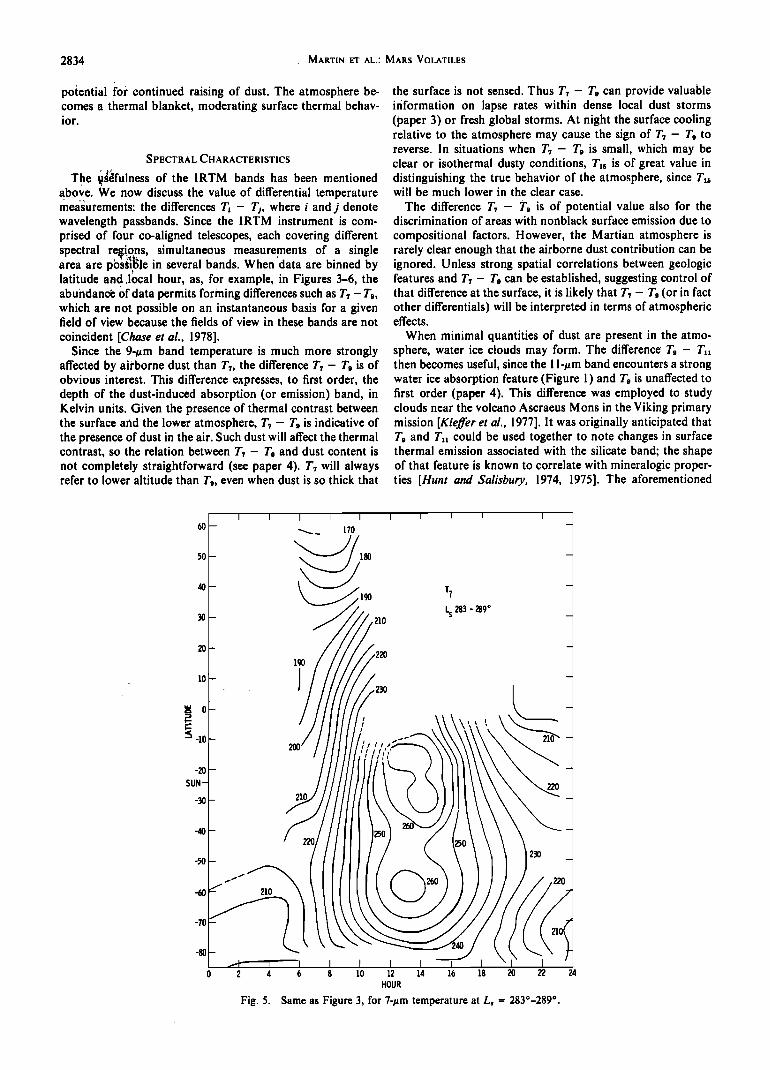
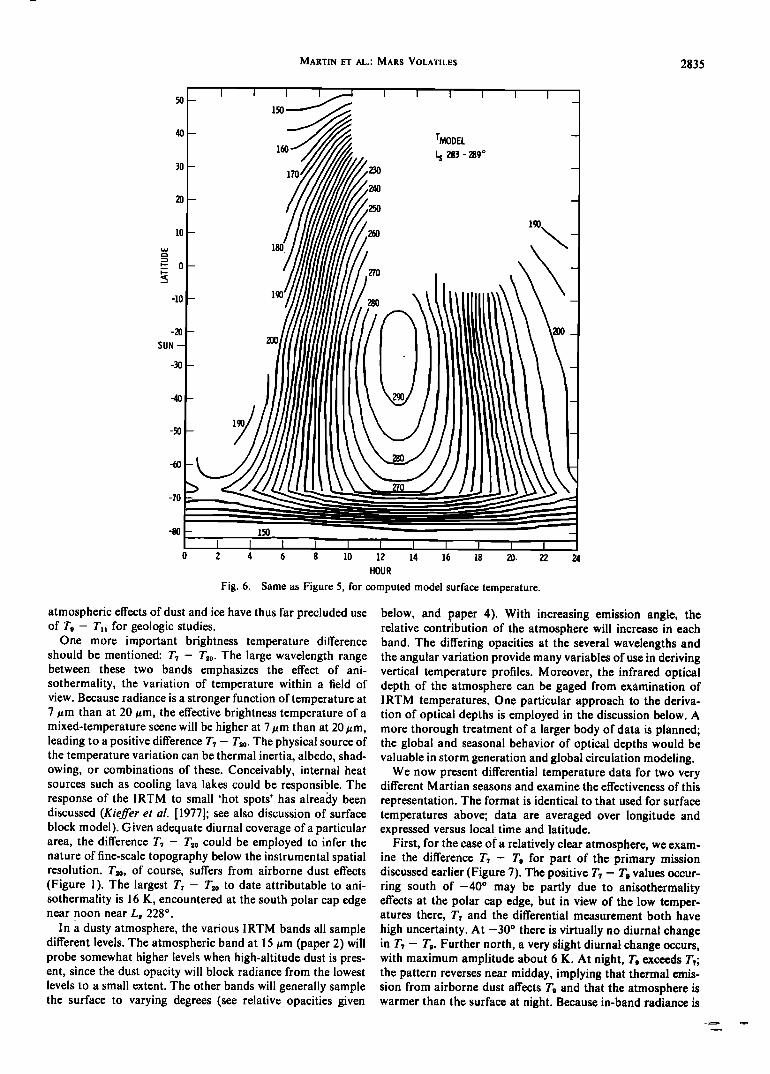
The 7-#m temperatures (F•gure 5) for the veryduõty•cOndi - tions sho TM the expected behavi6r: midday temperatures are• about 25-35 K below the model prediction for that • season (Figure 6), and predawn temperatures are a6out 10-20 K higfi, for equatorial latitudes. The diurnal ampli'i•ud e has decreased from 100 K to about 55 K, and the standard deviation n,ear noon is down to 3 K in equatorial latitudes..
There is a shift in peak tempei'ature for latitudes -20 ø t$ -40 ø of about I H (1 H = Yo.• Martian day), to 14 H. maximum temperature regime extends much farther south than in the model. Both of these effects are,•qn accord with the 15-#m band atmospheric temperatures measured at the same time (paper 2). To the extent that the warm atmosphele radiates downward, heating the surface, and considering the airborne dust contribution to T? radiance, we expect a phase lag in T• data, and an extension of diurnal maxima south- ward. The model, it should be noted, is inaccPrate near the polar cap edge, and gives rise to a false latitudinal gradient in the region south of-70 ø .
The T? data of Figures 3 and 7 bear comparison to the IRIS 7.7-#m brightness temperature data of Hand et al. [1972],
which depict surface •temperatt]res for clear .and duat-la. den atmospheric conditions encoumer•d by Mariner 9. The time bf maximum is the same'(13 H) for the 'clear' peri0ds,'•and the' maximum'of 275 K in {he Mariner 9 data. is just 5 K below the maximum in Figure 3. The data are Widely separated'in L• (-340 '• versus-1200); the•latitudc of maximum is s.ubsolar in both cases, 91though 'the IRTM•data sho TM little !atitudinhl 'dependence from •+5ø• to +35 ø during daytime. ,That iõ, as shown in the. model temperatures (Figure 4), the r•sult of prolonged warming in the nor•th during the preceding spring.
The dusty-period T, .data from •Mariner 9 and the IRTM
(Figure 5) cover similar' L• rang•; and show similar nighttimi• minimum and daytime maximum temperatures (-210 and 265 K, respectively; in southern la!;i•tudes). However, the extreme southern extension 0f the maximum in thee IRTM data is not present in the other data set;. probably that is the rcsul[0f the Mariner 9 dat a. encompassing a less dust-laden period (the storm had. certainly diss{pat6d substantially by rev 85, the end of the period covered).•
The change in surface temperature behavior effected by a .
dust storm is.impO'r. tant in several respects. The driving force for lower atmosphere radiativ6-convective activity is weak- ened. Boundary layer gradients are diminished, and static stability increases. Deposition of solar energy in the dust-laden atmosphere enhances the coupling Of surface-atmosphere tem- peratures still further, so that the conditions for violent raising of dust that must earlier have existed are quelled, allowing dust storm dissipation to proceed. The thermal contrast is also decreased across boundaries of dissimilar thermal inertia and
albedo; winds stimulated by differential heating of air above these terrains must decrease in magnitude, further sapping the
2834 • MARTIN ET AL.: MARS VOLATILES
poiential for continued raising of dust. The atmosphere be- comes a thermal blanket, moderating surface thermal behav- ior.
::- SPECTRAL CHARACTERISTICS
The •efulness of the IRTM bands has been mentioned above. We now discuss the value of differential temperature measurements: the differences T• - Tj, where i and j denote wavelength passbands. Since the IRTM instrument is com- prised of four co-aligned telescopes, each covering different spectral' regions, simultaneous measurements of a single area are p0ss!ble in several bands. When data are binned by latitude and ,lOcal hour, as, for example, in Figures 3-6, the
.
abundane• of data permits forming differences such as T7 - which are not possible on an instantaneous basis for a given field of view because the fields of view in these bands are not
coincident [Chase et al., 1978]. Since the 9-#m band temperature is much more strongly
affected by ai'rborne dust than TT, the difference T• - Tg is of obvious interest. This difference expresses, to first order, the depth of the dust-induced absorption (or emission) band, in Kelvin units. Given the presence of thermal contrast between the surface and the lower atmosphere, T• - T• is indicative of the presence of dust in the air. Such dust will affect the thermal contrast, so the relation between T• - T• and dust content is not Completely straightforward (see paper 4). T• will always refer to lower altitude than T•, even when dust is so thick that
the surface is not sensed. Thus T7 - T• can provide valuable information on lapse rates within dense local dust storms (paper 3) or fresh global storms. At night the surface cooling relative to the atmosphere may cause the sign of T• - Tg to reverse. In situations when T• - T• is small, which may be clear or isothermal dusty conditions, T•, is of great value in distinguishing the true behavior of the atmosphere, since T•, will be much lower in the clear case.
The difference T• - T• is of potential value also for the discrimination of areas with nonblack surface emission due to
compositional factors. However, the Martian atmosphere is rarely clear enough that the airborne dust contribution can be ignored. Unless strong spatial correlations between geologic features and T• - T• can be established, suggesting control of that difference at the surface, it is likely that T7 - T• (or in fact other differentials) will be interpreted in terms of atmospheric effects.
When minimal quantities of dust are present in the atmo- sphere, water ice clouds may form. The difference Tg - Txx then becomes useful, since the 1 l-#m band encounters a strong water ice absorption feature (Figure l) and T• is unaffected to first order (paper 4). This difference was employed to study clouds near the volcano Ascraeus Mons in the Viking primary mission [Kieffer et al., 1977]. It was originally anticipated that T• and Tx• could be used together to note changes in surface thermal emission associated with the silicate band; the shape of that feature is known to correlate with mineralogic proper- ties [Hunt and Salisbury, 1974, 1975]. The aforementioned
-2O
SUN-
-30
-50
-70
I I I I I
•_ 170
180
190
190
210
T?
L s 283 - •89 ø
2 4 6 I I 8 10 12 14 16 18 20 22 24
HOUR
Fig. 5. Same as Figure 3, for 7-t•m temperature at L8 = 283o-289 ø.
MARTIN ET AL.' MARS VOLATILES 2835
lO
-2O
SUN
-30
160
170
TMODEL ø
26O
180
27O
28O
-7O
0 2
1•0
4 6 8 10 12 14 16 18 20. 22 HOUR
Fig. 6. Same as Figure 5, for computed model surface temperature.
atmospheric effects of dust and ice have thus far precluded use of T9 - T• for geologic studies.
One more important brightness temperature difference should be mentioned: T7 - T•.0. The large wavelength range between these two bands emphasizes the effect of ani- sothermality, the variation of temperature within a field of view. Because radiance is a stronger function of temperature at 7 #m than at 20 #m, the effective brightness temperature of a mixed-temperature scene will be higher at 7 #m than at 20 #m, leading to a positive difference T7 - T•.0. The physical source of the temperature variation can be thermal inertia, albedo, shad- owing, or combinations of these. Conceivably, internal heat sources such as cooling lava lakes could be responsible. The response of the IRTM to small 'hot spots' has airearly been discussed (Kieffer et ai. [1977]; see also discussion of surface block model). Given adequate diurnal coverage of a particular area, the difference T7 - T•.0 could be employed to infer the nature of fine-scale topography below the instrumental spatial resolution. T•.0, of course, suffers from airborne dust effects (Figure l). The largest T, - T•.0 to date attributable to ani- sothermality is 16 K, encountered at the south polar cap edge near noon near L8 228 ø.
In a dusty atmosphere, the various IRTM bands all sample different levels. The atmospheric band at 15 #m (paper 2) will probe somewhat higher levels when high-altitude dust is pres- ent, since the dust opacity will block radiance from the lowest levels to a small extent. The Other bands will generally sample the surface to varying degrees (see relative opacities given
below, and paper 4). With increasing emission angle, the relative contribution of the atmosphere will increase in each band. The differing opacities at the several wavelengths and the angular variation provide many variables of use in deriving vertical temperature profiles. Moreover, the infrared optical depth of the atmosphere can be gaged from examination of I RTM temperatures. One particular approach to the'deriva- tion of optical depths is employed in the discussion below. A more thorough treatment of a larger body of data is planned; the global and seasonal behavior of optical depths would be valuable in storm generation and global circulation modeling.
We now present differential temperature data for two very different Martian seasons and examine the effectiveness of this
representation. The format is identical to that used for surface temperatures above; data are averaged over longitude and expressed versus local time and latitude.
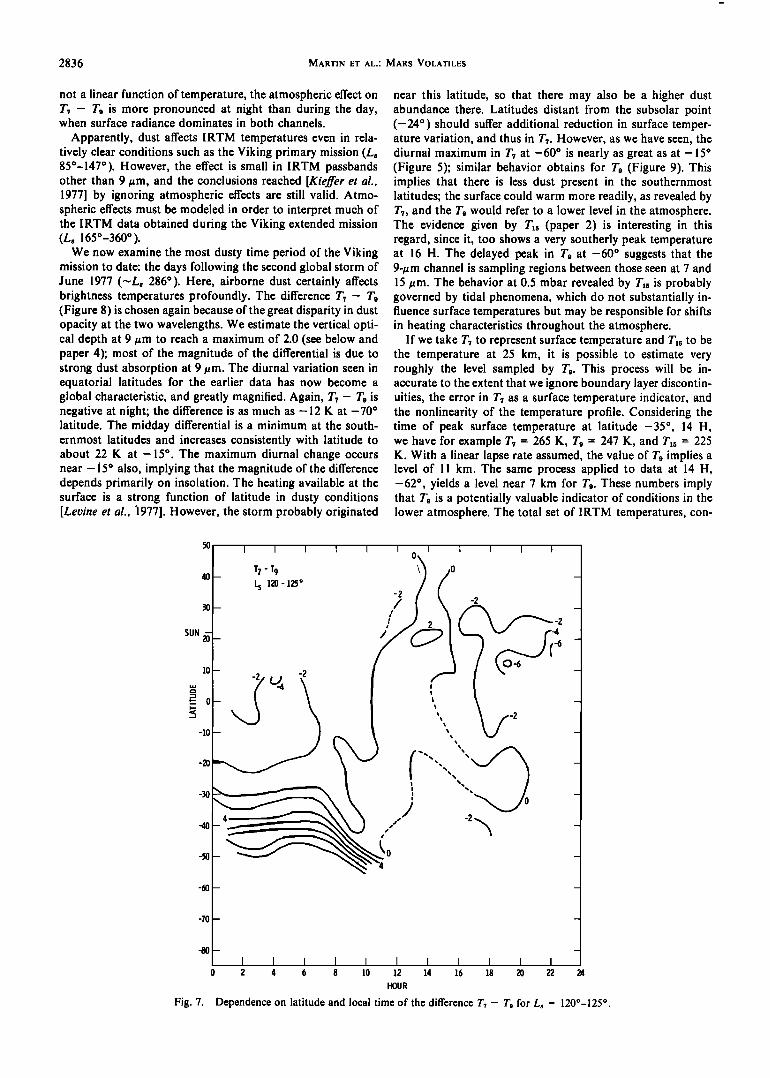
First, for the case of a'relatively clear atmosphere, we exam- ine the difference T, - T9 for part of the primary mission discussed earlier (Figure 7). The positive T? - T, values occur- ring south of-40 ø may be partly due to .anisothermality effects at the polar cap edge, but in view of the low temper- atures there, T, and the differential measurement both have
high uncertainty. At -30 ø there is virtually no diurnal Change in T, - T,. Further north, a very slight diurn• change oCCurs, with maximum amplitude about 6 K. At night, T9 exc•ds T?; the pattern reverses near midday, implying that thermal emis- sion from airborne dust affects T, and that the atmosphere is warmer than the surface at night. Because in-band radiance is
2836 MARTIN ET AL.: MARS VOLATILES
not a linear function of temperature, the atmospheric effect on T7 - To is more pronounced at night than during the day, when surface radiance dominates in both channels.
Apparently, dust affects IRTM temperatures even in rela- tively clear conditions such as the Viking primary mission (Ls 85ø-147 ø). However, the effect is small in IRTM passbands other than 9/•m, and the conclusions reached [Kieffer et al., 1977] by ignoring atmospheric effects are still valid. Atmo- spheric effects must be modeled in order to interpret much of the IRTM data obtained during the Viking extended mission (Ls 165ø-360ø).
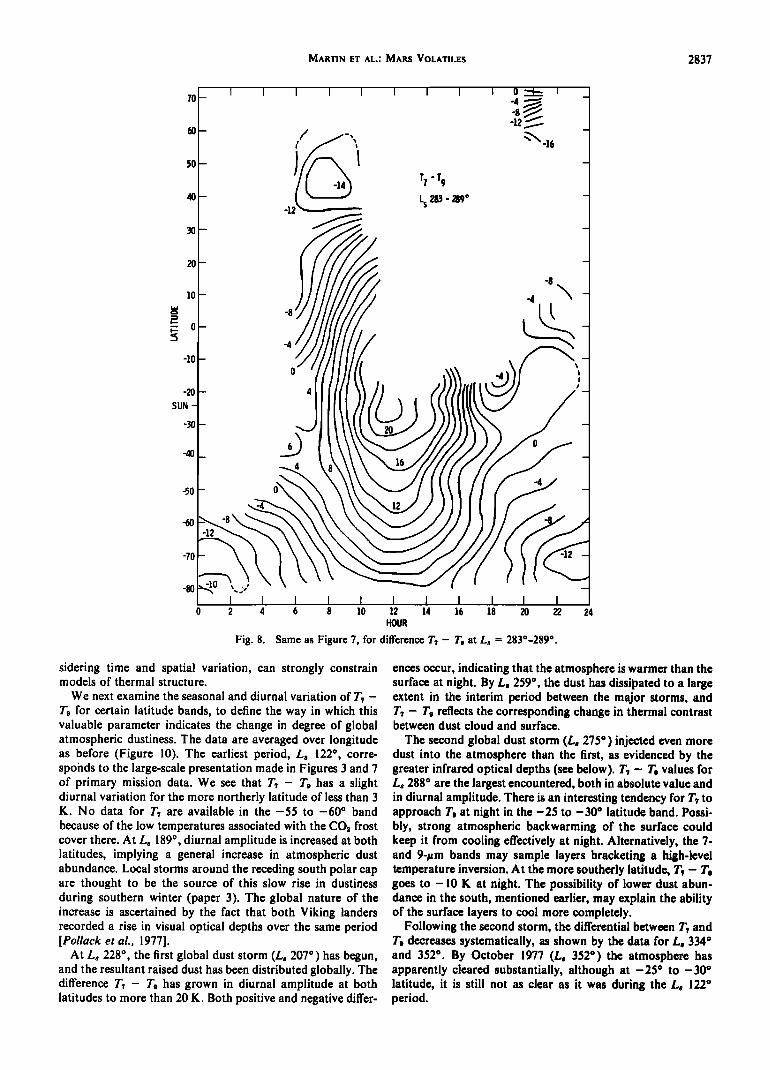
We now examine the most dusty time period of the Viking mission to date: the days following the second global storm of June 1977 (•L, 286ø). Here, airborne dust certainly affects brightness temperatures profoundly. The difference T7 - T, (Figure 8) is chosen again because of the great disparity in dust opacity at the two wavelengths. We estimate the vertical opti- cal depth at 9 um to reach a maximum of 2.0 (see below and paper 4); most of the magnitude of the differential is due to strong dust absorption at 9 um. The diurnal variation seen in equatorial latitudes for the earlier data has now become a global characteristic, and greatly magnified. Again, T, - T, is negative at night; the difference is as much as -12 K at -70 ø latitude. The midday differential is a minimum at the south- ernmost latitudes and increases consistently with latitude to about 22 K at -15 ø. The maximum diurnal change occurs near -15 ø also, implying that the magnitude of the difference depends primarily on insolation. The heating available at the surface is a strong function of latitude in dusty conditions [Leoine et al., ]977]. However, the storm probably originated
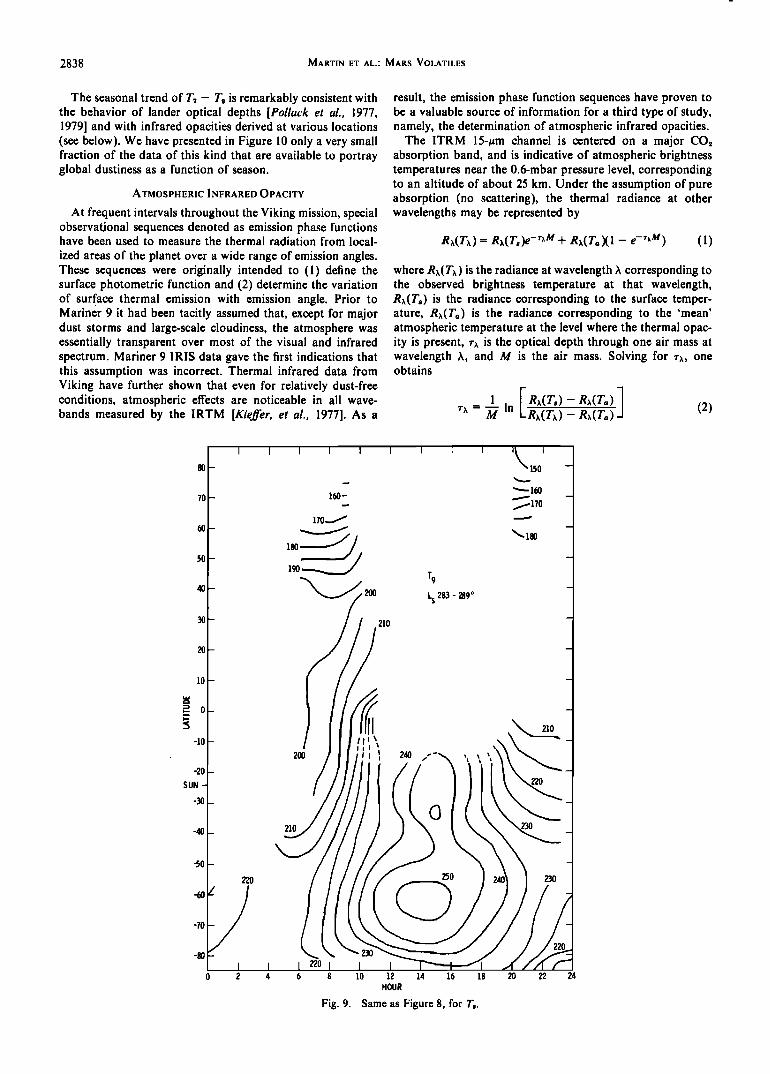
near this latitude, so that there may also be a higher dust abundance there. Latitudes distant from the subsolar point (-24 ø ) should suffer additional reduction in surface temper- ature variation, and thus in T,. However, as we have seen, the diurnal maximum in T, at -60 ø is nearly as great as at -15 ø (Figure 5); similar behavior obtains for Tg (Figure 9). This implies that there is less dust present in the southernmost latitudes; the surface could warm more readily, as revealed by T,, and the Tg would refer to a lower level in the atmosphere. The evidence given by T•5 (paper 2) is interesting in this regard, since it, too shows a very southerly peak temperature at 16 H. The delayed peak in T• at -60 ø suggests that the 9-/•m channel is sampling regions between those seen at 7 and 15/•m. The behavior at 0.5 mbar revealed by Tx5 is probably governed by tidal phenomena, which do not substantially in- fluence surface temperatures but may be responsible for shifts in heating characteristics throughout the atmosphere.
If we take T7 to represent surface temperature and Tx• to be the temperature at 25 km, it is possible to estimate very roughly the level sampled by T•. This process will be in- accurate to the extent that we ignore boundary layer discontin- uities, the error in T, as a surface temperature indicator, and the nonlinearity of the temperature profile. Considering the time of peak surface temperature at latitude -35 ø, 14 H, we have for example T, = 265 K, T• = 247 K, and Tx• = 225 K. With a linear lapse rate assumed, the value of T• implies a level of 11 km. The same process applied to data at 14 H, -62 ø, yields a level near 7 km for Tg. These numbers imply that T• is a potentially valuable indicator of conditions in the lower atmosphere. The total set of IRTM temperatures, con-
•0] I I I I I I 0 I I I I I . ! x?-b • /0
• 0
0 2 4 6 8 10 12 14 16 18 • 22 24
HOUR
Fig. 7. Dependence on latitude and local time of the difference T7 - Tg for Ls = 120ø-125 ø.
MARTIN ET AL..' MARS VOLATILES 2837
5O
1' 7 - T 9
L s 283 - 289 ø
2O
10
-10
-20
SUN
-30
-8
-5O
-6O
-7O
4 6 8 10 12 14 16 18 • •2 HOUR
Fig. 8. Same as Figure 7, for difference T7 - Te at Ls = 283ø-289 ø.
24
sidering time and spatial variation, can strongly constrain models of thermal structure.
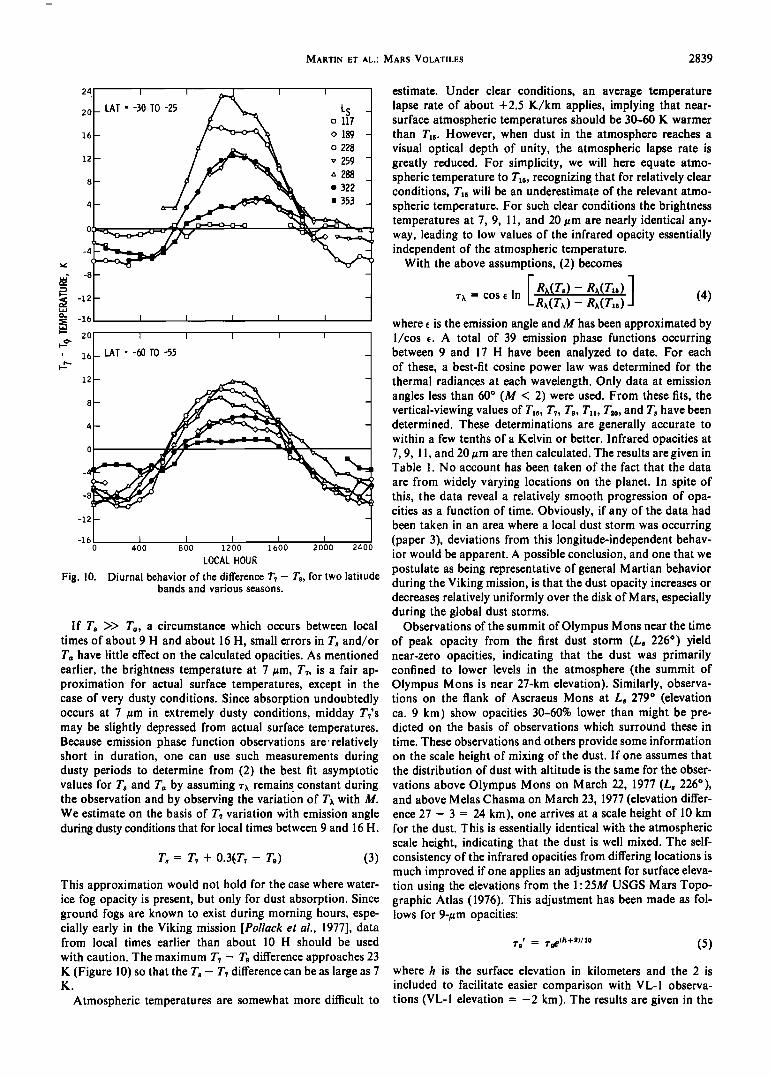
We next examine the seasonal and diurnal variation of T7 - Te for certain latitude bands, to define the way in which this valuable parameter indicates the change in degree of global atmospheric dustiness. The data are averaged over longitude as before (Figure 10). The earliest period, Ls 122 ø, corre- spohds to the large-scale presentation made in Figures 3 and 7 of primary mission data. We see that T? - Te has a slight diurnal variation for the more northerly latitude of less than 3 K. No data for T• are available in the -55 to -60 ø band because of the low temperatures associated with the CO2 frost cover there. At Ls 189ø,.diurnal amplitude is increased at both latitudes, implying a general increase in atmospheric dust abundance. Local storms around the receding south polar cap are thought to be the source of this slow rise in dustiness during southern winter (paper 3). The global nature of the increase is ascertained by the fact that both Viking landers recorded a rise in visual optical depths over the same period [Pollack et al., 1977].
At L• 228 ø, the first global dust storm (L• 207 ø) has begun, and the resultant raised dust has been distributed globally. The difference T, - T, has grown in diurnal amplitude at both latitudes to more than 20 K. Both positive and negative differ-
ences occur, indicating that the atmosphere is warmer than the surface at night. By L, 259 ø, the dust has dissipated to a large extent in the interim period between the major storms, and T? - T• reflects the corresponding change in thermal contrast between dust cloud and surface.
The second global dust storm (L, 275 ø) injected even more dust into the atmosphere than the first, as evidenced by the greater infrared optical depths (see below). T? - T• values for Ls 288 ø are the largest encountered, both in absolute value and in diurnal amplitude. There is an interesting tendency for T? to approach T• at night in the -25 to -30 ø latitude band. Possi- bly, strong atmospheric backwarming of the surface could keep it from cooling effectively at night. Alternatively, the 7- and 9-#m bands may sample layers bracketing a high-level temperature inversion. At the more southerly latitude, T? - T• goes to -10 K at night. The possibility of lower dust abun- dance in the south, mentioned earlier, may explain the ability of the surface layers to cool more completely.
Following the second storm, the differential between T? and T• decreases systematically, as shown by the data for L• 334 ø and 352 ø. By October 1977 (L, 352 ø) the atmosphere has apparently cleared substantially, although at -25 ø to-30 ø latitude, it is still not as clear as it was during the L, 122 ø period.
2838 MARTIN ET AL.: MARS VOLATILES
The seasonal trend of T7 - Tg is remarkably consistent with the behavior of lander optical depths [Pollack et al., 1977, 1979] and with infrared opacities derived at various locations (see below). We have presented in Figure 10 only a very small fraction of the data of this kind that are available to portray global dustiness as a function of season.
ATMOSPHERIC INFRARED OPACITY
At frequent intervals throughout the Viking mission, special observational sequences denoted as emission phase functions have been used to measure the thermal radiation from local-
ized areas of the planet over a wide range of emission angles. These sequences were originally intended to (1) define the surface photometric function and (2) determine the variation of surface thermal emission with emission angle. Prior to Mariner 9 it had been tacitly assumed that, except for major dust storms and large-scale cloudiness, the atmosphere was essentially transparent over most of the visual and infrared spectrum. Mariner 9 IRIS data gave the first indications that this assumption was incorrect. Thermal infrared data from Viking have further shown that even for relatively dust-free conditions, atmospheric effects are noticeable in all wave- bands measured by the IRTM [Kieffer, et al., 1977]. As a
result, the emission phase function sequences have proven to be a valuable source of information for a third type of study, namely, the determination of atmospheric infrared opacities.
The ITRM 15-•m channel is centered on a major CO: absorption band, and is indicative of atmospheric brightness temperatures near the 0.6-mbar pressure level, corresponding to an altitude of about 25 km. Under the assumption of pure absorption (no scattering), the thermal radiance at other wavelengths may be represented by
Rx(Tx) = Rx(Ts)e -rxM + Rx(TaXI - e -rxM) (1)
where Rx(Tx) is the radiance at wavelength 2, corresponding to the observed brightness temperature at that wavelength, Rx(Ts) is the radiance corresponding to the surface temper- ature, Rx(T.) is the radiance corresponding to the 'mean' atmospheric temperature at the level where the thermal opac- ity is present, rx is the optical depth through one air mass at wavelength 2,, and M is the air mass. Solving for rx, one obtains
I IRx(T,)-Rx(T.)I rx = • In Rx(Tx)- Rx(T•) (2)
70 160 -
170•
40 • 200
I I I I
210
19
L s 282t - 289 ø
'L'
/170
-10
-2O
SUN
-30
-7O
220
20O
210
I 22ø1 . 0 2 4 6 8
250
I 10 12 14 16
HOUR
Fig. 9. Same as Figure 8, for T,.
18 20 22 24
MARTIN ET AL.: MARS VOLATILES 2839
20- LAT = -30 TO -2.5 • L S _ • 117
ß o 189 - !
•• o228 12-- v 259 -
L•T • -• •0 -•
0
0 400 •00 •00
LOCAL HO0•
•ig. 10. Diurnal beh•vio• b•ds •nd v•fious se•so•s.
If Ts >> Ta, a circumstance which occurs between local
estimate. Under clear conditions, an average temperature lapse rate of about q-2.5 K/km applies, implying that near- surface atmospheric temperatures should be 30-60 K warmer than Txs. However, when dust in the atmosphere reaches a visual optical depth of unity, the atmospheric lapse rate is greatly reduced. For simplicity, we will here equate atmo- spheric temperature to Txs, recognizing that for relatively clear conditions, Tx• will be an underestimate of the relevant atmo- spheric temperature. For such clear conditions the brightness temperatures at 7, 9, 11, and 20 #m are nearly identical any- way, leading to low values of the infrared opacity essentially independent of the atmospheric temperature.
With the above assumptions, (2) becomes
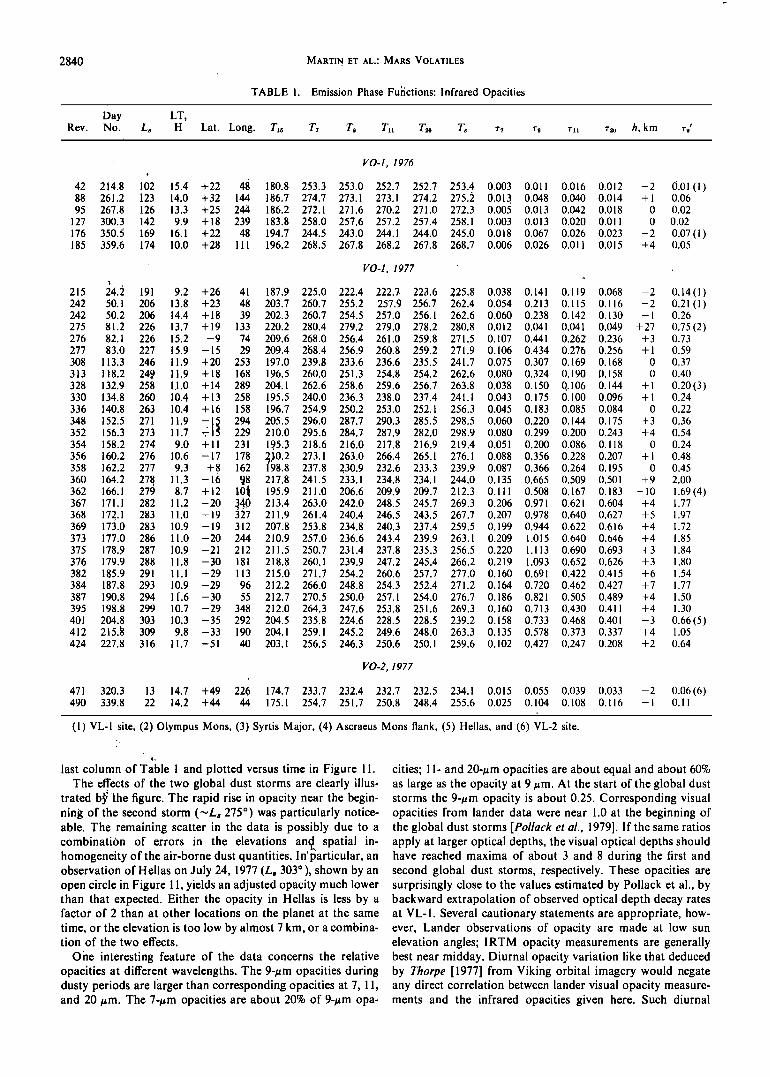
F. Rx_(Ts) - Rx(T•) ] rx = cos e In LRx(Tx) - Rx(T•) (4) where • is the emission angle and M has been approximated by 1/cos •. A total of 39 emission phase functions occurring between 9 and 17 H have been analyzed to date. For each of these, a best-fit cosine power law was determined for the thermal radiances at each wavelength. Only data at emission angles less than 60 ø (M < 2) were used. From these fits, the vertical-viewing values of T•, T?, Tg, Tn, T:o, and T• have been determined. These determinations are generally accurate to within a few tenths of a Kelvin or better. Infrared opacities at 7, 9, 11, and 20 #m are then calculated. The results are given in Table I. No account has been taken of the fact that the data
are from widely varying locations on the planet. In spite of this, the data reveal a relatively smooth progression of opa- cities as a function of time. Obviously, if any of the data had been taken in an area where a local dust storm was occurring (paper 3), deviations from this longitude-independent behav- ior would be apparent. A possible conclusion, and one that we postulate as being representative of general Martian behavior during the Viking mission, is that the dust opacity increases or decreases relatively uniformly over the disk of Mars, especially during the global dust storms.
ObServations of the summit of Olympus Mons near the time times of about 9 H and about 16 H, small errors in T• and/or of peak opacity from the first dust storm (L• 226 ø) yield Ta have little effect on the calculated opacities. As mentioned near-zero opacities, indicating that the dust was primarily earlier, the brightness temperature at 7 #m, T7, is a fair ap- confined to lower levels in the atmosphere (the summit of proximation for actual surface temperatures, except in the case of very dusty conditions. Since absorption undoubtedly occurs at 7 #m in extremely dusty conditions, midday T?'s may be slightly depressed from actual surface temperatures. Because emission phase function observations are'relatively short in duration, one can use such measurements during dusty periods to determine from (2) the best fit asymptotic values for T• and T• by assuming rx remains constant during the observation and by observing the variation of Tx with M. We estimate on the basis of T? variation with emission angle during dusty conditions that for local times between 9 and 16 H.
T.= + o.3(T, - (3)
This approximation would not hold for the case where water- ice fog opacity is present, but only for dust absorption. Since ground fogs are known to exist during morning hours, espe- cially early in the Viking mission [Pollack et al., 1977], data from local times earlier than about l0 H should be used
with caution. The maximum T? - T• difference approaches 23 K (Figure 10) so that the Ts - T? difference can be as large as 7 K.
Atmospheric temperatures are somewhat more difficult to
Olympus M ons is near 27-km elevation). Similarly, observa- tions on the flank of Ascraeus Mons at L• 279 ø (elevation ca. 9 km) show opacities 30-60% lower than might be pre- dicted on the basis of observations which surround these in
time. These observations and others provide some information on the scale height of mixing of the dust. If one assumes that the distribution of dust with altitude is the same for the obser-
vations above Olympus Mons on March 22, 1977 (L• 226ø), and above Melas Chasma on March 23, 1977 (elevation differ- ence 27 - 3 = 24 km), one arrives at a scale height of 10 km for the dust. This is essentially identical with the atmospheric scale height, indicating that the dust is well mixed. The self- consistency of the infrared opacities from differing locations is much improved if one applies an adjustment for surface eleva- tion using the elevations from the 1: 25M USGS Mars Topo- graphic Atlas (1976). This adjustment has been made as fol- lows for 9-#m opacities:
rd = r•e In+:•/'ø (5)
where h is the surface elevation in kilometers and the 2 is
included to facilitate easier comparison with VL-1 observa- tions (VL-1 elevation = -2 km). The results are given in the
2840 MARTIN ET AL.: MARs VOLATILES
TABLE 1. Emission Phase Fuhctions: Infrared Opacities
Day LT; Rev. No. Ls H Lat. Long. r9 r• r2o h, km T 9'
42 214.8 102 15.4 +22 48 88 261.2 123 14.0 +32 144 95 267.8 126 13.3 +25 244
127 300.3 142 9.9 + 18 239 176 350.5 169 16.1 +22 48 185 359.6 174 10.0 +28 Ill
358 162.2 277 9.3 +8 162
360 164.2 27• 11.3 -16 •8 362 166.1 279 8.7 +12 367 171.1 282 11.2 -20 }40 368 172.1 283 11.0 -19 327 369 173.0 283 10.9 -19 312 373 177.0 286 11.0 -20 244 375 178.9 287 10.9 -21 212 376 179.9 288 11.8 -30 181 382 185.9 291 11.1 -29 113 384 187.8 293 10.9 -29 96 387 190.8 294 1i.6 -30 55 395 198.8 299 10.7 -29 348 401 204.8 303 10.3 -35 292 412 215.8 309 9.8 -33 190
.
424 227.8 316 11.7 -51 40
VO-I, 1976
180.8 253.3 253.0 252.7 252.7 253.4 186.7 274.7 273.1 273.1 274.2 275.2 186.2 272.1 271.6 270.2 271.0 272.3 183.8 258.0 257.6 257.2 257.4 258.1 194.7 244.5 243.0 244.1 244.0 245.0 196.2 268.5 267.8 268.2 267.8 268.7
VO-I, 1977
187.9 225.0 222.4 222.7 223.6 2.25.8 203.7 260.7 255.2 257.9 256.7 202.3 260.7 254.5 257.0 256.1 220.2 280.4 279.2 279.0 278.2 209.6 268.0 256.4 261.0 259.8 209.4 268.4 256.9 260.8 259.2 197.0 239.8 233.6 236.6 235.5 196.5 260.0 251.3 254.8 254.2 204.1 262.6 258.6 259.6 256.7 195.5 240.0 236.3 238.0 237.4 196.7 254.9 250.2 253.0 252.1 205.5 296.0 287.7 290.3 285.5 210.0 295.6 284.7 287.9 282.0
1•5.3 218.6 216.0 217.8 216.9 2•0.2 273.1 263.0 266.4 265.1 /•8.8 237.8 230.9 232.6 233.3 217.8 241.5 233.1 234.8 234.1 195.9 211.0 206.6 209.9 209.7 213.4 263.0 242.0 248.5 245.7 211.9 261.4 240.4 246.5 243.5 207.8 253.8 234.8 240.3 237.4 210.9 257.0 236.6 243.4 239.9 211.5 250.7 231.4 237.8 235.3 218.8 260.1 239.9 247.2 245.4 215.0 271.7 254.2 260.6 257.7 212.2 266.0 248.8 254.3 252.4 212.7 270.5 250.0 257.1 254.0
212.0 264.3 247.6 253.8 251.6 204.5 235.8 224.6 228.5 228.5 204.1 259.1 245.2 249.6 248.0 203.1 256.5 246.3 250.6 250.1
262.4 262.6 280.8 271.5 271.9 241.7 262.6 263.8 241.1 256.3
298.5 298.9 219.4 276.1
239.9 244.0 212.3 269.3 267.7 259.5 263.1 256.5
266.2
277.0 271.2 276.7 269.3 239.2 263.3 259.6
VO-2, 1977
0.003 0.011 0.016 0.012 -2 0.01(I) 0.013 0.048 0.040 0.014 +1 0.06 0.005 0.013 0.042 0.018 0 0.02 0.003 0.013 0.020 0.011 0 0.02
0.018 0.067 0.026 0.023 -2 0.07(I) 0.006 0.026 0.011 0.015 +4 0.05
0.038 0.141 0.119 0.068 -2 0.14(1) 0.054 0.213 0.115 0.116 -2 0.21(1) 0.060 0.238 0.142 0.130 -1 0.26
0.012 0.041 0.041 0.049 +27 0.75(2) 0.107 0.441 0.262 0.236 +3 0.73 0.106 0.434 0.276 0.256 +1 0.59 0.075 0.307 0.169 0.168 0 0.37 0.080 0.324 0.190 0.158 0 0.40
0.038 0.150 q. 106 0.144 +1 0.20(3) 0.043 0.175 0.100 0.096 +1 0.24
0.045 0.183 0.085 0.084 0 0.22 0.060 0.220 0.144 0.175 +3 0.36 0.080 0.299 0.200 0.243 +4 0.54 0.051 0.200 0.086 0.118 0 0.24 0.088 0.356 0.228 0.207 +1 0.48 0.087 0.366 0.264 0.195 0 0.45 0.135 0.665 0.509 0.501 +9 2.00
0.111 0.508 0.167 0.183 +10 1.69(4) 0.206 0.971 0.621 0.604 +4 1.77 0.207 0.978 0.640 0.627 +5 1.97 0.199 0.944 0.622 0.616 +4 1.72 0.209 1.015 0.640 0.646 +4 1.85 0.220 1.113 0.690 0.693 +3 1.84 0.219 1.093 0.652 0.626 +3 1.80 0.160 0.691 0.422 0.415 +6 1.54 0.164 0.720 0.462 0.427 +7 1.77 0.186 0.821 0.505 0.489 +4 1.50 0.160 0.713 0.430 0.411 +4 1.30
0.158 0.733 0.468 0.401 -3 0.66(5) 0.135 0.578 0.373 0.337 +4 1.05 0.102 0.427 0.247 0.208 +2 0.64
471 320.3 13 14.7 +49 226 174.7 233.7 232.4 232.7 232.5 234.1 0.015 0.055 490 339.8 22 14.2 +44 44 175.1 254.7 251.7 250.8 248.4 255.6 0.025 0.104
0.039 0.033 -2 0.06(6) 0.108 0.116 -1 0.11
(1) VL-I site, (2) Olympus Mons, (3) Syrtis Major, (4) Ascraeus Mons flank, (5) Hellas, and (6) VL-2 site.
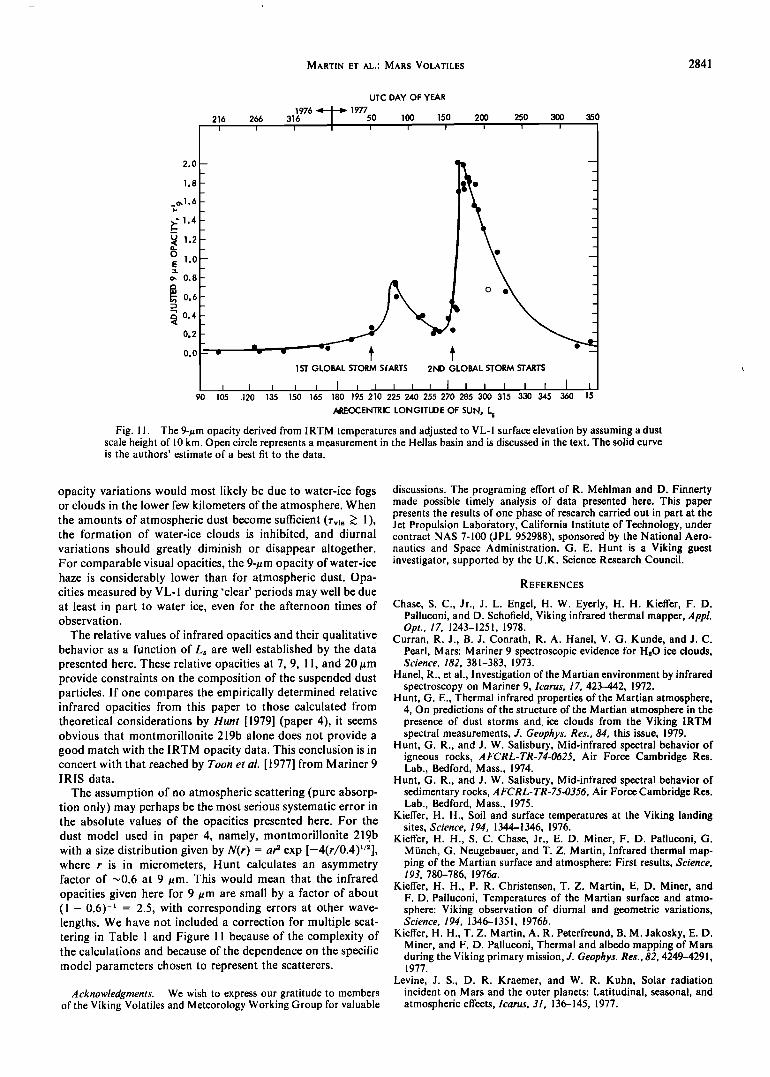
last column of Table I and plotted versus time in Figure 11. The effects of the two global dust storms are clearly illus-
trated b•'the figure. The rapid rise in opacity near the begin- ning of the second storm (•Ls 275 ø) was particularly notice- able. The remaining scatter in the data is possibly due to a combination of errors in the elevations and spatial in- homogeneity of the air-borne dust quantities. lffpart•cular, an observation of Hellas on July 24, 1977 (Ls 303 ø), shown by an open circle in Figure 11, yields an adjusted opacity much lower than that expected. Either the opacity in Hellas is less by a factor of 2 than at other locations on the planet at the same time, or the elevation is too low by almost 7 km, or a combina- tion of the two effects.
One interesting feature of the data concerns the relative opacities at different wavelengths. The 9-#m opacities during dusty periods are l;arger than corresponding opacities at 7, 1 l, and 20 #m. The 7-#m opacities are about 20% of 9-#m opa-
cities; 11- and 20-#m opacities are about equal and about 60% as large as the opacity at 9 #m. At the start of the global dust storms the 9-#m opacity is about 0.25. Corresponding visual opacities from lander data were near 1.0 at the beginning of the global dust storms [Pollack et al., 1979]. If the same ratios apply at larger optical depths, the visual optical depths should have reached maxima of about 3 and 8 during the first and second global dust storms, respectively. These opacities are surprisingly close to the values estimated by Pollack et al., by backward extrapolation of observed optical depth decay rates at VL-I. Several cautionary statements are appropriate, how- ever, Lander observations of opacity are made at low sun elevation angles; IRTM opacity measurements are generally best near midday. Diurnal opacity variation like that deduced by Thorpe [1977] from Viking orbital imagery would negate any direct correlation between lander visual opacity measure- ments and the infrared opacities given here. Such diurnal
MARTIN ET AL.: MARS VOLATILES 2841
216 I
2.0-- _
1o8- _
.•1.6 - --
•1.4 - 1.2-
1.0--
0.8-
- 0.6-
-
•0.4- _
0.2- _
0.0 ß
I 90 105
UTC DAY OF YEAR
1976 .• 1977 266 316 50 100 150 200 250 300 i I I I I I I I
35O
1ST GLOBAL STORM SfARTS 21•) GLOBAL STORM STARTS
ß • • • • I • • I • • J I • • I I I ,120 135 150 165 180 195 210 225 240 255 270 285 300 315 330 345 360 15
AREOCENTRIC LONGITUDE OF SUN, L s
Fig. 11. The 9-#m opacity derived from IRTM temperatures and adjusted to VL-1 surface elevation by assuming a dust scale height of 10 kin. Open circle represents a measurement in the Hellas basin and is discussed in the text. The solid curve is the authors' estimate of a best fit to the data.
opacity variations would most likely be due to water-ice fogs or clouds in the lower few kilometers of the atmosphere. When the amounts of atmospheric dust become sufficient (rvis •> 1), the formation of water-ice clouds is inhibited, and diurnal variations should greatly diminish or disappear altogether. For comparable visual opacities, the 9-#m opacity of water-ice haze is considerably lower than for atmospheric dust. Opa- cities measured by VL-1 during 'clear' periods may well be due at least in part to water ice, even for the afternoon times of observation.
The relative values of infrared opacities and their qualitative behavior as a function of Ls are well established by the data presented here. These relative opacities at 7, 9, 11, and 20 #m provide constraints on the composition of the suspended dust particles. If one compares the empirically determined relative infrared opacities from this paper to those calculated from theoretical considerations by Hunt [1979] (paper 4), it seems obvious that montmorillonite 219b alone does not provide a good match with the IRTM opacity data. This conclusion is in concert with that reached by Toon et al. [ 1977] from Mariner 9 IRIS data.
The assumption of no atmospheric scattering (pure absorp- tion only) may perhaps be the most serious systematic error in the absolute values of the opacities presented here. For the dust model used in paper 4, namely, montmorillonite 219b with a size distribution given by N(r) = a? exp [-4(r/0.4)•/2], where r is in micrometers, Hunt calculates an asymmetry factor of •0.6 at 9 #m. This would mean that the infrared opacities given here for 9 #m are small by a factor of about (1 -0.6) -• = 2.5, with corresponding errors at other wave- lengths. We have not included a correction for multiple scat- tering in Table 1 and Figure 11 because of the complexity of the calculations and because of the dependence on the specific model parameters chosen to represent the scatterers.
Acknowledgments. We wish to express our gratitude to members of the Viking Volatiles and Meteorology Working Group for valuable
discussions. The programing effort of R. Mehlman and D. Finnerty made possible timely analysis of data presented here. This paper presents the results of one phase of research carried out in part at the Jet Propulsion Laboratory, California Institute of Technology, under contract NAS 7-100 (JPL 952988), sponsored by the National Aero- nautics and Space Administration. G. E. Hunt is a Viking guest investigator, supported by the U.K. Science Research Council.
REFERENCES
Chase, S.C., Jr., J. L. Engel, H. W. Eyerly, H. H. Kieffer, F. D. Palluconi, and D. Schofield, Viking infrared thermal mapper, Appl. Opt., 17, 1243-1251, 1978.
Curran, R. J., B. J. Conrath, R. A. Hanel, V. G. Kunde, and J. C. Pearl, Mars: Mariner 9 spectroscopic evidence for H:O ice clouds, Science, 182, 381-383, 1973.
Hanel, R., et ai., Investigation of the Martian environment by infrared spectroscopy on Mariner 9, Icarus, 17, 423-442, 1972.
Hunt, G. E., Thermal infrared properties of the Martian atmosphere, 4, On predictions of the structure of the Martian atmosphere in the presence of dust storms and ice clouds from the Viking IRTM spectral measurements, J. Geophys. Res., 84, this issue, 1979.
Hunt, G. R., and J. W. Salisbury, Mid-infrared spectral behavior of igneous rocks, AFCRL-TR-74-0625, Air Force Cambridge Res. Lab., Bedford, Mass., 1974.
Hunt, G. R., and J. W. Salisbury, Mid-infrared spectral behavior of sedimentary rocks, A FCRL-TR-75-0356, Air Force Cambridge Res. Lab., Bedford, Mass., 1975.
Kieffer, H. H., Soil and surface temperatures at the Viking landing sites, Science, 194, 1344-1346, 1976.
Kieffer, H. H., S.C. Chase, Jr., E. D. Miner, F. D. Palluconi, G. Mi•nch, G. Neugebauer, and T. Z. Martin, Infrared thermal map- ping of the Martian surface and atmosphere: First results, Science, 193, 780-786, 1976a.
Kieffer, H. H., P. R. Christensen, T. Z. Martin, E. D. Miner, and F. D. Pailuconi, Temperatures of the Martian surface and atmo- sphere: Viking observation of diurnal and geometric variations, Science, 194, 1346-1351, 1976b.
Kieffer, H. H., T. Z. Martin, A. R. Peterfreund, B. M. Jakosky, E. D. Miner, and F. D. Palluconi, Thermal and albedo mapping of Mars during the Viking primary mission, J. Geophys. Res., 82, 4249-4291, 1977.
Levine, J. S., D. R. Kraemer, and W. R. K uhn, Solar radiation incident on Mars and the outer planets: Latitudinal, seasonal, and atmospheric effects, Icarus, 31, 136-145, 1977.
2842 MARTIN ET AL.: MARS VOLATILES
Martin, T. Z., and H. H. Kieffer, Thermal infrared properties of the Martian atmosphere, 2, The 15-/•m band measurements, J. Geophys. Res., 84, this issue, 1979.
Peterfreund, A. R., and H. H. Kieffer, Thermal infrared properties of the Martian atmosphere, 3, Local dust clouds, J. Geophys. Res., 84, this issue, 1979.
Pollack, J. B., D. Colburn, R. Kahn, J. Hunter, W. Van Camp, C. E. Carlston, and M. R. Wolf, Properties of aerosols in the Martian atmosphere as inferred from Viking lander imaging data, J. Geophys. Res., 82, 4479-4496, 1977.
Pollack, J. B., D. S. Colburn, F. M. Flasar, C. E. Carlston, D. Pidek,
and R. Kahn, Properties and effects of dust particles suspended in the Martian atmosphere, J. Geophys. Res., 84, this issue. 1979.
Thorpe, T. E., Viking orbiter observations of atmospheric opacity during July-November 1976, J. Geophys. Res., 82, 4151-4159, 1977.
Toon, O. B., J. B. Pollack, and C. Sagan, Physical properties of the particles composing the Martian dust storm of 1971-1972, Icarus, 30, 663-696, 1977.
(Received May 4, 1978; revised August 3, 1978;
accepted November 15, 1978.)