Embed Size (px)
Citation preview

This article was published in an Elsevier journal. The attached copyis furnished to the author for non-commercial research and
education use, including for instruction at the author’s institution,sharing with colleagues and providing to institution administration.
Other uses, including reproduction and distribution, or selling orlicensing copies, or posting to personal, institutional or third party
websites are prohibited.
In most cases authors are permitted to post their version of thearticle (e.g. in Word or Tex form) to their personal website orinstitutional repository. Authors requiring further information
regarding Elsevier’s archiving and manuscript policies areencouraged to visit:
http://www.elsevier.com/copyright

Author's personal copy
Thermal characteristics of coal fires 2: Results ofmeasurements on simulated coal fires
Jianzhong Zhang a, Claudia Kuenzer a,⁎, Anke Tetzlaff c, Dieter Oertel b,Boris Zhukov b, Wolfgang Wagner a
a Institute of Photogrammetry and Remote Sensing (IPF), Vienna University of Technology, Gusshausstr. 27–29, A-1040 Vienna, Austriab DLR Berlin, Optische Informationssysteme, Standort Berlin-Adlershof, Rutherfordstraβe 2, 12489 Berlin, Germanyc Swedish Meteorological and Hydrological Institute, SMHI, Folkborgsvaegen 1, SE-60176 Norrkoeping, Sweden
Received 26 November 2006; accepted 16 August 2007
Abstract
In this paper we present thermal characteristics of coal fires as measured during simulated fires under an experimental setting inGermany in July 2002. It is thus a continuation of the previously published paper “Thermal surface characteristics of coal fire 1:Results of in-situ measurement”, in which we presented temperature measurements of real subsurface coal fires in China [Zhang, J.,Kuenzer, C., accepted for publication. Thermal Surface Characteristics of Coal Fires 1: Results of in-situ measurements. Acceptedfor publication at Journal of Applied Geophysics.]. The focus is on simulated coal fires, which are less complex in nature than firesunder natural conditions. In the present study we simulated all the influences usually occurring under natural conditions in acontrollable manner (uniform background material of known thermal properties, known ventilation pathways, homogeneous coalsubstrate), creating two artificial outdoor coal fires under simplified settings. One surface coal fire and one subsurface coal firewere observed over the course of 2 days. The set up of the fires allowed for measurements not always feasible under “real” in-situconditions: thus compared to the in-situ investigations presented in paper one we could retrieve numerous temperaturemeasurements inside of the fires. Single temperature measurements, diurnal profiles and airborne thermal surveying present thetypical temperature patterns of a small surface-and a subsurface fire under undisturbed conditions (easily accessible terrain, 24 hourmeasurements period, homogeneous materials). We found that the outside air temperature does not influence the fire's surfacetemperature (up to 900 °C), while fire centre temperatures of up to 1200 °C strongly correlate with surface temperatures of the fire.The fires could heat their surrounding up to a distance of 4.5 m. However, thermal anomalies on the background surface onlypersist as long as the fire is burning and disappear very fast if the heat source is removed. Furthermore, heat outside of the fires istransported mainly by convection and not by radiation. In spatial thermal line scanner data the diurnal thermal patterns of the coalfire are clearly represented. Our experiments during that data collection also visualize the thermal anomaly differences betweencovered (underground) and uncovered (surface) coal fires. The latter could not be observed in-situ in a real coal fire area. Sub-surface coal fires express a much weaker signal than open surface fires and contrast only by few degrees against the background. Inairborne thermal imaging scanner data the fires are also well represented. Here we could show that the mid-infrared domain(3.8 μm) is more suitable to pick up very hot anomalies, compared to the common thermal (8.8 μm) domain. Our results help to
Available online at www.sciencedirect.com
Journal of Applied Geophysics 63 (2007) 135–147www.elsevier.com/locate/jappgeo
⁎ Corresponding author. Tel./fax: +43 1 58801 12249.E-mail addresses: [email protected] (J. Zhang), [email protected] (C. Kuenzer), [email protected] (D. Oertel), [email protected]
(B. Zhukov), [email protected] (W. Wagner).
0926-9851/$ - see front matter © 2007 Elsevier B.V. All rights reserved.doi:10.1016/j.jappgeo.2007.08.003

Author's personal copy
understand coal fires and their thermal patterns as well as the limitations occurring during their analysis. We believe that the resultspresented here can practicably help for the planning of coal fire thermal mapping campaigns — including remote sensing methodsand the thermal data can be included into numerical coal fire modelling as initial or boundary conditions.© 2007 Elsevier B.V. All rights reserved.
Keywords: Coal fire simulation; Simulated heat sources; Thermal analyses; Temperature profiles; Airborne thermal scanners
1. Introduction
Coal fires occur in many countries worldwide (Glover,1998; Prakash and Gupta, 1999; Pennig, 2003; Kuenzer,2005). A coal fire is defined as burning volume of coal,which can be a coal seam exposed to the surface, aburning underground seam or a burning coal waste or coalstorage pile. The ignition of the fires can occur naturally orthrough human influence. In most cases coal fire ignitionis triggered through mining activities (Kuenzer et al.,2007a). Through the moving and exposure of large coalvolumes, reaction surfaces increase and the carbon in thecoal reacts with oxygen in the air. This is an exothermalprocess. If the released heat cannot escape (insufficientventilation) the coal can ignite at temperatures as low as80 °C. (Walker 1999; Chaiken et al., 1998; Banerjee,1982; Banerjee et al., 1972; Bylo, 1960).
Negative influences of such fires are manifold. Theyinclude the emission of large amounts of green houserelevant as well as toxic and health threatening gasses(Kuenzer et al., 2007b,), the sudden collapse of bedrockdue to the volume loss underground (Chen, 1997), thedeterioration of vegetation, and the endangering ofmining activities (see Fig. 1). Economically, they lead tothe loss of the valuable resource coal. We havecalculated that the loss of coal due to coal fires in
China equals the German annual hard coal production(Kuenzer et al., 2007a). Accordingly, the amount of CO2
released due to coal fires in e.g. China is estimated tocontribute with 0.1% to all human induced CO2
emissions on a global scale (Kuenzer et al., 2007a,b).As a consequence of these devastating impacts,
numerous authors have addressed the problem of coalfires based on mineralogical, geophysical and remotesensing based research. One research group mainlyinvestigates the formation of new minerals around coalfire induced cracks and vents (Lapham et al., 1980; Coateset al., 2005, Masalehdani et al., 2005; Dai et al., 2002;Livingood et al., 1999). Other scientists employ methodssuch as gas sample analysis, electromagnetic profilemeasurements, geophysical modelling, temperature mea-surements, micro seismic, and geo-electrics to quantita-tively analyze, locate and predict the coal fires and theirdevelopment (Lohrer et al., 2005; Wessling et al., 2005;Litschke et al., 2005; Wessling, 2007. Remote sensingbased coal fire research has mainly focused on coal firerelated thermal anomaly detection (Ellyett and Fleming,1974; Fisher and Knuth, 1968; Knuth et al., 1968; Giglioet al., 1999; Mansor et al., 1994; Li, 1985; Moxham andGreene, 1967; Prakash and Gupta, 1999; Prakash et al.,1995; Saraf et al., 1995; Zhang, 2004; Kuenzer et al.,accepted for publication; Zhang and Kuenzer, accepted
Fig. 1. Coal fire area in Wuda, Inner Mongolia, China. Note the gas exhaust in the background of the left image. Surface fracturing and landsubsidence occurs due to the volume loss underground and is commonplace. Photograph: G. Schaumann, June 2005.
136 J. Zhang et al. / Journal of Applied Geophysics 63 (2007) 135–147

Author's personal copy
for publication) the detection of land cover changes in themining environments (Prakash and Gupta, 1998), thedetection of land surface subsidence due to the volumeloss underground (Guan, 1989) and the development ofmethods for coal fire risk area delineation (Kuenzer, 2005;Kuenzer et al., 2007c). Furthermore, in depth thermalanalysis, such as sub-pixel thermal mapping (Zhang et al.,2004), geologic mapping based on emissivity (Schmuggeet al., 1991) and coal fire quantification (Tetzlaff, 2004)were pursued.
Extinguishing coal fires is achieved by the depletion ofthe fire with oxygen (e.g. covering with sand and loess),the cooling of the fire (e.g. water injections), removal ofthe burning material (coal) as well as the separation ofburning areas from unaffected parts of the seam withmethods such as underground cement- or colloid barriers.
The objective of our experiment was to understand thethermal characteristics of coal fires (minimum-, maxi-mum-, mean temperatures, diurnal temperature cycles,thermal anomaly extents etc.) over the course of a diurnalcycle and with respect to various backgrounds Anintegrated controlled experiment of simulated coal fireswas conducted on 23rd and 24th of July 2002. Asimulation of coal fires has never been done by other coalfire researchers and is unique in its design. Also detailedtemperature measurements of coal fires have not beenreported about. The advantage of simulated coal firesversus natural coal fires is the fact that simulated coal firesunder easily controllable conditions can be investigated inmore detail than in the field. Firstly, materials used(background materials and the coal itself) are veryhomogeneous and temperature variation according tochanges in background material or coal layering densityetc. can be excluded. Furthermore, temperatures can bemeasured over the course of the night, which is difficult toachieve in dangerous coal fire terrain in-situ. Also,detailed inside-fire temperatures could be collectedthrough the special set up of the experiment. In thefield, inside-fire temperatures can only be obtained atplaces, where cracks in the bedrock allow a “directaccess” to the fire. This is rarely the case. Additionally thesimulated fires could be observed with a thermal linescannermounted on an observation tower aswell aswith athermal scanner from an airplane. Due to logistic limi-tations these two measurement options would not havebeen possible in-situ for the coal fires in China (which weusually investigate).
The purpose of the work is thus to receive moredetailed temperature information about coal fires that wecould not collect at real coal fires in-situ (e.g. the inside-fire temperatures). Furthermore, the applicability ofthermal line scanner instruments and thermal aerial
survey should be tested. Generally speaking, the pre-sented research belongs to the category of basic research–all aiming at a better understanding of coal fire thermalpatterns, separability of thermal anomalies and back-ground and the supply of data for future modelling.Currently, the topic of coal fires raises increased aware-ness in public and scientific media, since possibleextinction of fires could contribute to certified emissionstrading within the framework of the Kyoto Protocol andfuture protocols to follow. Currently, several researchersare involved in the question on how to define baselines forgreen house gas emission estimates. This tasks provesdifficult since underground coal fires are not accessible,vary strongly in size and burning intensity and manyquestions are still unanswered. Thus, we believe that anyadditional information on coal fire temperatures and theirdistribution is needed.
During the experiment on July 23rd it was sunny andon July 24th it was cloudy. Two coal fires, simulatingboth a surface and an underground coal fire, wereignited at 9:00 in the morning of the first day and keptcontinuously burning until 14:00 in the afternoon of thefollowing day. The fire's temperatures were measuredon the ground using contact thermometers as well as noncontact Raytec radiometers. Measurements were pur-sued in numerous spots on the surface and even withinthe fires as well as during numerous times of the ana-lyses period. Additionally, a Raytec MP 50 LineScanner, mounted on an observation tower, was testedfor the recording of radiant temperatures of the fires.Furthermore, an airplane equipped with the AdvancedBIRD Airborne Simulator (ABAS) sensor for detectingthermal anomalies passed over the test area 17 times atdifferent flight heights. The ABAS sensor is an airbornesensor, which has the same configuration as the satellitesensor BIRD (Oettl et al., 2003).
2. Setting of the experiment
The coal for the experimentwas high quality anthracitecoal of similar composition as part of the coal in theChinese coal fire areas, we usually investigate (Kuenzeret al., 2007a). As background material for the surface fireas well as for the covering of the subsurface fire a brightcoarse grained quartz sandwith a particle diameter of 0.1–0.5 mm was ordered. It was representative for the lightcoloured white to beige sandstone often overlaying thecoal seams in our Chinese test areas.
The experiment was located at a sports field of theGerman Aerospace Centre, DLR, Oberpfaffenhofen,Germany. As shown in Fig. 2, an observation tower islocated in the centre of the northern part of the test site.
137J. Zhang et al. / Journal of Applied Geophysics 63 (2007) 135–147

Author's personal copy
Thermal monitoring and camera equipment were placedabout 10 m above the ground. A concrete path withrailway tracks separates the test site into two parts: theeastern part and the western part. Both parts werecovered by green grass with a height of 50 cm. We referto it as’high grass’. The simulated underground coal firewas located in the eastern part and the simulated surfacecoal fire was located in the western part. They were 25 maway from the tower and 2 m away from edges of theconcrete path. Around the fires, the grass was cut to10 cm height. We refer to this second grass type as’lowgrass’ (see Figs. 2 and 3).
The simulated surface fire was ignited in a metal wirecontainer with dimensions of 0.5 m length, 0.5 m widthand 0.5 m height. The container was fixed on a basesupporter with a dimension of 1 m length, 1 m width and0.5m height. The container was constructed using thermalresistant material and was perforated to provide optimalair ventilation (see Fig. 3). An underground coal fire wassimulated by covering a burning coal fire with a sandcone. This fire was held in a similar container with
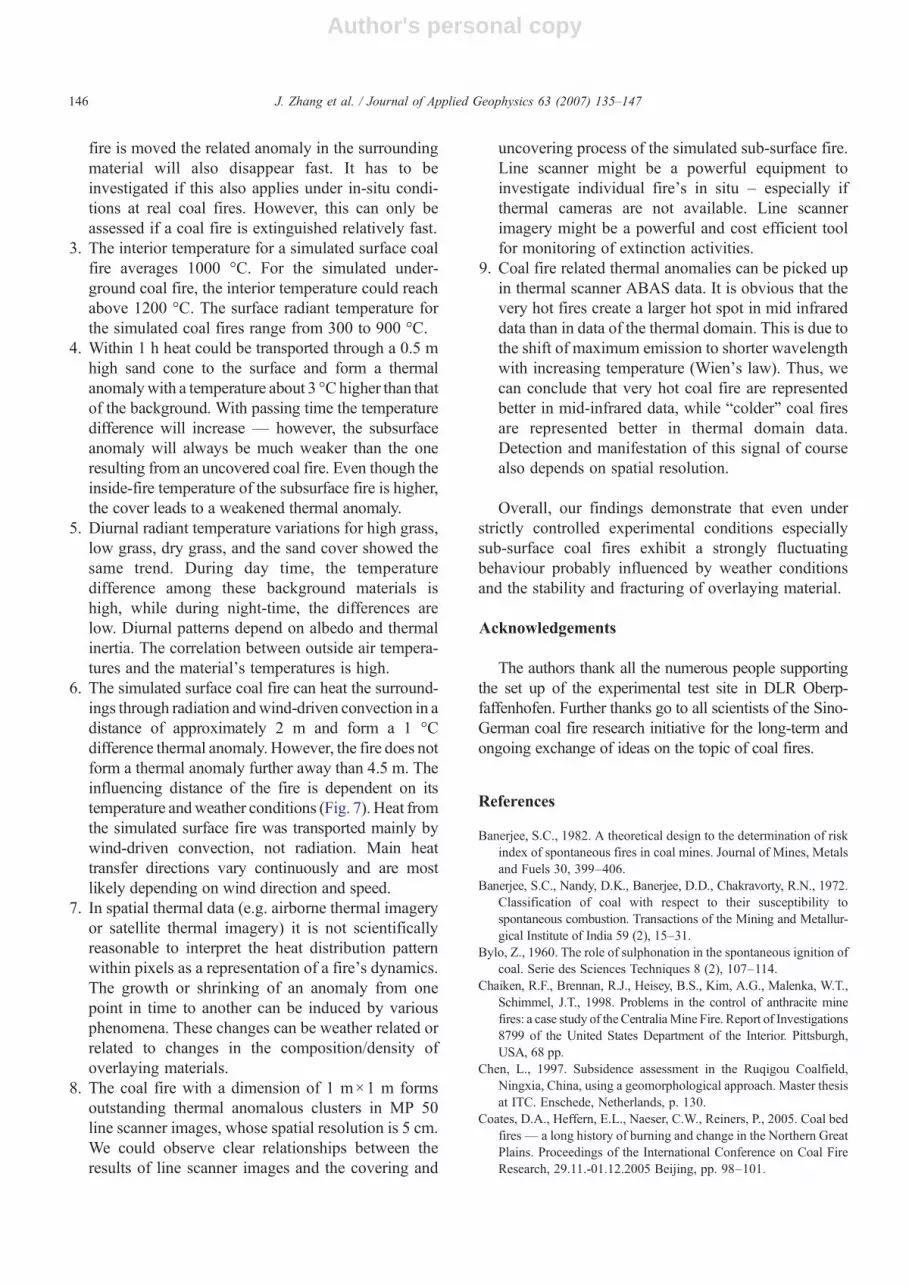
dimensions of 1m length, 1mwidth and 0.5m height (seeFig. 4). The size of the container is four times as big as theone for simulating the surface fire. The big container couldhold more coal, which could not only make the fire strongenough to not be extinguished by the sand cone, but alsoto make the fire last long enough for the measurementcycle. The underground container had an extra ventilationsystem, consisting of perforated tubes at the bottom of thebox. These three tubes were 2.5 m long. They couldtransport air from outside the covering sand cone into thecovered coal in case the fire would not get enough oxygenvia the other pathways. However, it showed that theseventilation pathways were not necessary for the fire toremain burning. At 19:00 the fire was covered by a sandcone with a height of 0.5 m. This happened 10 h after thefire was ignited to ensure that the fire had a homogeneousinside temperature distribution.
A sand covered surface area with dimensions of8.5 m×8.5 m was placed on the western part of the testsite to simulate a homogeneous environment. The sandwas the same sand as that forming the underground coal
Fig. 2. Map of test site at DLR, Oberpfaffenhofen. Note that the left side is the eastern part of the test area and the right part is the western part of thetest area since we visualized this map as observing the area from the observing tower. SUF: simulated underground fire. SSF: simulated surface fire.HG: high grass, LG: low grass. The magnified drawing in the lower right corner shows a more detailed setting of the two fires: the simulatedunderground fire left, and the simulated surface fire, right. Note that in the experiment set up an electric heater (star) is placed between those two firesfor calibration purposes. FCU: Contact temperature for simulated underground coal fire in fire centre, FRUN, FRUE, FRUS, and FRUW radianttemperature measurement on top of the sand cone, facing to the North, East, South andWest. FRU = Fire Radiant Temperature of underground fire onthe surface. SC11–55: Measuring spots on the sand cover area of the simulated surface fire.
138 J. Zhang et al. / Journal of Applied Geophysics 63 (2007) 135–147
Author's personal copy
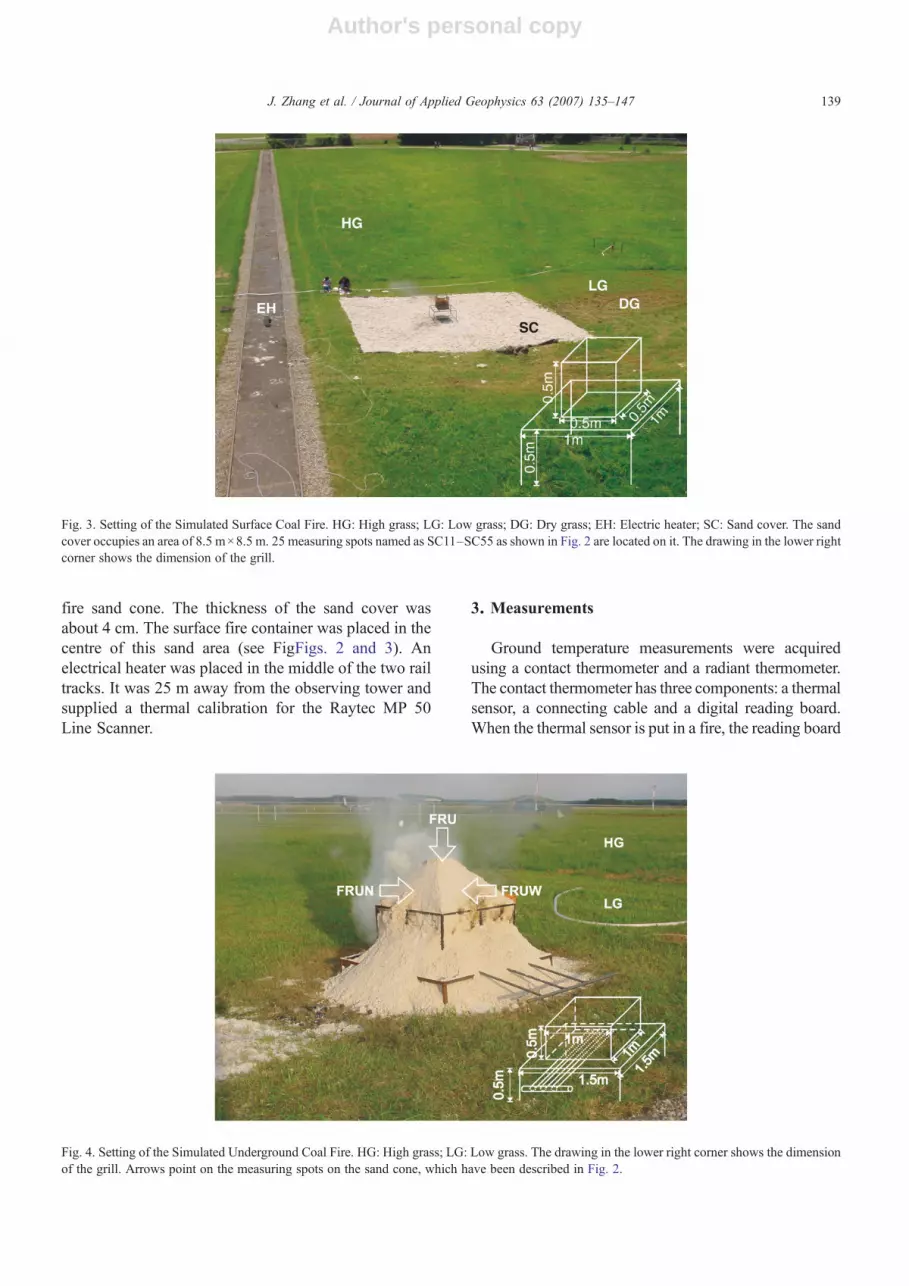
fire sand cone. The thickness of the sand cover wasabout 4 cm. The surface fire container was placed in thecentre of this sand area (see FigFigs. 2 and 3). Anelectrical heater was placed in the middle of the two railtracks. It was 25 m away from the observing tower andsupplied a thermal calibration for the Raytec MP 50Line Scanner.
3. Measurements
Ground temperature measurements were acquiredusing a contact thermometer and a radiant thermometer.The contact thermometer has three components: a thermalsensor, a connecting cable and a digital reading board.When the thermal sensor is put in a fire, the reading board
Fig. 4. Setting of the Simulated Underground Coal Fire. HG: High grass; LG: Low grass. The drawing in the lower right corner shows the dimensionof the grill. Arrows point on the measuring spots on the sand cone, which have been described in Fig. 2.
Fig. 3. Setting of the Simulated Surface Coal Fire. HG: High grass; LG: Low grass; DG: Dry grass; EH: Electric heater; SC: Sand cover. The sandcover occupies an area of 8.5 m×8.5 m. 25 measuring spots named as SC11–SC55 as shown in Fig. 2 are located on it. The drawing in the lower rightcorner shows the dimension of the grill.
139J. Zhang et al. / Journal of Applied Geophysics 63 (2007) 135–147

Author's personal copy
gives a value of its temperature. It had been used formeasuring the temperature inside the simulated surfacefire and the simulated underground fire. The radiantthermometer is directed at the target, and the measuringspot on the surface is marked by a red laser marker. Onereceives readings of the radiant temperature for the redlaser marked area. It had been used for measuring thesurface radiant temperature of the simulated surface fire,the simulated underground fire, high grass, low grass, drygrass, and the sand covered area. Fig. 2 shows locations ofmeasuring spots and their correspondent indexes usingthe radiant thermometer during the experiment. After thesimulated underground fire was covered by the sand cone,it had 6 measuring spots located on the top of the sandcone (index: FRU), the centre of the fire measured by acontact thermometer (index: FCU), and centres of 4 coneslopes facing to the North, East, South and West (index:FRUN, FRUE, FRUS, and FRUW). High grass had 6measuring spots (index: HG1-HG6). Low grass had 9(index: LG1-LG9) and Dry grass had one (index: DG). Inthe sand covered area, there were 25 measuring spots(index: SC11–SC55), which were evenly distributed inthe area with a distance between two spots of 2 m. Thecentre spot was the simulated surface fire. Each spot wasmarked to make sure that measurements were taken fromthe same point. Ground temperature measurements wereacquired each hour from 11:00 to 14:00 of the next day(measurements were not started at 9:00, because it tooksome time to get the fire going).
The Raytec MP 50 line scanner took images of thefires from the observation tower. The Raytec MP 50Line Scanner recorded temperatures of the fire areas 31times between 14:20–20:37 on the first day and 62times between 05:33–13:05 on the next day.
During the experiment, the ABAS sensor tookairborne IR images of the test site. ABAS stands forAdvanced BIRD Airborne Simulator. BIRD is a Bi-spectral InfraRed experimental Satellite, which wasworking between 2001 to 2004 (Oettl et al., 2003).The temperatures of the fires and background werealso measured on the ground. During ABAS over-passes the ground temperature measurements of thesand cover area were taken at 5 measuring spotsinstead of 25 measuring spots because of time limits.The ABAS sensor was flown over the test site 17times between 14:28–15:13 the first day and 05:41–06:23 and 07:57–08:31 on the next day, respectively.The ABAS main sensor payload consists of a two-channel infrared Hot Spot Recognition Sensor system(HSRS), and a Wide-Angle Optoelectronic StereoScanner(WAOSS-B). HSRS is a two-channel push-broom scanner with spectral bands in the mid-infrared
(MIR:3.4–4.2 μm) and thermal infrared (TIR: 8.5–9 μm) spectral ranges.
4. Results
4.1. Temperatures of simulated coal fires and theirthermal anomalies
The temperature inside the simulated surface fire(FCS) was measured 10 times using the contact ther-mometer between 11:00–19:00. The maximum temper-ature measured was 1080 °C. The minimum was 880 °C.The mean temperature was 983 °C (see Table 1) Thestandard deviation was 64 °C. Temperatures inside thesimulated surface fire were completely independent fromthe outside air temperature (correlation factor 0.065).
Surface radiant temperatures for the simulated surfacefire (FRS) have beenmeasured 34 times using the radiantthermometer between 11:00 on the 23rd to13:00 of thefollowing day. Within these 26 h, the maximum temper-ature measured was 900 °C. The minimum temperaturewas 309 °C. The mean temperature was 640 °C. Radianttemperature of the simulated surface fire could changeup to 250 °Cwithin one measurement time depending onspatial location. Radiant temperature for some parts of
Table 1Temperature measurements in centigrade
Time AT FCS FCU FRS Time AT FCS FCU FRS
11:15 24 880 313 1:45 15.7 950 40012:15 29.4 2:45 15.7 50012:52 25.7 309 3:45 14.9 850 60013:55 24.9 957 500 4:45 15.5 1200+ 17.814:20 920 600 5:42 15.3 700–90014:28 30 994 650 6:01 15.2 45(NF)14:38 26.3 937 680 6:08 15.6 700–90014:47 26.3 49(NF) 6:16 15.2 70014:59 28.8 33.8(NF) 6:24 15.3 650–90015:05 24.4 1050 790 7:46 17.2 700–90015:12 25.1 1050 600–850 8:04 17.8 750–90016:36 25 1080 600–700 8:11 17.2 98(NF)17:59 24.6 960 300–400 8:19 17.5 650–80018:55 26 1005 670–780 8:25 17.2 700–90019:15 21 842 8:39 17.3 700–90019:50 19.5 1000 750 9:04 17.4 60020:58 16.9 1070 800–900 10:08 18.2 60021:45 14.5 890 360 11:07 19.6 55022:46 14.4 900 600–700 12:05 19.8 500–60023:45 870 600 13:10 20.8 8600:45 15 970 600–700
AT: Air temperature; FCS: Temperature inside the simulated surfacefire measured with a contact thermometer; FCU: Temperature insidethe simulated underground fire measured with a contact thermometer.FRS: Surface radiant temperatures for the simulated surface firemeasured with a Raytec. NF: Temperature of the sand cover, where fireis removed away for a while as described in the text.
140 J. Zhang et al. / Journal of Applied Geophysics 63 (2007) 135–147

Author's personal copy
the fire was 650 °C, while at the same time, for otherparts it was 900 °C (see Table 1). The surface radianttemperature of the simulated surface fire was alsodependent on the inside fire temperature. Their correla-tion factor was 0.68.
The simulated surface fire was moved away from itsoriginal place 4 times during the experiment at the time of14:47, 14:59, 06:01 and 08:11. The fire was removed foronly about 1min to allow scanner measurements with andwithout the fires. This was done to investigate thebehaviour of the background relative to the removal of theheat source. The radiant temperature of the sand on the firespot was measured just a few seconds after the fire wasmoved, which were 49 °C, 34 °C, 45 °C and 98 °Crespectively. Before the removal they were 135 °C,102 °C, 109 and 160 °C The correspondent air temper-atures (AT) were 26.3 °C, 28.8 °C, 15.2 °C, and 17.2 °C.Measurements at 14:47 and 14:59 showed that thetemperature of the thermal anomaly formed by the surfacefire drops rapidly when the surface fire was moved away.
After the simulated underground fire was covered bythe sand cone, temperature inside it (FCU) had beenmeasured 10 times using the contact thermometer from19:00 to 05:00 of the next day. The minimum temperaturemeasuredwas 842 °C. Themean temperature was 954 °C.The standard deviation was 112 °C. During the lastmeasurement, the thermal sensor melted and the ther-mometer broke. The melting temperature of the thermalsensor is 1200 °C, which means that temperature insidethe simulated underground fire reached over 1200 °C.
The surface radiant temperature of the 5 measuringspots (FRU, FRUN, FRUE, FRUS, and FRUW) for thesimulated underground fire was measured 11 times usingthe radiant thermometer from 19:15 to 04:45 of the nextday. The results are shown in Fig. 5. It can be seen that at19:15, which is just a few seconds after the sand cone hadbeen built, the top measuring spot of the sand cone (FRU)had a 3.5 °C lower temperature than the maximumtemperature of the background. Here we use the fourcorner measuring spots SC11, SC15, SC51, and SC55 ofthe sand layer of the surface fire (see Fig. 2) as thebackground (they are not influences by the surface fire,which will be demonstrated later). After 35 min, at 19:50,it had a 1.5 °C higher temperature than the maximumtemperature of the background. This high temperaturecould be considered as a thermal anomaly induced by thecoal fire. The thermal anomaly had a temperature ranging1.5 °C to 4.2 °C higher than the maximum temperature ofthe background. The average is about 3 °C. The reasonthat the thermal anomaly was formed so rapidly is that thesand cone had a high porosity, which favours air ventila-tion and heat transfer through convection. The highest
temperature difference of 6.7 °C between the fire thermalanomaly and the backgroundmaximum occurred at 03:45due to a collapse of a cone slope. Radiant temperatures formeasuring spots FRUN, FRUE, FRUS, and FRUWshowed higher values than that of the top measuring spotFRU, because they were closer to the fire (sand cover onthe slopes of the cone was thinner). Temperaturesfor FRUE, FRUS, FRUW showed big variances. Theyranged from 20 to 50 °C. Heat coming from the side of thefire container influenced the measurements and it also hasto be kept in mind that the sand cone is not completelystable. As the coal burns, volume loss occurs and the sandwill slightly shift (see Fig. 4).
4.2. Temperature of background materials
If we investigate thermal anomalies we need areference that anomalies can be considered anomalousagainst. Each fire thermal anomaly can only be detected(in-situ or in thermal imagery) if the difference to thebackground is pronounced enough. Thus backgroundmeasurements act as a kind of standard and also reflectthe natural temperature variation of the commonsurfaces in real coal fire areas.
Fig. 6 shows diurnal radiant temperature variationsfor high grass (HG), low grass (LG), dry grass (DG), and
Fig. 5. Surface Temperature of the Simulated Underground Coal Fire.FRUN: Radiant temperature measured at the centre of the North Slope ofthe sand cone; FRUE: East slope; FRUS: South slope; FRUW: Westslope; FRU: Top as shown in Fig. 4; AT: Air temperature; SCB: Back-ground temperature from the sand cover in the simulated surface fire areaas SC shown in Fig. 3. From 19:30, the temperature of the backgroundwas the lowest. Heat from the fire transferred to the top of the sand conewithin 1 h. The top of the sand cone is warmer than the background by anaverage temperature of 3 °C. Note that the y-axis between 10–30 °C isextended (enlarged) to better visualize the parallel graphs of FRU, ATandSCB.
141J. Zhang et al. / Journal of Applied Geophysics 63 (2007) 135–147

Author's personal copy
air temperature (AT). Data on diurnal changes in radianttemperature for these materials are calculated from theaverages of all measurements. As fire backgroundtemperature the temperatures resulting from the averagemeasurements of the sand cover were taken (B). Themost rapid temperature changes, shown by steep curves,occur near dawn and sunset. Low grass always showedhigher temperatures than high grass. Dry grass showedcooler temperatures than low grass during night-time,but warmer temperatures than low grass during daytime.This is due to a higher biomass and thus water content inthe high grass, which leads to a higher thermal inertia ofthese areas. The higher the water content of an object thehigher its thermal inertia, meaning the higher itsresistance for a heating of 1 °C, e.g. water surfaceshave a lower diurnal temperature amplitude than landsurfaces. The curve for radiant temperature of the sandcover is located between the curves for high grass andlow grass during night-time. During daytime, high grassand low grass are warmer than the sand cover (with oneexception). During the day time, the temperaturedifference among these background materials is high,while at in night-time, the difference is low. The curvesfor all these materials have the same trends. Thecorrelation between air temperature and the sand coveris 0.90. The correlation factor between sand cover andlow grass is 0.92. Between high grass and low grass itis 0.98. Concluding we can say that all backgroundmaterial follow the same trend, which goes in accord-ance with the outside air temperature. Night-time ismore suitable for background-anomaly separation sincethe variation of background temperatures is lessaccentuated.
4.3. Temperature distribution of the surface fire'sbackground sand layer
The sand layer can be considered as a homogenousarea. In this 8.5 m*8.5 m area, 25 measuring spots(SC11–SC55) were set (see Fig. 2). Radiant tempera-tures for these observing spots were measured everyhour during the experiment. The uncovered surface fireitself was of course not measured for these backgroundobservations. The experiment setup (see Fig. 3) allowedto measure underneath the container holding the fire.According to the distance to the fire, these measure-ments were grouped into 5 groups (see lower right areaof Fig. 2). Group I includes the measuring spots SC32,SC23, SC43, and SC34, which were 2 m away from thecentre of the fire. Group II includes the measuring spotsSC22, SC42, SC24, and SC44, which were 2.8 m awayfrom the centre of the fire. Group III includes SC31,SC13, SC53, and SC35. They were 4 m away from thecentre. Group IV includes SC12, SC21, SC41, SC52,SC54, SC45, SC25 and SC14. They were 4.5 m awayfrom the centre. Group V includes 4 corner spots (SC11,SC15, SC51 and SC55). They were 5.6 m away from thecentre. Diurnal mean radiant temperature variations forthese five groups are shown in Fig. 7. It can be seen thatthe radiant temperature for group one was always higherthan that for other groups. From 18:00 to 13:00 the nextday the radiant temperature for group 2 was higher thanthat for group 3, 4 and 5. From 16:30 to 09:00 the nextday the radiant temperature for group 3 was higher thanthat for group 4 and 5. The diurnal radiant temperaturefor group 4 was almost the same as that for group 5. Thiscan be interpreted as following. The simulated surfacecoal fire can heat the surroundings through radiation andwind-induced convection in a proximate distance of 2 mand forms a 1 °C difference thermal anomaly (2 mea-surements out of 21 were smaller than 1 °C). Othersources for the anomaly can be excluded — the sandlayer was homogeneous, the measuring area wascompletely flat and the measuring device calibratedand temperature measurements were actually alwaysrecorded even with two radiance thermometers, whichshowed no difference during the whole measuringperiod. In our case the heat from coal fires does notinfluence areas at a distance further away than 4.5 m.Group 4 and group 5 can be considered as background.The heating extent of the fire can sometimes reach 2.8 or4 m and forms a thermal anomaly with temperaturedifference less than 1 °C.
Fig. 8 shows 4 diurnal maps of radiant temperaturesfor the background sand cover below the fires. The mapsindicate the thermal anomalous pattern formed by the
Fig. 6. Diurnal radiant temperature variations for different materials.AT: Air temperature; HG: High grass; LG: Low grass; DG: Dry grass.B: sand cover background as shown in Fig. 3. All surfaces show thesame trend: High radiant temperature during daytime and lowtemperature during night-time.
142 J. Zhang et al. / Journal of Applied Geophysics 63 (2007) 135–147

Author's personal copy
subsurface coal fire on the ground below the firecontainer. The axis of the high values (arrows) showsthe dominant heat transfer directions. Probably causedby wind influence (because other influences can beexcluded), the dominant heat transfer directions varied toalmost all directions. Although the radiant temperaturesare higher when the measuring spots are closer to the fire,the pixels close to the fire centre never formed a perfectcircle (or a concentric temperature pattern of gradualtemperature decrease with distance from the fire centre).
We think that a thermal anomaly is formed not throughradiation, but by wind driven convection of heat withshifting air masses. Of course no real-world conditionsallow for the measurement of surfaces below coal fires.However, the conclusions drawn from the measurementsare meaningful also for real world conditions. Fig. 8indicates that convection plays the major part for theirregularity of the thermal anomalies. This means that theshape and extent of thermal anomalies mapped in-situalso strongly depends on the weather situation.
From Fig. 8 we can draw a very important con-clusion. The assessment of coal fire dynamics is verydifficult. As we can see from Fig. 8 the manifestation ofthe coal fire anomaly with regard to the backgroundsurface is not exclusively depending on the fire'sintensity, but also on factors like wind direction andspeed, which is the only factor that varied during theexperiment. The fire represented in Fig. 8 has alwaysbeen stable. Comparing the 17:50 result (with threeanomalous hot pixels) with the 13:00 result on the nextday (2 outstanding pixels) does not allow for theconclusion that the fire has shrank or changed. Thisfinding is very important with respect to airborne andsatellite based remote sensing research undertaken,where some authors conclude from multi-date imagery(e.g. 1995 and 1999) that a fire has grown, shrank ormoved a certain direction (Prakash and Gupta, 1999,Prakash et al., 1995).
Fig. 8. Diurnal Maps of Radiant Temperatures for the Sand Cover as shown in Fig. 3 derived from point measurements (SC11–SC55 in Fig. 1) with aradiometer. Arrows indicate the main heat transfer directions. These shifts occur randomly and mainly seem to depend on outside wind.
Fig. 7. Diurnal Radiant Temperature Variations for Measurements withDifferent Distance to the Coal Fire. Group I: Measuring spots 2 maway from the fire; Group II: 2.8 m; Group III: 4 m; Group IV: 4.5 m;Group V: 5.6 m. Thermal anomalies caused by the fire can not reachfurther than 4.5 m.
143J. Zhang et al. / Journal of Applied Geophysics 63 (2007) 135–147

Author's personal copy
4.4. MP 50 line scanner images of coal fires
The MP 50 line scanner is a stationary scanner. Theradiation transmitted through an IR filter is focused ontoa detector that converts the radiation into an electricsignal. The resulting image records radiant temperaturefor targets in decimal degrees. A pixel will be saturatedat 300 °C. The MP 50 line scanner was set 25 m awayfrom the fires and 10 m above the ground. The resultingimages have a spatial resolution of 5 cm.
Fig. 9 shows a series of theMP 50 line scanner imagesacquired at 14:34 and 20:29 on the first experiment dayas well as on 05:33, 08:01, 11:01, and 13:05 on the nextday. The images cover an area of the simulated under-ground coal fire and its surroundings, including theelectric heater that served as a standard thermal emissionsource with a certain fixed temperature. The simulatedunderground coal fire was covered by the sand cone from19:00 of the first day to 08:30 of the next day.
In all images the fire formed a thermal anomalouscluster occupying a lot of pixels in all images. The thermalanomalous cluster was so outstanding that it could be
easily separated from the background. It saturated in Fig. 9a, and f, where the simulated surface fire is not covered yetand respectively uncovered again. The electric heaterforms a constant anomaly always saturating.
The differences between Fig. 9-a to f are obvious. InFig. 9-a the fire is still uncovered, burning at full intensity,and reaching saturation in the line scanner imagery. Infigure b, which was acquired 1 h and 29 min after the firehad been covered, the thermal anomaly is already muchweaker. It has split into a bimodal anomaly, which mightresult from uneven sand layering density of the coveredfire and existing ventilation channels. However, theanomaly weakens and only forms a very subtle anomalyagainst the background at 5:33 am the next day (seeFig. 9-c). The anomaly is more accentuated at 8:01, whichis due to increasing instabilities in the sand cone. 2 h and31 min after the burning coal was uncovered againthe anomaly picks up again and increases in strength(Fig. 9-e), until reaching its original strength before thecovering process (Fig. 9-f). The time lag between theuncovering and the anomaly reaching its full manifesta-tion depends on ventilation, which increases the burning
Fig. 9. MP 50 line scanner images. X: Rows; Y: Columns; Z: Temperature (°C); S.U.F.: Simulated underground coal fire; EH: Electric heater. The coalfire with a dimension of 1 m*1 m forms an outstanding thermal anomalous cluster in MP 50 line scanner images, whose spatial resolution is 5 cm.
144 J. Zhang et al. / Journal of Applied Geophysics 63 (2007) 135–147

Author's personal copy
intensity of the fire. When the fire is uncovered the coalwill be exposed to air. With increasing ventilation andwind the burning process will speed up again.
Concluding we can say that a thermal line scannerrepresents changes in coal fire thermal anomalies andtemperature distribution very accurately. The resolutionof the images is very high (5 cm). To mount a scanner ona observation rack would even be feasible in compli-cated coal fire terrain. Thus, line scanners could beemployed to monitor coal fire extinction activities andensure that coal fires do not flare up again.
4.5. ABAS images of the simulated coal fires
The ABAS sensor flew over the simulated coal fires ofthe experimental test site several times during the 2 days.However, due to strong distortions in geometry andradiometric instabilities at that time only few imagesprovided useful for later analyses. Fig. 10 shows blackand white image acquired on July 23rd at 15:11 in theafternoon. Fig. 10-a represents the area as seen in thereflected 0.89 μm band, which is more or less a visualrepresentation of the experimental site. Note that the sandcover of the sub-surface fire can be seen as a small lightdot left of the railway track. The background sand layer ofthe surface fire can be seen as a light square (compare alsowith Figs. 2, 3, and 4). In Fig. 10-b we see the mid-infrared image acquires at 3.8 μm wavelength. In thiswavelength domain very bright spots indicate very hot
spots. Note that the sub-surface fire anomaly seems a littlebit smaller (right hot spot). This is because the surface fireis smaller in dimensions (compare Figs. 3 and 4) and bothfires are uncovered (the sub-surface fire was covered withthe sand cone only at 19:00). Fig. 10-c represents theemission pattern in the thermal domain at 8.8 μm. Brightareas are regions of high temperature, while dark regionsexhibit low temperatures. As expected, vegetation (trees)emits the lowest temperatures. The two fires can bespotted as small hot spots, which are not as outstanding asin the mid infrared domain.
5. Conclusions
From the conducted two day experiment of simulatedcoal fires under outside simplified conditions we candraw the following conclusions.
1. The inside temperature of surface coal fires isindependent of the surrounding air temperature, whilethe fire's surface radiant temperature shows a highcorrelation with inside fire temperatures. In situ insidefire temperatures should thus be independent of season.Since the surface temperature should stay constantwhile the background varies, coal fire observations atlow temperatures (winter time or night-time) should befavoured for maximum contrast of thermal anomalies.
2. The stability of a thermal anomaly formed on thefire's background (sand layer) is relatively low. If the
Fig. 10. ABAS thermal scanner image acquire on July 23rd 2002 at 15:11 pm. a: NIR domain at 0.89 μm, b: MIR domain at 3.8 μm and c: TIRdomain at 8.8 μm. Images in the second row are the zooms of the areas of interest.
145J. Zhang et al. / Journal of Applied Geophysics 63 (2007) 135–147
Author's personal copy
fire is moved the related anomaly in the surroundingmaterial will also disappear fast. It has to beinvestigated if this also applies under in-situ condi-tions at real coal fires. However, this can only beassessed if a coal fire is extinguished relatively fast.
3. The interior temperature for a simulated surface coalfire averages 1000 °C. For the simulated under-ground coal fire, the interior temperature could reachabove 1200 °C. The surface radiant temperature forthe simulated coal fires range from 300 to 900 °C.
4. Within 1 h heat could be transported through a 0.5 mhigh sand cone to the surface and form a thermalanomalywith a temperature about 3 °C higher than thatof the background. With passing time the temperaturedifference will increase — however, the subsurfaceanomaly will always be much weaker than the oneresulting from an uncovered coal fire. Even though theinside-fire temperature of the subsurface fire is higher,the cover leads to a weakened thermal anomaly.
5. Diurnal radiant temperature variations for high grass,low grass, dry grass, and the sand cover showed thesame trend. During day time, the temperaturedifference among these background materials ishigh, while during night-time, the differences arelow. Diurnal patterns depend on albedo and thermalinertia. The correlation between outside air tempera-tures and the material's temperatures is high.
6. The simulated surface coal fire can heat the surround-ings through radiation andwind-driven convection in adistance of approximately 2 m and form a 1 °Cdifference thermal anomaly. However, the fire does notform a thermal anomaly further away than 4.5 m. Theinfluencing distance of the fire is dependent on itstemperature andweather conditions (Fig. 7). Heat fromthe simulated surface fire was transported mainly bywind-driven convection, not radiation. Main heattransfer directions vary continuously and are mostlikely depending on wind direction and speed.
7. In spatial thermal data (e.g. airborne thermal imageryor satellite thermal imagery) it is not scientificallyreasonable to interpret the heat distribution patternwithin pixels as a representation of a fire's dynamics.The growth or shrinking of an anomaly from onepoint in time to another can be induced by variousphenomena. These changes can be weather related orrelated to changes in the composition/density ofoverlaying materials.
8. The coal fire with a dimension of 1 m×1 m formsoutstanding thermal anomalous clusters in MP 50line scanner images, whose spatial resolution is 5 cm.We could observe clear relationships between theresults of line scanner images and the covering and
uncovering process of the simulated sub-surface fire.Line scanner might be a powerful equipment toinvestigate individual fire's in situ – especially ifthermal cameras are not available. Line scannerimagery might be a powerful and cost efficient toolfor monitoring of extinction activities.
9. Coal fire related thermal anomalies can be picked upin thermal scanner ABAS data. It is obvious that thevery hot fires create a larger hot spot in mid infrareddata than in data of the thermal domain. This is due tothe shift of maximum emission to shorter wavelengthwith increasing temperature (Wien's law). Thus, wecan conclude that very hot coal fire are representedbetter in mid-infrared data, while “colder” coal firesare represented better in thermal domain data.Detection and manifestation of this signal of coursealso depends on spatial resolution.
Overall, our findings demonstrate that even understrictly controlled experimental conditions especiallysub-surface coal fires exhibit a strongly fluctuatingbehaviour probably influenced by weather conditionsand the stability and fracturing of overlaying material.
Acknowledgements
The authors thank all the numerous people supportingthe set up of the experimental test site in DLR Oberp-faffenhofen. Further thanks go to all scientists of the Sino-German coal fire research initiative for the long-term andongoing exchange of ideas on the topic of coal fires.
References
Banerjee, S.C., 1982. A theoretical design to the determination of riskindex of spontaneous fires in coal mines. Journal of Mines, Metalsand Fuels 30, 399–406.
Banerjee, S.C., Nandy, D.K., Banerjee, D.D., Chakravorty, R.N., 1972.Classification of coal with respect to their susceptibility tospontaneous combustion. Transactions of the Mining and Metallur-gical Institute of India 59 (2), 15–31.
Bylo, Z., 1960. The role of sulphonation in the spontaneous ignition ofcoal. Serie des Sciences Techniques 8 (2), 107–114.
Chaiken, R.F., Brennan, R.J., Heisey, B.S., Kim, A.G., Malenka, W.T.,Schimmel, J.T., 1998. Problems in the control of anthracite minefires: a case study of the CentraliaMine Fire. Report of Investigations8799 of the United States Department of the Interior. Pittsburgh,USA, 68 pp.
Chen, L., 1997. Subsidence assessment in the Ruqigou Coalfield,Ningxia, China, using a geomorphological approach. Master thesisat ITC. Enschede, Netherlands, p. 130.
Coates, D.A., Heffern, E.L., Naeser, C.W., Reiners, P., 2005. Coal bedfires— a long history of burning and change in the Northern GreatPlains. Proceedings of the International Conference on Coal FireResearch, 29.11.-01.12.2005 Beijing, pp. 98–101.
146 J. Zhang et al. / Journal of Applied Geophysics 63 (2007) 135–147

Author's personal copy
Dai, S., Ren, D., Tang, Y., Shao, L., Li, S., 2002. Distribution, isotopicvariation and origin of sulfur in coals in the Wuda coalfield, InnerMongolia, China. International Journal of Coal Geology (57),237–250.
Ellyett, C.D., Fleming, A.W., 1974. Thermal infrared imagery of theBurningMountain coal fire. Remote Sensing of Environment 3 (1),79–86.
Fisher, W., Knuth, W., 1968. Detection and delineation of subsurfacecoal fires by aerial infrared scanning. Geological Society America115, 67–68.
Giglio, L., Kendall, J.D., Justice, C.O., 1999. Evaluation of global firedetection algorithms using simulated AVHRR infrared data.International Journal of Remote Sensing 20, 947–1985.
Glover, L., 1998. Burning Beneath the Surface. Tribune ReviewPublishing, USA. (May 3, 1998).
Guan, H., 1989. Applications of remote sensing techniques in coalgeology. Acta Geologica Sinica 2, 253–269.
Knuth, W.M., Fisher Jr., W., Stingelin, R.W., 1968. Detection,delineation and monitoring of subsurface coal fires by aerial infraredscanning. Geographer HRB-Singer, Inc., a subsidiary of the SingerCompany, state College, Pennsylvania, USA, pp. 877–881.
Kuenzer, C., 2005. Demarcating coal fire risk areas based on spectraltest sequences and partial unmixing using multi sensor remotesensing data. Ph.D. thesis, Technical University Vienna, Austria,199 pp.
Kuenzer, C., Zhang, J., Tetzlaff, A., Voigt, S., Van Dijk, P., Wagner,W., Mehl, H., 2007a. Uncontrolled coal fires and their environ-mental impacts: investigating two arid mining environments innorth-central China. Applied Geography 27, 42–62.
Kuenzer, C., Wessling, W., Zhang, J., Litschke, T., Schmidt, M.,Schulz, J., Gielisch, H., Wagner, W., 2007b. Concepts for greenhouse gas emission estimation of underground coal seam fires.Geophysical Research Abstracts of the EGU General Assembly2007, 16.4.-20.4. Vienna, Austria. 2 pp.
Kuenzer, C., Zhang, J., Li, J., Voigt, S., Mehl, H., Wagner, W., 2007c.Detection of unknown coal fires: synergy of coal fire risk areadelineation and improved thermal anomaly extraction. Interna-tional Journal of Remote Sensing 28, 4561–4585.
Kuenzer, C., Hecker, C., Zhang, Wessling, S., Wagner, W., accepted forpublication. The potential of mulit-diurnal MODIS thermal bandsdata for coal fire detection. International Journal of Remote Sensing.doi: 10.1080/01431160701352147
Lapham, D.M., Barnes, J.H., Downey, W.F., Finkelman, R., 1980.Mineralogy associated with burning anthracite deposits of EasternPennsylvania. Mineral Resource Report 78 of the PennsylvaniaGeological Survey. 82 pp.
Li, D.X., 1985. Applied study of airborne remote sensing in Taiyuancoalfield, China. Internal Report of the Remote sensing centre ofthe ministry of coal industry, Xian, China, pp. 3–10 (in Chinese).
Litschke, T., Wiegand, J., Schloemer, S., Gielisch, H., Bandelow, K.F.,2005. Detailed mapping of coal fire sites in combination with in-situ flux measurements of combustive gases to estimate gas floorbalance and fire development. Proceedings of the InternationalConference on Coal Fire Research, 29.11.-01.12.2005 Beijing,pp. 161–163.
Livingood, M., Winicaties, J., Stein, J., 1999. Centralia mine fireanalysis: presence of sulfur-bearing mineral deposits at thermalvents. Research paper at West Chester University, Pennsylvania,USA. 9 pp.
Lohrer, C., Schmidt, M., Krause, U., 2005. Influence of environmentalparameters on the self ignition of coal. Proceedings of the
International Conference on Coal Fire Research, 29.11.-01.12.2005Beijing, pp. 110–112.
Mansor, S.B., Cracknell, A.P., Shilin, B.V., Gornyi, V.I., 1994.Monitoring of underground coal fires using thermal infrared data.International Journal of Remote Sensing 15 (8), 1675–1685.
Masalehdani, M.N., Potdevin, J.L., Cazier, F., Courcot, D., Paquette,Y., 2005. Coal waste heap fires — emission of toxic gases andcondensation minerals, Northern France measurements andanalyses. Proceedings of the International Conference on CoalFire Research, 29.11.-01.12.2005 Beijing, pp. 101–103.
Moxham, R.M., Greene, G.W., 1967. Infrared surveys of coal minefires in the anthracite and bituminous fields, Pennsylvania. USA,Geological Survey Inter-Agency Report BM-2, U.S. Bureau ofMines. 67 pp.
Oettl, H., Briess, K., Lorenz, E., Oertel, D., Shrbek, W., Walter, I.,Zhukov, B., 2003. The disaster,’fires’, its detection and means toimprove information. Space Technology 23 (4), 249–256.
Pennig, L., 2003. Vergleich zweier Kohlebrandregionen in Nordchinamit Hilfe von Fernerkundungs-daten und GIS. Master Thesis at theUniversity of Jena, 90 pp.
Prakash, A., Gupta, R.P., 1998. Land-use mapping and change detectionin a coal mining area – a case study in the Jharia coalfield, India.International Journal of Remote Sensing 19 (3), 391–410.
Prakash, A., Gupta, R.P., 1999. Surface fires in Jharia Coalfield, India—their distribution and estimation of area and temperature from TMdata. International Journal of Remote Sensing 20 (10), 1935–4619.
Prakash, A., Saraf, A.K., Gupta, R.P., Dutta, M., Sundaram, R.M.,1995. Surface thermal anomalies with underground fires in Jhariacoal mine, India. International Journal of Remote Sensing 16 (2),2105–2109.
Saraf, A.K., Prakash, A., Sengupta, S., Gupta, R.P., 1995. Landsat-TMdata for estimating ground temperature and depth of subsurfacecoal fire in the Jharia coal field, India. International Journal ofRemote Sensing 16 (12), 2111–2124.
Schmugge, T.J., Becker, F., Li, Z.L., 1991. Spectral emissivityvariations observed in airborne surface temperature measurements.Remote Sensing of Environment 35 (2), 95–104.
Tetzlaff, 2004, Coal fire quantification using Aster, ETM and Birdsatellite instrument data. Ph.D thesis at the Ludwig MaximiliansUniversity Munich, Germany, 155 pp.
Walker, S., 1999. Uncontrolled fires in coal and coal wastes.International Energy Agency, IEA on Coal Research, London.73 pp.
Wessling, 2007. The investigation of underground coal fires-towards anumerical approach for thermally, hydraulically and chemicallycoupled processes. PhD thesis at the Westfälische WilhelmsUniversity of Münster, 157 pp.
Wessling, S., Litschke, T., Wiegand, J., Schloemer, S., Kessels, W.,2005. Simulating dynamic subsurface coal fires and its real lifeapplications. Proceedings of the International Conference on CoalFire Research, 29.11.-01.12.2005 Beijing, pp. 114–117.
Zhang, J., 2004. Spatial and Statistical Analysis of Thermal SatelliteImagery for Extraction of Coal Fire Related Anomalies. PhD thesisat the Technical University Vienna, Austria, 166 pp.
Zhang, J., Kuenzer, C., accepted for publication. Thermal SurfaceCharacteristics of Coal Fires 1: Results of in-situ measurements.Accepted for publication at Journal of Applied Geophysics.
Zhang, X., Zhang, J., Kuenzer, C., Voigt, S., Wagner, W., 2004.Capability evaluation of 3–5 mm and 8–12,5 mm airborne thermaldata for underground coalfire detection. International Journal ofRemote Sensing 25 (12), 2245–2258.
147J. Zhang et al. / Journal of Applied Geophysics 63 (2007) 135–147


