Embed Size (px)
Citation preview
THE SWRVENEW PLAYERSREPORTApril 2014
The Swrve New Players Report - April 2014 2
INTRODUCTIONThe mobile games business is driven by acquisition. Huge amounts of time and money are spent on attracting new players every month. An entire ecosystem has developed to help us find those players and deliver installs.
But what happens then?
In this report, for the first time ever we lift the lid on new players. We look at how long they stay, and what they pay. It’s essential reading for anyone in the mobile games space.
Enjoy!
Notes on Our Methodology
• The report covers data from the first 90 days (and only the first 90 days) of life of freemium games players. In order to provide that data, we took new players from November 2013: being defined as any player new to a particular game in that month
• The report is restricted to freemium games and examines only revenue delivered from in-app purchases
• This data is aggregated from millions of users across dozens of titles
• Using Swrve’s Fraud Filter technology, only ‘genuine’ revenue events are reported
• Whenever we quote ‘lifetime’ values, these apply to this 90 day period. Whilst clearly revenue occurs beyond this window, our revenue curve suggests that this amount is minimal
The Swrve New Players Report - April 2014 3
HOW LONG DO NEW PLAYERS STAY?Most of us in the industry are instinctively aware that many players don’t necessarily stay in our games for long. On the other hand, there are loyal players who remain within titles for periods of not months but years.
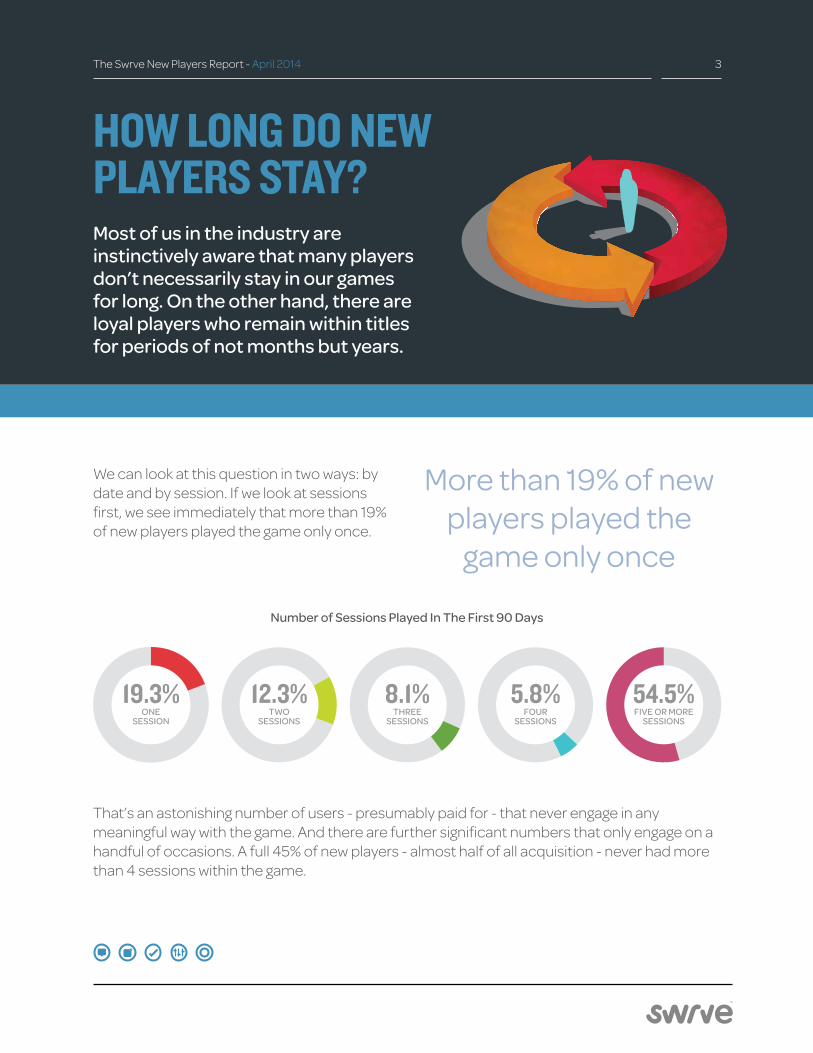
We can look at this question in two ways: by date and by session. If we look at sessions first, we see immediately that more than 19% of new players played the game only once.
More than 19% of new players played the
game only once
That’s an astonishing number of users - presumably paid for - that never engage in any meaningful way with the game. And there are further significant numbers that only engage on a handful of occasions. A full 45% of new players - almost half of all acquisition - never had more than 4 sessions within the game.
54.5%FIVE OR MORE
SESSIONS
5.8%FOUR
SESSIONS
8.1%THREE
SESSIONS
12.3%TWO
SESSIONS
19.3%ONE
SESSION
Number of Sessions Played In The First 90 Days
The Swrve New Players Report - April 2014 4
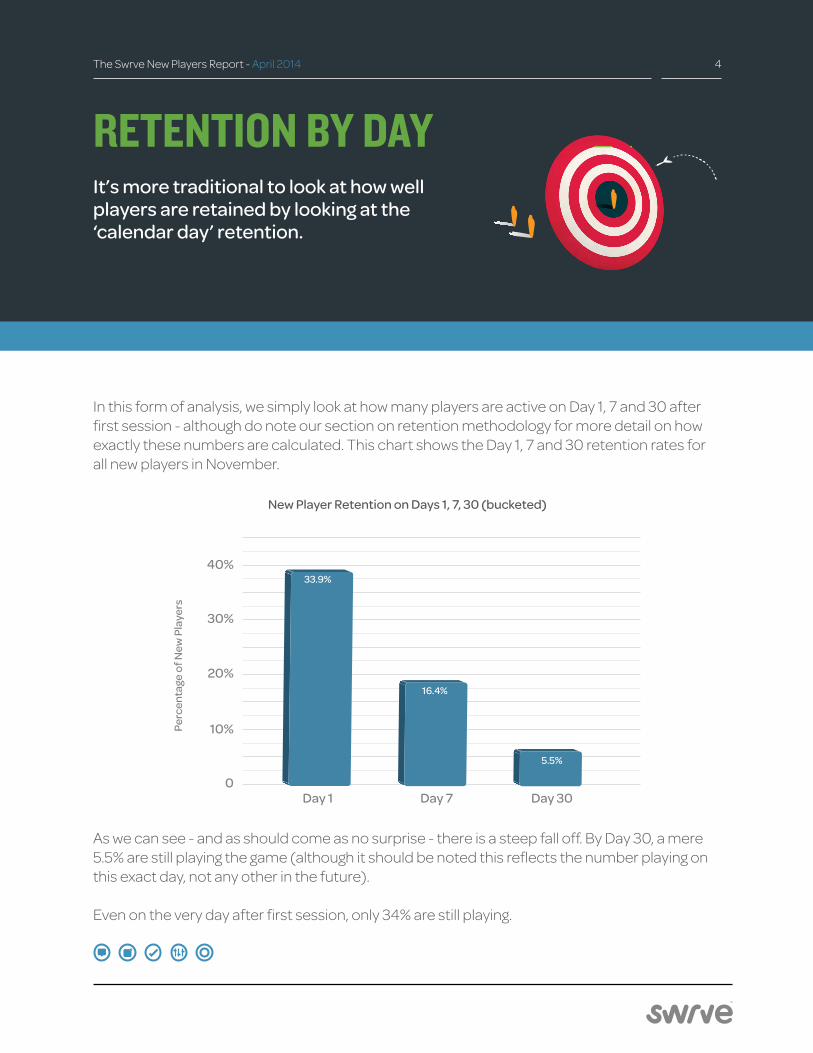
In this form of analysis, we simply look at how many players are active on Day 1, 7 and 30 after first session - although do note our section on retention methodology for more detail on how exactly these numbers are calculated. This chart shows the Day 1, 7 and 30 retention rates for all new players in November.
RETENTION BY DAYIt’s more traditional to look at how well players are retained by looking at the ‘calendar day’ retention.
As we can see - and as should come as no surprise - there is a steep fall off. By Day 30, a mere 5.5% are still playing the game (although it should be noted this reflects the number playing on this exact day, not any other in the future).
Even on the very day after first session, only 34% are still playing.
New Player Retention on Days 1, 7, 30 (bucketed)
0
20%
10%
30%
40%33.9%
16.4%
5.5%
The Swrve New Players Report - April 2014 5
What does this mean? Most importantly, these numbers relating to retention (and number of sessions played) suggest that acquisition as a metric is in many cases close to worthless. As we tend to spend a significant amount of money in this area, that is not a comforting thought.
In brief, game developers operating in the freemium model would do well to keep a careful eye on how new players from specific acquisition sources are retained. If they do not - they may well be wasting their money.
Calculating Retention
Many retention figures are simply calculated based on calendar days - with ‘Day 1’ retention being the percentage of players active at any time during the calendar day after install.
Unfortunately, that creates issues around users whose first session starts just ahead of midnight - or even worse, when due to time zone differences users simply playing a couple of first sessions either side of 8 o’clock (for example) appear to be ‘retained’ into Day 1.
For this reason, Swrve calculates retention based on buckets of 24 hours from first session start. For a player to be ‘Day 1 retained’, they must play at least one session in the period between 24 and 48 hours from the first session start.
The Swrve New Players Report - April 2014 6
To start with the headline, 2.2% of all new players made at least one new purchase over the course of their first 90 days of activity.
Of those ‘payers’ the average total spend was $20.62, which in turn consisted of an average of 3.3 purchases at an average SKU value of $6.15.
Those numbers in turn imply a total revenue per install (which is ultimately the number to be compared with acquisition costs) of $0.45.
WHAT THEY SPENDKeeping new players is one thing. Getting them to spend is another. Over the same 90 day period, we took a close look at how many of these players spent real money, when and how much they spent, and how those purchases were distributed over time.
That number may seem low, but we believe it reflects the single best data in this area published to date - following an actual cohort of users rather than attempting to infer player value from total revenue metrics.
Total revenue per install is 45 cents
It is worth remembering that this figure does not include revenue from advertising or paid installs, and that when comparing this figure with typical CPIs in the industry, the chart-hacking motive for the latter must be taken into account.
The Swrve New Players Report - April 2014 7
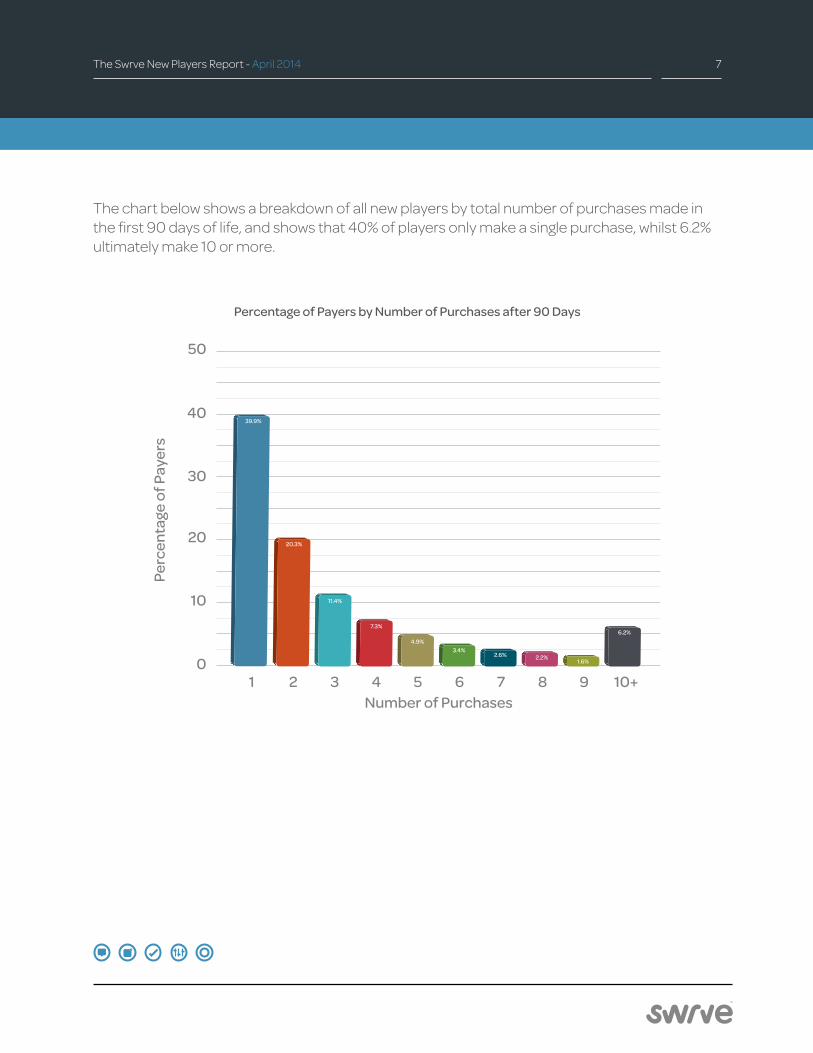
Percentage of Payers by Number of Purchases after 90 Days
The chart below shows a breakdown of all new players by total number of purchases made in the first 90 days of life, and shows that 40% of players only make a single purchase, whilst 6.2% ultimately make 10 or more.
The Swrve New Players Report - April 2014 8
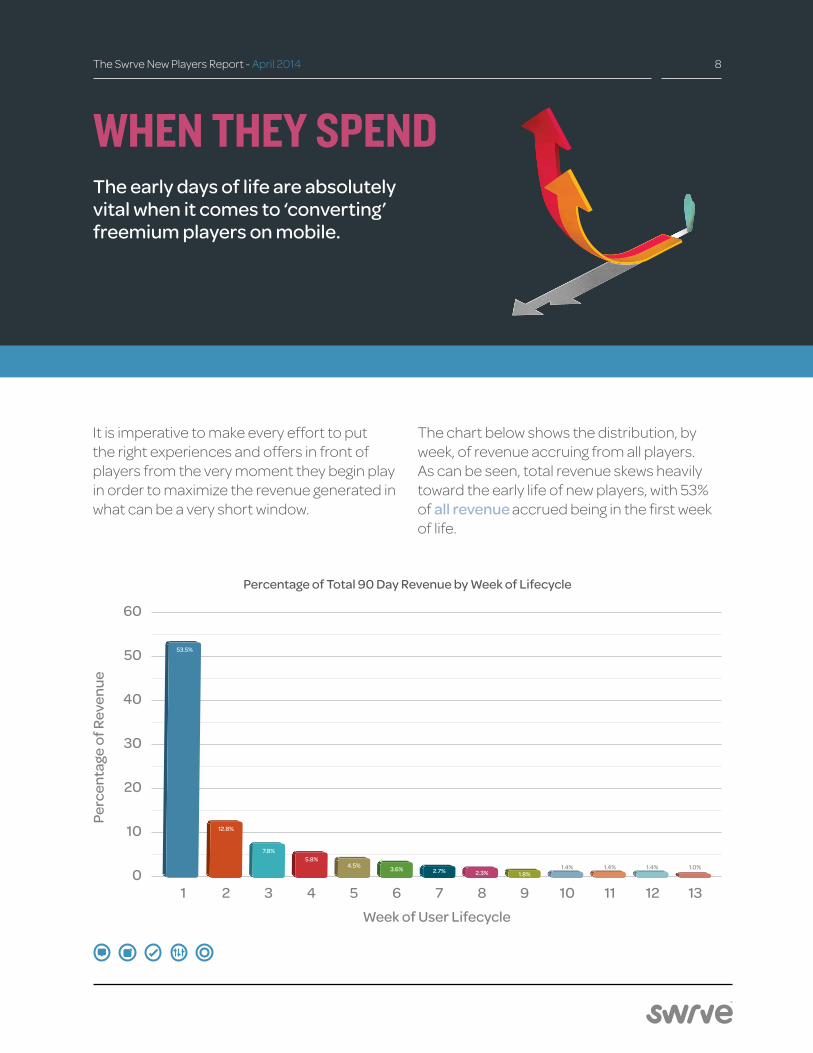
It is imperative to make every effort to put the right experiences and offers in front of players from the very moment they begin play in order to maximize the revenue generated in what can be a very short window.
Percentage of Total 90 Day Revenue by Week of Lifecycle
WHEN THEY SPENDThe early days of life are absolutely vital when it comes to ‘converting’ freemium players on mobile.
The chart below shows the distribution, by week, of revenue accruing from all players. As can be seen, total revenue skews heavily toward the early life of new players, with 53% of all revenue accrued being in the first week of life.
The Swrve New Players Report - April 2014 9
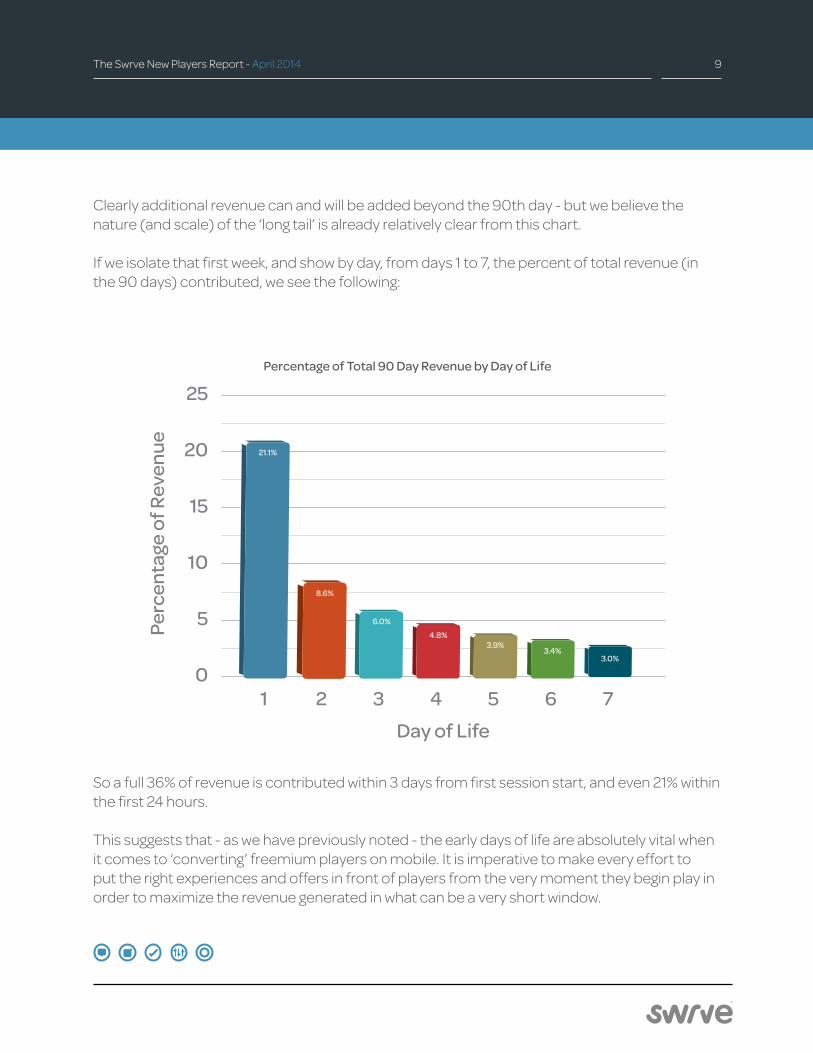
Clearly additional revenue can and will be added beyond the 90th day - but we believe the nature (and scale) of the ‘long tail’ is already relatively clear from this chart.
If we isolate that first week, and show by day, from days 1 to 7, the percent of total revenue (in the 90 days) contributed, we see the following:
So a full 36% of revenue is contributed within 3 days from first session start, and even 21% within the first 24 hours.
This suggests that - as we have previously noted - the early days of life are absolutely vital when it comes to ‘converting’ freemium players on mobile. It is imperative to make every effort to put the right experiences and offers in front of players from the very moment they begin play in order to maximize the revenue generated in what can be a very short window.
Percentage of Total 90 Day Revenue by Day of Life
The Swrve New Players Report - April 2014 10
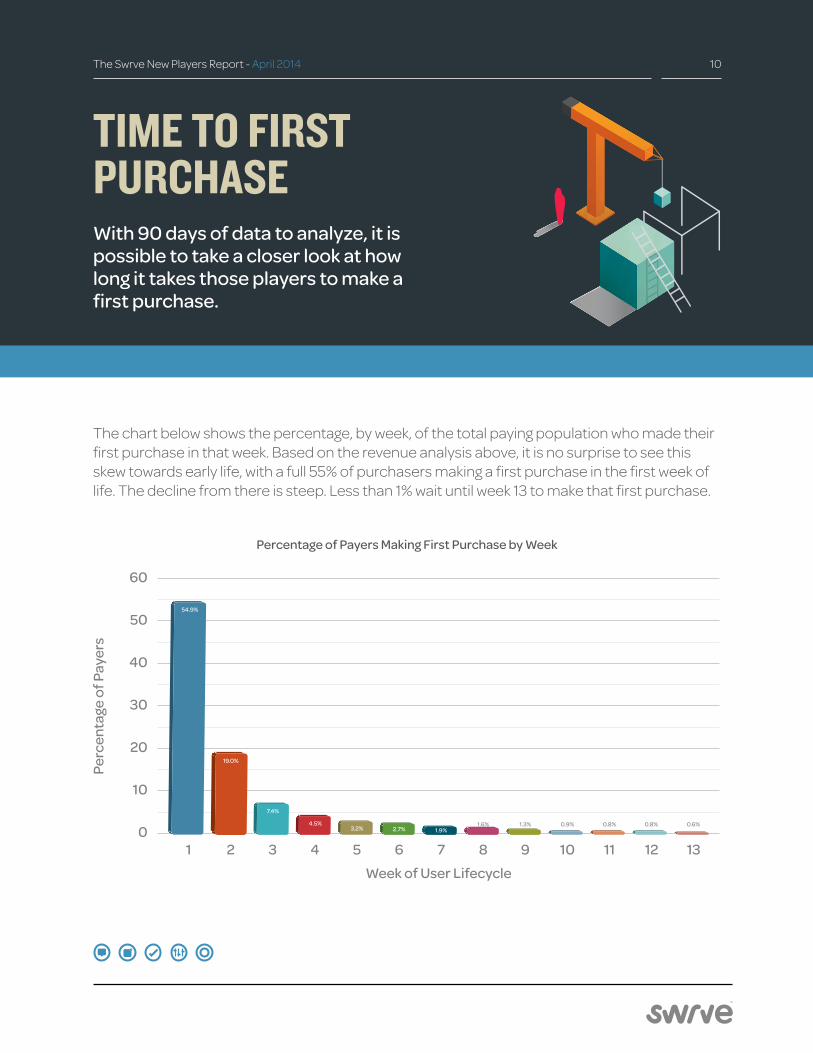
The chart below shows the percentage, by week, of the total paying population who made their first purchase in that week. Based on the revenue analysis above, it is no surprise to see this skew towards early life, with a full 55% of purchasers making a first purchase in the first week of life. The decline from there is steep. Less than 1% wait until week 13 to make that first purchase.
TIME TO FIRST PURCHASEWith 90 days of data to analyze, it is possible to take a closer look at how long it takes those players to make a first purchase.
Percentage of Payers Making First Purchase by Week
The Swrve New Players Report - April 2014 11
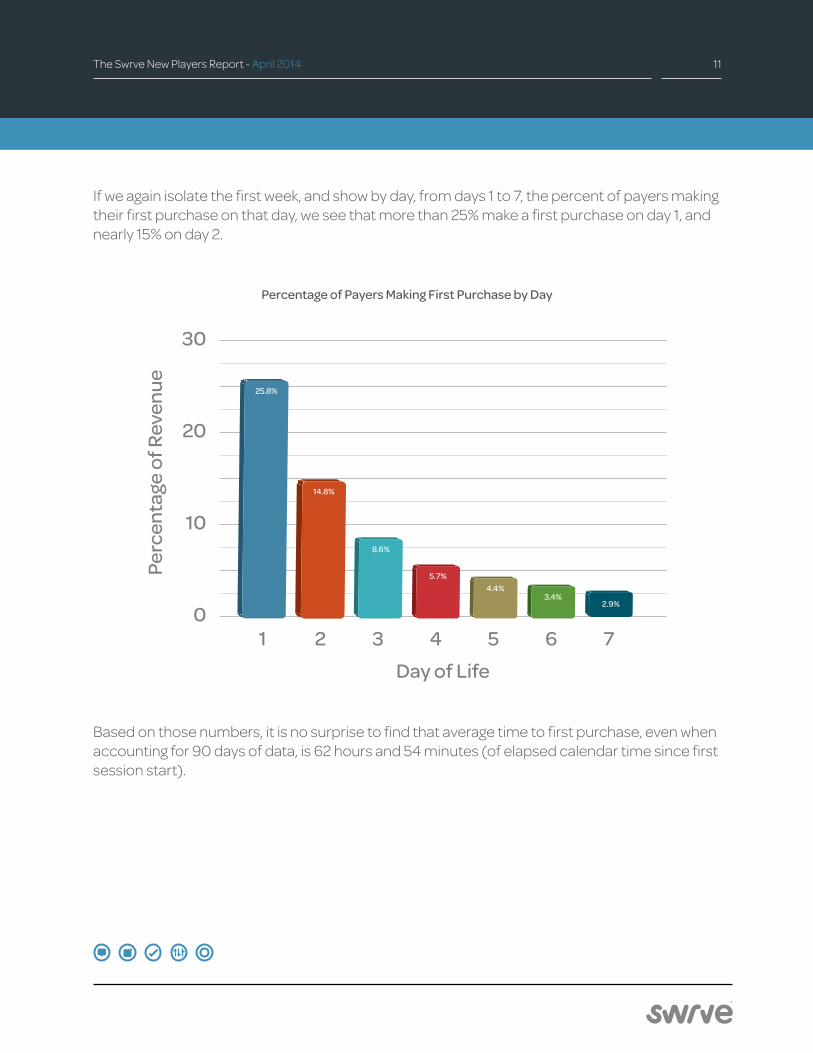
Based on those numbers, it is no surprise to find that average time to first purchase, even when accounting for 90 days of data, is 62 hours and 54 minutes (of elapsed calendar time since first session start).
If we again isolate the first week, and show by day, from days 1 to 7, the percent of payers making their first purchase on that day, we see that more than 25% make a first purchase on day 1, and nearly 15% on day 2.
Percentage of Payers Making First Purchase by Day
The Swrve New Players Report - April 2014 12
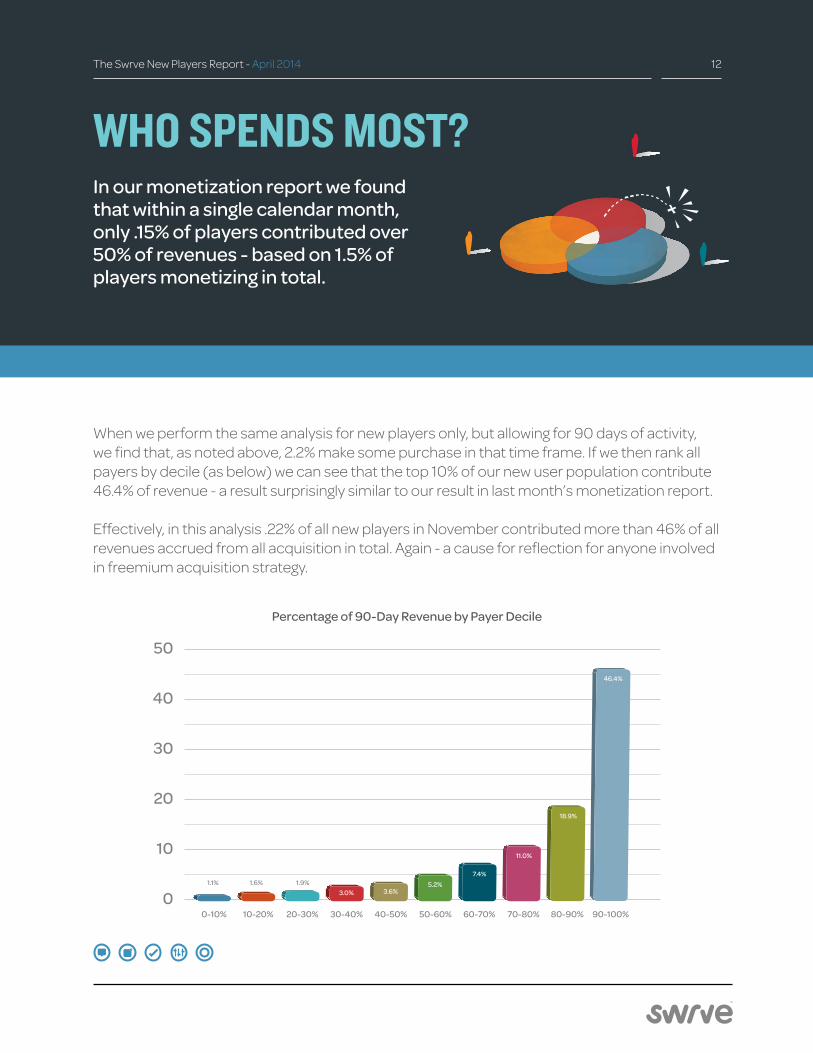
WHO SPENDS MOST?In our monetization report we found that within a single calendar month, only .15% of players contributed over 50% of revenues - based on 1.5% of players monetizing in total.
When we perform the same analysis for new players only, but allowing for 90 days of activity, we find that, as noted above, 2.2% make some purchase in that time frame. If we then rank all payers by decile (as below) we can see that the top 10% of our new user population contribute 46.4% of revenue - a result surprisingly similar to our result in last month’s monetization report.
Effectively, in this analysis .22% of all new players in November contributed more than 46% of all revenues accrued from all acquisition in total. Again - a cause for reflection for anyone involved in freemium acquisition strategy.
Percentage of 90-Day Revenue by Payer Decile
The Swrve New Players Report - April 2014 13
ABOUT SWRVESwrve is the world’s leader in driving engagement, retention and revenue in mobile apps and games.
Swrve is the world’s leader in driving engagement, retention and revenue in mobile apps and games.
The Swrve platform delivers everything product and monetization managers need to ensure their mobile apps succeed where it counts.
We do this by building long-lasting, profitable relationships with their users and driving the bottom line as a result.
Swrve includes:• A/B testing - to optimize user experience
and improve retention rates• Targeted in-app campaigns - delivering
the right offers, to the right audience, at the right time
• Push notifications - driving engagement even when users are outside the app
• Real-time optimization - automated campaigns reacting in real-time to user behavior in the app
• All the analytics and segmentation you’ll ever need
Swrve is trusted by some of the world’s largest and most successful mobile app businesses. We handle billions of events a day and process data in real-time for multi-million DAU titles.
If you’d like to join them, drop us a line at [email protected]


