Embed Size (px)
Citation preview
The Spore Differentiation Pathway in the EntericPathogen Clostridium difficileFatima C. Pereira1, Laure Saujet2,3, Ana R. Tome1¤, Monica Serrano1, Marc Monot3,
Evelyne Couture-Tosi3, Isabelle Martin-Verstraete2,3, Bruno Dupuy3*, Adriano O. Henriques1*
1 Instituto de Tecnologia Quımica e Biologica, Universidade Nova de Lisboa, ITQB-UNL, Estacao Agronomica Nacional, Oeiras, Portugal, 2 Univ. Paris Diderot, Sorbonne
Paris Cite, Cellule Pasteur, Paris, France, 3 Laboratoire Pathogenese des Bacteries Anaerobies, Institut Pasteur, Paris, France
Abstract
Endosporulation is an ancient bacterial developmental program that culminates with the differentiation of a highly resistantendospore. In the model organism Bacillus subtilis, gene expression in the forespore and in the mother cell, the two cellsthat participate in endospore development, is governed by cell type-specific RNA polymerase sigma subunits. sF in theforespore, and sE in the mother cell control early stages of development and are replaced, at later stages, by sG and sK,respectively. Starting with sF, the activation of the sigma factors is sequential, requires the preceding factor, and involvescell-cell signaling pathways that operate at key morphological stages. Here, we have studied the function and regulation ofthe sporulation sigma factors in the intestinal pathogen Clostridium difficile, an obligate anaerobe in which the endosporesare central to the infectious cycle. The morphological characterization of mutants for the sporulation sigma factors, inparallel with use of a fluorescence reporter for single cell analysis of gene expression, unraveled important deviations fromthe B. subtilis paradigm. While the main periods of activity of the sigma factors are conserved, we show that the activity ofsE is partially independent of sF, that sG activity is not dependent on sE, and that the activity of sK does not require sG. Wealso show that sK is not strictly required for heat resistant spore formation. In all, our results indicate reduced temporalsegregation between the activities of the early and late sigma factors, and reduced requirement for the sF-to-sE, sE-to-sG,and sG-to-sK cell-cell signaling pathways. Nevertheless, our results support the view that the top level of theendosporulation network is conserved in evolution, with the sigma factors acting as the key regulators of the pathway,established some 2.5 billion years ago upon its emergence at the base of the Firmicutes Phylum.
Citation: Pereira FC, Saujet L, Tome AR, Serrano M, Monot M, et al. (2013) The Spore Differentiation Pathway in the Enteric Pathogen Clostridium difficile. PLoSGenet 9(10): e1003782. doi:10.1371/journal.pgen.1003782
Editor: Patrick H. Viollier, University of Geneva Medical School, Switzerland
Received January 29, 2013; Accepted July 25, 2013; Published October 3, 2013
Copyright: � 2013 Pereira et al. This is an open-access article distributed under the terms of the Creative Commons Attribution License, which permitsunrestricted use, distribution, and reproduction in any medium, provided the original author and source are credited.
Funding: This work was supported by grants ERA-PTG/SAU/0002/2008 (ERA-NET PathoGenoMics) to AOH and BD, and Pest-C/EQB/LA0006/2011, both from‘‘Fundacao para a Ciencia e a Tecnologia’’ (FCT) to AOH, FCP (SFRH/BD/45459/08), MS (SFRH/BPD/36328/2007) and ART (018/BI/2012) were the recipients offellowships from the FCT. The funders had no role in study design, data collection and analysis, decision to publish, or preparation of the manuscript.
Competing Interests: The authors have declared that no competing interests exist.
* E-mail: [email protected] (BD); [email protected] (AOH)
¤ Current address: MRC, Molecular Haematology Unit, University of Oxford, Weatherall Institute of Molecular Medicine, John Radcliffe Hospital, Headington,Oxford, United Kingdom.
Introduction
Endosporulation is an ancient bacterial cell differentiation
program that culminates with the formation of a highly resistant
dormant cell, the endospore. Bacterial endospores (hereinafter
designated spores for simplicity), as those formed by species of the
well-known Bacillus and Clostridium genera, but also by many other
groups within the Firmicutes phylum, resist to extremes of physical
and chemical parameters that would rapidly destroy the vegetative
cells, and are the most resistant cellular structure known [1], [2].
Their resilience allows them to accumulate in highly diverse
environmental settings, often for extremely long periods of time.
The range of environments occupied by sporeformers, include
niches within metazoan hosts, in particular the gastro-intestinal
tract (GIT) (e.g. [3–5]). B. subtilis, for example, a non-pathogenic
sporeformer, can go through several cycles of growth, sporulation
and germination in the GIT [5]. For pathogenic sporeformers,
spores are often the infectious vehicle as in the inhalational or
gastric forms of anthrax, the potentially lethal disease caused by B.
anthracis [6]. Also, it is a protein present at the spore surface that
mediates spore internalization by macrophages, and spore
dissemination to local lymph nodes, which are central to
pathogenesis [6], [7]. Infection by the intestinal human and
animal pathogen C. difficile, an obligate anaerobe, and the subject
of the present investigation, often also starts with the ingestion of
spores [8], [9]. C. difficile is the causative agent of an intestinal
disease whose symptoms can range from mild diarrhea to severe,
potentially lethal inflammatory lesions such as pseudomembra-
neous colitis, toxic megacolon or bowel perforation [8], [10].
Ingested spores of this organism germinate in the colon, to
establish a population of vegetative cells that will produce two
potent cytotoxins and more spores [8], [10–12]. Infection
develops because C. difficile can colonize the gut if the normal
intestinal microbiota is disturbed [8] [9]. Toxinogenesis is
responsible for most of the disease symptoms, whereas the
spores, which can remain latent in the gut, are both a persistence
and transmission factor [8], [10–13]. While an asporogeneous
mutant of C. difficile can cause intestinal disease, it is unable to
persist within and transmit between host organism [13]. The
spore thus has a central role in persistence of the organism in the
PLOS Genetics | www.plosgenetics.org 1 October 2013 | Volume 9 | Issue 10 | e1003782
environment, infection, recurrence and transmission of the
disease. Recent years have seen the emergence of strains, so
called hypervirulent, linked to increased incidence of severe
disease, higher relapse rates and mortality, and C. difficile is now
both a main nosocomial pathogen associated with antibiotic
therapy as well as a major concern in the community [8], [9],
[14].
The basic spore plan is conserved [15–17]. The genome is
deposited in a central compartment delimited by a lipid
bilayer with a layer of peptidoglycan (PG) apposed to its
external leaflet. This layer of PG, known as the germ cell wall,
will serve as the wall of the outgrowing cell that forms when the
spore completes germination. The germ cell wall is encased in
a thick layer of a modified form of PG, the cortex, essential for
the acquisition and maintenance of heat resistance [15], [16].
The cortex is wrapped by a multiprotein coat, which protects
it from the action of PG-breaking enzymes produced by host
organisms or predators [15], [16]. In some species, including
the pathogens B. anthracis, B. cereus and C. difficile, the coat is
further enclosed within a structure known as the exosporium.
The coat and the exosporium, when present, mediate the
immediate interactions of the spore with the environment,
including the interaction with small molecules that trigger
germination [7], [15], [18–20].
The process of spore differentiation has been extensively studied
in the model organism B. subtilis [21] [22]. Rod-shaped vegetative
cells, growing by binary fission, will switch to an asymmetric
(polar) division when facing severe nutritional stress. Polar division
yields a larger mother cell and a smaller forespore, the future
spore. The mother cell then engulfs the forespore. This process,
akin to phagocytosis and a hallmark of endosporulation, isolates
the forespore from the surrounding medium, and releases it as a
cell, surrounded by a double membrane, within the mother cell
cytoplasm [21], [22]. With the exception of the germ cell wall,
which is formed from the forespore, the assembly of the main
spore protective structures is mostly a function of the mother cell
[15], [16]. At the end of the process, and following a period of
spore maturation, the mother cell undergoes autolysis, to release
the finished spore. For the organisms that have been studied to
date, mostly by transmission electron microscopy (TEM), this
basic sequence of morphological events appears conserved [15],
[21].
The developmental regulatory network of sporulation shows a
hierarchical organization and functional logic [17]. A master
regulatory protein, Spo0A, activated by phosphorylation,
governs entry into sporulation, including the switch to
asymmetric division [21], [23]. Gene expression in the forespore
and mother cell is controlled by 4 cell type-specific sigma
factors, which are sequentially activated, alternating between the
two cells. sF and sE control the early stages of development in
the forespore and the mother cell, respectively, and are replaced
by sG and sK when engulfment of the forespore is completed
[21–23]. Activation of the sporulation sigma factors coincides
with the completion of key morphological intermediates in the
process, at which stages cell-cell signaling events further allow
the alignment of the forespore and mother cell programs of
gene expression. The result is the coordinated deployment of
the forespore and mother cell lines of gene expression, in close
register with the course of cellular morphogenesis [21–23].
Additional regulatory proteins, working with the sigma factors,
generate feed forward loops (FFLs) that create waves of gene
expression, minimizing transcriptional noise and impelling
morphogenesis forward [17]. A large number of genes of B.
subtilis, distributed in the four cell type-specific regulons,
participate in spore morphogenesis [24–27]. The key regulatory
factors, Spo0A and the sporulation sigma factors, which define
the highest level in the functional and evolutionary hierarchy of
the sporulation network, are conserved in sporeformers. The
FFLs show an intermediary level of conservation, with the
‘‘structural’’ genes, with the lower level of conservation, at the
lowest level in the hierarchy [17], [24–27]. The conservation of
the sporulation sigma factors has suggested that their role and
sequential activation is also maintained across species [17].
However, recent studies have revealed differences in the roles
and time of activity of the sigma factors during spore
morphogenesis in several Clostridial species [28–35]. For
instance, sF and sE are active prior to asymmetric division in
C. acetobutylicum and C. perfringens [30], [31], [33], [35]. Also, sK,
which in B. subtilis controls late stages of morphogenesis in the
mother cell, is active in pre-divisional cells of C. perfringens and
C. botulinum [29], [34]. Collectively, and relative to the aerobic
Bacilli, the Clostridia represent an older group within the
Firmicutes phylum, at the base of which endosporulation has
emerged some 2.5 billion years ago, before the initial rise in
oxygen levels [24–28], [36].
Despite the importance of C. difficile for human health and
activities, and the central role of sporulation in the infection
cycle, a cytological and molecular description of sporulation has
been lacking. Here, we have combined cytological and genetics
methodologies to define the sequence of sporulation events in
C. difficile and the function of the cell type-specific sigma
factors. In addition, by using a fluorescent reporter for studies
of gene expression at the single cell level, we were able to
correlate the expression and activity of the sporulation-specific
sigma factors with the course of morphogenesis. A key
observation is that during C. difficile sporulation the forespore
and mother cell programs of gene expression are less tightly
coupled. Our study also provides a platform for additional
studies of the regulatory network and for integrating the
expression and function of the effector genes, many of which
will be species-specific, and possibly related to host colonization
and transmission.
Author Summary
Endospores, as those formed by the anaerobic Clostridialspecies, the aerobic Bacillus and related organisms, arehighly resilient dormant cell types. Endospore develop-ment has been extensively studied in Bacillus subtilis. Theprocess starts with an asymmetric division that forms alarger mother cell and a smaller forespore. Gene expres-sion in these two cells is primarily governed by four celltype-specific RNA polymerase sigma factors, two activesequentially in the mother cell and two active sequentiallyin the forespore. The precise timing of sigma factoractivation is coordinated between the mother cell andforespore by several mechanisms. By combining studies ofgene expression at the single cell level with the pheno-typic characterization of mutants for the sigma genes, wedescribe the regulation of gene expression during endo-spore development by the intestinal pathogen C. difficile.In this organism, the endospore is the vehicle fortransmission and persistence in the host and the environ-ment. The overall picture that emerges is of a develop-mental program in which the coordination of geneexpression between the forespore and mother cell is lesstight than in B. subtilis, in what may be a general feature ofendospore formation in the more ancient Clostridia groupof bacteria.
Clostridium difficile Sporulation
PLOS Genetics | www.plosgenetics.org 2 October 2013 | Volume 9 | Issue 10 | e1003782

Results
Sporulation in sporulation medium (SM)Earlier studies using TEM have suggested that the main stages
of sporulation are conserved amongst Bacillus and Clostridial
species [37]. Here, we examined sporulation of C. difficile using
phase contrast and fluorescence microscopy with the goal of
establishing a platform for both the phenotypic analysis of mutants
blocked in the process and for the analysis of developmental gene
expression in relation to the course of morphogenesis. This
approach requires the individual scoring of a relative large number
of cells. However, under culturing conditions widely used for C.
difficile sporulation, as in BHI medium, supplemented or not with
cysteine and yeast extract (BHIS), the process is highly heteroge-
neous, or asynchronous [11], [14], [38], [39], reviewed by [40]).
High titers of spores have been reported following 48 h incubation
of liquid cultures in the Sporulation Medium (or SM) described by
Wilson and co-authors [41], but how the spore titer developed
over time was not reported. More recently, SM was used, with
some modifications to the original formulation, for high yield spore
production on agar plates [42]. We determined the spore titer
during growth of the wild type strain 630Derm in liquid SM
cultures. As shown in Figure 1A, no heat resistant spores could be
detected at the time of inoculation, or during the first 10 hours of
growth. Heat resistant spores, 3.76102 spores/ml, were first
detected at hour 12, a titer that increased to 2.46105 at hour 24
(about 14 hours after entry into the stationary phase of growth),
the later number corresponding to a percentage of sporulation of
0.3% (Figure 1A and Table S1). From hour 24 onwards, the spore
titer increased slowly, to reach 4.76106 spores/ml 72 hours
following inoculation, corresponding to 43.8% sporulation
(Figure 1A). Importantly, the percentage of sporulation in SM
medium was higher than in BHI or BHIS for all the time points
tested (Figure S1). In particular, the titer of spores in SM was two
orders of magnitude higher than in BHIS, when measured
24 hours following inoculation (Figure S1). For our studies of spore
morphogenesis and cell type-specific gene expression, SM was
adopted.
Stages of sporulationWe then wanted to monitor progress through the morphological
stages of sporulation by phase contrast and fluorescence micros-
copy. In a first experiment, a sample from cultures of the wild type
strain 630Derm was collected 24 hours after inoculation into SM,
for microscopic examination following staining with the lipophilic
membrane dye FM4-64 and with the DNA marker DAPI. Cells
representative of several distinctive morphological classes are
shown on Figure 1B (top). Cells with straight asymmetrically
positioned septa (class a) and cells with curved spore membranes
(i.e., at intermediate stages in the engulfment sequence; class b),
both showing intense staining of the forespore DNA, were readily
seen (Figure 1B). Another class comprised cells showing strong
uniform FM4-64 staining around the entire contour of the
forespore (Figure 1B). The staining pattern suggests that the
forespore is entirely surrounded by a double membrane, and
therefore that the engulfment sequence was finalized. Those cells
in which the forespore shows a continuous, strong FM4-64 signal,
but has not yet developed partial or full refractility are considered
to have just completed the engulfment process, and define class c.
A strong, condensed DAPI signal in the forespore was also seen for
this class (Figure 1B). Intense, uniform staining of the forespore by
FM4-64 was maintained in cells carrying phase grey (partially
refractile) or phase bright spores, defining class d (Figure 1B).
DAPI staining of the forespore DNA was variable for both cells
with phase grey or phase bright spores in this class (data not
shown). Free spores, at least some of which could be stained with
DAPI, define a last morphological class (class e) (Figure 1B). The
stages of sporulation discerned conform well to the sequence
established for B. subtilis (Figure 1B, bottom) [15], [21], [37].
Staining of the developing spore by FM4-64 following engulfment
completion contrasts with the situation in B. subtilis, in which the
lipophilic dye does not label engulfed forespores [43] (see also
Figure S2A). However, in other organisms, FM4-64 stains the
engulfed forespore [3] (see also Text S1). Also, FM4-64 does not
stain free spores of B. subtilis (which do not have and exosporium)
or B. cereus (which are surrounded by an exosporium) (Figure S2B),
but stains C. difficile spores (which also possess an exosporium)
(Figure S3). Spore staining by FM4-64 may thus be more related
to the composition of the surface layers, rather than to the
presence of a specific structure. We note that affinity of FM dyes to
the spore coats has been reported [3] (see also Text S1).
Under our culturing conditions, cells belonging to each of the
five morphological classes considered (a to e) were seen at all the
time points examined (Figure 1C). This suggests that sporulation is
heterogeneous, or asynchronous, in agreement with other results
[43], with cells entering the sporulation pathway throughout the
duration of the experiment. Surprisingly, the representation of
cells at intermediate stages in development (classes a to c)
decreased from hour 36 to hour 48, without a corresponding rise
in later morphological classes (class d, phase grey/bright spores
and class e, free spores) (Figure 1C). However, Live/Dead staining
evidenced cell lysis, including of cells at intermediate stages of
sporulation (classes a to c), from hour 36 of growth onwards (data
not shown). As assessed by Live/Dead staining and fluorescence
microscopy, lysis of sporulating cells was only marginal at hour 24
of growth (data not shown). Therefore, in subsequent experiments,
sporulating cells were scored 24 hours following inoculation. At
hour 24, the total number of sporulating cells (i.e., the sum of
classes a to e in Figure 1C) represents about 15% of the total cell
population.
Disruption of the genes for the sporulation sigma factorsThe genes for the four cell type-specific RNA polymerase sigma
factors known to control gene expression during spore differen-
tiation in B. subtilis are conserved in sporeformers [24–27].
Moreover, their operon structure and genomic context is also
maintained (Figure S4A). To investigate whether the function of
the sF, sE, sG and sK factors is conserved, each of the
corresponding genes was disrupted (Figure S4). For this purpose,
type II introns were targeted to each of the sig genes, using the
ClosTron system [44]. As shown in Figure S4A, re-targeting of the
intron resulted in insertion after codon 153 of the sigF gene, codon
151 of sigE, codon 182 of sigG, and codon 34 of the 59-end of the
split sigK gene, interrupted by the skinCd element. Correct insertion
of the intron was verified, in all cases, by PCR, and Southern blot
analysis showed the presence of a single intron insertion in the
genome of the different mutants (Figure S4B through E). The sig
mutants, along with the parental 630Derm strain, were induced to
sporulate in SM, and the titer of heat resistant spores assessed after
24, 48, and 72 hours of growth. For the wild type strain 630Derm,
the titer of spores was of 36105 spores/ml at hour 24, 26106
spores/ml at hour 48, and of 16107 spores/ml at hour 72
(Table 1). In contrast, no heat resistant spores were found, at any
time point tested, for the sigF (AHCD533), sigE (AHCD532), or
sigG (AHCD534) mutants. However, a titer of 103 heat resistant
spores/ml of culture was found for the sigK mutant AHCD535 at
hour 72 (Table 1). For complementation studies, we generated
multicopy alleles of the sig genes, based on replicative plasmid
Clostridium difficile Sporulation
PLOS Genetics | www.plosgenetics.org 3 October 2013 | Volume 9 | Issue 10 | e1003782

pMTL84121 [45], expressed from their native promoters (the
extent of the promoter fragments is shown in Figure S4A). Note
that for complementation of the sigK mutation the two halves of
the gene, together with a short skinCd element composed only of the
putative recombinase gene (spoIVCA, or CD12310) was used (see
below for a more detailed description on the complementation of
the sigK mutation). When measured at hour 72 of growth in SM,
the heat resistant spore titer was of 1.76106 spores/ml for the wild
type strain 630Derm carrying the empty vector pMTL84121.
Derivatives of pMTL84121 carrying the sigF, sigE, sigG or sigK
genes (the later plasmid, pFT38, with the short skinCd allele)
restored spore formation to the sig mutants, as assessed by
microscopy (Figure 2B). The same plasmids largely restored heat
resistant spore formation to the sig mutants (1.66104, 8.36105,
3.96105, 4.86105 spores/ml for the sigF, sigE, sigG, and sigK
mutants, respectively, also measured at hour 72 of growth in SM).
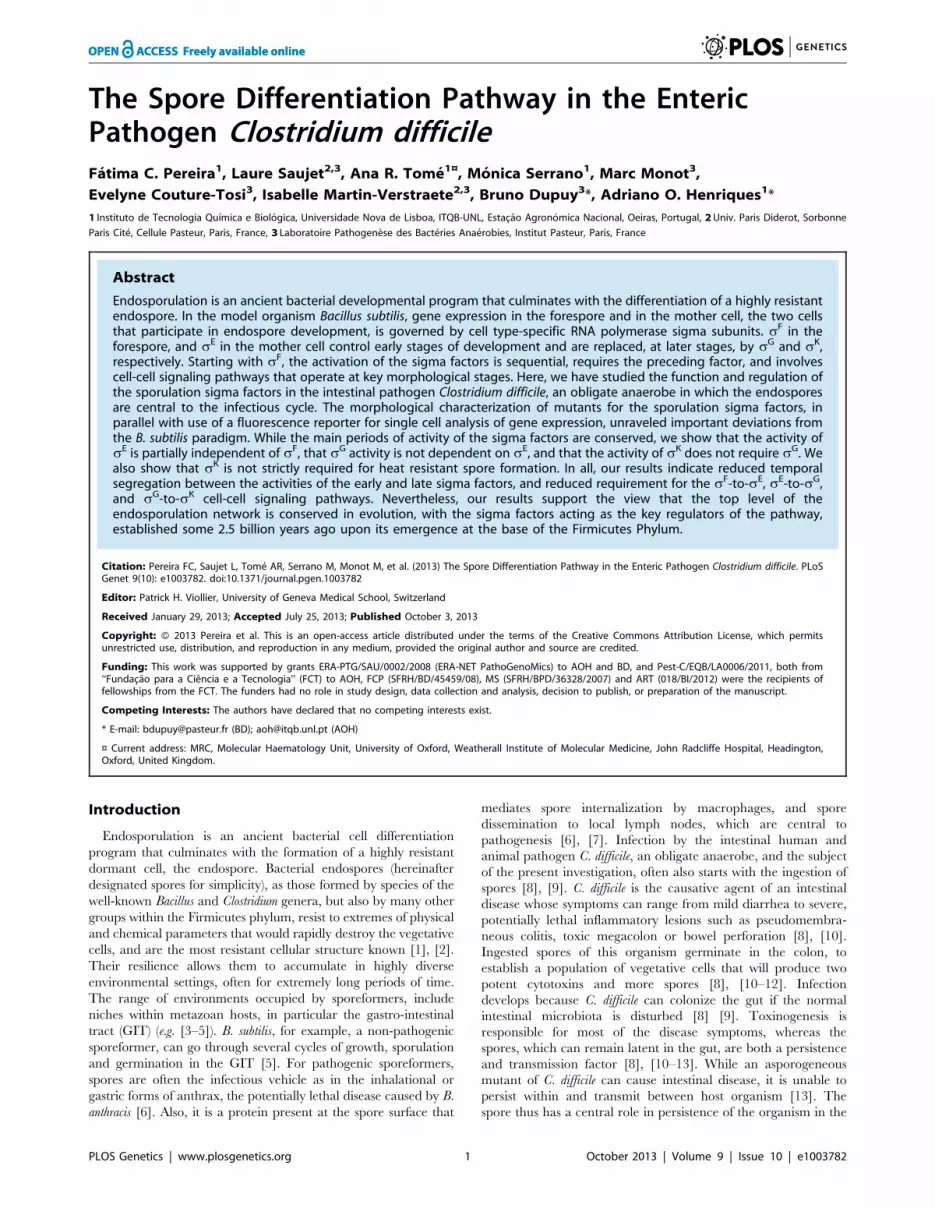
Morphological characterization of the sigF, sigE, and sigGmutants
To establish the morphological phenotype of the various
mutants we used phase contrast and fluorescence microscopy of
samples collected from SM cultures at hour 24, labeled with DAPI
and FM4-64 (Figure 2). These studies revealed that the sigF and
sigE mutants were blocked at the asymmetric division stage
(Figure 2A and C). As previously found for B. subtilis [37], [46],
[47] both mutants formed abortive disporic forms, and occasion-
ally multiple closely located polar septa (Figure 2A). In addition,
for the sigF mutant, small round cells were found, probably
resulting from detachment of the forespore (Figure 2A). In both
mutants, the DNA stained strongly in the forespore(s) and gave a
diffuse signal throughout the mother cell (Figure 2A). TEM
analysis confirmed the block at the asymmetric division stage for
the two mutants (Figure 2D).
Figure 1. Sporulation in C. difficile 630Derm. (A) The spore (red symbols) and total cell titer (blue symbols) was measured for a culture of strain630Derm at the indicated times post-inoculation in SM. The data represent the average 6 standard deviation (SD) of three independent experiments.No heat resistant CFUs were detected for an undiluted 100 ml culture sample (CFU/ml: #101). (B) Samples of an SM broth culture of strain 630Dermwere collected 24 h after inoculation, stained with DAPI and FM4-64 and examined by phase contrast (PC) and fluorescence microscopy. The panelillustrates the stages in the sporulation pathway, according to the classes defined in the text and represented schematically at the bottom of thepanel (see the Results section). Scale bar, 1 mm. (C) Quantification of the percentage of cells in the morphological classes represented in (B) (asdefined in the text), relative to the total viable cell population, for strain 630Derm at the indicated times following inoculation in SM broth. The datarepresent the average 6 SD of three independent experiments. The total number of cells scored (n) is indicated in each panel.doi:10.1371/journal.pgen.1003782.g001
Clostridium difficile Sporulation
PLOS Genetics | www.plosgenetics.org 4 October 2013 | Volume 9 | Issue 10 | e1003782

Cells of the sigG mutant completed the engulfment sequence,
but did not proceed further in morphogenesis (Figure 2A and C).
As for class c in the wild type (Figure 1B, and text above), the
forespores in the sigG mutant stained strongly with FM4-64
(Figure 2A). TEM of sporulating cells of the sigG mutant confirmed
engulfment completion, but also revealed deposition of electro-
dense material around the forespore protoplast (Figure 2D). This
deposit could represent coat material. By comparison, no
accumulation of electrodense coat-like material is seen by TEM
around the engulfed forespore of a B. subtilis sigG mutant [48]. In
this organism, coat assembly as discernible by TEM, is a late event
that requires activation of sK in the mother cell [15], [16], [37].
Importantly, activation of sK is triggered by sG, and coincides
with engulfment completion [49], [50]. Therefore, the possible
accumulation of coat material in the sigG mutant could imply that
in C. difficile, sK is active independently of sG. We therefore
wanted to test whether coat material was deposited around the
forespore in the C. difficile sigG mutant. In B. subtilis, studies of
protein localization have relied mainly on the use of translational
fusions to the gfp gene, or its variants (e.g., [51]). However, an
obstacle to the use of gfp or its derivatives in the anaerobe C.
difficile, is that formation of the GFP fluorophore involves an
oxidation reaction [52]. For this reason, we turned to the SNAP-
tag reporter, which reacts with fluorescent derivatives of benzyl
purine or pyrimidine substrates, and has been used in anaerobic
bacteria [53], [54]. We designed a variant of the SNAP26b gene,
termed SNAPCd, codon-usage optimized for expression in C. difficile
(see Materials and Methods; see also Text S1), and used it to
construct C-terminal fusions of the SNAP-tag to spore coat
proteins CotE and CotB [55], [56] in plasmid pFT58 (Figure S5B
and C). The fusions were introduced, in a replicative plasmid, in
strain 630Derm and the sigG and sigK mutants, and samples from
SM cultures at hour 24 were labeled with the cell-permeable
fluorescent substrate TMR-Star (see Materials and Methods).
Using fluorescence microscopy and fluorimaging of SDS-PAGE-
resolved whole cell extracts, no accumulation of CotE-SNAP was
detected in cells of a sigK mutant, suggesting that the cotE gene is
under the control of sK (Figure 2E; see also below). CotB-SNAP,
however, accumulated in cells of a sigK mutant (Figure 2E), but not
in cells of a sigE mutant (data not shown), suggesting that
expression of cotB is under the control of sE. Both CotE-SNAP
and CotB-SNAP localized around the forespore in both wild type
and in sigG cells (Figure 2E). SDS-PAGE and fluorimaging
suggested instability of CotB-SNAP for which several possible
proteolytic fragments were detected, all of which larger that the
SNAP domain (Figure 2E). That no release of a labeled SNAP
domain was detected for either protein implies that the localized
fluorescence signal is largely due to the fusion proteins. Thus, both
early (CotB) and late (CotE) coat proteins are assembled around
the forespore in cells of a sigG mutant. In all, the results suggest
that sK is active independently of sG, and thus, that the later
regulatory protein is not a strict requirement for deposition of at
least some coat in C. difficile.
Functional analysis of the sigK genePhase contrast microscopy revealed the presence of some phase
bright or partially phase bright spores in SM cultures of the sigK
mutant, although free spores were only rarely seen (Figure 2A).
The ellipsoidal spores were often positioned slightly tilted relative
to the longitudinal axis of the mother cell (Figure 2 and 3). The
appearance of phase bright spores normally correlates with
synthesis of the spore cortex PG, and the development of spore
heat resistance [37], [57], in line with the finding that the sigK
mutant formed heat resistant spores (above). TEM revealed the
presence of a cortex layer in cells of the sigK mutant, supporting
the inferences drawn on the basis of the phase contrast microscopy
and heat resistance assays (Figure 2A to E). The number of phase
bright or phase grey spores by phase contrast microscopy, was
3.2% of the total number of cells scored at hour 24 of growth in
liquid SM (Figure 2C). This is higher than the percentage of
sporulation, 0.03%, measured by heat resistance (Table 1).
Because full heat resistance requires synthesis of most of the
cortex structure, this observation suggests that a large number of
the spores formed have an incomplete or dysfunctional cortex.
However, we cannot discard the possibility that spores of the
mutant are deficient in germination. In any event, unlike in B.
subtilis, where a sigK mutant is unable to form the spore cortex
[37], [57], sK is not obligatory for the biogenesis of this structure
in C. difficile. In contrast, the TEM analysis did not reveal
deposition of coat material around the cortex in cells of the sigK
mutant (Figure 2D). Although coat assembly most likely starts
early, under the control of sE ([15], [16], [42]; above) the TEM
data, together with the data on assembly of CotE (Figure 2E),
suggest that the late stages in the assembly of the coats are under
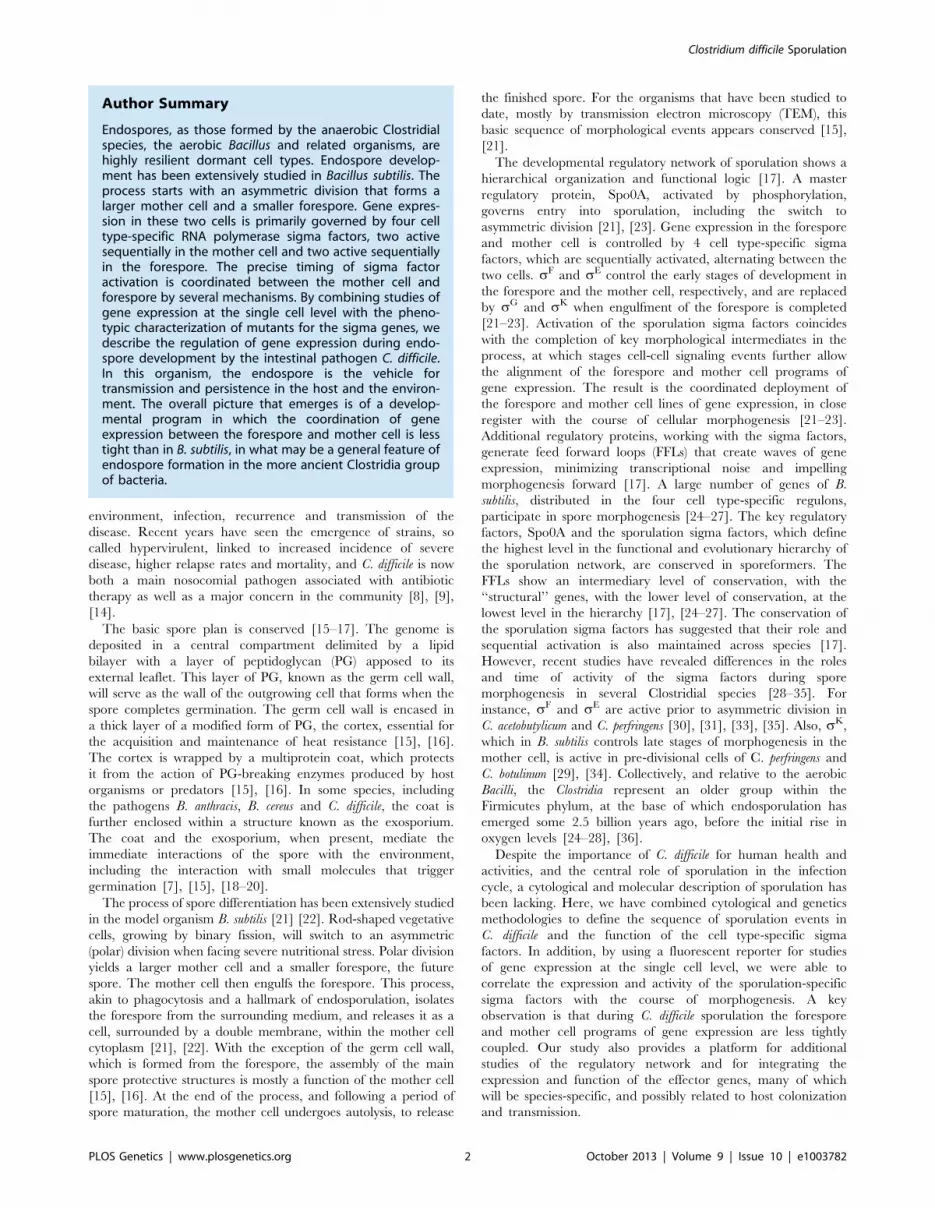
sK control. That free spores were only rarely seen for the sigK
mutant, prompted us to test whether sK could have a role in
mother cell lysis, using a Live/Dead stain and fluorescence
microscopy. In the wild type strain 630Derm, development of
refractility coincided with loss of viability of the mother cell (strong
staining with propidium iodide) and strong staining of the
developing spore with the Syto 9 dye (Figure 3A), [58]. In
contrast, the mother cell remained viable in the sigK mutant
(strong staining with Syto 9) (Figure 3A and B), and the spores
stained only weakly with the Syto 9 dye.
Lastly, our complementation analysis of the sigK mutant
provided additional functional insight. While wild type levels of
sporulation could be restored to a sigK mutant by a copy of the sigK
gene bearing a deletion of all the genes within the skinCd element
Table 1. Total and heat resistant (HeatR) cell counts (CFU/ml) for the wild type strain (630Derm) and congenic sigF, sigE, sigG andsigK mutants in SM.
Time(h) 630Derm sigF sigE sigG sigK
Total HeatR Total HeatR Total HeatR Total HeatR Total HeatR
24 7.3610761.66107 3.1610565.66104 2.3610866.46107 0 9.6610767.26107 0 9.0610764.56107 0 4.4610762.76107 0
48 4.2610768.56106 2.4610663.16105 7.9610766.36107 0 1.3610767.86107 0 9.6610664.56106 0 1.2610762.96106 2.1610263.66101
72 2.2.610762.96106 1.5610766.86106 4.3610762.16107 0 7.1610662.86106 0 3.0610663.96106 0 6.1610664.36107 1.7610366.06102
Note: values represent the average6SD of three independent experiments.doi:10.1371/journal.pgen.1003782.t001
Clostridium difficile Sporulation
PLOS Genetics | www.plosgenetics.org 5 October 2013 | Volume 9 | Issue 10 | e1003782
but the recombinase gene (Figure 3C; see above), an uninterrupted
copy of the gene, in plasmid pFT42, did not restore sporulation
(Figure 3C and D). An earlier study has suggested that the absence
of skinCd correlates with a sporulation defect and that a skinCd- allele
of sigK is dominant over the wild type [39]. Our results support the
view that generation of an intact sigK gene through SpoIVCA-
mediated excision of the skinCd element is essential for sporulation.
Moreover, we found that introduction of the multicopy skin-less
allele in strain 630Derm blocked sporulation at an early stage, as no
asymmetrically positioned septa could be seen in the transformed
strain (Figure 3E). The results suggest that the absence of skinCd
allows the production of active sK in pre-divisional cells, and that
active sK interferes with the events leading to asymmetric
septation in C. difficile.
Localizing the expression of the sporulation-specific siggenes
Having established the main features of sporulation under our
culturing conditions, as well as the phenotypes associated with
disruption of the sig genes, we next wanted to examine cell
Figure 2. The sporulation pathway in C. difficile 630Derm, and the role of sigF, sigE, sigG and sigK. Phase contrast (PC) and fluorescencemicroscopy analysis of spore morphogenesis in the following strains: (A) 630Derm (wild type, wt) and the congenic sigF, sigE, sigG and sigK mutants;(B) the sig mutants bearing the indicated plasmids or the wt strain carrying the empty vector pMTL84121. Cells were collected 24 (A) or 48 h (B) afterinoculation in SM broth, and stained with DAPI and FM4-64, prior to microscopic examination. (C) Quantification of the cells in each morphologicalclass, as defined in Figure 1, in the experiment documented in panel A, for the wt strain and the sig mutants. The data represent the average 6 SD ofthree independent experiments. The total number of cells analysed (n) is indicated for each strain. (D) TEM images of sigF, sigE, sigG and sigK mutantcells. The Images are representative of the most common morphological phenotype observed for each mutant. (E) Fluorescence microscopy of630Derm (wt) and sigG and sigK strains carrying CotE- and CotB-SNAP fusions. Cells were collected 24 h after inoculation in SM medium and labeledwith the SNAP substrate TMR-Star (red channel) and the membrane dye MTG (green channel), with which a membrane-staining pattern similar toFM4-64 was obtained. The numbers on the bottom panel represent the percentage of cells which have completed the engulfment process that showlocalization of the protein fusions around the forespore. Data shown are from one representative experiment in which 80–100 cells were analysed foreach strain. Scale bar in panels (A, B, D, E), 1 mm. Total cell extracts were prepared from 24 h SM cultures of derivatives of the 630Derm, sigG and sigKstrains producing the CotE- (left) and CotB-SNAP (right) fusions, immediately after labeling with TMR-Star. Proteins (30 mg) were resolved by SDS-PAGE and the gel scanned using a fluorimager. Production of the SNAP protein in the background of 630Derm strain from the Ptet promoter (Ptet-SNAPCd, in pFT46; see Text S1), was used as a control. The position of the SNAP or SNAP fusion proteins is indicated by arrowheads. Asteriks indicatepossible degradation products.doi:10.1371/journal.pgen.1003782.g002
Clostridium difficile Sporulation
PLOS Genetics | www.plosgenetics.org 6 October 2013 | Volume 9 | Issue 10 | e1003782
type-specific gene expression in relation to the course of
morphogenesis. As a first step, we examined the expression of
the genes coding for sF, sE, sG, and sK using the SNAPCd cassette
as a transcriptional reporter. In control experiments, detailed in
Text S1, in which expression of SNAPCd was placed under the
control of the anhydrotetracycline-inducible promoter Ptet (Figure
S5A) [59], we showed that complete labeling of all the SNAP
produced could be achieved; furthermore, no background was
detected for non-induced but labeled cells, or for unlabeled cells
producing the SNAP reporter, by either fluorescence microscopy
or the combination of fluorimaging and immunobloting with an
anti-SNAP antibody, of SDS-PAGE resolved whole cell extracts
(Figure S6).
The promoter regions of sigF, sigE, sigG, and sigK genes were
cloned in the SNAPCd-containing promoter probe vector pFT47
(Figure S5B). The upstream boundaries of the promoter fragments
fused to SNAPCd coincide with the 59-end of the fragments used for
the successful complementation of the various sig mutants
(Figure 3C and S4A; see above). To monitor the production of
SNAP during C. difficile sporulation, samples of cultures expressing
each of the promoter fusions were collected at 24 h of growth in
SM medium, and the cells doubly labeled with TMR-Star and the
Figure 3. Functional analysis of the sigK gene. (A) Live/dead assay for the wild type (630Derm) and the sigK mutant. Shown are phase contrastand the merge between syto 9- (live cells stain; green) and propidium iodide- (dead cells stain; red) stained cells collected at 24 h of growth in SMbroth. In the wild type, but not in the sigK mutant, development of spore refractility is accompanied by loss of mother cell viability. (B) Percentage ofthe sporulating cells of the wild type and sigK mutant strains (i.e., with visible spores) showing signs of mother cell lysis (red; propidium iodidestaining) as scored by direct microscopic observation, 24 hours after inoculation in SM medium. Values are the average 6 SD of three independentexperiments; ‘‘n’’ represents the total number of cells analyzed. (C) The sigK-skin region of the 630Derm chromosome and plasmids used tocomplement sigK mutant strain. Replicative plasmid pFT38 carries sigK interrupted by a shorter version of the skinCd element, which includes the gene(CD12310) for the recombinase (in orange). Replicative plasmid pFT42 carries an uninterrupted sigK gene. The coding sequences are numberedaccording to the reanotation of the C.difficile genome [91]. (D) Percentage of sporulation for strains 630Derm (wt), sigK and sigK bearing either pFT38or pFT42. The indicated percentages are the ratio between the titer of heat resistant spores and the total cell titer, measured 72 h followinginoculation in SM medium. Values are the average 6 SD of three independent experiments. (E) Fluorescence microscopy showing the phenotype ofsigK bearing pFT42. Cells were collected at 72 h of growth in SM broth, stained with DAPI and FM4-64, and viewed by phase contrast (PC) andfluorescence microscopy. Scale bar in (A) and (E), 1 mm.doi:10.1371/journal.pgen.1003782.g003
Clostridium difficile Sporulation
PLOS Genetics | www.plosgenetics.org 7 October 2013 | Volume 9 | Issue 10 | e1003782

membrane dye MTG, to allow identification of the different stages
of sporulation. These were defined based on Figure 1B, with the
addition of a class of pre-divisional cells (no signs of asymmetric
division). Expression of the various Psig-SNAPCd transcriptional
fusions could thus be correlated to the stage in spore morphogen-
esis. Expression of both sigF and sigE was first detected in pre-
divisional cells of the wild type strain 630Derm, but not in cells of a
spo0A mutant (Figure 4), consistent with previous reports [60–62]
(Figure S7A and B). Both genes continued to be expressed
following asymmetric division, in the forespore and the mother cell
of both the wild type, and the sigF or sigE mutants (Figure 4). In
these experiments, complete labeling of the SNAP protein was
achieved, as revealed by fluorimaging and immunobloting of SDS-
PAGE resolved proteins in whole cell extracts (Figure 5A).
Quantification of the fluorescence signal shows that while for sigF
the average intensity did not differ much between forespores
(1.860.5), and mother cells (1.860.5), it increased in both the
forespore and the mother cell relative to pre-divisional cells
(average signal, 1.560.4) (p,0.01). Transcription of sigE, in turn,
was lower in the forespore (average signal, 0.860.3) as compared
to pre-divisional cells (1.060.3) or the mother cell (1.060.3)
(p,0.0001) (Figure 5B). Thus, transcription of sigE, seems to occur
preferentially in the mother cell. Transcription of both sigF and
sigE persisted in both the forespore and the mother cell until a late
stage of sporulation, when the forespore becomes phase bright
(Figure 4).
In contrast to sigF and sigE, transcription of sigG and sigK was
confined to the forespore and to the mother cell, respectively
(Figure 4). Transcription of sigG is detected in the forespore just
after asymmetric division, consistent with the presence of a sF-
type promoter in its regulatory region (Figure S7C). In agreement
with this inference, expression of PsigG-SNAPCd was not detected in
cells of a sigF mutant (Figure 4). Transcription of sigG was detected
until the development of spore refractility (Figure 4). Fluorimaging
and immunoblot analysis of whole cell extracts shows that under
the conditions used, all of the SNAP protein detected was labeled
(Figure 5A). In B. subtilis, sF initiates transcription of sigG in the
forespore [48], [63]. However, transcription of sigG also depends
on sE, by an unknown mechanism [64]. In contrast, forespore-
specific expression of PsigG-SNAPCd was detected in most cells (82%)
of a sigE mutant (Figure 4). In B. subtilis, the main period of sigG
transcription takes place following engulfment completion, and
relies on a positive auto-regulatory loop [65]. We detected
transcription of sigG both prior and following engulfment
Figure 4. Temporal and cell type-specific expression of sigF, sigE, sigG and sigK during sporulation. Microscopy analysis of C. difficile cellscarrying fusions of the sigF, sigE, sigG and sigK promotors to SNAPCd in strain 630Derm (wt) and in the indicated mutants. The cells were collected after24 h of growth in SM liquid medium, stained with TMR-Star and the membrane dye MTG, and examined by phase contrast (PC) and fluorescencemicroscopy to monitor SNAP production. The merged images shows the overlap between the TMR-Star (red) and MTG (green) channels. The panelsare representative of the expression patterns observed for different stages of sporulation, ordered from early to late for the wild type strainsaccording to the morphological classes a-d defined in Figure 1, as indicated. For the sig strains, the morphological stage characteristic of each mutantis indicated. An extra class that accounts for pre-divisional cells (PD) was introduced for the analysis of both sigF and sigE transcription. The numbersrefer to the percentage of cells at the represented stage showing SNAP fluorescence. The data shown are from one representative experiment, ofthree performed independently. The number of cells analysed for each class, n, is as follows: PD, n = 100–150; class a, n = 30–50; class b, n = 50–60;class c, n = 30–40; class d, n = 15–25; for sigF/E mutants, n = 80–120; for sigG and sigK mutants, n = 40–50. Scale bar: 1 mm.doi:10.1371/journal.pgen.1003782.g004
Clostridium difficile Sporulation
PLOS Genetics | www.plosgenetics.org 8 October 2013 | Volume 9 | Issue 10 | e1003782

completion in a sigG mutant (Figure 4). However, the quantitative
analysis of the SNAP-TMR signal shows an increase in the average
fluorescence intensity following engulfment completion (classes c+d,
2.661.0 as opposed to 2.260.9 for classes a+b) (p,0.01)
(Figure 5B). Moreover, the average fluorescence signal for engulfed
forespores of a sigG mutant suffered a higher reduction compared to
the wild type (classes c+d, 1.960.7 for the mutant as compared to
2.661.0 for the wild type; p,0.01), than did the signal for pre-
engulfment forespores of the mutant (classes a+b, 1.760.5 as
opposed to 2.260.9; p,0.05) (Figure 5B). While evidencing that
sG contributes to transcription of its own gene both prior to and
following engulfment completion, these results suggest that the
auto-regulatory effect is stronger at the later stage.
In C. difficile, transcription of sigK was confined to the mother
cell and detected soon after asymmetric division (Figure 4).
Moreover, disruption of sigE resulted in undetected expression of
PsigK-SNAPCd (Figure 4). Together, the results suggest that the initial
transcription of sigK is activated by sE in the mother cell,
consistent with the presence of a possible sE-recognized promoter
in the sigK regulatory region (Figure S7D). Interestingly,
transcription of the sigK gene was also detected in a small
percentage (9%) of the sporulating cells of a sigF mutant (Figure 4).
This was unexpected because in B. subtilis, activation of sE in the
mother cell is dependent on sF [66], [67]. This observation thus
raises the possibility that the activation of sE in C. difficile is at least
partially independent of sF (see also the following section).
Transcription of sigK was also detected following engulfment
completion, in cells carrying phase grey and phase bright spores
(Figure 4). As shown in Figure 5A, all of the SNAP produced from
the PsigK-SNAPCd fusion was, under our experimental conditions,
Figure 5. Quantitative analysis of sigF, sigE, sigG and sigK expression during sporulation. (A) Whole cell extracts were prepared fromderivatives of strain 630Derm bearing the indicated plasmids or fusions, immediately after labeling with TMR-Star, indicated by the ‘‘+’’ sign (the ‘‘2’’sign indicates control, unlabeled samples). The indicated amount of total protein was resolved by SDS-PAGE, and the gels scanned on a fluorimager(top) or subject to immunoblotting with anti-SNAP antibodies (bottom). Black and red arrows point to unlabeled or TMR-Star-labeled, respectively,SNAP. Strain 630Derm carrying pFT47 (empty vector) was used as a negative control for SNAP production. The position of molecular weight markers(in kDa) is indicated. (B) Quantitative analysis of the fluorescence (Fl.) intensity in different cell types of the reporter strains for sigF, sigE, sigG and sigKtranscription, as indicated. The numbers in the legend represent the average 6 SD of fluorescence intensity for the cell class considered (n = 50 cellsanalysed for each morphological cell class). The data shown are from one experiment, representative of three independent experiments. Schematicrepresentation of the deduced spatial and temporal pattern of transcription (with darker red denoting increased transcription) is shown for eachtranscriptional fusion. The cell membrane is represented in green. PD, pre-divisional cell; MC, mother cell; FS, forespore; B, phase bright spore; a to d:sporulation classes as defined in Figure 1.doi:10.1371/journal.pgen.1003782.g005
Clostridium difficile Sporulation
PLOS Genetics | www.plosgenetics.org 9 October 2013 | Volume 9 | Issue 10 | e1003782

labeled. The average intensity of the fluorescence signal from PsigK-
SNAPCd in cells prior (classes a+b, 0.660.1) and after engulfment
completion (class c, 0.760.2) was very close. However, expression
was significantly increased for those cells that carried phase bright
spores (class d, 1.460.8; p,0.001) (Figure 5B). This suggests that
the onset of the main period of sigK transcription coincides with the
final stages in spore morphogenesis. Lastly, under our experimen-
tal conditions, we found no evidence for auto-regulation of sigK
transcription, as expression of PsigK-SNAPCd was not curtailed by
mutation of sigK at any morphological stage analyzed (Figure 4
and data not shown).
Localizing the activity of sF and sE
To investigate the genetic dependencies for sigma factor activity
during sporulation in C. difficile, we used transcriptional SNAPCd
fusions to promoters under the control of each cell type-specific
sigma factor. These promoters were selected on the basis of qRT-
PCR experiments and the presence on their regulatory regions, of
sequences conforming well to the consensus for promoter
recognition by the sporulation sigma factors of B. subtilis [68]
(Figure S8). The gpr gene of B. subtilis codes for a spore-specific
protease required for degradation of the DNA-protecting small
acid-soluble spore proteins (SASP) during spore germination ([1];
see also below). Even though this gene is under the dual control of
sF and sG in B. subtilis, the C. difficille orthologue of gpr (CD2470)
was chosen as a reporter for sF activity (Figure S8A). First, qRT-
PCR showed that transcription of the C. difficille orthologue
(CD2470) was severely reduced in a sigF mutant (Figure 6A).
Secondly, expression of a Pgpr-SNAPCd fusion, monitored by
fluorescence microscopy, was confined to the forespore and
detected soon after asymmetric division in 66% of the cells that
were at this stage of sporulation (Figure 6B). Lastly, expression was
eliminated by disruption of the sigF gene but detected in 99% of
the cells of the sigG mutant (compared for the wild type at the same
stage, i.e., 95%) (Figure 6B). This suggests that sG does not
contribute significantly to gpr expression. Forespore-specific
expression of Pgpr-SNAPCd was also detected following engulfment
completion (Figure 6B). Therefore, in spite of expression of the sigF
gene in both the forespore and the mother cell, sF is active
exclusively in the forespore. In these experiments, all of the SNAP
protein produced from Pgpr-SNAPCd was labeled with the TMR-
Star substrate (Figure 7A). A quantitative analysis of the
fluorescence signal from Pgpr-SNAPCd showed no significant
difference between cells before (average signal for classes a+b,
2.060.5) or after engulfment completion (classes c+d, 1.960.7)
(Figure 7B). This suggests that sF is active in the forespore
throughout development.
To monitor the activity of sE, we examined expression of the
first gene, spoIIIAA, of the spoIIIA operon. This operon is under the
control of sE in B. subtilis [69–71] and sequences that conform well
to the consensus for promoter recognition by B. subtilis sE are
found just upstream of the C. difficile spoIIIAA gene (or CD1192)
(Figure S8B). The qRT-PCR experiments showed that expression
of spoIIIAA was much more severely affected by a mutation in sigE
than by disruption of sigF (Figure 6A). While consistent with a
direct control of spoIIIAA by sE, this observation adds to the
evidence suggesting that unlike in B. subtilis [21], [66], [67], the
activity of sE is at least partially independent on the prior
activation of sF (as also hinted by the observation that
transcription of the sigK gene, abolished by mutation of sigE, was
still detected in a fraction of cells of a sigF mutant; above). If so,
then expression of a PspoIIIAA-SNAP Cd fusion should be confined to
the mother cell, dependent on sigE, but partially independent
on sigF. PspoIIIAA-SNAPCd-driven SNAP production was indeed
confined to the mother cell, detected just after asymmetric division
in 89% of the cells scored at this stage of sporulation, eliminated by
mutation of sigE, but still detected (in the mother cell) in 21% of
sigF cells (Figure 6B). Labeling of the SNAP protein produced from
the PspoIIIAA-SNAPCd fusion was quantitative (Figure 7A), and the
quantitative analysis of the average fluorescence signal shows no
significant difference in expression levels before or after engulf-
ment completion (Figure 7B). PspoIIIAA-SNAPCd expression persisted
until late stages in development, and was still detected for cells in
which phase bright spores were seen (Figure 7B).
Requirements for the activity of sG and sK
The sspA gene of B. subtilis codes for a small acid-soluble spore
protein (SASP) that, together with other SASP family members,
binds to and protects the spore DNA [1]. Expression of sspA in B.
subtilis is controlled by sG [68], [69], and a sG-type promoter can
be recognized upstream of the C. difficile orthologue (CD2688)
(Figure S8C). Unexpectedly, a mutation in sigF caused a greater
decrease in sspA transcription than disruption of sigE or sigG, in our
qRT-PCR analysis (Figure 6A). While not excluding a contribu-
tion of sF to the expression of sspA, this result may be affected by
the lack of synchronization of sporulation in the liquid SM
cultures. Consistent with sG control of sspA in C difficile, PsspA-
driven SNAP production was confined to the forespore and
eliminated by disruption of sigF or of sigG (but not of sigE or sigK)
(Figure 6B). This is in agreement with the requirement for sF for
the transcription of sigG (above), and seems to exclude a
contribution of sF for sspA transcription as suggested by the
qRT-PCR analysis. sspA expression was detected in 50% of the
cells that had just completed asymmetric division, but also
throughout the engulfment sequence (72% of the cells), following
engulfment completion (85% of the cells scored), and in cells (75%)
carrying phase bright spores (Figure 6B). Our analysis of sigG
transcription suggested that it increased following engulfment
completion, with a stronger auto-regulatory component than in
pre-engulfed cells (above). In B. subtilis, continued transcription in
the forespore when (upon engulfment completion) it becomes
isolated from the surrounding medium, requires the activity of sE
[72–76]. To determine whether the activity of sG increased
following engulfment completion in a manner that required sE,
we quantified the SNAP-TMR signal in cells expressing PsspA-
SNAPCd. Control experiments showed that all the SNAP protein
produced from the PsspA-SNAPCd fusion was labeled with the
TMR-Star substrate (Figure 7A). The average intensity of the
SNAP-TMR signal increased from 1.660.5 before engulfment
completion (classes a+b) to 2.1604, following engulfment comple-
tion (classes c+d) (p,0.0001) (Figure 7B). This result is consistent
with the analysis of sigG transcription (above) and indicates that the
activity of sG increases following engulfment completion. Impor-
tantly, even though sspA expression was found for 61% of the sigE
mutant cells, disruption of sigE reduced the average fluorescence
signal in the forespore (1.660.7) to the level seen before
engulfment completion for the wild type (1.660.5). We conclude
that disruption of sigE does not prevent activity of sG prior to
engulfment completion.
Finally, to monitor the activity of sK, we examined expression
of the cotE gene, coding for an abundant spore coat protein in C.
difficile [55]. This gene has no counterpart in B. subtilis, but as
shown above, production of a CotE-SNAP translational fusion was
dependent on sK (Figure 2E) and a sequence that conforms well to
the consensus for sK promoters of B. subtilis can be recognized in
its promoter region (Figure S8D). qRT-PCR experiments show
that disruption of the sigE and sigK genes caused a much stronger
reduction in the expression of cotE than mutations in sigF or sigG
Clostridium difficile Sporulation
PLOS Genetics | www.plosgenetics.org 10 October 2013 | Volume 9 | Issue 10 | e1003782
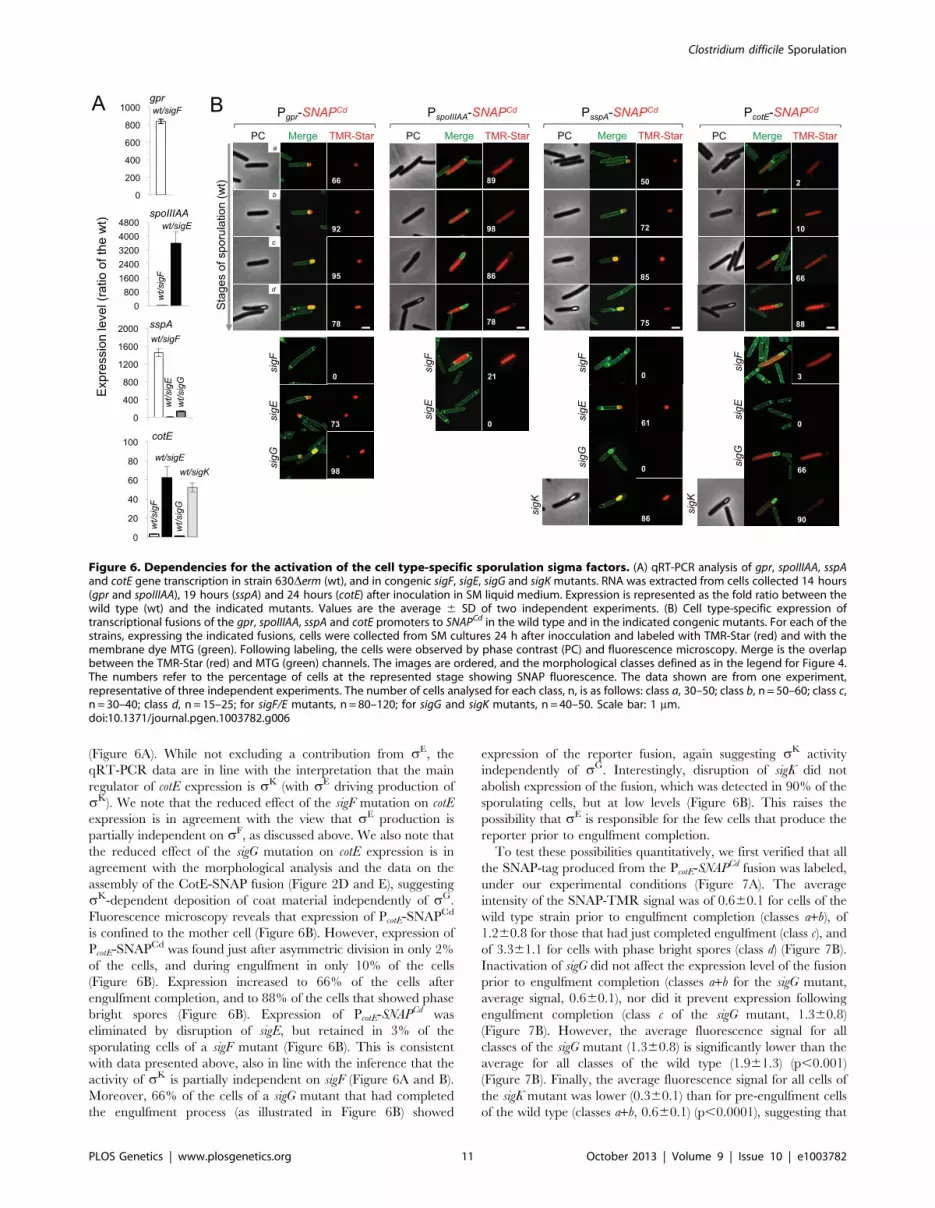
(Figure 6A). While not excluding a contribution from sE, the
qRT-PCR data are in line with the interpretation that the main
regulator of cotE expression is sK (with sE driving production of
sK). We note that the reduced effect of the sigF mutation on cotE
expression is in agreement with the view that sE production is
partially independent on sF, as discussed above. We also note that
the reduced effect of the sigG mutation on cotE expression is in
agreement with the morphological analysis and the data on the
assembly of the CotE-SNAP fusion (Figure 2D and E), suggesting
sK-dependent deposition of coat material independently of sG.
Fluorescence microscopy reveals that expression of PcotE-SNAPCd
is confined to the mother cell (Figure 6B). However, expression of
PcotE-SNAPCd was found just after asymmetric division in only 2%
of the cells, and during engulfment in only 10% of the cells
(Figure 6B). Expression increased to 66% of the cells after
engulfment completion, and to 88% of the cells that showed phase
bright spores (Figure 6B). Expression of PcotE-SNAPCd was
eliminated by disruption of sigE, but retained in 3% of the
sporulating cells of a sigF mutant (Figure 6B). This is consistent
with data presented above, also in line with the inference that the
activity of sK is partially independent on sigF (Figure 6A and B).
Moreover, 66% of the cells of a sigG mutant that had completed
the engulfment process (as illustrated in Figure 6B) showed
expression of the reporter fusion, again suggesting sK activity
independently of sG. Interestingly, disruption of sigK did not
abolish expression of the fusion, which was detected in 90% of the
sporulating cells, but at low levels (Figure 6B). This raises the
possibility that sE is responsible for the few cells that produce the
reporter prior to engulfment completion.
To test these possibilities quantitatively, we first verified that all
the SNAP-tag produced from the PcotE-SNAPCd fusion was labeled,
under our experimental conditions (Figure 7A). The average
intensity of the SNAP-TMR signal was of 0.660.1 for cells of the
wild type strain prior to engulfment completion (classes a+b), of
1.260.8 for those that had just completed engulfment (class c), and
of 3.361.1 for cells with phase bright spores (class d) (Figure 7B).
Inactivation of sigG did not affect the expression level of the fusion
prior to engulfment completion (classes a+b for the sigG mutant,
average signal, 0.660.1), nor did it prevent expression following
engulfment completion (class c of the sigG mutant, 1.360.8)
(Figure 7B). However, the average fluorescence signal for all
classes of the sigG mutant (1.360.8) is significantly lower than the
average for all classes of the wild type (1.961.3) (p,0.001)
(Figure 7B). Finally, the average fluorescence signal for all cells of
the sigK mutant was lower (0.360.1) than for pre-engulfment cells
of the wild type (classes a+b, 0.660.1) (p,0.0001), suggesting that
Figure 6. Dependencies for the activation of the cell type-specific sporulation sigma factors. (A) qRT-PCR analysis of gpr, spoIIIAA, sspAand cotE gene transcription in strain 630Derm (wt), and in congenic sigF, sigE, sigG and sigK mutants. RNA was extracted from cells collected 14 hours(gpr and spoIIIAA), 19 hours (sspA) and 24 hours (cotE) after inoculation in SM liquid medium. Expression is represented as the fold ratio between thewild type (wt) and the indicated mutants. Values are the average 6 SD of two independent experiments. (B) Cell type-specific expression oftranscriptional fusions of the gpr, spoIIIAA, sspA and cotE promoters to SNAPCd in the wild type and in the indicated congenic mutants. For each of thestrains, expressing the indicated fusions, cells were collected from SM cultures 24 h after inocculation and labeled with TMR-Star (red) and with themembrane dye MTG (green). Following labeling, the cells were observed by phase contrast (PC) and fluorescence microscopy. Merge is the overlapbetween the TMR-Star (red) and MTG (green) channels. The images are ordered, and the morphological classes defined as in the legend for Figure 4.The numbers refer to the percentage of cells at the represented stage showing SNAP fluorescence. The data shown are from one experiment,representative of three independent experiments. The number of cells analysed for each class, n, is as follows: class a, 30–50; class b, n = 50–60; class c,n = 30–40; class d, n = 15–25; for sigF/E mutants, n = 80–120; for sigG and sigK mutants, n = 40–50. Scale bar: 1 mm.doi:10.1371/journal.pgen.1003782.g006
Clostridium difficile Sporulation
PLOS Genetics | www.plosgenetics.org 11 October 2013 | Volume 9 | Issue 10 | e1003782

both sE and sK contribute to expression of the reporter fusion in
these cells. Together, these data suggest that the main period of sK
activity is delayed relative to engulfment completion, and coincides
with development of spore refractility.
Discussion
In this work, we analyzed the function of the four cell type-
specific sigma factors of sporulation in C. difficile, and we studied
gene expression in relation to the course of spore morphogenesis.
The morphological characterization of mutants for the sigG genes
allowed us to assign functions and to define the main periods of
activity for the 4 cell type-specific sporulation sigma factors. In
addition, the use of a fluorescence transcriptional reporter for
single cell analysis enabled us to establish the time, cell type and
dependency of transcription of the sig genes, as well as the time
and requirements for activity of the four cell type-specific sigma
factors.
Transcription of sigF and sigE, and activity of sF and sE
The cytological and TEM analysis shows that the sigF and sigE
mutants are arrested just after asymmetric division. It follows that
sF and sE control early stages of development in C. difficile,
consistent with the function of these sigma factors in B. subtilis.
Disruption of sigE also arrested development just after asymmetric
division in C. perfringens [29]. In contrast, disruption of either the
sigF or sigE genes in C. acetobutylicum blocks sporulation prior to
asymmetric division [31], [33]. In C. difficile, expression of both sigF
and sigE commenced in predivisional cells, in line with work
showing that expression of the sigF-containing operon (also coding
for two other proteins, SpoIIAA and SpoIIAB, that control sF)
occurs from a sH and Spo0A-controlled promoter, and with the
observation that transcription of sigE is activated from a sA-type
promoter to which Spo0A also binds [60], [61]. In B. subtilis,
following asymmetric septation, Spo0A becomes a cell-specific
transcription factor, active predominantly in the mother cell [77].
This may also be the case in C. difficile, because transcription of
Figure 7. Quantitative analysis of sigF, sigE, sigG and sigK activities during sporulation. (A) SDS-PAGE gel and Western Blot analysis ofextracts from 630Derm carrying fusions of gpr, spoIIIAA, sspA and cotE to SNAP. Black arrows point to unlabeled SNAPCd protein, while red arrowspoint to SNAP after TMR-Star labeling (distinguishable in the WB from the unlabeled form by a shift in protein migration). The TMR-Star fluorescentsignal from the SDS-PAGE gel was obtained using a fluorimager. TMR-Star incorporation as well as the amount of protein loaded is indicated for eachlane. 630Derm carrying pFT47 empty vector was used as a negative control of SNAP production. (B) Quantitative analysis of the SNAP fluorescence(Fl.) signal in different cell types of the reporter strains for sF, sE, sG and sK activity, as indicated. The numbers in the legend represent the average6 SD of fluorescence intensity for the cell class considered (NB: 50 cells were analysed for each cell type). The average fluorescence intensity (allclasses included) from PcotE-SNAPCd is 1.961.3 for the wild type, 1.360.8 for a sigG mutant and 0.360.1 for the sigK mutant. Data shown are from oneexperiment, representative of three independent experiments. Schematic representation of the deduced spatial and temporal pattern of transcriptionis shown for the different fusions (with darker red denoting increased transcription). The cell membrane is represented in green. No activity was seenin predivisional cells for any of the s factors (not represented). PD, pre-divisional cell; MC, mother cell; FS, forespore; B, phase bright spore; a to d:sporulation classes ordered and defined as in the legend for Figure 4.doi:10.1371/journal.pgen.1003782.g007
Clostridium difficile Sporulation
PLOS Genetics | www.plosgenetics.org 12 October 2013 | Volume 9 | Issue 10 | e1003782

sigE increased in the mother cell, relative to the forespore,
following asymmetric division (Figure 7B).
In B. subtilis, sF is held in an inactive complex by the anti-sigma
factor SpoIIAB [21], [23]. The reaction that releases sF takes
place specifically in the forespore, soon after septation, and
involves the anti-anti sigma factor SpoIIAA and the SpoIIE
phosphatase. SpoIIAB, SpoIIAA and SpoIIE are produced in the
C. difficile predivisional cell under Spo0A control [24–27], [60],
[61]. Because the activity of sF was confined to the forespore, we
presume that the pathway leading to the forespore-specific
activation of this sigma factor is also conserved. In C. acetobutylicum,
this pathway may lead to sF activation in pre-divisional cells, as
disruption of sigF or spoIIE blocks sporulation prior to asymmetric
division [33], [35].
In B. subtilis, sE is also synthesized in the predivisional but as an
inactive pro-protein [21], [23]. Processing of pro-sE in the mother
cell requires activation of the SpoIIGA protease by SpoIIR, a sF-
controlled signaling protein secreted from the forespore [66], [67].
Hence, the activity of sE requires the prior activation of sF. In C.
difficile, the activity of sE was also restricted to the mother cell
(Figure 7B). Because sE of C. difficile bears, like its B. subtilis
counterpart, a pro sequence, and because the SpoIIGA protease
and SpoIIR are conserved [24–27], the sE activation pathway also
seems conserved. Strikingly however, both the qRT-PCR and the
SNAP labeling experiments showed that the activity of sE is at
least partially independent on sF (Figure 6). We do not know
whether production of SpoIIR is also partially independent on sF.
However, in C. acetobutylicum, in which sF is activated (and
required) prior to asymmetric septation [33], [35], production of
SpoIIR is, at least in part, independent of sF [33].
Production and activity of sG
The cytological and TEM analysis showed that a sigG mutant
completes the engulfment sequence, suggesting that sG is mainly
required for late stages in development, consistent with its role in
B. subtilis. Disruption of sigG also causes a late morphological block
in C. acetobutylicum [78]. In B. subtilis, the forespore-specific
transcription of sigG is initiated by sF but is delayed, relative to
other sF-dependent genes, towards the engulfment sequence [21],
[64], [68], [69]. Moreover, the activity of sE, in the mother cell, is
required for transcription of sigG [21], [64]. In contrast,
transcription of sigG in C. difficile, was detected soon after
asymmetric septation, and was not dependent on sE (Figure 4
and 5). Transcription of sigG also appears to be independent of sigE
in C. perfringens [29]. The main period of sigG transcription in B.
subtilis relies on an auto-regulatory loop activated coincidently with
engulfment completion [65]. Therefore, the main period of sG
activity coincides with engulfment completion. At least the anti-
sigma factor CsfB (sF-controlled) appears important for impeding
the sG auto-regulatory loop from functioning prior to engulfment
completion, the main period of activity of the preceding forespore
sigma factor, sF [21], [23], [72], [79], [80]. CsfB is absent from C.
difficile as well as from other Clostridia [24], [25], [27]. In C.
difficile, not only is transcription of sigG observed soon after
asymmetric division, but the activity of sG, is also detected prior to
engulfment completion. Nevertheless, our analysis indicates that
sG activity increases following engulfment completion. In
addition, our results suggest that sG is auto-regulatory both
before, and more markedly, following engulfment completion.
A universal feature of endosporulation is the isolation of the
forespore, surrounded by two membranes, from the external
medium at the end of the engulfment sequence. In B. subtilis, the 8
mother cell proteins encoded by the spoIIIA operon, which localize
to the forespore outer membrane, and the forespore-specific
SpoIIQ protein, which localizes to the forespore inner membrane,
are involved in the assembly of a specialized secretion system that
links the cytoplasm of the two cells [72–76]. Recent work has
shown that the SpoIIIA-SpoIIQ secretion system functions as a
feeding tube required for continued macromolecular synthesis in
the engulfed forespore [76]. Mutation of sigE reduced the activity
of sG but because the mutant is blocked at an early stage, we do
not presently know whether sE is required for sG activity in the
engulfed forespore. The SpoIIIAH and SpoIIQ proteins also
facilitate forespore engulfment in B. subtilis [81]. The spoIIIA
operon is conserved in sporeformers [24], [25], [27], and spoIIIA is
under sE control in C. difficile (this work). A gene, CD0125, coding
for a LytM-containing protein (as the B. subtilis SpoIIQ protein)
may represent a non-orthologous gene replacement of spoIIQ [24].
We do not yet know whether spoIIIA and CD0125 are essential for
sporulation in C. difficile and if so, whether they are required for
engulfment and/or continued gene expression in the engulfed
forespore.
Production and activity of sK
The TEM analysis shows that the sigK mutant of C. difficile lacks
a visible coat (Figure 2D). However, as in B. subtilis [15], [16]
assembly of the coat begins with sE, as suggested by the forespore
localization of CotB-SNAP in cells of the sigK mutant, and
supported by recent work on the analysis of coat morphogenetic
proteins SpoIVA and SipL [42]. Most likely, sK controls the final
stages in the assembly of the spore surface structures, including the
coat and exosporium. However, sK is not a strict requirement for
the formation of heat resistant spores (Figure 2 and Table 1), and
we presume that sE and sG (see above) are largely responsible for
synthesis of the spore cortex. Final assembly of the coat together
with the role of C. difficile sK in mother cell autolysis, are functions
shared with its B. subtilis counterpart.
Transcription and activity of the C. difficile sigK gene was
dependent on sigE, and was detected at low levels prior to
engulfment completion. However, both transcription and activity
increased, following engulfment completion, coincidently with the
appearance of phase grey and phase bright spores. Transcription
of the sigK and spoIVCA genes of B. subtilis, the latter coding for the
recombinase that excises the skin element, is initiated under the
control of sE with the assistance of the regulatory protein SpoIIID,
and is delayed relative to a first wave of sE-directed genes [21],
[23], [69], [70]. SpoIIID is conserved in C. difficile [27] and it may
only accumulate to levels sufficient to enhance sigK and spoIVCA
transcription at late stages in morphogenesis. Two observations
highlight the importance of the skin element in C. difficile. First,
with the exception of an asporogenous strain of C. tetani, the skin
element is not present in other Clostridial species [17], [39].
Second, not only a skin-less allele of sigK fails to complement a sigK
mutation but also acts as a dominant negative mutation [39],
blocking entry into sporulation (Figure 3D and E) (while these
results seem to imply that sK is auto-regulatory, we did not detect
auto-regulation of sigK in our single cell analysis). Absence of the
skin element may allow the recruitment of sK for other functions.
In C. perfringens and in C. botulinum, sK is produced in pre-divisional
cells, and is involved in enterotoxin production in the first, and in
cold and osmotic stress tolerance in the second [29], [82].
A key finding of the present study is that contrary to B. subtilis,
sigG is not essential for the activity of sK. In B. subtilis a signaling
protein, SpoIVB, secreted from the forespore activates the pro-sK
processing protease SpoIVFB, which is kept inactive in a complex
with BofA and SpoIVFA, embedded in the forespore outer
membrane [21], [22]. SpoIVFB, BofA and possibly also SpoIVFA
are absent from C. difficile, suggesting that the sG to sK pathway is
Clostridium difficile Sporulation
PLOS Genetics | www.plosgenetics.org 13 October 2013 | Volume 9 | Issue 10 | e1003782
absent and consistent with the lack of a pro-sequence [24], [27],
[36]. However, C. difficile codes for two orthologues of SpoIVB
[24], [25], [27]. Mutations that bypass the need for sigG or spoIVB
in B. subtilis result in coat deposition, but not cortex formation,
phenocopying the sigG mutant of C. difficile [50]. In B. subtilis,
SpoIVB is also required for the engulfment-regulated proteolysis of
SpoIIQ [83]. The C. difficile SpoIVB orthologues may be involved
in cortex formation and/or proteolysis of CD0125 (above).
While the activity of sK did not require sG, our data shows that
mutation of sigG reduced the activity of sK at late stages of spore
morphogenesis. Because the sigG mutant fails to form phase grey/
bright spores, we do not presently know if a forespore-mother cell
signaling operates at this stage, or whether the late stages in spore
morphogenesis serve as a cue for enhanced activity of sK.
Concluding remarksWe show that the main periods of activity of the four cell type-
specific sigma factors of C. difficile are conserved, relative to the B.
subtilis model, with sF and sE controlling early stages of
development and sG and sK governing late developmental events
(Figure 8A and B). However, the fact that the activity of sE was
partially independent of sF, and that sG or sK did not require sE
or sG, respectively, seems to imply a weaker connection between
the forespore and mother cell lines of gene expression. In spite of
the important differences in the roles of the sporulation sigma
factors and the regulatory circuits leading to their activation
(Figure 8A and B), overall, in what concerns the genetic control of
sporulation, C. difficile seems closer to the model organism B. subtilis
than the other Clostridial species that have been studied.
Differences in the function/period of activity of the sporulation
sigma factors in other Clostridial species, may be related to the
coordination of solventogenesis, toxin production or other
functions with sporulation [28–35]. We note however that the
relationship between toxinogenesis and spore formation in C.
difficile is still unclear [13], [60].
Together with the accompanying work of Saujet and co-authors
[62], our study provides the first comprehensive description of
spore morphogenesis in relation to cell type-specific gene
expression in a Clostridial species that is also an important human
pathogen. The two studies establish a platform for analyzing the
control of toxin production in relation to C. difficile sporulation,
and for the functional characterization of genes predicted to be
important for spore functions related to host colonization, spore
germination, recurrent sporulation in the host, and spore
dissemination.
Materials and Methods
Strains and general techniquesBacterial strains and their relevant properties are listed in Table
S2. The Escherichia coli strain DH5a (Bethesda Research labora-
tories) was used for molecular cloning. Luria-Bertani medium was
routinely used for growth and maintenance of E. coli and B. subtilis.
The B. subtilis strains are congenic derivatives of the Spo+ strain
MB24 (trpC2 metC3). Sporulation of B. subtilis was induced by
growth and exhaustion in Difco sporulation medium (DSM) [84].
When indicated, ampicillin (100 mg/ml) or chloramphenicol
(15 mg/ml) was added to the culture medium. The C. difficile
strains used in this study are congenic derivatives of the wild type
strain 630Derm [85] and were routinely grown anaerobically (5%
H2, 15% CO2, 80% N2) at 37uC in brain heart infusion (BHI)
medium (Difco), BHIS [BHI medium supplemented with yeast
extract (5 mg/ml) and L-cysteine (0.1%), or SM medium (for 1l:
90 g Bacto-tryptone, 5 g Bacto-peptone, 1 g (NH4)2SO4 and 1.5 g
Tris base)] [41]. Sporulation assays were performed in SM
medium [41]. When necessary, cefoxitin (25 mg/ml), thiampheni-
col (15 mg/ml), or erythromycin (5 mg/ml) was added to C. difficile
cultures.
Sporulation assaysOvernight cultures grown at 37uC in BHI were used to
inoculate SM medium (at a dilution of 1:200). At specific time
points, 1 ml of culture was withdrawn, serially diluted in
phosphate-buffered saline (PBS; 137 mM NaCl, 10 mM Phos-
phate, 2.7 mM KCl, pH 7.4), and plated before and after heat
treatment (30 min at 60uC), to determine the total and heat-
resistant colony forming units (CFU). The samples were plated
onto BHI plates supplemented with 0.1% taurocholate (Sigma-
Aldrich), to promote efficient spore germination [41]. The
percentage of sporulation was determined as the ratio between
the number of spores/ml and the total number of bacteria/ml
times 100.
RNA isolation and real-time quantitative RT-PCRIn a preliminary set of experiments, we defined the time for
which the difference in expression of a selected s target gene
between the wild type and the corresponding mutant strain was
highest. To study sE- or sF-dependent control, we harvested cells
from 630Derm, sigF and sigE mutants after 14 h of growth in SM
medium. Strain 630Derm and the sigG or the sigK mutants were
harvested after 19 h (630Derm, sigG mutant) and 24 h (630Derm,
sigK mutant) of growth in SM medium. Total RNA was extracted
from at least two independent cultures. After centrifugation, the
culture pellets were resuspended in RNApro solution (MP
Biomedicals) and RNA extracted using the FastRNA Pro Blue
Kit, according to the manufacturer’s instructions. The RNA
quality was determined using RNA 6000 Nano Reagents (Agilent).
For quantitative RT-PCR experiments, 1 mg of total RNA was
heated at 70uC for 10 min along with 1 mg of hexamer
oligonucleotide primers p(dN)6 (Roche). After slow cooling,
cDNAs were synthesized as previously described [61]. The reverse
transcriptase was inactivated by incubation at 85uC for 5 min.
Real-time quantitative RT-PCR was performed twice in a 20 ml
reaction volume containing 20 ng of cDNAs, 10 ml of FastStart
SYBR Green Master mix (ROX, Roche) and 200 nM gene-
specific primers in a AB7300 real-time PCR instrument (Applied
Biosystems). The primers used for each marker are listed in Table
S3. Amplification and detection were performed as previously
described [61]. In each sample, the quantity of cDNAs of a gene
was normalized to the quantity of cDNAs of the DNApolIII gene.
The relative transcript changes were calculated using the 22DDCt
method as described [61].
Transcriptional and translational SNAPCd fusionsThe construction of transcriptional fusions of the promoters for
the sigF, sigE, sigG and sigK genes, as well as the construction of
translational fusions of cotB and cotE to the SNAP-tag [86] is
described in detail in Text S1. In these plasmids, listed in Table
S4, we used a synthetic SNAP cassette, codon usage optimized for
C. difficile (DNA 2.0, Menlo Park, CA), which we termed SNAPCd
(the sequence is available for download at www.itqb.unl.pt/,aoh/
SNAPCdDNAseq.docx).
SNAP labeling and analysisWhole cell extracts were obtained by withdrawing 10 ml
samples from C. difficile cultures in brain heart infusion (BHI) for
the Ptet-SNAP-bearing strains, or in SM medium for the
Clostridium difficile Sporulation
PLOS Genetics | www.plosgenetics.org 14 October 2013 | Volume 9 | Issue 10 | e1003782
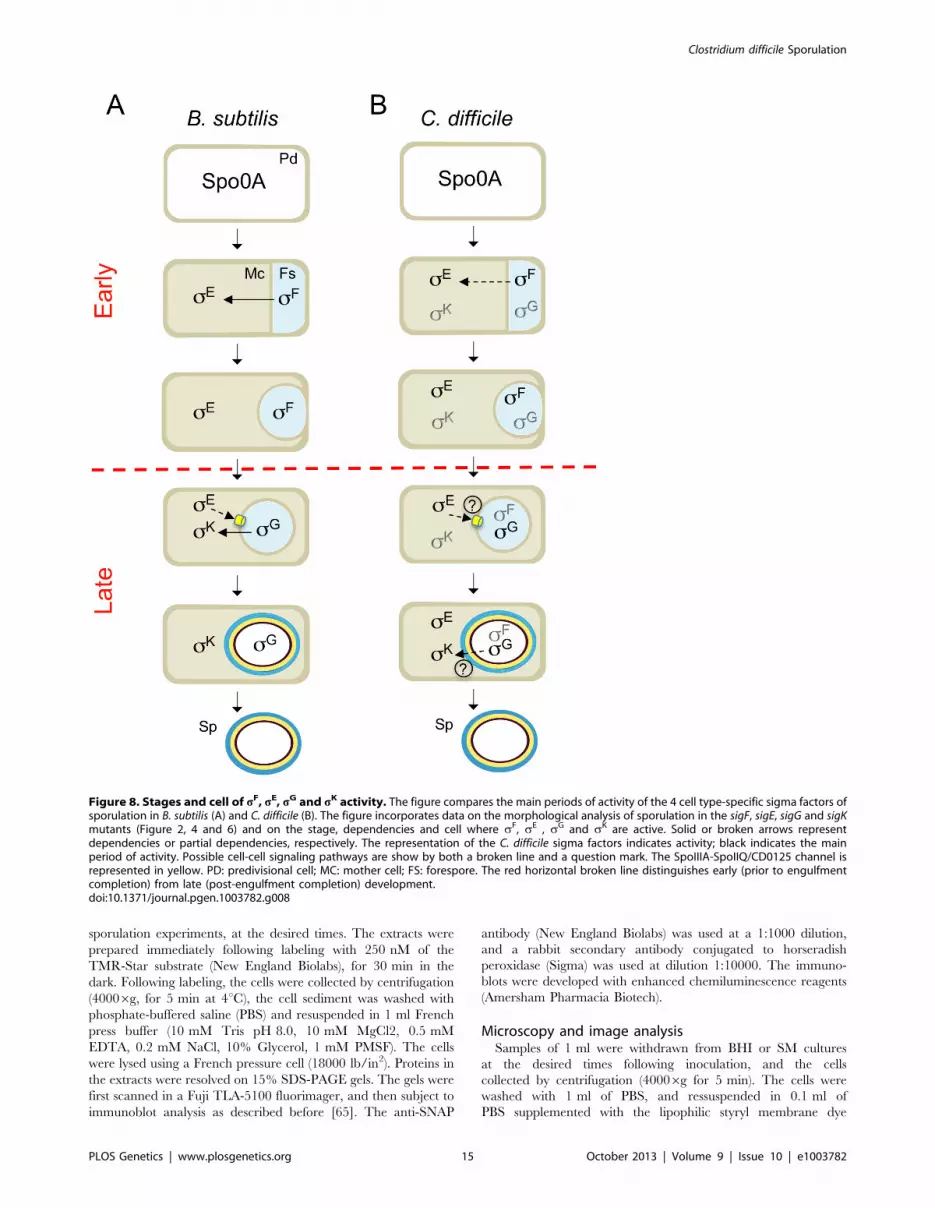
sporulation experiments, at the desired times. The extracts were
prepared immediately following labeling with 250 nM of the
TMR-Star substrate (New England Biolabs), for 30 min in the
dark. Following labeling, the cells were collected by centrifugation
(40006g, for 5 min at 4uC), the cell sediment was washed with
phosphate-buffered saline (PBS) and resuspended in 1 ml French
press buffer (10 mM Tris pH 8.0, 10 mM MgCl2, 0.5 mM
EDTA, 0.2 mM NaCl, 10% Glycerol, 1 mM PMSF). The cells
were lysed using a French pressure cell (18000 lb/in2). Proteins in
the extracts were resolved on 15% SDS-PAGE gels. The gels were
first scanned in a Fuji TLA-5100 fluorimager, and then subject to
immunoblot analysis as described before [65]. The anti-SNAP
antibody (New England Biolabs) was used at a 1:1000 dilution,
and a rabbit secondary antibody conjugated to horseradish
peroxidase (Sigma) was used at dilution 1:10000. The immuno-
blots were developed with enhanced chemiluminescence reagents
(Amersham Pharmacia Biotech).
Microscopy and image analysisSamples of 1 ml were withdrawn from BHI or SM cultures
at the desired times following inoculation, and the cells
collected by centrifugation (40006g for 5 min). The cells were
washed with 1 ml of PBS, and ressuspended in 0.1 ml of
PBS supplemented with the lipophilic styryl membrane dye
Figure 8. Stages and cell of sF, sE, sG and sK activity. The figure compares the main periods of activity of the 4 cell type-specific sigma factors ofsporulation in B. subtilis (A) and C. difficile (B). The figure incorporates data on the morphological analysis of sporulation in the sigF, sigE, sigG and sigKmutants (Figure 2, 4 and 6) and on the stage, dependencies and cell where sF, sE , sG and sK are active. Solid or broken arrows representdependencies or partial dependencies, respectively. The representation of the C. difficile sigma factors indicates activity; black indicates the mainperiod of activity. Possible cell-cell signaling pathways are show by both a broken line and a question mark. The SpoIIIA-SpoIIQ/CD0125 channel isrepresented in yellow. PD: predivisional cell; MC: mother cell; FS: forespore. The red horizontal broken line distinguishes early (prior to engulfmentcompletion) from late (post-engulfment completion) development.doi:10.1371/journal.pgen.1003782.g008
Clostridium difficile Sporulation
PLOS Genetics | www.plosgenetics.org 15 October 2013 | Volume 9 | Issue 10 | e1003782

N-(3-triethylammoniumprpyl)-4-(p-diethylaminophenyl-hexatrienyl)
pyridinium dibromide (FM4-64; 10 mg.ml21) [43], [87], and the
DNA stain DAPI (49,6-diamidino-2-phenylindole; 50 mg.ml21)
(both from Molecular Probes, Invitrogen). For the live/dead assay,
samples were collected as described above, ressuspended in 0.05 ml
of PBS and mixed with an equal volume of 26 LIVE/DEAD
BacLight 26 staining reagent mixture (Molecular Probes, Invitro-
gen) containing Propidium iodide (30 mM final concentration) and
syto9 (6 mM final concentration).
For SNAP labeling experiments, cells in culture samples were
labeled with TMR-Star (as above), collected by centrifugation
(40006g, 3 min, at room temperature), washed four times with
1 ml of PBS, and finally ressuspended in 1 ml of PBS containing
the membrane dye Mitotracker Green (0.5 mg.ml21) (Molecular
Probes, Invitrogen).
For phase contrast and fluorescence microscopy, cells were
mounted on 1.7% agarose coated glass slides and observed on a
Leica DM6000B microscope equipped with a phase contrast
Uplan F1 1006 objective and a CCD Ixon camera (Andor
Technologies) [65]. Images were acquired and analyzed using the
Metamorph software suite version 5.8 (Universal Imaging), and
adjusted and cropped using ImageJ (http://rsbweb.nih.gov/ij/).
Exposure times were adjusted and defined for each SNAP
transcriptional or translational fusion analyzed. For quantification
of the SNAPCd signal resulting from transcriptional fusions,
666 pixel regions were defined in the desired cell and the average
pixel intensity was calculated, and corrected by subtracting the
average pixel intensity of the background. Small fluctuations of
fluorescence among different fields were corrected by normalizing
to the average pixel intensity obtained for the intrinsic autofluo-
rescence of C. difficile cells [88].
Statistical analysisStatistical analysis was carried out using GraphPad Prism
(Version 6.0; GraphPad Software Inc.). The non-parametric
Kolmogorov-Smirnov test (KS-test) was applied to compare
distributions obtained from quantifications of the SNAP-TMR
signal. The P-value is indicated for all comparisons whose
differences were found to be statistically significant. Although the
results presented are from a single experiment, all experiments
involving quantification of a fluorescence signal were performed
independently three times and only results that were considered
statistically significant by a KS-test in all three experiments were
considered to be statistically relevant.
Electron microscopyFor transmission electron microscopy electron (TEM) analysis,
cells of the wild type 630Derm strains and of the various sig mutants
were collected at various times following inoculation onto
Columbia Horse Blood Agar plates (BioMerieux). The high
fraction of sporulating cells under these growth conditions,
facilitates the TEM analysis [89]. Samples were processed for
TEM as described previously [90].
Supporting Information
Figure S1 Sporulation of strain 630Derm in SM (red), BHI (dark
blue) and BHIS (light blue) liquid media. The heat resistant spore
titer (filled symbols) and the total cell titer (open symbols) was
measured for culture samples collected at the indicated time
points. Values represent the average 6 SD of three independent
experiments.
(EPS)
Figure S2 C. difficile spore structure. (A) Differential staining of
C. difficile and B. subtilis spores by the membrane dye FM4-64.
Sporulating cells (upper panel) and free spores (lower panel) of C.
difficile 630Derm strain were collected and mixed with sporulating
cells or free spores of B. subtilis MB24, respectively. Sporulating
cells and free spores of C. difficile 630Derm were collected after 2
and 5 days of growth in BHI agar. B. subtilis MB24 cells were
collected 6 and 24 hours after the onset of sporulation in DSM.
After mixing, cells were stained with FM4-64, and analyzed by
phase contrast (PC) and fluorescence microscopy. FITC column
shows the typical autofluorescence of C. difficile cells. The B. subtilis
strain used produces a CFP fusion to a coat protein (Tgl-CFP).
Scale bar, 1 mm. (B) Staining of Bacillus cereus strain ATCC4342
sporulating cells and free spores with FM4-64. B. cereus cells were
imaged after 48 h of growth in Leighton-Doi medium at 30uC.
Scale bar, 1 mm. (C) Decoating of C. difficile spores drastically
reduces staining with FM4-64. C. difficile purified spores were
submitted or not to a decoating treatment (see Text S1) prior to
staining with FM4-64, and analysed by fluorescence microscopy.
The percentage of total spores labeled with FM4-64 was scored for
both intact and decoated spores (total number of spores scored (n)
is indicated). Scale bar, 1 mm.
(EPS)
Figure S3 Ultrastructure of 630Derm spores. (A) and (B) show a
spore within a lysed mother cell; (C) and (D) show a free spore; (B)
and (D) are a magnification of the region encircled in (A) and (C).
Arrows point to a layer apposed to the external surface of the
spore. The main structural features of C.difficile spores are
indicated in C/D: Cr, core; Cx, cortex; IC, inner coat; OC,
outer coat. Scale bar, 1 mm (A,C) or 0.5 mm (B,D).
(EPS)
Figure S4 Inactivation of the sigF, sigE, sigG and sigK genes in C.
difficile using the ClosTron system. (A) Genetic organisation of the
C. difficile chromosome in the vicinity of sigF, sigE, sigG and sigK
(interrupted by the 14.2 kbp skin element). The red arrow indicates
the point of insertion of the re-targeted type II introns used for
gene disruption. The extent of the DNA fragment present in the
indicated replicative plasmids used for in trans complemetation of
the insertional mutations is shown below each of the genetic maps,
except for the sigK gene (see Figure 3C). (B) Schematic
representation of gene inactivation by a type II Intron with an
associated RAM. The group II intron (bracket), originally in
pMTL007 (top), carries a RAM element (yellow) interrupting an
ermB determinant (blue). The intron was retargeted to the sig gene
of interest (black; middle) by altering the IBS, EBS1 and EBS2
sequences (grey and white stripes; top) by overlapping PCR.
Splicing out of the td group I intron from the ermB gene in the
RAM restores a functional marker allowing positive selection of
mutants following intron integration. Primers used to confirm the
integration and orientation of the type II intron are also indicated
(bottom). (C, D) Chromosomal DNA of EmR C. difficile conjugants
was screened by PCR using primer pairs RAM-F/R to confirm
splicing out of the group I intron (C), or with primer pairs sigFw/
Rev, sigFw/EBS and RAM-F/sigRev to confirm disruption of the
sig genes (D). pMTL007 (C) and chromosomal DNA from the
630Derm (wild type, wt) strain (D) were used as controls. (E)
Southern blot of HindIII-digested genomic DNA from C. difficile
630Derm (wild type, wt), sigF, sigE, sigG and sigK mutant strains.
The probe used corresponds to part of the intron sequence (see
Suplemental Materials and Methods). The position of DNA size
markers is indicate on the left side of the panel.
(EPS)
Clostridium difficile Sporulation
PLOS Genetics | www.plosgenetics.org 16 October 2013 | Volume 9 | Issue 10 | e1003782

Figure S5 SNAP-tag vectors used in the study. (A) Schematic
representation of pFT46, a plasmid carrying SNAPCd under the
control of the Ptet inducible promotor (darker blue). The Ptet -
SNAPCd fusion is flanked by the transcriptional terminator sites of
the slpA and fdx genes. Unique restricition sites are indicated. (B)
Schematic representation and features of pFT47 vector, a
derivative of pMTL84121 [45], coding for a codon usage-
optimized SNAP-tag (SNAPCd). Unique restriction sites (SbfI, AscI,
FseI, PmeI) that allow replacement of functional blocks among
plasmids of the pMTL80000 series are also indicated along the
circular plasmid map. A detailled representation of the region
between XhoI/BamHI and HindIII sites (in blue) is shown on the
bottom (for pFT47) and in (C) (for pFT58). The SNAPCd gene,
preceded by an RBS, was inserted between the XhoI and HindIII
sites within the multiple cloning site (MCS) of pMTL84121
(unique sites upstream of XhoI, that are part of the pMTL84121
MCS, are indicated), yielding pFT47, a vector suitable for
transcriptional fusions. (C) For translational fusions, the region
between BamHI and HindIII sites of pFT47 (in blue) was replaced
by the one depicted, yielding pFT58. This vector retains the main
features of pFT47, except that a linker preceeds the SNAP coding
sequence, from which the start codon was also removed, allowing
the construction of C-terminal translational fusions to SNAP. NB:
Only the 5 last codons of the linker sequence are present in pFT58
(see Materials and Methods).
(EPS)
Figure S6 The SNAP-tag as a fluorescent reporter in C. difficile.
(A) Fluorescence microscopy of C. difficile cells producing SNAP
under the control of Ptet (in pFT46). Cells were grown in BHI
liquid medium and induced with anhydrous tetracycline (ATc) at
the mid-exponential phase, during 1 hour. Cells were then labeled
with for 30 minutes with the indicated concentrations (nM) of the
SNAP substrate TMR-Star and examined by phase contrast (PC)
and fluorescence microscopy, to monitor SNAP production. The
panels on the right show the relative levels of SNAP-TMR-Star
fluorescence within individual cells (n = 150), for the indicated
labeling times. Scale bar, 1 mm. (B) Values represented by the bars
are the average 6 SD of the fluorescence intensity shown in A, for
each of the labeling concentrations of TMR-Star used. (C)
Percentage of cells showing a fluorescent signal above the
background level for each labeling concentration. (D) Whole cell
extracts were prepared from strain 630Derm carrying pFT46
grown until mid-exponential phase, time at which cells were
induced by the addition of ATc (250 ng/ml), for 1 hour. The
extracts were prepared immediately following labeling with
increasing concentrations of TMR-Star, as described in (A) and
indicated for each lane. Proteins (10 mg) were resolved by SDS-
PAGE and the gels subject to western blot analysis with an anti-
SNAP antibody (New England Biolabs) (bottom) and scanned
using a fluorimager (top). Black or red arrows point to unlabeled or
labeled SNAP, respectively. Labeling with TMR-Star slows down
the migration of the SNAP protein. The position of molecular
weight markers (in kDa) is shown on the left side of the panels.
(EPS)
Figure S7 Structure of the promoter regions of the C. difficile sigF
(A), sigE (B), sigG (C) and sigK (D) genes. The upper part of each
panel is a representation of the genetic organization of the
different genes, the position of the type II intron insertion, and the
extent of the DNA fragments cloned in the indicated replicative
plasmids for complementation experiments (see also Figure S4A).
The bottom part of each panel shows the DNA sequence
immediately uptream of the coding region of each gene. The
210 and 235 promoter elements, Spo0A boxes (for the sigF gene),
and the start codon of each gene, are indicated. Numbering is
relative to the position of the start codon.
(EPS)
Figure S8 Structure of the promoter regions of the C. difficile gpr
(A), spoIIIAA (B), sspA (C) and cotE (D) genes. The upper part of
each panel is a representation of the genetic organization of the
different genes. The bottom part of each panel shows the DNA
sequence of the region immediately upstream of the coding region
of each gene, with the 210 and 235 promoter elements indicated.
Numbering is relative to the start codon.
(EPS)
Table S1 Sporulation of strain 630Derm in SM.
(PDF)
Table S2 Strains used in this study.
(PDF)
Table S3 Oligonucleotide primers used in this study.
(PDF)
Table S4 Plasmids used in this study.
(PDF)
Text S1 Supplemental Materials and Methods and Supplemen-
tal Results and Discussion.
(PDF)
Acknowledgments
We thank Catarina Fernandes for the gift of the Tgl-CFP fusion, Nigel
Minton and Neil Fairweather for the gift of plasmids, strains and helpful
discussions, Maja Rupnik and Jorge Carneiro for helpful discussions, Lars
Jansen for advice on the use of the SNAP-tag, and Tiago dos Vultos for
help in the initial stages of this study.
Author Contributions
Conceived and designed the experiments: FCP IMV BD AOH. Performed
the experiments: FCP LS ART MS MM ECT. Analyzed the data: FCP LS
MS IMV BD AOH. Contributed reagents/materials/analysis tools: FCP
LS ART MS MM ECT IMV BD AOH. Wrote the paper: FCP BD AOH.
References
1. Nicholson WL, Munakata N, Horneck G, Melosh HJ, Setlow P (2000)
Resistance of Bacillus endospores to extreme terrestrial and extraterrestrial
environments. Microbiol Mol Biol Rev 64: 548–572.
2. Nicholson WL (2004) Ubiquity, longevity, and ecological roles of Bacillus spores.
In: Henriques AO, Ricca E, Cutting S, editors. Bacterial Spore Formers:
Probiotics and Emerging Application. London: Horizon Scientific Press. pp. 1–
15.
3. Angert ER, Losick RM (1998) Propagation by sporulation in the guinea pig
symbiont Metabacterium polyspora. Proc Natl Acad Sci U S A 95: 10218–
10223.
4. Flint JF, Drzymalski D, Montgomery WL, Southam G, Angert ER (2005)
Nocturnal production of endospores in natural populations of epulopiscium-like
surgeonfish symbionts. J Bacteriol 187: 7460–7470.
5. Tam NK, Uyen NQ, Hong HA, Duc le H, Hoa TT, et al. (2006) The intestinal
life cycle of Bacillus subtilis and close relatives. J Bacteriol 188: 2692–2700.
6. Mock M, Fouet A (2001) Anthrax. Annu Rev Microbiol 55: 647–671.
7. Oliva C, Turnbough CL, Jr., Kearney JF (2009) CD14-Mac-1 interactions in
Bacillus anthracis spore internalization by macrophages. Proc Natl Acad
Sci U S A 106: 13957–13962.
8. Rupnik M, Wilcox MH, Gerding DN (2009) Clostridium difficile infection: new
developments in epidemiology and pathogenesis. Nat Rev Microbiol 7: 526–536.
9. Deneve C, Janoir C, Poilane I, Fantinato C, Collignon A (2009) New trends in
Clostridium difficile virulence and pathogenesis. Int J Antimicrob Agents 33
Suppl 1: S24–28.
10. Carter GP, Rood JI, Lyras D (2012) The role of toxin A and toxin B in the
virulence of Clostridium difficile. Trends Microbiol 20: 21–29.
Clostridium difficile Sporulation
PLOS Genetics | www.plosgenetics.org 17 October 2013 | Volume 9 | Issue 10 | e1003782
11. Burns DA, Heap JT, Minton NP (2010) The diverse sporulation characteristicsof Clostridium difficile clinical isolates are not associated with type. Anaerobe 16:
618–622.
12. Sarker MR, Paredes-Sabja D (2012) Molecular basis of early stages of
Clostridium difficile infection: germination and colonization. Future Microbiol7: 933–943.
13. Deakin LJ, Clare S, Fagan RP, Dawson LF, Pickard DJ, et al. (2012) The
Clostridium difficile spo0A gene is a persistence and transmission factor. InfectImmun 80: 2704–2711.
14. Cartman ST, Heap JT, Kuehne SA, Cockayne A, Minton NP (2010) Theemergence of ‘hypervirulence’ in Clostridium difficile. Int J Med Microbiol 300:
387–395.
15. Henriques AO, Moran CP, Jr. (2007) Structure, assembly, and function of the
spore surface layers. Annu Rev Microbiol 61: 555–588.
16. McKenney PT, Driks A, Eichenberger P (2012) The Bacillus subtilis endospore:
assembly and functions of the multilayered coat. Nat Rev Microbiol 11: 33–44.
17. de Hoon MJ, Eichenberger P, Vitkup D (2010) Hierarchical evolution of the
bacterial sporulation network. Curr Biol 20: R735–745.
18. Panessa-Warren BJ, Tortora GT, Warren JB (2007) High resolution FESEM
and TEM reveal bacterial spore attachment. Microsc Microanal 13: 251–266.
19. Paredes-Sabja D, Sarker MR (2012) Adherence of Clostridium difficile spores to
Caco-2 cells in culture. J Med Microbiol 61: 1208–1218.
20. Paredes-Sabja D, Cofre-Araneda G, Brito-Silva C, Pizarro-Guajardo M, Sarker
MR (2012) Clostridium difficile spore-macrophage interactions: spore survival.
PLoS One 7: e43635.
21. Hilbert DW, Piggot PJ (2004) Compartmentalization of gene expression during
Bacillus subtilis spore formation. Microbiol Mol Biol Rev 68: 234–262.
22. Higgins D, Dworkin J (2012) Recent progress in Bacillus subtilis sporulation.
FEMS Microbiol Rev 36: 131–148.
23. Piggot PJ, Hilbert DW (2004) Sporulation of Bacillus subtilis. Curr Opin
Microbiol 7: 579–586.
24. Galperin MY, Mekhedov SL, Puigbo P, Smirnov S, Wolf YI, et al. (2012)
Genomic determinants of sporulation in Bacilli and Clostridia: towards theminimal set of sporulation-specific genes. Environ Microbiol 14: 2870–2890.
25. Traag BA, Pugliese A, Eisen JA, Losick R (2012) Gene conservation amongendospore-forming bacteria reveals additional sporulation genes in Bacillus
subtilis. J Bacteriol 195(2):253–60.
26. Miller DA, Suen G, Clements KD, Angert ER (2012) The genomic basis for the
evolution of a novel form of cellular reproduction in the bacterium
Epulopiscium. BMC Genomics 13: 265.
27. Abecasis A, Serrano M, Alves L, Quintais L, Pereira-Leal JB, et al. (2013) A
genomic signature and the identification of new endosporulaion genes.J Bacteriol 195(9):2101–15.
28. Paredes CJ, Alsaker KV, Papoutsakis ET (2005) A comparative genomic view ofclostridial sporulation and physiology. Nat Rev Microbiol 3: 969–978.
29. Harry KH, Zhou R, Kroos L, Melville SB (2009) Sporulation and enterotoxin(CPE) synthesis are controlled by the sporulation-specific sigma factors SigE and
SigK in Clostridium perfringens. J Bacteriol 191: 2728–2742.
30. Li J, McClane BA (2010) Evaluating the involvement of alternative sigma factors
SigF and SigG in Clostridium perfringens sporulation and enterotoxin synthesis.Infect Immun 78: 4286–4293.
31. Tracy BP, Jones SW, Papoutsakis ET (2011) Inactivation of sigmaE and sigmaG
in Clostridium acetobutylicum illuminates their roles in clostridial-cell-formbiogenesis, granulose synthesis, solventogenesis, and spore morphogenesis.
J Bacteriol 193: 1414–1426.
32. Jones SW, Paredes CJ, Tracy B, Cheng N, Sillers R, et al. (2008) The
transcriptional program underlying the physiology of clostridial sporulation.Genome Biol 9: R114.
33. Jones SW, Tracy BP, Gaida SM, Papoutsakis ET (2011) Inactivation of sigmaFin Clostridium acetobutylicum ATCC 824 blocks sporulation prior to
asymmetric division and abolishes sigmaE and sigmaG protein expression but
does not block solvent formation. J Bacteriol 193: 2429–2440.
34. Kirk DG, Dahlsten E, Zhang Z, Korkeala H, Lindstrom M (2012) Involvement
of Clostridium botulinum ATCC 3502 sigma factor K in early-stage sporulation.Appl Environ Microbiol 78: 4590–4596.
35. Bi C, Jones SW, Hess DR, Tracy BP, Papoutsakis ET (2011) SpoIIE is necessaryfor asymmetric division, sporulation, and expression of sigmaF, sigmaE, and
sigmaG but does not control solvent production in Clostridium acetobutylicumATCC 824. J Bacteriol 193: 5130–5137.
36. Stragier P (2002) A gene odyssey: exploring the genomes of endospore-formingbacteria. In: AL S, editor. Bacillus subtilis and its closest relatives: from genes to
cells. Washington ASM. pp. 519–525.
37. Piggot PJ, Coote JG (1976) Genetic aspects of bacterial endospore formation.
Bacteriol Rev 40: 908–962.
38. Burns DA, Heeg D, Cartman ST, Minton NP (2011) Reconsidering the
sporulation characteristics of hypervirulent Clostridium difficile BI/NAP1/027.
PLoS One 6: e24894.
39. Haraldsen JD, Sonenshein AL (2003) Efficient sporulation in Clostridium
difficile requires disruption of the sigmaK gene. Mol Microbiol 48: 811–821.
40. Burns DA, Minton NP (2011) Sporulation studies in Clostridium difficile.
J Microbiol Methods 87: 133–138.
41. Wilson KH, Kennedy MJ, Fekety FR (1982) Use of sodium taurocholate to
enhance spore recovery on a medium selective for Clostridium difficile. J ClinMicrobiol 15: 443–446.
42. Putnam EE, Nock AM, Lawley TD, Shen A (2013) SpoIVA and SipL are
Clostridium difficile spore morphogenetic proteins. J Bacteriol 195(6):1214–25.
43. Pogliano J, Osborne N, Sharp MD, Abanes-De Mello A, Perez A, et al. (1999) A
vital stain for studying membrane dynamics in bacteria: a novel mechanism
controlling septation during Bacillus subtilis sporulation. Mol Microbiol 31:
1149–1159.
44. Heap JT, Pennington OJ, Cartman ST, Carter GP, Minton NP (2007) The
ClosTron: a universal gene knock-out system for the genus Clostridium.
J Microbiol Methods 70: 452–464.
45. Heap JT, Pennington OJ, Cartman ST, Minton NP (2009) A modular system for
Clostridium shuttle plasmids. J Microbiol Methods 78: 79–85.
46. Eldar A, Chary VK, Xenopoulos P, Fontes ME, Loson OC, et al. (2009) Partial
penetrance facilitates developmental evolution in bacteria. Nature 460: 510–514.
47. Eichenberger P, Fawcett P, Losick R (2001) A three-protein inhibitor of polar
septation during sporulation in Bacillus subtilis. Mol Microbiol 42: 1147–1162.
48. Karmazyn-Campelli C, Bonamy C, Savelli B, Stragier P (1989) Tandem genes
encoding sigma-factors for consecutive steps of development in Bacillus subtilis.
Genes Dev 3: 150–157.
49. Lu S, Halberg R, Kroos L (1990) Processing of the mother-cell sigma factor,
sigma K, may depend on events occurring in the forespore during Bacillus
subtilis development. Proc Natl Acad Sci U S A 87: 9722–9726.
50. Cutting S, Oke V, Driks A, Losick R, Lu S, et al. (1990) A forespore checkpoint
for mother cell gene expression during development in B. subtilis. Cell 62: 239–
250.
51. Wang KH, Isidro AL, Domingues L, Eskandarian HA, McKenney PT, et al.
(2009) The coat morphogenetic protein SpoVID is necessary for spore
encasement in Bacillus subtilis. Mol Microbiol 74: 634–649.
52. Reid BG, Flynn GC (1997) Chromophore formation in green fluorescent
protein. Biochemistry 36: 6786–6791.
53. Donovan C, Bramkamp M (2009) Characterization and subcellular localization
of a bacterial flotillin homologue. Microbiology 155: 1786–1799.
54. Nicolle O, Rouillon A, Guyodo H, Tamanai-Shacoori Z, Chandad F, et al.
(2010) Development of SNAP-tag-mediated live cell labeling as an alternative to
GFP in Porphyromonas gingivalis. FEMS Immunol Med Microbiol 59: 357–
363.
55. Permpoonpattana P, Tolls EH, Nadem R, Tan S, Brisson A, et al. (2011)
Surface layers of Clostridium difficile endospores. J Bacteriol 193: 6461–6470.
56. Permpoonpattana P, Phetcharaburanin J, Mikelsone A, Dembek M, Tan S,
et al. (2013) Functional characterization of Clostridium difficile spore coat
proteins. J Bacteriol 195: 1492–1503.
57. Vasudevan P, Weaver A, Reichert ED, Linnstaedt SD, Popham DL (2007)
Spore cortex formation in Bacillus subtilis is regulated by accumulation of
peptidoglycan precursors under the control of sigma K. Mol Microbiol 65:
1582–1594.
58. Magge A, Setlow B, Cowan AE, Setlow P (2009) Analysis of dye binding by and
membrane potential in spores of Bacillus species. J Appl Microbiol 106: 814–
824.
59. Fagan RP, Fairweather NF (2011) Clostridium difficile has two parallel and
essential Sec secretion systems. J Biol Chem 286: 27483–27493.
60. Rosenbusch KE, Bakker D, Kuijper EJ, Smits WK (2012) C. difficile
630Deltaerm Spo0A regulates sporulation, but does not contribute to toxin
production, by direct high-affinity binding to target DNA. PLoS One 7: e48608.
61. Saujet L, Monot M, Dupuy B, Soutourina O, Martin-Verstraete I (2011) The
key sigma factor of transition phase, SigH, controls sporulation, metabolism, and
virulence factor expression in Clostridium difficile. J Bacteriol 193: 3186–3196.
62. Saujet L, Pereira FC, Serrano M, Soutourina O, Monot M, et al. (2013)
Genome-wide analysis of cell type-specific gene expression during spore
formation in Clostridium difficile. PLOS Gen 9: e1003756
63. Sun DX, Cabrera-Martinez RM, Setlow P (1991) Control of transcription of the
Bacillus subtilis spoIIIG gene, which codes for the forespore-specific transcrip-
tion factor sigma G. J Bacteriol 173: 2977–2984.
64. Partridge SR, Errington J (1993) The importance of morphological events andintercellular interactions in the regulation of prespore-specific gene expression
during sporulation in Bacillus subtilis. Mol Microbiol 8: 945–955.
65. Serrano M, Real G, Santos J, Carneiro J, Moran CP, Jr., et al. (2011) A negative
feedback loop that limits the ectopic activation of a cell type-specific sporulation
sigma factor of Bacillus subtilis. PLoS Genet 7: e1002220.
66. Londono-Vallejo JA, Stragier P (1995) Cell-cell signaling pathway activating a
developmental transcription factor in Bacillus subtilis. Genes Dev 9: 503–508.
67. Karow ML, Glaser P, Piggot PJ (1995) Identification of a gene, spoIIR, that links
the activation of sigma E to the transcriptional activity of sigma F during
sporulation in Bacillus subtilis. Proc Natl Acad Sci U S A 92: 2012–2016.
68. Wang ST, Setlow B, Conlon EM, Lyon JL, Imamura D, et al. (2006) The
forespore line of gene expression in Bacillus subtilis. J Mol Biol 358: 16–37.
69. Steil L, Serrano M, Henriques AO, Volker U (2005) Genome-wide analysis of
temporally regulated and compartment-specific gene expression in sporulating
cells of Bacillus subtilis. Microbiology 151: 399–420.
70. Eichenberger P, Fujita M, Jensen ST, Conlon EM, Rudner DZ, et al. (2004) The
program of gene transcription for a single differentiating cell type during
sporulation in Bacillus subtilis. PLoS Biol 2: e328.
71. Eichenberger P, Jensen ST, Conlon EM, van Ooij C, Silvaggi J, et al. (2003) The
sigmaE regulon and the identification of additional sporulation genes in Bacillus
subtilis. J Mol Biol 327: 945–972.
Clostridium difficile Sporulation
PLOS Genetics | www.plosgenetics.org 18 October 2013 | Volume 9 | Issue 10 | e1003782

72. Doan T, Morlot C, Meisner J, Serrano M, Henriques AO, et al. (2009) Novel
secretion apparatus maintains spore integrity and developmental gene
expression in Bacillus subtilis. PLoS Genet 5: e1000566.
73. Serrano M, Vieira F, Moran CP, Jr., Henriques AO (2008) Processing of a
membrane protein required for cell-to-cell signaling during endospore formation
in Bacillus subtilis. J Bacteriol 190: 7786–7796.
74. Meisner J, Wang X, Serrano M, Henriques AO, Moran CP, Jr. (2008) A
channel connecting the mother cell and forespore during bacterial endospore
formation. Proc Natl Acad Sci U S A 105: 15100–15105.
75. Camp AH, Losick R (2008) A novel pathway of intercellular signalling in
Bacillus subtilis involves a protein with similarity to a component of type III
secretion channels. Mol Microbiol 69: 402–417.
76. Camp AH, Losick R (2009) A feeding tube model for activation of a cell-specific
transcription factor during sporulation in Bacillus subtilis. Genes Dev 23: 1014–
1024.
77. Fujita M, Losick R (2003) The master regulator for entry into sporulation in
Bacillus subtilis becomes a cell-specific transcription factor after asymmetric
division. Genes Dev 17: 1166–1174.
78. Tracy BP, Jones SW, Fast AG, Indurthi DC, Papoutsakis ET (2011) Clostridia:
the importance of their exceptional substrate and metabolite diversity for biofuel
and biorefinery applications. Curr Opin Biotechnol 23: 364–381.
79. Chary VK, Xenopoulos P, Piggot PJ (2007) Expression of the sigmaF-directed
csfB locus prevents premature appearance of sigmaG activity during sporulation
of Bacillus subtilis. J Bacteriol 189: 8754–8757.
80. Karmazyn-Campelli C, Rhayat L, Carballido-Lopez R, Duperrier S, Frandsen
N, et al. (2008) How the early sporulation sigma factor sigmaF delays the switch
to late development in Bacillus subtilis. Mol Microbiol 67: 1169–1180.
81. Broder DH, Pogliano K (2006) Forespore engulfment mediated by a ratchet-like
mechanism. Cell 126: 917–928.
82. Dahlsten E, Kirk D, Lindstrom M, Korkeala H (2013) Alternative Sigma Factor
SigK Has a Role in Stress Tolerance of Group I Clostridium botulinum StrainATCC 3502. Appl Environ Microbiol 79: 3867–3869.
83. Jiang X, Rubio A, Chiba S, Pogliano K (2005) Engulfment-regulated proteolysis
of SpoIIQ: evidence that dual checkpoints control sigma activity. Mol Microbiol58: 102–115.
84. Henriques AO, Beall BW, Roland K, Moran CP, Jr. (1995) Characterization ofcotJ, a sigma E-controlled operon affecting the polypeptide composition of the
coat of Bacillus subtilis spores. J Bacteriol 177: 3394–3406.
85. Hussain HA, Roberts AP, Mullany P (2005) Generation of an erythromycin-sensitive derivative of Clostridium difficile strain 630 (630Deltaerm) and
demonstration that the conjugative transposon Tn916DeltaE enters the genomeof this strain at multiple sites. J Med Microbiol 54: 137–141.
86. Keppler A, Gendreizig S, Gronemeyer T, Pick H, Vogel H, et al. (2003) Ageneral method for the covalent labeling of fusion proteins with small molecules
in vivo. Nat Biotechnol 21: 86–89.
87. Vida TA, Emr SD (1995) A new vital stain for visualizing vacuolar membranedynamics and endocytosis in yeast. J Cell Biol 128: 779–792.
88. George WL, Sutter VL, Citron D, Finegold SM (1979) Selective and differentialmedium for isolation of Clostridium difficile. J Clin Microbiol 9: 214–219.
89. Joshi LT, Phillips DS, Williams CF, Alyousef A, Baillie L (2012) Contribution of
spores to the ability of Clostridium difficile to adhere to surfaces. Appl EnvironMicrobiol 78: 7671–7679.
90. Balomenou S, Fouet A, Tzanodaskalaki M, Couture-Tosi E, Bouriotis V, et al.(2013) Distinct functions of polysaccharide deacetylases in cell shape, neutral
polysaccharide synthesis and virulence of Bacillus anthracis. Mol Microbiol87(4):867–83.
91. Monot M, Boursaux-Eude C, Thibonnier M, Vallenet D, Moszer I, et al. (2011)
Reannotation of the genome sequence of Clostridium difficile strain 630. J MedMicrobiol 60: 1193–1199.
Clostridium difficile Sporulation
PLOS Genetics | www.plosgenetics.org 19 October 2013 | Volume 9 | Issue 10 | e1003782


